Real-time monitoring of copper ions-induced cytotoxicity by EIS cell chips

Fish with Chips: Tracking Reef Fish Movements toEvaluate Size and Connectivity of Caribbean MarineProtected AreasSimon J. Pittman1,2,3*, Mark E. Monaco1, Alan M. Friedlander4, Bryan Legare2,5, Richard S. Nemeth2,
Matthew S. Kendall1, Matthew Poti1, Randall D. Clark1, Lisa M. Wedding1,6, Chris Caldow1
1 U.S. National Oceanic and Atmospheric Administration, Center for Coastal Monitoring and Assessment, Silver Spring, Maryland, United States of America, 2 Center for
Marine and Environmental Studies, University of the Virgin Islands, St. Thomas, Virgin Islands, U.S. Virgin Islands, 3 Centre for Marine and Coastal Policy Research, The
Marine Institute, Marine Building, Plymouth University, Plymouth, Devon, United Kingdom, 4 Department of Biology, Fisheries Ecology Research Laboratory, University of
Hawai‘i at Manoa, Honolulu, Hawai’i, United States of America, 5 Texas Parks and Wildlife, Dickinson Marine Lab, Dickinson, Texas, United States of America, 6 Center for
Ocean Solutions, Woods Institute for the Environment, Stanford University, Monterey, California, United States of America
Abstract
Coral reefs and associated fish populations have experienced rapid decline in the Caribbean region and marine protectedareas (MPAs) have been widely implemented to address this decline. The performance of no-take MPAs (i.e., marinereserves) for protecting and rebuilding fish populations is influenced by the movement of animals within and across theirboundaries. Very little is known about Caribbean reef fish movements creating a critical knowledge gap that can impedeeffective MPA design, performance and evaluation. Using miniature implanted acoustic transmitters and a fixed acousticreceiver array, we address three key questions: How far can reef fish move? Does connectivity exist between adjacent MPAs?Does existing MPA size match the spatial scale of reef fish movements? We show that many reef fishes are capable oftraveling far greater distances and in shorter duration than was previously known. Across the Puerto Rican Shelf, more thanhalf of our 163 tagged fish (18 species of 10 families) moved distances greater than 1 km with three fish moving more than10 km in a single day and a quarter spending time outside of MPAs. We provide direct evidence of ecological connectivityacross a network of MPAs, including estimated movements of more than 40 km connecting a nearshore MPA with a shelf-edge spawning aggregation. Most tagged fish showed high fidelity to MPAs, but also spent time outside MPAs, potentiallycontributing to spillover. Three-quarters of our fish were capable of traveling distances that would take them beyond theprotection offered by at least 40–64% of the existing eastern Caribbean MPAs. We recommend that key species movementpatterns be used to inform and evaluate MPA functionality and design, particularly size and shape. A re-scaling of ourperception of Caribbean reef fish mobility and habitat use is imperative, with important implications for ecology andmanagement effectiveness.
Citation: Pittman SJ, Monaco ME, Friedlander AM, Legare B, Nemeth RS, et al. (2014) Fish with Chips: Tracking Reef Fish Movements to Evaluate Size andConnectivity of Caribbean Marine Protected Areas. PLoS ONE 9(5): e96028. doi:10.1371/journal.pone.0096028
Editor: Christopher J. Fulton, The Australian National University, Australia
Received July 23, 2013; Accepted April 2, 2014; Published May 5, 2014
Copyright: � 2014 Pittman et al. This is an open-access article distributed under the terms of the Creative Commons Attribution License, which permitsunrestricted use, distribution, and reproduction in any medium, provided the original author and source are credited.
Funding: SJP, MEM, AMF and LMW were supported by U.S. National Park Service, NOAA Center for Coastal Monitoring and Assessment (CCMA) and NOAA CoralReef Conservation Program. BL was supported by University of the Virgin Islands. RSN was supported by the National Science Foundation’s Virgin IslandsExperimental Program to Stimulate Competitive Research (0814417) and the University of the Virgin Islands Center for Marine and Environmental Studies (CMES).The UVI acoustic array was supported by grants from Puerto Rico Sea Grant (R-31-1-06), NOAA Saltonstall-Kennedy (NA09NMF4270068), NOAA cooperativeagreement (NA08NOS4260348), and USGS State Partnership Program (07ERAG0078). The funders had no role in study design, data collection and analysis,decision to publish, or preparation of the manuscript.
Competing Interests: The authors have declared that no competing interests exist.
* E-mail: [email protected]
Introduction
In the past 50 years, coral reef ecosystems of the Caribbean Sea
have experienced considerable region-wide declines in the
abundance and body size of many fished species and in the
quality of their habitat [1,2,3]. In response, marine protected areas
(MPAs), including areas closed to fishing, have been established
throughout the region [4]. However, MPAs often fail to reach
their full potential as a consequence of factors such as illegal
harvesting, regulations that legally allow detrimental harvesting, or
emigration of animals outside boundaries because of continuous
habitat or inadequate size of the MPA [42]. In the Caribbean and
elsewhere, MPA placement, size and shape, typically have been
delineated without knowledge of the movements of the animals
they are intended to protect. This is a widespread practice for coral
reef-centered MPAs where placement and shape are generally
designed using relatively static biophysical features of the seafloor
and with political and socio-economic considerations rather than
criteria based on functional ecology [32,33,43,44]. Research on
the optimal design and connectivity of MPAs and networks of
MPAs has focused primarily on models of larval dispersal
[5,13,37]. It is now increasingly acknowledged, however, that
adult and juvenile movements have a considerable influence on
the functioning of MPAs [7,34,40,41]. Spatially-explicit informa-
tion on the movement patterns of fishes, including home range
size, relocation movements and distances traveled on migrations,
can play a central role to support the ecologically meaningful
PLOS ONE | www.plosone.org 1 May 2014 | Volume 9 | Issue 5 | e96028

design of MPAs [5,6,10,45]. For highly mobile fishes, protection
could be sub-optimal if MPAs are too small relative to the routine
space use patterns of fishes, or if placed in locations that offer
incomplete protection for animals when undertaking critical
migrations [5,6,7,13]. Modeling studies suggest that even limited
adult dispersal can have a large impact on MPA functioning [44].
Conversely, emigration from protected areas can contribute to
‘‘spillover’’ of fish into the neighboring fishery, an important
fisheries management goal [8]. Clearly, knowledge of the spatial
scale and patterns of fish movements across the seascape can
provide direct evidence of ecological connectivity between
individual MPAs, as well as data for the evaluation of ecological
coherence within an MPA network.
Understanding movement patterns has profound implications
for ecology too. Organism movement behavior is a fundamental
ecological process that can be used to identify habitat use patterns,
investigate bioenergetics, energy flows and to select the appropri-
ate spatial (and temporal) scale(s) at which to study species ecology
[9,11]. An organism-centered approach, that provides explicit
spatial and temporal data on organism movements, can help
ecologists formulate research questions and design studies that
measure ecological patterns and processes at ecologically mean-
ingful scales [9]. When analyzed together with maps of benthic
composition, or seafloor topographic structure, movement data
can identify critical pathways, or ‘blue corridors’, connecting patch
types in the seascape [9,10,11,12]. Very little is known, however,
about the spatial scale of adult fish movements, travel times and
locations visited by Caribbean fishes during their life span [7,9].
Fish assemblages of Caribbean coral reef ecosystems are
exceptionally diverse, with many species using multiple habitat
types (i.e., seagrasses, mangroves, coral reefs) through daily home
range movements, ontogenetic habitat shifts and spawning and
non-spawning migrations [9,14]. As such, the spatial domain of
routine movements, sometimes referred to as the ecological
neighborhood [9,10], will differ between species, individuals and
life-stages [6,14,15]. However, direct and spatially explicit
evidence for the distances traveled and timing of movements by
fishes associated with Caribbean coral reef ecosystems is scarce
[16]. Studies have either focused on fine-scale movements for
single species and families, usually confined geographically to a
single embayment or MPA [19,20], or large-bodied species of high
conservation or fishery concern, such as groupers, revealing long
(.30–220 km) distance movements to spawning aggregations
[35,36,49]. Relative to the fish life span, movement observations
have been short (days-weeks) potentially resulting in an underes-
timate of the spatial scale of movement [7].
The most effective technique for gathering direct evidence of
movements in time and space for highly mobile marine animals,
such as fish, is to tag them with miniature acoustic transmitters
[9,21]. Advances in microelectronics and a demand for ever
smaller tags has resulted in the development of miniaturized
underwater acoustic transmitters small enough to be harmlessly
implanted in small (,20 cm) fishes, yet with sufficient battery life
to emit a unique identification code every minute for a year or
more. These coded transmitters are detected by underwater
acoustic receivers that can be strategically moored above the
seafloor to form an array of listening stations [22].
A lack of information on fish movements has been identified as a
critical knowledge gap in the application of MPAs as a
management tool [17,18,34]. To address the knowledge gap for
the U.S Caribbean we utilized an array of 225 underwater
acoustic receivers to track fish movements between MPAs and
across the contiguous insular shelf of the U.S. Virgin Islands and
southeastern Puerto Rico. The array known as the U.S. Caribbean
Acoustic Network (USCAN), formed through a consortium of
collaborating scientists from multiple institutions, was one of the
largest acoustic fish telemetry networks in the world. Tracking
movements of highly mobile organisms with an acoustic array
allowed us, from afar, to locate fish and then map points of
presence along their movement pathways as they swam freely
across the seascape.
Our primary research questions were: 1.) How far do fish move
and how long does it take them to move those distances? 2.) Are
MPAs connected by fish movements and if so then how often do
fish cross MPA boundaries? and 3.) Are MPAs in the eastern
Caribbean of sufficient size to encompass the movements of reef
fish?
Materials and Methods
We tagged 184 individual fish with surgically implanted
miniature acoustic transmitters (see File S1) representing 19
species from 10 different families commonly occurring in
Caribbean coral reef ecosystems (Table 1) [23]. Tagged fishes
included ecologically and economically important species targeted
in the Virgin Islands fishery. Fish sizes, measured as total body
length (TL), ranged from 19 to 70 cm (mean = 30.3 cm). The
largest individual tagged was a 70 cm TL nurse shark (Ginglymos-
toma cirratum) and the smallest was a blue tang (Acanthurus coeruleus)
of 19 cm TL. Five species of snapper (Lutjanidae) accounted for
31% of all individuals tagged and three species of grunt
(Haemulidae) accounted for 23% of the sample. At the species
level, bluestriped grunt (Haemulon sciurus) comprised 22% of all
individuals tagged, lane snapper (Lutjanus synagris) 21%, bar jack
(Caranx ruber) 11%, and saucereye porgy (Calamus calamus) 10%.
Fish were captured, tagged and released between July 2006 and
July 2008 within the Virgin Islands National Park (VINP) under
research permit (# 118794) provided by the National Park Service
of the U.S. Department of Interior. Fish locations were recorded
for a total of 1,244 days (approx. 3 year and 4 months) calculated
as the time elapsed between the first and last detection on a
receiver. During that time, a total of 2,848,192 detections were
recorded from 163 individual fish of 18 species (21 individuals
were not detected after release).
Experimental procedures were approved by the Office of
Research Compliance Animal Welfare and Biosafety Program of
the University of Hawaii and the Animal Care and Use
Committee. Permission to capture fish and conduct experiments
including tagging and tracking inside waters managed by the U.S.
Department of Interior were provided by the National Park
Service under permit NPS PIMS Project #118794 Ecological
linkages between the Virgin Islands Coral Reef National
Monument and the Virgin Islands National Park.
Acoustic arrayThe underwater acoustic monitoring system consisted of an
array of VemcoTM VR2/VR2W acoustic receivers (340 mm long
960 mm diameter, weight in water 300 g) capable of detecting
coded transmitter signals when located within a 300 m minimum
radius of the receiver. Receivers were deployed on polypropylene
lines or vinyl coated stainless steel wire attached to the seabed with
sand screws or concrete blocks at depths of between 1 and 38
meters. The array was positioned close to the edges of nearshore
coral reefs and across the insular shelf to create both an alongshore
Reef Fish Movements and MPA Design
PLOS ONE | www.plosone.org 2 May 2014 | Volume 9 | Issue 5 | e96028

Ta
ble
1.
Fish
spe
cie
sta
gg
ed
wit
hu
ltra
son
ictr
ansm
itte
rsan
dth
eir
bio
log
ical
char
acte
rist
ics
and
sum
mar
yin
form
atio
no
nth
ed
ura
tio
no
ftr
acki
ng
and
leas
tco
std
ista
nce
be
twe
en
fart
he
stre
ceiv
ers
wit
hd
ete
ctio
ns.
Fa
mil
yS
cie
nti
fic
na
me
Co
mm
on
na
me
Nu
mb
er
tag
ge
dT
rop
hic
gro
up
To
tal
len
gth
ran
ge
(cm
)M
ax
.d
ay
str
ack
ed
Ma
xin
ter-
rece
ive
rd
ista
nce
(ra
ng
ein
km
)
Hae
mu
lidae
Ha
emu
lon
sciu
rus
Blu
est
rip
ed
gru
nt
40
Inve
rtiv
ore
24
–3
0.6
93
00
.4–
13
.5
Lutj
anid
aeLu
tja
nu
ssy
na
gri
sLa
ne
snap
pe
r3
8In
v/P
isc
20
–3
67
22
0.5
–1
1.5
Car
ang
idae
Ca
ran
xru
ber
Bar
jack
21
Pis
civo
re2
9.8
–4
73
29
0.5
8–
13
.6
Spar
idae
Ca
lam
us
cala
mu
sSa
uce
reye
po
rgy
19
Inve
rtiv
ore
21
.3–
35
18
00
.47
–1
5.3
Lutj
anid
aeO
cyu
rus
chry
suru
sY
ello
wta
ilsn
app
er
14
Inve
rtiv
ore
22
.5–
38
33
30
.3–
16
.1
Lutj
anid
aeLu
tja
nu
sa
na
lisM
utt
on
snap
pe
r1
2In
vert
ivo
re3
1–
65
78
41
.1–
42
.2
Ho
loce
ntr
idae
Ho
loce
ntr
us
ad
scen
sio
nis
Lon
gja
wsq
uir
relf
ish
9In
vert
ivo
re2
6–
29
34
81
.5–
5.1
Aca
nth
uri
dae
Aca
nth
uru
sco
eru
leu
sB
lue
tan
g5
He
rbiv
ore
19
–2
41
06
2–
8.5
Bal
isti
dae
Ba
liste
sve
tula
Qu
ee
ntr
igg
erf
ish
5In
vert
ivo
re2
9–
39
38
0.5
8–
1.5
Lutj
anid
aeLu
tja
nu
sg
rise
us
Gra
ysn
app
er
5In
vert
ivo
re2
5.2
–3
5.4
65
71
–3
.5
Mu
llid
aeM
ullo
idic
hth
ysm
art
inic
us
Ye
llow
go
atfi
sh3
Inve
rtiv
ore
31
–3
2.3
34
0.4
–4
.8
Aca
nth
uri
dae
Aca
nth
uru
sch
iru
rgu
sD
oct
orf
ish
2H
erb
ivo
re1
9.2
–2
3.9
85
1–
3.6
Serr
anid
aeEp
inep
hel
us
gu
tta
tus
Re
dh
ind
2In
v/P
isc
29
.5–
36
.54
02
6.3
Gin
gly
mo
sto
mat
idae
Gin
gly
mo
sto
ma
cirr
atu
mN
urs
esh
ark
2In
v/P
isc
55
–7
02
33
0.7
Hae
mu
lidae
Ha
emu
lon
fla
volin
eatu
mFr
en
chg
run
t2
Inve
rtiv
ore
20
–2
1.5
10
Hae
mu
lidae
Ha
emu
lon
plu
mie
rii
Wh
ite
gru
nt
2In
vert
ivo
re2
5–
31
.53
32
6.2
Lutj
anid
aeLu
tja
nu
sa
po
du
sSc
ho
olm
aste
r1
Inv/
Pis
c2
73
82
5.1
Lutj
anid
aeLu
tja
nu
sjo
cuD
og
snap
pe
r1
Inv/
Pis
c4
1.4
31
11
2.8
Mu
llid
aeP
seu
du
pen
eus
ma
cula
tus
Spo
tte
dg
oat
fish
1In
vert
ivo
re2
70
0
No
teth
atth
ese
est
imat
es
rep
rese
nt
the
min
imu
mkn
ow
ncr
oss
-bo
un
dar
ym
ove
me
nts
.We
exc
ep
tth
atth
em
axim
um
dis
tan
cee
stim
ate
sar
elik
ely
tob
elim
ite
db
yth
ear
ray
con
fig
ura
tio
nan
dth
atm
any
mo
vem
en
tsar
eu
nd
ete
cte
d,
bu
tth
iso
nly
incr
eas
es
the
pro
bab
ility
that
dis
tan
ces
trav
ele
dco
uld
be
eve
ng
reat
er
than
hig
hlig
hte
dh
ere
rath
er
than
less
ext
en
sive
.d
oi:1
0.1
37
1/j
ou
rnal
.po
ne
.00
96
02
8.t
00
1
Reef Fish Movements and MPA Design
PLOS ONE | www.plosone.org 3 May 2014 | Volume 9 | Issue 5 | e96028

and an inshore-offshore corridor of listening stations (Fig. 1).
Receivers were located both inside and outside four well-
established, permanent and seasonal marine protected areas of
the U.S. Virgin Islands: Virgin Islands Coral Reef National
Monument (VICR) (approx. 51.5 km2); the Virgin Islands
National Park (VINP) (approx. 22.9 km2); Hind Bank Marine
Conservation District (MCD) (approx. 41 km2), and Grammanik
Bank (GB) (approx. 4.5 km2), the latter two being sites of
regionally important multispecies fish spawning aggregations.
VICR and MCD are both no-take MPAs and GB is a seasonal
closure for a range of spawning species [50]. Our array also
provided information on trans-boundary movements from waters
managed by U.S. Federal Government to waters managed by the
Governments of Puerto Rico and U.S. Virgin Islands. Receivers
were maintained and data managed and shared by a consortium
of institutions known collectively as the U.S. Caribbean Acoustic
Network (USCAN) comprising the National Oceanic and Atmo-
spheric Administration’s (NOAA) National Centers for Coastal
Ocean Science (NCCOS) and NOAA National Marine Fisheries
Service (NMFS), together with the University of the Virgin Island’s
Center for Marine and Environmental Studies. When operating
simultaneously, this network was able to detect tagged fish
movements between receivers across distances of between 300 m
(closest receivers) to 103.3 km (farthest receivers) across the insular
shelf. Although the integrated data from the entire array network
provided greater coverage than could any of the individual project
arrays, some spatial clustering of receivers resulted from arrays
configured to address specific research questions.
Calculating least-cost pathways between acousticreceivers
To quantify the spatial domain of movements for each fish, we
calculated between- receiver distance for all receivers that detected
a fish and reported the distance between the pair of receivers that
were farthest apart, together with shortest time elapsed between
those detections. The distances we present here provide estimates
of maximum known movement capability to define a spatial
domain of space use for fishes. We select these data to address
specific questions about the spatio-temporal scale of movements
and we do not herein address detailed habitat use patterns. Rather
than calculating straight line distances between each pair of
receivers, some of which would have transected land or deep
waters beyond the shelf edge, we quantified distances from
modeled least-cost pathways (LCP) conditioned to follow suitable
habitat for reef fish (i.e. colonized hardbottom habitat and shallow
water non-reef habitat [sand]) while avoiding less suitable or
unsuitable environments (i.e., land and deep water beyond the
shelf edge) (see File S1). Tracking studies and underwater
observations provide evidence that fish follow coral reefs to
maximize access to food and minimize predation risk, whereas
land and deep water and sometimes large expanses of sand can
function as barriers to movement [7,24,39]. Non-reef sandy areas
were weighted with relatively low cost such that pathways could
cross sand to connect patches of more preferred (lowest cost) coral
reef patches. Parameterization of LCP models was based on the
known daytime occurrence of species over shallow water coral reef
ecosystems where a strong dependence exists for colonized
Figure 1. Location of underwater acoustic receivers in the U.S. Caribbean Acoustic Network (USCAN) on the southern insular shelfof Puerto Rico and U.S. Virgin Islands. MPA boundaries are shown for the Virgin Islands National Park (VINP), Virgin Islands Coral Reef Monument(VICR) and the Marine Conservation District (MCD).doi:10.1371/journal.pone.0096028.g001
Reef Fish Movements and MPA Design
PLOS ONE | www.plosone.org 4 May 2014 | Volume 9 | Issue 5 | e96028

carbonate seafloor which provides appropriate refuge from
predation and potential food resources for the traveling fish.
Quantifying movements across MPA boundariesTo examine movements relative to MPA boundaries, we
calculated the number of times each fish crossed a management
boundary including excursions to unprotected areas outside of
MPAs. Fish that did not cross a boundary and appeared to remain
within the VINP during the tracking period were also quantified.
Trans-boundary movements were recorded between the Virgin
Islands National Park (limited fishing restrictions); Virgin Islands
Coral Reef National Monument (no-take); Hind Bank Marine
Conservation District (no-take spawning aggregation); Grammanik
Bank (seasonal closure spawning aggregation/pelagic fishing only)
and non-MPA waters. Detections from receivers that were located
too close to a boundary to provide high certainty that a fish had
crossed a boundary were removed from this part of the analysis.
This resulted in removal of seven receivers along the VINP-VICR
boundary and a large spatial gap in detection, therefore, our
estimates of boundary crossings should be interpreted as a
minimum of crossings.
Estimating the proportion of tracked time fishes spendinside and outside MPAs
To examine the presence and residence times of individual fish
inside and outside MPAs, a Fidelity Index was calculated as a
relative estimate of minimum residency. Individuals were consid-
ered present if two or more detections occurred on at least one
receiver within a given day. Fishes were excluded from analysis
where less than a total of ten detections were recorded across the
monitoring period or where presence was recorded for only one
day or less. The monitoring period for each fish was defined as the
number of days between the tagging event and the last detection.
Hourly fish presence was calculated by pooling detections into
hourly increments (24 per day), such that if a fish was detected in
an MPA or outside between 00:00 and 00:59 of any hour then it
was considered present. If a fish was present in two zones in the
same hour it received a value of 1 hour for each zone.
The proportion of time a fish was observed during the study was
calculated as the hours present in all zones divided by the total
monitoring period. To understand the preference for each zone
(i.e. VICR, VINP and unprotected area), a location-specific
Fidelity Index (FI) was quantified for each fish as the sum of hours
in each zone divided by the total hours present. The proportion of
time represented in the FI ranged from 0 (no fidelity) to 1 (high
fidelity).
Due to uncertainty in fish locations during periods without
detections, the FI is best interpreted as the minimum amount of
time a fish is present in a zone and can be used to understand the
relative preference between zones, rather than absolute time spent
in each zone.
Quantifying spatial dimensions of eastern CaribbeanMPAs
To calculate the spatial dimensions of MPAs (n = 220)
throughout the Leeward and Windward Islands (U.S. Virgin
Islands to Aruba, Bonaire and Curacao) we applied a GIS tool
called Minimum Bounding Geometry using ArcGIS v10.1 (ESRI
Inc, 2012) to quantify the length of the long axis (referred to as
MPA length) and the perpendicular axis (referred to as MPA
width) for each MPA polygon. To estimate the greatest distance
that a fish inside an MPA would need to travel to reach the MPA
boundary, we calculated the farthest-edge to centroid distance (the
apothem for regular polygons) for each MPA polygon by halving the
length and width dimensions. Spatial data on MPAs was provided
by The Nature Conservancy compiled for the Caribbean Marine
Protected Areas Managers Network and Forum (CaMPAM). The
MPA database was in development at the time of writing and
therefore incomplete and the regulations associated with each
MPA were not available to determine the proportion of MPAs
designated as no-take marine reserves. Because of differences in
the way that fish pathways and MPA axes were measured we do
not statistically compare fish distances traveled versus MPA length
and width, but instead visually approximate the potential scale
mismatch between spatial domains of MPAs and fish movement
capability. In addition, differences in seascape configuration
between individual MPAs preclude any further comparison.
Results and Discussion
How far can Caribbean reef fishes move?Our long-term acoustic tracking data extend considerably the
known movement abilities for Caribbean reef fish (Fig. 2). The
mean tracking duration calculated from all tagged individuals was
164 days (615.6 SE), with a maximum detection period of 967
days for a bluestriped grunt (Haemulon sciurus), exceeding the
manufacturer’s estimate of battery life for the transmitters. Other
long duration tracking periods were 722 days for a lane snapper (L.
synagris); 784 days for a mutton snapper (L. analis); 657 days for a
gray snapper (L. griseus) and 402 days for a red hind (Epinephelus
guttatus) (Table 1).
From a total of 163 fish tracked, the estimated mean between-
receiver distance traveled was 3.8 km (median = 2.1 km). Seventy-
five percent of fish undertook long range movements greater than
1 km and 33% more than 5 km. Twenty-eight individual fish
traveled more than 1 km between two receivers in a single 24 hour
period. Three fishes traveled 14.9 km (Calamus calamus, 24.5 cm
TL); 11.7 km (Haemulon sciurus, 30 cm TL); and 10.6 km (Lutjanus
synagris, 30.4 cm TL) in a single day. At the family level, grunts
(haemulids), snappers (lutjanids), jacks (carangids), and porgies
(sparids) showed the greatest long-range movements. Unexpect-
edly high mobility, however, was also detected for several species
that are usually perceived as exhibiting relatively low mobility
highlighting how little is known about reef fish movements. For
instance, during a detection period of 348 days, a longjaw
squirrelfish (Holocentrus adscensionis) was detected on receivers
separated by an estimated least-cost path distance of 5.1 km. In
addition, we include information on species with little previous
information on distance travelled, including an individual blue
tang (Acanthurus coeruleus) with maximum estimated distance of
8.5 km; a yellow goatfish (Mulloidichthys martinicus) 4.8 km and
1.5 km for a Queen triggerfish (Balistes vetula). In contrast, eleven
fish were only detected within 500 m of their first detection point
during an average period of 40 days of tracking (range = 1–167).
Longer range movements, however, may have occurred out of
range of our receiver array. For example, in a conventional tag-
recapture study red hind migrated from 5 to 33 km from spawning
aggregation sites to home range sites [51,52]. The modeled
estimates of movement distances should be interpreted as best-
available information on the spatial dimensions of the activity
spaces for individual fish and an underestimate of the true
distances moved within the life span due to spatial bias in the
detectability of fish inherent with a fixed acoustic array.
Furthermore, quantification of model uncertainty for least cost
paths modeled on minimum cost for movements across a benthic
cost surface requires further validation with detailed animal
movement trajectories [48].
Reef Fish Movements and MPA Design
PLOS ONE | www.plosone.org 5 May 2014 | Volume 9 | Issue 5 | e96028

Association between fish body size and spatial scale ofmovements
Several reviews of home range movements have found large-
bodied reef fishes often have larger home ranges than smaller
bodied fishes [6,17]. After outliers were removed (fish detected
only on a single receiver and the shark), our data demonstrate that
body size (TL) and maximum distance of detection are positively
and significantly correlated (r = 0.48, p = ,0.05). Several large-
bodied snapper which undertook long-distance migrations to shelf-
edge spawning sites strengthened the positive correlation, but the
correlation was also decoupled by high variability among
individual fish together with highly variable tracking duration
(Table 1). These differences in mobility are likely to be related to
morphological and life-history characteristics, as well as the
distribution of habitat structure across the region they inhabit.
High behavioral polymorphism in movement patterns among fish
species, life stages and individuals of the same species presents a
major challenge in MPA network design, because over time
unequal protection will exert a selection pressure for certain life
history strategies [5]. In general, larger-bodied reef fishes are
highly mobile, such as many large snappers, groupers and jacks
that may undertake ontogenetic habitat shifts and spawning
migrations across the shelf [38]. These broad-scale movements are
thought to have a large impact on MPA functioning [5,10,17]. For
example, Edgar et al. [42] found that MPA size was important for
predicting biomass of jacks (Carangidae), a highly mobile family,
whereby smaller MPAs correlated with lower biomass which was
thought to result from increased time spent outside of park
boundaries.
As often is the case with remote sensing approaches like acoustic
telemetry, we are unable to provide information on the drivers of
the movements that we report here. With a diverse range of
species and families comes a diverse range of movement strategies.
Some movements will be ontogenetic habitat shifts, others will be
nomadic movements to find more optimal habitat, or enlarge-
ments of the home range, or very directional migratory
movements to spawning aggregations. To adequately protect a
range of species within an MPA or network of MPAs, the
movement patterns for adult fish from a range of fished species
needs to be considered in the MPA network design process
Figure 2. Distance and travel time between farthest receivers visited by acoustically tagged fish based on the time stamps ofdetections on the Caribbean acoustic array. Symbols identify fish family for0 each individual fish data point.doi:10.1371/journal.pone.0096028.g002
Reef Fish Movements and MPA Design
PLOS ONE | www.plosone.org 6 May 2014 | Volume 9 | Issue 5 | e96028
[7,9,10]. Although our study provides new information for several
species, longer duration continuous tracking of multiple individ-
uals at different life stages, together with high resolution mapping
of the seafloor will help to better understand the movement
ecology of fishes associated with Caribbean coral reefs.
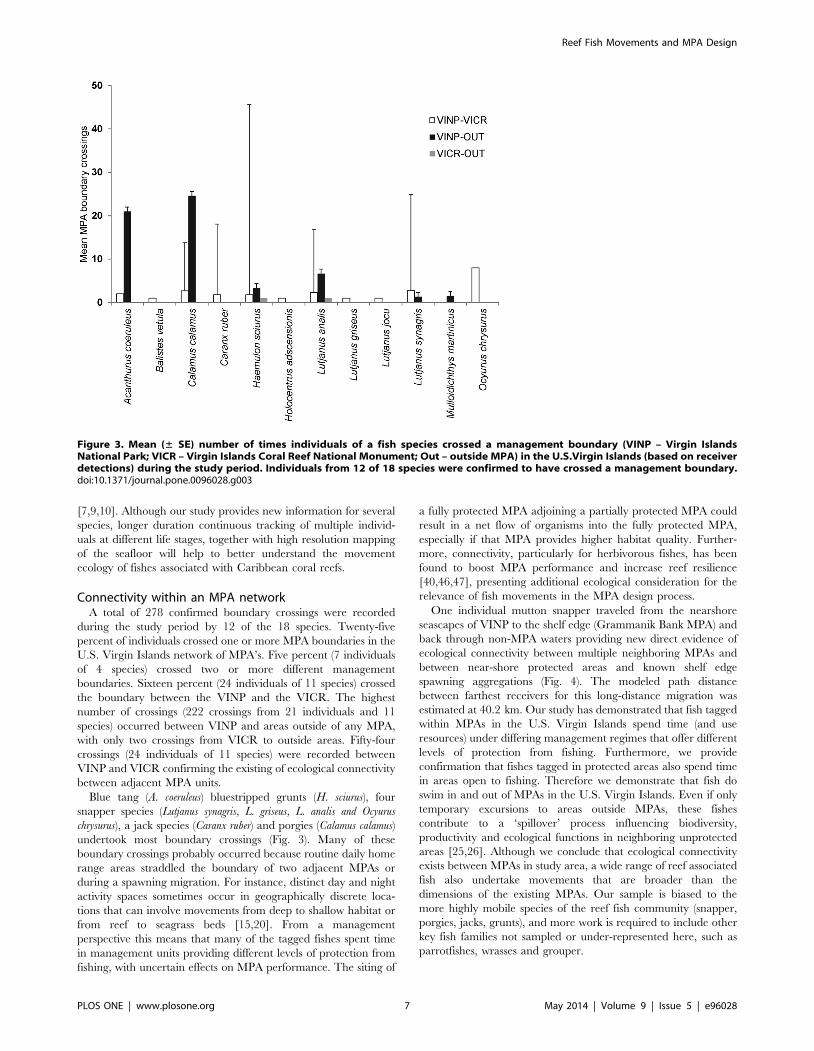
Connectivity within an MPA networkA total of 278 confirmed boundary crossings were recorded
during the study period by 12 of the 18 species. Twenty-five
percent of individuals crossed one or more MPA boundaries in the
U.S. Virgin Islands network of MPA’s. Five percent (7 individuals
of 4 species) crossed two or more different management
boundaries. Sixteen percent (24 individuals of 11 species) crossed
the boundary between the VINP and the VICR. The highest
number of crossings (222 crossings from 21 individuals and 11
species) occurred between VINP and areas outside of any MPA,
with only two crossings from VICR to outside areas. Fifty-four
crossings (24 individuals of 11 species) were recorded between
VINP and VICR confirming the existing of ecological connectivity
between adjacent MPA units.
Blue tang (A. coeruleus) bluestripped grunts (H. sciurus), four
snapper species (Lutjanus synagris, L. griseus, L. analis and Ocyurus
chrysurus), a jack species (Caranx ruber) and porgies (Calamus calamus)
undertook most boundary crossings (Fig. 3). Many of these
boundary crossings probably occurred because routine daily home
range areas straddled the boundary of two adjacent MPAs or
during a spawning migration. For instance, distinct day and night
activity spaces sometimes occur in geographically discrete loca-
tions that can involve movements from deep to shallow habitat or
from reef to seagrass beds [15,20]. From a management
perspective this means that many of the tagged fishes spent time
in management units providing different levels of protection from
fishing, with uncertain effects on MPA performance. The siting of
a fully protected MPA adjoining a partially protected MPA could
result in a net flow of organisms into the fully protected MPA,
especially if that MPA provides higher habitat quality. Further-
more, connectivity, particularly for herbivorous fishes, has been
found to boost MPA performance and increase reef resilience
[40,46,47], presenting additional ecological consideration for the
relevance of fish movements in the MPA design process.
One individual mutton snapper traveled from the nearshore
seascapes of VINP to the shelf edge (Grammanik Bank MPA) and
back through non-MPA waters providing new direct evidence of
ecological connectivity between multiple neighboring MPAs and
between near-shore protected areas and known shelf edge
spawning aggregations (Fig. 4). The modeled path distance
between farthest receivers for this long-distance migration was
estimated at 40.2 km. Our study has demonstrated that fish tagged
within MPAs in the U.S. Virgin Islands spend time (and use
resources) under differing management regimes that offer different
levels of protection from fishing. Furthermore, we provide
confirmation that fishes tagged in protected areas also spend time
in areas open to fishing. Therefore we demonstrate that fish do
swim in and out of MPAs in the U.S. Virgin Islands. Even if only
temporary excursions to areas outside MPAs, these fishes
contribute to a ‘spillover’ process influencing biodiversity,
productivity and ecological functions in neighboring unprotected
areas [25,26]. Although we conclude that ecological connectivity
exists between MPAs in study area, a wide range of reef associated
fish also undertake movements that are broader than the
dimensions of the existing MPAs. Our sample is biased to the
more highly mobile species of the reef fish community (snapper,
porgies, jacks, grunts), and more work is required to include other
key fish families not sampled or under-represented here, such as
parrotfishes, wrasses and grouper.
Figure 3. Mean (± SE) number of times individuals of a fish species crossed a management boundary (VINP – Virgin IslandsNational Park; VICR – Virgin Islands Coral Reef National Monument; Out – outside MPA) in the U.S.Virgin Islands (based on receiverdetections) during the study period. Individuals from 12 of 18 species were confirmed to have crossed a management boundary.doi:10.1371/journal.pone.0096028.g003
Reef Fish Movements and MPA Design
PLOS ONE | www.plosone.org 7 May 2014 | Volume 9 | Issue 5 | e96028

Time spent by fishes inside and outside MPAs in the U.S.Virgin Islands
Monitoring periods ranged from 1 to 967 days with high
variance within and between species (Table 2). Few fish were
detected for over 50% of the hours available during their
monitoring period. French grunt (n = 1) and yellow goatfish
(n = 3) exhibited the highest percentage time observed (81 &
646.12%), followed by red hind (63%), and doctorfish
(5260.09%). The majority of fishes (7 out of 18 species) were
present only 20-50% of the time and schoolmaster, nurse shark
and dog snapper less than 20% of the time. Tagged fish exhibited
high fidelity to VINP wherein they were initially captured and
tagged. VINP represented over 70% of the time observed for 17 of
the 18 fish species tagged. Fourteen percent of fishes (21
individuals of 6 species) tagged in VINP spent time outside of
MPAs. Eight species spent 5–30% of their time inside VICR, with
seven species not present at all and one species, queen triggerfish,
present 61% of the time in VICR. Relatively little time was spent
by fishes in the unprotected area outside of MPAs, with the highest
being bar jacks (12%) and mutton snapper (5%).
Regardless of some extensive long distance movements and
many shorter duration movements outside MPAs, the high fidelity
to VINP and VICR of fishes tagged inside VINP indicates that on
the south shore of St. John, these MPAs can be managed with
confidence that many reef-associated fishes will likely experience
the consequences of management actions. Most individuals,
however, were also detected in the unprotected zone at some
point during their tracking period. The time spent outside MPAs
has greater uncertainty due to the inherent physical gaps in
detection as a result of the design of our acoustic array. Our
estimates of time spent outside MPAs should therefore be
interpreted as a minimum estimate. Temporal gaps in detection
during the total period of the study were most likely because of: 1)
fish spending time in areas outside of the listening range of the
receivers (further than 300 m or under coral heads or in noisy
shallow water); or 2) fish moved outside of the study area and
could have been outside of MPAs. Although unaccounted for in
this study, it is possible that fish movements in and around highly
structured coral reefs interfered with acoustic detectability and
could explain the majority of unobserved time for reef-associated
species such as grunts, squirrelfish, nurse shark and small snapper
(i.e., schoolmaster, lane snapper). From a management efficacy
perspective, however, if U.S. Virgin Islands MPAs can offer
sufficient protection from fishing, and the boundaries and
spawning aggregations are not heavily fished, then the high
residence times recorded here suggest that these MPAs would offer
adequate protection for many fishes.
Potential scale mismatch with Caribbean MPAsAccording to the 2005 World Database on Protected Areas an
estimated 40% of the protected areas in the global network of
coral reef MPAs were smaller than 2 km2 [12]. Based on
measurements of the spatial dimensions of 220 MPAs in the
eastern Caribbean we reveal here that 85% are less than 5 km
Figure 4. Cost surface for the U.S. Virgin Islands based on relative environmental suitability for shallow-water reef fish. One modeledleast-cost path is shown for an individual mutton snapper (Lutjanus analis) that moved a maximum of 40.2 km between two receivers (Virgin IslandsNational Park [VINP] to shelf edge spawning aggregation). The path was parameterized to preferentially follow wherever possible the low cost coralreef to achieve a minimum accumulative travel cost between the two farthest receivers with detections.doi:10.1371/journal.pone.0096028.g004
Reef Fish Movements and MPA Design
PLOS ONE | www.plosone.org 8 May 2014 | Volume 9 | Issue 5 | e96028

Table 2. Summary data of percent time observed by species (total hours observed/total hours monitored (i.e., first to lastdetection) and the Fidelity Index score for VICR, VINP and non-MPA waters.
Family Scientific name
Percent time observed(hrs present/hrsavailable) Average Fidelity Index (± Stdev)
VICR VINP Outside MPA
Haemulidae Haemulon sciurus 3460.32 0.1260.26 0.9160.19 0.0360.14
Lutjanidae Lutjanus synagris 3760.3 0.1160.18 0.960.17 0.0160.03
Sparidae Caranx ruber 3660.26 0.206.25 0.8560.23 0.0260.06
Carangidae Calamus calamus 4960.31 0.0660.11 0.9160.2 0.1260.25
Lutjanidae Ocyurus chrysurus 4160.3 0.0160.03 0.9860.05 0.0260.08
Lutjanidae Lutjanus analis 4760.24 0.0360.07 0.9360.15 0.0560.14
Holocentridae Holocentrus adscensionis 3860.38 0.1460.37 0.9360.19 060
Acanthuridae Acanthurus coeruleus 3960.27 0.0160.02 0.9960.01 0.0160.02
Balistidae Balistes vetula 3060.24 0.6160.54 0.3960.54 060
Lutjanidae Lutjanus griseus 3960.17 0.3360.4 0.760.35 060
Mullidae Mulloidichthys martinicus 6460.12 0.1460.24 0.8760.2 0.0160.02
Acanthuridae Acanthurus chirurgus 5260.09 060 160 060
Serranidae Epinephelus guttatus 63 0 1 0
Rhincodontidae Ginglymostoma cirratum 22 0 1 0
Haemulidae Haemulon flavolineatum 81 0 1 0
Haemulidae Haemulon plumierii 13 0 1 0
Lutjanidae Lutjanus apodus 0 0 1 0
Lutjanidae Lutjanus jocu 11 0.06 0.94 0.04
The proportion of time represented in the FI ranged from 0 (no fidelity) to 1 (high fidelity).doi:10.1371/journal.pone.0096028.t002
Figure 5. Histograms for the maximum spatial extent of movements for all tagged fish (n = 163) based on the least-cost pathwaydistance between the two farthest receivers with detections in the U.S. Caribbean; and the spatial dimensions of existing MPAs(n = 220) in the eastern Caribbean (only Leeward and Windward Islands).doi:10.1371/journal.pone.0096028.g005
Reef Fish Movements and MPA Design
PLOS ONE | www.plosone.org 9 May 2014 | Volume 9 | Issue 5 | e96028

wide (median 1.35 km; range 0.04–21) and 70% are less than
5 km long (median 2.5 km; range 0.13–47.2 km). MPAs tend to be
longer (along shore) than they are wide (shore to shelf) because
they are sited primarily to protect the near-shore marine
environments. Our comparison of distances moved by fish versus
MPA size across the eastern Caribbean region revealed that 74%
of our tracked fish (from 16 of 18 species) traversed distances (i.e.
.1 km) greater than the dimensions of 40–64% of existing MPAs
(Fig. 5). Twenty-eight percent of our fish (from 12 of 18 species)
traversed distances broader than the dimensions of 69–85% of
MPAs, emphasizing a potentially problematic scale mismatch
between MPA design and the spatial scales of fish movements.
Many of the challenges encountered in managing populations of
highly mobile animals occur because of a mismatch between the
scale of management and the scale(s) of the ecological processes
being managed [9,10,16]. Movement studies and data such as
seafloor maps can be used to assess if an MPA encompasses the
routine and critical spaces (i.e., nursery, spawning) used during the
life-history of highly mobile marine fauna. Re-scaling MPAs to
more fully encompass ecological neighborhoods for a group of
target species could make major advances in achieving conserva-
tion goals. Alternatively, if MPA boundaries can be delineated
along physical features (i.e., expanses of unsuitable habitat) that
function as natural barriers to fish movement then perhaps even
relatively small marine reserves would offer enhanced protection
through de-facto containment of reef-associated fish [41,42,44].
On small tropical islands, designing MPAs that extend across the
insular shelf would better protect inshore-offshore migration
corridors, thus encompassing the critical habitats within the life-
cycle. For fishes vulnerable to fishing, but with well-defined linear
movement routes, design of MPAs that include key migration
pathways, so called ‘blue corridors’, connecting essential habitat
areas will likely result in greater protection. Terrestrial conserva-
tion planning for highly mobile populations routinely consider
connectivity and incorporate movement corridors in protected
area design, although efficacy of corridors is not well tested [27].
To some extent, the expansion of two no-take MPAs in the U.S.
Virgin Islands in 2003 to encompass some of the adjacent deeper
water coral reefs, improved the likelihood that fishes undertaking
onshore-offshore ontogenetic shifts or migrations will receive
protection from fishing. Further research is needed to examine the
shape of MPAs relative to their placement across the shelf in order
to assess the level of protection provided to fishes that undergo
cross-shelf movements (i.e. nearshore reefs to deeper offshore
waters) through ontogenetic habitat shifts and spawning migra-
tions. Conversely, if the objective is to enhance spillover then MPA
placement in an area where the habitat inside is spatially
connected to suitable habitat outside would enhance emigration
of fish biomass [19]. Little is known about the influence of MPA
placement and shape relative to seascape patterning, fish
population response and MPA performance. Comparative studies
of fish movements across multiple MPAs of different sizes
protecting different spatial configurations of coral reef are required
to address this knowledge gap.
It is important to note that our database of Caribbean MPAs
did not indicate which MPAs (or portions of MPAs) were no-take
areas/fishery closures. We also did not account for the level of
protection offered by individual MPAs or the fact that MPAs could
be adjacent or overlapping another MPA therefore providing
greater spatial coverage in protection. This level of information
has not yet been compiled for the entire Caribbean region, but it is
likely that most MPAs are multi-use and open to fishing. No-take
areas in the Caribbean are typically smaller than multi-use MPAs
due to the socio-economic impact of restricting fishing on small
island developing states. If true, this would mean that the scale
mismatch between no-take areas and the spatial scale of fish
movement could be an even greater disparity than highlighted
here possibly resulting in insufficient protection to achieve the
expected role in replenishing fished populations and rebuilding
sustainable local fisheries.
Implications for ecologistsRarely do fish ecologists measure habitat structure at spatial
scales relevant to organism movements [9]. Based on the spatial
movements revealed by our study, sampling and quantifying
habitat correlates only with conventional survey techniques such as
underwater transect lines and quadrats (10 s–100 s m2) appears
inadequate. Such fine-scale measurements provide only a snapshot
of habitat association and potentially result in identification of
misleading environmental drivers. In light of the greater mobility
of reef fish demonstrated here and an acknowledgement that many
fish use mosaics of habitat types, we advocate that the
quantification of fish-habitat requires a conceptual shift to a
multi-scale, multi-habitat, organism-centered approach analogous
to the recent growth of landscape ecology to study mobile
terrestrial fauna [28–30]. Several guiding principles that exist at
the core of landscape ecology have made major contributions to
terrestrial landscape planning and conservation, but in marine
systems our understanding is still in its infancy. For example, (1)
environmental heterogeneity exists at multiple spatial scales to
which organisms respond differently and at different scales; (2)
connectivity is an important ecological pattern and process; (3)
patch boundaries/edges influence ecological processes. In land-
scape ecology, the organism’s activity space helps us to anchor the
scale selection to a known and functionally meaningful spatiotem-
poral scale that can then form the focal scale in a hierarchical
approach [9]. The integration of concepts from behavioral ecology
and landscape ecology represents a new frontier in marine ecology
and offer many opportunities for scientific progress together with
providing support for information-led design in marine manage-
ment [31]. The ecological importance of adult movements is
receiving renewed attention and it has been argued that
information on adult-mediated population connectivity is critical
to understanding the complex dynamics of connectivity between
subpopulations, patterns of recruitment and the evolution of
population structuring [37]. If movements of adult fishes play a
large role in regulating regional patterns in productivity then this
has important implications for fisheries management and the
design and functioning of place-based strategies such as MPAs.
Technological advances in microelectronics for telemetry, spatial
analytical techniques and marine remote sensing now offer an
unprecedented opportunity to address major knowledge gaps in
marine animal movements for a wide range of mobile marine
organisms.
Supporting Information
File S1
(DOC)
Acknowledgments
The research was coordinated by NOAA National Centers for Coastal
Ocean Science (NCCOS) in collaboration with the National Park Service.
We thank S. Hitt and J. Blondeau for assisting with field work; R. Hill
(NOAA National Marine Fisheries Service, Galveston), G. Skomel
(Division of Marine Fisheries, Massachusetts State Government), B.
DeAngelis (The Nature Conservancy) M. Shivji (Nova Southeastern
Reef Fish Movements and MPA Design
PLOS ONE | www.plosone.org 10 May 2014 | Volume 9 | Issue 5 | e96028

University, Florida) and B. Weatherbee (University of Rhode Island) for
sharing receiver data, and J. Knowles of The Nature Conservancy for the
Caribbean MPA data. Thank you to three anonymous reviewers for
helping to refine the manuscript.
Author Contributions
Conceived and designed the experiments: MEM AMF MSK RDC CC.
Performed the experiments: SJP MEM AMF BL RSN MSK RDC.
Analyzed the data: SJP BL LMW. Contributed reagents/materials/
analysis tools: SJP MEM RSN MP. Wrote the paper: SJP BL.
References
1. Alvarez-Filip L, Dulvy NK, Gill JA, Cote IM, Watkinson AR (2009) Flattening
of Caribbean coral reefs: region-wide declines in architectural complexity.Proc R Soc B 276: 3019–3025.
2. Paddack MJ, Reynolds JD, Aguilar C, Appeldoorn RS, Beets J, et al. (2009)
Recent region-wide declines in Caribbean reef fish abundance. Curr Biol 19:590–595.
3. Stallings CD (2009) Fishery-independent data reveal negative effect of humanpopulation density on Caribbean predatory fish communities. PLoS One 4(5):
e5333.4. Guarderas AP, Hacker SD, Lubchenco J (2008) Current status of marine
protected areas in Latin America and the Caribbean. Conserv Biol 22: 1630–
1640.5. Gruss A, Kaplan DM, Guenette S, Roberts CM, Botsford LW (2011)
Consequences of adult and juvenile movement for marine protected areas. BiolConserv 144(2): 692–702.
6. Kramer DL, Chapman MR (1999) Implications of fish home range size and
relocation for marine reserve function. Env Biol Fish 55: 65–79.7. Meyer CG, Papastamatiou YP, Clark TB (2010) Differential movement patterns
and site fidelity among trophic groups of reef fishes in a Hawaiian marineprotected area. Mar Biol 157: 1499–1511.
8. Alcala AC, Russ GR, Maypa AP, Calumpong HP (2005) A long-term, spatially
replicated experimental test of the effect of marine reserves on local fish yields.Can J Fish Aquat Sci 62: 98–108.
9. Pittman SJ, McAlpine CA (2003) Movements of marine fish and decapodcrustaceans: Process, theory and application. Adv Mar Biol 44: 205–294.
10. Palumbi SR (2004) Marine reserves and ocean neighborhoods: The spatial scaleof marine populations and their management. Annu Rev Enviro Res 29: 31–68.
11. Nathan R, Getz WM, Revilla E, Holyoak M, Kadmon R, et al. (2008) A
movement ecology paradigm for unifying organismal movement research. PNAS105: 19052–19059.
12. Beck MW, Heck KL Jr., Able KW, Childers DL, Eggleston DB, et al. (2001)The identification, conservation, and management of estuarine and marine
nurseries for fish and invertebrates. Bioscience 51(8): 633–641.
13. Gaines SD, Lester SE, Grorud-Colvert K, Costello C, Pollnac R (2010) Evolvingscience of marine reserves: New developments and emerging research frontiers.
PNAS 107: 18251–18255.14. Chapman MR, Kramer DL (2000) Movement of post-settlement fishes within
and among fringing coral reefs in Barbados. Env Biol Fish 57: 11–24.15. Hitt S, Pittman SJ, Brown KA (2011) Tracking and mapping sun-synchronous
migrations and diel space use patterns of Haemulon sciurus and Lutjanus apodus in
the U.S. Virgin Islands. Environ Biol Fish 92(4): 525–538.16. Sale PF (1998) Appropriate spatial scales for studies of reef-fish ecology.
Aust J Ecol 23 (3): 202–208.17. Sale PF, Cowen RK, Danilowicz BS, Jones GP, Kritzer JP, et al. (2005) Critical
science gaps impede use of no-take fishery reserves. TREE 20: 74–80.
18. Mora C, Andrefouet S, Costello MJ, Kranenburg C, Rollo A, et al. (2006)Ecology. Coral reefs and the global network of Marine Protected Areas. Science
312: 1750–1751.19. Popple ID, Hunte W (2005) Movement patterns of Cephalopholis cruentata in a
marine reserve in St Lucia, WI, obtained from ultrasonic telemetry. J Fish Biol67: 981–992.
20. Hitt S, Pittman SJ, Nemeth RS (2011) Diel movements of fish linked to benthic
seascape structure in a Caribbean coral reef ecosystem. Mar Ecol Prog Ser 427:275–291.
21. Heupel MR, Semmens JM, Hobday AJ (2006) Automated acoustic tracking ofaquatic animals: scales, design, and deployment of listening station arrays. Mar
Fresh Res 57: 1–13.
22. Grothues TM (2009) A review of acoustic telemetry technology and aperspective on diversification in coastal tracking arrays. Meth.Techn. Fish Biol.
Fisheries 9: 77–90.23. Monaco ME, Friedlander A, Hile SD, Pittman SJ, Boulon RH (2009) The
coupling of St. John, US Virgin Islands marine protected areas based on reef fish
habitat affinities and movements across management boundaries. Proceedings11th International Coral Reef Symposium, Ft. Lauderdale, Florida, 7–11 July
2008.24. Turgeon K, Robillard A, Gregoire J, Duclos V, Kramer DL (2010) Functional
connectivity from a reef fish perspective: Behavioral tactics for moving in afragmented landscape. Ecology 91(11): 3332–3342.
25. Russ GR, Alcala AC (2004) Marine reserve benefits local fisheries. Ecol Appl 14:
597–606.26. Russ GR, Alcala AC (2011) Enhanced biodiversity beyond marine reserve
boundaries: the cup spillith over. Ecol Appl 21 (1): 241–250.27. Rosenberg DK, Noon BR, Meslow EC (1997) Biological corridors: form,
function, and efficacy. BioScience 47 (10): 667–687.
28. Levin SA (1992) The problem of pattern and scale in ecology: The Robert H.
MacArthur Award Lecture. Ecology 73: 1943–1967.
29. Pittman SJ, Kneib RT, Simenstad C (2011) Practicing coastal seascape ecology.
Mar Ecol Prog Ser 427: 187–190.
30. Bostrom C, Pittman SJ, Simenstad C, Kneib RT (2011) Seascape ecology of
coastal biogenic habitats: advances, gaps and challenges. Mar Ecol Prog Ser 427:
191–217.
31. Grober-Dunsmore R, Pittman SJ, Caldow C, Kendall MA, Fraser T (2009) A
landscape ecology approach for the study of ecological connectivity across
tropical marine seascapes. Chapter 14, p493–529. In (Nagelkerken ed.)
Ecological Connectivity of Coral Reef Ecosystems. Springer.
32. Roberts CM (2000) Selecting marine reserve locations: optimality versus
opportunism. Bull Mar Sci 66(3): 581–592.
33. Roberts CM, Andelman S, Branch G, Bustamante RH, Castilla JC, et al. (2003)
Ecological criteria for evaluating candidate sites for marine reserves. Ecol Appl
13: 199–214.
34. Botsford LW, Micheli F, Hastings A (2003) Principles for the design of marine
reserves. Ecol Appl 13(Supp. 1): 25–31.
35. Pina-Amargos F, Gonzalez-Sanson G (2009) Movement patterns of goliath
grouper Epinephelus itajara around southeast Cuba: implications for conservation.
Endang Spec Res 7(3): 243–247.
36. Bolden SK (2000) Long-distance movement of a Nassau grouper (Epinephelus
striatus) to a spawning aggregation in the central Bahamas. Fish Bull 98(3): 642–
645.
37. Frisk MG, Jordaan A, Miller TJ (2013) Moving beyond the current paradigm in
marine population connectivity: are adults the missing link? Fish Fish. doi:
10.1111/faf.12014.
38. Kobara S, Heyman WD, Pittman SJ, Nemeth RS (2013) Biogeography of
transient reef-fish spawning aggregations in the Caribbean: a synthesis for future
research and management. Oceanogr Mar Biol 51: 281–326.
39. Lee KA, Huveneers C, Macdonald T, Harcourt RG (2014) Size isn’t everything:
movements, home range, and habitat preferences of eastern blue gropers
(Achoerodus viridis) demonstrate the efficacy of a small marine reserve. Aquatic
Conserv: doi: 10.1002/aqc.243.
40. Mumby PJ (2006) Connectivity of reef fish between mangroves and coral reefs:
algorithms for the design of marine reserves at seascape scales. Biol Conserv
128(2): 215–222.
41. Roberts CM, Sargant H (2002) Fishery benefits of fully protected marine
reserves: why habitat and behavior are important. Nat Res Model 15(4): 487–
507.
42. Edgar GJ, Stuart-Smith RD, Willis TJ, Kininmonth S, Baker SC, et al. (2014)
Global conservation outcomes depend on marine protected areas with five key
features. Nature 506(7487): 216–220.
43. Devillers R, Pressey RL, Grech A, Kittinger JN, Edgar GJ, et al. (2014)
Reinventing residual reserves in the sea: are we favouring ease of establishment
over need for protection? Aquat Conserv. DOI: 10.1002/aqc.2445.
44. Gaines SD, White C, Carr MH, Palumbi SR (2010) Designing marine reserve
networks for both conservation and fisheries management. PNAS 107(43):
18286–18293.
45. Moffitt EA, Botsford LW, Kaplan DM, O’Farrell MR (2009) Marine reserve
networks for species that move within a home range. Ecol Appl 19: 1835–1847.
46. Olds AD, Connolly RM, Pitt KA, Maxwell PS (2012) Habitat connectivity
improves reserve performance. Cons Letters 5: 56–63.
47. Olds AD, Albert S, Maxwell PS, Pitt KA, Connolly RM (2013) Mangrove-reef
connectivity promotes the effectiveness of marine reserves across the western
Pacific. Global Ecol and Biogeogr 22: 1040–1049.
48. Sawyer SC, Epps CW, Brashares JS (2011) Placing linkages among fragmented
habitats: do least-cost models reflect how animals use landscapes? J Appl Ecol
48(3): 668–678.
49. Nemeth RS (2009) Chapter 4: Dynamics of reef fish and decapod crustacean
spawning aggregations: underlying mechanisms, habitat linkages and trophic
interactions. p 73–134. In: I Nagelkerken, ed. Ecological connectivity among
tropical coastal ecosystems. Springer, Netherlands.
50. Nemeth RS, Kadison E, Herzlieb S, Blondeau J, Whiteman E (2006) Status of a
yellowfin grouper (Mycteroperca venenosa) spawning aggregation in the U.S. Virgin
Islands with notes on other species. Proc. 57th Gulf Carib Fish Inst 57: 543–558.
51. Nemeth RS (2005) Population characteristics of a recovering U.S. Virgin Islands
red hind spawning aggregation following protection. Mar Ecol Prog Ser 286:
81–97.
52. Nemeth RS, Blondeau J, Herzlieb S, Kadison E (2007) Spatial and temporal
patterns of movement and migration at spawning aggregations of red hind,
Epinephelus guttatus, in the U.S.Virgin Islands. Env Biol Fish 78(4): 365–381.
Reef Fish Movements and MPA Design
PLOS ONE | www.plosone.org 11 May 2014 | Volume 9 | Issue 5 | e96028
Copyright © 2022 FDOKUMEN