Technology Achievements and Projections for Communication ...
Upload
independentCategory
view
2download
0
Unclassified ECO/WKP(2001)31
Organisation de Coopération et de Développement EconomiquesOrganisation for Economic Co-operation and Development 19-Sep-2001___________________________________________________________________________________________
English text onlyECONOMICS DEPARTMENT
FISCAL IMPLICATIONS OF AGEING:PROJECTIONS OF AGE-RELATED SPENDING
ECONOMICS DEPARTMENT WORKING PAPERS NO. 305
byThai Than Dang, Pablo Antolin and Howard Oxley
Most Economics Department Working Papers beginning with No. 144 are now available throughOECD’s Internet Web site at http://www.oecd.org/eco/eco/
JT00112940
Document complet disponible sur OLIS dans son format d’origineComplete document available on OLIS in its original format
EC
O/W
KP
(2001)31U
nclassified
English text only
Cancels & replaces the same document of 05 September 2001

ECO/WKP(2001)31
2
ABSTRACT/RÉSUMÉ
This paper provides new projections on the fiscal impact of age-related spending for OECD countries overthe next half century. These results are based on national models using an agreed upon set of assumptionsabout macroeconomic and demographic developments for all countries. Recent reforms to pension systemshave partly offset the impact on spending of an increasingly elderly population, and there has been a majorimprovement in the underlying fiscal situation in the 1990s. However, further age-related spending(including old age pensions, health and spending associated with children) is still projected to increase onaverage around 6 to 7 per cent of GDP over the projection period. This calls for maintaining the reformeffort and intensifying it in several countries, if fiscal sustainability is to be maintained.
JEL classification: I1, I3, J1, J11, J14, J26Keywords: Ageing populations, pensions, health care, long-term projections
****Cette étude contient de nouvelles projections sur l’impact budgétaire des dépenses liées à l’âge dans lespays de l’OCDE pour les cinquante prochaines années. Ces résultats reposent sur des modèles nationauxutilisant un cadre macroéconomique et démographique normalisé pour tous les pays. Les réformes récentesdes régimes de retraite ont compensé en partie l’incidence du vieillissement de la population sur lesdépenses et les situations budgétaires sous-jacentes se sont nettement améliorées dans les années 90.Toutefois, les dépenses liées à l’âge (c’est-à-dire aux pensions de vieillesse, à la santé et aux enfants)devraient augmenter en moyenne de 6 à 7 pour cent du PIB au cours de la période de projection. Il est doncnécessaire de maintenir les efforts de réforme et de les intensifier dans plusieurs pays si l’on veut préserverla viabilité budgétaire.
Classification JEL : I1, I3, J1, J11, J14, J26Mots-clés : vieillissement de la population, pensions de retraite, soins de santé, projections à long terme
Copyright: OECD 2001Applications for permission to reproduce or translate all, or part of, this material should be made to:Head of Publications Service, OECD, 2 rue André-Pascal, 75775 PARIS CEDEX 16, France.

ECO/WKP(2001)31
3
TABLE OF CONTENTS
Introduction................................................................................................................................................ 4
The baseline projections............................................................................................................................. 5
Underlying assumptions ............................................................................................................. 5The baseline projections for public expenditure......................................................................... 7
Old-age pension spending .......................................................................................................................... 9
Levels of spending around 2000 ................................................................................................. 9Old-age pension spending trends to 2050 ................................................................................ 10Programmes permitting early withdrawal from the labour market
(“early retirement” programmes).......................................................................................... 12
Health care ............................................................................................................................................... 13
Child-related programmes........................................................................................................................ 13
Total government spending, taxes and the primary deficit ...................................................................... 14
Sensitivity tests ........................................................................................................................................ 16
What are the policy options?.................................................................................................................... 18
BIBLIOGRAPHY.................................................................................................................................... 21
ANNEX: SUPPORTING MATERIAL ................................................................................................... 33
Box 1. Population projections and background assumptions ................................................................. 6Box 2. Spending programmes covered in projections............................................................................ 8Box 3. Ageing in a “stylised”country: the impact of deficits on debt .................................................. 15Box 4. Assumptions subject to sensitivity analysis.............................................................................. 17
Tables .................................................................................................................................................. 22
1. Assumptions for fertility, life expectancy and immigration2. Share of older workers (55-64), the very old (80+) and youth ratio (0-19)3. Programme coverage: differences between OECD data files and country submissions4. Age-related spending5. Decomposition of changes in old-age pension spending: 2000-20506. Changes in spending, revenues and the primary balance7. The impact of ageing in a “stylised” country, 2000-20508. Average impact of sensitivity tests on total age-related spending 2000-2050
Figures .................................................................................................................................................. 30
1. Trends in old age dependency ratios2. Projected growth of GDP and labour productivity3. Public pension spending in 2000 and changes 2000-2050
ECO/WKP(2001)31
4
FISCAL IMPLICATIONS OF AGEING: PROJECTIONS OFAGE-RELATED SPENDING
Thai Than Dang, Pablo Antolin and Howard Oxley1
Introduction
1. The combination of the baby boom in the early post-war period, the subsequent fall in fertilityrates from the end of the 1960s and increasing life expectancy are leading to a progressive ageing of thepopulation in virtually all OECD countries. This will begin to affect public finances significantly as thebaby-boom generation progressively reaches retirement age over the next few decades. The impact of thesedevelopments on public finances is an issue of concern and debate in most OECD countries, and asubstantial number of policy reforms have been introduced over the past decade. This paper reviews thesepublic finance developments on the basis of more up-to-date estimates covering the next half-century. Theestimates are based on results generated by Member countries, using the models of national administrationsor research institutes in order to ensure that better account is taken of institutional detail affectingexpenditures than has been possible in previous OECD work.2 At the same time, consistency andcomparability across countries have been strengthened by using a set of population projections andcommon assumptions for establishing GDP growth and other key macroeconomic variables that wereagreed between countries and the OECD Secretariat. Because of the wide margins of uncertainty over sucha long time horizon, sensitivity tests are also provided which show the impact of changes to keyassumptions. On the basis of these results, the paper then assesses the need for further reforms and whichkinds of reforms are likely to have the greatest impact on budget outcomes.3
2. A number of considerations need to be kept in mind when interpreting the results. First, theOECD Secretariat has helped co-ordinate the preparation of the results, with the actual projections basedon the work of national experts using their own models. This approach differs from previous OECDexercises -- where a standardised modelling approach was used -- but, as noted, has the advantage ofproviding richer institutional detail. Further, the OECD Secretariat has not controlled the use of underlyingassumptions within the models beyond those agreed by the participating countries (population and themacroeconomic environment). While the OECD Secretariat believes that a reasonable degree of uniformityhas been obtained, complete consistency across countries in assumptions and approach has not necessarilybeen achieved. Second, it should also be noted that the projections presented below may differ from those
1. This work presented in this paper has been based on the replies to OECD questionnaires from national
authorities and research teams of the reporting countries. The authors would like to express theirappreciation for the time, effort and attention that they devoted to this project. The authors would also liketo thank Jørgen Elmeskov, Mike Feiner, Nicholas Vanston and Ignazio Visco for their helpful commentsand suggestions. Special thanks go to Mark Kircher for statistical assistance and Paula Simonin andCharlotte Todd for secretarial skills. The views expressed in this Working Paper are those of the authorsand are not necessarily shared by the OECD.
2. See Hagemann and Nicoletti (1989), Van den Noord and Herd (1993, 1994), Leibfritz et al. (1995),Roseveare et al. (1996), OECD (1997, 1998 and 2000), Turner et al. (1998) and Visco (2000, 2001).
3. Part of this work has been carried out in collaboration with the Working Group on Ageing of the EconomicPolicy Committee of the European Union. Their study as well as this one are based on the samemacroeconomic framework and population projections. However, the public expenditure componentscovered as well as the timing of the studies have differed somewhat. Preliminary results for the EUcountries were presented in Economic Policy Committee of the European Union (2000).
ECO/WKP(2001)31
5
used by national administrations in their “most likely” scenarios, because of differences in assumptions.Third, in any case, projections over such a long period are, by their nature, highly uncertain as economieswill evolve and policies will change in ways that cannot be foreseen.
The baseline projections
Underlying assumptions
3. Estimates of the degree of ageing over the next 50 years were based on the middle variant ofEurostat population projections for the countries in the European Union (EU) and national projections forthe remaining countries. While there is considerable cross-country variation, these projections show anaverage increase in fertility of around 8 per cent and a lengthening in average lifetimes of about 4½ years(Table 1). Generally speaking, these developments lead over the period as a whole to:
− Very modest growth or declines in the total population (except in Australia, Canada, theNetherlands, New Zealand, Norway and the United States).
− A fall in the working age population (20 to 64 years of age) (except in Australia, Canada,New Zealand, Norway, and the United States), and, increases in the number of elderly and,particularly, in those over 80 (Table 2).
− A near doubling, on average, in the ratio of the elderly (individuals 65+) to the working-agepopulation (individuals 20-64) between 2000 and mid-century (the old-age dependency ratio)(Figure 1). For most countries, the ratio is projected to increase until about 2035 to 2045(depending on the country), and then to stabilise or decline by a small amount thereafter.However, in Australia, the Czech Republic, Hungary, Japan, Poland, Spain, and, to a lesserdegree, Canada and Korea, ageing appears to be increasing even at the end of the period,suggesting that these countries may experience further pressures on spending from ageingbeyond 2050.
− A rise in the average age both of the working-age population and of the elderly, i.e. both theshare of those aged 55 to 64 in the population aged 20 to 64 and the share of the very old(aged 80+) among the elderly (aged 65+) increase (Table 2). This latter development reflectsthe passing of the baby-boom generation and longer life expectancy.
− In contrast, a small decline in the ratio of youth (individuals less than 20) to the working-agepopulation, suggesting some minor offsetting declines in spending on children (Table 2).
4. The common assumptions on unemployment and participation rates (Box 1) imply that countriesthat now have high rates of unemployment relative to the OECD average and low participation rates ofwomen (e.g. Italy and Spain) have more scope for growth over the period. In practice, however, thedeclines projected for the working-age population offset such effects in most countries and averageemployment growth over the period is either weakly positive or negative except in Australia and theUnited States.
5. Almost all of the GDP growth -- which averages 1.9 per cent annually -- is due to the increase inlabour productivity (Figure 2), which was set to converge, to a trend rate of 1¾ per cent per annum (seeBox 1 for details). Some catch-up was allowed for the Czech Republic, Hungary, Korea, Poland andPortugal and, therefore, their productivity growth rates are significantly above those of the other countries.

ECO/WKP(2001)31
6
Finland starts from high productivity growth rates to converge by 2020. Norway and Canada to a lesserextent, show low growth rate in productivity as they start from low productivity growth rates. In addition,Norway’s projections reflect the impact of the oil sector.
Box 1. Population projections and background assumptions1
Population projections
Projections were based on the middle variant of national or, in the case of EU countries, Eurostatpopulation projections. The profile of populations over time in these projections depends on assumptions aboutfertility, mortality and immigration (see Table 1). The Eurostat population projections were specially prepared for thisexercise.
Fertility
In virtually all countries fertility rates are projected to rise from an average of around 1.5 towards levelsranging between 1.5 and 1.8 by 2050, with most of the increase occurring over the next two decades. The largestincreases are expected to occur in low-fertility countries such as the Czech Republic, Italy and Spain but increases arealso substantial in Austria, Belgium, Hungary, Japan, Poland, Portugal and Sweden. Denmark, Finland and Norwayare assumed to have fairly constant fertility rates. Only Australia, Canada, Korea, New Zealand and the United Statesare projected to experience significant declines.
Life expectancy
Life expectancy at birth is expected to increase, on average, by above 5 years for males and 4 years forfemales from 2000 to 2050, thus allowing some catch-up between the two sexes. Gains in life expectancy are similaracross the majority of countries, although they are smaller for men in the Czech Republic and Japan and higher inHungary and Poland, which both have a particularly low level at the beginning of the period. For women, theincreases are smaller in Canada, the Czech Republic, Japan, Norway and Spain and significantly higher in Australia,Hungary, Korea, Poland and the United Kingdom.
Net immigration
Net immigration is difficult to predict since it will depend on countries’ economic situation and policies.Countries with higher levels of immigration at the beginning of the period tend to project falls (Australia, Canada,Germany, Norway and the United States), while a number of countries with low levels project increases (Austria,Belgium, Italy and Spain). Once again, changes tend to be concentrated in the first half of the period.
Implications for dependency
These various developments contribute to the flattening in the dependency ratios toward the middle of thecentury. The replacement of the baby-boom generation by smaller cohorts leads to slower growth in the number ofelderly. At the same time, the projected increase in fertility during the first few decades, combined with risingimmigration (excluding North America, Australia, Germany and Norway), contributes to a slower fall in the working-age population towards the end of the period in some countries (See Tables A.1 and A.2 in Annex).
Main common background macroeconomic assumptions
Taking these population projections as the starting point, the profile of GDP to 2050 was calculated in thefollowing manner (See Table A.5 for specific country assumptions):
- Participation rates for the period to 2010 are based on ILO projections (ILO, 1997). For the subsequentperiod, the participation rates stay constant for men aged 20 to 54 (prime age) and 55 to 64 (olderworkers) as well as for all retirement-age individuals and all persons under the age of 20. Participationrates for women aged 20 to 54 and 55 to 64 rise progressively towards a ceiling at the end of the periodequal to 5 percentage points below those of men in countries with widely subsidised child-care and10 percentage points below elsewhere. Some countries deviate marginally from these rules because of
ECO/WKP(2001)31
7
the expected impact of recent policies (e.g. higher retirement ages). However, with the exception ofAustria,2 these differences do not appear large enough to affect the results significantly.
- Unemployment rates converge to their structural levels (as defined by the OECD) in 2005, withunemployment rates held constant at the 2005 rate throughout the period to 2050, except for countrieswhere existing labour-market reforms presupposed a further decline in structural unemployment overthe period.3 The authorities in Belgium, France and Italy, and, to a lesser extent, the Czech Republic,Germany, Finland, Hungary and Poland built in this decline. The Spanish authorities allowed itsunemployment rate to fall over the period to 4 per cent, well outside the agreed limits.
- Labour productivity growth (measured as GDP per worker) converges towards an annual rate of1¾ per cent as from between 2020 and 2030. Some catch-up is allowed for initially low-productivitycountries such as the Czech Republic, Hungary, Korea, Poland and Portugal. Assumptions forproductivity growth were so high as to seriously compromise cross-country comparability in Portugal,and this country has been treated separately in this documentation. Average productivity growth ratesare significantly lower in Canada and Norway because they start from low productivity growth rates.GDP was established by multiplying the number of employed by average productivity.
Where countries have short- to medium-term budget projections up to 2005, the ageing projections wererun off these. Non-age-related expenditures and government revenues are kept constant as a share of GDP after thispoint, except to the degree that there are clearly identified effects arising from ageing or from backgroundassumptions -- e.g. reduced spending on unemployment insurance as unemployment falls or higher tax revenues as aresult of pensions paid from tax-sheltered savings in pension funds.________________________
1. Sections 1 and 2 in the Annex provide further evidence on demographic and macroeconomic assumptions
2. Instead of broad constancy in the participation rates for older male workers after 2010, the Austrian projections assume thatthey will rise by 33 percentage points, to 71 per cent, by the end of the period. This reflects the assumed impact of recentreforms to early-retirement policies.
3. This adjustment was limited to one third of the structural unemployment levels in 2005.
The baseline projections for public expenditure
6. While much recent discussion has focused on old-age pension programmes, many other publicexpenditure programmes are affected by demographic shifts. These include programmes permitting earlywithdrawal from the labour market (long-term unemployment, disability, and early retirement programmesfor labour market reasons), health care and long-term care for the frail elderly, family/child benefits andeducation. Unfortunately, not all countries provide projections for these other components.4 Comparisonsacross countries should be treated with caution because coverage of age-related spending is uneven acrosscountries (Box 2). Nonetheless, based on information from countries that provided a wide range ofspending items, spending components that are sensitive to the age structure of the population representbetween 40 and 60 per cent of total public spending.
4. Thirteen countries provided information on programmes permitting early withdrawal from the labour
market; eleven included child and family benefits and education and fourteen provided data for health andlong-term care. Only eight countries provided data for all components of age-related spending, although, insome cases, this may reflect the fact that these programmes do not exist or that spending has been includedunder other components of age-related spending.

ECO/WKP(2001)31
8
Box 2. Spending programmes covered in projections
Projections for individual countries cover a varying number of expenditure items.1 Thus, while thefollowing spending components are likely to be strongly affected by changes in population structure, information onall of these is available for relatively few countries:
- Old-age pension spending: This category includes all old-age pension spending as well as all early retirementpension spending which is an integral part of the public pension system (often implying a reduced pension). Inaddition, it includes survivors and social assistance or minimum pensions (all countries).
- Programmes permitting early withdrawal from the labour market (“early-retirement” programmes): This coversprogrammes other than those included in old-age pension schemes permitting early withdrawal from the labourmarket. This includes programmes such as disability pensions, unemployment pensions, and some active labourmarket programmes targeted to workers aged 55+ to help them bridge the period between employment and receipt ofan old-age pension.
- Health care: This includes all public health care expenditure for ambulatory and acute hospital care and forpharmaceuticals.
- Long-term care: These expenditures cover retirement homes and nursing care provided by the government as wellas social services in the form of home help to keep the elderly as independent as possible.
- Education: This category includes all levels of education
- Family and child allowances.
Comparisons with the Social Expenditure Data file2
Comparisons between the historical data from the projections exercise for 1995 in country submissionswith data from the Social Expenditure Data File (SOCX) at the OECD (Table 3) suggests that there may be importantdifferences in the coverage of programmes. While some differences between the two data sets is likely because theydraw on different data sources or follow different accounting rules (e.g. national account vs. budget basis orexpenditures net of contributions), large differences between the two data sets help indicate expenditure items whichmay need to be treated with some caution. 3
As regards old-age pension benefits (column 1), the current data-set seems to imply significant under-reporting for: Austria (public sector employee pensions are not included), Denmark, Korea, the Netherlands, Norway,the United Kingdom (data exclude the income-tested Minimum Income Guarantee and the pensions for public sectoremployees) and the United States (data exclude state and local government employee’s pensions). For these countries,the increase in pension spending over the next decades could therefore be underestimated.4 At the same time, the datafor Sweden imply some over-reporting relative to the SOCX file, possibly because they include some disabilityspending with old age spending.
For nine countries (Austria, Canada, France, Germany, Italy, Japan, New Zealand, Spain and the UnitedKingdom) there is no information on programmes included in the category “early retirement” (column 2). For theremaining countries, comparisons with the SOCX file are somewhat difficult because programmes that have beenincluded can vary from one country to another. Nonetheless, significant under-reporting seems to occur for Belgiumand the Netherlands (where only old-age workers (55-64) are included) while the comparison indicates over-reportingfor Denmark and Portugal.
No information is available concerning spending on health or long-term care for Austria, France, Germany,Italy, Poland, Portugal and Spain. Both components of health care are available for only 8 countries (Australia, theCzech Republic, Denmark, Finland, Japan, Korea, Sweden and the United States), although in Belgium, Canada andthe Netherlands, long-term care is included in health care. For Norway and the United Kingdom projections of healthspending are available but not of spending on long-term care. Compared with the SOCX file, the submissions suggestunderestimation of health care costs in Belgium, Finland, Korea (which did not include social security health care
ECO/WKP(2001)31
9
spending), Sweden and the United States. For the latter, only programmes on the elderly have been included(Medicare), Medicare is presented net of premiums and state and local programmes for health care for the elderlyhave been excluded.5 Finland included health care for the elderly in long-term care.
A comparison of data for family benefits suggests underestimation by between ¾ and 1¼ of a percentagepoint of GDP in Australia, New Zealand, Norway and the United Kingdom. Sweden overestimates these benefits byover 2 percentage points (they include child-care facilities for working mothers). A comparison of OECD data andcountry submissions for public education expenditure suggests that the Czech Republic, Denmark, New Zealand,Sweden and the United States under-report by more than one percentage point, while Australia, Canada and theUnited Kingdom over-report.
1. Ageing can also affect tax revenues, particularly where assets in tax-sheltered and funded pension arrangements areprogressively paid out in pension benefits and become liable for tax. Only Canada, Denmark and the Netherlands providedinformation on this effect.
2. Data for Poland and Hungary are not yet available in the SOCX data file.3. It should be noted, however, that a number of countries explored in depth the sources of the data entering the SOCX file but
were unable to find the precise reasons for these differences.4. For the United States, the exclusion of state and local government employee pensions leads to an underestimation of total
general government spending on old-age pension as well. But, as these pension schemes are fully funded, this underestimationhas no fiscal implications.
5. Expenditure in United States excludes non-elderly Medicaid, other State and local spending on health care and miscellaneousFederal programmes, such as care for war veterans. In the SOCX file, total public health care spending in the United Stateswas around 6.3 per cent of GDP in 1995.
Old-age pension spending
Levels of spending around 2000
7. Old-age pension spending includes, in principle, all old-age pension spending, all earlyretirement pension spending which is an integral part of the public pension system, and survivors andminimum pensions. Currently, public old-age pension spending, as drawn from the national projectiondata, represents around 7½ per cent of GDP. Comparisons with OECD sources (Box 2) suggest that theprogramme coverage in the projections may be less than full for Austria, Denmark, Korea, the Netherlands,Norway, the United Kingdom and the United States5 and, hence, for these countries, the spendingprojections reported here may involve some degree of underestimation. Little of the cross-country variationin pension spending in 2000 is explained by the degree of ageing as measured by the old-age dependencyratio. Rather, differences reflect wide variation in programme characteristics, including the degree ofsystem maturity, and the degree to which pensions are financed through the public sector:
− In countries with programmes where benefits are largely paid through state-run or bi- or tri-partite earnings-related (ER) schemes, public retirement income is linked to past work and/orcontribution histories, although flat-rate elements are nearly always present in the form ofminimum pensions.6 Virtually all countries with well-developed and mature public-sector
5 . See footnote 5 in Box 2.
6. In some of these countries, there are additional, compulsory complementary pension arrangementsnegotiated on an industrial sector or professional basis (e.g. blue-collar or white-collar), and often managedby the social partners (e.g. France), although this spending does not always appear in the governmentaccounts.

ECO/WKP(2001)31
10
earnings-related systems (Austria, Belgium, France, Germany, Italy, Poland, Spain andSweden) tend to have above average pension spending, although the level of spending varieswith the generosity of benefits and the age of retirement (Figure 3, Panel A). The US systemprovides low average benefits relative to previous earnings and has a higher retirement agecompared with most of the European countries just referred to. In Korea and Norway, thepension system is still maturing;7
− In other countries, predominately flat rate (FR) schemes generally aim to provide a minimumbasic income for the elderly irrespective of their work history. Spending under these systemsis lower (Figure 3, Panel B), partly reflecting the fact that the basic pension component oftenserves as a safety net (and is therefore set at a lower level), with a larger share of income inretirement coming from private sources than for most countries with ER systems. For manycountries with flat-rate schemes, the retirement age is 65 with little opportunity to receivepension benefits before this age. Such FR arrangements can be complemented by mandatorylabour-market arrangements of a public or private nature and with various degrees of funding.The public component of these add-ons is, at present, generally less generous than in ERschemes.8
Old-age pension spending trends to 2050
8. Projections based on assumptions of unchanged policy -- though taking into account legislatedbut-not-yet implemented reforms -- suggest that old-age pension spending will rise on average by around3 to 4 percentage points of GDP in the period to 2050 (Table 4, Panel B), but with considerable cross-country variation. Pension spending is projected to fall as a share of GDP over the period for Poland,where shifts are taking place towards private pension arrangements, as well as for the United Kingdom,and to remain broadly stable for Italy, partly reflecting recent reforms. In contrast, increases of more than4 percentage points of GDP are projected for ten countries (including Portugal) and for seven among these,it will be 5 percentage points or more. Spending relative to GDP starts to rise quickly in the latter part ofthe current decade, but then slows from around 2035-40, with declines in a few countries.9 Indeed,significant differences between the change to the peak and the change over the entire period are projectedby Austria, Belgium, Denmark, Italy, Japan, the Netherlands, Sweden and the United Kingdom.
9. To illustrate the forces driving the change in the share of spending in GDP over the period 2000-2050, Table 5 breaks it into four factors:10
− A dependency or population-ageing effect, reflecting changes in the ratio of those aged 55+to the population aged 20 to 64.11
− An employment effect, driven by changes in the ratio of the population aged 20 to 64 toemployment.
7. While Korea is currently closer to a flat-rate system, spending increases are driven by a maturing earnings-
related scheme introduced in 1988.
8. The maturing of the Canada and Quebec Pension Plans may lead to a greater role for ER schemes in thefuture.
9. Projected effects of reforms in a few countries (e.g. Italy and Sweden) contribute to this result.
10. See Annex, section 4, for details on the methodology followed
11. This takes into account the fact that a considerable number of older workers retire before 65.

ECO/WKP(2001)31
11
− The benefit effect, related to changes in the average pension benefit relative to GDP perworker.
− An eligibility effect, corresponding to changes in the share of those receiving benefits in the55+ age group.12
10. The results show the increase in spending associated with the change in each one of thesecomponents taken independently. The last two factors are measures of the changing generosity of pensionsystems.
11. While the results of such decompositions need to be treated with caution, they suggest thatincreased ageing/dependency is the key factor driving pension spending over the period (Table 5, thirdcolumn). The average impact of ageing taken alone is around 5 percentage points of GDP. The ageing-induced increases are highest in a number of European countries which have fully developed and generousearnings-related pension schemes and/or rapid ageing (e.g. Austria, the Czech Republic, France, Germany,Italy, Poland, Portugal and Spain). Smaller increases are found in countries with limited ageing and lowinitial spending levels (e.g. Australia, Denmark, Hungary, the Netherlands, Norway, the United Kingdomand the United States).
12. Almost all country projections have increasing employment ratios as a result of assumed higherfemale participation rates, lower unemployment or increased average retirement ages. This boosts outputand reduces the cost of pension systems taken as a share of GDP. This effect is stronger in countries withcurrently low female participation rates and/or high unemployment rates at the beginning of the period(especially Austria, Hungary, Italy, Japan, Korea, Poland as well as Spain, where unemployment isassumed to fall to the same levels as in the early 1970s).
13. As a general rule, the effects of the two aspects of system generosity reflect maturing pensionsystems, changes in behaviour and the impact of reforms (see Box A.1 in the annex for a list of recentmajor policy measures).13 Most countries project increases in the share of beneficiaries in the populationaged 55 and over. Higher assumed employment of women and maturing pension systems should lead, bythemselves, to an increase in the share of beneficiaries but be offset by the reforms undertaken in asignificant number of countries aimed at directly increasing the effective age of retirement. But aside fromAustria, Italy and Poland, these do not appear to be considered sufficient to reduce significantly the overallshare of pensioners in the target population over the period.
14. In contrast, the projections indicate widespread declines in average benefits relative toproductivity, making for a fall in expenditure averaging around 1½ percentage points of GDP. Once again,this reflects a range of offsetting factors. There have been important reforms aimed at reducing benefitrates: shifts from indexation of pensions on wages towards prices14 (Finland, France, Hungary, Italy, Japan,
12. For France, Japan, Sweden and the United Kingdom, it was necessary to assume that the number of
beneficiaries equalled the non-active share of the population aged 55+. This approximation for theeligibility ratio leads to an overestimation of the number of beneficiaries. Correspondingly, with averagebenefits defined as total pension expenditure in any year divided by the number of beneficiaries, thisprocedure leads to an underestimation in the average benefit (calculated as the residual) for these countries.For Italy the number of pensions, rather than the number of pensioners, was used.
13. A recent and more detailed review of reforms can be found in OECD (2000).
14. This refers to earnings-related schemes. This change, in general, does not affect the individual’s level ofbenefit at the time of retirement. However, over the retirement period, real benefits will grow by less thanproductivity. This will lead to a fall in total public pension spending during a transition period, as aprogressively larger share of pensioners experience indexing only to prices through all of their retirement

ECO/WKP(2001)31
12
Korea) or from pre-tax to after-tax wages (Austria and Germany), lengthening of the contribution periodfor a full pension (France) and lengthening of the reference period for calculating pensions (Belgium, theCzech Republic, Finland, France, Italy and Spain). These changes appear to have been large enough tooffset a number of effects associated with the higher labour-market participation of women,15 lengtheningcontribution periods16 and composition effects as the baby boom generation enters retirement.17
15. Relative declines in benefits are particularly marked in a few countries. Italy will shift to asystem where benefits are contribution-based, indexed to prices and actuarially adjusted to allow forincreasing life expectancy. This is projected to lead to a reduction in average benefits equivalent to 5 to6 percentage points of GDP. Similar reforms in Sweden are also expected to lead to substantial declines inaverage benefits. The sharp fall for Japan reflects legislation that requires benefits to be adjusted every fiveyears to bring the pension system into balance. For France, the shift to indexing on prices, the lengtheningof contribution periods and of the reference period for calculating pensions will progressively impact onspending. In addition to changing the indexing to net wages, German pensions only rose in line with pricesin 2000 and 2001. From 2002, pension benefits will take into account lengthening in lifetimes. Declines inpension benefits in Poland reflect shifts to a private system. In the United Kingdom, the overall fall inpension spending reflects the assumed constancy in real terms of the flat-rate basic pension. Such policyreforms will lead to falls in average benefits relative to wages -- 20 per cent or more in some countries.These changes are sufficiently large as to require a build-up in private pension saving if income adequacyin retirement is to be maintained for all. Failing this, lower incomes and increased poverty among theelderly raise the risk of political pressure for a reversal of these policies, particularly as the elderly willmake up a growing share of the electorate. This underlines the need for creating conditions that encourageprivate savings for retirement.
Programmes permitting early withdrawal from the labour market (“early retirement” programmes)
16. In addition to old-age pensions, most countries have programmes that provide income support forthose of working age -- for example, disability pensions, long-term unemployment benefits and early-retirement arrangements for labour-market reasons. In a number of countries, expenditure on theseprogrammes is high, and they are often seen as an integral part of overall pension arrangements(e.g. Denmark, Finland, Norway). These programmes can be affected by ageing, for example via largernumbers of older workers with their higher probabilities of becoming disabled. They are also sensitive tolabour-market developments as these programmes have often been used to provide income support for
period. Estimated average benefits, calculated over all retirees, fall during the transition period, thougheventually pensions increase at the same (constant) rate of productivity growth.
15. The assumed increase in women’s participation should also lead to a progressive decline in the number ofindividuals on widows and survivor benefits and an increase in regular pension benefits which aregenerally higher in ER schemes. But outcomes will depend on hours worked and the development of male-female wage differentials.
16. Where pensions are linked to the number of years of work or contribution, average benefits will increase aspension systems mature. Many of the currently retired have short contribution histories and receiveminimum pensions. Longer contribution periods, particularly for women, will be reflected in higheraverage pensions.
17. In the case of an earnings-related schemes with pensions indexed to prices, those entering retirement havehigher pensions than those at the end of their lifetimes. The baby boom cohorts are larger than the currentcohorts in retirement. As a consequence, they will weigh more heavily in the total number of pensionerswhen they enter retirement. Since they have higher benefits than the average when they retire, the averagebenefit (calculated over all pensioners) will tend to rise. This process will be reversed towards the end ofthe period as these cohorts are replaced by the smaller cohorts that follow them.
ECO/WKP(2001)31
13
older workers who have difficulties finding employment, or remaining in employment, until retirement ageis reached. Such programmes have contributed in many countries to the marked fall in the participationrates of older male workers over the past several decades. Many countries have introduced reforms totighten access to these programmes and to limit benefits.
17. While the coverage varies across countries, these programmes represent around 1½ percentagepoints of GDP in the countries providing data, although considerably more in Denmark, Finland, Norwayand Portugal (Table 4, Panel C). Despite the increasing average age of the working population over theperiod, countries providing these data generally project broad stability or marginal declines inexpenditures, possibly reflecting programme reforms already undertaken and declining unemployment.Significant increases over the full 50-year period are projected only by Norway.
Health care
18. Public health care and long-term care spending varies considerably across countries, even amongthose at the same level of per capita income, reflecting a wide range of historical and institutional factors,including the fact that the share of total spending which is paid for directly by households (including viaprivate insurance schemes) can vary substantially. Reported public health- and long-term care spendingaverages around 6 per cent of GDP in 2000 (Table 4, Panel D), although some differences in coveragemean that these results may not be rigorously comparable across countries.
19. Projections of health care spending (including costs of care for the frail elderly) are considerablymore uncertain than for pension expenditure. Pension legislation provides a framework for estimatingfuture benefits. No equivalent set of rules is available for projecting the demand for and supply of healthcare. Further, there is a great deal of uncertainty as to which demographic features are most important fordriving health care spending -- in particular, whether it is the fact of having a higher share of thepopulation that are relatively old or whether it is having a higher share in the final years of their lives.Partly as a result, the method of projecting health care spending can vary considerably. For most countries,projections are broadly based on projected per capita health care expenditures by age group (which risewith age) multiplied by the number of people in each age group. These are then allowed to increase in linewith selected macroeconomic variables. However, the projections for the Netherlands allow for the factthat a large share of total lifetime health care costs occurs in the last year or two of life. Non-age-relatedfactors (such as higher income and technology change) have been taken into account to varying degrees.(The Annex, section 5, provides a fuller discussion of the method used by individual countries).
20. The average increase over the 2000-2050 period for the 14 countries where this information isavailable is 3 to 3½ percentage points of GDP. But for five countries (Australia, Canada, the Netherlands,New Zealand and the United States) increases of 4 percentage points or more are projected. Many factorscontribute to the large cross-country differences. Slow ageing is partly responsible for the smaller increasesin spending in Denmark, Sweden and the United Kingdom. However, differences in individual countryestimates of the health care costs per capita for the elderly relatively to younger age groups also appear tobe important additional factors as well as assumptions regarding how per-capita health care costs rise overtime.
Child-related programmes
21. Spending on education and family/child benefits taken together average 6¼ per cent of GDP forthe countries presenting data (Table 4, Panel E). With modest falls in youth dependency ratios expectedover the projection period, these two programmes are projected to offset spending increases elsewhere tothe extent of around 1 percentage point of GDP on average over the projection period. Falls in spending as
ECO/WKP(2001)31
14
a share of GDP are foreseen in all countries except Denmark, the Netherlands and Norway. There is nocertainty that all of these potential economies will be reaped. In practice, it has been difficult to make cutsin these areas and there may well be further pressures arising from longer periods of education for theyoung, increased training for older workers and more demand for publicly-subsidised child care as theshare of women working increases.
Total government spending, taxes and the primary deficit
22. The projections point to a generalised deterioration in the public sector primary financial balanceover the projection period reflecting:
− The increase in old-age pension spending.
− Changes to other age-related spending in countries providing such information.
− Changes to non-age-related spending and to revenues.
23. As regards the last tiret, it was agreed that, with some exceptions, the projections of revenues andnon-age-related spending would be based on assumptions of unchanged shares in GDP over the projectionperiod. However, some countries took into account changes to spending and/or revenues in the period to2005 as a result of policies already enacted. Other changes in non-age-related spending can also beexpected as a result of the macroeconomic assumptions, for example lower levels of spending onunemployment benefits. Moreover, Canada, Denmark and the Netherlands with large tax-sheltered private-sector pension schemes include increases in revenues from taxes paid on the associated pensions.
24. Bearing in mind these considerations, the projections point to a decline in the primary surplus orincrease in the deficit of 6 to 7 percentage points of GDP, over the period 2000-2050 for countriesprojecting more spending categories than just old-age pensions (Table 6, Panel A). Excluding the effects ofother age-related spending (column 4), the change in the deficit related to old-age pension spending acrossthe same set of countries amounts to around 4½ percentage points of GDP, but with wide countryvariation. In the three countries providing projections for old-age pension spending only, there is a largereduction in the surplus for Spain, a more modest fall for Germany (where, like the Netherlands, the rise inpensions is partly offset by a substantial rise in revenues) and a limited increase for Italy (Table 6,Panel B).
25. The likely deterioration in the primary balance is projected to be substantially larger than theimpact of old-age pension spending alone in the countries that project only the latter. This can be seen byexamining the projections for countries providing estimates of age-related budget items other than pensions(Table 6, Panel A). For those countries, the additional deterioration in the primary balance due to non-pension age-related spending is 2½ percentage points of GDP (Table 6, Panel A, third and fourth columns).
ECO/WKP(2001)31
15
Box 3. Ageing in a “stylised” country: the impact of deficits on debt
The change in debt associated with the rise in age-related spending is a better indicator for the overall fiscalimpact of ageing than the change in the primary balance. However, debt profiles for individual countries are sensitiveto assumptions and to the situation at the start of the projection period, making cross-country comparisons difficult tointerpret. To provide some idea of likely magnitudes, this box traces developments of the impact of ageing on debtand of policy measures needed to offset this impact, using a “stylised” OECD country (one which has the features ofthe median OECD country as regards individual parameters) as an example. In 2000, pension spending of the“stylised” country represents around 8 per cent of GDP, the primary surplus 2.5 per cent and net debt 55 per cent ofGDP. The profile of age-related spending over the 50-year period is constructed by using median values for the shareof pensioners in the population, average relative pension benefits, health care spending and other age-relatedspending. This leads to a projected increase in age-related spending of around 6 percentage points of GDP.1 Assumingother government spending and revenues remain constant as a share of GDP, the change in age-related spending isfully reflected in the overall primary balance.
The impact of ageing on primary balances and debt (Table 7, Panel A)
Assuming 1.9 per cent annual real GDP growth and a real interest rate of 4 per cent, debt would increaseover the period to 2050 by almost 100 percentage points of GDP. This baseline increase can be broken down into twoparts:
- A rise in net debt of almost 200 percentage points of GDP from the increase in age-related spending alone,i.e. abstracting from the initial levels of debt and the primary surplus.
- A decline in debt or increase in assets of around 115 percentage points of GDP as a result of the initialprimary surplus (the non-ageing related component of which is assumed unchanged through the period).2
Thus, for the “stylised” country, about half of the impact of age-related spending on debt can be offset bysustaining the initial “non-age-related” primary surplus over the entire period. In contrast, if a country had an initialprimary deficit of 1 per cent of GDP, sustained throughout (compared to a surplus of 2.5 per cent in the baseline) itstotal debt would increase by more than 400 percentage points of GDP by the end of the period. It is also important tosustain initial surpluses over time. If, for example, non-age-related budget items changed so as to reduce the “non-ageing” surplus to zero after 10 years, the debt would be almost triple the baseline value by the end of the period.
The following sensitivity tests provide some indication of the impact of different assumptions andcircumstances in individual countries (changes are indicated relative to baseline):
- A sustained increase in the primary surplus of 1 percentage point of GDP over the baseline will lead to abroadly unchanged debt to GDP ratio at the end of the period.
- If age-related spending rose somewhat less rapidly, ending at 1 percentage point of GDP lower by the endof the period relative to baseline, the increase in net debt would be around 35 percentage points less.
- If debt at the beginning of the period were 10 percentage points lower, the rise in net debt would be around20 percentage points of GDP less.
- If the interest rate were 1 percentage point lower through the period, the debt increase would be around35 percentage points of GDP lower at the end of the period.
Policy measures to limit the impact of ageing (Table 7, Panel B)
Two stylised reforms of pension systems are considered in Table 7, Panel B: a reduction in averagepension benefits and a fall in the number of pension beneficiaries (reflecting delayed retirement) that would berequired to keep debt in 2050 at the same level in terms of GDP as in 2000.3 The results suggest that the required percent fall in the number of pensioners would be lower than for average pensions, reflecting the feedback effects offewer pensioners on GDP (through higher employment), as well as increased tax revenues.4
ECO/WKP(2001)31
16
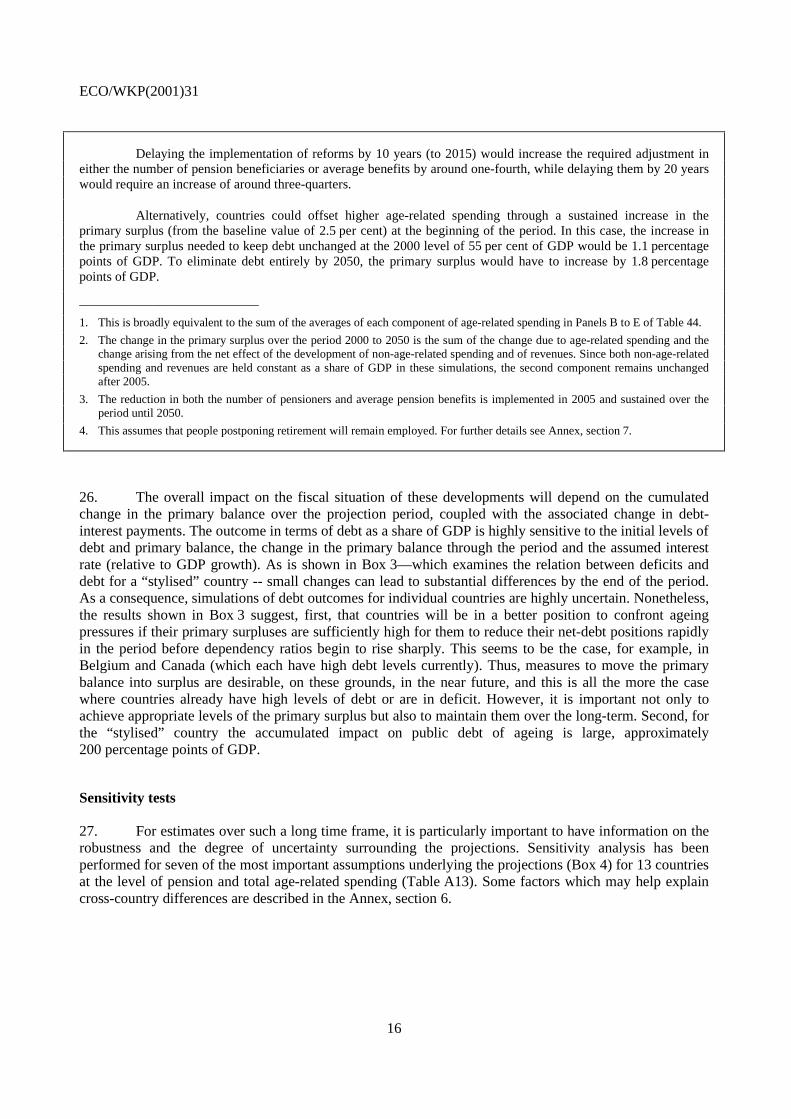
Delaying the implementation of reforms by 10 years (to 2015) would increase the required adjustment ineither the number of pension beneficiaries or average benefits by around one-fourth, while delaying them by 20 yearswould require an increase of around three-quarters.
Alternatively, countries could offset higher age-related spending through a sustained increase in theprimary surplus (from the baseline value of 2.5 per cent) at the beginning of the period. In this case, the increase inthe primary surplus needed to keep debt unchanged at the 2000 level of 55 per cent of GDP would be 1.1 percentagepoints of GDP. To eliminate debt entirely by 2050, the primary surplus would have to increase by 1.8 percentagepoints of GDP.
___________________________
1. This is broadly equivalent to the sum of the averages of each component of age-related spending in Panels B to E of Table 44.
2. The change in the primary surplus over the period 2000 to 2050 is the sum of the change due to age-related spending and thechange arising from the net effect of the development of non-age-related spending and of revenues. Since both non-age-relatedspending and revenues are held constant as a share of GDP in these simulations, the second component remains unchangedafter 2005.
3. The reduction in both the number of pensioners and average pension benefits is implemented in 2005 and sustained over theperiod until 2050.
4. This assumes that people postponing retirement will remain employed. For further details see Annex, section 7.
26. The overall impact on the fiscal situation of these developments will depend on the cumulatedchange in the primary balance over the projection period, coupled with the associated change in debt-interest payments. The outcome in terms of debt as a share of GDP is highly sensitive to the initial levels ofdebt and primary balance, the change in the primary balance through the period and the assumed interestrate (relative to GDP growth). As is shown in Box 3—which examines the relation between deficits anddebt for a “stylised” country -- small changes can lead to substantial differences by the end of the period.As a consequence, simulations of debt outcomes for individual countries are highly uncertain. Nonetheless,the results shown in Box 3 suggest, first, that countries will be in a better position to confront ageingpressures if their primary surpluses are sufficiently high for them to reduce their net-debt positions rapidlyin the period before dependency ratios begin to rise sharply. This seems to be the case, for example, inBelgium and Canada (which each have high debt levels currently). Thus, measures to move the primarybalance into surplus are desirable, on these grounds, in the near future, and this is all the more the casewhere countries already have high levels of debt or are in deficit. However, it is important not only toachieve appropriate levels of the primary surplus but also to maintain them over the long-term. Second, forthe “stylised” country the accumulated impact on public debt of ageing is large, approximately200 percentage points of GDP.
Sensitivity tests
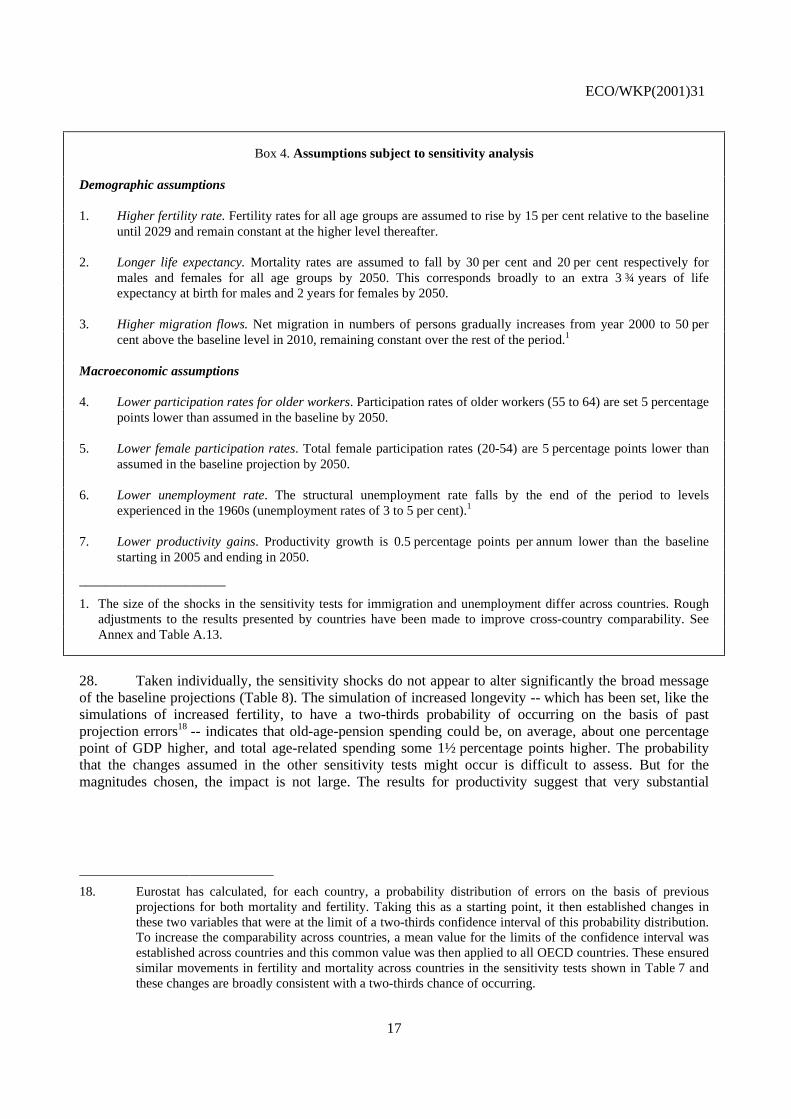
27. For estimates over such a long time frame, it is particularly important to have information on therobustness and the degree of uncertainty surrounding the projections. Sensitivity analysis has beenperformed for seven of the most important assumptions underlying the projections (Box 4) for 13 countriesat the level of pension and total age-related spending (Table A13). Some factors which may help explaincross-country differences are described in the Annex, section 6.
ECO/WKP(2001)31
17
Box 4. Assumptions subject to sensitivity analysis
Demographic assumptions
1. Higher fertility rate. Fertility rates for all age groups are assumed to rise by 15 per cent relative to the baselineuntil 2029 and remain constant at the higher level thereafter.
2. Longer life expectancy. Mortality rates are assumed to fall by 30 per cent and 20 per cent respectively formales and females for all age groups by 2050. This corresponds broadly to an extra 3 ¾ years of lifeexpectancy at birth for males and 2 years for females by 2050.
3. Higher migration flows. Net migration in numbers of persons gradually increases from year 2000 to 50 percent above the baseline level in 2010, remaining constant over the rest of the period.1
Macroeconomic assumptions
4. Lower participation rates for older workers. Participation rates of older workers (55 to 64) are set 5 percentagepoints lower than assumed in the baseline by 2050.
5. Lower female participation rates. Total female participation rates (20-54) are 5 percentage points lower thanassumed in the baseline projection by 2050.
6. Lower unemployment rate. The structural unemployment rate falls by the end of the period to levelsexperienced in the 1960s (unemployment rates of 3 to 5 per cent).1
7. Lower productivity gains. Productivity growth is 0.5 percentage points per annum lower than the baselinestarting in 2005 and ending in 2050.
______________________
1. The size of the shocks in the sensitivity tests for immigration and unemployment differ across countries. Roughadjustments to the results presented by countries have been made to improve cross-country comparability. SeeAnnex and Table A.13.
28. Taken individually, the sensitivity shocks do not appear to alter significantly the broad messageof the baseline projections (Table 8). The simulation of increased longevity -- which has been set, like thesimulations of increased fertility, to have a two-thirds probability of occurring on the basis of pastprojection errors18 -- indicates that old-age-pension spending could be, on average, about one percentagepoint of GDP higher, and total age-related spending some 1½ percentage points higher. The probabilitythat the changes assumed in the other sensitivity tests might occur is difficult to assess. But for themagnitudes chosen, the impact is not large. The results for productivity suggest that very substantial
18. Eurostat has calculated, for each country, a probability distribution of errors on the basis of previous
projections for both mortality and fertility. Taking this as a starting point, it then established changes inthese two variables that were at the limit of a two-thirds confidence interval of this probability distribution.To increase the comparability across countries, a mean value for the limits of the confidence interval wasestablished across countries and this common value was then applied to all OECD countries. These ensuredsimilar movements in fertility and mortality across countries in the sensitivity tests shown in Table 7 andthese changes are broadly consistent with a two-thirds chance of occurring.

ECO/WKP(2001)31
18
increases in economic growth (through higher productivity) would be necessary to significantly offset theincreased costs of ageing.19 Projected tax receipts varied little in the various sensitivity tests.
What are the policy options?
29. In sum, on the basis of present policies, age-related spending is likely to increase on average by 6to 7 percentage points of GDP and significantly more in some cases. Spending projections could be stillhigher than those presented here if the extent of population ageing turns out to be underestimated (Schieberand Hewitt, 2000). These impacts have to be evaluated in the light of the improvement in underlyingbudget positions over the past half decade. Cyclically adjusted primary balances have improved in mostOECD countries, in many cases moving into surplus. Debt is falling as a result. If the non-age-relatedcomponents of these surpluses can be sustained over time, a substantial part of the projected increase inage-related spending can be absorbed, thereby reducing the extent of fiscal strains. Nonetheless, there is noreason for complacency. First, higher non-ageing primary surpluses than currently registered, sustainedover half a century, would be required to prevent debt-to-GDP ratios rising above current levels -- whichare already considered to be too high in many countries. Second, a few countries are still in primary deficit,and reforms in these countries are all the more urgent if rapid accumulation of debt is to be avoided asageing accelerates. Third, large primary surpluses have been achieved, in most cases, by increases in taxpressure from an already high level, with accompanying distorting effects on markets, potentially leadingto slower growth. Fourth, a large stock of public debt implies a high degree of vulnerability to changes ininterest rates, particularly when a large share of the debt is short term. Fifth, most governments experiencepressure to “spend” surpluses where they occur -- either through higher expenditure or lower taxes --implying that these surpluses may not be easy to sustain. Finally, in most countries, pension spendingalready accounts for a large share of social spending and this will progressively increase. This, in turn, willlimit budget flexibility and the resources available for other spending programmes.
30. As regards pensions, reforms have already been introduced in many countries. But, even if theoverall fiscal situation appears better than several years ago, further reforms to age-related programmes arestill needed in many countries. While a comprehensive range of policies will be required to limit the rise inspending (OECD, 1998), it is of interest to consider the relative effects of key individual policies taken inisolation, and, in particular: a reduction in average benefits of old-age pensions; a reduction in the numberof beneficiaries of old-age pensions reflecting delayed retirement; and, an increase in the primary surplusthat is sustained throughout the period.
31. On the basis of a simplified methodology, and using the “stylised” country as the model, theOECD Secretariat has calculated the required change in average benefits and in the number of pensionbeneficiaries in 2005 (and sustained throughout the period) to keep the debt-to-GDP ratio constant ataround 55 per cent of GDP by 2050) (Table 7, Panel B).20 The results -- which should only be consideredas approximate -- suggest that the required reduction in the number of beneficiaries could be close to 8 percent -- corresponding to a rise in the effective age of retirement of about one year -- while the required fallin average benefits might have to be more than double that, at around 17 per cent. The larger requiredaction on pension benefits as opposed to pensioners reflects the feedback effects of fewer pensioners onhigher employment and GDP, as well as the effect on tax revenues. In reality, however, cutbacks inpension generosity might well induce people to work longer, while later retirement in some countries
19. Higher productivity growth increases both GDP growth and pension spending in the case of earnings-
related-pension schemes. The size of the impact of the change in productivity growth will be larger in flat-rate schemes, but only if the gap between wages and benefits is allowed to widen.
20. It was assumed that the reduced number of beneficiaries was balanced by an equivalent increase inemployment -- i.e. there was no increase in the share of the unemployed or of the inactive.

ECO/WKP(2001)31
19
automatically leads to higher pensions, suggesting that the separation of these two effects may not be soneat or the differences so marked.
32. Alternatively, countries could offset the impact of ageing on the deficit by running high enoughprimary surpluses through the remainder of the period. The simulations for the “stylised” country suggest,for example, that the age-related increase in spending, taken by itself, could be fully offset by a primarysurplus of 3½ percentage point of GDP and sustained through the period (Table 7, Panel B). This isbecause the non-age-related surplus, assumed unchanged, helps counteract the age-related fiscal pressuresas they emerge.
33. These averages embodied in the “typical” country case mask important differences acrosscountries reflecting the size of spending increases, their timing and the initial fiscal position. As discussedin the Annex, countries where spending increases are larger will need a larger sustained increase in theprimary surplus. However, the timing is also important: countries where age-related spending begins toincrease earlier will need a higher initial primary surplus to compensate if debt is to remain unchanged atthe end of the period. Finally, countries with a net asset or low public-debt position at the beginning of theperiod will require smaller adjustments as debt is, in most circumstances, already being reduced (or assetsbuilt up) at a sustained rate.
34. There is a narrow window of opportunity before dependency ratios begin to rise rapidly.Countries can profit from this period by improving the overall fiscal situation and announcing reforms,especially as policies have to be phased in progressively so as to allow households the time to adjust.Clearly, if policies are implemented with a considerable delay, stronger measures will be required toachieve the same fiscal outcomes by mid century. For example, the required reductions in pension benefitsand the number of beneficiaries to offset the impact of ageing on debt have been re-estimated assumingthat reforms were implemented 10 years later (i.e. in 2015 rather than 2005). The results indicate that, toachieve the same objective in terms of debt reduction, the reforms would need to be one-quarter larger thanif implemented immediately and a delay of 20 years would increase this amount to three-quarters (Table 7,Panel B).
35. In choosing which reforms to introduce, countries will also focus on the impact on incomes of theelderly. Sharp falls in average benefits may mean a widening gap between wage earners and incomes of theretired and increased poverty among the elderly. Where these changes are large, political pressure maybuild up to reverse these policies. To palliate such effects on incomes and increase the politicalsustainability of reforms, there may be a need for flanking policies that provide alternative sources ofincome in retirement -- for example funded private pension (or savings) arrangements, possibly of amandatory nature, or scope for maintaining earnings. In this context, it is notable that policies that delayretirement allow fiscal goals to be achieved with less need to reduce retirement incomes, underlining onceagain the desirability of measures that encourage people to work longer in order to qualify for a full publicpension.
36. In addressing long-term fiscal issues, countries need to consider a wider range of policyinstruments than those just discussed and a number of these have been laid out in Maintaining Prosperityin an Ageing Society (OECD, 1998) and in the OECD Jobs Strategy, (OECD, 1999).
− Policies permitting withdrawal of older workers from the labour market will have to bemonitored closely. Even though all reporting countries except Norway project broad stabilityor declines in spending on these programmes as a share of GDP, the rising share of olderworkers in the working-age population may still put upward pressure on expenditure.

ECO/WKP(2001)31
20
− The impact of later retirement, higher participation rates of older workers and immigrationdepends on whether the individuals concerned find employment. Their employmentopportunities will be promoted by reforms to reduce structural unemployment and encouragerapid employment growth, as laid out in the OECD Jobs Strategy.
37. Closer attention to ways of controlling health- and long-term care costs is also desirable. Demandfor publicly provided services will climb with the number of the elderly and of the very old. At the sametime, increasing participation rates of the working-age population and smaller family sizes are likely tolimit the scope for families to care for the elderly in the future. In this context, it is essential to increaseboth the efficiency and the effectiveness of the health care and long-term care system. At the level ofhealth care, budgetary caps remain the main method of spending control but such policies can lead torationing and reduced quality of care. Introducing needed micro-economic reforms aimed at improving theefficiency and the effectiveness of health care systems has proved much more difficult. Over the nearfuture, policy-makers need to find ways of limiting the demand for and supply of those aspects of healthcare that are unnecessary, strengthening the effectiveness of delivery, and improving the match betweenhealth care needs and the supply of services. Over the longer term, health care expenditure will be driven-- in addition to increased ageing -- by incentives embedded in health care systems, the diffusion oftechnology and relative prices for medical services, suggesting that a wide range of policies will need to beconsidered if the long-term costs of health care are to be kept under control.
38. Limiting the need for state-financed institutional care for the frail elderly will help contain costsof care significantly. In any case, ensuring that individuals are able to remain independent and to care forthemselves for as long as possible is an important policy goal in its own right. Since the demand forservices for the frail elderly is closely linked to disability, policies of a preventive nature may be a cost-effective response in certain cases (Jacobzone et al., 2000). In addition, an appropriate level and mix ofsupply, including significant support to remain at home, should help limit costs by ensuring that the levelof care is in line with the degree of disability and minimises overall costs -- e.g. less need to keep elderlyrequiring long-term-term nursing care in higher-cost acute-care institutions.

ECO/WKP(2001)31
21
BIBLIOGRAPHY
ECONOMIC POLICY COMMITTEE OF THE EUROPEAN UNION (2000), “Progress report to theEcofin Council on the impact of ageing population on public pension systems”,EPC/ECOFIN/581/00-EN REV1, Brussels.
HAGEMANN, R and G. NICOLETTI (1989), “Population ageing: economic effects and some policyimplications for financing public pensions”, OECD Economic Studies, No. 12.
ILO (1997), Economically Active Population, Geneva.
JACOBZONE, S., C. CAMBOIS and J.M. ROBINE (2000), “Is the health of older persons in OECDcountries improving fast enough to compensate for population ageing?”, OECD Economic Studies,No. 30.
LEIBFRITZ, W., D. ROSEVEARE, D. FORE and E. WURZEL (1995), “Ageing populations, pensionsystems, and government budgets: how do they affect savings?”, OECD Economics DepartmentWorking Papers, No. 156, Paris.
OECD (1997), “Ageing in OECD countries: a critical social policy challenge”, Social Policy Studies,No. 20, Paris.
OECD (1998), Maintaining Prosperity in an Ageing Society, Paris.
OECD (1998) Implementing the OECD Job Strategy, Assessing Performance and Policy, Paris.
OECD (2000), Reforms for an Ageing Society: Social Issues, Paris.
ROSEVEARE, D., W. LEIBFRITZ, D. FORE and E. WURZEL (1996), “Ageing population, pensionsystems and government budgets: simulations for 20 countries”, OECD Economics DepartmentWorking Papers, No. 168.
SCHIEBER, S. and P. HEWITT (2000), “Demographic risk in industrial societies, independent populationforecasts for the G7 countries”, World Economics, Vol. 1, No. 4.
TURNER, D., C. GIORNO, A. DE SERRES, A. VOURC’H and P. RICHARDSON (1998), “Themacroeconomic implications of ageing in a global context”, OECD Economics Department WorkingPapers, No. 193.
VAN DEN NOORD, P. and R. HERD (1993), “Pension liabilities in the seven major countries”, OECDEconomics Department Working Papers, No. 142.
VAN DEN NOORD, P. and R. HERD (1994), “Estimating pension liabilities: a methodologicalframework”, OECD Economic Studies, No. 23.
VISCO, I. (2000), “Welfare systems, ageing and work: an OECD perspective”, Banca Nazionale delLavoro Quarterly Review, No. 210, March.
VISCO, I. (2001), “Paying for pensions: how important is economic growth?”, Banca Nazionale delLavoro Quarterly Review, No. 214, March.

ECO/WKP(2001)31
22
Table 1. Assumptions for fertility, life expectancy and immigration
Fertility (children per woman) Life expectancy at birth for males
2000 2050 2000 2050
Australia 1.72 1.56 Australia 76.7 82.6Austria 1.31 1.50 Austria 75.0 80.3Belgium 1.54 1.80 Belgium 75.3 80.5Canada 1.62 1.50 Canada 75.5 80.0Czech Republic 1.14 1.50 Czech Republic 71.5 75.2Denmark 1.77 1.80 Denmark 74.8 79.1Finland 1.73 1.70 Finland 73.9 79.9France 1.73 1.80 France 74.8 80.0Germany 1.40 1.50 Germany 74.7 80.0Hungary 1.30 1.60 Hungary 66.8 74.6Italy 1.22 1.50 Italy 75.5 81.0Japan 1.38 1.61 Japan 77.4 79.4Korea 1.71 1.59 Korea 70.6 76.2Netherlands 1.71 1.80 Netherlands 75.5 80.0New Zealand 1.98 1.90 New Zealanda 74.3 79.5Norway 1.80 1.80 Norway 75.7 80.0Poland 1.34 1.58 Poland 69.9 78.5Portugal 1.53 1.70 Portugal 72.0 78.0Spain 1.19 1.50 Spain 74.9 79.0Sweden 1.50 1.80 Sweden 77.3 82.0United Kingdom 1.72 1.80 United Kingdom 75.2 80.0United States 2.05 1.95 United States 73.9 79.1
Average of countries aboveb 1.54 1.66 Average of countries aboveb 74.1 79.3
Immigration (per cent of total population) Life expectancy at birth for females
2000 2050 2000 2050
Australia 0.90 0.41 Australia 82.2 87.8Austria 0.12 0.26 Austria 81.2 86.0Belgium 0.10 0.15 Belgium 81.4 85.5Canada 0.60 0.43 Canada 81.3 84.0Czech Republic 0.09 0.18 Czech Republic 78.4 81.5Denmark 0.20 0.18 Denmark 79.2 82.8Finland 0.11 0.10 Finland 81.1 85.0France 0.08 0.08 France 82.8 87.0Germany 0.36 0.26 Germany 80.8 85.0Hungary -0.09 -0.04 Hungary 75.2 81.1Italy 0.09 0.17 Italy 82.0 86.0Japan .. .. Japan 84.1 86.5Korea .. .. Korea 78.1 83.0Netherlands 0.21 0.20 Netherlands 80.9 85.0New Zealand -0.30 0.11 New Zealanda 81.0 85.5Norway 0.30 0.19 Norway 81.4 84.5Poland .. .. Poland 78.2 84.7Portugal 0.12 0.23 Portugal 79.2 84.0Spain 0.08 0.17 Spain 82.1 85.0Sweden 0.17 0.22 Sweden 82.0 86.0United Kingdom 0.15 0.11 United Kingdom 80.0 85.0United States 0.33 0.25 United States 79.6 83.5Average of countries aboveb 0.22 0.20 Average of countries aboveb 80.6 84.7
.. Indicates unavailable data.
a) Data are for 1996 and 2051.
b) OECD average is unweighted and excludes countries where information is not available.
Source : OECD.

ECO/WKP(2001)31
23
Table 2. Share of older workers (55-64), the very old (80+) and youth ratio (0-19)
(Per cent share and changes in percentage points)
Older workers The very old Youth dependency ratio
Individuals aged 55-64 Individuals aged 80+ Individuals aged 0-19as a per cent of those 20-64 as a per cent of those 65 + as a per cent of those 20-64
2000Change, 2000-50
2000Change, 2000-50
2000Change, 2000-50
Australia 15.3 8.1 24.0 11.3 45.2 -10.7Austria 18.4 5.8 22.2 16.5 36.3 -4.0Belgium 17.1 6.5 20.6 15.8 39.3 -0.6Canada 14.8 9.4 23.8 12.3 41.9 -9.0
Czech Republic 17.1 9.8 .. .. 36.1 -4.3Denmark 20.8 2.2 26.3 8.2 39.7 -6.1Finland .. .. 22.3 13.4 38.5 -3.5France 15.8 7.0 22.5 15.1 43.6 -4.0
Germany 20.7 3.7 21.8 17.6 34.1 -1.4Hungary 17.8 7.1 .. .. 38.2 -3.5Italy 19.0 5.6 21.7 17.2 31.7 0.9Japan 20.8 2.6 .. .. 33.0 2.5
Korea 12.8 9.6 .. .. 47.0 -11.7Netherlands 16.1 6.0 23.2 13.8 39.3 0.3New Zealand 15.4 8.7 24.6 16.9 51.1 -10.0Norway 16.4 5.7 .. .. 43.8 -2.9
Poland 14.4 12.5 .. .. 46.5 -12.7Portugal 17.5 3.8 18.5 9.6 35.9 0.5Spain 16.3 7.4 22.0 11.2 35.1 -1.5
Sweden 19.9 5.4 28.4 7.3 40.9 -3.1United Kingdom 17.0 2.8 25.2 11.5 43.3 -5.4United States 14.9 6.5 26.5 9.6 48.7 -4.4
Average of countries abovea 17.1 6.5 23.3 12.7 40.4 -4.3
.. Indicates unavailable data.
a) OECD average is unweighted and excludes countries where information is not available. Source : OECD.

ECO/WKP(2001)31
24
Table 3. Programme coverage: differences between OECD data files1 and country submissions(percentage points of GDP, 1995)
Old-age
pension2
Early retirement
programmes3 Health care4
Long-term
care5
Child-family
benefits6
Education
expenditure7
Australia 0.5 0.3 -0.3 0.8 1.2 -0.4
Austria 4.1
Belgium8 0.9 1.1 1.0 0.2 0.3
Canada8 -0.4 0.0 0.2 -0.6
Czech Republic 0.1 0.0 0.3 0.0 0.1 1.3
Denmark 1.1 -0.5 0.5 0.8 0.2 1.7
Finland -0.4 -0.1 1.2 -2.2
France 0.0
Germany -0.8
Italy 0.2
Japan -0.6 0.7 -0.5
Korea 1.3 -0.1 1.5 0.1
Netherlands8 2.1 2.6 0.5 -0.5 0.8
New Zealand8 0.3 -0.2 1.2 1.4
Norway 1.1 0.5 0.9 1.0 0.4
Portugal 0.3 -0.9
Spain -0.3
Sweden -1.0 0.2 0.8 1.0 -2.3 1.2
United Kingdom 3.0 0.3 0.7 -0.3
United States 1.4 0.7 4.2 -0.6 -0.2 1.6
Note: A positive sign indicates that countries report lower spending than on that reported in ther OECD data files (e.g. the SOCX data).
Where SOCX data were not available countries were not included (e.g. Hungary, Poland).
1. The data file used is the OECD Social Expenditure Data File (2000) unless stated otherwise
2. Old-age cash benefits plus survivors in SOCX minus old-age pension spending in country submissions
3. Disability cash benefits and unemployment pensions in SOCX minus programmes permitting early withdrawal from the labour market
(disability pensions, unemployment pensions, and active labour market programmes targetted to workers 55+ to help them to bridge
the period between employment and the entitlement to an old age pension) in country submissions. The latter is mainly disability
4. Total health care in SOCX (excluding services for the elderly) minus total health care in country submissions
5. Services for the elderly and disabled in SOCX minus care for the elderly in country submissions
6. Family cash benefits in the SOCX data file minus child and family benefits in country submissions
7. Direct public expenditure for educational institutions for all levels of education combined in 1995 (OECD, Education at a Glance , 1998)
minus education expenditure in countries’ submissions
8. Long-term care is included in total health careSource: OECD

ECO/WKP(2001)31
25
Table 4. Age-related spending(Levels in per cent of GDP, changes in percentage points)
Total age-related Old-age pension "Early retirement" Health care and Child / Family benefits
spending programmes long-term care and education
Panel A Panel B Panel C Panel D Panel E
level change change level change change level change change level change change level change change
2000 2000-
peaka
2000-50 2000 2000-
peakb
2000-50 2000 2000-
peakc
2000-50 2000 2000-
peakd
2000-50 2000 2000-
peake
2000-50
Australia 16.7 5.6 5.6 3.0 1.6 1.6 0.9 0.2 0.2 6.8 6.2 6.2 6.1 0.0 -2.3Austria
f10.4 4.6 2.3 9.5 4.3 2.2 .. .. .. .. .. .. .. .. ..
Belgium 22.1 5.4 5.2 8.8 3.7 3.3 1.1 0.1 0.1 6.2 3.0 3.0 6.0 0.0 -1.3Canada 17.9 8.7 8.7 5.1 5.8 5.8 .. .. .. 6.3 4.2 4.2 6.4 0.0 -1.3Czech Republic 23.1 6.9 6.9 7.8 6.8 6.8 1.8 -0.7 -0.7 7.5 2.0 2.0 6.0 .. -1.2
Denmarkg
29.3 7.3 5.7 6.1 3.6 2.7 4.0 0.8 0.2 6.6 2.7 2.7 6.3 0.3 0.0Finland 19.4 8.5 8.5 8.1 4.8 4.8 3.1 -0.1 -0.1 8.1 3.8 3.8 .. .. ..
Franceh
.. .. .. 12.1 4.0 3.8 .. .. .. .. .. .. .. .. ..Germany .. .. .. 11.8 5.0 5.0 .. .. .. .. .. .. .. .. ..
Hungaryi
7.1 1.6 1.6 6.0 1.2 1.2 1.2 0.3 0.3 .. .. .. .. .. ..
Italy .. .. .. 14.2 1.7 -0.3 .. .. .. .. .. .. .. .. ..Japan 13.7 3.0 3.0 7.9 1.0 0.6 .. .. .. 5.8 2.4 2.4 .. .. ..Korea 3.1 8.5 8.5 2.1 8.0 8.0 0.3 0.0 0.0 0.7 0.8 0.5 .. .. ..Netherlands
j19.1 10.1 9.9 5.2 5.3 4.8 1.2 0.4 0.4 7.2 4.8 4.8 5.4 0.1 0.0
New Zealand 18.7 8.4 8.4 4.8 5.7 5.7 .. .. .. 6.7 4.0 4.0 7.2 0.0 -1.3
Norway 17.9 13.7 13.4 4.9 8.2 8.0 2.4 1.6 1.6 5.2 3.5 3.2 5.5 0.5 0.5Poland
i12.2 -2.6 -2.6 10.8 -2.5 -2.5 1.4 0.2 -0.1 .. .. .. .. .. ..
Spain .. .. .. 9.4 8.0 8.0 .. .. .. .. .. .. .. .. ..Sweden 29.0 3.4 3.2 9.2 2.2 1.6 1.9 -0.2 -0.4 8.1 3.2 3.2 9.8 0.0 -1.2United Kingdom 15.6 0.8 0.2 4.3 0.0 -0.7 .. .. .. 5.6 1.8 1.7 5.7 0.0 -0.9
United States 11.2 5.5 5.5 4.4 1.8 1.8 0.2 0.3 0.3 2.6 4.4 4.4 3.9 0.0 -1.0
Average of
countries abovek 16.9 5.9 5.5 7.4 3.8 3.4 1.6 0.3 0.2 6.0 3.3 3.3 6.2 .. -0.9
Average of countries whichprovide all or nearly allspending components
18.7 7.2 6.9
Portugall 15.6 6.6 4.3 8.0 4.5 4.5 2.5 0.4 -0.4 .. .. .. ..
a) The peak values are in 2050 except for Denmark (2030), Sweden and the United Kingdom (2035), and Belgium, Norway, the Netherlands and Korea (2040).b) The peak values are in 2050 except for Japan (2015), the United Kingdom and Italy (2030), the United States, Sweden, Austria, Denmark and France (2035),
and the Netherlands, Norway and Belgium (2040).c) The peak values are in 2050 except for Belgium and Denmark (2025), Finland (2010), the Netherlands (2020), Poland (2035) and Sweden (2005). For Czech Republic the highest level is in 2000.d) The peak values are in 2050 except for Denmark and Korea (2035), Norway and the United Kingdom (2040).e) 0.0 indicates the highest level is in 2000. The peak values are in 2035 for Denmark and in 2040 for Norway and the Netherlands.f) Total pension spending includes other age-related spending which does not fall within the difinition in Panels B to E. This represents 0.9 per cent of GDP in 2000 and rises by 0.1 percentage point in the period to 2050.g) Total includes other age-related spending not classifyable under the other headings. This represents 6.3 per cent of GDP in 2000 and increases by
0.2 percentage points from 2000 to 2050.h) For France, the latest available year is 2040.i) Total includes old-age pension spending and "early retirement" programmes only.j) "Early retirement" programmes only include spending on persons 55+.k) OECD average excludes countries where information is not available and Portugal which is less comparable than other countries.l) Portugal provided an estimate for total age-related spending but did not provide expenditure for all of the spending components.Source : OECD.
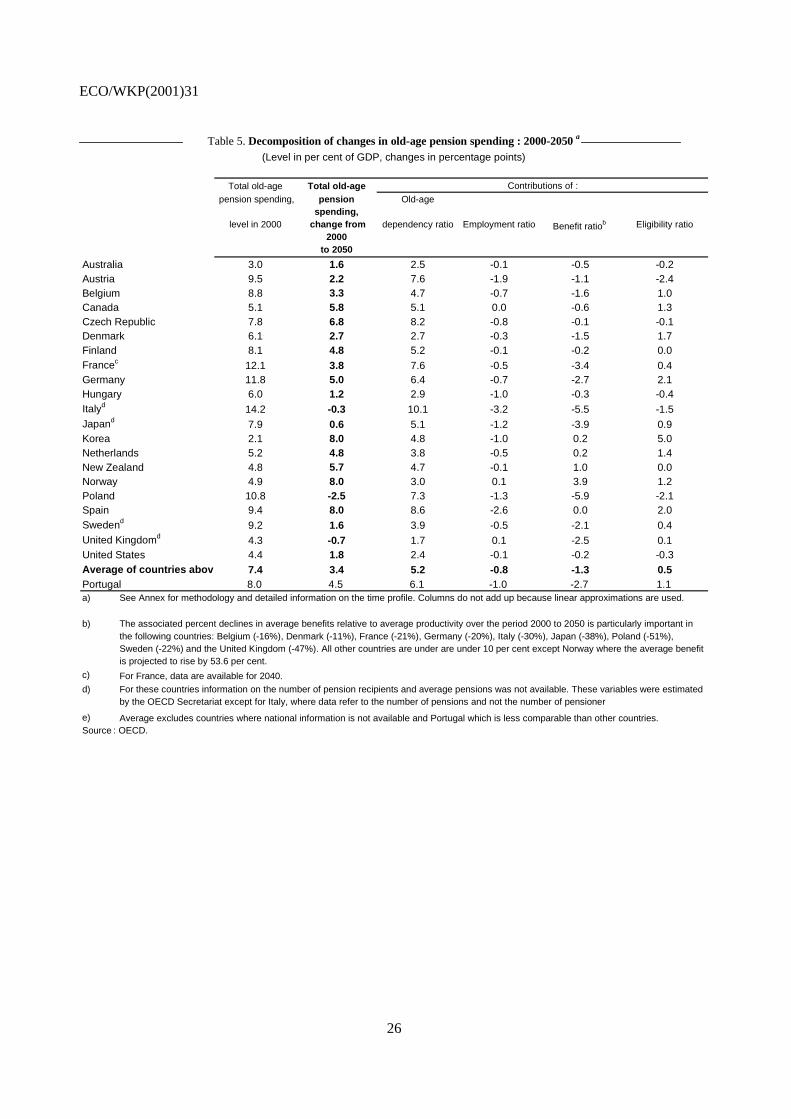
ECO/WKP(2001)31
26
Table 5. Decomposition of changes in old-age pension spending : 2000-2050 a
(Level in per cent of GDP, changes in percentage points)
Total old-age Total old-age Contributions of :
pension spending, pension spending,
Old-age
level in 2000 change from 2000
dependency ratio Employment ratio Benefit ratiob Eligibility ratio
to 2050
Australia 3.0 1.6 2.5 -0.1 -0.5 -0.2Austria 9.5 2.2 7.6 -1.9 -1.1 -2.4Belgium 8.8 3.3 4.7 -0.7 -1.6 1.0Canada 5.1 5.8 5.1 0.0 -0.6 1.3Czech Republic 7.8 6.8 8.2 -0.8 -0.1 -0.1Denmark 6.1 2.7 2.7 -0.3 -1.5 1.7Finland 8.1 4.8 5.2 -0.1 -0.2 0.0Francec 12.1 3.8 7.6 -0.5 -3.4 0.4Germany 11.8 5.0 6.4 -0.7 -2.7 2.1Hungary 6.0 1.2 2.9 -1.0 -0.3 -0.4Italyd 14.2 -0.3 10.1 -3.2 -5.5 -1.5Japand 7.9 0.6 5.1 -1.2 -3.9 0.9Korea 2.1 8.0 4.8 -1.0 0.2 5.0Netherlands 5.2 4.8 3.8 -0.5 0.2 1.4New Zealand 4.8 5.7 4.7 -0.1 1.0 0.0Norway 4.9 8.0 3.0 0.1 3.9 1.2Poland 10.8 -2.5 7.3 -1.3 -5.9 -2.1Spain 9.4 8.0 8.6 -2.6 0.0 2.0Swedend 9.2 1.6 3.9 -0.5 -2.1 0.4United Kingdomd 4.3 -0.7 1.7 0.1 -2.5 0.1United States 4.4 1.8 2.4 -0.1 -0.2 -0.3Average of countries above 7.4 3.4 5.2 -0.8 -1.3 0.5Portugal 8.0 4.5 6.1 -1.0 -2.7 1.1a)
b)
c) For France, data are available for 2040.d)
e) Average excludes countries where national information is not available and Portugal which is less comparable than other countries.Source : OECD.
See Annex for methodology and detailed information on the time profile. Columns do not add up because linear approximations are used.
The associated percent declines in average benefits relative to average productivity over the period 2000 to 2050 is particularly important in the following countries: Belgium (-16%), Denmark (-11%), France (-21%), Germany (-20%), Italy (-30%), Japan (-38%), Poland (-51%), Sweden (-22%) and the United Kingdom (-47%). All other countries are under are under 10 per cent except Norway where the average benefit is projected to rise by 53.6 per cent.
For these countries information on the number of pension recipients and average pensions was not available. These variables were estimated by the OECD Secretariat except for Italy, where data refer to the number of pensions and not the number of pensioner
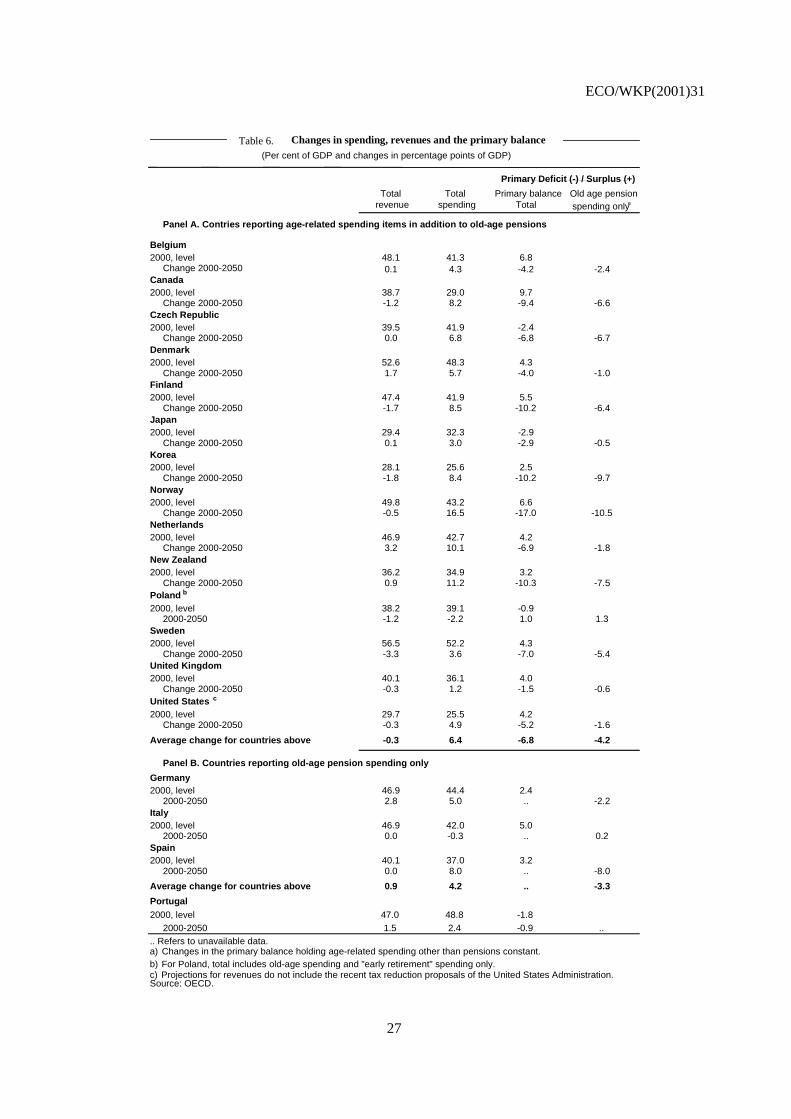
ECO/WKP(2001)31
27
Table 6. Changes in spending, revenues and the primary balance(Per cent of GDP and changes in percentage points of GDP)
Primary Deficit (-) / Surplus (+)
Total Total Primary balance Old age pensionrevenue spending Total spending onlya
Panel A. Contries reporting age-related spending items in addition to old-age pensions
Belgium2000, level 48.1 41.3 6.8
Change 2000-2050 0.1 4.3 -4.2 -2.4Canada2000, level 38.7 29.0 9.7
Change 2000-2050 -1.2 8.2 -9.4 -6.6Czech Republic2000, level 39.5 41.9 -2.4
Change 2000-2050 0.0 6.8 -6.8 -6.7Denmark2000, level 52.6 48.3 4.3
Change 2000-2050 1.7 5.7 -4.0 -1.0Finland2000, level 47.4 41.9 5.5
Change 2000-2050 -1.7 8.5 -10.2 -6.4Japan2000, level 29.4 32.3 -2.9
Change 2000-2050 0.1 3.0 -2.9 -0.5Korea2000, level 28.1 25.6 2.5
Change 2000-2050 -1.8 8.4 -10.2 -9.7Norway2000, level 49.8 43.2 6.6
Change 2000-2050 -0.5 16.5 -17.0 -10.5Netherlands2000, level 46.9 42.7 4.2
Change 2000-2050 3.2 10.1 -6.9 -1.8New Zealand2000, level 36.2 34.9 3.2
Change 2000-2050 0.9 11.2 -10.3 -7.5Poland b
2000, level 38.2 39.1 -0.92000-2050 -1.2 -2.2 1.0 1.3
Sweden2000, level 56.5 52.2 4.3
Change 2000-2050 -3.3 3.6 -7.0 -5.4United Kingdom2000, level 40.1 36.1 4.0
Change 2000-2050 -0.3 1.2 -1.5 -0.6United States c
2000, level 29.7 25.5 4.2Change 2000-2050 -0.3 4.9 -5.2 -1.6
Average change for countries above -0.3 6.4 -6.8 -4.2
Panel B. Countries reporting old-age pension spending only
Germany2000, level 46.9 44.4 2.4
2000-2050 2.8 5.0 .. -2.2Italy2000, level 46.9 42.0 5.0
2000-2050 0.0 -0.3 .. 0.2Spain2000, level 40.1 37.0 3.2
2000-2050 0.0 8.0 .. -8.0
Average change for countries above 0.9 4.2 .. -3.3
Portugal2000, level 47.0 48.8 -1.8
2000-2050 1.5 2.4 -0.9 .... Refers to unavailable data.a) Changes in the primary balance holding age-related spending other than pensions constant.b) For Poland, total includes old-age spending and "early retirement" spending only.c) Projections for revenues do not include the recent tax reduction proposals of the United States Administration.Source: OECD.

ECO/WKP(2001)31
28
Table 7. The Impact of Ageing in a "Stylised" Country, 2000-2050 a
Panel A. Changes in primary balances and net debt for a "stylised" country(difference between 2000 and 2050 in percentage points of GDP)
Change in: Difference
Primary Debt relative to
balance baseline
BaselineImpact of all age-related spending on the "stylised" country -6.1 -96-- Impact abstracting from initial debt and primary surplusesb -6.1 -210-- Impact of initial and sustained primary surplusesc 115
Impact of pension spending aloned -4.2 -74 22
Policy simulations
Sustained primary deficit of 1 per cent of GDPe -6.1 -435 -340Primary surpluses disappear after 10 years -8.6 -274 -178
Sensitivity testSustained increase in the primary surplus of 1 percentage point of GDPf -6.1 -1 97Age-related spending is 1 percentage point lower in 2050 -5.1 -62 34Initial debt is 10 percentage points lower -6.1 -75 21Real interest rates are one percentage point lower -6.1 -61 35
Panel B. Policy measures to keep debt constant as a share of GDP at the end of the period
Year policy measure takes effect:2005g 2015g 2025g
Reduction in the number of pension beneficiaries (per cent) 7.7 9.5 12.3Reduction in average pension benefits (per cent) 17.3 21.3 29.9
Increase in the primary surplus needed to keep debt constant at the level in 2000h 1.1
Memorandum item:Increase in the primary surplus needed to eliminate all debt by 2050h 1.8
a) The "stylised" country has pension spending equal to 8 per cent of GDP, a primary surplus of 2.5 per cent and net debt to 55 per cent of GDP. This country experiences an ageing-related shock measured by the median value in country submissions for the number of pensioners, average pensions, health-care spending and other age-related spending over the period.b) Initial debt and primary balances, excluding the effects of ageing, are set to zero.c) Assumes that age-related spending increases in line with GDP.d) Assumes that other age-related spending increases in line with GDP.e) The primary deficit is assumed to be 1 per cent of GDP initially (compared to a surplus of 2.5 per cent in the baseline). The deficit is assumed to remain constant over the period, excluding the effect of ageing. The impact of ageing is then introduced in this new baseline.f) Increase throughout the period from 2000 excluding the effect of ageing. The impact of ageing is then introduced in this new baseline.g) The reduction is fully implemented in the corresponding year and sustained through the period.h) The surpluses are sustained throughout the period.Source: OECD.

ECO/WKP(2001)31
29
Table 8. Average impact of sensitivity tests on total age-related spending: 2000-2050 a
(Percentage points of GDP)
Total TotalOld-age age-related Old-age age-related
pensions spending pensions spending
Increased longevity (+3 years for Fall in unemployment ratesmales and +2 years for 1.0 1.4 (decline to levels experienced in -0.3b -0.5b
females relative to baseline) late 1960s)
Higher fertility (+15% relative to Lower older worker participationbaseline) -0.7 -0.8 rates (5 percentage points lower 0.3 0.5
by 2050 relative to baseline)
Higher migration (+50% by end Lower female participation ratesof period relative to baseline) -0.5 -0.7 (5 percentage points lower in 0.3 0.5
2050 relative to baseline)
Fall in labour productivity growth(fall in growth rate by 1/2 point 0.5 0.6c
relative to baseline)
a) Results are defined relative to baseline at the end of the period. Results are averaged over countries providing data. For country coverage see Table A.13. France, Germany, Italy and Spain are excluded from the results for total age-related spending.b) This indicates the impact relative to baseline. However, the baseline forecasts included some decline in unemployment rates particularly for Belgium, Italy, France and Spain, such that the impact of the total fall in unemployment over the period would be larger than reported here.c) Excluding the Czech Republic and the United States because projections of spending on health and long-term care and education are insensitive to the change in productivity growth in these two countries, i.e. lower productivity growth does not lead to a fall in wage growth relative to baseline in these two countries. Source : OECD.
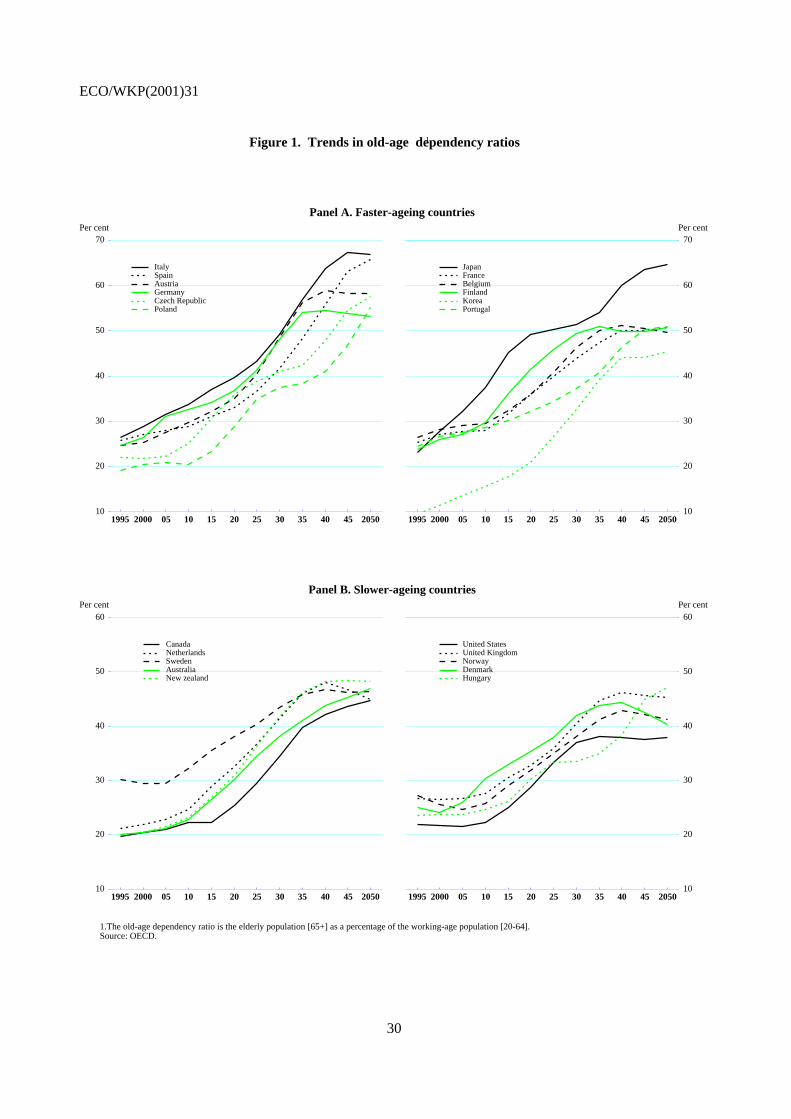
ECO/WKP(2001)31
30
Figure 1. Trends in old-age dependency ratios
10
20
30
40
50
60
70Per cent
Panel A. Faster-ageing countries
1995 2000 05 10 15 20 25 30 35 40 45 2050
ItalySpainAustriaGermanyCzech RepublicPoland
1
10
20
30
40
50
60
70Per cent
1995 2000 05 10 15 20 25 30 35 40 45 2050
JapanFranceBelgiumFinlandKoreaPortugal
10
20
30
40
50
60Per cent
Panel B. Slower-ageing countries
1995 2000 05 10 15 20 25 30 35 40 45 2050
CanadaNetherlandsSwedenAustraliaNew zealand
1.The old-age dependency ratio is the elderly population [65+] as a percentage of the working-age population [20-64].Source: OECD.
10
20
30
40
50
60Per cent
1995 2000 05 10 15 20 25 30 35 40 45 2050
United StatesUnited KingdomNorwayDenmarkHungary

ECO/WKP(2001)31
31
Figure 2. Projected growth of GDP and labour productivity (average annual growth rate from 2000 to 2050)
Projected growth of GDP
0.1 0.3 0.5 0.7 0.9 1.1 1.3 1.5 1.7 1.9 2.1 2.3 2.5 2.7 2.9 3.1 3.3 3.5
Japan
Norway
Germany
Italy
Denmark
France
United Kingdom
Belgium
Austria
Canada
Finland
Netherlands
Sweden
Spain
Poland
Czech Republic
New Zealand
Australia
United States
Korea
Portugal
Hungary
Projected growth of labour productivity
0.0 0.2 0.4 0.6 0.8 1.0 1.2 1.4 1.6 1.8 2.0 2.2 2.4 2.6 2.8 3.0 3.2
Japan
Norway
Germany
Italy
Denmark
France
United Kingdom
Belgium
Austria
Canada
Finland
Netherlands
Sweden
Spain
Poland
Czech Republic
New Zealand
Australia
United States
Korea
Portugal
Hungary
Average (1.91) Average (1.96)

ECO/WKP(2001)31
32
Figure 3. Public pension spending in 2000 and changes 2000-50(Percentage points of GDP)
Level in 2000 Change between 2000 and 2050
PANEL A. Mainly earnings related pension schemes
PANEL B. Mainly flat-rate pension schemes
Source : OCDE.
0.0 2.0 4.0 6.0 8.0 10.0 12.0 14.0 16.0
Korea
United States
Norway
Hungary
Czech Republic
Portugal
Finland
Belgium
Sweden
Spain
Austria
Poland
Germany
France
Italy
-5 -3 -1 1 3 5 7 9
Korea
United States
Norway
Hungary
Czech Republic
Portugal
Finland
Belgium
Sweden
Spain
Austria
Poland
Germany
France
Italy
-1 1 3 5 7 9 11 13 15
Australia
New Zealand
New Zealand
Netherlands
Japan
-3 -1 1 3 5 7 9
Australia
New Zealand
New Zealand
Netherlands
Japan

ECO/WKP(2001)31
33
ANNEX: SUPPORTING MATERIAL
1. Population projections
39. The total population is projected to decline in absolute terms in ten of the countries underconsideration (Austria, Belgium, Czech Republic, Finland, Germany, Hungary, Italy, Japan, Poland andSpain) (Table A.1). The old-age dependency ratio (defined as the ratio of the population age 65 and over tothe working-age population aged 20-64) rises in all countries but the speed and timing differ acrosscountries. A decomposition of the old-age dependency ratio indicates a continuing rapid fall in theworking-age population due to low fertility rates, combined with a continued increase in the number of theelderly but in many countries it will reach a peak between 2030-2035 (Table A.2). This mainly reflects anabsolute fall in the number of the elderly as the baby boom generation passes away and, to some extent, amore modest decline in the working age population, as result of immigration and the recovery in fertilityrates in some countries (See Box 1 in the main text). The youth dependency ratio (defined as the ratio ofthe population under 20 to the population aged 20 to 64) falls in all countries except Italy, the Netherlandsand Portugal. Particularly large declines are projected for Canada, Korea, New Zealand and Poland.
40. These demographic developments are also very sensitive to underlying demographic assumptionsand, in particular, to longevity. Alternative projections used in the sensitivity analysis (see below), inwhich the assumption for longevity is calibrated on an increase in average lifetimes at birth of 3¾ years formales and 2 years for females on top of those in the baseline (Table 1 in the main text), result in an old-agedependency ratio 6 percentage points higher than in the baseline projections at the end of the period.(Table A.3 and Table A.4).21
2. Assumptions underlying the macroeconomic projections
41. The values chosen by countries for unemployment and participation rates, on the basis of theassumptions in Box 1 of the main text, are shown in Table A.5. This indicates wide variation in the changein participation rates across countries, with larger increases in participation rates for women in countrieswith low participation rates at the beginning of the period. While participation rates for males aged 25 to54 were agreed to be kept constant, Australia, Austria, Italy, Poland, Spain and Sweden assumedincreasing rates. Since the increases of female participation rates were set in terms of the male rates, thishas knock-on effects on female participation rates as well. Upward adjustment in participation rates in the54-65 age group occurs in a few countries, reflecting the assumed impact of reforms to pension systems(Australia, Austria, Belgium, the Czech Republic, Germany, Italy, the Netherlands and Poland). Theincrease for Austria is 33 percentage points well above the other countries. Some countries reducedunemployment rates to below the structural rate in 2000 by the end of the period, reflecting the assumedimpact of the labour market reforms (Belgium, France, and Italy, and to a lesser extent, the CzechRepublic, Germany, Finland, Hungary and Poland). The decline in the unemployment rates for Spain wasoutside the agreed guidelines under this exercise. The sensitivity analysis reported below provides someindication of the importance that this might have.
20. These assumptions for increased longevity, which were estimated by Eurostat, were set so as to broadly
represent having a 2/3 probability of occurring. The probability distribution was based on previous errorsin population projections in EU countries. A similar approach was used for fertility. Thus, the results ofthese simulations are broadly comparable.

ECO/WKP(2001)31
34
3. Profile of age-related spending over time
42. The profiles of age-related spending from 1995 to 2050 are shown in Tables A.6 to A.12 for thesix components of age-related spending included here (old-age pension, “early retirement” pensions, healthcare, long-term care, family and child benefits and education).
4. Decomposition of the change in old-age-pension spending.
43. Table 4 in the main text uses a simple decomposition to isolate the impact of four ratios:
− A dependency ratio (ODR): those aged 55 and over as a share of the population aged 20to 54;22
− The employment ratio (EMP): the inverse of the ratio of employment to the working-agepopulation (20-64).
− The benefit ratio (BEN): the average benefit relative to GDP per worker;
− The eligibility ratio (ELIG): the share of individuals 55 and over receiving benefits;
These were estimated using the following formulae:
∗
=
typroductiviAverage
benifitpensionAverage
Employment
recipientspensionofNumber
GDP
spendingPension
where the ratio of pension recipients to employment can be decomposed into the ratio of those aged 55 orolder to the working age population (ODR), the inverse of the employment ratio (EMP) and the proportionof those aged 55 or older who are entitled to a pension (ELIG).
BENELIGEMPODRAvPdty
AvBen
Pop
c
Empl
Pop
Pop
Pop
GDP
Pens ∗∗∗=∗+
∗−∗−+=
)55(
Re)6420(
)6420(
)55((1)
44. The linear decomposition of the change in levels in the ratio of public pension spending as ashare of GDP can be expressed as:
=
∆
+ GDP
Pensg
GDP
Pens
GDP
Pensi
titt
�.,
( ) ( ) ( ) ( )[ ] iitt
ELIGContribBENContribEMPContribODRContribGDP
Pens ε++++=
∆
+,, (2)
and )(.)( XgGDP
PensXContrib i�
= ,
21. The ratio of 55+ to the working age population is used to take account of the fact that a considerable share
of older workers retire before 65.
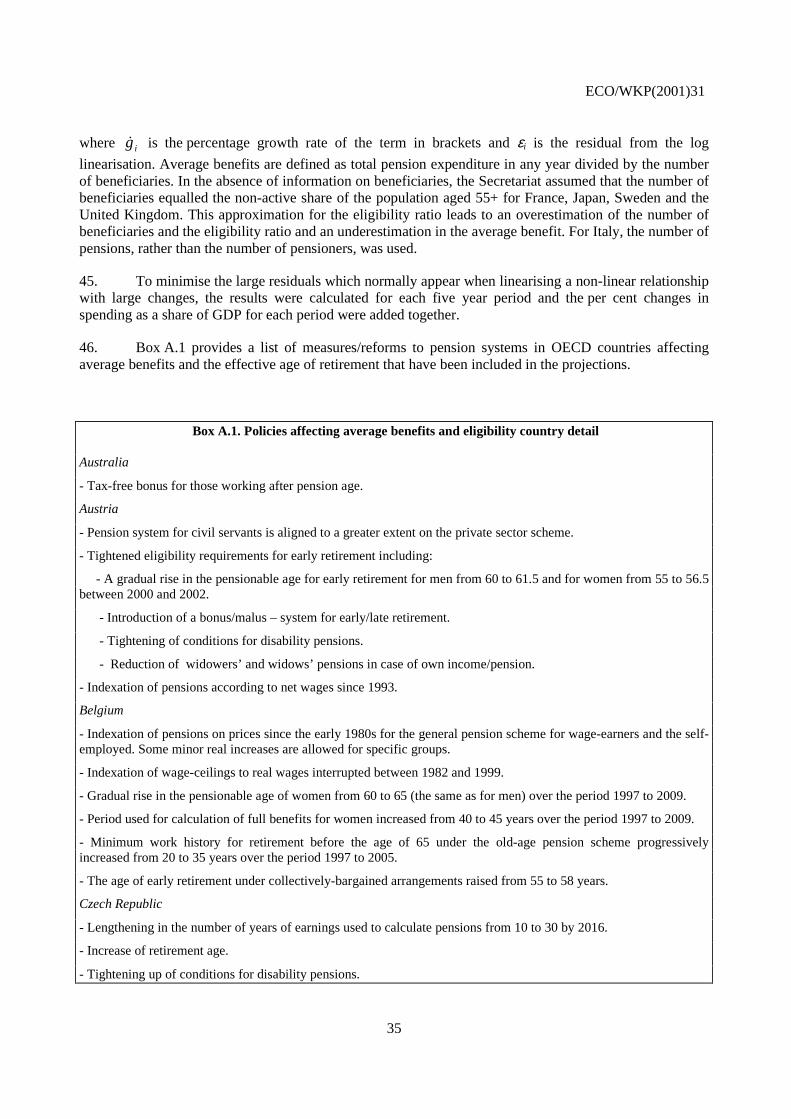
ECO/WKP(2001)31
35
where ig� is the percentage growth rate of the term in brackets and εi is the residual from the log
linearisation. Average benefits are defined as total pension expenditure in any year divided by the numberof beneficiaries. In the absence of information on beneficiaries, the Secretariat assumed that the number ofbeneficiaries equalled the non-active share of the population aged 55+ for France, Japan, Sweden and theUnited Kingdom. This approximation for the eligibility ratio leads to an overestimation of the number ofbeneficiaries and the eligibility ratio and an underestimation in the average benefit. For Italy, the number ofpensions, rather than the number of pensioners, was used.
45. To minimise the large residuals which normally appear when linearising a non-linear relationshipwith large changes, the results were calculated for each five year period and the per cent changes inspending as a share of GDP for each period were added together.
46. Box A.1 provides a list of measures/reforms to pension systems in OECD countries affectingaverage benefits and the effective age of retirement that have been included in the projections.
Box A.1. Policies affecting average benefits and eligibility country detail
Australia
- Tax-free bonus for those working after pension age.
Austria
- Pension system for civil servants is aligned to a greater extent on the private sector scheme.
- Tightened eligibility requirements for early retirement including:
- A gradual rise in the pensionable age for early retirement for men from 60 to 61.5 and for women from 55 to 56.5between 2000 and 2002.
- Introduction of a bonus/malus – system for early/late retirement.
- Tightening of conditions for disability pensions.
- Reduction of widowers’ and widows’ pensions in case of own income/pension.
- Indexation of pensions according to net wages since 1993.
Belgium
- Indexation of pensions on prices since the early 1980s for the general pension scheme for wage-earners and the self-employed. Some minor real increases are allowed for specific groups.
- Indexation of wage-ceilings to real wages interrupted between 1982 and 1999.
- Gradual rise in the pensionable age of women from 60 to 65 (the same as for men) over the period 1997 to 2009.
- Period used for calculation of full benefits for women increased from 40 to 45 years over the period 1997 to 2009.
- Minimum work history for retirement before the age of 65 under the old-age pension scheme progressivelyincreased from 20 to 35 years over the period 1997 to 2005.
- The age of early retirement under collectively-bargained arrangements raised from 55 to 58 years.
Czech Republic
- Lengthening in the number of years of earnings used to calculate pensions from 10 to 30 by 2016.
- Increase of retirement age.
- Tightening up of conditions for disability pensions.

ECO/WKP(2001)31
36
- Equalisation of widowers’ and widows’ pension.
- Introduction of an actuarially fair adjustment for early retirement pensions.
Denmark
- A premium paid to individuals working after 62.
Finland
- Reference earnings for calculating benefits increased from last 4 to last 10 years of earnings, phased in by 2003.
- Wages used to calculate benefits are defined net of employees’ pension contributions.
- Weight of the wage component in the formula for indexing old-age pensions (65 and over) reduced to 20 per cent.
- Reduction of the rate of accrual of pension rights under early retirement pensions.
- The minimum age for access to the individual early retirement pension raised by 2 years.
France
- Pensions indexed on prices rather than wages.
- Pensions calculated on the basis of best 25 years of earnings rather than 10.
- Minimum contribution period for retirement on a full pension at 60 progressively increased from 37.5 to 40 years.
Germany
- Indexing of pensions to net wages from 1992.
- Temporary indexing of pensions to inflation in 2001 and 2002. From 2002 onwards, a demographic progressionfactor takes into account the lengthening in average lifetimes at 65.
- Progressive standardisation of retirement ages to 65 over the period to 2004.
Greece
- Maximum replacement rates reduced by 25 per cent.
Hungary
- Weights used for indexing pensions changed to 50 per cent prices and 50 per cent net wages from 2001.
- Shift towards a private arrangement after 2013.
- Increase in the pension age to 63.
- Early retirement benefits reduced.
Italy
- Shift from wage to price indexing of pensions.
- Progressive move to a system where benefits are related to longevity and to contributions.
- Access to old-age pensions and long-service pension tightened.
Japan
- Benefits reduced or contributions increased every 5 years to keep the social insurance pension system in balance.
- Change in indexation from net disposable income to prices.
- Increase in the age at which flat-rate benefits are received from 60 to 65 with a phase in period ending in 2013.
Korea
- Revision in benefit formula resulting in a reduction of replacement rate from 70 to 60 per cent.
- Price rather than wage indexation introduced.

ECO/WKP(2001)31
37
- Age for receiving a full pension progressively increased from 60 to 65 over the period 2013 to 2033.
New Zealand
- Age for receipt of the state pension raised from 60 to 65.
Portugal
- The pension age of women raised from 60 to 65.
Spain
- Progressive increase in the number of years of earnings taken into account for the calculation of benefits from10 years in 1998 to 15 years in 2004 (Toledo Agreement).
Sweden
- Progressive move to contributions based system, taking account of lengthening lifetimes.
United Kingdom
- Alignment of the pension age of women to that of men (65 years of age).
United States
- Increase in the age for receiving a full pension to 67, phased in over, roughly, a twenty-year period from 2000.
5. Health care, long-term care and other age-related spending
47. As emphasised in the main text, the margins of error surrounding projections of health carespending are much wider than for pensions. Health and long-term care costs will be affected by a range offactors in addition to ageing: technology, increases in supply (hospitals and medical personnel), incentivesfacing suppliers and patients, changes in price/costs of health care relative to other goods and services andincreased underlying demand as incomes rise. While these additional factors have explained the bulk ofpast increases in spending, there is little consensus on the relative importance of each for the future.
48. In practice, most countries projecting health care have taken the impact of ageing into account byweighting per capita care costs by age/sex groups by the population structure for each five year period.However, Korea (which did not include medical care costs paid under the social insurance system)projected health care costs on the basis of a regression analysis that included only GDP, the number ofelderly and a (negative) time trend. This approach appears to have contributed to a relatively small increasein public health care spending over the projection period. The Norwegian approach is based on a model forthe production of public services (mostly located in local administration), using Leontief-type fixedcoefficients for labor, intermediate inputs and investments weighted according to the age structure ofpatients.
49. Even among countries using an approach based on per-capita costs per age group weighted by theimportance of each age group, the results can differ considerably. This depends on the following factors.
− Belgium, Canada and the Netherlands have included long-term care with health care costs.Their change in spending for these three countries needs to be compared with the total ofhealth care and long-term care spending of the other countries except the United Kingdom,where long-term-care costs do not appear to have been taken into account at all.
− The fineness of the breakdown of costs by age group and by sex varies across countries. Forhealth care spending the Japanese projections only distinguish between persons aged over andunder 70, while the Belgian projections are based on a breakdown by 5-year age groups andby sex. Even if the breakdowns were the same, the pattern of costs per capita across age

ECO/WKP(2001)31
38
groups and can differ considerably. For example, the ratio of health and long-term care costsof the over 65 age group relative to the under 65s is around 5.5 in Canada and theNetherlands, while for Belgium it is around 4.
− Countries have taken different approaches to take into the account trends in income, relativeprices or technology. This probably explains a good part of the variation across countries assmall differences in trends can have a large impact when cumulated over a period as long as50 years. Some key differences are:
− Canada, Denmark, and Sweden assume that the costs will rise in line with productivity orwages. The Netherlands set the annual increase at 1.75 per cent with 0.4 per cent added tothe growth rate over the period to 2020. The Czech Republic allows per capita health carecosts to rise by 3 per cent per annum to 2015 and then by 2 per thereafter (but only 1.5 percent growth for long-term care).
− The United Kingdom assumes that both current and capital costs rise in line with realGDP.
− Belgium has established the impact of different demand and supply factors affectinghealth care costs using regression analysis. On this basis, health and long-term care costs(adjusted for changing population structure) rise with per capita GDP using an elasticity of1.1. Japanese health care expenditures rise in line with GDP with an elasticity of 1 forpersons over 70 and 0.97 for those under 70. Australia allows for strong relative-price/income/quality effect which explains more than half of the overall 6 percentagepoint increase over the projection period;
− For the United States costs are also aligned on GDP per capita, but are allowed to risemore rapidly than GDP (for Medicare up to 2025 and for Medicare through the wholeperiod).
− Finally the Netherlands allows for “costs of death” in calculating the trends over time inhealth care costs. Costs per death are the same for all age groups and the share of thesecosts in total spending by age group is estimated by first multiplying the “cost of death”by the probability of death in that age group. “Recurrent” health care costs for each agegroup are then estimated by deducting the “death-related” costs from total health carecosts. Since the probability of death increases with age, the share of death-related costs intotal health care costs increases with the age of the group. Lengthening lifetimes and theassociated decline in the probability of death, leads to slower projected growth in overallhealth care spending as the ”costs of death” are delayed.
6. Sensitivity tests
50. Results of the sensitivity tests (presented as a share of GDP relative to baseline) differ acrosscountries depending on the extent to which the changes in assumptions alter spending and output(Table A.13). Comparisons of the sensitivity tests across countries need to be treated with caution. First,the size of the shocks differs across countries for two of the sensitivity tests:
− For the test of higher immigration, the number of net immigrants was increased by 50 percent relative to baseline. However, with the level of immigration (relative to the total

ECO/WKP(2001)31
39
population) differing across countries in the baseline, the change relative to the baselinevaries across countries as well.
− Similarly, in the test allowing a reduction in unemployment to levels experienced in thelate 1960s, the starting and end points for unemployment also differs across countries.23
For both these tests, rough adjustments were made to improve cross-country comparability (shown incolumns 2 and 4 of Table A.13):
− For each country the impact of higher immigration on spending was adjusted on the basis ofthe cumulated immigration over the projection period relative to end-of period population.The adjustment coefficient for each country was calculated as this ratio divided by theaverage of the ratios of all the countries (8.5 per cent). The reported change in the spending toGDP ratio (Columns 1 and 3 of Table A.13) was divided by this coefficient. While theadjustment narrows the variance, differences across countries remain wide.
− For unemployment, the reported change in the spending relative to GDP was divided by thechange in the unemployment rate in percentage points. This approximates the change for eachpercentage point fall in the unemployment rate. These results for the sensitivity test for lowerunemployment suggest that a 1 percentage point reduction in the unemployment rate wouldreduce total age-related spending as a share of GDP by 0.2 percentage points on average.
51. Second, there appear to be significant differences across countries in the impact of the changes inassumptions.24 These can reflect the institutional arrangements that vary from one country to another. Theycan also result from different modeling approaches: for example, the degree of feedback between differentspending programs and between macroeconomic variables.25 In a few cases, the changes may have beenintroduced in ways that could affect outcomes. Finally, they result from the differences in the size of age-related spending in GDP in the baseline.26 Some salient features are:
− Aside from immigration and unemployment, cross-country differences in the impact of thechange in assumptions on GDP within each test were relatively modest. Key cross-countrydifferences appear to reflect differences in the impact of the sensitivity test on spending.
− Increases in longevity have very different effects across countries. They are particularlylow for Italy and Sweden where pensions are adjusted to allow for the longer life-spans.They tend to be largest in Denmark and the Netherlands, which have flat-rate systems.Large increases in other age-related spending (mainly health care) are indicated for Koreaand the United States.
22. These differences also reflect the rules agreed in setting the baseline. Belgium, France, and Italy took
advantage of the rule that structural unemployment rates could fall by up to one third through theprojection period, while Spain reduced unemployment rates to 4 per cent, virtually eliminating anyadditional impact from the sensitivity test. For these countries, the fall in unemployment rates in thesensitivity tests was less than for most other countries.
23. Certain tests for Korea were difficult to interpret.
24. For example in Belgium and the Netherlands higher unemployment leads to increases in “early-retirement”spending.
25. For example, a country with a large share of age-related spending in GDP will experience a larger impactwhen the changes are measured in terms of percentage points of GDP for the same per cent change inspending.

ECO/WKP(2001)31
40
− There is relatively little impact from changing assumptions on fertility and immigration onpension spending as most of the additional workers associated with these changes will notreach retirement until after 2050. The increases in pension spending are particularly smallfor France. For countries projecting other age-related spending components, the largerpopulation (and more young people) leads to higher spending on other age-relatedcomponents (health care and child-related spending), with the exception of Denmark.
− Reductions in participation rates for older workers and women also have relatively modesteffects on spending. This is particularly the case for countries with flat rate systems(Canada, Denmark, the Netherlands and the United Kingdom) but also for the UnitedStates. There are falls in other age-related spending in a number of countries, althoughwhy this should be the case is not clear.
− For the test of a reduction in productivity growth, spending on pensions tends to move inline with productivity growth (except for the United Kingdom, where there is no change),Italy, Japan, Poland, Spain and the United Kingdom. For other age-related spending,differences reflect the degree to which costs automatically adjust to changes inproductivity. For example certain components such as education and health care are notlinked to productivity for the Czech Republic and the United States.
7. Method of estimating the impact of alternative policy measures
52. The Section on policy options and Table 7 (Panel B) in the main text examined three alternativepolicies to offset the impact of ageing on public finances:
− A reduction in the number of people receiving pension benefits (pensioners);
− A reduction in average pension benefits; and,
− Changes in primary surpluses.
53. Calculations of these three alternative policies were calibrated so as to maintain debt constant asa share of GDP at the end of the projection period. The first two policies are measured in termof percentage change in either pensioners or average benefits needed, respectively to achieve this outcome.The third policy alternative indicates the primary surplus that the “typical” country needs to sustainthroughout the period 2005-2050 to maintain debt to GDP ratios constant at the end of the period.
54. The exercise assumes that other government spending and revenues remain constant as a share ofGDP. Therefore, changes in the primary balance are fully driven by changes in age-related spending. The“non-age-related” primary balance is defined as the initial primary balance in 2005 and is kept constantthrough the projection period.
55. Primary balances plus interest payments on previous debt determine current deficits. Debt iscalculated as the debt in the previous period plus the current deficit. The long-term interest rate used in thecalculations was 4 per cent.
56. Projections for the following variables were drawn from countries submissions: pension spending– defined as the product of average pensions, Ab, and the number of pensioners, N ; other age relatedspending (OARE), including health care and long-long term care; other government spending (OGE)

ECO/WKP(2001)31
41
(excluding debt servicing), and government revenue as the share of GDP. The primary balance (positive ifin surplus) is defined as the difference between revenues and spending:
( ) ( )tjjjjjjjj OGEOAREAbNGDPtrspendingrevenuespb ++∗−∗=−= (3)
Where tr is the tax rate (defined as the share of total revenues in GDP), and GDP is defined as theproduct of average productivity and total employment.
57. Debt and debt-interest payments will vary with changes in pension spending and primarysurpluses as different policies are assumed. Because projections are presented at 5-year intervals, debt anddebt-interest payments were calculated on the basis of a linear interpolation of primary surpluses, using thefollowing formulas:
( ) ( )∑−
=++−−+
−+ +−+−+=
25
055)15(
155 11
ittit
itt ippdpdrdebtrdebt (4)
( ) ( )∑−
=−
−−+ +−+=
15
1
1155 1*1*
iit
itt pdrrdebtrrip (5)
Where ip stands for interest payments, defined as ipt=r*debtt-1, and r stands for the interest rate.
58. The policy goal is to reduce the debt to GDP ratio in 2050 to its level in 2005 either by reducingpensioners or average benefits, or by increasing primary surpluses. Therefore, the debt to GDP ratio in2050 has to be reduced by:
( ) ( ) ( ) ( ) ( )2005,2050200520502050 GDP
debtGDP
debtGDP
debtGDP
debtGDP
debtnew
==
−− (6)
59. Using equation (4) above, the debt in 2050 that results from implementing a specific policymeasure can be defined as:
( ) ( )∑=
− +−+−+=43
02050,2050,20492005
44,2050 11
inewnewi
inew ippdpdrdebtrdebt (7)
60. A reduction in the number of pensioners ( ���������new-Nold) has three inter-related effects. First,pension spending is reduced. Second, government revenues increase under the strong assumption that thosewho do not retire continue to work. Third higher employment leads an increase in GDP. That is:
[ ]jjjoldjnewj AbprodAvtrypbpb +∗∗+= .,,
where tr is the tax rate Av. prod stands for average productivity and Ab for average benefits.
( )( ) toldtttnewt prodAvNGDPprodAvNEGDP .. ,, ∗∆−=∗∆−+= (8)
where E is employment.
Using (6), (7) and (8), the required reduction in the number of pensioners to reduce the debt to GDP ratioin 2050 to its 2005 level is equal to:

ECO/WKP(2001)31
42
( ) ( ) ( )∑=
−−− +∗∗+++∗+∗
∗=∆
43
02049204920492050205020502050
2050
.1..i
iiii AbprodAvtrrAbprodAvtrprodAvA
GDPBN (9)
Where A is the debt to GDP ratio in 2005 and B is the difference between the debt to GDP ratioin 2050 and 2005
61. Reducing average pension benefits affects only pension spending. The savings in pension outlaysare equal to the number of pensioners per unit of pension benefits reduced. The required change is givenby:
∑=
− ++
∗=∆
43
020502049
2050
)1(i
ii NNr
GDPBAb (10)
62. Alternatively countries can offset the impact of ageing by running high enough primary surplusesthroughout the period from 2005 to 2050. The increase in the non-age-related primary surplus relative toGDP that has to be sustained through the entire period is given by:
)20502005(1)1(
)20502005( 43
0
2050 −++
∗=
−
=∑=
GDPaverager
GDPB
GDPaverage
surplusprimaryinincreaseT
i
i
(11)
63. Table 7, Panel B shows that the percent reduction in pension beneficiaries required to maintaindebt constant relative to GDP is lower than the required percentage reduction in average pensions,reflecting the feedback effects of lower pension payments, higher tax revenues and higher overall output.To better judge the magnitudes of a change in the number of beneficiaries, rough approximations suggestthat a reduction in debt of 10 percentage points of GDP can be achieved by a 2-month delay in the averageage of retirement over 45 years.27
64. The differences in the required change between the two policy measures are likely to beoverstated. First, it is assumed that a reduction in average benefits affects all pensioners equally. Second,no allowance is made for the fact that a longer period of employment could raise the average benefit ofindividuals. Finally, in the simulation of a reduction in the number of beneficiaries, it is assumed that thosewho do not retire continue working and pay taxes. However, the amount of tax paid will depend on thedifferences in tax rates between employees and the retired and their respective income levels. In thisexercise the increase in tax revenues was assumed to be half because retirees also pay taxes, although at alower rate.
65. Table 7, Panel B also shows that alternatively the “typical” country could offset the impact ofageing by running a moderate primary balance of 1 percentage point over the baseline 2½. However, thesesurpluses need to be sustained over the entire period. Averages hide important differences across countriesreflecting different initial fiscal positions and the size and timing of ageing. Using the same methodologyas for the “stylised” country, Table A.14 below shows primary surpluses (and the change in the primarysurplus relative to the baseline) that each country needs to achieve:
26. Assuming a proportional distribution of retirees across the age spectrum from 63 to 79, that is over 16
years, there is then 100/16=6.25 per cent of retirees in each year interval. Then, if a reduction of 6.25 percent in pensioners is equivalent to a year, a 1 per cent reduction in pensioners is equivalent to 2 months.

ECO/WKP(2001)31
43
− A debt to GDP ratio at the end of the projection period unchanged from the beginning (2005)(column 4); and
− A reduction in the debt to GDP ratio to zero by the end of the period (column 5).
These calculations take into account the increase in age-related expenditure (column 1).
66. In making these calculations, tax revenues associated with large tax-sheltered pension schemeswere included for Canada, Denmark and the Netherlands. Debt as a share of GDP was taken from theEconomic Outlook (June 2001) where different from the share provided in countries’ submissions. SinceFrance, Germany, Italy, Poland and Spain do not provide projections of age-related spending other thanage-related pensions, they are treated separately. Table A.14 (panel B.1) shows the primary surplus whenonly old-age spending increases are considered and other age-related expenditures are assumed to move inline with GDP over the projection period. However, countries which make projections of other age-relatedspending, have an additional increase in total age-related spending of around 3 percentage points of GDP.Therefore, Table A.14 (Panel B.2) shows the primary surplus when the average increase in other age-related spending of countries in panel A is added to the projected increase in old-age pension spending. Asa result, France, Italy, Spain, and Germany to a lesser extent, have to run the highest primary surplus tooffset the impact of ageing, together with the Netherlands and Belgium.
67. The results of these calculations for individual countries are open to wide margins of uncertainty.As shown in Table 7, small change in assumptions concerning interest rates, the levels of debt and theprimary deficit at the beginning of the period on debt at the end of the period. Nonetheless, they serve toillustrate some of the factors explaining the cross-country differences in the need for fiscal restraint. Forexample:
− Italy and Spain need to run similar primary surpluses even though Spain has a large increasein age-related spending while Italy has virtually none. This reflects the cost of financing thehigh level of debt in Italy;
− Despite the largest increase in age-related spending, Norway does not need to run one of thelargest primary surpluses to achieve a zero level of debt by the end of the period because ithas a large public sector net asset position;
− In addition, the timing of ageing can also have important effects. The Czech Republic has alarger increase in age related spending than Denmark and both have broadly similar debtpositions. Nonetheless, Denmark needs to run a higher primary surplus over the 50-yearperiod because the increase in age-related spending occurs much earlier in Denmark than inthe Czech Republic.28
28 While the increase in age-related spending reaches it maximum in 2030 in Denmark, 5.9 percentage points
of the overall spending increase of 6.9 points in the Czech Republic occurs after 2030.
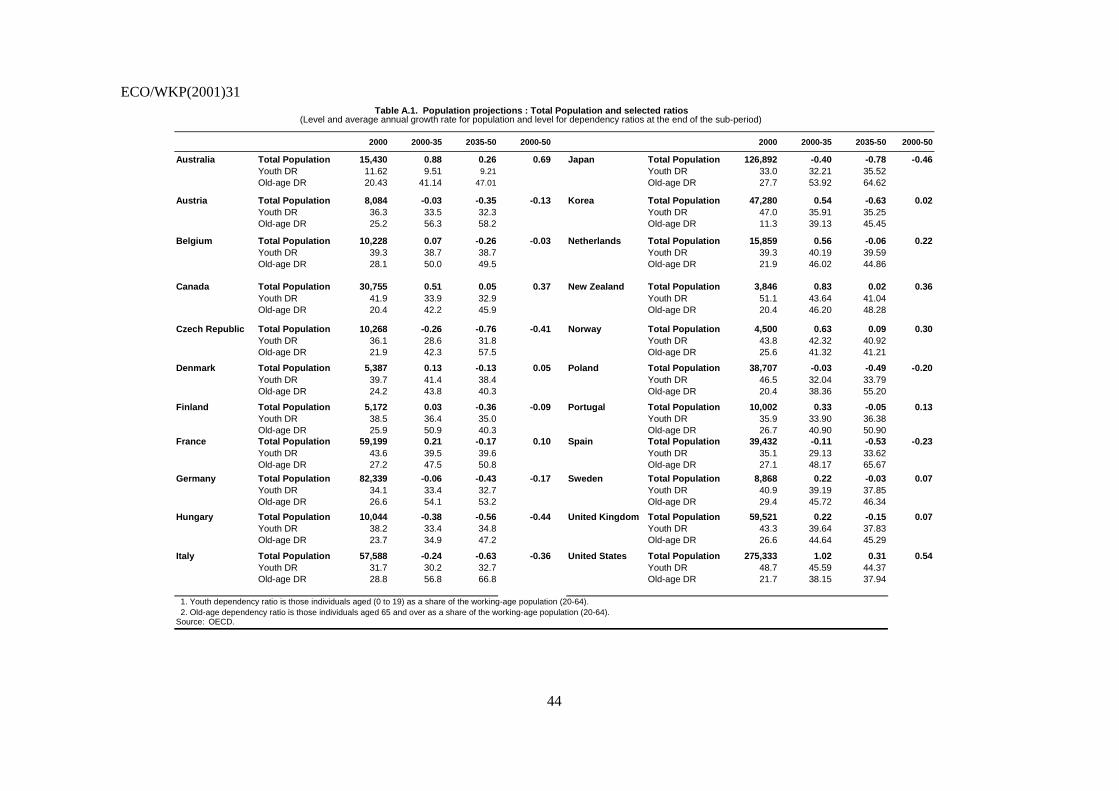
ECO/WKP(2001)31
44
Table A.1. Population projections : Total Population and selected ratios(Level and average annual growth rate for population and level for dependency ratios at the end of the sub-period)
2000 2000-35 2035-50 2000-50 2000 2000-35 2035-50 2000-50
Australia Total Population 15,430 0.88 0.26 0.69 Japan Total Population 126,892 -0.40 -0.78 -0.46Youth DR 11.62 9.51 9.21 Youth DR 33.0 32.21 35.52Old-age DR 20.43 41.14 47.01 Old-age DR 27.7 53.92 64.62
Austria Total Population 8,084 -0.03 -0.35 -0.13 Korea Total Population 47,280 0.54 -0.63 0.02Youth DR 36.3 33.5 32.3 Youth DR 47.0 35.91 35.25Old-age DR 25.2 56.3 58.2 Old-age DR 11.3 39.13 45.45
Belgium Total Population 10,228 0.07 -0.26 -0.03 Netherlands Total Population 15,859 0.56 -0.06 0.22Youth DR 39.3 38.7 38.7 Youth DR 39.3 40.19 39.59Old-age DR 28.1 50.0 49.5 Old-age DR 21.9 46.02 44.86
Canada Total Population 30,755 0.51 0.05 0.37 New Zealand Total Population 3,846 0.83 0.02 0.36Youth DR 41.9 33.9 32.9 Youth DR 51.1 43.64 41.04Old-age DR 20.4 42.2 45.9 Old-age DR 20.4 46.20 48.28
Czech Republic Total Population 10,268 -0.26 -0.76 -0.41 Norway Total Population 4,500 0.63 0.09 0.30Youth DR 36.1 28.6 31.8 Youth DR 43.8 42.32 40.92Old-age DR 21.9 42.3 57.5 Old-age DR 25.6 41.32 41.21
Denmark Total Population 5,387 0.13 -0.13 0.05 Poland Total Population 38,707 -0.03 -0.49 -0.20Youth DR 39.7 41.4 38.4 Youth DR 46.5 32.04 33.79Old-age DR 24.2 43.8 40.3 Old-age DR 20.4 38.36 55.20
Finland Total Population 5,172 0.03 -0.36 -0.09 Portugal Total Population 10,002 0.33 -0.05 0.13Youth DR 38.5 36.4 35.0 Youth DR 35.9 33.90 36.38Old-age DR 25.9 50.9 40.3 Old-age DR 26.7 40.90 50.90
France Total Population 59,199 0.21 -0.17 0.10 Spain Total Population 39,432 -0.11 -0.53 -0.23Youth DR 43.6 39.5 39.6 Youth DR 35.1 29.13 33.62Old-age DR 27.2 47.5 50.8 Old-age DR 27.1 48.17 65.67
Germany Total Population 82,339 -0.06 -0.43 -0.17 Sweden Total Population 8,868 0.22 -0.03 0.07Youth DR 34.1 33.4 32.7 Youth DR 40.9 39.19 37.85Old-age DR 26.6 54.1 53.2 Old-age DR 29.4 45.72 46.34
Hungary Total Population 10,044 -0.38 -0.56 -0.44 United Kingdom Total Population 59,521 0.22 -0.15 0.07Youth DR 38.2 33.4 34.8 Youth DR 43.3 39.64 37.83Old-age DR 23.7 34.9 47.2 Old-age DR 26.6 44.64 45.29
Italy Total Population 57,588 -0.24 -0.63 -0.36 United States Total Population 275,333 1.02 0.31 0.54Youth DR 31.7 30.2 32.7 Youth DR 48.7 45.59 44.37Old-age DR 28.8 56.8 66.8 Old-age DR 21.7 38.15 37.94
1. Youth dependency ratio is those individuals aged (0 to 19) as a share of the working-age population (20-64). 2. Old-age dependency ratio is those individuals aged 65 and over as a share of the working-age population (20-64).Source: OECD.
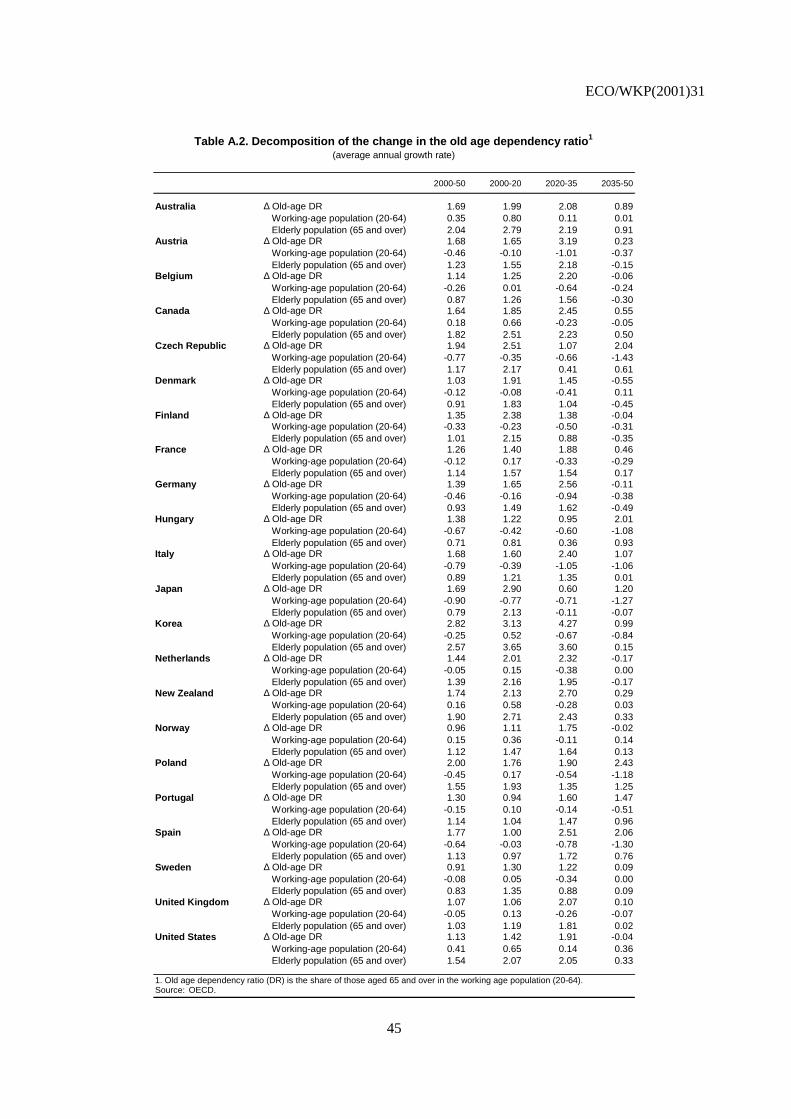
ECO/WKP(2001)31
45
Table A.2. Decomposition of the change in the old age dependency ratio1
(average annual growth rate)
2000-50 2000-20 2020-35 2035-50
Australia ∆ Old-age DR 1.69 1.99 2.08 0.89 Working-age population (20-64) 0.35 0.80 0.11 0.01 Elderly population (65 and over) 2.04 2.79 2.19 0.91
Austria ∆ Old-age DR 1.68 1.65 3.19 0.23 Working-age population (20-64) -0.46 -0.10 -1.01 -0.37 Elderly population (65 and over) 1.23 1.55 2.18 -0.15
Belgium ∆ Old-age DR 1.14 1.25 2.20 -0.06 Working-age population (20-64) -0.26 0.01 -0.64 -0.24 Elderly population (65 and over) 0.87 1.26 1.56 -0.30
Canada ∆ Old-age DR 1.64 1.85 2.45 0.55 Working-age population (20-64) 0.18 0.66 -0.23 -0.05 Elderly population (65 and over) 1.82 2.51 2.23 0.50
Czech Republic ∆ Old-age DR 1.94 2.51 1.07 2.04 Working-age population (20-64) -0.77 -0.35 -0.66 -1.43 Elderly population (65 and over) 1.17 2.17 0.41 0.61
Denmark ∆ Old-age DR 1.03 1.91 1.45 -0.55 Working-age population (20-64) -0.12 -0.08 -0.41 0.11 Elderly population (65 and over) 0.91 1.83 1.04 -0.45
Finland ∆ Old-age DR 1.35 2.38 1.38 -0.04 Working-age population (20-64) -0.33 -0.23 -0.50 -0.31 Elderly population (65 and over) 1.01 2.15 0.88 -0.35
France ∆ Old-age DR 1.26 1.40 1.88 0.46 Working-age population (20-64) -0.12 0.17 -0.33 -0.29 Elderly population (65 and over) 1.14 1.57 1.54 0.17
Germany ∆ Old-age DR 1.39 1.65 2.56 -0.11 Working-age population (20-64) -0.46 -0.16 -0.94 -0.38 Elderly population (65 and over) 0.93 1.49 1.62 -0.49
Hungary ∆ Old-age DR 1.38 1.22 0.95 2.01 Working-age population (20-64) -0.67 -0.42 -0.60 -1.08 Elderly population (65 and over) 0.71 0.81 0.36 0.93
Italy ∆ Old-age DR 1.68 1.60 2.40 1.07 Working-age population (20-64) -0.79 -0.39 -1.05 -1.06 Elderly population (65 and over) 0.89 1.21 1.35 0.01
Japan ∆ Old-age DR 1.69 2.90 0.60 1.20 Working-age population (20-64) -0.90 -0.77 -0.71 -1.27 Elderly population (65 and over) 0.79 2.13 -0.11 -0.07
Korea ∆ Old-age DR 2.82 3.13 4.27 0.99 Working-age population (20-64) -0.25 0.52 -0.67 -0.84 Elderly population (65 and over) 2.57 3.65 3.60 0.15
Netherlands ∆ Old-age DR 1.44 2.01 2.32 -0.17 Working-age population (20-64) -0.05 0.15 -0.38 0.00 Elderly population (65 and over) 1.39 2.16 1.95 -0.17
New Zealand ∆ Old-age DR 1.74 2.13 2.70 0.29 Working-age population (20-64) 0.16 0.58 -0.28 0.03 Elderly population (65 and over) 1.90 2.71 2.43 0.33
Norway ∆ Old-age DR 0.96 1.11 1.75 -0.02 Working-age population (20-64) 0.15 0.36 -0.11 0.14 Elderly population (65 and over) 1.12 1.47 1.64 0.13
Poland ∆ Old-age DR 2.00 1.76 1.90 2.43 Working-age population (20-64) -0.45 0.17 -0.54 -1.18 Elderly population (65 and over) 1.55 1.93 1.35 1.25
Portugal ∆ Old-age DR 1.30 0.94 1.60 1.47 Working-age population (20-64) -0.15 0.10 -0.14 -0.51 Elderly population (65 and over) 1.14 1.04 1.47 0.96
Spain ∆ Old-age DR 1.77 1.00 2.51 2.06 Working-age population (20-64) -0.64 -0.03 -0.78 -1.30 Elderly population (65 and over) 1.13 0.97 1.72 0.76
Sweden ∆ Old-age DR 0.91 1.30 1.22 0.09 Working-age population (20-64) -0.08 0.05 -0.34 0.00 Elderly population (65 and over) 0.83 1.35 0.88 0.09
United Kingdom ∆ Old-age DR 1.07 1.06 2.07 0.10 Working-age population (20-64) -0.05 0.13 -0.26 -0.07 Elderly population (65 and over) 1.03 1.19 1.81 0.02
United States ∆ Old-age DR 1.13 1.42 1.91 -0.04 Working-age population (20-64) 0.41 0.65 0.14 0.36 Elderly population (65 and over) 1.54 2.07 2.05 0.33
1. Old age dependency ratio (DR) is the share of those aged 65 and over in the working age population (20-64).Source: OECD.

ECO/WKP(2001)31
46
Table A.3. Sensitivity of population projections to alternative assumptions for fertility rates,
life expectancy and net migration(average annual growth rate)
Baseline scenario Higher fertility rate Longer life expectancy
Higher net migration
2000-50 2000-50 2000-50 2000-50
Austria Total Population -0.12 0.02 -0.04 0.03Old-age DR 1.58 1.46 1.82 1.44
Belgium Total Population -0.03 0.14 0.05 0.07Old-age DR 1.14 1.00 1.37 1.06
Canada Total Population 0.37 .. .. ..Old-age DR 1.64 .. .. ..
Czech Republic Total Population -0.41 -0.27 -0.31 -0.33Old-age DR 1.95 1.84 2.18 1.89
Denmark Total Population 0.05 0.23 0.12 0.17Old-age DR 1.03 0.75 1.18 0.96
Finland Total Population -0.09 0.08 -0.01 -0.02Old-age DR 1.36 1.22 1.61 1.30
France Total Population 0.10 0.27 0.17 0.15Old-age DR 1.26 1.12 1.48 1.21
Germany Total Population -0.17 -0.03 -0.08 0.00Old-age DR 1.40 1.27 1.65 1.26
Hungary Total Population -0.44 .. .. ..Old-age DR 1.14 .. .. ..
Italy Total Population -0.36 -0.23 -0.27 -0.26Old-age DR 1.69 1.57 1.93 1.59
Japan Total Population -0.46 -0.33 -0.39 ..Old-age DR 1.71 1.59 1.92 ..
Korea1 Total Population 0.02 -0.11 0.11 ..Old-age DR 2.83 2.94 3.08 ..
Netherlands Total Population 0.22 0.38 0.29 ..Old-age DR 1.44 1.31 1.70 ..
New Zealand Total Population 0.36 .. .. ..Old-age DR 1.14 .. .. ..
Norway Total Population 0.30 .. .. ..Old-age DR 1.14 .. .. ..
Poland Total Population -0.20 -0.05 -0.14 ..Old-age DR 2.01 1.88 2.17 ..
Portugal Total Population 0.13 0.29 0.20 0.27Old-age DR 1.33 1.20 1.54 1.21
Spain Total Population -0.23 -0.09 -0.14 -0.13Old-age DR 1.78 1.66 2.00 1.68
Sweden Total Population 0.07 0.24 0.14 0.21Old-age DR 0.91 0.78 1.13 0.80
United Kingdom Total Population 0.07 0.25 0.15 0.15Old-age DR 1.12 0.99 1.38 1.06
United States Total Population 0.09 0.29 0.18 0.24Old-age DR 2.31 2.24 2.59 2.23
1. Korea assumed a lower fertility rate for this scenario.Source: OECD.

ECO/WKP(2001)31
47
Table A.4. Demographic assumptions: Alternative assumptions in fertility rates, life expectancy and net migration
Fertility rates Life expectancy of males
Baseline scenario Higher fertility rates scenario Baseline scenario Longer life expectancy of males
2000 2050 2000 2050 2000 2050 2000 2050
Austria 1.3 1.5 1.3 1.7 75.0 81.0 75.3 84.7Belgium 1.5 1.8 1.6 2.1 74.8 80.0 75.2 83.6Canada 1.6 1.5 .. .. 75.5 80.0 .. ..Czech Republic 1.1 1.5 1.2 1.7 71.5 75.2 71.8 78.2Denmark 1.8 1.8 1.8 2.1 74.2 79.0 74.5 82.7Finland 1.7 1.7 1.8 2.0 73.9 80.0 74.3 84.0France 1.7 1.8 1.8 2.1 74.8 80.0 75.2 84.0Germany 1.4 1.5 1.4 1.7 74.7 80.0 75.1 83.8Hungary 1.3 1.6 66.8 74.6Italy 1.2 1.5 1.2 1.7 75.5 81.0 75.8 84.8Japan 1.4 1.6 1.4 1.9 77.4 79.4 77.7 83.3Korea1 1.7 1.6 1.7 1.4 70.6 76.6 71.0 80.2Luxembourg 1.7 1.8 1.8 2.1 74.4 80.0 74.7 83.7Netherlands 1.7 1.8 1.7 2.1 75.5 80.0 75.8 83.7New Zealand .. .. .. .. .. .. .. ..Norway .. .. .. .. .. .. .. ..Poland 1.3 1.6 1.4 1.8 69.9 78.5 70.2 82.4Portugal 1.5 1.7 1.6 2.0 72.0 78.0 72.4 81.7Spain 1.2 1.5 1.2 1.7 74.9 79.0 75.3 83.0Sweden 1.5 1.8 1.5 2.1 77.3 82.0 77.6 85.4United Kingdom 1.7 1.8 1.8 2.1 75.2 80.0 75.5 83.7United States 2.1 2.0 2.1 2.2 73.9 79.1 74.0 82.9
Life expectancy of females Net migration
Baseline scenario Longer life expectancy of females
Baseline scenario High net migration scenario
2000 2050 2000 2050 2000 2050 2000 2050
Austria 81.2 86.0 81.4 88.0 10,000 20,000 11,000 30,000Belgium 80.9 85.0 81.1 87.0 10,204 15,000 11,224 22,500Canada 81.3 84.0 .. .. 185,400 159,000 .. ..Czech Republic 78.4 81.5 78.7 84.5 9,500 15,000 10,100 22,500Denmark 79.0 83.0 79.2 85.2 11,000 10,000 12,100 15,000Finland 81.1 85.0 81.3 87.0 5,604 5,000 6,164 7,500France 82.8 87.0 83.0 89.1 50,094 50,000 55,103 75,000Germany 80.8 85.0 81.0 87.1 300,000 200,000 330,000 300,000Hungary 75.2 81.1 -8,879 -2,845 .. ..Italy 82.0 86.0 82.1 88.1 50,000 80,000 55,000 120,000Japan 84.1 86.5 84.3 88.4 .. .. .. ..Korea1 78.1 83.0 78.3 84.6 .. .. .. ..Netherlands 80.9 85.0 81.1 87.1 33,390 35,000 36,729 52,500New Zealand .. .. .. .. .. .. .. ..Norway .. .. .. .. .. .. .. ..Poland 78.2 84.7 78.4 86.9 .. .. .. ..Portugal 79.2 84.0 79.4 85.8 12,131 25,000 13,344 37,500Spain 82.1 85.0 82.3 87.0 31,054 60,000 34,159 90,000Sweden 82.0 86.0 82.2 88.0 15,165 20,000 16,682 30,000United Kingdom 80.0 85.0 80.2 87.4 90,000 70,000 99,000 105,000United States 79.6 83.5 79.9 86.9 900,000 900,000 900,000 1,350,000
Source : OECD.

ECO/WKP(2001)31
48
Table A.5. Countries’assumption regarding unemployment and participation rates(percentage points difference between 2000 and 2050)
Countries 2050 Change1 2050 Change1 2050 Change1 2050 Change1 2050 Change1 2050 Change1 2050 Change1 2050 Change1 2050 Change1
Australia 4.9 -1.2 59.2 0.8 77.8 5.6 43.3 8.5 3.7 0.5 59.1 2.0 91.3 2.4 66.7 6.1 10.0 0.3Austria 4.0 -1.9 7.7 -0.9 78.7 6.6 57.8 43.9 5.0 4.0 12.2 -0.1 89.6 2.4 71.3 33.3 6.0 4.0Belgium 6.6 -3.6 1.7 0.0 82.3 8.5 37.3 20.3 0.6 0.1 2.5 0.0 86.6 -0.2 38.6 4.6 1.3 0.0Canada 6.5 -0.2 13.6 0.0 81.2 3.5 51.2 12.4 2.8 -0.2 13.8 0.0 87.6 -0.4 56.0 -2.1 8.6 -0.9Czech Republic 6.5 -3.1 3.5 -1.5 87.1 8.7 51.2 24.2 2.6 -0.3 4.4 -1.9 92.1 0.0 61.2 4.6 6.2 -0.9Denmark 6.1 -0.1 12.1 1.6 91.5 4.5 54.1 7.8 2.4 -0.3 12.5 2.0 91.5 -0.9 59.1 -6.4 8.1 -1.3Finland 7.0 -2.8 6.3 -1.4 88.3 3.2 46.0 2.4 1.1 -0.3 7.4 -0.6 88.3 -1.2 46.0 0.3 3.3 -0.7France 6.1 -3.7 1.6 -0.1 85.0 9.2 34.9 5.4 1.0 -0.2 2.9 -0.3 90.0 -0.4 39.9 -2.5 1.7 -0.4Germany 5.6 -2.3 5.8 -2.0 82.6 6.1 51.4 14.4 1.1 -0.6 8.5 -1.6 90.3 -1.8 62.4 6.7 2.4 -2.1Hungary 5.1 -2.6 5.9 -2.9 75.3 -0.7 2.9 -0.4 0.3 0.0 6.8 -3.6 89.3 -2.0 29.0 -1.9 0.9 0.0Italy 7.0 -3.7 4.2 -0.2 77.5 22.2 44.5 27.1 1.4 0.0 5.3 -0.6 88.2 3.5 53.3 8.4 4.0 -2.2Japan 4.0 -0.7 3.1 -1.1 83.5 12.5 70.0 22.9 13.4 -1.0 3.5 -1.2 93.5 -0.2 80.0 -3.7 27.2 -6.2Korea 3.2 -0.9 3.8 0.4 77.2 19.0 60.3 10.5 20.0 -1.9 2.9 0.1 87.0 0.2 73.8 -0.4 40.1 -0.3Netherlands 4.0 0.8 23.5 -1.8 84.3 17.3 38.1 20.4 0.0 0.0 24.0 -4.2 88.9 -1.9 49.5 4.0 0.0 0.0New Zealand 6.0 -0.1 17.0 2.3 76.0 1.1 54.3 4.0 4.0 -1.0 17.6 2.5 87.6 -0.6 72.6 1.6 12.0 -2.3Norway 3.8 0.2 60.9 -0.2 83.4 -0.4 59.1 2.6 6.5 1.5 67.6 -0.5 91.1 0.1 62.7 -6.1 8.7 0.7Poland 10.3 -6.3 3.6 0.0 79.9 7.0 44.5 18.4 13.8 1.9 4.8 0.0 88.9 5.9 55.0 10.5 21.3 0.1Portugal 4.5 0.0 8.7 -2.2 81.8 9.0 54.5 20.8 6.5 -0.6 10.8 -1.5 91.8 0.0 61.1 -1.5 15.5 -1.2Spain 4.0 -10.2 5.7 0.0 80.3 19.3 48.3 26.5 1.1 0.0 7.2 0.0 90.3 2.2 58.3 0.0 2.8 0.0Sweden 5.1 -0.9 6.1 0.0 92.4 9.1 70.1 5.3 3.9 0.3 5.1 0.0 92.5 3.9 70.1 -1.9 7.1 0.4United Kingdom 5.6 0.3 9.8 -1.9 80.7 4.6 51.9 11.9 2.4 -0.3 11.0 -1.5 91.0 -1.2 62.9 -3.5 5.8 -1.0United States 5.1 1.0 51.2 -0.9 81.2 4.4 58.2 5.7 7.1 -1.5 52.5 -0.6 89.0 -1.1 65.5 -2.9 14.3 -2.0
1. Percentage points change from 2000 to 2050Source: OECD
[20-54] [55-64] [65+]Unemployment rate Participation rates females Participation rates males
[0-19] [20-54] [55-64] [65+] [0-19]
Table A.6. Age-related spending : Total1
(per cent of GDP)
1995 2000 2005 2010 2015 2020 2025 2030 2035 2040 2045 2050
Australia 15.8 16.7 16.4 16.4 16.8 17.6 18.5 19.5 20.4 21.1 21.7 22.4
Austria2 10.2 10.4 10.6 11.2 11.7 12.5 13.7 14.7 15.1 14.5 13.5 12.8
Belgium 23.4 22.1 21.5 22.0 22.8 23.9 25.4 26.6 27.3 27.5 27.4 27.2
Canada 18.9 17.9 17.8 18.5 19.2 20.6 22.5 24.1 25.0 25.6 25.7 26.6
Czech Republic 22.0 23.1 23.0 22.6 22.6 23.4 24.1 25.3 26.2 27.6 29.1 30.0
Denmark3 31.1 29.3 30.7 32.5 33.3 34.5 35.6 36.6 36.6 36.1 35.5 35.0
Finland 21.7 19.4 18.6 19.0 21.0 22.8 24.5 26.1 27.2 27.3 27.5 27.9
France .. .. .. .. .. .. .. .. .. .. .. ..
Germany .. .. .. .. .. .. .. .. .. .. .. ..
Hungary4 8.2 7.1 5.7 5.0 5.1 5.7 5.8 6.0 6.5 7.3 8.1 8.7
Italy .. .. .. .. .. .. .. .. .. .. .. ..
Japan 11.8 13.7 14.6 15.2 15.8 16.0 15.6 15.2 15.2 15.9 16.5 16.7
Korea 0.9 3.1 3.4 3.8 4.4 5.7 7.7 9.6 11.1 11.8 11.7 11.6
Netherlands5 20.1 19.1 19.3 20.5 21.7 23.0 24.7 26.7 28.0 29.2 29.1 29.0
New Zealand 17.3 18.7 17.7 18.1 19.1 20.4 22.4 24.4 26.0 26.8 27.1 27.1
Norway 19.1 17.9 19.5 20.1 22.0 24.0 25.9 28.0 29.8 31.6 31.4 31.3
Poland4 13.9 12.2 10.2 9.3 9.2 9.3 9.4 9.2 9.0 9.0 9.3 9.6
Spain .. .. .. .. .. .. .. .. .. .. .. ..
Sweden 29.4 29.0 28.5 28.2 28.7 29.4 30.5 31.8 32.4 32.2 31.9 32.2
United Kingdom 15.8 15.6 15.3 15.3 15.4 15.4 15.8 16.2 16.4 16.3 16.1 15.7
United States 11.9 11.2 11.1 11.3 12.1 13.3 14.5 15.4 16.0 16.2 16.4 16.7
Average5 17.1 16.9 16.7 17.0 17.7 18.7 19.8 20.9 21.7 22.1 22.2 22.4
Portugal 7 13.8 15.6 16.6 17.8 19.2 20.4 21.5 22.1 22.1 22.2 21.6 20.0
1) Does not include countries presenting data on old-age pension spending only2) Total pension spending includes other age-related spending which does not fall within the definitions. This represents 0.9 per cent of GDP in 2000 and rises by 0.1 percentage point in the period to 2050.
3) Total includes other age related spending not classifyable under the other headings. This represents 6.3 per cent of GDP
in 2000 and increases by 0.2 percentage points from 2000 to 2050.4) Total includes old-age pension spending and "early retirement" programmes only.
5) "Early retirement" programmes only inlcude spending on persons 55+
6) OECD average excludes countries where information is not available and Portugal which is less comparable than other countries.
7) Portugal provided an estimate for total age-related spending but did not provide expenditure individual spending components other than old-age pensions. Source : OECD.

ECO/WKP(2001)31
49
Table A.7. Age-related spending : old-age pensions(per cent of GDP)
1995 2000 2005 2010 2015 2020 2025 2030 2035 2040 2045 2050
Australia 3.0 3.0 2.9 3.0 3.2 3.6 3.9 4.2 4.3 4.5 4.5 4.5
Austria 9.2 9.5 9.7 10.7 10.7 11.5 12.6 13.5 13.8 13.3 12.4 11.8
Belgium 9.4 8.8 8.4 8.5 9.1 9.9 10.9 11.9 12.4 12.5 12.3 12.1
Canada 5.3 5.1 5.3 6.0 6.7 7.6 8.7 9.6 10.1 10.4 10.3 11.0
Czech Republic 6.3 7.8 8.2 8.8 9.4 10.4 10.9 11.8 12.4 13.3 14.2 14.6
Denmark 6.6 6.1 6.7 7.7 8.5 9.0 9.3 9.6 9.7 9.6 9.3 8.8
Finland 9.5 8.1 7.8 8.3 9.7 10.9 11.8 12.6 13.0 12.9 12.9 12.9
France1 12.2 12.1 12.2 13.1 14.2 15.0 15.6 16.0 16.0 15.8 .. ..
Germany 11.7 11.8 11.4 11.2 11.8 12.6 14.0 15.5 16.4 16.6 16.8 16.9
Hungary 6.8 6.0 4.7 4.1 4.3 4.8 4.9 5.0 5.3 6.0 6.7 7.2
Italy 13.4 14.2 14.1 14.3 14.7 14.9 15.4 15.9 15.9 15.7 14.9 13.9
Japan 6.8 7.9 8.3 8.6 8.8 8.5 7.9 7.5 7.5 8.2 8.5 8.5
Korea 0.0 2.1 2.4 2.7 0.3 4.5 6.3 8.0 9.4 10.0 10.1 10.1
Netherlands 5.7 5.2 5.3 6.0 6.6 7.3 8.3 9.3 10.0 10.5 10.2 10.0
New Zealand 5.5 4.8 4.7 5.1 5.9 6.8 8.0 9.1 10.0 10.4 10.5 10.6
Norway 5.1 4.9 5.2 5.6 6.7 8.1 9.3 10.7 11.8 13.0 13.0 12.9
Poland 12.5 10.8 9.0 7.9 7.7 8.1 8.2 7.9 7.5 7.4 7.8 8.3
Spain 9.5 9.4 9.2 9.2 9.5 10.1 11.2 12.7 14.5 16.1 17.3 17.4
Sweden 9.9 9.2 9.4 9.7 10.4 10.7 10.8 11.2 11.4 11.3 11.0 10.8
United Kingdom 4.3 4.3 4.2 4.1 4.0 3.9 4.1 4.3 4.3 4.1 3.8 3.6
United States 4.9 4.4 4.3 4.3 4.8 5.4 5.9 6.2 6.4 6.3 6.2 6.2
OECD above average2 7.5 7.4 7.3 7.6 8.0 8.7 9.4 10.1 10.6 10.9 10.6 10.6
Portugal 7.4 8.0 8.9 10.0 11.2 12.3 13.4 14.0 14.1 14.2 13.8 12.5
1) For France, the latest available year is 2040.2) OECD average excludes countries where information is not available and Portugal which is less comparable than other countries. Source : OECD.
Table A.8. Age-related spending : "Early retirement" programmes(per cent of GDP)
1995 2000 2005 2010 2015 2020 2025 2030 2035 2040 2045 2050
Australia 0.9 0.9 1.0 1.0 1.0 1.1 1.0 1.0 1.0 1.0 1.1 1.1
Austria .. .. .. .. .. .. .. .. .. .. .. ..
Belgium 1.3 1.1 1.2 1.4 1.4 1.5 1.5 1.4 1.3 1.3 1.2 1.3
Canada .. .. .. .. .. .. .. .. .. .. .. ..
Czech Republic 1.5 1.8 1.7 1.7 1.6 1.5 1.4 1.4 1.3 1.2 1.2 1.1
Denmark 4.1 4.0 4.5 4.7 4.6 4.7 4.8 4.7 4.4 4.0 3.9 4.1
Finland 3.8 3.1 3.1 3.3 3.2 3.2 3.1 3.1 2.9 3.1 3.1 3.1
France .. .. .. .. .. .. .. .. .. .. .. ..
Germany .. .. .. .. .. .. .. .. .. .. .. ..
Hungary 1.4 1.2 1.0 0.9 0.8 0.9 0.9 1.0 1.1 1.2 1.4 1.5
Italy .. .. .. .. .. .. .. .. .. .. .. ..
Japan .. .. .. .. .. .. .. .. .. .. .. ..
Korea 0.2 0.3 0.2 0.2 0.2 0.2 0.3 0.3 0.3 0.3 0.3 0.3
Netherlands1 1.5 1.2 1.3 1.4 1.5 1.6 1.6 1.6 1.6 1.5 1.5 1.6
New Zealand .. .. .. .. .. .. .. .. .. .. .. ..
Norway 2.2 2.4 3.0 3.4 3.5 3.6 3.7 3.9 3.9 3.9 3.9 4.0
Poland 1.4 1.4 1.3 1.4 1.5 1.3 1.2 1.3 1.5 1.6 1.5 1.3
Spain .. .. .. .. .. .. .. .. .. .. .. ..
Sweden 2.2 1.9 2.0 1.8 1.7 1.7 1.7 1.7 1.5 1.4 1.5 1.5
United Kingdom .. .. .. .. .. .. .. .. .. .. .. ..
United States 0.2 0.2 0.3 0.4 0.4 0.5 0.5 0.5 0.5 0.5 0.5 0.5
Average2 1.7 1.6 1.7 1.8 1.8 1.8 1.8 1.8 1.8 1.7 1.8 1.8
Portugal 3 2.7 2.5 2.6 2.7 2.8 2.8 2.9 2.8 2.6 2.4 2.2 2.1
1) "Early retirement" programmes only inlcude spending on persons 55+.
2) OECD average excludes countries where information is not available and Portugal which is less comparable than other countries. 3) Portugal provided an estimatefor total age-related spending but did not provide expenditure for spending components other than old-age pensions
Source : OECD.

ECO/WKP(2001)31
50
Table A.9. Age-related spending : Health-care(per cent of GDP)
1995 2000 2005 2010 2015 2020 2025 2030 2035 2040 2045 2050
Australia 5.1 6.0 6.2 6.5 7.0 7.5 8.1 8.8 9.4 9.9 10.5 11.0
Austria .. .. .. .. .. .. .. .. .. .. .. ..
Belgium1 6.0 6.2 6.5 7.0 7.4 7.7 8.1 8.4 8.7 8.9 9.1 9.2
Canada1 6.6 6.3 6.4 6.9 7.3 7.8 8.5 9.2 9.7 10.1 10.3 10.5
Czech Republic 6.6 6.9 7.1 6.9 6.7 6.7 6.8 7.2 7.5 7.9 8.3 8.6
Denmark 4.8 4.5 4.7 4.9 5.1 5.3 5.4 5.6 5.6 5.6 5.6 5.5
Finland 4.5 4.2 4.0 3.9 4.2 4.6 5.1 5.5 5.8 5.9 6.0 6.2
France .. .. .. .. .. .. .. .. .. .. .. ..
Germany .. .. .. .. .. .. .. .. .. .. .. ..
Hungary .. .. .. .. .. .. .. .. .. .. .. ..
Italy .. .. .. .. .. .. .. .. .. .. .. ..
Japan 4.9 5.0 5.4 5.7 6.0 6.5 6.7 6.7 6.7 6.9 7.2 7.4
Korea 0.4 0.7 0.8 0.8 0.8 0.9 1.1 1.2 1.4 1.4 1.2 1.1
Netherlands1 6.9 7.2 7.3 7.8 8.2 8.8 9.5 10.4 11.1 11.6 11.8 12.0
New Zealand1 5.7 6.7 6.3 6.5 6.9 7.5 8.4 9.2 9.9 10.3 10.6 10.7
Norway1 5.7 5.2 5.5 5.3 5.8 6.5 7.1 7.8 8.2 8.7 8.5 8.4
Poland .. .. .. .. .. .. .. .. .. .. .. ..
Spain .. .. .. .. .. .. .. .. .. .. .. ..
Sweden 5.1 5.6 5.5 5.5 5.7 6.0 6.3 6.5 6.6 6.7 6.7 6.8
United Kingdom 5.4 5.6 6.0 6.1 6.3 6.5 6.7 7.0 7.2 7.4 7.4 7.3
United States 2.1 2.0 2.1 2.3 2.5 2.9 3.2 3.6 3.8 3.9 4.0 4.0
OECD above average2 5.3 5.5 5.6 5.8 6.1 6.5 6.9 7.4 7.7 8.0 8.2 8.3
Portugal 3 .. .. .. .. .. .. .. .. .. .. .. ..
1) Includes care for the frail elderly
2) OECD average excludes countries where information is not available and Portugal which is less comparable than other countries. 3) Portugal provided an estimate for total age-related spending but did not provide expenditure for all of individual spending components other than for old-age pensions.
Source : OECD.
Table A.10. Age-related spending : Long-term care(per cent of GDP)
1995 2000 2005 2010 2015 2020 2025 2030 2035 2040 2045 2050
Australia 0.8 0.8 0.8 0.8 0.8 0.8 0.8 0.8 0.8 0.8 0.8 0.8
Austria .. .. .. .. .. .. .. .. .. .. .. ..
Belgium .. .. .. .. .. .. .. .. .. .. .. ..
Canada .. .. .. .. .. .. .. .. .. .. .. ..
Czech Republic 0.6 0.6 0.5 0.5 0.6 0.6 0.6 0.7 0.7 0.7 0.8 0.8
Denmark 2.2 2.1 2.2 2.4 2.5 2.8 3.2 3.5 3.6 3.7 3.8 3.8
Finland 3.9 3.9 3.7 3.6 3.8 4.2 4.6 4.9 5.4 5.4 5.5 5.7
France .. .. .. .. .. .. .. .. .. .. .. ..
Germany .. .. .. .. .. .. .. .. .. .. .. ..
Hungary .. .. .. .. .. .. .. .. .. .. .. ..
Italy .. .. .. .. .. .. .. .. .. .. .. ..
Japan 0.0 0.8 0.8 0.9 1.0 1.0 1.0 1.0 1.0 0.9 0.8 0.8
Korea .. .. .. .. .. .. .. .. .. .. .. ..
Netherlands .. .. .. .. .. .. .. .. .. .. .. ..
New Zealand .. .. .. .. .. .. .. .. .. .. .. ..
Norway .. .. .. .. .. .. .. .. .. .. .. ..
Poland .. .. .. .. .. .. .. .. .. .. .. ..
Spain .. .. .. .. .. .. .. .. .. .. .. ..
Sweden 2.4 2.6 2.5 2.6 2.7 2.9 3.2 3.7 4.1 4.2 4.3 4.5
United Kingdom .. .. .. .. .. .. .. .. .. .. .. ..
United States 0.7 0.6 0.7 0.9 1.1 1.4 1.7 2.0 2.3 2.6 2.8 3.1
OECD above average1 1.1 1.2 1.3 1.3 1.4 1.6 1.7 1.9 2.1 2.1 2.2 2.3
Portugal 2 .. .. .. .. .. .. .. .. .. .. .. ..
1) OECD average excludes countries where information is not available and Portugal which is less comparable than other countries.
2) Portugal provided an estimate for total age-related spending but did not provide expenditure individual spending components other than old-age pensions. Source : OECD.

ECO/WKP(2001)31
51
Table A.11. Age-related spending : Child/family benefits(per cent of GDP)
1995 2000 2005 2010 2015 2020 2025 2030 2035 2040 2045 2050
Australia 1.2 1.5 1.2 1.0 0.9 0.8 0.7 0.7 0.6 0.5 0.5 0.4
Austria .. .. .. .. .. .. .. .. .. .. .. ..
Belgium 2.0 1.8 1.5 1.3 1.2 1.1 1.1 1.1 1.0 1.0 0.9 0.9
Canada 0.6 0.5 0.5 0.5 0.5 0.5 0.5 0.5 0.5 0.5 0.5 0.5
Czech Republic 1.9 1.6 1.5 1.4 1.3 1.3 1.3 1.3 1.3 1.3 1.3 1.4
Denmark 1.7 1.7 1.8 1.7 1.6 1.6 1.7 1.7 1.8 1.7 1.7 1.6
Finland .. .. .. .. .. .. .. .. .. .. .. ..
France .. .. .. .. .. .. .. .. .. .. .. ..
Germany .. .. .. .. .. .. .. .. .. .. .. ..
Hungary .. .. .. .. .. .. .. .. .. .. .. ..
Italy .. .. .. .. .. .. .. .. .. .. .. ..
Japan .. .. .. .. .. .. .. .. .. .. .. ..
Korea .. .. .. .. .. .. .. .. .. .. .. ..
Netherlands 1.6 1.0 0.9 0.9 0.9 0.9 0.9 0.9 0.9 0.9 0.9 0.9
New Zealand 0.8 1.0 0.8 0.7 0.7 0.7 0.7 0.7 0.7 0.7 0.7 0.7
Norway 1.3 1.4 1.3 1.4 1.4 1.4 1.5 1.6 1.6 1.6 1.6 1.6
Poland .. .. .. .. .. .. .. .. .. .. .. ..
Spain .. .. .. .. .. .. .. .. .. .. .. ..
Sweden 4.4 3.8 3.3 3.2 3.1 3.3 3.4 3.4 3.4 3.3 3.3 3.3
United Kingdom 1.2 1.1 0.8 0.7 0.6 0.6 0.5 0.5 0.5 0.4 0.4 0.3
United States 0.5 0.6 0.5 0.5 0.5 0.4 0.4 0.4 0.3 0.3 0.3 0.3
OECD above average1 1.6 1.5 1.3 1.2 1.2 1.1 1.2 1.2 1.1 1.1 1.1 1.1
Portugal 2 .. .. .. .. .. .. .. .. .. .. .. ..
1) OECD average excludes countries where information is not available and Portugal which is less comparable than other countries.
2) Portugal provided an estimate for total age-related spending but did not provide expenditure for individual spending components other than old-age pensions. Source : OECD.
Table A.12. Age-related spending : Education(per cent of GDP)
1995 2000 2005 2010 2015 2020 2025 2030 2035 2040 2045 2050
Australia 5.0 4.6 4.2 3.9 3.7 3.6 3.5 3.5 3.5 3.4 3.4 3.3
Austria .. .. .. .. .. .. .. .. .. .. .. ..
Belgium 4.7 4.2 3.9 3.8 3.7 3.7 3.8 3.9 3.9 3.9 3.8 3.9
Canada 6.4 5.8 5.4 5.1 4.7 4.7 4.8 4.8 4.8 4.6 4.6 4.6
Czech Republic 5.2 4.4 3.9 3.3 3.0 2.9 2.9 3.0 3.0 3.1 3.3 3.4
Denmark 4.9 4.6 4.7 4.7 4.7 4.6 4.6 4.8 4.8 4.8 4.7 4.6
Finland .. .. .. .. .. .. .. .. .. .. .. ..
France .. .. .. .. .. .. .. .. .. .. .. ..
Germany .. .. .. .. .. .. .. .. .. .. .. ..
Hungary .. .. .. .. .. .. .. .. .. .. .. ..
Italy .. .. .. .. .. .. .. .. .. .. .. ..
Japan .. .. .. .. .. .. .. .. .. .. .. ..
Korea .. .. .. .. .. .. .. .. .. .. .. ..
Netherlands 4.5 4.4 4.5 4.5 4.5 4.4 4.4 4.4 4.5 4.6 4.6 4.5
New Zealand 5.4 6.2 5.9 5.8 5.6 5.4 5.4 5.4 5.4 5.4 5.3 5.2
Norway 4.8 4.1 4.6 4.4 4.4 4.4 4.3 4.2 4.3 4.4 4.4 4.4
Poland .. .. .. .. .. .. .. .. .. .. .. ..
Spain .. .. .. .. .. .. .. .. .. .. .. ..
Sweden 5.4 6.0 5.7 5.4 5.1 5.0 5.1 5.3 5.4 5.4 5.2 5.2
United Kingdom 4.9 4.6 4.4 4.4 4.4 4.4 4.4 4.4 4.4 4.4 4.4 4.4
United States 3.4 3.3 3.1 2.9 2.8 2.8 2.8 2.8 2.7 2.7 2.6 2.6
OECD above average1 5.0 4.7 4.6 4.4 4.2 4.2 4.2 4.2 4.3 4.2 4.2 4.2
Portugal 2 .. .. .. .. .. .. .. .. .. .. .. ..
1) OECD average excludes countries where information is not available and Portugal which is less comparable than other countries.
2) Portugal provided an estimate for total age-related spending but did not provide expenditure for individual spending components other than pensions. Source : OECD.
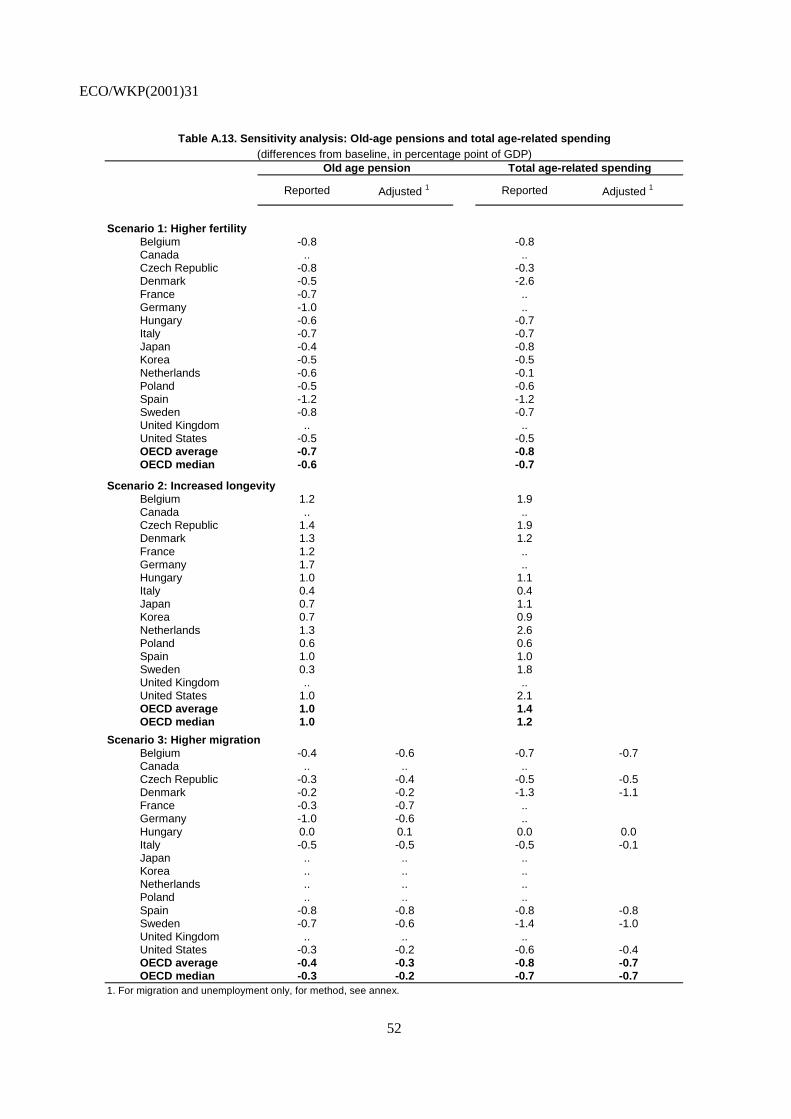
ECO/WKP(2001)31
52
Table A.13. Sensitivity analysis: Old-age pensions and total age-related spending(differences from baseline, in percentage point of GDP)
Old age pension Total age-related spending
Reported Adjusted 1 Reported Adjusted 1
Scenario 1: Higher fertility Belgium -0.8 -0.8Canada .. ..Czech Republic -0.8 -0.3Denmark -0.5 -2.6France -0.7 ..Germany -1.0 ..Hungary -0.6 -0.7Italy -0.7 -0.7Japan -0.4 -0.8Korea -0.5 -0.5Netherlands -0.6 -0.1Poland -0.5 -0.6Spain -1.2 -1.2Sweden -0.8 -0.7United Kingdom .. ..United States -0.5 -0.5OECD average -0.7 -0.8OECD median -0.6 -0.7
Scenario 2: Increased longevityBelgium 1.2 1.9Canada .. ..Czech Republic 1.4 1.9Denmark 1.3 1.2France 1.2 ..Germany 1.7 ..Hungary 1.0 1.1Italy 0.4 0.4Japan 0.7 1.1Korea 0.7 0.9Netherlands 1.3 2.6Poland 0.6 0.6Spain 1.0 1.0Sweden 0.3 1.8United Kingdom .. ..United States 1.0 2.1OECD average 1.0 1.4OECD median 1.0 1.2
Scenario 3: Higher migrationBelgium -0.4 -0.6 -0.7 -0.7Canada .. .. ..Czech Republic -0.3 -0.4 -0.5 -0.5Denmark -0.2 -0.2 -1.3 -1.1France -0.3 -0.7 ..Germany -1.0 -0.6 ..Hungary 0.0 0.1 0.0 0.0Italy -0.5 -0.5 -0.5 -0.1Japan .. .. ..Korea .. .. ..Netherlands .. .. ..Poland .. .. ..Spain -0.8 -0.8 -0.8 -0.8Sweden -0.7 -0.6 -1.4 -1.0United Kingdom .. .. ..United States -0.3 -0.2 -0.6 -0.4OECD average -0.4 -0.3 -0.8 -0.7OECD median -0.3 -0.2 -0.7 -0.7
1. For migration and unemployment only, for method, see annex.

ECO/WKP(2001)31
53
Table A.13. Sensitivity analysis: Old-age pensions and total age-related spending (continued)(differences from baseline, in percentage point of GDP)
Old age pension Total age-related spending
Reported Adjusted 1 Reported Adjusted 1
Scenario 4: Lower older worker participationBelgium 0.1 0.4Canada 0.1 0.2Czech Republic 0.5 0.8Denmark 0.1 0.8France 0.2 ..Germany 0.1 ..Hungary 0.1 0.1Italy 0.5 0.5Japan 0.1 0.1Korea 1.0 1.1Netherlands 0.2 0.6Poland 0.1 0.2Spain 1.0 1.0Sweden .. ..United Kingdom 0.1 0.0United States 0.1 0.2OECD average 0.3 0.5OECD median 0.1 0.4
Scenario 5: Lower female participationBelgium 0.2 0.3Canada 0.3 0.6Czech Republic 0.4 1.0Denmark 0.2 1.4France 0.5 ..Germany 0.4 ..Hungary 0.0 0.1Italy 0.2 0.2Japan 0.2 0.2Korea 1.0 1.1Netherlands 0.2 0.5Poland 0.0 0.0Spain .. ..Sweden .. ..United Kingdom 0.1 0.1United States 0.1 0.4OECD average 0.3 0.5OECD median 0.2 0.4
Scenario 6: Fall in unemployment ratesBelgium -0.6 -0.2 -1.0 -0.3Canada -0.3 -0.1 -0.7 -0.3Czech Republic -0.4 -0.2 -0.8 -0.3Denmark -0.2 -0.1 -1.0 -0.4France -0.4 -0.2 .. ..Germany -0.4 -0.2 .. ..Hungary 0.0 -0.1 -0.2 -0.1Italy -0.2 -0.1 -0.2 -0.1Japan -0.2 -0.1 -0.2 -0.1Korea .. .. .. ..Netherlands .. .. .. ..Poland -0.4 -0.1 -0.6 -0.1Spain .. .. .. ..Sweden .. .. .. ..United Kingdom 0.0 0.0 -0.1 0.0United States -0.1 -0.1 -0.3 -0.3OECD average -0.3 -0.1 -0.5 -0.2OECD median -0.5 -0.1 -0.7 -0.3
1. For migration and unemployment only, for method, see annex.

ECO/WKP(2001)31
54
Table A.13. Sensitivity analysis: Old-age pensions and total age-related spending (continued)(differences from baseline, in percentage point of GDP)
Old age pension Total age-related spending
Reported Adjusted 1 Reported Adjusted 1
Scenario 7: Fall in labour productivity growthBelgium -0.6 0.6Canada 0.0 -0.4Czech Republic2 0.0 ..Denmark -0.1 -0.3France .. ..Germany 0.0 ..Hungary .. ..Italy 1.2 1.2Japan 0.7 0.9Korea 0.0 0.2Netherlands 0.0 -0.5Poland 1.0 1.1Spain 1.9 1.9Sweden .. ..United Kingdom 0.9 1.1United States2 0.5 ..OECD average 0.4 0.7OECD median 0.0 0.8
1. For migration and unemployment only, for method, see annex.2. Values for total age realted spending for the Czech Republic and the United States are respectively 3.6 and 4.3 percentage points. These values are not included because certain importand spending components were not linked to the change in productivity growth.Sourc e: OECD.

ECO/WKP(2001)31
55
Table A.14. Primary balances needed to offset the impact of ageing, 2005-2050(Percentage points of GDP)
Increase in age-
related spending1Non-age-related
primary balance2Debt to GDP ratio in 2000
Keep debt constant at its 2000 level by 2050
Reduce debt to zero by 2050
A. Countries projecting most age-related spending componentsBelgium 5.1 7.1 103.0 4.2 5.3 Canada 7.1 9.0 66.0 3.7 4.5 Czech 6.9 -2.4 18.1 1.6 1.8 Denmark 5.7 2.7 26.4 3.7 4.0 Finland 8.5 3.4 -32.6 2.5 2.1 Japan4 3.0 -2.8 50.7 3.6 4.1 Korea 8.5 1.3 -31.0 3.9 3.5 Netherlands 9.9 2.9 44.4 6.1 6.6 New Zealand 8.4 1.0 0.6 2.9 2.9 Norway 13.5 7.8 -61.6 4.6 4.0 Portugal 4.5 -1.2 1.3 3.4 3.4 Sweden 3.2 0.9 5.7 1.0 1.1 UK 0.2 1.1 38.5 0.8 1.2 USA 5.6 3.4 41.8 2.7 3.2
B. Countries projecting old-age pension spending only 5
1. Other age related spending increases in line with GDPFrance4,6 4.2 -1.6 42.5 4.2 4.9 Germany 5.0 1.8 41.8 2.5 2.9 Italy -0.1 5.2 98.7 3.0 4.0 Poland -2.6 -1.8 -4.0 -2.8 -2.8 Spain 8.0 3.2 43.0 2.9 3.3
2. Other age related spending increases according to the average increase in countries in Panel AFrance4,6 7.5 -1.6 42.5 5.9 6.6 Germany 7.9 1.8 41.8 4.3 4.7 Italy 2.7 5.2 98.7 4.9 5.9 Poland 0.3 -1.8 -4.0 -1.0 -1.0 Spain 10.9 3.2 43.0 4.8 5.2 1. Sum of the increase projected in old-age pensions, programs permitting early withdrawal from the labour force, and other age-related spending such as health care and care for the frail elderly, family benefits and education.2. Primary balance implicit in the projection exercise when age-related expending remains constant relative to GDP at its 2005 level over the projection period. Non-age-related spending and total revenues remain constant relative to GDP.3. Primary surplus needed to run from 2005 until 2050 to either.4. Countries not providing projections on net interest payment or debt. These components were calculated by the Secretariat.5. These countries do not report projections on other old-age spending and therefore they implicitly assume that health care and care for the elderly will evolve in line with GDP (Panel B.1). However, to improve comparability, the Secretariat recalculated the primary surplus assuming that other age-related spending increases according to the average increase in the countries in panel A (Panel B.2): 2.9 percentage points by 2050.6. French projections only cover the period from 2000-2040.Source: OECD
Total primary surplus3
ECO/WKP(2001)31
56
ECONOMICS DEPARTMENT
WORKING PAPERS
304. The Width of the Intra-European Economic Borders(August 2001) Alain de Serres, Peter Hoeller and Christine de la Maisonneuve
303. Surveillance of Tax Policies: a Synthesis of Findings in Economic Surveys(July 2001) Paul van den Noord and Christopher Heady
302. Reforming the Tax System in Portugal(Jyly 2001) Chiara Bronchi, José C. Gomes-Santos
301. Tax Systems in European Union Countries(June 2001) Isabelle Joumard
300. Encouraging Environmentally Sustainable Growth in Belgium(June 2001) Paul O’Brien, David Carey, Jens Høj, Andreas Woergoetter
299. Encouraging Environmentally Sustainable Growth in Poland(June 2001) Grzegorz Peszko, Patrick Lenain
298. Tracking the Euro(June 2001) Vincent Koen, Laurence Boone, Alain de Serres, Nicola Fuchs
297. Firm Dynamics and Productivity Growth: A Review of Micro-evidence from OECD Countries(June 2001) Sanghoon Ahn
296. How should Norway Respond to Ageing?(May 2001) Pablo Antolín and Wim Suyker
295. How will Ageing Affect Finland?(May 2001) Pablo Antolín, Howard Oxley and Wim Suyker
294. Sectoral Regulatory Reforms in Italy: Framework and Implications(May 2001) Alessandro Goglio
293. Encouraging Environmentally Sustainable Growth: Experience in OECD Countries(May 2001) Paul O'Brien and Ann Vourc'h
292. Increasing Simplicity, Neutrality and Sustainability: A Basis for Tax Reform in Iceland(May 2001) Richard Herd and Thorsteinn Thorgeirsson
291. Options for Reforming the Tax System in Greece(April 2001) Chiara Bronchi
290. Encouraging Environmentally Sustainable Growth in Canada(March 2001) Ann Vourc’h
289. Encouraging Environmentally Sustainable Growth in Sweden(March 2001) Deborah Roseveare
288. Public Spending in Mexico: How to Enhance its Effectiveness(March 2001) Bénédicte Larre and Marcos Bonturi

ECO/WKP(2001)31
57
287. Regulation in Services: OECD Patterns and Economic Implications(February 2001) Giuseppe Nicoletti
286. A Small Global Forecasting Model(February 2001) David Rae and David Turner
285. Managing Public Expenditure: Some Emerging Policy Issues and a Framework for Analysis(February 2001) Paul Atkinson and Paul van den Noord
284. Trends in Immigration and Economic Consequences(February 2001) Jonathan Coppel, Jean-Christophe Dumont and Ignazio Visco
283. Economic Growth: The Role of Policies and Institutions.Panel Data Evidence from OECD Countries(January 2001) Andrea Bassanini, Stefano Scarpetta and Philip Hemmings
282. Does Human Capital Matter for Growth in OECD Countries? Evidence from Pooled Mean-Group Estimates(January 2001) Andrea Bassanini and Stefano Scarpetta
281. The Tax System in New Zealand: An Appraisal and Options for Change(January 2001) Thomas Dalsgaard
280. Contributions of Financial Systems to Growth in OECD Countries(January 2001) Michael Leahy, Sebastian Schich, Gert Wehinger, Florian Pelgrin and Thorsteinn Thorgeirsson
279. House Prices and Economic Activity(January 2001) Nathalie Girouard and Sveinbjörn Blöndal
278. Encouraging Environmentally Sustainable Growth in the United States(January 2001) Paul O’Brien
277. Encouraging Environmentally Sustainable Growth in Denmark(January 2001) Paul O’Brien and Jens Høj
276. Making Growth more Environmentally Sustainable in Germany(January 2001) Grant Kirkpatrick, Gernot Klepper and Robert Price
275. Central Control of Regional Budgets : Theory with Applications to Russia(January 2001) John M. Litwack
274. A Post-Mortem on Economic Outlook Projections(December 2000) Vassiliki Koutsogeorgopoulou
273. Fixed Cost, Imperfect Competition and Bias in Technology Measurement: Japan and the United States(December 2000) Kiyohiko G. Nishimura and Masato Shirai
272. Entry, Exit, and Aggregate Productivity Growth: Micro Evidence on Korean Manufacturing(December 2000) Chin-Hee Hahn
271. The Tax System in Korea: More Fairness and Less Complexity Required(December 2000) Thomas Dalsgaard
270. A Multi-Gas Assessment of the Kyoto Protocol(October 2000) Jean-Marc Burniaux
Copyright © 2022 FDOKUMEN