Fiscal Health Insights from the Michigan Public Policy Survey
26
Fiscal Health Insights from the Michigan Public Policy Survey December 4, 2018 Michigan Department of Treasury
-
Upload
khangminh22 -
Category
Documents
-
view
3 -
download
0
Transcript of Fiscal Health Insights from the Michigan Public Policy Survey

Fiscal Health Insightsfrom the
Michigan Public Policy Survey
December 4, 2018Michigan Department of Treasury

Presentation Outline
Brief overview of the Michigan Public Policy Survey
Measures of local government fiscal health on the MPPS
Review of MPPS fiscal health trends over time
Next steps at CLOSUP
2

Background: The MPPS
A census survey – all 1,856 Michigan counties, cities, villages, and townships
Respondents – chief elected and appointed officials
Administered – online and via hardcopy
Topics – wide range, such as fiscal health, government operations and budget policies, roads, local poverty, public safety, economic development, intergovernmental cooperation, service privatization, employee policies, labor unions, housing, environmental sustainability, Great Lakes, citizen engagement, much more.
3

MPPS is not a typical opinion poll 70+% regular response rates
Transparency Questionnaires online Pre-run data tables online Sharing of (anonymized) datasets with other researchers
Expert advisors on questionnaire content
Research partnership with Michigan local government associations MAC, MML, & MTA
Borrowing from other proven sources such as NLC and ICMA
4

What does the MPPS aim to do?
Improve understanding of local government to help inform policymaking and improve quality of life
Inform local leaders about peers across the state: challenges and responses
Inform state policymakers and practitioners and other stakeholders with data about local level challenges and responses not available from any other source
Build a longitudinal data archive to allow tracking of fundamental issues such as fiscal health, government operations, the economic transition, etc.
Foster academic research and teaching on state and local government issues
5

MPPS Special Notes
Opinion data – MPPS data are based on opinions of local leaders, not on administrative data
Confidentiality – CLOSUP must protect respondent & jurisdiction confidentiality
Forward looking – Numerous tracking questions ask about fiscal health, government operations, etc., in the future
Eager to partner with policymakers and practitioners
6

Presentation Outline
Brief overview of the Michigan Public Policy Survey
Measures of local government fiscal health on the MPPS
Review of MPPS fiscal health trends over time
Next steps at CLOSUP
7

MPPS Annual Fiscal & Budgetary Items
8
Summary indicators Better/less able to meet fiscal needs
This year vs. last year Next year vs. this year
Fiscal stress Index (1 = perfect health; 10 = fiscal crisis) Currently In 5 years
General Fund balance concerns Cash flow concerns Expected economic conditions
Individual indicators (increasing v. decreasing; current & forward looking) Revenues: Property taxes; state aid; federal aid; fees
Expenses: spending on public safety, infrastructure, human services, government operations; pay rates; pensions; benefits; OPEB
Other indicators: tax delinquencies; foreclosures; amount of debt; ability to repay debt; number of employees; service demands (public safety; infrastructure; human services; government operations); inter-governmental collaboration; privatization; sale of assets; shifting benefits & OPEB costs to employees

Other Items Related to Fiscal & Budgetary Policy
9
Carried on ad hoc basis Michigan’s system of funding local government Deeper dive on pension and OPEB issues Deeper dive on employee pay and benefits Single v. multi-year budgeting Priorities in trade-off between services v. taxes Satisfaction with services provided GFOA policies Union issues Emergency manager law Roads Water and sewer Deeper dive on Public safety services Deeper dive on inter-governmental collaboration
Presentation Outline
Brief overview of the Michigan Public Policy Survey
Measures of local government fiscal health on the MPPS
Review of MPPS fiscal health trends over time
Next steps at CLOSUP
10

Better/Less Able to Meet Fiscal Needs
11
MPPS: Would you say that your unit of government is less able or better able to meet its financial needs in this fiscal year compared to the last fiscal year?
MPPS
NLC

MPPS Fiscal Stress Index
12
MPPS: Thinking about the overall fiscal stress in your jurisdiction today and what you expect it to be down the road – including any future financial obligations it may have – on a scale from 1 to 10, where 1 is the best: perfect fiscal health and 10 is the worst: fiscal crisis, how would you rate your jurisdiction’s overall fiscal stress
2018
~ 148 jurisdictions (112 in MPPS)

MPPS Fiscal Stress Index Over Time
13
MPPS: Thinking about the overall fiscal stress in your jurisdiction today and what you expect it to be down the road – including any future financial obligations it may have – on a scale from 1 to 10, where 1 is the best: perfect fiscal health and 10 is the worst: fiscal crisis, how would you rate your jurisdiction’s overall fiscal stress
Net fiscal health: Percentage of low stress jurisdictions minus sum of medium + high stress jurisdictions

MPPS Fiscal Stress Index Over Time
14
Total Net fiscal health over Time
Net fiscal health over time, by population size

MPPS FSI 7+ Breakdowns (2018)
15
54%
66%61%
68%63%
34%
24%28%
23%25%
8%8% 11% 8% 11%
0%
10%
20%
30%
40%
50%
60%
70%
80%
90%
100%
<1500 1500-5000 5001-10000 10001-30000 >30000
FSI by Population Size
High stress
Medium stress
Low stress

MPPS FSI 7+ Breakdowns (2018)
16
56%63% 60% 57%
62%67%
31%
29%
26% 33% 25%
24%
10%6%
10%8%
10%7%
0%
10%
20%
30%
40%
50%
60%
70%
80%
90%
100%
UP NLP WC EC SW SE
FSI by Region
High stress
Medium stress
Low stress

MPPS FSI 7+ Breakdowns (2018)
17
59%66%
48%52%
27%
24%
39%35%
14% 7% 11% 10%
0%
10%
20%
30%
40%
50%
60%
70%
80%
90%
100%
Counties Townships Cities Villages
FSI by Jurisdiction Type
High stress
Medium stress
Low stress

MPPS FSI 7+ Breakdowns (2018)
18
89%
70%
31%
7%
24%
48%
2% 5%
19%
0%
10%
20%
30%
40%
50%
60%
70%
80%
90%
100%
Too High About Right Too Low
FSI by General Fund Balance
High stress
Medium stress
Low stress
MPPS FSI 7+ Breakdowns (2018)
19
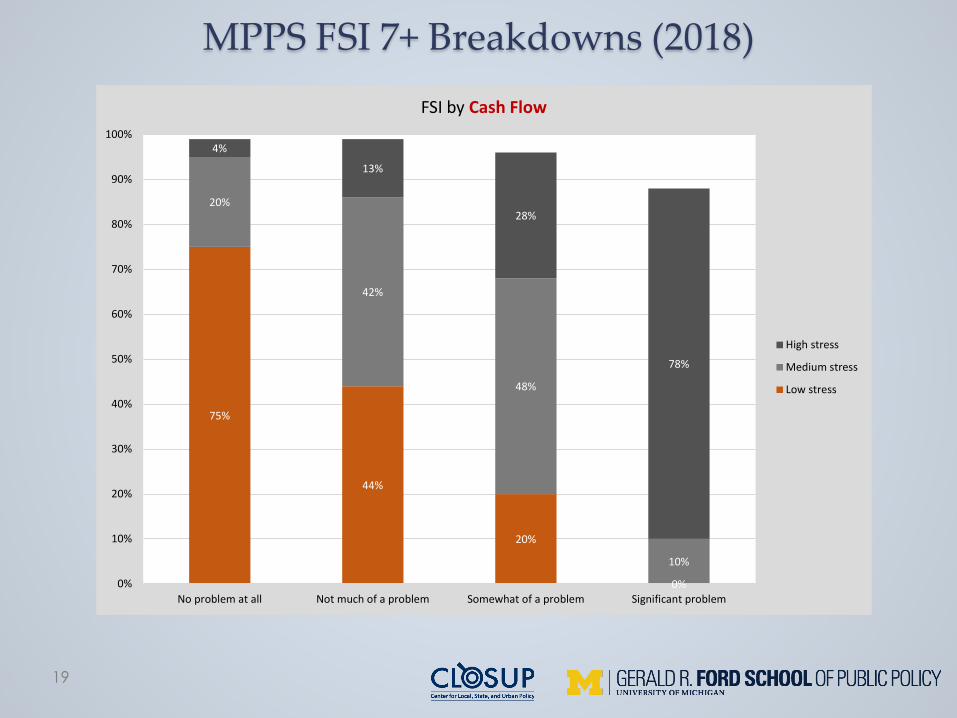
75%
44%
20%
0%
20%
42%
48%
10%
4%
13%
28%
78%
0%
10%
20%
30%
40%
50%
60%
70%
80%
90%
100%
No problem at all Not much of a problem Somewhat of a problem Significant problem
FSI by Cash Flow
High stress
Medium stress
Low stress

MPPS FSI 7+ Breakdowns (2018)
20
72%
51%
29%
21%
38%
44%
6%9%
25%
0%
10%
20%
30%
40%
50%
60%
70%
80%
90%
100%
Good times Neither Bad times
FSI by Expected Economic Conditions
High stress
Medium stress
Low stress

Presentation Outline
Brief overview of the Michigan Public Policy Survey
Measures of local government fiscal health on the MPPS
Review of MPPS fiscal health trends over time
Next steps at CLOSUP
21

Mismatch on High Fiscal Stress – MPPS FSI vs. Treasury List
22
The Treasury list (based on underfunded retirement systems)
Has 117 agencies Of them, 27 are “authorities” and 90 are general purpose local govts Of the 90, 15 are not included in 2018 MPPS That leaves 75 jurisdictions on Treasury list, with 2018 MPPS data Of the 75, ~43 (57%) look distressed on the MPPS (mostly using FSI 5+ …
and most are 6+) But of the 75, ~15 (20%) appear to have good fiscal health That leaves ~23% that are a bit messier to describe with MPPS data
The MPPS
Has 112 jurisdictions with FSI 7+ 102 are NOT on the Treasury list; 10 are on the list Of the 112, 36 do not have predicted FSI in 5 years; 76 do have it Of the 76, 22 (29%) expect same FSI in 5 years, while 24 (32%) expect
even worse FSI [total 61%]

CLOSUP Research on the MPPS FSI
23
Research on the MPPS FSI: Paper by Stephanie Leiser and Sarah Mills, comparing MPPS FSI against Munetrix Index:
The MPPS FSI can pick up important information not necessarily found in admin data (see below). Also, MPPS FSI has forward-looking data.
MPPS data can be available sooner than admin data. However, MPPS does not get 100% participation, so it has missing data.
More volatility on MPPS FSI than on Munetrix index.
MPPS FSI shows more stress (by an average 2.25 points on the 10 point scale).
When considering fiscal health: In places with good health, local leaders tend to think of short-term factors, such
as a balanced budget and good fund balance;
In places with poor health, local leaders tend to think of longer-term factors, which sometimes are not covered well by admin systems, such as: Major future costs (infrastructure, capital costs, personnel, pension and
OPEB). Other and external factors, such as property values, tax base,
management quality, economic and business conditions, state fiscal policy (inc. revenue sharing but also things like unfunded mandates, new property tax exemptions, business tax credits etc.).
New pilot study now w/S. Leiser: building CAFR database to compare to MPPS FSI (since data problems in F-65 prevented publication of MPPS-Munetrix comparisons).
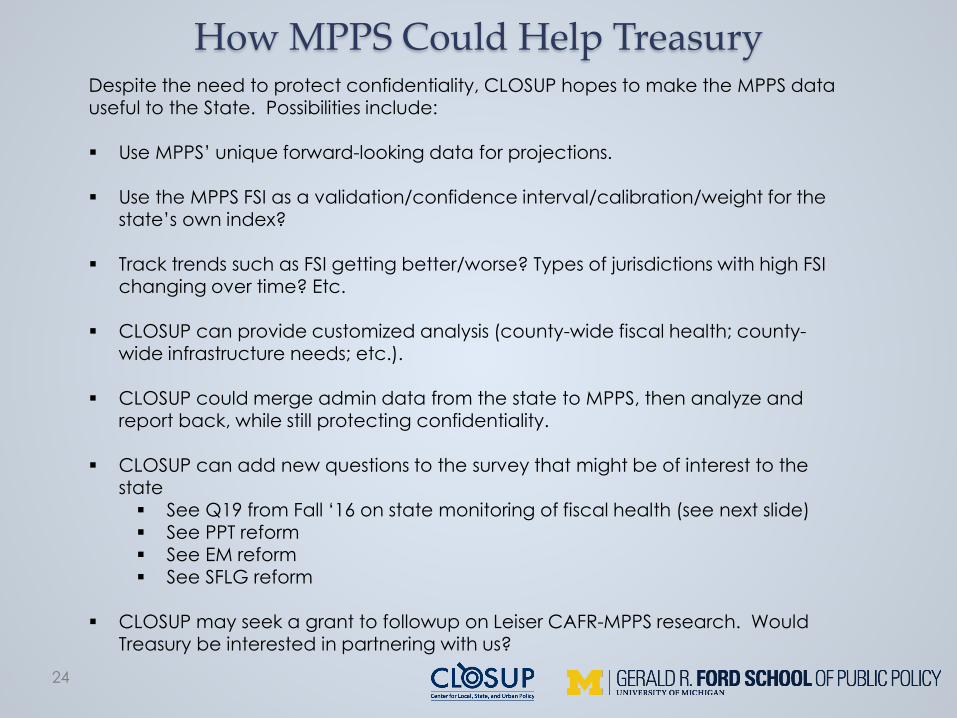
How MPPS Could Help Treasury
24
Despite the need to protect confidentiality, CLOSUP hopes to make the MPPS data useful to the State. Possibilities include:
Use MPPS’ unique forward-looking data for projections.
Use the MPPS FSI as a validation/confidence interval/calibration/weight for the state’s own index?
Track trends such as FSI getting better/worse? Types of jurisdictions with high FSI changing over time? Etc.
CLOSUP can provide customized analysis (county-wide fiscal health; county-wide infrastructure needs; etc.).
CLOSUP could merge admin data from the state to MPPS, then analyze and report back, while still protecting confidentiality.
CLOSUP can add new questions to the survey that might be of interest to the state See Q19 from Fall ‘16 on state monitoring of fiscal health (see next slide) See PPT reform See EM reform See SFLG reform
CLOSUP may seek a grant to followup on Leiser CAFR-MPPS research. Would Treasury be interested in partnering with us?

MPPS FSI 7+ Breakdowns
25
Some believe that more proactive monitoring of local government finances by the State could help avoid local fiscal emergencies through earlier detection and intervention. Others believe this may be unnecessary or even counterproductive. To what extent would you support or oppose more proactive State monitoring of finances for all local governments in Michigan? (Fall 2016)
5% 7% 5% 2% 1%5%
6% 4% 6%4%
11%
15%
20%16% 18% 26%
35%
29%
19%21% 18%
22%
18% 14%
25% 27% 27%
23%
22%
15%
24% 25% 26% 23%
13%22%
0%
10%
20%
30%
40%
50%
60%
70%
80%
90%
100%
Total <1500 1500-5000 5001-10000 10001-30000 >30000
Support/Oppose More Proactive State Monitoring of Finances
Strongly oppose
Somewhat oppose
Neither
Somewhat support
Strongly support
DK

Web: www.closup.umich.eduEmail: [email protected]
Twitter: @closup
The Michigan Public Policy Survey (MPPS)