
Maternal Cardiac Dysfunction and Remodeling in Women With Preeclampsia at Term

O
FfS
Op(c
S4lfDa
R9
C2
Pciniqtdto
FfLNVCZ
R2
RBKS
TF1
0©d
Research www.AJOG.org
4
BSTETRICS
irst-trimester maternal plasma cell-freeetal DNA and preeclampsiatavros Sifakis, MD; Apostolos Zaravinos, PhD; Nerea Maiz, MD; Demetrios A. Spandidos, PhD; Kypros H. Nicolaides, MD
eemtsb
Cpp
K
BJECTIVE: The purpose of this study was to determine whether, inregnancies that experience preeclampsia, plasma cell-free fetal DNAcffDNA) at 11-13 weeks of gestation is increased and whether this in-rease is related to the uterine artery pulsatility index (PI).
TUDY DESIGN: Plasma cffDNA and uterine artery PI were measured in4 cases with preeclampsia, which included 11 cases that required de-
ivery at �34 weeks of gestation and 176 normal control subjects. Alletuses were male, and cffDNA was assessed by amplification of theYS14 gene. The association between cffDNA and uterine artery PI wasssessed by regression analysis.
ESULTS: Median cffDNA was higher in early preeclampsia (median,
009;201:472.e1-7.
ben(eahsfb(eug
tpfhslsttamdctsia, there is reduced cl
oi: 10.1016/j.ajog.2009.05.025
72.e1 American Journal of Obstetrics & Gynecology NOVEMBER 2009
quivalents/mL), but not late preeclampsia (median, 50.8 genomequivalents/mL; interquartile range, 25.0-103.8 genome equivalents/L), than control subjects (median, 51.5 genome equivalents/mL; in-
erquartile range, 31.1-84.9 genome equivalents/mL). There was aignificant association between cffDNA and uterine artery PI (P � .038)ut not in the control subjects (P � .174).
ONCLUSION: The increase in plasma cffDNA in pregnancies that ex-erience preeclampsia is associated with the degree of impairment inlacental perfusion.
ey words: cell-free fetal DNA, Doppler, preeclampsia, screening,
5.5 genome equivalents/mL; interquartile range, 72.7-140.9 genome uterine arteryite this article as: Sifakis S, Zaravinos A, Maiz N, et al. First-trimester maternal plasma cell-free fetal DNA and preeclampsia. Am J Obstet Gynecol
fil(
gcpsfceepc
MSTtfpavhatml
reeclampsia, which affects approxi-mately 2% of pregnancies, is a major
ause of maternal and perinatal morbid-ty and death.1-3 The underlying mecha-ism for preeclampsia is thought to be
mpaired placentation because of inade-uate trophoblastic invasion of the ma-ernal spiral arteries, which has beenocumented by the findings of both his-ologic and Doppler ultrasound studiesf the uterine arteries.4-7 The differences
rom the Harris Birthright Research Centeror Fetal Medicine, King’s College Hospital,ondon, UK (Drs Sifakis, Maiz, andicolaides); and the Laboratory of Clinicalirology, Medical School, University ofrete, Heraklion, Greece (Drs Sifakis,aravinos, and Spandidos).
eceived Jan. 21, 2009; revised March 16,009; accepted May 14, 2009.
eprints: Kypros H. Nicolaides, MD, Harrisirthright Research Center for Fetal Medicine,ing’s College Hospital, Denmark Hill, LondonE5 9RS, UK. [email protected].
his study was supported by a Grant from theetal Medicine Foundation (UK Charity no.037116).
002-9378/$36.002009 Mosby, Inc. All rights reserved.
etween pregnancies in which pre-clampsia develops and control preg-ancies in uterine artery pulsatility indexPI) are marked particularly in severearly onset disease that requires deliveryt �34 weeks of gestation.7 The likeli-ood of the development of preeclamp-ia can be predicted by a combination ofactors in the maternal history, includinglack racial origin, high body mass indexBMI), personal or family history of pre-clampsia, and the measurement ofterine artery PI at 11-13 weeks ofestation.7,8
Several studies reported that, in pa-ients with preeclampsia, the maternallasma or serum concentration of cell-
ree fetal DNA (cffDNA) is 2- to 15-foldigher than in normotensive controlubjects (Table 1).9-23 It has been postu-ated that impaired trophoblastic inva-ion of the maternal spiral arteries leadso placental ischemia, with release intohe maternal circulation of necrotic orpoptotic syncytiotrophoblast frag-ents that contain fetal DNA.21,22 In ad-
ition to evidence for increased entry offfDNA into the maternal circulation,here is also evidence that, in preeclamp-
earance of cffDNA a
rom maternal plasma.13 However, theres controversy as to whether the alteredevels precede the onset of the diseaseTable 1).19-23
The aim of this study was to investi-ate whether the maternal plasmaffDNA at 11-13 weeks of gestation inregnancies in which preeclampsiaubsequently develops is differentrom pregnancies without this compli-ation and whether any possible differ-nces are related to the severity of pre-clampsia. We also examined theossible association between plasmaffDNA levels and uterine artery PI.
ATERIALS AND METHODStudy populationhis was a case-control study in single-
on pregnancies. In our center, we per-orm screening for hypertensive com-lications of pregnancy in women whottend for their routine first hospitalisit in pregnancy. In this visit, which iseld at 11�0-13�6 weeks of gestation,ll women have an ultrasound scan (1)o confirm gestational age from the
easurement of the fetal crown-rumpength, (2) to diagnose any major fetal
bnormalities, and (3) to measure fetal
nomastsbfwtKmcpt
dp
qiCrnofcapic
ptrgpngewts
4c�
Am
www.AJOG.org Obstetrics Research
uchal translucency thickness as partf screening for chromosomal abnor-alities.24,25 We record maternal char-
cteristics and medical history, mea-ure the uterine artery PI byransabdominal color Doppler,7 andtore plasma at – 80°C for subsequentiochemical analysis. Written in-ormed consent was obtained from theomen who agreed to participate in
he study, which was approved by theing’s College Hospital Ethics Com-ittee. Data from the patients in-
luded in this study were included inrevious publications on first-trimes-
TABLE 1Studies that compare maternal plain pregnancies with preeclampsia
Study MarkerSamptime
Duringpreeclampsia
..........................................................................................................
Lo et al9 SRY 32 (2..........................................................................................................
Zhong et al10 SRY — (2..........................................................................................................
Smid et al11 SRY — (2..........................................................................................................
Swinkels et al12 SRY 33 (2..........................................................................................................
Lau et al13 SRY 32 (3..........................................................................................................
Sekizawa et al14 DYS 35 (2..........................................................................................................
Shimada et al15 SRY — (2..........................................................................................................
Farina et al16 SRY 33.7..........................................................................................................
Zhong et al17 SRY 30 (2
..............
36 (3
..........................................................................................................
Smid et al18 SRY 32.5
..............
33 (2
...................................................................................................................
Beforepreeclampsia
..........................................................................................................
Leung et al19 SRY 17 (1..........................................................................................................
Zhong et al20 SRY 20 (1..........................................................................................................
Levine et al21 DYS — (1..........................................................................................................
Farina et al22 DYS 20 �..........................................................................................................
Crowley et al23 SRY 13 (1...................................................................................................................
IUGR, intrauterine growth restriction; MoM, multiples of the ma Data are given as median (range), unless otherwise indicated;
different from control subjects.
Sifakis. First-trimester plasma cffDNA and preeclampsia.
er screening for hypertensive disor- s
ers, but this is the first study onlasma cffDNA.Patients were asked to complete a
uestionnaire on maternal age, racial or-gin (white, black, Indian or Pakistani,hinese or Japanese, and Mixed), ciga-
ette smoking during pregnancy (yes oro), method of conception (spontane-us, use of ovulation drug, and in vitroertilization), medical history (ie,hronic hypertension, diabetes mellitus,ntiphospholipid syndrome, thrombo-hilia, human immunodeficiency virus
nfection, and sickle cell disease), medi-ation (ie, antihypertensive, antidepres-
a concentration of cell-free fetal DNAnormotensive control subjects
)aPreeclampsiagroup, n
Genomeequivalent/mLa
.........................................................................................................................
1) 20 381 (194-788).........................................................................................................................
0) 39 1599 (0-7968).........................................................................................................................
0) 17 256 (59-859).........................................................................................................................
4) 7 781 (503-1212)b.........................................................................................................................
7) 7 521 (274-3089).........................................................................................................................
6) 9 2.1 MoM (0.9-.........................................................................................................................
8) 15 173 � 95c
.........................................................................................................................
.9d 34 2.6 � 2.7 Mo.........................................................................................................................
3) 11 Early preeclampsi574 (113-7088)
.........................................................................................................................
1) 12 Late preeclampsia536 (61-1324)
.........................................................................................................................
38) 28 Preeclampsia, no195 (45-990)
.........................................................................................................................
6) 15 Preeclampsia and304.1 (96.5-1682
.........................................................................................................................
.........................................................................................................................
2) 18 42 (36-2375).........................................................................................................................
5) 10 423 (97-1642).........................................................................................................................
8) 138 36 � 6c
.........................................................................................................................
8d 6 2.4 � 2.8 Mo.........................................................................................................................
0) 16 31 (0-214)e.........................................................................................................................
.
ta are given as mean (95% confidence interval); c Data are given a
J Obstet Gynecol 2009.
ant, antiepileptic, antiinflammatory, as- e
NOVEMBER 2009 Americ
irin, �-mimetic, insulin, steroids,hyroxine), parity (parous or nullipa-ous, if no delivery beyond 23 weeks ofestation), obstetric history (ie, previousregnancy with preeclampsia or sponta-eous preterm delivery at �34 weeks ofestation), and family history of pre-clampsia (mother). The maternaleight and height were measured, and
he BMI was calculated in kilograms perquare meter.
We measured cffDNA in samples from4 cases with preeclampsia, which in-luded 11 cases that required delivery at34 weeks of gestation (early pre-
Controlgroup, n
Genomeequivalent/mLa
..................................................................................................................
20 76 (54-163)..................................................................................................................
46 333 (0-1608)..................................................................................................................
38 24 (0-138)..................................................................................................................
10 128 (96-170)b..................................................................................................................
10 277 (34-468)..................................................................................................................
20 1.0 MoM (0.4-2.0)..................................................................................................................
59 22 � 9c
..................................................................................................................
102 1.0 � 1.5 MoMd
..................................................................................................................
18 106 (47-269)
..................................................................................................................
12 125 (38-358)
..................................................................................................................
R: 89 58 (2-391)
..................................................................................................................
R:
..................................................................................................................
..................................................................................................................
33 22 (4.2-300)..................................................................................................................
40 129 (31-318)..................................................................................................................
137 16 � 6c
..................................................................................................................
30 1.0 � 0.8 MoMd
..................................................................................................................
72 28 (0-1280)..................................................................................................................
an � SEM; d Data are given as mean � SD; e Not significantly
smandling(wk
......... .........
7-4......... .........
8-4......... .........
6-4......... .........
7-3......... .........
0-3......... .........
9-3 9)......... .........
9-3......... .........
� 3 Md
......... .........
4-3 a:
......... .........
4-4 :
......... .........
(25- IUG
......... .........
3-3 IUG.3)
......... .........
......... .........
1-2......... .........
9-2......... .........
7-2......... .........
2.0 Md
......... .........
0-2......... .........
edianb Da s me
clampsia) and from 176 control preg-
an Journal of Obstetrics & Gynecology 472.e2

nppcfpt
fSwsawtm“ohepdwkhpvs
QmMmtwpappfmt2tedtvcdq(
ufp
faFwmsaMat(swwtqw5GG5CAprctfeuwascew6stunidcaWwccc(pt
STplttmcwdtaoainmscTcacUccoatcsedboo
(a2Pa
RMMa1aaecmh
Research Obstetrics www.AJOG.org
4
ancies that did not experience any com-lications and resulted in the live birth ofhenotypically normal neonates. Eachase was matched with 4 control subjectsor length of storage of their blood sam-les; none of the samples was previouslyhawed and refrozen.
The definition of preeclampsia wasrom the International Society for thetudy of Hypertension in Pregnancy,hich requires the development of dia-
tolic blood pressure of �90 mm Hg ont least 2 occasions 4 hours apart after 20eeks of gestation in previously normo-
ensive women and proteinuria of �300g in 24 hours or 2 readings of at least
��” on dipstick analysis of midstreamr catheter urine specimens if no 24-our collection is available.26 In pre-clampsia superimposed on chronic hy-ertension, significant proteinuria (asefined earlier) should develop �20eeks of gestation in women withnown chronic hypertension (history ofypertension before conception or theresence of hypertension at the bookingisit at �20 weeks of gestation in the ab-ence of trophoblastic disease).
uantification of cell-freeale fetal DNAaternal venous blood samples (5.0L) were collected into tubes that con-
ained ethylenediaminetetraacetic acid;ithin 15 minutes of collection, thelasma was separated (by centrifugationt 2000g for 10 minutes) and stored inropylene tubes at – 80°C until use. Thelasma samples were thawed and centri-
uged (�11,000g for 3 minutes) to re-ove residual cells, cell debris, and par-
iculate matter. DNA was extracted from40 �L of the supernatant with the use ofhe NucleoSpin Plasma XS kit (Mach-rey-Nagel, Duren, Germany) in accor-ance with the manufacturer’s specifica-ions. DNA was eluted in 20 �L finalolumes of water to result in highly con-entrated DNA; 5 �L of the appropriateilutions were used for downstreamuantitative polymerase chain reactionqPCR) application.
The Y-chromosome DYS14 locus wassed to determine the amount of cell-
ree male fetal DNA. Real-time PCR am-
lification of the �-globin gene was per- c72.e3 American Journal of Obstetrics & Gynecolo
ormed as a control to confirm themplifiability of plasma-extracted DNA.or the quantitative analysis of DYS14,e used the Plexor qPCR System (Pro-ega, Madison, WI), as previously de-
cribed.27,28 Multiplex real-time qPCRnalysis was performed with anx3000P Sequence Detector (Strat-
gene, La Jolla, CA); the raw data were fur-her analyzed by the Plexor qPCR softwarePromega). Primer sequences that werepecific for multiplexing were designedith the Plexor Primer Design Software,ith the use of all the necessary parameters
hat are required for use with the PlexorPCR system. The marker sequences thate designed were TSPY1(DYS14):=-FAM-iso-dC-GGGCACGTGGGAG-AAAGTC-3= and 5=-GGTACTCG-AGCCTCTATTTGC-3= and �-globin:–-ROX-iso-dC-GGTCTCCTTAAAC-TGTCTTGTAACC-3= and 5=-GGGCA-GGTGAACGTGGATGAA-3=. No tem-late and positive control reactions wereun in parallel to ensure the absence ofontamination of the DNA and to verifyhat the reagents and instrumentation per-ormed consistently. Five microliters of thextracted plasma DNA and dilutions weresed for amplification. The thermal profileas carried out using 2-minute incubation
t 95°C, followed by an initial denaturationtep at 95°C for 5 seconds, followed by 38ycles of 35 seconds at 60°C. The reactionnded with a Melt-Curve Analysis inhich the temperature was increased from0-95°C at a linear rate of 0.2°C/sec. Eachample was analyzed in duplicate, andhe average of the 2 measurements wassed for analysis. To determine theumber of copies of male DNA present
n the plasma sample, we ran a stan-ard dilution curve using a knownoncentration of a commercially avail-ble male genomic DNA (Promega).
e used 7 serial 5-fold dilutions,hich ranged from 460-0.02944 ng. A
onversion factor of 6.6 pg of DNA perell was used to express the results asopy numbers or genome equivalentsgenome equivalents/milliliter), asreviously described.9 Strict precau-ions were taken to avoid qPCR
ontamination. pgy NOVEMBER 2009
tatistical analysishe measured uterine artery PI andlasma concentration of cffDNA were
og-transformed to make the distribu-ions Gaussian; the normality of the dis-ributions was confirmed by the Kol-
ogorov-Smirnov test. In each case andontrol, the measured uterine artery PIas converted into multiples of the me-ian (MoM) after adjustment for gesta-ion, maternal age, racial origin, BMI,nd history of preeclampsia, as previ-usly described.7 Multiple regressionnalysis demonstrated that log cffDNAn the control group was not related sig-ificantly to fetal crown-rump length,aternal age, racial origin, weight, or
moking; therefore, the values were notonverted to multiples of the median.he Bland-Altman analysis was used toompare the measurement agreementnd bias for the paired measurements offfDNA in each case.29 Mann-Whitney
test was used to determine the signifi-ance of differences in the medianffDNA and uterine artery PI multiplesf the median between the preeclampsiand control groups; the Kruskal-Wallisest with Dunn’s procedure was used foromparison of early and late preeclamp-ia groups with the control groups. Lin-ar regression analysis was then used toetermine the significance of associationetween log cffDNA with log multiplesf the median uterine artery PI in eachutcome group.The SPSS statistical software package
version 12.0; SPSS, Inc, Chicago, IL)nd XLSTAT software package (version008.7.01; XLSTAT, Addinsoft SARL,aris, France) were used for all datanalyses.
ESULTSaternal blood was collected betweenarch 2006-March 2007 and analyzed at
median interval of 20.6 months (range,3.3–25.0 months). The maternal char-cteristics of each of the outcome groupsre compared in Table 2. In the pre-clampsia group, compared with theontrol group, the BMI was higher, andore women had a personal or family
istory of preeclampsia and chronic hy-
ertension. In the preeclampsia group,
www.AJOG.org Obstetrics Research
TABLE 2Maternal characteristics in the outcome groups
Maternal characteristic
Group
Control(n � 176)
Preeclampsia(n � 44)
EarlyPreeclampsia(n � 11)
LatePreeclampsia(n � 33)
Maternal age, ya 32.4 (28.6-36.3) 31.7 (26.3-36.1) 32.7 (27.7-38.6) 31.5 (25.0-36.0)................................................................................................................................................................................................................................................................................................................................................................................
Body mass index, kg/m2,a 24.3 (22.2-27.8) 26.6 (23.4-32.9)b 26.6 (23.3-33.3) 26.6 (23.5-32.5)b................................................................................................................................................................................................................................................................................................................................................................................
Crown-rump length, mma 64.6 (60.0-69.7) 63.5 (58.1-72.0) 67.0 (56.4-72.8) 63.1 (58.2-71.8)................................................................................................................................................................................................................................................................................................................................................................................
Racial group, n.......................................................................................................................................................................................................................................................................................................................................................................
White 120 (68.2%) 25 (56.8%) 4 (36.4%) 21 (63.6%).......................................................................................................................................................................................................................................................................................................................................................................
Black 32 (18.2%) 14 (31.8%) 5 (45.5%)b 9 (27.3%).......................................................................................................................................................................................................................................................................................................................................................................
Indian or Pakistani 11 (6.3%) 3 (6.8%) 1 (9.1%) 2 (6.1%).......................................................................................................................................................................................................................................................................................................................................................................
Chinese or Japanese 4 (2.3%) 0 0 0.......................................................................................................................................................................................................................................................................................................................................................................
Mixed 9 (5.1%) 2 (4.5%) 1 (9.1%) 1 (3.0%)................................................................................................................................................................................................................................................................................................................................................................................
Parity, n.......................................................................................................................................................................................................................................................................................................................................................................
Nulliparous 88 (50.0%) 32 (72.7%) 7 (63.6%) 25 (75.8%).......................................................................................................................................................................................................................................................................................................................................................................
Parous: no previous preeclampsia 85 (48.3%) 6 (13.6%)c 1 (9.1%) 5 (15.2%)b.......................................................................................................................................................................................................................................................................................................................................................................
Parous: previous preeclampsia 3 (1.7%) 6 (13.6%)b 3 (27.3%)b 3 (9.1%)................................................................................................................................................................................................................................................................................................................................................................................
Cigarette smoker, n 6 (3.4%) 4 (9.1%) 0 4 (12.1%)................................................................................................................................................................................................................................................................................................................................................................................
Family history of preeclampsia:mother, n
5 (2.8%) 6 (13.6%)c 2 (18.2%) 4 (12.1%)b
................................................................................................................................................................................................................................................................................................................................................................................
Conception, n.......................................................................................................................................................................................................................................................................................................................................................................
Spontaneous 170 (96.6%) 40 (90.0%) 9 (81.8%) 31 (93.9%).......................................................................................................................................................................................................................................................................................................................................................................
Ovulation drugs 5 (2.8%) 2 (4.5%) 1 (9.1%) 1 (3.0%).......................................................................................................................................................................................................................................................................................................................................................................
In vitro fertilization 1 (0.6%) 2 (4.5%) 1 (9.1%) 1 (3.0%)................................................................................................................................................................................................................................................................................................................................................................................
Medical history, n.......................................................................................................................................................................................................................................................................................................................................................................
None 175 (99.4%) 39 (88.64.1%) 9 (81.8%) 30 (90.9%).......................................................................................................................................................................................................................................................................................................................................................................
Chronic hypertension 1 (0.6%) 3 (6.8%)b 2 (18.2%)b 1 (3.0%).......................................................................................................................................................................................................................................................................................................................................................................
Diabetes mellitus 0 1 (2.3%) 0 1 (3.0%).......................................................................................................................................................................................................................................................................................................................................................................
Thrombophilia 0 1 (2.3%) 0 1 (3.0%)................................................................................................................................................................................................................................................................................................................................................................................
Medication during pregnancy, n.......................................................................................................................................................................................................................................................................................................................................................................
None 165 (93.8%) 39 (88.6%) 9 (81.8%) 30 (90.9%).......................................................................................................................................................................................................................................................................................................................................................................
Antihypertensives 0 1 (2.3%) 1 (9.1%) 0.......................................................................................................................................................................................................................................................................................................................................................................
Insulin 0 1 (2.3%) 0 1 (3.0%).......................................................................................................................................................................................................................................................................................................................................................................
�-mimetics 2 (1.1%) 0 0 0.......................................................................................................................................................................................................................................................................................................................................................................
Combined asthma 3 (1.7%) 1 (2.3%) 0 1 (3.0%).......................................................................................................................................................................................................................................................................................................................................................................
Thyroxine 2 (1.1%) 2 (4.5%) 1 (9.1%) 1 (3.0%).......................................................................................................................................................................................................................................................................................................................................................................
Antiepileptic 3 (1.7%) 0 0 0.......................................................................................................................................................................................................................................................................................................................................................................
Antidepressants 1 (0.6%) 0 0 0................................................................................................................................................................................................................................................................................................................................................................................
Comparison for categoric variables by �2 test or Fisher exact test; comparison between preeclampsia and control groups by t test for maternal age and fetal crown-lump length and by Mann-Whitneytest for body mass index; comparison between early and late preeclampsia groups with the control groups by analysis of variance test (with the Bonferroni post hoc test) for maternal age and fetalcrown-lump length; and Kruskal-Wallis test with Dunn’s procedure for body mass index.a Data are given as median (interquartile range); b P � .05; c P � .01.
Sifakis. First-trimester plasma cffDNA and preeclampsia. Am J Obstet Gynecol 2009.
NOVEMBER 2009 American Journal of Obstetrics & Gynecology 472.e4
tcaie
ppgdletCteb5-(�3
scsfwgttgaa..sctcntc0
CTacdcgamo
lwewsstwal
tms
tdYsSimD
ettii
RiaM
S
Am
Research Obstetrics www.AJOG.org
4
he median uterine artery PI was signifi-antly higher than in the control group,nd these differences were more markedn early preeclampsia than late pre-clampsia (Table 3).
Fetal DNA was detected in all 220 sam-les. The mean difference betweenaired measurements of cffDNA was 1.1enome equivalents/mL (95% confi-ence interval [CI], -0.8 to 3.0); the 95%
imits of agreement were –26.4 genomequivalents/mL (95% CI, -29.6 to -23.2)o 28.6 genome equivalents/mL (95%I, 25.4-31.8). The mean difference be-
ween paired measurements, which arexpressed as a percentage of the averageetween the 2, was 3.0% (95% CI, 0.6-.4); the 95% limits of agreement were32.8% (95% CI, -36.9 to -28.6) to 38.8%95% CI, 34.6-42.9). The difference was
15% in 77 cases (35.0%) and �20% in1 cases (14.1%).In the control group, multiple regres-
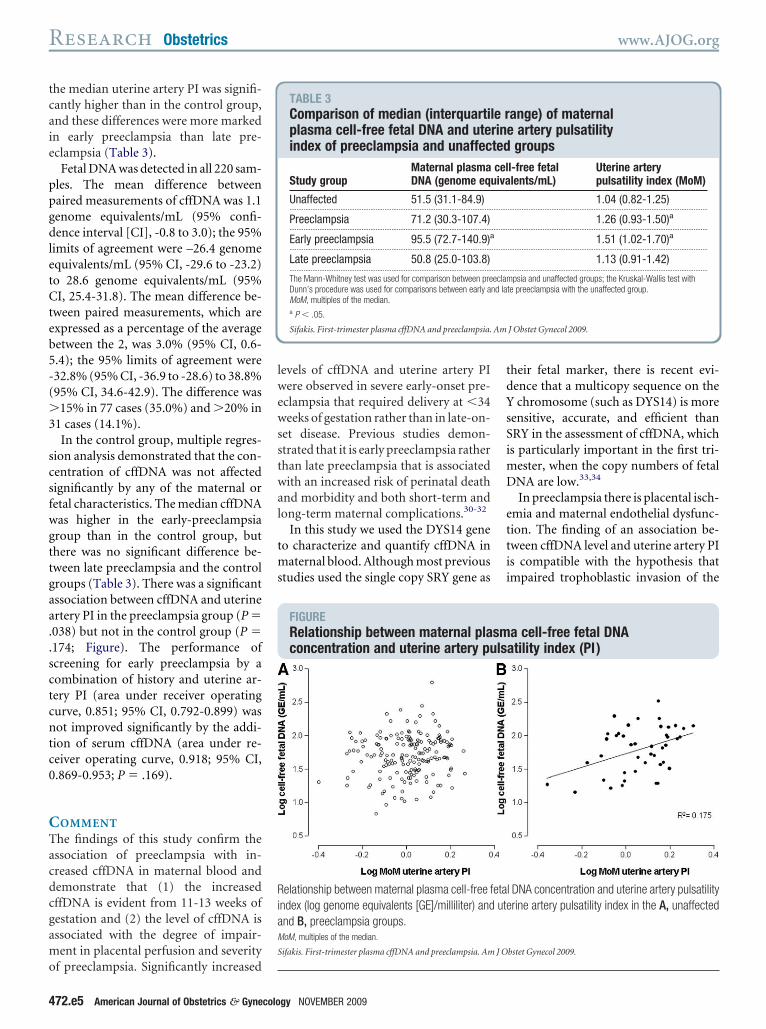
ion analysis demonstrated that the con-entration of cffDNA was not affectedignificantly by any of the maternal oretal characteristics. The median cffDNAas higher in the early-preeclampsiaroup than in the control group, buthere was no significant difference be-ween late preeclampsia and the controlroups (Table 3). There was a significantssociation between cffDNA and uterinertery PI in the preeclampsia group (P �038) but not in the control group (P �174; Figure). The performance ofcreening for early preeclampsia by aombination of history and uterine ar-ery PI (area under receiver operatingurve, 0.851; 95% CI, 0.792-0.899) wasot improved significantly by the addi-
ion of serum cffDNA (area under re-eiver operating curve, 0.918; 95% CI,.869-0.953; P � .169).
OMMENThe findings of this study confirm thessociation of preeclampsia with in-reased cffDNA in maternal blood andemonstrate that (1) the increasedffDNA is evident from 11-13 weeks ofestation and (2) the level of cffDNA isssociated with the degree of impair-ent in placental perfusion and severity
f preeclampsia. Significantly increased
72.e5 American Journal of Obstetrics & Gynecolo
evels of cffDNA and uterine artery PIere observed in severe early-onset pre-
clampsia that required delivery at �34eeks of gestation rather than in late-on-
et disease. Previous studies demon-trated that it is early preeclampsia ratherhan late preeclampsia that is associatedith an increased risk of perinatal death
nd morbidity and both short-term andong-term maternal complications.30-32
In this study we used the DYS14 geneo characterize and quantify cffDNA in
aternal blood. Although most previoustudies used the single copy SRY gene as
FIGURERelationship between maternal placoncentration and uterine artery pu
elationship between maternal plasma cell-free fndex (log genome equivalents [GE]/milliliter) andnd B, preeclampsia groups.oM, multiples of the median.
ifakis. First-trimester plasma cffDNA and preeclampsia. Am
TABLE 3Comparison of median (interquartilplasma cell-free fetal DNA and uteindex of preeclampsia and unaffec
Study groupMaternal plasmaDNA (genome equ
Unaffected 51.5 (31.1-84.9)...................................................................................................................
Preeclampsia 71.2 (30.3-107.4)...................................................................................................................
Early preeclampsia 95.5 (72.7-140.9)a...................................................................................................................
Late preeclampsia 50.8 (25.0-103.8)...................................................................................................................
The Mann-Whitney test was used for comparison between preDunn’s procedure was used for comparisons between early aMoM, multiples of the median.a P � .05.
Sifakis. First-trimester plasma cffDNA and preeclampsia.
gy NOVEMBER 2009
heir fetal marker, there is recent evi-ence that a multicopy sequence on thechromosome (such as DYS14) is more
ensitive, accurate, and efficient thanRY in the assessment of cffDNA, whichs particularly important in the first tri-
ester, when the copy numbers of fetalNA are low.33,34
In preeclampsia there is placental isch-mia and maternal endothelial dysfunc-ion. The finding of an association be-ween cffDNA level and uterine artery PIs compatible with the hypothesis thatmpaired trophoblastic invasion of the
a cell-free fetal DNAatility index (PI)
l DNA concentration and uterine artery pulsatilityrine artery pulsatility index in the A, unaffected
bstet Gynecol 2009.
ange) of maternale artery pulsatility
groupsl-free fetallents/mL)
Uterine arterypulsatility index (MoM)
1.04 (0.82-1.25)..................................................................................................................
1.26 (0.93-1.50)a..................................................................................................................
1.51 (1.02-1.70)a..................................................................................................................
1.13 (0.91-1.42)..................................................................................................................
psia and unaffected groups; the Kruskal-Wallis test withte preeclampsia with the unaffected group.
J Obstet Gynecol 2009.
smls
etaute
J O
e rrintedceliva
.........
.........
.........
.........
eclamnd la

miqpDTtpcpmttd
tcbpcDdctcSfhcafledtdrcpsspopcccictmwgdcs
wcwpfntw
orcwcceusbcvebnppdppmpo
pmawpo
R1m22ttR3cOpb14pc
5Icef6Pd67Nte38ev59ap1Ectp11tic21Wmloti21Dp21fwG1TYm21ftec21Kolp1
www.AJOG.org Obstetrics Research
aternal spiral arteries leads to placentalschemia and damage, with the conse-uent release of apoptotic syncytiotro-hoblast fragments that contain fetalNA into the maternal circulation.21
he extent to which the cffDNA in ma-ernal blood is a mere marker of im-aired placentation or the necrotic pla-ental products are involved in theathogenesis of preeclampsia by causingaternal endothelial dysfunction and
he development of the clinical symp-oms of the disease remains to beetermined.Established disease is associated cer-
ainly with a substantial increase inffDNA in maternal blood9-18 that coulde the consequence of both increasedassage from the placenta and decreasedlearance from maternal blood.13 FetalNA could be liberated directly fromying cells in the placenta and/or fetalells35 and cytotrophoblast microvilli,36
he escape of which into the maternal cir-ulation is increased in preeclampsia.tudies that have examined women be-ore the clinical onset of preeclampsiaave reported conflicting results con-erning levels of cffDNA. Because livernd renal functions are not impaired be-ore the onset of preeclampsia, it is un-ikely that women who are destined toxperience preeclampsia would have re-uced clearance of cffDNA.13,19 In con-rast, studies during the second trimesteremonstrated that increased fetal eryth-oblast trafficking into the maternal cir-ulation predates the clinical onset ofreeclampsia.37,38 The contradictory re-ults concerning cffDNA could be a con-equence of a difference in the studyopulations, both in terms of the severityf preeclampsia and gestation at sam-ling. In our study, significantly in-reased cffDNA was observed in theases of early preeclampsia but not inases with late preeclampsia. In the stud-es that have reported a 2- to 3-fold in-rease in cffDNA in women who are des-ined to experience preeclampsia, the
ean gestation at sampling was 17-20eeks,19,20,22 compared with 13 weeks ofestation in the study with no significantifference between the preeclampsia andontrol groups.23 Levine et al21 mea-
ured cffDNA longitudinally from 8 teeks of gestation and reported that,ompared with control subjects, inomen who subsequently experiencedreeclampsia, the levels were similar be-
ore 17 weeks of gestation, increased butot significantly at 17-24 weeks of gesta-
ion, and significantly increased at 25-28eeks of gestation.Effective screening for early detection
f pregnancies that are destined to expe-ience preeclampsia is provided by aombination of maternal characteristicsith uterine artery PI.7 Although plasma
ffDNA was increased significantly inases that experienced early-onset pre-clampsia, inclusion of this metabolite isnlikely to improve the performance ofcreening because of the high associationetween uterine artery PI and plasmaffDNA. Additionally, the potentialalue of cffDNA in screening for pre-clampsia by comparison with otheriochemical markers (such as preg-ancy-associated plasma protein-A andlacental growth factor39) is limitedresently by cumbersome methods ofetection, to its applicability only toregnancies with male fetuses, and tooor reproducibility for its measure-ent. The difference in levels between
aired measurements was �15% in 35%f the cases.In pregnancies that subsequently ex-
erience early-onset preeclampsia, theaternal plasma cffDNA concentration
t 11-13 weeks of gestation is increased,hich provides further support for im-aired placentation in the pathogenesisf the disease. f
EFERENCES. World Health Organization. Make everyother and child count: World Health Report,005. Geneva: World Health Organization; 2005.. Lewis G, ed. Why mothers die 2000-2002:he sixth report of confidential enquiries into ma-ernal deaths in the United Kingdom. London:COG Press; 2004.. American College of Obstetricians and Gyne-ologists: Committee on Practice Bulletins—bstetrics. Diagnosis and management ofreeclampsia and eclampsia: ACOG practiceulletin no: 33. Obstet Gynecol 2002;99:59-67.. Brosens I, Robertson WB, Dixon HG. Thehysiological response of the vessels of the pla-ental bed to normal pregnancy. J Pathol Bac-
eriol 1967;93:569-79. rNOVEMBER 2009 Americ
. Khong TY, De Wolf F, Robertson WB, Brosens. Inadequate maternal vascular response to pla-entation in pregnancies complicated by pre-clampsia and by small-for-gestational age in-ants. BJOG 1986;93:1049-59.. Pijnenborg R, Anthony J, Davey DA, et al.lacental bed spiral arteries in the hypertensiveisorders of pregnancy. BJOG 1991;98:48-55.. Plascencia W, Maiz N, Bonino S, Kaihura C,icolaides KH. Uterine artery Doppler at 11 � 0
o 13 � 6 weeks in the prediction of pre-clampsia. Ultrasound Obstet Gynecol 2007;0:742-9.. Duckitt K, Harrington D. Risk factors for pre-clampsia at antenatal booking: systematic re-iew of controlled studies. BMJ 2005;330:65-72.. Lo YM, Leung TN, Tein MS, et al. Quantitativebnormalities of fetal DNA in maternal serum inreeclampsia. Clin Chem 1999;45:184-8.0. Zhong XY, Laivuori H, Livingston JC, et al.levation of both maternal and fetal extracellularirculating deoxyribonucleic acid concentra-ions in the plasma of pregnant women withreeclampsia. Am J Obstet Gynecol 2001;84:414-9.1. Smid M, Vassallo A, Lagona F, et al. Quan-itative analysis of fetal DNA in maternal plasman pathological conditions associated with pla-ental abnormalities. Ann N Y Acad Sci001;945:132-7.2. Swinkels DW, de Kok JB, Hendriks JC,iegerinck E, Zusterzeel PL, Steegers EA. He-olysis, elevated liver enzymes, and low plate-
et count (HELLP) syndrome as a complicationf preeclampsia in pregnant women increaseshe amount of cell-free fetal and maternal DNAn maternal plasma and serum. Clin Chem002;48:650-3.3. Lau TW, Leung TN, Chan LY, et al. FetalNA clearance from maternal plasma is im-aired in preeclampsia. Clin Chem 2002;48:141-6.4. Sekizawa A, Jimbo M, Saito H, et al. Cell-
ree fetal DNA in the plasma of pregnant womenith severe fetal growth restriction. Am J Obstetynecol 2003;188:480-4.5. Shimada K, Murakami K, Shozu M, Segawa, Sumitani H, Inoue M. Sex-determining regionlevels in maternal plasma: evaluation in abnor-al pregnancy. J Obstet Gynaecol Res004;30:148-54.6. Farina A, Sekizawa A, Rizzo N, et al. Cell-
ree fetal DNA (SRY locus) concentration in ma-ernal plasma is directly correlated to the timelapsed from the onset of preeclampsia to theollection of blood. Prenat Diagn 2004;4:293-7.7. Zhong XY, Gebhardt S, Hillermann R, TofaC, Holzgreve W, Hahn S. Parallel assessmentf circulatory fetal DNA and corticotropin-re-
easing hormone mRNA in early- and late-onsetreeclampsia. Clin Chem 2005;51:1730-3.8. Smid M, Galbiati S, Lojacono A, et al. Cor-
elation of fetal DNA levels in maternal plasmaan Journal of Obstetrics & Gynecology 472.e6

wc1cte2ope72ssG2Dfat2Fis2Nsa1d1
2NtU2ap82NnC2Mpi2fo33SP3Psa13Lp
3KqD13Pff23Dc13Iip3Nwe3vbG3Sgo
Research Obstetrics www.AJOG.org
4
ith Doppler status in pathological pregnan-ies. Prenat Diagn 2006;26:785-90.9. Leung TN, Zhang J, Lau TK, Lo YM. In-reased maternal plasma fetal DNA concentra-ions in women who eventually develop pre-clampsia. Clin Chem 2001;47:137-9.0. Zhong XY, Holzgreve W, Hahn S. The levelsf circulatory cell free fetal DNA in maternallasma are elevated prior to the onset of pre-clampsia. Hypertens Pregnancy 2002;21:7-83.1. Levine RJ, Qian C, Leshane ES, et al. Two-tage elevation of cell-free fetal DNA in maternalera before onset of preeclampsia. Am J Obstetynecol 2004;190:707-13.2. Farina A, Sekizawa A, Sugito Y, et al. FetalNA in maternal plasma as a screening variable
or preeclampsia: a preliminary nonparametricnalysis of detection rate in low-risk nonsymp-omatic patients. Prenat Diagn 2004;24:83-6.3. Crowley A, Martin C, Fitzpatrick P, et al.ree fetal DNA is not increased before 22 weeks
n intrauterine growth restriction or pre-eclamp-ia. Prenat Diagn 2007;27:174-9.4. Snijders RJ, Noble P, Sebire N, Souka A,icolaides KH. UK multicentre project on as-essment of risk of trisomy 21 by maternal agend fetal nuchal-translucency thickness at0-14 weeks of gestation: Fetal Medicine Foun-ation First Trimester Screening Group. Lancet
998;352:343-6. B72.e7 American Journal of Obstetrics & Gynecolo
5. Kagan KO, Wright D, Baker A, Sahota D,icolaides KH. Screening for trisomy 21 by ma-
ernal age, fetal NT, free � hCG and PAPP-A.ltrasound Obstet Gynecol 2008;31:618-24.6. Davey DA, MacGillivray I. The classificationnd definition of the hypertensive disorders ofregnancy. Am J Obstet Gynecol 1988;158:92-8.7. Sherrill CB, Marshall DJ, Moser MJ, et al.ucleic acid analysis using an expanded ge-etic alphabet to quench fluorescence. J Amhem Soc 2004;126:4550-6.8. Johnson SC, Sherrill CB, Marshall DJ,oser MJ, Prudent JR. A third base pair for theolymerase chain reaction: inserting isoC and
soG. Nucleic Acids Res 2004;32:1937-41.9. Bland JM, Altman DG. Statistical methods
or assessing agreement between two methodsf clinical measurement. Lancet 1986;1:07-10.0. von Dadelszen P, Magee LA, Roberts JM.ubclassification of pre-eclampsia. Hypertensregnancy 2003;22:143-8.1. Witlin GA, Saade GR, Mattar FM, Sibai BM.redictors of neonatal outcome in women withevere pre-eclampsia or eclampsia between 24nd 33 weeks’ gestation. Am J Obstet Gynecol999;1(suppl):S19.2. Irgens HU, Reisaeter L, Irgens LM, Lie RT.ong term mortality of mothers and fathers afterre-eclampsia: population based cohort study.
MJ 2001;323:1213-7. Ugy NOVEMBER 2009
3. Zimmermann B, El-Sheikhah A, Nicolaides, Holzgreve W, Hahn S. Optimized real-timeuantitative PCR measurement of male fetalNA in maternal plasma. Clin Chem 2005;51:598-604.4. Picchiassi E, Coata G, Fanetti A, Centra M,ennacchi L, Di Renzo GC. The best approach
or early prediction of fetal gender by using freeetal DNA from maternal plasma. Prenat Diagn008;28:525-30.5. Holzgreve W, Ghezzi F, Di Naro E, Ganshirt, Maymon E, Hahn S. Disturbed feto-maternalell traffic in preeclampsia. Obstet Gynecol998;91:669-72.6. Knight M, Redman CW, Linton EA, Sargent
L. Shedding of syncytiotrophoblast microvillinto the maternal circulation in pre-eclampticregnancies. BJOG 1998;105:632-40.7. Al-Mufti R, Hambley H, Albaiges G, Lees C,icolaides KH. Increased fetal erythroblasts inomen who subsequently develop pre-clampsia. Hum Reprod 2000;15:1624-8.8. Holzgreve W, Li JC, Steinborn A, et al. Ele-ation in erythroblast count in maternal bloodefore the onset of preeclampsia. Am J Obstetynecol 2001;184:165-8.9. Akolekar R, Zaragoza E, Poon LCY, Pepes, Nicolaides KH. Maternal serum placentalrowth factor (PlGF) at 11 � 0 to 13 � 6 weeksf gestation in the prediction of preeclampsia.
ltrasound Obstet Gynecol 2008;32:732-9.Copyright © 2022 FDOKUMEN