First Nine Weeks: August 1, 2016 – September 30, 2016
115
1 Syllabus 6 th Grade Mathematics First Nine Weeks: August 1, 2016 – September 30, 2016 The Number System: Fractions, Decimals, and Percents Standards Objectives Major Assignments 6.NS.B.2 Fluently divide multi-digit numbers using the standard algorithm. 6.NS.B.3 Fluently add, subtract, multiply, and divide multi-digit decimals using the standard algorithm for each operation. 6.NS.A.1 Interpret and compute quotients of fractions, and solve word problems involving division of fractions by fractions, e.g., by using visual fraction models and equations to represent the problem. 6.NS.B.4 Find the greatest common factor of two whole numbers less than or equal to 100 and the least common multiple of two whole numbers less than or equal to 12. Use the distributive property to express a sum of two whole numbers 1–100 with a common factor as a multiple of a sum of two whole numbers with no common factor. I can…fluently use standard algorithms for math operations. I can…divide multi-digit whole numbers. I can…add and subtract multi-digit decimals. I can…multiply multi-digit decimals. I can…divide multi-digit decimals. I can…divide (compute quotients) using fractions. I can…interpret quotients of fractions using models. I can…interpret quotients of fractions using equations. I can…solve word problems involving the division of fractions. I can…find the GCF (greatest common factor) of two whole numbers less than or equal to 100. I can…find the LCM (least common multiple) of two whole numbers less than or equal to 12. I can…use the distributive property to express a common factor as a multiple of a sum of two whole numbers with no common factor. Daily formative assessments Weekly lesson quizzes End-of-unit assessments
-
Upload
khangminh22 -
Category
Documents
-
view
2 -
download
0
Transcript of First Nine Weeks: August 1, 2016 – September 30, 2016

1
Syllabus 6th Grade Mathematics
First Nine Weeks: August 1, 2016 – September 30, 2016 The Number System: Fractions, Decimals, and Percents Standards Objectives Major Assignments 6.NS.B.2 Fluently divide multi-digit numbers using the standard algorithm. 6.NS.B.3 Fluently add, subtract, multiply, and divide multi-digit decimals using the standard algorithm for each operation. 6.NS.A.1 Interpret and compute quotients of fractions, and solve word problems involving division of fractions by fractions, e.g., by using visual fraction models and equations to represent the problem. 6.NS.B.4 Find the greatest common factor of two whole numbers less than or equal to 100 and the least common multiple of two whole numbers less than or equal to 12. Use the distributive property to express a sum of two whole numbers 1–100 with a common factor as a multiple of a sum of two whole numbers with no common factor.
I can…fluently use standard algorithms for math operations. I can…divide multi-digit whole numbers. I can…add and subtract multi-digit decimals. I can…multiply multi-digit decimals. I can…divide multi-digit decimals. I can…divide (compute quotients) using fractions. I can…interpret quotients of fractions using models. I can…interpret quotients of fractions using equations. I can…solve word problems involving the division of fractions. I can…find the GCF (greatest common factor) of two whole numbers less than or equal to 100. I can…find the LCM (least common multiple) of two whole numbers less than or equal to 12. I can…use the distributive property to express a common factor as a multiple of a sum of two whole numbers with no common factor.
Daily formative assessments Weekly lesson quizzes End-of-unit assessments

2
Ratios and Proportional Relationships
Standards Objectives Major Assignments 6.RP.A.1 Understand the concept of a ratio and use ratio language to describe a ratio relationship between two quantities. 6.RP.A.2 Understand the concept of a unit rate a/b associated with a ratio a:b with b ≠ 0, and use rate language in the context of a ratio relationship.
I can…understand and describe a ratio using two quantities.
I can…understand and explain unit rates.
Daily formative assessments Lesson quizzes End-of-unit assessments
Second Nine Weeks: October 17, 2016 – December 16, 2016 Ratios and Proportional Relationships Continued…
Standards Objectives Major Assignments 6.RP.A.3a Use ratio and rate reasoning to solve real-world and mathematical problems, e.g., by reasoning about tables of equivalent ratios, tape diagrams, double number line diagrams, or equations. a. Make tables of equivalent ratios relating quantities with whole number measurements, find missing values in the tables, and plot the pairs of values on the coordinate plane. Use tables to compare ratios. 6.RP.A.3b and 6.RP.A.3d Use ratio and rate reasoning to solve real-world and mathematical problems, e.g., by reasoning about tables of equivalent ratios, tape diagrams, double number line diagrams, or equations. b. Solve unit rate problems including those involving unit pricing and constant speed. d. Use ratio reasoning to convert measurement units; manipulate and transform units appropriately when multiplying or dividing quantities.
I can…use ratios to solve real-world problems. I can… create, compare, and use tables of equivalent ratios. I can…solve unit pricing and speed problems using rate. I can…plot ratio data on the coordinate plane. I can…find %’s per 100 and find the whole when given the part and percent. I can…use ratios to convert and manipulate measurements by ∙ and .
Daily formative assessments Lesson quizzes End-of-unit assessments

3
6.RP.A.3c Use ratio and rate reasoning to solve real-world and mathematical problems, e.g., by reasoning about tables of equivalent ratios, tape diagrams, double number line diagrams, or equations. c. Find a percent of a quantity as a rate per 100 (e.g., 30% of a quantity means 30/100 times the quantity); solve problems involving finding the whole, given a part and the percent.
The Number System: Positive/Negative Numbers and The Number Line
Standards Objectives Major Assignments 6.NS.C.5 Understand that positive and negative numbers are used together to describe quantities having opposite directions or values (e.g., temperature above/below zero, elevation above/below sea level, credits/debits, positive/negative electric charge); use positive and negative numbers to represent quantities in real-world contexts, explaining the meaning of 0 in each situation. 6.NS.C.6a and 6.NS.C.6c Understand a rational number as a point on the number line. Extend number line diagrams and coordinate axes familiar from previous grades to represent points on the line and in the plane with negative number coordinates. a. Recognize opposite signs of numbers as indicating locations on opposite sides of 0 on the number line; recognize that the opposite of the opposite of a number is the number itself, e.g., –(–3) = 3, and that 0 is its own opposite. c. Find and position integers and other rational numbers on a horizontal or vertical number line diagram; find and position pairs of integers and other rational numbers on a coordinate plane.
I can…understand and use positive and negative numbers to represent real-world situations. I can…understand absolute value and ordering of positive and negative numbers. I can…use mathematical concepts to understand the opposite of an opposite is a positive (two negatives = a positive). I can…use positive and negative numbers to plot points on the coordinate plane. I can…find distances between points on the coordinate plane using absolute value. I can…use reflections on the coordinate plane when ordered pairs differ only by sign.
Daily formative assessments Lesson quizzes End-of-unit assessments

4
6.NS.C.7a , 6.NS.C.7b , 6.NS.C.7c , 6.NS.C.7d Understand ordering and absolute value of rational numbers. a. Interpret statements of inequality as statements about the relative position of two numbers on a number line diagram. b. Write, interpret, and explain statements of order for rational numbers in real-world contexts. c. Understand the absolute value of a rational number as its distance from 0 on the number line; interpret absolute value as magnitude for a positive or negative quantity in a real-world situation. d. Distinguish comparisons of absolute value from statements about order. 6.NS.C.6b and 6.NS.C.6c Understand a rational number as a point on the number line. Extend number line diagrams and coordinate axes familiar from previous grades to represent points on the line and in the plane with negative number coordinates. b. Understand signs of numbers in ordered pairs as indicating locations in quadrants of the coordinate plane; recognize that when two ordered pairs differ only by signs, the locations of the points are related by reflections across one or both axes. c. Find and position integers and other rational numbers on a horizontal or vertical number line diagram; find and position pairs of integers and other rational numbers on a coordinate plane. 6.NS.C.8 Solve real-world and mathematical problems by graphing points in all four quadrants of the coordinate plane. Include use of coordinates and absolute value to find distances between points with the same first coordinate or the same second coordinate.

5
Expressions and Equations
Standards Objectives Major Assignments 6.EE.A.1 Write and evaluate numerical expressions involving whole-number exponents. 6.EE.A.2a , 6.EE.A.2b , 6.EE.A.2c Write, read, and evaluate expressions in which letters stand for numbers. a. Write expressions that record operations with numbers and with letters standing for numbers.
b. Identify parts of an expression using mathematical terms (sum, term, product, factor, quotient, coefficient); view one or more parts of an expression as a single entity. c. Evaluate expressions at specific values of their variables. Include expressions that arise from formulas used in real-world problems. Perform arithmetic operations, including those involving whole number exponents, in the conventional order when there are no parentheses to specify a particular order (Order of Operations). 6.EE.A.3 Apply the properties of operations to generate equivalent expressions. For example, apply the distributive property to the expression 3 (2 + x) to produce the equivalent expression 6 + 3x; apply the distributive property to the expression 24x + 18y to produce the equivalent expression 6 (4x + 3y); apply properties of operations to y + y + y to produce the equivalent expression 3y. 6.EE.A.4 Identify when two expressions are equivalent (i.e., when the two expressions name the same number regardless of which value is substituted into them).
I can…write and evaluate numerical expressions using exponents. I can…read, write, and evaluate variable expressions. I can…use the distributive property to create equivalent expressions. I can…identify when two expressions are equivalent. I can…understand solving an equation or an inequality as a process of answering a question. I can…solve real world and mathematical problems using one-step equations. I can…write an inequality to represent a real world situation. I can…analyze relationships between independent and dependent variables.
Daily formative assessments Lesson quizzes End-of-unit assessments

6
Third Nine Weeks: January 4, 2017 – March 3, 2017 Expressions and Equations Continued…
Standards Objectives Major Assignments 6.EE.B.5 Understand solving an equation or inequality as a process of answering a question: which values from a specified set, if any, make the equation or inequality true? Use substitution to determine whether a given number in a specified set makes an equation or inequality true. 6.EE.B.6 Use variables to represent numbers and write expressions when solving a real-world or mathematical problem; understand that a variable can represent an unknown number, or, depending on the purpose at hand, any number in a specified set. 6.EE.B.7 Solve real-world and mathematical problems by writing and solving equations of the form x + p = q and px = q for cases in which p, q and x are all nonnegative rational numbers. 6.EE.B.5 Understand solving an equation or inequality as a process of answering a question: which values from a specified set, if any, make the equation or inequality true? Use substitution to determine whether a given number in a specified set makes an equation or inequality true. 6.EE.B.8 Write an inequality of the form x > c or x < c to represent a constraint or condition in a real-world or mathematical problem. Recognize that inequalities of the form x > c or x < c have infinitely many solutions; represent solutions of such inequalities on number line diagrams. 6.EE.C.9 Use variables to represent two quantities in a real-world problem that change in relationship to one another; write an equation to express one quantity, thought of as the dependent variable, in terms of the other quantity, thought of as the independent variable.
Daily formative assessments Lesson quizzes End-of-unit assessments

7
Analyze the relationship between the dependent and independent variables using graphs and tables, and relate these to the equation.
Geometry
Standards Objectives Major Assignments 6.G.A.1 Find the area of right triangles, other triangles, special quadrilaterals, and polygons by composing into rectangles or decomposing into triangles and other shapes; apply these techniques in the context of solving real-world and mathematical problems. 6.G.A.3 Draw polygons in the coordinate plane given coordinates for the vertices; use coordinates to find the length of a side joining points with the same first coordinate or the same second coordinate. Apply these techniques in the context of solving real world mathematical problems. 6.G.A.4 Represent three-dimensional figures using nets made up of rectangles and triangles, and use the nets to find the surface area of these figures. Apply these techniques in the context of solving real-world and mathematical problems. 6.G.A.2 Find the volume of a right rectangular prism with fractional edge lengths by packing it with unit cubes of the appropriate unit fraction edge lengths, and show that the volume is the same as would be found by multiplying the edge lengths of the prism. Apply the formulas V = l w h and V = b h to find volumes of right rectangular prisms with fractional edge lengths in the context of solving real-world and mathematical problems.
I can…calculate perimeter and area of triangle and quadrilaterals when given base and height. I can…calculate base and height when given area. I can…draw polygons in the coordinate plane given coordinates for vertices and apply these techniques to real world problems. I can…calculate surface area using a formula and using nets. I can…compute volume after packing a rectangular prism with unit cubes. I can…solve real world problems involving area, surface area, and volume.
Daily formative assessments Lesson quizzes End-of-unit assessments

8
Fourth Nine Weeks: March 6, 2017 – May 25, 2017 Statistics and Probability
Standards Objectives Major Assignments 6.SP.A.1 Recognize a statistical question as one that anticipates variability in the data related to the question and accounts for it in the answers. 6.SP.A.2 Understand that a set of data collected to answer a statistical question has a distribution which can be described by its center, spread, and overall shape. 6.SP.A.3 Recognize that a measure of center for a numerical data set summarizes all of its values with a single number, while a measure of variation describes how its values vary with a single number. 6.SP.B.4 Display numerical data in plots on a number line, including dot plots, histograms, and box plots. 6.SP.B.5a, 6.SP.B.5b, 6.SP.B.5c, 6.SP.B.5d Summarize numerical data sets in relation to their context, such as by: a. Reporting the number of observations. b. Describing the nature of the attribute under investigation, including how it was measured and its units of measurement. c. Giving quantitative measures of center (median and/or mean) and variability (interquartile range and/or mean absolute deviation), as well as describing any overall pattern and any striking deviations from the overall pattern with reference to the context in which the data were gathered. d. Relating the choice of measures of center and variability to the shape of the data distribution and the context in which the data were gathered.
I can…recognize a statistical question. I can…calculate measures of center (mean, median, mode, and range) of a set of numerical data. I can…display numerical data in plots on a number line, dot plot, histogram, and box plot. I can…calculate measures of variation using range, interquartile range, or mean absolute deviation of a set of numerical data. I can…identify clusters, gaps, extremes, and outliers in an group of data. I can…summarize numerical data sets in relation to their context. I can…describe and relate patterns to the context of a set of data. I can…describe and relate deviations to the context of a set of data.
Daily formative assessments Lesson quizzes End-of-unit assessments

9

1
Dickson County Schools Syllabus 7th Grade Math
1st Nine Weeks Unit 1 – 9 weeks The Number System Standards Objectives Major Assignments 7.NS.A.1abcd Apply and extend previous understandings of addition and subtraction to add and subtract rational numbers; represent addition and subtraction on a horizontal or vertical number line diagram.
a. Describe situations in which opposite quantities combine to make 0. For example, a hydrogen atom has 0 charge because its two constituents are oppositely charged.
b. Understand p + q as the number located a distance |q| from p, in the positive or negative direction depending on whether q is positive or negative. Show that a number and its opposite have a sum of 0 (are additive inverses). Interpret sums of rational numbers by describing real-world contexts.
c. Understand subtraction of rational numbers as adding the additive inverse, p – q = p + (–q). Show that the distance between two rational numbers on the number line is the absolute value of their difference, and apply this principle in real-world contexts.
d. Apply properties of operations as strategies to add and subtract rational numbers.
7.NS.A.2abcd Apply and extend previous understandings of multiplication and division and of fractions to multiply and divide rational numbers.
The students will: Understand that the sum of a number
and its opposite is zero in mathematical and real-world situations.
Understand the relationship between addition and subtraction
Represent p + q as the number located a distance lql from p on a number line.
Subtract rational numbers by adding the additive inverse.
Use subtraction and absolute value to find the distance between two numbers on a number line.
Find the distance between two points on a coordinate plane that have either the same x- or y-value.
Add and subtract integers. Represent addition and subtraction of
integers on horizontal and/or vertical number lines.
Apply properties of operations to add and subtract integers.
Develop rules for multiplying and dividing integers using patterns.
Identify equivalent numbers Multiply and divide integers resulting
in integer answers. Convert a positive proper fraction to a
terminating decimal.
Daily and weekly formative assessments. 3 Assessments
Adding and Subtracting Integers
Multiplying and Dividing Integers
Operations with Rational Numbers

2
a. Understand that multiplication is extended from fractions to rational numbers by requiring that operations continue to satisfy the properties of operations, particularly the distributive property, leading to products such as (–1)(–1) = 1 and the rules for multiplying signed numbers. Interpret products of rational numbers by describing real-world contexts.
b. Understand that integers can be divided, provided that the divisor is not zero, and every quotient of integers (with non-zero divisor) is a rational number. If p and q are integers, then –(p/q) = (–p)/q = p/(–q). Interpret quotients of rational numbers by describing real world contexts.
c. Apply properties of operations as strategies to multiply and divide rational numbers.
d. Convert a rational number to a decimal using long division; know that the decimal form of a rational number terminates in 0s or eventually repeats.
7.NS.A.3 Solve real-world and mathematical problems involving the four operations with rational numbers. 7.EE.B.3
Solve multi-step real-life and mathematical problems posed with positive and negative rational numbers in any form (whole numbers, fractions, and decimals), using tools strategically. Apply properties of operations to calculate with numbers in any form; convert between forms as appropriate; and assess the reasonableness of answers using mental computation and estimation strategies
Convert a positive improper fraction to a repeating decimal. Use symbols for repeating decimals.
Convert positive proper and improper fractions to repeating and non-repeating decimals.
Connect multiplying and dividing positive and negative fractions to what students already know about multiplying and dividing fractions and multiplying and dividing integers.
Multiply and divide rational numbers, with a focus on positive and negative proper and improper fractions, but also including multiplying and dividing integers by fractions and fractions by integers.
Interpret products and quotients of rational numbers by describing real-world contexts.
Connect adding and subtracting positive and negative fractions to what students already know about adding and subtracting fractions and adding and subtracting integers.
Use a number line with easy fractions to connect to distance model.
Add & subtract positive and negative proper, improper fractions, and mixed numbers
Solve problems involving negative integers.
Use whole number approximations to estimate, and then compare the estimate to the actual result of computation.
Connect previous one- or two- step equation solving to solving equations with positive and negative fractions.
Connect previous equation-solving to solving equations with positive and negative decimals.

3
2nd Nine Weeks
Unit 2 – 5 weeks Ratios and Proportional Relationships
Standards Objectives Major Assignments 7.RP.A.1 Compute unit rates associated with ratios of fractions, including ratios of lengths, areas and other quantities measured in like or different units. 7.RP.A.2abcd Recognize and represent proportional relationships between quantities.
a. Decide whether two quantities are in a proportional relationship, e.g., by testing for equivalent ratios in a table or graphing on a coordinate plane and observing whether the graph is a straight line through the origin.
b. Identify the constant of proportionality (unit rate) in tables, graphs, equations, diagrams, and verbal descriptions of proportional relationships.
c. Represent proportional relationships by equations
d. Explain what a point (x, y) on the graph of a proportional relationship means in terms of the situation, with special attention to the points (0, 0) and (1, r) where r is the unit rate.
7.RP.A.3 Use proportional relationships to solve multistep ratio and percent problems.
The students will: Compute unit rates involving ratios
with a fraction in the denominator Compute unit rates involving ratios
with a fraction in the numerator Compute unit rates involving ratios
with fractions in both the numerator and denominator
Determine whether two quantities are in a proportional relationship by looking at values in a table, a line in the coordinate plane, and an equation. (Use equivalent fraction relationships and multiplication/division to find proportional ratios.)
Identify the constant of proportionality (unit rate) in a table and represented by an equation.
Represent proportional relationships by equations.
Graph proportional equations representing real-world situations on a coordinate grid.
Explain what a given point (x, y) on the graph of the equation of a proportional relationship means in terms of a real-world situation.
Set up and solve multi-step simple interest problems.
Set up and solve multi-step tax problems
Set up and solve multi-step problems involving markup and markdowns.
Daily and weekly formative assessments. 2 Assessments
Equations for Proportional Relationships
Problem Solving with Proportional Relationships

4
Set up and solve multi-step problems involving gratuities, commissions, and fees.
Set up and solve multi-step problems involving percent increase and decrease.
Set up and solve multi-step problems involving percent error.
2nd Nine Weeks Unit 3 – 4 weeks Expressions and Equations
Standards Objectives Major Assignments 7.EE.A.1 Apply properties of operations as strategies to add, subtract, factor, and expand linear expressions with rational coefficients. 7.EE.A.2 Understand that rewriting an expression in different forms in a problem context can shed light on the problem and how the quantities in it are related 7.EE.B.3 Solve multi-step real-life and mathematical problems posed with positive and negative rational numbers in any form (whole numbers, fractions, and decimals), using tools strategically. Apply properties of operations to calculate with numbers in any form; convert between forms as appropriate; and assess the reasonableness of answers using mental computation and estimation strategies. 7.EE.B.4a Use variables to represent quantities in a real-world or mathematical problem, and construct simple equations and inequalities to solve problems by reasoning about the quantities.
The students will:
Add and subtract linear expressions with fractional and decimal coefficients by combining like terms.
Simplify expressions that include the distributive property, multiple variable terms, and negative numbers.
Apply properties of simplifying expressions to contexts such as perimeters and areas of triangles and rectangles.
Determine whether two expressions are equivalent
Write equivalent expressions for linear expressions
Rewrite expressions in different forms to better understand relationships within contexts.
Incorporate expressions representing length and width into the formulas for perimeter and area of triangles and rectangles.
Solve problems involving rational numbers
Daily and weekly formative assessments. 1 Assessment: Expressions and Equations

5
a. Solve word problems leading to equations of the form px + q = r and p(x + q) = r, where p, q, and r are specific rational numbers. Solve equations of these forms fluently. Compare an algebraic solution to an arithmetic solution, identifying the sequence of the operations used in each approach. b. Solve word problems leading to inequalities of the form px + q > r or px + q < r, where p, q, and r are specific rational numbers. Graph the solution set of the inequality and interpret it in the context of the problem.
Convert among fractions, decimals, and percents as needed to solve the problem.
Estimate the reasonableness of answers
Solve word problems leading to equations of the form px + q = r and p(x + q) = r, where p, q, and r are integers, fractions, or decimals
Solve using estimates for the fractions and decimals first to get an estimate solution.
Write and solve real-life inequalities that lead to the form px + q < r or px + q > r, where p, q, and r are integers, fractions, or decimals
Graph and interpret the solution set of an inequality
3rd Nine Weeks Unit 4: 9 weeks Geometry
Standards Objectives Major Assignments 7.G.B.5 Use facts about supplementary, complementary, vertical, and adjacent angles in a multi-step problem to write and solve simple equations for an unknown angle in a figure. 7.G.A.2 Draw (freehand, with ruler and protractor, and with technology) geometric shapes with given conditions. Focus on constructing triangles from three measures of angles or sides, noticing when the conditions determine a unique triangle, more than one triangle, or no triangle. 7.G.B.6 Solve real-world and mathematical problems involving area, volume and surface area of two- and three-
The students will:
Write equations to find unknown angle measures using properties of supplementary and complementary angles
Write equations to find unknown angle measures using properties of vertical angles
Write equations to find unknown angle measures using properties of adjacent angles
Write equations to find unknown angle measures in more complex figures combining supplementary,
Daily and weekly formative assessments. 3 Assessments:
Area and Circumference Scale Drawings and Volume Surface Area and Plane
Sections

6
dimensional objects composed of triangles, quadrilaterals, polygons, cubes, and right prisms. 7.G.B.4 Know the formulas for the area and circumference of a circle and use them to solve problems; give an informal derivation of the relationship between the circumference and area of a circle 7.G.A.1 Solve problems involving scale drawings of geometric figures, including computing actual lengths and areas from a scale drawing and reproducing a scale drawing at a different scale. 7.RP.A.1 Compute unit rates associated with ratios of fractions, including ratios of lengths, areas and other quantities measured in like or different units. For example, if a person walks 1/2 mile in each 1/4 hour, compute the unit rate as the complex fraction 1/2/1/4 miles per hour, equivalently 2 miles per hour. 7.G.B.6 Solve real-world and mathematical problems involving area, volume and surface area of two- and three-dimensional objects composed of triangles, quadrilaterals, polygons, cubes, and right prisms. 7.G.A.3 Describe the two-dimensional figures that result from slicing three dimensional figures, as in plane sections of right rectangular prisms and right rectangular pyramids.
complementary, vertical, and adjacent angles
Construct triangles given angle measures, side lengths, or congruence
Determine whether or not it is possible to draw a triangle with given characteristics. If so, draw the triangle, If not, explain why not.
Determine whether a triangle is unique, if you can draw more than one variety of that triangle, or if no such triangle exists
Draw a quadrilateral when given a description of side lengths and angle measures
Find the areas of two-dimensional objects composed of triangles, quadrilaterals, and polygons
Apply formulas to solve real-world and mathematical problems
Understand the relationship between the radius and diameter of a circle
Understand that the ratio of the circumference of a circle to its diameter can be expressed as pi
Discover an expression for the area of a circle using the area of a parallelogram
Solve real-world problems involving the circumference of a circle and the area of a circle
Understand that a scale is a ratio Compute actual lengths from a scale
drawing involving geometric figures Reproduce a scale drawing using a
different scale Determine the scale of a drawing
given the ratios of lengths and areas in the drawing and the actual dimensions

7
Find the volumes of cubes and right prisms by multiplying the area of the base by the height. (Focus on V=Bh, not l x w x h)
Find the volume of cubes and right prisms in real-world situations
Use two-dimensional formulas to calculate surface areas of cubes and right prisms
Describe the intersection of a plane and a right rectangular prism
Describe the intersection of a plane and a right rectangular pyramid
Describe the intersection of a plane parallel to the base of a cone or cylinder
Understand that intersections may be parallel, perpendicular, or neither parallel or perpendicular to the base of the solid
4th Nine Weeks Unit 5: 9 weeks Statistics & Probability
Standards Objectives Major Assignments 7.SP.A.1 Understand that statistics can be used to gain information about a population by examining a sample of the population; generalizations about a population from a sample are valid only if the sample is representative of that population. Understand that random sampling tends to produce representative samples and support valid inferences. 7.SP.A.2
The students will:
Understand that a representative sample can be used to make predictions about a large population
Describe different ways of finding a sample and determine which sample is the most representative of a given population
Create a representative sample and use it to make predictions about a population
Daily and weekly formative assessments. 2 Assessments:
Statistics Probability

8
Use data from a random sample to draw inferences about a population with an unknown characteristic of interest. Generate multiple samples (or simulated samples) of the same size to gauge the variation in estimates or predictions. For example, estimate the mean word length in a book by randomly sampling words from the book; predict the winner of a school election based on randomly sampled survey data. Gauge how far o! the estimate or prediction might be. 7.SP.B.3 Informally assess the degree of visual overlap of two numerical data distributions with similar variabilities, measuring the difference between the centers by expressing it as a multiple of a measure of variability. For example, the mean height of players on the basketball team is 10 cm greater than the mean height of players on the soccer team, about twice the variability (mean absolute deviation) on either team; on a dot plot, the separation between the two distributions of heights is noticeable. 7.SP.B.4 Use measures of center and measures of variability for numerical data from random samples to draw informal comparative inferences about two populations. For example, decide whether the words in a chapter of a seventh-grade science book are generally longer than the words in a chapter of a fourth-grade science book. 7.SP.C.5 Understand that the probability of a chance event is a number between 0 and 1 that expresses the likelihood of the event occurring. Larger numbers indicate greater likelihood. A probability near 0 indicates an unlikely event, a probability around 1/2 indicates an event that is neither unlikely nor likely, and a probability near 1 indicates a likely event. 7.SP.C.6 Approximate the probability of a chance event by collecting data on the chance process that produces it and observing its long-run relative frequency, and predict the
Use data from two samples to write ratios that can be easily used to make an estimate about a population
Compare estimates made from multiple samples of the same size to gauge the variation in the estimates
Predict the accuracy of the estimates made by various samples
Use visual representations, such as dot plots, to compare two real-world numerical data sets with similar and differing variabilities
Compare data sets and measure the difference between the centers
Represent the difference between centers of data sets by using the mean
Step through the calculations necessary to find the mean absolute deviation for each of two data sets
Describe the variation in data sets Use data gathered from two
populations to compare the mean, median, and mode
Describe which measure of center is the best to represent data
Use data gathered from two populations to compare the measures of variability including range, mean absolute deviation, and interquartile range
Understand that the probability of a chance event is a number between 0 and 1, with 0 being impossible, close to zero being unlikely, close to ½ being neither unlikely nor likely, near 1 being likely, and 1 being certain.
Represent the likelihood of an event on a number line
For a given situation, determine if the probability of an event is close to 0 or to 1.

9
approximate relative frequency given the probability. For example, when rolling a number cube 600 times, predict that a 3 or 6 would be rolled roughly 200 times, but probably not exactly 200 times. 7.SP.C.7ab Develop a probability model and use it to find probabilities of events. Compare probabilities from a model to observed frequencies; if the agreement is not good, explain possible sources of the discrepancy.
a. Develop a uniform probability model by assigning equal probability to all outcomes, and use the model to determine probabilities of events. For example, if a student is selected at random from a class, find the probability that Jane will be selected and the probability that a girl will be selected.
b. Develop a probability model (which may not be uniform) by observing frequencies in data generated from a chance process. For example, find the approximate probability that a spinning penny will land heads up or that a tossed paper cup will
7.SP.C.8abc Find probabilities of compound events using organized lists, tables, tree diagrams, and simulation.
a. Understand that, just as with simple events, the probability of a compound event is the fraction of outcomes in the sample space for which the compound event occurs.
b. Represent sample spaces for compound events using methods such as organized lists, tables and tree diagrams. For an event described in everyday language (e.g., “rolling double sixes”), identify the outcomes in the sample space which compose the event.
c. Design and use a simulation to generate frequencies for compound events. For example, use random digits as a simulation tool to approximate the answer to the question: If 40% of donors have type A blood, what is the
Given the probability of an event, determine if the event is impossible, unlikely, equally likely, very likely, or certain
Connect probabilities of 1, ¼, ½, ¾, and 1 to equivalent decimal and percent representations
Perform an experiment multiple times (pulling a colored marble out of a bag or rolling a number cube) to gather data for a number of outcomes. Calculate the experimental probability
Calculate the experimental probability of an event using the combined data of many groups. Compare this probability to the individual probabilities.
Describe some reasons why the experimental probabilities of the groups might be different.
Describe the probability you would expect for 1000 outcomes or 10,000 outcomes. (Begin to introduce the idea of theoretical probability informally)
Make a conjecture about the outcome of a similar experiment with different numbers
Find theoretical probabilities using real-world situations
Develop a uniform probability model and use the model to determine probabilities of events. Compare these probabilities to experimental results. Explain possible discrepancies.
Develop a probability model (which may not be uniform) and use the model to determine probabilities of events. Compare these probabilities to experimental results. Explain possible discrepancies.’

10
probability that it will take at least 4 donors to find one with type A blood.
List the possible outcomes for a compound event using organized lists, tables, and tree diagrams.
Identify the desired outcomes and the total number of outcomes from organized lists, tables, and tree diagrams.
Identify the probability of a compound event using organized lists, tables, and tree diagram.

1
Dickson County Schools Syllabus 8th Grade Math: 1st Semester
Unit 1: Expressions and Equations (Exponents) and the Number System - 5 Weeks Lesson 1: Properties of Integer Exponents Standards Objectives Major Assignments 8.EE.A.1 Know and apply the properties of integer exponents to generate equivalent numerical expressions.
-Understand the properties of integer exponents. -Use the properties of integer exponents to evaluate expressions with exponents. -Generate equivalent expressions.
Daily Formative Assessments Weekly Lesson Quiz
Lesson 2: Square Roots and Cube Roots Standards Objectives Major Assignments 8.EE.A.2 Use square root and cube root symbols to represent solutions to equations of the form x^2 = p and x^3= p, where p is a positive rational number. Evaluate square roots of small perfect squares and cube roots of small perfect cubes. Know that √2 is irrational.
-Identify perfect squares between 1 and 225. -Understand that and √ are inverses as are and √ . -Solve equations with squares and cubes. -Use squares, cubes, square roots, and cube roots to solve word problems.
Daily Formative Assessments Weekly Lesson Quiz
Lesson 3: Understand Rational and Irrational Numbers Standards Objectives Major Assignments 8.NS.A.1 Know that numbers that are not rational are called irrational. Understand informally that every number has a decimal expansion; for rational numbers show that the decimal expansion repeats eventually, and
-Understand what rational and irrational numbers are. -Identify rational and irrational numbers. -Express a repeating decimal as a fraction.
Daily Formative Assessments Weekly Lesson Quiz

2
convert a decimal expansion which repeats eventually into a rational number. 8.NS.A.2 Use rational approximations of irrational numbers to compare the size of irrational numbers, locate them approximately on a number line diagram, and estimate the value of expressions (e.g.,π^2).
-Estimate square roots to the nearest hundredth. -Compare and order rational and irrational numbers using a number line. -Estimate the value of expressions.
Exponents, Roots, and Rational/Irrational Summative Assessment
Lesson 4: Scientific Notation
Standards Objectives Major Assignments 8.EE.A.3 Use numbers expressed in the form of a single digit times an integer power of 10 to estimate very large or very small quantities, and to express how many times as much one is than the other.
-Write numbers using scientific notation. -Express numbers written in scientific notation in standard form. -Given two numbers written in scientific notation, identify how many times as much one is than the other.
Daily Formative Assessments Weekly Lesson Quiz
Lesson 5: Operations and Scientific Notation Standards Objectives Major Assignments 8.EE.A.4 Perform operations with numbers expressed in scientific notation, including problems where both decimal and scientific notation are used. Use scientific notation and choose units of appropriate size for measurements of very large or very small quantities (e.g., use millimeters per year for seafloor spreading). Interpret scientific notation that has been generated by technology.
-Perform operations with numbers expressed in scientific notation, including problems where both decimal and scientific notation are used. -Solve real-world problems that require operations with numbers expressed in scientific notation. -Choose units of appropriate size for large and small measurements. -Interpret scientific notation that has been generated by technology.
Daily Formative Assessments Weekly Lesson Quiz Operations and Scientific Notation Summative Assessment

3
Unit 2: Functions - 5 Weeks Lesson 6: Understand Functions
Standards Objectives Major Assignments 8.F.A.1 Understand that a function is a rule that assigns to each input exactly one output. The graph of a function is the set of ordered pairs consisting of an input and the corresponding output.
-Understand that a function is a rule that assigns to each input exactly one output. -Identify whether a relationship is a function from a diagram, tables of values, graph, or equation.
Daily Formative Assessments Weekly Lesson Quiz
Lesson 7: Compare Functions
Standards Objectives Major Assignments 8.F.A.2 Compare properties of two functions each represented in a different way (algebraically, graphically, numerically in tables, or by verbal descriptions).
-Translate among forms of linear functions: equation, table, graph, or verbal description. -Identify the rate of change and initial value of a function. -Compare rate of change and initial value
Daily Formative Assessments Weekly Lesson Quiz
Lesson 8: Understand Linear Functions
Standards Objectives Major Assignments 8.F.A.3 Interpret the equation as defining a linear function, whose graph is a straight line; give examples of functions that are not linear.
-Determine if a function is linear or nonlinear. -Interpret the equation as defining a linear equation.
Daily Formative Assessments Weekly Lesson Quiz
Lesson 9: Analyze Linear Functions
Standards Objectives Major Assignments 8.F.B.4 Construct a function to model a linear relationship between two quantities. Determine the rate of
-Understand that the rate of change of a linear function is the slope of a line.
Daily Formative Assessments Weekly Lesson Quiz

4
change and initial value of the function from a description of a relationship or from two , values, including reading these from a table or from a graph. Interpret the rate of change and initial value of a linear function in terms of the situation it models, and in terms of its graph or a table of values.
-Find slope of a line given two points from a table or graph using the formula. -Find the slope of a line from an equation. -Understand that the initial value of a function is the y-intercept. -Find the y-intercept given a table, graph, or equation. -Make a table of values, write an equation, or construct a graph to represent a linear function in a real-world context.
Lesson 10: Graphs of Functional Relationships
Standards Objectives Major Assignments 8.F.B.5 Describe qualitatively the functional relationship between two quantities by analyzing a graph (e.g., where the function is increasing or decreasing, linear or nonlinear). Sketch a graph that exhibits the qualitative features of a function that has been described verbally.
-Analyze a graph to qualitatively describe a relationship between two quantities. -Sketch a graph of a function from a verbal description.
Daily Formative Assessments Weekly Lesson Quiz Linear Functions Summative Assessment
Unit 3: Expressions and Equations (Linear Equations) - 7 Weeks Lesson 11: Represent Proportional Relationships
Standards Objectives Major Assignments 8.EE.B.5 Graph proportional relationships, interpreting the unit rate as the slope of the graph. Compare two different proportional relationships represented in different ways.
-Graph proportional relationships. -Interpret the unit rate of a proportional relationship as the slope of its graph. -Understand that the y-intercept is always 0 for proportional relationships. -Compare two different proportional relationships represented in different ways.
Daily Formative Assessments Weekly Lesson Quiz

5
Lesson 12: Understand the Slope-Intercept Equation for a Line Standards Objectives Major Assignments 8.EE.B.6 Use similar triangles to explain why the slope m is the same between any two distinct points on a non-vertical line in the coordinate plane; derive the equation for a line through the origin and the equation for a line intercepting the vertical axis at b.
-Understand that similar triangles have proportional side lengths. -Use the slope and y-intercept to derive an equation for a linear function.
Daily Formative Assessments Weekly Lesson Quiz Proportional Relationships and Slope Intercept Equation Summative Assessment
Lesson 13: Solve Linear Equations with Rational Coefficients
Standards Objectives Major Assignments 8.EE.C.7b Solve linear equations in one variable. Solve linear equations with rational number coefficients, including equations whose solutions require expanding expressions using the distributive property and collecting like terms.
-Solve multi-step linear equations with rational coefficients on both sides.
Daily Formative Assessments Weekly Lesson Quiz
Lesson 14: Solutions of Linear Equations
Standards Objectives Major Assignments 8.EE.C.7a Solve linear equations in one variable. Give examples of linear equations in one variable with one solution, infinitely many solutions, or no solutions. Show which of these possibilities is the case by successively transforming the given equation into simpler forms, until an equivalent equation of the form x = a, a = a, or a = b results (where a and b are different numbers).
-Identify and provide examples of equations that have exactly one solution, infinitely many solutions, or no solutions.
Daily Formative Assessments Weekly Lesson Quiz Solving Linear Equations Summative Assessment

6
Lesson 15: Understand Systems of Equations Standards Objectives Major Assignments 8.EE.C.8a Analyze and solve pairs of simultaneous linear equations.
a. Understand that solutions to a system of two linear equations in two variables correspond to points of intersection of their graphs, because points of intersection satisfy both equations simultaneously.
-Determine whether a system of linear equations has exactly one solution, infinitely many solutions, or no solution, by graphing and analyzing the equations. -Describe solution sets of systems of linear equations.
Daily Formative Assessments Weekly Lesson Quiz
Lesson 16: Solve Systems of Equations Algebraically
Standards Objectives Major Assignments 8.EE.C.8b Analyze and solve pairs of simultaneous linear equations. Solve systems of two linear equations in two variables algebraically, and estimate solutions by graphing the equations. Solve simple cases by inspection.
-Solve systems of two linear equations algebraically, by substitution or elimination. -Estimate solutions of systems of two linear equations by graphing the equations.
Daily Formative Assessments Weekly Lesson Quiz
Lesson 17: Solve Problems Using Systems of Equations
Standards Objectives Major Assignments 8.EE.C.8c Analyze and solve pairs of simultaneous linear equations.
b. Solve real-world and mathematical problems leading to two linear equations in two variables. For example, given coordinates for two pairs of points, determine whether the line through the first pair of points intersects the line through the second pair.
-Write systems of linear equations to represent mathematical and real-world problems. -Understand that variables in the related equations must represent the same quantities and have the same value. -Graph systems to estimate solutions and describe how the graph represent the situation modeled.
Daily Formative Assessments Weekly Lesson Quiz

7
-Solve systems algebraically and explain what the solution means in the context of the problem.
Systems of Equations Summative Assessment
Dickson County Schools Syllabus 8th Grade Math 2nd Semester Unit 4: Geometry 10 weeks Lesson 18: Understand Properties of Transformations Standards Objectives Major Assignments 8.G.A.1abc Verify experimentally the properties of rotations, reflections, and translations:
a. Lines are taken to lines, and line segments to line segments of the same length.
b. Angles are taken to angles of the same measure.
c. Parallel lines are taken to parallel lines.
-Give a general description of a rotation, reflection, or translation. -Describe the effect of translations on the properties of two-dimensional figures. -Describe the effect of rotations on the properties of two-dimensional figures. -Describe the effect of reflections on the properties of two-dimensional.
Daily Formative Assessments Weekly Lesson Quiz
Lesson 19: Transformations and Congruence Standards Objectives Major Assignments 8.G.A.2 Understand that a two-dimensional figure is congruent to another if the second can be obtained from the first by a sequence of rotations, reflections, and translations; given two congruent figures,
-Understand that a figure is congruent to its image after a rigid transformation. -Describe translations, rotations and reflections individually and in a sequence.
Daily Formative Assessments Weekly Lesson Quiz

8
describe a sequence that exhibits the congruence between them. 8.G.A.3 Describe the effect of dilations, translations, rotations, and reflections on two-dimensional figures using coordinates.
-Understand how to translate, rotate, and reflect two-dimensional figures on the coordinate plane. -Describe the effect of translations, rotations, and reflections on two-dimensional figures using coordinates.
Lesson 20: Transformations and Similarity Standards Objectives Major Assignments 8.G.A.3 Describe the effect of dilations, translations, rotations, and reflections on two-dimensional figures using coordinates. 8.G.A.4 Understand that a two-dimensional figure is similar to another if the second can be obtained from the first by a sequence of rotations, reflections, translations, and dilations; given two similar two dimensional figures, describe a sequence that exhibits the similarity between them.
-Understand that a two-dimensional figure is similar to another if the second can be obtained from the first by a sequence of rotations, reflections, translations, and dilations. -Recognize and describe translations, rotations, reflections, and dilations individually and in a sequence. -Given an image and its transformed image, use coordinate notation to describe the transformation. -Make dilations of figures by a given scale factor. -Distinguish between similar and congruent.
Daily Formative Assessments Weekly Lesson Quiz Transformations Summative Assessment
Lesson 21: Understand Angle Relationships
Standards Objectives Major Assignments 8.G.A.5 Use informal arguments to establish facts about the angle sum and exterior angle of triangles, about the angles created when parallel lines are cut by a transversal, and the angle-angle criterion for similarity of triangles.
-Determine the relationships among corresponding angles, alternate interior angles, alternate exterior angles, vertical angles, and supplementary angles when parallel lines are cut by a transveral. -Find missing angle measures when parallel lines are cut by a transversal.
Daily Formative Assessments Weekly Lesson Quiz

9
Lesson 22: Understand Angle Relationships in Triangles Standards Objectives Major Assignments 8.G.A.5 Use informal arguments to establish facts about the angle sum and exterior angle of triangles, about the angles created when parallel lines are cut by a transversal, and the angle-angle criterion for similarity of triangles.
-Understand that the measure of an exterior angle of a triangle is equal to the sum of the measures of the non-adjacent angles. -Know that the sum of the measures of the angles of a triangle equals 180°. -Find the measures of the interior and exterior angles of triangles. -Recognize that if two triangles have two pairs of congruent angles, then they are similar triangles (angle-angle criterion).
Daily Formative Assessments Weekly Lesson Quiz Angle Relationships Summative Assessment
Lesson 23: Understand The Pythagorean Theorem
Standards Objectives Major Assignments 8.G.B.6 Explain a proof of the Pythagorean Theorem and its converse.
-Explore the relationships of the areas of squares built on all sides of a right triangle. - Know that in a right triangle,
(the Pythagorean Theorem). -Understand and explain a proof of the Pythagorean Theorem. -Understand and explain a proof of the converse of the Pythagorean Theorem.
Daily Formative Assessments Weekly Lesson Quiz
Lesson 24: Solve Problems Using the Pythagorean The
Standards Objectives Major Assignments 8.G.B.7 Apply the Pythagorean Theorem to determine unknown side lengths in right triangles in real-world and mathematical problems in two and three dimensions.
-Use the Pythagorean Theorem to solve for a missing side length of a right triangle given the other two side lengths. -Use the Pythagorean Theorem to solve problems in real-world contexts, including three-dimensional contexts.
Daily Formative Assessments Weekly Lesson Quiz

10
Lesson 25: Distance in the Coordinate Plane Standards Objectives Major Assignments 8.G.G.8 Apply the Pythagorean Theorem to find the distance between two points in a coordinate system.
-Use the Pythagorean Theorem to find the distance between any two points on the coordinate plane.
Daily Formative Assessments Weekly Lesson Quiz Pythagorean Theorem Summative Assessment
Lesson 26: Understand Volume of Cylinders, Cones, and Spheres
Standards Objectives Major Assignments 8.G.C.9 Know the formulas for the volumes of cones, cylinders, and spheres and use them to solve real-world and mathematical problems.
-Understand the relationship between the volume of a cylinder and the volume of a cone. -Understand the relationship between the volume of a cylinder and the volume of a sphere. -Compare the volumes of different-sized cylinders cones, and spheres, and explain how different-sized figures can have the same volume.
Daily Formative Assessments Weekly Lesson Quiz
Lesson 27: Solve Problems with Cylinders, Cones, and Spheres
Standards Objectives Major Assignments 8.G.C.9 Know the formulas for the volumes of cones, cylinders, and spheres and use them to solve real-world and mathematical problems.
-Use formulas to find the volumes of cylinders, cones, and spheres. -Solve real-world and mathematical problems involving the volumes of cylinders, cones, and spheres. -compare volumes of cylinders, cones, and spheres.
Daily Formative Assessments Weekly Lesson Quiz Volume Summative Assessment
11
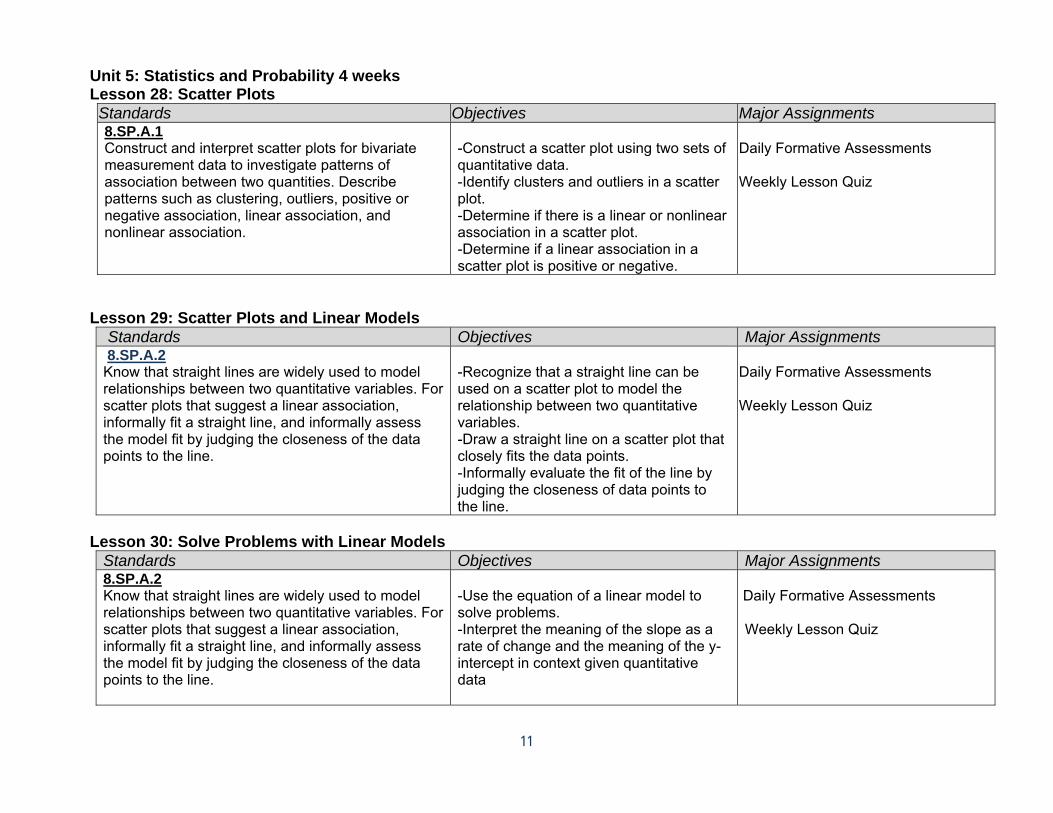
Unit 5: Statistics and Probability 4 weeks Lesson 28: Scatter Plots Standards Objectives Major Assignments 8.SP.A.1 Construct and interpret scatter plots for bivariate measurement data to investigate patterns of association between two quantities. Describe patterns such as clustering, outliers, positive or negative association, linear association, and nonlinear association.
-Construct a scatter plot using two sets of quantitative data. -Identify clusters and outliers in a scatter plot. -Determine if there is a linear or nonlinear association in a scatter plot. -Determine if a linear association in a scatter plot is positive or negative.
Daily Formative Assessments Weekly Lesson Quiz
Lesson 29: Scatter Plots and Linear Models Standards Objectives Major Assignments 8.SP.A.2 Know that straight lines are widely used to model relationships between two quantitative variables. For scatter plots that suggest a linear association, informally fit a straight line, and informally assess the model fit by judging the closeness of the data points to the line.
-Recognize that a straight line can be used on a scatter plot to model the relationship between two quantitative variables. -Draw a straight line on a scatter plot that closely fits the data points. -Informally evaluate the fit of the line by judging the closeness of data points to the line.
Daily Formative Assessments Weekly Lesson Quiz
Lesson 30: Solve Problems with Linear Models
Standards Objectives Major Assignments 8.SP.A.2 Know that straight lines are widely used to model relationships between two quantitative variables. For scatter plots that suggest a linear association, informally fit a straight line, and informally assess the model fit by judging the closeness of the data points to the line.
-Use the equation of a linear model to solve problems. -Interpret the meaning of the slope as a rate of change and the meaning of the y-intercept in context given quantitative data
Daily Formative Assessments Weekly Lesson Quiz

12
Lesson 31: Categorical Data in Frequency Tables
Standards Objectives Major Assignments 8.SP.A.4 Understand that patterns of association can also be seen in bivariate categorical data by displaying frequencies and relative frequencies in a two-way table. Construct and interpret a two-way table summarizing data on two categorical variables collected from the same subjects. Use relative frequencies calculated for rows or columns to describe possible association between the two variables.
-Construct a two-way frequency table of categorical data. -Interpret and describe relative frequencies for possible associations from a two-way table.
Daily Formative Assessments Weekly Lesson Quiz Unit Assessment

1
Dickson County Schools Syllabus: Advanced Algebra & Trigonometry
1st Nine Weeks
Standards Objectives Major Assignments N-NE.3 Classify real numbers and order real numbers that include transcendental expressions, including roots and fractions of pi and e.
N-NE.4 Simplify complex radical and rational expressions; discuss and display understanding that rational numbers are dense in the real numbers and the Integers are not. N-NE.5 Understand that rational expressions form a system analogous to the rational numbers, closed under addition, subtraction, multiplication, and division by a nonzero rational expression; add, subtract, multiply, and divide rational expressions. N-CN.1 Perform arithmetic operations with complex numbers expressing answers in the form a+bi. N-CN.2 Find the conjugate of a complex number; use conjugates to find moduli and quotients of complex numbers. N-CN.3 Represent complex numbers on the complex plane in rectangular and polar form (including real and imaginary numbers), and explain why the rectangular and polar forms of a given complex number represent the same number. N-CN. 6 Extend polynomial identities to the complex numbers. F-IF.3 Identify the real zeros of a function and explain the relationship between the real zeros and the x-intercept of the graph of a function (polynomial, rational, exponential, logarithmic, and trigonometric) F-IF.7 Solve real world problems that can be modeled using quadratic functions (by hand and with appropriate technology.)
The student will: Evaluate algebraic
expressions containing real numbers occurring in mathematical models.
Simplify expressions containing exponents.
Solve problems involving radicals, rational exponents and polynomials.
Factor polynomials of different degree and number of terms.
Simplify rational expressions
Graph linear and nonlinear equations with and without graphing utilities.
Solve linear and rational equations using a variety of methods.
Solve quadratic equations by factoring, the square root property, completing the square, and the quadratic formula.
Solve polynomial equations by factoring.
Daily and weekly formative assessments Unit assessments One project embedded within the nine weeks

2
F-IF.2 Identify or analyze the distinguishing properties of exponential, polynomial, logarithmic, trigonometric, and rational functions from tables, graphs, and equations.
F-BF.4 Construct the difference quotient for a given function and simplify the resulting expression.
F-IF.1 Determine whether a function is even, odd, or neither.
F-IF.5 Visually locate critical points on the graphs of functions and determine if each critical point is a minimum, a maximum, or point of inflection. Describe intervals of concavity and increasing and decreasing.
S-MD.1 Create scatter plots, analyze patterns and describe relationships for bivariate data (linear, polynomial, trigonometric or exponential) to model real-world phenomena and to make predictions.
S-MD.2 Determine a regression equation to model a set of bivariate data. Justify why this equation best fits the data.
S-MD.3 Use a regression equation modeling bivariate data to make predictions. Identify possible considerations regarding the accuracy of predictions when interpolating or extrapolating.
Solve radical equations, equations with rational exponents, equations in quadratic form, and equations involving absolute value.
Solve problems modeled by equations.
Use interval notation when finding intersections and unions.
Solve linear inequalities recognizing those with no solution or all real numbers as solutions.
Solve compound inequalities and absolute value inequalities.
Evaluate and graph functions
Identify the domain and range, intercepts, intervals of increase, decrease, or constant, relative maxima and minima, and symmetry of a function from its graph.
Understand and use piecewise functions.
Use the slope, intercepts, and other general information to write the equation of a line.

3
2nd Nine Weeks
Standards Objectives Major Assignments
F-BF.1 Understand how the algebraic properties of an equation transform the geometric properties of its graph. For example, given a function, and describe the transformation of the graph resulting from the manipulation of the algebraic properties of the equation (i.e., translations, stretches, and changes in periodicity and amplitude). F-BF.2 Develop an understanding of functions as elements that can be operated upon to get new functions: addition, subtraction, multiplication, division, and composition of functions. F-BF.3 Compose function. For example, if T(y) is the temperature in the atmosphere as a function of height, and h(t) is the height of a weather balloon as a function of time, then T(h(t)) is the temperature at the location of the weather balloon as a function of time.
F-BF.5.a Calculate the inverse of a function, f(x), with respect to each of the functional operations; in other words, the additive inverse, -f(x), the multiplicative inverse, 1/f(x), and the inverse with respect to the composition, f^-1(x). Understand the algebraic and graphical implications of each type. F-BF.5.b Verify by composition that one function is the inverse of another. F.BF.5.c Read values of an inverse function from a graph or table, given that the function has an inverse. F-BF.5.d Produce an invertible function from a non-invertible function by restricting the domain. Recognize a function is invertible if and only if it is one-to-one. F.BF.6 Explain why the graph of a function and its inverse are reflections of one another over the line y = x. I-IF.4 Identify characteristics of graphs based on a set of conditions or on a general equation such as y =ax^2+c. F-If.7 Solve real world problems that can be modeled using quadratic, exponential, or logarithmic functions (by hand and with appropriate technology).
Use vertical and
horizontal shifts, reflections, vertical stretching and shrinking and horizontal stretching and shrinking to graph functions involving a sequence of transformations.
Combine functions specifying domains.
Form composite functions and determine the domain.
Write functions as compositions.
Use the graph of a one-to-one function to graph its inverse.
Find the inverse of a function and graph both functions on the same axes.
Determine the center and radius of a circle and graph the circle.
Recognize characteristics of parabolas.
Graph parabolas. Determine a quadratic
function’s minimum or maximum value.
Daily and weekly formative assessments Unit assessments One project embedded within the nine weeks

4
F-IF.2 Identify or analyze the distinguishing properties of exponential, polynomial, logarithmic, trigonometric, and rational functions from tables, graphs, and equations. N-CN.7 Know the Fundamental Theorem of Algebra; show that it is true for quadratic polynomials. F-IF.3 Identify the real zeros of a function and explain the relationship between the real zeros and the x-intercepts of the graph of a function (polynomial, rational, exponential, logarithmic, and trigonometric) F-IF.6 Graph rational functions, identifying zeros, asymptotes (including slant), and holes when suitable factorizations are available, and showing end-behavior. A-REI.3 Solve nonlinear inequalities (quadratic, trigonometric, conic, exponential, logarithmic, and rational) by graphing (solutions in interval notation if one-variable), by hand and with appropriate technology. F-BF.5 Find inverse functions (including exponential, trigonometric, and logarithmic) N-NE.2 Understand the inverse relationship between exponents and logarithms and use this relationship to solve problems involving logarithms and exponents. S-MD.1 Create scatter plots, analyze patterns and describe relationships for bivariate data (linear, polynomial, trigonometric or exponential) to model real-world phenomena and to make predictions. A-C.2 From an equation in standard form, graph the appropriate conic section: ellipses, hyperbolas, circles, and parabolas. IF.4 Identify characteristics of graphs based on a set of conditions or on a general equation such as y =ax^2+c. F-If.7 Solve real world problems that can be modeled using quadratic, exponential, or logarithmic functions (by hand and with appropriate technology). F-IF.2 Identify or analyze the distinguishing properties of exponential, polynomial, logarithmic, trigonometric, and rational functions from tables, graphs, and equations.
Solve problems involving a quadratic function’s minimum or maximum value.
Identify and recognize characteristic of graphs of polynomial functions.
Identify zeros and their multiplicities.
Understand the relationship between degree and turning points.
Graph polynomial functions.
Use long division and synthetic division to divide polynomials.
Use the Remainder and Factor Theorems.
Find the domains of rational functions.
Identify vertical and horizontal asymptotes.
Solve polynomial and rational inequalities with applications.
Evaluate and graph exponential functions
Change to and from exponential to logarithmic form
Use basic logarithmic properties
Graph logarithmic functions
Use common and natural logarithmic

5
N-CN.7 Know the Fundamental Theorem of Algebra; show that it is true for quadratic polynomials. F-IF.3 Identify the real zeros of a function and explain the relationship between the real zeros and the x-intercepts of the graph of a function (polynomial, rational, exponential, logarithmic, and trigonometric). S-MD.1 Create scatter plots, analyze patterns and describe relationships for bivariate data (linear, polynomial, trigonometric or exponential) to model real-world phenomena and to make predictions.
Solve exponential and logarithmic functions and growth and decay
3rd 9 weeks Standards Objectives Major Assignments A-C.1 Display all of the conic sections as portions of a cone. A-C.2 From an equation in standard form, graph the appropriate conic section: ellipses, hyperbolas, circles, and parabolas. A-C.3 Transform equations of conic sections to convert between general and standard form. A-REI.4 Solve systems of nonlinear inequalities by graphing. G-AT.3 Derive and apply the formulas for the area of a sector of a circle. G-AT.4 Calculate the arc length of a circle subtended by a central angle. F-TF.1 Convert from radians to degrees and from degrees to radians.
The learners will
Graph ellipses centered at the origin
Writing equation of ellipses in standard form
Graph ellipses not centered at the origin
Solve applied problems involving ellipses
Locate a hyperbola’s vertices and foci
Write equations of hyperbolas in standard form
Solve applied problems involving hyperbolas
Write equations of parabolas in standard form
Graph parabolas with vertices at or not at the origin
Decide whether an ordered pair is
Daily and weekly formative assessments Unit assessments One project embedded within the nine weeks
6
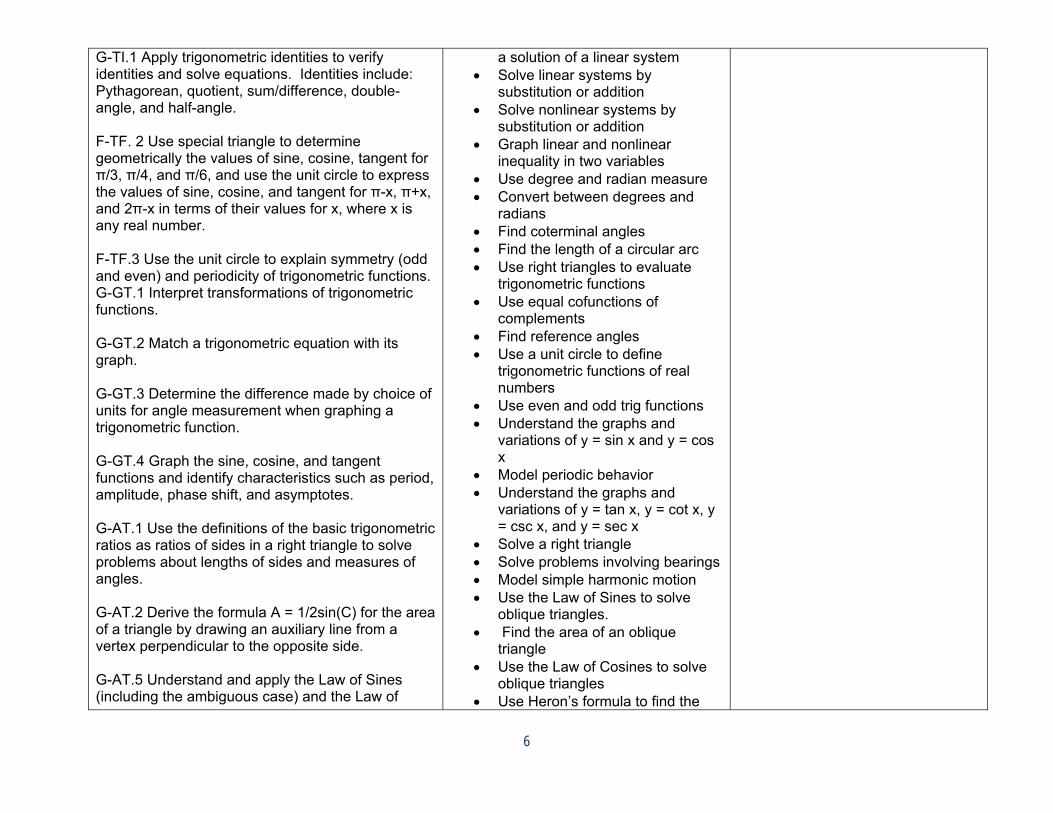
G-TI.1 Apply trigonometric identities to verify identities and solve equations. Identities include: Pythagorean, quotient, sum/difference, double-angle, and half-angle. F-TF. 2 Use special triangle to determine geometrically the values of sine, cosine, tangent for π/3, π/4, and π/6, and use the unit circle to express the values of sine, cosine, and tangent for π-x, π+x, and 2π-x in terms of their values for x, where x is any real number. F-TF.3 Use the unit circle to explain symmetry (odd and even) and periodicity of trigonometric functions. G-GT.1 Interpret transformations of trigonometric functions. G-GT.2 Match a trigonometric equation with its graph. G-GT.3 Determine the difference made by choice of units for angle measurement when graphing a trigonometric function. G-GT.4 Graph the sine, cosine, and tangent functions and identify characteristics such as period, amplitude, phase shift, and asymptotes. G-AT.1 Use the definitions of the basic trigonometric ratios as ratios of sides in a right triangle to solve problems about lengths of sides and measures of angles. G-AT.2 Derive the formula A = 1/2sin(C) for the area of a triangle by drawing an auxiliary line from a vertex perpendicular to the opposite side. G-AT.5 Understand and apply the Law of Sines (including the ambiguous case) and the Law of
a solution of a linear system Solve linear systems by
substitution or addition Solve nonlinear systems by
substitution or addition Graph linear and nonlinear
inequality in two variables Use degree and radian measure Convert between degrees and
radians Find coterminal angles Find the length of a circular arc Use right triangles to evaluate
trigonometric functions Use equal cofunctions of
complements Find reference angles Use a unit circle to define
trigonometric functions of real numbers
Use even and odd trig functions Understand the graphs and
variations of y = sin x and y = cos x
Model periodic behavior Understand the graphs and
variations of y = tan x, y = cot x, y = csc x, and y = sec x
Solve a right triangle Solve problems involving bearings Model simple harmonic motion Use the Law of Sines to solve
oblique triangles. Find the area of an oblique
triangle Use the Law of Cosines to solve
oblique triangles Use Heron’s formula to find the

7
Cosines to find unknown measurements in right and non-right triangles (e.g., surveying problems, resultant forces). N-CN.3 Represent complex numbers on the complex plane in rectangular and polar form(including real and imaginary numbers), and explain why the rectangular and polar forms of a given complex number represent the same number. N-CN.4 Represent addition, subtraction, multiplication, and conjugation of complex numbers geometrically on the complex plane; use properties of this representation for computation. N-CN.5 Calculate the distance between numbers in the complex plane as the modulus of the difference, and the midpoint of a segment as the average of the numbers at its endpoints.
area of a triangle Find the absolute value of a
complex number Write complex numbers in polar
form Find products, quotients, powers,
and roots of complex numbers in polar form

8
4th 9 weeks Standards Objectives Major Assignments N-VM. 1 Recognize vector quantities as having both magnitude and direction. Represent vector quantities by directed line segments, and use appropriate symbols for vectors and their magnitudes (e.g., v, lvl, llvll, v). N-VM.2 Find the components of a vector by subtracting the coordinates of an initial point from the coordinates of a terminal point. N-VM.3 Solve problems involving velocity and other quantities that can be represented by vectors. N-VM.4 Add and subtract vectors. a. Add vectors end-to-end, component-wise, and by the parallelogram rule. Understand that the magnitude of a sum of two vectors is typically not the sum of the magnitudes. Given two vectors in magnitude and direction form, determine the magnitude and direction of their sum. Understand vector subtraction v - w as v+ (-w), where -w is the additive inverse of w, with the same magnitude as w and pointing in the opposite direction. Represent vector subtraction graphically by connecting the tips in the appropriate order, and perform vector subtraction component-wise. N-VM.5 Multiply a vector by a scalar. a. Represent scalar multiplication graphically by scaling vectors and possibly reversing their direction; perform scalar multiplication component-wise, e.g., as Compute the magnitude of a scalar multiple cv using llcvll = lclv. Compute the direction of cv knowing that when lclv≠ 0, the direction of cv is either along v (for c> 0) or against v (for c < 0).
The learners will
Use magnitude and direction to show vectors are equal
Perform operations with vectors in terms of I and j
Find the unit vector in the direction of v
Write a vector in terms of its magnitude and direction
Find the dot product of two vectors Find the angle between two
vectors Find the projection of a vector
onto another vector Write the augmented matrix for a
linear system Perform matrix row operations Use matrices and Gaussian
elimination to solve systems Apply Gaussian elimination to
systems without unique solutions Apply Gaussian elimination to
systems with more variables in the equations
Use matrix notation Add and subtract matrices Perform scalar multiplication Solve matrix equations Multiply matrices Find multiplicative inverse of a
square matrix Use inverses to solve matrix
equations Encode and decode messages
Daily and weekly formative assessments Unit assessments One project embedded within the nine weeks

9
N-V.6 Calculate and interpret the dot product of two vectors. A-REI.1 Represent a system of linear equations as a single matrix equation in a vector variable. N-VM.7 Use matrices to represent and manipulate data, e.g., to represent payoffs or incidence relationships in a network. N-VM.8 Multiply matrices by scalars to produce new matrices, e.g., as when all of the payoffs in a game are doubled. N-VM.9 Add, subtract, and multiply matrices of appropriate dimensions. N-VM.10 Understand that, unlike multiplication of numbers, matrix multiplication for square matrices is not a commutative operation, but still satisfies the associative and distributive properties. N-VM.11 Understand that the zero and identity matrices play a role in matrix addition and multiplication similar to the role of 0 and 1 in the real numbers. The determinant of a square matrix is nonzero if and only if the matrix has a multiplicative inverse. N-VM.12 Multiply a vector (regarded as a matrix with one column by a matrix of suitable dimensions to produce another vector. Work with matrices as transformations of vectors. A-REI.2 Find the inverse of a matrix if it exists and use it to solve systems of linear equations (using technology for matrices of dimension 3x3 or greater).
Evaluate a second-order determinant
Evaluate a third-order determinant Evaluate higher-order
determinants Find particular terms of a
sequence from the general term Use recursion formulas, factorial
notation, and summation notation Write an arithmetic sequence Write a geometric sequence Find the value of an annuity Evaluate a binomial coefficient Expand a binomial raised to a
power Find a particular term in a binomial
expansion

10
N-VM.13 Work with 2x2 matrices as transformations of the plane, and interpret the absolute value of the determinant in terms of area. A-S.1 Demonstrate an understanding of sequences by representing them recursively and explicity. A-S.2 Use sigma notation to represent a series; expand and collect expressions in both finite and infinite settings. A-S.3 Derive and use the formulas for the general term and summation of finite or infinite arithmetic and geometric series, if they exist. a. Determine whether a given arithmetic series converges or diverges. b. Find the sum of a given geometric series (both infinite and finite). c. Find the sum of a finite arithmetic series. A-S.4 Understand that series represent the approximation of a number when truncated; estimate truncation error in specific examples. A-S.5 Know and apply the Binomial Theorem for the expansion of powers of x and y for a positive integer n, where x and y are any numbers, with coefficients determined for example by Pascal's Triangle.

1
Dickson County Schools Algebra I Syllabus
Unit 1/ Linear Equations (1st 9 weeks) Standards Objectives Major Assignments A-REI.A.1 Explain each step in solving a simple equation as following from the equality of numbers asserted at the previous step, starting from the assumption that the original equation has a solution. Construct a viable argument to justify a solution method. *N-Q.A.1 Use units as a way to understand problems and to guide the solution of multi-step problems; choose and interpret units consistently in formulas; choose and interpret the scale and the origin in graphs and data displays. *N-Q.A.2 Define appropriate quantities for the purpose of descriptive modeling. *N-Q.A.3 Choose a level of accuracy appropriate to limitations on measurement when reporting quantities. *A-SSE.1ab Interpret expressions that represent a quantity in terms of its context.★ a. Interpret parts of an expression, such as terms, factors, and coefficients. b. Interpret complicated expressions by viewing one or more of their parts as a single entity. A-CED.A.1 Create equations and inequalities in one variable and use them to solve problems. A-REI.B.3
The learner will
- Describe the form, direction, strength, and outliers of an association using mathematical terms. - Measure and collect data, selecting appropriate units and degrees of precision for a given situation - Justify answers to problems using tables, graphs, formulas, and equations. - Make predictions based on linear models and interpret slope and y-intercept in context - Make connections between solving equations, graphing, and manipulating expressions. - Recognize whether given quantities are discrete or continuous. - Determine if solution is appropriate for situation. - Describe data and relationships from various representations. - Recognize trends in data and make predictions in relation to context with an understanding - Describe the precision of a measurement tool. - Identify the parts of any expression as terms, factors, coefficients, exponents, quotients, divisors, dividends, remainders, and constants - Determining the real-world context of the variables, factors, or terms in an expression. - Write formulas using two or more variables. - Construct and solve linear and exponential equations in one variable given real-world situations.
Daily formative assessments Weekly lesson quizzes End of unit assessment

2
Solve linear equations and inequalities in one variable, including equations with coefficients represented by letters. A-CED.A.4 Rearrange formulas to highlight a quantity of interest, using the same reasoning as in solving equations.
-understand how to build an equation or inequality from a mathematical situation -Solve literal equations using the same processes used in solving numerical equations -Justify the steps in solving equations by applying and explaining the properties of equality, inverse and identity -Find and analyze mistakes in work samples. -Share different ways of solving equations that lead to the same solution. -realize equations can have multiple solutions or no solutions. -Build an equation from a mathematical situation
Unit 3/ Linear Equations (1st 9 weeks)
Standards Objectives Major Assignments *F-LE.A.1ab
Distinguish between situations that can be modeled with linear functions and with exponential functions.
a. Prove that linear functions grow by equal differences over equal intervals,
b. Recognize situations in which one quantity changes at a constant rate per unit interval relative to another.
*F-IF.C.7a
Graph functions expressed symbolically and show key features of the graph, by hand in simple cases and using technology for more complicated cases.
a. Graph linear functions and show intercepts, maxima, and minima.
*F-LE.B.5 Interpret the parameters in a linear function in terms of a context.
A-REI.D.10 Understand that the graph of an equation in
The learner will - Build equations from mathematical situations - Graph one or more created equations on a coordinate axes with appropriate labels and scales. - Write equations from given graph, table, or situation. - understand that constraints are necessary to balance a mathematical model with real-world context. - decipher when a problem should be represented by an equation, inequality, systems of equations and/or inequalities -Write equations of line given slope and y-intercept, two points, or slope and a point. -Identify different graphs as belonging to the same family of graphs -Find the intersection points of two graphs and understand its meaning -Calculate the slope between two points -Calculate the rate of change when presented
Daily formative assessments Weekly lesson quizzes End of unit assessment

3
two variables is the set of all its solutions plotted in the coordinate plane, often forming a curve (which could be a line).
*F-IF.B.6
Calculate and interpret the average rate of change of a function (presented symbolically or as a table) over a specified interval. Estimate the rate of change from a graph. A-CED.A.2
Create equations in two or more variables to represent relationships between quantities; graph equations on coordinate axes with labels and scales. A-REI.D.10
Understand that the graph of an equation in two variables is the set of all its solutions plotted in the coordinate plane, often forming a curve (which could be a line).
F-IF.C.9
Compare properties of two functions each represented in a different way (algebraically, graphically, numerically in tables, or by verbal descriptions). A-CED.A.3 Represent constraints by equations and interpret solutions as viable or nonviable options in a modeling context. A.REI.D.12 Graph the solutions to a linear inequality in two variables as a half-plane (excluding the boundary in the case of a strict inequality), and graph the solution set to a system of linear inequalities in two variables as the intersection of the corresponding half-planes.
as an equation or table -Distinguish between situations that model linear and exponential functions. -Create and graph linear, quadratic, and exponential functions - Describe a parabola, using its intercepts, minima, and maxima - Graph quadratic equations using vertex form. - Express functions using multiple representations and compare the properties for quadratic functions. (e.g. equation, table of values, graph, or mathematical situation) - Model quadratic functions in real-world context - Calculate simple interest - Generalize the roles of a and b for the equation y = a ( )

4
Unit 5/ Inequalities and Systems (2rd 9 weeks) Standards Objectives Major Assignments *A-REI.D.11 Explain why the x-coordinates of the points where the graphs of the equations y = f(x) and y = g(x) intersect are the solutions of the equation f(x) = g(x); find the solutions approximately, e.g., using technology to graph the functions, make tables of values, or find successive approximations. Include cases where f(x) and/or g(x) are linear, polynomial, rational, absolute value, exponential, and logarithmic functions. A-REI.C.5 Prove that, given a system of two equations in two variables, replacing one equation by the sum of that equation and a multiple of the other produces a system with the same solutions. A-REI.C.6 Solve systems of linear equations exactly and approximately (e.g., with graphs), focusing on pairs of linear equations in two variables. A-CED.A.3 Represent constraints by equations or inequalities, and by systems of equations and/or inequalities, and interpret solutions as viable or nonviable options in a modeling context. For example, represent inequalities describing nutritional and cost constraints on combinations of different foods. A-REI.D.12 Graph the solutions to a linear inequality in two variables as a half-plane (excluding the boundary in the case of a strict inequality), and graph the solution set to a system of linear inequalities in two variables as the intersection of the corresponding half-planes. F-LE.B.5 Interpret the parameters in a linear or exponential function in terms of a context
The learner will -understand that constraints are necessary to balance a mathematical model with real-world context. - decipher when a problem should be represented by an equation, inequality, systems of equations and/or inequalities -Write and solve real-world and mathematical situation problems for systems of equations -Determine the best method for solving systems of equations. -Determine whether a system of linear equations has no, one, or infinitely many solutions -Discuss misconceptions and assumptions associated with the standard screen view when using graphing technology to graph systems of equations and approximating intersection points. -Solve system of equations when one or both equations is/are not linear -Graph constraints using systems of inequalities -Use a system of inequalities to create a graph of a feasible region and then analyze different scenarios based on the feasible region. - Graph quadratic equations using vertex form. - Describe a parabola, using its intercepts, minima, and maxima - Describe a parabola, using its intercepts, minima, maxima, vertex, symmetry, and whether it is positively or negatively oriented - Factor polynomials completely using various factoring techniques. - Use graphing technology to explore transformations of functions. -describe the meaning and effects that the
Daily formative assessments Weekly lesson quizzes End of unit assessment

5
*F-IF.C.7b Graph functions expressed symbolically and show key features of the graph, by hand in simple cases and using technology for more complicated cases.★ Graph square root, cube root, and piecewise-defined functions, including step functions and absolute value functions. Identify the effect on the graph of replacing f(x) by f(x) + k, k f(x), f(kx), and f(x + k) for specific values of k (both positive and negative); find the value of k given the graphs. Experiment with cases and illustrate an explanation of the effects on the graph using technology. *A-REI.D.11 Explain why the x-coordinates of the points where the graphs of the equations y = f(x) and y = g(x) intersect are the solutions of the equation f(x) = g(x); find the solutions approximately, e.g., using technology to graph the functions, make tables of values, or find successive approximations. Include cases where f(x) and/or g(x) are linear, polynomial, rational, absolute value, exponential, and logarithmic functions.★ F-LE.B.5 Interpret the parameters in a linear or exponential function in terms of a context. *F-IF.B.4 For a function that models a relationship between two quantities, interpret key features of graphs and tables in terms of the quantities, and sketch graphs showing key features given a verbal description of the relationship. Key features include: intercepts; intervals where the function is increasing, decreasing, positive, or negative; relative maximums and minimums; symmetries; end behavior; and periodicity.★ F-IF.C.9 Compare properties of two functions each represented in a different way (algebraically, graphically, numerically in tables, or by verbal descriptions).
coefficients, factors, exponents, and/or intercepts in a linear and exponential function have when describing the attributes of graphs. - Generalize the roles of a and b for the equation y = a ( ) - Calculate simple interest

6
Unit 6/ Rational/Irrational and Sequences (2nd 9 weeks) Standards Objectives Major Assignments N-RN.B.3 Explain why the sum or product of two rational numbers is rational; that the sum of a rational number and an irrational number is irrational; and that the product of a non-zero rational number and an irrational number is irrational. F-LE.A.2 Construct linear and exponential functions, including arithmetic and geometric sequences, given a graph, a description of a relationship, or two input-output pairs (include reading these from a table). *F-BF.A.1a Write a function that describes a relationship between two quantities.★ a. Determine an explicit expression, a recursive process, or steps for calculation from a context. F-IF.A.2 Use function notation, evaluate functions for inputs in their domains, and interpret statements that use function notation in terms of a context. A.SSE.B.3c Choose and produce an equivalent form of an expression to reveal and explain properties of the quantity represented by the expression.★ c. Use the properties of exponents to transform expressions for exponential functions. *F-LE.A.1abc Distinguish between situations that can be modeled with linear functions and with exponential functions. a. Prove that linear functions grow by equal differences over equal intervals, and that exponential functions grow by equal factors over equal intervals. b. Recognize situations in which one quantity changes at a constant rate per unit interval relative to another. c. Recognize situations in which a quantity grows or decays by a constant percent rate per unit interval relative to another.
The learner will - Simplify and solve expressions involving radicals and rational exponents. - Extend the properties of integer exponents to rational exponents - Explain why rational numbers are closed under addition and multiplication. - Factor expressions completely using various factoring skills. -Interpret key features of functions -Use set and interval notation to represent domain -Write exponential functions from graphs, tables, and mathematical and real-world situations recursively and with an explicit formula -Make conjectures about equations, tables, and graphs of linear and exponential functions. -Construct linear and exponential function given a graph, a description of a relationship, and two input-output pairs. -Write rules for arithmetic and geometric sequences that model real world problems and mathematical situations. - Explain and justify why a quantity increasing exponentially will eventually exceed a quantity increasing linearly - Recognize and interpret characteristics of graphs of exponential functions - Write a relation in function notation.
Daily formative assessments Weekly lesson quizzes End of unit assessment

7
F-IF.B.5 Relate the domain of a function to its graph and, where applicable, to the quantitative relationship it describes. F.LE.A.3 Observe using graphs and tables that a quantity increasing exponentially eventually exceeds a quantity increasing linearly, quadratically, or (more generally) as a polynomial function.
Unit 2/ Linear Function Notation (3rd 9 weeks) Standards Objectives Major Assignments *F-IF.B.4 For a function that models a relationship between two quantities, interpret key features of graphs and tables in terms of the quantities, and sketch graphs showing key features given a verbal description of the relationship. . *F-IF.A.1 Understand that a function from one set (called the domain) to another set (called the range) assigns to each element of the domain exactly one element of the range. If f is a function and x is an element of its domain, then f(x) denotes the output of f corresponding to the input x. The graph of f is the graph of the equation y = f(x). F-IF.A.2 Use function notation, evaluate functions for inputs in their domains, and interpret statements that use function notation in terms of a context. F-IF.A.3 Recognize that sequences are functions, sometimes defined recursively, whose domain is a subset of the integers. F-LE.A.2 Construct linear and exponential functions, including arithmetic and geometric sequences, given a graph, a description of a relationship, or two input-output pairs
The learner will -Use the definition of a function to determine whether a relationship is a function given a table -Find a rule to describe a set of input and output values. -Write a relation in function notation -Use function notation to express relationships between contextual variables. -Determine whether a table represents a linear function -Describe a parabola, using its intercepts, minima, maxima, vertex, symmetry, and whether it is positively or negatively oriented -Use key features of a function to sketch a graph -Determine whether a relationship is a function based on its description, graph, or table of values -Compare graphs of functions and equations. - Construct linear and exponential functions given a graph, description of relationship, and two input-output pairs. - Write rules for arithmetic and geometric sequences that model real world problems and mathematical situations.
Daily formative assessments Weekly lesson quizzes End of unit assessment

8
(include reading these from a table). *F-BF.A.1a Write a function that describes a relationship between two quantities. a. Determine an explicit expression, a recursive process, or steps for calculation from a context.
Unit 7/ Polynomials (3rd 9 weeks) Standards Objectives Major Assignments A-SSE.A.1ab Interpret expressions that represent a quantity in terms of its context. a. Interpret parts of an expression, such as terms, factors, and coefficients. b. Interpret complicated expressions by viewing one or more of their parts as a single entity. A-SSE.A.2 Use the structure of an expression to identify ways to rewrite it. For example, see - as (x²)² - (y²)², thus recognizing it as a difference of squares that can be factored as (x² – y²)(x² + y²). A-APR.A.1 Understand that polynomials form a system analogous to the integers, namely, they are closed under the operations of addition, subtraction, and multiplication; add, subtract, and multiply polynomials. A-APR.A.1 Understand that polynomials form a system analogous to the integers, namely, they are closed under the operations of addition, subtraction, and multiplication; add, subtract, and multiply polynomials.
The learner will - Factor polynomials. - Rearrange terms to rewrite an equivalent expression. - Write expressions in equivalent forms by factoring. - Add and subtract polynomials - Multiply polynomials using multiple methods -understand the mathematical meaning of the following words: factors, coefficients, terms, exponent, base, constant, and variable. -identify the parts of any expression as terms, factors, coefficients, exponents, quotients, divisors, dividends
Daily formative assessments Weekly lesson quizzes End of unit assessment

9
Unit 8/ Quadratics (3rd 9 weeks) Standards Objectives Major Assignments F-IF.A.2
Use function notation, evaluate functions for inputs in their domains, and interpret statements that use function notation in terms of a context.
*F-IF.B.4
For a function that models a relationship between two quantities, interpret key features of graphs and tables in terms of the quantities, and sketch graphs showing key features given a verbal description of the relationship. Key features include: intercepts; intervals where the function is increasing, decreasing, positive, or negative; relative maximums and minimums; symmetries; end behavior; and periodicity.★
*F-IF.C.7a
Graph functions expressed symbolically and show key features of the graph, by hand in simple cases and using technology for more complicated cases.★ Graph linear and quadratic functions and show intercepts, maxima, and minima
F-IF.C.8
Write a function defined by an expression in different but equivalent forms to reveal and explain different properties of the function.
F-BF.B.3
Identify the effect on the graph of replacing f(x) by f(x) + k, k f(x), f(kx), and f(x + k) for specific values of k (both positive and negative); find the value of k given the graphs. Experiment with cases and illustrate an explanation of the effects on the graph using technology.
The learner will - Use the zeros to construct a rough graph of the function defined by the polynomial. - understand how factors, zeros and x-intercepts of a polynomial function are related. - understand why each factor is set to equal zero -Identify the y-intercept, zeros and vertex of a quadratic function and use that to create a rough sketch of the function -notice what different forms for writing quadratics reveal about the function -Describe a parabola, using its intercepts, minima, and maxima -Distinguish between linear and quadratic equations based on equations, tables, graphs and verbal descriptions -Graph quadratic equations using vertex form -Compare properties of quadratic functions from multiple representations. -Model real world problems using quadratic functions Write a relation in function notation - Describe a parabola, using its intercepts, minima, maxima, vertex, symmetry, and whether it is positively or negatively oriented - Distinguish between linear and quadratic equations based on equations, tables, graphs and verbal descriptions - Use graphing technology to explore transformations of functions. - The meaning and effects that the coefficients, factors, exponents, and/or intercepts in a linear and exponential function have when describing the attributes of graphs. - Use factoring to solve equations - Factor expressions completely using various factoring skills -Use intersections of functions to find
Daily formative assessments Weekly lesson quizzes End of unit assessment

10
A-APR.B.3
Identify zeros of polynomials when suitable factorizations are available, and use the zeros to construct a rough graph of the function defined by the polynomial. *F-IF.C.7a
Graph functions expressed symbolically and show key features of the graph, by hand in simple cases and using technology for more complicated cases.★ Graph linear and quadratic functions and show intercepts, maxima, and minima. *A-SSE-B.3
Choose and produce an equivalent form of an expression to reveal and explain properties of the quantity represented by the expression.
A-APR.A.1
Understand that polynomials form a system analogous to the integers, namely, they are closed under the operations of addition, subtraction, and multiplication; add, subtract, and multiply polynomials.
A-REI.B.4
Solve quadratic equations in one variable.
*A-REI.D.11 Explain why the x-coordinates of the points where the graphs of the equations y = f(x) and y = g(x) intersect are the solutions of the equation f(x) = g(x); find the solutions approximately, e.g., using technology to graph the functions, make tables of values, or find successive approximations. Include cases where f(x) and/or g(x) are linear, polynomial, rational, absolute value, exponential, and logarithmic functions.★
solutions to the related single-variable equations

11
Unit 4/ Statistics and Probability (4th 9 weeks) Standards Objectives Major Assignments S-ID.B.5 Summarize categorical data for two categories in two-way frequency tables. Interpret relative frequencies in the context of the data (including joint, marginal, and conditional relative frequencies). Recognize possible associations and trends in the data. S-ID.A.1 Represent data with plots on the real number line (dot plots, histograms, and box plots). S-ID.A.2 Use statistics appropriate to the shape of the data distribution to compare center (median, mean) and spread (interquartile range, standard deviation) of two or more different data sets. S-ID.A.3 Interpret differences in shape, center, and spread in the context of the data sets, accounting for possible effects of extreme data points (outliers). N-Q.A.1 Use units as a way to understand problems and to guide the solution of multi-step problems; choose and interpret units consistently in formulas; choose and interpret the scale and the origin in graphs and data displays. S-ID.B.6ac Represent data on two quantitative variables on a scatter plot, and describe how the variables are related. Fit a function to the data; use functions fitted to data to solve problems in the context of the data. Informally assess the fit of a function by plotting and analyzing residuals Fit a linear function for a scatter plot that suggests a
The learner will -Use graphing technology to explore transformations of functions -Perform transformation on quadratic and absolute value functions with and without technology. -determine the meaning and effects that the coefficients, factors, exponents, and/or intercepts in a linear and exponential function have when describing the attributes of graphs. - Construct dot plots, histograms and box-and-whisker plots for data on real number lines - Analyze data and compare data in different data sets. - Identify outliers and their effects on data sets. - Compare two or more different data set using the center and spread of each - Identify a data set by its shape and describe the data set as symmetric, skewed, flat, or bell-shaped - Organize multiple sets of data for comparison and articulates similarities and differences - Create and summarize a twoway frequency table for a set of categorical data - The difference between quantitative data vs. categorical data. - Create a scatter plot from two quantitative variables and analyze possible associations between two variables. - Explain the meaning of slope, yintercept, the constant and coefficients, in terms of the context of the data - Write equations of best-fit lines using linear
Daily formative assessments Weekly lesson quizzes End of unit assessment

12
linear association. S-ID.C.7 Interpret the slope (rate of change) and the intercept (constant term) of a linear model in the context of the data. S-ID.C.8 Compute (using technology) and interpret the correlation coefficient of a linear fit. S-ID.C.9 Distinguish between correlation and causation. b. Graph square root, cube root, and piecewise-defined functions, including step functions and absolute value functions. F-BF.B.3 Identify the effect on the graph of replacing f(x) by f(x) + k, k f(x), f(kx), and f(x + k) for specific values of k (both positive and negative); find the value of k given the graphs. Experiment with cases and illustrate an explanation of the effects on the graph using technology. *F-IF.B.4 For a function that models a relationship between two quantities, interpret key features of graphs and tables in terms of the quantities, and sketch graphs showing key features given a verbal description of the relationship.
regression - Calculate and interpret the correlation coefficient for linear regression models. - Fit a linear function (trend line) to a scatter plot with and without technology - Determine whether the graph shows a positive, negative, or no correlation - Describe the form, strength, and direction of the relationship. - Solve problems that involve interpreting slope as a rate of change. - Calculate the correlation coefficient of a linear fit using technology - Correlation does not imply causation - Distinguish linear, quadratic and exponential equations based on equations, tables, graphs and verbal descriptions - Use key features of a function to sketch a graph.
Unit 9/ Factoring (4th 9 weeks) Standards Objectives Major Assignments *A-SSE-B.3 Choose and produce an equivalent form of an expression to reveal and explain properties of the quantity represented by the expression. Factor a quadratic expression to reveal the zeros of the function it defines. A-REI.B.4 Solve quadratic equations in one variable. Solve quadratic equations by inspection (e.g., for x2 = 49), taking square roots, completing
The learner will - Use factoring to solve equations. - Explain and justify the relationship between the factorization of a quadratic expression and the solutions of a quadratic equation. - Factor expressions completely using various factoring skills. -Identify the y-intercept, zeros and vertex of a quadratic function and use that to create a rough sketch of the function. -identify what different forms for writing
Daily formative assessments Weekly lesson quizzes End of unit assessment

13
the square, the quadratic formula and factoring, as appropriate to the initial form of the equation. Recognize when the quadratic formula gives complex solutions and write them as a ± bi for real numbers a and b. A-REI.B.4ab Solve quadratic equations in one variable. a. Use the method of completing the square to transform any quadratic equation in x into an equation of the form (x – p)2 = q that has the same solutions. Derive the quadratic formula from this form. b. Solve quadratic equations by inspection (e.g., for x2 = 49), taking square roots, completing the square, the quadratic formula and factoring, as appropriate to the initial form of the equation. Recognize when the quadratic formula gives complex solutions and write them as a ± bi for real numbers a and b. *A-SSE.B.3b Choose and produce an equivalent form of an expression to reveal and explain properties of the quantity represented by the expression.★ Complete the square in a quadratic expression to reveal the maximum or minimum value of the function it defines. F-IF.C.8a Write a function defined by an expression in different but equivalent forms to reveal and explain different properties of the function. Use the process of factoring and completing the square in a quadratic function to show zeros, extreme values, and symmetry of the graph, and interpret these in terms of a context. A-CED.A.2 Create equations in two or more variables to represent relationships between quantities; graph equations on coordinate axes with labels
quadratics reveal about the function -identify where on a graph you can find the solutions, zeros, roots, or x-intercepts of a quadratic function. - explain how the slope of a graph relates to a rate of change - Calculate the slope between two points. - Recognize a linear function when analyzing a table, graph, or equation. - When the rate of change is not constant, the function cannot be linear - How and why you can use exponential functions in real world applications - Describe the differences between the rates of change of a linear function vs. an exponential function - Use factoring to solve equations - Factor expressions completely using various factoring skills
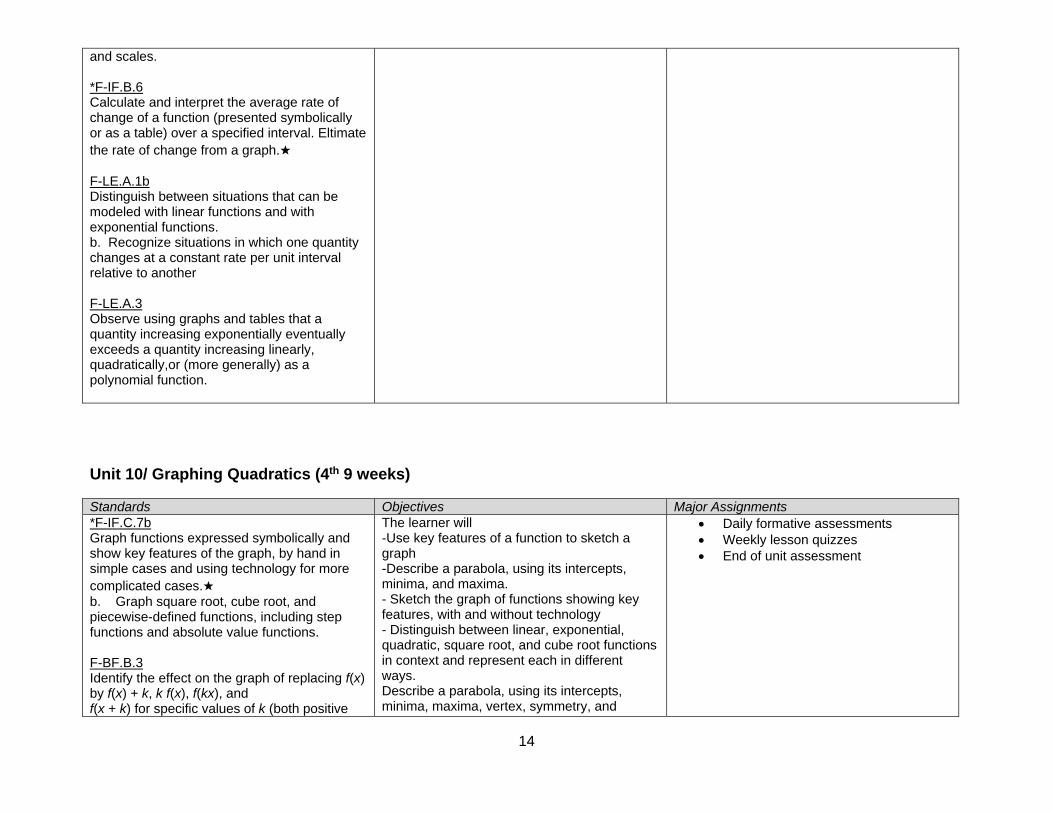
14
and scales. *F-IF.B.6 Calculate and interpret the average rate of change of a function (presented symbolically or as a table) over a specified interval. Eltimate the rate of change from a graph.★ F-LE.A.1b Distinguish between situations that can be modeled with linear functions and with exponential functions. b. Recognize situations in which one quantity changes at a constant rate per unit interval relative to another F-LE.A.3 Observe using graphs and tables that a quantity increasing exponentially eventually exceeds a quantity increasing linearly, quadratically,or (more generally) as a polynomial function. Unit 10/ Graphing Quadratics (4th 9 weeks) Standards Objectives Major Assignments *F-IF.C.7b Graph functions expressed symbolically and show key features of the graph, by hand in simple cases and using technology for more complicated cases.★ b. Graph square root, cube root, and piecewise-defined functions, including step functions and absolute value functions. F-BF.B.3 Identify the effect on the graph of replacing f(x) by f(x) + k, k f(x), f(kx), and f(x + k) for specific values of k (both positive
The learner will -Use key features of a function to sketch a graph -Describe a parabola, using its intercepts, minima, and maxima. - Sketch the graph of functions showing key features, with and without technology - Distinguish between linear, exponential, quadratic, square root, and cube root functions in context and represent each in different ways. Describe a parabola, using its intercepts, minima, maxima, vertex, symmetry, and
Daily formative assessments Weekly lesson quizzes End of unit assessment

15
and negative); find the value of k given the graphs. Experiment with cases and illustrate an explanation of the effects on the graph using technology. *F-IF.B.4 For a function that models a relationship between two quantities, interpret key features of graphs and tables in terms of the quantities, and sketch graphs showing key features given a verbal description of the relationship.
whether it is positively or negatively oriented - Use graphing technology to explore transformations of functions. - The meaning and effects that the coefficients, factors, exponents, and/or intercepts in a linear and exponential function have when describing the attributes of graphs.

1
Dickson County Syllabus Algebra 2: 1st Semester
Unit 1: Functions 1st Nine Weeks Standards Objectives Major Assignments *F-IF.B.4 For a function that models a relationship between two quantities, interpret key features of graphs and tables in terms of the quantities, and sketch graphs showing key features given a verbal description of the relationship. Key features include: intercepts; intervals where the function is increasing, decreasing, positive, or negative; relative maximums and minimums; symmetries; end behavior; and periodicity.★ *F-IF.B.6 Calculate and interpret the average rate of change of a function (presented symbolically or as a table) over a specified interval. Estimate the rate of change from a graph. ★ *A-REI.D.11 Explain why the x-coordinates of the points where the graphs of the equations y = f(x) and y = g(x) intersect are the solutions of the equation f(x) = g(x); find the solutions approximately, e.g., using technology to graph the functions, make tables of values, or find successive approximations. Include cases where f(x) and/or g(x) are linear, polynomial, rational, absolute value, exponential, and logarithmic functions.★
The students will be able to view graphs as relationships between quantities and identify the following when given a graph: o Vertex o Maximum or minimum o Axis of symmetry o Domain and range of quadratic functions o Intercepts o Increasing and decreasing intervals o Relative maximums and minimums o End behavior
The students will be able to calculate and estimate the rate of change from a graph.
The students will be able to understand that the intersection of two equations is the solution to the system of equations. Include cases where the functions are linear, polynomial, rational, absolute value, exponential, and logarithmic functions. The students will be able to find the intersection of any two functions using graphing technology.
The students will be assessed with daily/weekly formative assessments, a summative assessment at the end of each unit and a midterm exam.
F-IF.C.9 Compare properties of two functions each represented in a different way (algebraically, graphically, numerically in tables, or by verbal descriptions). For example, given a graph of one quadratic function and an algebraic expression for another, say which has the larger
The students will be able to compare

2
maximum. *A-CED.A.1 Create equations and inequalities in one variable and use them to solve problems. Include equations arising from linear and quadratic functions, and simple rational and exponential functions. Scope and Clarification: Tasks are limited to exponential equations with rational or real exponents and rational functions
properties of two function when represented in different ways. The students will be able to can review solving absolute value equations and inequalities.
F-BF.B.3 Identify the effect on the graph of replacing f(x) by f(x) + k, k f(x), f(kx), and f(x + k) for specific values of k (both positive and negative); find the value of k given the graphs. Experiment with cases and illustrate an explanation of the effects on the graph using technology. Include recognizing even and odd functions from their graphs and algebraic expressions for them. F.BF.B.4a Find inverse functions.
a. Solve an equation of the form f(x) = c for a simple function f that has an inverse and write an expression for the inverse. For example, f(x) =2x3 or f(x) = (x+1)/(x–1) for x ≠ 1.
The students will be able to identify the effect on a graph from a constant k. (i.e. ( )+ , ( ), k f(x), and ( + )) whether k is positive or negative. The students will be able to graph a cubic function.
The students will be able to write the inverse of a function by solving f(x) = c for x. The students will be able to write the inverse of a function by interchanging the values of the x and y values and solving for y. The students will be able to verify that one function is the inverse of another by using the composition of functions, i.e. ( −1( )).
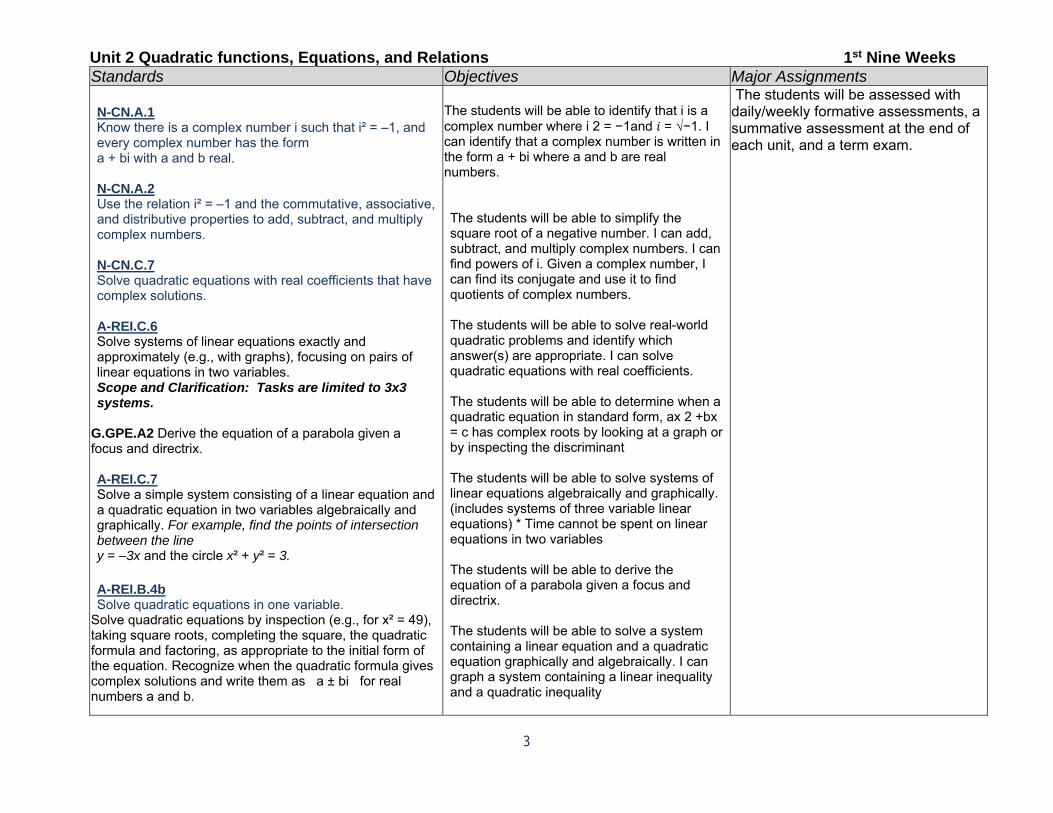
3
Unit 2 Quadratic functions, Equations, and Relations 1st Nine Weeks Standards Objectives Major Assignments N-CN.A.1 Know there is a complex number i such that i² = –1, and every complex number has the form a + bi with a and b real. N-CN.A.2 Use the relation i² = –1 and the commutative, associative, and distributive properties to add, subtract, and multiply complex numbers. N-CN.C.7 Solve quadratic equations with real coefficients that have complex solutions. A-REI.C.6 Solve systems of linear equations exactly and approximately (e.g., with graphs), focusing on pairs of linear equations in two variables. Scope and Clarification: Tasks are limited to 3x3 systems.
G.GPE.A2 Derive the equation of a parabola given a focus and directrix. A-REI.C.7 Solve a simple system consisting of a linear equation and a quadratic equation in two variables algebraically and graphically. For example, find the points of intersection between the line y = –3x and the circle x² + y² = 3. A-REI.B.4b Solve quadratic equations in one variable.
Solve quadratic equations by inspection (e.g., for x² = 49), taking square roots, completing the square, the quadratic formula and factoring, as appropriate to the initial form of the equation. Recognize when the quadratic formula gives complex solutions and write them as a ± bi for real numbers a and b.
The students will be able to identify that i is a complex number where i 2 = −1and = √−1. I can identify that a complex number is written in the form a + bi where a and b are real numbers.
The students will be able to simplify the square root of a negative number. I can add, subtract, and multiply complex numbers. I can find powers of i. Given a complex number, I can find its conjugate and use it to find quotients of complex numbers. The students will be able to solve real-world quadratic problems and identify which answer(s) are appropriate. I can solve quadratic equations with real coefficients. The students will be able to determine when a quadratic equation in standard form, ax 2 +bx = c has complex roots by looking at a graph or by inspecting the discriminant The students will be able to solve systems of linear equations algebraically and graphically. (includes systems of three variable linear equations) * Time cannot be spent on linear equations in two variables The students will be able to derive the equation of a parabola given a focus and directrix. The students will be able to solve a system containing a linear equation and a quadratic equation graphically and algebraically. I can graph a system containing a linear inequality and a quadratic inequality
The students will be assessed with daily/weekly formative assessments, a summative assessment at the end of each unit, and a term exam.

4
The students will be able to solve quadratic equations using a variety of methods
Unit 3: Polynomial Functions, Expressions, and Equations 2nd Nine Weeks Standards Objectives Major Assignments A-APR.B.2 Know and apply the Remainder Theorem: For a polynomial p(x) and a number a, the remainder on division by x – a is p(a), so p(a) = 0 if and only if (x – a) is a factor of p(x). A-APR.B.3 Identify zeros of polynomials when suitable factorizations are available, and use the zeros to construct a rough graph of the function defined by the polynomial. Scope and Clarification: Tasks include quadratic, cubic, and quartic polynomials and polynomials for which factors are not provided. For example, find the zeros of (x² - 1)(x² + 1). A-SSE.A.2 Use the structure of an expression to identify ways to rewrite it. For example, see x⁴– y⁴ as (x²) ² – (y²) ², thus recognizing it as a difference of squares that can be factored as (x² – y²)(x² + y²). Scope and Clarification: i) Tasks are limited to polynomial, rational, or exponential expressions. ii) Examples: see x4 – y4 as (x2) 2 – (y2) 2, thus recognizing it as a difference of squares that can be factored as (x2 – y2)(x2+ y2). In the equation x2 + 2x + 1 + y2 = 9, see an opportunity to rewrite the first three terms as (x+1)2, thus recognizing the equation of a circle with radius 3 and center (-1, 0). See (x2 + 4)/(x2 + 3) as ( (x2+3) + 1 )/(x2+3), thus recognizing an opportunity to write it as 1 + 1/(x2 +3).
The students will be able to explain and apply the Remainder Theorem to check answers when dividing polynomials. The students will be able to understand that a is a root of a polynomial function if and only if x-a is a factor of the function.
The students will be able to find the zeros of a polynomial when the polynomial is factored.
The students will be able to recognize the patterns in the sum and differences of cubes. The students will be able to factor sum and difference of cubic expressions.
The students will be assessed wotj daily/weekly formative assessments, a summative assessment at the end of each unit and a midterm exam.
*F-IF.C.7c Graph functions expressed symbolically and show key features of the graph, by hand in simple cases and using
The students will be able to graph exponential and logarithmic functions and

5
technology for more complicated cases.★ c. Graph polynomial functions, identifying zeros when suitable factorizations are available, and showing end behavior. A-APR.D.6 Rewrite simple rational expressions in different forms; write a(x)/b(x) in the form q(x) + r(x)/b(x), where a(x), b(x), q(x), and r(x) are polynomials with the degree of r(x) less than the degree of b(x), using inspection, long division, or, for the more complicated examples, a computer algebra system. A-CED.A.1 Create equations and inequalities in one variable and use them to solve problems. Include equations arising from linear and quadratic functions, and simple rational and exponential functions. Scope and Clarification: Tasks are limited to exponential equations with rational or real exponents and rational functions. Tasks have a real-world context.
identify o Intercepts o End behavior
The students will be able to distinguish between exponential functions that model exponential growth and decay. The students will be able to compose an original problem situation and construct an exponential function to model it.
F-BF.B.3 Identify the effect on the graph of replacing f(x) by f(x) + k, k f(x), f(kx), and f(x + k) for specific values of k (both positive and negative); find the value of k given the graphs. Experiment with cases and illustrate an explanation of the effects on the graph using technology. Include recognizing even and odd functions from their graphs and algebraic expressions for them. A-APR.C.4 Prove polynomial identities and use them to describe numerical relationships. For example, the polynomial identity (x2 + y2) 2 = (x2 – y2) 2 + (2xy) 2 can be used to generate Pythagorean triples. Additional Standards Integrated in this Unit: F-IF.B.4, F-BF.A.1b. A-REI.D.11
The students will be able to graph and analyze exponential growth and decay functions. - The students will be able to graph and analyze functions with base e.
The students will be able to multiply polynomials and use the patterns observed in identities such as the difference of squares to multiply polynomials.

6
Dickson County Schools Syllabus Algebra II: 2nd Semester Unit 4 Rational Functions, Expressions, and Equations (Jan) 3rd Nine Weeks Standards Objectives Major Assignments A-SSE.A.2 Use the structure of an expression to identify ways to rewrite it. For example, see x⁴– y⁴ as (x²) ² – (y²) ², thus recognizing it as a difference of squares that can be factored as (x² – y²)(x² + y²). Scope and Clarification: i) Tasks are limited to polynomial, rational, or exponential expressions. ii) Examples: see x4 – y4 as (x2) 2 – (y2) 2, thus recognizing it as a difference of squares that can be factored as (x2 – y2)(x2+ y2). In the equation x2 + 2x + 1 + y2 = 9, see an opportunity to rewrite the first three terms as (x+1)2, thus recognizing the equation of a circle with radius 3 and center (-1, 0). See (x2 + 4)/(x2 + 3) as ( (x2+3) + 1 )/(x2+3), thus recognizing an opportunity to write it as 1 + 1/(x2 +3). A-REI.A.1 Explain each step in solving a simple equation as following from the equality of numbers asserted at the previous step, starting from the assumption that the original equation has a solution. Construct a viable argument to justify a solution method. Scope and Clarification: Tasks are limited to simple rational or radical equations. A-REI.A.2 Solve simple rational and radical equations in one variable, and give examples showing how extraneous solutions may arise.
I can rewrite algebraic expressions in different equivalent forms such as combining like terms and factoring. I can simplify expressions including combine like terms, using the distributive property and other operations with polynomials. I can factor using greatest common factors and grouping. I can factor using a difference of two squares. I can factor using the sum or difference of two cubes. I can choose the appropriate methods for factoring a polynomial.
I understand that the intersection of two equations is the solution to the system of equations. Include cases where the functions are linear, polynomial, rational, absolute value, exponential, and logarithmic functions. I can find the intersection of any two functions using graphing technology.
The students will be assessed with daily/weekly formative assessments, a summative assessment at the end of each unit, and a term exam.
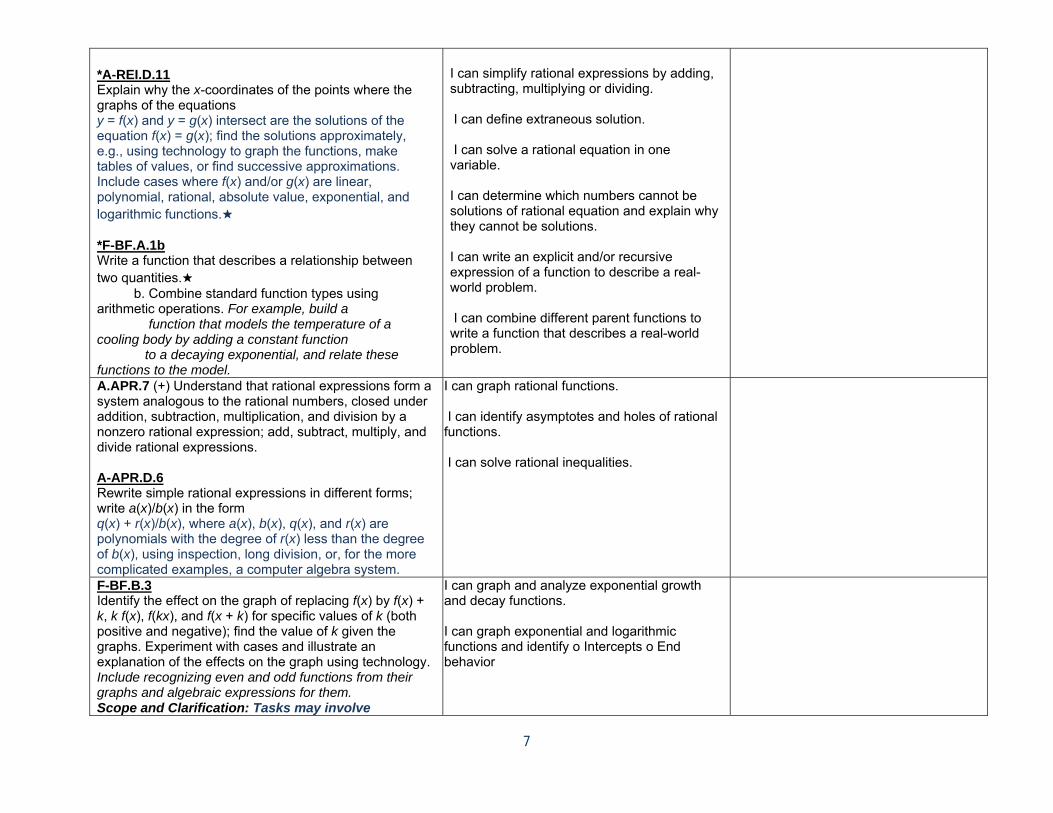
7
*A-REI.D.11 Explain why the x-coordinates of the points where the graphs of the equations y = f(x) and y = g(x) intersect are the solutions of the equation f(x) = g(x); find the solutions approximately, e.g., using technology to graph the functions, make tables of values, or find successive approximations. Include cases where f(x) and/or g(x) are linear, polynomial, rational, absolute value, exponential, and logarithmic functions.★ *F-BF.A.1b Write a function that describes a relationship between two quantities.★ b. Combine standard function types using arithmetic operations. For example, build a function that models the temperature of a cooling body by adding a constant function to a decaying exponential, and relate these functions to the model.
I can simplify rational expressions by adding, subtracting, multiplying or dividing. I can define extraneous solution. I can solve a rational equation in one variable. I can determine which numbers cannot be solutions of rational equation and explain why they cannot be solutions. I can write an explicit and/or recursive expression of a function to describe a real-world problem. I can combine different parent functions to write a function that describes a real-world problem.
A.APR.7 (+) Understand that rational expressions form a system analogous to the rational numbers, closed under addition, subtraction, multiplication, and division by a nonzero rational expression; add, subtract, multiply, and divide rational expressions. A-APR.D.6 Rewrite simple rational expressions in different forms; write a(x)/b(x) in the form q(x) + r(x)/b(x), where a(x), b(x), q(x), and r(x) are polynomials with the degree of r(x) less than the degree of b(x), using inspection, long division, or, for the more complicated examples, a computer algebra system.
I can graph rational functions. I can identify asymptotes and holes of rational functions. I can solve rational inequalities.
F-BF.B.3 Identify the effect on the graph of replacing f(x) by f(x) + k, k f(x), f(kx), and f(x + k) for specific values of k (both positive and negative); find the value of k given the graphs. Experiment with cases and illustrate an explanation of the effects on the graph using technology. Include recognizing even and odd functions from their graphs and algebraic expressions for them. Scope and Clarification: Tasks may involve
I can graph and analyze exponential growth and decay functions.
I can graph exponential and logarithmic functions and identify o Intercepts o End behavior

8
polynomial, exponential, logarithmic, and trigonometric functions Additonal Standard Integrated in this Unit: *F-IF.C.7 Graph functions expressed symbolically and show key features of the graph, by hand in simple cases and using technology for more complicated cases.★
Unit 5 Rational Functions, Expressions, and Equation (Feb)
Standards Objectives Major Assignments N-RN.A.1 Explain how the definition of the meaning of rational exponents follows from extending the properties of integer exponents to those values, allowing for a notation for radicals in terms of rational exponents. For example, we define 5 to be the cube root of 5 because we want (5 )³ = 5 to hold, so 5 must equal 5. N-RN.A.2 Rewrite expressions involving radicals and rational exponents using the properties of exponents. *F-IF.B.6 Calculate and interpret the average rate of change of a function (presented symbolically or as a table) over a specified interval. Estimate the rate of change from a graph. ★ Scope and Clarification: Tasks may involve polynomial, exponential, logarithmic, and trigonometric functions.
I can evaluate and simplify an expression with a rational exponent. I can move flexibly between radical notation and rational exponents. I can calculate and estimate the rate of change from a graph. I can simplify rational expressions by adding, subtracting, multiplying or dividing. I can define extraneous solution. I can solve a rational equation in one variable. I can determine which numbers cannot be solutions of rational equation and explain why they cannot be solutions
The students will be assessed with daily/weekly formative assessments, a summative assessment at the end of each unit, and a term exam.

9
A-REI.A.1 Explain each step in solving a simple equation as following from the equality of numbers asserted at the previous step, starting from the assumption that the original equation has a solution. Construct a viable argument to justify a solution method. A-REI.A.2 Solve simple rational and radical equations in one variable, and give examples showing how extraneous solutions may arise. F-BF.B.4a Find inverse functions. a. Solve an equation of the form f(x) = c for a simple function f that has an inverse and write an expression for the inverse. For example, f(x) =2x3 or f(x) = (x+1)/(x–1) for x ≠ 1. F.IFC.7 Graph functions expressed symbolically and show key features of the graph, by hand in simple cases and using technology for more complicated cases.
I can find the inverses of simple quadratic and cubic functions. I can graph polynomial functions in both standard and vertex form and identify key features using inspection and technology

10
Unit 6 Exponential and Logarithmic Functions and Equations (Feb 20 – April 7) 3rd/4th Nine Weeks
Standards Objectives Major Assignments *F-BF.A.1a Write a function that describes a relationship between two quantities.★
a. Determine an explicit expression, a recursive process, or steps for calculation from a context.
*F-BF.A.2 Write arithmetic and geometric sequences both recursively and with an explicit formula, use them to model situations, and translate between the two forms.★ *A-SSE.B.3c Choose and produce an equivalent form of an expression to reveal and explain properties of the quantity represented by the expression.★ c. Use the properties of exponents to transform expressions for exponential functions. For example the expression 1.15 can be rewritten as 1.15 ≈ 1.012 to reveal the approximate equivalent monthly interest rate if the annual rate is 15% *A-SSE.B.4 Derive the formula for the sum of a finite geometric series (when the common ratio is not 1), and use the formula to solve problems. For example, calculate mortgage payments.★ *A-REI.D.11 Explain why the x-coordinates of the points where the graphs of the equations y = f(x) and y = g(x) intersect are the solutions of the equation f(x) = g(x); find the solutions approximately, e.g., using technology to graph the functions, make tables of values, or find successive approximations. Include cases where f(x) and/or g(x) are linear, polynomial, rational, absolute value, exponential, and logarithmic functions.★
I can write an explicit and/or recursive expression of a function to describe a real-world problem. I can combine different parent functions to write a function that describes a real-world problem.
I can write a recursive and explicit formula for an arithmetic or geometric sequence. I can differentiate between arithmetic and geometric sequences. I can decide when a real world problem models an arithmetic or geometric sequence and write an equation to model the situation.
I can rewrite exponential functions using the properties of exponents.
I can derive the formula for the sum of a finite geometric series.
I understand that the intersection of two equations is the solution to the system of equations. Include cases where the functions are linear, polynomial, rational, absolute value, exponential, and logarithmic functions. I can find the intersection of any two functions using graphing technology.
The students will be assessed with daily/weekly formative assessments, a summative assessment at the end of each unit, and a term exam.

11
F.IF.A.3 Recognize that sequences are functions, sometimes defined recursively, whose domain is a subset of the integers. For example, the Fibonacci sequence is defined recursively by f(0) = f(1) = 1, f(n+1) = f(n) + f(n-1) for n ≥ 1. Scope and Clarification: This standard is Supporting work in Algebra II. This standard should support the Major work in F-BF.A.2 for coherence. *F-IF.C.7e Graph functions expressed symbolically and show key features of the graph, by hand in simple cases and using technology for more complicated cases.★ e. Graph exponential and logarithmic functions, showing intercepts and end behavior, and trigonometric functions, showing period, midline, and amplitude. F-IF.C.8b Write a function defined by an expression in different but equivalent forms to reveal and explain different properties of the function.
b. Use the properties of exponents to interpret expressions for exponential functions. For example, identify percent rate of change in functions such as y = 1.02 , y = 0.97 , y = 1.01 , y = 1.2 / , and classify them as representing exponential growth or decay.
F-LE.A.2 Construct linear and exponential functions, including arithmetic and geometric sequences, given a graph, a description of a relationship, or two input-output pairs (include reading these from a table). Scope and Clarification: Tasks will include solving multi-step problems by constructing linear and exponential functions.
I can distinguish between explicit and recursive formulas for sequences.
I can graph polynomial functions in both standard and vertex form and identify key features using inspection and technology.
I can use the properties of logarithms to condense and expand expressions. I can solve exponential and logarithmic equations. I can use properties of exponents to rewrite an exponential function to emphasize one of its properties. I can define an exponential function, f(x) = abx. I can explain the meaning of each variable in a real-world exponential function in standard form.
I can apply compound interest problems to exponential functions.
*F-IF.B.4 For a function that models a relationship between two quantities, interpret key features of graphs and tables in

12
terms of the quantities, and sketch graphs showing key features given a verbal description of the relationship. Key features include: intercepts; intervals where the function is increasing, decreasing, positive, or negative; relative maximums and minimums; symmetries; end behavior; and periodicity.★
I can write the inverse of a function by solving f(x) = c for x. I can write the inverse of a function by interchanging the values of the x and y values and solving for y. I can verify that one function is the inverse of another by using the composition of functions, i.e. ( −1( )).
F-LE.A.4 For exponential models, express as a logarithm the solution to = d where a, c, and d are numbers and the base b is 2, 10, or e; evaluate the logarithm using technology. S-ID.B.6a Represent data on two quantitative variables on a scatter plot, and describe how the variables are related.
a. Fit a function to the data; use functions fitted to data to solve problems in the context of the data. Use given functions or choose a function suggested by the context. Emphasize linear, quadratic, and exponential models.
I can translate between exponential and logarithmic forms.
I can use technology to find the function of best fit for a scatterplot and use that function to make predictions.
F-BF.B.3 Identify the effect on the graph of replacing f(x) by f(x) + k, k f(x), f(kx), and f(x + k) for specific values of k (both positive and negative); find the value of k given the graphs. Experiment with cases and illustrate an explanation of the effects on the graph using technology. Include recognizing even and odd functions from their graphs and algebraic expressions for them. Scope and Clarification: Tasks may involve polynomial, exponential, logarithmic, and trigonometric functions F-LE.B.5 Interpret the parameters in a linear or exponential function in terms of a context.
I can identify the effect on a graph from a constant k. (i.e. ( )+ , ( ), k f(x), and ( + )) whether k is positive or negative.
I can identify and explain the difference between an even and odd function.
I can explain the meaning (using appropriate units) of the constants a,b,c and the y-intercept in the exponential function, f(x) =a*bx +c.
I can demonstrate the inverse relationship between exponents and logarithms and use this relationship to solve problems involving logarithms and exponents.

13
F.BF.B.5 (+) Understand the inverse relationship between exponents and logarithms and use this relationship to solve problems involving logarithms and exponents.
F.IF.B8 Write a function defined by an expression in different but equivalent forms to reveal and explain different properties of the function. b. Use the properties of exponents to interpret expressions for exponential functions. For example, identify percent rate of change in functions such as
=(1.02) , =(0.97) , =(1.01)12 , =(1.2) /10, and classify them as representing exponential growth or decay.
I can demonstrate the inverse relationship between exponents and logarithms and use this relationship to solve problems involving logarithms and exponents.
I can use the properties of logarithms to condense and expand expressions. I can solve exponential and logarithmic equations. I can use properties of exponents to rewrite an exponential function to emphasize one of its properties. I can define an exponential function, f(x) = abx. I can explain the meaning of each variable in a real-world exponential function in standard form.

14
Unit 9 Statistics (April 7-28) 4th Nine Weeks
Standards Objectives Major Assignments S-IC.B.3 Recognize the purposes of and differences among sample surveys, experiments, and observational studies; explain how randomization relates to each. S-IC.B.4 Use data from a sample survey to estimate a population mean or proportion; develop a margin of error through the use of simulation models for random sampling. S-IC.B.5 Use data from a randomized experiment to compare two treatments; use simulations to decide if differences between parameters are significant. S-IC.B.6 Evaluate reports based on data. S-IC.A.1 Understand statistics as a process for making inferences about population parameters based on a random sample from that population. S-IC.A.2 Decide if a specified model is consistent with results from a given data-generating process, e.g., using simulation. For example, a model says a spinning coin falls heads up with probability 0.5. Would a result of 5 tails in a row cause you to question the model?
I can identify situations as sample survey, experiment, or observational study and can discuss the importance of randomization in these processes. I can explain why randomization is used to draw a sample that represents a population well.
I can estimate the total population values including the margin of error using sample means.
I can compare data sets using graphs and summary statistics.
I can make data-based decisions.
The students will be assessed with daily/weekly formative assessments, a summative assessment at the end of each unit, and a term exam.
S-ID.A.4 Use the mean and standard deviation of a data set to fit it to a normal distribution and to estimate population percentages. Recognize that there are data sets for which such a procedure is not appropriate. Use calculators, spreadsheets, and tables to estimate areas under the normal curve.
I can calculate the mean, standard deviation and variance for a set of data. I can apply the 68-95-99.7 rule for the normal distribution using calculators, spreadsheets, and tables to estimate areas.
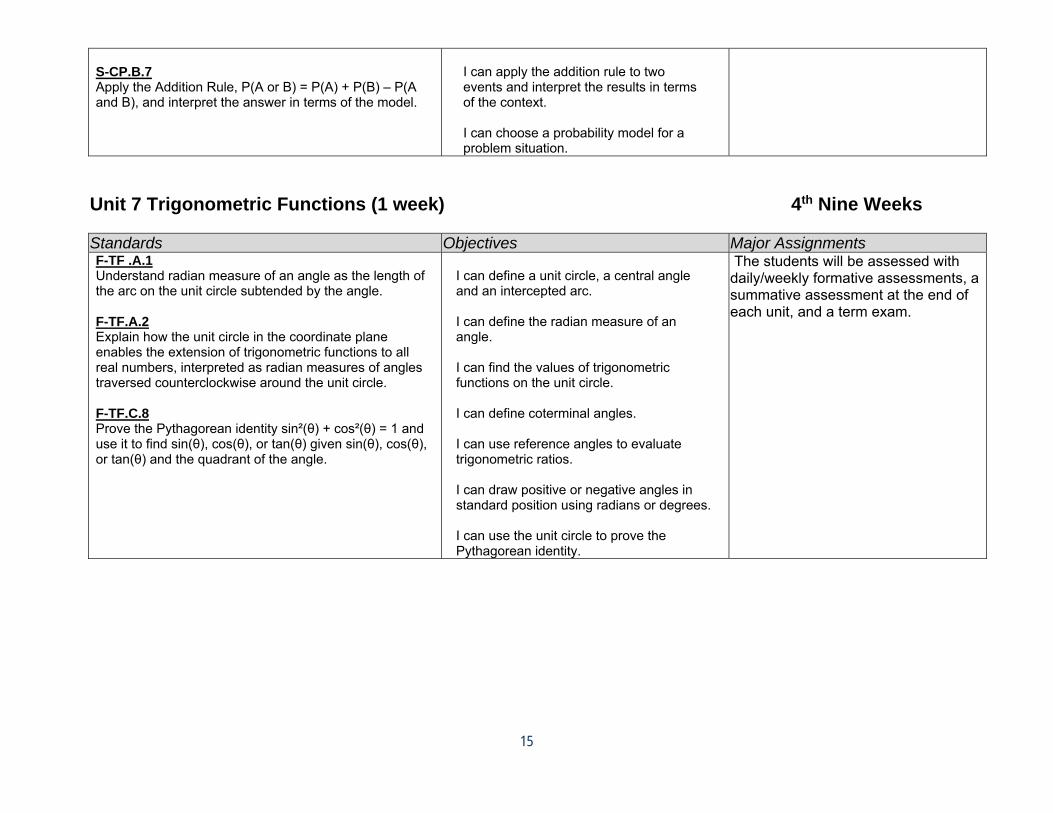
15
Unit 7 Trigonometric Functions (1 week) 4th Nine Weeks
S-CP.B.7 Apply the Addition Rule, P(A or B) = P(A) + P(B) – P(A and B), and interpret the answer in terms of the model.
I can apply the addition rule to two events and interpret the results in terms of the context. I can choose a probability model for a problem situation.
Standards Objectives Major Assignments F-TF .A.1 Understand radian measure of an angle as the length of the arc on the unit circle subtended by the angle. F-TF.A.2 Explain how the unit circle in the coordinate plane enables the extension of trigonometric functions to all real numbers, interpreted as radian measures of angles traversed counterclockwise around the unit circle. F-TF.C.8 Prove the Pythagorean identity sin²(θ) + cos²(θ) = 1 and use it to find sin(θ), cos(θ), or tan(θ) given sin(θ), cos(θ), or tan(θ) and the quadrant of the angle.
I can define a unit circle, a central angle and an intercepted arc. I can define the radian measure of an angle.
I can find the values of trigonometric functions on the unit circle. I can define coterminal angles. I can use reference angles to evaluate trigonometric ratios. I can draw positive or negative angles in standard position using radians or degrees.
I can use the unit circle to prove the Pythagorean identity.
The students will be assessed with daily/weekly formative assessments, a summative assessment at the end of each unit, and a term exam.

16
Unit 8 Probability (2 weeks)
Standards Objectives Major Assignments S-CP.A.1 Describe events as subsets of a sample space (the set of outcomes) using characteristics (or categories) of the outcomes, or as unions, intersections, or complements of other events (“or,” “and,” “not”). S-CP.A.2 Understand that two events A and B are independent if the probability of A and B occurring together is the product of their probabilities, and use this characterization to determine if they are independent. S-CP.A.4 Construct and interpret two-way frequency tables of data when two categories are associated with each object being classified. Use the two-way table as a sample space to decide if events are independent and to approximate conditional probabilities. For example, collect data from a random sample of students in your school on their favorite subject among math, science, and English. Estimate the probability that a randomly selected student from your school will favor science given that the student is in tenth grade. Do the same for other subjects and compare the results. S-CP.A.5 Recognize and explain the concepts of conditional probability and independence in everyday language and everyday situations. For example, compare the chance of having lung cancer if you are a smoker with the chance of being a smoker if you have lung cancer. S-CP.B.6 Find the conditional probability of A given B as the fraction of B’s outcomes that also belong to A, and interpret the answer in terms of the model. S.CP.8 (+) Apply the general Multiplication Rule in a uniform probability model, P( A and B) = P(A)P(B|A) =
I can define a sample space and events within the sample space. I can identify subsets within a sample space. I can give examples of unions, intersections and complements of sets and events.
I can identify two events as independent or not. I can predict if two events are independent, explain my reasoning, and verify my statement by calculating probabilities.
I can collect data about students in my school. I can organize the data in a chart. I can calculate the probability of independent and dependent events. I can determine if the events are dependent or independent.
I can calculate the probability of an event.
I can apply the general Multiplication Rule to calculate the probability of the intersection of two events using the formula.
The students will be assessed with daily/weekly formative assessments, a summative assessment at the end of each unit, and a term exam.

17
P(B) P(A|B),and interpret the answer in terms of the model.

1
Dickson County Schools Syllabus -- Advanced Placement Calculus
1st Nine Weeks
Standards Objectives Major Assignments F-BF.2: Discuss the various types of end behavior of functions; identify prototypical functions for each type of end behavior F-LF.2: Estimate limits of functions (including one-sided limits) from graphs or tables of data. Apply the definition of a limit to a variety of functions, including piecewise functions F-LF.3: Draw a sketch that illustrates the definition of the limit; develop multiple real world scenarios that illustrate the definition of the limit F-LF.1: Calculate limits using algebra F-C.1: Define continuity at a point using limits; define continuous functions F-C.2: Determine whether a given function is continuous at a specific point F-C.3: Determine and define different types of discontinuity (point, jump, infinite) in terms of limits F-C.4: Apply the Intermediate Value Theorem to continuous functions F-LF.1: Describe asymptotic behavior (analytically and graphically) in terms of infinite limits and limits at infinity D-CD.1: Represent and interpret the derivative of a function graphically, numerically, and analytically D-CD.3: Define the derivative as the limit of the difference quotient; illustrate with the sketch of a graph D-CD.4: Demonstrate the relationship between differentiability and continuity D-CD.5: Interpret the derivative as the slope of a curve (which could be a line) at a point, including points at which there are vertical tangents and points at which there are no tangents (i.e., where a function is not locally linear) D-CD.7: Write the equation of the line tangent to the curve at a given point D-CD.2: Interpret the derivative as an instantaneous rate of change D-CD.6: Approximate both the instantaneous rate of change and the average rate of change given a graph or table of values D-AD.1: Describe in detail how the basic derivative rules are used to differentiate a function; discuss the difference between using the limit definition of the derivative and using the derivative rules D-AD.2: Calculate the derivative of basic power and trigonometric functions D-AD.3: Calculate the derivatives of sums, products and quotients of basic functions D-AD.14: Translate verbal descriptions into equations involving derivatives and vice versa
The student will be able to:
Sketch the graph of an equation Find the intercepts of a graph Test a graph for symmetry Find the points of intersection of 2 graphs Interpret mathematical models for real-
life data Find the slope of a line Write the equation of a line given a point
and slope Interpret slope in a real-life application Sketch the graph of a linear equation in
slope intercept form Write equations of lines that are parallel
or perpendicular to a given line Use function notation to represent and
evaluate a function Find the domain and range of a function Sketch the graph of a function Identify different types of
transformations of functions Fit linear, quadratic, and trigonometric
models to real-life data sets Understand what calculus is Understand the tangent line as used in
calculus Understand the area problem as it relates
to calculus Evaluate a limit using a numerical or
graphical approach Learn different ways that a limit can exit
Daily and weekly assessments
Unit assessments
One project embedded within the nine weeks

2
D-AD.17: Use differentiation to solve problems involving velocity, speed, and acceleration D-AD.4: Apply the chain rule to find the derivative of a composite function D-AD.5: Implicitly differentiate an equation in two or more variables D-AD.15: Model rates of change, including related rates problems. In each case, include a discussion of units
Evaluate a limit using the properties of limits and using various techniques such as dividing out and rationalizing and using the Squeeze Theorem
Determine continuity at a point and on an open interval
Determine one-sided limits and continuity on a closed interval
Use properties of continuity Understand and use the Intermediate
Value Theorem Determine infinite limits from the left and
right Find and sketch the vertical asymptotes of
the graph of a function Find the slope of the tangent line to a
curve at a point Use the limit definition to find the
derivative of a function Understand the relationship between
differentiability and continuity Find the derivatives using the rules:
constant, power, constant multiple, sum and difference, product, quotient
Find the derivatives of trigonometric functions
Use derivative to fine rates of change Find a higher-order derivative Find the derivative of a composite
function Use the Chain Rule to find various
derivatives Distinguish between functions written in
explicit and implicit form Use implicit differentiation to find
derivatives

3
2nd Nine Weeks
Standards Objectives Major Assignments F-C.4: Apply the Extreme Value Theorem to continuous functions D-AD.8: Use the first derivative to find extrema (local or global) D-CD.8: Apply the Mean Value Theorem D-CD.9: Understand Rolle's Theorem as a special case of the Mean Value Theorem D-AD.7: Relate the increasing and decreasing behavior of f to the sign of f ′ both analytically and graphically D-AD.9: Analytically locate the intervals on which a function is increasing, decreasing, or neither D-AD.10: Relate the concavity of f to the sign of f′′ both analytically and graphically D-AD.11: Use the second derivative to find points of inflection as points where concavity changes D-AD.12: Analytically locate intervals on which the function is concave up, down, or neither F-LF.1: Calculate limits at infinity using algebra D-AD.13: Relate corresponding characteristics of the graphs of f, f′, f′′ D-AD.16: Solve optimization problems to find a desired maximum or minimum value D-AD.18: Use tangent lines to approximate function values and changes in function values when inputs change (linearization)
The student will be able to:
Find related rates Use related rates to solve real-life
problems Understand the definition of relative and
absolute extrema (on open and closed intervals, as appropriate)
Find relative and absolute extrema Understand and use Rolle’s Theorem Understand and use the Mean Value
Theorem Determine intervals on which a function
is increasing or decreasing Apply the First Derivative Test to find
relative extrema of a function Determine the intervals on which a
function is concave up or concave down Determine points of inflection Apply the 2nd derivative test to find
relative extrema of a function Determine finite limits at infinity Determine the horizontal asymptotes of
the graph of a function Determine infinite limits at infinity Analyze and sketch the graph of a
function Solve applied minimum and maximum
problems Approximate a zero of a function using
Newton’s Method Understand the concept of a tangent line
approximation Compare the value of the differential
with the actual y Find the differential of a function
Daily and
weekly assessments
Unit assessments
One project embedded within the nine weeks

4
3rd Nine Weeks
Standards Objectives Major Assignments I-UI.4: Recognize differentiation and antidifferentiation as inverse operations I-AI.1: Develop facility with finding antiderivatives that follow directly from derivatives of basic power functions A-AI.3: Find specific antiderivatives using initial conditions I-UI.3: Use the midpoint evaluation points to approximate area represented graphically I-UI.1: Define the definite integral as the limit of Riemann sums and as net accumulation of change I.UI.2: Correctly write a Riemann Sum that represents the definition of a definite integral I-UI.7: Apply basic properties of definite integrals (e.g. additive, constant multiple, translations) I-UI.5: Evaluate definite integrals using the Fundamental Theorem of Calculus I-UI.6: Use the Fundamental Theorem of Calculus to represent a particular antiderivative of a function and to understand when the antiderivative so represented is continuous and differentiable I-AI.2: Use substitution of variables to calculate antiderivatives (including changing limits for definite integrals) I-UI.3: Use Riemann Sums (left, right, and midpoint evaluation points) and trapezoid sums to approximate definite integrals of functions represented graphically, numerically, and by tables of values D-AD.2: Calculate the derivative of basic logarithmic functions I-AI.1: Develop facility with finding antiderivatives that follow directly from derivatives of basic logarithmic functions D-AD.6: Use implicit differentiation to find the derivative of the inverse of a function D-AD.2: Calculate the derivative of basic exponential functions I-AI.1: Develop facility with finding antiderivatives that follow directly from derivatives of basic exponential functions
The student will be able to:
Write the general solution of a differential equation and use indefinite integral notation for antiderivatives
Use basic integration rules Find a particular solution of a
differential equation Use sigma notation to write and evaluate
a sum Understand the concept of area Approximate and find the area of a plane
region Understand the definition of a Riemann
sum Evaluate a definite integral using limits
and using properties of definite integrals Evaluate a definite integral using the
Fundamental Theorem of Calculus Understand and use the Mean Value
Theorem for Integrals Find the average value of a function over
a closed interval Understand and use the Second
Fundamental Theorem of Calculus and the Net Change Theorem
Use pattern recognition to find an indefinite integral
Use a change of variable to find an indefinite integral
Use the General Power rule for integrating an indefinite integral
Approximate a definite integral using the Trapezoidal Rule
Develop and use properties of the natural log function
Understand the definition of the number e
Daily and
weekly assessments
Unit assessments
One project embedded within the nine weeks

5
Find the derivatives of functions involving the natural log
Use the log rule to integrate a rational function
Integrate trigonometric functions Verify that one function is the inverse
function of another function Find the derivative of an inverse
function Differentiate and integrate natural logs Use exponential functions to model
compound interest and exponential growth
Develop properties of inverse trig function
Differentiate inverse trig functions
4th Nine Weeks Standards Objectives Major Assignments I-AI.6: Use integrals to solve a variety of problems (e.g., distance traveled by a particle along a line, exponential growth/decay) I-AI.3: Find specific antiderivatives using initial conditions I-AI.4: Use a definite integral to find the area of a region I-AI.5: Use a definite integral to find the volume of a solid formed by rotating a regions around a given axis
The student will be able to: Use initial conditions to find particular
solutions of differential equations Use slope fields to approximate
solutions of differential equations Use separation of variables to solve a
simple differential equation Use exponential functions to model
growth and decay in applied problems Recognize and solve differential
equations that can be solve by separation of variables
Use differential equations to model and solve applied problems
Solve and analyze logistic differential equations
Use first order linear differential equations to solve applied problems
Daily and
weekly assessments
Unit assessments
One project embedded within the nine weeks

6
Find the area of a region between tow curves using integration
Find the area of a region between intersection curves using integration
Describe integration as an accumulation process
Find the volume of a solid of revolution using the disk method and the washer method
Find the volume of a solid with a known cross section
Find an antiderivative using integration by parts

1
Dickson County Schools Syllabus: Discrete Math
1st Semester Standards Objectives Major Assignments N-ET.1 Use election theory techniques to analyze election data. N-ET.2 Investigate and describe weighted voting and the results of various election methods. Both very standard and less-known techniques will be studied and compared; these may include approval and preference voting as well as plurality majority, run-off, sequential run-off, Borda count, and Condorcet winners. N-ET.3 Use fair division techniques to solve apportionment problems. D-CR.10 Discuss the various examples and consequences of innumeracy; consider poor estimation, improper experimental design, inappropriate comparisons, and scientific notation comparisons. G-GT.1 Use graph theory to model and solve contextual problems. G-GT.2 Use vertex-edge graphs to model and solve a variety of problems related to paths, circuits, networks, and relationships among a finite number of objects. G-GT.3 Apply graphs to conflict-resolution problems, such as map coloring, scheduling, matching, and optimization. G-E.1 Put numbers in perspective through estimation, comparisons, and scaling. A-LB.3 Analyze basic electrical networks; compare the networks to Boolean Algebra configurations.
The students will: Use preference ballots and
preference schedules Understand & apply the Plurality
Method Understand & apply the Borda Count
Method Understand & apply the Plurality-with-
Elimination Method Understand & apply the Method of
Pairwise Comparisons Describe rankings Know Weighted Voting Understand the Banzhaf Power Index Apply the Banzhaf Power Index Understand the Shapley-Shubik
Power Index Apply the Shapley-Shubik Power
Index Compare Fair-Division Games Investigate the Divider-Chooser
Method Examine the Lone-Divider Method Investigate the Last-Diminisher
Method Analyze the Method of Sealed Bids Understand the Method of Markers Interpret Apportionment Problems Compare/Contrast Hamilton’s Method
and the Quota Rule Evaluate the Alabama and Other
Paradoxes Understand & apply Jefferson’s
Method
Daily and weekly formative assessments.
End of Unit Assessments

2
A-LB.4 Develop electrical networks and translate them into Boolean algebra equations. F-IR.2 Use iteration and recursion to model and solve problems. F-IR.1 Represent and analyze functions by using iteration and recursion. G-E.3 Apply estimation techniques to data given in a variety of ways.
Understand & apply Adam’s Method Understand & apply Webster’s
Method Describe Euler Circuit Problems Interpret, manipulate, and experiment
with graph models Understand & apply Euler’s Theorems Analyze Fluery’s Algorithm Investigate Hamilton Paths and
Circuits Discuss and describe the Brute-Force
and Nearest Neighbor Algorithm Discuss and describe the Repetitive
Nearest-Neighbor Algorithm Discuss and Describe the Cheapest-
Link Algorithm Understand and apply Kruskal’s
Algorithm Compare the shortest network
connecting three points with four or more points
Identify the basic elements of scheduling
Schedule with priority lists Understand & apply the Decreasing-
Time Algorithm Describe Critical Paths and apply the
Critical-Path Algorithm Schedule with Independent Tasks
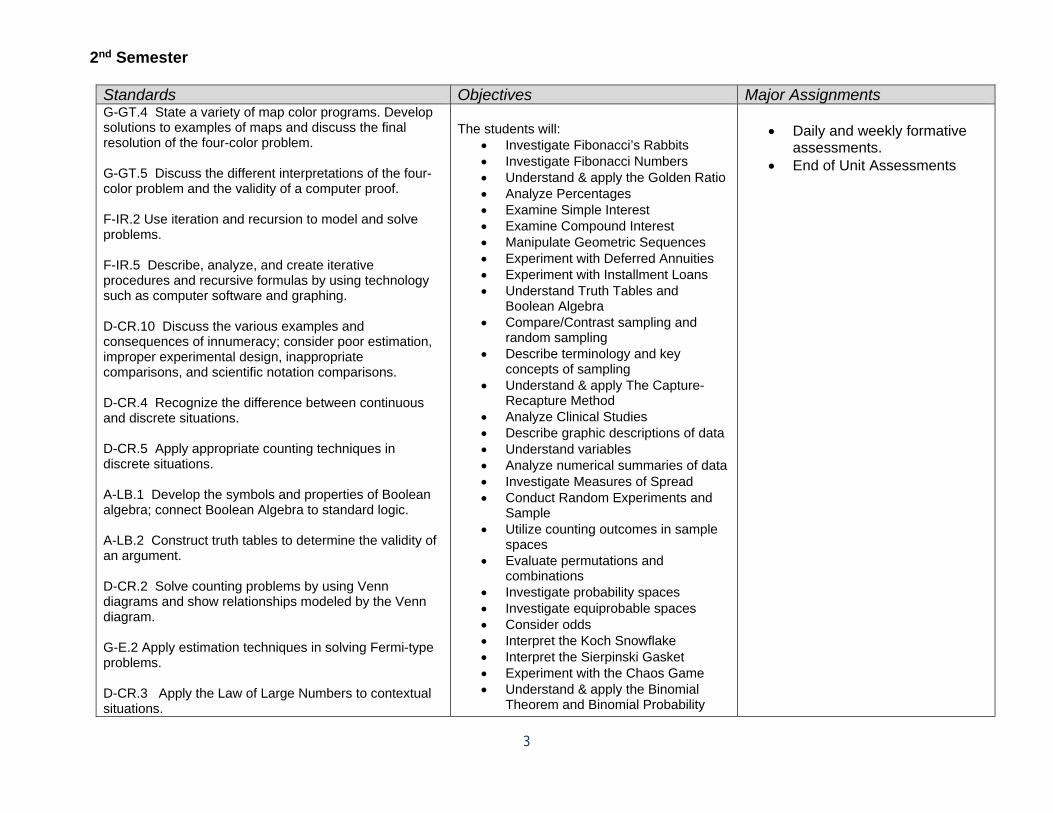
3
2nd Semester
Standards Objectives Major Assignments G-GT.4 State a variety of map color programs. Develop solutions to examples of maps and discuss the final resolution of the four-color problem. G-GT.5 Discuss the different interpretations of the four-color problem and the validity of a computer proof. F-IR.2 Use iteration and recursion to model and solve problems. F-IR.5 Describe, analyze, and create iterative procedures and recursive formulas by using technology such as computer software and graphing. D-CR.10 Discuss the various examples and consequences of innumeracy; consider poor estimation, improper experimental design, inappropriate comparisons, and scientific notation comparisons. D-CR.4 Recognize the difference between continuous and discrete situations. D-CR.5 Apply appropriate counting techniques in discrete situations. A-LB.1 Develop the symbols and properties of Boolean algebra; connect Boolean Algebra to standard logic. A-LB.2 Construct truth tables to determine the validity of an argument. D-CR.2 Solve counting problems by using Venn diagrams and show relationships modeled by the Venn diagram. G-E.2 Apply estimation techniques in solving Fermi-type problems. D-CR.3 Apply the Law of Large Numbers to contextual situations.
The students will:
Investigate Fibonacci’s Rabbits Investigate Fibonacci Numbers Understand & apply the Golden Ratio Analyze Percentages Examine Simple Interest Examine Compound Interest Manipulate Geometric Sequences Experiment with Deferred Annuities Experiment with Installment Loans Understand Truth Tables and
Boolean Algebra Compare/Contrast sampling and
random sampling Describe terminology and key
concepts of sampling Understand & apply The Capture-
Recapture Method Analyze Clinical Studies Describe graphic descriptions of data Understand variables Analyze numerical summaries of data Investigate Measures of Spread Conduct Random Experiments and
Sample Utilize counting outcomes in sample
spaces Evaluate permutations and
combinations Investigate probability spaces Investigate equiprobable spaces Consider odds Interpret the Koch Snowflake Interpret the Sierpinski Gasket Experiment with the Chaos Game Understand & apply the Binomial
Theorem and Binomial Probability
Daily and weekly formative
assessments. End of Unit Assessments

4
G-E.3 Apply estimation techniques to data given in a variety of ways. G-E.1 Put numbers in perspective through estimations, comparisons, and scaling D-PC.2 Design and interpret simple experiments using tree-diagrams, permutations, and combinations. D-PC.1 Represent, analyze, and apply permutations and combinations. D-PC.3 Use reasoning and formulas to solve counting problems in which repetition is not allowed and in which ordering does not matter. D-CR.7 Use combinatorial reasoning to construct proofs as well as solve a variety of problems. D-CR.1 Apply counting principals to probabilistic situations involving equally likely outcomes. F-IR.3 Use iterative and recursive thinking to solve a variety of contextual problems. F-IR.4 Create and analyze iterative geometric patterns, including fractals. A-BP.1 Use the Binomial Theorem to expand powers of binomials A-BP.3 Represent, apply, and describe relationships among the binomial theorem, Pascal's Triangle, and combinations. A-BP.2 Build the Binomial Theorem using graphics/pyramid design; interpret it for both a multivariable binomial expansion and a variable and numeric binomial expansion. G-GT.6 Interpret the Binomial Theorem to solve coloring problems and numerical problems.
Consider Ancient Number Systems

5
A-BP.4 Construct and describe patterns in Pascal's Triangle D-CR.9 Connect Pascal's Triangle and probability to solve problems D-CR.4 Recognize the difference between continuous and discrete situations D-CR.5 Apply appropriate counting techniques in discrete situations. D-CR.11 Prove the sum of the first n integers adds up to n(n+1)/2 in three different manners. N-NB.1 Understand various bases as used in computer science and numerical data transmission, especially base 2, base 8 and base 12 N-NB.2 Expand the understanding of place value to include numbers written in various numerical systems and in various bases N-NB.3 Use base 2 arithmetic to understand checksums in data transmission N-NB.4 Convert numbers between bases, especially multi- digit numbers. N-NB.5 Compare ancient numeral systems in various bases to base t and base 8. N-NB.6 Perform familiar arithmetic processes in base 2, base 8 and base 12 D-CR.6 Derive basic cominatorics identities by counting the same sets different ways to get a basic identity. D-CR.8 Informally prove the classical identity for C(n,k) = C(n-1,k-1) + C(n-1,k) for integers n and k with 0<k<n.
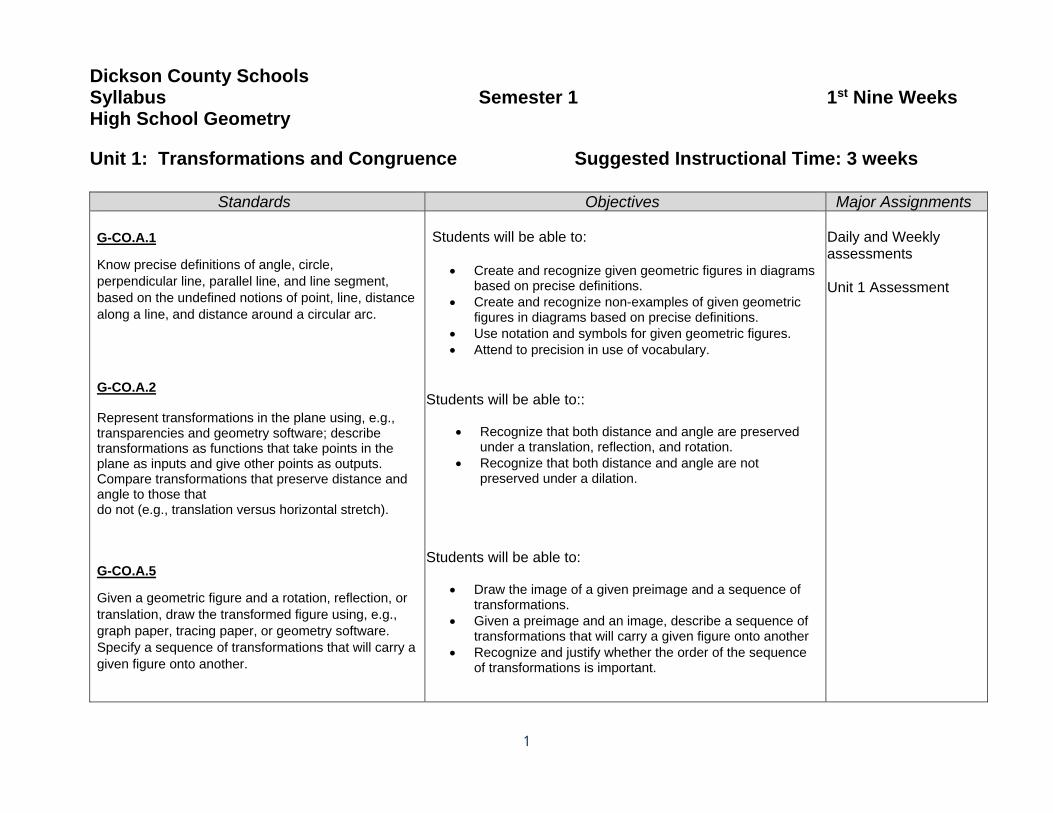
1
Dickson County Schools Syllabus Semester 1 1st Nine Weeks High School Geometry Unit 1: Transformations and Congruence Suggested Instructional Time: 3 weeks
Standards Objectives Major Assignments
G-CO.A.1
Know precise definitions of angle, circle, perpendicular line, parallel line, and line segment, based on the undefined notions of point, line, distance along a line, and distance around a circular arc.
G-CO.A.2 Represent transformations in the plane using, e.g., transparencies and geometry software; describe transformations as functions that take points in the plane as inputs and give other points as outputs. Compare transformations that preserve distance and angle to those that do not (e.g., translation versus horizontal stretch).
G-CO.A.5
Given a geometric figure and a rotation, reflection, or translation, draw the transformed figure using, e.g., graph paper, tracing paper, or geometry software. Specify a sequence of transformations that will carry a given figure onto another.
Students will be able to:
Create and recognize given geometric figures in diagrams
based on precise definitions. Create and recognize non-examples of given geometric
figures in diagrams based on precise definitions. Use notation and symbols for given geometric figures. Attend to precision in use of vocabulary.
Students will be able to::
Recognize that both distance and angle are preserved under a translation, reflection, and rotation.
Recognize that both distance and angle are not preserved under a dilation.
Students will be able to:
Draw the image of a given preimage and a sequence of transformations.
Given a preimage and an image, describe a sequence of transformations that will carry a given figure onto another
Recognize and justify whether the order of the sequence of transformations is important.
Daily and Weekly assessments Unit 1 Assessment

2
Standards Objectives Major Assignments
G-CO.D.12
Make formal geometric constructions with a variety of tools and methods (compass and straightedge, string, reflective devices, paper folding, dynamic geometric software, etc.). Copying a segment; copying an angle; bisecting a segment; bisecting an angle; constructing perpendicular lines, including the perpendicular bisector of a line segment; and constructing a line parallel to a given line through a point not on the line. G-CO.C.9
Prove theorems about lines and angles. Theorems include: vertical angles are congruent; when a transversal crosses parallel lines, alternate interior angles are congruent and corresponding angles are congruent; points on a perpendicular bisector of a line segment are exactly those equidistant from the segment’s endpoints.
G-CO.A.4
Develop definitions of rotations, reflections, and translations in terms of angles, circles, perpendicular lines, parallel lines, and line segments.
G-CO.A.3
Given a rectangle, parallelogram, trapezoid, or regular polygon, describe the rotations and reflections that carry it onto itself
Students will be able to:
Use appropriate tools strategically. Name pairs of angles, triangles, segments, arcs, and
other figures that are congruent as a result of a geometric construction.
Students will be able to:
Recognize a valid argument for proving theorems about lines and angles.
Recognize an invalid argument for proving theorems about lines and angles
Create a valid argument for proving theorems about lines and angles.
Students will be able to:
Recognize and create examples and non-examples of rotations, reflections, and translations based on precise definitions.
Use rotations, reflections, and translations in diagrams based on precise definitions.
Students will be able to:
Recognize that reflecting a figure about a line of symmetry for that figure will carry the figure onto itself.
Recognize that rotating a figure about its center by an angle of rotation that is a multiple of the measure of on of its central angles will carry the figure onto itself.

3
Standards Objectives Major Assignments G-CO.B.6
Use geometric descriptions of rigid motions to transform figures and to predict the effect of a given rigid motion on a given figure; given two figures, use the definition of congruence in terms of rigid motions to decide if they are congruent.
G-CO.B.7
Use the definition of congruence in terms of rigid motions to show that two triangles are congruent if and only if corresponding pairs of sides and corresponding pairs of angles are congruent.
Students will be able to:
Recognize whether 2 figures are congruent to each other.
Recognize the sequence of rigid motions that will map one figure onto another.
Students will be able to:
Recognize whether 2 figures are congruent to each other.
Recognize the sequence of rigid motions that will map one figure onto another figure
Recognize that corresponding pairs of sides and corresponding pairs of angles will be congruent when there is a rigid motion (or sequence of rigid motions) that maps one figure onto another figure
Unit 2: Lines, Angles, and Triangles Suggested Instructional Time: 6 weeks Standards Objectives Major Assignments G-CO.C.9
Prove theorems about lines and angles. Theorems include: vertical angles are congruent; when a transversal crosses parallel lines, alternate interior angles are congruent and corresponding angles are congruent; points on a perpendicular bisector of a line segment are exactly those equidistant from the segment’s endpoints.
Students will be able to:
Recognize a valid argument for proving theorems about lines and angles.
Recognize an invalid argument for proving theorems about lines and angles
Create a valid argument for proving theorems about lines and angles.
Daily and Weekly Assessments Unit 2 Assessment

4
Standards Objectives Major Assignments G-GPE.B.5
Prove the slope criteria for parallel and perpendicular lines and use them to solve geometric problems (e.g., find the equation of a line parallel or perpendicular to a given line that passes through a given point).
G-CO.B.7
Use the definition of congruence in terms of rigid motions to show that two triangles are congruent if and only if corresponding pairs of sides and corresponding pairs of angles are congruent.
G-CO.B.8
Explain how the criteria for triangle congruence (ASA, SAS, and SSS) follow from the definition of congruence in terms of rigid motions.
G-CO.C.10
Prove theorems about triangles. Theorems include: measures of interior angles of a triangle sum to 180°; base angles of isosceles triangles are congruent; the segment joining midpoints of two sides of a triangle is parallel to the third side and half the length; the medians of a triangle meet at a point.
Students will be able to:
Create a valid argument for why the slopes of perpendicular lines have a product of -1.
Use slope calculations to determine whether 2 lines are perpendicular
Write an equation of a line parallel of perpendicular to a given line that passes through a given point.
Students will be able to:
Recognize whether 2 figures are congruent to each other.
Recognize the sequence of rigid motions that will map one figure onto another figure.
Students will be able to:
Given 2 triangles that are congruent by ASA, SAS, SSS, AAS, show a sequence of rigid motions that maps one triangle onto the other triangle.
Students will be able to:
Recognize a valid argument for proving theorems about triangles.
Recognize an invalid argument for proving theorems about triangles.
Create a valid argument for proving theorems about triangles.

5
Standards Objectives Major Assignments
G-SRT.B.5 Use congruence and similarity criteria for triangles to solve problems and to prove relationships in geometric figures.
Students will be able to:
Calculate unknown measurements using know measurements and relationships among congruent and similar triangles.
Given a valid argument for calculating unknown measurements using known measurements and relationships among congruent and similar triangles.

6
Dickson County Schools Syllabus 2nd Nine Weeks High School Geometry Unit 3: Quadrilaterals and Coordinate Proof Suggested Instructional Time: 6 weeks
Standards Objectives Major Assignments G-C.A.3 Construct the inscribed and circumscribed circles of a triangle, and prove properties of angles for a quadrilateral inscribed in a circle. G-CO.C.11 Prove theorems about parallelograms. Theorems include: opposite sides are congruent, opposite angles are congruent, the diagonals of a parallelogram bisect each other, and conversely, rectangles are parallelograms with congruent diagonals. G-SRT.B.5 Use congruence and similarity criteria for triangles to solve problems and to prove relationships in geometric figures. G-GPE.B.4
Use coordinates to prove simple geometric theorems algebraically. For example, prove or disprove that a figure defined by four given points in the coordinate plane is a rectangle; prove or disprove that the point (1,√3) lies on the circle centered at the origin and containing the point (0, 2).
Students will be able to:
Use appropriate tools strategically. Name pairs of angles triangles, segments, arcs, and
other figures that are congruent as a result of a geometric construction
Students will be able to:
Recognize a valid argument for proving a valid argument for proving theorems about parallelograms
Students will be able to:
: Calculate unknown measurements using know
measurements and relationships among congruent and similar triangles.
Given a valid argument for calculating unknown measurements using known measurements and relationships among congruent and similar triangles.
Students will be able to:
Use slope calculations to determine whether 2 lines are parallel or perpendicular
Use distance calculations to determine whether 2 segments are congruent
Use midpoint calculations to determine whether a segment has
Daily and Weekly Assessments Unit 3 Assessment

7
Standards Objectives Major Assignments
G-GPE.B.5
Prove the slope criteria for parallel and perpendicular lines and use them to solve geometric problems (e.g., find the equation of a line parallel or perpendicular to a given line that passes through a given point). G-GPE.6 Find the point on a directed line segment between two given points that partitions the segment in a given ratio.
G-GPE.B.7
Use coordinates to compute perimeters of polygons and areas of triangles and rectangles, e.g., using the distance formula.★
Students will be able to:
Create a valid argument for why the slopes of perpendicular lines have a product of -1.
Use slope calculations to determine whether 2 lines are perpendicular
Write an equation of a line parallel of perpendicular to a given line that passes through a given point.
Students will be able to:
Look for and make use of structure, such as drawing similar slope triangles on directed line segment to set up a proportion with corresponding side lengths.
Students will be able to:
Calculate the perimeter of a polygon using the distance between 2 points
Calculate the area of a polygon by decomposing the polygon into triangles and rectangles.
Unit 4: Similarity Suggested Instructional Time: 3 weeks
Standards Objectives Major Assignments G-SRT.A.1ab
Verify experimentally the properties of dilations given by a center and a scale factor:
a. A dilation takes a line not passing through the center of the dilation to a parallel line, and leaves a line passing through the center unchanged.
b. The dilation of a line segment is longer or shorter in the ratio given by the scale factor.
Students will be able to:
Place points on the given line to dilate. The line that contains the images of the points on given line will be the image of the given line.
Daily and Weekly Assessments Unit 4 Assessment

8
Standards Objectives Major Assignments G-SRT.A.2
Given two figures, use the definition of similarity in terms of similarity transformations to decide if they are similar; explain using similarity transformations the meaning of similarity for triangles as the equality of all corresponding pairs of angles and the proportionality of all corresponding pairs of sides. G-SRT.A.3
Use the properties of similarity transformations to establish the AA criterion for two triangles to be similar. G-SRT.B.4 Prove theorems about triangles. Theorems include: a line parallel to one side of a triangle divides the other two proportionally, and conversely; the Pythagorean Theorem proved using triangle similarity. G-SRT.B.5 Use congruence and similarity criteria for triangles to solve problems and to prove relationships in geometric figures. G-SRT.B.6 Understand that by similarity, side ratios in right triangles are properties of the angles in the triangle, leading to definitions of trigonometric ratios for acute angles.
Students will be able to:
Given 2 figures, determine whether the figures are similar.
Given 2 similar figures, determine the sequence of rotations, reflections, translations, and dilations from which one figure can be obtained by the other figure
Students will be able to:
Given 2 triangles that are similar by AA, show a sequence of transformations by which one triangle can be obtain from the other triangle.
Students will be able to:
Recognize a valid argument for proving theorems about triangles
Recognize and create a valid argument for proving the Pythagorean Theorem using triangle similarity.
Students will be able to:
Calculate unknown measurements using known measurements and relationships among congruent and similar triangles.
Students will be able to:
Recognize the effects of changing the sides and angles of a right triangle on the sine, cosine, and tangent ratios.
Connect sine, cosine, and tangent with appropriate ratios for the acute angles in a right triangle.

9
Dickson County Schools Syllabus Semester 2 3rd Nine Weeks High School Geometry Unit 5: Trigonometry with Right Triangles Suggested Instructional Time: 6 weeks
Standards Objectives Major Assignments
G-SRT.C.6
Understand that by similarity, side ratios in right triangles are properties of the angles in the triangle, leading to definitions of trigonometric ratios for acute angles
G-SRT.C.7 Explain and use the relationship between the sine and cosine of complementary angles.
G-SRT.C.8 Use trigonometric ratios and the Pythagorean Theorem to solve right triangles in applied problems.
Students will be able to:
Recognize the effects of changing the sides and angles of a right triangle on the sine, cosine, and tangent ratios.
Connect sine, cosine, and tangent with appropriate ratios for the acute angles in a right triangle.
Students will be able to:
Create a valid argument for why the sine of one acute angle in a right triangle is equal to the cosine of the other acute angle in the right triangle.
Students will be able to:
Use the Pythagorean Theorem to calculate unknown measures when appropriate.
Select an appropriate trigonometric ratio using the acute angles in a right triangle to solve an applied problem.
Daily and Weekly assessments. Unit 5 Assessment
Unit 7: Measuring and Modeling in 2 and 3 Dimensions Suggested Instructional Time: 3 weeks
Standards Objectives Major Assignments G-GMD.A.1 Give an informal argument for the formulas for the circumference of a circle, area of a circle, volume of a cylinder, pyramid, and cone. Use dissection arguments, Cavalieri’s principle, and informal limit arguments.
Students will be able to: Recognize and create a valid argument for the
formulas for the volume of a cylinder, pyramid, and cone.
Daily and Weekly assessments.

10
Unit 7: Measuring and Modeling in 2 and 3 Dimension continued
Standards Objectives Major Assignments G-GMD.A.3 Use volume formulas for cylinders, pyramids, cones, and spheres to solve problems. G-GMD.B.4 Identify the shapes of two-dimensional cross-sections of three dimensional objects, and identify three-dimensional objects generated by rotations of two-dimensional objects. G-MG.A.1 Use geometric shapes, their measures, and their properties to describe objects (e.g., modeling a tree trunk or a human torso as a cylinder). G-MG.A.2 Apply concepts of density based on area and volume in modeling situations. G-MG.A.3 Apply geometric methods to solve design problems (e.g., designing an object or structure to satisfy physical constraints or minimize cost.)
Students will be able to:
Solve a volume formula for an unknown measure.
Students will be able to: Identify the shape of the 2-D cross section when a
3D object is sliced in different ways.
Students will be able to:
Represent real-world objects as geometric shapes Estimate measures of real-world objects by
calculating measures of the geometric shapes such as area and volume.
Students will be able to:
Calculate density in a real-world situation using area and volume.
Students will be able to:
Design an object to satisfy given constraints.
Unit 7 Assessment

11
Dickson County Schools Syllabus 4th Nine Weeks High School Geometry Unit 6: Properties of Circles Suggested Instructional Time: 6 weeks
Standards Objectives Major Assignments G-C.A.1 Prove that all circles are similar. G-C.A.2 Identify and describe relationships among inscribed angles, radii, and chords. Include the relationship between central, inscribed, and circumscribed angles; inscribed angles on a diameter are right angles; the radius of a circle is perpendicular to the tangent where the radius intersects the circle. G-C.A.3 Construct the inscribed and circumscribed circles of a triangle, and prove properties of angles for a quadrilateral inscribed in a circle. G-C.B.5 Derive using similarity the fact that the length of the arc intercepted by an angle is proportional to the radius, and define the radian measure of the angle as the constant of proportionality; derive the formula for the area of a sector. G-GMD.A.1 Give an informal argument for the formulas for the circumference of a circle, area of a circle, volume of a cylinder, pyramid, and cone. Use dissection arguments, Cavalieri’s principle, and informal limit arguments.
Students will be able to: Create a valid argument for proving that all
circles are similar. Students will be able to:
Calculate missing angle and/or arc measures for central angles, inscribed angles, and circumscribed angles.
Students will be able to:
Name pairs of angles, triangles, segments, arcs, and other figures that are congruent as a result of a geometric construction.
Calculate missing angle measures for a cyclic quadrilateral.
Students will be able to:
Calculate arc length and area of a sector. Given any 2 of the following measurements for a
sector, calculate the 3rd: arc length or area, angle measure, radius.
Students will be able to:
Recognize and create a valid argument for the formulas for the area and circumference of a circle.
Daily and Weekly Assessments Unit 6 Assessment The remaining time will be spent reviewing key topics
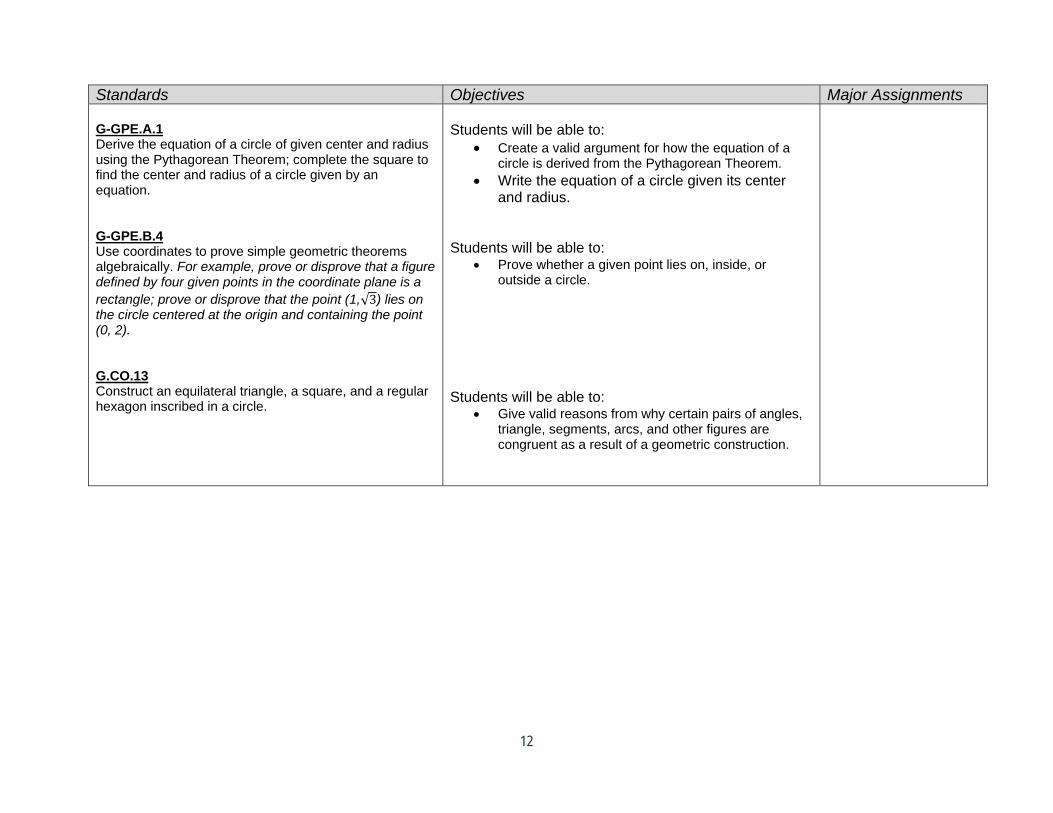
12
Standards Objectives Major Assignments G-GPE.A.1 Derive the equation of a circle of given center and radius using the Pythagorean Theorem; complete the square to find the center and radius of a circle given by an equation. G-GPE.B.4 Use coordinates to prove simple geometric theorems algebraically. For example, prove or disprove that a figure defined by four given points in the coordinate plane is a rectangle; prove or disprove that the point (1,√3) lies on the circle centered at the origin and containing the point (0, 2). G.CO.13 Construct an equilateral triangle, a square, and a regular hexagon inscribed in a circle.
Students will be able to:
Create a valid argument for how the equation of a circle is derived from the Pythagorean Theorem.
Write the equation of a circle given its center and radius.
Students will be able to:
Prove whether a given point lies on, inside, or outside a circle.
Students will be able to:
Give valid reasons from why certain pairs of angles, triangle, segments, arcs, and other figures are congruent as a result of a geometric construction.

1
Dickson County Schools Syllabus -- Precalculus Honors
1st Nine Weeks Standards Objectives Major
Assignments
A-REI.3: Solve nonlinear inequalities by graphing (solutions in interval notation if one-variable), by hand and with appropriate technology F-IF.5: Identify characteristics of graphs based on a set of conditions or on a general equation F-BF.4: Construct the difference quotient for a given function and simplify the resulting expression. F-IF.1: Determine whether a function is even, odd, or neither F-BF.1: Understand how the algebraic properties of an equation transform the geometric properties of its graph F-BF.2: Develop an understanding of functions as elements that can be operated upon to get new functions: addition, subtraction, multiplication, division, and composition of functions F-BF.3: Compose functions F-BF.5: Find inverse functions F-BF.5a: Calculate the inverse of a function, f(x), with respect to each of the functional operations; in other words, the additive inverse, -f(x), the multiplicative inverse, 1/f(x), and the inverse with respect to composition, f-1(x). Understand the graphical implication of each type. F-BF.5b: Verify by composition that one function is the inverse of another F-BF.5c: Read values of an inverse function from a graph or a table, given the function has an inverse F-BF.5d: Recognize a function is invertible if and only if it is one-to-one. Produce an invertible function from a non-invertible function by restricting the domain F-BF.6: Explain why the graph of a function and its inverse are reflections of one another over the line y = x S-MD.1: Create scatter plots, analyze patterns and describe relationships for bivariate data (linear, polynomial, trigonometric or exponential) to model real-world phenomena and to make predictions S-MD.2: Determine a regression equation to model a set of bivariate data. Justify why this equation best fits the data
The student will be able to:
Find the slopes of lines Write linear equations given points on lines and their
slopes Use slope-intercept forms of linear equations to sketch
lines Use slope to identify parallel and perpendicular lines Use function notation and evaluate functions Find the domains of functions use functions to model
real-life problems Evaluate difference quotients Find the domains and ranges of functions Use the Vertical Line Test for functions Determine intervals on which functions are
increasing, decreasing, or constant Determine relative extra and associated values of
functions Identify and graph step functions and piecewise
functions Identify even and odd functions Recognize graphs of parent functions Use rigid and non-rigid transformations of parent
graphs to sketch new graphs Use the operations add, subtract, multiply, divide, and
composition on functions Use composition of functions to model and solve real-
life problems Find inverse functions algebraically and graphically Determine whether functions are one-to-one Construct scatter plots and interpret correlation Use scatter plots and a graphing utility to find linear
Daily and weekly assessments
Unit assessments
One project embedded within the nine weeks

2
S-MD.3: Use a regression equation modeling bivariate data to make predictions. Identify possible considerations regarding the accuracy of predictions when interpolating or extrapolating. F-IF.5: Identify the characteristics of graphs based on a set of conditions or on a general equation such as y = ax2 + c F-IF.3: Identify or analyze the distinguishing properties of exponential, polynomial, logarithmic, trigonometric, and rational functions from tables, graphs, and equations F-IF.6: Visually locate critical points on the graphs of functions and determine if each critical point is a minimum, a maximum, or a point of inflection. Describe intervals where the function is increasing or decreasing and where different types of concavity occur F-IF.4: Identify the real zeros of a function and explain the relationship between the real zeros and the x-intercept of the graph of a function. N-CN.1: Perform arithmetic operations with complex numbers expressing answers in the form a + bi N-CN.4: Represent addition, subtraction, multiplication, and conjugation of complex numbers geometrically on the complex plane; use properties of this representation for computation N-CN.2: Find the conjugate of a complex number; use conjugates to find moduli and quotients of complex numbers N-CN.6: Extend polynomial identities to the complex numbers N-CN.7: Know the Fundamental Theorem of Algebra; show that it is true for quadratic polynomials N-NE.4: Simplify complex radical and rational expressions; discuss and display understanding that rational numbers are dense in the real numbers and the integers are not N-NE.5: Understand that rational expressions form a system analogous to the rational numbers F-IF.7: Graph rational functions, identifying zeros, asymptotes (including slant), and holes (when suitable factorizations are available) and showing end-behavior F-IF.4: Identify the real zeros of a function and explain the relationship between the real zeros and the x-intercepts of the graph of a function (exponential, polynomial, logarithmic, trigonometric, and rational) F-IF.2: Analyze qualities of exponential, polynomial, logarithmic, trigonometric, and rational functions and solve real world problems that can be modeled with these functions (by hand and with appropriate technology)
models for data Analyze graphs of quadratic functions Write quadratic functions in standard form and use
this model to sketch the graphs Find minimum and maximum values of quadratic
functions of real-life problems Use transformations to sketch graphs of polynomial
functions Use the Leading Coefficient Test to determine the end
behavior of graphs of polynomial functions Find and use zeros of polynomial functions as
sketching aids Use the Intermediate Value Theorem to help locate
zeros of polynomials functions Use long division and synthetic division to divide
polynomials Use the Remainder and Factor Theorems Use the Rational Zero Test to determine possible
rational zeros of polynomial functions Use DeCartes’s Rule of Signs to help find zeros of
polynomials Use the imaginary number, i, with the operations of
adding, subtracting, and multiplying Use complex conjugates to write the quotient of 2
complex numbers in standard form Find complex solutions of quadratic functions Use the Fundamental Theorem of Algebra to
determine the number of zeros of a polynomial function
Find all zeros of polynomial functions Find conjugate pairs of complex zeros Find zeros of polynomials by factoring Find the domain, and vertical and horizontal
asymptotes of rational functions Use rational functions to model and solve real-life
problems Analyze and sketch the graph of rational functions,
including slant asymptotes Use graphs of rational functions to model and solve
real-life problems Use scatter plots and a graphing utility to find
quadratic models for data and a model that best fits

3
the data
2nd Nine Weeks
Standards Objectives Major Assignments
N-NE.3: Classify real numbers and order real numbers that include transcendental expressions, including roots and fractions of pi and e F-IF.3: Identify or analyze the distinguishing properties of exponential, polynomial, logarithmic, trigonometric and rational functions from tables, graphs, and equations F-BF.5: Find inverse functions (including exponential, logarithmic, and trigonometric) N-NE.1: Use the laws of exponents and logarithms to expand or collect terms in expressions; simplify expressions or modify them in order to analyze them or compare them N-NE.2: Understand the inverse relationship between exponents and logarithms and use this relationship to solve problems involving logarithms and exponents A-REI.4: Solve systems of nonlinear inequalities by graphing by graphing A-REI.1: Represent a system of linear equations as a single matrix equation in a vector variable N-VM.12: Multiply a vector (regarded as a matrix with one column) by a matrix of suitable dimensions to produce another vector N-VM.12: Multiply a vector (regarded as a matrix with one column) by a matrix of suitable dimensions to produce another vector. Work with matrices as transformations of vectors N-VM.7: Use matrices to represent and manipulate data, e.g., to represent payoffs or incidence relationships in a network N-VM.8: Multiply matrices by scalars to produce new matrices, e.g., as when all of the payoffs in a game are doubled N-VM.9: Add, subtract, and multiply matrices of appropriate dimensions N-VM.10: Understand that, unlike multiplication of numbers, matrix multiplication for square matrices is not a commutative operation, but still satisfies the associative and distributive properties N-VM.11: Understand that the zero and identity matrices play a role in matrix addition and multiplication similar to the role of 0 and 1 in the real numbers. The determinant of a square matrix is nonzero if and only if the matrix has a multiplicative inverse A-REI.2: Find the inverse of a matrix if it exists and use it to solve
The student will be able to:
Recognize, evaluate, and graph exponential functions with base a and base e
Use exponential functions to model and solve real-life problems
Recognize, evaluate, and graph logarithmic functions with base a and base e
Use logarithmic functions to model and solve real-life problems
Rewrite logarithms with different bases Use properties of logarithms to expand, condense, or
evaluate logarithmic expressions Use logarithmic functions to model and solve real-
life problems Solve both simple and complicated exponential
equations Solve both simple and complicated logarithmic
equations Use exponential and logarithmic equations to model
and solve real-life problems Recognize the five most common types of models
involving exponential or logarithmic function’s Use exponential growth and decay functions to
model and solve real-life problems Use Gaussian functions to model and solve real-life
problems Use logistic growth functions to model and solve
real-life problems Use logarithmic functions to model and solve real-
life problems Use scatter plots and a graphing utility to find
exponential and logistic models that best fit the data Use methods of substitution and graphing to solve
Daily and
weekly assessments
Unit assessments
One project embedded within the nine weeks

4
systems of linear equations (using technology for matrices of dimension 3x3 or greater) N-VM.13: Work with 2x2 matrices as transformations of the plane, and interpret the absolute value of the determinant in terms of area A-S.1: Demonstrate an understanding of sequences by representing them recursively and explicitly A-S.2: Use sigma notation to represent a series; expand and collect expressions in both finite and infinite settings A-S.4: Understand that series represent the approximation of a number when truncated; estimate truncation error in specific examples A-S.3a: Determine whether a given arithmetic or geometric series converges or diverges A-S.3b: Find the sum of a given geometric series (both infinite and finite) A-S.5: Know and apply the Binomial Theorem for the expansion of (x + y)n in powers of x and y for a positive integer n, where x and y are any numbers, with coefficients determined, for example, by Pascal’s Triangle
systems of equations in two variables Use systems of equations to model and solve real-life
problems Use the Elimination Method to solve systems of
linear equations in 2 variables Graphically interpret the number of solutions of a
system of linear equations in 2 variables Solve nonsquare systems of linear equations Graphically interpret three-variable linear systems Use systems of linear equations in 3 or more
variables to model and solve real-life problems Write matrices and identify their dimensions Perform elementary row operations on matrices Use Gaussian and Gauss-Jordan elimination to solve
systems of linear equations Using matrices, decide equality and perform the
operations of addition, subtraction, multiplication, and scalar multiplication
Use matrix operations to model and solve real-life problems
Verify that 2 matrices are inverses of each other Use Gauss-Jordan elimination to find inverses of
matrices Use a formula to find the inverse of a 2x2 matrix Use inverse matrices to solve systems of linear
equations Find the determinant of a square matrix Use determinants to find areas of triangles and to
decide whether points are collinear Use Cramer’s Rule to solve systems of linear
equations Use matrices to encode and decode messages

5
3rd Nine Weeks
Standards Objectives Major
Assignments F-TF.1: Convert from radians to degrees and from degrees to radians G-AT.3: Derive and apply the formulas for the area of a sector or of a circle G-AT.4: Calculate the arc length of a circle subtended by a central angle F-TF.3: Use the unit circle to explain symmetry (odd and even) and periodicity of trigonometric functions F-TF.2: Use special triangles to determine geometrically the values of sine, cosine, and tangent for π /3, π /4, and π /6 and use the unit circle to express the values of sine, cosine, and tangent for π – x, π + x, and 2π – x in terms of their values for x, where x is any real number G-AT.1: Use the definitions of the six trigonometric ratios as ratios of sides in a right triangle to solve problems about length of sides and measures of angles F-FT.1: Interpret transformations of trigonometric functions F-GT.2: Determine the difference made by choice of units for angle measurement when graphing a trig function F-GT.3: Graph the six trig functions and identify characteristics such as period, amplitude, phase shift, and asymptotes F-GT.4: Find values of inverse trig expressions (including compositions), applying appropriate domain and range restrictions F-GT.5: Understand that restricting a trig function to a domain on which it is always increasing or always decreasing allows its inverse to be constructed F-GT.6: Determine the appropriate domain and corresponding range for each of the inverse trig functions F-GT.7: Graph the inverse trig functions and identify their key characteristics F-GT.8: Use inverse functions to solve trig equations that arise in modeling contexts; evaluate the solutions using technology, and interpret them in terms of context G-TI.1: Apply trigonometric identities to verify identities and solve equations. Identities include: Pythagorean, reciprocal, quotient, sum/difference, double-angle, and half-angle G-TI.2: Prove the addition and subtraction formulas for sine, cosine and tangent and use them to solve problems G-AT.2: Derive the formula A = ½ ab sin(C) for the area of a triangle by
The student will be able to: Describe angles in both radian and degree measure Convert between radian and degree measure Use angles to model and solve real-life problems Identify a unit circle and describe its relationship to
real numbers Evaluate trig functions using the unit circle Use domain and period to evaluate sine and cosine
functions and use a calculator to evaluate trig functions
Use the fundamental trig identities Use trig functions to model and solve real-life
problems Find reference angles Evaluate frig functions of any angle Evaluate trig functions of real numbers Sketch the basic graphs of all six trig functions Use amplitude and period to help sketch the trig
graphs when appropriate Sketch translations of the basic trig graphs Use sine and cosine functions to model and solve
real-life problems Evaluate and graph the inverse trig functions Solve real-life problems involving right triangles and
directional bearings Use the fundamental trig identities to evaluate
simplify and rewrite trig expressions Verify trig identities Use standard algebraic techniques to solve trig
equations Solve trig equations of quadratic type Use inverse trig functions to solve trig equations Use the sum and difference formulas, the multiple-
angle formulas, the half-angle formulas, and the product-to sum and sum-to product formulas to
Daily and
weekly assessments
Unit assessments
One project embedded within the nine weeks

6
drawing an auxiliary line from a vertex perpendicular to the opposite side G-AT.5: Prove the Laws of Sines and Cosines and use them to solve problems G-AT.6: Understand and apply the Law of Sines (including ambiguous case) and the Law of Cosines to find unknown measurements in right and non-right triangles (e.g., surveying problems, resultant forces)
evaluate trig functions, verify trig identities, and solve trig equations
Use the Law of Sines and the Law of Cosines to solve oblique triangles
Find the area of oblique triangles use the Law of Sines and the Law of Cosines to model and solve real-life problems
Use Heron’s Are Formula to find areas of triangles
4th Nine Weeks
Standards Objectives Major Assignments
N-VM.1: Recognize vector quantities as having both magnitude and direction. Represent vector quantities by directed line segments, and use appropriate symbols for vectors and their magnitudes N-VM.2: Find the components of a vector by subtracting the coordinates of an initial point from the coordinates of a terminal point N-VM.3: Solve problems involving velocity and other quantities that can be represented by vectors N-VM.4a: Add vectors end-to end, component-wise, and by the parallelogram rule. Understand that the magnitude of a sum of two vectors is typically not the sum of the magnitudes N-VM.4b: Given two vectors in magnitude and direction form, determine the magnitude and direction of their sum N-VM.4c: Understand vector subtraction v - w as v + (-w), where –w is the additive inverse of w, with the same magnitude as w and pointing in the opposite direction. Represent vector subtraction graphically by connecting the tips in the appropriate order, and perform vector subtraction component-wise N-VM.5a: Represent scalar multiplication graphically by scaling vectors and possibly reversing their direction; perform scalar multiplication component-wise N-VM.5b: Compute the magnitude of a scalar multiple cv using ||cv|| = |c|v. Compute the direction of cv knowing that when |c|v ≠ 0, the direction of cv is either along v (for c 0) or against v ( for c < 0) N-VM.6: Calculate and interpret the dot product of two
The student will be able to: Represent vectors as directed line segments Write the component form of vectors Perform basic vector operations and represent vectors
graphically Write vectors as linear combinations of the unit vectors Find the direction of angles of vectors Use vectors to model and solve real-life problems Find the dot product of vectors Find the angle between two vectors and determine whether the
vectors are orthogonal Write vectors as the sums of two vector components Use vectors to find the work done by a force Plot complex numbers in the complex plan and find absolute
values of complex numbers Write trig forms of complex numbers Multiply and divide complex numbers written in trig form Use DeMoivre’s Theorem to find powers of complex numbers Find nth roots of complex numbers Recognize the conic as the intersection of a plane and a double-
napped cone Write equations of circles, parabolas, ellipses, and hyperbolas
in standard form and graph them Use the reflective property of parabolas to model and solve
real-life problems
Daily and
weekly assessments
Unit assessments
One project embedded within the nine weeks

7
vectors N-CN.3: Represent complex numbers on the complex plane in rectangular and polar form and explain why the rectangular and polar forms of a given complex number represent the same number N-CN.6: Calculate the distance between numbers in the complex plane as the modulus of the difference, and the midpoint of a segment as the average of the numbers at its endpoints A-C.1: Display all of the conic sections as portions of a cone A-C.3: From an equation in standard form, graph the appropriate conic section: ellipses, hyperbolas, circles, and parabolas. Demonstrate an understanding of the relationship between their standard algebraic form and the graphical characteristics A-C.4: Transform equations of conic sections to convert between general and standard form A-C.2: Derive the equations of ellipses and hyperbolas given the foci, using the fact that the sum or difference of distances from the foci is constant A-PE.1: Graphs curves parametrically (by hand or with appropriate technology) A-PE.2: Eliminate parameters by rewriting parametric equations as a single equation G-PC.1: Graph functions in polar coordinates G-PC.2: Convert between rectangular and polar coordinates G-PC.3: Represent situations and solve problems involving polar coordinates
Find eccentricities of ellipses Find asymptotes of hyperbolas as an aid to sketching the graph Use properties of hyperbolas to model and solve real-life
problems Classify conics from their general equation form Plot points and find multiple representations of points in polar
coordinate systems Convert points from rectangular to polar form and vice versa Convert equations from rectangular to polar form and vice
versa

1
Dickson County Schools Syllabus -- Statistics Honors
1st Nine Weeks
Standards Objectives Major Assignments Interpreting Categorical and Quantitative Data (S-ID)
Understand, represent, and use univariate data 1. Understand the term 'variable' and differentiate between the data types: measurement, categorical, univariate and bivariate. 2. Understand histograms, parallel box plots, and scatterplots, and use them to display and compare data. 3. Summarize distributions of univariate data. 4. Compute basic statistics and understand the distinction between a statistic and a parameter. 5. For univariate measurement data, be able to display the distribution, describe its shape; select and calculate summary statistics. 6. Recognize how linear transformations of univariate data affect shape, center, and spread. 7. Analyze the effect of changing units on summary measures. 8. Construct and analyze frequency tables and bar charts. 9. Describe individual performances in terms of percentiles, z-scores, and t- scores. Probability Distributions Using Probability to Make Decisions (S-MD) Understand the normal probability distribution 10. Calculate the mean (expected value) and standard deviation of both a random variable and a linear transformation of a random variable. 11. Use the mean and standard deviation of a data set to fit it to a normal distribution and to estimate population percentages. Recognize that there are data sets for which such a procedure is not appropriate. Use calculators, spreadsheets, and tables to estimate areas under the normal curve. Making Inferences and Justifying Conclusions (S-IC) Know the characteristics of well-designed studies. 1. Understand the differences among various kinds of studies and which types of inferences can be legitimately drawn from each. 2. Compare census, sample survey, experiment, and observational study. 3. Describe the role of randomization in surveys and experiments. 4. Demonstrate an understanding of bias in sampling. Design and conduct a statistical experiment to study a problem, then interpret and communicate the outcomes. 7. Select a method to collect data and plan and conduct surveys and experiments.
The student will be able to:
Differentiate between the two branches of statistics
Demonstrate knowledge of statistical terms
Identify types of data Identify the measurement level for each
variable Identify the four basic sampling
techniques Explain the difference between an
observational and experimental study Explain how statistics can be used and
misused Explain the importance of computers and
calculators in statistics Organize data using a frequency
distribution Represent frequency distributions
graphically using histograms, frequency polygons, bar graphs, time series, dot plots, ogives, stem and leaf charts, pie charts, and Pareto charts.
Summarize data using measures of central tendency and measures of variation
Identify the position of a data value in a data set using percentiles, deciles, and quartiles
Daily and weekly formative assessments;
Unit assessments
One project embedded within the nine weeks

2
8. Compare and use sampling methods, including simple random sampling, stratified random sampling, and cluster sampling. 10. Analyze results and make conclusions from observational studies, experiments, and surveys. 11. Evaluate reports based on data.
2nd Nine Weeks
Standards Objectives Major Assignments Probability Conditional Probability and the Rules of Probability (S-CP) Understand and apply the basic concepts of probability
1. Describe events as subsets of a sample space (the set of outcomes) using characteristicsevents (“or,” “and,” “not”). 2. Use permutations and combinations to compute probabilities of compound events and s3. Demonstrate an understanding of the Law of Large Numbers (Strong and Weak).
Use the rule of probability to compute probabilities of compound events in a uniform probability model 4. Demonstrate an understanding of the addition rule, the multiplication rule conditional probability, and independence. 5. Apply the general Multiplication Rule in a uniform probability model, P(A and B) = P(A)P(B|A) = P(B)P(A|B), and interpret the answer in terms of the model.
Probability Distributions Using Probability to Make Decisions (S-MD) Understand and use discrete probability distributions. 1. Define a random variable for a quantity of interest by assigning a numerical value to each event in a sample space; graph the corresponding probability distribution using the same graphical displays as for data distributions. 2. Calculate the expected value of a random variable; interpret it as the mean of the probability distribution. 3. Design a simulation of random behavior and probability distributions. 4. Analyze discrete random variables and their probability distributions, including binomial and geometric. 5. Develop a probability distribution for a random variable defined for a sample space in which theoretical probabilities can be calculated; find the expected value. 6. Develop a probability distribution for a random variable defined for a sample space in which probabilities are assigned empirically; find the expected value. 7. Weigh the possible outcomes of a decision by assigning probabilities to payoff values and finding expected values. a. Find the expected payoff for a game of chance.
The student will be able to: Determine the sample spaces, and find
the probability of an event, using classical probability or empirical probability
Find the probability of compound events using addition rules
Find the probability of compound events using the multiplication rules
Find the conditional probability of an event
Find the total number of outcomes in a sequence of events, using the fundamental counting rule
Find the number of ways that r objects can be selected from n objects, using the permutation rule
Find the number of ways that r objects can be selected from n objects without regard to order, using the combination rule
Find the probability of an event using the counting rules
Construct a probability distribution for a random variable
Find the mean, variance, standard deviation, and expected value for a discrete random variable
Find the exact probability for x successes in n trials of a binomial experiment
Daily and weekly formative assessments
Unit assessments
One project embedded within the nine weeks

3
b. Evaluate and compare strategies on the basis of expected values. 8. Use probabilities to make fair decisions (e.g., drawing by lots, using a random number generator). 9. Analyze decisions and strategies using probability concepts (e.g., product testing, medical testing, pulling a hockey goalie at the end of a game).
Sampling and Experimentation Making Inferences and Justifying Conclusions (S-IC) Know the characteristics of well-designed studies. 5. Describe the sampling distribution of a statistic and define the standard error of a statistic. 6. Demonstrate an understanding of the Central Limit Theorem. Use distributions to make inferences about a data set. 18. Apply the properties of the normal distribution in appropriate situations in order to make inferences about a data set.
Find the mean, variance, and standard deviation for the variable of a binomial distribution
Find the probabilities for outcomes of variables using the Poisson and geometric distributions
Identify the properties of a normal distribution
Find the area under the standard normal curve given various z-values
Find specific data values for given percentages
Use the Central Limit Theorem to solve problems involving sample means
Use the normal approximation to compute probabilities for a binomial variable
3rd Nine Weeks Standards Objectives Major Assignments
Exploring Data Interpreting Categorical and Quantitative Data (S-ID)
Understand, represent, and use bivariate data 10. Explore categorical data. 11. Display and discuss bivariate data where at least one variable is categorical. 12. For bivariate measurement data, be able to display a scatterplot and describe its shape; use technological tools to determine regression equations and correlation coefficients. 13. Identify trends in bivariate data; find functions that model the data and that transform the data so that they can be modeled.
Sampling and Experimentation Making Inferences and Justifying Conclusions (S-IC)
Design and conduct a statistical experiment to study a problem, then interpret and communicate the outcomes. 9. Test hypotheses using appropriate statistics. Make inferences about population parameters based on a random sample from that population. 12. Develop and evaluate inferences and predictions that are based on data. 13. Use properties of point estimators, including biased/unbiased, and variability. Understand and use confidence intervals.
The student will be able to: Find the confidence interval for the
mean when sigma is known Find the confidence interval for the
mean when sigma is unknown Find the confidence interval for a
proportion Determine the minimum sample size for
finding a confidence interval for a proportion
Find the confidence interval for a variance and a standard deviation
Understand the definitions used in hypothesis testing
State the null and alternative hypothesis Find the critical value for the z test Test means when sigma is known and
unknown suing the z-test and the t-test Test proportions using the z-test Test variances or standard deviations
using the chi-square tests
Daily and weekly formative assessments
Unit assessments
One project embedded within the nine weeks

4
14. Understand the meaning of confidence level, of confidence intervals, and the properties of confidence intervals. 15. Construct and interpret a large sample confidence interval for a proportion and for a difference between two proportions. 16. Construct the confidence interval for a mean and for a difference between two means. Use distributions to make inferences about a data set. 17. Apply the properties of a Chi-square distribution in appropriate situations in order to make inferences about a data set. 18. Apply the properties of the normal distribution in appropriate situations in order to make inferences about a data set. 19. Interpret the t-distribution and determine the appropriate degrees of freedom.
Test hypotheses using confidence intervals
Explain the relationship between type I and type II errors
Test the difference between sample means
Test the difference between two means for independent samples using the t-test
Test the difference between two means for the dependent samples
4th Nine Weeks Standards Objectives Major Assignments
Exploring Data Interpreting Categorical and Quantitative Data (S-ID)
Understand, represent, and use bivariate data 10. Explore categorical data. 11. Display and discuss bivariate data where at least one variable is categorical. 12. For bivariate measurement data, be able to display a scatterplot and describe its shape; use technological tools to determine regression equations and correlation coefficients. 13. Identify trends in bivariate data; find functions that model the data and that transform the data so that they can be modeled Use distributions to make inferences about a data set. 17. Apply the properties of a Chi-square distribution in appropriate situations in order to make inferences about a data set.
The student will be able to:
Test the difference between proportions Test the difference between two
variances or standard deviations Draw a scatter plot for a set of ordered
pairs Compute the correlation coefficient Test the hypothesis when rho equals
zero Compute the equation of the regression
line Test a distribution for goodness of fit
using chi-square Test two variables for independence
using chi-square
Daily and weekly formative assessments;
Unit assessments
One project embedded within the nine weeks

1
Dickson County Schools Syllabus Bridge Mathematics
1st Nine Weeks: Numbers, Functions Standards Objectives Major Assignments W‐SM.1 Develop a thorough understanding of both rational and irrational numbers: make both historical and concrete connections between irrational numbers and the real world W‐NM.1 Understand that there are numbers that are not rational numbers, called irrational numbers, e.g., ∏, ℮, and √2, which together with the rational numbers form the real number system that satisfies the laws of arithmetic. W‐NM.2 Apply and use elementary number concepts and number properties to model and solve non‐routine problems that involve new ideas. M‐SV.1 Explain, solve, and/or draw conclusions for complex problems using relationships and elementary number concepts M‐SV.2 Solve simple rational and radical equations in one variable, noting and explaining extraneous solutions. W‐VM.6 Use mathematical grammar and appropriate mathematical symbols to represent contextual situations W‐SM.3 Use mathematical symbols and variables to express a relationship between quantities W‐SM.4 Model a variety of problem situations with expressions
**The way the standards are written are the objectives. Below are objectives based on ACT Standards. NCP: 201 Recognize equivalent fractions and fractions in lowest terms BOA: 301 Solve routine one‐step arithmetic problems (using ...fractions...) 302 Solve some routine two‐step arithmetic problems NCP: 505 Work with squares and square roots of numbers 507 Work with cubes and cube roots of numbers GRE: 704 Analyze and draw conclusions based on information from graphs in the coordinate plane XEI: 504 Add, subtract, and multiply polynomials 405 Multiply two binomials 604 Solve absolute value equations 703 Solve simple absolute value inequalities FUN: 501 Evaluate polynomial functions, expressed in function notation, at integer values
Daily and Weekly Formative Assessments Unit Assessments

2
W‐SM.7 Perform polynomial arithmetic, including addition, subtraction, multiplying, dividing, factoring, and simplifying results. M‐SV.1 Explain, solve, and/or draw conclusions for complex problems using relationships and elementary number concepts W‐VM.5 Multiply, divide, and simplify radicals. W‐SM.8 Demonstrate fluency with techniques needed to simplify radical expressions and calculate with them, including addition, subtraction, and multiplication. W‐SM.9 Rationalize denominators in order to perform division with radicals W‐GM.5 Operate (add, subtract, multiply, divide, simplify, powers) with radicals and radical expressions including radicands involving rational numbers and algebraic expressions M‐SV.2 Solve simple rational and radical equations in one variable, noting and explaining extraneous solutions.
NCP: 401 Exhibit knowledge of elementary number concepts including...absolute value 506 Work problems involving positive integer exponents 604 Apply rules of exponents NCP: 505 Work with squares and square roots of numbers
2nd Nine Weeks: Geometry and Trigonometry, Probability, Ratios & Proportions
Standards Objectives Major Assignments W‐GM.9 Use algebra and geometry to solve problems involving midpoints and distances (i.e. geometric figures). A‐AG.2 Solve problems involving finding missing dimensions given area or perimeter of the figure. W‐DM.5 Apply a variety of strategies to determine the circumference and the area for circles
BOA: 203 Perform common conversions (e.g., in to ft or hr to min) 501 Solve multi‐step arithmetic problems that involve planning or converting units of measure (e.g., ft/sec to mph)
Daily and Weekly Formative Assessments Unit Assessments

3
W‐DM.6 Investigate the area of a sector and the arc length of a circle. A‐AG.3 Solve problems involving surface areas and volumes of 3‐dimensional figures, including maximization, scale, and increment problems. W‐VM.4 Describe, compare, and contrast plane and solid figures using their attributes. M‐SD.4 Investigate the properties of plane figures, developing precise mathematical descriptions of geometric shapes, both in the plane and in space. W‐DM.4 Compute the perimeter of simple composite geometric figures with unknown side lengths. M‐SD.5 Apply a variety of strategies using relationships between perimeter, area, and volume to calculate desired measures in composite figures. W‐VM.1 Understand that a line parallel to one side of a triangle divides the other two proportionally, and conversely. W‐VM.2 Apply similar triangles to solve problems, such as finding heights and distances. W‐VM.3 Use several angle properties to find an unknown angle measure (i.e. supplementary, complementary, vertical, angles along a transversal, and sum of angles in a polygon). A‐AG.1 Solve problems involving ratios in geometric settings, such as similar figures and right triangle distance problems. A‐AG.4 Solve problems involving angles of elevation and angles of declination. M‐NG.7 Apply special right‐triangle properties and the Pythagorean Theorem to solve congruent, similar shape, and contextual problems.
MEA: 601 Use relationships involving area, perimeter, and volume of geometric figures to compute another measure ** may need to re‐visit some of the following: MEA 302, 401, 402, 501, 502, 503 PPF: 501 Use several angle properties to find an unknown angle measure **may need to re‐visit some of the following: PPF 301, 401, 402 703 Use relationships among angles, arcs, and distances in a circle FUN: 602 Apply basic trigonometric ratios to solve right‐triangle problems 702 Use trigonometric concepts and basic identities to solve problems 502 Express the sine, cosine, and tangent of an angle in a right triangle as a ratio of given side lengths 704 Match graphs of basic trigonometric functions with their equations
PPF: 602 Use the Pythagorean Theorem (Review PPF 502 if needed.) 502 Express the sine, cosine, and tangent of an angle in a right triangle as a ratio of given side lengths 704 Match graphs of basic trigonometric functions with their equations

4
M‐SG.3 Relate the basic definitions of the trigonometric ratios to the right triangle. M‐NG.7 Apply special right‐triangle properties and the Pythagorean Theorem to solve congruent, similar shape, and contextual problems. A‐AG.1 Solve problems involving ratios in geometric settings, such as similar figures and right triangle distance problems. M‐SG.3 Relate the basic definitions of the trigonometric ratios to the right triangle. M‐SG.4 Identify the graphs of basic trigonometric functions and shifts of those graphs. A‐AG.4 Solve problems involving angles of elevation and angles of declination. M‐ND.1 Understand and use basic counting techniques in contextual settings. M‐ND.2 Use counting techniques to calculate probabilities for conditional and independent events. A‐AD.3 Solve problems involving geometric probabilities. W‐NM.4 Find the probability of simple events, disjoint events, compound events, and independent events in a variety of settings using a variety of counting techniques. M‐ND.3 Compare a theoretical probability model to an experimental probability model for the same process. M‐ND.2 Use counting techniques to calculate probabilities for conditional and independent events. M‐SV.3 Write ratios, proportions, and solve proportions in a contextual setting for an unknown value.
FUN: 602 Apply basic trigonometric ratios to solve right‐triangle problems 702 Use trigonometric concepts and basic identities to solve problems 704 Match graphs of basic trigonometric functions with their equations PSD: 603 Apply counting techniques 604 Compute a probability when the event and/or sample space are not given or obvious 703 Exhibit knowledge of conditional and joint probability BOA: 401 Solve routine 2‐step or 3‐step arithmetic problems involving concepts such as rate & proportion, tax added, percentage off, & computing with a given average 601 Solve word problems containing several rates, proportions, or percentages 701 Solve complex arithmetic problems involving percent of increase or decrease and problems requiring integration of several concepts from pre‐algebra and/or pre‐geometry

5
A‐AN.2 Solve problems involving percent of increase or decrease, for example mark‐ups and mark‐downs. A‐AF.2 Solve problems involving direct and inverse variations, such as frequency, interest, and pressure. A‐AF.3 Solve problems involving systems of equations such as mixture problems.
3rd Nine Weeks: Linear Functions & Inequalities, Polynomial & Non-Polynomial Functions Standards Objectives Major Assignments W‐DM.3 Given an equation of a line, write an accurate definition of a line by determining the unique characteristics that define it (i.e. slope and intercepts). M‐NG.1 Given a variety of appropriate information, determine the equation of a line. W‐GM.1 Understand that a linear function models a situation in which a quantity changes at a constant rate, m, relative to another W‐NM.3 Determine if a data set represents a line through numerically analyzing slope calculations. If appropriate, interpret the slope in terms of a rate. W‐GM.8 Analyze data to make predictions based on an understanding of the data set, for example, use a scatter‐plot to determine if a linear relationship exists and describe the association between the variables. M‐NG.2 Use appropriate technology to generate the equation of a line from a set of data and if appropriate, use it to make a prediction. A‐AF.1 Solve problems involving applications of linear equations.
GRE: 403 Exhibit knowledge of slope 502 Determine the slope of a line from points or equations 503 Match linear graphs with their equations 601Interpret & use information from graphs in the coordinate plane 702 Identify characteristics of graphs based on a set of conditions or on a general equation 704 Analyze & draw conclusions based on information from graphs in the coordinate plane. XEI: 606 Find solutions to systems of linear equations GRE: 501 Identify the graph of a linear inequality on the number line XEI: 602 Write expressions, equations, & inequalities for common algebra settings
Daily and Weekly Formative Assessments Unit Assessments

6
M‐SG.1 Graphically represent the solution to a linear equation and the solution to a system of linear equations in two variables. M‐SG.2 Graphically represent the solution to a linear inequality and the solution to a system of linear inequalities in two variables. W‐DM.1 Identify the graph of a linear inequality on the number line. M‐SD.2 Solve a linear inequality and provide an interpretation of the solution. W‐DM.2 Create and use absolute value functions to model and solve problems in common settings. W‐GM.2 Graph quadratic equations and identify key characteristics of the function W‐GM.3 Find the solution of a quadratic equation and/or zeros of a quadratic function
M‐SD.3 Recognize special products and factors of polynomials to facilitate problem solving with polynomials; in particular, find the zeros of a quadratic polynomial. A‐AF.4 Solve problems involving quadratic equations such as area and gravity; additionally examine the fact that quadratic functions have maximum or minimum values and can be used to model problems with optimum solutions. M‐SV.4 Solve literal equations for any variable; interpret the results based on units. M‐SN.3 Recognize functions as mappings of an independent variable into a dependent variable. M‐SN.4 Evaluate polynomial and exponential functions that use function notation.
XEI: 505 Factor simple quadratics 605 Solve quadratic equations GRE: 702 Identify characteristics of graphs based on a set of conditions or on a general equation FUN: 401 Evaluate quadratic functions, expressed in function notation, at integer values FUN 501: Evaluate polynomial functions, expressed in function notation, at integer values 601 Evaluate composite functions at integer values 701 Write an expression for the composite of two simple functions

7
M‐SN.5 Recognize composite functions as an application of substitution and use this understanding to write expressions for and evaluate composite functions.
4th Nine Weeks: Polynomial & Non-Polynomial Functions, Data Analysis
Standards Objectives Major Assignments M‐NG.6 Examine radical and rational equations, both graphically and numerically, to determine restrictions on the domain of the variables. A‐AF.5 Solve problems involving radical equations, such as wind chill and body mass index. A‐AF.6 Solve problems involving rational equations such as work problems. M‐SG.4 Identify the graphs of basic trigonometric functions and shifts of those graphs. M‐NG.3 Use appropriate technology to find the mathematical model for a set of non‐linear data. M‐SN.1 In the context of exponential models, solve equations of the form a• = d where a, c, and d are specific numbers and the base b is 2, 10, or e. M‐SN.1 In the context of exponential models, solve equations of the form a• = d where a, c, and d are specific numbers and the base b is 2, 10, or e. M‐NG.3 Use appropriate technology to find the mathematical model for a set of non‐linear data. A‐AN.4 Solve problems involving evaluation of exponential functions, for example applications involving simple and compound interest.
FUN: 704 Match graphs of basic trigonometric functions with their equations NCP: 702 Exhibit knowledge of logarithms & geometric sequences PSD: 504 Use Venn diagrams in counting 602 Interpret and use information from figures, tables, and graphs 702 Analyze & draw conclusions based on information from figures, tables, and graphs PSD: 701 Distinguish between mean, median, and mode for a list of numbers
Daily and Weekly Formative Assessments Unit Assessments

8
A‐AF.7 Solve problems involving exponential applications such as half‐life and continuous interest. M‐SG.5 Solve a simple system consisting of one linear equation and one quadratic equation in two variables; for example, find points of intersection between the line y = –3x and the circle x² + y² = 3. Illustrate the solution graphically. A‐AG.5 Solve problems requiring the interpretation of polynomial, rational, and exponential graphs that depict real‐world phenomena, including identification of max/min and end behavior of functions A‐AD.1 Solve problems involving constructing and interpreting pie charts. A‐AD.2 Solve problems that use the construction and interpretation of Venn diagrams to analyze the attributes of a set of data, for example logic and counting problems. W‐GM.6 Identify and calculate the measures of central tendency and spread in a set of data. M‐NG.4 Compare measures of central tendency and spread for a single data set along with its graph and summary statistics M‐NG.5 Compare data sets using graphs and summary statistics, and measures of central tendency and spread. W‐GM.7 Understand the correlation coefficient and its role in measuring the goodness of fit for a model for a data set. W‐GM.8 Analyze data to make predictions based on an understanding of the data set, for example, use a scatter‐plot to determine if a linear relationship exists and describe the association between the variables. M‐NG.2 Use appropriate technology to generate the equation of a line from a set of data and if appropriate, use it to make a prediction.
TSpicer
Typewritten Text
Other instructional resources may be accessed upon request.


![[Is two weeks the optimum duration criterion for major depression?]](https://static.fdokumen.com/doc/165x107/63366991242ed15b940db544/is-two-weeks-the-optimum-duration-criterion-for-major-depression.jpg)