First combined total reflection X-ray fluorescence and grazing incidence X-ray absorption...
8
First combined total reflection X-ray fluorescence and grazing incidence X-ray absorption spectroscopy characterization of aeolian dust archived in Antarctica and Alpine deep ice cores ☆ G. Cibin a,b,c, ⁎, A. Marcelli d , V. Maggi e , M. Sala e,f , F. Marino e , B. Delmonte e , S. Albani e,g , S. Pignotti b a Diamond Light Source, Harwell Science and Innovation Campus, Didcot, Oxon OX110DE, UK b IMONT/EIM, Ente Italiano della Montagna, P.za dei Caprettari 70, 00176 Roma, Italy c Universita' degli Studi di Roma Tre, Dipartimento di Scienze Geologiche, L.go S. Leonardo Murialdo 1, 00146 Roma, Italy d INFN - Laboratori Nazionali di Frascati, P.O. Box 13, 00044 Frascati (Roma), Italy e Università degli Studi di Milano-Bicocca, Dipartimento di Scienze dell'Ambiente e del Territorio, Piazza della Scienza 1, 20126 Milano, Italy f Università degli Studi di Milano, Dipartimento di Scienze della Terra “A. Desio”, Sez. Mineralogia, Via Mangiagalli 34, 20133 Milano, Italy g Università degli Studi di Siena, Dottorato in Scienze Polari, via Laterina 8, 53100 Siena, Italy abstract article info Article history: Received 30 November 2007 Accepted 5 October 2008 Available online 21 October 2008 Keywords: TXRF XAS GI-XAS Aerosol Ice core Aeolian mineral dust archived in polar and mid latitude ice cores represents a precious proxy for assessing environmental and climatic variations at different timescales. In this respect, the identification of dust mineralogy plays a key role. In this work we performed the first preliminary X-ray absorption spectroscopy (XAS) experiments on mineral dust particles extracted from Antarctic and from Alpine firn cores using grazing incidence geometry at the Fe K-edge. A dedicated high vacuum experimental chamber was set up for normal-incidence and total-reflection X-Ray Fluorescence and Absorption Spectroscopy analyses on minor amounts of mineral materials at the Stanford Synchrotron Radiation Laboratory. Results show that this experimental technique and protocol allows recognizing iron inclusion mineral fraction on insoluble dust in the 1–10 μg range. © 2008 Elsevier B.V. All rights reserved. 1. Introduction Polar ice sheet and continental glaciers are natural archives of paleoclimatic information which can provide undisturbed records of environmental and climatic change at different timescales. In particular, aeolian mineral dust from Antarctic ice cores is actively studied in order to assess climate and atmospheric changes in the Late Quaternary in the Southern Hemisphere [1–4] while insoluble particles from Alpine firn cores are representative for climatic conditions in Western Europe and in the Mediterranean region during the last century [5–7]. Aeolian dust trapped in firn and ice originates from continental landmasses; its mobilization, transport and deposition at the drilling sites are mainly related to changes in atmospheric circulation, in the hydrological cycle and in the activity of source areas themselves [8]. The mineralogical composition and the size distribution of particles are mainly related to the selection occurring in the atmosphere during dust transport. The first studies on the mineralogical composition of aeolian Antarctic dust were performed by Electron Microscopy on the Vostok and on the old Dome C ice cores. Results showed the presence of clays as major mineral phases (i.e., illite, kaolinite, smectite and chlorite), associated to K-feldspar and quartz [9–12]. The 87Sr/86Sr versus 143Nd/144Nd isotopic signature of the mineral particles indicates that South America was the dominant dust supplier to sites located in the interior of the East Antarctic plateau during glacial ages [13] an evidence confirmed also by major element analyses from PIXE (Proton Induced X-Ray Emission) [14]. Conversely, a different source mixing characterizes the Holocene and the last interglacial at Vostok and Dome C [15]. In this respect, the geochemical analyses of Eastern Australian sediments suggest a possible contribution from this area to the Antarctic dust during warm times [16], but the question is still debated. Unfortunately, isotopic data on dust from coastal East Antarctic sites are not available yet. A few studies using electron microscope technique were also applied on an Alpine firn core (Colle Gnifetti, Monte Rosa, Italian Alps) [17] spanning the 20th century in order to understand differences in mineral dust composition between the so called “background” aeolian dust and the composition of Saharan dust events. Spectrochimica Acta Part B 63 (2008) 1503–1510 ☆ This paper was presented at the 12th Conference on Total Reflection X-ray Fluorescence Analysis and Related Methods held in Trento (Italy), 18–22 June 2007, and is published in the Special Issue of Spectrochimica Acta Part B, dedicated to that conference. ⁎ Corresponding author. Diamond Light Source, Harwell Science and Innovation Campus, Didcot, Oxon OX110DE, UK. Tel.: +44 1235778645; fax: +44 1235778448. E-mail address: [email protected] (G. Cibin). 0584-8547/$ – see front matter © 2008 Elsevier B.V. All rights reserved. doi:10.1016/j.sab.2008.10.012 Contents lists available at ScienceDirect Spectrochimica Acta Part B journal homepage: www.elsevier.com/locate/sab
-
Upload
independent -
Category
Documents
-
view
0 -
download
0
Transcript of First combined total reflection X-ray fluorescence and grazing incidence X-ray absorption...
Spectrochimica Acta Part B 63 (2008) 1503–1510
Contents lists available at ScienceDirect
Spectrochimica Acta Part B
j ourna l homepage: www.e lsev ie r.com/ locate /sab
First combined total reflection X-ray fluorescence and grazing incidence X-rayabsorption spectroscopy characterization of aeolian dust archived in Antarctica andAlpine deep ice cores☆
G. Cibin a,b,c,⁎, A. Marcelli d, V. Maggi e, M. Sala e,f, F. Marino e, B. Delmonte e, S. Albani e,g, S. Pignotti b
a Diamond Light Source, Harwell Science and Innovation Campus, Didcot, Oxon OX110DE, UKb IMONT/EIM, Ente Italiano della Montagna, P.za dei Caprettari 70, 00176 Roma, Italyc Universita' degli Studi di Roma Tre, Dipartimento di Scienze Geologiche, L.go S. Leonardo Murialdo 1, 00146 Roma, Italyd INFN - Laboratori Nazionali di Frascati, P.O. Box 13, 00044 Frascati (Roma), Italye Università degli Studi di Milano-Bicocca, Dipartimento di Scienze dell'Ambiente e del Territorio, Piazza della Scienza 1, 20126 Milano, Italyf Università degli Studi di Milano, Dipartimento di Scienze della Terra “A. Desio”, Sez. Mineralogia, Via Mangiagalli 34, 20133 Milano, Italyg Università degli Studi di Siena, Dottorato in Scienze Polari, via Laterina 8, 53100 Siena, Italy
☆ This paper was presented at the 12th ConferenFluorescence Analysis and Related Methods held in Trenis published in the Special Issue of Spectrochimica Aconference.⁎ Corresponding author. Diamond Light Source, Ha
Campus, Didcot, Oxon OX110DE, UK. Tel.: +44 12357786E-mail address: [email protected] (
0584-8547/$ – see front matter © 2008 Elsevier B.V. Aldoi:10.1016/j.sab.2008.10.012
a b s t r a c t
a r t i c l e i n f oArticle history:
Aeolian mineral dust archiv Received 30 November 2007Accepted 5 October 2008Available online 21 October 2008Keywords:TXRFXASGI-XASAerosolIce core
ed in polar and mid latitude ice cores represents a precious proxy for assessingenvironmental and climatic variations at different timescales. In this respect, the identification of dustmineralogy plays a key role. In this work we performed the first preliminary X-ray absorption spectroscopy(XAS) experiments on mineral dust particles extracted from Antarctic and from Alpine firn cores usinggrazing incidence geometry at the Fe K-edge. A dedicated high vacuum experimental chamber was set up fornormal-incidence and total-reflection X-Ray Fluorescence and Absorption Spectroscopy analyses on minoramounts of mineral materials at the Stanford Synchrotron Radiation Laboratory. Results show that thisexperimental technique and protocol allows recognizing iron inclusion mineral fraction on insoluble dust inthe 1–10 µg range.
© 2008 Elsevier B.V. All rights reserved.
1. Introduction
Polar ice sheet and continental glaciers are natural archives ofpaleoclimatic information which can provide undisturbed records ofenvironmental and climatic change at different timescales. Inparticular, aeolian mineral dust from Antarctic ice cores is activelystudied in order to assess climate and atmospheric changes in the LateQuaternary in the Southern Hemisphere [1–4] while insolubleparticles from Alpine firn cores are representative for climaticconditions inWestern Europe and in the Mediterranean region duringthe last century [5–7].
Aeolian dust trapped in firn and ice originates from continentallandmasses; its mobilization, transport and deposition at the drillingsites are mainly related to changes in atmospheric circulation, in thehydrological cycle and in the activity of source areas themselves [8].
ce on Total Reflection X-rayto (Italy), 18–22 June 2007, andcta Part B, dedicated to that
rwell Science and Innovation45; fax: +44 1235778448.G. Cibin).
l rights reserved.
The mineralogical composition and the size distribution of particlesaremainly related to the selection occurring in the atmosphere duringdust transport.
Thefirst studies on themineralogical compositionof aeolianAntarcticdust were performed by Electron Microscopy on the Vostok and on theold Dome C ice cores. Results showed the presence of clays as majormineral phases (i.e., illite, kaolinite, smectite and chlorite), associated toK-feldspar andquartz [9–12]. The87Sr/86Srversus143Nd/144Nd isotopicsignature of the mineral particles indicates that South America was thedominantdust supplier to sites located in the interiorof theEastAntarcticplateau during glacial ages [13] an evidence confirmed also by majorelement analyses from PIXE (Proton Induced X-Ray Emission) [14].Conversely, a different sourcemixing characterizes the Holocene and thelast interglacial at Vostok and Dome C [15]. In this respect, thegeochemical analyses of Eastern Australian sediments suggest a possiblecontribution from this area to the Antarctic dust duringwarm times [16],but thequestion is still debated.Unfortunately, isotopic data ondust fromcoastal East Antarctic sites are not available yet.
A few studies using electron microscope technique were alsoapplied on an Alpine firn core (Colle Gnifetti, Monte Rosa, Italian Alps)[17] spanning the 20th century in order to understand differences inmineral dust composition between the so called “background” aeoliandust and the composition of Saharan dust events.

Fig. 1. Map of Antarctica (A) and Alpine (B) drilling site.
Fig. 2. Experimental set-up for Total X-Ray Reflection Fluorescence and GrazingIncidence Absorption Spectrometry experiments.
1504 G. Cibin et al. / Spectrochimica Acta Part B 63 (2008) 1503–1510
In this contribution we present the first Synchrotron RadiationTotal X-Ray Fluorescence (TXRF) [18–20] and Grazing Incidence X-rayAbsorption Spectroscopy (GI-XAS)[21] data obtained on mineralparticles extracted from Alpine and Antarctic ice cores, dating back160 kyrs. For this kind of experiments, a dedicated High Vacuum (HV)experimental chamber was developed and realized in the frameworkof the CryoAlp collaboration of IMONT, the Italian National Institute forMountains. It was installed for the experiments at the StanfordSynchrotron Radiation Laboratory at the beamline 6-2. The originalexperimental set-up, thanks to the presence of an in-vacuum samplemicromanipulator [22] and sample alignment and docking systemallowed both normal-incidence X-ray Fluorescence, Total X-rayReflection Fluorescence and Absorption Spectroscopy measurements.The high quality of the X-Ray Absorption Near Edge Structure (XANES)experiments performed, using both normal incidence and TotalReflection XAS measurements, combined with the TXRF results,allowed recognizing iron inclusion mineral fractions and demonstratethe feasibility of such kind of analysis. XAS analysis gives a specificmineral characterization of the mineral dust, so this approach can beused to support and complement the information coming from otherwell-established techniques commonly used in the ice core analysis,like X-Ray Powder Diffraction (XRPD) [23] and PIXE [14,24] in order toobtain a more clear comprehension of the atmospheric dynamics inthe past and actual climatic conditions.
2. Samples and methods
2.1. Samples selected for this study
Our study focuses on samples collected from two shallow firn coresfrom Antarctica and from the Italian Alps. The Antarctic coastal firncore was drilled at Talos Dome (TDC core, 72° 48′S, 159° 06′E, 2316 ma.s.l., 53.7 m long, mean snow accumulation rate 80 kg m−2 per year,290 km from the Ross Sea and Southern Ocean) in the framework ofthe 2001 IT-ITASE (Italian-International Trans Antarctic ScientificExpedition) traverse [25]. The Alpine firn core was drilled in 2003 onColle del Lys saddle, located in the upper part of the Lys Glacier on theMonte Rosa Group [5] (CDL03 core, 45° 92′ N, 7° 86′ E, 4248 m a.s.l.,106.2 m long, mean snow accumulation rate 1340 kg m−2 per year)(Fig. 1). Both the Antarctic and Alpine cores were recovered using anelectromechanical drilling system.
The main experimental challenge is the very low concentration ofmineralmaterials trapped in the snow, especially for Antarctic firn andice samples, typically around 10–20 ppb (10−9 g⁎g−1 of ice) during theHolocene [15].
The limited amount of aeolian dust to be analyzed requires aspecific protocol for sample preparation. Firn cores were cut in a coldroom (Tb−15 °C) at DISAT – University of Milano-Bicocca. Samples
were decontaminated in a 1000 class clean room by means of aceramic knife in order to discard the external part of the core while icesamples were generally decontaminated following the proceduredescribed in [13]. Samples were melted at environment temperatureunder laminar flow bench in pre-cleaned beakers. After melting, dustconcentration and size distribution were measured by a particlecounter following the procedure described in [26]. The instrumentwas set in order to investigate particles from 1 to 30 µm in diameter(spherical equivalent). Dust from Antarctic samples is generallyreferred to the 1 to 5 µm interval, which is common for long rangetransport, while in the case of dust trapped in Alpine cores the wholespectrum of particle size is considered, as advection of dust from localsources to the Lys glacier is likely [5]. Dust concentration valuesobtained in this work for Alpine and Antarctic samples are comparablewith data reported in [5] and [27] respectively.
After dust concentration measurements, samples were divided intwo equal aliquots and deposited respectively on a Nucleporepolycarbonate membrane by means of a dedicated filtering engine[23,24] and evaporated on Si wafer substrates. The amount of firn usedfor the preparation of the samples has been adjusted to give for allsamples a total amount ofmaterial deposited in the range of 1–10 μg. Afew analyses were performed onweighted illite and kaolinite certifiedstandard minerals prepared in the sameway of real samples [23,28] inorder to evaluate the instrument detection limit.
2.2. Analytical methods
2.2.1. Experimental chamber and sample manipulatorFor these experiments we designed and realized a dedicated HV
experimental chamber. In particular, for grazing incidence experi-ments on samples of natural origin, the availability of a micrometricsystem, compatible with the demanding experimental environmentrequired by the aeolian dusts, is a challenging task. The majortechnical challenge is the need of a high precision positioning in a high
1505G. Cibin et al. / Spectrochimica Acta Part B 63 (2008) 1503–1510
vacuum environment, with a number of degrees of freedom highenough tomatchwith the possible need of mapping complex surfaces.In our case, the sample alignment to the beam is done using an in-vacuum micropositioner from MICOS GmbH [22]. The manipulator ischaracterized by having six degrees of freedom with high precision(b1 µm accuracy for translation along X, Yand Z directions and 50 µradof angular accuracy), while large travel ranges (50 and 25 mm in X,Yvs. Z directions, respectively and 5 degrees for rotations) are possiblethanks to an original design in a relatively compact size.
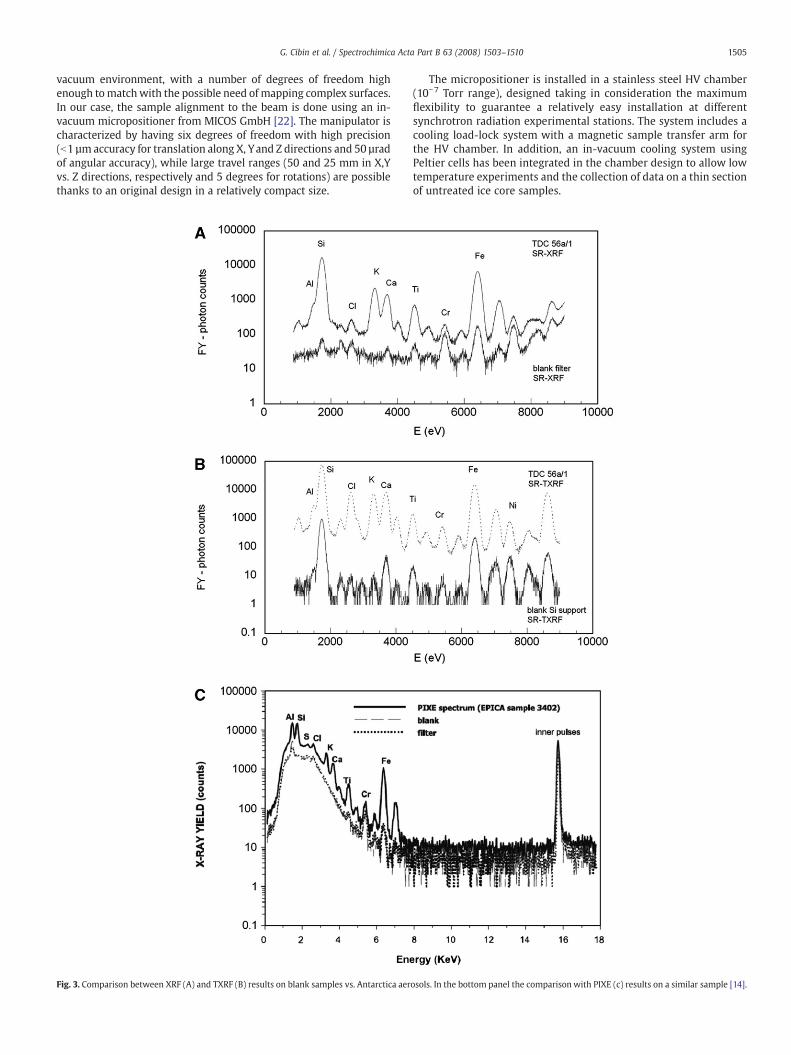
Fig. 3. Comparison between XRF (A) and TXRF (B) results on blank samples vs. Antarctica aer
The micropositioner is installed in a stainless steel HV chamber(10−7 Torr range), designed taking in consideration the maximumflexibility to guarantee a relatively easy installation at differentsynchrotron radiation experimental stations. The system includes acooling load-lock system with a magnetic sample transfer arm forthe HV chamber. In addition, an in-vacuum cooling system usingPeltier cells has been integrated in the chamber design to allow lowtemperature experiments and the collection of data on a thin sectionof untreated ice core samples.
osols. In the bottom panel the comparisonwith PIXE (c) results on a similar sample [14].
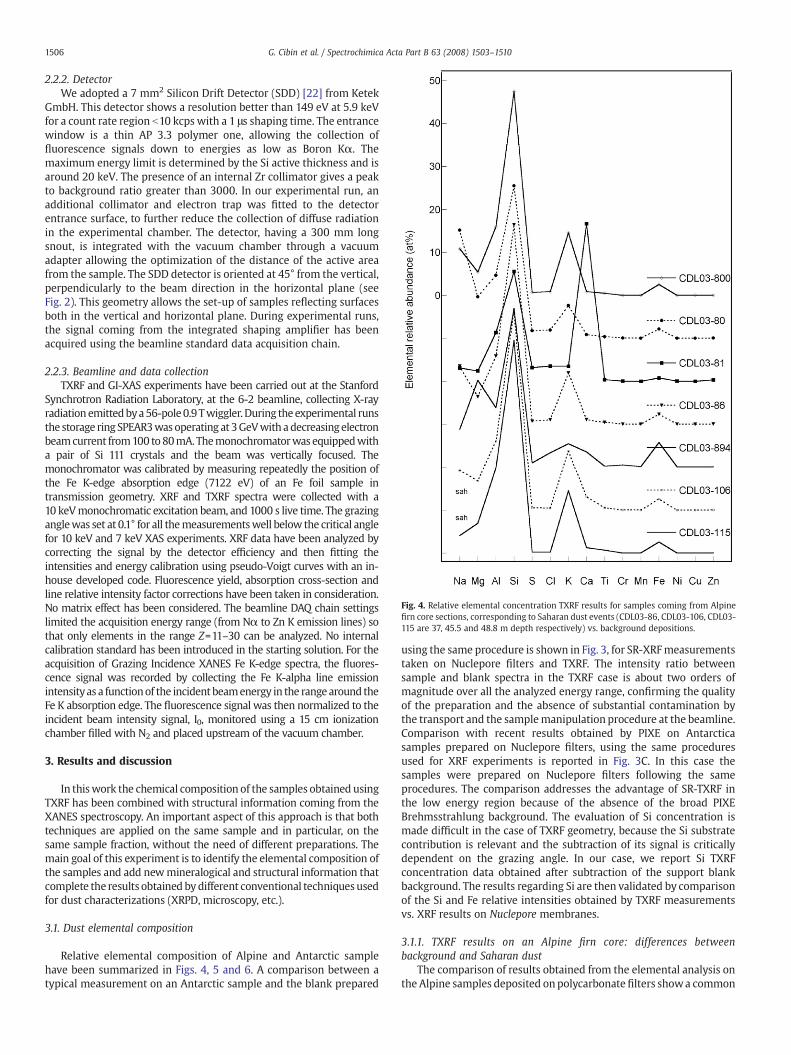
Fig. 4. Relative elemental concentration TXRF results for samples coming from Alpinefirn core sections, corresponding to Saharan dust events (CDL03-86, CDL03-106, CDL03-115 are 37, 45.5 and 48.8 m depth respectively) vs. background depositions.
1506 G. Cibin et al. / Spectrochimica Acta Part B 63 (2008) 1503–1510
2.2.2. DetectorWe adopted a 7 mm2 Silicon Drift Detector (SDD) [22] from Ketek
GmbH. This detector shows a resolution better than 149 eV at 5.9 keVfor a count rate region b10 kcps with a 1 μs shaping time. The entrancewindow is a thin AP 3.3 polymer one, allowing the collection offluorescence signals down to energies as low as Boron Kα. Themaximum energy limit is determined by the Si active thickness and isaround 20 keV. The presence of an internal Zr collimator gives a peakto background ratio greater than 3000. In our experimental run, anadditional collimator and electron trap was fitted to the detectorentrance surface, to further reduce the collection of diffuse radiationin the experimental chamber. The detector, having a 300 mm longsnout, is integrated with the vacuum chamber through a vacuumadapter allowing the optimization of the distance of the active areafrom the sample. The SDD detector is oriented at 45° from the vertical,perpendicularly to the beam direction in the horizontal plane (seeFig. 2). This geometry allows the set-up of samples reflecting surfacesboth in the vertical and horizontal plane. During experimental runs,the signal coming from the integrated shaping amplifier has beenacquired using the beamline standard data acquisition chain.
2.2.3. Beamline and data collectionTXRF and GI-XAS experiments have been carried out at the Stanford
Synchrotron Radiation Laboratory, at the 6-2 beamline, collecting X-rayradiation emittedbya56-pole0.9Twiggler.During theexperimental runsthe storage ring SPEAR3wasoperating at 3GeVwith adecreasingelectronbeamcurrent from100 to80mA. Themonochromatorwas equippedwitha pair of Si 111 crystals and the beam was vertically focused. Themonochromator was calibrated by measuring repeatedly the position ofthe Fe K-edge absorption edge (7122 eV) of an Fe foil sample intransmission geometry. XRF and TXRF spectra were collected with a10 keVmonochromatic excitation beam, and 1000 s live time. The grazinganglewas set at 0.1° for all themeasurementswell below the critical anglefor 10 keV and 7 keV XAS experiments. XRF data have been analyzed bycorrecting the signal by the detector efficiency and then fitting theintensities and energy calibration using pseudo-Voigt curves with an in-house developed code. Fluorescence yield, absorption cross-section andline relative intensity factor corrections have been taken in consideration.No matrix effect has been considered. The beamline DAQ chain settingslimited the acquisition energy range (from Nα to Zn K emission lines) sothat only elements in the range Z=11–30 can be analyzed. No internalcalibration standard has been introduced in the starting solution. For theacquisition of Grazing Incidence XANES Fe K-edge spectra, the fluores-cence signal was recorded by collecting the Fe K-alpha line emissionintensityas a functionof the incident beamenergy in the rangearound theFe K absorption edge. The fluorescence signal was then normalized to theincident beam intensity signal, I0, monitored using a 15 cm ionizationchamber filled with N2 and placed upstream of the vacuum chamber.
3. Results and discussion
In thiswork the chemical composition of the samples obtained usingTXRF has been combined with structural information coming from theXANES spectroscopy. An important aspect of this approach is that bothtechniques are applied on the same sample and in particular, on thesame sample fraction, without the need of different preparations. Themain goal of this experiment is to identify the elemental composition ofthe samples and add newmineralogical and structural information thatcomplete the results obtained bydifferent conventional techniquesusedfor dust characterizations (XRPD, microscopy, etc.).
3.1. Dust elemental composition
Relative elemental composition of Alpine and Antarctic samplehave been summarized in Figs. 4, 5 and 6. A comparison between atypical measurement on an Antarctic sample and the blank prepared
using the same procedure is shown in Fig. 3, for SR-XRFmeasurementstaken on Nuclepore filters and TXRF. The intensity ratio betweensample and blank spectra in the TXRF case is about two orders ofmagnitude over all the analyzed energy range, confirming the qualityof the preparation and the absence of substantial contamination bythe transport and the samplemanipulation procedure at the beamline.Comparison with recent results obtained by PIXE on Antarcticasamples prepared on Nuclepore filters, using the same proceduresused for XRF experiments is reported in Fig. 3C. In this case thesamples were prepared on Nuclepore filters following the sameprocedures. The comparison addresses the advantage of SR-TXRF inthe low energy region because of the absence of the broad PIXEBrehmsstrahlung background. The evaluation of Si concentration ismade difficult in the case of TXRF geometry, because the Si substratecontribution is relevant and the subtraction of its signal is criticallydependent on the grazing angle. In our case, we report Si TXRFconcentration data obtained after subtraction of the support blankbackground. The results regarding Si are then validated by comparisonof the Si and Fe relative intensities obtained by TXRF measurementsvs. XRF results on Nuclepore membranes.
3.1.1. TXRF results on an Alpine firn core: differences betweenbackground and Saharan dust
The comparison of results obtained from the elemental analysis onthe Alpine samples deposited onpolycarbonatefilters showa common
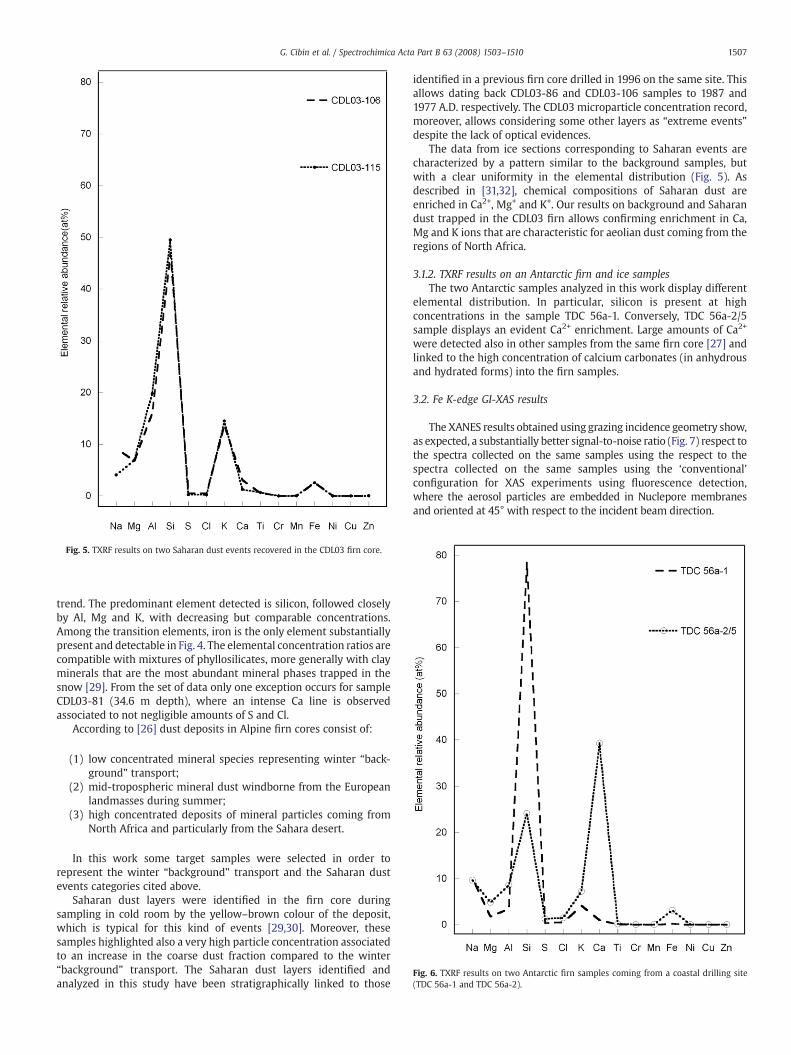
Fig. 6. TXRF results on two Antarctic firn samples coming from a coastal drilling site(TDC 56a-1 and TDC 56a-2).
Fig. 5. TXRF results on two Saharan dust events recovered in the CDL03 firn core.
1507G. Cibin et al. / Spectrochimica Acta Part B 63 (2008) 1503–1510
trend. The predominant element detected is silicon, followed closelyby Al, Mg and K, with decreasing but comparable concentrations.Among the transition elements, iron is the only element substantiallypresent and detectable in Fig. 4. The elemental concentration ratios arecompatible with mixtures of phyllosilicates, more generally with clayminerals that are the most abundant mineral phases trapped in thesnow [29]. From the set of data only one exception occurs for sampleCDL03-81 (34.6 m depth), where an intense Ca line is observedassociated to not negligible amounts of S and Cl.
According to [26] dust deposits in Alpine firn cores consist of:
(1) low concentrated mineral species representing winter “back-ground” transport;
(2) mid-tropospheric mineral dust windborne from the Europeanlandmasses during summer;
(3) high concentrated deposits of mineral particles coming fromNorth Africa and particularly from the Sahara desert.
In this work some target samples were selected in order torepresent the winter “background” transport and the Saharan dustevents categories cited above.
Saharan dust layers were identified in the firn core duringsampling in cold room by the yellow–brown colour of the deposit,which is typical for this kind of events [29,30]. Moreover, thesesamples highlighted also a very high particle concentration associatedto an increase in the coarse dust fraction compared to the winter“background” transport. The Saharan dust layers identified andanalyzed in this study have been stratigraphically linked to those
identified in a previous firn core drilled in 1996 on the same site. Thisallows dating back CDL03-86 and CDL03-106 samples to 1987 and1977 A.D. respectively. The CDL03 microparticle concentration record,moreover, allows considering some other layers as “extreme events”despite the lack of optical evidences.
The data from ice sections corresponding to Saharan events arecharacterized by a pattern similar to the background samples, butwith a clear uniformity in the elemental distribution (Fig. 5). Asdescribed in [31,32], chemical compositions of Saharan dust areenriched in Ca2+, Mg+ and K+. Our results on background and Saharandust trapped in the CDL03 firn allows confirming enrichment in Ca,Mg and K ions that are characteristic for aeolian dust coming from theregions of North Africa.
3.1.2. TXRF results on an Antarctic firn and ice samplesThe two Antarctic samples analyzed in this work display different
elemental distribution. In particular, silicon is present at highconcentrations in the sample TDC 56a-1. Conversely, TDC 56a-2/5sample displays an evident Ca2+ enrichment. Large amounts of Ca2+
were detected also in other samples from the same firn core [27] andlinked to the high concentration of calcium carbonates (in anhydrousand hydrated forms) into the firn samples.
3.2. Fe K-edge GI-XAS results
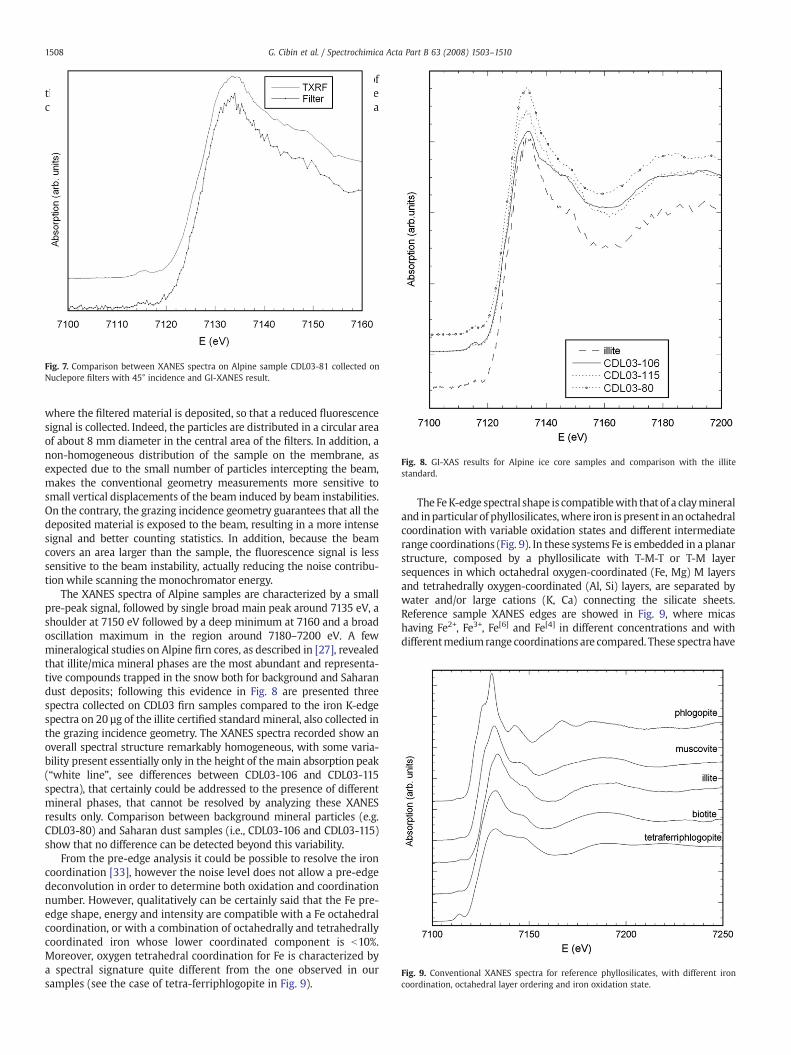
The XANES results obtained using grazing incidence geometry show,as expected, a substantially better signal-to-noise ratio (Fig. 7) respect tothe spectra collected on the same samples using the respect to thespectra collected on the same samples using the ‘conventional’configuration for XAS experiments using fluorescence detection,where the aerosol particles are embedded in Nuclepore membranesand oriented at 45° with respect to the incident beam direction.
1508 G. Cibin et al. / Spectrochimica Acta Part B 63 (2008) 1503–1510
Thedifference in the signal to noise ratio is due to a better rejectionofthe background signal in the grazing geometry. Moreover, in theconventional geometry the beam illuminates not all themembrane area
Fig. 7. Comparison between XANES spectra on Alpine sample CDL03-81 collected onNuclepore filters with 45° incidence and GI-XANES result.
Fig. 8. GI-XAS results for Alpine ice core samples and comparison with the illitestandard.
Fig. 9. Conventional XANES spectra for reference phyllosilicates, with different ironcoordination, octahedral layer ordering and iron oxidation state.
where the filtered material is deposited, so that a reduced fluorescencesignal is collected. Indeed, the particles are distributed in a circular areaof about 8 mm diameter in the central area of the filters. In addition, anon-homogeneous distribution of the sample on the membrane, asexpected due to the small number of particles intercepting the beam,makes the conventional geometry measurements more sensitive tosmall vertical displacements of the beam induced by beam instabilities.On the contrary, the grazing incidence geometry guarantees that all thedeposited material is exposed to the beam, resulting in a more intensesignal and better counting statistics. In addition, because the beamcovers an area larger than the sample, the fluorescence signal is lesssensitive to the beam instability, actually reducing the noise contribu-tion while scanning the monochromator energy.
The XANES spectra of Alpine samples are characterized by a smallpre-peak signal, followed by single broad main peak around 7135 eV, ashoulder at 7150 eV followed by a deep minimum at 7160 and a broadoscillation maximum in the region around 7180–7200 eV. A fewmineralogical studies on Alpine firn cores, as described in [27], revealedthat illite/mica mineral phases are the most abundant and representa-tive compounds trapped in the snow both for background and Saharandust deposits; following this evidence in Fig. 8 are presented threespectra collected on CDL03 firn samples compared to the iron K-edgespectra on 20 µg of the illite certified standard mineral, also collected inthe grazing incidence geometry. The XANES spectra recorded show anoverall spectral structure remarkably homogeneous, with some varia-bility present essentially only in the height of the main absorption peak(“white line”, see differences between CDL03-106 and CDL03-115spectra), that certainly could be addressed to the presence of differentmineral phases, that cannot be resolved by analyzing these XANESresults only. Comparison between background mineral particles (e.g.CDL03-80) and Saharan dust samples (i.e., CDL03-106 and CDL03-115)show that no difference can be detected beyond this variability.
From the pre-edge analysis it could be possible to resolve the ironcoordination [33], however the noise level does not allow a pre-edgedeconvolution in order to determine both oxidation and coordinationnumber. However, qualitatively can be certainly said that the Fe pre-edge shape, energy and intensity are compatible with a Fe octahedralcoordination, or with a combination of octahedrally and tetrahedrallycoordinated iron whose lower coordinated component is b10%.Moreover, oxygen tetrahedral coordination for Fe is characterized bya spectral signature quite different from the one observed in oursamples (see the case of tetra-ferriphlogopite in Fig. 9).
The FeK-edge spectral shape is compatiblewith that of a claymineraland inparticular of phyllosilicates,where iron is present in anoctahedralcoordination with variable oxidation states and different intermediaterange coordinations (Fig. 9). In these systems Fe is embedded in a planarstructure, composed by a phyllosilicate with T-M-T or T-M layersequences in which octahedral oxygen-coordinated (Fe, Mg) M layersand tetrahedrally oxygen-coordinated (Al, Si) layers, are separated bywater and/or large cations (K, Ca) connecting the silicate sheets.Reference sample XANES edges are showed in Fig. 9, where micashaving Fe2+, Fe3+, Fe[6] and Fe[4] in different concentrations and withdifferentmediumrange coordinations are compared. These spectrahave
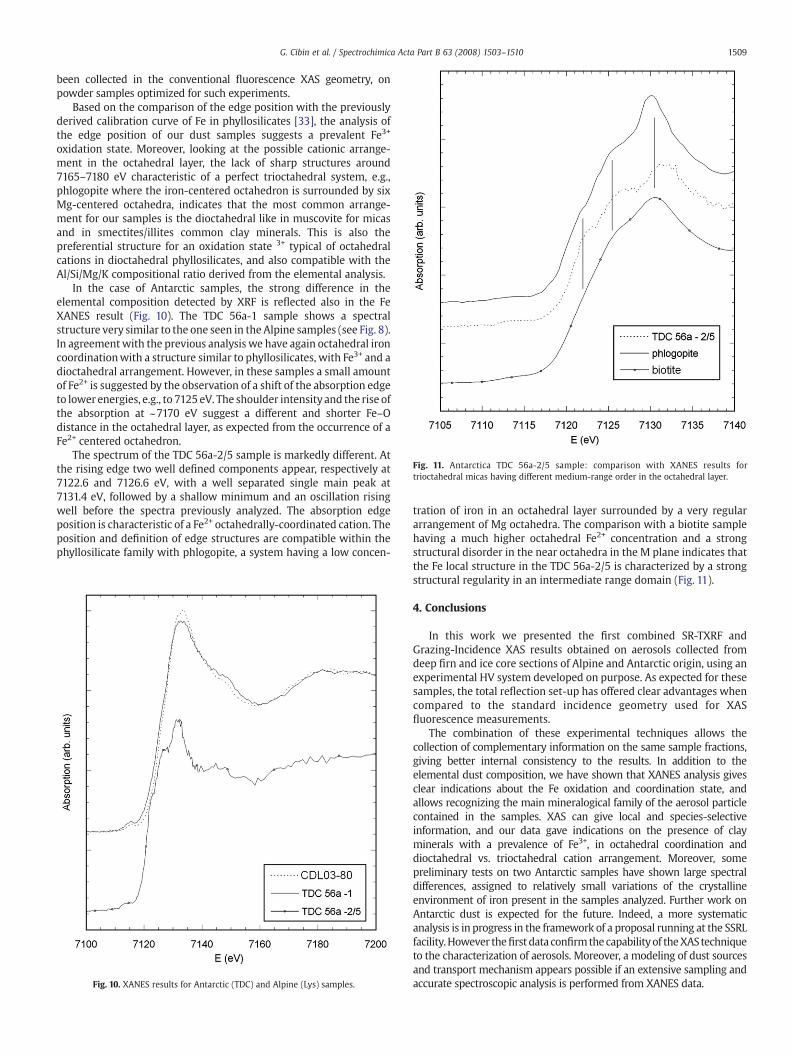
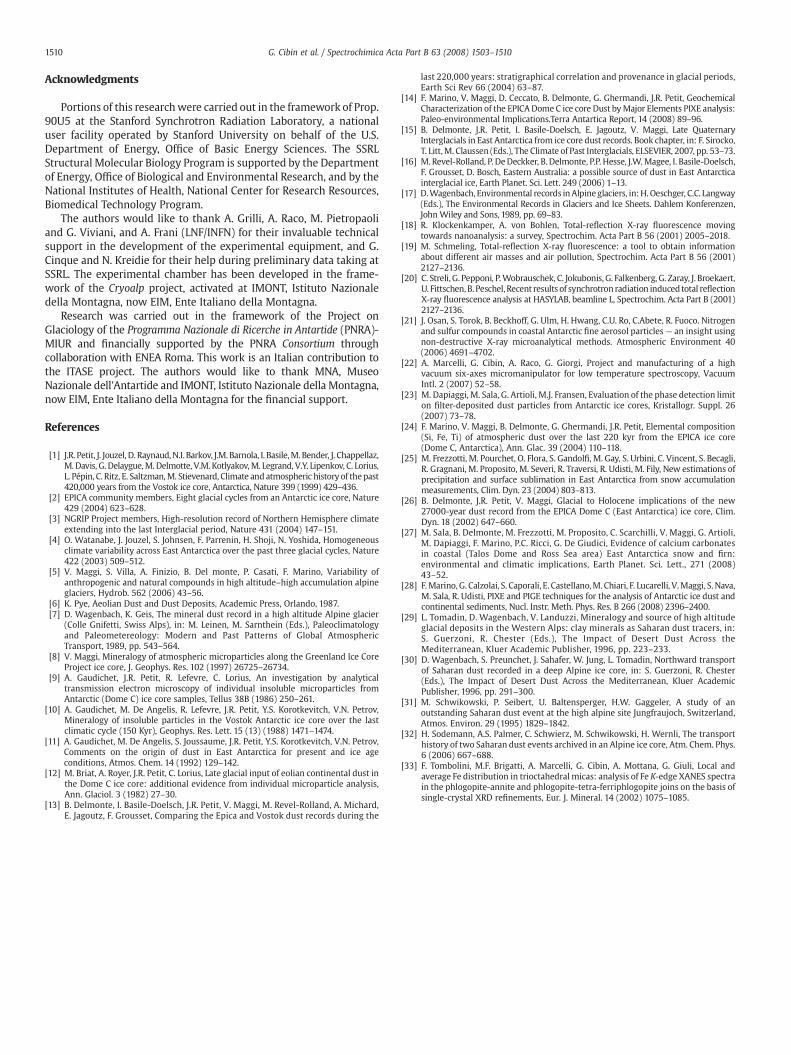
Fig. 11. Antarctica TDC 56a-2/5 sample: comparison with XANES results fortrioctahedral micas having different medium-range order in the octahedral layer.
1509G. Cibin et al. / Spectrochimica Acta Part B 63 (2008) 1503–1510
been collected in the conventional fluorescence XAS geometry, onpowder samples optimized for such experiments.
Based on the comparison of the edge position with the previouslyderived calibration curve of Fe in phyllosilicates [33], the analysis ofthe edge position of our dust samples suggests a prevalent Fe3+
oxidation state. Moreover, looking at the possible cationic arrange-ment in the octahedral layer, the lack of sharp structures around7165–7180 eV characteristic of a perfect trioctahedral system, e.g.,phlogopite where the iron-centered octahedron is surrounded by sixMg-centered octahedra, indicates that the most common arrange-ment for our samples is the dioctahedral like in muscovite for micasand in smectites/illites common clay minerals. This is also thepreferential structure for an oxidation state 3+ typical of octahedralcations in dioctahedral phyllosilicates, and also compatible with theAl/Si/Mg/K compositional ratio derived from the elemental analysis.
In the case of Antarctic samples, the strong difference in theelemental composition detected by XRF is reflected also in the FeXANES result (Fig. 10). The TDC 56a-1 sample shows a spectralstructure very similar to the one seen in the Alpine samples (see Fig. 8).In agreementwith the previous analysis we have again octahedral ironcoordinationwith a structure similar to phyllosilicates, with Fe3+ and adioctahedral arrangement. However, in these samples a small amountof Fe2+ is suggested by the observation of a shift of the absorption edgeto lower energies, e.g., to 7125 eV. The shoulder intensity and the rise ofthe absorption at ~7170 eV suggest a different and shorter Fe–Odistance in the octahedral layer, as expected from the occurrence of aFe2+ centered octahedron.
The spectrum of the TDC 56a-2/5 sample is markedly different. Atthe rising edge two well defined components appear, respectively at7122.6 and 7126.6 eV, with a well separated single main peak at7131.4 eV, followed by a shallow minimum and an oscillation risingwell before the spectra previously analyzed. The absorption edgeposition is characteristic of a Fe2+ octahedrally-coordinated cation. Theposition and definition of edge structures are compatible within thephyllosilicate family with phlogopite, a system having a low concen-
Fig. 10. XANES results for Antarctic (TDC) and Alpine (Lys) samples.
tration of iron in an octahedral layer surrounded by a very regulararrangement of Mg octahedra. The comparison with a biotite samplehaving a much higher octahedral Fe2+ concentration and a strongstructural disorder in the near octahedra in the M plane indicates thatthe Fe local structure in the TDC 56a-2/5 is characterized by a strongstructural regularity in an intermediate range domain (Fig. 11).
4. Conclusions
In this work we presented the first combined SR-TXRF andGrazing-Incidence XAS results obtained on aerosols collected fromdeep firn and ice core sections of Alpine and Antarctic origin, using anexperimental HV system developed on purpose. As expected for thesesamples, the total reflection set-up has offered clear advantages whencompared to the standard incidence geometry used for XASfluorescence measurements.
The combination of these experimental techniques allows thecollection of complementary information on the same sample fractions,giving better internal consistency to the results. In addition to theelemental dust composition, we have shown that XANES analysis givesclear indications about the Fe oxidation and coordination state, andallows recognizing the main mineralogical family of the aerosol particlecontained in the samples. XAS can give local and species-selectiveinformation, and our data gave indications on the presence of clayminerals with a prevalence of Fe3+, in octahedral coordination anddioctahedral vs. trioctahedral cation arrangement. Moreover, somepreliminary tests on two Antarctic samples have shown large spectraldifferences, assigned to relatively small variations of the crystallineenvironment of iron present in the samples analyzed. Further work onAntarctic dust is expected for the future. Indeed, a more systematicanalysis is in progress in the framework of a proposal running at the SSRLfacility.However thefirst data confirmthe capabilityof theXAStechniqueto the characterization of aerosols. Moreover, a modeling of dust sourcesand transport mechanism appears possible if an extensive sampling andaccurate spectroscopic analysis is performed from XANES data.
1510 G. Cibin et al. / Spectrochimica Acta Part B 63 (2008) 1503–1510
Acknowledgments
Portions of this researchwere carried out in the framework of Prop.90U5 at the Stanford Synchrotron Radiation Laboratory, a nationaluser facility operated by Stanford University on behalf of the U.S.Department of Energy, Office of Basic Energy Sciences. The SSRLStructural Molecular Biology Program is supported by the Departmentof Energy, Office of Biological and Environmental Research, and by theNational Institutes of Health, National Center for Research Resources,Biomedical Technology Program.
The authors would like to thank A. Grilli, A. Raco, M. Pietropaoliand G. Viviani, and A. Frani (LNF/INFN) for their invaluable technicalsupport in the development of the experimental equipment, and G.Cinque and N. Kreidie for their help during preliminary data taking atSSRL. The experimental chamber has been developed in the frame-work of the Cryoalp project, activated at IMONT, Istituto Nazionaledella Montagna, now EIM, Ente Italiano della Montagna.
Research was carried out in the framework of the Project onGlaciology of the Programma Nazionale di Ricerche in Antartide (PNRA)-MIUR and financially supported by the PNRA Consortium throughcollaboration with ENEA Roma. This work is an Italian contribution tothe ITASE project. The authors would like to thank MNA, MuseoNazionale dell'Antartide and IMONT, Istituto Nazionale della Montagna,now EIM, Ente Italiano della Montagna for the financial support.
References
[1] J.R. Petit, J. Jouzel, D. Raynaud,N.I. Barkov, J.M. Barnola, I. Basile,M. Bender, J. Chappellaz,M. Davis, G. Delaygue,M.Delmotte, V.M. Kotlyakov,M. Legrand, V.Y. Lipenkov, C. Lorius,L. Pépin, C. Ritz, E. Saltzman,M. Stievenard, Climate andatmospheric history of thepast420,000 years from the Vostok ice core, Antarctica, Nature 399 (1999) 429–436.
[2] EPICA community members, Eight glacial cycles from an Antarctic ice core, Nature429 (2004) 623–628.
[3] NGRIP Project members, High-resolution record of Northern Hemisphere climateextending into the last Interglacial period, Nature 431 (2004) 147–151.
[4] O. Watanabe, J. Jouzel, S. Johnsen, F. Parrenin, H. Shoji, N. Yoshida, Homogeneousclimate variability across East Antarctica over the past three glacial cycles, Nature422 (2003) 509–512.
[5] V. Maggi, S. Villa, A. Finizio, B. Del monte, P. Casati, F. Marino, Variability ofanthropogenic and natural compounds in high altitude–high accumulation alpineglaciers, Hydrob. 562 (2006) 43–56.
[6] K. Pye, Aeolian Dust and Dust Deposits, Academic Press, Orlando, 1987.[7] D. Wagenbach, K. Geis, The mineral dust record in a high altitude Alpine glacier
(Colle Gnifetti, Swiss Alps), in: M. Leinen, M. Sarnthein (Eds.), Paleoclimatologyand Paleometereology: Modern and Past Patterns of Global AtmosphericTransport, 1989, pp. 543–564.
[8] V. Maggi, Mineralogy of atmospheric microparticles along the Greenland Ice CoreProject ice core, J. Geophys. Res. 102 (1997) 26725–26734.
[9] A. Gaudichet, J.R. Petit, R. Lefevre, C. Lorius, An investigation by analyticaltransmission electron microscopy of individual insoluble microparticles fromAntarctic (Dome C) ice core samples, Tellus 38B (1986) 250–261.
[10] A. Gaudichet, M. De Angelis, R. Lefevre, J.R. Petit, Y.S. Korotkevitch, V.N. Petrov,Mineralogy of insoluble particles in the Vostok Antarctic ice core over the lastclimatic cycle (150 Kyr), Geophys. Res. Lett. 15 (13) (1988) 1471–1474.
[11] A. Gaudichet, M. De Angelis, S. Joussaume, J.R. Petit, Y.S. Korotkevitch, V.N. Petrov,Comments on the origin of dust in East Antarctica for present and ice ageconditions, Atmos. Chem. 14 (1992) 129–142.
[12] M. Briat, A. Royer, J.R. Petit, C. Lorius, Late glacial input of eolian continental dust inthe Dome C ice core: additional evidence from individual microparticle analysis,Ann. Glaciol. 3 (1982) 27–30.
[13] B. Delmonte, I. Basile-Doelsch, J.R. Petit, V. Maggi, M. Revel-Rolland, A. Michard,E. Jagoutz, F. Grousset, Comparing the Epica and Vostok dust records during the
last 220,000 years: stratigraphical correlation and provenance in glacial periods,Earth Sci Rev 66 (2004) 63–87.
[14] F. Marino, V. Maggi, D. Ceccato, B. Delmonte, G. Ghermandi, J.R. Petit, GeochemicalCharacterization of the EPICADome C ice core Dust byMajor Elements PIXE analysis:Paleo-environmental Implications.Terra Antartica Report, 14 (2008) 89–96.
[15] B. Delmonte, J.R. Petit, I. Basile-Doelsch, E. Jagoutz, V. Maggi, Late QuaternaryInterglacials in East Antarctica from ice core dust records. Book chapter, in: F. Sirocko,T. Litt,M. Claussen (Eds.), The Climate of Past Interglacials, ELSEVIER, 2007, pp. 53–73.
[16] M. Revel-Rolland, P. DeDeckker, B. Delmonte, P.P. Hesse, J.W.Magee, I. Basile-Doelsch,F. Grousset, D. Bosch, Eastern Australia: a possible source of dust in East Antarcticainterglacial ice, Earth Planet. Sci. Lett. 249 (2006) 1–13.
[17] D.Wagenbach, Environmental records inAlpineglaciers, in:H. Oeschger, C.C. Langway(Eds.), The Environmental Records in Glaciers and Ice Sheets. Dahlem Konferenzen,JohnWiley and Sons, 1989, pp. 69–83.
[18] R. Klockenkamper, A. von Bohlen, Total-reflection X-ray fluorescence movingtowards nanoanalysis: a survey, Spectrochim. Acta Part B 56 (2001) 2005–2018.
[19] M. Schmeling, Total-reflection X-ray fluorescence: a tool to obtain informationabout different air masses and air pollution, Spectrochim. Acta Part B 56 (2001)2127–2136.
[20] C. Streli, G. Pepponi, P.Wobrauschek, C. Jokubonis, G. Falkenberg, G. Zaray, J. Broekaert,U. Fittschen,B.Peschel,Recent results of synchrotron radiation induced total reflectionX-ray fluorescence analysis at HASYLAB, beamline L, Spectrochim. Acta Part B (2001)2127–2136.
[21] J. Osan, S. Torok, B. Beckhoff, G. Ulm, H. Hwang, C.U. Ro, C.Abete, R. Fuoco. Nitrogenand sulfur compounds in coastal Antarctic fine aerosol particles— an insight usingnon-destructive X-ray microanalytical methods. Atmospheric Environment 40(2006) 4691–4702.
[22] A. Marcelli, G. Cibin, A. Raco, G. Giorgi, Project and manufacturing of a highvacuum six-axes micromanipulator for low temperature spectroscopy, VacuumIntl. 2 (2007) 52–58.
[23] M. Dapiaggi, M. Sala, G. Artioli, M.J. Fransen, Evaluation of the phase detection limiton filter-deposited dust particles from Antarctic ice cores, Kristallogr. Suppl. 26(2007) 73–78.
[24] F. Marino, V. Maggi, B. Delmonte, G. Ghermandi, J.R. Petit, Elemental composition(Si, Fe, Ti) of atmospheric dust over the last 220 kyr from the EPICA ice core(Dome C, Antarctica), Ann. Glac. 39 (2004) 110–118.
[25] M. Frezzotti, M. Pourchet, O. Flora, S. Gandolfi, M. Gay, S. Urbini, C. Vincent, S. Becagli,R. Gragnani, M. Proposito, M. Severi, R. Traversi, R. Udisti, M. Fily, New estimations ofprecipitation and surface sublimation in East Antarctica from snow accumulationmeasurements, Clim. Dyn. 23 (2004) 803–813.
[26] B. Delmonte, J.R. Petit, V. Maggi, Glacial to Holocene implications of the new27000-year dust record from the EPICA Dome C (East Antarctica) ice core, Clim.Dyn. 18 (2002) 647–660.
[27] M. Sala, B. Delmonte, M. Frezzotti, M. Proposito, C. Scarchilli, V. Maggi, G. Artioli,M. Dapiaggi, F. Marino, P.C. Ricci, G. De Giudici, Evidence of calcium carbonatesin coastal (Talos Dome and Ross Sea area) East Antarctica snow and firn:environmental and climatic implications, Earth Planet. Sci. Lett., 271 (2008)43–52.
[28] F.Marino,G. Calzolai, S. Caporali, E. Castellano,M. Chiari, F. Lucarelli, V.Maggi, S. Nava,M. Sala, R. Udisti, PIXE and PIGE techniques for the analysis of Antarctic ice dust andcontinental sediments, Nucl. Instr. Meth. Phys. Res. B 266 (2008) 2396–2400.
[29] L. Tomadin, D. Wagenbach, V. Landuzzi, Mineralogy and source of high altitudeglacial deposits in the Western Alps: clay minerals as Saharan dust tracers, in:S. Guerzoni, R. Chester (Eds.), The Impact of Desert Dust Across theMediterranean, Kluer Academic Publisher, 1996, pp. 223–233.
[30] D. Wagenbach, S. Preunchet, J. Sahafer, W. Jung, L. Tomadin, Northward transportof Saharan dust recorded in a deep Alpine ice core, in: S. Guerzoni, R. Chester(Eds.), The Impact of Desert Dust Across the Mediterranean, Kluer AcademicPublisher, 1996, pp. 291–300.
[31] M. Schwikowski, P. Seibert, U. Baltensperger, H.W. Gaggeler, A study of anoutstanding Saharan dust event at the high alpine site Jungfraujoch, Switzerland,Atmos. Environ. 29 (1995) 1829–1842.
[32] H. Sodemann, A.S. Palmer, C. Schwierz, M. Schwikowski, H. Wernli, The transporthistory of two Saharan dust events archived in an Alpine ice core, Atm. Chem. Phys.6 (2006) 667–688.
[33] F. Tombolini, M.F. Brigatti, A. Marcelli, G. Cibin, A. Mottana, G. Giuli, Local andaverage Fe distribution in trioctahedral micas: analysis of Fe K-edge XANES spectrain the phlogopite-annite and phlogopite-tetra-ferriphlogopite joins on the basis ofsingle-crystal XRD refinements, Eur. J. Mineral. 14 (2002) 1075–1085.