a Theoretical Model Contrasting Expert and Novice Teachers ...
Upload
independentCategory
view
5download
0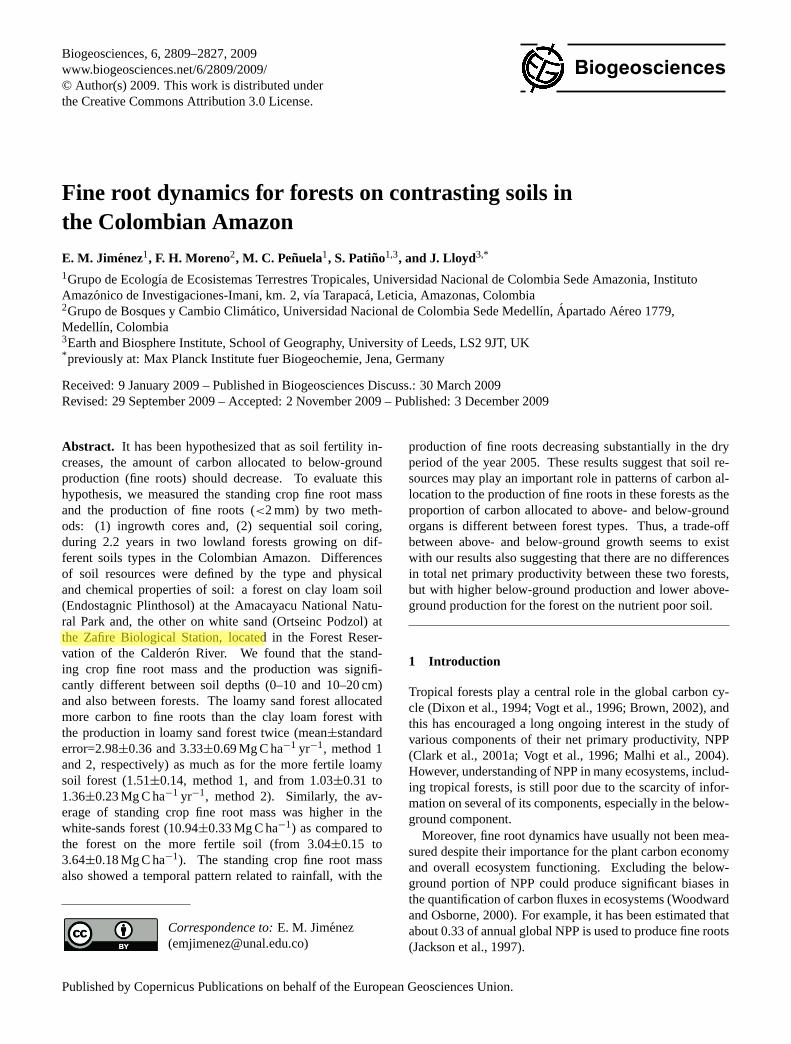
Biogeosciences, 6, 2809–2827, 2009www.biogeosciences.net/6/2809/2009/© Author(s) 2009. This work is distributed underthe Creative Commons Attribution 3.0 License.
Biogeosciences
Fine root dynamics for forests on contrasting soils inthe Colombian Amazon
E. M. Jimenez1, F. H. Moreno2, M. C. Penuela1, S. Patino1,3, and J. Lloyd3,*
1Grupo de Ecologıa de Ecosistemas Terrestres Tropicales, Universidad Nacional de Colombia Sede Amazonia, InstitutoAmazonico de Investigaciones-Imani, km. 2, vıa Tarapaca, Leticia, Amazonas, Colombia2Grupo de Bosques y Cambio Climatico, Universidad Nacional de Colombia Sede Medellın, Apartado Aereo 1779,Medellın, Colombia3Earth and Biosphere Institute, School of Geography, University of Leeds, LS2 9JT, UK* previously at: Max Planck Institute fuer Biogeochemie, Jena, Germany
Received: 9 January 2009 – Published in Biogeosciences Discuss.: 30 March 2009Revised: 29 September 2009 – Accepted: 2 November 2009 – Published: 3 December 2009
Abstract. It has been hypothesized that as soil fertility in-creases, the amount of carbon allocated to below-groundproduction (fine roots) should decrease. To evaluate thishypothesis, we measured the standing crop fine root massand the production of fine roots (<2 mm) by two meth-ods: (1) ingrowth cores and, (2) sequential soil coring,during 2.2 years in two lowland forests growing on dif-ferent soils types in the Colombian Amazon. Differencesof soil resources were defined by the type and physicaland chemical properties of soil: a forest on clay loam soil(Endostagnic Plinthosol) at the Amacayacu National Natu-ral Park and, the other on white sand (Ortseinc Podzol) atthe Zafire Biological Station, located in the Forest Reser-vation of the Calderon River. We found that the stand-ing crop fine root mass and the production was signifi-cantly different between soil depths (0–10 and 10–20 cm)and also between forests. The loamy sand forest allocatedmore carbon to fine roots than the clay loam forest withthe production in loamy sand forest twice (mean±standarderror=2.98±0.36 and 3.33±0.69 Mg C ha−1 yr−1, method 1and 2, respectively) as much as for the more fertile loamysoil forest (1.51±0.14, method 1, and from 1.03±0.31 to1.36±0.23 Mg C ha−1 yr−1, method 2). Similarly, the av-erage of standing crop fine root mass was higher in thewhite-sands forest (10.94±0.33 Mg C ha−1) as compared tothe forest on the more fertile soil (from 3.04±0.15 to3.64±0.18 Mg C ha−1). The standing crop fine root massalso showed a temporal pattern related to rainfall, with the
Correspondence to:E. M. Jimenez([email protected])
production of fine roots decreasing substantially in the dryperiod of the year 2005. These results suggest that soil re-sources may play an important role in patterns of carbon al-location to the production of fine roots in these forests as theproportion of carbon allocated to above- and below-groundorgans is different between forest types. Thus, a trade-offbetween above- and below-ground growth seems to existwith our results also suggesting that there are no differencesin total net primary productivity between these two forests,but with higher below-ground production and lower above-ground production for the forest on the nutrient poor soil.
1 Introduction
Tropical forests play a central role in the global carbon cy-cle (Dixon et al., 1994; Vogt et al., 1996; Brown, 2002), andthis has encouraged a long ongoing interest in the study ofvarious components of their net primary productivity, NPP(Clark et al., 2001a; Vogt et al., 1996; Malhi et al., 2004).However, understanding of NPP in many ecosystems, includ-ing tropical forests, is still poor due to the scarcity of infor-mation on several of its components, especially in the below-ground component.
Moreover, fine root dynamics have usually not been mea-sured despite their importance for the plant carbon economyand overall ecosystem functioning. Excluding the below-ground portion of NPP could produce significant biases inthe quantification of carbon fluxes in ecosystems (Woodwardand Osborne, 2000). For example, it has been estimated thatabout 0.33 of annual global NPP is used to produce fine roots(Jackson et al., 1997).
Published by Copernicus Publications on behalf of the European Geosciences Union.

2810 E. M. Jimenez et al.: Fine root dynamics for Amazon forests
Calderón river
Peru
AMP
Leticia
Brazil
ZAB
AGP-01
ZAR-01
AGP-02
Brazil Peru
Colombia
300 m
Fig. 1. Localization of the study sites in the Colombian Amazon (Trapecio Amazonico, Leticia): Amacayacu National Natural Park (AMP)with two 1-ha plots: AGP-01 and AGP-02, and Biological Station Zafire (ZAB) with one 1-ha plot: ZAR-01, in the Forest Reservation ofthe Calderon river. The circles show the areas to sampling fine roots.
Fine root dynamics are particularly important for tropicalforests, where biomass and rates of production and decom-position of fine roots are high (Silver et al., 2005). The ap-parent paradox of the exuberance and large size of tropicalhumid forests growing on intensively leached soils, suggeststhat fine roots play an important role in optimizing nutrientacquisition and maintaining a closed nutrient cycle in theseforests (Gower, 1987). However, understanding the dynam-ics of biomass and the factors controlling fine root productiv-ity in tropical forests, including in Amazonia, remains poor(Vogt et al., 1998; Clark et al., 2001b; Silver et al., 2005;Trumbore et al. 2006, Metcalfe et al., 2007, 2008; Aragao etal., 2009).
Hendricks et al. (1993) summarize two contrasting hy-potheses proposed to explain the control of soil resourceson carbon allocation and NPP. The first one is called the“differential allocation hypothesis”, and states that total NPPincreases with the increase in the availability of resources,and that allocation between above- and below-ground com-ponents is differential, with a higher allocation to foliageand wood than to fine roots on richer sites (Gower et al.,1992; Albaugh et al., 1998). The other hypothesis is the“constant allocation hypothesis”, also proposes an increasein total NPP with the increase in the availability of soil re-sources, but the relative allocation of NPP to above- andbelow-ground organs remaining relatively constant (Aber etal., 1985; Nadelhoffer et al., 1985; Raich and Nadelhoffer,1989).
This study evaluates below-ground productivity (fineroots≤2 mm) in two mature forests ofTerra firmedevelop-ing on contrasting soils in the Colombian Amazon. Thesoil underneath one forest was a relatively fertile Plinthosol
with loam clay texture and a higher nutrient content than anearby loamy sand textured Podzol. In particular, we aimedto answer the following questions: (1) How different are thestanding crop fine root mass and production between theseforest types? (2) How do these variables change with soildepth (0–10 and 10–20 cm) in each forest and between them?(3) Is there any temporal variation in the standing crop fineroots mass? And if so, is it related variations in precipita-tion? As the period of data collection in 2005 occurred anunusually strong dry period, we added one more question:(4) Did the Amazon drought of 2005 affect the productionof fine roots at our sites? To answer these questions, we es-timated the standing crop fine root mass (SFR), production(FRP), the relative growth rates (RGR) and the turnover ratesof fine roots.
This study is orientated by the differential allocation hy-pothesis, which has been one of the most accepted for tropi-cal forests (Albaugh et al., 1998; Gower et al., 1992; Keyesand Grier, 1981). As a consequence, we predicted a decreaseof standing crop fine root mass and production with the in-crease of soil resources (review in Hendricks et al., 1993).We also predicted that the pattern of FRP would be the op-posite to results obtained for wood production by Malhi etal. (2004). They found a positive relationship between woodproductivity and soil fertility in the Amazonian basin.
2 Material and methods
2.1 Study sites
Three 1 ha old-growth forest plots were used tostudy fine roots in the Colombian Amazon (Trapecio
Biogeosciences, 6, 2809–2827, 2009 www.biogeosciences.net/6/2809/2009/
E. M. Jimenez et al.: Fine root dynamics for Amazon forests 2811
Table 1. Main characteristics of the study sites (Colombian Amazon): Amacayacu National Natural Park (AMP) and Biological StationZafire (ZAB).
Characteristics AMP ZAB
Principal Investigator A. Rudas and A. Prieto M. C.Penuela and E.AlvarezPlot Codea AGP-01 AGP-02 ZAR-01Latitude −3.72 −3.72 −4.01Longitude −70.31 −70.30 −69.91Altitude (m) 105 110 130Forest type Terra firme CaatingaSoil typeb Endostagnic Plinthosol Orteinic Podzol (Oxyaquic) –
(Alumic, Hyperdystric) – loamy sandclay loam
Chemical properties (depth 0 – 30 cm)c
pH 4.50 4.29 4.27Resin extractable P (mg kg−1) 1 1 12Total extractable P (mg kg−1) 131 123 22Mean N (%) 0.15 0.16 0.11Mean C (%) 1.2 1.4 2.4C/N 8 8 27Ca (mmolc kg−1) 6 5 3Mg (mmolc kg−1) 3 3 2K (mmolc kg−1) 1 1 1Na (mmolc kg−1) 0 0 1Al (mmolc kg−1) 52 52 1SB (mmolc kg−1) 10 10 6CIC (mmolc kg−1) 6.21 6.26 0.71Al Saturation (%) 84 84 10Base saturation (%) 16 16 90
Physical propertiesc
Sand (%) 21 19 75Clay (%) 42 43 1Silt (%) 37 38 25Main root depth (cm) 20 20 10Total root depth (cm) 50 50 100
Available water capacity, cm water per cm depth0–30 cm 3.75 3.51 2.82
Vegetationd
Richness (species ha−1) 225 244 25Mean height of crown (m) 30 30 20Mean stem diameter (cm) 17.3 21 15Stem density (ha−1) 647 606 866above-ground biomass (Mg ha−1) 281 276 161
a Codes follow those published in Patino et al. (2009).b World Reference Base for Soil Resources (2006).c Quesada et al. (2009b).d
RAINFOR (http://www.rainfor.org).
www.biogeosciences.net/6/2809/2009/ Biogeosciences, 6, 2809–2827, 2009
2812 E. M. Jimenez et al.: Fine root dynamics for Amazon forests
39
820 Fig. 2. 821 822
22
23
24
25
26
27
28
0
100
200
300
400
500
600
700
E F M A M J J A S O N D E F M A M J J A S O N D E F M A M J J A S O N D
Tem
per
atu
re (oC)
Rain
fall (m
m)
2004 2005 2006
J F M A M J J A S O N D J F M A M J J A S O N D J F M A M J J A S O N D
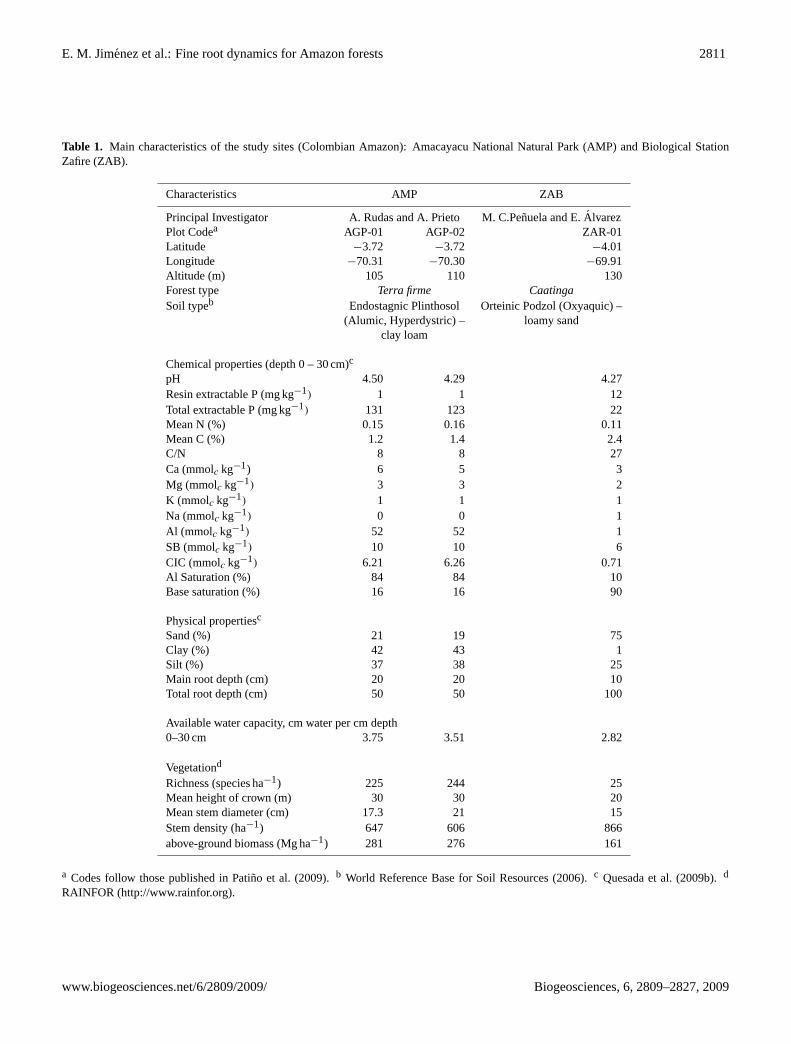
Fig. 2. Patterns of monthly and mean monthly precipitation (1973–2006) and mean temperature from the meteorological station of theVasquez Cobo airport, Leticia (Amazonas, Colombia) during the time of the research. Shady areas show the dry period of each year, thedark one represents the drought periods. Mean monthly precipitation is plotted repeatedly for every year.
Amazonico) (Fig. 1, Table 1) between September 2004 andDecember 2006. Two plots, AGP-01 and AGP-02 weresampled in Amacayacu Natural National Park (AMP) aspart of the RAINFOR-NPP project (www.rainfor.org). Oneplot, ZAR-01 was sampled at the Zafire Biological Station(ZAB), Calderon River Forest Preserve as part ofGrupo deEcologıa de Ecosistemas Terrestres TropicalesNet PrimaryProductivity Project (http://www.imani.unal.edu.co/).
In general, theTrapecio Amazonicoshows a mean monthlyrainfall of 278 mm with a drier period from June to Septem-ber (mean monthly rainfall of 190 mm), and a rainy seasonfrom October to May (mean monthly rainfall of 324 mm)(data from the Vasquez Cobo airport of Leticia for the pe-riod 1973–2006). Mean temperature is about 26◦C and doesnot fluctuate greatly through the year (Fig. 2). Relative hu-midity is high, with a yearly average of 86%. In 2005, inthe middle of the measurements described here, an extendedand unusually dry period occurred from June to September(“the 2005 Amazon drought” see for example Phillips et al.,2009). The rainfall in 2005 was thus only 2873 mm, substan-tially lower than the previous and subsequent year (3250 in2004 and 3710 in 2006), and than the multi-annual average(3335 mm).
AMP belongs to the geologic unit namedPebas orSolimoesFormation; the terrain is slightly undulated and uni-form, with soils moderately deep, well drained, and stronglyacidic with moderately fine textures (Herrera, 1997). Soilsfrom ZAB belong to theTerciario Superior Amazonicounit
(Herrera, 1997; PRORADAM, 1979), probably originatingfrom the Guiana Shield (Hoorn, 1994, 2006), and composedmainly by quartz. The terrain is flat and uniform.
Vertical profiles in exchangeable cations, carbon densityand particle size distribution have been illustrated for thesoils two of the three plots sampled here (AGP-02 and ZAR-01) by Quesada et al. (2009b) with the physical and chemicalnature of these soils also specifically discussed in that paper.Of particular note is the presence in ZAR-01, classified ac-cording to the World Reference Base (2006) as anOrtseinicPodzol (Oxyaquic)of a layer at approximately 1 m deep inwhich aluminium concentration increases abruptly as doescarbon and to some extent clay content. This reflects thecomposition of the defining ortseinic layer where Al-humuschelates act as cementing substances and despite the sandynature of the soil above, can be regarded as a form of “hard-pan” both limiting root distribution and impeding drainage.On the other hand, although both AGP-01 and AGP-02 wereclassified in Quesada et al. (2009b) as being anEndostag-nic Plinthosol (Alumic, Hyperdystric), the plinthic layer wasconsidered relatively permeable exerting only moderate con-straints on drainage (Quesada et al., 2009a). Data from Ta-ble 1 clearly show that AGP-01 and AGP-02 are more fer-tile than ZAR-01, especially in terms of “total exchangeablephosphorus”, a measure as defined by Quesada et al. (2009a)and also being shown by Quesada et al. (2009c) to be oneof the best indicators of Amazon soil fertility because of itsdominating influence on above-ground wood productivity.
Biogeosciences, 6, 2809–2827, 2009 www.biogeosciences.net/6/2809/2009/

E. M. Jimenez et al.: Fine root dynamics for Amazon forests 2813Page 3 of 11
PAGE 5, Figure 3.
Method Site Action
Establishment 105 63 3925 12 13 13 13 13 6 10
12 13 13 13 1213 13 13
Establishment 79 5919 12 13 13 11 6 2 3
10 13 13 13 3 7Establishment 136 39
26 26 28 28 14 1413 13 13
AGP-01 13 13 13 13 13 6 13 13 13AGP-02 13 12 13 13 13 5 13ZAR-01 124 14 14 14 14 14 14 13 13
J F M A M J J A S O N D J F M A M J J A S O N D J F M A M J J A S O N D
Number of cores
RetrievalAGP-01
RetrievalAGP-02
Retrieval
Retrieval
ZAR-01
Ingrowth
Sequential
Fig. 3. Schematic representation of the time table for establishment and retrieval of fine root cores. Each colour indicates the establishmentof a given set of cores and their correspondent retrieval sequence considering only the 0–20 cm depth soil core. Note that for sequential coresthere is only retrieval (blue).
2.2 Sampling design
2.2.1 The AMP sampling design
AGP-01 and AGP-02 are two 20×500 m plots. We selected13 areas every 40 m along the plots (Fig. 1). Ingrowth coreswere established on three dates: (1) February 2004, (2)September 2004, and (3) February 2006 (Fig. 3). Ingrowthcores were located 1–2 m from trees≥10 cm in diameter atbreast height (DBH) to avoid coarse roots next to trees; coreswere also 0.20–1 m apart from each other.
2.2.2 The ZAB sampling design
ZAR-01 is a plot composed of two rectangular blocks of40×140 m and 40×130 m (Fig. 1). We established ingrowthcores in 14 areas (following the same criteria as for AMP).
2.3 Core methods
2.3.1 Ingrowth cores
In AMP soil cores were extracted using a root auger 8 cm-diameter and 20 cm-length; in ZAB we used a soil core sam-pler 5 cm-diameter and 15 cm-length. Differences in coresize between sites occurred because the two sampling pro-grams started as independent research projects. Soil cores atboth sites were 20 cm long. Once extracted from the groundcores were divided into two parts: from 0–10 cm and from10–20 cm depth. The soil from each part was sieved twice(through 6 and 1 mm mesh size, respectively), and all rootsand fragments were extracted by hand using forceps. Finally,this root-free soil was sown back in the same hole and depthlevel of the original sample. In this method only a portionof the initially installed cores were retrieved each samplingdate, so the total amount of time that the cores were in theground increased with each successive sampling.
2.3.2 Sequential cores
In the same areas where ingrowth cores were planted wecollected undisturbed cores whenever ingrowth cores wereplanted and extracted (Fig. 3). Handling and processing ofsamples was the same as described for ingrowth cores.
2.4 Fine root extraction
In all cases, the first collection of ingrowth cores was done5–7 months after establishment; subsequent collections weredone at 2–4 month intervals (Fig. 3). Selection of the timeinterval for the first collection was based on reports of meanfine roots life time for several tropical forests, which rangesfrom 6 to 12 months (Priess et al., 1999), previous studieshaving shown that starting collection after a shorter periodthan this is too early to allow representative root growth intothe root-free soil cores.
After extraction, soil cores were packed in labelled poly-thene bags and transported to field stations where they werewashed and sorted in nearby streams. Samples were then air-dried before transportation to the laboratory, where they werewashed with deionised water, sieved (mesh size 0.1 mm), andremaining roots manually extracted with forceps. Roots werepacked in paper bags and oven-dried for 24 h at 80◦C, andthen weighed (0.001 g precision).
2.5 Statistical methods
Tests for differences between forest types, time and soildepths were carried out with one way ANOVA. Data hadbeen previously checked for normality of distributions withthe Kolmogorov-Smirnov and Shapiro-Wilk tests and, forhomogeneity of variances with the test of Levene (Dytham,2003). When ANOVA was significant (p<0.05), we used thepost hoctest of Tukey to compare means. When the require-ments of ANOVA were not met, we used non-parametricaltests, such as the test of Kruskal-Wallis followed by the testU of Mann-Whitney between pairs of data until the differ-ences of the entire group were evaluated. Statistical analyses
www.biogeosciences.net/6/2809/2009/ Biogeosciences, 6, 2809–2827, 2009

2814 E. M. Jimenez et al.: Fine root dynamics for Amazon forests
were done with the software SPSS 11.5.0 (6 September 2002,LEAD Technologies, Inc).
FRP (Mg ha−1 yr−1) was calculated as the time betweeningrowth core installation (time zero) and the subsequent 6–10 months, scaled to a yearly basis (Vogt et al., 1998). In thisway, for the first establishment in the loamy soil forest, cal-culation of yearly production was based on growth betweenFebruary and December 2004; for the establishment 2, ongrowth between September 2004 and April 2005; and for theloamy sand forest, on growth between September 2004 andJuly 2005; for the establishment 3 in both forest types, pro-duction was based on growth between February and Decem-ber 2006.
To compare FRP in standard units between forests andtime intervals, we calculated the relative growth rate (RGR),defined by Fogg (1967) and Kozlowski et al. (1991) as:
RGR=log(W1)−log(W0)
t(1)
where, log represents the natural logarithm;W1 andW0 arethe final and initial dry weight of fine roots, respectively andt is the time between the two collections in days.
Due to the occurrence of a strong drought period in themiddle of our sampling in 2005 (Fig. 2), we tested for its ef-fect on root production through the comparison of RGR be-fore (September–December 2004), during (April–July 2005),and after drought (September–December 2006). For theloamy sand forest, we also analysed the RGR in the time in-terval between the installation and the harvest 370 days later,and between measurements separated by 89 days, this be-ing with the purpose of having an estimate of RGR duringdrought, between July and September 2005. We consideredfor the estimation of RGR the time elapsed between the es-tablishment and the retrieval time of cores, trying to comparesimilar periods of growth.
Annual production of fine roots (Mg ha−1 yr−1) was alsoestimated from the data of sequential cores as the differencebetween maximum and minimum biomass measured in oneyear (Vogt et al., 1998). To analyse the same time intervalsfor all plots, even though the length of monitoring was dif-ferent, we selected two 12 month periods (April 2005–2006and December 2005–2006) for this analysis. The initial pe-riod, from September 2004 to April 2005 was not used forcalculations because the sharp seasonality of SFR observedin the clay loam soil forest during this period could introducebiases in the estimations.
Turnover rate was calculated as the FRP divided into theaverage SFR for that year; carbon content in fine roots wasassumed to be equal to 50% of dry mass (Silver et al., 2005).
To evaluate the association between SFR (Mg ha−1) –from data of sequential cores- and mean daily rainfall (mmday−1), we used the Spearman’s correlation coefficient,rS(Dytham, 2003).
Several works have correlated the production and thestanding crop fine roots mass with rainfall (Gower et al.,
1992; Kavanagh and Kellman, 1992; Vogt et al., 1998; Yavittand Wright, 2001). However, the speed of the response andits temporal scale is unknown. It is presumed that this re-sponse can be variable depending on soil conditions and rain-fall regimes (Yavitt and Wright, 2001). For this reason, weexplored a wide range of time intervals with respect to rain-fall, examining the average daily rainfall of the previous 7,15, 30, 60, 90, 100, and 120 days before the sampling day.We also explored the existence of a lagged response of SFRto rainfall; for this purpose we considered the average dailyrainfall for fixed time periods of 15, 30, 60, and 90 days withtime lags of 7, 15, 30, 120, and 150 days from the samplingdate.
3 Results
In total we collected 207, 138, and 175 cores from AGP-01 and AGP-02 and ZAR-01 respectively with the ingrowthcores method and 110 and 82 soil cores during the monitor-ing period from AGP-01 and AGP-02 respectively and with234 samples from ZAR-01 with the sequential core. Figure 3shows details of the establishment and retrieval timetable forthe two methods and plots.
3.1 Standing crop fine root mass and production fromingrowth cores
The standing crop for each collection date and soil depth (0–10, 10–20, and 0–20 cm) did not show significant differences(p>0.05) between the two clay loam soil plots (AGP-01 andAGP-02). For this reason, these plots were considered asa unique site in subsequent analyses and were significantlydifferent (p<0.05) from the loamy sand forest plot (ZAR-01).
SFR and FRP were higher in the 0–10 cm than in the0–20 cm soil depth for all establishment dates and forests(Fig. 4 and Table 2). SFR in the clay loam soil forestshowed significant differences (p<0.05) between soil depths(0–10 cm and 10–20 cm) in most collection times and estab-lishment dates, the exception being the collection of April2005 for the second establishment. Similarly, in the loamysand forest, SFR showed significant differences betweensoil depths in most collection dates, but differences betweendepths were not significant for the first collection dates.
Figures of FRP were higher in the forest on loamy sandforest than in the clay loam forest in all depths and estab-lishment dates (Table 2). Differences of FRP in the 0-20 cmlayer were significant (p<0.05) in establishments 2 and 3;however, in establishment 2 differences between forest typeswere not significant (p>0.05) when evaluated independentlyat each soil depth (0–10 cm and 10–20 cm). In establish-ment 3, we found significant differences (p<0.05) of FRPbetween forest types at all soil depths. Results for SFR hadsimilar trends: establishments 2 and 3 showed significant
Biogeosciences, 6, 2809–2827, 2009 www.biogeosciences.net/6/2809/2009/

E. M. Jimenez et al.: Fine root dynamics for Amazon forests 2815
41
826 Fig. 4. 827
0,0
1,0
2,0
3,0
4,0
5,0
6,0
E F MAM J J A S O N D E FMAM J J A S O N D E F MAM J J A S O ND
2004 2005 2006
* *
*
*
*
Monitoring time (months)
Loamy sand forest
Accumulated fine root mass (Mg ha-1)
1)
2)
3)
Clay loam forest
0,0
1,0
2,0
3,0
4,0
5,0
6,0
E F MAM J J A S O N D E F MAM J J A S O N D E F MAM J J A S O N D
2004 2005 2006
0-10 cm
10-20 cm
0-20 cm
* *
* *
*
* * *
0,0
1,0
2,0
3,0
4,0
5,0
6,0
E F MAM J J A S O N D E F MAM J J A S O N D E F MAM J J A S O N D
2004 2005 2006
*
*
*
*
*
*
*
*
0,0
1,0
2,0
3,0
4,0
5,0
6,0
E F MAM J J A S O N D E F MAM J J A S O N D E F MAM J J A S O N D
2004 2005 2006
*
*
*
0,0
1,0
2,0
3,0
4,0
5,0
6,0
E FMAM J J A S O N D E FMAM J J A S O N D E F MAM J J A S O ND
2004 2005 2006
*
*
*
*
*
J F M AM J J A S OND J F M AM J J A S OND J F M AM J J A S OND J F M AM J J A S OND J F M AM J J A S OND J F M AM J J A S OND
J F M AM J J A S OND J F M AM J J A S OND J F M AM J J A S OND J F M AM J J A S OND J F M AM J J A S OND J F M AM J J A S OND
J F M AM J J A S OND J F M AM J J A S OND J F M AM J J A S OND
Fig. 4. Fine root production (Mg ha−1) in the first 20 cm of soil depth estimated by the ingrowth core method in two forests with differentsoil types in the Colombian Amazon. Cores were established in three times: (1) February of 2004, (2) September of 2004 and, (3) Februaryof 2006. Values are the means and the standard errors. The shady area is the drought period of the year 2005.∗Significant differences(p<0.05) of fine root mass in relation to: (1) differences between soil depths (0–10 cm and 10–20 cm) per collection date in each plot, (2)differences between all soil depths per collection date and forest type.
differences (p<0.05) between the two forest types at eachsoil depth in most dates of collection, the except being forestablishment 2 in April 2005 for which differences were notsignificant between sites at any soil depth, and in April 2006at the 10–20 cm depth. Nevertheless, for this collection date,the other depths (0–10 cm and 0–20 cm) showed significantdifferences (p<0.05) between the two forests.
The rates of FRP in the first 20 cm of soil ranged from1.60 Mg ha−1 yr−1 in the forest growing on the clay loamsoil to 6.00 Mg ha−1 yr−1 on sandy soil, both rates obtainedfor establishment 3 (Table 2). Likewise, mean FRP waslower for the clay loam forest (3.02 Mg ha−1 yr−1) than inthe loamy sand forest with an estimate of 5.97 Mg ha−1 yr−1
being obtained (Table 2).
Relative growth rates (RGR) for the three periods evalu-ated were higher for the loamy sand forest than for the clayloam forest (Fig. 5). RGR in the clay loam forest both beforeand after drought were also higher than during drought in
www.biogeosciences.net/6/2809/2009/ Biogeosciences, 6, 2809–2827, 2009

2816 E. M. Jimenez et al.: Fine root dynamics for Amazon forests
Table 2. Fine root production (Mg ha−1 yr−1) in the first 20 cm of soil depth in two forests with different soil types in the ColombianAmazon, estimated from ingrowth cores established in three times: (1) February of 2004, (2) September of 2004 and, (3) February of 2006.
Soil depthClay loam forest Loamy sand forest
N Mean N Mean
Establishment 1 (0.83 years)0–10 cm 24 3.082 (0.196) – –10–20 cm 25 1.153 (0.144) – –0–20 cm 24 4.215 (0.307) – –Total C 2.108
Establishment 2 (0.52 and 0.77 years, respectively)0–10 cm 22 2.104 (0.357) a 26 3.530 (0.520) a10–20 cm 22 1.243 (0.212) a 26 2.404 (0.414) a0–20 cm 22 3.346 (0.472) a 26 5.934 (0.773) bTotal C 1.680 2.967
Establishment 3 (0.82 and 0.81 years, respectively)0–10 cm 13 1.210 (0.178) a 13 3.910 (0.990) b10–20 cm 13 0.390 (0.078) a 13 2.091 (0.589) b0–20 cm 13 1.600 (0.203) a 13 6.001 (1.388) bTotal C 0.800 3.001
Mean0–20 cm 3.022 (0.279) a 5.968 (0.721) bTotal C 1.511 (0.140) 2.984 (0.361)
In parenthesis the time elapsed between the establishment and the retrieve of cores. Standard errors in parenthesis. Different letters showsignificant differences (p<0.05) in the production between forests.
2005. Before the drought RGR was 4.47 yr−1 and 3.94 yr−1
for AGP-01 and AGP-02, respectively, and after drought itwas 1.21 yr−1 for AGP-01. RGR during the drought periodwere lower: −1.00 and−0.72 yr−1 for AGP-01 and AGP-02, respectively. RGR before and after drought in the loamysand forest were similar: 2.94 and 2.08 yr−1, respectively,while the RGR estimated during the final part of the droughtperiod were much lower (−0.77 yr−1), similar to those ob-tained for the forest on clay loam soil.
3.2 Standing crop fine root mass, production, andturnover rates from sequential soil coring
Similar to results obtained for the ingrowth cores, SFR wassignificantly higher (p<0.05) at 0–10 cm depth than at 10–20 cm (Fig. 5 and Table 3). Temporal variation of SFR alongthe monitoring period also showed significant differencesamong collection dates for all plots: AGP-01 (F8,101=4.754,p<0.01), AGP-02 (X2=23.130, D.F.=6, p=0.001), andZAR-01 (X2=49.258,D.F.=8, p=0.000) (Fig. 6). Decem-ber 2005 had the highest value of SFR (5.04 Mg ha−1) inAGP-01. In AGP-02 September 2004, April and December2005 showed higher values (3.90, 4.27 and 5.04 Mg ha−1,respectively) whereas July 2006 showed the lowest value(2.44 Mg ha−1). For ZAR-01, September 2004, July 2005,
and December 2006, showed significant differences (Fig. 6).In the clay loam forest (plots AGP-01 and AGP-02) thestanding crop increased between September and December,while for the loamy sand forest the increase occurred be-tween March and July.
The standing crop also showed significant differences be-tween plots (p<0.05) at each collection date and at all soildepths (0–10, 10–20 and 0–20 cm), but differences betweenplots of clay loam forest (AGP-01 and AGP-02) were notsignificant (p>0.05) for most sampling dates (Fig. 7), the ex-ception being April 2005. The loamy sand forest (ZAR-01)showed values significantly higher (p<0.05) than the plotson clay loam soil for almost all collection dates.
By contrast, SFR measured for the entire monitoring time(2.2 years) showed significant differences (p<0.05) betweenplots at all soil depths considered (Table 3). The average SFRfor over the monitoring period was almost three times higherin the loamy sand forest plot than in plots of clay loam forest(10.94 Mg ha−1 in ZAR-01 and 3.04 and 3.64 Mg ha−1 forAGP-01 and AGP-02, respectively). Likewise, when the twoyears were evaluated independently, SFR was higher in theloamy sand forest (8.92 and 4.41 Mg ha−1 yr−1 for years 1and 2, respectively) than in the clay loam forest (for AGP-01:2.77 and 2.67 Mg ha−1 yr−1 for years 1 and 2, respectively,and 2.05 Mg ha−1 yr−1 for AGP-02 in year 1) (Table 3).
Biogeosciences, 6, 2809–2827, 2009 www.biogeosciences.net/6/2809/2009/

E. M. Jimenez et al.: Fine root dynamics for Amazon forests 2817
42
828 Fig. 5. 829
-3
-2
-1
0
1
2
3
4
5
6
-200
-100
0
100
200
300
400
E F MAM J J A S O N D E F MAM J J A S O N D E F MAM J J A S O ND
TCR (t ha-1
año-1)
Anom
alía en la p
recipitación m
ensu
al (m
m)
2004 2005 2006
Anomalia
TCR
* RGR (yr-1 )
Anomaly of monthly rainfall (mm)
Anomaly
RGR
J F MAM J J A S O N D J F MAM J J A S O N D J F MAM J J A S O N D
2004 2005 2006
Fig. 5. Anomaly of rainfall along the period of study, calculatedas the precipitation of each month minus the mean monthly precip-itation (1973–2006) and relative growth rates (RGR) of fine rootmass (yr−1) for the forests studied. Dotted vertical lines show thetime intervals considered for the estimation of RGR from ingrowthcores; the portion dashed shows the drought of 2005. Circles withvertical bars represent the mean and standard errors of RGR; whiteand gray circles for plots on clay loam forest (AGP-01 and AGP-02, respectively) and black circles for the plot on loamy sands for-est (ZAR-01). ∗RGR for ZAR-01, calculated between the formerharvest (July 2005) and the following harvest (September 2005).
Turnover rates (yr−1) estimated from sequential cores foreach year (Table 3), varied between 0.53–0.84 in the clayloam forest, and between 0.51–0.81 in the loamy sand forest.Averages per plot were 0.84 and 0.53 for AGP-01 and AGP-02, and 0.66 for ZAR-01.
3.3 Relationship between the standing crop fine rootmass and rainfall
We found a significant correlation between SFR and rain-fall (mm day−1) in both forest types (Table 6). For plots inthe clay loam soil forest (AGP-01 and AGP-02), the corre-lation was positive and significant between SFR and meandaily rainfall with and without time lag. Rainfall variablesthat showed a positive correlation (R between 0.1884 and0.2397) in AGP-01 were average daily rainfall of the previ-ous 90 days, average rainfall of the previous 60 and 90 dayswith time lags of 7 and 15 days, and average rainfall of theprevious 60 days with a time lag of 30 days. In AGP-02 weobtained a higher number of rainfall variables with positiveand higher correlations (0.2397–0.4702); variables with sig-nificant correlations were average daily rainfall of last 60,90, 100 and 120 days, as well as rainfall with time lags of7 days in all the fixed periods considered (15, 30, 60 and 90days), rainfall with time lag of 15 days for fixed periods of30 and 60 days, and rainfall with time lag of 30 days with afixed period of 15 days. Rainfall with the longest time lags
Page 3 of 7
Monitoring time (months)
Stan
din
g cr
op f
ine
root
mas
s (M
g h
a-1)
0,0
1,0
2,0
3,0
4,0
5,0
6,0
7,0
E FMAM J J A S OND E FMAM J J A S OND E FMAM J J A S OND
2004 2005 2006
Bosque sobre arcillas - AME
0-10 cm10-20 cm0-20 cm
a
b
aa a* a
aa
ab
**
* *
*
* * * *
0,02,04,06,08,0
10,012,014,016,018,020,0
E FMAM J J A S OND E FMAM J J A S OND E FMAM J J A S OND
2004 2005 2006
Bosque sobre arenas blancas - ZAB
a
c
ab
ab
ac
ab*
ab
ab b
*
*
*
**
**
* *
0,0
1,0
2,0
3,0
4,0
5,0
6,0
7,0
E FMAM J J A S OND E FMAM J J A S OND E FMAM J J A S OND
2004 2005 2006
Bosque sobre arcillas - AMU
a
ab
a
a
ab ab
b
* ** *
*
**
Forest on clay soils - AME
Forest on clay soils - AMU
Forest on white sands - ZAB
J F M A M J J A S O N D J F M A M J J A S O N D J F M A M J J A S O N D
J F M A M J J A S O N D J F M A M J J A S O N D J F M A M J J A S O N D
J F M A M J J A S O N D J F M A M J J A S O N D J F M A M J J A S O N D
Clay loam forest (AGP-01)
Clay loam forest (AGP-02)
Loamy sand forest (ZAR-01)
Fig. 6. Temporal variation of fine root mass (Mg ha−1) in the 0–20 cm soil depth in two forests on different soil types in ColombianAmazon: one forest on clay loam soils (plots AGP-01 and AGP-02) and another on loamy sands (plot ZAR-01), estimated with themethod of sequential cores. Values are averages and standard devia-tions. The area dashed shows the drought period in 2005. Differentletters in each plot show significant differences (p<0.05) of fineroot mass (0–20 cm) between collection dates.∗Significant differ-ences (p<0.05) of fine root mass in each collection date betweendepths 0–10 and 10–20 cm.
(120 and 150 days) and almost all fixed periods considered,showed negative correlation with SFR in plots of clay loamforest (−0.2593 to−0.3719).
www.biogeosciences.net/6/2809/2009/ Biogeosciences, 6, 2809–2827, 2009
2818 E. M. Jimenez et al.: Fine root dynamics for Amazon forests
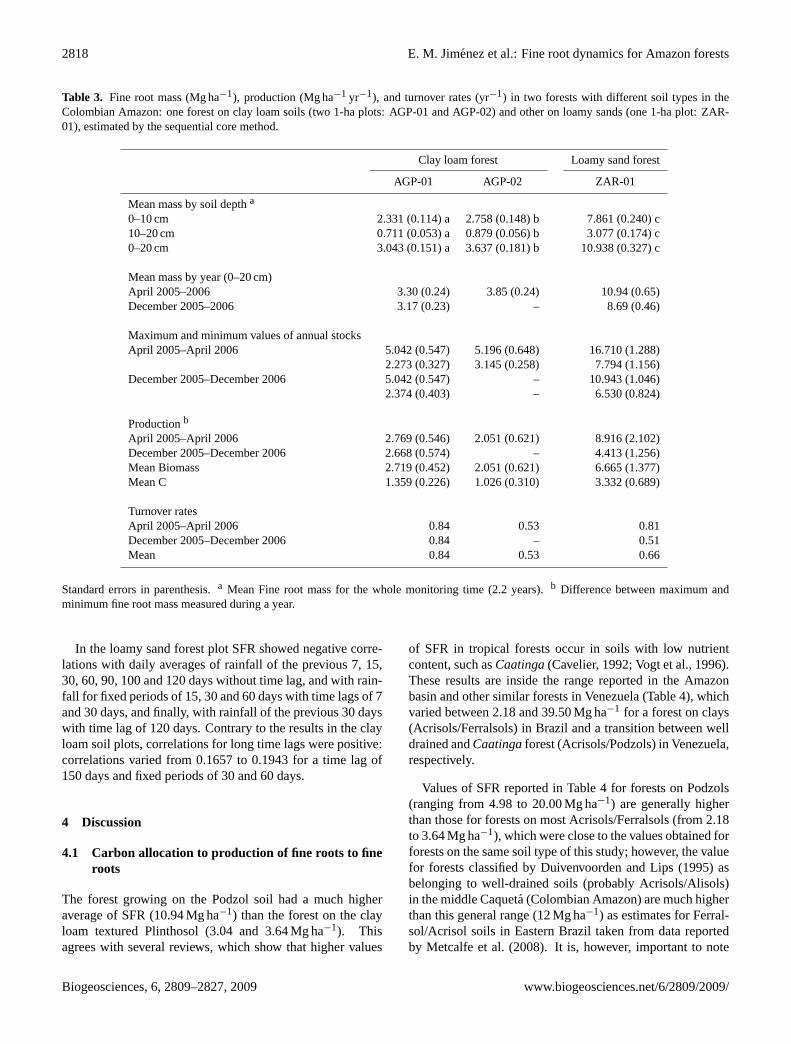
Table 3. Fine root mass (Mg ha−1), production (Mg ha−1 yr−1), and turnover rates (yr−1) in two forests with different soil types in theColombian Amazon: one forest on clay loam soils (two 1-ha plots: AGP-01 and AGP-02) and other on loamy sands (one 1-ha plot: ZAR-01), estimated by the sequential core method.
Clay loam forest Loamy sand forest
AGP-01 AGP-02 ZAR-01
Mean mass by soil deptha
0–10 cm 2.331 (0.114) a 2.758 (0.148) b 7.861 (0.240) c10–20 cm 0.711 (0.053) a 0.879 (0.056) b 3.077 (0.174) c0–20 cm 3.043 (0.151) a 3.637 (0.181) b 10.938 (0.327) c
Mean mass by year (0–20 cm)April 2005–2006 3.30 (0.24) 3.85 (0.24) 10.94 (0.65)December 2005–2006 3.17 (0.23) – 8.69 (0.46)
Maximum and minimum values of annual stocksApril 2005–April 2006 5.042 (0.547) 5.196 (0.648) 16.710 (1.288)
2.273 (0.327) 3.145 (0.258) 7.794 (1.156)December 2005–December 2006 5.042 (0.547) – 10.943 (1.046)
2.374 (0.403) – 6.530 (0.824)
Productionb
April 2005–April 2006 2.769 (0.546) 2.051 (0.621) 8.916 (2.102)December 2005–December 2006 2.668 (0.574) – 4.413 (1.256)Mean Biomass 2.719 (0.452) 2.051 (0.621) 6.665 (1.377)Mean C 1.359 (0.226) 1.026 (0.310) 3.332 (0.689)
Turnover ratesApril 2005–April 2006 0.84 0.53 0.81December 2005–December 2006 0.84 – 0.51Mean 0.84 0.53 0.66
Standard errors in parenthesis.a Mean Fine root mass for the whole monitoring time (2.2 years).b Difference between maximum andminimum fine root mass measured during a year.
In the loamy sand forest plot SFR showed negative corre-lations with daily averages of rainfall of the previous 7, 15,30, 60, 90, 100 and 120 days without time lag, and with rain-fall for fixed periods of 15, 30 and 60 days with time lags of 7and 30 days, and finally, with rainfall of the previous 30 dayswith time lag of 120 days. Contrary to the results in the clayloam soil plots, correlations for long time lags were positive:correlations varied from 0.1657 to 0.1943 for a time lag of150 days and fixed periods of 30 and 60 days.
4 Discussion
4.1 Carbon allocation to production of fine roots to fineroots
The forest growing on the Podzol soil had a much higheraverage of SFR (10.94 Mg ha−1) than the forest on the clayloam textured Plinthosol (3.04 and 3.64 Mg ha−1). Thisagrees with several reviews, which show that higher values
of SFR in tropical forests occur in soils with low nutrientcontent, such asCaatinga(Cavelier, 1992; Vogt et al., 1996).These results are inside the range reported in the Amazonbasin and other similar forests in Venezuela (Table 4), whichvaried between 2.18 and 39.50 Mg ha−1 for a forest on clays(Acrisols/Ferralsols) in Brazil and a transition between welldrained andCaatingaforest (Acrisols/Podzols) in Venezuela,respectively.
Values of SFR reported in Table 4 for forests on Podzols(ranging from 4.98 to 20.00 Mg ha−1) are generally higherthan those for forests on most Acrisols/Ferralsols (from 2.18to 3.64 Mg ha−1), which were close to the values obtained forforests on the same soil type of this study; however, the valuefor forests classified by Duivenvoorden and Lips (1995) asbelonging to well-drained soils (probably Acrisols/Alisols)in the middle Caqueta (Colombian Amazon) are much higherthan this general range (12 Mg ha−1) as estimates for Ferral-sol/Acrisol soils in Eastern Brazil taken from data reportedby Metcalfe et al. (2008). It is, however, important to note
Biogeosciences, 6, 2809–2827, 2009 www.biogeosciences.net/6/2809/2009/
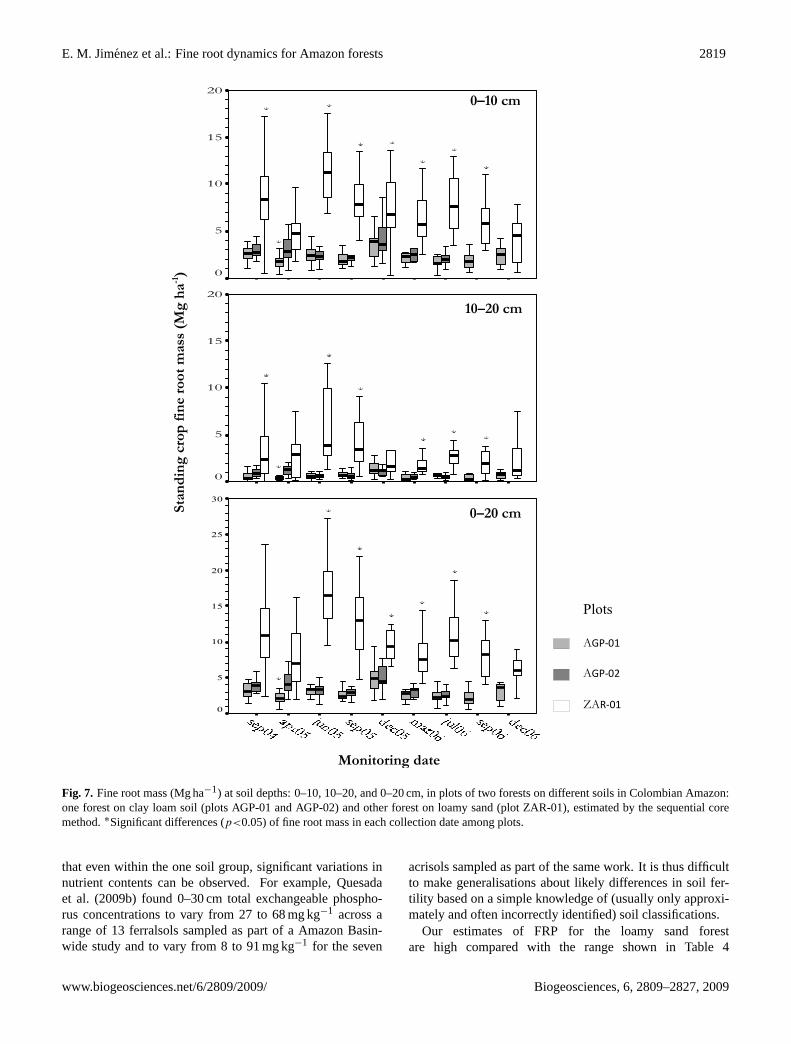
E. M. Jimenez et al.: Fine root dynamics for Amazon forests 2819
44
832 Fig. 7. 833
Monitoring date
20
15
10
5
0
*
*
*
*
* * *
20
15
10
5
0
*
*
*
* *
* *
*
30
25
20
15
10
5
0
*
*
*
* *
*
*
0–10 cm
10–20 cm
0–20 cm Standing crop fine root mass (Mg ha-1 )
Plots
AGP-01
AGP-02
ZAR-01
Fig. 7. Fine root mass (Mg ha−1) at soil depths: 0–10, 10–20, and 0–20 cm, in plots of two forests on different soils in Colombian Amazon:one forest on clay loam soil (plots AGP-01 and AGP-02) and other forest on loamy sand (plot ZAR-01), estimated by the sequential coremethod.∗Significant differences (p<0.05) of fine root mass in each collection date among plots.
that even within the one soil group, significant variations innutrient contents can be observed. For example, Quesadaet al. (2009b) found 0–30 cm total exchangeable phospho-rus concentrations to vary from 27 to 68 mg kg−1 across arange of 13 ferralsols sampled as part of a Amazon Basin-wide study and to vary from 8 to 91 mg kg−1 for the seven
acrisols sampled as part of the same work. It is thus difficultto make generalisations about likely differences in soil fer-tility based on a simple knowledge of (usually only approxi-mately and often incorrectly identified) soil classifications.
Our estimates of FRP for the loamy sand forestare high compared with the range shown in Table 4
www.biogeosciences.net/6/2809/2009/ Biogeosciences, 6, 2809–2827, 2009

2820 E. M. Jimenez et al.: Fine root dynamics for Amazon forests
Table 4. Standing crop fine root mass (SFR), production (FRP) and turnover rates (FRT) of fine roots (<2 mm) in forests of the Amazonbasin.
Forest type Soil Depth SFR FRP FRT Reference(cm) (Mg ha−1) (Mg ha−1 yr−1) (yr−1)
BrazilCampina on humus (Podzol) 29 4.98 – – Klinge (1973)TF Forest (Ferralsol) 27 5.33 – – Klinge (1973)TF Forest (Ferralsol) “clay plot”1 30 – 11.40 – Metcalfe et al. (2007)TF Forest (Ferralsol) “clay plot”1 30 – 5.00 – Metcalfe et al. (2007)TF Forest (Ferralsol) “clay plot”1 30 – 5.60 – Metcalfe et al. (2007)TF Forest (Ferralsol) “clay plot”1 30 – 2.10 – Metcalfe et al. (2007)TF Forest (Acrisol) “sand plot” 30 14.00 4.00 0.29 Metcalfe et al. (2008)∗∗
TF Forest (Acrisol) “dry plot” 30 10.00 3.00 0.30 Metcalfe et al. (2008)∗∗
TF Forest (Ferralsol) “clay plot” 30 15.00 4.00 0.27 Metcalfe et al. (2008)∗∗
TF Forest (Archao-Anthroposol) “fertile plot” 30 11.00 7.00 0.64 Metcalfe et al. (2008)∗∗
Forest on clay soils (Ferralsol) – year 1 10 2.18 2.04 0.70 Silver et al. (2005)Forest on clay soils (Ferralsol) – year 2 10 2.18 1.57 0.69 Silver et al. (2005)Forest on sandy loam soils (Acrisol) – year 1 10 2.92 2.54 0.57 Silver et al. (2005)Forest on sandy loam soils (Acrisol) – year 2 10 2.92 1.49 0.39 Silver et al. (2005)Mature forest (Acrisol/Ferralsol)2a 10 2.60 0.35 0.14 Trumbore et al. (2006)∗∗
Mature forest (Acrisol/Ferralsol)2b 10 2.60 0.92 0.35 Trumbore et al. (2006)∗∗
Mature forest (Acrisol/Ferralsol)2c 10 2.60 1.18 0.45 Trumbore et al. (2006)∗∗
Mature forest (Acrisol/Ferralsol)2d 10 2.60 0.52 0.20 Trumbore et al. (2006)∗∗
Secondary forest of 17 years old (Acrisol/Ferralsol)2d 10 3.42 0.85 0.25 Trumbore et al. (2006)∗∗
ColombiaFlooded forest on well drained soils (Cambisol)3∗ 20 10.00 – – Duivenvoorden and Lips (1995)TF Forest on well drained soils (Acrisol/Alisol)3∗ 20 12.00 – – Duivenvoorden and Lips (1995)TF Forest on white sands (Podzol)3∗ 20 20.00 – – Duivenvoorden and Lips (1995)Secondary forest of 18 years old in low terraces in the Caqueta river 20 12.82 – – Pavlis and Jenık (2000)Secondary forest of 25 years old in low terraces in the Caqueta river 20 11.24 – – Pavlis and Jenık (2000)Secondary forest of 37 years old in low terraces in the Caqueta river 20 16.87 – – Pavlis and Jenık (2000)Mature forest in low terraces in the Caqueta river 20 30.61 – – Pavlis and Jenık (2000)TF Forest on clay soils (Plinthosol)4a 20 – 3.02 – Present studyTF Forest on white sands/Caatinga(Podzol)4a 20 – 5.97 – Present studyTF Forest on clay soils (Plinthosol)4b 20 3.04 2.72 0.84 Present studyTF Forest on clay soils (Plinthosol)4b 20 3.64 2.05 0.53 Present studyTF Forest on white sands/Caatinga(Podzol)4b 20 10.94 6.67 0.66 Present study
Venezuela5
High Caatinga – – 1.20 – Cuevas and Medina (1988)TF Forest (Acrisol/Ferralsol)∗ – – 2.01 – Jordan and Escalante (1980)TF Forest (Acrisol/Ferralsol)∗ – – 11.17 – Jordan and Escalante (1980)High forest (Ferralsol) 20 11.40 3.12 0.27 Priess et al. (1999)∗∗
Medium forest (Ferralsol) 20 12.20 3.06 0.25 Priess et al. (1999)∗∗
Low forest (Ferralsol) 20 9.63 4.20 0.44 Priess et al. (1999)∗∗
TF Forest 30 13.80 – – Rev. in Cavelier (1992)Bana 30 15.70 – – Rev. in Cavelier (1992)Transitional forestCaatinga/Bana(Podzol) 30 15.70 – – Rev. in Cavelier (1992)Caatinga 30 17.90 – – Rev. in Cavelier (1992)Transitional forest TF/Caatinga(Podzol) 30 39.50 – – Rev. in Cavelier (1992)TF Forest 10 – 15.4 – Rev. in Nadelhoffer and Raich (1992)TF Forest 10 – 1.90 – Sanford (1990)TF Forest 10 1.00 – Sanford (1990)TF Forest 10 – 1.00 – Sanford (1990)
TF: Terra firme∗ Fine root diameter<5 mm∗∗ FRT as calculated from production and SFR reported for each forest.1 FRP was estimated in the same site using rhizotrons with different methods to convert root length into root mass per unit ground area.2 They make reference to the method used to estimate production:a maximum-minimum,b decision matrix,c flow compartment, andd decomposition model.3 Values of SFR are the averages for different forests per landscape unit.4 They make reference to the method used to estimate production:a ingrowth cores andb maximum-minimum.5 These sites were included due their similar conditions with our study sites.
Biogeosciences, 6, 2809–2827, 2009 www.biogeosciences.net/6/2809/2009/

E. M. Jimenez et al.: Fine root dynamics for Amazon forests 2821
(5.97 Mg ha−1 yr−1 with the ingrowth core methodand 6.67 Mg ha−1 yr−1 with sequential cores), whileestimations for the clay loam forest are interme-diate (3.02 Mg ha−1 yr−1 with ingrowth cores and2.05 Mg ha−1 yr−1, 2.72 Mg ha−1 yr−1 with sequentialcores).
The decrease of SFR and FRP with soil depth found hereis a general trend reported in tropical forests (Cavelier, 1992;Duivenvoorden and Lips, 1995; Klinge, 1973; Pavlis andJenık, 2000; Silver et al., 2000) due to the proliferation offine roots near the surface. These roots are considered impor-tant for resource acquisition because they allow the direct cy-cling of nutrients from organic matter, which probably is anadaptation to the low nutrient supply in infertile soils (Sayeret al., 2006).
Both SFR and FRP were significantly higher in the loamysand forest than in the clay loam forest. These resultsshow that in loamy sand forest, with lower nutrient contents,below-ground mass allocation is higher than for other forests.This result has been found in other forests on soils with lownutrient availability and content (Cavelier, 1992; Priess etal., 1999), and specifically in sites such as the mountainsin Guiana (Priess et al., 1999) and elsewhere in Amazonia(Klinge and Herrera, 1978).
Differences found here between forest types support ourhypothesis about the decrease of stocks and production offine roots with the increase of soil resources and agree withother hypotheses proposing the increase of SFR and car-bon allocation below-ground with the decrease of site qual-ity, nutrient availability or under more xerophytic conditions(Shaver and Aber, 1996, Landsberg and Gower, 1997). Theinvestment in leaf compounds, such as tannins, to retard lit-ter decomposition and hence slow down the rate of nutrientcycling, could result in an increase of below-ground produc-tivity to improve the supply of nutrients to the plant (Fischeret al., 2006). These authors found that FRP was highly cor-related with leaf tannin content and the genetic compositionof individual trees, which suggests a potential genetic controlof the compensatory growth of fine roots in response to theaccumulation of secondary compounds of foliage in the soil.This is a factor that could be evaluated as a potential mecha-nism of allocation to below-ground productivity, particularlyin sand forests which tend to contain high amounts of tanninsin the foliage.
Several studies show that soil plays an important role inthe carbon allocation to below-ground production (Block etal., 2006; Cavelier, 1992; Haynes and Gower, 1995; Yavittand Wright, 2001), and Malhi et al. (2004) found thatsoil is an important factor affecting above-ground NPP withQuesada et al. (2009c) showing soil available phosphorusavailability to be the likely driving variable. Haynes andGower (1995) analysed how soil fertility affected carbon al-location to below-ground productivity in a plantation ofPi-nus resinosaAit. on fertilized and unfertilized soils, andfound that fertilization decreased the relative carbon allo-
cation to below-ground production. Gower et al. (1992),analysed how the availability of water and nutrients affectedthe NPP in a coniferous forest (Pseudosuga menziesiivar.galuca), and found a negative relationship between water andnutrient availability and carbon allocation to below-groundorgans. In the case of the forests studied, the fact that theyare subject to the same climatic regime, we conclude thatsoil is the factor playing the principal role on the amount ofcarbon allocated to roots. In this way, both SFR and FRPdecreased with the increase of soil fertility, which is oppositeto the results of Malhi et al. (2004) for above-ground NPP.
On the other hand, integrating above- and below-groundproductivity of the forests studied (Table 5) suggests thatallocation of NPP between above (wood and foliage)- andbelow-ground (fine roots) is differential, just as suggested bythe differential allocation hypothesis proposes. Even thoughcarbon allocation to the above-ground portion was higherthan that to fine roots, this difference is more accentuatedin the clay loam forest than in the forest growing on loamysand. Indeed, differences in the total productivity (above plusbelow-ground) between the two forests were not high (be-tween 8.66 and 8.76 Mg C ha−1 yr−1 for the clay loam forestand, 7.12 Mg C ha−1 yr−1 for the loamy sand forest). Theseresults on above- and below-ground productivity show thelarge variation of Amazonian forests at smaller scales thanthat presented by Malhi et al. (2004), which reflects the im-portance of soil and widen the knowledge about the alloca-tion to above- and below-ground productivity in different for-est types and soils of the Amazon region (see Aragao et al.,2009).
4.2 Turnover rates of fine roots
Turnover rates of this study (0.51–0.84 yr−1) are similarto values reported for other Amazonian forests (0.14 and0.70 yr−1) (Table 4). Nevertheless, the average turnoverrate for the plot AGP-01 in the loamy soil forest was com-paratively high (0.84 yr−1). Fine roots are tissues energeti-cally expensive to build (Yavitt and Wright, 2001) and theirlongevity is critical for the functionality of the root system.Short longevity supposes higher energetic demands for theformation of new roots to replace dead roots and to main-tain the concomitant absorption surface. Aber et al. (1985)propose that turnover rates of fine roots are higher on richsoils than on poor ones. However, turnover rates in bothforest types showed similar values (0.53–0.84 yr−1 for theclay loam forest, and 0.51–0.81 yr−1 for the forest on whitesands). The large variability of turnover rates in each foresttype could mask differences between them.
4.3 Temporal variation of standing crop fine root mass
Several authors have correlated environmental variables withbiomass or production of fine roots (Gower et al., 1992; Ka-vanagh and Kellman, 1992; Vogt et al., 1998; Yavitt and
www.biogeosciences.net/6/2809/2009/ Biogeosciences, 6, 2809–2827, 2009

2822 E. M. Jimenez et al.: Fine root dynamics for Amazon forests
Table 5. Above- and below-ground productivity (Mg C ha−1 yr−1) in two forests with different soil types in the Colombian Amazon: oneforest on clay loam soil in the Amacayacu National Natural Park (two 1-ha plots: AGP-01 and AGP-02), and other on loamy sands in theBiological Station Zafire (one 1-ha plot: ZAR-01).
Productivity (Mg C ha−1 yr−1)Clay loam forest Loamy sand forest
AGP-01 AGP-02 ZAR-01
Above-ground productivityWood productivitya 3.35 3.84 1.32Litterfall productionb 3.87a 3.65a 2.67bTotal 7.22 7.49 3.99
Below-ground productivity (fine roots)c
Ingrowth cores 1.51 2.94Sequential soil coring 1.36 1.03 3.33Mean 1.44 1.27 3.14
Total productivity 8.66 8.76 7.13
a E. M. Jimenez and M. C. Penuela (data not published).b Navarrete (2006).c Mean production, results from the present study. Differentletters show significant differences (p<0.05).
Wright, 2001). Among these variables, rainfall has beenfound to be one of the most influential factors affecting SFRand its longevity in tropical forests (Green et al., 2005).Standing crop fine root mass showed a clear temporal vari-ation during the monitoring period, a result in line with nu-merous studies showing that for certain periods of the year ahigher growth rate of fine roots occurs in response to specificclimatic events (Vogt et al., 1986). Though results suggestthat differences in carbon allocation to production of fineroots between forest types are governed by the availabilityof soil resources, patterns of temporal variation of SFR areexplained by their correlation with rainfall, which has beenreported for other tropical forests (Green et al., 2005; Ka-vanagh and Kellman, 1992; Yavitt and Wright, 2001).
Though SFR responded to the average daily rainfall inboth forest types, these responses were of a contrasting na-ture. For the loamy soil forest soil plot SFR increased withrainfall of the last three months and decreased with rainfalloccurring over long time lags (120–150 days). In the foreston white sands SFR decreased with rainfall of the previous4 months, and increased with the rainfall observed at longertime lags (up to 5 months). Differences of the response ofboth forest types to rainfall might be explained by differencesin their soils: the loamy sand forest contained a hard pan at90–100 cm depth, which inevitably produces water loggingin the soil above during rainy season and likely impedinggrowth of fine roots; this is shown by the negative correla-tion of SFR with rainfall of last 4 months. This phenomenondoes not occur in the clay loam soil forest which respondspositively to the increase of rainfall.
On the other hand, the effect of rainfall on FRP was evi-dent in the drought season of 2005. RGR during the drought
showed that both forests responded in similar way, becauseboth showed a decrease in FRP. However, for the loamy sandforest this decrease was more obvious over the last monthsof the drought (Fig. 5). The impermeable orstenic layer ofthe Podzol soil probably plays an important role in the soilwater content of this forest by causing water retained aboveit during the rainy season to only be slowly released duringthe dry season, and therefore delaying the forest responseto the drought. The general behaviour during drought sug-gests that both forest types are susceptible to strong changesof rainfall. However, the main difference between them isthe speed of the response of each forest: the clay loam for-est showed a faster decrease of FRP as a response to droughtthan the loamy sand forest. Due to this differential responseof two forest types to drought we can not compare FRP be-tween forests to dry season.
Likewise, in both forest types RGR before drought werehigher than after drought. This probably is related with thehigher rainfall of last months before the first collections (year2004), than that after the drought, in 2006 (Fig. 4). In the clayloam forest of AGP-01, the periods between collections thatshowed an increase of SFR were October–December 2005,and September–December 2006, which coincided with therainy season. Also in AGP-02 October-December 2005 wasthe period of increase of SFR. In both plots the SFR washigher in December 2005 than in the same month of 2006,which could be explained by the higher rainfall of the twoprevious months in 2005 than in 2006 (Fig. 2).
In the loamy sand forest the periods of increase of the SFRoccurred between April–July 2005, and March–July 2006,when rainfall decreased and we suggests because the waterlogging of soil caused by the hardpan also decreased. On
Biogeosciences, 6, 2809–2827, 2009 www.biogeosciences.net/6/2809/2009/

E. M. Jimenez et al.: Fine root dynamics for Amazon forests 2823
Table 6. Spearman coefficients (rs ) for the standing crop fine root mass in two forests with different soil types in the Colombian Amazon,correlated with the mean precipitation per day (PD) of the last 7, 15, 30, 60, 90, 100 and 120 days until the date of collection and, with themean precipitation per day with a time lag (TL) of 7, 15, 30, 120 and 150 days from the date of collection with fixed intervals of time of 15,30, 60 and 90 days.
Mean precipitation (mm day−1)Clay loam forest Loamy sand forest
AGP-01 AGP-02 ZAR-01
PD-7 −0.0844 −0.0244 −0.2581∗∗
PD-15 −0.0560 0.0691 −0.2872∗∗
PD-30 −0.0118 0.1700 −0.1414∗
PD-60 0.1479 0.3052∗∗−0.2857∗∗
PD-90 0.2169∗ 0.3422∗∗−0.1612∗
PD-100 0.1721 0.2397∗ −0.1544∗
PD-120 0.1492 0.2397∗ −0.1294∗
TL7-15 0.1835 0.4666∗∗−0.3223∗∗
TL7-30 0.0455 0.3548∗∗−0.1502∗
TL7-60 0.2190∗ 0.4702∗∗−0.2769∗∗
TL7-90 0.2397∗ 0.2845∗∗−0.1222
TL15-15 0.0068 0.1314 0.0555TL15–30 0.0142 0.2494∗ −0.0240TL15–60 0.2015∗ 0.3422∗∗
−0.1168TL15-90 0.1884∗ 0.1820 −0.1100
TL30-15 0.1417 0.2512∗ −0.1563∗
TL30-30 0.1195 0.1941 −0.2261∗∗
TL30-60 0.2060∗ 0.1820 −0.1652∗
TL30-90 0.1831 0.1820 −0.0601
TL120-15 −0.2813∗∗−0.2653∗
−0.0779TL120-30 −0.3719∗∗
−0.2805∗−0.1562∗
TL120-60 −0.3260∗∗−0.2603∗
−0.1283TL120-90 −0.2775∗∗
−0.3871∗∗ 0.0923
TL150-15 −0.3369∗∗−0.0254 0.1179
TL150-30 −0.2834∗∗−0.2777∗ 0.1943∗∗
TL150-60 −0.2627∗∗−0.3449∗∗ 0.1657∗
TL150-90 −0.2593∗∗−0.4480∗∗ 0.1120
∗ Significance levelp<0.05.∗∗ Significance levelp<0.01
the other hand, SFR was higher in July 2005 than in July2006, which can be explained by the decrease in the soil wa-ter logging in July 2005 when the first months of droughtoccurred, which allowed an increase of SFR. The two pre-ceding months to July 2006 showed a mean rainfall higherthan in 2005, which suggests that water logging conditionsof soil were greater at this time than in 2005, which was ex-pressed in a lesser SFR.
Our results thus show that rainfall plays a crucial role inthe seasonal variation of fine root growth in both forests; inthe clay loam soil forest the pattern accords with reports forother well drained forests (Green et al., 2005; Metcalfe etal., 2008; Priess et al., 1999; Silver et al., 2005), where SFR
increased in the rainy season and decreases during the dryseason. The loamy sand forest showed a different pattern,similar to that of flooded forests. This behaviour is appar-ently conditioned by the hardpan (orstenic layer) that causeswater logging during the rainy season thus limiting growthof fine roots and lagging the timing of fine root growth inresponse to rainfall.
4.4 The methods of sampling/estimation used
The selection of methods for the estimation of FRP and itscontrolling factors is tremendously important and has raisedgreat interest nowadays (Hendricks et al., 2006; Lauenrothet al., 1986; Majdi et al., 2005; Makkonen and Helmisaari,
www.biogeosciences.net/6/2809/2009/ Biogeosciences, 6, 2809–2827, 2009
2824 E. M. Jimenez et al.: Fine root dynamics for Amazon forests
1999; Metcalfe et al., 2007; Vogt et al., 1986, 1998). Hen-dricks et al. (2006), used a wide range of common methodsto estimate FRP in three types of ecosystems in a gradientof soil humidity, with different soil characteristics and re-source availability. They found that FRP was not negativelycorrelated with the availability of soil resources. Their re-sults support in some cases the hypothesis of differential re-source allocation and in some others the constant allocationhypothesis. With respect to the methods used in the presentstudy – sequential cores and the ingrowth cores – these au-thors mention, as well as others (Madji et al., 2005; Vogt etal., 1986, 1998), that they probably underestimate FRP; how-ever, they seem to be the most appropriate to compare sitesand to evaluate the temporal variation of FRP and SFR (Vogtet al., 1998; Makkonen and Helmisaari, 1999).
We acknowledge that sampling differences have the poten-tial to bias the results of this study. On the one hand, samplesizes might not have a significant effect because they werealmost identical in both forest types (22 vs. 26 in the estab-lishment 2, and 1 3 vs. 13 in the establishment 3 in the loamysand forest and clay loam forest, respectively). On the otherhand, the main potential limitation of our sampling schemeis the effect on FRP of different core sizes in the ingrowthexperiment. The use of two independent methods to estimateFRP (ingrowth and sequential cores), allowed us to cross-check our results. Sequential cores are samples of fine rootmass under the natural conditions of the site and their resultsare expected to be little affected by the diameters of cores, asexpected in ingrowth cores due to the differential coloniza-tion of roots.
Results of FRP and its temporal variation did not showlarge differences between the two methods used here in eachforest type. The clay loam forest showed similar results ofSFR between the two methods, but differences in the loamysand forest were marked: SFR estimated by the ingrowthcores was about 5.00 Mg ha−1, while by the sequential coreswas about twice that value (10.94 Mg ha−1). This resultsuggests that probably more important than the diameter ofauger, there is a strong effect of the changed physical proper-ties of soil on root growth in loamy sands and that those soilsrequire a longer time to reach the original root density afterthe disturbance implied by the ingrowth method.
Despite the different results of FRP obtained with the dif-ferent methods as widely documented by several authors(Hendricks et al., 2006; Vogt et al., 1998), all of them con-tinue being used because of the lack of consensus about themost appropriate one to study the dynamics of fine roots.For these reasons, the combination of different methods usedhere seems to be a good strategy for the estimation of FRP.
5 Conclusions
Carbon allocation to production of fine roots fine roots wasdifferent between forest types. As expected in a gradient of
availability of soil resources, the clay loam soil forest, withless limitation in soil resources, showed a lower carbon allo-cation to production of fine roots than the loamy sand forestwhich had more limitations in soil resource availability. SFRand FRP also showed differences with soil depth, with highervalues in the first 10 cm than in the 10–20 cm layer of soil.
Temporal variation of SFR was correlated with mean dailyrainfall; however, this inverse relationship was between for-est types: in the clay loam soil forest SFR increased withthe increase of rainfall of the previous three months; in theloamy sand forest SFR decreased with the increase of rain-fall of the previous four months. Likewise, RGR of fine rootswere different before, during, and after the drought period.Both forest types showed lower RGR during drought, whichsuggests that severe changes of rainfall could strongly affectboth forest types.
In summary, from results shown here we can say that thisstudy: (1) that the amount and fraction of carbon allocatedto fine roots was different between plots, (2) that there aredifferences in NPP allocation at these plots, (3) suggests thatprobably Total NPP (above plus below-ground) was not verydifferent between the plots, and (4) a strong cautionary warn-ing is provided against assuming that patterns of total ecosys-tem NPP can be adequately understood/studied solely fromabove-ground NPP.
Finally, this study shows that variation in the functioningof Amazonian ecosystems at small spatial and time scales islarge; it also shows that both rainfall patterns and soils act indifferent ways on the carbon allocation to production of fineroots in these forests and that understanding how Amazonianecosystems can respond to these factors is fundamental con-sidering the events expected by climate change.
Acknowledgements.This paper is a product of the RAINFORnetwork and Pan-Amazonia project from University of Leeds.RAINFOR is currently supported by the Gordon and Betty MooreFoundation. This work was supported also by the Amazon Droughtproject of the University of Leeds, the Zafire Biological Stationand the project “Saber y Gestion Ambiental Amazonica” of theUniversidad Nacional de Colombia Sede Amazonia. We alsowish to thank to E.Alvarez, D. Navarrete and O. Phillips for theircontribution to this research, A. Prieto and A. Rudas who madeit possible to work in the plots in Amacayacu Natural Park andespecially C. A. Quesada who generously shared his informationon soils of the sites studied. We also thank to the indigenouscommunities of Palmeras and San Martın of Amacayacu and thestaff of the Amacayacu National Natural Park and the crew of theZafire Biological Station, especially Eufrasia Kuyuedo, ArcesioPijachi, Edilberto Rivero, Angel Pijachi, Ivan Nino, Ilmer Nino,Zulma Alban and Magnolia Restrepo, and the Universidad Na-cional de Colombia Sede Amazonia by permitting and facilitatingthe fieldwork. Finally, we thank to D. Metcalfe, S. Vasconcelosand P. Meir for valuable suggestions and comments to improve themanuscript.
Edited by: P. Meir
Biogeosciences, 6, 2809–2827, 2009 www.biogeosciences.net/6/2809/2009/

E. M. Jimenez et al.: Fine root dynamics for Amazon forests 2825
References
Aber, J. D., Melillo, J. M., Nadelhoffer, K. J. McClaugherty, C. A.,and Pastor, J.: Fine root turnover in forest ecosystems in relationto quantity and form of nitrogen availability: a comparison oftwo methods, Oecologia, 66, 317–321, 1985.
Albaugh, T. J., Allen, H. L., Dougherty, P. M., Kress, L. W., andKing, J. S.: Leaf area and above-and below-ground growth re-sponses of loblolly pine to nutrient and water additions, ForestSci., 44, 317–328, 1998.
Aragao, L. E. O. C., Malhi, Y., Metcalfe, D. B., Silva-Espejo, J.E., Jimenez, E., Navarrete, D., Almeida, S., Costa, A. C. L.,Salinas, N., Phillips, O. L., Anderson, L. O ., Baker, T. R.,Goncalvez, P. H., Huaman-Ovalle, J., Mamani-Solorzano, M.,Meir, P., Monteagudo, A., Penuela, M. C., Prieto, A., Quesada,C. A., Rozas-Davila, A., Rudas, A., Silva Junior, J. A., andVasquez, R.: Above- and below-ground net primary productiv-ity across ten Amazonian forests on contrasting soils, Biogeo-sciences Discuss., 6, 2441–2488, 2009,http://www.biogeosciences-discuss.net/6/2441/2009/.
Block, R. M. A., Van Rees, K. C. J., and Knight, J. D.: A review offine root dynamics in Populus plantations, Agroforest. Syst., 67,73–84, 2006.
Brown, S.: Measuring carbon in forests: current status and futurechallenges, Environ. Pollut., 116(3), 363–372, 2002.
Cavelier, J.: Fine-root biomass and soil properties in a semidecidu-ous and a lower montane rain-forest in Panama, Plant Soil, 142,187–201, 1992.
Clark, D. A., Brown, S., Kicklighter, D. W., Chambers, J. Q., Thom-linson, J. R., Ni, J., and Holland, E. A.: Net primary productionin tropical forests: An evaluation and synthesis of 20 existingfield data, Ecol. Appl., 11, 371–384, 2001a.
Clark, D. A., Brown, S., Kicklighter, D. W., Chambers, J. Q., Thom-linson, J. R., and Ni, J.: Measuring net primary production inforests: Concepts and field methods, Ecol. Appl., 11, 356–370,2001b.
Cuevas, E. and Medina, E.: Nutrient dynamics within Amazonianforest ecosystems, I. Nutrient 25 flux in fine litter fall and effi-ciency of nutrient utilization, Oecologia, 68, 466–472, 1986.
Cuevas, E. and Medina, E.: Nutrient dynamics within Amazonianforests. II. Fine root growth, nutrient availability and leaf litterdecomposition, Oecologia, 76, 222–235, 1988.
Dixon, R. K., Brown, S., Houghton, R. A., Solomon, A. M., Trexler,M. C., and Wisniewski, J.: Carbon pools and flux of global forestecosystems, Science, 263, 185–190, 1994.
Duivenvoorden, J. F. and Lips, J. M.: A land-ecological study ofsoils, vegetation, and plant diversity in Colombian Amazonia.The Tropenbos Foundation, Wageningen, Netherlands, 438 pp.,1995.
Dytham, C.: Choosing and using statistics. A biologist’s guide,Blackwell Publishing, 2nd edn. Oxford, UK, 248 pp., 2003.
Fischer, D. G., Hart, S. C., Rehill, B. J., Lindroth, R. L., Keim, P.,and Whitham, T. G.: Do high-tannin leaves require more roots?,Oecologia, 149, 668–675, 2006.
Fogg, G. E.: El crecimiento de las plantas, Editorial Eudeba,Buenos Aires, Argentina, 327 pp., 1967.
Goward, S. N., Dye, D. G., Turner, S., and Yang, J.: Objectiveassessment of the NOAA global vegetation index data product,Int. J. Remote Sens., 14, 3365–3394, 1993.
Gower, S. T.: Relations between mineral nutrient availability andfine root biomass in two Costa Rican tropical wet forests: a hy-pothesis, Biotropica, 19, 171–175, 1987.
Gower, S. T., Vogt, K. A., and Grier, C. C.: Carbon dynamics ofrocky-mountain Douglas-fir - 10 influence of water and nutrientavailability, Ecol. Monogr., 62, 43–65, 1992.
Green, J. J., Dawson, L. A., Proctor, J., Duff, E. I., and Elston, D.A.: Fine root dynamics in a tropical rain forest is influenced byrainfall, Plant Soil, 276, 23–32, doi:10.1007/s11104-004-0331-3, 2005.
Grier, C. C., Vogt, K. A., Keyes, M. R., and Edmonds, R. L.:Biomass distribution and above and below-ground production inyoung and mature Abies amabilis zone ecosystems of the Wash-ington Cascades, Can. J. Forest Res., 11, 155–167, 1981.
Haynes, B. E. and Gower, S. T.: Below-ground carbon allocation inunfertilized and fertilized red pine plantations in Northern Wis-consin, Tree Physiol., 15, 317–325, 1995.
Hendricks, J. J., Hendrick, R. L., Wilson, C. A., Mitchell, R. J.,Pecot, S. D., and Guo, D. L.: As sessing the patterns and con-trols of fine root dynamics: an empirical test and methodologicalreview, J. Ecol., 94, 40–57, 2006.
Hendricks, J. J., Nadelhoffer, K. J., and Aber, J. D.: Assessing therole of fine roots in carbon and nutrient cycling, Trends Ecol.Evol., 8, 174–178, 1993.
Herrera, J.: Geografıa, in: Zonificacion ambiental para el plan mod-elo Colombo-Brasilero (Eje Apaporis-Tabatinga: PAT), InstitutoGeografico Agustın Codazzi -IGAC, Bogota, Colombia, 137–163, 1997.
Hoorn, C.: An environmental reconstruction of the paleo-AmazonRiver system (Middle-Late Miocene, NW Amazonia), Palaeo-geogr. Palaeocl., 112, 187–238, 1994.
Hoorn, C.: Mangrove forests and marine incursions in NeogeneAmazonia (Lower Apaporis River, Colombia), Palaios, 21, 197–209, 2006.
Jackson, R. B., Mooney, H. A., and Schulze, E. D.: A global budgetfor fine root biomass, surface area, and nutrient contents, Ecol-ogy, 94, 7362–7366, 1997.
Jordan, C. F. and Escalante, G.: Root productivity in an Amazonianrain forest, Ecology, 61, 14–18, 1980.
Kavanagh, T. and Kellman, M.: Seasonal pattern of fine root prolif-eration in a tropical dry forest, Biotropica, 24, 157–165, 1992.
Keyes, M. R. and Grier, C. C.: Above- and below-ground net pro-duction in 40-year-old Douglas-fir stands on low and high pro-ductivity sites, Can. J. Forest Res., 11, 599–605, 1981.
Klinge, H. and Herrera, R.: Biomass studies in Amazon Caatingaforest in southern Venezuela. I. Standing crop of composite rootmass in selected stands, Tropical Ecology, 19, 93–110, 1978.
Klinge, H.: Root mass estimation in lowland tropical rain forestsof Central Amazon, Brazil. I. Fine root masses of a pale yellowlatosol and a giant humus podzol, Tropical Ecology, 14, 29–38,1973.
Kozlowski, T. T., Kramer, P. J., and Pallardi, S. G.: The physio-logical ecology of woody plants, Academic Press, San Diego,California, USA, 657 pp., 1991.
Landsberg, J. J. and Gower, S. T.: Applications of physiologicalecology to forest management, in: Physiological Ecology, editedby: Mooney, H. A., Academic Press, San Diego, USA, 354 pp.,1997.
www.biogeosciences.net/6/2809/2009/ Biogeosciences, 6, 2809–2827, 2009

2826 E. M. Jimenez et al.: Fine root dynamics for Amazon forests
Lauenroth, W. K., Hunt, H. W., Swift, D. M., and Sing, J. S.: Replyto Vogt et al., Ecology, 67, 580–582, 1986.
Majdi, H., Pregitzer, K., Moren, A. S., Nylund, J. E. M., and Agren,G. I.: Measuring fine root turnover in forest ecosystems, PlantSoil, 276, 1–8, 2005.
Makkonen, K. and Helmisaari, H. S.: Assessing fine-root biomassand production in a Scots pine stand-comparison of soil core androot ingrowth core methods, Plant Soil, 210, 43–50, 1999.
Malhi, Y., Baker, T. R., Phillips, O. L., Almeida, S., Alvarez, E.,Arroyo, L., Chave, J., Czimczik, C., Di Fiore, A., Higuchi, N.,Killeen, T., Laurance, S. G., Laurance, W. F., Lewis, S. L., Mer-cado, L. M., Monteagudo, A., Neill, D. A., Pitman, N. C. A.,Quesada, C. A., Silva, J. N. M., Vasquez Martınez, R., Terborgh,J., Vinceti, B., and Lloyd, J.: The above-ground wood produc-tivity and net primary productivity of 100 Neotropical forests,Global Change Biol., 10, 563–591, 2004.
Metcalfe, D. B., Meir, P., and Williams, M.: A comparison of meth-ods for converting rhizotron root length measurements into esti-mates of root mass production per unit ground area, Plant Soil,301, 279–288, 2007.
Metcalfe, D. B., Meir, P., Aragao, L. E., Da Costa, A. C. L., Braga,A. P., Goncalves, P. H. L., De Athaydes Silva Jr., J., De Almeida,S. S., Dawson, L. A., Malhi, Y., and Williams, M.: The effects ofwater availability on root growth and morphology in an Amazonrainforest, Plant Soil, 311, 189–199, 2008.
Nadelhoffer, K. J. and Raich, J. W.: Fine root production estimatesand belowground carbon allocation in forest ecosystems, Ecol-ogy, 73, 1139–1147, 1992.
Nadelhoffer, K. J., Aber, J. D., and Melillo, J. M.: Fine roots, netprimary production, and soil nitrogen availability-a new hypoth-esis, Ecology, 66, 1377–1390, 1985.
Navarrete, D. A.: Variacion de la caıda de la hojarasca fina a travesde diferentes tipos de suelos y regiones en la Amazonia, MasterThesis in Amazon studies, Universidad Nacional de Colombia,Sede Amazonia, Leticia, Colombia, 86 pp., 2006.
Patino, S., Lloyd, J., Paiva, R., Baker, T. R., Quesada, C. A.,Mercado, L. M., Schmerler, J., Schwarz, M., Santos, A. J.B., Aguilar, A., Czimczik, C. I., Gallo, J., Horna, V., Hoyos,E. J., Jimenez, E. M., Palomino, W., Peacock, J., Pena-Cruz,A., Sarmiento, C., Sota, A., Turriago, J. D., Villanueva, B.,Vitzthum, P., Alvarez, E., Arroyo, L., Baraloto, C., Bonal, D.,Chave, J., Costa, A. C. L., Herrera, R., Higuchi, N., Killeen, T.,Leal, E., Luizao, F., Meir, P., Monteagudo, A., Neil, D., Nunez-Vargas, P., Penuela, M. C., Pitman, N., Priante Filho, N., Prieto,A., Panfil, S. N., Rudas, A., Salomao, R., Silva, N., Silveira, M.,Soares deAlmeida, S., Torres-Lezama, A., Vasquez-Martınez,R., Vieira, I., Malhi, Y., and Phillips, O. L.: Branch xylemdensity variations across the Amazon Basin, Biogeosciences, 6,545–568, 2009,http://www.biogeosciences.net/6/545/2009/.
Pavlis, J. and Jenik, J.: Roots of pioneer trees in the Amazonian rainforest, Trees-Struct. Funct., 14, 442–455, 2000.
Phillips, O. L., Aragao, L. E. O. C. , Lewis, S. L., Fisher, J. B.,Lloyd, J., Lopez-Gonzalez, G., Malhi, Y., Monteagudo, A., Pea-cock, J., Quesada, C. A., Van Der Heijden, G., Almeida, S.,Amaral, I., Arroyo, L., Aymard, G., Baker, T. R., Banki, O.,Blanc, L., Bonal, D., Brando, P., Chave, J., Alves De Oliveira,A. C., Davila Cardozo, N., Czimczik, C. I., Feldpausch, T. R.,Freitas, M. A., Gloor, E., Higuchi, N., Jimenez, E. M., Lloyd,
G., Meir, P., Mendoza, C., Morel, A., Neill, D. A., Nepstad, D.,Patino, S. Penuela, M. C., Prieto, A., Ramırez, F., Schwarz, M.,Silva, J., Silveira, M., Sota Thomas, A., Ter Steege, H., Stropp,J., Vasquez, R., Zelazowski, P., Alvarez Davila, E., Andelman,S., Andrade, A., Chao, K. J., Erwin, T., Di Fiore, A., Honorio C.,E., Keeling, H., Killeen, T. J., Laurance, W. F., Pena Cruz, A.,Pitman, N. C. A., Nunez Vargas, P., Ramırez-Angulo, H., Rudas,A., Salamao, R., Silva, N., Terborgh, J., and Torres-Lezama,A.: Drought Sensitivity of the Amazon Rainforest, Science, 323,1344–1347, 2009.
Priess, J., Then, C., and Folster, H.: Litter and fine-root productionin three types of tropical premontane rain forest in SE Venezuela,Plant Ecol., 143, 171–187, 1999.
PRORADAM: La Amazonia Colombiana y sus recursos. Proyectoradargrametrico del Amazonas, Republica de Colombia, Bogota,590 pp., 1979.
Quesada, C. A., Lloyd, J., Anderson, L. O., Fyllas, N. M., Schwarz,M., and Czimczik, C. I.: Soils of amazonia with particular refer-ence to the rainfor sites, Biogeosciences Discuss., 6, 3851–3921,2009a,http://www.biogeosciences-discuss.net/6/3851/2009/.
Quesada, C. A., Lloyd, J., Schwarz, M., Patino, S., Baker, T. R., Cz-imczik, C., Fyllas, N. M., Martinelli, L., Nardoto, G. B., Schmer-ler, J., Santos, A. J. B., Hodnett, M. G., Herrera, R., Luizao, F.J., Arneth, A., Lloyd, G., Dezzeo, N., Hilke, I., Kuhlmann, I.,Raessler, M., Brand, W. A., Geilmann, H., Moraes Filho, J. O.,Carvalho, F. P., Araujo Filho, R. N., Chaves, J. E., Cruz Junior,O. F., Pimentel, T. P., and Paiva, R.: Chemical and physical prop-erties of Amazon forest soils in relation to their genesis, Biogeo-sciences Discuss., 6, 3923–3992, 2009b,http://www.biogeosciences-discuss.net/6/3923/2009/.
Quesada, C. A., Lloyd, J., Schwarz, M., Baker, T. R., Phillips, O.L., Patino, S., Czimczik, C., Hodnett, M. G., Herrera, R., Ar-neth, A., Lloyd, G., Malhi, Y., Dezzeo, N., Luizao, F. J., Santos,A. J. B., Schmerler, J., Arroyo, L., Silveira, M., Priante Filho,N., Jimenez, E. M., Paiva, R., Vieira, I., Neill, D. A., Silva, N.,Penuela, M. C., Monteagudo, A., Vasquez, R., Prieto, A., Rudas,A., Almeida, S., Higuchi, N., Lezama, A. T., Lopez-Gonzalez,G., Peacock, J., Fyllas, N. M., Alvarez Davila, E., Erwin, T.,di Fiore, A., Chao, K. J., Honorio, E., Killeen, T., Pena Cruz,A., Pitman, N., Nunez Vargas, P., Salomao, R., Terborgh, J., andRamırez, H.: Regional and large-scale patterns in Amazon foreststructure and function are mediated by variations in soil physi-cal and chemical properties, Biogeosciences Discuss., 6, 3993–4057, 2009c,http://www.biogeosciences-discuss.net/6/3993/2009/.
Raich, J. W. and Nadelhoffer, R. J.: Below-ground carbon alloca-tions in forest ecosystems: Global trends, Ecology, 70, 1346–1354, 1989.
Rudas-Ll., A. and Prieto-C., A.: Florula del Parque Nacional Nat-ural AMACAYACU, Amazonas, Colombia, Monographs in Sys-tematic Botany from the Missouri Botanical Garden, 99, Mis-souri Botanical Garden, Saint Louis, Missouri, 2005.
Sayer, E. J., Tanner, E. V. J., and Cheesman, A. W.: Increased litter-fall changes fine root distribution in a moist tropical forest, PlantSoil, 281, 5–13, 2006.
Shaver, G. R. and Aber, J. D.: Carbon and nutrient allocation interrestrial ecosystems, in: Global change: effects on conifer-ous forests and grasslands Melillo, edited by: Breymeyer, J. and
Biogeosciences, 6, 2809–2827, 2009 www.biogeosciences.net/6/2809/2009/

E. M. Jimenez et al.: Fine root dynamics for Amazon forests 2827
Breymeyer, A., John Wiley, New York, USA, 183–198, 1996.Silver, W. L., Neff, J., McGroddy, M., Veldkamp, E., Keller, M.,
and Cosme, R.: Effects of soil texture on below-ground carbonand nutrient storage in a lowland Amazonian forest ecosystem,Ecosystems, 3, 193–209, 2000.
Silver, W. L., Thompson, A. W., Mcgroddy, M. E., Varner, R. K.,Dias, J. D., Silva, H., Crill, P. M., and Keller, M.: Fine rootdynamics and trace gas fluxes in two lowland tropical forest soils,Global Change Biol., 11, 290–306, 2005.
Trumbore, S., Da Costa, E. S., Nepstad, D. C., De Camargo, P. B.,Martinelli, L., Ray, D., Restom, T., and Silver, W.: Dynamicsof fine root carbon in Amazonian tropical ecosystems and thecontribution of roots to soil respiration, Global Change Biol., 12,217–229, 2006.
Vogt, K. A., Grier, C. C., and Vogt, D. J.: Production, turnover, andnutrient dynamics in above-and below-ground detritus of worldforests, Adv. Ecol. Res., 15, 303–377, 1986.
Vogt, K. A., Grier, C. C., Meier, C. E., and Keyes, M. R.: Organicmatter and nutrient dynamics in forest floors of young and matureAbies amabilis stands in western Washington, as affected by fine-root input, Ecol. Monogr., 53, 139–157, 1983.
Vogt, K. A., Vogt, D. J., and Bloomfield, J.: Analysis of some directand indirect methods for estimating root biomass and productionof forests at an ecosystem level, Plant Soil, 200, 71–89, 1998.
Vogt, K. A., Vogt, D. J., Moore, E. E., and Sprugel, D. G.: Method-ological considerations in measuring biomass, production, respi-ration and nutrient resorption for tree roots in natural ecosystems,in: Applications of continuous and steady-state methods to rootbiology, edited by: Torrey, J. G. and Winship, L. J., Kluwer Aca-demic Publishers, Dordrecht, The Netherlands, 217–232, 1989.
Vogt, K. A., Vogt, D. J., Moore, E. E., Littke, W., Grier, C. C., andLeney, L.: Estimating Douglasfir fine root biomass and produc-tion from living bark and starch, Can. J. Forest Res., 15, 177–179, 1985.
Vogt, K. A., Vogt, D. J., Palmiotto, P. A., Boon, P., O’Hara, J., andAsbjornsen, H.: Review of root dynamics in forest ecosystemsgrouped by climate, climatic forest type and species, Plant Soil,187, 159–219, 1996.
Woodward, F. I. and Osborne, C. P.: Research Review: the repre-sentation of root processes in models addressing the responses ofvegetation to global change, New Phytol., 147, 223–232, 2000.
World Reference Base for Soil Resources: A framework for interna-tional classification, correlation and communication, World SoilResources Report 103, FAO, Rome, 2006.
Yavitt, J. B. and Wright, S. J.: Drought and irrigation effects on fineroot dynamics in a tropical moist forest, Panama, Biotropica, 33,421–434, 2001.
www.biogeosciences.net/6/2809/2009/ Biogeosciences, 6, 2809–2827, 2009
Copyright © 2022 FDOKUMEN