
XIV Geometrical Olympiad in honour of I.F.Sharygin Final ...
Upload
khangminh22Category
view
4download
0
Craców University of Technology
Department of Mechanical Engineering
Tim Eichner M.Sc.
PhD Thesis
Finding of geometrical parameters as a base of
In-process metrology system in WPM gear forming
Promoter: Dr hab. eng. M. Wieczorowski prof. PP
Craków 2013

I would like to thank for their help, valuable advice and care
Prof. Dr. Michal Wieczorowski (Poznan University of Technology) Prof. Dr. Jerzy A. Sladek (Craków University of Technology)
Dr. Adam Gaska and Dr. Marcin Krawczyk
Prof. Dr.-Ing. Ernst Hammerschmidt (University Darmstadt) and his collegues and employees
Dipl.-Ing. Ingo Lindner M.Sc. (Hexagon Metrology, Leitz)
All my family for their support and understanding especially my wife Duygu and our little son Batu
who gave the right relief the last couple of months
June 2013
1
A. Agenda
A. Agenda ........................................................................................ 1
B. List of Abbreviations ...................................................................... 3
C. List of Tables ................................................................................ 5
D. List of Appendix............................................................................. 6
E. List of Figures ............................................................................... 7
1. Introduction ................................................................................ 11
2. State of the art - Production toothed machine elements .................... 15
2.1. Toothed Machine Elements ..................................................... 16
2.1.1. Spline Shafts ............................................................. 18
3. Metal Forming ............................................................................. 22
3.1. Rolling Methods .................................................................... 24
3.1.1. Advantages of Rolling Methods ..................................... 29
3.2. Rolling according to the WPM Method ....................................... 31
4. Production of Test Parts ................................................................ 38
4.1. Preparing of Rolling Tests ....................................................... 38
4.2. Test Parameters / Measuring Equipment ................................... 41
4.3. Engineering Results and Assessment ........................................ 50
4.4. Measurement Results and Evaluation ....................................... 57
5. Geometry Measurements PMM 654 ................................................ 60
5.1. Technical Basis coordinate measuring technology ...................... 60
5.1.1. Construction of the Coordinate Measuring Device /
Measurement Accuracy .................................................... 62
5.2. Measurement of Blank Geometry ............................................. 66
5.2.1. Determination of the Workpiece Coordinate System ........ 66
5.3 Measurements Toothing Geometry (DIN 3960 ff) ............................ 77
5.3.1 Probe Configuration and Calibration ............................... 77
2
5.3.2 Determination Workpiece Coordinate System ................. 78
5.3.3 Acquisition of the Toothing Geometry ............................ 79
5.4 Measurement Geometry Rolling Tools ...................................... 91
5.4.1 Probe Configuration and Calibration .............................. 91
5.4.2 Coordinate System Rolling Tools .................................... 92
5.4.3 Acquisition Geometry Outer Contour of the Tools ............. 94
5.4.4 Acquisition Gear Geometry Rolling Tools ......................... 95
5.5 Contour Measurements on Rolling Samples ............................ 101
5.5.1 Contour Measurements Rolling Samples ....................... 103
5.6 Contour Measurements of Tools ........................................... 108
6. Evaluation / Discussion Geometry Results ..................................... 113
6.1 Evaluation / Discussion of Measurement DIN .......................... 113
6.2 Evaluation / Discussion of Contour Measurements ................... 127
7. In-Process Acquisition of the Geometrical Peculiarities .................... 132
7.1 Acquisition of Geometrical Deviations .................................... 133
7.1.1 Acquisition of Tooth Profile .......................................... 135
7.1.2 Acquisition of Axial Position ......................................... 135
7.1.3 Acquisition of Angular Position ..................................... 136
7.2 Application / Distance Sensors / WPM Work Cycles .................. 137
7.3 Geometrical Deviations / Peculiarities .................................... 139
7.3.1 Eccentricity ............................................................... 139
7.3.2 Pitch (Angular, Fluctuation) / Tooth Thickness ............... 142
7.3.3 Axial Position and Orientation ...................................... 149
7.3.4 Tooth Trace .............................................................. 151
7.4 Sensor Requirements .......................................................... 153
7.4.1 Instrumentation ........................................................ 153
7.4.2 Conclusions of In-Process Measurement Requirements
using Suitable Sensors ................................................... 156
8. Conclusion and Outlook .............................................................. 157
9. Abstract/ Streszczenie ............................................................ 161

3
B. List of Abbreviations
2nd second
3D 3-Dimensional
A Amper
AXI Axis
Acc. according
CIR_M Circle Mitte
CIR_O Circle Oben
CIR_U Circle Unten
CNC Computerized Numerical Control
CSY Coordinate System
CYL Cylinder
Calc. calculation
D diameter
DDR Double Data Rate
DIN Deutsche Industrie Norm
Diff. difference
e.g. exempli gratia
FA Total pitch/profile deviation
FB Tooth trace total deviation
ff. further following
ffA Profile form deviation
ffB Tooth trace form deviation

4
fHA Profile angle deviation
fHB Tooth trace angle deviation
fp Individual pitch deviation
Fp Total pitch deviation
fu Pitch error
GB Gigabyte
GHz Gigahertz
HV Vickers hardness
Hz Hertz
ISO International Organization of Standardization
kHz Kilohertz
kW Kilowatt
m module
MB Megabyte
min minute
mm milimeter
Nm Newtonmeter
pcs. pieces
PNT Point
PRB Probe
Rp Pitch fluctuation
VDI Verein Deutscher Ingenieure
vs. versus
WPM Polish Rolling Machine
5
C. List of Tables
Table 1: Sensor Fabricate / Sony Magnescale .................................. 43
Table 2: Sensors ......................................................................... 44
Table 3: Sensor Leuze Electronics .................................................. 46
Table 4: Sensor Hydrosens Löfflingen ............................................. 47
Table 5: Arrangement of the Tactile Pins ......................................... 77
Table 6: Evaluated Specific Criteria ................................................ 82
Table 7: Evaluated Specific Criteria ................................................ 85
Table 8: Tooth Trace .................................................................... 87
Table 9: Principle of Operation ..................................................... 135

6
D. List of Appendix
Appendix 1: Blank Geometry ............................................................ 164
Appendix 2: Gear tooth quality (DIN 3960 ff.) ..................................... 172
Appendix 3: Tool geometry (DIN 3960 ff) ........................................... 189
Appendix 4: Statistical analysis of gear tooth quality (DIN 3960 ff) ........ 203
Appendix 5: List of Literature ............................................................ 237
Appendix 6: List of Standards ........................................................... 241

7
E. List of Figures
Figure 1 Thesis Structure .............................................................. 14
Figure 2 Compilation of the various technologies and processes ......... 16
Figure 3 Pair of Gears ................................................................... 17
Figure 4 Pair of Gears – Toothed Shaft / Internal Gear Hub ............... 17
Figure 5 Shaft-Hub Connection ...................................................... 19
Figure 6 Shaft-Hub Connection ...................................................... 19
Figure 7 Shaft-Hub Connection / Flank Centered .............................. 20
Figure 8 Shaft-Hub Connection / Root Diameter Centered ................. 21
Figure 9 Shaft-Hub Connection / Tip Diameter Centered.................... 21
Figure 10 Ingression of a wedge-shaped tool ..................................... 25
Figure 11 PeeWee / External Toothed Tools ....................................... 26
Figure 12 RotoFlow / Rack Shaped Rolling Tools ................................ 27
Figure 13 WPM / two internally toothed tools ..................................... 27
Figure 14 Cutting / Rolling .............................................................. 29
Figure 15 Preliminary Diameters ...................................................... 29
Figure 16 Material Structure after Rolling .......................................... 30
Figure 17 Fragment of the Volume Rolled Spline ................................ 31
Figure 18 WPM - Motion Principle Rolling Tools / Workpiece ................. 31
Figure 19 Machine WPM 120 ........................................................... 32
Figure 20 Machines top view / Three Massive Columns / Feed Carriage . 33
Figure 21 Main Drive ...................................................................... 33
Figure 22 Tool Movement / Four Eccentric Shafts/Left Auxiliary Drive ... 34
Figure 23 Left Side Hydraulic Tip ..................................................... 35
Figure 24 Right Side the Spring-Biased Tip ....................................... 35
Figure 25 Feed Carriage / Feed Drive ............................................... 36
Figure 26 Geometry Spline Shaft ..................................................... 38
Figure 27 Drawing Blank ................................................................ 39
Figure 28 Mounting Notch / Assembly Ruler ...................................... 40
8
Figure 29 Clamping Tools ............................................................... 40
Figure 30 High-Resolution Position Measuring Sensors ........................ 42
Figure 31 Power Measurement ........................................................ 44
Figure 32 Stroke Frequency ............................................................ 45
Figure 33 Sensor / Pre-charged Pressure .......................................... 46
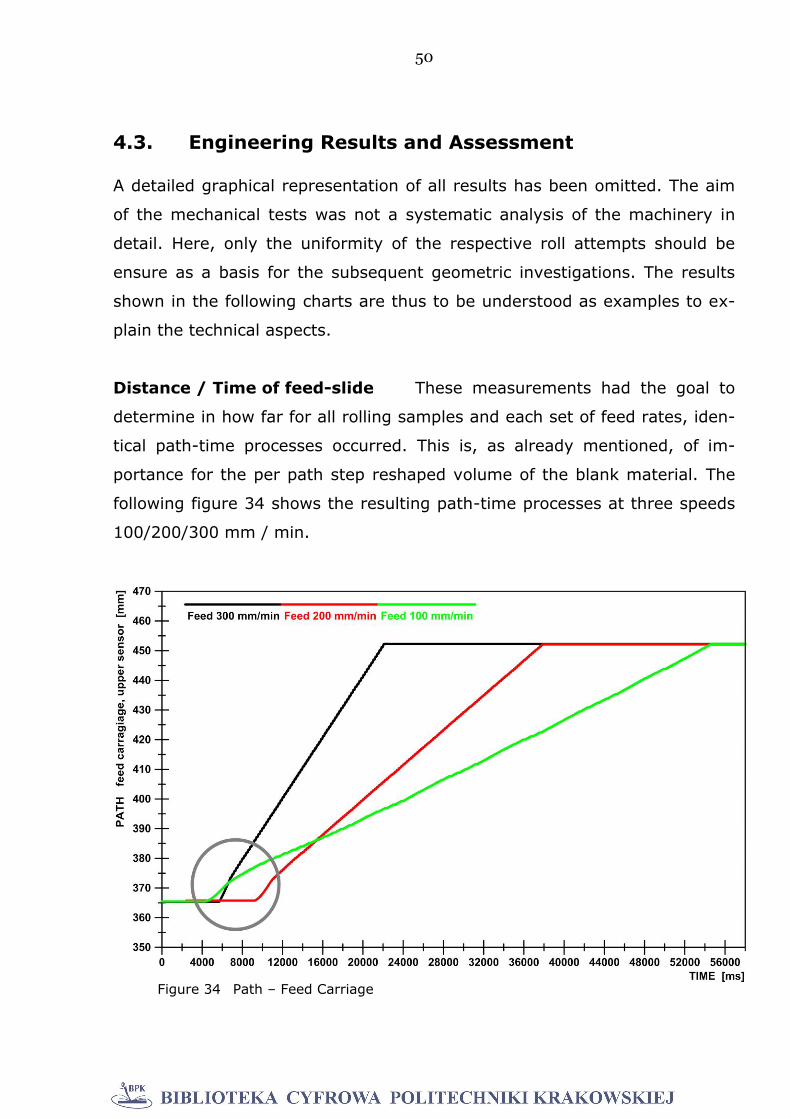
Figure 34 Path – Feed Carriage ....................................................... 50
Figure 35 Enlarged Path / Time ....................................................... 52
Figure 36 Power Consumption – Main Drive ....................................... 54
Figure 37 Power Consumption – Main Drive / Start after 10 sec. .......... 56
Figure 38 Power Consumption – Feed Drive ...................................... 58
Figure 39 Resulting Signals of an Inductive Sensor – Tool Movement .... 59
Figure 40 Basic Principle of Coordinate Metrology ............................... 60
Figure 41 Principle of Tactile 3-D Metrology ....................................... 61
Figure 42 Components of a Coordinate ............................................. 63
Figure 43 Measuring Machine PMM 654 ............................................. 64
Figure 44 probe pin configuration .................................................... 66
Figure 45 Machine and workpiece coordinate system .......................... 67
Figure 46 Blank Geometry .............................................................. 70
Figure 47 Measurement strategy / Geometry detection on the blank ..... 71
Figure 48 Workpiece coordinate system ............................................ 72
Figure 49 Clamping situation blank / measuring machine table ............ 73
Figure 50 Scanning a circle / ROUNDNESS ........................................ 74
Figure 51 Cylindrical Toothing Zone / FORM OF CYLINDERS................. 75
Figure 52 Probe Configuration, b = 60 mm ....................................... 77
Figure 53 Clamping situation of a sample .......................................... 78
Figure 54 Workpiece coordinate system rolling sample ....................... 79
Figure 55 probe configuration ......................................................... 80
Figure 56 Measurement Pitch / Concentricity ..................................... 81
Figure 57 Situation in PMM Measurement Pitch ................................ 82
Figure 58 Pitch / Concentricity Deviation w/o and with Eccentricity ....... 83
Figure 59 Probing / Profile Measurement ........................................... 84
9
Figure 60 Situation in PMM Scan line / Profile Measurement ............. 84
Figure 61 Profile deviations of 4 gaps ............................................... 85
Figure 62 Measurement / Probing / Tooth Direction / Flank Line ........... 86
Figure 63 Scane Line / Flank Direction .............................................. 87
Figure 64 Flank Line Deviations of 4 gaps ......................................... 88
Figure 65 Detection Tip- / Root Circle Diameter ................................. 89
Figure 66 Probing Point Root Diameter Probing Point Tip Diameter ..... 89
Figure 67 Situation in PMM ............................................................. 90
Figure 68 Tip circle diameter Root circle diameter .......................... 90
Figure 69 Probe Configuration ......................................................... 92
Figure 70 Detection of the Outer Cylinder Coordinate System Tools .... 93
Figure 71 Situation in PMM Roundness Outer Cylinder ........................ 94
Figure 72 Frontal Flats Alignment Groove ....................................... 95
Figure 73 Measuring / Probing Strategy ............................................ 95
Figure 74 Situation in PMM ............................................................. 96
Figure 75 Pitch / Concentricity Deviation of the Tools ......................... 97
Figure 76 Internal Tooth Profile Deviations Rolling Tools ..................... 98
Figure 77 Flank Trace Deviations Internally Toothed Rolling Tools ........ 99
Figure 78 Roundness Root Circle Fk Internally Toothed Rolling Tools ... 100
Figure 79 Contour Measurement Workpiece .................................... 104
Figure 80 Scan-Line Workpiece Situation in PMM .......................... 104
Figure 81 Contour Sections Workpiece ............................................ 105
Figure 82 Contour Cut .................................................................. 107
Figure 83 Contour Sections Tools ................................................... 109
Figure 84 Situation in PMM ........................................................... 109
Figure 85 Contour Cuts ................................................................ 110
Figure 86 Side View of a Sample ................................................... 111
Figure 87 Profile Deviation – Gap 1 – 4 v = 100 mm / min ................ 116
Figure 88 Profile Deviation – Gap 1 – 4 v = 300 mm / min ................ 117
Figure 89 Tooth Trace Deviations v = 100 mm / min ....................... 118
Figure 90 Tooth Trace Deviations v = 300 mm / min ....................... 118
10
Figure 91 Root Circle Diameter ...................................................... 119
Figure 92 Tip Circle Diameter ........................................................ 120
Figure 93 Development of tip- / root diameter dependence feed rate .. 121
Figure 94 Axial Course of Tip Circle Diameter .................................. 123
Figure 95 Profile Lines in different axial Heights ............................... 124
Figure 96 Pitch / Concentricity different Heights ............................... 126
Figure 97 Axial Tooth Tip contour, Axial Scan Line in the ZX-Plane ..... 127
Figure 98 Cross-Sectional Contour of the Tooth ............................... 128
Figure 99 Forms of Teeth / Different Feed Rats ............................... 129
Figure 100 Config. sensors / workpiece coord. system R, Z, φ ............ 134
Figure 101 Principle sampling sequence / surface in forming phase n .. 137
Figure 102 Principle sampling sequence / surface in axial feed phase... 137
Figure 103 Principle sampling sequence / forming phase n+1 ............. 138
Figure 104 Sensor signals / forming / axial feed / rotational ............... 138
Figure 105 Signal curves for forming cycle n+1 (schematical) ............ 139
Figure 106 Specification Runout Tolerance / workpiece acc. ISO 1101 . 140
Figure 107 Sensor placement / determination eccentricity (Sensor 2) .. 141
Figure 108 Principal sensor signal vs. time and calc. of eccentricity ..... 141
Figure 109 Path of the sensor spot pitch variation / gap thickness ....... 143
Figure 110 Signal process. pitch, pitch fluctuation, tooth, gap thickness 144
Figure 111 Tooth profile, (Chapter 5) .............................................. 147
Figure 112 Analysis of form deviation / tip symmetry / asymmetric ..... 148
Figure 113 Measuring Axial Position Orientation ................................ 150
Figure 114 Sensor signals Axial- Position Orientation ......................... 150
Figure 115 Axial Configuration 2 Sensors for the acquisition ............... 151
Figure 116 2 distance sensors / axial angle diff. / tooth trace deviation 152
Figure 117 Calculation of tool trace deviation hFβ .............................. 153
11
1. Introduction
The elaboration describes a research which is based on a little-known rolling
technology which was developed in Poland in the 70’s. To better understand
the facts today in connection therewith statements made by a witness of the
former WPM activities should be prepended. It is important to know that at
that time in Europe, the communist and the capitalist block faced. Corre-
spondingly, it was especially difficult to design projects between politically
different blocks at that time as part of economical-technological exchanges
between states.
Theoretically, the WPM-Rolling-Technology was developed by Prof. Z.
Marciniak. The WPM-Rolling is characterized by two internally toothed rolling
tools which move on symmetrical eccentric courses around the workpiece.
The aim is to produce a spline chipless. Back then, the machine and the roll-
ing method WPM was highly suitable for chipless production of large face-
geared machine elements in the range of module 2,5 and higher. Other
methods on the market with a similar performance were known only partial-
ly. The Polish company Plasomat designed and produced in accordance with
this tool-motion principle, rolling machines like the type WPM 120. Some
machines were used in the Ursus tractor factory in Warsaw, others in the
former Soviet Union.
The foreign trade company Metalexport, of the then communistic Poland co-
operated with the West German firm German Industrial Society and other
interested companies. End of the 70's one of those rolling machines WPM
120 reached to the Institute for Metal Forming of the Technical University of
Darmstadt, Prof. Dr.-Ing. D. Schmoeckel. The machine has been tested and
it was found that the achievable spline quality of this machine did not meet
the quality standards required by the industry. The machine WPM 120 was
12
not scientifically examined because their structural design was quickly rec-
ognized as a fundamental cause of the insufficient quality of the rolling re-
sults. The principle of motion in itself is classified as extremely interesting,
so that various prototype machines were developed in the following years.
The political developments of the late 80-ies and other technological devel-
opments in the machinery market led to the machine WPM 120 fell into
oblivion. The rolling on the WPM method of Prof. Z. Marciniak is now de-
scribed in standard works of the literature of metal forming. About WPM only
a few reports were published (Prof. Z. Marciniak, Z. Kopacz, Prof.
Schmoeckel and employees). Other research papers that examine the issue
of rolling with internally toothed tools in detail are not known worldwide.
This is explained by the history of the rolling method WPM.
Prof. Dr.-Ing. Ernst Hammerschmidt, University of Darmstadt, Department
of Mechanical Engineering, Head of Metrology Laboratory
Since 1994, probably the only still functioning rolling machine WPM 120 is
located at the University of Applied Science Darmstadt in the laboratory for
production technology. The machine serves there as a laboratory machine
for student internships, bachelor's and master's theses.
Professor Hammerschmidt and his colleagues at the University of Darmstadt
cooperate since about 1980 with the company Leitz in Wetzlar. At that time
measurement software for measuring gears has been developed together. A
former student of the University of Darmstadt Ingo Lindner got to know the
rolling technology developed by Prof. Marciniak during his engineering stud-
ies. The later Master's degree in Industrial Engineering from Ingo Lindner
and Tim Eichner led to the first joint studies of rolling technology WPM. At
that time, Ingo Lindner was head of development of Leitz. In the course of
his business, he realized in the market of production technology that the in-
process monitoring in machine tools would become increasingly important.
That’s how the idea of using the rolling machine WPM 120 as a base for de-
13
veloping a process control for machine tools arose. Such a development
could lead to a new and particularly interesting commercial business area of
the company Leitz. Technical discussions with professors in Darmstadt and
work-related contacts with Professor Sladek (Krakow) and Prof. Wieczor-
owski (Poznan) in the field of coordinate metrology led to the idea of devel-
oping a metrological policy framework for machine tools. The starting point
for this research is the increasing economic importance of forming technolo-
gy on the global market. In this connection, the chipless production of
toothed machine elements has been standard practice for decades. Howev-
er, the achievable geometric quality of the teeth and their magnitude set m>
2 are clearly limited. Besides the technical advantages, such as the solidifi-
cation and the economic benefits, such as material savings and the shorter
manufacturing time all relevant processes have in common that the so pro-
duced work pieces have specific geometric characteristics. These character-
istics are typical for the respective forming technology. They are mainly
caused by the tool movement of the forming principle and the resultant forc-
es during forming. The geometric quality of such toothing is dependent on
the quality of the tool guiding during the forming process and of the un-
wanted movement of the workpiece by the forces required for deformation.
Both factors determine the manufactured geometric quality of the toothed
machine elements without using a cutting method. The forming production
of toothed components is only then economical when they are manufactured
in large batches. A reliable statement about the resulting part quality after
forming is nowadays fully possible only through the coordinate metrology in
form of geometric POST-process measurements. A quality control of this
kind takes time. The result is therefore a conflict of aims between the eco-
nomic demands of mass production of toothing and the need for a compre-
hensive quality control of production [4]. The above described circumstances
suggest monitoring the deformation process even during the transformation
in order to react quickly to any unwanted change of events. The ideal situa-
tion would be a process monitoring for chipless production of toothed ma-
14
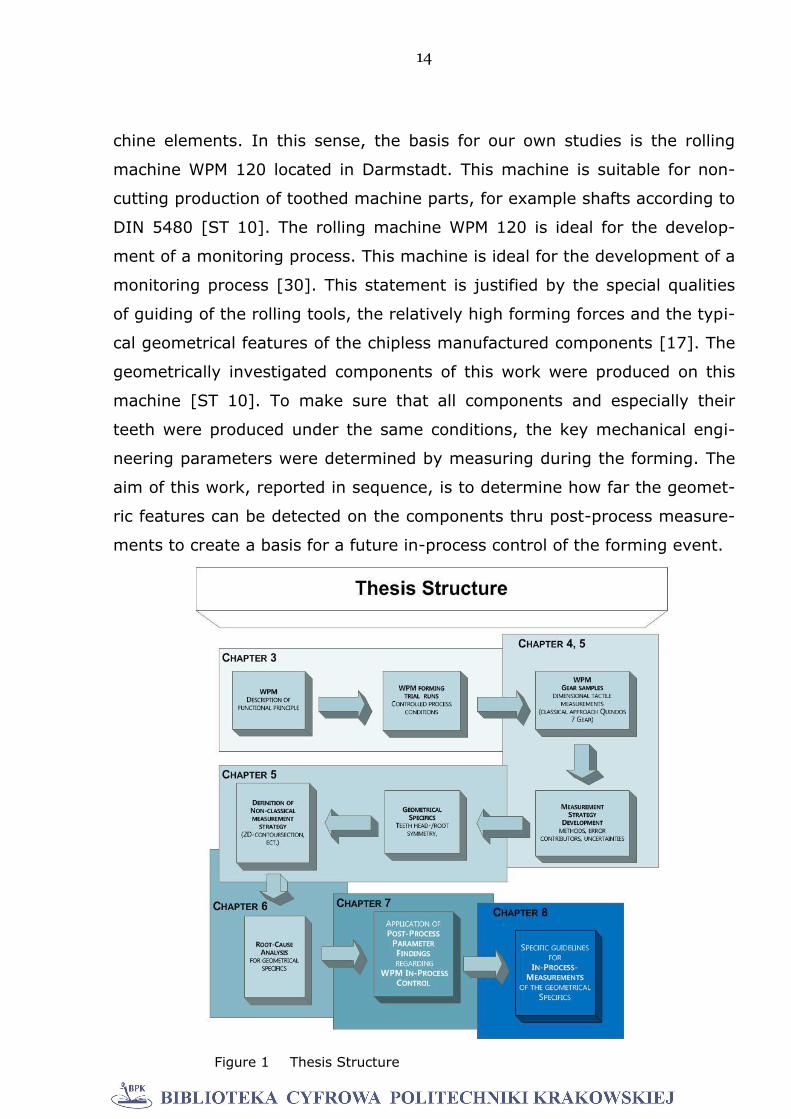
Figure 1 Thesis Structure
chine elements. In this sense, the basis for our own studies is the rolling
machine WPM 120 located in Darmstadt. This machine is suitable for non-
cutting production of toothed machine parts, for example shafts according to
DIN 5480 [ST 10]. The rolling machine WPM 120 is ideal for the develop-
ment of a monitoring process. This machine is ideal for the development of a
monitoring process [30]. This statement is justified by the special qualities
of guiding of the rolling tools, the relatively high forming forces and the typi-
cal geometrical features of the chipless manufactured components [17]. The
geometrically investigated components of this work were produced on this
machine [ST 10]. To make sure that all components and especially their
teeth were produced under the same conditions, the key mechanical engi-
neering parameters were determined by measuring during the forming. The
aim of this work, reported in sequence, is to determine how far the geomet-
ric features can be detected on the components thru post-process measure-
ments to create a basis for a future in-process control of the forming event.
15
2. State of the art - Production toothed machine elements
The modern production technology for the manufacture of splined compo-
nents is complex. All currently known production technologies are used here
[3]. The production of toothed parts is in general distinguishable into the
manufacturing of individual parts and mass production [57].
A single component or a small amount of splined components is manufac-
tured usually by machining. In this case various metal cutting methods are
used. In the context of series production large numbers are usually produced
in a combination of different technologies [61]. Here at the beginning of the
production chain is the primary forming or metal forming [65, 58]. This
means that, for example, thru the primary forming or metal forming a pre-
form is produced [66].
The final shape is then formed by subsequent metal cutting or other metal
forming processes [94]. The structure of such production lines, for example,
depends on the geometry of the toothed part, the material from which the
part is made, and the quality requirements to the final geometry [54].
Each series production is dominated by questions of production efficiency. In
this sense, individual parts or small quantities of toothed components cannot
be made through a preform by primary forming or metal forming.
The arising high tool costs would affect the economics of such production
negatively [37]. For individual parts in this sense the production line starts
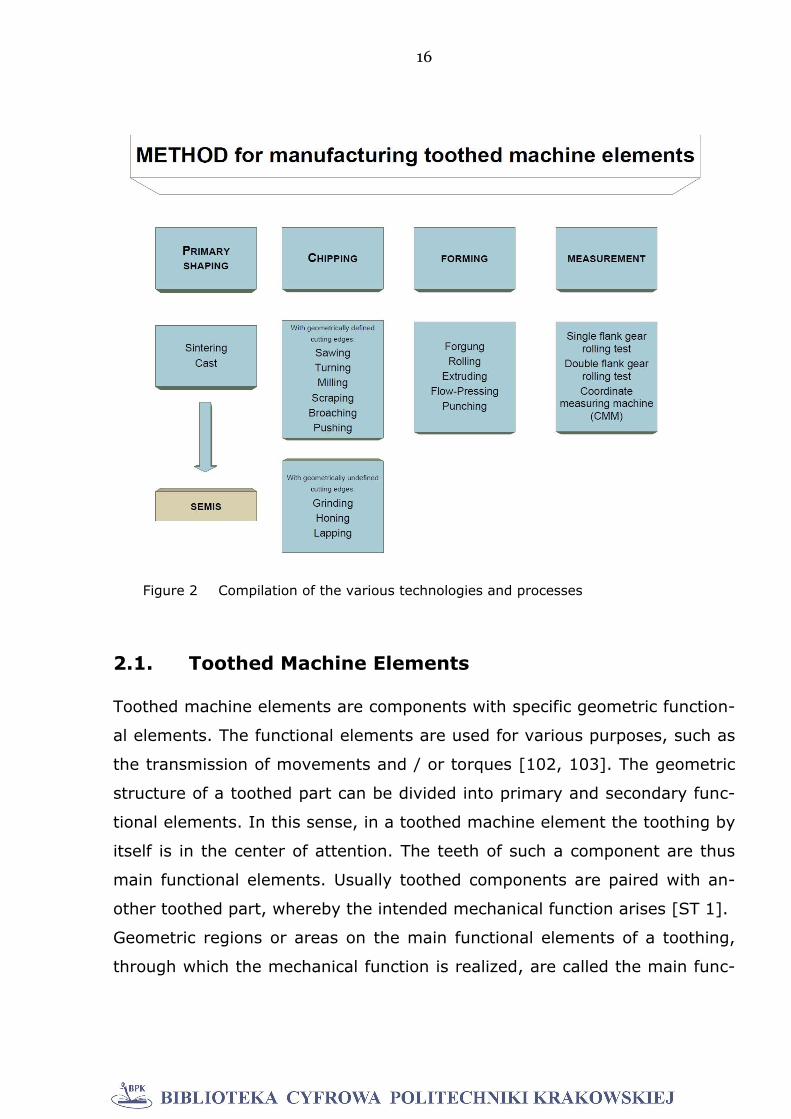
with, for example, semi-finished bars. The following figure shows a compila-
tion of the various technologies and processes that are used in modern gear
manufacturing. The figure 2 shows typical methods used in the large-scale
production of gears in combination. Starting from a preform which has been
produced e.g. by molding or forming, is made by rotating the output body
[ST 9]. Then the toothing is realized by machining or forming. Onto the
mention of various intermediate steps, in particular the metrological exami-
nation of the various production steps has been abdicated.
16
2.1. Toothed Machine Elements
Toothed machine elements are components with specific geometric function-
al elements. The functional elements are used for various purposes, such as
the transmission of movements and / or torques [102, 103]. The geometric
structure of a toothed part can be divided into primary and secondary func-
tional elements. In this sense, in a toothed machine element the toothing by
itself is in the center of attention. The teeth of such a component are thus
main functional elements. Usually toothed components are paired with an-
other toothed part, whereby the intended mechanical function arises [ST 1].
Geometric regions or areas on the main functional elements of a toothing,
through which the mechanical function is realized, are called the main func-
Figure 2 Compilation of the various technologies and processes
17
tion areas. The following discussion refers only to face-geared machine ele-
ments as exemplified in the following pictures [ST 2, ST3].
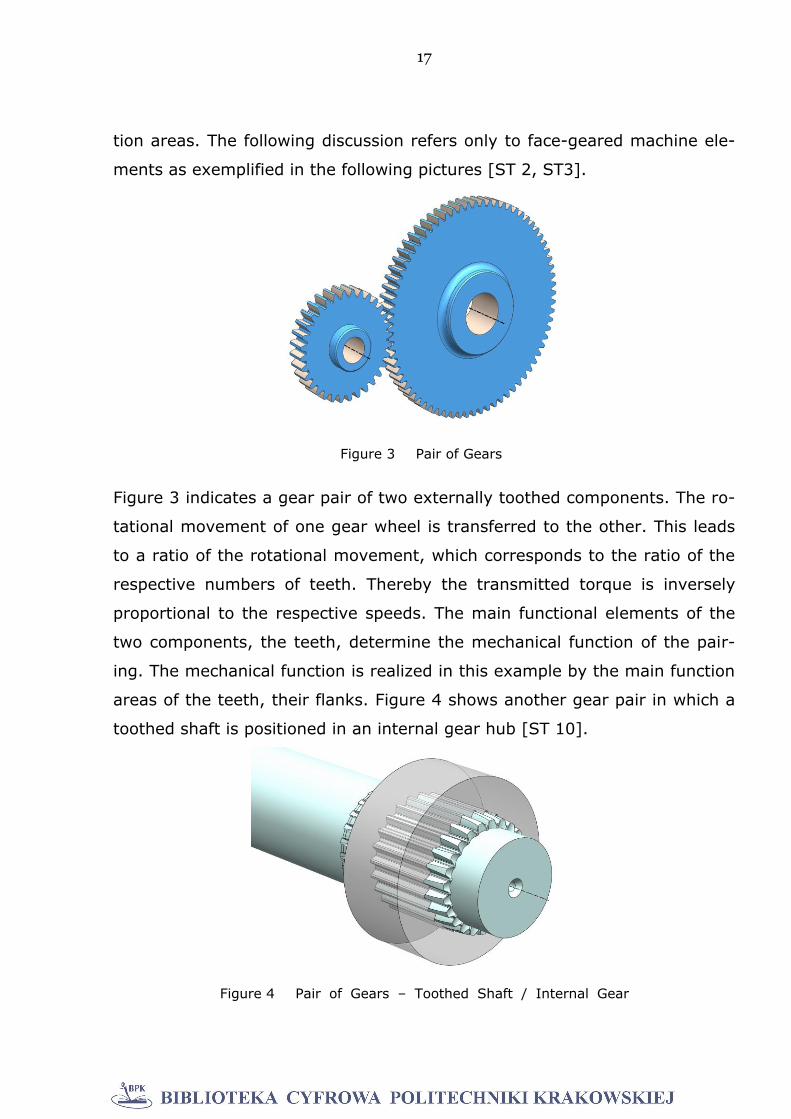
Figure 3 indicates a gear pair of two externally toothed components. The ro-
tational movement of one gear wheel is transferred to the other. This leads
to a ratio of the rotational movement, which corresponds to the ratio of the
respective numbers of teeth. Thereby the transmitted torque is inversely
proportional to the respective speeds. The main functional elements of the
two components, the teeth, determine the mechanical function of the pair-
ing. The mechanical function is realized in this example by the main function
areas of the teeth, their flanks. Figure 4 shows another gear pair in which a
toothed shaft is positioned in an internal gear hub [ST 10].
Figure 3 Pair of Gears
Figure 4 Pair of Gears – Toothed Shaft / Internal Gear
Hub
18
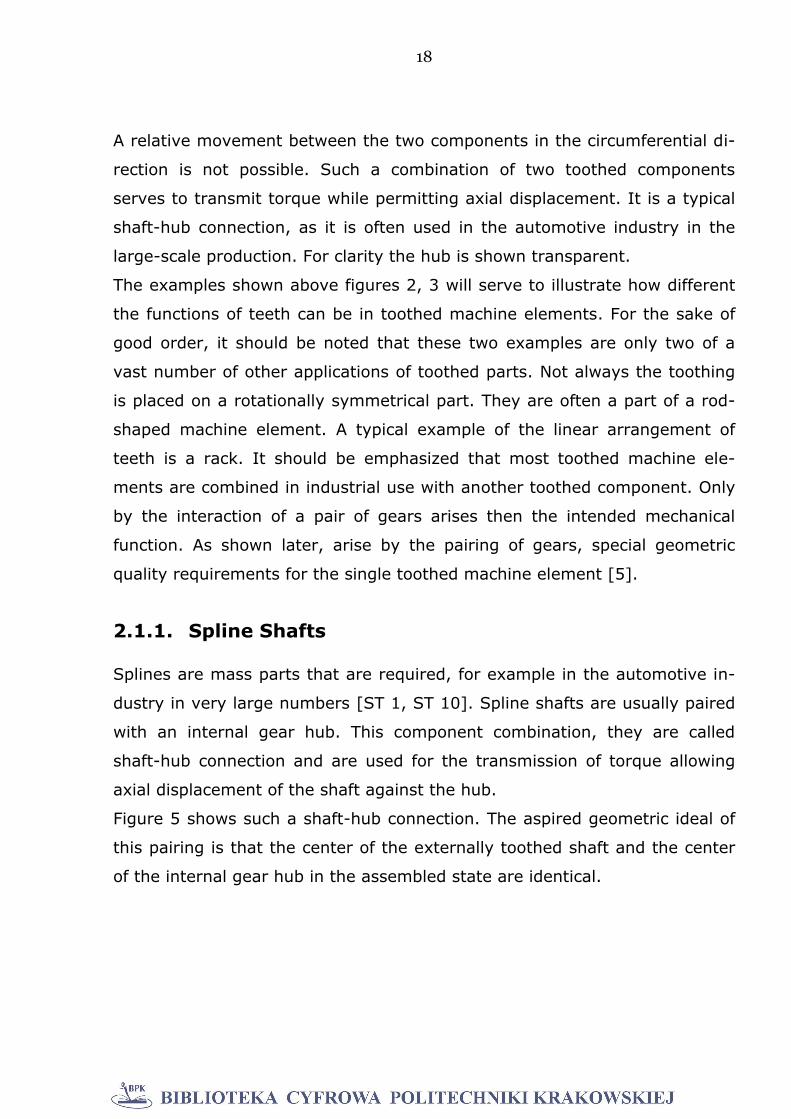
A relative movement between the two components in the circumferential di-
rection is not possible. Such a combination of two toothed components
serves to transmit torque while permitting axial displacement. It is a typical
shaft-hub connection, as it is often used in the automotive industry in the
large-scale production. For clarity the hub is shown transparent.
The examples shown above figures 2, 3 will serve to illustrate how different
the functions of teeth can be in toothed machine elements. For the sake of
good order, it should be noted that these two examples are only two of a
vast number of other applications of toothed parts. Not always the toothing
is placed on a rotationally symmetrical part. They are often a part of a rod-
shaped machine element. A typical example of the linear arrangement of
teeth is a rack. It should be emphasized that most toothed machine ele-
ments are combined in industrial use with another toothed component. Only
by the interaction of a pair of gears arises then the intended mechanical
function. As shown later, arise by the pairing of gears, special geometric
quality requirements for the single toothed machine element [5].
2.1.1. Spline Shafts
Splines are mass parts that are required, for example in the automotive in-
dustry in very large numbers [ST 1, ST 10]. Spline shafts are usually paired
with an internal gear hub. This component combination, they are called
shaft-hub connection and are used for the transmission of torque allowing
axial displacement of the shaft against the hub.
Figure 5 shows such a shaft-hub connection. The aspired geometric ideal of
this pairing is that the center of the externally toothed shaft and the center
of the internal gear hub in the assembled state are identical.
19
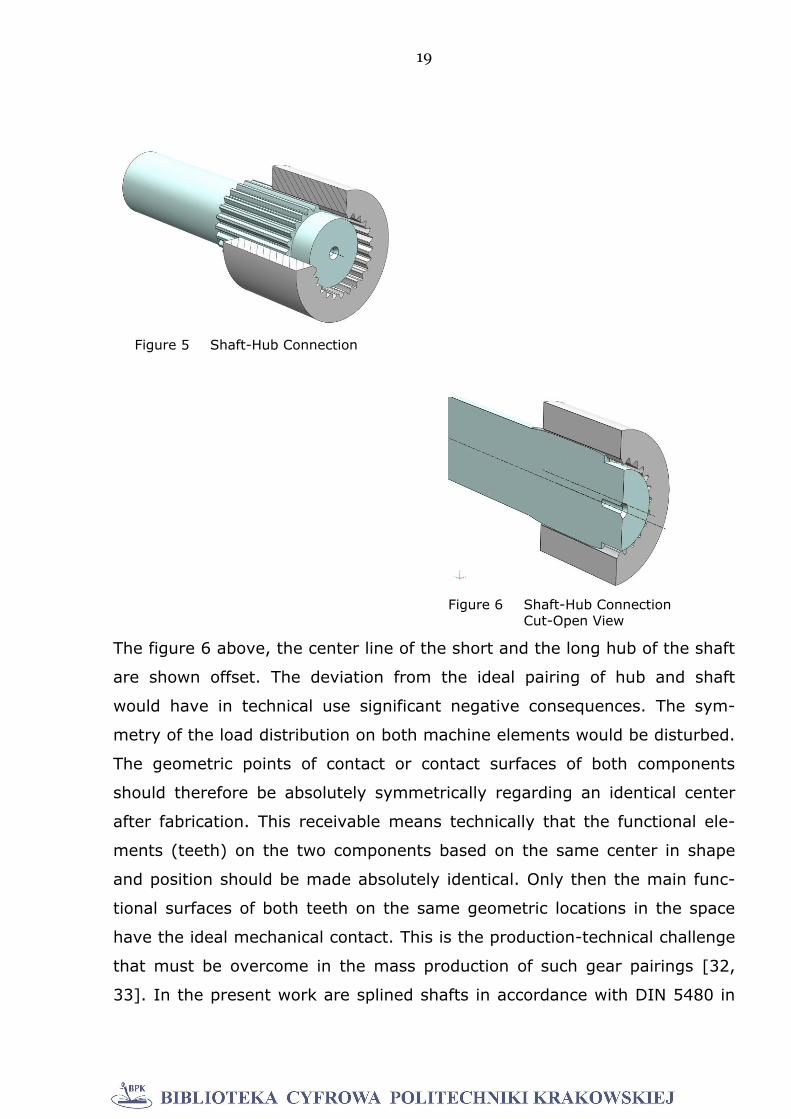
The figure 6 above, the center line of the short and the long hub of the shaft
are shown offset. The deviation from the ideal pairing of hub and shaft
would have in technical use significant negative consequences. The sym-
metry of the load distribution on both machine elements would be disturbed.
The geometric points of contact or contact surfaces of both components
should therefore be absolutely symmetrically regarding an identical center
after fabrication. This receivable means technically that the functional ele-
ments (teeth) on the two components based on the same center in shape
and position should be made absolutely identical. Only then the main func-
tional surfaces of both teeth on the same geometric locations in the space
have the ideal mechanical contact. This is the production-technical challenge
that must be overcome in the mass production of such gear pairings [32,
33]. In the present work are splined shafts in accordance with DIN 5480 in
Figure 5 Shaft-Hub Connection
Figure 6 Shaft-Hub Connection Cut-Open View
20
the center of attention [ST 10, 96]. In simple terms, a problem with such a
gear pair results. This is the centering of the two machine elements against
each other. Accordingly, DIN 5480 T1 defines the different types of mutual
centering [ST 10].
To illustrate this geometric relationships in the sequence images are shown.
In such a partial volume of the pair is shown broken.
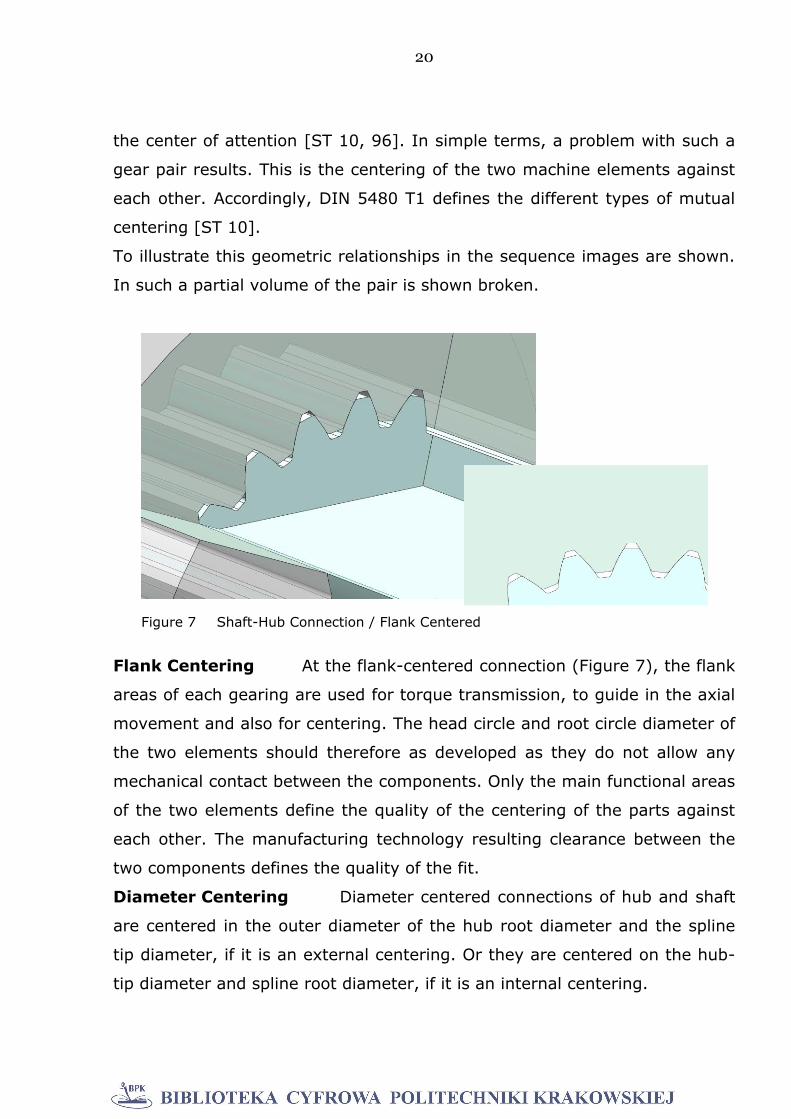
Flank Centering At the flank-centered connection (Figure 7), the flank
areas of each gearing are used for torque transmission, to guide in the axial
movement and also for centering. The head circle and root circle diameter of
the two elements should therefore as developed as they do not allow any
mechanical contact between the components. Only the main functional areas
of the two elements define the quality of the centering of the parts against
each other. The manufacturing technology resulting clearance between the
two components defines the quality of the fit.
Diameter Centering Diameter centered connections of hub and shaft
are centered in the outer diameter of the hub root diameter and the spline
tip diameter, if it is an external centering. Or they are centered on the hub-
tip diameter and spline root diameter, if it is an internal centering.
Figure 7 Shaft-Hub Connection / Flank Centered
21
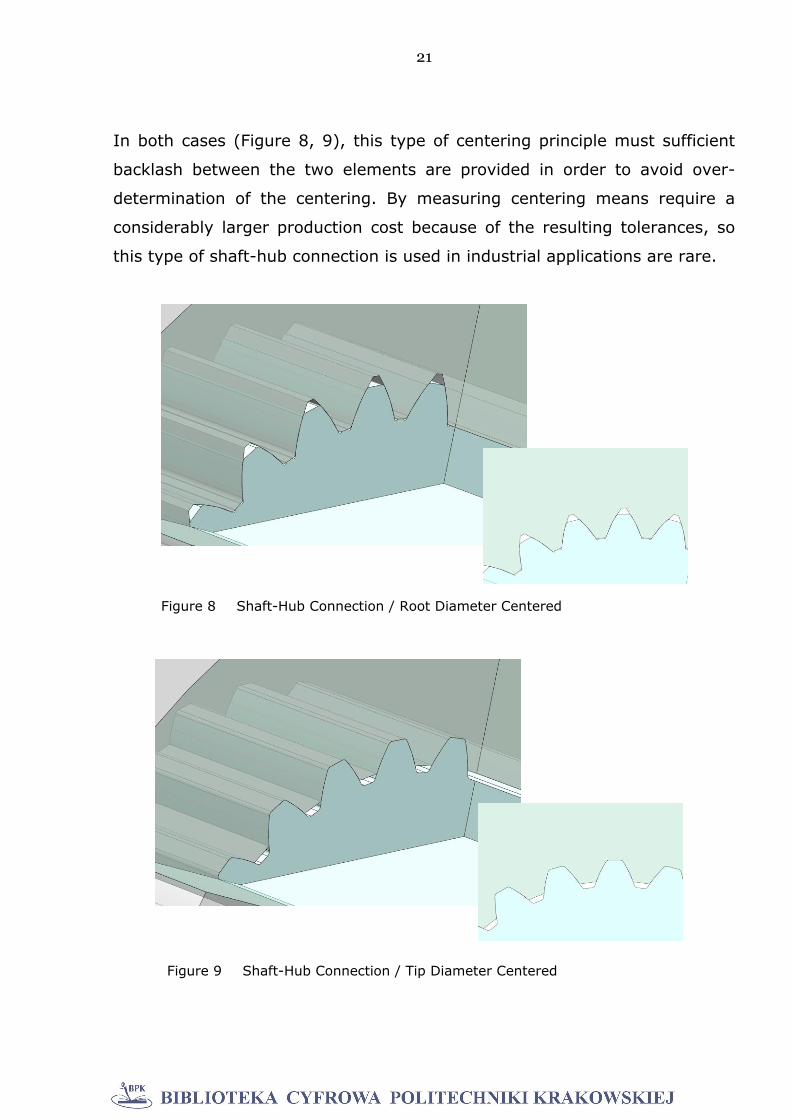
In both cases (Figure 8, 9), this type of centering principle must sufficient
backlash between the two elements are provided in order to avoid over-
determination of the centering. By measuring centering means require a
considerably larger production cost because of the resulting tolerances, so
this type of shaft-hub connection is used in industrial applications are rare.
Figure 8 Shaft-Hub Connection / Root Diameter Centered
Figure 9 Shaft-Hub Connection / Tip Diameter Centered

22
3. Metal Forming
Metal forming is a very old technology for shaping components. One of the
oldest methods of forming is the forging of metals [123]. Thereby, thru one
or more tools the required energy for shaping is introduced into the material
[60, 62, 115, 116]. At all methods of forming mechanical energy changes
the shape of a material volume [45, 46, 80]. The volume of the processed
material remains constant, regardless of whether it is solid or sheet-shaped
material [68, 81]. At toothed machine elements mostly solid material is in
the center of attention. A distinction is made into hot, warm and cold forg-
ing. During hot-or semi-hot forming, the volume is deformed dependent on
the material at temperatures of approximately 600°C – 1200°C, while cold
forming at room temperature [47]. Nowadays, toothed machine elements
are produced chipless thru forging, extruding or rolling [117, 124]. The de-
sired geometrical quality of the components determines the employed
manufacturing process [120]. The advantages of all forming processes are
inter alia the material savings and the associated solidification of the materi-
al structure thru metal forming. Today, for the production of toothed ma-
chine elements, all known methods of forming technology are used [123].
Forging is used primarily for the production of a preform [1]. The resulting
geometric components quality after forging does not always match the re-
quired quality standard [7, 73, 74]. The required quality is usually achieved
by subsequent cutting processes [63, 101]. Extrusion is used mostly by cy-
lindrical components with a long axial toothing. And the rolling processes are
always used wherever rotationally symmetric components are to be toothed.
Often, the reshaping is followed by a carburizing and / or a hardening pro-
cess, so that the surface or near-surface areas of the teeth have better
abrasion behavior [93]. For the highest geometric requirements the reshap-
ing can also be followed by a cutting process such as grinding. A clear
statement which method or combination of methods is used for specific
23
types of gear components cannot be made [75]. The variety of different ge-
ometric shapes of such components and the desired quality characteristics
are too different [64]. The goal of any production must be to work with the
lowest expenses [54]. Consequently, the technical necessary production
steps are also evaluated in terms of costs [55]. As long as, the required
technical function of the toothed component is ensured, different combina-
tions of manufacturing steps and used methods can result in success [59,
67]. The question of the success of a production is closely linked to the issue
of quality control of production. Mass production and technical standards for
the quality of manufactured components include various trade-offs. Mass
production vs. part accuracy and part accuracy vs. material properties are
particularly for cutting production, the key challenge [76, 77]. Besides many
other factors the metal forming is determined thru the material properties of
the deformed material and the unavoidable tool abrasion [79]. Unwanted
variations of the composition of the formed material or changes of the tool
shape thru abrasion can significantly affect the resulting quality. This state-
ment concerns the geometry of the component after forming, as well as the
then existing mechanical component properties.
At the forming production of toothed machine elements, this relationship is
of particular importance. The proper function of teeth is directly dependent
on the geometric quality of the teeth. By which the large need for control of
forming production is explained. Mass production and quality control are an-
other conflict, which takes a special importance while manufacturing toothed
machine elements. Short production times that are required in connection
with mass production, and great loss of time through quality control is a
contradiction in terms. Thru this the economics of production is significantly
influenced ultimately [69]. The large amount of time which has to be provid-
ed for the correct geometric control of a toothed element, allows just only
random checks after the production of a component series. Therefore, the
post-process control can only record individual components. Consequently, a
comprehensive inspection of all parts is only possible within the manufactur-
24
ing process. The challenge for the future is to control the mass production of
toothed machine elements completely by monitoring the forming process
[132]. For the own research test samples were manufactured under con-
trolled conditions. The sample material came from a batch of steel produc-
tion and was examined metallurgical to its composition. Then the used se-
quence of manufacturing steps begins for example with rod-shaped carbon
steel C15. Accordingly long pieces of this material were annealed (HV ~ 130)
and shaped to predetermined dimensions by turning. The desired geometry
of the blank is determined by the method which is used for the production of
the toothed component. In this research, it was the rolling according to the
Polish WPM method [92]. Here the teeth are formed without cutting through
two internally toothed tools. The roll samples were rolled in the cold state
(room temperature).
3.1. Rolling Methods
Rolling processes includes the area of the pressure forming processes, DIN
8583 T1/T2 [ST 11]. In these methods, mainly compressive stresses result-
ing in the forming zone [11, 12, 13]. The rolling processes for manufacturing
toothed components are usually divided by the geometric shape of the used
tools [6, 9, 94]. The method are differed into methods with rotationally
symmetrical external toothed tools (PeeWee), with flat back shaped tools
(RotoFlow), with internal toothed tools (WPM) and the so-called planetary
rolling method (Grob), about which will not be further reported [72, 78,
123]. In consequence, the aforementioned rolling processes will only be ex-
plained briefly in principle. Specific process variants remain unmentioned.
The two oldest methods, PeeWee and RotoFlow were developed for non-
cutting thread production end of the 20-ies. A typical component is the
screw, as it is produced worldwide for many decades [129]. The screw is a
cylindrical toothed machine element, which includes inter alia an essential
geometric functional element, the thread. The technological relationships
25
and sequence of manufacturing steps are very similar to the modern manu-
facturing sequence in modern manufacturing of toothed components [67,
69]. Starting from a cylindrical preform, the blank, portions of the preform
are formed to the desired functional elements, threads or gears. The screw
is a typical mass-part; the production is based almost exclusively on the
metal forming. For screw production about 20 years ago different process
monitoring systems have been developed. Without the monitoring a modern
screw production is hard to imagine today. However, the qualitative re-
quirements for the process monitoring of a screw-production are significantly
lower than in the manufacturing of toothed machine elements. The process
monitoring of screw production is based solely on the detection of technical
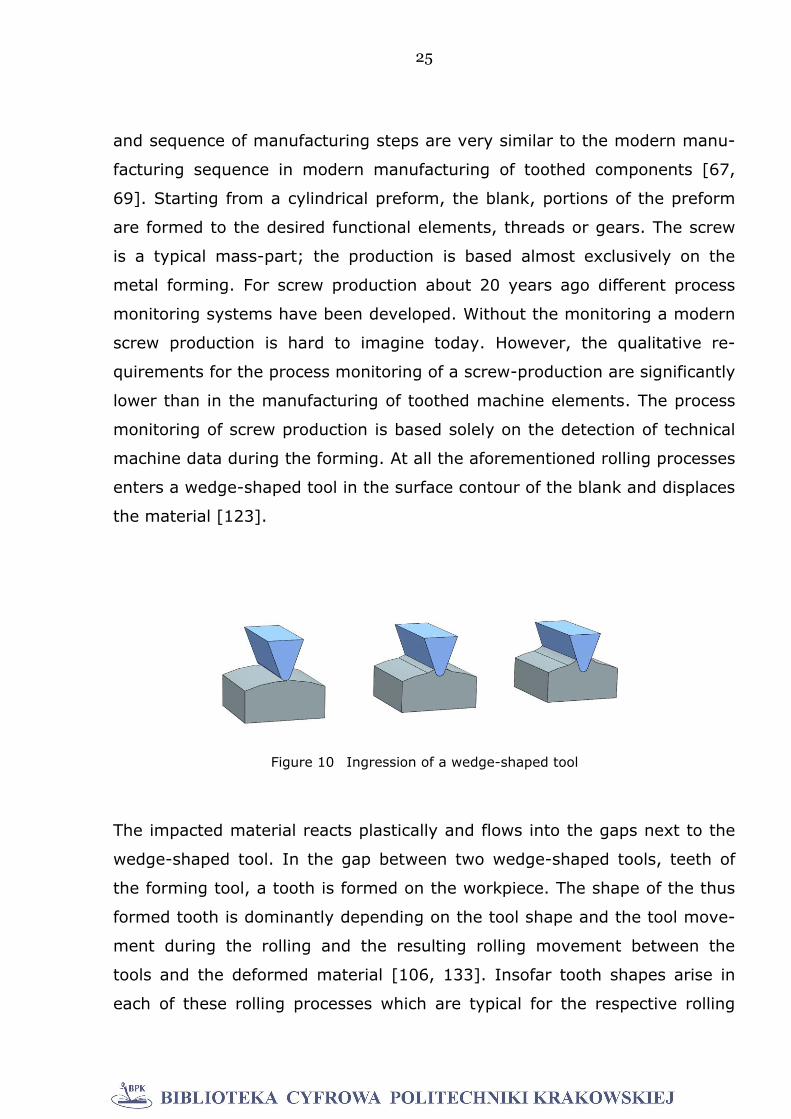
machine data during the forming. At all the aforementioned rolling processes
enters a wedge-shaped tool in the surface contour of the blank and displaces
the material [123].
The impacted material reacts plastically and flows into the gaps next to the
wedge-shaped tool. In the gap between two wedge-shaped tools, teeth of
the forming tool, a tooth is formed on the workpiece. The shape of the thus
formed tooth is dominantly depending on the tool shape and the tool move-
ment during the rolling and the resulting rolling movement between the
tools and the deformed material [106, 133]. Insofar tooth shapes arise in
each of these rolling processes which are typical for the respective rolling
Figure 10 Ingression of a wedge-shaped tool
26
process [94, 107]. Each of the aforementioned rolling processes are based
on a typical machine mechanics and typical drive kinematic which imple-
ments the tool movements.
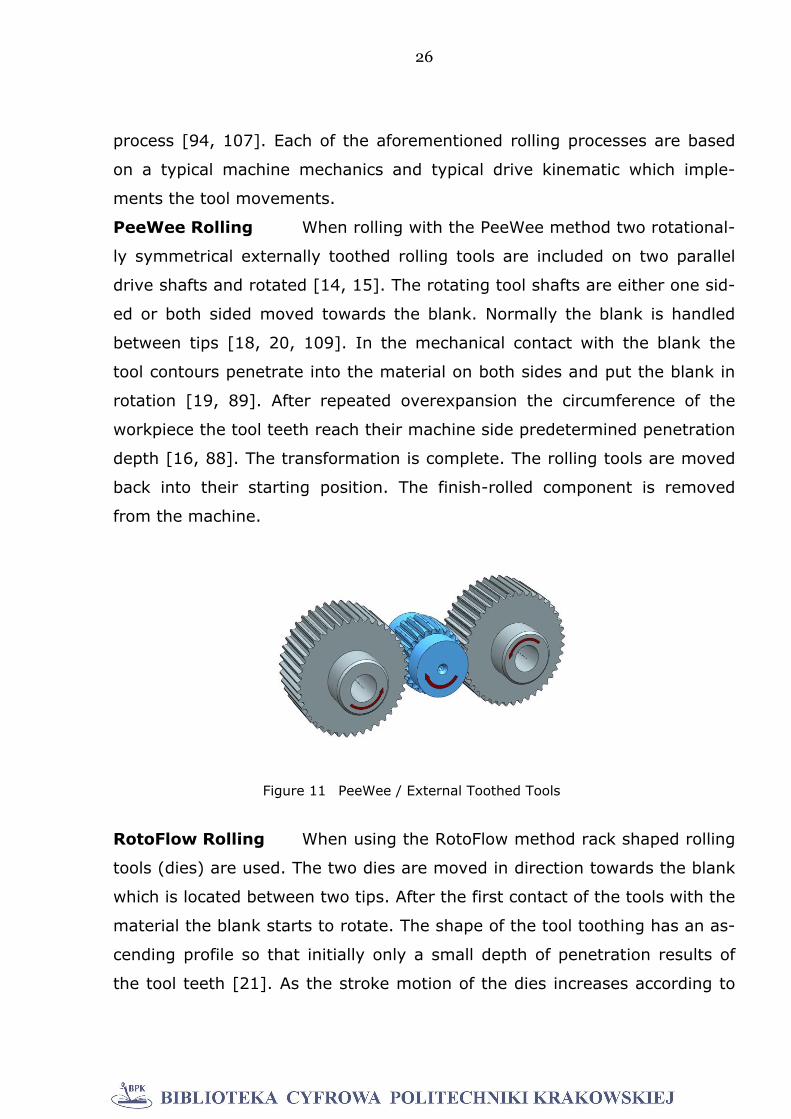
PeeWee Rolling When rolling with the PeeWee method two rotational-
ly symmetrical externally toothed rolling tools are included on two parallel
drive shafts and rotated [14, 15]. The rotating tool shafts are either one sid-
ed or both sided moved towards the blank. Normally the blank is handled
between tips [18, 20, 109]. In the mechanical contact with the blank the
tool contours penetrate into the material on both sides and put the blank in
rotation [19, 89]. After repeated overexpansion the circumference of the
workpiece the tool teeth reach their machine side predetermined penetration
depth [16, 88]. The transformation is complete. The rolling tools are moved
back into their starting position. The finish-rolled component is removed
from the machine.
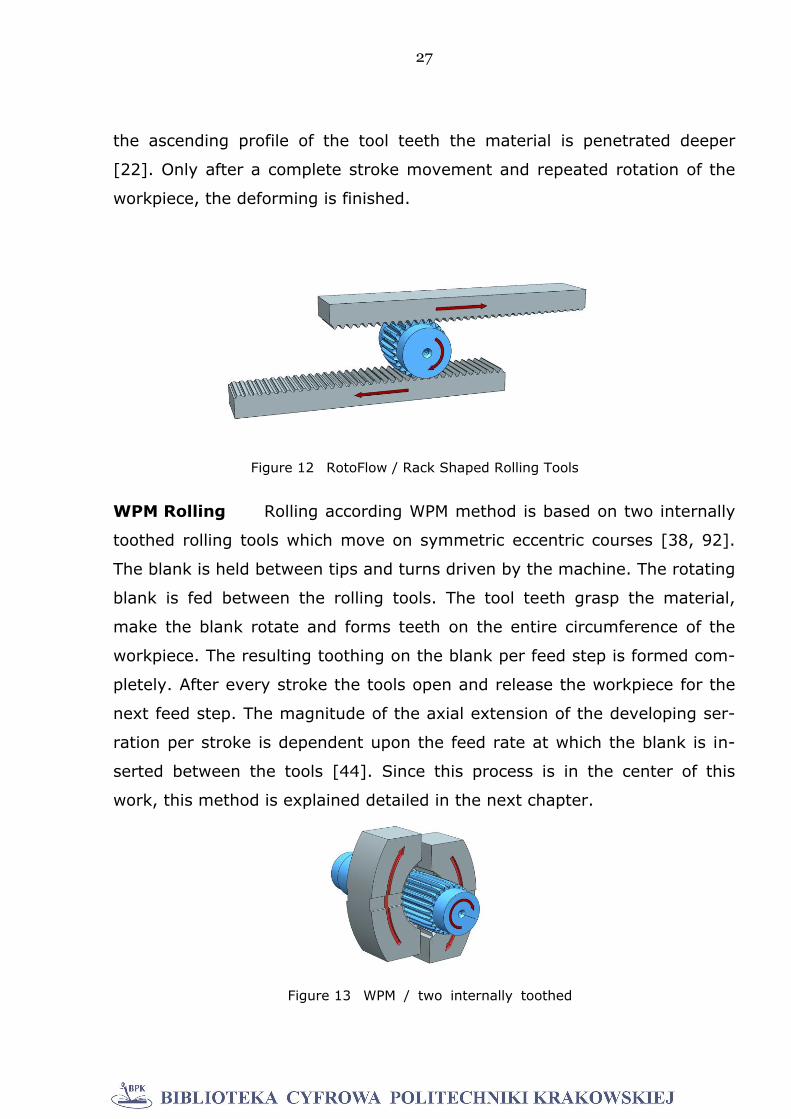
RotoFlow Rolling When using the RotoFlow method rack shaped rolling
tools (dies) are used. The two dies are moved in direction towards the blank
which is located between two tips. After the first contact of the tools with the
material the blank starts to rotate. The shape of the tool toothing has an as-
cending profile so that initially only a small depth of penetration results of
the tool teeth [21]. As the stroke motion of the dies increases according to
Figure 11 PeeWee / External Toothed Tools
27
the ascending profile of the tool teeth the material is penetrated deeper
[22]. Only after a complete stroke movement and repeated rotation of the
workpiece, the deforming is finished.
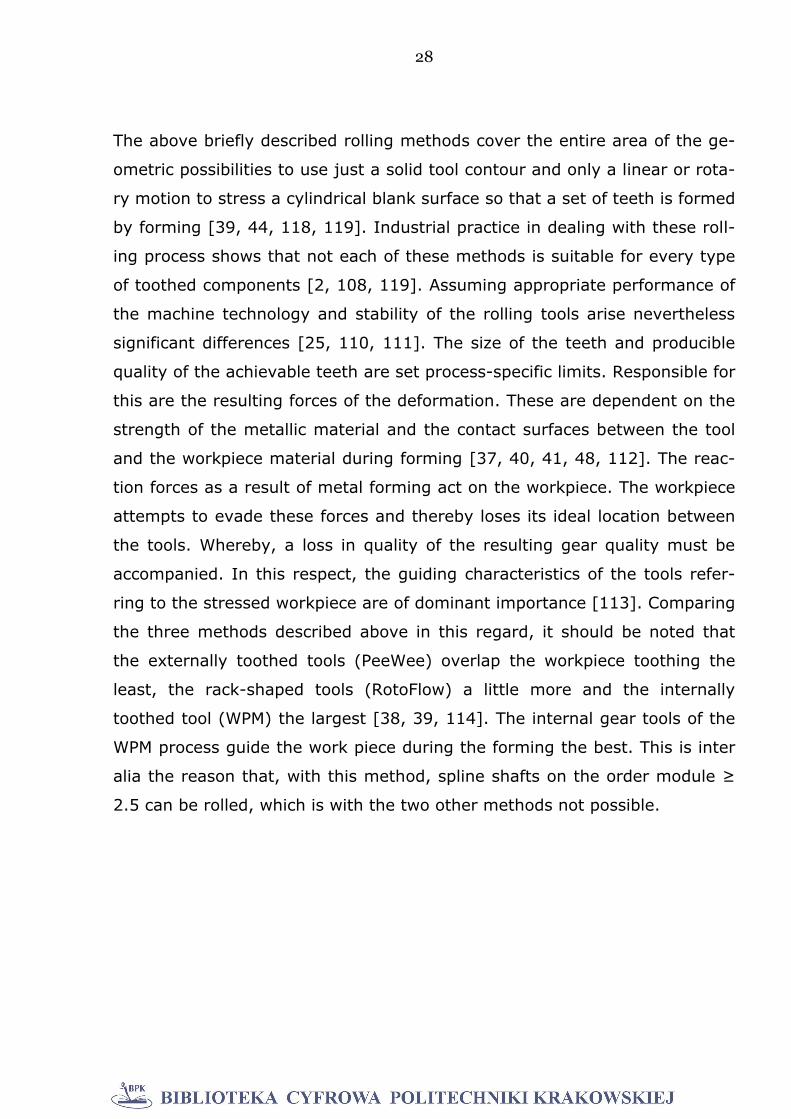
WPM Rolling Rolling according WPM method is based on two internally
toothed rolling tools which move on symmetric eccentric courses [38, 92].
The blank is held between tips and turns driven by the machine. The rotating
blank is fed between the rolling tools. The tool teeth grasp the material,
make the blank rotate and forms teeth on the entire circumference of the
workpiece. The resulting toothing on the blank per feed step is formed com-
pletely. After every stroke the tools open and release the workpiece for the
next feed step. The magnitude of the axial extension of the developing ser-
ration per stroke is dependent upon the feed rate at which the blank is in-
serted between the tools [44]. Since this process is in the center of this
work, this method is explained detailed in the next chapter.
Figure 13 WPM / two internally toothed
tools
Figure 12 RotoFlow / Rack Shaped Rolling Tools
28
The above briefly described rolling methods cover the entire area of the ge-
ometric possibilities to use just a solid tool contour and only a linear or rota-
ry motion to stress a cylindrical blank surface so that a set of teeth is formed
by forming [39, 44, 118, 119]. Industrial practice in dealing with these roll-
ing process shows that not each of these methods is suitable for every type
of toothed components [2, 108, 119]. Assuming appropriate performance of
the machine technology and stability of the rolling tools arise nevertheless
significant differences [25, 110, 111]. The size of the teeth and producible
quality of the achievable teeth are set process-specific limits. Responsible for
this are the resulting forces of the deformation. These are dependent on the
strength of the metallic material and the contact surfaces between the tool
and the workpiece material during forming [37, 40, 41, 48, 112]. The reac-
tion forces as a result of metal forming act on the workpiece. The workpiece
attempts to evade these forces and thereby loses its ideal location between
the tools. Whereby, a loss in quality of the resulting gear quality must be
accompanied. In this respect, the guiding characteristics of the tools refer-
ring to the stressed workpiece are of dominant importance [113]. Comparing
the three methods described above in this regard, it should be noted that
the externally toothed tools (PeeWee) overlap the workpiece toothing the
least, the rack-shaped tools (RotoFlow) a little more and the internally
toothed tool (WPM) the largest [38, 39, 114]. The internal gear tools of the
WPM process guide the work piece during the forming the best. This is inter
alia the reason that, with this method, spline shafts on the order module ≥
2.5 can be rolled, which is with the two other methods not possible.
29
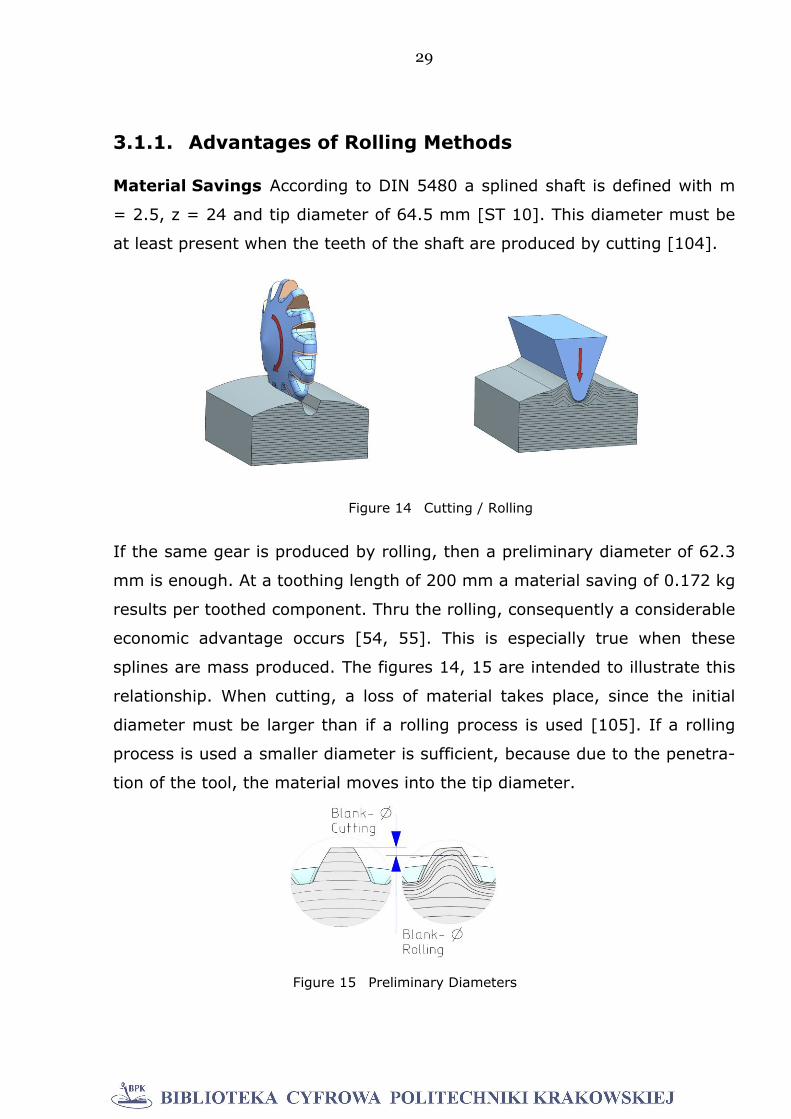
3.1.1. Advantages of Rolling Methods
Material Savings According to DIN 5480 a splined shaft is defined with m
= 2.5, z = 24 and tip diameter of 64.5 mm [ST 10]. This diameter must be
at least present when the teeth of the shaft are produced by cutting [104].
If the same gear is produced by rolling, then a preliminary diameter of 62.3
mm is enough. At a toothing length of 200 mm a material saving of 0.172 kg
results per toothed component. Thru the rolling, consequently a considerable
economic advantage occurs [54, 55]. This is especially true when these
splines are mass produced. The figures 14, 15 are intended to illustrate this
relationship. When cutting, a loss of material takes place, since the initial
diameter must be larger than if a rolling process is used [105]. If a rolling
process is used a smaller diameter is sufficient, because due to the penetra-
tion of the tool, the material moves into the tip diameter.
Figure 14 Cutting / Rolling
Figure 15 Preliminary Diameters
30
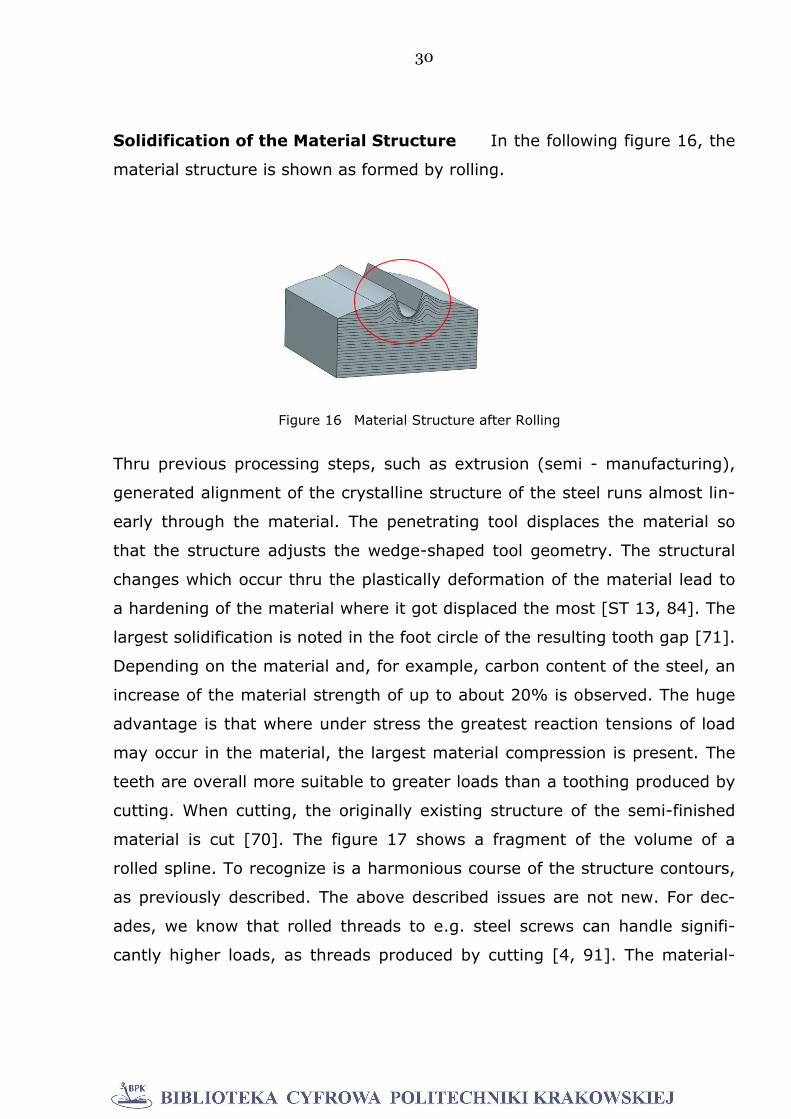
Solidification of the Material Structure In the following figure 16, the
material structure is shown as formed by rolling.
Thru previous processing steps, such as extrusion (semi - manufacturing),
generated alignment of the crystalline structure of the steel runs almost lin-
early through the material. The penetrating tool displaces the material so
that the structure adjusts the wedge-shaped tool geometry. The structural
changes which occur thru the plastically deformation of the material lead to
a hardening of the material where it got displaced the most [ST 13, 84]. The
largest solidification is noted in the foot circle of the resulting tooth gap [71].
Depending on the material and, for example, carbon content of the steel, an
increase of the material strength of up to about 20% is observed. The huge
advantage is that where under stress the greatest reaction tensions of load
may occur in the material, the largest material compression is present. The
teeth are overall more suitable to greater loads than a toothing produced by
cutting. When cutting, the originally existing structure of the semi-finished
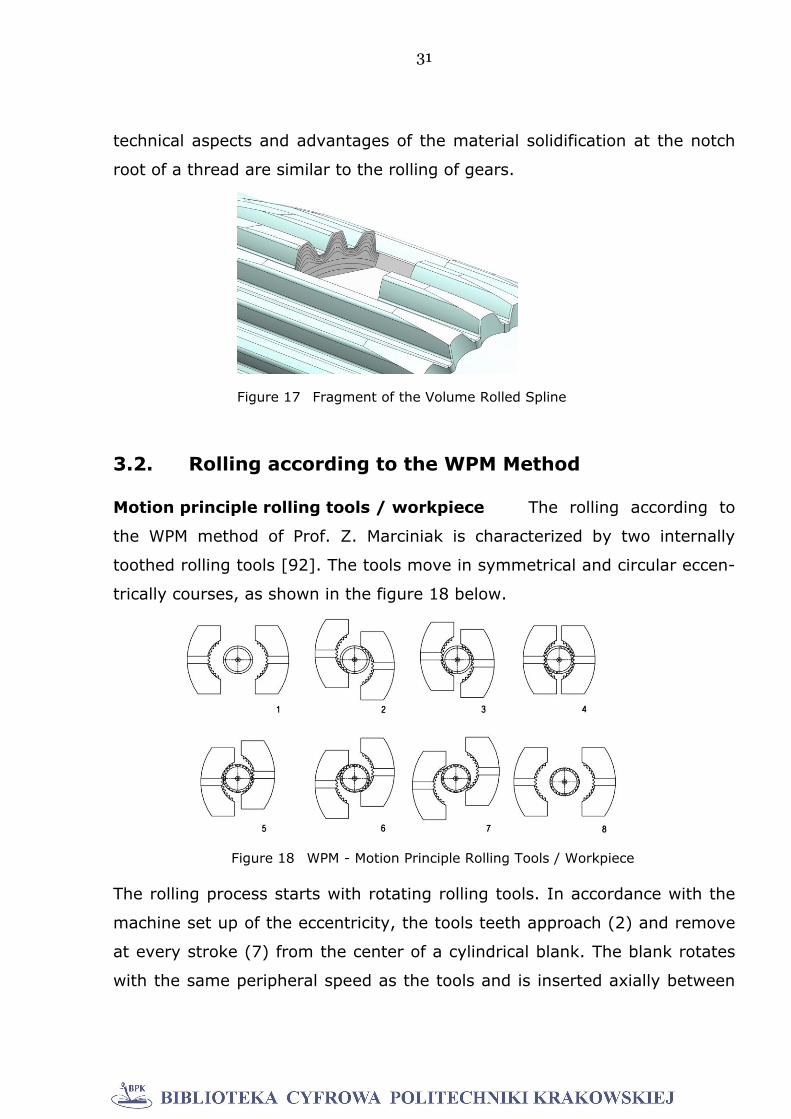
material is cut [70]. The figure 17 shows a fragment of the volume of a
rolled spline. To recognize is a harmonious course of the structure contours,
as previously described. The above described issues are not new. For dec-
ades, we know that rolled threads to e.g. steel screws can handle signifi-
cantly higher loads, as threads produced by cutting [4, 91]. The material-
Figure 16 Material Structure after Rolling
31
technical aspects and advantages of the material solidification at the notch
root of a thread are similar to the rolling of gears.
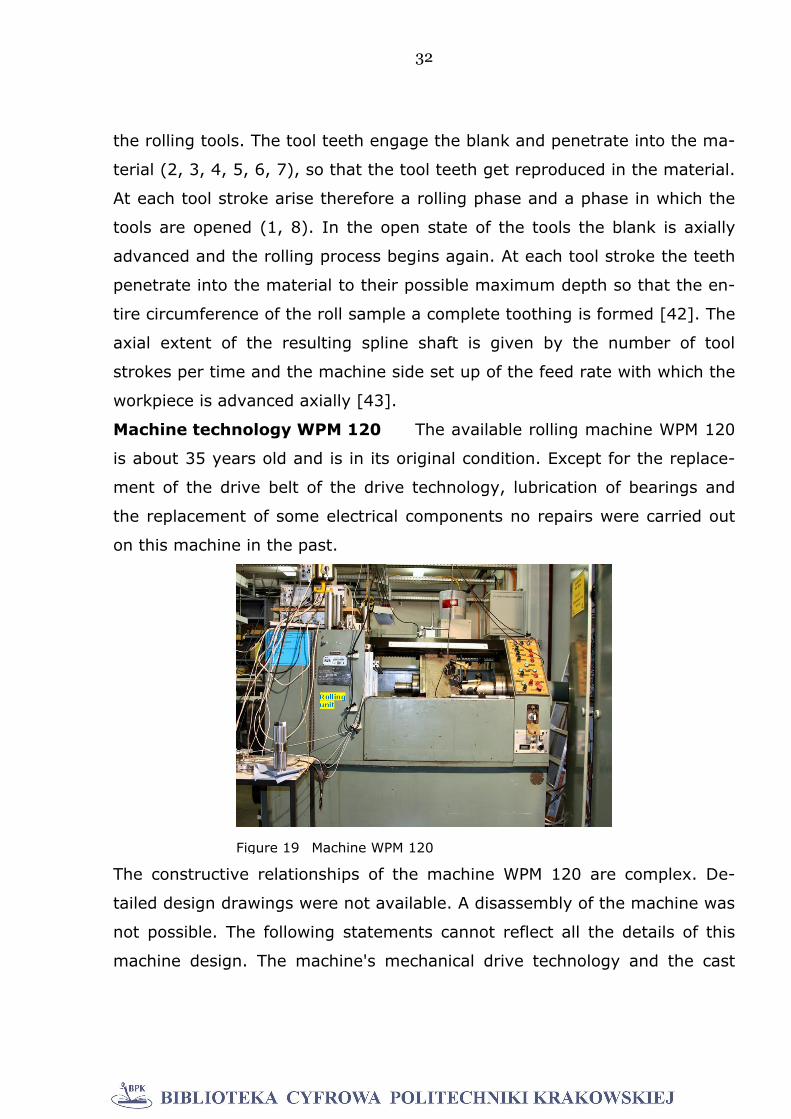
3.2. Rolling according to the WPM Method
Motion principle rolling tools / workpiece The rolling according to
the WPM method of Prof. Z. Marciniak is characterized by two internally
toothed rolling tools [92]. The tools move in symmetrical and circular eccen-
trically courses, as shown in the figure 18 below.
The rolling process starts with rotating rolling tools. In accordance with the
machine set up of the eccentricity, the tools teeth approach (2) and remove
at every stroke (7) from the center of a cylindrical blank. The blank rotates
with the same peripheral speed as the tools and is inserted axially between
Figure 18 WPM - Motion Principle Rolling Tools / Workpiece
Figure 17 Fragment of the Volume Rolled Spline
32
the rolling tools. The tool teeth engage the blank and penetrate into the ma-
terial (2, 3, 4, 5, 6, 7), so that the tool teeth get reproduced in the material.
At each tool stroke arise therefore a rolling phase and a phase in which the
tools are opened (1, 8). In the open state of the tools the blank is axially
advanced and the rolling process begins again. At each tool stroke the teeth
penetrate into the material to their possible maximum depth so that the en-
tire circumference of the roll sample a complete toothing is formed [42]. The
axial extent of the resulting spline shaft is given by the number of tool
strokes per time and the machine side set up of the feed rate with which the
workpiece is advanced axially [43].
Machine technology WPM 120 The available rolling machine WPM 120
is about 35 years old and is in its original condition. Except for the replace-
ment of the drive belt of the drive technology, lubrication of bearings and
the replacement of some electrical components no repairs were carried out
on this machine in the past.
The constructive relationships of the machine WPM 120 are complex. De-
tailed design drawings were not available. A disassembly of the machine was
not possible. The following statements cannot reflect all the details of this
machine design. The machine's mechanical drive technology and the cast
Figure 19 Machine WPM 120
33
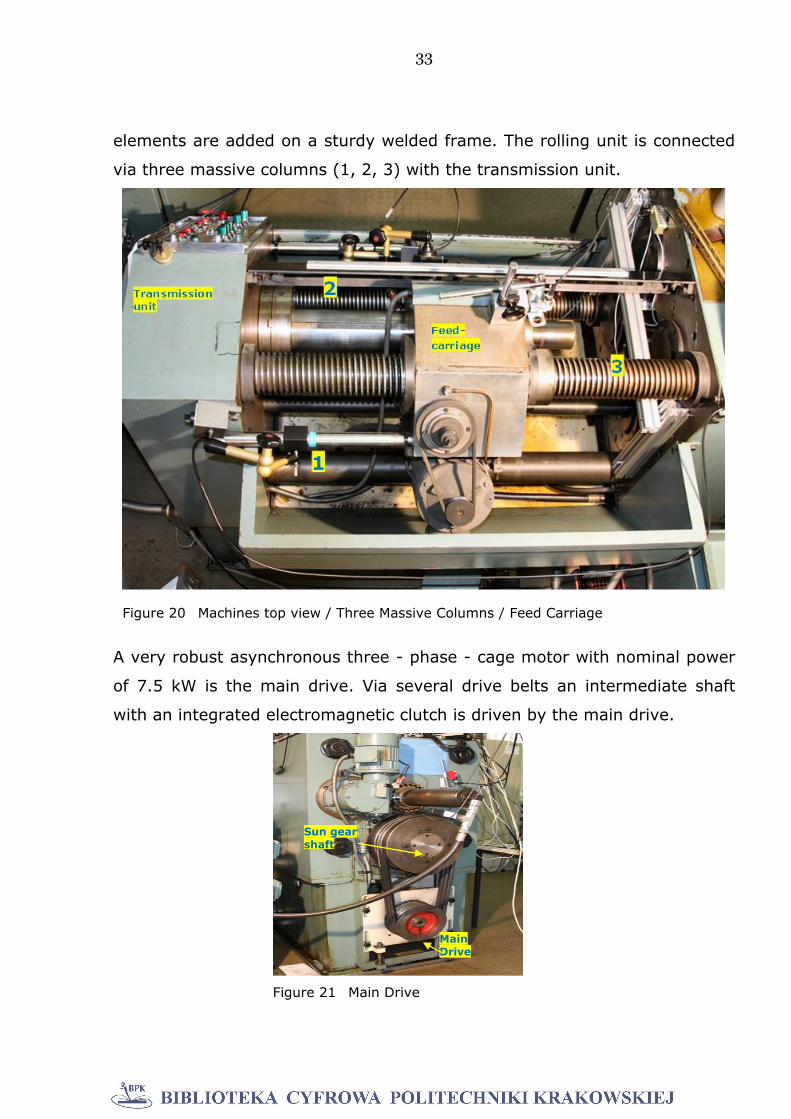
elements are added on a sturdy welded frame. The rolling unit is connected
via three massive columns (1, 2, 3) with the transmission unit.
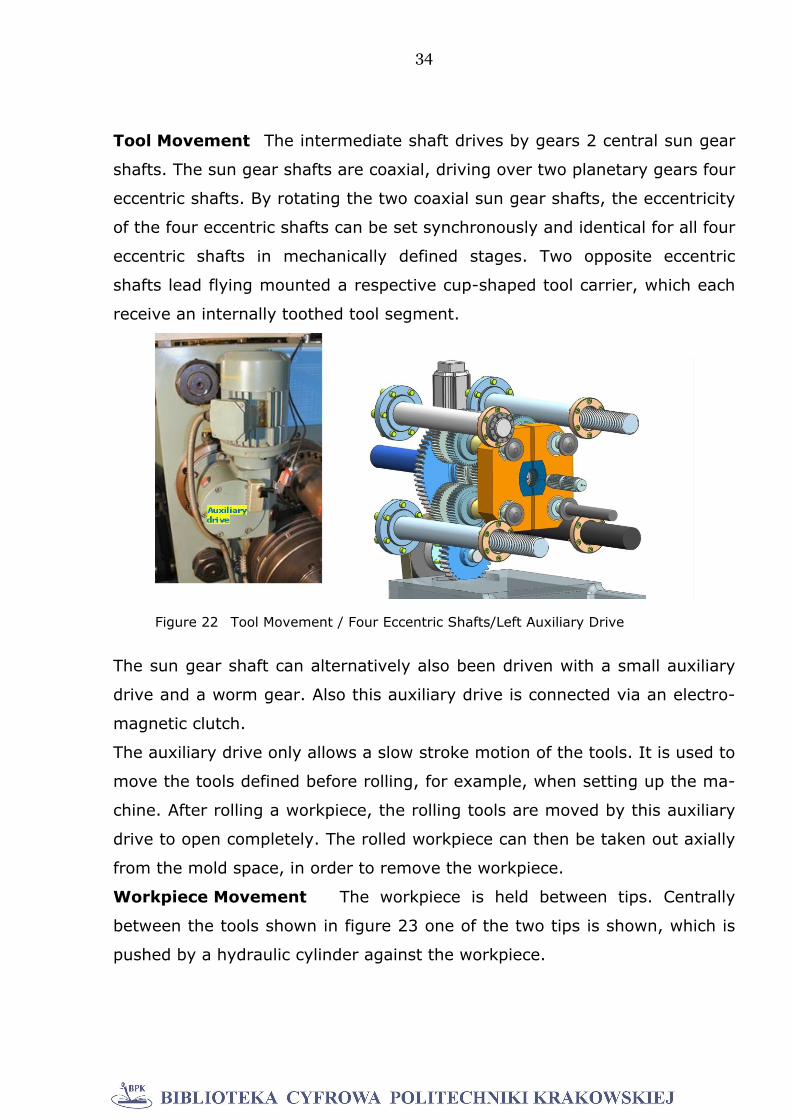
A very robust asynchronous three - phase - cage motor with nominal power
of 7.5 kW is the main drive. Via several drive belts an intermediate shaft
with an integrated electromagnetic clutch is driven by the main drive.
Figure 20 Machines top view / Three Massive Columns / Feed Carriage
Sun gear shaft
Main Drive
Figure 21 Main Drive
34
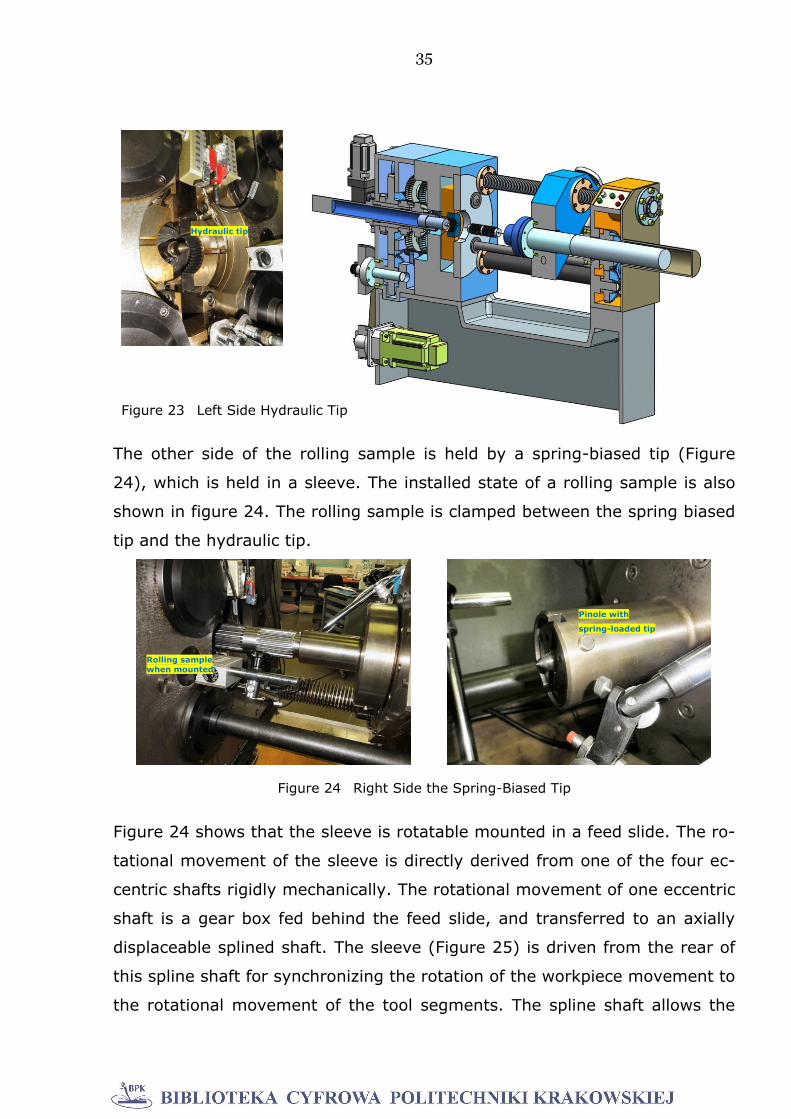
Tool Movement The intermediate shaft drives by gears 2 central sun gear
shafts. The sun gear shafts are coaxial, driving over two planetary gears four
eccentric shafts. By rotating the two coaxial sun gear shafts, the eccentricity
of the four eccentric shafts can be set synchronously and identical for all four
eccentric shafts in mechanically defined stages. Two opposite eccentric
shafts lead flying mounted a respective cup-shaped tool carrier, which each
receive an internally toothed tool segment.
The sun gear shaft can alternatively also been driven with a small auxiliary
drive and a worm gear. Also this auxiliary drive is connected via an electro-
magnetic clutch.
The auxiliary drive only allows a slow stroke motion of the tools. It is used to
move the tools defined before rolling, for example, when setting up the ma-
chine. After rolling a workpiece, the rolling tools are moved by this auxiliary
drive to open completely. The rolled workpiece can then be taken out axially
from the mold space, in order to remove the workpiece.
Workpiece Movement The workpiece is held between tips. Centrally
between the tools shown in figure 23 one of the two tips is shown, which is
pushed by a hydraulic cylinder against the workpiece.
Figure 22 Tool Movement / Four Eccentric Shafts/Left Auxiliary Drive
35
The other side of the rolling sample is held by a spring-biased tip (Figure
24), which is held in a sleeve. The installed state of a rolling sample is also
shown in figure 24. The rolling sample is clamped between the spring biased
tip and the hydraulic tip.
Figure 24 shows that the sleeve is rotatable mounted in a feed slide. The ro-
tational movement of the sleeve is directly derived from one of the four ec-
centric shafts rigidly mechanically. The rotational movement of one eccentric
shaft is a gear box fed behind the feed slide, and transferred to an axially
displaceable splined shaft. The sleeve (Figure 25) is driven from the rear of
this spline shaft for synchronizing the rotation of the workpiece movement to
the rotational movement of the tool segments. The spline shaft allows the
Hydraulic tip
Figure 23 Left Side Hydraulic Tip
Rolling sample when mounted
Pinole with
spring-loaded tip
Figure 24 Right Side the Spring-Biased Tip
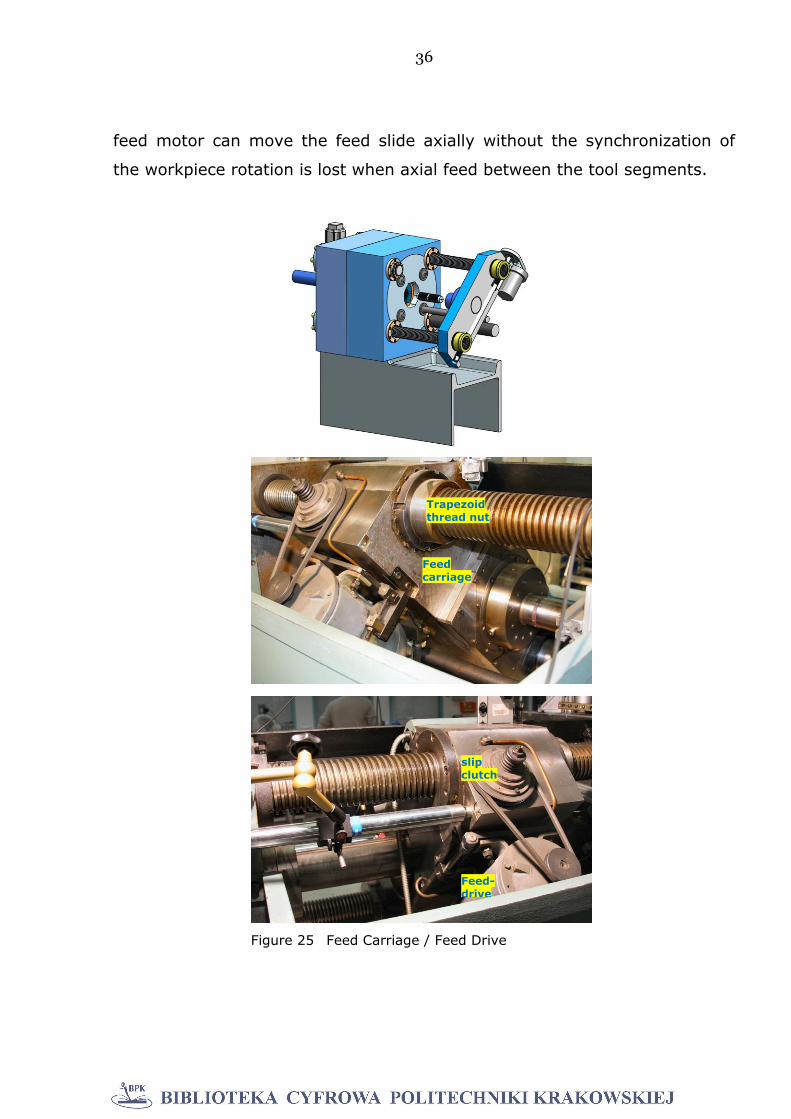
36
feed motor can move the feed slide axially without the synchronization of
the workpiece rotation is lost when axial feed between the tool segments.
Feed carriage
Trapezoid thread nut
Figure 25 Feed Carriage / Feed Drive
Feed- drive
slip clutch

37
The axial feed of the workpiece between the rolling tools is realized with a
DC motor (power 0.8 kW). The feed drive is seated on the feed carriage, and
is screwed to it. By means of a belt, and a slip clutch are driven, each with a
screw top and the bottom of the feed slides each a worm. These worm
wheels are simultaneously nuts that the feed slides on each of a large trape-
zoidal threaded rod drive up and down the machine bed or in the feed slide
and lead. During the rolling operation the axial feed of the workpiece is
blocked. The aforementioned clutch at the DC motor allows slippage. If then
the rolling tools are in the open position, the next step of advance happens.
38
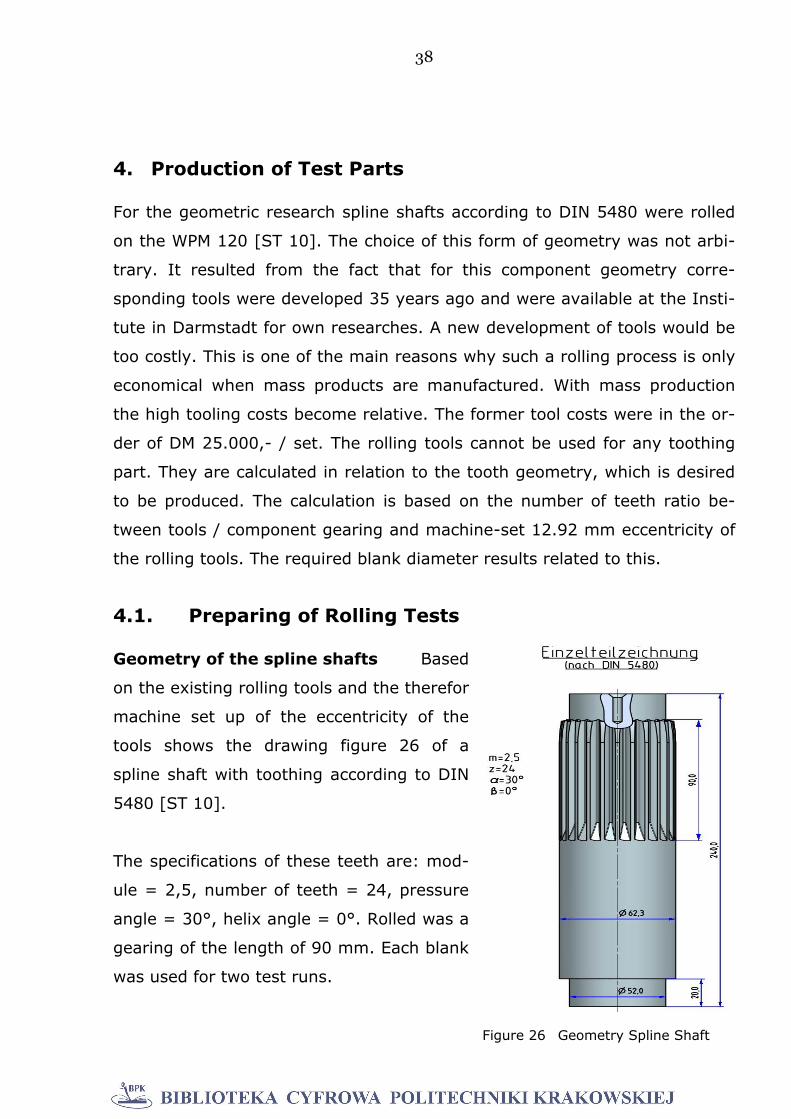
Figure 26 Geometry Spline Shaft
4. Production of Test Parts
For the geometric research spline shafts according to DIN 5480 were rolled
on the WPM 120 [ST 10]. The choice of this form of geometry was not arbi-
trary. It resulted from the fact that for this component geometry corre-
sponding tools were developed 35 years ago and were available at the Insti-
tute in Darmstadt for own researches. A new development of tools would be
too costly. This is one of the main reasons why such a rolling process is only
economical when mass products are manufactured. With mass production
the high tooling costs become relative. The former tool costs were in the or-
der of DM 25.000,- / set. The rolling tools cannot be used for any toothing
part. They are calculated in relation to the tooth geometry, which is desired
to be produced. The calculation is based on the number of teeth ratio be-
tween tools / component gearing and machine-set 12.92 mm eccentricity of
the rolling tools. The required blank diameter results related to this.
4.1. Preparing of Rolling Tests
Geometry of the spline shafts Based
on the existing rolling tools and the therefor
machine set up of the eccentricity of the
tools shows the drawing figure 26 of a
spline shaft with toothing according to DIN
5480 [ST 10].
The specifications of these teeth are: mod-
ule = 2,5, number of teeth = 24, pressure
angle = 30°, helix angle = 0°. Rolled was a
gearing of the length of 90 mm. Each blank
was used for two test runs.
39
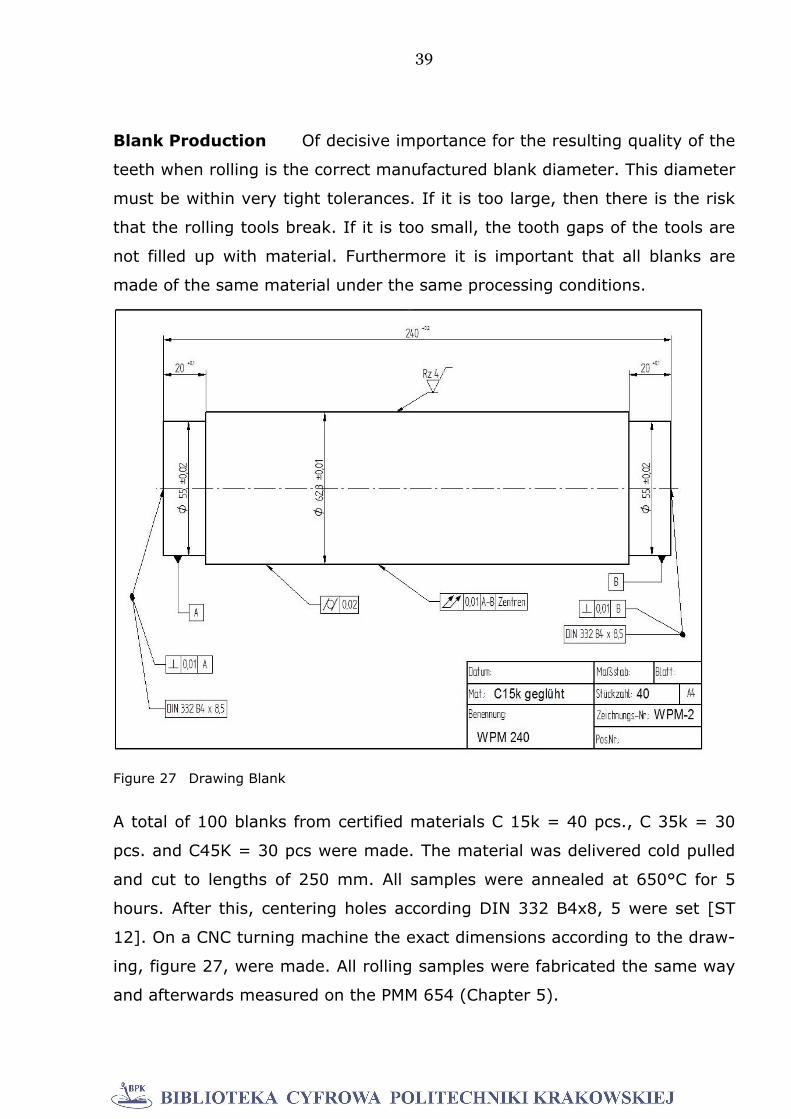
Blank Production Of decisive importance for the resulting quality of the
teeth when rolling is the correct manufactured blank diameter. This diameter
must be within very tight tolerances. If it is too large, then there is the risk
that the rolling tools break. If it is too small, the tooth gaps of the tools are
not filled up with material. Furthermore it is important that all blanks are
made of the same material under the same processing conditions.
A total of 100 blanks from certified materials C 15k = 40 pcs., C 35k = 30
pcs. and C45K = 30 pcs were made. The material was delivered cold pulled
and cut to lengths of 250 mm. All samples were annealed at 650°C for 5
hours. After this, centering holes according DIN 332 B4x8, 5 were set [ST
12]. On a CNC turning machine the exact dimensions according to the draw-
ing, figure 27, were made. All rolling samples were fabricated the same way
and afterwards measured on the PMM 654 (Chapter 5).
Figure 27 Drawing Blank
40
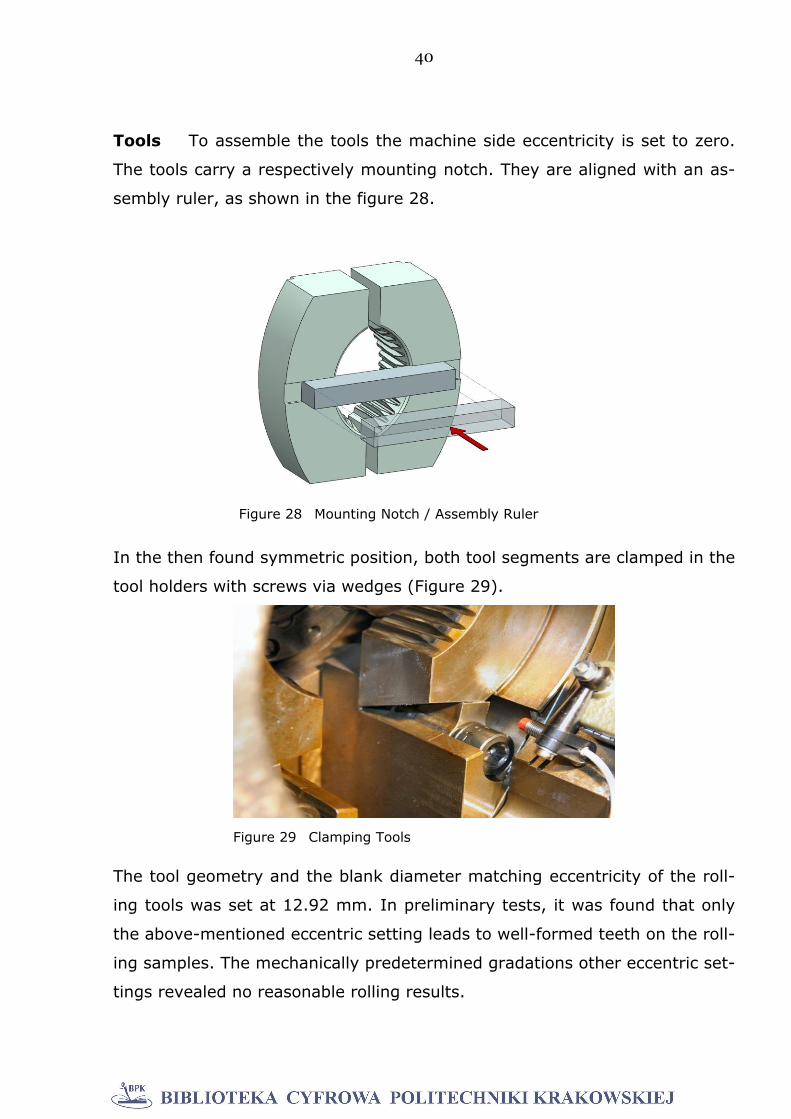
Tools To assemble the tools the machine side eccentricity is set to zero.
The tools carry a respectively mounting notch. They are aligned with an as-
sembly ruler, as shown in the figure 28.
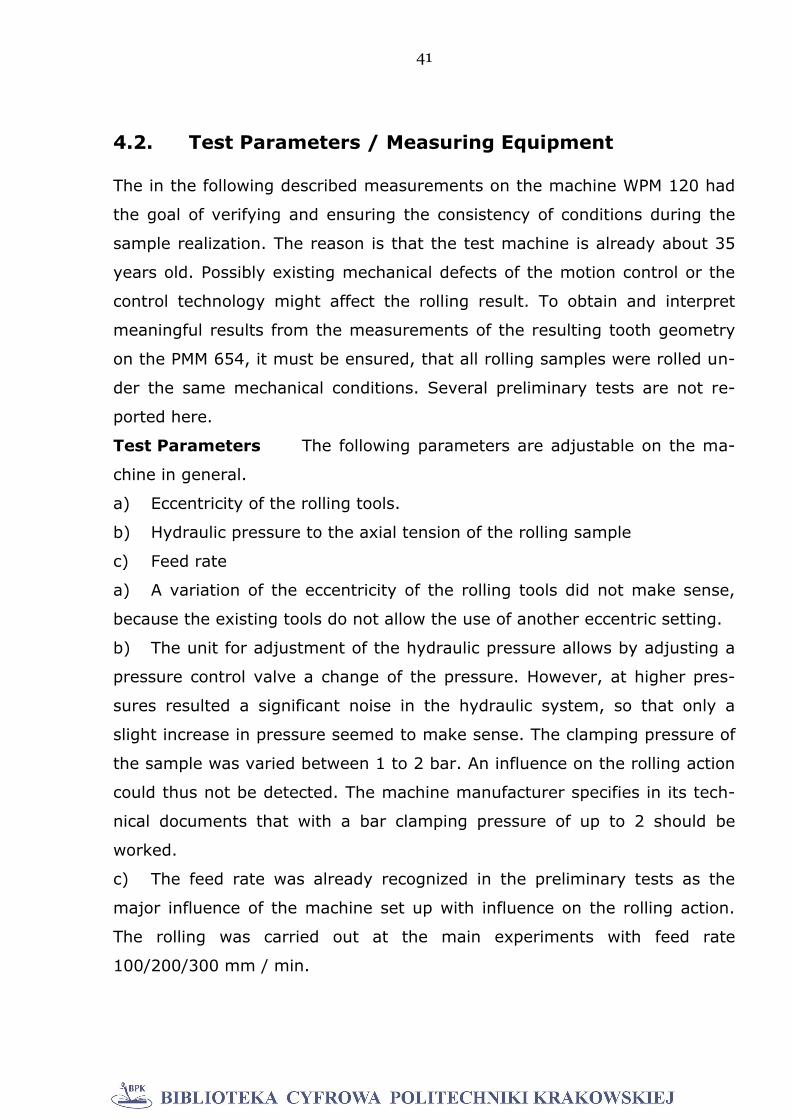
In the then found symmetric position, both tool segments are clamped in the
tool holders with screws via wedges (Figure 29).
The tool geometry and the blank diameter matching eccentricity of the roll-
ing tools was set at 12.92 mm. In preliminary tests, it was found that only
the above-mentioned eccentric setting leads to well-formed teeth on the roll-
ing samples. The mechanically predetermined gradations other eccentric set-
tings revealed no reasonable rolling results.
Figure 28 Mounting Notch / Assembly Ruler
Figure 29 Clamping Tools
41
4.2. Test Parameters / Measuring Equipment
The in the following described measurements on the machine WPM 120 had
the goal of verifying and ensuring the consistency of conditions during the
sample realization. The reason is that the test machine is already about 35
years old. Possibly existing mechanical defects of the motion control or the
control technology might affect the rolling result. To obtain and interpret
meaningful results from the measurements of the resulting tooth geometry
on the PMM 654, it must be ensured, that all rolling samples were rolled un-
der the same mechanical conditions. Several preliminary tests are not re-
ported here.
Test Parameters The following parameters are adjustable on the ma-
chine in general.
a) Eccentricity of the rolling tools.
b) Hydraulic pressure to the axial tension of the rolling sample
c) Feed rate
a) A variation of the eccentricity of the rolling tools did not make sense,
because the existing tools do not allow the use of another eccentric setting.
b) The unit for adjustment of the hydraulic pressure allows by adjusting a
pressure control valve a change of the pressure. However, at higher pres-
sures resulted a significant noise in the hydraulic system, so that only a
slight increase in pressure seemed to make sense. The clamping pressure of
the sample was varied between 1 to 2 bar. An influence on the rolling action
could thus not be detected. The machine manufacturer specifies in its tech-
nical documents that with a bar clamping pressure of up to 2 should be
worked.
c) The feed rate was already recognized in the preliminary tests as the
major influence of the machine set up with influence on the rolling action.
The rolling was carried out at the main experiments with feed rate
100/200/300 mm / min.
42
d) The rolling machine WPM 120 operates with a stroke frequency of the
rolling tools of 5 strokes / sec. The stroke rate is set fixed and unchangea-
ble. In combination with the maximum feed rate (~ 400 mm / min) results a
maximum length of toothed gearing of ~ 400 mm / min.
Measurement Parameters During the main tests for the production of
rolled samples, the following measurement parameters were recorded:
A) Path with respect to time s = f(t)
B) Power of main drive with respect to time PMD = f(t)
C) Power feed drive with respect to time PFD = f(t)
D) Stroke frequency tools with respect to time n = f(t)
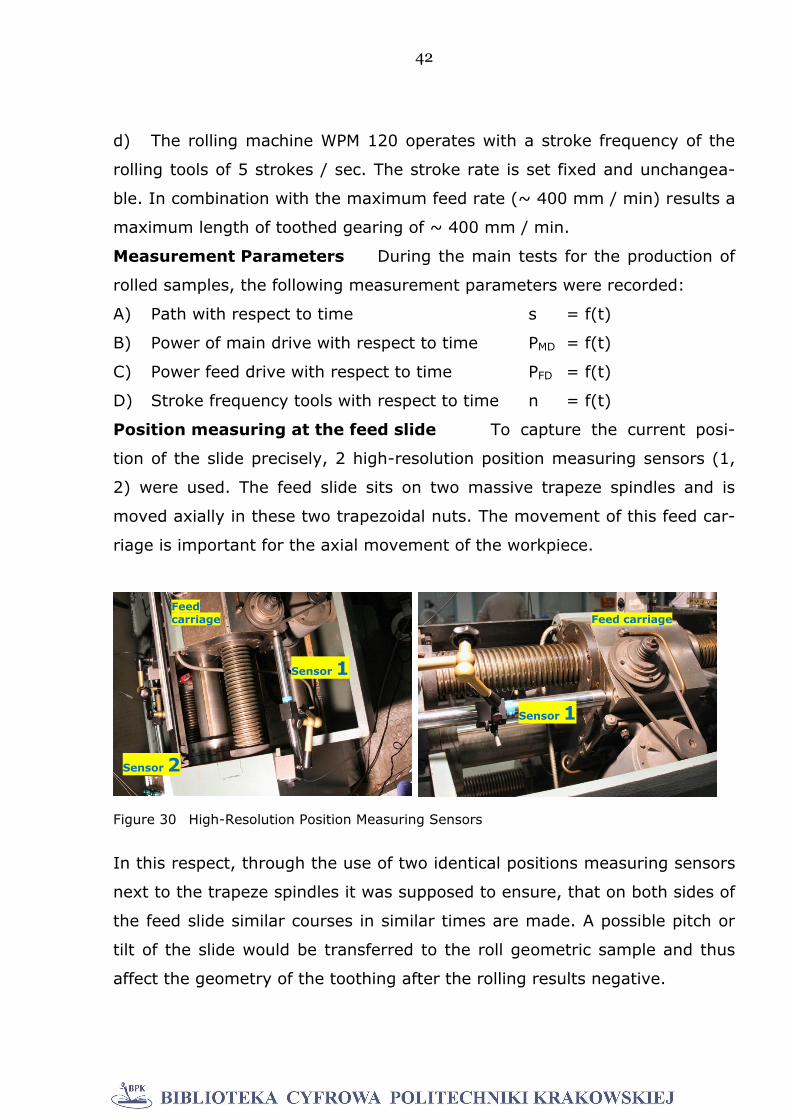
Position measuring at the feed slide To capture the current posi-
tion of the slide precisely, 2 high-resolution position measuring sensors (1,
2) were used. The feed slide sits on two massive trapeze spindles and is
moved axially in these two trapezoidal nuts. The movement of this feed car-
riage is important for the axial movement of the workpiece.
In this respect, through the use of two identical positions measuring sensors
next to the trapeze spindles it was supposed to ensure, that on both sides of
the feed slide similar courses in similar times are made. A possible pitch or
tilt of the slide would be transferred to the roll geometric sample and thus
affect the geometry of the toothing after the rolling results negative.
Feed carriage
Sensor 1
Feed carriage
Sensor 1
Sensor 2
Figure 30 High-Resolution Position Measuring Sensors
43
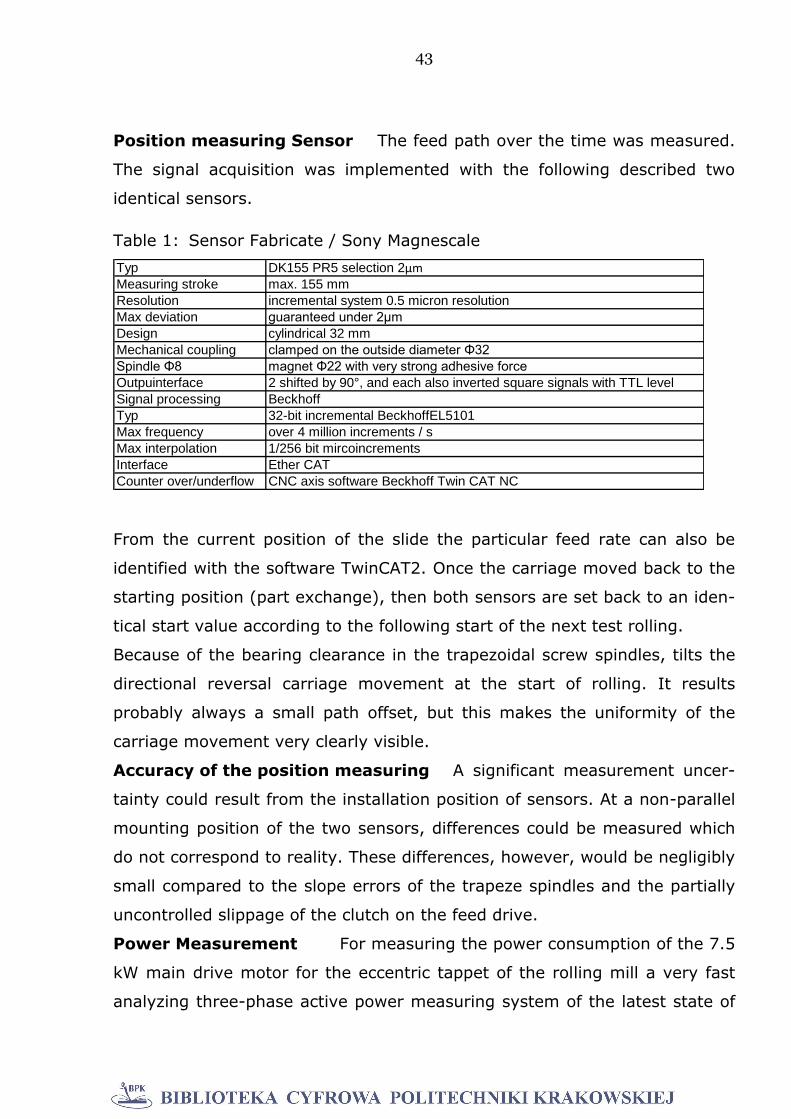
Position measuring Sensor The feed path over the time was measured.
The signal acquisition was implemented with the following described two
identical sensors.
Table 1: Sensor Fabricate / Sony Magnescale
Typ DK155 PR5 selection 2μmMeasuring stroke max. 155 mm
Resolution incremental system 0.5 micron resolution
Max deviation guaranteed under 2μm
Design cylindrical 32 mm
Mechanical coupling clamped on the outside diameter Φ32
Spindle Φ8 magnet Φ22 with very strong adhesive force
Outpuinterface 2 shifted by 90°, and each also inverted square signals with TTL level
Signal processing Beckhoff
Typ 32-bit incremental BeckhoffEL5101
Max frequency over 4 million increments / s
Max interpolation 1/256 bit mircoincrements
Interface Ether CAT
Counter over/underflow CNC axis software Beckhoff Twin CAT NC
From the current position of the slide the particular feed rate can also be
identified with the software TwinCAT2. Once the carriage moved back to the
starting position (part exchange), then both sensors are set back to an iden-
tical start value according to the following start of the next test rolling.
Because of the bearing clearance in the trapezoidal screw spindles, tilts the
directional reversal carriage movement at the start of rolling. It results
probably always a small path offset, but this makes the uniformity of the
carriage movement very clearly visible.
Accuracy of the position measuring A significant measurement uncer-
tainty could result from the installation position of sensors. At a non-parallel
mounting position of the two sensors, differences could be measured which
do not correspond to reality. These differences, however, would be negligibly
small compared to the slope errors of the trapeze spindles and the partially
uncontrolled slippage of the clutch on the feed drive.
Power Measurement For measuring the power consumption of the 7.5
kW main drive motor for the eccentric tappet of the rolling mill a very fast
analyzing three-phase active power measuring system of the latest state of

44
the art is used. The same measurement set-up with an identical but suitably
configured for the smaller power rating meter APM380 is also used for the
axial advance of the workpiece, with the DC motor (power 0.8 kW).
Since there is no intermediate circuit and no significant energy storage, it
also was measured very close to the engine, and thus measured on the pro-
cess.
Table 2: Sensors
Manuafacturer Ulrich Buhr Industrial Soltau (Sales D) Hydria Electronics ApS
Type Unipower APM 380
Voltage 230 - 575V switchable
Current range 1-80A (max. 140A), switchable
Measurement Hall sensors without phase shift
Accuracy Class2
Frequency range 10Hz - 1kHz
Pulse and analog outouts programmable
digital filter programmable
The analog measurement output is programmed to 0 ... 10V for each scale
value and then again with a 16-bit differential input to a Beckhoff - analog /
digital converter EL3104 on EtherCAT bus digitally recorded (Input filter limit
frequency: 5 kHz sampling rate 1 kHz, no oversampling).
Figure 31 Power Measurement
45
Uncertainty of power measurements Regarding the selection of the
measuring range a compromise between the resolution and the full scale had
to be entered. When starting the machine, very high power peaks occur.
These power peaks of the main drive were previously reported separately
just for the documentation of them. For the main experiments the full de-
flection of the measuring range has been adjusted to the resulting rolling
power curves appropriate. The drive train of the movement mechanics of the
rolling tools is associated with high friction parts and very high inertial
masses. The friction components were found to be highly temperature de-
pendent. The lubrication system of the machine always required a long dura-
tion until stable constant conditions were set. In consequence, the main
tests were always carried out only after an operating time of the machine of
at least 3 hours. Regarding the feed drive, it was found that the influence of
the slipping clutch is speed-dependent. Without prejudging the later dis-
cussed outcome, it was noticed, that the clutch of the feed drive rarely slips,
but hardly comprehensible. Whereby, the results of the feed drive perfor-
mance measurement are of course influenced.
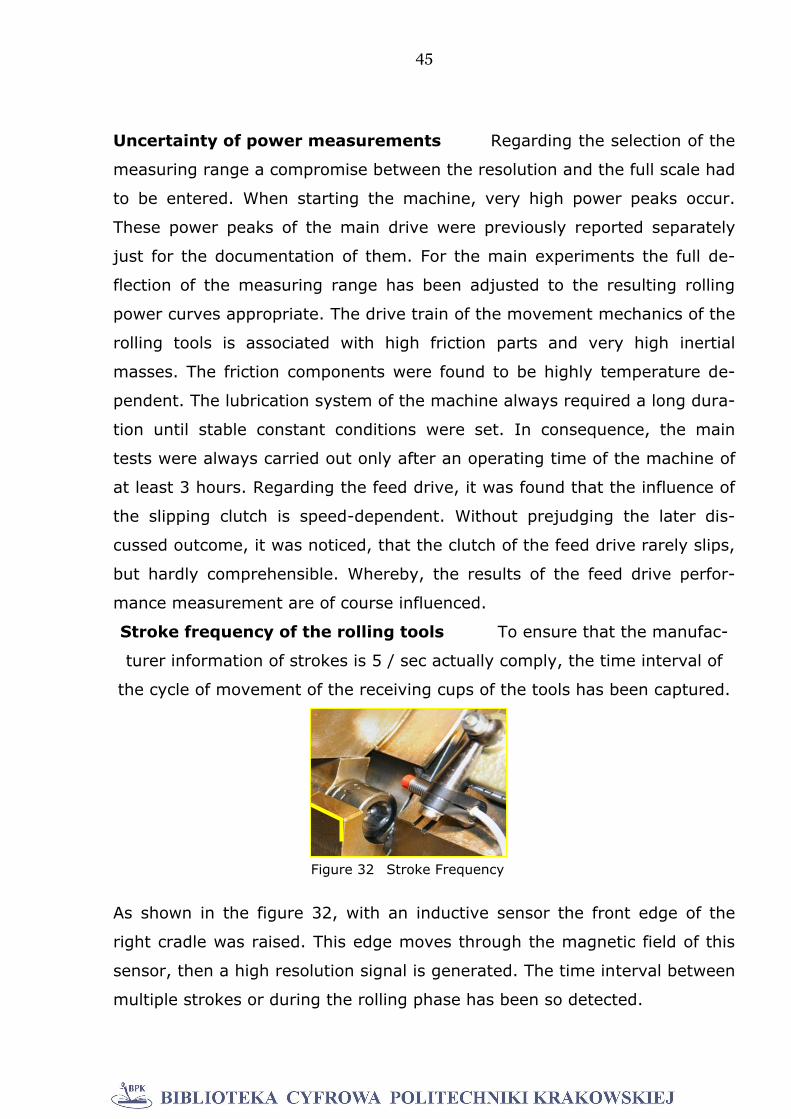
Stroke frequency of the rolling tools To ensure that the manufac-
turer information of strokes is 5 / sec actually comply, the time interval of
the cycle of movement of the receiving cups of the tools has been captured.
As shown in the figure 32, with an inductive sensor the front edge of the
right cradle was raised. This edge moves through the magnetic field of this
sensor, then a high resolution signal is generated. The time interval between
multiple strokes or during the rolling phase has been so detected.
Figure 32 Stroke Frequency

46
The sensor is an inductive probe of the company Leuze electronics with the
following specifications:
Table 3: Sensor Leuze Electronics
Manufacturer Leuze Electronics
Typ IS 208 N5
Operating range 0-2.0 mm
Operating frequency 5 kHz
Installation position not flush, stainless steel
The output signal is detected with an input terminal at the Beckhoff EL1018
EtherCAT bus.
Measuring pressure of the hydraulic preload The inside of the hydrau-
lic cylinder mechanism mounted tip is, as already mentioned above, hydrau-
lically pre-stressed. Although already recognized in the preliminary tests, the
pre-charge pressure has no visible impact on the metal forming. Neverthe-
less, the pressure profile was measured to make sure that actually no influ-
ence of the metal forming is happening.
Directly on the rotary joint at the shaft end (Figure 33), was measured with
a T-piece with large diameter and the maximum pressure to avoid throttle
effects and additional dead volumes.
Figure 33 Sensor / Pre-charged Pressure
47
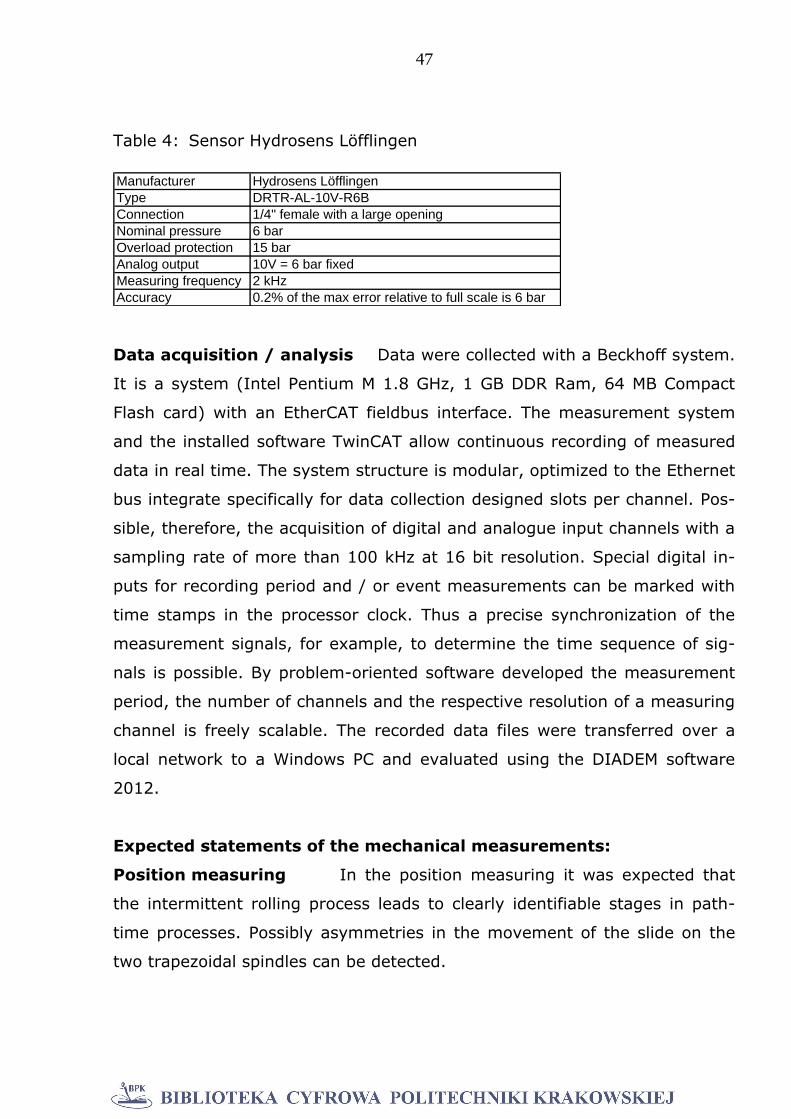
Table 4: Sensor Hydrosens Löfflingen
Manufacturer Hydrosens Löfflingen
Type DRTR-AL-10V-R6B
Connection 1/4" female with a large opening
Nominal pressure 6 bar
Overload protection 15 bar
Analog output 10V = 6 bar fixed
Measuring frequency 2 kHz
Accuracy 0.2% of the max error relative to full scale is 6 bar
Data acquisition / analysis Data were collected with a Beckhoff system.
It is a system (Intel Pentium M 1.8 GHz, 1 GB DDR Ram, 64 MB Compact
Flash card) with an EtherCAT fieldbus interface. The measurement system
and the installed software TwinCAT allow continuous recording of measured
data in real time. The system structure is modular, optimized to the Ethernet
bus integrate specifically for data collection designed slots per channel. Pos-
sible, therefore, the acquisition of digital and analogue input channels with a
sampling rate of more than 100 kHz at 16 bit resolution. Special digital in-
puts for recording period and / or event measurements can be marked with
time stamps in the processor clock. Thus a precise synchronization of the
measurement signals, for example, to determine the time sequence of sig-
nals is possible. By problem-oriented software developed the measurement
period, the number of channels and the respective resolution of a measuring
channel is freely scalable. The recorded data files were transferred over a
local network to a Windows PC and evaluated using the DIADEM software
2012.
Expected statements of the mechanical measurements:
Position measuring In the position measuring it was expected that
the intermittent rolling process leads to clearly identifiable stages in path-
time processes. Possibly asymmetries in the movement of the slide on the
two trapezoidal spindles can be detected.
48
Main drive power measurement It was expected that the power of
the main drive is dependent on the feed rate. The larger the individual feed
step of the blank between the rolling dies, the greater is the per stroke tools
deformed material volume per time. Thereby, the energy demand of the
main drive should increase.
Furthermore, it was expected that the power consumption of the main drive
changes when different materials are rolled. Since the rolling experiments,
various carbon steels have been used the main drive power should increase
with increasing carbon content of the raw material.
The carbon content characterizes the strength of the material and is of criti-
cal importance for its solidification during forming [ST 13]. With increasing
yield stress of the material, thus increasing its resistance to deformation.
This necessarily results in higher energy consumption.
Performance measurement feed drive: Regarding the power con-
sumption of the feed drive it was expected a clear dependence on the ad-
justed feed rate. To accelerate masses of the feed mechanism higher power
consumption with increasing feed rate is required. A dependence of the
power consumption of the feed drive regarding the different materials should
not be detected.
Stroke frequency of the rolling tools An influence of the stroke fre-
quency of the rolling tools by the set feed rate or the used blank material
cannot be expected. The existing inertial masses of the drive mechanism of
the WPM 120 are so large that here a more consistent stroke rate can be
expected.
Pressure measurement of the hydraulic preload Even at the prelimi-
nary tests, it was found that a clean measurement of the pressure profile of
the hydraulic preload of the blanks is difficult. The hydraulic unit is for an
operating time of approx. 35 years, apparently no longer fully functional.
This results in fluctuating pressure curves for each parameter combination of
the performed preliminary tests. Nevertheless, the measurement of the

49
pressure profile is maintained in the main experiments. Meaningful and pur-
poseful statements about these pressure measurements were not expected.
Experimental design For the main experiments 100 rolling samples
were prepared (40 pcs. material C15, 30 pcs. C35, 30 pcs. C45). Consider-
ing previous experiments, the feed speed and the blank material were de-
fined as the two important experimental parameters. In consequence 9 se-
ries were designed with 10 parts with the parameter combinations of the
three feed rates and the three materials. Parallel to the rolling tests, after
the completion of a series of experiments, the measurement work in the
PMM was started. It could be checked to what extent changes in the test
procedure may be useful. The background to this approach was that even at
the preliminary tests no significant differences between the materials C 35
and C 45 were found. For both materials approximately the same geometry
deviations resulted.
So a total of 90 samples was planned to roll. At the beginning of the study
the series with the material C 15 were fully rolled. In the series with the ma-
terials C 35 and C 45 confirmed the findings from the preliminary tests. Of
crucial importance for the further course of action was that even after 11
rolling samples C35 considerable engine noises occurred. After 9 rolling ex-
periments with the material C45, this engine noise increased significantly. It
was assumed that the drive mechanism of the machine had reached its limit.
To avoid damage, all until then rolled samples were measured geometrically.
It should be noted, how far additional rolling tests would increase the
knowledge. In all until then available rolling samples (C35, C45), no effect
on the resulting geometry results was found. Further insights were not ex-
pected, more rolling tests were not necessary. The results presented in later
chapters geometric are based therefore on rolling sample 30 x C15, 11 x
C35 and 9 x C 45. The further statements (Chapter 5, 6) made are based on
the complete C15 series.
50
4.3. Engineering Results and Assessment
A detailed graphical representation of all results has been omitted. The aim
of the mechanical tests was not a systematic analysis of the machinery in
detail. Here, only the uniformity of the respective roll attempts should be
ensure as a basis for the subsequent geometric investigations. The results
shown in the following charts are thus to be understood as examples to ex-
plain the technical aspects.
Distance / Time of feed-slide These measurements had the goal to
determine in how far for all rolling samples and each set of feed rates, iden-
tical path-time processes occurred. This is, as already mentioned, of im-
portance for the per path step reshaped volume of the blank material. The
following figure 34 shows the resulting path-time processes at three speeds
100/200/300 mm / min.
Figure 34 Path – Feed Carriage
51
The shown graphs, figure 34, represent the upper sensor on the upper part
of the feed geometry. The graphs shown are original data without any data
manipulation. They show an example of the resulting path-time process
which resulted for all combinations of parameters almost identical. In figure
34 is shown the initial region of the feed movement characterized by a cir-
cle. The shown starting points are not identical because the start of the
movement and the start of the measurement recording data were triggered
by hand. An identical start time could thus not be realized. It shows the be-
ginning of the slide movement through the first bend in the curves. The ad-
justed feed rates give different ascending paths in the initial region. Within
short distances of the initial region (circle) the tools contact the blank and
are decelerated, so that a second sharp bend results in the graphs. Later the
graph shows rising lines according to the current feed rates. After 450 mm
horizontal curves result. The carriage is then in its final position. The time
period within the end position is optional, as the return stroke of the carriage
movement is also triggered by hand. In all experiments, there were always
identical path-time processes with just minimal deviations. As far as the feed
movement of the respectively set feed velocities, all the rolling samples were
produced under the same conditions.
Position / Time of feed-slide (upper + lower Sensor 1 + 2)
The measurements of the paths with two sensors on the feed carriage had to
determine how far the slide moves symmetrically on the two trapezoidal
spindles. A tilting of the carriage would affect the middle position of the roll-
ing part negative. It should also be determined whether the intermittent roll-
ing process can be found in stages of the carriage movement. The following
figure 35 shows a period of one second process time whereby path-time pro-
cesses appear enlarged.
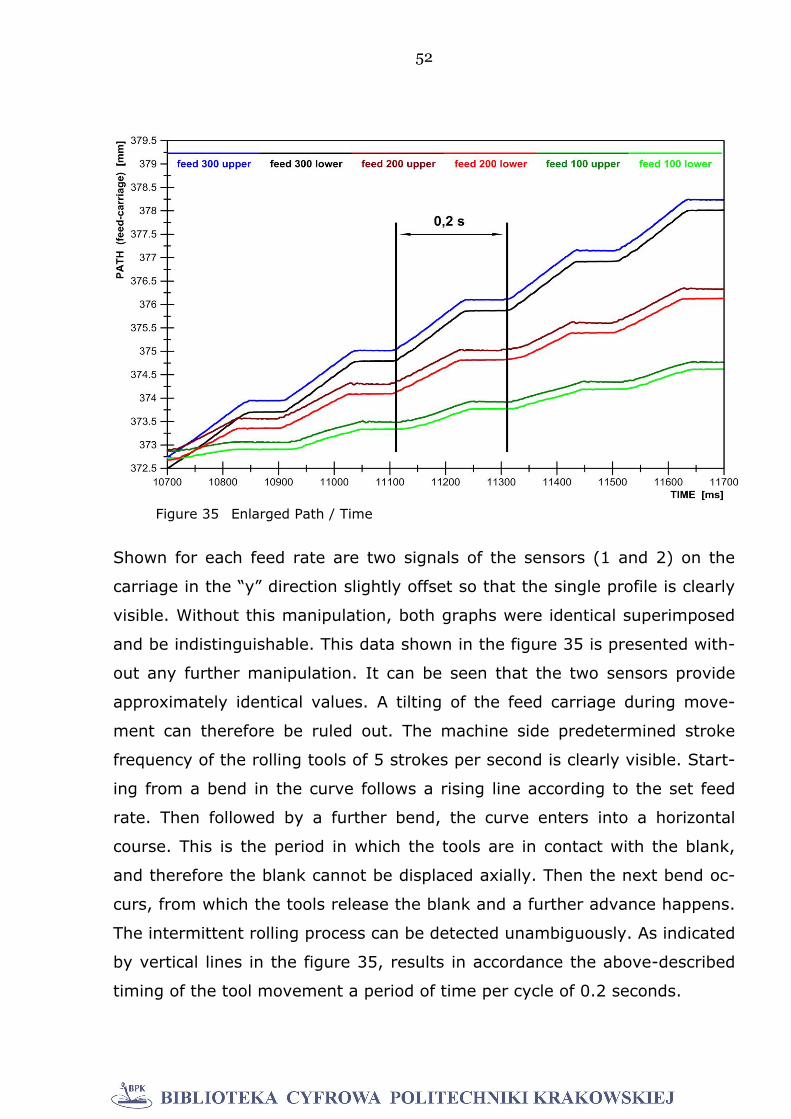
52
Shown for each feed rate are two signals of the sensors (1 and 2) on the
carriage in the “y” direction slightly offset so that the single profile is clearly
visible. Without this manipulation, both graphs were identical superimposed
and be indistinguishable. This data shown in the figure 35 is presented with-
out any further manipulation. It can be seen that the two sensors provide
approximately identical values. A tilting of the feed carriage during move-
ment can therefore be ruled out. The machine side predetermined stroke
frequency of the rolling tools of 5 strokes per second is clearly visible. Start-
ing from a bend in the curve follows a rising line according to the set feed
rate. Then followed by a further bend, the curve enters into a horizontal
course. This is the period in which the tools are in contact with the blank,
and therefore the blank cannot be displaced axially. Then the next bend oc-
curs, from which the tools release the blank and a further advance happens.
The intermittent rolling process can be detected unambiguously. As indicated
by vertical lines in the figure 35, results in accordance the above-described
timing of the tool movement a period of time per cycle of 0.2 seconds.
Figure 35 Enlarged Path / Time
53
This corresponds to the manufacturer's specification of the WPM 120 of five
strokes per second of the rolling tools. Furthermore, shown in figure 35, the
largest feed rate shows a sharp bend (transition of the rolling phase to posi-
tion tools open). With decreasing feed rates result rather smooth transitions
between these phases of a motion cycle of the rolling tools. One explanation
for this is that the forward movement of the carriage is stopped by the con-
tact of the rolling part with the rolling tools. The feed drive works however
continues at this stage. Namely against a slipping clutch, which slips when
the tools and the blank are in mechanical contact. The smaller the feed steps
between the tools (small feed rate), the smaller the formed volume and thus
the contact area of the tool with the material. The contact area between the
rolling tools and the blank material increases with increasing feed rate. This
results in a better guiding of the tools relative to the rolling part. At smaller
steps of feed rate a lower guide of the material is given by the tools. This
will obviously allow axial movement of the blank, even though the tools are
still in the rolling phase. The graphs shown above were obtained for all the
experiments carried out independently of the rolling parameter combination
nearly identical. The expected results of the measurements of the paths of
the feed carriage were confirmed.
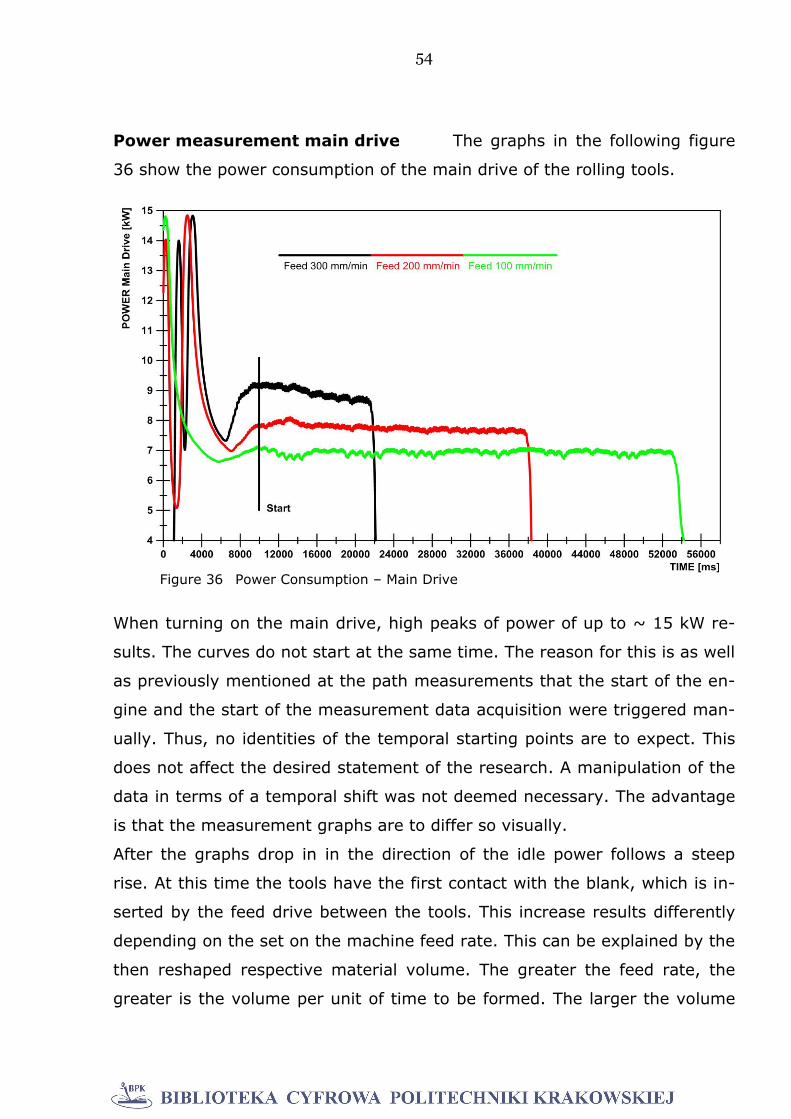
54
Power measurement main drive The graphs in the following figure
36 show the power consumption of the main drive of the rolling tools.
When turning on the main drive, high peaks of power of up to ~ 15 kW re-
sults. The curves do not start at the same time. The reason for this is as well
as previously mentioned at the path measurements that the start of the en-
gine and the start of the measurement data acquisition were triggered man-
ually. Thus, no identities of the temporal starting points are to expect. This
does not affect the desired statement of the research. A manipulation of the
data in terms of a temporal shift was not deemed necessary. The advantage
is that the measurement graphs are to differ so visually.
After the graphs drop in in the direction of the idle power follows a steep
rise. At this time the tools have the first contact with the blank, which is in-
serted by the feed drive between the tools. This increase results differently
depending on the set on the machine feed rate. This can be explained by the
then reshaped respective material volume. The greater the feed rate, the
greater is the volume per unit of time to be formed. The larger the volume
Figure 36 Power Consumption – Main Drive
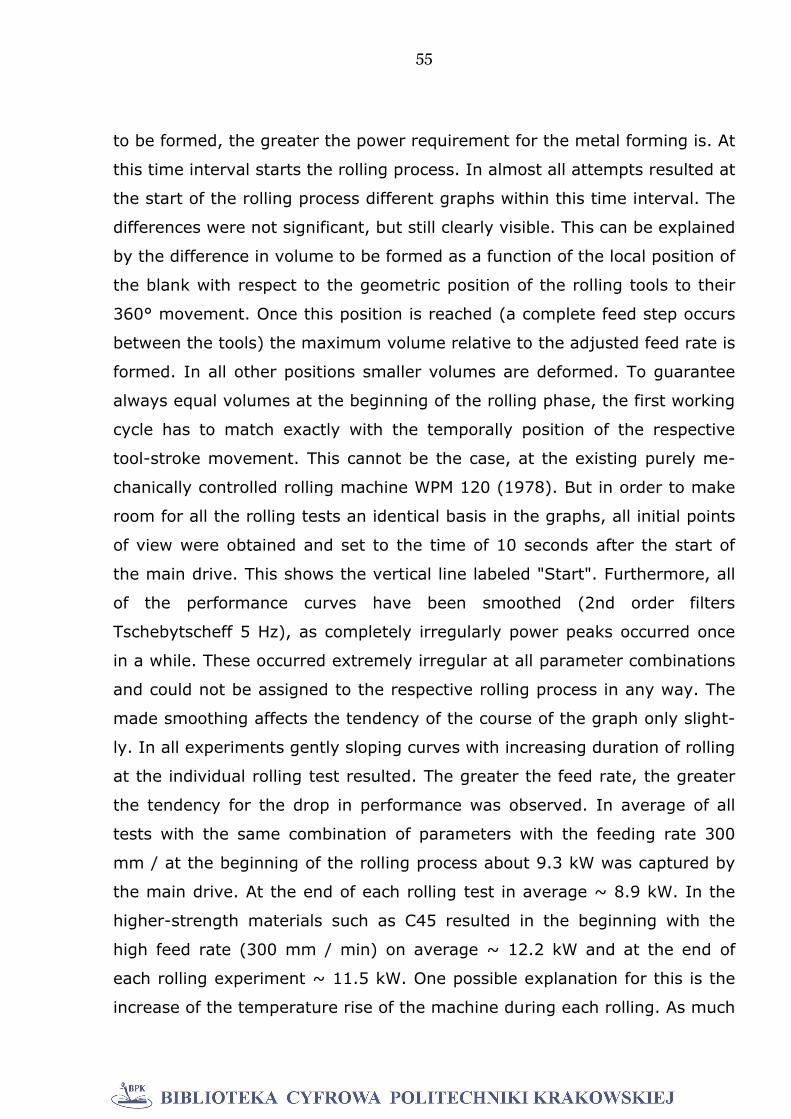
55
to be formed, the greater the power requirement for the metal forming is. At
this time interval starts the rolling process. In almost all attempts resulted at
the start of the rolling process different graphs within this time interval. The
differences were not significant, but still clearly visible. This can be explained
by the difference in volume to be formed as a function of the local position of
the blank with respect to the geometric position of the rolling tools to their
360° movement. Once this position is reached (a complete feed step occurs
between the tools) the maximum volume relative to the adjusted feed rate is
formed. In all other positions smaller volumes are deformed. To guarantee
always equal volumes at the beginning of the rolling phase, the first working
cycle has to match exactly with the temporally position of the respective
tool-stroke movement. This cannot be the case, at the existing purely me-
chanically controlled rolling machine WPM 120 (1978). But in order to make
room for all the rolling tests an identical basis in the graphs, all initial points
of view were obtained and set to the time of 10 seconds after the start of
the main drive. This shows the vertical line labeled "Start". Furthermore, all
of the performance curves have been smoothed (2nd order filters
Tschebytscheff 5 Hz), as completely irregularly power peaks occurred once
in a while. These occurred extremely irregular at all parameter combinations
and could not be assigned to the respective rolling process in any way. The
made smoothing affects the tendency of the course of the graph only slight-
ly. In all experiments gently sloping curves with increasing duration of rolling
at the individual rolling test resulted. The greater the feed rate, the greater
the tendency for the drop in performance was observed. In average of all
tests with the same combination of parameters with the feeding rate 300
mm / at the beginning of the rolling process about 9.3 kW was captured by
the main drive. At the end of each rolling test in average ~ 8.9 kW. In the
higher-strength materials such as C45 resulted in the beginning with the
high feed rate (300 mm / min) on average ~ 12.2 kW and at the end of
each rolling experiment ~ 11.5 kW. One possible explanation for this is the
increase of the temperature rise of the machine during each rolling. As much
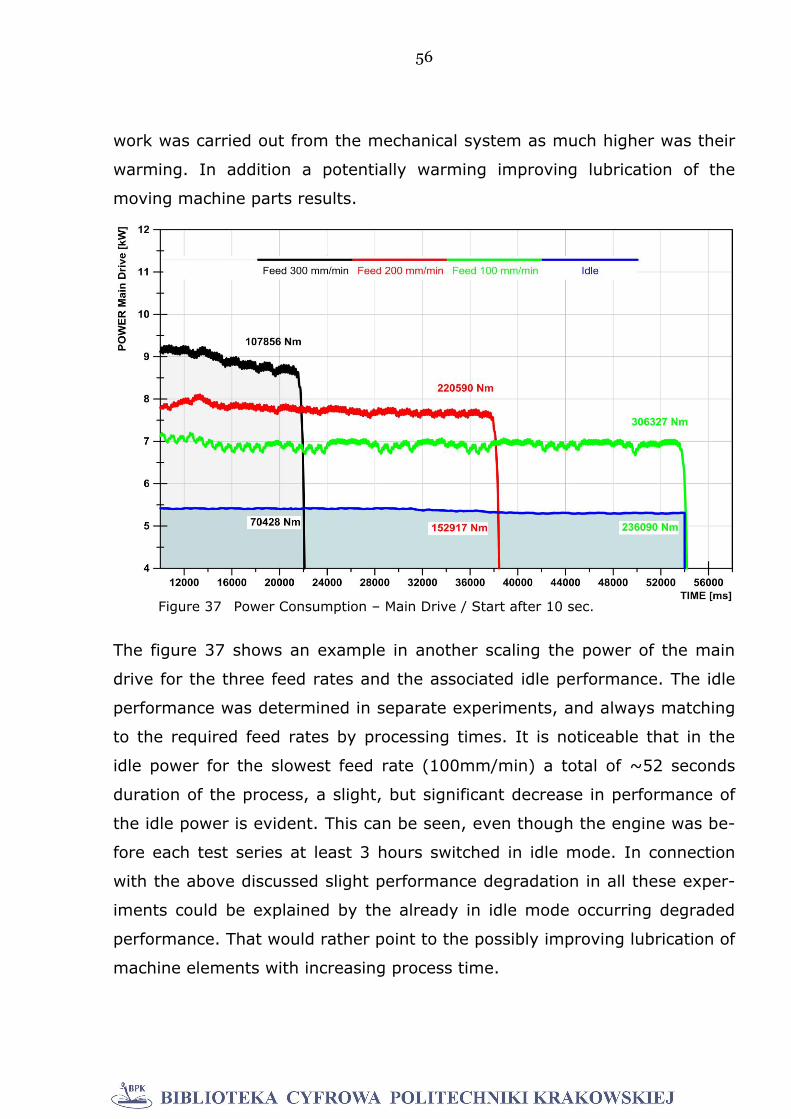
56
work was carried out from the mechanical system as much higher was their
warming. In addition a potentially warming improving lubrication of the
moving machine parts results.
The figure 37 shows an example in another scaling the power of the main
drive for the three feed rates and the associated idle performance. The idle
performance was determined in separate experiments, and always matching
to the required feed rates by processing times. It is noticeable that in the
idle power for the slowest feed rate (100mm/min) a total of ~52 seconds
duration of the process, a slight, but significant decrease in performance of
the idle power is evident. This can be seen, even though the engine was be-
fore each test series at least 3 hours switched in idle mode. In connection
with the above discussed slight performance degradation in all these exper-
iments could be explained by the already in idle mode occurring degraded
performance. That would rather point to the possibly improving lubrication of
machine elements with increasing process time.
Figure 37 Power Consumption – Main Drive / Start after 10 sec.
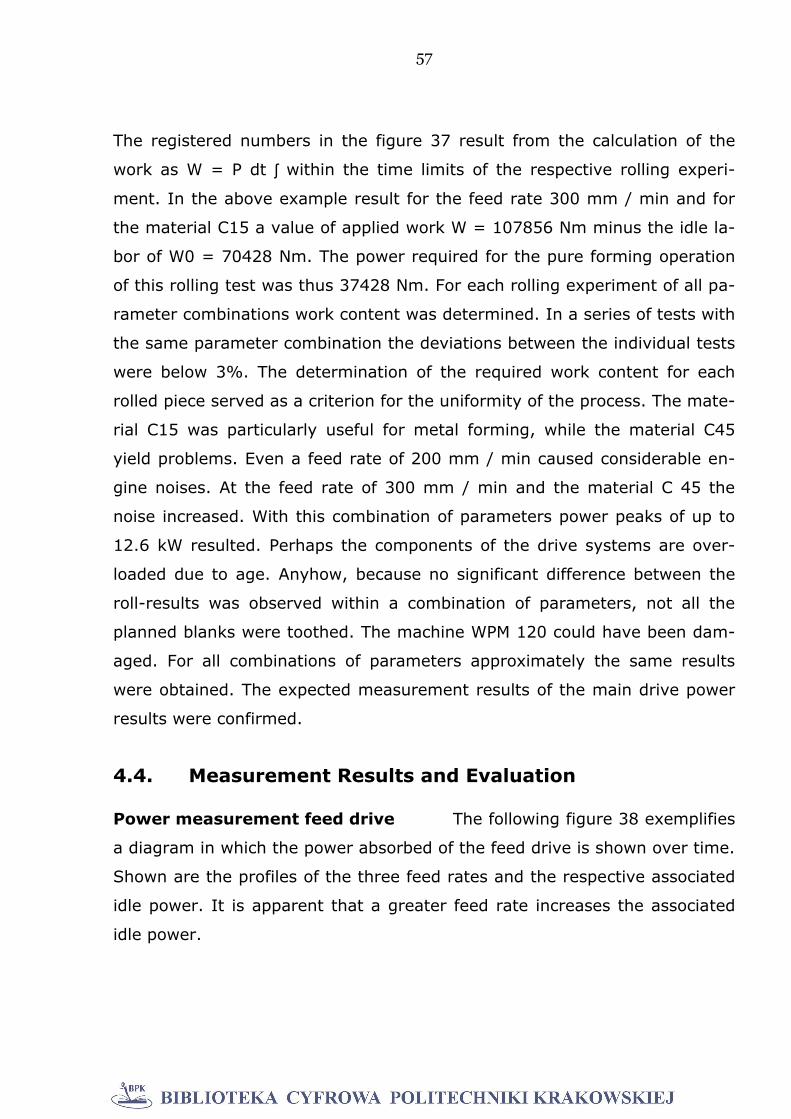
57
The registered numbers in the figure 37 result from the calculation of the
work as W = P dt ʃ within the time limits of the respective rolling experi-
ment. In the above example result for the feed rate 300 mm / min and for
the material C15 a value of applied work W = 107856 Nm minus the idle la-
bor of W0 = 70428 Nm. The power required for the pure forming operation
of this rolling test was thus 37428 Nm. For each rolling experiment of all pa-
rameter combinations work content was determined. In a series of tests with
the same parameter combination the deviations between the individual tests
were below 3%. The determination of the required work content for each
rolled piece served as a criterion for the uniformity of the process. The mate-
rial C15 was particularly useful for metal forming, while the material C45
yield problems. Even a feed rate of 200 mm / min caused considerable en-
gine noises. At the feed rate of 300 mm / min and the material C 45 the
noise increased. With this combination of parameters power peaks of up to
12.6 kW resulted. Perhaps the components of the drive systems are over-
loaded due to age. Anyhow, because no significant difference between the
roll-results was observed within a combination of parameters, not all the
planned blanks were toothed. The machine WPM 120 could have been dam-
aged. For all combinations of parameters approximately the same results
were obtained. The expected measurement results of the main drive power
results were confirmed.
4.4. Measurement Results and Evaluation
Power measurement feed drive The following figure 38 exemplifies
a diagram in which the power absorbed of the feed drive is shown over time.
Shown are the profiles of the three feed rates and the respective associated
idle power. It is apparent that a greater feed rate increases the associated
idle power.
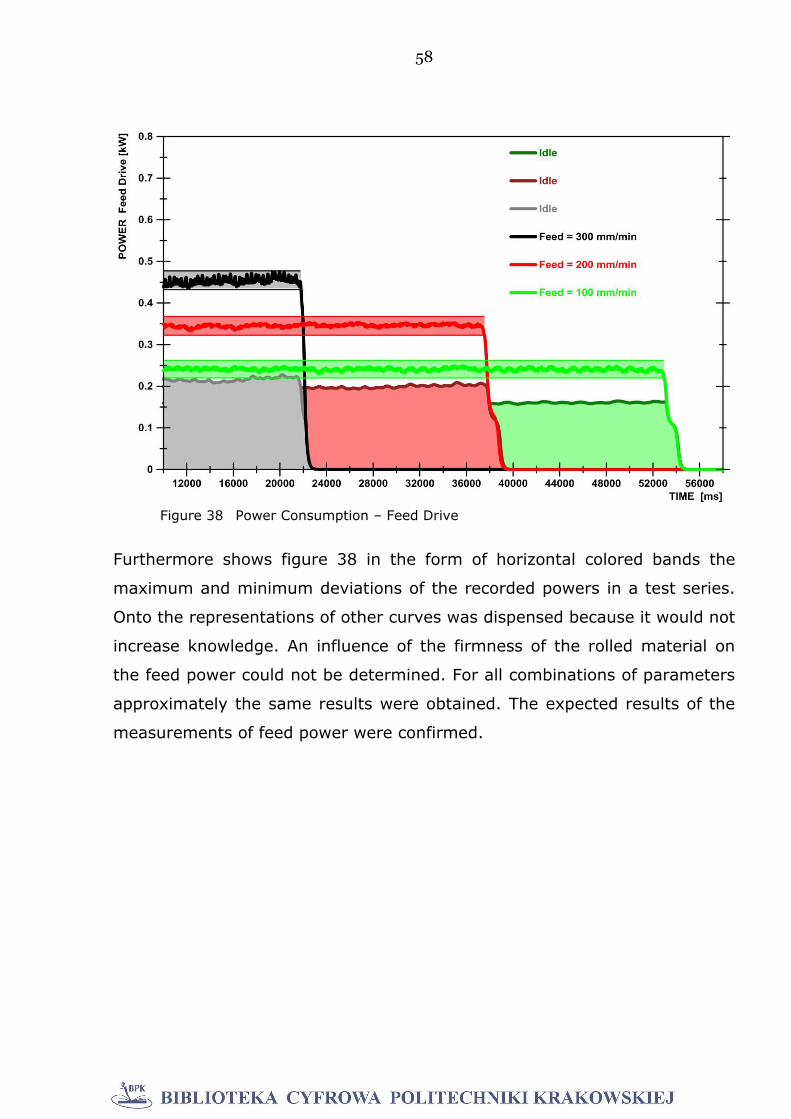
58
Furthermore shows figure 38 in the form of horizontal colored bands the
maximum and minimum deviations of the recorded powers in a test series.
Onto the representations of other curves was dispensed because it would not
increase knowledge. An influence of the firmness of the rolled material on
the feed power could not be determined. For all combinations of parameters
approximately the same results were obtained. The expected results of the
measurements of feed power were confirmed.
Figure 38 Power Consumption – Feed Drive
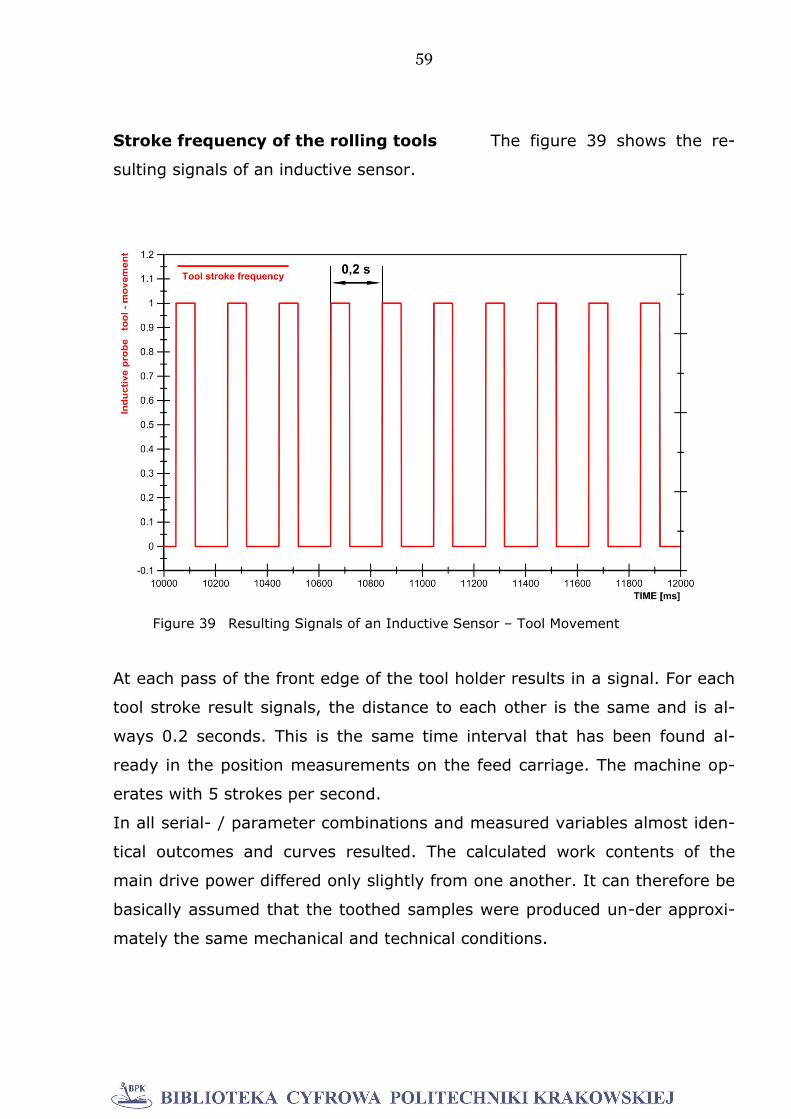
59
Stroke frequency of the rolling tools The figure 39 shows the re-
sulting signals of an inductive sensor.
At each pass of the front edge of the tool holder results in a signal. For each
tool stroke result signals, the distance to each other is the same and is al-
ways 0.2 seconds. This is the same time interval that has been found al-
ready in the position measurements on the feed carriage. The machine op-
erates with 5 strokes per second.
In all serial- / parameter combinations and measured variables almost iden-
tical outcomes and curves resulted. The calculated work contents of the
main drive power differed only slightly from one another. It can therefore be
basically assumed that the toothed samples were produced un-der approxi-
mately the same mechanical and technical conditions.
Figure 39 Resulting Signals of an Inductive Sensor – Tool Movement
60
5. Geometry Measurements PMM 654
5.1. Technical Basis coordinate measuring technology
The principle of coordinate measuring technique is based on the fundamental
relationship that each workpiece realized by manufacturing technology, can
be described by points in space geometrically (Figure 40) [27, 31, ST 4].
Each point in space is described geometrically by three coordinates. These
are the geometric lengths (distances) of the point in space relative to the
origin of the corresponding coordinate axes. The principle of tactile three-
coordinate measuring technique (Figure 41) contains the probing of the spa-
Figure 40 Basic Principle of Coordinate Metrology
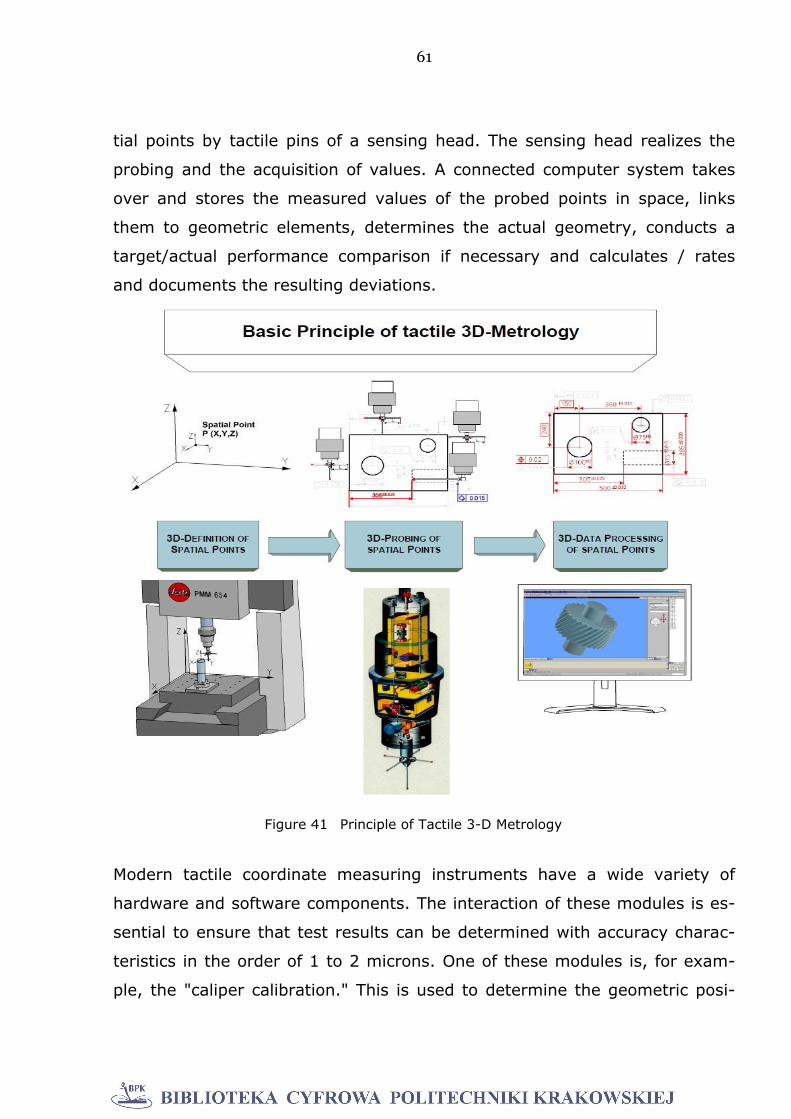
61
tial points by tactile pins of a sensing head. The sensing head realizes the
probing and the acquisition of values. A connected computer system takes
over and stores the measured values of the probed points in space, links
them to geometric elements, determines the actual geometry, conducts a
target/actual performance comparison if necessary and calculates / rates
and documents the resulting deviations.
Modern tactile coordinate measuring instruments have a wide variety of
hardware and software components. The interaction of these modules is es-
sential to ensure that test results can be determined with accuracy charac-
teristics in the order of 1 to 2 microns. One of these modules is, for exam-
ple, the "caliper calibration." This is used to determine the geometric posi-
Figure 41 Principle of Tactile 3-D Metrology
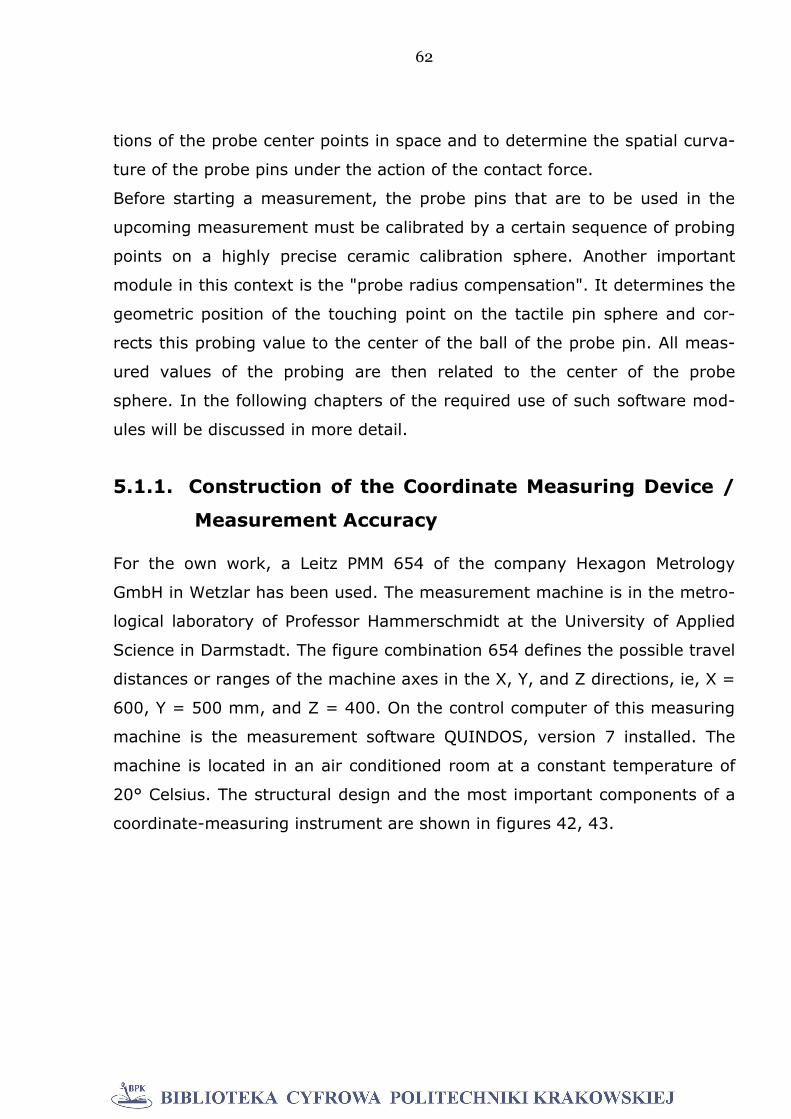
62
tions of the probe center points in space and to determine the spatial curva-
ture of the probe pins under the action of the contact force.
Before starting a measurement, the probe pins that are to be used in the
upcoming measurement must be calibrated by a certain sequence of probing
points on a highly precise ceramic calibration sphere. Another important
module in this context is the "probe radius compensation". It determines the
geometric position of the touching point on the tactile pin sphere and cor-
rects this probing value to the center of the ball of the probe pin. All meas-
ured values of the probing are then related to the center of the probe
sphere. In the following chapters of the required use of such software mod-
ules will be discussed in more detail.
5.1.1. Construction of the Coordinate Measuring Device /
Measurement Accuracy
For the own work, a Leitz PMM 654 of the company Hexagon Metrology
GmbH in Wetzlar has been used. The measurement machine is in the metro-
logical laboratory of Professor Hammerschmidt at the University of Applied
Science in Darmstadt. The figure combination 654 defines the possible travel
distances or ranges of the machine axes in the X, Y, and Z directions, ie, X =
600, Y = 500 mm, and Z = 400. On the control computer of this measuring
machine is the measurement software QUINDOS, version 7 installed. The
machine is located in an air conditioned room at a constant temperature of
20° Celsius. The structural design and the most important components of a
coordinate-measuring instrument are shown in figures 42, 43.
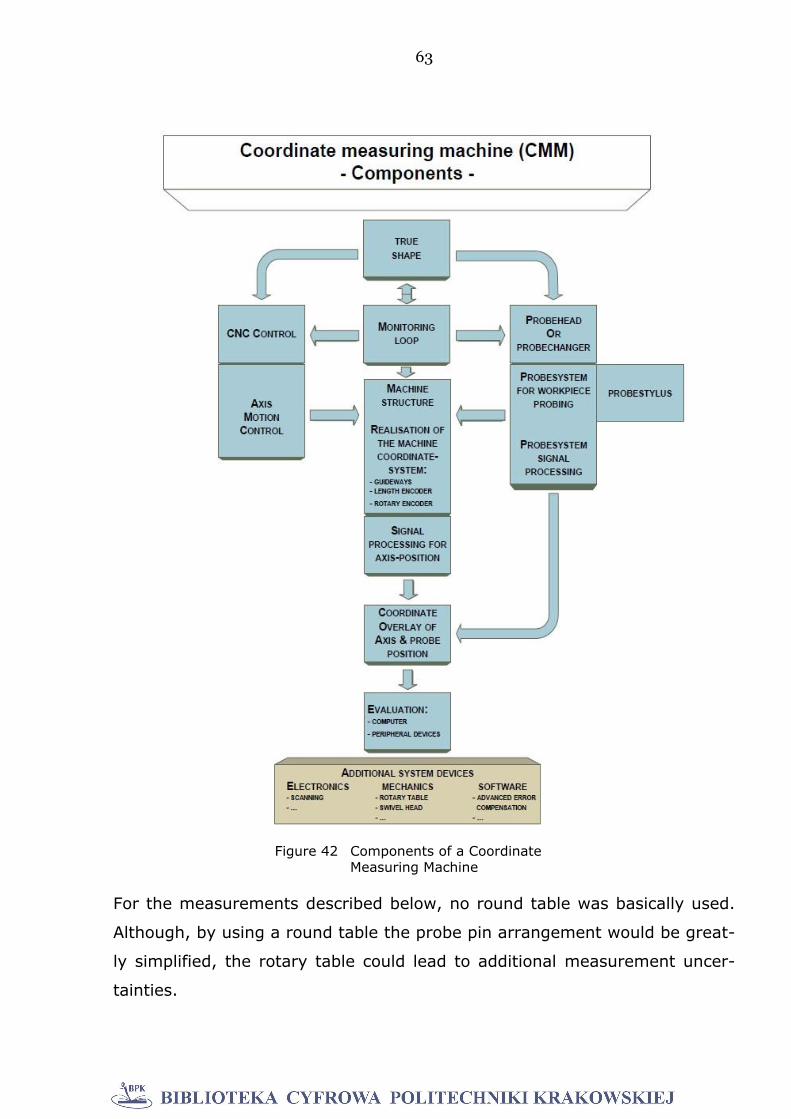
63
For the measurements described below, no round table was basically used.
Although, by using a round table the probe pin arrangement would be great-
ly simplified, the rotary table could lead to additional measurement uncer-
tainties.
Figure 42 Components of a Coordinate Measuring Machine
64
In this respect the own measurements were performed with appropriate
probe combinations.
The measurement uncertainty (in accordance with VDI 2617) diagonally in
space with U = 1.2 + L / 300 [microns] and the reproducibility of the probe
system when probing with R <0.7 [microns] are specified by the manufac-
turer [121, 122, ST 14]. The measurement uncertainty and the reproducibil-
ity of probing points of the probe system are detected by measurements and
protocol of the manufacturer.
Measurement uncertainty (according to VDI 2617) The diagonal meas-
urement uncertainty in space is given by U = 1.2 + L / 300 [µm], the repro-
ducibility of the probe system in probing with R <0.7 [µm] by the manufac-
Figure 43 Measuring Machine PMM 654
65
turer. The measurement uncertainty and the reproducibility of probing of the
probe are detected by measurement and protocol of the manufacturer. The
test suitability of the PMM 654 for gear measurement, derived from the ex-
pected accuracy class, may be evaluated according to VDI 2612 [ST 15].
The expected geometric qualities of the examined involute toothing are IT 5-
11 for concentricity and pitch and IT 8-12 for flank- and profile line varia-
tions. According to VDI 2612, arise therefrom as a requirement for the pro-
file measuring device (PMM 654), within the allowable measurement uncer-
tainty based on profile and flank line measurement:
1. Profile angle deviation fHA 2,5-4,5 µm,
2. Total pitch deviation FA 3,0-6,0 µm,
3. Tooth trace angle deviation fHB 2,5-4,5 µm,
4. Tooth trace total deviation FB 3,5-7,0 µm,
The repeatability of the individual line measurements should be at 0.5 to 1.0
microns. The manufacturer documented actual measurement uncertainties
of the used PMM 654 (VDI 2617) leads to the following classification in terms
of gear measurement [ST 14]:
1. Profile angle deviation fHA < 1,2 µm,
2. Total pitch deviation FA < 1,7 µm,
3. Tooth trace angle deviation fHb < 1,7 µm,
4. Tooth trace total deviation FB < 2,0 µm,
According to above statements may in principle be assumed that the availa-
ble coordinate measuring machine PMM 654 satisfies the demands made.
The qualitative performance of the measuring machine is significantly better
than required [121].
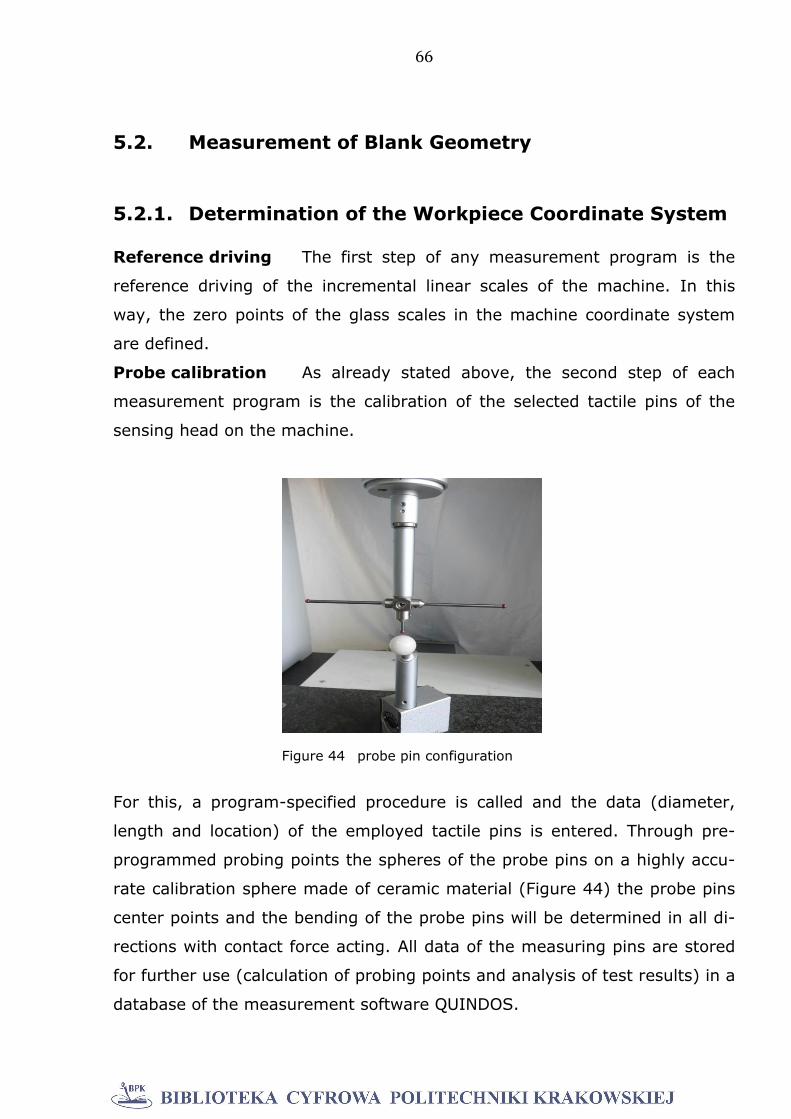
66
5.2. Measurement of Blank Geometry
5.2.1. Determination of the Workpiece Coordinate System
Reference driving The first step of any measurement program is the
reference driving of the incremental linear scales of the machine. In this
way, the zero points of the glass scales in the machine coordinate system
are defined.
Probe calibration As already stated above, the second step of each
measurement program is the calibration of the selected tactile pins of the
sensing head on the machine.
For this, a program-specified procedure is called and the data (diameter,
length and location) of the employed tactile pins is entered. Through pre-
programmed probing points the spheres of the probe pins on a highly accu-
rate calibration sphere made of ceramic material (Figure 44) the probe pins
center points and the bending of the probe pins will be determined in all di-
rections with contact force acting. All data of the measuring pins are stored
for further use (calculation of probing points and analysis of test results) in a
database of the measurement software QUINDOS.
Figure 44 probe pin configuration
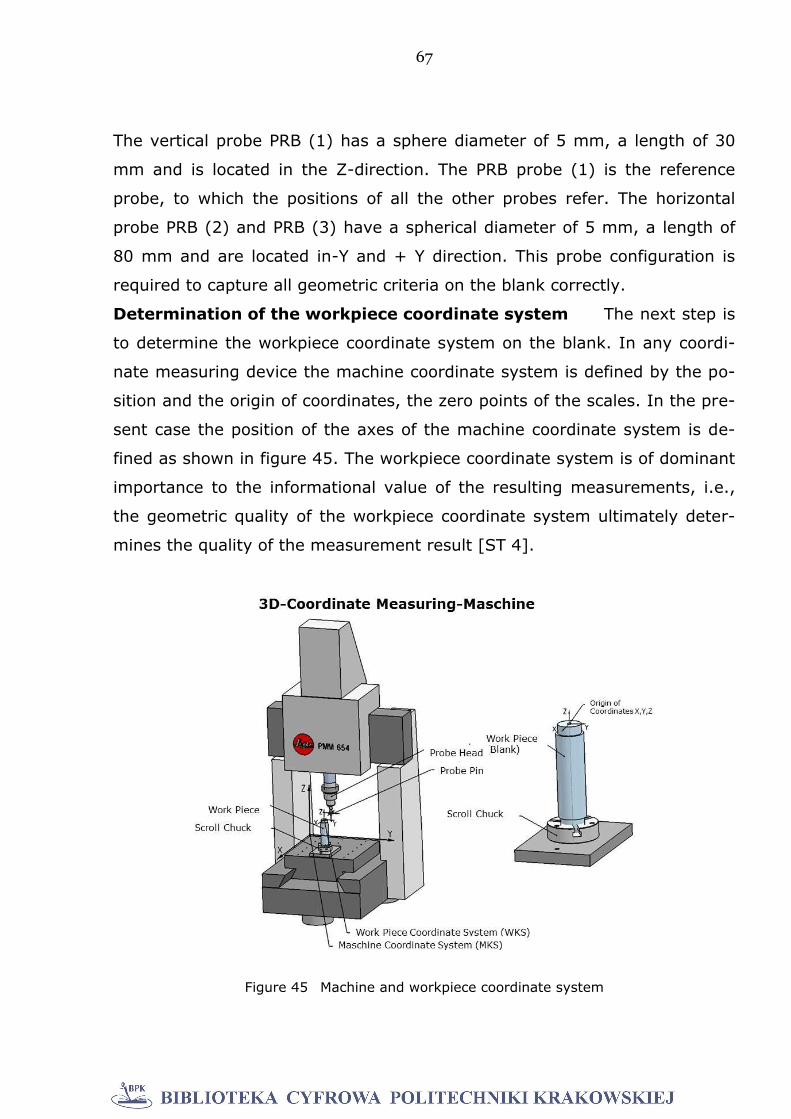
67
The vertical probe PRB (1) has a sphere diameter of 5 mm, a length of 30
mm and is located in the Z-direction. The PRB probe (1) is the reference
probe, to which the positions of all the other probes refer. The horizontal
probe PRB (2) and PRB (3) have a spherical diameter of 5 mm, a length of
80 mm and are located in-Y and + Y direction. This probe configuration is
required to capture all geometric criteria on the blank correctly.
Determination of the workpiece coordinate system The next step is
to determine the workpiece coordinate system on the blank. In any coordi-
nate measuring device the machine coordinate system is defined by the po-
sition and the origin of coordinates, the zero points of the scales. In the pre-
sent case the position of the axes of the machine coordinate system is de-
fined as shown in figure 45. The workpiece coordinate system is of dominant
importance to the informational value of the resulting measurements, i.e.,
the geometric quality of the workpiece coordinate system ultimately deter-
mines the quality of the measurement result [ST 4].
Figure 45 Machine and workpiece coordinate system
68
The reasons for the mandatory provision of a workpiece coordinate system
are discussed briefly below.
1. The workpiece coordinate system is the reference coordinate system for
each measurement of a geometric criterion in the following program and
their subsequent evaluation. A reference that is located outside of the com-
ponent, for example, the machine coordinate system, is useful neither for
the programming of the measurements nor for the subsequent evaluation of
the component geometry.
2. The workpiece coordinate system must be on or in the component to be
tested, since the geometry of the component is described thru dimensions in
a drawing corresponding to the component. A dimensioning with an external
reference system does not make sense from the perspective of production or
from the perspective of testing.
3. The workpiece coordinate system defines geometrically the position of
the component in the machine coordinate system. Without a workpiece co-
ordinate system, calibrated to the component, location and clamping errors
of the component with respect to the machine coordinate system would oc-
cur in the test results and lead to erroneous analysis results. A negative ex-
ample would be in this context, an angular position deviation in the central
axis of the workpiece. This is geometrically defined by the clamping on the
measuring table based on the defined Z-axis of the machine coordinate sys-
tem. Such an angular position deviation would lead to significant errors and
thus massive misinterpretation of the actual geometry of the work pieces to
be tested.
4. In the case of the present work it is about blanks, as well as sample
parts after rolling, whose geometry is essentially rotationally symmetrical.
The main reference axis of rotationally symmetric components is the central
axis of the components. The position of the central axis with respect to the
overall geometry must be determined by suitable probe points of the com-
ponent connected to suitable geometric elements. The result is therefore a
reference axis for the component. All other geometric determinants of the
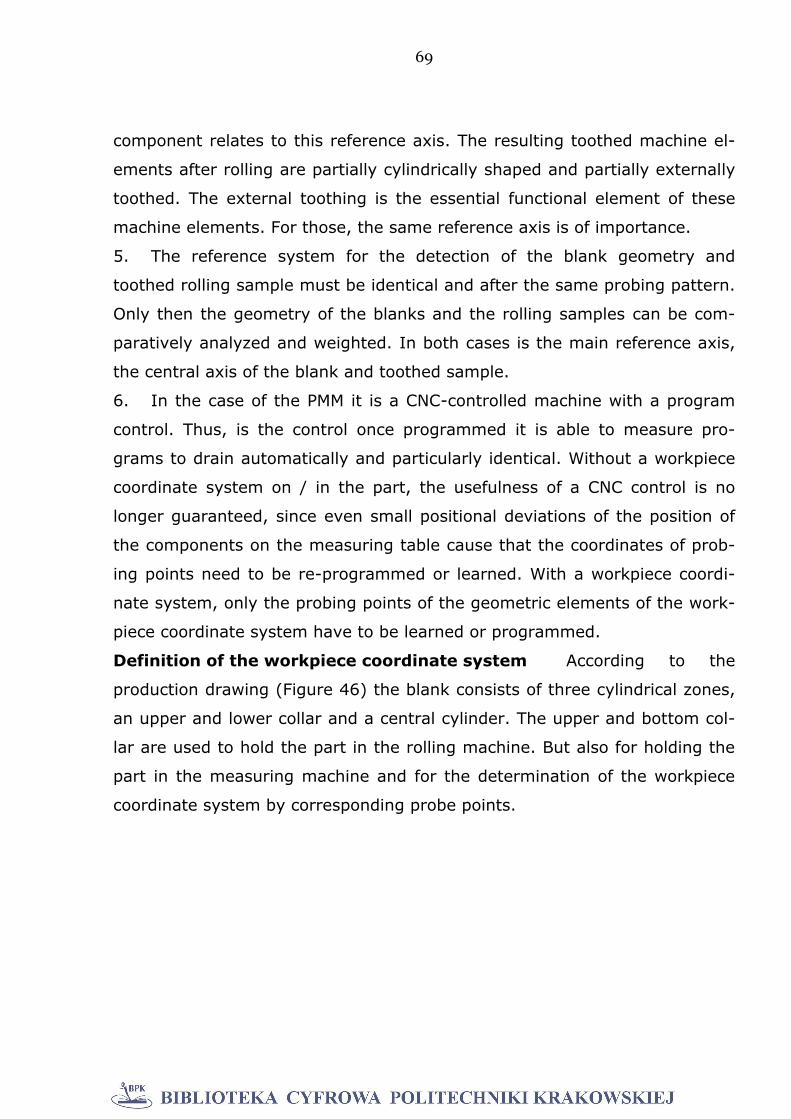
69
component relates to this reference axis. The resulting toothed machine el-
ements after rolling are partially cylindrically shaped and partially externally
toothed. The external toothing is the essential functional element of these
machine elements. For those, the same reference axis is of importance.
5. The reference system for the detection of the blank geometry and
toothed rolling sample must be identical and after the same probing pattern.
Only then the geometry of the blanks and the rolling samples can be com-
paratively analyzed and weighted. In both cases is the main reference axis,
the central axis of the blank and toothed sample.
6. In the case of the PMM it is a CNC-controlled machine with a program
control. Thus, is the control once programmed it is able to measure pro-
grams to drain automatically and particularly identical. Without a workpiece
coordinate system on / in the part, the usefulness of a CNC control is no
longer guaranteed, since even small positional deviations of the position of
the components on the measuring table cause that the coordinates of prob-
ing points need to be re-programmed or learned. With a workpiece coordi-
nate system, only the probing points of the geometric elements of the work-
piece coordinate system have to be learned or programmed.
Definition of the workpiece coordinate system According to the
production drawing (Figure 46) the blank consists of three cylindrical zones,
an upper and lower collar and a central cylinder. The upper and bottom col-
lar are used to hold the part in the rolling machine. But also for holding the
part in the measuring machine and for the determination of the workpiece
coordinate system by corresponding probe points.
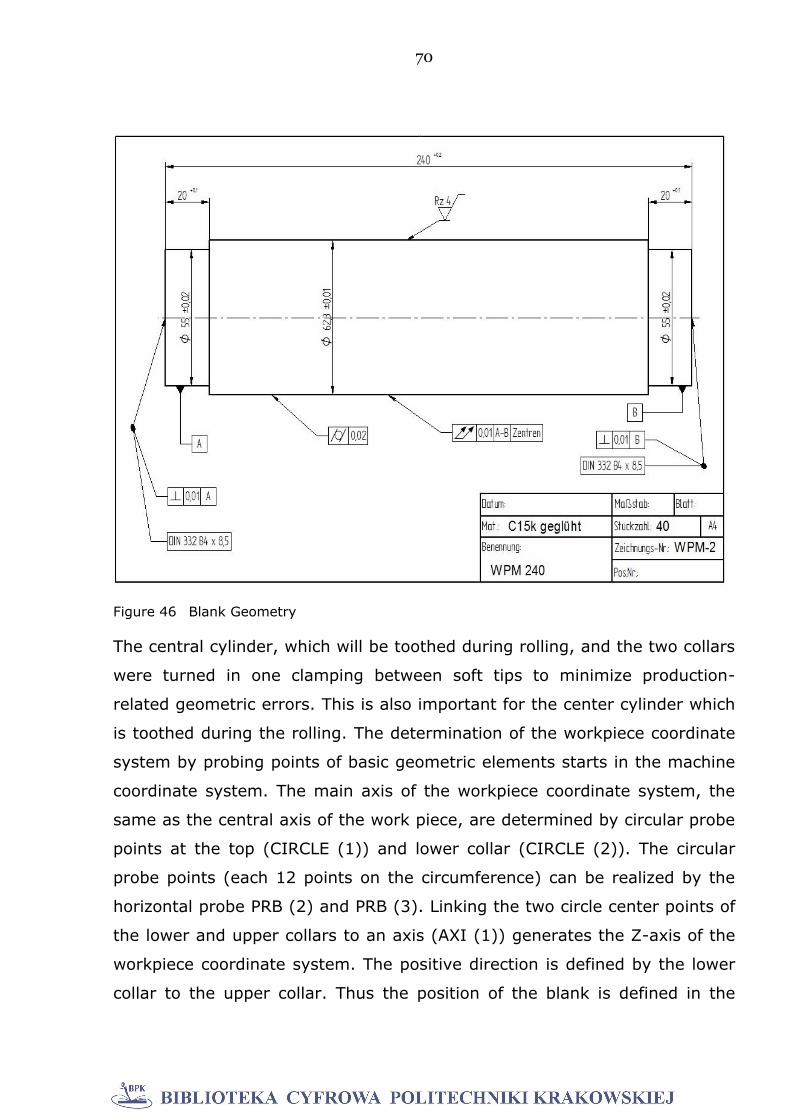
70
The central cylinder, which will be toothed during rolling, and the two collars
were turned in one clamping between soft tips to minimize production-
related geometric errors. This is also important for the center cylinder which
is toothed during the rolling. The determination of the workpiece coordinate
system by probing points of basic geometric elements starts in the machine
coordinate system. The main axis of the workpiece coordinate system, the
same as the central axis of the work piece, are determined by circular probe
points at the top (CIRCLE (1)) and lower collar (CIRCLE (2)). The circular
probe points (each 12 points on the circumference) can be realized by the
horizontal probe PRB (2) and PRB (3). Linking the two circle center points of
the lower and upper collars to an axis (AXI (1)) generates the Z-axis of the
workpiece coordinate system. The positive direction is defined by the lower
collar to the upper collar. Thus the position of the blank is defined in the
Figure 46 Blank Geometry
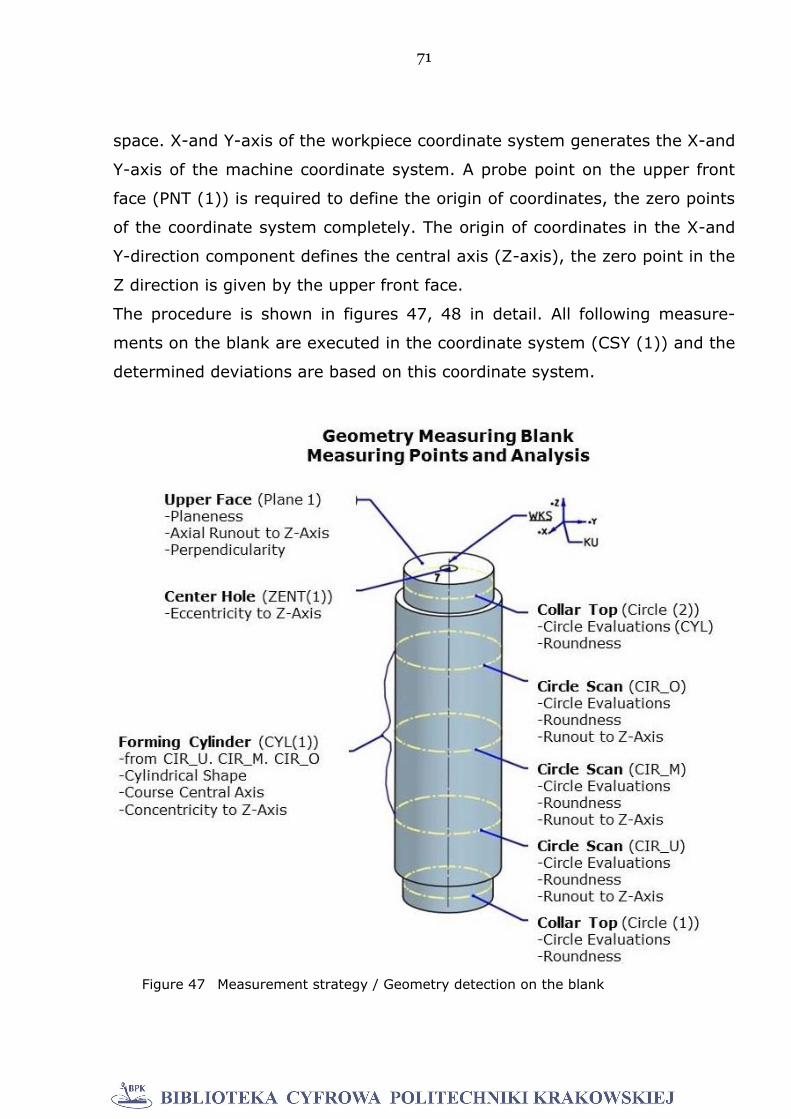
71
space. X-and Y-axis of the workpiece coordinate system generates the X-and
Y-axis of the machine coordinate system. A probe point on the upper front
face (PNT (1)) is required to define the origin of coordinates, the zero points
of the coordinate system completely. The origin of coordinates in the X-and
Y-direction component defines the central axis (Z-axis), the zero point in the
Z direction is given by the upper front face.
The procedure is shown in figures 47, 48 in detail. All following measure-
ments on the blank are executed in the coordinate system (CSY (1)) and the
determined deviations are based on this coordinate system.
Figure 47 Measurement strategy / Geometry detection on the blank
72
Acquisition of the actual geometry of the blank
The clamping situation of the blank on the table of the measuring machine
can be seen in figure 49.
The blank is clamped in a three jaw chuck, which is anchored on the table of
the measuring machine. Location and arrangement of probes is also indicat-
ed in figure 49.
Figure 48 Workpiece coordinate system
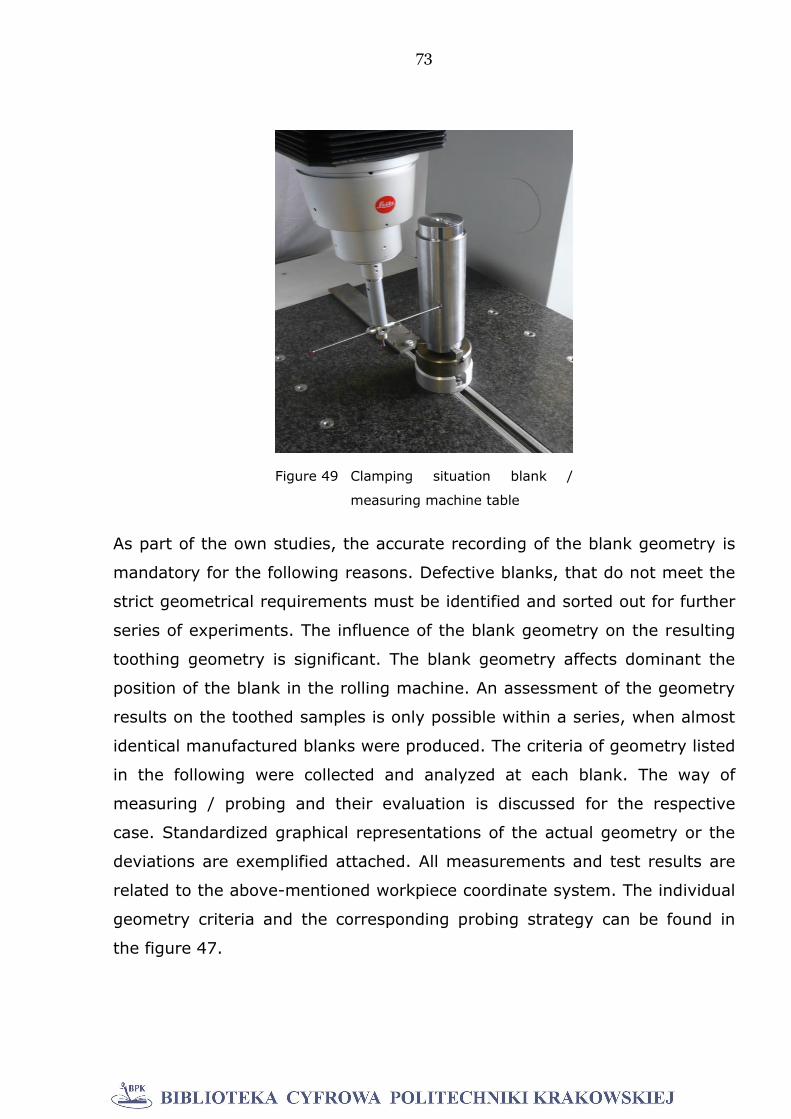
73
As part of the own studies, the accurate recording of the blank geometry is
mandatory for the following reasons. Defective blanks, that do not meet the
strict geometrical requirements must be identified and sorted out for further
series of experiments. The influence of the blank geometry on the resulting
toothing geometry is significant. The blank geometry affects dominant the
position of the blank in the rolling machine. An assessment of the geometry
results on the toothed samples is only possible within a series, when almost
identical manufactured blanks were produced. The criteria of geometry listed
in the following were collected and analyzed at each blank. The way of
measuring / probing and their evaluation is discussed for the respective
case. Standardized graphical representations of the actual geometry or the
deviations are exemplified attached. All measurements and test results are
related to the above-mentioned workpiece coordinate system. The individual
geometry criteria and the corresponding probing strategy can be found in
the figure 47.
Figure 49 Clamping situation blank /
measuring machine table
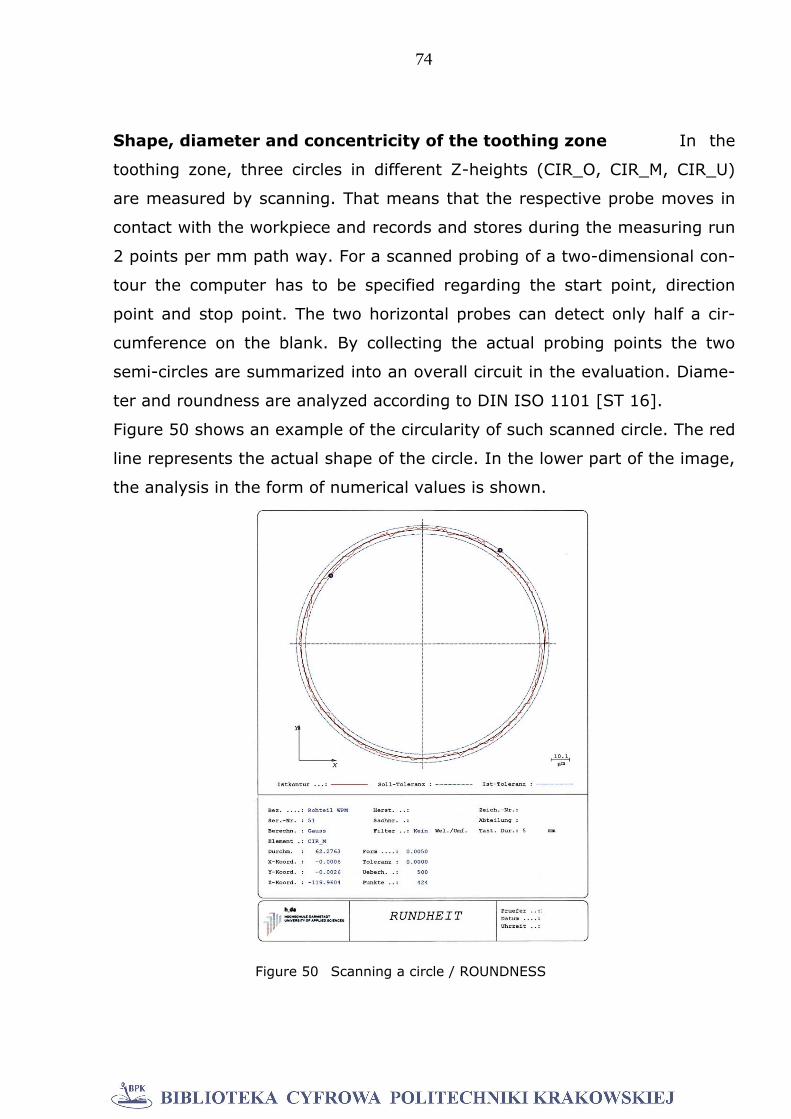
74
Shape, diameter and concentricity of the toothing zone In the
toothing zone, three circles in different Z-heights (CIR_O, CIR_M, CIR_U)
are measured by scanning. That means that the respective probe moves in
contact with the workpiece and records and stores during the measuring run
2 points per mm path way. For a scanned probing of a two-dimensional con-
tour the computer has to be specified regarding the start point, direction
point and stop point. The two horizontal probes can detect only half a cir-
cumference on the blank. By collecting the actual probing points the two
semi-circles are summarized into an overall circuit in the evaluation. Diame-
ter and roundness are analyzed according to DIN ISO 1101 [ST 16].
Figure 50 shows an example of the circularity of such scanned circle. The red
line represents the actual shape of the circle. In the lower part of the image,
the analysis in the form of numerical values is shown.
Figure 50 Scanning a circle / ROUNDNESS
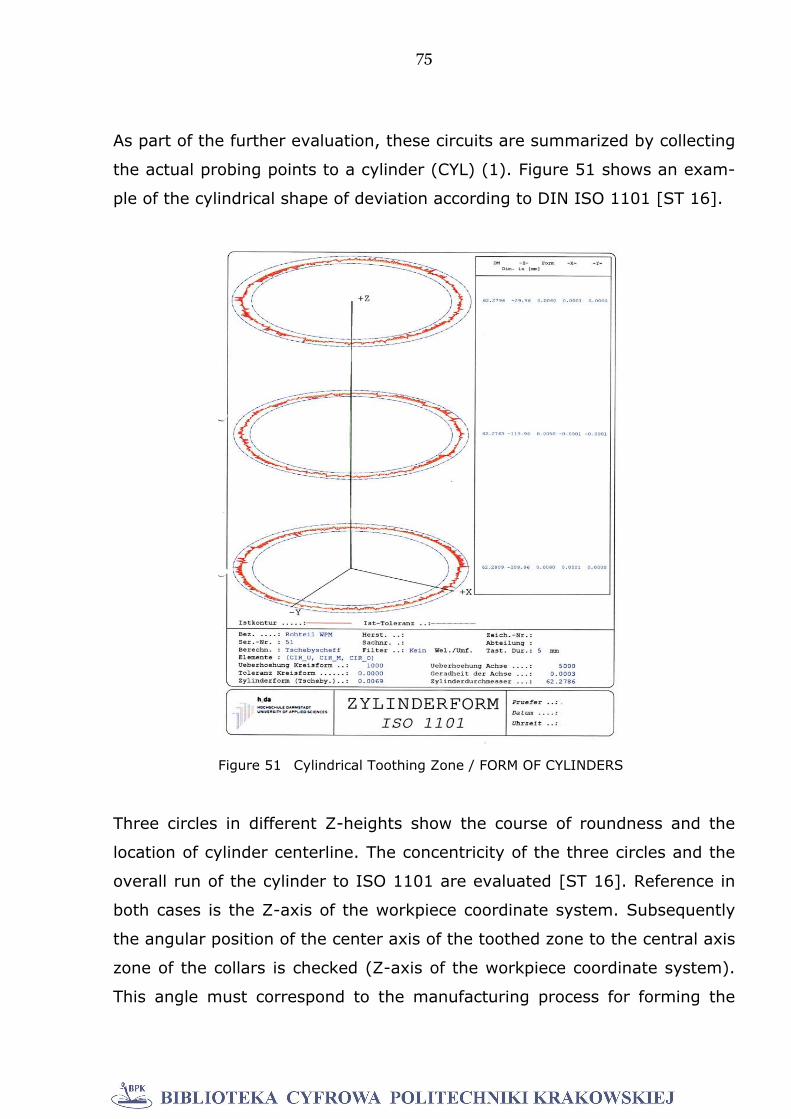
75
As part of the further evaluation, these circuits are summarized by collecting
the actual probing points to a cylinder (CYL) (1). Figure 51 shows an exam-
ple of the cylindrical shape of deviation according to DIN ISO 1101 [ST 16].
Three circles in different Z-heights show the course of roundness and the
location of cylinder centerline. The concentricity of the three circles and the
overall run of the cylinder to ISO 1101 are evaluated [ST 16]. Reference in
both cases is the Z-axis of the workpiece coordinate system. Subsequently
the angular position of the center axis of the toothed zone to the central axis
zone of the collars is checked (Z-axis of the workpiece coordinate system).
This angle must correspond to the manufacturing process for forming the
Figure 51 Cylindrical Toothing Zone / FORM OF CYLINDERS
76
raw material. In the present case it was the rotation of the overall geometry
in one clamping. The workpiece was clamped between tips. A very small an-
gle error was detected by a correctly turned sample, (~ 0.001 °).
Shape, runout and perpendicularity of the forehead levels
The position of the end faces of the blank influences the position of the blank
in the forming machine. This effect must be considered in the final geome-
try. Therefore, the location of these front faces was measured. The top face
has been probed with single points (LEVEL (1)) with the vertical probe pin.
Flatness, runout and perpendicularity were evaluated according to DIN ISO
1101 [ST 16].
Eccentricity of the center holes The blanks to create the splined shaft
are clamped between tips in the rolling machine. The two center holes on
the face of the blank are the basis of the concentricity of the component in
the rolling machine before and partly during the rolling operation. In prelim-
inary tests it was shown that the positions of the center holes have a deci-
sive influence (eccentricity relative to the cylinder axis) on the resulting
pitch and concentricity deviations [28]. The center hole on the front surface
was thus probed self-centered by the vertical probe pin. The distance in the
XY plane of the probe-tip center to the central axis of the component (Z-axis
of the workpiece coordinate system) has been evaluated as eccentricity. For
rolling samples to be used in the investigation, only blanks with minimal ec-
centricities (less than 0.01 mm) were allowed. All results describing the
measured blank geometry (circles outer cylinder, roundness, cylinder form
deviation) are shown in appendix 1, exemplary for part 32.
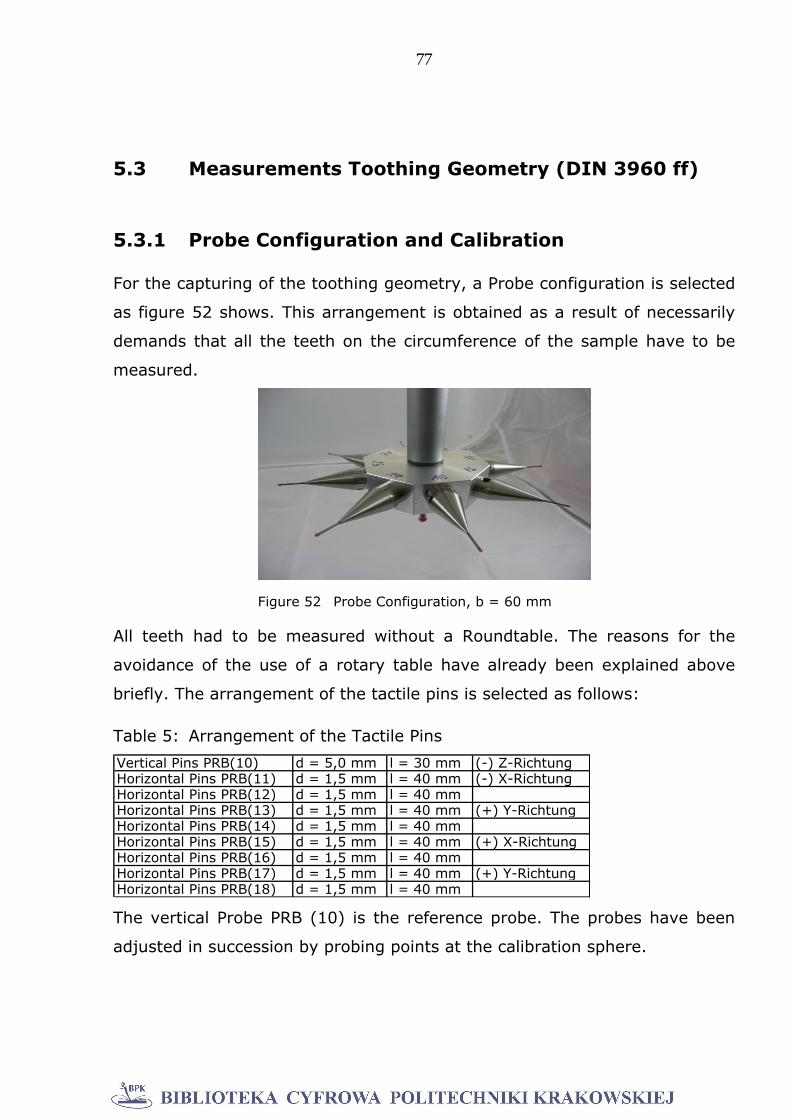
77
5.3 Measurements Toothing Geometry (DIN 3960 ff)
5.3.1 Probe Configuration and Calibration
For the capturing of the toothing geometry, a Probe configuration is selected
as figure 52 shows. This arrangement is obtained as a result of necessarily
demands that all the teeth on the circumference of the sample have to be
measured.
All teeth had to be measured without a Roundtable. The reasons for the
avoidance of the use of a rotary table have already been explained above
briefly. The arrangement of the tactile pins is selected as follows:
Table 5: Arrangement of the Tactile Pins
Vertical Pins PRB(10) d = 5,0 mm l = 30 mm (-) Z-RichtungHorizontal Pins PRB(11) d = 1,5 mm l = 40 mm (-) X-RichtungHorizontal Pins PRB(12) d = 1,5 mm l = 40 mmHorizontal Pins PRB(13) d = 1,5 mm l = 40 mm (+) Y-RichtungHorizontal Pins PRB(14) d = 1,5 mm l = 40 mmHorizontal Pins PRB(15) d = 1,5 mm l = 40 mm (+) X-RichtungHorizontal Pins PRB(16) d = 1,5 mm l = 40 mmHorizontal Pins PRB(17) d = 1,5 mm l = 40 mm (+) Y-RichtungHorizontal Pins PRB(18) d = 1,5 mm l = 40 mm
The vertical Probe PRB (10) is the reference probe. The probes have been
adjusted in succession by probing points at the calibration sphere.
Figure 52 Probe Configuration, b = 60 mm

78
5.3.2 Determination Workpiece Coordinate System
The clamping situation of the toothed workpiece on the measuring machine
table is shown in figure 53. The toothed part is positioned in a three jaw
chuck in the center of the table.
To evaluate the influence of the blank geometry on the resulting toothing
geometry after rolling the workpiece coordinate system of the gear meas-
urement must necessarily be the same as the coordinate system for the
blank measurement (see chapter 5.2.1 Workpiece coordinate system blank)
[ST 5, 82]. Accordingly, the workpiece central axis (Z-axis) in the gear
measurement was also formed from the midpoints of the probed circles at
the lower and upper collars. X-and Y-axes represent the axes of the machine
coordinate system. The origin is located on the upper end surface (Z = 0)
and on the central axis (X, Y = 0), (Figure 54).
Figure 53 Clamping situation of a sample
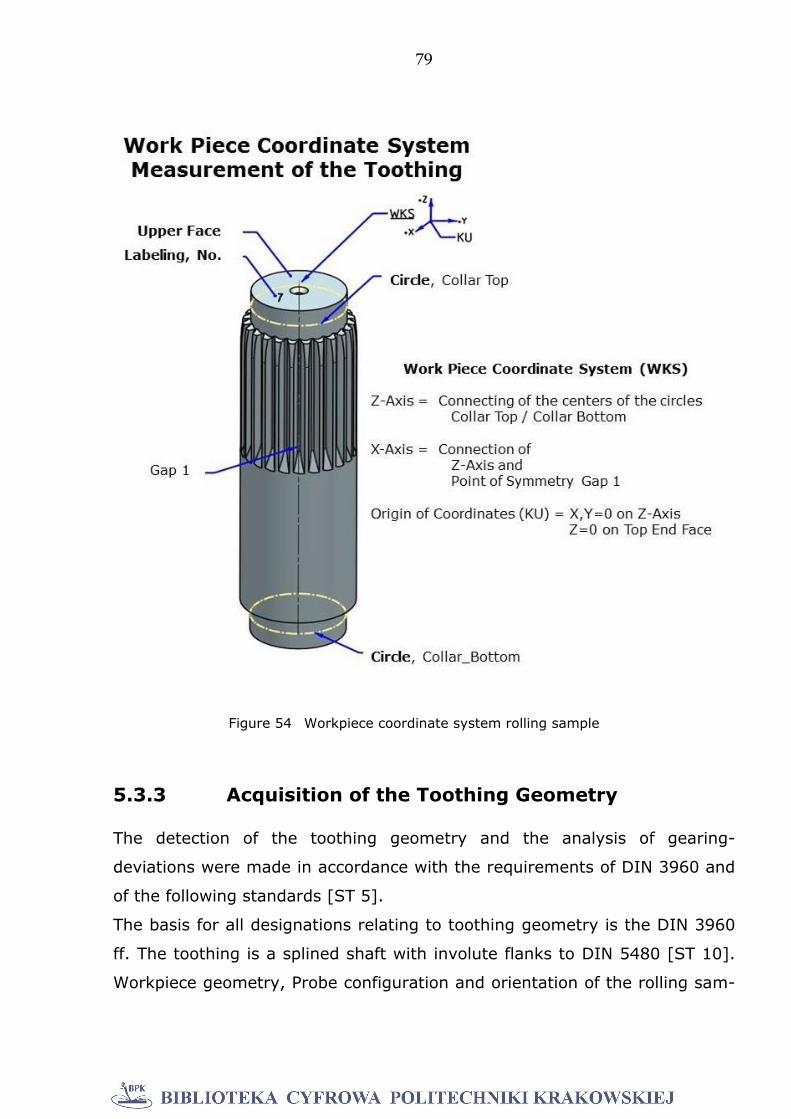
79
5.3.3 Acquisition of the Toothing Geometry
The detection of the toothing geometry and the analysis of gearing-
deviations were made in accordance with the requirements of DIN 3960 and
of the following standards [ST 5].
The basis for all designations relating to toothing geometry is the DIN 3960
ff. The toothing is a splined shaft with involute flanks to DIN 5480 [ST 10].
Workpiece geometry, Probe configuration and orientation of the rolling sam-
Figure 54 Workpiece coordinate system rolling sample
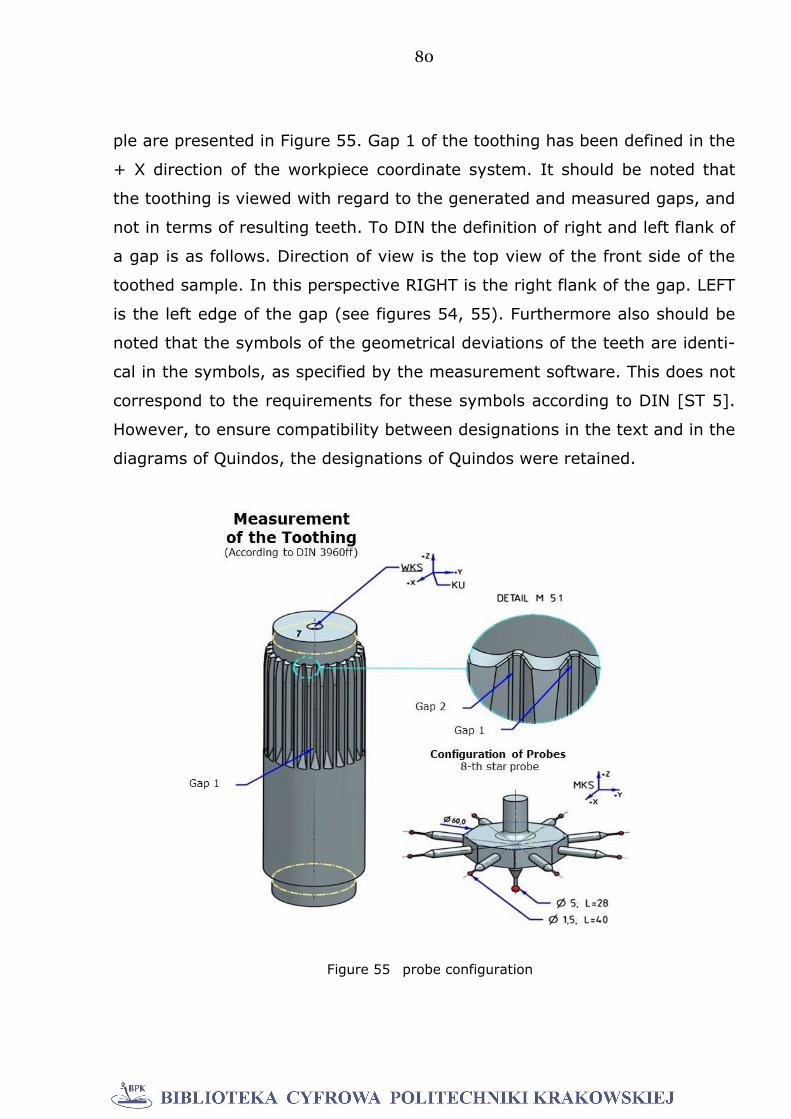
80
ple are presented in Figure 55. Gap 1 of the toothing has been defined in the
+ X direction of the workpiece coordinate system. It should be noted that
the toothing is viewed with regard to the generated and measured gaps, and
not in terms of resulting teeth. To DIN the definition of right and left flank of
a gap is as follows. Direction of view is the top view of the front side of the
toothed sample. In this perspective RIGHT is the right flank of the gap. LEFT
is the left edge of the gap (see figures 54, 55). Furthermore also should be
noted that the symbols of the geometrical deviations of the teeth are identi-
cal in the symbols, as specified by the measurement software. This does not
correspond to the requirements for these symbols according to DIN [ST 5].
However, to ensure compatibility between designations in the text and in the
diagrams of Quindos, the designations of Quindos were retained.
Figure 55 probe configuration
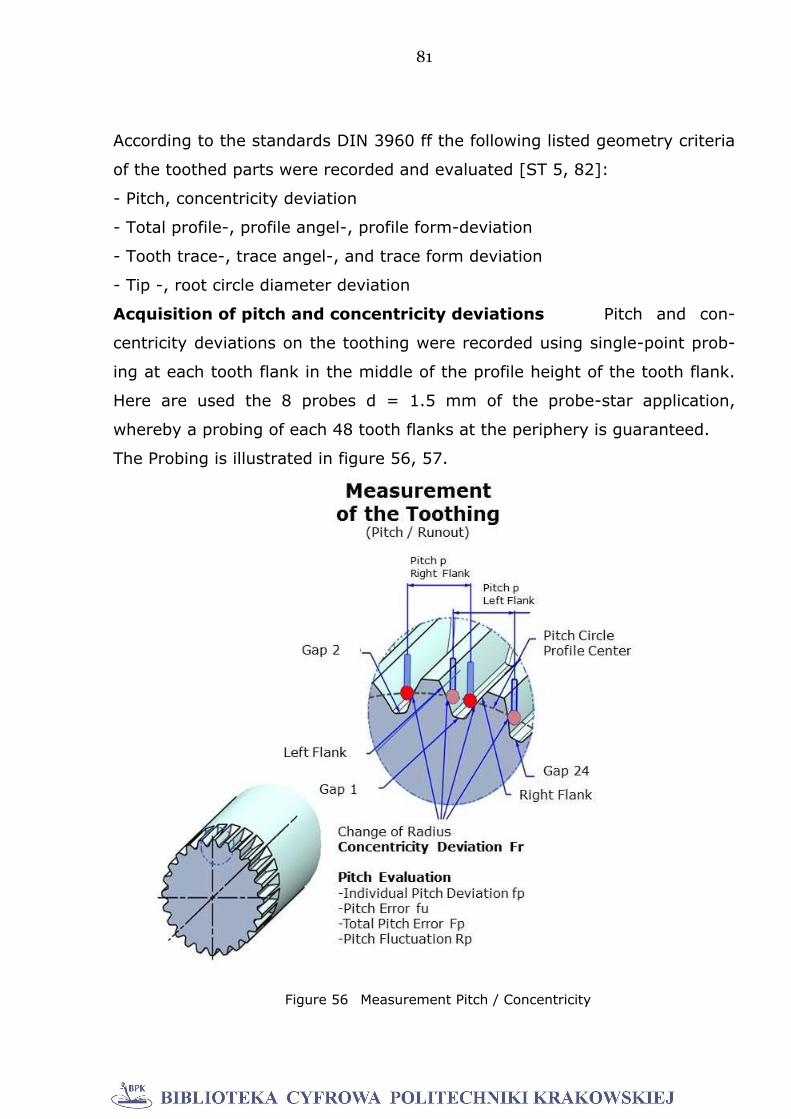
81
According to the standards DIN 3960 ff the following listed geometry criteria
of the toothed parts were recorded and evaluated [ST 5, 82]:
- Pitch, concentricity deviation
- Total profile-, profile angel-, profile form-deviation
- Tooth trace-, trace angel-, and trace form deviation
- Tip -, root circle diameter deviation
Acquisition of pitch and concentricity deviations Pitch and con-
centricity deviations on the toothing were recorded using single-point prob-
ing at each tooth flank in the middle of the profile height of the tooth flank.
Here are used the 8 probes d = 1.5 mm of the probe-star application,
whereby a probing of each 48 tooth flanks at the periphery is guaranteed.
The Probing is illustrated in figure 56, 57.
Figure 56 Measurement Pitch / Concentricity
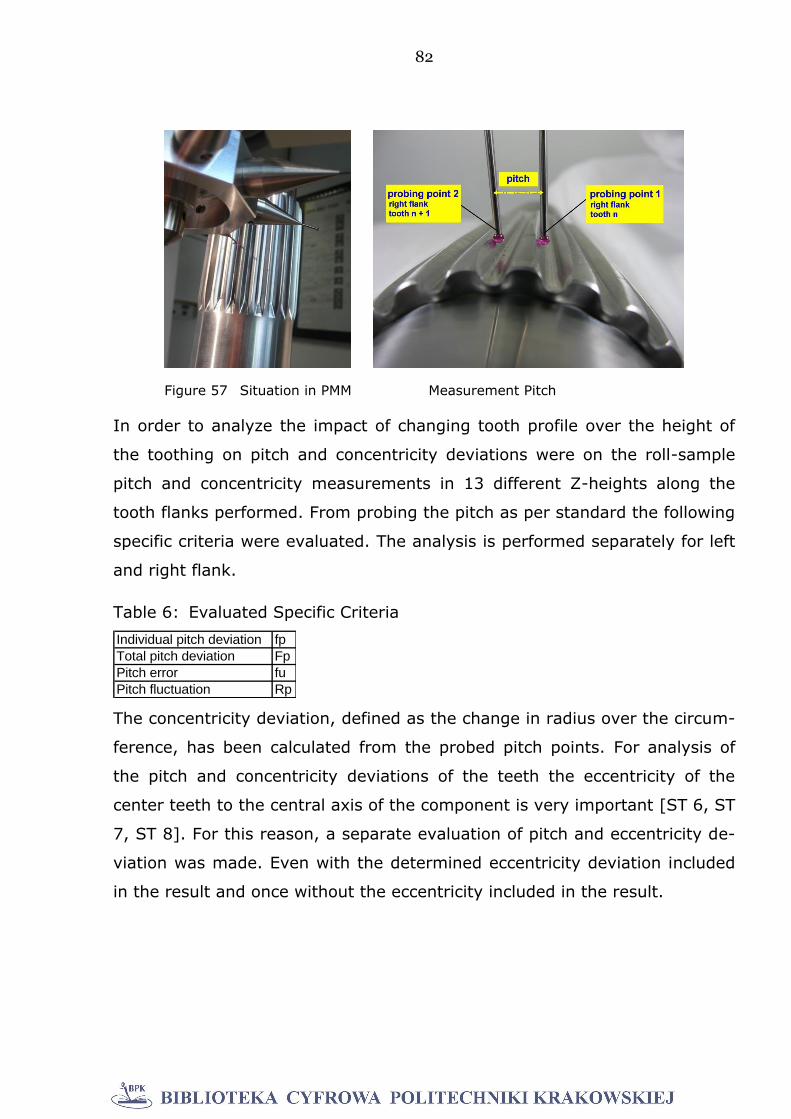
82
In order to analyze the impact of changing tooth profile over the height of
the toothing on pitch and concentricity deviations were on the roll-sample
pitch and concentricity measurements in 13 different Z-heights along the
tooth flanks performed. From probing the pitch as per standard the following
specific criteria were evaluated. The analysis is performed separately for left
and right flank.
Table 6: Evaluated Specific Criteria
Individual pitch deviation fp
Total pitch deviation Fp
Pitch error fu
Pitch fluctuation Rp
The concentricity deviation, defined as the change in radius over the circum-
ference, has been calculated from the probed pitch points. For analysis of
the pitch and concentricity deviations of the teeth the eccentricity of the
center teeth to the central axis of the component is very important [ST 6, ST
7, ST 8]. For this reason, a separate evaluation of pitch and eccentricity de-
viation was made. Even with the determined eccentricity deviation included
in the result and once without the eccentricity included in the result.
Figure 57 Situation in PMM Measurement Pitch
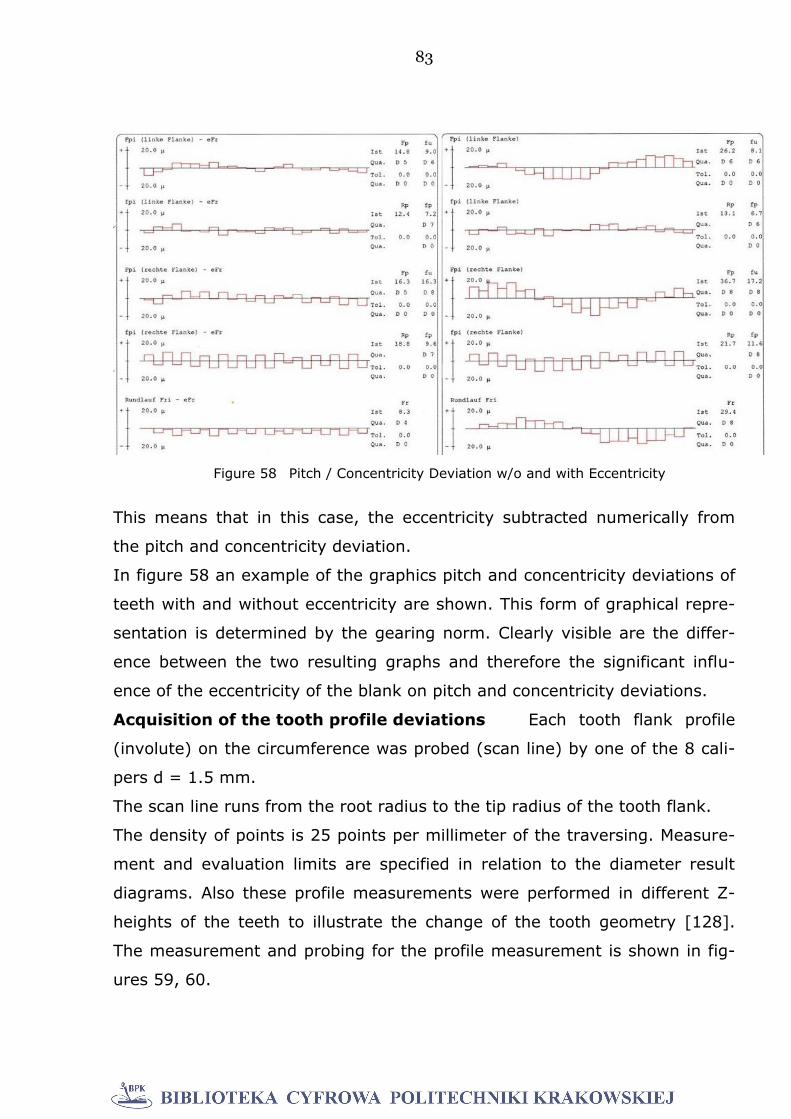
83
This means that in this case, the eccentricity subtracted numerically from
the pitch and concentricity deviation.
In figure 58 an example of the graphics pitch and concentricity deviations of
teeth with and without eccentricity are shown. This form of graphical repre-
sentation is determined by the gearing norm. Clearly visible are the differ-
ence between the two resulting graphs and therefore the significant influ-
ence of the eccentricity of the blank on pitch and concentricity deviations.
Acquisition of the tooth profile deviations Each tooth flank profile
(involute) on the circumference was probed (scan line) by one of the 8 cali-
pers d = 1.5 mm.
The scan line runs from the root radius to the tip radius of the tooth flank.
The density of points is 25 points per millimeter of the traversing. Measure-
ment and evaluation limits are specified in relation to the diameter result
diagrams. Also these profile measurements were performed in different Z-
heights of the teeth to illustrate the change of the tooth geometry [128].
The measurement and probing for the profile measurement is shown in fig-
ures 59, 60.
Figure 58 Pitch / Concentricity Deviation w/o and with Eccentricity
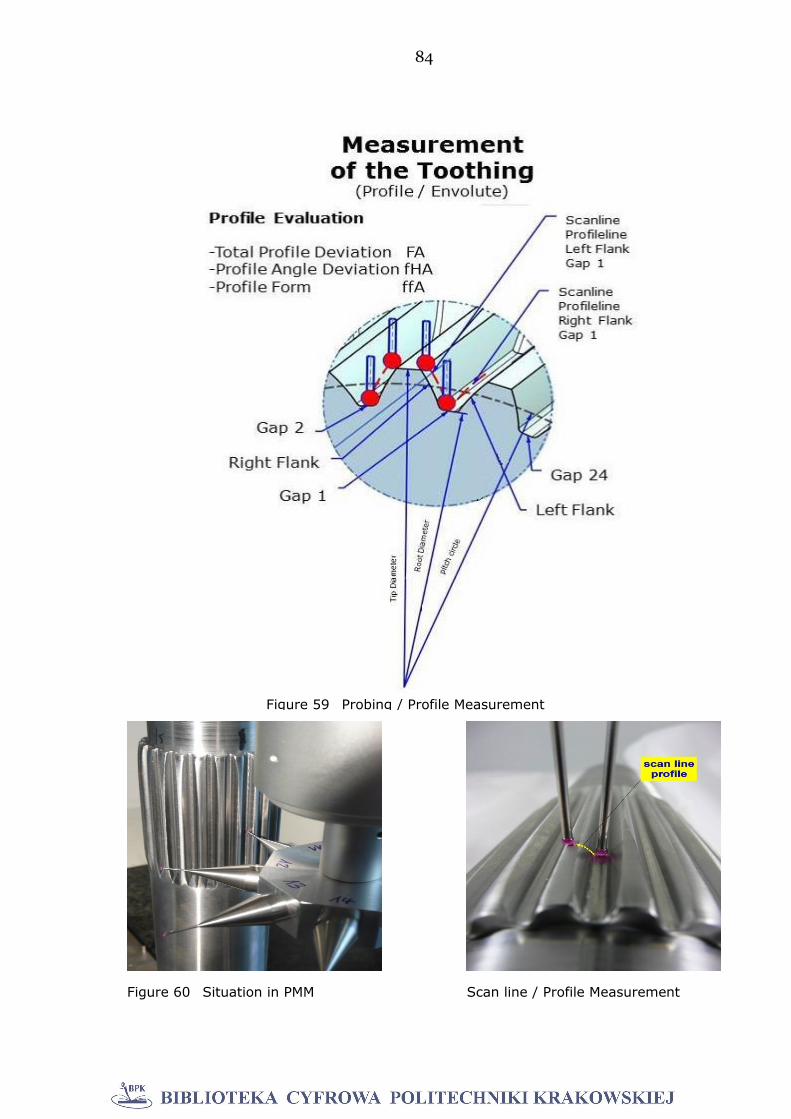
84
Figure 60 Situation in PMM Scan line / Profile Measurement
Figure 59 Probing / Profile Measurement
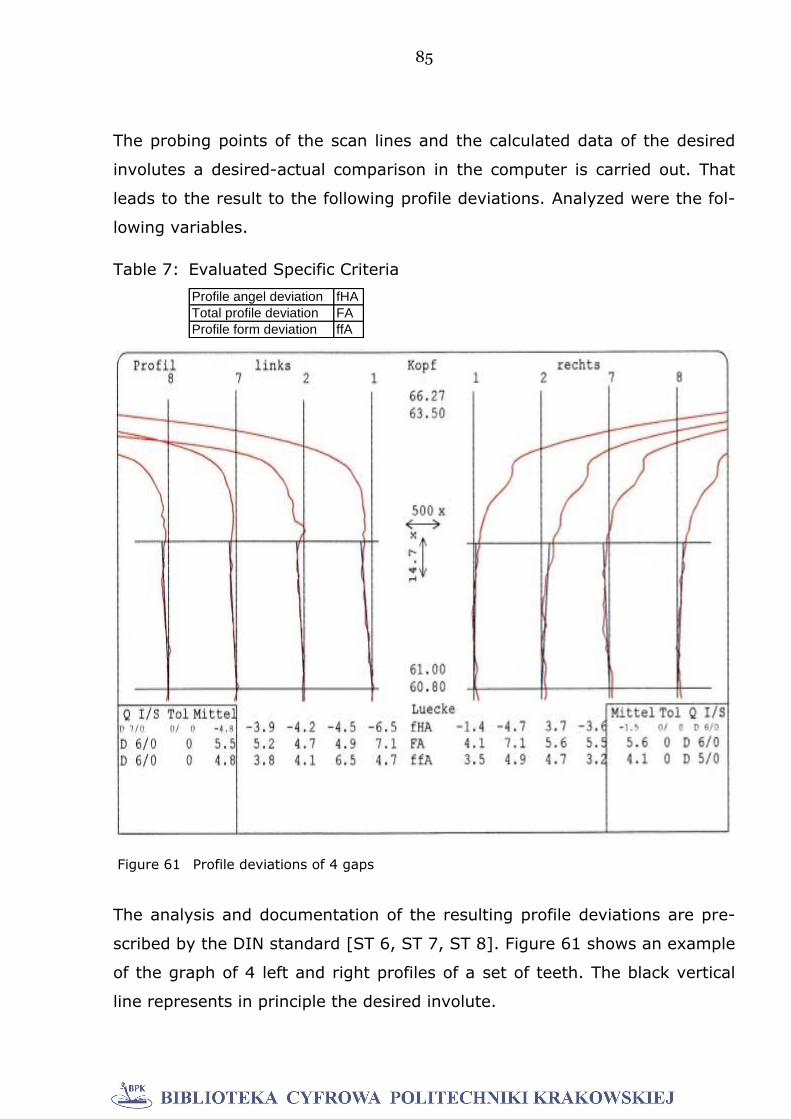
85
The probing points of the scan lines and the calculated data of the desired
involutes a desired-actual comparison in the computer is carried out. That
leads to the result to the following profile deviations. Analyzed were the fol-
lowing variables.
Table 7: Evaluated Specific Criteria
Profile angel deviation fHA
Total profile deviation FA
Profile form deviation ffA
The analysis and documentation of the resulting profile deviations are pre-
scribed by the DIN standard [ST 6, ST 7, ST 8]. Figure 61 shows an example
of the graph of 4 left and right profiles of a set of teeth. The black vertical
line represents in principle the desired involute.
Figure 61 Profile deviations of 4 gaps
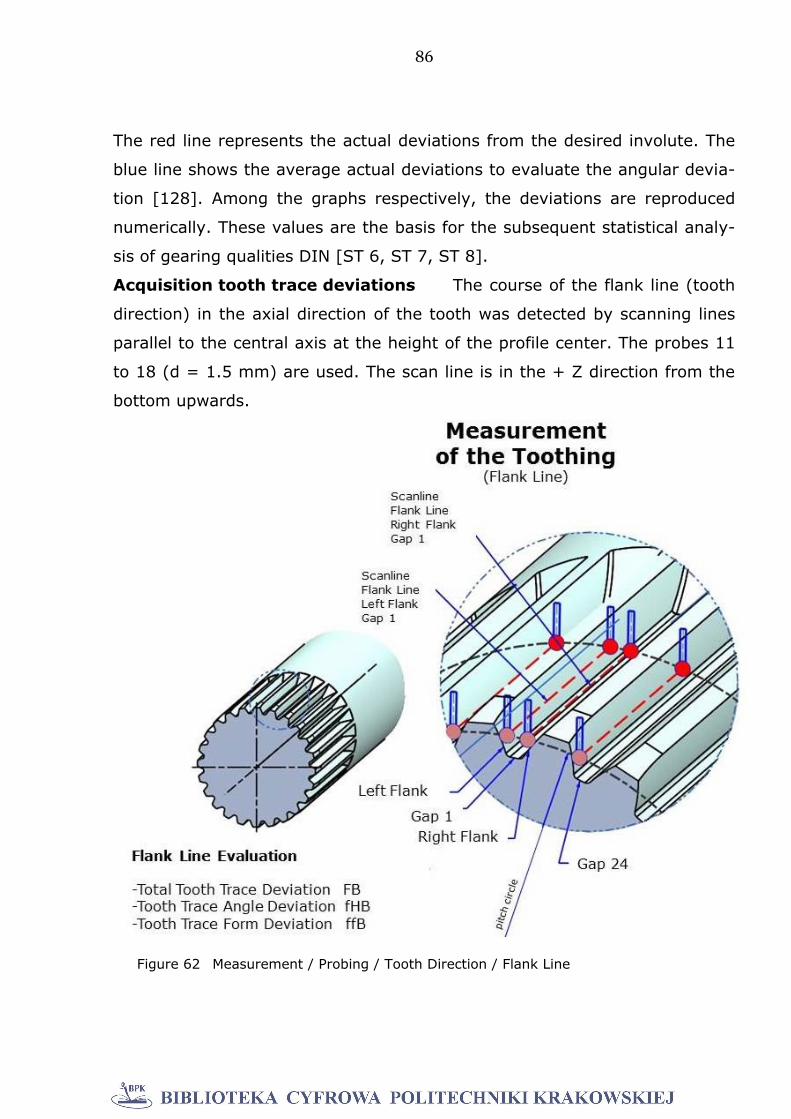
86
The red line represents the actual deviations from the desired involute. The
blue line shows the average actual deviations to evaluate the angular devia-
tion [128]. Among the graphs respectively, the deviations are reproduced
numerically. These values are the basis for the subsequent statistical analy-
sis of gearing qualities DIN [ST 6, ST 7, ST 8].
Acquisition tooth trace deviations The course of the flank line (tooth
direction) in the axial direction of the tooth was detected by scanning lines
parallel to the central axis at the height of the profile center. The probes 11
to 18 (d = 1.5 mm) are used. The scan line is in the + Z direction from the
bottom upwards.
Figure 62 Measurement / Probing / Tooth Direction / Flank Line
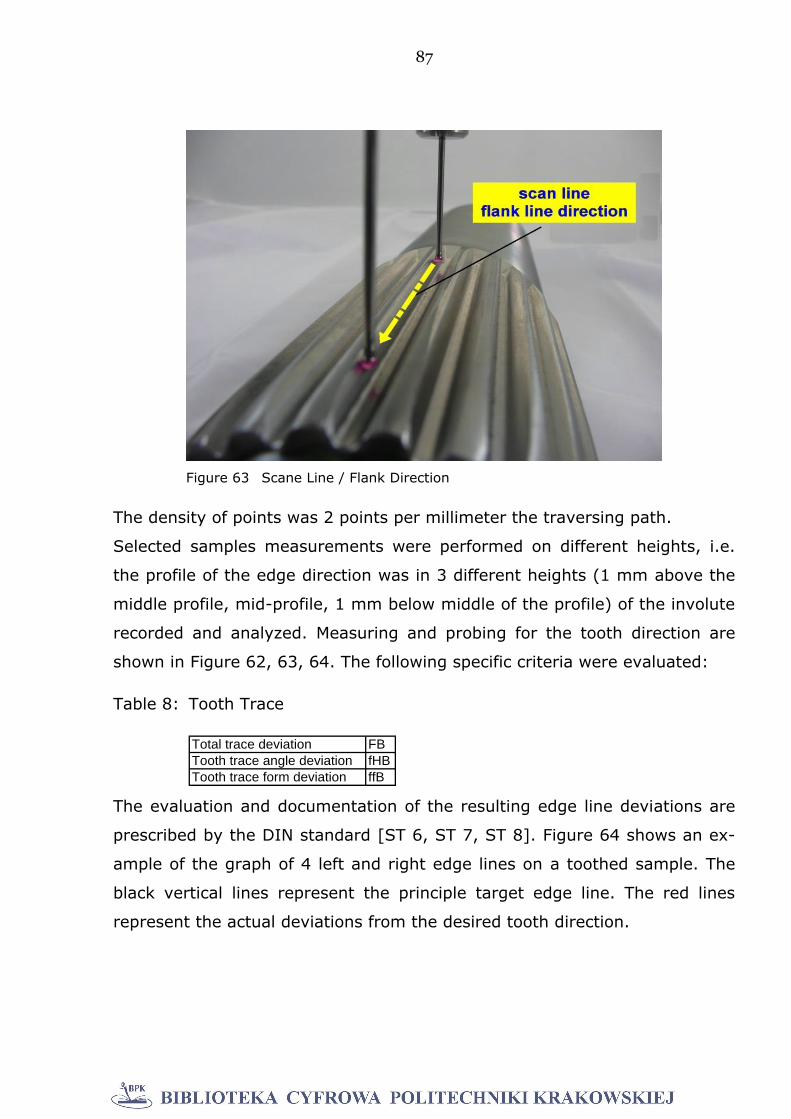
87
The density of points was 2 points per millimeter the traversing path.
Selected samples measurements were performed on different heights, i.e.
the profile of the edge direction was in 3 different heights (1 mm above the
middle profile, mid-profile, 1 mm below middle of the profile) of the involute
recorded and analyzed. Measuring and probing for the tooth direction are
shown in Figure 62, 63, 64. The following specific criteria were evaluated:
Table 8: Tooth Trace
Total trace deviation FB
Tooth trace angle deviation fHB
Tooth trace form deviation ffB
The evaluation and documentation of the resulting edge line deviations are
prescribed by the DIN standard [ST 6, ST 7, ST 8]. Figure 64 shows an ex-
ample of the graph of 4 left and right edge lines on a toothed sample. The
black vertical lines represent the principle target edge line. The red lines
represent the actual deviations from the desired tooth direction.
Figure 63 Scane Line / Flank Direction
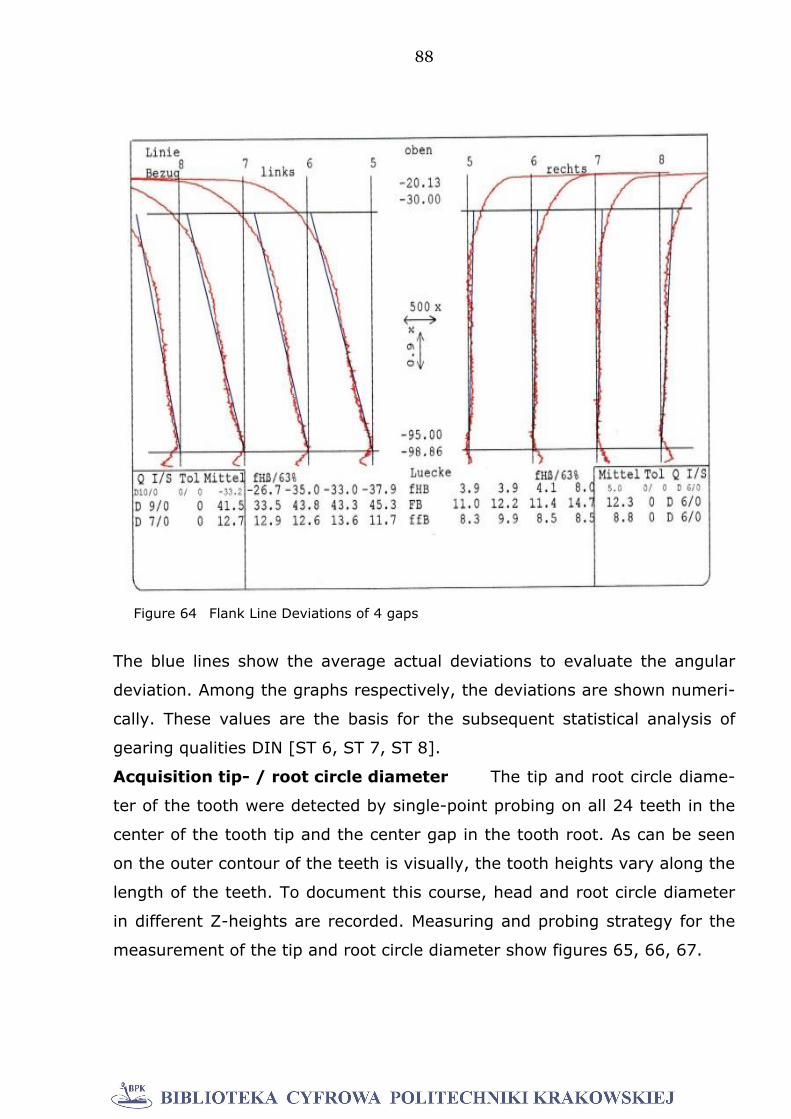
88
The blue lines show the average actual deviations to evaluate the angular
deviation. Among the graphs respectively, the deviations are shown numeri-
cally. These values are the basis for the subsequent statistical analysis of
gearing qualities DIN [ST 6, ST 7, ST 8].
Acquisition tip- / root circle diameter The tip and root circle diame-
ter of the tooth were detected by single-point probing on all 24 teeth in the
center of the tooth tip and the center gap in the tooth root. As can be seen
on the outer contour of the teeth is visually, the tooth heights vary along the
length of the teeth. To document this course, head and root circle diameter
in different Z-heights are recorded. Measuring and probing strategy for the
measurement of the tip and root circle diameter show figures 65, 66, 67.
Figure 64 Flank Line Deviations of 4 gaps
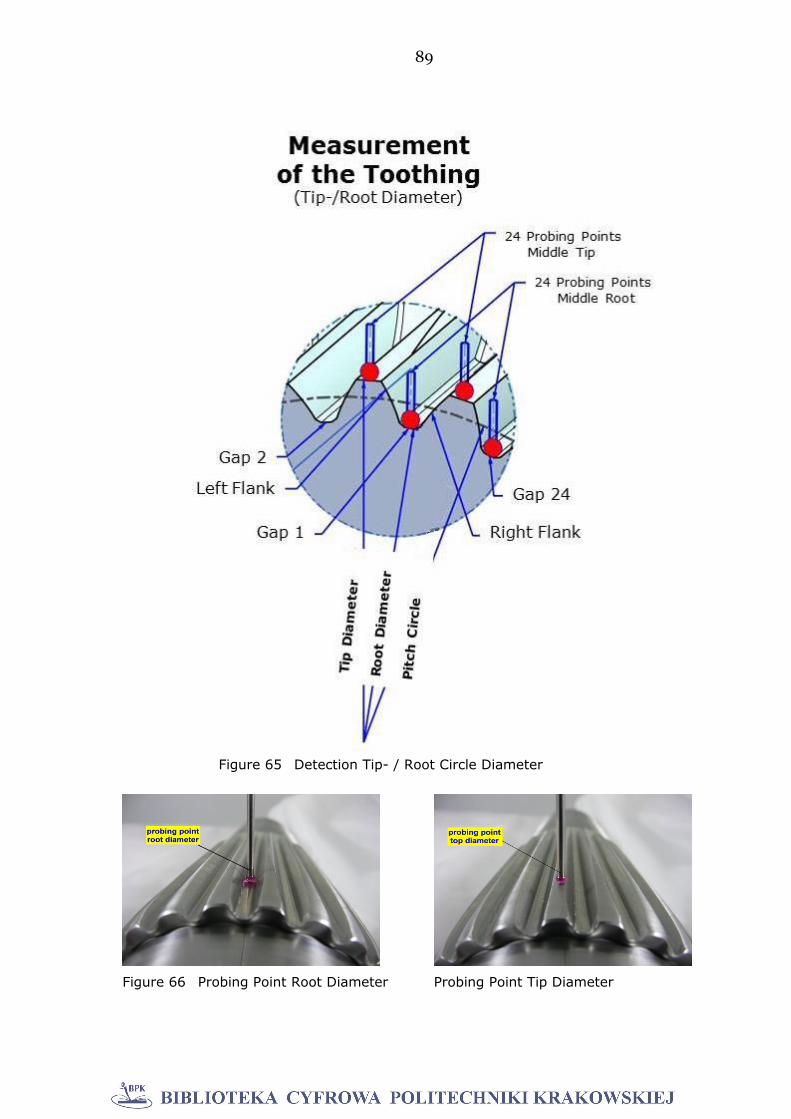
89
Figure 66 Probing Point Root Diameter Probing Point Tip Diameter
Figure 65 Detection Tip- / Root Circle Diameter
90
The 24 probing points were grouped to form a circle and its roundness is
evaluated and documented according to DIN and ISO 1101 [ST 16]. The re-
sults of tip and root circle diameter represent the diagrams in figure 68.
All above mentioned quality features of toothing, pitch/concentricity devia-
tion, root diameter/roundness, tip diameter/roundness, tooth trace deviation
and profile deviation are shown in appendix 2 for all 24 teeth, exemplary for
the sample 07. There was no specific reason to choose sample 07. The re-
sults of all other samples look more or less identical.
Figure 67 Situation in PMM
Figure 68 Tip circle diameter Root circle diameter
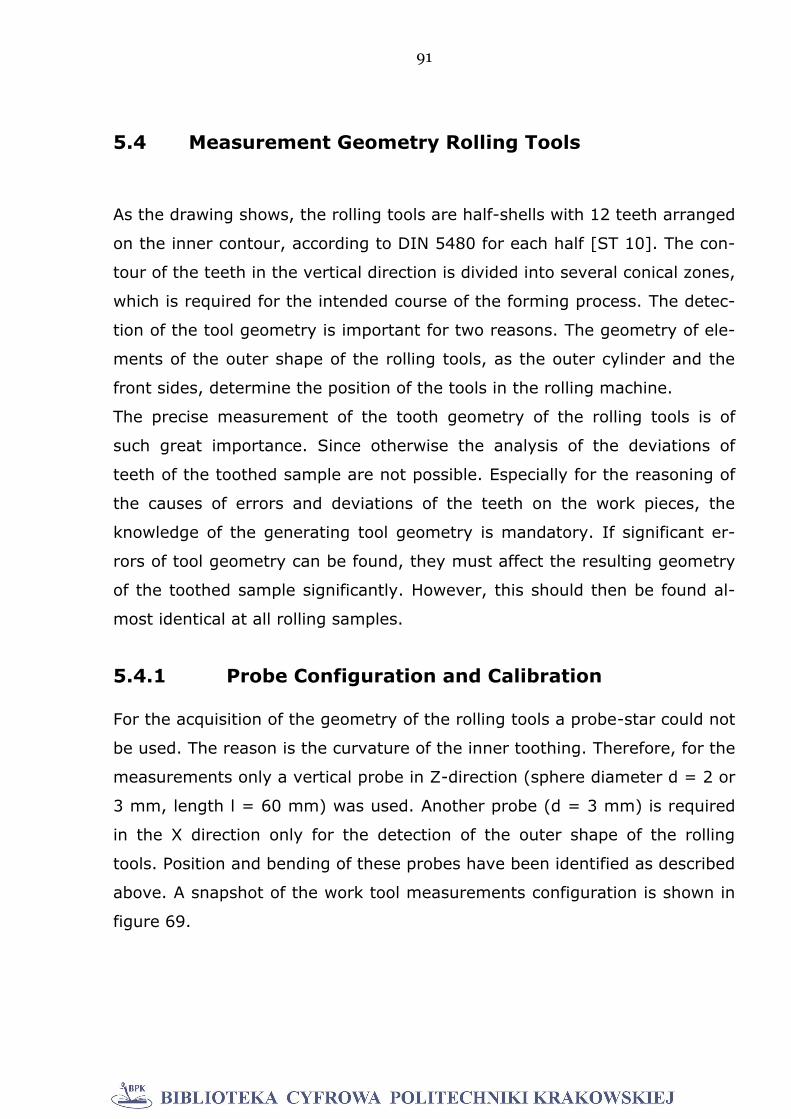
91
5.4 Measurement Geometry Rolling Tools
As the drawing shows, the rolling tools are half-shells with 12 teeth arranged
on the inner contour, according to DIN 5480 for each half [ST 10]. The con-
tour of the teeth in the vertical direction is divided into several conical zones,
which is required for the intended course of the forming process. The detec-
tion of the tool geometry is important for two reasons. The geometry of ele-
ments of the outer shape of the rolling tools, as the outer cylinder and the
front sides, determine the position of the tools in the rolling machine.
The precise measurement of the tooth geometry of the rolling tools is of
such great importance. Since otherwise the analysis of the deviations of
teeth of the toothed sample are not possible. Especially for the reasoning of
the causes of errors and deviations of the teeth on the work pieces, the
knowledge of the generating tool geometry is mandatory. If significant er-
rors of tool geometry can be found, they must affect the resulting geometry
of the toothed sample significantly. However, this should then be found al-
most identical at all rolling samples.
5.4.1 Probe Configuration and Calibration
For the acquisition of the geometry of the rolling tools a probe-star could not
be used. The reason is the curvature of the inner toothing. Therefore, for the
measurements only a vertical probe in Z-direction (sphere diameter d = 2 or
3 mm, length l = 60 mm) was used. Another probe (d = 3 mm) is required
in the X direction only for the detection of the outer shape of the rolling
tools. Position and bending of these probes have been identified as described
above. A snapshot of the work tool measurements configuration is shown in
figure 69.
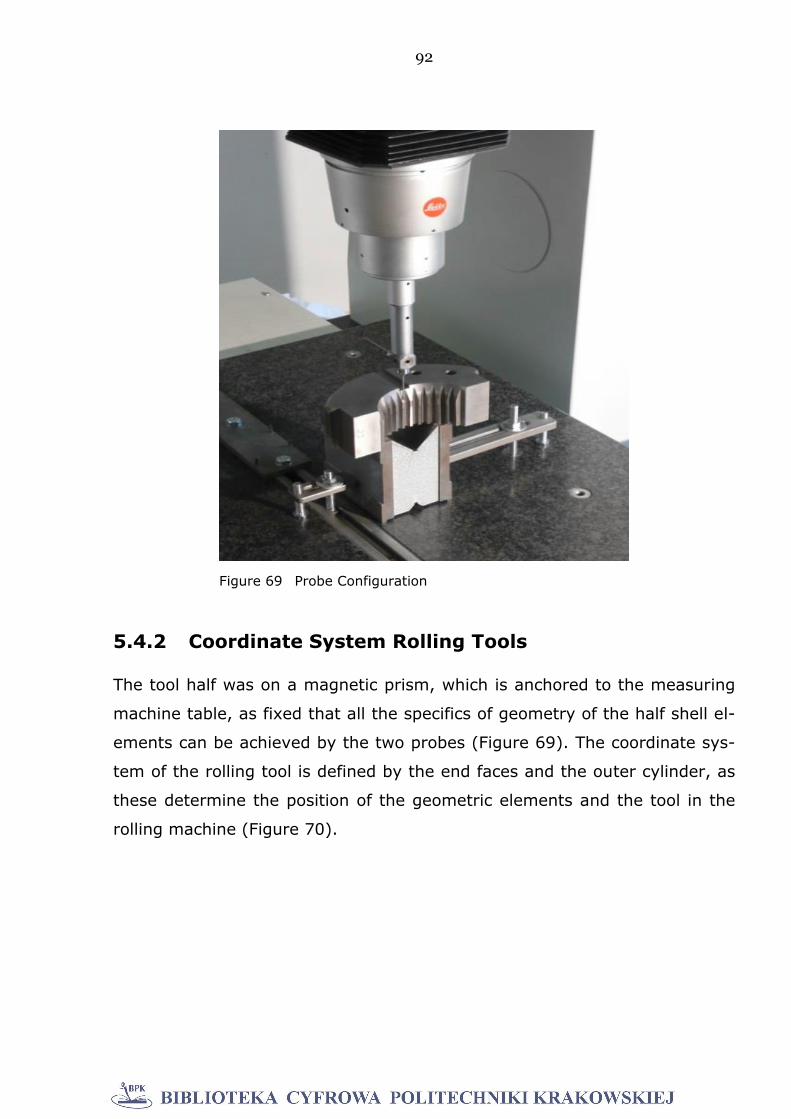
92
5.4.2 Coordinate System Rolling Tools
The tool half was on a magnetic prism, which is anchored to the measuring
machine table, as fixed that all the specifics of geometry of the half shell el-
ements can be achieved by the two probes (Figure 69). The coordinate sys-
tem of the rolling tool is defined by the end faces and the outer cylinder, as
these determine the position of the geometric elements and the tool in the
rolling machine (Figure 70).
Figure 69 Probe Configuration
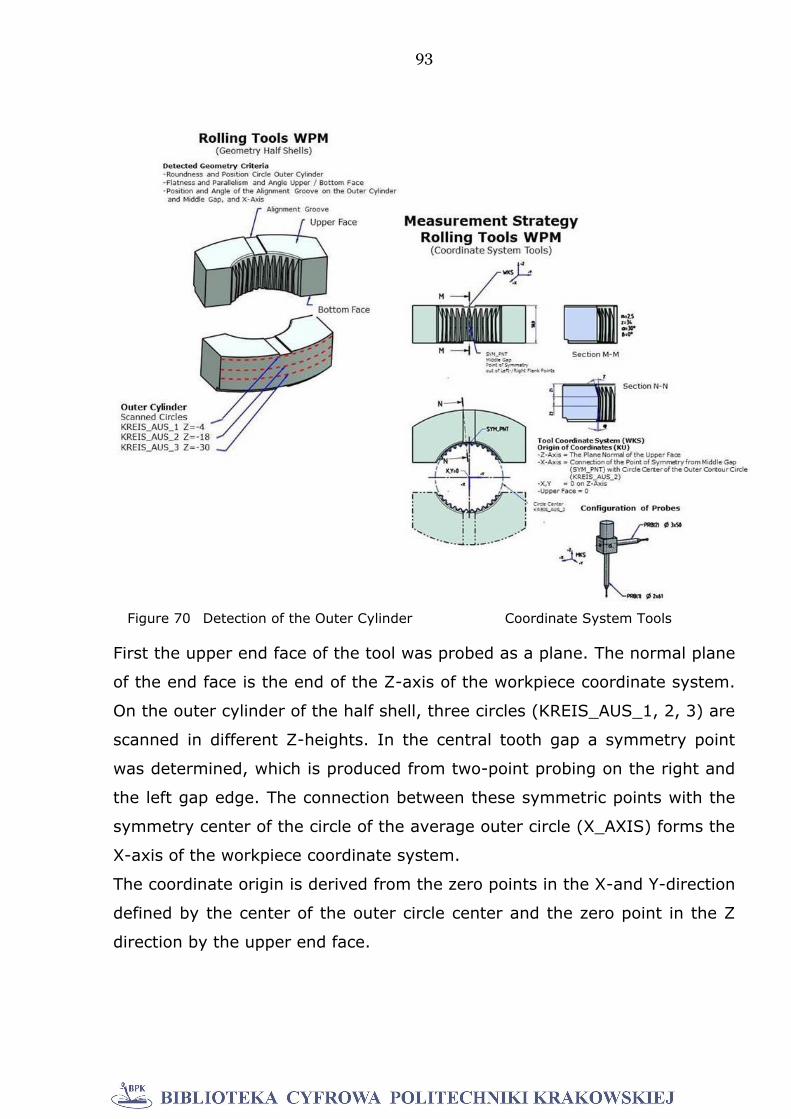
93
First the upper end face of the tool was probed as a plane. The normal plane
of the end face is the end of the Z-axis of the workpiece coordinate system.
On the outer cylinder of the half shell, three circles (KREIS_AUS_1, 2, 3) are
scanned in different Z-heights. In the central tooth gap a symmetry point
was determined, which is produced from two-point probing on the right and
the left gap edge. The connection between these symmetric points with the
symmetry center of the circle of the average outer circle (X_AXIS) forms the
X-axis of the workpiece coordinate system.
The coordinate origin is derived from the zero points in the X-and Y-direction
defined by the center of the outer circle center and the zero point in the Z
direction by the upper end face.
Figure 70 Detection of the Outer Cylinder Coordinate System Tools
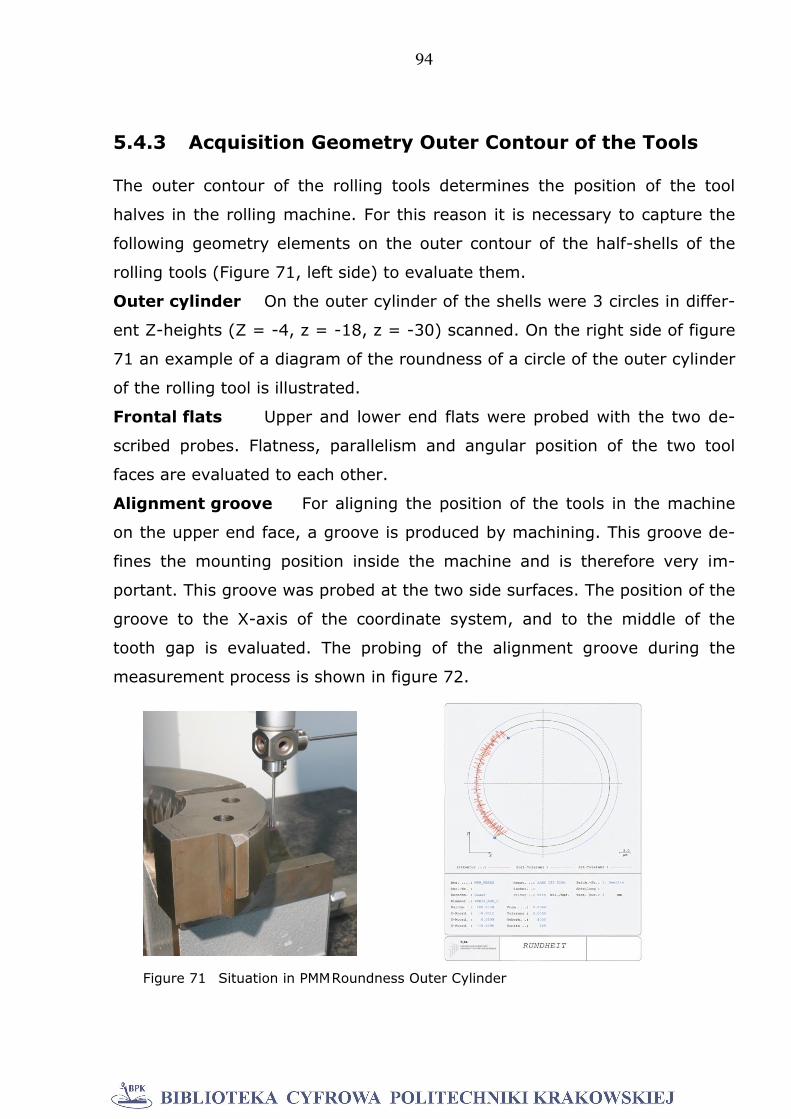
94
5.4.3 Acquisition Geometry Outer Contour of the Tools
The outer contour of the rolling tools determines the position of the tool
halves in the rolling machine. For this reason it is necessary to capture the
following geometry elements on the outer contour of the half-shells of the
rolling tools (Figure 71, left side) to evaluate them.
Outer cylinder On the outer cylinder of the shells were 3 circles in differ-
ent Z-heights (Z = -4, z = -18, z = -30) scanned. On the right side of figure
71 an example of a diagram of the roundness of a circle of the outer cylinder
of the rolling tool is illustrated.
Frontal flats Upper and lower end flats were probed with the two de-
scribed probes. Flatness, parallelism and angular position of the two tool
faces are evaluated to each other.
Alignment groove For aligning the position of the tools in the machine
on the upper end face, a groove is produced by machining. This groove de-
fines the mounting position inside the machine and is therefore very im-
portant. This groove was probed at the two side surfaces. The position of the
groove to the X-axis of the coordinate system, and to the middle of the
tooth gap is evaluated. The probing of the alignment groove during the
measurement process is shown in figure 72.
Figure 71 Situation in PMM Roundness Outer Cylinder
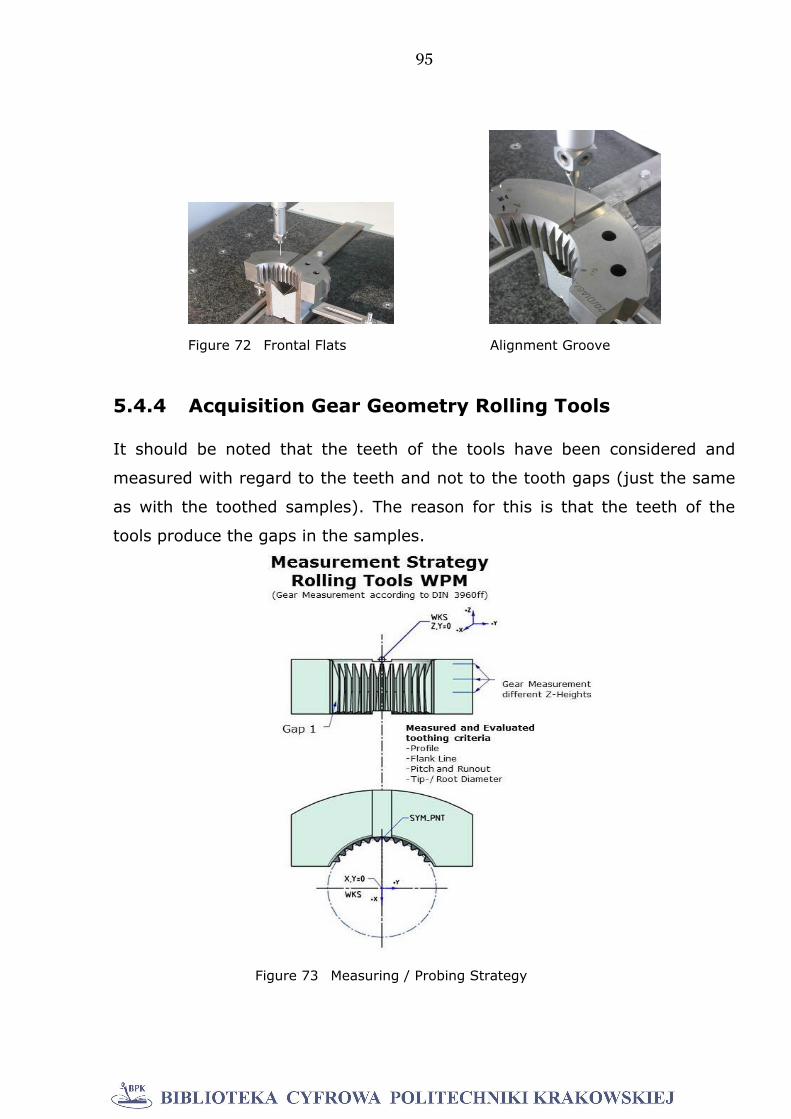
95
5.4.4 Acquisition Gear Geometry Rolling Tools
It should be noted that the teeth of the tools have been considered and
measured with regard to the teeth and not to the tooth gaps (just the same
as with the toothed samples). The reason for this is that the teeth of the
tools produce the gaps in the samples.
Figure 72 Frontal Flats Alignment Groove
Figure 73 Measuring / Probing Strategy
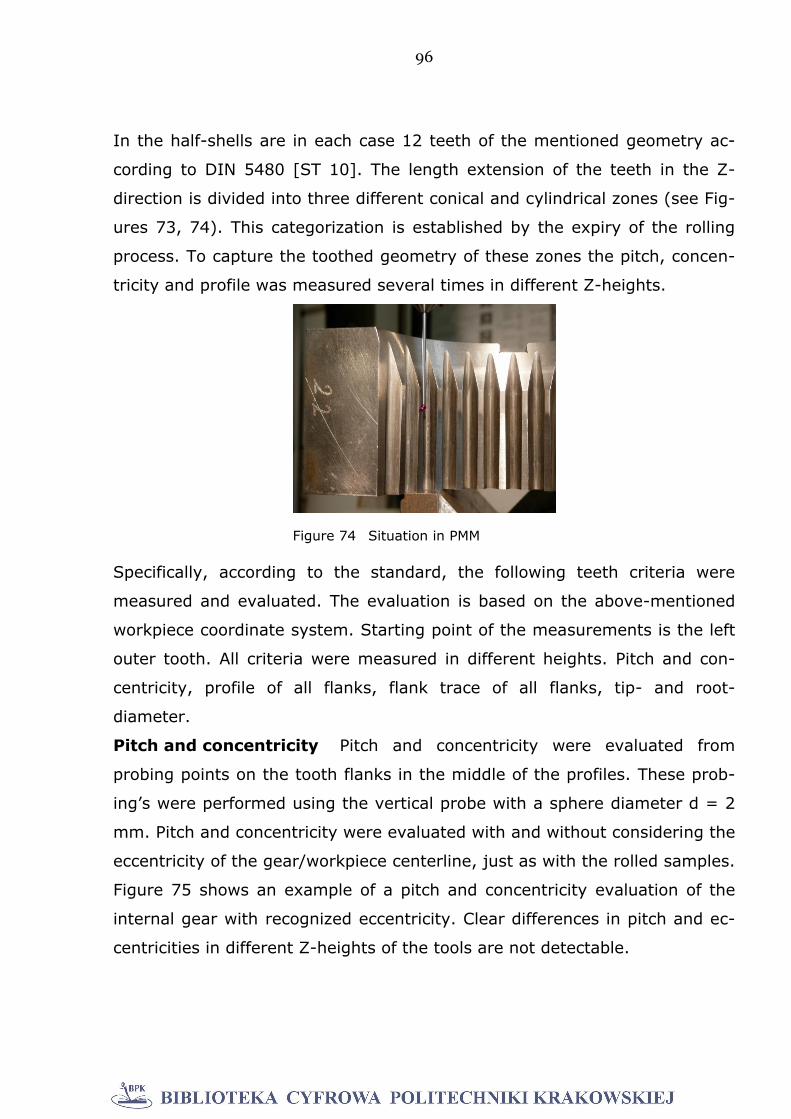
96
In the half-shells are in each case 12 teeth of the mentioned geometry ac-
cording to DIN 5480 [ST 10]. The length extension of the teeth in the Z-
direction is divided into three different conical and cylindrical zones (see Fig-
ures 73, 74). This categorization is established by the expiry of the rolling
process. To capture the toothed geometry of these zones the pitch, concen-
tricity and profile was measured several times in different Z-heights.
Specifically, according to the standard, the following teeth criteria were
measured and evaluated. The evaluation is based on the above-mentioned
workpiece coordinate system. Starting point of the measurements is the left
outer tooth. All criteria were measured in different heights. Pitch and con-
centricity, profile of all flanks, flank trace of all flanks, tip- and root-
diameter.
Pitch and concentricity Pitch and concentricity were evaluated from
probing points on the tooth flanks in the middle of the profiles. These prob-
ing’s were performed using the vertical probe with a sphere diameter d = 2
mm. Pitch and concentricity were evaluated with and without considering the
eccentricity of the gear/workpiece centerline, just as with the rolled samples.
Figure 75 shows an example of a pitch and concentricity evaluation of the
internal gear with recognized eccentricity. Clear differences in pitch and ec-
centricities in different Z-heights of the tools are not detectable.
Figure 74 Situation in PMM
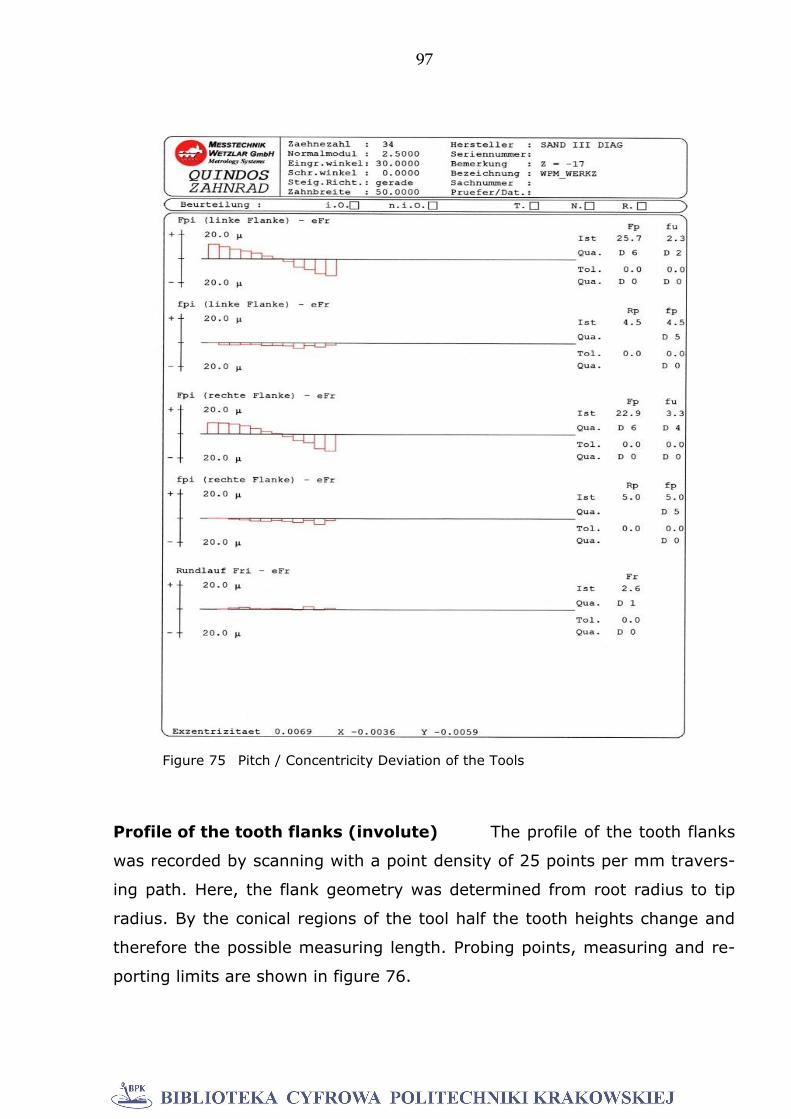
97
Profile of the tooth flanks (involute) The profile of the tooth flanks
was recorded by scanning with a point density of 25 points per mm travers-
ing path. Here, the flank geometry was determined from root radius to tip
radius. By the conical regions of the tool half the tooth heights change and
therefore the possible measuring length. Probing points, measuring and re-
porting limits are shown in figure 76.
Figure 75 Pitch / Concentricity Deviation of the Tools
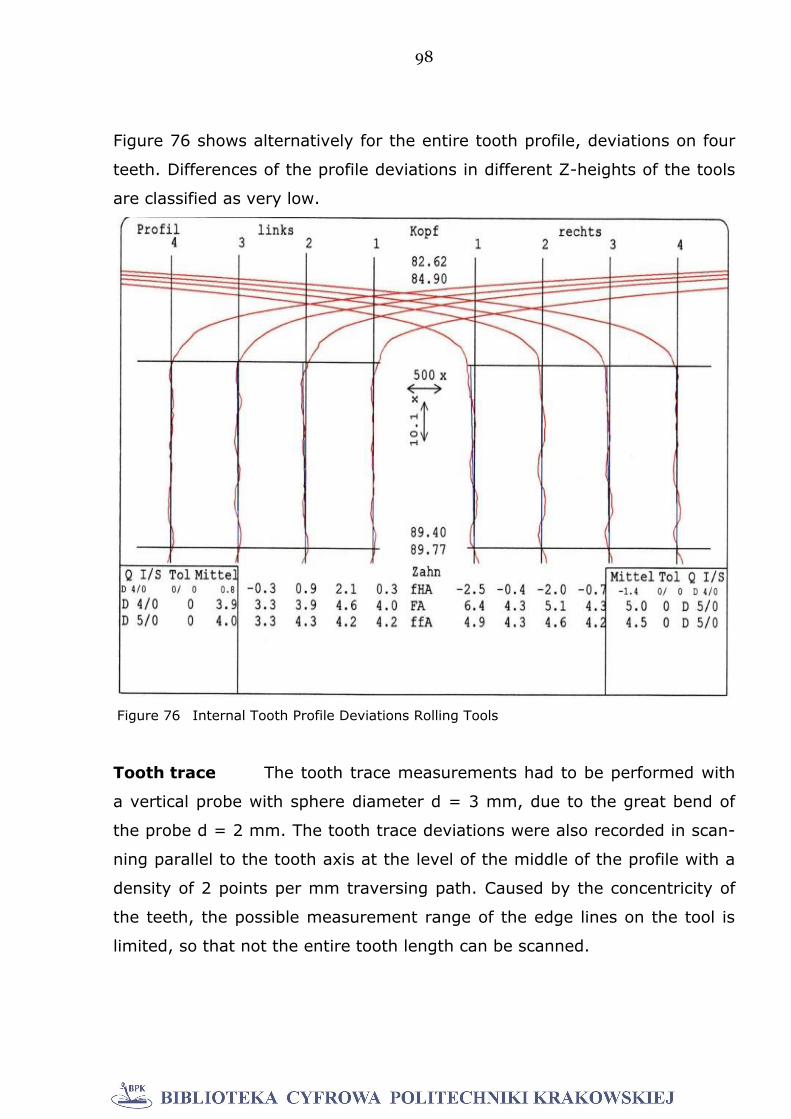
98
Figure 76 shows alternatively for the entire tooth profile, deviations on four
teeth. Differences of the profile deviations in different Z-heights of the tools
are classified as very low.
Tooth trace The tooth trace measurements had to be performed with
a vertical probe with sphere diameter d = 3 mm, due to the great bend of
the probe d = 2 mm. The tooth trace deviations were also recorded in scan-
ning parallel to the tooth axis at the level of the middle of the profile with a
density of 2 points per mm traversing path. Caused by the concentricity of
the teeth, the possible measurement range of the edge lines on the tool is
limited, so that not the entire tooth length can be scanned.
Figure 76 Internal Tooth Profile Deviations Rolling Tools
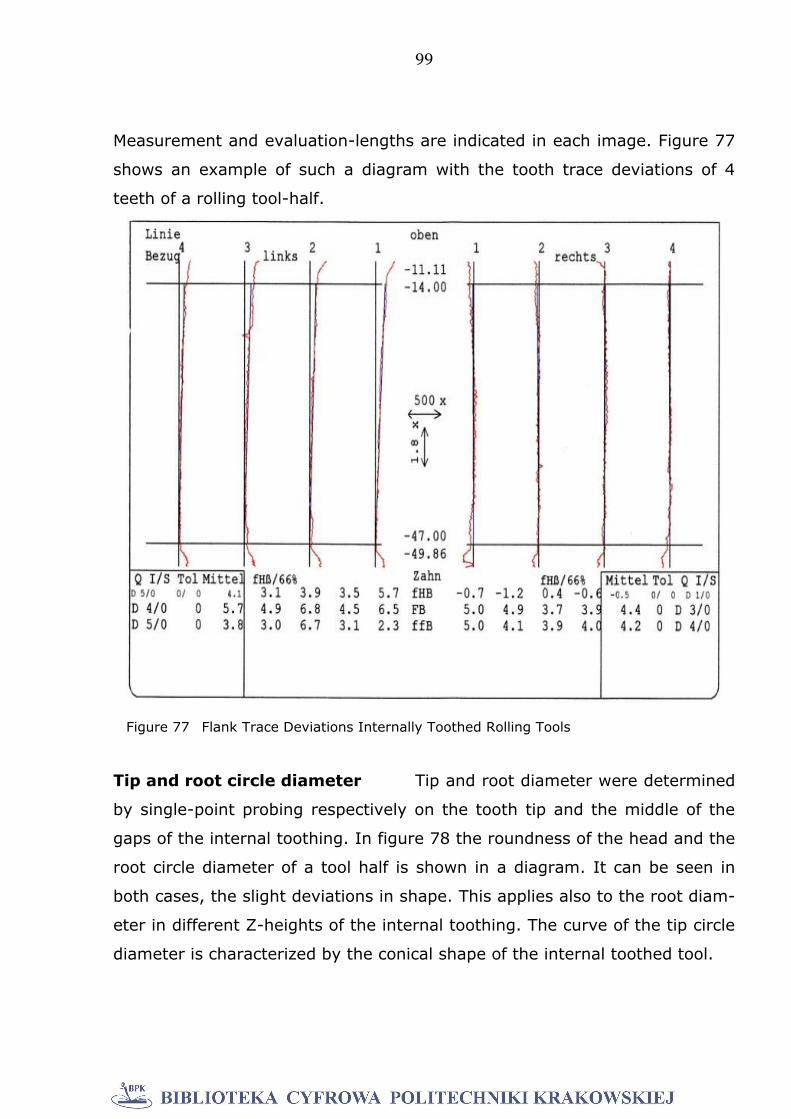
99
Measurement and evaluation-lengths are indicated in each image. Figure 77
shows an example of such a diagram with the tooth trace deviations of 4
teeth of a rolling tool-half.
Tip and root circle diameter Tip and root diameter were determined
by single-point probing respectively on the tooth tip and the middle of the
gaps of the internal toothing. In figure 78 the roundness of the head and the
root circle diameter of a tool half is shown in a diagram. It can be seen in
both cases, the slight deviations in shape. This applies also to the root diam-
eter in different Z-heights of the internal toothing. The curve of the tip circle
diameter is characterized by the conical shape of the internal toothed tool.
Figure 77 Flank Trace Deviations Internally Toothed Rolling Tools
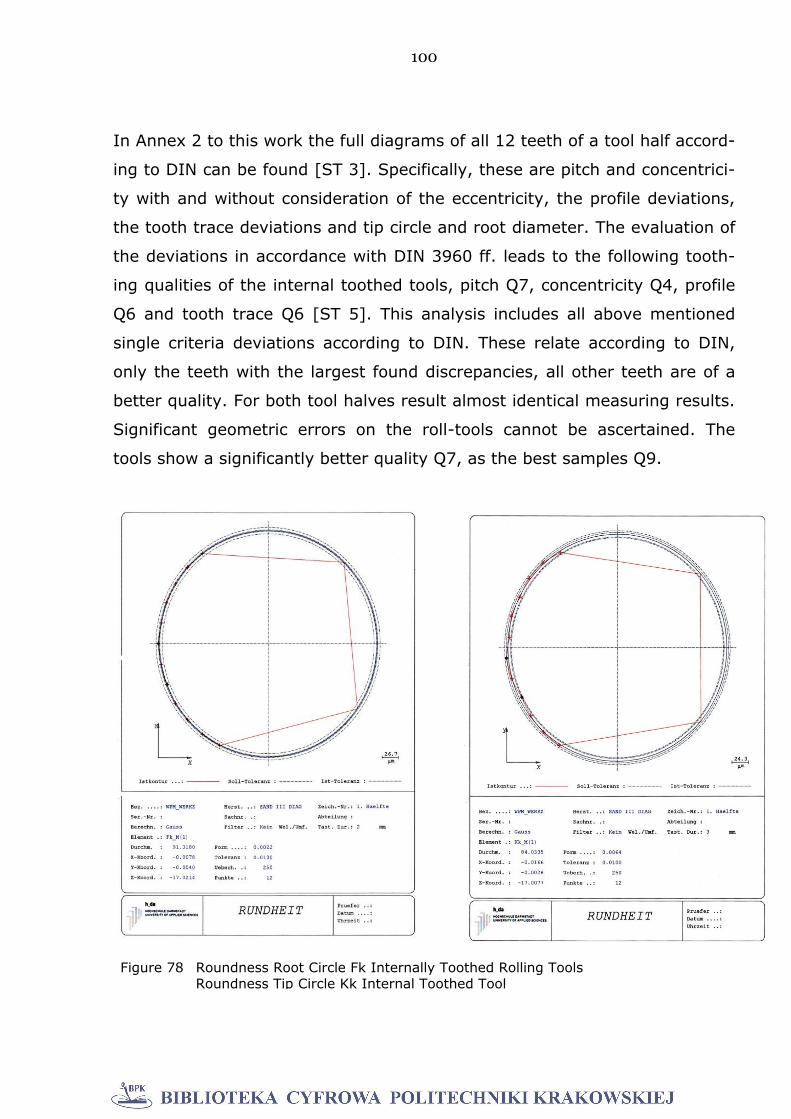
100
In Annex 2 to this work the full diagrams of all 12 teeth of a tool half accord-
ing to DIN can be found [ST 3]. Specifically, these are pitch and concentrici-
ty with and without consideration of the eccentricity, the profile deviations,
the tooth trace deviations and tip circle and root diameter. The evaluation of
the deviations in accordance with DIN 3960 ff. leads to the following tooth-
ing qualities of the internal toothed tools, pitch Q7, concentricity Q4, profile
Q6 and tooth trace Q6 [ST 5]. This analysis includes all above mentioned
single criteria deviations according to DIN. These relate according to DIN,
only the teeth with the largest found discrepancies, all other teeth are of a
better quality. For both tool halves result almost identical measuring results.
Significant geometric errors on the roll-tools cannot be ascertained. The
tools show a significantly better quality Q7, as the best samples Q9.
Figure 78 Roundness Root Circle Fk Internally Toothed Rolling Tools
Roundness Tip Circle Kk Internal Toothed Tool
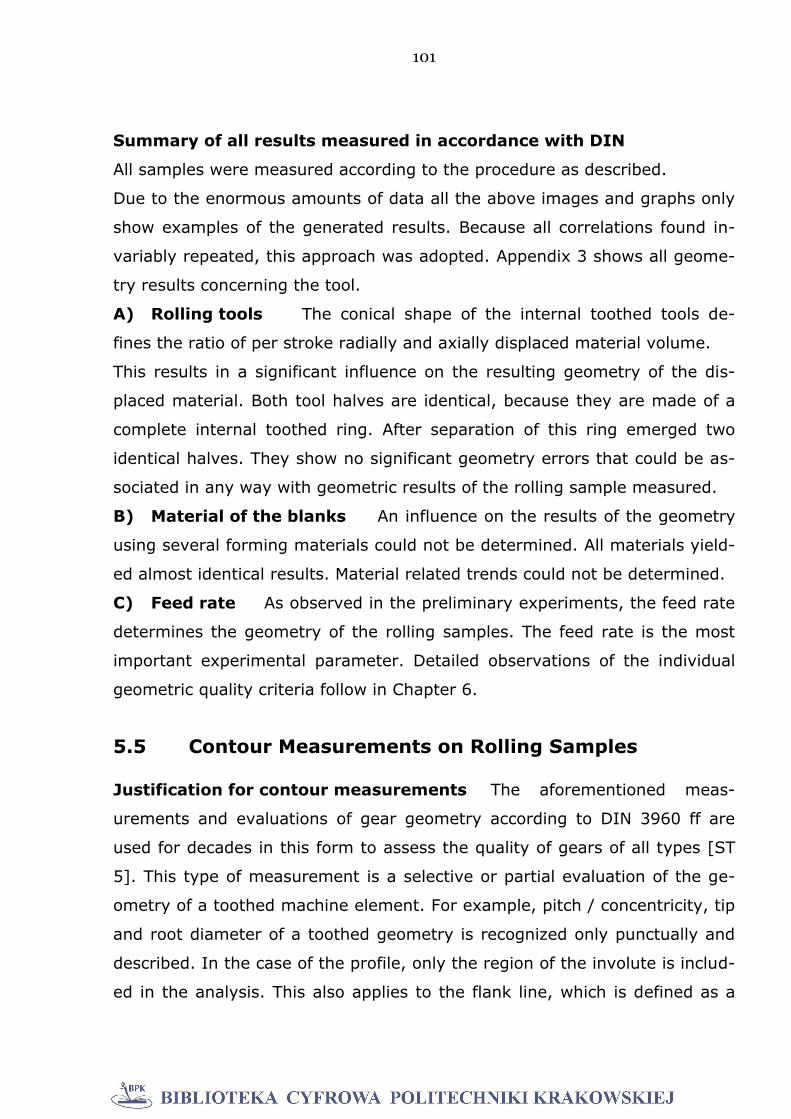
101
Summary of all results measured in accordance with DIN
All samples were measured according to the procedure as described.
Due to the enormous amounts of data all the above images and graphs only
show examples of the generated results. Because all correlations found in-
variably repeated, this approach was adopted. Appendix 3 shows all geome-
try results concerning the tool.
A) Rolling tools The conical shape of the internal toothed tools de-
fines the ratio of per stroke radially and axially displaced material volume.
This results in a significant influence on the resulting geometry of the dis-
placed material. Both tool halves are identical, because they are made of a
complete internal toothed ring. After separation of this ring emerged two
identical halves. They show no significant geometry errors that could be as-
sociated in any way with geometric results of the rolling sample measured.
B) Material of the blanks An influence on the results of the geometry
using several forming materials could not be determined. All materials yield-
ed almost identical results. Material related trends could not be determined.
C) Feed rate As observed in the preliminary experiments, the feed rate
determines the geometry of the rolling samples. The feed rate is the most
important experimental parameter. Detailed observations of the individual
geometric quality criteria follow in Chapter 6.
5.5 Contour Measurements on Rolling Samples
Justification for contour measurements The aforementioned meas-
urements and evaluations of gear geometry according to DIN 3960 ff are
used for decades in this form to assess the quality of gears of all types [ST
5]. This type of measurement is a selective or partial evaluation of the ge-
ometry of a toothed machine element. For example, pitch / concentricity, tip
and root diameter of a toothed geometry is recognized only punctually and
described. In the case of the profile, only the region of the involute is includ-
ed in the analysis. This also applies to the flank line, which is defined as a
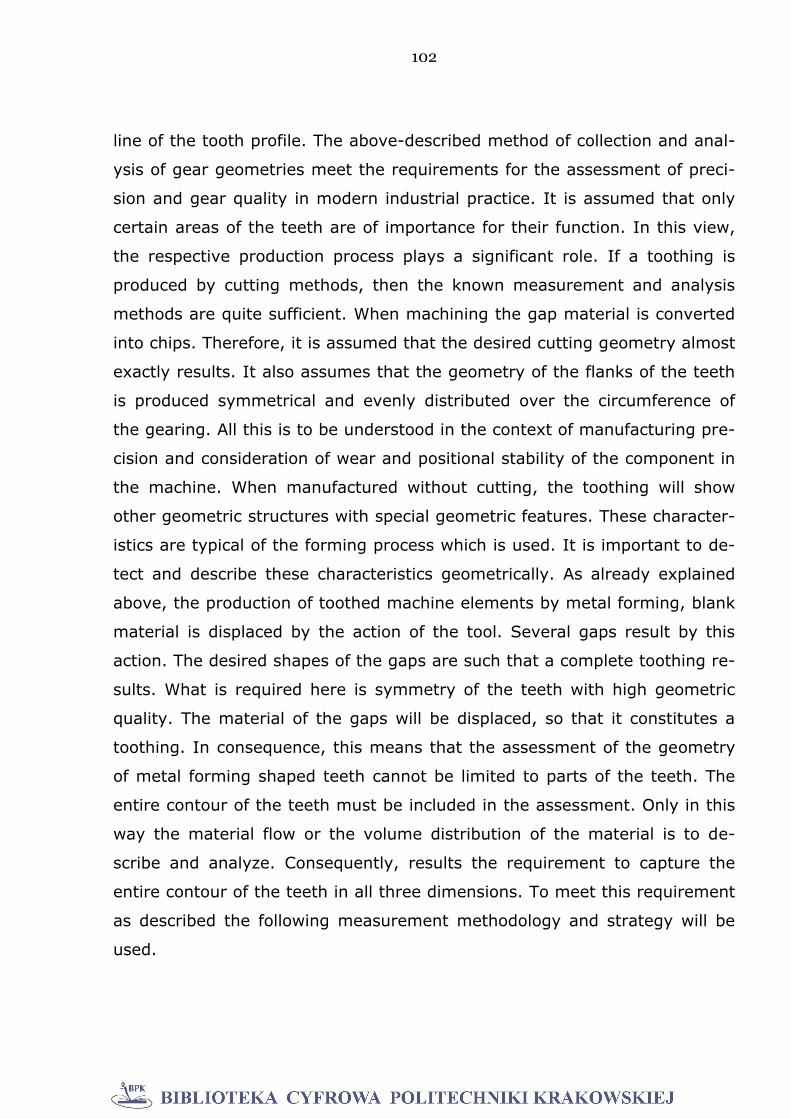
102
line of the tooth profile. The above-described method of collection and anal-
ysis of gear geometries meet the requirements for the assessment of preci-
sion and gear quality in modern industrial practice. It is assumed that only
certain areas of the teeth are of importance for their function. In this view,
the respective production process plays a significant role. If a toothing is
produced by cutting methods, then the known measurement and analysis
methods are quite sufficient. When machining the gap material is converted
into chips. Therefore, it is assumed that the desired cutting geometry almost
exactly results. It also assumes that the geometry of the flanks of the teeth
is produced symmetrical and evenly distributed over the circumference of
the gearing. All this is to be understood in the context of manufacturing pre-
cision and consideration of wear and positional stability of the component in
the machine. When manufactured without cutting, the toothing will show
other geometric structures with special geometric features. These character-
istics are typical of the forming process which is used. It is important to de-
tect and describe these characteristics geometrically. As already explained
above, the production of toothed machine elements by metal forming, blank
material is displaced by the action of the tool. Several gaps result by this
action. The desired shapes of the gaps are such that a complete toothing re-
sults. What is required here is symmetry of the teeth with high geometric
quality. The material of the gaps will be displaced, so that it constitutes a
toothing. In consequence, this means that the assessment of the geometry
of metal forming shaped teeth cannot be limited to parts of the teeth. The
entire contour of the teeth must be included in the assessment. Only in this
way the material flow or the volume distribution of the material is to de-
scribe and analyze. Consequently, results the requirement to capture the
entire contour of the teeth in all three dimensions. To meet this requirement
as described the following measurement methodology and strategy will be
used.

103
5.5.1 Contour Measurements Rolling Samples
Probe configuration and calibration Central requirement for the
contour detection was to detect the contour in all axial regions of the respec-
tive toothing. Therefore e.g. the narrow tooth root area was measured with
small sphere radii. For this purpose, a probe-star with 8 horizontal star-
shaped probes (sphere diameter d = 1.5 mm) and a vertical probe (d = 5
mm) had to be used. This probe-star was already used in the gear meas-
urement on the rolling samples. This probe calibration has already been ex-
plained in section 5.3.1.
Workpiece coordinate system To compare the measurements in
accordance to DIN, for the contour measurements an identical workpiece
coordinate system had to be used [ST 6, ST 7, ST 8]. The workpiece center
axis forms the z-axis of the coordinate system, X-and Y-axes correspond to
the axes of the machine coordinate system, the zero points in the X and Y
direction are located on the Z-axis, the zero point in the Z-direction lies on
the upper end face of the roll sample. The determination of the workpiece
coordinate system is described in detail in section 5.2.1.
Acquisition of the contour cuts rolling samples The clamping situa-
tion of the workpiece on the table of the PMM and the probe configuration is
already shown in figure 49. This arrangement has been retained. The con-
tour sections were scanned as two-dimensional contours in the XY plane
(Figure 79, 80).
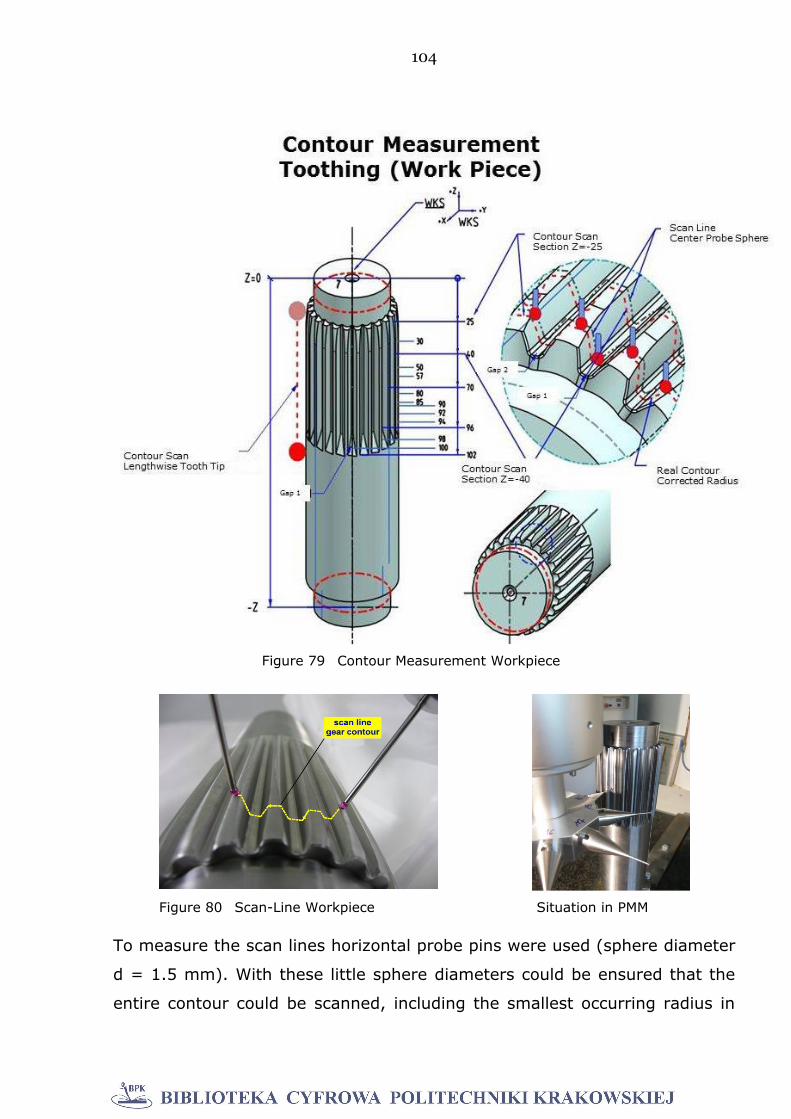
104
To measure the scan lines horizontal probe pins were used (sphere diameter
d = 1.5 mm). With these little sphere diameters could be ensured that the
entire contour could be scanned, including the smallest occurring radius in
Figure 80 Scan-Line Workpiece Situation in PMM
Figure 79 Contour Measurement Workpiece
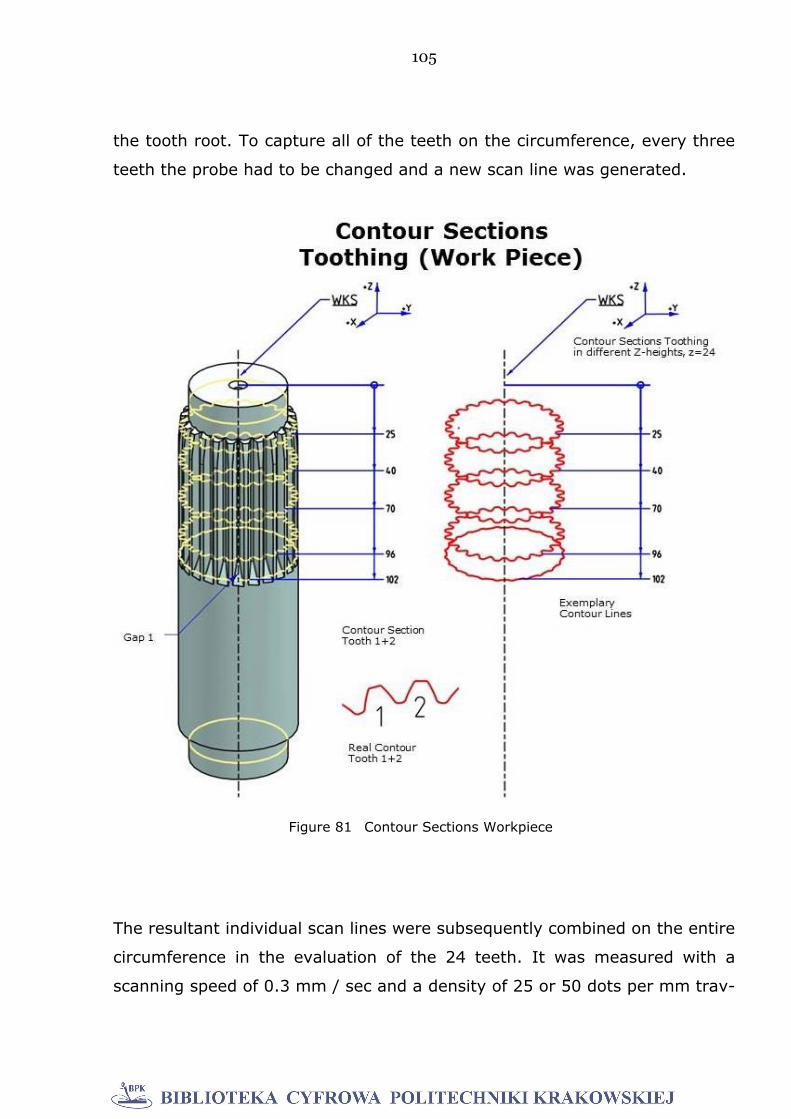
105
the tooth root. To capture all of the teeth on the circumference, every three
teeth the probe had to be changed and a new scan line was generated.
The resultant individual scan lines were subsequently combined on the entire
circumference in the evaluation of the 24 teeth. It was measured with a
scanning speed of 0.3 mm / sec and a density of 25 or 50 dots per mm trav-
Figure 81 Contour Sections Workpiece
106
erse path. Preliminary tests for the selection of point density had revealed
that with 50 points per mm traverse path, compared to 25 points, no signifi-
cant improvement of the informational value of the measurements was
achieved (Figure 81).
The scan lines of the individual teeth were measured with a dot density of 50
dots per millimeter traversing path. The related time involved was taken into
account, as only these specific geometric problems could be analyzed. Ap-
propriate preliminary experiments led to this discovery.
Thus generated contour cuts of the toothing in the XY plane of the workpiece
coordinate system are shown in figure 81. In all representations of the work
pieces can be seen visually that the geometry of the gear changes in the
longitudinal direction (Z-direction). This is caused by the flow of material
during the rolling of the teeth. This geometric feature is also dependent on
the rolling parameters. To capture these specific metrological, various sec-
tions were scanned on the length of the teeth in different Z-heights.
The axial position of these sections was unevenly distributed over the entire
length. Cuts were performed in the following Z-heights Z = - 20, - 25, - 30,
- 40, - 50, - 57, - 70, - 80, - 85, - 90, - 92, - 94, - 96, - 98, - 100, - 102.
Thereby the contour of the teeth over the entire axial extent is detected. Es-
pecially in the axial zones in which geometric features can be recognized
visually, contour cuts were laid. The axial position of the cuts starts at - 20,
because starting from the end face Z = 0 at the toothing - 20 starts in ac-
cordance with the position of the workpiece coordinate system. In the initial
region of the sample at the upper collar cuts were set closely spaced, since
the tooth geometry is subject to changes over the length. Largest contour
changes over a short length can be seen visually in the forming area at the
lower end of the toothing.
In the middle part of the tooth length the tooth geometry is over a greater
length approximately constant.
In figure 82 an example of the contour cutting of tooth 1 to 5 of a tooth from
the middle region (Z = - 57) is mapped to the corresponding explanations.
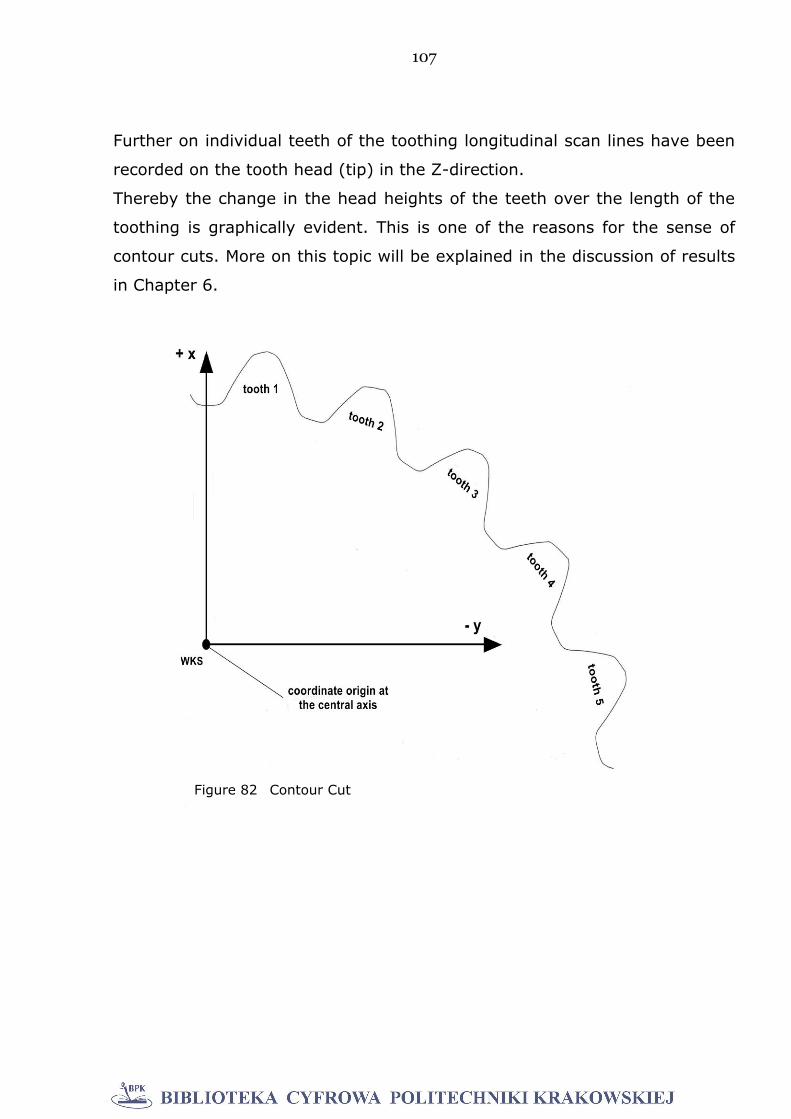
107
Further on individual teeth of the toothing longitudinal scan lines have been
recorded on the tooth head (tip) in the Z-direction.
Thereby the change in the head heights of the teeth over the length of the
toothing is graphically evident. This is one of the reasons for the sense of
contour cuts. More on this topic will be explained in the discussion of results
in Chapter 6.
Figure 82 Contour Cut
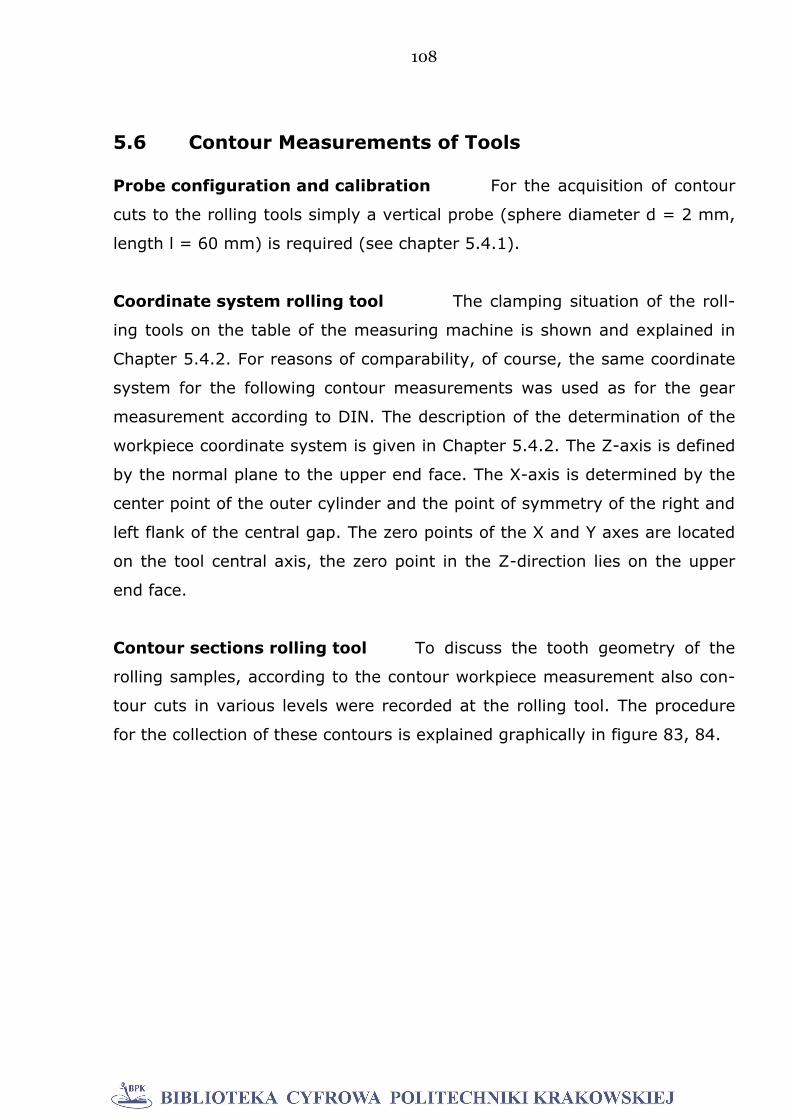
108
5.6 Contour Measurements of Tools
Probe configuration and calibration For the acquisition of contour
cuts to the rolling tools simply a vertical probe (sphere diameter d = 2 mm,
length l = 60 mm) is required (see chapter 5.4.1).
Coordinate system rolling tool The clamping situation of the roll-
ing tools on the table of the measuring machine is shown and explained in
Chapter 5.4.2. For reasons of comparability, of course, the same coordinate
system for the following contour measurements was used as for the gear
measurement according to DIN. The description of the determination of the
workpiece coordinate system is given in Chapter 5.4.2. The Z-axis is defined
by the normal plane to the upper end face. The X-axis is determined by the
center point of the outer cylinder and the point of symmetry of the right and
left flank of the central gap. The zero points of the X and Y axes are located
on the tool central axis, the zero point in the Z-direction lies on the upper
end face.
Contour sections rolling tool To discuss the tooth geometry of the
rolling samples, according to the contour workpiece measurement also con-
tour cuts in various levels were recorded at the rolling tool. The procedure
for the collection of these contours is explained graphically in figure 83, 84.
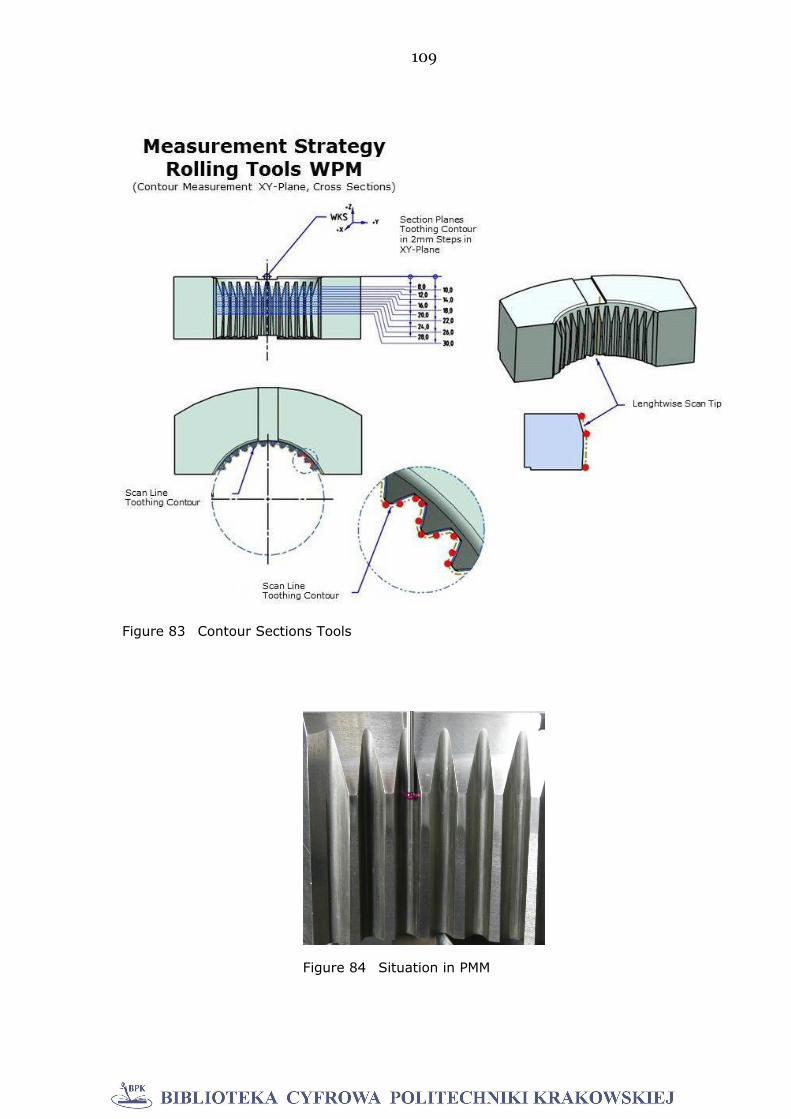
109
Figure 84 Situation in PMM
Figure 83 Contour Sections Tools
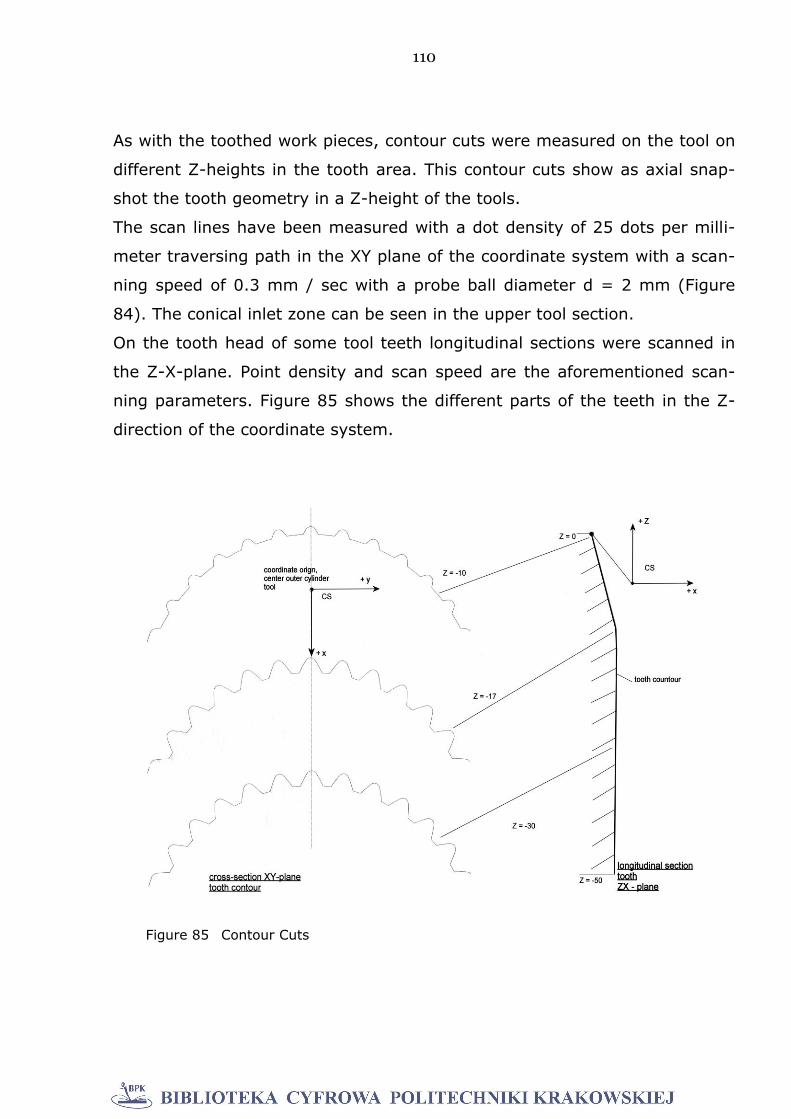
110
As with the toothed work pieces, contour cuts were measured on the tool on
different Z-heights in the tooth area. This contour cuts show as axial snap-
shot the tooth geometry in a Z-height of the tools.
The scan lines have been measured with a dot density of 25 dots per milli-
meter traversing path in the XY plane of the coordinate system with a scan-
ning speed of 0.3 mm / sec with a probe ball diameter d = 2 mm (Figure
84). The conical inlet zone can be seen in the upper tool section.
On the tooth head of some tool teeth longitudinal sections were scanned in
the Z-X-plane. Point density and scan speed are the aforementioned scan-
ning parameters. Figure 85 shows the different parts of the teeth in the Z-
direction of the coordinate system.
Figure 85 Contour Cuts
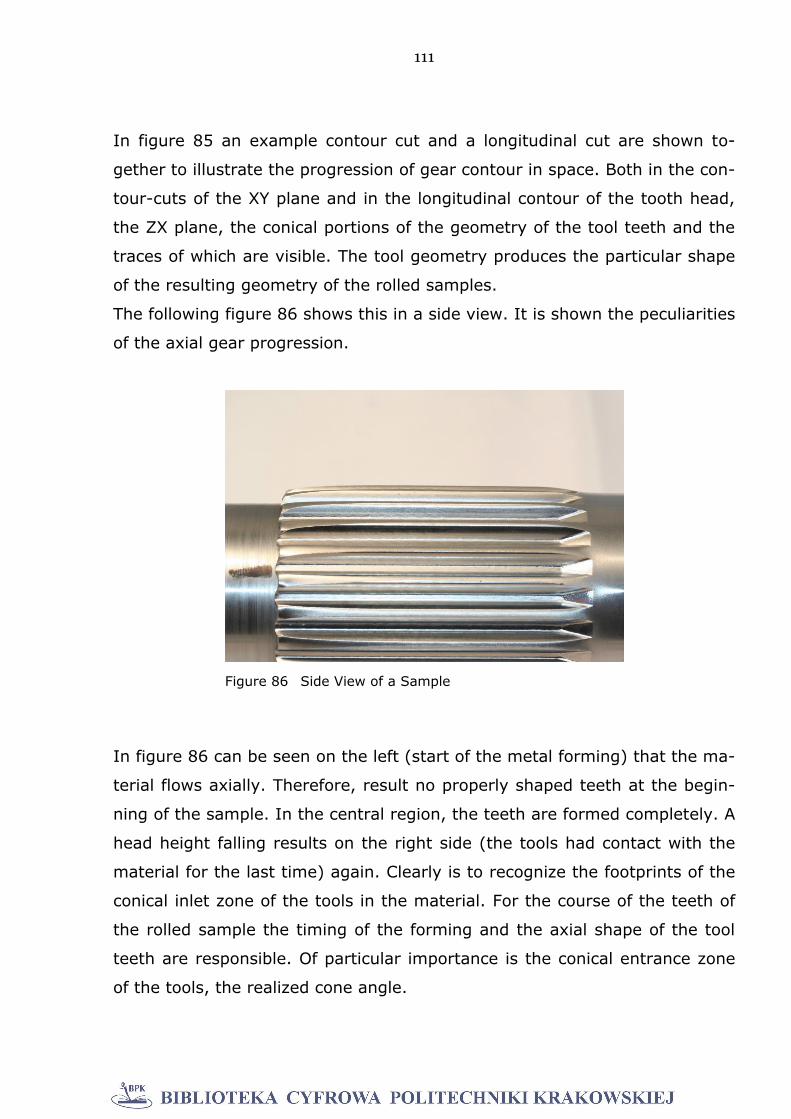
111
In figure 85 an example contour cut and a longitudinal cut are shown to-
gether to illustrate the progression of gear contour in space. Both in the con-
tour-cuts of the XY plane and in the longitudinal contour of the tooth head,
the ZX plane, the conical portions of the geometry of the tool teeth and the
traces of which are visible. The tool geometry produces the particular shape
of the resulting geometry of the rolled samples.
The following figure 86 shows this in a side view. It is shown the peculiarities
of the axial gear progression.
In figure 86 can be seen on the left (start of the metal forming) that the ma-
terial flows axially. Therefore, result no properly shaped teeth at the begin-
ning of the sample. In the central region, the teeth are formed completely. A
head height falling results on the right side (the tools had contact with the
material for the last time) again. Clearly is to recognize the footprints of the
conical inlet zone of the tools in the material. For the course of the teeth of
the rolled sample the timing of the forming and the axial shape of the tool
teeth are responsible. Of particular importance is the conical entrance zone
of the tools, the realized cone angle.
Figure 86 Side View of a Sample
112
Summary of Results contour measurement The previously re-
peatedly shown geometric characteristics in rolled sample geometry are the
result after forming with the WPM method. These characteristics are not, or
only partially be determined by the conventional toothing measurement ac-
cording to DIN [ST 5]. For the evaluation of the process and the achievable
geometric qualities contour measurements on the fabricated samples are
necessary. The previously described contour measurements correspond and
confirm overall the results of the measurements according to DIN [ST 6, ST
7, ST 8]. The following set of results cannot be ascertained with the tradi-
tional measurement methodology according to DIN. The entire tooth form is
formed convex in the longitudinal Z-direction. Between the inlet at the be-
ginning of the forming process, the central region and the end region of the
metal forming results in considerable differences with respect to the height
of head and the head-shape. It was found that between two low tooth tips is
always a high tooth. The high gear is always fully formed than the two adja-
cent teeth of low head height. This statement corresponds to a further reali-
zation, which affects the respective tooth shape. The resulting tooth shapes
are dependent on the tooth height, so that typical tooth shape characteris-
tics can be noted. With regard to the statement regarding the significance of
the feed rate on the resulting geometry results the contour measurement,
confirm the results of the measurements according to DIN.
113
6. Evaluation / Discussion Geometry Results
All rolled samples were examined metrological. In terms of geometrical re-
sults all rolled samples show the same tendencies. Due to the resulting large
amount of data, only the results are exemplified and discussed which are
particularly meaningful. All measurement results are listed in appendix 1 - 4.
The analysis and discussion of the results of the workpiece geometry meas-
urements in detail is divided into two parts.
A) Evaluation / discussion of the measurements according DIN (standard)
B) Evaluation / discussion of the contour measurements (non-standard)
6.1 Evaluation / Discussion of Measurement DIN
A) The results of the tooth geometry according to DIN were separately sta-
tistically evaluated after the individual criteria of a toothing geometry and
namely for the gearing qualities, which are defined in the DIN 3960 ff. [ST
5]. The quality of the gear geometry is divided into 12 classes (1 to 12)
wherein these classes represent areas of permissible variations [95]. Quality
1 has the smallest range of permissible variations from the desired geometry
while in grade 12 the maximum variations are permitted. These areas again
are dependent on the relative size and dimensions of the considered tooth-
ing. So a toothing module m = 3 with the same quality class may have
greater variability than a toothing module m = 1. This size-dependence of
the permissible variations per quality-class course applies also for the di-
ameter of the toothing as well as their axial extent. Diagrams, in which the
percentage of the work pieces or rather the tooth flanks relative to the total
number applied to the gearing quality, result from the statistical analysis.
This analysis is performed separately for left and right sides for all major
stated in the standard single geometry criteria.
The individual geometric criteria that describe the geometry of a tooth are
shown in the sequence. The various sub-criteria of the tooth geometry are
114
explained in the following. The order of discussion of the results is done as
follows:
- Pitch
- Concentricity
- Flank profile
- Tooth trace
- Root- / tip circle diameter
All graphs of statistical analysis can be found in Appendix 4, separated by
geometric criteria and feed rates.
Pitch The pitch, as a single deviation criterion, the pitch error Fp and in-
dividual pitch deviation fp separately for right and left edges are evaluated
statistically. The pitch deviations are each represented by only one result
value = maximum deviation of the workpiece, so that the percentage of
work pieces is evaluated based on the total number of workpiece combina-
tions of these parameters. Furthermore, the diagrams shown for the three
different feed rates are applied separately. Each chart is shown in each case
with eccentricity (Fp, fp) and without eccentricity (Fp-e, fp-e). This has to be
understood as follows. At the pitch deviation in the measurement, the ec-
centricity of the toothing to the workpiece center axis of the workpiece coor-
dinate system is calculated from the measured data. This eccentricity is
found in the diagrams without eccentricity mathematically eliminated from
the pitch deviations. This procedure is useful for splines according to DIN
5480. These splined shafts are centered in the internal toothing of the hollow
counterparts [ST 10]. The diagrams of the total pitch deviation with and
without eccentricity for the 3 feed rates are illustrated in Appendix 4.1. to
4.12. The diagrams of the individual pitch deviation can be found in Appen-
dix 4.13 to 4.24. The study of these diagrams shows no significant effects of
variable parameters on the resulting quality classes. This fact is not surpris-
ing, since this was already found in previous investigations. The magnitude
115
of the pitch deviations is dominated by the location of the workpiece in the
rolling machine, the kinematics tool / workpiece and the blank geometry.
This state of affairs will change nothing when using selected blanks with
minimal geometric deviations. The investigation of other pitch criteria, such
as pitch error fu and pitch fluctuation showed a similar picture. Their detailed
presentation has been omitted. Neither the variations in feed rate, nor the
blank-material showed a significant effect on the resultant distribution of the
determined pitch deviations.
Concentricity The concentricity deviations are defined as the maximum
radius variation of the circumference of a toothing. The graphs of the per-
centage distribution of the concentricity deviations are shown in the graphs
4.25 to 4.30 Appendix 4. As with the pitch deviations, according to the
standard only one value is evaluated for the entire toothing without flank
distinction. Clearly the difference in the concentricity with and without ec-
centricity is evident. This is logical, since the observed eccentricity repre-
sents geometrically a part of the concentricity next to the circular deviation.
This is the reason that the concentricity error without eccentricity results al-
ways significantly less than the concentricity error with eccentricity. A de-
pendence of the observed eccentricities of the feed rate and the blank mate-
rial is not visible. The reasons are already the same as those related to the
pitch deviations mentioned above.
Profile deviations The profile variations of the tooth flanks (involute
profile), the total deviation profile FA, the profile angle deviation FHA and
the profile form deviation ffA were evaluated and documented graphically.
The graphs of the percentage distribution of the flanks of these geometry
criteria are separately presented for the right and left side in diagrams 4.31
to 4.48, Appendix 4.
Depending on the feed rate significant shifts to poorer qualities at the total
profile deviation and the profile angle deviations, can be seen. The focus of
the Gaussian distribution of the plots varies significantly towards poorer
qualities. In the angular deviations, the entire curve deteriorates to a quality
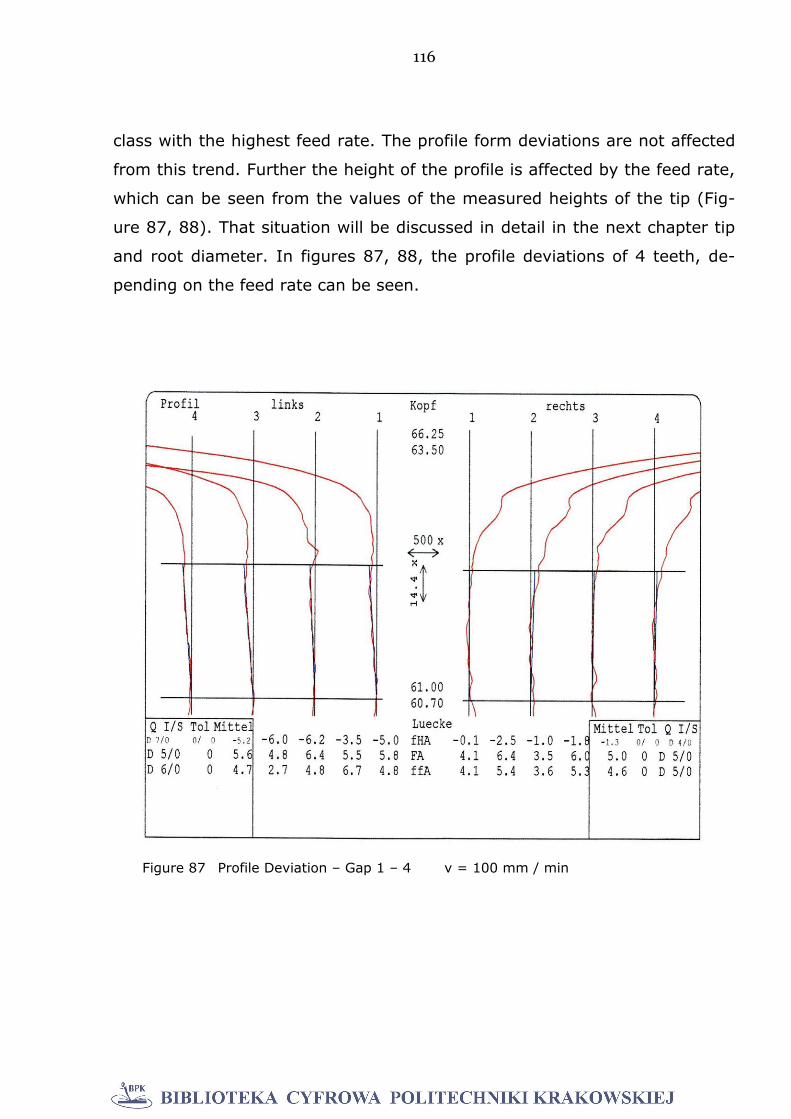
116
class with the highest feed rate. The profile form deviations are not affected
from this trend. Further the height of the profile is affected by the feed rate,
which can be seen from the values of the measured heights of the tip (Fig-
ure 87, 88). That situation will be discussed in detail in the next chapter tip
and root diameter. In figures 87, 88, the profile deviations of 4 teeth, de-
pending on the feed rate can be seen.
Figure 87 Profile Deviation – Gap 1 – 4 v = 100 mm / min
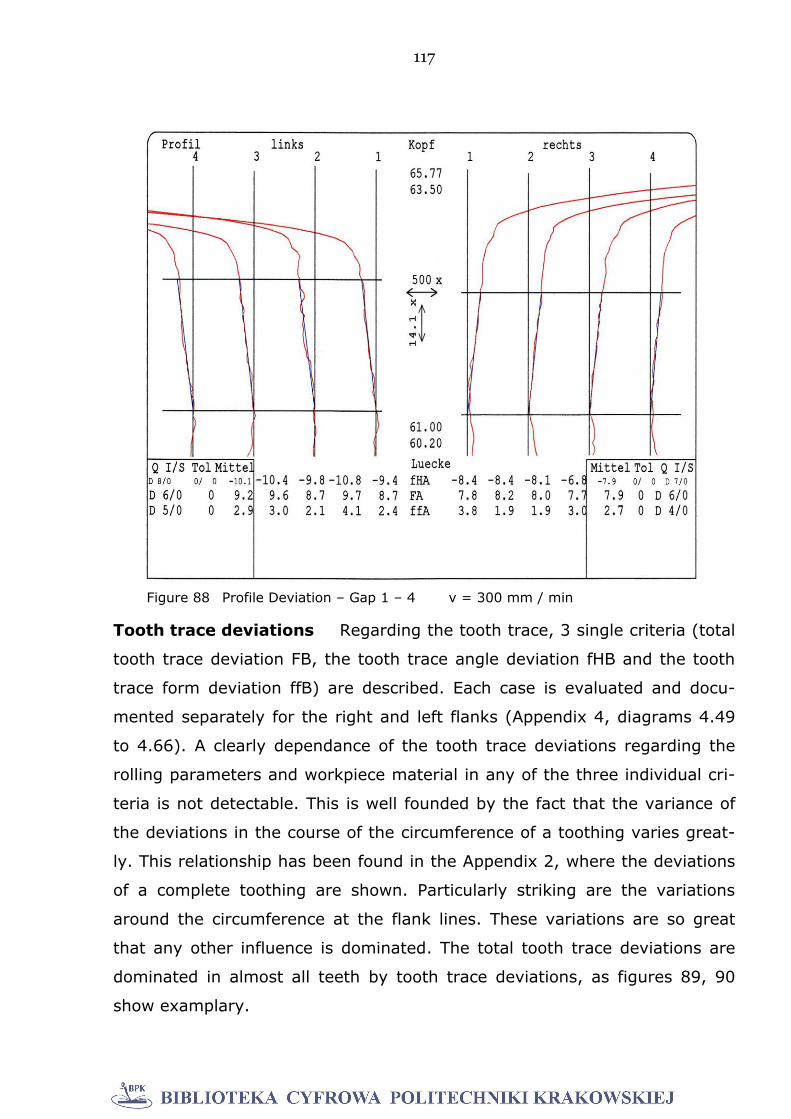
117
Tooth trace deviations Regarding the tooth trace, 3 single criteria (total
tooth trace deviation FB, the tooth trace angle deviation fHB and the tooth
trace form deviation ffB) are described. Each case is evaluated and docu-
mented separately for the right and left flanks (Appendix 4, diagrams 4.49
to 4.66). A clearly dependance of the tooth trace deviations regarding the
rolling parameters and workpiece material in any of the three individual cri-
teria is not detectable. This is well founded by the fact that the variance of
the deviations in the course of the circumference of a toothing varies great-
ly. This relationship has been found in the Appendix 2, where the deviations
of a complete toothing are shown. Particularly striking are the variations
around the circumference at the flank lines. These variations are so great
that any other influence is dominated. The total tooth trace deviations are
dominated in almost all teeth by tooth trace deviations, as figures 89, 90
show examplary.
Figure 88 Profile Deviation – Gap 1 – 4 v = 300 mm / min
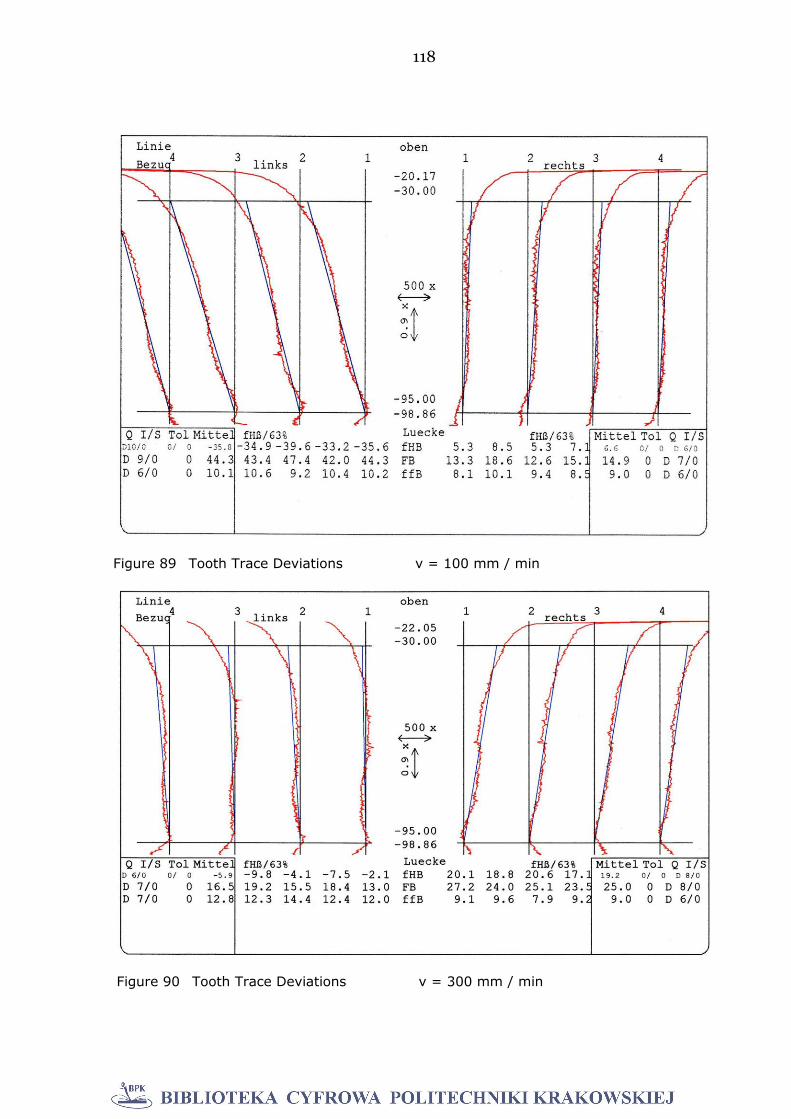
118
Figure 89 Tooth Trace Deviations v = 100 mm / min
Figure 90 Tooth Trace Deviations v = 300 mm / min
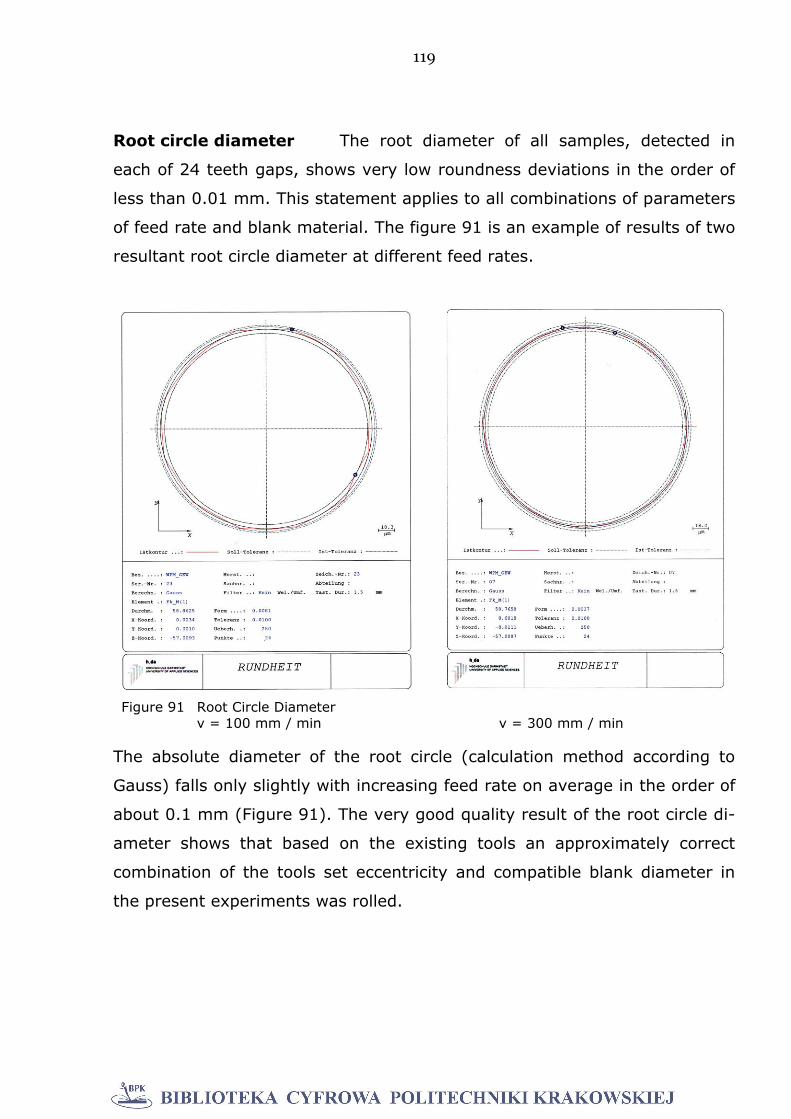
119
Root circle diameter The root diameter of all samples, detected in
each of 24 teeth gaps, shows very low roundness deviations in the order of
less than 0.01 mm. This statement applies to all combinations of parameters
of feed rate and blank material. The figure 91 is an example of results of two
resultant root circle diameter at different feed rates.
The absolute diameter of the root circle (calculation method according to
Gauss) falls only slightly with increasing feed rate on average in the order of
about 0.1 mm (Figure 91). The very good quality result of the root circle di-
ameter shows that based on the existing tools an approximately correct
combination of the tools set eccentricity and compatible blank diameter in
the present experiments was rolled.
Figure 91 Root Circle Diameter v = 100 mm / min v = 300 mm / min
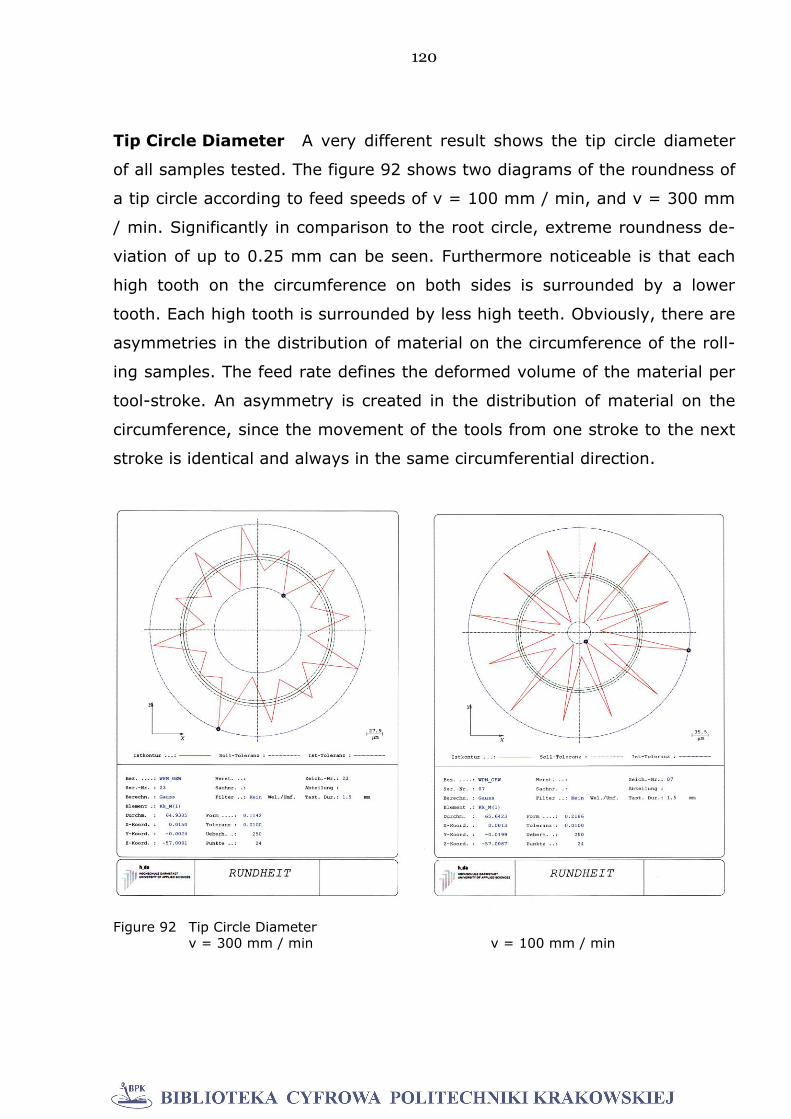
120
Tip Circle Diameter A very different result shows the tip circle diameter
of all samples tested. The figure 92 shows two diagrams of the roundness of
a tip circle according to feed speeds of v = 100 mm / min, and v = 300 mm
/ min. Significantly in comparison to the root circle, extreme roundness de-
viation of up to 0.25 mm can be seen. Furthermore noticeable is that each
high tooth on the circumference on both sides is surrounded by a lower
tooth. Each high tooth is surrounded by less high teeth. Obviously, there are
asymmetries in the distribution of material on the circumference of the roll-
ing samples. The feed rate defines the deformed volume of the material per
tool-stroke. An asymmetry is created in the distribution of material on the
circumference, since the movement of the tools from one stroke to the next
stroke is identical and always in the same circumferential direction.
Figure 92 Tip Circle Diameter v = 300 mm / min v = 100 mm / min
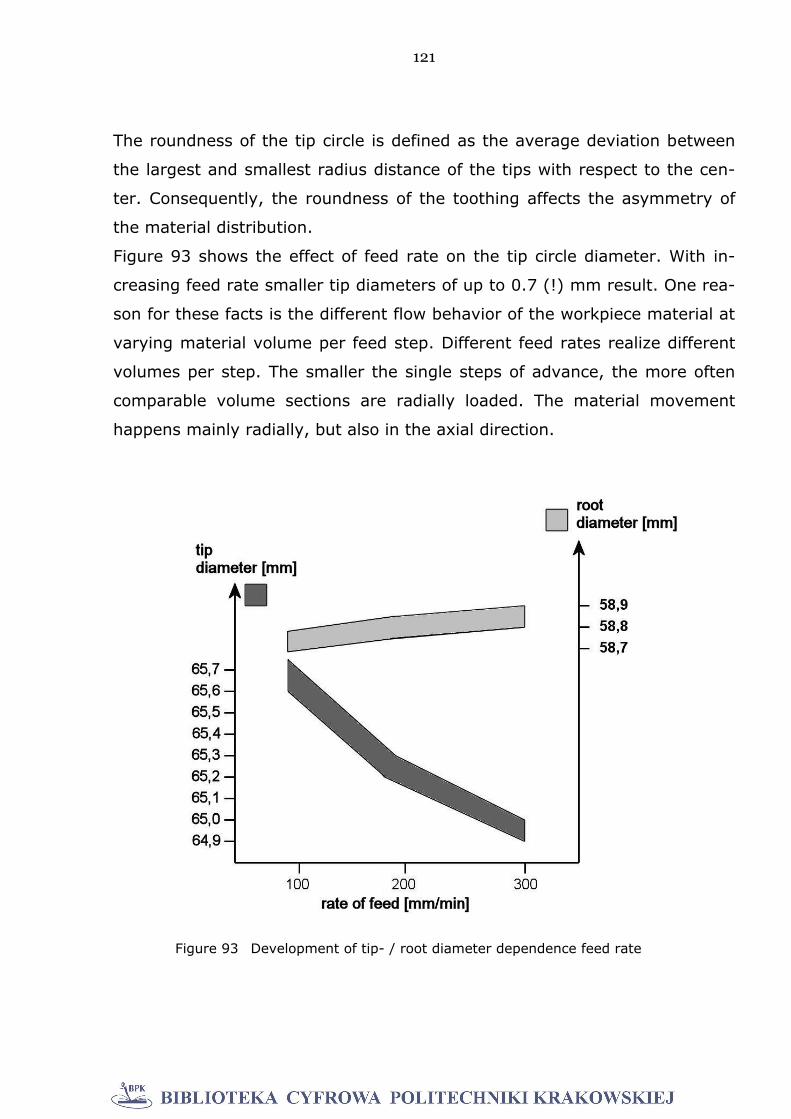
121
The roundness of the tip circle is defined as the average deviation between
the largest and smallest radius distance of the tips with respect to the cen-
ter. Consequently, the roundness of the toothing affects the asymmetry of
the material distribution.
Figure 93 shows the effect of feed rate on the tip circle diameter. With in-
creasing feed rate smaller tip diameters of up to 0.7 (!) mm result. One rea-
son for these facts is the different flow behavior of the workpiece material at
varying material volume per feed step. Different feed rates realize different
volumes per step. The smaller the single steps of advance, the more often
comparable volume sections are radially loaded. The material movement
happens mainly radially, but also in the axial direction.
Figure 93 Development of tip- / root diameter dependence feed rate
122
The axial proportion of material movement is very small compared to the
radial component. Whereby, the radial part of the material movement of
equal volumes is often repeated and amplified. In this sense, the above-
mentioned results of the profile deviations depending on the feed rates can
be seen. The material flows less high into the tooth gaps of the tools with
increasing feed rate. The differences between the tooth height and the
toothing variations over the axial length of the teeth, depending on the feed
rate, will be discussed in the chapter "contour measurements" in detail.
Tooth geometry according to DIN in different axial heights
As stated previously, different tooth geometries result in the axial direction
of the rolled parts. It is expected that these change in tip diameter also af-
fects other changes in the thoothing geometry. To investigate this issue, the
toothed geometry was measured at different levels of its axial extension to
DIN. (Chapter 5.3.3). The results of the determination of the deviations of
the flank profile, the pitch and the concentricity are evaluated in different Z-
heights of the teeth and documented. To recap, the Z-axis of the workpiece
coordinate system is the central axis of the workpiece, the zero point in the
Z-direction lies on the upper end face of the sample.
Tip circle diameter In figure 94 the different Z-heights of the profile
measurements are shown. The comparison of the numerical values of the tip
circle diameter shows the significant differences. The resulting axial course
of the tip diameter of the toothing can be seen from the data.
For the two feed rates, v = 100 mm / min and 300 mm / min clear differ-
ences between the tip circle diameters result.
The graphs in figure 95 show profile lines measured in different Z-heights.
Z = - 25 mm at the upper end of the toothing (tool inlet) which is character-
ized by axially strongly flowing material. In consequence result not well-
formed teeth. Z = - 50 mm, approximately in the middle of the toothing ar-
ea shows almost completely shaped teeth. Z = - 95 mm at the lower end of
the toothing is the area where the last tool contacts have taken place.
There, the toothing is not yet fully developed.
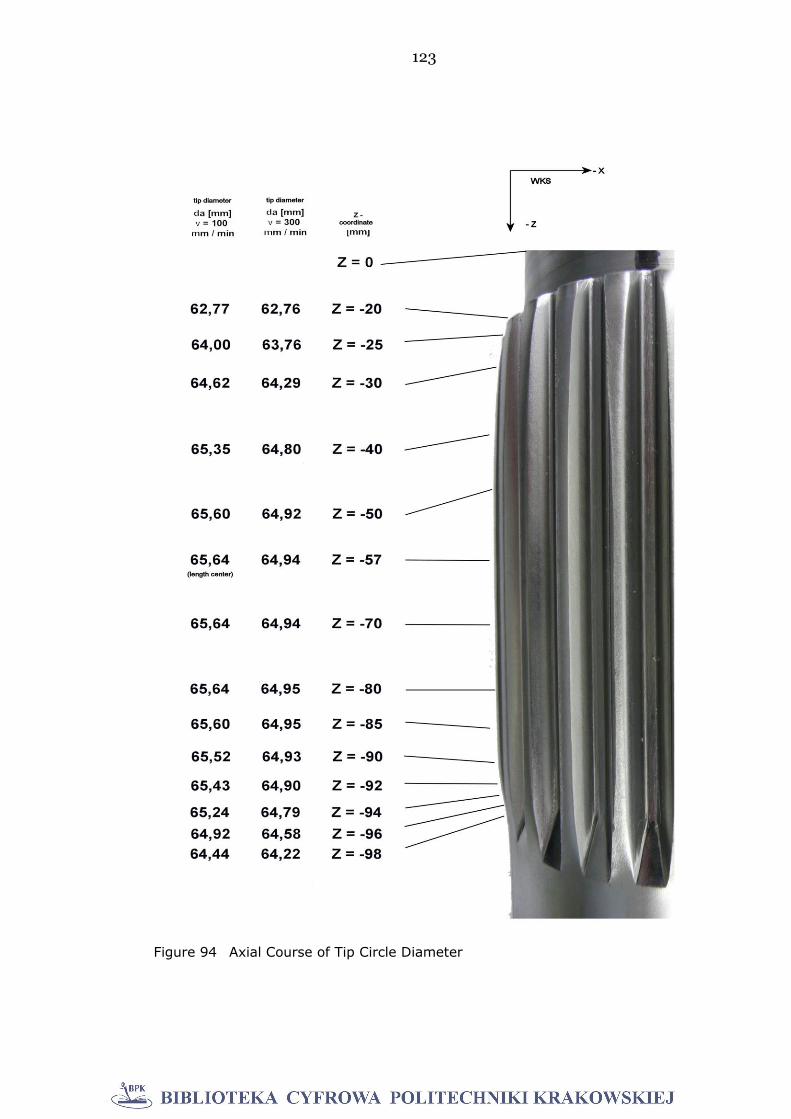
123
Figure 94 Axial Course of Tip Circle Diameter

124
Figure 95 Profile Lines in different axial Heights
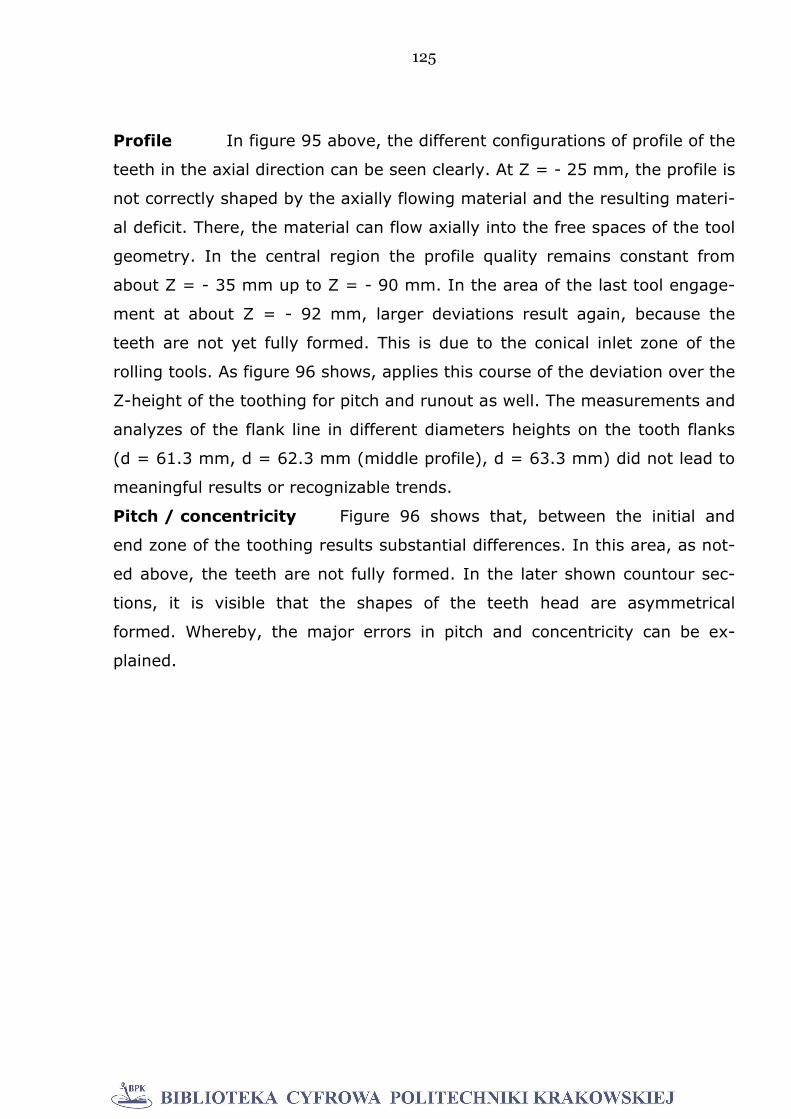
125
Profile In figure 95 above, the different configurations of profile of the
teeth in the axial direction can be seen clearly. At Z = - 25 mm, the profile is
not correctly shaped by the axially flowing material and the resulting materi-
al deficit. There, the material can flow axially into the free spaces of the tool
geometry. In the central region the profile quality remains constant from
about Z = - 35 mm up to Z = - 90 mm. In the area of the last tool engage-
ment at about Z = - 92 mm, larger deviations result again, because the
teeth are not yet fully formed. This is due to the conical inlet zone of the
rolling tools. As figure 96 shows, applies this course of the deviation over the
Z-height of the toothing for pitch and runout as well. The measurements and
analyzes of the flank line in different diameters heights on the tooth flanks
(d = 61.3 mm, d = 62.3 mm (middle profile), d = 63.3 mm) did not lead to
meaningful results or recognizable trends.
Pitch / concentricity Figure 96 shows that, between the initial and
end zone of the toothing results substantial differences. In this area, as not-
ed above, the teeth are not fully formed. In the later shown countour sec-
tions, it is visible that the shapes of the teeth head are asymmetrical
formed. Whereby, the major errors in pitch and concentricity can be ex-
plained.
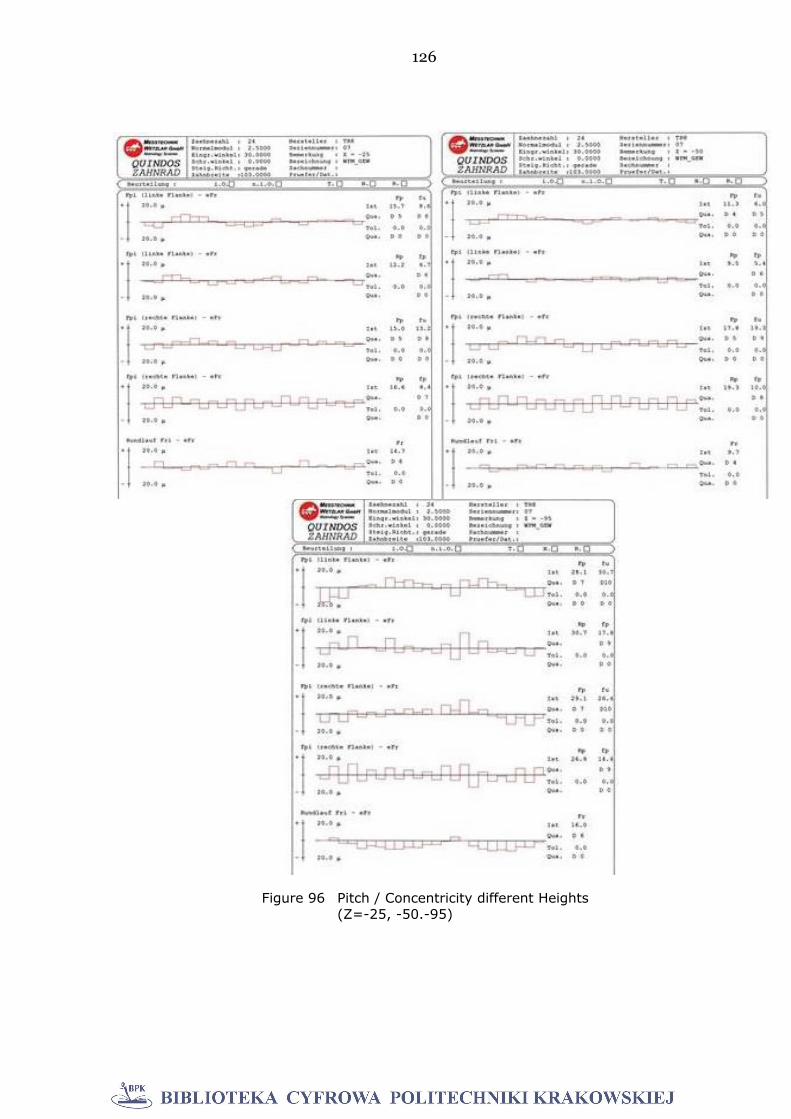
126
Figure 96 Pitch / Concentricity different Heights (Z=-25, -50.-95)
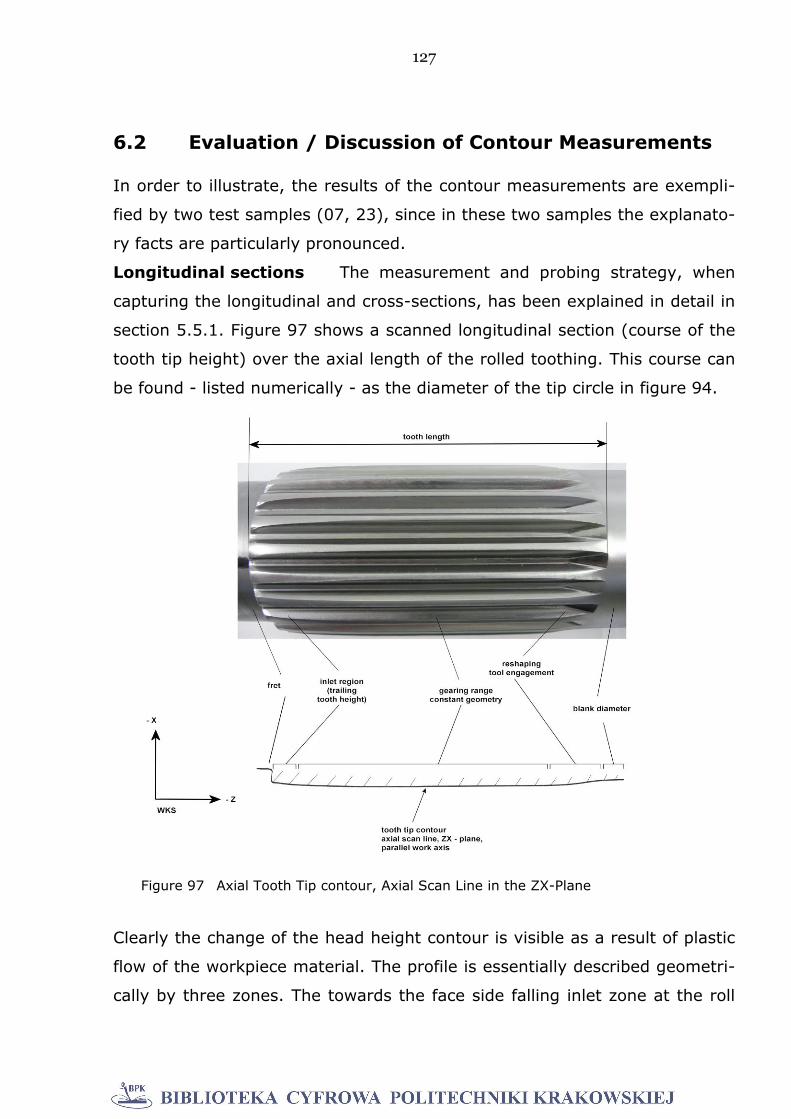
127
6.2 Evaluation / Discussion of Contour Measurements
In order to illustrate, the results of the contour measurements are exempli-
fied by two test samples (07, 23), since in these two samples the explanato-
ry facts are particularly pronounced.
Longitudinal sections The measurement and probing strategy, when
capturing the longitudinal and cross-sections, has been explained in detail in
section 5.5.1. Figure 97 shows a scanned longitudinal section (course of the
tooth tip height) over the axial length of the rolled toothing. This course can
be found - listed numerically - as the diameter of the tip circle in figure 94.
Clearly the change of the head height contour is visible as a result of plastic
flow of the workpiece material. The profile is essentially described geometri-
cally by three zones. The towards the face side falling inlet zone at the roll
Figure 97 Axial Tooth Tip contour, Axial Scan Line in the ZX-Plane
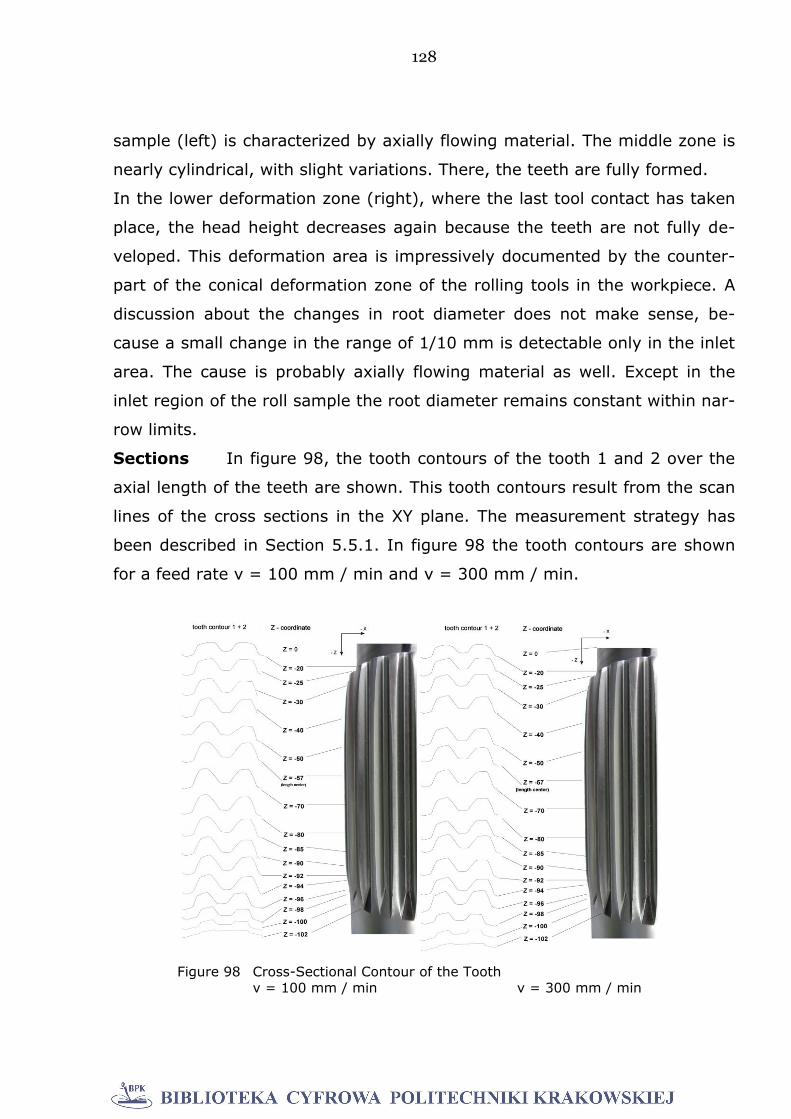
128
sample (left) is characterized by axially flowing material. The middle zone is
nearly cylindrical, with slight variations. There, the teeth are fully formed.
In the lower deformation zone (right), where the last tool contact has taken
place, the head height decreases again because the teeth are not fully de-
veloped. This deformation area is impressively documented by the counter-
part of the conical deformation zone of the rolling tools in the workpiece. A
discussion about the changes in root diameter does not make sense, be-
cause a small change in the range of 1/10 mm is detectable only in the inlet
area. The cause is probably axially flowing material as well. Except in the
inlet region of the roll sample the root diameter remains constant within nar-
row limits.
Sections In figure 98, the tooth contours of the tooth 1 and 2 over the
axial length of the teeth are shown. This tooth contours result from the scan
lines of the cross sections in the XY plane. The measurement strategy has
been described in Section 5.5.1. In figure 98 the tooth contours are shown
for a feed rate v = 100 mm / min and v = 300 mm / min.
Figure 98 Cross-Sectional Contour of the Tooth v = 100 mm / min v = 300 mm / min
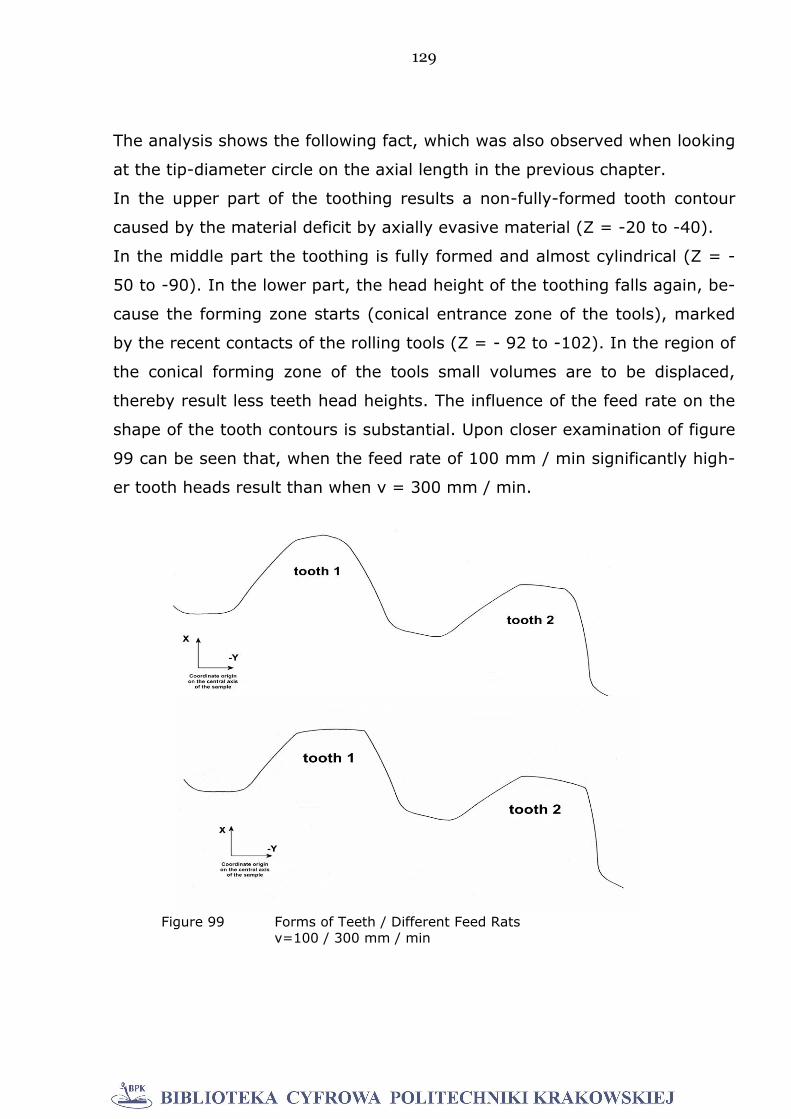
129
The analysis shows the following fact, which was also observed when looking
at the tip-diameter circle on the axial length in the previous chapter.
In the upper part of the toothing results a non-fully-formed tooth contour
caused by the material deficit by axially evasive material (Z = -20 to -40).
In the middle part the toothing is fully formed and almost cylindrical (Z = -
50 to -90). In the lower part, the head height of the toothing falls again, be-
cause the forming zone starts (conical entrance zone of the tools), marked
by the recent contacts of the rolling tools (Z = - 92 to -102). In the region of
the conical forming zone of the tools small volumes are to be displaced,
thereby result less teeth head heights. The influence of the feed rate on the
shape of the tooth contours is substantial. Upon closer examination of figure
99 can be seen that, when the feed rate of 100 mm / min significantly high-
er tooth heads result than when v = 300 mm / min.
Figure 99 Forms of Teeth / Different Feed Rats v=100 / 300 mm / min
130
This was already observed in the analysis of the toothing geometry accord-
ing to DIN, mainly in profile and tip circle-diameter. When considering the
shape of the head of the tooth contours the differences in the tooth heads
are even more pronounced. Figure 99 shows the tooth contour of the tooth 1
+ 2 at the middle of the toothing (Z = - 50) at the lowest and the highest
feed rate (v = 100 and 300 mm / min). There, the difference in head shape
is remarkably clearly visible. At the sample 07, (v = 100 mm / min), the
tooth is higher, which means that the material flowed higher than in the
sample 23, (v = 300 mm / min). Furthermore, a difference of the head
shape can be observed at the tip circle. At the rolling sample 07 (v = 100
mm / min) the shape of every second tooth head is different and the tip cir-
cle is differently high. Tooth 1 shows at the tip a radius form, which suggests
that the deformed material abuts the root-radius of the tool. The material at
tooth 2 flows less high, but it forms an asymmetric flank height of the right
and left flank. In figure 99, sample 23 (v = 300 mm / min), the differences
in head shape in this distinct expression cannot be ascertained. But also, the
asymmetry of the left and right flank can be recognized. The tooth heights
(tip diameter) are different, the magnitude of these differences, however, is
much smaller than at the lower feed rate. The differences between the con-
tours of the head tooth 1 / tooth 2 were already detected in the analysis of
the tip diameter in the preceding chapter, and explained in detail.
The above figures show in examples the results of the resulting contour
measurements on the selected samples. It is noteworthy that these results
are for all other rolling samples of all test series basically the same. The re-
ally important experimental parameter with clearly demonstrable influence
on the resulting toothing geometry is the feed rate. This was detected relia-
bly by the analysis of the measurement results according to DIN and is con-
firmed by the results of the contour measurements. The contour measure-
ments illustrate these relationships in the sense that a detailed examination
of the tooth forms in different toothing areas is possible now.
131
The determination of the geometric qualities of a toothing according to DIN
allows a qualitative classification of the outputs.
For work pieces produced by metal forming, geometric characteristics occur
that make an additional contour measurement necessary. This is significant,
for example, for future developments of the tool geometry and for reviewing
the technical functionality of the produced machine elements by metal form-
ing.
Statistical Analysis In appendix 4 all results of the measured toothing
qualities are shown. Basis for the statistical analysis are a batch of 10 sam-
ples per feed rate. At three speed rates, 30 samples were statistical ana-
lyzed and deviations were evaluated. The samples for the detailed analysis
got selected randomly, even though all rolled samples have been measured
completely (that means all teeth and flanks of the rolled samples have been
measured). A separated analysis in evaluation is made in left and right
flanks.
Statistical analysis of gear tooth quality of samples and flanks:
Total pitch deviation FP 4.1 – 4.12
Individual pitch deviation fp 4.13 – 4.24
Concentricity deviation Fr 4.25 – 4.30
Total profile deviation FA 4.31 – 4.36
Profile angle deviation fHa 4.37 – 4.42
Profile form deviation ffA 4.43 – 4.48
Tooth trace total deviation FB 4.49 – 4.54
Tooth trace angle deviation fHB 4.55 – 4.60
Tooth trace form deviation ffB 4.61 – 4.66
132
7. In-Process Acquisition of the Geometrical Peculiarities
In the previous chapters 5 and 6, post-process geometry acquisition and
valuation according DIN 3961 have been described. Hence, a validation of
the formed work pieces from a quality point of view is possible. The profile
measurements carried out, show the specific geometrical peculiarities which
result from the forming process. These are not covered by the form devia-
tions according to DIN 3961-3962 [ST 6, ST 7].
These geometrical peculiarities are of importance for the final technical func-
tionality of the toothed components formed by the WPM process. Their
change in dependence of feed velocity, for example, can be used to describe
the forming process. Insofar the acquisition of the geometrical peculiarities
in the machine could lead to early insights.
The advantage of such an action would enable an early assessment of manu-
facturing process. A subsequent just-in-time reaction would allow for cost
reductions. On the base of the geometrical peculiarities detected by face
profile measurement described above, it will be considered in the following
part, which technical requirements have to be imposed on instrumentation
and sensors in order to allow for future in-process monitoring of the WPM
metal forming process [49, 50, 97, 98, 99].
Certain typical deviations of shape, position and orientation could detected
in-process online and possibly even corrected in real-time by application of
appropriate sensors / instrumentation devices. In the following, the geomet-
rical peculiarities described in chapter 5 and 6, together with the resulting
shape and orientation properties of the workpiece will be analysed and dis-
cussed regarding possible variables to be measured and significant process
quantities which can be calculated thereof. From the results of this analysis,
the requirements on the sensors, their range, accuracy and resolution will be
derived [51, 52, 53, 56, 85, 86, 87, 90, 125, 127].
133
7.1 Acquisition of Geometrical Deviations
As mentioned, the geometrical peculiarities of the WPM process and the re-
sults of the tactile measurement of “Form, orientation, location and run-out”
and the “Tolerances for Cylindrical Gear Teeth – Bases” will lead to the geo-
metrical elements which shall be measured, calculated and monitored [ST 6,
ST 16].
Among the geometrical deviations which influence the result of the WPM
forming process mainly, the pre-dominant parameters are:
Eccentricity Pitch Tooth trace Tooth Depth, Profile Form and Tip Form
The possibilities to acquire appropriate measuring quantities, which are able
to describe these geometrical deviations and which will allow to perform re-
al-time calculations of process quantities and are finally able to predict the
further process. The properties of the WPM forming process prohibit the em-
ployment of tactile sensors, as the forming process is discontinuous, but yet
the workpiece is subject to a continuously rotation. In principle, the use of
tactile sensors coupled by means of friction could possibly be considered, but
usually these devices feature higher measuring inaccuracy. Only for the pur-
pose of additional tests before or after the process, a tactile sensor could
brought in contact with the workpiece in a fixed measuring position; yet this
would have the disadvantage of a complete change of the process and the a
redesign of the power train and the feed drive train, in addition to an expan-
sion and redesign of the axis control. Obviously, the recommended means
for continuous acquisition of the surface geometry are non-tactile, non-
contact distance sensors, which are able to capture the radial distance be-
tween their mounting position and the surface of the workpiece, as the pri-
mary measuring quantity [8, 83, 86, 100, 130, 131, 134]. From this dis-
tance quantity, the main quantities of the tooth profile geometry can be cal-
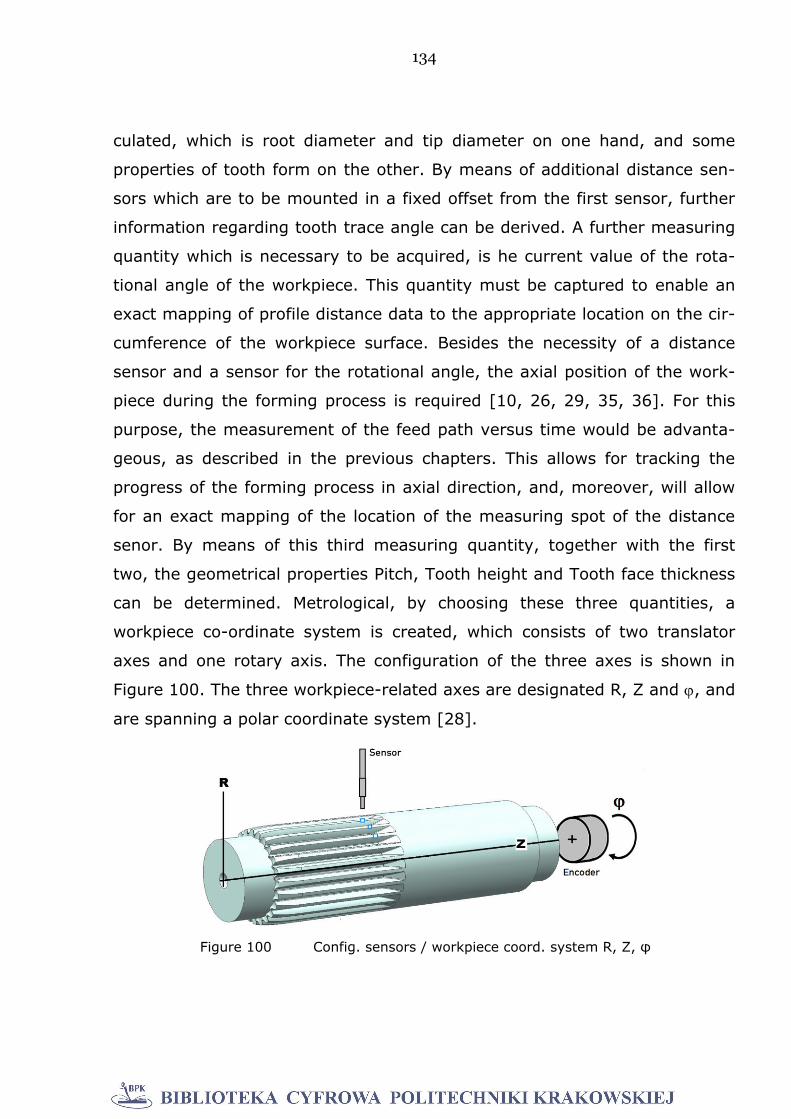
134
culated, which is root diameter and tip diameter on one hand, and some
properties of tooth form on the other. By means of additional distance sen-
sors which are to be mounted in a fixed offset from the first sensor, further
information regarding tooth trace angle can be derived. A further measuring
quantity which is necessary to be acquired, is he current value of the rota-
tional angle of the workpiece. This quantity must be captured to enable an
exact mapping of profile distance data to the appropriate location on the cir-
cumference of the workpiece surface. Besides the necessity of a distance
sensor and a sensor for the rotational angle, the axial position of the work-
piece during the forming process is required [10, 26, 29, 35, 36]. For this
purpose, the measurement of the feed path versus time would be advanta-
geous, as described in the previous chapters. This allows for tracking the
progress of the forming process in axial direction, and, moreover, will allow
for an exact mapping of the location of the measuring spot of the distance
senor. By means of this third measuring quantity, together with the first
two, the geometrical properties Pitch, Tooth height and Tooth face thickness
can be determined. Metrological, by choosing these three quantities, a
workpiece co-ordinate system is created, which consists of two translator
axes and one rotary axis. The configuration of the three axes is shown in
Figure 100. The three workpiece-related axes are designated R, Z and , and
are spanning a polar coordinate system [28].
Figure 100 Config. sensors / workpiece coord. system R, Z, φ
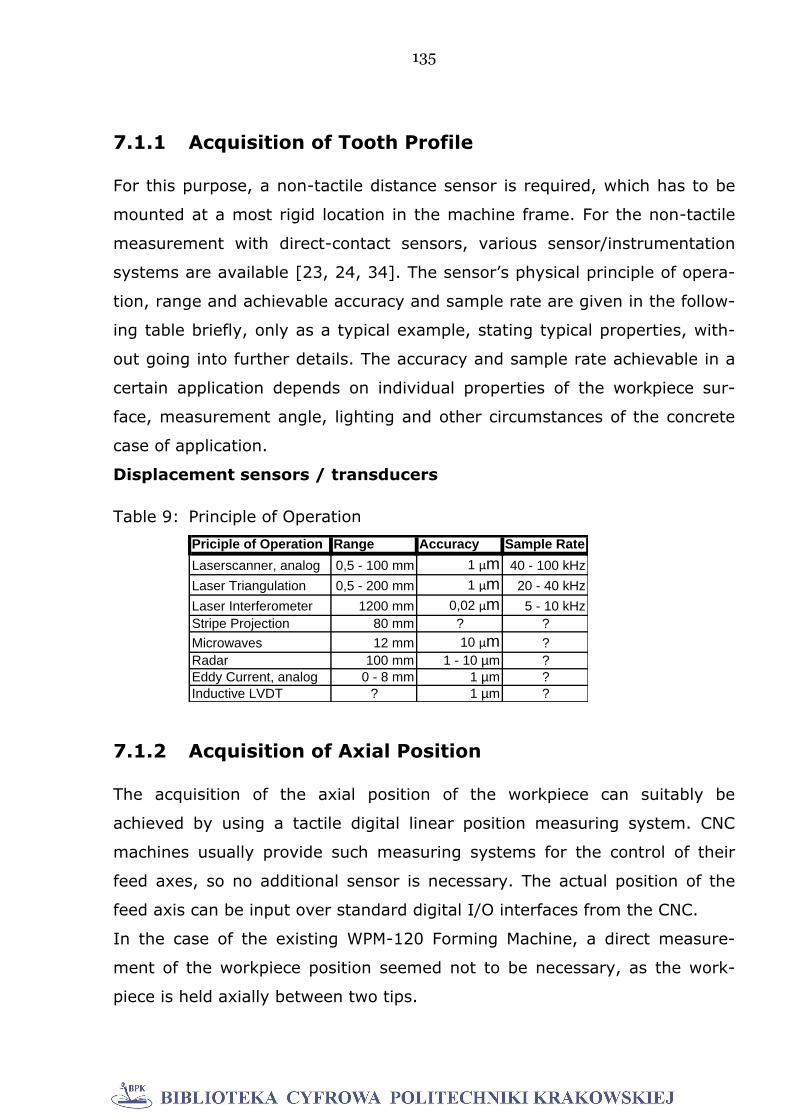
135
7.1.1 Acquisition of Tooth Profile
For this purpose, a non-tactile distance sensor is required, which has to be
mounted at a most rigid location in the machine frame. For the non-tactile
measurement with direct-contact sensors, various sensor/instrumentation
systems are available [23, 24, 34]. The sensor’s physical principle of opera-
tion, range and achievable accuracy and sample rate are given in the follow-
ing table briefly, only as a typical example, stating typical properties, with-
out going into further details. The accuracy and sample rate achievable in a
certain application depends on individual properties of the workpiece sur-
face, measurement angle, lighting and other circumstances of the concrete
case of application.
Displacement sensors / transducers
Table 9: Principle of Operation
Priciple of Operation Range Accuracy Sample Rate
Laserscanner, analog 0,5 - 100 mm 1 µm 40 - 100 kHz
Laser Triangulation 0,5 - 200 mm 1 µm 20 - 40 kHz
Laser Interferometer 1200 mm 0,02 µm 5 - 10 kHz
Stripe Projection 80 mm ? ?
Microwaves 12 mm 10 µm ?
Radar 100 mm 1 - 10 µm ?
Eddy Current, analog 0 - 8 mm 1 µm ?
Inductive LVDT ? 1 µm ?
7.1.2 Acquisition of Axial Position
The acquisition of the axial position of the workpiece can suitably be
achieved by using a tactile digital linear position measuring system. CNC
machines usually provide such measuring systems for the control of their
feed axes, so no additional sensor is necessary. The actual position of the
feed axis can be input over standard digital I/O interfaces from the CNC.
In the case of the existing WPM-120 Forming Machine, a direct measure-
ment of the workpiece position seemed not to be necessary, as the work-
piece is held axially between two tips.
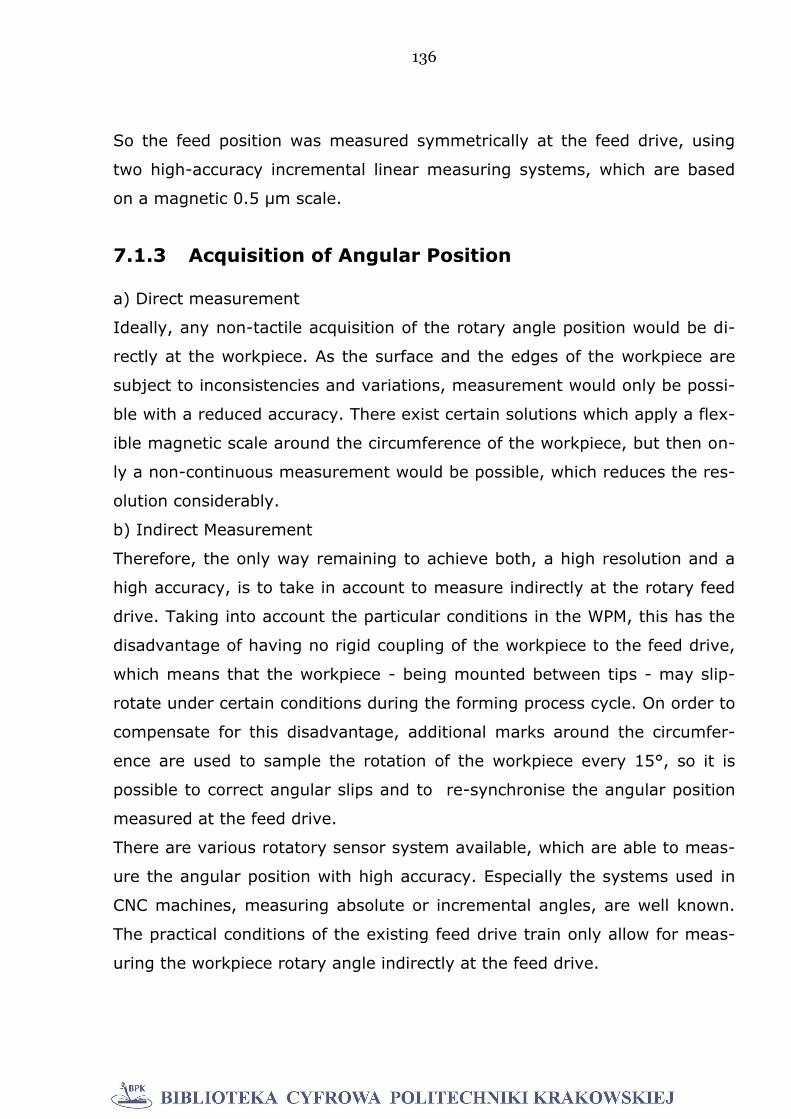
136
So the feed position was measured symmetrically at the feed drive, using
two high-accuracy incremental linear measuring systems, which are based
on a magnetic 0.5 µm scale.
7.1.3 Acquisition of Angular Position
a) Direct measurement
Ideally, any non-tactile acquisition of the rotary angle position would be di-
rectly at the workpiece. As the surface and the edges of the workpiece are
subject to inconsistencies and variations, measurement would only be possi-
ble with a reduced accuracy. There exist certain solutions which apply a flex-
ible magnetic scale around the circumference of the workpiece, but then on-
ly a non-continuous measurement would be possible, which reduces the res-
olution considerably.
b) Indirect Measurement
Therefore, the only way remaining to achieve both, a high resolution and a
high accuracy, is to take in account to measure indirectly at the rotary feed
drive. Taking into account the particular conditions in the WPM, this has the
disadvantage of having no rigid coupling of the workpiece to the feed drive,
which means that the workpiece - being mounted between tips - may slip-
rotate under certain conditions during the forming process cycle. On order to
compensate for this disadvantage, additional marks around the circumfer-
ence are used to sample the rotation of the workpiece every 15°, so it is
possible to correct angular slips and to re-synchronise the angular position
measured at the feed drive.
There are various rotatory sensor system available, which are able to meas-
ure the angular position with high accuracy. Especially the systems used in
CNC machines, measuring absolute or incremental angles, are well known.
The practical conditions of the existing feed drive train only allow for meas-
uring the workpiece rotary angle indirectly at the feed drive.
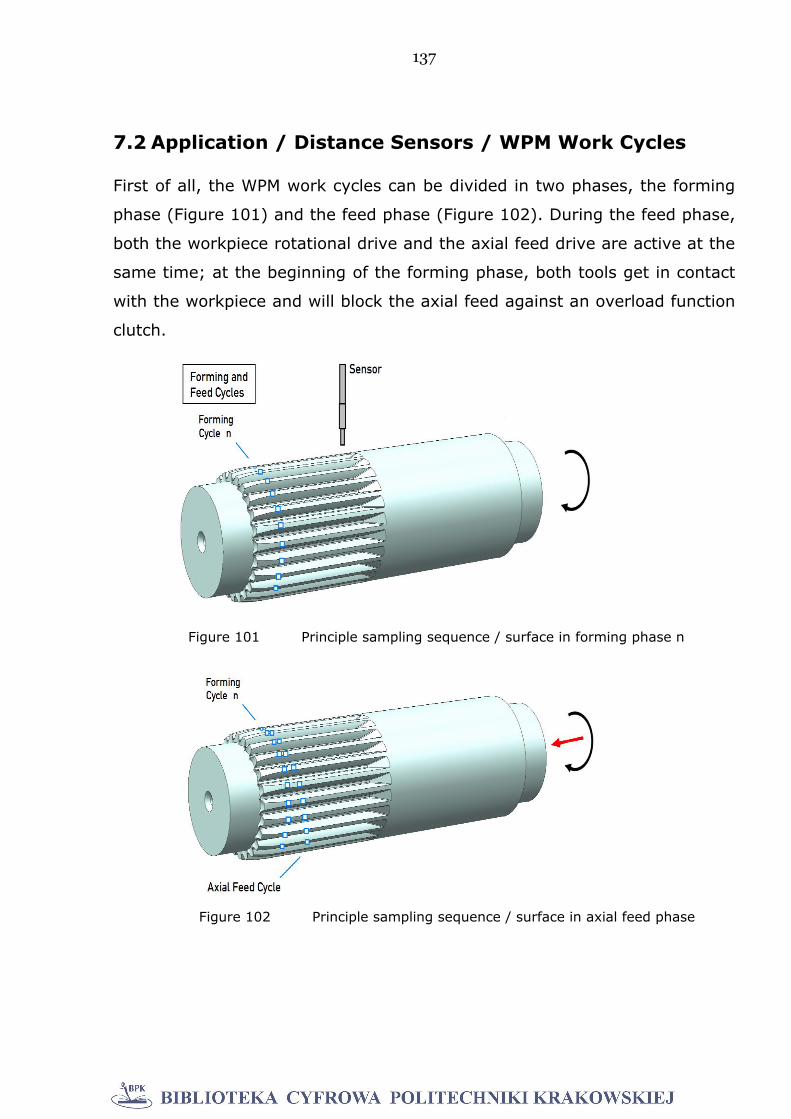
137
7.2 Application / Distance Sensors / WPM Work Cycles
First of all, the WPM work cycles can be divided in two phases, the forming
phase (Figure 101) and the feed phase (Figure 102). During the feed phase,
both the workpiece rotational drive and the axial feed drive are active at the
same time; at the beginning of the forming phase, both tools get in contact
with the workpiece and will block the axial feed against an overload function
clutch.
Figure 101 Principle sampling sequence / surface in forming phase n
Figure 102 Principle sampling sequence / surface in axial feed phase
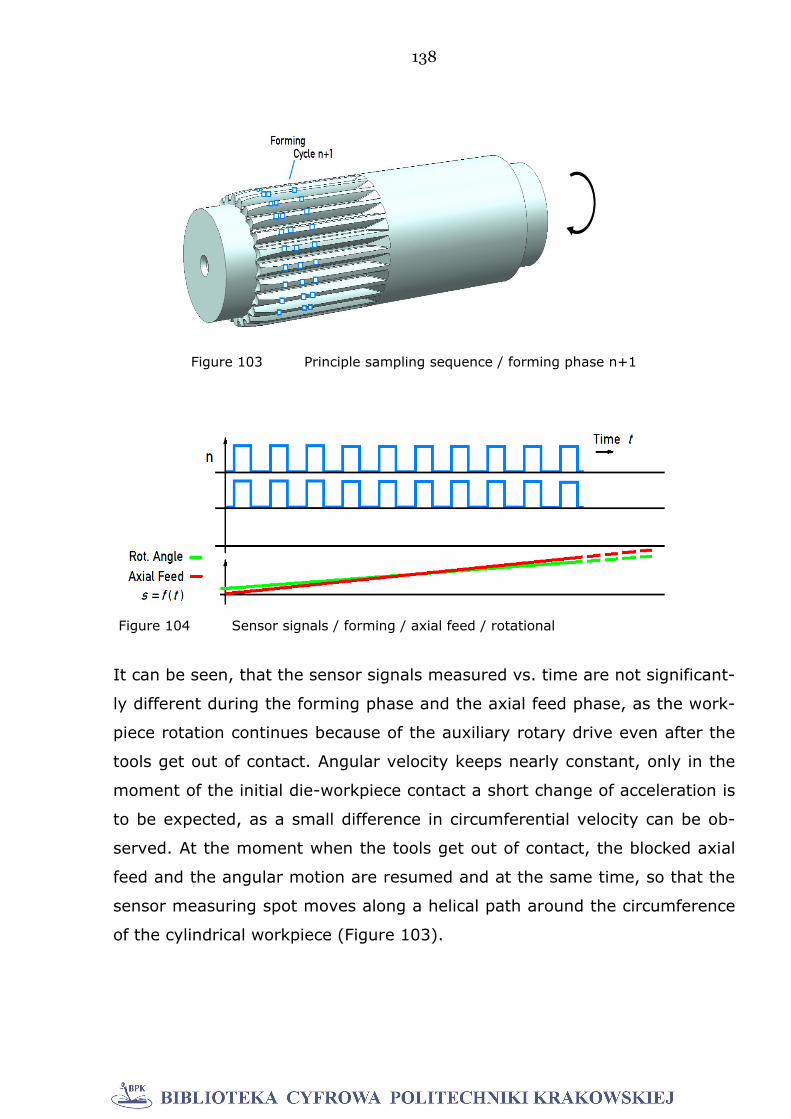
138
It can be seen, that the sensor signals measured vs. time are not significant-
ly different during the forming phase and the axial feed phase, as the work-
piece rotation continues because of the auxiliary rotary drive even after the
tools get out of contact. Angular velocity keeps nearly constant, only in the
moment of the initial die-workpiece contact a short change of acceleration is
to be expected, as a small difference in circumferential velocity can be ob-
served. At the moment when the tools get out of contact, the blocked axial
feed and the angular motion are resumed and at the same time, so that the
sensor measuring spot moves along a helical path around the circumference
of the cylindrical workpiece (Figure 103).
Figure 104 Sensor signals / forming / axial feed / rotational
Figure 103 Principle sampling sequence / forming phase n+1
139
In this way, an existing tooth profile will not be sampled on a circular path,
but on a helical path. The geometrical information contained in the distance
sensor’s signal will relate one tooth after the other with an axial offset of the
axial feed. Yet this fact cannot be detected in the sensor signal curve timing,
as the rotational speed will be the same as during the forming cycle where
no axial feed is superimposed. Forming cycle n+1 starts at the moment
when the tools get in contact again. The signal curve forming cycle n+1 is
shown schematically (after the curves of previous forming cycle n) in figures
104, 105. It can be seen from the diagram that axial feed (red curve) has
stopped, and at the same time rotation (green curve) continues with con-
stant slope.
7.3 Geometrical Deviations / Peculiarities
7.3.1 Eccentricity
The workpiece being held between two tips generally has certain concentrici-
ty (Figure 106). This concentricity deviation is composed of eccentricity plus
roundness deviation, which both will be contained in any radial measure-
ment. Roundness deviation of a cylindrical part can easily be measured be-
fore inserting a workpiece and by this measure it will become a priori known
to the process, so that roundness deviation can be input to future process
Figure 105 Signal curves for forming cycle n+1 (schematical)
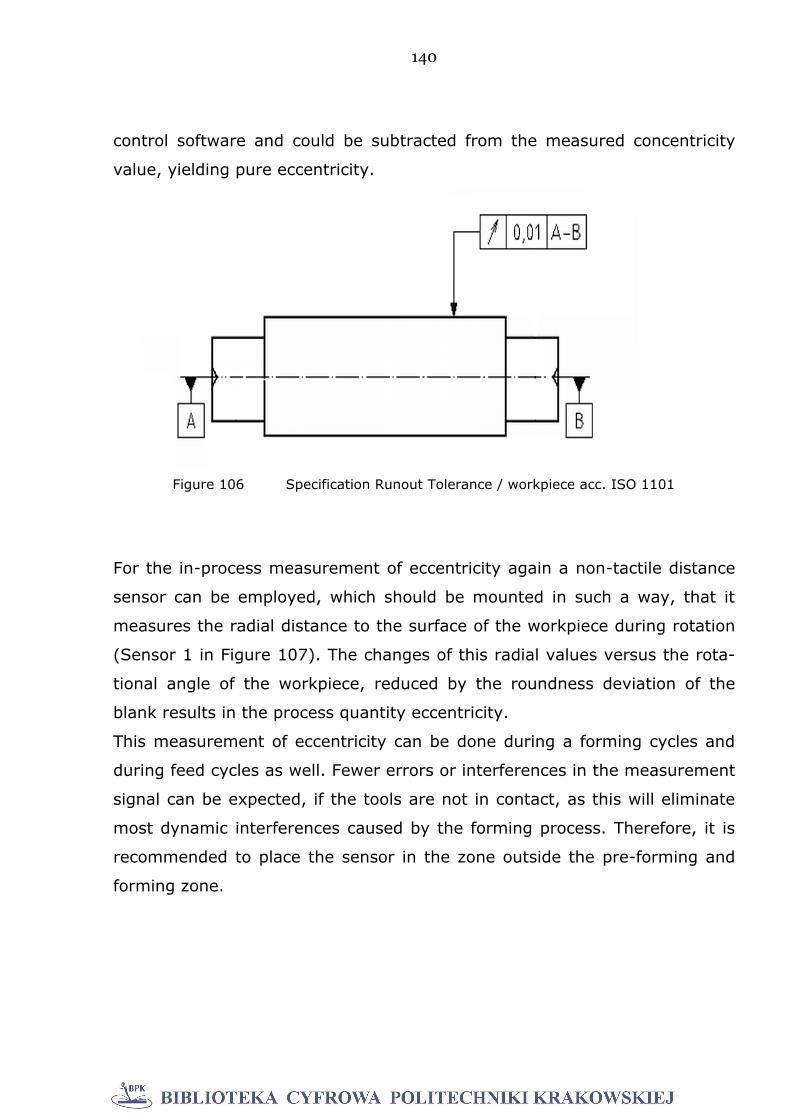
140
control software and could be subtracted from the measured concentricity
value, yielding pure eccentricity.
For the in-process measurement of eccentricity again a non-tactile distance
sensor can be employed, which should be mounted in such a way, that it
measures the radial distance to the surface of the workpiece during rotation
(Sensor 1 in Figure 107). The changes of this radial values versus the rota-
tional angle of the workpiece, reduced by the roundness deviation of the
blank results in the process quantity eccentricity.
This measurement of eccentricity can be done during a forming cycles and
during feed cycles as well. Fewer errors or interferences in the measurement
signal can be expected, if the tools are not in contact, as this will eliminate
most dynamic interferences caused by the forming process. Therefore, it is
recommended to place the sensor in the zone outside the pre-forming and
forming zone.
Figure 106 Specification Runout Tolerance / workpiece acc. ISO 1101

141
It could also be an advantage to use two sensors, as depicted in Figure 107,
which would allow monitoring the formed zone of the workpiece and the
zone outside the forming zone as well. Sensor 1 was placed in the forming
zone to measure the distance to the surface of the workpiece. The sensor
signal vs. time which is measured during workpiece rotation exhibits a con-
centricity deviation, caused for example by a workpiece mounted eccentri-
cally. Signal acquisition and signal processing for eccentricity monitoring is
explained in detail, as shown in Figure 108 schematically.
Figure 108 Principal sensor signal vs. time and calc. of eccentricity
Figure 107 Sensor placement / determination eccentricity (Sensor 2)
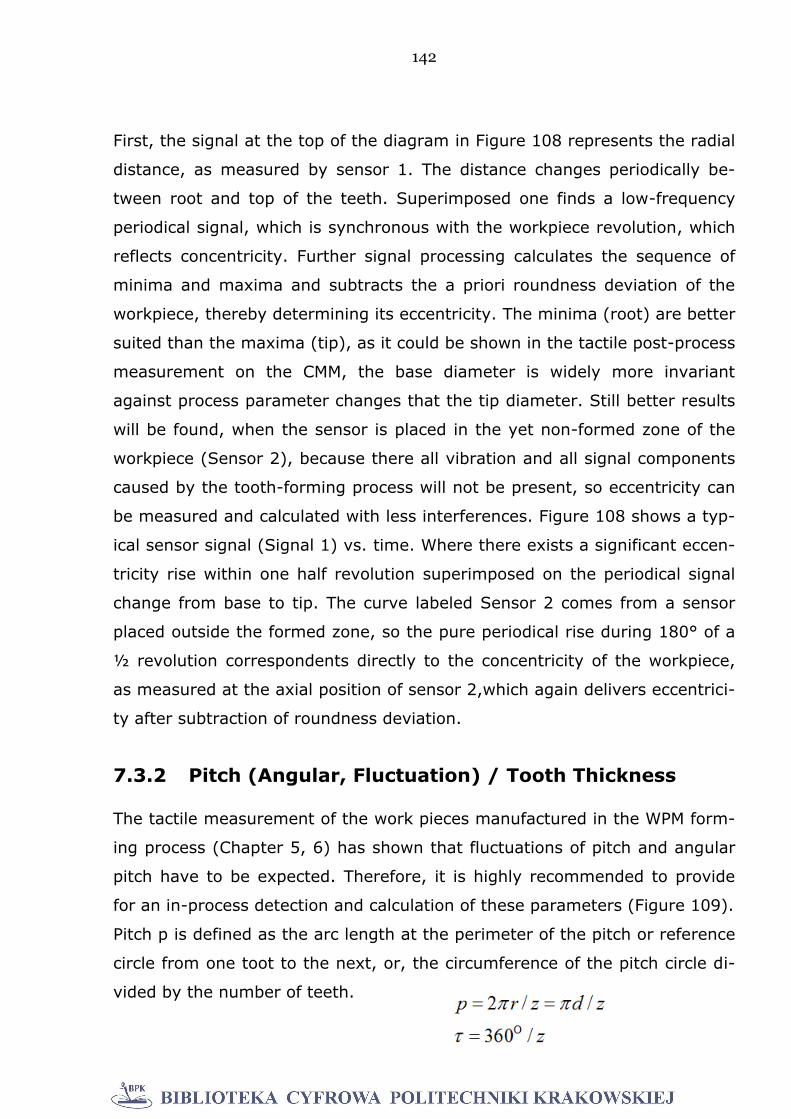
142
First, the signal at the top of the diagram in Figure 108 represents the radial
distance, as measured by sensor 1. The distance changes periodically be-
tween root and top of the teeth. Superimposed one finds a low-frequency
periodical signal, which is synchronous with the workpiece revolution, which
reflects concentricity. Further signal processing calculates the sequence of
minima and maxima and subtracts the a priori roundness deviation of the
workpiece, thereby determining its eccentricity. The minima (root) are better
suited than the maxima (tip), as it could be shown in the tactile post-process
measurement on the CMM, the base diameter is widely more invariant
against process parameter changes that the tip diameter. Still better results
will be found, when the sensor is placed in the yet non-formed zone of the
workpiece (Sensor 2), because there all vibration and all signal components
caused by the tooth-forming process will not be present, so eccentricity can
be measured and calculated with less interferences. Figure 108 shows a typ-
ical sensor signal (Signal 1) vs. time. Where there exists a significant eccen-
tricity rise within one half revolution superimposed on the periodical signal
change from base to tip. The curve labeled Sensor 2 comes from a sensor
placed outside the formed zone, so the pure periodical rise during 180° of a
½ revolution correspondents directly to the concentricity of the workpiece,
as measured at the axial position of sensor 2,which again delivers eccentrici-
ty after subtraction of roundness deviation.
7.3.2 Pitch (Angular, Fluctuation) / Tooth Thickness
The tactile measurement of the work pieces manufactured in the WPM form-
ing process (Chapter 5, 6) has shown that fluctuations of pitch and angular
pitch have to be expected. Therefore, it is highly recommended to provide
for an in-process detection and calculation of these parameters (Figure 109).
Pitch p is defined as the arc length at the perimeter of the pitch or reference
circle from one toot to the next, or, the circumference of the pitch circle di-
vided by the number of teeth.
143
The Angular pitch is the appropriate angle (DIN 3960), with z = number of
teeth, and pitch p, the arc length of the angular pitch. Applying this to the
sample workpiece examined, which has z = 24 teeth, the angular pitch =
360 / 24 = 15°.
Signal processing The sensor signal of a suitable distance sensor will
deliver a raw signal vs. time, which reflects duration and height of the teeth
sampled. By comparison with an adjustable trigger levels, pulses can be
generated at the rising and at the falling edge of the raw signal. This can be
done in both ways, by hardware or by software.
Fig. 110 shows an example, where by use of two different trigger levels, so
that pulses just above the base circle and pulse just below the tooth will be
generated. For each of the two trigger levels, this results in two rising edge
pulses (Sr, blue line) and two falling edge pulses (Sf, red line).
Moreover, depending on individual requirements, also advanced methods of
signal slope or edge detection could be applied. The next few steps of signal
processing for the determination of pitch angular pitch and pitch fluctuation
will be explained referring to Figure 110:
Figure 109 Path of the sensor spot pitch variation / gap thickness

144
Angular Pitch and Pitch The points in time t1, t2 … tn can be derived from
the first rising edge pulse Sr1 , Sr2 … , Srn and then be stored; time durations
can easily be calculated from their difference. By registration of the rotation
angles (t) = 1, 2 … , 2 at the same points in times t1, t2 … tn, the calcu-
lation of angle differences directly yield values of angular pitch according
equation:
Angular Pitch (t) = (t) = ( (t1)) - (t2))
Repeatedly calculating values of angular pitch can also be done for the rising
edge and falling edge pulses separately, so there is another opportunity of
detecting symmetry deviations of left and right flanks. It should be pointed
out, that it is also possible to obtain the pitch at the tip diameter, or at the
root diameter, by adjusting the trigger level accordingly. In this way special
advanced analysis of various pitches becomes possible. The calculation uses
the angular pitch and multiplies its values by the tip radius ra or the bottom
radius rf. The equations are given as follows:
Pitch: p(t) = r (t)
Tip pitch: pa(t) = ra (t)
Root pitch: pf(t) = rf (t)
Figure 110 Signal process. pitch, pitch fluctuation, tooth, gap thickness
145
If the adjustability of the Trigger level STL is used, it is possible to adjust to a
medium height. This principle is capable of generating pulses at the pitch
diameter, so one could immediately obtain pitch values p(t). The achievable
accuracy is unknown. Possibly that appropriate radii cannot be acquired and
calculated with sufficient accuracy, so the pitch is not recommended as a
process quantity.
Pitch fluctuation Having measured and calculated the individual pitch
values pi or angular pitch values i, then these can be analysed regarding in-
dividual pitch fluctuation pi and its Maximum pmax. It is advisable to fur-
ther analyse the process data for systematic and random properties of the
process. Therefore, the average (mean value, median) and the variance are
calculated. The Median is not preferred in this case, because it drops the min
and max values, whereas the gear quality criteria usually are oriented to-
wards the concept of maximum deviation. In order to obtain the random
characteristic of the process, the standard deviation , as well as Range R
may be calculated, but the ladder being preferable, as R represents the dif-
ference between maximum value and minimum value, which again corre-
sponds to the maximum deviation quality criteria, used in coordinate me-
trology.
Pitch mean value: 1
1 n
ip pn
Pitch median: p = central value of sorted data
Pitch variance:
2
2 1
( )
1
n
i
p
p p
n
Pitch Range: max( ) min( )p i iR p p
By use of these statistical quantities, systematic errors can be separated
from random deviations, which promise to derive conclusions for process
improvement. Offset of the mean value from the nominal value of a parame-
ter allow for the conclusion of systematic errors, whereas a big value of
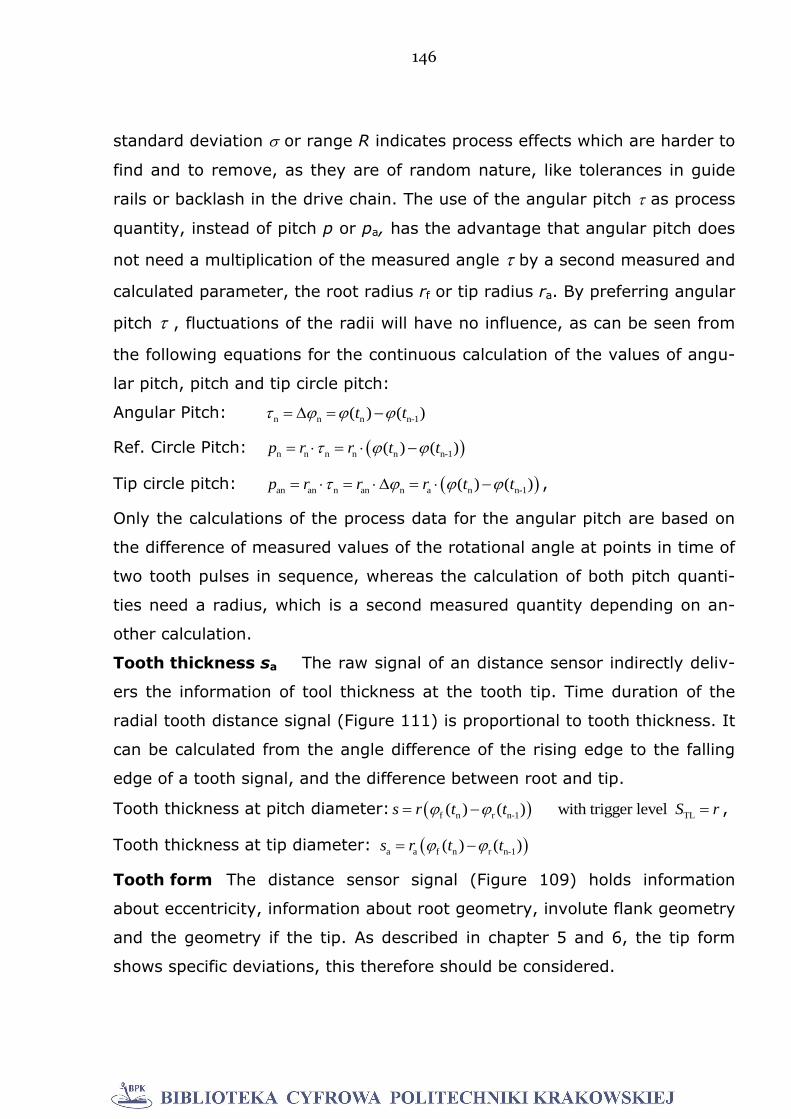
146
standard deviation or range R indicates process effects which are harder to
find and to remove, as they are of random nature, like tolerances in guide
rails or backlash in the drive chain. The use of the angular pitch as process
quantity, instead of pitch p or pa, has the advantage that angular pitch does
not need a multiplication of the measured angle by a second measured and
calculated parameter, the root radius rf or tip radius ra. By preferring angular
pitch , fluctuations of the radii will have no influence, as can be seen from
the following equations for the continuous calculation of the values of angu-
lar pitch, pitch and tip circle pitch:
Angular Pitch: n n n n-1( ) ( )t t
Ref. Circle Pitch: n n n n n n-1( ) ( )p r r t t
Tip circle pitch: an an n an n a n n-1( ) ( )p r r r t t ,
Only the calculations of the process data for the angular pitch are based on
the difference of measured values of the rotational angle at points in time of
two tooth pulses in sequence, whereas the calculation of both pitch quanti-
ties need a radius, which is a second measured quantity depending on an-
other calculation.
Tooth thickness sa The raw signal of an distance sensor indirectly deliv-
ers the information of tool thickness at the tooth tip. Time duration of the
radial tooth distance signal (Figure 111) is proportional to tooth thickness. It
can be calculated from the angle difference of the rising edge to the falling
edge of a tooth signal, and the difference between root and tip.
Tooth thickness at pitch diameter: f n r n-1 TL( ) ( ) with trigger level s r t t S r ,
Tooth thickness at tip diameter: a a f n r n-1( ) ( )s r t t
Tooth form The distance sensor signal (Figure 109) holds information
about eccentricity, information about root geometry, involute flank geometry
and the geometry if the tip. As described in chapter 5 and 6, the tip form
shows specific deviations, this therefore should be considered.
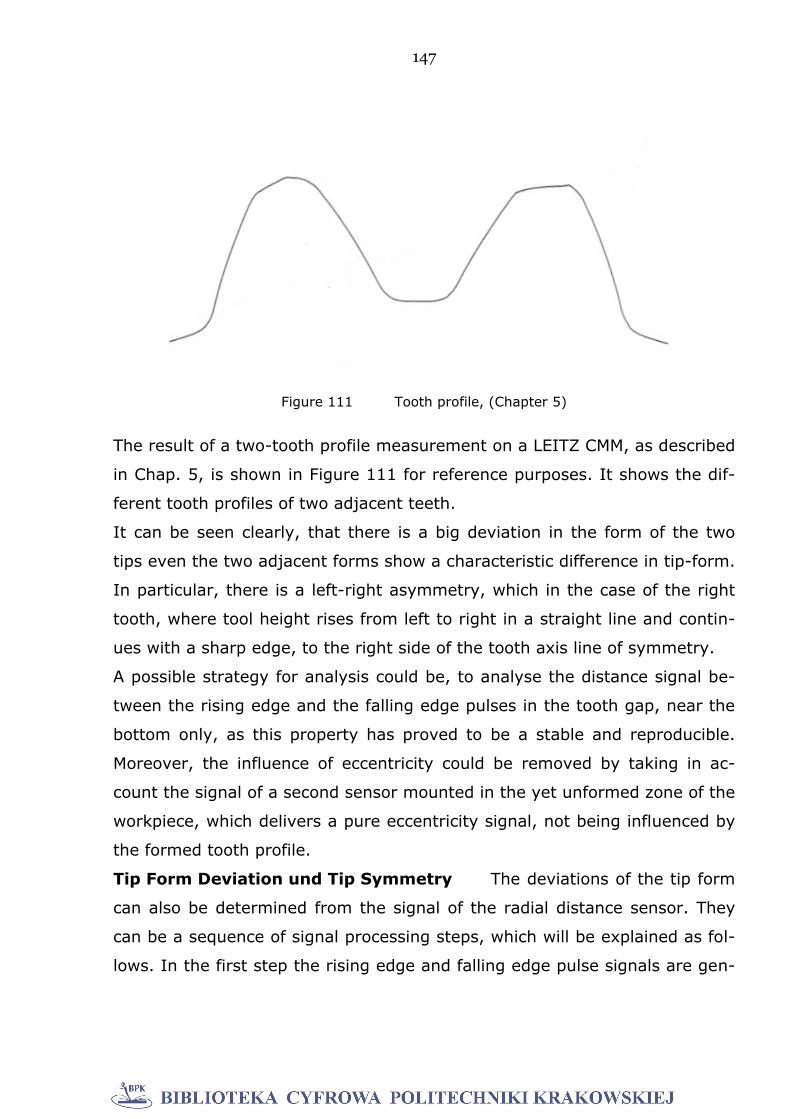
147
The result of a two-tooth profile measurement on a LEITZ CMM, as described
in Chap. 5, is shown in Figure 111 for reference purposes. It shows the dif-
ferent tooth profiles of two adjacent teeth.
It can be seen clearly, that there is a big deviation in the form of the two
tips even the two adjacent forms show a characteristic difference in tip-form.
In particular, there is a left-right asymmetry, which in the case of the right
tooth, where tool height rises from left to right in a straight line and contin-
ues with a sharp edge, to the right side of the tooth axis line of symmetry.
A possible strategy for analysis could be, to analyse the distance signal be-
tween the rising edge and the falling edge pulses in the tooth gap, near the
bottom only, as this property has proved to be a stable and reproducible.
Moreover, the influence of eccentricity could be removed by taking in ac-
count the signal of a second sensor mounted in the yet unformed zone of the
workpiece, which delivers a pure eccentricity signal, not being influenced by
the formed tooth profile.
Tip Form Deviation und Tip Symmetry The deviations of the tip form
can also be determined from the signal of the radial distance sensor. They
can be a sequence of signal processing steps, which will be explained as fol-
lows. In the first step the rising edge and falling edge pulse signals are gen-
Figure 111 Tooth profile, (Chapter 5)
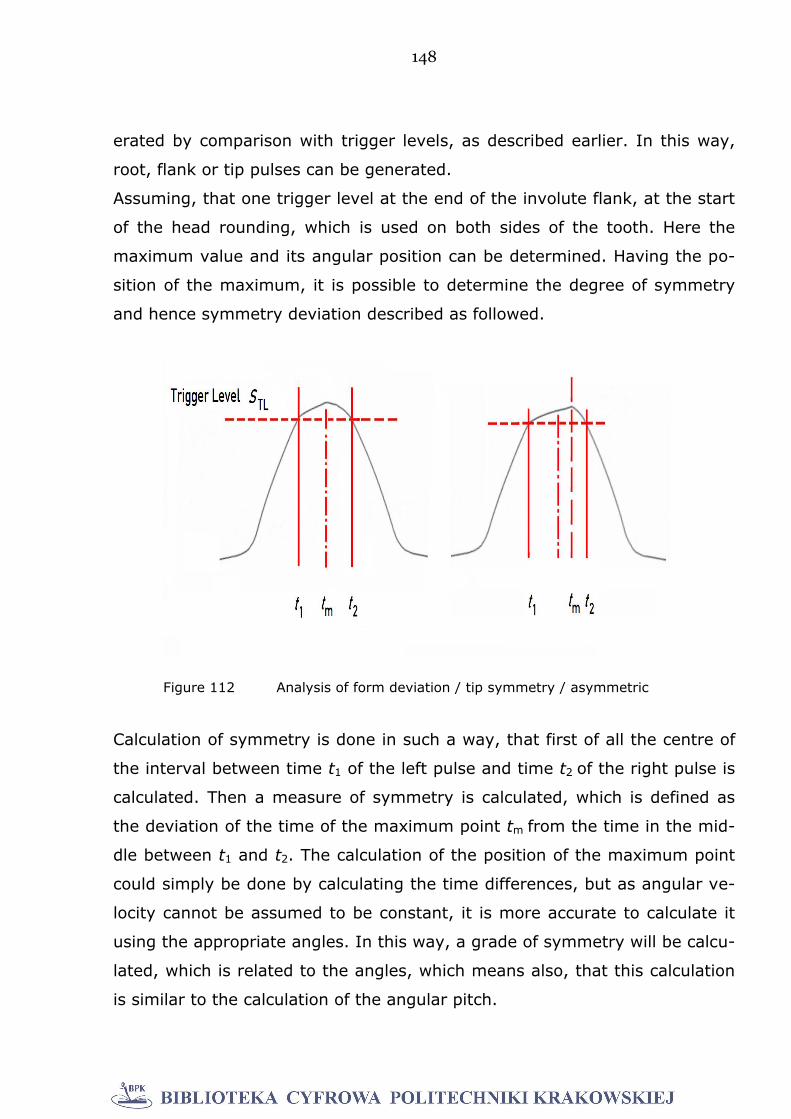
148
erated by comparison with trigger levels, as described earlier. In this way,
root, flank or tip pulses can be generated.
Assuming, that one trigger level at the end of the involute flank, at the start
of the head rounding, which is used on both sides of the tooth. Here the
maximum value and its angular position can be determined. Having the po-
sition of the maximum, it is possible to determine the degree of symmetry
and hence symmetry deviation described as followed.
Calculation of symmetry is done in such a way, that first of all the centre of
the interval between time t1 of the left pulse and time t2 of the right pulse is
calculated. Then a measure of symmetry is calculated, which is defined as
the deviation of the time of the maximum point tm from the time in the mid-
dle between t1 and t2. The calculation of the position of the maximum point
could simply be done by calculating the time differences, but as angular ve-
locity cannot be assumed to be constant, it is more accurate to calculate it
using the appropriate angles. In this way, a grade of symmetry will be calcu-
lated, which is related to the angles, which means also, that this calculation
is similar to the calculation of the angular pitch.
Figure 112 Analysis of form deviation / tip symmetry / asymmetric
149
Compared to the similar symmetry calculation based on the arc length, this
alternative has the advantage of a lesser number calculations in real-time,
so this angle-related “degree of symmetry” is recommended.
The absolute angular deviation of the maximum will be calculated as fol-
lows: From the measured pulse signals S1, S2 und Sm follow the correspond-
ing points in time t1, t2, tm and the measured and registered angle data
1(t1), 1(t2) und m(tm). The calculation of symmetry is now based on the
offset of the maximum point to the centre point and will be calculated as fol-
lows:
a) Temporal: 2 1m
2
t tt t
(time offset)
b) Angular: 2 1m
2
(angle offset)
c) Circumferential: as r (arc length offset) (ra = tip diameter)
The second alternative, the angular case (b) is preferred. Having available
this angular offset, one can calculate a relative symmetry deviation in %.
7.3.3 Axial Position and Orientation
The axial position and orientation of the workpiece relative to guidance rails
of the WPM machine can be acquired and monitored by the use of two dis-
tance sensors. Figure 113 shows the sensor configuration, where the two
sensors mounted with a fixed axial offset. If a special axial measuring cycle
is performed by the axial feed drive, there will result the signal curves of
sensor 1 and sensor 2 in principle, as shown in Figure 113. The signal of
sensor 1 shows a ramp starting from the root and extends to the tip over the
pre-formed zone on the surface of the workpiece. As an example, there is
also shown a case without any errors (curve horizontal; constant level, blue
curve), whereas a slightly rising straight line (red curve) shows a misalign-
ment. The signal of sensor 2 Signal, which is mounted outside the formed
zone of the workpiece, shows the axial feed vs. time, in case of no error,
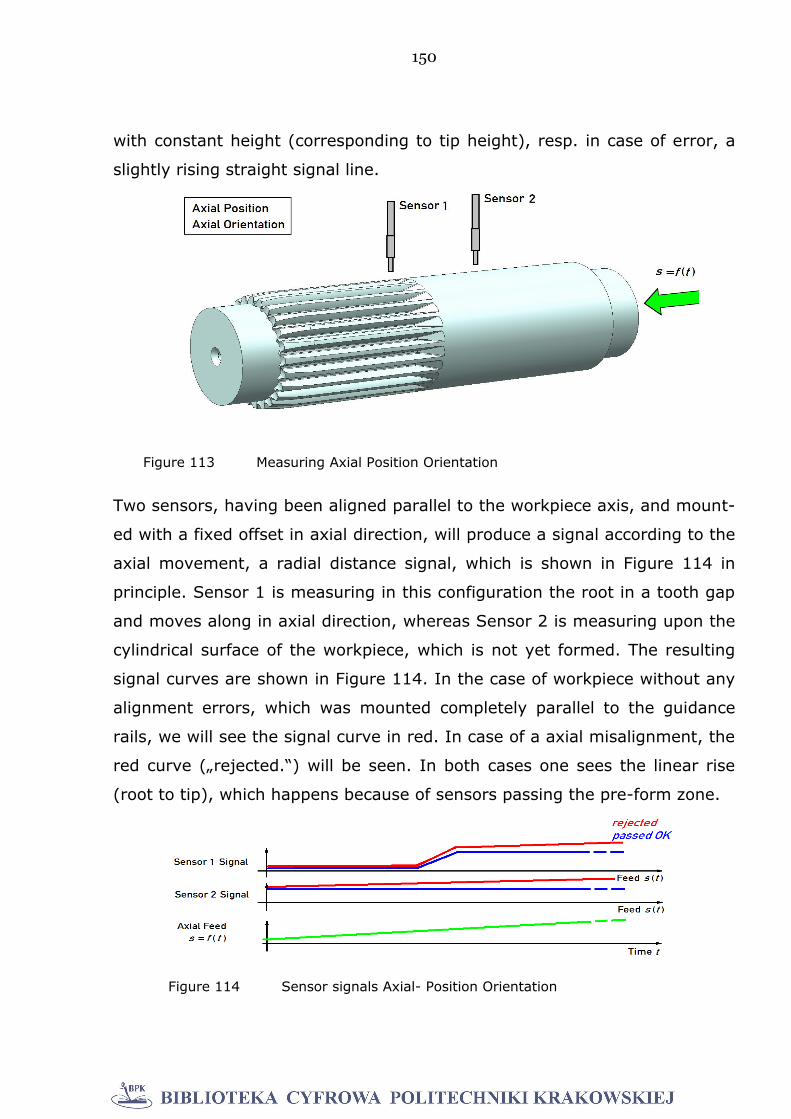
150
with constant height (corresponding to tip height), resp. in case of error, a
slightly rising straight signal line.
Two sensors, having been aligned parallel to the workpiece axis, and mount-
ed with a fixed offset in axial direction, will produce a signal according to the
axial movement, a radial distance signal, which is shown in Figure 114 in
principle. Sensor 1 is measuring in this configuration the root in a tooth gap
and moves along in axial direction, whereas Sensor 2 is measuring upon the
cylindrical surface of the workpiece, which is not yet formed. The resulting
signal curves are shown in Figure 114. In the case of workpiece without any
alignment errors, which was mounted completely parallel to the guidance
rails, we will see the signal curve in red. In case of a axial misalignment, the
red curve („rejected.“) will be seen. In both cases one sees the linear rise
(root to tip), which happens because of sensors passing the pre-form zone.
Figure 114 Sensor signals Axial- Position Orientation
Figure 113 Measuring Axial Position Orientation
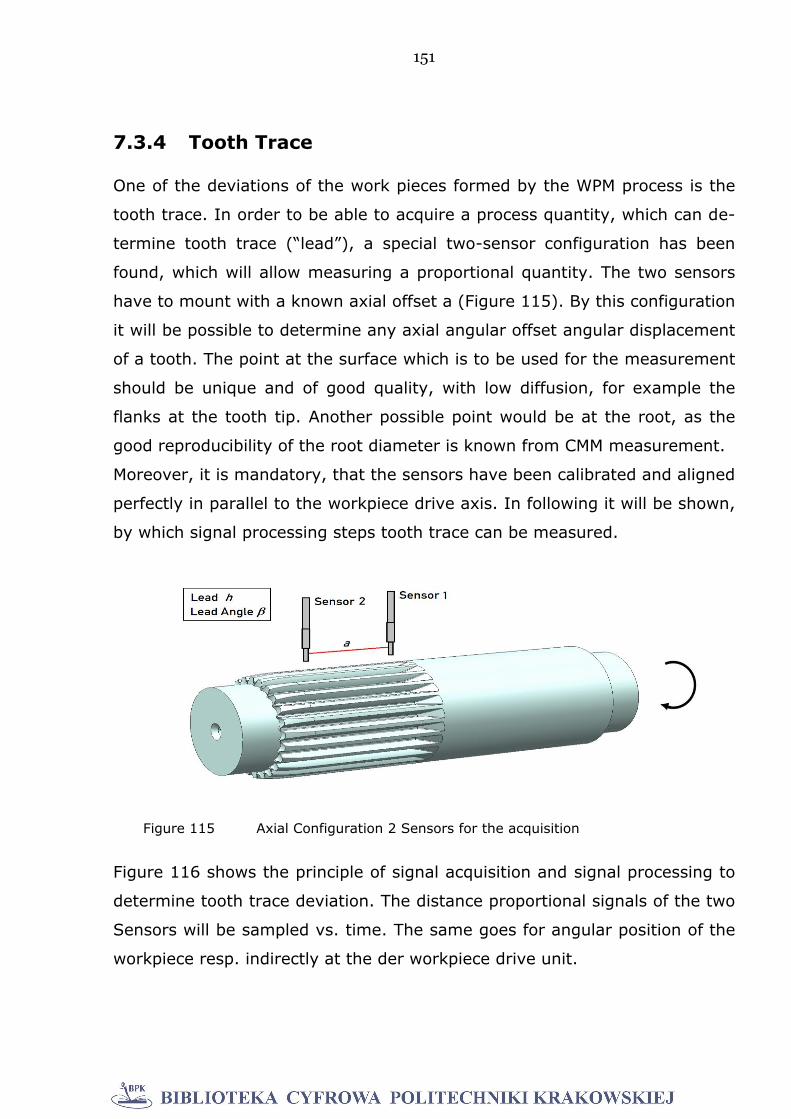
151
7.3.4 Tooth Trace
One of the deviations of the work pieces formed by the WPM process is the
tooth trace. In order to be able to acquire a process quantity, which can de-
termine tooth trace (“lead”), a special two-sensor configuration has been
found, which will allow measuring a proportional quantity. The two sensors
have to mount with a known axial offset a (Figure 115). By this configuration
it will be possible to determine any axial angular offset angular displacement
of a tooth. The point at the surface which is to be used for the measurement
should be unique and of good quality, with low diffusion, for example the
flanks at the tooth tip. Another possible point would be at the root, as the
good reproducibility of the root diameter is known from CMM measurement.
Moreover, it is mandatory, that the sensors have been calibrated and aligned
perfectly in parallel to the workpiece drive axis. In following it will be shown,
by which signal processing steps tooth trace can be measured.
Figure 116 shows the principle of signal acquisition and signal processing to
determine tooth trace deviation. The distance proportional signals of the two
Sensors will be sampled vs. time. The same goes for angular position of the
workpiece resp. indirectly at the der workpiece drive unit.
Figure 115 Axial Configuration 2 Sensors for the acquisition
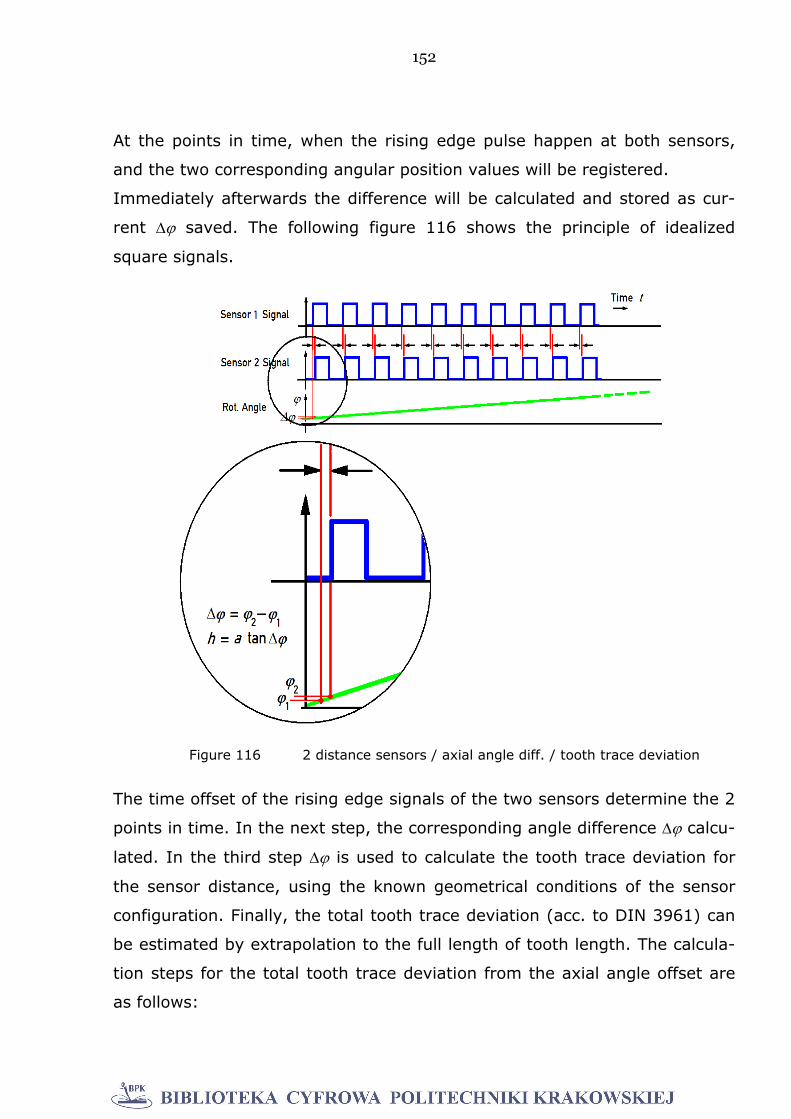
152
At the points in time, when the rising edge pulse happen at both sensors,
and the two corresponding angular position values will be registered.
Immediately afterwards the difference will be calculated and stored as cur-
rent saved. The following figure 116 shows the principle of idealized
square signals.
The time offset of the rising edge signals of the two sensors determine the 2
points in time. In the next step, the corresponding angle difference calcu-
lated. In the third step is used to calculate the tooth trace deviation for
the sensor distance, using the known geometrical conditions of the sensor
configuration. Finally, the total tooth trace deviation (acc. to DIN 3961) can
be estimated by extrapolation to the full length of tooth length. The calcula-
tion steps for the total tooth trace deviation from the axial angle offset are
as follows:
Figure 116 2 distance sensors / axial angle diff. / tooth trace deviation
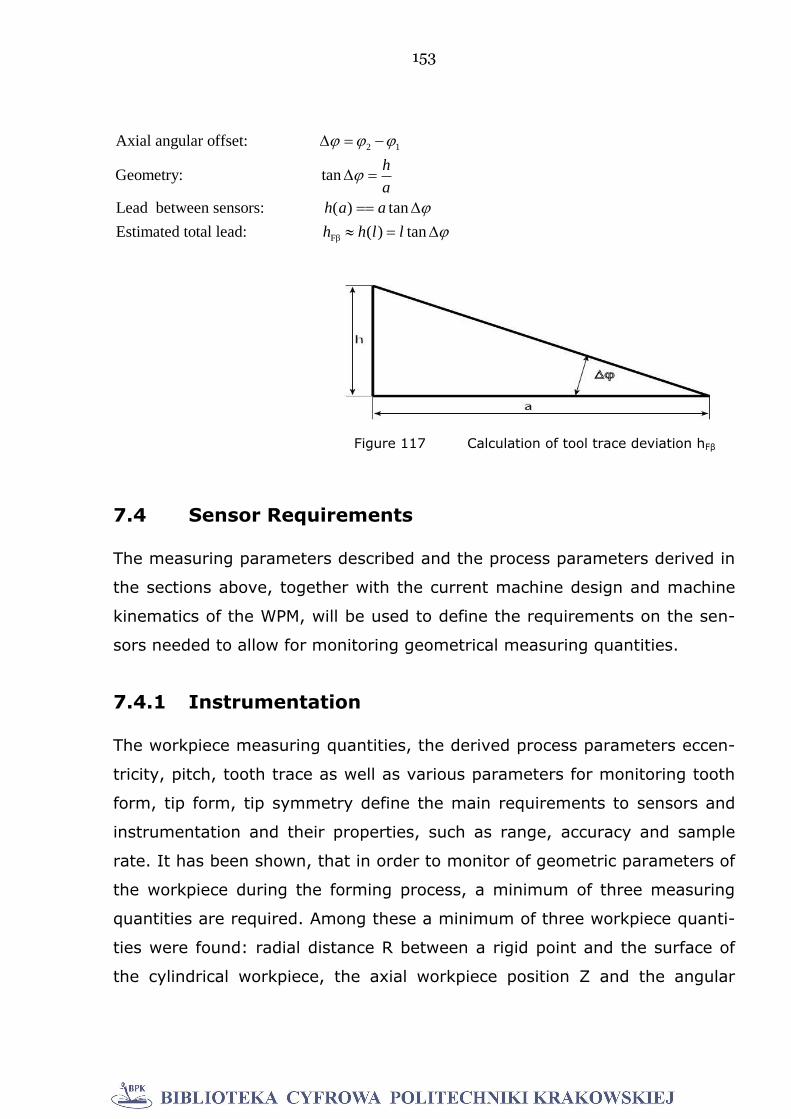
153
2 1
Fβ
Axial angular offset:
Geometry: tan
Lead between sensors: ( ) tan
Estimated total lead: ( ) tan
h
a
h a a
h h l l
7.4 Sensor Requirements
The measuring parameters described and the process parameters derived in
the sections above, together with the current machine design and machine
kinematics of the WPM, will be used to define the requirements on the sen-
sors needed to allow for monitoring geometrical measuring quantities.
7.4.1 Instrumentation
The workpiece measuring quantities, the derived process parameters eccen-
tricity, pitch, tooth trace as well as various parameters for monitoring tooth
form, tip form, tip symmetry define the main requirements to sensors and
instrumentation and their properties, such as range, accuracy and sample
rate. It has been shown, that in order to monitor of geometric parameters of
the workpiece during the forming process, a minimum of three measuring
quantities are required. Among these a minimum of three workpiece quanti-
ties were found: radial distance R between a rigid point and the surface of
the cylindrical workpiece, the axial workpiece position Z and the angular
Figure 117 Calculation of tool trace deviation hFβ

154
workpiece position . This workpiece coordinate system will be sufficient to
monitor the parameters described above.
From the measuring methods considered, certain consequences for the se-
lection of sensors, their properties and accuracies can be derived.
Most of geometric properties of the workpiece during the gear forming pro-
cess require sensors for measuring a combination of two geometric quanti-
ties: the distance between a fixed rigid point in the machine and the cylin-
drical workpiece to acquire the information of the tooth profile being formed.
As the workpiece is in a combined rotational and translational motion, which
changes its characteristics periodically, it is essential to also provide for the
acquisition of the rotation angle, which is mandatory for the interpretation of
the raw sensor signals, which are basically acquired versus time, and which
need a precise relation the momentary value of the rotation angle.
The requirements to the sensors regarding measurement range, measure-
ment accuracy and the minimum sample rate will be considered for the sug-
gested measurement quantities individually.
Quantity Sensor type Range
Distance R non-tactile 10 to 50 mm Position Z directly coupled 0 to 500 mm Ang. Pos. directly coupled 0 to 360 °
Distance R Measurement of distance between the sensors to the surface
of the workpiece must be performed in a non-contact way. The relevant non-
tactile method must be suitable for metallic surfaces, in this case turned
parts. A special problem exists as a sensor mounted vertically above the
workpiece will deliver an optimal signal in the range of the tip and the base,
but a suboptimum signal when the sampling spot moves across the vertical
section of the tooth, near the involute. The only solution will be to mount the
sensor with inclined orientation. Sampling the surface with two sensors, one
155
mounted vertically and the other inclined, may be necessary, but this will
increase the overhead and double the cost.
Circumferential resolution The resolution along the surface of the ro-
tating cylindrical workpiece should at least be 50 to 100 sample points per
tooth at the circumference. Assuming the present 24 teeth, the required
sample point density at the perimeter and a minimum sample rate a meas-
uring rate will be estimated. Res. = 24 teeth / 360° (50 … 100) samples
per tooth = 1200 … 2400 samples/360°
Assuming the current workpiece n = 300 / min one can estimate the re-
quired sample rate t Sample rate at n = 300 min-1 = 5 s-1: f = n p = 5 (1200
… 2400) samples/360° = 6000 … 12000 samples / s
Rotational Angle Ideally, the angular position would be measured di-
rectly at the workpiece. This not possible continuously, so as a replacement
solution, an indirect measurement of the rotational angle will be done at the
workpiece drive unit, however an additional monitoring channel is required,
which monitors the workpiece at certain points on its circumference, in order
to detect any slip between the workpiece and the drive unit. In case of a ro-
tational slip special measures to guarantee re-synchronisation have to be
taken.
Axial Position Z The WPM machine has an axial feed drive mechanic which
allows for indirectly measuring the axial position at the feed slide. Machine
tools usually have feed measurement systems with a resolution of typically
0.5 to 1 µm, whereas the accuracy of machines without temperature control
is worse, mostly 5 to 10 µm. The WPM-120 originally had no NC axes, but
the feed axis has been equipped with a digital incremental position meas-
urement system, using a magnetic scale with a nominal accuracy of 0.5 µm.
The feed mechanics is not designed and constructed to guarantee a constant
axial feed. The existing feed drive is fluctuating in the 0,1 mm range, so
there is no requirement for a better axial feed position measurement sys-
tem.

156
7.4.2 Conclusions of In-Process Measurement Require-
ments using Suitable Sensors
As the result of an analysis it could be shown that a minimum of three resp.
four quantities have to be measured. The acquisition of measuring data from
two non-tactile distance sensors, one linear position sensor and one rota-
tional angle sensor for measuring the angular position of the workpiece, as
well as the process quantities derived from these quantities by in-process
real-time calculation was being discussed. The requirements regarding
measuring range, accuracy and sample rate resulting from these considera-
tions were determined resp. estimated. Which of the many sensors available
on the market eventually could be selected according to these requirements,
and the question if sensors having the required accuracy and sample rate do
exist or have to developed, is beyond the scope of this work.
157
8. Conclusion and Outlook
In the present work, the little-known rolling method WPM with internally
toothed tools was used. This method was developed by Prof. Marciniak at
the beginning of 70th in Poland. A corresponding experimental machine
WPM 120 including rolling tools is located in Darmstadt and was used for the
research.
First of all, roll samples were prepared, which were manufactured under con-
trolled mechanical engineering conditions. Subsequently, these samples
were geometrically measured on a coordinate measuring machine Leitz PMM
654. The geometry measurements were divided into the conventional gear
measuring according to DIN and special contour measurements on the
toothing. With the contour measurements, which are visible with the naked
eye, geometrical characteristics of the teeth were examined. These geomet-
rical features are typical for the metal forming by using internal toothed
tools. It has been found that the resulting geometry of the examined sam-
ples is substantially dependent on the feed rate. In all other process pa-
rameters such as the blank material, no significant influence could be ob-
served on the toothing geometry.
The aim of the presented study is to determine through tactile post process
measurements, significant geometric features on the resulting component
geometry. These should serve as a basis for a future in-process monitoring
of the rolling process. The features of interest were found and described.
Among other features, the different tooth heights and the tooth tip forms
dominate the compiled results. Using the WPM method with internal toothed
tools an asymmetrical distribution of the blank material results on the cir-
cumference.
The WPM-rolling is a metal forming method for chipless production of
toothed machine elements. Methods of forming technology are generally
used for the production of mass-produced parts. The mass production is
158
subject to specific criteria. These criteria basically relate to the profitability in
consistency. This leads to the conflict to produce a maximum of toothed
components in the shortest possible time. This is the main reason that the
resulting toothing geometries can only be checked on a random basis.
This is today’s industrial practice, because the required measurement quality
leads to an expenditure of time. Therefore it cannot be checked each com-
ponent. So it is now the target of the production technology to search for
solutions which make it possible to monitor the production of any component
already in the machine. This would save time and avoid that defective parts
are produced in large quantities. To late noticed manufacturing errors cause
costs. The efficiency of the entire production is adversely affected.
The own studies document the fact that during the metal forming with inter-
nally toothed tools typical errors at the toothing result. A timely detection of
these geometrical features in-process is, in principle possible, since these
geometrical deviations from the desired ideal shape of a tooth system are
located on the surface of the cylindrical components.
Tactile probes for geometry detection are not suitable, because the work-
piece rotates during the rolling process. Insofar measurement methods simi-
lar to the measuring structure in a coordinate measuring machine are un-
suitable for this task. Constructive problem areas of the rolling machine
would be affected and would lead to significant technical problems. The im-
plementation of coordinate metrology within the rolling machine is therefore
hardly possible for various reasons. Consequently, tactile measuring probes
with respect to an in-process monitoring of the rolling process are unsuita-
ble. Based on our own results, solutions to capture the geometric features of
the process with non-tactile probes were developed. These suggestions are
based on knowledge of the characteristics of head shapes and head heights.
As a particularly stable feature of the WPM-rolling, was observed that the
resulting root circle diameter results nearly identical for all examined param-
eter combinations. In this respect the features head height, head shape and
foot circle are generally suitable for detecting the rolling process metrologi-

159
cal. It is presumed in this case that in addition to the detection of geometric
features on the parts processed, also machine-technical data, such as drive
power of the rolling tools and feed movement of the rolled part, would be
measured and interpreted.
Changes of the special features in combination with machine-technical
measurements in the single process or throughout the production time of
many toothed components could be detected and interpreted. In this con-
nection stands the monitoring of the uniformity of an ongoing mass produc-
tion in the foreground. If nearly identical head and foot geometries result, it
can be assumed that production takes place under the same conditions.
When the corresponding measured values tend to change, then modified
rolling conditions must have revealed. A timely response of the machine op-
erator is therefore possible.
In terms of the previously mentioned proposals of a future in-process control
of the WPM-rolling, non-tactile sensors would be used. This measures the
geometric distance between the component surface and a mechanically sta-
ble point within the machine. The necessary number of sensors is dependent
on the selected measurement and analysis strategy. Depending on the geo-
metric issue are different combinations of sensors conceivable.
The question of an ideal in-process monitoring process cannot be conclusive-
ly answered today. This research does not explain in detail how the geomet-
rical features emerge. It can be assumed that the contact under load be-
tween the tools and the blank lead to changes in the geometric center posi-
tion of the rolled part. The knowledge of these relationships should be inves-
tigated in detail in the future. Furthermore, it is not sufficiently known in de-
tail how the material is distributed on the circumference of the rolled part. It
was found that on the circumference of the rolled sample asymmetries arise
in the tooth tips. Whereby these geometric features are caused is not clear
yet. If clarity would be gained, then different approaches can arise to define
the strategy for the future geometric monitoring. In addition to the detection
160
of the resulting component geometry, capturing other features which char-
acterize the forming process is also conceivable. The observed differences in
tooth height and head shapes mean in consequence, that at the emergence
of the tooth gaps different material movements must be preceded. There-
fore, various material movements must have happened, relative to the indi-
vidual teeth. These would lead to different work hardening gradients of the
material. It would be ideal, if it would be possible to detect metrological dif-
ferent work hardening between the left flank and the right flank at every
tooth. Measurements with an ultrasonic sensor could possibly be a reasona-
ble approach in principle.
Another feature for the interpretation of the rolling process may be the con-
dition of the rolled surface of the workpiece. This statement relates to the
roughness and formation of cracks on the surfaces. In the preliminary exper-
iments to the present work different rolling samples were examined under a
microscope. Surface variations were clearly recognizable down to small
cracks. To what extent appropriate sensor is already available on the market
today and with how much effort this would be to develop, cannot be conclu-
sively determined. The rotational movement of the part would be certainly
the main problem.
The acquisition of geometrical features with non-tactile sensors based on de-
tailed evidence regarding the contact situation between the tools and the
material could serve as a starting point for the development of in-process
monitoring. In addition considering the geometric relationships on the result-
ing workpiece geometry, further analysis of the work hardening of the mate-
rial and the surface characteristics may lead to a comprehensive in-process
monitoring of rolling with the WPM method.
161
9. Abstract/ Streszczenie
The subject of the present work concerns the production of splined shafts.
On an industrial scale, they are made in series production using a succession
of different manufacturing processes. The increasing demand of high preci-
sion machine elements manufactured in mass production results in a target
conflict with respect to quality control of the production lots, esp. if metal
forming techniques are the production principles. Usually individual parts are
measured post process in form of random checks. This type of quality assur-
ance is highly patchy and costly. The aim is thus to capture quality-related
characteristics of the components in future integrated within the producing
machine. In the case of the present work, the WPM-rolling was used in the
final machining of the toothing. This method is a chipless process with inter-
nal gear rolling tools, which was developed in Poland by Prof. Marciniak in
the 70s. The method is particularly suitable for the high speed production of
splined shafts. The goal of the own investigations is to determine significant
geometric feature characteristics of the toothed components that are suita-
ble for future in-process measurement within the machine. For this purpose,
different rolling series were performed on a rolling machine WPM 120. The
technical process data of the WPM 120 were collected to ensure that all
toothed components were produced under nearly identical conditions. By
post-process measurements on a Leitz PMM 654 the geometric quality of all
parts series was recorded and evaluated. It was found that the conventional
definition of the gear quality is not sufficient to describe the resulting geom-
etry after rolling. Through special section measurements on the splines in
axial and radial directions, geometric characteristics of the gear components
could be detected. The particular geometrical features of interest are the
special head height and head shape of the rolled splines. These typical geo-
metric features always arise during rolling with internally toothed tools. They
are essentially dependent on the feed rate set on the machine. Using corre-
sponding sensor systems provided inside the machine, these geometric fea-
tures can serve as a reference base for a future in-process measurement
framework. Further work on this topic should examine the problem of unbal-
162
anced volume distribution (tooth height and shape) of the deformed material
at the circumference of the toothed sample.
Streszczenie
Tematyka rozprawy doktorskiej związana jest z produkcją wałków wie-
lowypustowych. Na skalę przemysłową w produkcji seryjnej są one
wytwarzane w ciągu różnych procesów obróbkowych. Rosnące wymagania
dotyczące wykonywania części maszyn o wysokiej precyzji powodują konflikt
pomiędzy koniecznością wytwarzania dużej liczby przedmiotów w produkcji
masowej a koniecznością realizacji kontroli jakości partii, szczególnie jeśli
wytwarzanie odbywa się przy zastosowaniu obróbki plastycznej. Zazwyczaj
pojedyncze części mierzone są po zakończeniu procesu jako próbki losowe
będące podstawą do oceny większej populacji. Ten sposób zapewnienia
jakości przedmiotów jest bardzo wybiórczy i kosztowny.
W takim układzie celem rozprawy jest wyodrębnienie cech wykonywanych
przedmiotów związanych z jakością w celu późniejszego integracji ich in-
spekcji w maszynie produkcyjnej. W pracy do wytwarzania gotowych ele-
mentów uzębionych zastosowano maszynę WPM opracowaną w Polsce przez
profesora Marciniaka w latach 70-tych XX wieku. Pozwala ona realizować
proces obróbkowy bezwiórowy, w którym narzędzia mają charakter ele-
mentów uzębionych o zębach wewnętrznych. Taka metoda wytwarzania jest
szczególnie przydatna do bardzo szybkiej produkcji wałków wie-
lowypustowych. Badania własne autora ukierunkowano na określenie is-
totnych cech geometrycznych charakteryzujących element uzębiony, które
byłyby odpowiednie do kontroli w trakcie procesu. Do tego zadania
wykonano serię przedmiotów badawczych na maszynie WPM 120. Dane pro-
cesu zostały zgromadzone i szczegółowo przebadane aby zapewnić, że
wszystkie przedmioty wytworzono przy niemal identycznych warunkach
obróbki. Zostały one następnie zmierzone po procesie wytwórczym na
współrzędnościowej maszynie pomiarowej Leitz PMM 654, a wyniki poddano
analizie. W jej trakcie okazało się, że konwencjonalna definicja jakości uz-

163
ębień jest niewystarczająca do opisu wynikowej geometrii po procesie
walcowania. Poprzez odpowiednią selekcję sekwencji pomiarowych na wie-
lowypustach w kierunku osiowym i promieniowym możliwe jest określenie
cech geometrycznych elementów zębatych. Szczególnie interesującymi
cechami są wysokość głowy zęba i jej kształt dla walcowanych wielowypus-
tów. Te typowe cechy geometryczne są zawsze miarą jakości wykonania w
czasie walcowania za pomocą narzędzi z zębami wewnętrznymi. Są one is-
totnie zależne od posuwu ustawionego na maszynie. Stosując odpowiedni
system sensorów zainstalowanych wewnątrz maszyny produkcyjnej cechy te
można wykorzystać jako bazę odniesienia dla przyszłego układu pomiaro-
wego zrealizowanego w kontroli czynnej. Dalsze prace na ten temat będą
dotyczyły badania problemu niezrównoważonego rozkładu objętości
(wysokość i kształt zęba) deformowanego materiału na obwodzie przedmiotu
uzębionego.

164
Appendix 1: Blank Geometry
Circles outer cylinder roundness 1.1 -1.3
Cylinder form deviation 1.4
List of measurement results 1.5 a –c

165
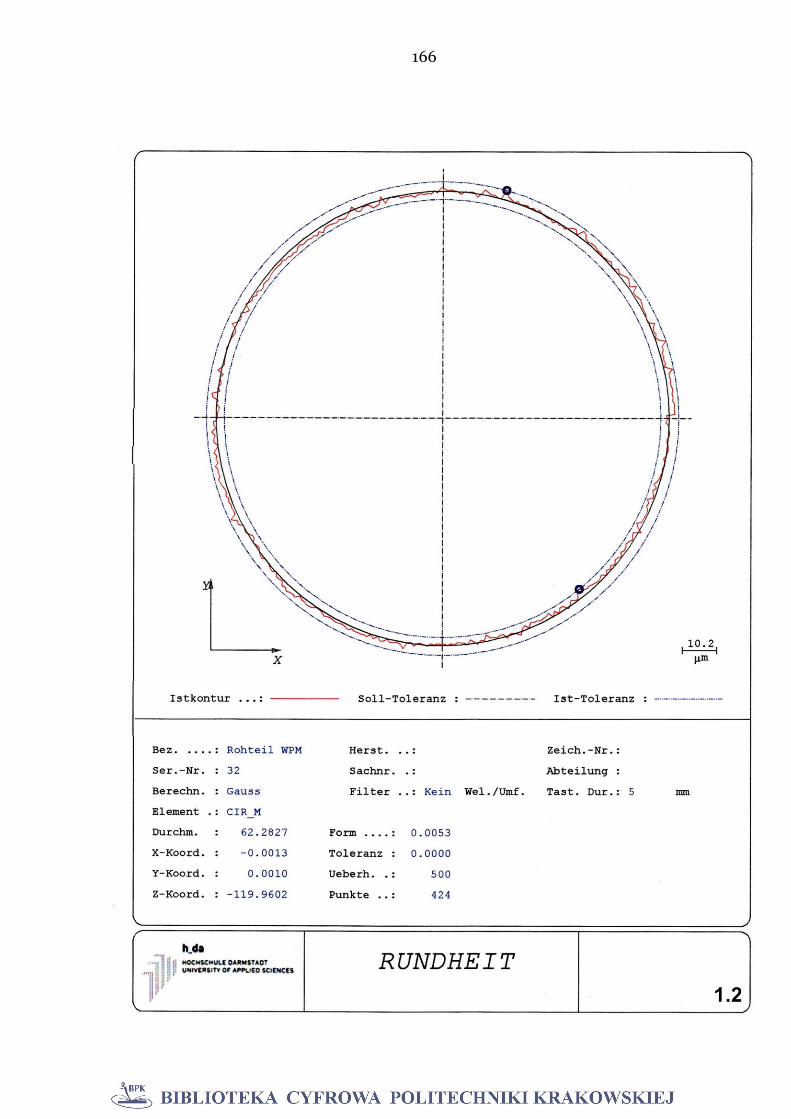
166
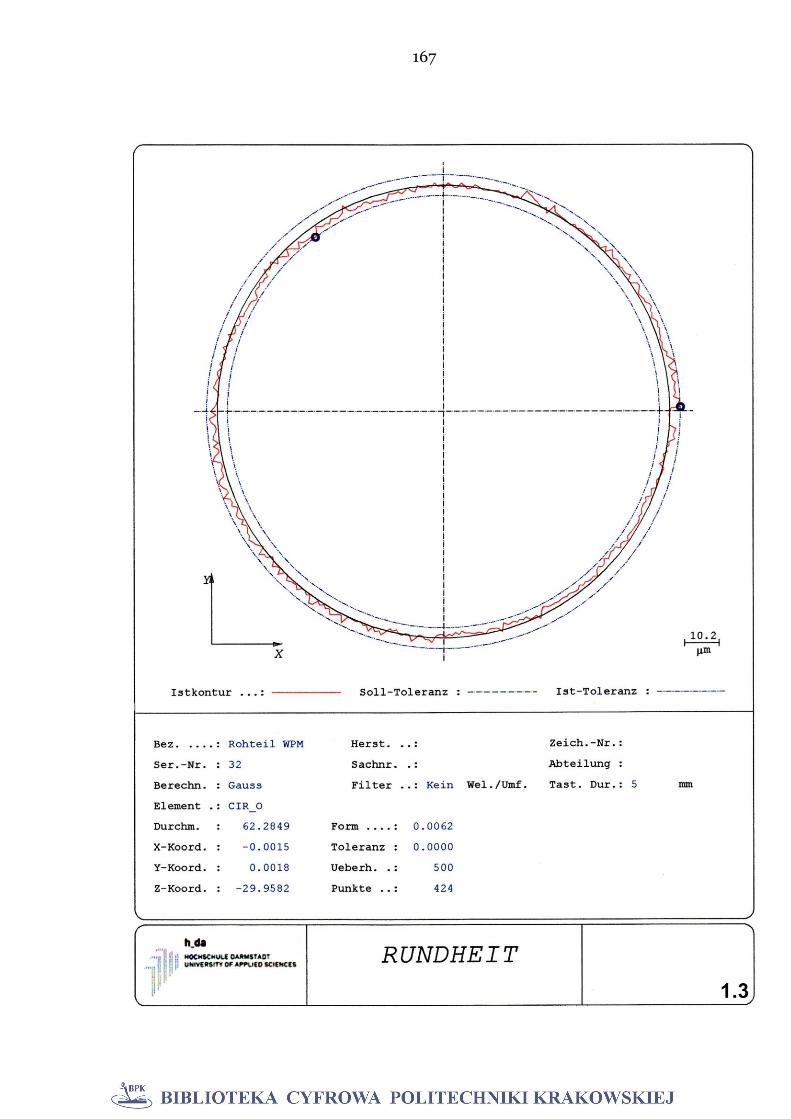
167
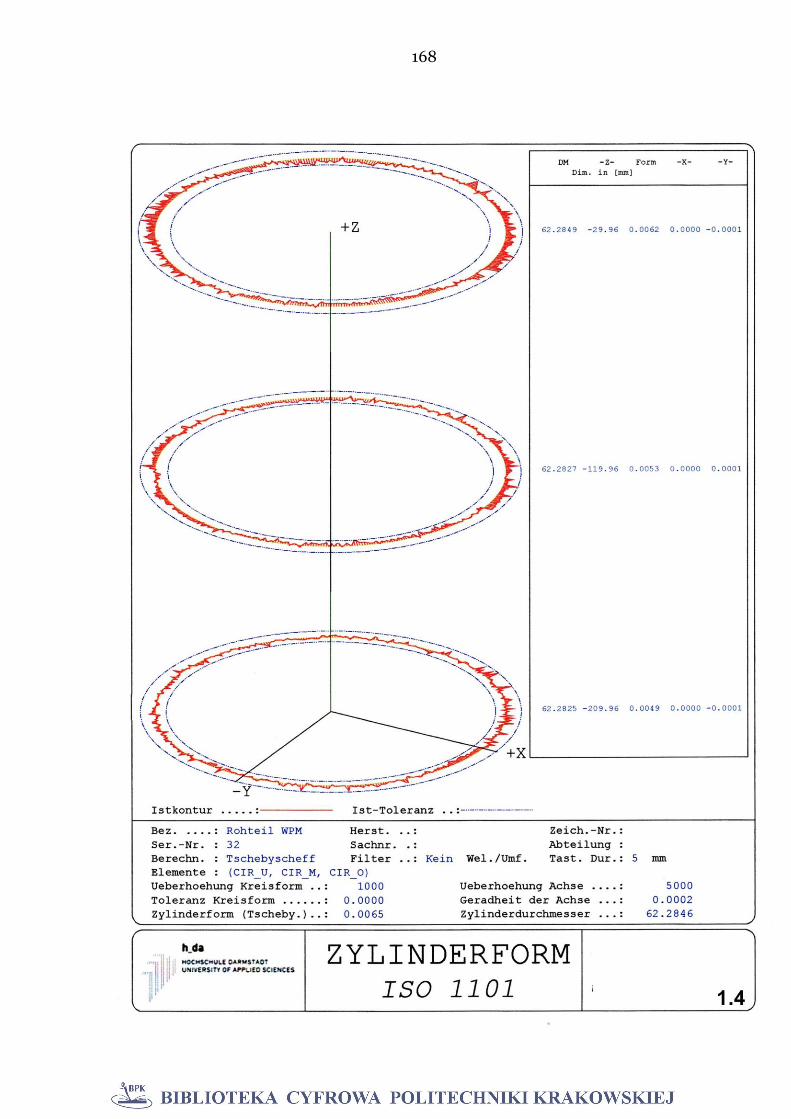
168
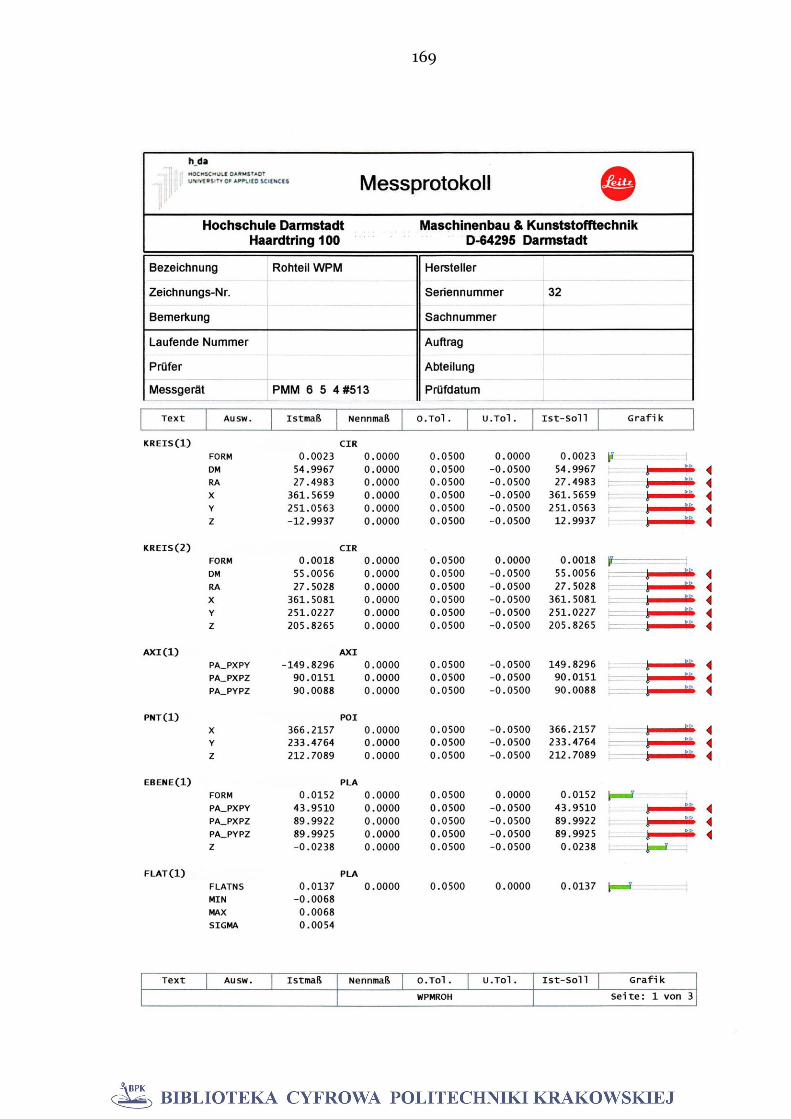
169
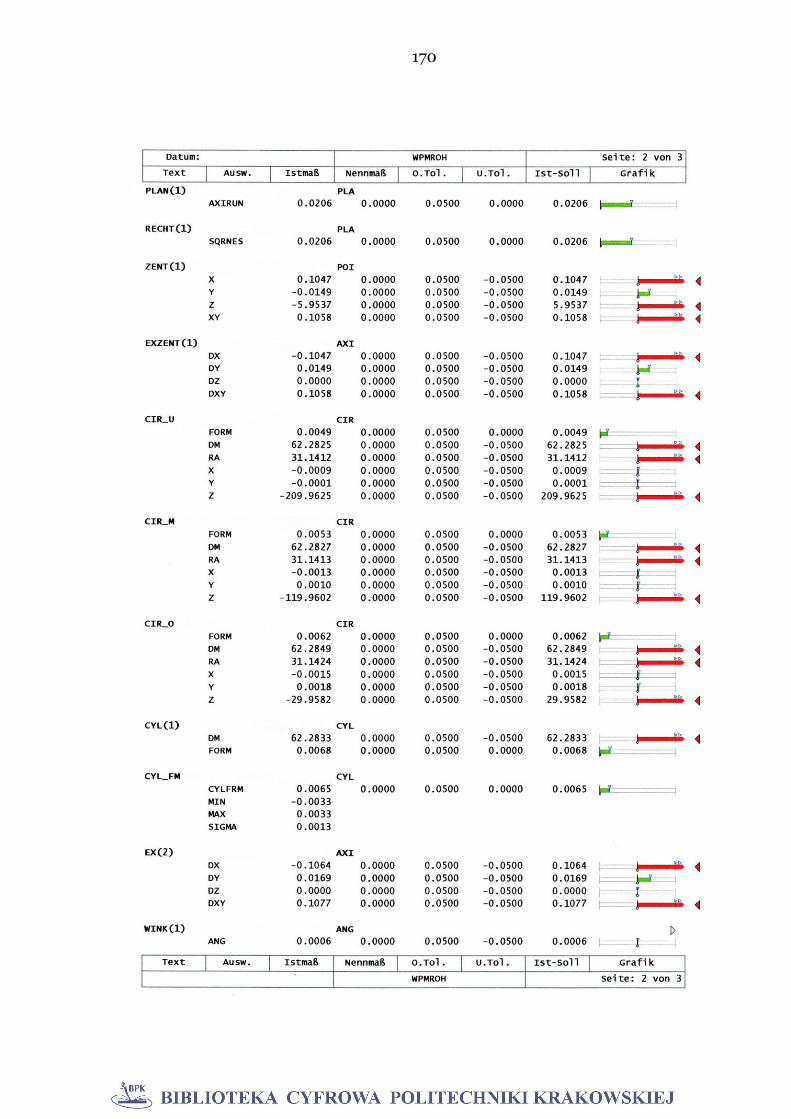
170
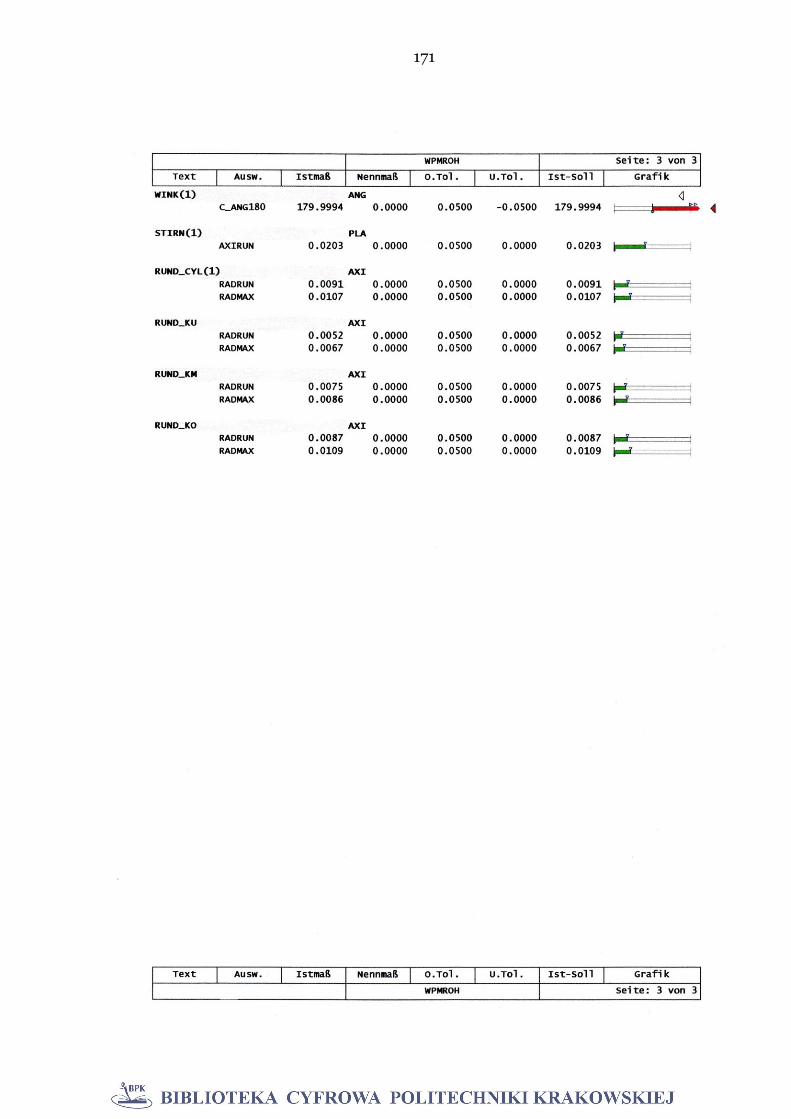
171

172
Appendix 2: Gear tooth quality (DIN 3960 ff.)
Pitch and concentricity deviation 2.1 – 2.2
Root diameter, roundness 2.3
Tip diameter, roundness 2.4
Tooth trace deviation 2.5 – 2.10
Profile deviation 2.11 – 2.16
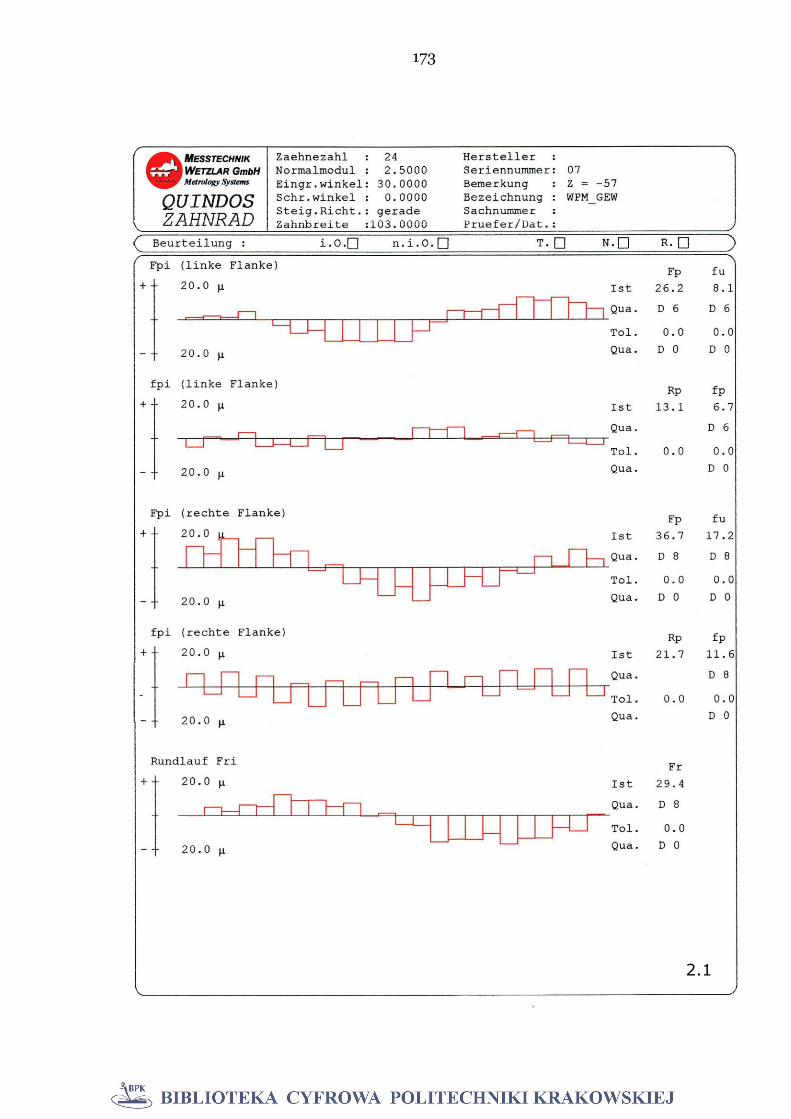
173
2.1
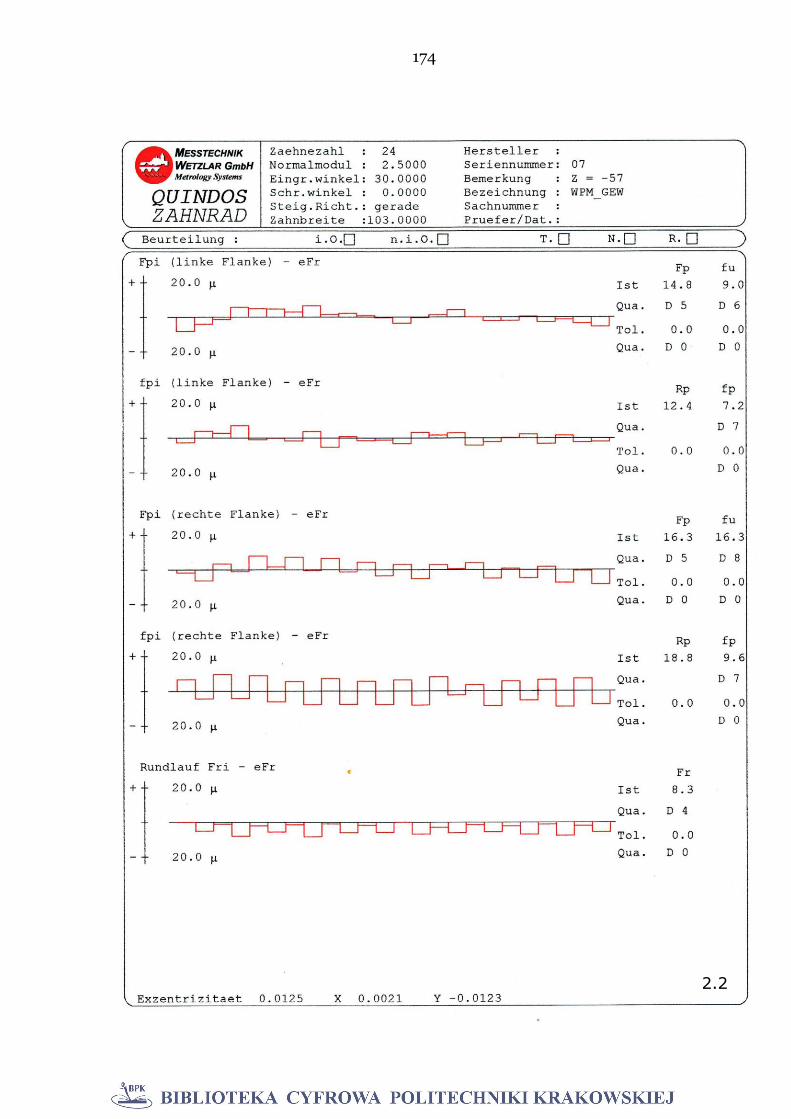
174
2.2

175
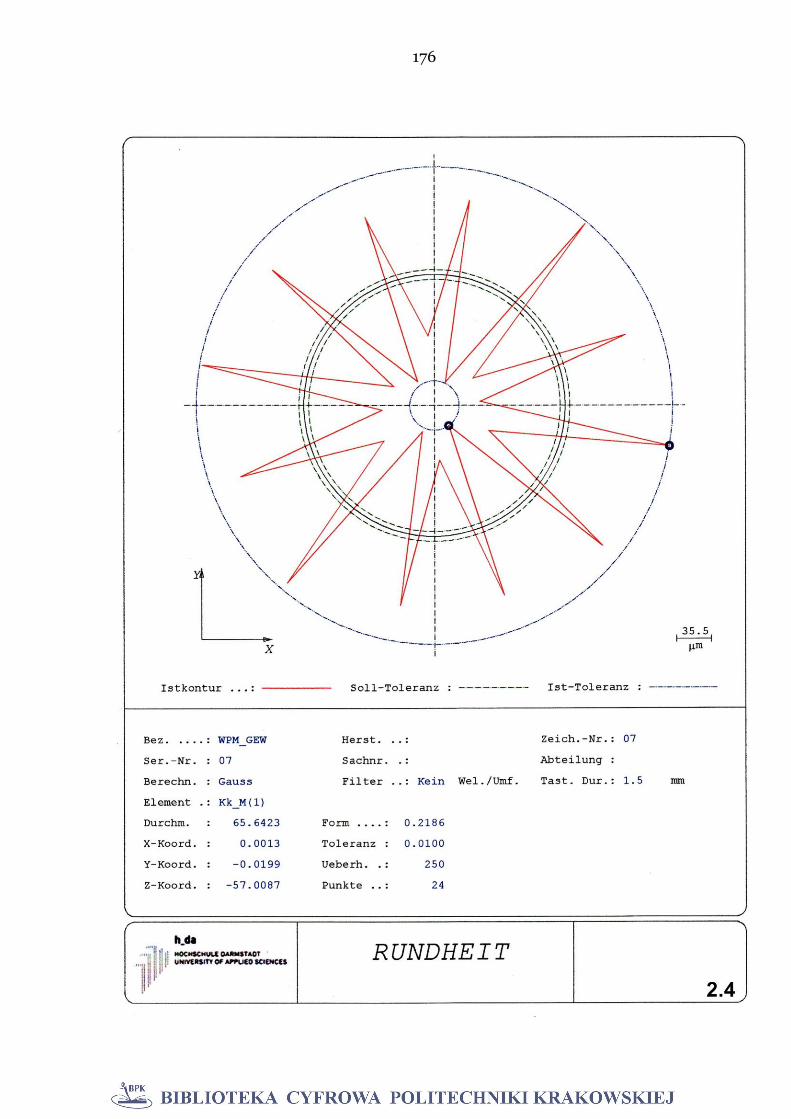
176
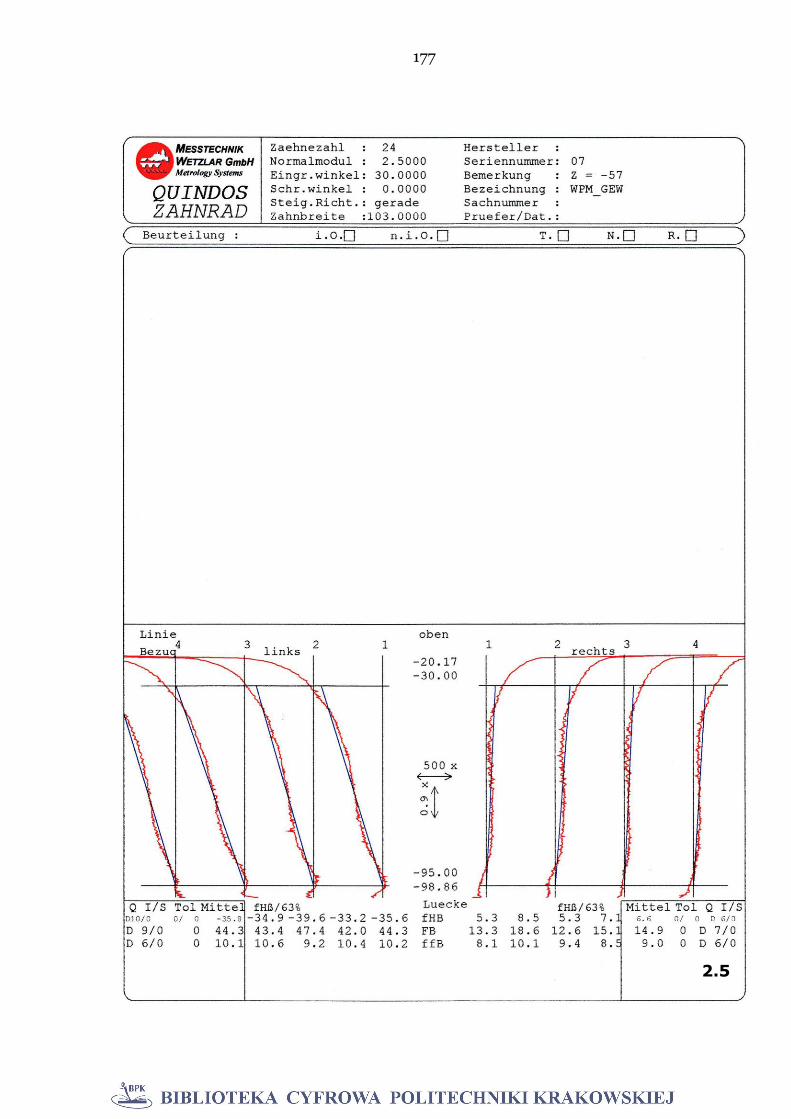
177
2.5
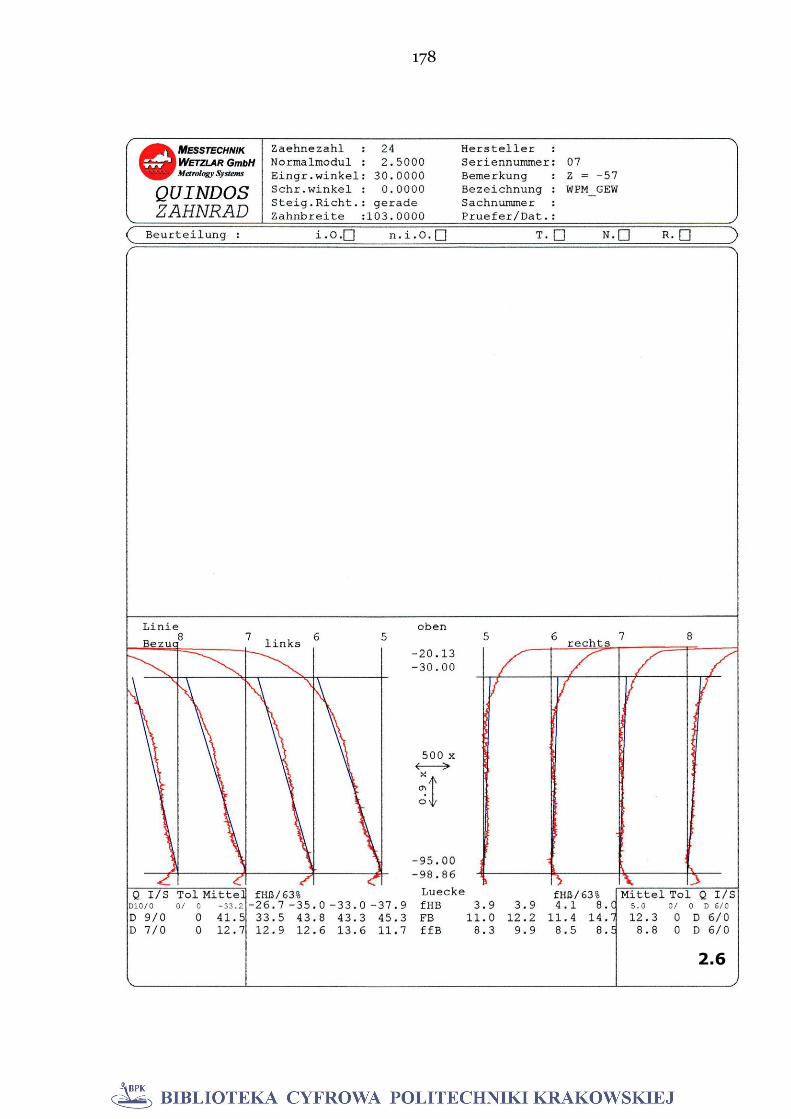
178
2.6
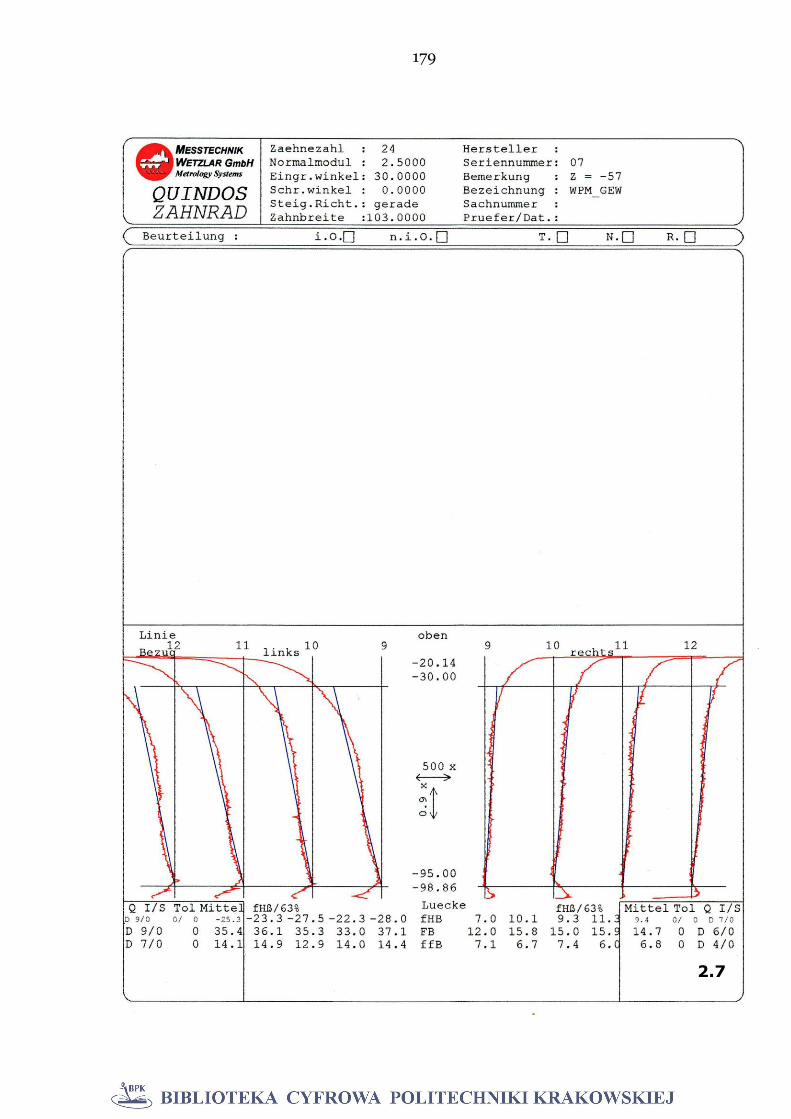
179
2.7
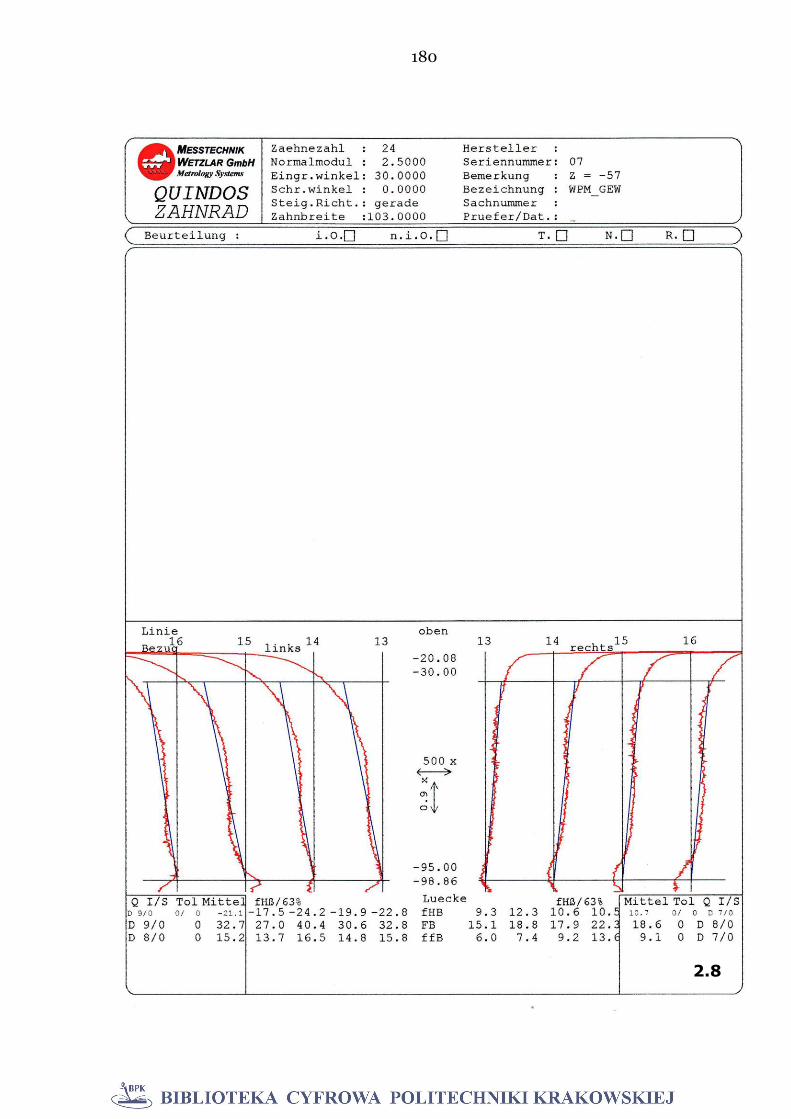
180
2.8
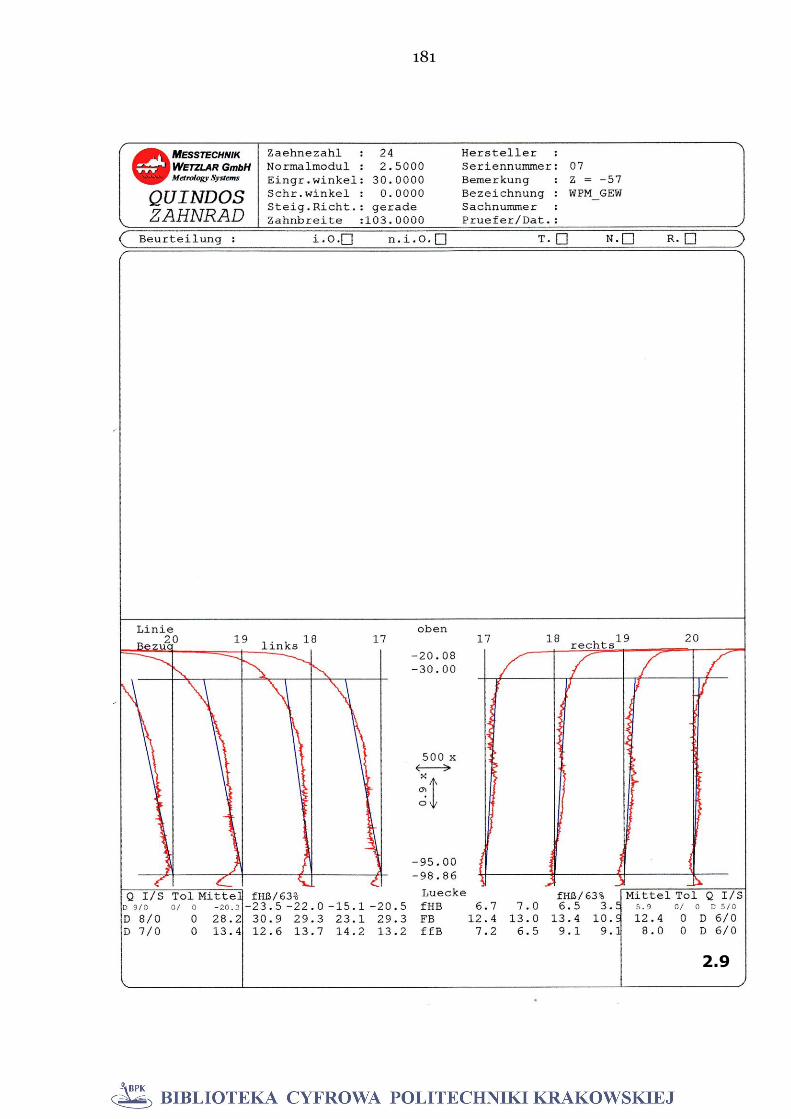
181
2.9

182
2.10
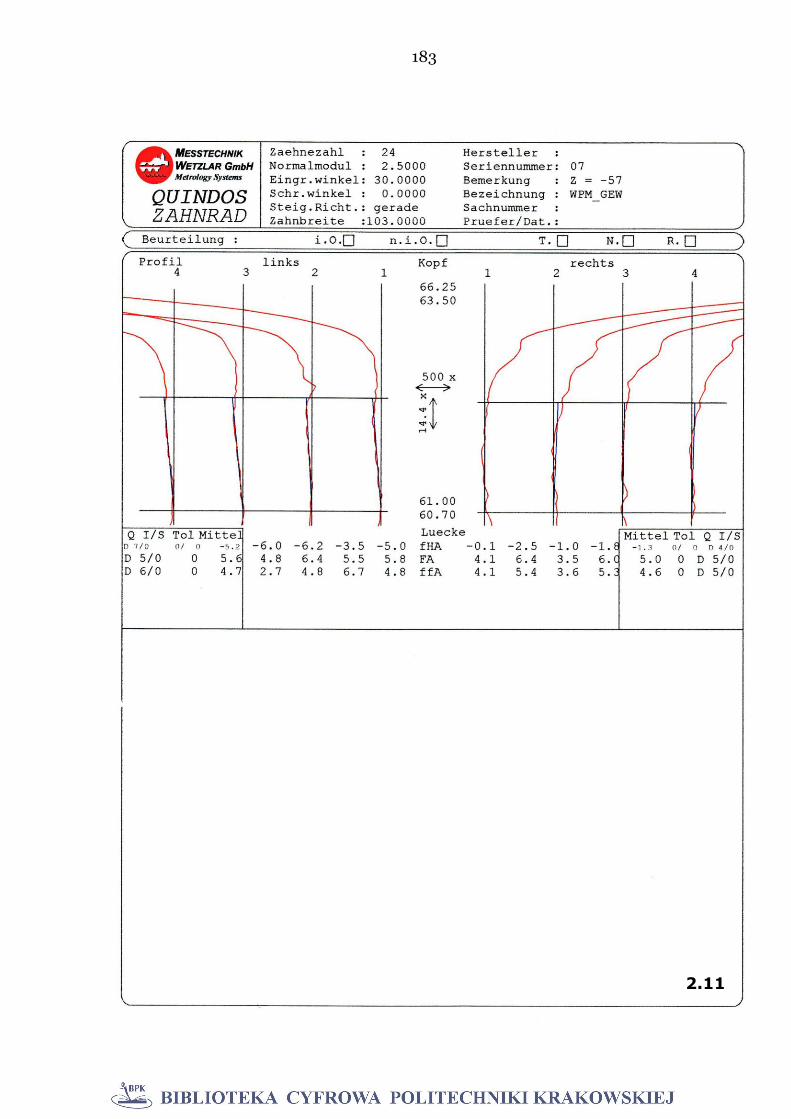
183
2.11
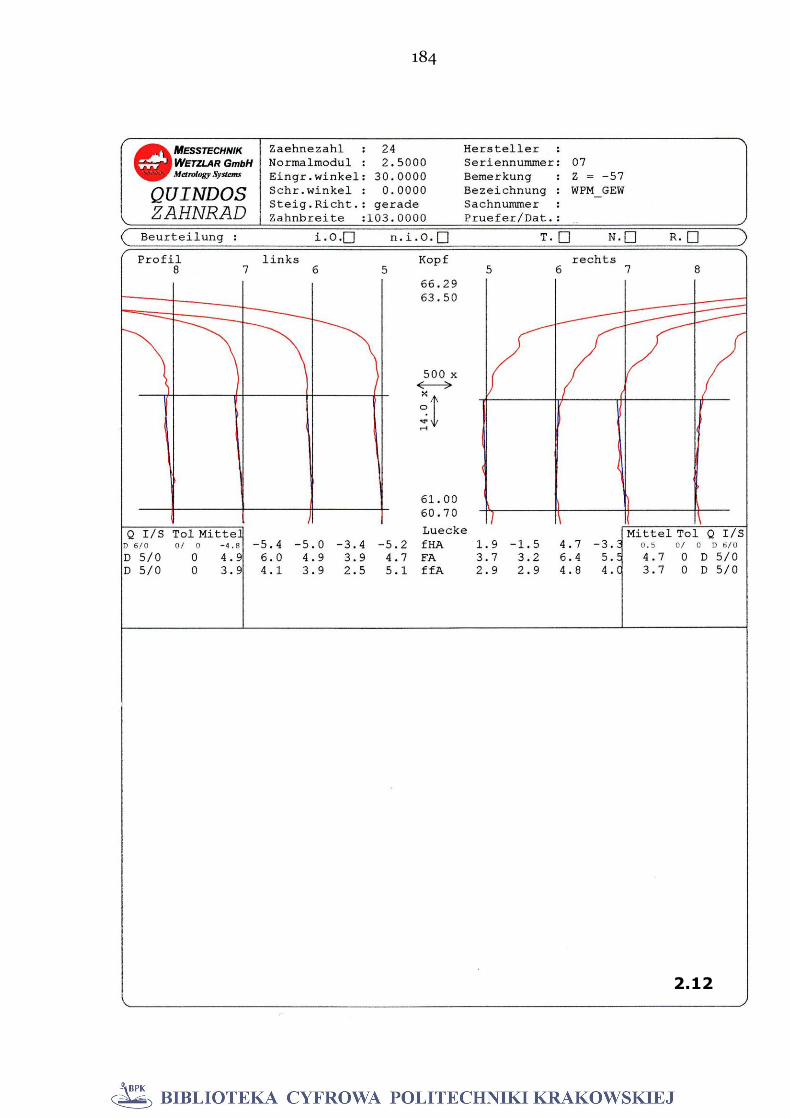
184
2.12
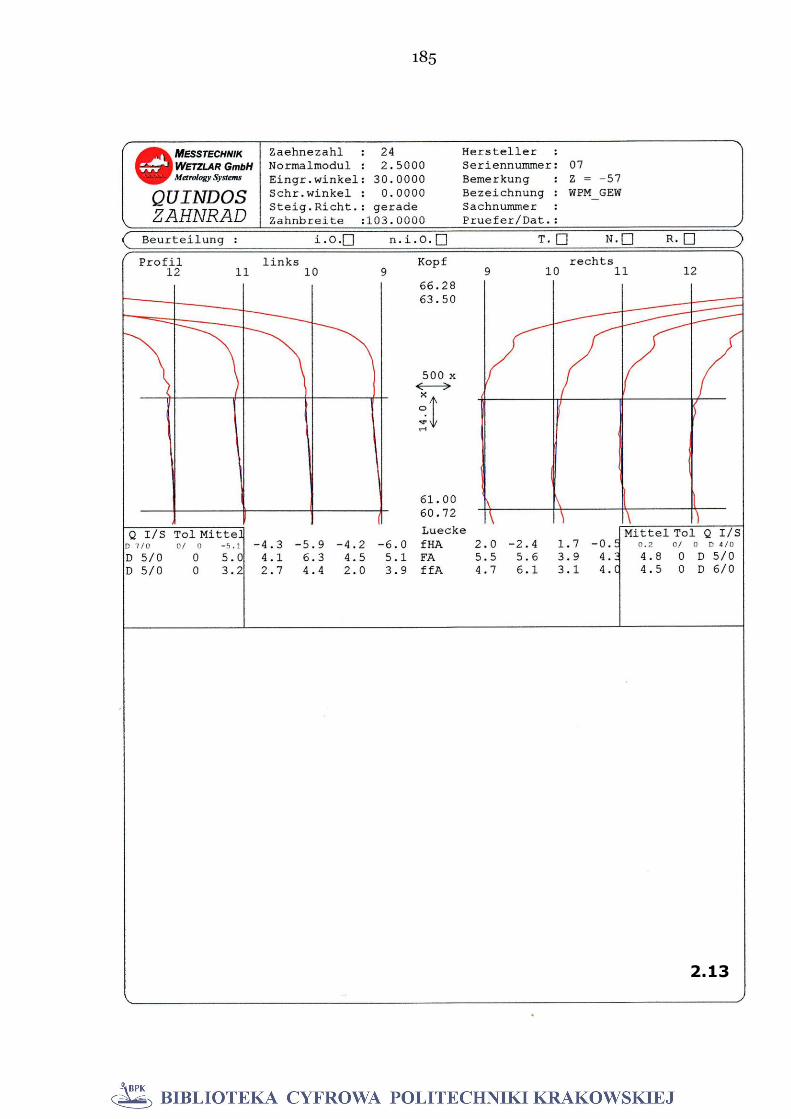
185
2.13
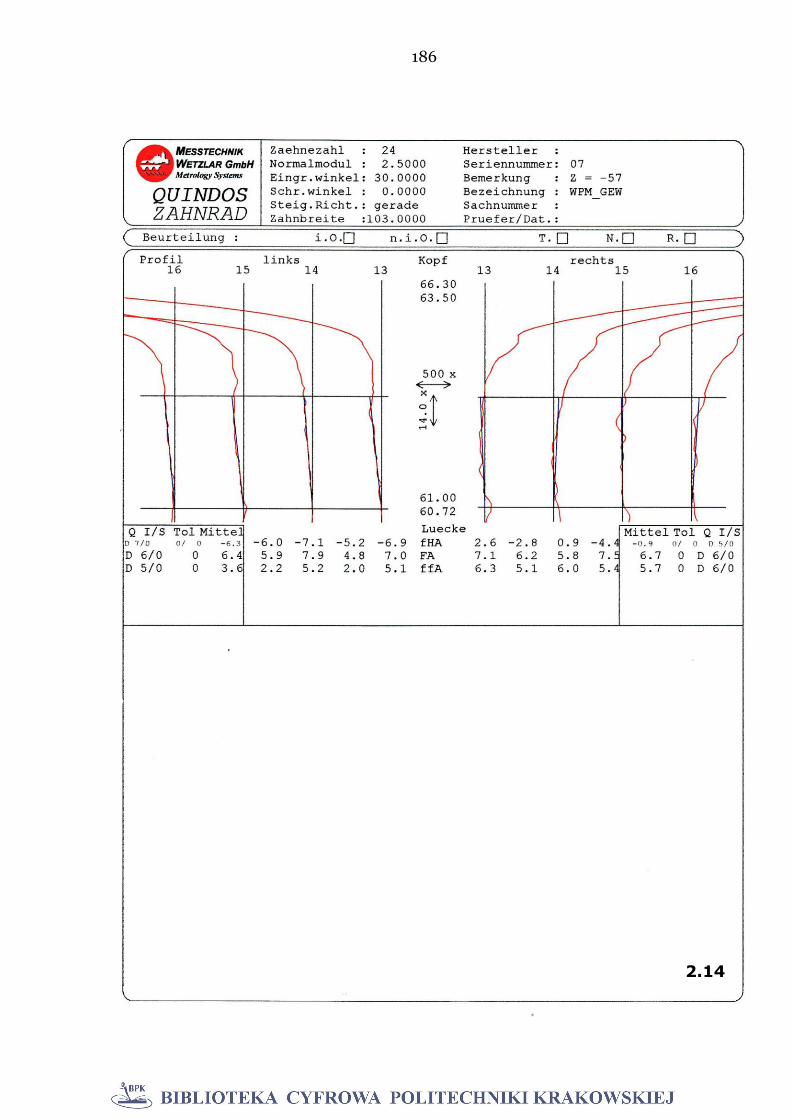
186
2.14

187
2.15

188
2.16
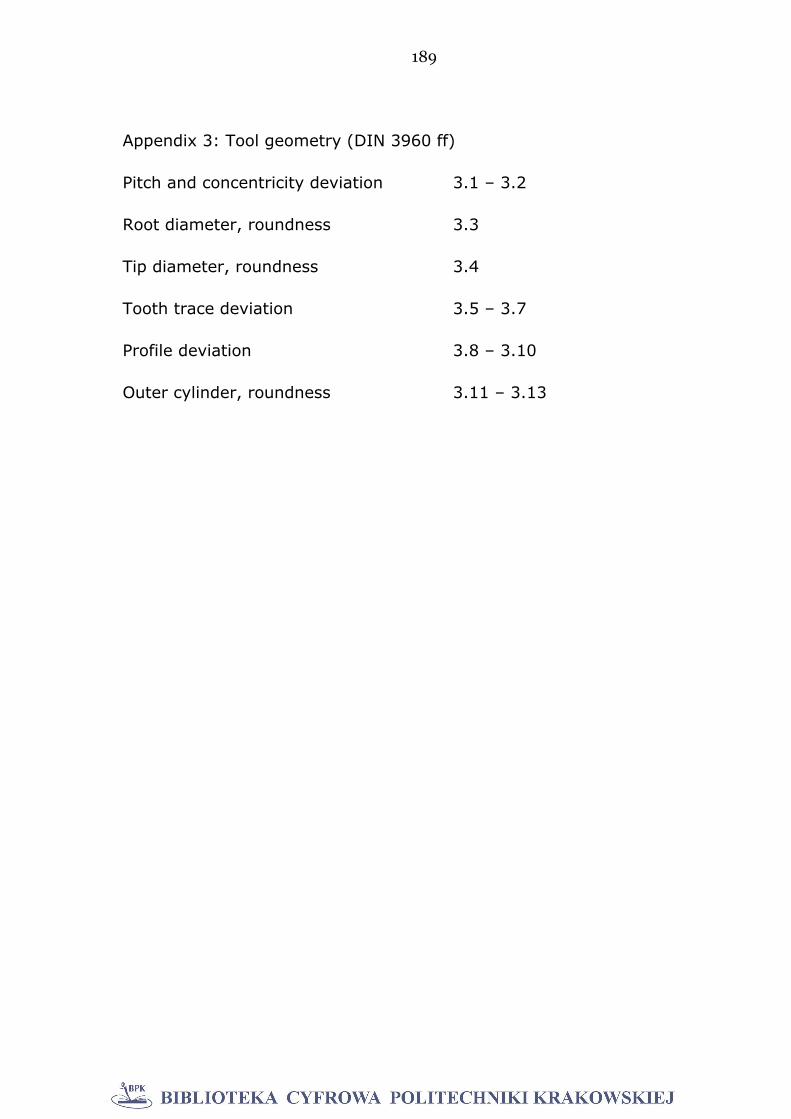
189
Appendix 3: Tool geometry (DIN 3960 ff)
Pitch and concentricity deviation 3.1 – 3.2
Root diameter, roundness 3.3
Tip diameter, roundness 3.4
Tooth trace deviation 3.5 – 3.7
Profile deviation 3.8 – 3.10
Outer cylinder, roundness 3.11 – 3.13
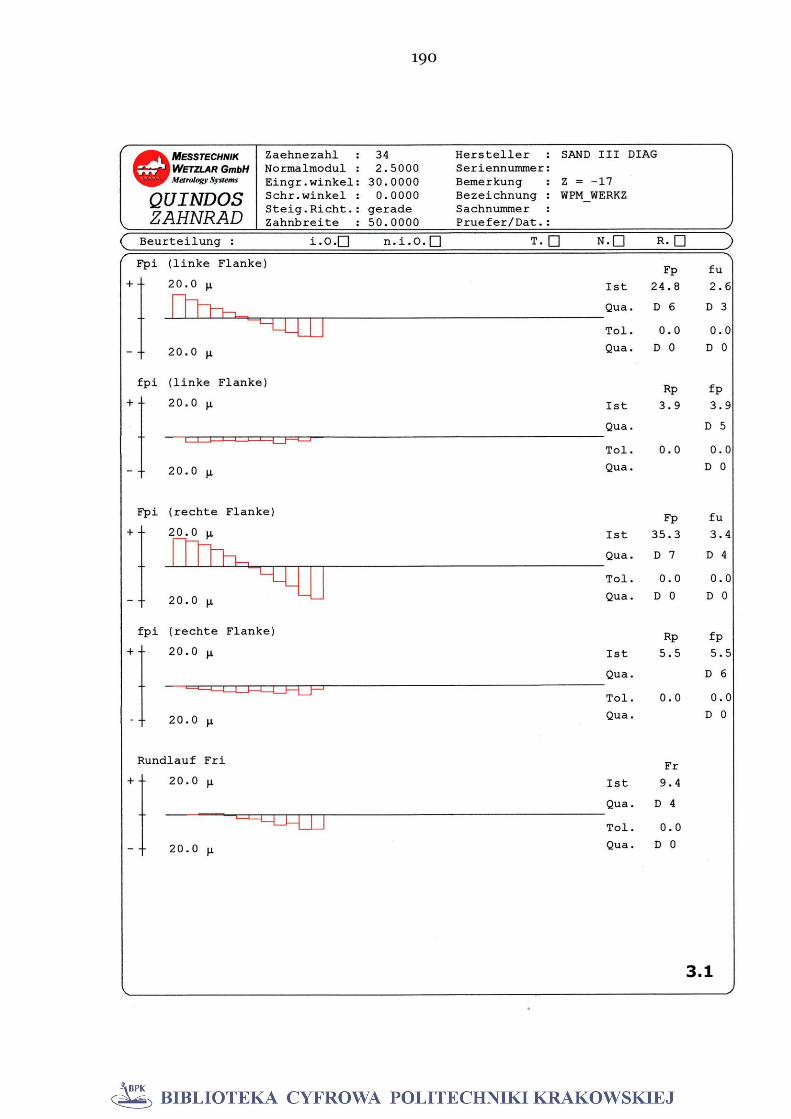
190
3.1
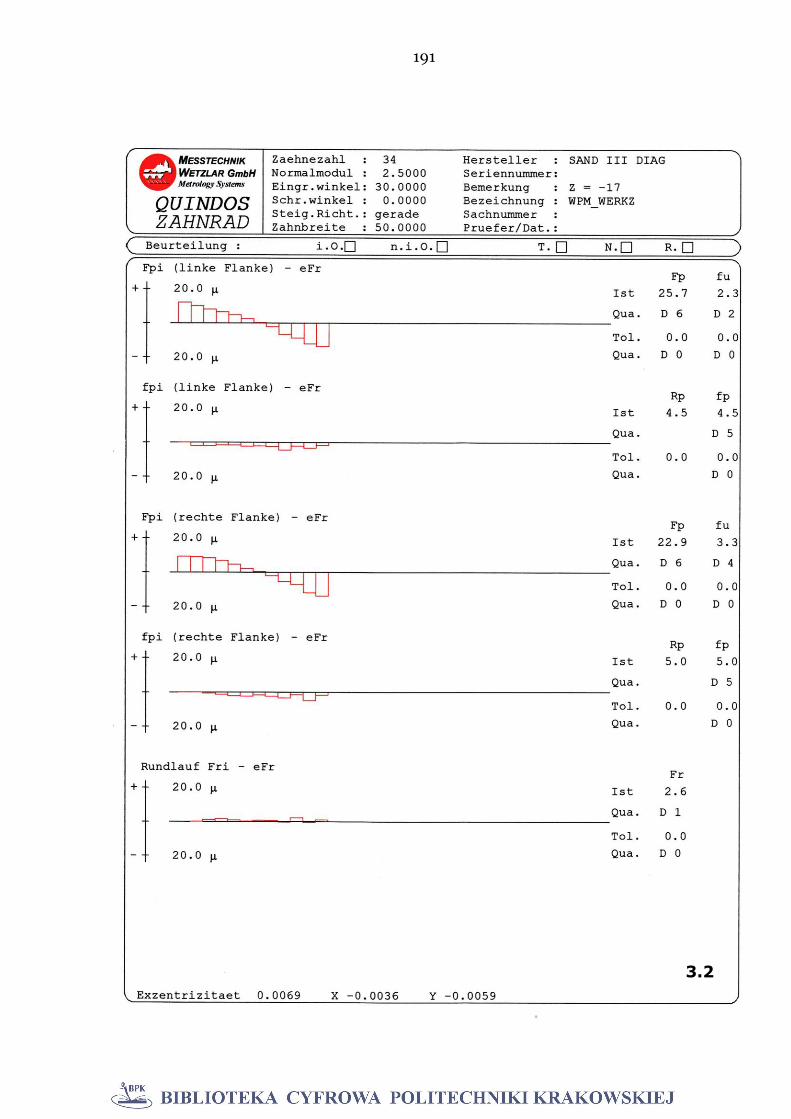
191
3.2
192
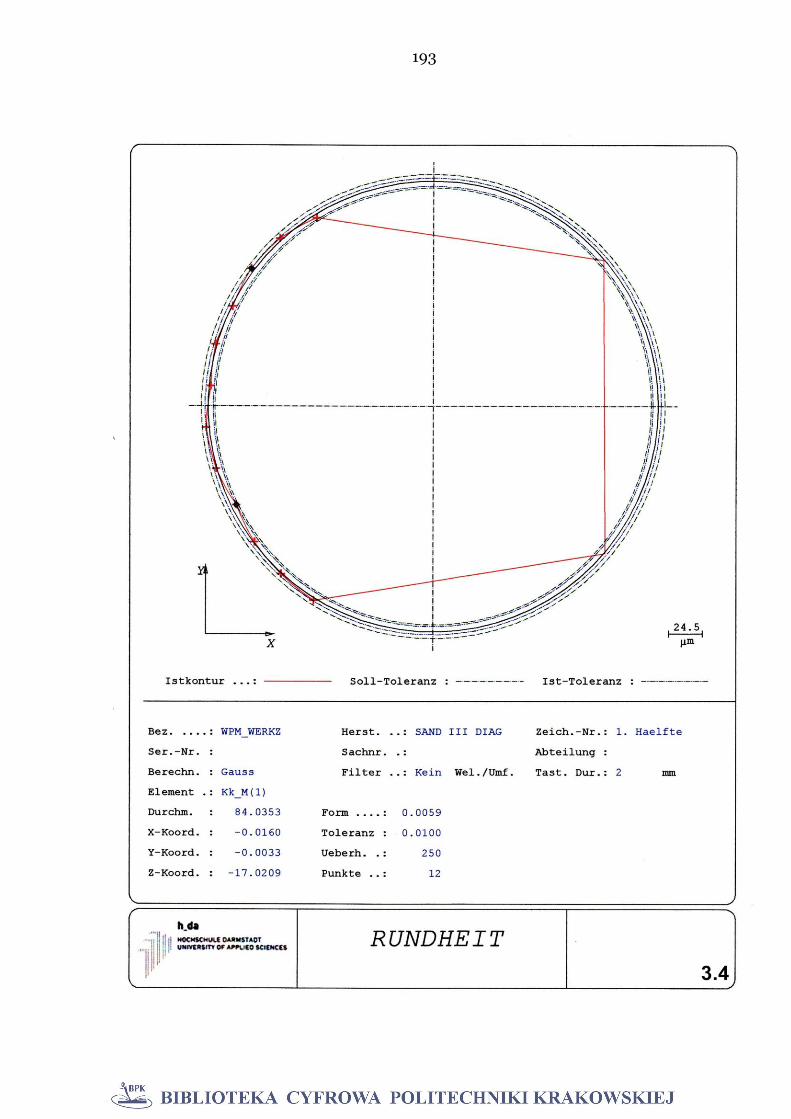
193
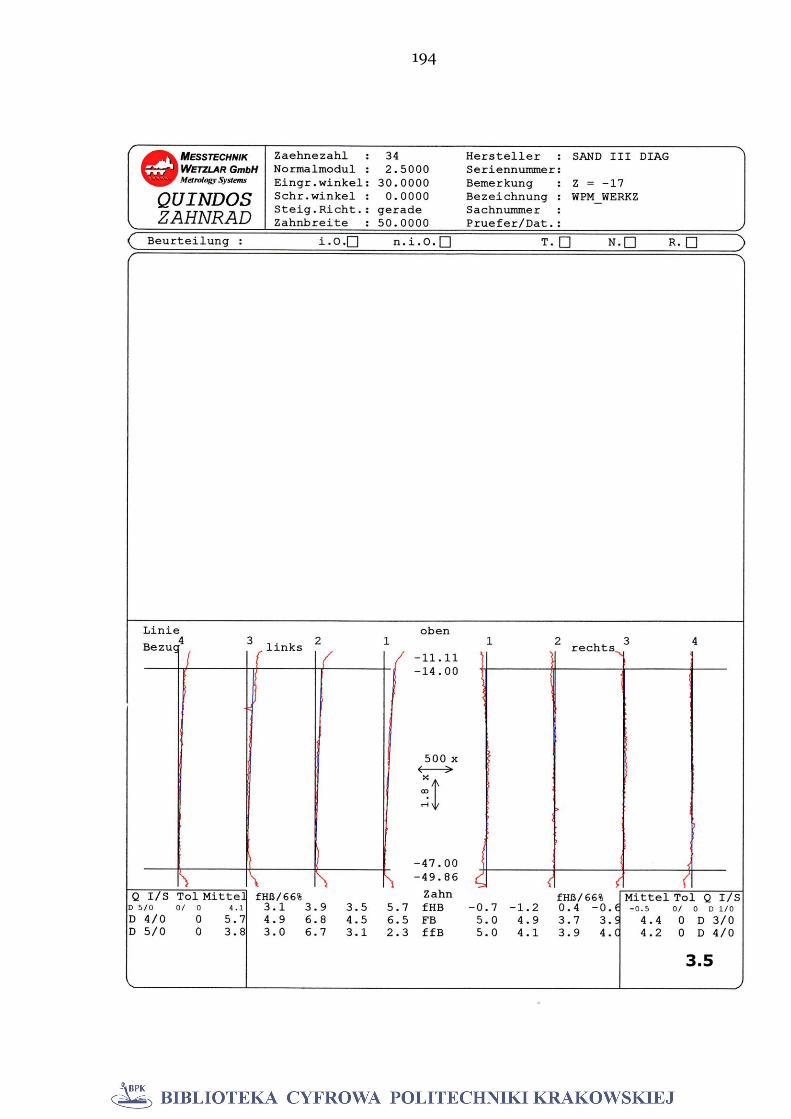
194
3.5
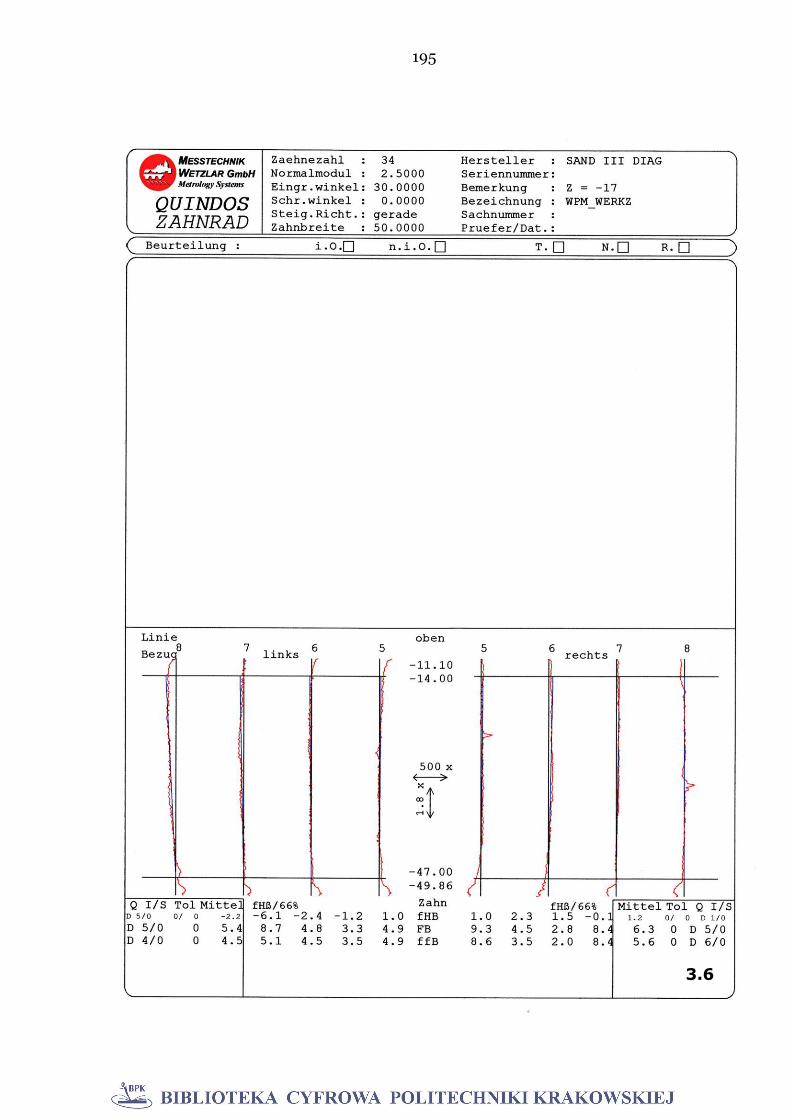
195
3.6
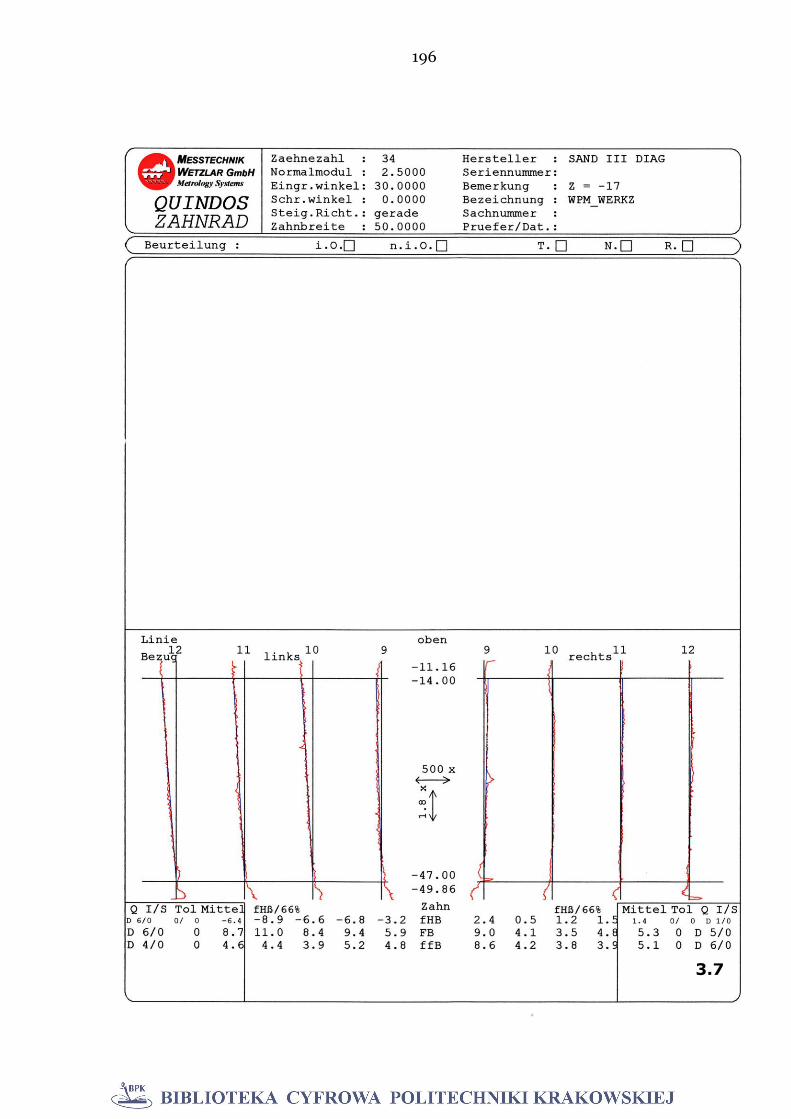
196
3.7

197
3.8
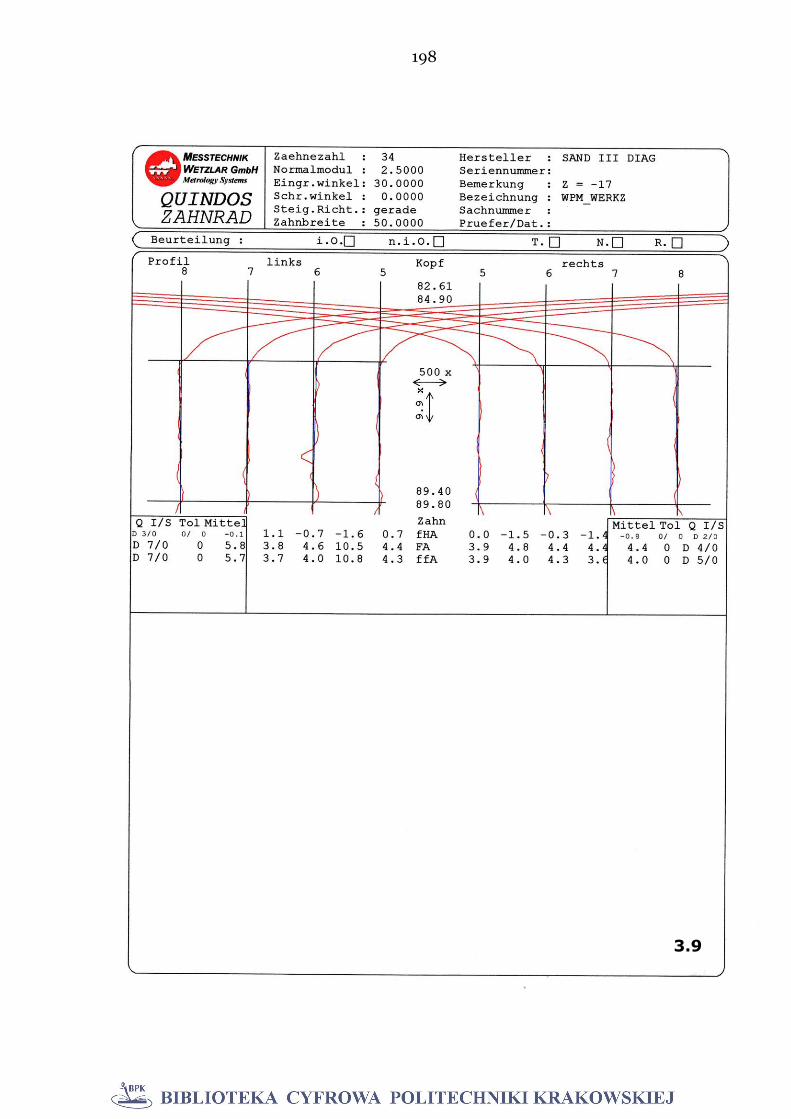
198
3.9

199
3.10

200
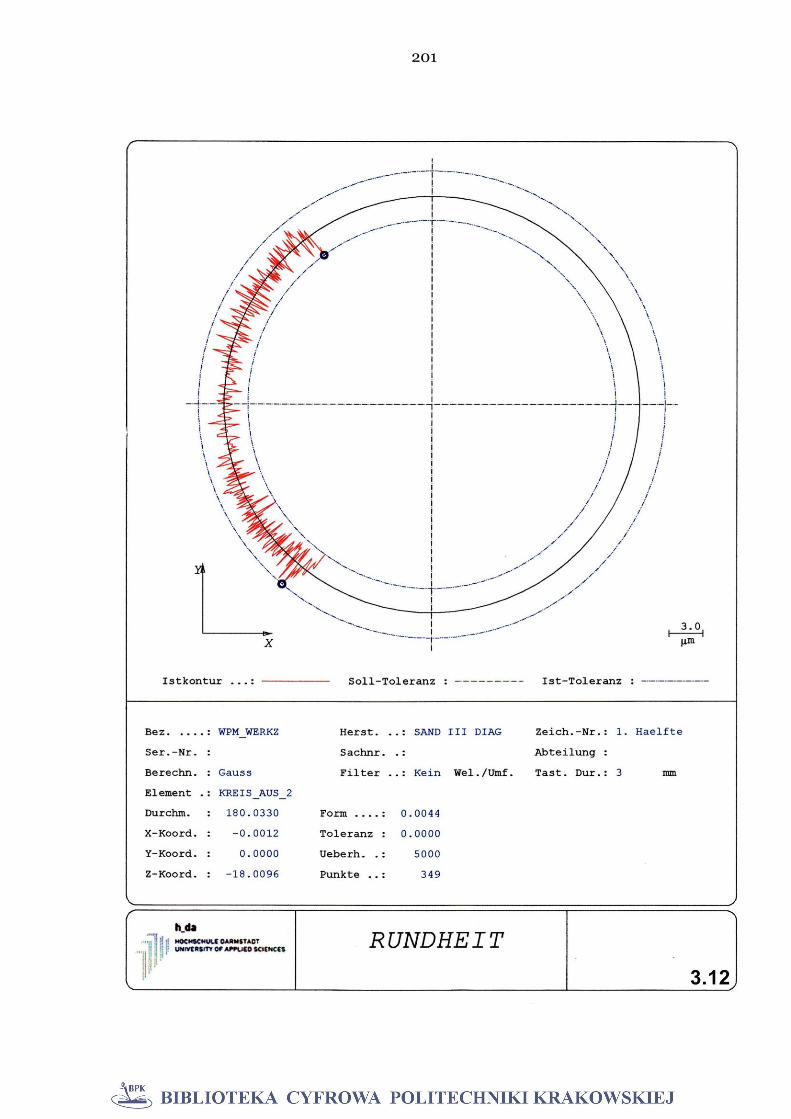
201
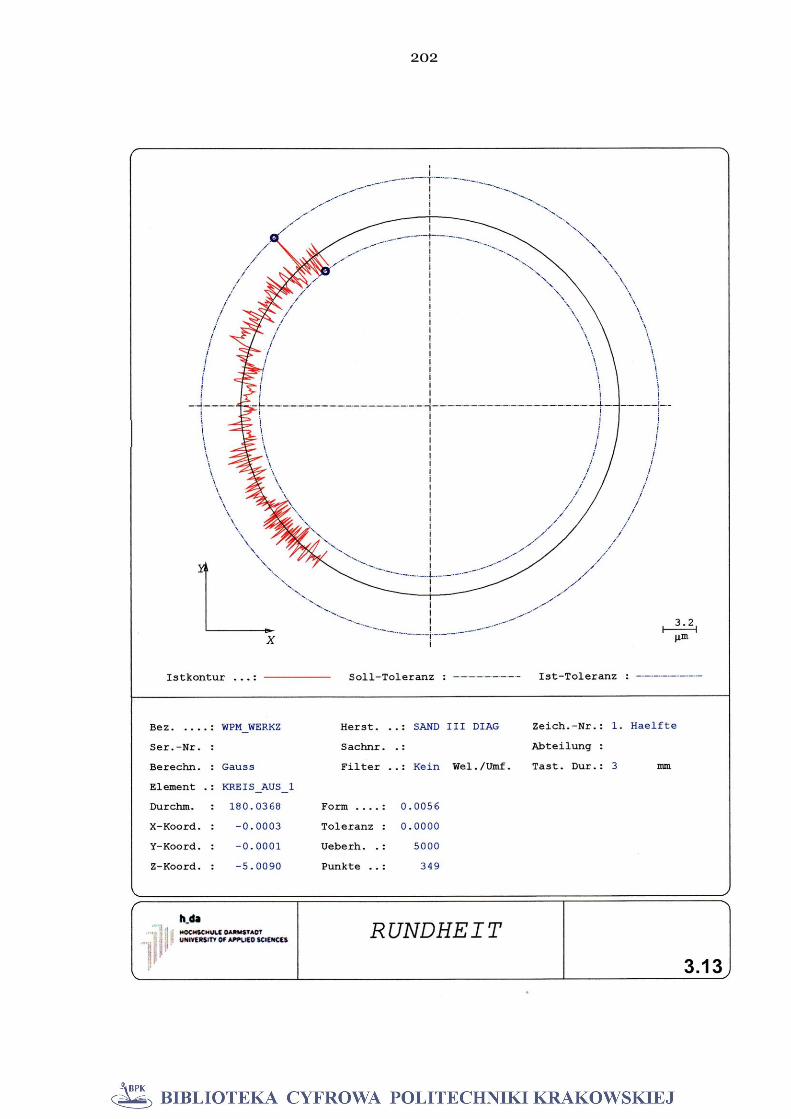
202

203
Appendix 4: Statistical analysis of gear tooth quality (DIN 3960 ff)
of samples and flanks
Total pitch deviation FP 4.1 – 4.12
Individual pitch deviation fp 4.13 – 4.24
Concentricity deviation Fr 4.25 – 4.30
Total profile deviation FA 4.31 – 4.36
Profile angle deviation fHa 4.37 – 4.42
Profile form deviation ffA 4.43 – 4.48
Tooth trace total deviation FB 4.49 – 4.54
Tooth trace angle deviation fHB 4.55 – 4.60
Tooth trace form deviation ffB 4.61 – 4.66
Basis for the statistical analysis are a batch of 10 samples per rate of feed.
At three speed rates 30 samples were statistical analyzed and deviations
were evaluated. The samples for the detailed analysis got selected random-
ly, even though all rolled samples have been measured completely (that
means all teeth and flanks of the rolled samples have been measured). A
separated analysis in evaluation is made in left and right flanks.
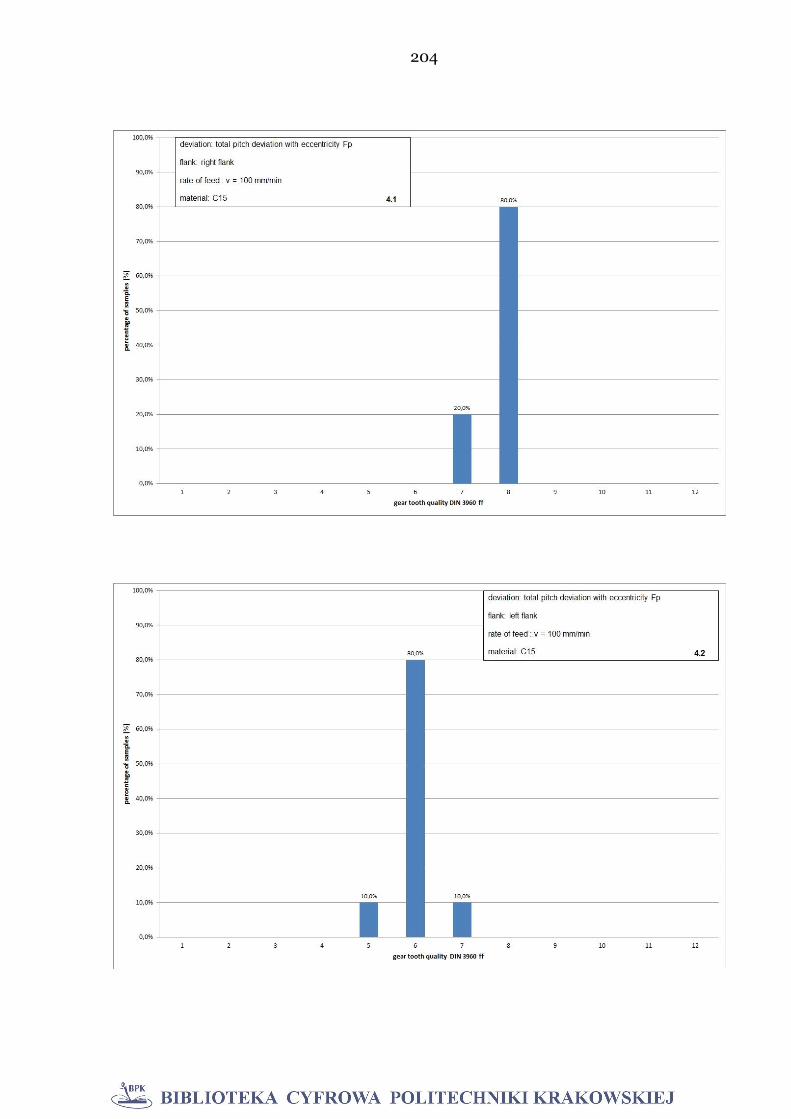
204
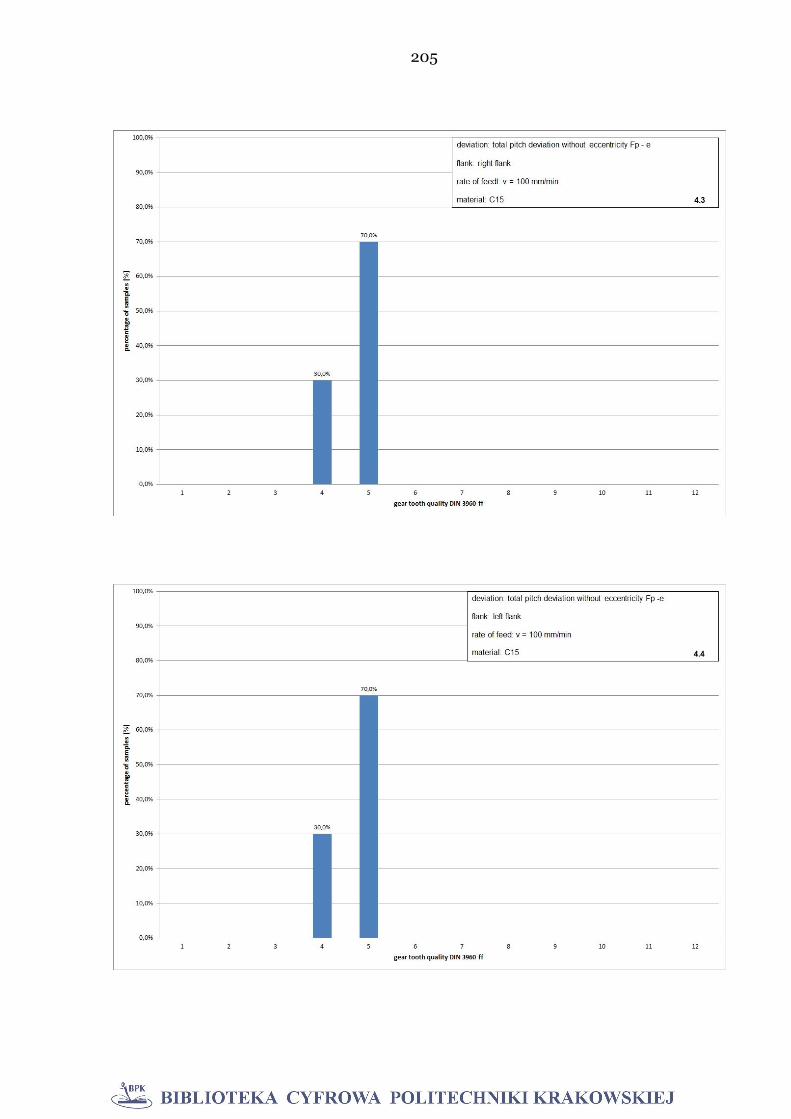
205
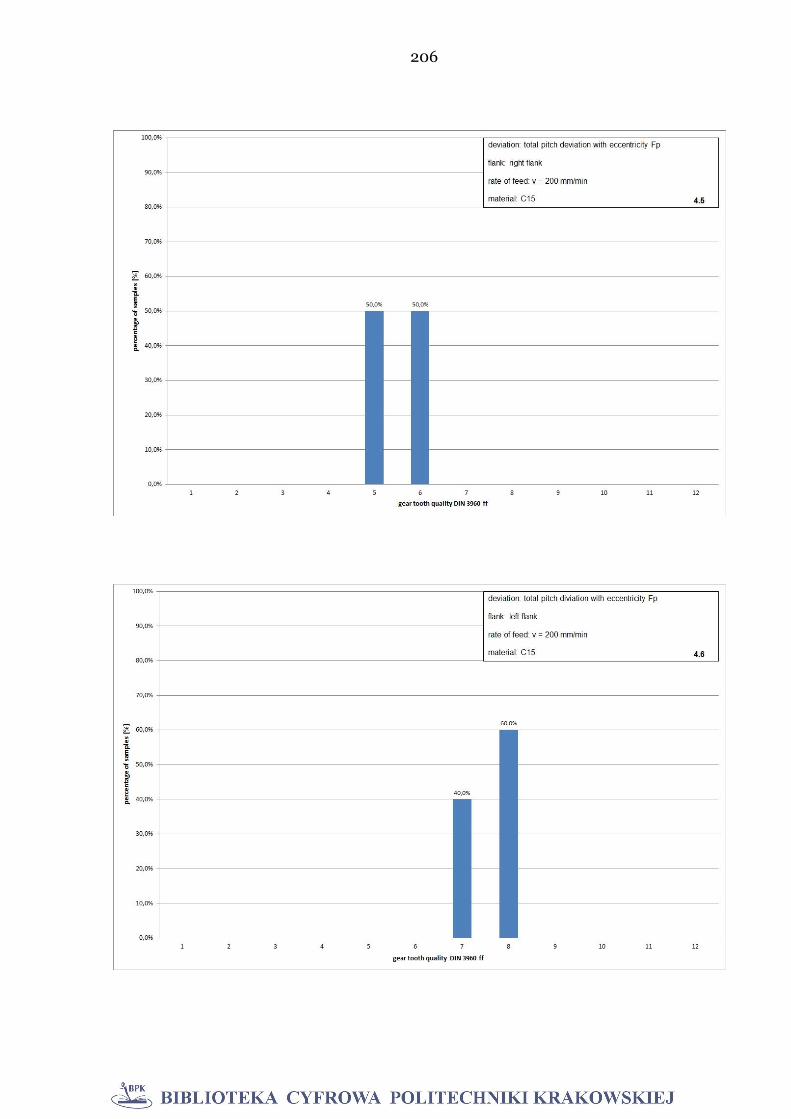
206
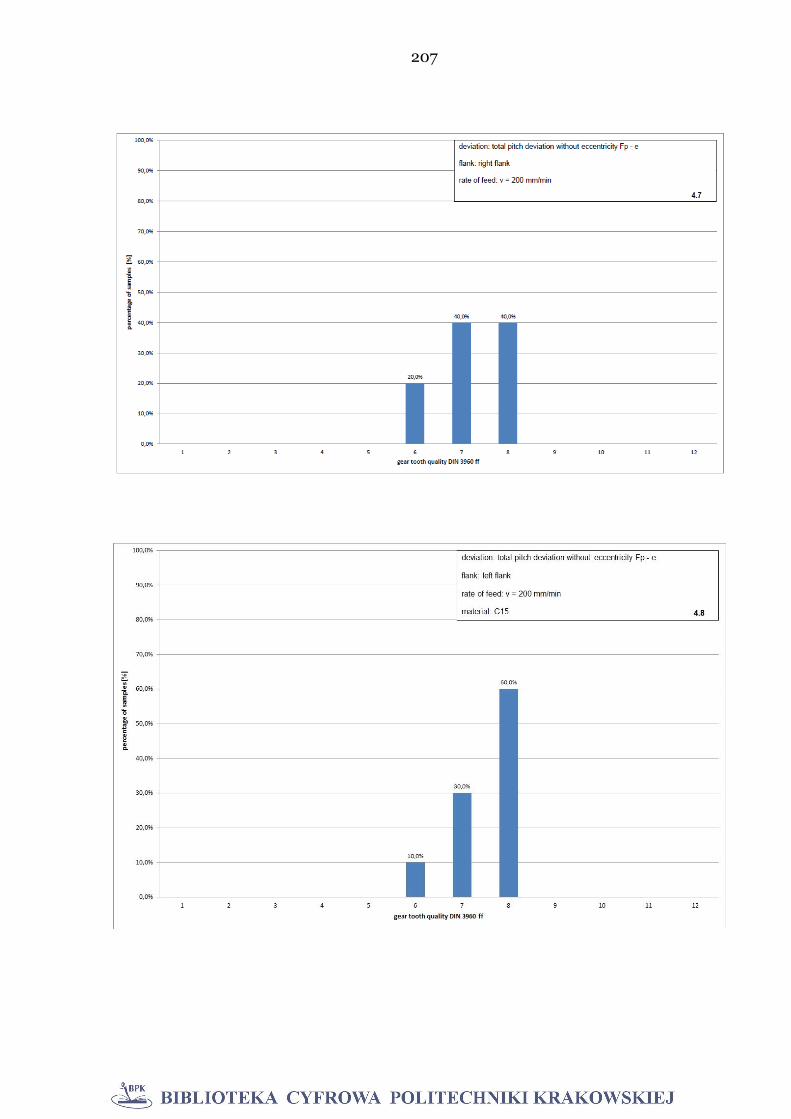
207
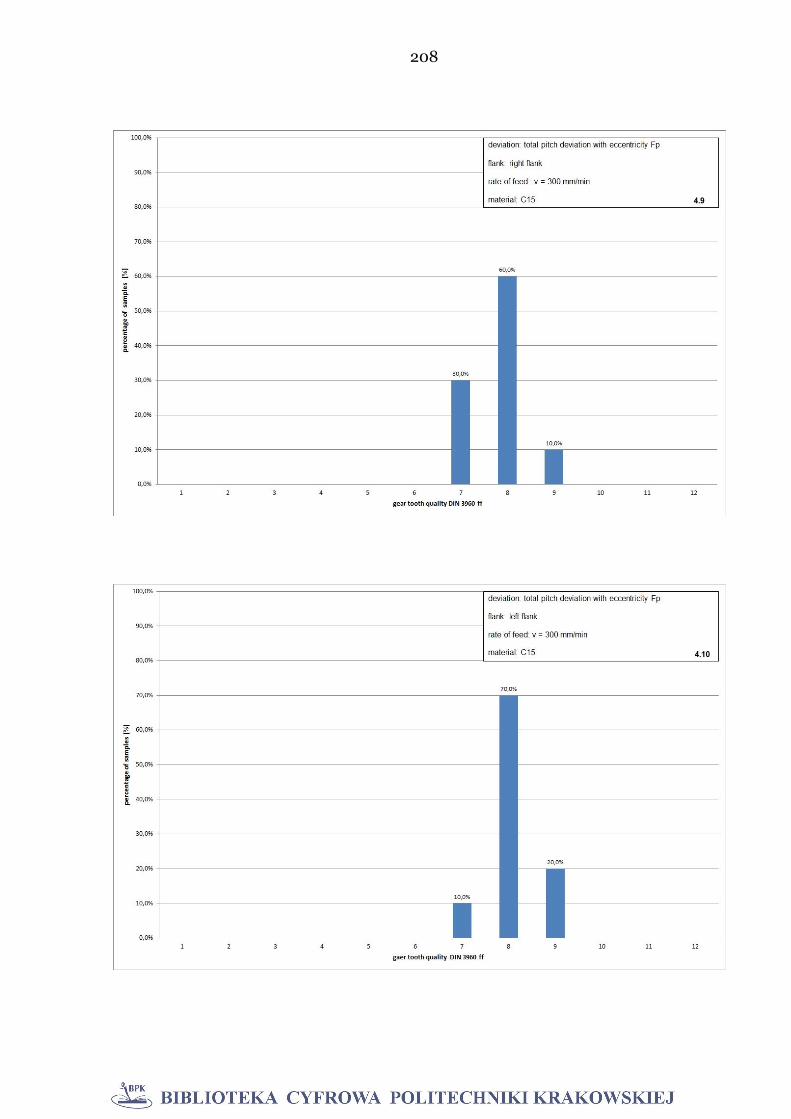
208
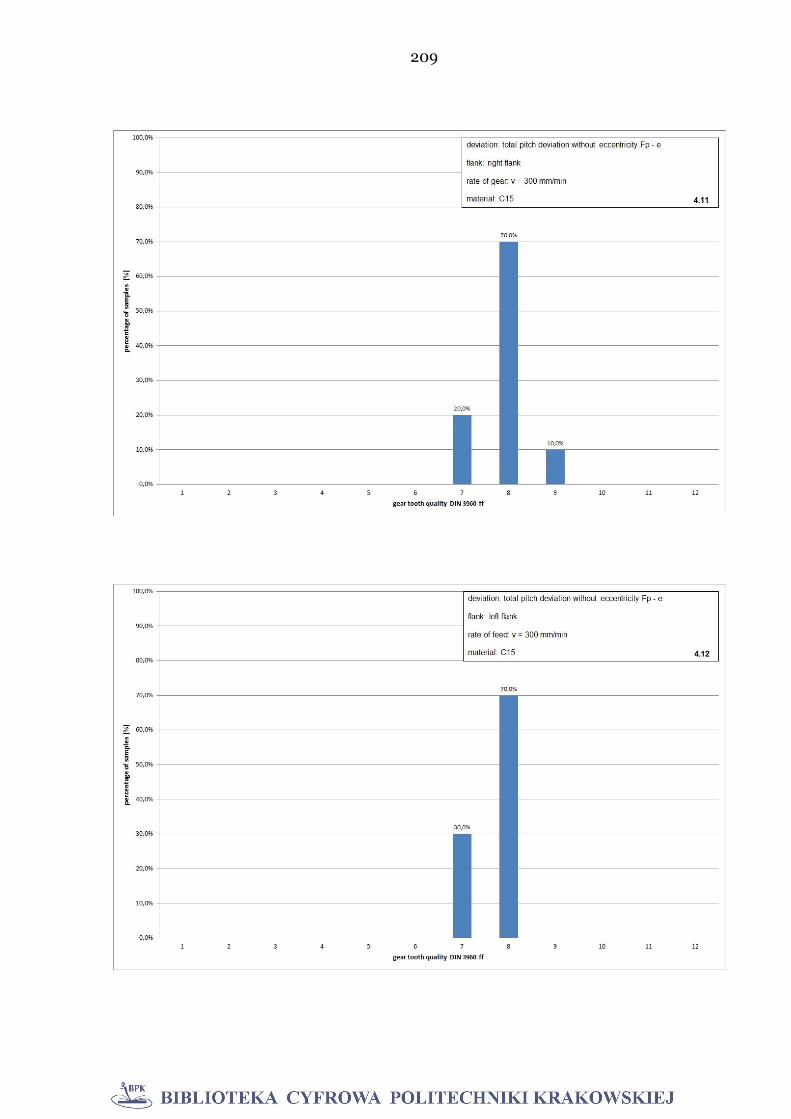
209
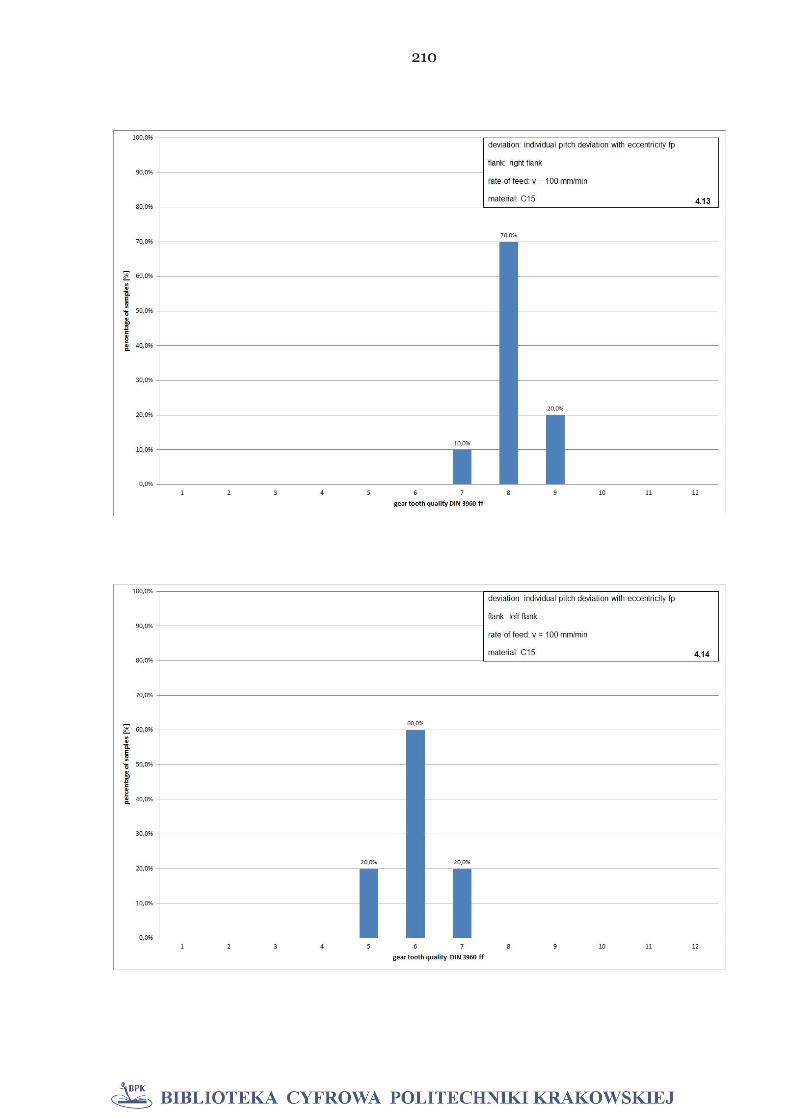
210
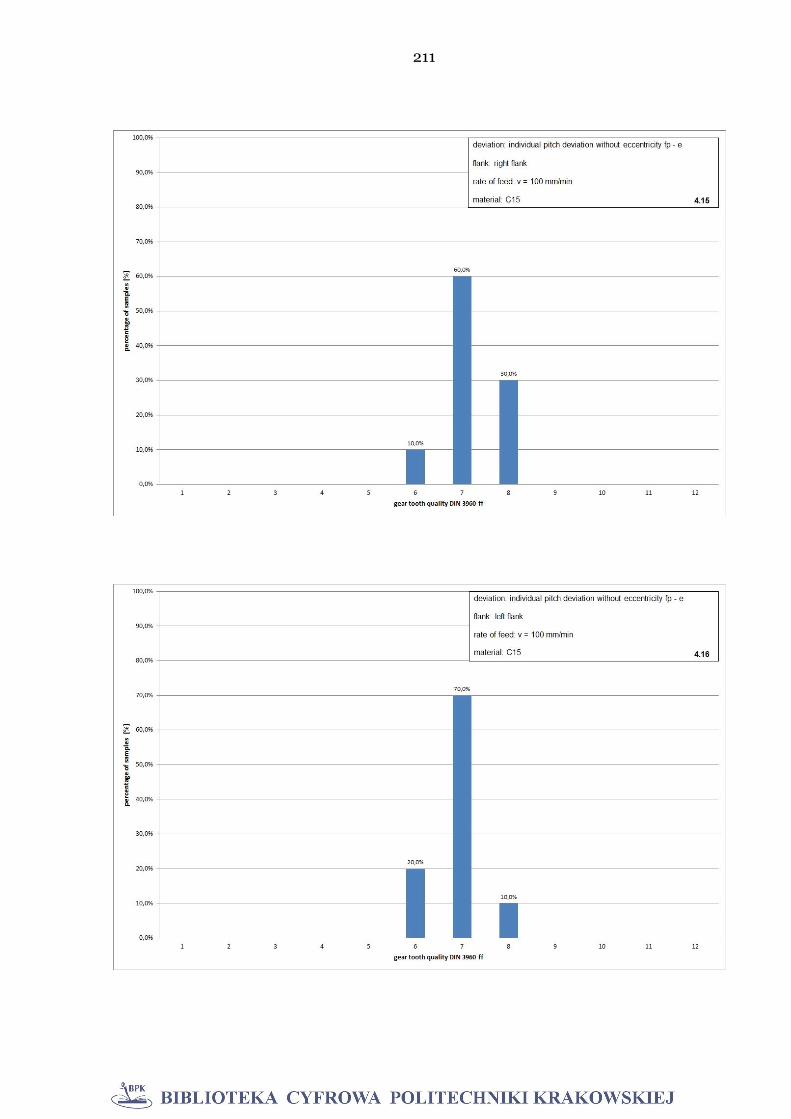
211
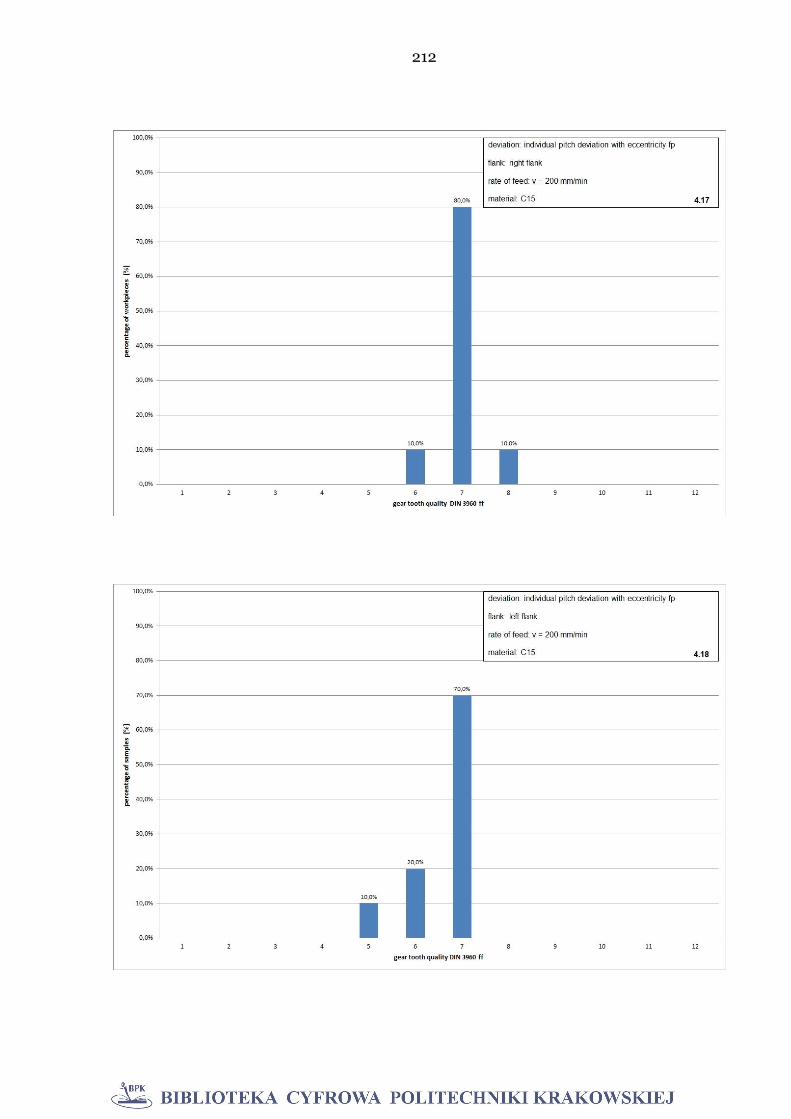
212
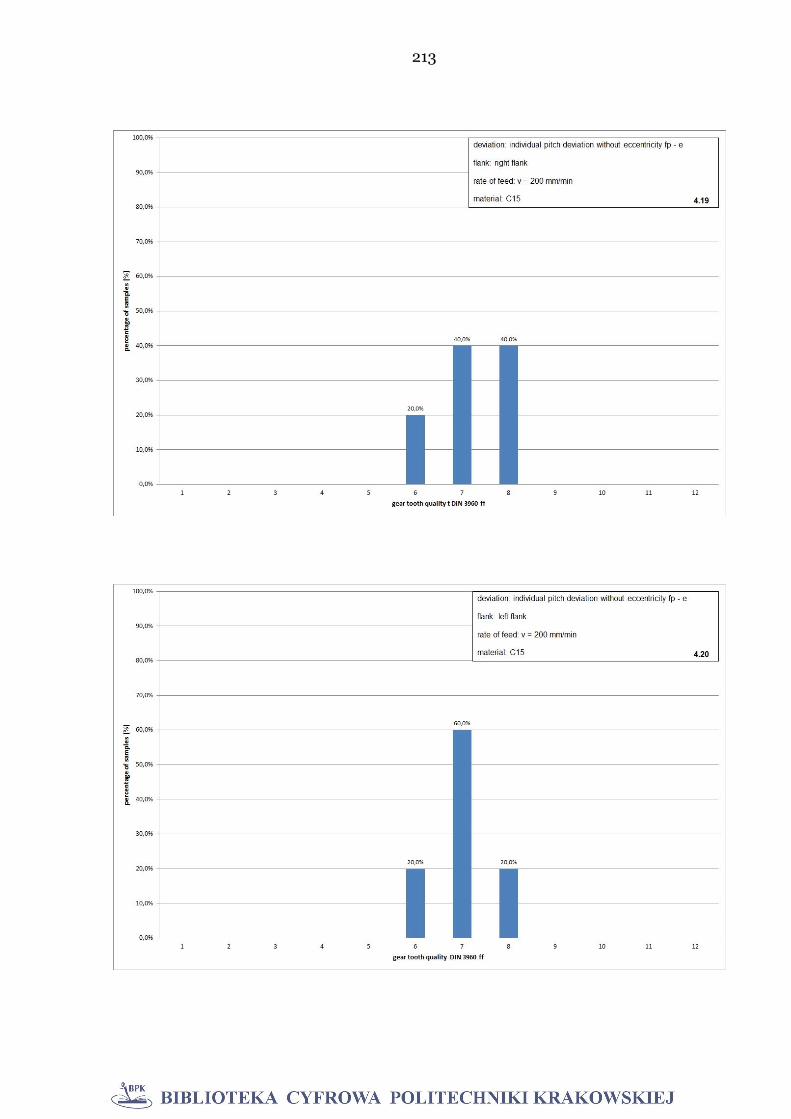
213
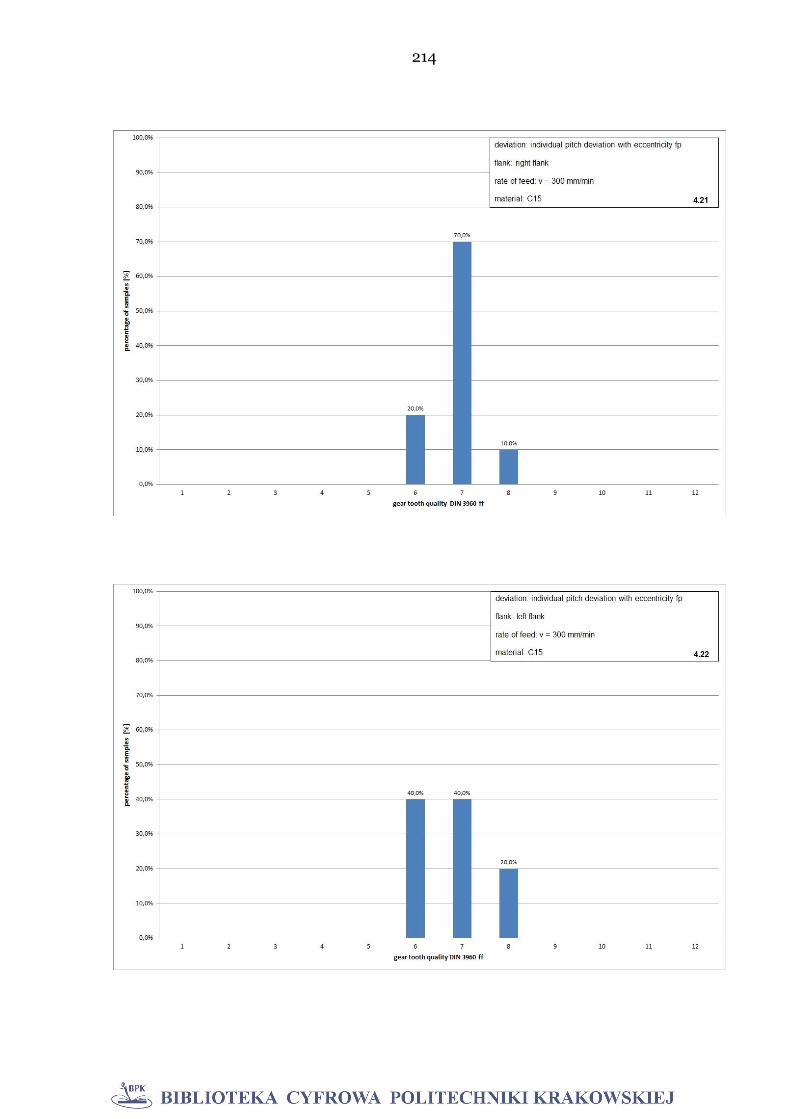
214
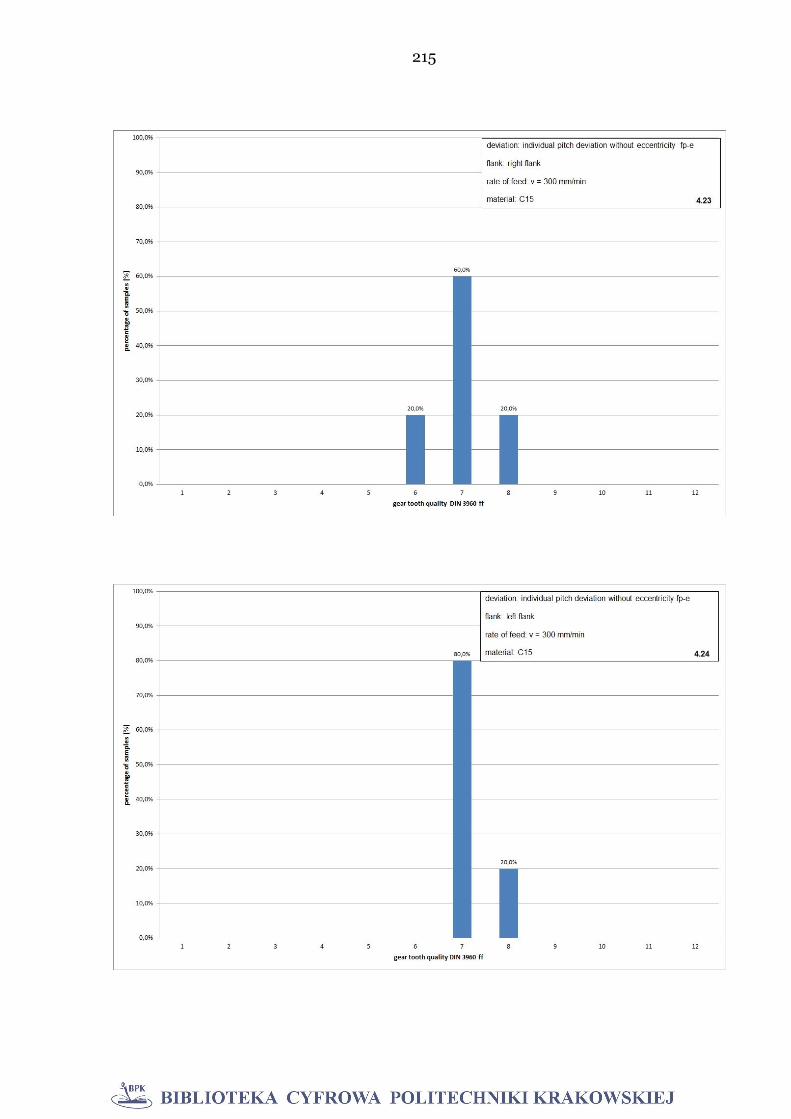
215
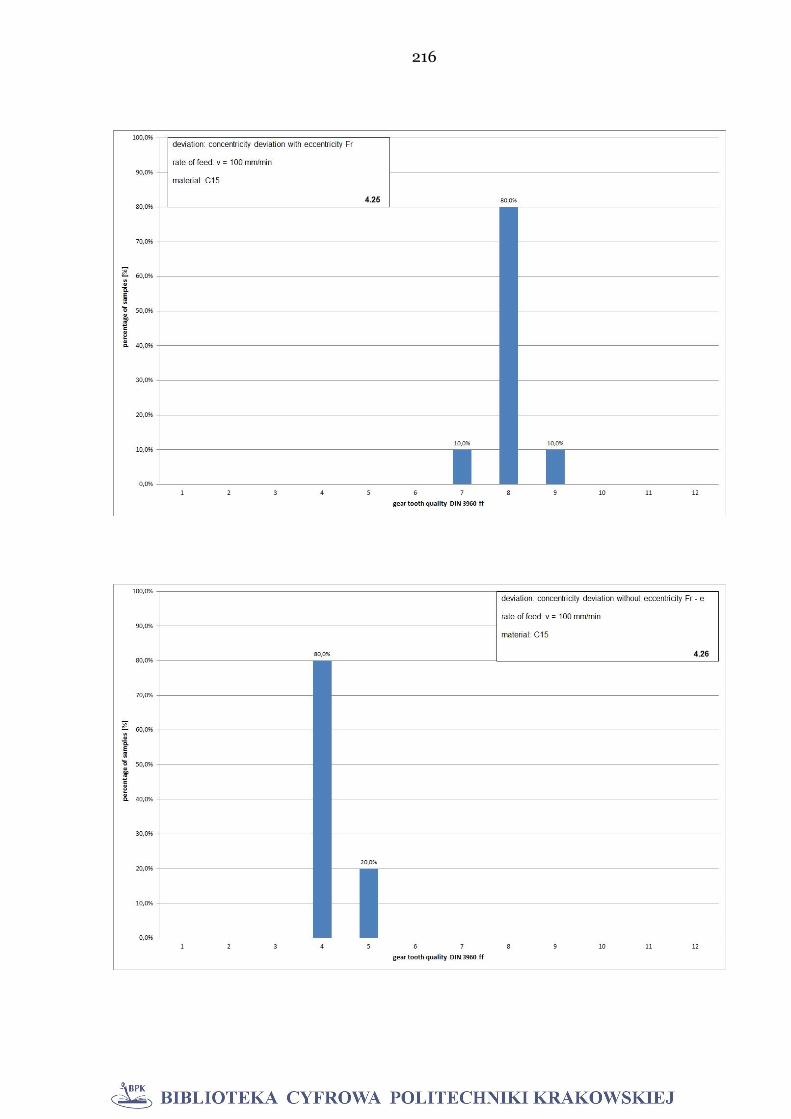
216
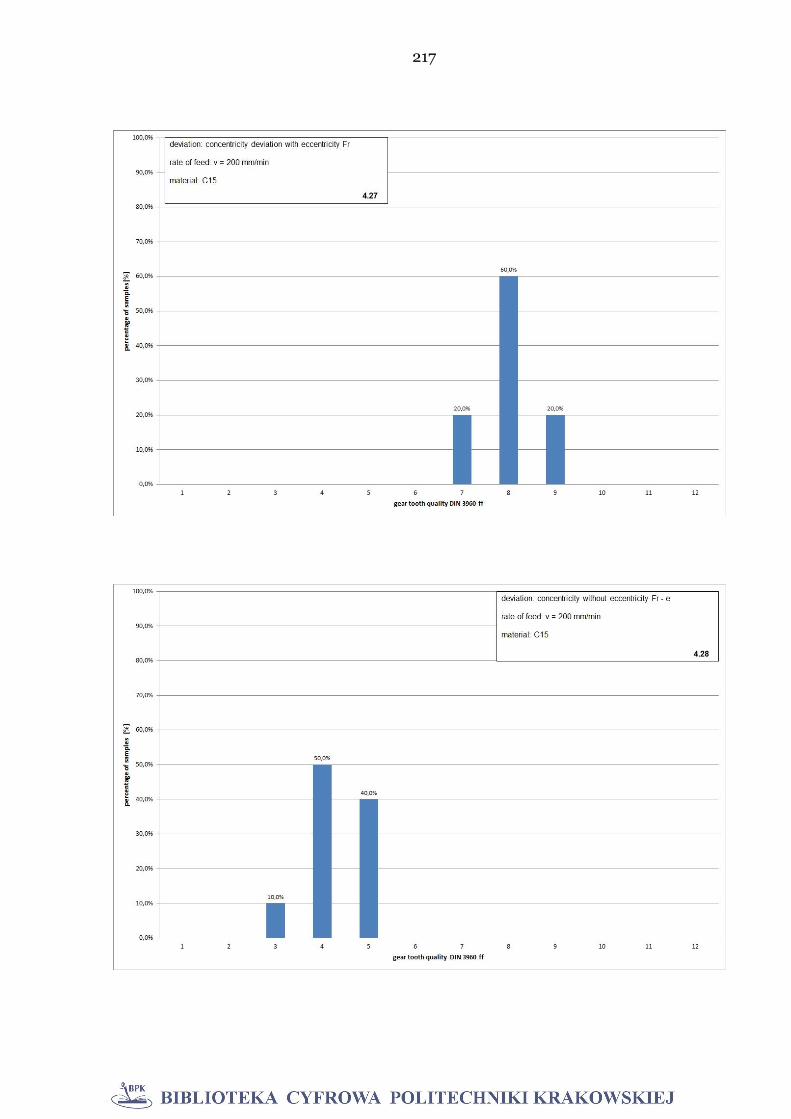
217
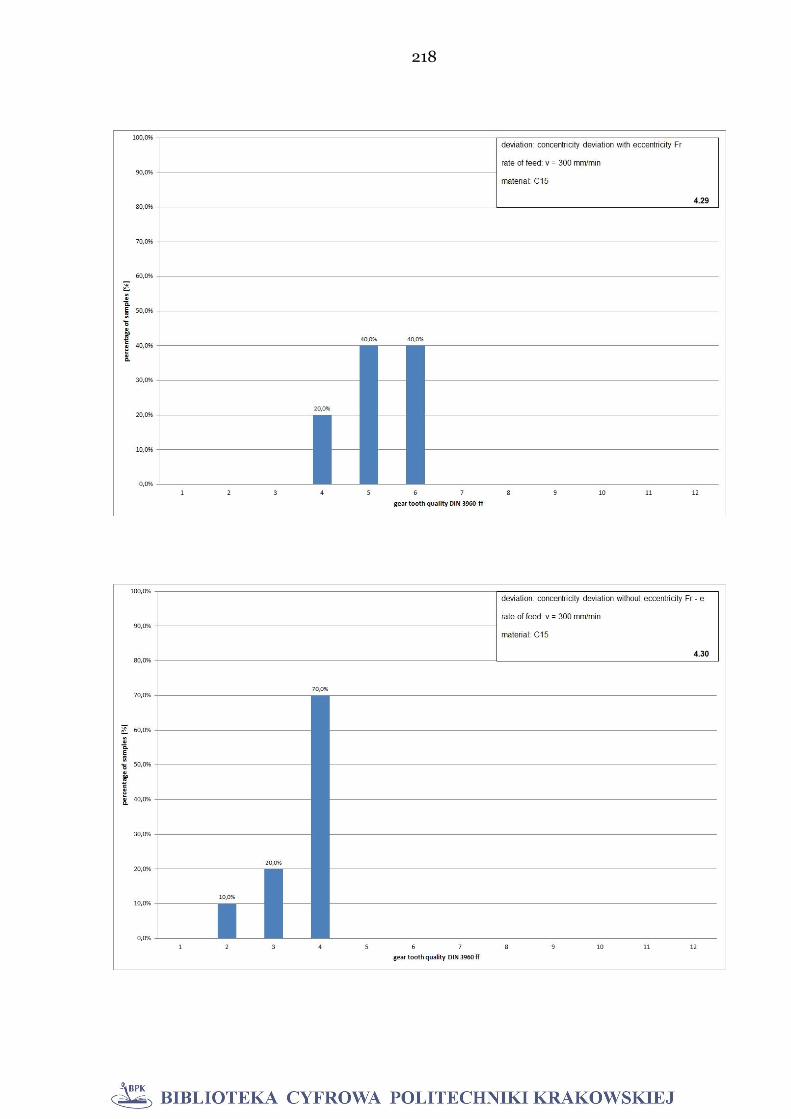
218
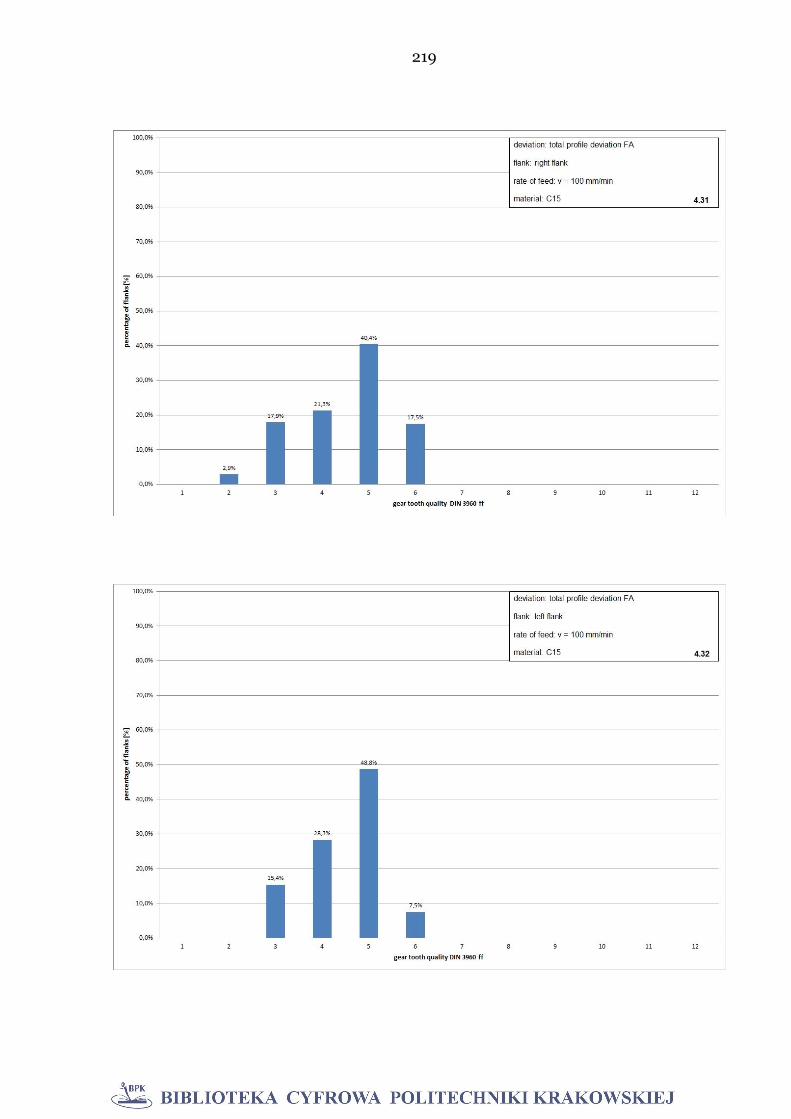
219

220
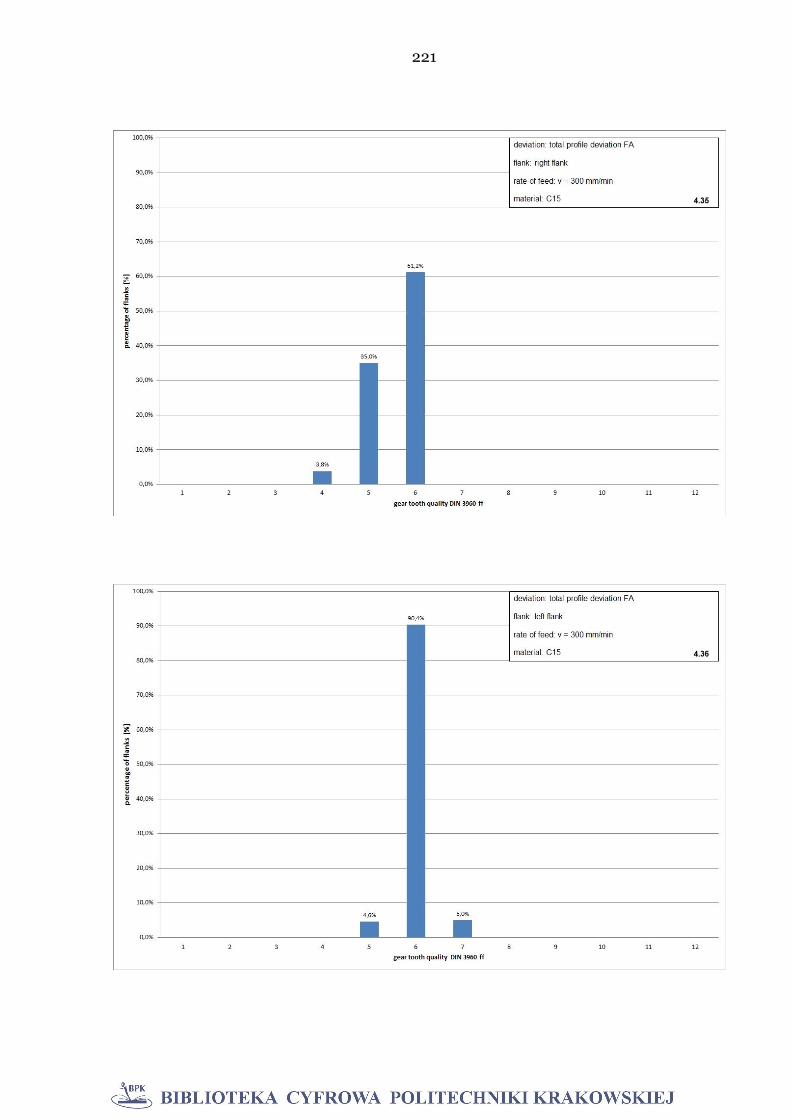
221
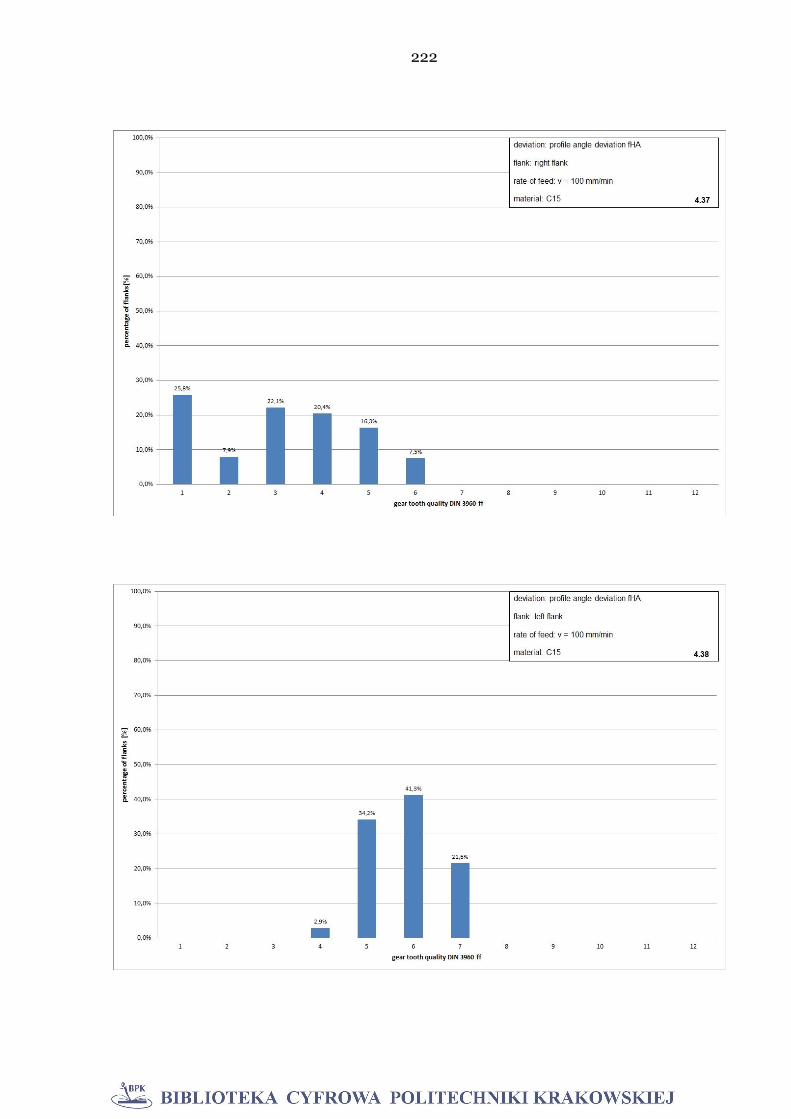
222
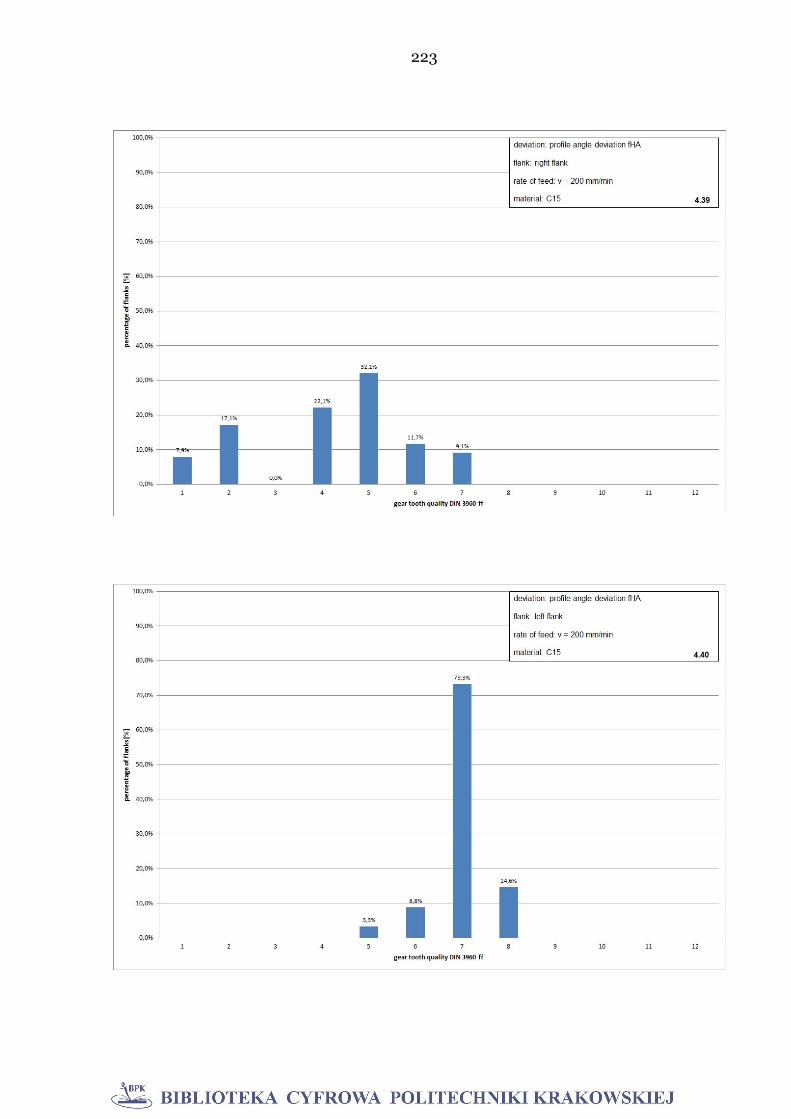
223
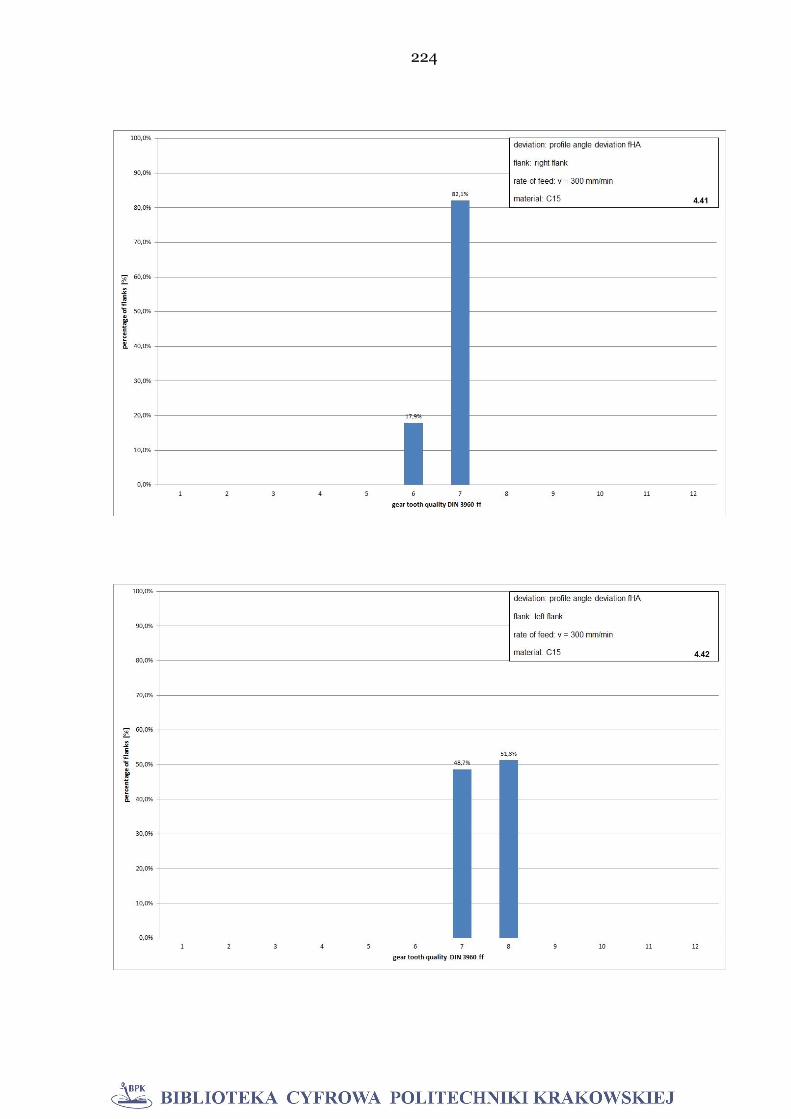
224
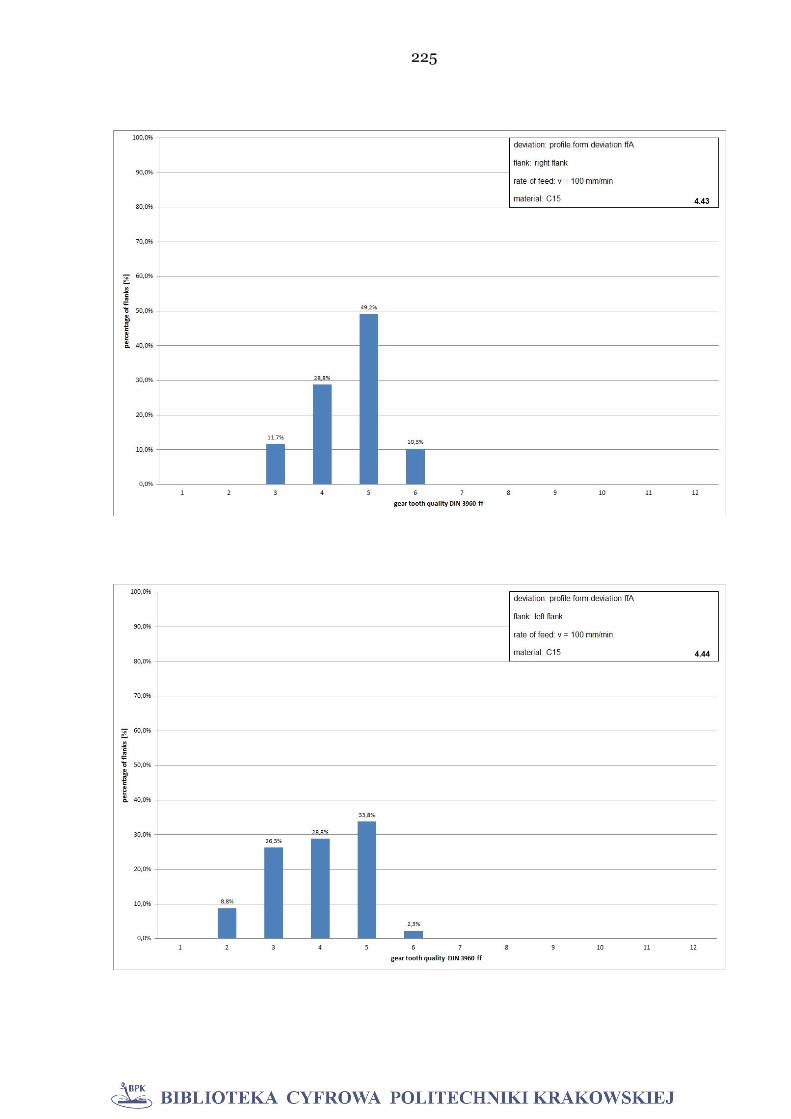
225
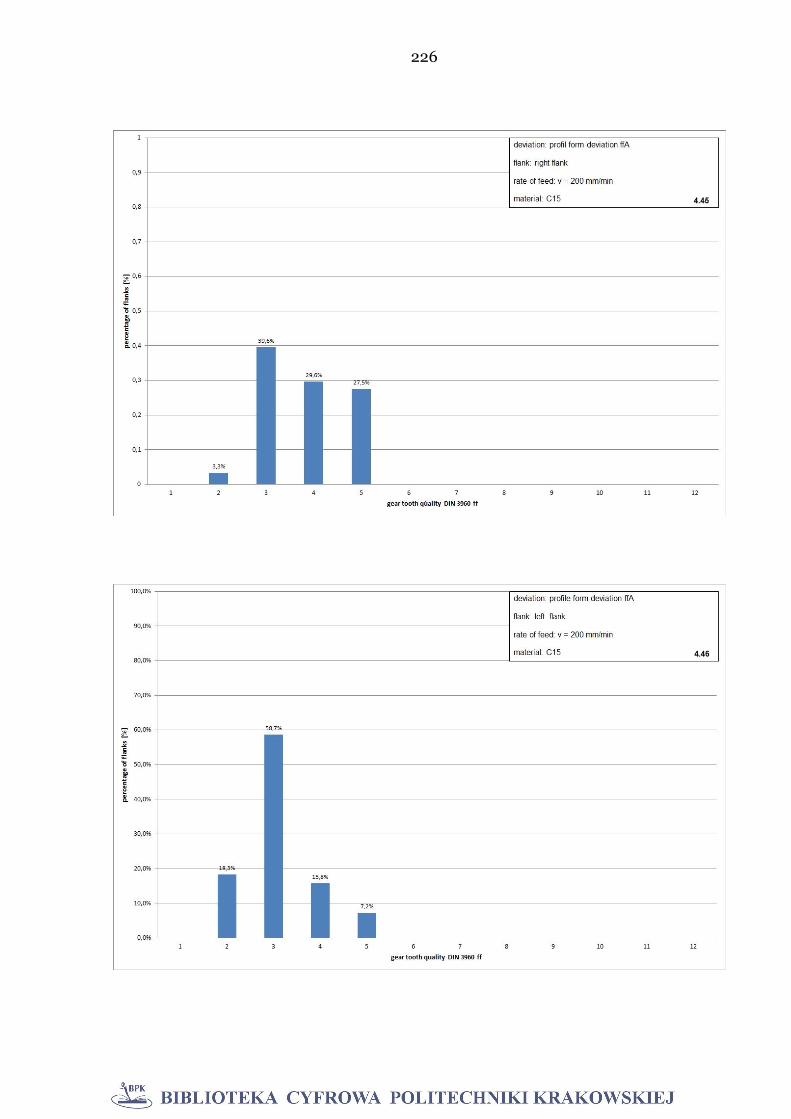
226
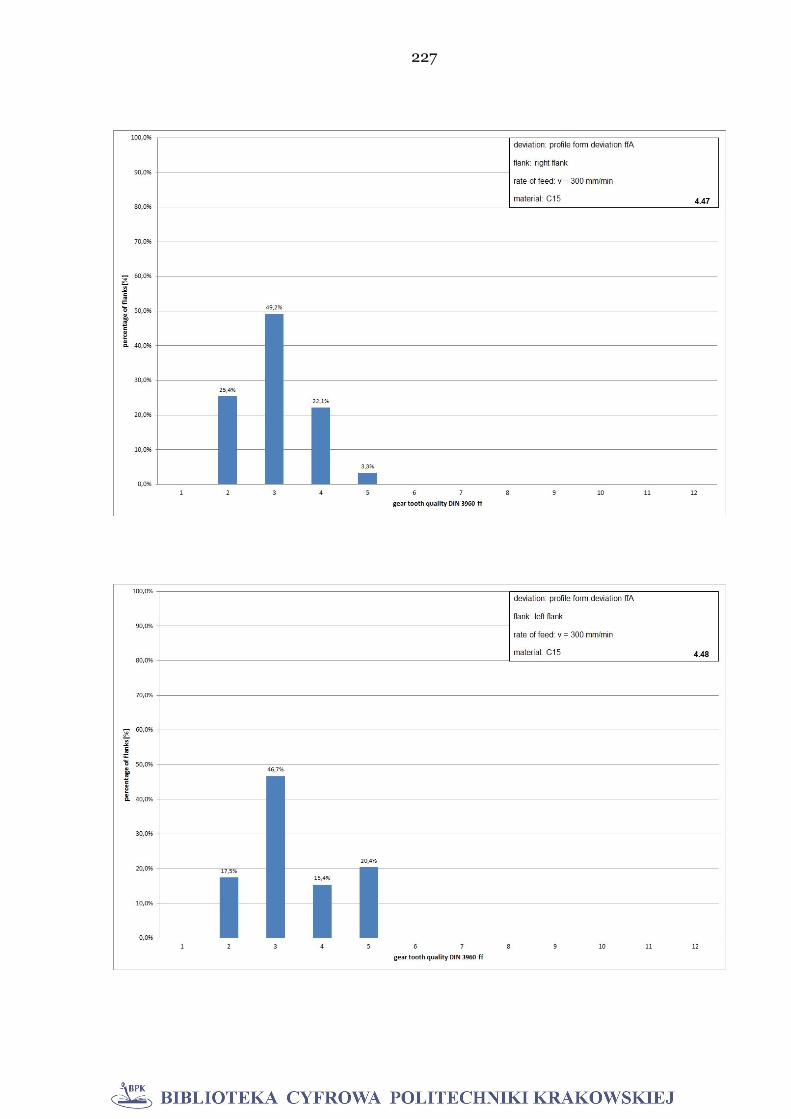
227

228
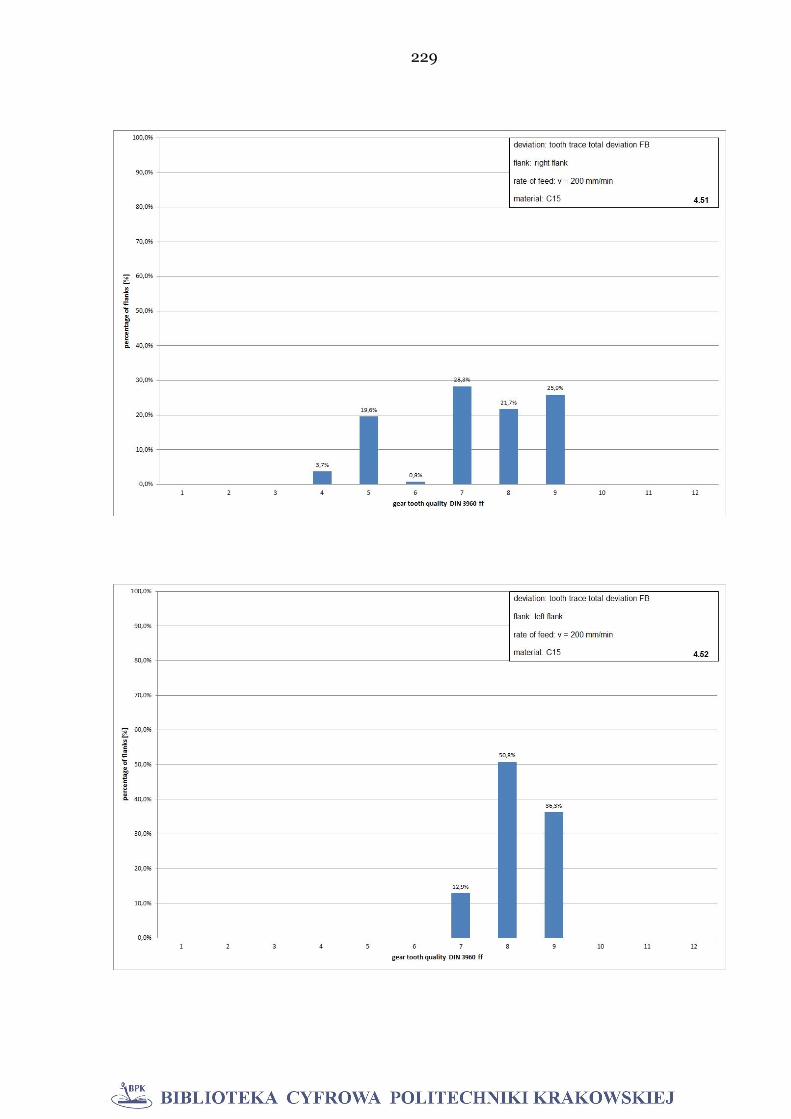
229
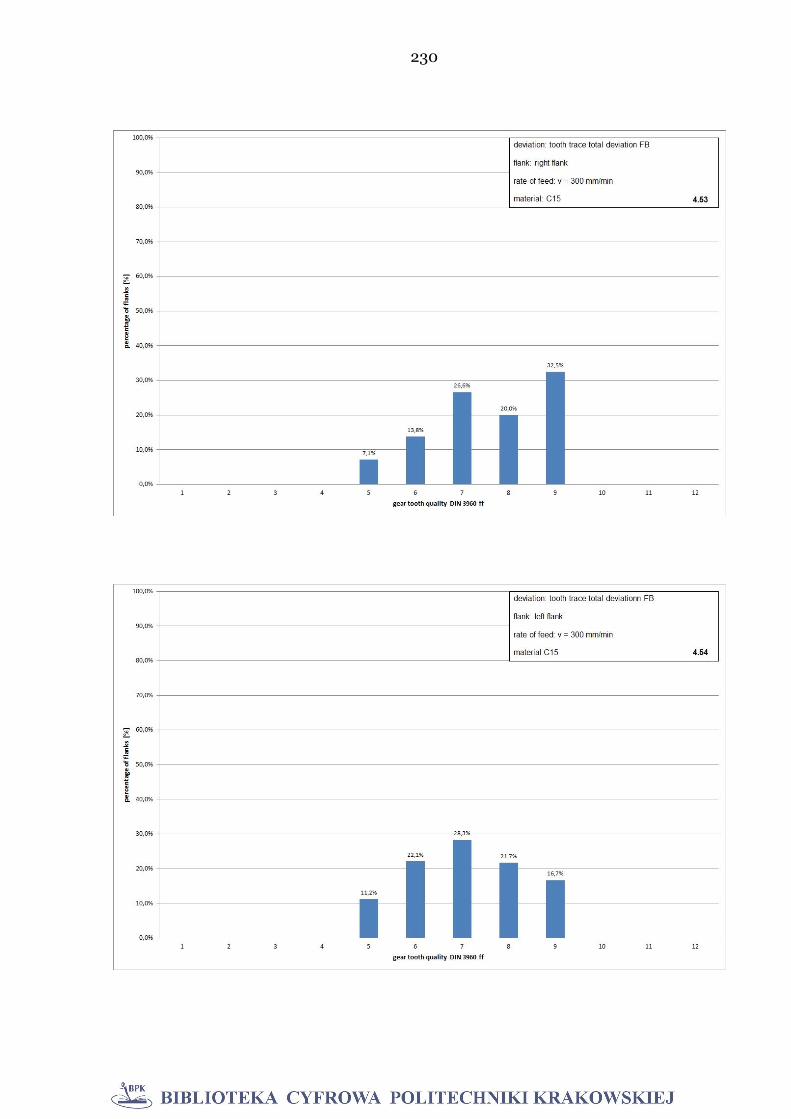
230
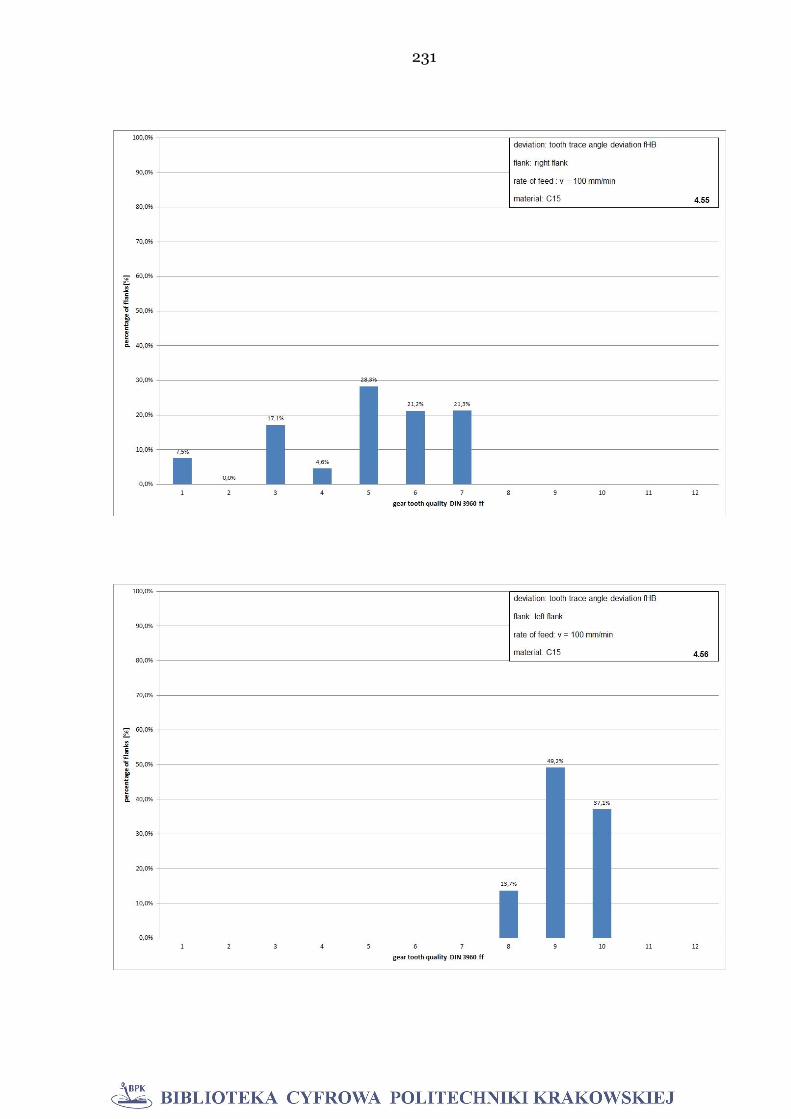
231
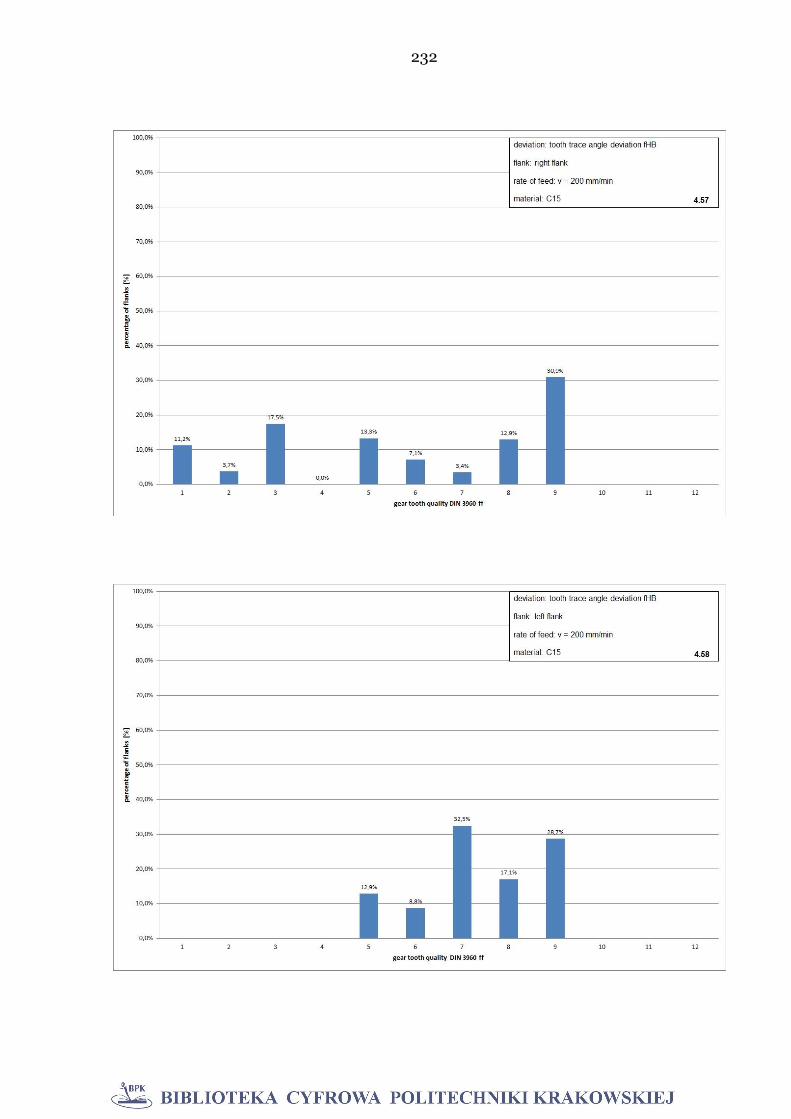
232

233
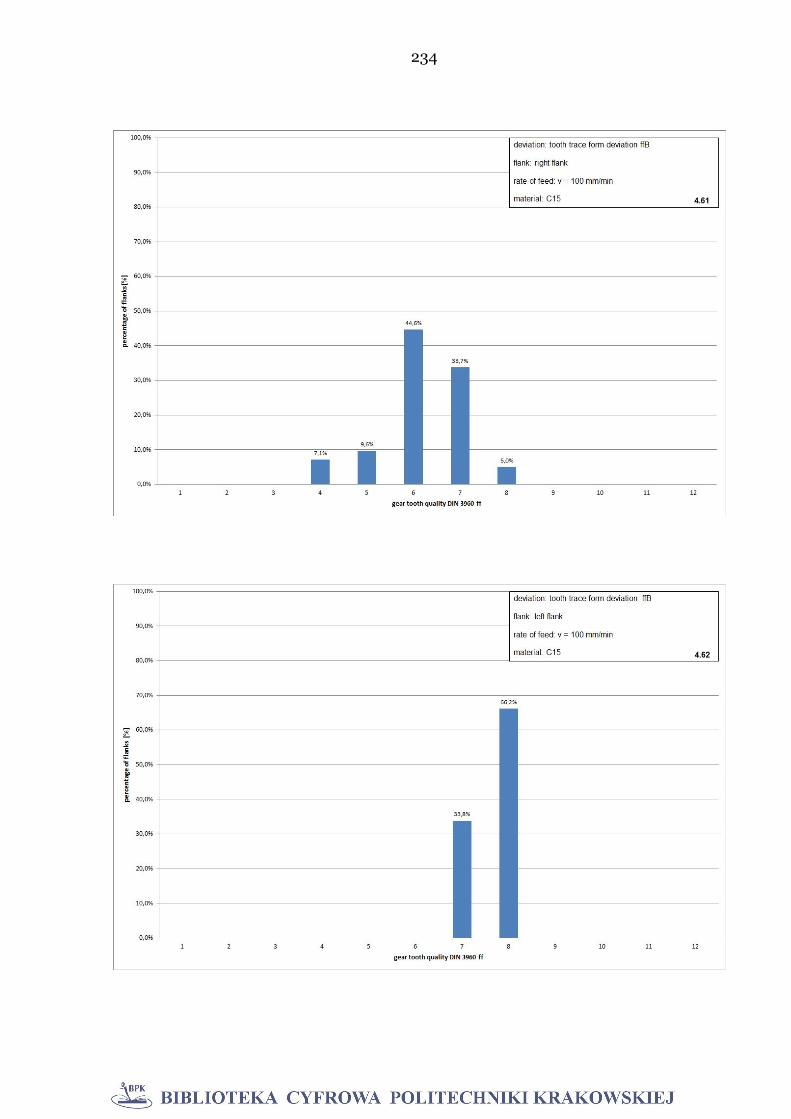
234
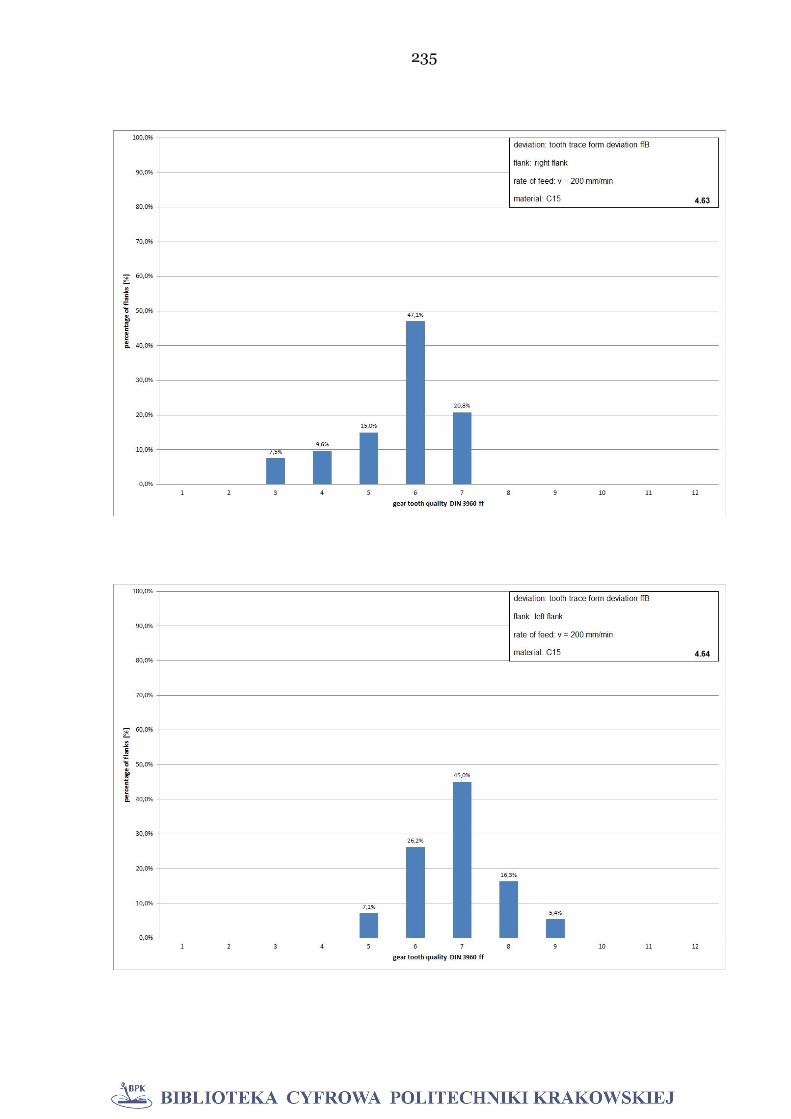
235
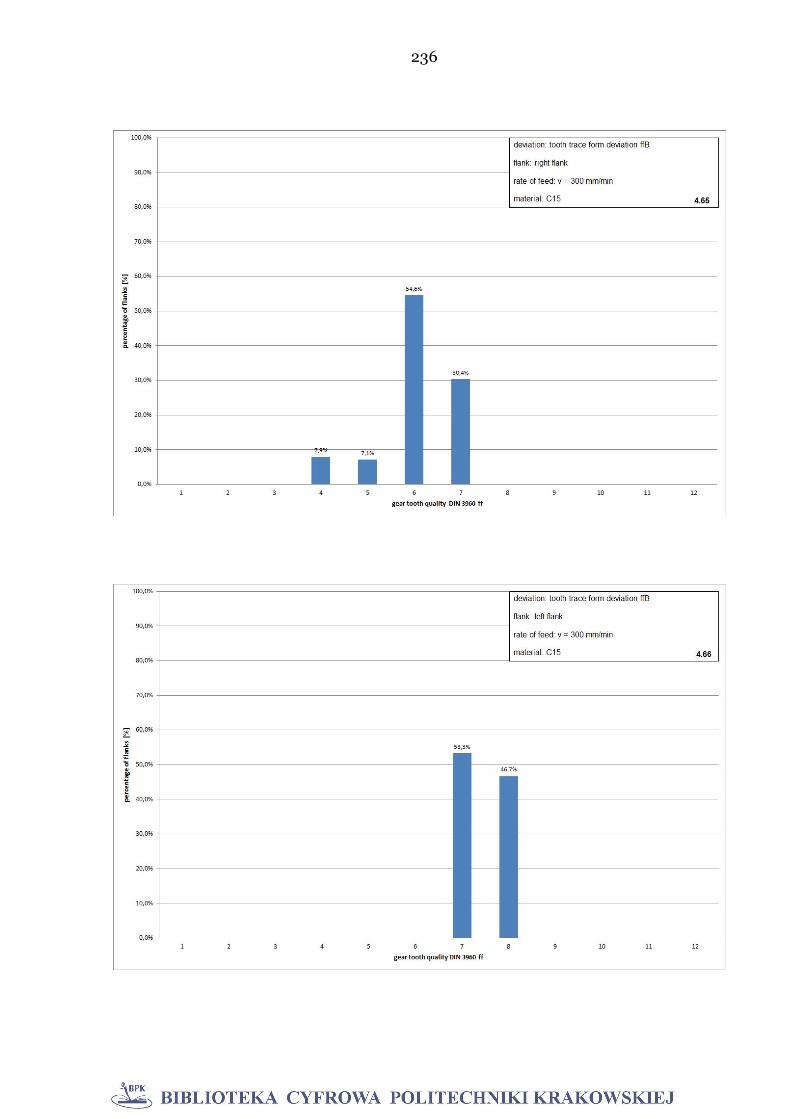
236

237
Appendix 5: List of Literature
Nr. Author Title Date Place Publisher
1
Bach, F.W.; Doege, E.; Auswirkungen einer Integration der Wärmebe-handlung auf die Prozesskette zur Zahnradher-stellung durch Präzisionsschmieden
2003 pp. 375-379
Berichte aus dem IWU
2 Basedow, G., Intermittierendes Kaltwalzen
1979 pp.1893-1895 Maschinenmarkt
3 Bausch Moderne Zahnradfertigung
2011 expert-Verlag
4
Bausch, Thomas Innovative Zahnradfertigung : Verfahren, Maschinen und Werkzeuge zur kostengünstigen Herstellung von Stirnrädern mit hoher Qualität
2011 pp. 777
Moderne Zahnradfertigung; pp., expert-Verl. , Renningen
5 Bogojavlenskij, K.N. Kaltprofilwalzen von Schneckenwellen
1980 pp.30; 3 Fertigungstechnik und Betrieb
6 Bosch, M.; Rohmert, J., Verzahnen
1973 pp. 972-976 VDI-Zeitschrift
7 Dähndel, Helge Beitrag zur Systematisierung der Prozessausle-
gung für das Präzisionsschmieden von Zahnrä-dern
2011 Berichte aus dem IFUM. Universität Hannover
8 Dobosz, Marek, Laser diode distance measuring
interferometer - metrological properties 2012 pp. 553–564 Metrology and Measurement Systempp. Vol. XIX/3, pp
9 Doege, E.; Westerkamp, C.; Wiarda, M.; Nägele, H.
Präzisionsumformtechnik auf dem Weg zur Herstellung schrägverzahnter Zylinderräder 1994 pp. 24-25
MM-Maschinenmarkt, Würzburg
10 E. Schrüfer Elektrische Meßtechnik, Studienbücher der
techn. Wispp. 1992 Carl Hanser Verlag, München/Wien
11
Eichner, K.W. Problemkreis ist vielschichtig. Fuehrungseigen-schaften eines Werkzeuges und Umformkraefte zum Verzahnen sind wichtige Beurteilungskriterien der Verfahren
1988 pp. 20-23
MM - Maschinenmarkt, Würzburg
12
Eichner, K.W. Neuentwicklung gefordert. Verzahnungen fertigen mittels Walzen bei hoher Guete und Genauigkeit verlangt gezielte Stofflusssteuerung
1988 pp. 58-61
MM - Maschinenmarkt, Würzburg
13 Eichner, K.W. DimensionsanalytischeUeberlegungen zum
Walzen 1981 pp. 37-38 Dissertation, TH-Darmstadt, Institut für Umformtechnik
14 Eichner, K.W. Neuere Erkenntnisse beim Walzen von Profilen
und Verzahnungen 1983 pp. 163-175 Deutsche Gesellschaftfuer Metallkunde e.V.
15 Eichner, K.W. Herstellen von Zahnraedern durch das Zwei-
Walzen-Verfahren 1986 pp. 147-158 VDI-Gepp. Produktionstechnik
16 Eichner, K.W. Ist umformende Verzahnungsherstellungein
Problem? 1988
Umformtechnisches Kolloquium
17
Eichner, K.W. Problemkreis ist vielschich-tig.Fuehrungseigenschaften eines Werkzeuges 1988 pp. 20-23
MM - Maschinenmarkt
18 Eichner, K.W. Neuentwicklung gefordert. Verzahnungen
fertigen mittels Walzen 1988 pp. 58-61 MM - Maschinenmarkt
19 Eichner, K.W. Ist umformende Verzahnungsherstellung ein
Problem? 1988 Umformtechnisches Kolloquium Mar; 11-7 ; TH Darmstadt, 16.-17.3.1988
20 Eichner, K.W.; Heberer, C. Kein Unterschied im Fließverhalten.
Schrägverzahnungswalzen von Sinterwerkstof-fen
1991 pp. 38-39 HGF-Bericht, 09/91
21 Feldmann, H.D. Kaltmassivumformung
2003 pp. 42-46 VDI-Z Integrierte Produktion
22 Feldmann, H.D. Kaltmassivumformung. Fachgebiete in Jahres-
übersichten 2003 pp. 145; 42-46 VDI-Z Integrierte Produktion
23
Francisco Javier Brosed, Juan José Aguilar, David Guillomía and Jorge Santolaria
3D Geometrical Inspection of Complex Geomet-ry Parts Using a Novel Laser Triangulation Sensor and a Robot
2011 pp. 90-110
Sensors
24
Gan, Zhongxue, Tang, Qing Visual Sensing and its application - Integration of Laser Sensors to Industrial Robots 2011
Series: Advanced Topics in Science and Technology in China, Springer & Zhejiang University Press
25 Giebecke, H., Anwendung und Gestaltung von Walzwerkzeu-
gen fuer Profilwalzmaschinen 1983 pp. 17; 3 Umformtechnik
26 Goch, G.: Gear Metrology
2001 pp. 659-695 Annals of the CIRP
27
Goch, G.: Theorie und Prüfung gekrümmter Werkstück-oberflächen in der Koordinatenmeßtechnik
1982
Universität der Bundeswehr
28 Goch, G.: Efficient Multi-Purpose Algorithmfor
Approximation- and Alignment-Problems 1990 pp. 553-556 Annals of the CIRP Val. 39/1
29 Goch, G.; A Universal Algorithm forthe
Alignment of Sculptured Surfaces 1992 pp. 597-600 Annals Of the CIRP Vol. 41/1
30 Goch, G.;Günther, A Future Gear Metrology
2003 pp.751-768 VDI-Berichte 1665
238
31
Goch, G.;Peters, R.-D Beschreibung gekrümmter Werkstück-Oberflächenin der Mehrkoordinaten-Meßtechnik.
1980 pp. 85-91
VDI-Berichte Nr. 378
32 Günther, A.: Flächenhafte Beschreibung und Ausrichtung
von Zylinderrädern mit Evolventenprofil 1996 pp. 160-165 Diplomarbeit
33 Günther, A.;Peters, J.; Flächenhafte numerische Beschreibung,
2001 VDI-Berichte Nr. 1880
34 H. Herold Sensortechnik 1993 Hüthig-Verlag
35 H.R. Tränkler Taschenbuch der Meßtechnik mit Schwerpunkt
Sensortechnik (3. Auflage) 1992 R. Oldenburg-Verlag
36 H.R. Tränkler, E, Obermeier
"Sensortechnik" Handbuch für Praxis und Wis-senschaft 1998
Springer Verlag
37 Hagener Symposium Pulvermetallurgie
Energie- und Ressourceneffizienz durch Pulver-metallurgie 2009 pp. 32-35
Heimdall Verlag
38 Hammerschmidt, E. Innenprofilierte Verzahnungswerkzeuge
erreichen großen großen Überdeckungsgrad 1998 pp. 22-26 HGF-Bericht, 06/98
39 Hammerschmidt, E. Verbesserte Kinematik beim Profilieren
führt Werkzeuge auch unter Last genau 1999 pp. 28-32 Maschinenmarkt, ,Würzburg
40 Hammerschmidt, E. Verzahnungswalzen mit verschiedenen Maschi-
nensystemen 1980 Umformtechnisches Kolloquium
41 Hammerschmidt, E. Kaltwalzen von Profilenverzahnungsfoermiger
Geometrien 1985 Umformtechnisches Kolloquium, T H-Darmstadt, Institut für Umform-technik
42 Hammerschmidt, E. Geometrieuntersuchungen an gewalzten Ober-
flaechenprofilen 1987 Instituts-Berichte über Fertigungsforschung
43 Hammerschmidt, E. Geometrieuntersuchungen an gewalzten Ober-
flaechenprofilen; Umformtechnik Darmstadt 1987 pp. 7 Berichte ueber Fertigungsforschung
44 Hammerschmidt, E., Verzahnungswalzen mit
verschiedenen Maschinensystemen 1981 pp. 350-354 Draht
45 Hellfritzsch, U. Walzen statt spanen in der Stirnradfertigung
2002 pp. 54-56 WB Werkstatt und Betrieb
46 Hellfritzsch, U.; Strehmel, P. Walzen statt spanen in der Stirnradfertigung
2002 pp. 135; 3 ; 54-56 WB Werkstatt und Betrieb Aufsatz (Zeitschrift)
47 Höhn, B.R. Gestaltung von Verzahnungsgeometrien für die
Umformtechnik, Wege erkennen - Potentiale nutzen
2006 pp. 223-233 UKD, Umformtechnisches Kolloquium Darmstadt
48 Höhn, B.R., Gestaltung von Verzahnungsgeometrien
für die Umformtechnik 1997 pp. 223-233 Umformtechnisches Kolloquium
49 J. Fraden AIP Handbook of Modern Sensors:
Physicpp. Designs and Application 1993 AIP American Institute of Physics
Press, New York
50 J. Niebuhr, G. Lindner
Physikalische Meßtechnik mit Sensoren 1994 R. Oldenburg-Verlag
51 J.W. Gardner Microsensors: Principles and Applications 1994 J. Wiley & Sons Ltd.. Chichester
52 James Clark, Emanuele Trucco, Lawrence B. Wolff
Using Light Polarization in Laser Scanning, Image and Vision Computing, Volume 15, Issue 2
1997 pp. 107–117 Elsevier Science
53 Jianxin Zhang, Alexandar Djordjevich
Study on laser stripe sensor 1999 pp. 224–228
Sensors and Actors, Elsevier Science
54 Jontschev, B. Wirtschaftlichkeit durch höhere Genauigkeit.
Kaltumformen genauer Zahnräder 1991 pp. 46-47 (Zeitschrift) Technische Rundschau, Bern
55 Jontschev, B., Wirtschaftlichkeit durch höhere Genauigkeit
1991 pp. 46-47 Technische Rundschau
56 K. B. Smith and Y. F. Zheng Accuracy Analysis of Point Laser Triangulation
Probes Using Simulation 1998 pp. 736-745 Journal of Manufact. Science & Eng., Vol. 120(4)
57
Kästner, M.; Meeß, K.; Seewig, J.; Reithmeier, E.,
Optische Geometrieerfassung von Zahnrädern. Flächenhafte Detektion von Verzahnungsabwei-chungen
2005 pp. 155-163
VDI-Berichte, VDI-Verlag , Düsseldorf
58 Kauffmann, Philipp Impulse für Getriebebauer
2009 pp. 58-61 WB Werkstatt und Betrieb
59 Kauffmann, Philipp Gear-rolling study
2009 pp. 58 PowderMet
60
Kauffmann, Philipp; Gorgels, Christof; Klocke, Fritz
Gear-rolling study, PowderMet
2009 pp. 6/47-6/58,
Metal Powder Industries Federation, Princeton
61 Kauffmann, Philipp; Gorgels, Christof; Klocke, Fritz
Impulse für Getriebebauer. Status quo und Trends der Stirnradfertigung 2009
pp. 142; 5 ; 58-61,
Aufsatz (Zeitschrift); WB Werkstatt und Betrieb
62 Klocke, Fritz; Solutions in PM gear rolling
2010 Powder Metallurgy World Congress & Exhibition
63
Klocke, Fritz; Gorgels, Christof; Gräser, Eva; Kauffmann, Philipp; Strehmel, Peter; Hirsch, Michael,
Solutions in PM gear rolling, World PM,
2010 pp. 1-7
Powder Metallurgy World Congress & Exhibition
64
Klocke, Fritz; Kleinjans, Manfred; Klein, Alexander
Mikrometer für Millisekunden. Hartstoffschichten zur Leistungssteigerung beim Wälzfräsen
2004 pp. 67-69
VDI-Z Integrierte Produktion Aufsatz (Zeitschrift)
239
65 Koenig, W., Stand der Technik in der Zahnradfertigung
1985 pp. 173-182 VDI Berichte
66 Koenig, W., Stand der Technik in der Zahnradfertigung
1983 pp. 173-182 VDI Berichte
67 Koenig, W.; Gutmann, P., Aktuelle Technologien in der Fertigungsfolge
Umformen 1986 pp. 114-127 VDI-Gepp. Produktionstechnik
68 Koenig, W.; Steffens, K. Gear production by cold forming
1985 pp. 481-483 CIRP Annals
69 Koenig, W.;Bonzakis, K. Wirtschaftliche Zahnradfertigung
1978 pp. 32; 19; 29 VDI-Nachrichten
70
Kohlhoff, T.; Prinz, C.; Rentsch, R.; Surm, H.
Influence of manufacturing parameters on gear distortion 2012
pp. 43; 1-2; 84-90
WILEY‐VCH Verlag
71 Kotthoff, Gerd; Wattenberg, Frank
Hochfeste PM Zahnräder - Neue Werkstoffe und Verfahren 2006 pp. 113-138
Pulvermetallurgie in Wissenschaft und Praxis
72 Krapfenbauer, H. Neue Einsatzmoeglichkeiten des
Kaltwalzens dank CNC-Technik 1989 pp. 64-70 Zeitschrift für wirtschaftliche Fertigung und Automatisierung ZWF/CIM
73 Krapfenbauer, H. Kaltwalzen eng tolerierter Verzahnungen
1978 pp. 657-661 Maschinenmark
74 Krapfenbauer, H. Verzahnungswalzen mit verschiedenen
Maschinensystemen nach dem Grob-Verfahren 1980 Umformtechnisches Kolloquium
75 Krapfenbauer, H. Verzahnungswalzen mit verschiedenen
Maschinensystemen nach dem Grob-Verfahren 1981 pp. 32; 7 Draht
76
Krapfenbauer, H. Kaltwalzen von Innen- und Aussen-Verzahnungen an duennwandigen Hohlkoerpern
1981 pp. 161-164
Seminar
77 Krapfenbauer, H., Neue Gesichtspunkte fuer die
Fertigung von Stirnzahnraedern durch Kaltwal-zen
1984 pp. 40-47 Z. Wirtsch. Fertigung
78 Krapfenbauer, H., Neue Einsatzmoeglichkeiten
des Kaltwalzens dank CNC-Technik 1989 pp. 64-S70 Zeitschrift ZWF
79 Krapfenbauer, H., Kaltgewalzte Praezisionsverzahnungen
1979 pp. 107-112 VDI-Berichte
80 Lange, K.; Kling, E. Stand und Entwicklung der Kaltmassivumfor-
mung 1981 pp. 76-1
Draht
81 Lange, Kurt; Liewald, Mathias
Umformtechnik 1988
Springer-Verlag
82 Latze, W.: Neue Wege und Systeme für die wirtschaftliche
3D-Verzahnungsprüfung 1996 pp. 1021-1030 VDI Bericht Nr. 1230
83 Latze, W.; Härtig, F Laser Metrology and Machine Performance
2002 pp. 333 Konferenz "Lambdamap"
84 Liebisch, A. Durch Festwalzen induzierte Eigenspannungen in
einsatzgehärteten Zahnrädern mit FEM bestim-men
1990 pp. 36-39 Aufsatz (Zeitschrift)
85 Lindsay Kleeman Advanced Sonar Sensing
2003 pp. 485-498 Springer Tracts in Advanced Robotics, Vol. 6
86 Lindsay Kleeman, Roman Kuc
An Optimal Sonar Array for Target Localization and Classification 1994 pp. 3130-3135
IEEE International Conference on Robotics and Automation, San Diego
87 Lindsay Kleeman, Roman Kuc
Sonar Sensing 2008 pp. 491-519
Springer Handbook of Robotics, Part C
88 Linke, H., Stirnradverzahnung
1996 pp. 54. 547ff,
593 ff.
Carl Hanser Verlag, München/Wien
89 Loos, H., Zahnrad-rollen
1970 pp. 103; 7 Werkstatt und Betrieb
90
M. Cui , M.G. Zeitouny, N. Bhattacharya, pp.A. van den Berg, H.P. Urbach
New laser system for distance metrology - High Accuracy Long Distance Measurements with a Frequency Comb Laser 2010
Symposium Photonics and Opto-electronic (SOPO)
91 Mages,W.; Vorteilhafte Anwendung
neuzeitlicher Umformverfahren 1979 Dokumentation Kraftfahrtwesen e.V
92
Marciniak, Z.;Kopacz, Z., New rotary metalworking processes developed in Poland2. international conference on rotary metalworking processes
1982
Verlag IFS (Publications) Ltd. , Bedford (GB), 1982
93
Möller, Klaus; Ried, Jens Komplettbearbeitung von Zahnradpaaren in den drei Arbeitsschritten Weichbearbeitung - Warmbehandlung - Hartfeinbearbeitung
2003 pp. 718
Forschungsvorhaben Nr. 443 "Komplettbearbeitung", Forschungsheft // Forschungsvereini-gung Antriebstechnik e.V. FVA , Frankfurt
94
Neugebauer, R.; Putz, M.; Hellfritzsch, U.
Improved process design and quality for gear manufacturing with flat and round rolling Manu-facturing Technology - Annals of the Internatio-nal Institute for Production Engineering Research
2007 pp. 56; 1 ; 307-
312
CIRP Annals, General Assembly of CIRP Elsevier , Amsterdam,
95 Neugebauer, R.;Putz, M.; Improved process design and quality for gear
manufacturing 2007 pp. 307-312 General Assembly of CIRP
96 Niemann, G., Winter, H.: Maschinenelemente
1989 Springer-Verlag
97 Norbert Bauer (Pub.) Handbuch zur industriellen Bildverarbeitung -
Qualitätssicherung in der Praxis 2008 Springer Verlag

240
98
Oliver P. Lay, Serge Dubo-vitsky , Robert D. Peters, Johan Burger, William H. Steier, Seh-Won Ahn, Harrold R. Fetterman
Jet Propulsion Laboratory
2004
California Institute of Technology, Pasadena CA
99 P. Hauptmann "Sensoren: Prinzipien und Anwendungen" 1990 C. Hanser-Verlag. München/Wien
100 Pedrick, M., Tittmann, B.R. Ultrasonic micrometer position indicator with
temperature compensation 2004 pp. 1199 – 1202 Ultrasonics Symposium IEEE
101 Rentsch, H., blanksEinflussgrößen des Verzuges beim
Schmieden von Zahnradrohlingen 2010 pp. 68-72 WILEY‐VCH Verlag
102 Rohmert, J. Verfahren und Maschinen zur spanenden Her-
stellung von Verzahnungen 1980 VDI Zeitschrift
103 Rohmert, J., Verzahnen
1976 pp. 1085-1093 VDI-Zeitschrift
104 Rohmert, Jürgen Verzahnen
1997 pp. 36-43 VDI-Zeitschrift
105 Roth, K.: Zahnradtechnik
1989 Springer-Verlag
106 Schmoeckel, D., Kaltwalzen von Verzahnungen durch Querwalzen
1983 pp. 75 Springer-Verl.
107 Schmoeckel, D., Kaltwalzen von Verzahnungen durch Querwalzen
1983 pp. 75 Springer-Verl.
108
Schmoeckel, D.; Hauk, pp. Entwicklung eines kombinierten Drück-Walz-Verfahrens zur Herstellung von Zahnradvorfor-men
1996
VDI-Z Integrierte Produktion ; 138 , Special Blechbearbeitung ; 46-48, Aufsatz (Zeitschrift),
109 Schmoeckel, D.; Hammerschmidt, E.
Schmieden, Uebersicht der Verfahrenstechnologie 1980 pp. 1-10
Ingenieur Digest
110 Schmoeckel, D.; Hammerschmidt, E.
Uebersicht der Verfahrenstechnologie 1980 pp. 20
Ingenieur Digest
111 Schmoeckel, D.; Hammerschmidt, E.
Ermittlung des Einflusses der Maschinenkenngroessen 1983 pp. 43-48
Dt. Verb. f. Materialprüfung
112 Schmoeckel, D.; Kuebert, M.
Urformen und Umformen von Zahnraedern 1982
Verein Deutscher Ingenieure
113 Schmoeckel, D.;Hauk, pp., Entwicklung eines kombinierten Drück-Walz-
Verfahrens 1996 VDI-Z Integrierte Produktion
114 Schmoekel, D., Hammer-schmidt
UKD'88. 3. Umformtechnisches Kolloquium 1988
UKD'88. 3. colloquium on metal forming
115 Schöck, J.; Kammerer, M. Verzahnungsherstellung durch Kaltfließpressen
1999 pp. 36-42 Umformtechnik
116 Schuler GmbH Handbuch der Umformtechnik
1996 Springer-Verlag
117 Sheljaskow, pp. Kaltwalzen von Innenverzahnungen
1983 Forschungsgesellschaft
118 Sheljaskow, pp. Kaltwalzen von Innenverzahnungen
1983 Forschungsgesellschaft
119 Siegert, K.; Geiger, R. Neuere Entwicklungen in der Massivumformung
1991 DGM
120
Siegert, K.; Geiger, R.; Beuscher, K.; Zeller, R.; Keller, K.; Kopp, R.; Wiegels, W.; Lieb, A.; Nicoll, R.; Pöll, A. et al.
Neuere Entwicklungen in der Massivumformung
1991
Vorträge 13-23, DGM-Informationsgesellschaft , Oberursel,
121 Sładek J. Errors Identification and Measurement Accuracy
Assessment of Coordinate Measuring Machines (CMM)
1999 pp. 113-136 Postępy Technologii Maszyn i Urząd-zeń
122 Sładek J., Gawlik K. Looking for uncertainty of measurement
2007 IV International Congress on
123 Spur u. Stöferle. Handbuch der Fertigungstechnik
1983 pp. 200 ff. Umformen Hanser-Verlag
124
Strehl, R. Umformtechnische Herstellung von Zahnrädern : Studie und Literaturrecherche; Forschungsvorhaben Nr. 219 "Umformverfah-ren"
1993
FVA-219(Vorhaben); FVA , Frankfurt a.M.
125 Swinkels, Bastiaan Lucas High-accuracy absolute distance metrology
2006 Dissertation Technische Universiteit Delft
126
Symposium Praxis der Zahnradfertigung, Technische Akademie
Praxis der Zahnradfertigung : Symposium
2007
Tagungshandbuch 2007 TAE
127 Th. Eibel Mikrosensorik 1996 Vieweg&Sohn Verlag
128 Uematsu, Seizo; Houser, Donald R.
A study on reducing gear tooth profile error 2005 pp. 34-39
Gear Technology
129 Volkov, M.;Korotkov, A Thread-Rolling Worm Shafts
1970 pp. 90-92 W+B
130 W. Göbel, J. Hesse, J.N. Zernel
Sensors: A Comprehensive Survey 1995 VCH-Verlag Weinheim
131 W. Heiwang "Sensorik". Reihe: Halbleiter-Elektronik Bd. 17 1993 Springer-Verlag
132 Weck, M.;Koenig, W.; Bartsch, B.
Production of involut-toothed gears by cold rolling
1981 pp. 125-132 Repp. Conf. Proc., SME

241
133 Weser, Gunther Am Zahn der Zeit. Exakte Zahnform von Kegel-
rädern für alternative Herstellungsmethoden, Antriebstechnik
2010 Aufsatz (Zeitschrift)
134
Zhongxue Gan, Qing Tang Laser Stripe Sensor Calibration, Visual Sensing and its Applications: Advanced Topics in Science and Technology in China, Vol. 0
2011 pp. 41-91
Springer Berlin
Appendix 6: List of Standards
Nr. Standard Description
ST 1 DIN ISO 14 Keilwellen-Verbindungen mit geraden Flanken und Innenzentrierung; Maße, Toleranzen, Prüfung; Identisch mit ISO 14
ST 2 DIN 0867 Bezugsprofile für Evolventenverzahnungen an Stirnrädern (Zylinderrädern) für den allgemeinen Maschinenbau und den Schwermaschinenbau
ST 3 DIN 0868 Allgemeine Begriffe und Bestimmungsgrößen für Zahnräder, Zahnradpaare und Zahnradgetriebe
ST 4 DIN 1319 -1 Grundlagen der Meßtechnik - Teil 1: Grundbegriffe
ST 5 DIN 3960 Begriffe und Bestimmungsgrößen für Stirnräder (Zylinderräder) und Stirnradpaare (Zylinderradpaare) mit Evolventen-verzahnung; Zusammenstellung der Gleichungen
ST 6 DIN 3961 Toleranzen für Stirnradverzahnungen
ST 7 DIN 3962 - 1 Toleranzen für Stirnradverzahnungen; Toleranzen für Abweichungen einzelner Bestimmungsgrößen
ST 8 DIN 3963 Toleranzen für Stirnradverzahnungen; Toleranzen für Wälzabweichungen
ST 9 DIN 8580 Fertigungsverfahren - Begriffe, Einteilung
ST 10 DIN 5480 ff. Keilwellenverbindungen
ST 11 DIN 8583 Umformverfahren
ST12 DIN 332 Zentrierbohrungen
ST 13 VDI 3200 Fließkurven metallischer Werkstoffe; Grundlagen
ST 14 VDI 2617 Messunsichheit, Koordinatenmessen
ST15 VDI 2612 Anforderungen Messgeräte
ST 16 DIN 1101 Durchmesser und Rundheit
Copyright © 2022 FDOKUMEN