Financing of global health: tracking development assistance for health from 1990 to 2007
12
Articles www.thelancet.com Vol 373 June 20, 2009 2113 Financing of global health: tracking development assistance for health from 1990 to 2007 Nirmala Ravishankar, Paul Gubbins, Rebecca J Cooley, Katherine Leach-Kemon, Catherine M Michaud, Dean T Jamison, Christopher J L Murray Summary Background The need for timely and reliable information about global health resource flows to low-income and middle-income countries is widely recognised. We aimed to provide a comprehensive assessment of development assistance for health (DAH) from 1990 to 2007. Methods We defined DAH as all flows for health from public and private institutions whose primary purpose is to provide development assistance to low-income and middle-income countries. We used several data sources to measure the yearly volume of DAH in 2007 US$, and created an integrated project database to examine the composition of this assistance by recipient country. Findings DAH grew from $5·6 billion in 1990 to $21·8 billion in 2007. The proportion of DAH channelled via UN agencies and development banks decreased from 1990 to 2007, whereas the Global Fund to Fight AIDS, Tuberculosis and Malaria, the Global Alliance for Vaccines and Immunization (GAVI), and non-governmental organisations became the conduit for an increasing share of DAH. DAH has risen sharply since 2002 because of increases in public funding, especially from the USA, and on the private side, from increased philanthropic donations and in-kind contributions from corporate donors. Of the $14·5 billion DAH in 2007 for which project-level information was available, $5·1 billion was for HIV/AIDS, compared with $0·7 billion for tuberculosis, $0·8 billion for malaria, and $0·9 billion for health-sector support. Total DAH received by low-income and middle-income countries was positively correlated with burden of disease, whereas per head DAH was negatively correlated with per head gross domestic product. Interpretation This study documents the substantial rise of resources for global health in recent years. Although the rise in DAH has resulted in increased funds for HIV/AIDS, other areas of global health have also expanded. The influx of funds has been accompanied by major changes in the institutional landscape of global health, with global health initiatives such as the Global Fund and GAVI having a central role in mobilising and channelling global health funds. Funding Bill & Melinda Gates Foundation. Introduction In the years leading up to the present global economic downturn, international support for improving health in low-income and middle-income countries grew sub- stantially, which gave rise to a lively debate among global health experts on how development assistance for health (DAH) could be used effectively. 1–4 With the onset of a global recession, many expect decreases in future funding. 5–7 Surprisingly, discussions about global health financing continue to take place in the absence of a comprehensive system for tracking DAH. The existing research on health resource flows has yielded some important estimates, but has large gaps. 8–12 The Development Assistance Committee of the Organisation for Economic Co-operation and Development (OECD) provides estimates of official development assistance by sector. 13 However, these estimates track only public sources and exclude private philanthropy, which is an important source of development assistance. 14 The OECD data also omit other important health flows, such as contributions from the Global Alliance for Vaccines and Immunization (GAVI) and core-funded activities of WHO. 13,15 Studies investigating resources for specific diseases or types of interventions 16–19 have similar disadvantages. Studies of aggregate flows provide only data from single years, 12,20 and those capturing time-series data are outdated. 21,22 In view of the interest in DAH, why have these flows been so difficult to track comprehensively and systematically? Defining what constitutes DAH is conceptually challenging. Clarity on the scope of health resource tracking is needed, including a delineation of the types of institutions that should be tracked, what counts as health dollars and what might be health-related such as support for allied sectors, and whether assistance for all countries or just those of low and middle income should be included. Additionally, whether the quantity of interest is commitments, disbursements, or expenditure (panel) needs to be clearly defined. Several measurement challenges make careful analysis complex, time-consuming, and at times uncertain. First, crucial variables in OECD’s databases such as yearly disbursements and project descriptions are often incomplete. Second, there are no integrated databases Lancet 2009; 373: 2113–24 See Editorial page 2083 See Comment page 2087 Institute for Health Metrics and Evaluation, University of Washington, Seattle, WA, USA (N Ravishankar PhD, P Gubbins BA, R J Cooley MED, K Leach-Kemon MPH, Prof D T Jamison PhD, Prof C J L Murray MD); and Harvard Initiative for Global Health, Harvard University, Cambridge, MA, USA (C M Michaud MD) Correspondence to: Prof Christopher J L Murray, Institute for Health Metrics and Evaluation, University of Washington, 2301 5th Avenue, Suite 600, Seattle, WA 98121, USA [email protected]
-
Upload
independent -
Category
Documents
-
view
0 -
download
0
Transcript of Financing of global health: tracking development assistance for health from 1990 to 2007

Articles
www.thelancet.com Vol 373 June 20, 2009 2113
Financing of global health: tracking development assistance for health from 1990 to 2007Nirmala Ravishankar, Paul Gubbins, Rebecca J Cooley, Katherine Leach-Kemon, Catherine M Michaud, Dean T Jamison, Christopher J L Murray
SummaryBackground The need for timely and reliable information about global health resource fl ows to low-income and middle-income countries is widely recognised. We aimed to provide a comprehensive assessment of development assistance for health (DAH) from 1990 to 2007.
Methods We defi ned DAH as all fl ows for health from public and private institutions whose primary purpose is to provide development assistance to low-income and middle-income countries. We used several data sources to measure the yearly volume of DAH in 2007 US$, and created an integrated project database to examine the composition of this assistance by recipient country.
Findings DAH grew from $5·6 billion in 1990 to $21·8 billion in 2007. The proportion of DAH channelled via UN agencies and development banks decreased from 1990 to 2007, whereas the Global Fund to Fight AIDS, Tuberculosis and Malaria, the Global Alliance for Vaccines and Immunization (GAVI), and non-governmental organisations became the conduit for an increasing share of DAH. DAH has risen sharply since 2002 because of increases in public funding, especially from the USA, and on the private side, from increased philanthropic donations and in-kind contributions from corporate donors. Of the $14·5 billion DAH in 2007 for which project-level information was available, $5·1 billion was for HIV/AIDS, compared with $0·7 billion for tuberculosis, $0·8 billion for malaria, and $0·9 billion for health-sector support. Total DAH received by low-income and middle-income countries was positively correlated with burden of disease, whereas per head DAH was negatively correlated with per head gross domestic product.
Interpretation This study documents the substantial rise of resources for global health in recent years. Although the rise in DAH has resulted in increased funds for HIV/AIDS, other areas of global health have also expanded. The infl ux of funds has been accompanied by major changes in the institutional landscape of global health, with global health initiatives such as the Global Fund and GAVI having a central role in mobilising and channelling global health funds.
Funding Bill & Melinda Gates Foundation.
Introduction In the years leading up to the present global economic downturn, international support for improving health in low-income and middle-income countries grew sub-stantially, which gave rise to a lively debate among global health experts on how development assistance for health (DAH) could be used eff ectively.1–4 With the onset of a global recession, many expect decreases in future funding.5–7 Surprisingly, discussions about global health fi nancing continue to take place in the absence of a comprehensive system for tracking DAH.
The existing research on health resource fl ows has yielded some important estimates, but has large gaps.8–12 The Development Assistance Committee of the Organisation for Economic Co-operation and Development (OECD) provides estimates of offi cial devel opment assistance by sector.13 However, these estimates track only public sources and exclude private philanthropy, which is an important source of development assistance.14 The OECD data also omit other important health fl ows, such as contributions from the Global Alliance for Vaccines and Immunization
(GAVI) and core-funded activities of WHO.13,15 Studies investigating resources for specifi c diseases or types of interventions16–19 have similar disadvantages. Studies of aggregate fl ows provide only data from single years,12,20 and those capturing time-series data are outdated.21,22
In view of the interest in DAH, why have these fl ows been so diffi cult to track comprehensively and systematically? Defi ning what constitutes DAH is conceptually challenging. Clarity on the scope of health resource tracking is needed, including a delineation of the types of institutions that should be tracked, what counts as health dollars and what might be health- related such as support for allied sectors, and whether assistance for all countries or just those of low and middle income should be included. Additionally, whether the quantity of interest is commitments, disbursements, or expenditure (panel) needs to be clearly defi ned.
Several measurement challenges make careful analysis complex, time-consuming, and at times uncertain. First, crucial variables in OECD’s databases such as yearly disbursements and project descriptions are often incomplete. Second, there are no integrated databases
Lancet 2009; 373: 2113–24
See Editorial page 2083
See Comment page 2087
Institute for Health Metrics and Evaluation, University of Washington, Seattle, WA, USA (N Ravishankar PhD, P Gubbins BA, R J Cooley MED, K Leach-Kemon MPH, Prof D T Jamison PhD, Prof C J L Murray MD); and Harvard Initiative for Global Health, Harvard University, Cambridge, MA, USA (C M Michaud MD)
Correspondence to:Prof Christopher J L Murray, Institute for Health Metrics and Evaluation, University of Washington, 2301 5th Avenue, Suite 600, Seattle, WA 98121, [email protected]
Articles
2114 www.thelancet.com Vol 373 June 20, 2009
for health-related assistance fl ows from private founda-tions and non-governmental organisations (NGOs) worldwide. Third, development assistance fl ows from primary funding sources through various fi nancial intermediaries to many imple menting institutions, increasing the danger of the same money being counted multiple times. Fourth, the poor quality of data from previous years makes quantifi cation of time trends diffi cult. Fifth, diff erent published sources of information for the same organisation are often inconsistent. And last, organ isations use diff erent fi scal years and accounting methods, which complicate the task of developing coherent information over time.
We aimed to tackle these challenges and develop a consistent time series of DAH from 1990 to 2007 on the basis of clear defi nitions and data drawn from several sources.
MethodsConceptual frameworkThe fi rst step in estimation of DAH was to identify all important public and private channels of assistance in the health sector. The webappendix p 1 shows how resources for health fl ow to and from these channels of assistance. In practice, some channels such as bilateral aid agencies and private foundations behave more as funding sources, whereas others such as the UN agencies and NGOs are channels of assistance as well as implementing institutions (webappendix p 2).
DAH in each year equals the sum of gross yearly disbursements on all health-sector grants and loans, and health-related programme expenditures from the channels of assistance, net of any transfers to other channels of assistance included in the study. Five points are worth noting. First, we defi ned health as all disease-specifi c support and general health-sector support, and excluded support for allied sectors such as water and sanitation, education, general budget support, and humanitarian assistance. Although develop-ment assistance to most sectors aff ects health, the aim of this study was to estimate direct assistance to the health sector. For comparison purposes, however, we report overall time trends in general budget support and debt relief separately. Second, we counted yearly disburse-ments on health-sector loans and grants rather than commitments made towards future payments. Third, DAH includes gross disbursements rather than net resource fl ows. Fourth, to avoid double-counting, we subtracted any fl ows from the channels that we were tracking to other channels also tracked by us—ie, we counted DAH from the channel most proximal to the recipient country or destination of the funds. Last, research funded by DAH channels of assistance are included in our estimate, whereas health research by institutions that do not meet our defi ni tion of a channel of assistance have been excluded.
Overview of data sourcesThe study tracks bilateral aid agencies in 22 member countries of the OECD Development Assistance Committee, the European Commission, WHO, the UN Children’s Fund (UNICEF), the UN Population Fund (UNFPA), the Joint UN Programme on HIV/AIDS (UNAIDS), the World Bank, the Asian Development Bank, the Inter-American Development Bank, the African Development Bank, GAVI, the Global Fund to Fight AIDS, Tuberculosis and Malaria, US-based private foundations including the Bill & Melinda Gates Foundation, and US-based NGOs. Channels for which we were unable to identify robust data sources have been
Panel: Defi nitions of terms
CommitmentsPromises of future payments made at one point in time.
DisbursementsActual payments made against a previous commitment.
Development assistanceFunds from and activities by donor governments, multilateral agencies, and private agencies for promoting economic, social, and political development in low-income and middle-income countries.
Channels of assistanceInstitutions whose primary purpose is providing development assistance to low-income and middle-income countries.
Development assistance for health (DAH)Financial and in-kind contributions from channels of assistance to improve health in low-income and middle-income countries. DAH aims to achieve either country-specifi c health improvements or to fi nance health-related global public goods such as research and development, disease surveillance, monitoring and evaluation, and data collection. DAH does not include support for allied fi elds such as humanitarian assistance, food aid, water and sanitation, education, and poverty alleviation that indirectly aff ect health. DAH includes loans on concessional terms, which charge below-market interest rates. We distinguish gross DAH, which is the actual outfl ow of resources in a specifi c year, from net DAH, which is the gross amount minus repayments for DAH loans in previous years. Results in this Article are for gross DAH only. Research funded by DAH channels of assistance is counted as DAH, whereas health research by other institutions whose primary purpose is not development assistance is not included.
Sources of fundingRevenue streams for the channels of assistance.
Implementing institutionsInternational and domestic agencies implementing health programmes for improving health in low-income and middle-income countries.
See Online for webappendix

Articles
www.thelancet.com Vol 373 June 20, 2009 2115
Year
5·59
5·59 5·476·11
6·61
7·76 8·01 8·108·42 8·65
9·80
10·69 10·90
12·44
13·55
15·60
17·90
18·99
21·79
5·59 5·476·11
6·61
7·76 8·01 8·108·42 8·65
9·80
10·69 10·90
12·44
13·55
15·60
17·90
18·99
21·79
5·476·11
6·61
7·76 8·01 8·108·42 8·65
9·80
10·69 10·90
12·44
13·55
15·60
17·90
18·99
21·79
5·59 5·476·11
6·61
7·76 8·01 8·108·42 8·65
9·80
10·69 10·90
12·44
13·55
15·60
17·90
18·99
21·79
19901991
19921993
19941995
19961997
19981999
20002001
20022003
20042005
20062007
Year1990
19911992
19931994
19951996
19971998
19992000
20012002
20032004
20052006
2007
UnallocableOtherDebt repayments (IBRD)
National treasuries:Other governmentsItalyNorwaySwedenCanadaNetherlandsFranceGermanyJapanUKUSA
Private philanthropy:OtherCorporate donationsBMGF
By funding sourceB
0
2
4
6
8
10
12
14
16
18
20
22
0
2
4
6
8
10
12
14
16
18
20
22
2007
US$
(bill
ions
)20
07 U
S$ (b
illio
ns)
NGOsOther foundationsBMGFGFATMGAVIEuropean CommissionWHO, UNICEF, UNFPA and UNAIDSWorld Bank–IBRDWorld Bank–IDARegional development banksBilateral development agencies
By channel of assistanceA
UnspecifiedUnallocable by donorOtherAustralia and New ZealandCanadaJapanUKEurope (excluding UK)USA
By country of originCTransfers:In-kind: commodities (drugs and medical supplies)In-kind: services management, research, technical assistanceFinancial: grants and loans
By type of transferD
Figure 1: Development assistance for health (DAH) from 1990 to 2007 by channel of assistance (A), source of funding (B), country of origin (C), and type of assistance (D)In B, funds from channels for which we were unable to fi nd separated revenue information and interagency transfers from non-DAH institutions are included in the unallocable category; other refers to interest income, currency exchange adjustments, and other miscellaneous income. In C, the unallocable category includes funds such as interagency transfers from non-DAH institutions, interest income, and miscellaneous income that could not be attributed to countries. Channels for which we had no revenue information are included under unspecifi ed. NGO=non-governmental organisation. BMGF=Bill & Melinda Gates Foundation. GAVI=Global Alliance for Vaccines and Immunization. GFATM=Global Fund to Fight AIDS, Tuberculosis and Malaria. UNICEF=UN Children’s Fund. UNFPA=UN Population Fund. UNAIDS=Joint UN Programme on HIV/AIDS. IBRD=International Bank for Reconstruction and Development. IDA=International Development Association.

Articles
2116 www.thelancet.com Vol 373 June 20, 2009
excluded from the analysis. We constructed two integrated databases: one refl ecting aggregate fl ows and a second project-level database for channels that provided project-level information.
Research methodsWe counted as DAH all health-related disbursements from bilateral donor agencies excluding funds that they transferred to any of the other channels tracked to avoid double-counting. We extracted this information from the OECD’s creditor reporting system (CRS) database. Since donors under-reported disbursement information to the CRS before 2002, we developed a method to predict disbursements from the observed data (webappendix pp 18–24). For other grant-making and loan-making institutions, we similarly included their yearly dis burse ments on health grants and loans, excluding transfers to any other channels and ignoring any repayments on outstanding debts (web -appendix pp 25–38 and 45–47). The yearly disbursements for grant-making and loan-making DAH institutions indicate only the fi nancial transfers made by these agencies. Therefore, we separately estimated in-kind transfers from these institutions in the form of staff time for providing technical assistance and the costs of managing programmes (webappendix pp 53–55).
For the UN agencies, we included their yearly expenditure on health both from their core budgets and
from voluntary contributions. For UNICEF, we also estimated the proportion of total expen di ture that was spent on health (web appendix pp 39–44). For NGOs, we used data from US Government sources and fi nancial documents from a sample of NGOs to estimate health expenditures by NGOs registered in the USA. The amount for 2007, which has not been released yet, was estimated on the basis of data from previous years (webappendix pp 48–52). We used data for the Bill & Melinda Gates Foundation from its tax documents, and relied on data from the Foundation Center for all other US foundations (webappendix pp 45–47). We were unable to include NGOs and foundations registered in other donor countries because of data restrictions.
To estimate the total amounts, we carefully corrected for double-counting. For example, the global health programme at the Bill & Melinda Gates Foundation disbursed funds to several channels tracked by this study, each of which also received funds from elsewhere (webappendix p 3). We excluded the fl ows from the Bill & Melinda Gates Foundation to these channels from our estimate of DAH, since inclusion of those and outfl ows from these channels would lead to an exaggerated estimate of DAH.
We collected information about each channel’s income and used it to disaggregate its contribution to DAH according to the proportion of income received from diff erent sources. The resulting values for DAH by source are imputed rather than observed and do not indicate the total amount that the channels received from diff erent sources.
We used the project-level database to analyse the composition of DAH by recipient country. We then assessed DAH for HIV/AIDS, tuberculosis, malaria, and health-sector budget support with keyword searches within the descriptive fi elds (webappendix p 56). We chose to focus on these areas in view of their relevance to present policy debates about global health fi nances. We separately extracted from the CRS data for general budget support and debt relief, and estimated total disbursements for both (webappendix pp 18–24). Last, we explored the relation between DAH and the burden of disease measured in disability-adjusted life-years (DALYs),23 and between per head DAH24 and income measured by the gross domestic product (GDP) of recipient countries.25–27 All results are presented in 2007 US$ by fi rst converting fi gures from local currencies into nominal US$ with OECD’s exchange rates and then defl ating these nominal dollar sequences into real 2007 US$.25 All analyses were done in Stata (version 10.0) and R (version 2.7.1).
Role of the funding sourceThe funding source for this study had no role in the study design, data collection, data analysis, data interpretation, or writing of the Article. The corresponding author had full access to all data analysed and had fi nal responsibility for the decision to submit for publication.
Figure 2: Development assistance for health (DAH) from 1990 to 2007 by disease Unallocable corresponds to DAH for which we did not have project level information about disease-focus.
UnallocableOtherHealth-sector supportTuberculosisMalariaHIV/AIDS
By disease21·79
18·99
17·90
15·60
13·55
12·44
10·90
7·76
6·61
5·475·596·11
8·108·018·658·42
9·80
10·69
Year1990
19911992
19931994
19951996
19971998
19992000
20012002
20032004
20052006
20070
2
4
6
8
10
12
14
16
18
20
22
2007
US$
(bill
ions
)

Articles
www.thelancet.com Vol 373 June 20, 2009 2117
ResultsFigure 1A shows total DAH from 1990 to 2007 in 2007 US$ disaggregated by the channel of assistance. The total amount of DAH quadrupled from $5·6 billion in 1990 to $21·8 billion in 2007. Although DAH doubled over the course of the 11 years between 1990 and 2001, it doubled again in the 6 years between 2001 and 2007. The relative contributions of diff erent channels of assistance changed substantially over time. The percentage of DAH mobilised by the UN agencies decreased from 32·3% in 1990 to 14·0% in 2007. The World Bank and regional banks accounted for 21·7% of DAH at their relative peak in 2000, which reduced to 7·2% by 2007. The share of DAH from bilateral agencies as channels of assistance decreased from 46·8% in 1990 to 27·1% in 2001, and then increased in subsequent years to 34·0% in 2007. The Global Fund and GAVI scaled up rapidly from less than 1% of DAH each in 2002 to 8·3% and 4·2%, respectively, in 2007. The Bill & Melinda Gates Foundation as a
channel peaked in 2007 at 3·9% of DAH. The share of resources fl owing through NGOs increased from 13·1% of DAH in 1990 to 24·9% in 2006, the last year for which we have reported data for the NGOs.
Figure 1B separates DAH by the original source of funding. Both public and private funding for health increased over time and grew more substantially after 2001. The US Government was the largest donor of public DAH during this time. The other big donors in terms of cumulative disbursements from 2002 to 2007, in decreasing order of size, were the governments of the UK, Japan, Germany, France, Netherlands, Canada, Sweden, Norway, and Italy. Private sources of funding were responsible for a growing share of DAH, up from 19·0% in 1998 to 26·7% in 2007. This peak corresponded with the entry of the Bill & Melinda Gates Foundation into the development arena. However, this graph does not capture the Bill & Melinda Gates Foundation’s total disbursements.
1990
4·15
5·32 5·37
7·82
14·08
1994
Year
1998 2002 2007
2
0
4
6
10
8
12
14
2007
US$
(bill
ions
)
UnspecifiedIDAGlobal health partnerships:GAVIGFATMMultilaterals:European CommissionUNICEFUNAIDSUNFPAWHO
NGOs, PPPs (excluding GAVI and GFATM), otherRecipient governments
Figure 3: Publicly-fi nanced development assistance for health (DAH) in 1990, 1994, 1998, 2002, and 2007 separated by channel Non-governmental organisations (NGOs), public–private partnerships (PPPs) excluding the Global Alliance for Vaccines and Immunization (GAVI) and the Global Fund to Fight AIDS, Tuberculosis and Malaria (GFATM), and other miscellaneous channels are shown together. Disbursements from the creditor reporting system when the channel of delivery code was not specifi ed are shown here as unspecifi ed. IDA=International Development Association. UNICEF=UN Children’s Fund. UNFPA=UN Population Fund. UNAIDS=Joint UN Programme on HIV/AIDS.
2·0
1·5
1·0
2007
US$
(bill
ions
)
0·5
1999 2000 2001 2002 2003
Year
2004 2005 2006 20070
Country governmentsUNWorld BankGAVIGFATMPPPs (excluding GAVI and GFATM)Universities and research institutionsCSOs and corporationsCommitments
Figure 4: Bill & Melinda Gates Foundation commitments and disbursements from 1999 to 2007The recipients of disbursed grants, which we coded, are also shown. The category universities and research institutions includes universities, non-governmental organisations, foundations, and government institutions in all countries with a research focus. The category country governments includes all non-research oriented government agencies. GAVI=Global Alliance for Vaccines and Immunization. GFATM=Global Fund to Fight AIDS, Tuberculosis and Malaria. PPPs=public–private partnerships. CSO=civil society organisations, including non-governmental organisations and foundations.

Articles
2118 www.thelancet.com Vol 373 June 20, 2009
Figure 1C shows DAH from both public and private sources, by its country of origin. The results show that the USA was the biggest contributor overall and that its share has increased over the years. This fi nding could be an overestimate because private contributions from citizens of other donor countries to NGOs in their countries have not been quantifi ed due to data restrictions. The eight largest non-US NGOs for which we obtained data for some select years (webappendix pp 48–52) spent $231 million on health programmes in 2006, which is small compared with the health expen-ditures of US NGOs. Hence, we believe that the overall pattern is still largely as shown despite the exclusion of non-US NGOs from the study. This comparison disregards diff erences in national incomes across these countries. We calculated DAH as a percentage of GDP for the 22 member countries of the OECD in 2007. By this measure, the USA (0·08%) ranked fi fth, behind Sweden (0·24%), Luxembourg (0·15%), Norway (0·14%), and Ireland (0·10%).
The webappendix p 4 depicts DAH by target region. The proportion of DAH for which data for target country was not available decreased from 70·6% in 1990 to 44·2%
in 2007. All regions had increases in funding but the relative share of DAH for sub-Saharan Africa increased from 9·7% in 1990 to 13·8% in 2001, and then to 22·7% in 2007. This growth partly indicates the expansion of funding for HIV/AIDS.
Figure 1D disaggregates DAH into fi nancial transfers and in-kind assistance, showing that the in-kind share of DAH is large and has grown disproportionally. Financial assistance includes all fi nancial disbursements from DAH channels to implementing agencies and research institutions in both high-income countries and those of low and middle income. In-kind assistance has two components. The fi rst—services management, research, and technical assistance—includes all expen ditures by UN agencies on health programmes, the costs incurred by loan-making and grant-making institutions for providing technical assistance and programme management, and expenditures by NGOs net of any commodities delivered. Donated drugs and other commodities comprise the second component of in-kind transfers, and are shown separately.
Figure 2 shows DAH funding for HIV/AIDS, tuberculosis, and malaria. Disbursements for HIV/AIDS have grown, fi rst gradually from $0·2 billion (3·4% of DAH) in 1990 to $0·8 billion (7·0%) in 2000, and then more rapidly to $5·1 billion (23·3%) in 2007. DAH for tuberculosis and malaria remained small by comparison: $0·7 billion (3·2%) and $0·8 billion (3·5%), respectively, in 2007. However, resources for malaria have substantially increased since 2005. Although donors have made arguments emphasising the importance of funds providing general health-system support that are not linked to specifi c programmes or diseases, the volume of these fl ows remained low.
Some donors, particularly the UK and the European Commission, have provided substantial general budget support. Such grants, along with debt relief, have the potential to increase resources for the health sector. The webappendix p 5 shows our estimated trend for disbursements of general budget support and debt relief, as well as the additional funds that probably fl owed into the health sector as a result of these streams, with the assumption that governments from low-income and middle-income countries spent 5% of the resources on health.28 Our results show that general budget support and debt relief generated was small compared with DAH.
Figure 3 shows the composition of public DAH by channel of assistance. We used the channel of delivery code in the CRS to separate bilateral assistance from members of the Development Assistance Committee into funds going to recipient governments versus other civil society and private agencies. Contributions to GAVI and the Global Fund, as well as funds fl owing to governments and civil society groups in recipient countries, have grown substantially, whereas funds fl owing through the World Bank, European Commission, WHO, UNICEF, and other UN agencies have not
Figure 5: Total overseas health expenditure by US non-governmental organisations from 1990 to 2007Funds are separated by proportions of revenue received from the US Government, other public sources of funding, from the Bill & Melinda Gates Foundation (BMGF), fi nancial donations from private contributors, and in-kind donations from private contributors. Since revenue and expenditure data for 2007 are not currently available, the overseas health expenditure for 2007 was estimated from yearly growth rates in the previous 5 years.
2007
US$
(bill
ions
)
0
1
2
3
4
5
Other publicUS publicBMGFPrivate financial contributionsPrivate in-kind donations
19901991
19921993
19941995
19961997
19981999
20002001
20022003
20042005
20062007
Year
Articles
www.thelancet.com Vol 373 June 20, 2009 2119
expanded at the same pace. Since the share that fl owed through unspecifi ed channels has fallen from 1990 to 2007, these trends need to be interpreted with some caution. The webappendix p 6 shows the composition of public monies by channel for every donor country in 2007. Some countries such as France, Italy, Netherlands, and Finland have largely channelled their public funds through multilateral mechanisms. Other large donors such as the UK and the USA have channelled a substantial proportion through bilateral mechanisms or NGOs.
The Bill & Melinda Gates Foundation is the single biggest source of private DAH. Figure 4 shows its global health commitments and disbursements. Resources for global health from the Bill & Melinda Gates Foundation have substantially risen since 2000. Since many commitments are multiyear projects, yearly disburse-ments are lower than the commitments. They have scaled up global health commitments substantially since 2004, reaching nearly $2 billion in both 2006 and 2007. A large share of their disbursements were transferred to other channels of assistance tracked in this study, including GAVI, the Global Fund, the World Bank, and UN agencies.
Figure 5 shows total overseas health expenditure by US NGOs included in our study from 1990 to 2007, and the proportion received from diff erent funding sources. The share of expenditure fi nanced through private revenues is divided into amounts from the Bill & Melinda Gates Foundation, other private fi nancial donations, and
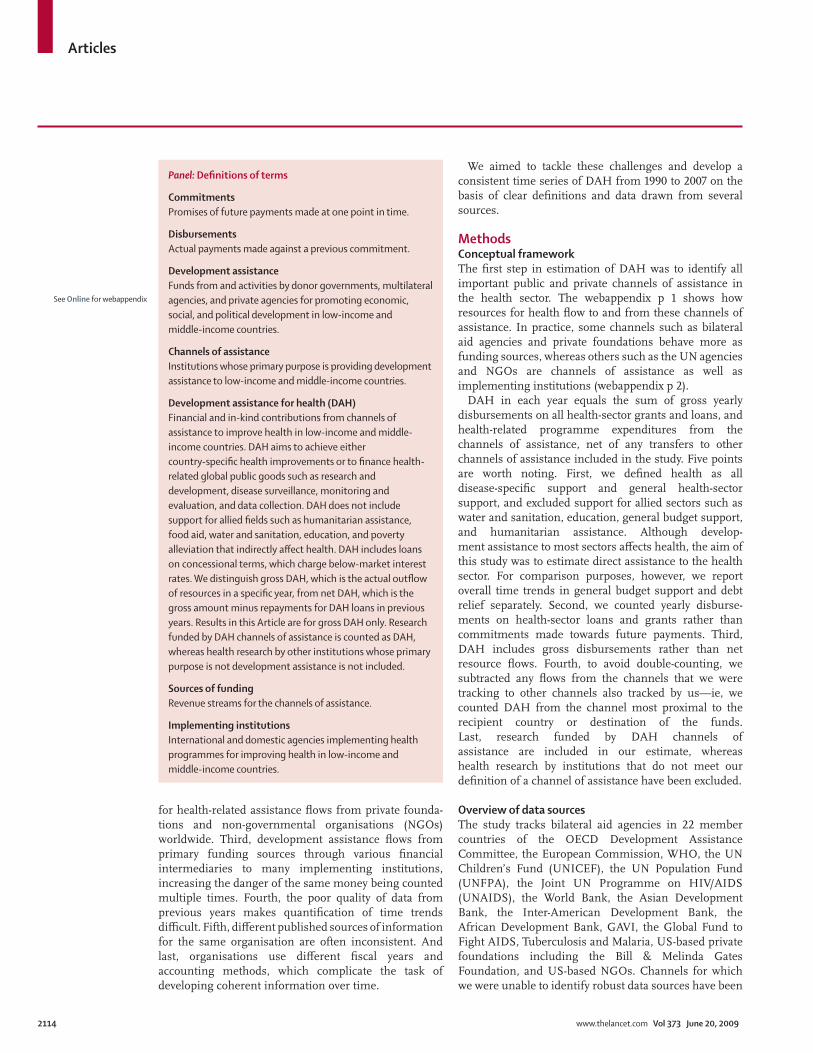
in-kind con tributions. The in-kind component, which is more than 50% in most years, included donations of drugs from pharmaceutical companies that were valued at current market prices. This accounting practice has potentially resulted in an exaggeration of the magnitude of resources fl owing via US NGOs. The table lists the 20 US-based NGOs with the highest overseas health expenditure. Most of these NGOs with the highest percentages of revenue from in-kind contributions helped to channel drugs and medical supplies to recipient countries and partner agencies.
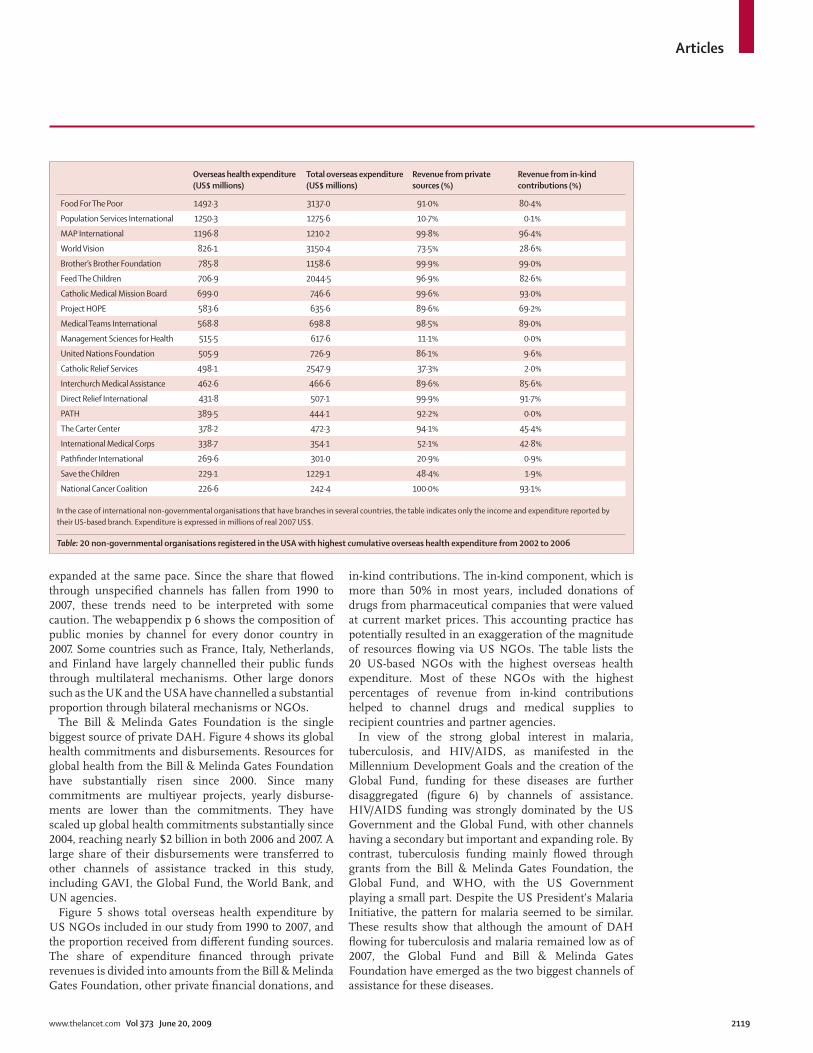
In view of the strong global interest in malaria, tuberculosis, and HIV/AIDS, as manifested in the Millennium Development Goals and the creation of the Global Fund, funding for these diseases are further disaggregated (fi gure 6) by channels of assistance. HIV/AIDS funding was strongly dominated by the US Government and the Global Fund, with other channels having a secondary but important and expanding role. By contrast, tuberculosis funding mainly fl owed through grants from the Bill & Melinda Gates Foundation, the Global Fund, and WHO, with the US Government playing a small part. Despite the US President’s Malaria Initiative, the pattern for malaria seemed to be similar. These results show that although the amount of DAH fl owing for tuberculosis and malaria remained low as of 2007, the Global Fund and Bill & Melinda Gates Foundation have emerged as the two biggest channels of assistance for these diseases.
Overseas health expenditure (US$ millions)
Total overseas expenditure (US$ millions)
Revenue from private sources (%)
Revenue from in-kind contributions (%)
Food For The Poor 1492·3 3137·0 91·0% 80·4%
Population Services International 1250·3 1275·6 10·7% 0·1%
MAP International 1196·8 1210·2 99·8% 96·4%
World Vision 826·1 3150·4 73·5% 28·6%
Brother’s Brother Foundation 785·8 1158·6 99·9% 99·0%
Feed The Children 706·9 2044·5 96·9% 82·6%
Catholic Medical Mission Board 699·0 746·6 99·6% 93·0%
Project HOPE 583·6 635·6 89·6% 69·2%
Medical Teams International 568·8 698·8 98·5% 89·0%
Management Sciences for Health 515·5 617·6 11·1% 0·0%
United Nations Foundation 505·9 726·9 86·1% 9·6%
Catholic Relief Services 498·1 2547·9 37·3% 2·0%
Interchurch Medical Assistance 462·6 466·6 89·6% 85·6%
Direct Relief International 431·8 507·1 99·9% 91·7%
PATH 389·5 444·1 92·2% 0·0%
The Carter Center 378·2 472·3 94·1% 45·4%
International Medical Corps 338·7 354·1 52·1% 42·8%
Pathfi nder International 269·6 301·0 20·9% 0·9%
Save the Children 229·1 1229·1 48·4% 1·9%
National Cancer Coalition 226·6 242·4 100·0% 93·1%
In the case of international non-governmental organisations that have branches in several countries, the table indicates only the income and expenditure reported by their US-based branch. Expenditure is expressed in millions of real 2007 US$.
Table: 20 non-governmental organisations registered in the USA with highest cumulative overseas health expenditure from 2002 to 2006
Articles
2120 www.thelancet.com Vol 373 June 20, 2009
The share of DAH allocable by recipient country grew from 30·3% in 1990 to 56·6% in 2007. The webappendix pp 7–9 plots cumulative DAH from 2002–07 against the total burden of disease measured in DALYs for all low-income and middle-income countries. We make the comparison on a log-log scale because of
the large range in amounts of DAH and DALYs across countries. Disease burden and DAH are positively correlated. However, donor assistance can greatly vary at the same level of burden; for example, there is a 33-fold diff erence between DAH received by Turkmenistan and Nicaragua, two countries with similar disease burden.
5000
4000
3000
2000
1000
0
100
200
300
400
500
600
700
0
100
200
300
400
500
600
700
800
0
World Bank:IDAIBRDUS foundations:BMGFGlobal health partnerships:GFATMUN and European Commission:European CommissionUNAIDSWHOBilateral agencies:OtherUKUSA
2007
US$
(mill
ions
)20
07 U
S$ (m
illio
ns)
DAH for tuberculosis
Year1990
19911992
19931994
19951996
19971998
19992000
20012002
20032004
20052006
2007
DAH for HIV
DAH for malaria
Year1990
19911992
19931994
19951996
19971998
19992000
20012002
20032004
20052006
2007
A
C
B
Figure 6: Development assistance for health (DAH) for HIV/AIDS (A), tuberculosis (B), and malaria (C), separated by channels of assistance, 1990–2007 IDA=International Development Association. IBRD=International Bank for Reconstruction and Development. BGMF=Bill & Melinda Gates Foundation. GFATM=Global Fund to Fight AIDS, Tuberculosis and Malaria. UNAIDS=Joint UN Programme on HIV/AIDS.

Articles
www.thelancet.com Vol 373 June 20, 2009 2121
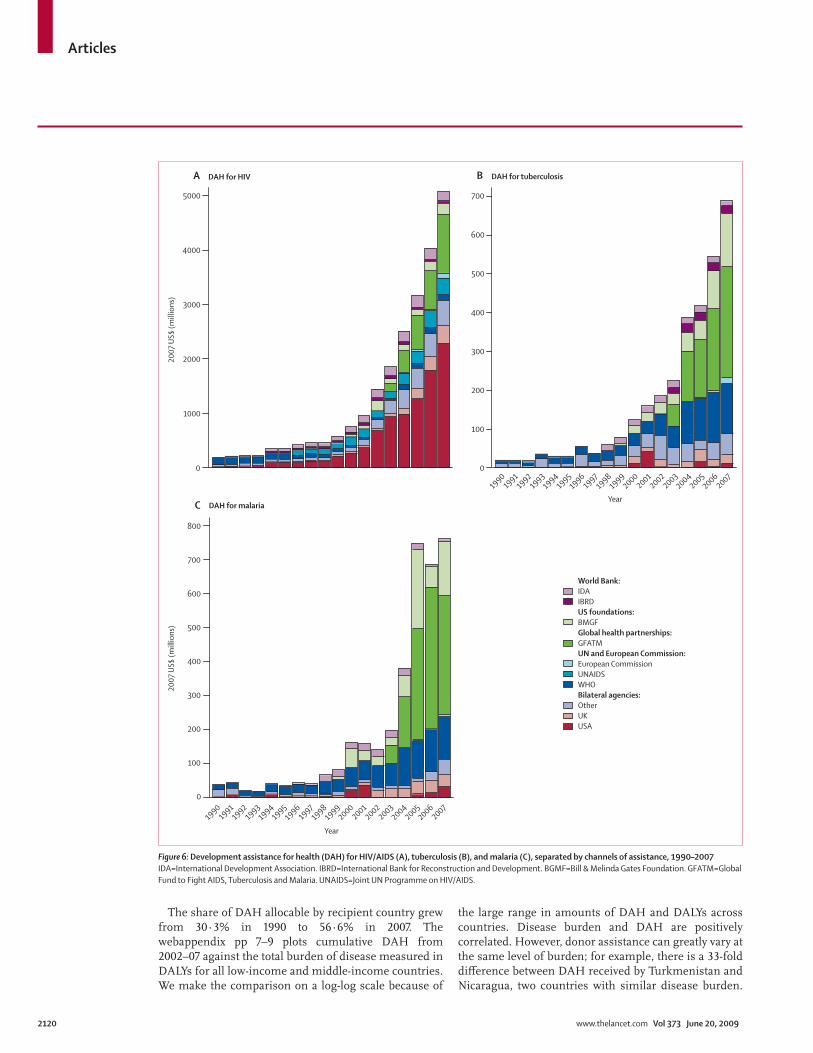
Some small island states such as Micronesia, Tonga, and the Marshall Islands get high levels of DAH per DALY. The correlation between health aid and disease burden has risen from 0·6 to 0·8 between 1997 and 2007. Further more, there is little diff erence in the pattern for low-income, lower middle-income, and upper middle-income countries. The correlation between per head DAH and per head GDP was near zero until the mid-1990s but has decreased steadily from –0·1 in 1999 to –0·3 in 2007, which suggests that poorer countries are receiving increasing amounts of DAH. Figure 7 shows a map of total DAH per DALY and the webappendix pp 10–12 shows disease-specifi c maps of DAH per DALY for HIV/AIDS, tuberculosis, and malaria. The maps show substantial variation in DAH per DALY across regions and within regions. These results suggest that country allocation of DAH is driven by many considerations, including income, burden of disease, political stability, and historical and political rela tions between specifi c donors and recipient countries.
In fi gure 8, the 30 countries with greatest DAH are ordered by rank in the left column, while countries are ranked in decreasing order of burden on the right. India topped both lists. Although some high-burden countries such as China, Brazil, and Bangladesh had a much higher rank on the burden list than on the DAH list, the situation was the reverse for Ethiopia, Uganda, Tanzania, Kenya, and Mozambique. Additional research into factors
predicting the amount of DAH received can explain these patterns. For the ten countries receiving the most cumulative DAH and per head DAH from 2002 to 2007, the webappendix pp 13 and 14 shows the composition of DAH in terms of the channel of assistance through which these funds were received.
Discussion This study documents what is widely recognised in the area of global health—namely, that development assistance for improving health in countries of low and middle income has expanded substantially in the past 18 years. Resources quadrupled between 1990 and 2007, and the rate of growth accelerated after 2002. The infl ux of resources has not only been from public sources but also from private philanthropy. Although the scale-up of global health resources from the Bill & Melinda Gates Foundation is striking, the magnitude of resources that US NGOs mobilised from other private philanthropy was greater. In particular, corporate drug and equipment donations have expanded substantially. However, the true value of these donations to recipients in developing countries might be less than the value that was recorded on US tax returns.29
The expansion of resources for global health especially in the past 10 years has been accompanied by a major change in the institutional landscape. Two new and large channels of resource fl ows, the Global Fund and GAVI, have attracted a growing share of funds, while the
$0·00–3·80$3·81–6·60$6·61–13·80$13·81–29·40$29·41–3055·60NA
DAH per all-cause DALY
Figure 7: Map showing cumulative 2002–07 development assistance for health (DAH) per all-cause disability-adjusted life-year (DALY) The map shows international boundaries in 2006. Since DALY data were available for 2002 only, we used these data as a proxy for burden in all subsequent years. Only DAH allocable by country is shown in the map. Countries that received zero DAH over the study period and those with missing burden are not shown. DAH received is shown in millions of real 2007 $US.
Articles
2122 www.thelancet.com Vol 373 June 20, 2009
proportion of assistance going to UN agencies and development banks has decreased during this period. The role of NGOs in terms of spending funds from the public and private sectors has expanded tremendously, as
has direct bilateral assistance to governments in low-income and middle-income countries. The shift is not only towards a smaller relative role for the UN system and the World Bank, but also for the changed status of these organisations. Over time, the share of their expenditure from voluntary contributions as opposed to assessed contributions has grown steadily (webappendix pp 39–44). To sustain their present role, the UN agencies—especially WHO and UNICEF—have to compete with recipient countries, NGOs, and other organisations for available DAH funds. This steady shift to a competitive model of funding runs the risks of undermining their crucial role as trusted neutral brokers between the scientifi c and technical communities on the one hand, and governments of developing countries on the other.
Although HIV/AIDS, tuberculosis, and malaria account for an important part of the expansion in resources, other areas of health have also increased. While there is much discussion among donors about increasing funds transferred to developing countries through general health-sector support, the data suggest that it remains a very small part of DAH. The diff erence between the rhetoric and reality emphasises the value of resource tracking.
Any presentation or analysis of this type will inevitably lead to debate about the validity of the fi gures for all the institutions presented here. Even fi nancial offi cers of the organisations that we are tracking might dis agree with our fi gures. Although many of these diff erences can be accounted for on the basis of research strategies used in the study (detailed in the webappendix), we fi rmly believe that the best way forward will be to foster a vigorous and open debate about all the data. A broader understanding of the intricacies involved in such analysis will hopefully produce improved data in the future.
We believe that our fi gures provide an accurate portrayal of the reality of DAH. Nevertheless, our study has limitations. We have not included private resources raised by non-US NGOs and foundations. We obtained data for health expenditure for 1–7 years for a few large non-US NGOs for 2000–06, but were unable to include these fi gures in our DAH totals because we were missing data before 2000. We do not capture fi nancial fl ows from low-income and middle-income countries to other such countries, and fl ows from non-OECD high-income countries to those of low and middle income. The most important case in this category is probably China, which is believed to be scaling up international assistance to other low-income and middle-income countries. We do not provide separate estimates for country-specifi c DAH and DAH for objectives such as research and development that serve many countries.30 We have had to estimate disbursements from commitments for many donors. The validity of our results thus depends on the mapping of commitment to
Figure 8: 30 countries with greatest development assistance for health (DAH) from 2002 to 2007, compared with 30 countries with greatest all-cause disease burden in 2002 Countries of low, lower-middle, and upper-middle income are shown with red, blue, and green markers and arrows, respectively. Countries in either column that received a rank lower than 30 in the other column and are, therefore, unmatched in the fi gure are underlined. Only DAH allocable by country is shown. DALY=disability-adjusted life-year. DR=Democratic Republic.
India 1
CumulativeDAH (2002–07)
Total DALYS(2002)
1 India
Ethiopia 2 2 China
Uganda 3 3 Nigeria
Nigeria 4 4 Indonesia
Tanzania 5 5 Pakistan
Indonesia 6 6 Russia
Kenya 7 7 Bangladesh
Pakistan 8 8 Brazil
Zambia 9 9 Ethiopia
China 10 10 DR Congo
Mozambique 11 11 South Africa
Bangladesh 12 12 Tanzania
Iraq 13 13 Afghanistan
South Africa 14 14 Mexico
Brazil 15 15 Philippines
Colombia 16 16 Burma
Ghana 17 17 Egypt
Argentina 18 18 Vietnam
Vietnam 19 19 Uganda
Malawi 20 20 Kenya
DR Congo 21 21 Thailand
Afghanistan 22 22 Iran
Philippines 23 23 Mozambique
Rwanda 24 24 Sudan
Cambodia 25 25 Turkey
Mexico 26 26 Ukraine
Zimbabwe 27 27 Angola
Senegal 28 28 Niger
Haiti 29 29 Burkina Faso
Peru 30 30 Mali

Articles
www.thelancet.com Vol 373 June 20, 2009 2123
disbursement by donor. It would be desirable to have donors provide the full sequence of disbursements going back in time to 1990. We have also estimated health expenditures for the US NGOs. Although some of the quantities are estimated with statistical methods, we are unable to report uncertainty for our estimates at this time. These are all areas that we will work to improve in future years.
In this study we report DAH up to 2007; because of the lags in data reporting we are unable to report DAH disbursements or commitments in 2008. The 14–20 month lag in most of the data sources means that tracking trends in a timely way is very diffi cult at present. The current fi nancial crisis has drawn attention to the importance of this situation. Concerns that development assistance could drop have been widely expressed.5–7 At present, we have no real data for what is actually happening. Private foundations have lost a considerable component of their assets, which will inevitably lead to decreased donation. The key unknown is whether public monies for DAH will grow at a slower rate, stay constant, or contract. The need for timelier reporting of commitments and disbursements by institutions is reinforced in this setting of global recession and fi nancial turmoil.
In this Article, we have not examined what happens when resources are received by an implementing government or NGO, and what proportion is spent at diff erent points in the system. Answering these questions is essential to advance our understanding of the actual fl ow of resources within recipient countries. A related question asks what developing-country governments do with their own resources when they receive increased health aid. Some of the authors of this Article are engaged in research that uses DAH disbursement estimates and data for government health expenditure to investigate this crucial issue. Tracking fl ows for other sectors such as education, water and sanitation, and poverty alleviation, all of which aff ect health, will yield additional insights about develop ment assistance to low-income and middle-income countries.
Timely and reliable information about DAH is essential for national policy making and planning. It is also needed for monitoring whether donors are honouring their commitments, to foster greater transparency in aid reporting, and as an essential component of assessments of eff ectiveness. As the debate on aid eff ectiveness intensifi es,31 careful documentation of the magnitude of DAH can be a key building block for an evidence-based discussion.
ContributorsNR managed the research project, undertook data analysis, contributed
to the interpretation of the data, and drafted the Article. PG created the
integrated databases, undertook data analysis, developed tools for
visualisation of the results, and contributed to the interpretation of the
data. RJC implemented the survey of US NGOs, undertook data
collection, and coded grants from foundations. KLK compiled data for
private fl ows and generated maps. CMM assisted with data collection
and analysis. DTJ contributed to development of the conceptual basis for
this research and to interpretation of the results. CJLM made key
contributions to developing methods for data analysis, interpreting the
data, and writing the Article.
Confl icts of interestWe declare that we have no confl icts of interest.
AcknowledgmentsWe thank Richard Feachem, Julio Frenk, and members of IHME’s
Advisory Panel on Financial Resources for Health for their advice and
comments; the various people at the OECD Development Assistance
Committee, The Global Fund to Fight AIDS, Tuberculosis, and Malaria,
GAVI, UNICEF, WHO, UNFPA, UNAIDS, the World Bank, and several
NGOs who responded to data requests and queries from us; Stanislava
Nikolova for help with editing the paper; Meghan Werner for logistical
support; and David Sapienza, Christina Bernard, Shannon Harris,
Jennifer Berthiaume, and Haley Lee for assistance with data collection.
References1 Farmer P, Garrett L. From “marvelous momentum” to health care
for all: success is possible with the right programs. Foreign Aff airs 2007; 86: 155–61. http://www.foreignaff airs.org/20070301faresponse86213/paul-farmer-laurie-garrett/from-marvelous-momentum-to-health-care-for-all-success-is-possible-with-the-right-programs.html (accessed March 11, 2009).
2 Farrar J. Global health science: a threat and an opportunity for collaborative clinical science. Nat Immunol 2007; 8: 1277–79.
3 Garrett L. The challenge of global health. Foreign Aff airs 2007; 86: 14. http://www.foreignaff airs.org/20070101faessay86103/laurie-garrett/the-challenge-of-global-health.html (accessed March 11, 2009).
4 Schieber GJ, Gottret P, Fleisher LK, Leive AA. Financing global health: mission unaccomplished. Health Aff (Millwood) 2007; 26: 921–34.
5 Kaiser Daily HIV/AIDS Report. HIV/AIDS / global fi nancial crisis could harm HIV/AIDS funding, Piot says. October 29, 2008. http://www.globalhealthreporting.org/article.asp?DR_ID=55258 (accessed March 11, 2009).
6 McNeil DG Jr. Global fund is billions short. New York Times (New York), Feb 2, 2009: D6. http://www.nytimes.com/2009/02/03/health/research/03glob.html?_r=2 (accessed March 11, 2009).
7 UN News Centre. Financial crisis threatens push to boost global health, says top UN offi cial. November 12, 2008. http://www.un.org/apps/news/story.asp?NewsID=28911&Cr=fi nancial&Cr1=crisis (accessed March 11, 2009).
8 Eiseman E, Fossum D. The challenges of creating a global health resource tracking system. Santa Monica: Rand Corporation, 2005.
9 Global Health Resource Tracking Working Group. Following the money in global health. Center for Global Development, 2005. http://www.cgdev.org/doc/ghprn/FollowingMoney_GlobalHealth.pdf (accessed March 11, 2009).
10 Levine R, Blumer K. Gaps and missing links: what do we know about resources in global health? Paper presented at Forum 8, Mexico City, November 2004. Center for Global Development. http://www.globalforumhealth.org/Forum8/Forum8-CDROM/OralPresentations/Levine%20R%20F8-358.doc (accessed March 11, 2009).
11 Powell-Jackson T, Mills A. A review of health resource tracking in developing countries. Health Policy Plan 2007; 22: 353–62.
12 Sridhar D, Batniji R. Misfi nancing global health: a case for transparency in disbursements and decision making. Lancet 2008; 372: 1185–91.
13 Organisation for Economic Co-operation and Development. Purpose of aid charts: focus on aid to health. http://www.oecd.org/document/44/0,3343,en_2649_34469_24670956_1_1_1_1,00.html (accessed March 11, 2009).
14 Hudson Institute. The index of global philanthropy 2008. Washington, DC: Hudson Institute Center for Global Prosperity, 2008. http://www.global-prosperity.org (accessed May 12, 2008).
15 Organisation for Economic Co-operation and Development. Measuring aid to health. Paris: OECD-DAC, 2008. http://www.oecd.org/dataoecd/20/46/41453717.pdf (accessed March 11, 2009).
16 Ethelston S, Bechtel A, Chaya N, Kantner A, Vogel CG. Progress and promises: trends in international assistance for reproductive health and population, 2004. Washington, DC: Population Action International, 2004.

Articles
2124 www.thelancet.com Vol 373 June 20, 2009
17 Narasimhan V, Attaran A. Roll back malaria? The scarcity of international aid for malaria control. Malar J 2003; 2: 8.
18 Powell-Jackson T, Borghi J, Mueller DH, Patouillard E, Mills A. Countdown to 2015: tracking donor assistance to maternal, newborn, and child health. Lancet 2006; 368: 1077–87.
19 Waddington C, Martin J, Walford V. Trends in international funding for malaria control. Prepared for the Roll Back Malaria Partnership. London: HLSP Institute, 2005.
20 Kates J, Morrison JS, Lief E. Global health funding: a glass half full? Lancet 2006; 368: 187–88.
21 Michaud C. Development assistance for health: recent trends and resource allocation. Boston: Harvard Center for Population Development, 2003.
22 Michaud C, Murray CJ. External assistance to the health sector in developing countries: a detailed analysis, 1972–90. Bull World Health Organ 1994; 72: 639–51.
23 WHO. WHO burden of disease data. Previous estimates: 2000-2002. Geneva: World Health Organization, 2004. http://www.who.int/healthinfo/global_burden_disease/estimates_2000_2002/en/index.html (accessed Feb 1, 2009).
24 United Nations. Population Division. World population prospects: the 2008 revision. Population database. New York: United Nations, 2008. http://esa.un.org/unpp/index.asp (accessed Aug 1, 2008).
25 International Monetary Fund. World economic outlook database. Washington, DC: IMF, 2008. http://www.imf.org/external/pubs/ft/weo/2008/02/weodata/index.aspx. (accessed Aug 1, 2008).
26 United Nations. Statistics Division. National accounts main aggregates database. New York: United Nations, 2008. http://unstats.un.org/unsd/snaama/dnllist.asp (accessed Aug 1, 2008).
27 World Bank. World development indicators online. Washington, DC: World Bank, 2008. http://web.worldbank.org (accessed Aug 1, 2008).
28 WHO. WHO national health accounts. Geneva: World Health Organization, 2009. http://www.who.int/nha/country/en/index.html (accessed March 12, 2009).
29 Reich MR, Wagner AK, McLaughlin TJ, Dumbaugh KA, Derai-Cochin M. Pharmaceutical donations by the USA: an assessment of relevance and time-to-expiry. Bull World Health Organ 1999; 77: 675–80.
30 Jamison DT, Frenk J, Knaul F. International collective action in health: objectives, functions, and rationale. Lancet 1998; 351: 514–17.
31 Moyo D. Dead aid: why aid is not working and how there is a better way for Africa. New York: Farrar, Straus and Giroux, 2009.