Financial Statements Summary for the Nine Months Ended ...
30
Company name: NIDEC CORPORATION URL https://www.nidec.com/en/ Stock listing: Tokyo Stock Exchange - First Section Code number: 6594 Representative: Jun Seki, Representative Director, President and CEO Information on contact: Masahiro Nagayasu, General Manager of the Investor Relations & CSR Promotion Department Tel: +81-75-935-6140 [email protected] Scheduled date of filing of Japanese quarterly report: February 10, 2022 Scheduled date of dividend payable: - Supplemental materials for quarterly results: Yes Quarterly earning presentation held: Yes (1) Consolidated Operating Results (Percentage represents year-on-year changes) Net sales Operating profit Profit before income taxes Profit attributable to owners of the parent Comprehensive income for the period % % % % % For the nine months ended December 31, 2021 1,407,210 18.8 134,631 16.6 130,554 19.4 100,443 20.1 154,139 102.5 For the nine months ended December 31, 2020 1,184,991 - 115,509 - 109,314 - 83,615 - 76,104 - Earnings per share attributable to owners of the parent-basic (Yen) Earnings per share attributable to owners of the parent-diluted (Yen) For the nine months ended December 31, 2021 171.67 - For the nine months ended December 31, 2020 142.75 - Total assets Total equity Total equity attributable to owners of the parent Ratio of total equity attributable to owners of the parent to total assets % As of December 31, 2021 2,528,459 1,217,708 1,198,620 47.4 As of March 31, 2021 2,256,024 1,113,935 1,096,020 48.6 Dividends per share (Yen) 1 st quarter end 2 nd quarter end 3 rd quarter end Fiscal year end Total Year ended March 31, 2021 - 30.00 - 30.00 60.00 Year ending March 31, 2022 - 30.00 - Year ending March 31, 2022 (Forecast) 35.00 65.00 English translation Financial Statements Summary for the Nine Months Ended December 31, 2021 [IFRS](Consolidated) January 26, 2022 (Amount Unit: Yen in Millions, unless otherwise indicated) (Amounts are rounded to nearest million yen) 1. Consolidated Financial Results for the Nine Months ended December 31, 2021 (April 1, 2021 to December 31, 2021) (Notes) 1. “Earnings per share attributable to owners of the parent-basic” and “Earnings per share attributable to owners of the parent-diluted” have been calculated based on figures of “Profit attributable to owners of the parent”. 2. NIDEC finalized the provisional accounting treatment for the business combination in the nine months ended December 31, 2021. Condensed quarterly consolidated financial statements and consolidated financial statements for the year ended March 31, 2021 reflect the revision of the initially allocated amounts of acquisition cost as NIDEC finalized the provisional accounting treatment for the business combination. (2) Consolidated Financial Position 2. Dividends (Note) Revision of previously announced dividend targets during this reporting period: Yes
-
Upload
khangminh22 -
Category
Documents
-
view
0 -
download
0
Transcript of Financial Statements Summary for the Nine Months Ended ...

Company name: NIDEC CORPORATION URL https://www.nidec.com/en/Stock listing: Tokyo Stock Exchange - First SectionCode number: 6594Representative: Jun Seki, Representative Director, President and CEOInformation on contact: Masahiro Nagayasu, General Manager of the Investor Relations & CSR Promotion
Department Tel: +81-75-935-6140 [email protected] date of filing of Japanese quarterly report: February 10, 2022Scheduled date of dividend payable: -Supplemental materials for quarterly results: YesQuarterly earning presentation held: Yes
(1) Consolidated Operating Results (Percentage represents year-on-year changes)
Net sales Operating profit Profit beforeincome taxes
Profit attributable toowners of the parent
Comprehensiveincome for the period
% % % % %For the nine months endedDecember 31, 2021 1,407,210 18.8 134,631 16.6 130,554 19.4 100,443 20.1 154,139 102.5
For the nine months endedDecember 31, 2020 1,184,991 - 115,509 - 109,314 - 83,615 - 76,104 -
Earnings per share attributable toowners of the parent-basic (Yen)
Earnings per share attributable toowners of the parent-diluted (Yen)
For the nine months ended December 31, 2021 171.67 -For the nine months ended December 31, 2020 142.75 -
Total assets Total equity Total equity attributable toowners of the parent
Ratio of total equity attributable toowners of the parent to total assets
%As of December 31, 2021 2,528,459 1,217,708 1,198,620 47.4As of March 31, 2021 2,256,024 1,113,935 1,096,020 48.6
Dividends per share (Yen)1st quarter end 2nd quarter end 3rd quarter end Fiscal year end Total
Year ended March 31, 2021 - 30.00 - 30.00 60.00Year ending March 31, 2022 - 30.00 -Year ending March 31, 2022 (Forecast) 35.00 65.00
English translation
Financial Statements Summary for the Nine Months Ended December 31, 2021 [IFRS](Consolidated)January 26, 2022
(Amount Unit: Yen in Millions, unless otherwise indicated)(Amounts are rounded to nearest million yen)
1. Consolidated Financial Results for the Nine Months ended December 31, 2021 (April 1, 2021 to December 31, 2021)
(Notes) 1. “Earnings per share attributable to owners of the parent-basic” and “Earnings per share attributable to owners of theparent-diluted” have been calculated based on figures of “Profit attributable to owners of the parent”.
2. NIDEC finalized the provisional accounting treatment for the business combination in the nine months ended December31, 2021. Condensed quarterly consolidated financial statements and consolidated financial statements for the year endedMarch 31, 2021 reflect the revision of the initially allocated amounts of acquisition cost as NIDEC finalized theprovisional accounting treatment for the business combination.
(2) Consolidated Financial Position
2. Dividends
(Note) Revision of previously announced dividend targets during this reporting period: Yes

Net sales Operating profit Profit beforeincome taxes
Profit attributable toowners of the parent
Earnings per shareattributable to owners
of the parent-basic % % % % (Yen)Fiscal year end 1,800,000 11.2 190,000 18.8 185,000 21.0 148,000 21.4 252.68
resulting in the change in scope of consolidation) : None
1. Changes in accounting policies required by IFRS : None2. Changes in accounting policies due to other reasons : None3. Changes in accounting estimates : None
As of December 31, 2021: 596,284,468 As of March 31, 2021: 596,284,468
As of December 31, 2021: 11,752,606 As of March 31, 2021: 10,552,192
For the nine months ended December 31, 2021: 585,111,113 For the nine months ended December 31, 2020: 585,733,349
3. Forecast of Consolidated Financial Performance for the Year ending March 31, 2022 (April 1, 2021 to March 31, 2022)
(Percentage represents year-on-year changes)
(Note) Revision of the previously announced financial performance forecast during this reporting period: None
Notes (1) Changes in Significant Subsidiaries during This Period (changes in “specified subsidiaries” (tokutei kogaisha)
(2) Changes in Accounting Policies and Changes in Accounting Estimates:
(3) Number of Shares Issued (Ordinary Shares)1. Number of shares issued at the end of the period (including treasury stock):
2. Number of treasury stock at the end of the period:
3. Weighted-average number of shares outstanding during the period:
*This quarterly report is not subject to quarterly review procedures by certified public accountants or an auditing firm.*Explanation for appropriate use of forecast and other notes
Forward-looking statements, such as forecast of consolidated financial performance, stated in this document are based oninformation currently possessed by NIDEC or certain assumptions that NIDEC has deemed as rational. NIDEC cannot make anyassurances that the contents mentioned in these forward-looking statements will ever materialize. Actual financial performance couldbe significantly different from NIDEC’s expectations as a result of various factors. For the assumptions used and other notes, pleaserefer to “1. Overview of Operating Results, Etc. (3). Explanation Regarding Future Forecast Information of Consolidated FinancialResults” on page 12.
In this document, the terms “we”, “us”, “our” and “NIDEC” refer to Nidec Corporation and consolidated subsidiaries or, as the
context may require, Nidec Corporation on a non-consolidated basis. NIDEC finalized the provisional accounting treatment for the business combination in the nine months ended December 31, 2021.
Condensed quarterly consolidated financial statements and consolidated financial statements for the year ended March 31, 2021reflect the revision of the initially allocated amounts of acquisition cost as NIDEC finalized the provisional accounting treatment forthe business combination.
Investor presentation materials relating to our financial results for the nine months ended December 31, 2021 are expected to be
published on our corporate website on January 26, 2022.

1. Overview of Operating Results, Etc.(1) Overview of Operating Results for the Nine Months Ended December 31, 2021
1. Overview of Business Environment for the Nine Months Ended December 31, 2021
As of October 2021, the IMF forecasts global economic growth of 5.9% in 2021. In the environment surrounding NIDEC, risk
factors such as a shortage of semiconductors, soaring raw material prices, and the spread of COVID-19 in emerging countries
surfaced. In particular, the automotive division has yet to see a full-scale recovery in customer production volume from a declining
trend, and the business environment remains challenging.
Under these circumstances, we have set a new medium-term strategic target for fiscal year 2025 (Vision2025) and aim to be a
growing company that is strongly adapted to changes in the environment.
The outline is as follows.
FY2021 to FY2022
1) Target for consolidated net sales : ¥2 trillion
2) Productivity improvement : To increase sales and profit per employee by 30%
3) ROIC (Return On Invested Capital) : over 10%
4) To be a top-rated ESG company
FY2023 to FY2025
1) Target for consolidated net sales : ¥4 trillion
2) Productivity improvement : To double sales and profit per employee
3) ROIC (Return On Invested Capital) : over 15%
4) To be a top-rated ESG company
1

(Yen in millions)
For the nine months ended December 31, Increase or
decrease Ratio of change2020 2021
Net sales 1,184,991 1,407,210 222,219 18.8%
Operating profit 115,509 134,631 19,122 16.6%
Operating profit ratio 9.7 % 9.6% - -
Profit before income taxes 109,314 130,554 21,240 19.4%
Profit for the period from continuing operations 84,499 100,395 15,896 18.8%
Loss for the period from discontinued operations (132) (232) (100) -
Profit attributable to owners of the parent 83,615 100,443 16,828 20.1%
2. Consolidated Operating ResultsConsolidated Operating Results for the Nine Months Ended December 31, 2021 (“this nine-month period”), Compared to the
Nine Months Ended December 31, 2020 (“the same period of the previous year”)
Consolidated net sales from continuing operations increased 18.8% to ¥1,407,210 million for this nine-month period compared to
the same period of the previous year. We renewed the highest record for nine-month period due to higher sales of compressors for
home appliances, motors for air conditioners, and motors and gears for transportation robots in the U.S. and Europe.
Operating profit increased 16.6% to ¥134,631 million for this nine-month period compared to the same period of the previous year,
and we renewed the highest record for nine-month period. This was mainly due to increased sales of appliance, commercial and
industrial products in addition to thorough manufacturing cost improvement and fixed cost rationalization through WPR4 Project
despite the negative effects by difficulties in procuring semiconductors and other electronic components among customers and a rise
in raw materials costs.
Profit before income taxes increased 19.4% to ¥130,554 million compared to the same period of the previous year, and we renewed
the highest record for nine-month period. Profit for the period from continuing operations increased 18.8% to ¥100,395 million
compared to the same period of the previous year.
Profit attributable to owners of the parent increased 20.1% to ¥100,443 million for this nine-month period compared to the same
period of the previous year due to a significant increase of profit for the period from continuing operations.
The average exchange rate between the Japanese yen and the U.S. dollar for this nine-month period was ¥111.10 to the U.S. dollar,
which reflected an approximately 5% depreciation of the Japanese yen against the U.S. dollar, compared to the same period of the
previous year. The average exchange rate between the Japanese yen and the Euro for this nine-month period was ¥130.62 to the Euro,
which reflected an approximately 7% depreciation of the Japanese yen against the Euro, compared to the same period of the previous
year. The fluctuations of the foreign currency exchange rates had positive effects on net sales by approximately ¥65,300 million and
on operating profit by approximately ¥7,300 million for this nine-month period compared to the same period of the previous year.
NIDEC finalized the provisional accounting treatment for the business combination in the nine months ended December 31, 2021.
Condensed quarterly consolidated financial statements for the nine months ended December 31, 2020 reflect the revision of the
initially allocated amounts of acquisition cost as NIDEC finalized the provisional accounting treatment for the business combination.
2

(Yen in millions)
For the nine months ended December 31,
Increase or decrease Ratio of change2020 2021
Net sales to external customers 339,952 321,225 (18,727) (5.5)%
Spindle motors for hard diskdrives (HDDs) 116,417 76,859 (39,558) (34.0)%
Other small precision motors 223,535 244,366 20,831 9.3%
Operating profit 51,220 37,126 (14,094) (27.5)%
Operating profit ratio 15.1% 11.6% - -
Operating Results by Product Category for This Nine-Month Period Compared to the Same Period of the Previous Year Small precision motors
Net sales of this category decreased 5.5% to ¥321,225 million for this nine-month period compared to the same period of the
previous year. The fluctuations of the foreign currency exchange rates had a positive effect on net sales of this category by
approximately ¥18,500 million for this nine-month period compared to the same period of the previous year.
Net sales of spindle motors for HDDs decreased 34.0% to ¥76,859 million for this nine-month period compared to the same period
of the previous year due to a decrease in the number of units sold. On the other hand, net sales of other small precision motors
increased 9.3% to ¥244,366 million for this nine-month period compared to the same period of the previous year by engaging in new
demands one after another by launching a number of new products such as IT fan motors, high-efficiency motors for home
appliances, and thermal solution products for game consoles and other products.
Operating profit of this category decreased 27.5% to ¥37,126 million for this nine-month period compared to the same period of the
previous year despite thorough cost improvements, such as in-house production of parts. This was mainly due to the decrease in sales.
The fluctuations of the foreign currency exchange rates had a positive effect on operating profit of this category by approximately
¥5,300 million for this nine-month period compared to the same period of the previous year.
3

(Yen in millions)
For the nine months ended December 31,
Increase or decrease Ratio of change2020 2021
Net sales to external customers 256,008 301,118 45,110 17.6%
Operating profit 12,074 10,829 (1,245) (10.3)%
Operating profit ratio 4.7% 3.6% - -
(Yen in millions)
For the nine months ended December 31,
Increase or decrease Ratio of change2020 2021
Net sales to external customers 429,299 575,778 146,479 34.1%
Operating profit 36,220 57,916 21,696 59.9%
Operating profit ratio 8.4% 10.1% - -
Automotive products
Net sales of this category increased 17.6% to ¥301,118 million for this nine-month period compared to the same period of the
previous year due to a slight recovery trend. The fluctuations of the foreign currency exchange rates had a positive effect on net sales
of this category by approximately ¥12,000 million for this nine-month period compared to the same period of the previous year.
Although NIDEC made manufacturing cost improvement through WPR4 project with our total efforts, operating profit of this
category decreased 10.3% to ¥10,829 million for this nine-month period compared to the same period of the previous year. This was
due to the negative effects by difficulties in procuring semiconductors and other electronic components among customers and the
continuing development costs and others for the traction motor system (E-Axle), whose inquiries and orders have been rapidly
increasing.
The fluctuations of the foreign currency exchange rates had a negative effect on operating profit of this category by approximately
¥700 million for this nine-month period compared to the same period of the previous year.
Appliance, commercial and industrial products
Net sales of this category increased 34.1% to ¥575,778 million for this nine-month period compared to the same period of the
previous year, primarily due to higher sales of compressors for home appliances, motors for air conditioners, and motors and gears for
transportation robots in the U.S. and Europe. The fluctuations of the foreign currency exchange rates had a positive effect on net sales
of this category by approximately ¥27,300 million for this nine-month period compared to the same period of the previous year.
Operating profit of this category significantly increased 59.9% to ¥57,916 million for this nine-month period compared to the same
period of the previous year due to the effect of increased sales from engaging in the demands for energy-saving, high-efficiency and
high-value-added new products in all business fields and continuous manufacturing cost improvement and fixed cost rationalization
for global rise in raw material prices. The fluctuations of the foreign currency exchange rates had a positive effect on operating profit
of this category by approximately ¥2,600 million for this nine-month period compared to the same period of the previous year.
4

(Yen in millions)
For the nine months ended December 31,
Increase or decrease Ratio of change2020 2021
Net sales to external customers 111,516 154,254 42,738 38.3%
Operating profit 19,667 31,223 11,556 58.8%
Operating profit ratio 17.6% 20.2% - -
(Yen in millions)
For the nine months ended December 31,
Increase or decrease Ratio of change2020 2021
Net sales to external customers 45,681 51,988 6,307 13.8%
Operating profit 4,986 7,349 2,363 47.4%
Operating profit ratio 10.9% 14.1% - -
(Yen in millions)
For the nine months ended December 31,
Increase or decrease Ratio of change2020 2021
Net sales to external customers 2,535 2,847 312 12.3%
Operating profit 238 324 86 36.1%
Operating profit ratio 9.4% 11.4% - -
Machinery
Net sales of this category increased 38.3% to ¥154,254 million for this nine-month period compared to the same period of the
previous year due to significantly higher sales of semiconductor inspection systems in strong demand for 5G, press machines and
speed reducers by continuous launching new products that meet customers' needs in the Chinese market. The fluctuations of the
foreign currency exchange rates had a positive effect on net sales of this category by approximately ¥4,500 million for this nine-
month period compared to the same period of the previous year.
Operating profit of this category significantly increased 58.8% to ¥31,223 million for this nine-month period compared to the same
period of the previous year, mainly due to the higher sales. The fluctuations of the foreign currency exchange rates had a negative
effect on operating profit of this category by approximately ¥500 million for this nine-month period compared to the same period of
the previous year.
Electronic and optical components
Net sales of this category increased 13.8% to ¥51,988 million for this nine-month period compared to the same period of the
previous year and the fluctuations of the foreign currency exchange rates had a positive effect on net sales of this category by
approximately ¥3,000 million for this nine-month period compared to the same period of the previous year.
Operating profit of this category increased 47.4% to ¥7,349 million for this nine-month period compared to the same period of the
previous year, mainly due to the higher sales by continuous launching new products. The fluctuations of the foreign currency
exchange rates had a positive effect on operating profit of this category by approximately ¥500 million for this nine-month period
compared to the same period of the previous year.
Other products
Net sales of this category increased 12.3% to ¥2,847 million and operating profit of this category increased 36.1% to ¥324 million
for this nine-month period compared to the same period of the previous year.
5

(Yen in millions)
For the three months ended
Increase or decrease Ratio of changeSeptember 30, 2021 December 31, 2021
Net sales 463,198 496,542 33,344 7.2%
Operating profit 45,768 44,308 (1,460) (3.2)%
Operating profit ratio 9.9% 8.9% - -
Profit before income taxes 44,530 42,272 (2,258) (5.1)%
Profit for the period from continuingoperations 34,299 32,712 (1,587) (4.6)%
Loss for the period from discontinuedoperations (109) (84) 25 -
Profit attributable to owners of the parent 34,316 32,676 (1,640) (4.8)%
Consolidated Operating Results for the Three Months Ended December 31, 2021 (“3Q”), Compared to the Previous Three Months Ended September 30, 2021 (“2Q”)
Consolidated net sales from continuing operations increased 7.2% to ¥496,542 million for 3Q compared to 2Q. We renewed the
highest record of the quarterly consolidated accounting period, despite the continued situations of difficulties in procuring
semiconductors and other electronic components among customers.
Operating profit decreased 3.2% to ¥44,308 million despite thorough manufacturing cost improvement, fixed cost rationalization,
and others through WPR4 Project. This was due to the negative effects by difficulties in procuring semiconductors and other
electronic components among customers and soaring raw material prices.
Profit before income taxes decreased 5.1% to ¥42,272 million and profit for the period from continuing operations decreased 4.6%
to ¥32,712 million for 3Q compared to 2Q.
Profit attributable to owners of the parent decreased 4.8% to ¥32,676 million for 3Q compared to 2Q.
The average exchange rate between the Japanese yen and the U.S. dollar for 3Q was ¥113.71 to the U.S. dollar, which reflected an
approximately 3% depreciation of the Japanese yen against the U.S. dollar, compared to 2Q. The average exchange rate between the
Japanese yen and the Euro for 3Q was ¥130.07 to the Euro, which reflected a slight depreciation of the Japanese yen against the Euro,
compared to 2Q. The fluctuations of the foreign currency exchange rates had a positive effect on net sales by approximately
¥12,500 million and on operating profit by approximately ¥600 million for 3Q compared to 2Q.
NIDEC finalized a part or all of the provisional accounting treatment for the business combination in the nine months ended
December 31, 2021. Condensed quarterly consolidated financial statements for the three months ended September 30, 2021 reflect the
revision of the initially allocated amounts of acquisition cost as NIDEC finalized the provisional accounting treatment for the business
combination.
6
(Yen in millions)
For the three months ended
Increase or decrease Ratio of changeSeptember 30, 2021 December 31, 2021
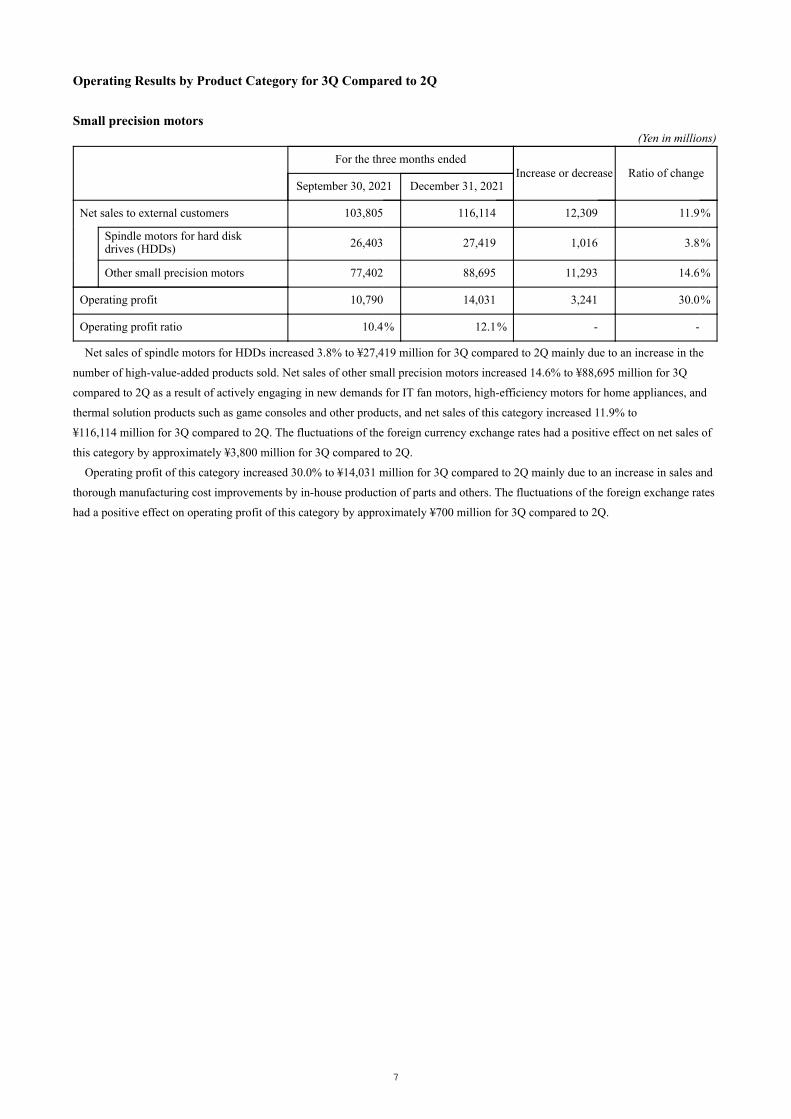
Net sales to external customers 103,805 116,114 12,309 11.9%
Spindle motors for hard disk drives (HDDs) 26,403 27,419 1,016 3.8%
Other small precision motors 77,402 88,695 11,293 14.6%
Operating profit 10,790 14,031 3,241 30.0%
Operating profit ratio 10.4% 12.1% - -
Operating Results by Product Category for 3Q Compared to 2Q
Small precision motors
Net sales of spindle motors for HDDs increased 3.8% to ¥27,419 million for 3Q compared to 2Q mainly due to an increase in the
number of high-value-added products sold. Net sales of other small precision motors increased 14.6% to ¥88,695 million for 3Q
compared to 2Q as a result of actively engaging in new demands for IT fan motors, high-efficiency motors for home appliances, and
thermal solution products such as game consoles and other products, and net sales of this category increased 11.9% to
¥116,114 million for 3Q compared to 2Q. The fluctuations of the foreign currency exchange rates had a positive effect on net sales of
this category by approximately ¥3,800 million for 3Q compared to 2Q.
Operating profit of this category increased 30.0% to ¥14,031 million for 3Q compared to 2Q mainly due to an increase in sales and
thorough manufacturing cost improvements by in-house production of parts and others. The fluctuations of the foreign exchange rates
had a positive effect on operating profit of this category by approximately ¥700 million for 3Q compared to 2Q.
7

(Yen in millions)
For the three months ended
Increase or decrease Ratio of changeSeptember 30, 2021 December 31, 2021
Net sales to external customers 99,450 103,921 4,471 4.5%
Operating profit 3,445 2,492 (953) (27.7)%
Operating profit ratio 3.5% 2.4% - -
(Yen in millions)
For the three months ended
Increase or decrease Ratio of changeSeptember 30, 2021 December 31, 2021
Net sales to external customers 191,589 197,757 6,168 3.2%
Operating profit 20,909 17,388 (3,521) (16.8)%
Operating profit ratio 10.9% 8.8% - -
Automotive products
Net sales of this category increased 4.5% to ¥103,921 million for 3Q compared to 2Q. This was due to an increase in sales of the
traction motor systems (E-Axle) and other factors, despite the negative effect by the continued difficulties in procuring
semiconductors and other electronic components among customers. The fluctuations of the foreign currency exchange rates had a
positive effect on net sales of this category by approximately ¥1,500 million for 3Q compared to 2Q.
Operating profit of this category decreased 27.7% to ¥2,492 million for 3Q compared to 2Q despite thorough manufacturing cost
improvement through WPR4 project with our total efforts. This was due to the continuing development costs and others for the
traction motor system (E-Axle), whose inquiries and orders have been rapidly increasing.
The fluctuations of the foreign exchange rates had a negative effect on operating profit of this category by approximately ¥300
million for 3Q compared to 2Q.
Appliance, commercial and industrial products
Net sales of this category increased 3.2% to ¥197,757 million for 3Q compared to 2Q, due to strong sales of compressors and
motors for home appliances. The fluctuations of the foreign currency exchange rates had a positive effect on net sales of this category
by approximately ¥5,700 million for 3Q compared to 2Q.
Operating profit of this category decreased 16.8% to ¥17,388 million for 3Q compared to 2Q despite the effect of increased sales
from engaging in the demands for energy-saving, high-efficiency and high-value-added new products in all business fields and
continuous manufacturing cost improvement and fixed cost rationalization for global rise in raw material prices. The fluctuations of
the foreign currency exchange rates had a positive effect on operating profit of this category by approximately ¥500 million for 3Q
compared to 2Q.
8

(Yen in millions)
For the three months ended
Increase or decrease Ratio of changeSeptember 30, 2021 December 31, 2021
Net sales to external customers 50,714 58,889 8,175 16.1%
Operating profit 12,016 10,598 (1,418) (11.8)%
Operating profit ratio 23.7% 18.0% - -
(Yen in millions)
For the three months ended
Increase or decrease Ratio of changeSeptember 30, 2021 December 31, 2021
Net sales to external customers 16,729 18,842 2,113 12.6%
Operating profit 2,144 2,903 759 35.4%
Operating profit ratio 12.8% 15.4% - -
(Yen in millions)
For the three months ended
Increase or decrease Ratio of changeSeptember 30, 2021 December 31, 2021
Net sales to external customers 911 1,019 108 11.9%
Operating profit 103 133 30 29.1%
Operating profit ratio 11.3% 13.1% - -
Machinery
Net sales of this category increased 16.1% to ¥58,889 million for 3Q compared to 2Q, mainly due to an increase in sales of
semiconductor inspection systems in strong demand for 5G, robots for semiconductors and so forth. The fluctuations of the foreign
currency exchange rates had a positive effect on net sales of this category by approximately ¥900 million for 3Q compared to 2Q.
Operating profit of this category decreased 11.8% to ¥10,598 million for 3Q compared to 2Q. The fluctuations of the foreign
currency exchange rates had a negative effect on operating profit of this category by approximately ¥300 million for 3Q compared to
2Q.
Electronic and optical components
Net sales of this category increased 12.6% to ¥18,842 million for 3Q compared to 2Q and the fluctuations of the foreign currency
exchange rates had a positive effect on net sales of this category by approximately ¥500 million for 3Q compared to 2Q.
Operating profit of this category increased 35.4% to ¥2,903 million for 3Q compared to 2Q.
Other products
Net sales of this category increased 11.9% to ¥1,019 million for 3Q compared to 2Q and operating profit of this category increased
29.1% to ¥133 million for 3Q compared to 2Q.
9

(Yen in millions)
As of March 31, 2021 As of December 31,2021
Increase ordecrease
Total assets 2,256,024 2,528,459 272,435
Total liabilities 1,142,089 1,310,751 168,662
Total equity attributable to owners of the parent 1,096,020 1,198,620 102,600
Interest-bearing debt *1 531,473 559,298 27,825
Net interest-bearing debt *2 311,949 371,398 59,449
Debt ratio (%) *3 23.6 22.1 (1.5)
Debt to equity ratio (“D/E ratio”) (times) *4 0.48 0.47 (0.01)
Net D/E ratio (times) *5 0.28 0.31 0.03
Ratio of total equity attributable to owners of the parent to totalassets (%) *6 48.6 47.4 (1.2)
(2) Financial Position
(Notes) *1. Interest-bearing debt: The sum of “short term borrowings”, “long term debt due within one year” and “long term debt” onthe consolidated statements of financial position
*2. Net interest-bearing debt: Interest-bearing debt less “cash and cash equivalents”*3. Debt ratio: Interest-bearing debt divided by total assets*4. D/E ratio: Interest-bearing debt divided by total equity attributable to owners of the parent*5. Net D/E ratio: Net interest-bearing debt divided by total equity attributable to owners of the parent*6. Ratio of total equity attributable to owners of the parent to total assets: Total equity attributable to owners of the parent
divided by total assets
Total assets increased ¥272,435 million to ¥2,528,459 million as of December 31, 2021 compared to March 31, 2021. This was
mainly due to increases of ¥116,530 million in inventories, ¥84,794 million in trade and other receivables, and ¥47,113 million in
property, plant and equipment.
Total liabilities increased ¥168,662 million to ¥1,310,751 million as of December 31, 2021 compared to March 31, 2021. This was
mainly due to increases of ¥98,400 million in trade and other payables, and ¥27,825 million in interest-bearing debt. Specifically,
short term borrowings increased ¥80,448 million to ¥111,425 million, long term debt due within one year increased ¥81,837 million
to ¥157,433 million and long term debt decreased ¥134,460 million to ¥290,440 million as of December 31, 2021 compared to March
31, 2021.
As a result, net interest-bearing debt increased to ¥371,398 million as of December 31, 2021 from ¥311,949 million as of March
31, 2021. The debt ratio that includes lease liabilities decreased to 22.1% as of December 31, 2021 from 23.6% as of March 31, 2021.
The D/E ratio decreased to 0.47 times as of December 31, 2021 from 0.48 times as of March 31, 2021. The net D/E ratio increased to
0.31 times as of December 31, 2021 from 0.28 times as of March 31, 2021.
Total equity attributable to owners of the parent increased ¥102,600 million to ¥1,198,620 million as of December 31, 2021
compared to March 31, 2021. This was mainly due to an increase in retained earnings of ¥65,766 million, and ¥52,773 million in
other components of equity. Ratio of total equity attributable to owners of the parent to total assets decreased to 47.4% as of
December 31, 2021 from 48.6% as of March 31, 2021.
NIDEC finalized the provisional accounting treatment for the business combination in the nine months ended December 31, 2021.
Consolidated financial statements for the year ended March 31, 2021 reflect the revision of the initially allocated amounts of
acquisition cost as NIDEC finalized the provisional accounting treatment for the business combination.
10

(Yen in millions)
For the nine months ended December 31,
Increase or decrease2020 2021
Net cash provided by operating activities 146,169 68,477 (77,692)
Net cash used in investing activities (77,231) (90,603) (13,372)
Free cash flow *1 68,938 (22,126) (91,064)
Net cash used in financing activities (89,159) (32,000) 57,159
Overview of Cash Flow
(Note) *1. Free cash flow: The sum of “net cash provided by operating activities” and “net cash used in investing activities”.
Net cash provided by operating activities for the nine months ended December 31, 2021 amounted to ¥68,477 million mainly due
to ¥100,163 million in profit for the period and ¥67,062 million increase in accounts payable and other factors, despite
¥98,418 million increase in inventories and ¥54,049 million increase in accounts receivable. Net cash provided by operating activities
decreased by ¥77,692 million year on year.
Net cash used in investing activities amounted to ¥90,603 million mainly due to additions to property, plant and equipment of
¥75,488 million and other factors. Net cash used in investing activities increased by ¥13,372 million year on year.
As a result, free cash flow decreased by ¥91,064 million to ¥22,126 million, compared with ¥68,938 million used in the same
period of the previous year.
Net cash used in financing activities amounted to ¥32,000 million mainly due to increase in short term borrowings of
¥80,147 million and other factors, despite ¥38,940 million in redemption of corporate bonds and ¥35,132 million in payment of
dividends to owners of the parent. Net cash used in financing activities decreased by ¥57,159 million year on year.
As a result of the aforementioned factors and the impact of foreign exchange rates, the balance of cash and cash equivalents as of
December 31, 2021 decreased by ¥31,624 million to ¥187,900 million from March 31, 2021.
11

Net sales ¥1,800,000 million (111.2% compared to the previous fiscal year)
Operating profit ¥190,000 million (118.8% compared to the previous fiscal year)
Profit before income taxes ¥185,000 million (121.0% compared to the previous fiscal year)
Profit attributable to owners of the parent ¥148,000 million (121.4% compared to the previous fiscal year)
(3) Explanation Regarding Future Forecast Information of Consolidated Financial ResultsAs of October 2021, the IMF forecasts global economic growth of + 4.9 % in 2022. In addition to risk factors such as concerns
over the supply of semiconductors and soaring raw material prices, the emergence of new variants of COVID-19 has led to a
significant increase in the number of people infected worldwide, raising concerns about the impact on the economies of these
countries. The number of vehicles produced by customers in the automotive division has yet to show a full-scale recovery trend, and
the business environment is expected to remain unpredictable.
The forecasts for the year ending March 31, 2022 described below are prepared based on an assumption that exchange rates are
US$1 = ¥105 and €1 = ¥117.
Forecast of Consolidated Financial Performance for the Year Ending March 31, 2022
(Notes) 1. Consolidated performance is based on IFRS.
2. The calculations for the conversion of Asian currencies into Japanese yen also used the exchange rates, US$1 = ¥105
and €1 = ¥117.
Cautionary Note Regarding Forward-Looking Statements
Forward-looking statements, such as forecast of consolidated financial performance, stated in this document are based on
information currently possessed by NIDEC or certain assumptions that NIDEC has deemed as rational. NIDEC cannot make any
assurances that the contents mentioned in these forward-looking statements will ever materialize. Actual financial performance could
be significantly different from NIDEC’s expectations as a result of various factors.
12

(Yen in millions)
As of March 31, 2021 As of December 31, 2021
Assets
Current assets
Cash and cash equivalents 219,524 187,900
Trade and other receivables 441,083 525,877
Other financial assets 10,556 6,669
Income tax receivables 9,454 9,860
Inventories 296,641 413,171
Other current assets 46,869 83,897
Total current assets 1,024,127 1,227,374
Non-current assets
Property, plant and equipment 662,659 709,772
Goodwill 319,926 326,763
Intangible assets 195,601 204,042
Investments accounted for using the equity method 2,422 1,536
Other investments 19,360 19,868
Other financial assets 6,056 6,094
Deferred tax assets 15,022 16,376
Other non-current assets 10,851 16,634
Total non-current assets 1,231,897 1,301,085
Total assets 2,256,024 2,528,459
2. Condensed Quarterly Consolidated Financial Statements and Other Information(1) Condensed Quarterly Consolidated Statements of Financial Position
13

(Yen in millions)
As of March 31, 2021 As of December 31, 2021
Liabilities
Current liabilities
Short term borrowings 30,977 111,425
Long term debt due within one year 75,596 157,433
Trade and other payables 400,307 498,707
Other financial liabilities 2,463 4,741
Income tax payables 17,910 18,362
Provisions 33,546 28,888
Other current liabilities 68,869 107,885
Total current liabilities 629,668 927,441
Non-current liabilities
Long term debt 424,900 290,440
Other financial liabilities 1,666 282
Retirement benefit liabilities 31,703 34,259
Provisions 756 994
Deferred tax liabilities 48,214 52,736
Other non-current liabilities 5,182 4,599
Total non-current liabilities 512,421 383,310
Total liabilities 1,142,089 1,310,751
Equity
Common stock 87,784 87,784
Additional paid-in capital 105,179 103,404
Retained earnings 1,016,559 1,082,325
Other components of equity (49,633) 3,140
Treasury stock (63,869) (78,033)
Total equity attributable to owners of the parent 1,096,020 1,198,620
Non-controlling interests 17,915 19,088
Total equity 1,113,935 1,217,708
Total liabilities and equity 2,256,024 2,528,459
14

Condensed Quarterly Consolidated Statements of Income (Yen in millions)
For the nine months ended December 31,
2020 2021
Continuing operations
Net Sales 1,184,991 1,407,210
Cost of sales (917,813) (1,102,623)
Gross profit 267,178 304,587
Selling, general and administrative expenses (102,027) (112,720)
Research and development expenses (49,642) (57,236)
Operating profit 115,509 134,631
Financial income 3,133 3,464
Financial expenses (4,771) (3,732)
Derivative gain (loss) (1,181) 136
Foreign exchange differences (2,777) (2,860)
Share of net profit (loss) from associate accounting using theequity method (599) (1,085)
Profit before income taxes 109,314 130,554
Income tax expenses (24,815) (30,159)
Profit for the period from continuing operations 84,499 100,395
Discontinued operations
Loss for the period from discontinued operations (132) (232)
Profit for the period 84,367 100,163
Profit for the period attributable to:
Owners of the parent 83,615 100,443
Non-controlling interests 752 (280)
Profit for the period 84,367 100,163
(2) Condensed Quarterly Consolidated Statements of Income and Condensed Quarterly Consolidated Statements of Comprehensive Income
15

Condensed Quarterly Consolidated Statements of Comprehensive Income (Yen in millions)
For the nine months ended December 31,
2020 2021
Profit for the period 84,367 100,163
Other comprehensive income, net of taxation
Items that will not be reclassified to net profit or loss:
Remeasurement of defined benefit plans (111) 188
Fair value movements on FVTOCI equity financial assets 1,995 307
Items that may be reclassified to net profit or loss:
Foreign currency translation adjustments (16,374) 54,591
Effective portion of net changes in fair value of cash flow hedges 6,221 (1,113)
Fair value movements on FVTOCI debt financial assets 6 3
Total other comprehensive income for the period, net of taxation (8,263) 53,976
Comprehensive income for the period 76,104 154,139
Comprehensive income for the period attributable to:
Owners of the parent 74,706 153,673
Non-controlling interests 1,398 466
Comprehensive income for the period 76,104 154,139
16

(Yen in millions) For the three months ended December 31, 2020 2021
Continuing operations Net Sales 433,197 496,542
Cost of sales (332,728) (390,916)
Gross profit 100,469 105,626
Selling, general and administrative expenses (35,734) (41,821)
Research and development expenses (18,400) (19,497)
Operating profit 46,335 44,308
Financial income 903 946
Financial expenses (1,569) (1,238)
Derivative gain (loss) (561) (3)
Foreign exchange differences (1,474) (1,456)
Share of net profit (loss) from associate accountingusing the equity method (319) (285)
Profit before income taxes 43,315 42,272
Income tax expenses (8,249) (9,560)
Profit for the period from continuing operations 35,066 32,712
Discontinued operations Loss for the period from discontinued operations (33) (84)
Profit for the period 35,033 32,628
Profit for the period attributable to:
Owners of the parent 34,837 32,676
Non-controlling interests 196 (48)
Profit for the period 35,033 32,628
For the three months ended December 31, 2020 and 2021Condensed Quarterly Consolidated Statements of Income
17

For the three months ended December 31, 2020 2021
Profit for the period 35,033 32,628
Other comprehensive income, net of taxation
Items that will not be reclassified to net profit or loss:
Remeasurement of defined benefit plans (90) 53
Fair value movements on FVTOCI equity financial assets 1,517 90
Items that may be reclassified to net profit or loss:
Foreign currency translation adjustments (3,011) 42,662
Effective portion of net changes in fair value of cash flow hedges 2,125 (66)
Fair value movements on FVTOCI debt financial assets (19) 1
Total other comprehensive income for the period, net of taxation 522 42,740
Comprehensive income for the period 35,555 75,368
Comprehensive income for the period attributable to:
Owners of the parent 34,897 74,818
Non-controlling interests 658 550
Comprehensive income for the period 35,555 75,368
Condensed Quarterly Consolidated Statements of Comprehensive Income(Yen in millions)
18

For the nine months ended December 31, 2020 (Yen in millions)
Total equity attributable to owners of the parentNon-
controllinginterests
Total equityCommonStock
Additionalpaid-incapital
Retainedearnings
Othercomponents
of equity
Treasurystock Total
Balance at April 1, 2020 87,784 114,754 924,293 (115,791) (63,750) 947,290 20,343 967,633
Comprehensive income
Profit for the period 83,615 83,615 752 84,367
Other comprehensive income (8,909) (8,909) 646 (8,263)
Total comprehensive income 74,706 1,398 76,104
Transactions with owners directly recognized inequity:
Purchase of treasury stock (116) (116) - (116)
Dividends paid to the owners of the parent (35,145) (35,145) - (35,145)
Dividends paid to non-controlling interests - (645) (645)
Share-based payment transactions 144 144 - 144
Transfer to retained earnings 1,895 (1,895) - - -
Changes in equity by purchase of shares ofconsolidated subsidiaries (5,453) (5,453) (1,144) (6,597)
Other 941 8 949 93 1,042
Balance at December 31, 2020 87,784 109,445 975,599 (126,595) (63,858) 982,375 20,045 1,002,420
For the nine months ended December 31, 2021 (Yen in millions)
Total equity attributable to owners of the parentNon-
controllinginterests
Total equityCommonStock
Additionalpaid-incapital
Retainedearnings
Othercomponents
of equityTreasury
stock Total
Balance at April 1, 2021 87,784 105,179 1,016,559 (49,633) (63,869) 1,096,020 17,915 1,113,935
Comprehensive income
Profit for the period 100,443 100,443 (280) 100,163
Other comprehensive income 53,230 53,230 746 53,976
Total comprehensive income 153,673 466 154,139
Transactions with owners directly recognized inequity:
Purchase of treasury stock (14,258) (14,258) - (14,258)
Dividends paid to the owners of the parent (35,132) (35,132) - (35,132)
Dividends paid to non-controlling interests - (112) (112)
Share-based payment transactions 537 537 - 537
Transfer to retained earnings 456 (456) - - -
Changes in equity by purchase of shares ofconsolidated subsidiaries (2,330) (2,330) 726 (1,604)
Other 18 (1) (1) 94 110 93 203
Balance at December 31, 2021 87,784 103,404 1,082,325 3,140 (78,033) 1,198,620 19,088 1,217,708
(3) Condensed Quarterly Consolidated Statements of Changes in Equity
19

(Yen in millions)
For the nine months ended December 31,
2020 2021
Cash flows from operating activities:
Profit for the period from continuing operations 84,499 100,395
Loss for the period from discontinued operations (132) (232)
Profit for the period 84,367 100,163
Adjustments to reconcile profit for the period to net cashprovided by operating activities
Depreciation and amortization 72,171 76,722
Loss (gain) from sales, disposal or impairment of property,plant and equipment 1,975 (2,855)
Loss from sales of discontinued operations 132 232
Financial expenses (income) 1,627 394
Share of net loss (profit) from associate accounting using theequity method 599 1,085
Deferred income taxes 2,025 2,338
Current income taxes 22,790 27,820
Foreign currency adjustments (8,655) (6,990)
Increase (decrease) in retirement benefit liability 1,195 664
Decrease (increase) in accounts receivable (24,950) (54,049)
Decrease (increase) in inventories 785 (98,418)
Increase (decrease) in accounts payable 30,026 67,062
Other, net (15,069) (16,898)
Interests and dividends received 2,670 2,576
Interests paid (3,973) (3,408)
Income taxes paid (21,546) (27,961)
Net cash provided by operating activities 146,169 68,477
(4) Condensed Quarterly Consolidated Statements of Cash Flows
20

(Yen in millions)
For the nine months ended December 31,
2020 2021
Cash flows from investing activities:
Additions to property, plant and equipment (66,049) (75,488)
Proceeds from sales of property, plant andequipment 2,345 7,115
Additions to intangible assets (10,020) (12,269)
Proceeds from sales of discontinued operations 2,637 -
Acquisitions of business, net of cash acquired (5,451) (9,015)
Other, net (693) (946)
Net cash used in investing activities (77,231) (90,603)
Cash flows from financing activities:
Increase (decrease) in short term borrowings (30,198) 80,147
Repayments of long term debt (18,975) (21,463)
Proceeds from issuance of bonds 50,000 -
Redemption of bonds (50,000) (38,940)
Payments for acquisition of interests in subsidiariesfrom non-controlling interests (5,311) (4,012)
Purchase of treasury stock (116) (14,258)
Dividends paid to the owners of the parent (35,145) (35,132)
Other, net 586 1,658
Net cash (used in) provided by financing activities (89,159) (32,000)
Effect of exchange rate changes on cash and cash equivalents 1,605 22,502
Net increase (decrease) in cash and cash equivalents (18,616) (31,624)
Cash and cash equivalents at beginning of period 206,986 219,524
Cash and cash equivalents at end of period 188,370 187,900
21

(5) Notes to Condensed Quarterly Consolidated Financial StatementsNotes Regarding Going Concern Assumption
Not applicable.
Notes to Condensed Quarterly Consolidated Financial Statements1. Reporting entity
Nidec Corporation (the “Company”) is a corporation located in Japan, whose shares are listed on the Tokyo Stock Exchange.
The registered addresses of headquarters and principal business offices are available on the Company’s website
(https://www.nidec.com/en/).
Condensed quarterly consolidated financial statements as of December 31, 2021 and for the nine months then ended consist of the
Company and its consolidated subsidiaries (“NIDEC”) and interests in associates of NIDEC.
NIDEC mainly designs, develops, produces, and sells products as described below:
1) Small precision motors, which include spindle motors for hard disk drives, brushless motors, fan motors, vibration motors, brush
motors and motor applications.
2) Automotive products, which include automotive motors and components.
3) Appliance, commercial and industrial products, which include home appliance, commercial and industrial motors and related
products.
4) Machinery, which includes industrial robots, card readers, test systems, press machines and power transmission drives.
5) Electronic and optical components, which include switches, trimmer potentiometers, lens units and camera shutters.
6) Others, which include services.
2. Basis of preparation
(1) Compliance with International Financial Reporting Standards (IFRS)
The condensed quarterly consolidated financial statements of NIDEC have been prepared in accordance with IAS 34 “Interim
Financial Reporting” pursuant to the provision of article 93 of Regulations for Quarterly Consolidated Financial Statements, as the
Company meets the criteria of a “Designated IFRS Specified Company” defined in article 1-2 of the regulations.
The condensed quarterly consolidated financial statements do not include all the information that must be disclosed in the annual
consolidated financial statements, and therefore should be used in conjunction with the consolidated financial statements for the
year ended March 31, 2021.
(2) Basis of measurement
The condensed quarterly consolidated financial statements have been prepared on a historical cost basis, except for some assets
and liabilities, including derivative and other financial instruments measured at fair value.
(3) Presentation currency and level of rounding
The condensed quarterly consolidated financial statements are presented in Japanese Yen, which is also the Company’s functional
currency, and figures are rounded to the nearest million yen, unless otherwise indicated.
3. Significant accounting policies
Significant accounting policies adopted in preparation of the condensed quarterly consolidated financial statements are consistent
with those used in the preparation of the NIDEC’s annual consolidated financial statements for the year ended March 31, 2021.
Income taxes for the nine months ended December 31, 2021 are computed using the estimated annual effective tax rate.
22
4. Significant accounting estimates, judgments and assumptions
The preparation of the condensed quarterly consolidated financial statements requires management to make estimates, judgments
and assumptions that affect the reported amounts of assets and liabilities, disclosure of contingent assets and liabilities at the end of
the reporting period and the reported amounts of income and expenses during the reporting period. Actual results may differ from
those estimates.
The estimates and the assumptions are reviewed on an ongoing basis, and the effects resulting from the revisions of accounting
estimates are recognized in the period in which the estimates are revised and in future periods.
Significant accounting estimates and judgments that accompany estimates for the condensed quarterly consolidated financial
statements as of December 31, 2021 are same as those estimates and judgments for the consolidated financial statements for the year
ended March 31, 2021.
5. Business combinations
NIDEC adopts the provisions of IFRS 3 “Business Combinations”.
During the three months ended June 30, 2021, NIDEC completed its valuation of the assets acquired and the liabilities assumed
upon the acquisition of the Metal Stamping Support Group, LLC and its group companies in the previous fiscal year. NIDEC’s
consolidated financial statements for the year ended March 31, 2021 reflect the revision of the initially allocated amounts of
acquisition price as NIDEC finalized the provisional accounting treatment for the business combination.
During the three months ended December 31, 2021, NIDEC partly completed its valuation of the assets acquired and the liabilities
assumed upon the share acquisition of Mitsubishi Heavy Industries Machine Tool Co., Ltd. (“Nidec Machine Tool”) ; all the
Mitsubishi Heavy Industries Group-owned shares of three overseas subsidiaries specialized in machine tool business; and the machine
tool business run by overseas subsidiaries in the six months ended September 30, 2021. The condensed quarterly consolidated
financial statements for the nine months ended December 31, 2021 reflect the revision of the initially allocated amounts of acquisition
price as NIDEC finalized the provisional accounting treatment for the business combination.
Of the assets acquired and the liabilities assumed upon the acquisitions of companies in the nine months ended December 31, 2021,
the assets and liabilities which are currently under evaluation have been recorded on NIDEC’s consolidated statements of financial
position based on provisional management estimation as of December 31, 2021.
6. Events after the reporting period
No items to report
23

For the three months ended
June 30, 2021 September 30, 2021 December 31, 2021
Net sales 447,470 463,198 496,542
Operating profit 44,555 45,768 44,308
Profit before income taxes 43,752 44.530 42,272
Profit for the period 33,345 34,190 32,628
Profit attributable to owners of the parent 33,451 34,316 32,676
For the nine months ended December 31, 2020 (Yen in millions)
Small
precisionmotors
AutomotiveProducts
Appliance,commercial
and industrialproducts
Machinery
Electronicand
optical components
Others Total Eliminations/Corporate Consolidated
Net sales:
External sales 339,952 256,008 429,299 111,516 45,681 2,535 1,184,991 - 1,184,991
Intersegment 2,434 943 5,042 6,938 3,027 631 19,015 (19,015) -
Total 342,386 256,951 434,341 118,454 48,708 3,166 1,204,006 (19,015) 1,184,991
Operating expenses 291,166 244,877 398,121 98,787 43,722 2,928 1,079,601 (10,119) 1,069,482
Operating profit 51,220 12,074 36,220 19,667 4,986 238 124,405 (8,896) 115,509
For the nine months ended December 31, 2021 (Yen in millions)
Small
precisionmotors
AutomotiveProducts
Appliance,commercial
and industrialproducts
Machinery
Electronicand
optical components
Others Total Eliminations/Corporate Consolidated
Net sales:
External sales 321,225 301,118 575,778 154,254 51,988 2,847 1,407,210 - 1,407,210
Intersegment 4,018 882 5,858 16,566 5,255 856 33,435 (33,435) -
Total 325,243 302,000 581,636 170,820 57,243 3,703 1,440,645 (33,435) 1,407,210
Operating expenses 288,117 291,171 523,720 139,597 49,894 3,379 1,295,878 (23,299) 1,272,579
Operating profit 37,126 10,829 57,916 31,223 7,349 324 144,767 (10,136) 134,631
3. Others(1) Quarterly Financial Data for the three months ended December 31, 2021 and September 30, 2021 and June 30, 2021
(Yen in millions)
(2) Information by Product Category
24

For the three months ended December 31, 2020 (Yen in millions)
Small
precisionmotors
AutomotiveProducts
Appliance,commercial
and industrialproducts
Machinery
Electronicand
optical components
Others Total Eliminations/Corporate Consolidated
Net sales:
External sales 116,490 106,873 155,965 36,866 16,074 929 433,197 - 433,197
Intersegment 857 349 2,343 2,585 1,214 213 7,561 (7,561) -
Total 117,347 107,222 158,308 39,451 17,288 1,142 440,758 (7,561) 433,197
Operating expenses 99,226 99,545 144,110 32,107 15,619 1,085 391,692 (4,830) 386,862
Operating profit 18,121 7,677 14,198 7,344 1,669 57 49,066 (2,731) 46,335
For the three months ended December 31, 2021 (Yen in millions)
Small
precisionmotors
AutomotiveProducts
Appliance,commercial
and industrialproducts
Machinery
Electronicand
optical components
Others Total Eliminations/Corporate Consolidated
Net sales:
External sales 116,114 103,921 197,757 58,889 18,842 1,019 496,542 - 496,542
Intersegment 1,351 325 1,690 5,636 1,814 241 11,057 (11,057) -
Total 117,465 104,246 199,447 64,525 20,656 1,260 507,599 (11,057) 496,542
Operating expenses 103,434 101,754 182,059 53,927 17,753 1,127 460,054 (7,820) 452,234
Operating profit 14,031 2,492 17,388 10,598 2,903 133 47,545 (3,237) 44,308
(Notes) 1. Product categories are classified based on similarities in product type, product attributes, and production and sales methods.2. Major products of each product category:
(1) Small precision motors: Spindle motors for HDDs, brushless motors, fan motors, vibration motors, brush motors andmotor applications, etc.
(2) Automotive products: Automotive motors and components.(3) Appliance, commercial and industrial products: Home appliance, commercial and industrial motors and related
products.(4) Machinery: Industrial robots, card readers, test systems, press machines and power transmission drives, etc.(5) Electronic and optical components: Switches, trimmer potentiometers, lens units and camera shutters, etc.(6) Others: Services, etc.
25
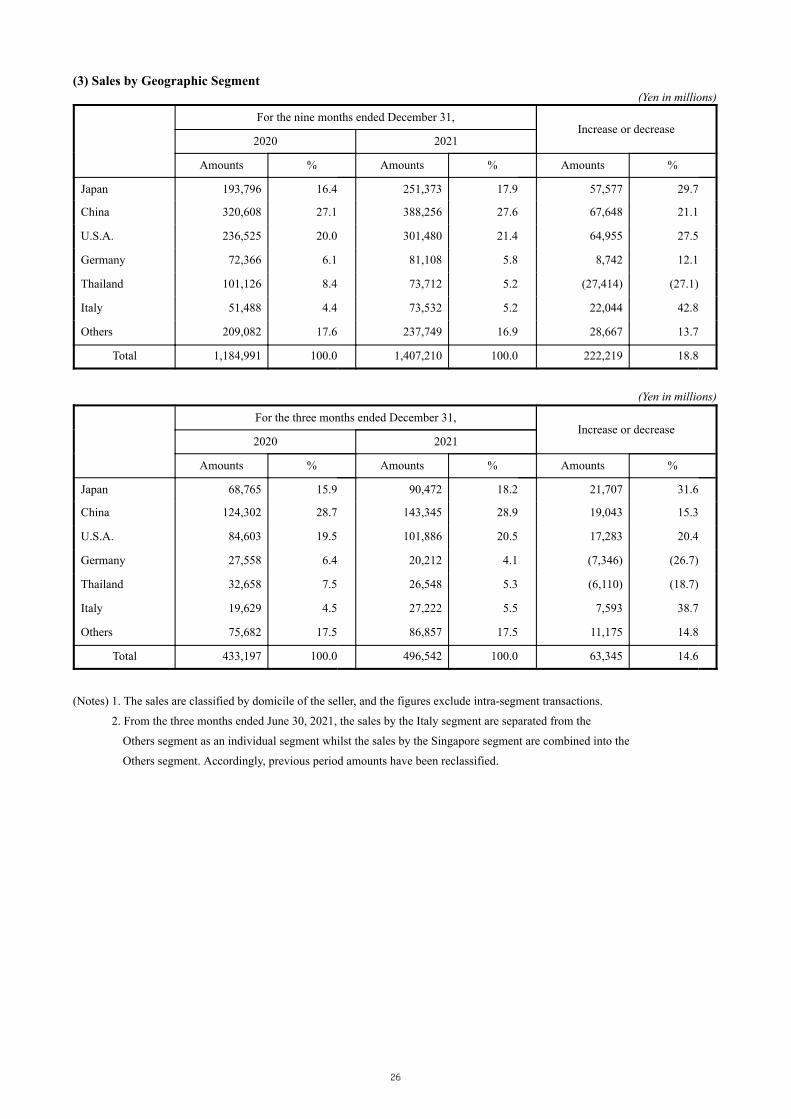
For the nine months ended December 31,Increase or decrease
2020 2021
Amounts % Amounts % Amounts %
Japan 193,796 16.4 251,373 17.9 57,577 29.7
China 320,608 27.1 388,256 27.6 67,648 21.1
U.S.A. 236,525 20.0 301,480 21.4 64,955 27.5
Germany 72,366 6.1 81,108 5.8 8,742 12.1
Thailand 101,126 8.4 73,712 5.2 (27,414) (27.1)
Italy 51,488 4.4 73,532 5.2 22,044 42.8
Others 209,082 17.6 237,749 16.9 28,667 13.7
Total 1,184,991 100.0 1,407,210 100.0 222,219 18.8
For the three months ended December 31,Increase or decrease
2020 2021
Amounts % Amounts % Amounts %
Japan 68,765 15.9 90,472 18.2 21,707 31.6
China 124,302 28.7 143,345 28.9 19,043 15.3
U.S.A. 84,603 19.5 101,886 20.5 17,283 20.4
Germany 27,558 6.4 20,212 4.1 (7,346) (26.7)
Thailand 32,658 7.5 26,548 5.3 (6,110) (18.7)
Italy 19,629 4.5 27,222 5.5 7,593 38.7
Others 75,682 17.5 86,857 17.5 11,175 14.8
Total 433,197 100.0 496,542 100.0 63,345 14.6
(3) Sales by Geographic Segment(Yen in millions)
(Yen in millions)
(Notes) 1. The sales are classified by domicile of the seller, and the figures exclude intra-segment transactions.
2. From the three months ended June 30, 2021, the sales by the Italy segment are separated from the
Others segment as an individual segment whilst the sales by the Singapore segment are combined into the
Others segment. Accordingly, previous period amounts have been reclassified.
26
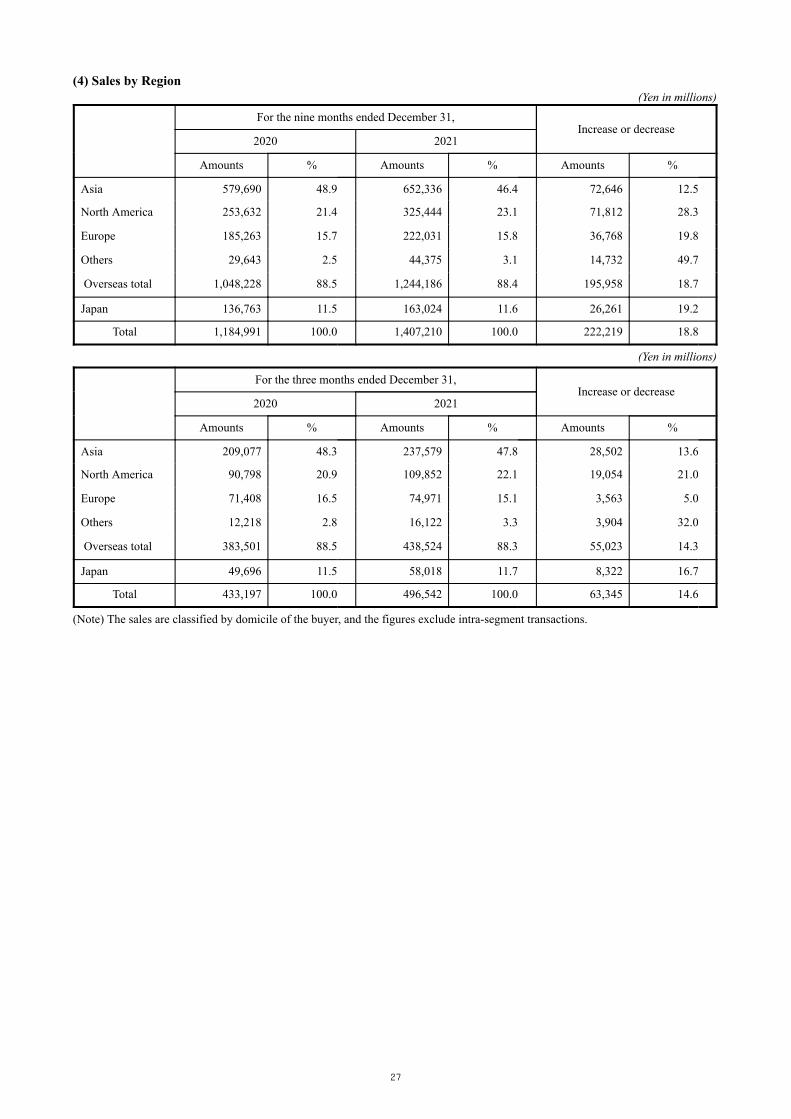
For the nine months ended December 31,Increase or decrease
2020 2021
Amounts % Amounts % Amounts %
Asia 579,690 48.9 652,336 46.4 72,646 12.5
North America 253,632 21.4 325,444 23.1 71,812 28.3
Europe 185,263 15.7 222,031 15.8 36,768 19.8
Others 29,643 2.5 44,375 3.1 14,732 49.7
Overseas total 1,048,228 88.5 1,244,186 88.4 195,958 18.7
Japan 136,763 11.5 163,024 11.6 26,261 19.2
Total 1,184,991 100.0 1,407,210 100.0 222,219 18.8
For the three months ended December 31,Increase or decrease
2020 2021
Amounts % Amounts % Amounts %
Asia 209,077 48.3 237,579 47.8 28,502 13.6
North America 90,798 20.9 109,852 22.1 19,054 21.0
Europe 71,408 16.5 74,971 15.1 3,563 5.0
Others 12,218 2.8 16,122 3.3 3,904 32.0
Overseas total 383,501 88.5 438,524 88.3 55,023 14.3
Japan 49,696 11.5 58,018 11.7 8,322 16.7
Total 433,197 100.0 496,542 100.0 63,345 14.6
(4) Sales by Region(Yen in millions)
(Yen in millions)
(Note) The sales are classified by domicile of the buyer, and the figures exclude intra-segment transactions.
27

(1) Summary of Consolidated Financial Performance (Yen in millions)
For the nine
months ended December 31,
2020
For the ninemonths ended
December 31,2021
Increase or decrease
For the threemonths endedDecember 31,
2020
For the threemonths endedDecember 31,
2021
Increase ordecrease
Net Sales 1,184,991 1,407,210 18.8 % 433,197 496,542 14.6 %
Operating profit 115,509 134,631 16.6 % 46,335 44,308 (4.4) %9.7 % 9.6 % 10.7 % 8.9 %Profit before income taxes 109,314 130,554 19.4 % 43,315 42,272 (2.4) %9.2 % 9.3 % 10.0 % 8.5 %Profit attributable to owners of the parent 83,615 100,443 20.1 % 34,837 32,676 (6.2) %7.1 % 7.1 % 8.0 % 6.6 %Earnings per share attributable to ownersof the parent - basic (Yen) 142.75 171.67 59.48 55.90
Earnings per share attributable to ownersof the parent - diluted (Yen) - - - -
(2) Summary of Consolidated Financial Position and Cash Flows (Yen in millions) As of December 31, 2020 As of December 31, 2021 As of March 31, 2021
Total assets 2,113,401 2,528,459 2,256,024 Total equity attributable to owners of the parent 982,375 1,198,620 1,096,020 Ratio of total equity attributable to owners of theparent to total asset 46.5% 47.4% 48.6%
For the nine months ended December 31, 2020
For the nine months ended December 31, 2021
For the year ended March 31, 2021
Net cash provided by operating activities 146,169 68,477 219,156 Net cash used in investing activities (77,231) (90,603) (100,568) Net cash (used in) provided by financing activities (89,159) (32,000) (136,191) Cash and cash equivalents at end of period 188,370 187,900 219,524
(3) Dividends (Yen) 3rd quarter end Fiscal year end Total
Year ended March 31, 2021 (actual) 30.00 30.00 60.00Year ending March 31, 2022 (actual) 30.00 - -Year ending March 31, 2022 (forecast) - 35.00 65.00
Number of consolidated subsidiaries 335Number of associates accounted for under the equity method 4
Change from March 31, 2021 Change from December 31, 2020Number of companies newly consolidated 12 14Number of companies excluded from consolidation 7 12Number of companies newly accounted for by the equity method 1 1Number of companies excluded from accounting by the equity method 0 0
4. Overview of Consolidated Financial Results January 26, 2022
(4) Scope of Consolidation and Application of the Equity Method
(Notes) 1. The amounts of percentage in “(1) Summary of Consolidated Financial Performance” represent percentage of sales.2. “Earnings per share attributable to owners of the parent-basic” and “Earnings per share attributable to owners of the parent-diluted” have
been calculated based on figures of “Profit attributable to owners of the parent”.3. NIDEC finalized the provisional accounting treatment for the business combination in the nine months ended December 31, 2021.
Condensed quarterly consolidated financial statements and consolidated financial statements for the year ended March 31, 2021 reflect therevision of the initially allocated amounts of acquisition cost as NIDEC finalized the provisional accounting treatment for the businesscombination.
28