Financial Statements and Federal Single Audit Report - Pierce ...
53
Washington State Auditor’s Office Financial Statements and Federal Single Audit Report Pierce County Housing Authority Audit Period January 1, 2012 through December 31, 2012 Report No. 1010413 Issue Date September 23, 2013
-
Upload
khangminh22 -
Category
Documents
-
view
3 -
download
0
Transcript of Financial Statements and Federal Single Audit Report - Pierce ...
Washington State Auditor’s Office
Financial Statements and Federal Single Audit Report
Pierce County Housing Authority
Audit Period
January 1, 2012 through December 31, 2012
Report No. 1010413
Issue Date September 23, 2013
September 23, 2013 Board of Commissioners Pierce County Housing Authority Tacoma, Washington
Report on Financial Statements and Federal Single Audit Please find attached our report on the Pierce County Housing Authority’s financial statements and compliance with federal laws and regulations. We are issuing this report in order to provide information on the Housing Authority’s financial condition. Sincerely,
TROY KELLEY STATE AUDITOR
Washington State Auditor Troy Kelley
Insurance Building, P.O. Box 40021 Olympia, Washington 98504-0021 (360) 902-0370 TDD Relay (800) 833-6388

Table of Contents
Pierce County Housing Authority January 1, 2012 through December 31, 2012
Federal Summary ...................................................................................................................... 1
Independent Auditor’s Report on Internal Control over Financial Reporting and on Compliance and Other Matters Based on an Audit of Financial Statements Performed in Accordance with Government Auditing Standards ..................................................................... 3
Independent Auditor’s Report on Compliance For Each Major Federal Program and on Internal Control Over Compliance in Accordance with OMB Circular A-133 ............................... 5
Independent Auditor’s Report on Financial Statements .............................................................. 8
Financial Section .......................................................................................................................11

Federal Summary
Pierce County Housing Authority January 1, 2012 through December 31, 2012
The results of our audit of the Pierce County Housing Authority are summarized below in accordance with U.S. Office of Management and Budget Circular A-133.
FINANCIAL STATEMENTS An unmodified opinion was issued on the basic financial statements. Internal Control Over Financial Reporting:
• Significant Deficiencies: We reported no deficiencies in the design or operation of internal control over financial reporting that we consider to be significant deficiencies.
• Material Weaknesses: We identified no deficiencies that we consider to be material
weaknesses. We noted no instances of noncompliance that were material to the financial statements of the Housing Authority.
FEDERAL AWARDS Internal Control Over Major Programs:
• Significant Deficiencies: We reported no deficiencies in the design or operation of internal control over major federal programs that we consider to be significant deficiencies.
• Material Weaknesses: We identified no deficiencies that we consider to be material
weaknesses. We issued an unmodified opinion on the Authority’s compliance with requirements applicable to its major federal program. We reported no findings that are required to be disclosed under section 510(a) of OMB Circular A-133.
_________________________________________________________________________________________________________ Washington State Auditor's Office
1

Identification of Major Programs: The following was a major program during the period under audit:
CFDA No. Program Title
14.871 Housing Voucher Cluster - Section 8 Housing Choice Vouchers The dollar threshold used to distinguish between Type A and Type B programs, as prescribed by OMB Circular A-133, was $679,202. The Housing Authority qualified as a low-risk auditee under OMB Circular A-133.
_________________________________________________________________________________________________________ Washington State Auditor's Office
2

Independent Auditor’s Report on Internal
Control over Financial Report ing and on
Compliance and Other Matters Based on an
Audit of Financial Statements Performed in
Accordance w ith Government Audit ing
Standards
Pierce County Housing Authority January 1, 2012 through December 31, 2012
Board of Commissioners Pierce County Housing Authority Tacoma, Washington We have audited, in accordance with auditing standards generally accepted in the United States of America and the standards applicable to financial audits contained in Government Auditing Standards, issued by the Comptroller General of the United States, the financial statements of the Pierce County Housing Authority, Pierce County, Washington, as of and for the year ended December 31, 2012, and the related notes to the financial statements, which collectively comprise the Housing Authority’s basic financial statements, and have issued our report thereon dated September 6, 2013. During the year ended December 31, 2012, the Housing Authority implemented Governmental Accounting Standards Board Statement No. 63, Financial Reporting of Deferred Outflows of Resources, Deferred Inflows of Resources and Net Position.
INTERNAL CONTROL OVER FINANCIAL REPORTING In planning and performing our audit of the financial statements, we considered the Housing Authority’s internal control over financial reporting (internal control) to determine the audit procedures that are appropriate in the circumstances for the purpose of expressing our opinion on the financial statements, but not for the purpose of expressing an opinion on the effectiveness of the Housing Authority’s internal control. Accordingly, we do not express an opinion on the effectiveness of the Housing Authority’s internal control. A deficiency in internal control exists when the design or operation of a control does not allow management or employees, in the normal course of performing their assigned functions, to prevent, or detect and correct, misstatements on a timely basis. A material weakness is a deficiency, or a combination of deficiencies, in internal control such that there is a reasonable possibility that a material misstatement of the Housing Authority's financial statements will not be prevented, or detected and corrected on a timely basis. A significant deficiency is a deficiency, or a combination of deficiencies, in internal control that is less severe than a material weakness, yet important enough to merit attention by those charged with governance.
_________________________________________________________________________________________________________ Washington State Auditor's Office
3
Our consideration of internal control was for the limited purpose described in the first paragraph of this section and was not designed to identify all deficiencies in internal control that might be material weaknesses or significant deficiencies. Given these limitations, during our audit we did not identify any deficiencies in internal control that we consider to be material weaknesses. However, material weaknesses may exist that have not been identified.
COMPLIANCE AND OTHER MATTERS As part of obtaining reasonable assurance about whether the Housing Authority’s financial statements are free from material misstatement, we performed tests of the Housing Authority’s compliance with certain provisions of laws, regulations, contracts and grant agreements, noncompliance with which could have a direct and material effect on the determination of financial statement amounts. However, providing an opinion on compliance with those provisions was not an objective of our audit, and accordingly, we do not express such an opinion. The results of our tests disclosed no instances of noncompliance or other matters that are required to be reported under Government Auditing Standards.
PURPOSE OF THIS REPORT The purpose of this report is solely to describe the scope of our testing of internal control and compliance and the results of that testing, and not to provide an opinion on the effectiveness of the Housing Authority’s internal control or on compliance. This report is an integral part of an audit performed in accordance with Government Auditing Standards in considering the Housing Authority’s internal control and compliance. Accordingly, this communication is not suitable for any other purpose. However, this report is a matter of public record and its distribution is not limited. It also serves to disseminate information to the public as a reporting tool to help citizens assess government operations.
TROY KELLEY STATE AUDITOR September 6, 2013
_________________________________________________________________________________________________________ Washington State Auditor's Office
4

Independent Auditor’s Report on Compliance
For Each Major Federal Program and on
Internal Control Over Compliance in
Accordance w ith OMB Circular A-133
Pierce County Housing Authority January 1, 2012 through December 31, 2012
Board of Commissioners Pierce County Housing Authority Tacoma, Washington
REPORT ON COMPLIANCE FOR EACH MAJOR FEDERAL PROGRAM We have audited the compliance of the Pierce County Housing Authority, Pierce County, Washington, with the types of compliance requirements described in the U.S. Office of Management and Budget (OMB) Circular A-133 Compliance Supplement that could have a direct and material effect on each of its major federal programs for the year ended December 31, 2012. The Housing Authority’s major federal programs are identified in the accompanying Federal Summary. Management’s Responsibility
Management is responsible for compliance with the requirements of laws, regulations, contracts and grants applicable to its federal programs. Auditor’s Responsibility
Our responsibility is to express an opinion on compliance for each of the Housing Authority’s major federal programs based on our audit of the types of compliance requirements referred to above. We conducted our audit of compliance in accordance with auditing standards generally accepted in the United States of America; the standards applicable to financial audits contained in Government Auditing Standards, issued by the Comptroller General of the United States; and OMB Circular A-133, Audits of States, Local Governments, and Non-Profit Organizations. Those standards and OMB Circular A-133 require that we plan and perform the audit to obtain reasonable assurance about whether noncompliance with the types of compliance requirements referred to above that could have a direct and material effect on a major federal program occurred. An audit includes examining, on a test basis, evidence about the Housing Authority’s compliance with those requirements and performing such other procedures as we considered necessary in the circumstances. We believe that our audit provides a reasonable basis for our opinion on compliance for each major federal program. Our audit does not provide a legal determination on the Housing Authority’s compliance.
_________________________________________________________________________________________________________ Washington State Auditor's Office
5
Opinion on Each Major Federal Program
In our opinion, the Housing Authority complied, in all material respects, with the types of compliance requirements referred to above that could have a direct and material effect on each of its major federal programs for the year ended December 31, 2012.
REPORT ON INTERNAL CONTROL OVER COMPLIANCE Management of the Housing Authority is responsible for establishing and maintaining effective internal control over compliance with the types of compliance requirements referred to above. In planning and performing our audit of compliance, we considered the Housing Authority’s internal control over compliance with the types of requirements that could have a direct and material effect on each major federal program in order to determine the auditing procedures that are appropriate in the circumstances for the purpose of expressing an opinion on compliance for each major federal program and to test and report on internal control over compliance in accordance with OMB Circular A-133, but not for the purpose of expressing an opinion on the effectiveness of internal control over compliance. Accordingly, we do not express an opinion on the effectiveness of the Housing Authority's internal control over compliance. A deficiency in internal control over compliance exists when the design or operation of a control over compliance does not allow management or employees, in the normal course of performing their assigned functions, to prevent, or detect and correct, noncompliance with a type of compliance requirement of a federal program on a timely basis. A material weakness in internal control over compliance is a deficiency, or combination of deficiencies, in internal control over compliance, such that there is a reasonable possibility that material noncompliance with a type of compliance requirement of a federal program will not be prevented, or detected and corrected, on a timely basis. A significant deficiency in internal control over compliance is a deficiency, or a combination of deficiencies, in internal control over compliance with a type of compliance requirement of a federal program that is less severe than a material weakness in internal control over compliance, yet important enough to merit attention by those charged with governance. Our consideration of internal control over compliance was for the limited purpose described in the first paragraph of this section and was not designed to identify all deficiencies in internal control that might be material weaknesses or significant deficiencies. We did not identify any deficiencies in internal control over compliance that we consider to be material weaknesses. However, material weaknesses may exist that have not been identified. PURPOSE OF THIS REPORT The purpose of this report on internal control over compliance is solely to describe the scope of our testing of internal control over compliance and the results of that testing based on the requirements of OMB Circular A-133. Accordingly, this report is not suitable for any other purpose. However, this report is a matter of public record and its distribution is not limited. It
_________________________________________________________________________________________________________ Washington State Auditor's Office
6
also serves to disseminate information to the public as a reporting tool to help citizens assess government operations.
TROY KELLEY STATE AUDITOR September 6, 2013
_________________________________________________________________________________________________________ Washington State Auditor's Office
7

Independent Auditor’s Report on Financial
Statements
Pierce County Housing Authority January 1, 2012 through December 31, 2012
Board of Commissioners Pierce County Housing Authority Tacoma, Washington
REPORT ON THE FINANCIAL STATEMENTS We have audited the accompanying financial statements of the Pierce County Housing Authority, Pierce County, Washington, as of and for the year ended December 31, 2012, and the related notes to the financial statements, which collectively comprise the Housing Authority’s basic financial statements as listed on page 11. Management’s Responsibility for the Financial Statements
Management is responsible for the preparation and fair presentation of these financial statements in accordance with accounting principles generally accepted in the United States of America; this includes the design, implementation, and maintenance of internal control relevant to the preparation and fair presentation of financial statements that are free from material misstatement, whether due to fraud or error. Auditor’s Responsibility
Our responsibility is to express an opinion on these financial statements based on our audit. We conducted our audit in accordance with auditing standards generally accepted in the United States of America and the standards applicable to financial audits contained in Government Auditing Standards, issued by the Comptroller General of the United States. Those standards require that we plan and perform the audit to obtain reasonable assurance about whether the financial statements are free from material misstatement. An audit involves performing procedures to obtain audit evidence about the amounts and disclosures in the financial statements. The procedures selected depend on the auditor’s judgment, including the assessment of the risks of material misstatement of the financial statements, whether due to fraud or error. In making those risk assessments, the auditor considers internal control relevant to the Housing Authority’s preparation and fair presentation of the financial statements in order to design audit procedures that are appropriate in the circumstances, but not for the purpose of expressing an opinion on the effectiveness of the Housing Authority’s internal control. Accordingly, we express no such opinion. An audit also includes evaluating the appropriateness of accounting policies used and the reasonableness of significant accounting estimates made by management, as well as evaluating the overall presentation of the financial statements. We believe that the audit evidence we have obtained is sufficient and appropriate to provide a basis for our audit opinion.
_________________________________________________________________________________________________________ Washington State Auditor's Office
8

Opinion
In our opinion, the financial statements referred to above present fairly, in all material respects, the financial position of the Pierce County Housing Authority, as of December 31, 2012, and the changes in financial position and cash flows thereof for the year then ended in accordance with accounting principles generally accepted in the United States of America. Matters of Emphasis
As discussed in Note 11 to the financial statements, in 2012, the Authority adopted new accounting guidance, Governmental Accounting Standards Board Statement No. 63, Financial Reporting of Deferred Outflows of Resources, Deferred Inflows of Resources and Net Position. Our opinion is not modified with respect to this matter. Other Matters
Required Supplementary Information
Accounting principles generally accepted in the United States of America require that the management’s discussion and analysis on pages 12 through 17 be presented to supplement the basic financial statements. Such information, although not a part of the basic financial statements, is required by the Governmental Accounting Standards Board who considers it to be an essential part of financial reporting for placing the basic financial statements in an appropriate operational, economic or historical context. We have applied certain limited procedures to the required supplementary information in accordance with auditing standards generally accepted in the United States of America, which consisted of inquiries of management about the methods of preparing the information and comparing the information for consistency with management’s responses to our inquiries, the basic financial statements, and other knowledge we obtained during our audit of the basic financial statements. We do not express an opinion or provide any assurance on the information because the limited procedures do not provide us with sufficient evidence to express an opinion or provide any assurance. Supplementary and Other Information
Our audit was conducted for the purpose of forming an opinion on the financial statements that collectively comprise the Housing Authority’s basic financial statements. The accompanying Schedule of Expenditures of Federal Awards is presented for purposes of additional analysis as required by U.S. Office of Management and Budget Circular A-133, Audits of States, Local Governments, and Non-Profit Organizations. The accompanying Financial Data Schedule and HUD form are supplementary information required by HUD. These schedules are not a required part of the basic financial statements. Such information is the responsibility of management and was derived from and relates directly to the underlying accounting and other records used to prepare the basic financial statements. The information has been subjected to the auditing procedures applied in the audit of the basic financial statements and certain additional procedures, including comparing and reconciling such information directly to the underlying accounting and other records used to prepare the basic financial statements or to the basic financial statements themselves, and other additional procedures in accordance with auditing standards generally accepted in the United States of America. In our opinion, the information is fairly stated, in all material respects, in relation to the basic financial statements taken as a whole.
_________________________________________________________________________________________________________ Washington State Auditor's Office
9
OTHER REPORTING REQUIRED BY GOVERNMENT AUDITING STANDARDS In accordance with Government Auditing Standards, we have also issued our report dated September 6, 2013 on our consideration of the Housing Authority’s internal control over financial reporting and on our tests of its compliance with certain provisions of laws, regulations, contracts and grant agreements and other matters. The purpose of that report is to describe the scope of our testing of internal control over financial reporting and compliance and the results of that testing, and not to provide an opinion on internal control over financial reporting or on compliance. That report is an integral part of an audit performed in accordance with Government Auditing Standards in considering the Housing Authority’s internal control over financial reporting and compliance.
TROY KELLEY STATE AUDITOR September 6, 2013
_________________________________________________________________________________________________________ Washington State Auditor's Office
10

Financial Sect ion
Pierce County Housing Authority January 1, 2012 through December 31, 2012
REQUIRED SUPPLEMENTARY INFORMATION
Management’s Discussion and Analysis – 2012
BASIC FINANCIAL STATEMENTS Statement of Net Position – 2012 Statement of Revenues, Expenses and Changes in Net Position – 2012 Statement of Cash Flows – 2012 Notes to Financial Statements – 2012
SUPPLEMENTARY AND OTHER INFORMATION
Schedule of Expenditures of Federal Awards – 2012 Notes to the Schedule of Expenditures of Federal Awards – 2012 Financial Data Schedule – 2012 Actual Modernization Cost Certificate – WA19P054501-12
_________________________________________________________________________________________________________ Washington State Auditor's Office
11

MANAGEMENT'S DISCUSSION AND ANALYSIS The Authority administers a broad range of federally and locally financed housing programs within Pierce County. The Authority owns and manages 817 housing units and provides housing assistance subsidies and other services to about 2,900 households. Our discussion and analysis of the Pierce County Housing Authority's (Authority) financial performance provides an overview of the Authority's financial activities for the fiscal year ended December 31, 2012. Please read it in conjunction with the Authority's financial statements. FINANCIAL HIGHLIGHTS
• During 2012, HUD provided $445,000 more in budget appropriations for the Housing Choice Voucher program than the Authority used for housing assistance expenses.
• The Authority expended about $460,000 more to operate the Low-Income Public Housing program than revenues that were generated, due in part to the offset of the operating subsidy that HUD imposed in order to address national appropriation shortfalls.
• The Authority used approximately $1.3 million from its Replacement Reserve to fund capital projects in the Affordable Housing program.
• The Authority generated revenues in excess of requirements under a trust indenture for its Housing Revenue
Bonds resulting in the requirement for a special redemption of bonds in in the amounts of $200,000.
• The Authority completed capital improvement projects and recorded a corresponding reduction to buildings and accumulated depreciation comprising most of the loss on the disposition of assets of $954,000.
The Authority is a highly leveraged operation, as is common in the residential real estate business. Because its rents are set at rates to provide affordable housing to low-income individuals and families, net income from operating the Affordable Housing programs is expected to be very minor. The operation of the Assisted Housing Programs is designed to operate on a break-even basis with a small administrative fee allowed for managing the program for Federal agencies. The capital improvement projects and operating losses in the Low-Income Public Housing Program caused substantially all of the decreases identified in the Housing Authority’s key financial measures as represented in the following chart.
2012 2011
Working Capital 9,196,557 11,070,598
Working Capital Ratio 419.28% 536.48%
Long-term Liabilities to Net Position 78.82% 87.66%
Return on Assets -0.46% 14.87%
Return on Net Position -0.88% 29.60%
Cash Flow before Debt Service 2,848,682 2,324,407
Debt Service 2,669,149 2,214,072
Debt Service Coverage 107% 105%
Key Financial Measures
_________________________________________________________________________________________________________ Washington State Auditor's Office
12

• Working capital measures the Authority’s available financial resources to meet its short-term obligations. Working capital was reduced during 2012 to fund the capital improvement projects in the Affordable Housing programs. The Authority has sufficient resources to pay its current obligations.
• Because the Authority did not generate more revenues than expenses during 2012, the return on assets and return on net position are both negative. As was previously discussed, the capital improvement projects offset by the excess HUD budget appropriations resulted in a decrease to the Authority’s net position.
• The measure of debt service coverage from operations is important to the Authority’s long-term creditors because it provides a broad measure of the Authority’s ability to generate sufficient cash flow to fund its annual debt service requirements. This measure increased 2011 to 2012 primarily as a result of the changes to the debt repayment obligations of the Authority’s Housing Revenue Bonds. The debt service coverage measure is an aggregate of the Authority as a whole, and is not based on the contractual method of calculating debt service coverage based on the operating results of specific properties.
Introduction to the Financial Statements The Authority operates the following two major business type programs that are included in these financial statements. Assisted Housing Programs This major program is used to account for the various U.S. Housing and Urban Development (HUD) and other Federal housing programs administered by the Authority such as Section 8, Low-Income Public Housing and Rural Development programs. Affordable Housing Programs This major program is used to account for apartment building operations that are financed and operated in a manner similar to private business enterprise. The intent of the Authority is that the costs (expenses, including depreciation) of providing services to the general public on a continuing basis be financed or recovered primarily through rental revenues. Revenues and expenses related to financing or investing activities are treated as non-operating revenues and expenses in the Statement of Revenues, Expenses and Changes in Net Position. This major program also accounts for the sale and financing of single-family residences under its Homeownership program. USING THIS ANNUAL REPORT This annual report consists of a series of financial statements. The Statement of Net Position, the Statement of Revenues, Expenses and Changes in Net Position and the Statement of Cash Flows found after Management’s Discussion and Analysis, provide information about the activities of the Authority as a whole and present a longer-term view of the Authority's finances. Reporting the Authority as a Whole The Statement of Net Position, the Statement of Revenues, Expenses and Changes in Net Position and the Statement of Cash Flows report information about the Authority as a whole and about its activities in a way that helps communicate the financial condition of the Authority. These statements include all assets and liabilities using the accrual basis of accounting, which is similar to the accounting used by most private sector companies. All of the current year's revenues and expenses are taken into account regardless of when cash is received or paid. These statements report the Authority's net position, and changes in them, as well as how cash was generated and used during the year. The Authority's net position is the difference between assets and liabilities. It is one way to measure the Authority's financial position. Over time, increases or decreases in the Authority's net position are one indicator of whether its financial condition is improving or deteriorating. You will need to consider other non-financial
_________________________________________________________________________________________________________ Washington State Auditor's Office
13

factors, however, such as changes in the Authority's funding structures and the condition of the Authority's housing stock, to assess the overall financial health of the Authority. THE AUTHORITY AS A WHOLE The Authority's net position decreased in 2012 by approximately $194,000. In comparison, the Authority’s net position increased by $6.6 million in 2011 and $3 million in 2010 as a result of the sale of housing stock from its portfolio. The following analysis focuses on the changes in assets, liabilities and net position of the Authority's operations as a whole. Total net position of the Authority decreased by about 1%.
The increase in investment in capital assets is caused by several offsetting factors. Capital additions paid from operating cash flow increased the investment in capital assets while asset disposals and the accumulated depreciation and amortization that exceeded the normal principal payments on the related capital debt reduced this category. Decreases in restricted net position result primarily from the use of $1.3 million from Replacement Reserves to fund capital improvement projects offset by excess HUD budget appropriations provided for housing assistance of about $445,000. Congress had imposed a change in HUD’s Housing Assistance Payments program in 2005, which placed additional restrictions on certain appropriations received in fiscal years 2005-2012. Those restrictions, however, do provide for using prior excess funding specifically for housing assistance subsidies. Unrestricted net position represents the portion of net position that can be used to finance day-to-day operations without constraints established by debt covenants, enabling legislation, or other legal requirements. The Authority’s expenditures in excess of revenues generated in the Low-Income Public Housing program of about $460,000 is the cause of the decrease in unrestricted net position. The Authority's total operating revenues reflected in the following chart increased 1% from 2011 to 2012. The decrease in rent and other tenant revenues of $800,000 is the primarily the result of the sale of the four apartment projects during 2011. In 2012, the Authority experienced an increase in HUD contributions of about $775,000 over 2011 levels. The $340,000 increase in other revenues was caused by an increase in portability housing revenues offset by a decrease in revenues for the Homelessness Prevention and Rapid Re-housing Concierge program that ended during 2012.
Percentage
2012 2011 Change
Current and Other Assets 15,867,593$ 18,090,037$ -12.29%
Capital Assets, Net 26,339,289 26,080,715 0.99%
Total Assets 42,206,882 44,170,752 -4.45%
Long Term Liabilities 17,334,066 19,448,548 -10.87%
Current Liabilities 2,880,389 2,536,310 13.57%
Total Liabilities 20,214,455 21,984,858 -8.05%
Net Position:
Invested in Capital Assets, Net of Debt 8,143,448 7,059,244 15.36%
Restricted 10,861,711 11,687,163 -7.06%
Unrestricted 2,987,268 3,439,487 -13.15%
Total Net Position 21,992,427$ 22,185,894$ -0.87%
ASSETS AND NET POSITION
_________________________________________________________________________________________________________ Washington State Auditor's Office
14

Operating costs in the Affordable Housing programs decreased as a result of the sale of the four apartment projects in 2011 and were offset by normal inflationary increases in costs to operate the program for the housing that remained in the portfolio. An increase in the amount of portability housing assistance paid to landlords explain primarily all of the change for operating the Assisted Housing programs. Overall, operating expenses decreased by about $260,000 or 1% from the prior year. The net effect of these revenue and expense changes increased net operating income in 2012 by approximately $600,000 from the prior year. The combination of all of these factors resulted in the current year decrease in net position of $194,000, compared to the 2011 increase in net position of $6.6 million reflected in the above chart.
Percentage
2012 2011 Change
Rent and Other Tenant Revenues 5,836,975$ 6,639,167$ -12.08%
Annual Contributions (HUD) 22,321,232 21,549,195 3.58%
Other Revenues 1,890,022 1,547,636 22.12%
Total Operating Revenues 30,048,229 29,735,998 1.05%
Insurance Proceeds 9,453 -
Interest Revenue 525,078 466,709 12.51%
Total Non-Operating Revenue 534,531 466,709 14.53%
Affordable Housing Operations and Administration Expense 4,123,065 4,675,630 -11.82%
Assisted Housing Operations and Administration 24,757,394 24,462,891 1.20%
Total Operating Expenses 28,880,459 29,138,521 -0.89%
Loss (Gain) on Disposition of Assets 953,881 (6,686,407) -114.27%
Amortization of Bond Discounts 32,398 32,398 0.00%
Interest Expense 1,112,291 1,308,173 -14.97%
Total Non-Operating Expense (Income) 2,098,570 (5,345,836) -139.26%
Increase (Decrease) in Net Assets Before Capital Grant
Contributions (396,269) 6,410,022 -106.18%
Capital Grant Contributions 202,802 157,987 28.37%
Increase (Decrease) in Net Position (193,467) 6,568,009 -102.95%
Ending Net Position 21,992,427$ 22,185,894$ -0.87%
Net operating income-Affordable Housing 1,454,578$ 1,639,528 -11.28%
Net operating income-Assisted Housing (286,808)$ (1,074,449) -73.31%
CHANGES IN NET POSITION
_________________________________________________________________________________________________________ Washington State Auditor's Office
15
Budgetary Highlights The Authority’s executive staff developed its 2012 budget in December 2011. Informal budget revisions were completed during the year in response to operational changes made to meet regulatory requirements in the Low-Income Public Housing program. The Authority met its revenue targets and spent approximately $410,000 less than its operating expense budget. The main factors causing the variance are as follows:
• Housing assistance expenses were about $430,000 less than budgeted as a result of a reduction in utilization in the Housing Choice Voucher program.
• Operating and maintenance costs in the Affordable Housing program were approximately $180,000 less than anticipated as a result of staffing reductions and unrealized utility rate and liability insurance increases.
• Operating and maintenance costs in the Low-Income Public Housing program were $250,000 more than budgeted due to increases in staffing and maintenance and repair costs associated with operational changes made to meet regulatory requirements.
• Start-up costs of about $30,000 associated with the organization of the Authority’s non-profit corporation were delayed pending final approval from the Internal Revenue Service.
• Staffing reductions of about $20,000 in the Ready to Rent and Opportunity Works programs was reduced in response to funding reductions.
CAPITAL ASSET AND DEBT ADMINISTRATION Capital Assets At the end of 2012, the Authority had $24.8 million invested in its portfolio of housing stock and $1.5 million invested in assets used in administration and program support. This amount represents a net increase (including additions, sales, disposals and depreciation) of $260,000 from last year. The increase to capital assets is due to major maintenance and building additions (and related disposals) and purchases of technology related items for administrative use. This year's major additions include major capital improvement projects as well as costs incurred for interior modernization activities; however those additions are partially offset by reductions from normal recurring depreciation. The Authority maintains capital replacement reserves under a bond indenture, under a loan agreement requirement and under a HUD disposition agreement. As of December 31, 2012, the Authority has approximately $6.6 million in reserves held specifically for capital replacements on the pooled housing refunding bonds, a Rural Development project, and the Authority’s Low-Income Public Housing program. The Authority's fiscal-year 2013 capital budget calls for it to spend approximately $1.8 million for capital projects involving the pooled housing bond properties, Low Income Public Housing program and the Rural Development project. These capital improvements will be funded from existing reserves and additionally will require the use of operating cash flow. For additional information refer to Note 1.D.6. in the notes to the financial statements. Debt Administration At year-end, the Authority had $18.8 million in bonds and loans outstanding versus $19.7 million last year, a decrease of 5%. Reductions were a result of normal, recurring principal payments.
_________________________________________________________________________________________________________ Washington State Auditor's Office
16

The Authority met its obligations set forth under bond covenants to maintain pre-determined debt service coverage ratios. Additional information regarding long-term debt and related bond covenants is provided in Note 4 of the Authority’s notes to the financial statements. ECONOMIC FACTORS AND NEXT YEAR'S BUDGETS AND RATES The Authority's appointed commissioners and management considered many factors when setting the preliminary fiscal year 2013 budget. At the time this report was published, funding levels for the programs operated and funded through the Section 8 Housing Choice Voucher and Low-Income Public Housing programs remained undetermined as a result of the federal government’s sequestration; however even short term impacts are expected to reduce funding levels in 2013. Effects of sequestration motivated the Authority’s management to mirror operating costs of 2012 in the 2013 budget. Additionally, the Authority’s preliminary budget assumes certain vacated apartments previously off-line for capital improvement projects will receive occupancy certificates and begin producing revenues early in the year. The investment in capital assets, net of related debt is expected to increase as a result of capital improvements that are expected to be completed in 2013. The restricted net position balance will be reduced primarily by HUD imposed requirements to offset budget appropriations with existing housing assistance reserves held by the Authority, funding reductions resulting from sequestration, and expenditures for capital improvements that will be funded by reserve amounts restricted for that purpose. While the full extent of impacts of sequestration are uncertain, the Authority expects its unrestricted net position to decrease by at least $600,000 by the close of 2013. In order to meet the budget targets, the occupancy targets will need to be met, productivity in managing the assisted housing programs will need to be achieved and expense controls will need to be rigorously enforced. Contacting the Authority’s Financial Management This financial report is designed to provide our citizens, renters, housing assistance customers, and creditors with a general overview of the Authority's finances and to show the Authority's accountability for the money it receives. If you have questions about this report or need additional financial information, contact the Authority’s finance department, at Pierce County Housing Authority, 603 South Polk Street, PO Box 45410, Tacoma, WA 98445-5410.
_________________________________________________________________________________________________________ Washington State Auditor's Office
17

PIERCE COUNTY HOUSING AUTHORITY
STATEMENT OF NET POSITION
AS OF DECEMBER 31, 2012
ASSETS
Current Assets
Cash, Cash Equivalents and Investments 2,718,306
Restricted Cash, Cash Equivalents and Investments 9,200,925
Accounts Receivable/prepaids (net) 111,452
Notes Receivable 32,304
Inventory 13,959
TOTAL CURRENT ASSETS 12,076,946
Non Current Assets
Restricted Cash, Cash Equivalents, and Investments 2,482,449
Notes Receivable 1,144,927
Financing Gains and Costs (net) 163,271
Capital Assets:
Land 5,334,117
Construction in Progress 262,602
Buildings 33,356,696
Intangible Assets 89,224
Equipment and Flooring 3,056,815
Less accumulated depreciation (15,760,165)
TOTAL NON CURRENT ASSETS 30,129,936
TOTAL ASSETS 42,206,882
LIABILITIES
Accounts Payable 433,677
Accrued Interest Payable 84,783
Tenant Deposits and Prepaid Rent 270,884
Other Accrued Liabilities 247,091
Accrued Payroll & Compensated Absences 160,796
Grant Advances 126,300
Current portion of long term liabilities 1,556,858
TOTAL CURRENT LIABILITIES 2,880,389
Non Current Liabilities
Bonds and Loans Payable 16,802,254
Compensated Absences, Other Non-Current Liabilities and Grant Advances 531,812
TOTAL LIABILITIES 20,214,455
NET POSITION
Invested (deficit) in Capital Assets 8,143,448
Restricted 10,861,711
Unrestricted 2,987,268
TOTAL NET POSITION 21,992,427
The notes to the financial statements are an integral part of this statement.
_________________________________________________________________________________________________________ Washington State Auditor's Office
18
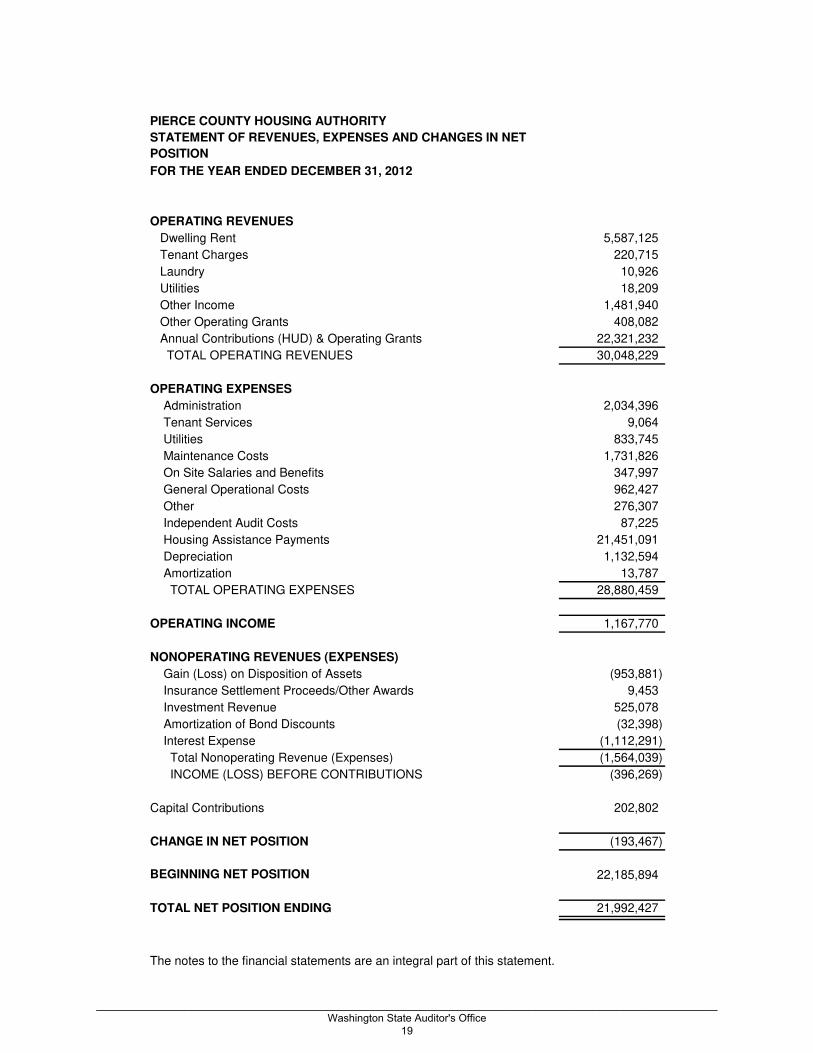
PIERCE COUNTY HOUSING AUTHORITY
STATEMENT OF REVENUES, EXPENSES AND CHANGES IN NET
POSITION
FOR THE YEAR ENDED DECEMBER 31, 2012
OPERATING REVENUES
Dwelling Rent 5,587,125
Tenant Charges 220,715
Laundry 10,926
Utilities 18,209
Other Income 1,481,940
Other Operating Grants 408,082
Annual Contributions (HUD) & Operating Grants 22,321,232
TOTAL OPERATING REVENUES 30,048,229
OPERATING EXPENSES
Administration 2,034,396
Tenant Services 9,064
Utilities 833,745
Maintenance Costs 1,731,826
On Site Salaries and Benefits 347,997
General Operational Costs 962,427
Other 276,307
Independent Audit Costs 87,225
Housing Assistance Payments 21,451,091
Depreciation 1,132,594
Amortization 13,787
TOTAL OPERATING EXPENSES 28,880,459
OPERATING INCOME 1,167,770
NONOPERATING REVENUES (EXPENSES)
Gain (Loss) on Disposition of Assets (953,881)
Insurance Settlement Proceeds/Other Awards 9,453
Investment Revenue 525,078
Amortization of Bond Discounts (32,398)
Interest Expense (1,112,291)
Total Nonoperating Revenue (Expenses) (1,564,039)
INCOME (LOSS) BEFORE CONTRIBUTIONS (396,269)
Capital Contributions 202,802
CHANGE IN NET POSITION (193,467)
BEGINNING NET POSITION 22,185,894
TOTAL NET POSITION ENDING 21,992,427
The notes to the financial statements are an integral part of this statement.
_________________________________________________________________________________________________________ Washington State Auditor's Office
19

PIERCE COUNTY HOUSING AUTHORITY
STATEMENT OF CASH FLOWS
FOR THE YEAR ENDED DECEMBER 31, 2012
CASH FLOWS FROM OPERATING ACTIVITIES
Receipts from customers 7,527,197$
Payments to suppliers, employees and landlords (27,776,287)
Receipts from governments 22,473,063
NET CASH PROVIDED BY OPERATING ACTIVITIES 2,223,973
CASH FLOWS FROM CAPITAL AND RELATED FINANCING ACTIVITIESProceeds from insurance claim settlements 9,453
Proceeds from capital debt 33,774
Capital contributions 202,802
Purchases of capital assets (2,632,803)
Principal paid on capital debt (905,589)
Interest paid on capital debt (1,116,214)
NET CASH USED BY CAPITAL AND RELATED FINANCING ACTIVITIES (4,408,577)
CASH FLOWS FROM INVESTING ACTIVITIES
Proceeds from sales and maturities of investments 1,724,885
Purchase of investments (625,000)
Proceeds from Payments on Notes Receivable 70,496
Interest and dividends 525,078
NET CASH USED BY INVESTING ACTIVITIES 1,695,459
Net increase in cash and cash equivalents (489,145)
Balances - beginning of the year 4,992,729
Balances - end of the year 4,503,584
Investments 9,898,096
Total Cash, Cash Equivalents and Investments 14,401,680$
RECONCILIATION OF OPERATING INCOME (LOSS) TO NET CASH
PROVIDED (USED) BY OPERATING ACTIVITIES
Operating income 1,167,770$
Adjustments to reconcile operating income to net cash provided (used)
by operating activities:
Depreciation expense 1,132,594
Amortization expense 13,787
Changes in assets and liabilities:
Receivables, net 72,097
Inventories 1,226
Accounts Payable (22,747)
Accrued Expenses 8,027
Tenant Deposits and Prepaid Rent (2,481)
Accrued Payroll and Compensated absences 6,863 Advance Payment of Grants (10,500)
Non Current Liabilities (142,663)
NET CASH PROVIDED BY OPERATING ACITVITIES 2,223,973$
RECONCILIATION OF TOTAL CASH, CASH EQUIVALENTS AND
INVESTMENTS TO THE STATEMENT OF NET POSITION
Categories Reflected in the Statement of Net Assets
Current:
Cash, Cash Equivalents and Investments 2,718,306
Restricted Cash and Cash Equivalents 9,200,925
Non Current:
Restricted Cash Equivalents and Investments 2,482,449
Total Cash, Cash Equivalents and Investments in Cash Flow Statement 14,401,680$
The notes to the financial statements are an integral part of this statement
_________________________________________________________________________________________________________ Washington State Auditor's Office
20
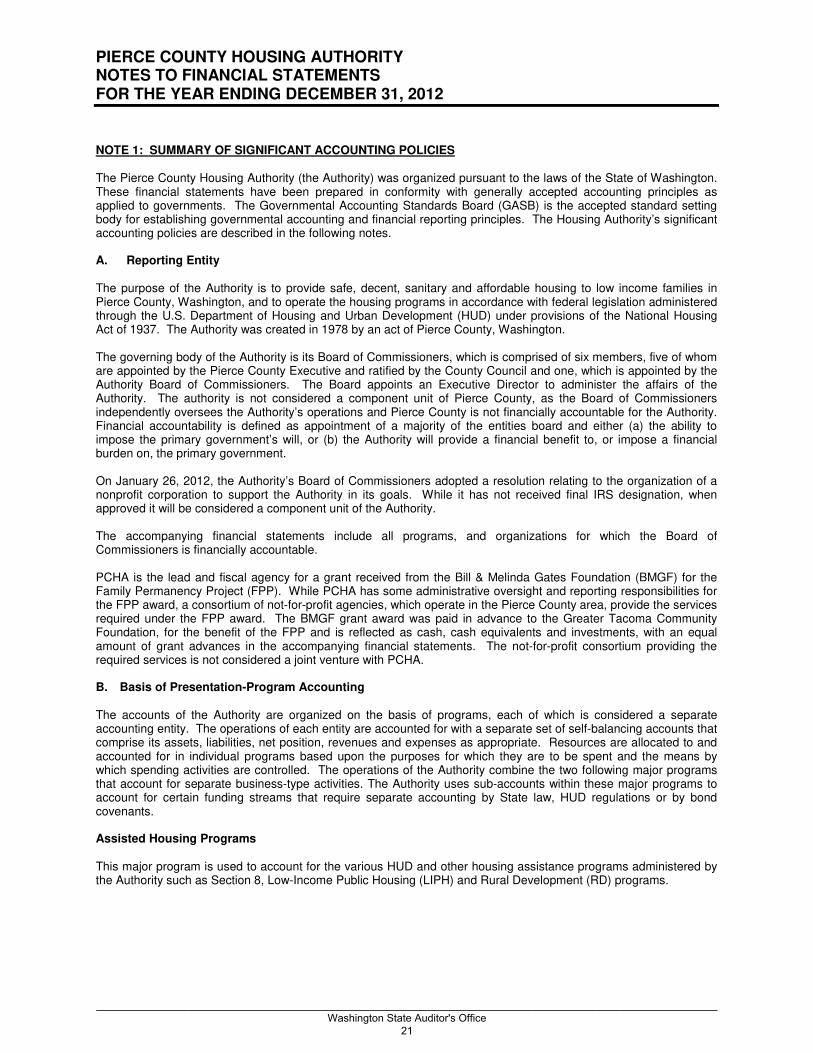
PIERCE COUNTY HOUSING AUTHORITY NOTES TO FINANCIAL STATEMENTS FOR THE YEAR ENDING DECEMBER 31, 2012
NOTE 1: SUMMARY OF SIGNIFICANT ACCOUNTING POLICIES The Pierce County Housing Authority (the Authority) was organized pursuant to the laws of the State of Washington. These financial statements have been prepared in conformity with generally accepted accounting principles as applied to governments. The Governmental Accounting Standards Board (GASB) is the accepted standard setting body for establishing governmental accounting and financial reporting principles. The Housing Authority’s significant accounting policies are described in the following notes. A. Reporting Entity The purpose of the Authority is to provide safe, decent, sanitary and affordable housing to low income families in Pierce County, Washington, and to operate the housing programs in accordance with federal legislation administered through the U.S. Department of Housing and Urban Development (HUD) under provisions of the National Housing Act of 1937. The Authority was created in 1978 by an act of Pierce County, Washington. The governing body of the Authority is its Board of Commissioners, which is comprised of six members, five of whom are appointed by the Pierce County Executive and ratified by the County Council and one, which is appointed by the Authority Board of Commissioners. The Board appoints an Executive Director to administer the affairs of the Authority. The authority is not considered a component unit of Pierce County, as the Board of Commissioners independently oversees the Authority’s operations and Pierce County is not financially accountable for the Authority. Financial accountability is defined as appointment of a majority of the entities board and either (a) the ability to impose the primary government’s will, or (b) the Authority will provide a financial benefit to, or impose a financial burden on, the primary government. On January 26, 2012, the Authority’s Board of Commissioners adopted a resolution relating to the organization of a nonprofit corporation to support the Authority in its goals. While it has not received final IRS designation, when approved it will be considered a component unit of the Authority. The accompanying financial statements include all programs, and organizations for which the Board of Commissioners is financially accountable. PCHA is the lead and fiscal agency for a grant received from the Bill & Melinda Gates Foundation (BMGF) for the Family Permanency Project (FPP). While PCHA has some administrative oversight and reporting responsibilities for the FPP award, a consortium of not-for-profit agencies, which operate in the Pierce County area, provide the services required under the FPP award. The BMGF grant award was paid in advance to the Greater Tacoma Community Foundation, for the benefit of the FPP and is reflected as cash, cash equivalents and investments, with an equal amount of grant advances in the accompanying financial statements. The not-for-profit consortium providing the required services is not considered a joint venture with PCHA. B. Basis of Presentation-Program Accounting The accounts of the Authority are organized on the basis of programs, each of which is considered a separate accounting entity. The operations of each entity are accounted for with a separate set of self-balancing accounts that comprise its assets, liabilities, net position, revenues and expenses as appropriate. Resources are allocated to and accounted for in individual programs based upon the purposes for which they are to be spent and the means by which spending activities are controlled. The operations of the Authority combine the two following major programs that account for separate business-type activities. The Authority uses sub-accounts within these major programs to account for certain funding streams that require separate accounting by State law, HUD regulations or by bond covenants. Assisted Housing Programs This major program is used to account for the various HUD and other housing assistance programs administered by the Authority such as Section 8, Low-Income Public Housing (LIPH) and Rural Development (RD) programs.
_________________________________________________________________________________________________________ Washington State Auditor's Office
21
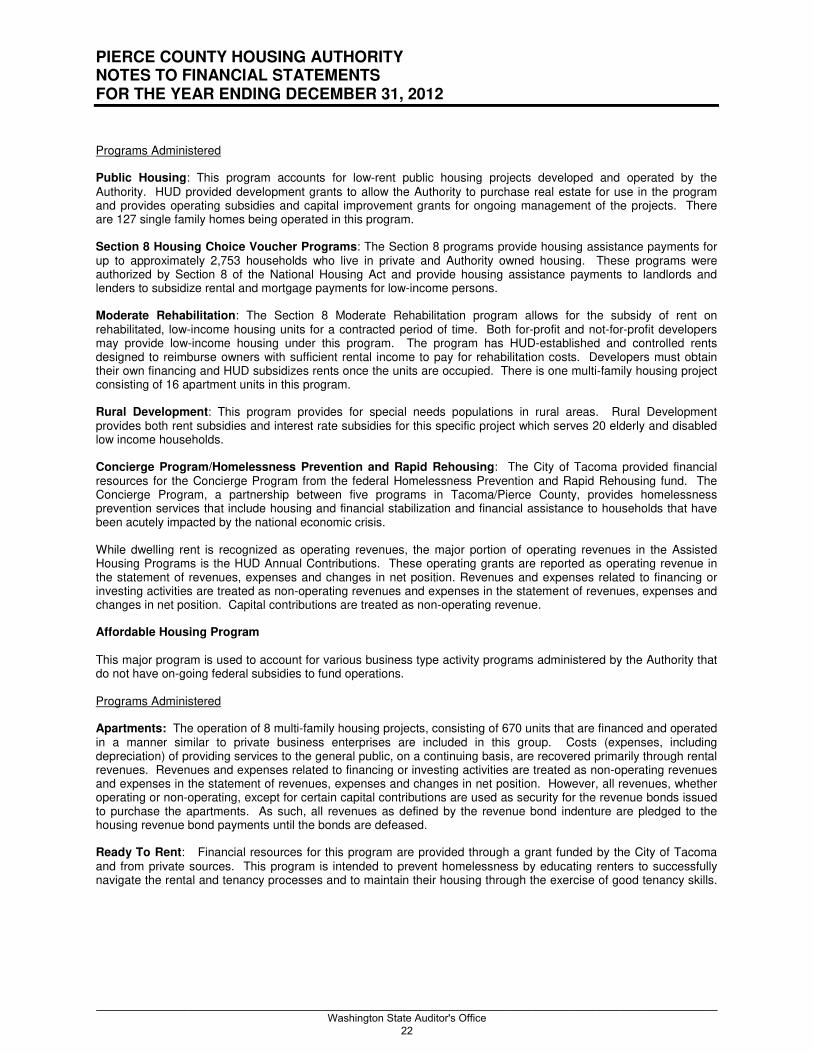
PIERCE COUNTY HOUSING AUTHORITY NOTES TO FINANCIAL STATEMENTS FOR THE YEAR ENDING DECEMBER 31, 2012
Programs Administered Public Housing: This program accounts for low-rent public housing projects developed and operated by the Authority. HUD provided development grants to allow the Authority to purchase real estate for use in the program and provides operating subsidies and capital improvement grants for ongoing management of the projects. There are 127 single family homes being operated in this program. Section 8 Housing Choice Voucher Programs: The Section 8 programs provide housing assistance payments for up to approximately 2,753 households who live in private and Authority owned housing. These programs were authorized by Section 8 of the National Housing Act and provide housing assistance payments to landlords and lenders to subsidize rental and mortgage payments for low-income persons. Moderate Rehabilitation: The Section 8 Moderate Rehabilitation program allows for the subsidy of rent on rehabilitated, low-income housing units for a contracted period of time. Both for-profit and not-for-profit developers may provide low-income housing under this program. The program has HUD-established and controlled rents designed to reimburse owners with sufficient rental income to pay for rehabilitation costs. Developers must obtain their own financing and HUD subsidizes rents once the units are occupied. There is one multi-family housing project consisting of 16 apartment units in this program. Rural Development: This program provides for special needs populations in rural areas. Rural Development provides both rent subsidies and interest rate subsidies for this specific project which serves 20 elderly and disabled low income households. Concierge Program/Homelessness Prevention and Rapid Rehousing: The City of Tacoma provided financial resources for the Concierge Program from the federal Homelessness Prevention and Rapid Rehousing fund. The Concierge Program, a partnership between five programs in Tacoma/Pierce County, provides homelessness prevention services that include housing and financial stabilization and financial assistance to households that have been acutely impacted by the national economic crisis. While dwelling rent is recognized as operating revenues, the major portion of operating revenues in the Assisted Housing Programs is the HUD Annual Contributions. These operating grants are reported as operating revenue in the statement of revenues, expenses and changes in net position. Revenues and expenses related to financing or investing activities are treated as non-operating revenues and expenses in the statement of revenues, expenses and changes in net position. Capital contributions are treated as non-operating revenue. Affordable Housing Program This major program is used to account for various business type activity programs administered by the Authority that do not have on-going federal subsidies to fund operations. Programs Administered Apartments: The operation of 8 multi-family housing projects, consisting of 670 units that are financed and operated in a manner similar to private business enterprises are included in this group. Costs (expenses, including depreciation) of providing services to the general public, on a continuing basis, are recovered primarily through rental revenues. Revenues and expenses related to financing or investing activities are treated as non-operating revenues and expenses in the statement of revenues, expenses and changes in net position. However, all revenues, whether operating or non-operating, except for certain capital contributions are used as security for the revenue bonds issued to purchase the apartments. As such, all revenues as defined by the revenue bond indenture are pledged to the housing revenue bond payments until the bonds are defeased. Ready To Rent: Financial resources for this program are provided through a grant funded by the City of Tacoma and from private sources. This program is intended to prevent homelessness by educating renters to successfully navigate the rental and tenancy processes and to maintain their housing through the exercise of good tenancy skills.
_________________________________________________________________________________________________________ Washington State Auditor's Office
22

PIERCE COUNTY HOUSING AUTHORITY NOTES TO FINANCIAL STATEMENTS FOR THE YEAR ENDING DECEMBER 31, 2012
Funds provide a portion of the education, supplies and administrative costs to operate the program. Approximately 230 individuals participated in this program during 2012. 5H Homeownership: This program accounts for the sale of public housing program homes to current residents. Homes sold under this program are transferred from the Assisted Housing Program to the Homeownership program sub-account within the Apartments Program at its net book value. The proceeds of the sales are a combination of cash, for privately financed first mortgages, and second mortgage notes receivable. The Authority holds a “silent second” mortgage that bears no interest. These mortgages are due upon sale of the property or at such time as the family can afford to pay at least $50 per month in debt service as determined under program guidelines. Since the timing of repayment of these notes is uncertain, the investment in the related notes receivable have not been discounted. As such, these notes are stated at their face value in the accompanying statement of net position. There were 22 households served in this program during 2012. C. Measurement Focus and Basis of Accounting Basis of Accounting refers to when revenues and expenses are recognized in the accounts and reported in the financial statements. All of the Authority’s programs are considered business-type activities, which use the economic resources measurement focus and the accrual basis of accounting. Under this basis of accounting, revenues are recognized when they are earned and expenses recognized when incurred. Substantially all transactions in the Affordable Housing Program are considered to be exchange type transactions. Annual HUD Contributions reflected in the Assisted Housing Program are considered to be voluntary non-exchange transactions. Revenues for such transactions are recorded when eligible payments have been made. The Authority presents a classified statement of net position, which distinguishes between short-term and long-term assets and liabilities. The criterion used to determine whether an asset or liability is long or short-term is one year. This means that assets that are expected to convert to cash or will benefit the ensuing year’s operations are treated as current assets. Likewise, liabilities that will likely be settled within the ensuing year are treated as current liabilities. For example, cash and cash equivalents held by the trustee that will be used to pay the next scheduled debt service payment are classified as Restricted Cash and Cash Equivalents in current assets while cash equivalents and investments held by the trustee that are held as reserves that can be used only under unlikely circumstances are treated as Restricted Cash Equivalents and Investments under non-current assets. Certain liabilities, such as Unclaimed Property and Compensated Absences, are classified into current and long-term portions based upon estimates of the amounts that will be settled during the ensuing year. D. Specific Assets, Liabilities and Revenue Recognition Policies 1. Cash, Cash Equivalents and Investments The Authority’s cash and cash equivalents are considered to be cash on hand, demand deposits, balances held by the bond trustee and short term investments with original maturities of three months or less from the date of acquisition. Investments are reported at fair value. Investment Contracts held by the bond trustee are not considered marketable securities and, therefore, are recorded at cost. 2. Accounts Receivable The Allowance Method for uncollectable accounts receivable (tenant rental and tenant charges) is utilized. All rents and other charges due from vacated tenants, tenants pending eviction or residency termination and all rents and other charges due from active tenants that are in excess of 60 days past due are deemed to be uncollectable. These amounts reduce the amount of accounts receivable and increase General Operational Costs reflected in these financial statements. 3. Restricted Cash Equivalents and Investments These accounts contain resources restricted by external parties for debt service, housing assistance payments, repair and replacement and capital improvements in the various funds. Specific debt service reserve requirements are described in Note 4. The bond trustee holds $8,872,673 in an investment agreement in bond reserve funds that
_________________________________________________________________________________________________________ Washington State Auditor's Office
23

PIERCE COUNTY HOUSING AUTHORITY NOTES TO FINANCIAL STATEMENTS FOR THE YEAR ENDING DECEMBER 31, 2012
yield a fixed rate of return for the life of the bonds. This investment agreement from one financial institution yields an interest rate of 5.31%. The trustee has valued this agreement at cost, as it is not considered marketable. Cash held for the operation of the assisted housing programs are not considered restricted, as they are available for operating expenses of those and other designated Authority programs, except for excess housing assistance appropriated for the Housing Choice Voucher Program in calendar years 2005-2012 in the amount of $1,883,691, funds held in FSS escrow accounts in the amount of $179,850, and $105,348 restricted for modernization and development activities for the Low-Income Public Housing and Rural Development programs. Cash and investments of $460,809, held for the Family Permanency Project is considered restricted, as it is restricted for operating expenses of that program. Tenant damage deposits held in trust accounts of $181,003 are considered restricted for return to the tenant or until they are applied to amounts owed by the tenant. 4. Due From and Due to other programs During the course of the Authority’s operations, numerous transactions occur between programs and/or between specific apartment rental buildings to finance operations and provide services. Internal activity within a program and between programs is eliminated except for residual balances remaining at year-end in the preparation of these financial statements. These residual balances are eliminated in these entity-wide financial statements. 5. Notes Receivable Notes held by the Authority under its Homeownership Program are stated at the face value of unpaid second mortgages. Because the ultimate timing of receipt of these funds is uncertain, no discounting of amounts to reflect the time value of money is reflected in these financial statements. Mortgage payments that are due in 2013 are classified as current assets. In keeping with HUD’s Real Estate Assessment Center Financial Data Schedule reporting requirements, mortgage balances that may be past due are considered non-current. 6. Capital Assets All capital assets are valued at historical cost, which is comprised of acquisition, development and modernization costs of buildings, property improvements and equipment. Capital assets, except for land, are being depreciated on the straight-line method over estimated useful lives ranging from five to forty years. Buildings are depreciated over forty years, building improvements are depreciated over the remaining useful life of the particular building at the time of the improvement and intangible assets, equipment and floor covering are depreciated over five years. The Authority’s capitalization policies are as follows: Costs for land or structures (buildings and improvements) are capitalized. Costs for equipment and furnishings, including tenant unit flooring, having a unit cost in excess of $200 and a useful life of more than one year are capitalized. Costs for betterments and additions, which add to the value or life of existing capital assets, are capitalized. The majority of the Authority’s capital assets are apartment buildings acquired as operating units in connection with the issuance of Housing Revenue Bonds. In most cases, the acquisition price was allocated between land and buildings, with no allocation of the purchase price to equipment or other internal apartment unit furnishings. In these cases, when equipment or other internal apartment unit furnishings are replaced, the loss on disposition of capital assets is recorded as a reduction to buildings while the disposition for equipment or other internal apartment furnishings that where separately purchased are recorded as a reduction to equipment. The Authority applies certain HUD guidelines regarding eligible capital costs to all of the Authority’s programs. As a result, major maintenance items such as roof replacements and exterior painting are capitalized and are depreciated over the remaining life of the structure. Other expenses for non-major maintenance and repairs, which do not add to the value or life of capital assets, are charged to operating expenses as incurred. Additions to building, equipment and flooring are costs incurred under the HUD Capital Fund and Public Housing Programs, reconstruction costs at certain apartment buildings and other improvements and additions. A portion of the additions to equipment and flooring and some of the disposals in this category represent replacement of
_________________________________________________________________________________________________________ Washington State Auditor's Office
24

PIERCE COUNTY HOUSING AUTHORITY NOTES TO FINANCIAL STATEMENTS FOR THE YEAR ENDING DECEMBER 31, 2012
appliances and flooring in tenant units. The building disposals include the disposition of the declined value for building reconstruction and equipment replacement. Capital asset activity for the year ended December 31, 2012 is as follows:
7. Compensated Absences Vested and accumulated vacation and sick leave are reported as expenses and classified into current and long term portions in the applicable program. 8. Debt Issue Costs and Bond Discounts Debt issue costs and gains on bond refunding programs are amortized over the period for which the related debt is outstanding and are reflected as financing gains and costs (net) in the statement of net position. Original issue discounts are also amortized over the period for which the debt is outstanding and are included in the long term portion of bonds and loans payable. Changes in financial reporting from prior years is described in Note 11. 9. Revenue Recognition Tenant rent revenue is recognized on the first day of the month for which the rent is due. Rental payments received in advance of the month for which the payment is made is deferred as prepaid rent and is included in current liabilities. HUD contributions for continuing contracts and revenues from local and private grants are recognized as funding is allocated. For non-recurring or new HUD contribution contracts, revenue is not recognized until the Authority receives a signed contract or notice of funding allocation. 10. Operating Revenues and Expenses Operating revenues include fees and charges from providing services in connection with the ongoing operations of providing affordable and low-income housing. Operating revenues also include operating subsidies and grants provided by Housing and Urban Development (HUD). The use of this classification is based on guidance from HUD, the primary user of the financial statements. Operating expenses are those expenses that are directly incurred while
Beginning Balance Additions Disposals Ending Balance
Nondepreciable Capital Assets:
Land 5,334,117$ -$ -$ 5,334,117$
Construction in Progress 1,803,161 226,151 1,766,710$ 262,602
Total Nondepreciable Capital Assets: 7,137,278 226,151 1,766,710 5,596,719
Depreciable Capital Assets:
Buildings 31,772,544 3,408,223 1,824,071 33,356,696
Intangible Assets - 89,224 89,224
Equipment & Flooring 3,100,932 393,795 437,912 3,056,815
Total Depreciable Capital Assets: 34,873,476 3,891,242 2,261,983 36,502,735
Accumulated Depreciation
Buildings (13,308,952) (943,134) 892,555 (13,359,531)
Equipment & Flooring (2,621,087) (189,460) 409,913 (2,400,634)
Total Accumulated Depreciation (15,930,039) (1,132,594) 1,302,468 (15,760,165)
Total Depreciable Capital Assets, Net: 18,943,437 2,758,648 959,515 20,742,570
Total Capital Assets, Net 26,080,715$ 26,339,289$
_________________________________________________________________________________________________________ Washington State Auditor's Office
25
PIERCE COUNTY HOUSING AUTHORITY NOTES TO FINANCIAL STATEMENTS FOR THE YEAR ENDING DECEMBER 31, 2012
in the operation of providing affordable and low-income housing. This presentation results in an operating income that is higher than a non-operating revenue presentation by the amount of the subsidies and grants. Overall it does not affect the presentation of net income or the change in net position in the statement of revenues, expenses and changes in net position, or the presentation of cash and cash equivalents in the statement of cash flows. 11. Inventory Maintenance supplies maintained in the Authority’s maintenance warehouse are valued at cost using the last-in, first-out method. NOTE 2: LEGAL COMPLIANCE-BUDGETS The Authority has no legal obligation to provide a comprehensive annual budget. For certain HUD and RD programs, the Authority is contractually required to prepare budgets. These budgets were prepared in accordance with applicable program requirements and were approved by the Board of Commissioners as required. When necessary, budget revisions were submitted to the oversight agency and approved. NOTE 3: DEPOSITS, CASH EQUIVALENTS AND INVESTMENTS
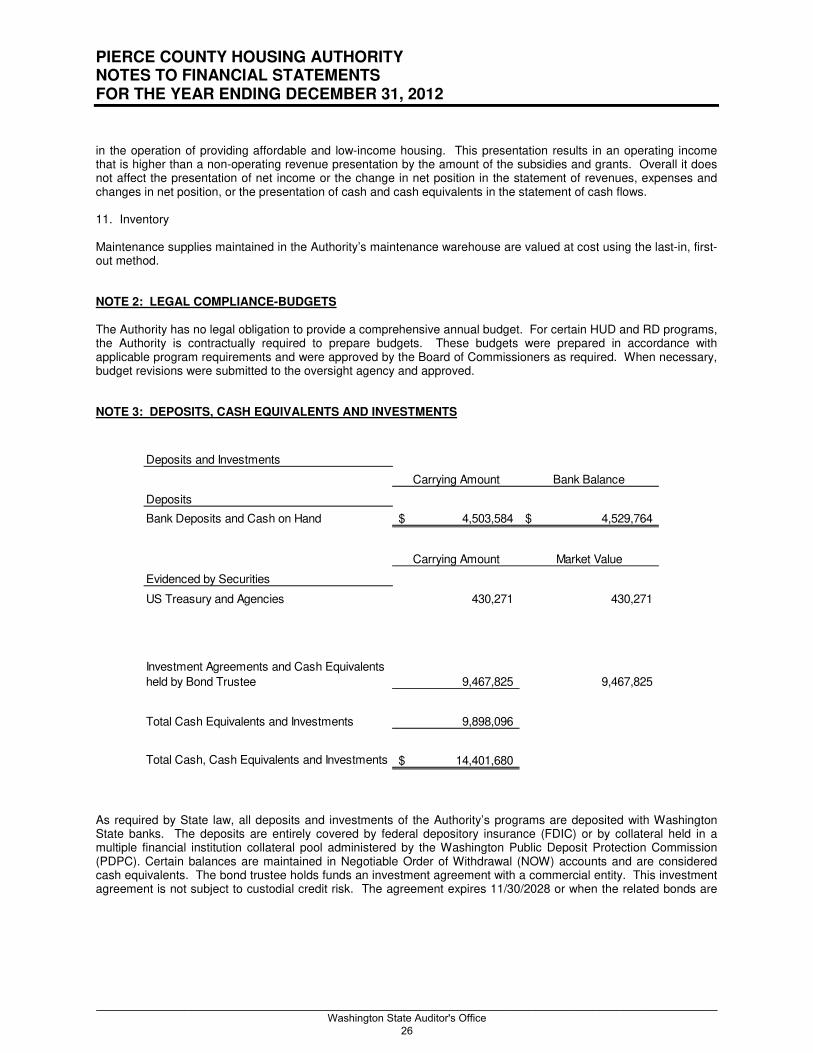
As required by State law, all deposits and investments of the Authority’s programs are deposited with Washington State banks. The deposits are entirely covered by federal depository insurance (FDIC) or by collateral held in a multiple financial institution collateral pool administered by the Washington Public Deposit Protection Commission (PDPC). Certain balances are maintained in Negotiable Order of Withdrawal (NOW) accounts and are considered cash equivalents. The bond trustee holds funds an investment agreement with a commercial entity. This investment agreement is not subject to custodial credit risk. The agreement expires 11/30/2028 or when the related bonds are
Deposits and Investments
Carrying Amount Bank Balance
Deposits
Bank Deposits and Cash on Hand 4,503,584$ 4,529,764$
Carrying Amount Market Value
Evidenced by Securities
US Treasury and Agencies 430,271 430,271
Investment Agreements and Cash Equivalents
held by Bond Trustee 9,467,825 9,467,825
Total Cash Equivalents and Investments 9,898,096
Total Cash, Cash Equivalents and Investments 14,401,680$
_________________________________________________________________________________________________________ Washington State Auditor's Office
26

PIERCE COUNTY HOUSING AUTHORITY NOTES TO FINANCIAL STATEMENTS FOR THE YEAR ENDING DECEMBER 31, 2012
fully defeased. The S&P credit rating of the guarantor of the investment is AA+. The Authority has no policy for custodial credit risk separate from State law. Approximately $30,000 of the bank deposits listed above is held by the Greater Tacoma Community Foundation (GTCF) as agent for the Sound Families Grant. Substantially all of the remaining GTCF funds are invested in US Treasury Notes. These US Treasury Notes mature in increments of approximately $35,000 to $88,000 per year, from 2013 to 2018. NOTE 4: LONG TERM OBLIGATIONS The Authority’s long-term obligations consist of low-income housing revenue bonds, a Rural Development loan, a business activity loan incurred in connection with the purchase of three parcels intended for the development of an administrative facility, a SHB 2060 forgivable loan obtained for a capital improvement project and a capital lease. In addition, the authority records long term liabilities for a portion of compensated absences, advance grant payments, unclaimed property, escrow accounts associated with the Section 8 and Low-Income Public Housing Family Self Sufficiency Program, and an obligation from the Chapter 9 Plan that was discharged during 2012. The change in the various classifications of the Authority’s debt from 2011 to 2012 is shown below.
The Authority classifies certain liabilities between its current and long-term portions. Compensated absences, unclaimed property and FSS program funds were classified between their current and long-term portions. In addition, the Authority received an advance of a long-term Family Permanency Project (FPP) Grant. Since the FPP grant will be used over several years, a portion is included in other long-term liabilities. The other long-term liabilities represent the estimate of the portion of certain liabilities expected to be liquidated after December 31, 2013. Tenants are allowed to pay for a bond to satisfy their security deposit requirements. These transactions are managed by a third party. The assets held by the third party and the related tenant deposit liabilities are not reflected in the Financial Statements.
Balance Outstanding
December 31, 2011 Additions PaymentsBalance Outstanding
December 31, 2012 Current Portion
Housing Revenue Bonds 18,200,000$ -$ (835,000)$ 17,365,000$ 1,090,000$
SHB 2060 65,000 - - 65,000 -
Rural Development Program Loans 581,290 - (15,399) 565,891 16,492
Business Activity Loan 844,182 - (55,190) 788,992 437,286
Capital Lease - 33,774 - 33,774 13,080
Total Outstanding Debt at year End 19,690,472$ 33,774$ (905,589)$ 18,818,657$
Less Bond Discounts (491,943) (459,545)$
Less Current Portion of Long Term Debt (905,899) (1,556,858) 1,556,858
Total Long Term Debt Outstanding 18,292,630$ 16,802,254$
_________________________________________________________________________________________________________ Washington State Auditor's Office
27
PIERCE COUNTY HOUSING AUTHORITY NOTES TO FINANCIAL STATEMENTS FOR THE YEAR ENDING DECEMBER 31, 2012
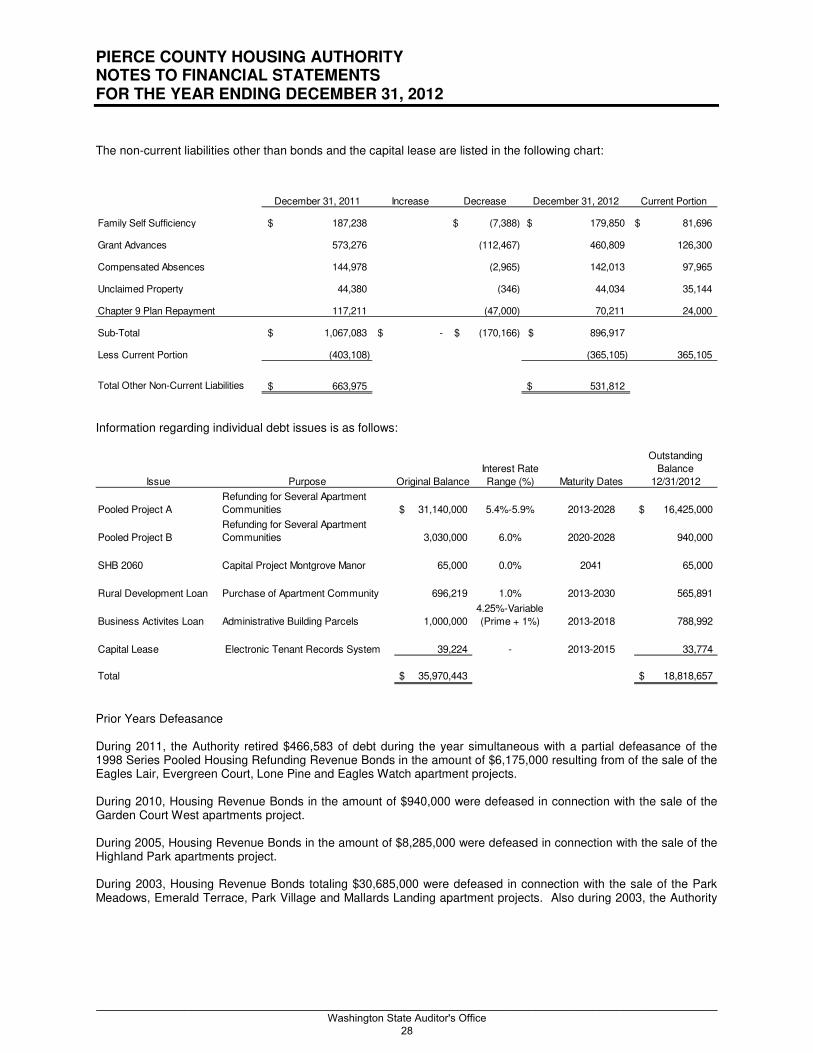
The non-current liabilities other than bonds and the capital lease are listed in the following chart:
Information regarding individual debt issues is as follows:
Prior Years Defeasance During 2011, the Authority retired $466,583 of debt during the year simultaneous with a partial defeasance of the 1998 Series Pooled Housing Refunding Revenue Bonds in the amount of $6,175,000 resulting from of the sale of the Eagles Lair, Evergreen Court, Lone Pine and Eagles Watch apartment projects. During 2010, Housing Revenue Bonds in the amount of $940,000 were defeased in connection with the sale of the Garden Court West apartments project. During 2005, Housing Revenue Bonds in the amount of $8,285,000 were defeased in connection with the sale of the Highland Park apartments project. During 2003, Housing Revenue Bonds totaling $30,685,000 were defeased in connection with the sale of the Park Meadows, Emerald Terrace, Park Village and Mallards Landing apartment projects. Also during 2003, the Authority
December 31, 2011 Increase Decrease December 31, 2012 Current Portion
Family Self Sufficiency 187,238$ (7,388)$ 179,850$ 81,696$
Grant Advances 573,276 (112,467) 460,809 126,300
Compensated Absences 144,978 (2,965) 142,013 97,965
Unclaimed Property 44,380 (346) 44,034 35,144
Chapter 9 Plan Repayment 117,211 (47,000) 70,211 24,000
Sub-Total 1,067,083$ -$ (170,166)$ 896,917$
Less Current Portion (403,108) (365,105) 365,105
Total Other Non-Current Liabilities 663,975$ 531,812$
Issue Purpose Original Balance
Interest Rate
Range (%) Maturity Dates
Outstanding
Balance
12/31/2012
Pooled Project A
Refunding for Several Apartment
Communities $ 31,140,000 5.4%-5.9% 2013-2028 $ 16,425,000
Pooled Project B
Refunding for Several Apartment
Communities 3,030,000 6.0% 2020-2028 940,000
SHB 2060 Capital Project Montgrove Manor 65,000 0.0% 2041 65,000
Rural Development Loan Purchase of Apartment Community 696,219 1.0% 2013-2030 565,891
Business Activites Loan Administrative Building Parcels 1,000,000
4.25%-Variable
(Prime + 1%) 2013-2018 788,992
Capital Lease Electronic Tenant Records System 39,224 - 2013-2015 33,774
Total $ 35,970,443 $ 18,818,657
_________________________________________________________________________________________________________ Washington State Auditor's Office
28

PIERCE COUNTY HOUSING AUTHORITY NOTES TO FINANCIAL STATEMENTS FOR THE YEAR ENDING DECEMBER 31, 2012
exercised its option to fully prepay the amount of $45,781 for the outstanding bond issued in 1992 for an administrative building. During 2000, the Harbor Heights bonds totaling $3,190,000 were defeased in connection with the sale of that property. Securities with a cost of approximately $3,250,000 were placed in escrow to fund the advanced defeasance. The advance refunding met the requirements of an in-substance defeasance and the old bonds were removed from the Authority’s financial statements. As of December 31, 2003 no bonds are outstanding. On December 1, 1998 Pierce County Housing Authority issued Senior Revenue Bonds of $31,140,000 and $3,030,000 Subordinate bonds at par with an effective interest rate of 5.74%. These bonds were used to refinance existing short-term debt that was coming due and to defease other debt with higher interest rates and short term financing. Interest on the short-term debt ranges from 5.25% to 8%. The net proceeds were used to pay off debt, which was short-term, and or callable, or were placed in an irrevocable trust to defease the Bonds, which were not immediately available to be paid off. The US Government Securities purchased with the proceeds remained in trust until September 1, 2003, when the final bonds were called at par for the then outstanding bonds. The advance refunding met the requirements of an in-substance defeasance and the old bonds were removed from the Authority’s financial statements. As of December 31, 2003 none of these bonds are outstanding.
Debt Service to Maturity The balance of individual Housing Revenue Bonds and other Authority debt are as follows:
Due to the partial defeasance of the 1998 Series Pooled Housing Refunding Revenue Bonds in the amount of $6,175,000 wherein the trustee selected which bonds were defeased, annual installments vary widely. Installments of principal and interest for the Pooled Project A Bonds range from $396,000 in 2024 to $2,180,000 in 2027. Installments the Pooled Project B Bonds is $250,000 for 2013, interest only at $44,400 per year until June 2023 at which time sinking fund payments are required. Sinking fund requirements for the Pooled Project B Bonds range from $10,000 in 2023 to $205,000 in 2027. Installments for the Rural Development Program Loan approximate $27,000 per year. Installments for the Administrative Building Loan are $90,000 per year, except in 2013 when ½ of the remaining balance is due in a balloon payment. This loan has a variable interest rate which adjusts annually at the Prime Rate plus 1%. There are no scheduled installments for the SHB 2060 loan which is will be forgiven at the end of a 30 year term provided commitments of the loan agreement to use the project for eligible purposes were fulfilled.
Issue Rates Principal Balance Interest Total Debt Service
Pooled Project A 5.4%-5.9% 16,425,000$ 9,580,851$ 26,005,851$
Pooled Project B 6.0% 940,000 597,450 1,537,450
SHB 2060 0.0% 65,000 - 65,000
Rural Development Program Loan 1.0% 565,891 45,315 611,206
Administrative Building Loan 4.25%-Variable 788,992 56,662 845,654
Capital Lease .0304 Lease Factor 33,774 - 33,774
Total 18,818,657$ 10,280,278$ 29,098,935$
_________________________________________________________________________________________________________ Washington State Auditor's Office
29

PIERCE COUNTY HOUSING AUTHORITY NOTES TO FINANCIAL STATEMENTS FOR THE YEAR ENDING DECEMBER 31, 2012
The Authority’s debt service requirements to maturity are as follows:
Bond discounts included in the long-term portion of bonds and loans payable at December 31, 2012 is $459,545, net of accumulated amortization of $753,512. Bond issue costs and the deferred amount on refunding captured in financing gains and costs (net) in the statement of net position at December 31, 2012 is $163,271, net of accumulated amortization of $644,355 Debt service requirements on the bond issues are paid from funds established pursuant to Board resolutions. Such bond funds are funded primarily from the net operating revenues of the respective housing projects on which the bonds are secured. These funds are used to accumulate sufficient amounts for debt service and are reflected as current restricted assets. The bonds also have established debt service reserve funds that were funded from the original debt proceeds, and were subsequently modified in accordance with the confirmation of the Authority’s Plan as described in Note 10.
Year Principal Interest Principal Interest Principal Interest
2013 890,000$ 938,225$ 200,000$ 50,400$ -$ -$
2014 - 902,045 - 44,400 - -
2015 470,000 902,045 - 44,400 - -
2016 1,045,000 860,941 - 44,400 - -
2017 1,110,000 801,051 - 44,400 - -
2018-2022 4,635,000 3,295,618 - 222,000 - -
2023-2027 6,195,000 1,788,443 730,000 147,150 - -
2028-2032 2,080,000 92,483 10,000 300 - -
2033-2037 - - - - - -
2038-2041 - - - - 65,000
Total 16,425,000$ 9,580,851$ 940,000$ 597,450$ 65,000$ -$
Capital Lease
Year Principal Interest Principal Interest
2013 16,492$ 10,380$ 437,286$ 23,073$ 13,080$
2014 17,662 9,210 76,532 13,468 13,080
2015 18,915 7,956 79,849 10,151 7,614
2016 20,258 6,614 83,309 6,691 -
2017 21,695 5,177 86,919 3,081 -
2018-2022 133,871 5,978 25,097 198 -
2023-2027 188,604 - - - -
2028-2032 148,394 - - - -
2033-2037 - - - - -
2038-2041 - - - - -
Total 565,891$ 45,315$ 788,992$ 56,662$ 33,774$
Authority Wide Debt Service to Maturity
Pooled Project A Revenue Bonds Pooled Project B Revenue Bonds
Administrative Building LoanRural Development Loan
SHB 2060 Loan
_________________________________________________________________________________________________________ Washington State Auditor's Office
30
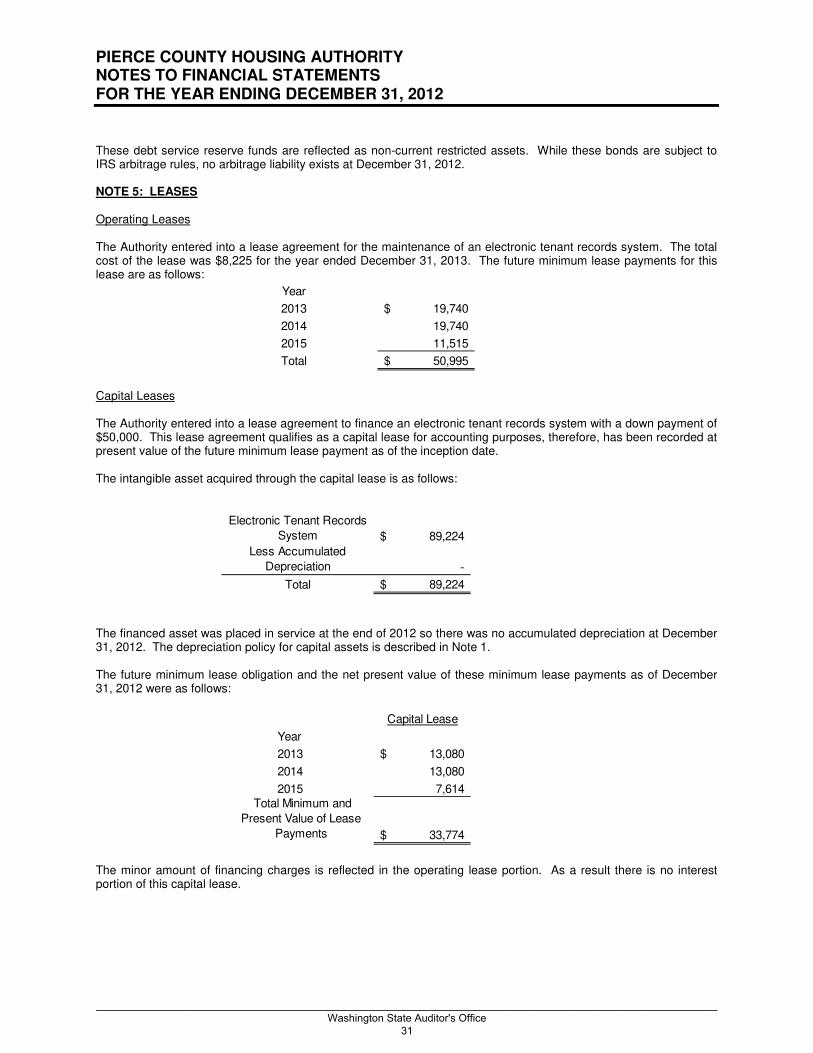
PIERCE COUNTY HOUSING AUTHORITY NOTES TO FINANCIAL STATEMENTS FOR THE YEAR ENDING DECEMBER 31, 2012
These debt service reserve funds are reflected as non-current restricted assets. While these bonds are subject to IRS arbitrage rules, no arbitrage liability exists at December 31, 2012. NOTE 5: LEASES Operating Leases The Authority entered into a lease agreement for the maintenance of an electronic tenant records system. The total cost of the lease was $8,225 for the year ended December 31, 2013. The future minimum lease payments for this lease are as follows:
Capital Leases The Authority entered into a lease agreement to finance an electronic tenant records system with a down payment of $50,000. This lease agreement qualifies as a capital lease for accounting purposes, therefore, has been recorded at present value of the future minimum lease payment as of the inception date. The intangible asset acquired through the capital lease is as follows:
The financed asset was placed in service at the end of 2012 so there was no accumulated depreciation at December 31, 2012. The depreciation policy for capital assets is described in Note 1. The future minimum lease obligation and the net present value of these minimum lease payments as of December 31, 2012 were as follows:
The minor amount of financing charges is reflected in the operating lease portion. As a result there is no interest portion of this capital lease.
Year
2013 19,740$
2014 19,740
2015 11,515
Total 50,995$
Electronic Tenant Records
System 89,224$
Less Accumulated
Depreciation -
Total 89,224$
Capital Lease
Year
2013 13,080$
2014 13,080
2015 7,614 Total Minimum and
Present Value of Lease
Payments 33,774$
_________________________________________________________________________________________________________ Washington State Auditor's Office
31

PIERCE COUNTY HOUSING AUTHORITY NOTES TO FINANCIAL STATEMENTS FOR THE YEAR ENDING DECEMBER 31, 2012
NOTE 6: DEFINED BENEFIT PENSION PLAN Substantially all Pierce County Housing Authority full-time and qualifying part-time employees participate in one of the following statewide retirement systems administered by the Washington State Department of Retirement Systems, under cost-sharing multiple-employer public employee defined benefit retirement plans. The Department of Retirement Systems (DRS), a department within the primary government of the State of Washington, issues a publicly available comprehensive annual financial report (CAFR) that includes financial statements and required supplementary information for each plan. The DRS CAFR may be obtained by writing to: Department of Retirement Systems, Communications Unit, P.O. Box 48380, Olympia, WA 98504-8380; or it may be downloaded from the DRS website at www.drs.wa.gov. The following disclosures are made pursuant to the GASB Statement 27, Accounting for Pensions by State and Local Government Employers and the GASB Statement 50, Pension Disclosures, an Amendment of GASB Statements No. 25 and No. 27. Public Employees’ Retirement System (PERS) Plans 1, 2, and 3 Plan Description
The Legislature established PERS in 1947. Membership in the system includes: elected officials; state employees; employees of the Supreme, Appeals, and Superior courts; employees of legislative committees; community and technical colleges, college and university employees not participating in higher education retirement programs; employees of district and municipal courts; and employees of local governments. Approximately 50 percent of PERS salaries are accounted for by state employment. PERS retirement benefit provisions are established in Chapters 41.34 and 41.40 RCW and may be amended only by the State Legislature. PERS is a cost-sharing multiple-employer retirement system comprised of three separate plans for membership purposes: Plans 1 and 2 are defined benefit plans and Plan 3 is a defined benefit plan with a defined contribution component. PERS members who joined the system by September 30, 1977 are Plan 1 members. Those who joined on or after October 1, 1977 and by either, February 28, 2002 for state and higher education employees, or August 31, 2002 for local government employees, are Plan 2 members unless they exercised an option to transfer their membership to Plan 3. PERS members joining the system on or after March 1, 2002 for state and higher education employees, or September 1, 2002 for local government employees have the irrevocable option of choosing membership in either PERS Plan 2 or Plan 3. The option must be exercised within 90 days of employment. Employees who fail to choose within 90 days default to Plan 3. Notwithstanding, PERS Plan 2 and Plan 3 members may opt out of plan membership if terminally ill, with less than five years to live. PERS is comprised of and reported as three separate plans for accounting purposes: Plan 1, Plan 2/3, and Plan 3. Plan 1 accounts for the defined benefits of Plan 1 members. Plan 2/3 accounts for the defined benefits of Plan 2 members and the defined benefit portion of benefits for Plan 3 members. Plan 3 accounts for the defined contribution portion of benefits for Plan 3 members. Although members can only be a member of either Plan 2 or Plan 3, the defined benefit portions of Plan 2 and Plan 3 are accounted for in the same pension trust fund. All assets of this Plan 2/3 defined benefit plan may legally be used to pay the defined benefits of any of the Plan 2 or Plan 3 members or beneficiaries, as defined by the terms of the plan. Therefore, Plan 2/3 is considered to be a single plan for accounting purposes. PERS Plan 1 and Plan 2 retirement benefits are financed from a combination of investment earnings and employer and employee contributions. Employee contributions to the PERS Plan 1 and Plan 2 defined benefit plans accrue interest at a rate specified by the Director of DRS. During DRS’ Fiscal Year 2012, the rate was five and one-half percent compounded quarterly. Members in PERS Plan 1 and Plan 2 can elect to withdraw total employee contributions and interest thereon upon separation from PERS-covered employment. PERS Plan 1 members are vested after the completion of five years of eligible service.
_________________________________________________________________________________________________________ Washington State Auditor's Office
32

PIERCE COUNTY HOUSING AUTHORITY NOTES TO FINANCIAL STATEMENTS FOR THE YEAR ENDING DECEMBER 31, 2012
PERS Plan 1 members are eligible for retirement after 30 years of service, or at the age of 60 with five years of service, or at the age of 55 with 25 years of service. The monthly benefit is 2 percent of the average final compensation (AFC) per year of service, but the benefit may not exceed 60 percent of the AFC. The AFC is the monthly average of the 24 consecutive highest-paid service credit months. The monthly benefit is subject to a minimum for retirees who have 25 years of service and have been retired 20 years, or who have 20 years of service and have been retired 25 years. If a survivor option is chosen, the benefit is reduced. Plan 1 members retiring from inactive status prior to the age of 65 may also receive actuarially reduced benefits. Plan 1 members may elect to receive an optional COLA that provides an automatic annual adjustment based on the Consumer Price Index. The adjustment is capped at 3 percent annually. To offset the cost of this annual adjustment, the benefit is reduced. PERS Plan 1 provides duty and non-duty disability benefits. Duty disability retirement benefits for disablement prior to the age of 60 consist of a temporary life annuity. The benefit amount is $350 a month, or two-thirds of the monthly AFC, whichever is less. The benefit is reduced by any workers’ compensation benefit and is payable as long as the member remains disabled or until the member attains the age of 60, at which time the benefit is converted to the member’s service retirement amount. A member with five years of covered employment is eligible for non-duty disability retirement. Prior to the age of 55, the benefit amount is 2 percent of the AFC for each year of service reduced by 2 percent for each year that the member’s age is less than 55. The total benefit is limited to 60 percent of the AFC and is actuarially reduced to reflect the choice of a survivor option. Plan 1 members may elect to receive an optional COLA amount (based on the Consumer Price Index), capped at 3 percent annually. To offset the cost of this annual adjustment, the benefit is reduced. PERS Plan 1 members can receive credit for military service while actively serving in the military if such credit makes them eligible to retire. Members can also purchase up to 24 months of service credit lost because of an on-the-job injury. The survivor of a PERS Plan 1 member who dies after having earned ten years of service credit has the option, upon the member’s death, of either a monthly survivor benefit or the lump sum of contributions plus interest. PERS Plan 2 members are vested after the completion of five years of eligible service. Plan 2 members are eligible for normal retirement at the age of 65 with five years of service. The monthly benefit is 2 percent of the AFC per year of service. The AFC is the monthly average of the 60 consecutive highest-paid service months. There is no cap on years of service credit; and a cost-of-living allowance is granted (based on the Consumer Price Index), capped at 3 percent annually. PERS Plan 2 members who have at least 20 years of service credit and are 55 years of age or older are eligible for early retirement with a reduced benefit. The benefit is reduced by an early retirement factor (ERF) that varies according to age, for each year before age 65. PERS Plan 2 members who have 30 or more years of service credit and are at least 55 years old can retire under one of two provisions: • With a benefit that is reduced by 3 percent for each year before age 65; or. • With a benefit that has a smaller (or no) reduction (depending on age) that imposes stricter return-to-work rules. PERS Plan 2 retirement benefits are also actuarially reduced to reflect the choice, if made, of a survivor option. The surviving spouse or eligible child(ren) of a PERS Plan 2 member who dies after having earned ten years of service credit has the option of either a monthly benefit or a lump sum payment of the member’s contributions plus interest. PERS Plan 3 has a dual benefit structure. Employer contributions finance a defined benefit component and member contributions finance a defined contribution component. As established by Chapter 41.34 RCW, employee contribution rates to the defined contribution component range from 5 percent to 15 percent of salaries, based on member choice. There are currently no requirements for employer contributions to the defined contribution component of PERS Plan 3.
_________________________________________________________________________________________________________ Washington State Auditor's Office
33

PIERCE COUNTY HOUSING AUTHORITY NOTES TO FINANCIAL STATEMENTS FOR THE YEAR ENDING DECEMBER 31, 2012
PERS Plan 3 defined contribution retirement benefits are dependent upon the results of investment activities. Members may elect to self-direct the investment of their contributions. Any expenses incurred in conjunction with self-directed investments are paid by members. Absent a member’s self-direction, PERS Plan 3 investments are made in the same portfolio as that of the PERS 2/3 defined benefit plan. For DRS’ fiscal year 2012, PERS Plan 3 employee contributions were $95.2 million, and plan refunds paid out were $66.2 million. The defined benefit portion of PERS Plan 3 provides members a monthly benefit that is 1 percent of the AFC per year of service. The AFC is the monthly average of the 60 consecutive highest-paid service months. There is no cap on years of service credit, and Plan 3 provides the same cost-of-living allowance as Plan 2. Effective June 7, 2006, PERS Plan 3 members are vested in the defined benefit portion of their plan after ten years of service; or after five years of service, if twelve months of that service are earned after age 44; or after five service credit years earned in PERS Plan 2 by June 1, 2003. Plan 3 members are immediately vested in the defined contribution portion of their plan. Vested Plan 3 members are eligible for normal retirement at age 65, or they may retire early with the following conditions and benefits: • If they have at least ten service credit years and are 55 years old, the benefit is reduced by an ERF that varies
with age, for each year before age 65. • If they have 30 service credit years and are at least 55 years old, they have the choice of a benefit that is
reduced by 3 percent for each year before age 65; or a benefit with a smaller (or no) reduction factor (depending on age) that imposes stricter return-to-work rules.
PERS Plan 3 benefit retirement benefits are also actuarially reduced to reflect the choice, if made, of a survivor option. PERS Plan 2 and Plan 3 provide disability benefits. There is no minimum amount of service credit required for eligibility. The Plan 2 monthly benefit amount is 2 percent of the AFC per year of service. For Plan 3, the monthly benefit amount is 1 percent of the AFC per year of service. These disability benefit amounts are actuarially reduced for each year that the member’s age is less than 65, and to reflect the choice of a survivor option. There is no cap on years of service credit, and a cost-of-living allowance is granted (based on the Consumer Price Index) capped at 3 percent annually. PERS Plan 2 and Plan 3 members may have up to ten years of interruptive military service credit; five years at no cost and five years that may be purchased by paying the required contributions. PERS Plan 2 and Plan 3 members who become totally incapacitated for continued employment while serving the uniformed services, or a surviving spouse or eligible child(ren), may request interruptive military service credit. PERS Plan 2 and Plan 3 members can purchase up to 24 months of service credit lost because of an on-the-job injury. PERS members may also purchase up to five years of additional service credit once eligible for retirement. This credit can only be purchased at the time of retirement and can be used only to provide the member with a monthly annuity that is paid in addition to the member’s retirement benefit. Beneficiaries of a PERS Plan 2 or Plan 3 member with ten years of service who is killed in the course of employment receive retirement benefits without actuarial reduction. This provision applies to any member killed in the course of employment, on or after June 10, 2004, if found eligible by the Director of the Department of Labor and Industries.
_________________________________________________________________________________________________________ Washington State Auditor's Office
34

PIERCE COUNTY HOUSING AUTHORITY NOTES TO FINANCIAL STATEMENTS FOR THE YEAR ENDING DECEMBER 31, 2012
A one-time duty-related death benefit is provided to the estate (or duly designated nominee) of a PERS member who dies in the line of service as a result of injuries sustained in the course of employment, or if the death resulted from an occupational disease or infection that arose naturally and proximately out of the member’s covered employment, if found eligible by the Department of Labor and Industries. There are 1,184 participating employers in PERS. Membership in PERS consisted of the following as of the latest actuarial valuation date for the plans of June 30, 2011:
Funding Policy Each biennium, the state Pension Funding Council adopts PERS Plan 1 employer contribution rates, PERS Plan 2 employer and employee contribution rates, and PERS Plan 3 employer contribution rates. Employee contribution rates for Plan 1 are established by statute at 6 percent for state agencies and local government unit employees, and at 7.5 percent for state government elected officials. The employer and employee contribution rates for Plan 2 and the employer contribution rate for Plan 3 are developed by the Office of the State Actuary to fully fund Plan 2 and the defined benefit portion of Plan 3. Under PERS Plan 3, employer contributions finance the defined benefit portion of the plan and member contributions finance the defined contribution portion. The Plan 3 employee contribution rates range from 5 percent to 15 percent, based on member choice. Two of the options are graduated rates dependent on the employee’s age. As a result of the implementation of the Judicial Benefit Multiplier Program in January 2007, a second tier of employer and employee rates was developed to fund, along with investment earnings, the increased retirement benefits of those justices and judges that participate in the program. The methods used to determine the contribution requirements are established under state statute in accordance with Chapters 41.40 and 41.45 RCW. The required contribution rates expressed as a percentage of current-year covered payroll, as of December 31, 2012, are as follows: Members Not Participating in JBM:
* The employer rates include the employer administrative expense fee currently set at 0.16%. ** The employer rate for state elected officials is 10.74% for Plan 1 and 7.21% for Plan 2 and Plan 3. *** Plan 3 defined benefit portion only. **** The employee rate for state elected officials is 7.50% for Plan 1 and 4.64% for Plan 2. ***** Variable from 5.0% minimum to 15.0% maximum based on rate selected by the PERS 3 member. Both Pierce County Housing Authority and the employees made the required contributions. The Pierce County Housing Authority required contributions for the years ended December 31 were as follows:
Retirees and Beneficiaries Receiving Benefits 79,363
Terminated Plan Members Entitled to But Not Yet Receiving Benefits 29,925
Active Plan Members Vested 105,578
Active Plan Members Non-vested 46,839
Total 261,705
PERS Plan 1 PERS Plan 2 PERS Plan 3
Employer* 7.08%-7.25%** 7.08%-7.25%** 7.08%-7.25%***
Employee 6%**** 4.64%**** 5-15%*****
_________________________________________________________________________________________________________ Washington State Auditor's Office
35

PIERCE COUNTY HOUSING AUTHORITY NOTES TO FINANCIAL STATEMENTS FOR THE YEAR ENDING DECEMBER 31, 2012
NOTE 7: DEFERRED COMPENSATION PLAN The Authority offers its employees a deferred compensation plan created in accordance with the Internal Revenue Code section 457. This plan, available to all regular full-time and part-time Authority employees are permitted to defer receipt of a portion of their salary until future years. Participation in the plan is optional. The deferred compensation is not available to the employee or their beneficiaries until termination, retirement, death or an unforeseeable emergency. The amounts of compensation deferred under the plan and all income attributable to these amounts are the sole property of the participant or their beneficiary. ING and DRS holds and invests these funds on behalf of the Authority’s employees. No amounts related to this plan are reflected in these financial statements. NOTE 8: OTHER POST-EMPLOYMENT BENEFITS Prior to 2011, the Authority provided medical benefits through the Washington Counties Insurance Pool (WCIP). The plan provided medical, drug, and dental benefits to eligible retirees and their dependents. The eligible retirees were able to choose to participate in the plan and pay 100% of the same premiums offered to active participants. Entities that belonged to the WCIP pool had an OPEB liability related to the implicit rate subsidy for insurance offered to retirees. The WCIP pool ended operations in 2010 and no longer incurs claims. The current medical plan offered to Authority employees through Washington Counties Insurance Fund (WCIF) provides retiree benefits that are rated separately and rates are not subsidized by active employees, therefore, the Authority no longer has other post-employment benefit liabilities. NOTE 9: INSURANCE Pierce County Housing Authority is currently a member of Housing Authority Risk Retention Group, Inc. (HARRG) and Housing Authority Insurance, Inc. (HAI) which is the Authority’s primary supplier of General Liability and Commercial Property coverage, respectively. The Authority finances its various risks of loss through the payment of premiums to the organizations discussed above as well as commercial insurance. The Authority handles its risk of property loss with insurance that covers building, contents and loss of rents in a coverage amount of estimated replacement value, with a deductible of $25,000 for building losses and a deductible of $25,000 for contents. Risk of loss from general liability is handled with general liability coverage, which provides for $5,000,000 aggregate per occurrence coverage with a $5,000 deductible. Coverage for errors and omissions provides $1,000,000 of coverage per occurrence with a $50,000 deductible. Coverage for employment practices liability provides $1,000,000 of coverage per occurrence with a $50,000 deductible. The Authority also carried employee dishonesty bonding for $100,000 with a $5,000 deductible. The Authority has also purchased their Auto Liability, Auto Physical Damage and Excess Auto coverage’s effective 11/1/2012, which carries a combined single limit of $ 5,000,000 per occurrence. HARRG is fully funded by member assessments that are adjusted annually by the HARRG Board on the basis of independent actuarial studies. These assessments cover loss, loss adjustment expenses, reinsurance and other administrative expenses. HARRG does not have the right to assess the membership for any shortfall in its funding. Such shortfalls are made up through future rate adjustments. There were no litigation settlements that exceeded insurance, net of deductible amounts, for the periods from 2010 to 2012.
PERS Plan 1 PERS Plan 2 PERS Plan 3
2012 3,667 126,191 14,745
2011 3,163 118,760 10,673
2010 2,697 116,903 12,248
_________________________________________________________________________________________________________ Washington State Auditor's Office
36

PIERCE COUNTY HOUSING AUTHORITY NOTES TO FINANCIAL STATEMENTS FOR THE YEAR ENDING DECEMBER 31, 2012
HARRG and HAPI are owned by their members and each member is asked to make an individual initial capital contribution upon entering the membership to each company of either 50% of their first year’s premium or a minimum $100 contribution. Pierce County Housing Authority has not contributed surplus to either company as of December 31, 2012. NOTE 10: DEBT SERVICE COVERAGE AND CAPITAL PROJECT COMMITMENTS The Authority is responsible under the individual bond covenants to maintain predetermined debt service coverage. All of the Apartments Program properties are debt financed as is disclosed in Note 4. The debt instruments carry debt service coverage covenants. Such covenants require the authority to maintain net operating income for the project at prescribed levels exceeding total annual debt service for the bonds. Debt service coverage covenants were met for the Revenue bonds during 2012. Bond covenants also set forth conditions for Special Redemption of the bonds resulting from Excess Revenues, wherein revenues for a period exceed the sum for that period of operation and maintenance costs, required debt service, rebate amounts, if any, amounts required to restore balances in the debt service reserve accounts to their respective reserve requirements and the cost of eligible maintenance expenses. During 2012, Excess Revenue was generated from the bond projects resulting in Special Redemption of the bonds in the amount of $200,000 scheduled for payment on June 1, 2013. This amount is included in the current portion of long term liabilities in the statement of net position. During the course of its operations, the Authority enters into commitments for various capital projects and major maintenance work. At December 31, 2012, there was approximately $397,000 in commitments under these types of contracts. NOTE 11: ACCOUNTING AND REPORTING CHANGES
In accordance with GASB 63, the Authority re-captioned the line item capturing balances of bond issue costs and deferred gains from refunding bonds on the statement of net position to Financing Gains and Costs (net). As a result of the above caption changes and in preparation for the implementation of GASB 65, the Authority changed its reporting of the balances of bond discounts on the statement of net position and the reporting of amortization on the statement of revenues, expenses and changes in net position. Prior to 2012, the amortization of bond discounts was reported as operating expenses and balances were reported as deferred charges. Amortization is now reported as non-operating expenses and balances are included in long term liabilities. NOTE 12: BANKRUPTCY
In connection with performing its operations, the Authority may occasionally be named as a defendant in litigation. During 2008, the Authority was named as a defendant in several claims regarding alleged personal injury incurred at one of its apartment complexes. This litigation is similar in nature to that which was settled during 2007 in the amount of $750,000. The Authority management made efforts to settle the second group of claims during 2008 but was not successful.
Review of the nature and driving force of the claims, and the inability of the Authority to address all potential claims at one time, subsequently convinced the Authority management to take the prudent approach to file a voluntary petition under Chapter 9 of the Bankruptcy Code on October 13, 2008. The petition put a stay on the above referenced 2008 litigation, created a single forum where all alleged claims could be addressed, and allowed the Authority to send out notice to all possible claimants against the Authority so those claims could also be addressed.
Sections 903 and 904 of the Bankruptcy Code were designed to limit the bankruptcy court jurisdiction and authority over operations of the chapter 9 debtor, thus limiting the power of the bankruptcy court to "interfere with – (1) any of the political or governmental powers of the debtor; (2) any of the property or revenues of the debtor; or (3) the
_________________________________________________________________________________________________________ Washington State Auditor's Office
37

PIERCE COUNTY HOUSING AUTHORITY NOTES TO FINANCIAL STATEMENTS FOR THE YEAR ENDING DECEMBER 31, 2012
debtor's use or enjoyment of any income-producing property" unless the debtor consents or the plan so provides. That provision allowed the Authority’s activities to continue with its day to day operations including fulfillment of its financial obligations.
On December 17, 2009, the bankruptcy court confirmed the Third Amended Plan for Adjustment of Debts of Pierce County Housing Authority (Plan). A copy of the Plan may be obtained by written request to the Authority at P.O. Box 45410, Tacoma, WA 98448-5410. The result of the Plan allowed the Authority to operate with no reduction in service levels. The Plan classified secured and unsecured claims into five groups of claimants. The Plan provided for full payment of the three groups of secured claims representing notes and bonds payable. The fourth group is a class of unsecured claims with a remaining balance of approximately $70,000. It will also be paid in full, through future rent offsets, and has been recorded as a liability. For the remaining class of unsecured claims of approximately $6 million, the Plan provided that claims would be paid under the fiduciary direction of a Post Confirmation Committee (PCC). The PCC is only able to pay claimants from a distribution account which is funded solely through proceeds of the sale of a vacant parcel of land owned by the Authority, or proceeds it may receive through the PCC pursuit of claims against the Authority’s former legal counsel, insurance, and alleged causes of action against Pierce County and/or its insurance policies for coverage of claims asserted against the Authority. Furthermore, the Plan provided that administration of claims would be at no cost to the Authority, nor would the administration of claims cause the Authority to incur any expenses. As such, the subject land, with a cost value of $23,000, was reclassified to assets held for sale, and recorded as liability. The excess amount of estimated net realizable value of the land, over the costs basis of $61,000 was not recorded. In August 2012, the Authority sold this vacant land and all proceeds were forwarded to the PCC legal counsel. Remaining amounts for these claims were never recorded by the Authority, so no liabilities were re-measured as a result of the court’s decision and as such there were no gains or losses to record. In May 2011, the Authority received proceeds from avoidance action settlements in the amount of $31,000. Approximately $26,100 was disbursed to the PCC legal counsel in accordance with the Plan. In September 2012, the Authority presented a motion to the bankruptcy court requesting authorization of the abandonment of certain assets, comprised of alleged causes of action against third parties that, to the extent they ever existed, had expired due to the passage of the applicable statute of limitations; allowing all claims filed that had not been previously allowed or disallowed in the amount set forth by the claimant; determination that the case had been fully administered and closure of the case. The Authority’s motion asserted that the Eagles Watch Creditors (substantially all of the unsecured claims) were never clear in their articulation of the claims and causes of action they believed that the Authority held, and even based upon incomplete understanding of the claims and regardless of whether such claims actually existed and could have been pursued it was evident that any applicable statute of limitations had expired. The Authority’s motion also proposed to allow each claim filed in order to finalize a single distribution to creditors. On October 19, 2012, the bankruptcy court ordered that all claims would be allowed; all assets remaining under the Plan, to include any proceeds from the above land sale and remaining amounts previously collected from PCC avoidance action settlements as described above, and insurance claims and causes of actions as described in the Plan be transferred to the PCC and that the PCC may at its discretion administer, pursue or abandon any or all insurance claims and causes of action at no cost to the Authority. Furthermore, the bankruptcy ordered that the case should be closed and granted a discharge of the bankruptcy. NOTE 13: CONDUIT DEBT The Housing Authority has issued debt instruments for the purpose of providing capital financing for specific non-governmental entities, which are not a part of the Housing Authority’s financial reporting entity. In general, the Housing Authority has issued conduit debt, but the Housing Authority is not responsible for the payment of the
_________________________________________________________________________________________________________ Washington State Auditor's Office
38

PIERCE COUNTY HOUSING AUTHORITY NOTES TO FINANCIAL STATEMENTS FOR THE YEAR ENDING DECEMBER 31, 2012
original debt. That debt is secured by a Multifamily Deed of Trust, Assignment of Rents and Security Agreement for the underlying properties. Owners of the debt have no recourse to any revenues of the Housing Authority. The Housing Authority participated in the following transactions: Name of Non- Project Description Date of Issue Original Governmental Entity Issue Amount
Hidden Hills 2001, LP Acquisition and rehabilitation January 1, 2002 $8,100,000 of Hidden Hills Apartments Sumner Commons, LP Acquisition of land and December 20, 2002 $1,750,000 construction of Sumner Commons Apartments
_________________________________________________________________________________________________________ Washington State Auditor's Office
39

Pierce County Housing Authority
Schedule of Expenditures of Federal Awards
For The Year Ended December 31, 2012
Federal Agency / Pass-Through Entity Federal Program Name
CFDA Number
Other ID Number
Pass-Through Awards Direct Awards Total
City of Tacoma
Homelessness Prevention and Rapid Re-housing Program (Recovery Act Funded) 14.257 63,101$ -
City of Tacoma Sub-Total 63,101$ - 63,101$
US Department of Agriculture Rural Housing Service Rural Rental Housing Loans 10.415 - 27,922$
US Department of Agriculture Rural Housing Service
Rural Rental Asistance Payments 10.427 - 77,926
US Department of Agriculture Rural Housing Service Sub-Total - 105,848$ 105,848$
US Department of Housing and Urban Development
LI HAP Section 8 Moderate Rehabilitation 14.856 - 82,628
US Department of Housing and Urban Development
Section 8 Housing Choice Vouchers 14.871 - 22,238,604
US Department of Housing and Urban Development
Public Housing Capital Fund Program 14.872 - 149,880
US Department of Housing and Urban Development Sub-Total - 22,471,112$ 22,471,112$
Total Assistance 63,101$ 22,576,960$ 22,640,061$
_________________________________________________________________________________________________________ Washington State Auditor's Office
40
43
PIERCE COUNTY HOUSING AUTHORITY Notes to the Schedule of Expenditures of Federal Awards
For the Year Ending December 31, 2012
NOTE 1 – BASIS OF ACCOUNTING
The Schedule of Expenditures of Federal Awards is prepared on the same basis of accounting as Pierce County Housing Authority’s financial statements.
NOTE 2 – PROGRAM COSTS
The amounts shown as current year expenditures represent only the federal portion of the program cost. Actual program costs, including the Housing Authority’s portion, may be more than shown.
_________________________________________________________________________________________________________ Washington State Auditor's Office
41

Page 1
of 7
HA
Of
Pie
rce
Co
unty
(W
A0
54
)S
ubm
issio
n T
ype
: U
na
ud
ited
/A-1
33
TA
CO
MA
, W
A
Entit
y W
ide
Ba
lance
She
et S
um
ma
ryF
isca
l Ye
ar
End
: 1
2/3
1/2
01
2
Pro
ject T
ota
l1
4.8
71
Ho
usin
g
Cho
ice
Vo
uche
rs
10
.41
5
Rura
l Re
nta
l
Ho
usin
g
Lo
ans
14
.25
7
Ho
me
lessne
ss
Pre
ve
ntio
n
and
Ra
pid
Re
-Ho
usin
g
Pro
gra
m
(RA
F)
14
.VS
H
HU
D-
VE
TE
RA
NS
AF
FA
IRS
SU
PP
OR
TI
VE
HO
US
ING
(HU
D-
VA
SH
)
PR
OG
RA
M
10
.42
7
Rura
l
Re
nta
l
Assis
tance
Pa
yme
nts
8 O
the
r F
ed
era
l
Pro
gra
m 1
2
Sta
te/
Lo
ca
l
1 B
usin
ess
Activ
itie
s
14
.85
6 L
ow
er
Inco
me
Ho
usin
g
Assis
tance
Pro
gra
m_
Se
ctio
n 8
Mo
de
rate
Re
ha
bili
tat
Subto
tal
To
tal
11
1 C
ash -
Unre
str
icte
d5
22
,46
4
12
6,0
43
11
8,4
82
-
-
-
65
5,8
73
-
60
0,7
68
99
,49
1
2,1
23
,12
1
2,1
23
,12
1
11
2 C
ash -
Re
str
icte
d -
Mo
de
rniz
atio
n a
n5
0,2
00
-
55
,14
8
-
-
-
-
-
6,2
69
,88
5
-
6,3
75
,23
3
6,3
75
,23
3
11
3 C
ash -
Oth
er
Re
str
icte
d6
,28
9
1,9
58
,95
6
-
-
-
-
-
-
-
-
1,9
65
,24
5
1,9
65
,24
5
11
4 C
ash -
Te
na
nt S
ecurity
De
po
sits
39
,65
0
-
4,6
93
-
-
-
-
-
13
6,6
60
-
18
1,0
03
18
1,0
03
11
5 C
ash -
Re
str
icte
d f
or
Pa
yme
nt o
f C
u1
0,8
18
87
,47
7
-
-
-
-
-
-
22
5,7
61
-
32
4,0
56
32
4,0
56
10
0 T
ota
l Ca
sh
62
9,4
21
2,1
72
,47
6
17
8,3
23
-
-
-
65
5,8
73
-
7,2
33
,07
4
99
,49
1
10
,96
8,6
58
10
,96
8,6
58
12
1 A
cco
unts
Re
ce
iva
ble
- P
HA
Pro
jects
-
5,5
00
-
-
-
-
-
-
-
-
5,5
00
5,5
00
12
2 A
cco
unts
Re
ce
iva
ble
- H
UD
Oth
er
P-
-
-
-
-
-
-
-
-
3,8
34
3,8
34
3,8
34
12
4 A
cco
unts
Re
ce
iva
ble
- O
the
r G
ove
rn-
-
-
-
-
-
-
-
45
3
-
45
3
45
3
12
5 A
cco
unts
Re
ce
iva
ble
- M
isce
llane
ous
-
-
-
-
-
-
-
-
7,9
70
-
7,9
70
7,9
70
12
6 A
cco
unts
Re
ce
iva
ble
- T
ena
nts
7,5
59
-
51
5
-
-
-
-
-
10
,84
6
-
18
,92
0
18
,92
0
12
6.1
A
llow
ance
fo
r D
oubtf
ul A
cco
unts
-T
(4,9
16
)
-
(24
5)
-
-
-
-
-
(4,4
26
)
-
(9,5
87
)
(9,5
87
)
12
6.2
A
llow
ance
fo
r D
oubtf
ul A
cco
unts
-
-
-
-
-
-
-
-
-
-
-
-
-
12
7 N
ote
s, L
oa
ns, &
Mo
rtga
ge
s R
ece
iva
1,7
64
-
-
-
-
-
30
,54
0
-
-
-
32
,30
4
32
,30
4
12
8 F
raud
Re
co
ve
ry-
-
-
-
-
-
-
-
-
-
-
-
12
8.1
A
llow
ance
fo
r D
oubtf
ul A
cco
unts
-
-
-
-
-
-
-
-
-
-
-
-
-
12
9 A
ccru
ed
Inte
rest R
ece
iva
ble
-
-
-
-
-
-
59
9
-
41
,65
2
-
42
,25
1
42
,25
1
12
0 T
ota
l Re
ce
iva
ble
s, N
et o
f A
llow
ance
s4
,40
7
5,5
00
27
0
-
-
-
31
,13
9
-
56
,49
5
3,8
34
10
1,6
45
10
1,6
45
13
1 In
ve
stm
ents
- U
nre
str
icte
d-
-
-
-
-
-
-
-
59
5,2
18
-
59
5,2
18
59
5,2
18
13
2 In
ve
stm
ents
- R
estr
icte
d-
-
-
-
-
-
-
-
2,3
84
,29
5
-
2,3
84
,29
5
2,3
84
,29
5
13
5 In
ve
stm
ents
- R
estr
icte
d f
or
Pa
yme
n-
-
-
-
-
-
-
-
45
3,5
09
-
45
3,5
09
45
3,5
09
14
2 P
repa
id E
xpe
nse
s a
nd
Oth
er
Asse
ts-
-
-
-
-
-
-
-
42
,11
0
-
42
,11
0
42
,11
0
14
3 In
ve
nto
rie
s7
73
-
-
-
-
-
-
-
13
,18
6
-
13
,95
9
13
,95
9
14
3.1
A
llow
ance
fo
r O
bso
lete
Inve
nto
rie
s-
-
-
-
-
-
-
-
-
-
-
-
14
4 In
ter
Pro
gra
m D
ue
Fro
m-
-
-
-
-
-
-
-
-
-
-
-
14
5 A
sse
ts H
eld
fo
r S
ale
-
-
-
-
-
-
-
-
-
-
-
-
15
0 T
ota
l Curr
ent A
sse
ts6
34
,60
1
2,1
77
,97
6
17
8,5
93
-
-
-
68
7,0
12
-
10
,77
7,8
87
10
3,3
25
14
,55
9,3
94
14
,55
9,3
94
16
1 L
and
2,0
44
,16
1
-
90
,10
0
-
-
-
-
-
3,1
99
,85
6
-
5,3
34
,11
7
5,3
34
,11
7
16
2 B
uild
ings
9,9
57
,17
9
-
56
9,5
67
-
-
-
-
-
22
,82
9,9
50
-
33
,35
6,6
96
33
,35
6,6
96
16
3 F
urn
iture
, E
quip
me
nt &
Ma
chin
ery
- D
37
2,3
84
-
39
,98
9
-
-
-
-
-
1,8
61
,03
5
-
2,2
73
,40
8
2,2
73
,40
8
16
4 F
urn
iture
, E
quip
me
nt &
Ma
chin
ery
- A
10
0,7
33
91
,88
8
-
-
-
-
-
-
68
0,0
10
-
87
2,6
31
87
2,6
31
_________________________________________________________________________________________________________ Washington State Auditor's Office
42

Page 2
of 7
HA
Of
Pie
rce
Co
unty
(W
A0
54
)S
ubm
issio
n T
ype
: U
na
ud
ited
/A-1
33
TA
CO
MA
, W
A
Entit
y W
ide
Ba
lance
She
et S
um
ma
ryF
isca
l Ye
ar
End
: 1
2/3
1/2
01
2
Pro
ject T
ota
l1
4.8
71
Ho
usin
g
Cho
ice
Vo
uche
rs
10
.41
5
Rura
l Re
nta
l
Ho
usin
g
Lo
ans
14
.25
7
Ho
me
lessne
ss
Pre
ve
ntio
n
and
Ra
pid
Re
-Ho
usin
g
Pro
gra
m
(RA
F)
14
.VS
H
HU
D-
VE
TE
RA
NS
AF
FA
IRS
SU
PP
OR
TI
VE
HO
US
ING
(HU
D-
VA
SH
)
PR
OG
RA
M
10
.42
7
Rura
l
Re
nta
l
Assis
tance
Pa
yme
nts
8 O
the
r F
ed
era
l
Pro
gra
m 1
2
Sta
te/
Lo
ca
l
1 B
usin
ess
Activ
itie
s
14
.85
6 L
ow
er
Inco
me
Ho
usin
g
Assis
tance
Pro
gra
m_
Se
ctio
n 8
Mo
de
rate
Re
ha
bili
tat
Subto
tal
To
tal
16
5 L
ea
se
ho
ld Im
pro
ve
me
nts
-
-
-
-
-
-
-
-
-
-
-
-
16
6 A
ccum
ula
ted
De
pre
cia
tion
(4,6
70
,17
1)
(60
,74
7)
(19
6,9
65
)
-
-
-
-
-
(10
,83
2,2
82
)
-
(15
,76
0,1
65
)
(15
,76
0,1
65
)
16
7 C
onstr
uctio
n in
Pro
gre
ss
-
-
-
-
-
-
-
-
26
2,6
02
-
26
2,6
02
26
2,6
02
16
8 In
fra
str
uctu
re-
-
-
-
-
-
-
-
-
-
-
-
16
0 T
ota
l Ca
pita
l Asse
ts, N
et o
f A
ccum
ul
7,8
04
,28
6
31
,14
1
50
2,6
91
-
-
-
-
-
18
,00
1,1
71
-
26
,33
9,2
89
26
,33
9,2
89
17
1 N
ote
s, L
oa
ns a
nd
Mo
rtga
ge
s R
ece
iv-
-
-
-
-
-
1,0
80
,52
7
-
50
,00
0
-
1,1
30
,52
7
1,1
30
,52
7
17
2 N
ote
s, L
oa
ns, &
Mo
rtga
ge
s R
ece
iva
-
-
-
-
-
-
14
,40
0
-
-
-
14
,40
0
14
,40
0
17
3 G
rants
Re
ce
iva
ble
- N
on C
urr
ent
-
-
-
-
-
-
-
-
-
-
-
-
17
4 O
the
r A
sse
ts-
-
-
-
-
-
-
-
16
3,2
72
-
16
3,2
72
16
3,2
72
17
6 In
ve
stm
ents
in J
oin
t V
entu
res
-
-
-
-
-
-
-
-
-
-
-
-
18
0 T
ota
l No
n-C
urr
ent A
sse
ts7
,80
4,2
86
31
,14
1
50
2,6
91
-
-
-
1,0
94
,92
7
-
18
,21
4,4
43
-
27
,64
7,4
88
27
,64
7,4
88
19
0 T
ota
l Asse
ts8
,43
8,8
87
2,2
09
,11
7
68
1,2
84
-
-
-
1,7
81
,93
9
-
28
,99
2,3
30
10
3,3
25
42
,20
6,8
82
42
,20
6,8
82
31
1 B
ank
Ove
rdra
ft-
-
-
-
-
-
-
-
-
-
-
-
31
2 A
cco
unts
Pa
yable
<=
90
Da
ys-
-
-
-
-
-
-
-
43
3,6
77
-
43
3,6
77
43
3,6
77
31
3 A
cco
unts
Pa
yable
>9
0 D
ays
Pa
st D
u-
-
-
-
-
-
-
-
-
-
-
-
32
1 A
ccru
ed
Wa
ge
/Pa
yro
ll T
axe
s P
aya
b-
-
-
-
-
-
-
-
62
,83
1
-
62
,83
1
62
,83
1
32
2 A
ccru
ed
Co
mpe
nsa
ted
Abse
nce
s -
C1
2,6
16
50
,03
9
-
-
-
-
-
-
35
,31
0
-
97
,96
5
97
,96
5
32
4 A
ccru
ed
Co
ntin
ge
ncy
Lia
bili
ty-
-
-
-
-
-
-
-
-
-
-
-
32
5 A
ccru
ed
Inte
rest P
aya
ble
-
-
90
8
-
-
-
-
-
83
,87
5
-
84
,78
3
84
,78
3
33
1 A
cco
unts
Pa
yable
- H
UD
PH
A P
rogr
-
-
-
-
-
-
-
-
-
-
-
-
33
2 A
cco
unt P
aya
ble
- P
HA
Pro
jects
-
-
-
-
-
-
-
-
-
-
-
-
33
3 A
cco
unts
Pa
yable
- O
the
r G
ove
rnm
e-
-
-
-
-
-
-
-
-
-
-
-
34
1 T
ena
nt S
ecurity
De
po
sits
39
,65
0
-
4,6
93
-
-
-
-
-
13
6,6
60
-
18
1,0
03
18
1,0
03
34
2 D
efe
rre
d R
eve
nue
s-
-
-
-
-
-
-
-
-
-
-
-
34
3 C
urr
ent P
ort
ion o
f L
ong-t
erm
De
bt -
C-
-
16
,49
2
-
-
-
-
-
1,5
40
,36
6
-
1,5
56
,85
8
1,5
56
,85
8
34
4 C
urr
ent P
ort
ion o
f L
ong-t
erm
De
bt -
O-
-
-
-
-
-
-
-
-
-
-
-
34
5 O
the
r C
urr
ent L
iabili
ties
15
,20
0
62
,76
5
59
6
-
-
-
-
-
22
4,6
82
-
30
3,2
43
30
3,2
43
34
6 A
ccru
ed
Lia
bili
ties -
Oth
er
41
,81
5
91
,12
1
19
9
-
-
-
-
-
26
,89
4
-
16
0,0
29
16
0,0
29
34
7 In
ter
Pro
gra
m -
Due
To
-
-
-
-
-
-
-
-
-
-
-
-
34
8 L
oa
n L
iabili
ty -
Curr
ent
-
-
-
-
-
-
-
-
-
-
-
-
31
0 T
ota
l Curr
ent L
iabili
ties
10
9,2
81
20
3,9
25
22
,88
8
-
-
-
-
-
2,5
44
,29
5
-
2,8
80
,38
9
2,8
80
,38
9
_________________________________________________________________________________________________________ Washington State Auditor's Office
43

Page 3
of 7
HA
Of
Pie
rce
Co
unty
(W
A0
54
)S
ubm
issio
n T
ype
: U
na
ud
ited
/A-1
33
TA
CO
MA
, W
A
Entit
y W
ide
Ba
lance
She
et S
um
ma
ryF
isca
l Ye
ar
End
: 1
2/3
1/2
01
2
Pro
ject T
ota
l1
4.8
71
Ho
usin
g
Cho
ice
Vo
uche
rs
10
.41
5
Rura
l Re
nta
l
Ho
usin
g
Lo
ans
14
.25
7
Ho
me
lessne
ss
Pre
ve
ntio
n
and
Ra
pid
Re
-Ho
usin
g
Pro
gra
m
(RA
F)
14
.VS
H
HU
D-
VE
TE
RA
NS
AF
FA
IRS
SU
PP
OR
TI
VE
HO
US
ING
(HU
D-
VA
SH
)
PR
OG
RA
M
10
.42
7
Rura
l
Re
nta
l
Assis
tance
Pa
yme
nts
8 O
the
r F
ed
era
l
Pro
gra
m 1
2
Sta
te/
Lo
ca
l
1 B
usin
ess
Activ
itie
s
14
.85
6 L
ow
er
Inco
me
Ho
usin
g
Assis
tance
Pro
gra
m_
Se
ctio
n 8
Mo
de
rate
Re
ha
bili
tat
Subto
tal
To
tal
35
1 L
ong-t
erm
De
bt, N
et o
f C
urr
ent -
Ca
p-
-
54
9,3
99
-
-
-
-
-
16
,25
2,8
55
-
16
,80
2,2
54
16
,80
2,2
54
35
2 L
ong-t
erm
De
bt, N
et o
f C
urr
ent -
Ope
-
-
-
-
-
-
-
-
-
-
-
-
35
3 N
on-c
urr
ent L
iabili
ties -
Oth
er
6,4
53
99
,00
2
18
8
-
-
-
-
-
38
2,1
21
-
48
7,7
64
48
7,7
64
35
4 A
ccru
ed
Co
mpe
nsa
ted
Abse
nce
s -
N5
,67
2
22
,49
9
-
-
-
-
-
-
15
,87
7
-
44
,04
8
44
,04
8
35
5 L
oa
n L
iabili
ty -
No
n C
urr
ent
-
-
-
-
-
-
-
-
-
-
-
-
35
6 F
AS
B 5
Lia
bili
ties
-
-
-
-
-
-
-
-
-
-
-
-
35
7 A
ccru
ed
Pe
nsio
n a
nd
OP
EB
Lia
bili
tie-
-
-
-
-
-
-
-
-
-
-
-
35
0 T
ota
l No
n-C
urr
ent L
iabili
ties
12
,12
5
12
1,5
01
54
9,5
87
-
-
-
-
-
16
,65
0,8
53
-
17
,33
4,0
66
17
,33
4,0
66
30
0 T
ota
l Lia
bili
ties
12
1,4
06
32
5,4
26
57
2,4
75
-
-
-
-
-
19
,19
5,1
48
-
20
,21
4,4
55
20
,21
4,4
55
50
8.1
In
ve
ste
d In C
apita
l Asse
ts, N
et o
f R
7,8
04
,28
6
31
,14
1
(63
,20
0)
-
-
-
-
-
37
1,2
22
-
8,1
43
,44
9
8,1
43
,44
9
51
1.1
R
estr
icte
d N
et A
sse
ts5
0,2
00
1,8
83
,69
1
55
,14
8
-
-
-
-
-
8,8
72
,67
3
-
10
,86
1,7
12
10
,86
1,7
12
51
2.1
U
nre
str
icte
d N
et A
sse
ts4
62
,99
5
(31
,14
1)
11
6,8
61
-
-
-
1,7
81
,93
9
-
55
3,2
87
10
3,3
25
2,9
87
,26
6
2,9
87
,26
6
51
3 T
ota
l Equity
/Ne
t A
sse
ts8
,31
7,4
81
1,8
83
,69
1
10
8,8
09
-
-
-
1,7
81
,93
9
-
9,7
97
,18
2
10
3,3
25
21
,99
2,4
27
21
,99
2,4
27
60
0 T
ota
l Lia
bili
ties a
nd
Equity
/Ne
t A
sse
t8
,43
8,8
87
2,2
09
,11
7
68
1,2
84
-
-
-
1,7
81
,93
9
-
28
,99
2,3
30
10
3,3
25
42
,20
6,8
82
42
,20
6,8
82
_________________________________________________________________________________________________________ Washington State Auditor's Office
44
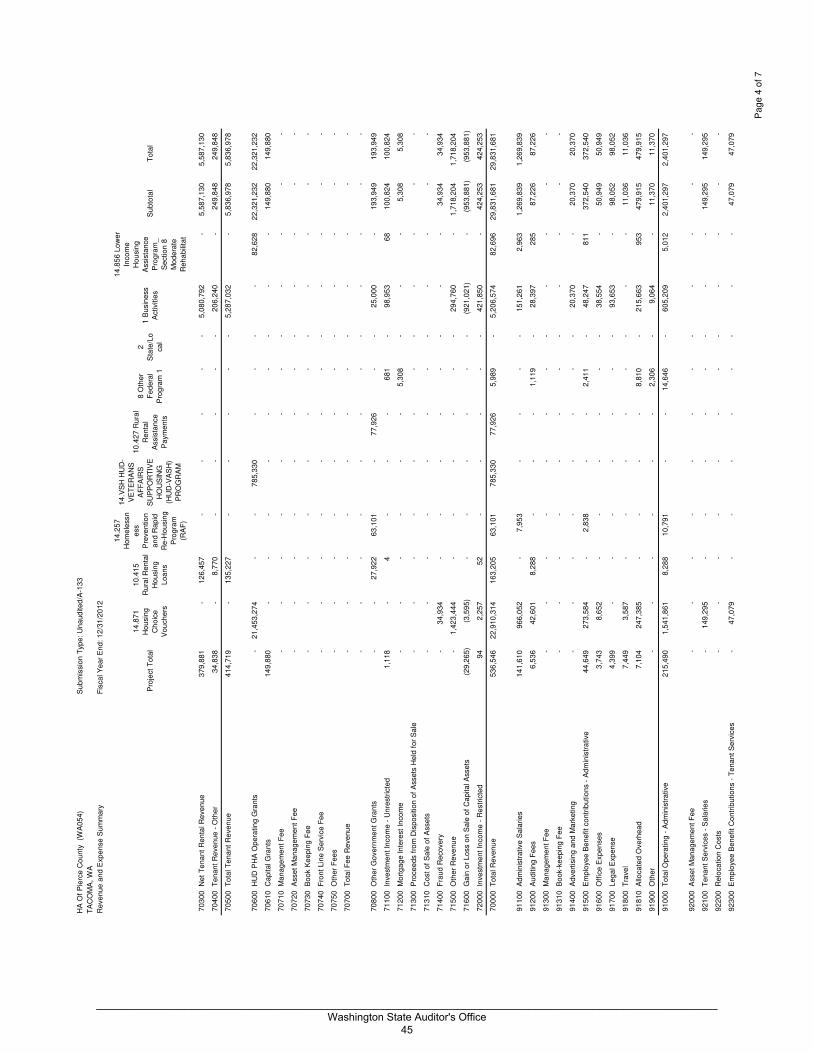
Page 4
of 7
HA
Of
Pie
rce
Co
un
ty
(WA
05
4)
Su
bm
issio
n T
yp
e:
Un
au
dite
d/A
-13
3
TA
CO
MA
, W
A
Re
ve
nu
e a
nd
Exp
en
se
Su
mm
ary
Fis
ca
l Y
ea
r E
nd
: 1
2/3
1/2
01
2
Pro
ject
To
tal
14
.87
1
Ho
usin
g
Ch
oic
e
Vo
uch
ers
10
.41
5
Ru
ral R
en
tal
Ho
usin
g
Lo
an
s
14
.25
7
Ho
me
lessn
ess
Pre
ve
ntio
n
an
d R
ap
id
Re
-Ho
usin
g
Pro
gra
m
(RA
F)
14
.VS
H H
UD
-
VE
TE
RA
NS
AF
FA
IRS
SU
PP
OR
TIV
E
HO
US
ING
(HU
D-V
AS
H)
PR
OG
RA
M
10
.42
7 R
ura
l
Re
nta
l
Assis
tan
ce
Pa
ym
en
ts
8 O
the
r
Fe
de
ral
Pro
gra
m 1
2
Sta
te/L
o
ca
l
1 B
usin
ess
Activitie
s
14
.85
6 L
ow
er
Inco
me
Ho
usin
g
Assis
tan
ce
Pro
gra
m_
Se
ctio
n 8
Mo
de
rate
Re
ha
bili
tat
Su
bto
tal
To
tal
70
30
0
Ne
t T
en
an
t R
en
tal R
eve
nu
e3
79
,88
1
-
12
6,4
57
-
-
-
-
-
5
,08
0,7
92
-
5
,58
7,1
30
5
,58
7,1
30
70
40
0
Te
na
nt
Re
ve
nu
e -
Oth
er
34
,83
8
-
8
,77
0
-
-
-
-
-
20
6,2
40
-
24
9,8
48
24
9,8
48
70
50
0
To
tal T
en
an
t R
eve
nu
e4
14
,71
9
-
13
5,2
27
-
-
-
-
-
5
,28
7,0
32
-
5
,83
6,9
78
5
,83
6,9
78
70
60
0
HU
D P
HA
Op
era
tin
g G
ran
ts-
21
,45
3,2
74
-
-
78
5,3
30
-
-
-
-
8
2,6
28
22
,32
1,2
32
22
,32
1,2
32
70
61
0
Ca
pita
l G
ran
ts1
49
,88
0
-
-
-
-
-
-
-
-
-
1
49
,88
0
1
49
,88
0
70
71
0
Ma
na
ge
me
nt
Fe
e-
-
-
-
-
-
-
-
-
-
-
-
70
72
0
Asse
t M
an
ag
em
en
t F
ee
-
-
-
-
-
-
-
-
-
-
-
-
70
73
0
Bo
ok K
ee
pin
g F
ee
-
-
-
-
-
-
-
-
-
-
-
-
70
74
0
Fro
nt
Lin
e S
erv
ice
Fe
e-
-
-
-
-
-
-
-
-
-
-
-
70
75
0
Oth
er
Fe
es
-
-
-
-
-
-
-
-
-
-
-
-
70
70
0
To
tal F
ee
Re
ve
nu
e-
-
-
-
-
-
-
-
-
-
-
-
-
-
-
-
-
-
-
-
-
-
-
-
70
80
0
Oth
er
Go
ve
rnm
en
t G
ran
ts-
-
2
7,9
22
63
,10
1
-
7
7,9
26
-
-
2
5,0
00
-
1
93
,94
9
1
93
,94
9
71
10
0
Inve
stm
en
t In
co
me
- U
nre
str
icte
d1
,11
8
-
4
-
-
-
68
1
-
98
,95
3
68
1
00
,82
4
1
00
,82
4
71
20
0
Mo
rtg
ag
e In
tere
st
Inco
me
-
-
-
-
-
-
5
,30
8
-
-
-
5,3
08
5,3
08
71
30
0
Pro
ce
ed
s f
rom
Dis
po
sitio
n o
f A
sse
ts H
eld
fo
r S
ale
-
-
-
-
-
-
-
-
-
-
-
-
71
31
0
Co
st
of
Sa
le o
f A
sse
ts-
-
-
-
-
-
-
-
-
-
-
-
71
40
0
Fra
ud
Re
co
ve
ry-
34
,93
4
-
-
-
-
-
-
-
-
3
4,9
34
3
4,9
34
71
50
0
Oth
er
Re
ve
nu
e-
1,4
23
,44
4
-
-
-
-
-
-
2
94
,76
0
-
1
,71
8,2
04
1
,71
8,2
04
71
60
0
Ga
in o
r L
oss o
n S
ale
of
Ca
pita
l A
sse
ts(2
9,2
65
)
(3,5
95
)
-
-
-
-
-
-
(92
1,0
21
)
-
(9
53
,88
1)
(95
3,8
81
)
72
00
0
Inve
stm
en
t In
co
me
- R
estr
icte
d9
4
2,2
57
52
-
-
-
-
-
4
21
,85
0
-
4
24
,25
3
4
24
,25
3
70
00
0
To
tal R
eve
nu
e5
36
,54
6
2
2,9
10
,31
4
16
3,2
05
6
3,1
01
78
5,3
30
7
7,9
26
5,9
89
-
5,2
06
,57
4
82
,69
6
2
9,8
31
,68
1
2
9,8
31
,68
1
91
10
0
Ad
min
istr
ative
Sa
larie
s1
41
,61
0
9
66
,05
2
-
7
,95
3
-
-
-
-
1
51
,26
1
2
,96
3
1,2
69
,83
9
1,2
69
,83
9
91
20
0
Au
ditin
g F
ee
s6
,53
6
4
2,6
01
8
,28
8
-
-
-
1
,11
9
-
2
8,3
97
2
85
87
,22
6
87
,22
6
91
30
0
Ma
na
ge
me
nt
Fe
e-
-
-
-
-
-
-
-
-
-
-
-
91
31
0
Bo
ok-k
ee
pin
g F
ee
-
-
-
-
-
-
-
-
-
-
-
-
91
40
0
Ad
ve
rtis
ing
an
d M
ark
etin
g-
-
-
-
-
-
-
-
2
0,3
70
-
2
0,3
70
2
0,3
70
91
50
0
Em
plo
ye
e B
en
efit
co
ntr
ibu
tio
ns -
Ad
min
istr
ative
44
,64
9
27
3,5
84
-
2,8
38
-
-
2
,41
1
-
4
8,2
47
8
11
37
2,5
40
37
2,5
40
91
60
0
Off
ice
Exp
en
se
s3
,74
3
8
,65
2
-
-
-
-
-
-
3
8,5
54
-
5
0,9
49
5
0,9
49
91
70
0
Le
ga
l E
xp
en
se
4,3
99
-
-
-
-
-
-
-
9
3,6
53
-
9
8,0
52
9
8,0
52
91
80
0
Tra
ve
l7
,44
9
3
,58
7
-
-
-
-
-
-
-
-
11
,03
6
11
,03
6
91
81
0
Allo
ca
ted
Ove
rhe
ad
7,1
04
24
7,3
85
-
-
-
-
8
,81
0
-
2
15
,66
3
9
53
47
9,9
15
47
9,9
15
91
90
0
Oth
er
-
-
-
-
-
-
2
,30
6
-
9
,06
4
-
1
1,3
70
1
1,3
70
91
00
0
To
tal O
pe
ratin
g -
Ad
min
istr
ative
21
5,4
90
1,5
41
,86
1
8
,28
8
10
,79
1
-
-
1
4,6
46
-
6
05
,20
9
5
,01
2
2,4
01
,29
7
2,4
01
,29
7
92
00
0
Asse
t M
an
ag
em
en
t F
ee
-
-
-
-
-
-
-
-
-
-
-
-
92
10
0
Te
na
nt
Se
rvic
es -
Sa
larie
s-
14
9,2
95
-
-
-
-
-
-
-
-
1
49
,29
5
1
49
,29
5
92
20
0
Re
loca
tio
n C
osts
-
-
-
-
-
-
-
-
-
-
-
-
92
30
0
Em
plo
ye
e B
en
efit
Co
ntr
ibu
tio
ns -
Te
na
nt
Se
rvic
es
-
4
7,0
79
-
-
-
-
-
-
-
-
47
,07
9
47
,07
9
_________________________________________________________________________________________________________ Washington State Auditor's Office
45
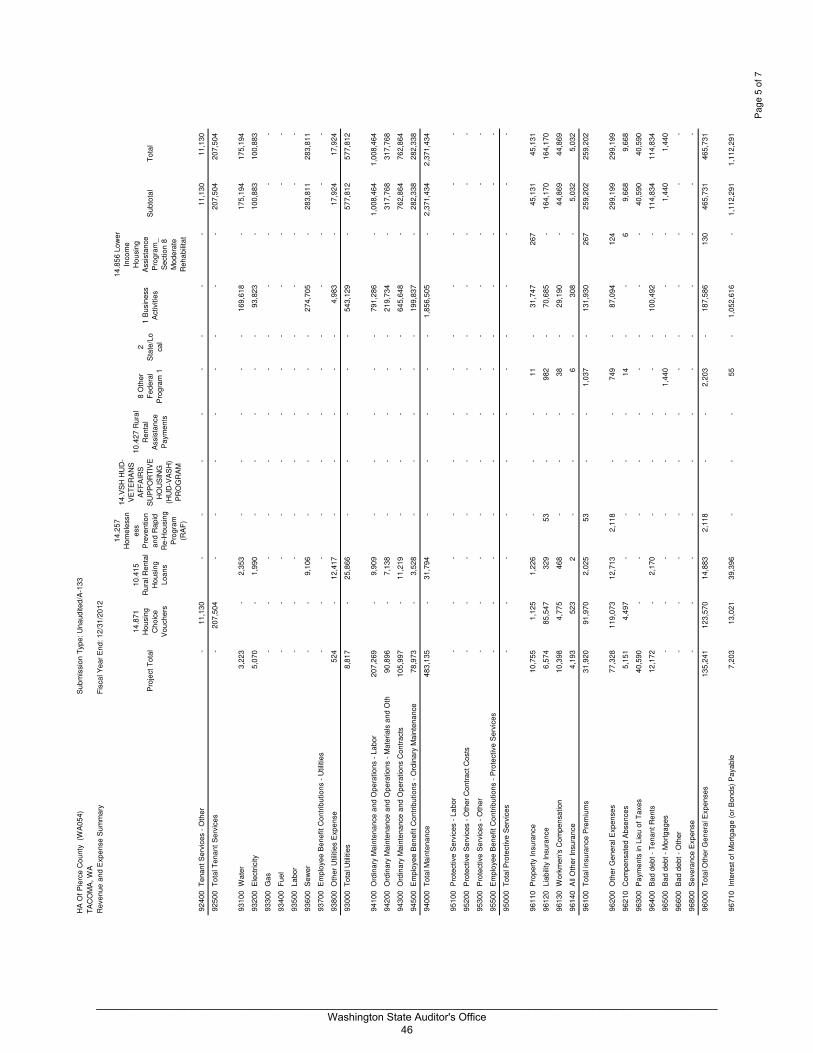
Page 5
of 7
HA
Of
Pie
rce
Co
un
ty
(WA
05
4)
Su
bm
issio
n T
yp
e:
Un
au
dite
d/A
-13
3
TA
CO
MA
, W
A
Re
ve
nu
e a
nd
Exp
en
se
Su
mm
ary
Fis
ca
l Y
ea
r E
nd
: 1
2/3
1/2
01
2
Pro
ject
To
tal
14
.87
1
Ho
usin
g
Ch
oic
e
Vo
uch
ers
10
.41
5
Ru
ral R
en
tal
Ho
usin
g
Lo
an
s
14
.25
7
Ho
me
lessn
ess
Pre
ve
ntio
n
an
d R
ap
id
Re
-Ho
usin
g
Pro
gra
m
(RA
F)
14
.VS
H H
UD
-
VE
TE
RA
NS
AF
FA
IRS
SU
PP
OR
TIV
E
HO
US
ING
(HU
D-V
AS
H)
PR
OG
RA
M
10
.42
7 R
ura
l
Re
nta
l
Assis
tan
ce
Pa
ym
en
ts
8 O
the
r
Fe
de
ral
Pro
gra
m 1
2
Sta
te/L
o
ca
l
1 B
usin
ess
Activitie
s
14
.85
6 L
ow
er
Inco
me
Ho
usin
g
Assis
tan
ce
Pro
gra
m_
Se
ctio
n 8
Mo
de
rate
Re
ha
bili
tat
Su
bto
tal
To
tal
92
40
0
Te
na
nt
Se
rvic
es -
Oth
er
-
1
1,1
30
-
-
-
-
-
-
-
-
11
,13
0
11
,13
0
92
50
0
To
tal T
en
an
t S
erv
ice
s-
20
7,5
04
-
-
-
-
-
-
-
-
2
07
,50
4
2
07
,50
4
93
10
0
Wa
ter
3,2
23
-
2
,35
3
-
-
-
-
-
16
9,6
18
-
17
5,1
94
17
5,1
94
93
20
0
Ele
ctr
icity
5,0
70
-
1
,99
0
-
-
-
-
-
93
,82
3
-
10
0,8
83
10
0,8
83
93
30
0
Ga
s-
-
-
-
-
-
-
-
-
-
-
-
93
40
0
Fu
el
-
-
-
-
-
-
-
-
-
-
-
-
93
50
0
La
bo
r-
-
-
-
-
-
-
-
-
-
-
-
93
60
0
Se
we
r-
-
9
,10
6
-
-
-
-
-
27
4,7
05
-
28
3,8
11
28
3,8
11
93
70
0
Em
plo
ye
e B
en
efit
Co
ntr
ibu
tio
ns -
Utilit
ies
-
-
-
-
-
-
-
-
-
-
-
-
93
80
0
Oth
er
Utilit
ies E
xp
en
se
52
4
-
12
,41
7
-
-
-
-
-
4
,98
3
-
1
7,9
24
1
7,9
24
93
00
0
To
tal U
tilit
ies
8,8
17
-
2
5,8
66
-
-
-
-
-
54
3,1
29
-
57
7,8
12
57
7,8
12
94
10
0
Ord
ina
ry M
ain
ten
an
ce
an
d O
pe
ratio
ns -
La
bo
r2
07
,26
9
-
9,9
09
-
-
-
-
-
7
91
,28
6
-
1
,00
8,4
64
1
,00
8,4
64
94
20
0
Ord
ina
ry M
ain
ten
an
ce
an
d O
pe
ratio
ns -
Ma
teria
ls a
nd
Oth
90
,89
6
-
7
,13
8
-
-
-
-
-
21
9,7
34
-
31
7,7
68
31
7,7
68
94
30
0
Ord
ina
ry M
ain
ten
an
ce
an
d O
pe
ratio
ns C
on
tra
cts
10
5,9
97
-
1
1,2
19
-
-
-
-
-
64
5,6
48
-
76
2,8
64
76
2,8
64
94
50
0
Em
plo
ye
e B
en
efit
Co
ntr
ibu
tio
ns -
Ord
ina
ry M
ain
ten
an
ce
78
,97
3
-
3
,52
8
-
-
-
-
-
19
9,8
37
-
28
2,3
38
28
2,3
38
94
00
0
To
tal M
ain
ten
an
ce
48
3,1
35
-
3
1,7
94
-
-
-
-
-
1,8
56
,50
5
-
2,3
71
,43
4
2,3
71
,43
4
95
10
0
Pro
tective
Se
rvic
es -
La
bo
r-
-
-
-
-
-
-
-
-
-
-
-
95
20
0
Pro
tective
Se
rvic
es -
Oth
er
Co
ntr
act
Co
sts
-
-
-
-
-
-
-
-
-
-
-
-
95
30
0
Pro
tective
Se
rvic
es -
Oth
er
-
-
-
-
-
-
-
-
-
-
-
-
95
50
0
Em
plo
ye
e B
en
efit
Co
ntr
ibu
tio
ns -
Pro
tective
Se
rvic
es
-
-
-
-
-
-
-
-
-
-
-
-
95
00
0
To
tal P
rote
ctive
Se
rvic
es
-
-
-
-
-
-
-
-
-
-
-
-
96
11
0
Pro
pe
rty In
su
ran
ce
10
,75
5
1,1
25
1,2
26
-
-
-
11
-
31
,74
7
26
7
4
5,1
31
4
5,1
31
96
12
0
Lia
bili
ty In
su
ran
ce
6,5
74
85
,54
7
32
9
5
3
-
-
98
2
-
70
,68
5
-
16
4,1
70
16
4,1
70
96
13
0
Wo
rkm
en
's C
om
pe
nsa
tio
n1
0,3
98
4
,77
5
4
68
-
-
-
3
8
-
2
9,1
90
-
4
4,8
69
4
4,8
69
96
14
0
All
Oth
er
Insu
ran
ce
4,1
93
52
3
2
-
-
-
6
-
30
8
-
5
,03
2
5
,03
2
96
10
0
To
tal in
su
ran
ce
Pre
miu
ms
31
,92
0
91
,97
0
2,0
25
5
3
-
-
1,0
37
-
13
1,9
30
26
7
2
59
,20
2
2
59
,20
2
96
20
0
Oth
er
Ge
ne
ral E
xp
en
se
s7
7,3
28
1
19
,07
3
1
2,7
13
2,1
18
-
-
7
49
-
8
7,0
94
1
24
29
9,1
99
29
9,1
99
96
21
0
Co
mp
en
sa
ted
Ab
se
nce
s5
,15
1
4
,49
7
-
-
-
-
14
-
-
6
9,6
68
9,6
68
96
30
0
Pa
ym
en
ts in
Lie
u o
f T
axe
s4
0,5
90
-
-
-
-
-
-
-
-
-
4
0,5
90
4
0,5
90
96
40
0
Ba
d d
eb
t -
Te
na
nt
Re
nts
12
,17
2
-
2
,17
0
-
-
-
-
-
10
0,4
92
-
11
4,8
34
11
4,8
34
96
50
0
Ba
d d
eb
t -
Mo
rtg
ag
es
-
-
-
-
-
-
1
,44
0
-
-
-
1,4
40
1,4
40
96
60
0
Ba
d d
eb
t -
Oth
er
-
-
-
-
-
-
-
-
-
-
-
-
96
80
0
Se
ve
ran
ce
Exp
en
se
-
-
-
-
-
-
-
-
-
-
-
-
96
00
0
To
tal O
the
r G
en
era
l E
xp
en
se
s1
35
,24
1
1
23
,57
0
1
4,8
83
2,1
18
-
-
2
,20
3
-
1
87
,58
6
1
30
46
5,7
31
46
5,7
31
96
71
0
Inte
rest
of
Mo
rtg
ag
e (
or
Bo
nd
s)
Pa
ya
ble
7,2
03
13
,02
1
39
,39
6
-
-
-
55
-
1,0
52
,61
6
-
1,1
12
,29
1
1,1
12
,29
1
_________________________________________________________________________________________________________ Washington State Auditor's Office
46

Page 6
of 7
HA
Of
Pie
rce
Co
un
ty
(WA
05
4)
Su
bm
issio
n T
yp
e:
Un
au
dite
d/A
-13
3
TA
CO
MA
, W
A
Re
ve
nu
e a
nd
Exp
en
se
Su
mm
ary
Fis
ca
l Y
ea
r E
nd
: 1
2/3
1/2
01
2
Pro
ject
To
tal
14
.87
1
Ho
usin
g
Ch
oic
e
Vo
uch
ers
10
.41
5
Ru
ral R
en
tal
Ho
usin
g
Lo
an
s
14
.25
7
Ho
me
lessn
ess
Pre
ve
ntio
n
an
d R
ap
id
Re
-Ho
usin
g
Pro
gra
m
(RA
F)
14
.VS
H H
UD
-
VE
TE
RA
NS
AF
FA
IRS
SU
PP
OR
TIV
E
HO
US
ING
(HU
D-V
AS
H)
PR
OG
RA
M
10
.42
7 R
ura
l
Re
nta
l
Assis
tan
ce
Pa
ym
en
ts
8 O
the
r
Fe
de
ral
Pro
gra
m 1
2
Sta
te/L
o
ca
l
1 B
usin
ess
Activitie
s
14
.85
6 L
ow
er
Inco
me
Ho
usin
g
Assis
tan
ce
Pro
gra
m_
Se
ctio
n 8
Mo
de
rate
Re
ha
bili
tat
Su
bto
tal
To
tal
96
72
0
Inte
rest
on
No
tes P
aya
ble
(S
ho
rt a
nd
Lo
ng
Te
rm)
-
-
-
-
-
-
5
-
-
-
5
5
96
73
0
Am
ort
iza
tio
n o
f B
on
d Issu
e C
osts
-
-
-
-
-
-
-
-
13
,78
7
-
13
,78
7
13
,78
7
96
70
0
To
tal In
tere
st
Exp
en
se
an
d A
mo
rtiz
atio
n C
ost
7,2
03
13
,02
1
39
,39
6
-
-
-
60
-
1,0
66
,40
3
-
1,1
26
,08
3
1,1
26
,08
3
96
90
0
To
tal O
pe
ratin
g E
xp
en
se
s8
81
,80
6
1
,97
7,9
26
12
2,2
52
1
2,9
62
-
-
17
,94
6
-
4,3
90
,76
2
5,4
09
7
,40
9,0
63
7
,40
9,0
63
97
00
0
Exce
ss o
f O
pe
ratin
g R
eve
nu
e o
ve
r O
pe
ratin
g E
xp
en
se
s(3
45
,26
0)
20
,93
2,3
88
4
0,9
53
50
,13
9
7
85
,33
0
77
,92
6
(1
1,9
57
)
-
8
15
,81
2
7
7,2
87
22
,42
2,6
18
22
,42
2,6
18
97
10
0
Extr
ao
rdin
ary
Ma
inte
na
nce
-
-
-
-
-
-
-
-
-
-
-
-
97
20
0
Ca
su
alty L
osse
s -
No
n-c
ap
ita
lize
d-
-
-
-
-
-
-
-
-
-
-
-
97
30
0
Ho
usin
g A
ssis
tan
ce
Pa
ym
en
ts-
19
,33
7,9
76
-
5
2,4
93
58
7,9
73
7
7,9
26
-
-
-
68
,49
6
2
0,1
24
,86
4
2
0,1
24
,86
4
97
35
0
HA
P P
ort
ab
ility
-In
-
1
,32
6,2
27
-
-
-
-
-
-
-
-
1
,32
6,2
27
1
,32
6,2
27
97
40
0
De
pre
cia
tio
n E
xp
en
se
32
5,7
94
23
,05
5
16
,62
7
-
-
-
-
-
7
99
,42
8
9
0
1,1
64
,99
4
1,1
64
,99
4
97
50
0
Fra
ud
Lo
sse
s-
-
-
-
-
-
-
-
-
-
-
-
97
60
0
Ca
pita
l O
utla
ys
- G
ove
rnm
en
tal F
un
ds
-
-
-
-
-
-
-
-
-
-
-
-
97
70
0
De
bt
Prin
cip
al P
aym
en
t -
Go
ve
rnm
en
tal F
un
ds
-
-
-
-
-
-
-
-
-
-
-
-
97
80
0
Dw
elli
ng
Un
its R
en
t E
xp
en
se
-
-
-
-
-
-
-
-
-
-
-
-
90
00
0
To
tal E
xp
en
se
s1
,20
7,6
00
2
2,6
65
,18
4
13
8,8
79
6
5,4
55
58
7,9
73
7
7,9
26
17
,94
6
-
5,1
90
,19
0
73
,99
5
3
0,0
25
,14
8
3
0,0
25
,14
8
10
01
0
Op
era
tin
g T
ran
sfe
r In
-
-
-
-
-
-
-
-
-
-
-
-
10
02
0
Op
era
tin
g t
ran
sfe
r O
ut
-
-
-
-
-
-
-
-
-
-
-
-
10
03
0
Op
era
tin
g T
ran
sfe
rs f
rom
/to
Prim
ary
Go
ve
rnm
en
t-
-
-
-
-
-
-
-
-
-
-
-
10
04
0
Op
era
tin
g T
ran
sfe
rs f
rom
/to
Co
mp
on
en
t U
nit
-
-
-
-
-
-
-
-
-
-
-
-
10
05
0
Pro
ce
ed
s f
rom
No
tes,
Lo
an
s a
nd
Bo
nd
s-
-
-
-
-
-
-
-
-
-
-
-
10
06
0
Pr o
ce
ed
s f
rom
Pro
pe
rty S
ale
s-
-
-
-
-
-
-
-
-
-
-
-
10
07
0
Extr
ao
rdin
ary
Ite
ms,
Ne
t G
ain
/Lo
ss
-
-
-
-
-
-
-
-
-
-
-
-
10
08
0
Sp
ecia
l Ite
ms (
Ne
t G
ain
/Lo
ss)
-
-
-
-
-
-
-
-
-
-
-
-
10
09
1
Inte
r P
roje
ct
Exce
ss C
ash
Tra
nsfe
r In
-
-
-
-
-
-
-
-
-
-
-
-
10
09
2
Inte
r P
roje
ct
Exce
ss C
ash
Tra
nsfe
r O
ut
-
-
-
-
-
-
-
-
-
-
-
-
10
09
3
Tra
nsfe
rs b
etw
ee
n P
rog
ram
an
d P
roje
ct
- In
-
-
-
-
-
-
-
-
-
-
-
-
10
09
4
Tra
nsfe
rs b
etw
ee
n P
roje
ct
an
d P
rog
ram
- O
ut
-
-
-
-
-
-
-
-
-
-
-
-
10
10
0
To
tal O
the
r fin
an
cin
g S
ou
rce
s (
Use
s)
-
-
-
-
-
-
-
-
-
-
-
-
-
-
10
00
0
Exce
ss (
De
ficie
ncy)
of
To
tal R
eve
nu
e O
ve
r (U
nd
er)
To
tal E
(67
1,0
54
)
2
45
,13
0
2
4,3
26
(2,3
54
)
1
97
,35
7
-
(11
,95
7)
-
16
,38
4
8,7
01
(1
93
,46
7)
(19
3,4
67
)
11
02
0
Re
qu
ire
d A
nn
ua
l D
eb
t P
rin
cip
al P
aym
en
ts-
-
1
5,3
99
-
-
-
-
-
68
0,0
00
-
69
5,3
99
69
5,3
99
11
03
0
Be
gin
nin
g E
qu
ity
8,9
88
,53
5
59
6,9
40
84
,48
3
(8
,57
2)
-
-
1,7
93
,89
6
(3,2
44
)
1
0,6
39
,23
2
9
4,6
24
22
,18
5,8
94
22
,18
5,8
94
11
04
0
Prio
r P
erio
d A
dju
stm
en
ts,
Eq
uity T
ran
sfe
rs a
nd
Co
rre
ctio
n
-
1
,04
1,6
21
-
10
,92
6
(1
97
,35
7)
-
-
3,2
44
(85
8,4
34
)
-
-
-
11
05
0
Ch
an
ge
s in
Co
mp
en
sa
ted
Ab
se
nce
Ba
lan
ce
-
-
-
-
-
-
-
-
-
-
-
-
11
06
0
Ch
an
ge
s in
Co
ntin
ge
nt
Lia
bili
ty B
ala
nce
-
-
-
-
-
-
-
-
-
-
-
-
11
07
0
Ch
an
ge
s in
Un
reco
gn
ize
d P
en
sio
n T
ran
sitio
n L
iab
ility
-
-
-
-
-
-
-
-
-
-
-
-
_________________________________________________________________________________________________________ Washington State Auditor's Office
47

Page 7
of 7
HA
Of
Pie
rce
Co
un
ty
(WA
05
4)
Su
bm
issio
n T
yp
e:
Un
au
dite
d/A
-13
3
TA
CO
MA
, W
A
Re
ve
nu
e a
nd
Exp
en
se
Su
mm
ary
Fis
ca
l Y
ea
r E
nd
: 1
2/3
1/2
01
2
Pro
ject
To
tal
14
.87
1
Ho
usin
g
Ch
oic
e
Vo
uch
ers
10
.41
5
Ru
ral R
en
tal
Ho
usin
g
Lo
an
s
14
.25
7
Ho
me
lessn
ess
Pre
ve
ntio
n
an
d R
ap
id
Re
-Ho
usin
g
Pro
gra
m
(RA
F)
14
.VS
H H
UD
-
VE
TE
RA
NS
AF
FA
IRS
SU
PP
OR
TIV
E
HO
US
ING
(HU
D-V
AS
H)
PR
OG
RA
M
10
.42
7 R
ura
l
Re
nta
l
Assis
tan
ce
Pa
ym
en
ts
8 O
the
r
Fe
de
ral
Pro
gra
m 1
2
Sta
te/L
o
ca
l
1 B
usin
ess
Activitie
s
14
.85
6 L
ow
er
Inco
me
Ho
usin
g
Assis
tan
ce
Pro
gra
m_
Se
ctio
n 8
Mo
de
rate
Re
ha
bili
tat
Su
bto
tal
To
tal
11
08
0
Ch
an
ge
s in
Sp
ecia
l T
erm
/Se
ve
ran
ce
Be
ne
fits
Lia
bili
ty-
-
-
-
-
-
-
-
-
-
-
-
11
09
0
Ch
an
ge
s in
Allo
wa
nce
fo
r D
ou
btf
ul A
cco
un
ts -
Dw
elli
ng
Re
-
-
-
-
-
-
-
-
-
-
-
-
11
10
0
Ch
an
ge
s in
Allo
wa
nce
fo
r D
ou
btf
ul A
cco
un
ts -
Oth
er
-
-
-
-
-
-
-
-
-
-
-
-
11
17
0
Ad
min
istr
ative
Fe
e E
qu
ity
-
-
-
-
-
-
-
-
-
-
-
-
11
18
0
Ho
usin
g A
ssis
tan
ce
Pa
ym
en
ts E
qu
ity
-
1
,88
3,6
91
-
-
-
-
-
-
-
-
1
,88
3,6
91
1
,88
3,6
91
11
19
0
Un
it M
on
ths A
va
ilab
le1
50
73
15
96
24
05
9
13
65
24
0-
-
80
40
19
25
9
59
11
21
0
Nu
mb
er
of
Un
it M
on
ths L
ea
se
d1
48
12
89
51
23
15
9
10
17
23
1-
-
73
94
17
55
9
59
11
27
0
Exce
ss C
ash
39
4,4
12
-
-
-
-
-
-
-
-
-
39
4,4
12
39
4,4
12
11
61
0
La
nd
Pu
rch
ase
s-
-
-
-
-
-
-
-
-
-
-
-
11
62
0
Bu
ildin
g P
urc
ha
se
s1
39
,24
7
-
-
-
-
-
-
-
-
-
1
39
,24
7
1
39
,24
7
11
63
0
Fu
rnitu
re &
Eq
uip
me
nt
- D
we
llin
g P
urc
ha
se
s4
6,8
25
-
-
-
-
-
-
-
-
-
4
6,8
25
4
6,8
25
11
64
0
Fu
rnitu
re &
Eq
uip
me
nt
- A
dm
inis
tra
tive
Pu
rch
ase
s1
0,6
67
-
-
-
-
-
-
-
-
-
1
0,6
67
1
0,6
67
11
65
0
Le
ase
ho
ld Im
pro
ve
me
nts
Pu
rch
ase
s-
-
-
-
-
-
-
-
-
-
-
-
11
66
0
Infr
astr
uctu
re P
urc
ha
se
s-
-
-
-
-
-
-
-
-
-
-
-
13
51
0
CF
FP
De
bt
Se
rvic
e P
aym
en
ts-
-
-
-
-
-
-
-
-
-
-
-
13
90
1
Re
pla
ce
me
nt
Ho
usin
g F
acto
r F
un
ds
-
-
-
-
-
-
-
-
-
-
-
-
_________________________________________________________________________________________________________ Washington State Auditor's Office
48

_________________________________________________________________________________________________________ Washington State Auditor's Office
49

ABOUT THE STATE AUDI TOR'S OFFI CE
The State Auditor's Office is established in the state's Constitution and is part of the executive
branch of state government. The State Auditor is elected by the cit izens of Washington and
serves four-year terms.
Our mission is to work with our audit clients and cit izens as an advocate for government
accountability. As an elected agency, the State Auditor's Office has the independence
necessary to objectively perform audits and investigations. Our audits are designed to comply
with professional standards as well as to satisfy the requirements of federal, state, and local
laws.
The State Auditor's Office employees are located around the state to deliver services effectively
and efficiently.
Our audits look at financial information and compliance with state, federal and local laws on the
part of all local governments, including schools, and all state agencies, including institutions of
higher education. In addition, we conduct performance audits of state agencies and local
governments and fraud, whistleblower and cit izen hotline investigations.
The results of our work are widely distributed through a variety of reports, which are available
on our Web site and through our free, electronic subscription service.
We take our role as partners in accountability seriously. We provide training and technical
assistance to governments and have an extensive quality assurance program.
State Auditor Troy Kelley Chief of Staff Doug Cochran
Director of State and Local Audit Chuck Pfeil, CPA
Deputy Director of State and Local Audit Kelly Collins, CPA Deputy Director of State and Local Audit Jan M. Jutte, CPA, CGFM
Deputy Director of State and Local Audit Sadie Armijo Deputy Director of Quality Assurance Barb Hinton
Deputy Director of Communications Thomas Shapley
Local Government Liaison Mike Murphy Public Records Officer Mary Leider
Main number (360) 902-0370
Toll- free Citizen Hotline (866) 902-3900
Website www.sao.wa.gov
Subscription Service www.sao.wa.gov/ EN/ News/ Subscriptions