Financial Review and Other Information - Petronas
8
217 Financial Review and Other Information An overview of our financial performance and other relevant details. Group Financial Results and Position 217 • Analysis of Financial Results • Analysis of Financial Position • Analysis of Cash Flow • Five-Year Key Financial Indicators Appendix 228 Glossary of Terms 230 Group Financial Results and Position Profit/(Loss After Tax) PAT/(LAT) (RM billion) PAT FY2019 Net impairment losses FY2019 1 PAT FY2019 excluding net impairment losses PAT FY2020 excluding net impairment losses Net impairment losses FY2020 1 LAT FY2020 Lower revenue Lower other costs 2 40.5 8.3 48.8 (61.6) 23.3 10.5 (31.5) (21.0) 1 Includes write-off of exploration expenditure under intangible assets, loss on remeasurement of finance lease receivables and provision for contracts exposure. 2 Other costs mainly comprise lower product costs. In RM million FY2020 FY2019 Revenue 178,741 240,263 Cost of revenue (134,958) (155,926) Gross profit 43,783 84,337 Selling and distribution expenses (8,174) (7,536) Administration expenses (9,675) (12,862) Net impairment losses/write-off (32,681) (7,151) Other expenses (5,871) (2,261) Other income 4,102 5,158 Operating (loss)/profit (8,516) 59,685 Financing costs (4,133) (3,734) Share of profit after tax and non-controlling interests of equity accounted associates and joint ventures 328 1,019 (Loss)/Profit before taxation (12,321) 56,970 Tax expense (8,708) (16,498) (Loss)/Profit for the year (21,029) 40,472 (Loss)/Profit attributable to: Shareholders of the Company (23,851) 33,021 Non-controlling interests 2,822 7,451 (Loss)/Profit for the year (21,029) 40,472 Consolidated Statement of Profit or Loss and Other Comprehensive Income Analysis of Financial Results PETRONAS Group Earnings Scan this QR code to access our Financial Report 2020 In FY2020, lower Group Costs resulted from cost compression efforts had cushioned the impact of lower revenue realised. This contributed towards PETRONAS Group recording a PAT excluding net impairment losses of RM10.5 billion in FY2020. PAT movement during the year (excluding net impairment losses)
-
Upload
khangminh22 -
Category
Documents
-
view
0 -
download
0
Transcript of Financial Review and Other Information - Petronas

217
Financial Review and Other InformationAn overview of our financial performance and other relevant details.
Group Financial Results and Position 217
• Analysis of Financial Results
• Analysis of Financial Position
• Analysis of Cash Flow
• Five-Year Key Financial Indicators
Appendix 228
Glossary of Terms 230
Group Financial Results and Position
Profit/(Loss After Tax) PAT/(LAT)(RM billion)
PATFY2019
Net impairment
losses FY20191
PAT FY2019 excluding net
impairment losses
PAT FY2020 excluding net
impairment losses
Net impairment
losses FY20201
LATFY2020
Lower revenue
Lower other costs2
40.5
8.3 48.8 (61.6)
23.3 10.5 (31.5)
(21.0)
1 Includes write-off of exploration expenditure under intangible assets, loss on remeasurement of finance lease receivables and provision for contracts exposure.
2 Other costs mainly comprise lower product costs.
In RM million FY2020 FY2019
Revenue 178,741 240,263
Cost of revenue (134,958) (155,926)
Gross profit 43,783 84,337
Selling and distribution expenses (8,174) (7,536)
Administration expenses (9,675) (12,862)
Net impairment losses/write-off (32,681) (7,151)
Other expenses (5,871) (2,261)
Other income 4,102 5,158
Operating (loss)/profit (8,516) 59,685
Financing costs (4,133) (3,734)
Share of profit after tax and non-controlling interests of equity accounted associates and joint ventures 328 1,019
(Loss)/Profit before taxation (12,321) 56,970
Tax expense (8,708) (16,498)
(Loss)/Profit for the year (21,029) 40,472
(Loss)/Profit attributable to:
Shareholders of the Company (23,851) 33,021
Non-controlling interests 2,822 7,451
(Loss)/Profit for the year (21,029) 40,472
Consolidated Statement of Profit or Loss and Other Comprehensive Income
Analysis of Financial Results
PETRONAS Group Earnings
Scan this QR code to access our Financial Report 2020
In FY2020, lower Group Costs resulted from cost compression efforts had cushioned the impact of lower revenue realised.
This contributed towards PETRONAS Group recording a PAT excluding net impairment losses of RM10.5 billion in FY2020.
PAT movement during the year
(excluding net impairment losses)
Petroliam Nasional Berhad (PETRONAS)
Integrated Report 2020
218 219
In FY2020, the Group registered total revenue of RM178.7 billion, the bulk of which was contributed by petroleum products and LNG which accounted for 35 per cent and 21 per cent of our revenue respectively.
Petroleum Products
LNG
Crude Oil and Condensates
Natural and Processed Gas
Petrochemicals
Others*
TotalRM178.7
billion
10%RM18.1 billion
8%RM14.2 billion
13%RM22.3 billion
13%RM23.7 billion
21%RM37.7 billion
35%RM62.7 billion
* Others comprise Property & Others and Maritime & Logistics.
Revenue By Product
International Operations Exports Domestic
* Figures have been restated due to changes in accounting policies with respect to revenue reporting and inventory valuation of gas trading activities.
FY2020 178.7
58.0 66.3 54.4
FY2019 240.3
75.4 85.8 79.1
FY2018 251.0
80.3 98.9 71.8
FY2017 223.6
73.3 88.3 62.0
FY2016* 195.1
68.9 71.5 54.7
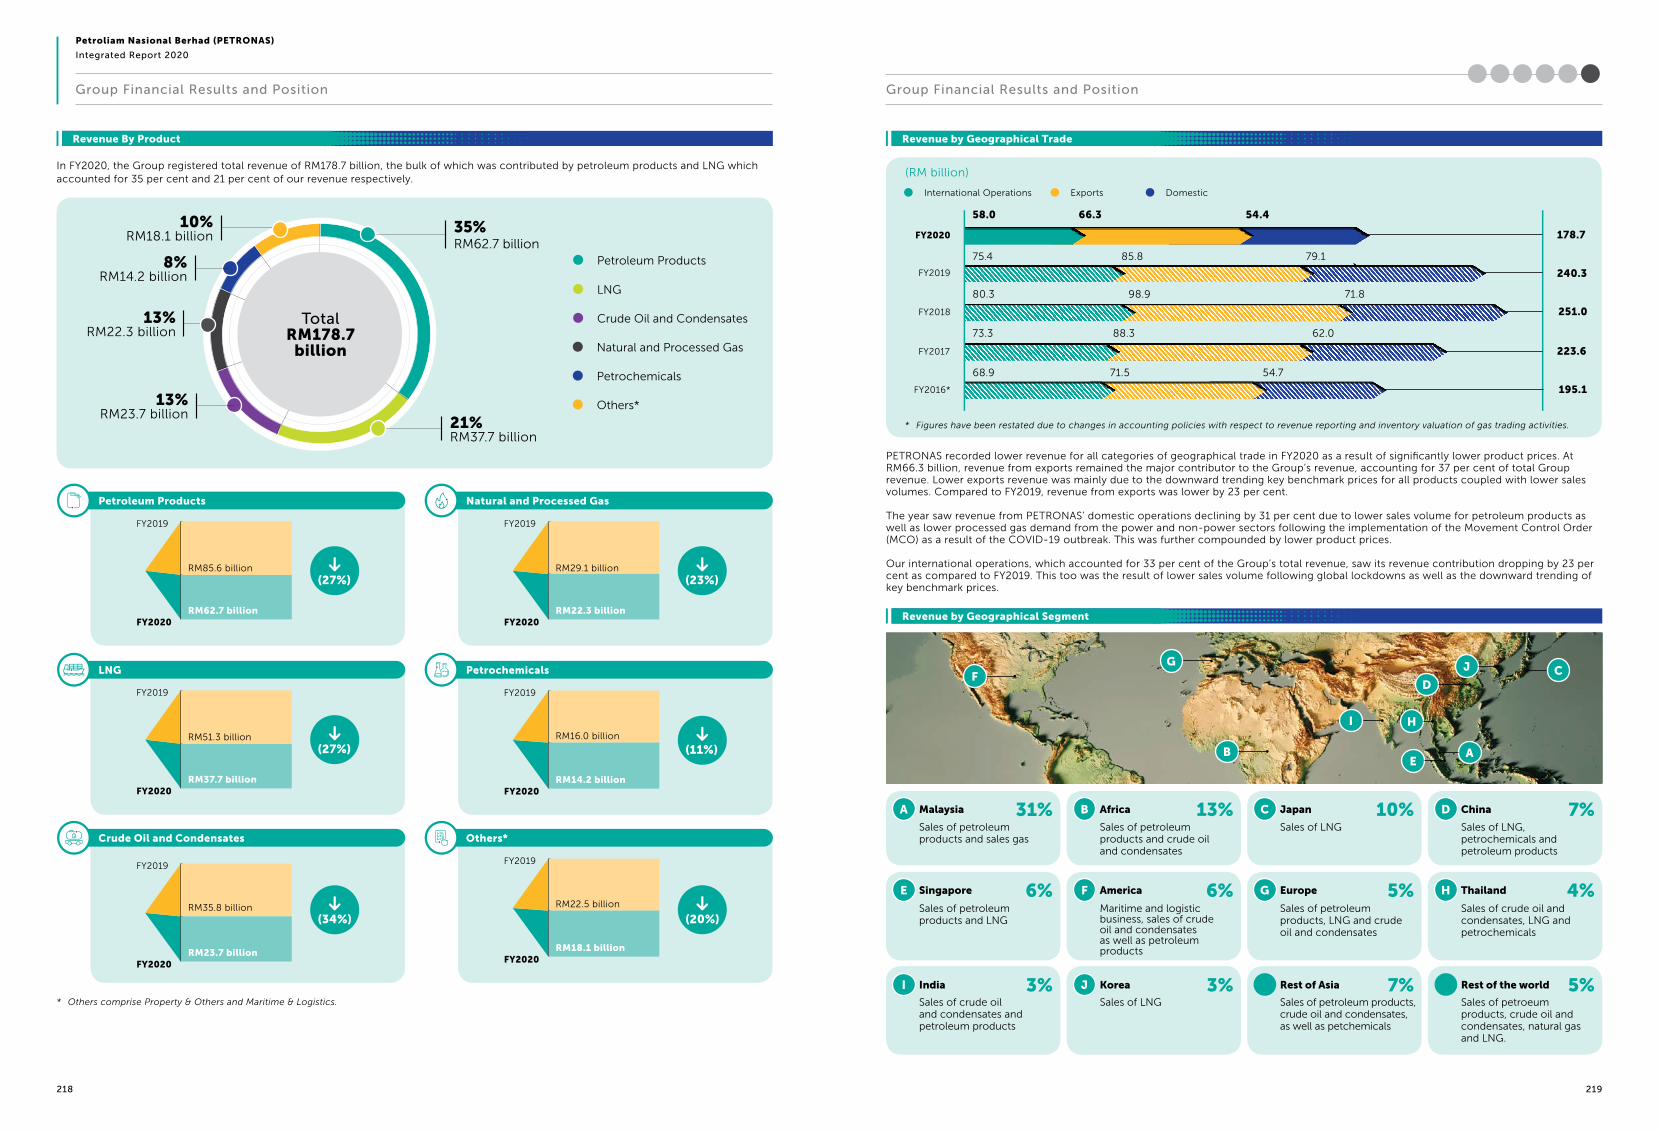
PETRONAS recorded lower revenue for all categories of geographical trade in FY2020 as a result of significantly lower product prices. At RM66.3 billion, revenue from exports remained the major contributor to the Group’s revenue, accounting for 37 per cent of total Group revenue. Lower exports revenue was mainly due to the downward trending key benchmark prices for all products coupled with lower sales volumes. Compared to FY2019, revenue from exports was lower by 23 per cent.
The year saw revenue from PETRONAS’ domestic operations declining by 31 per cent due to lower sales volume for petroleum products as well as lower processed gas demand from the power and non-power sectors following the implementation of the Movement Control Order (MCO) as a result of the COVID-19 outbreak. This was further compounded by lower product prices.
Our international operations, which accounted for 33 per cent of the Group’s total revenue, saw its revenue contribution dropping by 23 per cent as compared to FY2019. This too was the result of lower sales volume following global lockdowns as well as the downward trending of key benchmark prices.
A
E
I
B
F
J
C
G
D
H
Malaysia
Singapore
India
Africa
America
Korea
Japan
Europe
Rest of Asia
China
Thailand
Rest of the world
31%
6%
3%
13%
6%
3%
10%
5%
7%
7%
4%
5%
Sales of petroleum products and sales gas
Sales of petroleum products and LNG
Sales of crude oil and condensates and petroleum products
Sales of petroleum products and crude oil and condensates
Maritime and logistic business, sales of crude oil and condensates as well as petroleum products
Sales of LNG
Sales of LNG
Sales of petroleum products, LNG and crude oil and condensates
Sales of petroleum products, crude oil and condensates, as well as petchemicals
Sales of LNG, petrochemicals and petroleum products
Sales of crude oil and condensates, LNG and petrochemicals
Sales of petroeum products, crude oil and condensates, natural gas and LNG.
H
D
J C
AE
B
I
G
(RM billion)
Revenue by Geographical Trade
Revenue by Geographical Segment
Group Financial Results and Position Group Financial Results and Position
Petroleum Products
LNG
Crude Oil and Condensates
(34%)
Natural and Processed Gas
Petrochemicals
(11%)
Others*
(20%)
FY2019
RM35.8 billion
RM23.7 billionFY2020
(27%)
FY2019
RM85.6 billion
RM62.7 billionFY2020
(23%)
FY2019
RM29.1 billion
RM22.3 billionFY2020
FY2019
RM16.0 billion
RM14.2 billionFY2020
FY2019
RM22.5 billion
RM18.1 billionFY2020
(27%)
FY2019
RM51.3 billion
RM37.7 billionFY2020
F

Petroliam Nasional Berhad (PETRONAS)
Integrated Report 2020
220 221
The Group operates three core business segments, namely Upstream, G+NE, as well as Downstream. Corporate and Others,
which complements our core businesses, comprises the logistics and maritime segment, property segment as well as the
central treasury and Project Delivery and Technology (PD&T) functions.
UpstreamThe Upstream segment recorded a LAT of RM10.2 billion in FY2020 which was primarily due to the lower prices for liquids and gas as well as higher net impairment losses on assets. This was partially offset by a lower tax expense, operating expenses and cash payments.
Excluding net impairment losses, Upstream registered RM5.1 billion in PAT, which was lower by RM19.1 billion compared to the previous year.
In line with PETRONAS’ focus on upholding operational efficiencies, commercial excellence and maintaining fiscal discipline, Upstream continued to enhance its strategies to cushion the adverse impact arising from the twin shocks on its business. Upstream undertook several tactical interventions including optimisation of production, in response to lower demand to protect value.
As a result, Upstream recorded a lower total daily production average of 2,209 thousand boe per day in FY2020, as compared to 2,406 thousand boe per day in FY2019.
Refer to pages 72 to 81 for more information on Upstream’s operational performance.
RM22.2 billion
FY2019
(>100%)
(RM10.2) billion
FY2020
PAT/(LAT) Upstream
Gas + New EnergyG+NE recorded a LAT amounting to RM10.0 billion in FY2020. This was mainly due to the lower overall average realised prices and sales volume as well as higher net impairment losses on assets which was partially offset by lower product costs.
Excluding net impairment losses, the segment recorded PAT of RM2.7 billion, which was lower by RM12.9 billion as compared to FY2019.
In response to the weakened market demand, the segment has established adaptive measures to optimise its production profile to ensure the best value for the molecules, while meeting contractual obligations to customers. In addition, the business also adopted the agile operating philosophy to ensure value preservation, thus mitigating the impact of softer demand and prices on profitability.
Refer to pages 82 to 91 for more information on G+NE’s operational performance.
PAT/(LAT) Gas + New Energy
RM9.8 billion
FY2019
(RM10.0) billion
FY2020
(>100%)
DownstreamThe Downstream business recorded a LAT of RM3.5 billion in FY2020 as compared to a PAT of RM5.2 billion recorded in FY2019. The drop in profit was mainly attributable to the inventory and net impairment losses on assets, compressed margins and lower petroleum product marketing sales volume.
Excluding net impairment losses, Downstream recorded a LAT of RM1.7 billion, which was some RM7.2 billion lower than the preceding year’s PAT of RM5.5 billion.
Due to the demand erosion. Downstream undertook swift action to adjust its refineries utilisation based on demand and market movements.
Refer to pages 92 to 101 for more information on Downstream’s operational performance.
PAT/(LAT) Downstream
RM5.2 billion
FY2019
(RM3.5) billion
FY2020
(>100%)
Corporate and OthersPETRONAS’ Corporate and Others business recorded a lower PAT of RM0.2 billion, as compared to FY2019’s PAT of RM4.7 billion. The lower profit recorded was mainly due to higher net impairment losses on assets recognised and provision for litigation claims arising from an unfavourable arbitration result. The segment recorded a PAT excluding net impairment losses of RM1.9 billion.
MISC Berhad (MISC) and KLCC Property Holdings Berhad (KLCCP) were the two major contributors to this segment. MISC recorded a LAT of RM0.2 billion during the year, mainly from offshore businesses following the impact of an unfavourable arbitration result. Meanwhile, KLCCP’s PAT decreased to RM0.4 billion as compared to RM0.8 billion in the same period last year mainly due to the loss of revenue from its retail and hotel segment due to the impact of the COVID-19 pandemic.
Refer to the respective 2020 Integrated Annual Reports of MISC and KLCCP for more information.
PATCorporate and Others
Segment Earnings
RM4.7 billion
FY2019
RM0.2 billion
FY2020
96%
In RM million
As at
31.12.2020
As at
31.12.2019
Assets
Property, plant and equipment 291,717 319,204
Investment properties and land held for
development
13,454 11,708
Investments in associates and joint ventures 12,599 15,902
Intangible assets 20,044 26,260
Fund and other investments 1,009 1,929
Other non-current assets 41,854 40,956
Total non-current assets 380,677 415,959
Trade and other inventories 12,491 14,447
Trade and other receivables 40,583 41,285
Assets classified as held for sale 18 398
Fund and other investments 9,779 8,710
Cash and cash equivalents 130,523 141,622
Total current assets 193,394 206,462
Total assets 574,071 622,421
Equity
Share capital 100 100
Reserves 330,521 388,996
Total equity attributable to shareholders of
the Company
330,621 389,096
Non-controlling interests 50,413 49,819
Total equity 381,034 438,915 Liabilities
Borrowings 76,808 53,422
Deferred tax liabilities 8,455 12,598
Other long-term liabilities and provisions 51,056 44,486
Total non-current liabilities 136,319 110,506
Trade and other payables 43,728 53,968
Borrowings 11,421 15,316
Taxation 1,569 3,716
Total current liabilities 56,718 73,000
Total liabilities 193,037 183,506
Total equity and liabilities 574,071 622,421
Property, Plant and Equipment &Intangible Assets(RM billion)
Lower mainly due to significant net impairment losses recognised on oil and gas property, project-in-progress, plant and equipment as well as intangible assets.
(10%)
Cash and Fund Investments(RM billion)
Lower mainly as a result of dividend payments and cash paid on capital expenditures partially offset by cash flows from operations.
(7%)
Borrowings(RM billion)
Higher mainly as the result of the issuance of USD6 billion multi-tranche senior bonds during the year.
28%
Trade and Other Payables(RM billion)
Lower in line with lower product prices.
(19%)
Consolidated Statement of Financial Position
Analysis of Financial Position
Group Financial Results and Position Group Financial Results and Position
31 Dec 2019
31 Dec 2020 RM311.8
RM345.5
31 Dec 2019
31 Dec 2020 RM141.3
RM152.3
31 Dec 2019
31 Dec 2020 RM88.2
RM68.7
31 Dec 2019
31 Dec 2020 RM43.7
RM54.0

Petroliam Nasional Berhad (PETRONAS)
Integrated Report 2020
222 223
Mainly comprise remaining funds of non-wholly owned subsidiaries and trust funds within the Group
Funds of wholly owned subsidiaries and PETRONAS’ portion of non-wholly owned subsidiaries
Total Assets
(RM billion)
Property, Plant and Equipment & Intangible Assets Cash and Fund Investments
Trade and Other Receivables OthersTrade and Other Inventories
141.3 67.912.5
152.3 41.3 68.914.4
Total Liabilities
(RM billion)
31 Dec
2020
31 Dec
2019
43.7
193.0
183.5
88.2 61.1
54.0 68.7 60.8
Trade and Other Payables Borrowings Others
Movement in Cash and Fund Investments
(RM billion)
10.9
31 Dec 2019 CFFO Drawdown of borrowings
Capital investmentsDividends Financing repayments
Others 31 Dec 2020
152.2
40.743.1
(34.0)
(33.4)
(24.9)(2.4) 141.3
31 Dec
2020
31 Dec
2019
311.8
345.5
574.1
622.4
Net Cash PositionThe Group’s ability to continue holding a unique Net Cash position of RM52.1 billion demonstrates our disciplined fiscal management approach in fulfilling existing financing commitments while sustaining our momentum for long-term growth.
In RM million FY2020 FY2019
Cash flows from operating activities
(Loss)/Profit before taxation (12,321) 56,970
Adjustments for non-cash items 69,840 41,542
Net changes in working capital (4,197) 8,385
Cash generated from operations 53,322 106,897
Interest expenses paid (2,689) (2,990)
Interest income from fund and other investments 4,838 6,889
Taxation paid, net of refund (14,726) (20,025)
Net cash generated from operating activities 40,745 90,771
Cash flows from investing activities (32,914) (52,177)
Cash flows from financing activities (17,467) (69,880)
Net decrease in cash and cash equivalents (9,636) (31,286)
Increase in cash and cash equivalents restricted (298) (699)
Net foreign exchange differences (1,752) (622)
Cash and cash equivalents at beginning of the year 139,851 172,458
Cash and cash equivalents at end of the year 128,165 139,851
PETRONAS Group managed to register a positive free cash
flow of RM7.8 billion during the year despite the challenging
market environment. However, free cash flow in FY2020 was
lower as compared to RM43.0 billion in the preceeding year
mainly due to:
Consolidated Statement of Cash Flows
Analysis of Cash Flow
Free Cash Flow Analysis
Free Cash Flow
(RM billion)
7.8
FY2020 FY2019
43.0
Reduced cash generated from operations in line with lower profits which was partially offset by lower taxes paid.
Partially offset by lower capital expenditure as a result of strategic reassessment of capital allocation through prioritisation of projects.
82%
40.6
Group Financial Results and Position Group Financial Results and Position
94.2
58.060.1
81.2

Petroliam Nasional Berhad (PETRONAS)
Integrated Report 2020
224 225
For the year in review, the Group’s capital investment decreased to RM33.4 billion as compared to RM47.8 billion in the
preceding year. The reduction reflects the collective effort by all business segments in optimising their portfolios and
reprioritising projects with the aim to safeguard PETRONAS’ liquidity. Despite the spending optimisation effort, PETRONAS
continued to invest in key projects which are aligned with the Group’s long-term Sustainability Agenda.
Domestic and International Capital Investments Breakdown(RM billion)
* The figures has been restated to include cost of acquisition of subsidiaries and investment in associates and joint ventures.
Capital Investments byBusiness Segments in FY2020
Capital Investments byGeographical Segments in FY2020
Upstream
Gas + New Energy
Downstream
Corporate and Others
Malaysia
Canada
USA
Rest of the World
Asia (excluding Malaysia)
FY2020 33.4
17.5 15.9
FY2019 47.8
24.7 23.1
FY2018 46.9
25.3 21.6
FY2017 45.0
36.1 8.1
FY2016* 51.6
41.1 10.5
Dosmetic International
TotalRM33.4 billion
RM7.6 billion
RM14.4 billion
RM5.0 billion
RM6.4 billion
Upstream51%RM9.0 billion
10%RM3.5 billion
TotalRM33.4 billion
RM17.5 billion
Downstream26%RM4.5 billion
Gas + New Energy13%RM2.3 billion
Corporate and Others10%RM1.7 billion
16%RM5.2 billion
15%RM4.9 billion
7%RM2.3 billion
Capital Investments
Segment Capital Investments
Upstream continued to dominate the larger percentage of capital
investments at RM14.4 billion or 43 per cent of the Group’s total
capital investment in FY2020. Upstream’s capital investments for
FY2020 were predominantly spent on exploration, development and
production activities aimed at sustaining and growing production in
Malaysia and international operations.
Domestically, RM9.0 billion or 62 per cent of Upstream’s total capital
investment was spent on key projects such as the Kasawari Gas Field
Development, Bayan Phase 2, Baram Delta Enhanced Oil Recovery
and Pegaga Gas Field Development.
A total of RM5.4 billion was allocated towards international portfolio
investments with key countries including Canada, Iraq, Azerbaijan
and Mexico. Notable investments include Upstream’s first entry
into the oil and gas operations in the Gulf of Mexico, USA through
a subsidiary, Progress Resources USA LLC (PRUL), for a 30 per cent
working interest in the Monument Prospect in early FY2020.
Segment Capital Investments
The G+NE business accounted for 23 per cent of the Group’s
total capital investments and incurred a total spending of
RM7.6 billion in FY2020.
The capital investments for FY2020 were predominantly spent
on its international ventures particularly for its LNG project
in Canada. During the year, the segment also made further
investments through the acquisition of solar assets under Acme
Solar in India.
The Downstream segment utilised capital investments of
RM5.0 billion during the year or 15 per cent of the Group’s
overall capital investment allocation.
The spending made during the year was mainly allocated
towards further investments in the Pengerang Integrated
Complex (PIC), which is currently on track with its plan to
transition to commercial operations. Other investments were
mainly related to operational capital investments as well as
turnaround activities.
The businesses under Corporate and Others spent RM6.4 billion
during the year, higher by RM1.9 billion as compared to 2019
with MISC accounting for 81 per cent of the total spending.
During the year, MISC’s significant investments include the
milestone payment for six units of Very Large Ethane Carrier
(VLEC) and petroleum newbuild vessels.
Group Financial Results and Position Group Financial Results and Position
Upstream
Gas + New Energy
Corporate andOthers
Downstream

Petroliam Nasional Berhad (PETRONAS)
Integrated Report 2020
226 227
FY2018FY2017 FY2020FY2019FY2016*
* The figures have been restated due to the change in accounting policies with respect to revenue reporting and inventory valuation for gas trading activities.* Certain financial information and their corresponding financial ratios have been restated due to the change in accounting policies with respect to revenue reporting and inventory valuation for gas trading activities.
(RM billion)
Revenue Profit/(Loss After Tax) PAT/(LAT)
195.1 223.6 251.0 240.3 178.7
FY2016* FY2017 FY2018 FY2019 FY2020
23.8 45.5 55.3 40.5
(21.0)
EBITDA
70.7 92.0 116.5 96.3 55.3
FY2016* FY2017 FY2018 FY2019 FY2020
Net Cash Position
63.4 71.8 110.2 81.6 52.1
FY2016* FY2017 FY2018 FY2019 FY2020
CFFO
53.8 75.7 86.3 90.8 40.7
FY2016* FY2017 FY2018 FY2019 FY2020
Total Assets
603.4 599.8 636.3 622.4 574.1
FY2016* FY2017 FY2018 FY2019 FY2020
FY2018FY2017 FY2020FY2019FY2016*
PAT Margin (%)
12.2 20.3 22.0 16.9
(11.8)
FY2018FY2017 FY2020FY2019FY2016*
Return on Total Assets (ROTA) (%)
5.4 10.7 11.8 8.6
(2.3)
FY2018FY2017 FY2020FY2019FY2016*
Return on Average Capital Employed (ROACE) (%)
5.4 9.8 12.0 8.7
(4.1)
Gearing Ratio (%)
17.4 16.1 19.7 19.4 25.3
FY2016* FY2017 FY2018 FY2019 FY2020
Debt/Assets Ratio (x)
0.11 0.11 0.11 0.11 0.11
FY2016* FY2017 FY2018 FY2019 FY2020
Dividend Payout Ratio (%)
>100 93 69 >100 >100
FY2016* FY2017 FY2018 FY2019 FY2020
Five-Year Key Financial Indicators
Group Financial Results and Position Group Financial Results and Position

Petroliam Nasional Berhad (PETRONAS)
Integrated Report 2020
228 229
Appendix Appendix
Non-Financial Content Index
The results of our Materiality Assessment helped determine the non-financial topics covered in this report. This index includes
reference to IPIECA/API/IOGP Sustainability reporting guidance for oil and gas industry as well as the Global Reporting Initiative
Standards that correspond to the topics covered in the report. The guidelines are available at ipieca.org and globalreporting.org.
Content IPIECA GRI Standards Page
About this Report
Reporting Framework, Scope and
Boundaries
102-1, 102-11, 102-32, 102-41, 102-45,
102-46, 102-50, 102-52, 102-56
4-5
PETRONAS in 2020
We are PETRONAS CCE1 102-16 8-9, 162
Sustainability Agenda GOV1, CCE1, CCE2 102-12, 102-13, 102-20, 102-21, 102-31,
102-33
8-13,
214-125
Business Snapshots 102-2 14-15
The Group Overview 102-3, 102-4, 102-6 16-17
Corporate Structure 102-5 18-29
Strategic Progress
Letter from the Chairman 102-14, 102-13, 102-16 32-37
Letter from the President and Group Chief
Executive Officer
102-7, 102-14 38-43
Letter from the Executive Vice President
and Group Chief Financial Officer
102-14 44-53
Contribution to Government GOV4 201-1 32-47
The World in 2020 102-10 48-53
Engaging with Stakeholders SOC6 102-40, 102-42, 102-43, 102-44 54-57
Material Topics 102-47, 103-1, 103-2 59
Risks Linked to Creating Value CCE1 102-11, 102-15 64-71
Upstream 102-2, 102-10 72-81
Gas + New Energy 102-2, 102-10 82-91
Downstream 102-2, 102-10 92-101
Project Delivery and Technology CCE3 102-2, 102-10 102-109
Creating Sustainable Value
Five-Year Sustainability Key Performance
Data
CCE4, ENV1, ENV2,
ENV5, ENV6, ENV7,
SHS3, SHS6, SOC5
102-8, 102-48, 303-4, 303-5, 305-1,
305-2, 305-4, 305-7, 306-3(2018), 306-3,
401-1, 403-9, 403-10, 405-1, 407-1
112-115
Safeguard the Environment
Waste Management ENV7 306-3, 306-4, 306-5 127-129
Water Management ENV1, ENV2 303-3, 303-4 67-113,
130-132
Air Emission ENV5 305-7 113, 133
Biodiversity & Ecosystem Services ENV3 134-135
PETRONAS Climate Change Position CCE1, CCE2,
CCE4, CCE5, CCE7
305-1, 305-2, 305-4, 305-5 112-114,
116-127
Oil Spills and Respond Preparedness ENV6 306-3(2016) 113, 133
Decommissioning ENV8 134
Content IPIECA GRI Standards Page
Creating Sustainable Value (continued)
Positive Social Impact
Generative HSSE Culture SHS1, SHS3 102-16 137-140
Talent and Education SOC7 401-1, 401-2, 404-2 115, 160-167
Occupational Health & Safety Management SHS1, SHS2, SHS3,
SHS4, SHS6
403-1, 403-2, 403-3, 403-4, 403-5, 403-6,
403-7, 403-8, 403-9, 403-10
112, 136-159
Security SHS7 157-159
Diversity and Equal Opportunity SOC5 405-1 115, 164-165,
192-201
Number of Unionised Employees SOC4 407-1 115, 175
Human Rights in Supply Chain SOC2 408-1, 409-1, 414-2 175
Social Performance SOC1, SOC3,
SOC4, SOC9,
SOC10, SOC11,
SOC12, SOC13
412-1, 412-2, 413-1 168-171
Corporate Social Responsibilities SOC9, SOC13 413-1 178-189
Environmental Health SHS2 416-2 133
Product Stewardship SHS5 416-1, 417-1 176-177
Supply Chain SOC14 102-10 172-174
Commitment to Governance
Board Composition GOV1 102-18, 102-22, 102-23 192-193
Profile of Board of Directors GOV1 102-18, 102-22, 102-27 194-196
Profile of Company Secretaries 102-18, 102-22, 102-27 197
Profile of Executive Leadership Team GOV1 102-18, 102-22, 102-27 198-201
Corporate Governance at PETRONAS GOV1, GOV2,
GOV3, SOC8
102-17, 102-19, 205-2, 102-22, 102-24,
102-25, 102-26, 102-28, 102-29, 102-30,
102-35, 102-36, 102-37
202-213
Sustainability Governance GOV1 102-20, 102-21, 102-31, 102-33 214-215
Appendix
Non-Financial Content Index 102-55 228-229

Petroliam Nasional Berhad (PETRONAS)
Integrated Report 2020
230 231
Glossary of Terms Glossary of Terms
Abbreviation Full Term/Definition
2C Contingent Resources
2P Petroleum Reserves
3R Reduce, reuse, recycle
AC Audit Committee
ABC Anti-Bribery and Corruption
AI Artificial Intelligence
ASEAN Association of Southeast Asian Nations
B40 Bottom 40 per cent of income earners
bbl Barrel
bboe Billion barrel of oil equivalent
BCM Business Continuity Management
BCP Business Continuity Plan
Board Board of Directors
boe Barrel of oil equivalent
C3 Corporate Command Centre
CAPEX Capital expenditure
CCS Carbon Capture and Storage
CCUS Carbon Capture, Utilisation and Storage
CEFS Centralised Emergency and Fire Services
CFFO Cash Flows from Operations
CG Corporate Governance
CIMS Crisis and Incident Management System
CMT Crisis Management Team
CO2 Carbon dioxide
CO2e Carbon dioxide (CO2) equivalent
CoBE Code of Conduct and Business Ethics
CoCHR Contractors Code of Conduct on Human
Rights
COVID-19 2019 novel coronavirus (or 2019-nCoV)
CSR Corporate Social Responsibility
D&I Diversity and Inclusion
DOE Department of Environment
DOSH Department of Occupational Safety and
Health
E&P Exploration and production
EBITDA Earnings Before Interest, Tax, Depreciation
and Amortisation
ECER East Coast Economic Region
ELT Executive Leadership Team
ERE Emergency Response Exercise
ERM Enterprise Risk Management
ERP Enterprise Risk Profile
Abbreviation Full Term/Definition
ERS Equipment Reliability Strategy Programme
ESG Environmental, Social and Governance
FAR Fatal Accident Rate
FID Final Investment Decision
FLNG Floating Liquefied Natural Gas
GCEO Group Chief Executive Officer
GDP Gross Domestic Production
GEES Graduate Employment Enhancement Scheme
GHG Greenhouse gas
GJ Gigajoule
G+NE Gas + New Energy
G&P Gas and Power
GRI Global Reporting Initiative
GWh Gigawatt Hour
HCU Holding Company Unit
HOTS Higher Order Thinking Skills
HRM Human Resource Management
HSE Health, Safety and Environment
HSSE Health, Safety, Security and Environment
ICT Information and Communication Technology
IFRS International Financial Reporting Standards
IIRC International Integrated Reporting Council
INED Independent Non-Executive Director
INSTEP Institut Teknologi Petroleum PETRONAS
IPIECA International Petroleum Industry
Environmental Conservation Association
JTC Joint Technical Committee
JVs Joint ventures
kboe Kilo barrels of oil equivalent
kboed Kilo barrels of oil equivalent per day
kbpd kilo barrels per day
kg Kilogramme
KMt Kilometric tonnes
kWp Kilowatt peak
LAT Loss After Tax
LBV LNG Bunkering Vessel
LNG Liquefied Natural Gas
LOPC Loss of Primary Containment
LTE Long-term evolution
LTIF Loss Time Injury Frequency
MEKAR Memampankan Ekonomi Asas Rakyat
MCF Mandatory Control Framework
Abbreviation Full Term/Definition
MCO Movement Control Order
MFRS Malaysian Financial Reporting Standards
mmBtu Million British Thermal Units
MMscfd Million Standard Cubic Feet Per Day
MMT Million metric tonnes
MOE Ministry of Education
MOH Ministry of Health
MoU Memorandum of Understanding
mtpa Metric tonnes per annum
MW Megawatt
MWh Megawatt-hour
NADMA National Disaster Management Agency
NCER Northern Corridor Economic Region
NCIA Northern Corridor Implementation Authority
NEDs Non-Executive Directors
NGOs Non-governmental organisations
NGV Natural gas vehicle
NINED Non-Independent Non-Executive Director
nm3 Normal cubic meters
NZCE 2050 Net zero carbon emissions by 2050
OE Operational Excellence
OEE Overall Equipment Effectiveness
OPEC+ Organisation of the Petroleum Exporting
Countries Plus
OPEX Operating expenditure
OPU Operating unit
PAT Profit after tax
PCB PETRONAS Cultural Beliefs
PCC PETRONAS Carbon Commitment
PCG PETRONAS Chemicals Group Berhad
PDB PETRONAS Dagangan Berhad
PD&T Project Delivery and Technology
PDR Product Delivery Reliability
PGB PETRONAS Gas Berhad
PGU Peninsular Gas Utilisation
PLC PETRONAS Leadership Centre
PIC Pengerang Integrated Complex
PIVOT PETRONAS Integrated Vision for Operational
Excellence Transformation
PPMS PETRONAS Project Management System
PPRT Pandemic Preparedness and Response Team
PSC Production Sharing Contract
Abbreviation Full Term/Definition
R&D Research and Development
RC Risk Committee
RESCISCO Project to change the paradigm and the
approach of developing competencies
in PETRONAS through enhancement of
capability development philosophy and
framework
RFSU Ready for Start-Up
RGT Regasification terminal
RM Ringgit Malaysia
ROVR An innovative service which allows for a
seamless and safe refuelling experience for
both the commercial and everyday drivers,
beyond conventional petrol stations
SDG Sustainable Development Goals
SeMS Security Management System
SME Small and Medium Enterprise
SME Subject Matter Expert
STEM Science, Technology, Engineering and
Mathematics
SOP Standard Operating Procedure
tCO2e Tonnes (t) of carbon dioxide (CO2) equivalent
The Board Petroliam Nasional Berhad (PETRONAS)
Board of Directors
The Group Petroliam Nasional Berhad (PETRONAS) and
its subsidiaries
TPA Third Party Access
tpa Tonnes per annum
TRCF Total Reportable Case Frequency
TROIF Total Recordable Occupational Illness
Frequency
UN United Nations
UNGP United Nations Guiding Principles
UN SDGs United Nations’ Sustainability Development
Goals
UTP Universiti Teknologi PETRONAS
UPC Unit Production Cost
USD US dollar
VPS Virtual Pipeline System
WFH Work from home
WTI West Texas Intermediate
WTO World Trade Organisation
ZeTo Zero Tolerance