Financial Report - Lansing Community College
86
Financial Report Comprehensive Annual Fiscal Years Ended June 30, 2015 and June 30, 2014 Lansing, Michigan
-
Upload
khangminh22 -
Category
Documents
-
view
0 -
download
0
Transcript of Financial Report - Lansing Community College

Financial Report
Comprehensive Annual
Fiscal Years Ended June 30, 2015 and June 30, 2014
Lansing, Michigan

This page intentionally left blank.
LANSING COMMUNITY COLLEGE Lansing, MI
COMPREHENSIVE ANNUAL FINANCIAL REPORT Fiscal Years Ended June 30, 2015 and June 30, 2014
Prepared by: Financial Services Division
Donald L. Wilske
Chief Financial Officer
Lisa L. Mazure Controller
Megan L. Garrett
Assistant Controller

This page intentionally left blank.
LANSING COMMUNITY COLLEGE COMPREHENSIVE ANNUAL FINANCIAL REPORT FISCAL YEARS ENDED JUNE 30, 2015 AND JUNE 30, 2014
TABLE OF CONTENTS PAGE
INTRODUCTORY SECTION (UNAUDITED)
Letter of Transmittal ..................................................................................... 1
Lansing Community College Principal Officials ........................................................ 8
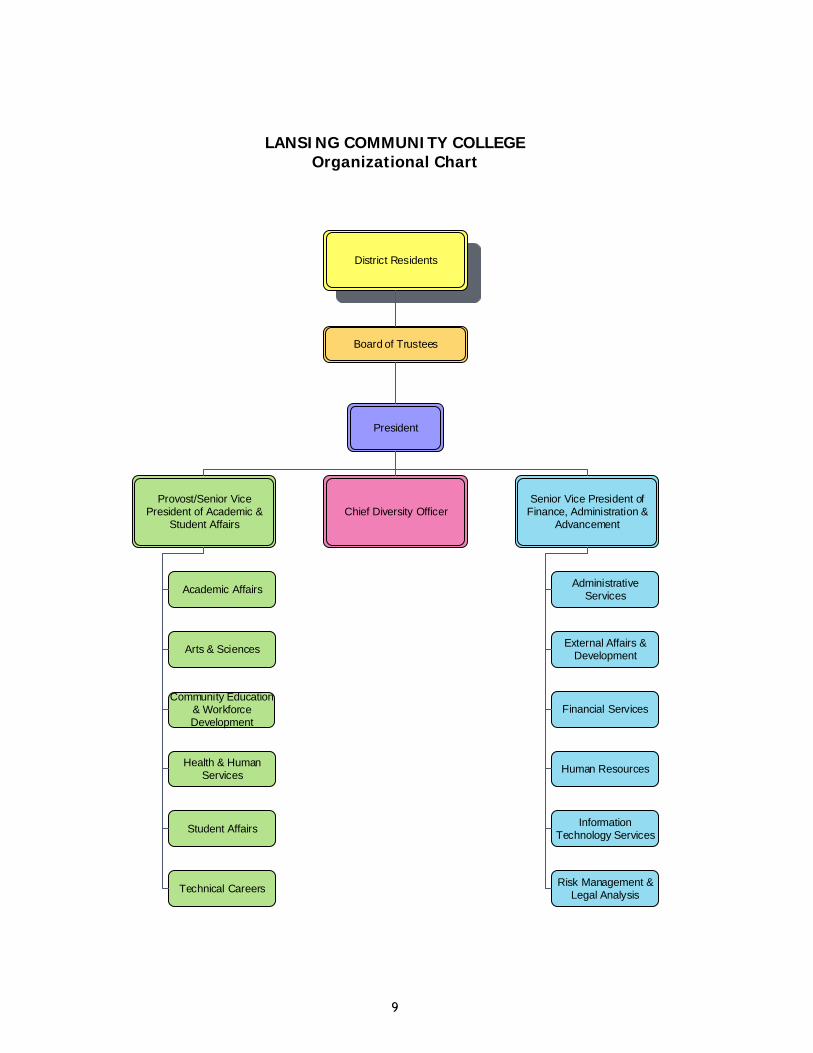
Organization Chart ......................................................................................... 9
Certificate of Achievement for Excellence in Financial Reporting ................................ 10
FINANCIAL SECTION
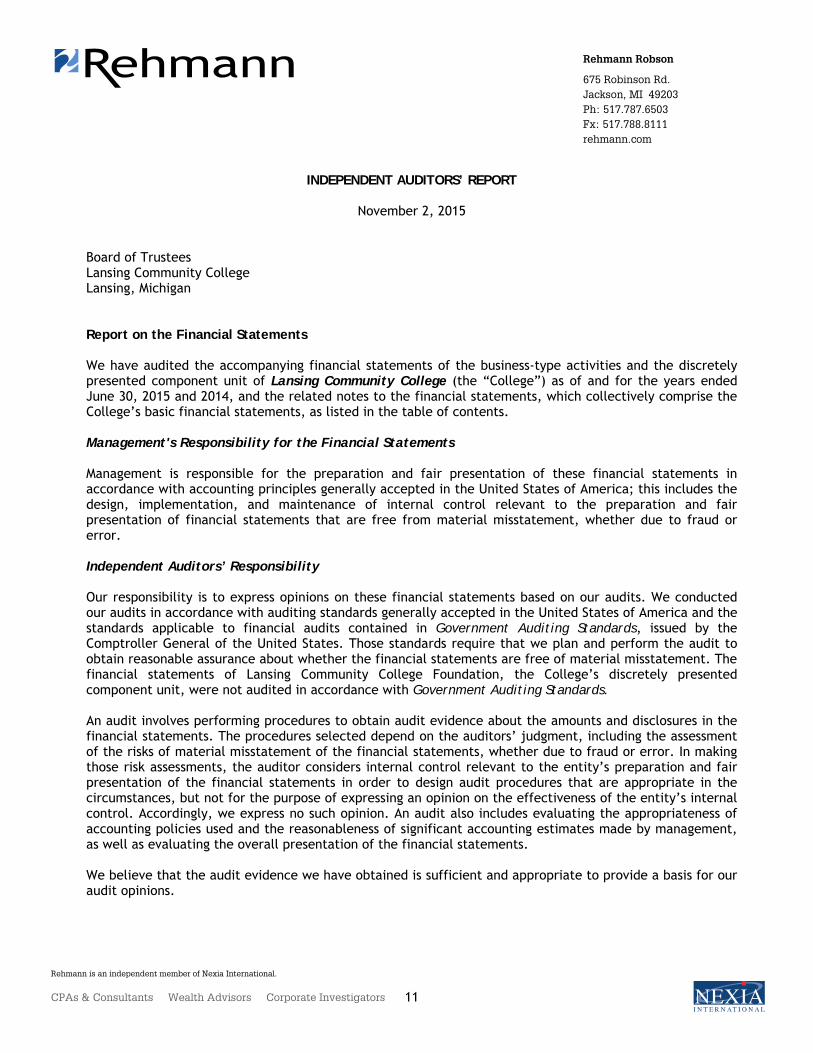
Independent Auditors’ Report ......................................................................... 11
Management’s Discussion and Analysis .............................................................. 13
Basic Financial Statements
Statements of Net Position ......................................................................... 27
Statements of Revenues, Expenses and Changes in Net Position ............................. 28
Statements of Cash Flows ........................................................................... 29
Notes to Financial Statements ..................................................................... 31
Required Supplementary Information
MPSERS Cost-Sharing Multiple Employer Plan:
Schedule of the College’s Proportionate Share of the Net Pension Liability ............... 51
Schedule of College Contributions ................................................................. 52
STATISTICAL SECTION (UNAUDITED)
Statistical Information .................................................................................... 53
Statements of Revenues, Expenses and Changes in Net Position .................................. 54
Net Position by Components ............................................................................. 55
Major Taxpayers .......................................................................................... 56
Assessed Value and Taxable Value of Property ....................................................... 57
Property Tax Levies and Collections ................................................................... 58
Legal Debt Margin ......................................................................................... 59
Personal Income per Capita ............................................................................. 60
Top Ten Principal Employers ............................................................................ 61
Capital Asset Statistics ................................................................................... 62
Enrollment, Tuition and Fee Rates, Credit Hours, and Tuition and Fee
Revenues Generated ................................................................................. 63
Full-Time Equivalent Employees ........................................................................ 64
SPECIAL REPORTS SECTION (UNAUDITED)
Combining Statements of Net Position ................................................................. 65
Combining Statements of Revenues, Expenses, Transfers and Changes
in Net Position ........................................................................................... 67

This page intentionally left blank.

Introductory Section
1
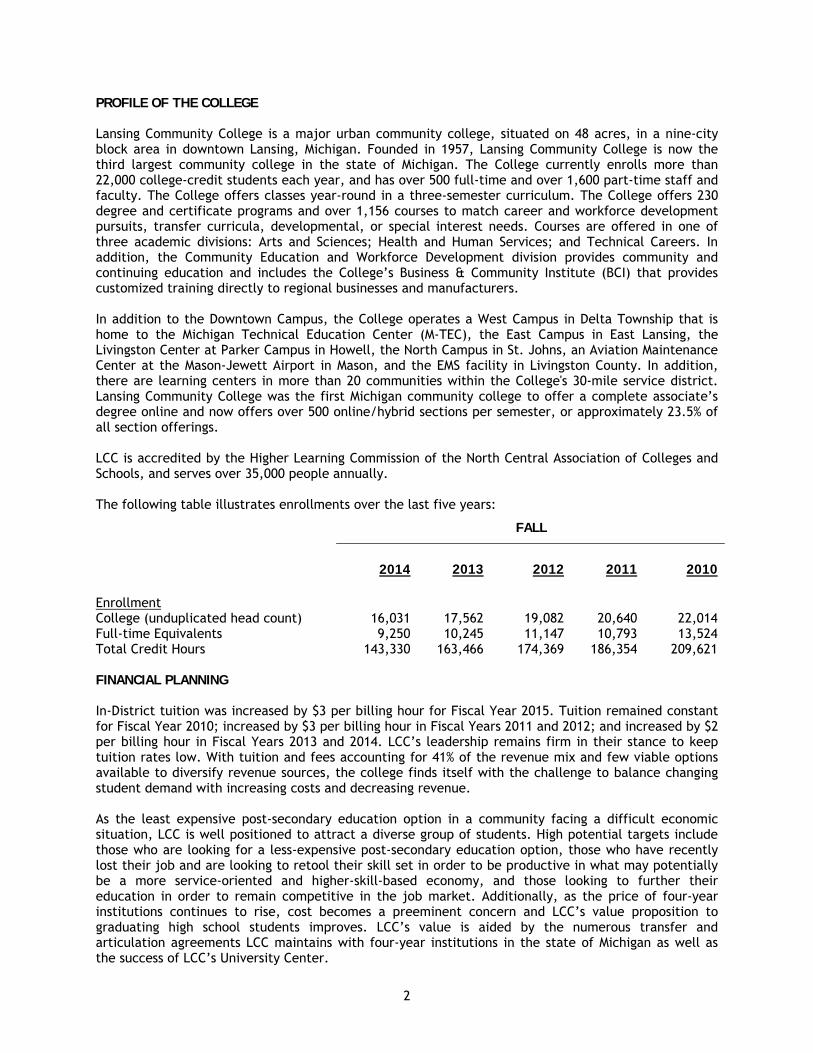
November 2, 2015 Members of the Board of Trustees, and Citizens of Lansing Community College District The Comprehensive Annual Financial Report (CAFR) of Lansing Community College for the fiscal years ended June 30, 2015 and June 30, 2014, is hereby submitted. Responsibility for both the accuracy of the data and the completeness and fairness of the presentation, including all disclosures, rests with the College. To the best of our knowledge and belief, the enclosed data are accurate in all material respects and is reported in a manner designed to present fairly the net position and changes in net position of the College. All disclosures necessary to enable the reader to gain an understanding of the College’s financial activities in relation to its mission have been included. Rehmann Robson, Certified Public Accountants, have issued an unmodified (clean) opinion on Lansing Community College’s financial statements for the years ended June 30, 2015 and 2014. The Independent Auditors’ Report is located at the front of the financial section of the report. The Management Discussion and Analysis (MD&A) immediately follows the Independent Auditors’ Report and provides a narrative introduction, overview, and analysis of the basic financial statements. The MD&A complements this letter of transmittal and should be read in conjunction with it. We strive for fiscally responsible planning for our immediate and future needs. As the financial operations shows in the recent CAFR, we continue to exercise fiscal prudence, to maintain a healthy financial condition and to protect tax dollars in the use of available resources while maintaining our commitment to academic excellence. In March 2013 the College adopted a new Strategic Plan, Learn Forward, which set the institution’s direction for the next three fiscal years. This plan was integrated into the College’s planning and budgeting processes to support student success and institutional growth. The College’s capital plan is dynamic and is updated on a regular basis to reflect the most recent assessment of all projects required to address the evolving academic programs and services needed. During the fiscal year ending June 30, 2015 the College continued upon a $67 million capital program funded by bond proceeds, internally designated funds, externally raised funds and a State of Michigan capital outlay appropriation. This broad initiative is transforming facilities for teaching and learning on campus now and for decades to come. We have remained flexible in these most challenging economic times to provide services efficiently while maintaining our commitment to students. We are encouraged by the continued dedication of our faculty, administrators, staff and the Board of Trustees to make Lansing Community College an excellent place of higher education. Lansing Community College ~ “Where Success Begins”.
2
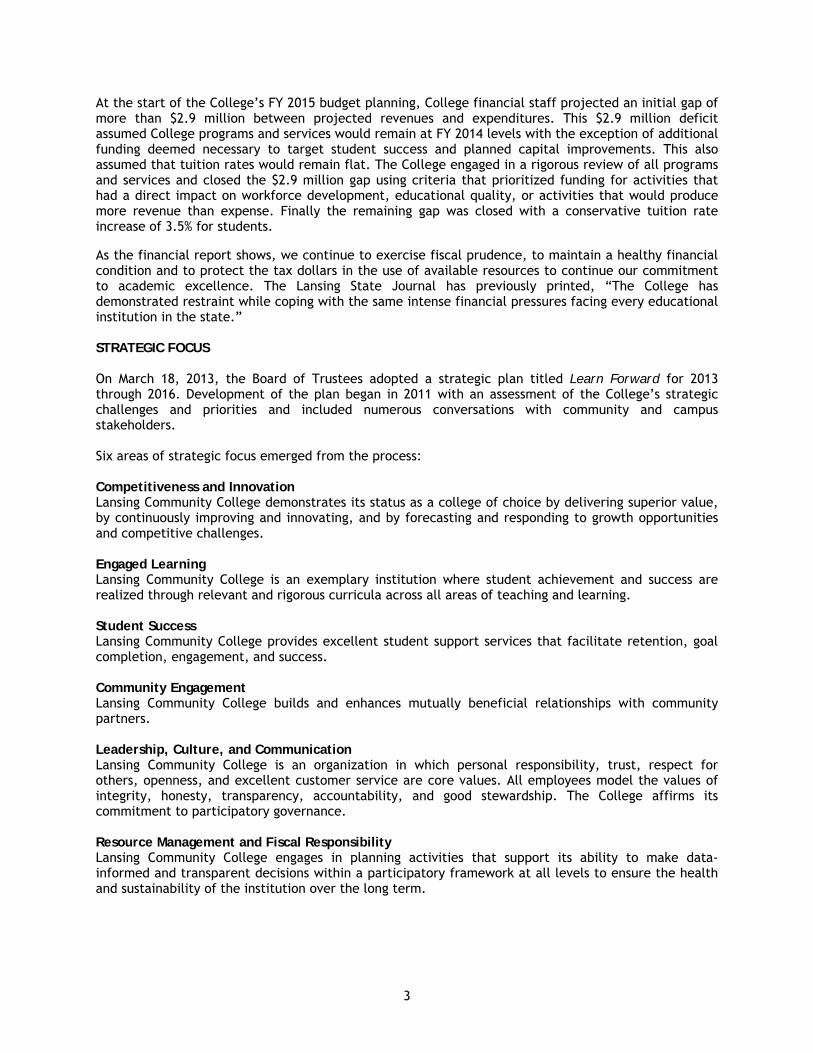
PROFILE OF THE COLLEGE Lansing Community College is a major urban community college, situated on 48 acres, in a nine-city block area in downtown Lansing, Michigan. Founded in 1957, Lansing Community College is now the third largest community college in the state of Michigan. The College currently enrolls more than 22,000 college-credit students each year, and has over 500 full-time and over 1,600 part-time staff and faculty. The College offers classes year-round in a three-semester curriculum. The College offers 230 degree and certificate programs and over 1,156 courses to match career and workforce development pursuits, transfer curricula, developmental, or special interest needs. Courses are offered in one of three academic divisions: Arts and Sciences; Health and Human Services; and Technical Careers. In addition, the Community Education and Workforce Development division provides community and continuing education and includes the College’s Business & Community Institute (BCI) that provides customized training directly to regional businesses and manufacturers. In addition to the Downtown Campus, the College operates a West Campus in Delta Township that is home to the Michigan Technical Education Center (M-TEC), the East Campus in East Lansing, the Livingston Center at Parker Campus in Howell, the North Campus in St. Johns, an Aviation Maintenance Center at the Mason-Jewett Airport in Mason, and the EMS facility in Livingston County. In addition, there are learning centers in more than 20 communities within the College's 30-mile service district. Lansing Community College was the first Michigan community college to offer a complete associate’s degree online and now offers over 500 online/hybrid sections per semester, or approximately 23.5% of all section offerings. LCC is accredited by the Higher Learning Commission of the North Central Association of Colleges and Schools, and serves over 35,000 people annually. The following table illustrates enrollments over the last five years:
FALL
2014 2013 2012 2011 2010
Enrollment College (unduplicated head count) 16,031 17,562 19,082 20,640 22,014 Full-time Equivalents 9,250 10,245 11,147 10,793 13,524 Total Credit Hours 143,330 163,466 174,369 186,354 209,621 FINANCIAL PLANNING In-District tuition was increased by $3 per billing hour for Fiscal Year 2015. Tuition remained constant for Fiscal Year 2010; increased by $3 per billing hour in Fiscal Years 2011 and 2012; and increased by $2 per billing hour in Fiscal Years 2013 and 2014. LCC’s leadership remains firm in their stance to keep tuition rates low. With tuition and fees accounting for 41% of the revenue mix and few viable options available to diversify revenue sources, the college finds itself with the challenge to balance changing student demand with increasing costs and decreasing revenue. As the least expensive post-secondary education option in a community facing a difficult economic situation, LCC is well positioned to attract a diverse group of students. High potential targets include those who are looking for a less-expensive post-secondary education option, those who have recently lost their job and are looking to retool their skill set in order to be productive in what may potentially be a more service-oriented and higher-skill-based economy, and those looking to further their education in order to remain competitive in the job market. Additionally, as the price of four-year institutions continues to rise, cost becomes a preeminent concern and LCC’s value proposition to graduating high school students improves. LCC’s value is aided by the numerous transfer and articulation agreements LCC maintains with four-year institutions in the state of Michigan as well as the success of LCC’s University Center.
3
At the start of the College’s FY 2015 budget planning, College financial staff projected an initial gap of more than $2.9 million between projected revenues and expenditures. This $2.9 million deficit assumed College programs and services would remain at FY 2014 levels with the exception of additional funding deemed necessary to target student success and planned capital improvements. This also assumed that tuition rates would remain flat. The College engaged in a rigorous review of all programs and services and closed the $2.9 million gap using criteria that prioritized funding for activities that had a direct impact on workforce development, educational quality, or activities that would produce more revenue than expense. Finally the remaining gap was closed with a conservative tuition rate increase of 3.5% for students.
As the financial report shows, we continue to exercise fiscal prudence, to maintain a healthy financial condition and to protect the tax dollars in the use of available resources to continue our commitment to academic excellence. The Lansing State Journal has previously printed, “The College has demonstrated restraint while coping with the same intense financial pressures facing every educational institution in the state.” STRATEGIC FOCUS On March 18, 2013, the Board of Trustees adopted a strategic plan titled Learn Forward for 2013 through 2016. Development of the plan began in 2011 with an assessment of the College’s strategic challenges and priorities and included numerous conversations with community and campus stakeholders. Six areas of strategic focus emerged from the process: Competitiveness and Innovation Lansing Community College demonstrates its status as a college of choice by delivering superior value, by continuously improving and innovating, and by forecasting and responding to growth opportunities and competitive challenges. Engaged Learning Lansing Community College is an exemplary institution where student achievement and success are realized through relevant and rigorous curricula across all areas of teaching and learning. Student Success Lansing Community College provides excellent student support services that facilitate retention, goal completion, engagement, and success. Community Engagement Lansing Community College builds and enhances mutually beneficial relationships with community partners. Leadership, Culture, and Communication Lansing Community College is an organization in which personal responsibility, trust, respect for others, openness, and excellent customer service are core values. All employees model the values of integrity, honesty, transparency, accountability, and good stewardship. The College affirms its commitment to participatory governance. Resource Management and Fiscal Responsibility Lansing Community College engages in planning activities that support its ability to make data-informed and transparent decisions within a participatory framework at all levels to ensure the health and sustainability of the institution over the long term.
4
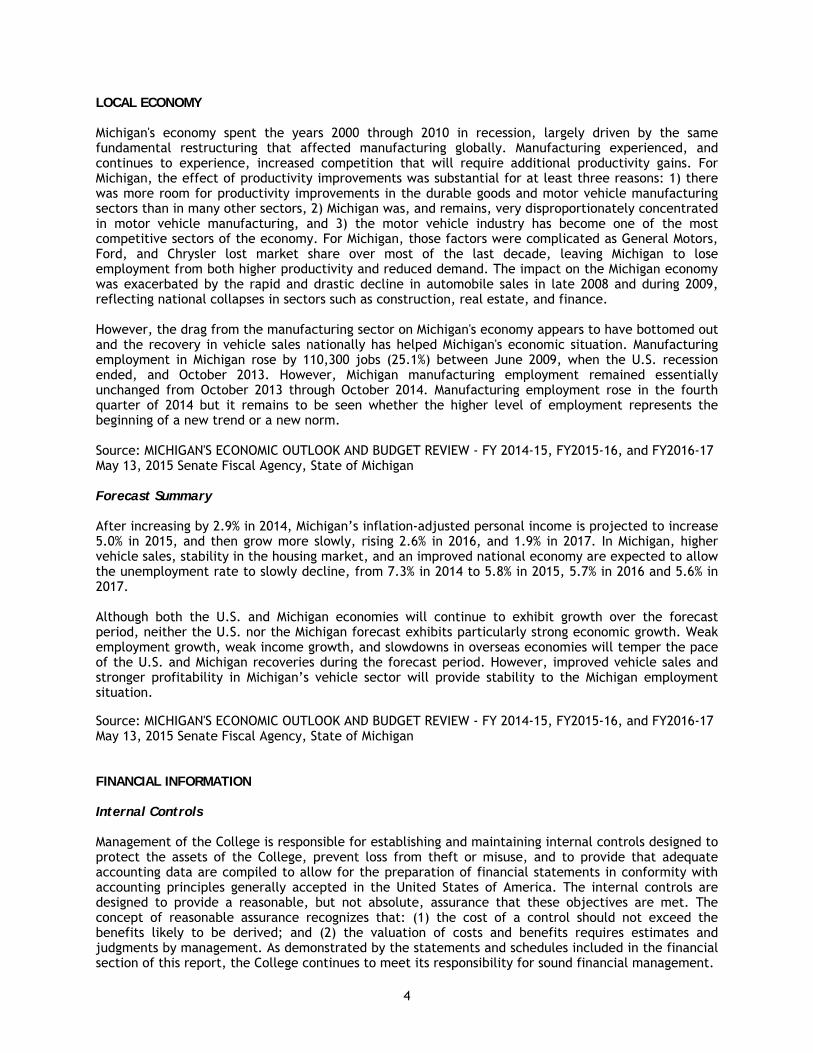
LOCAL ECONOMY Michigan's economy spent the years 2000 through 2010 in recession, largely driven by the same fundamental restructuring that affected manufacturing globally. Manufacturing experienced, and continues to experience, increased competition that will require additional productivity gains. For Michigan, the effect of productivity improvements was substantial for at least three reasons: 1) there was more room for productivity improvements in the durable goods and motor vehicle manufacturing sectors than in many other sectors, 2) Michigan was, and remains, very disproportionately concentrated in motor vehicle manufacturing, and 3) the motor vehicle industry has become one of the most competitive sectors of the economy. For Michigan, those factors were complicated as General Motors, Ford, and Chrysler lost market share over most of the last decade, leaving Michigan to lose employment from both higher productivity and reduced demand. The impact on the Michigan economy was exacerbated by the rapid and drastic decline in automobile sales in late 2008 and during 2009, reflecting national collapses in sectors such as construction, real estate, and finance. However, the drag from the manufacturing sector on Michigan's economy appears to have bottomed out and the recovery in vehicle sales nationally has helped Michigan's economic situation. Manufacturing employment in Michigan rose by 110,300 jobs (25.1%) between June 2009, when the U.S. recession ended, and October 2013. However, Michigan manufacturing employment remained essentially unchanged from October 2013 through October 2014. Manufacturing employment rose in the fourth quarter of 2014 but it remains to be seen whether the higher level of employment represents the beginning of a new trend or a new norm. Source: MICHIGAN'S ECONOMIC OUTLOOK AND BUDGET REVIEW - FY 2014-15, FY2015-16, and FY2016-17 May 13, 2015 Senate Fiscal Agency, State of Michigan Forecast Summary After increasing by 2.9% in 2014, Michigan’s inflation-adjusted personal income is projected to increase 5.0% in 2015, and then grow more slowly, rising 2.6% in 2016, and 1.9% in 2017. In Michigan, higher vehicle sales, stability in the housing market, and an improved national economy are expected to allow the unemployment rate to slowly decline, from 7.3% in 2014 to 5.8% in 2015, 5.7% in 2016 and 5.6% in 2017. Although both the U.S. and Michigan economies will continue to exhibit growth over the forecast period, neither the U.S. nor the Michigan forecast exhibits particularly strong economic growth. Weak employment growth, weak income growth, and slowdowns in overseas economies will temper the pace of the U.S. and Michigan recoveries during the forecast period. However, improved vehicle sales and stronger profitability in Michigan’s vehicle sector will provide stability to the Michigan employment situation.
Source: MICHIGAN'S ECONOMIC OUTLOOK AND BUDGET REVIEW - FY 2014-15, FY2015-16, and FY2016-17 May 13, 2015 Senate Fiscal Agency, State of Michigan FINANCIAL INFORMATION Internal Controls Management of the College is responsible for establishing and maintaining internal controls designed to protect the assets of the College, prevent loss from theft or misuse, and to provide that adequate accounting data are compiled to allow for the preparation of financial statements in conformity with accounting principles generally accepted in the United States of America. The internal controls are designed to provide a reasonable, but not absolute, assurance that these objectives are met. The concept of reasonable assurance recognizes that: (1) the cost of a control should not exceed the benefits likely to be derived; and (2) the valuation of costs and benefits requires estimates and judgments by management. As demonstrated by the statements and schedules included in the financial section of this report, the College continues to meet its responsibility for sound financial management.
5
Property Taxes The College’s property tax levy per $1,000 of taxable valuation has been $3.8072 since 2006. The state average for all community colleges was $2.4605 in 2014. PROSPECTS FOR THE FUTURE The forecast expects employment levels in the transportation equipment manufacturing sector to increase slightly through 2015, but to remain relatively flat in both 2016 and 2017. Overall employment in Michigan is expected to grow slightly, with virtually all of the growth in private sector employment. However, for both the economy and State tax revenue to improve markedly, more substantial employment gains in the economy as a whole will need to occur. While increased profitability in the vehicle industry has stabilized much of the Michigan economy, significant and sustained growth at both the national and statewide levels is unlikely to occur until the housing industry experiences a meaningful recovery and consumers exhibit improved debt-to-income ratios and growing wages. FY 2015-16 Revised Revenue Estimate
General Fund/General Purpose (GF/GP) and School Aid Fund (SAF) revenue is expected to total $22.1 billion, up 2.2% or $476.6 million from the revised estimate for FY 2014-15. The revised estimate for FY 2015-16 is $79.6 million above the January 2015 consensus revenue estimate. As in FY 2014-15, the revenue increase in FY 2015-16 reflects improvements in the level of economic activity that are partially offset by increased business tax credits and revenue reductions attributable to personal property tax reform.
FY 2016-17 Revised Revenue Estimate
GF/GP and SAF revenue is expected to total $22.6 billion in FY 2016-17. This revised estimate for FY 2016-17 is up 2.6% or $573.8 million from the revised estimate for FY 2015-16. As in FY 2015-16, the revenue increase in FY 2016-17 reflects growth in Michigan economic activity, combined with a reduction in expected business tax credits.
Source: MICHIGAN'S ECONOMIC OUTLOOK AND BUDGET REVIEW - FY 2014-15, FY2015-16, and FY2016-17 May 13, 2015 Senate Fiscal Agency, State of Michigan CAPITAL PROJECTS In July, 2012, the Lansing Community College Board of Trustees approved a forward-thinking set of renovation projects designed to transform teaching and learning on campus for the next several decades. It is a sweeping vision grounded in the practical needs of our students — one that will enable them to pursue their educational and professional goals in settings that have been purposefully designed to help them perform at their best and to succeed. These projects fundamentally change the student experience by creating a variety of dynamic and adaptable teaching, learning, and support environments. They include:
Technology-rich learning spaces and infrastructure Student-centered commons areas that encourage learning beyond the classroom Inviting environments for attracting and retaining students and enhancing campus-community
connections
6
Together, these projects position LCC as a national leader in community college education, linking best practices in teaching and learning to the needs of Michigan employers and the expectations of baccalaureate-granting colleges and universities. In our transfer and career programs, as well as in our partnerships with K-12 schools in mid-Michigan, the College is committed to providing students with a superior learning environment that effectively prepares them to participate in today’s economy. Multiple funding strategies were used. The State of Michigan Capital Outlay appropriation funded $9.4 million of the Arts & Sciences Building renovation. The College accumulated $11.9 million for these projects. The College received $1.4 million from LCC Foundation capital funds, and the remainder was financed with net proceeds of a bond issuance of approximately $44.3 million dollars, net of the cost of issuance. OTHER INFORMATION Awards The Government Finance Officers Association of the United States and Canada (GFOA) awarded a Certificate of Achievement for Excellence in Financial Reporting to Lansing Community College for its Comprehensive Annual Financial Report (CAFR) for the fiscal year ended June 30, 2014. In order to be awarded a Certificate of Achievement, a government must publish an easily readable and efficiently organized CAFR. This report must satisfy both generally accepted accounting principles and applicable legal requirements. A Certificate of Achievement is valid for a period of one year only. LCC has received a Certificate of Achievement for six consecutive years. We believe that our current CAFR continues to meet the Certificate of Achievement Program’s requirements and we are submitting it to the GFOA to determine its eligibility for another certificate. LCC has received the Distinguished Budget Presentation Award from the GFOA for the 2014/2015 fiscal year. In order to receive this award, a governmental unit must publish a budget document that meets program criteria as a policy document, as an operations guide, as a financial plan, and as a communications device. LCC has received this award for six consecutive years. A copy of this award can be viewed on the College’s website at http://www.lcc.edu/finservices/FY%202016%20Budget.pdf. LCC has received the Award for Outstanding Achievement in Popular Annual Financial Reporting from the GFOA for the fiscal year ended June 30, 2014. The GFOA established the Popular Annual Financial Reporting Awards Program to encourage and assist state and local governments to extract information from their comprehensive annual financial report to produce high quality popular annual financial reports specifically designed to be readily accessible and easily understandable to the general public and other interested parties without a background in public finance and then to recognize individual governments that are successful in achieving that goal. LCC has received this award for four consecutive years. A copy of this award can be viewed on the College’s website at http://www.lcc.edu/finservices/2014-LCC-Annual-Report.pdf. LCC’s Purchasing Department is the recipient of the 19th Annual Achievement of Excellence in Procurement (AEP) Award. Lansing Community College has received the award for twelve consecutive years and is one of only four government agencies in Michigan to receive the national award. The award is designed to recognize organizational excellence in procurement through efficient and effective practices within an organization’s procurement policies and processes. It acknowledges measures in innovation, professionalism, e-procurement, productivity and leadership attributes of the procurement function. Independent Audit State statutes require an annual audit by independent certified public accountants. The accounting firm of Rehmann Robson was selected by the College’s Board of Trustees. The Independent Auditors’ Report on the financial statements is included in the financial section of this report.
7
Acknowledgments The timely preparation of the CAFR was made possible by the dedicated service of the entire staff of the finance department. Each member of the department has our sincere appreciation for the contributions made in the preparation of this report. Respectfully submitted,
Donald L. Wilske Lisa Webb Sharpe, Ed.D Chief Financial Officer Senior Vice President for Finance, Administration, and
Advancement
8
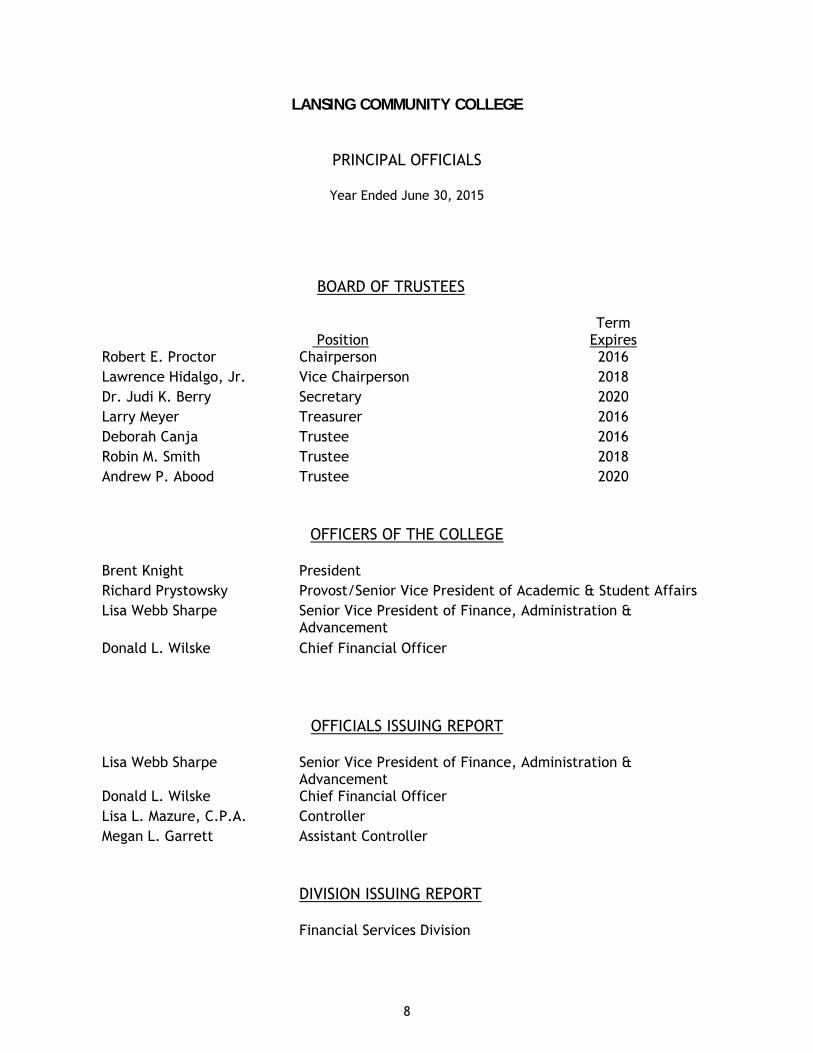
LANSING COMMUNITY COLLEGE
PRINCIPAL OFFICIALS
Year Ended June 30, 2015
BOARD OF TRUSTEES
Position Term
Expires Robert E. Proctor Chairperson 2016 Lawrence Hidalgo, Jr. Vice Chairperson 2018 Dr. Judi K. Berry Secretary 2020 Larry Meyer Treasurer 2016 Deborah Canja Trustee 2016 Robin M. Smith Trustee 2018 Andrew P. Abood Trustee 2020
OFFICERS OF THE COLLEGE
Brent Knight President Richard Prystowsky Provost/Senior Vice President of Academic & Student Affairs Lisa Webb Sharpe Senior Vice President of Finance, Administration &
Advancement Donald L. Wilske Chief Financial Officer
OFFICIALS ISSUING REPORT
Lisa Webb Sharpe Senior Vice President of Finance, Administration & Advancement
Donald L. Wilske Chief Financial Officer Lisa L. Mazure, C.P.A. Controller Megan L. Garrett Assistant Controller
DIVISION ISSUING REPORT
Financial Services Division
9
LANSING COMMUNITY COLLEGE Organizational Chart
District Residents
Board of Trustees
President
Chief Diversity OfficerSenior Vice President of
Finance, Administration & Advancement
Provost/Senior Vice President of Academic &
Student Affairs
Academic AffairsAdministrative
Services
External Affairs & Development
Financial Services
Human Resources
Information Technology Services
Risk Management & Legal Analysis
Arts & Sciences
Community Education & Workforce Development
Health & Human Services
Student Affairs
Technical Careers
10

This page intentionally left blank.

Financial Section

This page intentionally left blank.
Rehmann Robson
675 Robinson Rd. Jackson, MI 49203 Ph: 517.787.6503 Fx: 517.788.8111 rehmann.com
CPAs & Consultants Wealth Advisors Corporate Investigators
Rehmann is an independent member of Nexia International.
11
INDEPENDENT AUDITORS’ REPORT
November 2, 2015
Board of Trustees Lansing Community College Lansing, Michigan Report on the Financial Statements We have audited the accompanying financial statements of the business-type activities and the discretely presented component unit of Lansing Community College (the “College”) as of and for the years ended June 30, 2015 and 2014, and the related notes to the financial statements, which collectively comprise the College’s basic financial statements, as listed in the table of contents. Management's Responsibility for the Financial Statements Management is responsible for the preparation and fair presentation of these financial statements in accordance with accounting principles generally accepted in the United States of America; this includes the design, implementation, and maintenance of internal control relevant to the preparation and fair presentation of financial statements that are free from material misstatement, whether due to fraud or error. Independent Auditors’ Responsibility Our responsibility is to express opinions on these financial statements based on our audits. We conducted our audits in accordance with auditing standards generally accepted in the United States of America and the standards applicable to financial audits contained in Government Auditing Standards, issued by the Comptroller General of the United States. Those standards require that we plan and perform the audit to obtain reasonable assurance about whether the financial statements are free of material misstatement. The financial statements of Lansing Community College Foundation, the College’s discretely presented component unit, were not audited in accordance with Government Auditing Standards. An audit involves performing procedures to obtain audit evidence about the amounts and disclosures in the financial statements. The procedures selected depend on the auditors’ judgment, including the assessment of the risks of material misstatement of the financial statements, whether due to fraud or error. In making those risk assessments, the auditor considers internal control relevant to the entity’s preparation and fair presentation of the financial statements in order to design audit procedures that are appropriate in the circumstances, but not for the purpose of expressing an opinion on the effectiveness of the entity’s internal control. Accordingly, we express no such opinion. An audit also includes evaluating the appropriateness of accounting policies used and the reasonableness of significant accounting estimates made by management, as well as evaluating the overall presentation of the financial statements. We believe that the audit evidence we have obtained is sufficient and appropriate to provide a basis for our audit opinions.
12
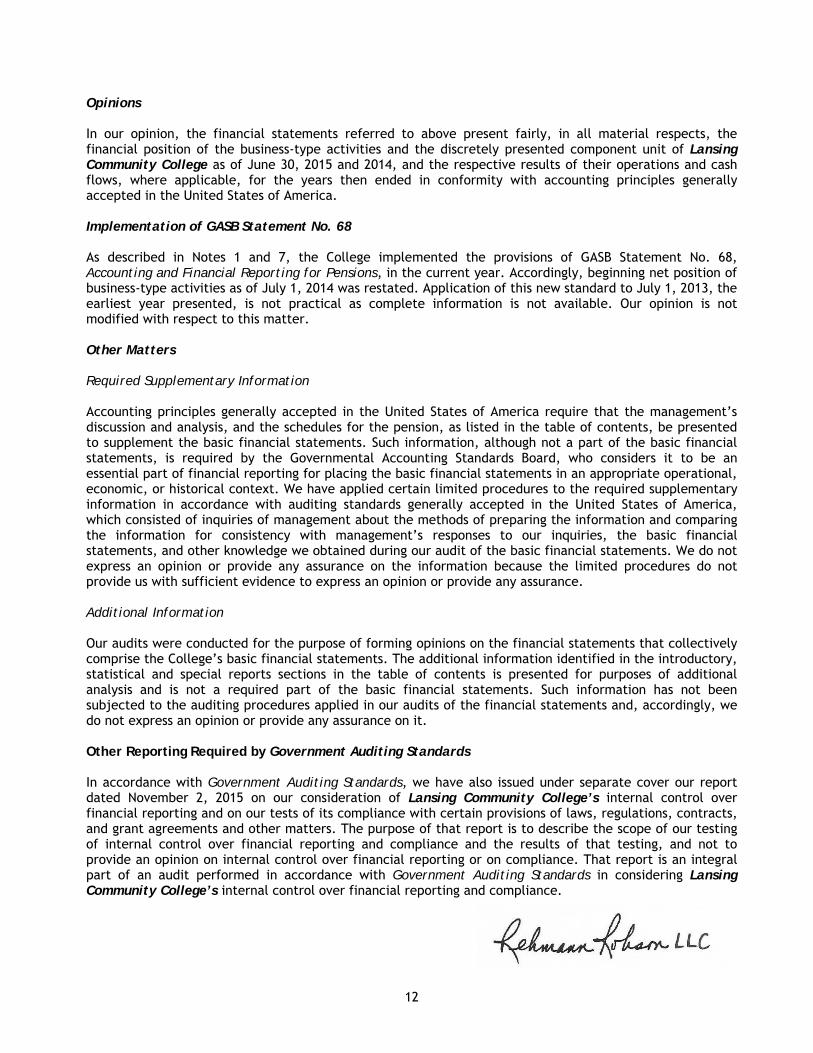
Opinions In our opinion, the financial statements referred to above present fairly, in all material respects, the financial position of the business-type activities and the discretely presented component unit of Lansing Community College as of June 30, 2015 and 2014, and the respective results of their operations and cash flows, where applicable, for the years then ended in conformity with accounting principles generally accepted in the United States of America. Implementation of GASB Statement No. 68 As described in Notes 1 and 7, the College implemented the provisions of GASB Statement No. 68, Accounting and Financial Reporting for Pensions, in the current year. Accordingly, beginning net position of business-type activities as of July 1, 2014 was restated. Application of this new standard to July 1, 2013, the earliest year presented, is not practical as complete information is not available. Our opinion is not modified with respect to this matter. Other Matters Required Supplementary Information Accounting principles generally accepted in the United States of America require that the management’s discussion and analysis, and the schedules for the pension, as listed in the table of contents, be presented to supplement the basic financial statements. Such information, although not a part of the basic financial statements, is required by the Governmental Accounting Standards Board, who considers it to be an essential part of financial reporting for placing the basic financial statements in an appropriate operational, economic, or historical context. We have applied certain limited procedures to the required supplementary information in accordance with auditing standards generally accepted in the United States of America, which consisted of inquiries of management about the methods of preparing the information and comparing the information for consistency with management’s responses to our inquiries, the basic financial statements, and other knowledge we obtained during our audit of the basic financial statements. We do not express an opinion or provide any assurance on the information because the limited procedures do not provide us with sufficient evidence to express an opinion or provide any assurance. Additional Information Our audits were conducted for the purpose of forming opinions on the financial statements that collectively comprise the College’s basic financial statements. The additional information identified in the introductory, statistical and special reports sections in the table of contents is presented for purposes of additional analysis and is not a required part of the basic financial statements. Such information has not been subjected to the auditing procedures applied in our audits of the financial statements and, accordingly, we do not express an opinion or provide any assurance on it. Other Reporting Required by Government Auditing Standards In accordance with Government Auditing Standards, we have also issued under separate cover our report dated November 2, 2015 on our consideration of Lansing Community College’s internal control over financial reporting and on our tests of its compliance with certain provisions of laws, regulations, contracts, and grant agreements and other matters. The purpose of that report is to describe the scope of our testing of internal control over financial reporting and compliance and the results of that testing, and not to provide an opinion on internal control over financial reporting or on compliance. That report is an integral part of an audit performed in accordance with Government Auditing Standards in considering Lansing Community College’s internal control over financial reporting and compliance.
LANSING COMMUNITY COLLEGE MANAGEMENT’S DISCUSSION AND ANALYSIS
YEARS ENDED JUNE 30, 2015 AND 2014
13
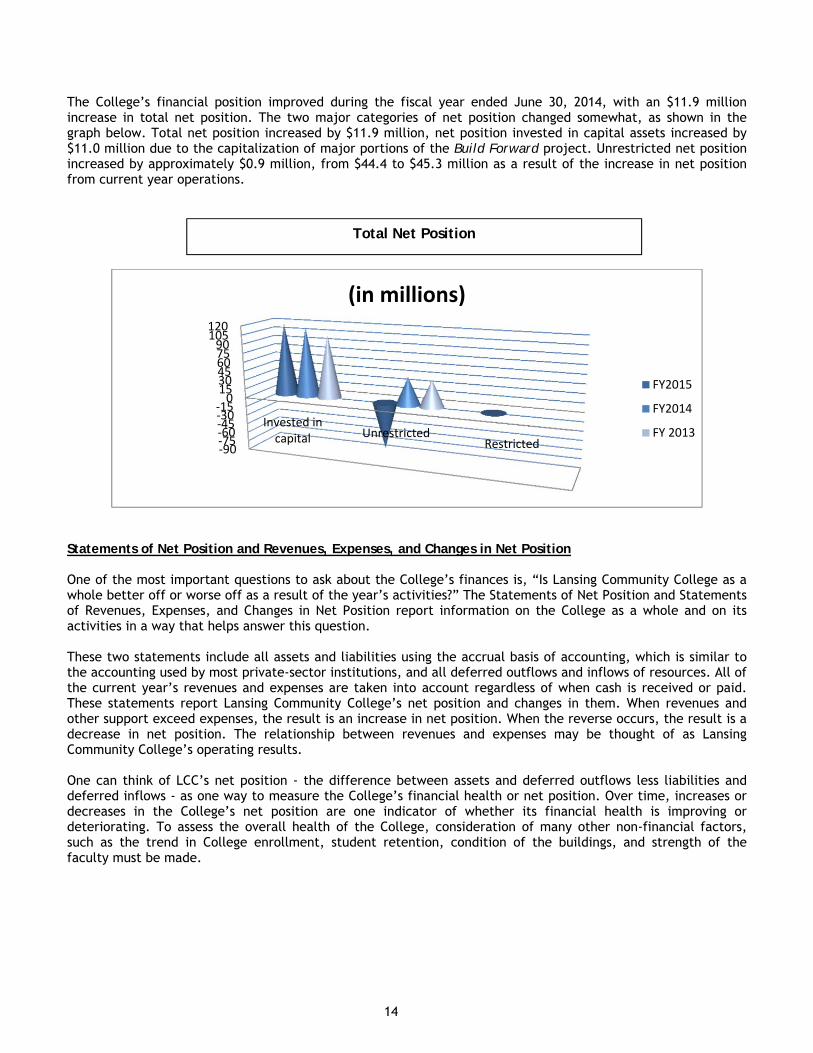
The discussion and analysis of Lansing Community College’s financial statements provides an overview of the College’s financial activities for the years ended June 30, 2015 and 2014. Management has prepared the fiscal 2015 and 2014 financial statements and the related footnote disclosures along with the discussion and analysis. Responsibility for the completeness and fairness of this information rests with the College’s management. Using this Report The College's financial statements have been prepared in accordance with the following standards. In June 1999, the Governmental Accounting Standards Board (GASB) released Statement No. 34, Basic Financial Statements and Management’s Discussion and Analysis for State and Local Governments. Changes in Statement No. 34 require a comprehensive one-line look at the entity as a whole including capitalization and depreciation of assets. In November 1999, GASB issued Statement No. 35, Basic Financial Statements and Management’s Discussion and Analysis for Public Colleges and Universities, which applies these standards to public colleges and universities. The State of Michigan has adopted these standards and therefore, has revised and issued the Manual for Uniform Financial Reporting for Michigan Public Community Colleges, 2001. Subsequent GASB statements, when applicable, have been implemented as well. Component Unit GASB Statement No. 61, The Financial Reporting Entity: Omnibus, an amendment of GASB Statements No. 14 and No. 34, requires that separate legal entities associated with a primary government that meet certain criteria are included with the financial statements of the Primary Reporting Unit. In compliance with this statement, the Lansing Community College Foundation is reported as a component unit of the College and its financial position and financial activities are presented separately from the rest of the College’s activities in the Statements of Net Position and Statements of Revenues, Expenses and Changes in Net Position, in separate columns headed “Component Unit”. This Comprehensive Annual Financial Report (CAFR) includes the report of independent auditors, management’s discussion and analysis, the basic financial statements in the above referred to format, notes to financial statements, required supplementary information, and additional information. Financial Highlights The College’s financial position declined during the fiscal year ended June 30, 2015, with a $118.1 million decrease in total net position. One of the two major categories of net position changed somewhat, as shown in the graph below. Total net position decreased by $118.1 million, while net position invested in capital assets increased by $3.9 million due to the capitalization of additional portions of the Build Forward project. Unrestricted net position decreased by $122.1 million, from $45.3 to $(76.8) million as a result of the recording of the College’s share of the Michigan Public School Employees Retirement System long-term net pension liability as required by GASB Statement 68, Accounting and Financial Reporting for Pensions. While the implementation of GASB 68 impacted total net position, it did not have any impact on the College’s cash flows or operating budgets.
14
The College’s financial position improved during the fiscal year ended June 30, 2014, with an $11.9 million increase in total net position. The two major categories of net position changed somewhat, as shown in the graph below. Total net position increased by $11.9 million, net position invested in capital assets increased by $11.0 million due to the capitalization of major portions of the Build Forward project. Unrestricted net position increased by approximately $0.9 million, from $44.4 to $45.3 million as a result of the increase in net position from current year operations.
Statements of Net Position and Revenues, Expenses, and Changes in Net Position One of the most important questions to ask about the College’s finances is, “Is Lansing Community College as a whole better off or worse off as a result of the year’s activities?” The Statements of Net Position and Statements of Revenues, Expenses, and Changes in Net Position report information on the College as a whole and on its activities in a way that helps answer this question. These two statements include all assets and liabilities using the accrual basis of accounting, which is similar to the accounting used by most private-sector institutions, and all deferred outflows and inflows of resources. All of the current year’s revenues and expenses are taken into account regardless of when cash is received or paid. These statements report Lansing Community College’s net position and changes in them. When revenues and other support exceed expenses, the result is an increase in net position. When the reverse occurs, the result is a decrease in net position. The relationship between revenues and expenses may be thought of as Lansing Community College’s operating results. One can think of LCC’s net position - the difference between assets and deferred outflows less liabilities and deferred inflows - as one way to measure the College’s financial health or net position. Over time, increases or decreases in the College’s net position are one indicator of whether its financial health is improving or deteriorating. To assess the overall health of the College, consideration of many other non-financial factors, such as the trend in College enrollment, student retention, condition of the buildings, and strength of the faculty must be made.
‐90‐75‐60‐45‐30‐150
153045607590
105120
Invested incapital Unrestricted
Restricted
(in millions)
FY2015
FY2014
FY 2013
Total Net Position
15
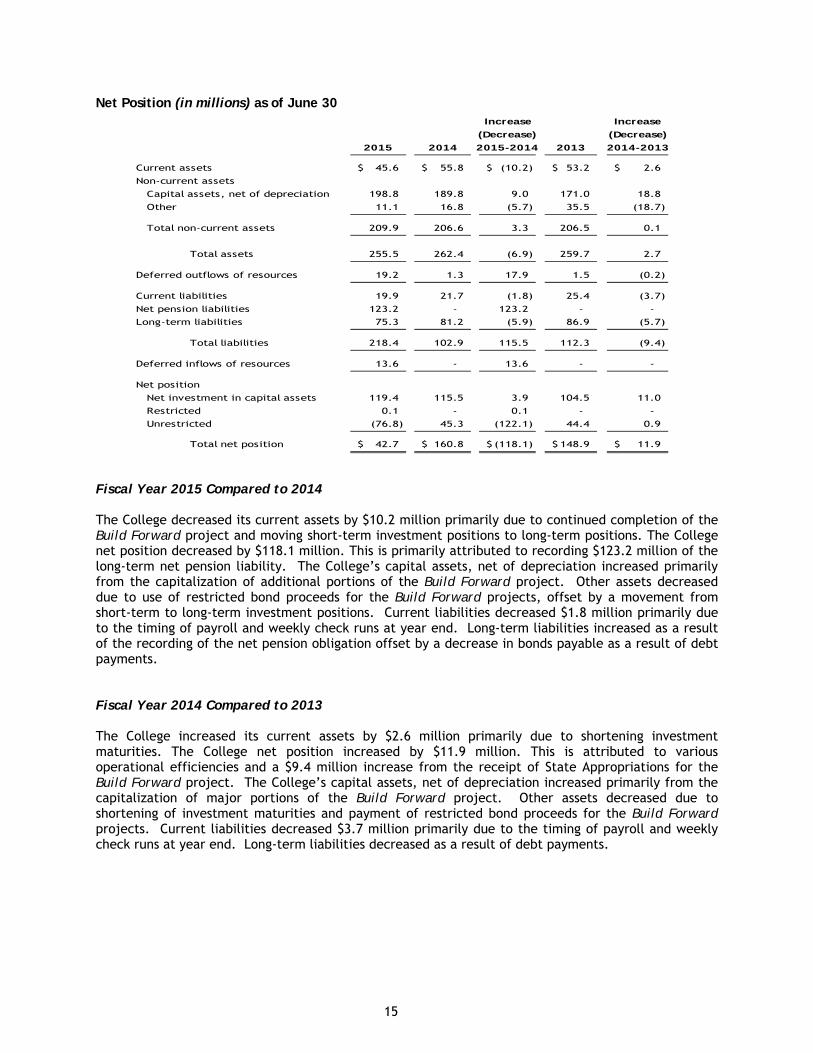
Net Position (in millions) as of June 30 Fiscal Year 2015 Compared to 2014 The College decreased its current assets by $10.2 million primarily due to continued completion of the Build Forward project and moving short-term investment positions to long-term positions. The College net position decreased by $118.1 million. This is primarily attributed to recording $123.2 million of the long-term net pension liability. The College’s capital assets, net of depreciation increased primarily from the capitalization of additional portions of the Build Forward project. Other assets decreased due to use of restricted bond proceeds for the Build Forward projects, offset by a movement from short-term to long-term investment positions. Current liabilities decreased $1.8 million primarily due to the timing of payroll and weekly check runs at year end. Long-term liabilities increased as a result of the recording of the net pension obligation offset by a decrease in bonds payable as a result of debt payments. Fiscal Year 2014 Compared to 2013 The College increased its current assets by $2.6 million primarily due to shortening investment maturities. The College net position increased by $11.9 million. This is attributed to various operational efficiencies and a $9.4 million increase from the receipt of State Appropriations for the Build Forward project. The College’s capital assets, net of depreciation increased primarily from the capitalization of major portions of the Build Forward project. Other assets decreased due to shortening of investment maturities and payment of restricted bond proceeds for the Build Forward projects. Current liabilities decreased $3.7 million primarily due to the timing of payroll and weekly check runs at year end. Long-term liabilities decreased as a result of debt payments.
Increase Increase
(Decrease) (Decrease)
2015 2014 2015-2014 2013 2014-2013
Current assets 45.6$ 55.8$ (10.2)$ 53.2$ 2.6$
Non-current assets
Capital assets, net of depreciation 198.8 189.8 9.0 171.0 18.8
Other 11.1 16.8 (5.7) 35.5 (18.7)
Total non-current assets 209.9 206.6 3.3 206.5 0.1
Total assets 255.5 262.4 (6.9) 259.7 2.7
Deferred outflows of resources 19.2 1.3 17.9 1.5 (0.2)
Current liabilities 19.9 21.7 (1.8) 25.4 (3.7)
Net pension liabilities 123.2 - 123.2 - -
Long-term liabilities 75.3 81.2 (5.9) 86.9 (5.7)
Total liabilities 218.4 102.9 115.5 112.3 (9.4)
Deferred inflows of resources 13.6 - 13.6 - -
Net position
Net investment in capital assets 119.4 115.5 3.9 104.5 11.0
Restricted 0.1 - 0.1 - -
Unrestricted (76.8) 45.3 (122.1) 44.4 0.9
Total net position 42.7$ 160.8$ (118.1)$ 148.9$ 11.9$
16
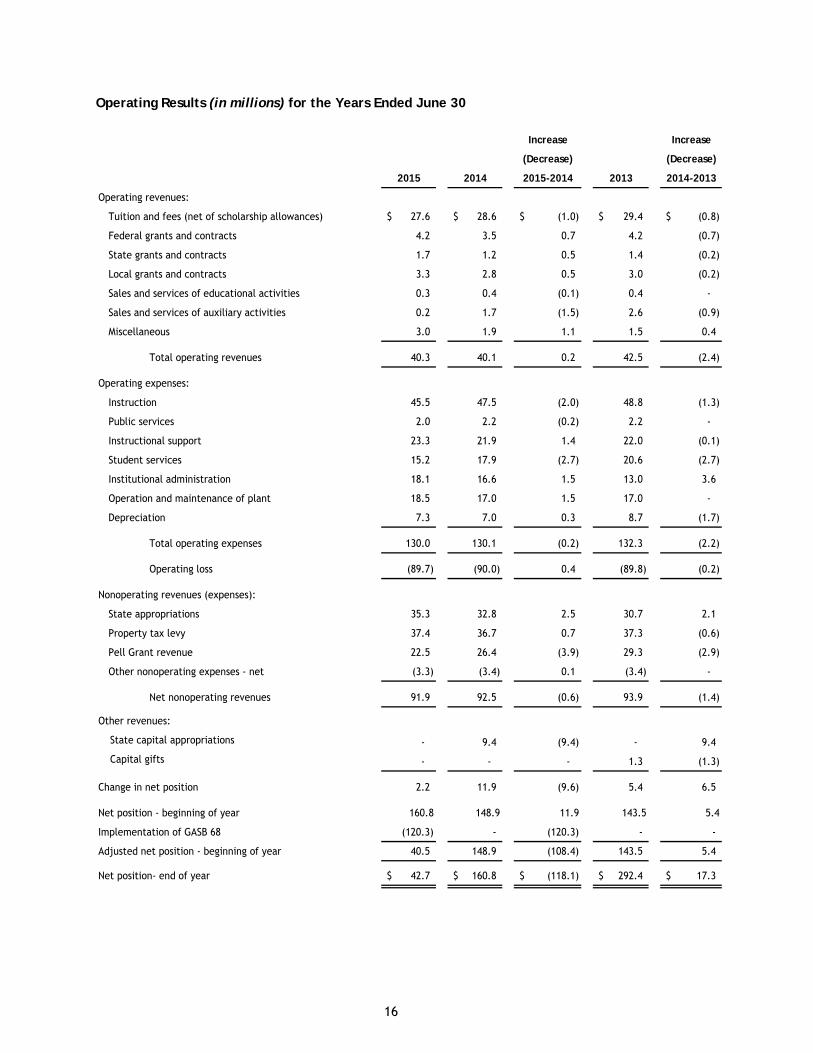
Operating Results (in millions) for the Years Ended June 30
Increase Increase
(Decrease) (Decrease)
2015 2014 2015-2014 2013 2014-2013
Operating revenues:
Tuition and fees (net of scholarship allowances) 27.6$ 28.6$ (1.0)$ 29.4$ (0.8)$
Federal grants and contracts 4.2 3.5 0.7 4.2 (0.7)
State grants and contracts 1.7 1.2 0.5 1.4 (0.2)
Local grants and contracts 3.3 2.8 0.5 3.0 (0.2)
Sales and services of educational activities 0.3 0.4 (0.1) 0.4 -
Sales and services of auxiliary activities 0.2 1.7 (1.5) 2.6 (0.9)
Miscellaneous 3.0 1.9 1.1 1.5 0.4
Total operating revenues 40.3 40.1 0.2 42.5 (2.4)
Operating expenses:
Instruction 45.5 47.5 (2.0) 48.8 (1.3)
Public services 2.0 2.2 (0.2) 2.2 -
Instructional support 23.3 21.9 1.4 22.0 (0.1)
Student services 15.2 17.9 (2.7) 20.6 (2.7)
Institutional administration 18.1 16.6 1.5 13.0 3.6
Operation and maintenance of plant 18.5 17.0 1.5 17.0 -
Depreciation 7.3 7.0 0.3 8.7 (1.7)
Total operating expenses 130.0 130.1 (0.2) 132.3 (2.2)
Operating loss (89.7) (90.0) 0.4 (89.8) (0.2)
Nonoperating revenues (expenses):
State appropriations 35.3 32.8 2.5 30.7 2.1
Property tax levy 37.4 36.7 0.7 37.3 (0.6)
Pell Grant revenue 22.5 26.4 (3.9) 29.3 (2.9)
Other nonoperating expenses - net (3.3) (3.4) 0.1 (3.4) -
Net nonoperating revenues 91.9 92.5 (0.6) 93.9 (1.4)
Other revenues:
State capital appropriations - 9.4 (9.4) - 9.4
Capital gifts - - - 1.3 (1.3)
Change in net position 2.2 11.9 (9.6) 5.4 6.5
Net position - beginning of year 160.8 148.9 11.9 143.5 5.4
Implementation of GASB 68 (120.3) - (120.3) - -
Adjusted net position - beginning of year 40.5 148.9 (108.4) 143.5 5.4
Net position- end of year 42.7$ 160.8$ (118.1)$ 292.4$ 17.3$
17
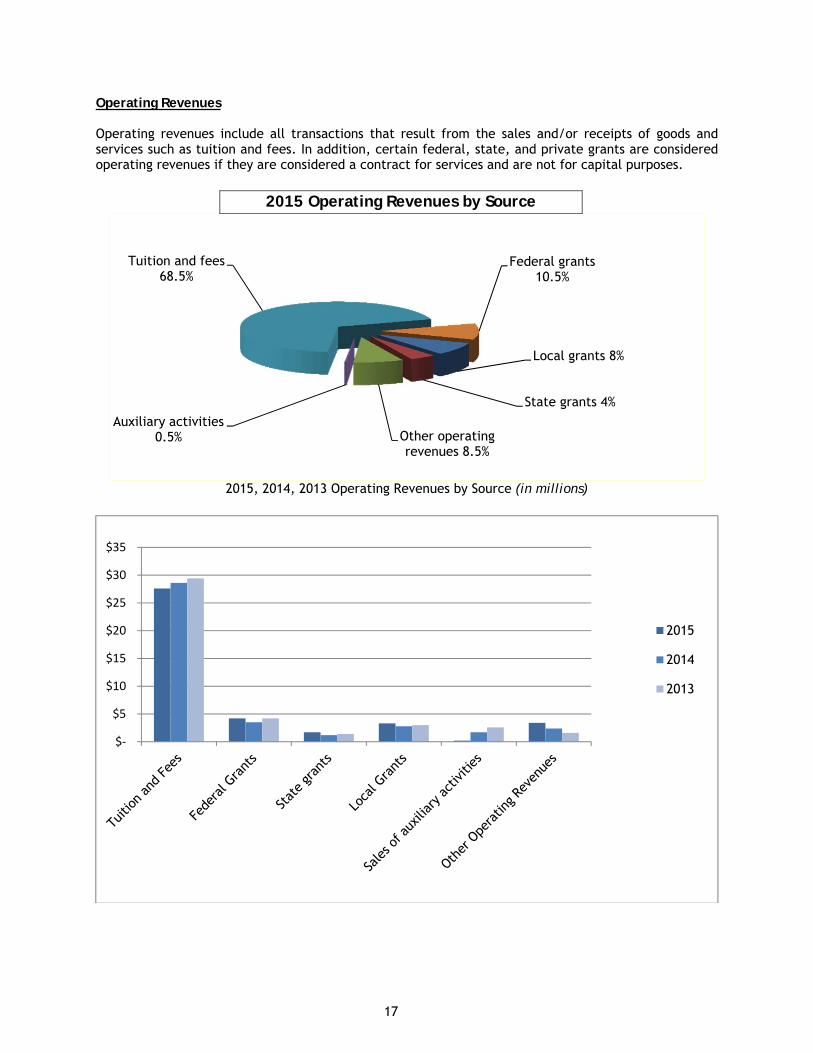
Operating Revenues Operating revenues include all transactions that result from the sales and/or receipts of goods and services such as tuition and fees. In addition, certain federal, state, and private grants are considered operating revenues if they are considered a contract for services and are not for capital purposes.
2015 Operating Revenues by Source
2015, 2014, 2013 Operating Revenues by Source (in millions)
Local grants 8%
State grants 4%
Other operating revenues 8.5%
Auxiliary activities 0.5%
Tuition and fees 68.5%
Federal grants 10.5%
$‐
$5
$10
$15
$20
$25
$30
$35
2015
2014
2013
18
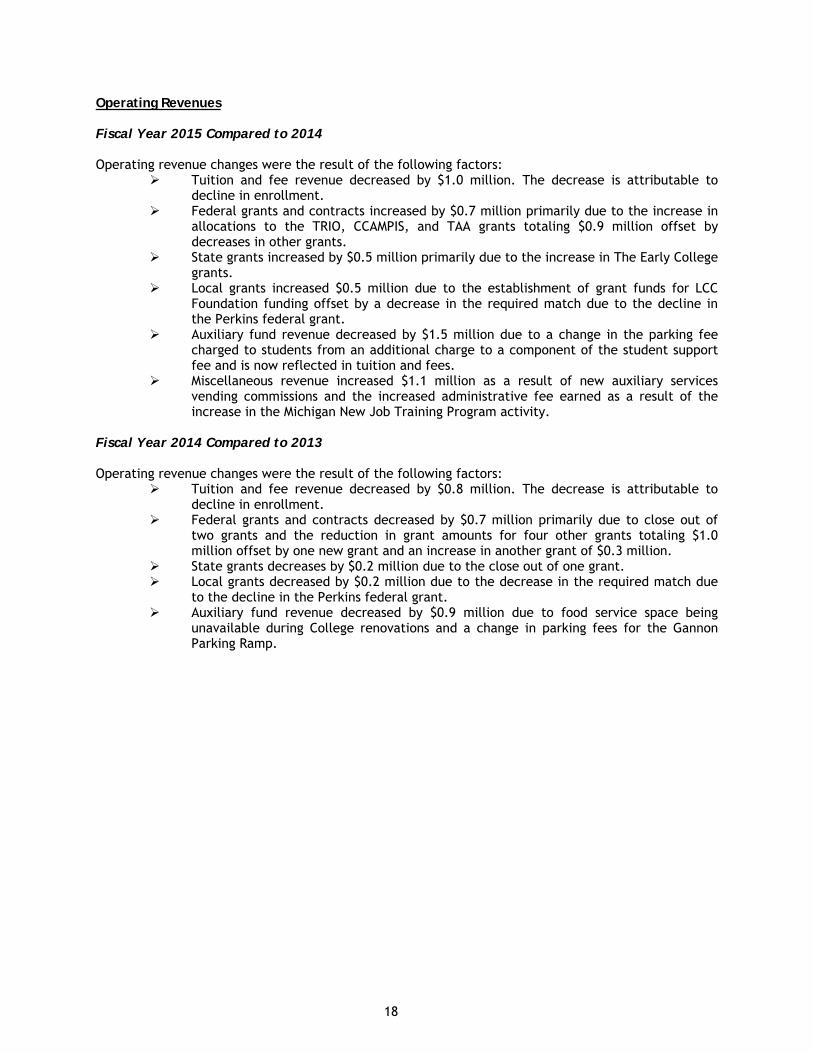
Operating Revenues Fiscal Year 2015 Compared to 2014 Operating revenue changes were the result of the following factors:
Tuition and fee revenue decreased by $1.0 million. The decrease is attributable to decline in enrollment.
Federal grants and contracts increased by $0.7 million primarily due to the increase in allocations to the TRIO, CCAMPIS, and TAA grants totaling $0.9 million offset by decreases in other grants.
State grants increased by $0.5 million primarily due to the increase in The Early College grants.
Local grants increased $0.5 million due to the establishment of grant funds for LCC Foundation funding offset by a decrease in the required match due to the decline in the Perkins federal grant.
Auxiliary fund revenue decreased by $1.5 million due to a change in the parking fee charged to students from an additional charge to a component of the student support fee and is now reflected in tuition and fees.
Miscellaneous revenue increased $1.1 million as a result of new auxiliary services vending commissions and the increased administrative fee earned as a result of the increase in the Michigan New Job Training Program activity.
Fiscal Year 2014 Compared to 2013 Operating revenue changes were the result of the following factors:
Tuition and fee revenue decreased by $0.8 million. The decrease is attributable to decline in enrollment.
Federal grants and contracts decreased by $0.7 million primarily due to close out of two grants and the reduction in grant amounts for four other grants totaling $1.0 million offset by one new grant and an increase in another grant of $0.3 million.
State grants decreases by $0.2 million due to the close out of one grant. Local grants decreased by $0.2 million due to the decrease in the required match due
to the decline in the Perkins federal grant. Auxiliary fund revenue decreased by $0.9 million due to food service space being
unavailable during College renovations and a change in parking fees for the Gannon Parking Ramp.
19
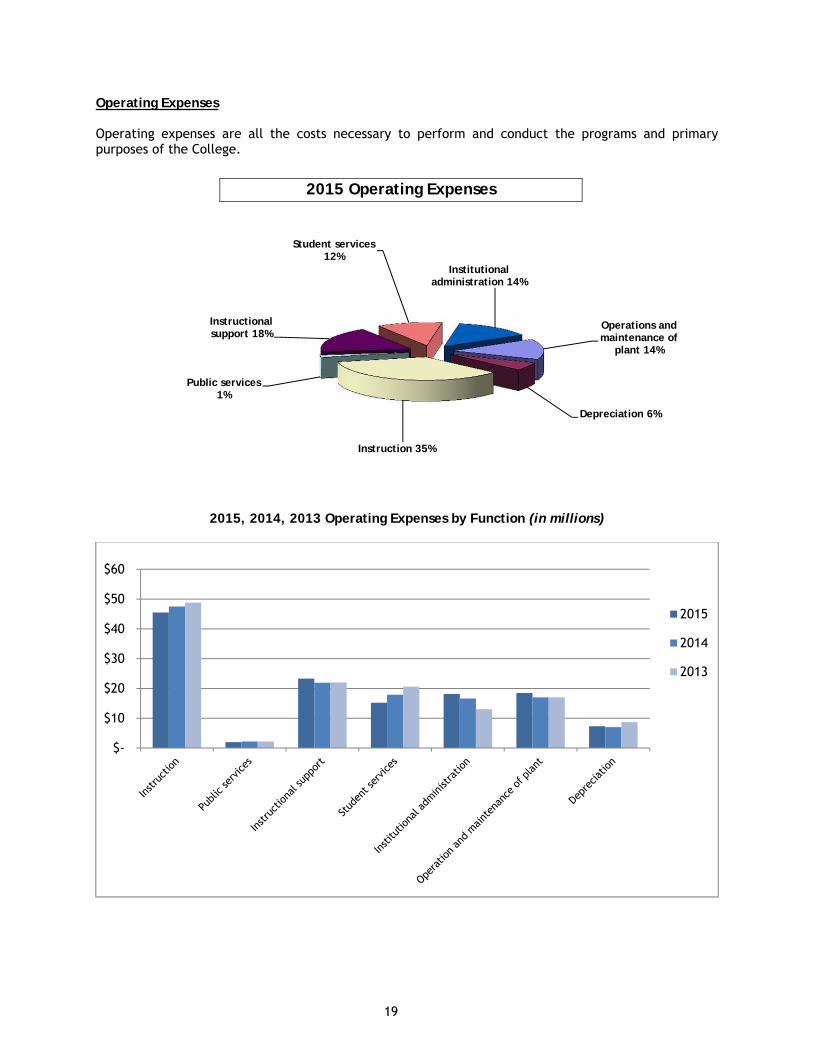
Operating Expenses Operating expenses are all the costs necessary to perform and conduct the programs and primary purposes of the College.
2015 Operating Expenses
2015, 2014, 2013 Operating Expenses by Function (in millions)
$-
$10
$20
$30
$40
$50
$60
2015
2014
2013
Operations and maintenance of
plant 14%
Depreciation 6%
Instruction 35%
Public services1%
Instructional support 18%
Student services 12%
Institutional administration 14%
20
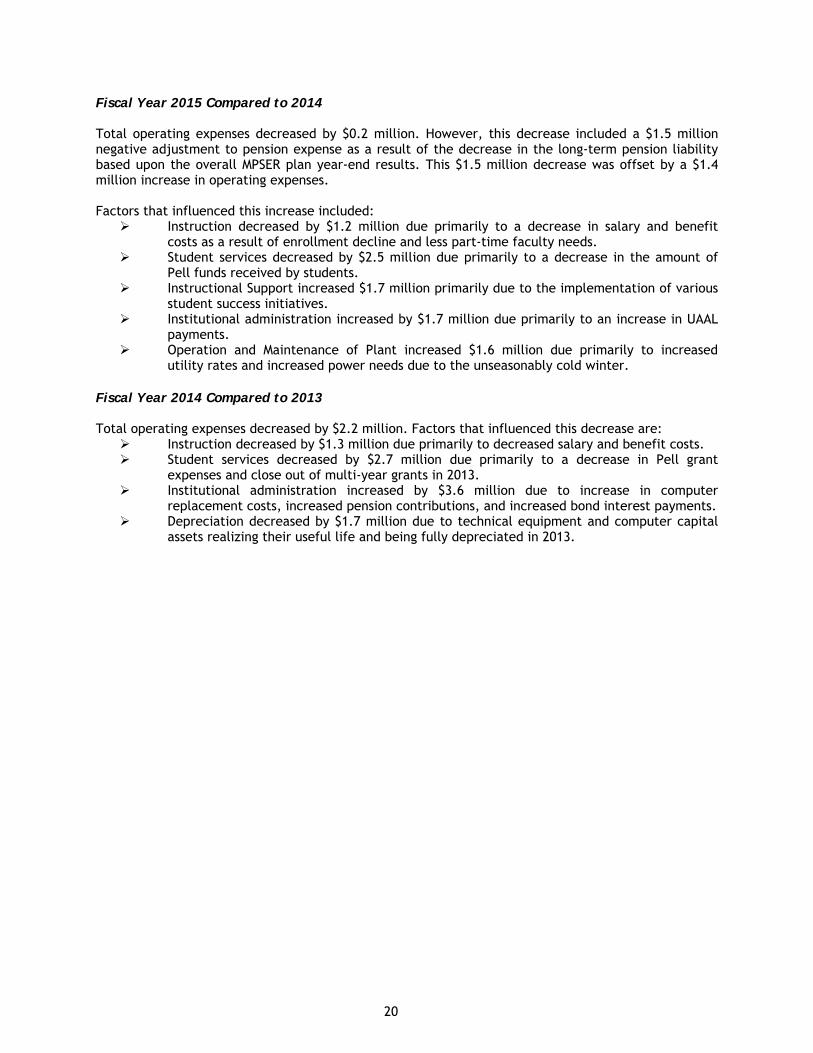
Fiscal Year 2015 Compared to 2014 Total operating expenses decreased by $0.2 million. However, this decrease included a $1.5 million negative adjustment to pension expense as a result of the decrease in the long-term pension liability based upon the overall MPSER plan year-end results. This $1.5 million decrease was offset by a $1.4 million increase in operating expenses. Factors that influenced this increase included:
Instruction decreased by $1.2 million due primarily to a decrease in salary and benefit costs as a result of enrollment decline and less part-time faculty needs.
Student services decreased by $2.5 million due primarily to a decrease in the amount of Pell funds received by students.
Instructional Support increased $1.7 million primarily due to the implementation of various student success initiatives.
Institutional administration increased by $1.7 million due primarily to an increase in UAAL payments.
Operation and Maintenance of Plant increased $1.6 million due primarily to increased utility rates and increased power needs due to the unseasonably cold winter.
Fiscal Year 2014 Compared to 2013 Total operating expenses decreased by $2.2 million. Factors that influenced this decrease are:
Instruction decreased by $1.3 million due primarily to decreased salary and benefit costs. Student services decreased by $2.7 million due primarily to a decrease in Pell grant
expenses and close out of multi-year grants in 2013. Institutional administration increased by $3.6 million due to increase in computer
replacement costs, increased pension contributions, and increased bond interest payments. Depreciation decreased by $1.7 million due to technical equipment and computer capital
assets realizing their useful life and being fully depreciated in 2013.
21
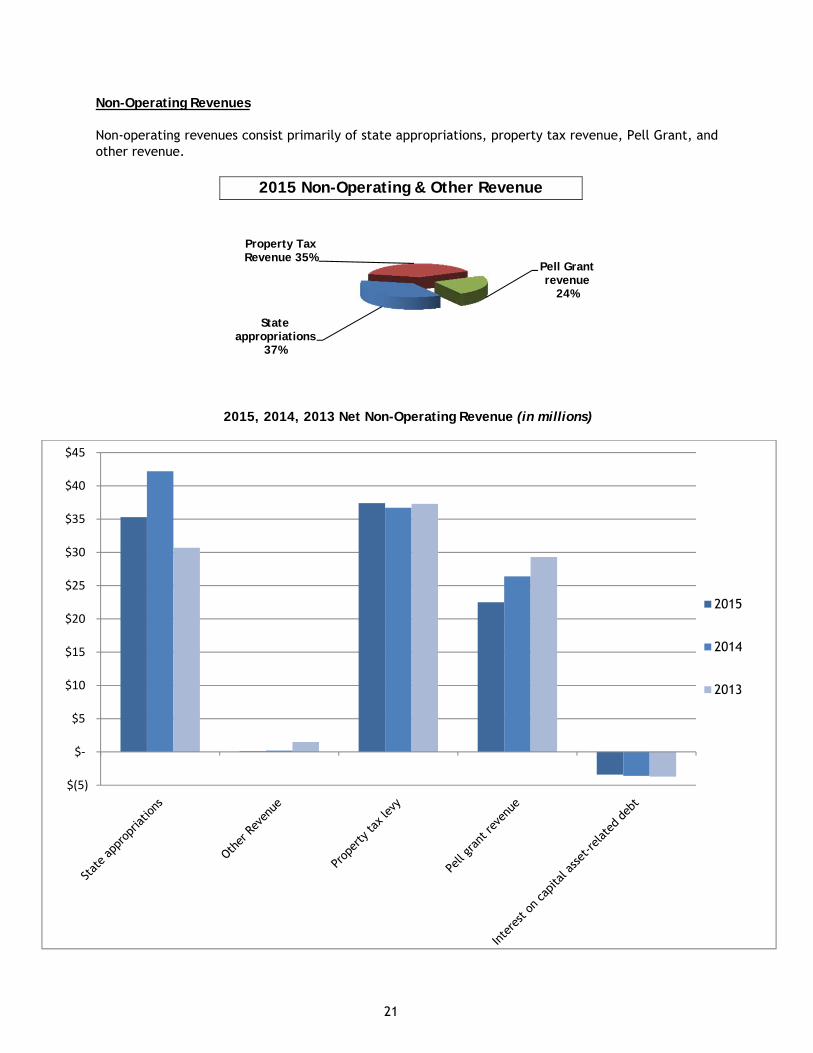
Non-Operating Revenues Non-operating revenues consist primarily of state appropriations, property tax revenue, Pell Grant, and other revenue.
2015 Non-Operating & Other Revenue
2015, 2014, 2013 Net Non-Operating Revenue (in millions)
State appropriations
37%
Property TaxRevenue 35%
Pell Grant revenue
24%
$(5)
$‐
$5
$10
$15
$20
$25
$30
$35
$40
$45
2015
2014
2013
22
Fiscal Year 2015 Compared to 2014 Changes in non-operating revenues were the result of the following factors:
Pell Grant awards decreased $3.9 million due to economic changes, and a decrease in enrollment.
Property tax revenue increased $0.7 million due to a slight increase in property values and increased collections.
State appropriations increased $2.5 million due to an increase of the state operational grant and increased appropriations for pension liability costs, this was offset by a decrease in capital appropriations of $9.4 million.
Fiscal Year 2014 Compared to 2013 Changes in non-operating revenues were the result of the following factors:
Pell Grant awards decreased by $2.9 million due to economic changes, and a decrease in enrollment.
Decline of $0.6 million in property tax revenue is due to a decline in taxable values. State appropriations increased $11.5 million due to an increase of the state operational
grant, increased appropriations for pension liability costs, and receiving $9.4 million for capital projects.
Statement of Cash Flows Another way to assess the financial health of a college is to look at the statement of cash flows. Its primary purpose is to provide relevant information about the cash receipts and cash payments of an entity during a designated period. The statement of cash flows also helps users assess the College's:
Ability to generate future net cash flows Ability to meet its obligations as they come due Needs for external financing
23
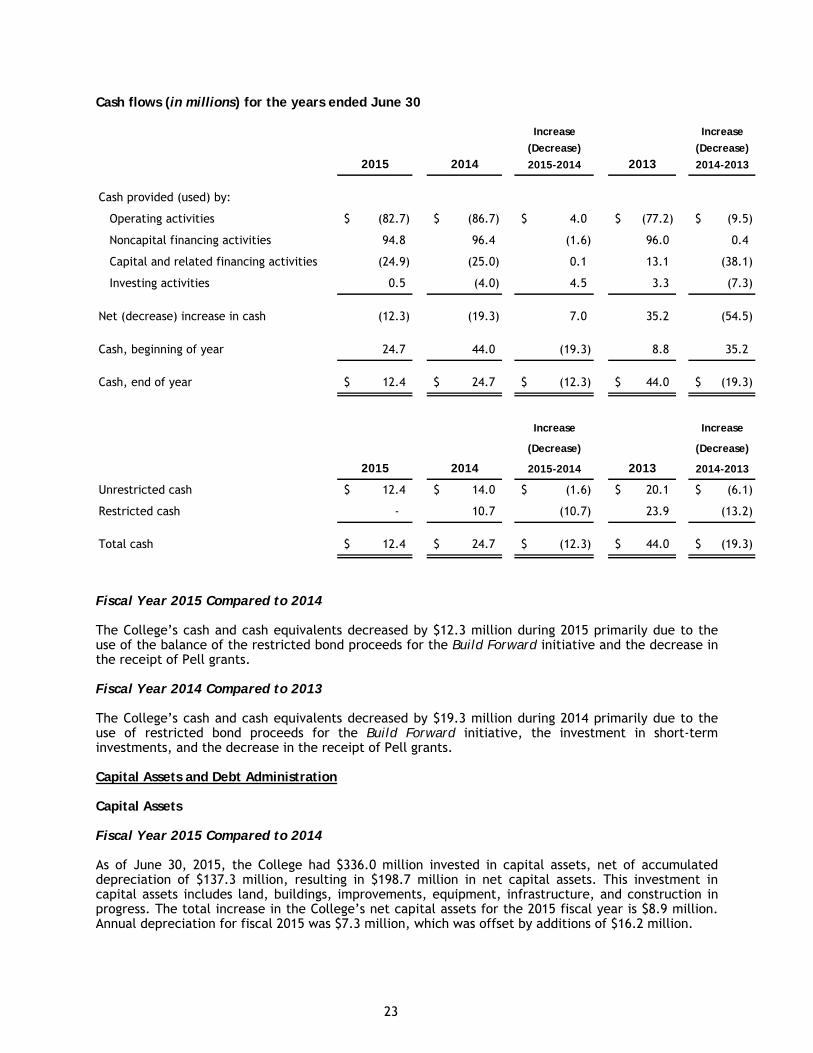
Cash flows (in millions) for the years ended June 30
Increase Increase
(Decrease) (Decrease)
2015 2014 2015-2014 2013 2014-2013
Cash provided (used) by:
Operating activities (82.7)$ (86.7)$ 4.0$ (77.2)$ (9.5)$
Noncapital financing activities 94.8 96.4 (1.6) 96.0 0.4
Capital and related financing activities (24.9) (25.0) 0.1 13.1 (38.1)
Investing activities 0.5 (4.0) 4.5 3.3 (7.3)
Net (decrease) increase in cash (12.3) (19.3) 7.0 35.2 (54.5)
Cash, beginning of year 24.7 44.0 (19.3) 8.8 35.2
Cash, end of year 12.4$ 24.7$ (12.3)$ 44.0$ (19.3)$
Increase Increase
(Decrease) (Decrease)
2015 2014 2015-2014 2013 2014-2013
Unrestricted cash 12.4$ 14.0$ (1.6)$ 20.1$ (6.1)$
Restricted cash - 10.7 (10.7) 23.9 (13.2)
Total cash 12.4$ 24.7$ (12.3)$ 44.0$ (19.3)$
Fiscal Year 2015 Compared to 2014 The College’s cash and cash equivalents decreased by $12.3 million during 2015 primarily due to the use of the balance of the restricted bond proceeds for the Build Forward initiative and the decrease in the receipt of Pell grants. Fiscal Year 2014 Compared to 2013 The College’s cash and cash equivalents decreased by $19.3 million during 2014 primarily due to the use of restricted bond proceeds for the Build Forward initiative, the investment in short-term investments, and the decrease in the receipt of Pell grants. Capital Assets and Debt Administration Capital Assets Fiscal Year 2015 Compared to 2014 As of June 30, 2015, the College had $336.0 million invested in capital assets, net of accumulated depreciation of $137.3 million, resulting in $198.7 million in net capital assets. This investment in capital assets includes land, buildings, improvements, equipment, infrastructure, and construction in progress. The total increase in the College’s net capital assets for the 2015 fiscal year is $8.9 million. Annual depreciation for fiscal 2015 was $7.3 million, which was offset by additions of $16.2 million.
24
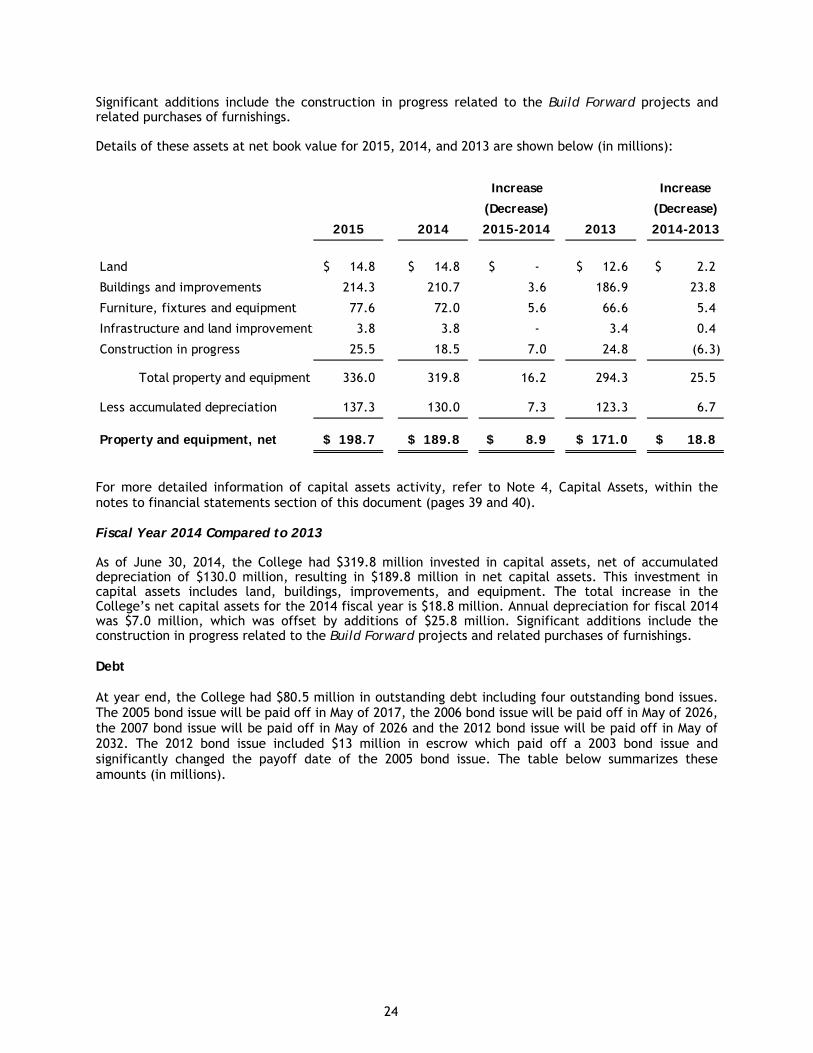
Significant additions include the construction in progress related to the Build Forward projects and related purchases of furnishings. Details of these assets at net book value for 2015, 2014, and 2013 are shown below (in millions):
For more detailed information of capital assets activity, refer to Note 4, Capital Assets, within the notes to financial statements section of this document (pages 39 and 40). Fiscal Year 2014 Compared to 2013 As of June 30, 2014, the College had $319.8 million invested in capital assets, net of accumulated depreciation of $130.0 million, resulting in $189.8 million in net capital assets. This investment in capital assets includes land, buildings, improvements, and equipment. The total increase in the College’s net capital assets for the 2014 fiscal year is $18.8 million. Annual depreciation for fiscal 2014 was $7.0 million, which was offset by additions of $25.8 million. Significant additions include the construction in progress related to the Build Forward projects and related purchases of furnishings. Debt At year end, the College had $80.5 million in outstanding debt including four outstanding bond issues. The 2005 bond issue will be paid off in May of 2017, the 2006 bond issue will be paid off in May of 2026, the 2007 bond issue will be paid off in May of 2026 and the 2012 bond issue will be paid off in May of 2032. The 2012 bond issue included $13 million in escrow which paid off a 2003 bond issue and significantly changed the payoff date of the 2005 bond issue. The table below summarizes these amounts (in millions).
Increase Increase
(Decrease) (Decrease)
2015 2014 2015-2014 2013 2014-2013
Land 14.8$ 14.8$ -$ 12.6$ 2.2$
Buildings and improvements 214.3 210.7 3.6 186.9 23.8
Furniture, fixtures and equipment 77.6 72.0 5.6 66.6 5.4
Infrastructure and land improvements 3.8 3.8 - 3.4 0.4
Construction in progress 25.5 18.5 7.0 24.8 (6.3)
Total property and equipment 336.0 319.8 16.2 294.3 25.5
Less accumulated depreciation 137.3 130.0 7.3 123.3 6.7
Property and equipment, net 198.7$ 189.8$ 8.9$ 171.0$ 18.8$
25
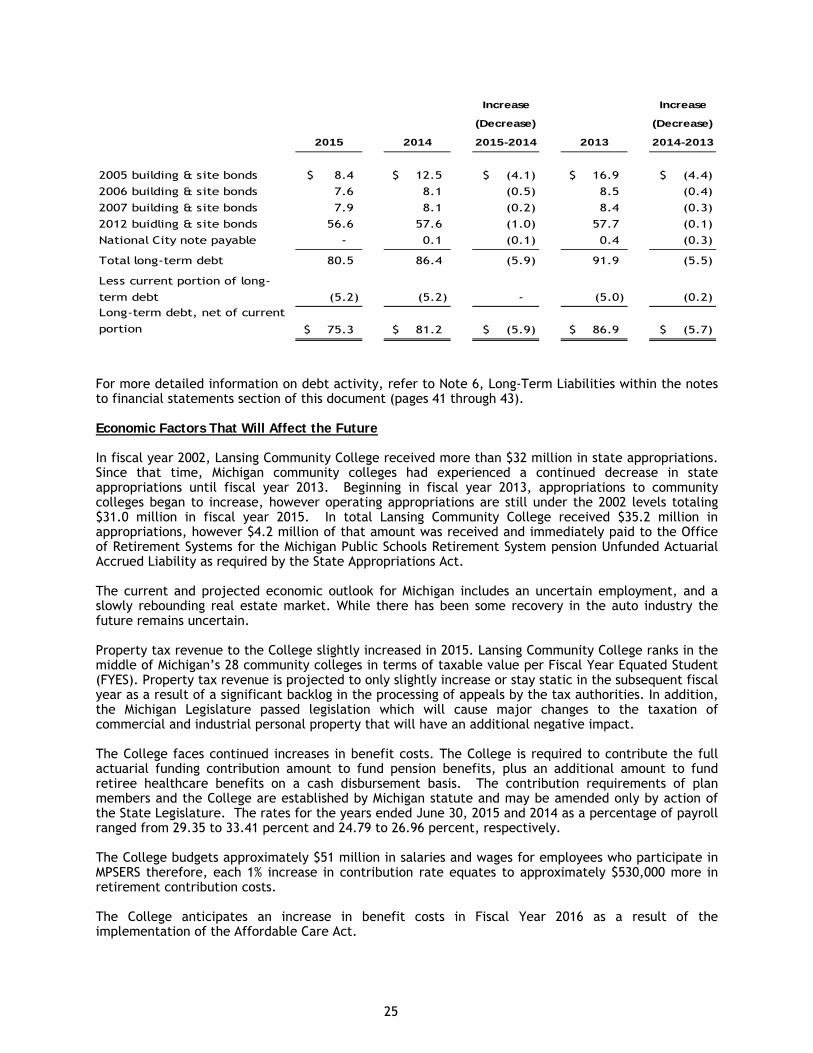
Increase Increase
(Decrease) (Decrease)
2015 2014 2015-2014 2013 2014-2013
2005 building & site bonds 8.4$ 12.5$ (4.1)$ 16.9$ (4.4)$
2006 building & site bonds 7.6 8.1 (0.5) 8.5 (0.4)
2007 building & site bonds 7.9 8.1 (0.2) 8.4 (0.3)
2012 buidling & site bonds 56.6 57.6 (1.0) 57.7 (0.1)
National City note payable - 0.1 (0.1) 0.4 (0.3)
Total long-term debt 80.5 86.4 (5.9) 91.9 (5.5)
Less current portion of long-
term debt (5.2) (5.2) - (5.0) (0.2)
Long-term debt, net of current
portion 75.3$ 81.2$ (5.9)$ 86.9$ (5.7)$
For more detailed information on debt activity, refer to Note 6, Long-Term Liabilities within the notes to financial statements section of this document (pages 41 through 43). Economic Factors That Will Affect the Future In fiscal year 2002, Lansing Community College received more than $32 million in state appropriations. Since that time, Michigan community colleges had experienced a continued decrease in state appropriations until fiscal year 2013. Beginning in fiscal year 2013, appropriations to community colleges began to increase, however operating appropriations are still under the 2002 levels totaling $31.0 million in fiscal year 2015. In total Lansing Community College received $35.2 million in appropriations, however $4.2 million of that amount was received and immediately paid to the Office of Retirement Systems for the Michigan Public Schools Retirement System pension Unfunded Actuarial Accrued Liability as required by the State Appropriations Act. The current and projected economic outlook for Michigan includes an uncertain employment, and a slowly rebounding real estate market. While there has been some recovery in the auto industry the future remains uncertain. Property tax revenue to the College slightly increased in 2015. Lansing Community College ranks in the middle of Michigan’s 28 community colleges in terms of taxable value per Fiscal Year Equated Student (FYES). Property tax revenue is projected to only slightly increase or stay static in the subsequent fiscal year as a result of a significant backlog in the processing of appeals by the tax authorities. In addition, the Michigan Legislature passed legislation which will cause major changes to the taxation of commercial and industrial personal property that will have an additional negative impact. The College faces continued increases in benefit costs. The College is required to contribute the full actuarial funding contribution amount to fund pension benefits, plus an additional amount to fund retiree healthcare benefits on a cash disbursement basis. The contribution requirements of plan members and the College are established by Michigan statute and may be amended only by action of the State Legislature. The rates for the years ended June 30, 2015 and 2014 as a percentage of payroll ranged from 29.35 to 33.41 percent and 24.79 to 26.96 percent, respectively. The College budgets approximately $51 million in salaries and wages for employees who participate in MPSERS therefore, each 1% increase in contribution rate equates to approximately $530,000 more in retirement contribution costs. The College anticipates an increase in benefit costs in Fiscal Year 2016 as a result of the implementation of the Affordable Care Act.
26
Contacting the College's Financial Management The financial report is designed to provide our citizens, taxpayers, customers, investors and creditors with a general overview of the College's finances and to demonstrate the College's accountability for the money it receives. If you have questions about this report or need additional financial information, contact the business office, Lansing Community College, 309 N. Washington Square, Suite 203, Lansing, Michigan 48933.

LANSING COMMUNITY COLLEGE
STATEMENTS OF NET POSITIONJUNE 30, 2015 AND JUNE 30, 2014
2015 2014 2015 2014
Current assets
Cash and cash equivalents 12,422,536$ 14,005,912$ 103,312$ 292,969$
Short-term investments 19,421,016 24,901,543 21,945 32,715
Property taxes receivable, net 530,893 535,629 - -
State appropriations receivable 6,383,580 5,901,226 - -
Accounts receivable, net 5,152,717 6,094,304 6,220 82,811
Federal and state grants receivable 1,190,680 3,610,635 - -
Inventories 226,181 163,130 - -
Prepaid expenses and other assets 226,497 487,398 - -
Due from Component Unit 50,825 88,761 - -
Total current assets 45,604,925 55,788,538 131,477 408,495
Noncurrent assets
Restricted cash - unspent bond proceeds - 10,729,919 - -
Long-term investments 11,142,907 6,041,548 10,445,404 10,443,164
Promises to give, net of current portion - - 2,074 -
Capital assets not being depreciated 40,288,040 33,346,894 - -
Capital assets being depreciated, net 158,465,482 156,445,302 - -
Total noncurrent assets 209,896,429 206,563,663 10,447,478 10,443,164
Total assets 255,501,354 262,352,201 10,578,955 10,851,659
Deferred outflows of resources
Deferred charge on refunding 1,164,295 1,330,622 - -
Deferred pension amounts (Notes 1 and 7) 18,050,453 - - -
Total deferred outflows of resources 19,214,748 1,330,622 - -
Liabilities
Current liabilities
Accounts payable 3,657,124 6,003,530 25,885 -
Due to primary government - - 50,825 88,761
Accrued payroll and other compensation 5,471,408 4,904,126 - -
Accrued vacation 1,560,803 1,529,609 - -
Accrued interest payable 560,995 586,800 - -
Unearned revenue 3,382,722 3,408,606 - -
Other current liabilities 27,564 41,841 - -
Current portion of debt obligations 5,215,000 5,234,848 - -
Total current liabilities 19,875,616 21,709,360 76,710 88,761
Noncurrent liabilities
Long-term debt obligations, net of current portion 75,293,790 81,175,907 - -
Net pension liability (Notes 1 and 7) 123,194,232 - - -
Other noncurrent liabilities - 27,564 - -
Total noncurrent liabilities 198,488,022 81,203,471 - -
Total liabilities 218,363,638 102,912,831 76,710 88,761
Deferred inflows of resources Deferred pension amounts (Notes 1 and 7) 13,619,218 - - -
Net position
Net investment in capital assets 119,409,027 115,441,982 - -
Restricted:
Restricted for restricted fund activities 152,940 - - -
Non-expendable - permanently restricted - - 6,872,751 6,633,971
Expendable - temporarily restricted - - 3,489,472 3,961,892
Unrestricted (deficit) (Note 9) (76,828,721) 45,328,010 140,022 167,035
Total net position 42,733,246$ 160,769,992$ 10,502,245$ 10,762,898$
Assets
Lansing Community CollegeComponent Unit
Lansing Community College FoundationPrimary Government
The accompanying notes are an integral part of these financial statements.
27
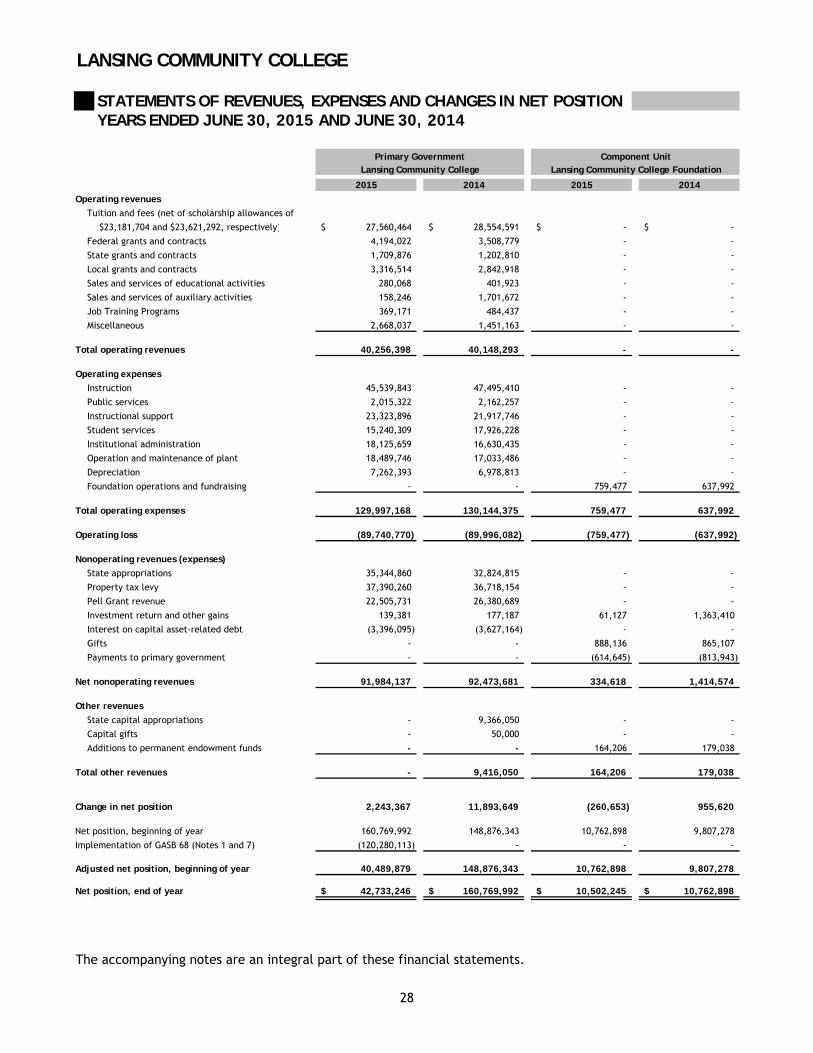
LANSING COMMUNITY COLLEGE
STATEMENTS OF REVENUES, EXPENSES AND CHANGES IN NET POSITIONYEARS ENDED JUNE 30, 2015 AND JUNE 30, 2014
2015 2014 2015 2014
Operating revenues
Tuition and fees (net of scholarship allowances of
$23,181,704 and $23,621,292, respectively) 27,560,464$ 28,554,591$ -$ -$
Federal grants and contracts 4,194,022 3,508,779 - -
State grants and contracts 1,709,876 1,202,810 - -
Local grants and contracts 3,316,514 2,842,918 - -
Sales and services of educational activities 280,068 401,923 - -
Sales and services of auxiliary activities 158,246 1,701,672 - -
Job Training Programs 369,171 484,437 - -
Miscellaneous 2,668,037 1,451,163 - -
Total operating revenues 40,256,398 40,148,293 - -
Operating expenses
Instruction 45,539,843 47,495,410 - -
Public services 2,015,322 2,162,257 - -
Instructional support 23,323,896 21,917,746 - -
Student services 15,240,309 17,926,228 - -
Institutional administration 18,125,659 16,630,435 - -
Operation and maintenance of plant 18,489,746 17,033,486 - -
Depreciation 7,262,393 6,978,813 - -
Foundation operations and fundraising - - 759,477 637,992
Total operating expenses 129,997,168 130,144,375 759,477 637,992
Operating loss (89,740,770) (89,996,082) (759,477) (637,992)
Nonoperating revenues (expenses)
State appropriations 35,344,860 32,824,815 - -
Property tax levy 37,390,260 36,718,154 - -
Pell Grant revenue 22,505,731 26,380,689 - -
Investment return and other gains 139,381 177,187 61,127 1,363,410
Interest on capital asset-related debt (3,396,095) (3,627,164) - -
Gifts - - 888,136 865,107
Payments to primary government - - (614,645) (813,943)
Net nonoperating revenues 91,984,137 92,473,681 334,618 1,414,574
Other revenues
State capital appropriations - 9,366,050 - -
Capital gifts - 50,000 - -
Additions to permanent endowment funds - - 164,206 179,038
Total other revenues - 9,416,050 164,206 179,038
Change in net position 2,243,367 11,893,649 (260,653) 955,620
Net position, beginning of year 160,769,992 148,876,343 10,762,898 9,807,278
Implementation of GASB 68 (Notes 1 and 7) (120,280,113) - - -
Adjusted net position, beginning of year 40,489,879 148,876,343 10,762,898 9,807,278
Net position, end of year 42,733,246$ 160,769,992$ 10,502,245$ 10,762,898$
The accompanying notes are an integral part of these financial statements.
28
Lansing Community College Lansing Community College FoundationComponent UnitPrimary Government
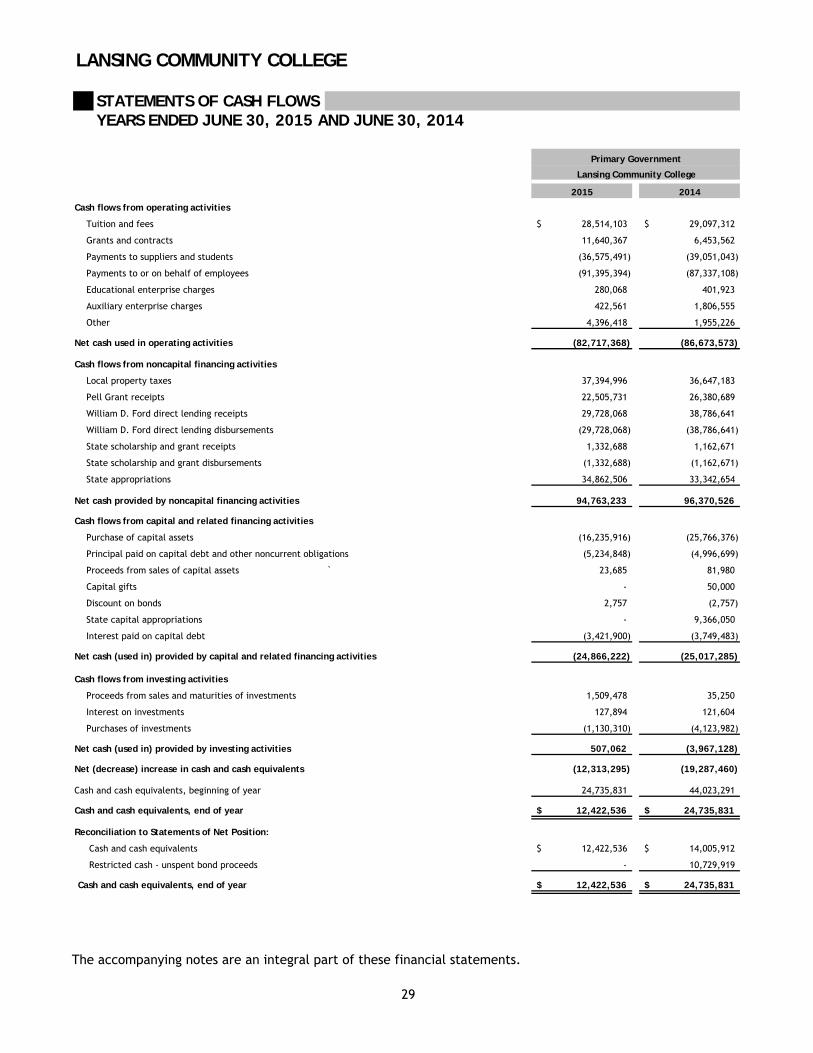
LANSING COMMUNITY COLLEGE
STATEMENTS OF CASH FLOWSYEARS ENDED JUNE 30, 2015 AND JUNE 30, 2014
2015 2014
Cash flows from operating activities
Tuition and fees 28,514,103$ 29,097,312$
Grants and contracts 11,640,367 6,453,562
Payments to suppliers and students (36,575,491) (39,051,043)
Payments to or on behalf of employees (91,395,394) (87,337,108)
Educational enterprise charges 280,068 401,923
Auxiliary enterprise charges 422,561 1,806,555
Other 4,396,418 1,955,226
Net cash used in operating activities (82,717,368) (86,673,573)
Cash flows from noncapital financing activities
Local property taxes 37,394,996 36,647,183
Pell Grant receipts 22,505,731 26,380,689
William D. Ford direct lending receipts 29,728,068 38,786,641
William D. Ford direct lending disbursements (29,728,068) (38,786,641)
State scholarship and grant receipts 1,332,688 1,162,671
State scholarship and grant disbursements (1,332,688) (1,162,671)
State appropriations 34,862,506 33,342,654
Net cash provided by noncapital financing activities 94,763,233 96,370,526
Cash flows from capital and related financing activities
Purchase of capital assets (16,235,916) (25,766,376)
Principal paid on capital debt and other noncurrent obligations (5,234,848) (4,996,699)
Proceeds from sales of capital assets ` 23,685 81,980
Capital gifts - 50,000
Discount on bonds 2,757 (2,757)
State capital appropriations - 9,366,050
Interest paid on capital debt (3,421,900) (3,749,483)
Net cash (used in) provided by capital and related financing activities (24,866,222) (25,017,285)
Cash flows from investing activities
Proceeds from sales and maturities of investments 1,509,478 35,250
Interest on investments 127,894 121,604
Purchases of investments (1,130,310) (4,123,982)
Net cash (used in) provided by investing activities 507,062 (3,967,128)
Net (decrease) increase in cash and cash equivalents (12,313,295) (19,287,460)
Cash and cash equivalents, beginning of year 24,735,831 44,023,291
Cash and cash equivalents, end of year 12,422,536$ 24,735,831$
Reconciliation to Statements of Net Position:
Cash and cash equivalents 12,422,536$ 14,005,912$
Restricted cash - unspent bond proceeds - 10,729,919
Cash and cash equivalents, end of year 12,422,536$ 24,735,831$
Primary Government
Lansing Community College
The accompanying notes are an integral part of these financial statements.
29
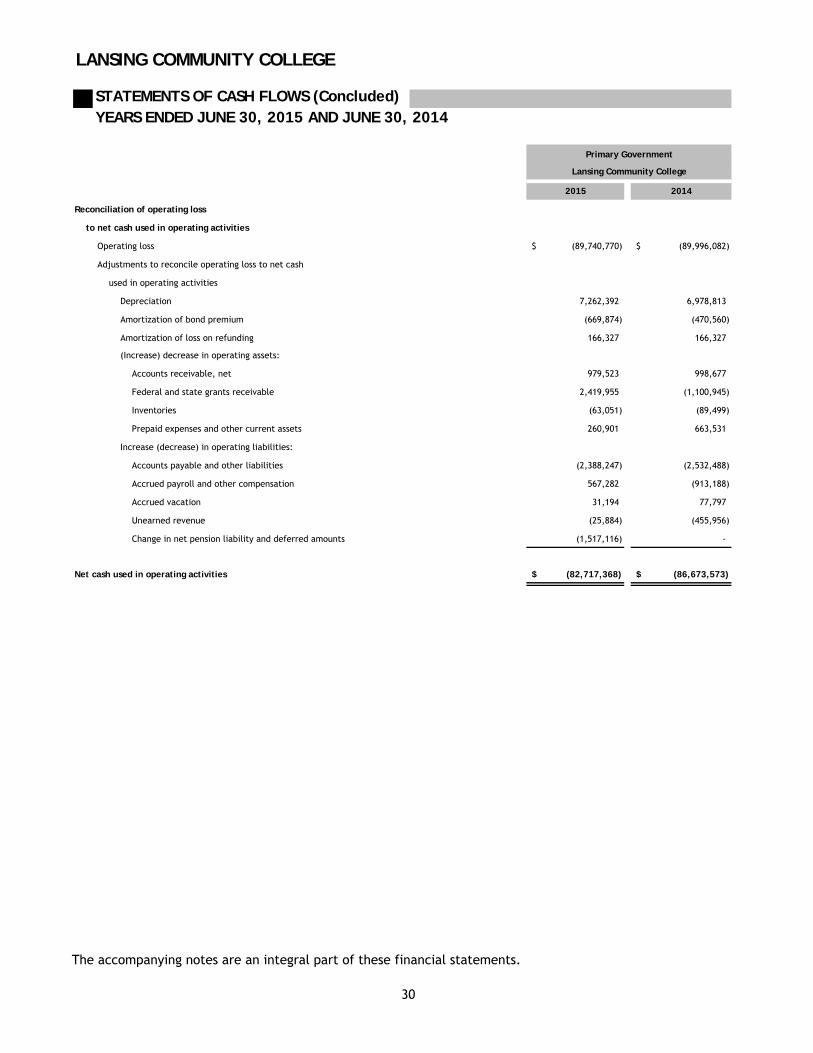
LANSING COMMUNITY COLLEGE
STATEMENTS OF CASH FLOWS (Concluded)YEARS ENDED JUNE 30, 2015 AND JUNE 30, 2014
2015 2014
Reconciliation of operating loss
to net cash used in operating activities
Operating loss (89,740,770)$ (89,996,082)$
Adjustments to reconcile operating loss to net cash
used in operating activities
Depreciation 7,262,392 6,978,813
Amortization of bond premium (669,874) (470,560)
Amortization of loss on refunding 166,327 166,327
(Increase) decrease in operating assets:
Accounts receivable, net 979,523 998,677
Federal and state grants receivable 2,419,955 (1,100,945)
Inventories (63,051) (89,499)
Prepaid expenses and other current assets 260,901 663,531
Increase (decrease) in operating liabilities:
Accounts payable and other liabilities (2,388,247) (2,532,488)
Accrued payroll and other compensation 567,282 (913,188)
Accrued vacation 31,194 77,797
Unearned revenue (25,884) (455,956)
Change in net pension liability and deferred amounts (1,517,116) -
Net cash used in operating activities (82,717,368)$ (86,673,573)$
Primary Government
Lansing Community College
The accompanying notes are an integral part of these financial statements.
30
LANSING COMMUNITY COLLEGE NOTES TO FINANCIAL STATEMENTS
31
1. BASIS OF PRESENTATION AND SIGNIFICANT ACCOUNTING POLICIES
The basic financial statements of Lansing Community College (the College) have been prepared in accordance with generally accepted accounting principles (GAAP) as applicable to public colleges and universities as described in Governmental Accounting Standards Board (GASB) Statement No. 35 and the Manual for Uniform Financial Reporting—Michigan Public Community Colleges (the MUFR). The College follows the “business-type” activities model of GASB Statement No. 35. Business-type activities are those that are financed in whole or in part by fees charged to external parties for goods and services. The College’s functional expense classifications are in accordance with the guidance in the MUFR.
A. Reporting Entity
Lansing Community College is a Michigan community college with its main campus located in Lansing, Michigan. The College is governed by a Board of Trustees consisting of seven members. The accompanying financial statements have been prepared in accordance with criteria established by the GASB for determining the various governmental organizations to be included in the reporting entity. These criteria include significant operational or financial relationships with the College. Based on application of the criteria, the College has determined that Lansing Community College Foundation (the Foundation) meets the criteria of a component unit. Lansing Community College Foundation is a legally separate, tax-exempt component unit of the College. The Foundation acts primarily as a fundraising organization to supplement the resources that are available to the College in support of its programs. The board of the Foundation is self-perpetuating and consists of friends of the College. Although the College does not control the timing or amount of receipts from the Foundation, the majority of resources or income thereon that the Foundation holds and invests, are restricted to the activities of the College by the donors. Because these restricted resources held by the Foundation can only be used by, or for the benefit of, the College, the Foundation is considered a component unit of the College and is discretely presented in the College’s financial statements. The College provides certain support and facilities to the Foundation. During the years ended June 30, 2015 and 2014, the Foundation distributed $614,645 and $813,943, respectively, to the College for both restricted and unrestricted purposes. Complete financial statements prepared in accordance with accounting standards established by the Financial Accounting Standards Board for the Foundation can be obtained from the Administrative Office at 309 N. Washington, Suite 203, Lansing, Michigan, 48933. Significant accounting policies followed by Lansing Community College are described below to enhance the usefulness of the financial statements to the reader.
B. Measurement Focus, Basis of Accounting and Financial Statement Presentation
The financial statements have been prepared on the economic resource measurement focus and the accrual basis of accounting, whereby revenue is recognized when earned and expenses are recognized when the related liabilities are incurred and certain measurement and matching criteria are met.
LANSING COMMUNITY COLLEGE NOTES TO FINANCIAL STATEMENTS
32
C. Cash and Cash Equivalents
Cash and cash equivalents consists of demand deposits in banks, cash on hand, and highly liquid investments with an initial maturity of three months or less.
D. Investments
Investments are recorded at fair value based on quoted market prices.
E. Inventories
Inventories are valued at the lower of cost (first-in, first-out) or market. Inventories consist of expendable supplies held for consumption and resale.
F. Accounts Receivable
Accounts receivable are stated at the amount management expects to collect from outstanding balances. Management provides for probable uncollectible amounts through a provision for bad debt expense when necessary and an adjustment to a valuation allowance based on its assessment of the current status of individual accounts. Balances that are still outstanding after management has used reasonable collection efforts are written off through a charge to the valuation allowance and a credit to accounts receivable.
G. Capital Assets
Capital assets purchased or acquired are capitalized at historical cost or estimated historical cost. Donated assets are valued at their estimated fair market value on the date received. The costs of normal maintenance and repairs that do not add to the value of the asset or materially extend lives are not capitalized. Improvements are capitalized and depreciated over the remaining useful lives of the related assets. Depreciation on all assets is provided on the straight-line basis over the estimated useful lives as follows:
Buildings and improvements 40 years
Furniture and equipment 5 - 20 years Infrastructure and improvements 10 - 20 years
Buildings and major building improvements are depreciated using a 10% salvage value. The College’s capitalization policy is to capitalize property improvements exceeding $150,000 and all other individual items exceeding $5,000.
In accordance with GASB Statement No. 51, Accounting and Financial Reporting for Intangible Assets, internally generated software costs have been recorded as an intangible asset and are included within the Infrastructure and improvements caption in Note 4.
H. Prepaid Expenses and Other Assets
Expenses, such as insurance premiums, that are expected to be of benefit within the next fiscal year are included in prepaid expenses. Deposits paid for equipment not yet received are included in other assets.
LANSING COMMUNITY COLLEGE NOTES TO FINANCIAL STATEMENTS
33
I. Deferred Outflows of Resources
In addition to assets, the statement of net position will sometimes report a separate section for deferred outflows of resources. This separate financial statement element represents a consumption of net position that applies to one or more future periods and so will not be recognized as an outflow of resources (expense/expenditure) until then. The College reports a deferred outflow of resources for its deferred charge on refunding, which results from the difference in the carrying value of refunded debt and its reacquisition price. This deferred outflow is amortized over the shorter of the life of the refunded or refunding bonds. The College also reports deferred outflows or resources for certain pension related amounts, such as changes in assumptions, and certain contributions made to the plan subsequent to the measurement date. More detailed information can be found in Note 7.
J. Deferred Inflow of Resources
In addition to liabilities, the statement of net position will sometimes report a separate section for deferred inflows of resources. This separate financial statement element, deferred inflows of resources, represents an acquisition of net position that applies to one or more future periods and so will not be recognized as an inflow of resources (revenue) until that time. The College reports deferred inflows of resources for certain pension-related amounts, such as the difference between projected and actual earnings of the pension plan’s investments. More detailed information can be found in Note 7.
K. Pension
For purposes of measuring the net pension liability, deferred outflows of resources and deferred inflows of resources related to pensions, and pension expense, information about the fiduciary net position of the Plan and additions to/deductions from the plan fiduciary net position have been determined on the same basis as they are reported by the plan. For this purpose, benefit payments (including refunds of employee contributions) are recognized when due and payable in accordance with the benefit terms. Investments are reported at fair value.
L. Revenue and Expense Recognition
Operating revenues of the College consist of tuition and fees, grants and contracts, sales and services of educational activities and auxiliary enterprise revenues. Transactions related to capital and financing activities, noncapital financing activities, investing activities, State appropriations, property taxes, and Pell Grant revenue are components of nonoperating and other revenues. Operating expenses include the cost of services, administrative expenses, and depreciation on capital assets. All expenses not meeting this definition are reported as nonoperating expenses. For financial reporting purposes, restricted resources are deemed to be utilized first when both restricted and unrestricted resources are available to satisfy an expense. Revenues received prior to year-end that are related to the next fiscal period are recorded as unearned revenues. Unearned revenue relates primarily to student tuition and fees on the summer semester and student deposits. The 2015 summer semester began June 5, 2015 and ended August 2, 2015. The 2014 summer semester began June 6, 2014 and ended August 3, 2014.
LANSING COMMUNITY COLLEGE NOTES TO FINANCIAL STATEMENTS
34
M. Property Tax Levy
Property taxes levied by the College are collected by various municipalities and periodically remitted to the College. The taxes are levied as of July 1 and December 1 and are due upon receipt of the billing by the taxpayer and become a lien on the first day of the levy year. The actual due dates are September 14 and February 14, after which time the bills become delinquent and penalties and interest may be assessed by the collecting entity. Property tax revenues are recognized when levied to the extent that they are determined to be collectible. Property taxes receivable are recorded net of an allowance for uncollectibles. For the years ended June 30, 2015 and 2014, the College levied 3.8072 mills per $1,000 of assessed valuation for general operations. In August 2010, the College became aware of a property tax settlement between Delta Township and General Motors which resulted in a tax refund that will be repaid by reducing the levy to General Motors over a period of 6 years. The refundable amount of $27,564 and $69,405 has been recorded within other liabilities in the accompanying statements of net position at June 30, 2015 and June 30, 2014, respectively.
N. State Appropriations Revenue
State appropriations revenue has been recorded in accordance with the MUFR.
O. Internal Service Activities
Both revenue and expenses related to internal service activities including print shops, office equipment, maintenance, telecommunications, and institutional services have been eliminated.
P. Accrued Vacation
Accrued vacation represents the accumulated liability to be paid under the College’s vacation pay policy. Under the College’s policy, employees earn vacation time based on time of service with the College and must use their accrued vacation within one year or it is forfeited. Accordingly, the entire accrued vacation balance as of June 30, 2015 and 2014 is classified as a current liability in the accompanying statements of net position.
Q. Long-Term Obligations
In the College’s financial statements, long-term debt and other long-term obligations are reported as liabilities on the statements of net position. Bond premiums and discounts, as well as the difference between the reacquisition price and the net carrying amount of the old debt, are deferred and amortized over the life of the bonds using the straight-line method which approximates the effective interest method.
R. Sabbatical Leaves
In accordance with the collective bargaining agreement between the College and its faculty, the College grants sabbatical leaves to various full-time instructors. The leaves are granted to enhance the professional competence of the instructors, who are required to return to the College for a period of one year. Compensation is recorded as an expense in the fiscal year that the leave is taken.

LANSING COMMUNITY COLLEGE NOTES TO FINANCIAL STATEMENTS
35
S. Use of Estimates
The process of preparing basic financial statements in conformity with generally accepted accounting principles requires the use of estimates and assumptions regarding certain types of assets, liabilities, revenues, and expenses. Such estimates primarily relate to unsettled transactions and events as of the date of the financial statements. Accordingly, upon settlement, actual results may differ from estimated amounts. Estimates include allowances for doubtful accounts, estimated useful lives and salvage value of property, net pension liability, and deferred outflows and inflows related to pension amounts.
T. Foundation Reporting
The Foundation is a private nonprofit organization that reports under Financial Accounting Standards Board (FASB) standards, including FASB Accounting Standards Codification (ASC) Topic 958 regarding financial reporting for not-for-profit entities. As such, certain revenue recognition criteria and presentation features are different from GASB revenue recognition criteria and presentation features. No modifications have been made to the Foundation’s financial information in the College’s financial reporting for these differences.
U. New Accounting Pronouncement
As of July 1, 2014, the College adopted GASB Statement No. 68, Accounting and Financial Reporting for Pensions. This statement requires that the College recognize a net pension liability on the statement of net position, equal to the College’s proportionate share of the net pension liability of the Michigan Public School Employees Retirement System (MPSERS), as defined and calculated in accordance with the new standard. More detailed information can be found in Note 7. As a result of this change, the College recognized a net pension liability of $131,054,135 and deferred outflows of resources of $10,774,022, which resulted in a decrease in net position of $120,280,113 as of July 1, 2014. Application of this new standard to July 1, 2013, the earliest year presented, is not practical as complete information is not available.
2. DEPOSITS AND INVESTMENTS
Deposit and investment amounts are reported in the statements of net position at June 30 as follows:
2015 2014
Cash and cash equivalents $ 12,422,536 $ 14,005,912 Short-term investments (certificates of deposit) 19,421,016 24,901,543 Restricted cash - 10,729,919 Long-term investments (certificates of deposit) 11,142,907 6,041,548 $ 42,986,459 $ 55,678,922
The College did not hold any investment securities as of June 30, 2015 or 2014.
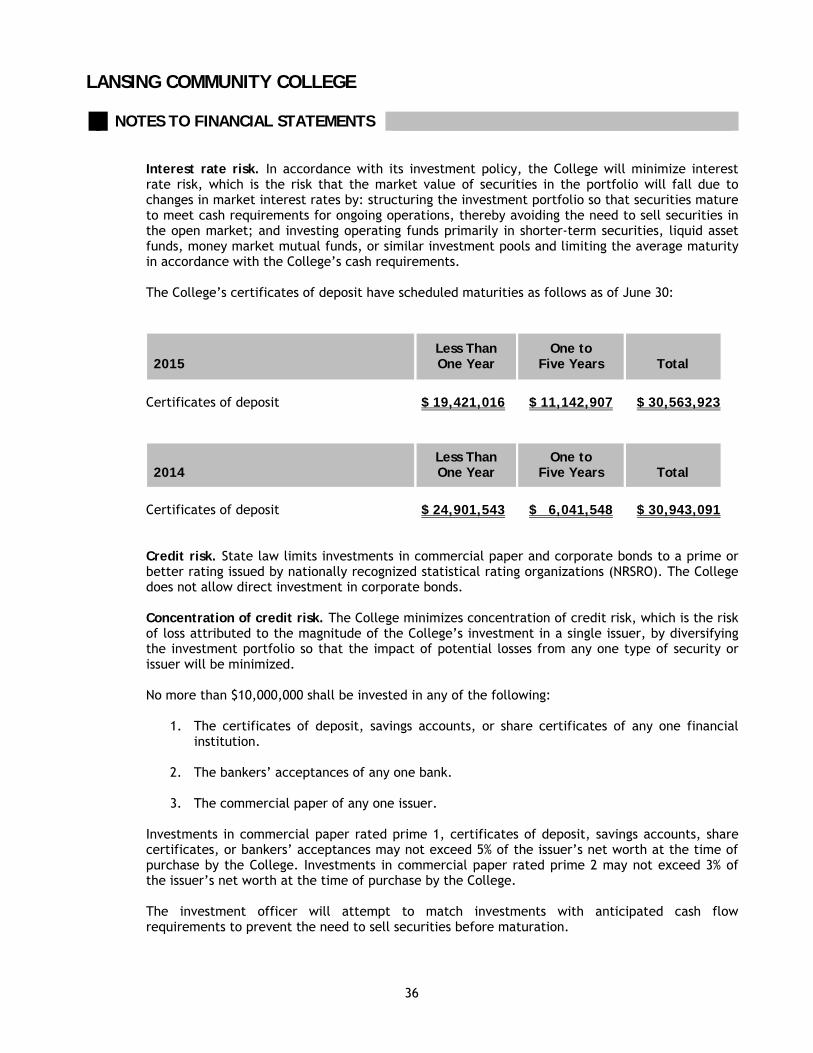
LANSING COMMUNITY COLLEGE NOTES TO FINANCIAL STATEMENTS
36
Interest rate risk. In accordance with its investment policy, the College will minimize interest rate risk, which is the risk that the market value of securities in the portfolio will fall due to changes in market interest rates by: structuring the investment portfolio so that securities mature to meet cash requirements for ongoing operations, thereby avoiding the need to sell securities in the open market; and investing operating funds primarily in shorter-term securities, liquid asset funds, money market mutual funds, or similar investment pools and limiting the average maturity in accordance with the College’s cash requirements. The College’s certificates of deposit have scheduled maturities as follows as of June 30:
2015
Less Than One Year
One to Five Years
Total
Certificates of deposit $ 19,421,016 $ 11,142,907 $ 30,563,923
2014
Less Than One Year
One to Five Years
Total
Certificates of deposit $ 24,901,543 $ 6,041,548 $ 30,943,091
Credit risk. State law limits investments in commercial paper and corporate bonds to a prime or better rating issued by nationally recognized statistical rating organizations (NRSRO). The College does not allow direct investment in corporate bonds. Concentration of credit risk. The College minimizes concentration of credit risk, which is the risk of loss attributed to the magnitude of the College’s investment in a single issuer, by diversifying the investment portfolio so that the impact of potential losses from any one type of security or issuer will be minimized. No more than $10,000,000 shall be invested in any of the following:
1. The certificates of deposit, savings accounts, or share certificates of any one financial
institution. 2. The bankers’ acceptances of any one bank. 3. The commercial paper of any one issuer.
Investments in commercial paper rated prime 1, certificates of deposit, savings accounts, share certificates, or bankers’ acceptances may not exceed 5% of the issuer’s net worth at the time of purchase by the College. Investments in commercial paper rated prime 2 may not exceed 3% of the issuer’s net worth at the time of purchase by the College. The investment officer will attempt to match investments with anticipated cash flow requirements to prevent the need to sell securities before maturation.
LANSING COMMUNITY COLLEGE NOTES TO FINANCIAL STATEMENTS
37
Custodial credit risk - deposits. In the case of deposits, this is the risk that in the event of a bank or financial institution failure, the College’s deposits may not be returned to it because the deposits were uninsured and uncollateralized. It is the policy of the College to minimize custodial credit risk whenever possible. At June 30, 2015, $0 of the College’s bank balance of $43,793,676 was uninsured and uncollateralized. At June 30, 2014, $0 of the College’s bank balance of $55,665,898 was uninsured and uncollateralized. The College does have over $10,000,000 at one institution as of June 30, 2015 and 2014. That institution collateralizes the College’s balances with U.S. Treasury Notes. Custodial credit risk - investments. For an investment, this is the risk that, in the event of the failure of the counterparty, the College will not be able to recover the value of its investments or collateral securities that are in the possession of an outside party. The College will minimize custodial credit risk, which is the risk of loss due to the failure of the security issuer or backer by: limiting investments to the types of securities allowed by law; and pre-qualifying the financial institutions, broker/dealers, intermediaries and advisors with which the College will do business. Foreign currency risk. The College is not authorized to invest in investments which have this type of risk.
The College is authorized by Michigan Public Act 331, as amended through 1997, and by resolution of the Board of Trustees, to invest surplus monies in:
1. Bonds, bills or notes of the United States (or of an agency or instrumentality of the United
States) or obligations of this state. 2. Negotiable certificates of deposit, savings accounts, or other interest earning deposit
accounts of a financial institution. As used in this subdivision, financial institution means a bank that is a member of the Federal Deposit Insurance Corporation, a savings and loan association that is a member of the Federal Savings and Loan Insurance Corporation, or a credit union whose deposits are insured by the National Credit Union Administration that have their principal office or a branch office in Michigan and which otherwise meets the requirement imposed by law.
3. Bankers’ acceptances that are issued by a bank that is a member of the Federal Deposit
Insurance Corporation. 4. Commercial paper that is supported by an irrevocable letter of credit issued by a bank that
is a member of the Federal Deposit Insurance Corporation. 5. Commercial paper of corporations rated prime by at least one of the standard rating
services. 6. Mutual funds, trusts or investment pools composed entirely of instruments that are eligible
collateral. 7. Repurchase agreements against eligible collateral of the type specified in subsection (1)
hereof, the market value of which must be maintained during the life of the agreements at levels equal to or greater than the amounts advanced. An undivided interest in the instruments pledged for these agreements must be granted to the College and the securities held by an independent custodial bank for the College without any right of set off. The repurchase agreement may allow for the substitution of collateral but shall not otherwise allow for the pledging or transfer of such collateral.
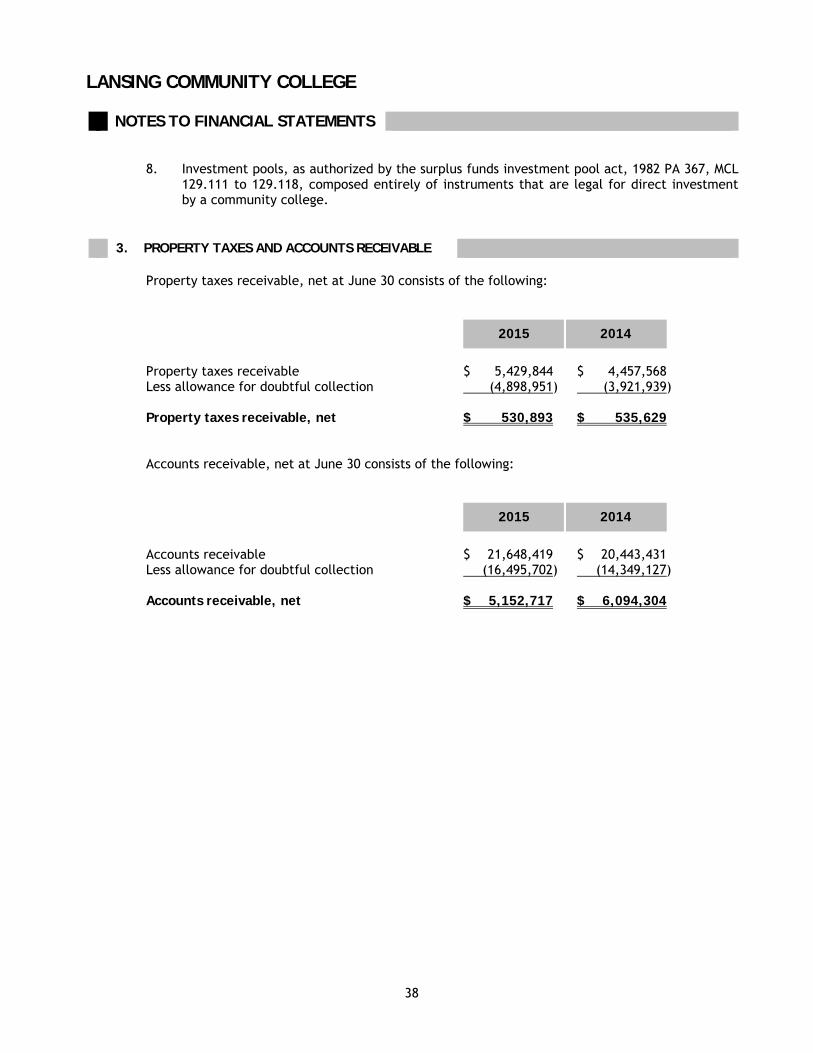
LANSING COMMUNITY COLLEGE NOTES TO FINANCIAL STATEMENTS
38
8. Investment pools, as authorized by the surplus funds investment pool act, 1982 PA 367, MCL 129.111 to 129.118, composed entirely of instruments that are legal for direct investment by a community college.
3. PROPERTY TAXES AND ACCOUNTS RECEIVABLE
Property taxes receivable, net at June 30 consists of the following:
2015 2014
Property taxes receivable $ 5,429,844 $ 4,457,568 Less allowance for doubtful collection (4,898,951) (3,921,939) Property taxes receivable, net $ 530,893 $ 535,629
Accounts receivable, net at June 30 consists of the following:
2015 2014
Accounts receivable $ 21,648,419 $ 20,443,431 Less allowance for doubtful collection (16,495,702) (14,349,127) Accounts receivable, net $ 5,152,717 $ 6,094,304

LANSING COMMUNITY COLLEGE NOTES TO FINANCIAL STATEMENTS
39
4. CAPITAL ASSETS
Capital assets activity for the years ended June 30, 2015 and 2014 follows:
Beginning Ending
Balance Balance
July 1, 2014 Additions Deletions Transfers June 30, 2015
Assets not being depreciated:
Land 14,824,146$ -$ -$ -$ 14,824,146$
Construction in progress 18,522,748 11,054,091 - (4,112,945) 25,463,894
Total capital assets not being depreciated 33,346,894 11,054,091 - (4,112,945) 40,288,040
Capital assets being depreciated:
Buildings and improvements 210,679,785 321,535 - 3,280,376 214,281,696
Furniture and equipment 72,030,222 4,797,959 (45,025) 832,569 77,615,725
Infrastructure and improvements 3,760,998 62,331 - - 3,823,329
Total capital assets being depreciated 286,471,005 5,181,825 (45,025) 4,112,945 295,720,750
Less accumulated depreciation:
Buildings and improvements 64,064,648 5,026,378 - - 69,091,026
Furniture and equipment 62,806,845 2,102,164 (32,827) - 64,876,182
Infrastructure and improvements 3,154,210 133,850 - - 3,288,060
Total accumulated depreciation 130,025,703 7,262,392 (32,827) - 137,255,268
Capital assets being depreciated, net 156,445,302 (2,080,567) (12,198) 4,112,945 158,465,482
Property and equipment, net 189,792,196$ 8,973,524$ (12,198)$ -$ 198,753,522$
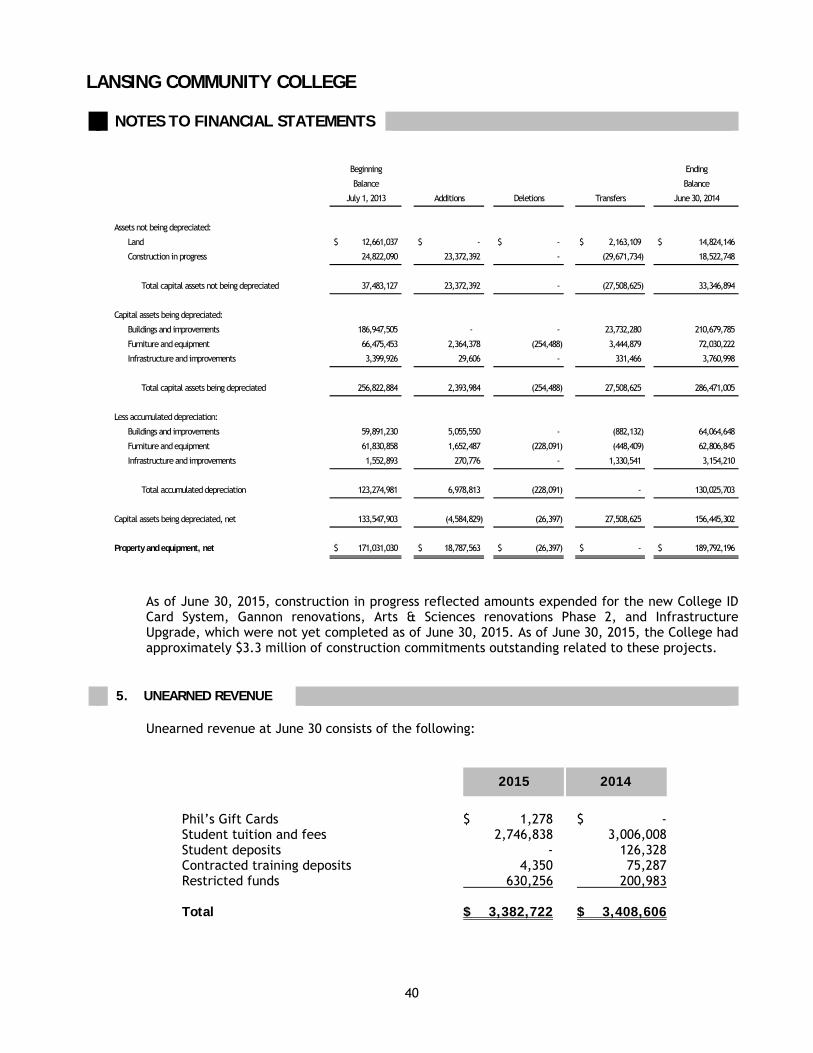
LANSING COMMUNITY COLLEGE NOTES TO FINANCIAL STATEMENTS
40
As of June 30, 2015, construction in progress reflected amounts expended for the new College ID Card System, Gannon renovations, Arts & Sciences renovations Phase 2, and Infrastructure Upgrade, which were not yet completed as of June 30, 2015. As of June 30, 2015, the College had approximately $3.3 million of construction commitments outstanding related to these projects.
5. UNEARNED REVENUE Unearned revenue at June 30 consists of the following:
2015 2014
Phil’s Gift Cards $ 1,278 $ - Student tuition and fees 2,746,838 3,006,008 Student deposits - 126,328 Contracted training deposits 4,350 75,287 Restricted funds 630,256 200,983 Total $ 3,382,722 $ 3,408,606
Beginning Ending
Balance Balance
July 1, 2013 Additions Deletions Transfers June 30, 2014
Assets not being depreciated:
Land 12,661,037$ -$ -$ 2,163,109$ 14,824,146$
Construction in progress 24,822,090 23,372,392 - (29,671,734) 18,522,748
Total capital assets not being depreciated 37,483,127 23,372,392 - (27,508,625) 33,346,894
Capital assets being depreciated:
Buildings and improvements 186,947,505 - - 23,732,280 210,679,785
Furniture and equipment 66,475,453 2,364,378 (254,488) 3,444,879 72,030,222
Infrastructure and improvements 3,399,926 29,606 - 331,466 3,760,998
Total capital assets being depreciated 256,822,884 2,393,984 (254,488) 27,508,625 286,471,005
Less accumulated depreciation:
Buildings and improvements 59,891,230 5,055,550 - (882,132) 64,064,648
Furniture and equipment 61,830,858 1,652,487 (228,091) (448,409) 62,806,845
Infrastructure and improvements 1,552,893 270,776 - 1,330,541 3,154,210
Total accumulated depreciation 123,274,981 6,978,813 (228,091) - 130,025,703
Capital assets being depreciated, net 133,547,903 (4,584,829) (26,397) 27,508,625 156,445,302
Property and equipment, net 171,031,030$ 18,787,563$ (26,397)$ -$ 189,792,196$
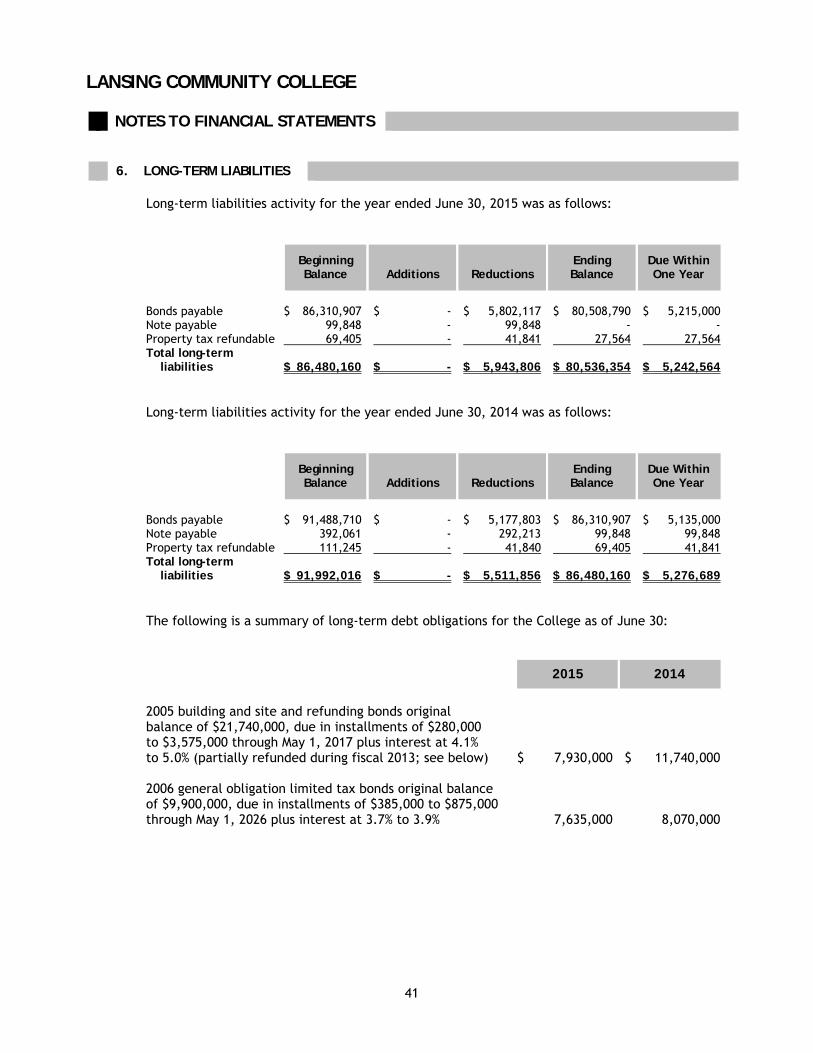
LANSING COMMUNITY COLLEGE NOTES TO FINANCIAL STATEMENTS
41
6. LONG-TERM LIABILITIES Long-term liabilities activity for the year ended June 30, 2015 was as follows:
Beginning Balance
Additions
Reductions
Ending Balance
Due Within One Year
Bonds payable $ 86,310,907 $ - $ 5,802,117 $ 80,508,790 $ 5,215,000 Note payable 99,848 - 99,848 - - Property tax refundable 69,405 - 41,841 27,564 27,564 Total long-term liabilities $ 86,480,160 $ - $ 5,943,806 $ 80,536,354 $ 5,242,564 Long-term liabilities activity for the year ended June 30, 2014 was as follows:
Beginning Balance
Additions
Reductions
Ending Balance
Due Within One Year
Bonds payable $ 91,488,710 $ - $ 5,177,803 $ 86,310,907 $ 5,135,000 Note payable 392,061 - 292,213 99,848 99,848 Property tax refundable 111,245 - 41,840 69,405 41,841 Total long-term liabilities $ 91,992,016 $ - $ 5,511,856 $ 86,480,160 $ 5,276,689 The following is a summary of long-term debt obligations for the College as of June 30:
2015 2014
2005 building and site and refunding bonds original balance of $21,740,000, due in installments of $280,000 to $3,575,000 through May 1, 2017 plus interest at 4.1% to 5.0% (partially refunded during fiscal 2013; see below) $ 7,930,000 $ 11,740,000 2006 general obligation limited tax bonds original balance of $9,900,000, due in installments of $385,000 to $875,000 through May 1, 2026 plus interest at 3.7% to 3.9% 7,635,000 8,070,000
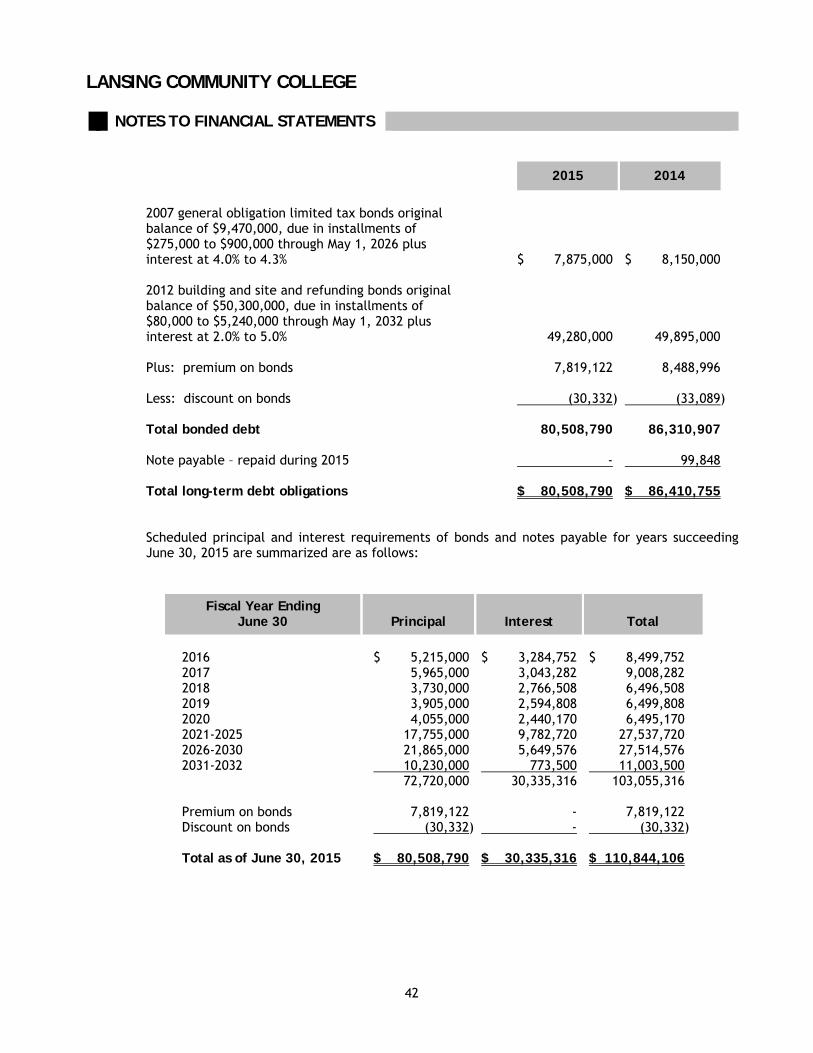
LANSING COMMUNITY COLLEGE NOTES TO FINANCIAL STATEMENTS
42
2015 2014
2007 general obligation limited tax bonds original balance of $9,470,000, due in installments of $275,000 to $900,000 through May 1, 2026 plus interest at 4.0% to 4.3% $ 7,875,000 $ 8,150,000 2012 building and site and refunding bonds original
balance of $50,300,000, due in installments of $80,000 to $5,240,000 through May 1, 2032 plus interest at 2.0% to 5.0% 49,280,000 49,895,000
Plus: premium on bonds 7,819,122 8,488,996 Less: discount on bonds (30,332) (33,089) Total bonded debt 80,508,790 86,310,907 Note payable – repaid during 2015 - 99,848 Total long-term debt obligations $ 80,508,790 $ 86,410,755
Scheduled principal and interest requirements of bonds and notes payable for years succeeding June 30, 2015 are summarized are as follows:
Fiscal Year Ending June 30
Principal
Interest
Total
2016 $ 5,215,000 $ 3,284,752 $ 8,499,752 2017 5,965,000 3,043,282 9,008,282 2018 3,730,000 2,766,508 6,496,508 2019 3,905,000 2,594,808 6,499,808 2020 4,055,000 2,440,170 6,495,170 2021-2025 17,755,000 9,782,720 27,537,720 2026-2030 21,865,000 5,649,576 27,514,576 2031-2032 10,230,000 773,500 11,003,500 72,720,000 30,335,316 103,055,316 Premium on bonds 7,819,122 - 7,819,122 Discount on bonds (30,332) - (30,332) Total as of June 30, 2015 $ 80,508,790 $ 30,335,316 $ 110,844,106
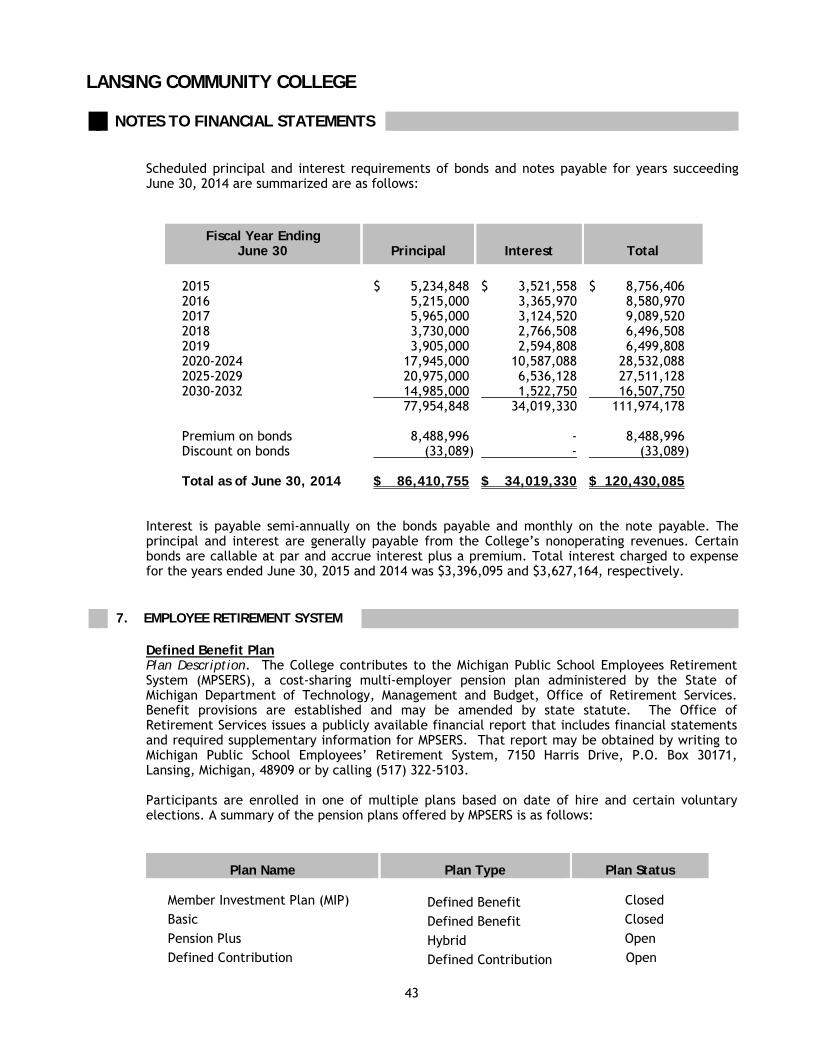
LANSING COMMUNITY COLLEGE NOTES TO FINANCIAL STATEMENTS
43
Scheduled principal and interest requirements of bonds and notes payable for years succeeding June 30, 2014 are summarized are as follows:
Fiscal Year Ending June 30
Principal
Interest
Total
2015 $ 5,234,848 $ 3,521,558 $ 8,756,406 2016 5,215,000 3,365,970 8,580,970 2017 5,965,000 3,124,520 9,089,520 2018 3,730,000 2,766,508 6,496,508 2019 3,905,000 2,594,808 6,499,808 2020-2024 17,945,000 10,587,088 28,532,088 2025-2029 20,975,000 6,536,128 27,511,128 2030-2032 14,985,000 1,522,750 16,507,750 77,954,848 34,019,330 111,974,178 Premium on bonds 8,488,996 - 8,488,996 Discount on bonds (33,089) - (33,089) Total as of June 30, 2014 $ 86,410,755 $ 34,019,330 $ 120,430,085
Interest is payable semi-annually on the bonds payable and monthly on the note payable. The principal and interest are generally payable from the College’s nonoperating revenues. Certain bonds are callable at par and accrue interest plus a premium. Total interest charged to expense for the years ended June 30, 2015 and 2014 was $3,396,095 and $3,627,164, respectively.
7. EMPLOYEE RETIREMENT SYSTEM
Defined Benefit Plan Plan Description. The College contributes to the Michigan Public School Employees Retirement System (MPSERS), a cost-sharing multi-employer pension plan administered by the State of Michigan Department of Technology, Management and Budget, Office of Retirement Services. Benefit provisions are established and may be amended by state statute. The Office of Retirement Services issues a publicly available financial report that includes financial statements and required supplementary information for MPSERS. That report may be obtained by writing to Michigan Public School Employees’ Retirement System, 7150 Harris Drive, P.O. Box 30171, Lansing, Michigan, 48909 or by calling (517) 322-5103. Participants are enrolled in one of multiple plans based on date of hire and certain voluntary elections. A summary of the pension plans offered by MPSERS is as follows:
Plan Name Plan Type Plan Status
Member Investment Plan (MIP) Defined Benefit Closed Basic Defined Benefit Closed Pension Plus Hybrid Open Defined Contribution Defined Contribution Open
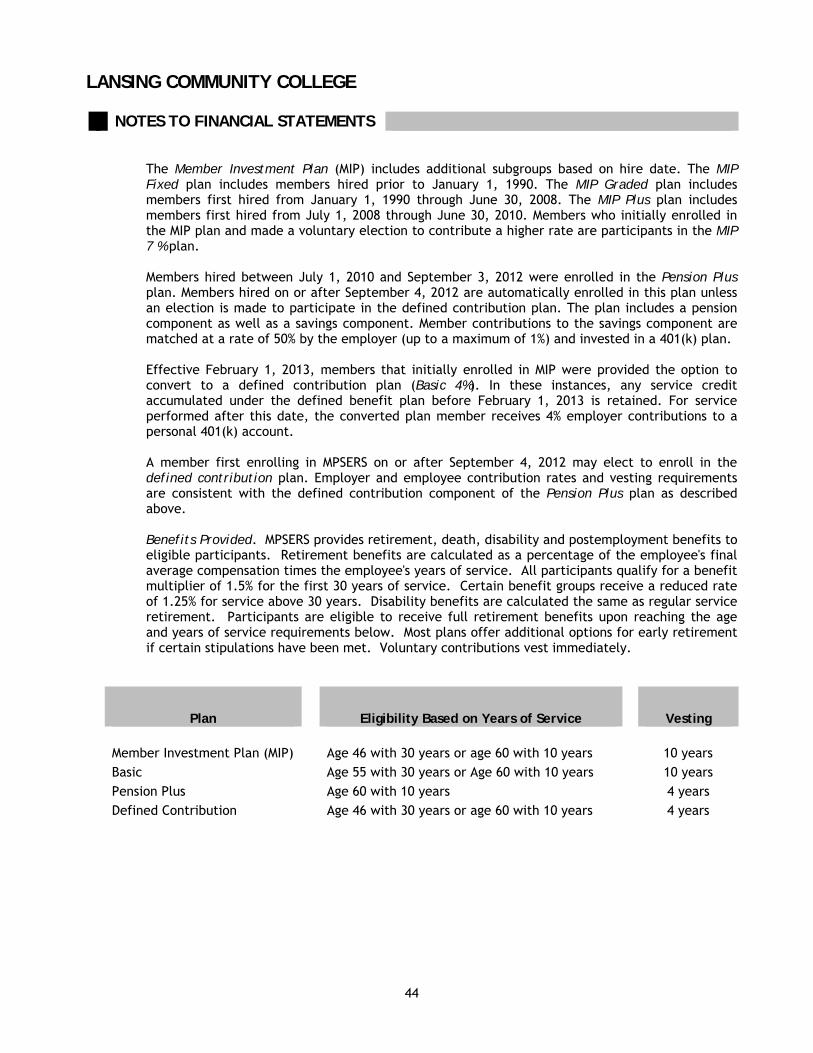
LANSING COMMUNITY COLLEGE NOTES TO FINANCIAL STATEMENTS
44
The Member Investment Plan (MIP) includes additional subgroups based on hire date. The MIP Fixed plan includes members hired prior to January 1, 1990. The MIP Graded plan includes members first hired from January 1, 1990 through June 30, 2008. The MIP Plus plan includes members first hired from July 1, 2008 through June 30, 2010. Members who initially enrolled in the MIP plan and made a voluntary election to contribute a higher rate are participants in the MIP 7 % plan. Members hired between July 1, 2010 and September 3, 2012 were enrolled in the Pension Plus plan. Members hired on or after September 4, 2012 are automatically enrolled in this plan unless an election is made to participate in the defined contribution plan. The plan includes a pension component as well as a savings component. Member contributions to the savings component are matched at a rate of 50% by the employer (up to a maximum of 1%) and invested in a 401(k) plan. Effective February 1, 2013, members that initially enrolled in MIP were provided the option to convert to a defined contribution plan (Basic 4%). In these instances, any service credit accumulated under the defined benefit plan before February 1, 2013 is retained. For service performed after this date, the converted plan member receives 4% employer contributions to a personal 401(k) account. A member first enrolling in MPSERS on or after September 4, 2012 may elect to enroll in the defined contribution plan. Employer and employee contribution rates and vesting requirements are consistent with the defined contribution component of the Pension Plus plan as described above. Benefits Provided. MPSERS provides retirement, death, disability and postemployment benefits to eligible participants. Retirement benefits are calculated as a percentage of the employee's final average compensation times the employee's years of service. All participants qualify for a benefit multiplier of 1.5% for the first 30 years of service. Certain benefit groups receive a reduced rate of 1.25% for service above 30 years. Disability benefits are calculated the same as regular service retirement. Participants are eligible to receive full retirement benefits upon reaching the age and years of service requirements below. Most plans offer additional options for early retirement if certain stipulations have been met. Voluntary contributions vest immediately.
Plan Eligibility Based on Years of Service Vesting Member Investment Plan (MIP) Age 46 with 30 years or age 60 with 10 years 10 years Basic Age 55 with 30 years or Age 60 with 10 years 10 years Pension Plus Age 60 with 10 years 4 years Defined Contribution Age 46 with 30 years or age 60 with 10 years 4 years
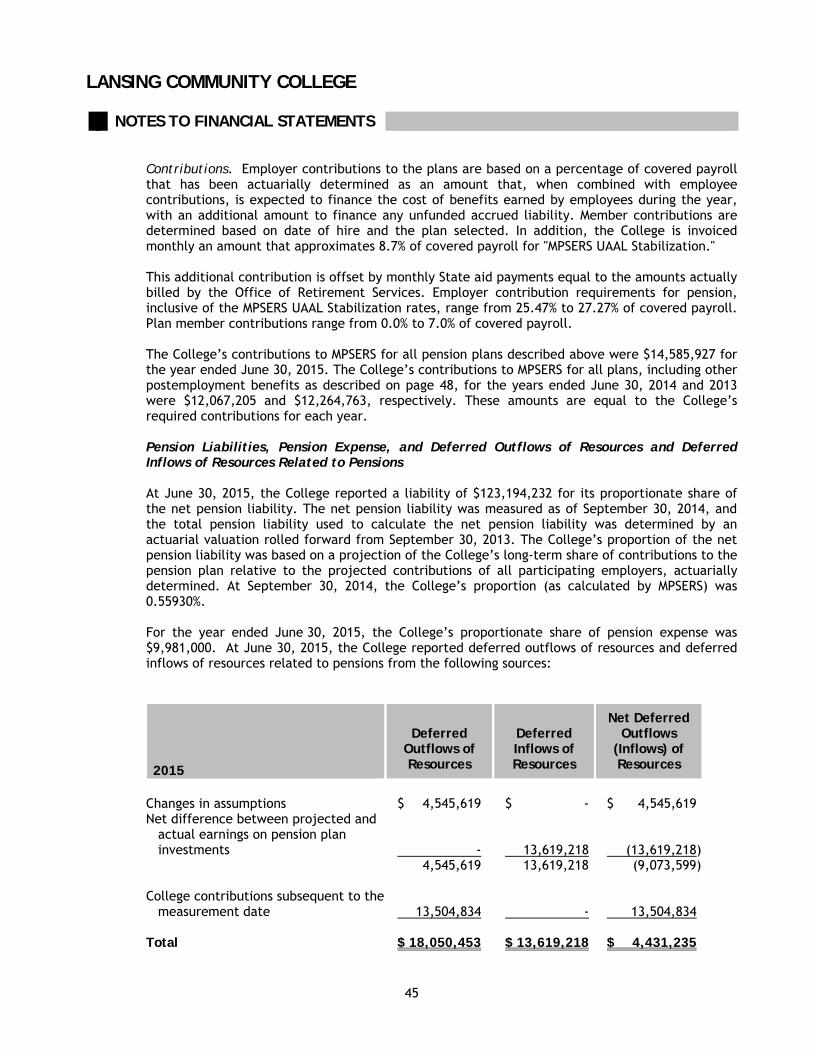
LANSING COMMUNITY COLLEGE NOTES TO FINANCIAL STATEMENTS
45
Contributions. Employer contributions to the plans are based on a percentage of covered payroll that has been actuarially determined as an amount that, when combined with employee contributions, is expected to finance the cost of benefits earned by employees during the year, with an additional amount to finance any unfunded accrued liability. Member contributions are determined based on date of hire and the plan selected. In addition, the College is invoiced monthly an amount that approximates 8.7% of covered payroll for "MPSERS UAAL Stabilization." This additional contribution is offset by monthly State aid payments equal to the amounts actually billed by the Office of Retirement Services. Employer contribution requirements for pension, inclusive of the MPSERS UAAL Stabilization rates, range from 25.47% to 27.27% of covered payroll. Plan member contributions range from 0.0% to 7.0% of covered payroll. The College’s contributions to MPSERS for all pension plans described above were $14,585,927 for the year ended June 30, 2015. The College’s contributions to MPSERS for all plans, including other postemployment benefits as described on page 48, for the years ended June 30, 2014 and 2013 were $12,067,205 and $12,264,763, respectively. These amounts are equal to the College’s required contributions for each year. Pension Liabilities, Pension Expense, and Deferred Outflows of Resources and Deferred Inflows of Resources Related to Pensions At June 30, 2015, the College reported a liability of $123,194,232 for its proportionate share of the net pension liability. The net pension liability was measured as of September 30, 2014, and the total pension liability used to calculate the net pension liability was determined by an actuarial valuation rolled forward from September 30, 2013. The College’s proportion of the net pension liability was based on a projection of the College’s long-term share of contributions to the pension plan relative to the projected contributions of all participating employers, actuarially determined. At September 30, 2014, the College’s proportion (as calculated by MPSERS) was 0.55930%. For the year ended June 30, 2015, the College’s proportionate share of pension expense was $9,981,000. At June 30, 2015, the College reported deferred outflows of resources and deferred inflows of resources related to pensions from the following sources:
2015
Deferred
Outflows of Resources
Deferred Inflows of Resources
Net Deferred Outflows
(Inflows) of Resources
Changes in assumptions $ 4,545,619 $ - $ 4,545,619 Net difference between projected and actual earnings on pension plan investments - 13,619,218 (13,619,218) 4,545,619 13,619,218 (9,073,599) College contributions subsequent to the measurement date 13,504,834 - 13,504,834 Total $ 18,050,453 $ 13,619,218 $ 4,431,235
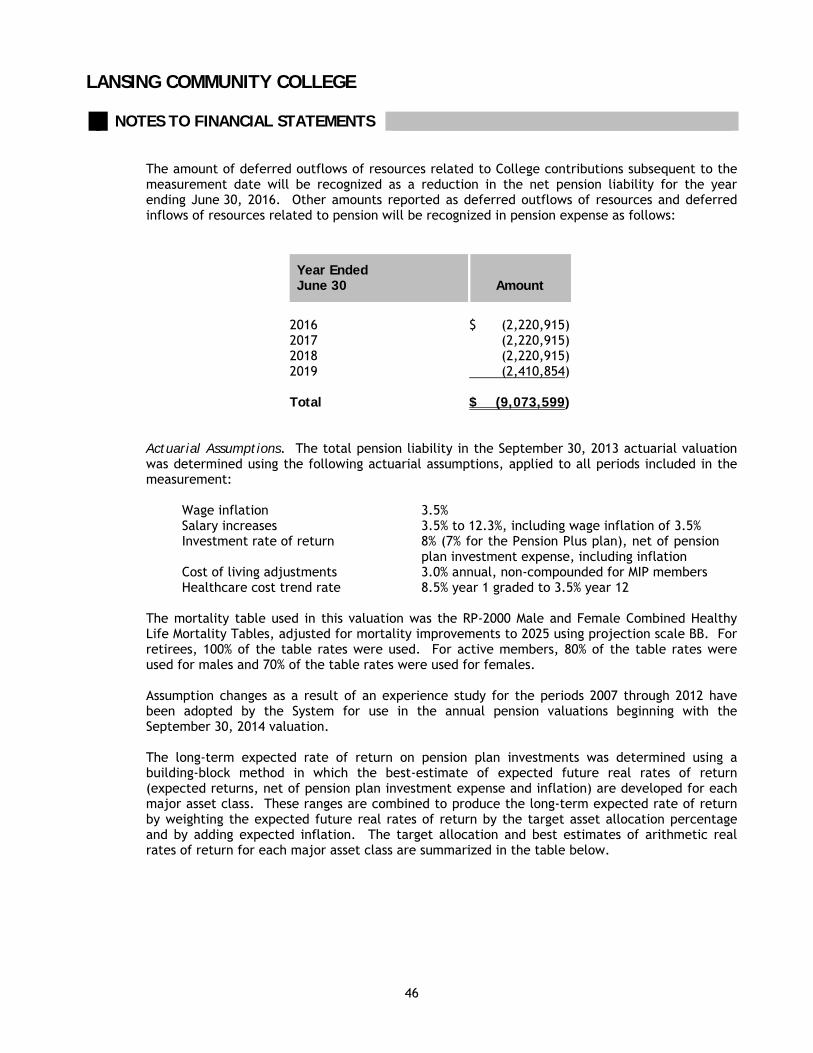
LANSING COMMUNITY COLLEGE NOTES TO FINANCIAL STATEMENTS
46
The amount of deferred outflows of resources related to College contributions subsequent to the measurement date will be recognized as a reduction in the net pension liability for the year ending June 30, 2016. Other amounts reported as deferred outflows of resources and deferred inflows of resources related to pension will be recognized in pension expense as follows:
Year Ended June 30
Amount
2016 $ (2,220,915) 2017 (2,220,915) 2018 (2,220,915) 2019 (2,410,854) Total $ (9,073,599)
Actuarial Assumptions. The total pension liability in the September 30, 2013 actuarial valuation was determined using the following actuarial assumptions, applied to all periods included in the measurement:
Wage inflation 3.5% Salary increases 3.5% to 12.3%, including wage inflation of 3.5% Investment rate of return 8% (7% for the Pension Plus plan), net of pension
plan investment expense, including inflation Cost of living adjustments 3.0% annual, non-compounded for MIP members Healthcare cost trend rate 8.5% year 1 graded to 3.5% year 12
The mortality table used in this valuation was the RP-2000 Male and Female Combined Healthy Life Mortality Tables, adjusted for mortality improvements to 2025 using projection scale BB. For retirees, 100% of the table rates were used. For active members, 80% of the table rates were used for males and 70% of the table rates were used for females. Assumption changes as a result of an experience study for the periods 2007 through 2012 have been adopted by the System for use in the annual pension valuations beginning with the September 30, 2014 valuation. The long-term expected rate of return on pension plan investments was determined using a building-block method in which the best-estimate of expected future real rates of return (expected returns, net of pension plan investment expense and inflation) are developed for each major asset class. These ranges are combined to produce the long-term expected rate of return by weighting the expected future real rates of return by the target asset allocation percentage and by adding expected inflation. The target allocation and best estimates of arithmetic real rates of return for each major asset class are summarized in the table below.
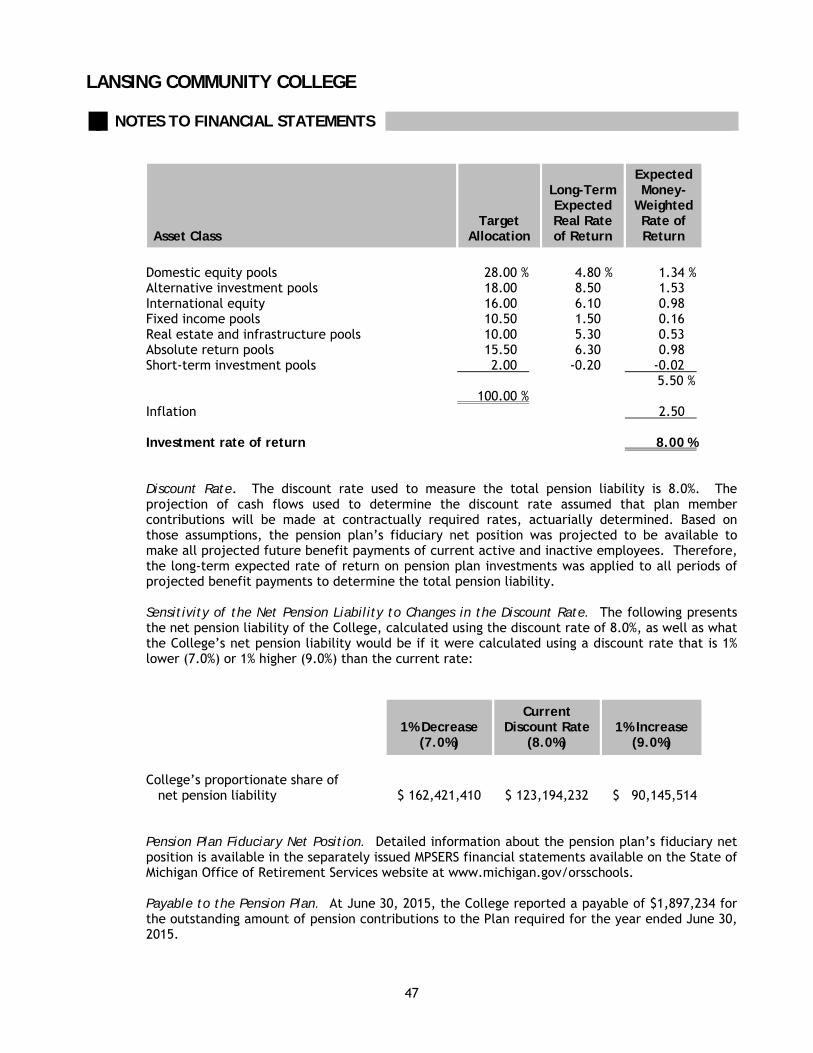
LANSING COMMUNITY COLLEGE NOTES TO FINANCIAL STATEMENTS
47
Asset Class
Target Allocation
Long-Term Expected Real Rate of Return
Expected Money-
Weighted Rate of Return
Domestic equity pools 28.00 % 4.80 % 1.34 % Alternative investment pools 18.00 8.50 1.53 International equity 16.00 6.10 0.98 Fixed income pools 10.50 1.50 0.16 Real estate and infrastructure pools 10.00 5.30 0.53 Absolute return pools 15.50 6.30 0.98 Short-term investment pools 2.00 -0.20 -0.02
5.50 % 100.00 % Inflation 2.50 Investment rate of return 8.00 %
Discount Rate. The discount rate used to measure the total pension liability is 8.0%. The projection of cash flows used to determine the discount rate assumed that plan member contributions will be made at contractually required rates, actuarially determined. Based on those assumptions, the pension plan’s fiduciary net position was projected to be available to make all projected future benefit payments of current active and inactive employees. Therefore, the long-term expected rate of return on pension plan investments was applied to all periods of projected benefit payments to determine the total pension liability. Sensitivity of the Net Pension Liability to Changes in the Discount Rate. The following presents the net pension liability of the College, calculated using the discount rate of 8.0%, as well as what the College’s net pension liability would be if it were calculated using a discount rate that is 1% lower (7.0%) or 1% higher (9.0%) than the current rate:
1% Decrease
(7.0%)
Current Discount Rate
(8.0%)
1% Increase
(9.0%)
College’s proportionate share of net pension liability $ 162,421,410 $ 123,194,232 $ 90,145,514
Pension Plan Fiduciary Net Position. Detailed information about the pension plan’s fiduciary net position is available in the separately issued MPSERS financial statements available on the State of Michigan Office of Retirement Services website at www.michigan.gov/orsschools. Payable to the Pension Plan. At June 30, 2015, the College reported a payable of $1,897,234 for the outstanding amount of pension contributions to the Plan required for the year ended June 30, 2015.
LANSING COMMUNITY COLLEGE NOTES TO FINANCIAL STATEMENTS
48
Other Postemployment Benefits Retirees enrolled in MPSERS before September 4, 2012 have the option of participating in the Premium Subsidy plan, a defined benefit postemployment healthcare plan, which is funded by employers on a cash disbursement basis. The State of Michigan has contracted to provide the comprehensive group medical, hearing, dental and vision coverage for retirees and beneficiaries. All health care benefits are on a self-funded basis. A significant portion of the premium is paid by MPSERS with the balance deducted from the monthly pension. Employer contributions range from 2.20% to 2.71% of covered payroll. Plan participants contribute 3% of covered payroll to the Retiree Healthcare Fund. At retirement, these individuals receive a subsidy for healthcare premiums that covers up to 80% of cost. Plan members enrolled on or after September 4, 2012 participate in the Personal Healthcare Fund. This defined contribution other postemployment benefits plan includes a required 2% employee contribution into a personal tax-deferred account, which is matched by an additional 2% employer contribution. Employees are fully vested in these contributions which can be used, along with earnings thereon, to pay for postemployment healthcare expenses. Plan members working prior to September 4, 2012 were given the option to convert from the Premium Subsidy plan to the Personal Healthcare Fund option. Effective February 1, 2013, these members are no longer required to make the 3% employee contribution. Amounts paid into the Retiree Healthcare Fund between September 4, 2012 and February 1, 2013 were credited to each individual’s Personal Healthcare Fund account. Any contributions made prior to September 4, 2012 are pending a Supreme Court resolution. The College’s contributions to MPSERS for other postemployment benefits amounted to $1,743,040 for the year ended June 30, 2015. Other Per MPSERS’ comprehensive annual financial report as of September 30, 2014, the unfunded actuarial accrued liability (UAAL) for other postemployment benefits (OPEB/Healthcare) for MPSERS is $12.5 billion, and the ratio of the UAAL to covered payroll is 151.0%. For fiscal year ended June 30, 2015, Lansing Community College had approximately $53.9 million of covered payroll. Applying the MPSERS ratio of the UAAL to Lansing Community College’s covered payroll results in an estimated share of the UAAL for OPEB Healthcare of $81.4 million.
8. OPTIONAL RETIREMENT PROGRAM
Plan Description The College has adopted the Lansing Community College Optional Retirement Plan (ORP) under IRS Code Section 403(A). This defined contribution plan is administered by the College and provides retirement benefits to participants. The ORP was established pursuant to Public Act No. 296 of 1994 and permits full-time faculty and administrative staff of the College to elect an optional retirement plan in lieu of coverage under MPSERS. The Plan had 107 and 99 participants at June 30, 2015 and 2014, respectively.
LANSING COMMUNITY COLLEGE NOTES TO FINANCIAL STATEMENTS
49
Funding Policy The contribution requirements of plan members and the College are established by the plan document as 4.3% and 12.0% of MPSERS compensation, respectively. Institutional plan contributions will only be made for participants who have authorized the required participant plan contribution. Participant contributions are fully vested and non-forfeitable when made. Institutional contributions vest after two years of continuous full-time service as interpreted under MPSERS guidelines. The participant and College contributions to ORP for the year ended June 30, 2015 were $364,844 and $1,018,165, respectively. The participant and College contributions to ORP for the year ended June 30, 2014 were $333,342 and $930,257, respectively.
9. UNRESTRICTED NET (DEFICIT) POSITION
The College has designated the use of unrestricted net (deficit) position at June 30 as follows:
2015 2014
Auxiliary activities $ 2,433,815 $ 3,030,549 Encumbrances 1,262,469 1,330,325 Plant improvement 19,502,672 13,893,484 Pension liability fund deficit (118,762,997) - Undesignated 18,735,320 27,073,652 Total unrestricted net (deficit) position $ (76,828,721) $ 45,328,010
10. LEASES
The College conducts a portion of its operations with leased property, including a parking structure and a building. Net rental expense on these operating leases was $1,115,609 and $945,579 for fiscal 2015 and 2014, respectively. The following is a schedule of annual future minimum lease payments required under these non-cancelable operating leases as of June 30, 2015:
Year Amount
2016 $ 1,038,394 2017 792,322 2018 452,817 2019-2020 873,975 2021-2036 728,529 Total minimum payments due $ 3,886,037
LANSING COMMUNITY COLLEGE NOTES TO FINANCIAL STATEMENTS
50
11. RISK MANAGEMENT
The College is exposed to various risks of loss related to property loss, errors and omissions, and employee injuries (workers’ compensation), as well as medical benefits provided to employees. The College participates in the Middle Cities Risk Management Pool for claims relating to auto, property, and liability; the College is separately insured for medical benefits provided to employees’ claims. The Middle Cities Risk Management Trust (the Trust) provides a single multi-peril contract under which the members are covered for various types of risk including auto, property and liability. Contributions for premiums received from members are recorded as revenue by the Trust. Claim losses, along with excess insurance premiums and services fees, are recorded as expenses by the Trust. The estimated total costs of claim losses are accrued by the Trust. To the extent the group’s contributions are deemed to exceed claim losses and other costs, the excess amount is refunded to the members by the Trust. If necessary, funding deficits in individual policy years are recovered through additional member contributions assessed to members of that policy year.
12. CONTINGENCIES
The College may be subject to various legal proceedings and claims which arise in the ordinary course of its business. The College believes that the amount, if any, of ultimate liability with respect to legal actions will be immaterial or will be covered by insurance. The College conducts certain programs pursuant to grants and contracts funded, and subject to audit, by various federal and state agencies. Amounts questioned as a result of audits, if any, may result in refunds to these governmental agencies. Any liabilities for reimbursements which may arise as the result of these audits is not believed to be material.
LANSING COMMUNITY COLLEGE
Required Supplementary InformationMPSERS Cost-Sharing Multiple-Employer Plan
Schedule of the College's Proportionate Share of the Net Pension Liability
Year Ended June 30, 2015
College's proportion of the net pension liability 0.55930%
College's proportionate share of the net pension liability 123,194,232$
College's covered-employee payroll 52,829,768
College's proportionate share of the net pension liability as a percentage
of its covered-employee payroll 233.19%
Plan fiduciary net position as a percentage of the total pension liability 66.2%
The amounts presented for the fiscal year were determined as of September 30 of the preceding year.
Note: GASB 68 was implemented in fiscal year 2015. This schedule is being built prospectively. Ultimately, 10 years ofdata will be presented.
51
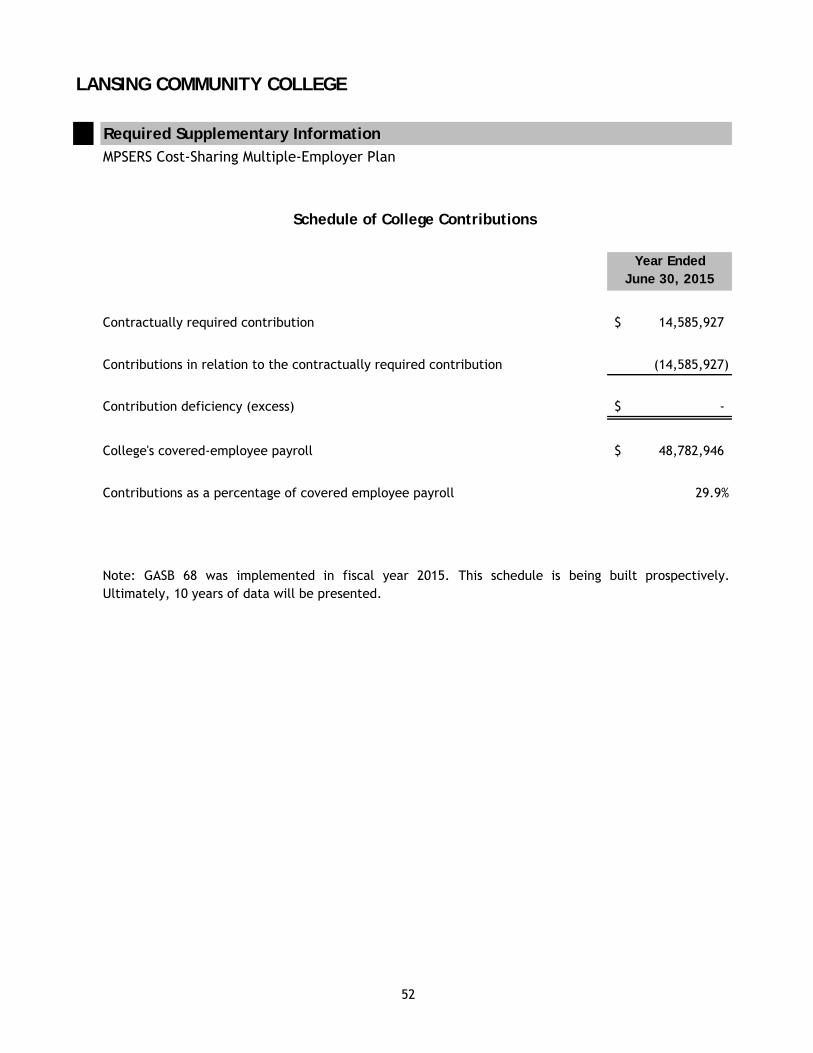
LANSING COMMUNITY COLLEGE
Required Supplementary InformationMPSERS Cost-Sharing Multiple-Employer Plan
Schedule of College Contributions
Year Ended June 30, 2015
Contractually required contribution 14,585,927$
Contributions in relation to the contractually required contribution (14,585,927)
Contribution deficiency (excess) -$
College's covered-employee payroll 48,782,946$
Contributions as a percentage of covered employee payroll 29.9%
Note: GASB 68 was implemented in fiscal year 2015. This schedule is being built prospectively.Ultimately, 10 years of data will be presented.
52
Statistical Section

This page intentionally left blank.

53
LANSING COMMUNITY COLLEGE
STATISTICAL SECTION
This part of the College’s Statistical Section of the Comprehensive Annual Financial Report presents detailed information as a context for understanding what the information in the financial statements, note disclosures and required supplementary information says about the College’s overall financial health. Contents Financial Trends These schedules contain trend information to help the reader understand how
the College’s financial performance and well-being have changed over time. Revenue Capacity These schedules contain information to help the reader assess the College’s
most significant local revenue source, the property tax, and tuition and fees data.
Debt Capacity These schedules present information to help the reader assess the affordability
of the College’s current levels of outstanding debt and the College’s ability to issue additional debt in the future.
Demographic and Economic Information These schedules contain service and infrastructure data to help the reader
understand how the information in the College’s financial report relates to the services the College provides and the activities it performs.
Sources: Unless otherwise noted, the information in these schedules is derived from
the comprehensive annual financial reports for the relevant year.

This page intentionally left blank.
Special Reports Section

This page intentionally left blank.
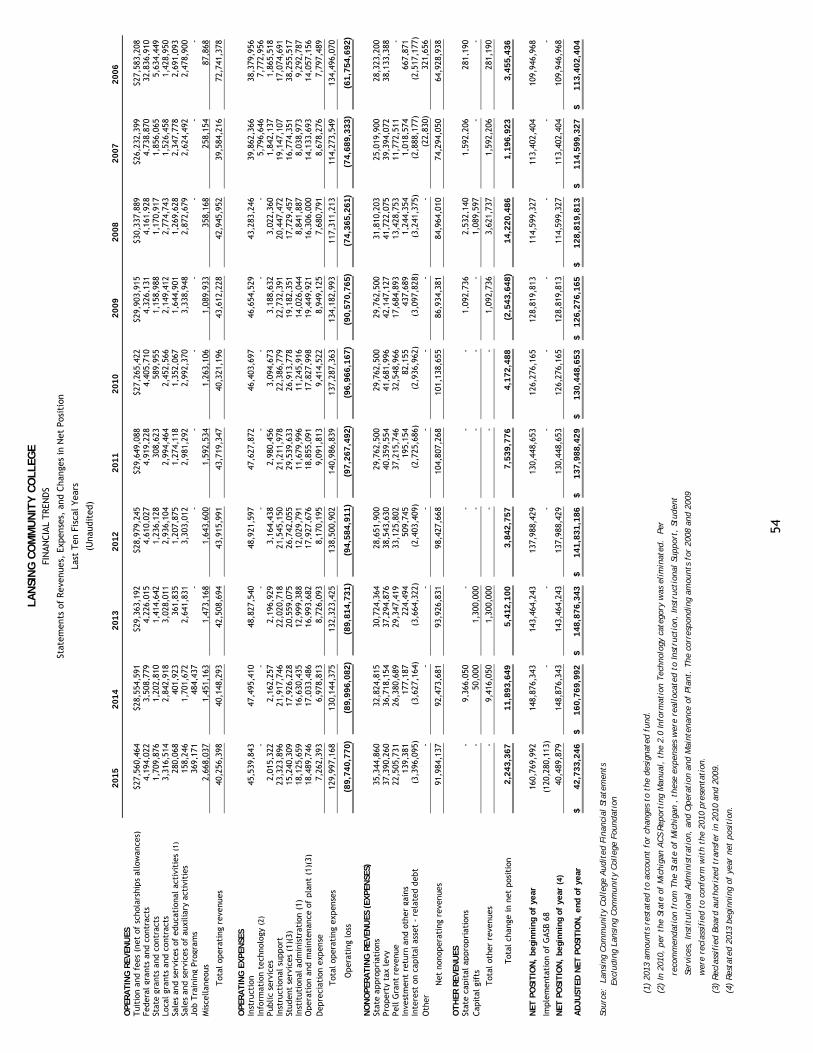
2015
2014
2013
2012
2011
2010
2009
2008
2007
2006
OPER
AT
ING
REV
ENU
ESTui
tion
and
fee
s (n
et o
f sc
hola
rshi
ps a
llow
ance
s)$2
7,56
0,46
4$2
8,55
4,59
1$2
9,36
3,19
2$2
8,97
9,24
5$2
9,64
9,08
8$2
7,26
5,42
2$2
9,90
3,91
5$3
0,33
7,88
9$2
6,23
2,39
9$2
7,58
3,20
8Fe
dera
l gr
ants
and
con
trac
ts4,
194,
022
3,
508,
779
4,
226,
015
4,
610,
027
4,
919,
228
4,
405,
710
4,
326,
131
4,16
1,92
8
4,73
8,87
0
32,8
36,9
10
St
ate
gran
ts a
nd c
ontr
acts
1,70
9,87
6
1,20
2,81
0
1,41
4,64
2
1,23
6,12
8
308,
623
589,
955
1,15
8,98
8
1,
170,
917
1,
856,
065
5,
634,
449
Lo
cal
gran
ts a
nd c
ontr
acts
3,31
6,51
4
2,84
2,91
8
3,02
8,01
1
2,93
6,10
4
2,99
4,46
4
2,45
2,56
6
2,14
9,41
2
2,
774,
743
1,
526,
458
1,
428,
950
Sa
les
and
serv
ices
of
educ
atio
nal ac
tivi
ties
(1)
280,
068
401,
923
361,
835
1,20
7,87
5
1,27
4,11
8
1,35
2,06
7
1,64
4,90
1
1,
269,
628
2,
347,
778
2,
691,
093
Sa
les
and
serv
ices
of
auxi
liar
y ac
tivi
ties
158,
246
1,70
1,67
2
2,64
1,83
1
3,30
3,01
2
2,98
1,29
2
2,99
2,37
0
3,33
8,94
8
2,
872,
679
2,
624,
492
2,
478,
900
Jo
b Tra
inin
g Pr
ogra
ms
369,
171
484,
437
-
-
-
-
-
-
-
-
Mis
cellan
eous
2,66
8,03
7
1,45
1,16
3
1,47
3,16
8
1,64
3,60
0
1,59
2,53
4
1,26
3,10
6
1,08
9,93
3
35
8,16
8
25
8,15
4
87
,868
Tot
al o
pera
ting
rev
enue
s40
,256
,398
40,1
48,2
93
42
,508
,694
43,9
15,9
91
43
,719
,347
40,3
21,1
96
43
,612
,228
42
,945
,952
39,5
84,2
16
72
,741
,378
OPER
AT
ING
EX
PEN
SES
Inst
ruct
ion
45,5
39,8
43
47
,495
,410
48,8
27,5
40
48
,921
,597
47,6
27,8
72
46
,403
,697
46,6
54,5
29
43,2
83,2
46
39
,862
,366
38,3
79,9
56
In
form
atio
n te
chno
logy
(2)
-
-
-
-
-
-
-
-
5,79
6,64
6
7,77
2,95
6
Publ
ic s
ervi
ces
2,01
5,32
2
2,16
2,25
7
2,19
6,92
9
3,16
4,43
8
2,98
0,45
6
3,09
4,67
3
3,18
8,63
2
3,
022,
360
1,
842,
137
1,
865,
518
In
stru
ctio
nal
supp
ort
23,3
23,8
96
21
,917
,746
22,0
20,7
18
21
,545
,150
21,2
11,9
78
22
,386
,779
22,7
32,3
91
20,4
47,4
72
19
,147
,107
17,0
74,6
91
St
uden
t se
rvic
es (
1)(3
)15
,240
,309
17,9
26,2
28
20
,559
,075
26,7
42,0
55
29
,539
,633
26,9
13,7
78
19
,182
,351
17
,729
,457
16,7
74,3
51
38
,255
,517
Inst
itut
iona
l ad
min
istr
atio
n (1
)18
,125
,659
16,6
30,4
35
12
,999
,388
12,0
29,7
91
11
,679
,996
11,2
45,9
16
14
,026
,044
8,
841,
887
8,
038,
973
9,
292,
787
O
pera
tion
and
mai
nten
ance
of
plan
t (1
)(3)
18,4
89,7
46
17
,033
,486
16,9
93,6
82
17
,927
,676
18,8
55,0
91
17
,827
,998
19,4
49,9
21
16,3
06,0
00
14
,133
,693
14,0
57,1
56
D
epre
ciat
ion
expe
nse
7,26
2,39
3
6,97
8,81
3
8,72
6,09
3
8,17
0,19
5
9,09
1,81
3
9,41
4,52
2
8,94
9,12
5
7,
680,
791
8,
678,
276
7,
797,
489
Tot
al o
pera
ting
exp
ense
s12
9,99
7,16
8
130,
144,
375
13
2,32
3,42
5
138,
500,
902
14
0,98
6,83
9
137,
287,
363
13
4,18
2,99
3
11
7,31
1,21
3
114,
273,
549
13
4,49
6,07
0
Ope
rati
ng l
oss
(89,7
40,7
70)
(8
9,9
96,0
82)
(8
9,8
14,7
31)
(9
4,5
84,9
11)
(9
7,2
67,4
92)
(9
6,9
66,1
67)
(9
0,5
70,7
65)
(7
4,3
65,2
61)
(7
4,6
89,3
33)
(6
1,7
54,6
92)
NO
NO
PER
AT
ING
REV
ENU
ES (
EXPEN
SES)
Stat
e ap
prop
riat
ions
35,3
44,8
60
32
,824
,815
30,7
24,3
64
28
,651
,900
29,7
62,5
00
29
,762
,500
29,7
62,5
00
31,8
10,2
03
25
,019
,900
28,3
23,2
00
Pr
oper
ty t
ax l
evy
37,3
90,2
60
36
,718
,154
37,2
94,8
76
38
,543
,630
40,3
59,5
54
41
,681
,996
42,1
47,1
27
41,7
22,0
75
39
,394
,072
38,1
33,3
88
Pe
ll G
rant
rev
enue
22,5
05,7
31
26
,380
,689
29,3
47,4
19
33
,125
,802
37,2
15,7
46
32
,548
,966
17,6
84,8
93
13,4
28,7
53
11
,772
,511
-
In
vest
men
t re
turn
and
oth
er g
ains
139,
381
177,
187
224,
494
509,
745
195,
154
82,1
55
437,
689
1,
244,
354
1,
018,
574
66
7,87
1
In
tere
st o
n ca
pita
l as
set
- re
late
d de
bt(3
,396
,095
)
(3
,627
,164
)
(3
,664
,322
)
(2
,403
,409
)
(2
,725
,686
)
(2
,936
,962
)
(3
,097
,828
)
(3,2
41,3
75)
(2,8
88,1
77)
(2,5
17,1
77)
Oth
er-
-
-
-
-
-
-
-
(2
2,83
0)
321,
656
Net
non
oper
atin
g re
venu
es
91,9
84,1
37
92
,473
,681
93,9
26,8
31
98
,427
,668
104,
807,
268
10
1,13
8,65
5
86,9
34,3
81
84,9
64,0
10
74
,294
,050
64,9
28,9
38
OT
HER
REV
ENU
ESSt
ate
capi
tal
appr
opri
atio
ns-
9,36
6,05
0
-
-
-
-
1,09
2,73
6
2,
532,
140
1,
592,
206
28
1,19
0
C
apit
al g
ifts
-
50
,000
1,
300,
000
-
-
-
-
1,
089,
597
-
-
Tot
al o
ther
rev
enue
s-
9,41
6,05
0
1,30
0,00
0
-
-
-
1,
092,
736
3,62
1,73
7
1,59
2,20
6
281,
190
Tot
al c
hang
e in
net
pos
itio
n2,2
43,3
67
11,8
93,6
49
5,4
12,1
00
3,8
42,7
57
7,5
39,7
76
4,1
72,4
88
(2,5
43,6
48)
14,2
20,4
86
1,1
96,9
23
3,4
55,4
36
NET
PO
SIT
ION
, beg
innin
g of
yea
r16
0,76
9,99
2
148,
876,
343
14
3,46
4,24
3
137,
988,
429
13
0,44
8,65
3
126,
276,
165
12
8,81
9,81
3
11
4,59
9,32
7
113,
402,
404
10
9,94
6,96
8
Impl
emen
tati
on o
f G
ASB
68
(120
,280
,113
)
-
-
-
-
-
-
-
-
-
NET
PO
SIT
ION
, beg
innin
g of
yea
r (4
)40
,489
,879
148,
876,
343
14
3,46
4,24
3
137,
988,
429
13
0,44
8,65
3
126,
276,
165
12
8,81
9,81
3
11
4,59
9,32
7
113,
402,
404
10
9,94
6,96
8
AD
JUST
ED N
ET P
OSI
TIO
N,
end o
f ye
ar42,7
33,2
46
$
160,7
69,9
92
$
148,8
76,3
43
$
141,8
31,1
86
$
137,9
88,4
29
$
130,4
48,6
53
$
126,2
76,1
65
$
128,8
19,8
13
$
114,5
99,3
27
$
113,4
02,4
04
$
Sour
ce:
Lan
sing
Com
mun
ity
Col
lege
Aud
ited
Fin
anci
al S
tate
men
t s
Ex
clud
ing
Lans
ing
Com
mun
ity
Col
lege
Fou
ndat
ion
(
1) 2
013
amou
nts
rest
ated
to
acco
unt
for
chan
ges
to t
he d
esig
nate
d fu
nd.
(2)
In
2010
, pe
r th
e St
ate
of M
ichi
gan
AC
S Rep
orti
ng M
anua
l, t
he 2
.0 Inf
orm
atio
n Tec
hnol
ogy
cate
gory
was
eli
min
ated
. P
er
reco
mm
enda
tion
fro
m T
he S
tate
of
Mic
higa
n ,
thes
e ex
pens
es w
ere
real
loca
ted
to Ins
truc
tion
, In
stru
ctio
nal
Supp
ort,
Stu
dent
Serv
ices
, In
stit
utio
nal
Adm
inis
trat
ion,
and
Ope
rati
on a
nd M
aint
enan
ce o
f Pl
ant.
The
cor
resp
ondi
ng a
mou
nts
for
2008
and
200
9
wer
e re
clas
sifi
ed t
o co
nfor
m w
ith
the
2010
pre
sent
atio
n.
(
3) R
ecla
ssif
ied
Boar
d au
thor
ized
tra
nsfe
r in
201
0 an
d 20
09.
(
4) R
esta
ted
2013
beg
inni
ng o
f ye
ar n
et p
osit
ion.
LAN
SIN
G C
OM
MU
NIT
Y C
OLL
EGE
FIN
AN
CIA
L TREN
DS
Stat
emen
ts o
f Rev
enue
s, E
xpen
ses,
and
Cha
nges
in
Net
Pos
itio
n
Last
Ten
Fis
cal Ye
ars
(Una
udit
ed)
54
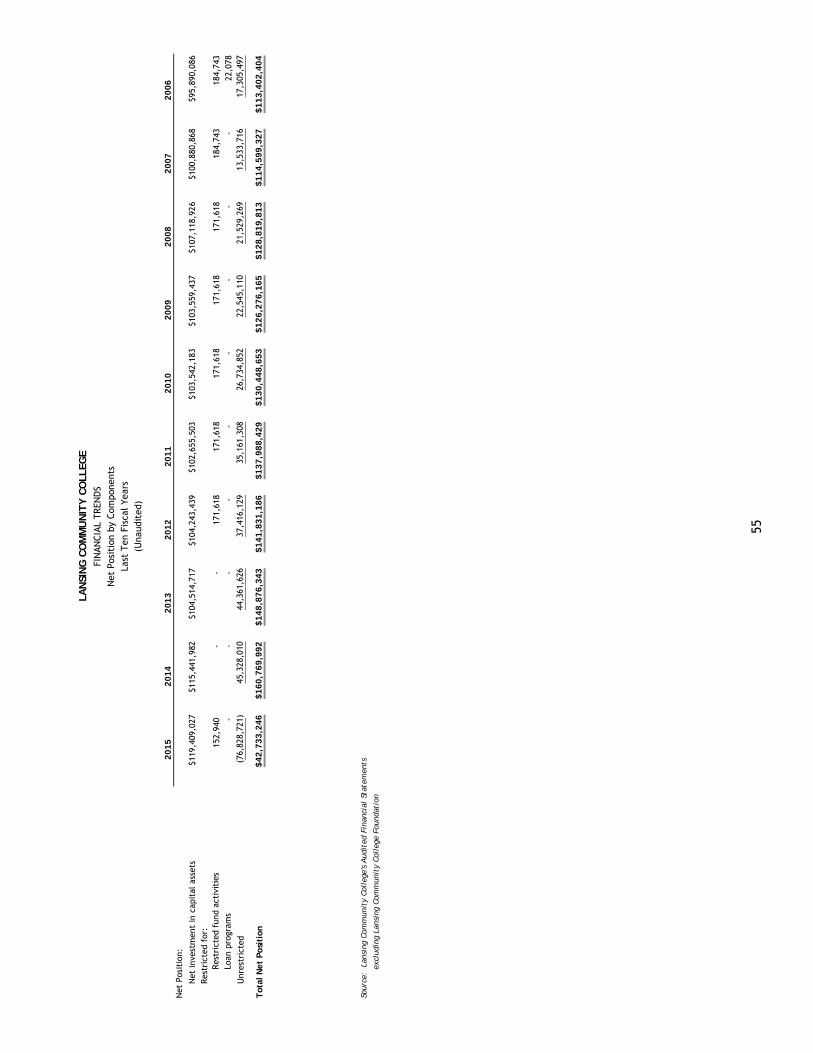
2015
2014
2013
2012
2011
2010
2009
2008
2007
2006
Net
Pos
itio
n:
Net
inve
stm
ent
in c
apit
al a
sset
s$1
19,4
09,0
27$1
15,4
41,9
82$1
04,5
14,7
17$1
04,2
43,4
39$1
02,6
55,5
03$1
03,5
42,1
83$1
03,5
59,4
37$1
07,1
18,9
26$1
00,8
80,8
68$9
5,89
0,08
6Re
stri
cted
for
:Re
stri
cted
fun
d ac
tivi
ties
152,
940
-
-
171,
618
171,
618
171,
618
171,
618
171,
618
184,
743
184,
743
Loan
pro
gram
s-
-
-
-
-
-
-
-
-
22,0
78U
nres
tric
ted
(76,
828,
721)
45,3
28,0
1044
,361
,626
37,4
16,1
2935
,161
,308
26,7
34,8
5222
,545
,110
21,5
29,2
6913
,533
,716
17,3
05,4
97
Tot
al N
et P
osit
ion
$42,7
33,2
46
$160,7
69,9
92
$148,8
76,3
43
$141,8
31,1
86
$137,9
88,4
29
$130,4
48,6
53
$126,2
76,1
65
$128,8
19,8
13
$114,5
99,3
27
$113,4
02,4
04
Sour
ce:
Lan
sing
Com
mun
ity
Col
lege
's A
udit
ed F
inan
cial
Sta
tem
ents
excl
udin
g La
nsin
g Com
mun
ity
Col
lege
Fou
ndat
ion
LAN
SIN
G C
OM
MU
NIT
Y C
OLL
EGE
FIN
AN
CIA
L TREN
DS
Net
Pos
itio
n by
Com
pone
nts
Last
Ten
Fis
cal Ye
ars
(Una
udit
ed)
55
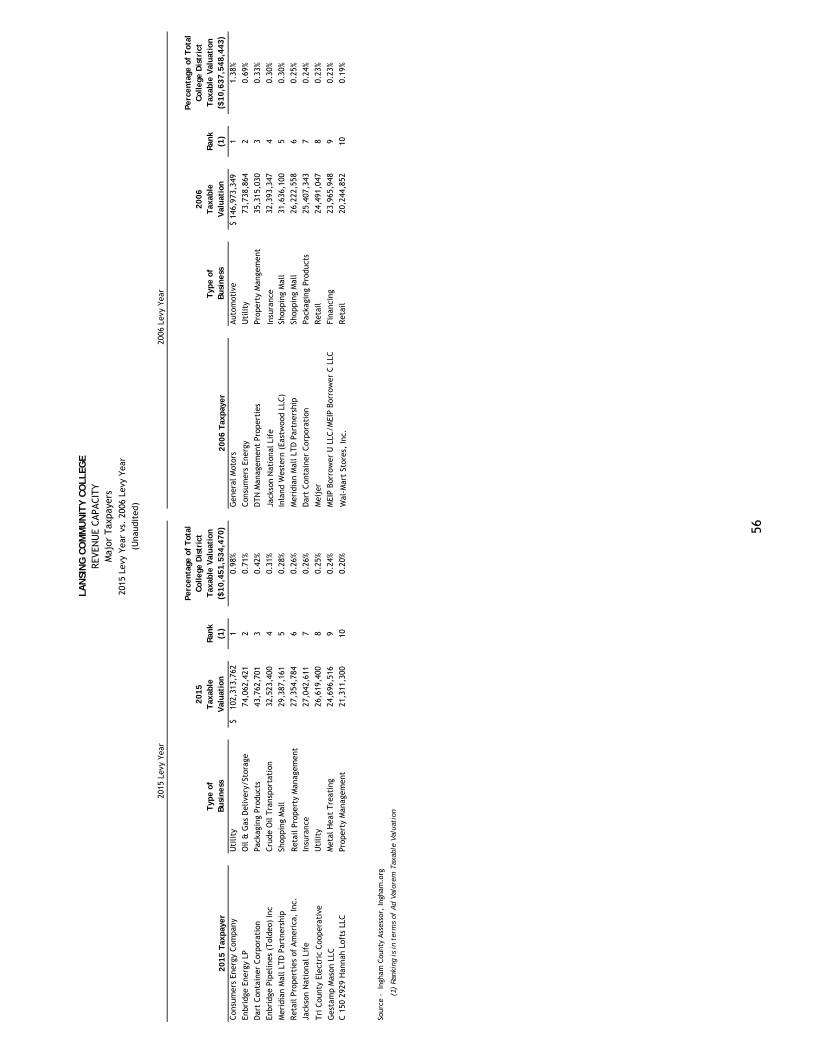
2015 T
axpay
er
Typ
e of
Busi
nes
s
2015
Tax
able
V
aluat
ion
Ran
k (1
)
Per
centa
ge o
f T
otal
C
olle
ge D
istr
ict
Tax
able
Val
uat
ion
($10,4
51,5
34,4
70)
2006 T
axpay
er
Typ
e of
Busi
nes
s
2006
Tax
able
V
aluat
ion
Ran
k (1
)
Per
centa
ge o
f T
otal
C
olle
ge D
istr
ict
Tax
able
Val
uat
ion
($10,6
37,5
48,4
43)
Con
sum
ers
Ener
gy C
ompa
nyU
tility
$ 10
2,31
3,76
2 1
0.98
%G
ener
al M
otor
sAut
omot
ive
$ 1
46,9
73,3
49
11.
38%
Enbr
idge
Ene
rgy
LPO
il &
Gas
Del
iver
y/St
orag
e 74
,062
,421
2
0.71
%C
onsu
mer
s En
ergy
Uti
lity
73
,738
,864
2
0.69
%
Dar
t C
onta
iner
Cor
pora
tion
Pack
agin
g Pr
oduc
ts 43
,762
,701
3
0.42
%D
TN
Man
agem
ent
Prop
erti
esPr
oper
ty M
ange
men
t 35
,315
,030
3
0.33
%
Enbr
idge
Pip
elin
es (
Tol
deo)
Inc
Cru
de O
il T
rans
port
atio
n 32
,523
,400
4
0.31
%Ja
ckso
n N
atio
nal Li
feIn
sura
nce
32
,393
,347
4
0.30
%
Mer
idia
n M
all LT
D P
artn
ersh
ipSh
oppi
ng M
all
29
,387
,161
5
0.28
%In
land
Wes
tern
(Ea
stw
ood
LLC
)Sh
oppi
ng M
all
31
,636
,100
5
0.30
%
Ret
ail Pr
oper
ties
of
Am
eric
a, In
c.Ret
ail Pr
oper
ty M
anag
emen
t 27
,354
,784
6
0.26
%M
erid
ian
Mal
l LT
D P
artn
ersh
ipSh
oppi
ng M
all
26
,222
,558
6
0.25
%
Jack
son
Nat
iona
l Li
feIn
sura
nce
27
,042
,611
7
0.26
%D
art
Con
tain
er C
orpo
rati
onPa
ckag
ing
Prod
ucts
25
,407
,343
7
0.24
%
Tri
Cou
nty
Elec
tric
Coo
pera
tive
Uti
lity
26
,619
,400
8
0.25
%M
eije
rRet
ail
24
,491
,047
8
0.23
%
Ges
tam
p M
ason
LLC
Met
al H
eat
Tre
atin
g 24
,696
,516
9
0.24
%M
EIP
Borr
ower
U L
LC/M
EIP
Borr
ower
C L
LCFi
nanc
ing
23
,965
,948
9
0.23
%
C 1
50 2
929
Han
nah
Loft
s LL
CPr
oper
ty M
anag
emen
t 21
,311
,300
10
0.20
%W
al-M
art
Stor
es,
Inc.
Ret
ail
20
,244
,852
10
0.19
%
Sour
ce -
In
gham
Cou
nty
Ass
esso
r, Ing
ham
.org
(
1) R
anki
ng i
s in
ter
ms
of A
d Val
orem
Tax
able
Val
uati
on
REV
ENU
E CAPA
CIT
YLA
NSI
NG
CO
MM
UN
ITY
CO
LLEG
E
2015
Lev
y Ye
ar20
06 L
evy
Year
(Una
udit
ed)
2015
Lev
y Ye
ar v
s. 2
006
Levy
Yea
r
Maj
or T
axpa
yers
56

Levy
Yea
r
Tax
able
Val
uat
ion
(1)
Tax
Rat
es
(per
$1,0
00)
of V
aluat
ion
(1)
Tax
esEx
tended
Col
lect
ions
thro
ugh
June
30
Each
Yea
r*
Per
cent
of T
axes
Ex
tended
U
nco
llec
ted
thro
ugh
June
30
Each
Yea
r
2015
10,4
51,5
34,4
70$
3.80
7239
,791
,082
$
--
--
--
--20
1410
,131
,872
,904
3.80
7238
,574
,067
37
,264
,108
$
3.40
%20
139,
989,
851,
902
3.80
7238
,033
,364
36
,654
,758
3.62
%20
1210
,068
,843
,104
3.80
7238
,334
,099
37
,252
,732
2.82
%20
1110
,477
,691
,694
3.80
7239
,890
,668
38
,652
,739
3.10
%
2010
10,8
63,2
91,5
27
3.80
7241
,358
,724
40
,038
,978
3.61
%
2009
11,4
34,7
29,0
14
3.80
7243
,534
,300
41
,441
,780
4.81
%
2008
11,3
94,3
16,0
77
3.80
7243
,380
,440
41
,594
,429
4.12
%
2007
11,1
73,4
28,0
53
3.80
7242
,539
,475
41
,185
,737
3.18
%
2006
10,6
37,5
48,4
43
3.80
7240
,499
,274
39
,394
,072
2.73
%
(1)
2015
Mill
age
Rep
ort
to C
ount
y Bo
ard
of C
omm
issi
oner
s
(*)
Per
LCC C
ontr
olle
r O
ffic
e
----
Info
rmat
ion
is u
nava
ilab
le
LAN
SIN
G C
OM
MU
NIT
Y C
OLL
EGE
REV
ENU
E CAPA
CIT
YAss
esse
d Val
ue a
nd T
axab
le V
alue
of
Prop
erty
Last
Ten
Fis
cal Ye
ars
(Una
udit
ed)
57
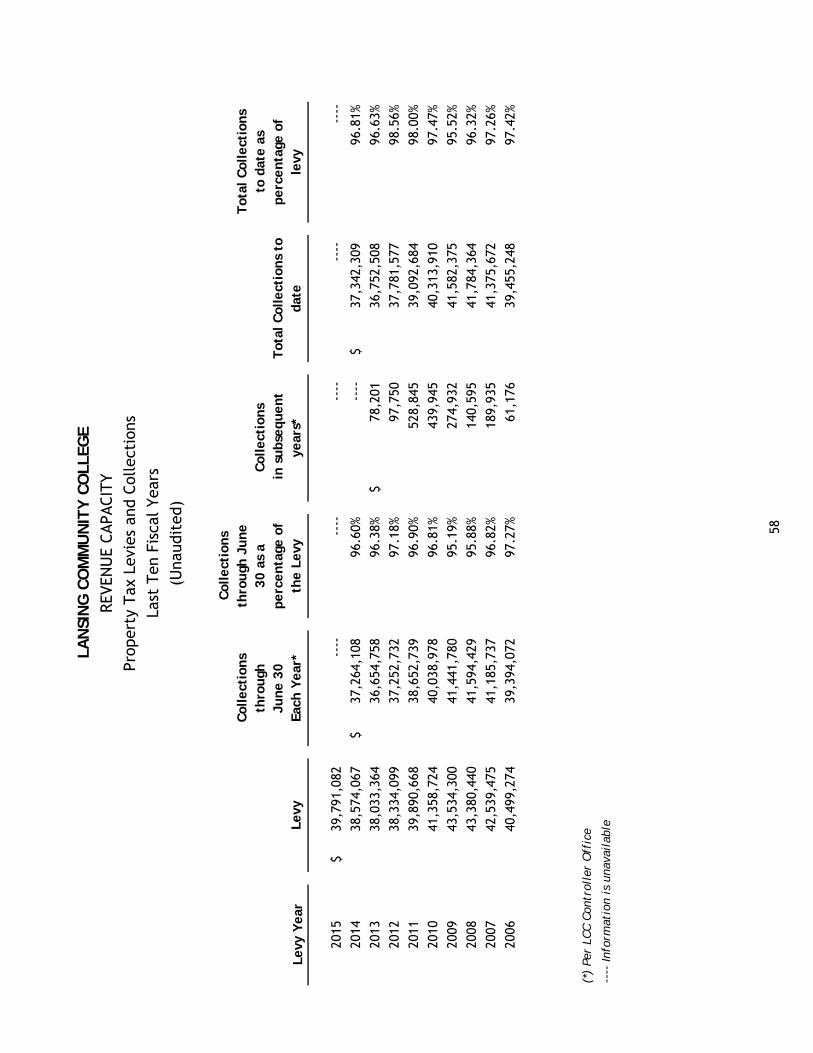
Levy
Yea
rLe
vy
Col
lect
ions
thro
ugh
June
30
Each
Yea
r*
Col
lect
ions
thro
ugh
June
30 a
s a
per
centa
ge o
f th
e Le
vy
Col
lect
ions
in s
ubse
quen
t ye
ars*
Tot
al C
olle
ctio
ns
to
dat
e
Tot
al C
olle
ctio
ns
to d
ate
as
per
centa
ge o
f
levy
2015
39,7
91,0
82$
-
---
-
---
-
---
-
---
-
---
2014
38,5
74,0
67
37,2
64,1
08$
96
.60%
----
37,3
42,3
09$
96.8
1%
2013
38,0
33,3
64
36,6
54,7
58
96
.38%
78,2
01$
36,7
52,5
08
96.6
3%
2012
38,3
34,0
99
37,2
52,7
32
97
.18%
97,7
50
37,7
81,5
77
98.5
6%
2011
39,8
90,6
68
38,6
52,7
39
96
.90%
528,
845
39,0
92,6
84
98.0
0%
2010
41,3
58,7
24
40,0
38,9
78
96
.81%
439,
945
40,3
13,9
10
97.4
7%
2009
43,5
34,3
00
41,4
41,7
80
95
.19%
274,
932
41,5
82,3
75
95.5
2%
2008
43,3
80,4
40
41,5
94,4
29
95
.88%
140,
595
41,7
84,3
64
96.3
2%
2007
42,5
39,4
75
41,1
85,7
37
96
.82%
189,
935
41,3
75,6
72
97.2
6%
2006
40,4
99,2
74
39,3
94,0
72
97
.27%
61,1
76
39,4
55,2
48
97.4
2%
(*)
Per
LCC C
ontr
olle
r O
ffic
e
----
Info
rmat
ion
is u
nava
ilab
le
LAN
SIN
G C
OM
MU
NIT
Y C
OLL
EGE
REV
ENU
E CAPA
CIT
Y
Prop
erty
Tax
Lev
ies
and
Col
lect
ions
Last
Ten
Fis
cal Ye
ars
(Una
udit
ed)
58

Fis
cal
Year
Tax
able
Val
uat
ion
Stat
e E
qual
ized
Val
uat
ion (
SEV
)D
ebt
Lim
it (
a)
Genera
l O
bliga
tion
Bon
ds
Not
e Pay
able
*
Tot
al
Outs
tandin
g D
ebt*
* (
b)
Tot
al A
ddit
ional
D
ebt
Allow
able
for
All T
ax D
ebt
(c)
Tot
al A
ddit
ional
D
ebt
Allow
able
for
Lim
ited T
ax D
ebt
(d)
Addit
ional
Lim
ited
Tax
Debt
Cou
ld
Lega
lly
Incu
rred
(e
)Per
Cap
ita
(f)
2015
$10,
451,
534,
470
$11,
493,
211,
119
$1,7
23,9
81,6
68$8
0,50
8,79
0$0
$80,
508,
790
$1,6
43,4
72,8
78$1
16,1
82,1
11$3
5,67
3,32
1 -
---
2014
10,1
31,8
72,9
0410
,869
,735
,968
1,63
0,46
0,39
586
,310
,907
99
,848
86,4
10,7
551,
544,
049,
640
109,
947,
360
23,5
36,6
0522
020
139,
989,
851,
902
10,5
97,8
03,0
801,
589,
670,
462
91,4
88,7
1039
2,06
191
,880
,771
1,49
7,78
9,69
110
7,22
8,03
115
,347
,260
235
2012
10,0
68,8
43,1
0410
,673
,406
,039
1,60
1,01
0,90
651
,428
,711
673,
970
52,1
02,6
811,
548,
908,
225
107,
984,
060
55,8
81,3
7913
420
1110
,477
,691
,694
11,3
67,9
15,8
081,
705,
187,
371
56,4
58,4
0694
5,79
057
,404
,196
1,64
7,78
3,17
511
4,92
9,15
857
,524
,962
147
2010
10,8
63,2
91,5
2711
,731
,383
,600
1,75
9,70
7,54
061
,298
,381
1,20
7,88
262
,506
,263
1,69
7,20
1,27
711
8,56
3,83
656
,057
,573
161
2009
11,4
35,2
97,4
0012
,863
,353
,645
1,92
9,50
3,04
765
,908
,356
1,46
0,75
467
,369
,110
1,86
2,13
3,93
712
9,88
3,53
662
,514
,426
176
2008
11,4
00,4
78,7
1913
,505
,218
,382
2,02
5,78
2,75
770
,318
,331
1,70
4,26
272
,022
,593
1,95
3,76
0,16
413
6,30
2,18
464
,279
,591
185
2007
11,1
08,5
92,2
1813
,607
,027
,906
2,04
1,05
4,18
674
,495
,662
1,93
9,20
976
,434
,871
1,96
4,61
9,31
513
7,32
0,27
960
,885
,408
197
2006
10,5
76,8
15,4
5713
,088
,039
,702
1,96
3,20
5,95
559
,159
,562
2,16
5,74
861
,325
,310
1,90
1,88
0,64
513
2,13
0,39
770
,805
,087
159
*Not
e Pa
yabl
e to
the
ban
k be
gan
Oct
ober
24,
200
4, w
hich
is
secu
red
by e
quip
men
t, w
ith
mon
thly
pay
men
ts a
t an
int
eres
t ra
te a
t 6.
5%,
mat
urin
g O
ctob
er 2
014.
**A
djus
ted
2006
-201
3 ou
tsta
ndin
g de
bt f
igur
es b
ased
on
com
men
ts f
rom
GFO
A o
n FY
2012
CA
FR s
ubm
issi
on.
Sour
ce:
Col
lege
Aud
ited
Fin
anci
al S
tate
men
ts a
nd S
taud
er,
Barc
h &
Ass
ocia
tes
Mun
icip
al D
iscl
osur
e A
nnua
l Fi
ling
(a)
15% o
f SE
V(b
) Col
lege
Aud
ited
Fin
anci
al S
tate
men
ts e
xclu
ding
Lan
sing
Com
mun
ity
Col
lege
Fou
ndat
ion
(c)
Deb
t Li
mit
les
s To
tal
Out
stan
ding
Deb
t(d
) Th
e Col
lege
may
inc
ur i
ndeb
tedn
ess
that
is
not
grea
ter
than
1.5
% o
f th
e fi
rst
$25,
000,
000
of S
EVof
the
tax
able
pro
pert
y w
ithi
n th
e co
lleg
e di
stri
ct a
nd 1
% o
f th
e ex
cess
SEV
ove
r $2
50,0
00,0
00 w
itho
ut a
vot
e of
the
ele
ctor
s of
the
Col
lege
(e)
Tot
al A
ddit
iona
l D
ebt
All
owab
le f
or L
imit
ed T
ax D
ebt
less
Tot
al O
utst
andi
ng D
ebt
(f)
Tot
al O
utst
andi
ng D
ebt
divi
ded
by p
opul
atio
n--
-- Inf
orm
atio
n is
una
vail
able
LAN
SIN
G C
OM
MU
NIT
Y C
OLL
EGE
DEB
T CAPA
CIT
YLe
gal D
ebt
Mar
gin
Last
Ten
Fis
cal Ye
ars
(Una
udit
ed)
59
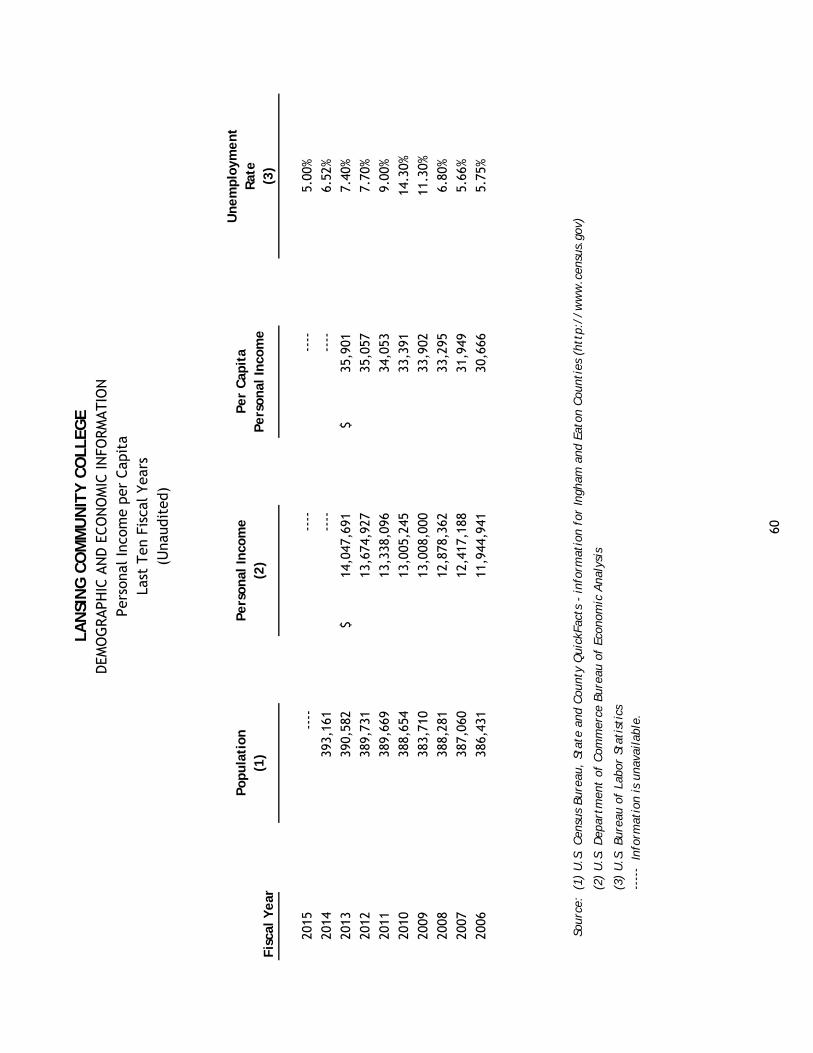
Fis
cal Y
ear
Pop
ula
tion
(1)
Per
sonal
Inco
me
(2)
Per
Cap
ita
Per
sonal
Inco
me
Unem
plo
ymen
tR
ate
(3)
2015
----
----
----
5.00
%
2014
393,
161
----
----
6.52
%
2013
390,
582
14,0
47,6
91$
35
,901
$
7.40
%
2012
389,
731
13,6
74,9
27
35
,057
7.
70%
2011
389,
669
13,3
38,0
96
34
,053
9.
00%
2010
388,
654
13,0
05,2
45
33
,391
14
.30%
2009
383,
710
13,0
08,0
00
33
,902
11
.30%
2008
388,
281
12,8
78,3
62
33
,295
6.
80%
2007
387,
060
12,4
17,1
88
31
,949
5.
66%
2006
386,
431
11,9
44,9
41
30
,666
5.
75%
Sour
ce:
(1)
U.S
. Cen
sus
Bure
au,
Stat
e an
d Cou
nty
Qui
ckFa
cts
- in
form
atio
n fo
r In
gham
and
Eat
on C
ount
ies
(htt
p://
ww
w.c
ensu
s.go
v)
(2)
U.S
. D
epar
tmen
t of
Com
mer
ce B
urea
u of
Eco
nom
ic A
naly
sis
(3)
U.S
. Bu
reau
of
Labo
r St
atis
tics
----
- I
nfor
mat
ion
is u
nava
ilab
le.
LAN
SIN
G C
OM
MU
NIT
Y C
OLL
EGE
DEM
OG
RAPH
IC A
ND
ECO
NO
MIC
INFO
RM
ATIO
NPe
rson
al In
com
e pe
r Cap
ita
(Una
udit
ed)
Last
Ten
Fis
cal Ye
ars
60
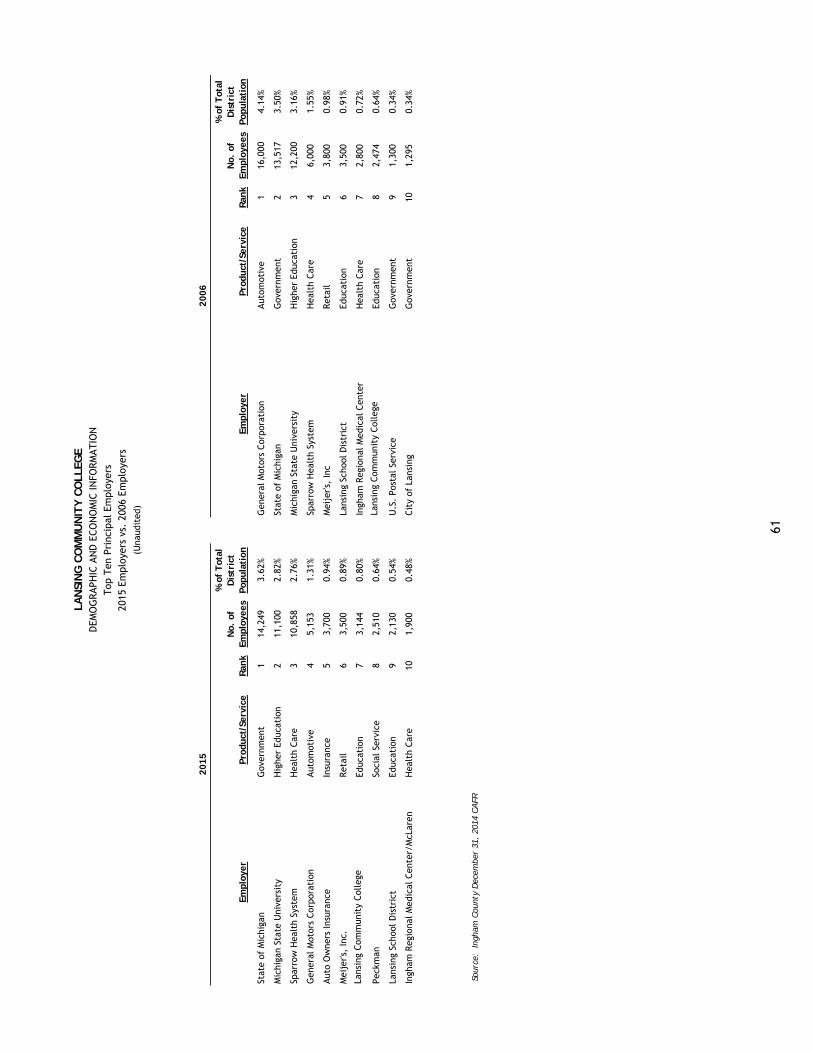
Emplo
yer
Pro
duct
/Ser
vice
Ran
kN
o. o
f Em
plo
yees
% o
f T
otal
D
istr
ict
Pop
ula
tion
Emplo
yer
Pro
duct
/Ser
vice
Ran
kN
o. o
f Em
plo
yees
% o
f T
otal
D
istr
ict
Pop
ula
tion
Stat
e of
Mic
higa
nG
over
nmen
t1
14,2
493.
62%
Gen
eral
Mot
ors
Cor
pora
tion
Aut
omot
ive
116
,000
4.14
%
Mic
higa
n St
ate
Uni
vers
ity
Hig
her
Educ
atio
n2
11,1
002.
82%
Stat
e of
Mic
higa
nG
over
nmen
t2
13,5
173.
50%
Spar
row
Hea
lth
Syst
em
Hea
lth
Car
e3
10,8
582.
76%
Mic
higa
n St
ate
Uni
vers
ity
Hig
her
Educ
atio
n3
12,2
003.
16%
Gen
eral
Mot
ors
Cor
pora
tion
Aut
omot
ive
45,
153
1.31
%Sp
arro
w H
ealt
h Sy
stem
H
ealt
h Car
e4
6,00
01.
55%
Aut
o O
wne
rs In
sura
nce
Insu
ranc
e5
3,70
00.
94%
Mei
jer's
, In
cRet
ail
53,
800
0.98
%
Mei
jer's
, In
c.Ret
ail
63,
500
0.89
%La
nsin
g Sc
hool
Dis
tric
tEd
ucat
ion
63,
500
0.91
%
Lans
ing
Com
mun
ity
Col
lege
Educ
atio
n7
3,14
40.
80%
Ingh
am R
egio
nal M
edic
al C
ente
rH
ealt
h Car
e7
2,80
00.
72%
Peck
man
Soci
al S
ervi
ce8
2,51
00.
64%
Lans
ing
Com
mun
ity
Col
lege
Educ
atio
n8
2,47
40.
64%
Lans
ing
Scho
ol D
istr
ict
Educ
atio
n9
2,13
00.
54%
U.S
. Po
stal
Ser
vice
Gov
ernm
ent
91,
300
0.34
%
Ingh
am R
egio
nal M
edic
al C
ente
r/M
cLar
enH
ealt
h Car
e10
1,90
00.
48%
Cit
y of
Lan
sing
Gov
ernm
ent
101,
295
0.34
%
Sou
rce:
In
gham
Cou
nty
Dec
embe
r 31
, 20
14 C
AFR
LAN
SIN
G C
OM
MU
NIT
Y C
OLL
EGE
DEM
OG
RAPH
IC A
ND
ECO
NO
MIC
INFO
RM
ATIO
N
2015
Em
ploy
ers
vs.
2006
Em
ploy
ers
(Una
udit
ed)
2015
2006
Top
Ten
Pri
ncip
al E
mpl
oyer
s
61
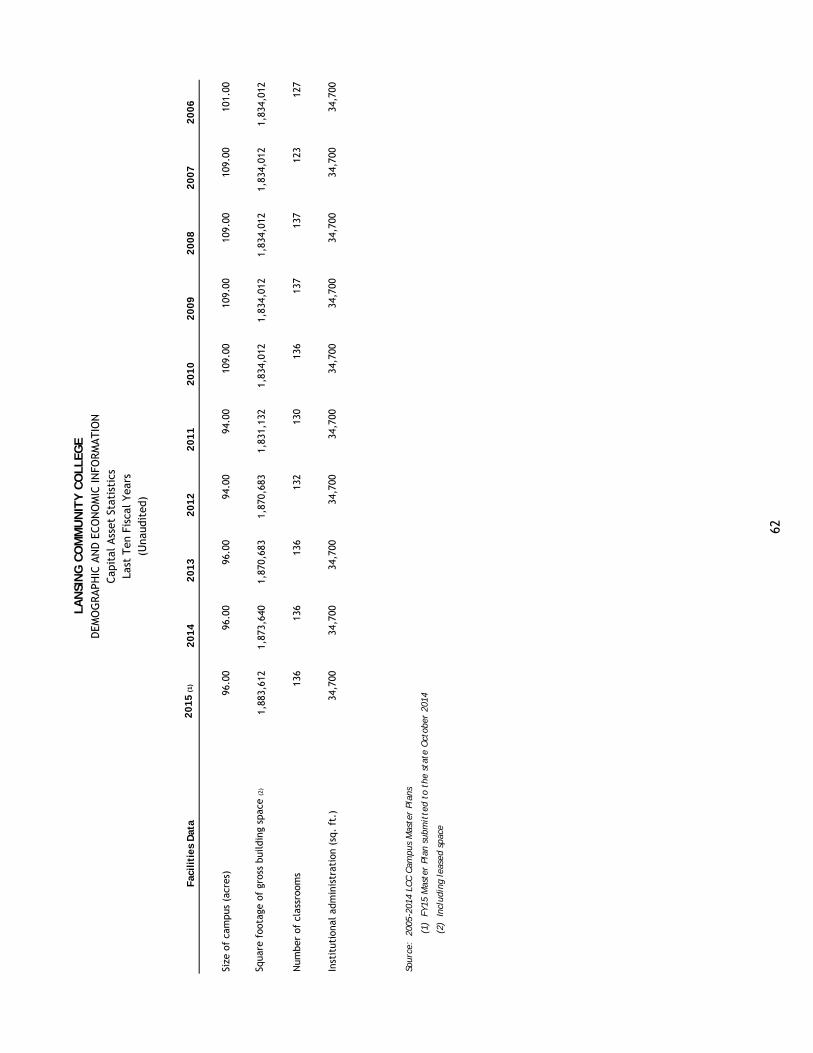
Fac
ilit
ies
Dat
a2015
(1)
2014
2013
2012
2011
2010
2009
2008
2007
2006
Size
of
cam
pus
(acr
es)
96.0
096
.00
96.0
094
.00
94.0
010
9.00
109.
0010
9.00
109.
0010
1.00
Squa
re f
oota
ge o
f gr
oss
build
ing
spac
e (2
)1,
883,
612
1,87
3,64
01,
870,
683
1,87
0,68
31,
831,
132
1,83
4,01
21,
834,
012
1,83
4,01
21,
834,
012
1,83
4,01
2
Num
ber
of c
lass
room
s13
613
613
613
213
013
613
713
712
312
7
Inst
itut
iona
l ad
min
istr
atio
n (s
q. f
t.)
34,7
0034
,700
34,7
0034
,700
34,7
0034
,700
34,7
0034
,700
34,7
0034
,700
Sour
ce:
200
5-20
14 L
CC C
ampu
s M
aste
r Pl
ans
(1
) F
Y15
Mas
ter
Plan
sub
mit
ted
to t
he s
tate
Oct
ober
201
4
(2
) In
clud
ing
leas
ed s
pace
LAN
SIN
G C
OM
MU
NIT
Y C
OLL
EGE
DEM
OG
RAPH
IC A
ND
ECO
NO
MIC
INFO
RM
ATIO
NCap
ital
Ass
et S
tati
stic
s
(Una
udit
ed)
Last
Ten
Fis
cal Ye
ars
62
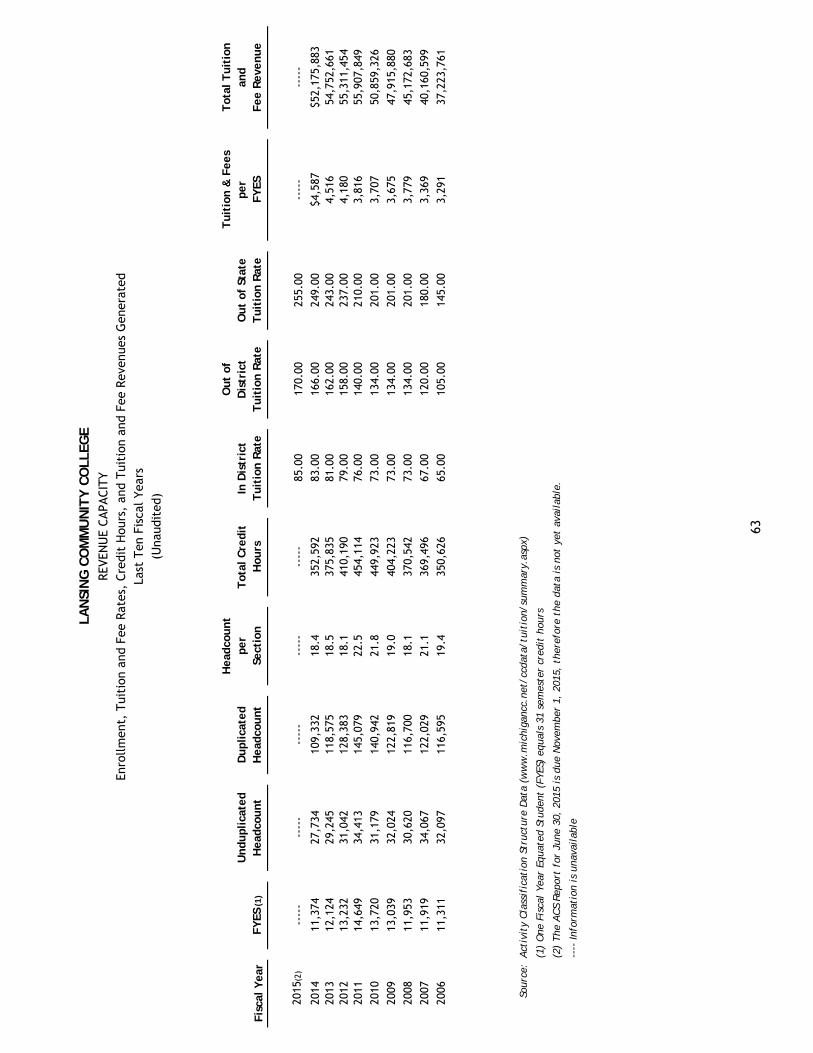
Fis
cal Y
ear
FY
ES (
1)
Unduplica
ted
Hea
dco
unt
Duplica
ted
Hea
dco
unt
Hea
dco
unt
per
Sect
ion
Tot
al C
redit
H
ours
In D
istr
ict
Tuit
ion R
ate
Out
of
Dis
tric
t T
uit
ion R
ate
Out
of S
tate
T
uit
ion R
ate
Tuit
ion &
Fee
sper
FY
ES
Tot
al T
uit
ion
and
Fee
Rev
enue
2
015 (
2)--
---
----
---
---
----
---
---
85.0
017
0.00
255.
00--
---
----
-
2014
11,3
7427
,734
109,
332
18.4
352,
592
83.0
016
6.00
249.
00$4
,587
$52,
175,
883
2013
12,1
2429
,245
118,
575
18.5
375,
835
81.0
016
2.00
243.
004,
516
54,7
52,6
6120
1213
,232
31,0
4212
8,38
318
.141
0,19
079
.00
158.
0023
7.00
4,18
055
,311
,454
2011
14,6
4934
,413
145,
079
22.5
454,
114
76.0
014
0.00
210.
003,
816
55,9
07,8
49
2010
13,7
2031
,179
140,
942
21.8
449,
923
73.0
013
4.00
201.
003,
707
50,8
59,3
26
2009
13,0
3932
,024
122,
819
19.0
404,
223
73.0
013
4.00
201.
003,
675
47,9
15,8
80
2008
11,9
5330
,620
116,
700
18.1
370,
542
73.0
013
4.00
201.
003,
779
45,1
72,6
83
2007
11,9
1934
,067
122,
029
21.1
369,
496
67.0
012
0.00
180.
003,
369
40,1
60,5
99
2006
11,3
1132
,097
116,
595
19.4
350,
626
65.0
010
5.00
145.
003,
291
37,2
23,7
61
Sour
ce:
Act
ivit
y Cla
ssif
icat
ion
Stru
ctur
e D
ata
(ww
w.m
ichi
ganc
c.ne
t/cc
data
/tui
tion
/sum
mar
y.as
px)
(1)
One
Fis
cal
Year
Equ
ated
Stu
dent
(FY
ES)
equa
ls 3
1 se
mes
ter
cred
it h
ours
(2)
The
ACS
Rep
ort
for
June
30,
201
5 is
due
Nov
embe
r 1,
201
5, t
here
fore
the
dat
a is
not
yet
ava
ilab
le.
----
Info
rmat
ion
is u
nava
ilab
le
LAN
SIN
G C
OM
MU
NIT
Y C
OLL
EGE
REV
ENU
E CAPA
CIT
YEn
rollm
ent,
Tui
tion
and
Fee
Rat
es,
Cre
dit
Hou
rs,
and
Tui
tion
and
Fee
Rev
enue
s G
ener
ated
Last
Ten
Fis
cal Ye
ars
(Una
udit
ed)
63
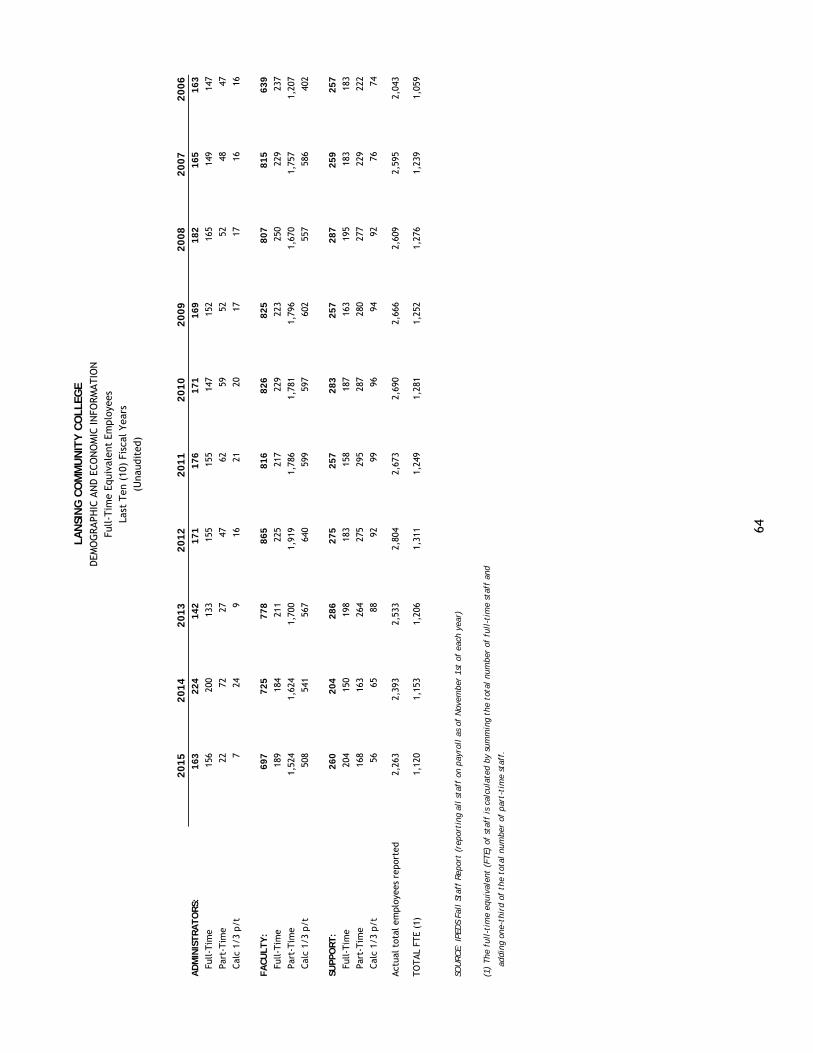
2015
2014
2013
2012
2011
2010
2009
2008
2007
2006
AD
MIN
IST
RA
TO
RS:
163
224
142
171
176
171
169
182
165
163
Full-T
ime
156
200
133
155
155
147
152
165
149
147
Part
-Tim
e22
7227
4762
5952
5248
47
Cal
c 1/
3 p/
t7
249
1621
2017
1716
16
FA
CU
LTY
:697
725
778
865
816
826
825
807
815
639
Full-T
ime
189
184
211
225
217
229
223
250
229
237
Part
-Tim
e1,
524
1,62
41,
700
1,91
91,
786
1,78
11,
796
1,67
01,
757
1,20
7
Cal
c 1/
3 p/
t50
854
156
764
059
959
760
255
758
640
2
SUPPO
RT
:260
204
286
275
257
283
257
287
259
257
Full-T
ime
204
150
198
183
158
187
163
195
183
183
Part
-Tim
e16
816
326
427
529
528
728
027
722
922
2
Cal
c 1/
3 p/
t56
6588
9299
9694
9276
74
Act
ual to
tal em
ploy
ees
repo
rted
2,26
32,
393
2,53
32,
804
2,67
32,
690
2,66
62,
609
2,59
52,
043
TO
TAL
FTE
(1)
1,12
01,
153
1,20
61,
311
1,24
91,
281
1,25
21,
276
1,23
91,
059
SOU
RC
E: IPE
DS
Fall
Sta
ff R
epor
t (r
epor
ting
all
sta
ff o
n pa
yrol
l as
of
Nov
embe
r 1s
t of
eac
h ye
ar)
(1)
The
ful
l-ti
me
equi
vale
nt (
FTE)
of
staf
f is
cal
cula
ted
by s
umm
ing
the
tota
l nu
mbe
r of
ful
l-ti
me
staf
f an
d
addi
ng o
ne-t
hird
of
the
tota
l nu
mbe
r of
par
t-ti
me
staf
f.
Last
Ten
(10
) Fi
scal
Yea
rs
LAN
SIN
G C
OM
MU
NIT
Y C
OLL
EGE
DEM
OG
RAPH
IC A
ND
ECO
NO
MIC
INFO
RMATI
ON
(Una
udit
ed)
Full-T
ime
Equi
vale
nt E
mpl
oyee
s
64

This page intentionally left blank.

Special Reports Section

This page intentionally left blank.
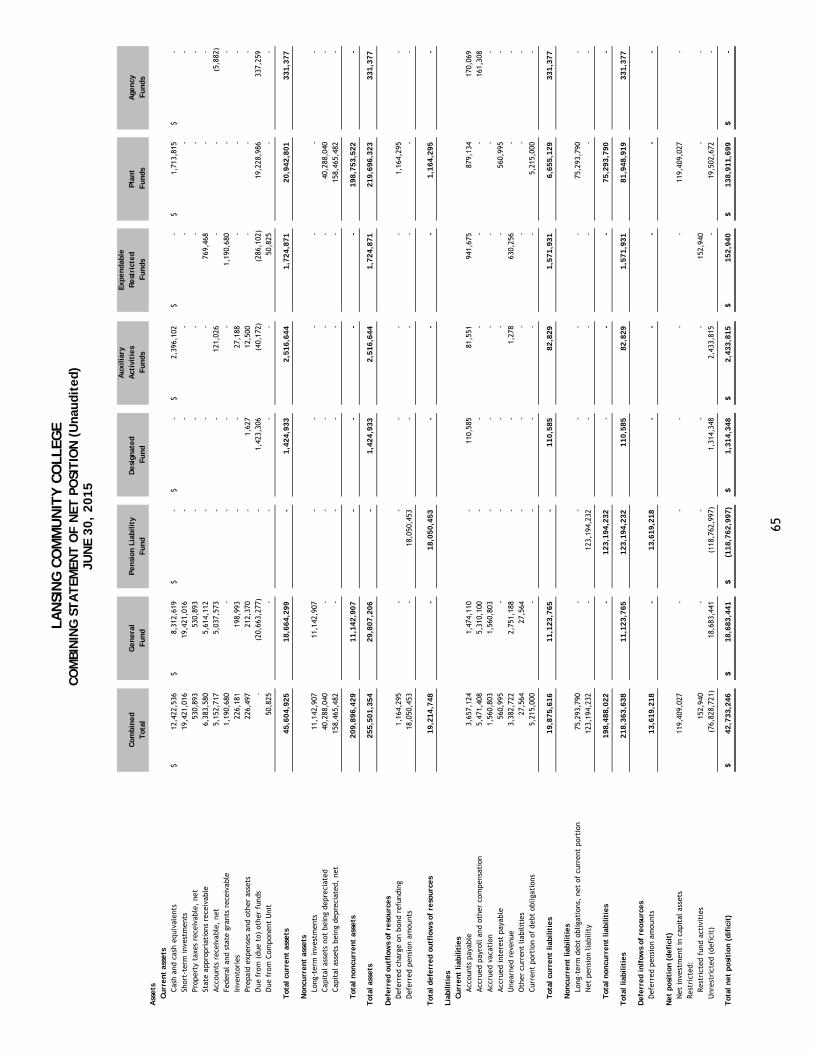
LAN
SIN
G C
OM
MU
NIT
Y C
OLL
EGE
CO
MBIN
ING
ST
AT
EMEN
T O
F N
ET P
OSI
TIO
N (
Unau
dit
ed)
JUN
E 30,
2015
Auxi
liar
yEx
pen
dab
leC
ombin
edG
ener
alPen
sion
Lia
bilit
yD
esig
nat
ed
Act
ivit
ies
Res
tric
ted
Pla
nt
Age
ncy
Tot
alFund
Fund
Fund
Funds
Funds
Funds
Funds
Ass
ets
Curr
ent
asse
tsCas
h an
d ca
sh e
quiv
alen
ts12
,422
,536
$
8,31
2,61
9$
-$
-
$
2,39
6,10
2$
-$
1,
713,
815
$
-
$
Shor
t-te
rm inv
estm
ents
19,4
21,0
16
19
,421
,016
-
-
-
-
-
-
Prop
erty
tax
es r
ecei
vabl
e, n
et53
0,89
3
530,
893
-
-
-
-
-
-
St
ate
appr
opri
atio
ns r
ecei
vabl
e6,
383,
580
5,
614,
112
-
-
-
769,
468
-
-
Acc
ount
s re
ceiv
able
, ne
t5,
152,
717
5,
037,
573
-
-
12
1,02
6
-
-
(5,8
82)
Fede
ral an
d st
ate
gran
ts r
ecei
vabl
e1,
190,
680
-
-
-
-
1,
190,
680
-
-
In
vent
orie
s22
6,18
1
198,
993
-
-
27
,188
-
-
-
Pr
epai
d ex
pens
es a
nd o
ther
ass
ets
226,
497
21
2,37
0
-
1,
627
12
,500
-
-
-
D
ue f
rom
(du
e to
) ot
her
fund
s-
(20,
663,
277)
-
1,
423,
306
(4
0,17
2)
(286
,102
)
19
,228
,986
337,
259
D
ue f
rom
Com
pone
nt U
nit
50,8
25
-
-
-
-
50
,825
-
-
Tot
al c
urr
ent
asse
ts45,6
04,9
25
18,6
64,2
99
-
1,4
24,9
33
2,5
16,6
44
1,7
24,8
71
20,9
42,8
01
331,3
77
Non
curr
ent
asse
tsLo
ng-t
erm
inv
estm
ents
11,1
42,9
07
11
,142
,907
-
-
-
-
-
-
Cap
ital
ass
ets
not
bein
g de
prec
iate
d40
,288
,040
-
-
-
-
-
40
,288
,040
-
Cap
ital
ass
ets
bein
g de
prec
iate
d, n
et15
8,46
5,48
2
-
-
-
-
-
158,
465,
482
-
Tot
al n
oncu
rren
t as
sets
209,8
96,4
29
11,1
42,9
07
-
-
-
-
198,7
53,5
22
-
Tot
al a
sset
s255,5
01,3
54
29,8
07,2
06
-
1,4
24,9
33
2,5
16,6
44
1,7
24,8
71
219,6
96,3
23
331,3
77
Def
erre
d o
utf
low
s of
res
ourc
esD
efer
red
char
ge o
n bo
nd r
efun
ding
1,16
4,29
5
-
-
-
-
-
1,
164,
295
-
Def
erre
d pe
nsio
n am
ount
s18
,050
,453
-
18
,050
,453
-
-
-
-
-
Tot
al d
efer
red o
utf
low
s of
res
ourc
es19,2
14,7
48
-
18,0
50,4
53
-
-
-
1,1
64,2
95
-
Liab
ilit
ies
Curr
ent
liab
ilit
ies
Acc
ount
s pa
yabl
e3,
657,
124
1,
474,
110
-
110,
585
81
,551
941,
675
87
9,13
4
170,
069
Acc
rued
pay
roll a
nd o
ther
com
pens
atio
n5,
471,
408
5,
310,
100
-
-
-
-
-
161,
308
Acc
rued
vac
atio
n1,
560,
803
1,
560,
803
-
-
-
-
-
-
Acc
rued
int
eres
t pa
yabl
e56
0,99
5
-
-
-
-
-
56
0,99
5
-
U
near
ned
reve
nue
3,38
2,72
2
2,75
1,18
8
-
-
1,27
8
630,
256
-
-
O
ther
cur
rent
lia
biliti
es27
,564
27,5
64
-
-
-
-
-
-
Cur
rent
por
tion
of
debt
obl
igat
ions
5,21
5,00
0
-
-
-
-
-
5,
215,
000
-
Tot
al c
urr
ent
liab
ilit
ies
19,8
75,6
16
11,1
23,7
65
-
110,5
85
82,8
29
1,5
71,9
31
6,6
55,1
29
331,3
77
Non
curr
ent
liab
ilit
ies
Long
-ter
m d
ebt
oblig
atio
ns,
net
of c
urre
nt p
orti
on75
,293
,790
-
-
-
-
-
75
,293
,790
-
N
et p
ensi
on lia
bilit
y12
3,19
4,23
2
-
123,
194,
232
-
-
-
-
-
Tot
al n
oncu
rren
t liab
ilit
ies
198,4
88,0
22
-
123,1
94,2
32
-
-
-
75,2
93,7
90
-
Tot
al lia
bilit
ies
218,3
63,6
38
11,1
23,7
65
123,1
94,2
32
110,5
85
82,8
29
1,5
71,9
31
81,9
48,9
19
331,3
77
Def
erre
d inlf
ows
of r
eosu
rces
Def
erre
d pe
nsio
n am
ount
s13,6
19,2
18
-
13,6
19,2
18
-
-
-
-
-
Net
pos
itio
n (
def
icit
)N
et inv
estm
ent
in c
apit
al a
sset
s11
9,40
9,02
7
-
-
-
-
-
119,
409,
027
-
Res
tric
ted:
Res
tric
ted
fund
act
ivit
ies
152,
940
-
-
-
-
15
2,94
0
-
-
Unr
estr
icte
d (d
efic
it)
(76,
828,
721)
18,6
83,4
41
(1
18,7
62,9
97)
1,
314,
348
2,
433,
815
-
19,5
02,6
72
-
Tot
al n
et p
osit
ion (
dif
icit
)42,7
33,2
46
$
18,6
83,4
41
$
(118,7
62,9
97)
$
1,3
14,3
48
$
2,4
33,8
15
$
152,9
40
$
138,9
11,6
99
$
-
$
65
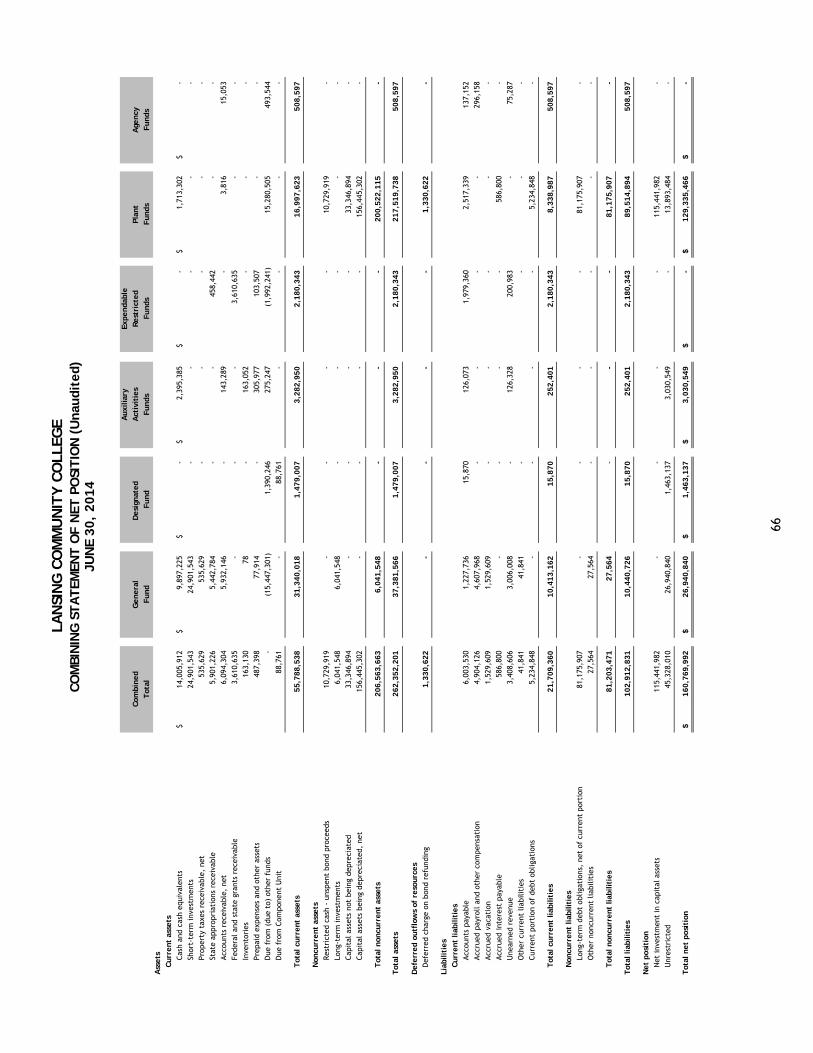
LAN
SIN
G C
OM
MU
NIT
Y C
OLL
EGE
CO
MBIN
ING
ST
AT
EMEN
T O
F N
ET P
OSI
TIO
N (
Unau
dit
ed)
JUN
E 30,
2014
Auxi
liar
yEx
pen
dab
leC
ombin
edG
ener
alD
esig
nat
ed
Act
ivit
ies
Res
tric
ted
Pla
nt
Age
ncy
Tot
alFund
Fund
Funds
Funds
Funds
Funds
Ass
ets
Curr
ent
asse
tsCas
h an
d ca
sh e
quiv
alen
ts14
,005
,912
$
9,
897,
225
$
-$
2,39
5,38
5$
-$
1,71
3,30
2$
-$
Shor
t-te
rm inv
estm
ents
24,9
01,5
43
24
,901
,543
-
-
-
-
-
Prop
erty
tax
es r
ecei
vabl
e, n
et53
5,62
9
535,
629
-
-
-
-
-
Stat
e ap
prop
riat
ions
rec
eiva
ble
5,90
1,22
6
5,
442,
784
-
-
458,
442
-
-
Acc
ount
s re
ceiv
able
, ne
t6,
094,
304
5,
932,
146
-
143,
289
-
3,81
6
15,0
53
Fede
ral an
d st
ate
gran
ts r
ecei
vabl
e3,
610,
635
-
-
-
3,61
0,63
5
-
-
Inve
ntor
ies
163,
130
78
-
163,
052
-
-
-
Prep
aid
expe
nses
and
oth
er a
sset
s48
7,39
8
77,9
14
-
305,
977
103,
507
-
-
Due
fro
m (
due
to)
othe
r fu
nds
-
(15,
447,
301)
1,39
0,24
6
27
5,24
7
(1,9
92,2
41)
15,2
80,5
05
49
3,54
4
Due
fro
m C
ompo
nent
Uni
t88
,761
-
88,7
61
-
-
-
-
Tot
al c
urr
ent
asse
ts55,7
88,5
38
31,3
40,0
18
1,4
79,0
07
3,2
82,9
50
2,1
80,3
43
16,9
97,6
23
508,5
97
Non
curr
ent
asse
tsRes
tric
ted
cash
- u
nspe
nt b
ond
proc
eeds
10,7
29,9
19
-
-
-
-
10,7
29,9
19
-
Long
-ter
m inv
estm
ents
6,04
1,54
8
6,
041,
548
-
-
-
-
-
Cap
ital
ass
ets
not
bein
g de
prec
iate
d33
,346
,894
-
-
-
-
33,3
46,8
94
-
Cap
ital
ass
ets
bein
g de
prec
iate
d, n
et15
6,44
5,30
2
-
-
-
-
156,
445,
302
-
Tot
al n
oncu
rren
t as
sets
206,5
63,6
63
6,0
41,5
48
-
-
-
200,5
22,1
15
-
Tot
al a
sset
s262,3
52,2
01
37,3
81,5
66
1,4
79,0
07
3,2
82,9
50
2,1
80,3
43
217,5
19,7
38
508,5
97
Def
erre
d o
utf
low
s of
res
ourc
esD
efer
red
char
ge o
n bo
nd r
efun
ding
1,3
30,6
22
-
-
-
-
1,3
30,6
22
-
Liab
ilit
ies
Curr
ent
liab
ilit
ies
Acc
ount
s pa
yabl
e6,
003,
530
1,
227,
736
15
,870
126,
073
1,97
9,36
0
2,
517,
339
13
7,15
2
Acc
rued
pay
roll a
nd o
ther
com
pens
atio
n4,
904,
126
4,
607,
968
-
-
-
-
296,
158
Acc
rued
vac
atio
n1,
529,
609
1,
529,
609
-
-
-
-
-
Acc
rued
int
eres
t pa
yabl
e58
6,80
0
-
-
-
-
586,
800
-
Une
arne
d re
venu
e3,
408,
606
3,
006,
008
-
126,
328
200,
983
-
75,2
87
Oth
er c
urre
nt lia
bilit
ies
41,8
41
41,8
41
-
-
-
-
Cur
rent
por
tion
of
debt
obl
igat
ions
5,23
4,84
8
-
-
-
-
5,23
4,84
8
-
Tot
al c
urr
ent
liab
ilit
ies
21,7
09,3
60
10,4
13,1
62
15,8
70
252,4
01
2,1
80,3
43
8,3
38,9
87
508,5
97
Non
curr
ent
liab
ilit
ies
Long
-ter
m d
ebt
oblig
atio
ns,
net
of c
urre
nt p
orti
on81
,175
,907
-
-
-
-
81,1
75,9
07
-
Oth
er n
oncu
rren
t lia
bilit
ies
27,5
64
27,5
64
-
-
-
-
-
Tot
al n
oncu
rren
t liab
ilit
ies
81,2
03,4
71
27,5
64
-
-
-
81,1
75,9
07
-
Tot
al lia
bilit
ies
102,9
12,8
31
10,4
40,7
26
15,8
70
252,4
01
2,1
80,3
43
89,5
14,8
94
508,5
97
Net
pos
itio
nN
et inv
estm
ent
in c
apit
al a
sset
s11
5,44
1,98
2
-
-
-
-
115,
441,
982
-
Unr
estr
icte
d45
,328
,010
26
,940
,840
1,
463,
137
3,
030,
549
-
13,8
93,4
84
-
Tot
al n
et p
osit
ion
160,7
69,9
92
$
26,9
40,8
40
$
1,4
63,1
37
$
3,0
30,5
49
$
-$
129,3
35,4
66
$
-$
66
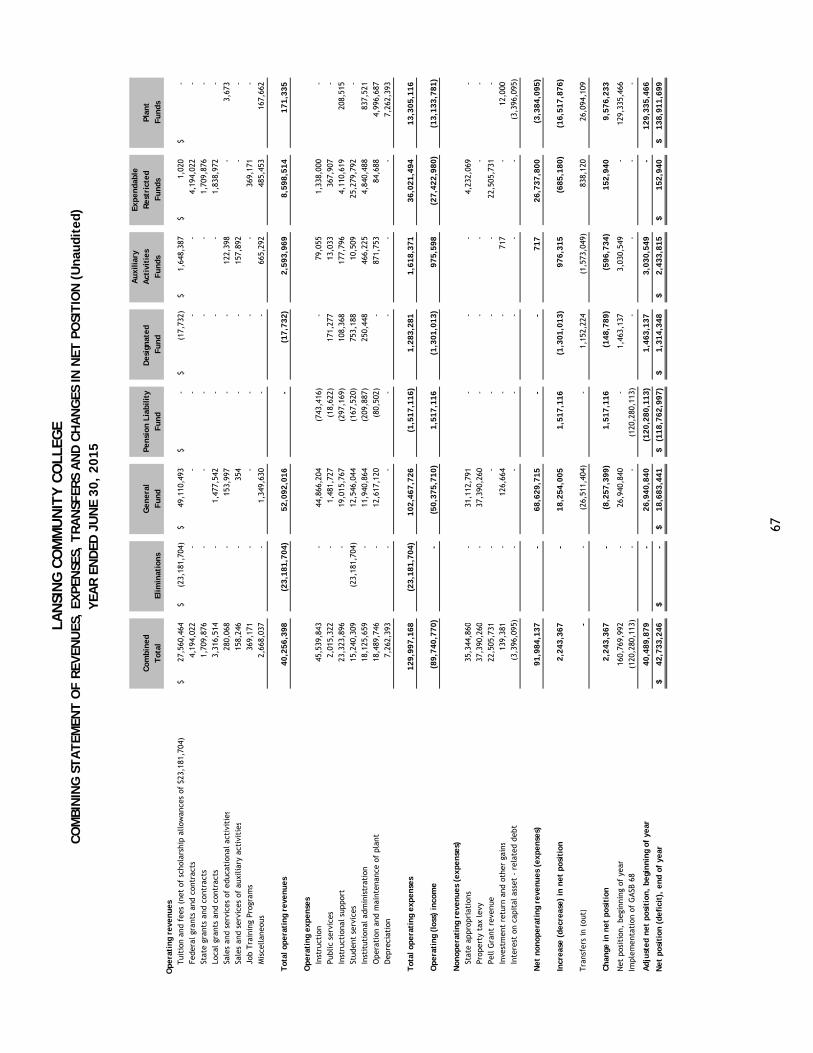
LAN
SIN
G C
OM
MU
NIT
Y C
OLL
EGE
CO
MBIN
ING
ST
AT
EMEN
T O
F R
EVEN
UES
, EX
PEN
SES,
TR
AN
SFER
S A
ND
CH
AN
GES
IN N
ET P
OSI
TIO
N (
Unau
dit
ed)
YEA
R E
ND
ED J
UN
E 30,
2015
Auxi
liar
yEx
pen
dab
leC
ombin
edG
ener
alPen
sion
Lia
bilit
yD
esig
nat
ed
Act
ivit
ies
Res
tric
ted
Pla
nt
Tot
alEl
imin
atio
ns
Fund
Fund
Fund
Funds
Funds
Funds
Oper
atin
g re
venues
Tui
tion
and
fee
s (n
et o
f sc
hola
rshi
p al
low
ance
s of
$23
,181
,704
)
27,5
60,4
64$
(23,
181,
704)
$
49,1
10,4
93$
-$
(17,
732)
$
1,
648,
387
$
1,02
0$
-$
Fe
dera
l gr
ants
and
con
trac
ts4,
194,
022
-
-
-
-
-
4,19
4,02
2
-
Stat
e gr
ants
and
con
trac
ts1,
709,
876
-
-
-
-
-
1,70
9,87
6
-
Loca
l gr
ants
and
con
trac
ts3,
316,
514
-
1,47
7,54
2
-
-
-
1,83
8,97
2
-
Sale
s an
d se
rvic
es o
f ed
ucat
iona
l ac
tivi
ties
280,
068
-
153,
997
-
-
12
2,39
8
-
3,
673
Sa
les
and
serv
ices
of
auxi
liary
act
ivit
ies
158,
246
-
354
-
-
15
7,89
2
-
-
Job
Tra
inin
g Pr
ogra
ms
369,
171
-
-
-
-
-
369,
171
-
M
isce
llan
eous
2,66
8,03
7
-
1,34
9,63
0
-
-
66
5,29
2
485,
453
167,
662
Tot
al o
per
atin
g re
venues
40,2
56,3
98
(23,1
81,7
04)
52,0
92,0
16
-
(17,7
32)
2,5
93,9
69
8,5
98,5
14
171,3
35
Oper
atin
g ex
pen
ses
Inst
ruct
ion
45,5
39,8
43
-
44,8
66,2
04
(743
,416
)
-
79
,055
1,33
8,00
0
-
Publ
ic s
ervi
ces
2,01
5,32
2
-
1,48
1,72
7
(18,
622)
171,
277
13,0
33
36
7,90
7
-
In
stru
ctio
nal su
ppor
t23
,323
,896
-
19,0
15,7
67
(297
,169
)
108,
368
177,
796
4,11
0,61
9
20
8,51
5
Stud
ent
serv
ices
15,2
40,3
09
(23,
181,
704)
12,5
46,0
44
(167
,520
)
753,
188
10,5
09
25
,279
,792
-
Inst
itut
iona
l ad
min
istr
atio
n
18,1
25,6
59
-
11,9
40,8
64
(209
,887
)
250,
448
466,
225
4,84
0,48
8
83
7,52
1
Ope
rati
on a
nd m
aint
enan
ce o
f pl
ant
18,4
89,7
46
-
12,6
17,1
20
(80,
502)
-
87
1,75
3
84,6
88
4,
996,
687
Dep
reci
atio
n 7,
262,
393
-
-
-
-
-
-
7,
262,
393
Tot
al o
per
atin
g ex
pen
ses
129,9
97,1
68
(23,1
81,7
04)
102,4
67,7
26
(1,5
17,1
16)
1,2
83,2
81
1,6
18,3
71
36,0
21,4
94
13,3
05,1
16
Oper
atin
g (l
oss)
inco
me
(89,7
40,7
70)
-
(50,3
75,7
10)
1,5
17,1
16
(1,3
01,0
13)
975,5
98
(27,4
22,9
80)
(13,1
33,7
81)
Non
oper
atin
g re
venues
(ex
pen
ses)
Stat
e ap
prop
riat
ions
35,3
44,8
60
-
31,1
12,7
91
-
-
-
4,23
2,06
9
-
Prop
erty
tax
lev
y37
,390
,260
-
37,3
90,2
60
-
-
-
-
-
Pell G
rant
rev
enue
22,5
05,7
31
-
-
-
-
-
22,5
05,7
31
-
In
vest
men
t re
turn
and
oth
er g
ains
139,
381
-
126,
664
-
-
71
7
-
12
,000
Inte
rest
on
capi
tal as
set
- re
late
d de
bt(3
,396
,095
)
-
-
-
-
-
-
(3
,396
,095
)
Net
non
oper
atin
g re
venues
(ex
pen
ses)
91,9
84,1
37
-
68,6
29,7
15
-
-
717
26,7
37,8
00
(3,3
84,0
95)
Incr
ease
(dec
reas
e) in n
et p
osit
ion
2,2
43,3
67
-
18,2
54,0
05
1,5
17,1
16
(1,3
01,0
13)
976,3
15
(685,1
80)
(16,5
17,8
76)
Tra
nsfe
rs in
(out
)-
-
(26,
511,
404)
-
1,15
2,22
4
(1
,573
,049
)
838,
120
26,0
94,1
09
Chan
ge in n
et p
osit
ion
2,2
43,3
67
-
(8,2
57,3
99)
1,5
17,1
16
(148,7
89)
(596,7
34)
152,9
40
9,5
76,2
33
Net
pos
itio
n, b
egin
ning
of
year
160,
769,
992
-
26,9
40,8
40
-
1,46
3,13
7
3,
030,
549
-
12
9,33
5,46
6
Im
plem
enta
tion
of
GASB
68
(120
,280
,113
)
-
-
(120
,280
,113
)
-
-
-
-
Adju
sted
net
pos
itio
n,
beg
innin
g of
yea
r40,4
89,8
79
-
26,9
40,8
40
(120,2
80,1
13)
1,4
63,1
37
3,0
30,5
49
-
129,3
35,4
66
Net
pos
itio
n (
def
icit
), e
nd o
f ye
ar42,7
33,2
46
$
-$
18,6
83,4
41
$
(118,7
62,9
97)
$
1,3
14,3
48
$
2,4
33,8
15
$
152,9
40
$
138,9
11,6
99
$
67
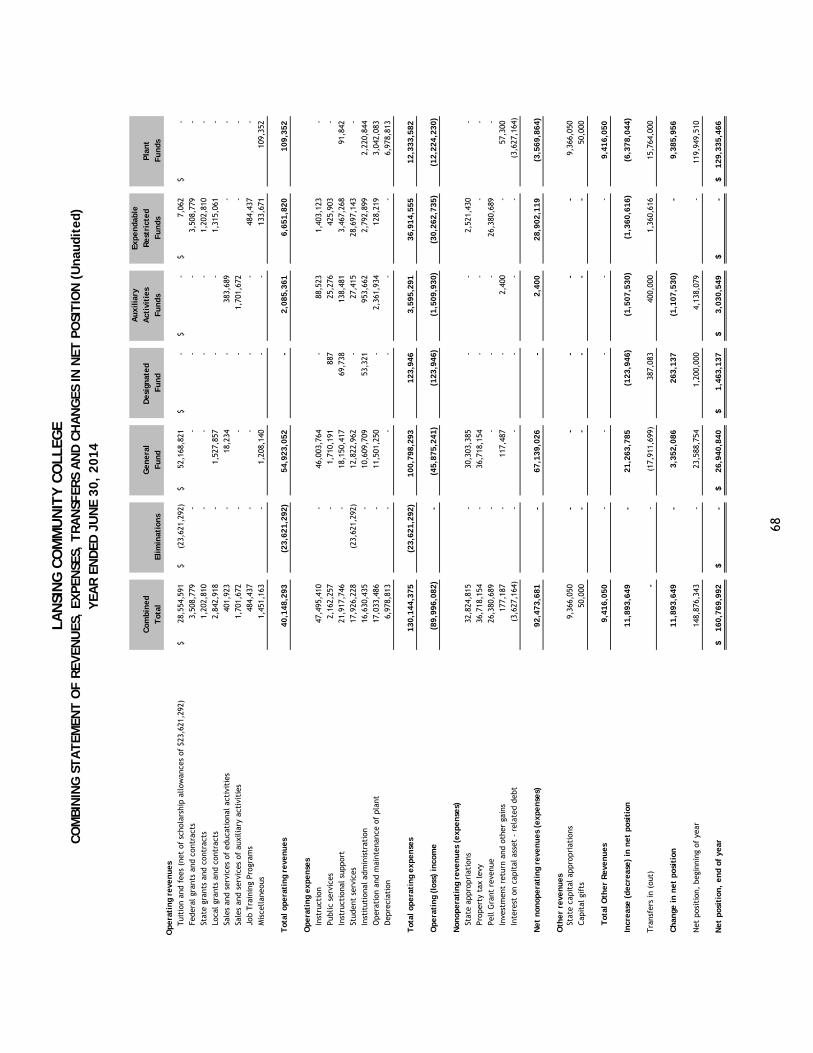
LAN
SIN
G C
OM
MU
NIT
Y C
OLL
EGE
CO
MBIN
ING
ST
AT
EMEN
T O
F R
EVEN
UES
, EX
PEN
SES,
TR
AN
SFER
S A
ND
CH
AN
GES
IN N
ET P
OSI
TIO
N (
Unau
dite
d)Y
EAR
EN
DED
JU
NE
30,
2014
Auxi
liar
yEx
pendab
leC
ombin
ed
Genera
lD
esi
gnat
ed
Act
ivit
ies
Rest
rict
ed
Plan
tT
otal
Elim
inat
ions
Fund
Fund
Funds
Funds
Funds
Opera
ting
reve
nues
Tui
tion
and
fee
s (n
et o
f sc
hola
rshi
p al
low
ance
s of
$23
,621
,292
)28
,554
,591
$
(23,
621,
292)
$
52,1
68,8
21$
-$
-$
7,06
2$
-
$
Fede
ral gr
ants
and
con
trac
ts3,
508,
779
-
-
-
-
3,
508,
779
-
St
ate
gran
ts a
nd c
ontr
acts
1,20
2,81
0
-
-
-
-
1,
202,
810
-
Lo
cal gr
ants
and
con
trac
ts2,
842,
918
-
1,
527,
857
-
-
1,
315,
061
-
Sa
les
and
serv
ices
of
educ
atio
nal ac
tivi
ties
401,
923
-
18
,234
-
38
3,68
9
-
-
Sa
les
and
serv
ices
of
auxi
liar
y ac
tivi
ties
1,70
1,67
2
-
-
-
1,
701,
672
-
-
Jo
b Tr
aini
ng P
rogr
ams
484,
437
-
-
-
-
48
4,43
7
-
M
isce
llan
eous
1,45
1,16
3
-
1,
208,
140
-
-
13
3,67
1
10
9,35
2
Tot
al o
pera
ting
reve
nues
40,1
48,2
93
(23,
621,
292)
54,9
23,0
52
-
2,
085,
361
6,65
1,82
0
109,
352
Opera
ting
exp
ense
sIn
stru
ctio
n47
,495
,410
-
46
,003
,764
-
88
,523
1,40
3,12
3
-
Pu
blic
ser
vice
s2,
162,
257
-
1,
710,
191
887
25
,276
425,
903
-
In
stru
ctio
nal su
ppor
t21
,917
,746
-
18
,150
,417
69,7
38
138,
481
3,
467,
268
91,8
42
Stud
ent
serv
ices
17,9
26,2
28
(23,
621,
292)
12,8
22,9
62
-
27
,415
28,6
97,1
43
-
In
stit
utio
nal ad
min
istr
atio
n
16,6
30,4
35
-
10
,609
,709
53,3
21
953,
662
2,
792,
899
2,22
0,84
4
Ope
rati
on a
nd m
aint
enan
ce o
f pl
ant
17,0
33,4
86
-
11
,501
,250
-
2,
361,
934
128,
219
3,
042,
083
Dep
reci
atio
n 6,
978,
813
-
-
-
-
-
6,
978,
813
Tot
al o
pera
ting
exp
ense
s130,1
44,3
75
(23,
621,
292)
100,
798,
293
123,
946
3,
595,
291
36,9
14,5
55
12,3
33,5
82
Ope
rati
ng
(los
s) inco
me
(89,9
96,0
82)
-
(4
5,87
5,24
1)
(123
,946
)
(1,5
09,9
30)
(30,
262,
735)
(12,
224,
230)
Non
opera
ting
reve
nues
(exp
ense
s)St
ate
appr
opri
atio
ns32
,824
,815
-
30
,303
,385
-
-
2,
521,
430
-
Pr
oper
ty t
ax lev
y36
,718
,154
-
36
,718
,154
-
-
-
-
Pe
ll G
rant
rev
enue
26,3
80,6
89
-
-
-
-
26
,380
,689
-
In
vest
men
t re
turn
and
oth
er g
ains
177,
187
-
11
7,48
7
-
2,
400
-
57
,300
Inte
rest
on
capi
tal as
set
- re
late
d de
bt(3
,627
,164
)
-
-
-
-
-
(3
,627
,164
)
Net
non
opera
ting
reve
nues
(exp
ense
s)92
,473
,681
-
67
,139
,026
-
2,
400
28
,902
,119
(3,5
69,8
64)
Oth
er
reve
nues
Stat
e ca
pita
l ap
prop
riat
ions
9,36
6,05
0
-
-
-
-
-
9,
366,
050
Cap
ital
gif
ts50
,000
-
-
-
-
-
50
,000
Tot
al O
ther
Rev
enues
9,41
6,05
0
-
-
-
-
-
9,
416,
050
Incr
ease
(dec
reas
e) in n
et p
osit
ion
11,8
93,6
49
-
21
,263
,785
(123
,946
)
(1,5
07,5
30)
(1,3
60,6
16)
(6,3
78,0
44)
Tran
sfer
s in
(ou
t)-
-
(1
7,91
1,69
9)
387,
083
40
0,00
0
1,
360,
616
15,7
64,0
00
Chan
ge in n
et
posi
tion
11,8
93,6
49
-
3,
352,
086
263,
137
(1
,107
,530
)
-
9,
385,
956
Net
pos
itio
n, b
egin
ning
of
year
148,
876,
343
-
23
,588
,754
1,20
0,00
0
4,13
8,07
9
-
11
9,94
9,51
0
Net
posi
tion
, end o
f ye
ar160,7
69,9
92
$
-$
26,9
40,8
40$
1,46
3,13
7$
3,03
0,54
9$
-$
129,
335,
466
$
68