Financial, Physical and Process Audit: An Independent Report ...
396
Main Report and Recommendations NEITI Oil and Gas Industry 2013 Audit 1 Financial, Physical and Process Audit: An Independent Report Assessing and Reconciling Physical and Financial Flows within Nigeria’s Oil and Gas Industry 2013
-
Upload
khangminh22 -
Category
Documents
-
view
0 -
download
0
Transcript of Financial, Physical and Process Audit: An Independent Report ...

Main Report and Recommendations
NEITI Oil and Gas Industry 2013 Audit
1
Financial, Physical and Process Audit: An Independent Report Assessing and
Reconciling Physical and Financial Flows within Nigeria’s Oil and Gas Industry
2013

Main Report and Recommendations
NEITI Oil and Gas Industry 2013 Audit
2
Financial, Physical and Process Audit: An Independent Report Assessing and
Reconciling Physical and Financial Flows within Nigeria’s Oil and Gas Industry
2013
Presented by
TAJU AUDU & CO
September, 2015
(Chartered Accountants)
20B Mombassa Street
Wuse Zone 5 Abuja.
08033119089, (09)2913734
Email:[email protected]
www.tajuaudu.com
Taju Audu &Co

Main Report and Recommendations
NEITI Oil and Gas Industry 2013 Audit
3
September 2015
The Executive Secretary,
Nigeria Extractive Industries Transparency Initiative (NEITI),
4thFloor Murjanatu House, 1,Zambezi Crescent,
Off Aguiyi Ironsi Street,
Maitama, Abuja.
Financial, Physical and Process Audit-An Independent Report Assessing and Reconciling Physical and
Financial Flows within Nigeria’s Oil Industry and Gas Industry-2013
TAJU AUDU & CO.(Chartered Accountants) in association with YKY Consulting (UK), was appointed by the
NSWG in accordance with the requirements of NEITI act 2007 to carry out an Assessment and Reconciliation
of Financial , Physical and Process Flows within the Nigerian Oil and Gas Industry for the year ended 31st
December 2013.
The Engagement was undertaken in accordance with the International Financial Reporting Standards (IFRS)
on Related Services applicable to agreed-upon procedures engagements. The procedures performed were
those set out in the Terms of Reference appended to this report except stated otherwise in this report
including its appendices.
We set out our findings in the following report; the procedures adopted in this engagement were not
designed to constitute an audit or review made in accordance with the International Standards on Auditing
(ISA). We therefore do not express any assurance on the transaction beyond the explicit statement set out in
this reports. Had we performed additional procedures, other matters might have come to our attention that
would have been reported to you.
Our report is solely for informing the NSWG on the matters set out in the Terms of Reference and is not to
be used for any other purpose.
The report relates only to the subject matter specifically set out herein and does not extend to any financial
statement of any entity taken as whole.
Yours Faithfully, For: Taju Audu & Co.
Tajudeen Audu, FCA Engagement Partner.

Main Report and Recommendations
NEITI Oil and Gas Industry 2013 Audit
4
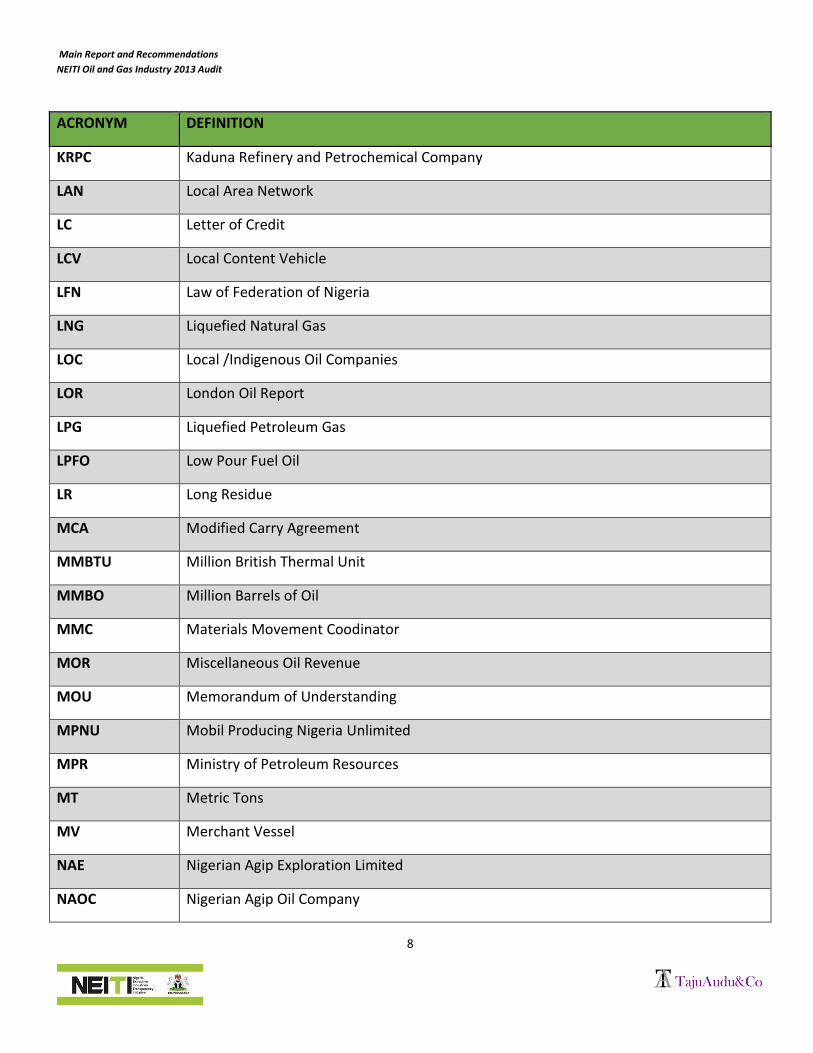
LIST OF ABBREVIATIONS AND ACRONYMS
ACRONYM DEFINITION
AENR Agip Energy and Natural Resources Limited
AF Alternative Funding
AFS Audited Financial Statements
AGO Automotive Gas Oil
AIP Average Interest Percentage
AMNI Amni International Petroleum Development Company Limited
APDNL Addax Production Development Nigeria Limited
APENL Addax Production and Exploration Nigeria Limited
API American Petroleum Institute (measurement for heaviness crude)
BBL Barrels
Bbl/d Barrels Per Day
BIS Bank for International Settlement
BOD Banking Operations Department
BO Beneficial Ownership
BOJ Best Of Judgement
BOL Bill of Lading
BSW Basic Sediments and Water(amount of contaminants in crude)
BTU British Thermal Unit
CA Confidentiality Agreement
CAs Carry Agreements
CAC Corporate Affairs Commission

Main Report and Recommendations
NEITI Oil and Gas Industry 2013 Audit
5
ACRONYM DEFINITION
CAPEX Capital Expenditure
CBN Central Bank of Nigeria
CBN-MPR Central Bank of Nigeria Monetary Policy Rate
CE Covered Entity
CCC Carry Capital Cost
CGT Capital Gains Tax
CITA Company Income Tax Act
CIT Company Income Tax
CNL Chevron Nigeria Limited
COMD Crude Oil Marketing Division of NNPC
COSM Crude Oil Stock Management
CRF Consolidated Revenue Fund
CSU Corporate Service Unit
CTR Carry Tax Relief
DG Director General
DMO Debt Management Office
DPK Dual Purpose Kerosene
DPR Department of Petroleum Resources
E&P Exploration and Production
ECA Excess Crude Account
ECOWAS Economic Community of West African States
EDT Education Tax
EEZA Exclusive Economic Zone Act

Main Report and Recommendations
NEITI Oil and Gas Industry 2013 Audit
6
ACRONYM DEFINITION
EIA Environmental Impact Assessment
EIA Energy Information Administration
EIC Extractive Industry Company
EI Extractive Industry
EOI Expression of Interest
EITI Extractive Industries Transparency Initiative
ESSO Esso Exploration and Production Nigeria Limited
ERP Enterprise Resource Planning
ES Executive Secretary
FAAC Federation Accounts Allocation Committee
FCT Federal Capital Territory
FDE Fraud and Debt Enforcement
FEC Federal Executive Council
FES Frontier Exploration Services
FGN Federal Government of Nigeria
FHN First Hydrocarbon Nigeria Limited
FIRR Financial Internal Rate of Return
FIRS Federal Inland Revenue Service
FMF Federal Ministry of Finance
FOB Free on Board
FRB Federal Reserve Bank
GDP Gross Domestic Product
GED F&A Group Executive Director Finance &Account

Main Report and Recommendations
NEITI Oil and Gas Industry 2013 Audit
7
ACRONYM DEFINITION
GGM Group General Manager(NNPC)
GID Gas Infrastructure Development
GMD Group Managing Director(NNPC)
GRC Gas Regulatory Commission
GSA Gas Sales Agreement
GSV Gross Standard Volume
HPFO High Pour Fuel Oil
HSE Health, Safety & Environment
IASs International Standards in Auditing
IDSL Integrated Data Services Limited
IOC International Oil Company
IPP Independent Power Producer
ITA Investment Tax Allowance
ITC Investment Tax Credit
JDA Joint Development Authority
JDZ Joint Development Zone
JMC Joint Ministerial Council of JDZ
JOA Joint Operating Agreement
JVAFA Joint Venture Alternative Funding Arrangement
JVC Joint Venture Companies
JVCC Joint Venture Cash Calls
JVF Joint Venture Funding
JV Joint Venture
Main Report and Recommendations
NEITI Oil and Gas Industry 2013 Audit
8
ACRONYM DEFINITION
KRPC Kaduna Refinery and Petrochemical Company
LAN Local Area Network
LC Letter of Credit
LCV Local Content Vehicle
LFN Law of Federation of Nigeria
LNG Liquefied Natural Gas
LOC Local /Indigenous Oil Companies
LOR London Oil Report
LPG Liquefied Petroleum Gas
LPFO Low Pour Fuel Oil
LR Long Residue
MCA Modified Carry Agreement
MMBTU Million British Thermal Unit
MMBO Million Barrels of Oil
MMC Materials Movement Coodinator
MOR Miscellaneous Oil Revenue
MOU Memorandum of Understanding
MPNU Mobil Producing Nigeria Unlimited
MPR Ministry of Petroleum Resources
MT Metric Tons
MV Merchant Vessel
NAE Nigerian Agip Exploration Limited
NAOC Nigerian Agip Oil Company

Main Report and Recommendations
NEITI Oil and Gas Industry 2013 Audit
9
ACRONYM DEFINITION
NAPIMS National Petroleum Investment Management Service
NBS National Bureau of Statistics
NCDA Nigerian Content Development Act
NCDMB Nigerian Content Development and Monitoring Board
NCS Nigeria Customs Service
NDDC Niger Delta Development Commission
NDPR Niger Delta Petroleum Resources
NEITI Nigeria Extractive Industries Transparency Initiative
NESS Nigerian Export Supervision Scheme
NESREA National Environmental Standards and Regulations Agency
NETCO National Engineering & Technical Company
NGC Nigerian Gas Company
NGL Natural Gas Liquid
NHT Nigerian Hydro Carbon Tax
NIADBMS NEITI Industry Audit Data Base Management System
NIMASA Nigerian Maritime Administration and Safety Agency
NIPEX Nigerian Petroleum Exchange
NIWA National Inland Waterways Authority
NLNG Nigeria Liquefied Natural Gas
NNPC Nigerian National Petroleum Corporation
NNOC Nigerian National Oil Corporation
NOC National Oil Company
NOSDRA National Oil Spill Detection and Response Agency

Main Report and Recommendations
NEITI Oil and Gas Industry 2013 Audit
10
ACRONYM DEFINITION
NPA Nigerian Petroleum Act
NPC National Planning Commission
NPDC Nigerian Petroleum Development Company
NSE Nigerian Stock Exchange
NSV Net Standard Volume
NSWG National Stakeholders Working Group
NXP Nigeria Export Proceeds
OAGF Office of the Accountant General of the Federation
OEL Oil Exploration License
OGJ Oil and Gas Journal
OML Oil Mining Lease
OPCO Operating Company
OPCOM Operating Committees
OPEC Organization of Petroleum Exporting Countries
OPIC Overseas Private Investment Corporation
OPL Oil Prospecting License
OPTS Oil Producers Trade Section
OSP Official Selling Price
OSP Offshore Safety Permit
PA Petroleum Act
PAYE Pay As You Earn
PD Positive Development/Displacement
PEFMB Petroleum Equalization Fund Management Board

Main Report and Recommendations
NEITI Oil and Gas Industry 2013 Audit
11
ACRONYM DEFINITION
PGS Petroleum Geo-Services
PHCN Power Holding Company of Nigeria
PEL Petroleum Exploration License
PHRC Port Harcourt Refining Company
PIB Petroleum Industry Bill
PLATFORM Platform Petroleum Limited
PMS Premium Motor Spirit
POCNL Philips Oil Company Nigeria Limited
POOCN Pan Ocean Oil Corporation (Nigeria) Limited
PPMC Pipelines and Products Marketing Company
PPPRA Petroleum Products Pricing Regulatory Agency
PPT Petroleum Profits Tax
PRS&IT Planning Research, Statistics and Information Technology
PSC Production Sharing Contract
PSF Petroleum Support Fund
PTDF Petroleum Technology Development Fund
PWC Price Waterhouse Coopers
QIT Qua Iboe Terminal
RDP Reserves Development Project
RMAFC Revenue Mobilization Allocation and Fiscal Commission
RP Realisable Price
RPP Returns Payment Processing
SAP System Application Products (NNPC)
Main Report and Recommendations
NEITI Oil and Gas Industry 2013 Audit
12
ACRONYM DEFINITION
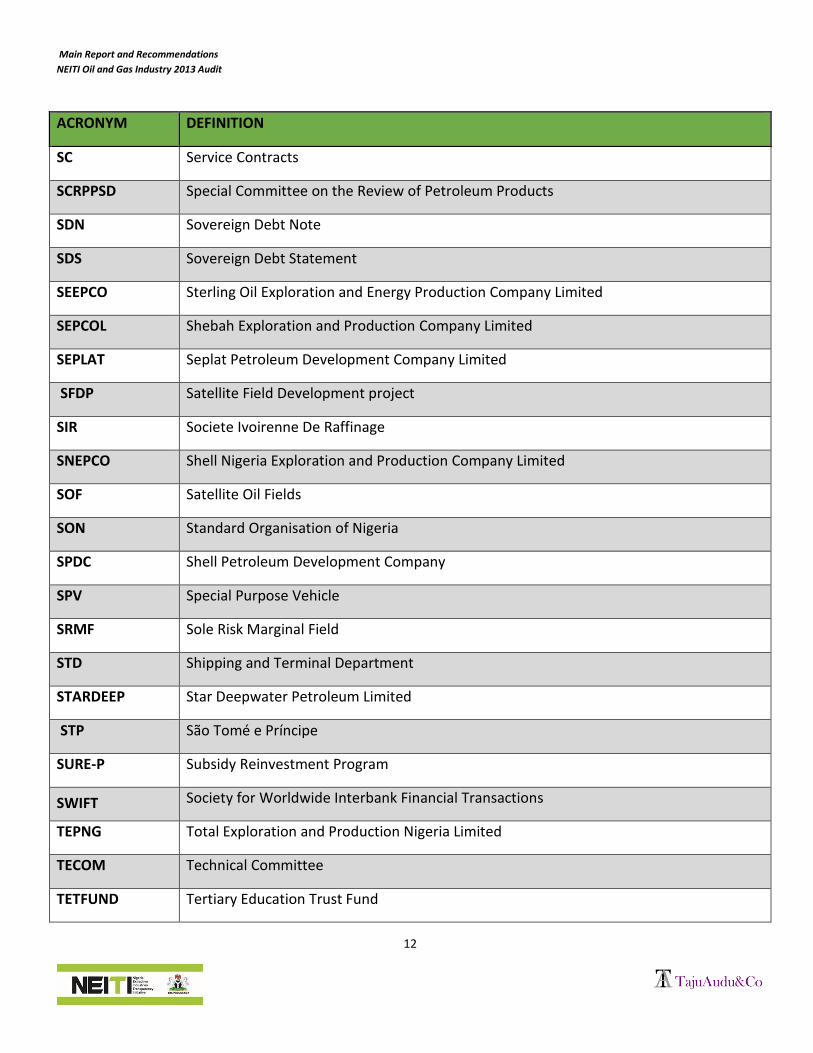
SC Service Contracts
SCRPPSD Special Committee on the Review of Petroleum Products
SDN Sovereign Debt Note
SDS Sovereign Debt Statement
SEEPCO Sterling Oil Exploration and Energy Production Company Limited
SEPCOL Shebah Exploration and Production Company Limited
SEPLAT Seplat Petroleum Development Company Limited
SFDP Satellite Field Development project
SIR Societe Ivoirenne De Raffinage
SNEPCO Shell Nigeria Exploration and Production Company Limited
SOF Satellite Oil Fields
SON Standard Organisation of Nigeria
SPDC Shell Petroleum Development Company
SPV Special Purpose Vehicle
SRMF Sole Risk Marginal Field
STD Shipping and Terminal Department
STARDEEP Star Deepwater Petroleum Limited
STP São Tomé e Príncipe
SURE-P Subsidy Reinvestment Program
SWIFT Society for Worldwide Interbank Financial Transactions
TEPNG Total Exploration and Production Nigeria Limited
TECOM Technical Committee
TETFUND Tertiary Education Trust Fund

Main Report and Recommendations
NEITI Oil and Gas Industry 2013 Audit
13
ACRONYM DEFINITION
TMP Trial Marketing Period
TOR Terms of Reference
TUPNI Total Upstream Nigeria Limited
USD United States Dollar
VAT Value Added Tax
VGO Vacuum Gas Oil
WAGP West African Gas Pipeline
WHT Withholding Tax
WRPC Warri Refining and Petrochemicals Company

Main Report and Recommendations
NEITI Oil and Gas Industry 2013 Audit
14
NEITI AUDIT 2013 OFFICIAL EXCHANGE RATE
COMPUTED AVERAGE EXCHANGE RATE FOR 2013 AS OBTAINED FROM OANDA.
Note: The above table shows the average exchange rate for the year 2013 as obtained from
Oanda Link: http://www.oanda.com/currency/average
Yearly
AverageAED NGNGBPEURCHF
Yearly
Average
Yearly
Average
Yearly
Average
Yearly
Average
157.709720.639530.753160.926753.67222

Main Report and Recommendations
NEITI Oil and Gas Industry 2013 Audit
15
CONTENTS
1 INTRODUCTION ............................................................................................................................................... 19
1.1 BACKGROUND TO THE GLOBAL EITI ...................................................................................................................... 19
1.2 BRIEF HISTORICAL PERSPECTIVE OF EITI IMPLEMENTATION IN NIGERIA .......................................................................... 19
1.3 APPROACH AND METHODOLOGY .......................................................................................................................... 20
1.4 OBJECTIVES OF THE AUDIT .................................................................................................................................. 21
1.5 SOURCES OF DATA ............................................................................................................................................ 21
1.6 BASIS OF ACCOUNTING ...................................................................................................................................... 21
1.7 MATERIALITY THRESHOLD................................................................................................................................... 22
1.8 SCOPE OF THE AUDIT ......................................................................................................................................... 22
1.9 OIL AND GAS COMPANIES COVERED ...................................................................................................................... 23
1.10 GOVERNMENT AGENCIES COVERED ..................................................................................................................... 23
1.11 SUMMARY OF FINANCIAL FLOWS ........................................................................................................................ 23
1.12 SUMMARY OF PHYSICAL AND PROCESS FLOWS ....................................................................................................... 24
1.13 DATA QUALITY AND REVIEW OF TEMPLATES .......................................................................................................... 24
2 CONTEXTUAL INFORMATION ON NIGERIAN OIL AND GAS INDUSTRY ................................................................ 27
2.1 INTRODUCTION ................................................................................................................................................ 27
2.2 OVERVIEW OF THE OIL AND GAS INDUSTRY ............................................................................................................. 27
2.3 LEGAL FRAMEWORKS, LEGISLATIONS AND FISCAL REGIMES IN THE NIGERIAN OIL & GAS INDUSTRY ...................................... 28
2.4 HIGHLIGHTS OF OIL AND GAS CONTRIBUTION TO THE ECONOMY .................................................................................. 29
2.5 SUMMARY OF EXPLORATION AND PRODUCTION DATA FOR 2013 FISCAL YEAR ................................................................ 33
2.6 GOVERNMENT PARTICIPATION IN THE OIL AND GAS SECTOR ....................................................................................... 34
2.7 OVERVIEW OF REVENUE COLLECTION FROM OIL AND GAS INDUSTRY ............................................................................. 35
2.8 OVERVIEW OF FEDERATION REVENUE DISTRIBUTION, MANAGEMENT & EXPENDITURE ...................................................... 36
2.9 OVERVIEW OF LICENSING AND LICENSE ALLOCATIONS ................................................................................................ 40
2.10 OVERVIEW OF BENEFICIAL OWNERSHIP OF CORPORATE ENTITIES OPERATING IN THE OIL AND GAS SECTOR ........................... 41
2.11 OVERVIEW OF OPERATING CONTRACTS DISCLOSURE IN NIGERIAN OIL AND GAS INDUSTRY ............................................... 42
3 SUMMARY OF AGGREGATED FINANCIAL FLOWS .............................................................................................. 44
3.1 INTRODUCTION ................................................................................................................................................ 44
3.2 RECONCILIATION AND VALIDATION OF PROCEEDS OF SALES OF FEDERATION EQUITY CRUDE OIL AND GAS .............................. 49
3.3 RECONCILIATION AND VALIDATION OF PRODUCTION VOLUME DELIVERED TO TERMINALS .................................................. 54
3.4 RECONCILIATION AND VALIDATION OF FINANCIAL FLOWS FROM COMPANIES .................................................................. 84
3.4.5.4 KEY FINDINGS FROM ROYALTY VALIDATION ....................................................................................................... 92

Main Report and Recommendations
NEITI Oil and Gas Industry 2013 Audit
16
3.5 SOCIAL EXPENDITURES, INFRASTRUCTURE PROJECT AND QUASI-FISCAL EXPENDITURE ..................................................... 105
4 IN-KIND FLOWS ............................................................................................................................................. 109
4.1 INTRODUCTION .............................................................................................................................................. 109
4.2 IN-KIND FLOWS UNDER PRODUCTION SHARING CONTRACT OPERATIONS ..................................................................... 109
4.3 JOINT VENTURE ALTERNATIVE FUNDING ARRANGEMENTS ........................................................................................ 114
5 JOINT DEVELOPMENT ZONE - SÃO TOMÉ AND PRÍNCIPE (STP) AND NIGERIA................................................... 125
6 COMPANY LEVEL FINANCIAL FLOWS .............................................................................................................. 127
6.1 PETROLEUM PROFIT TAX (PPT) ......................................................................................................................... 127
6.2 ROYALTY OIL ................................................................................................................................................. 128
6.3 ROYALTY GAS ................................................................................................................................................ 130
6.4 LICENSE FEES AND CONCESSION RENTALS ............................................................................................................. 130
6.5 COMPANY INCOME TAX (GAS) ........................................................................................................................... 131
6.6 CASH CALL .................................................................................................................................................... 132
6.7 GAS FLARE PENALTY ........................................................................................................................................ 142
6.8 EDUCATION TAX (EDT) .................................................................................................................................... 144
6.9 NDDC 3% CONTRIBUTION LEVY ........................................................................................................................ 145
6.10 NIGERIA CONTENT DEVELOPMENT AND MONITORING BOARD (NCDMB) .................................................................. 146
6.11 VALUE ADDED TAX (VAT) .............................................................................................................................. 147
6.12 WITHHOLDING TAX (WHT) ............................................................................................................................ 149
6.13 PAY AS YOU EARN (PAYE) TAX ....................................................................................................................... 158
6.14 LOCAL GOVERNMENT TAXES............................................................................................................................ 163
6.15 NIMASA LEVIES .......................................................................................................................................... 163
6.16 NIWA LEVIES .............................................................................................................................................. 165
6.17 NESS FEES .................................................................................................................................................. 165
7 DOWNSTREAM OPERATIONS ......................................................................................................................... 169
7.1 OVERVIEW OF THE DOWNSTREAM OPERATIONS. .................................................................................................... 169
7.2 DETERMINATION OF SUBSIDY PAYMENTS .............................................................................................................. 170
7.3 PRODUCT QUANTITIES FOR WHICH SUBSIDIES WERE PROCESSED FOR PAYMENT IN 2013 ................................................ 174
7.4 SUBSIDIES CLAIMED BY NNPC IN 2013 ............................................................................................................... 175
7.5 SUMMARY OF SUBSIDIES PAID ON EACH PRODUCT ................................................................................................. 175
7.6 PRODUCT VOLUMES OF (PMS) IMPORTED BY THE IMPORTERS IN 2013 ....................................................................... 176
7.7 ISSUANCE OF SDSS BY PPPRA ........................................................................................................................... 177
7.8 ISSUANCE OF SDNS BY DMO ............................................................................................................................ 177
7.9 OVER PAID SUBSIDY DUE TO CURRENCY EXCHANGE DIFFERENTIALS ............................................................................ 178

Main Report and Recommendations
NEITI Oil and Gas Industry 2013 Audit
17
7.10 SUMMARY OF PETROLEUM SUBSIDY PAYMENTS (SDNS REDEEMED) IN 2013 BY CBN .................................................. 180
7.11 RECONCILIATION OF PAYMENTS OF SUBSIDY BY THE FEDERAL GOVERNMENT WITH AMOUNT RECEIVED BY IMPORTERS ......... 183
7.12 APPROVED ALLOCATION TO IMPORT IN 2013 ...................................................................................................... 184
7.13 SUBSIDY REINVESTMENT AND EMPOWERMENT PROGRAMME (SURE-P)..................................................................... 187
7.14 REVIEW OF PPPRA- PSF FINANCIAL STATEMENTS ................................................................................................ 188
7.15 DETERMINATION OF NATIONAL DEMAND OF REFINED PRODUCT .............................................................................. 188
8 PHYSICAL AND PROCESS AUDIT ..................................................................................................................... 191
8.1 GAS UTILIZATION ........................................................................................................................................... 191
8.2 UPSTREAM MASS BALANCE .............................................................................................................................. 204
8.3 CRUDE OIL MASS BALANCE RECONCILIATION ........................................................................................................ 218
8.4 DISAGGREGATED OIL FLOWS ............................................................................................................................. 224
8.5 PETROLEUM PRODUCTS MASS BALANCE RECONCILIATION ........................................................................................ 262
8.6 SYSTEM AND PROCESS REVIEW .......................................................................................................................... 293
8.7 OIL AND GAS PRODUCTION COMPANIES IN 2013 ................................................................................................... 309
8.8 REVIEW OF MANAGEMENT OF SECTOR FINANCES ................................................................................................... 320
8.9 SYSTEMS AND PROCESSES FOR PAYING/RECEIVING ENTITIES ...................................................................................... 325
8.10 NATIONAL PETROLEUM INVESTMENT MANAGEMENT SERVICES (NAPIMS) ................................................................ 330
8.11 FEDERAL INLAND REVENUE SERVICE (FIRS) ......................................................................................................... 334
8.12 CENTRAL BANK OF NIGERIA (CBN) ................................................................................................................... 337
8.13 OFFICE OF THE ACCOUNTANT GENERAL OF THE FEDERATION (OAGF) ........................................................................ 338
8.14 FRAMEWORK FOR GROWTH IN THE OIL AND GAS SECTOR ....................................................................................... 339
8.15 PRODUCTION MEASUREMENT/METERING INFRASTRUCTURE – UPSTREAM ................................................................. 367
8.16 PRODUCTION ARRANGEMENTS ........................................................................................................................ 383
8.17 FUNDING ARRANGEMENTS.............................................................................................................................. 390
9 CONCLUSION AND RECOMMENDATIONS ....................................................................................................... 392
10 STATUS OF REMEDIATION ISSUES FROM PREVIOUS AUDITS ......................................................................... 392
10.1 CONCLUDED ISSUES INCLUDE: .......................................................................................................................... 392
10.2 ONGOING ISSUES INCLUDE: ............................................................................................................................. 394

Main Report and Recommendations
NEITI Oil and Gas Industry 2013 Audit
18

Main Report and Recommendations
NEITI Oil and Gas Industry 2013 Audit
19
1 INTRODUCTION
1.1 Background to the Global EITI
The Extractive Industries Transparency Initiative (EITI) is a global coalition of governments, companies and
civil society groups that promotes revenue transparency and accountability in the operations and
management of resources accruable from the Oil, Gas and Mining Sectors.
EITI is based on the agreement of shared principles, which states that the wealth from a country’s natural
resource should benefit all its citizens and that this will require high standards of transparency and
accountability. The Principles were agreed in June, 2003 and the rules were drawn up to ensure that all EITI
member countries committed to a minimum level of transparency in company reporting of revenues paid
and government reporting of receipts.
EITI issued a new global standard in July 2013 and this requires the production of comprehensive EITI
Reports that include full government disclosure of extractive industry revenues and disclosure of all material
payments to government by oil, gas and mining companies. The Requirements further provide for the
reconciliation of company payments and government revenues to be undertaken by an Independent
Administrator applying international professional standards and the report published annually alongside
contextual information on the extractive industry.
1.2 Brief Historical Perspective of EITI implementation in Nigeria
The Nigeria Extractive Industries Transparency Initiative (NEITI) is a national subset of the global EITI as well
as a national agency established by law. Nigeria signed up to the EITI in 2003 and enacted the NEITI Act on
the 28th of May 2007 to domesticate the EITI principles and enforce its implementation. This law was the
first pillar in the institutionalisation of NEITI and EITI process in Nigeria and also made Nigeria the first
country to back up the global EITI principle by law. The NEITI act 2007 is a reference point in all advocacy,
public agitation and demand for transparency in contemporary Nigeria.
A major function of NEITI as contained in the act is to develop a framework for transparency and
accountability in the reporting and disclosure by all extractive industry companies revenues due to or paid
to the Federal Government.
It was on the basis of the EITI Standard Requirements and the NEITI Act 2007 that the firm of Messrs TAJU
AUDU & Co. was re-appointed for an Independent evaluation of material oil and gas payments and
revenues for the year 2013 after the 2012 audit report in continuation of previous audit mandates that
commenced with the first audit cycle of 1999-2004.

Main Report and Recommendations
NEITI Oil and Gas Industry 2013 Audit
20
The purpose of this report is to present in explicit terms the results of the review and validation of all
material payments and receipts associated with crude oil and gas as well as the reconciliation of these
payments made by participants in the oil and gas sector and government receipts of such payments in
accordance with International Auditing Standards and the Terms of Reference included in Appendix 1.2
1.3 Approach and Methodology
The methodology and work approach adopted is in accordance with the EITI reporting process, which has
six phases (see figure 1.3). The Consultant’s responsibilities in each phase are elaborated below.
Figure 1.3 – Overview of the EITI Reporting process and deliverables
Standard data collection templates were prepared by NEITI and issued to Covered Entities. The consultant
reviewed, validated and updated the populated templates for all relevant financial transactions and Oil and
Gas volumetric for the year 2013 where necessary. The populated templates received from the Government
Agencies were also reviewed, updated and analysed in comparison with populated templates from the
companies in order to identify and reconcile material discrepancies.
The audited financial statements and records obtained from all the covered entities were reviewed to
ensure that the populated templates are linked to the financial statements and company records. The
policies and procedures for the preparation of Financial Statements and the procedures for payments were
also documented and reviewed to ensure compliance with the International Standards in Auditing (IASs)
and the relevant Oil and Gas regulatory laws on payments.
Applicable materiality guidelines, stipulated in the TOR were followed in addressing differences and
discrepancies that arose from the reconciliation.
Main Report and Recommendations
NEITI Oil and Gas Industry 2013 Audit
21
1.4 Objectives of the Audit
The objectives of the audit is to carry out the following tasks amongst others:
1. Report on the quantities of hydrocarbons (oil and gas and refined product, including condensate
where appropriate) produced, exported and utilized/imported in a manner, which is insightful, and
of such integrity as to be reasonably relied upon by NEITI and to also make recommendations on any
issues arising in the course of conducting the work.
2. To report on the revenue flows and investment flows amongst the Covered Entities, as more fully
described below, with transactions made by participants (both public and private) in Nigeria’s oil and
gas industry.
3. To undertake special verification work on certain classes of transactions.
4. To report on balances payable / receivable at the end of the audit period for certain financial flows.
5. To reconcile the physical/financial transactions reported by payers and recipients as appropriate, as
per the scope set out herein.
1.5 Sources of Data
The primary source of data is the Data Templates completed by Government Agencies and the companies
and returned to the auditor electronically for the purpose of the audit. Other primary sources of data are
documents generated by the covered entities such as financial statements, accounting records and various
transaction registers.
Publicly available data from various sources were also used to corroborate or reinforce information
provided in the primary data. Data contained in past audit reports were also used in the analyses of current
audit in other to be able to form an opinion.
Secondary data was sometimes generated by analyses and computations resulting from primary data
sources or by third party confirmations.
1.6 Basis of Accounting
Cash basis of accounting was adopted in the sourcing of data for the audit while the audit procedures
adopted for all Covered Entities was in accordance with the International EITI Guidelines, International
Auditing Standards (IS4400 Engagements to perform agreed upon procedures regarding financial
information) and the verification procedures as contained in the TOR.

Main Report and Recommendations
NEITI Oil and Gas Industry 2013 Audit
22
1.7 Materiality Threshold
The Audit and Reconciliation services was conducted in line with the following materiality considerations
approved by the NSWG:
For aggregate revenue and investment flows to the Federation: zero point zero five percent (0.05%)
of the annual total flow.
(This means that the permissible margin of error for aggregate reporting is zero point zero five percent of
the aggregate value of all flows encompassed within our audit scope)
All financial flows (excluding PAYE, VAT, WHT and CIT) of $5 million and above shall be reconciled
subject to a net reconciliation difference of 0.05% for the aggregate value of total financial flows and
total physical flows.
Our review of CBN Template revealed that 40 companies paid Petroleum Profit Tax (PPT) totalling $17.2
billion with 9 companies each paying less than $5 million. The total paid by the 9 companies is $5.96 million
representing 0.04% of total PPT payment.
However, 26 companies paid royalty totalling $6.2 billion with 6 companies each paying less than $5 million.
The total paid by the 6 companies is $8.74 million representing 0.14% of total Royalty paid.
On this basis and in consideration of the NSWG approved materiality threshold, the scope of the audit
covered all producing companies, while only companies with material payments (above $5 million) were
reconciled. This implies that 2013 NEITI Report include 99.96% of the flows reconciled on the basis of PPT
payments while 99.86% of the flows were reconciled on the basis of royalty payments with all other
companies below the threshold mading unilateral disclosures.
1.8 Scope of the Audit
As required by the disclosure provisions of the 2013 EITI Requirements (especially Requirement Nos 3, 4 and
5), the EITI Rules, and the Guidance note 9 of December 2013 containing suggested checklist establishing
the scope of EITI Reporting, this report among others:
Presents the contextual information on the Nigeria Oil and Gas Industry;
Shows the financial and volumetric flows between Industry Operators and Government Agencies
for the year 2013;
Compares the initial submissions from both the Industry Operators and the Government Agencies;
Identifies, investigates and explains material discrepancies;

Main Report and Recommendations
NEITI Oil and Gas Industry 2013 Audit
23
Reviews the Governance processes and procedures in the management of Oil and Gas sector
financial and hydrocarbon flows;
Reviews the systems and procedures utilized by the Covered Entities for purposes of calculating,
recording, processing, and settling financial transactions, and;
Makes recommendations for remedial actions to be taken where necessary.
1.9 Oil and Gas Companies covered
This reconciliation report specifically covers transactions for the period 2013 on Cash basis of accounting.
The covered entities in the project include all participating Industry Operators that for the purpose of this
audit are involved in Oil and Gas sector during the period under review and in accordance with the TOR.
The TOR specifically excludes all Oil and Gas entities without financial or production flow to the federation
during the period under review.
1.10 Government Agencies Covered
The Government Agencies covered by the Audit are either those Government regulatory entities specifically
mentioned in the TOR (CBN, OAGF, FIRS, DPR) or those that have responsibility and oversight functions in
the receipt, disbursement or management of state finances accruing from the Oil and Gas sector (NNDC,
NCMDB, NIMASA. NIWA). Others include state owned enterprises that are engaged in different strata of the
Oil and Gas expenditure (NNPC and its subsidiaries).
1.11 Summary of financial flows
The following major revenue payments made by all Covered Entities and receipts by the relevant
Government Agencies from the Oil and Gas sector were reviewed during the period except for NIMASA and
NESS payments by companies which could not be confirmed to the relevant Government entities because
the Entities did not provide corroborative data on the payments:
a. Sale of Government Crude Oil and Gas
b. Petroleum Profits Tax (PPT)
c. Royalty (Oil & Gas)
d. Concession Rentals
e. Companies Income Tax (CIT)
f. NDDC Levy

Main Report and Recommendations
NEITI Oil and Gas Industry 2013 Audit
24
g. NCDMB payments
h. Withholding Tax (WHT)
i. Pay-As-You-Earn (PAYE)
j. Value Added Tax (VAT)
k. Education Tax (EDT)
l. Gas Flared Penalties
m. NESS fees
n. NIMASA payments
o. NIWA payments
In addition to the above revenue flows, we have also reviewed other financial flows shown below:
Cash Calls
Dividends and Loan Repayment from NLNG
Subsidy Payments
Non-financial flows pertaining to “in-kind‟ transactions and the settlement of liabilities of royalties and taxes
and Carried Party Carry Cost and other items by means of crude oil allocations rather than financial
transfers were also reviewed.
1.12 Summary of Physical and Process flows
The physical and process flows covered in this report include the following:
Production and Terminal balances.
Process for Pricing of Federation Equity Crude Oil
Product importation and distribution
Production and Utilization of gas
Hydrocarbon metering system
Review of Systems and Procedures
Production arrangements and licensing
Recommendations on the review process
1.13 Data Quality and Review of Templates
Companies’ data provided in the completed templates were comprehensively reviewed and also vouched
(for consistency) to accounts that have been audited to Financial Statements and explanations obtained
from the companies where discrepancies occur.

Main Report and Recommendations
NEITI Oil and Gas Industry 2013 Audit
25
Copies of audited accounts were requested and obtained from all reporting companies.
The data provided on templates by government reporting entities were kept in accordance with the
provisions of Nigerian laws, Government Financial Regulations and Generally Accepted Accounting
Standards.
The Auditor General for the Federation has attested (see Appendix 1.13) that:
1. Government Agencies have fully declared all ‘material flows’ to the Nigerian Government, as set out
on the reconciliation forms;
2. Those amounts are consistent with the Financial Statements of the Government for the period
audited.
In our review, we have also excluded the following revenue flows.
a) Financing of the budgets of Government entities.
b) Internal flows between entities owned by NNPC.
c) Commercial transactions between non-state companies, except to the extent necessary to validate
transactions affecting terminal stock ownership, quantities and values.
d) Commercial transactions between non-state companies and state agencies for which the
consideration for such transactions does not involve Oil and Gas.
e) Commercial transactions between state companies in which the subject or the consideration for
such transaction does not involve oil or gas.
f) Crude Oil theft is reported as presented by companies but not considered in the summary of
financial flows.
It is in the opinion of the audit, that reconciled data reported by Government Entities and Companies are
reliable and consistent with the underline records made available at the respective Entities. Appropriate
confidentiality agreements were also signed in order to safeguard information provided by the companies.

Main Report and Recommendations
NEITI Oil and Gas Industry 2013 Audit
26

Main Report and Recommendations
NEITI Oil and Gas Industry 2013 Audit
27
2 CONTEXTUAL INFORMATION ON NIGERIAN OIL AND GAS INDUSTRY
2.1 Introduction
Nigeria is located within Sub – Saharan Africa and has a total land area of 923,768.64 sq. km. It shares
borders with the Republic of Benin in the west, Cameroon in the East, Niger and Chad in the north and the
Gulf of Guinea to the South. With a population estimate of about 170 million people, Nigeria is the largest
country in Africa and the largest producer and exporter of Crude Oil on the continent. Nigeria also has the
largest natural gas reserves in Africa and is among the world’s top five exporters of LNG. Given these large
reserves of human and natural resources, the country has significant potential to build a prosperous
economy characterized by rapid economic growth that can significantly reduce poverty and inequality while
at the same time improving standards of living of the population through better access to and quality of
health care, education and infrastructure services.
Unfortunately, this potential has not been achieved due partly to the over-dependence on Crude Oil and
Gas revenue and lack of transparency in the Oil and Gas Sector. The importance of NEITI in the
improvement of governance in the Oil and Gas sector for the overall interest of the vast majority of
Nigerians can therefore not be overemphasised.
2.2 Overview of the Oil and Gas industry
Nigeria is estimated to have a proven oil reserve of 37.2 billion barrels and a proven natural gas reserve of
180 trillion cubic feet (Tcf), which is the World’s 7th largest gas reserve.
Out of the thirty-six constituent states of the federation, nine states (Abia, Akwa Ibom, Bayelsa, Cross
Rivers, Delta, Edo, Imo, Ondo and Rivers) situated in the southern part, particularly the Niger Delta region of
the Country produce the onshore oil and gas, while the source of the country’s offshore production is from
wells in the Bight of Bonny, Bight of Benin and the Gulf of Guinea.
The United States traditionally had been the largest importer of Nigeria’s oil until the last few years, it is
worthy to note that in 2011, 33% (767,000 bbl/d) of Nigeria’s crude oil export was sent to the United States,
making Nigeria the fourth largest foreign crude oil supplier to the U.S. However with the recent exploration
of Shale Oil by the U.S, India is now the largest importer of Nigeria’s oil, importing 370,000bpd or 18% of
total crude exports in 2014.
Nigeria is also heavily dependent on the importation of Petroleum Products, importing about 164,000 bpd
of petroleum products in 2013 despite having four refineries with a combined crude oil distillation capacity
of 445,000 bpd. The refineries operate below full capacity because of operational failures, fires, vandalism

Main Report and Recommendations
NEITI Oil and Gas Industry 2013 Audit
28
and sabotage on the crude pipelines conveying domestic crude oil to the refineries. The combined capacity
utilisation of the four local refineries was 22% in 2013.
Nigeria operates a regime of subsidy on petroleum products and this has been a contentious political and
economic issue. According to Energy Global magazine, fuel subsidies costs was about US$8 billion in 2011,
accounting for 30% of the government’s expenditure, approximately 4% of GDP and 118% of the capital
budget. Fuel subsidy costs reported in the last NEITI Audit Report was about $8.6 Billion for year 2012.
The production and development of the huge natural gas reserve has been constrained largely due to the
lack of infrastructure to monetise natural gas that is currently flared. This is apart from the fact that the
natural gas industry is affected by the same security and regulatory challenges that affect the Oil Industry.
Nigeria exports the vast majority of its natural gas in the form of LNG through the partly government owned
Nigeria Liquefied Natural Gas (NLNG) company. The 2012 NEITI report gave Cumulative revenue of US$11.6
billion due to Nigerian government from NLNG as unaccounted for.1
2.3 Legal Frameworks, Legislations and Fiscal Regimes in the Nigerian Oil & Gas Industry
The Constitution of the Federal Republic of Nigeria 1999, section 44(3), vest the ownership and control of all
minerals, mineral oils and natural gas in, under or upon any land in Nigeria, its territorial waters, and
exclusive economic zone on the Federal Government. The Federal Government is to manage such minerals
in such manner as may be prescribed by the National Assembly. Thus the Constitution confers exclusive
jurisdiction on the National Assembly on matters relating to oil, gas and other minerals.
The Petroleum industry as it is today is governed through a myriad of Principal and subsidiary pieces of inter
related legislations dealing with specific aspect of the operations of the Oil and Gas industry.
There are aspects of the law stipulating ways in which businesses should be formed and organized. There
are equally others that explain the industry’s transactions, scope of operation, responsibility to government,
consumers and the international community.
Key legislation relating to the sector includes the Petroleum Act Cap P10 LFN 2004 (the Petroleum Act), the
Nigerian National Petroleum Corporation Act Cap N123 LFN 2004 (the NNPC Act), the Associated Gas
Reinjection Act 2004 and the Associated Gas Re-injection (Amendment Act) 2004 (the Associated Gas Acts),
the Petroleum Profits Tax Act Cap P13 LFN 2004 (the PPTA) and the Nigerian Oil & Gas Industry Content
Development Act 2010 (the NCDA).2
1 An overview of Oil and Gas Industry by Dennis Otiotio
2 Nigeria Oil and Gas Report- Freshfields Bruckhaus Deringer llp

Main Report and Recommendations
NEITI Oil and Gas Industry 2013 Audit
29
The Federal Ministry of Petroleum Resources has overall regulatory oversight of the Nigerian oil and gas
industry. The Ministry acts primarily through the Department of Petroleum Resources(DPR). Other
regulatory bodies include the Petroleum Products Pricing Regulatory Agency(PPPRA), which regulates the
rates for the transportation and distribution of petroleum products; the Federal Ministry of Environment,
Housing and Urban Development, which is responsible for approving environmental impact assessment
reports in respect of oil and gas projects; the Nigerian Content Development and Monitoring
Board(NCDMB), which is responsible for ensuring compliance with the Nigerian Content Development Act
(NCDA); and the Joint Development Authority(JDA), which is responsible for the supervision of petroleum
activities within the Nigeria–São Tomé and Príncipe Joint Development Authority. The Nigerian National
Petroleum Corporation (NNPC)also has regulatory roles that it performs through the Department of
Petroleum Resources(DPR). 3
2.3.1 Industry Reform - The Petroleum Industry Bill (PIB)
In recent years, the country has sought to overhaul the legislative framework relating to the oil and gas
industry, restructure the regulatory and commercial institutions in the industry and also change the fiscal
dynamics and reform the operational mechanisms of the upstream, downstream and natural gas industries.
This has resulted in the draft of the Petroleum Industry Bill (PIB) presented before the Nigerian parliament
or National Assembly in July 2012. The draft contains changes to taxation regimes, improved economies for
small, onshore developments, amended royalty structure and the unbundling of the State Owned
Enterprise, the NNPC4. The passage of the bill, which is likely to have a significant impact on, the Nigerian oil
and gas industry, has met a lot of resistance from the IOCs.
The PIB sets out to establish an omnibus legislation that will set transparent rules for the management of
the Oil and Gas Industry.
More information about the NEITI position on the PIB can be obtained from the NEITI website:
www.neiti.org.ng/index.php?q=press-releases/neiti-and-debate-petroleum-industry-bill-pib
2.4 Highlights of Oil and Gas Contribution to the Economy
The Nigerian Economy is one of the fastest growing economies in Africa. It was ranked 36th in the world (in
terms of nominal GDP) in 2012 and 30th in 2013 before rebasing (40th in 2005, 52nd in 2000), in April 2013,
3 Nigeria Oil and Gas Report- Freshfields Bruckhaus Deringer llp
4 Petroleum Industry Bill (PIB) 2008

Main Report and Recommendations
NEITI Oil and Gas Industry 2013 Audit
30
which made it the largest economy in Africa. Nigeria is also on track to become one of the 20 largest
economies in the world by 2020.
The country recently changed its economic analysis to account for rapidly growing contributors to its GDP,
such as telecommunications, banking, and its entertainment industry. As a result of this statistical revision,
Nigeria has added 89% to its GDP, making it the largest African economy. According to a Citigroup report
published in February 2011, Nigeria will get the highest average GDP growth in the world between 2010 and
2050. The country is also one of the two countries from Africa listed among 11 Global Growth Generators
countries.
The Oil and Gas Sector in Nigeria, employed the least number of employees in the Country in 2013.
According to the National Bureau of Statistics Job Creation Survey Report for the 1st, 2nd, 3rd, and 4th
quarters of 2013, out of the 10.97 Million employed in 2013, the Oil and Gas Sector accounted for 582
employements, representing 0.01% of the Total number employed in 20135.
Although much has been said about the status of Nigeria as a major exporter of oil, Nigeria produces only
about 2.7% of the world's supply (Saudi Arabia: 12.9%, Russia: 12.7%, USA: 8.6%) and to further put Oil and
Gas production in perspective, the sector contributed about 13% to Real GDP in 2013 (this will be lower if
the informal sector is considered) compared to Agricultural sector which contributed 38.2%. Therefore,
though the petroleum sector is important, it remains in fact a small part of an overall vibrant and diversified
economy6.
Table 2.4A – Growth Rate of Real GDP and Sectoral Shares (Percent)
Source: Central Bank of Nigeria, Economic Report, Fourth Quarter 2013
5 http://www.vanguardngr.com/2014/06/unemployment-oil-sector
6 Central Bank of Nigeria (CBN), Economic Report, Fourth Quarter 2013
Q4-11 Q1-12 Q2-12 Q3-12 Q4-12 Q1-13 Q2-13 Q3-13 Q4-13
Growth Rate (%)
Real 8.7 6.3 6.4 6.5 7.0 6.6 6.2 6.9 7.7
Oil (Crude Petroleum/Natural Gas) 6.5 -2.3 -0.7 0.1 -0.8 -0.5 -1.2 -0.5 0.3
Non-oil 9.1 8.1 7.6 7.6 8.2 7.2 7.4 8.0 8.7
Share in Real GDP (%)
Real GDP 100 100 100 100 100 100 100 100 100
Oil (Crude Petroleum/Natural Gas) 14.4 15.8 13.9 13.4 12.6 14.8 12.9 12.6 11.7
Non-oil 85.6 84.2 86.1 86.7 87.4 85.2 87.1 87.4 88.3

Main Report and Recommendations
NEITI Oil and Gas Industry 2013 Audit
31
Figure 2.4A - Real GDP Growth Rate and Share of Oil and Non-oil in GDP
Source: Central Bank of Nigeria, Economic Report, Fourth Quarter 2013
The importance of the petroleum industry to the economic growth of the country can best be appreciated
when the Central Bank of Nigeria statistics, which shows that Oil and Gas revenue constituted 69.9% of
Gross Federally-collected revenue in 2013, is considered.
Table 2.4B, Figure 2.4B, Table 2.4C and Figure 2.4C below are illustrations of components and contributions
to Federation Accounts Revenue.
Table 2.4B - Gross Federation Account Revenue (N billion)
Q4-11 Q1-12 Q2-12 Q3-12 Q4-12 Q1-13 Q2-13 Q3-13 Q4-13
Federally-Collected Revenue (Gross)
3,025.1
2,955.4
2,596.2
2,602.3 2,484.1
2,425.3
2,373.8
2,746.7
2,201.9
Oil Revenue 2,408.1
2,376.0
1,981.6
1,936.2 1,823.6
1,849.5
1,813.8
1,622.8
1,538.4
Non-Oil Revenue 617.0
579.4
614.6
666.1 660.5
575.8
560.0
1,123.9
663.5
Source: CBN Economic Report, Fourth Quarter 2013

Main Report and Recommendations
NEITI Oil and Gas Industry 2013 Audit
32
Figure 2.4B - Components of Gross Federally Collected Revenue
Source: CBN Economic Report, Fourth Quarter 2013
The main components of Gross Oil Revenue collected into the Federation account are Crude Oil and Gas
sales (net of allocation to Joint Venture Cash calls), Petroleum Profit Tax, Royalties (Crude Oil and Gas).
Others include Gas flared penalties, Concession Rentals and other taxes other than PPT.
Table 2.4C - Components of Oil and Gas Revenue
Source: CBN Economic Report, Fourth Quarter 2013

Main Report and Recommendations
NEITI Oil and Gas Industry 2013 Audit
33
Figure 2.4C - Components of Oil and Gas Revenue
Source: CBN, Economic Report, Fourth Quarter 2013
2.5 Summary of Exploration and Production Data for 2013 Fiscal Year
The NNPC reported the acquisition of 4,695.67 sq. kms of 3D Seismic data, while 4,396 sq kms was
processed/reprocessed. Thirty-Three (33) rigs were in operation and One hundred and Eighty-One (181)
wells were drilled. Significant part of the exploration activity was in the North (Chad Basin) and the East
(Anambra Basin)7.
The total production of Crude oil for 2013 is 800,488,000 bbl, this is a drop of 7.63% from 866,651,059 bbl
recorded in 2012. The breakdown of the production liftings is as shown in Table 2.5 below:
Table 2.5 -Total Production of Crude Oil for 2013 and the Breakdown of the Production Liftings
PRODUCTION 2013
Bbl'000
Total Opening Inventory 12,489
Production 800,488
Ekanga/Zafiro Crude 4,030
Total Inventory for Lifting 817,007
Terminal adjustment/shrinkage (381)
Available Total Terminal Inventory 816,626
LIFTING
Federation Export:
Joint Venture Operators (JV) 79,929
7 NNPC 2013 Annual Statistical Bulletin

Main Report and Recommendations
NEITI Oil and Gas Industry 2013 Audit
34
PRODUCTION 2013
Bbl'000
Production Sharing contractors (PSCs) 99,375
Service Contractors (SCs) 2,649
Sub –Total Federation Export 181,953
PPMC Domestic Crude Supply (Refining / Sales):
Joint Venture Operator (JVs) 153,965
Production Sharing Contractors 4,849
Sub –Total Domestic Crude Supply (Refining / Sales) 158,814
Sub-Total: Federation +PPMC Lifting 340,767
Other Operators:
JV Operators 167,466
Production Sharing Contractors PSCs 207,385
Service Contractors (SCs) 999
Sole Risk 65,667
Marginal Fields 18,054
Sub-Total: Other Operators 459,571
Total Lifting 800,338
Balance Closing Inventory 16,288
Source: NNPC-COMD Records
The Ekanga/Zafiro Crude Oil shown in the table above is the total production from the untised field in the Joint
Development Zone (JDZ) of Nigeria and São Tomé and Príncipe
2.6 Government Participation in the Oil and Gas Sector
The NNPC is the State oil company that represents Government interests in the various production
arrangements and contracts in the Oil and Gas Industry. It is a statutory corporation that also play
regulatory roles aside from engaging in activities that span through the whole spectrum of the oil and gas
value chain, from exploration, to production, refining, transportation, distribution and supply of petroleum
products.
NNPC sometimes operates directly in petroleum operations (for example, its participation in upstream
petroleum arrangements with international oil companies) and sometimes indirectly through subsidiaries.
One of the more prominent subsidiaries is the Nigerian Petroleum Development Company (“NPDC”), which
is engaged in petroleum exploration and production. Another well-known subsidiary is the Pipelines and
Product Marketing Company Limited (“PPMC”). The PPMC is responsible for the transportation of crude oil
to the refineries and the transportation of petroleum products to depots located in various parts of Nigeria.

Main Report and Recommendations
NEITI Oil and Gas Industry 2013 Audit
35
Government has already commenced plans to privatise the PPMC as well as other subsidiaries operating in
the downstream petroleum sector.
Another important arm of the NNPC is the National Petroleum Investment Management Services
(“NAPIMS”). The NAPIMS is responsible for overseeing the investments of the Federal Government of
Nigeria in upstream petroleum operations conducted under joint ventures, production sharing contracts
and other petroleum arrangements with the international oil companies (“IOCs”).
In the downstream, NNPC has four refineries in Kaduna, Port Harcourt and Warri that were built between
1978 and 1985 with a total installed capacity of 445,000 bpd and these refineries are linked with a network
of pipelines and Depots.
The Nigerian government in 1988 restructured the NNPC into six Directorates namely; Exploration and
Production, Refineries and Petrochemicals, Finance and Accounts, Commercial and Investment, Corporate
Services, and Gas and Power under a Group Managing Director. Twelve subsidiaries were also formed
namely; Duke Oil, Hyson (Carlson Bermuda), Integrated Data Services Ltd (IDSL), National Engineering &
Technical Co. (NETCO), Nigerian Gas Co. (NGC), Nigerian Petroleum Development Co. (NPDC), National
Petroleum Investment Management Service (NAPIMS), Warri Refining & Petrochemical Co. (WRPC), Kaduna
Refining & Petrochemical Co. ‘(KRPC), and Port Harcourt Refining Co. (PHRC).
There are also indications that the current Nigeria government is on the path of restructuring the NNPC as
part of the current investigations and reviews going on in the Oil and Gas Industry.8
2.7 Overview of Revenue collection from Oil and Gas Industry
The revenue payments from the Oil and Gas Industry are made to various tiers of government and Sub-
National entities. Revenues paid to the National Government include the following:
a. Proceeds from sale of Government Crude Oil and Gas.
This refers to the Federal share of Crude Oil from the various production arrangements. It could be
in the form of equity share from Joint Ventures (JVs) or Profit Oil from Production Sharing Contracts
(PSCs). The proceeds are paid into the revenue account in both local (Domestic crude Oil) and
foreign currency (Export crude Oil)
b. Petroleum Profits Tax (PPT)
The Petroleum Profits Tax (PPT) is a tax imposed on the profits from petroleum operations in an
accounting period.
8 An overview of Oil and Gas Industry by Dennis Otiotio

Main Report and Recommendations
NEITI Oil and Gas Industry 2013 Audit
36
c. Royalty (Oil & Gas)
d. Signature Bonuses
e. Licenses and Concession Rental
f. Gas Flared Penalties.
g. Companies Income Tax (CIT)
h. Value Added Tax (VAT)
i. Withholding Tax (WHT)
j. Pay-As-You-Earn (PAYE) of Federal Capital Territory residents.
k. Education Tax (EDT)
The Withholding Tax deductions from individuals and Registered Business Names are payable to the States
in accordance with the Personal Income Tax Act.
Other revenue flows to Sub-national entities are:
a. Niger Delta Development Commission (NDDC) Levy b. Nigerian Content Development and Monitoring Board (NCDMB) payments c. Nigerian Export Supervision Scheme (NESS) fees d. Nigerian Maritime Administration and Safety Agency (NIMASA) payments e. National Inland Waterway Authority (NIWA) payments.
The various revenue flows to the Oil and Gas Industry mentioned above are discussed in Section 8.8.1 of this report.
2.8 Overview of Federation Revenue Distribution, Management & Expenditure
The Revenue Allocation Act provides for the Distribution of the federation funds. Section 1 of the Act
provides that, “the amount standing to the credit of the Federation Account, less the sum equivalent to 13
per cent of the revenue accruing to the Federation Account directly from any natural resources as a first line
charge for distribution to the beneficiaries of the derivation funds in accordance with the Constitution is
distributed among the Federal and State Governments and the Local Government Councils in each State of
the Federation9.” The current Revenue Allocation Formula and distribution of Federation Account Revenue
among the three tiers of Government are as follows:
9 Revenue Allocation Act, 2004

Main Report and Recommendations
NEITI Oil and Gas Industry 2013 Audit
37
Table 2.8A: Revenue Allocation Formula
%
Federal Government 52.68
State Government 26.72
Local Government Councils 20.6
Figure 2.8A – Federation Revenue Vertical Sharing Model
10Source: NEITI Fiscal Allocation and Statutory Disbursement (FASD) Audit 2007-2011 Summary Report
The distribution of revenue from the Oil and Gas Industry and other non-oil and gas sources is illustrated in Figure
2.8A above.
The percentage accruable to each tier of Government (36 states and 774 Local Governments) is shared among the constituents of each tier by applying factors such as Equality, Population, Land Mass, Internally Generated Revenue, Social Development (Health, Education and Water) while the 13% derivation fund deducted as a first line charge is further shared among the Oil producing states based on the derivation principle. The Federal Government also earmark special budgetary provisions for oil producing states of Abia, Akwa Ibom, Bayelsa, Cross Rivers, Delta, Edo, Imo, Ondo and Rivers States, which are channelled through the Federal Ministry of Niger Delta, and the Amnesty Programme under the Presidency for efficiency and effective impact. The Niger Delta Development Commission (NDDC) also receives direct payments from oil and gas Industry to cater
10
NEITI Fiscal Allocation and Statutory Disbursement (FASD) 2007-2011 Summary Report

Main Report and Recommendations
NEITI Oil and Gas Industry 2013 Audit
38
for the Oil producing states and this is not part of the federation budget.
More information on Accountant General of the Federation and Nigerian Bureau of Statistics can be obtained from
: http://oagf.gov.ng/ and http://www.nigerianstat.gov.ng/ respectively.
Table 2.8B: Federation Account Allocation Statement for the period of January to December, 2013
DETAILS JAN-DEC, 2013
N
Mineral Revenue 5,862,169,249,565.15
Deduction (1,131,191,531,904.40)
Sub-Total 4,730,977,717,660.75
Non-Mineral Revenue 1,419,115,331,197.45
Deduction (161,419,163,386.94)
Sub-Total 1,257,696,167,810.51
Grand-Total 5,988,673,885,471.26
Source: Office of the Accountant-General of the Federation
Table 2.8C: Analysis of Distribution: Oil and Gas Revenue for the period of January to December, 2013
DETAILS Rate JAN-DEC, 2013
N
Amount for Distribution 4,730,977,717,660.75
Federal Government 52.68% 2,168,282,783,647.40
State Government 26.72% 1,099,782,004,158.29
Local Government 20.60% 847,885,826,559.16
Derivation (13% of Mineral Revenue) 13.00% 615,027,103,295.90
Total 4,730,977,717,660.75
Source: Office of the Accountant-General of the Federation
Table 2.8D: Analysis of Distribution: Non- Oil and Gas Revenue for the period of January to December, 2013
DETAILS Rate JAN-DEC, 2013
N
Amount for Distribution 1,257,696,167,810.51
Federal Government 52.68% 662,554,341,202.58
State Government 26.72% 336,056,416,038.97
Local Government 20.60% 259,085,410,568.97
Derivation (13% of Mineral Revenue) 13.00% -

Main Report and Recommendations
NEITI Oil and Gas Industry 2013 Audit
39
Total 1,257,696,167,810.51
Source: Office of the Accountant-General of the Federation
Table 2.8E: Analysis of Distribution: Oil and Gas/Non Oil and Gas Revenue for the period of January to December, 2013
DETAILS JAN-DEC, 2013
N
Amount for Distribution 5,988,673,885,471.26
Federal Government 2,830,837,124,849.98
State Government 1,435,838,420,197.26
Local Government 1,106,971,237,128.12
Derivation (13% of Mineral Revenue) 615,027,103,295.90
Total 5,988,673,885,471.26 Source: Office of the Accountant-General of the Federation
The budgeting process at the Federal level is initiated through Budget Office meetings with key revenue
generating agencies (including the Federal Inland Revenue Service, Nigerian Customs Service and the NNPC)
as well as key economic agencies (including National Planning Commission, National Bureau of Statistics and
the Central Bank of Nigeria).
The Budget Office, under the supervision of the Minister of Finance then issues a “Call Circular” instructing
the Ministries, Departments and Agencies (MDAs) to submit estimates of their capital and recurrent
expenditure requirements, which is evaluated and consolidated as a draft budget.
The Minister of Finance subsequently presents the draft budget to the President for approval. The approved
budget, together with supporting documents, is formally presented by the President to the joint session of
the National Assembly for consideration and appropriation.
The two arms of the legislature separately consider and harmonize the draft budget and thereafter approves
separately, after which it is presented as the Appropriation Bill to the President for assent. Once the
President assents to the Appropriation Bill, it becomes an Act of parliament passed into law. The budgeting
circle is shown in the flow diagram below:

Main Report and Recommendations
NEITI Oil and Gas Industry 2013 Audit
40
Figure 2.8B – Simplified Budget Circle
More information on Budget Office of the Federation can be obtained from: http://www.budgetoffice.gov.ng/
The Auditor General of the Federation is responsible for carrying out the audit of public accounts while post-
budget period audits are the responsibility of the Public Accounts Committee (PAC). PAC examines historical
records for disbursements and budget performance.
More information on Auditor General for the Federation can be obtained from:
http://www.oaugf.gov.ng/
2.9 Overview of Licensing and License Allocations
The Petroleum Act provides for three types of licenses in other to conduct upstream petroleum operations
in Nigeria. Participants must first obtain from the Minister an Oil Exploration License (OEL), Oil Prospecting
License (OPL) or Oil Mining License (OML) to explore, exploit and produce petroleum (including natural gas)
within the concession area. Only a company incorporated in Nigeria may be granted such a license. An
application must contain prescribed information and be accompanied by the applicable fee.

Main Report and Recommendations
NEITI Oil and Gas Industry 2013 Audit
41
An OPL gives the holder the exclusive right to explore and prospect for petroleum. The holder of an OPL, on
successfully prospecting and discovering oil in commercial quantities, may apply for an OML. The OML is the
final stage for petroleum exploration and production, giving the holder the right to explore for and dispose
of any petroleum discovered within the area covered by the OML.
The duration of the licenses differ. An OEL is valid for one year and is renewable for a further one year
provided the licensee fulfills prescribed conditions. The maximum tenure of an OPL is five years when
granted over land and territorial waters and seven years when granted in respect of continental shelf and
Exclusive Economic Zone areas. An OML has a term of 20 years but may be renewed on the written approval
of the Minister. The OPL or OML is deemed to have attained commercial quantity if there is a production of
10,000 bpd from the lease area11.
The list of existing OMLs, OPLs, equity holding companies, and type of commercial arrangements (JVs, PSCs,
and Sole Risks etc.), effective date of subsisting ownership and other field data are contained in Appendix
2.9. No new licenses were issued in 2013.
2.10 Overview of Beneficial Ownership of Corporate Entities operating in the Oil and Gas Sector
There is currently no law in Nigeria that compels companies to disclose their Beneficial Owners. The 2013
NEITI Oil and Gas Audit sought to obtain the Beneficial Owners of Companies operating in the Nigerian Oil
and Gas Industry as defined within the scope of the EITI requirement 3 and was able to obtain names of the
natural person(s) who directly or indirectly (through another company) ultimately controls the corporate
entity except for publicly listed companies and wholly owned subsidiaries.
Information on beneficial owners of Oil and Gas Entities is available to the public on application to the
Corporate Affairs Commission by a registered Legal Practitioner or Chartered Accountant.
The companies provided information on Beneficial Owners as part of Audit Request and this was further
validated by information provided by the CAC. The companies covered are those within the scope of the
NEITI 2013 Oil and Gas Industry Audit.
Full details of the Beneficial Owners as completed by covered entities in the NEITI 2013 Oil and Gas Industry
Audit and authenticated by information from the CAC is contained in Appendix 2.10.
11
Petroleum Act 1969 and Petroleum (Drilling and Production) Regulation 1969

Main Report and Recommendations
NEITI Oil and Gas Industry 2013 Audit
42
2.11 Overview of Operating Contracts Disclosure in Nigerian Oil and Gas Industry
Information relating to Oil and Gas exploitation Contracts are not freely available in the public domain.
NEITI Oil and Gas audit 2013 therefore sought for the completion of contract data templates and full text of
actual contract documents as part of the EITI requirements for a need to publicly disclose Contracts and
Licenses that provide the terms attached to the exploitation of Oil and Gas.
Twenty-Nine (29) of the forty one (41) Companies covered in the audit, completed the Field legal contract
templates showing type of commercial arrangements, shareholding structure between companies in the
arrangement, OPL/OML number and date granted. Details of Field Legal Contracts as completed by the
Companies are contained in Appendix 2.11 to this report.
The operating contracts in the Nigeria Oil and Gas industry are classified into Joint Venture Agreements
(JVs), Production Sharing Contracts (PSCs), the service contracts, Farm-out agreements and the Modified
Carry Agreements (MCAs).
The Department of Petroleum Resources (DPR), which is responsible for the issuance and regulation of
licenses, also has the standard formats of the contracts with Government and the complete listings of
licenses and the type of contract arrangements. The NNPC, which usually signs the agreement on behalf of
the Federation, also has copies of the agreements entered into on behalf of the Federation. Details of
contracts and licenses provided by DPR are contained in Appendix 2.9

Main Report and Recommendations
NEITI Oil and Gas Industry 2013 Audit
43

Main Report and Recommendations
NEITI Oil and Gas Industry 2013 Audit
44
3 SUMMARY OF AGGREGATED FINANCIAL FLOWS
3.1 Introduction
The total Financial Flows from all sources in the Oil and Gas sector of the Extractive Industries in Nigeria in
2013 amounted to $58.080 billion. These Financial Flows are summarised in Table 3.1 below.
The total flow from all sources as stated above was the revenue from Oil and Gas industry to the Federation
and other sub-national entities in 2013. However, the actual collections into the Federation account was
less than amount reported in the table below due to the differences between the physical values in Crude
Oil and Gas flows and actual cash payments received into the various accounts. Specific details of these
differences form part of this audit report and are discussed in Section 3.3.
In addition to the revenue flows in table 3.1, we have also reviewed the following financial flows:
Cash Calls - section 6.6
Subsidy Payments – section 7
These Financial flows and other Non-financial flows relating to “in-kind‟ transactions and the settlement of
liabilities of Royalties and PPT as well as Carried Party Carry Cost and other items by means of crude oil
allocations rather than financial transfers were also reviewed and discussed in this report.
Table 3.1: Summaries of Financial Flows from all Sources
2013
US$'000
Sales of Crude Oil and Gas
Federation Equity & Profit Oil 19,050,886
Domestic Crude 17,435,818
Gas 616,006
Feed Stock 1,357,525
Sales of Crude Oil and Gas (Total) 38,460,235
*Less: PSCs / MCAs in Kind Payments
Petroleum Profit Tax (PPT) - PSCs/MCAs 10,273,854
Royalty (Oil) - PSCs/MCAs 993,167
MCA Gas CIT/EDT 83,954
MCA Royalty (Gas) 18,343
PSCs/MCAs in Kind Payments (Total) 11,369,318
Sub-Total (A) 27,090,917
Other Specific Financial Flows
Petroleum Profit Tax (PPT) 17,591,512

Main Report and Recommendations
NEITI Oil and Gas Industry 2013 Audit
45
2013
US$'000
Royalty (Oil) 6,182,319
Royalty (Gas) 119,093
**Signature Bonus 12,500
Gas Flared Penalties 18,475
Concession Rentals 133,750
Total Confirmed Flows 24,057,650
Other Flows to Federation Account
Companies Income Tax (CIT) 556,050
Value Added Tax (VAT) 965,521
Total Other Flows to Federation Account 1,521,571
Sub-Total (B) 25,579,220
Total Flows to the Federation Account (A+B) 52,670,137
Other Flows
Dividends & Repayment of Loans by NLNG 1,289,592
PAYE 168,524
Withholding Tax 991,693
Total other Flows 2,449,809
Flows to States and Local Govt.
Withholding Tax 17,740
PAYE 556,030
NLNG Tax Payments to Local Govt. 1,089
Total Flows to States 574,859
Flows to other Entities
Contributions to NDDC 562,921
Education Tax 1,477,764
NCDMB 1% Levy 115,925
***NESS Fee 63,100
***NIWA Levy 221
****Carbotage levy 164,945
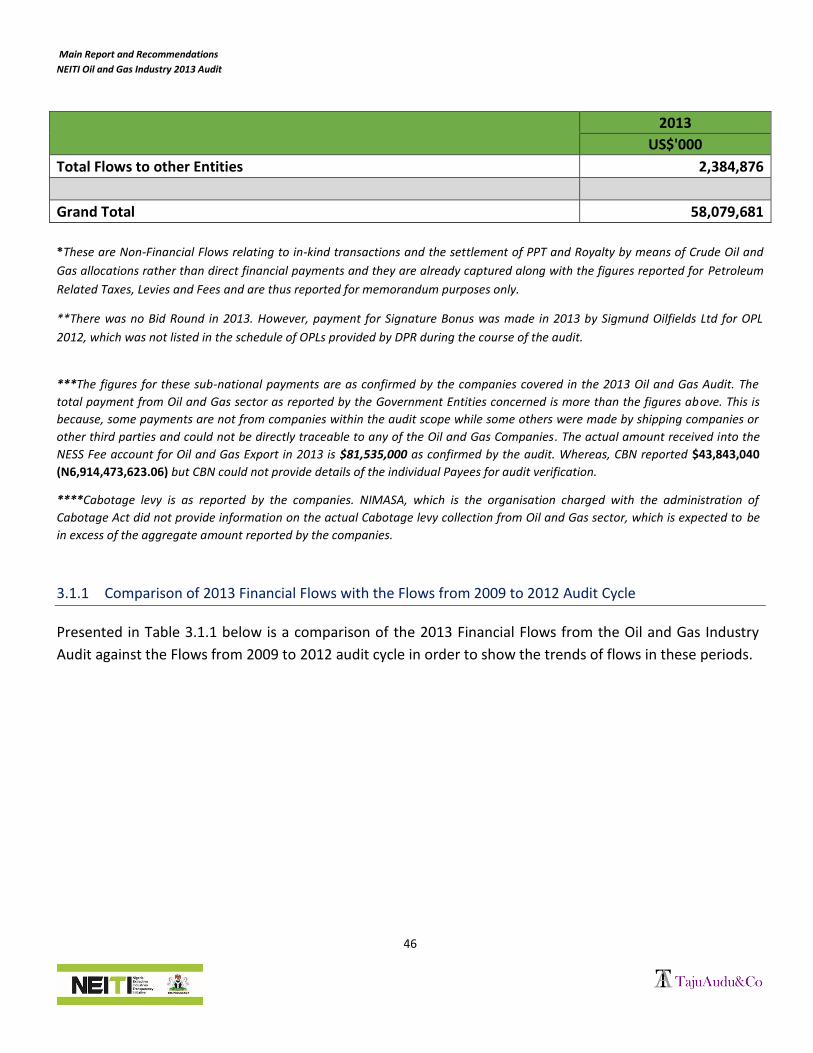
Main Report and Recommendations
NEITI Oil and Gas Industry 2013 Audit
46
2013
US$'000
Total Flows to other Entities 2,384,876
Grand Total 58,079,681
*These are Non-Financial Flows relating to in-kind transactions and the settlement of PPT and Royalty by means of Crude Oil and
Gas allocations rather than direct financial payments and they are already captured along with the figures reported for Petroleum
Related Taxes, Levies and Fees and are thus reported for memorandum purposes only.
**There was no Bid Round in 2013. However, payment for Signature Bonus was made in 2013 by Sigmund Oilfields Ltd for OPL
2012, which was not listed in the schedule of OPLs provided by DPR during the course of the audit.
***The figures for these sub-national payments are as confirmed by the companies covered in the 2013 Oil and Gas Audit. The
total payment from Oil and Gas sector as reported by the Government Entities concerned is more than the figures above. This is
because, some payments are not from companies within the audit scope while some others were made by shipping companies or
other third parties and could not be directly traceable to any of the Oil and Gas Companies. The actual amount received into the
NESS Fee account for Oil and Gas Export in 2013 is $81,535,000 as confirmed by the audit. Whereas, CBN reported $43,843,040
(N6,914,473,623.06) but CBN could not provide details of the individual Payees for audit verification.
****Cabotage levy is as reported by the companies. NIMASA, which is the organisation charged with the administration of
Cabotage Act did not provide information on the actual Cabotage levy collection from Oil and Gas sector, which is expected to be
in excess of the aggregate amount reported by the companies.
3.1.1 Comparison of 2013 Financial Flows with the Flows from 2009 to 2012 Audit Cycle
Presented in Table 3.1.1 below is a comparison of the 2013 Financial Flows from the Oil and Gas Industry
Audit against the Flows from 2009 to 2012 audit cycle in order to show the trends of flows in these periods.

Main Report and Recommendations
NEITI Oil and Gas Industry 2013 Audit
47
Table 3.1.1: Comparison of Financial Flows
2009
US$'000
2010
US$'000
2011
US$'000
2012
US$'000
2013
US$'000
% Changes
between
2012 and
2013
Sales of Crude Oil and Gas
Federation Equity & Profit Oil 10,133,931 17,693,065 24,760,831 21,611,186 19,050,886 -12%
Domestic Crude 9,903,033 13,228,942 18,363,100 18,147,751 17,435,818 -4%
Gas 351,357 456,284 610,857 489,033 616,006 26%
Feed Stock 415,328 1,320,043 1,825,617 1,845,370 1,357,525 -26%
Sales of Crude Oil and Gas (Total) 20,803,649 32,698,334 45,560,405 42,093,340 38,460,235 -9%
*Less: PSCs / MCAs in Kind Payments
Petroleum Profit Tax (PPT) - PSCs/MCAs 2,854,787 4,861,801 8,234,874 10,759,802 10,273,854 -5%
Royalty (Oil) - PSCs/MCAs 337,916 201,512 601,413 959,781 993,167 3%
MCA Gas CIT/EDT - - - - 83,954
MCA Royalty (Gas) - - - - 18,343
PSCs/MCAs in Kind Payments (Total) 3,192,703 5,063,313 8,836,287 11,719,583 11,369,318 -3%
Sub-Total (A) 17,610,946 27,635,021 36,724,118 30,373,757 27,090,917 -11%
Other Specific Financial Flows
Petroleum Profit Tax (PPT) 5,399,508 8,590,183 18,763,688 18,851,676 17,591,512 -7%
Royalty (Oil) 2,578,360 3,853,835 6,041,396 6,725,282 6,182,319 -8%
Royalty (Gas) 30,658 75,327 90,076 107,601 119,093 11%
**Signature Bonus 5,000 - 216,146 - 12,500 100%
Gas Flared Penalties 19,300 17,873 22,487 24,580 18,475 -25%
Concession Rentals 1,446 1,151 2,225 2,895 133,750 4520%
Total Confirmed Flows 8,034,272 12,538,369 25,136,018 25,712,034 24,057,650 -6%
Other Flows to Federation Account
Companies Income Tax (CIT) 236,347 367,998 273,481 441,048 556,050 26%
Value Added Tax (VAT) 1,289,346 910,620 1,005,030 770,834 965,521 25%
Total Other Flows to Federation Account 1,525,693 1,278,618 1,278,511 1,211,882 1,521,571 26%
Sub-Total (B) 9,559,965 13,816,987 26,414,529 26,923,916 25,579,220 -5%
Total Flows to the Federation Account (A+B) 27,170,911 41,452,008 63,138,647 57,297,675 52,670,137 -8%
Other Flows
Dividends & Repayment of Loans by NLNG 879,839 1,427,512 2,537,503 2,795,531 1,289,592 -54%
PAYE 9,111 3,510 13,120 87,918 168,524 92%
Withholding Tax 550,543 604,181 918,685 794,880 991,693 25%
Total other Flows 1,439,493 2,035,203 3,469,308 3,678,329 2,449,809 -33%
Flows to States and Local Govt.
Withholding Tax 10,544 12,771 12,045 11,314 17,740 57%
PAYE 471,758 476,516 586,001 197,667 556,030 181%
NLNG Tax Payments to Local Govt. - - - 36 1,089 2925%
Total Flows to States 482,302 489,287 598,046 209,017 574,859 175%
Flows to other Entities
Contributions to NDDC 398,416 561,390 703,292 558,808 562,921 1%
Education Tax 638,364 407,107 533,035 1,120,421 1,477,764 32%
NCDMB 1% Levy - - - 80,010 115,925 45%
***NESS Fee - - - - 63,100 100%
***NIWA Levy - - - 96 221 130%
****Carbotage levy - - - - 164,945 100%
Total Flows to other Entities 1,036,780 968,497 1,236,327 1,759,335 2,384,876 36%
Grand Total 30,129,486 44,944,995 68,442,328 62,944,356 58,079,681 -8%

Main Report and Recommendations
NEITI Oil and Gas Industry 2013 Audit
48
3.1.2 Analysis of Financial Flows
The previous audit cycles witnessed a steadily increasing trend in the total Financial Flows to Federation
from $30.129 billion in 2009, to $44.944 billion in 2010, and $68.442 in 2011. However there was a decline
in 2012 and 2013 to $62.944 billion and $58.080 billion respectively. The decrease in 2013 was largely due
to a drop in the Sales Revenue from Crude Oil and Gas attributable to reduction in production and lifting
volumes as in the case of 2012. The reduction in production and lifting Volumes is as a result of the
following:
Divestment of Federation equity in some OMLs, notably from NAOC and SPDC JVs from which NNPC
lifted Crude Oil on behalf of NPDC instead of Federation account.
Deferred production and Crude losses due to destruction of production facilities and pipeline
breakages.
Crude Theft
Figure 3.1.2A – 2009-2013 Comparative Financial Flows from all Sources
-
10,000,000
20,000,000
30,000,000
40,000,000
50,000,000
60,000,000
70,000,000
2009 2010 2011 2012 2013
30,129,486
44,944,995
68,442,328
62,944,355
58,079,681
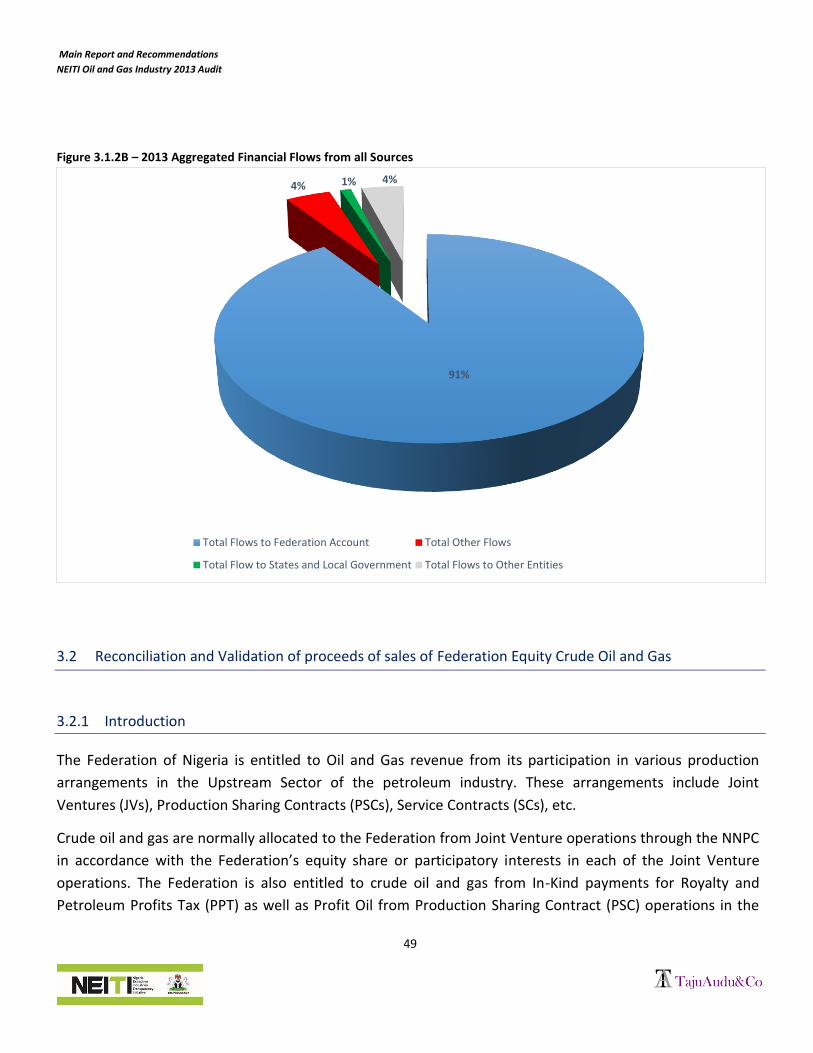
Main Report and Recommendations
NEITI Oil and Gas Industry 2013 Audit
49
Figure 3.1.2B – 2013 Aggregated Financial Flows from all Sources
3.2 Reconciliation and Validation of proceeds of sales of Federation Equity Crude Oil and Gas
3.2.1 Introduction
The Federation of Nigeria is entitled to Oil and Gas revenue from its participation in various production
arrangements in the Upstream Sector of the petroleum industry. These arrangements include Joint
Ventures (JVs), Production Sharing Contracts (PSCs), Service Contracts (SCs), etc.
Crude oil and gas are normally allocated to the Federation from Joint Venture operations through the NNPC
in accordance with the Federation’s equity share or participatory interests in each of the Joint Venture
operations. The Federation is also entitled to crude oil and gas from In-Kind payments for Royalty and
Petroleum Profits Tax (PPT) as well as Profit Oil from Production Sharing Contract (PSC) operations in the
91%
4% 1% 4%
Total Flows to Federation Account Total Other Flows
Total Flow to States and Local Government Total Flows to Other Entities

Main Report and Recommendations
NEITI Oil and Gas Industry 2013 Audit
50
country. Furthermore, Oil and Gas Revenue is derived by the Federation from residual crude oil and gas
production from JV fields under certain Alternative Funding arrangements such as Third-Party Financing
arrangements and Carry Agreements (CAs) / Modified Carry Agreement (MCAs).
The NNPC-COMD is saddled with the responsibility to lift, market and sell all Government crude oil
entitlements on behalf of the Federation from the above sources. The proceeds from the sale of the various
lifting are, however, accounted for through designated foreign and local bank accounts with JP Morgan
Chase and CBN for each of the parties (FIRS, DPR, NNPC, etc.). Thus, The Federation equity crude oil and gas
is accounted for directly by the NNPC, while the sales proceeds, with respect to crude oil and gas lifting for
Royalty and Petroleum Profits Tax / Companies Income Tax as well as Education Tax, are accounted through
bank accounts opened and maintained by the DPR and FIRS respectively.
The off takers of the crude oil and gas are normally directed to make payments for the invoice values of
their lifting of crude oil and / or gas – as the case may be – into the respective accounts, and the affected
parties are informed by SWIFT messages when the transaction is completed. It is therefore the
responsibility of the DPR to account for the sales proceeds of Royalty oil and gas while the FIRS accounts for
Tax oil and gas as the case may be. The Central Bank of Nigeria remains the custodian of all the funds in the
Foreign Bank Accounts. Below is the diagram depicting national Crude Oil production, lifting and revenue
stream.

Main Report and Recommendations
NEITI Oil and Gas Industry 2013 Audit
51
Figure 3.2.1 - National Crude Oil Production, Liftings and Revenue Streams
Source: Nigeria National Petroleum Corporation (NNPC)
3.2.2 Scope of Work
The scope of work and tasks performed are in line with the requirements of Validation of Federation Equity
crude as detailed in 2013 NEITI Oil and Gas Audit Terms of Reference (TOR) contained in the attached
appendix 1.2 and in accordance with the EITI Standard requirements.
3.2.3 Approach and Methodology
In addressing the Specific Scope of Work, a Work Programme was designed covering key areas of Data
Identification and gathering, Literature Review and comprehensive review of the template data provided by
NNPC-COMD to ascertain their level of completeness or otherwise. Validation and Reconciliation on a 100%
basis was carried out on all classes of transactions in the year under review, while discrepancies were
investigated within the Materiality Threshold.
3.2.4 System Documentation and Procedural Review
NNPC Crude Oil Marketing Division (COMD) is responsible for the marketing and sale of Nigeria equity Crude
Oil on behalf of the Federation. In this capacity, the NNPC-COMD also markets and sells crude oil for the

Main Report and Recommendations
NEITI Oil and Gas Industry 2013 Audit
52
Account of DPR, FIRS, PPMC, certain Joint venture projects (Third party finance and MCAs), NPDC and Pan
Ocean.
System Flow for Crude Oil Marketing begins with Curtailment Meeting usually held on every first week of
every month between Staff of the Crude Oil Stock Management (COSM) and Representatives of Crude Oil
Producers (PSCs, JVs, Marginal fields, etc.). Objectives of the Curtailment Meeting, among others include:
a. To discuss the total crude oil production estimate by producers for the following month.
b. To ascertain the Quantity of Crude Oil allotted to the NNPC, FIRS, and DPR and other stakeholders.
Other critical steps in the Crude Oil marketing process include the allotment to beneficiaries and off-takers,
preparation of shipping documents, invoicing, Letters of Credits, payment by LC banks and reconciliation
meetings. These critical steps are shown in the system flow diagram below while a more detailed
descriptive step can be found in appendix 3.2.4. Figure 3.2.4: System flow for Crude Oil and NGLs Sales

Main Report and Recommendations
NEITI Oil and Gas Industry 2013 Audit
53
Detailed system Compliance Test Procedures on all Domestic and Export crude oil sales transactions in 2013
was also performed to ascertain amongst others, that the pricing methodology was correctly applied to all
transactions. These test procedures and the results thereon are covered under section 8.14.1, which deals
with the process of pricing Federation Equity Crude.
3.2.5 Revenue Flows from NNPC Lifting
Revenue Flows from NNPC Crude Oil lifting are for the Account of various Parties such as the Federation
Entitlement, Federal Inland Revenue Service (FIRS), Department of Petroleum Resources (DPR), Modified
Carrying Agreement (MCA) Escrow Accounts, NPDC Account, Pan Ocean Account (after deduction of Debt
Service Charge), and these are depicted in the Diagrammatic Process Flow below.
Figure 3.2.5 - Revenue Flows from NNPC Crude Oil lifting
Source: NNPC- COMD
The diagram above shows the various lifting entitlements and the beneficiaries/ beneficiary accounts.
Production volumes are allocated based on both company and NNPC entitlements while NNPC entitlement
liftings are on behalf of FIRS, DPR, Federation (Profit Oil or Equity) and alternative Funding Partners. NPDC
entitlements are also lifted by NNPC but payments made into NPDC account.
NIG
ER
IAN
NATIONAL PETR
OLE
UM
CORPORATIO
N
Flow of Revenue from NNPC Liftings
Balance of Alternative
Funding Equity
PSC Profit Oil
Marginal Field ORR
Joint Venture Equity
Service Contract Profit Oil
PSC Tax Oil
MCA Tax Oil
Service Contract Tax Oil
NPDC Lifting's
PSC Royalty Oil
MCA Royalty Oil
Service Contract Royalty Oil
MCAs Cost & Partners’
Equity Oil
445
Allocation
Fed Act $
Payment Less
Cash Calls
Direct
Federation
Export
Refinery
Deliveries
Unprocessed
Export
Direct Remit into FIRS Account
Direct Remit into NPDC Account
Direct Remit into DPR Account
Designated Entities Account
TMP & 40% Panocean equity +
IOC Share/Carry
Direct Remit into Escrow Account
Third Party Financing Oil Payment into SPV Escrow Account
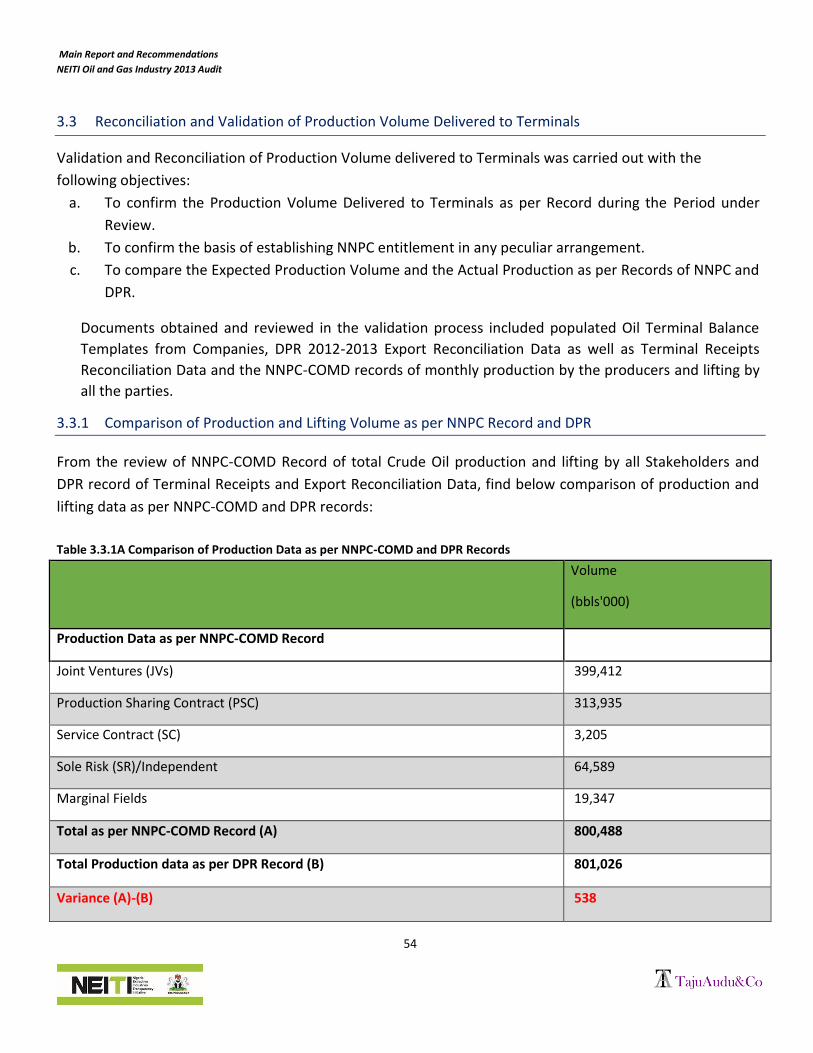
Main Report and Recommendations
NEITI Oil and Gas Industry 2013 Audit
54
3.3 Reconciliation and Validation of Production Volume Delivered to Terminals
Validation and Reconciliation of Production Volume delivered to Terminals was carried out with the
following objectives:
a. To confirm the Production Volume Delivered to Terminals as per Record during the Period under
Review.
b. To confirm the basis of establishing NNPC entitlement in any peculiar arrangement.
c. To compare the Expected Production Volume and the Actual Production as per Records of NNPC and
DPR.
Documents obtained and reviewed in the validation process included populated Oil Terminal Balance
Templates from Companies, DPR 2012-2013 Export Reconciliation Data as well as Terminal Receipts
Reconciliation Data and the NNPC-COMD records of monthly production by the producers and lifting by
all the parties.
3.3.1 Comparison of Production and Lifting Volume as per NNPC Record and DPR
From the review of NNPC-COMD Record of total Crude Oil production and lifting by all Stakeholders and
DPR record of Terminal Receipts and Export Reconciliation Data, find below comparison of production and
lifting data as per NNPC-COMD and DPR records:
Table 3.3.1A Comparison of Production Data as per NNPC-COMD and DPR Records
Volume
(bbls'000)
Production Data as per NNPC-COMD Record
Joint Ventures (JVs) 399,412
Production Sharing Contract (PSC) 313,935
Service Contract (SC) 3,205
Sole Risk (SR)/Independent 64,589
Marginal Fields 19,347
Total as per NNPC-COMD Record (A) 800,488
Total Production data as per DPR Record (B) 801,026
Variance (A)-(B) 538

Main Report and Recommendations
NEITI Oil and Gas Industry 2013 Audit
55
Note: The total production of 800.488 Million BBLS in table 3.3.3A excludes production from the unitized
fields (Ekanga/Zafiro). Table 3.3.1B Comparison of Lifting Data as per NNPC-COMD and DPR Records
Liftings
Volume
Variance NNPC-COMD (bbls'000)
DPR (bbls'000)
Joint Ventures (JVs) 401,360 402,119 -759
Production Sharing Contract (PSC) 311,609 311,609 0
Service Contract (SC) 3,648 3,648 0
Sole Risk (SR)/Independent 65,667 65,667 0
Marginal Fields 18,054 17,884 170
Total Liftings 800,338 800,927 -589
3.3.1.1 Key Findings in the reconciliation of Production data in the records of NNPC to that of DPR
In the course of carrying out validation and reconciliation of Production and lifting volumes between the
records of NNPC and DPR, it was noted that a difference of 538,000 bbls and 589,000 bbls exists in
aggregate Production and lifting volumes respectively. This is a serious issue in the sense that:
1. The JV companies signed off all reconciled production figures with DPR and NNPC separately for the
same period. Ideally, there ought to be no difference in the production volumes presented by NNPC and
DPR as they were duly reconciled with the JVs. However, the volumes presented by NNPC and DPR are
different in most cases.
2. Also, in some instances there were more than one reconciled production volume duly signed off by
both DPR and the companies for the same period. For example DPR and Chevron jointly signed off
74,228,949 bbls (2nd December, 2014 - Operator’s Date and 17th November, 2014 – DPR’s Date ) and
74,879,296 bbls (3rd December, 2014) as production volumes for Escravos crude type as well as 2,638,334
bbls (3rd December, 2014) and 2,638,681 bbls (3rd December, 2014) as production for Pennington crude
type in separate documents.
3. It is worthy of note that the reconciliation of 2012 and 2013 production and lifting volumes between
DPR and the companies did not take place until August 2014.
4. The signed off for production volumes was only done by both DPR and the JV companies without
NNPC, a partner in the JV.

Main Report and Recommendations
NEITI Oil and Gas Industry 2013 Audit
56
Implication
The recurring lack of reconciled positions between the records of NNPC and DPR puts doubt on the integrity
of production and lifting figures and raises issues of accountability.
The differences between DPR and NNPC figures also accounted for the differences between Audit figures
which are based on NNPC records and the companies reconciled figures with DPR.
Recommendation
All the stakeholders (NNPC, DPR and the Oil companies) to ensure timely, periodic and joint reconciliation of
production and lifting volumes and update records accordingly.
3.3.2 Analysis of Inventory of Crude Oil at Terminal
Following from the Validation and Reconciliation of Total Crude Oil Production Volumes as well as NNPC
Terminal Lifting, find below Analysis of Movement in Inventory of Crude Oil with respect to Opening
Balances, Production, Lifting and Closing Balances in the year under review.
Table 3.3.2 - Analysis of Inventory of Crude Oil at Terminal (Crude Oil Production and Lifting)
PRODUCTION 2013
Bbl'000
Total Opening Inventory 12,489
Production 800,488
Zafiro Crude 4,030
Total Inventory for Lifting 817,007
Terminal adjustment/shrinkage (381)
Available Total Terminal Inventory 816,626
LIFTING
Federation Export:
Joint Venture Operators (JV) 79,929
Production Sharing contractors (PSCs) 99,375
Service Contractors (SCs) 2,649
Sub –Total Federation Export 181,953
PPMC Domestic Crude Supply (Refining / Sales):
Joint Venture Operator (JVs) 153,965
Production Sharing Contractors 4,849
Service Contractors (SCs)
Sub –Total Domestic Crude Supply (Refining / Sales) 158,814
Sub-Total: Federation +PPMC Lifting 340,767
Other Operators:

Main Report and Recommendations
NEITI Oil and Gas Industry 2013 Audit
57
PRODUCTION 2013
Bbl'000
JV Operators 167,466
Production Sharing Contractors PSCs 207,385
Service Contractors (SCs) 999
Sole Risk 65,667
Marginal Fields 18,054
Sub-Total: Other Operators 459,571
Total Lifting 800,338
Balance Closing Inventory 16,288
3.3.3 Analysis of NNPC-COMD sales volumes on behalf of the Federation as per audit validation
From the validation and reconciliation of NNPC-COMD record of liftings from the various arrangements and
sales data on behalf of the Federation, find below summary of trend analysis of validated sales volumes by
NNPC-COMD.
Table 3.3.3: Analysis of NNPC-COMD sales volumes on behalf of the Federation as per audit validation
2009
Bbl'000
2010
Bbl'000
2011
Bbl'000
2012
Bbl'000
2013
Bbl'000
Export Crude Sales
JV Operations 88,551 127,753 127,810 101,728 52,231
Share of profit from PSC Operations
18,417
Equity from Alternative Funding Arrangement 2,895
Add: Alternative Funding Arrangement 71,163 93,356 93,673 105,602 99,993
159,714 221,109 221,483 207,330 173,536
Add: Trial Marketing Product (TMP) 14,533 - - 10,949 -
Sub Total (A) 174,247 221,109 221,483 218,279 173,536
Domestic Crude Sales
Refinery Delivery 19,363 34,701 45,393 34,927 38,293
Domestic Crude Export 142,551 97,792 39,340 49,214 36,392
Offshore Processing -
27,337 23,689 22,755 24,665

Main Report and Recommendations
NEITI Oil and Gas Industry 2013 Audit
58
2009
Bbl'000
2010
Bbl'000
2011
Bbl'000
2012
Bbl'000
2013
Bbl'000
Product Exchange - 5,743 56,032 55,447 59,464
Crude Exchange - 950 - - -
Sub Total (B) 161,914 166,523 164,454 162,343 158,814
Total Export and Domestic Volumes (A+B) 336,161 387,632 385,937 380,622 332,350
Figure 3.3.3 - Analysis of NNPC-COMD sales volumes on behalf of Federation as per audit validation
3.3.4 Key Findings from the validation and reconciliation of NNPC Liftings
In the course of carrying out validation and reconciliation of lifting volumes by NNPC-COMD on behalf of the
Federation, we noted the following issues:
i. Aggregate lifting of 7,000,926 barrels from NAOC JV (Brass crude type) valued at $763,405,478.80
was traced to NPDC account.
Implication
As a result of the payment into NPDC account, there was a shortfall in Federation account
remittance to the tune of $763,405,478.80.
-
50,000
100,000
150,000
200,000
250,000
Bbl'000 Bbl'000 Bbl'000 Bbl'000 Bbl'000
2009 2010 2011 2012 2013
Total Export Crude Total Demestic Crude

Main Report and Recommendations
NEITI Oil and Gas Industry 2013 Audit
59
Recommendation
Federal Government to review the proprietary rights, process and transactions involving the
assignment of OMLs from NAOC JV to NPDC by NNPC.
NNPC Response
The proceeds were rightly in NPDC account because OML 60-63 was assigned to NPDC vide DPR letter
dated November 15, 2015.
ii. Aggregate lifting of 1,037,619 barrels from SPDC JV (Forcados Crude Type) valued at $33,209,100
was traced to NPDC account.
Implication
Shortfall in revenue to the federation to the tune of $33,209,100
Recommendation
Federal Government to review the process and transactions leading to the assignment of OMLs from
SHELL JV to NPDC.
NNPC Response
The proceeds were rightly in NPDC account because 55% equity in the assets in reference was
divested to NPDC vides DPR letter dated March 19, 2013.
The audit did not establish any justification for the assignment of Federation equity in some OMLs
previously in the SHELL JV and all the OMLs in NAOC JV to NPDC.
a) No justification has been provided by NNPC for the transfer, other than the Minister’s legal
authority to assign and the need for NPDC to develop upstream capacity.
b) No consideration has been paid to the Federation till date with respect to the OMLs in NAOC
JV assigned in December 2012 and neither was the value of the consideration stated in the deed of
assignment.
c) The consideration computed by DPR with respect to the OMLs assigned to NPDC from SHELL
JV between 2010 and 2011 was $1.8 Billion and of this amount, no consideration was paid from the
dates of transfer up till April 2014 when the sum of $100 Million was paid, leaving an outstanding
balance of $1.7 Billion as at the time of reporting.
The assignments of the OMLs were not arm’s length transactions and were also undervalued. For
instance, the PWC forensic audit report on NNPC in 2014 estimated the value of NNPC’s 55% equity

Main Report and Recommendations
NEITI Oil and Gas Industry 2013 Audit
60
assigned to NPDC to be about $3.4 Billion based on commercial value paid by third parties on the
sale of SHELL’s equity (45%) in the same OMLs.
d) NPDC has continuously enjoyed full rights and benefits accruing from the assets transferred
as dictated by the terms of the deed of assignment i.e. Oil and Gas revenue from the assigned fields
have been paid to the account of NPDC.
e) The NNPC did not declare any surplus to the Federation from the operations of the group
since these OMLs were assigned to its subsidiary.
iii. Lifting of 950,135 barrels in September from MPN JV (Qua-Iboe Crude Type) valued at
$105,735,773.48 was also traced to NPDC account, which was later refunded to the Federation
account in November as follows: 853,000 bbls from NPDC Shoreline JV (OML 30) and 96,052 bbls
from Seplat JV valued at $103,992,372.90, leaving a value difference of $1,743,400.58.
Implication
Shortfall in revenue to the federation to the tune of $1,743,400.58
Recommendation
NNPC to account for the sum of $1,743,400.58 shortfall
NNPC Response
Efforts are ongoing to pay the balance into Federation Account.
The difference between Total Federation and PPMC lifting volumes of 340.767 Million bbls in table 3.3.2
(obtained from COMD-COSM records) and total export and Domestic lifting volume of 332.350 Million bbls
in table 3.3.3 (validated from the record of COMD-Revenue and Account) is largely attributable to items i to
iii above.
3.3.5 Components of Actual Crude Oil Lifted by NNPC
A summary components of Actual Crude Oil Lifted by NNPC-COMD in 2013 on behalf of the Federation, DPR,
FIRS, NPDC, Pan Ocean Debt Servicing and Entities funding MCA is shown in Table 3.3.5A below in
comparison with 2012 audit cycle.

Main Report and Recommendations
NEITI Oil and Gas Industry 2013 Audit
61
Table 3.3.5A Components of Actual Crude Oil Lifted by NNPC
Figure 3.3.5 - Summary of Components of Crude Oil Lifted by NNPC in value
The Distribution framework of the Revenue Flows amongst the various Beneficiary Accounts is also shown in
Table 3.3.5B below.
-
5,000,000
10,000,000
15,000,000
20,000,000
S/N NNPC Lifting on Behalf of:
2012
Volume
Bbls'000
2012
Value
$'000
2013
Volume
Bbls'000
2013
Value
$'000
1 Federation Export 81,380 9,115,834 73,543 8,098,883
2 Domestic Sales 162,343 18,147,751 158,814 17,435,818
3 FIRS 88,523 9,871,595 73,236 8,029,264
4 DPR 6,478 718,972 7,722 829,783
5 MCA (Alternative Funding) 11,497 1,129,016 6,453 705,941
6 Satellite Field Development Project Account 6,650 757,826 5,701 628,117
7 Reserve Development Project - - 7,648 842,921
8 Pre-Export Financing - - 1,799 200,415
9 NPDC Account 35,275 3,975,221 27,680 3,069,188
10 PAN OCEAN Account 716 79,086 593 65,777
11 Trial Marketing Period 9,951 1,053,519 - -
TOTAL 402,813 44,848,820 363,190 39,906,107

Main Report and Recommendations
NEITI Oil and Gas Industry 2013 Audit
62
Table 3.3.5B - Summary of Volume and Value of NNPC Lifting and the Destination Accounts
Following from the Validations, Reconciliations and substantive tests carried out on available Records of
Crude Oil, issues have been observed with respect to the flows to the individual beneficiary Accounts shown
above. The observed issues are as a result of variances between expected flows and actual flows to the
destination accounts.
With respect to Federation export crude, the difference between the sums of $8.099 Billion invoiced by
NNPC-COMD and actual receipts of $7.325 Billion amounting to about $774Million has been fully
accounted for by invoices not yet due for payment ($744.754 Million), first lifting deposit ($17.5 Million),
and Credit Notes ($11.425 Million). (See section 3.3.11 for details).
The sum of $100.925 Million was traced to the JP Morgan Chase Crude Oil & Gas Revenue Account with
respect to Satellite Field Development Project out of the total amount of $628.117 Million revenue from
the project. The balance of $527.192 Million is retained in Proceeds Account in line with loan agreement.
The sum of $842.921Million is the total revenue accruable from Reserve Development Project in 2013
whereas the sum of $300 Million was the amount to the credit of JP Morgan Chase Crude Oil & Gas
Revenue Account from the project. The balance of $542.921 Million is retained in Proceeds Account in line
with loan agreement.
3.3.5.1 Key findings on reconciliation of Crude Oil sales values to remittances to the Federation account
The following are Key Findings with respect to the reconciliation of Crude Oil values to remittances to the
Federation account.
NNPC Lifting on Behalf of:
Crude Oil
Volume
Crude Oil
Value
Direct
Federation
FIRS
Account
DPR
Account
Partners'
Account
SFDP
Account
RDP
Account
Pre-Export
Accounts
NPDC
Account
Pan Ocean
Account
Bbls'000 $'000 $'000 $'000 $'000 $'000 $'000 $'000 $'000 $'000 $'000
Federation Export 73,543 8,098,883 8,098,883
Domestic Sales 158,814 17,435,818 17,435,818
FIRS 73,236 8,029,264 8,029,264
DPR 7,722 829,783 829,783
MCA (Alternative Funding) 6,453 705,941 490,274 134,722 80,946
Satellite Field Development Project 5,701 628,117 628,117
Reserve Development Project 7,648 842,921 842,921
Pre-Export Financing 1,799 200,415 200,415
NPDC Account 27,680 3,069,188 3,069,188
PAN OCEAN Account 593 65,777 65,777
Total 363,190 39,906,108 25,534,701 8,519,538 964,505 80,946 628,117 842,921 200,415 3,069,188 65,777
Beneficiary Accounts2013

Main Report and Recommendations
NEITI Oil and Gas Industry 2013 Audit
63
1. The total domestic Crude Sales valued at $17.436 Billion (N2.698 Trillion) was invoiced by NNPC-
COMD, whereas the sum of $6.495 Billion (N1.005 Trillion) was traced to NNPC/CBN Crude Oil
Revenue Naira Account. The difference is accounted for as follows:
a) Amount not due for payment: $3.542 Billion (N548.153Billion)
b) Subsidy approved by PPPRA: $5.125Billion (N792.961Billion)
c) Amount outstanding $2.274Billion (N351.886Billion)
Implication
There was a shortfall in Federation account remittance to the tune of N351.886Billion.
Recommendation
NNPC to remit the sum of $2.274Billion (N351.886Billion) and ensure strict compliance with the three (3)
months period of grace for remittance.
NNPC Response
As at December 2013, total Domestic Crude Oil purchased by NNPC amounted to ₦2,657,209,731,508.19,
out of which ₦1,551,935,625,000 was remitted to Federation Account leaving gross outstanding balance of
₦1,105,274,106,508 (See FAAC report). Of the balance ₦1,105,274,106,508, PPPRA approved and certified
₦792,961,142,799.52 for 2013 subsidy (See 2013 PPPRA subsidy certificates) and balances of
₦312,312,963,708.67 relate to expenses incurred by NNPC on behalf of the Federation Account and are
undergoing Forensic Audit.
ii. Total sales value of liftings from MCA was $705.941 million (6.453 million Barrels) out of which the sum
of $134.722 million (1.231million bbls) was traced to the account of DPR, $490.274 million (4.482
million bbls) to the account of FIRS, while $65.561 million (601.569 thousand bbls) and $15.385 million
(138.417 thousand bbls) were said to be for JV Partners’ cost Oil and share Oil respectively.
NNPC provided explanation on the entitlement allocation model, but did not make a copy of the model
available for audit test and validation of the allocations, citing the need to maintain security, propriety
and integrity of data.
Implication
The Federation may be shortchanged from entitlement model or its inappropriate application.
Recommendation
There is need for NNPC to provide complete information necessary for audit in a timely manner. Auditor
could be made to sign confidentiality agreement where security, propriety and integrity of data are
involved.

Main Report and Recommendations
NEITI Oil and Gas Industry 2013 Audit
64
3.3.6 Aggregate Revenue flow from Sale of Government Crude Oil and Gas
From review of NNPC-COMD Populated Template and validation/reconciliation carried out, find below the
summary of the Gross Revenue accruable to the Federation from Sale of Crude Oil and Gas in 2013 as
compared to that of 2012.
Table 3.3.6 - Gross Revenue flows accruable to the Federation from Crude Oil, Gas and NLNG Feedstock Sales
2012
$'000
2013
$'000
Sale of Crude Oil & Gas:
Federation Equity & Profit Oil 9,115,834 8,098,883
Satellite Field Development Project (SFDP) 757,826 628,117
Reserve Development Project (RDP) - 842,921
PSC In-Kind Sales:
TMP- NNPC Share of Profit Oil 17,944 -
PSC Royalty Oil 718,972 829,783
PSC Tax Oil 9,871,595 8,029,264
MCA Tax Oil (JV Alternative Funding) 888,207 490,274
MCA Royalty Oil (JV Alternative Funding) 240,809 134,722
Total Export Crude Oil 21,611,187 19,053,964
Domestic Crude Oil 18,147,751 17,435,818
Gas (Net NGL 2 Retention) 489,033 364,500
Gas (NGL 2 Retention) - 251,506
Feedstock (Cash Call) 1,845,370 1,261,396
Feedstock (MCA) - 96,130
Total Revenue 42,093,341 38,463,314
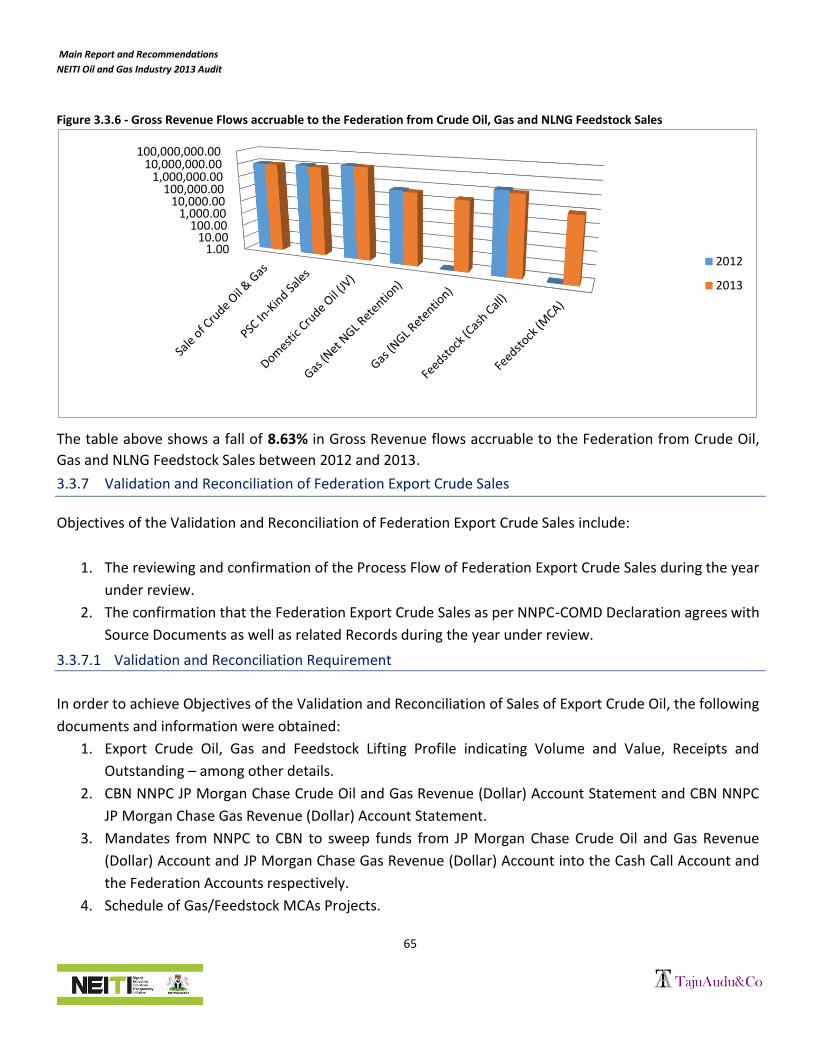
Main Report and Recommendations
NEITI Oil and Gas Industry 2013 Audit
65
Figure 3.3.6 - Gross Revenue Flows accruable to the Federation from Crude Oil, Gas and NLNG Feedstock Sales
The table above shows a fall of 8.63% in Gross Revenue flows accruable to the Federation from Crude Oil,
Gas and NLNG Feedstock Sales between 2012 and 2013.
3.3.7 Validation and Reconciliation of Federation Export Crude Sales
Objectives of the Validation and Reconciliation of Federation Export Crude Sales include:
1. The reviewing and confirmation of the Process Flow of Federation Export Crude Sales during the year
under review.
2. The confirmation that the Federation Export Crude Sales as per NNPC-COMD Declaration agrees with
Source Documents as well as related Records during the year under review.
3.3.7.1 Validation and Reconciliation Requirement
In order to achieve Objectives of the Validation and Reconciliation of Sales of Export Crude Oil, the following
documents and information were obtained:
1. Export Crude Oil, Gas and Feedstock Lifting Profile indicating Volume and Value, Receipts and
Outstanding – among other details.
2. CBN NNPC JP Morgan Chase Crude Oil and Gas Revenue (Dollar) Account Statement and CBN NNPC
JP Morgan Chase Gas Revenue (Dollar) Account Statement.
3. Mandates from NNPC to CBN to sweep funds from JP Morgan Chase Crude Oil and Gas Revenue
(Dollar) Account and JP Morgan Chase Gas Revenue (Dollar) Account into the Cash Call Account and
the Federation Accounts respectively.
4. Schedule of Gas/Feedstock MCAs Projects.
1.00 10.00
100.00 1,000.00
10,000.00 100,000.00
1,000,000.00 10,000,000.00
100,000,000.00
2012
2013

Main Report and Recommendations
NEITI Oil and Gas Industry 2013 Audit
66
5. Export Crude Oil, Gas and NLNG Feedstock Sales Invoices together with Bill of Lading, Letters of
Credit, and other Related Shipping Documents.
6. DPR Export Reconciliation Data as well as Terminal Receipts Reconciliation Data.
7. NNPC-Company Reconciliation Data.
3.3.8 Summary of Export Crude Oil, Gas and NLNG Feedstock Sales Volume and Value
The table below shows a quarterly summary of Export Crude Oil, Gas and NLNG Feedstock sales volume and
value for 2013 in comparison with similar values and volumes for 2012.
Table 3.3.8 – Quarterly Comparison of Export Crude Oil, Gas and NLNG Feedstock sales volume and value between 2012 and
2013
Figure 3.3.8 - Quarterly Comparison of Export Crude Oil, Gas and NLNG Feedstock sales volume and value between 2012 and
2013
Volume Value Volume Value Volume Value Volume Value Volume Value Volume Value
Bbl'000 US$'000 Bbl'000 US$'000 MT'000 US$'000 MT'000 US$'000 MBTU'000 US$'000 MBTU'000 US$'000
1st
Quarter 21,049 2,526,705 19,410 2,207,201 231 200,556 210 139,790 183,620 463,729 149,587 380,917
2nd Quarter 22,478 2,380,587 21,045 2,196,317 150 89,386 244 155,885 177,878 456,725 145,414 365,695
3rd Quarter 17,989 1,994,704 15,332 1,723,734 122 85,043 219 154,648 193,856 477,456 151,395 344,184
4th
Quarter 19,865 2,213,838 17,756 1,971,630 147 114,047 214 165,683 176,193 447,440 178,026 432,644
Total 81,380 9,115,834 73,543 8,098,883 649 489,032 886 616,006 731,548 1,845,350 624,422 1,523,440
Quarters2012 20132012
Export Crude Sales
2013 2012 2013
Gas Sales Feed Stock Sales

Main Report and Recommendations
NEITI Oil and Gas Industry 2013 Audit
67
The analysis above shows generally lower volumes and corresponding values in 2013 when compared to
those of 2012, except for Gas volume and sales value, which showed an improvement in 2013
3.3.9 Export Crude Oil, Gas and Feedstock Receivables Control Account
We have reviewed the NNPC-COMD Populated Template with available corroborating documents and have
prepared the following control accounts for Export Crude Oil, Gas and Feedstock Receivables summarising
the entire Transactions and Payments received for the year under review.
0
500,000
1,000,000
1,500,000
2,000,000
2,500,000
3,000,000
2012 US$'000 2013 US$'000 2012 US$'000 2013 US$'000 2012 US$'000 2013 US$'000
Export Crude Sales Gas Sales Feed Stock Sales
1st Quarter 2nd Quarter 3rd Quarter 4th Quarter

Main Report and Recommendations
NEITI Oil and Gas Industry 2013 Audit
68
Table 3.3.9A - Export Crude Oil, Gas and Feedstock Receivables Control Account as at 31st
December
Balance as per Audit validation is $1,602,107,000 as at 31st December 2013 while the NNPC record revealed
$1,162,391,000, which gives a difference of $439,715,000. The details of this difference are analysed below.
$000 $000 $000 $000 $000 $000
Balance as at 1st January (A) 1,602,424 1,499,914
Add: Sales
(Ai)- Crude Oil Sales
Crude oil liftings - Federation 9,115,834 8,098,883
Satellite Field Development Project 757,826 628,117
Reserve Development Project 842,921
TMP - NNPC Share of Profit 17,944
Net Debit Notes 277
Less: First Lifting Deposit - (17,500)
Less: Credit Notes (68) 9,891,812 (11,425) 9,540,996
(Aii)- Gas Sales 489,033 616,006
(Aiii)- Feedstock Sales 1,845,370 1,523,440
2,334,402 2,139,446
Less: Spiking Cost (1,259)
Exchange Loss (1,167)
Credit Notes (825) 2,333,577 (772) 2,136,248
Total Sales for the Year (B) 12,225,389 11,677,244
Total Receivables (C= A+B) 13,827,813 13,177,158
Less: Receipts
Receipts into:
JP Morgan Crude Oil and Gas Revenue (Dollar) Account 9,959,280 8,094,476
Classified Other Income- SFDP 100,925
RDP 300,000
JP Morgan Gas Revenue (Dollar) Account:
Gas & Feedstocks Prior Year Outstanding Receipt 161,200
Gas Sales Receipt 170,628 271,316
NGL 2 Revenue Account price balance Receipt 39,559 109,780
Feedstock and other Gas Receipts 1,679,712 1,889,899 1,095,658 1,637,954
NGL 2 Revenue Account Receipt 266,879 251,506 Less: Price balance paid into JP Morgan Gas Revenue
Account (39,559) 227,320 (109,780) 141,726
Feedstock Escrow Account (MCA) Receipt 251,400 225,515
Feedstock Escrow Account(NDPR) Receipt 4,342
SFDP proceeds account 527,192
RDP proceeds account 542,921
Total Receipts (D) 12,327,899 11,575,051
Outstanding balance as at 31st December (E= C-D) 1,499,914 1,602,107
Balance as at 31st December (As Per NNPC Record) (910,651) (1,162,391)
Un-explained Difference 589,263 439,715
2012 2013
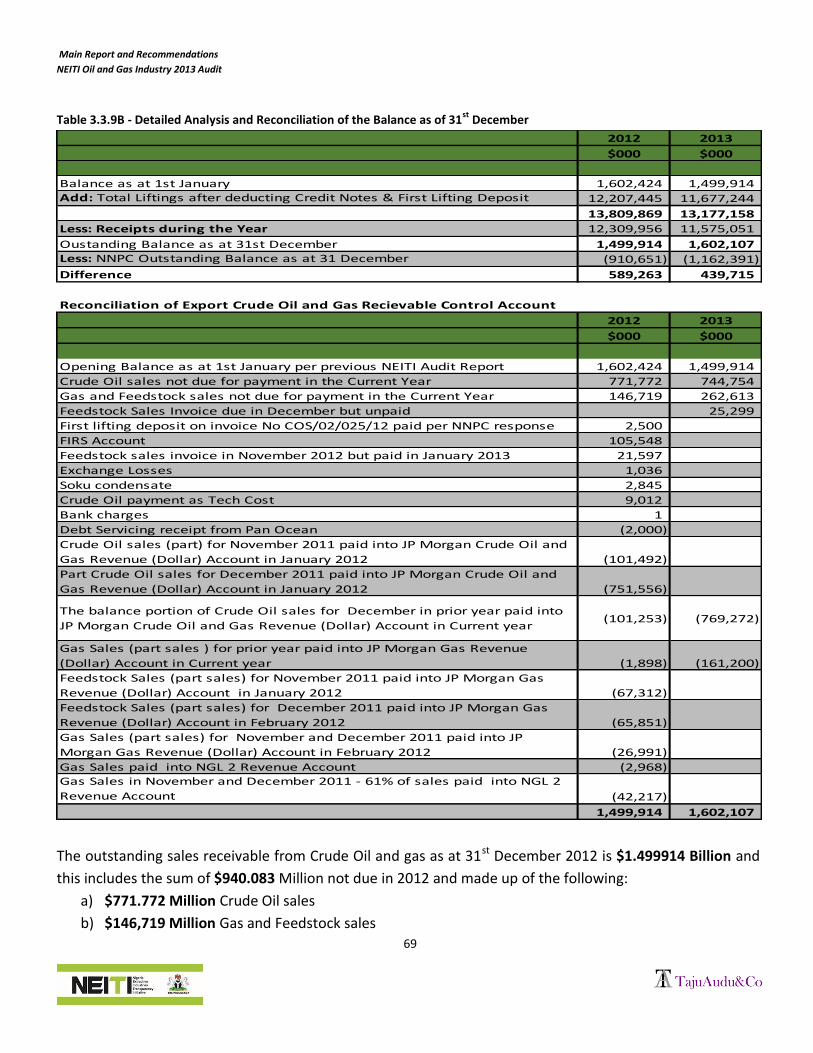
Main Report and Recommendations
NEITI Oil and Gas Industry 2013 Audit
69
Table 3.3.9B - Detailed Analysis and Reconciliation of the Balance as of 31st
December
The outstanding sales receivable from Crude Oil and gas as at 31st December 2012 is $1.499914 Billion and
this includes the sum of $940.083 Million not due in 2012 and made up of the following:
a) $771.772 Million Crude Oil sales
b) $146,719 Million Gas and Feedstock sales
2012 2013
$000 $000
Balance as at 1st January 1,602,424 1,499,914
Add: Total Liftings after deducting Credit Notes & First Lifting Deposit 12,207,445 11,677,244
13,809,869 13,177,158
Less: Receipts during the Year 12,309,956 11,575,051
Oustanding Balance as at 31st December 1,499,914 1,602,107
Less: NNPC Outstanding Balance as at 31 December (910,651) (1,162,391)
Difference 589,263 439,715
Reconciliation of Export Crude Oil and Gas Recievable Control Account
2012 2013
$000 $000
Opening Balance as at 1st January per previous NEITI Audit Report 1,602,424 1,499,914
Crude Oil sales not due for payment in the Current Year 771,772 744,754
Gas and Feedstock sales not due for payment in the Current Year 146,719 262,613
Feedstock Sales Invoice due in December but unpaid 25,299
First lifting deposit on invoice No COS/02/025/12 paid per NNPC response 2,500
FIRS Account 105,548
Feedstock sales invoice in November 2012 but paid in January 2013 21,597
Exchange Losses 1,036
Soku condensate 2,845
Crude Oil payment as Tech Cost 9,012
Bank charges 1
Debt Servicing receipt from Pan Ocean (2,000)
Crude Oil sales (part) for November 2011 paid into JP Morgan Crude Oil and
Gas Revenue (Dollar) Account in January 2012 (101,492)
Part Crude Oil sales for December 2011 paid into JP Morgan Crude Oil and
Gas Revenue (Dollar) Account in January 2012 (751,556)
The balance portion of Crude Oil sales for December in prior year paid into
JP Morgan Crude Oil and Gas Revenue (Dollar) Account in Current year (101,253) (769,272)
Gas Sales (part sales ) for prior year paid into JP Morgan Gas Revenue
(Dollar) Account in Current year (1,898) (161,200)
Feedstock Sales (part sales) for November 2011 paid into JP Morgan Gas
Revenue (Dollar) Account in January 2012 (67,312)
Feedstock Sales (part sales) for December 2011 paid into JP Morgan Gas
Revenue (Dollar) Account in February 2012 (65,851)
Gas Sales (part sales) for November and December 2011 paid into JP
Morgan Gas Revenue (Dollar) Account in February 2012 (26,991)
Gas Sales paid into NGL 2 Revenue Account (2,968)
Gas Sales in November and December 2011 - 61% of sales paid into NGL 2
Revenue Account (42,217)
1,499,914 1,602,107

Main Report and Recommendations
NEITI Oil and Gas Industry 2013 Audit
70
c) $21.592 Million Feedstock sales invoiced in November
However, only the sum of $930.472 Million from the amount not due in 2012 (consisting of $769.272
Million and $161.200 Million in Table 3.3.9B above) could be traced to JP Morgan Chase Crude Oil and Gas
Revenue Accounts and JP Morgan Chase Gas Revenue Accounts in 2013.
In addition to above, Audit validation revealed that the total outstanding amount receivable as at December
2013 stood at $1.602 Billion, whereas $1.162 Billion was recorded by NNPC as sales receivable, which
results to an un-reconciled difference of $439.715Million.
3.3.9.1 Key findings on Export Crude Oil, Gas and Feedstock Receivables Control Account
a) NNPC records of revenue receivable are not consistent with the underlying records of sales
transactions and NEITI audit reports.
b) Some of the Crude Oil and Gas Traders did not comply with the 30 days credit rule for remittance to
the designated revenue accounts.
c) Loss of time value of money as a result of late remittance.
Implication
There is under reporting of revenue receivable, which may result in revenue losses to the tune of
$439.715Million.
Recommendations
a) NEITI to ensure reconciliation with NNPC to arrest the yearly build-up of un-reconciled balances and
consequent loss of revenue due to the Federation.
b) NNPC to ensure strict compliance with the 30 days credit rule for revenue remittance.
3.3.10 Summary of Payments Received into JP Morgan Crude Oil and Gas Revenue Accounts
A review and validation of NNPC-COMD Federation Crude Oil Sales record template along with the CBN -
NNPC JP Morgan Chase Crude Oil and Gas Revenue (Dollar) Account Statement was carried out and Table
3.3.10 below provides the summary of the payments made into the JP Morgan account for the year under
review. Table 3.3.10 - CBN-NNPC JP Morgan Chase Crude Oil and Gas Revenue (Dollar) Account
2012
$'000
2013
$'000
Balance as at 1st January (A) 1,211,924 923,816
Lodgements:
Export Crude Proceeds- Prior Year 769,272
Export Crude Proceeds- Current year 9,959,280 7,325,204

Main Report and Recommendations
NEITI Oil and Gas Industry 2013 Audit
71
The table above shows the reconciliation of Crude Oil Sales Proceeds with the Sales Invoices as well as the
prior year’s balances. The sum of $622.733 Million represents Interests and other classified lodgements,
which were grouped as Other Miscellaneous Receipts in the populated template, received from NNPC-
COMD
3.3.10.1 Key findings on payments received into JP Morgan Crude Oil and Gas revenue Account
The sum of $622.733 Million was classified as Miscellaneous lodgments, out of which $114.123 Million
relates to transactions described by NNPC as Insurance Claims, Receipts from P. Exploration Nigeria Limited,
MPN JV, SPDC JV, CNL JV, Sterling Oil, Azenith Energy Resources, FBN, TEPNG Usan, Trial Marketing. NNPC
was to provide further explanations on the transactions in view of the huge amounts involved but has not
provided this.
Implication
The audit was not able to obtain details nor ascertain the basis for the transactions relating to $114.123
Million as specified above.
Recommendation
NNPC to provide futher details and relevant source documents with respect to the transactions classified as
Miscellaneous Lodgments to enable further reconciliations and validations
3.3.11 Analysis of variance between Export Crude Oil and Actual Sales Receipts
An analysis of actual crude oil sales in comparison with lodgements into JP Morgan Chase Crude Oil & Gas
Revenue (Dollar) Account reveals variances contained in the table below.
Interest and Other Classified Lodgements 170,653 622,733
Total Lodgements during the year (B) 10,129,933 8,717,209
Total Inflow (A+B)=C 11,341,857 9,641,025
Payments:
Payment to Federation Account 3,162,077 2,045,347
Transfer to JV Cash call Account 7,255,964 7,012,280
Total Outflow (D) 10,418,041 9,057,627
Balance as at 31st December 923,816 583,398

Main Report and Recommendations
NEITI Oil and Gas Industry 2013 Audit
72
Table 3.3.11 Monthly Analysis of Export Crude Oil Sales Volume and Value and amount received into the JP Morgan Crude Oil
and Gas Revenue (Dollar) Account
The table above shows the total sum of $8.099 Billion as the amount invoiced by NNPC-COMD for export
crude oil and the actual receipts of the sum of $7.325 Billion was traced to JP Morgan Chase Crude Oil &
Gas Revenue Account. The variance of $773.679 Million was reconciled and accounted for as follows:
I. $11.425 Million was Credit Notes (That is, Customers claim for demurrage or cargo loss as the case
may be) to reduce invoice payable by the Customers
II. $17.5 Million was as offset for First Lifting Deposit
III. $744.754 Million as Invoices that were not yet due for payment in 2013.
3.3.12 Summary of Payments Received into JP Morgan Gas Revenue Accounts
A review and validation of NNPC-COMD Federation Gas/Feedstock Sales record template along with the
CBN -NNPC JP Morgan Chase Gas Revenue (Dollar) Account Statement was carried out and Table 3.3.12
below provides the summary of the payments made into the JP Morgan account for the year under review.
Month of
LiftingVolume
NNPC/COMD
Sales Value
CBN
ReceiptsVariance
Credit
Notes
First
Lifting
Deposit
Undue &
UnpaidTotal
Bbl'000 $'000 $'000 $'000 $'000 $'000 $'000 $'000
January 9,667 1,117,102 778,923 338,180 390 2,500 2,890
February 4,872 558,455 782,161 (223,706) 992 2,500 3,491
March 4,871 531,644 630,201 (98,557) 7,036 2,500 9,536
April 4,976 514,168 506,609 7,559 59 7,500 7,559
May 9,178 951,871 957,482 (5,611) 1,435 2,500 3,935
June 6,891 730,278 676,661 53,617 1,410 - 1,410
July 5,907 658,048 710,256 (52,208) - - -
August 6,072 690,954 588,896 102,058 - - -
September 3,353 374,733 359,915 14,817 65 - 65
October 3,054 341,607 341,568 39 39 - 39
November 7,078 777,800 992,533 (214,733) - - -
December 7,624 852,223 852,223 744,754 744,754
Total 73,543 8,098,883 7,325,204 773,679 11,425 17,500 744,754 773,679

Main Report and Recommendations
NEITI Oil and Gas Industry 2013 Audit
73
Table 3.3.12 - CBN-NNPC JP Morgan Chase Gas Revenue (Dollar) Account
3.3.13 Analysis of Gas value variances with actual Sales Receipts
An analysis of the validated NNPC-COMD Sales values compared to actual Gas receipts into JP Morgan
Chase Gas Revenue (Dollar) Account was carried out. Table 3.3.13 below gives a summary of the observed
variances between actual Sales and receipts for the year under review.
Table 3.3.13 - Monthly Analysis of Gas Sales Volume and Value
The table above shows the total value of Gas in the sum of $616.006 Million invoiced by NNPC-COMD and a
net Receipts of $381.095 Million, consisting of $271.316 Million (Direct transfer from traders) and $109.780
2012 2013
$'000 $'000
Balance as at 1st January (A) 284,025 207,994
Lodgments:
Gas & Feedstock Proceeds -Prior Year 161,200
Gas & Feedstock Proceeds- Current Year 1,889,899 1,366,974
Interest and Other Classified Lodgments 213,027 307,833
Total Lodgment during the year (B) 2,102,926 1,836,008
Total Inflow (A+B)=C 2,386,951 2,044,002
Payments:
Payment to Federation Account 2,124,060 1,467,655
Transfer to JV Cash call Account 54,897 265,070
Total Outflow (D) 2,178,957 1,732,725
Balance as at 31st December 207,994 311,277
Direct from
Traders
NGL 2 price
balance
MT'000 $'000 $'000 $'000 $'000 $'000 $'000 $'000 $'000
January 106 76,411 14,768 28,365 33,277 (28,365) (28,365)
February 30 15,195 39,236 (24,041) 37,602 37,602
March 74 48,184 13,979 34,205 - -
April 74 45,750 27,398 18,352 20,865 119 20,984
May 95 65,393 26,491 38,902 41,434 322 41,756
June 75 44,742 14,677 18,892 11,173 (16,187) (16,187)
July - - 21,871 (21,871) 34,208 34,208
August 113 79,043 14,699 - 64,344 - 526 526
September 106 75,605 39,619 35,985 40,844 200 41,044
October 101 73,665 21,154 52,511 37,607 37,607
November 7 6,152 37,424 (31,272) 36,241 6,152 42,393
December 106 85,866 62,522 23,344 (62,522) 85,866 23,344
Total 886 616,006 271,316 109,780 234,911 141,726 92,018 1,167 234,911
Exchange
lossTotalVolume
Month of
Sales
NNPC /COMD
Sales ValueVariance
Gas Escrow
Account
Undue &
Unpaid
Invoice
CBN Receipts
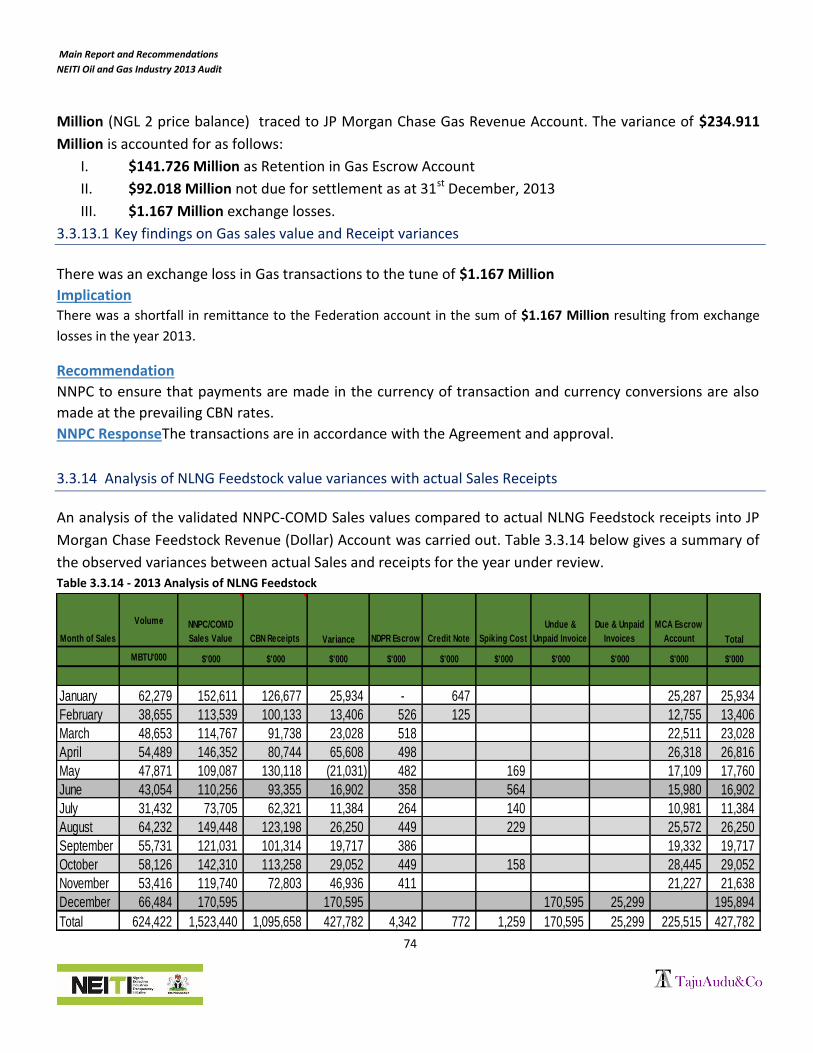
Main Report and Recommendations
NEITI Oil and Gas Industry 2013 Audit
74
Million (NGL 2 price balance) traced to JP Morgan Chase Gas Revenue Account. The variance of $234.911
Million is accounted for as follows:
I. $141.726 Million as Retention in Gas Escrow Account
II. $92.018 Million not due for settlement as at 31st December, 2013
III. $1.167 Million exchange losses.
3.3.13.1 Key findings on Gas sales value and Receipt variances
There was an exchange loss in Gas transactions to the tune of $1.167 Million
Implication There was a shortfall in remittance to the Federation account in the sum of $1.167 Million resulting from exchange
losses in the year 2013.
Recommendation
NNPC to ensure that payments are made in the currency of transaction and currency conversions are also
made at the prevailing CBN rates.
NNPC ResponseThe transactions are in accordance with the Agreement and approval.
3.3.14 Analysis of NLNG Feedstock value variances with actual Sales Receipts
An analysis of the validated NNPC-COMD Sales values compared to actual NLNG Feedstock receipts into JP
Morgan Chase Feedstock Revenue (Dollar) Account was carried out. Table 3.3.14 below gives a summary of
the observed variances between actual Sales and receipts for the year under review. Table 3.3.14 - 2013 Analysis of NLNG Feedstock
Month of Sales
Volume NNPC/COMD
Sales Value CBN Receipts Variance NDPR Escrow Credit Note Spiking Cost
Undue &
Unpaid Invoice
Due & Unpaid
Invoices
MCA Escrow
Account Total
MBTU'000 $'000 $'000 $'000 $'000 $'000 $'000 $'000 $'000 $'000 $'000
January 62,279 152,611 126,677 25,934 - 647 25,287 25,934
February 38,655 113,539 100,133 13,406 526 125 12,755 13,406
March 48,653 114,767 91,738 23,028 518 22,511 23,028
April 54,489 146,352 80,744 65,608 498 26,318 26,816
May 47,871 109,087 130,118 (21,031) 482 169 17,109 17,760
June 43,054 110,256 93,355 16,902 358 564 15,980 16,902
July 31,432 73,705 62,321 11,384 264 140 10,981 11,384
August 64,232 149,448 123,198 26,250 449 229 25,572 26,250
September 55,731 121,031 101,314 19,717 386 19,332 19,717
October 58,126 142,310 113,258 29,052 449 158 28,445 29,052
November 53,416 119,740 72,803 46,936 411 21,227 21,638
December 66,484 170,595 170,595 170,595 25,299 195,894
Total 624,422 1,523,440 1,095,658 427,782 4,342 772 1,259 170,595 25,299 225,515 427,782

Main Report and Recommendations
NEITI Oil and Gas Industry 2013 Audit
75
The total sum of $427.782 Million in the above table represents the variance between sales value and
actual proceeds and the sum was accounted for as follows:
i. $4.342 Million as first line transfer to NDPR Escrow Account
ii. $0.772 Million credit notes
iii. $1.259 Million Spiking/handling cost
iv. $170.595 Million representing invoices not due for settlement in 2013
v. $255.515 Million as transfer to MCA Escrow account
vi. $25.299 Million as amount due and unpaid as at 31st December 2013
3.3.14.1 Key Findings on NLNG Feedstock sales value and Receipt variances
a) The sum of $25.299 Million was due and unpaid as at 31st December 2013.
b) NNPC did not provide statements of Escrow account for reconciliation and validation of
transactions while NDPR could also not confirm the transaction.
Implication
a) There was a shortfall in remittance to the Federation account in the sum of $25.299
Million in the year 2013 resulting from unpaid but due invoices as at 31st December 2013
b) Loss of time value of money due to late payment
Recommendation
a) NNPC to ensure strict compliance with the 30 days credit period and collection of late
payment penalty from the defaulting Customers.
3.3.15 Reconciliation of Export Crude Oil, Gas and Feedstock Sales per Audit Validation against NNPC
Analysis
Table 3.3.15 - Reconciliation of Monthly Crude Oil and Gas/ Feedstock Sales per Audit against NNPC Analysis for 2013
Reconciliation Export Crude Oil Sales LPG/NGL (Gas) NLNG (Feedstock)
Volume Value Sales Value Sales Value
Bbls' 000 $'000 $'000 $'000
As Per NNPC Analysis 74,542 8,205,538 616,006 1,523,440
As Per Audit 73,543 8,098,883 616,006 1,523,440
Difference 999 106,655 0 0
The difference shown in the table above is as a result of INVOICE NO FIRS/06/052/2013 bearing lifting value
and volume of 999,006 BBL and $106,654,879.57 respectively that was erroneously paid into NNPC/CBN JP
Morgan Chase Oil and Gas Revenue Account by the Customer.
The volume was lifted on behalf of FIRS and the Audit has included this amount in FIRS lifting schedule.

Main Report and Recommendations
NEITI Oil and Gas Industry 2013 Audit
76
3.3.15.1 Key finding on NNPC analysis of export crude oil sales
NNPC included the FIRS lifting of 999,006 bbl valued at $106,654,879.57 to the federation cargo
Implication
Overstatements of export crude oil sales and understatement of PSC PPT
Recommendation
NNPC should give mandate for the reversal of such transactions whenever they occur for proper
accountability.
3.3.16 Validation and Reconciliation of Domestic Crude Oil Sales Volume and Value
Objectives of the Validation and Reconciliation of Domestic Crude Oil Sales Volumes and Value include:
1. To confirm the Volume of Domestic Crude Oil actually invoiced by NNPC-COMD to NNPC-PPMC, the
subsidiary of NNPC responsible for handling domestic crude oil activities.
2. To confirm that Domestic Crude Oil supplied to NNPC-PPMC during the year under review were
promptly and correctly paid for by NNPC-PPMC and the payments traced and agreed to the
NNPC/CBN Crude Oil Sales (Naira) Account.
3. To validate NNPC mandates to CBN and confirm that proceeds from Domestic crude oil sales were
swept into the Federation Account.
4. To report on lapses observed in the marketing and sale of domestic crude during the year under
review.
In order to achieve the objectives of the Validation and Reconciliation of Domestic Crude Oil Sales Volume
and Value during the year under review, the under listed Documents and Information were obtained from
the NNPC-COMD, Treasury and Accounts Department as well as Covered Entities.
1. Domestic Crude Oil Sales Invoices and Shipping Documents.
2. Populated Domestic Crude Lifting Profile.
3. CBN/NNPC Crude Oil and Gas Naira Account Statements.
4. NNPC mandate values for sweepings into Federation Account.
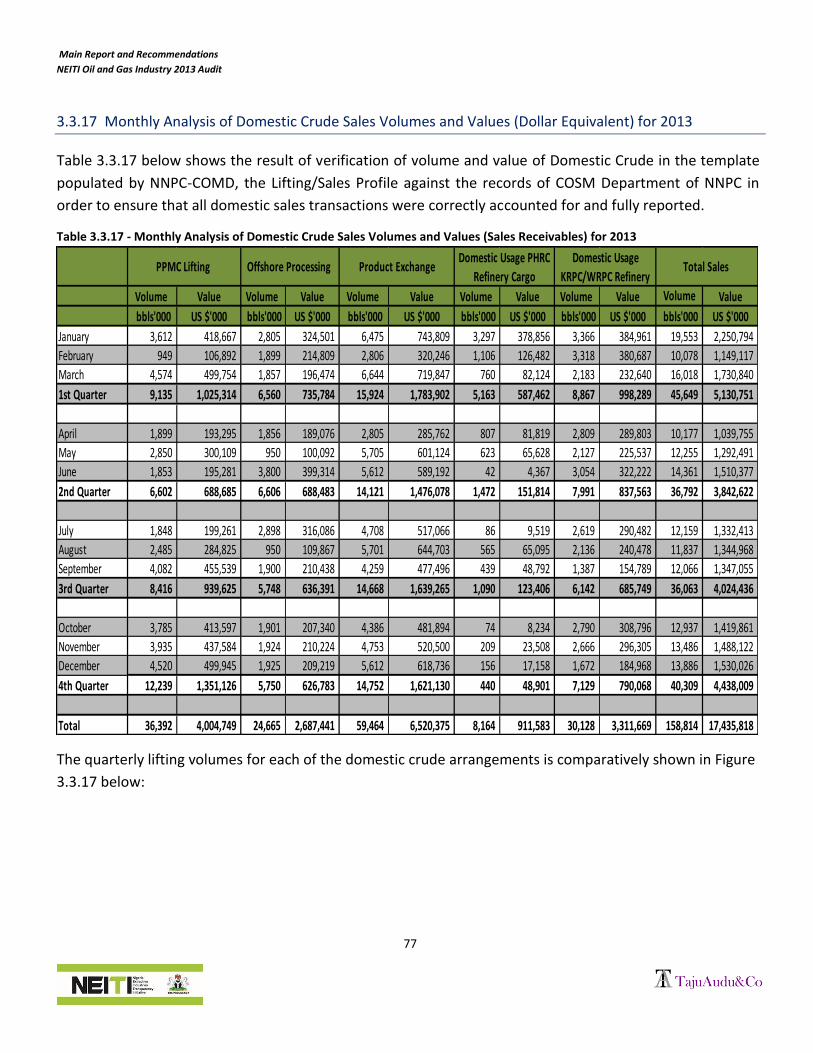
Main Report and Recommendations
NEITI Oil and Gas Industry 2013 Audit
77
3.3.17 Monthly Analysis of Domestic Crude Sales Volumes and Values (Dollar Equivalent) for 2013
Table 3.3.17 below shows the result of verification of volume and value of Domestic Crude in the template
populated by NNPC-COMD, the Lifting/Sales Profile against the records of COSM Department of NNPC in
order to ensure that all domestic sales transactions were correctly accounted for and fully reported.
Table 3.3.17 - Monthly Analysis of Domestic Crude Sales Volumes and Values (Sales Receivables) for 2013
The quarterly lifting volumes for each of the domestic crude arrangements is comparatively shown in Figure
3.3.17 below:
Volume Value Volume Value Volume Value Volume Value Volume Value Volume Value
bbls'000 US $'000 bbls'000 US $'000 bbls'000 US $'000 bbls'000 US $'000 bbls'000 US $'000 bbls'000 US $'000
January 3,612 418,667 2,805 324,501 6,475 743,809 3,297 378,856 3,366 384,961 19,553 2,250,794
February 949 106,892 1,899 214,809 2,806 320,246 1,106 126,482 3,318 380,687 10,078 1,149,117
March 4,574 499,754 1,857 196,474 6,644 719,847 760 82,124 2,183 232,640 16,018 1,730,840
1st Quarter 9,135 1,025,314 6,560 735,784 15,924 1,783,902 5,163 587,462 8,867 998,289 45,649 5,130,751
April 1,899 193,295 1,856 189,076 2,805 285,762 807 81,819 2,809 289,803 10,177 1,039,755
May 2,850 300,109 950 100,092 5,705 601,124 623 65,628 2,127 225,537 12,255 1,292,491
June 1,853 195,281 3,800 399,314 5,612 589,192 42 4,367 3,054 322,222 14,361 1,510,377
2nd Quarter 6,602 688,685 6,606 688,483 14,121 1,476,078 1,472 151,814 7,991 837,563 36,792 3,842,622
July 1,848 199,261 2,898 316,086 4,708 517,066 86 9,519 2,619 290,482 12,159 1,332,413
August 2,485 284,825 950 109,867 5,701 644,703 565 65,095 2,136 240,478 11,837 1,344,968
September 4,082 455,539 1,900 210,438 4,259 477,496 439 48,792 1,387 154,789 12,066 1,347,055
3rd Quarter 8,416 939,625 5,748 636,391 14,668 1,639,265 1,090 123,406 6,142 685,749 36,063 4,024,436
October 3,785 413,597 1,901 207,340 4,386 481,894 74 8,234 2,790 308,796 12,937 1,419,861
November 3,935 437,584 1,924 210,224 4,753 520,500 209 23,508 2,666 296,305 13,486 1,488,122
December 4,520 499,945 1,925 209,219 5,612 618,736 156 17,158 1,672 184,968 13,886 1,530,026
4th Quarter 12,239 1,351,126 5,750 626,783 14,752 1,621,130 440 48,901 7,129 790,068 40,309 4,438,009
Total 36,392 4,004,749 24,665 2,687,441 59,464 6,520,375 8,164 911,583 30,128 3,311,669 158,814 17,435,818
Total Sales PPMC Lifting Offshore Processing Product ExchangeDomestic Usage PHRC
Refinery Cargo
Domestic Usage
KRPC/WRPC Refinery

Main Report and Recommendations
NEITI Oil and Gas Industry 2013 Audit
78
Figure 3.3.17 Quarterly Analysis of Domestic Crude Sales Volumes and Values (Sales Receivables) for 2013
From the above Table, the total volume of Domestic Crude oil lifted by NNPC-COMD for NNPC-PPMC was
158.814 Million barrels valued at $17.436 Billion. This position was corroborated from the records of
COMD-COSM and DPR records as against NNPC-COMD lifting profiles which recorded 154.796 Million
barrels valued at $16.996 Billion in the year under review.
The difference of about $440 Million, which was accounted for by NNPC in September 2014, is included in
the value of domestic Crude Oil due but not paid amounting to $2.274Billion (N351.886Billion) mentioned
in Section 3.3.5.1 above. The details of un-accounted lifting transactions are presented in Appendix 3.3.17
to this report.
3.3.17.1 Key findings on Domestic Crude Sales Volume and Value
Aggregate lifting of 4,017,839 bbl Valued at $439,853,712.95 (N68,065,150,673.36) allocated to refinery
from Forcados Terminal between the periods of May to December 2013 was not accounted for by NNPC-
COMD in the year under review.
Implication
1. Shortfall in remittance to the Federation account in the sum of $439,853,712.95
(N68,065,150,673.36) in the year under review.
2. From economic perspective, the Federation may have lost N7.02 Billion, considering the time value
of investing the amount due within the period of default at CBN-MPR interest rate of 12%. Audit
-
2,000
4,000
6,000
8,000
10,000
12,000
14,000
16,000
1st Quarter 2nd Quarter 3rd Quarter 4th Quarter
PPMC Lifting Offshore Processing
Product Exchange Domestic Usage PHRC Refinery Cargo
Domestic Usage KRPC/WRPC Refinery Cargo

Main Report and Recommendations
NEITI Oil and Gas Industry 2013 Audit
79
review could not confirm any evidence of late payment penalty made by NNPC as in the case with
Off-takers.
Recommendation
1. NNPC should always ensure compliance with the 90 days credit period
NNPC Response
The volume in question was part of Refinery deliveries from Ugheli (OML 34) between May, 2013 and June,
2014. Though the deliveries were made in 2013, the cargoes could not be valued and accounted for by
COMD because shipping documents for those cargoes were not provided by the Terminal. However, the
shipping documents were later provided in September, 2014 and the cargoes had since been valued
accordingly.
3.3.18 Monthly Analysis of Domestic Crude Oil Sales Value conversion to Naira Equivalent
A Monthly Analysis of Domestic Crude Oil Sales value conversion from Dollar to Naira Equivalent at the
appropriate CBN advised conversion rate is shown in Table 3.3.18 below.
Table 3.3.18 - Monthly Analysis of Domestic Crude Oil Sales Volumes and Values in Naira Equivalent
Month Volume bbls'000
Value $'000
Conversion Rate Value N'000
January 19,553 2,250,794 154.77 348,355,377
February 10,078 1,149,117 154.74 177,814,385
March 16,018 1,730,840 154.75 267,847,551
1st Quarter 45,649 5,130,751 794,017,312
April 10,177 1,039,755 154.74 160,891,661
May 12,255 1,292,491 154.75 200,012,977
June 14,361 1,510,377 154.75 233,730,791
2nd Quarter 36,792 3,842,622 594,635,428
July 12,159 1,332,413 154.76 206,204,207
August 11,837 1,344,968 154.75 208,133,823
September 12,066 1,347,055 154.76 208,470,160
3rd Quarter 36,063 4,024,436 622,808,190
October 12,937 1,419,861 154.73 219,695,075
November 13,486 1,488,122 154.70 230,212,402
December 13,886 1,530,026 154.73 236,740,970
4th Quarter 40,309 4,438,009 686,648,447
Total 158,814 17,435,818 2,698,109,378

Main Report and Recommendations
NEITI Oil and Gas Industry 2013 Audit
80
3.3.19 Domestic Crude Oil receivable Control Account for the year ended 31st December 2013
Following from the review of NNPC-COMD records and documents, which includes Sales Invoices, Shipping
documents, Bank Statements and various Mandates, find below the Analysis of Domestic Crude Receivable
Control Account for the year under review:
Table 3.3.19A - Domestic Crude Receivable Control Account for the year ended 31st December 2013
Table 3.3.19B - Analysis of the constituents of the outstanding balance at the year ended 31st
December 2013
N'Billion
Outstanding as at 1st January, 2013 2,256.17
Payment for Sep-2012 lifting (112.40)
Payment for Oct-2012 lifting (112.54)
Payment for Nov-2012 lifting (109.33)
Payment for Dec-2012 lifting (127.19)
Unpaid January-2013 lifting 165.97
Unpaid February-2013 lifting 65.43
Unpaid March-202013 lifting 155.46
Unpaid April-2013 lifting 55.70
Unpaid May-2013 lifting 83.63
Unpaid June-2013 lifting 111.33
Unpaid July-2013 lifting 93.80
Unpaid August-202013 lifting 66.17
N'Billion
Opening balance at 1st Jan 2013 2,256.17
Add:
Cost of Crude Supplied to NNPC 2,698.11
Total Receivable (A) 4,954.27
Less:
Subsidy Deductions * 138.49
Payment to Federation Account 1,466.95
Total Payments (B) 1,605.44
Balance due to Federation Account as at 31st December, 2013(A-B) 3,348.84

Main Report and Recommendations
NEITI Oil and Gas Industry 2013 Audit
81
N'Billion
Unpaid September-2013 lifting 208.47
Amount not yet due for settlement in 2013 548.15
Outstanding as at 31st December, 2013 3,348.84
Table 3.3.19C - Analysis of the constituents of the outstanding balance at the year ended 31
st December 2013
Summary of the above analysis N'Billion
Outstanding from previous years 1,794.71
Unpaid 2013 invoices 1,005.98
Outstanding not due for settlement 548.15
Total 3,348.84
*Note that the total subsidy approved for NNPC by PPPRA in 2013 is N792, 961,142,799.52, but subsidy deducted at
source by NNPC is N 138,487,103,205.59
The details of the above transactions on monthly basis are presented in Appendix 3.3.19 to this report.
Table 3.3.19A shows the total domestic crude oil sales value at N2.698 Trillion, which is accounted for as
follows:
a. Amount not due for payment in the sum of N548.152Billion ($3.542 Billion)
b. Subsidy approved by PPPRA was N792.961Billion ($5.125Billion)
c. Amount remitted to NNPC/CBN Crude Oil Revenue Naira account amounting to N1.466 Trillion
(which includes N461.46 Billion prior year receivables and N1.005 Trillion or $6.495 Billion for
settlement of 2013 invoices)
d. Amount outstanding N351.886Billion ($2.274Billion)
3.3.19.1 Key findings on Domestic Crude Sales outstanding as at 31st December, 2013
The total amount receivable from NNPC-PPMC as at 31st December 2013 stood at N3.349 Trillion as shown
in Table 3.3.19C above and the components of this amount are:
a. The sum of N1.795 Trillion outstanding from previous years
b. The sum of N1.006 Trillion ($6.527 Billion) that was due and unpaid for the year 2013
c. The sum of N548.153 Billion ($3.542 Billion) not due for settlement as at 31st December 2013.
Implication
1. Shortfall in remittance to the Federation account in the sum of N2.146 Trillion after considering
N654.474 Billion (N792.961 Billion-N138.487 Billion) subsidy not deducted at source from amount
approved by PPPRA in 2013.
2. Loss of time value of money as a result of delays in remittance

Main Report and Recommendations
NEITI Oil and Gas Industry 2013 Audit
82
Recommendations
1. NNPC should clear all the total domestic sales outstanding of N2.146 Trillion
2. NNPC to always ensure adherence to the 90 days credit period.
3.3.20 Analysis of Delays in Domestic Crude Oil Sales Settlement by NNPC
An analysis of the delays in the settlement of Domestic Crude Oil sales invoices was carried out and the
result is summarised in Table 3.3.20 below. Table 3.3.20 - Analysis of Domestic Crude Oil Sales Invoices due for Settlement and Actual Payment by NNPC
Table above shows the default cycle of invoices actually due for settlement in 2013 (i.e. those relating to
2012 transactions and those relating to the year under review) and the actual amount swept into the
Federation in 2013 for settlement of the invoices due.
3.3.20.1 Key Findings on the delays in remittance of Crude Oil sales proceeds
The non-compliance with the 90 days credit limit by NNPC, despite the fact that payment is made by off-
takers within 30 days has resulted to an aggregate default days of 190 days on the assumption that Bill of
Lading dates (on aggregate basis) were the last day of the months, which is the worst case scenario.
Implication
The implication of this practice from the economic perspective is that the Federation may have lost N13.42
Billion, considering the time value of investing the amount due within the period of default at CBN interest
rate of 12%.
Audit review could not confirm any evidence of late payment penalty made by NNPC as in the case with Off-
takers.
E s timated
B ill of
L ading Date
E xpected
P ayment
Date
Actual
P ayment
Date
E xpected
P ayment
C yc le
Actual
P ayment
C yc le
Default in
P ayment
C yc le
Amount
Due
S ubs idy
Deduction
Actual
Amount
P aid
Amount
O uts tanding Interes t
R ate(12% )
Days Days Days N'B illion N'B illion N'B illion N'B illion N'B illion
30-O ct-12 28-J an-13 11-F eb-13 90 104 (14) 203.48 - 112.54 90.94 (0.94) 30-Nov-12 28-F eb-13 5-Mar-13 90 95 (5) 197.91 - 109.33 88.58 (0.33)
31-D ec-12 31-Mar-13 8-Apr-13 90 98 (8) 291.47 - 127.19 164.27 (0.77) 31-J an-13 1-May-13 6-May-13 90 95 (5) 348.36 - 182.38 165.97 (0.57)
28-F eb-13 29-May-13 10-J un-13 90 102 (12) 177.81 - 112.38 65.43 (0.70)
31-Mar-13 29-J un-13 9-J ul-13 90 100 (10) 267.85 - 112.38 155.46 (0.88) 30-Apr-13 29-J ul-13 6-Aug-13 90 98 (8) 160.89 - 105.19 55.70 (0.42)
31-May-13 29-Aug-13 9-S ep-13 90 101 (11) 200.01 - 116.38 83.63 (0.72)
30-J un-13 28-S ep-13 8-O ct-13 90 100 (10) 233.71 - 122.38 111.33 (0.77) 31-J ul-13 29-O ct-13 8-Nov-13 90 100 (10) 206.18 - 112.38 93.80 (0.68)
31-Aug-13 29-Nov-13 6-D ec-13 90 97 (7) 208.17 - 142.00 66.17 (0.48)
30-S ep-13 29-D ec-13 90 (90) 208.47 - 208.47 (6.17)
(190.00) 2,704.32 - 1,354.55 1,349.77 (13.42)

Main Report and Recommendations
NEITI Oil and Gas Industry 2013 Audit
83
Recommendation
NNPC to be made to comply strictly with the 90 days payment terms while penalties for delays in
remittances should be paid.
3.3.21 Summary of CBN/NNPC Crude Oil and Gas Revenue (Naira) Control Accounts as at 31st December
From the review and validation of NNPC-COMD Domestic Crude Oil Sales Record as Populated; Monthly
sweeping Mandates, CBN/NNPC Crude Oil and Gas Revenue (Naira) Account Statement and 2012 NEITI Oil
and Gas Audit Report vis-à-vis Explanation, find below the summary movement in the Account for the year
under review. Table 3.3.21 Summary of CBN/NNPC Crude Oil and Gas Revenue (Naira) Control Accounts as at 31
st December 2013
N' Billion N' Billion
Balance as at 1st January, 2013 1.95
Add Lodgments:
Crude Oil Lifting Proceeds 1,466.95
Outstanding Subsidy Repayment 91.41
Other Miscellaneous Lodgments 13.67 1,572.03
Total Receipt 1,573.99
Less Payments:
Transfer to the Federation Account 1,573.70
Transfer to JV Cash Call Account - 1,573.70
Balance at 31st December, 2013 0.29
Sources: Domestic crude oil sales profile for 2013 period, NNPC debit advice mandate to CBN and CBN/NNPC Crude Oil and Gas
Revenue (Naira) Account
The table above summarises the transactions in the CBN/NNPC Crude Oil and Gas Revenue (Naira) account in
2013.
The total receipts into the CBN/NNPC Crude Oil and Gas Revenue (Naira) Account was N1.572 Trillion
(i.e. N1.467 Trillion for domestic crude oil sales, N91.41 Billion for Outstanding subsidy repayment
and N13.67 Billion for other miscellaneous lodgements).
The sum of N1.574 Trillion was swept to the Federation account from the total amount of N1.574
Trillion available in the account (i.e. N1.95 Billion balance from previous year and N1.572 Trillion
receipts in 2013), leaving a balance of N.29 Billion in the account.
The details of the above transactions on monthly basis are presented in Appendix 3.3.21 to this report.
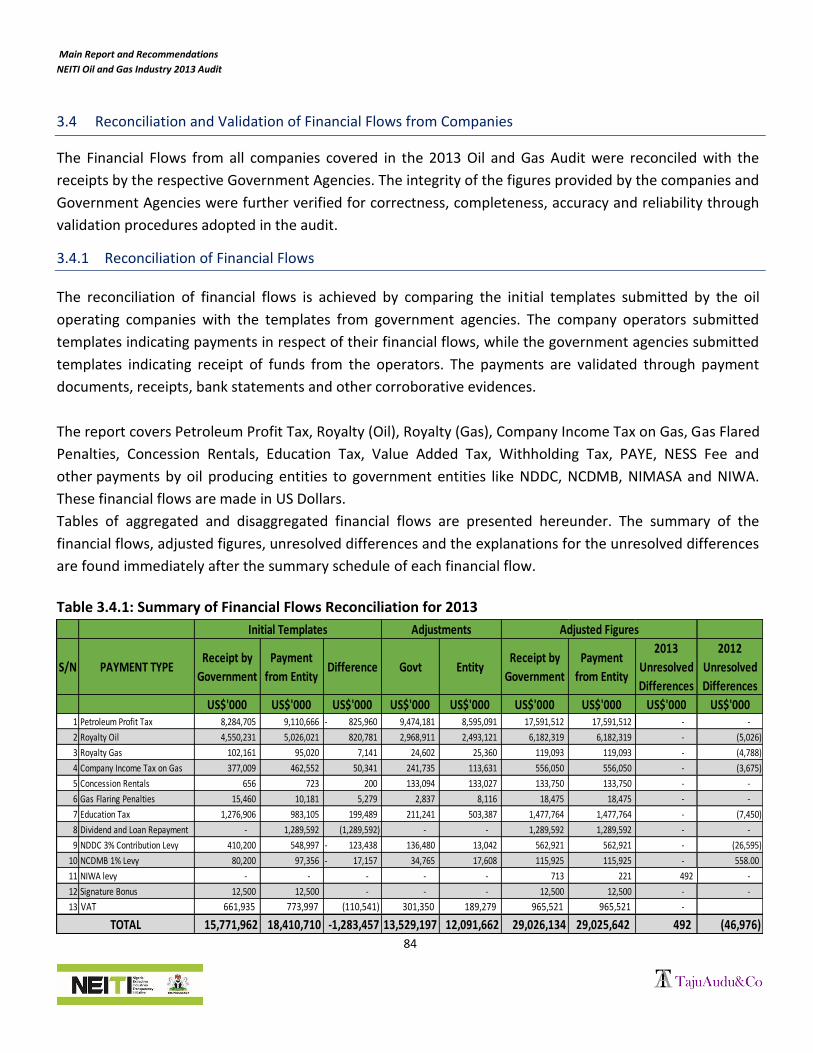
Main Report and Recommendations
NEITI Oil and Gas Industry 2013 Audit
84
3.4 Reconciliation and Validation of Financial Flows from Companies
The Financial Flows from all companies covered in the 2013 Oil and Gas Audit were reconciled with the
receipts by the respective Government Agencies. The integrity of the figures provided by the companies and
Government Agencies were further verified for correctness, completeness, accuracy and reliability through
validation procedures adopted in the audit.
3.4.1 Reconciliation of Financial Flows
The reconciliation of financial flows is achieved by comparing the initial templates submitted by the oil
operating companies with the templates from government agencies. The company operators submitted
templates indicating payments in respect of their financial flows, while the government agencies submitted
templates indicating receipt of funds from the operators. The payments are validated through payment
documents, receipts, bank statements and other corroborative evidences.
The report covers Petroleum Profit Tax, Royalty (Oil), Royalty (Gas), Company Income Tax on Gas, Gas Flared
Penalties, Concession Rentals, Education Tax, Value Added Tax, Withholding Tax, PAYE, NESS Fee and
other payments by oil producing entities to government entities like NDDC, NCDMB, NIMASA and NIWA.
These financial flows are made in US Dollars.
Tables of aggregated and disaggregated financial flows are presented hereunder. The summary of the
financial flows, adjusted figures, unresolved differences and the explanations for the unresolved differences
are found immediately after the summary schedule of each financial flow.
Table 3.4.1: Summary of Financial Flows Reconciliation for 2013
S/N PAYMENT TYPEReceipt by
Government
Payment
from EntityDifference Govt Entity
Receipt by
Government
Payment
from Entity
2013
Unresolved
Differences
2012
Unresolved
Differences
US$'000 US$'000 US$'000 US$'000 US$'000 US$'000 US$'000 US$'000 US$'0001 Petroleum Profit Tax 8,284,705 9,110,666 825,960- 9,474,181 8,595,091 17,591,512 17,591,512 - -
2 Royalty Oil 4,550,231 5,026,021 820,781 2,968,911 2,493,121 6,182,319 6,182,319 - (5,026)
3 Royalty Gas 102,161 95,020 7,141 24,602 25,360 119,093 119,093 - (4,788)
4 Company Income Tax on Gas 377,009 462,552 50,341 241,735 113,631 556,050 556,050 - (3,675)
5 Concession Rentals 656 723 200 133,094 133,027 133,750 133,750 - -
6 Gas Flaring Penalties 15,460 10,181 5,279 2,837 8,116 18,475 18,475 - -
7 Education Tax 1,276,906 983,105 199,489 211,241 503,387 1,477,764 1,477,764 - (7,450)
8 Dividend and Loan Repayment - 1,289,592 (1,289,592) - - 1,289,592 1,289,592 - -
9 NDDC 3% Contribution Levy 410,200 548,997 123,438- 136,480 13,042 562,921 562,921 - (26,595)
10 NCDMB 1% Levy 80,200 97,356 17,157- 34,765 17,608 115,925 115,925 - 558.00
11 NIWA levy - - - - - 713 221 492 -
12 Signature Bonus 12,500 12,500 - - - 12,500 12,500 - -
13 VAT 661,935 773,997 (110,541) 301,350 189,279 965,521 965,521 -
15,771,962 18,410,710 -1,283,457 13,529,197 12,091,662 29,026,134 29,025,642 492 (46,976)
Initial Templates Adjustments Adjusted Figures
TOTAL
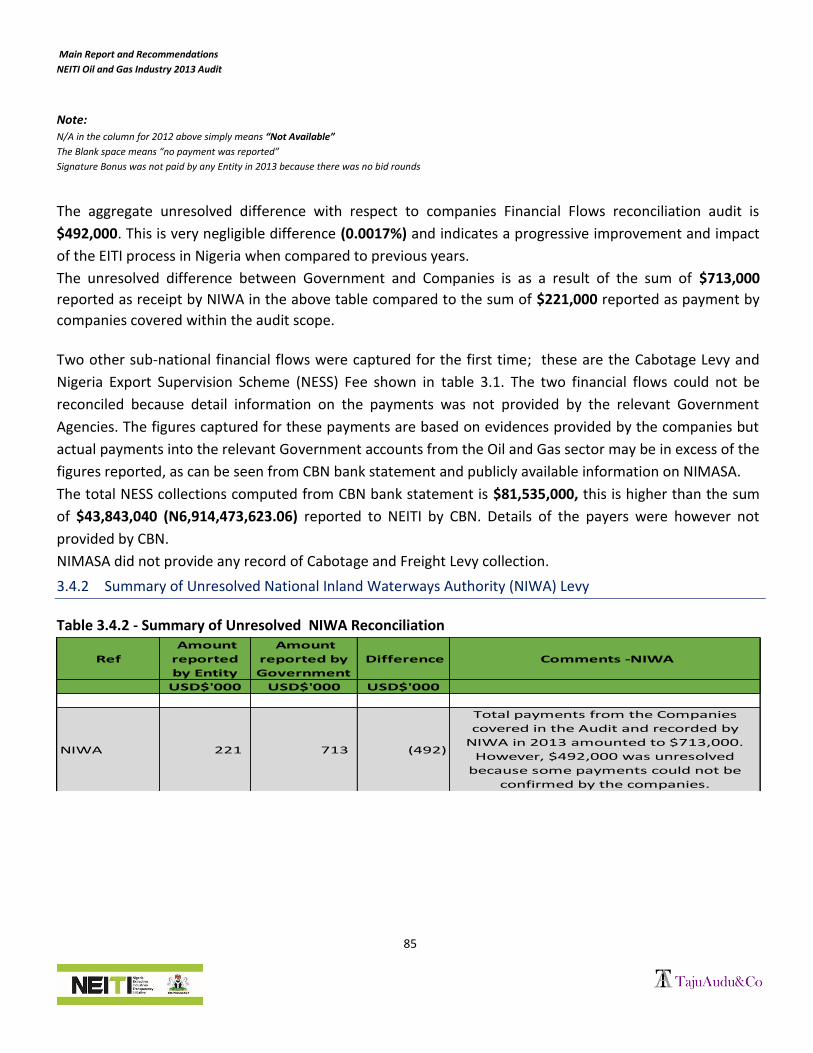
Main Report and Recommendations
NEITI Oil and Gas Industry 2013 Audit
85
Note: N/A in the column for 2012 above simply means “Not Available”
The Blank space means “no payment was reported”
Signature Bonus was not paid by any Entity in 2013 because there was no bid rounds
The aggregate unresolved difference with respect to companies Financial Flows reconciliation audit is
$492,000. This is very negligible difference (0.0017%) and indicates a progressive improvement and impact
of the EITI process in Nigeria when compared to previous years.
The unresolved difference between Government and Companies is as a result of the sum of $713,000
reported as receipt by NIWA in the above table compared to the sum of $221,000 reported as payment by
companies covered within the audit scope.
Two other sub-national financial flows were captured for the first time; these are the Cabotage Levy and
Nigeria Export Supervision Scheme (NESS) Fee shown in table 3.1. The two financial flows could not be
reconciled because detail information on the payments was not provided by the relevant Government
Agencies. The figures captured for these payments are based on evidences provided by the companies but
actual payments into the relevant Government accounts from the Oil and Gas sector may be in excess of the
figures reported, as can be seen from CBN bank statement and publicly available information on NIMASA.
The total NESS collections computed from CBN bank statement is $81,535,000, this is higher than the sum
of $43,843,040 (N6,914,473,623.06) reported to NEITI by CBN. Details of the payers were however not
provided by CBN.
NIMASA did not provide any record of Cabotage and Freight Levy collection.
3.4.2 Summary of Unresolved National Inland Waterways Authority (NIWA) Levy
Table 3.4.2 - Summary of Unresolved NIWA Reconciliation
Ref
Amount
reported
by Entity
Amount
reported by
Government
Difference Comments -NIWA
USD$'000 USD$'000 USD$'000
NIWA 221 713 (492)
Total payments from the Companies
covered in the Audit and recorded by
NIWA in 2013 amounted to $713,000.
However, $492,000 was unresolved
because some payments could not be
confirmed by the companies.

Main Report and Recommendations
NEITI Oil and Gas Industry 2013 Audit
86
3.4.3 Key Findings on Reconciliation of Financial flows from companies.
a. CBN failed to provide information on company-by-company basis for payments into the NESS account
while most Oil and Gas companies did not present records on NESS payment, although some of the
companies responded that shipping companies mostly paid NESS fees on their behalf.
b. NIMASA failed to provide records of Cabotage and Freight Levy collection.
c. The receipt of NLNG payments of dividends, loan and interest repayments for 2013 were confirmed by
NNPC but could not be traced to the Federation account.
Implication
a. The non-availability of company-by-company records on NESS payments at the CBN poses challenges to NEITI audit reconciliations and also defeats one of the cardinal objectives of NESS, which is the tracking of exports and repatriation of proceeds by companies engaged in Oil and Gas export.
b. The non-availability of records from NIMASA poses challenges to the reconciliation of marine transport revenue accruing from companies engaged in Oil and Gas export.
c. The non remittance of NLNG dividends, interest and loan repayment in the sum of $1.289 Billion in 2013 makes the cumulative amount received from NLNG and not remitted to Federation account by NNPC as at the end of 2013 (including amounts revealed in previous NEITI audit reports) as $12.92 Billion.
Recommendations
a. CBN should maintain comprehensive information on a company-by-company basis for NESS payments.
b. NIMASA should take the NEITI audit process seriously to avoid sanctions. The non-compliance with
provision of information on marine transport related revenue from the Oil and Gas Companies is a
violation of section 16 of NEITI Act.
c. The recurring non-remittance of NLNG dividends, interest and loan repayments to the Federation
Account by NNPC should be investigated.
CBN Response
a. The total NESS levy collections on oil & gas in 2013 as reported by the designated deposit money
banks (DMBs) and submitted to NEITI was N6,914,473,623.06. However, NNPC NESS levy
payment is usually paid in areas by the organization not through the DMBs.
In addition to payments made through the DMBs, the NNPC made direct payments amounting to
N1,602,250,577.20 and N2,216,326,938.30 into the NESS account with CBN on 29th April, & 3rd
October, 2013, respectively. These direct payments into the account by NNPC as well as
unreported NESS levy collections / remittances by the DMBs were accountable for the differences
between the figure reported by the DMBs amounting to N6,914,473,623.06 and the actual inflow
into the NESS account of N12,858.922,697.36 ($81,535,000) as at 31st December, 2013.

Main Report and Recommendations
NEITI Oil and Gas Industry 2013 Audit
87
Statement of NESS oil & gas account is attached. NEITI may wish to note that NESS levy
collections account is reported only in Naira not in foreign currency (FX).
b. The breakdown of Oil and Gas NESS monthly payments which amounted to N6,914,473,623.06
from the DMBs for 2013, submitted on company by company basis is hereby attached. In
addition, it should be noted that the NNPC NESS levy payments of N1,602,250,577.20 and
N2,216,326,938.30 on 29th April, and 3rd October, 2013, respectively, were not included in the
DMBS returns initially submitted to NEITI, hence the difference.
c. The NESS process which is presently manual is being automated by the CBN Management and the
recommendation of NEITI would be fully addressed upon completion.
3.4.4 Summary of Reconciled Flows from Companies
Table 3.4.4 below shows total company-by-company financial flows. This includes other payments that were
not confirmed to the respective Government Entities. E.g. PAYE to States, WHT to States and other
payments for which the Government Entities did not provide data for the reconciliation.

Main Report and Recommendations
NEITI Oil and Gas Industry 2013 Audit
88
Table 3.4.4. – Summary of Reconciled Flows from Companies
Petroleum Profit
Tax (PPT)Royalty Oil
Royalty
Gas
License Fees and
Concession
Rentals
Value Added
Tax
Witholding Tax
FIRS
Signature
Bonus
Gas
Flared
Penalties
Companies
Income Tax
(CIT)
PAYE to FIRSPAYE to
States
Withholding
Tax to States
Dividends &
Repayment
of Loans by
NLNG
NLNG Tax
Payments to
Local Govt.
Contributions
to NDDCEducation Tax
NCDMB
1% Levy
NESS
Fee
NIWA
Levy
NIMASA
LevyTotal
$'000 $'000 $'000 $'000 $'000 $'000 $'000 $'000 $'000 $'000 $'000 $'000 $'000 $'000 $'000 $'000 $'000 $'000 $'000 $'000 $'000
AENR - - - - 650 - - - - - - - - - 1,673 6,047 442 310 - - 9,121
ALLIED ENERGY - - - - - 30 - - - - 159 - - - - - - 118 - - 307
AMNI 45,466 74,593 - - 5,826 3,707 - 3,807 - - 6,008 4,225 - - 2,000 3,290 1,832 - - 250 151,004
APDNL 476,828 290,491 - - 29,331 30,478 - 2,749 - 175 10,626 901 - - 35,956 22,529 8,578 1,677 - 2,400 912,720
APENL 328,679 163,382 - - 11,536 12,486 - 216 - - - 15 - - 25,442 18,955 2,803 610 - - 564,123
ATLAS - 5,827 - 15 - - - 52 - - 13 - - - - - - - - - 5,907
BRITTANIA- U - - - - 166 701 - - - - 73 0.3 - - - - - 46 - - 987
CAVENDISH - - - 19 - - - - - - - - - - - - - - - - 19
CHEVRON 595,410 733,180 10,884 133 73,467 88,359 - 2,073 - 10,939 182,530 804 - - 61,879 61,550 15,785 8,487 - 4,782 1,850,263
CONOIL 45,139 9,475 - - 5,521 5,858 - 1,831 - - - - - - - 4,128 2,622 - - - 74,575
CONTINENTAL 92,608 118,148 - - 3,059 991 - 2,333 - - - - - - - 2,509 - - - - 219,648
DUBRI - 711 - 1,430 81 233 - 79 - - 82 15 - - 44 37 - 14 6 - 2,732
ENERGIA - 1,759 - - 4,169 3,705 - 159 - - 914 116 - - 963 - 4,111 193 - - 16,088
ESSO 2,167,730 15,735 - - 18,993 18,629 - - - 38 6,948 60 - - 8,094 96,704 - 1,602 - 170 2,334,703
EXPRESS - - - - - - - - - 1 - - - - 6 - - 6 - - 13
FHN 2,059 10,461 - - 115 162 - - - - - 20 - - - 132 - 8 - - 12,958
FRONTIER OIL LIMITED - - - - 2,242 1,522 - - - - 716 72 - - - - - - - -
MIDWESTERN - 23,807 - - - 576 - 34 - - - 42 - - 256 0.03 670 256 - - 25,640
MOBIL 2,967,360 1,363,899 - 52 127,718 135,027 - 1,024 117,447 1,038 84,063 1,106 - - 65,002 490,198 26,599 9,233 119 3,800 5,393,684
MONIPULO 19,033 27,478 - - 226 356 - 61 - - - - - - - - - - - - 47,154
NAE 291,840 74,995 - - 29,575 148 - - - 3,313 3,313 - - - 6,526 12,888 4,523 563 - - 427,684
NAOC 363,816 235,158 20,153 - - - - 428 8,545 - - - - - 9,787 23,564 4,912 812 - - 667,175
ND WESTERN 443 34,701 - - 56 45 - - - - 112 13 - - - - - 241 - - 35,611
NDPR - 1,134 - - 1,097 1,351 - - - - 179 70 - - - - - - - - 3,832
NECONDE - 29,140 - - 2,487 2,699 - - - - 1,216 302 - - - - - 171 - - 36,014
NEWCROSS 999 - - 10 886 805 - 325 - - 206 9 - - - 112 329 - - - 3,681
NLNG - - - - 133,518 275,459 - - - 2,799 43,820 689 1,289,592 1,089 - 118,529 - - 96 150,930 2,016,520
NNPC - - - - - - - - - - - - - - - - - 24,213 - - 24,213
NPDC 192,000 722,943 - - - - - - - - - - - - - - - - - - 914,943
OANDO - - - - 1 2 - - - - - - - - - - - - - - 3
ORIENTAL - 185,972 - - 12,672 567 - 308 - - 61 14 - - 1,325 - 4,956 1,504 - - 207,379
PANOCEAN 450 9,951 - 10 29,428 - - - - - - - - - - - - - - - 39,839
PHILIPS 64,270 85,044 9,850 - 1,009 112 - 254 48,280 656 679 23 - - - 3,157 - - - - 213,333
PILLAR 850 619 - - 982 396 - - - 726 726 613 - - 71 5 63 71 - - 5,123
PLATFORM 1,976 885 - - 53 711 - 315 - - - - - - 2,250 185 87 51 - - 6,514
SEEPCO - 72,000 - - 578 422 - 6 - 129 129 - - - 272 - 82 272 - - 73,891
SEPLAT 94,439 151,532 1,613 40 20,730 - - 504 7,314 - - - - - 18,316 4,833 6,158 953 - - 306,432
SHEBA - - - - - - - - - - 30 - - - - - - 20 - - 50
SHORELINE NATURAL RESOURCES - 57,364 - - 137 8 - - - - 423 - - - - - - 312 - - 58,243
SIGMUND OILFIELDS LTD - - - - - - 12,500 - - - - - - - - - - - - - 12,500
SNEPCO 2,397,603 65,627 - - 36,162 37,110 - 194 - 60 27,080 93 - - 32,373 123,870 5,235 2,140 - 1,511 2,729,059
SPDC 1,469,627 781,462 44,964 324 140,303 138,469 - 794 194,829 1,151 120,173 4,824 - - 136,181 151,931 19,560 - - - 3,204,592
STARDEEP 2,341,380 - - 26 30,503 36,212 - - - - - 36 - - 27,999 81,624 6,567 2,312 - 1,102 2,527,762
STATOIL 1,070,531 - - - 109 - - - - 139,841 - - - - 6,160 62,735 12 895 - - 1,280,283
TEPNG 813,140 832,946 31,629 131,640 188,522 141,541 - 639 179,636 7,658 65,753 3,658 - - 41,886 56,806 - 4,240 - - 2,499,694
TUPNI 1,745,608 - - - 53,393 52,574 - 290 - - - 20 - - 78,360 131,021 - 1,669 - - 2,062,934
WALTERSMITH 2,226 1,900 - 50 220 243 - - - - - - - - 99 425 - 99 - - 5,263
TOTAL 17,591,512 6,182,319 119,093 133,750 965,521 991,693 12,500 18,475 556,050 168,524 556,030 17,740 1,289,592 1,089 562,921 1,477,764 115,925 63,100 221 164,945 30,984,211

The Petroleum Profit Tax figure reported for STARDEEP in table 3.4.4 above is the actual amount paid by
STARDEEP including amount paid on behalf of Partners (FAMFA and PETROBRASS) in the sum of
$842,887,000 which was recorded by CBN as payment from STARDEEP.
3.4.5 Validation of Flows
The Key Findings in the validation of financial flows was in respect of Petroleum Profit Tax (PPT), Royalty
and Gas Flare Penalty.
3.4.5.1 Introduction
The Petroleum Profits Tax (PPT) is a tax imposed on the profits from the winning of petroleum in the
course of petroleum operations in an accounting period. The principal legislation guiding the
computation of this tax is the Petroleum Profits Tax Act 2004 (as amended).
Under the JV arrangement, there is consolidation of revenues and expenses in Nigerian petroleum
profits taxation as revenue aggregation and deductible expense rules are set on a company basis
and not at the level of wells, fields, blocks etc. Thus, there is no Ring Fencing.
The Production Sharing Contract (PSC) arrangements with NNPC appear to have introduced Ring
Fencing to the Contract Areas covered by the PSC, thus each entity is requested to file its PPT
Returns on a license-by-license basis and filed through NNPC-NAPIMS to FIRS.
For Royalty administration in Nigeria, the Department of Petroleum Resources (DPR) is responsible
for the reconciliation of production volumes, computation and receipt of royalty on oil from all
upstream companies in Nigeria.
In validating the royalty liabilities and payments made by the entities during the review year, the
consultants were guided by the under listed sections of the various acts and regulations operating
in Nigeria.
A. Petroleum (Drilling and Production) Regulation of 1969
B. Petroleum Profit Tax Act 1959 (LFN 2004)
C. Deep Offshore and Inland Basin Production Sharing Contracts Act of 1999
D. Marginal Fields Operations (Fiscal Regime) Regulations 2005
Details on the basis for computing PPT, Royalty and other taxes/levies are contained in Appendix
3.4.5.1A.
In addition, the following issues were noted with respect to Royalty and PPT validations for the year
2013:
I. Termination of 2000 MoU and establishment of new pricing regime
In an effort by DPR to resolve the lingering price dispute between the Federal Government and
OPTS, the DPR in consultation with NNPC-COMD and FIRS, resolved in 2013 that:
a. Realizable price should be used as fiscal price from January 2008 to June 2010.
b. The OSP be used as fiscal price from July 2010 to December 2012. However, the companies
objected to this.

Main Report and Recommendations
NEITI Oil and Gas Industry 2013 Audit
90
c. The weighting ratio of 50% Platts, 30% Argos and 20% LOR be adopted for the new pricing
mechanism for the first 2 years and thereafter changed to 40% Platts, 40% Argos and 20%
LOR. (See Appendix 3.4.5.1B). The new pricing mechanism takes effect from 1st January,
2013.
II. FIRS Interpretation of Court Ruling on the use of RP
FIRS communication of Court ruling in 2015 with effect that all parties to the dispute arising from
the pricing mechanism of Crude Oil are advised to use RP as against OSP pending the resolution of
the case.
This FIRS interpretation of court rulling was the position adopted by FIRS in its review of 2012 NEITI
Audit report (See Appendix 3.4.5.1C) This position is contrary to the interpretation by the
companies,hence the need to urgently resolve all pricing issues.
In the application of the two positions above, it is observed that in 2013, there were minimal issues
with respect to the application of pricing (provided by NNPC) in the computation of royalties as the
new OSP provided by NNPC is also referred to as RP (See Appendix 3.4.5.1D). However, some
companies still adopt their respective RP, which is (different from that provided by NNPC) in pricing
for PPT computations.
3.4.5.2 Review of 2012 PPT and Royalty Validation Report
The summary of findings as per the 2012 Audit and the present status as at 2013 audit are stated in
the table below:
Table 3.4.5.2 - Summary of Findings in 2012 Audit Report
S/N Summary of Findings in 2012 Update as at 2013 Audit
1
The lingering pricing dispute between the IOCs and Nigerian government resulted in revenue loss of over US$4.04billion in the last8 years.
The price differentials continued as government and the IOCs could not reach a mutual agreement on the pricing methodology to be adopted.
2
The disputes between DPR and SNEPCO persisted as both parties continued to compute royalty liabilities using different rates. While SNEPCo applied 1% for the OML 118 (Bonga), DPR continued to apply 1.75%.
Dispute persisted as SNEPCO applied 1% on its royalty computation against DPR's advised rate of 1.75%.
3
Default in payments by the indigenous operating companies as regards Royalty and PPT payments.
Majority of the marginal field entities continued to default in payments of royalty and PPT in 2013 in total breach of the Petroleum Regulation Act.

Main Report and Recommendations
NEITI Oil and Gas Industry 2013 Audit
91
3.4.5.3 Summary of Royalty Validation
The table below shows comparison of the re-computed royalty liabilities against the entities
computation.
The royalty validation is grouped according to the operating arrangements of the entities for
analysis purposes:
Table 3.4.5.3 - Revalidation of the Royalty Value on Chargeable Oil
Royalty Validation 2013 NEITI OIL & GAS AUDIT
Computation by NEITI Auditors
Computation by Entity
Under/(Over) Assessment
USD$ USD$ USD$
Entities operating in PSCs
1 SNEPCO 116,572,856 65,626,839 50,946,017
2 STERLING 49,223,800 44,528,610 4,695,190
3 NAE 71,159,875 71,149,908 9,967
236,956,531 181,305,357 55,651,174
Entities operating in JVs
1 SPDC 643,474,685 570,313,211 73,161,474
2 CNL 696,719,172 691,513,775 5,205,397
3 PANOCEAN 28,006,846 0 28,006,846
4 TEPNG 387,788,921 385,520,336 2,268,586
1,755,989,624 1,647,347,322 108,642,302
Entities operating in Marginal fields/sole risks
1 WALTERSMITH 2,661,798 2,656,550 5,248
2 ENERGIA 2,005,156 1,997,655 7,501
3 PILLAR 1,424,605 1,421,426 3,179
4 NEWCROSS 524,347 519,938 4,409
5 MONIPULO 23,352,430 23,275,960 76,469
6 FHN 18,029,976 16,367,014 1,662,962
7 SHEBA 2,203,490 0 2,203,490
8 NECONDE 37,131,954 37,065,699 66,255
9 SHORELINE 75,518,204 75,517,744 461
162,851,960 158,821,986 4,029,974
GRAND UNDER/(OVER) ASSESSMENTS 2,155,798,114 1,987,474,665 168,323,449

Main Report and Recommendations
NEITI Oil and Gas Industry 2013 Audit
92
3.4.5.4 Key findings from Royalty Validation
I. Pricing Methodology
The Royalty payable on Crude Oil by companies is a function of the value of the Crude Oil, which in
turn is determined by the price. There have always been issues over the pricing mechanism to be
adopted in the computation of Royalty, i.e whether OSP (as determined by NNPC) or RP (as
determined by Companies) should be used.
a. Royalty under assessments decreased from USD$465million (30 entities) in 2012 to
US$166.54 Million (17 entities) in 2013, representing a decrease of 64%. The under
assessment recorded was mainly as a result of price differentials between the official
Government position and that of the Oil Companies.
b. The PSC entities had the proportion of 34% under-assessment, while the JV entities had
65%. Total under assessment from Marginal fields amounted to USD$443.182 Million1%,
this was due to the fact that reconciliation meetings were held regularly with these
indigenous companies and the Official Selling Price (OSP) was applied on their production.
c. The prices applied by SPDC on its royalty computation continued to differ from the advised
prices of NNPC-COMD. This difference resulted in an underpayment of US$73,161,473.98
for 2013.
Implication
The lingering pricing dispute between the IOCs and Nigerian government has resulted in revenue
loss of over US$4.2billion in the last 8years.
Recommendation
a. The Minister of Petroleum Resources should compel the DPR to finalize the appropriate
pricing methodology for royalty computation.
b. The controversy over the new pricing regime of 2013 and the Court ruling of 2015 on the
application of OSP should be speedily resolved.
c. DPR, FIRS and NNPC should conclude the on-going discussions on pricing methodology.
d. An adequate pricing framework should be clearly defined in the Petroleum Industry Bill
(PIB).
II. Inconsistent application method of OSP to compute Royalty by DPR
It was observed that the application of prices on production volumes were not consistent
during the year. E.g. OSP was applied on production volumes as per their B/L date in some
months while average monthly OSP was applied in some other periods by DPR.

Main Report and Recommendations
NEITI Oil and Gas Industry 2013 Audit
93
Implication
Inconsistent valuation of production volumes leads to different computation of Royalty payable.
Recommendation
Royalty computation should be carried out based on the average monthly price as provided by
NNPC-COMD adjusted by the crude type’s API gravity (considering the pricing option adopted by
the entity).
III. Disputes in Applicable Rates for SNEPCO
During the 2013 audit, it was observed that the disputes between DPR and the PSCs (SNEPCO)
persisted as both parties continued to compute royalty liabilities using different rates. While
SNEPCO apply 1% DPR continues to apply 1.75%. This brought about an under assessment of
USD$50,946,017.
Implication
Shortfall in revenue remittance to the Federation account.
Recommendations
The Federal Government should compel the Regulatory Agencies and the IOCs to agree on a rate to
be adopted for subsequent years or compel SNEPCO to adopt DPR's rate, being the agency
responsible.
The Ministry of Petroleum Resources should appoint an independent consultant to confirm the
accurate water depth level for these blocks and advise on an appropriate rate which should be
agreed with the operators of the blocks.
Alternatively, an amendment to the deep offshore and inland basin Act can be effected by the
National Assembly to cater for the water depths in disputes.
IV. Default in Royalty payments by the indigenous operating companies
The audit observed that over 44% of the marginal field and sole risks companies defaulted in the
payments of the obligatory dues to the Federation.
Implication
Shortfalls in revenue remittance to the Federation account
Recommendation
The respective agencies; DPR, FIRS, NDDC, NCDMB and TETFUND should ensure the entities pay
what is due as at when due or they should be strict with the penalties imbedded in their Act.

Main Report and Recommendations
NEITI Oil and Gas Industry 2013 Audit
94
V. Clarification of the Petroleum (Drilling and Production) Regulations of 1969 as amended
In accordance with section 61(1) of the Petroleum (Drilling and Production) Regulations of 1969 (as
amended), the lessee is expected to pay to the Minister not more than one month after the end of
every quarter or otherwise as the Minister may direct a royalty at a rate of the chargeable value of
the crude oil and casing-head petroleum spirit, produced from the relevant area in the relevant
period. However, we observed that while JVs were paying on a monthly basis (with the provision of
the two-month in arrears), the indigenous entities were paying lump sum on a quarterly basis.
Implication
Inconsistent timing in revenue flows to the Federation account.
Recommendation
DPR is to clarify or interpret this clause and ensure uniform enforcement on payments across all
petroleum companies.
3.4.5.5 Entities Response
I. SNEPCO.
“The reason for the difference between the royalty rate applied by NAPIMs in the tax return filed on behalf of the contract area and the rate applied by the contractor, SNEPCO, in the tax computation is due to the fact that ongoing negotiations between DPR and SNEPCO are yet to be concluded regarding the compromise/mutually acceptable royalty rate that should be applied for purposes of royalty computation and payment. The necessity for a mutually agreeable compromise arose because by virtue of the Section 61, subsection 1a, vii, of the Petroleum Act, Laws of the Federation of Nigeria, the applicable rate defined under the law for production in water depths beyond 1,000 metres, is actually zero percent. Considering that on the average the Bonga PSC is at water depths in excess of 1,000m, it would be expected that no royalty is payable from the Bonga PSC. However due to the practical fact that by nature, the sea bed is not static as obtains onshore, both DPR and SNEPCO recognised that there would be areas within the Bonga PSC that may be more or less than 1,000m water depth. Accordingly discussions commenced between both parties to ascertain the compromise royalty that should be applied. Unfortunately this has not been concluded and has formed part of the issues currently under dispute between NNPC and SNEPCO It is noteworthy that Section 61, subsection 2a and 2b, of the Petroleum Act, also recognises and supports that in the event of a dispute or disagreement as to royalty due, the tax payer is permitted to apply the rate it believes in pending resolution of the issue. Please see extract of the relevant sections of the Petroleum Act attached for your guidance.”

Main Report and Recommendations
NEITI Oil and Gas Industry 2013 Audit
95
II. STERLING
a. “We do not agree with the Royalty difference amount of $ 4,695,191.69 as computed in
the above report. This is arising mainly on account of production quantity difference,
which has been contested with DPR and due to the method of calculation used by NEITI.
We had also provided a letter from NNPC which gives a year end status wherein they
have mentioned that all our dues with regards to Royalty for Year 2013 have been
cleared.
Hence we do not accept this differential amount of $ 4,695,191.69, for the year 2013, as
payable by our company.”
b. “There was discrepancy in production volume between SEEPCO & DPR in which DPR
volumes were much higher. This resulted in a difference for royalty calculated by NEITI
based on DPR’s volumes.
This issue has been now reconciled and DPR have given a sign off agreeing to our
volumes, a copy of which has been given to NEITI. This should now take care of the diff.
in Royalty…”
III. NAE
“…While NAE applied the actual Sales Prices for Contractor’s liftings and estimated prices for
NNPC’s liftings, as NNPC does not make their actual lifting prices available to Contractor, NEITI
has applied the Official Sale Price (OSP) of NNPC. NAE applied the actual sales price in computing
the royalty because the RP mechanism as enshrined in the PSC Agreement has not been agreed
by NNPC and contractor.
It should be noted that even though the RP mechanism has not been agreed by the Parties
(NNPC & Contractor), NNPC lifted their Royalty oil entitlement based on their computations
which used the OSP. Therefore, there is no any outstanding royalty liability on the part of
Contractor.”
IV. SPDC
“Variances mainly due to:
1. NEITI did not capture SPDC’s November and December 2012 liabilities of ($91,193,699 and $87,140,562) respectively, which were paid in January and February 2013. Kindly incorporate this to show a full view of payments made for 2013.
2. The variance in hydrocarbon volume of 1,576,059Bbls noted above arose because the NEITI auditors did capture the Brass volume as reported. The difference in royalty computation of $73,161,473.98 as noted by the NEITI auditors arose from the use of 53.6% as SPDC equity holding in EA instead of 30% and use of different price regime. In addition, the NEITI auditors did not take into consideration the OML Rental payment of $109,476 into its computation.

Main Report and Recommendations
NEITI Oil and Gas Industry 2013 Audit
96
We noted that NEITI have used a series of what it described as 'prices advised by NNPC-COMD'
otherwise referred to as official selling price (OSP) as the basis of its computation. Please note
that we are not aware of any provisions of the Petroleum Act (PA) which provides for the use of
fiscal prices advised by NNPC as the basis for determining royalty payable.
Furthermore, as you may be aware, the concept of Official Selling Price (OSP) is not recognised
under any provisions of the PA and hence could not be recognised by us. We note however that
Section 23 of the Petroleum Profit Tax Act (PPTA), Laws of the Federation of Nigeria (LFN) 2004,
mentioned the use of Posted Price when certain conditions are met. Please note that a key
condition required under Section 23 (3 & 5) of the PPTA is an agreement of such prices between
the Government of Nigeria and the Company in writing before it could be used for PPT or Royalty
purposes. To date, SPDC has no such agreement with Government and hence could not
recognise Posted Price even if it were issued by NNPC.
It is also worth mentioning that in recognition of the significance of Section 23 of the PPTA and
its provisions, there is an ongoing Department of Petroleum Resources (DPR) initiated discussion
with the industry which is aimed at reaching an agreement in compliance with Section 23 (3 & 5)
of the PPTA on the pricing basis for fiscal purposes.
We also observed that contrary to the provisions of the law, your computation was based on
production volume from January to December 2012. The law provides that the first monthly
payment shall be due and payable not later than the third month of the accounting period;
hence the payment in scope for the 2012 audit is in respect of Production volume from
November 2011 to October 2012 as the royalty payable was paid in January 2012 to December
2012. We also observed that the OML Rental was not deducted from the Royalty Payable for the
period.
Kindly update your computation accordingly.
Conclusion:
Based on the above submission, we request that you adopt the prices as advised by SPDC and
update your computation; this will bring outstanding royalty highlighted in NEITI's draft report
to nil.”
V. CHEVRON
“The computation of $691,513,775.00 by Chevron was as of the period when RP was used as basis of Royalty calculation. However as a result of the agreement of using a New pricing formula effect 2013, Chevron had recalculated the 2013 Royalty and came up with a total of $698,319,410. The differential of the initial payments made to the royalty due which stands at $5,785,003.14 had been paid to the government. (A copy of the receipt had been submitted to the Auditors).”

Main Report and Recommendations
NEITI Oil and Gas Industry 2013 Audit
97
VI. PANOCEAN
“We have had reconciliation meetings with DPR on the subject matter and have agreed a
payment plan for same.”
VII. TEPNG
1. ”We observed that NEITI’s computations were based on production volumes for January to
December 2013, rather than cash basis (November 2012 to October 2013) envisaged and as
directed by NEITI at the time of completing the template. Your paragraph 1.4 above
summarises our total payments in 2013 (TEPNG JV & SPDC JV) on cash basis covering
November 2012 to October 2013, as payments are made two (2) months in arrears.
2. US$385,520,335.58 was the royalty due as computed by the DPR using OSP, while
US$383,734,051.61 was computed and duly paid by TEPNG using RP as shown in the signed
resolutions of the reconciliation exercise between DPR and TEPNG, pending the resolution of
a new mutually agreed pricing mechanism.
We are not in agreement with the application of Official Selling Price (OSP) by NEITI as
provided by NNPC in computing revenue. This approach in computing the fiscal value of
crude oil based on the OSP as provided by NNPC/COMD contravenes the provisions of the
Petroleum Profits Tax Act (PPTA) 1959.
Section 9(2)(a) of the Petroleum Profits Tax Act (PPTA) stipulates that the value of oil for the
purpose of royalty shall be in accordance with the provisions of any enactment applicable
thereto and any financial arrangement or arrangements between the Federal Government of
Nigeria and the oil producing company.
In furtherance to this directive, Section 21(5) of the PPTA provides for a “posted price”
established by the company, after agreement with the Government of Nigeria as to the
procedure to be followed for the purpose, as its posted price for Nigerian crude oil of that
gravity and quality.
These sections of the PPTA clearly spell out the processes for establishing a ‘pricing
methodology” for the valuation of crude oil produced for the purpose of export and payment
of Royalty.
The directive of NNPC on OSP was not mutually agreed with oil producing companies and is
in contravention of the provisions of the PPTA on pricing. Discussions are ongoing with NNPC
as representatives of the Government of Nigeria. Consequently, TEPNG has valued the lifting
volumes for the purpose of revenue using Realisable Price (RP), being the most recent agreed
position between the Government of Nigeria (represented by NNPC) and the Oil Industry.
VIII. WALTERSMITH
“Noted, however our royalty obligation is reconciled and signed off by the DPR at regularly
scheduled meetings.”

Main Report and Recommendations
NEITI Oil and Gas Industry 2013 Audit
98
IX. ENERGIA
“The outstanding has been settled by Energia Limited.”
X. PILLAR
No response.
XI. NEWCROSS
“The royalty amount is a reconciled amount computed by DPR.”
XII. MONIPULO
No response.
XIII. FHN
No response.
XIV. SHEBA
No response.
XV. NECONDE
“…NEL is an indigenous newcomer and a small off taker with only one asset (OML 42) operated
by NPDC as at 31 December, 2013. OML 42 was acquired from SPDC & the other JV partners in
an arrangement whereby NEL has a “Spot price Offtake Agreement” with Shell Western Supply
and Trading Limited (SWEST), an affiliate of SPDC. SWEST trades NEL’s crude in total based on
spot prices. NEL has an average of one lifting of about 120,000 bbls monthly.
NEL does not have any control over its realizable prices and only earns revenues from crude sold
at spot prices. Therefore, NEL can only recognize revenues, royalties and compute taxes based
on NEL’s realized prices and that has been the practice since 2013 as agreed with DPR. It will
amount to inequity and unfair practices for NEL to be assessed to royalties on revenues
unearned by the Company.”
XVI. SHORELINE
“All outstanding payments for 2013 royalty were paid in 2014, following the full year reconciliation exercise jointly carried out between Shoreline and DPR.”

Main Report and Recommendations
NEITI Oil and Gas Industry 2013 Audit
99
3.4.6 Summary of PPT Validation
3.4.6.1 Revalidation of the Fiscal Value on Chargeable Oil
During the 2013 audit, the consultants recomputed the fiscal value on chargeable oil. The analysis
below shows the under-assessment from the respective entities:
Table 3.4.6.1 - Revalidation of the Fiscal Value on Chargeable Oil
3.4.6.2 Findings and Recommendations
I. Granting of Pioneer Status
The grant of Pioneer Status to Oil and Gas Companies has greatly undermined the optimal
collection of revenue due from PPT. A total of 18 companies were granted pioneer status, as at
2013 and all the companies are operators in the marginal field segment of the Nigerian Oil and Gas
Industry.
The legal framework governing the operations of the pioneer status is the Industrial Development
(Income Tax Relief) Act of 1971 (IDITRA), a subsidiary legislation of the Companies Income Act
(CITA), which is the legal basis of taxing non-oil and gas companies in Nigeria. The pioneer status is
a form of tax waiver issued by the Nigeria Investment Promotion Council (NIPC) as an incentive
Computation by
NEITI Auditors
Computation
by Entity
Computation
Variance
Under/(Over)
Assessment
USD$ USD$ USD$ USD$Entities operating in PSCs
1 SNEPCO 5,678,784,563 5,665,832,133 12,952,430 6,476,215 2 ESSO 4,138,872,989 4,133,250,413 5,622,576 2,811,288 3 STATOIL 863,916,844 863,237,999 678,845 577,018 4 TUPNI 3,252,740,675 3,248,071,086 4,669,590 3,969,151
13,934,315,072 13,910,391,630 23,923,441 13,833,673
Entities operating in JVs1 SPDC 3,721,708,779 3,658,295,412 63,413,367 53,901,3612 NAOC 1,051,357,682 1,036,165,852 15,191,830 12,913,055 3 MPNU 7,502,501,756 7,444,611,295 57,890,461 49,206,892 4 TEPNG 3,164,408,108 2,817,503,111 346,904,996 294,869,247 5 CONOCO PHILIPS 469,814,380 469,772,526 41,854 35,576
15,909,790,704 15,426,348,196 483,442,508 410,926,130
Entities operating in Marginal fields/sole risks1 CONOIL 62,311,160 62,161,160 150,000 127,500 2 MONIPULO 151,491,685 148,514,449 2,977,236 2,530,651 3 ATLAS 66,477,575 64,021,281 2,456,294 2,087,850 4 SEPLAT 803,996,925 801,635,574 2,361,351 2,007,148
1,084,277,345 1,076,332,464 7,944,881 6,753,149
GRAND UNDER/(OVER) ASSESSMENTS 30,928,383,120 30,413,072,291 515,310,830 431,512,952
Petroleum Profit Tax Validation
2013 NEITI OIL & GAS AUDIT

Main Report and Recommendations
NEITI Oil and Gas Industry 2013 Audit
100
granted to companies that have been considered to be engaged in “pioneer businesses” or simply
as a means of encouraging the development of certain type of businesses.
The first pioneer status was granted in 2009 and as at October 2014, the sum of US$
1,172,800,956.38 was established by Federal Ministry of Finance to have been waived by the FGN
through tax holidays to 12 of the beneficiary companies.
There is also the issue of whether the granting of Tax waivers is appropriately located within the
NIPC and also the applicability of Pioneer status to oil and gas companies, given the fact that the
IDITRA is a subsidiary legislation of CITA, whereas Oil and Gas companies are taxed under the PIT
Implication
The waiver granted to companies under pioneer status has led to huge shortfalls in revenue
remittance to the Federation account.
Recommendations
a. Pioneer status should not be granted to any company in the Oil & Gas Sector unless it is
evidently clear that the company is actually pioneering an aspect of the industry in the country.
b. A coordinating Desk should be established in the FMF for all the agencies that process tax
incentives while the final approval for tax waivers should be issued by the Minister of Finance.
II. Pricing Methodology
The differences in the method of pricing between the IOCs and Nigerian Government, the NNPC
issues Official Selling Price (OSP) for value determination while the IOCs prefer the Realisable Price
(RP). This lingering price dispute is a major challenge in the assessment of Taxes and Royalties.
As shown in table 3.4.6.1 above, the value of under-assessment on the fiscal valuation of
chargeable oil was over USD$431.5million in 2013. The JV Companies had the highest under-
assessment in the sum of over USD$410.9million followed by the PSCs with over USD$13.8million
and Marginal Fields/Sole Risk – USD$6.8million. The under/over assessments were computed
based on the advised pricing methodology by NNPC-COMD as against pricing methodologies used
by the companies. For instance, SPDC applied a different pricing methodology against the prices
advised by NNPC-COMD, resulting in revenue loss of over USD$6.2billion in the last 8years.
Implication
Shortfalls in revenue remittance to the Federation account.
Recommendations
The Federal Government should compel the regulatory agencies and the IOCs to finalize the
methodology to be adopted for subsequent years or speed up the committee set up to resolve this
dispute.The Regulatory agencies and IOCs should speed-up and conclude the on-going discussions.

Main Report and Recommendations
NEITI Oil and Gas Industry 2013 Audit
101
3.4.6.3 Entities Response
I. SNEPCO.
“We noted that NEITI have used prices described as 'OSP provided by COMD-NNPC' as the basis of its computation. Please note that we are not aware of any provisions of the Petroleum Profit Tax Act (PPTA) which provides for the use of fiscal prices unilaterally advised by NNPC, as the basis for determining the fiscal value of crude oil sales for PPT purposes. Furthermore, as you may be aware, the concept of Official Selling Price (OSP) is not recognized under any provisions of the PPTA and hence could not be recognized by us in our tax (PPT) computations/returns. We note however that Section 23 of the Petroleum Profit Tax Act (PPTA), Laws of the Federation of Nigeria (LFN) 2004, mentioned the use of Posted Price when certain conditions are met. Please note that a key condition required under Section 23 (3 & 5) of the PPTA is an agreement, in writing, of the crude prices, which will form the basis of fiscal valuation, between the Government of Nigeria and the Company before it could be used for PPT purposes. To date, SNEPCo has no such agreement with Government and hence could not recognise Posted Price (or OSP) even if it were issued by NNPC. It is also worth mentioning that in recognition of the significance of Section 23 of the PPTA and its provisions, there is an ongoing Department of Petroleum Resources (DPR) initiated discussions with the industry which is aimed at reaching an agreement in compliance with Section 23 (3 & 5) of the PPTA on the pricing basis for fiscal valuation purposes. Pending resolution and agreement on the fiscal prices between the government and SNEPCO/and other industry producers, SNEPCO’s fiscal valuation is based on a Realisable Price (RP) which forms the basis of the actual sales prices reported by Company for tax purposes. The RP is based on the last set of agreed fiscal valuation pricing agreed between the government (DPR) and the industry, i.e. the 2000 Memorandum of Understanding issued by the Government. Conclusion: Based on the above submission, NEITI is incorrect to claim that SNEPCO failed to disclose its actual sales value from liftings. It should be noted that SNEPCO’s oil sales are based on its actual proceeds which was based on the RP, which has been clearly disclosed in SNEPCO’s tax computations/returns, copies of which have been already provided to NEITI. We therefore request that you adopt the Realisable Price as advised by the parties to the Production Sharing Contract (PSC) and as contained in our PPT Returns earlier provided to you.”
II. ESSO
“The “NEITI Audit Value” shown above amounting to USD4,138,872,989.22 is based on
application of NNPC’s official selling price (OSP) to determine the value for each OML 133 PSC
Parties’ crude oil lifting. Whereas, by the provisions of the PSC, the PSC Act and the PPTA, each

Main Report and Recommendations
NEITI Oil and Gas Industry 2013 Audit
102
lifting is to be valued at the respective OML 133 PSC parties’ actual f.o.b. sales price in the
absence of an agreed crude oil price between the Contractor and the government (Section 13 of
the Deep Offshore and Inland Basin Production Sharing Act, Section 23 of the PPTA, and Clause
9.1 (b) (v) (c) of OML 133 PSC).
Consequently the application of NNPC’s OSP to all parties lifting is not in line with any known
statutes and is thus not valid for the purpose of computing fiscal value for PPT computation.
Thus EEPNL has no refund to the Federal Government of Nigeria.
Based on the forgoing, we recommend that this issue be closed.”
III. STATOIL
No response.
IV. TUPNI
“We are not in agreement with the application of Official Selling Price (OSP) by NEITI as provided
by NNPC in computing revenue. This approach in computing the fiscal value of crude oil based
on the OSP as provided by NNPC/COMD contravenes the provisions of the Petroleum Profits Tax
Act (PPTA) 1959.
Section 9(2)(a) of the Petroleum Profits Tax Act (PPTA) stipulates that the value of oil for the
purpose of royalty shall be in accordance with the provisions of any enactment applicable
thereto and any financial arrangement or arrangements between the Federal Government of
Nigeria and the oil producing company.
In furtherance to this directive, Section 21(5) of the PPTA provides for a “posted price”
established by the company, after agreement with the Government of Nigeria as to the
procedure to be followed for the purpose, as its posted price for Nigerian crude oil of that gravity
and quality.
These sections of the PPTA clearly spell out the processes for establishing a ‘pricing
methodology” for the valuation of crude oil produced for the purpose of export and payment of
Royalty.
The directive of NNPC on OSP was not mutually agreed with oil producing companies and is in
contravention of the provisions of the PPTA on pricing. Discussions are ongoing with NNPC as
representatives of the Government of Nigeria. Consequently, the OML 130 PSA partners have
valued the lifting volumes for the purpose of revenue using Realisable Price (RP), being the most
recent agreed position between the Government of Nigeria (represented by NNPC) and the Oil
Industry.
Based on our comments above, the OML 130 PSA contract area is not liable to further payment
of PPT for 2013.”

Main Report and Recommendations
NEITI Oil and Gas Industry 2013 Audit
103
V. SPDC
1. PRICING “We noted that NEITI have used a series of what it described as 'prices advised by NNPC-COMD' otherwise referred to as official selling price (OSP) as the basis of its computation. Please note that we are not aware of any provisions of the Petroleum Act (PA) which provides for the use of fiscal prices advised by NNPC as the basis for determining petroleum profit tax payable.
Furthermore, as you may be aware, the concept of Official Selling Price (OSP) is not recognised under any provisions of the PA and hence could not be recognised by us. We note however that Section 23 of the Petroleum Profit Tax Act (PPTA), Laws of the Federation of Nigeria (LFN) 2004, mentioned the use of Posted Price when certain conditions are met. Please note that a key condition required under Section 23 (3 & 5) of the PPTA is an agreement of such prices between the Government of Nigeria and the Company in writing before it could be used for PPT or Royalty purposes. To date, SPDC has no such agreement with Government and hence could not recognise Posted Price even if it were issued by NNPC.
It is also worth mentioning that in recognition of the significance of Section 23 of the PPTA and its provisions, there is an ongoing Department of Petroleum Resources (DPR) initiated discussion with the industry which is aimed at reaching an agreement in compliance with Section 23 (3 & 5) of the PPTA on the pricing basis for fiscal purposes.
Conclusion:
Based on the above submission, we request that NEITI adopt the prices as advised by SPDC; this should address the outstanding PPT highlighted in NEITI's draft report.”
VI. NAOC
Kindly find below NAOC’s reconciliation to the above PPT Difference.
USD $ USD $
NEITI's Audit Fiscal Value 1,051,416,056.44
Less: Duplicated Entry
BORDEIRA (70,000 barrels @ $106) - 07.06.13 (7,420,000.00)
Less: Inclusion of NAE PSC lifting
ALMI SKY (76,000 barrels @ 103.029) -5/7/2013 (7,830,204.00) (15,250,204.00)
NAOC's Fiscal Value 1,036,165,852.44
Please find attached (Appendix 3.4.6.3) providing NAOC’s clarification on the above as well as
supporting documents on the incorrect categorization of NAE’s Abo lifting of 75,000 barrels as
NAOC in the NNPC crude lifting advice on 7th May 2013. Also note that as contained in the
supporting documents the correct volume of the ALMI SKY lifting is 75,000 barrels.

Main Report and Recommendations
NEITI Oil and Gas Industry 2013 Audit
104
VII. MPNU
“The “NEITI Audit Value” shown above amounting to USD7, 502,501,755.72 is based on
application of NNPC’s official selling price (OSP) to determine the value for each cargo of crude
lifted by MPNU. Whereas, by the provisions of the Section 23 of the PPTA, the price to be used
for the purpose of computation of fiscal price shall be as agreed by the Government of Nigeria
and the Company from time to time. Please see excerpts below.
S.23 (3) - “For the purpose of subsection (2) of this section the relevant sum per barrel of crude
oil exported by a company is the posted price applicable to that crude oil reduced by such
allowances (if any) as may from time to time be agreed in writing between the Government of
Nigeria and the company”.
MPNU and the Regulatory Agencies (DPR & NNPC) have agreed in principle the fiscal price
methodology applicable effective January 2013. 2013 fiscal value have been determined by
MPNU on the basis of this aligned methodology Consequently, MPN has no refund to the Federal
Government of Nigeria.
Based on the forgoing, we recommend that this issue be closed.”
VIII. TEPNG
“We are not in agreement with the application of Official Selling Price (OSP) by NEITI as provided
by NNPC in computing revenue. This approach in computing the fiscal value of crude oil based
on the OSP as provided by NNPC/COMD contravenes the provisions of the Petroleum Profits Tax
Act (PPTA) 1959.
Section 9(2)(a) of the Petroleum Profits Tax Act (PPTA) stipulates that the value of oil for the
purpose of royalty shall be in accordance with the provisions of any enactment applicable
thereto and any financial arrangement or arrangements between the Federal Government of
Nigeria and the oil producing company.
In furtherance to this directive, Section 21(5) of the PPTA provides for a “posted price”
established by the company, after agreement with the Government of Nigeria as to the
procedure to be followed for the purpose, as its posted price for Nigerian crude oil of that gravity
and quality.
These sections of the PPTA clearly spell out the processes for establishing a ‘pricing
methodology” for the valuation of crude oil produced for the purpose of export and payment of
Royalty.
The directive of NNPC on OSP was not mutually agreed with oil producing companies and is in
contravention of the provisions of the PPTA on pricing. Discussions are ongoing with NNPC as
representatives of the Government of Nigeria. Consequently, TEPNG has valued the lifting

Main Report and Recommendations
NEITI Oil and Gas Industry 2013 Audit
105
volumes for the purpose of revenue using Realisable Price (RP), being the most recent agreed
position between the Government of Nigeria (represented by NNPC) and the Oil Industry.
Based on our comments above, TEPNG is not liable to further payment of PPT for 2013.”
IX. CONOCO PHILIPS
“…the difference between our numbers and your (NEITI) numbers is from the difference in sales price for our crude. We used the retail price we sold it while you have applied 'OSP'. The law is that the price that should be used is the posted price (PP), defined as the Free on Board value at the point of export of crude of similar quality and gravity as agreed between the company and the Government of Nigeria..”
X. CONOIL
“The Conoil fiscal value was never $62,161,160.00. The difference of $150,000.00 was due to
November OSP of $111.927 used instead of $114.927 official OSP. This was corrected during the
2013 audit and audit adjustment was passed in respect of this. Therefore, Conoil fiscal value is
$62,311,160.00 as against your computation of $62,161,160.00...”
XI. MONIPULO
“We have carefully reviewed the PPT Validation Report by your company, and wish to state that we are not in agreement with the additional PPT liability of $2,530,650.57. The reason for our disagreement is due to the fact that in arriving at the Fiscal Value of Crude Oil (Antan Blend) (i.e. $151,491,685.44), you used official selling price instead of the actual price realized from the sales of our crude.”
XII. ATLAS
No response. Atlas presented Unaudited Management Account showing company’s own
computation on Fiscal Value on Chargeable Oil.
XIII. SEPLAT
No response.
3.5 Social Expenditures, Infrastructure Project and Quasi-Fiscal Expenditure

Main Report and Recommendations
NEITI Oil and Gas Industry 2013 Audit
106
3.5.1 Social Expenditure
Social Expenditures are incurred on infrastructural projects by companies as a form of giving back
to the society in which they operate (corporate social responsibilities). These can be in form of
buildings, structures and facilities specifically constructed to serve the community at large. The
most apparent form of the social infrastructure projects are hospitals, schools and community
facilities.
The table 3.5.1 below compares the total amount spent on Social Infrastructural Projects in 2012
and 2013. The Total social infrastructural project for the period under review is 407 units valued at
N14,152,696,823 and $13,546,000 as against 268 units valued at N4,302,089,446 and $4,354,807
in 2012. Detail of projects are contained in Appendix 3.6.1
Table 3.5.1 Social Expenditure
Figure 3.5.1 Social Expenditure between 2012 and 2013
ENTITIES (A) (B)
Total Dollar
Equivalent
(A+B)
(A) (B)
Total Dollar
Equivalent
(A+B)
N $ $ N $ $
CHEVRON NIGERIA LIMITED (CNL) 81 1,879,507,243 - 11,933,379 121 3,478,996,153 - 22,059,452
MOBIL PRODUCING NIGERIA UNLIMITED (MPNU) 48 411,965,587 370,519 2,986,173 42 586,726 612 4,332
NIGERIAN AGIP OIL COMPANY LIMITED (NAOC) 12 4,956,360 - 31,469 0 - - -
TEPNG AND TUPNI 128 10,337,571,844 5,248,801 70,884,178 0 - - -
ADDAX PETROLEUM DEVELOPMENT NIGERIA LIMITED (APDNL) 9 261,058 1,681 3,339 10 45,398 - 288
ESSO EXPLORATION AND PRODUCTION NIGERIA LIMITED (EEPNL) 2 230,726,665 - 1,464,931 16 202,756 1,704 2,990
NIGERIAN AGIP EXPLORATION LIMITED (NAE) 4 92,948 250 840 7 123,869,029 250,000 1,035,423
Shell Nigeria Exploration and Production Company (SNEPCO) 27 153,200 967 1,940 0 - - -
STAR DEEP WATER PETROLEUM LIMITED 19 2,038,296 1,470 14,412 15 1,829,905 - 11,603
STERLING OIL EXPLORATION & ENERGY PRODUCTION CO. LIMITED 6 230,185 85 1,546 7 304,101,000 230,000 2,158,229
AMNI INTERNATIONAL PETROLEUM DEVELOPMENT COMPANY LTD 8 67,405,118 3,209,531 3,637,500 8 32,173,849 3,872,491 4,076,497
DUBRI OIL COMPANY LIMITED 1 1,520,000 - 9,651 0 - - -
MONI PULO LIMITED 19 185,117,339 - 1,175,348 0 - - -
NIGER DELTA PETROLEUM RESOURCES LTD (NDPR) 12 224,346,075 - 1,424,420 11 167,413,713 - 1,061,529
ORIENTAL ENERGY RESOURCES LIMITED 11 585,258,720 3,657,867 7,373,795 0 - - -
PILLAR OIL LIMITED 6 19,780,000 - 125,587 0 - - -
SEPLAT 9 169,500,000 1,093,547 2,169,737 0 - - -
WALTERSMITH PETROMAN OIL LTD 5 32,266,186 - 204,865 6 65,556,450 415,677
ENERGIA 0 - - - 20 126,382,961 - 801,363
CONTINENTAL OIL 0 - - - 3 425,906 - 2,701
CONOIL 0 - - - 2 505,600 - 3,206
TOTAL 407 14,152,696,823 13,584,718 103,443,111 268 4,302,089,446 4,354,807 31,633,290
2013 Expenditure 2012 Expenditure
Social Expenditure
No. of
Projects
No. of
Projects

Main Report and Recommendations
NEITI Oil and Gas Industry 2013 Audit
107
3.5.2 Infrastructural Project
The Infrastructure Projects set out expenditures on any agreement, or set of agreements involving
the provision of goods and services (including loans, grants and infrastructure works), in full or
partial exchange for oil, gas or mining exploration or production concessions or physical delivery of
such commodities. Such agreement may be in the form of infrastructure or other commitments
made by the Licensee.
Full details of the Infrastructure Project expenditures as completed by covered entities in the NEITI
2013 Oil and Gas Industry Audit is contained in Appendix 3.5.2
3.5.3 Quasi Fiscal Expenditure
Quasi-fiscal expenditures refer to those expenditures by State Owned Enterprises (NNPC and NNPC
Subsidiaries). These are expenditures, which are not directly related to the core business of NNPC
as a petroleum company and industry concessionaire. NEITI Oil and Gas audit 2013 sought for the
completion of Quasi-Fiscal Expenditure templates from NNPC Subsidiary (NAPIMS). The templates
as completed by NAPIMS are contained in Appendix 3.6.3 of this report
- 10,000,000.00 20,000,000.00 30,000,000.00 40,000,000.00 50,000,000.00 60,000,000.00 70,000,000.00 80,000,000.00
CH
EVR
ON
NIG
ERIA
…M
OB
IL P
RO
DU
CIN
G…
NIG
ERIA
N A
GIP
OIL
…TE
PN
G A
ND
TU
PN
IA
DD
AX
PET
RO
LEU
M…
ESSO
EX
PLO
RA
TIO
N…
NIG
ERIA
N A
GIP
…
Shel
l Nig
eria
…
STA
R D
EEP
WA
TER
…
AM
NI I
NTE
RN
ATI
ON
AL…
DU
BR
I OIL
CO
MP
AN
Y…
MO
NI P
ULO
LIM
ITED
NIG
ER D
ELTA
…
OR
IEN
TAL
ENER
GY…
PIL
LAR
OIL
LIM
ITED
SEP
LAT
WA
LTER
SMIT
H…
ENER
GIA
CO
NTI
NEN
TAL
OIL
CO
NO
IL
Total Dollar Equivalent (2012) Total Dollar Equivalent (2013)

Main Report and Recommendations
NEITI Oil and Gas Industry 2013 Audit
108

Main Report and Recommendations
NEITI Oil and Gas Industry 2013 Audit
109
4 IN-KIND FLOWS
4.1 Introduction
In kind Flows are non-Financial transactions, under Production Sharing Contracts (PSCs) and Joint
Venture Alternative Funding Arrangements. They involve the settlement of Taxes and Royalty
liabilities, Carried Party Costs, compensation and loan settlement by means of crude oil allocations,
instead of financial payments.
Under PSC arrangement, the Government levies in respect of Royalty and Petroleum Profit Tax
(PPT), as well as share of Profit from PSC operations are settled by crude oil allocation to NNPC on
behalf of the Federation.
Alternative Funding Arrangement includes Carry /Modified Carry Agreements and Third Party
Financing. Capital commitments by the Operators (Carrying Party) on behalf of NNPC are settled
through tax offsets and Crude oil allocation for the balance.
4.2 In-Kind Flows under Production Sharing Contract Operations
Production Sharing Contract is an arrangement that allows an International Oil Company to bring in
the technology and capital to explore for oil and gas resources, with the hope of recovering its
investment and share the rewards with the host National Oil Company (NNPC).
Cost is recoverable with crude oil in the event of commercial finding, with provisions made for:
Royalty Oil – to meet the Royalty liability due to the Government for the period.
Tax Oil – to cover the Petroleum Profits Tax liability determined for the period.
Cost Oil – to meet the PSC Operator’s CAPEX and OPEX costs.
Profit Oil – Shared between NNPC and the PSC Operator on an agreed profit sharing ratio.
Acreages operating under PSC arrangements in 2013 are as classified below:
1 Block allocated to Ashland in 1973.
19 Blocks allocated in 1990:
12 to Foreign Companies.
7 to Indigenous companies.
Eighteen blocks allocated to 9 Companies, between 2002 and 2004.
Forty four blocks were allocated in 2005.
Fifteen blocks allocated in 2006.
The following are the three sets of fiscal regimes under the PSC:
The 1993 fiscal regime applicable to PSC agreements signed in 1993 (ITC) & ITA Post July
1998.
The 2000 fiscal regime applicable to PSC agreements signed in 2000 to 2005 (ITA & cost
Uplift).

Main Report and Recommendations
NEITI Oil and Gas Industry 2013 Audit
110
The 2005 fiscal regime applicable to PSC agreements signed in 2005 and beyond (R-Factor
i.e. high cost penalty applies).
During the year under review, nine (9) Production Sharing Contract arrangements were engaged in
exploration and production activities. The details of these PSC Companies are presented below:
Table 4.2 – Production Sharing Contract Companies
S/N Contractors/Operators Blocks
Major Fields Contract
Year
1st Oil
Date OPLs OMLs
1 Addax Petr. Dev.(Nig) Ltd. 98/118 123/124 Antan/Brass 1973/1998 May-98
2 Addax Petr. Expl.(Nig) Ltd. 90/225 126/137 Okwori 1992/1998 Mar-05
3 Nigerian Agip Exploration 316 125 Abo 1993 Apr-03
4 Shell Nig. Expl. & Co. 212 118 Bonga 1993 Nov-05
5 Esso Expl. & Prod. Co. 209 133 Erha 1993 Mar-06
6 Statoil Nigeria Limited 217 128 Agbami Unit
Tract 2
1993 Sep-08
7 Total Upstream Nig. Limited 246 130 Akpo
Main/Apko
1998/2005 Mar-09
8 Sterling Oil Expl. & Energy 280 143 Okwuibome 2006 Apr-11
9 Total Expl. Prod. Ltd. 222 138 Usan 1993 Mar-12
Under this arrangement, NNPC lifts crude oil, on behalf of the Federation, in settlement of
Contractors’ PPT and Royalty liabilities. NNPC-NAPIMS in conjunction with the PSC Companies
determine what the Royalty and PPT liability are, for each period, which is based on the PSC
Agreements and provisions of the law. Below is a schematic diagram of allocation of Crude Oil
Lifting from PSC arrangement. Figure 4.2 – A schematic diagram of allocation of Crude Oil Lifting from PSC arrangement
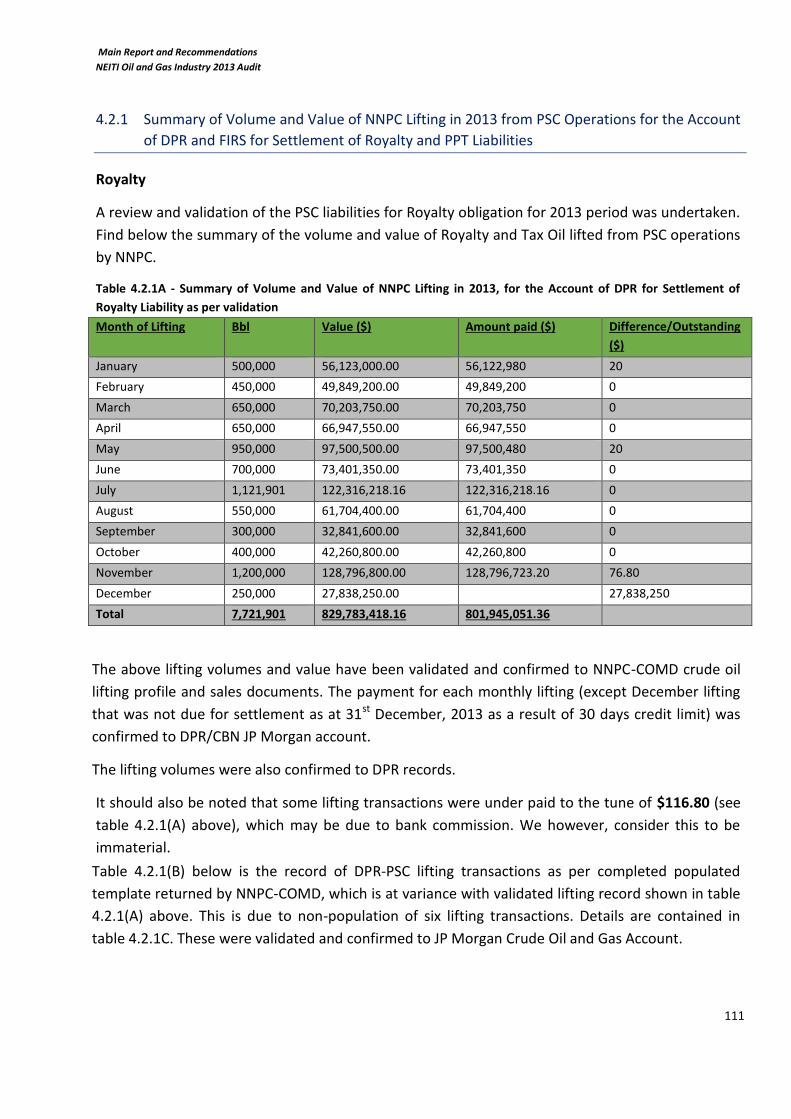
Main Report and Recommendations
NEITI Oil and Gas Industry 2013 Audit
111
4.2.1 Summary of Volume and Value of NNPC Lifting in 2013 from PSC Operations for the Account
of DPR and FIRS for Settlement of Royalty and PPT Liabilities
Royalty
A review and validation of the PSC liabilities for Royalty obligation for 2013 period was undertaken.
Find below the summary of the volume and value of Royalty and Tax Oil lifted from PSC operations
by NNPC.
Table 4.2.1A - Summary of Volume and Value of NNPC Lifting in 2013, for the Account of DPR for Settlement of
Royalty Liability as per validation
Month of Lifting Bbl Value ($) Amount paid ($) Difference/Outstanding
($)
January 500,000 56,123,000.00 56,122,980 20
February 450,000 49,849,200.00 49,849,200 0
March 650,000 70,203,750.00 70,203,750 0
April 650,000 66,947,550.00 66,947,550 0
May 950,000 97,500,500.00 97,500,480 20
June 700,000 73,401,350.00 73,401,350 0
July 1,121,901 122,316,218.16 122,316,218.16 0
August 550,000 61,704,400.00 61,704,400 0
September 300,000 32,841,600.00 32,841,600 0
October 400,000 42,260,800.00 42,260,800 0
November 1,200,000 128,796,800.00 128,796,723.20 76.80
December 250,000 27,838,250.00 27,838,250
Total 7,721,901 829,783,418.16 801,945,051.36
The above lifting volumes and value have been validated and confirmed to NNPC-COMD crude oil
lifting profile and sales documents. The payment for each monthly lifting (except December lifting
that was not due for settlement as at 31st December, 2013 as a result of 30 days credit limit) was
confirmed to DPR/CBN JP Morgan account.
The lifting volumes were also confirmed to DPR records.
It should also be noted that some lifting transactions were under paid to the tune of $116.80 (see
table 4.2.1(A) above), which may be due to bank commission. We however, consider this to be
immaterial.
Table 4.2.1(B) below is the record of DPR-PSC lifting transactions as per completed populated
template returned by NNPC-COMD, which is at variance with validated lifting record shown in table
4.2.1(A) above. This is due to non-population of six lifting transactions. Details are contained in
table 4.2.1C. These were validated and confirmed to JP Morgan Crude Oil and Gas Account.

Main Report and Recommendations
NEITI Oil and Gas Industry 2013 Audit
112
Table 4.2.1B - Summary of Volume and Value of NNPC Lifting in 2013 for the Account of DPR for Settlement of
Royalty Liability as per NNPC-COMD returned template
Month of Lifting Bbl Value ($)
January 500,000 56,123,000.00
February 450,000 49,849,200.00
March 650,000 70,203,750.00
April 650,000 66,947,550.00
May 950,000 97,500,500.00
June 700,000 73,401,350.00
July 1,121,901 122,316,218.16
November 800,000 84,331,600.00
Total 5,821,901.00 620,673,168.16
The monthly summary of the omitted liftings are presented in table 4.2.1C below
There were however, two lifting transactions combined in August and one transaction each for the
months of September to December, which were omitted in the initial template. Table 4.2.1C - Summary of Volume and Value of the omitted transactions in the data template submitted by NNPC-COMD
Month Month of Lifting (Bbls) Value ($)
August 550,000.00 61,704,400.00
September 300,000.00 32,841,600.00
October 400,000.00 42,260,800.00
November 400,000.00 44,465,200.00
December 250,000.00 27,838,250.00
Total 1,900,000.00 209,110,250.00
Petroleum Profit Tax (PPT)
A review and validation of the PSC Petroleum Profits Tax (PPT) liabilities for 2013 period was
undertaken. Find below the summary of the volume and value of Tax Oil lifted from PSC operations
by NNPC.
Table 4.2.1D- Summary of Volume and Value of NNPC Lifting in 2013 for the account of FIRS for settlement of PPT
Liabilities
Month of
Lifting
Bbl Value ($) Amount Paid ($) Difference/Outstanding
($)
January 7,955,280 911,055,570.08 911,055,550.08 20
February 5,014,569 572,173,743.91 572,173,743.91
March 8,802,379 957,166,090.39 957,166,070.39 20

Main Report and Recommendations
NEITI Oil and Gas Industry 2013 Audit
113
Month of
Lifting
Bbl Value ($) Amount Paid ($) Difference/Outstanding
($)
April 8,339,406 861,327,519.82 861,328,482.82 (963)
May 5,459,131 574,450,437.14 574,450,377.14 60
June 4,963,894 523,436,632.77 523,436,632.77
July 6,071,734 656,422,551.53 656,422,500.53 51
August 5,795,257 665,331,917.86 665,331,897.86 20
September 6,717,800 748,470,919.59 748,470,799.59 20
October 5,418,212 592,970,423.32 592,970,393.32 30
November 4,362,220 483,016,724.57 483,016,724.57
December 4,336,394 483,441,526.03 483,441,526.03
Total 73,236,276 8,029,264,057.01 7,545,823,172.98
The above lifting volumes and value have been validated and confirmed to NNPC-COMD crude oil
lifting profile and sales documents. The payment for each monthly lifting (except December lifting
that was not due for settlement as at 31st December, 2013 as a result of 30 days credit limit) was
confirmed to FIRS/CBN JP Morgan account.
The lifting volumes were also confirmed to DPR records.
However, some lifting transactions were under paid to the tune of $221, which may be due to bank
commission, while April lifting was overpaid by $963 (see table 4.2.1D above). We however,
consider this to be immaterial.
It should be noted that the total lifting volume of 73,236,276bbl valued at $8,029,264,057.01 in
table 4.2.1D above includes June cargo of 999,006bbl with the corresponding value of
$106,654,879.57, erroneously paid by a Customer to NNPC/CBN JP Morgan Crude Oil and Gas
Account. The recommendation on this is stated in section 3.3.15.1
4.2.1.1 Key findings relating to production Sharing Contract (PSC)
1. NNPC-COMD could not provide a copy of production allocation entitlement model to enable
audit test procedure on it application.
2. It was observed that Royalty oil (for Royalty liability) was not lifted by NNPC-COMD from
statoil (OML128) and TUPNI (OML 130) in the year under review despite record of crude oil
production by the companies. On an audit enquiry, we were informed that Royalty rate is 0%
for Statoil and TUPNI as the two assets are beyond 1,000m water depth.
Implication
1. The Federation may be shortchanged from entitlement model or its inappropriate
application.
2. Loss of revenue to the Federation as a result of 0% royalty consideration to some
companies.

Main Report and Recommendations
NEITI Oil and Gas Industry 2013 Audit
114
Recommendations
NNPC should make available all information relevant to the NEITI Oil and Gas industry audit while
Auditors should sign relevant confidentiality and data protection agreements.
The non-payment of Royalty for water depth above 1000m should be reviewed as companies
operating in such water depths are already making huge profits especially as technology to exploit
in such water depths are now readily available unlike the past.
NNPC Response:
NNPC entitlement computation models are available for review and evaluation to any interested
party should the need arise. The templates are encrypted and resident on selected workstations in
order to maintain security, propriety and integrity of our data.
4.3 Joint Venture Alternative Funding Arrangements
The traditional method for funding Joint Venture Operations, as provided in the Joint Operating
Agreement (JOA) is the Cash Call. The Joint Operating Agreement – JOA, is the legal framework that
defines the working relationship between the NNPC and its joint venture partners.
The JOA defines Cash Call as the amount, which the parties to the Joint Venture Agreement must
pay into the Joint Account, in order to meet their respective participating interest. This includes
share of both the Capital Expenditure (CAPEX) and Operating Expenditure (OPEX).
As a result of the Federal Government inability to meet up with its Cash Call obligations on a timely
basis, various Alternative Funding Arrangements have been entered into with some Joint Venture
Companies to provide the funds needed to enable the running of oil and gas operations of certain
fields.
In the late 1980s/early 1990s, Crude Swap Arrangements were resorted to, whereby the Operator
funded NNPC’s share of Cash Call requirements and thereafter lifted NNPC’s share of production
from the related field, to sell and meet the Cash Call default. However, the current forms of
Alternative Funding Arrangements are in two broad categories, namely:
Third Party Financing
Carry Agreements and Modified Carry Agreements (MCAs).
4.3.1 Third Party Financing
This involves the creation of a Special Purpose Vehicle (SPV) by the JV Partners, who assign the right of future production from the approved selected project to the SPV. The SPV enters into a long-term Sales and Purchase Agreement with off takers (buyers), which is used as security for the loan required for financing the selected project. Proceeds from the sale of the crude oil/gas are remitted to a dedicated “proceeds account”, domiciled with the lending bank. Payments are made from this account for:

Main Report and Recommendations
NEITI Oil and Gas Industry 2013 Audit
115
Debt Service (Principal and Interest) and any other loan requirement
Balance in the account is shared in accordance with the JV equity holding
Under this form of Alternative Arrangement, the Joint Venture Partners identify an approved
project, which requires third party financing. The project is then isolated from the entire JV
operations. A Special Purpose Vehicle (SPV) is created by the JV Partners, which acts as the
borrower. A Bridge Loan or Facility agreement is drawn up between the SPV and the project
Financiers or Bridge Lenders. The Loan facility has a principal and interest component. There are
also loan administrative expenses that must be paid. Proceeds from the sale of the crude oil/gas
are remitted into the Escrow Account already opened, and funds are disbursed from the account
for payment of the Third Party loan principal, together with the related Interest and administrative
expenses. Balance in the Escrow Account (if any), is shared by the JV partners, in accordance with
their respective JV equity holding.
The current Third Party financed projects are as follows:
Natural gas Liquids Project (NGL 2).
Satellite Field Development Project.
Reserve Development Project.
4.3.2 Overview of NGL 1 And 2 Projects and Performance Profile as at 31st December, 2013
Project Background
The Natural Gas Liquids (NGL) Project is a JV project between NNPC and MPNU, under the
NNPC/MPNU Joint Venture. The entire project is made up of two parts – NGL 1 and NGL 2. NGL 1
had a total project cost of $810 million, and was funded via Equity Contribution from the sponsors.
The NGL 1 facility was commissioned in 1998, and commenced commercial export in 1999.
NGL 2 Facility, on the other hand, is an expansion of NGL 1 production and export facilities. It
commenced production in March 2008. NGL 2 was, and is still being funded through Third Party
Finance, and it is structured in such a way that the MPNU retains 51% and NNPC has 49 %.
Table 4.3.2A - Summary of NGL 2 funding history
Year Description Amount (USD$ Billion)
2004 Initial Funding ($1.406 billion):
Sponsors’ equity
International Lenders
Local Lenders
Total Initial Funding
0.131
1.173
0.102
1.406
2008 Supplemental Cost Financing by Local banks 0.220
2009 Loan Re-sizing ($265 million):
UBA
SCB
0.150
0.015
0.100

Main Report and Recommendations
NEITI Oil and Gas Industry 2013 Audit
116
Year Description Amount (USD$ Billion)
Exxon Mobil
Total Loan re-sizing
0.265
2010 Additional Loan 1.100
Note that the Supplemental Loan of USD$220 million was re-sized to USD$265 million in 2009, and
taken over by a new set of financiers, as listed above.
The total funding for NGL 2, as at 31st December, 2013, including the Sponsor’s initial equity
contribution was, USD$2.771 billion (i.e. $Billion: 1.406 + .220 + .045 +1.100).
Table 4.3.2B - Summary of NGL 2 Loan profile as at 31st
December, 2013
Description Senior Loan ($’M) Additional Loan ($’M)
Principal Advanced 1,275.5 1,100
Principal repayment 1,225.95 255.53
Interest payment 377.22 116.49
Outstanding principal 49.55 844.47
NNPC’s Exposure @ 49% 24.28 413.79
4.3.3 Summary of revenue earned as at 31st December, 2013 from NGL 2
The summary of the revenue derived from NGL 2 as presented by NNPC is shown in the table
below:
Table 4.3.3 - Summary of revenue earned in 2013 from NGL 2 project
Description USD $’M
NNPC Share of Revenue earned in 2013 300.839
Amount not due for payment as at 31st December, 2013 (73.724)
Remittance into JP Morgan Gas revenue a/c (109.780)
Amount retained in the Proceeds A/c 117.335
4.3.3.1 Key finding on NGL 2 project
The revenue sharing structure of 51% and 49% for MPN and NNPC respectively does not confer
commercial fairness to the Federation whose interest in MPN JV is 60%. There is no evidence to
suggest that MPNU is bearing additional costs to warrant a change from the original JV
participation ratio.
Implication
The net cash flow to the Federation from third party financed projects is very insignificant when compared to the project gross revenue flows and also not in accordance with the equity participation of the JV partners.

Main Report and Recommendations
NEITI Oil and Gas Industry 2013 Audit
117
Recommendation
NNPC should always ensure that there is commercial fairness to the Federation whenever loan agreements are entered with third parties.
NNPC’s Response
The structure of 51% to MPNU and 49% to NNPC is as requested by the Guarantor to the loan deal
– Overseas Private Investment Corporation (OPIC).
4.3.4 Satellite Field Development Project (SFDP)
The Satellite Field Development project (SFDP) is a Joint Venture project set up to fund and
develop up to 22 undeveloped oil and gas fields. The Project was set up in Phase I and Phase II is a
roll-over of Phase I. NNPC and MPNU lifting revenue from this project are deposited into an
offshore account and used for periodic debt services after which the balance is transferred to the
JV Partners’ (NNPC & MPNU) designated accounts after meeting the necessary conditions.
Presented below is a summary of the Satellite Field Project Revenue flow in 2013:
Table 4.3.4 - Satellite Field Development Project
Month of Lifting Bbl Value ($)
March 912,326.00 100,925,151.42
September 1,900,157.00 214,071,821.00
October 1,938,777.00 209,818,305.08
November 950,080.00 103,302,198.40
Total 5,701,340.00 628,117,475.90
The total crude oil lifted from the project by NNPC-COMD was 5,701,340 bbls valued at
$628,117,475.90. This has been confirmed to NNPC-COMD lifting schedule. The lifting volume has
also been confirmed to NNPC-COMD record of monthly allocation (between NNPC and partners) of
crude oil lifting from production volumes. The sales value of $100,925,151.42 for March lifting was
traced and confirmed to the CBN/NNPC JP Morgan Crude Oil and Gas (Dollar) Revenue Account,
while the balance of $527,192,324.48 from the total liftings of $628,117,475.90 was retained in
Proceeds Accounts in line with loan agreement.
4.3.5 Reserve Development Project (RDP)
The Reserve Development Project (RDP) was set up for the construction and drilling of 27 oil wells
in 10 Joint Venture assets with Mobil Producing Nigeria Unlimited. The total cost of the RDP was
$1.5billion which was sourced as loans from both Nigerian and international commercial banks.
The table below shows summary of lifting volume and value from RDP in 2013.

Main Report and Recommendations
NEITI Oil and Gas Industry 2013 Audit
118
Table 4.3.5 - Reserve Development Project
Month of Lifting Bbl Value ($)
February 949,926.00 106,870,474.70
March 950,349.00 103,779,061.15
April 950,057.00 96,153,368.86
June 949,803.00 101,237,602.16
July 997,397.00 110,028,847.45
August 950,279.00 107,924,136.31
September 950,279.00 107,352,743.90
October 950,279.00 109,574,366.83
Total 7,648,369.00 842,920,601.36
The total crude oil lifted from the Project was 7,648,369 Bbls with sales value of $842,920,601.36
(as shown in the table above), out of which the total sum of $300,000,000 was traced and
confirmed to CBN/NNPC JP Morgan Crude Oil and Gas (Dollar) Revenue Account. However, the
total balance of $542,920,601.36 was retained in proceeds accounts in line with loan agreement.
The crude oil lifting as summarized in the above table has also been validated and confirmed to
NNPC-COMD schedule of crude oil lifting and NNPC-COMD record of monthly allocation (between
NNPC and partners) of crude oil lifting from production volumes in 2013.
4.3.6 Carry Agreements
This is an Alternative Funding arrangement in which Joint Venture (JV) Partner(s) in addition to its
equity contribution for the execution of Capital Projects, carries NNPC’s equity contribution, in
form of a loan, which is payable through tax offsets (Carry Tax relief) and in-kind (i.e. crude oil), for
balance of Carry Cost (Carry Oil) and Profit share (Share Oil).
Under this arrangement, the Operator agrees to carry the non-operator, and bears the cost of the
CAPEX portion of the project on behalf of the NNPC. This arrangement allows for financing based
on cost estimates. However, there is no dedicated account established for carry proceeds. The
Operator lifts NNPC’s share of crude oil produced from the project, to meet the residual Carry Cost,
after the Carry Tax Relief (CTR) has been set off from the total Carry Cost.
NNPC had no control over the sales proceeds realized from the disposal of the crude oil and gas
lifted by the Operator to meet the Carry Cost (Carry Oil) and compensation (Share Oil) due to the
Operator. Consequently, the traditional carry arrangement is no longer attractive to NNPC as an
alternative funding arrangement, and has, therefore, given way to the Modified Carry Agreement
(MCA) model.

Main Report and Recommendations
NEITI Oil and Gas Industry 2013 Audit
119
4.3.7 Modified Carry Agreement
This arrangement is very similar to the Carry Agreement described above. However, NNPC lifts and
markets the Carry Oil and Share Oil, due to the Carrying party, and pays cash to the operator for
the cash financing provided. The Carrying party recovers the Carry Capital Cost (CCC) in Dollars. An
Escrow Account is opened, and the sales proceeds with respect to the Carry oil and Share oil are
paid into the Escrow Account. NNPC’s Portion of the Agreed Capital Cost approved by the Joint
venture partners is financed by the Operator through monthly cash call payments into a dedicated
account for the project.
In other word, Modified Carry Agreement (MCA) is a modification of the existing Carry Agreement
(CA). In this case, the recovery of the full capital cost is made through tax offsets (Carry Tax Relief),
by the carrying party, and the balance of the carry cost (Carry Oil) is lifted by NNPC, and cash
remitted to the Carrying Parties’ account.
In order to compensate the Carrying Party for providing the finances to meet the Carried Party’s
share of approved capital cost, an interest rate designed to yield a financial internal rate of return
(FIRR) of 8% is factored into the financial model for the project.
The project monthly Cash Call requests are approved by the NNPC- NAPIMS who issues written
Mandate to the Carrying Party to fund the cash call due. The Carrying Party pays NNPC’s portion of
the approved Cash Call request (CAPEX portion) into the Carry Proceeds Account dedicated for the
Carry project, and jointly controlled by the JV parties. From this Account, funds are swept daily into
the JV Construction Account based on a one time standing instruction to sweep funds from the
Carry Proceed Account into the JV Construction Account. In other words, the Carry Proceeds
Account is a zero daily balance account. The Carrying Party is expected to pay its own equity share
of the Cash Call due into the JV Construction Account the same day, as money is swept from the
Carry Proceeds Account into the JV Construction Account. From the JV Construction Account, the
capital costs of the project are settled as at when due.
The recovery of the Carry Capital Cost and Compensation by the Carrying Party is through tax
offsets, and the Carried Party’s share from the project is as follows:
a. 85% of the Carry Capital Cost is recovered through tax offsets, by transferring NNPC’s tax
benefits to the Carrying Party.
b. The balance 15% of the Carry Capital Cost is recovered from NNPC’s equity production.
A principal distinguishing feature of MCA is that NNPC is the only party that lifts and markets the
Carrying Party in settlement of the Carry Capital Cost (CCC) and the Compensation.

Main Report and Recommendations
NEITI Oil and Gas Industry 2013 Audit
120
There are 13 active MCAs contracts. However, production of Crude Oil or Gas were made from 9
contracts (See: S/N 1,2,3,4,5,9,10,11 and 13 in the table below) in 2013 according to NNPC-COMD
record. Below is the schedule of active MCAs contracts. Table 4.3.7 - Schedule of active MCAs contracts
S/N CONTRACT NAME OPERATOR COMMENCEMENT DATE STATUS
1 2007-2009 MPN BUNDLE MPN 2009 ACTIVE
2 2010 DRILLING BUNDLE MPN 2010 ACTIVE
3 2010 OSO RE/CONDENSATE MPN 2010 ACTIVE
4 GBARAN-UBIE SPDC 2008 ACTIVE
5 NEMBE CREEK BUNDLE SPDC 2008 ACTIVE
6 CAWTHORNE CHENNEL SPDC 2009 ACTIVE
7 GBARAN-UBIE PHASE 2 SPDC 2012 ACTIVE
8 TNP BUNDLE SPDC 2012 ACTIVE
9 NLNG T4/T5 NAOC 2009 ACTIVE
10 BENIBOYE/EBOCHA NAOC 2010 ACTIVE
11 OML 58 UPGRADE TEPNG 2009 ACTIVE
12 OFON PHASE 2 TEPNG 2009 ACTIVE
13 2008 CHEVRON CHEVRON 2009 ACTIVE
4.3.8 Validation of MCA transactions in 2013
A comprehensive review of the Modified Carry Agreement (MCA) transactions for 2013 was carried
out, with a view to identifying the JVs involved and the number of MCA projects being executed by
each JV, and their performance in 2013.
During the course of validation, we also verified crude oil and gas lifted in 2013 under each of the
MCA projects and traced Government Take, regarding payment of MCA Royalty Oil and PPT Oil to
the respective DPR and FIRS accounts.
4.3.9 Summary of Royalty Oil and Tax Oil Revenue Derived by the Federation from MCA Projects
in 2013
Presented in Table 4.3.9(A) below is a summary of the Royalty revenue flows to the Federation
from MCA projects in 2013.

Main Report and Recommendations
NEITI Oil and Gas Industry 2013 Audit
121
Table 4.3.9A - Summary of Royalty Oil Revenue Derived by the Federation from MCA Projects in 2013
Month of Lifting Bbl Value ($) Amount Paid ($) Outstanding ($)
January 35,039 4,040,145.29 4,040,145.29
February 40,000 4,473,480.00 4,473,480.00
March 158,754 17,358,003.79 17,358,003.79
April 213,672 22,369,377.86 22,369,377.86
May 60,495 6,366,729.49 6,366,729.49
June 93,795 10,038,998.73 10,038,998.73
July 156,595 17,338,881.08 17,338,881.08
August 172,685 19,336,812.62 19,336,812.62
September 8,510 948,541.63 948,541.63
October 100,170 11,239,749.71 11,239,749.71
November 17,480 1,923,768.60 1,923,768.60
December 174,295 19,287,178.81 19,287,178.81
Total 1,231,490 134,721,667.61 115,434,488.80 19,287,178.81
The above table shows that the total sales value of MCA Royalty Oil lifted in 2013 was
$134,721,667.61, out which $115,434,488.80 was traced to DPR/CBN JP Morgan Account, as the
balance of $19,287,178.81 was not due for settlement as at 31st December, 2013.
Presented in Table 4.3.9(B) below is a summary of the Tax revenue flows to the Federation from
MCA projects in 2013.
Table 4.3.9B - Summary of Tax Oil Revenue Derived by the Federation from MCA Projects in 2013
Month of
Lifting
Bbl Value ($) Amount Paid ($) Outstanding ($)
January 131,207 15,128,706.22 15,128,706.22 -
February 136,000 15,209,832.00 15,209,832.00 -
March 559,972 61,239,899.11 61,239,899.38
April 760,616 79,561,850.69 79,561,850.69 -
May 226,529 23,840,820.83 23,840,820.83 -
June 356,726 38,183,738.85 38,183,738.85 -
July 580,593 64,274,967.00 64,274,967.00 -
August 622,777 69,746,475.87 69,746,475.87 -
September 31,866 3,551,903.82 3,551,903.82 -
October 366,205 41,108,443.99 41,108,443.99 -
November 62,492 6,879,539.94 6,879,539.94 -
December 646,599 71,547,870.41 - 71,547,870.41
Total 4,481,582 490,274,048.72 418,726,178.31 71,547,870.41

Main Report and Recommendations
NEITI Oil and Gas Industry 2013 Audit
122
Validation/confirmation of payments to FIRS/CBN JP Morgan account shows that all the sales value
(except $71,547,870.41 not yet due for settlement as at 31st December, 2013) for MCA Tax Oil
lifted in 2013 were confirmed. It should be noted that the analysis of lifting in respect of MCA tax
oil above includes $6,167,986.36 MCA Education Tax (EDT).
4.3.10 Summary of MCA Revenue from Crude Oil and Gas Liftings in 2013 and its Distribution
Presented in Table 4.3.10A and 4.3.10B below are the summaries of the revenue flows from sales
of (Crude Oil and Gas) MCA projects in 2013, and itheir distribution.
Table 4.3.10A - MCA Crude Oil Revenue and its Distribution
Joint Venture Volume
(Bbl000)
Value
($’000)
FIR-
PPT
($’000)
DPR- ROYALTY
($’000)
EDU
Tax
($’000)
Carry+
Share
($’000)
NNPC/MPN JV 3,342 363,938 252,118 67,328 44,491
NNPC/NAOC
JV
1,003 110,757 75,315 22,151 13,291
NNPC/CNL JV 604 67,169 45,101 12,426 3,089 6,553
NNPC/SPDC JV 1,503 164,077 111,573 32,815 3,078 16,611
Total 6,452 705,941 484,107 134,720 6,167 80,946
The above summary has been validated to the NNPC-COMD crude oil sales profile and source
documents. It was observed that August total MCAs lifting volume of 64,000bbl valued at
$7,307,328 from NNPC/CNL JV was not included in the populated template. We also carried out
further validation of lifting volumes to NNPC-COMD record of monthly allocation (between NNPC
and partners) of crude oil lifting from production volumes and confirmed that the crude oil
volumes due to the federation have been accounted for.
The breakdown of the above MCA crude oil revenue, on project by project basis, is presented in
Appendix 4.3.10A of this report.
Table 4.3.10B - MCA Gas Revenue and Distribution
Joint Venture Volume
(Mbtu’000)
Value
($’000)
FIRS-CIT
($’000)
DPR-
ROYALTY
($’000)
EDU Tax
($’000)
Carry
($’000)
Share
($’000)
NNPC/TEPNG
JV
24,439 63,947 17,841 4,476 584 21,571 19,474
NNPC/NAOC JV 12,745 30,626 8,545 2,144 624 9,405 9,905
NNPC/SPDC JV 70,869 167,471 46,725 11,723 3,468 25,413 80,143
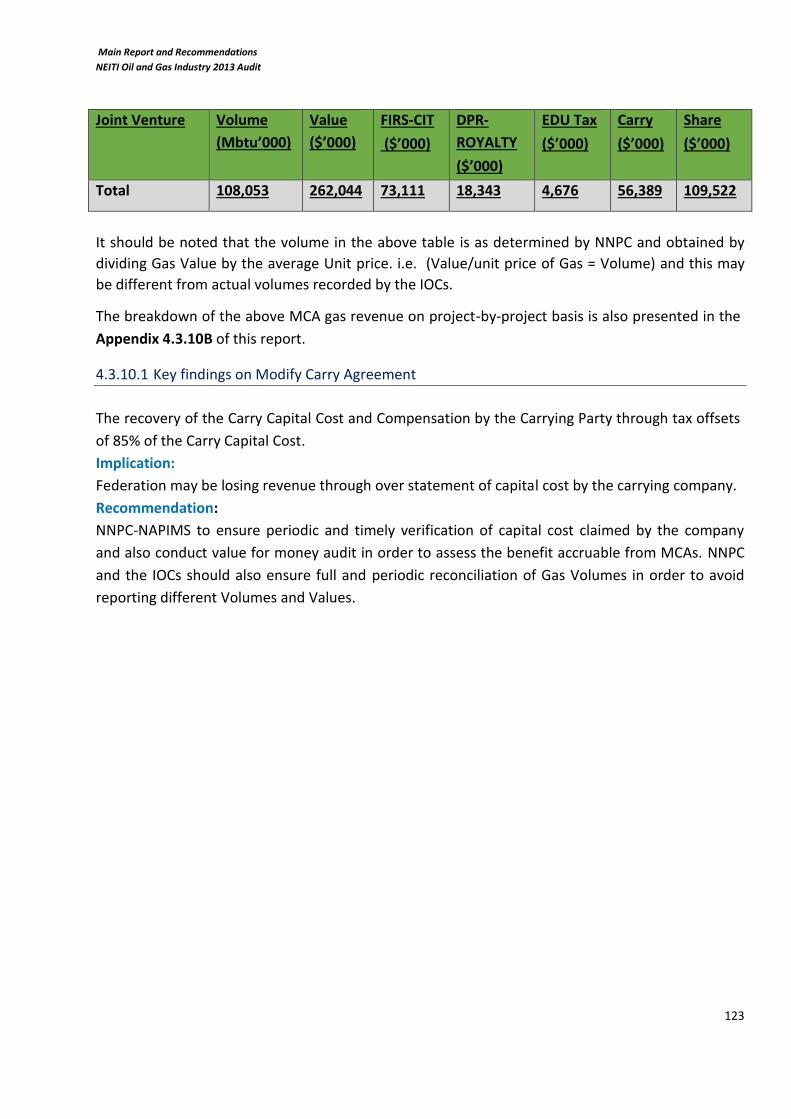
Main Report and Recommendations
NEITI Oil and Gas Industry 2013 Audit
123
Joint Venture Volume
(Mbtu’000)
Value
($’000)
FIRS-CIT
($’000)
DPR-
ROYALTY
($’000)
EDU Tax
($’000)
Carry
($’000)
Share
($’000)
Total 108,053 262,044 73,111 18,343 4,676 56,389 109,522
It should be noted that the volume in the above table is as determined by NNPC and obtained by
dividing Gas Value by the average Unit price. i.e. (Value/unit price of Gas = Volume) and this may
be different from actual volumes recorded by the IOCs.
The breakdown of the above MCA gas revenue on project-by-project basis is also presented in the
Appendix 4.3.10B of this report.
4.3.10.1 Key findings on Modify Carry Agreement
The recovery of the Carry Capital Cost and Compensation by the Carrying Party through tax offsets
of 85% of the Carry Capital Cost.
Implication:
Federation may be losing revenue through over statement of capital cost by the carrying company.
Recommendation:
NNPC-NAPIMS to ensure periodic and timely verification of capital cost claimed by the company
and also conduct value for money audit in order to assess the benefit accruable from MCAs. NNPC
and the IOCs should also ensure full and periodic reconciliation of Gas Volumes in order to avoid
reporting different Volumes and Values.

Main Report and Recommendations
NEITI Oil and Gas Industry 2013 Audit
124

Main Report and Recommendations
NEITI Oil and Gas Industry 2013 Audit
125
5 JOINT DEVELOPMENT ZONE - SÃO TOMÉ AND PRÍNCIPE (STP) AND NIGERIA
The Governments of São Tomé and Príncipe (STP) and Nigeria signed a 45-year Treaty on February
21st, 2001 establishing the Joint Development Zone (JDZ) in order to address issues relating to
overlapping maritime boundaries.
In line with the signed Treaty, coordinates and blocks define the JDZ and a resource sharing
formula of 60% to Nigeria and 40% to STP was agreed. PwC was appointed Independent Reconciler
of the Joint Development Zone (JDZ) for the period covering 1st January 2003 to 31st December
2013.
According to the PwC report, confirmations were received from Stakeholders which include Joint
Development Authority, Nigerian Government, Central Bank of São Tomé and Príncipe, Ministry of
Planning and Finance of São Tomé and Príncipe, Addax, Sinopec, Equator Exploration, Dangote,
Afren PLC, Petroleum Geo-Services (PGS), DNO/EER, Atlas Petroleum, Exxon Mobil, Total, and
Anadarko.
Full details of the Independent Reconciler’s report can be found at:
https://eiti.org/files/First%20Report%20%202003-2013%20(Nigeria-Sao%20Tome%20and%20Principe).pdf

Main Report and Recommendations
NEITI Oil and Gas Industry 2013 Audit
126

Main Report and Recommendations
NEITI Oil and Gas Industry 2013 Audit
127
6 COMPANY LEVEL FINANCIAL FLOWS
Company level financial flows pertains to the record of individual company payments made to the
Government and this is ascertained by comparing the initial templates submitted by the Oil and Gas
operating companies with the templates from government agencies. The payments are validated
through payment documents, receipts, bank statements and other corroborative evidences and
differences are subsequently reconciled.
For the year under review, all financial flows reported as payment by the Oil and Gas Companies
are as confirmed receipt by the respective receiving Government Agencies.
In-Kind financial flows not involving cash payments as in the case of PSCs and MCAs are recorded in
the value of actual Crude Oil Liftings for the year under review since it can be safely assumed that
payment has been made by the companies concerned as at the time of lifting by NNPC. All In-Kind
payments have been confirmed to NNPC records and validated to CBN statements of accounts. The
above explains the difference that might arise in the In-Kind flow figures and actual cash remittance
by NNPC into CBN accounts from the liftings within the year.
6.1 Petroleum Profit Tax (PPT)
The PPT payments by the companies are shown according to the operating arrangements in Table
6.1 below:
Table 6.1 Petroleum Profit Tax (PPT)
S/N ENTITY PPT
USD $'000
1 AMNI 45,466
2 CHEVRON 550,309
3 CONOIL 45,139
4 CONTINENTAL 92,608
5 FHN 2,059
6 MOBIL 2,715,242
7 MONIPULO 19,033
8 NAOC 288,501
9 ND WESTERN 443
10 NEWCROSS 999
11 NPDC 192,000
12 PANOCEAN 450
13 PHILLIPS 64,270
14 PILLAR 850
15 PLATFORM 1,976
16 SEPLAT 94,439
17 SPDC 1,358,054

Main Report and Recommendations
NEITI Oil and Gas Industry 2013 Audit
128
S/N ENTITY PPT
USD $'000
18 STATOIL 1,070,531
19 TEPNG 773,061
20 WALTERSMITH 2,226
PSC
21 APDNL 476,828
22 APENL 328,679
23 ESSO 2,167,730
24 NAE 291,840
25 SNEPCO 2,397,603
26 STAR DEEP 2,341,380
27 TEPNG USAN 40,079
28 TUPNI 1,745,608
MCA
29 CHEVRON MCA 45,101
30 MOBIL MCA 252,118
31 NAOC MCA 75,315
32 SPDC MCA 111,573
TOTAL 17,591,512
*of the total payment of $2,341,380 made by stardeep, only $1,498,489 is the actual payment of PPT for stardeep
while, $842,887 was payments made on-behalf of FAMFA & PETROBRASS in 2013.
In 2013, the total Petroleum Profit Tax payment by all companies amounted to $17,591,512,000
showing a decline of 7% when compared to PPT payment in 2012. Several factors may be
attributable for the decline such as; lower production in 2013, granting of pioneer status to
marginal field operators and poor collection rate by FIRS.
6.2 Royalty Oil
The Royalty payments by the companies are shown according to the operating arrangements in
Table 6.2 below. Table 6.2 Royalty Oil
S/N ENTITY Royalty Oil
USD $'000
JOINT VENTURES
1. SPDC 748,647
2. MOBIL 1,296,571
3. CHEVRON 720,754
4. NAOC 213,007
5. TEPNG 656,729

Main Report and Recommendations
NEITI Oil and Gas Industry 2013 Audit
129
S/N ENTITY Royalty Oil
USD $'000
6. PANOCEAN 9,951
SOLE RISK/MARGINAL FIELD
7. AMNI 74,593
8. ATLAS 5,827
9. CONOIL 9,475
10. CONTINENTAL 118,148
11. DUBRI 711
12. ENERGIA 1,759
13. FHN 10,461
14. MIDWESTERN 23,807
15. MONIPULO 27,478
16. ND WESTERN 34,701
17. NDPR 1,134
18. NECONDE 29,140
19. NPDC 722,943
20. ORIENTAL ENERGY 185,972
21. PHILLIPS 85,044
22. PILLAR 619
23. PLATFORM 885
24. SEPLAT 151,532
25. SHORELINE NATURAL RESOURCES 57,364
26. WALTERSMITH 1,900
PRODUCTION SHARING CONTRACTS
27. APDNL 290,491
28. APENL 163,382
29. ESSO 15,735
30. NAE 74,995
31. SEEPCO 72,000
32. SNEPCO 65,627
33. TEPNG USAN 176,217
MODIFIED CARRY AGREEMENTS
34. CHEVRON 12,426
35. MOBIL 67,328
36. NAOC 22,151
37. SPDC 32,815
TOTAL 6,182,319

Main Report and Recommendations
NEITI Oil and Gas Industry 2013 Audit
130
Total Royalty Oil payments amounted to $6,182,319,000 compared to $6,725,282,000 paid in 2012
representing a 8% decline in payment. This is attributable to the decline in production during the
year and lower collection rates by the DPR.
6.3 Royalty Gas
Table 6.3 Royalty Gas
S/N ENTITY Royalty Gas
$'000
1 CHEVRON 10,884
2 NAOC 18,009
3 NAOC MCA 2,144
4 PHILLIPS OIL 9,850
5 SEPLAT 1,613
6 SPDC 33,241
7 SPDC JV MCA* 11,723
8 TEPNG 27,153
9 TEPNG MCA 4,476
TOTAL 119,093 *the financial flow represents the payment for all the parties in the JV arrangement.
Total Royalty Gas payments amounted to $119,093,000 compared to $112,389,000 paid in 2012
representing an 6% increase in payment. The increase agrees with our findings on improved Gas
utilization during the year under review.
6.4 License Fees and Concession Rentals
Oil and Gas companies pay concession Rentals as rent on oil blocks for which they have been
granted concession. There are two categories of Rentals, which are:
Oil Prospecting Licenses (OPL)
Oil mining Lease (OML)
The license is non-exclusive and is granted for a period of one year. It is renewable annually.
The applicable rental rates are;
OPL - US$10/SQ KM or part there Off (Non-Producing Block)
OML- US$20.00/SQ KM or part there Off (up to 10 years of Conversion) and US$15.00/SQ
KM or part there off (until the Expiration of the Lease)
There are other Licenses that are granted by DPR apart from the OPLs and OMLs, this include
license for the operation of refineries, filling stations and costal vessel licenses. This licenses are
renewable on an annual basis.

Main Report and Recommendations
NEITI Oil and Gas Industry 2013 Audit
131
Table 6.4 License Fees and Concession Rentals
S/N License Fee and Concession Rentals
Entity US$'000
1 ATLAS 15
2 CAVENDISH 19
3 Chevron 133
4 Dubri 1,430
5 MOBIL 52
6 Newcross 10
7 Panocean 10
8 SEPLAT 40
9 SPDC 324
10 STAR DEEP 26
11 TEPNG 131,640
12 Waltersmith 50
TOTAL 133,750
Total License fees and Concession Rentals paid in 2013 amounted to $133,750,000, an increase of
4520% compared with $2,895,000 paid in 2012. TEPNG accounts for over 98% of the total payment
and the significant increase in the payment recorded in 2013 was as a result of payments relating
to previous years outstandings.
6.5 Company Income Tax (Gas)
Table 6.5 Company Income Tax (Gas)
S/N ENTITY CIT (GAS)
USD$'000
1 MOBIL 117,447
2 NAOC MCA 8,545
3 PHILLIPS OIL 48,280
4 SEPLAT 7,314
5 SPDC 148,104
6 SPDC MCA 46,725
7 TEPNG 161,795
8 TEPNG MCA 17,841
TOTAL 556,050
There was a rise of 26% in Company Income Tax (Gas) reported in 2013 as against $441,048,000
reported in 2012. This is also corroborative of the increased Gas utilization during the year under
review.

Main Report and Recommendations
NEITI Oil and Gas Industry 2013 Audit
132
6.6 Cash Call
6.6.1 Introduction
Nigerian National Petroleum Corporation (NNPC) operates a joint venture relationship with
International oil companies in the exploration and exploitation of Nigeria’s oil reserves.
National Petroleum Investment Management Services (NAPIMS) is the division of NNPC charged
with the management of the Federation’s investment in the Oil and Gas Joint Venture Operations
The JV Operators are:
Shell Petroleum Development Company (SPDC)
Mobil Producing Nigeria Unlimited (MPNU)
Chevron Nigeria Limited (CNL)
Total Exploration and Production Nigeria Limited (TEPNG)
Nigerian Agip Oil Company Limited (NAOC)
Pan Ocean Oil Corporation (Nigeria Limited (POOCN)
The structure of the Joint Venture arrangements with the IOCs mentioned above and their
participating interests are shown in table 6.6.1 below: Table 6.6.1: JV Participating interests
S/NO JV OPERATOR PARTICIPATORY INTEREST
NNPC
%
SPDC
%
MOBIL
%
CHEVRON
%
TOTAL
%
NAOC
%
POCNL
%
POOCN
%
1. SPDC JV SPDC 55 30 - - 10 5 - -
2. MOBIL JV MOBIL 60 - 40 - - - - -
3. CHEVRON JV CHEVRON 60 - - 40 - - - -
4. TEPNG JV TOTAL E&P 60 - - - 40 - - -
5. NAOC JV NAOC 60 - - - - 20 20 -
6. PAN OCEAN JV PANOCEAN 60 - - - - - - 40
7. NPDC/CHEVRON JV NPDC 60 - - 40 - - - -
8. NPDC/SPDC JV NPDC 55 30 - - 10 5 - -
See Appendix 6.6.1A for the list of OMLs managed in each JV.
The JV arrangements in S/NOs 7 and 8 in Table 6.6.1 above arose from NNPC exercising its right
under the JOA to appoint its upstream subsidiary-Nigerian Petroleum Development Company
Main Report and Recommendations
NEITI Oil and Gas Industry 2013 Audit
133
(NPDC) to manage the operatorship of certain fields. The exercise of this right, which is not
intended to change the ownership or participatory interest ratio, gave rise to the following two
arrangements or subsidiary JVs:
I. NNPC (NPDC)/SHELL/TEPNG/NAOC
The OMLs transferred by SPDC to NPDC under this change of operatorship arrangement are OMLs
13 and 20. OML 13 is licensed to operate within Utapate field while OML 20 operates within
Egbema, Egbema West and Ugada fields.
II. NNPC (NPDC)/CHEVRON
The OMLs transferred by CNL to NPDC from the CNL JV are OMLs 49 and 51. The OMLs are licensed
to operate within Aroh and Oghareki fields.
The transfer of Operatorship has invariably created two additional JV relationships to which cash
calls are paid in addition to the six shown in Table 1.3 (JV Participating interests) above. NNPC
however remains the interest holder in these JV relationships.
As at 2013, OML 13 (SPDC JV) was not producing while OMLs 20, 49 and 51 were producing.
Production from OMLs 20, 49 and 51 is attached in the Appendix 6.6.1B. It is to be noted that, the
Federation equity in OML 60, 61, 62 and 63 were assigned to NPDC (Appendix 6.6.1C) in December
2012.
6.6.2 Cash Call Request, Budgeting and Approval Process
Cash calls are based on the Annual Work Programme of each Joint Operation and covers such diverse areas as Exploration, Drilling, Production, Development, Construction, Engineering Facilities, Technical Materials, for both crude oil and gas, in addition to administrative overheads, referred to as OPEX. On receipt of the Cash Call, NNPC summons a meeting of the Cash Call Processing Committee where unacceptable items of cost are rejected and the net value accepted by the Committee is signed by all parties i.e. NNPC and other Partners including the Operator. The IOCs are members of the Cash Call Processing Committee. The work programme is agreed in advance among the Joint Partners and approved by their Operating Committees (OPCOM) as provided in the JOA. The OPCOM is constituted in accordance with the JOA as the highest decision making authority and is charged with the overall supervision, control and direction of all matters pertaining to the Joint Operations. Cash Calls are initiated monthly by the JV Operator and served on NNPC and other Partners early enough to enable NNPC and all Partners including the Operators to lodge their equity portions of the Cash Calls into the JV Dollar and Naira Cash Call Bank Accounts on or before the 1st day of the Cash Call month.
NNPC has prying and audit rights over all these Accounts, but the custody and transactional
authority over these Joint Operating Bank Accounts rests with the Operators.

Main Report and Recommendations
NEITI Oil and Gas Industry 2013 Audit
134
6.6.2.1 2013 Budget for Cash Call Items
The Budget Office of the Federation always conveys to NNPC the approved spending limits for Cash
Call activities of each year in absolute value (Dollars).
Table 6.6.2.1: 2013 Budget for Cash Call Items
2013 NATIONAL ASSEMBLY APPROVED BUDGET
₦'000 EQV $'000
JV CASH CALLS (CRUDE OIL) 858,588,000.00 5,366,175.00
NATIONAL DOMESTIC GAS DEVELOPMENT 209,150,000.00 1,307,187.50
TOTAL 1,067,738,000.00 6,673,362.50
Note: The dollar was translated at the National Assembly exchange rate given by CBN at $1.00 to
160NGN.
The approved limit so conveyed hardly ever tallies with the Annual Budget request of NNPC.
Therefore on receipt of this approved limit, which is now the approved Cash Call Budget for the
year, NNPC splits the amount among the JV partners after due process of consultations and
meetings.
The Initial Annual Budget for 2013 is shown in Table 6.6.4.1 below. The Budget below was further
distributed by NNPC in dollars for 2013 for each JV as per Crude Oil, DOMGAS and LNG Brass
Supply.
6.6.3 CBN/NNPC Cash Call Funding
The total funding in 2013 from JP Morgan Chase Oil and Gas Revenue Account (in dollars) for both
Naira and Dollar request by NNPC through NAPIMS are as stated below:
Table 6.6.3A - 2013 Total Cash Call Funding in Dollar
$
Total funding from JP Morgan Oil and Gas Revenue Account 7,27
7,277,349,866.46
Net Interest Credit for Current Period 372,048.38
Total funding into JP Morgan CBN JVCC Account 7,277,721,914.84
Source: JPMorgan Chase CBN Cash Call Joint Venture Account

Main Report and Recommendations
NEITI Oil and Gas Industry 2013 Audit
135
Table 6.6.3B: Comparison of Cash Call Account Funding for 2012 and 2013 in Dollar
2012 2013
INCREASE/ (DECREASE)
$ $ $
Total funding from JP Morgan Oil and Gas Revenue Account
7,310,861,360.62 7,277,349,866.46 (33,511,494.16)
Net Interest Credit for Current Period 998,881.77 372,048.38 (626,833.39)
Total funding into JP Morgan CBN JVCC Account
7,311,860,242.39 7,277,721,914.84 (34,138,327.55)
Source: JPMorgan Chase CBN Cash Call Joint Venture Account, NEITI Audit Report 2012
The table above shows a decline of $34,138,327.55 in 2013 Dollar Cash Call Account Funding
compared to 2012, indicating approximately 0.5% fall in 2013.
The total funding of cash call account totalling $7,277,349,866.46 represents the amount
transferred for both cash call and non-cash call items.
A part of the 2013 total Cash Call i.e. $3,148,850,510.73 was monetised to Naira
(₦487,306,511,885.45 at prevailing CBN conversion rate) within the month of transfer and paid into
the CBN/NNPC JV Cash Call Naira Account, while the dollar component was retained in JP
MorganChase CBN JV Cash Call Account.
6.6.4 Cash Call Items
6.6.4.1 Cash Call Payments
The summary of Cash Calls paid by NNPC/NAPIMS to the Joint Venture Partners in Naira and Dollar
for 2013 compared with figures from previous audit cycles (2009 – 2012) are presented in Tables
6.6.4.1A and 6.6.4.1B respectively:
Table 6.6.4.1A: Summary of Naira Cash Calls Paid by NNPC to JV Operators
FIVE YEAR SUMMARY OF TOTAL AMOUNT DISBURSED IN NAIRA FOR CASH CALL TO EACH JV OPERATOR BETWEEN 2009-2013
₦ ₦ ₦ ₦ ₦
2009 2010 2011 2012 2013
NNPC/SPDC/TEPNL/NAOC 114,714,788,000 143,823,346,000 144,053,085,000 157,199,559,000 178,964,797,610
NNPC/MOBIL 83,312,705,000 81,103,423,000 69,155,453,000 101,587,679,000 86,797,809,900
NNPC/CNL 58,873,884,000 74,241,804,000 75,871,795,000 115,771,655,000 84,058,864,870
NNPC/TEPNL 38,913,916,000 60,414,517,000 57,645,890,000 68,521,229,000 66,339,694,180
NNPC/NAOC/POCNL 62,154,627,000 64,115,935,000 52,128,343,000 67,630,174,000 64,693,158,290
NNPC/POOCN 12,119,294,000 16,922,053,000 16,334,595,000 12,604,099,000 10,308,882,800
NPDC/CNL 529,874,000 489,278,000 676,337,000 367,033,000 317,636,440
NPDC/SPDC 464,203,000 331,427,000 716,426,000 1,283,473,000 1,336,756,440
CURRENT YEAR 371,083,291,000 441,441,783,000 416,581,924,000 524,964,901,000 492,817,600,530
PRIOR YEAR CASH CALL
PAID BY NNPC TO JV
OPERATORS 55,671,722,000 - - 81,006,230,000 -
POST YEAR CASH CALL
PAID 29,114,740,000 - - - -
POST YEAR CASH CALL
PAID (NIPP DOMGAS) 4,378,847,000 - - - -
CREDIT TRANSFER FOR
0B3 GAS PIPELINE - - - 6,967,206,000 -
TOTAL 460,248,600,000 441,441,783,000 416,581,924,000 612,938,337,000 492,817,600,530

Main Report and Recommendations
NEITI Oil and Gas Industry 2013 Audit
136
There was a decrease of ₦120.120 billion in Naira cash calls paid in 2013 when compared with the
total Naira Cash Calls paid in 2012, indicating approximately 20% fall in 2013. The decrease in cash
call funding cannot be strictly linked to the assignment of some OMLS mentioned in Section 6.6.1
above as would be expected, since cash calls were still paid with respect to all the OMLs assigned
from NAOC JV.
The challenge of timeliness and apropriate value cash call payments by the Federation also creates
difficulties in matching cash call payments to production volumes within any particular period.
Figure 6.6.4.1A: Summary of Naira Cash Calls paid by NNPC to JV Operators
Table 6.6.4.1B: Summary of Dollar Cash Calls paid by NNPC to JV Operators
Source: (a) NEITI's Audit Report 2012 (b) JP Morgan Chase CBN/NNPC Cash Call JV Account (Dollar Account)
There was a decrease of $121.229 million in Dollar cash call payments in 2013 when compared to
the figure for 2012 as presented above, indicating a decrease of approximately 4%. The issues
involved in the decrease discussed under the Naira payments above are also applicable to the Dollar
components of cash call payments.
FIVE YEAR SUMMARY OF TOTAL AMOUNT DISBURSED IN DOLLAR FOR CASH CALL TO EACH JV OPERATOR FOR 2009-2013
$ $ $ $ $
2009 2010 2011 2012 2013
NNPC/SPDC/TEPNL/NAOC 705,064,000 811,685,000 685,288,000 836,240,000 839,879,980
NNPC/MOBIL 601,255,000 638,694,000 321,131,000 503,799,000 478,915,080 NNPC/CNL 770,408,000 728,075,000 780,692,000 634,015,000 608,496,480 NNPC/TEPNL 356,623,000 651,238,000 421,320,000 458,656,000 406,463,480
NNPC/NAOC/POCNL 392,595,000 274,751,000 234,401,000 276,673,000 237,155,710
NNPC/POOCN 130,577,000 190,889,000 90,487,000 115,731,000 120,655,240
NPDC/CNL 3,235,000 883,000 2,024,000 1,005,000 694,690 NPDC/SPDC 298,000 180,000 1,895,000 1,388,000 4,941,520
CURRENT YEAR 2,960,055,000 3,296,395,000 2,537,238,000 2,827,507,000 2,697,202,180 PRIOR YEAR CASH CALL PAID BY
NNPC TO JV OPERATORS 579,012,000 485,398,000 65,256,000 281,684,000 290,759,689
POST YEAR CASH CALL PAID 191,820,000
TOTAL 3,730,887,000 3,781,793,000 2,602,494,000 3,109,191,000 2,987,961,869

Main Report and Recommendations
NEITI Oil and Gas Industry 2013 Audit
137
SPDC however observed that the figures reported in Tables 6.6.4.1A and 6.6.4.1B for cash calls paid
to SPDC JV for 2010 which was reported in previous NEITI Audit cycles is to be adjusted due to
NNPC’s retroactive recovery of a cash call over payment in 2008 and that the correct NNPC cash call
numbers for 2010 are: N116,037,868,000 and $779,679,967. These figures could not be confirmed
as at the time of reporting.
Figure 6.6.4.1B: Summary of Dollar Cash Calls Paid by NNPC to JV Operators
6.6.5 Key findings on non-JV Cash Call Payments
The total sum of $927.247 Million, consisting of $709.191 Million and N18.617 Billion ($118.056
Million) was expended on non-cash-call items from the Cash call account in 2013. This amount
expended on the non-cash call items by NAPIMS is higher than the actual sum of $716.194 Million
appropriated by the National Assembly for 2013. The breakdown of these expenditures are shown
in Tables 6.6.5A and 6.6.5B for Naira and Dollar payments respectively.
Table 6.6.5A: Non JV Naira Cash Call Payments
Source: NNPC/CBN Naira Cash Call 2013 Bank Statement, NAPIMS Records
₦
Special Frontier Exploration Services -
Security Payments-payments to Nigerian Army Operations6,600,000,000.00
Gas Infrastructure Development Projects 12,017,454,894.90
Grand Total 18,617,454,894.90
SUMMARY OF NON JV CASH CALL PAYMENTS

Main Report and Recommendations
NEITI Oil and Gas Industry 2013 Audit
138
Table 6.6.5B: Non JV Dollar Cash Call Payments
Source: NNPC/CBN JPMorgan Chase Cash Call 2013 Bank Statement, NAPIMS Records
Implication
a. The sum of $211.053 Million incurred by NAPIMS, was without appropriation. b. Payments for non-cash call items in the sum of $927.247 Million were made from cash call
account. Recommendations
a. NAPIMS to account for non-cash call expenditures incurred especially given the fact that the sum of $35.127 Million was refunded by NPDC into JPMorgan Chase Cash Call Dollar Account in July 2013 with respect to Cash Calls paid for the period April to November 2011 on OML 42 as indicated in Section 1.3.2 above.
b. NAPIMS to operate separate accounts into which other expenditures appropriated in NAPIMS budget is to be paid. This is to ensure that cash call operations are separated from other appropriated costs.
NAPIMS Response
All payments for both JV and non-JV cash calls are based on operational exigencies. Therefore, the
non-JV cash call payments made in 2013 was for Gas Infrastructure Development projects, Security
payments to Nigerian Army and Navy, NAPIMS overhead and special frontier exploration services.
6.6.6 Unreconciled JV Cash Call Payments
During the validation exercise, our team observed that the cash call payments in NNPC/Pan Ocean
JV payment schedule/template differred from the amount acknowledged in the JV Operator’s (Pan
Ocean) bank statement.
The review of PANOCEAN cash call templates on contributions revealed that cash call payments
documented in cash call schedule/template in some instances differred from actual payments
reflected in JV Operator’s bank statement. For example, Pan Ocean cash call payment summary
showed that the following payments were made, but audit review of the company's bank
statements could not confirm the payments in 2013
i. E & P- July payment of $2,066,300
ii. Domgas payment of $3,000,000
$
Special Frontier Exploration Services 100,000,000.00
NAPIMS Overhead- January - December 2013 275,800,000.00
Security Payments-payments to Nigerian Navy 55,000,000.00
Gas Infrastructure Development Projects 278,391,898.71
Grand Total 709,191,898.71
SUMMARY OF NON JV CASH CALL PAYMENTS

Main Report and Recommendations
NEITI Oil and Gas Industry 2013 Audit
139
iii. E& P- January payment of N900, 000,000
iv. E& P- April payment of N220, 000,000
v. E& P- June payment of N1, 448,079,000
vi. Domgas - August of N200, 000,000
In December 2013, the company's summary sheet showed $16,500,000 while the bank statement
only reflected $2,499,950 as actual payment. The company explained that the payments were
made from its sole account and not the JV Operator’s bank Account. This is contrary to the JOA.
In addition, Pan Ocean could only provide evidence for the validation of N500,000,000 with respect
to E& P- January payment of N900, 000,000.
Implication
The counterpart funding by JV partners may not be properly accounted for.
Recommendation
NNPC to periodically exercise its right of Audit on the operators account as contained in the Joint
Operating Agreement to ensure proper reconciliation of cash call accounts and ensure that Pan
Ocean make payments of outstanding cash call.
6.6.7 Key findings relating to cash calls paid by NAPIMS on OMLs assigned to NPDC
a. The sum of $536.922 Million was the total amount of cash calls paid in 2013 (Naira and Dollar) by NAPIMS with respect to OMLs in NAOC JV that had already been assigned to NPDC in December, 2012 despite the fact that the Crude Oil lifted by NNPC from the OMLs concerned were paid into the account of NPDC.
NAOC firmly highlighted that, as the operator of NAOC JV, under the JOA for OMLs 60, 61,
62 and 63, the company has not signed or endorsed any novation agreement from
NNPC/NAPIMS to NPDC and has never interfaced with NPDC as partner in OMLs 60,61, 62
63 and continuously involves and shares all communication or obligation under the JOA only
with NNPC/NAPIMS.
NAPIMS however provided evidence of a refund of the sum of $389.057 Million by NPDC in
2014 leaving an outstanding balance of $147.864 Million. There was however no evidence
of any transfer of the refund to the Federation account.
b. Audit evidence also revealed that cash calls were paid on asset(s) divested by NNPC to NPDC from SPDC JV between September 2010 and April 2011. The OMLs concerned and the date of Deed of Assignment approval by the Minister are listed below:

Main Report and Recommendations
NEITI Oil and Gas Industry 2013 Audit
140
T
h
e
The sum of $35.127 Million was refunded by NPDC into JPMorgan Chase Cash Call Dollar
Account in July 2013 with respect to Cash Calls paid for the period April to November 2011
on OML 42.
Review of NAPIMS documents also indicated that there is an outstanding refund request by
NAPIMS on OML 26 ($414,000 and ₦249,272,000) and OML 42 (₦2,171,235,000) for the
same period.
c. NAPIMS did not provide details or basis of refund computation. NAPIMS’s explanation was that Cash Calls are not paid on OML-by-OML basis but are rather paid at company level. NAPIMS further responded that NPDC is to make similar cash call refunds on OMLs 30, 34 and 40, but the breakdown and amounts to be refunded for each of these divested assets is to be advised by SPDC.
d. The various amounts of cash call refunded by NPDC to NAPIMS are due to the Federation account from which budgets were made. NAPIMS could not produce an appropriate authority to expend the refunds.
Table 6.6.7C: Cash Call paid to NAOC on behalf of NPDC and Cash Call Refunded by NPDC
2013 CRUDE CASH CALL REFUND
CASH CALL PAID TO NAOC BY NAPIMS ON BEHALF OF NPDC
NPDC REFUND OF CRUDE CASH CALL TO NAPIMS
MONTH $'000 ₦'000 F$'000 $'000 ₦'000 F$'000
JANUARY 18,330
4,556,970
46,990
(18,330)
(4,556,970)
(46,990)
FEBRUARY 10,716
3,650,143
33,673
(10,716)
(3,650,143)
(33,673)
MARCH 3,871
4,287,948
30,839
(3,871)
(4,287,948)
(30,839)
APRIL 11,799
6,215,722
50,891
(11,799)
(6,215,722)
(50,891)
MAY 24,414
6,479,733
65,167
(24,414)
(6,479,733)
(65,167)
JUNE 26,493
5,659,151
62,085
(26,493)
(5,659,151)
(62,085)
JULY 15,836
6,514,642
56,809
(15,836)
(6,514,642)
(56,809)
AUGUST 4,863
6,000,709
42,603
(4,863)
(6,000,709)
(42,603)
SEPTEMBER - - -
OMLs Date of Assignment
4/38/41 16th September, 2010
26/30/34/40/42 21st April, 2011

Main Report and Recommendations
NEITI Oil and Gas Industry 2013 Audit
141
8,322 5,487,854 42,837
OCTOBER 12,807
1,655,062
23,216 - - -
NOVEMBER 15,188
1,726,657
26,047 - - -
DECEMBER 20,298
5,639,090
55,764 - - -
TOTAL 172,937
57,873,681
536,921
(116,322)
(43,365,018)
(389,057)
Source: NAPIMS Records
It should be noted that the sum of $389,057,000 in Functional Currency shown in the table above
was refunded by NPDC to NAPIMS in April 2014. The breakdown of the refund due and made is
below:
Implication
a. Cash calls budgeted by the Federation were used to fund crude oil and gas production activities from OMLs already assigned to NPDC by NNPC.
b. The Federation has not only lost the crude oil and gas proceeds from the assigned OMLs but has additionally incurred costs in the form of cash calls paid.
Recommendations
a. All past transactions involving divestment/assignment of JV assets should be investigated. The
position of the audit is that, the process of divestment of assets within the JV arrangements is
not economically justifiable and lacks transparency.
b. The sum of $389,057,000 refunded by NPDC should have been paid back to the Federation
Account. NAPIMS should therefore account for the utilization of the refund.
c. NAPIMS being the custodian of NNPC’s investment should have records of cash calls
paid/refunded on each OML and these records are to be produced for audit review of cash calls
paid to JV operators with respect to OMLs assigned to NPDC by NNPC for the verification of
expenditure incurred with the refunds.
SPDC has confirmed its willingness to give necessary support if and when required, in the
provision of information relating to breakdown and amounts to be refunded with respect to
OMLs 30, 34 and 40. The Federal Government is advised to follow up on this.
d. The use of gas revenue to offset cash call refundable from assets assigned to NPDC as revealed from audit findings is not transparent and accountable.

Main Report and Recommendations
NEITI Oil and Gas Industry 2013 Audit
142
6.7 Gas Flare Penalty
Gas Flare Penalty is the penalty imposed on Oil and Gas producing Companies operating within the
country. The objective is to serve as a deterrent for burning the natural gas that is associated with
crude oil when it is pumped from the ground. This correctional measure is to reduce air pollution,
environmental degradation caused by Gas flaring and also encourage investment in Gas
infrastructure by the Oil and Gas Companies.
The regulations governing gas flare penalty include:
Regulation 42 of the Petroleum (Drilling and Production) Regulations, 1969.
Associated Gas Re-injection Act, 1979.
Associated Gas Re-injection (Continued Flaring of Gas) Regulations, 1984.
Cap. 26 Laws of the Federation of Nigeria, 1990.
Gas flare penalty rates used under various fiscal regimes are:
2K applicable from 1985 to June 1992
50K applicable from July 1992 to December 1997
N10 applicable from January 1998 to March 2008
$3.5 applicable from April 2008 to Date (still in contention)
The rate of N10 as provided by the Regulation of January 1998 is still being applied as against the
$3.5, which is the latest rate. The companies complete a Self-Assessment based on the parameters
in the Act and make monthly payments to the designated JP Morgan Accounts which are
subsequently reconciled with the DPR. Table 6.7 - Gas Flare Penalty
S/N ENTITY Gas Flared Penalty
USD $'000
1 AMNI 3,807
2 APDNL 2,749
3 APENL 216
4 ATLAS 52
5 Chevron 2,073
6 CONOIL 1,831
7 CONTINENTAL 2,333
8 Dubri 79
9 Energia 159
10 Midwestern 34
11 MOBIL 1,024
12 MONI PULO 61

Main Report and Recommendations
NEITI Oil and Gas Industry 2013 Audit
143
S/N ENTITY Gas Flared Penalty
USD $'000
13 NAOC 428
14 Newcross 325
15 Oriental Energy 308
16 PHILLIPS OIL 254
17 PLATFORM 315
18 SEEPCO 6
19 SEPLAT 504
20 SNEPCo 194
21 SPDC 794
22 TEPNG 639
23 TUPNI 290
TOTAL 18,475
Total payments of Gas flare penalty in 2013 amounted to $18,475,000 representing a 25% decline
in payment as compared with $24,580,000 reported in 2012. This is as a result of reduction in gas
flared during the year under review.
6.7.1 Key findings on Gas Flare Penalty
The following are issues revealed by the audit in the assessment and collection of Gas Flare
Penalties which were also reported in the previous audit cycle:
a. Inadequate measurement infrastructure to determine the quantity of Gas Flared by the Oil and
Gas Companies.
b. Non-compliance with the 2008 Gas flaring penalty rates.
c. Poor collection of Gas flared penalties and lack of political will to implement the April 2008
Regulation on the new rate.
d. Lack of enabling legal and regulatory environment that will encourage the development of Gas
Infrastructure by the Oil and Gas Companies.
Implication
a. Incorrect determination of Gas Flared volumes and consequent under assessment of Gas flared
penalties.
b. Sub-optimal collections of Gas Flared penalties and consequent lower revenue to the
Federation.
c. Low-level investment in Gas infrastructure by the Oil and Gas Companies.

Main Report and Recommendations
NEITI Oil and Gas Industry 2013 Audit
144
Recommendations
a. DPR should enforce payment of new gas flare penalty rate.
b. DPR should exercise greater control over the assessment and collections of gas flare penalty.
c. Develop and implement a National Master plan on Gas.
6.8 Education Tax (EDT)
The adminstration of thisTax is governed by the Education Tax Act No. 7 of 1993 and amended by
Act No. 40 of (22nd Dec.) 1998. The Act imposes tax at the rate of 2% on the assessable profits of
all incorporated bodies. The tax applies to all companies registered in Nigeria. The assessable
profits of the companies within the audit scope are ascertained in the manner specified in the
Petroleum Profits Tax Act. Table 6.8 – Education Tax (EDT)
S/N ENTITY EDT
USD$'000
1 AENR 6,047
2 AMNI 3,290
3 APDNL 22,529
4 APENL 18,955
5 Chevron 58,461
6 Chevron MCA 3,089
7 CONOIL 4,128
8 CONTINENTAL 2,509
9 Dubri 37
10 ESSO 96,704
11 FHN 132
12 Midwestern 0.03
13 MOBIL 490,198
14 NAE 12,888
15 NAOC 22,940
16 NAOC MCA 624
17 Newcross 112
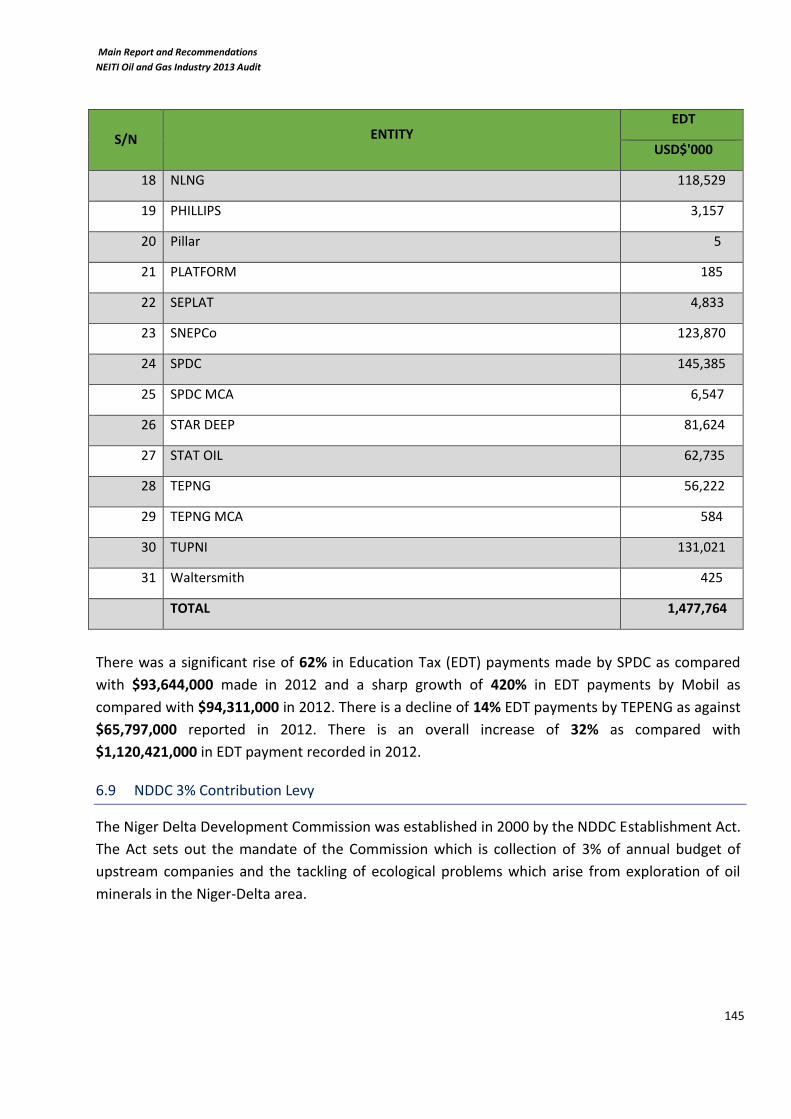
Main Report and Recommendations
NEITI Oil and Gas Industry 2013 Audit
145
S/N ENTITY EDT
USD$'000
18 NLNG 118,529
19 PHILLIPS 3,157
20 Pillar 5
21 PLATFORM 185
22 SEPLAT 4,833
23 SNEPCo 123,870
24 SPDC 145,385
25 SPDC MCA 6,547
26 STAR DEEP 81,624
27 STAT OIL 62,735
28 TEPNG 56,222
29 TEPNG MCA 584
30 TUPNI 131,021
31 Waltersmith 425
TOTAL 1,477,764
There was a significant rise of 62% in Education Tax (EDT) payments made by SPDC as compared
with $93,644,000 made in 2012 and a sharp growth of 420% in EDT payments by Mobil as
compared with $94,311,000 in 2012. There is a decline of 14% EDT payments by TEPENG as against
$65,797,000 reported in 2012. There is an overall increase of 32% as compared with
$1,120,421,000 in EDT payment recorded in 2012.
6.9 NDDC 3% Contribution Levy
The Niger Delta Development Commission was established in 2000 by the NDDC Establishment Act.
The Act sets out the mandate of the Commission which is collection of 3% of annual budget of
upstream companies and the tackling of ecological problems which arise from exploration of oil
minerals in the Niger-Delta area.
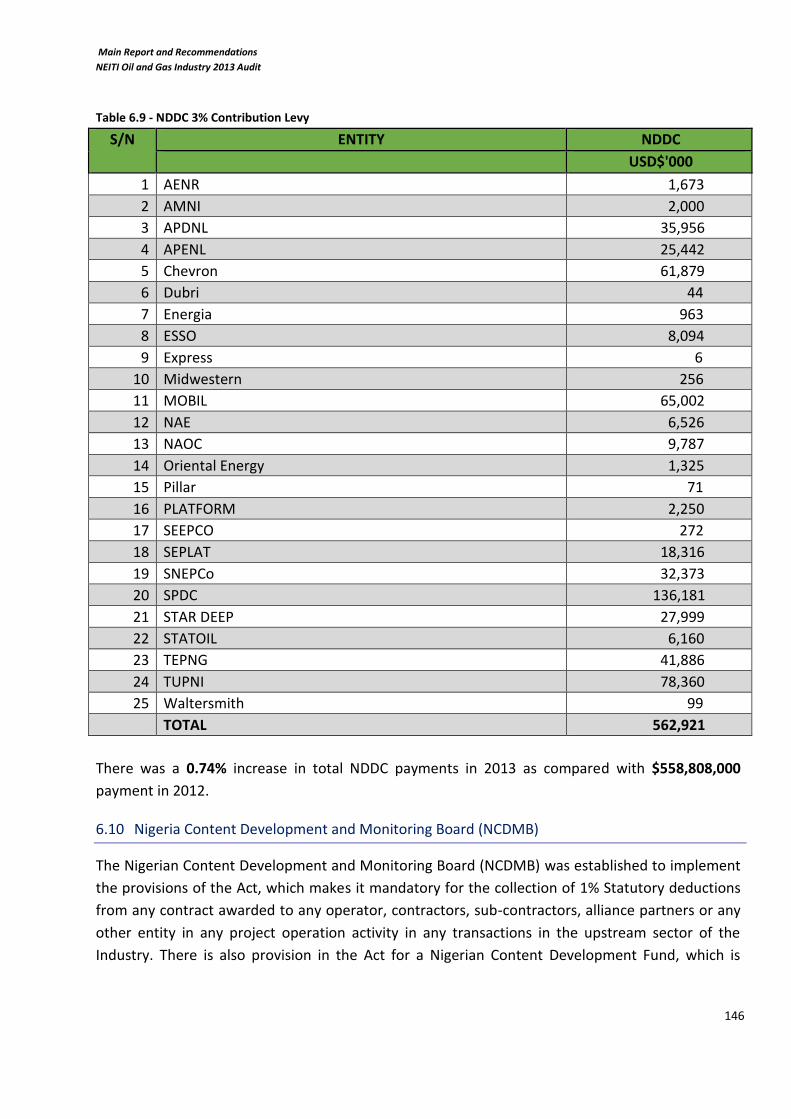
Main Report and Recommendations
NEITI Oil and Gas Industry 2013 Audit
146
Table 6.9 - NDDC 3% Contribution Levy
S/N ENTITY NDDC
USD$'000
1 AENR 1,673
2 AMNI 2,000
3 APDNL 35,956
4 APENL 25,442
5 Chevron 61,879
6 Dubri 44
7 Energia 963
8 ESSO 8,094
9 Express 6
10 Midwestern 256
11 MOBIL 65,002
12 NAE 6,526
13 NAOC 9,787
14 Oriental Energy 1,325
15 Pillar 71
16 PLATFORM 2,250
17 SEEPCO 272
18 SEPLAT 18,316
19 SNEPCo 32,373
20 SPDC 136,181
21 STAR DEEP 27,999
22 STATOIL 6,160
23 TEPNG 41,886
24 TUPNI 78,360
25 Waltersmith 99
TOTAL 562,921
There was a 0.74% increase in total NDDC payments in 2013 as compared with $558,808,000
payment in 2012.
6.10 Nigeria Content Development and Monitoring Board (NCDMB)
The Nigerian Content Development and Monitoring Board (NCDMB) was established to implement
the provisions of the Act, which makes it mandatory for the collection of 1% Statutory deductions
from any contract awarded to any operator, contractors, sub-contractors, alliance partners or any
other entity in any project operation activity in any transactions in the upstream sector of the
Industry. There is also provision in the Act for a Nigerian Content Development Fund, which is

Main Report and Recommendations
NEITI Oil and Gas Industry 2013 Audit
147
established for the purpose of funding the implementation of Nigerian content development in the
Nigeria oil and gas industry.
The table below shows NCDMB contribution by the respective Oil and Gas Companies during the
year under review. Table 6.10 - Nigeria Content Development and Monitoring Board (NCDMB)
S/N ENTITY NCDMB
USD$'000
1 AENR 442
2 AMNI 1,832
3 APDNL 8,578
4 APENL 2,803
5 CNL 15,785
6 CONOIL 2,622
7 Energia 4,111
8 Midwestern 670
9 MOBIL 26,599
10 NAE 4,523
11 NAOC 4,912
12 Newcross 329
13 Oriental Energy 4,956
14 Pillar 63
15 PLATFORM 87
16 SEEPCO 82
17 SEPLAT 6,158
18 SNEPCo 5,235
19 SPDC 19,560
20 STAR DEEP 6,567
21 STATOIL 12
TOTAL 115,925
In 2013, total NCDMB payments amounted to $115,925,000 representing a 45% increase over
$80,010,000 recorded in 2012. SNEPCO had a 78% decline in NCDMB levies paid in 2013.
6.11 Value Added Tax (VAT)
Value Added Tax (VAT) was introduced in Nigeria in 1993 and the current rate is 5%. The payments
reported and validated to the accounts of FIRS is shown inthe table below:

Main Report and Recommendations
NEITI Oil and Gas Industry 2013 Audit
148
Table 6.11 (a) Value Added Tax (VAT) Payments in 2013
VAT 2013 $'000 Percentage Proportion %
JV 560,447 58.05%
PSC 210,181 21.77%
SC 650 0.07%
MF&SR 60,725 6.29%
NLNG 133,518 13.83%
TOTAL 965,521 100%
Table 6.11 (b) Value Added Tax (VAT)
S/N ENTITY Value Added Tax
$'000
1 AENR 650
2 AMNI 5,826
3 APDNL 29,331
4 APENL 11,536
5 BRITTANIA- U 166
6 CHEVRON 73,467
7 CONOIL 5,521
8 CONTINENTAL 3,059
9 DUBRI 81
10 ENERGIA 4,169
11 ESSO 18,993
12 FHN 115
13 FRONTIER OIL LIMITED 2,242
14 MOBIL 127,718
15 MONIPULO 226
16 NAE 29,575
17 ND WESTERN 56
18 NDPR 1,097
19 NECONDE 2,487
20 NEWCROSS 886
21 NLNG 133,518
22 OANDO 1
23 ORIENTAL 12,672
24 PANOCEAN 29,428
25 PHILIPS 1,009
26 PILLAR 982
27 PLATFORM 53
28 SEEPCO 578

Main Report and Recommendations
NEITI Oil and Gas Industry 2013 Audit
149
S/N ENTITY Value Added Tax
$'000
29 SEPLAT 20,730
30 SHORELINE NATURAL RESOURCES 137
31 SNEPCO 36,162
32 SPDC 140,303
33 STARDEEP 30,503
34 STATOIL 109
35 TEPNG 188,522
36 TUPNI 53,393
37 WALTERSMITH 220
TOTAL 965,521
The Value Added Tax payments in Joint Venture (JV) rose by 29% from 2012 payment of
$435,226,000, while total VAT payments had an increase of 25% when compared to 2012 payment
of $770,834,000.
6.12 Withholding Tax (WHT)
A withholding tax is basically an advance and indirect source of taxation deducted at source from
the invoices of the tax payer.
Withholding tax rates are usually 10% or 5% depending on the type of transaction and collecting
authority for the tax (which can be a Federal Inland Revenue or the State Inland Revenue).
6.12.1 WHT Payments to FIRS
Table 6.12.1 WHT Payments to FIRS
S/N ENTITY Witholding Tax FIRS
$'000
1 ALLIED ENERGY 30
2 AMNI 3,707
3 APDNL 30,478
4 APENL 12,486
5 BRITTANIA- U 701
6 CHEVRON 88,359
7 CONOIL 5,858
8 CONTINENTAL 991
9 DUBRI 233
10 ENERGIA 3,705
11 ESSO 18,629
12 FHN 162
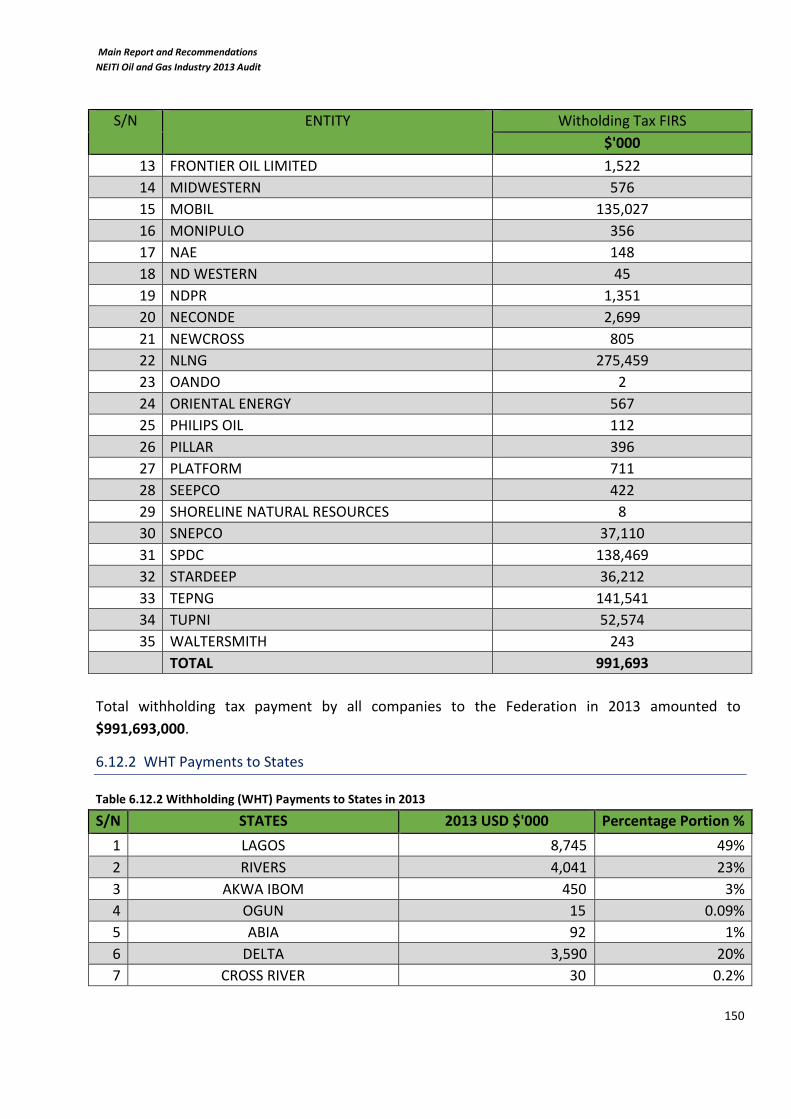
Main Report and Recommendations
NEITI Oil and Gas Industry 2013 Audit
150
S/N ENTITY Witholding Tax FIRS
$'000
13 FRONTIER OIL LIMITED 1,522
14 MIDWESTERN 576
15 MOBIL 135,027
16 MONIPULO 356
17 NAE 148
18 ND WESTERN 45
19 NDPR 1,351
20 NECONDE 2,699
21 NEWCROSS 805
22 NLNG 275,459
23 OANDO 2
24 ORIENTAL ENERGY 567
25 PHILIPS OIL 112
26 PILLAR 396
27 PLATFORM 711
28 SEEPCO 422
29 SHORELINE NATURAL RESOURCES 8
30 SNEPCO 37,110
31 SPDC 138,469
32 STARDEEP 36,212
33 TEPNG 141,541
34 TUPNI 52,574
35 WALTERSMITH 243
TOTAL 991,693
Total withholding tax payment by all companies to the Federation in 2013 amounted to
$991,693,000.
6.12.2 WHT Payments to States
Table 6.12.2 Withholding (WHT) Payments to States in 2013
S/N STATES 2013 USD $'000 Percentage Portion %
1 LAGOS 8,745 49%
2 RIVERS 4,041 23%
3 AKWA IBOM 450 3%
4 OGUN 15 0.09%
5 ABIA 92 1%
6 DELTA 3,590 20%
7 CROSS RIVER 30 0.2%

Main Report and Recommendations
NEITI Oil and Gas Industry 2013 Audit
151
S/N STATES 2013 USD $'000 Percentage Portion %
8 EDO 34 0.19%
9 OYO 7 0.04%
10 IMO 150 1%
11 KOGI 2 0.01%
12 OSUN 1 0.00%
14 ANAMBRA 1 0.01%
16 BAYELSA 536 3%
18 EKITI 0.14 0.001%
20 ENUGU 10 0.056%
22 KADUNA 35.00 0.197%
24 KWARA 2.00 0.011%
TOTAL 17,740 100%
Note: Rivers State includes payment from NLNG.
Withholding Tax payment to all States of the Federation amounted to $17,740,000 representing a
57% rise as compared to $11,314,000 paid in 2012. Lagos State which had the highest percentage
of Withholding tax Collections included payment of $1,195,000 by TEPNG and $4,219,000 by AMNI.
6.12.2.1 WHT Payments to Lagos State
Table 6.12.2.1 WHT Payments to Lagos State
S/N ENTITY WHT LAGOS
USD$'000
1 AMNI 4,219
2 APDNL 819
3 APENL 10
4 Brittania-U 0.3
5 Chevron 408
6 Dubri 13
7 Energia 51
9 ESSO 54
10 FHN 16
11 FHN 4
12 FRONTIER OIL LIMITED 48
13 Midwestern 37
15 MOBIL 589
16 ND WESTERN 13
17 NDPR 43
18 NECONDE 301

Main Report and Recommendations
NEITI Oil and Gas Industry 2013 Audit
152
S/N ENTITY WHT LAGOS
USD$'000
19 Newcross 9
20 Oriental 14
21 PHILLIPS OIL 22
22 PHILLIPS OIL 1
23 Pillar 613
24 SNEPCo 71
25 SPDC 152
26 STARDEEP 29
27 TEPNG 1,195
28 TUPNI 14
Total 8,745
Withholding Tax Payments to Lagos State amounted to $8,745,000 with TEPNG and AMNI
contributing 14% and 48% of the total payments respectively.
6.12.2.2 WHT Payments to Rivers States
Table 6.12.2.2 WHT Payments to Rivers States
S/N ENTITY WHT RIVERS
USD$'000
1. AMNI 6
2. APDNL 16
3. APENL 1
4. Chevron 140
5. ESSO 0.35
6. MOBIL 106
7. NDPR 25
8. NLNG 689
9. SNEPCo 4
10. SPDC 650
11. STARDEEP 3
12. TEPNG 2,394
13. TUPNI 6
TOTAL 4,041
Withholding tax payments to Rivers State amounted to $4,041,000 in 2013 with NLNG contributing
17% of payment.

Main Report and Recommendations
NEITI Oil and Gas Industry 2013 Audit
153
6.12.2.3 WHT Payments to Akwa-Ibom State
Table 6.12.2.3 WHT Payments to Akwa-Ibom State
S/N ENTITY USD$'000
1 Chevron 0.38
2 ESSO 6
3 FRONTIER OIL LIMITED 24
4 MOBIL 371
5 SPDC 7
6 TEPNG 42
TOTAL 450
Total payments of withholding tax to Akwa- Ibom State amounted to $450,000 in 2013.
6.12.2.4 WHT Payments to Ogun State
Table 6.12.2.4 WHT Payments to Ogun State
S/N ENTITY USD$'000
1 Chevron 0.10
2 ESSO 0.04
3 MOBIL 8
4 SPDC 7
TOTAL 15
Total payments of withholding tax amounted to $15,000 in 2013.
6.12.2.5 WHT Payments to Abia State
Table 6.12.2.5 WHT Payments to Abia State
S/N ENTITY
WHT ABIA
USD$'000
1 MOBIL 5
2 SPDC 87
TOTAL 92
Total withholding tax payments to Abia State amounted to $92,000 in 2013.

Main Report and Recommendations
NEITI Oil and Gas Industry 2013 Audit
154
6.12.2.6 WHT Payments to Delta State
Table 6.12.2.6 WHT Payments to Delta State
S/N ENTITY USD$'000
1 Chevron 248
2 Energia 65
3 MOBIL 6
4 NDPR 2
5 Neconde 1
6 SNEPCo 14
7 SPDC 3,225
8 STARDEEP 5
9 TEPNG 24
TOTAL 3,590
Total withholding tax payment to Delta State amounted to $3,590,000 in 2013.
6.12.2.7 WHT Payments to Cross River State
Table 6.12.2.7 WHT Payments to Cross River State
S/N ENTITY WHT CROSS RIVER
USD$'000
1 APDNL 14
2 APENL 3
3 MOBIL 10.35
4 SPDC 2
TOTAL 29.97
Cross Rivers State withholding tax payments amounted to $29,970 in 2013.
6.12.2.8 WHT Payments to Edo State
Table 6.12.2.8 WHT Payments to Edo State
S/N ENTITY USD$'000
1 APDNL 1
2 Chevron 2
3 Dubri 1.77
4 Midwestern 5
5 MOBIL 6
6 SPDC 16

Main Report and Recommendations
NEITI Oil and Gas Industry 2013 Audit
155
S/N ENTITY USD$'000
7 TEPNG 2.57
TOTAL 34
Total withholding tax payment in Edo State amounted to $34,000 in 2013.
6.12.2.9 WHT Payments to Oyo State
Table 6.12.2.9 WHT Payments to Oyo State
S/N ENTITY USD$'000
1 Chevron 1.11
2 MOBIL 4.41
3 TEPNG 1.13
TOTAL 6.65
Total withholding tax payments in Oyo State amounted to $6,650 in 2013.
6.12.2.10 WHT Payments to Imo State
Table 6.12.2.10 WHT Payments to Imo State
S/N ENTITY USD$'000
1 APDNL 50
2 Chevron 5
3 SPDC 95
TOTAL 150
Total withholding tax payments to Imo State amounted to $150,000 in 2013.
6.12.2.11 WHT Payments to Kogi State
Table 6.12.2.11 WHT Payments to Kogi State
S/N ENTITY USD$'000
SPDC 2
TOTAL 2
Total withholding tax payments to Kogi State amounted to $2,000 in 2013.

Main Report and Recommendations
NEITI Oil and Gas Industry 2013 Audit
156
6.12.2.12 WHT Payments to Osun State
Table 6.12.2.12 WHT Payments to Osun State
S/N ENTITY USD$'000
SPDC 1
TOTAL 1
Total withholding tax payments in Osun State amounted to $1,000 in 2013
6.12.2.13 WHT Payments to Kwara State
Table 6.12.2.13 WHT Payments to Kwara State
S/N ENTITY USD$'000
SPDC 2
TOTAL 2
Total withholding tax payments to Kwara State amounted to $2,000 in 2013
6.12.2.14 WHT Payments to Anambra State
Table 6.12.2.14 WHT Payments to Anambra State
S/N ENTITY USD$'000
SPDC 1
TOTAL 1
Total withholding tax payments to Anambra State amounted to $1,000 in 2013.
6.12.2.15 WHT Payments to Bayelsa State
Table 6.12.2.15 WHT Payments to Bayelsa State
S/N ENTITY USD$'000
1 Chevron 2
2 SPDC 534
TOTAL 536
Total withholding tax payments to Bayelsa State amounted to $536,000 in 2013.

Main Report and Recommendations
NEITI Oil and Gas Industry 2013 Audit
157
6.12.2.16 WHT Payments to Ekiti State
Table 6.12.2.16 WHT Payments to Ekiti State
S/N ENTITY USD$'000
1 SPDC 0.14
TOTAL 0.14
Total withholding tax payments to Ekiti State amounted to $140 in 2013
6.12.2.17 WHT Payments to Enugu State
Table 6.12.2.17 WHT Payments to Enugu State
S/N ENTITY USD$'000
1 SNEPCo 3
2 SPDC 7
TOTAL 10
Total withholding tax payments to Enugu State amounted to $10,000 in 2013.
6.12.2.18 WHT Payments to Kaduna State
Table 6.12.2.18 WHT Payments to Kaduna State
S/N ENTITY USD$'000
1 SPDC 35
TOTAL 35
Total withholding tax payments to Kaduna State amounted to $35,000 in 2013.

Main Report and Recommendations
NEITI Oil and Gas Industry 2013 Audit
158
6.13 Pay As You Earn (PAYE) Tax
6.13.1 PAYE Payment to FIRS
Table 6.13.1 PAYE Payment to FIRS
S/N ENTITY PAYE FIRS
USD$'000
1 APDNL 175
2 Chevron 10,939
3 ESSO 38
4 Express 1
5 MOBIL 1,038
6 NAE 3,313
7 NLNG 2,799
8 PHILIPS 656
9 Pillar 726
10 SEEPCO 129
11 SNEPCo 60
12 SPDC 1,151
13 STATOIL 139,841
14 TEPNG 7,658
TOTAL 168,524
The total sum of PAYE payments in 2013 amounted to $168,524,000.
6.13.2 PAYE Payment to States
Table 6.13.2 PAYE Payment to States
STATE 2013 USD $'000 Percentage Proportion %
LAGOS 211,881 38%
RIVERS 183,891 33%
AKWA IBOM 39,887 7.17%
DELTA 116,836 21.01%
IMO 1,009 0.18%
BAYELSA 169 0.030%
CROSS RIVER 1,120 0.201%
OGUN 1,164 0.209%
EDO 14 0.003%
BORNO 61 0.01%
TOTAL 556,030 100%

Main Report and Recommendations
NEITI Oil and Gas Industry 2013 Audit
159
There was an increase of 164% in PAYE to Rivers State as compared to $69,681,000 in 2012 and a
15% increase to Akwa Ibom State as against $34,581,000 reported in 2012. There is an overall
increase of 184% of PAYE payments to States as compared with 2012. This may be due to
expansion in staff strength of these companies and increase in payroll.
6.13.2.1 Payment to Lagos State Table 6.13.2.1 Payment to Lagos State
S/N ENTITY PAYE LAGOS
USD $'000
1 ALLIED 159
2 AMNI 5,658
3 APDNL 8,368
4 ATLAS 13
5 Brittania U 73
6 Chevron 80,551
7 Dubri 68
8 Energia 461
9 ESSO 6,855
11 FRONTIER OIL LIMITED 258
12 MOBIL 41,135
13 ND WESTERN 102
14 NDPR 54
15 Neconde 962
16 Newcross 206
17 NLNG 78
18 PHILLIPS 663
19 Pillar 432
20 SHEBA 30
21 Shoreline Natural Resources 423
22 SNEPCo 24,430
23 SPDC 18,515
24 TEPNG 22,387
TOTAL 211,881
Total PAYE payments to Lagos State amounted to $211,881,000 in 2013.

Main Report and Recommendations
NEITI Oil and Gas Industry 2013 Audit
160
6.13.2.2 Payment to Rivers State
Table 6.13.2.2 Payment to Rivers State
S/N ENTITY USD$'000
1 AMNI 349
2 Chevron 7,713
3 ESSO 22
4 MOBIL 3,571
5 NDPR 125
6 PHILLIPS 15
7 TEPNG 43,366
8 NLNG 43,742
9 SPDC 79,484
10 SNEPCo 1,786
11 APDNL 467
12 NAE 3,251
TOTAL 183,891
Total PAYE payments to Rivers State amounted to $183,891,000 in 2013 with TEPENG and NLNG
contributing about 47% of the total payments.
6.13.2.3 Payment to Akwa Ibom
Table 6.13.2.3 Payment to Akwa Ibom
S/N ENTITY USD$'000
1 ESSO 71
2 FRONTIER OIL LIMITED 458
3 MOBIL 39,357
TOTAL 39,887
Total PAYE payments to Akwa Ibom State amounted to $39,887,000 with MOBIL contributing
about 99% of the total payments.
6.13.2.4 Payment to Delta State

Main Report and Recommendations
NEITI Oil and Gas Industry 2013 Audit
161
Table 6.13.2.4 Payment to Delta State
S/N ENTITY USD$'000
1 Chevron 93,256
2 Energia 453
3 ND WESTERN 10
4 Neconde 254
5 Pillar 294
6 SEEPCO 129
7 SNEPCo 576
8 SPDC 21,863
TOTAL 116,836
Total PAYE payments to Delta State amounted to $116,836,000 with Chevron contributing 80% of
the total payments.
6.13.2.5 Payment to Imo State
Table 6.13.2.5 Payment to Imo State
S/N ENTITY USD$'000
1 APDNL 670
2 Chevron 338
TOTAL 1,009
Total PAYE payments to Imo State amounted to $1,009,000.
6.13.2.6 Payment to Bayelsa State
Table 6.13.2.6 Payment to Bayelsa State
S/N ENTITY USD$'000
1 Chevron 106
2 NAE 62
TOTAL 168
Total PAYE payments to Bayelsa State amounted to $168,000.

Main Report and Recommendations
NEITI Oil and Gas Industry 2013 Audit
162
6.13.2.7 Payment to Cross River State
Table 6.13.2.7 Payment to Cross River State
S/N ENTITY USD$'000
APDNL 560
APDNL 560
TOTAL 1,120
Total PAYE payments to Cross River State amounted to $1,120,000.
6.13.2.8 Payment to Ogun State
Table 6.13.2.8 Payment to Ogun State
S/N ENTITY USD$'000
1 APDNL 0.08
2 Chevron 565
3 SNEPCo 288
4 SPDC 311
TOTAL 1,164
Total PAYE payments to Ogun State amounted to $1,164,000.
6.13.2.9 Payment to Edo State
Table 6.13.2.9 Payment to Edo State
S/N ENTITY USD$'000
Dubri 14
TOTAL 14
Total PAYE payments to Edo State amounted to $14,000.

Main Report and Recommendations
NEITI Oil and Gas Industry 2013 Audit
163
6.13.2.10 Payment to Borno State
Table 6.13.2.10 Payment to Borno States
S/N ENTITY PAYE BORNO
USD $'000
1 Oriental Energy 61
TOTAL 61
Total PAYE payments to Borno State amounted to $61,000 in 2013
6.14 Local Government Taxes
Table 6.14 Local Government Taxes
In 2013 NLNG reported local government taxes of $1,089,000. These payments were made to
various Local Governments (Bonny, Obio/Akpor, Emohua, Port Harcourt City and Ahoada West) in
Rivers State.
6.15 NIMASA Levies
Nigerian Maritime Administration and Safety Agency (NIMASA) is an agency of government
charged with the responsibility of:
Promoting the development of indigenous commercial shipping in international and coastal
shipping trade;
Regulating and promoting maritime safety, security, marine pollution control and maritime
labour.
The agency is governed by NIMASA Act 2007 which stipulates the powers, sources of finance and
regulations of its activities. The Agency is under the supervision of Federal Ministry of
Transportation.
The NIMASA Act 2007 states that the agency shall be funded by monies accruing from the
following sources:
i. 3% of gross freight on all international inbound and outbound cargo from ships or shipping
companies operating in Nigeria to be collected and paid over to the Agency to meet its
operational costs;
ii. 0.5% of stevedoring charges collected by employers of dock labour;
LOCAL GOVT TAX
USD$'000
1 NLNG 1,089
TOTAL 1,089
S/NENTITY

Main Report and Recommendations
NEITI Oil and Gas Industry 2013 Audit
164
iii. All fees for ship registration, licenses, surveys, examination certification and permits issued
by the Agency, fine and levies paid to the Agency;
iv. All other financial assets that may from time to time be vested in or accrue to the Agency in
the course of performing its functions under the Act or pursuant of the Act;
v. All other sums collected or received by the Agency for services rendered or facilities
provided by the Agency;
vi. Gifts, grant, aids, etc. and
vii. All such other sums as may be received by the Agency from other sources.
The revenue of interest to NEITI Oil and Gas Audit is the 3% gross freight mentioned above apart
from the Cabotage levy which is also administered by NIMASA.
Revenue Paid by Oil & Gas Industry
i. 2% Cabotage levies: Section 42 of the Cabotage Act 2003 establishes the Cabotage Vessel
Financing Fund. Section 43(a) stipulates that “a surcharge of 2 per cent of the contract sum
performed by any vessel engaged in the coastal trade”. The currency of the levy collection is
denominated in Naira and Dollar.
Section 44 of the Act empowers NIMASA to collect, deposit and administer the fund in
commercial banks under guidelines proposed by the Minister of Transport and approved by
the National Assembly.
i. 3% of gross freight: Section 15(a) empowers NIMASA to collect “3% of gross freight on all
international inbound and outbound cargo from ships or shipping companies operating in
Nigeria to be collected and paid over to the Agency to meet its operational costs”. The
currency of the levy collection is Dollar denominated.
The table below show payments to NIMASA as reported by the companies during the year under
review.
Table 6.15 NIMASA Levies
S/N ENTITY NIMASA Levy
$'000
1 AMNI 250
2 APDNL & APENL 2,400
3 CNL 4,782
4 ESSO 170
5 MOBIL 3,800
6 NLNG 150,930
7 SNEPCO 1,511
8 STARDEEP 1,102
TOTAL 164,945

Main Report and Recommendations
NEITI Oil and Gas Industry 2013 Audit
165
Total payments made to NIMASA as disclosed by entities covered in 2013 Audit amounted to
$164,945,000 of which NLNG contributed 92% of the total payments. However, these payments
could not be traced to NIMASA’s records.
NIMASA did not cooperate with the audit process in the population of templates and provision of
necessary documents for audit review.
6.16 NIWA Levies
Decree No. 13 of 1997 established the National Inland Waterways Authority (NIWA) with a
mandate to manage Nigeria’s vast inland waterway resources. The Decree vests in NIWA the power
of exclusive management, direction and control on the Nigerian inland waterways. This power is
exercised on Nigeria’s 3000km navigable waterways from the Nigeria/Niger and Nigeria/Cameroon
borders to the Atlantic Ocean. Nigeria is blessed with a river configuration very suitable for North-
South movement of people and goods.
The inland waterways of Nigeria comprise of the main river system (Rivers Niger and Benue which
form a confluence at Lokoja), creeks, lagoons, lakes and intra-coastal waters. The levies collected
include Right of way, dredging permit etc.
Table 6.16 NIWA Levies
S/N ENTITY NIWA
$'000
1 Dubri 6
2 MPNU 119
3 NLNG 96
TOTAL 221
6.17 NESS Fees
The Nigeria Export Supervision Scheme (NESS) Fee is a statutory payment to the Federal
Government on all legitimate goods which include payments for crude oil and it derivatives and
payments for non-oil goods. NESS is a self-financing Scheme where the Inspection Agents are paid
from the NESS fee collected from the exporters. Any balance in the NESS account domiciled with
CBN is used for the administration of the Scheme. The enabling law, Act No. 10 of 1996, section 14
(3-4) stipulates that; all expenses relating to the remuneration, fees, and other charges payable to
the inspection agent(s) shall be defrayed from the NESS fee account and any balance remaining in
the account shall be used to administer the NESS program. The NESS fee rate is 0.12% of FOB
value of crude oil export in the period under review.

Main Report and Recommendations
NEITI Oil and Gas Industry 2013 Audit
166
Table 6.17 - NESS Fees
S/N ENTITY NESS Fees
$'000
1 AENR 310
2 ALLIED ENERGY 118
3 APDNL 1,677
4 APENL 610
5 BRITTANIA - U 46
6 CHEVRON 8,487
7 DUBRI 14
8 ENERGIA 193
9 ESSO 1,602
10 EXPRESS 6
11 FHN 8
12 MIDWESTERN 256
13 MOBIL 9,233
14 NAE 563
15 NAOC 812
16 ND WESTERN 241
17 NECONDE 171
18 NNPC 24,213
19 ORIENTAL ENERGY 1,504
20 PILLAR 71
21 PLATFORM 51
22 SEEPCO 272
23 SEPLAT 953
24 SHEBA 20
25 SHORELINE NATURAL RESOURCES 312
26 SNEPCO 2,140
27 STAR DEEP 2,312
28 STATOIL 895
29 TEPNG 4,240
30 TUPNI 1,669
31 WALTERSMITH 99
TOTAL 63,100
The sum of $63 Million in the above table is the amount reported by the companies. However, the
total payment of NESS fees as aggregated from the account (NESS fee crude oil export) with CBN
amounted to $81.535 Million (NGN12,858,922,697) compared to the sum of $43,843,040
(N6,914,473,623.06) reported by CBN. The total NESS fee collections by CBN could not be tied to
individual entities because CBN did not provide details of payments. It is also evident that Mobil,
Chevron and NNPC contributed 24%, 22% and 40% of total payments respectively.

Main Report and Recommendations
NEITI Oil and Gas Industry 2013 Audit
167
Findings
a. The audit revealed improper record keeping with respect to NESS fee collections. There are
no records of “who paid what” from the Oil and Gas Sector and neither did the NESS
Secretariat produce Audited Annual Reports containing statements of income and
expenditures made in accordance with the pre-shipment Inspection of Export Act 1996.
b. It was observed that Ness fee collections were used to finance other activities not related
to NESS operations.
Recommendations
The Federal Ministry of Finance to ensure better transparency and accountability in the operations
of NESS through:
i. Comprehensive and regular reporting of NESS operations to include NESS Collections,
details of NESS Fee payers and the corresponding export values;
ii. The Annual Financial report should also seek to reconcile export volumes recorded with
those of other regulatory Agencies like DPR and the Department of Weights and Measures
of the Federal Ministry of Trade and Investments;
iii. The NESS Secretariat, which is domiciled in CBN, should in collaboration with Trade and
Exchange Department of the Bank ensure that export proceeds are tracked using the NXP
forms, which is an integral part of the NESS operations. This will ensure achieving the
important objective of NESS, which is the repatriation of exports.

Main Report and Recommendations
NEITI Oil and Gas Industry 2013 Audit
168

Main Report and Recommendations
NEITI Oil and Gas Industry 2013 Audit
169
7 DOWNSTREAM OPERATIONS
7.1 Overview of the Downstream Operations.
The downstream sector involves operations such as refining of crude into its various components,
importation of refined products, distribution and marketing.
The Nigeria National Petroleum Corporation (NNPC) is the largest player in the downstream
industry through its subsidiary, the Pipelines and Products Marketing Company (PPMC) which has
four refineries with a total petroleum refining capacity of 445,000 barrels per day. Federal
Government allocates this quantity of crude to NNPC for domestic processing.
The crude is pumped from the fields through pipelines to the oil storage tanks at the terminals
where it is thereafter sent through fiscal meters to the refineries for processing into petroleum
products.
Objectives
I. Identification of payments to and offsets made by NNPC in respect of fuel subsidy and
shall provide a brief commentary on the methodology used by NNPC to compute such
amounts but shall not otherwise verify the amount involved.
II. Comprehensively reconcile the information disclosed by the reporting entities and
identify any discrepancies.
The Refineries and their installed production capacity in barrels per day are stated in table below:
Table 7.1: Daily Refining Capacities
Refinery Capacity
Port Harcourt Refining Company (PHRC) – Old 65,000BPD
Port Harcourt Refining Company (PHRC) – New 150,000BPD
Warri Refining and Petrochemical Company Limited (WRPC) 120,000BPD
Kaduna Refining and Petrochemical Company (KRPC) 110,000BPD
Total 445,000 BPD
The four refineries operate below name plate capacity and the combined production output is
insufficient to meet domestic fuel requirements, hence the introduction of product importation
became imperative. The NNPC / PPMC introduced off shore processing /swap arrangements to
augment local refining in order to ensure adequate petroleum products supply. Product

Main Report and Recommendations
NEITI Oil and Gas Industry 2013 Audit
170
importation therefore, consists of direct product importation, offshore processing Arrangements
(OPA) and the exchange of crude for finished products (SWAP).
In view of the inadequacy of the petroleum products supplied by NNPC, licenses were granted by
PPPRA to other independent marketers to import the products. To this effect, subsidy is paid on
such products to both NNPC and independent marketers.
7.2 Determination of Subsidy payments
7.2.1 Background
Fuel subsidy was introduced as a policy in Nigeria during the Military rule when the refineries failed
due to poor maintenance. This policy, which was introduced as a temporary measure to stabilise
the price of petroleum products and cushion the comparatively high price of imported products
while the local refineries underwent rehabilitation, has since become a standing policy of
successive governments. The policy that was meant to last for just six months has now lasted for
more than two decades.
PPPRA defines Subsidy as reimbursement to the Marketers based on the landing cost of the
product, less its approved ex- depot price. It is a mechanism that is designed to present the real
costs incurred by marketers in the process of products procurement while ensuring that end users
pay a limited amount for the product.
The subsidy claims are computed based on the following considerations:
(i) Shore - tank volume confirmed by the PPPRA appointed Inspectors and Federal
Ministry of Finance Auditors.
(ii) The reference-pricing period is 5 days around MV bill of lading dates using PPPRA
pricing template based on the period of calculation.
The payments are processed in batches for the marketers that meet 80% truck out. This is done
twice in a month.
PROCESSING OF SOVEREIGN DEBT STATEMENTS (SDS) AND SOVEREIGN DEBT NOTES (SDN)
The Finance Department of PPPRA confirms the computation of subsidy from PSF unit and signs
the summary sheet while the Audit signs the final copy. The Finance department issues the
Sovereign Debt Statement (SDS). The signatories on SDS are AGM (Finance), GM (Operations) and
the Executive Secretary (ES) in that order. The legal unit seals the SDS.
Debt Management Office (DMO) issues Sovereign Debt Note (SDN) to the marketers. The DMO will
notify PPPRA, Ministry of Finance Auditor and CBN. The SDS qualifies marketers to get SDN from
DMO. The marketers receive the payment of the value on the SDN from the CBN as issued by DMO
at maturity date.

Main Report and Recommendations
NEITI Oil and Gas Industry 2013 Audit
171
Figure 7.2 - PPPRA-System of Authorities and Procedures within PPPRA on Subsidy Process flow Chart
Source: PPPRA
7.2.2 Subsidy Regime
The PPPRA employs Import Parity Principle, which is referred to aspricing template. This includes:
(a) Landing cost of the product
(b) Margins for the marketers, Dealers and Transporters
(c) Jetty- Depot through-put
(d) Other charges and Taxes.

Main Report and Recommendations
NEITI Oil and Gas Industry 2013 Audit
172
The objectives of the pricing templates are to ensure transparency, full cost recovery, fairness and
efficiency in the importation process.
Based on the above considerations, PPPRA determines the applicable subsidy per litre for the
product on daily basis. The subsidy for any petroleum product is obtained by multiplying the
quantity of product by the under-recovery rate.
Where the ex-depot price (which is arrived at by deducting the distribution margins from the open
market price) is higher than the landing cost, there is over-recovery and the oil marketing
companies would be required to pay back to the Federal Government the amount of worked
over-recovered. When it is lower, the marketers are entitled to be paid the under-recovery from
the government through PPPRA who issues Sovereign Debt Statements (SDS) and forwards them
to DMO that issues Sovereign Debt Notes (SDN) to the marketers to be redeemed at the Central
Bank of Nigeria. The redemption is being done through the excess crude oil Naira account
domiciled with the CBN as against the earlier position when payments were done from the
Petroleum Support Fund account domiciled with the Central Bank of Nigeria.
According to the Agency, Subsidy gap = open market price - pump price.
7.2.3 Computation of Subsidy
Generally, subsidy per litre or the under-recovery rate is the difference between landing Cost and
the Ex Depot Price of the petroleum product. Landing cost is calculated thus:
For Imported products:
Landing Cost = Product Price per Litre X Exchange Rate +Freight+ lightering +Jetty Cost + Financing
+Trader’s margin
Litres per metric tonne (1,341 litres)
For Locally Refined Products:
Freight, Finance Charges, Trader’s Margin and lightering Charges are excluded from Landing Cost.
(Note: lightering charge is part of Product cost on PPPRA Price Template)
7.2.4 The Petroleum Support Fund (PSF)
The Government established the Petroleum Support Fund (PSF) with effect from 2006 as an
intervention fund. The Petroleum Support Fund (PSF) is a pool of funds provided for by the three
tiers of Government to stabilize the domestic prices of petroleum products against volatility in
international crude and product prices. For details on the PSF see: http://pppra.gov.ng/o/psf/

Main Report and Recommendations
NEITI Oil and Gas Industry 2013 Audit
173
7.2.4.1 Eligibility for Drawing from the Fund
Oil Marketing/Trading Companies are expected to meet the rules and regulations set by the PPPRA
on the management /administration of the Petroleum Support Fund (PSF) as follows:
i. Applicant must be an Oil Marketing/Trading Company registered in Nigeria with the
Corporate Affair Commission (CAC) to conduct petroleum products business.
ii. Beneficiary/Claimant must possess the following:
a. Proof of Ownership or a valid throughput agreement of storage facility with a
minimum of 5,000 metric tons for the particular product. Ownership of retail
stations is an added advantage.
b. Possession of a valid DPR import permit.
iii. Having satisfied 1 and 2 above, an applicant shall submit application for participation in the
Scheme to the PPPRA.
iv. Successful applicants shall sign an agreement with the PPPRA to become a participant
under the Scheme.
v. Approval to import shall be expressly conveyed by the PPPRA to the participant Importer.
vi. Beneficiary/Claimant must be notify PPPRA within a minimum of three (3) days ahead of
cargo arrival in the country and furnish the PPPRA with the relevant documents including
copies of involves, bills of landing, source of funding and expected date of arrival for
documentation.
vii. The product loading and arrival time must be within a maximum of 30 days and must meet
products specification by the DPR and SON.
viii. All approvals for important are valid for a maximum of three months based on the current
PPPRA quarterly importation plan.
ix. Deliveries must be made to depot location approved by the DPR and witnessed by PPPRA
Operatives, External Auditors and the Industry Consultant.
x. All documents forwarded to the PPPRA must contain shore tank report duly signed by
PPPRA Representatives at discharge locations.
xi. (i) All out-turn deliveries to approved locations must be through invoices at approved ex-
depot prices.
(ii) Marketers shall render out-turn delivery returns which must contain the invoiced ex-
depot prices and volumes to the PPPRA as part of conditions for continued participation in
the Scheme.
In 2012, the PPPRA management put in place additional Policy measures that the oil marketers
need to fulfil before they could be eligible. The full additional policy is at the end of the report.

Main Report and Recommendations
NEITI Oil and Gas Industry 2013 Audit
174
7.3 Product Quantities for Which Subsidies Were Processed for Payment in 2013
The volume of petroleum products supplied by the marketers through the PPPRA under the PSF
scheme in 2013 was 10.245 billion litres for Premium Motor Spirit (PMS). Other marketers did not
import Dual Purpose Kerosene (DPK) during the period under review.
NNPC imported 7.315billion litres of PMS and 2.650billion litres of DPK, while the refineries
produced 1.768billion litres of PMS and 828.715million litres of DPK during the same period. These
volumes are shown in the table below and form the basis for which subsidies were processed by
the PPPRA and advised to NNPC.
Table 7.3 - Summary of Quantities of Petroleum Products Supplied by Marketers in 2013
In comparison with the 2012, imported quantity of Premium Motor Spirit (PMS) supplied by
marketers through PPPRA substantially increased by 32.8% from 7.714billion litres in 2012 to
10.245 billion litres in 2013. On the other hand, NNPC importation decreased marginally from
7.948billion litres of PMS in 2012 to 7.315billion litres of PMS in 2013 given a percentage decrease
of about 7.97%.
MARKETERS 2012
QUANTITY
(Litres
‘000)
2013
QUANTITY
(Litres ‘000)
INCREASE /
(DECREASE)
QUANTITY
(Litres ‘000)
Other marketers through
PPPRA
PMS 7,714,725 10,244,813 2,530,088
DPK - - -
SUB –TOTAL 7,714,725 10,244,813 2,530,088
NNPC
PMS- Import 7,948,354 7,315,033 ( 633,321)
Local 1,788,373 1,768,105 ( 20,268)
DPK (HHK) -Import 2,576,591 2,650,451 73,860
Local 750,313 828,715 78,402
SUB TOTAL 13,063,631 12,562,304 (501,327)
GRAND TOTAL 20,778,356 22,807,117 2,028,761

Main Report and Recommendations
NEITI Oil and Gas Industry 2013 Audit
175
7.4 Subsidies Claimed by NNPC in 2013
Of the total sum of N792.961 billion subsidy processed and advised to the NNPC by the PPPRA for
2013, NNPC deducted N138.487 billion at source from the domestic crude oil proceeds. Schedule
of subsidy deductions are shown below:
S/N MONTH AMOUNT (N) REMARK
1. NOVEMBER, 2013 64,462,736,421.84
2. DECEMBER, 2013 74,024,366,783.75
TOTAL 138,487,103,205.59
Source: CMOD
NOTE: Out of the total volume of 10,244,813,039.80 litres discharged in 2013, a total of
10,217,678,005.80 litres was processed for subsidy claims, while the balance of 27,135,034.00
litres was said to have been processed in 2014 and not included in the table above.
The affected transactions are shown in the table below:
TRANS REF NO. MARKETER OBSERVED
SHORETANK
QUANTITY (LTRS)
BATCH
BEL/3301/BLA/PMS/24/12/13 BLACKLIGHT ENERGY LIMITED 10,365,185.00 B/14
FIR/3879/FIR/PMS/28/10/13 FIRST DEEP WATER DISCOVERY LTD 8,581,574.00 S/14
FIR/3880/FIR/PMS/05/11/13 FIRST DEEP WATER DISCOVERY LTD 8,188,275.00 S/14
GRAND TOTAL 27,135,034.00
Source: PPPRA
Data requested from the Office of the Accountant General of the Federation (OAGF) and Federal
Ministry of Finance- Budget office of the Federation, were not provided for corroboration as at the
time of reporting.
7.5 Summary of Subsidies Paid on Each Product
Petroleum products are imported based on quarterly allocation granted to marketers by PPPRA.
PPPRA templates were analysed to obtain information on subsidy processed for payment to oil
marketers. This is to ascertain the total expected expenditure on subsidy for the period under
review.

Main Report and Recommendations
NEITI Oil and Gas Industry 2013 Audit
176
Table 7.5 - Summary of Subsidy Processed by the PPPRA to be paid by Federal Government for 2013
Product/Entity
TOTAL TOTAL INCREASE / (DECREASE)
2012 2013
N’000 N’000 N’000
Other Marketers through PPPRA
Premium Motor Spirit 461,040,708 522,665,347 61,624,639
Dual Purpose Kerosene - - -
Sub-Total 461,040,708 522,665,347 61,624,639
NNPC-PMS-IMPORT 452,748,698 355,532,600 (97,216,098)
LOCAL PROUCTION 83,034,724 72,105,642 (10,929,082)
NNPC- DPK (HHK)-IMPORT 284,908,781 284,398,871 (509,910)
LOCAL PRODUCTION 73,054,313 80,924,030 (7,869,717)
Sub-Total 893,746,516 792,961,143 (100,785,373)
Grand Total 1,354,787,224 1,315,626,490 (39,160,734)
The total subsidy processed for payments for 2013 amounted to N1.316 trillion. This shows a
marginal reduction from N1.355 trillion in 2012 as reported in the last audit. This gives a reduction
of about 2.88% from 2012.
However, from the table above there was an increase of N61.6billion in the subsidy processed for
payment by PPPRA for other marketers in 2013 over that of last audit. This gives an increase of
about 13.37%. The subsidy processed for the NNPC in the same period decreased by N100.8billion.
This gives a decrease of about 11.28%.
7.6 Product Volumes of (PMS) Imported by the Importers in 2013
The number of importers in 2013 remains the same as at the last audit of 2012. The quantity of
premium motor spirit (PMS) imported by marketers through PPPRA increased from 7.714 billion
litres in 2012 to 10.245 billion litres in 2013.
The quantity of premium motor spirit (PMS) imported by NNPC decreased marginally from 7.948
billion litres in 2012 to 7.315 billion litres in 2013.
Out of a total volume of 17.560 billion litres of PMS imported in 2013, Independent Oil Marketers
accounted for 58.34% while NNPC accounted for the balance of 41.66%. This was in contrast with
that of 2012 when NNPC imported 50.62% of PMS and Other Oil marketers accounted for 49.38%.

Main Report and Recommendations
NEITI Oil and Gas Industry 2013 Audit
177
7.7 Issuance of SDSs by PPPRA
The PPPRA issued SDSs in favour of the individual oil marketers which were processed and issued
to the tune of N522, 665,346,576.34 for 2013.
Table 7.7 – SDSs Issued for 2013
BATCHES SDS ISSUED FOR 2013
A/13 19,367,797,940.75
B/13 17,531,518,579.42
C/13 19,906,694,232.28
D/13 32,898,428,758.27
E/13 32,005,884,035.88
F/13 29,467,038,868.91
G/13 27,017,928,196.61
H/13 24,385,608,458.53
I/13 14,629,609,018.43
J/13 22,305,104,419.93
K/13 41,085,289,507.45
L/13 32,027,278,635.18
M/13 22,417,245,295.23
N/13 22,249,467,142.93
O/13 41,074,772,210.95
P/13 25,129,596,789.94
Q/13 10,945,279,656.11
R/13 24,044,601,540.83
S/13 9,131,513,386.61
T/13 36,000,732,246.68
U/13 14,315,365,072.37
V/13 1,265,256,234.89
W/13 3,463,336,348.16
522,665,346,576.34
SDSs worth of N502,710,742,305.83 were sent to DMO by the PPPRA in 2013. These were made up
of batches B/12D to B/12F,H//12 and T/12 to Y/ 12 that were meant for 2012 and batches A/13 to
O/13 out of 2013 batches.
7.8 Issuance of SDNs by DMO
According to PPPRA, the Agency is no longer handling the payment of subsidy claims to oil
marketers since the introduction of the Sovereign Debit Notes (SDN) in 2010. The role of the
agency is now limited to the computation/ processing of the subsidy claims and the issuance of the
sovereign debit statements are then forwarded to DMO. The DMO is responsible for the issuance

Main Report and Recommendations
NEITI Oil and Gas Industry 2013 Audit
178
of SDNs to be given to the individual oil marketers for presentation at the Central Bank of Nigeria
for redemption.
The DMO explained that the SDNs were being financed through the excess crude oil account and
the issuance of the SDN is dependent on the availability of funds. Because of this, the maturity
dates indicated on the SDSs by the PPPRA were no longer considered at the time of redemption of
the SDNs but availability of funds.
In 2013, SDSs valued at N554,369,806,670 were processed by the DMO and SDN valued at
N495,182,079,201.12 were issued leaving a balance of N59,187,727,469.28 untreated in 2013 and
carried forward to 2014.
The sum of N459,363,650,296 was released to the marketers out of SDN issued in 2013, leaving a
balance of N35,818,428,905.11 not released as at 31st December, 2013.
The total SDNs of N459,363,650,296.01 that were issued and released in 2013 are as follows:
N
SDNs issued and released in 2013 422,457,903,563.13
SDSs from 2012 & SDNs issued & released in 2013 36,905,746,732.88
459,363,650,296.01
The total SDNs released by the DMO in 2013 are stated below.
N
Total SDNs issued and released in2013 459,363,650,296.01
SDNs issued in 2012 but released in 2013 77,666,307,344.22
Total SDNs released in 2013 537,029,957,640.23
The details of the above are presented in Appendix 7.8
7.9 Over Paid Subsidy due to Currency Exchange Differentials
The two companies with overpaid subsidy on account of foreign exchange differentials are listed in
the table below:

Main Report and Recommendations
NEITI Oil and Gas Industry 2013 Audit
179
Table 7.9 - Over paid subsidy due to currency exchange differentials
S/N MARKETERS SDN NUMBER Actual Subsidy
Claim(N)
Subsidy over Paid
due to Currency
Differentials
REMARK
1. MOBIL OIL
NIG PLC J/ 13 FGN/2013/J13/1109 946,932,114.70 653,867,350.47
Difference
due to foreign
exchange
differentials
2. MRS OIL NIG
PLC K/13 FGN/2013/01//K13/1133 1,777,025,263.81 58,893,414.38
Difference
due to foreign
exchange
differentials
The actual subsidy claims that were processed for each company are shown in the table above. It is
out of the amount due to each company that the over payment on foreign exchange was
deducted.
From each company, the amount indicated as over payment that was deducted from the subsidy
paid to each company were as follows.
1. Mobil Oil Nigeria Plc N653,867,350.47
2. MRS Oil Nigeria Plc N58,893,414.38
The above sums were deducted based on an indemnity issued by each company to the Federal
Government in respect of interest and foreign exchange differential cost claims. The deductions
were done by the DMO before the SDNs to be presented at the CBN were issued and the CBN
Governor was so informed about the deductions.
Hence, the amount stated on the new SDN for presentation at the CBN is as shown below.
S/N MARKETERS BATCH
NO
SDN NUMBER VALUE (N)
1. MOBIL OIL NIG PLC J/13 FGN/2013/J13/1109 293,064,764.23
2. MRS OIL NIG PLC K/13 FGN/2013/01/K13/1133 1,718,131,849.43
Copies of the SDNs with the above stated sum were sighted by us in the audit review.
LITIGATION
The result of a concluded court case between Petrotrade Energy Ltd and First Deepwater Discovery
in 2013, led to additional SDN of N822,019,407.61 shown in the table below.

Main Report and Recommendations
NEITI Oil and Gas Industry 2013 Audit
180
7.10 Summary of Petroleum Subsidy Payments (SDNs Redeemed) in 2013 by CBN
The summary of SDNs worth N536,649,743,180.67 that were presented by the oil marketers and
redeemed by the CBN in 2013 is presented in the table below:
Table 7.10 - Summary of fuel subsidy payments SDNs redeemed by the CBN in 2013
S/N COMPANY AMOUNT PAID BY CBN
=N=
1 ACORN PETROLEUM PLC 4,793,919,922.02
2 AITEOENERGY RESOURCES LTD 19,373,267,363.21
3 ASCON OIL LIMITED 8,086,288,716.48
4 AVIDOR OIL AND GAS LTD 2,466,028,389.68
5 A-Z PETROLEUM PRODUCTS LTD 9,399,872,304.90
6 BOVAS & COMPANY LTD 11,878,608,365.02
7 CAADES OIL & GAS LTD 993,558,199.59
8 CARNIVAL ENERGY OIL AND GAS LTD 1,228,505,189.42
9 CHANNEL OIL AND PETROLEUM LTD 4,122,261.58
10 CONOIL PLC 22,005,498,332.75
11 CRUST ENERGY LTD 580,350,230.85
12 DEE JONES PETROLEUM & GAS LTD 9,777,187,085.06
13 DOZZY OIL AND GAS LTD 6,172,960,876.72
14 EXXONMOBIL OIL NIGERIA PLC 1,410,071,941.98
15 FIRST DEEP WATER DISCOVERY LTD 2,183,277,791.71
16 FOLAWIYO ENERGY LTD 40,754,775,925.87
S/N MARKETERS BATCH NO SDN NUMBER VALUE (N)
1
TEMILOLU ADAMOLEKUN
(COUNSEL TO PETROTRADE
ENERGY LTD)
Y/12 FGN/2012/ 01/Y/12/1052A 622,239,656.19
2 FIRST DEEP WATER DISCOVERY LTD Y/12 FGN/2012/01/Y/12/1052B 199,779,751.42
822,019,407.61TOTAL

Main Report and Recommendations
NEITI Oil and Gas Industry 2013 Audit
181
S/N COMPANY AMOUNT PAID BY CBN
=N=
17 FORTE OIL PLC 10,055,414,102.52
18 FRESH SYNERGY LTD 3,090,636,679.23
19 GULF TREASURES LTD 10,371,470,495.11
20 HEYDEN PETROLEUM LTD 7,050,899,858.30
21 IBAFON OIL LTD 3,472,609,457.78
22 INTEGRATED OIL AND GAS LTD 9,022,129,811.06
23 IPMAN INVESTMENT LTD 3,673,120,854.57
24 IPMAN REFINERY AND MARKETING COY LTD 6,550,439,520.60
25 LINETRALE OIL SUPPLY & TRADING CO LTD 478,139,066.60
26 MASTERS ENERGY OIL AND GAS LTD 10,534,817,382.14
27 MATRIX ENERGY LTD 6,389,581,280.16
28 MENOL OIL AND GAS 470,015,597.25
29 MIDAS OIL AND GAS LTD 582,783,372.34
30 MOBIL OIL NIGERIA PLC 10,966,180,999.18
31 MRS OIL AND GAS COMPANY LTD 28,262,707,285.83
32 MRS OIL NIGERIA PLC 18,995,888,184.84
33 NIPCO PLC 34,871,910,212.86
34 NORTHWEST PETROLEUM & GAS CO LTD 13,192,480,299.10
35 OANDO PLC 54,234,684,004.24
36 OBAT OIL AND PETROLEUM LTD 5,298,244,753.27
37 PINNACLE CONTRACTORS LTD 1,410,607,033.74
38 PVN CAPITAL LTD 554,616,852.30
39 QUAGGA OILS LTD 991,078,979.66
40 RAHMANIYYA OIL AND GAS LTD 12,416,726,808.09
41 RAINOIL LTD 17,281,533,316.00
42 RONALD OIL AND GAS LTD 485,964,762.47

Main Report and Recommendations
NEITI Oil and Gas Industry 2013 Audit
182
S/N COMPANY AMOUNT PAID BY CBN
=N=
43 SAHARA ENERGY RESOURCES 40,589,754,987.32
44 SEA PETROLEUM & GAS CO LTD 3,483,922,289.08
45 SHEILD PETROLEUM COY NIGERIA LTD 1,395,444,505.12
46 SHORELINK OIL AND GAS SERVICES LTD 20,950,424,329.63
47 SOMERSET ENERGY SERVICES LTD 1,984,458,230.43
48 SUPREME AND MITCHELLS OIL LTD 1,336,503,755.28
49 SWIFT OIL LTD 13,376,346,212.69
50 TECHNO OIL LTD 17,644,038,390.80
51 TEMILOLU ADAMOLEKUN &Co. Counsel to IPMAN 622,239,656.19
52 TEMPO ENERGY LTD 1,513,868,528.14
53 TOP OIL AND GAS DEVELOPMENT CO LTD 2,093,786,610.95
54 TOTAL NIGERIA PLC 19,385,013,051.91
55 XALON PETROLEUM LTD 460,968,767.05
TOTAL 536,649,743,180.67
The redeemed SDNs in 2013 as contained in the CBN template for 2013 audit made available to us
stood at N536,649,743,180.67.
When the redeemed SDNs of N536,649,743,180.67 is compared with what was redeemed in 2012
which was N430,818,739,406.12, there was an increase of N105,831,003,774.55 over that of last
audit. This gives a percentage increase of 24.57% which is an improvement in the settlement of the
oil marketers subsidy claims.
When N536.650bilion is compared with the total SDNs of N602.385bilion available for presentation
at the CBN in 2013, SDNs worth N65.735billion were yet to be presented at the CBN as at 31st
December, 2013. The reconciliation is as shown below:
The total SDNs available for presentation at the CBN for redemption in 2013 are stated below
N’000
1. SDNs issued and released in 2013 N422,457,904
2. SDNs issued in 2012 but released in 2013 77,666,307
3. 2012 SDSs but SDNs issued & released in 2013 36,905,747
N537,029,958
4. Balance b/f 65,355,034

Main Report and Recommendations
NEITI Oil and Gas Industry 2013 Audit
183
Sub-total N602,384,992
LESS Amount Redeemed in 2013 by CBN 536,649,743
Balance C/F to 2014 N65,735,249
The balance that was not presented at CBN as at 31st December 2013 by the oil marketers
amounted to N65.735billion.
DMO explained that the possible delays in the processing of SDNs were caused partly by the
following factors:
With effect from August 2012, the process of issuing SDNs took longer time because the
Minister of Finance’s approval needed to be sought and obtained before payments could
be effected;
Issuance of SDNs depended on the availability of funds;
Companies under investigation during the fuel subsidy probe were embargoed not to be
paid until they were cleared by the agents of government handling the investigations.
Some transactions were classified as legitimate and non- legitimate
Companies that were unable to get clearance.
Maturity dates on the SDNs were no longer taken into account. It was the PPPRA that
normally indicated the maturity dates on the SDSs based on 45 days processing and
payment but this was no longer a factor.
The SDNs issued were like a bond. They did not carry a time limit, hence it made it difficult
to determine which period the marketer redeemed the SDN collected.
7.11 Reconciliation of Payments of Subsidy by the Federal Government with Amount Received by
Importers
The SDNs issued and released by the DMO to the oil marketers in 2013 were reviewed against the
schedule of redeemed Sovereign Debt Notes got from the CBN.
The SDNs issued and those released by the DMO in 2013 stood at N537.030billion and adding the
outstanding of N65.355billion as at 31st December, 2012 gives a total of N602.385billion.
Total sum of N602.385billion SDNs available for presentation at the CBN in 2013,
Total sum of N536.650billion redeemed by CBN in 2013
Balance of N65.735billion yet to be redeemed as at 31st December, 2013.
The bank statements through which the subsidy payments were made by the Central Bank of
Nigeria were not made available for review by the Central Bank of Nigeria as at reporting date.

Main Report and Recommendations
NEITI Oil and Gas Industry 2013 Audit
184
However, from the template submitted by CBN, it was stated that the payment was made through
the Excess Crude Oil Naira account domiciled in CBN. This is contrary to the earlier policy that the
payment should be made through the PSF Account domiciled with the CBN.
It is difficult to establish how much of the 2013 subsidy processed and the SDNs issued in 2013 by
the DMO was paid because the holder of the SDNs can present it at any convenient time to CBN for
redemption since the SDNs carry no time limit. Audit could also not carryout independent
circularization and confirmation of amounts paid to each marketer due to late submission of
information on the marketers.
The schedule of the redeemed SDNs made available by the CBN madedid not indicate the batch
numbers while the SDN numbers provided by the DMO did not indicate when they were issued.
The maturity dates were only indicated on the SDNs without indicating when it could expire. This
means the holder can present it at the CBN at any time.
The total SDNs available for presentation at the CBN for redemption in 2013 are stated below
N’000
1. SDNs issued and released in 2013 N422,457,904
2. SDNs issued in 2012 but released in 2013 N77,666,307
3. 2012 SDSs but SDNs issued & released in 2013 N36,905,747
N537,029,958
4. Balance b/f N65,355,034
Sub-total N602,384,992
LESS Amount Redeemed in 2013 N536,649,743
Balance C/F to 2014 N65,735,249
7.12 Approved Allocation to Import In 2013
The table below shows relative performances of imported PMS quantity discharged in metric tons
and their contributions to the overall volume discharged in 2013.
Table 7.12 - Marketers in 2013 - Performance Evaluation Appraisal
S/N COMPANY NAME
TOTAL QUANTITY APPROVED
MT
TOTAL CHARGED
MT
TOTAL DISCHARGED
SUMMARY GOV
PERFORMANCE RELATIVE TO APPROVAL %
CONTRIBUTION TO TOTAL QUANTITY
DISCHARGED %
1 NNPC 5,400,000 6,773,406.30 9,117,721,909 125.43% 45.23%
2 A & E Energy Ltd 30,000 14,521.21 19,653,090.00 48.40% 0.10%

Main Report and Recommendations
NEITI Oil and Gas Industry 2013 Audit
185
S/N COMPANY NAME
TOTAL QUANTITY APPROVED
MT
TOTAL CHARGED
MT
TOTAL DISCHARGED
SUMMARY GOV
PERFORMANCE RELATIVE TO APPROVAL %
CONTRIBUTION TO TOTAL QUANTITY
DISCHARGED %
3 ACORN PET. LTD 30,000 31,337.91 42,706,146.00 104.46% 0.21%
4 AITEO ENERGY LTD 465,000 420,234.35 571,595,295 90.37% 2.81%
5 ASCON OIL LTD 165,000 169,991.74 235,485,892 103.03% 1.14%
6 AVIDOR OIL & GAS LTD
210,000 110,531.48 151,257,149 52.63% 0.74%
7 A-Z PET. LTD 210,000 211,915.78 288,380,528 100.91% 1.41%
8 BLACKLIGHT LTD 90,000 109,466.46 150,168,562 121.63% 0.73%
9 BOVAS LTD 195,000 201,245.56 273,314,998 103.20% 1.34%
10 BULK STRATEGIC LTD
15,000 14,893.65 20,421,374 0.00% 0.10%
11 CAPITAL OIL & GAS LTD
30,000 0 0 0.00% 0.00%
12 CONOIL PLC 300,000 296,785.33 404,457,615 98.93% 1.98%
13 CYBERNETICS 50,000 51,630.11 70,286,282.00 103.26% 0.34%
14 DEEJONES PET. LTD 210,000 187,598.55 256,201,244 89.33% 1.25%
15 DOZZY OIL & GAS 165,000 149,769.20 203,653,052 90.77% 1.00%
16 FATGBEMS 25,000 24,967.39 34,158,082.00 99.87% 0.17%
17 FIRSTDEEPWATER LTD
100,000 33,477.58 44,983,593.00 33.48% 0.22%
18 FOLAWIYO ENERGY LTD
480,000 482,350.80 662,410,370 100.49% 3.22%
19 FORTE OIL PLC 300,000 315,318.72 426,172,987 105.11% 2.11%
20 FRESH SYNERGY LTD 45,000 44,133.35 60,330,420 98.07% 0.29%
21 GULF TREASURE LTD
120,000 114,018 155,027,591 95.02% 0.76%
22 HEYDEN PET. LTD 120,000 92,438.22 125,830,918 77.03% 0.62%
23 HUDSON 20,000 18,414.86 25,222,213.00 92.07% 0.12%
24 HYDE ENERGY LTD 60,000 56,926.80 78,634,739.00 94.88% 0.38%
25 IBAFON OIL LTD 60,000 60,563.40 82,163,035 100.94% 0.40%
26 IMAD OIL & GAS 30,000 0 0 0.00% 0.00%
27 INDEX PETROLEUM 20,000 18,779.70 25,510,172.00 93.90% 0.13%
28 INTEGRATED OIL & GAS LTD
225,000 215,884.52 296,917,230 95.95% 1.44%

Main Report and Recommendations
NEITI Oil and Gas Industry 2013 Audit
186
S/N COMPANY NAME
TOTAL QUANTITY APPROVED
MT
TOTAL CHARGED
MT
TOTAL DISCHARGED
SUMMARY GOV
PERFORMANCE RELATIVE TO APPROVAL %
CONTRIBUTION TO TOTAL QUANTITY
DISCHARGED %
29 IPMAN REFINING & MKTING LTD
30,000 32,775.94 44,788,646 109.25% 0.22%
30 LINC OIL & GAS 30,000 30,135.78 40,879,903.00 100.45% 0.20%
31 MAINLAND OIL & GAS LTD
75,000 70,805.83 97,528,501.00 94.41% 0.47%
32 MARTIX ENERGY LTD
90,000 91,554.00 124,785,097.00 101.73% 0.61%
33 MASTERS ENERGY LTD
260,000 250,511.30 328,076,491.00 96.35% 1.67%
34 METTLE ENERGY LTD
45,000 37,951.84 51,608,410.00 84.34% 0.25%
35 MOBIL OIL PLC 240,000 235,616.94 323,302,420 98.17% 1.57%
36 MRS OIL & GAS LTD 240,000 126,966.58 173,873,755 52.90% 0.85%
37 MRS OIL NIG PLC 240,000 178,304.46 245,081,779 74.29% 1.19%
38 NEPAL OIL & GASLTD
90,000 79,142.36 108,129,922.00 87.94% 0.53%
39 NIPCO PLC 570,000 535,185.47 729,497,584 93.89% 3.57%
40 NORTHWEST PET. LTD
285,000 310,406.72 422,385,280 108.91% 2.07%
41 OANDO PLC 555,000 534,256.46 737,888,427 96.26% 3.57%
42 OBAT OIL 60,000 56,504.54 77,129,431.00 94.17% 0.38%
43 RAHAMANIYYA 130,000 131,324.59 178,873,407 101.02% 0.88%
44 RAIN OIL LTD 345,000 363,136.40 495,570,031 105.26% 2.42%
45 SAHARA ENERGY RES. L
240,000 238,060.41 323,264,371 99.19% 1.59%
46 SHORELINK OIL 320,000 300,344.87 412,197,280 93.86% 2.01%
47 SWIFT OIL LTD 225,000 241,311.73 330,178,531 107.25% 1.61%
48 TECHNO OIL 365,000 369,779.53 503,759,582 101.31% 2.47%
49 TEMPOGATE 40,000 39,357.15 53,732,183.00 98.39% 0.26%
50 TOTAL NIG. PLC 390,000 412,059.32 566,067,034 105.66% 2.75%
51 TSL LTD 90,000 90,733.97 124,598,794 100.82% 0.61%
TOTAL 14,125,000 14,976,827 20,315,861,345 106.03% 100.00%
Source: PPPRA

Main Report and Recommendations
NEITI Oil and Gas Industry 2013 Audit
187
7.12.1 Key Findings on approved import allocation for 2013
1. The total approved quantity (metric tonne) compared with the total quantity discharged
indicates that there were a few companies including NNPC that exceeded the allocated
quantity.
2. A few of these companies performed below average while three of them did not import any
petroleum products .. The companies are Bulk Strategic Ltd, Capital oil & Gas Ltd and Imad
Oil & Gas.
Implication
The companies involved in poor performance may have collected foreign exchange which could
have been diverted for other uses other than importation of petroleum products.
Recommendations
1. PPPRA should put in place an efficient means of monitoring actual imports against the
approved allocation to import.
2. Bulk Strategic Ltd, Capital oil & Gas Ltd and Imad Oil & Gas should be black listed from
future participation in the import process and investigated in order to ascertain what they
might have used the FOREX allocated for.
7.13 Subsidy Reinvestment and Empowerment Programme (Sure-P)
In January, 2012, the decision to remove the subsidy on Premium Motor Spirit (PMS) was
announced by government, the pump price was before January, 2012 put at N140 / litre. Since
then, the subsidy that is paid to the oil marketers that are involved in the importation of PMS is
based on a price-gap of N97 per litre instead of the former N65/litre.
The Government proposed to save the price differential of N32/ litre from the increased pump
price as a genuine intention of the government on the deregulation policy. The savings is expected
to be channelled to fund a combination of programmes to stimulate the economy and alleviate
poverty through provision of critical infrastructures and safety projects. This initiative led to the
establishment of Subsidy Reinvestment and Empowerment Programme (SURE-P) by the Federal
Government to apply its share on various sectors of the economy.
In 2012, a total saving of N309,586,964,147.85 was made by the Federal Government.
In 2013, the Office of the Accountant General of the Federation (OAGF) gave total SURE-P
distribution of revenue to all tiers of Government as N426,590,828,297.16 and the breakdown is as
shown in Table 7.13 below:

Main Report and Recommendations
NEITI Oil and Gas Industry 2013 Audit
188
Table 7.13 - SURE-P distribution to all tiers of Government
N
2013 2012
Federal Govt. 180,000,000,000.00 N/A
FGN Share of Derivation & Ecology 3,711,340,206.19 39,376,305,339.25
Federal Capital Territory 3,711,340,206.19 N/A
Stabilization Account 1,855,670,103.09 N/A
FGN Share of Development of Natural Resources 6,235,051,546.39 N/A
Total to FGN including FCT 195,513,402,061.86 181,723,280,399.61
State Governments N/A 72,200,288,033.65
Local Government Councils N/A 55,663,395,714.59
Total to States and Local Govt. Councils 231,077,426,235.32 127,863,683,748.24
Grand Total 426,590,828,297.18 309,586,964,147.85 Source: Office of the Accountant General of the Federation (Ministry of Finance)
7.14 Review of PPPRA- PSF Financial Statements
The 2013 audited financial statement for Petroleum Support Fund (PSF) was not made available for
audit review We asked them about the credit balance of N5,426,632,690.37 as at 31st December,
2012 in the PSF account as at the 2012 audit.
From the CBN statement made available, the amount had increased to N5,508,041,747.92. We
were also made to understand that when the Accountant-General of the Federation was mopping
up all government’s account in 2013, this credit balance of N5,508,014,747.92 was transferred out
of Account No 0020196441019 on September 11, 2013 leaving the account with a nil balance.
7.15 Determination of National Demand of refined Product
NNPC with all stakeholders in the downstream industry determine the national consumption of
refined product. Relevant information is gathered from the refineries to determine their
production level for the next quarter, at least two months ahead of the arrival of the first cargoes.
Land-based stocks and marine stocks are also established.
On these bases, the likely shortfall of petroleum products is determined. Twenty days of products
sufficiency as a buffer is also put into consideration and provided. At the end of this exercise, the
shortfall between demand for products and local production by refineries are established and is
covered by imports.
Currently, there is no standard model for determining national consumption for petroleum
products.

Main Report and Recommendations
NEITI Oil and Gas Industry 2013 Audit
189
7.15.1 Oil marketing Companies Over-recovered Subsidy Claims
The under listed debts are with respect to unremitted over-recovery reported in the 2012 audit
report for which PPPRA is yet to conclude the reconciliations of the Marketers’ accounts.
Debtor Amount (N)
NIPCO Plc. 966,740,379.56
AMG Petro Energy Ltd 96,439,912.38
NNPC 2,652,263,000
PPPRA provided documents to the effect that the debts of AMG Petro Energy ltd of
N96,439,912.38 and that of NIPCO Plc amounting to $966,740,379.56 have been fully
recovered from subsequent under-recoveries, interest charges and Foreign Exchange due to
the two companieswhile that of NNPC is yet to be recovered. NNPC formally confirmed this
outstanding debt and said the process of paying the over-recovered amount into the
PSF/PPPRA Account domiciled with the CBN has commenced.
The documents provided were not verified to the records to confirm these recoveries as at the
time of reporting.
7.15.1.1 Key Findings on subsidy payments and reconciliations.
The following issues were observed with respect to payments and reconciliation of subsidy in 2013:
a. NNPC continuous deduction of subsidy at source despite previous NEITI recommendations
b. NNPC outstanding debts of N3.981 Billion as a result of over-recovery under Petroleum
Support Fund Scheme (PSF) mentioned in 2012 NEITI Audit report is yet to be paid. NNPC
formally confirmed this outstanding debt and said the process of paying the over-
recovered amount into the PSF/PPPRA Account domiciled with the CBN has commenced.
Implication
a. Deduction of subsidy at source from domestic crude Oil revenue is contrary to Federal Government Financial Regulation.
b. Non-payment of outstanding amount by NNPC has created shortfalls in the PSF Account.
Recommendations
a. NNPC to ensure strict compliance with Federal Government Financial Regulations and all
subsidy claims by the corporation should be processed like other marketers.
b. NEITI to ensure refund of amount due from NNPC.

Main Report and Recommendations
NEITI Oil and Gas Industry 2013 Audit
190

Main Report and Recommendations
NEITI Oil and Gas Industry 2013 Audit
191
8 PHYSICAL AND PROCESS AUDIT
8.1 Gas Utilization
8.1.1 Introduction
Nigeria is endowed with abundant natural gas resources, which in energy terms, is in excess of the
Nations proven crude oil reserve. The current reserve estimate of Nigeria’s gas is over 120 trillion
cubic feet, with about 50/50 distribution ratio between Associated Gas (AG) and Non Associated
Gas (NAG). Only a small fraction of this quantity is currently being utilized.
A major concern has been that only a small fraction of this quantity is currently being utilized, while
a large fraction of the AG produced during the production of crude oil is currently being flared. This
is a considerable improvement in the level of AG being flared presently which is between 7% - 17%
from what it used to be three years ago, when it flared between 70% to 80%.
In order to diversify its revenue base, reduce the huge wastage of valuable resource by optimizing
gas utilization and thus stemming the degradation of the environment as a result of flaring, the
Nigerian Government has embarked on a number of natural gas utilization projects with its joint
venture partners whereby associated gas would be harnessed to achieve these objectives.
In addition, a Gas Master Plan, which seeks to provide a guide for the commercial exploitation and
management of Nigeria’s gas sector, was approved in 2008 but details of the strategies are still
sketchy.
The Gas Master Plan aims at growing the Nigerian economy by pursuing three key strategies:
i. Stimulate the multiplier effect of gas in the domestic economy
ii. Position Nigeria competitively in high value export markets
iii. Guarantee the long term energy security of Nigeria
It is against this background that the audit has sought to review the procedures for the protection
of Government interest and ensure optimum gas utilization.
8.1.2 The Gas Value Chain
The gas supply activity involves buying natural gas directly from the upstream source and the major
players are the NNPC, JV partners, and some PSCs as producers while the NLNG and NGC remain
the major buyers from these producers.
The NLNG obtains its feedstock mainly from the JVs and export the Liquefied Natural Gas (LNG)
directly to the export market whereas the Nigeria Gas Company (NGC) is the major player in the
domestic Gas Value Chain.
The sources of supply of gas to NGC are:

Main Report and Recommendations
NEITI Oil and Gas Industry 2013 Audit
192
Shell Petroleum Development Company (East)
Chevron Nigeria Limited (West) supply from Escravos field.
Pan Ocean Oil Corporation (West) supply from Ogharefe field.
Nigeria Petroleum Development Company (West) Utorogu and Oredo oil and gas field
Seplat Petroleum Development Company (West)
Figure 8.1.2 – Gas Value Chain in Nigeria
The end users of domestic gas supply through NGC can be classified as Commercial, Power or
Industrial. Shell supplies Gas to NGC for Notore (Fertiliser Industry), Afam Power plant, EHGC and
Ibom Power Plant.
8.1.3 Gas Supply Arrangements
The arrangement for gas supply has been through long term Gas Supply Agreements (GSAs) and
Gas Purchase Agreements (GPAs) between the two major buyers (NLNG and NGC) and the Gas
Producers.

Main Report and Recommendations
NEITI Oil and Gas Industry 2013 Audit
193
Payment by NLNG and NGC are made directly to the accounts of each of the parties involved in the
production arrangements, for example payment for gas produced from the MOBIL JV operations,
which was the largest producer in 2013 according to the production templates, are made directly
to the accounts of NNPC, and MOBIL in accordance with each party’s equity participation in the JV
arrangement.
It is noted that within the JV production arrangements, there are also special gas projects e.g. the
Natural Gas Liquid projects (NGL) consisting of NGL1 and NGL2 which gathers gas from all the
MOBIL fields, compress, extract and inject lean gas to recover natural gas liquids from associated
gas produced in the East Area reservoirs from blocks OML 67, 68 and 70. The NGL project is a
special arrangement between MPN and NNPC outside the MOBIL JV.
The domestic gas supply through NGC and the transfer points are shown in the diagram below.
Figure 8.1.3 – Domestic Gas Supply
8.1.4 Gas Price Determination
Although, the Federal Government has the overall responsibility to determine the price of gas
through the Minister of Petroleum (after carefully considering the input from the stakeholders),

Main Report and Recommendations
NEITI Oil and Gas Industry 2013 Audit
194
Gas pricing still remains a contentious issue in the Nigeria oil and gas industry; there is no clear-cut
policy or formulae for price determination. In addition, several agencies of government (e.g NNPC,
PPPRA, NERC) have at one time or the other made pronouncements on price changes. The
strategic importance of domestic gas supply especially for the Nigeria power sector is to a large
extent responsible for the strong influence of government in the fixing of the price of gas.
For example, the Nigeria Electricity Regulatory Commission recently approved an upward review of
the gas price from $1.5 per thousand cubic feet, MCF, to $2.5 per MCF as short-term approach to
address the challenge of inadequate gas supply to thermal power generation plants across the
country.
The new gas-to-power pricing benchmark also included 80 cents as transportation cost per MCF for
new electricity generation capacity.
The approval of the price review had also triggered fears about the plan by government to increase
electricity tariffs by about 40 per cent but the power producers are yet to adjust to the new
arrangement more than two months after it was approved.
Accordingly, the gas-pricing regime is such that there are different prices for different industries or
end users. Audit findings on NGC pricing methods further indicate discretionary pricing in some
instances.
The price regime for 2013 domestic gas from different suppliers as obtained from NGC are as
shown below:
Table 8.1.4A - Shell Petroleum Development Company Gas Prices
COMPANY SUPPLIED PRICE/MSCF =N= REMARK
ALAKIRI (NOTORE) Gas Plant 106.96 Power Plant
*ALSCON Gas Plant 38.81 Power Plant* (lower price)
OBIGBO Gas Plant 155.24 Power Plant
IBOM Gas Plant 155.24 Power Plant
UNICEM / EAST HORIZON 388.11 Commercial
*At the time ALSCON was privatized the federal government granted price subsidy to RUSAL, the company that bought over the
ALSCON as an incentive which was part of the purchase agreement.
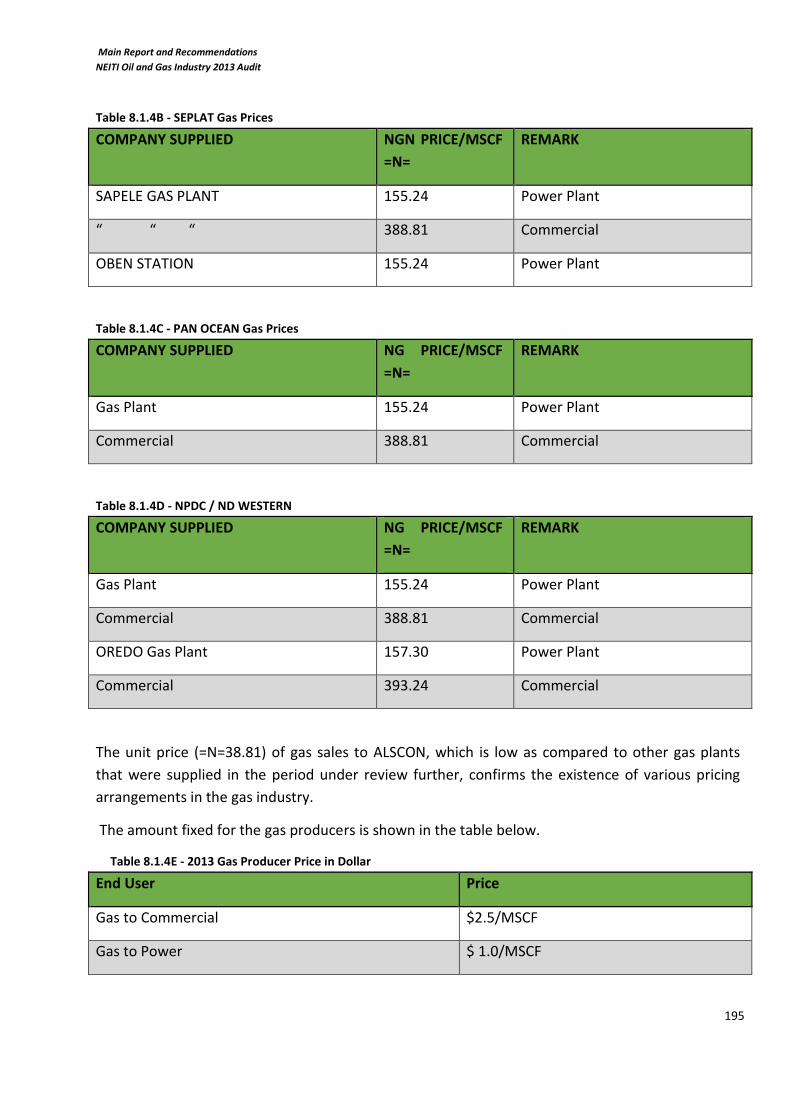
Main Report and Recommendations
NEITI Oil and Gas Industry 2013 Audit
195
Table 8.1.4B - SEPLAT Gas Prices
COMPANY SUPPLIED NGN PRICE/MSCF
=N=
REMARK
SAPELE GAS PLANT 155.24 Power Plant
“ “ “ 388.81 Commercial
OBEN STATION 155.24 Power Plant
Table 8.1.4C - PAN OCEAN Gas Prices
COMPANY SUPPLIED NG PRICE/MSCF
=N=
REMARK
Gas Plant 155.24 Power Plant
Commercial 388.81 Commercial
Table 8.1.4D - NPDC / ND WESTERN
COMPANY SUPPLIED NG PRICE/MSCF
=N=
REMARK
Gas Plant 155.24 Power Plant
Commercial 388.81 Commercial
OREDO Gas Plant 157.30 Power Plant
Commercial 393.24 Commercial
The unit price (=N=38.81) of gas sales to ALSCON, which is low as compared to other gas plants
that were supplied in the period under review further, confirms the existence of various pricing
arrangements in the gas industry.
The amount fixed for the gas producers is shown in the table below.
Table 8.1.4E - 2013 Gas Producer Price in Dollar
End User Price
Gas to Commercial $2.5/MSCF
Gas to Power $ 1.0/MSCF

Main Report and Recommendations
NEITI Oil and Gas Industry 2013 Audit
196
8.1.5 Gas Production and Utilization
The total gas production and utilization (sales, re-injection/lift and fuel) and quantity flared in 2013
is compared with previous years and shown in table below.
Table 8.1.5A – Comparison of Gas Production and Utilization between 2009 - 2013
Usage (mmscf) 2009 2010 2011 2012 2013
A. Total Gas Production
3,313,550.90 3,418,106.30 3,346,973.37 2,559,129.96 3,209,321.14
Gas Sales 842,515.24 1,265,966.87 1,436,856.29 588,345.91 1,198,756.94
Gas Flared 1,641,516.72 1,279,272.84 884,357.98 369,500.14 373,178.46
Utilised/Fuel Gas 95,997.14 115,738.97 129,329.38 123,247.79 154,601.76
B. Total (Sales, Flared, Utilised/Fuel)
2,580,029.10 2,660,978.68 2,450,543.65 1,081,093.84 1,726,537.16
C. Gas Re-injected ** 595,528.02 756,124.53 764,261.90 1,224,915.32 814,269.32
D. Total (B+ C) 3,175,557.12 3,417,103.21 3,214,805.55 2,306,009.16 2,540,806.48
E. Difference (A-D) 137,993.78 1,003.09 132,167.82 253,120.80 668,514.66
Difference = Unaccounted Gas (this may be due to vandalisation of Gas lines)
Figure 8.1.5A – Comparison of Gas Production and Utilization between 2009 – 2013
0.00
500,000.00
1,000,000.00
1,500,000.00
2,000,000.00
2,500,000.00
3,000,000.00
3,500,000.00
2009 2010 2011 2012 2013
3,313,550.90 3,418,106.30 3,346,973.37
2,559,129.96
3,209,321.14
mm
scf
Production Year
Total Gas Production

Main Report and Recommendations
NEITI Oil and Gas Industry 2013 Audit
197
The graph shown above indicates an increased gas production in 2013 compared to 2012, this may
be partially attributable to the failure of SPDC (a major Gas producer) to submit Gas Volumetric
Template for the 2012 Audit.
The individual company’s gas production and its utilization is shown in the table below while gas
flaring activity in 2013 is depicted in the graph.
Table 8.1.5B – Summary of Gas Production and Utilization 2013
COMPANIES GAS PRODUCED
UTILIZED/FUEL REINJECTED FLARED SALES
ADDAX
66,181.00
2,558.00
20,422.00
41,337.61
AENR
8,598.15
85.52 -
8,512.63
ALLIED
14,917.03
886.20
2,184.38
11,846.45
AMNI
7,346.74
204.27
1,034.32
6,090.86
BRITTANIA U
382.66
325.53
63.16
CHEVRON
243,958.32
27,967.08
34,269.25
72,331.11
129,862.44
CONOIL
214.95
53.11
161.88
CONTINENTAL
2,360.22
110.80
2,249.43
DUBRI
2,194.18
26.80
2,167.38
ENERGIA
2,040.42
113.40
1,552.92
ESSO
121,103.76
6,525.94
105,199.08
9,378.74
MOBIL
889,914.65
33,077.86
335,732.51
42,733.34
MONIPULO
439.66
NAE
13,065.18
1,083.03
3,116.24
8,724.29
NAOC
565,866.89
38,504.97
13,035.96
46,387.22
252,276.07
NDPRL
9,071.49
93.76
254.26
8,610.20
NEWCROSS *
NPDC
23,394.94
1,100.66
22,234.10
ORIENTAL
3,309.82
543.86
916.13
2,765.95

Main Report and Recommendations
NEITI Oil and Gas Industry 2013 Audit
198
COMPANIES GAS PRODUCED
UTILIZED/FUEL REINJECTED FLARED SALES
PANOCEAN
7,049.42
449.74
82.48
6,443.64
PILLAR
92.53
92.53
PLATFORM
7,229.09
244.41
6,984.68
SEEPCO
807.50
512.47
240.65
73.61
SNEPCO
47,000.70
4,002.57
3,545.14
39,601.07
SPDC
590,053.10
13,269.14
9,356.30
45,612.53
528,851.72
STARDEEP
156,815.50
8,071.19
139,413.93
9,330.37
TEPNG
233,384.15
8,033.43
86,741.04
24,528.50
114,085.68
TUPNI
192,203.75
6,737.61
62,302.72
4,137.28
119,026.13
WALTERSMITH
325.35
20.40
304.80
TOTAL
3,209,321.14
154,601.76
814,269.32
373,178.46
1,198,756.94
Figure 8.1.5B – Gas Flared Volumes 2013
-
10,000.00
20,000.00
30,000.00
40,000.00
50,000.00
60,000.00
70,000.00
80,000.00
AD
DA
X
AEN
R
ALL
IED
AM
NI
BR
ITTA
NIA
U
CH
EVR
ON
CO
NO
IL
CO
NTI
NEN
TAL
DU
BR
I
ENER
GIA
ESSO
MO
BIL
MO
NIP
ULO
NA
E
NA
OC
ND
PR
L
NEW
CR
OSS
*
NP
DC
OR
IEN
TAL
PA
NO
CEA
N
PIL
LAR
PLA
TFO
RM
SEEP
CO
SNEP
CO
SPD
C
STA
RD
EEP
TEP
NG
TUP
NI
WA
LTER
SMIT
H
MM
SCF

Main Report and Recommendations
NEITI Oil and Gas Industry 2013 Audit
199
From the above chart, Chevron flared the highest volume of gas in 2013 as was the case in 2012.
Chevron flared 72,331.11 mmscf of gas, which is 19.382% of the total gas flared volume of
373,178.48 mmscf.
The table below shows the percentage of gas flared as a proportion of total gas productions from
2009 to 2013.
Table 8.1.5C – Gas flared as a proportion of gas produced from 2009 - 2013
Usage (mmscf) 2009 2010 2011 2012 2013
A. Total Gas Production
3,313,550.90 3,418,106.30 3,346,973.37 2,559,129.96 3,209,321.14
Gas Flared 1,641,516.72 1,279,272.84 884,357.98 369,500.14 373,178.46
% of Gas Flared to Production 49.54% 37.43% 26.42% 14.44% 11.63%
The total volume of gas flared in 2013 is 11.63% of total gas production as against 14.44% in 2012.
This decline in flared gas volume was attained as a result of increased gas sales.
Figure 8.1.5C – Comparison of Gas Flared Volumes 2009 - 2013
The table below shows companies re-injected gas volumes:
0.00
200,000.00
400,000.00
600,000.00
800,000.00
1,000,000.00
1,200,000.00
1,400,000.00
1,600,000.00
1,800,000.00
2009 2010 2011 2012 2013
mm
scf

Main Report and Recommendations
NEITI Oil and Gas Industry 2013 Audit
200
Figure 8.1.5D – 2013 Gas Reinjected Volumes
The overall re-injected volumes in 2013 is 814,269.32 mmscf which is a 33.525% decrease on 2012
re-injected volumes of 1,224,915.32 mmscf. Mobil Producing Nigeria Unlimited (MPNU) re-injected
the highest volume of gas in 2013 accounting for 41.231% of the overall re-injected gas in 2013.
This greater utilization of gas by MPNU is as a result of the NGL projects.
Gas is re-injected into formation to assist oil production. Some oil reservoirs need gas pressure to
push oil to the surface. If this gas pressure depletes, the desired rate of oil production will be
affected. To maintain the desired reservoir pressure, the gas is re-injected into the reservoir to
assist oil flow to the surface. This gas is not sold or lost, but re-cycled in operation to produce more
oil. The graph below shows gas utilization volumes by companies.
Figure 8.1.5E – 2013 Gas Utilized Volumes
-
50,000.00
100,000.00
150,000.00
200,000.00
250,000.00
300,000.00
350,000.00
400,000.00
AD
DA
X
AEN
R
ALL
IED
AM
NI
BR
ITTA
NIA
U
CH
EVR
ON
CO
NO
IL
CO
NTI
NEN
TAL
DU
BR
I
ENER
GIA
ESSO
MO
BIL
MO
NIP
ULO
NA
E
NA
OC
ND
PR
L
NEW
CR
OSS
*
NP
DC
OR
IEN
TAL
PA
NO
CEA
N
PIL
LAR
PLA
TFO
RM
SEEP
CO
SNEP
CO
SPD
C
STA
RD
EEP
TEP
NG
TUP
NI
WA
LTER
SMIT
H
MM
SCF
-
5,000.00
10,000.00
15,000.00
20,000.00
25,000.00
30,000.00
35,000.00
40,000.00
45,000.00
AD
DA
X
AEN
R
ALL
IED
AM
NI
BR
ITTA
NIA
U
CH
EVR
ON
CO
NO
IL
CO
NTI
NEN
TAL
DU
BR
I
ENER
GIA
ESSO
MO
BIL
MO
NIP
ULO
NA
E
NA
OC
ND
PR
L
NEW
CR
OSS
*
NP
DC
OR
IEN
TAL
PA
NO
CEA
N
PIL
LAR
PLA
TFO
RM
SEEP
CO
SNEP
CO
SPD
C
STA
RD
EEP
TEP
NG
TUP
NI
WA
LTER
SMIT
H

Main Report and Recommendations
NEITI Oil and Gas Industry 2013 Audit
201
There were also unaccounted gas volumes as populated in the company templates and shown in
the Gas summary table above. A total of 669,950.27 mmscf of gas could not be accounted for,out
of which NAOC records 241,734.59 mmscf as unaccounted gas.
Table 8.1.5D - Further Analytical Review of Gas Sales Volumes- Using Trend Analysis
2012 2013
Volume Volume Changes
MT'000 MT'000 %
1st Quarter 231 210 -9%
2nd Quarter 150 244 63%
3rd Quarter 122 219 80%
4th Quarter 147 214 46%
Cumulative Total 649 886 37%
Table 8.1.5E - Further Analytical Review of NLNG Feedstock Sales Volumes- Using Trend Analysis
2012 Volume MBTU'000 2013 Volume MBTU'000 % Changes
1st Quarter 183,620 149,587 -19%
2nd Quarter 177,878 145,414 -18%
3rd Quarter 193,856 151,395 -22%
4th Quarter 176,193 178,026 1%
Cumulative Total 731,548 624,422 -15%
The two scenarios above, are further analysed in the trend analyses depicted in the graphs below.

Main Report and Recommendations
NEITI Oil and Gas Industry 2013 Audit
202
Figure 8.1.5F - Further Analytical Review of Gas Sales Volumes- Using Trend Analysis
Figure 8.1.5G - Further Analytical Review of NLNG Feedstock Sales Volumes- Using Trend Analysis
The previous year’s quarter volumes were used as Comparative Base Volume to show the changes
in gas and feedstock volumes accruable to the Federation in the graphs above. A detail result of the
validation of gas and feedstock revenue accruable to the Federation is contained in the Federal
Government Equity Crude Oil and Gas validation report.
8.1.6 Key Findings on optimal gas utilisation
Audit findings do not reveal any remarkable improvement in gas production over the period 2009 –
2013 but there seems to be a significant increase in gas utilization and a gradual decline in gas
flaring trend.
-
50
100
150
200
250
1st Quarter 2nd Quarter 3rd Quarter 4th Quarter
210
244
219 214 231
150
122
147
2013 Volume 2012 Volume
-
20,000.00
40,000.00
60,000.00
80,000.00
100,000.00
120,000.00
140,000.00
160,000.00
180,000.00
200,000.00
1st Quarter 2nd Quarter 3rd Quarter 4th Quarter
149,586.67 145,414.41 151,395.17
178,026.25 183,620.44 177,877.96 193,856.46
176,193.41
2013 Volume 2012 Volume

Main Report and Recommendations
NEITI Oil and Gas Industry 2013 Audit
203
Despite this seeming improvement in gas utilization over the years, progress towards zero gas
flaring appears slow and inconsistent. For example, between 2010 – 2011 and 2011- 2012, gas
flaring dropped by 30.9% and 58.3% respectively. Whereas between 2012 and 2013, the quantity
of gas fared showed a slight increase of about 1%.
Implication
These results show that Nigeria is still far from achieving optimal gas utilization and there is the
need to identify and address some of the challenges.
In the course of the audit , the following challenges were identified among others.
i. Inadequate infrastructure and investment in the gas sector to harness the huge gas
deposit.
ii. Uncertain and Ineffective regulatory environment. Potential investors are also watching and
waiting on the outcome of the PIB.
iii. Unattractive fiscal regimes.
iv. Lack of a proper, well-defined and attractive pricing regime that will attract investments.
v. Lack of adequate incentives.
vi. Insecurity and corruption.
The above factors will also impact negatively on the revenue accruable to the Federation from gas
operations, which will further limit government investment in gas infrastructures.
Recommendations
1. Government to create an enabling environment for investments in the gas exploitation and
development by ensuring the competitive pricing of gas, attractive fiscal regimes and
provision of adequate security for gas infrastructures to prevent vandalism and sabotage.
2. Government to encourage investment in domestic gas utilization infrastructures that will
meet increasing demand of gas for power, feedstock industries and other local uses.
3. Government should pass the PIB to ensure regulatory certainties.
4. Government to ensure an adequate and effective metering system in gas operations.
5. Government to review the current trend in the divestment of Federal government equity
holdings in oil and gas operations. The assignment of some gas revenue yielding OMLs
lacked transparency and this has greatly reduced gas and feedstock revenue accruable to
the federation.

Main Report and Recommendations
NEITI Oil and Gas Industry 2013 Audit
204
8.2 Upstream Mass Balance
8.2.1 Production Entitlement
The Federal Government gets revenue from the oil and gas industry through direct equity
participation or Joint Venture (JV) with the international oil companies. The funding is done
through cash calls. Each party funds the operation according to their percentage share in the
operation.
As the industry grew, more companies got involved in the operation in Nigeria andfunding on the
Government part became a problem. The Government decided to fund emerging projects
differently. With the JVs, the Government made an alternative arrangement called the ‘Carry
Agreement’. In this arrangement, the Government, represented by NNPC does not fund capital
developments. The operators fund the capital developments. The operators then recover their
costs from the Government in form of crude oil. The remaining production is then shared according
to their equity holdings in the JV.
Later, the Carry Agreement was modified as ‘Modified Carry Agreement’.
Under this agreement, the Government takes its share of the oil and gas produced, sells and pays
cash to fund the operation.
The Federal Government issues different licences to operators in the industry under the
‘production Sharing Contract’ (PSC) arrangement.
Under this arrangement, NNPC owns the concession. The operators fund all expenditures in the
operations of the companies. NNPC settles the liabilities of the PSCs by paying their Royalty and
Petroleum Profit Tax (PPT). In this arrangement, the parties are allocated production to enable
them pay for these services. Whatever is left is shared as profit oil in proportions set out in the PSC
agreement.
8.2.1.1 Federation Entitlement
Federation Equity Crude Oil Entitlement 8.2.1.1.1
The Federation is entitled to oil from its participation in upstream Joint Venture operations (equity
crude); and as payment in kind for Royalty, and PPT from PSCs; and as payment in kind for its share
of profits arising from PSCs.
The Federation’s crude oil entitlement is divided into two parts: Crude that is sold internationally
(Export Crude) and Crude that is allocated for domestic use (Domestic Crude).

Main Report and Recommendations
NEITI Oil and Gas Industry 2013 Audit
205
MARKETING
Export Crude is marketed on behalf of the Federation by NNPC Crude Oil Marketing Division
(COMD) and Domestic Crude is sold to PPMC to be refined at its refineries for domestic
consumption.
The Domestic Crude allocation has remained unchanged at 445,000 bpd since it was fixed by
Government in 2003; this volume is the design capacity of the four refineries in Nigeria. In 2010, as
a result of production inefficiency of the refineries, PPMC engaged in Alternative Production
arrangements such as Offshore Processing Arrangement (OPA) and Swap Arrangements to make
available products for the increasing domestic demands.
8.2.1.2 Production Entitlement by Companies
All Crude Oil producing Companies also have Crude Oil and Gas entitlements from productions
depending on the equity holdings in the production arrangement. The Federation (NNPC)
entitlements is as stated in section 8.2.1.1.1 above. The following additional information is to be
noted with respect to company entitlements.
For the Sole Risk Companies, NNPC does not have any entitlements to their production.
For the PSCs, NNPC has entitlement to production as per their contractual agreement. We
analysed NNPC’s entitlement to PSC production through the lifting volumes from the PSC
Terminals. See table 5.6 above which shows that where there is a disagreement, the parties
fall back to the Production Sharing Contract (PSC) or Arbitration.
The Joint Venture companies have equity arrangements with NNPC and as such, their
entitlements are not in dispute.
Joint Venture 8.2.1.2.1
The following tables show NNPC and Companies production entitlement of crude oil for 2013. The
stated entitlement are the volumes that the entities are entitled to pursuant to conditions laid
down in the Joint Venture agreements (JOA). The production volumes are in Net Standard Volumes
(NSV).
Table 8.2.1.2.1A - Joint Venture Entitlement to Production in 2013
Company Production
(bbls)
NNPC
Equity
%
NNPC share
(bbls)
Company
Equity %
Company
share
(bbls)
Shell
104,217,351 55
62,530,411
45
46,897,808
Chevron
80,123,501 60
48,074,101
40
32,049,400

Main Report and Recommendations
NEITI Oil and Gas Industry 2013 Audit
206
Company Production
(bbls)
NNPC
Equity
%
NNPC share
(bbls)
Company
Equity %
Company
share
(bbls)
Nig. Agip Oil co.
19,644,380 60
11,786,628
40
7,857,752
Mobil
156,160,764 60
93,696,458
40
62,464,306
TEPNG
41,461,328 60
24,876,797
40
16,584,531
Pan Ocean
1,834,469 60
1,100,681
40
733,788
Total
403,441,793
242,065,076
166,587,585
Source: NNPC-COMD
Figure 8.2.1.2.1A - JV Entitlement to Production
-
10,000,000
20,000,000
30,000,000
40,000,000
50,000,000
60,000,000
70,000,000
80,000,000
90,000,000
100,000,000
BB
LS
JV OPERATORS
NNPC share Company share

Main Report and Recommendations
NEITI Oil and Gas Industry 2013 Audit
207
Table 8.2.1.2.1B - Comparison of Production Entitlement to Actual Volume Lifted
Company NNPC Equity
%
NNPC
ACTUAL
LIFTING
(bbls)
VARIANCE
(bbls)
Company
Equity %
COMPANY
ACTUAL
LIFTING
(bbls)
VARIANCE
(bbls)
Shell
62,530,411
58,734,572
3,795,839
46,897,808
48,680,659
(1,782,851)
Chevron
48,074,101
46,531,587
1,542,514
32,049,400
32,295,313
(245,913)
Nig. Agip Oil co.
11,786,628
10,879,615
907,013
7,857,752
8,240,473
(382,721)
Mobil
93,696,458
92,596,173
1,100,285
62,464,306
62,761,809
(297,503)
TEPNG
24,876,797
24,263,112
613,685
16,584,531
14,894,472
1,690,059
Pan Ocean
1,100,681
889,244
211,437
733,788
592,830
140,958
Total
242,065,076
233,894,303
8,170,773
166,587,585
167,465,556
(877,971)
Source: NNPC-COMD
Figure 8.2.1.2.1B - NNPC Equity Volumes vs Actual Volumes Lifted
-
10,000,000
20,000,000
30,000,000
40,000,000
50,000,000
60,000,000
70,000,000
80,000,000
90,000,000
100,000,000
BB
LS
NNPC Equity % NNPC ACTUAL LIFTING

Main Report and Recommendations
NEITI Oil and Gas Industry 2013 Audit
208
Figure 8.2.1.2.1C - Company Equity Volumes vs Actual Volumes Lifted
Table 8.2.1.2.1C - Crude Lifting between NNPC and the PSC's Through the PSC's Terminal/FPSO
- 10,000,000 20,000,000 30,000,000 40,000,000 50,000,000 60,000,000 70,000,000
BB
LS
Company Equity % COMPANY ACTUAL LIFTING
Company PRODUCTION
(bbls)
NNPC LIFTING
(bbls)
NNPC
LIFTING
%
COMPANIES
LIFTING(bbls)
COMPANIES
LIFTING %
TOTAL LIFTING
(bbls)
Abo
8,022,903
3,394,184
42.3
4,579,331
57.1
7,973,515
Agbami
84,871,128
15,536,126
18.3
69,216,249
81.6
84,752,375
Akpo
60,798,261
18,923,498
31.1
41,863,545
68.9
60,787,043
Antan
19,816,696
6,642,636
33.5
13,294,184
67.1
19,936,820
Bonga
50,947,329
29,032,055
57.0
21,825,974
42.8
50,858,029
Erha
37,634,014
20,813,321
55.3
16,218,381
43.1
37,031,702
Okwori
9,532,752
4,532,227
47.5
4,525,608
47.5
9,057,835
Tulja
2,909,852
365,000
12.5
2,592,822
89.1
2,957,822
Usan
39,214,610
4,539,012
11.6
33,818,649
86.2
38,357,661
Total
313,747,545
103,778,059
207,934,743
311,712,802

Main Report and Recommendations
NEITI Oil and Gas Industry 2013 Audit
209
Figure 8.2.1.2.1D - Production Entitlement at PSC's Terminals
8.2.2 Definition of Production
The United States Energy Information Administration defines ‘Crude Production’ as “the volume of
oil produced from oil reservoir during given periods of time. The amount of such production for a
given period is measured as volumes delivered from lease storage tanks. (i.e. the point of custody
transfer) to pipelines, trucks, or other media for transport to refineries or terminals with
adjustments for-net differences between opening and closing lease inventories, basic sediment
and water (BS&W).”
Section 63 of the Nigeria Petroleum (Drilling and Production) Regulations 1969 (as amended)
defines ‘casing-head petroleum spirit’ or ‘crude oil production’ as any liquid hydrocarbon which:
a. have been obtained from natural separation or by any chemical or physical process, and
b. have not been refined or otherwise treated.
-
10,000,000
20,000,000
30,000,000
40,000,000
50,000,000
60,000,000
70,000,000
Abo Agbami Akpo Antan Bonga Erha Okwori Tulja Usan
BB
LS
NNPC LIFTING COMPANIES LIFTING

Main Report and Recommendations
NEITI Oil and Gas Industry 2013 Audit
210
8.2.3 Crude Oil Terminals in Nigeria
The table below shows the various/respective crude oil terminals in Nigeria:
Table 8.2.3 – Crude Oil Terminals in Nigeria
Name Operator Location CAPACITY (Barrels) CRUDE STREAM
Bonny SPDC On-shore 5,580,000 Bonny Light
Forcados SPDC On-shore 4,600,000 Forcados blend
Escravos CNL On-shore 2,223,730 Escravos Light
Escravos
(LPG) CNL Off-shore 385,000 Gas
Qua Iboe MPNU On-shore 4,200,000/2,000,000 Qua Iboe
light/Condensate
BRT MPNU On-shore 690,000x2/570,000 C1,C2,C3
Oso MPNU On-shore OSO Condensate
Brass NAOC On-shore 3,217,000 Brass blend
Anthan Addax Knock Adon (Off-
shore) 1,040,000 Anthan blend
Okwori Addax Sendje Berge (Off-
shore) 1,415,726 Okwor1 crude
Ima Amni Alisa Kraig (Off-
shore) 1,391,265 Ima condensate
Okoro Amni Armada
Perkasa(Off-shore) 200,000 Okoro crude
Oloibiri CNL Pennington (Off-
shore) 1,35,000
Obe * Cavendish Crystal Sea*(Off-
shore) 212,067
Obe Crude(Not
operational)
Ukpokiti Express/Sepcol/Atlas Trinity Spirit (Off-
shore)
Yoho MPNU Falcon (Off-shore) 2,00,000 Yoho Crude
Abo NAE Gray Warrior (Off-
shore) 932,076 Abo Crude

Main Report and Recommendations
NEITI Oil and Gas Industry 2013 Audit
211
Name Operator Location CAPACITY (Barrels) CRUDE STREAM
Okono NPDC/AENR Mystras (Off-shore) 1,055,000 Okono Crude
EA SPDC Sea Eagle (Off-
shore) 1,400,000 Sea Eagle Crude
Bonga SNEPCO Bonga (Off-shore) 2,000,000 Bonga Crude
Odudu TEPNG Unity (Off-shore) 2,418,000 Amenam blend
Akpo TUPNI FPSO (Off-shore) 2,000,000 AKPO Condensate
Erha EEPNL Erha (Off-shore) 2,220,000 Erha Crude
Agbami Stardeep FPSO (Off-shore) 2,200,000 Agbami Crude
Tulja SEEPCOL Senge Barge (Off-
shore) 2,000,000 Okwuibome Crude
OYO NAE Off-shore 1,005,000 OYO Crude
USAN TEPNG Off-shore 2,131,639 USAN Crude
NB: Cavendish did not operate within this audit period.
Some of the Companies that operated within this audit period do not have their own terminals.
They injected their crude oil to other terminals listed above and export from those terminals. There
is usually an agreement for use of the terminals between the terminal owners and the companies.
The agreements among other issues dwell on crude oil handling, management of terminal stock
and lifting.
8.2.4 Upstream Crude Oil Volumetric Reconciliation
The volumetric reconciliation deals with:
1. Production, terminal balances and stock changes in the terminal.
2. Crude export reconciliation between the volumes lifted as reported by the terminal
operator, the companies and DPR records of liftings and
3. Crude oil allocation to the equity participants.
The operators attempt to know how much each well produces by testing each well every month at
the flow station. This enables the approximate estimation of quantity of hydrocarbon as a Well
may produce. Measurements are taken 8am-8am daily by DPR and 12am-12am daily by the
companies at the flow stations in approximation because the meters are not very accurate (a range
of ±10%).

Main Report and Recommendations
NEITI Oil and Gas Industry 2013 Audit
212
Table 8.2.4A - All Companies Fiscalised Crude Oil Production Volumes by Operating Arrangement (Bbls)
PRODUCING COMPANIES
CRUDE TYPE Actual 2013 Production(a) PER DAY % of Total Production
BONNY LIGHT 53,702,320 147,130 6.71%
FORCADOS BLEND 33,301,206 91,236 4.16%
SHELL FB(Condensates) - - 0.00%
BRASS BLEND 1,586,917 4,348 0.20%
EA (af) 15,626,908 42,813 1.95%
Sub-Total 104,217,351 285,527 13.02%
ESC 50,826,197 139,250 6.35%
BONNY LIGHT 2,236,558 6,128 0.28%
CHEVRON BRASS BLEND 1,019,077 2,792 0.13%
FORCADOS BLEND - - 0.00%
ESC(af) 23,402,752 64,117 2.92%
Sub-Total 54,081,832 148,169 6.76%
AGIP BRASS BLEND 19,249,544 52,738 2.40%
FORCADOS BLEND 394,836 1,082 0.05%
Sub-Total 19,644,380 53,820 2.45%
MOBIL QUA IBOE LIGHT 56,711,372 155,374 7.08%
OSO CONDENSATES 1,424,471 3,903 0.18%
OSO(MCA) 4,014,400 10,998 0.50%
QIL(PIP-af) 12,762,000 7,287,600 1.59%
QIL(MCA) 45,394,800 27,236,880 5.67%
QIL(S-af) 10,712,895 6,419,729 1.34%
YOHO 25,140,826 68,879 3.14%
Sub-Total 83,276,669 228,155 10.40%
TEPNG
FORCADOS BLEND - - 0.00%
BONNY LIGHT 7,841,779 21,484 0.98%
EKANGA/ZAFIRO 4,029,844 11,041 0.50%
AMENAM BLEND 15,987,558 43,802 2.00%
AMENAM BLEND(af) 13,602,147 37,266 1.70%

Main Report and Recommendations
NEITI Oil and Gas Industry 2013 Audit
213
PRODUCING COMPANIES
CRUDE TYPE Actual 2013 Production(a) PER DAY % of Total Production
Sub-Total 23,829,337 65,286 2.98%
CHEVRON PENNINGTON LIGHT 2,638,917 7,230 0.33%
PAN OCEAN FORCADOS BLEND 1,834,469 5,026 0.23%
TOTAL: (JV) 289,522,955 793,214 36.17%
TOTAL: (AF-JV) 109,888,994 301,066 13.73%
TOTAL: (JV & AF-JV)
399,411,949 1,094,279 49.90%
NIG. AGIP EXPL(NAE)
ABO (psc) 8,022,903 21,981 1.00%
CHEVRON AGBAMI (psc) 84,871,128 232,524 10.60%
TUPNI AKPO Condesate (psc) 60,798,261 166,571 7.60%
SNEPCO BONGA(psc) 50,947,329 139,582 6.36%
ESSO EXP&PRO NIG LTD
ERHA(psc) 37,634,014 103,107 4.70%
ADDAX
BRASS BLEND(psc) 1,347,172 3,691 0.17%
ANTAN BLEND(psc) 18,656,969 51,115 2.33%
OKWB(psc) 9,532,752 26,117 1.19%
Sub-Total 29,536,893 80,923 3.69%
SEEPCO OKWUIBOME (psc) 2,909,852 7,972 0.36%
TEPNG USAN (psc) 39,214,610 107,437 4.90%
AGIP ENERGY BB(sc) 3,204,453 8,779 0.40%
Total: PSC & SC 317,139,443 868,875 39.62%
NPDC/AGIP ENERGY
OKONO (NPDC) 14,917,919 40,871 1.86%
OKONO (AENR) LIFTING FIGURE ONLY
NPDC/SEPLAT FB(NPDC) 9,800,019 26,849 1.22%
FB(SEPLAT) 7,901,562 21,648 0.99%
NPDC/FIRST HYDROCARBON
FB (NPDC) 407,611 1,117 0.05%
FB (FHC) 333,500 914 0.04%
NPDC/NECONDE FB (NPDC) 1,694,294 4,642 0.21%

Main Report and Recommendations
NEITI Oil and Gas Industry 2013 Audit
214
PRODUCING COMPANIES
CRUDE TYPE Actual 2013 Production(a) PER DAY % of Total Production
FB (NECONDE) 1,386,240 3,798 0.17%
NPDC/SHORELINE FB (NPDC) 3,862,111 10,581 0.48%
FB (SHORELINE) 3,159,909 8,657 0.39%
NPDC/ND WESTERN
FB (NPDC) 2,293,733 6,284 0.29%
FB (ND WESTERN) 1,876,692 5,142 0.23%
NPDC FORCADOS BLEND 2,182,331 5,979 0.27%
Sub-Total 49,815,921 136,482 6.22%
CONSOLIDATED OIL
ESC 510,238 1,398 0.06%
MONI PULO LTD. ANTAN BLEND 1,159,727 3,177 0.14%
DUBRI ESCRAVOS 109,464 300 0.01%
AMNI IMA 260,051 712 0.03%
OKORO 6,624,751 18,150 0.83%
ATLAS UKPOKITI 423,789 1,161 0.05%
EXPRESS PETROLEUM
UKPOKITI 163,116 447 0.02%
CONTINENTAL OIL PENNINGTON LIGHT 4,719,545 12,930 0.59%
CAVENDISH PETROLEUM
OBE - - 0.00%
NIG AGIP EXPL/ALLIED/CAMAC
OYO BLEND 803,229 2,201 0.10%
Total: INDEPENDENT
64,589,831 176,958 8.07%
NIGER DELTA PET. RES. LTD
BONNY LIGHT 328,968 901 0.04%
PLATFORM PETROLEUM LTD
BRASS BLEND 602,463 1,651 0.08%
MIDWESTERN OIL & GAS
BRASS BLEND 2,978,992 8,162 0.37%
WALTER SMITH PET OIL LTD
BONNY LIGHT 901,640 2,470 0.11%
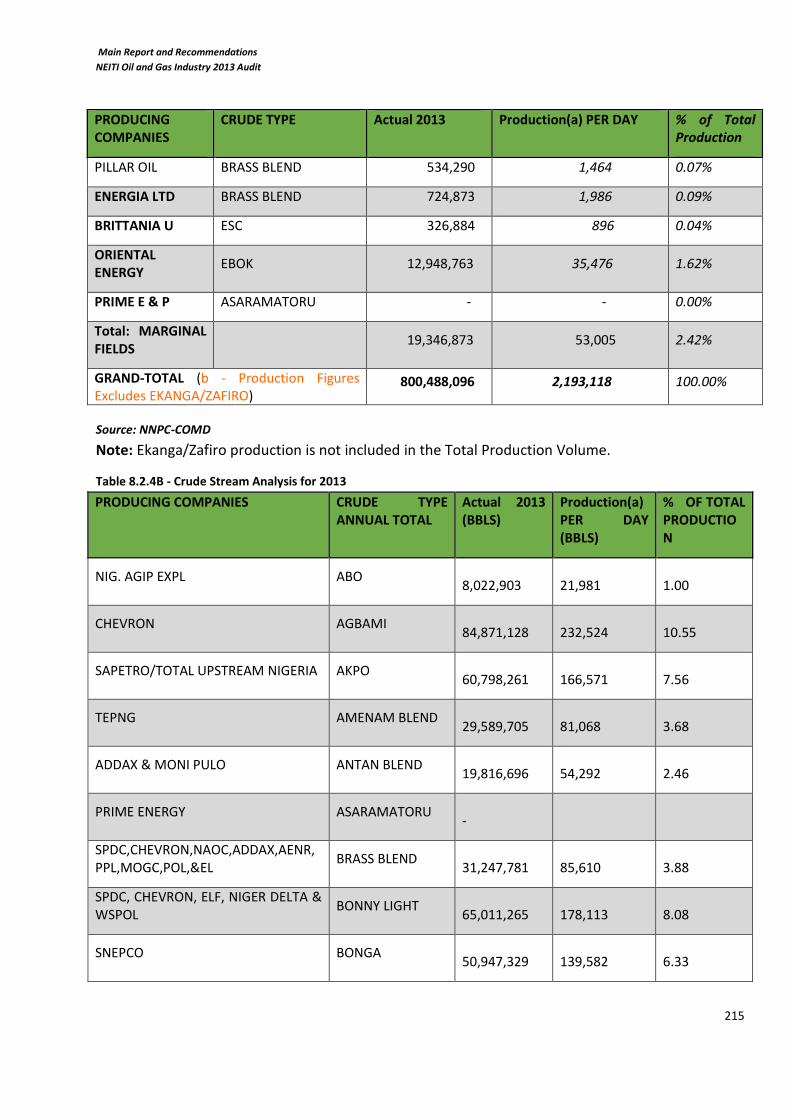
Main Report and Recommendations
NEITI Oil and Gas Industry 2013 Audit
215
PRODUCING COMPANIES
CRUDE TYPE Actual 2013 Production(a) PER DAY % of Total Production
PILLAR OIL BRASS BLEND 534,290 1,464 0.07%
ENERGIA LTD BRASS BLEND 724,873 1,986 0.09%
BRITTANIA U ESC 326,884 896 0.04%
ORIENTAL ENERGY
EBOK 12,948,763 35,476 1.62%
PRIME E & P ASARAMATORU - - 0.00%
Total: MARGINAL FIELDS
19,346,873 53,005 2.42%
GRAND-TOTAL (b - Production Figures Excludes EKANGA/ZAFIRO)
800,488,096 2,193,118 100.00%
Source: NNPC-COMD
Note: Ekanga/Zafiro production is not included in the Total Production Volume.
Table 8.2.4B - Crude Stream Analysis for 2013
PRODUCING COMPANIES CRUDE TYPE ANNUAL TOTAL
Actual 2013 (BBLS)
Production(a) PER DAY (BBLS)
% OF TOTAL PRODUCTION
NIG. AGIP EXPL ABO 8,022,903
21,981
1.00
CHEVRON AGBAMI 84,871,128
232,524
10.55
SAPETRO/TOTAL UPSTREAM NIGERIA AKPO 60,798,261
166,571
7.56
TEPNG AMENAM BLEND 29,589,705
81,068
3.68
ADDAX & MONI PULO ANTAN BLEND 19,816,696
54,292
2.46
PRIME ENERGY ASARAMATORU -
SPDC,CHEVRON,NAOC,ADDAX,AENR,PPL,MOGC,POL,&EL
BRASS BLEND 31,247,781
85,610
3.88
SPDC, CHEVRON, ELF, NIGER DELTA & WSPOL
BONNY LIGHT 65,011,265
178,113
8.08
SNEPCO BONGA 50,947,329
139,582
6.33

Main Report and Recommendations
NEITI Oil and Gas Industry 2013 Audit
216
PRODUCING COMPANIES CRUDE TYPE ANNUAL TOTAL
Actual 2013 (BBLS)
Production(a) PER DAY (BBLS)
% OF TOTAL PRODUCTION
SPDC EA 15,626,908
42,813
1.94
ORIENTAL ENERGY EBOK 12,948,763
35,476
1.61
TOTAL EKANGA/ZAFIRO 4,029,844
11,041
0.50
MOBIL ERHA 37,634,014
103,107
4.68
CHEVRON, CONOIL & DUBRI ESCRAVOS 75,175,535
205,960
9.34
SPDC,CHEVRON,NAOC,ELF,PAN OCEAN&NPDC
FORCADOS 70,428,513
192,955
8.75
AMNI IMA COND. 260,051
712
0.03
CAVENDISH PETROLEUM OBE -
-
-
NPDC/AENR OKONO 14,917,919
40,871
1.85
AMNI OKORO 6,624,751
18,150
0.82
ADDAX OKWORI 9,532,752
26,117
1.18
SEEPCO OKWUIBOME 2,909,852
7,972
0.36
MOBIL OSO 5,438,871
14,901
0.68
NIG AGIP EXPL/ALLIED/CAMAC OYO 803,229
2,201
0.10
CHEVRON, CONTINENTAL & MOVIDO E&P
PENN. LIGHT 7,358,462
20,160
0.91
MOBIL QUA IBOE 125,581,067
344,058
15.61
ATLAS & EXPRESS UKPOKITI 586,905
1,608
0.07
TEPNG USAN

Main Report and Recommendations
NEITI Oil and Gas Industry 2013 Audit
217
PRODUCING COMPANIES CRUDE TYPE ANNUAL TOTAL
Actual 2013 (BBLS)
Production(a) PER DAY (BBLS)
% OF TOTAL PRODUCTION
39,214,610 107,437 4.87
MOBIL YOHO 25,140,826
68,879
3.12
TOTAL (including Ekanga/Zafiro) 804,517,940
2,204,159
100.00
Source: NNPC-COMD
Note: Ekanga/Zafiro production is included in the Total Production Volume.
Table 8.2.4C - All Companies Fiscalised Crude Oil Production by Month
MONTH
CRUDE OIL & CONDENSATES
PRODUCTION
Barrels/Month Barrels/Day(a)
JANUARY 75,303,447 2,429,143
FEBRUARY 62,358,212 2,227,079
MARCH 68,559,165 2,211,586
APRIL 66,816,918 2,227,231
MAY 64,014,595 2,064,987
JUNE 60,563,907 2,018,797
JULY 68,067,376 2,195,722
AUGUST 71,123,086 2,294,293
SEPTEMBER 66,519,862 2,217,329
OCTOBER 69,083,768 2,228,509
NOVEMBER 62,647,642 2,088,255
DECEMBER 65,430,118 2,181,004
TOTAL 800,488,096
From above tables, total fiscalised Crude Oil production for the year 2013 was 800,488,096 bbls
with a daily average of 2,181,004 bbls excluding production from the unitized fields
(Ekanga/Zafiro).

Main Report and Recommendations
NEITI Oil and Gas Industry 2013 Audit
218
8.3 Crude Oil Mass Balance Reconciliation
8.3.1 Crude Oil Production and Lifting Data
The total Crude Oil Production and lifting volumes by NNPC and the Oil companies for the period
2013 is summarised below:
Table 8.3.1 - Total Crude Oil Production and Liftings from 2009-2013
PRODUCTION 2009 2010 2011 2012 2013
mmbbls mmbbbls mmbbls mmbbls mmbbls
Total production 780.964 894.506 866.245 853.127 800.488
Total opening stock 18.841 13.972 14.637 15.314 12.495
Zafiro Crude[1] 4.752 4.785 3.759 4.131 4.030
Total stock for liftings 804.557 913.263 884.641 868.091 817.007
Terminal adjustment/shrinkage[2]
-1.358 -0.33 -0.247 -0.728 -0.381
Available total Terminal stock 803.199 912.933 884.394 867.363 816.626
LIFTING
Federation Export:
Joint Venture Operators (JV) 101.373 131.376 133.444 101.733 159.210
Production Sharing contractors (PSCs) 71.886 87.748 86.343 115.081 104.224
Service Contractors (SCs) 0.988 1.985 1.696 1.47 2.649
Sub –Total Federation Export 174.247 221.109 221.483 218.284 266.083
PPMC Domestic Crude Supply(Refining / Sales )
Joint Venture Operator (JVs) 153.661 164.872 163.457 161.208 74.684
Production Sharing Contractors 7.368 1.271 0.997 0.975 0
Service Contractors (SCs) 0.885 0.38 0 0.16 0
PPMC Domestic Crude Supply(Refining / Sales ) 161.914 166.523 164.454 162.343 74.684
Sub-Total: Federation +PPMC Lifting 336.161 387.632 385.937 380.627 340.767
Other Operators:
JV Operators 218.35 235.833 228.375 209.552 167.466
Production Sharing Contractors PSCs 189.152 228.817 198.194 205.382 207.385
Service Contractors (SCs) 1.206 0.92 0.868 2.445 0.998
Sole Risk 40.785 40.76 46.655 50.778 65.667
Marginal Fields 4.057 4.286 7.258 17.868 18.054
Sub-Total: Other Operators 453.549 510.616 481.35 486.025 459.57
Total Lifting 789.71 898.248 867.287 866.652 800.337
Balance closing stock 13.489 14.685 17.107 0.711 16.974
[1] Ekanga/Zafiro crude represents the production from the unitized zone operated by Nigeria and Mobil Equatorial Guinea which is
not included in the Operating Companies’ production in Nigeria, but has been included in the total lifting by the Operators and NNPC.
[2]Shrinkages or Terminal adjustments represent losses due to evaporation and drainage of the crude in the terminals during the
process of removing water and sediments in the period that the crude stayed in the tanks before export.

Main Report and Recommendations
NEITI Oil and Gas Industry 2013 Audit
219
Figure 8.3.1 - Total Crude Production 2009 – 2013
Production dropped from 853.127 million bbls in 2012 to 800.488 million bbls in 2013. The
difference of 52.639 million bbls reflects a decline of 6.17% in 2013.
In 2013, the federation export volumes was 181.953 million bbls as compared to 218.284 million
bbls in 2012 which reflects a decrease of 16.64%.
8.3.1.1 Crude Oil Production by Operating Arrangements
The total production of crude oil obtained from COSM-COMD records in 2013 is as shown below:
Table 8.3.1.1 - Crude Oil Production by Operating Arrangements Total production 2009
(‘000 bbls)
2010
(‘000 bbls)
2011
(‘000 bbls)
2012
(‘000 bbls)
2013
(‘000 bbls)
Joint Ventures (JVs) 463,668 529,166 521,517 465,329 399,412
Production Sharing
Contracts (PSCs) 268,792 316,887 289,334 320,434 313,935
Service Contracts (SCs) 3,237 2,711 2,802 3,056 3,205
Sole Risk (SR) 41,389 41,938 44,511 46,246 64,589
Marginal Fields 3,878 3,804 8,081 18,061 19,347
TOTAL 780,964 894,506 866,245 853,126 800,488
780.964
894.506
866.245
853.127
800.488
2009 2010 2011 2012 2013
mm
bls
Production Year

Main Report and Recommendations
NEITI Oil and Gas Industry 2013 Audit
220
Figure 8.3.1.1A - Crude Oil Production by Operating Arrangements
Figure 8.3.1.1B – 2013 JV Production
Joint Venture (JV) production declined from 465.329 million bbls in 2012 to 399.412 million bbls in
2013. This shows a 14.166% production decline of 65.917 million bbls.
0
100,000
200,000
300,000
400,000
500,000
600,000
Joint Ventures(JVs)
ProductionSharing Contracts
(PSCs)
Service Contracts(SCs)
Sole Risk (SR) Marginal Fields
mb
ls
Production Arangement
2009 2010 2011 2012 2013
0
100,000
200,000
300,000
400,000
500,000
600,000
2 0 0 9 2 0 1 0 2 0 1 1 2 0 1 2 2 0 1 3
'00
0 B
BLS

Main Report and Recommendations
NEITI Oil and Gas Industry 2013 Audit
221
Figure 8.3.1.1C – 2013 PSC Production
Production Sharing Contract (PSC) production decreased from 320.434 million bbls in 2012 to
313.945 million bbls in 2013 reflecting a 2.025% decline.
Figure 8.3.1.1D – 2013 Sole Risk Production
Sole Risk production volumes increased significantly from 46.246 million bbls in 2012 to 64.589
million bbls in 2013 showing an appreciation of 39.664%.
Marginal fields’ production volumes increased from 18.061 million bbls in 2012 to 19.347 million
bbls in 2013. This increase of 7.120% is impressive as it builds on the 7 9.17% increase of 2012
volume. This shows increased participation in the upstream operations by indigenous firms.
240,000
250,000
260,000
270,000
280,000
290,000
300,000
310,000
320,000
330,000
2 0 0 9 2 0 1 0 2 0 1 1 2 0 1 2 2 0 1 3
'00
0 B
BLS
0
10,000
20,000
30,000
40,000
50,000
60,000
70,000
2 0 0 9 2 0 1 0 2 0 1 1 2 0 1 2 2 0 1 3
'00
0 B
BLS

Main Report and Recommendations
NEITI Oil and Gas Industry 2013 Audit
222
8.3.1.2 Crude Oil Lifting by Operating Arrangements
The volume of crude oil lifting by operating arrangements is shown in the table below:
Table 8.3.1.2A Total Crude Oil Lifting by Operating Arrangements
Total Lifting 2009
(‘000 bbls)
2010
(‘000 bbls)
2011
(‘000 bbls)
2012
(‘000 bbls)
2013
(‘000 bbls)
NNPC Lifting 336,161 387,632 385,937 380,621 340,767
Other JV Operators 218,350 235,833 228,375 209,552 167,466
Production Sharing
Contract (PSC) 189,152 228,817 198,194 205,382 207,385
Service Contracts 1,206 920 868 2,445 998
Sole risk
(Independent
Operators)
40,785 40,760 46,655 50,778 65,667
Marginal field 4,057 4,286 7,258 17,868 18,054
Grand Total 789,710 898,248 867,287 866,646 800,337
Source: NNPC-COMD
Figure 8.3.1.2A - Crude Oil Lifting by Operating Arrangements
0
50,000
100,000
150,000
200,000
250,000
300,000
350,000
400,000
NNPC Lifting Other JVOperators
ProductionSharing
Contract(PSC)
ServiceContracts
Sole risk(Independent
Operators)
Marginal field
MB
BLS
2009
2010
2011
2012
2013

Main Report and Recommendations
NEITI Oil and Gas Industry 2013 Audit
223
Figure 8.3.1.2B - Crude Oil Lifting By NNPC and Other JV Operators
NNPC and JV Operators’ liftings declined in 2013 by 10.471% and 20.074% respectively
when compared to 2012 which corresponds with the overall drop in production volumes.
Table 8.3.1.2B – Month by Month Lifting during the Year for all Production Arrangements
Source: NNPC-COMD
0
50,000
100,000
150,000
200,000
250,000
300,000
350,000
400,000
450,000
2 0 0 9 2 0 1 0 2 0 1 1 2 0 1 2 2 0 1 3
'00
0 B
BLS
NNPC & JV OPERATORS LIFTINGS
NNPC Lifting Other JV Operators
MONTH TOTAL JOINT VENTURE (JV) AF (CARRY) P S C SERVICE CONTRACT (SC) INDEPENDENT MARGINAL FIELDS
LIFTINGS NNPC COMPANIES NNPC COMPANIES NNPC COMPANIES NNPC COMPANIES
JANUARY 73,888,274 21,959,248 10,441,901 5,373,546 4,302,022 10,352,197 15,292,896 180,000 - 5,304,408 682,056
FEBRUARY 57,424,103 11,758,450 10,737,431 2,729,100 1,254,400 6,717,188 17,164,427 360,000 - 5,352,757 1,350,350
MARCH 74,074,301 17,923,280 10,592,842 4,499,850 3,500,844 10,898,229 19,256,256 - - 5,366,044 2,036,956
APRIL 66,640,159 12,272,593 12,936,547 4,495,306 2,363,898 9,474,729 18,045,189 257,850 248,300 5,732,939 812,809
MAY 62,822,255 14,231,240 8,750,644 5,644,730 3,103,869 10,148,059 15,423,956 - 130,000 3,334,075 2,055,682
JUNE 59,988,886 16,335,316 9,177,368 3,818,461 1,865,700 7,439,691 14,190,276 690,000 21,000 5,026,039 1,425,036
JULY 68,844,263 15,575,433 9,790,792 4,425,460 4,427,889 8,955,586 20,093,585 - 199,000 4,760,828 615,690
AUGUST 71,146,909 9,584,361 12,910,175 6,832,296 3,984,081 9,396,297 18,312,098 293,000 - 8,032,035 1,802,566
SEPTEMBER 67,624,749 12,162,164 10,703,928 5,949,388 3,515,431 8,930,058 17,587,950 130,000 160,000 6,061,880 2,423,950
OCTOBER 66,149,019 12,824,202 8,193,483 7,625,207 4,404,255 6,405,108 20,145,391 320,588 70,000 4,834,735 1,326,050
NOVEMBER 65,368,775 11,612,231 10,817,450 6,364,404 3,513,692 8,584,070 15,945,314 206,207 80,000 6,321,393 1,924,014
DECEMBER 66,365,513 14,971,977 12,892,874 4,926,061 3,284,041 6,922,405 15,928,011 211,562 90,000 5,540,091 1,598,491
TOTAL 800,337,206 171,210,495 127,945,435 62,683,808 39,520,121 104,223,617 207,385,349 2,649,207 998,300 65,667,224 18,053,650
LESS : VOLUME LIFTED BY NNPC IN THE YEAR DURING TRIAL MARKETING PERIOD (TMP): -
ACTUAL VOLUME OF PSC CRUDE LIFTED BY NNPC FOR FEDERATION ACCOUNT DURING THE YEAR: 104,223,617
TOTAL NNPC LIFTINGS (DOMESTIC, REFINERIES AND FEDERATION ACCOUNT) DURING THE YEAR: 340,767,127

Main Report and Recommendations
NEITI Oil and Gas Industry 2013 Audit
224
Total Lifting of Crude Oil by NNPC and other Companies
The percentage lifting between NNPC and other Companies is shown in table 8.3.1.2c below.
Table 8.3.1.2C - Total Lifting of Crude Oil by NNPC and Other Companies
Figure 8.3.1.2C Total Lifting By NNPC and Other Companies
Total crude oil liftings by NNPC and the companies dropped by 39.854 million bbls (10.471%) and
26.455 million bbls (05.443%) respectively or a drop of 66.309million bbls(7.651%). This is as a
result of the drop in production when compared to 2012.
8.4 Disaggregated Oil Flows
8.4.1 Comparison of Crude Oil Production between Companies and DPR
Table below shows the comparison between the volumes of crude oil produced by stream as
reported by the companies, NNPC and DPR in 2013.
0
100,000
200,000
300,000
400,000
500,000
600,000
2009 2010 2011 2012 2013
mb
bls
NNPC Other Companies
Total
Liftings
2009 % of
Lifting
2010 % of
Lifting
2011 % of
Lifting
2012 % of
Lifting
2013 % of
Lifting
NNPC 336,161 42.57% 387,632 43.15% 385,937 44.50% 380,621 43.92% 340,767 42.58%
Other
Companies 453,549 57.43% 510,616 56.85% 481,350 55.50% 486,025 56.08% 459,570 57.42%
TOTAL 789,710 100% 898,248 100% 867,287 100% 866,646 100% 800,337 100%

Main Report and Recommendations
NEITI Oil and Gas Industry 2013 Audit
225
Table 8.4.1A – Comparison of Fiscalised Crude Production by Stream
STREAM NNPC DPR COMPANY
ABO 8,022,903 8,022,897 8,022,903
AGBAMI 84,871,128 84,871,128 84,871,128
AKPO 60,798,261 61,012,205 61,022,217
AMENAM 29,589,705 29,478,222 29,478,229
ANTAN 19,816,696 19,816,696 19,816,696
BONGA 50,947,329 50,904,162 50,904,162
BONNY 65,011,265 64,667,075 64,808,268
BRASS 31,247,781 31,339,249 31,339,246
EA 15,626,908 15,626,909 15,626,908
EBOK 12,948,763 12,948,763 12,948,763
ERHA 37,634,014 37,657,596 37,657,595
ESCRAVOS 75,175,535 75,172,726 75,172,726
FORCADOS 70,428,513 71,000,792 70,886,944
IMA 260,051 260,051 260,051
OKORO 6,624,751 6,584,898 6,584,898
OKONO 14,917,919 14,904,197 14,886,967
OKWORI 9,532,752 9,532,779 9,532,752
OYO 803,229 812,467 812,467
PENNINGTON 7,358,462 7,357,435 7,229,801
QIT 131,019,938 130,674,938 130,674,970
TULJA 2,909,852 3,204,478 3,104,832
UKPOKITI 586,905 982,136 982,136
USAN 39,214,610 39,191,544 39,184,610
YOHO 25,140,826 25,140,803 25,140,826
TOTAL 800,488,096 801,164,146 800,950,095
ZAFIRO 4,029,844 4,104,610 4,104,610 Source: NNPC Crude Production by Stream Template, DPR Reconciled Crude Production Template and Company's
Terminal Balance Templates

Main Report and Recommendations
NEITI Oil and Gas Industry 2013 Audit
226
Figure 8.4.1A - Comparison of Fiscalised Crude Production by Stream
Table 8.4.1B - Comparison of Production between NNPC and DPR
STREAM NNPC DPR VARIANCE
ABO 8,022,903 8,022,897 6
AGBAMI 84,871,128 84,871,128 -
AKPO 60,798,261 61,012,205 (213,944)
AMENAM 29,589,705 29,478,222 111,483
ANTAN 19,816,696 19,816,696 -
BONGA 50,947,329 50,904,162 43,167
BONNY 65,011,265 64,667,075 344,190
BRASS 31,247,781 31,339,249 (91,468)
EA 15,626,908 15,626,909 (1)
EBOK 12,948,763 12,948,763 -
ERHA 37,634,014 37,657,596 (23,582)
ESCRAVOS 75,175,535 75,172,726 2,809
FORCADOS 70,428,513 71,000,792 (572,279)
IMA 260,051 260,051 -
OKORO 6,624,751 6,584,898 39,853
OKONO 14,917,919 14,904,197 13,722
OKWORI 9,532,752 9,532,779 (27)
OYO 803,229 812,467 (9,238)
-
20,000,000
40,000,000
60,000,000
80,000,000
100,000,000
120,000,000
140,000,000
AB
O
AG
BA
MI
AK
PO
AM
ENA
M
AN
TAN
BO
NG
A
BO
NN
Y
BR
ASS EA
EBO
K
ERH
A
ESC
RA
VO
S
FOR
CA
DO
S
IMA
OK
OR
O
OK
ON
O
OK
WO
RI
OYO
PEN
NIN
GTO
N
QIT
TULJ
A
UK
PO
KIT
I
USA
N
YOH
O
BB
LS
COMPARISON OF FISCALISED CRUDE PRODUCTION BY STREAM
NNPC DPR COMPANY

Main Report and Recommendations
NEITI Oil and Gas Industry 2013 Audit
227
STREAM NNPC DPR VARIANCE
PENNINGTON 7,358,462 7,357,435 1,027
QIT 131,019,938 130,674,938 345,000
TULJA 2,909,852 3,204,478 (294,626)
UKPOKITI 586,905 982,136 (395,231)
USAN 39,214,610 39,191,544 23,066
YOHO 25,140,826 25,140,803 23
TOTAL 800,488,096 801,164,146 (676,050)
ZAFIRO 4,029,844 4,104,610 (74,766)
Table 8.4.1C - Comparison of Production between DPR and Companies
STREAM DPR COMPANY VARIANCE
ABO 8,022,897 8,022,903 (6)
AGBAMI 84,871,128 84,871,128 -
AKPO 61,012,205 61,022,217 (10,012)
AMENAM 29,478,222 29,478,229 (7)
ANTAN 19,816,696 19,816,696 -
BONGA 50,904,162 50,904,162 -
BONNY 64,667,075 64,808,268 (141,193)
BRASS 31,339,249 31,339,246 3
EA 15,626,909 15,626,908 1
EBOK 12,948,763 12,948,763 -
ERHA 37,657,596 37,657,595 1
ESCRAVOS 75,172,726 75,172,726 -
FORCADOS 71,000,792 70,886,944 113,848
IMA 260,051 260,051 -
OKORO 6,584,898 6,584,898 -
OKONO 14,904,197 14,886,967 17,230
OKWORI 9,532,779 9,532,752 27
OYO 812,467 812,467 -
PENNINGTON 7,357,435 7,229,801 127,634
QIT 130,674,938 130,674,970 (32)
TULJA 3,204,478 3,104,832 99,646
UKPOKITI 982,136 982,136 -
USAN 39,191,544 39,184,610 6,934
YOHO 25,140,803 25,140,826 (23)
TOTAL 801,164,146 800,950,095 214,051
ZAFIRO 4,104,610 4,104,610 -

Main Report and Recommendations
NEITI Oil and Gas Industry 2013 Audit
228
The Total production volume for the Companies is not inclusive of Sheba Ukpokiti Crude stream as
they did not provide volumetric data, this however has no material effect as to the overall
production volume for the year under review.
Table 8.4.1D - Comparison between Liftings Reported by Terminal Operators, DPR, NNPC and Companies
STREAM NNPC DPR COMPANY TERMINAL OPERATOR
ABO 7,973,513 7,973,515 7,973,515 7,973,515
AGBAMI 84,752,375 84,752,375 84,752,375 84,752,375
AKPO 60,787,043 60,787,043 60,787,043 60,787,043
ASARAMATORU 169,756 - - -
AMENAM 28,080,832 28,080,832 27,740,518 28,080,832
ANTAN 19,936,820 19,936,820 19,936,820 19,936,820
BONGA 50,858,029 50,858,029 50,858,029 50,858,029
BONNY 65,147,741 65,147,741 65,147,741 65,147,741
BRASS 30,866,918 30,866,918 30,866,918 30,866,918
EA 16,175,525 16,175,525 16,175,525 16,175,525
EBOK 13,118,644 13,118,643 13,118,643 13,118,643
ERHA 37,031,702 37,031,702 37,031,702 37,031,702
ESCRAVOS 75,041,673 75,041,673 75,041,673 75,041,673
FORCADOS 70,710,265 71,470,045 70,710,265 70,710,265
IMA 209,822 209,822 209,822 209,822
OKORO 6,431,941 6,431,941 6,431,941 6,431,941
OKONO 14,831,223 14,831,286 14,831,286 14,831,286
OKWORI 9,057,835 9,057,835 9,057,835 9,057,835
OYO 671,221 671,221 671,221 671,221
PENNINGTON 6,891,180 6,891,180 7,359,788 6,891,180
QIT 130,387,983 130,387,983 130,387,983 130,387,981
TULJA 2,957,822 2,957,822 2,957,822 2,957,822
UKPOKITI 982,136 982,136 982,136 684,686
USAN 38,357,661 38,357,661 38,357,661 38,357,661
YOHO 24,969,999 24,969,999 24,969,999 24,969,999
TOTAL 796,399,659 796,989,747 796,358,261 795,932,515
ZAFIRO 3,937,545 3,937,545 3,937,545 3,937,545 Source: COMD/DPR 2013 Crude Oil Production Profile, Companies Terminal Balance and Terminal Operations

Main Report and Recommendations
NEITI Oil and Gas Industry 2013 Audit
229
Figure 8.4.1D – Comparison of Crude Lifting by Stream
Table 8.4.1E: Disaggregated Export Data by region
STREAM NNPC DPR COMPANY TERMINAL OPERATOR
Western Zone
EA 16,175,525 16,175,525 16,175,525 16,175,525
ABO 7,973,513 7,973,515 7,973,515 7,973,515
ESCRAVOS 75,041,673 75,041,673 75,041,673 75,041,673
FORCADOS 70,710,265 71,470,045 70,710,265 70,710,265
OYO 671,221 671,221 671,221 671,221
PENNINGTON 6,891,180 6,891,180 7,359,788 6,891,180
TULJA 2,957,822 2,957,822 2,957,822 2,957,822
UKPOKITI 982,136 982,136 982,136 684,686
TOTAL 181,403,335 182,163,117 181,871,945 181,105,887
Lagos Zone
AGBAMI 84,752,375 84,752,375 84,752,375 84,752,375
AKPO 60,787,043 60,787,043 60,787,043 60,787,043
BONGA 50,858,029 50,858,029 50,858,029 50,858,029
ERHA 37,031,702 37,031,702 37,031,702 37,031,702
USAN 38,357,661 38,357,661 38,357,661 38,357,661
TOTAL 271,786,810 271,786,810 271,786,810 271,786,810
Eastern Zone
STREAM NNPC DPR COMPANY TERMINAL OPERATOR
AMENAM 28,080,832 28,080,832 27,740,518 28,080,832
0
20,000,000
40,000,000
60,000,000
80,000,000
100,000,000
120,000,000
140,000,000
NNPC DPR COMPANY TERMINAL OPERATOR

Main Report and Recommendations
NEITI Oil and Gas Industry 2013 Audit
230
ANTAN 19,936,820 19,936,820 19,936,820 19,936,820
ASARAMATORU 169,756 - - -
BONNY 65,147,741 65,147,741 65,147,741 65,147,741
BRASS 30,866,918 30,866,918 30,866,918 30,866,918
EBOK 13,118,644 13,118,643 13,118,643 13,118,643
IMA 209,822 209,822 209,822 209,822
OKORO 6,431,941 6,431,941 6,431,941 6,431,941
OKONO 14,831,223 14,831,286 14,831,286 14,831,286
OKWORI 9,057,835 9,057,835 9,057,835 9,057,835
QIT 130,387,983 130,387,983 130,387,983 130,387,981
YOHO 24,969,999 24,969,999 24,969,999 24,969,999
TOTAL 343,209,514 343,039,820 342,699,506 343,039,818
8.4.2 Terminal Balance
Terminal balance is the reconciliation of gross volumes of crude oil (oil, water and sediments)
produced and transferred to the terminals. This is how the operators calculate their net barrels in
the terminals. However, there were differences in the populated terminal balance templates. These
differences were reconciled after reviewing the original log used by the operators.
Table 8.4.2 - Comparison between Terminal and Calculated Opening and Closing Stock
BBLS
TERMINAL
2013
OPENING STOCK
2013
CLOSING STOCK
Terminal values ABO 514,855 564,243
Calculated values 514,855 551,614
Terminal values AGBAMI 576,390 695,143
Calculated values 576,390 695,143
Terminal values AKPO 638,262 873,436
Calculated values 638,267 873,436
Terminal values ANTAN 716,017 595,893
Calculated values 716,017 595,893
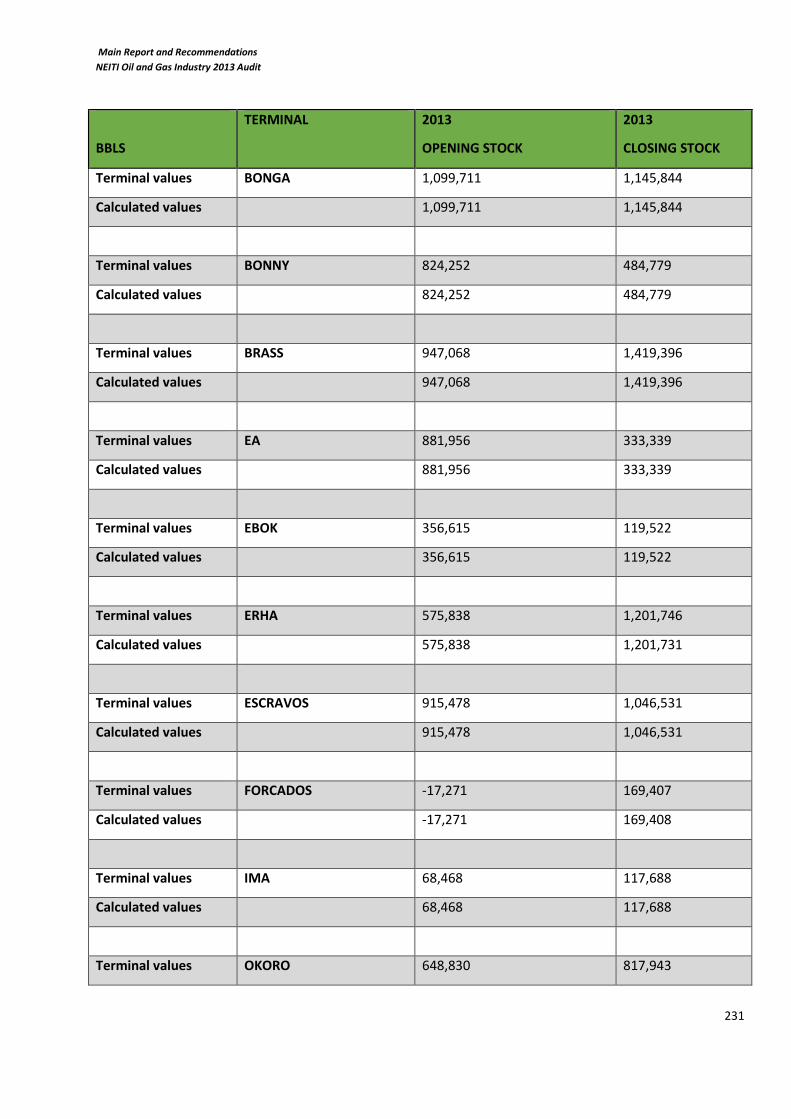
Main Report and Recommendations
NEITI Oil and Gas Industry 2013 Audit
231
BBLS
TERMINAL
2013
OPENING STOCK
2013
CLOSING STOCK
Terminal values BONGA 1,099,711 1,145,844
Calculated values 1,099,711 1,145,844
Terminal values BONNY 824,252 484,779
Calculated values 824,252 484,779
Terminal values BRASS 947,068 1,419,396
Calculated values 947,068 1,419,396
Terminal values EA 881,956 333,339
Calculated values 881,956 333,339
Terminal values EBOK 356,615 119,522
Calculated values 356,615 119,522
Terminal values ERHA 575,838 1,201,746
Calculated values 575,838 1,201,731
Terminal values ESCRAVOS 915,478 1,046,531
Calculated values 915,478 1,046,531
Terminal values FORCADOS -17,271 169,407
Calculated values -17,271 169,408
Terminal values IMA 68,468 117,688
Calculated values 68,468 117,688
Terminal values OKORO 648,830 817,943

Main Report and Recommendations
NEITI Oil and Gas Industry 2013 Audit
232
BBLS
TERMINAL
2013
OPENING STOCK
2013
CLOSING STOCK
Calculated values 648,830 817,943
Terminal values ODUDU/AMENAM 347,037 1,744,434
Calculated values 347,037 1,744,434
Terminal values OKONO 99,323 195,952
Calculated values 54,051 155,004
Terminal values OKWORI 503,042 977,959
Calculated values 503,042 977,959
Terminal values OYO 104,259 245,505
Calculated values 104,259 245,505
Terminal values PENNINGTON 0 0
Calculated values -4,930 -135,965
Terminal values QIT 1,309,335 1,464,533
Calculated values 1,309,328 1,569,322
Terminal values TULJA 27,945 174,599
Calculated values 27,945 174,599
Terminal values UKPOKITI
Calculated values 228,430
Terminal values USAN 560,482 1,450,364
Calculated values 431,081 1,387,431

Main Report and Recommendations
NEITI Oil and Gas Industry 2013 Audit
233
BBLS
TERMINAL
2013
OPENING STOCK
2013
CLOSING STOCK
Terminal values YOHO 473,406 644,653
Calculated values 473,406 643,813
Terminal values EKANGA/ZAFIRO 324,577 491,642
Calculated values 324,577 491,642
Terminal values TOTAL 12,495,875 16,974,551
Calculated values 12,544,700 16,826,011
Source: 2012 NEITI Oil & Gas Report and Company’s' Terminal Balance For 2013
The reported opening stock for 2013 as reported by the companies in their terminal balance and
the reconciled closing stock for 2012 showed little variance.
Analysis of each terminal balance revealed that data on some templates were incorrectly
populated. There were issues of transposition of data as the companies tried to transfer data from
their existing system to fit into NEITI templates. The main objective of reconciling respective
terminals’ opening and closing stocks is to make sure that there is volumetric balance between
crude oil transferred into the terminal and exported.
8.4.3 Analysis of Net Oil Balances and Gross Volumes Mass Balances
Summaries of the reconciliations of the gross balances at each terminal are set out below.
Note that reference is made to the following for each terminal:
2012 stock balance (closing stock)
Production data for the year as reported in the templates (with additional sections added
for 3rd party injections where applicable).
Terminal Balance (total receipts, liftings, terminal dewatering, terminal adjustment and
stock change)
Liftings data (as reported by the terminal operator, reconciled to data provided by each
individual lifter)

Main Report and Recommendations
NEITI Oil and Gas Industry 2013 Audit
234
Facility: Abo FPSO
Location: Offshore
Operator: Nigerian Agip Exploration (NAE)
Production Arrangement: Production Sharing Contract (PSC)
3rd Party Injector/Concession/Partners: OANDO E&P
Observations:
Overall production declined by 5.028% compared to 2012 production volumes
Total fiscalised terminal receipts was reported as 8,010,274 bbls (after all adjustments) by NAE
DPR and NNPC fiscalised production figures varied with NAE’s volume with -38,473 bbls and 38,473 bbls respectively.
There was a variance of 12,629 bbls in Abo’s closing stock volume and the Audit calculated closing stock.
The audit could not reconcile these variances as at the time of reporting because NAE, NNPC and DPR could not provide all the supporting documents.
Liftings (Terminal Balance) bbls Terminal/Fiscal Data
NNPC NNPC
NAE NAE
OANDO OANDO
Year %
2012
2013
Opening Stock from Last Audit = The reconcilled Closing Stock between the Auditors and the Operator for 2012 in the Last Audit
Production (NSV)
8,488,131 5.028
8,061,376
Lifting Differences (TER. Vs Coy) bbls
0
7,973,515 7,973,515 7,973,515 0
330,000 330,000 330,000 0
4,249,331 4,249,331 4,249,331 0
Closing Stock 564,243 551,614 12,629
bbls Liftings (DPR) bbls Variance (Coy vs DPR)
3,394,184 3,394,184 3,394,184 0
variance
Total Liquid Receipts 8,075,004 8,022,897 -38,479De-Water/Shrinkage 13,628Terminal Adjustments -51,102Liftings 7,973,515 Calculated Closing Stock
variance (DPR - Coy)
8,022,903 38,473
Opening Stock 1 Jan 13 514,855 DPR Production Crude variance (DPR - Coy)
NNPC Crude Production
8,075,004 13,628 8,061,376
8,061,376
ABO 2013 Operator: NAE
Production (P1.02) Opening Stock from last Audit Variance
Gross Production De-watering/Shrinkage Liquid Passed 514,855 -
Calculated Closing Stock = The Computed Closing Stock by the Auditor using information provided by the Operator in Terminal Balance Template
Shows variances between the companies 2013 Opening Stock-Reconcilled 2012 Closing Stock, Company Fiscalised Crude Production-DPR Ficalised Crude
Production, Operators Closing Stock-Auditors Calculated Closing Stock and Lifting Differences between Operator, Company and DPR
Shows variance between Operators Fiscalised Crude Production-NNPC Fiscalised Crude Production
Data not available at the time of analysis. Respective Entity to provide
Source: NNPC Crude Production by Stream Template, DPR Reconcilled Crude Production Template and Company's Terminal Balance/Crude Lifting Templates

Main Report and Recommendations
NEITI Oil and Gas Industry 2013 Audit
235
Facility: Agbami FPSO
Location: Offshore
Operator: Star Deep Water
Production Arrangement: Production Sharing Contract (PSC)
3rd Party Injector/Concession/Partners: Chevron, Famfa Oil, Petrobras & Statoil
Observations
Overall production declined by 0.2% compared to 2012 production volumes
The audit found no variances in the individual entities submissions.
Liftings (Terminal Balance) bbls Terminal/Fiscal Data
NNPC NNPC
TNOS TNOS
PETROBRAS PETROBRAS
STATOIL STATOIL
FAMFA FAMFA
STARDEEP STARDEEP
Year %
2012
2013
PETROBRAS
STATOIL
FAMFA
STARDEEP/NNPC
Lifting Differences (TER. Vs Coy) bbls
0
Production (NSV) PRODUCTION CONTRIBUTION (NSV)
85,041,559 0.2
TERMINAL OPERATOR
84,871,128 TNOS 7,704,312
43,713,264 43,713,264 43,713,264 0
84,752,375 84,752,375 84,752,375 0
4,918,540 4,918,540 4,918,540 0
7,875,049 7,875,049 7,875,049 0
4,919,961 4,919,961 4,919,961 0
84,871,128
0
Closing Stock 695,143 695,143 0
bbls Liftings (DPR) bbls Variance (Coy vs DPR)
15,536,126 15,536,126 15,536,126 0
AGBAMI 2013 Operator: STARDEEP
Production (P1.02) Opening Stock from last Audit Variance
84,871,128 0 84,871,128
Gross Production De-watering/Shrinkage Liquid Passed 576,390 -
Source: NNPC Crude Production by Stream Template, DPR Reconcilled Crude Production Template and Company's Terminal Balance/Crude Lifting Templates
84,871,128 variance (DPR - Coy)
84,871,128 0
Opening Stock 1 Jan 13 576,390 DPR Production Crude variance (DPR - Coy)
NNPC Crude Production
0De-Water/Shrinkage 0Terminal Adjustments 0Liftings 84,752,375 Calculated Closing Stock
7,789,435 7,789,435 7,789,435
variance
Total Liquid Receipts 84,871,128
Opening Stock from Last Audit = The reconcilled Closing Stock between the Auditors and the Operator for 2012 in the Last Audit
Calculated Closing Stock = The Computed Closing Stock by the Auditor using information provided by the Operator in Terminal Balance Template
Shows variances between the companies 2013 Opening Stock-Reconcilled 2012 Closing Stock, Company Fiscalised Crude Production-DPR Ficalised Crude
Production, Operators Closing Stock-Auditors Calculated Closing Stock and Lifting Differences between Operator, Company and DPR
Shows variance between Operators Fiscalised Crude Production-NNPC Fiscalised Crude Production
Data not available at the time of analysis. Respective Entity to provide
58,554,869
4,526,326
8,710,088
5,375,534

Main Report and Recommendations
NEITI Oil and Gas Industry 2013 Audit
236
Facility: Akpo FPSO
Location: Offshore
Operator: Total Upstream Nigeria Limited
Production Arrangement: Production Sharing Contract (PSC)
3rd Party Injector/Concession/Partners: Sapetro, CNOOC & Petrobras (Brasoil)
Observations:
Overall production increased by 7.686% compared to 2012 production volumes
There were variances in production volume between NNPC, DPR and TUPNI
Liftings (Terminal Balance) bbls Terminal/Fiscal Data
NNPC NNPC
SAPETRO SAPETRO
CNOOC CNOOC
BRASOIL BRASOIL
TUPNI TUPNI
Year %
2012
2013
Source: NNPC Crude Production by Stream Template, DPR Reconcilled Crude Production Template and Company's Terminal Balance/Crude Lifting Templates
60,787,043 60,787,043 60,787,043 0
Lifting Differences (TER. Vs Coy) bbls
0
Production (NSV)
56,667,027 7.686
61,022,217
14,673,721 14,673,721 14,673,721 0
16,066,162 16,066,162 16,066,162 0
8,039,025 8,039,025 8,039,025 0
18,923,498 18,923,498 18,923,498 0
3,084,637 3,084,637 3,084,637 0
variance (DPR - Coy)
Variance (Coy vs
Closing Stock 873,436 873,436 0
bbls Liftings (DPR) bbls
Terminal Adjustments -2,072Liftings 60,787,043 Calculated Closing Stock variance
AKPO 2013 Operator: TUPNI
Production (P1.02) Opening Stock from last Audit Variance
Gross Production De-watering/Shrinkage Liquid Passed 638,267 5
Opening Stock from Last Audit = The reconcilled Closing Stock between the Auditors and the Operator for 2012 in the Last Audit
Calculated Closing Stock = The Computed Closing Stock by the Auditor using information provided by the Operator in Terminal Balance Template
Shows variances between the companies 2013 Opening Stock-Reconcilled 2012 Closing Stock, Company Fiscalised Crude Production-DPR Ficalised Crude
Production, Operators Closing Stock-Auditors Calculated Closing Stock and Lifting Differences between Operator, Company and DPR
Shows variance between Operators Fiscalised Crude Production-NNPC Fiscalised Crude Production
Data not available at the time of analysis. Respective Entity to provide
61,032,036 9,819 61,022,217
61,022,217 NNPC Crude Production
Total Liquid Receipts 61,032,036 61,012,205 -10,012De-Water/Shrinkage -7,747
variance (DPR - Coy)
60,798,261 223,956
Opening Stock 1 Jan 13 638,262 DPR Production Crude

Main Report and Recommendations
NEITI Oil and Gas Industry 2013 Audit
237
Facility: Odudu FSO
Location: Offshore
Operator: Total E&P Nigeria Limited
Production Arrangement: Joint Venture (JV)
3rd Party Injector/Concession/Partners: NNPC
Observations:
Overall production declined by 19.821% compared to 2012 production volumes
Total fiscalised terminal receipts was reported as 29,478,229 bbls (after all adjustments) by TEPNG
NNPC fiscalised production figures varied with TEPNG volume with -111,476 bbls.
There was a variance of 340,314 bbls in Lifting volumes as reported by the same entity (TEPNG) in its Terminal Balance and Crude Lifting (Fiscal Value Data) Templates.
The audit could not reconcile these variances as at the time of reporting.
Liftings (Terminal Balance) bbls Terminal/Fiscal Data
NNPC NNPC
TEPNG TEPNG
Year %
2012
2013
Gross Production De-watering/Shrinkage Liquid Passed 347,037 -
AMENAM/ODUDU 2013 Operator: TEPNG
Production (P1.02) Opening Stock from last Audit Variance
29,478,229 0 29,478,229
29,478,229 variance (DPR - Coy)
29,589,705 -111,476
Opening Stock 1 Jan 13 347,037 DPR Production Crude variance (DPR - Coy)
NNPC Crude Production
variance
Total Liquid Receipts 29,478,229 29,478,222 -7De-Water/Shrinkage 0Terminal Adjustments 0Liftings 28,080,832 Calculated Closing Stock
10,991,322 10,991,322 10,991,322 0
Closing Stock 1,744,434 1,744,434 0
bbls Liftings (DPR) bbls Variance (Coy vs DPR)
17,089,510 16,749,196 17,089,510 340,314
Lifting Differences (TER. Vs Coy) bbls
28,080,832 27,740,518 28,080,832 340,314
340,314
Production (NSV)
36,765,692 19.821
29,478,229
Source: NNPC Crude Production by Stream Template, DPR Reconcilled Crude Production Template and Company's Terminal Balance/Crude Lifting Templates
Opening Stock from Last Audit = The reconcilled Closing Stock between the Auditors and the Operator for 2012 in the Last Audit
Calculated Closing Stock = The Computed Closing Stock by the Auditor using information provided by the Operator in Terminal Balance Template
Shows variances between the companies 2013 Opening Stock-Reconcilled 2012 Closing Stock, Company Fiscalised Crude Production-DPR Ficalised Crude
Production, Operators Closing Stock-Auditors Calculated Closing Stock and Lifting Differences between Operator, Company and DPR
Shows variance between Operators Fiscalised Crude Production-NNPC Fiscalised Crude Production
Data not available at the time of analysis. Respective Entity to provide

Main Report and Recommendations
NEITI Oil and Gas Industry 2013 Audit
238
Facility: Antan
Location: Offshore
Operator: Addax Petroleum Limited
Production Arrangement: Production Sharing Contract (PSC)
3rd Party Injector/Concession/Partners: Monipulo
Observations
Overall production increased by 6.308% compared to 2012 production volumes
The audit found no variances in the individual entities submissions.
Liftings (Terminal Balance) bbls Terminal/Fiscal Data
NNPC NNPC
ADDAX ADDAX
MONIPULO MONIPULO
Year %
2012
2013
Production (NSV)
18,640,807 6.308
19,816,696
Opening Stock from Last Audit = The reconcilled Closing Stock between the Auditors and the Operator for 2012 in the Last Audit
Calculated Closing Stock = The Computed Closing Stock by the Auditor using information provided by the Operator in Terminal Balance Template
1,159,727
18,656,696
1,159,727
Lifting Differences (TER. Vs Coy) bbls
0
MONIPULO
DPR
PRODUCTION CONTRIBUTION (NSV)
ADDAX 18,656,696
TERMINAL OPERATOR
19,936,820 19,936,820 19,936,820 0
1,370,228 1,370,228 1,370,228 0
11,923,437 11,923,956 11,923,956 0
Closing Stock 595,893 595,893 0
bbls Liftings (DPR) bbls Variance (Coy vs DPR)
6,643,155 6,642,636 6,642,636 0
variance
Total Liquid Receipts 19,816,696 19,816,696 0De-Water/Shrinkage 0Terminal Adjustments 0Liftings 19,936,820 Calculated Closing Stock
DPR Production Crude variance (DPR - Coy)
ANTAN 2013 Operator: ADDAX
Production (P1.02) Opening Stock from last Audit Variance
NNPC Crude Production
0
Opening Stock 1 Jan 13 716,017
Source: NNPC Crude Production by Stream Template, DPR Reconcilled Crude Production Template and Company's Terminal Balance/Crude Lifting Templates
Shows variances between the companies 2013 Opening Stock-Reconcilled 2012 Closing Stock, Company Fiscalised Crude Production-DPR Ficalised Crude
Production, Operators Closing Stock-Auditors Calculated Closing Stock and Lifting Differences between Operator, Company and DPR
Shows variance between Operators Fiscalised Crude Production-NNPC Fiscalised Crude Production
Data not available at the time of analysis. Respective Entity to provide
Gross Production De-watering/Shrinkage Liquid Passed 716,017 -
19,816,696 0 19,816,696
19,816,696 variance (DPR - Coy)
19,816,696

Main Report and Recommendations
NEITI Oil and Gas Industry 2013 Audit
239
Facility: Bonga FPSO
Location: Offshore
Operator: Shell Nigeria Exploration and Production Company
Production Arrangement: Production Sharing Contract (PSC)
3rd Party Injector/Concession/Partners: TEPNG, ExxonMobil, NAE
Observations
Overall production declined significantly by 20.547% compared to 2012 production volumes
The audit found no significant variances in the individual entities submissions.
Liftings (Terminal Balance) bbls Terminal/Fiscal Data
NNPC NNPC
SNEPCO SNEPCO
MPNU MPNU
TEPNG TEPNG
NAE NAE
Year %
2012
2013
TEPNG
NAOC
MPNU
Shows variance between Operators Fiscalised Crude Production-NNPC Fiscalised Crude Production
Data not available at the time of analysis. Respective Entity to provide
Shows variances between the companies 2013 Opening Stock-Reconcilled 2012 Closing Stock, Company Fiscalised Crude Production-DPR Ficalised Crude
Production, Operators Closing Stock-Auditors Calculated Closing Stock and Lifting Differences between Operator, Company and DPR
Production (NSV) PRODUCTION CONTRIBUTION (NSV)
64,067,957 20.547
TERMINAL OPERATOR
4,858,267
3,036,417
3,036,417
Lifting Differences (TER. Vs Coy) bbls
0
50,904,162 SNEPCO/NNPC 39,973,061
Opening Stock from Last Audit = The reconcilled Closing Stock between the Auditors and the Operator for 2012 in the Last Audit
Calculated Closing Stock = The Computed Closing Stock by the Auditor using information provided by the Operator in Terminal Balance Template
50,858,029 50,858,029 50,858,029 0
4,720,335 4,720,335 4,720,335 0
2,955,005 2,955,005 2,955,005 0
29,032,055 29,032,055 29,032,055 0
11,242,863 11,242,863 11,242,863 0
2,907,771 2,907,771 2,907,771 0
bbls Liftings (DPR) bbls
Terminal Adjustments 0Liftings 50,858,029 Calculated Closing Stock variance
Variance (Coy vs DPR)
50,947,329 -43,167
Opening Stock 1 Jan 13 1,099,711 DPR Production Crude variance (DPR - Coy)
Closing Stock 1,145,844 1,145,844 0
Source: NNPC Crude Production by Stream Template, DPR Reconcilled Crude Production Template and Company's Terminal Balance/Crude Lifting Templates
50,904,162 0 50,904,162
50,904,162 NNPC Crude Production
BONGA 2013 Operator: SNEPCO
Production (P1.02) Opening Stock from last Audit Variance
Gross Production De-watering/Shrinkage Liquid Passed 1,099,711 -
Total Liquid Receipts 50,904,162 50,904,162 0De-Water/Shrinkage 0
variance (DPR - Coy)

Main Report and Recommendations
NEITI Oil and Gas Industry 2013 Audit
240
Facility: Bonny Terminal
Location: Onshore
Operator: Shell Petroleum Development Company (SPDC)
Production Arrangement: Joint Venture (JV)
3rd Party Injector/Concession/Partners: TEPNG, Chevron, WalterSmith, Agip & NDPR
Observations
Overall production declined significantly by 24.20% compared to 2012 production volumes
Total fiscalised terminal receipts was reported as 64,808,268 bbls (after all adjustments) by
SPDC
DPR and NNPC fiscalised production figures varied with SPDC’s volume.
The audit could not reconcile these variances as at the time of reporting.
Liftings (Terminal Balance) bbls Terminal/Fiscal Data
SPDC SPDC
TEPNG/SPDC JV TEPNG
NAOC NAOC
CNL CNL
WSPOL WSPOL
NDPR NDPR
TEPNG/NNPC JV
Total ex-SPDC
Total ex-Total
Year %
2012
2013
NDPR 329,282 391,022 329,282
TEPNG JV 7,615,431 7,706,832 7,706,832
CNL JV 2,269,744 2,267,712 2,267,712
3RD PARTY DPR
64,819,152 SPDC/NNPC JV 53,728,972 53,784,953
WSPOL 875,722 870,338 870,338
0
NNPC/REFINERY
Production (NSV) PRODUCTION CONTRIBUTION (NSV)
85,516,915
65,147,741 65,147,741 65,147,741 0
Lifting Differences (TER. Vs Coy) bbls
265,000
24.20 TERMINAL OPERATOR
265,000 265,000 0
0
2,355,608 829,600 829,600 0
809,250 809,250 809,250 0
0
Variance (Coy vs DPR)
29,333,619 35,090,582 35,090,582 0
16,722,785 16,722,785 16,722,785 0
2,805,527
Closing Stock 484,779 484,779 0
bbls Liftings (DPR) bbls
Terminal Adjustments -10,884Liftings 65,147,741 Calculated Closing Stock variance
BONNY 2013 Operator: SPDC
Production (P1.02) Opening Stock from last Audit Variance
Gross Production De-watering/Shrinkage Liquid Passed 824,252 -
Opening Stock from Last Audit = The reconcilled Closing Stock between the Auditors and the Operator for 2012 in the Last Audit
Calculated Closing Stock = The Computed Closing Stock by the Auditor using information provided by the Operator in Terminal Balance Template
Shows variances between the companies 2013 Opening Stock-Reconcilled 2012 Closing Stock, Company Fiscalised Crude Production-DPR
Ficalised Crude Production, Operators Closing Stock-Auditors Calculated Closing Stock and Lifting Differences between Operator, Company and
DPR
Shows variance between Operators Fiscalised Crude Production-NNPC Fiscalised Crude Production
Data not available at the time of analysis. Respective Entity to provide
64,819,152 0 64,819,152
64,819,152 NNPC Crude Production
Total Liquid Receipts 64,819,152 64,667,075 -152,077De-Water/Shrinkage 0
variance (DPR - Coy)
65,011,265 -192,113
Opening Stock 1 Jan 13 824,252 DPR Production Crude variance (DPR - Coy)
Source: NNPC Crude Production by Stream Template, DPR Reconcilled Crude Production Template and Company's Terminal Balance/Crude Lifting Templates
Broken down into
5,716,745
2,908,252
NNPC/REFINERY
7,139,207
Analysis of Lifting
35,090,582
NNPC ex-SPDC JV
NNPC ex-Chevron JV
29,333,619
NNPC ex-Total JV
1,526,008
4,230,955
TOTAL NNPC LIFTING
Broken down into
TOTAL TEPNG LIFTING 8,624,997
5,716,745 8,624,997 8,624,997 0
2,805,527 2,805,527

Main Report and Recommendations
NEITI Oil and Gas Industry 2013 Audit
241
Facility: Brass Terminal
Location: Onshore
Operator: Nigerian Agip Oil Company (NAOC)
Production Arrangement: Joint Venture (JV)
3rd Party Injector/Concession/Partners: Philips Oil, SPDC, Agip Energy and Natural Resources,
Addax Petroleum, Total E&P Nig. Limited, Midwestern Oil & Energia.
Observations
Overall production declined by 17.790% compared to 2012 production volumes
Total fiscalised terminal receipts was reported as 31,339,246 bbls (after all adjustments) by
NAOC
There was slight variance with DPR and NNPC fiscalised production figures.
The audit could not reconcile these variances as at the time of reporting.
Liftings (Terminal Balance) bbls Terminal/Fiscal Data
NNPC NNPC
AGIP AGIP
PHILLIPS PHILLIPS
SPDC SPDC
AENR AENR
ADDAX ADDAX
PLATFORM PLATFORM
TOTAL
MIDWESTERN
PILLAR
ENERGIA
Year %
2012
2013
Source: NNPC Crude Production by Stream Template, DPR Reconcilled Crude Production Template and Company's Terminal Balance/Crude Lifting Templates
Production (NSV)
38,431,091 17.79
31,593,562
Opening Stock from Last Audit = The reconcilled Closing Stock between the Auditors and the Operator for 2012 in the Last Audit
Calculated Closing Stock = The Computed Closing Stock by the Auditor using information provided by the Operator in Terminal Balance Template
Shows variances between the companies 2013 Opening Stock-Reconcilled 2012 Closing Stock, Company Fiscalised Crude Production-DPR Ficalised Crude
Production, Operators Closing Stock-Auditors Calculated Closing Stock and Lifting Differences between Operator, Company and DPR
Shows variance between Operators Fiscalised Crude Production-NNPC Fiscalised Crude Production
Data not available at the time of analysis. Respective Entity to provide
Lifting Differences (TER. Vs Coy) bbls
0
30,866,918 30,866,918 30,866,918 0
571,000 571,000 0
1,950,000 1,950,000 0
383,000 383,000 0
3,293,000 389,000 389,000 0
0 0 0
3,647,507 998,300 998,300 0
2,777,902 1,266,392 1,266,392 0
4,165,268 4,165,268 4,165,268 0
2,118,677 949,510 949,510 0
Variance (Coy vs DPR)
10,879,615 15,989,499 15,989,499 0
3,984,949 4,204,949 4,204,949 0
Closing Stock 1,419,396 1,419,396 0
bbls Liftings (DPR) bbls
Terminal Adjustments -254,316Liftings 30,866,918 Calculated Closing Stock variance
Total Liquid Receipts 65,554,490 31,339,249 -254,313De-Water/Shrinkage -33,981,792
variance (DPR - Coy)
31,247,781 345,781
Opening Stock 1 Jan 13 947,068 DPR Production Crude variance (DPR - Coy)
65,575,354 33,981,792 31,593,562
31,593,562 NNPC Crude Production
BRASS 2013 Operator: NAOC
Production (P1.02) Opening Stock from last Audit Variance
Gross Production De-watering/Shrinkage Liquid Passed 947,068 -

Main Report and Recommendations
NEITI Oil and Gas Industry 2013 Audit
242
Facility: Sea Eagle FPSO
Location: Offshore
Operator: Shell Petroleum Development Company (SPDC)
Production Arrangement: Joint Venture (JV)
3rd Party Injector/Concession/Partners: Total E&P Nig. Limited & Nigerian Agip Oil Company
(NAOC)
Observations
Overall production declined significantly by 25.853% compared to 2012 production volumes
The audit found no variances in the individual entities submissions.
Liftings (Terminal Balance) bbls Terminal/Fiscal Data
NNPC NNPC
SPDC SPDC
TEPNG TEPNG
NAOC NAOC
Year %
2012
2013
Opening Stock from Last Audit = The reconcilled Closing Stock between the Auditors and the Operator for 2012 in the Last Audit
Calculated Closing Stock = The Computed Closing Stock by the Auditor using information provided by the Operator in Terminal Balance Template
Shows variances between the companies 2013 Opening Stock-Reconcilled 2012 Closing Stock, Company Fiscalised Crude Production-DPR Ficalised Crude
Production, Operators Closing Stock-Auditors Calculated Closing Stock and Lifting Differences between Operator, Company and DPR
Shows variance between Operators Fiscalised Crude Production-NNPC Fiscalised Crude Production
Data not available at the time of analysis. Respective Entity to provide
Production (NSV)
21,075,517 25.853
16,175,525 16,175,525 16,175,525 0
Lifting Differences (TER. Vs Coy) bbls
15,626,908
0
9,440,507 9,440,507 9,440,507 0
3,889,756 3,889,756 3,889,756 0
bbls Liftings (DPR) bbls
1,897,301 1,897,301 1,897,301 0
947,961 947,961 947,961 0
variance
Closing Stock 333,339
EA 2013 Operator: SPDC
Production (P1.02) Opening Stock from last Audit Variance
Gross Production De-watering/Shrinkage -
15,626,908
15,626,908 NNPC Crude Production variance (DPR - Coy)
Source: NNPC Crude Production by Stream Template, DPR Reconcilled Crude Production Template and Company's Terminal Balance/Crude Lifting Templates
15,626,908 0
Liquid Passed
15,626,908
881,956
Total Liquid Receipts 15,626,908De-Water/Shrinkage 0
15,626,909 1
Opening Stock 1 Jan 13 881,956 DPR Production Crude variance (DPR - Coy)
Variance (Coy vs DPR)
Terminal Adjustments 642
333,339 0
Liftings 16,175,525 Calculated Closing Stock

Main Report and Recommendations
NEITI Oil and Gas Industry 2013 Audit
243
Facility: Ebok
Location: Offshore
Operator: Oriental Energy
Production Arrangement: Sole Risk
3rd Party Injector/Concession/Partners: Afren Resources Limited
Observations
Overall production increased by 14.107% compared to 2012 production volumes
The relevant entities (Oriental & DPR) could not provide the audit with signed reconciled
lifting data.
Liftings (Terminal Balance) bbls Terminal/Fiscal Data
ORIENTAL ORIENTAL
Year %
2012
2013
Source: NNPC Crude Production by Stream Template, DPR Reconcilled Crude Production Template and Company's Terminal Balance/Crude Lifting Templates
Calculated Closing Stock = The Computed Closing Stock by the Auditor using information provided by the Operator in Terminal Balance Template
Shows variances between the companies 2013 Opening Stock-Reconcilled 2012 Closing Stock, Company Fiscalised Crude Production-DPR Ficalised Crude
Production, Operators Closing Stock-Auditors Calculated Closing Stock and Lifting Differences between Operator, Company and DPR
12,948,763
Lifting Differences (TER. Vs Coy) bbls
0
Production (NSV)
11,122,113 14.107
Opening Stock from Last Audit = The reconcilled Closing Stock between the Auditors and the Operator for 2012 in the Last Audit
Variance (Coy vs DPR)
13,118,643 13,118,643 13,118,643
13,118,643 13,118,643 0 13,118,643
Closing Stock 119,522 119,522 0
bbls Liftings (DPR) bbls
variance
Total Liquid Receipts 18,908,044 12,948,763 0De-Water/Shrinkage 5,959,281Terminal Adjustments -67,213Liftings 13,118,643 Calculated Closing Stock
Opening Stock 1 Jan 13 356,615 DPR Production Crude variance (DPR - Coy)
NNPC Crude Production
EBOK 2013 Operator: ORIENTAL ENERGY
Production (P1.02) Opening Stock from last Audit Variance
Shows variance between Operators Fiscalised Crude Production-NNPC Fiscalised Crude Production
Data not available at the time of analysis. Respective Entity to provide
Gross Production De-watering/Shrinkage Liquid Passed 356,615 0
18,908,044 5,959,281 12,948,763
12,948,763 variance (DPR - Coy)
12,948,763 0

Main Report and Recommendations
NEITI Oil and Gas Industry 2013 Audit
244
Facility: Erha FPSO
Location: Offshore
Operator: Esso Exploration and Production Nigeria Limited (EEPNL)
Production Arrangement: Production Sharing Contract (PSC)
3rd Party Injector/Concession/Partners: SNEPCO
Observations
Overall production declined significantly by 17.563% compared to 2012 production volumes
The audit found no significant variances in the individual entities submissions.
Liftings (Terminal Balance) bbls Terminal/Fiscal Data
NNPC NNPC
SNEPCO SNEPCO
EEPNL EEPNL
Year %
2012
2013
Calculated Closing Stock = The Computed Closing Stock by the Auditor using information provided by the Operator in Terminal Balance Template
Production (NSV)
45,680,658
Shows variances between the companies 2013 Opening Stock-Reconcilled 2012 Closing Stock, Company Fiscalised Crude Production-DPR Ficalised Crude
Production, Operators Closing Stock-Auditors Calculated Closing Stock and Lifting Differences between Operator, Company and DPR
37,657,595 17.563
Lifting Differences (TER. Vs Coy) bbls
0
Opening Stock from Last Audit = The reconcilled Closing Stock between the Auditors and the Operator for 2012 in the Last Audit
37,031,702 37,031,702 37,031,702 0
9,366,539 9,366,539 9,366,539 0
6,851,842 6,851,842 6,851,842 0
Closing Stock 1,201,746 1,201,731 15
bbls Liftings (DPR) bbls Variance (Coy vs DPR)
20,813,321 20,813,321 20,813,321 0
variance
Total Liquid Receipts 37,657,595 37,657,596 1De-Water/Shrinkage 0Terminal Adjustments 0Liftings 37,031,702 Calculated Closing Stock
Opening Stock 1 Jan 13 575,838 DPR Production Crude variance (DPR - Coy)
NNPC Crude Production
ERHA 2013 Operator: ESSO EXPLORATION
Production (P1.02) Opening Stock from last Audit Variance
Source: NNPC Crude Production by Stream Template, DPR Reconcilled Crude Production Template and Company's Terminal Balance/Crude Lifting Templates
Shows variance between Operators Fiscalised Crude Production-NNPC Fiscalised Crude Production
Data not available at the time of analysis. Respective Entity to provide
Gross Production De-watering/Shrinkage Liquid Passed 575,838 -
37,657,595 0 37,657,595
37,657,595 variance (DPR - Coy)
37,634,014 23,581

Main Report and Recommendations
NEITI Oil and Gas Industry 2013 Audit
245
Facility: Escravos Terminal
Location: Onshore
Operator: Chevron Nigeria Limited (CNL)
Production Arrangement: Joint Venture (JV)
3rd Party Injector/Concession/Partners: Britania-U, ConOil, Dubri Oil
Observations
Overall production declined by 9.423% compared to 2012 production volumes
The audit found no significant variances in the individual entities submissions.
Liftings (Terminal Balance) bbls Terminal/Fiscal Data
BRITANIA U BRITANIA U
DUBRI DUBRI
CONOIL CONOIL
CNL CNL
Year %
2012
2013
DUBRI
CONOIL
CNL/NNPC
Opening Stock from Last Audit = The reconcilled Closing Stock between the Auditors and the Operator for 2012 in the Last Audit
Production (NSV) PRODUCTION CONTRIBUTION (NSV)
9.42375,172,726 BRITANIA U 324,094 334,646 334,646
82,992,947 TERMINAL OPERATOR 3RD PARTY DPR
109,453 109,988 109,988
510,230 516,668 516,668
74,228,949 NA 74,228,949
75,175,535 -2,809
Liquid Passed
75,172,726
915,478
0
Opening Stock 1 Jan 13 915,478 DPR Production Crude variance (DPR - Coy)Total Liquid Receipts 75,172,726De-Water/Shrinkage 0
75,172,726
bbls Liftings (DPR) bbls Variance (Coy vs DPR)
Terminal Adjustments 0
1,046,531 0
Liftings 75,041,673 Calculated Closing Stock variance
42,507,460 0
398,000 398,000 398,000 0
110,500 110,500 110,500 0
42,507,46042,507,460
0
31,465,713 31,465,713 31,465,713
ESCRAVOS 2013 Operator: CHEVRON
Production (P1.02) Opening Stock from last Audit Variance
-
75,172,726 0
75,172,726 NNPC Crude Production variance (DPR - Coy)
Gross Production De-watering/Shrinkage
75,041,673 0
Lifting Differences (TER. Vs Coy)
Source: NNPC Crude Production by Stream Template, DPR Reconcilled Crude Production Template and Company's Terminal Balance/Crude Lifting Templates
Calculated Closing Stock = The Computed Closing Stock by the Auditor using information provided by the Operator in Terminal Balance Template
Shows variances between the companies 2013 Opening Stock-Reconcilled 2012 Closing Stock, Company Fiscalised Crude Production-DPR Ficalised Crude
Production, Operators Closing Stock-Auditors Calculated Closing Stock and Lifting Differences between Operator, Company and DPR
Shows variance between Operators Fiscalised Crude Production-NNPC Fiscalised Crude Production
Data not available at the time of analysis. Respective Entity to provide
bbls
Closing Stock 1,046,531
0
560,000 560,000 560,000 0
NNPC/PPMC NNPC/PPMC
75,041,673 75,041,673

Main Report and Recommendations
NEITI Oil and Gas Industry 2013 Audit
246
Facility: Forcados Terminal
Location: Onshore
Operator: Shell Petroleum Development Company (SPDC)
Production Arrangement: Joint Venture (JV)
3rd Party Injector/Concession/Partners: Total E&P Nig. Limited, NAOC, Philips Oil, NPDC, Seplat,
First Hydrocarbon, Neconde, Septa & ND Western
Observations
Overall production declined by 2.13% compared to 2012 production volumes
Total fiscalised terminal receipts was reported as 70,896,944 bbls (after all adjustments) by
SPDC
DPR and NNPC fiscalised production figures varied with SPDC’s volume with 101,026 bbls
and 471,253 bbls respectively.
There was a variance of 759,780 bbls in lifting records between SPDC and DPR
PanOcean did not provide reconciled Production Volume data with DPR
The audit could not reconcile these variances as at the time of reporting.
Liftings (Terminal Balance) bbls Terminal/Fiscal Data
NNPC NNPC
SPDC SPDC
TEPNG TEPNG
NAOC NAOC
FHN FHN
ND WESTERN ND WESTERN
NECONDE NECONDE
NPDC NPDC
PHILIPS PHILIPS
SEPLAT SEPLAT
AGIP AGIP
SHORELINE SHORELINE
Year %
2012
2013
TEPNG
NAOC
FHN
ND WESTERN
NECONDE
NPDC
SEPLAT
AGIP
SHORELINE
PANOCEAN
Shows variance between Operators Fiscalised Crude Production-NNPC Fiscalised Crude Production
1,401,254
3,080,534
7,419,698
371,490
18,618,743
2,192,179
3,763,507
741,112
Shows variances between the companies 2013 Opening Stock-Reconcilled 2012 Closing Stock, Company Fiscalised Crude Production-DPR Ficalised Crude
Production, Operators Closing Stock-Auditors Calculated Closing Stock and Lifting Differences between Operator, Company and DPR
Lifting Differences (TER. Vs Coy) bbls
0
SPDC/NNPC
Opening Stock from Last Audit = The reconcilled Closing Stock between the Auditors and the Operator for 2012 in the Last Audit
Calculated Closing Stock = The Computed Closing Stock by the Auditor using information provided by the Operator in Terminal Balance Template
Production (NSV) PRODUCTION CONTRIBUTION (NSV)
72,439,137 2.13
TERMINAL OPERATOR DPR
70,899,766
33,197,358
7,419,698
371,479
18,732,446
2,192,379
3,080,534
741,112
3,763,507
70,710,265 70,710,265 71,470,045 759,780
90,256 3,287,071 -3,287,071
9,161,369 4,100,211 4,100,211 0
1,482,074 90,256 90,256 0
16,130,919 7,243,905 7,243,905 0
2,928,079 1,312,226 1,312,226 0
1,735,725 18,059,214 19,864,211 1,804,997
654,176 1,787,096 1,787,096 0
2,947,577 2,947,577 2,947,577 0
1,319,780 1,319,780 1,319,780 0
19,011,279 19,011,279 21,253,133 2,241,854
11,263,717 11,263,717 11,263,717 0
3,985,314 287,933 287,933 0
bbls Liftings (DPR) bbls
Terminal Adjustments -2,822Liftings 70,710,265 Calculated Closing Stock variance
Variance (Coy vs DPR)
variance (DPR - Coy)
70,428,513 471,253
Opening Stock 1 Jan 13 -17,271 DPR Production Crude variance (DPR - Coy)
Closing Stock 169,407 169,408 -1
Data not available at the time of analysis. Respective Entity to provide
Source: NNPC Crude Production by Stream Template, DPR Reconcilled Crude Production Template and Company's Terminal Balance/Crude Lifting Templates
70,899,766 0 70,899,766
70,899,766 NNPC Crude Production
FORCADOS 2013 Operator: SPDC
Production (P1.02) Opening Stock from last Audit Variance
Gross Production De-watering/Shrinkage Liquid Passed (17,271) -
Total Liquid Receipts 70,899,766 71,000,792 101,026De-Water/Shrinkage 0

Main Report and Recommendations
NEITI Oil and Gas Industry 2013 Audit
247
Facility: Okoro
Location: Offshore
Operator: AMNI
Production Arrangement: Marginal
3rd Party Injector/Concession/Partners:
Observations
Overall production change could not be determined as there is no data for such in the
previous audit.
The audit found no variances in the individual entities submissions.
Liftings (Terminal Balance) bbls Terminal/Fiscal Data
OKORO OKORO
Year %
2012
2013
Opening Stock from Last Audit = The reconcilled Closing Stock between the Auditors and the Operator for 2012 in the Last Audit
Calculated Closing Stock = The Computed Closing Stock by the Auditor using information provided by the Operator in Terminal Balance Template
Shows variances between the companies 2013 Opening Stock-Reconcilled 2012 Closing Stock, Company Fiscalised Crude Production-DPR Ficalised Crude
Production, Operators Closing Stock-Auditors Calculated Closing Stock and Lifting Differences between Operator, Company and DPR
Lifting Differences (TER. Vs Coy) bbls
0
Production (NSV)
NA?
6,584,898
Variance (Coy vs DPR)
6,431,941 6,431,941 6,431,941 0
6,431,941 6,431,941 6,431,941 0
Closing Stock 817,943 817,943 0
bbls Liftings (DPR) bbls
variance
Total Liquid Receipts 6,584,898 6,584,898 0De-Water/Shrinkage 0Terminal Adjustments 16,156Liftings 6,431,941 Calculated Closing Stock
Opening Stock 1 Jan 13 648,830 DPR Production Crude variance (DPR - Coy)
NNPC Crude Production
OKORO 2013 Operator: AMNI
Production (P1.02) Opening Stock from last Audit Variance
Source: NNPC Crude Production by Stream Template, DPR Reconcilled Crude Production Template and Company's Terminal Balance/Crude Lifting Templates
Shows variance between Operators Fiscalised Crude Production-NNPC Fiscalised Crude Production
Data not available at the time of analysis. Respective Entity to provide
Gross Production De-watering/Shrinkage Liquid Passed NA
6,584,898 0 6,584,898
6,584,898 variance (DPR - Coy)
6,624,751 -39,853

Main Report and Recommendations
NEITI Oil and Gas Industry 2013 Audit
248
Facility: Ima
Location: Offshore
Operator: AMNI
Production Arrangement: Marginal
3rd Party Injector/Concession/Partners:
Observations
Overall production change could not be determined as there is no data for such in the
previous audit.
The audit found no variances in the individual entities submissions.
Liftings (Terminal Balance) bbls Terminal/Fiscal Data
IMA IMA
Year %
2012
2013
Calculated Closing Stock = The Computed Closing Stock by the Auditor using information provided by the Operator in Terminal Balance Template
Shows variances between the companies 2013 Opening Stock-Reconcilled 2012 Closing Stock, Company Fiscalised Crude Production-DPR Ficalised Crude
Production, Operators Closing Stock-Auditors Calculated Closing Stock and Lifting Differences between Operator, Company and DPR
Lifting Differences (TER. Vs Coy) bbls
0
Opening Stock from Last Audit = The reconcilled Closing Stock between the Auditors and the Operator for 2012 in the Last Audit
Production (NSV)
NA?
260,051
209,822 209,822 209,822 0
Variance (Coy vs DPR)
209,822 209,822 209,822 0
Closing Stock 117,688 117,688 0
bbls Liftings (DPR) bbls
variance
Total Liquid Receipts 260,051 260,051 0De-Water/Shrinkage 0Terminal Adjustments -1,009Liftings 209,822 Calculated Closing Stock
Opening Stock 1 Jan 13 68,468 DPR Production Crude variance (DPR - Coy)
NNPC Crude Production
IMA 2013 Operator: AMNI
Production (P1.02) Opening Stock from last Audit Variance
Source: NNPC Crude Production by Stream Template, DPR Reconcilled Crude Production Template and Company's Terminal Balance/Crude Lifting Templates
Shows variance between Operators Fiscalised Crude Production-NNPC Fiscalised Crude Production
Data not available at the time of analysis. Respective Entity to provide
Gross Production De-watering/Shrinkage Liquid Passed NA
260,051 0 260,051
260,051 variance (DPR - Coy)
260,051 0

Main Report and Recommendations
NEITI Oil and Gas Industry 2013 Audit
249
Facility: Okono
Location: Onshore
Operator: Nigerian Petroleum Development Company (NPDC)
Production Arrangement: Sole Risk
3rd Party Injector/Concession/Partners: Agip Energy and Natural Resources (AENR)
Observations
Overall production declined by 8.562% compared to 2012 production volumes
Total fiscalised terminal receipts was reported as 14,886,967 bbls (after all adjustments) by
NPDC
There were variances in the Opening stock, closing stock and production volumes with DPR
and NNPC.
The audit could not reconcile these variances as at the time of reporting.
Liftings (Terminal Balance) bbls Terminal/Fiscal Data
AENR AENR
NPDC NPDC
Year %
2012
2013
Calculated Closing Stock = The Computed Closing Stock by the Auditor using information provided by the Operator in Terminal Balance Template
Shows variances between the companies 2013 Opening Stock-Reconcilled 2012 Closing Stock, Company Fiscalised Crude Production-DPR Ficalised Crude
Production, Operators Closing Stock-Auditors Calculated Closing Stock and Lifting Differences between Operator, Company and DPR
Lifting Differences (TER. Vs Coy) bbls
0
Opening Stock from Last Audit = The reconcilled Closing Stock between the Auditors and the Operator for 2012 in the Last Audit
Production (NSV)
16,303,397 8.562
14,907,441
14,831,286 14,831,286 14,831,286 0
13,585,348 13,585,348 13,585,348 0
Closing Stock 195,952 155,004 40,948
bbls Liftings (DPR) bbls Variance (Coy vs DPR)
1,245,938 1,245,938 1,245,938 0
variance
Total Liquid Receipts 19,332,292 14,904,197 -3,244De-Water/Shrinkage 4,424,851Terminal Adjustments -20,474Liftings 14,831,286 Calculated Closing Stock
Opening Stock 1 Jan 13 99,323 DPR Production Crude variance (DPR - Coy)
NNPC Crude Production
OKONO 2013 Operator: NPDC
Production (P1.02) Opening Stock from last Audit Variance
Source: NNPC Crude Production by Stream Template, DPR Reconcilled Crude Production Template and Company's Terminal Balance/Crude Lifting Templates
Shows variance between Operators Fiscalised Crude Production-NNPC Fiscalised Crude Production
Data not available at the time of analysis. Respective Entity to provide
Gross Production De-watering/Shrinkage Liquid Passed 54,051 45,272
19,332,292 4,424,851 14,907,441
14,907,441 variance (DPR - Coy)
14,917,919 -10,478

Main Report and Recommendations
NEITI Oil and Gas Industry 2013 Audit
250
Facility: Okwori
Location: Offshore
Operator: Addax Petroleum Exploration Nigeria Limited (APENL)
Production Arrangement: Production Sharing Contract (PSC)
3rd Party Injector/Concession/Partners:
Observations
Overall production declined significantly by 21.183% compared to 2012 production volumes
The audit found no variances in the individual entities submissions.
Liftings (Terminal Balance) bbls Terminal/Fiscal Data
NNPC NNPC
ADDAX ADDAX
Year %
2012
2013
Shows variances between the companies 2013 Opening Stock-Reconcilled 2012 Closing Stock, Company Fiscalised Crude Production-DPR Ficalised Crude
Production, Operators Closing Stock-Auditors Calculated Closing Stock and Lifting Differences between Operator, Company and DPR
Shows variance between Operators Fiscalised Crude Production-NNPC Fiscalised Crude Production
Data not available at the time of analysis. Respective Entity to provide
Lifting Differences (TER. Vs Coy) bbls
0
Opening Stock from Last Audit = The reconcilled Closing Stock between the Auditors and the Operator for 2012 in the Last Audit
Calculated Closing Stock = The Computed Closing Stock by the Auditor using information provided by the Operator in Terminal Balance Template
Production (NSV)
12,094,784 21.183
9,532,752
9,057,835 9,057,835 9,057,835 0
4,525,608 4,525,608 4,525,608 0
Closing Stock 977,959 977,959 0
bbls Liftings (DPR) bbls Variance (Coy vs DPR)
4,532,227 4,532,227 4,532,227 0
DPR Production Crude variance (DPR - Coy)
NNPC Crude Production
variance
Total Liquid Receipts 9,532,752 9,532,779 27De-Water/Shrinkage 0Terminal Adjustments 0Liftings 9,057,835 Calculated Closing Stock
OKWORI 2013 Operator: ADDAX
Production (P1.02) Opening Stock from last Audit Variance
Source: NNPC Crude Production by Stream Template, DPR Reconcilled Crude Production Template and Company's Terminal Balance/Crude Lifting Templates
Gross Production De-watering/Shrinkage Liquid Passed 503,042 -
9,532,752 0 9,532,752
9,532,752 variance (DPR - Coy)
9,532,752 0
Opening Stock 1 Jan 13 503,042

Main Report and Recommendations
NEITI Oil and Gas Industry 2013 Audit
251
Facility: Oyo
Location: Offshore
Operator: Allied Energy Plc.
Production Arrangement: Marginal
3rd Party Injector/Concession/Partners:
Observations
Overall production declined by 19.545% compared to 2012 production volumes
The audit found no variances in the individual entities submissions.
Liftings (Terminal Balance) bbls Terminal/Fiscal Data
ALLIED ALLIED
Year %
2012
2013
Source: NNPC Crude Production by Stream Template, DPR Reconcilled Crude Production Template and Company's Terminal Balance/Crude Lifting Templates
Calculated Closing Stock = The Computed Closing Stock by the Auditor using information provided by the Operator in Terminal Balance Template
Shows variances between the companies 2013 Opening Stock-Reconcilled 2012 Closing Stock, Company Fiscalised Crude Production-DPR Ficalised Crude
Production, Operators Closing Stock-Auditors Calculated Closing Stock and Lifting Differences between Operator, Company and DPR
Lifting Differences (TER. Vs Coy) bbls
0
Opening Stock from Last Audit = The reconcilled Closing Stock between the Auditors and the Operator for 2012 in the Last Audit
Production (NSV)
1,009,842 19.545
812,467
Variance (Coy vs DPR)
671,221 671,221 671,221 0
671,221 671,221 671,221 0
Closing Stock 245,505 245,505 0
bbls Liftings (DPR) bbls
variance
Total Liquid Receipts 3,232,624 812,467 9,418De-Water/Shrinkage 2,429,575Terminal Adjustments 9,418Liftings 671,221 Calculated Closing Stock
Opening Stock 1 Jan 13 104,259 DPR Production Crude variance (DPR - Coy)
NNPC Crude Production
OYO 2013 Operator: ALLIED ENERGY
Production (P1.02) Opening Stock from last Audit Variance
Shows variance between Operators Fiscalised Crude Production-NNPC Fiscalised Crude Production
Data not available at the time of analysis. Respective Entity to provide
Gross Production De-watering/Shrinkage Liquid Passed 104,259
3,232,624 2,429,575 803,049
803,049 variance (DPR - Coy)
803,229 -180

Main Report and Recommendations
NEITI Oil and Gas Industry 2013 Audit
252
Facility: Pennington
Location: Offshore
Operator: Chevron Nigeria Limited
Production Arrangement: Joint Venture (JV)
3rd Party Injector/Concession/Partners: CONOG
Observations
Overall production declined significantly by 20.609% compared to 2012 production volumes
Total fiscalised terminal receipts was reported as 7,229,801 bbls (after all adjustments) by CNL
There were variances in the production volume with DPR and NNPC, opening stock and closing stock
DPR reconciled export data recorded no lifting for CNL in 2013 as against 985,668 bbls recorded in the
terminal balance template by CNL
The audit could not reconcile these variances as at the time of reporting. However, the following comment was made
by Chevron:
“The terminal balance template and the crude lifting/ export reconciliation sign-off are not the same because “Direct
Export” operations is employed in the production and export operations in Pennington Terminal since 2007. It follows
therefore that some volumes in the terminal balance in a particular year gets lifted in the following year and this
overlap continues into every year. the export data is only determined with the date on the Bill of Lading documents,
while the data in the Terminal balance template is estimated for each year end.”
Liftings (Terminal Balance) bbls Terminal/Fiscal Data
CONOG CONOG
NNPC NNPC
CNL CNL
Year %
2012
2013
CONOG 4,588,478 4,719,101
468,608
Production (NSV) PRODUCTION CONTRIBUTION (NSV)
9,102,862 20.609
TERMINAL OPERATOR DPR
7,226,812 CNL/NNPC 2,638,334 2,638,334
7,359,788 6,891,180 6,891,180 0
Lifting Differences (TER. Vs Coy) bbls
935,668 0 0
986,609 986,609 986,609 0
Closing Stock 0 -135,965 135,965
bbls Liftings (DPR) bbls Variance (Coy vs DPR)
5,437,511 5,904,571 5,904,571 0
DPR Production Crude variance (DPR - Coy)
NNPC Crude Production
variance
Total Liquid Receipts 7,226,812 7,357,435 130,623De-Water/Shrinkage 0Terminal Adjustments 2,989Liftings 7,359,788 Calculated Closing Stock
PENNINGTON 2013 Operator: CHEVRON
Production (P1.02) Opening Stock from last Audit Variance
Source: NNPC Crude Production by Stream Template, DPR Reconcilled Crude Production Template and Company's Terminal Balance/Crude Lifting Templates
Gross Production De-watering/Shrinkage Liquid Passed (4,930) (4,930)
7,226,812 0 7,226,812
7,226,812 variance (DPR - Coy)
7,358,462 -131,650
Opening Stock 1 Jan 13 0
Opening Stock from Last Audit = The reconcilled Closing Stock between the Auditors and the Operator for 2012 in the Last Audit
Calculated Closing Stock = The Computed Closing Stock by the Auditor using information provided by the Operator in Terminal Balance Template
Shows variances between the companies 2013 Opening Stock-Reconcilled 2012 Closing Stock, Company Fiscalised Crude Production-DPR Ficalised Crude
Production, Operators Closing Stock-Auditors Calculated Closing Stock and Lifting Differences between Operator, Company and DPR
Shows variance between Operators Fiscalised Crude Production-NNPC Fiscalised Crude Production
Data not available at the time of analysis. Respective Entity to provide

Main Report and Recommendations
NEITI Oil and Gas Industry 2013 Audit
253
Facility: Qua-Iboe
Location: Onshore
Operator: Mobil Producing Nigeria Unlimited (MPNU)
Production Arrangement: Joint Venture (JV)
3rd Party Injector/Concession/Partners:
Production from OSO platform is exported through QIT hence OSO platform data is part of QIT
data.
Observations
Overall production increased by 1.41% compared to 2012 production volumes
There were variances in the production volume with DPR and NNPC and closing stock
The audit could not reconcile these variances as at the time of reporting.
Liftings (Terminal Balance) bbls Terminal/Fiscal Data
MPN MPN
NNPC NNPC
Year %
2012
2013
Calculated Closing Stock = The Computed Closing Stock by the Auditor using information provided by the Operator in Terminal Balance Template
Opening Stock from Last Audit = The reconcilled Closing Stock between the Auditors and the Operator for 2012 in the Last Audit
Shows variances between the companies 2013 Opening Stock-Reconcilled 2012 Closing Stock, Company Fiscalised Crude Production-DPR Ficalised Crude
Production, Operators Closing Stock-Auditors Calculated Closing Stock and Lifting Differences between Operator, Company and DPR
Data not available at the time of analysis. Respective Entity to provide
Shows variance between Operators Fiscalised Crude Production-NNPC Fiscalised Crude Production
Source: NNPC Crude Production by Stream Template, DPR Reconcilled Crude Production Template and Company's Terminal Balance/Crude Lifting Templates
Lifting Differences (TER. Vs Coy) bbls
2
Production (NSV)
128,853,436 1.41
130,674,970
130,387,983 130,387,981 130,387,983 2
76,439,723 79,194,144 77,344,560 -1,849,584
Closing Stock 1,464,533 1,596,322 -131,789
bbls Liftings (DPR) bbls Variance (Coy vs DPR)
53,948,260 51,193,837 53,043,423 1,849,586
variance
Total Liquid Receipts 130,674,970 130,762,200 87,230De-Water/Shrinkage 0Terminal Adjustments 0Liftings 130,387,983 Calculated Closing Stock
variance (DPR - Coy)
131,019,938 -344,968
Opening Stock 1 Jan 13 1,309,335 DPR Crude Production variance (DPR - Coy)
NNPC Crude Production
130,674,970 0 130,674,970
130,674,970
QIT 2013 Operator: MPNU
Production (P1.02) Opening Stock from last Audit Variance
Gross Production De-watering/Shrinkage Liquid Passed 1,309,328 (7)

Main Report and Recommendations
NEITI Oil and Gas Industry 2013 Audit
254
Facility: Tulja
Location: Offshore
Operator: Sterling Oil Exploration and Energy Production Company Limited (SEEPCO)
Production Arrangement: Production Sharing Contract (PSC)
3rd Party Injector/Concession/Partners:
Observations
Overall production increased significantly by 91.561% compared to 2012 production
volumes
There were variances in the production volume with DPR and NNPC.
The audit could not reconcile these variances as at the time of reporting.
Liftings (Terminal Balance) bbls Terminal/Fiscal Data
STERLING STERLING
NNPC NNPC
Year %
2012
2013
Source: NNPC Crude Production by Stream Template, DPR Reconcilled Crude Production Template and Company's Terminal Balance/Crude Lifting Templates
Calculated Closing Stock = The Computed Closing Stock by the Auditor using information provided by the Operator in Terminal Balance Template
Shows variances between the companies 2013 Opening Stock-Reconcilled 2012 Closing Stock, Company Fiscalised Crude Production-DPR Ficalised Crude
Production, Operators Closing Stock-Auditors Calculated Closing Stock and Lifting Differences between Operator, Company and DPR
Lifting Differences (TER. Vs Coy) bbls
396
Opening Stock from Last Audit = The reconcilled Closing Stock between the Auditors and the Operator for 2012 in the Last Audit
Production (NSV)
1,620,804 91.561
3,104,832
2,958,178 2,957,782 2,957,822 40
365,000 365,000
Closing Stock 174,599 174,599 0
bbls Liftings (DPR) bbls Variance (Coy vs DPR)
2,958,178 2,957,782 2,592,822 -364,960
variance
Total Liquid Receipts 3,104,832 3,204,478 99,646De-Water/Shrinkage 0Terminal Adjustments 0Liftings 2,958,178 Calculated Closing Stock
Opening Stock 1 Jan 13 27,945 DPR Production Crude variance (DPR - Coy)
NNPC Crude Production
TULJA 2013 Operator: SEEPCO
Production (P1.02) Opening Stock from last Audit Variance
Shows variance between Operators Fiscalised Crude Production-NNPC Fiscalised Crude Production
Data not available at the time of analysis. Respective Entity to provide
Gross Production De-watering/Shrinkage Liquid Passed 27,945 -
3,104,832 0 3,104,832
3,104,832 variance (DPR - Coy)
2,909,852 194,980

Main Report and Recommendations
NEITI Oil and Gas Industry 2013 Audit
255
Facility: Ukpokiti
Location: Offshore
Operator: Shebah E&P Company Limited (SEPCOL)
Production Arrangement: Sole Risk
3rd Party Injector/Concession/Partners: Express Petroleum, Atlas Petroleum & SOGW
Atlas/Express operators of this facility did not populate/return template for Terminal balance
operations neither did they provide signed reconciled Production, Terminal receipts and export
volumes with DPR.
All attempts to get them to comply proved abortive.
Liftings (Terminal Balance) bbls Terminal/Fiscal Data
ATLAS ATLAS
EXPRESS EXPRESS
Year %
2012
2013
EXPRESS
Gross Production De-watering/Shrinkage Liquid Passed 228,430
UKPOKITI 2013 Operator: ATLAS/EXPRESS/SHEBAH
Production (P1.02) Opening Stock from last Audit Variance
0 variance (DPR - Coy)
586,905 -586,905
Opening Stock 1 Jan 13 DPR Production Crude variance (DPR - Coy)
NNPC Crude Production
variance
Total Liquid Receipts 756,261 756,261De-Water/Shrinkage
Terminal Adjustments
Liftings Calculated Closing Stock
68,000 -68,000
Closing Stock 0
bbls Liftings (DPR) bbls Variance (Coy vs DPR)
616,686 -616,686
Production (NSV) PRODUCTION CONTRIBUTION (NSV)
509,177 ?
TERMINAL OPERATOR DPR
Lifting Differences (TER. Vs Coy)
0 684,686 0 -684,686
Source: NNPC Crude Production by Stream Template, DPR Reconcilled Crude Production Template and Company's Terminal Balance/Crude Lifting Templates
Shows variance between Operators Fiscalised Crude Production-NNPC Fiscalised Crude Production
Data not available at the time of analysis. Respective Entity to provide
bbls
-684,686
ATLAS 414,425
341,836
Opening Stock from Last Audit = The reconcilled Closing Stock between the Auditors and the Operator for 2012 in the Last Audit
Calculated Closing Stock = The Computed Closing Stock by the Auditor using information provided by the Operator in Terminal Balance Template
Shows variances between the companies 2013 Opening Stock-Reconcilled 2012 Closing Stock, Company Fiscalised Crude Production-DPR Ficalised Crude
Production, Operators Closing Stock-Auditors Calculated Closing Stock and Lifting Differences between Operator, Company and DPR

Main Report and Recommendations
NEITI Oil and Gas Industry 2013 Audit
256
Facility: Usan
Location: Offshore
Operator: Total E&P Nigeria
Production Arrangement: Production Sharing Contract (PSC)
3rd Party Injector/Concession/Partners: Chevron, ESSO & Nexen Petroleum Nigeria
Observations
Overall production increased significantly by 33.40% compared to 2012 production volumes
There were variances in the production volume with DPR and NNPC, opening stock and
closing stock
The audit could not reconcile these variances as at the time of reporting.
Liftings (Terminal Operator) bbls Liftings (Lifting Coy)
NNPC NNPC
TEPNG TEPNG
ESSO ESSO
CNL CNL
NEXEN NEXEN
Year %
2012
2013
Gross Production De-watering/Shrinkage Liquid Passed 431,081 129,401
USAN 2013 Operator: TEPNG
Production (P1.02) Opening Stock from last Audit Variance
39,184,610 0 39,184,610
39,184,610 variance (DPR - Coy)
39,214,610 -30,000
Opening Stock 1 Jan 13 560,482 DPR Production Crude variance (DPR - Coy)
NNPC Crude Production
variance
Total Liquid Receipts 39,184,610 39,191,544 6,934De-Water/Shrinkage 0Terminal Adjustments 0Liftings 38,357,661 Calculated Closing Stock
5,987,429 5,987,429 5,987,429 0
Closing Stock 1,450,364 1,387,431 62,933
bbls Liftings (DPR) bbls Variance (Coy vs DPR)
4,539,012 4,539,012 4,539,012 0
10,884,060 10,884,060 10,884,060 0
10,990,011 10,990,011 10,990,011 0
0
Lifting Differences (TER. Vs Coy) bbls
5,957,149 5,957,149 5,957,149
38,357,661 38,357,661 38,357,661 0
0
Production (NSV)
29,373,767 33.4
39,184,610
Source: NNPC Crude Production by Stream Template, DPR Reconcilled Crude Production Template and Company's Terminal Balance/Crude Lifting Templates
Opening Stock from Last Audit = The reconcilled Closing Stock between the Auditors and the Operator for 2012 in the Last Audit
Calculated Closing Stock = The Computed Closing Stock by the Auditor using information provided by the Operator in Terminal Balance Template
Shows variances between the companies 2013 Opening Stock-Reconcilled 2012 Closing Stock, Company Fiscalised Crude Production-DPR Ficalised Crude
Production, Operators Closing Stock-Auditors Calculated Closing Stock and Lifting Differences between Operator, Company and DPR
Shows variance between Operators Fiscalised Crude Production-NNPC Fiscalised Crude Production
Data not available at the time of analysis. Respective Entity to provide

Main Report and Recommendations
NEITI Oil and Gas Industry 2013 Audit
257
Facility: Yoho
Location: Offshore
Operator: Mobil Producing Nigeria Unlimited (MPNU)
Production Arrangement: Joint Venture (JV)
3rd Party Injector/Concession/Partners:
Observations
Overall production declined by 10.12% compared to 2012 production volumes
The audit found no variances in the individual entities submissions.
Liftings (Terminal Balance) bbls Terminal/Fiscal Data
MPN MPN
NNPC NNPC
Year %
2012
2013
Shows variances between the companies 2013 Opening Stock-Reconcilled 2012 Closing Stock, Company Fiscalised Crude Production-DPR Ficalised Crude
Production, Operators Closing Stock-Auditors Calculated Closing Stock and Lifting Differences between Operator, Company and DPR
Shows variance between Operators Fiscalised Crude Production-NNPC Fiscalised Crude Production
Lifting Differences (TER. Vs Coy) bbls
0
Opening Stock from Last Audit = The reconcilled Closing Stock between the Auditors and the Operator for 2012 in the Last Audit
Calculated Closing Stock = The Computed Closing Stock by the Auditor using information provided by the Operator in Terminal Balance Template
Production (NSV)
27,685,619 10.12
25,140,406
24,969,999 24,969,999 24,969,999 0
15,251,613 15,251,613 15,251,613 0
Closing Stock 644,653 643,813 840
bbls Liftings (DPR) bbls Variance (Coy vs DPR)
9,718,386 9,718,386 9,718,386 0
Terminal Adjustments -420Liftings 24,969,999 Calculated Closing Stock
Total Liquid Receipts 25,140,826 25,140,803 -23De-Water/Shrinkage 0
473,406 DPR Production Crude variance (DPR - Coy)
NNPC Crude Production
variance
YOHO 2013 Operator: MPNU
Production (P1.02) Opening Stock from last Audit Variance
Source: NNPC Crude Production by Stream Template, DPR Reconcilled Crude Production Template and Company's Terminal Balance/Crude Lifting Templates
Data not available at the time of analysis. Respective Entity to provide
Gross Production De-watering/Shrinkage Liquid Passed 473,406 -
25,140,826 0 25,140,826
25,140,826 variance (DPR - Coy)
25,140,826 0
Opening Stock 1 Jan 13

Main Report and Recommendations
NEITI Oil and Gas Industry 2013 Audit
258
Facility: Zafiro
Location: Offshore
Operator: TEPNG (Nigeria) & Mobil (Equatorial Guinea)
Production Arrangement: Joint Venture (JV)
3rd Party Injector/Concession/Partners:
This is a unitized zone jointly operated by TEPNG (60%) and Mobil Equatorial Guinea (40%)
Observations
Overall production decreased by 9.045% compared to 2012 production volumes
There was variance in the production volume NNPC.
The audit could not reconcile these variances as at the time of reporting.
Liftings (Terminal Operator) bbls Liftings (Lifting Coy)
NNPC NNPC
TEPNG TEPNG
Year %
2012
2013
Gross Production De-watering/Shrinkage Liquid Passed 324,577 0
EKANGA ZAFIRO 2013 Operator: TEPNG
Production (P1.02) Opening Stock from last Audit Variance
4,104,610 0 4,104,610
4,104,610 variance (DPR - Coy)
4,029,844 74,766
Opening Stock 1 Jan 13 324,577 DPR Production Crude variance (DPR - Coy)
NNPC Crude Production
variance
Total Liquid Receipts 4,104,610 4,104,610 0De-Water/Shrinkage 0Terminal Adjustments 0Liftings 3,937,545 Calculated Closing Stock
994,898 994,898 994,898 0
Closing Stock 491,642 491,642 0
bbls Liftings (DPR) bbls Variance (Coy vs DPR)
2,942,647 2,942,647 2,942,647 0
3,937,545 3,937,545 3,937,545 0
Opening Stock from Last Audit = The reconcilled Closing Stock between the Auditors and the Operator for 2012 in the Last Audit
Lifting Differences (TER. Vs Coy) bbls
0
Production (NSV)
4,512,780 9.045
4,104,610
Calculated Closing Stock = The Computed Closing Stock by the Auditor using information provided by the Operator in Terminal Balance Template
Shows variances between the companies 2013 Opening Stock-Reconcilled 2012 Closing Stock, Company Fiscalised Crude Production-DPR Ficalised Crude
Production, Operators Closing Stock-Auditors Calculated Closing Stock and Lifting Differences between Operator, Company and DPR
Shows variance between Operators Fiscalised Crude Production-NNPC Fiscalised Crude Production
Data not available at the time of analysis. Respective Entity to provide
Source: NNPC Crude Production by Stream Template, DPR Reconcilled Crude Production Template and Company's Terminal Balance/Crude Lifting Templates

Main Report and Recommendations
NEITI Oil and Gas Industry 2013 Audit
259
8.4.4 Key findings in the reconciliation of Production Data in the records of NNPC to that of DPR
In the course of carrying out validation and reconciliation of Production volumes in the records of
NNPC to that of DPR, it was observed that there is a difference of 538,000 bbls between the
records of NNPC and DPR. This volume difference is however lower by about 85% when compared
to the figure of 3,638,412 bbls recorded in the 2012 audit.
All producing companies attend Curtailment meetings (monthly) to reconcile their production and
export volumes with DPR and NNPC. Upon reconciliation of these volumes, all parties are required
to sign-off on a data sheet.
We observed that NNPC was not a signatory to the annual reconciled production volumes but
signed-off on the annual reconciled export volumes. This anomaly is responsible for the variances
observed between the production volumes as reported by NNPC, DPR and the Terminal Operators.
For some terminals, the Audit was able to obtain a complete reconciled sign-off from all respective
parties including 3rd party injectors for each terminal while for some terminals the audit only
obtained partial or no reconciled positions at all.
Implication
The recurring lack of reconciled positions between the records of NNPC and DPR puts doubt in the
integrity of production figures and raises issues of accountability. This also creates differences
between audit figures which are based on NNPC records and individual company’s position.
Recommendation
NNPC and DPR to ensure timely and periodic reconciliation of production volumes and update
records accordingly.
8.4.5 Domestic Lifting
The Federal Government allocates 445,000 bbls/day for domestic crude processing at the local
Refineries based on their combined installed capacity. The table below shows Domestic Crude
allocation according to COMD’s Domestic Crude Sales schedule for 2013.

Main Report and Recommendations
NEITI Oil and Gas Industry 2013 Audit
260
Table 8.4.5A – PPMC Lifting
PPMC LIFTING (mmbls) 2013
Supply to Refineries 38.293
PPMC Crude Oil Exchange 59.464
Offshore Processing 24.665
Export as Unprocessed PPMC Crude 36.392
A. Total PPMC Lifting 158.814
B. Supposed PPMC Yearly Allocation of 445,000 bpd 162.425
Difference (B-A) 3.610
Domestic crude oil allocation is made-up of Crude oil Supplied to the Refineries, Crude oil used for
offshore processing/Swap arrangements and Exported unprocessed crude.
The refineries put together have not been able to refine up to 30% of the Domestic Crude Oil
allocation of 445,000 bpd. This has resulted in Alternative production arrangements such as
Offshore Processing and Swap in order to meet up with the increasing local demand for refined
petroleum products. These arrangements, have so far not been profitable to the government and
people of Nigeria even though the corporation (NNPC) insists it’s the best option.
The table below shows the percentage of domestic allocation which is refined locally.
Table 8.4.5B – Domestic Crude Allocation Proportion Refined from Total Refinery Delivery
Domestic Allocation
(MBBLS)
Refinery Delivery
(MBBLS)
% Refined
2009 161,914 19,363 11.96
2010 166,523 34,703 20.84
2011 164,454 45,394 27.60
2012 162,343 34,927 21.51
2013 158,814 38,293 24.11

Main Report and Recommendations
NEITI Oil and Gas Industry 2013 Audit
261
The table below gives a summary of the various channels of how the domestic crude oil allocation
is utilized. This includes off-shore processing, production and crude exchanges aside the deliveries
to local refineries.
Table 8.4.5C – Utilization of Allocated Domestic Crude
Allocated
Crude
Refinery
Delivery
Export Offshore
Processing
Crude
Exchange
Product
Exchange
Bbl’000 Bbl’000 Bbl’000 Bbl’000 Bbl’000 Bbl’000
2009 161,914 19,363 142, 551 - - -
2010 166,523 34,703 97,792 27,336 950 5,742
2011 164,454 45,394 39,341 23,688 - 56,032
2012 162,343 34,927 49,214 22,755 - 55,447
2013 158,814 38,293 36,392 24,665 - 59,464
Figure 8.4.5 – Domestic Crude Lifting between Refineries and Export
From the tables above, the refineries were able to refine a total of 38.293 million bbls in 2013 out
of 158.814 million bbls of the allocated domestic crude; this represents 24.11% of the total
domestic crude allocation.
0
20,000
40,000
60,000
80,000
100,000
120,000
140,000
160,000
2009 2010 2011 2012 2013
'00
0 b
bls
Refinery Delivery Export

Main Report and Recommendations
NEITI Oil and Gas Industry 2013 Audit
262
8.5 Petroleum Products Mass Balance Reconciliation
8.5.1 Product Importation and Distribution
The Nigeria National Petroleum Corporation (NNPC) has four refineries with a design capacity of
445,000 barrels per day. The Federal Government allocates this quantity of crude to NNPC for its
domestic liftings.
The crude is pumped through the pipelines from the oil terminals to the refineries Crude-intake
tank farms where it is then refined into petroleum products.
The individual refining capacities of the refineries, in barrels per stream day (BPD) are as follows:
Table 8.5.1 - Total Refining Capacity in Nigeria
Refinery Capacity
Port Harcourt Refining Company (PHRC) – Old 65,000BPD
Port Harcourt Refining Company (PHRC) - New 150,000BPD
Warri Refining and Petrochemical Company Limited (WRPC) 120,000BPD
Kaduna Refining and Petrochemical Company (KRPC) 110,000BPD
Total 445,000 BPD
Source: PPMC
The PHRC old refinery has been moribund for about 20 years but the allocation of 65,000 bbls still
continues. The performances of the other three refineries have fallen below designed capacity
partly due to aging and inadequate maintenance, necessitating the external sourcing of refined
petroleum products to address increasing domestic demand. This alternative production
arrangement commenced in 2010 with the introduction of Offshore Processing Arrangement (OPA)
with Nigermed and SIR and in 2011 PPMC introduced the SWAP arrangement with four contractors
namely;DUKE-OIL AITEO, ONTARIO, TRAFIGURA and TELEVERAS.
The OPA contract with Nigermed was discontinued at the end of 2010 even though THIS WAS THE
ONLY CONTRACT with gains. PPMC continued OPA with SIR and SWAP arrangements despite the
continual losses recorded in these contracts. The Audit was unable to obtain written explanations
from PPMC as to why the Nigermed contract with gains was discontinued while the SIR and Swap
contracts with huge losses were retained.
8.5.2 Crude Allocation to Refineries
The table below gives a summary of the various channels of how the domestic crude oil allocation is utilized. This includes off-shore processing, production and crude exchanges aside the deliveries to local refineries.

Main Report and Recommendations
NEITI Oil and Gas Industry 2013 Audit
263
Table 8.5.2 - Summary of Domestic Crude Oil Utilization 2009-2013
Allocated Crude
Refinery Delivery
Export OPA Crude Exchange
SWAP
Bbl’000 Bbl’000 Bbl’000 Bbl’000 Bbl’000 Bbl’000
2009 161,914 19,363 142, 551 - - -
2010 166,523 34,703 97,792 27,336 **950 5,742
2011 164,454 45,394 39,341 23,688 - 56,032
Total 492,891 99,458 279,684 51,024 950 61, 774
Percentage 100% 20.20% 56.74% 10.35% 0.19% 12.53%
2012 162,343 34,927 49,214 22,755 - 55,447
Percentage 100% 21.51% 30.32% 14.02% 34.15%
2013 158,814 38,293 36,392 24,665 - 59,464
Percentage 100% 24.11% 22.91% 15.53% 37.44%
**In 2010, 950,000 bbls was exchanged for heavy crude for KRPC processing. Figure 8.5.2 – Domestic Crude Oil Utilization 2009-2013
Based on the 445,000 bpd domestic allocation, the total crude due to PPMC annually is 162,420,000 bbls. In 2013, PPMC was allocated 158,814,000 bbls.
In 2013, a total of 52.97% of the domestic crude allocation was used for OPA and SWAP which shows that the Federation depends mainly on imported refined products for local consumption.
8.5.2.1 Audit issue on Crude Allocation to Refineries
From the above, the refineries capacity utilisation was only 24.11%, which means in 2013 out of a
total allocation of 158.814 million barrels, only 38.293 million barrels were processed in the
country. The balance of 75.89% was either processed outside the country or exported by NNPC.
0.00%
10.00%
20.00%
30.00%
40.00%
50.00%
60.00%
70.00%
80.00%
90.00%
2009 2010 2011 2012 2013
pe
rce
nta
ge
Year
Refinery Delivery Export OPA Crude Exchange SWAP

Main Report and Recommendations
NEITI Oil and Gas Industry 2013 Audit
264
Implication
These arrangements, have so far not been profitable to the government and people of Nigeria
even though the corporation (NNPC) insists it’s the best option.
Recommendations
The crude allocation to the NNPC for the refineries should be limited to their current
capacity utilisation.
NNPC should terminate all ad-hoc arrangements involving crude oil exchange barter or off-
shore processing and embark on direct crude sales or product purchase.
The allocation to the old moribund Port Harcourt Refinery should be stopped forthwith.
As a matter of urgency, the Federal Government through the appropriate agency should set
the agenda for the privatisation of the Refineries that are underperforming.
8.5.3 Refinery Balance
The total crude oil allocated to the four refineries at Warri, Kaduna and Port Harcourt is analysed in
the tables below to Show Crude intake and Utilsation in tonnage.
Table 8.5.3A - WRPC REFINERY BALANCE MT
CRUDE TYPE
2012
Closing
Stock
Opening
StockProduction Evacuation Losses
Closing
Stock
Calculated
Closing
Stock
Variance
ESCRAVOS OFF GAS
LPG 84,340 84,340 77,672 15,672
- 2,837 146,340 143,503
UGHELLI PMS 24,288 114,556 615,272 723,098
- 58,417 6,730 -51,687
DPK 16,560 16,560 387,517 381,713
- 22,366 22,364 -2
SLOP AGO 38,507 38,507 426,349 476,589
- 29,209 -11,733 -40,942
LPFO 42,122 125,007 567,696 562,110
- 130,576 130,593 17
ASPHALT
CONSUMPTION
COKE BURNT
Losses
26,675
There are a l ittle
over 7barrels of
Crude Oil in a
Metric Ton
PRODUCTS

Main Report and Recommendations
NEITI Oil and Gas Industry 2013 Audit
265
Observations:
There were huge variances in the Closing stock for 2012 as reported by WRPC and the
Opening stock of 2013 as reported by WRPC for PMS and LPFO.
The reported closing stock showed variances with the calculated Closing stock after material
balance.
According to WRPC, “CONSUMPTION” includes Gas, LPG, LPFO and AGO but the Losses of
26, 675 MT was not broken down into products.
WRPC reported that Propane and Butane counters were faulty; this resulted in 2,837 MT
differences. The Audit could not verify these claims.
WRPC did not provide the Audit with the Crude intake volumes.
Table 8.5.3B - KRPC Refinery Balance (Crude Material Balance) MT
OPENING STOCK
RECEIPT PROCESSED CLOSING STOCK
AUDIT CLOSING STOCK
VARIANCE
ESCRAVOS
20,393
939,530
990,930
31,506
(31,007)
62,513
URALS 15,237
-
-
15,237
15,237
-
UGELLI BLEND
95,687
556,436
545,221
35,160
106,902
(71,742)
SLOP 7,513
46,208
55,718
9,912
(1,997)
11,909
Table 8.5.3C - KRPC Refinery Balance (Products Material Balance) MT
PRODUCTS 2012 Closing Stock
Opening Stock
Production
Evacuation
Losses Closing Stock
Calculated Closing Stock
Variance
OFF GAS
LPG 84
84
- -
-
84
84
-
PMS 11,509
11,509
395,532
393,080
10,877
13,961
3,084
DPK 6,110
6,111
200,362
192,107
- 14,720
14,366
(354)
AGO 8,532
8,532
321,476
317,036
- 11,444
12,972
1,528

Main Report and Recommendations
NEITI Oil and Gas Industry 2013 Audit
266
PRODUCTS 2012 Closing Stock
Opening Stock
Production
Evacuation
Losses Closing Stock
Calculated Closing Stock
Variance
LPFO 11,019
11,019
336,719
331,106
- 15,515
16,632
1,117
ASPHALT 15,248
15,248
(5,289)
2,667
- 6,627
7,292
665
KERO-SOLVENT 881
467
(1,158)
948
- 216
(1,639)
(1,855)
INTERMEDIATE PRODUCT
237,492
216,308
24,778
167,397
- 194,197
73,689
(120,508)
INTERNAL CONSUMPTION
3,438
890
234,903
233,255
- 2,538
2,538
-
KRPC recorded a total production loss of 82,230 MT. This was not broken down by products.
Observations:
There were huge crude stock imbalances. The Operators provided no reasons for this.
KRPC had a total available crude stock of 1,681,004 MT of which 1,542,174 MT was crude
received.
KRPC refined a total of 1,591,869 of its available crude.
They were material imbalances for the refined products. The operator gave no reason for
these imbalances.
KRPC recorded a total production loss of 82,230 MT. This was not broken down by products.
Table 8.5.3D - PHRC Refinery Balance (Crude Material Balance) MT
OPENING STOCK
RECEIPT PROCESSED CLOSING STOCK
AUDIT CLOSING STOCK
VARIANCE
BONNY LIGHT 91,197
973,019
1,034,428
32,142
29,788
2,354
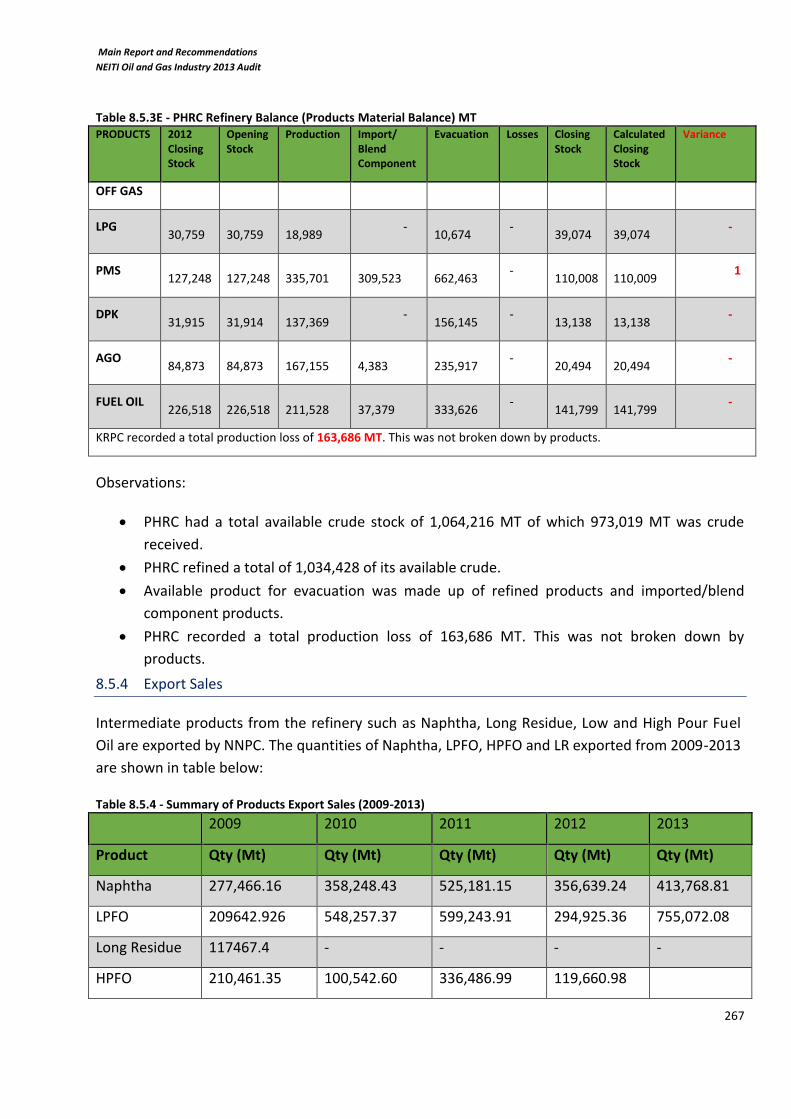
Main Report and Recommendations
NEITI Oil and Gas Industry 2013 Audit
267
Table 8.5.3E - PHRC Refinery Balance (Products Material Balance) MT PRODUCTS 2012
Closing Stock
Opening Stock
Production Import/ Blend Component
Evacuation Losses Closing Stock
Calculated Closing Stock
Variance
OFF GAS
LPG 30,759
30,759
18,989
- 10,674
- 39,074
39,074
-
PMS 127,248
127,248
335,701
309,523
662,463
- 110,008
110,009
1
DPK 31,915
31,914
137,369
- 156,145
- 13,138
13,138
-
AGO 84,873
84,873
167,155
4,383
235,917
- 20,494
20,494
-
FUEL OIL 226,518
226,518
211,528
37,379
333,626
- 141,799
141,799
-
KRPC recorded a total production loss of 163,686 MT. This was not broken down by products.
Observations:
PHRC had a total available crude stock of 1,064,216 MT of which 973,019 MT was crude
received.
PHRC refined a total of 1,034,428 of its available crude.
Available product for evacuation was made up of refined products and imported/blend
component products.
PHRC recorded a total production loss of 163,686 MT. This was not broken down by
products.
8.5.4 Export Sales
Intermediate products from the refinery such as Naphtha, Long Residue, Low and High Pour Fuel
Oil are exported by NNPC. The quantities of Naphtha, LPFO, HPFO and LR exported from 2009-2013
are shown in table below:
Table 8.5.4 - Summary of Products Export Sales (2009-2013)
2009 2010 2011 2012 2013
Product Qty (Mt) Qty (Mt) Qty (Mt) Qty (Mt) Qty (Mt)
Naphtha 277,466.16 358,248.43 525,181.15 356,639.24 413,768.81
LPFO 209642.926 548,257.37 599,243.91 294,925.36 755,072.08
Long Residue 117467.4 - - - -
HPFO 210,461.35 100,542.60 336,486.99 119,660.98

Main Report and Recommendations
NEITI Oil and Gas Industry 2013 Audit
268
The table above shows significant increase in the exported volumes of these intermediary products
in 2013. The increase in these exported volumes is a reflection of the decline in industrial activities
in the country as these products could be used as fuel for the local industries. This increase is also
attributed to poor performance of our refineries as these products could be processed to
petroleum products and generate more internal revenue.
8.5.5 Alternative Production Arrangements
In 2010, PPMC initiated an arrangement to augment shortfall in supply of refined products called
“Offshore Processing Arrangement (OPA)”. According to PPMC, this was necessary as the local
refineries production could not meet the daily local demands of white fuels. In 2011, PPMC further
introduced SWAP arrangement to increase the availability of white fuels in the country. These
contracts are carried out with the unrefined crude from the domestic allocation of 445,000 bpd
and records over-the-years have shown that these arrangements are not beneficial.
This audit requested explanation from PPMC for sustaining a contract that was clearly a “loss” to the federation and below is an extract of PPMC’s explanation of the process involved in OPA and SWAP. “…in order to mitigate the price vulnerability, shortages in products availability and guarantee of nationwide steady supply while at the same time freeing cash for other expenditures, NNPC sought and obtained approval to enter into Crude Oil Offshore Processing Arrangement (OPA) with Societe Ivoirienne de Raffinage (S.I.R.); and Crude Oil/Product Exchange Arrangement (SWAP) with Messrs Trafigura Beheer B.V and Duke Oil Company Incorporated (a fully owned subsidiary of NNPC). Under the OPA arrangement, NNPC delivers nominated Crude Oil grade to S.I.R. for processing and
subsequent delivery of the products to NNPC. In the execution of the programme two sets of
operational costs are incurred by NNPC, i.e. costs associated with the Crude Oil Supplies –
processing fee, freight and demurrage; and costs associated with the Products Deliveries –freight
and demurrage.
For the Products Deliveries, NNPC receives PMS, DPK and AGO (as required) in parcels of 30,000 to
60,000MT; while others - LPG, LPFO, VGO, Butane, Propane (referred to as Retained products in the
contract) not required by NNPC are sold and proceeds remitted to NNPC’s account.
Reconciliation meetings are held between NNPC and S.I.R. to determine the quantities of Crude Oil
supplied, the Refined products received and also the value of the Retained products. Any position
arrived at the end of each reconciliation meeting will be offset in the next cycle of transactions. The
transaction therefore is an on-going account, i.e. until such a time that the contract is terminated
and the final net positions ascertained.
NNPC made agreements with Societe Ivoirenne De Raffinage, (SIR) and Nigermed and others for
processing some quantities of the crude oil offshore. Part of the refined products such as PMS, AGO
and DPK are returned whilst LPG, VGO and Fuel Oil (LPFO and HPFO) are retained and paid for at a
negotiated price.

Main Report and Recommendations
NEITI Oil and Gas Industry 2013 Audit
269
Crude SWAP is a Value for Value arrangement where the operators deliver corresponding net
product value, i.e. inclusive of demurrage cost, to the net value derived from the Crude Oil loaded,
i.e. exclusive of associated costs - demurrage. Thus, the arrangement encompassed all costs (Crude
Oil, Products and associated costs), thereby relieving NNPC of the burden of cash payment.
Therefore, an over delivery means PPMC owes the party the value in Crude Oil, while an under
delivery means the other party owes PPMC the value in refined products; thus, either party is under
obligation to settle the over/under delivery in subsequent transactions. Accordingly, any difference
between the value of Crude Oil and that of refined products delivered are not construed as a net
gain or loss, instead the balance is taken as either over delivery or under delivery.
Keeping in line with the above, periodic account reconciliation is carried out to ascertain each
Party’s position and overall status of the programme. This is an on-going transaction and NOT a
financial loss or gain to the Corporation.”
Observations:
PPMC entered into OPA contract in 2010 with two companies (S.I.R and Nigermed). The
contract with Nigermed was discontinued at the end of 2010 even though it returned gains
to the Corporation while that of S.I.R with a steady loss is continued. PPMC was not able to
provide explanations for this.
PPMC said that these transactions are reconciled every two months to net-off the
differences with respect to under/over delivery. The under/over delivery are supposed to
be settled in subsequent transactions. The Audit observed that if this was the case then
how come these contracts have always recorded losses from 2010 up to the period under
review (2013).
In OPA, where PPMC estimates the value of returned product as Cost, Insurance and Freight
(CIF), the Audit estimates this value as Free on Board (FOB). This is so as all associated costs
in these transactions (outgoing crude, refining and returning white fuels) are borne by
PPMC.
The summary of Offshore Processing Arrangement for 2013 is shown below:
Table 8.5.5A - Summary of 2013 OPA (PPMC-SIR)
VOLUME (BBLS)
VALUE ($) FREIGHT ($) DEMURRAGE ($)
PROCESSING FEE ($)
TOTAL ($)
20,865,385 2,266,594,678.87 37,432,465.23
155,192.20 52,163,462.50
2,356,345,798.80
RETURNED PRODUCTS
-
PMS (MT) 1,732,677,248.590

Main Report and Recommendations
NEITI Oil and Gas Industry 2013 Audit
270
622,194.476 609,933,022.840 19,638,854.57
9,804,259.370
DPK (MT)
1,137,657.336
1,122,744,225.750
31,519,862.07
16,181,009.55
RETAINED PRODUCTS
LPG
394,651,355.37
49,215.593 38,226,564.710
FUEL OIL
268,271.899 168,260,801.030
VGO
270,855.490 188,163,989.630
Net Difference (Loss) (306,161,180.40)
The summary of Offshore Processing Arrangement (OPA) from 2010-2013 is shown below:
Table 8.5.5B - Summary of Products Imported between NNPC, Nigermed and SIR Processing Arrangements
NIGERMED 2010 SIR 2010 SIR 2011 SIR 2012 SIR 2013
CRUDE VOLUME (BBLS)
21,758,018
5,578,618
24,636,392
24,657,100
20,865,385
CRUDE VALUE ($) 1,738,569,282.00
496,255,654.00
2,787,176,618.00
2,750,815,143.38
2,266,594,678.87
TOTAL PRODUCT VALUE ($)
1,729,543,657.76
452,790,436.00
2,015,312,141.93
2,304,133,161.07
1,732,677,248.59
RETAINED PRODUCT VALUE ($)
197,590,015.73
83,360,570.00
518,600,077.33
523,877,525.39
394,651,355.37
OTHER COST ($) 116,853,236.00
48,273,619.00
176,182,885.00
212,988,862.02
166,895,105.49
NET GAIN/LOSS 71,711,155.49
(8,378,267.00)
(429,447,283.74)
(135,793,318.94)
(306,161,180.40)
From the above table, “Other cost” are costs borne by PPMC apart from the value of the Crude Oil
and it includes; Crude Oil Freight, Crude Oil Processing Fee at S.I.R facility, Demurrage on Crude Oil,
Freight for Returned Products and Demurrage associated with Returned Products.

Main Report and Recommendations
NEITI Oil and Gas Industry 2013 Audit
271
PPMC could not provide explanation for discontinuing the contract with Nigermed which was
profitable in 2010 in favour of S.I.R. despite the huge losses in revenue recorded in the various S.I.R
transactions
8.5.6 Swap Arrangement
In other to avoid scarcity of petroleum products in the country, PPMC signed a barter (value-for-
value) contracts with Trafigura Beheer B.V and Duke Oil in 2011. The contract with Trafigura was
initially signed on 1st October, 2010 and later renewed on 1st October 2011 to terminate on 31st
December 2014.
Basically, this is an arrangement for the exchange of crude oil for refined petroleum products. The
following arrangements were in place during the period covered by this audit:
PPMC/Duke Oil-Taleveras-Crude Oil – Refined Products Exchange Agreement; February -
December 2011.
PPMC/Duke Oil-AITEO Crude Oil – Refined Product Exchange Agreement; February –
December 2011.
PPMC/Duke Oil-Ontario-Crude Oil - Refined Products Exchange Agreement; February -
December 2011
PPMC/Trafigura Crude Oil-Refined Product Exchange Agreement - Liftings and Deliveries;
October -December 2010.
PPMC/Trafigura Crude Oil - Refined Product Agreement- Liftings and Deliveries; January –
December 2011.
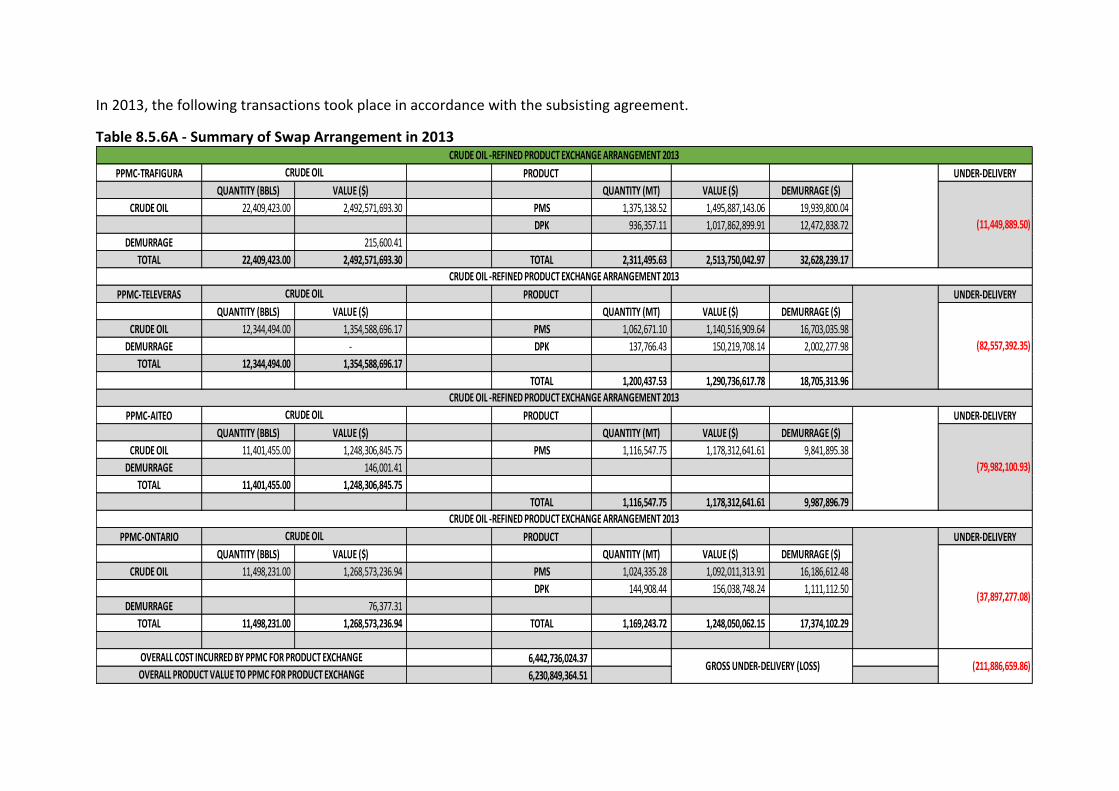
In 2013, the following transactions took place in accordance with the subsisting agreement.
Table 8.5.6A - Summary of Swap Arrangement in 2013
PPMC-TRAFIGURA PRODUCT UNDER-DELIVERY
QUANTITY (BBLS) VALUE ($) QUANTITY (MT) VALUE ($) DEMURRAGE ($)
CRUDE OIL 22,409,423.00 2,492,571,693.30 PMS 1,375,138.52 1,495,887,143.06 19,939,800.04
DPK 936,357.11 1,017,862,899.91 12,472,838.72
DEMURRAGE 215,600.41
TOTAL 22,409,423.00 2,492,571,693.30 TOTAL 2,311,495.63 2,513,750,042.97 32,628,239.17
PPMC-TELEVERAS PRODUCT UNDER-DELIVERY
QUANTITY (BBLS) VALUE ($) QUANTITY (MT) VALUE ($) DEMURRAGE ($)
CRUDE OIL 12,344,494.00 1,354,588,696.17 PMS 1,062,671.10 1,140,516,909.64 16,703,035.98
DEMURRAGE - DPK 137,766.43 150,219,708.14 2,002,277.98
TOTAL 12,344,494.00 1,354,588,696.17
TOTAL 1,200,437.53 1,290,736,617.78 18,705,313.96
PPMC-AITEO PRODUCT UNDER-DELIVERY
QUANTITY (BBLS) VALUE ($) QUANTITY (MT) VALUE ($) DEMURRAGE ($)
CRUDE OIL 11,401,455.00 1,248,306,845.75 PMS 1,116,547.75 1,178,312,641.61 9,841,895.38
DEMURRAGE 146,001.41
TOTAL 11,401,455.00 1,248,306,845.75
TOTAL 1,116,547.75 1,178,312,641.61 9,987,896.79
PPMC-ONTARIO PRODUCT UNDER-DELIVERY
QUANTITY (BBLS) VALUE ($) QUANTITY (MT) VALUE ($) DEMURRAGE ($)
CRUDE OIL 11,498,231.00 1,268,573,236.94 PMS 1,024,335.28 1,092,011,313.91 16,186,612.48
DPK 144,908.44 156,038,748.24 1,111,112.50
DEMURRAGE 76,377.31
TOTAL 11,498,231.00 1,268,573,236.94 TOTAL 1,169,243.72 1,248,050,062.15 17,374,102.29
6,442,736,024.37
6,230,849,364.51
CRUDE OIL -REFINED PRODUCT EXCHANGE ARRANGEMENT 2013
CRUDE OIL
(37,897,277.08)
OVERALL COST INCURRED BY PPMC FOR PRODUCT EXCHANGE GROSS UNDER-DELIVERY (LOSS) (211,886,659.86)
OVERALL PRODUCT VALUE TO PPMC FOR PRODUCT EXCHANGE
CRUDE OIL
(82,557,392.35)
CRUDE OIL -REFINED PRODUCT EXCHANGE ARRANGEMENT 2013
CRUDE OIL
(79,982,100.93)
CRUDE OIL -REFINED PRODUCT EXCHANGE ARRANGEMENT 2013
CRUDE OIL
(11,449,889.50)
CRUDE OIL -REFINED PRODUCT EXCHANGE ARRANGEMENT 2013

The summary of SWAP Arrangement from 2010-2013 is in the table below Table 8.5.6B – Summary of SWAP Arrangements from 2010-2013
PPMC-TRAFIGURA 2010 2011 2012 2013
CRUDE VOLUME (BBLS)
6,691,206
24,489,415
20,494,470 22,409,423
CRUDE VALUE ($) 613,769,368.00
2,790,349,514.00
2,358,352,598.00 2,492,571,693.30
TOTAL PRODUCT VALUE ($)
628,012,134.00
2,678,811,353.00
2,313,730,540.05 2,513,750,042.97
OTHER COST ($) 14,897,206.00
62,248,439.00
28,811,608.40 32,628,239.17
NET GAIN/LOSS (654,440.00)
(173,786,600.00)
(73,433,666.35) (11,449,889.50)
PPMC-TELEVERAS 2011 2012 2013
CRUDE VOLUME (BBLS) 10,178,140 14,026,372 12,344,494
CRUDE VALUE ($) 1,179,283,683.00 1,521,439,547.95 1,354,588,696.17
TOTAL PRODUCT VALUE ($) 1,147,083,749.00 1,549,534,908.43 1,290,736,617.78
OTHER COST ($) 20,108,944.00 28,069,522.30 18,705,313.96
NET GAIN/LOSS (52,308,878.00) 25,838.18 (82,557,392.35)
PPMC-AITEO 2011 2012 2013
CRUDE VOLUME (BBLS) 10,231,122 10,496,582 11,401,455
CRUDE VALUE ($) 1,170,302,024.00 1,222,080,928.40 1,248,306,845.75
TOTAL PRODUCT VALUE ($) 1,100,373,508.00 1,259,744,737.68 1,178,312,641.61
OTHER COST ($) 23,118,074.00 17,351,550.52 9,987,896.79
NET GAIN/LOSS (93,046,590.00) 20,312,258.76 (79,982,100.93)
PPMC-ONTARIO 2011 2012 2013
CRUDE VOLUME (BBLS) 10,184,750 10,430,838 11,498,231
CRUDE VALUE ($) 1,183,099,016.00 1,174,887,505.72 1,268,573,236.94
TOTAL PRODUCT VALUE ($) 1,002,820,284.00 1,137,681,890.50 1,248,050,062.15
OTHER COST ($) - 16,951,130.99 17,374,102.29
NET GAIN/LOSS (180,278,732.00) (54,156,746.21) (37,897,277.08)

Main Report and Recommendations
NEITI Oil and Gas Industry 2013 Audit
274
From the above table, “Other cost” are costs borne by PPMC apart from the value of the Crude Oil
and it includes; Demurrage on Crude Oil and Demurrage associated with Products.
There is no cost efficiency in the transactions between NNPC and its Offshore Processing partner
(SIR) and its SWAP partners (Trafigura and Duke Oil). This is because when the total cost of
offshore processing consisting of cost of crude, processing fees, freight and demurrage (if
applicable) are compared with the reported value of returned products (PMS, DPK, AGO) and the
retained products proceeds received by NNPC, the transactions are not economically beneficial.
The table below shows the variances in the reported volumes of Crude Oil used for OPA and SWAP
by COMD and PPMC in 2013. There was a variance 5.610 million bbls that could not be reconciled.
Table 8.5.6C - Crude Allocation Volumes
TOTAL ALLOCATED CRUDE VOLUMES
000 bbls COMD Records PPMC OPA/SWAP Record Variance
OPA Volume 24,665 20,865 3,800
SWAP Volume 59,464 57,654 1,810
Total 84,129 78,519 5,610
Table 8.5.6D - Summary of losses on Product Exchange (SWAP) and Off-Shore Processing Arrangement in 2013
8.5.6.1 Audit Issues on Swap and OPA Arrangements
I. There were variances in the reported volumes of Crude Oil used for OPA and SWAP by
COMD and PPMC in 2013 to the tune of 5.610 million bbls which could not be reconciled.
II. The total value of losses to NNPC on the Off-shore processing transactions and SWAP
arrangements in 2013 were in the sum of $306,161,180.40 and $211,886,659.86
respectively.
Implication
Loss of revenue to the Federation to the tune of $518,047,840.26
ARRANGEMENT NET LOSS/GAIN ($)
SWAP Arrangement ($211,886,659.86)
Offshore processing arrangement (OPA) ($306,161,180.40)
TOTAL ($518,047,840.26)

Main Report and Recommendations
NEITI Oil and Gas Industry 2013 Audit
275
Recommendation
NNPC should discontinue these alternative arrangements altogether and in its place, limit itself to
exportation of crude oil and importation of refined petroleum products.
NNPC Response
In line with the Offshore Processing Agreement and Crude Oil Refined Products Exchange Agreement
each Crude Oil cargo is tied to corresponding refined Products delivered irrespective of the date the
Crude Oil is loaded. The purpose is to enable us match every Crude Oil loaded with Products
delivered. It is also to ascertain the performance of the Operators in line with the contract.
However, COMD reports Crude Oil loading for the year without matching it to refined Products
delivered.
It is important to note that the differences observed in Table 8.10.6C above were due to the
method of recording the information.
In view of the above, we reiterate that all the Crude Oil volumes were recorded in our reports.
8.5.7 Coastal and Marine Shipments
Coastal and Marine shipment operations in PPMC started in the late 90’s, with the liberalization of
the downstream sector of the Petroleum industry, which saw DPR licensing some companies to
construct and operate Petroleum products storage Depots in the Coastal areas.
The intention was to complement the distribution efforts of NNPC/PPMC following the advent of
product pipeline vandalisation and epileptic performance of the nation’s refineries in order to
ensure product availability nationwide.
At the time, PPMC operated an expansive fleet of Coastal vessels with which it distributed products
to the various Major Marketers and DAPPMAN storage facilities upon product allocation and
payment confirmation.
Following the expansion of the market from Lagos and thereafter Port Harcourt, Calabar and Warri
resulting in increased number of storage facilities, PPMC became overwhelmed by the delivery
challenges occasioned by the multiple deliveries/locations, and therefore, resorted to encouraging
the marketers to provide their own vessels for cargo receipt and onward delivery to their storage
facilities. This was later followed by the creation of the PPPRA Petroleum Product Pricing Template
which provided the segmented margins, showing a calculation of the expected landing costs of all
petroleum products and approving specific rates to be applied to each stakeholder along the chain
of distribution.

Main Report and Recommendations
NEITI Oil and Gas Industry 2013 Audit
276
MERITS:
The merits of Coastal and Marine Shipments include;
Bulk sales of Petroleum products to Storage facilities in order to complement the
distribution efforts of NNPC/PPMC depots nationwide.
Cash and Carry transactions which ensure immediate payment for products before delivery.
Increased availability of petroleum products nationwide due to bulk product allocation to
storage facilities owned by DAPPMAN members.
Reduction of the strain of bridging on NNPC/PPMC Depots nationwide.
Evacuation of Refinery Depots to ensure ullage and avoid untimely shutdown of the
Refinery.
DEMERITS:
Removes focus from the need to restore the integrity of the NNPC/PPMC pipelines for use
in product movement to all the NNPC/PPMC Depots nationwide
CHALLENGES:
Inadequate product stock to meet up with the demand by Coastal Marketers, due to the
incessant vandal activities which affect Refineries operations.
Non-dredging of jetties by NPA which limits the size of vessels for product
discharge/deliveries
Shortage of shuttle vessels to expedite Ship-to-Ship transhipment operations, leading to
huge cost in demurrage.
Aged vessels resulting in frequent rejection of shuttle vessels by Mother Vessels resulting in
high demurrage cost on PPMC.
Activities/inactivities of other Government Agencies in Coastal/Marine operations.
The distribution of petroleum products within the coastal areas of Port Harcourt, Warri and Calabar is as summarized below. Table 8.5.7 - Summary of Coastal Liftings
SUMMARY OF COASTAL LIFTINGS IN 2013
PRODUCT VOLUME (MT) VOLUME (LTS)
AGO 43,961.92 51,001,888.00
DPK 2,240,221.60 2,774,104,216.00
PMS 443,266.64 599,152,447.00 Source: PPMC
8.5.8 Pipeline Movements
There are twenty-two depots located at strategic towns across the country to enhance the storage
and distribution of petroleum products to the populace.

Main Report and Recommendations
NEITI Oil and Gas Industry 2013 Audit
277
The data obtained from PPMC shows that only nine depots were active, namely; Atlas Cove,
Mosimi, Satellite, Ibadan, Ilorin, Ore, Warri, Gombe and Kaduna.
The Mosimi Area, which is the most active during the period is made up of the Atlas Cove, Mosimi,
Satellite, Ibadan, Ilorin and Ore.
Pipeline movement experienced losses during the period under consideration Details are as shown
in the table below:
Table8.5.8A - Summary of Pipeline Product Movement (Overall Product Losses via Pipeline)
Product Dispatched (MT) Received (MT) Variance (MT)
PMS 3,746,190 3,436,570 (309,620)
DPK 49,994 47,418 (2,576)
AGO 340,607 306,117 (34,490)
A breakdown of the above losses as experienced in the different operational areas is shown below: Table8.5.8B - Summary of Pipeline Product Movement (Mosimi Area)
Product Dispatched (MT) Received (MT) Variance (MT)
PMS 3,325,704 3,061,896 (263,808)
DPK
AGO 42,162 38,827 (3,335)
Table8.5.8C - Summary of Pipeline Product Movement (PH Area)
Product Dispatched (MT) Received (MT) Variance (MT)
PMS 123,800 124,560 760
DPK 23,325 22,343 (982)
AGO 52,652 51,118 (1,534)
Table8.5.8D - Summary of Pipeline Product Movement (Warri Area)
Product Dispatched (MT) Received (MT) Variance (MT)
PMS 124,842 108,691 (16,151)
DPK 26,669 25,075 (1,594)
AGO 98,074 96,836 (1,238)

Main Report and Recommendations
NEITI Oil and Gas Industry 2013 Audit
278
Table8.5.8E - Summary of Pipeline Product Movement (Kaduna Area)
Product Dispatched (MT) Received (MT) Variance (MT)
PMS 150,889 130,600 (20,289)
DPK
AGO 111,727 99,752 (11,975)
Table8.5.8F - Summary of Pipeline Products Movement (Gombe Area)
Product Dispatched (MT) Received (MT) Variance (MT)
PMS 20,955 10,823 (10,132)
DPK
AGO 17,996 9,792 (8,204) Source: PPMC Pipeline Movement 2013 Template
Conversion
1 MT = 1,356.4471935108 Litres for liquid of 737.22 kg/m3 for PMS
1 MT = 1,223.7655265251 Litres for liquid of 817.5 kg/m3 for HHK
1 MT = 1,129.9435025249 Litres for liquid of 885 kg/m3 for AGO
There was a total loss of 309,620 MT of PMS equivalent to 419,983,180 Litres estimated at N40.78
billion (@ N97 per litre). Mosimi area recorded the highest loss of 263, 808 MT which could be
attributable to pipeline vandalization between Atlas Cove and Mosimi and evaporation due to non-
installation of internal floating roof covers. Overall losses for AGO and DPK was 34,490 MT and
2,576 MT respectively.
The audit also observed that there was no pipeline movement for DPK in the Mosimi, Kaduna and
Gombe areas. The percentage loss for PMS was 8.265%. The normal losses for such operations are
between 0.5% - 1%. These abnormal losses reported are a reflection of the theft, pipeline
vandalization and poor maintenance culture.
NNPC should strengthen its security network of pipeline infrastructure as well as its storage
facilities to enable smooth product movement.
8.5.8.1 Product Movements and Depot Balances
By design, refined products are transferred from one depot to another through pipelines. Over the years, transfer of products through pipelines have significantly reduced due to pipeline vandalization. The summary of the petroleum products (PMS, DPK & AGO) discharged at the various depots are shown in tables below:

Main Report and Recommendations
NEITI Oil and Gas Industry 2013 Audit
279
Table 8.5.8.1A - Summary of Depot Balances for PMS in Metric Tons
Table 8.5.8.1B - Summary of Depot Balances for DPK in Metric Tons
CLOSING
STOCK AS
REPORTED
BY LAST
AUDIT
CLOSING
STOCK AS
REPORTED
BY PPMC FOR
2012
2013
OPENING
STOCK
RECIEPTSDE-WATER/
TO SLOP
SALES/
TRANSFERS
OUT
OTHERSCLOSING
STOCK
UNACCOUN
TED LOSSES
CALCULATE
D CLOSING
STOCK
CLOSING
STOCK
VARIANCE
ATLAS COVE 9,448.82 9,448.82 9,448.82 42,533.88 42,162.36 1,482.64 8,589.68 251.98 8,085.72 503.96
WARRI (396.00) - 0.00 334,454.00 334,454.00 0.00 0.00 0.00
CALABAR 5,901.46 5,901.46 5,901.00 14,173.00 392.00 12,986.94 6,694.00 6,695.06 -1.06
MOSIMI 17,107.12 15,971.92 15,971.92 38,827.28 42,133.12 1,143.70 11,635.80 11,522.38 113.42
SATELLITE 560.72 550.40 550.40 161.38 388.72 389.02 -0.30
IBADAN 4,477.16 4,477.16 3,930.53 755.00 165.35 2,742.92 3,010.19 -267.27
ILORIN 352.60 352.60 352.60 352.60 352.60 0.00
BENIN 8,650.00 8,653.00 8,653.00 99,040.00 10,740.00 91,659.00 5,241.00 287.00 5,007.00 234.00
ORE 604.58 604.58 604.58 3.44 601.14 601.14 0.00
SULEJA 2,247.00 2,253.00 2,253.00 43,549.00 30,059.00 16,355.00 630.00 15,113.00 1,242.00
MINNA 2,849.00 2,857.00 2,857.00 17,517.00 7,726.00 12,433.00 214.00 12,434.00 -1.00
KADUNA (530.00) (45.00) 0.00 317,034.00 308,084.00 8,373.00 577.00 8,373.00 0.00
JOS 11,083.00 11,083.00 11,083.00 20,286.00 20,816.00 8,388.00 2,165.00 8,388.00 0.00
GOMBE 812.00 812.00 812.00 9,792.00 2,785.00 5,566.00 2,393.00 5,426.00 140.00
MAIDUGRI 1,340.00 1,324.00 1,324.00 1,324.00 1,324.00 0.00
PH 2,582.65 2,583.00 2,583.00 86,434.00 14.00 89,036.00 1,112.00 -33.00 1,145.00
ABA 22,405.67 22,405.56 22,406.00 54,115.00 794.00 73,035.00 2,691.00 2,692.00 -1.00
ENUGU 3,435.24 3,435.37 3,435.00 33.00 3,402.00 3,402.00 0.00
MKD - 0.00 0.00
YOLA 1,447.00 1,447.00 1,447.00 1,447.00 1,447.00 0.00
GUSAU 5,533.00 5,564.00 5,564.00 2,672.00 3,200.00 105.00 2,787.00 413.00
KANO 22,640.00 22,642.00 20,822.00 12,715.00 27,482.00 6,023.00 46.00 6,009.00 14.00
3RD PARTY (17.56) (17.00) 0.00 0.00
TOTAL 119,998.85 1,090,470.16 11,973.00 1,085,845.42 2,956.51 106,559.86 6,668.98
DEPOT BALANCES FOR AGO 2013 (MT)
I MT = 1,129.9435028249 liters for Liquid of 885 kg/m3 for AGO
Source: PPMC Depot balance Templates
CLOSING
STOCK AS
REPORTED
BY LAST
AUDIT
CLOSING
STOCK AS
REPORTED
BY PPMC FOR
2012
2013
OPENING
STOCK
RECIEPTS De-WATER
SALES/
TRANSFERS
OUT
OTHERSCLOSING
STOCK
UNACCOUN
TED LOSSES
CALCULATE
D CLOSING
STOCK
CLOSING
STOCK
VARIANCE
ATLAS COVE 23,080.35 26,216.62 26,216.62 2,227,932.52 2,231,783.02 411.48 21,782.51 323.15 21,631.49 151.02
WARRI -372.00 0.00 0.00 268,884.00 268,884.00 0.00 0.00 0.00
CALABAR 2,978.01 2,978.01 2,978.00 112,832.00 110,174.00 532.00 6,162.00 5,104.00 1,058.00
MOSIMI 30,377.43 23,543.17 23,543.17 1,610,204.36 1,593,706.85 3,520.59 41,337.01 45.30 36,474.78 4,862.22
SATELLITE 3,373.34 3,719.13 3,719.13 492,261.51 492,722.82 3,273.68 17.38 3,240.44 33.24
IBADAN 8,450.72 8,973.18 8,973.18 723,934.77 219,065.02 440.94 13,869.35 65.69 513,336.30 -499,466.95
ILORIN 3,039.63 3,643.63 3,643.63 137,352.62 130,140.11 365.42 10,046.03 828.24 9,662.48 383.55
BENIN 18,249.00 18,249.00 18,249.00 113,060.00 3,076.00 108,910.00 19,134.00 313.00 19,010.00 124.00
ORE 2,489.99 2,619.85 2,619.85 98,143.21 92,920.87 585.13 7,757.63 17.37 7,239.69 517.94
SULEJA 5,363.00 5,064.00 5,064.00 56,520.00 262,874.00 25,375.00 1,678.00 -202,968.00 228,343.00
MINNA 2,832.00 3,078.00 3,078.00 9,919.00 6,033.00 6,238.00 59.00 6,905.00 -667.00
KADUNA -667.00 0.00 0.00 393,108.00 384,032.00 0.00 671.00 8,405.00 -8,405.00
JOS 22,887.00 22,907.00 22,907.00 24,819.00 23,847.00 20,870.00 3,009.00 20,870.00 0.00
GOMBE 3,576.00 3,584.00 3,584.00 10,823.00 1,633.00 10,141.00 2,633.00 10,141.00 0.00
MAIDUGRI 411.00 411.00 411.00 411.00 411.00 0.00
PH 2,132.85 2,132.85 2,133.00 325,789.00 294.00 331,023.00 1,306.00 -3,395.00 4,701.00
ABA 29,486.37 29,486.79 29,487.00 124,551.00 4,845.00 129,845.00 19,349.00 19,348.00 1.00
ENUGU 4,858.68 4,860.96 4,861.00 624.00 5,482.00 5,485.00 -3.00
MKD 0.00 0.00 0.00
YOLA 7,134.00 7,134.00 7,134.00 7,134.00 7,134.00 0.00
GUSAU 5,854.00 5,581.00 5,581.00 2,916.00 1,016.00 7,126.00 391.00 7,090.00 36.00
KANO 6,583.00 6,425.00 6,425.00 39,829.00 13,869.00 31,885.00 504.00 31,881.00 4.00
TOTAL 180,607.57 6,773,502.99 8,215.00 6,402,478.69 5,855.56 258,679.21 10,555.13
DEPOT BALANCES FOR PMS 2013 (MT)
I MT = 1,356.4471935108 liters for Liquid of 737.22 kg/m3 for PMS
Source: PPMC Depot balance Templates

Main Report and Recommendations
NEITI Oil and Gas Industry 2013 Audit
280
Table 8.5.8.1C - Summary of Depot Balances for AGO in Metric Tons
Observations
Data from PPMC on depot balances are incomplete. The imbalances observed as a result of
differences in opening stock balances from closing stock balances were irreconcilable. In inventory
accounting, the closing stock should be a reflection of the activities from opening stock plus
receipts, sales, transfers and other uses. This is not so from the three tables above as all the
products (PMS, AGO, DPK) throughout the reporting period with the exception of a few depots
where there were no serious activities, reflected incomplete depot balances.
Findings
PMS
Calabar, Mosimi, Ibadan, Ilorin, Benin, Ore, Suleja, Minna, Kaduna and PH depots recorded
huge imbalances in their closing stocks.
DPK
Calabar, Satellite, Kaduna and PH depots recorded huge imbalances in their closing stocks.
AGO
Atlas cove, Mosimi, Ibadan, Benin, Suleja, Gombe, Gusau and PH depots recorded huge
imbalances in their closing stocks.
Active depots such as Atlas Cove, Mosimi, and PH have ‘wider’ imbalances.
The reasons that can be deduced from these anomalies are:
Obsolete/defective measuring equipment (flow meters, tank level gauges etc.)
Human related factors (theft and/or vandalization).
C/STOCK AS
REPORTED
BY LAST
AUDIT
CLOSING
STOCK AS
REPORTED
BY PPMC FOR
2012
2013
OPENING
STOCK
RECIEPTSDE-WATER/
TO SLOP
SALES/
TRANSFERS
OUT
OTHERSCLOSING
STOCK
UNACCOUN
TED LOSSES
CALCULATE
D CLOSING
STOCK
CLOSING
STOCK
VARIANCE
ATLAS COVE 0.00 0.00 0.00
WARRI -223.00 0.00 0.00 330,227.00 330,227.00 0.00 0.00 0.00
CALABAR 0.00 52.00 -52.00 52.00
MOSIMI 555.48 575.64 575.64 575.64 575.64 0.00
SATELLITE 131.20 131.20 131.2 63.14 67.24 0.00 0.82 126.28 -126.28
IBADAN 1,116.84 1,116.84 1,116.84 5.74 1,113.56 2.46 1,120.12 -6.56
ILORIN 443.06 443.62 443.62 424.76 18.86 424.76 0.00
BENIN 1,936.00 1,950.00 1,950.00 25,075.00 992.00 24,914.00 1,119.00 1,119.00 0.00
ORE 364.08 364.08 364.08 0.82 363.26 363.26 0.00
SULEJA 0.00 4,842.00 4,788.00 54.00 4,788.00 0.00
MINNA 8,747.00 8,744.00 8,744.00 327.00 8,419.00 7.00 8,410.00 9.00
KADUNA -710.00 0.00 0.00 192,109.00 192,286.00 0.00 439.00 -616.00 616.00
JOS 1,700.00 1,700.00 1,696.00 325.00 1,365.00 1,371.00 -6.00
GOMBE 124.00 124.00 124.00 124.00 124.00 0.00
MAIDUGRI 787.00 787.00 787.00 787.00 787.00 0.00
PH 4,092.65 4,092.65 4,093.00 106,276.00 110,559.00 1,145.00 -190.00 1,335.00
ABA 5,113.00 5,126.00 4,251.00 22,348.00 1,163.00 25,101.27 287.00 334.73 -47.73
ENUGU 781.86 789.03 789.00 17.00 806.00 806.00 0.00
MKD 0.00 0.00 0.00
YOLA 1,162.00 1,162.00 1,162.00 1,169.00 1,162.00 7.00
GUSAU 556.00 592.00 592.00 321.00 279.00 18.00 253.00 26.00
KANO 1,231.00 1,247.00 1,247.00 1,233.00 14.00 1,233.00 0.00
3RD PARTY
TOTAL 32,908.38 676,120.88 2,155.00 684,179.51 0.82 23,998.22 554.14
DEPOT BALANCES FOR DPK 2013 (MT)
I MT = 1,223.7655265251 liters for Liquid of 817.5 kg/m3 for HHK
Source: PPMC Depot balance Templates

Main Report and Recommendations
NEITI Oil and Gas Industry 2013 Audit
281
PPMC explained that Stock management for the refinery depots-Warri and Kaduna is handled by
the respective refineries. Gains and losses on the other hand are mostly apparent, primarily due to
the state of the products accounting instruments.
Recommendations
NNPC should commence urgent overhaul of PPMC’s obsolete and defective infrastructure especially
electronic measuring equipment, pipelines and all areas that lead to inconsistent data emanating
from PPMC. Efforts should be put in place to reconcile these imbalances immediately.
Inaccurate data reporting can also emanate from inability to properly operate, read and maintain
the equipment within the PPMC facilities. It is imperative that a structured human capacity
development is put in place along with the refurbishment activity.
Procedures should be put in place to prevent any form of fraudulent acts and malpractices. These
include standing orders, documented procedures systems, internal controls and risk (on fraud)
assessment.
8.5.9 Crude Oil Theft in 2013
Crude oil theft may refer to any activity relating to the theft or sabotage of crude oil, facilities or
installations in form of illegal bunkering, pipeline vandalism, fuel scooping, illegal refining and
transport and oil terrorism. Illegal oil bunkering is the most commonly known form of oil theft and
it involves direct tapping of oil. Though oil bunkering is a necessity for maritime shipping within the
maritime sector, it becomes illegal when it is carried out without requisite statutory licenses or
valid documents, or in violation of the Nigerian Maritime Sector and the guidelines made by the
statutory institutions regarding it.
Nigeria is the country with the highest incidents of crude oil theft in the world, according to the
data released by Oilprice.com .
According to the website, with as much as 400,000 barrels of crude oil stolen daily, Nigeria is
ranked worse than Mexico, Iraq, Russia and Indonesia on the top five countries most plagued by oil
theft.
The report put Nigeria’s losses to crude theft at $1.7 billion, about N272 billion per month,
representing 7.7 percent of Nigeria’s Gross Domestic Product, GDP.
“This represents 7.7 percent of Nigeria’s GDP vanishing, or more than the country spends on
education and healthcare.
“These numbers paint a harsh picture about the inability of the Nigerian government and the
multinational oil companies in Niger Delta, to do anything about this rampant theft.

Main Report and Recommendations
NEITI Oil and Gas Industry 2013 Audit
282
“However, as the Global Financial Initiative points out, ‘stolen Nigerian crude oil is transported on
internationally registered vessels, sold to international buyers, processed by international oil
refineries and paid for using international bank accounts’
The analysis below is as submitted by the IOC’s with no corroborating or disputing data from
NNPC and DPR.
NNPC-NAOC JV
Table 8.5.9A - NAOC 2013 Crude Oil Theft and Sabotage (bbls)
MONTHS VOLUME FACILITY PRICE ESTIMATE (USD) VALUE (USD)
JAN 579,067 D
ELIV
ERY
PIP
ELIN
ES
115.24 66,731,681
FEB 441,525 118.81 52,457,585
MAR 409,190 112.79 46,152,540
APR 256,791 105.55 27,104,290
MAY 571,088 106 60,535,328
JUN 708,978 106.06 75,194,207
JUL 604,593 109.78 66,372,220
AUG 421,046 107.84 45,405,601
SEP 637,710 113.59 72,437,479
OCT 771,958 112.29 86,683,164
NOV 568,980 111.14 63,236,437
DEC 527,185 112.75 59,440,109
TOTAL 6,498,111 721,750,640
Source: 2013 NAOC Crude Theft/Sabotage Template, CBN 2013 Crude Oil Price for Bonny Light
Figure 8.5.9A – 2013 NNPC-NAOC JV Crude Theft
-
100,000
200,000
300,000
400,000
500,000
600,000
700,000
800,000
JAN FEB MAR APR MAY JUN JUL AUG SEP OCT NOV DEC
BB
LS

Main Report and Recommendations
NEITI Oil and Gas Industry 2013 Audit
283
From the table above, there was an average theft of 541,509 bpm of Crude Oil with the highest in
the month of October (771,958 bbls) and the lowest in April (256,791 bbls).
NNPC operates a 60-40% Joint Venture with Nigerian Agip Oil Company (NAOC 20%, ConocoPhilips
20%) thus the losses due to theft are distributed in accordance with the participating interest
(equity) as shown below.
Table 8.5.9B - Entitlement to Loss (NNPC-NAOC JV)
TOTALS NNPC (60%) NAOC (40%)
VOLUME (BBLS) 6,498,111 3,898,867 2,599,244
VALUE (USD) 721,750,640 433,050,384 288,700,256
From the above table, NNPC lost $433,050,384 (estimated based on CBN’s 2013 Crude prices for
Bonny Light) to Crude theft.
NNPC-CNL JV
Table 8.5.9C - CNL 2013 CRUDE OIL THEFT AND SABOTAGE (BBLS)
MONTHS VOLUME FACILITY
PRICE
ESTIMATE
(USD) VALUE (USD)
JAN 59,861
DEL
IVER
Y P
IPEL
INES
(EA
STER
N A
REA
&
ON
SHO
RE
WES
T)
115.24 6,898,382
FEB 49,252 118.81 5,851,630
MAR 25,172 112.79 2,839,150
APR 15,750 105.55 1,662,413
MAY 15,190 106 1,610,140
JUN 12,420 106.06 1,317,265
JUL 13,237 109.78 1,453,158
AUG 18,445 107.84 1,989,109
SEP 17,610 113.59 2,000,320
OCT 20,522 112.29 2,304,415
NOV 38,520 111.14 4,281,113
DEC 36,673 112.75 4,134,881
TOTAL 322,652 36,341,975
Source: 2013 CNL Crude Theft/Sabotage Template, CBN 2013 Crude Oil Price for Bonny Light

Main Report and Recommendations
NEITI Oil and Gas Industry 2013 Audit
284
Figure 8.5.9B – 2013 NNPC-CNL JV Theft
From the table above, there was an average theft of 26,887 bpm of Crude Oil with the highest in
the month of January (59,861 bbls) and the lowest in June (12,420 bbls).
NNPC operates a 60-40% Joint Venture with Chevron Nigeria Limited thus the losses due to theft
are distributed in accordance with the participating interest (equity) as shown below.
Table 8.5.9D - Entitlement to Loss (NNPC-CNL JV)
TOTALS NNPC (60%) CNL (40%)
VOLUME (BBLS) 322,652 193,591 129,061
VALUE (USD) 36,341,975 21,805,185 14,536,790
From the above table, NNPC lost $21,805,185 (estimated based on CBN’s 2013 Crude prices for
Bonny Light) to Crude theft.
NNPC-SPDC JV
Table 8.5.9E - SPDC 2013 Crude Oil Theft (Bbls)
MONTHS VOLUME FACILITY PRICE ESTIMATE (USD) VALUE (USD)
JAN 723,674
The
ft
are
e
stab
lish
ed
m
on
thly
at
th
e
vari
ou
s Te
rmin
als
[Bo
nn
y &
Fo
rcad
os]
as
a
fun
ctio
n o
f to
tal
Lose
s. T
ota
l lo
ses
is t
he
app
ren
t sh
ort
fall
in
Term
inal
R
ece
ipts
follo
win
g Fi
scal
isat
ion
at
0
8:0
0
of
eve
ry
mo
nth
un
de
r su
pe
rvis
ion
of
DP
R &
NN
PC
115.24 83,396,192
FEB 674,527 118.81 80,140,553
MAR 189,657 112.79 21,391,413
APR 128,538 105.55 13,567,186
MAY 144,114 106 15,276,084
JUN 117,316 106.06 12,442,535
JUL 22,053 109.78 2,420,978
AUG 75,503 107.84 8,142,244
SEP 98,208 113.59 11,155,447
OCT 353,352 112.29 39,677,896
NOV 68,444 111.14 7,606,866
DEC 358,272 112.75 40,395,168
TOTAL 2,953,658 335,612,561
-
10,000
20,000
30,000
40,000
50,000
60,000
JAN FEB MAR APR MAY JUN JUL AUG SEP OCT NOV DEC
BB
LS

Main Report and Recommendations
NEITI Oil and Gas Industry 2013 Audit
285
Figure 8.5.9C - 2013 NNPC-SPDC JV Theft
From the table above, there was an average theft of 246,138 bpm of Crude Oil with the highest in
the months of January (723,674 bbls) and the lowest in July (22,053 bbls). The table further shows;
all through the year, the volume of crude oil stolen was steady and this would point to some
possible reasons:
According to SPDC, Theft are established monthly at the various Terminals [Bonny & Forcados] as a
function of total Losses. Total losses is the apprent shortfall in Terminal Receipts following
Fiscalisation at 08:00am daily of every month under supervision of DPR & NNPC.
NNPC operates a 55-45% Joint Venture with Shell Petroleum Development Company (SPDC 30%,
Elf 10% and Agip 5%) thus the losses due to theft are distributed in accordance with the
participating interest (equity) as shown below.
Table 8.5.9F - Entitlement to Loss (NNPC-SPDC JV)
TOTALS NNPC (55%) SPDC (45%)
VOLUME (BBLS) 2,953,658 1,624,512 1,329,146
VALUE (USD) 335,612,561 184,586,909 151,025,652
From the above table, NNPC lost $184,586,909 (estimated based on CBN’s 2013 Crude prices for
Bonny Light) to Crude theft.
NNPC-SPDC JV SABOTAGE (DEFERRED PRODUCTION)
Incessant sabotage of oil and gas assets resulted into production challenges (deferred production)
that in turn affected export and revenue.
The table below shows the volume and value of Crude Oil as a result of Deferred Production.
-
100,000
200,000
300,000
400,000
500,000
600,000
700,000
800,000
JAN FEB MAR APR MAY JUN JUL AUG SEP OCT NOV DEC
BB
LS

Main Report and Recommendations
NEITI Oil and Gas Industry 2013 Audit
286
Table 8.5.9G - SPDC 2013 Production Deferments are a result of Sabotage
MONTHS VOLUME FACILITY PRICE ESTIMATE (USD) VALUE (USD)
JAN 1,943,768
WEL
L H
EAD
S &
FLO
WST
ATI
ON
S
115.24 223,999,824
FEB 3,526,136 118.81 418,940,218
MAR 5,525,104 112.79 623,176,480
APR 15,859,920 105.55 1,674,014,550
MAY 19,622,447 106 2,079,979,382
JUN 3,268,313 106.06 346,637,277
JUL 2,731,099 109.78 299,820,048
AUG 4,067,647 107.84 438,655,052
SEP 5,869,045 113.59 666,664,822
OCT 1,745,450 112.29 195,996,581
NOV 2,420,747 111.14 269,041,822
DEC 1,950,774 112.75 219,949,769
TOTAL 68,530,450 7,456,875,825
Table 8.5.9H - Entitlement to Loss (NNPC-SPDC JV)
TOTALS NNPC (55%) SPDC (45%)
VOLUME (BBLS) 68,530,450 37,691,747 30,838,702
VALUE (USD) 7,456,875,825 4,101,281,704 3,355,594,121
The above table shows; the corporation (NNPC) lost revenue due to deferred production to a tune
of $4,101,281,704 under the NNPC-SPDC JV in 2013.
Table 8.5.9I - Summary of Losses due to Theft and Sabotage
All volumes in BBLS 2012 2013
NNPC-NAOC JV THEFT 6,778,749.00 6,498,111
NNPC-SPDC JV THEFT 16,400,290.00 2,953,658
NNPC-SPDC JV SABOTAGE 24,896,467.00 68,530,450
NNPC-CNL JV THEFT 663,129 322,652
TOTAL 48,738,635 78,304,871

Main Report and Recommendations
NEITI Oil and Gas Industry 2013 Audit
287
Table 8.5.9J - Value of Losses Accrued to NNPC due to Losses and Sabotage
All Value in USD ($) 2012 2013
NNPC-NAOC JV THEFT 461,846,528 433,050,384
NNPC-SPDC JV THEFT 1,030,059,940 184,586,909
NNPC-SPDC JV SABOTAGE 1,705,479,980 4,101,281,704
NNPC-CNL JV THEFT 45,615,984 21,805,185
TOTAL 3,243,002,432 4,740,724,182
Figure 8.5.9D - 2012-2013 Comparison of Theft & Sabotage
The chart above shows that there was an overall decrease in 2013 theft volumes when compared
to 2012. Deferred production volumes due to sabotage increased significantly by 175.484% in 2013
when compared to 2012.
8.5.9.1 2013 Domestic Crude Oil Losses
Crude Oil theft is not only synonymous with upstream operations but also an evil experienced in
the midstream operations. There are cases of theft on the domestic allocated crude (refinery
allocations) which are summarised below:
-
10,000,000
20,000,000
30,000,000
40,000,000
50,000,000
60,000,000
70,000,000
80,000,000
2012 2013
BB
LS
NNPC-NAOC JV THEFT NNPC-SPDC JV THEFT NNPC-SPDC JV SABOTAGE NNPC-CNL JV THEFT

Main Report and Recommendations
NEITI Oil and Gas Industry 2013 Audit
288
FLOW LINES/PIPELINES LOSSES (BBL) ESTIMATED VALUE
UNIT ($) VALUE
ESCRAVOS/CNL – WARRI 834,435 100 83,443,500
WARRI – KADUNA 566,230 100 56,623,000
NPDC – WARRI 135,262 100 13,526,200
BONNY – PHRC 865,225 100 86,522,500
TOTAL 2,401,152 240,115,200
Note: The Estimated value is based on a flat rate of $100/bbls Source: PPMC Crude Loss Template
FLOW LINES/PIPELINES LOSSES (BBL)
2012 2013
ESCRAVOS/CNL – WARRI 1,236,516 834,435
WARRI - KADUNA 752,598 566,230
NPDC – WARRI 88,990 135,262
BONNY - PHRC 967,521 865,225
TOTAL 3,045,625 2,401,152
From COMD records, a total of 38.292 mbbls was allocated to the refineries in 2013 for local
refining as part of the domestic crude allocation of 445,000 bpd.
From the actual pumped volume to the actual received volume, there was a variance of 2.402
mbbls (6.27% ) which PPMC attributes to theft along its pipelines.
PPMC commenced marine shipment of Crude oil in February 2011 to supply 3 refineries (2 in Port
Harcourt and 1 in Warri) as against using pipelines to transport crude oil to the refineries. This was
as a result of the constant attacks on the crude supply pipelines which over the years has created
serious challenges for the refineries. The use of marine vessels to transport crude to the refineries
is innovative and commendable as there has been steady supply of feedstock even though it has
increased the cost of doing business.
8.5.9.2 Product Losses
PPMC is the dominant supplier of Refined Petroleum Products to the existing domestic and
growing export markets within West African Sub-Region. It operates an integrated network of
about 5,120 km of pipeline constructed through communities and different terrains (Land,
Swamps, Forests, Savannah, Rivers, etc). Petroleum products are distributed through the pipeline

Main Report and Recommendations
NEITI Oil and Gas Industry 2013 Audit
289
network connecting 21 loading Depots and 24 Pump stations across the nation. Petroleum
Products supply and distribution through pipeline is the most effective and cheapest means of
transportation. The integrity of these pipeline networks over the years has been severely affected
by the nefarious activities of vandals.
Below are the existing pipeline networks operated by PPMC.
• System 2a: Warri-Ben -Ore-Mosimi
• System 2cx: Warri- Auchi-Benin
• System 2b: Atlas Cove-Mos-Ib-Ilorin
• System 2c: Esc-War-Kd(Crude Line)
• System 2d: Kd-Zar-Kn, Zar-Gusau, Kd-Jos
Jos-Gombe-Maiduguri
• System 2e: ph-aba-enugu-yola
• System 2ex: ph-aba-enugu-makurdi-yola
• System 2cx: enugu-auchi, auchi-suleja-kd, suleja-minna
• System 2dx: jos-gombe –maiduguri
Figure 8.5.9.2A - Downstream Infrastructure including Pipeline
Activities of vandals became noticeable in PPMC operations in 1999. It began progressively from
the Port Harcourt and Warri Areas of PPMC operations and spread to every part of PPMC pipeline
network.

Main Report and Recommendations
NEITI Oil and Gas Industry 2013 Audit
290
Figure 8.5.9.2B - Pipeline Vandalism Hot Spots
From the above figure, the hotspots are the Atlas Cove Area, Mosimi Aream, PH Area, Gombe Area
and Suleja Area. Table 8.5.9.2 - Records of Pipeline Breaks/Ruptures (1999 - 2013)
YEAR GOMBE KADUNA MOSIMI PHC WARRI YEARLY
TOTAL
1999 7 7 50 355 78 497
2000 1 3 46 732 217 999
2001 2 36 11 385 83 517
2002 6 46 28 360 93 533
2003 2 42 45 233 130 452
2004 2 122 152 429 266 971
2005 20 243 209 1,017 769 2,258
2006 265 176 480 2,091 662 3,674
2007 716 122 459 1,655 306 3,258
2008 357 129 530 557 745 2,318
2009 86 123 483 405 208 1,305
2010 1,712 371 394 2,226 815 5,518
2011 2,573 578 467 302 548 4,468
2012 1,994 646 309 284 475 3,708
2013 866 667 1,080 641 317 3,571
Refineries
Depots
Receiving terminals
Working Products line
Working Crude line
Down Products line
Functioning Products line
(but no product)
Hot Spots

Main Report and Recommendations
NEITI Oil and Gas Industry 2013 Audit
291
Figure 8.5.9.2C - Yearly Total of Product Pipeline Breaks/Ruptures (1999-2013)
8.5.9.3 Impact of Crude Oil Theft
ECONOMIC
Nigeria Produces about two million barrels of crude oil per day while up to 200,000 barrels is
speculated as being lost to Oil Theft daily. This accounts for estimates that Nigeria loses $20bn
yearly which could have Provided Massive Infrastructure, Employment and Provide Social
Amenities like Clean Water, Basic Healthcare and Schools and Stronger Cash Reserves needed to
finance development in the country.
ENVIRONMENTAL
Among the many factors responsible for the Degradation of the Environment is oil spillage
resulting from oil theft especially the hacking of pipelines and the activities of illegal refineries
which is responsible for the uncontrolled emission of Carbon into the atmosphere. Sabotage and
Crude oil theft according to a report are responsible for a large percentage of Oil Spills. Oil Spills
result in Ground Water Poisoning, Destruction of Agricultural Land, Fishery and Livestock and fast
Disappearing Mangrove Forests.
SOCIAL
Crude Oil theft and militancy constitute major inhibitors to the socioeconomic development of the
Niger-delta. As a result the responsibility towards the area has been largely neglected by
administrations, organizations and companies. Another worrisome trend is the increasing
percentages of school aged children who are denied formal education and action of the various
0
1000
2000
3000
4000
5000
6000
1999 2000 2001 2002 2003 2004 2005 2006 2007 2008 2009 2010 2011 2012 2013

Main Report and Recommendations
NEITI Oil and Gas Industry 2013 Audit
292
militant groups who see them as potential recruits for their illegal trade.This uneducated youths
become veru vulnerable and are recruited by mititant groups into lifstyles of criminality
characterized by violence and restiveness, teenage parenthood and anti-societal tendencies.
HEALTH
Crude Oil theft largely contributes to the deteriorating health conditions prevalent in the Niger
Delta region of the Country. It is reported that Liquid, Solid Waste and Residues from Dumps which
are not properly disposed or treated causes Contamination of Domestic Water Supplies which is
responsible for a host of known diseases in this region such as Malaria and Diarrhea while
respiratory diseases which constitute another percentage of the diseases in this area can be
attributed to uncontrolled emissions and gas flaring.
GOVERNANCE
As the International spotlight beams on Nigeria due to the various activities of Crude Oil theft and
Illegal Bunkering, the Federal Government should institutionalise the right policies and reforms in
the Oil and Gas sector that will ensure more transparency, accountability and security. The passage
of the long awaited PIB and the present anti-corruption stance will also ensure better governance
and ultimately checkmate crude oil theft.
FACTORS RESPONSIBLE FOR CRUDE OIL THEFT
Thriving black market
Bribery and corruption
Availability of Foreign buyers of stolen crude
Inadequate funding & resources to combat Crude Oil theft
8.5.10 Key Findings relating to Crude Oil and Product losses
The following issues relate to Crude Oil and Product losses;
a. NNPC did not provide any corroborating or disputing data on crude oil losses from its operation with the JV partners
b. Some IOCs, notably MOBIL and TOTAL failed to populate crude losses templates, while SPDC submitted different templates from the initial templates for Crude theft and Sabotage at the conclusion of Audit.
c. The value of NNPC’s share of Crude Oil losses as reported by the companies in 2013 is about 13% of total Federation lifting (Total NNPC lifting less those on behalf of NPDC and PANOCEAN).
d. Export Crude Oil losses reported by companies is significant and on the increase.

Main Report and Recommendations
NEITI Oil and Gas Industry 2013 Audit
293
Implication
The extent of reliability to be placed on Export Crude Oil losses reported is limited, due to
incomplete records from producers and lack of corroborative evidence by NNPC. There is however,
no doubt that the actual losses may be more than the quantities reported in 2013.
Recommendations
a. NNPC and DPR should maintain proper physical and financial reporting of crude and product
losses through close monitoring and sharing of information with IOCs on transactions and
activities relating to Oil theft and Sabotage.
b. Federal Ministry of Petroleum Resources should ensure allocation of adequate resources
technology, equipment and logistics to security agencies to enable them function effectively.
These may include the use of Unmanned Aerial Vehicles (UAV’s) such as quad copters for
surveillance and integrity pipeline monitoring system to detect leaks.
c. Enabling legislation, special courts and swift prosecution of offenders and their sponsors.
d. Adoption of a standard scientific method/process as benchmark for the crude oil trade such as
crude oil fingerprinting.
e. Creating awareness about crude oil theft and engendering cooperation between the public,
stakeholders and relevant local and international agencies.
8.6 System and Process Review
8.6.1 Governance Process: Review of Systems and Procedures
The global energy environment is evolving. New technology, rapid industrialization in emerging
economies and a drive to cleaner sources of energy are on the landscape. The oil sands are not the
only game in town. But increasingly, Nigeria and other countries have got new competition from
shale oil and gas, thanks to the gains made in the U.S with hydraulic fracturing. The key
probing/bothering question in all of these developments is what’s Nigeria’s Strategy?
The Extractive Industries Transparency Initiative (EITI) is a global standard that promotes
transparency and accountability in the oil and gas and mining sectors.
Nigeria EITI (NEITI) has the responsibility for monitoring and ensuring that all payments due to the
Government from all extractive industry companies, including taxes, royalties, dividends, bonuses,
penalties, levies and such other income streams from the industry, are duly made. NEITI is also
charged with ensuring that all fiscal allocations and statutory disbursements of revenue from EI
sources due from the Federation Accounts to statutory recipients are made and properly accounted
for.
This report covers the review of systems and procedures in the Nigerian Oil and Gas industry with
the aim of providing recommendations for the optimal management of the sector.

Main Report and Recommendations
NEITI Oil and Gas Industry 2013 Audit
294
8.6.2 Nature and extent of our work
The Consultant was expected t o conduct a review of the systems and procedures utilized by
government agencies in the oil and gas sector for purposes of calculating, recording, processing,
and settling financial transactions. The procedures performed were those set out in the terms of
reference.
We set out our findings in this report, we do not express an assurance of the transactions beyond
the explicit statements set out in this report.
This report provides a brief background scope and objectives, our methodology and approach to
the review. It then provides details of findings, recommendations for improvement and way
forward for the management for the oil and gas sector.
8.6.3 Methodology
Our approach to the assignment is depicted in the diagram below:
Our methodology involves information gathering, data collection and analyses depicted below:
Figure 8.6.3 - Project methodology
The framework for the review of systems and procedures involved the following:
Literature review: involving critical review of documents
o research work on the information about the size of the extractive industry in Nigeria;
o understanding the payment streams from extractive companies to Governmental
agencies;

Main Report and Recommendations
NEITI Oil and Gas Industry 2013 Audit
295
Interviews: with management (of government agencies and extractive companies’
representatives) in a one-to-one approach at different times. This approach gives the
interviewers and interviewees opportunity to confirm or complement the information
gathered from our various reviews and interviews.
Validation: this process provided ample opportunity for the project team members and
other stakeholders to clarify the issues raised as well as revalidate the information gathered
from different sources,
formulation of an opinion on the systems used in the process and
preparation of the report on the management of the oil and gas sector
8.6.4 Structure of the Oil and Gas Sector
The future of Oil and Gas Industry has changed.
The Nigerian oil and gas industry is one of the most active petroleum province in Africa despite the
challenges in recent times.
Exploration for oil and gas in Nigeria began in 1908, with the first discovery being made in the Niger
Delta in 1956. Nigeria’s first refinery began operations in 1965, with a capacity of 38,000 bbl/day;
enough to meet domestic requirements at the time. The demand and production of oil in Nigeria
has since increased tremendously, such that Nigeria’s current daily production is estimated at about
2.5m bbl/day, with a domestic consumption level of 279,000 bbl/day. At the end of 2013, Nigeria’s
proven oil reserves were estimated to be 37.01bn barrels, a decline from the 37.2 bn barrels in
2012. The decline has been attributed to the fact that little or no significant investment has been
recorded in oil exploration in the last five years and the number of wells drilled has also been on
the decline since 2006. Since 2007, there has been no bid rounds.
The Nigerian National Petroleum Corporation (NNPC) was created in 1977 to oversee the regulation
of the oil and natural gas industries, with secondary responsibilities for upstream and downstream
developments. In 1988, the NNPC was divided into 12 subsidiary companies to regulate the sub-
sectors within the industry. The Department of Petroleum Resources (DPR), within the Ministry of
Petroleum Resources, is another key regulator, focusing on general compliance, leases and permits,
and environmental standards.
Currently, the majority of Nigeria's major oil and natural gas projects are funded through joint
ventures (JV) between international oil companies (IOCs) and NNPC, where NNPC is the majority
shareholder. The rest of the contracts are managed through production sharing contracts (PSCs)
with IOCs. PSCs are the fiscal regime typically, but not always, governing deep-water projects and
contain more attractive terms than those in JV arrangements, the fiscal regime typically governing
onshore/shallow water projects. PSC terms on deep-water projects tend to be more favorable to
incentivize the development of deep-water projects.

Main Report and Recommendations
NEITI Oil and Gas Industry 2013 Audit
296
The crude oil produced in Nigeria is classified as ‘sweet’, as it is largely sulphur-free. About 80 per
cent of production wells are located in the Niger- Delta region in the southern part of the country,
with notable projects including the Afam Integrated Oil and Gas Project operated by Shell and the
Bonga Deep Water Project, Nigeria’s first deep-water oil discovery. The key participants in the
Nigerian upstream sector include Shell, Exxon, Chevron, Eni and Total.
Nigeria holds the ninth largest gas reserves in the world. The largest oil producing African country
was estimated to contain 180Tcf of proven natural gas reserves as of December 2013. Most of
natural gas reserves of the country are located in the Niger Delta. Amenam-Kpono, Bonga and Akpo
are the major oil and gas fields located in Niger Delta. Gbaran-Ubie, one of the latest integrated oil
and gas projects in the country, achieved peak production of one billion cubic feet per day in 2011.
Much of the country's natural gas is flared since most of the oil fields lack the infrastructure to
produce and market associated natural gas.
Shell is the leading gas producer in the country. It's Soku gas-gathering and condensate plant
provides nearly half of the feed gas to the only LNG facility of Nigeria. Total, Eni and Chevron are
among the other major foreign companies involved in Nigerian gas production. The Nigerian Gas
Company (NGC), a subsidiary of Nigerian National Petroleum Corporation (NNPC), is responsible for
the marketing, transmission and distribution of gas. Most of Nigeria's marketed natural gas is
exported as LNG.
Due to the lack of gas infrastructure and the widespread flaring of associated gas, the Nigerian gas
sector has been relatively underdeveloped and surveys have put the country’s proven natural gas
reserves at about 5.29 trillion cubic metres (180Tcf). In a bid to tackle this underdevelopment, the
federal government prepared a Gas Master Plan in 2008, the implementation of which is currently
underway. The initiative is geared at promoting natural gas production, and encouraging the supply
of natural gas to domestic power stations so as to alleviate the country’s energy shortage. As part
of the Gas Master Plan, the National Gas Supply and Pricing Policy (Gas Pricing Policy) and the
National Domestic Gas Supply and Pricing Regulations (Policy Regulations) have been issued by the
government and both instruments impose obligations on gas producers to set aside a
predetermined portion of their gas production for supply to the domestic market. This policies have
not yet been implemented, the IOC’s prefer to export gas as this is more lucrative, because it is not
profitable to provide gas to the domestic market.
It is noteworthy to statethat the oil and gas naturally reacts to global events and such events
sometimes challenge settled models and predictions, compelling analysts to go back to the drawing
boards in search of new solutions or definitions. For example, the issue of shale oil discovery in the
US, has taken a toll on our crude export, since the US has reduced its demand for Nigerian crude.
The Nigerian sedimentary basin is divided into the following: Anambra, Benue, Bida, Chad,
Dahomey embayment, Sokoto and Niger delta. See the diagram below:

Main Report and Recommendations
NEITI Oil and Gas Industry 2013 Audit
297
Figure 8.6.4A - Map of Nigeria showing sedimentary basins (DPR presentation)
The Niger Delta is still the powerhouse of Nigerian petroleum activities. A total of 177 blocks have
been allocated, out of which 104 fields are currently producing oil/gas. The current acreage
situation is shown below: Figure 8.6.4B - Acreage situation
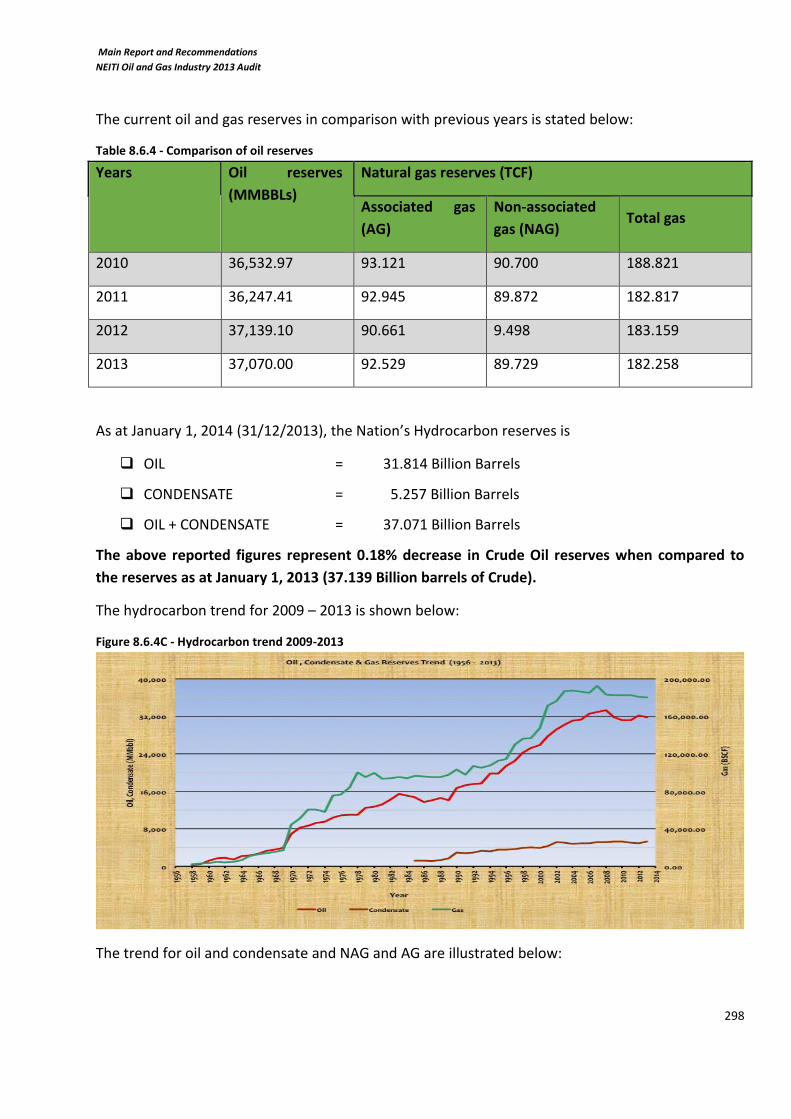
Main Report and Recommendations
NEITI Oil and Gas Industry 2013 Audit
298
The current oil and gas reserves in comparison with previous years is stated below:
Table 8.6.4 - Comparison of oil reserves
Years Oil reserves
(MMBBLs)
Natural gas reserves (TCF)
Associated gas
(AG)
Non-associated
gas (NAG) Total gas
2010 36,532.97 93.121 90.700 188.821
2011 36,247.41 92.945 89.872 182.817
2012 37,139.10 90.661 9.498 183.159
2013 37,070.00 92.529 89.729 182.258
As at January 1, 2014 (31/12/2013), the Nation’s Hydrocarbon reserves is
OIL = 31.814 Billion Barrels
CONDENSATE = 5.257 Billion Barrels
OIL + CONDENSATE = 37.071 Billion Barrels
The above reported figures represent 0.18% decrease in Crude Oil reserves when compared to
the reserves as at January 1, 2013 (37.139 Billion barrels of Crude).
The hydrocarbon trend for 2009 – 2013 is shown below:
Figure 8.6.4C - Hydrocarbon trend 2009-2013
The trend for oil and condensate and NAG and AG are illustrated below:

Main Report and Recommendations
NEITI Oil and Gas Industry 2013 Audit
299
Figure 8.6.4D - Oil and condensate, NAG and AG trend 2009-2013
The gas reserves shown above has been increasing constantly over the period.
8.6.5 Conceptual definition of the existing systems
The legal/regulatory system of exploration and production of hydrocarbons consists of the way
Nigeria organizes oil activities and how it is involved and relates with the different agents of that
industry. The legal/regulatory system also determines the relationship and involvement between
Nigerian and IOCs/LOCs.
Every legal/regulatory system depends on the political and economic structure of the State, that is
to say:
Its legal structure – constitutional and infra-constitutional – and;
Its level of involvement and participation in E&P activities.
8.6.6 Legal context
The regulation of petroleum exploration and production is governed by the Petroleum Act of 1969
as amended. The main sections included in the act are as follows:
Vesting of petroleum in the State
Oil exploration licenses, oil prospecting licenses and oil mining licenses
Refineries
Control of petroleum products
Offences in connection with the distribution of petroleum products
Price control
Rights of pre-emption
Power and duties of public officers
Regulations
Discharge of obligation to make payments

Main Report and Recommendations
NEITI Oil and Gas Industry 2013 Audit
300
Settlement of duties by arbitration
Delegation of powers
Offences
Repeals, amendments, transitional and savings provisions
Interpretation
Short title and commencement
Other key legislation include:
Nigerian Oil and Gas Industry Content Development Act 2010.
Oil Pipelines Act 1965.
Oil in Navigable Waters Act 1968.
Associated Gas Reinjection Act 1979.
Petroleum Profits Tax Act 1958.
The Environmental Impact Assessment Act 1992.
Each law plays a different but significant role in the administration and regulation of the industry. In
addition, they create regulatory agencies that implement government policy and ensure
compliance with the respective enabling laws.
The entire ownership and control of petroleum resources (including oil and gas) in, under and on
any land in Nigeria, its territorial waters and its exclusive economic zone is vested in the Federal
Government of Nigeria (FGN) by virtue of the Constitution, the Petroleum Act 1969 (PA) as
amended and the Exclusive Economic Zone Act (EEZA).
However, under the PA, the Minister may grant qualified persons rights to prospect, explore and
produce oil and gas through the issuance of an:
Oil exploration license (OEL) which entitles the licensee to the non-exclusive right to explore
for oil and gas within the area of the grant.
Oil prospecting license (OPL) which confers on the licensee the exclusive right to explore for
oil and gas within the area of the grant, and to carry away and dispose of the petroleum
won and saved during its prospective operations.
Oil mining leases (OML) which entitles the licensee the exclusive right within the leased area
to conduct exploration and prospective operations and to win, get, work, store, carry away,
transport, export or otherwise treat petroleum discovered in or under the lease area.
In addition, participatory rights are granted by the FGN to contractors to conduct sole risk
petroleum operations with respect to OMLs held by the NNPC (Deep Offshore and Inland Basin
Production Sharing Contracts Act).

Main Report and Recommendations
NEITI Oil and Gas Industry 2013 Audit
301
Abandoned or unproductive fields in lease areas covered by OMLs are farmed-out to independent
leaseholders and indigenous companies periodically (PA and Guidelines for Farm-out and Operation
of Marginal Fields 2011).
8.6.7 Structure
The industry is broadly divided into:
Upstream sector,
Midstream,
Downstream sector, and
Services sector.
The upstream operations covers the exploration, field development and production operations; the
midstream covers the processing, storage & distribution, marketing and transportation of crude oil,
gas, gas-to Liquids and liquefied natural gas; while the downstream involves the operations such as
manufacturing, refining & petrochemicals and wholesale and marketing.
8.6.8 Upstream Sector
This sector is characterized by exploration and production of crude oil and gas (petroleum
operations). The income of companies engaged in these activities is subject to tax under the
Petroleum Profits Tax Act, 2004 (PPTA), as amended.
The upstream oil sector is the single most important sector in the economy, accounting for over
90% of the country’s exports and about 80% of the Federal Government (FG’s) revenue. Crude Oil is
currently produced from three different basins: the onshore Anambra, the offshore
Benin/Dahomey (deep-water and ultra-deep-water) and the Niger Delta (shallow and deep offshore
basins). The Niger Delta and Benin basins are known to be the richest basins and hold the vast
majority of reserves, and the source of a large portion of current production. During the late 1990s,
exploration focus turned to high risk ventures in the frontier basins of deep water offshore, with
encouraging success. These ventures are becoming increasingly attractive, with developments in
deep-water exploration and production technology.
Nigeria’s crude oil generally has a gravity between 21oAPI and 45oAPI. It’s mainly exported crudes
are Bonny Light (37o) and Forcados (31o). About 65% of Nigeria’s oil is above 35oAPI with a very low
sulphur content. Exploration activities have slowed down recently due to the uncertainties
surrounding the passage of the proposed Petroleum Industry Bill into law. The PIB is an omnibus
legislation, which will introduce significant changes into oil and gas operations in the country.
With respect to gas, a recent BP Statistical Energy Survey1 put the proven natural gas reserves at
5.29 trillion cubic metres, 2.82% of the world’s estimated reserve. Estimates of Nigeria’s
undiscovered gas reserves range from 300 – 600 TCF. Nigeria has therefore been described largely

Main Report and Recommendations
NEITI Oil and Gas Industry 2013 Audit
302
as a gas province with some oil. The gas quality is high – particularly rich in liquids and low in
sulphur. Due to the lack of gas infrastructure, 75% of associated gas is flared and only about 12% is
re-injected.
There are various arrangement in the Nigerian upstream sector namely:
Joint venture (JV)
Production sharing contracts (PSCs)
Service contract (SC)
Marginal field / indigenous contract
8.6.9 Midstream sector
The Midstream sector (processing, transportation, refining, petrochemicals), is where crude oil,
natural gas and gas liquids are transported and transformed into products for the retail market. In
Nigeria, the transportation of oil and gas to the refinery and gas station is carried out via the
pipeline network from the wellhead to the refinery or plant. Tankers and purpose-built vessels are
also used for this purpose. See the diagram below for illustration purposes:
Figure 8.6.9 - Crude oil transportation process
8.6.10 Downstream sector
The key segments in the downstream sector are discussed below:
Refining
Nigeria has four refineries: two situated in Port Harcourt and one each in Warri and Kaduna. The
refineries are all wholly owned by the NNPC. However, these refineries are only working at about
30% of their installed capacity; necessitating the importation of refined products to meet growing
local demand. The FGN has recently awarded contracts for Turn-Around- Maintenance to be
performed on the refineries to boost the level of their production.

Main Report and Recommendations
NEITI Oil and Gas Industry 2013 Audit
303
Distribution and Marketing
Distribution and Marketing of refined petroleum products are complementary activities.
Distribution involves the transportation of refined petroleum products from the refineries through
pipelines, coastal vessels, road trucks, rail wagon etc. to the storage/sale depots.
Petroleum products are supplied in Nigeria principally through the Petroleum Product Marketing
Company’s (PPMC) pipeline system, which links the refineries to the about 21 regional storage/sale
depots.
Petroleum product marketing involves the procurement and sale of refined petroleum products.
Marketers lift products from PPMC depots and deliver to their various retail outlets. They also
import refined products from outside of Nigeria to meet the demands of their customers. There are
however guidelines issued by the DPR to prevent importation of substandard products.
The distribution and marketing value chain for oil & gas are illustrated below:
Figure 8.6.10A - Oil distribution & marketing value chain
Figure 8.6.10B - Natural gas distribution & marketing value chain

Main Report and Recommendations
NEITI Oil and Gas Industry 2013 Audit
304
8.6.11 Oil service sector
The classification of services under this sector is summarized in the table below: Table 8.6.11 - Classification of oil services sector
Exploration support services - Seismic data acquisition
- Processing and interpretation
- logging
- fishing
- cementing
Drilling services -Welding services
-Well drilling
-Cementing
-Logging
-Fishing
Production support services -Wireline services
-Work over services
-Production testing services
-Construction of oil & gas facilities
Downstream services -Wireline services
-Refinery maintenance
-Pipeline/depots construction
-Petroleum products haulage
-Petroleum product marketing
Others Banking services, Catering services,
Communication services

Main Report and Recommendations
NEITI Oil and Gas Industry 2013 Audit
305
8.6.12 Gas Sector
The primary market for Nigeria's natural gas was historically the export market. However, there is
increased local demand for natural gas.
Domestic consumption of natural gas is mainly for:
Power generation.
Fertiliser production.
Methanol production.
Aluminium smelting.
Cement production.
Steel manufacturing.
Residential consumption of bottled liquid propane gas (LPG).
A typical process of gas processing is illustrated below: Figure 8.6.12A - Gas processing
An overview of the Nigerian gas sector is illustrated below: Figure 8.6.12B - Production and utilization of gas (culled from DPR presentation)

Main Report and Recommendations
NEITI Oil and Gas Industry 2013 Audit
306
About 37% of gas produced is supplied to Nigeria liquefied natural gas (NLNG) and the West African
Gas Pipeline (WAGP), while 15% is supplied to NGC and which invariably is used in the domestic
market; 35% is used for processing and the balance of 13% is flared. The Nigerian Gas Company
(NGC), a subsidiary of Nigerian National Petroleum Corporation (NNPC), is responsible for the
marketing, transmission and distribution of gas.
Nigeria holds the largest natural gas reserves in Africa but has limited infrastructure in place to
develop the sector. Nigeria’s first and most ambitious gas project, the Nigeria LNG (NLNG) facility
on Bonny Island has six LNG trains currently operational with a total annual capacity of 31bcm. It
has become an increasingly important supplier of liquefied natural gas (LNG) to European buyers.
The LNG facility is currently supplied natural gas from dedicated gas fields.
8.6.13 Results from the review process of the oil and gas sector
The review was conducted by various consultants and the methodology was adhered to. Variations
of the process from 2012 audit include:
DPR from July 2013 issues receipts for all revenue streams payments it receives
The Accountant general’s office stopped the issuance of receipts with reference to DPR
receipts
Note: The variance from 2012 Audit is the issuance of receipts for all payments by DPR which
started in July 2013.
8.6.14 Key Findings on Systems and Process Review
Issues from the various agencies and IOCs/IC (indigenous companies) and recommendations are
enumerated in the table below:
GOVERNANCE
1. Oil bidding
No bidding took place in the year under review, the last bidding exercise occurred in 2007 whereas,
there have been issuance/reallocation of licenses.
Implication
Lack of transparency and reduction in revenue accruable to government.
Recommendation
We recommend that there should be an annual or bi-annual bidding exercise and then allocation of
blocks to suitable operators.

Main Report and Recommendations
NEITI Oil and Gas Industry 2013 Audit
307
Section 190 of the draft Petroleum Industry Bill (PIB) subsection 6 ensures transparency by
requesting that NEITI monitors the proceedings during Bid rounds. (“All bids received based on the
bid parameters established in subsection (2) of 190 shall be processed in accordance with the
published guidelines and monitored by NEITI”). NEITI should therefore pursue the speedy passage
of the bill.
2. Allocation of Oil Blocks
Discretionary award of oil blocks; The Petroleum Act allows the Minister to award oil block as
he/she deems fit.
Implication
This does not ensure transparency and may result in loss of revenue to the Federation.
Recommendation
The discretionary power to award should be discontinued. Due process should be followed for the
allocation of oil blocks.
3. Petroleum Act
There are some provisions of the Petroleum Act that are outdated and inconsistent.
Implication
Some provisions of the Act are subject to misinterpretation.
Recommendation
The Federal Governmrnt should ensure speedy passage of the Petroleum industry Bill (PIB) which is
expected to consolidate the various fiscal enactment in the Oil and Gas Industry.
4. Gas policy
There is no clear policy on Gas Utilization.
Implication
1. There are conflicting standards for Gas pricing and Utilization
2. There is no incentive for non-flaring of gas (ie 100% utilisation of all Gas produced) and
penalty for Gas flaring is rather insignificant, also harnesing Gas needs major infrastructure.
Recommendation
The Federal Government should develop and implement a National Policy on Gas Utilization.

Main Report and Recommendations
NEITI Oil and Gas Industry 2013 Audit
308
CENTRAL BANK OF NIGERIA Audit validation of payments into CBN account revealed that some receipts were recorded without
names of the paying entities and this resulted to improper recording. Unidentified templates were
created by CBN to post such receipts without names of the payees. This resulted to incomplete
recording and accounting. This applies to payments for Petroleum Profit Tax, Value Added Tax,
Royalty Payments and payments for Gas Flare Penalties.
Implication
The implication is that some oil companies transactions could not be easily traced and reconcilied
with the CBN accounts.
Recommendation
The Central Bank Desk Officers in the Foreign Operations Division of the Banking Systems and
Payments should always sort out complete information for the names of every paying oil
companies from the Fund Remittance Platform of the foreign banks. Proper narration should
always be made of every payment received by the bank to enhance easy and proper recording and
accounting.
The Federal Inland Revenue Services and the Department of Petroleum Resources should re-
examine the present mode of direct remittance to the concerned accounts with a view for
improvement.
Audit process
1. PPPRA Post Payment Audit
The audit process leading to post payment audit of Subsidy by the Independent Auditor appointed
by Ministry of Finance (MOF) need to be re-appraised. Huge and sometimes wrong payments are
usually made prior to audit.
Implication
The Federation could lose funds which may be difficult to recover.
Recommendation
The system should incorporate the vetting to be done by the Independent Auditor within the 45
days period allowed.
2. DPR Receipt issuance
There is no effective receipt issuance and collection system at the DPR. The Oil and Gas Companies
do not follow up on collections of DPR receipts and DPR does not have an effective means of
delivering payment receipts to Oil and Gas Comapnies.

Main Report and Recommendations
NEITI Oil and Gas Industry 2013 Audit
309
Implication
The Companies make payments without any supporting evidence from DPR thus creating
difficulties in audit validation.
Recommendation
Payment receipts should be issued immediately after payments and Oil Companies should ensure
timely collection of the receipts to ensure better reconciliation and validation in future NEITI audits.
DPR should ensure that receipts are issued once payment has been received in the JP Morgan
chase account.
Technical Capacity building and Operational Facilities
The tecnical capacity and modern infrastructure for carrying out critical regulatory functions are
lacking among Government agencies.
Implication
Sub-optimal performance in the discharge of regulatory functions
Recommendation
Governrmnt should ensure adequate training and development for officers involve in regulatory
functions and also provide modern facilities for the discharge of their functions in accordance with
internaltional best practices.
8.7 Oil and Gas Production Companies in 2013
The list of companies that produced Crude Oil and Gas, their current production arrangements and
respective operators for 2013 are stated below:
Table 8.7 - 2013 Producing Companies
Operators for 2013
Joint Ventures (JV)
1 Total Exploration and Production Nigeria
Limited (TEPNG)
4 Chevron Nigeria Limited (CNL)
2 Nigerian Agip Oil Company Limited
(NAOC)
5 Mobil Producing Nigeria Unlimited (MPNU)
3 Shell Petroleum Development Company
Limited (SPDC)
6 Pan Ocean Nigeria Limited

Main Report and Recommendations
NEITI Oil and Gas Industry 2013 Audit
310
Operators for 2013
Production Sharing Contract (PSC)
1 Addax Petroleum Development
Company Limited
5 Addax Petroleum Exploration Company
Limited
2 Esso Exploration and Production Nigeria
Limited (EHRA)
6 Sterling Oil Exploration and Energy - SEEPCO
(OKWUIBOME)
3 Nigerian Agip Exploration (ABO) 7 Shell Nigeria Exploration and Production
Company SNEPCO (BONGA)
4 Total Upstream Nigeria Limited -TUPNI
(USAN)
8 Phillips Oil Company Nigeria Limited
SOLE RISK (SR)
1 Continental Oil and Gas Limited 9 Atlas Petroleum International Limited
2 Conoil Producing Limited 10 Dubri Oil Company Limited
3 Amni International Petroleum
Development Company Limited
11 Express Petroleum and Gas Company Limited
4 Nigerian Petroleum Development
Company Limited (NPDC)
12 Neconde Energy Limited
5 Allied Energy Resources Limited 13 Shebah Exploration and Production CO.
Limited
6 Seplat Petroleum and Development Co.
Ltd
14 Camac International Nig. Limited
7 First Hydrocarbon Nigeria 15 Shoreline Natural Resources Limited.
8 ND Western Ltd 16 Moni Pulo Petroleum Development
MARGINAL FIELD (MF)
1 Platform Petroleum Limited 6 Niger Delta Petroleum Resources Limited
2 Midwestern Oil and Gas Company
Limited
7 New Cross Petroleum Limited
3 Pillar Petroleum Limited 8 Energia Limited
4 Walter Smith Petroman Oil Limited 9 Brittania-U Nigeria Limited

Main Report and Recommendations
NEITI Oil and Gas Industry 2013 Audit
311
Operators for 2013
5 Oriental Energy Resources Limited
Service Contracts (SC)
1 Agip Energy and Natural Resources
(AENR)
8.7.1 Review of Licensing
In the period under review, no bid rounds were conducted. The last bid round conducted was in
2007. The current status of the awarded blocks are depicted in the chart below:
Figure 8.7.1- Concession Status of 2013 data culled from Oil & Gas statistical bulletin
However, In the year under review, the sum of $12.5m was paid by SIGMUND OILFIELDS LTD as
signature bonus with respect to OML 2012.
Furthermore to buttress the issue of revenue drainage due to lack of bidding exercise, the table
below shows the allocated and open blocks:
228 (158)
19 (7)
9 (3)
43 (2)
17 (0)
46 (7)
28 (0)
NIGER DELTA
ANAMBRA
BENIN
BENUE
BIDA
CHAD
SOKOTO

Main Report and Recommendations
NEITI Oil and Gas Industry 2013 Audit
312
Table 8.7.1- Open and Allocated blocks status; data culled from Oil & Gas statistical bulletin
S/N Basin/Terrain Allocated Open Total no. of
Blocks
1 Niger Delta & Benin (Deep Offshore) 40 54 94
2 Niger Delta (Continental Shelf) 51 6 57
3 Niger Delta (Onshore) 67 5 72
4 Anambra (Inland) Basin 7 12 19
5 Benin (Inland) Basin 3 6 9
6 Chad (Inland) Basin 7 39 46
7 Benue (Inland) Basin 2 41 43
8 Sokoto (Inland) Basin 0 28 28
9 Bida (Inland) Basin 0 17 17
TOTAL 177 208 385
8.7.1.1 The Licensing Legal Process
In accordance with Petroleum Act of 1969 (as amended), the Ministry of Petroleum Resources,
through the Department of Petroleum Resources (DPR) is empowered to oversee Oil Blocks
Licensing in Nigeria. The legislations governing DPR are:
a) Petroleum Act 1969 and the Petroleum (Amendment) Decree 1996.
b) Petroleum (Drilling and Production) Regulations, 1969 with amendments in 1973, 1979,
1995, 1996 and Petroleum (Amendment) Decree 1996.
c) Mineral Oils (Safety) Regulations, 1963.
d) Petroleum Profit Tax Act, 1959 with amendments in 1967, 1970, 1973 and 1979.
e) Oil Pipeline Act 1956, as amended in 1965.
f) Nigerian National Petroleum Corporation Decree 1977.
g) Associated Gas Re-injection Decree 1979, as amended in 1985. (viii) Production Sharing
Decree 1999.
h) Deep Water Block Allocations to companies (Back-in-Rights) Regulations 2003.
i) Oil Prospecting Licenses (Conversion to Oil Mining Leases etc.) Regulations 2003.
The above legislations contain details of the License and permit types, as well as the obligations
and rights of the concessionaire to guide new entrants and all other existing operating companies.

Main Report and Recommendations
NEITI Oil and Gas Industry 2013 Audit
313
Terms and conditions of operations, technical specifications of the equipment and installations,
health, safety and the environment matters are also covered in the legislation. More information
can be found on https://dpr.gov.ng/index/license-permit/.
8.7.2 The Licensing Process
The Nigerian Petroleum Act as amended sets out the criteria for issuance of licenses. DPR
processes applications for various Licenses, Permits and approvals across the entire Oil and Gas
value chain. The table below shows the licenses and the office the value is accruable:
Table 8.7.2 - Licenses and accounts accruable
License Accounts
OEL (oil exploration license)
OPL (oil prospecting license)
OML (oil mining license)
Accrues to the Federation
Account
BUNKERING
EXPORT PERMIT
FILLING STATION
DEPOT
LUBRICANT RETAILERS LICENSE
PIPELINE
LUBE PLANT
REFINERY AND HYDROCARBON PROCESSING PLANTS
PETROLEUM PRODUCTS IMPORT
STATUTORY GUIDELINES FOR OPERATION OF COASTAL
VESSELS
OFFSHORE SAFETY PERMIT (OSP)
PROCEDURE GUIDE FOR THE CONSTRUCTION AND
MAINTENANCE OF FIXED OFFSHORE PLATFORMS.
DESIGN AND CONSTRUCTION OF OIL AND GAS SURFACE
PRODUCTION FACILITIES.
Accrues to the Accountant
General’s Office

Main Report and Recommendations
NEITI Oil and Gas Industry 2013 Audit
314
The licensing system for Nigeria varies depending on the license as stated below:
(i) The deep offshore areas (water depth beyond 200m) and inland areas.
(ii) The Onshore and shallow water areas.
The summary of the licensing process is shown below:
Figure 8.2.2 - Licensing process diagram
NB: The variance from 2012 is the issuance of receipts for all payments.
Details are stated in the next subsections.
8.7.3 Procedures for oil blocks bidding and licensing rounds
8.7.3.1 Participation in Bids
To participate in Licensing Rounds, a company must:
Be a Limited Liability Company incorporated in Nigeria with a share capital of not less than
Two Million Naira in ordinary shares.
Have a recognizable office and employing not less than 20 personnel.
Have at least two of its Directors as Nigerians with Oil and Gas experience.

Main Report and Recommendations
NEITI Oil and Gas Industry 2013 Audit
315
8.7.3.2 Oil Block Bidding and Award Procedures
The approval of the Hon. Minister of Petroleum Resources is required for the granting of an Oil
Prospecting License (OPL). The approval procedures are as follows:
8.7.3.3 Advertisement
The Department of Petroleum Resources (DPR) is charged with the responsibility to advertise all
blocks available for bidding in Nigeria through:
a. National dailies and magazines, and International publications as approved by Government.
b. Dedicated DPR website, which shall also provide the platform for various bid processes including
registration, qualification, analysis and interactive communication with bidders.
8.7.3.4 Bid Guidelines
Bid Guidelines are issued by the DPR to prospective Bidders to guide them. The Guidelines contain
details of the application modalities, documentation to be provided, application fees payable and
deadline for submission of Bid Documents.
8.7.3.5 Bid Application and Application Fees
A Bidding Form shall be provided by the DPR and the non-refundable chargeable fees shall be
$10,000.00 (Ten Thousand US Dollars) per block.
8.7.3.6 Bid Processing and Processing Fees
Bid Processing Fee is usually US $10,000.00 (Ten Thousand US Dollars) per block. The Bid
Processing Fee shall be paid in Certified Bank Draft into a DPR Domiciliary Account. The amount
shall be used by the DPR to meet the processing expenses of the Licensing Rounds.
8.7.3.7 Data Prying Fees
Data prying fee is $25,000.00 (Twenty Five Thousand US Dollars) per block and is optional. It
enables prospective Bidders to have access to general Seismic Data already acquired with respect
to the particular blocks on offer. Data may also be purchased or leased at commercial rates from
certain oil services companies, a list of which will be made available by the DPR.
8.7.3.8 Pre-Qualification Requirements
The following are the Pre-qualification requirements for the bid process;
a) Evidence of Registration: The Company must be registered solely for Exploration and
Production business and shall provide evidence of such registration by way of a Certificate
of Incorporation and a copy of the Articles and Memorandum of Association.
b) Evidence of Financial Resources: Companies intending to obtain Operator status shall
present a letter from their bank confirming that the Company has at least US

Main Report and Recommendations
NEITI Oil and Gas Industry 2013 Audit
316
$10,000,000.00 (Ten Million Dollars) or N1,000,000,000.00 (One Billion Naira) as the case
may be.
In the case of a Nigerian company with technical partner, they shall provide such joint
evidence of same amount.
There must be evidence also that the company has maintained an account balance of at
least One Billion Naira or Ten Million United States Dollars for at least six months prior to
the date of application.
Companies intending to participate as Local Content providers or those intending to obtain
upstream acreage owing to their involvement in strategic downstream projects should
demonstrate the ability to pay their equity participation.
c) Evidence of the Company's Technical Capability. Evidence of a company's technical
capacity, capability and track record with emphasis on experience and expertise in
exploration, development and production shall be required. The ability of an applicant to
fully meet the objective of encouraging expeditious, efficient exploration to identify and
produce oil and gas resources of the nation will enhance its application.
d) Environmental Policies of Applicant: Detailed Health, Safety and Environment (HSE)
policies and procedure of the company should be stated with particular reference to
environmental impact assessment/analyses.
e) Local Content: Local content refers to those activities (or parts of them) in the proposed
work programme which the applicant shall mandate to a Local Content provider approved
or designated by Government. A list of the activities that qualify as Local Content is
published in the DPR website. The Local Content Development Act, 2010 has given legal
backing to local content requirements which are expected to be strictly observed by
prospective Bidders.
Government’s intention since 2005 is to make local content a biddable item in Bid Rounds
with the introduction of the Local Content Vehicle (LCV) in Oil Blocks allocation procedures.
f) Evidence of Payments
This will include evidence of payment of the Application Fee and Bid Processing Fee.

Main Report and Recommendations
NEITI Oil and Gas Industry 2013 Audit
317
8.7.3.9 Bid Evaluation
Technical Evaluation 8.7.3.9.1
The objective of this phase is to analyse and weight the technical capacities and competencies of
prospective bidders. Those qualified as Operators are classified in three categories:
Class (A) operator: qualified to operate in the deep offshore and frontier inland basins;
Class (B) operator: classified to operate in blocks located in Niger Delta shallow waters or
onshore and Inland basins; and
Class (C) operator: qualified to operate in Niger Delta shallow waters or onshore only.
At the end of the qualification exercise the Bid Committee shall publish a list of all qualified
operators and partners (including the list of blocks that partners may participate in, and their
allocated equity.
A company may qualify both as an operator in certain zones and as a partner in other zones.
Commercial Evaluation 8.7.3.9.2
The objective of this phase is to obtain a fair value for the State and determine the companies to
be designated Operators on the basis of the commercial package offered by the companies. Only
qualified operators can submit commercial offers in respect of the blocks applied for. The
Commercial Offers shall consist of the following:
a. Signature Bonus: This is the amount in US$ that the company is willing to pay at once on
signing the production sharing contract (PSC) Agreement. The Bid Guidelines will normally
indicate a minimum value of the Signature Bonus. The sum paid shall be equal to or exceed
the prescribed minimum.
b. Work Programme Commitment: The work programme (seismic and wells expressed in both
volume and US$ value) that the company is willing to carry out on the block. Again, this
shall be equal to or exceed the prescribed minimum.
c. Local Content: The activities that the Operator is willing to mandate to its local content
partner from the Activity List defined for Work Programme Commitment expressed in US$
value.
d. Ceiling for Cost Oil Recovery: The Maximum level of Cost Oil expressed as a percentage of
total production that the company is willing to accept in the Production Sharing Contract.
The ceiling shall not exceed 80%.
Commercial Evaluation Parameters 8.7.3.9.3
The Commercial Bids shall normally be based on the following four parameters:
1. Signature Bonus (Weight 40%): The maximum is scored by bids that are twice the minimum
or more. Bids are then evaluated at percentage over the minimum.

Main Report and Recommendations
NEITI Oil and Gas Industry 2013 Audit
318
2. Cost Oil Ceiling (Weight 20%): The maximum is scored by bids that specify 70% or below.
Bids are then evaluated at percentage below 80%
3. Local Content (Weight 20%): The percentage of the work programme commitment to score
the minimum is 30%. Bids are scored according to the percentage of work commitment
prorated below 30%.
4. Work Commitment. (Weight 20%): The maximum is scored by bids that are twice the
minimum. Bids are then evaluated at percentage over the minimum.
8.7.3.10 Bidding Conference
The companies offer the commercial bids on the date set for the bidding conference. The bidding
shall normally be a two day event to which all stakeholders –industry including the press are
invited. The offers are presented openly, verified, evaluated and announced on the spot, with the
aid of a computer system and the result displayed on a video screen in front of the audience.
Procedures at the Bidding conference 8.7.3.10.1
a) Registration
This involves delivery of offers (in specific Registration Form and envelopes), as well as in
magnetic media such as CD-ROM or Floppy disk. The company's accredited representative is
called to place their offer in an envelope and deliver an electronic copy on disk to the Bid
Round staff. The company's accredited representative places the Offer envelope and waits
for the opening;
b) Analyses and comparisons of Offers
The Bidding Round staff pronounces the opening of each envelope (provided by the
company's representative); the offer is validated and checked against the electronic copy
(checking for errors or offers not adherent to requirements). The analysis of the offer is
done based on the given parameters and weights to finally establish a winner for the block.
8.7.3.11 Bid Winner and Contract Signing
a. Announcement of the winner: Announcement of results to stakeholders is done through
certain channels - website, press (official or private) and also instantly to the Bid Round
participants through wide screen TV platforms.
b. Closing of the Bid Round: The closing is the last part of the Licensing Round overall process
and is composed by:
I. Finalization of the draft PSC Agreement by including the company data and
adjusting specific clauses of contract.
II. PSC Signing -Effective signature of contract and dissemination of relevant
information about it to the other relevant arms of Government -NNPC, FMF, Justice,
FIRS etc. The main objective here is to synchronize information about the PSC
agreement and allow further follow-up of company activities.

Main Report and Recommendations
NEITI Oil and Gas Industry 2013 Audit
319
8.7.3.12 Payment of Signature Bonus
On the grant of an Oil Prospecting License (OPL), the signature bonus shall be due for payment
within a period of 90 days from the date of signing the applicable agreement.
If the company fails to pay the required Signature Bonus at the expiration of the 90-day period,
revocation notices, which will last 30 days, shall be given. This brings the maximum allowable
period for Signature Bonus payment to 120 days.
If the company is not able to pay up within the 30 days of revocation notice the allocation shall be
revoked without further notice.
8.7.4 National Policy on Petroleum Exploration and Development
The policy allows participation by both public and private (indigenous or foreign) interests in the
exploration and development of petroleum resources of the country. The main objectives of the
policy are as follows:
I. Expand the scope of participation in Nigeria's oil industry and diversify the sources of
investment and inflow of funds.
II. Increase the oil and gas reserves base through aggressive exploration.
III. Promote indigenous participation in the oil industry thereby fostering technological
transfer, local goods and services utilization, and indigene employees' skills and
competencies acquisition.
IV. Ensure that periodic, open competitive bidding for acreages are carried out and that
awardees do not hawk these blocks in the open market to third parties.
8.7.5 Ownership of Petroleum Resources in Nigeria and State Powers
All the hydrocarbon resources in Nigeria are vested in the Federal Government, whose sole
responsibility is to control the resources and only permit their exploitation under license, in
accordance with the Petroleum Act 1969.
The State allocates acreages (licenses) to operators in any such areas deemed to have potential for
petroleum accumulation at the discretion of the Minister of Petroleum Resources.
The allocations shall be based on a set of criteria made known to qualified and deserving
companies at the time such blocks are open for bidding.
The State reserves the right to participate in the operations of any block and to determine the type
of contractual arrangements between the awardees and the Government.
The State reserves the right to recommend Local Content providers to participate in any block for
the purposes of furthering the Local Content policy aspirations of Government. The Local Content
Development Act 2010 has now given legal backing to local content requirements in the industry
for participation in oil and gas operations in Nigeria.

Main Report and Recommendations
NEITI Oil and Gas Industry 2013 Audit
320
8.7.6 Participation in Petroleum Exploration and Production Operations in Nigeria
Only the holder of a concession or assignee, or their accredited contractors shall engage in
petroleum exploration and production operations in Nigeria.
Concessions shall be allocated to operators based on Open Competitive Bidding process.
Concessions or licenses may be granted only to a company incorporated in Nigeria to carry out
petroleum operations under the Petroleum Act, 1969, as amended.
The company must be registered solely to carry on the business of Petroleum operations.
Special incentives are given to investors willing to participate in exploration and production
activities in the inland basins comprising Chad, Benue, Bida, Sokoto, Anambra, etc.
8.7.7 The efficiency and effectiveness of licensing systems
From detailed review of the licensing system in Nigeria Oil and Gas Industry, the audit observed
that though there is a robust established licensing system, the system however, cannot be said to
be efficient and effective. An example of the contravention of the laid down licensing procedures
was the divestment of some OMLs from SPDC and NAOC JVs by NNPC (the national oil company of
the federation) to NPDC (NNPC subsidiary) under a non transparent circumstance and also not an
arm’s length transaction.
8.8 Review of Management of Sector Finances
8.8.1 Introduction
The Management of the Oil and Gas Sector is an enormous task. The Nigeria Extractive Industries
Transparency Initiative (NEITI) has the responsibility for monitoring and ensuring that all payments
due to the Government from all extractive industry companies, including taxes, royalties,
dividends, bonuses, penalties, levies and such other income streams from the industry, are duly
made. NEITI is also charged with ensuring that all fiscal allocations and statutory disbursements of
revenue from Extractive Industry (EI) sources due from the Federation Account to statutory
recipients are made and properly accounted for.
The Accountant-General of the Federation (OAGF) is the Chief Accounting Officer charged with the
constitutional role of preparing the nation’s financial statements arising from collection and
Receipts of income, Fees, Rentals and Taxes and payment out of the Federation Account.
Accordingly, Sec 85 S.5 of the Constitution provides that, “The Auditor-General shall, within ninety
(90) days of the receipts of the Accountant-General’s Financial Statement, submit his reports under
this section to each House of the National Assembly responsible for public accounts”.
The office of the Accountant-General of the Federation (OAGF) is the executive arm of Government
responsible for maintaining records for all revenues and receipt and payments into and out of the
Federation Account.

Main Report and Recommendations
NEITI Oil and Gas Industry 2013 Audit
321
The key issues centre around these areas:
I. Recording of transactions
II. Receipting of transactions
In order for the relevant agencies to be transparent, all transactions must be recorded
appropriately and against the accounts. Receipts must be given to the IOCs/LOCs once payment
has been effected. Proper narration should always be made of every payment received by the bank
to enhance easy and proper recording and accounting. We encourage that monthly reconciliation
meetings be held between the Central Bank of Nigeria, the Oil Companies and the beneficiary
revenue agencies to reconcile records of transactions. The Office of the Accountant –General of
the Federation should put in place a formal structure to monitor the financial contributions from
the Oil Companies to the Niger Delta Development Commission (NDDC) and Nigerian Content
Development and Monitoring Board (NCDMB).
8.8.2 Financial Flows
The financial flows received by the Government from the covered entities are illustrated below:
Figure 8.8.2A - Financial flows
FGN/CBN Accounts
crude oil revenue
income from domestic crude
gas revenue
gas penalty
signature bonus
royalty Licenses and Concession
Rentals Taxes (VAT,
WHT, CIT, CGT, PPT, PAYE and education tax)
income from NDDC
income from NCDB
cash call

Main Report and Recommendations
NEITI Oil and Gas Industry 2013 Audit
322
The payment flows are received from various agencies (FIRS – taxes, DPR – royalty oil and gas,
signature bonuses, concession rentals, gas flare penalty, miscellaneous) and IOC’s. A further
description of the figure is stated below:
Income from domestic crude oil
The Income is realised from the sale of unrefined crude allocation for domestic refining.
NNPC pays for domestic crude allocated in Naira at a converted export crude price using
CBN exchange rate on the day of invoicing. Unrefined crude in excess capacity are sold and
proceeds received into NNPC Account.
Federation crude oil income
The revenue proceeds are from the sale of crude oil and gas by the NNPC to international oil
market. Proceeds are received in United States Dollar. This flow is reported by the Central
Bank of Nigeria which is the receiving entity since payments are made to it on instruction of
the foreign customer.
Taxes
o Petroleum profit tax
Petroleum Profit Tax is tax paid on profit generated by companies in the Upstream
Sector of the oil industry. Petroleum Profit Tax is regulated by the PPT Acts of 2007.
Petroleum producing operators like Joint Venture Companies, Production Sharing
the Companies and other oil producers are first two statutorily required to prepare
estimate of their income with the first two months and to forward the same to the
Federal Inland Revenue Services. The agreed estimate of tax is payable in twelve
equal monthly instalments.
o Company income tax
Company Income Tax is tax paid on profit arising from gas operations of companies.
Oil and Gas companies pay Company Income Tax in United States Dollar, on profit
arising from gas operations.
o Value added tax
This is consumption tax that is placed on a product whenever value is added at a
stage of production and at the point of Sales. The rate of Value Added Tax is
currently five percent (5%). Value Added Tax is paid by all covered entities in local
and foreign currencies to the Federation Account with J.P. Morgan Chase Bank
Domiciliary account with the Central Bank of Nigeria.
o Withholding tax
With Holding Tax is a government requirement for the payer for an item of income
to withhold or deduct tax from payment, and pay the tax to the relevant government
authority, the Federal Inland Revenue Services. Withholding tax is paid by all covered

Main Report and Recommendations
NEITI Oil and Gas Industry 2013 Audit
323
entities in Naira to the State Government and in the USD to the Federation Account
with the Central Bank of Nigeria.
o Pay as you earn (PAYE)
A Pay As You Earn Tax (PAYE) is a tax on Income of Employees on a monthly basis.
The relevant deductions are paid by all covered entities in Naira or Dollar to the State
Government to which they relate, as required by the specific State Personal Income
Tax Act 2011 enactments as amended to date.
o Tertiary Education Tax
Education Tax Fund was created by an Act in the year 1993 for the funding of
educational Institutions in the Country. The fund is provided through Tertiary
Education Tax collected by the Federal Inland Revenue Service (FIRS) in accordance
with Tertiary Education Trust Fund (Establishment, etc.) Act 2011.
Tertiary Education Tax is chargeable on assessable profit of petroleum companies at
a rate of two percent (2%). The tax is an allowable deduction in computing an
Exploration and Production (E&P) company adjusted profit.
Royalties
This is a regular payment from the oil companies in the Upstream to the Federal
Government in return for the right of access to the crude oil. Royalty is a sum of money paid
by a holder of a concession to the Federation based on the value of quantity of oil extracted
at the fixed percentage from time to time by the government. Department of Petroleum
Resources (DPR) is the government agency that receives the amount paid as royalty.
Signature bonus
The revenue is received at the time Oil Prospecting License is given to oil company.
Payments are made to the Department of Petroleum Resources (DPR) designated account at
the Central Bank of Nigeria for the allocation of oil blocks.
Licenses and Concession Rentals
Oil and Gas companies pay concession Rentals as rent on oil blocks for which they have been
granted concession. There are two categories of Rentals, which are:
o Oil Prospecting License (OPL)
o Oil mining Lease (OML)
The license is non-exclusive and is granted for a period of one year. It is renewable annually.
Funding Niger Delta Development Commission
The Niger Delta Development Commission is a Federal Government Agency established in
the year 2000, with the sole mandate of developing the oil rich Niger Delta region of

Main Report and Recommendations
NEITI Oil and Gas Industry 2013 Audit
324
Southern Nigeria. In September 2008 the Niger Delta Ministry was formed and it became a
parastatal under the ministry.
Presently, there is three percent (3%) Statutory Contribution required from upstream
companies to the NDDC based on their Annual Budget. The Act establishing the NDDC
provides that in addition to monies from the Federal Government, it has to be funded by
annual contributions of the total budget of any oil producing company, operating on-shore
and off-shore in the Niger Delta area of the country. Contributions are made in both foreign
and local currencies to the commission.
Funding of Nigerian Content Development and Monitoring Board (NCDMB)
The Nigerian Content Development and Monitoring Board is the Regulatory Agency vested
with the responsibility of regulating local content in the oil and gas industry in Nigeria. The
Board was established by the Nigeria Oil and Gas Development Act which applies to all
operators in Nigeria Oil and Gas Industry, including Exploration and Production and Services
Companies.
The board is funded by the Federal Government of Nigeria and by the Upstream Companies
through remittance of one percent (1%) Statutory deductions from any contract awarded to
any operator, contractors, sub-contractors alliance partners or any other entity in any
project operation activity in any transactions in the upstream sector of the Industry.
Cash call
This is cash advance payment required to be paid by each Joint Venture operating company
to meet up with the cash operation requirements of the Joint Venture. The Nigeria National
Petroleum Corporation pays on behalf of the Nigerian Government in its Joint Venture
Agreement.
The payment is made on monthly basis for each of the financial year. This only applies to the
Joint Venture between NNPC and the Joint Venture Operators.
Payments are made to the Joint Venture Operators both in local and foreign currencies by
NNPC on behalf of the Federal Government.
The financial transaction flow can be illustrated in the diagram below and a further
description of the entities processes will be described further in the next section (8.9):

Main Report and Recommendations
NEITI Oil and Gas Industry 2013 Audit
325
Figure 8.8.2B - Financial transaction flow
CBN distribution
NNPC FIRS DPR
Domestic
Oil & Gas
Federation
CrudePPT EDTVAT CIT
Signature
BonusRoyalty
Gas
FlaringRentals
Foreign Customers Bsnk
CBN JP Morgan Account
Cash CallFederation Account
IOCs / LOCs
8.9 Systems and processes for paying/receiving entities
The procedures for paying for royalty, tax etc. are described below (according to the respective
agencies :
8.9.1 Department of Petroleum Resources (DPR)
Department of Petroleum Resources (DPR) started as a Hydrocarbon Section of the Ministry of
Lagos Affairs in 1947.
The Department of Petroleum Resources (DPR) was created as a Department in the Ministry of
Petroleum Resources with the excision of the Petroleum Inspectorate of the NNPC upon
commercialization in 1988.
Its mission statement is stated as “To ensure the sustainable development of Nigeria’s Oil and Gas
resources across the value chain for our stakeholders through effective regulation, while
entrenching world class professionalism, accountability and transparency”.
DPR has the statutory responsibility of ensuring compliance to petroleum laws, regulations and
guidelines in the Oil and Gas Industry. The discharge of these responsibilities involves monitoring of
operations at drilling sites, producing wells, production platforms and flow-stations, crude oil
export terminals, refineries, storage depots, pump stations, retail outlets, any other locations
where petroleum is either stored or sold, and all pipelines carrying crude oil, natural gas and
petroleum products.

Main Report and Recommendations
NEITI Oil and Gas Industry 2013 Audit
326
DPR, as the regulatory body in the Oil and Gas Sector, is vested with powers by various legal provisions to discharge the following functions:
• Supervise all petroleum industry operations being carried out under licenses and leases in the country
• Monitor the petroleum industry operations • Enforce health safety and environmental regulations and ensure that those operations
conform to national and international industry practices and standards. • Maintain records on petroleum industry operations, particularly on matters relating to
petroleum reserves, production and exports of crude oil, gas and condensate, licenses and leases as well as rendering regular reports on them to Government.
• Advise Government and relevant Agencies on technical matters and policies which may have impact on the administration and control of petroleum.
• Process all applications for licenses so as to ensure compliance with laid-down guidelines before making recommendations to the Minister of Petroleum Resources.
• Ensure timely and adequate payments of all rents and royalties as at when due. • Monitor Government Indigenization policy to ensure that local content philosophy is
achieved. • Maintain and administer an effective repository for archiving and retrieval of all oil and gas
data in Nigeria. • Administer and manage oil and gas acreages and concessions in Nigeria. • Implement all policies of government on oil and gas matters.
8.9.1.1 Classes of revenue received by DPR
DPR operates a Cashless Revenue Collection System. All the Revenue collected by the DPR is done either by Bank Drafts or direct wire transfer by the Oil companies into FGN accounts domiciled with the CBN. DPR computes revenue due to the FGN using the reconciled field production figures. Companies are also allowed to do self-assessment, effect payments and advice DPR accordingly. Companies are allowed sixty days to make monthly payments. The DPR receives pay advice from companies, confirms payment on the CBN Monthly JP Morgan Bank Statement and holds meetings with the companies to reconcile payments with the amounts due. Various types of revenue are generated and collected by DPR on behalf of Federal Government of Nigeria namely:
signature bonus
concession rentals
royalty on oil production
royalty on gas sales
gas flare penalty
miscellaneous oil revenue

Main Report and Recommendations
NEITI Oil and Gas Industry 2013 Audit
327
8.9.2 Signature bonus
This is the premium paid on account of concession granted the winner of an oil block to express interest in the concession. The payment of signature bonus is made directly to the FGN designated Accounts as advised by the OAGF. Payments are usually made either by US Dollar drafts or wire/telegraphic transfer. The Accounts to which payments have been made include:
CBN/FGN Independent Revenue accounts with JP Morgan Chase Bank, New York, USA
CBN/AGF FGN account with JP Morgan Chase Bank NY, USA
Consolidated Revenue Fund (CRF) account with CBN Finding: There were no Bid Rounds in the period covering 2013.
8.9.3 Concession rentals receipt procedures
Concession Rentals are described in section 8.8.2 above . The license is non-exclusive and is granted for a period of one year. It is renewable annually. The applicable rental rates are;
OPL - US$10/SQ KM or part there Off (Non-Producing Block)
OML - US$ 20.00/SQ KM or part there Off (up to 10 years of Conversion) and US$15.00/SQ KM or part there off (until the Expiration of the Lease)
Concession rentals are paid either on the anniversary of the concession or in advance. It is usually paid either in Naira or US Dollars. The process is depicted in the diagram below:
Figure 8.9.3 - Concession rentals process
DPR determines
amount payable
Operator (IOC)
pays the amount
through a bank
draft
DPR revenue
section of F&A
receives and
processes bank
draft and pays into
CBN/DPR fee
account
DPR issues
receipt to the
operator (IOC/
LOC)
IOC/LOC receives receipt
and copies are sent to
assessment and lease
allocation division and
revenue branch of F&A
division
Document payment is
entered in the register
Monthly
reconciliation
End

Main Report and Recommendations
NEITI Oil and Gas Industry 2013 Audit
328
8.9.4 Royalty on oil
Royalties originated in the United States of America, and takes the form of a percentage production which is payable in cash or in kind (Crude Oil) at the option of the host country. The purpose of royalties is to provide the owner of the subsoil with a steady income in compensation for the irreplaceable loss resulting from the exploitation of non-renewable reserves. In the Nigerian Oil Industry, Royalty refers to payments, either in cash or in kind, made by a holder of a concession to the Federation based on the value of the quantity of Crude oil or Gas produced (saved after the oil has been separated from its components) from the field within the concession in line with the fiscal terms approved statutorily by the Government. Royalty payment is a statutory obligation of every corporate body involved in the production of Oil and Gas. It is guided principally by the Petroleum Act of 1969 as amended by Cap 10 Volume 13 Law of Federation of Nigeria (LFN) 2004. The Petroleum (Drilling and Production) regulations Act No. 69 LFN of 1996 Section 60 stipulates that Royalty on crude oil and casing head petroleum spirit is computed by applying the appropriate rate of royalty to the chargeable value of crude oil and casing head petroleum spirit under the regulation. Calculation of chargeable oil as provided in the 1996 regulation Act is as follows: -
a) ascertaining the quantity of crude oil produced on a field by field basis in the relevant OML; and
b) reducing that quantity by the deduction of: o Quantities used for production operations o Quantities used for re-injection. o Quantities lost through evaporation.
The above Act Interpretations (section 63) also explains that "casing-head petroleum spirit" means any liquid hydrocarbons which
c) have been obtained from natural gas by natural separation or by any chemical or physical process; and
d) have not been refined or otherwise treated; From the above it can be inferred that Royalty is calculated on net crude oil produced on a field by field basis. Finding: During the course of our audit we were made to understand that the Department of Petroleum Resources (DPR) interprets this to mean that royalty is assessed on net crude oil production after removal of associated gas, water, sediments and other impurities.
The calculation and payment of royalty on oil is guided principally by Section 61 of the 1969 Petroleum Act as amended.

Main Report and Recommendations
NEITI Oil and Gas Industry 2013 Audit
329
Royalty (R) = V*P*R Where:
R = Royalty rate (depending on the terms and terrain V = Production volume P (Crude oil price) =
Official selling price (OSP) or releasable price (RP) as adjusted by API gravity of the crude oil
Note: the royalty paid is also determined by the operating contract.
8.9.5 Royalty on gas
Royalty on gas is based on gas sales. Royalty on gas sales refers to the sum paid by the holder of a Concession to the Federation based on the volume of gas produced and sold from the fields within the concession in line with the following fiscal terms:
a) Onshore 7% of gas sale b) Offshore 5% of gas sale
8.9.6 Gas flare penalty
This refers to the amount paid for flaring gas in Nigeria (it is a penalty). The regulations governing gas flare penalty include:
a) Regulation 42 of the Petroleum (Drilling and Production) Regulations, 1969. b) Associated Gas Re-injection Act, 1979. c) Associated Gas Re-injection (Continued Flaring of Gas) Regulations, 1984. d) Cap. 26 Laws of the Federation of Nigeria, 1990.
Gas flare penalty rates used under various fiscal regimes are:
a) 2K applicable from 1985 to June 1992 b) 50K applicable from July 1992 to December 1997 c) N10 applicable from January 1998 to March 2008 d) $3.5 applicable from April 2008 to Date (still in contention)
The rate of N10 as provided by the Regulation of January, 1998 is still being applied. We understand that lack of political will on the part of Government to uphold the April 2008 Regulation may be responsible for the non-implementation. The companies complete a Self -Assessment based on the parameters in the Act and make monthly payments to the designated JP Morgan Accounts which are subsequently reconciled with the DPR after receipt of calculations from the fields.

Main Report and Recommendations
NEITI Oil and Gas Industry 2013 Audit
330
8.9.7 DPR process
Figure 8.9.7 - DPR high level process
Note:
DPR computes royalties due to FGN, using the reconciled field production data, API and crude oil
prices advised by NNPC. Companies are allowed the option of performing a self-assessment of
royalty due and to effect payment within 60 days of production and advice DPR accordingly. DPR
receives the payment advice from companies which includes swift copies and confirms payment
with the CBN/JP Morgan Chase Bank statements. DPR issues receipts to covered entities for all
revenue received. DPR undertakes quarterly reconciliations with producing companies to ascertain
differences if any. Operational penalty fees are charged when payments are not made when due.
8.10 National Petroleum Investment Management Services (NAPIMS)
National Petroleum Investment Management Services (NAPIMS) is the Corporate Services Unit
(CSU) and the Exploration and Production (E&P) Directorate of the NNPC. It is charged with the
responsibility of managing the Nigerian Government's investment in the upstream sector of the Oil
and Gas industry. The operators in the relationship are:
Shell Petroleum Development Company (SPDC)
Mobil Producing Nigeria Unlimited (MPNU)
Chevron Nigeria Limited (CNL)
Total Exploration and Production Nigeria Limited (TEPNL)
Nigerian Agip Oil Company Limited (NAOC)
Pan Ocean Oil Company Limited (POOCN)

Main Report and Recommendations
NEITI Oil and Gas Industry 2013 Audit
331
NAPIM’s objective is to enhance the margin accruing to the Nigerian Federal Government through
effective supervision of the Joint Venture Companies (JVCs), Production Sharing Companies (PSCs)
and Service Companies (SCs). It aims to achieve its objective through adequate supervision of
budgets and performance, as well as ranking of projects that give higher "returns on investment" to
the Nigerian government.
8.10.1 NAPIMS processes – cash call process
Cash calls are based on the annual work programme (AWP) of each joint operation and covers such diverse areas as exploration, drilling, production, development, construction, engineering facilities, technical materials, for both crude oil and gas, in addition to administrative overheads, referred to as OPEX. On receipt of the cash call, NNPC summons a meeting of the cash call processing committee where unacceptable items of cost are rejected and the net value accepted by the committee is signed by all parties i.e. NNPC and other partners including the operator. The IOCs are members of the cash call processing committee. The work programme agreed in advance among the Joint Partners is approved by their operating committees (OPCOM) as provided in the JOA. The OPCOM is constituted in accordance with the JOA as the highest decision making authority and is charged with the overall supervision, control and direction of all matters pertaining to the joint operations. Cash calls are initiated monthly by the JV operator and served on NNPC and other partners early enough to enable NNPC and all Partners including the operators to lodge their equity portions of the cash calls into the JV Dollar and Naira cash call bank accounts on or before the 1st day of the cash call month. NNPC has prying and audit rights over all these Accounts, but the custody and transactional authority over these joint operating bank accounts rests with the operators. Based on the Annual Budget allocated for Joint Venture Operations as approved by the Government and communicated to NNPC by the Budget Office of the Federation, a portion of revenue realized from the sale of crude oil and gas is set aside for the payment of Cash calls by NAPIMS.
a) Revenue from the sale of crude oil is paid into the JP Morgan Chase CBN/NNPC Crude Oil Revenue Account.
b) Revenue derived from Gas and Feed Stock is paid into JP Morgan CBN/NNPC Gas Revenue Account.
c) Funds from both Accounts meant for Cash Calls are subsequently paid into JP Morgan Chase CBN/NNPC JV Cash Call Payment Account.
d) From the account in (c) above, CBN disburses Dollars to the Dollar Accounts of the JV operators as authorized by NNPC mandates. A second amount of US Dollars is monetized from same Account into Naira and paid into CBN/NNPC JV Cash Call Naira Payment Account and from there is disbursed into individual JV bank accounts maintained by the operators.

Main Report and Recommendations
NEITI Oil and Gas Industry 2013 Audit
332
e) The individual IOCs or JV partners will in turn pay their equity portion of the Cash Call into the JV Naira and Dollar Cash Call Account.
The summary of the cash call process is depicted in the diagram below:
Figure 8.10.1A - Summary of cash call process
Cash Call Process
OIL/GAS
DIRECTORATE
FINANCE ADMIN
DIRECTORATE
(FAD)
ALL
STAKEHOLDERSNAPIMS/NNPCIOC
6
Cash call committee
reviews the cash call/
mandate request
9
GM FAD reviews the
request and authorizes
Mgr JIA to issue a
mandate
10
OPCOM (GGM NAPIMS) signs and
approves the mandate and dispatched to
IOC
8
GM Oil/Gas reviews the
request and forwards it
to GM FAD
7
ALL stakeholders sign-
off cash call request and
forward to GM Oil/Gas
12
NAPIMS recognize
and book the entries in
the ledger
End
5
IOC submits mandate/
monthly cash call report
&/monthly returns report
1
Annual budget
proposals and strategic
plans are submitted
2
Budget and strategic
plans are reviewed by
technical committees
and submitted
3
NASS reviews,
approves and budget is
appropriated
4
IOC and NAPIMS reviews the
appropriated budget and re-aligns the
budget
11
Mandate/cash call
payment (Naira and $)
is made via the CBN/
related accounts
13
At year end, comprehensive annual performance of the project are discussed and
approvals from TECOM and OPCOM are received

Main Report and Recommendations
NEITI Oil and Gas Industry 2013 Audit
333
The cash call budgeting process can be depicted below:
Figure 8.10.1B - Cash call budgeting process
The cash call disbursement process is shown below:
Figure 8.10.1C - Cash call disbursement process

Main Report and Recommendations
NEITI Oil and Gas Industry 2013 Audit
334
8.11 Federal Inland Revenue Service (FIRS)
The Federal Inland Revenue Service (FIRS) is saddled with the following key responsibilities:
Assessment and collection of Taxes
Accounting for taxes collected and maintenance of tax records
Enforcement of payment of taxes as may be due to the Government
Review the tax regimes and promote the application of tax revenues to stimulate economic
activities and development.
Establishment and maintenance of a system for monitoring international dynamics of
taxation in order to identify suspicious transactions and perpetrators and other persons
involved
Issuance of taxpayer identification number
Advising the Federal Board of Inland Revenue on professional and technical tax issues
referred to it
Taxes with respect to the oil and gas industry is handled by three major departments/sections of
FIRS:
Upstream
Downstream (for marketing companies)
Oil Services
8.11.1 FIRS process- Tax identification number (TIN) process
The tax identification is illustrated below:

Main Report and Recommendations
NEITI Oil and Gas Industry 2013 Audit
335
Figure 8.11.1 - Issuance of tax identification number process

Main Report and Recommendations
NEITI Oil and Gas Industry 2013 Audit
336
8.11.2 Tax clearance certificate issuance
The tax clearance issuance process is depicted the chart below:
Figure 8.11.2 - Tax clearance certificate issuance process
8.11.3 Filing of returns
The filing of returns process is depicted in the chart below:
Figure 8.11.3 Filing of returns process
8.11.4 Tax monitoring
On a regular basis the various taxes are being monitored by the RPP unit. VAT (returns are expected
by the 21st of every month) and WHT are being monitored too. The RPP unit reviews VAT returns
and communicates to taxpayers.

Main Report and Recommendations
NEITI Oil and Gas Industry 2013 Audit
337
8.12 Central Bank of Nigeria (CBN)
The Central Bank of Nigeria has full responsibility for the custody of Federal Government Fund. It is
the Supreme Monetary Authority in Nigeria. It issues Nigerian naira currency, maintains foreign
currency reserves and is charged with the responsibility for maintaining monetary stability. It is also
the lender of last resort for Nigeria banks. It was established by law in 1958.
The CBN operates various accounts for the federation (on behalf of the relevant agencies) in-flows
as shown in the table below:
Table 8.12 - CBN inflows account details (oil and gas sector revenue)
Government Agencies Account description Account details
NNPC NNPC operates Domiciliary Accounts with JP Morgan Chase Bank New York USA in the Central Bank of Nigeria (CBN) where revenue payments from the sales of Export Crude Oil and Gas to foreign Customers are paid and received. Nigerian National Petroleum Corporation (NNPC) Crude Oil Marketing Department (COMD) make Sales of Crude Oil and Gas to Foreign Customers, issues invoices to their foreign banks in line with terms of Letter of Credit, and payment is received within 30 (Thirty) days. The following accounts were in operation during the 2013 Audit Year. All payments were received in United States of America (USA) Dollar. The accounts and records were maintained by the Foreign Operations Division of the CBN Banking and Payment Systems Department.
NNPC/CBN Crude Oil and Gas Revenue (Export) Account
000000400941775
NNPC/CBN Gas Revenue Account
000000816296438
CBN/JV Cash Call Account 000000011658366
NNPC- The Revenue proceeds arising from the sales of Domestic Crude Oil and Gas by the Crude Oil Marketing Department (COMD) of Nigerian National Petroleum Corporation (NNPC) was also maintained by the Central Bank (CBN) Banking Operations Department of the Banking and Payment Systems. The accounts were called NAIRA ACCOUNTS. All transactions were made and recorded in Naira.
NNPC/CBN Domestic Crude Oil Revenue Account
0020157141024
NNPC/CBN Gas Revenue Account
20157141105

Main Report and Recommendations
NEITI Oil and Gas Industry 2013 Audit
338
Government Agencies Account description Account details
DPR It maintains JP Morgan Chase Bank New York with CBN for the collection of revenue i.e. signature bonus etc.
CBN Joint Venture Royalty 000000802906875
CBN Production Sharing Contract Royalty
000000802906883
CBN Gas Flared Penalty 000000802906909
CBN Concession Rentals 000000802906917
CBN Miscellaneous Oil Revenue
000000802906925
CBN Gas Royalty 000000802906891
CBN Signature Bonus 000000753811397
FIRS It maintains JP Morgan Chase Bank New York with CBN for the collection of taxes
FIRS/Petroleum Profit Tax 000000400216647
FIRS/Companies Income Tax 000000400216620
FIRS/Value Added Tax 000000400216698
FIRS/With Holding Tax 000000400216639
FIRS/Education Tax 000000400216728
8.13 Office of the Accountant General of the Federation (OAGF)
The Office of the Accountant General of the Federation (OAGF) was established for Treasury
Management of Government. It has responsibility for providing adequate accounting systems and
controls in the ministries, extra ministerial offices and other Arms of Government. The office also
has the mandate of collating receipts and reporting on revenues of the Federal Government
derived from Sec. 80(1) of the Constitution 1999 which stipulates that “All revenues or other money
raised are received by the Federation (not being revenues or other moneys payable under this
constitution or any Act of the National Assembly into any other public fund of the Federation
established for a specific purpose) shall be paid into and from one Consolidated Revenue Fund of
the Federation.”
The Accountant- General of the Federation (OAGF) is the Chief Accounting Officer and he is charged
with the constitutional role of preparing the nation’s financial statements arising from collection
and receipts of income, fees, rentals and taxes and payment out of the Federation Account.
Accordingly Sec 85 S.5 of the Constitution provides that, “the Auditor-General shall, within ninety
days of the receipts of the Accountant-General’s Financial Statement, submit his reports under this
section to each House of the National Assembly responsible for public accounts”.
The office of the Accountant-General of the Federation (OAGF) is the executive arm of Government
responsible for maintaining records for all revenues and receipt and payments into and out of the
Federation Account.
The OAGF transaction recording procedures can be depicted in the diagram below:

Main Report and Recommendations
NEITI Oil and Gas Industry 2013 Audit
339
Figure 8.13 - OAGF transaction recording process
NNPC sends
monthly revenue
reports and letters
of advice
DPR sends
monthly returns on
royalty etc
payments
FIRS sends
monthly returns on
all tax receipts
CBN sends
monthly return
Call statement (
“federation
account
component
statement)
OAGF receives
and analyses the
various reports
IOC/LOC send
copies of advice
on their
remittance(PPT,
royalty etc) to
CBN
receipts
Internal
reconciliation
meeting are held
with IOCs,
government
agencies on their
submissions to
resolve
differencies
Federal account
allocation
committee (FAAC)
meeting
Da
ta
(p
aym
en
ts)
fro
m IO
Cs/
LO
Cs
Revenue is
distributed to
the three tiers
of
government
8.14 Framework for growth in the Oil and Gas Sector
At its simplest, the world will still want oil, though its demand profile will come under pressure and
the price is unlikely to rise as much again as it has in the last decade. The world will also want a lot
more gas, but as this is available the price may go down rather than up. As projects become both
larger and more risky, there is an increased need for well-functioning partnerships (for both risk
management and access to funding). What is clear is that a ‘do nothing’ option is only delaying the
inevitable.
The framework for growth cannot be overemphasized; see below:

Main Report and Recommendations
NEITI Oil and Gas Industry 2013 Audit
340
Figure 8.14 - Framework for the Oil & gas sector
The diagram above is self-explanatory. A lot can be done depending on the sincerity of the leaders
of the country.
The future growth of this industry will come from investments in new assets, technology and
people which invariably depends on the policies that will be set in place by the government.
Other bi-products of crude (ethanol, bitumen) should be fully exploited; see the diagram below
(from a barrel of crude):
Figure 8.14B - Bi-products from a barrel of crude

Main Report and Recommendations
NEITI Oil and Gas Industry 2013 Audit
341
Gas should be exploited more aggressively as this invariably assists to boost the current power
supply in the country. Private sector should be encouraged. Biofuels investments should be
encouraged. The future is ours if we do the right thing beginning with privatization of NNPC and the
passage of the PIB into law.
8.14.1 Method for Pricing of Federation Equity Crude
In order to achieve the term of reference of the NEITI audit, the review covers both the direct and
indirect factors responsible for achieving market driven and optimal crude oil pricing setting and
revenue generation to the federation.
8.14.1.1 Direct Factors – Methodology for Pricing of Nigerian Crude Oil
Find below the issues identified as direct factors for pricing, with a direct impact on the revenue
accruable to the Federation.
Pricing Philosophy 8.14.1.1.1
The team reviewed the adoption of three pricing options by the NNCP-COMD. Crude oil buyers are
given the option to elect one of the three pricing options within six days of the BOL date.
We were not given any studies or review to justify the adoption of the above pricing option or why
other pricing options could not be considered by NNCP-COMD, such as an average of 30 days
before the BOL date, or 30 days after the BOL date, or 30 days average during the month of lifting.
As a part of our review, we are still expecting responses from COMD with respect to the date the
pricing policy was approved, and by whom.
Implication
We believe that the Federation could be losing substantial revenue if the policy adopted by NNPC
is not reviewed on a consistent basis to reflect market conditions. The current pricing policy need
to be reviewed considering the latest market conditions i.e within the African continent only, the
increase of competitive threats, as traditional producers like Angola are ramping up production and
new oil producers, namely, Ghana, Ethiopia, Kenya, Uganda, Tanzania and Mozambique have
entered the market. Onshore exploration activities are also ongoing in Senegal, Gabon and other
African markets.
Recommendations
We recommend the following:
The adoption of any pricing policy by NNPC should be supported by rigorous and empirical
studies. This pricing policy should be approved by the Federal Executive council on the
recommendations of a committee that has technical, marketing and commercial awareness
of Nigeria crude oil traded and sold worldwide.

Main Report and Recommendations
NEITI Oil and Gas Industry 2013 Audit
342
The policy should be reviewed on a regular basis to reflect current market conditions.
Compliance Testing on the Application of the Pricing Option 8.14.1.1.2
Performance test on the application of the three pricing options carried out during the year in
accordance with the requirement of the TOR.
Compliance/Consistency test was carried out on the application of NNPC’s pricing methodology on
crude oil (export as well as domestic) lifting transactions and observed that the pricing
methodology was consistently applied on the export crude sales except for twenty-one (21)
transactions out of the total transactions of two hundred and Nineteen (219) domestic crude oil
transactions that failed the test (Appendix 8.14.1.1.2), and this resulted in a shortfall of 3.2 billion
naira ($20.8m) from the twenty-one (21) transactions.
Implication
Non-compliance by COMD’s application of the adopted pricing option has resulted in a financial
loss of $20.8m to the federation.
Recommendation
We recommend that the arithmetical accuracy and transparency of the pricing option elected
should be reviewed by the Audit Department of NNPC and subsequently approved by senior
management before the finalization of the invoice.
Actualization or benchmarking of OSP 8.14.1.1.3
COMD set the Official Selling Price (OSP) in advance of the following month crude sales. An
actualisation or benchmarking exercise of the OSP against Platt’s differentials was performed. The
result presented below showed the difference between the OSP and Platt’s daily differential:
Figure 8.3.3.1.3A – 2013 Daily Tracking of Dated Platt Differentials vs NNPC OSP
The above graph (Appendix 8.14.1.1.3A) showed the price differentials of Agbami, Brass River,
Bonny, Escravos, Forcados and Qua Iboe grades highlighted mixed results.

Main Report and Recommendations
NEITI Oil and Gas Industry 2013 Audit
343
Further analysis of the graph above shows that Escravos and Agbami grossly underperformed
against Platt’s daily differentials. In 2013, Escravos had 147 days (of 253 days) or 58% and Agbami
had 138 days (of 253 days) or 55% wherein NNPC-COMD OSP is less than Platt daily differentials.
Figure 8.3.3.1.3B – Benchmarking NNPC OSP vs Platt’s Differentials in 2013
Implication
i. Underperformance of monthly OSP
From our sample reviewed, the underperformance of Agbami and Escravos monthly OSP has
resulted to a shortfall of approximately $2m to the federation.
Recommendation
We recommend that the monthly setting of OSP should be market driven and transparent for all
grades traded by NNPC-COMD.
Performance Tracker - No. of days Bonny - Platt
Vs OSP
QIL - Platt
Vs OSP
Forcados - Platt
Vs OSP
Agbami - Platt
Vs OSP
Escravos - Platt
Vs OSP
Brass River - Platt
Vs OSP
No. Days Differential Less Zero 27% 50% 29% 55% 58% 30%
No. of Days Differential Greater than Zero 73% 49% 71% 44% 41% 69%
No of Days Differential Equal to Zero 0% 1% 0% 1% 1% 0%
100% 100% 100% 100% 100% 100%
Keys
Differential Less than Zero : NNPC OSP Underperformed against Dated Brent Differential
Differential Greater than Zero : NNPC OSP Outperformed Dated Brent Differential
Differential Equal to Zero: NNPC OSP and Dated Brent Differential are equalised
0
0.5
1
1.5
2
2.5
3
3.5
020406080
100120140160180200
Bonny -Platt Vs
OSP
QIL - PlattVs OSP
Forcados -Platt Vs
OSP
Agbami -Platt Vs
OSP
Escravos -Platt Vs
OSP
Benchmarking NNPC OSP Vs Platt's Differential in 2013
No. Days Differential Less Zero No. of Days Differential Greater than Zero
No of Days Differential Equal to Zero

Main Report and Recommendations
NEITI Oil and Gas Industry 2013 Audit
344
ii. Credit Terms
It was observed that the off-takers are granted a 30 days credit period to settle crude oil bills while
the NNPC is granted 90 days. However, the NNPC does not strictly adhere to the 90 day credit
period as it was also observed that payments were made in lump sum for all lifting transaction
values on a monthly basis without due regard to the credit period allowed.
This practice led to aggregate default of 190days on the assumption that bill of lading dates (on
aggregate basis) were the last day of the months, which is the worst-case scenario. From the audit
review and validation carried out, no evidence of late payment penalty was made by NNPC as in
the case with off-takers. See Appendix 8.14.1.1.3B for more details.
Recommendation
NNPC to adhere strictly to the 90 days credit period considering the economic loss that non-
compliance is causing the country.
iii. Conflict of Interest
We observed that the NNPC acts as an agent to and sells crude oil on behalf of the Federation, but
the NNPC is also a customer of Nigerian crude oil and sells crude oil for domestic refining to itself
through one of its subsidiaries – PPMC. This confers unnecessary advantage to the NNPC in terms
of selection of pricing options and when viewed against the fact that the NNPC hardly pays for
crude lifting within the stipulated 90 days as against 30 days for other off-takers.
Recommendation
Federal Government should consider unbundling NNPC to allow the SBUs operate independently
and on commercial basis like other participants in the Oil and Gas business.
NNPC Response
NNPC has been mandated to act as strategic reserve holder and supplier of last resort on
petroleum products for the federation, with attendant social responsibility. In order to achieve this
mandate NNPC minimizes losses which may be incurred due to storage costs, etc hence the need
for PPMC to have the least pricing option than other off-takers.
Election of Pricing Options 8.14.1.1.4
From the table below, our testing showed that some crude oil buyers did not elect their pricing
option, 6 days before the BOL date, as stipulated by the NNPC policy and the prompt pricing option
would have been adopted, but a different pricing option was used.

Main Report and Recommendations
NEITI Oil and Gas Industry 2013 Audit
345
Additionally, the election of the pricing of 159 crude oil transactions traded could not be validated
with a cumulative volume of over 109m bbls, due to lack of evidence validating the dates the
pricing options were elected. See Appendix 8.14.1.1.4.
Implication
Non-compliance with NNPC-COMD pricing policy or crude oil traders acting in collision with NNPC-
COMD personnel, resulting in a loss of approximately $1.9m from the sample reviewed. This loss to
the federation could be substantial if the total crude traded in 2013 were reviewed.
Recommendations
We recommend that all price elected by crude oil buyers should be supported by a valid audit trail.
We also recommend the pricing option elected be sent to a department independent of COMD-
NNPC (e.g. Audit Department) for review prior to approval.
NNPC Response
The cargoes referred to in Auditor’s appendix 13 are injected cargoes. NNPC’s Crude oil term con-
tract Part I Article 7(L) allows buyer to elect pricing options even after the due date for option sub-
mission as long as it is cargo injection.
Tracking the Transparency of Electing a Particular Pricing Options 8.14.1.1.5
The transparency of COMD’s current pricing policy is based on the fact that crude oil buyers should
elect to choose particular pricing options within 6 days before the BOL date. The price elected must
be supported by valid evidence or an audit trail of the choice made by a crude buyer. If a crude
buyer fails to elect a particular pricing option or fails to elect a particular pricing option within the
stipulated time, the prompt pricing option would be used to calculate the average price.
CustomersContractual
ArrangmentsInvoice Numbers
Quantity
(bbls) BOL Date
Date of Prices
Options were
Eleceted
Time Lag
(6 days)
Price
Option used
to Calculate
average
price
Average
using the
wrong
procing
option
Price option
sholud had
been (<6
days)
New
average
using
Prompt
Diff. per
bbls Diff. Value $
TRAFIGURA BEHEER B.V. NNPC Equity Lifting- PSC COS/09/088/2013 50,000.00 30-Sep-13 27-Sep-13 (3.00) Deferred 110.42 Promt 109.08 1.34 66,950.00
CALSON (BERMUDA) LTD JV COS/11/PPMC/041/2013 948,530.00 25-Nov-13 25-Nov-13 - Advance 109.31 Promt 111.44 (2.13) (2,015,626.25)
CALSON (BERMUDA) JV COS/12/PPMC/042B/2013 75,000.00 10-Dec-13 06-Dec-13 4.00 Deferred 111.25 Promt 109.16 2.09 156,525.00
AMG NNPC-SNEPCO-PSC FIRS/05/045/2013 50,000.00 17-May-13 13-May-13 4.00 Deferred 102.02 Promt 102.30 (0.28) (14,000.00)
(1,806,151.25)

Main Report and Recommendations
NEITI Oil and Gas Industry 2013 Audit
346
Market condition would greatly influence the particular options elected by a crude oil buyer. For
the purpose of clarifications, let us make the following assumptions:
1. All crude oil buyers are rationale i.e. they will only elect the lowest pricing option at any
particular trading window;
2. The bill of lading date is on the 14 April 2013. And , the days before and after the bill of
lading days are all working days, no weekends and bank holidays;
3. We are faced with two market conditions, a consistent raising or falling daily crude oil dated
Brent price.
These assumptions are tabulated below:
The analysis of the table above showed the price average of a rising or falling crude oil price and
the average prices for prompt or advanced pricing option:
It is clear from the above analysis that a rational crude oil buyer would elect a particular pricing
options depending on the market conditions - a rising or falling crude oil price.
When crude oil price is rising: In hindsight, a rationale crude oil buyer would elect the
advanced pricing option of $106, because it is lower when compared to prompt, $109.25
Rising at a
constant
rate
Falling at a
constant
rate
Prompt / Default Advanced Deferred
08/04/2013 104.50 105.50
09/04/2013 105.00 105.00
10/04/2013 105.50 104.50
11/04/2013 106.00 104.00
12/04/2013 106.50 103.50
13/04/2013 107.00 103.00
14/04/2013
15/04/2013 108.00 102.00
16/04/2013 108.50 101.50
17/04/2013 109.00 101.00
18/04/2013 109.50 100.50
19/04/2013 110.00 100.00
20/04/2013 110.50 99.50
Pricing Options
Working
Days
5 consecutive published
quotations of Platt's Dated Brent
price , with the fifth day BEFORE
the Bill of Lading Day with the
Bill of Lading date as Day one.
5 consecutive published
quotations of Platt's Dated
Brent price, with the sixth
quotation day AFTER the Bill of
Lading Date with the Bill of
Lading date as Day one.
5 consecutive published
quotations of Platt's Dated Brent
price AFTER the Bill of Lading
Date with the Bill of Lading date
as Day Zero.
Dated Brent ($)
BOL DAY
Prompt / Default Advanced
Rising at a
constant
rate
109.25 106.00
Falling at a
constant
rate
101.00 104.00
Averages ($)Senarios

Main Report and Recommendations
NEITI Oil and Gas Industry 2013 Audit
347
When crude oil price is falling: In hindsight, a rationale crude oil buyer would elect the
prompt pricing option of $101, because it is lower when compared to advance, $104
Issue – the auditor used this assumption to analyse the pricing election of 2013 COMD crude oil
sales. See the graph below:
Figure 8.3.3.1.5 – 2013 Daily Dated Brent and the Advanced Pricing Option Elected by Crude Oil Buyers
The above graph showed that crude oil buyers, for example are electing to choose the advance
pricing option, the lowest pricing options subject to market conditions i.e up trending crude oil
price. However, this analysis would only hold true if the whole process is transparent i.e. pricing
elections are validated by a supporting audit trail. The issue above demonstrates that this process
is not transparent.
Implication
Non-compliance with NNPC-COMD pricing policy or in collision with NNPC COMD personnel, the
federation could lose substantial revenue if the total crude traded in 2013 were reviewed. This is
more worrisome as the audit could not validate the election of the pricing of 159 crudes oil
transactions traded with a cumulative volume of over 109m bbls, due to lack of evidence validating
the dates the pricing options were elected. See Appendix 8.14.1.1.4.
Recommendations
We recommend that all price elected by crude oil buyers should be supported by a valid audit trail.
We also recommend that the pricing option elected be sent to a department independent from
COMD-NNPC for review and in other to ensure control.
KEY
Showed the period where daily dated Brent was rising, and crude oil buyers elected the advance pricing option
0.000
20.000
40.000
60.000
80.000
100.000
120.000
140.000
7-Dec-12 26-Jan-13 17-Mar-13 6-May-13 25-Jun-13 14-Aug-13 3-Oct-13 22-Nov-13 11-Jan-14 2-Mar-14
2013 Daily Dated Brent and the Advanced Pricing Option Elected by Crude OIL Buyers
DATED BRENT Advanced

Main Report and Recommendations
NEITI Oil and Gas Industry 2013 Audit
348
Other Crude Oil Grades Benchmarking or Differentials 8.14.1.1.6
Crude grade differentials are quoted and published by Platt on a daily basis.
Crude oil is priced based on differentials – the following differentials are provided by the NNPC-
COMD, Bonny Light, Qua Ibo differentials, Forcados differentials, Agbami differentials, Escravos
differentials, Brass River differentials. However, other blends or grades are traded by the NNPC,
which are not quoted on Platt. These grades are as follows:
Implication
The market value of crude oil grades is principally driven by the quality of crude oil grades traded.
There is a risk that NNPC-COMD could be trading higher grade for a lower differentials or premium
if the grade is not quoted on Platt’s publications. The federation could be losing several millions of
dollars if higher quality crude oil grades are traded on a lower differentials or premium.
Recommendation
We recommend that all crude oil grade traded by NNPC-COMD should reflect the quality of the
crude oil grade traded and where some of the grades are not quoted (as above), by platt’s, these
unquoted grades should be mirrored with quoted grade were the qualities are similar, for optimal
price setting.
NNPC Response
Unpublished differentials are priced relative to similar grades based on quality, market, etc.
Tracking OSP against the Quality of the Crude 8.14.1.1.7
COMD set the Official Selling Price (OSP) in advance of the following month crude sales. In order
words, the OSP should reflect the market value of each type of Nigeria grade.
The market value of an individual crude stream reflects its quality characteristics. Two of the most
important quality characteristics are density and sulfur content. Density ranges from light to
heavy, while sulfur content is characterized as sweet or sour.
ABO AMB ERHA UGHELLI
AGBAMI AMENAM OKONO USAN
AKPO ANTAN OKWORI YOHO
AKPO BONGA OKWUIBOME ZAFIRO
PENNINGTON
Crude Type Differentails Not Provided by COMD

Main Report and Recommendations
NEITI Oil and Gas Industry 2013 Audit
349
Crude oils that are light (higher degrees of API gravity, or lower density) and sweet (low sulfur
content) are usually priced higher than heavy, sour crude oils. The light sweet grades are desirable
because they can be processed with far less sophisticated and energy-intensive
processes/refineries.
Figure 8.3.3.1.7A – Density and Sulfur Content of Selected Crude Oils
Sources – eia energy institute.
A review was conducted on NNPC-COMD monthly OSP compared against each crude grade quality.
From the graph (A) below it was clear that EA blend and Pennington Light have the highest
monthly OSP and Okwuibome and Ebok have the lowest monthly OSP.
Figure 8.3.3.1.7B – NNPC 2013 Monthly OSP
Source – NNPC Monthly OSP and Crude grade
Forcados
Erha
Ima
Ima priced lower
(OSP) than Erha,
Forcados inspite
of its higher API
and lower sulphur(8.00)
(6.00)
(4.00)
(2.00)
0.00
2.00
4.00
6.00
8.00
Dec-12 Jan-13 Mar-13 May-13 Jun-13 Aug-13 Oct-13 Nov-13 Jan-14
NNPC 2013 MONTHLY OSP
Bonny Light Qua Iboe Light Escravos Light Brass Blend Pennington Light Forcados Blend
Amenam Blend Yoho Light EA Blend Abo Blend Okono Blend Antan Blend
Okwori Bonga Erha Agbami Akpo Ukpokiti
Obe Ima Okoro Oyo Okwuibome Ebok
Usan Zafiro
0.000
0.100
0.200
0.300
0.400
0.500
0.600
0.700
0.800
0.900
1.000
0.00
5.00
10.00
15.00
20.00
25.00
30.00
35.00
40.00
45.00
50.00API and Sulphur of Nigeria Grades
API ° Sulphur wt%

Main Report and Recommendations
NEITI Oil and Gas Industry 2013 Audit
350
As shown in the graph above, the higher the API (a measure of density), the lighter the crude. The
lower the Sulphur (measure acidity), the sweater the crude. In order words, Crude oils that are
light (higher degrees of API gravity, or lower density) and sweet (low sulfur content) are usually
priced higher than heavy, sour crude oils.
From the graph above it was clear that Agbami, Apko, Ima, EA blend, Yoho Pennington Light for
example have the higher API and low Sulphur – they are termed light sweet crude, and should be
priced higher.
We identified the following issues with respect to the OSP. Our analysis of 2013 NNPC monthly OSP
for Bonny Light, Qua Iboe, Forcados, Agbami, Escravos and Brass River against the quality of each
grades as measured by the heaviness (API) and sweetness (Sulphur) of the each grade showed that,
for example, Agbami was priced lower in spite of its higher API and lower Sulphur compared to
Bonny Light, Qua Iboe, Forcados, Escravos and Brass River. See graphs below:
Figure 8.3.3.1.7C – NNPC Monthly OSP and Crude Oil Grade API and Sulphur Content
The same analysis showed that Ima priced lower (OSP) than Erha, Forcados in spite of its higher API
and lower Sulphur (see graph A above).
Agbami priced
lower (OSP) inspite
of its higher API
and lower sulphur
(1.00)
0.00
1.00
2.00
3.00
4.00
5.00
Dec-12 Jan-13 Mar-13 May-13 Jun-13 Aug-13 Oct-13 Nov-13 Jan-14
NNPC MONTHLY OSP
Bonny Light Qua Iboe Light Escravos Light
Brass Blend Forcados Blend Agbami
0
0.02
0.04
0.06
0.08
0.1
0.12
0.14
0.16
0.18
0
5
10
15
20
25
30
35
40
45
50
Bonny Light Qua Iboe Light Escravos Light Brass Blend Forcados Blend Agbami
Crude Oil Grade API and Sulphur Content

Main Report and Recommendations
NEITI Oil and Gas Industry 2013 Audit
351
Audit request was made to find out the methodology and studies adopted and carried out by
COMD for setting the monthly OSP. This validation is key because the revenue generated by the
Federation through NNPC is driven by the quality of crude traded by COMD. This request has not
been honored.
Implication
This finding corroborates 1.1.6 above. The market value of crude oil grades is principally driven by
the quality of crude oil grades traded. There is a risk that NNPC-COMD could be trading grade for a
lower differentials or premium if the grade is not quoted on Platt’s publications. The federation
could be losing several millions of dollars if higher quality crude oil grades are traded on a lower
differentials or premium.
Recommendation
We recommend that all crude oil grade traded by NNPC-COMD should reflect the quality of the
quality of the crude oil grade traded and where some of the grades are not quoted (as above), by
Platt’s, these unquoted grades should be mirrored with quoted grade were the qualities are
similar, for optimal price setting.
Sales and Purchase Agreement and Crude Oil Traders on the Master list 8.14.1.1.8
The auditors could not validate the crude traders in 2013, because we were not provided with the
approved sales and purchase agreements of all the crude oil traders.
Based on the 2013 approved crude oil buyer list provided by COMD, the following traders below
appeared in the COMD crude oil sales but not in the approved list:
Republic of Ghana (TEMA), Republic of Zambia (SARB), Sierra Leone (Sahara), SINOPEC and PTT.
Implication
If the selection and approval of NNPC crude oil traders are not transparent, there is the risk that
these traders will lack the capacity and capabilities to trade the federation oil.
Recommendations
We recommend that the process of selecting and approving crude oil traders be transparent more
transparent with a valid approval as well as Sales and Purchase Agreements in place for each crude
oil trader. We also recommend that an audit right be included in the Sales and Purchase
Agreements.

Main Report and Recommendations
NEITI Oil and Gas Industry 2013 Audit
352
Pricing Structure for the Sale of Nigeria Crude 8.14.1.1.9
It is instructive to note that NNPC –COMD traded and marketed approximately 240mm bbls in
2013 through Sales and Purchase Agreements with different crude oil traders. Crude oil is traded to
buyers on the basis of three different pricing options elected by off-takers.
There are however, other different pricing arrangements COMD should review and adopt. These
options could be;
Spot sales
Engaging reputable crude oil traders to source for buyers through a tendering process for
crude oil price differentials
Adoption of Contract of Different strategy (CFD)
Futures or hedging contracts
Figure 8.14.1.1.9 – Dated Brent Monthly Average for 2013
From the graph above, the average dated Brent crude oil prices in 2013 rose as high as US$116.05
per barrel in February 2013 and as low as US$102.25 in April 2013. If the federation crude oil sale is
hedged, the federation will be guaranteed a floor or ceiling crude oil price irrespective of the
market conditions- this is dependent on the hedging arrangements.
Implication
The Federation would be exposed to unexpected financial losses if there is crude oil price volatility.
Hedging as a risk management process would ensure some level of predictability of cash flow
generated into the federation accounts.
95
100
105
110
115
120
82
83
84
85
86
87
88
89
90
91
Jan-2013 Mar-2013 May-2013 Jul-2013 Sep-2013 Nov-2013 Jan-2014
Dated Brent Monthly Average for 2013
Floor
Ceiling
MonthlyAverageDtdBrent

Main Report and Recommendations
NEITI Oil and Gas Industry 2013 Audit
353
Recommendations
NNPC-COMD should consider starting a hedging program for Nigeria crude oil sales. The NNPC-
COMD can consider hedging in parts - for example 10% to 20% of daily productions like some other
oil producing countries.
8.14.1.2 In Direct Factors - Methodology for Pricing of Nigerian Crude
The auditors carried out a data analysis of the COMD customer list and COMD populated template
data.
The data analysis are detailed below:
Crude Oil Buyers Categorisations
Based on the list of buyers provided by COMD, the list of COMD buyers are categorised as:
Table 8.14.1.2A – List of COMD Buyers
From the graph below, Nigerian traders accounted for 42% (21 of 50) of the total traders, the
highest allocation. On the other hand, NNPC subsidiaries accounted for 4 % (2 of 50), the least.
Figure 8.14.1.2A – Composition of Nigeria Crude Oil Buyers
42%
26%
20%
8%4%
0%
5%
10%
15%
20%
25%
30%
35%
40%
45%
0
5
10
15
20
25
Nigeria traders International Traders Bilateral Customers Refineries NNPC Tradingcompanies
Composition of Nigeria Crude Oil Buyers
Nos. %
Traders Descriptions Nos. % Nigeria traders These Oil traders are local Nigeria companies. 21 42% International Traders These oil traders are classified as international companies , they
are mostly based in Switzerland. 13 26% Bilateral Customers They are countries or National Oil companies of countries with
whom NNPC through COMD trade crude oil. 10 20% Refineries These oil traders can be classified as the end users. They include
a few foreign refineries. 4 8% NNPC Trading companies NNPC has subsidiaries with whom COMD also trade crude oil
with . 2 4%
50 100% Source : COMD - Crude Oil Customers, address and contact information TOTAL

Main Report and Recommendations
NEITI Oil and Gas Industry 2013 Audit
354
Value and Quantity of Crude Oil Traded in 2013
In actual terms based on the 2013 data from COMD (see Appendix 8.14.1.2), the total quantity of
crude oil traded was 245,214,991bbls, valued at $26, 992,993,809.32. These quantities and values
traded were generated by the 571 transactions in 2013.
Number of Transactions of Crude Oil Traded in 2013
From the graph below, Nigerian traders accounted for 43% (244 of 571) of the total number of
crude oil transactions, the highest numbers of allocations. Refineries, however, accounted for just
3% (18 of 571) of the number of crude oil transactions, i.e. the least.
Figure 8.3.3.2B – Number of 2013 Crude Oil Transactions
Volume of Crude Oil in Bbls Traded in 2013
From the graph below, Nigeria traders accounted for 44% (108,084,920 bbls of 245,214,991 bbls)
of the total number of crude oil (bbl) sold in 2013, i.e. the highest number of crude oil sold; whilst
refineries accounted for just 5 % (11,450,075 bbls of 245,214,991 bbls) of crude oil traded, the
least.
Figure 8.14.1.2C – Volume of Crude Oil Traded in Bbls in 2013
43%
28%
17%
8%3%
0%
10%
20%
30%
40%
50%
-
50.00
100.00
150.00
200.00
250.00
300.00
Nigerian traders NNPC Tradingcompanies
Internationaltraders
Bilateralcustomers
Refineries
Number of 2013 Crude Oil Transactions
No. of Transactions %
11%17%
44%
23%
5%0%
10%
20%
30%
40%
50%
-
20,000,000.00
40,000,000.00
60,000,000.00
80,000,000.00
100,000,000.00
120,000,000.00
Bilateralcustomers
Internationaltraders
Nigerian traders NNPC Tradingcompanies
Refineries
Volume of Crude Oil Traded in Bbls in 2013
Volume of Crude Oil Traded %

Main Report and Recommendations
NEITI Oil and Gas Industry 2013 Audit
355
Figure 8.14.1.2D – Value of Crude Oil in bbls Traded in 2013
From the graph above, of the $26, 992,993,809 valued of crude sold, Nigerian traders accounted
for 44% ($11,875,243,704) of the total value of crude oil sold in 2013, i.e. the highest value of
crude oil sold. Whilst refineries accounted for just 5% ($1,271,784,443) of crude value sold, the
least.
Table 8.14.1.2B – Summary of 2013 Crude oil Traded
44%
23%
17%
11%
5%
0%
5%
10%
15%
20%
25%
30%
35%
40%
45%
50%
-
2,000,000,000.00
4,000,000,000.00
6,000,000,000.00
8,000,000,000.00
10,000,000,000.00
12,000,000,000.00
14,000,000,000.00
Nigerian traders NNPC Tradingcompanies
Internationaltraders
Bilateralcustomers
Refineries
Value of Crude Oil Traded in 2013 ($)
Value of Crude Oil Traded ($) %
Crude Oil Traders Categories of Traders
Approved by COMD
No. of
Transactions
Volume of Crude Oil
Traded (bbls)
Value of Crude Oil
Traded ($)
Nigerian traders 21 244 108,084,920 11,875,243,704
NNPC Trading companies 2 162 56,880,283 6,307,632,833
International traders 13 99 40,668,355 4,462,818,097
Bilateral customers 10 48 28,131,358 3,075,514,730
Refineries 4 18 11,450,075 1,271,784,443
Grand Total 50 571 245,214,991 26,992,993,807
Crude Oil Traders Categories of Traders
Approved by COMD (%)
No. of
Transactions (%)
Volume of Crude Oil
Traded (%)
Value of Crude Oil
Traded (%)
Nigerian traders 42% 43% 44% 44%
NNPC Trading companies 4% 28% 23% 23%
International traders 26% 17% 17% 17%
Bilateral customers 20% 8% 11% 11%
Refineries 8% 3% 5% 5%
Grand Total 100% 100% 100% 100%
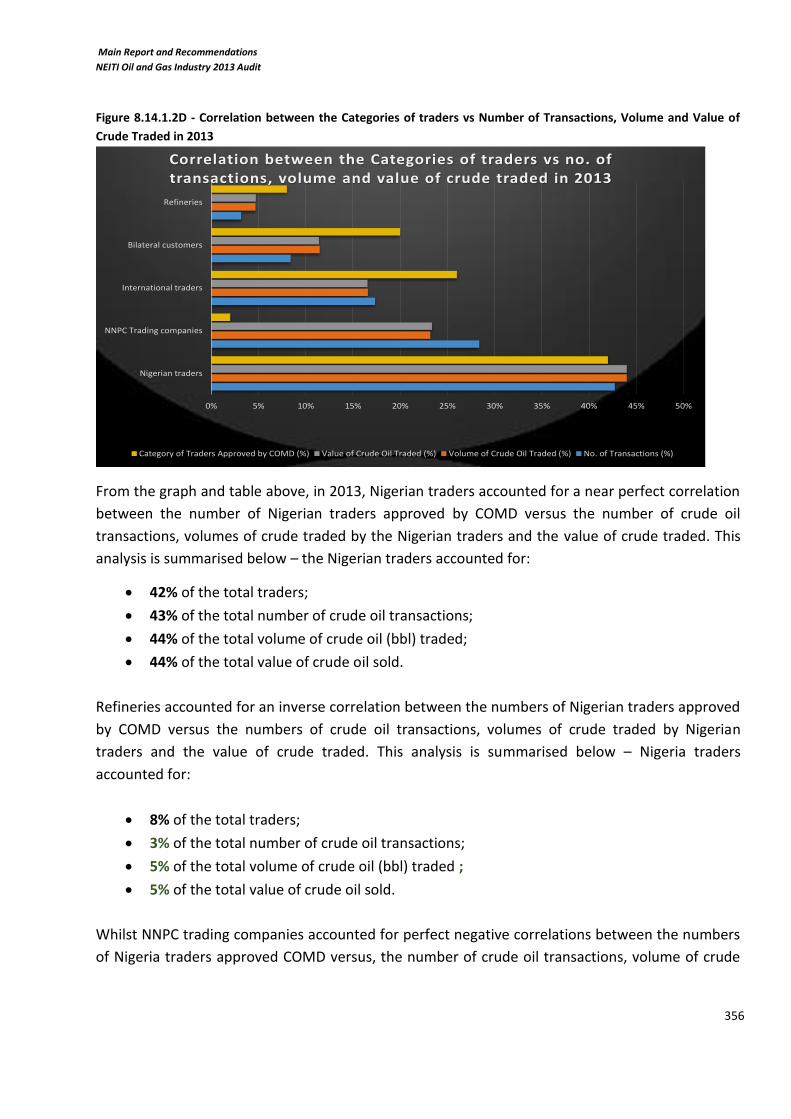
Main Report and Recommendations
NEITI Oil and Gas Industry 2013 Audit
356
Figure 8.14.1.2D - Correlation between the Categories of traders vs Number of Transactions, Volume and Value of
Crude Traded in 2013
From the graph and table above, in 2013, Nigerian traders accounted for a near perfect correlation
between the number of Nigerian traders approved by COMD versus the number of crude oil
transactions, volumes of crude traded by the Nigerian traders and the value of crude traded. This
analysis is summarised below – the Nigerian traders accounted for:
42% of the total traders;
43% of the total number of crude oil transactions;
44% of the total volume of crude oil (bbl) traded;
44% of the total value of crude oil sold.
Refineries accounted for an inverse correlation between the numbers of Nigerian traders approved
by COMD versus the numbers of crude oil transactions, volumes of crude traded by Nigerian
traders and the value of crude traded. This analysis is summarised below – Nigeria traders
accounted for:
8% of the total traders;
3% of the total number of crude oil transactions;
5% of the total volume of crude oil (bbl) traded ;
5% of the total value of crude oil sold.
Whilst NNPC trading companies accounted for perfect negative correlations between the numbers
of Nigeria traders approved COMD versus, the number of crude oil transactions, volume of crude
0% 5% 10% 15% 20% 25% 30% 35% 40% 45% 50%
Nigerian traders
NNPC Trading companies
International traders
Bilateral customers
Refineries
Correlation between the Categories of traders vs no. of transactions, volume and value of crude traded in 2013
Category of Traders Approved by COMD (%) Value of Crude Oil Traded (%) Volume of Crude Oil Traded (%) No. of Transactions (%)

Main Report and Recommendations
NEITI Oil and Gas Industry 2013 Audit
357
traded by Nigerian traders and the value of crude traded. This analysis is summarised below –
NPPC subsidiaries accounted for:
4% of the total traders;
28% of the total number of crude oil transactions;
23% of the total volume of crude oil (bbl) traded;
23% of the total value of crude oil sold.
Issues - based on the above analysis, the following issues are identified.
Composition of NNPC Crude Oil Traders 8.14.1.2.1
From the graph below the end user of crude, refineries accounted for just 8% of the total number
of approved crude oil buyers in Nigeria.
.
This clearly shows that there are too many brokers between COMD and the final consumers, i.e.
refineries.
NNPC-COMD Brokers Refineries/Ends users
These brokers would be making margins that would have gone to the federation’s account.
Implication
NNPC’s inability to penetrate the end users of crude in its 38 years of existence clearly shows an
ineffective marketing and commercial system and possible lack of expertise in the award of crude
oil sales contracts. The current marketing system cannot optimize sales realization.
Recommendations
We recommend that in order for the Federation to realize optimal revenue to the federation
accounts, NNPC should awards a significant portion of its contracts to end users in addition to the
review of pricing methodology.
42%
26%
20%
8%4%
0%
5%
10%
15%
20%
25%
30%
35%
40%
45%
0
5
10
15
20
25
Nigeria traders International Traders Bilateral Customers Refineries NNPC Tradingcompanies
Composition of Nigeria Crude Oil Buyers
Nos. %

Main Report and Recommendations
NEITI Oil and Gas Industry 2013 Audit
358
Self-Review Interest 8.14.1.2.2
From the table and graph above, the NNPC subsidiaries accounted for
Just 4% of the total traders; but
28% of the total number of crude oil transactions;
23% of the total volume of crude oil (bbl) traded;
23% of the total value of crude oil sold.
This clearly showed that the NNPC, as the national oil company of the federation, is taking
advantage against other crude oil traders, “as a buyer and the same time a seller”, by selling crude
to itself through its subsidiaries.
Implication
The sale of the federation crude by NNPC and its affiliates is not at arm’s length. This is so, because
NNPC is acting like the judge, the lead defense and prosecutor in its own case. The federation may
be losing revenue from these transactions.
Crude Oil Traders Categories of Traders
Approved by COMD
No. of
Transactions
Volume of Crude Oil
Traded (bbls)
Value of Crude Oil
Traded ($)
Nigerian traders 21 244 108,084,920 11,875,243,704
NNPC Trading companies 2 162 56,880,283 6,307,632,833
International traders 13 99 40,668,355 4,462,818,097
Bilateral customers 10 48 28,131,358 3,075,514,730
Refineries 4 18 11,450,075 1,271,784,443
Grand Total 50 571 245,214,991 26,992,993,807
Crude Oil Traders Categories of Traders
Approved by COMD (%)
No. of
Transactions (%)
Volume of Crude Oil
Traded (%)
Value of Crude Oil
Traded (%)
Nigerian traders 42% 43% 44% 44%
NNPC Trading companies 4% 28% 23% 23%
International traders 26% 17% 17% 17%
Bilateral customers 20% 8% 11% 11%
Refineries 8% 3% 5% 5%
Grand Total 100% 100% 100% 100%
0% 5% 10% 15% 20% 25% 30% 35% 40% 45% 50%
Nigerian traders
NNPC Trading companies
International traders
Bilateral customers
Refineries
Correlation between the Categories of traders vs no. of transactions, volume and value of crude traded in 2013
Category of Traders Approved by COMD (%) Value of Crude Oil Traded (%) Volume of Crude Oil Traded (%) No. of Transactions (%)

Main Report and Recommendations
NEITI Oil and Gas Industry 2013 Audit
359
Recommendations
We recommend that in order to create a level playing field, NNPC’s role should be clearly
segregated from being a buyer and seller at any particular point in time. NNPC cannot be a referee
and player at the same time. We also recommend that in order to monitor and track NNPC
performance and efficiencies, NNPC and its affiliates should have the same terms and conditions
like any other crude oil traders in Nigeria.
Value Created by Trader Categorisation per bbl; per value ($); and Transaction of 8.14.1.2.3
Crude Traded
As illustrated in the table below, the Nigerian traders accounted for 44% ($11,875,243,704) of the
total value of crude oil sold in 2013, the highest value of crude oil sold in 2013. This value of crude
can be attributable to the volume of crude traded, 108.8mm bbls (44% of the total) and based on
the number of transactions, 244 transactions (43% of the total).
Table 8.14.1.2.3 - Traders Categorisation and Transactions of Crude Traded
However, from the graph below, the value created by each category of traders was calculated by
dividing the value of crude oil traded (c) by the volumes (b) and number or frequency (a) of
transaction in 2013.
Figure 8.14.1.2.3 – Value Created by Trader Categories
Crude Oil Traders No. of
Transactions
Volume of
Crude Oil
Traded (bbls)
Value of Crude Oil
Traded ($)
Value Created per
trasactiosn, per bbls
and value ($)
a b d =c/(a*b)
Nigerian traders 244 108,084,920 11,875,243,704 0.45
NNPC Trading companies 162 56,880,283 6,307,632,833 0.68
International traders 99 40,668,355 4,462,818,097 1.11
Bilateral customers 48 28,131,358 3,075,514,730 2.28
Refineries 18 11,450,075 1,271,784,443 6.17
Grand Total 571 245,214,991 26,992,993,807
0.45 0.68 1.11
2.28
6.17
-
1.00
2.00
3.00
4.00
5.00
6.00
7.00
-
2,000,000,000
4,000,000,000
6,000,000,000
8,000,000,000
10,000,000,000
12,000,000,000
14,000,000,000
Nigeriantraders
NNPC Tradingcompanies
Internationaltraders
Bilateralcustomers
Refineries
Value Created by Trader Categories
Value of Crude Oil Traded ($)
Value Created per trasactiosn, per bbls and value ($) d =c/(a+b)

Main Report and Recommendations
NEITI Oil and Gas Industry 2013 Audit
360
The value created by each category of traders showed that even though refineries accounted for
3% (18 of 571) of the number of crude oil transactions and 5% of the volume of crude oil traded,
the refining category accounted for the highest value created $6.17 per volume (bbl), per value and
per transaction. The only empirical analysis of this scenario could be that COMD was dealing with
the end user (refineries), thereby eliminating middlemen margins and brokerage fees.
On the other hand, despite the fact that Nigerian traders accounted for 43% (244 of 571) of the
total number of crude oil transactions and 44% of the total volumes of crude oil traded, the
highest, the Nigerian trader category accounted for the least value created $0.45 per volume (bbl),
per value and per transaction. The only empirical analysis of this scenario could be that the COMD
was dealing with some if not most of Nigeria traders who act as middlemen or brokers that
routinely resell the cargoes to another intermediaries, for example, the more experienced, larger
commodities trading companies with worldwide international reach and marketing network.
NNPC-COMD Some Nigeria Traders brokers / or trading companies Refineries/Ends users
Implication
NNPC inability to penetrate the end users of crude in its 38 years of existence clearly shows an
inept marketing and commercial expertise in its awarding of crude oil sales contracts. Based on
professional judgment, it was estimated that the federation has lost approximately $1.2billion by
not trading to end users.
Recommendation
We recommend that in order for the Federation to realize optimal revenue to the federation
accounts, NNPC should award a significant portion of its contract to end users.
Crude Oil Sales Claims per Trader and Vessel 8.14.1.2.4
Claims within the crude oil sales are made when the quantity measured at the point of discharge is
less than the quantity quoted on the BOL. In order to test the validity of these claims, the auditors
requested for a list of claims made and payments in 2013. The claim list should include
The BOL number and quantity;
The destination of the vessel;
The name of the vessel and vessel experience factor;
The quantity measured at the point of discharge;
The date the claim was made by the buyer.
Implication
There is the risk that the federation will be losing revenues, if quantity discharge at the point of
outturn is different from the quantity quoted on the bill of lading.

Main Report and Recommendations
NEITI Oil and Gas Industry 2013 Audit
361
Recommendations
We recommend that NNPC-COMD should request and keep track of each “vessel experience
factor” and where claims are not made as per requirement of International Best practice, such
claims should be declared time barred.
8.14.2 Crude Oil Marketing Division (COMD) of the NNPC
COMD trade crude oil from principally three sources of contractual arrangement:
8.14.2.1 Joint Venture
NNPC hold between 55% and 60% equity interest in each JV.
The current structure and participating interest in the existing Joint Venture arrangements is as
presented in Table below:
Table 8.14.2.1 - Joint Venture Arrangements and Federation participatory interest
Due to cash constraints,resulting in inability of the NNPC to pay its equity participation, various
Alternative Funding Arrangements have been entered into, with some Joint Venture Companies.
The current forms of Alternative Funding Arrangements are in two broad categories:
Third Party Financing
Carry Agreements and Modified Carry Agreements (MCAs).
8.14.2.2 Production Sharing Contracts
Under PSC arrangements, companies bear the risk and cost for exploration, production and
maintenance of an oil field.
Cost is recoverable with crude oil in the event of commercial finding, with provisions for
Royalty Oil – to meet the Royalty liability due to the Government for the period;
Tax Oil – to cover the Petroleum Profits Tax liability determined for the period;
Cost Oil – to meet the PSC Operator’s CAPEX and OPEX costs;
Profit Oil – Shared between NNPC and the PSC Operator on an agreed profit sharing ratio.
NNPC SPDC MOBIL CHEVRON TOTAL NAOC POCNL PANOC
% % % % % % % %
1 SPDC JV SPDC 55 30 - - 10 5 - -
2 MOBIL JV MOBIL 60 - 40 - - - - -
3 CHEVRON JV CHEVRON 60 - - 40 - - - -
4 TEPNG JV TOTAL E&P 60 - - - 40 - - -
5 NAOC JV NAOC 60 - - - - 20 20 -
6 PAN OCEAN JV PANOCEAN 60 - - - - - - 40
PARTICIPATORY INTEREST
S/NO JV OPERATOR

Main Report and Recommendations
NEITI Oil and Gas Industry 2013 Audit
362
During the year under review, nine (9) production sharing contract arrangements were engaged in
exploration and production activities. The details of these PSC companies are presented below:
Table 8.14.2.2 – PSC Contract Arragemnets during the Period Under Review
S/N Contractors/Operators Blocks Major
Fields Contract Year
Ist Oil
Date OPLs OMLs
1 Addax Petr. Dev.(Nig) Ltd. 98/118 123/124 Antan/Brass 1973/1998 May-98
2 Addax Petr. Expl.(Nig) Ltd. 90/225 126/137 Okwori 1992/1998 Mar-05
3 Nigerian Agip Exploration 316 125 Abo 1993 Apr-03
4 Shell Nig. Expl. & Co. 212 118 Bonga 1993 Nov-05
5 Esso Expl. & Prod. Co. 209 133 Erha 1993 Mar-06
6 Statoil Nigeria Limited 217 128 Agbami
Unit Tract 2
1993 Sep-08
7 Total Upstream Nig. Limited 246 130 Akpo
Main/Apko
1998/2005 Mar-09
8 Sterling Oil Expl. & Energy 280 143 Okwuibome 2006 Apr-11
9 Total Explo. Prod. Ltd. 222 138 Usan 1993 Mar-12
8.14.2.3 Oil Block Owned by NPDC
The Nigerian Petroleum Development Company (NPDC) Ltd is a fully owned subsidiary of the
Nigerian National Petroleum Corporation (NNPC). The company has carried out exploration and
production operations since 1998. The company has stake in both onshore and offshore. This
equity stake ranges from 55%, 60% to 100% ownership of different assets.
In the period under review, a total of 27.7 mm bbls valued at $3.1bb was traded by COMD on
behalf of NPDC. See Appendix 8.14.1.2
8.14.2.4 Crude Oil Allocated to PPMC
The PPMC is allocated 445,000 bbl/day to meet refinery needs. However, the refineries cannot
utilise all the 450,000 bbls/day. The excess crude allocated to PPMC is traded by the COMD.
In the period under review, a total of 36.3mm bbls valued at $4.0bb was traded by COMD. See
Appendix 8.14.1.2.
8.14.2.5 Key issues - based on the various arrangements identified above
The key issues below could influence the production, sales volume and ultimately the revenue
accruing to the federation.
1. Joint Venture
Under the existing JV arrangement, crude oil is allocated to the NNPC, based on the 55% or 60%
equity interest in each JV. These allocations are traded by the COMD.

Main Report and Recommendations
NEITI Oil and Gas Industry 2013 Audit
363
Under the JV, the NNPC has entered into special funding arrangements to finance its own share of
funding. The current forms of alternative funding arrangements are in two broad categories:
Third Party Financing –
Satellite Field Development Projects
Reserve Development Projects
Carry Agreements and Modified Carry Agreements (MCAs).
An audit request was made to review and validate the production numbers coming through the
allocation model, as well as the financial arrangement underpinning the financial and commercial
fairness of these transactions. This validation is key, because the revenue generated by the
Federation through the NNPC is driven by the quantity of crude allocated to NNPC. This request
has not been honoured.
Implication
The allocation of crude to the federation could be under-reported, resulting in loss of revenue to
the federation.
Recommendation
We recommend that the commercial fairness and special review be conducted to validate
federation share of the production numbers coming through the allocation model, as well as the
financial arrangement underpinning the financial and commercial fairness of these transactions.
NNPC Response
NNPC entitlement computation models are available for review and evaluation to any inter-ested
party should the need arise. The templates are encrypted and resident on selected workstations in
order to maintain security, propriety and integrity of our data.
2. Production Sharing Contracts
Under the existing arrangement, crude oil is allocated to the NNPC and the allocations are traded
by the COMD.
These allocations could come in the form of
Royalty Oil – to meet the royalty liability due to the government for the period;
Tax Oil – to cover the petroleum profits tax liability determined for the period;
Profit Oil – Shared between NNPC and the PSC Operator on an agreed profit-sharing ratio.

Main Report and Recommendations
NEITI Oil and Gas Industry 2013 Audit
364
The auditors issued a request to review and validate the production numbers coming through the
allocation model Vis a Vis the applications of the production sharing contracts. This validation is
key, because the revenue generated by the Federation through NNPC is driven by the quantity of
crude allocated to NNPC. This request has not been honoured.
Implication
The allocation of crude to the federation from royalty, tax and profit oil could be under-reported,
resulting to a loss of revenue to the federation.
Recommendation
We recommend that a special review be conducted to validate federation share of the production
numbers coming through the allocation model.
NNPC Response
NNPC entitlement computation models are available for review and evaluation to any inter-ested
party should the need arise. The templates are encrypted and resident on selected workstations in
order to maintain security, propriety and integrity of our data.
3. NPDC Production and Crude Oil Traded
The NNPC has assigned it equity in onshore and offshore block to NPDC, between 2010 and 2011.
These assets are operated under various JVs, PSCs, and service contracts.
Table 8.14.2.5A - NNPC Equity Blocks Assigned to NPDC between 2010 and 2011
Blocks JV Partners NNPC Equity %
OML 4, 38,41 Septa 55%
OML 26 First Hydrocarbon Nigeria 55% These blocks
were
divested by
Shell
OML 30 Shoreline 55%
OML 34 Niger Delta 55%
OML 40 Elcrest 55%
OML 42 Neconde 55%
OML 119 Service contract with Agip 100%
For operational and financial reasons, in 2011, the NPDC signed a strategic alliance agreement
(SAA) with Atlantic to provide funding and technical support for the development of OML 26, 30,
34 and 42.

Main Report and Recommendations
NEITI Oil and Gas Industry 2013 Audit
365
Figure 8.14.2.5A – NPDC 10 Year Production from Different OMLs
(Data source; 2013 NNPC Annual Statistical Bulletin)
The auditors made request to review and validate the production numbers coming through the
allocation model Vis a Vis the interpretation of the various agreements in place. This validation is
key; because of the need to review the revenue generated by NPDC through COMD Vis a Vis the
sale of the NPDC production allocation from its different OMLs and ultimately assess the SAAs. This
request has not been honoured.
Implication
The allocation of crude to NPDC could be under-reported, resulting to losses of revenue. The
commercial fairness of the various agreements could undermine the ability of the federation to
generate optimal revenue
Recommendations
We recommend that the commercial fairness and special review be conducted to validate NPDC
share of the production numbers coming through the allocation model, as well as the financial
arrangement underpinning the financial and commercial fairness of these transactions. The big
question however remains the propriety of the sale of the OMLs to NPDC and loss of revenue to
the federation. There is also the need to review the sales.
NNPC Response
NNPC entitlement computation models are available for review and evaluation to any interested
party should the need arise. The templates are encrypted and resident on selected workstations in
order to maintain security, propriety and integrity of our data.
- 10,000,000 20,000,000 30,000,000 40,000,000 50,000,000 60,000,000 70,000,000 80,000,000
Yea r 2004 Year 2005 Yea r 2006 Year 2007 Yea r 2008 Year 2009 Yea r 2010 Year 2011 Yea r 2012 Year 2013
NPDC 10 Years Production from Different
OMLs
OML 4,38,41 Block - OML 026 Block - OML 42 Block - OML 30
Block - OML 40 Block - OML 34 Block - OML 119 Total Production

Main Report and Recommendations
NEITI Oil and Gas Industry 2013 Audit
366
8.14.2.6 Crude Oil Allocation to PPMC
The allocation of 445,000 to the PPMC is through various sources as shown below:
Figure 8.12.2.6 – Crude Oil Allocation to PPMC Flow
*NNPC Subsidiary
An audit request to review and validate the crude allocated to these various agreements Vis a Vis
the interpretation of the Offshore Processing Agreements (OPAs) and swaps has not been
honoured.
Implication
The allocation of crude to the federation could be under-reported, resulting to a loss of revenue to
the federation. The commercial fairness of the various agreements could undermine the ability of
the federation to generate optimal revenue
Recommendation
The various alternative product import arrangements have been analysed to have reported losses
from previous audit reports and there is the need to further review the commercial fairness and
also validate federation share of the production numbers coming through the allocation model, as
well as the financial arrangement underpinning the financial and commercial fairness of these
transactions.
Application of 445,000 bbls /day allocated to PPMC
Nigeria refineries
Agreements
Sahara
Nigemed
Offshore agreements (opa)
SIR, Abidjan
Swap agreements
*Duke Trafigura
Ontario
Televara
Aieto
Unutilised – sold by COMD
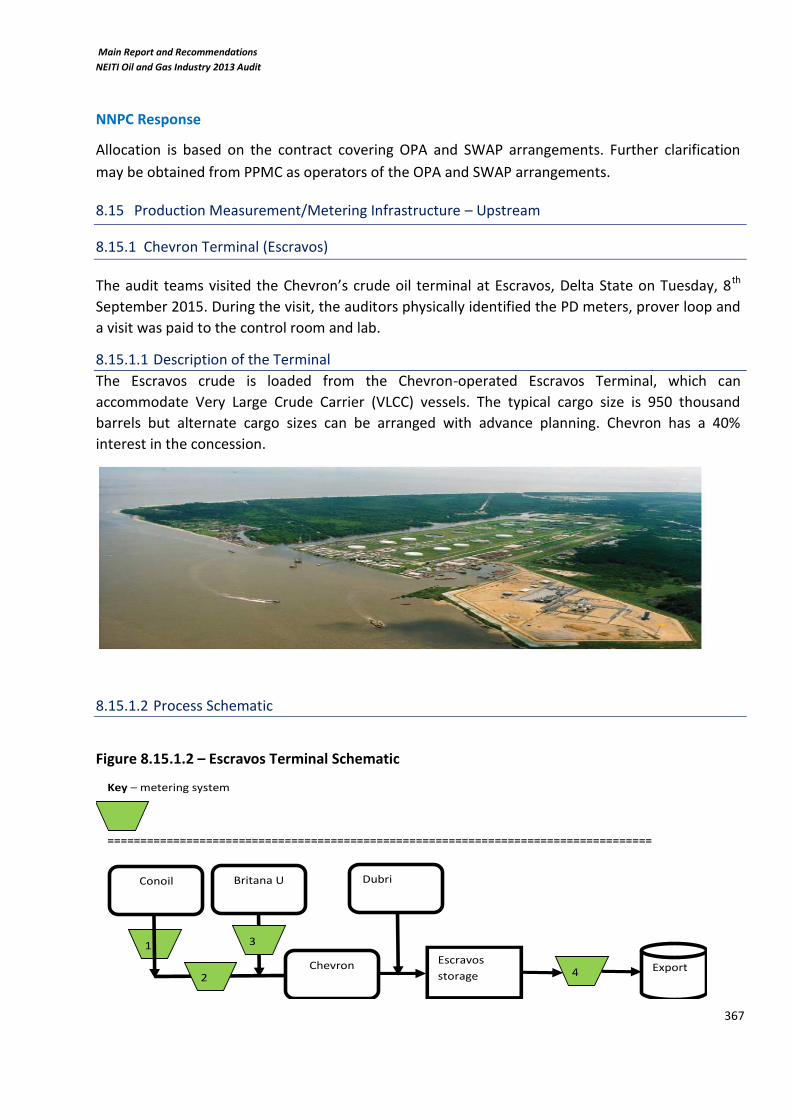
Main Report and Recommendations
NEITI Oil and Gas Industry 2013 Audit
367
NNPC Response
Allocation is based on the contract covering OPA and SWAP arrangements. Further clarification
may be obtained from PPMC as operators of the OPA and SWAP arrangements.
8.15 Production Measurement/Metering Infrastructure – Upstream
8.15.1 Chevron Terminal (Escravos)
The audit teams visited the Chevron’s crude oil terminal at Escravos, Delta State on Tuesday, 8th
September 2015. During the visit, the auditors physically identified the PD meters, prover loop and
a visit was paid to the control room and lab.
8.15.1.1 Description of the Terminal
The Escravos crude is loaded from the Chevron-operated Escravos Terminal, which can
accommodate Very Large Crude Carrier (VLCC) vessels. The typical cargo size is 950 thousand
barrels but alternate cargo sizes can be arranged with advance planning. Chevron has a 40%
interest in the concession.
8.15.1.2 Process Schematic
Figure 8.15.1.2 – Escravos Terminal Schematic
1
Key – metering system
===================================================================================
Conoil Dubri
Chevron
Britana U
1 Escravos
storage 2
4 Export
3

Main Report and Recommendations
NEITI Oil and Gas Industry 2013 Audit
368
From the schematic above, Crude oil from the Escravos is comingled with a few marginal fields.
The Conoil field is metered (1) before it is comingled with the Escravos crude oil. At midmonth, the
representative of Conoil and Chevron would normally record the measurement from meter 1
above. This record of the measurement is signed off by the representative of Conoil and Chevron,
via a ticket.
At the Chevron site, another meter (2) is used to measure the flow of crude oil from the Conoil
field. The readings of meter 2 are used to reconcile the reading from Conoil meter (1).
Crude oil from the Britana U is measured by meter (3), before it is comingled with the Chevron
crude. Dubri oil is supplied by barges into tanks and a manual tank tape is used to measure the
quantity of crude supplied by Dubri.
All oil received at the Escravos terminal are processed, dehydrated and sample taken for quality
tests before storage and export. There are 9 storage tanks in use and 2 of which have been
scheduled for upgrade at the Escravos terminal.
During export, there are four Positive Displacement meters that are used for export of crude oil.
SGS, a leading inspection, verification and testing and Certification Company independently
calibrate these meters. These meters have a prover loop used for health-checking the accuracy of
the PD meter. The prover loop is also annually calibrated by SGS, an independent body.
8.15.1.3 Escravos Visit Audit Findings
Maintenance Record of Metering System 8.15.1.3.1
At the Escaravos terminal, there is a maintenance system called Computerized Maintenance
Management System (CMMS). The system is used to plan for work orders used for routine
maintenance. However, planned maintenance and calibration of the Escravos metering system are
not captured using the CMMS. All maintenance of the metering system are captured and
maintained manually in a folder.
Implication
Sub-optimal utilization of the CMMS.
Recommendation
Audit recommends that CMMS should be used to capture all the maintenance and calibration
schedules.
Chevron Response
“CMMS captures in – house maintenance activities. It does not cover contractors activities. Meter
maintenance was done only in 2015 and was done by a third party contractor, this cannot be
captured in CMMS as the job is not a work order job. Calibration is also done by Third party
contractors and the activity is an annual one…..”

Main Report and Recommendations
NEITI Oil and Gas Industry 2013 Audit
369
Crude Oil Measurement Taken for Conoil Production 8.15.1.3.2
At midmonth, representative of Conoil and Chevron takes oil measurement at the Esan, with no
NNPC or DPR official in attendance. Conoil crude is comingled with the Escravos oil, in which NNPC
has a 60% stake.
Implication
With a majority stake of 60%, NNPC should be represented at the site to sign off the measurement,
this is particularly important because Conoil oil is a third party oil that comingles with NNPC and
Chevron crude.
Recommendation
We recommend that NNPC and DPR officials should be present when the midmonth measurement
is taken.
Meters at Conoil 8.15.1.3.3
It has been reported that the meter used at midmonth to measure the crude oil produced by
Conoil before comingling with NNPC/Chevron oil has not been maintained or calibrated.
Implication
If the meters are not calibrated or maintained, there is the risk of under- or over-reporting crude
allocation to Conoil or NNPC/Chevron
Recommendation
We recommend that the meter used for midmonth measurement is regularly maintained and
calibrated.
DPR Measurement Guidelines 8.15.1.3.4
The DPR measurement guideline that defines the measurement practice in Nigeria titled
“Procedure Guide for the Determination of Quantity and Quality of Crude Oil and Petroleum
Product at Custody Transfer Point” has not been reviewed in a long time. The last version sighted
at the terminal was the 1999 version.
Implication
There could be a risk of inconsistent or outdated practice if the procedures are not updated to
meet current practices.
Recommendation
We recommend that the procedure be updated to meet international and current best practices.
8.15.2 Atlas Cove, Lagos
The audit team visited Atlas Cove facility on Wednesday, 9 September 2015.

Main Report and Recommendations
NEITI Oil and Gas Industry 2013 Audit
370
8.15.2.1 Description of the Terminal
Products moved or imported into Lagos through the coastal vessels are discharged primarily at the
Atlas Cove Terminal where they are received into storage tanks for onward pumping to Mosimi
depot near Sagamu in Ogun State, from where the products are pumped to other depots in that
axis, such as Ibadan, Ilorin and Ore.
View of Atlas Cove facility
8.15.2.2 Process Schematics
The new Atlas Cove was built in 2012 and commissioned in 2014.
Figure 8.15.2.2 – Atlas Cove Terminal Schematics
The simplified process schematic above at the new Atlas Cove terminal shows that the products
are received from coastal vessels. The products could be PMS or AGO. There are four 24” pipeline
unloading arms, used during products discharge. These unloading arms have valve manifold each,
for switching the use of a particular unloading arm for storage. The pipelines attached to the
unloading arms are installed with meters, as shown by 1 above. These meters are four Pressure
Indicator Transmitters and four Prosonic Probes installed on each of the four pipelines.
1
Key – metering system
===================================================================================
Discharging
Vessel
es
Scada
System
Storage tanks
1 Pump
Mosimi,
llorin
Ore
Offshore
facility
2

Main Report and Recommendations
NEITI Oil and Gas Industry 2013 Audit
371
The pressure indicator transmitter measures the flow rate and volumes of product during
discharge whiles the Prosonic Probes transmits the measurement details to a computer systems at
the control room called, Scada. The Scada systems, during product discharge monitor and track
products pressure, flow rate, total volumes.
The new Atlas Cove was built by Julius Berger Plc, and the maintenance of these metering systems
is under the care of the same company.
Atlas Cove also received product from offshore facility. The product received from offshore facility
is measured by Ultrasonic meters, also maintained by Julius Berger Nigeria.
There are 7 storage tanks at the Atlas Cove. The summary of these tanks are detailed below:
Table 8.15.2.2 – Atlas Cove Storage Tanks
Number of Tanks Usage / Notes Capacity
Three Use for PMS storage 25,000, 23,000 and 21,000 MT
Two Use for AGO storage 12,600 MT each
Two Use for PMS storage. Out of use. These tanks have been under rehabilitation since 2013
11,000 and 21,000 MT
8.15.2.3 Atlas Cove Visit Audit Findings
Maintenance of Transmitters 8.15.2.3.1
The four Pressure and Temperature Indicators that measure the pressure, flow rate and total
volumes were last calibrated in 2012 when they were installed . These meters have no
maintenance or frequency regime for their change out. The Julius Berger maintenance personnel
informed that the meters are changed out only when issues are identified with the meters.
It is was also observed that there was only 1 spare Pressure Indicator Transmitter in store, when
physical check was conducted at the store.
Implication
If there is no maintenance regime for the pressure and temperature transmitter there is the risk of
inaccurate measurement from the transmitters. There is also the risk of disruptive services if there
are no spares in hand to replace faulty transmitters.
Recommendation
A regular maintenance and defined calibration regime is recommended. It is also recommended
that spares of the transmitter be kept in store.
Maintenance of the Prosonic Probes 8.15.2.3.2

Main Report and Recommendations
NEITI Oil and Gas Industry 2013 Audit
372
The four Prosonic Probes that transmit the pressure, flow rate and total volume to the Scada
computers systems were last calibrated in 2012 when they were installed . These meters have no
maintenance or frequency regime for their change out. We were told by the Julius Berger
maintenance personnel that the meters are changed out when issues are identified.
We also noted that there were no spares of Prosonic Probes in store, when the auditor physically
visited the stores.
Implication
If there is no maintenance regime for the pressure and temperature transmitters there is the risk
of inaccurate measurement from the transmitters. There is also the risk of disruptive services if
there are no spares in hand to replace faulty transmitters.
Recommendations
We recommend a regular maintenance and calibration regime . We also recommend that spares of
transmitter be kept in store.
Maintenance and Calibration of Ultrasonic Meters 8.15.2.3.3
Products received from offshore facility into the Atlas Cove are metered using Ultrasonic-metering
systems. These meters were last calibrated when they were installed in 2004.
Implication
There is a high risk that the Ultrasonic metering measurements will be inaccurate if the meters are
not well maintained and calibrated at a regular frequency.
Recommendation
We recommend that a planned maintenance regime should be in place. The Ultrasonic meters
should be regularly maintained and calibrated.
Manual Measurements Tapes (UTI) and Automatic Tank Gauge 8.15.2.3.4
When products are discharged at the Atlas Cove storage tanks, the personnel of Atlas Cove had to
rely on the measurement tape of the discharging vessels to meter or measure the volumes of oil
discharged – there is no independent authentication of the measurement accuracy of the
discharging vessel tape.
Personnel at Atlas Cove use Manuel tape measurement devices to record the volume discharged
as there are no automatic tank gauge installed in each storage tank. The measurement tapes
cannot measure the products temperature when measurement is taking place. Samples are taken
for lab analysis and temperature measurement.

Main Report and Recommendations
NEITI Oil and Gas Industry 2013 Audit
373
Implication
There is the risk of under-reporting the volume of product discharge if temperature measurements
are not taken real-time or if there is no automatic gauging system.
Recommendation
We recommend that an electronic measurement tape with automatic device for temperature
measurement and automatic tank gauge be purchased for Atlas Cove use. These measurement
devices could also be used to benchmark the accuracy of measurement of the discharging vessel.
Storage Tanks Maintenance and Cleaning 8.15.2.3.5
There were no record at the Atlas Cove to show the maintenance, cleaning and inspection regimes
of all the storage tanks
Implication
Without a planned maintenance regime in place, storage tanks could be damaged and unsuitable
for use due to corrosion and sludge built over time.
Recommendation
We recommend that a planned cleaning and inspection regime be put in place for all storage tanks
Storage Tanks 8.15.2.3.6
Two of the storage tanks used for storing PMC with storage capacity of 11,000 and 21,000 MT have
been under rehabilitation since 2013, and currently out of use.
Implication
If storage tanks are not in use, there is the risk of underutilization of storage capacity and
payments of demurrage for ships at high sea, should there be lack of storage space.
Recommendation
In order to increase the capacity for storage and avoid payments of demurrage, we recommend
the immediate completion of the rehabilitation of the two storage tanks.
Strategic Storage Reserves 8.15.2.3.7
Atlas Cove is a major jetty where petroleum products imported into Nigeria is discharged from
tankers to the jetty’s storage tank. The original design of Atlas cove is to serve as strategic reserves
for the nation and also to provide storage facility for petroleum products to be sold to other
African countries.
A multi-million dollar contracts awarded to IPCO (Nig.) PLC to build three 50,000MT storage
capacity was abandoned at foundation level.
Implication

Main Report and Recommendations
NEITI Oil and Gas Industry 2013 Audit
374
In an emergency, the Nigeria Federation would not be able to supply local demand from strategic
reserves. A nation without a strategic oil reserves would be exposed to higher petroleum prices
during product scarcity and consequently, higher demurrage costs if the products have to be
imported or conveyed through the ports.
Recommendation
Full investigation should be carried out on this abandoned project with the view of ensuring the
completion/revival of this laudable projects.
Pipeline Vandalisation 8.15.2.3.8
Senior management of Atlas Cove has expressed their concerns over pipeline vandalization at the
Ejigbo and Arepo areas when products are pumped from the Atlas Cove to Mosimi. In certain
instances, Atlas Cove cannot pump product due to pipeline vandalistion.
Implication
Millions of dollars and products are lost to theft due to pipeline vandalistion.
Recommendation
It is recommended that a comprehensive and sustainable security arrangement system be put in
place to curb pipeline vandalisation.
Generators 8.15.2.3.9
The generators used for powering and pumping products during discharge to other areas are
obsolete and in a poor condition.
Implication
If the generators are not working effectively and efficiently there could be pumping delay of
petroleum products.
Recommendation
We recommend that a new generator be purchased for the Atlas Cove. Consideration should be
given busing the nation abundance gas to power the Atlas cove.
Maintenance Log 8.15.2.3.10
No metering maintenance log or systems are used at the Atlas Cove to capture and monitor when
meters are maintained, inspected or calibrated.
Implication
There is the risk of omitting key meters for future maintenance, if maintenance of key metering
systems are not tracked and monitored.
Recommendation
We recommend that all maintenance of meters be recorded and tracked.

Main Report and Recommendations
NEITI Oil and Gas Industry 2013 Audit
375
8.15.3 Agbami FPSO
An audit team visited Atlas Cove on Thursday, 10 September 2015 for facility inspection and
observation of metering activities. An interactive conference call was also made from the FPSO to
Lekki with other members of them audit team.
8.15.3.1 Description of Agbami
The Agbami oilfield project is Nigeria's largest deepwater development. The field is operated by
CHEVRON. Partners are Famfa Oil, Petrobras, Statoil and Stardeep (a subsidiary of CHEVRON0 and
the oilfield is operated as a PSC. It’s located in water depth of 1463m with recoverable reserve of
900million barrels of oil.
The Agbami field is a subsea well development. The FPSO has 2.3 MMBO storage and
accommodation with an offloading Buoy of 1 MMBO parcel. The first oil date was achieved in July
28, 2008. The production rate for oil and gas were 240k Bbl/d and 400k mscf/day. There are 19
production wells, 4 gas injections and 9 water injections. The Agbami oil blocks consists of two unit
tracts, Agbami Unit tract 1 (OML 127) is operated by Stardeep water petroleum Ltd while Agbami
Unit tract 2 (OML 128) is operated by Statoil Nigeria Ltd.
8.15.3.2 Process Schematics
The platform is designed to handle 250,000 bpd, 450 MMscf/d of gas production and 450,000
barrels of injected water per day.
Figure 8.15.3.2 – Agbami FPSO Schematics

Main Report and Recommendations
NEITI Oil and Gas Industry 2013 Audit
376
The simplified process schematic of Agbami FPSO above shows the main metering system (1
above) used for custody transfer during cargo off-take, called the Lease Automatic Custody
Transfer Unit (LACT). The LACT units are made up of:
Four 12” turbine flow meters of which three are in use for every export and one as a spare.
During cargo offtake the turbine meters have to be proved for integrity by the prover loop.
One prover loop used to test the accuracy of the turbine meters. This is a key metering
system calibrated annually by an independent metering expert. Once calibrated, the
Department of Petroleum Resources (DPR) has to approve the certificate. See Appendix
8.15.3.2A for the 2013 calibration certificate.
Auto sampling system used for automated garbbing of oil sample during cargo offtake for
oil analysis such as B&WS
Temperature and Pressure tranmitters
Four-way diveter valves
OMNI flow computers – used to monitor the pressure, temperature and flow rate of the
turbine meters.
The LACT unit as a whole has to be approved annually by DPR before it can be used as a custody
tranfer system during cargo offtake.
Secondary instrumentation called Ullage temprature Interface Indicator (UTI) are also used to
measure tanks before and after each cargo offtake. There are 13 UTI on board the FPSO. Of the 13,
2 have been taken offshore for repairs. The remaining 11 have valid calibration certificates.
It is also mandatory that Lab analyst, representative of DPR, NNPC representative, independent
inspectors and cargo surveyors have to be present during any cargo offtake. See Appendix
8.15.3.2B, export lifting AGB-631, 10 September 2015.
A maintenance management system called JED is used at the Agbami FPSO to track metering
maintenance.
8.15.3.3 Agbamin FPSO Visit Audit Finding
No Issues Were Noted
8.15.4 Bonga FPSO
The audit team visited the Bonga FPSO on Friday, 11 September 2015.

Main Report and Recommendations
NEITI Oil and Gas Industry 2013 Audit
377
8.15.4.1 Description of Bonga
Bonga is the first deepwater project for the Shell Nigeria Exploration and Production Company
(SNEPCO) and for Nigeria. The discovery well is located in oil prospecting license (OPL) 212, which
was awarded during Nigeria's first round of deepwater frontier acreage awards in 1993.
The Bonga field is a subsea well development. As at January 2014, 500 million barrels have been
exported from Bonga FPSO. The first oil date was achieved in November 25, 2005. The production
rate for oil and gas were 225k Bbl/d and gas export of 170k mscf/day. There are 23 production
wells and 19 water injections.
8.15.4.2 Process Schematics
The vessel is designed to handle 225,000 bpd, gas lift of 65 MMscf/g, Gas export of 170 MMcf/d
and 300 barrels of injected water a day.
Figure 8.15.4.2 - Bonga FPSO Schematics
The simplified process schematic above at the Bonga FPSO shows that oil produced is metered and
sold, whilst gases produced are metered and exported to LNG Bonny and gas is also bought back

Main Report and Recommendations
NEITI Oil and Gas Industry 2013 Audit
378
from Bonny to Bonga as fuel gas. The main fiscal oil metering system (2 above) used for custody
transfer during cargo off take is called the Lease Automatic Custody Transfer Unit (LACT). The LACT
unit is made up of:
Three 16” turbine flow meters of which two are in use for every export and I spare.
42” bi-directional prover loop with four way diveter valves, used to test the accuracy of the
turbine meters. This is a key metering systems and is calibrated annualy by an independent
metering expert. Once calibrated, the Department of Petroleum Resources (DPR) has to
approve the certificate. See Appendix 8.15.4.2 for 2015 calibration certificate.
Auto sampling system used for automated grabbing of oil sample during cargo offtake for
oil analysis such as B&WS
Three steam flow computers and one prover flow computer – used to monitor the
pressure, temperature and flow rate of the turbine meters.
The Bonga Fiscal Sales of Gas Export system in 2 above, is comprised of two gas export streams and
one gas buy-back stream, comprising of:
An orifice carrier per stream
One gas sample fast loop and two sample conditioning systems
Two gas chromatographs and one dew point analyser
Two flow computers, gas density transducers, pressure transmitters and temperature
elements per stream.
On board the Bonga FPSO, the following maintenance regime is in place:
Three-monthly validation of oil export and sampling instrumentation performed by the in-
house metering specialist technicians.
Annual validation of all the oil export instruments including the proover loop performed by
a specialist third party company.
Three monthly validtin of the gas export and sampling instruments performed by the in-
house metering specialist technicians and witnessed by representatives of DPR and NLNG
Annual recertification of the flow transmitters and gas density tranducers by a standard
calibration body.
Secondary instrumentation called MMC are also used to measure tanks before and after each
cargo offtake. There are 6 MMC on board the FPSO with valid calibration certificates.
The LACT unit as a whole has to be approved annually by DPR before it can be used as a custody
transfer system during cargo offtake.
During cargo offtake, representatives of DPR, NNPC, independent inspectors and cargo surveys
have to be present.

Main Report and Recommendations
NEITI Oil and Gas Industry 2013 Audit
379
A maintenance management system called Kelton Intstrument Management System (KIMS) is used
at the Bonga FPSO to track metering maintenance. Also there are metering log books maintained
for each line of streams.
8.15.4.3 Bonga FPSO Visit Audit Findings
Inspection of Orifice Plate Meters 8.15.4.3.1
The Orifice plate meters used to measure the gas buy-back stream could not be inspected due to
the inlet and outlet valve passing. The personnel on board stated that there is no risk of gas
mismeasurement.
Summary of DPR Procedure Guidelines 8.15.4.3.2
The “DPR Procedure guide for the Determination of the Quantity and Quality of Crude Oil and
Petroleum Pruducts at Custody Tranfer Point” specially provides guidance for the maintenance and
proving of Positive Displacement Meters and Turbine Meters. The procedure does not provide
guidance for the maintenance and calibration of other meters such as Ultrasonis Meters, Carilois
Meters, Venturi meters or Gas Chromat, etc. Also, the procedure does not provide guidance and
criteria for the measurement of gas.
The guidance should be updated to define the maintenance record to be kept, frequency of
calibration and the cratinity level for both gas and oil.
Our visit highlighted different maintenance regimes and how records are kept by different
organisations as shown below.
8.15.5 Nigerian Agip Oil Company (Brass Terminal)
The audit team visited Nigerian Agip Oil Company (NAOC) crude oil terminal in Brass, Bayelsa State
on Tuesday, 15th September 2015. During the visits the audit teams physically identified the

Main Report and Recommendations
NEITI Oil and Gas Industry 2013 Audit
380
positive displacement meters (PD meters), Master prover and a visit was also made to the control
room.
8.15.5.1 Description of the Terminal
Brass crude oil terminal is located in Nigeria. It is loaded from Nigerian Agip Oil Company (NAOC) –
operated Brass terminal, which can accommodate Very Large Crude Carrier (VLCC) vessels. The
typical cargo size is 950 thousand barrels but alternate cargo sizes can be arranged to do the work.
Nigerian Agip Oil Company Limited (NAOC), a joint venture operated by Agip and owned by the
NNPC (60%), Agip (20%), and ConocoPhillips (20%) produces 150,000bbl/d (24,000m3/d) mostly
from small onshore fields.
8.15.5.2 Process Schematic Figure 8.15.5.2 – NAOC Brass Terminal Schematic

Main Report and Recommendations
NEITI Oil and Gas Industry 2013 Audit
381
From the schematic above, crude oil from AGBARA 12’ pipeline, SAR 24’ pipeline and LAR 24’
pipeline enters GUN BARREL (separator) which separates crude oil from water. The crude oil enters
production tanks (six (6) are in use) before being transferred to the storage tanks (three (3) are in
use). Delivery pumps ( three (3) are in use) are used to transfer crude oil from the storage tanks to
the ship berthed 32 nautical miles from the terminal. Water from the tanks is re- circulated to the
new API skimmer, then to the old API skimmer before being discharged to Brass canal. The sludge
is dumped in a tank.
During export, there are three positive displacement meters that are used for export of crude oil.
These meters are independently calibrated and have a proven loop for health checking the
accuracy of the PD meters.
8.15.5.3 NAOC Brass Terminal Visit Audit Findings
Maintenance of Metering System 8.15.5.3.1
At Brass terminal, the master meter/master prover used as solution to prove the accuracy of
turbine meters is bad.
Implication
Non - utilization of the master prover loop.
Recommendation
Audit recommends that a new prover loop should be procured and installed since the old one is
not functioning due to ageing.
Manual Measurement Tape 8.15.5.3.2
Audit observed that manual dipping measurement Tape is used to capture the crude oil volume in
Brass Terminal Tanks.
Implication
Incorrect capture of the actual crude oil volumes and the actual degree temperatures inside the
tanks .
Recommendation
Ullage – Temperature Interface Indicator (UTI) manual measurement instrument is more reliable,
the temperature of the tanks for each measurement is also captured, and this is the best practice
now.

Main Report and Recommendations
NEITI Oil and Gas Industry 2013 Audit
382
Vandalized valves, pipelines and bunkering ships 8.15.5.3.3
At Brass Terminal, pipelines carrying crude oil from AGBARA, SAR and LAR to the GUN BARREL tank
is prone to vandalism and lots of illegal crude oil thefts go on along the pipeline. Audit team was
conducted round to see vandalized valves, blown out pipes and impounded crude oil bunkering
ships berth in different locations in the ocean.
Implication
Pipeline vandalism and crude theft have significant impact on oil revenue derived by government.
Recommendation
Government and the immediate communities to give adequate attention to security of terminal
infrastructures while also addressing the social factors that lead to these economic crimes against
the State.
8.15.6 General Recommendations on Production Measurement/Metering Infrastructure
In addition to the recommendations arising from the facility visits discussed above, other general
recommendations from the last audit reports that are yet to be implemented include the
following:
DPR’s measurement guideline should be updated, approved and implemented.
The Weights and Measurement Department of the Federal Ministry of Trade and
Investments should be more incisive in its monitoring activities in the oil and gas industry.
Periodic hydrocarbon mass balance meetings should be held regularly and NEITI should be
in attendance. The current practice of reconciling hydrocarbon volumes between covered
entities and DPR for 2012 and 2013 in 2014 is not encouraging.
Establishment of a national frame work on hydrocarbon measurement.
Define minimum standards of measurement at each stage of the flow from Wellhead to
Terminal (that is to stipulate the uncertainty limits of measuring equipment; the “level of
proof” that the measurement method is meeting that requirement).
Define frequency of independent calibration required to provide assurance that the
measurements are sufficiently accurate on an on-going basis.
Define the records to be kept of measurements, meter settings, calibrations and
maintenance activities.
Define the procedure it would require to accept a “new” measurement technology as
sufficiently accurate.
Define the certified records to be lodged with DPR confirming that meter proving/tank
calibration had been/certified and confirming the current meter factors and tank
calibration charts.
Develop a pilot Programme (in addition to the existing national data repository-NDR) for
an on-line production-reporting tool that would be based on the definitions identified
above.

Main Report and Recommendations
NEITI Oil and Gas Industry 2013 Audit
383
Terminal operators should install meters at their incoming trunk lines to serve as back up
for the meters at the tanks and hand dips.
There should be an approved standard measurement in the upstream and downstream
operations. The acceptable range should be clearly specified in order to minimize
inconsistencies in the measurement process.
We strongly recommend the implementation of the suggestions listed above.
8.16 Production Arrangements
Introduction
Nigerian oil and gas industry has been vibrant since the discovery of crude oil in 1956 by Shell
Group. The structure of the industry comprises:
Upstream – exploration and production of crude oil and gas
Downstream – processing, storage, marketing and transportation of crude oil, gas, gas to
liquids and liquefied natural gas (LNG)
Service
In the Nigerian upstream sector, there are various production arrangement namely:
Joint Venture (JV)
Production Sharing Contract
Marginal Fields/Sole Risk Operations
Service Contracts
Modified Carry Agreements (from Joint Venture Arrangements)
8.16.1 Review of Production Arrangements
Production arrangements are contractual framework within which the Nigerian Government and
the operators conduct petroleum operations in Nigeria. The industry is categorized in order to
identify the fields in which the various companies operate.
The current production arrangements and respective operators for 2013 are listed below:
Table 8.16.1 - 2013 Oil and Gas Producing Companies
Operators for 2013
Joint Ventures (JV)
1 Total Exploration and Production Nigeria Limited (TEPNG)
4 Chevron Nigeria Limited (CNL)
2 Nigeria Agip Oil Company Limited (NAOC) 5 Mobil Producing Nigeria Unlimited (MPNU)

Main Report and Recommendations
NEITI Oil and Gas Industry 2013 Audit
384
Operators for 2013
3 Shell Petroleum Development Company Limited (SPDC)
6 Pan Ocean Nigeria Limited
Production Sharing Contract (PSC)
1 Addax Petroleum Development Company Limited
6 Addax Petroleum Exploration Company Limited
2 Esso Exploration and Production Nigeria Limited (EHRA)
7 Sterling Oil Exploration and Energy - SEEPCO (OKWUIBOME)
3 Nigeria Agip Exploration (ABO) 8 Shell Nigeria Exploration and Production Company SNEPCO (BONGA)
4 Total Upstream Nigeria Limited TEPNG (USAN)
9 Phillips Oil Company Nigeria Limited
5 Star Deep Water Petroleum Limited
SOLE RISK (SR)
1 Continental Oil and Gas Limited 10 Moni Pulo Petroleum Development
2 Consolidated Oil Producing Limited 11 Atlas Petroleum International Limited
3 Amni International Petroleum Development Company Limited
12 Dubri Oil Company Limited
4 Nigeria Petroleum Development Company Limited (NPDC)
13 Express Petroleum and Gas Company Limited
5 Cavendish Petroleum 14 Neconde Energy Limited
6 Allied Energy Resources Limited 15 Shebah Exploration and Production CO. Limited
7 Seplat Petroleum and Development Co. Ltd
16 Camac International Nig. Limited
8 First Hydrocarbon Nigeria 17 Shoreline Natural Resources Limited.
9 ND Western Ltd (in JV arrangement with NPDC)
MARGINAL FIELD (MF)
1 Platform Petroleum Limited 6 Niger Delta Petroleum Resources Limited
2 Midwestern Oil and Gas Company Limited 7 New Cross Petroleum Limited
3 Pillar Petroleum Limited 8 Energia Limited

Main Report and Recommendations
NEITI Oil and Gas Industry 2013 Audit
385
Operators for 2013
4 Walter Smith Petroman Oil Limited 9 Brittania-U Nigeria Limited
5 Oriental Energy Resources Limited
Service Contracts (SC)
1 Agip Energy and Natural Resources (AENR)
These operators produced crude oil and / gas from their respective oil mining licenses (OML) or oil
producing licenses(OPL) within the audit period except Star Deep and Cavendish Petroleum.
8.16.1.1 Production Arrangement
The production arrangements present in Nigeria are explained below:
1. Joint Ventures
These are arrangements between Nigerian National Petroleum Corporation (NNPC) on behalf of the government and a counterpart International Oil Companies (IOC) whereby the parties hold the oil prospecting licenses (OPL) or oil mining licenses (OML) jointly and funding for the exploration, development and production of petroleum, and the hydrocarbons produced are shared in proportion to the participating interest held by each party. This arrangement is typically governed by a joint operating agreement (JOA) between the NNPC and its IOC joint venture partner that provides for the conduct of petroleum operations. The IOC is typically the operator, with a management committee established to supervise operations. The participatory interest of NNPC is 60 per cent in all JVs, except the Shell (SPDC) operated JV, where it is 55 per cent. The current JV arrangements are:
Table 8.16.1.1 - Joint Ventures (JVs) Equity Arrangement
Operators Arrangements
SPDC JV
NNPC 55%
SPDC 30%
TEPNG 10%
NAOC 5%
CNL JV
NNPC 60%
CNL 40%
TEPNG JV
NNPC 60%
TEPNG 40%

Main Report and Recommendations
NEITI Oil and Gas Industry 2013 Audit
386
Operators Arrangements
MPNU NNPC 60%
MPNU 40%
NAOC JV
NNPC 60%
NAOC 20%
POCN 20%
PAN OCEAN JV
NNPC 60%
POOC 40%
It is however important to note that the JV model is currently being phased out in the oil and gas industry, due mainly to the inability of the NNPC to fund its share of JV costs. The inability of NNPC to pay its obligations gave birth to alternative form of financing namely: carry arrangement and modified carry arrangement.
2. Modified Carry Arrangement
The Modified Carry Arrangement (MCA) is a modification of existing Carry Arrangements (CA) where in the past, IOCs finance the NNPC’s share of agreed project costs as a loan and repayment of this loan was paid with oil. Under the MCA NNPC’s Joint Venture (JV) partners finance their share of agreed project costs and pay compensation and interest on cash basis instead of payment with oil. The party that funds a project on behalf of the other(s) is called the Carrying. The Carrying Party recovers its costs through Tax offset and a share of the equity production of the party being funded. Before any project is accepted and admitted as an MCA project, there are certain specific requirements that the project is expected to satisfy. If the project fails to satisfy these requirements, it would either remain part of the JV project or recommended for another type of alternative funding. The specific requirements include the fact that incremental production revenue as well as benefits under the JV would have to be clearly identified, showing what incremental production is going to be realized. Secondly the “Business Economics” of the project should be calculated taking into cognizance the Internal Rate of Return (IRR) of 8% and also confirming that the project cannot be financed under the JV. In doing so the costs for the projects should be known and shown clearly in the Capital costs and Operating Expenditure (CAPEX and OPEX) as well as any other associated costs.
Main Report and Recommendations
NEITI Oil and Gas Industry 2013 Audit
387
The Capital Cost that is agreed and approved by all parties are settled as follows: a) Tax Relief at 85% is paid through transfer of NNPC’s tax benefits to the Carrying
Party. b) Balance of 15% referred to as Residual Carry Oil is paid from the NNPC’s equity
portion of the incremental oil and gas production from the relevant projects which are lifted and marketed by NNPC.
c) Compensation (Interest): In consideration of financing the Carry capital expenditure (CAPEX), the Carrying Party is compensated at an interest rate that would yield a financial internal rate of return (FIRR) of 8%. This payment comes from the NNPC’s equity portion of the incremental oil and gas production from the relevant projects which are lifted and marketed by NNPC.
d) An important feature of MCA is that Carry Capital Cost (CCC) is only recovered in monetary terms (dollars) for both Carry Oil and Share Oil transactions. NNPC sells the crude at a set price and the monetary values of the equivalent barrels are paid into the escrow account. Royalty and Petroleum Profits Tax (PPT) are paid to the Federal Inland Revenue Service (FIRS) and the Department of Petroleum Resources (DPR) respectively.
3. Production sharing contracts (PSCs)
As a result of the increasing funding pressure from the JVs, the Federal Government of Nigeria (FGN) adopted the PSC model in 1993 as the preferred petroleum arrangement with IOCs for onshore and offshore operations. This arrangement was modelled from Indonesia.
Under the PSC arrangement, the OPL and the OML is held by the NNPC, which engages the IOC or indigenous private investor as a contractor to conduct petroleum operations on behalf of itself and the NNPC. The contractor is responsible for financing all costs of the various stages of petroleum operations – i.e. exploration, development and production within a concession area under an OPL for a period not longer than 10 years. When the exploration is successful, the IOC will be entitled to recover its costs, together with reasonable profit when commercial production begins and also pay royalty, PPT and other bonuses to FGN. If the operation is not successful, the contractor will bear all losses. The government participates through NNPC, which holds the relevant concession/license and then engages third parties under the PSC to conduct petroleum operations. NNPC is entitled to a share of the Profit Petroleum under the PSC.
4. Sole risk/Marginal field contracts
The Federal Government (FG), in furtherance of its Nigerian Content agenda, encourages IOCs to surrender their marginal fields for assignment to indigenous concession holders. To provide special incentives to marginal field operators, the FG promulgated the Petroleum (Amendment) Act No. 23 and the Marginal Field Operations (Fiscal Regime) Regulations 2005 on the development of marginal fields.

Main Report and Recommendations
NEITI Oil and Gas Industry 2013 Audit
388
Generally, a Marginal Field is defined as any field that has reserves booked and reported annually to DPR and has remained unproduced for a period of over 10 years.
These fields are reallocated to indigenous operators as "Marginal Fields". Marginal Fields are
subject to a different Royalty, Petroleum Profits Tax and Investment Tax Credit regimes as
follows:
Petroleum Profits Tax (PPT) 50% Flat
Investment Tax Credit 50% Flat
ROYALTY: Is graduated as follows for Deep Offshore -
In areas up to 200 meters of water depth 16.67%
In areas from 201 to 500 meters of water depth 12%
From 501 to 800 meters of water depth 8%
From 801 to 1000 meters of water depth 4%
Areas in excess of 1000 meters of water depth 0%
Royalty rate for Inland Basins is a flat rate of 10%
The main objectives of the government for introducing Marginal Field regime include:
I. Expand the scope of participation by small (indigenous) players in Nigeria’s oil industry.
II. Increase the country’s oil and gas reserves base.
III. Provide opportunity for portfolio rationalization.
IV. Enhance employment opportunity.
See appendix 8.16.1.1 for current marginal field status.
5. Service contracts
Under the service contract arrangement, the OPL is held by the NNPC, while the service company funds petroleum operations. Each Service Contract relates to a single concession. The primary term is usually five years or for a shorter period, renewable at NNPC’s option for a further two years. In the event there is no oil discovered in commercial quantities, the contractor does not recover its costs and there is no obligations on either party. When oil is found, the contractor is reimbursed cost incurred only from proceeds of oil sold and is paid back in instalments, according to the formulae stipulated in the contract.

Main Report and Recommendations
NEITI Oil and Gas Industry 2013 Audit
389
The contractor is liable to pay Companies Income Tax (at 30 per cent) and not PPT. As an incentive for the risk taken, the contractor has the first option to purchase certain fixed quantities of crude oil produced from the service contract area at market prices. Note: the concession ownership remains entirely with NNPC and the contractor has no
title to the oil produced.
See Appendix 2.9 for the various arrangements and license area that impact the various
arrangements.
8.16.2 Production Arrangement Status versus Concession in 2013
The current status of the production arrangement as against concession can be depicted in the
chart below:
Figure 8.16.2A - Distribution of concessions by lease contract type
Production Arrangements
Production is defined as the “sum of barrels of crude oil extracted each day from drilling operations
compounded with the equivalent production of natural gas liquid and refinery gains from domestic
or imported petroleum production”.
Section 63 of the Nigeria Petroleum Regulations 1969 as amended defines “casing –head petroleum
spirit or crude oil production as any liquid hydrocarbon which:
a. Have been obtained from natural separation or by any chemical or physical process, and
b. Have not been refined or otherwise treated.
JV 34%
MF/SR 23%
SC 1%
PSC 42%

Main Report and Recommendations
NEITI Oil and Gas Industry 2013 Audit
390
DPR considers crude production as that which is produced from the well and received at the flow
station (inclusive of oil, gas, water, and sediments-sand) and it is measured in barrels.
Producing concessions
The comparison of producing oil blocks to that of allocated blocks with respect to the arrangements
is shown below:
Figure 8.16.2B - Comparison of allocated blocks to producing blocks according to contract type
8.17 Funding Arrangements
The funding for the various agreements depends on the production arrangements as depicted
below:
Figure 8.17 - Funding Arrangements
0
10
20
30
40
50
60
70
80
JV MF/SR SC PSC
TOTAL BLOCKS PRODUCING BLOCKS
MF/
SR JV
C
SC
PSC
100% funded by IOCs
production shared based on entitlement
profit realised after expenses have been deducted
partly funded by both parties although sometimes funded by IOCs in MCA
production shared on equity basis
funded by indigenous producers funded by
the IOCs
Main Report and Recommendations
NEITI Oil and Gas Industry 2013 Audit
391
8.17.1 Key Findings on Production Arragements
1. Divestment of assets
Under the Petroleum Act (section 14, 35 (2c)), a holder of a licence or a lease granted under the Petroleum Act is prohibited from transferring such licence or lease or any right, power or interest in the same without the consent of the Minister and the payment of the prescribed fee or premium. The consent of the Minister is granted when he is satisfied that:
(i) The proposed assignee is of good reputation or a member of companies of good reputation or is owned by a company or companies of good reputation;
(ii) There will be available to the proposed assignee sufficient technical knowledge, experience and sufficient financial resources to effectively carry out a programme satisfactory to the Minister in respect of the operations under the lease; and
(iii) The proposed assignee is in all other respects acceptable to the government. Such transfer will attract the payment of stamp duty, which is assessable on the basis of the amount of consideration involved. The duty is payable directly to the Federal Inland Revenue Service. There is no capital gains tax payable on the transfer of an interest. The Petroleum Act does not require the consent of the Minister if there is a change of control of a holder of an interest in licence or a lease. However, an applicable PSC or JV agreement may set out requirements for consents.
Implication Due process was not seen to be adhered to Recommendation The process of divestment should follow due process (and the bidding process should be encouraged). This would enable companies with integrity to purchase the assets
2. Reforms
Issue Slow passage of the PIB
Implication It further delays the proposed reforms in the Oil and Gas Industry Recommendation We encourage the new Government to ensure the Petroleum Industry Bill (PIB) is passed. This would enable due monitoring process of the oil and gas industry

Main Report and Recommendations
NEITI Oil and Gas Industry 2013 Audit
392
9 CONCLUSION AND RECOMMENDATIONS
The audit has been able to reconcile all revenue payments from the Covered Entities in the Oil and
Gas sector to the revenue received by the Government agencies within the materiality threshold
approved by NEITI-NSWG and unresolved differences noted during the course of the audit have
been investigated and highlighted in the report.
From the comprehensive review of all transactions within the scope of the audit and the findings
thereto, details of which are presented in this report, it is pertinent to conclude that there is the
need for the stakeholders in the Oil and Gas Sector to promote integrated reporting for greater
transparency and accountability. The efforts by NEITI to introduce the NEITI Audit Data Base
Management System (NADBMS) is therefore commendable.
A major recommendation from this audit is the need for the Federal Government to carry out total
reform in the Oil and Gas sector which in our opinion can be achieved through the passage of the
Petroleum Industry Bill (PIB). The passage of the PIB along with the introduction of an integrated
reporting system will address most of the audit issues noted in this report and ensure greater
transparency in the Oil and Gas Sector.
10 STATUS OF REMEDIATION ISSUES FROM PREVIOUS AUDITS
10.1 Concluded issues include:
10.1.1 Education Tax
FIRS assessed the amount of $540,989,604.37 as against the audits findings of $667.8 million. The sum of
$355,293,274.07 has been collected and the sum of $184,572,673 was set off by the companies against PPT
as Section 10 deductions.
10.1.2 Accounting for In-Kind transactions - PSC
Previous NEITI audit reports noted unresolved accounting issues for In-kind transactions. However, the
current audit revealed that FIRS and DPR have addressed the issue by opening separate accounts in 2007 for
Tax and Royalty proceeds.
Update: Monthly reconciliation meetings are being held to ensure smooth implementation of the
resolutions.
10.1.3 Signature bonus
DPR is responsible for collecting signature bonus. NNPC however, does not inform DPR of the date of signing
of each PSC to ensure that all committed signature bonuses are collected. This created difficulties in
obtaining reliable and comprehensive information on the arrears of signature bonus.
Update: DPR has established adequate accounting system to manage all signature bonus commitments
entered into by companies.

Main Report and Recommendations
NEITI Oil and Gas Industry 2013 Audit
393
10.1.4 Petroleum Profit TAX (PPT) for Chevron and Mobil
The sum of $62,960,401 has been paid by the two companies while the variance is being contested.
10.1.5 Sales of Government Crude (Domestic)
NNPC is expected to pay the Federation for domestic crude oil allocation not later than 90 days from the bill
of lading date. However, NNPC has not been complying to due dates of payments: the Federation may have
lost the time value of money for the amounts not remitted on due dates.
Update: A monitoring framework has been jointly developed by OAGF/RMAFC/NNPC to ensure that
payments are made by NNPC as at when due.
10.1.6 Bid Rounds
Some oil blocks are subjects of court litigation in relation to DPR’s right to offer the blocks e.g. (OML 13, 16).
This has created delays in the allocation of the blocks with attendant setbacks in production and income loss
to the Federation.
Update: Settlement was reached, OML 13 & 16 are now back to the government and ministerial approval
was gotten to conclude the award process for OPLs 2001 – 2003 (former OML 13) and OPL 2004 (former
OML 16).
10.1.7 NNPC subsidy claims
The 2012 audit recommended the need for further reconciliation of NNPC subsidy claims. NNPC confirmed
that the total subsidy approved and certified by the PPPRA for the period of January to December 2012
amounted to N893.746 billion.
Update: This issue has been concluded and fully reconciled.
10.1.8 Subsidy Data, Payments and PPPRA Audited Financial Statements (AFS)
The Reconciliation issues relating to PPPRA over recovery remittances, PPPRA and OAGF processing time
differences and the PPPRA Annual Financial Statements.
Update: The issue has been resolved and updated schedule sent in. PPPRA has reconciled the difference with
a view to ensuring accuracy of the payment records.
10.1.9 Management of Crude sales during Trial Marketing Period
Crude oil from new producing fields is subject to trial marketing. Cargoes are lifted by both NNPC and the
operator. After the trial marketing, NNPC and the operator meet to agree on the pricing formula for the
crude. Consequently, different practices exist between the PSC's on how the proceeds of the sales during the
TMP are managed. This implies that methods for calculating funds allocation are not standardized.
Update: A guideline is in place and the auditors had access to this during the audit exercise.

Main Report and Recommendations
NEITI Oil and Gas Industry 2013 Audit
394
10.1.10 Exchange Rates used for conversion of US$ into Naira for Domestic Crude
Allocations.
The Exchange rate used by NNPC for payment of domestic crude sales was selected at their discretion.
Update: The issue has been resolved. The conversion rates used by the NNPC to pay for domestic crude oil
allocation in 2013 into the Federation Account was as advised by Central Bank of Nigeria (CBN).
10.2 Ongoing Issues Include:
10.2.1 PPT and carry agreements
All issues relating to tax is affected by pricing which is presently in arbitration.
Progress: Updated status report from FIRS to be provided on the current reconciliation exercise with the
companies. The issue is unresolved.
10.2.2 Royalty and PPT validation
This is also affected by the pricing which is being contested by the companies.
Progress: Details of audit validation conveyed to FIRS, DPR for review and reassessment to the companies.
10.2.3 Non financial flows
The basis for royalty computation under the PSC has led to disagreement with a consequence of over
$8billion contingent liability.
Progress: Government is advised to renegotiate the terms of the 1993 PSC.
10.2.4 Dividends from NLNG to NNPC - $11.63billion
Progress: There is no trace of this amount to the Federation Account till date.
10.2.5 Replacement of the 2000 MOU
An agreement in place effective January 2013
Progress: New fiscal regime in place. But the new agreement still doesn’t use OSP which is the required
regime to use. In addition some years are still being contested.
10.2.6 Production Sharing Contract (Gas treatment)
No defined agreement for sharing associated gas under the PSC
Progress: Issue is yet to be resolved. Government should ensure the signing of these agreements.
10.2.7 Measurement of Crude Oil for payment of Royalty
There is no defined standard for crude oil measurement for royalty purpose.

Main Report and Recommendations
NEITI Oil and Gas Industry 2013 Audit
395
Progress: Issue is yet to be resolved. DPR is to provide a uniform basis for measurement of crude oil. DPR has
proposed a new measurement guideline which was meant to take effect in the Q3 2014.
10.2.8 Management of refined product importation and distribution
PPMC has obsolete measurement equipment.
Progress: PPMC has embarked on the conversion of the loading meters in the depots from Analogue to
Digital. The conversion project has already commenced at some depots nationwide.
10.2.9 Pipleline movements and losses of petroleum products through theft and sabotage
Progress: Issue is yet to be resolved. NNPC is collaborating with the relevant security agencies to minimize
losses. It is also reviewing various proposals on hi-tech option to minimize vandalism.
10.2.10 Pioneer Status for Covered Entities
Companies were enjoying Pioneer status leading to huge revenue loss to the Federation.
Progress: Issue is yet to be resolved. The recommendation of the Committee that looked into this report is
yet to be implemented.
10.2.11 Deduction of Subsidy from Domestic Crude Revenue
NNPC deducts subsidy at source from domestic crude sales.
Progress: Issue is yet to be resolved. NNPC should be made to stop such deductions until an enabling law is
passed.
10.2.12 Product Exchange and Importation Arrangements
The OPA/SWAP arrangement is operated at a loss to the Federation.
Progress: Issue is yet to be resolved. Government has been duly informed that this process is fraught with
transparency and accountability issues and needs to be stopped.
10.2.13 Fiscal regime used by Addax in Royalty computations
Addax pay their royalty in tranches rather than absolute value in view of the side letter from the Presidential
Adviser on Petroleum (20/12/2001).
Progress: Issue is yet to be resolved. The matter is now in the Supreme Court for final adjudication.
Government is advised to look into the issue of Side Letters and its implications in view of the huge revenue
losses
10.2.14 Royalty for PSC production beyond 1,000 metres water depth
Progress: Issue unresolved. DPR to provides update on the current PSC disputes.
10.2.15 Federation Equity Crude
1. OMLs in which NPDC acts as an operator on behalf of NNPC:

Main Report and Recommendations
NEITI Oil and Gas Industry 2013 Audit
396
Government pays cash calls to the NPDC for the Aroh and Egbema fields but no record of crude liftings for
the federation.
Progress: Issues unresolved. The nation pays cash call for the operation but no crude oil is lifted.
2. NNPC Divestment of some OMLs to NPDC:
NNPC assigned its equity share in 2010-2012 in 8 OMLs under the SPDC JV. The value of the divestment was
put at $1,847 billion and only the sum of $100 million was paid in 2014 and this amount was not paid to
federation account but into the NNPC/NPDC special account.
Progress: Issue Unresolved. This process did not follow due process in the determination of the assets value,
there was no due process in the allocation of these assets. The outstanding amount is still unpaid.