FINAL REPORT PROJECT AP08008 (June 2012 ... - Hort Innovation
95
FINAL REPORT PROJECT AP08008 (June 2012) HIGH DENSITY PRODUCTION SYSTEMS FOR AUSTRALIAN-BRED SCAB RESISTANT APPLES Simon Middleton et al. Department of Agriculture, Fisheries and Forestry, Queensland
-
Upload
khangminh22 -
Category
Documents
-
view
1 -
download
0
Transcript of FINAL REPORT PROJECT AP08008 (June 2012 ... - Hort Innovation

FINAL REPORT
PROJECT AP08008 (June 2012)
HIGH DENSITY PRODUCTION SYSTEMS FOR
AUSTRALIAN-BRED SCAB RESISTANT
APPLES
Simon Middleton et al.
Department of Agriculture, Fisheries and Forestry,
Queensland
AP08008
Project Leader
Dr Simon G. Middleton
Principal Horticulturist
Department of Agriculture, Fisheries and Forestry, Queensland
Applethorpe Research Station
PO Box 501
STANTHORPE QLD 4380
Ph 07 46 816126
Fax 07 46 811769
Email [email protected]
Other Key Personnel (addresses as above)
Dr John D. Wilkie
Horticulturist, Department of Agriculture, Fisheries and Forestry, Queensland
Mr Allan D. McWaters
Senior Experimentalist, Department of Agriculture, Fisheries and Forestry, Queensland
Dr Osi Tabing
Experimentalist, Department of Agriculture, Fisheries and Forestry, Queensland
Mr Peter R. Nimmo
Senior Experimentalist, Department of Agriculture, Fisheries and Forestry, Queensland
The primary objective of this project was to evaluate the productivity and performance of six superior
scab-resistant apple selections from the apple breeding program (project AP08041) when grown semi-
commercially in high density planting systems at ARS. This document is the final report for the
project and as such contains the details and results of work carried out in this project.
This report was prepared for submission on 15 June 2012.
This project has been funded by HAL using the apple and pear industry levy and matched funds from
the Australian Government.
Any recommendations contained in this publication do not necessarily represent current Horticulture
Australia Limited policy. No person should act on the basis of the contents of this publication,
whether as to matters of fact or opinion or other content, without first obtaining specific, independent
professional advice in respect of the matters set out in this publication.

1
Table of Contents Acknowledgements ................................................................................................................................ 3
Abbreviations ......................................................................................................................................... 3
Media Summary .................................................................................................................................... 4
Technical Summary .............................................................................................................................. 5
1. Introduction ....................................................................................................................................... 6
2. Materials and Methods ..................................................................................................................... 8 2.1 Orchard Management .................................................................................................................... 8 2.2 Tree Vigour and Orchard Productivity ....................................................................................... 10
3. The productivity and performance of ‘Kalei’ in high density planting systems ....................... 12 3.1 Introduction ................................................................................................................................. 12 3.2 Materials and Methods ................................................................................................................ 13 3.3 Results and Discussion ................................................................................................................ 14
3.3.1 „Kalei‟ Experiment 1 ............................................................................................................ 14 3.3.2 „Kalei‟ Experiment 2 ............................................................................................................ 23 3.3.3 „Kalei‟ Experiment 3 ............................................................................................................ 26
3.4 Conclusions ................................................................................................................................. 35
4. The productivity and performance of ‘Selection 1’ in high density planting systems ............. 36 4.1 Introduction ................................................................................................................................. 36 4.2 Materials and Methods ................................................................................................................ 36 4.3 Results and Discussion ................................................................................................................ 38
4.3.1 „Selection 1‟ Experiment 1 ................................................................................................... 38 4.3.2 „Selection 1‟ Experiment 2 ................................................................................................... 43 4.3.3 „Selection 1‟ Experiment 3 ................................................................................................... 47
4.4 Conclusions ................................................................................................................................. 50
5. The light interception of intensive orchard systems for ‘Kalei’ and ‘Selection 1’.................... 51 5.1 Introduction ................................................................................................................................. 51 5.2 Materials and Methods ................................................................................................................ 51 5.3 Results and Discussion ................................................................................................................ 53
5.3.1 The light interception and LAI of „Kalei‟ orchard systems ................................................. 53 5.3.2 The light interception and LAI of „Selection 1‟ orchard systems ........................................ 57
5.4 Conclusions ................................................................................................................................. 59
6. The productivity and performance of ‘Selection 3’ in high density planting systems ............. 60 6.1 Introduction ................................................................................................................................. 60 6.2 Materials and Methods ................................................................................................................ 60 6.3 Results and Discussion ................................................................................................................ 61 6.4 Conclusions ................................................................................................................................. 66
7. The productivity and performance of ‘Selection 4’ in high density planting systems ............. 67 7.1 Introduction ................................................................................................................................. 67 7.2 Materials and Methods ................................................................................................................ 68 7.3 Results and Discussion ................................................................................................................ 68 7.4 Conclusions ................................................................................................................................. 72
8. The productivity and performance of ‘Selection 2’ grown as open V-trellis systems .............. 73 8.1 Introduction ................................................................................................................................. 73 8.2 Materials and Methods ................................................................................................................ 73 8.3 Results and Discussion ................................................................................................................ 74 8.4 Conclusions ................................................................................................................................. 78
9. The productivity and performance of ‘Selection 5’ grown as open V-trellis systems .............. 79 9.1 Introduction ................................................................................................................................. 79 9.2 Materials and Methods ................................................................................................................ 79

2
9.3 Results and Discussion ................................................................................................................ 80 9.4 Conclusions ................................................................................................................................. 83
10. Technology Transfer ..................................................................................................................... 84
11. Recommendations ......................................................................................................................... 86 11.1 Industry ...................................................................................................................................... 86 11.2 Scientific ................................................................................................................................... 87
12. Bibliography .................................................................................................................................. 89
Appendix. Overview of hdp systems planted at Applethorpe Research Station ........................... 92

3
Acknowledgements
The authors would like to thank Apple and Pear Australia Limited (APAL), Horticulture Australia
Limited (HAL) and the Department of Agriculture, Fisheries and Forestry, Queensland (DAFF, Qld)
in providing funding support for this project.
The assistance of Mr Jeffrey Paten and Mr John Finocchiaro in maintaining, spraying and harvesting
the orchard block, and of Dr Heidi Parkes and Mr David Rickard in experimental work, fruit grading
and field measurements is also gratefully acknowledged.
We also wish to acknowledge Ms Jodie Campbell (Business Manager, Horticulture & Forestry
Science, DAFF, Qld), who had a key role in negotiating and finalising the licence agreement with
APAL for the commercialisation of „Kalei‟ (tested as „RS103-130‟).
Abbreviations
APAL Apple and Pear Australia Limited
ARS Applethorpe Research Station, Stanthorpe, Queensland
DAFF, Qld Department of Agriculture, Fisheries and Forestry, Queensland
HAL Horticulture Australia Limited
hdp high density planting
LAI Leaf Area Index
LSD Least Significant Difference
PAR Photosynthetically Active Radiation
PBR Plant Breeders Rights
SPI Starch Pattern Index
TCSA Trunk Cross-Sectional Area
mm millimetre
cm centimetre
m metre
g gram
kg kilogram
L litre
t tonne
ha hectare
apple scab apple black spot caused by Venturia inaequalis

4
Media Summary
Apple scab (colloquially known as black spot), is a major fungal disease of apples worldwide, and
costs the Australian industry upwards of $10 million annually in chemical control and fruit losses.
New apple varieties resistant to scab have been bred by the Department of Agriculture, Fisheries and
Forestry, Queensland (DAFF, Qld).
„Kalei‟ is the first scab-resistant apple to be released from this program, and was publically launched
in May 2012. Apple and Pear Australia Ltd (APAL) has signed a licence agreement with DAFF, Qld
to commercialise „Kalei‟.
„Kalei‟ is an attractive, crisp, sweet, juicy red apple maturing just before Pink LadyTM
. It retains
firmness and crispness after long-term storage and when left at room temperature for three weeks.
A one hectare block of trees was established at Applethorpe Research Station, Queensland to evaluate
the productivity of six scab-resistant apple selections, including „Kalei‟, in high density plantings
under semi-commercial conditions. High density planting systems and appropriate tree management
are critical to increasing the productivity of Australian apple orchards.
No sprays for apple scab control (apart from green tip copper) were applied. Since planting, all six
scab-resistant apple selections have shown no leaf or fruit symptoms of apple scab, despite the
presence of the disease in the orchard. „Granny Smith‟ and „Pink Lady‟TM
trees planted as pollenisers
showed moderate to severe incidence of scab on fruit over the past two seasons.
Trees of „Kalei‟ are well-suited to high density planting (upwards of 2000 trees/ha). The semi-spur
growth habit of „Kalei‟ trees is easy for growers to manage, and yields of 60-70 tonnes/ha/annum can
be expected from fully mature trees. „Kalei‟ can be a large apple (> 200 g) if trees are under-cropped.
„Kalei‟ is also tolerant to Alternaria disease and western flower thrip, and can be grown both
conventionally and organically.
Trees of a second scab-resistant apple selection, maturing just after „Gala‟, yielded 60 t/ha in 2012 (7th
leaf), with over 90 percent packouts of first grade apples. Early fruitlet thinning is essential to
minimise the production of small fruit in this variety, which will be the next scab-resistant apple to be
commercialised.
The first „Kalei‟ trees for commercial planting should be available through APAL (Coregeo) in winter
2013.

5
Technical Summary
Apple scab caused by the fungus Venturia inaequalis, is a major disease of apples (Malus domestica
Borkh.) in Australia and throughout the world. Apple varieties resistant to scab have been bred and
developed in the Department of Agriculture, Fisheries and Forestry, Queensland (DAFF, Qld) apple
breeding program, and several show promise as high quality apples with commercial potential to be
grown both conventionally and organically.
One of these, „RS103-130‟, was released in May 2012 as „Kalei‟. Apple and Pear Australia Ltd
(APAL) has signed a licence agreement with DAFF, Qld to commercialise „Kalei‟, and the first
„Kalei‟ trees for commercial planting should be available through APAL (Coregeo) in winter 2013.
„Kalei‟ matures one to two weeks before „Pink Lady‟TM
, and is an attractive, sweet, crisp, red apple
that has exceptional shelf-life and quality, whether marketed fresh or out of long-term storage. In
addition to resistance to apple scab, „Kalei‟ is tolerant to Alternaria and western flower thrip
(Frankliniella occidentalis).
The industry adoption of high density planting (hdp) systems and appropriate tree management is
critical to increasing the productivity of Australian apple orchards to global competitiveness. A one
hectare block of trees was established at Applethorpe Research Station, Qld. to evaluate the
productivity of six scab-resistant apple selections, including „Kalei‟, in hdp systems, and to facilitate
the adoption of intensive systems by growers through on site farm walks and discussions.
Trees were planted in replicated trials on M.9, M.26, MM.106, MM.102 and Ottawa 3 rootstocks at
densities of 1428 to 5925 trees/hectare. The trees were in their 7th to 10
th leaf in 2011/12, and trained
as either a Vertical Axis to a five-wire trellis, or as a double-row open V-trellis. The light interception
of „Kalei‟ and a second superior selection, which matures just after „Gala‟, was also measured in these
systems. An Australian Plant Breeder‟s Rights application for this second scab-resistant selection is
currently being prepared.
No sprays for apple scab control (apart from the green tip copper spray) were applied in up to ten
seasons of conventional production of „Kalei‟ and the other five scab-resistant apple selections. No
apple scab has occurred on leaves or fruit of any of the six selections, despite some very wet, humid
seasons when the incidence of scab on commercial varieties was high. Apple scab regularly occurred
on leaves and fruit of „Granny Smith‟ and „Pink Lady‟TM
trees planted as pollenisers in the block.
„Kalei‟ has high yield and packout potential and is well-suited to hdp systems on semi-dwarfing or
dwarfing rootstocks (M.26, M.9) at densities of 2000 trees per hectare or higher. The semi-spur
growth habit of „Kalei‟ trees is easy to manage, and yields of 60-70 tonnes/ha/annum can be expected
from well-managed, fully mature trees. The 2012 crop was exceptionally heavy. Trees of „Kalei‟ were
highly productive, and several rootstock x planting density combinations yielded 90-100
tonnes/hectare in consecutive years. „Kalei‟ can be a large apple (> 200 g) if trees are under-cropped.
Trees of the second scab-resistant apple selection yielded 60 tonnes/hectare in 2012 (7th leaf), with
packouts of over 90 per cent. Yields for this selection are lower than „Kalei‟ as it produces smaller
fruit. Early fruitlet thinning is essential to minimise the production of small fruit in this selection, and
“Artificial Spur Extinction” should be explored as a management tool to increase fruit size.
A third scab-resistant apple consistently produced heavy yields but fruit tended to be too large and
soft. A further scab-resistant selection is highly susceptible to Alternaria leaf spot, with 50% leaf fall
by mid-summer and low yields as a consequence. Experience with this selection emphasises the
importance of evaluating potential varietal releases under semi-commercial conditions.

6
1. Introduction
The DAFF Qld apple breeding program based at ARS commenced in 1985, with the objective of
developing scab-resistant apple varieties that are adapted to Australian growing conditions, and that
satisfy the fruit quality requirements of consumers (Zeppa et al., 2002).
Apple scab (colloquially known in Australia as apple black spot), is caused by the fungus Venturia
inaequalis, and is a major disease of apples in Australia and throughout the world. Apples resistant to
the apple scab fungus have been successfully bred in the DAFF Qld apple breeding program, using a
procedure of controlled cross-pollinations followed by successive glasshouse and field evaluations of
the resultant seedlings for scab resistance (Zeppa et al., 2007).
Several superior selections from the scab-resistant apple breeding program show considerable promise
as high quality apples with potential to be grown in both conventional and organic systems. Consumer
studies in Brisbane comparing two of the superior selections („RS103-130‟ and „Selection 1‟) with
currently available commercial apple varieties, showed high consumer acceptability of „RS103-130‟
and „Selection 1‟ for appearance, flavour, texture and overall likeability (Zeppa et al., 2006).
One of these selections, „RS103-130‟, was publically released as „Kalei‟ in May 2012. A licence
agreement has now been signed with APAL to commercialise „Kalei‟ on behalf of DAFF Qld.
Regardless of consumer feedback, apple growers will not plant the new scab-resistant apple selections
unless it is economically viable to do so. The productivity and performance of trees of these potential
new varieties therefore needs to be evaluated under semi-commercial orchard conditions.
The average yield and production efficiency of Australian apple orchards is low relative to many
other apple producing countries, and lags well behind New Zealand and Italy (World Apple Review,
2009; as cited by the APAL R, D & E Investment Plan, 2010-2015). Widespread industry adoption of
intensive planting systems is the key to lifting the productivity, profitability and efficiency of
Australian apple orchards to a level that is globally competitive.
An additional aspect of this project was therefore to help facilitate the adoption of intensive systems,
through experiments designed to measure the yield and fruit quality potential of new scab-resistant
apple selections when grown in high density planting systems. Orchard intensification and tree
management in hdp systems needs to be based on a sound understanding of apple tree growth and
fruiting under Australian conditions. This is particularly relevant to new varieties.
The development and intensification of orchard systems worldwide has lifted productivity and
efficiency through increased planting densities, dwarfing rootstocks and tree canopy management
strategies that maximise yield and fruit quality through the control and manipulation of tree vigour.
Light interception and distribution are the keys to high apple orchard productivity (Middleton et al.,
2002), and are the critical determinants of yield and fruit quality. Over the past several decades, low
density apple orchards of poor productivity have been steadily replaced by more intensive systems
planted on precocious dwarfing and semi-dwarfing rootstocks that reduce tree size and permit closer
planting. Intensification of apple orchards has occurred widely throughout the world (Barritt, 1992;
Mantinger, 2000; Palmer and Warrington, 2000; Robinson and Hoying, 2002), as an efficient means
to attain high yields early in the lifetime of the orchard, maximise light interception and optimise light
distribution within the tree canopy for high fruit quality.
The trend to intensification of apple orchards has also occurred in Australia (Middleton et al., 2002),
albeit at a much slower rate and generally at less intensive planting densities than in Europe and
elsewhere. High density planting systems require appropriate trellis designs to provide tree support

7
and help maintain tree structure. In recent years, double-row V-trellis systems (Robinson, 2000) that
intercept high levels of sunlight (angled arms of the tree canopy are trained upwards and out over the
alleyways) have been planted in many apple growing regions of Australia.
The advantages of high density planting systems for apple have been demonstrated in several research
trials in Australia (James, 1997; Campbell, 1997; Middleton and McWaters, 2001; Jotic and Oakford,
2003), and specific rootstock, planting density and tree training recommendations developed as
appropriate for each local environment.
Although the recommendations from these trials vary due to differences in the performance of
rootstocks and varieties in the distinctive soil and climatic conditions of each region of Australia, light
interception provides an excellent comparative guide to the productivity of apple orchard systems. In
all of these trials, the systems of highest productivity had midseason diurnal light interception of close
to 60% (Middleton et al., 2002).
The sunlight intensities of Australia‟s apple growing regions are high relative to most other apple
producing countries (Jackson, 1997). Despite this, the use of over-vigorous rootstocks and
inappropriate training systems and planting densities can create levels of shading within intensive
orchards in Australia that severely reduce their yield and fruit quality (Middleton and McWaters,
1997; James and Middleton, 2001).
Declines in fruit set, yield and fruit quality through overcrowded leaf canopies on mature apple trees
at higher planting densities have been reported by many authors, including Parry (1978), Christensen
(1979) and Mika and Piatkowski (1986). Reduced fruit size (Palmer and Wertheim, 1980; Parry,
1981; Wertheim, 1985) and colour (Sansavini et al., 1980; Parry, 1981; Barritt et al., 1987) are the
most commonly reported effects of excessive shading within intensive orchards.
The new scab-resistant apple varieties developed at ARS are untested on semi-dwarfing and dwarfing
rootstocks grown in high density planting systems. It is therefore unknown what the vigour, growth
habit, biennial bearing habit, fruit colour sensitivity to sunlight, potential yield and fruit quality of
these varieties are, and how best to grow and manage trees of these new selections in modern
intensive orchard systems. Without this information it is impossible to further develop the varieties
and evaluate their true potential for commercial release.
The primary objective of this project was to evaluate the productivity and performance of six superior
scab-resistant apple selections from the apple breeding program (project AP08041) when grown semi-
commercially in high density planting systems at ARS.
Additional project objectives were to (i) produce sufficient fruit from this block of trees to undertake
consumer evaluations of the six apple selections in Brisbane (project AP08041) and (ii) provide a site
for growers to view the productivity and performance of trees grown in a range of intensive planting
systems at different planting densities and on different rootstocks. This enabled growers to see the
potential yields and fruit quality of the scab-resistant apple selections firsthand, and included
farmwalks, practical demonstrations and on-site grower discussions as a means of encouraging
industry adoption of hdp systems, linking in with the “Future Orchards 2012” program as appropriate.
It should be noted that for the purposes of Plant Breeders Rights, until the selections in these trials are
secured by PBR, the „intellectual property‟ (IP) of these potential varietal releases is at risk.
Consequently, „Selection 1‟ and „Selection 2‟ have not been named.

8
2. Materials and Methods
For ease of comprehension by the reader, the „Materials and Methods‟ and experimental design that
specifically relate to individual experiments for the six scab-resistant apple selections are included as
appropriate in the chapters that follow this.
The „Materials and Methods‟ outlined here pertain to all experiments.
2.1 Orchard Management
The trial site at ARS (Plate 2.1) consisted of a one hectare semi-commercial planting of trees of six
new scab-resistant apple selections from the DAFF Qld apple breeding program. The six selections
were considered at the time of planting to have potential for commercial release, and were „RS103-
130‟ (now released as „Kalei‟), „Selection 1‟, „Selection 3‟, „Selection 4‟, „Selection 2‟ and „Selection
5‟.
The trees were planted as replicated experiments on dwarfing, semi-dwarfing and semi-vigorous
rootstocks at densities that ranged from 1428 trees/ha to 5925 trees/ha. Each experiment consisted of
different combinations of rootstock, planting density and tree training. A summary of the systems,
rootstocks and tree densities in the one hectare block is provided as an Appendix.
The trees in the block were protected by a permanent hail netting structure covering five hectares at
ARS.
Plate 2.1. A view of two rows of ‘Kalei’ scab-resistant apples in the hdp systems block at ARS

9
Soil type at the trial site consists of gritty, siliceous sand, derived from decomposed granite (Wills,
1976), and is typical of the Granite Belt apple growing region. Soil depth is shallow (typically 50-80
cm) overlying a semi-pervious to impervious clay layer. Pre-plant soil analysis showed pH 5.0-5.5,
organic matter 0.8-1.0% and low N, P and Mg. The soil also had low water holding capacity.
The one hectare site was unfumigated apple replant ground. Roots from the previous apple trees were
removed, and the land spelled for two years prior to replanting. During this period, two crops of
„Jumbo‟ sorghum (Sorghum bicolor) were grown each summer and incorporated into the soil to add
vegetative bulk and organic matter. Bull manure (20 tonnes/ha/annum) was also incorporated into the
soil over the two years preceding planting.
Pre-plant soil preparation also included 2 t/ha dolomite, 0.5 t/ha superphosphate and 250 kg/ha
sulphate of potash. Tree rows were mounded up prior to planting, to increase the soil depth along the
rows by a further 30 cm.
Prior to planting, dormant scion wood was taken from virus-tested mother trees of the six scab-
resistant apple selections, bench-grafted onto the appropriate rootstock and planted in a designated
nursery area. The trees were grown for one year in the nursery, then planted in the orchard as
unbranched one-year-old „whip‟ trees the following winter. Polleniser trees of „Manchurian‟ crab
apple, „Golden Hornet‟ crab apple, „Granny Smith‟, „Braeburn‟, „Pink Lady‟TM
and „Red Jonathan‟
were also planted throughout the block.
After tree planting, the alleyways were sown to a mixture of white clover (Trifolium repens) and
perennial rye grass (Lolium perenne) to create a permanent sod. A drip irrigation system was installed
(one 8 L/hour dripper per tree) immediately after planting.
Since planting, no sprays for apple scab (caused by Venturia inaequalis) control were applied, with
the exception of a copper spray at green tip (mid-late September) each year. Powdery mildew (caused
by Podosphaera leucotricha) was minimal in most seasons, and kept under control either with
targeted Nimrod® sprays, or removal of infected shoots.
A standard spray program was used in all experiments to control the major pests: codling moth (Cydia
pomonella), light brown apple moth (Epiphyas posvittana), native budworms (Heliocoverpa
punctigera) and Queensland fruit fly (Bactrocera tryoni). No sprays were applied for control of apple
dimpling bug (Campylomma liebknechti), plague thrip (Thrips imaginis), two-spotted mite
(Tetranychus urticae) or western flower thrip (Frankliniella occidentalis).
The absence of fungicide sprays since planting and the wet humid conditions of spring/summer 2009
saw bitter rot (Glomerella cingulata) infection on some fruit at harvest in 2010. Three Delan® sprays
in each of spring 2010 and spring 2011 were applied to control bitter rot in the wet 2010/11 and
2011/12 seasons.
Weeds beneath trees were controlled with herbicide, and the grass sward in the alleyways was mowed
regularly. All trees were irrigated and fertilised as required. Non-bearing trees were fertigated
fortnightly with calcium nitrate from September to April. Calcium nitrate (30 kg/ha) was applied to
bearing trees through the trickle irrigation system at fortnightly intervals between September and late
November each year, and again on two to three occasions in April, after harvest. Analysis in February
2009 showed leaf nitrogen levels of 2.7%, so no nitrogen fertilizer was applied to trees in 2010/11 and
2011/12. Leaf nitrogen levels have now returned to a more desirable 2.1-2.2%.
Supplementary PitStop® calcium sprays were applied up to ten times per season, between early
November and late March. A 5% w/v urea spray was also applied at leaf fall in late May each year to
assist in apple scab control.

10
Sulphate of potash (40 kg/ha) was also applied through the trickle irrigation system at fortnightly
intervals between late December and early March, to enhance fruit colour development and fruit
storage potential.
Four hives of honeybees (Apis mellifera) were introduced into the block each spring to ensure
adequate pollination of flowers. Hand thinning of trees was done in November and December each
year.
Tree training and pruning in all experiments was based on maintaining a dominant upright leader,
using a minimum of pruning cuts, and tying down limbs to control growth and encourage fruiting. All
trees were planted in rows oriented north-south, and trained to trellises erected just prior to planting.
Trees grown in single-rows were trained to a „standard‟ 5-wire vertical trellis, with wires spaced at
heights of 1.1 m, 1.8 m, 2.5 m, 2.9 m and 3.3 m above ground level. They were pruned as a Vertical
Axis, with a well-defined central leader and „Christmas tree‟ shape that allowed light penetration to
lower regions of the tree canopy. At closer spacings, (densities above 3000 trees/ha) the trees were
akin to tall Slender Spindles, and had narrow canopies to restrict the overlap of growth between trees.
The Vertical Axis and Slender Spindle tree training systems are more fully described by Barritt
(1992).
„RS103-130‟ („Kalei‟) trees grown as a double-row open V-trellis were initially trained to a 5-wire
trellis with wires spaced at heights of 1.1 m, 1.7 m, 2.1 m, 2.7 m and 3.0 m above ground level. Three
wires at heights of 1.4 m, 2.4 m and 3.3 m were added in 2009/10 to better manipulate tree structure
and ensure adequate gaps in the canopy to allow light penetration to lower parts of the trees. Each side
of the V-trellis was angled at 20° from the vertical. The two rows in the double-row were spaced 0.5
m apart, and the entire trees in each row were leaned to either the east or west side of the trellis, as
appropriate for the row they were in, and trained as tall Slender Spindles. Lateral branches were tied
to the wires along the row, and upright vigorous shoots removed. V-trellis systems are described by
Robinson (2000).
2.2 Tree Vigour and Orchard Productivity
The basic methods and procedures used to measure tree vigour, yield and fruit quality were common
across all experiments.
The vigour of trees in each experiment was measured annually in winter. The parameters used
included tree height, annual shoot growth, pruning weights and trunk cross-sectional area (TCSA)
calculated from measurements of trunk circumference 15cm above the graft union.
The timing of harvest for each of the six selections was based on starch:iodine measurements (1.5%
aqueous iodine solution). Apple selections were harvested when the starch pattern index (SPI) of cut
apples (five apple sample) correlated to SPI 4-5 as per the Cornell Cooperative Extension Starch-
Iodine Index Chart (Blanpied and Silsby, 1997).
Most selections required multiple harvests. At each harvest, all fruit on individual trees was counted
and weighed. As outlined in the respective chapters for each of the six selections, fruit weight, colour
and sunburn were either measured on all individual apples harvested, or on apples from selected
datum trees. From these measurements, the packouts of the different planting systems were
calculated.
Apple fruit colour for „Kalei‟ (Plate 3.2. page 14) and „Selection 1‟ (Plate 4.2. page 38) was assessed
visually on a scale of 1 to 3 A colour rating of 1 was used for reject fruit of unacceptable, sub-
standard colour; 2 for adequately coloured (2nd
grade) fruit; and 3 for apples with premium colour (1st

11
grade). A more complex colour grading system of five colour classes was initially used, however the
sheer volume of thousands of fruit necessitated a simpler, more rapid system (1 to 3) to be able to
evaluate all the individual apples of these two selections.
The colour grading standards used for the other selections are indicated in the respective chapters.
For all selections, sunburn was visually assessed using a scale of 0 (nil), 1 (slight) or 2 (severe). Due
to protection of the trees with hail netting, there was insignificant sunburn damage to apples in any of
the experiments.
Statistical analyses
Data sets were analysed using linear mixed models. These were fitted using asreml-R software, with
F-tests used to test the significance of fixed effects and the LSD used to determine differences
between treatment means. Details specific to each experiment are provided in the following chapters.

12
3. The productivity and performance of ‘Kalei’ in high density
planting systems
3.1 Introduction
„Kalei‟ is the first scab-resistant apple to be released from the DAFF Qld apple breeding program, and
was publically launched at the Brisbane Markets on 3 May 2012 by the Minister for Agriculture,
Fisheries and Forestry, Queensland, the Hon John McVeigh.
Apple and Pear Australia Ltd (APAL) has recently signed a licence agreement with DAFF Qld to
commercialise „Kalei‟, and was instrumental in developing the „Kalei‟ name for the apple selection
previously known and tested as „RS103-130‟.
„Kalei‟ matures mid to late season (one to three weeks before Pink LadyTM
), and has a broken red
stripe to almost full block red overcolour on a yellow-green to yellow background. Fruit is round-
conic in shape with a medium stalk length (Plate 3.1).
Flesh is off-white, medium textured, crisp and breaking. „Kalei‟ is juicy with a sweet, low-acid and
mild flavour. Fruit colour up very late on the tree, within two to three weeks of harvest, which helps
ensure the apples are harvested close to optimum maturity for eating and storage quality. „Kalei‟ trees
are semi-spur and of medium to high vigour. Two to three harvests are required over a one month
picking season for this variety.
Plate 3.1. Scab-resistant apple variety 'Kalei'

13
3.2 Materials and Methods
Three high density planting system experiments for „Kalei‟ were planted at ARS, as described below.
Experiment 1
The first experiment was planted in winter 2002, with trees of „Kalei‟ trained as a Vertical Axis to a
6-wire trellis. The trial was a randomised complete block design consisting of six treatments x four
replicates, with six trees in each replicate. The six rootstock x spacing treatments for „Kalei‟ were
MM.106 rootstock at 4.0 m x 1.75 m (1428 trees/ha) and 4.0 m x 1.5 m (1666 trees/ha); and M.26
rootstock at 4.0 m x 1.5 m (1666 trees/ha), 4.0 m x 1.25 m (2000 trees/ha), 4.0 m x 1.0 m (2500
trees/ha) and 4.0 m x 0.5 m (5000 trees/ha). The trees were in their 10th leaf in 2011/12. Trees planted
at 5000 trees/ha were trained as tall Slender Spindles, with long laterals removed to prevent over-
crowding between trees. All other trees were trained as a Vertical Axis.
Linear mixed models fitted using asreml-R software were used to determine the effect of rootstock
and planting density treatment combinations (fixed effect) on yield and fruit quality data sets, with
block included as a random effect.
Experiment 2
A rootstock trial for „Kalei‟ was planted in September 2004. The experiment was a randomised
complete block design, with four rootstocks (MM.106, MM.102, M.26 and M.9) x four replicates x
five trees per replicate. All trees were planted at 4.0 m x 1.0 m spacing (2500 trees/ha) and trained as
a Vertical Axis to a 6-wire trellis. The four rootstocks used were in the semi-vigorous (MM.106),
semi-dwarf (M.26, MM.102) and dwarf (M.9) vigour range. The trees were in their 8th leaf in
2011/12.
Linear mixed models fitted using asreml-R software were used to determine the effect of rootstock
(fixed effect) on yield and fruit quality data sets, with block included as a random effect.
Experiment 3
In a separate experiment also planted in September 2004, „Kalei‟ trees on M.26 and MM.106
rootstocks were trained to a double-row open „V‟ trellis (Plate 5) and to a single-row 6-wire vertical
trellis. The experiment was designed as a randomised block, with tree densities of 2500, 3555, 4444
and 5925 trees/ha for MM.106, and densities of 2500 and 4444 trees/ha for M.26. Each of the six
systems was replicated five times, and each replicate consisted of up to 10 trees, depending on the
planting system used. Unfortunately there were insufficient trees of „Kalei‟ on M.26 to plant at the
5925 trees/ha density. The trees were in their 8th leaf in 2011/12.
Linear mixed models fitted using asreml-R software were used to determine the effect of planting
systems treatment on yield and fruit quality data sets, with block included as a random effect. For the
V-trellis, the planting systems treatment included the four rootstock and planting density treatment
combinations. For the Vertical Axis, the planting systems treatment included the effect of rootstock
only.
Measurements
Annual measurements of yield, fruit quality and TCSA were made on all trees in the three
experiments, as per the „Materials and Methods‟ page 10. Apple fruit colour was assessed visually on
a scale of 1-3 as shown below in Plate 3.2. When grading the fruit, first grade was defined as apples
of weight ≥ 120 g and of colour 3 (Plate 3.2); second grade as apples of weight 100-119 g and/or
colour 2; and reject as apples of weight < 100 g and/or colour 1.

14
The weight standards selected were somewhat arbitrary, and were aligned to standards applied to
current commercial varieties. Regardless of this, „Kalei‟ is a large apple. Very few were < 140-150 g,
and only a very small number were < 120 g.
Plate 3.2. Rating classes (1-3) used to visually assess the colour of ‘Kalei’ apples
3.3 Results and Discussion
3.3.1 ‘Kalei’ Experiment 1
The annual yields (Fig 3.1) harvested from the first planting of high density „Kalei‟ trees at ARS
steadily increased to reach 50-70 t/ha in the 5th leaf (2007), with the exception of trees on M.26
rootstock at 1666 trees/ha (40 t/ha in 5th leaf). The 2
nd and 3
rd leaf yields were low as the trees were
planted as unfeathered „whips‟. As a consequence of this, and the low availability of water in the dry
seasons from planting until 2006, it took several years for the trees to develop adequate canopies to
produce high yields.
The sharp decline in yields for all systems in 2010 was attributed to two very severe dust storms that
occurred in late Sepember 2009. The storms coincided exactly with the peak flowering period of
„Kalei‟ in that year, and left a thick coating of dust on flowers, buds and developing spur leaves.
The blossom that spring was heavy, but bees were unable to effectively pollinate the flowers due to
the dust coverage. Attempts to wash the dust off the trees with the spray plant were unsuccessful.
After leaf fall in autumn 2010, thick coatings of dust were still evident on buds, shoots and tree
trunks. The dust storms also impacted severely on the 2010 productivity of „Kalei‟ trees in
experiments 2 and 3.
High yields were consecutively produced in the following two seasons. Five of the six systems
yielded 75-105 t/ha in 2011, and all systems yielded 75-110 t/ha in 2012 (Fig 3.1). The 58 t/ha yield
of „Kalei‟ trees on M.26 rootstock (1666 trees/ha) was lower in 2011 than the yields of the other
systems, as the trees had still not filled their allotted space in the orchard.

15
With some specific exceptions, the hand thinning of „Kalei‟ trees in all three experiments was
standardised. Fruit clusters were thinned to singles and evenly spaced throughout the canopies. As a
result, the average fruit numbers per tree tended to be higher for the more widely spaced, larger trees
on MM.106 rootstock, and declined as tree density increased (Fig 3.1). This also meant that with the
crop loads of individual trees thereby adjusted to canopy volume, there was no significant difference
in the average fruit weights of Kalei‟ apples produced by the six orchard systems in any year from the
4th leaf onwards.(Fig 3.1).
On the very lightly cropped trees in their 2nd
and 3rd
leaf, „Kalei‟ apples were quite large, and
averaged 210-260 g across 2004 and 2005 for all systems except MM.106 at 1666 trees/ha (Fig 3.1).
Fruit size declined to a more acceptable level as the crop loads increased, averaging 155-200 g in all
systems from the 7th leaf onwards (Fig 3.1). The lowest average fruit weights of 155-160 g are very
acceptable for an apple, and fall in a desirable size class to market.
The cumulative yields of systems to their 10th leaf (2012) ranged from 290-450 t/ha (Fig 3.2). The
poorest performing system was „Kalei‟ on M.26 rootstock planted at 1666 trees/ha, a density not high
enough to take full advantage of the semi-dwarfing characteristics of M.26. The cumulative yields in
the early years were poor, as the trees were planted as „whips‟ and received inadequate water (due to
drought and low water supplies) in their first few years. There has been a dramatic increase in the
cumulative yields over recent years (Fig 3.2), and this trend is expected to continue.
Significant differences in the cumulative yields of the six systems were evident from the 2nd
leaf
onwards (Fig 3.2). „Kalei‟ trees on M.26 rootstock at 5000 trees/ha have consistently outperformed
the other systems, but not sufficiently enough to warrant planting trees as a single row Vertical
Axis/tall Slender Spindle system at this very high density. Indeed, the tonnages harvested from this
system were only marginally better than what „Kalei‟ trees on MM.106 rootstock produced at much
lower densities (Fig 3.2).
The trees on MM.106 rootstock were very large, with trunk cross-sectional areas (TCSA)
significantly greater than trees on M.26 rootstock (Fig 3.3). The TCSA of „Kalei‟ trees in Fig 3.3 is an
accurate representation of the relative tree sizes in the six systems, and very neatly followed the
expected trend of decreasing TCSA with increasing tree density. The extensive and sometimes dense
canopies of the large trees on MM.106 rootstock at 1428 and 1666 trees/ha required considerably
more work in pruning and management to control their vigour.
The yield efficiency (kg fruit.tree-1
/cm2
TCSA) of all six systems since planting has been practically
identical (Fig 3.4). The highest yield efficiencies of 1.35-1.55 kg apples/cm2 tree TCSA occurred in
2007 (5th leaf) when yields averaged 50-70 t/ha across most systems, and the tree volumes supporting
these crops were still relatively small. The identical yield efficiencies of the systems also
demonstrates (a) how well-standardised the hand thinning of trees has been each season, in relation to
individual tree canopy volumes, and (b) how closely tree TCSA mirrored tree size and volume.
The packouts of first grade fruit varied considerably between seasons (Fig 3.5), and were lowest for
the huge trees on MM.106 rootstock at 1428 trees/ha. From 4th leaf onwards, the packouts of first
grade fruit for trees on M.26 rootstock were consistently between 85 and 97%. In 2012 (10th leaf) all
systems produced ≥ 90% first grade apples, except for MM.106 at 1428 trees/ha (Fig 3.5), which
produced 81% first grade and 14% second grade apples.
The production of poor quality (reject) apples was highest at 17% and 23%. This was from trees on
MM.106 at 1666 and 1428 trees/ha densities respectively, and occurred in 2008 (6th leaf). By this age
the MM.106 trees were becoming quite large and dense, with shading in middle and lower regions of
their canopies impacting on fruit colour. Considerable time was spent re-structuring these trees in
subsequent years, through sawing off large vigorous limbs, delayed winter pruning and bending and
tying of shoots at all heights in the canopy. This was a successful strategy, and in their 10th leaf, the

16
reject fruit produced by these trees was down to 5%, and no different to the other systems (Fig 3.5).
„Kalei‟ trees on M.26 rootstock required far less work to manage vigour.
The proportion of first grade fruit harvested across all systems was lowest (68-75%) in 2011 (9th leaf),
and the proportion of second grade fruit harvested was highest (15-18%) in that year (Fig 3.5). Across
all years, most poor quality fruit was classed as reject due to inadequate red blush, however 2011 was
an exception, and a high proportion of the rejects were due to poor fruit size.
The low average packouts of first grade apples and the higher proportion of reject apples produced in
2011 were the direct consequence of a pruning/crop load sub-experiment. Two replicates of each of
the six orchard systems were dormant pruned and hand thinned as normal (Conventional) in 2010-11
(9th leaf). The other two replicates of each orchard system were not pruned or thinned at all (Unthin)
in 2010-11. There were 70 trees for each of the two treatments. In the following 2012 season (10th
leaf), all trees were dormant pruned as normal, and lightly hand thinned.
One of the experimental aims was to determine how heavily trees of „Kalei‟ could be cropped, and
what the impact of this would be on yield, fruit size, packout and the level of return crop in the
following year. For clarity, Table 3.1 presents a broad overview of the averaged results, rather than
more detailed statistically analysed data for paired trees of a range of crop loads in each treatment.
Trees that were unpruned and unthinned (Unthin) in 2010-11 produced average yields of 87-151 t/ha
in in their 9th leaf in 2011 (Table 3.1). At the higher crop loads, the tree limbs were bowed down by
the sheer weight of crop, and in some cases branches snapped from the weight of apples. In contrast,
the yields from conventionally managed trees (Conv) averaged just 28-70 t/ha (Table 3.1). The
average fruit weights (178-195 g) and packouts of first grade fruit (93-96%) on the “Conv” trees were
high.
The very heavy crop loads on the “Unthin” trees saw dramatic reductions in the packouts of first
grade fruit at harvest, down to 40-56% (Table 3.1). This was primarily due to a large number of
poorly sized fruit on the overcropped trees; hence the average fruit weights across the six systems for
the “Unthin” trees were reduced to 119-132 g.
This result was to be expected, however it was also expected that following such heavy tonnages in
2011, the yields in 2012 would be very low. Following a snowball blossom on all trees in spring 2011,
and a targeted light hand thinning to remove competing fruitlets and allow space for remaining apples
to adequately size up, the return crop for “Unthin” trees was exceptional, averaging 72-138 t/ha
(Table 3.1). The light hand thinning of “Unthin” trees in spring 2011 was sufficient to see packouts
returned to over 90% for all four M.26 systems, and average fruit weights of 172-199 g (Table 3.1).
The return crop tonnages for “Conv” trees of all six systems in 2012 were also high (Table 3.1), but
for four of these systems were actually lower than for “Unthin” trees.
The production of average tonnages of over 100t/ha in two consecutive seasons by „Kalei‟ trees
demonstrates the very high yield potential of this new variety. The relatively low yields of the “Conv”
trees in 2011 and the high yields and packouts of the “Unthin” trees in 2012 raises the important
question of whether our crop load management of „Kalei‟ trees in the experiments in this report has
been too conservative, and that heavier crop loads could have been retained on the trees, with
commensurate further increases in yield. Our experience across experiments 1, 2 and 3 over the last
two seasons suggests that we have tended to over-thin „Kalei‟ trees in previous years, which has
potentially cost us yield.
A strategy of leaving more fruit clusters as doubles rather than always thinning to single fruit is worth
investigating. „Kalei‟ apples that are retained as doubles in a cluster are able to develop adequate fruit
size, provided there is sufficient space in which they can grow. Unlike many other varieties, when
„Kalei‟ apples set, there are few clusters of three or more fruitlets. It is possible that a light hand

17
thinning of multiple fruit clusters and the retention of a high proportion of double fruit clusters may
increase annual yields of „Kalei‟ without compromising fruit size, colour and return crop.
No apple scab has been observed on leaves or fruit of „Kalei‟ in the ten years of this experiment,
despite the almost total absence of sprays for apple scab (black spot) control, and the presence of
apple scab inoculum in the orchard. „Pink Lady‟TM
and „Granny Smith‟ trees planted as pollenisers
within this block have shown moderate to severe symptoms of apple scab in many seasons (Plate 3.3).
In addition to resistance to apple scab, „Kalei‟ is tolerant to Alternaria and western flower thrip
(Frankliniella occidentalis). With such attributes, „Kalei‟ is a high quality apple eminently suited to
organic production (Middleton et al., 2007). Despite counts of up to 12 western flower thrips per
flower cluster, apples of „Kalei‟ have not developed the “pansy spot” symptom of western flower
thrip damage that occurs in other varieties, such as „Gala‟ and „Granny Smith‟.
Plate 3.3. Apple scab on’Pink Lady’TM
fruit in 2012. Apples in the background are ‘Kalei’

18
Yie
ld (
tonne
s/h
a)
0
20
40
60
80
100
120
Me
an f
ruit n
um
be
r p
er
tre
e
0
100
200
300
400
500
600
700
Year
2004 2006 2008 2010 2012
Me
an f
ruit w
eig
ht (g
)
140
160
180
200
220
240
260
280
300
(a)
(b)
(c)
Fig 3.1. (a) The annual yield (t/ha), (b) mean fruit number per tree and (c) mean fruit weight (g)
of ‘Kalei’ on M.26 rootstock planted at 1666 (), 2000 (), 2500 () and 5000 () trees/ha;
and on MM.106 rootstock at 1428 () and 1666 () trees/ha. ANOVA undertaken for each
year 2004-2012 (2nd
to 10th
leaf) of cropping; vertical bars represent LSD’s for comparison
between treatments within years where there is a significant effect of treatment (P < 0.05).

19
Year
2004 2006 2008 2010 2012
Cum
mula
tive
yie
ld (
tonne
s/h
a)
0
100
200
300
400
500
Fig 3.2. The cumulative yield (t/ha) of ‘Kalei’ on M.26 rootstock planted at 1666 (), 2000 (),
2500 () and 5000 () trees/ha, and on MM.106 rootstock at 1428 () and 1666 () trees/ha.
ANOVA undertaken for each year 2004-2012 (2nd
to 10th
leaf) of cropping; vertical bars
represent LSD’s for comparison between treatments within years where there is a significant
effect of treatment (P < 0.05).
Year
2002 2004 2006 2008 2010 2012
TC
SA
(cm
2)
0
20
40
60
80
100
Fig 3.3. The trunk cross-sectional area (TCSA cm2/tree) of ‘Kalei’ trees on M.26 rootstock
planted at 1666 (), 2000 (), 2500 () and 5000 () trees/ha, and on MM.106 rootstock at
1428 () and 1666 () trees/ha. ANOVA undertaken for each year 2002-2011 (planting to
completion of 9th
leaf); vertical bars represent LSD’s for comparison between treatments within
years where there is a significant effect of treatment (P < 0.05).

20
Year
2004 2006 2008 2010 2012
Yie
ld e
ffic
iency (
kg
.tre
e-1
/cm
2 T
CS
A)
0.0
0.2
0.4
0.6
0.8
1.0
1.2
1.4
1.6
1.8
Fig 3.4. The yield efficiency (kg fruit.tree
-1/cm
2 TCSA) of ‘Kalei’ trees on M.26 rootstock
planted at 1666 (), 2000 (), 2500 () and 5000 () trees/ha, and on MM.106 rootstock at
1428 () and 1666 () trees/ha. ANOVA undertaken for each year 2004-2012 (2nd
to 10th
leaf)
of cropping; vertical bars represent LSD’s for comparison between treatments within years
where there is a significant effect of treatment (P < 0.05).

21
First g
rad
e f
ruit (
%)
60
70
80
90
100
110
Se
co
nd
gra
de
fru
it (
%)
0
5
10
15
20
Year
2004 2006 2008 2010 2012
Re
ject fr
uit (
%)
0
5
10
15
20
25
30
35
(a)
(b)
(c)
Fig 3.5. The mean % (a) first grade fruit (b) second grade fruit and (c) reject fruit of ‘Kalei’
produced from trees on M.26 rootstock planted at 1666 (), 2000 (), 2500 () and 5000 ()
trees/ha, and on MM.106 rootstock at 1428 () and 1666 () trees/ha. ANOVA undertaken for
each year 2004-2012 (2nd
to 10th
leaf) of cropping; vertical bars represent LSD’s for comparison
between treatments within years where there is a significant effect of treatment (P < 0.05). - First grade fruit % (by weight) apple weight ≥ 120 g and colour rating 3 on a 1-3 scale.
- Second grade fruit % (by weight) apple weight 100-119 g and/or colour rating 2 on a 1-3 scale.
- Reject grade fruit % (by weight) apple weight < 100 g and/or colour rating 1 on a 1-3 scale.

22
Table 3.1. The yield (t/ha), mean fruit weight (g) and % first grade fruit of
six orchard systems and two prune/thin treatments (aConv,
bUnthin)
for ‘Kalei’ trees in 2011 (9th
leaf) and 2012 (10th
leaf)
Rootstock Density 2011 (9th
leaf) 2012 (10th
leaf)
(trees/ha) aConv
bUnthin
aConv b
Unthin
Yield (tonnes/ha)
M.26 5000 46.6 132.2 80.9 138.0
M.26 2500 42.3 118.1 63.0 96.6
M.26 2000 31.8 110.1 85.3 83.7
M.26 1666 27.8 87.0 78.3 72.8
MM.106 1666 69.6 137.2 97.4 110.9
MM.106 1428 57.6 151.1 87.3 104.8
Mean fruit weight (g)
M.26 5000 189 121 172 186
M.26 2500 187 120 183 171
M.26 2000 190 119 199 181
M.26 1666 195 129 186 184
MM.106 1666 184 128 179 183
MM.106 1428 178 132 175 173
*First grade fruit ( %)
M.26 5000 96.2 44.1 94.6 92.4
M.26 2500 93.8 56.0 91.7 95.0
M.26 2000 95.4 39.6 93.1 98.1
M.26 1666 93.2 56.6 88.8 95.4
MM.106 1666 96.0 51.7 91.3 88.9
MM.106 1428 92.8 53.3 86.6 75.1
a
Conv: In 2010-11 the trees were dormant pruned and hand thinned as per conventional
standard commercial practice. bUnthin: In 2010-11 the trees were NOT dormant pruned and NOT hand thinned.
In 2011-12 a
Conv and bUnthin trees were ALL dormant pruned and ALL lightly hand thinned
* First grade fruit % (by weight): apple weight ≥ 120 g and colour rating 3 on a 1-3 scale.

23
3.3.2 ‘Kalei’ Experiment 2
Two years after the planting of experiment 1, sufficient trees had been propagated to establish a trial
comparing the productivity of „Kalei‟ on four rootstocks planted at 2500 trees/ha, a density commonly
used by Australian apple growers.
The annual yields of 3rd
leaf trees were a promising 24-31 t/ha (Table 3.2), but the subsequent lack of
water in 2008 and 2009 restricted tree growth, and hence significant annual yield increases. It was
only in their 8th leaf that the trees attained 70-80 t/ha. From their 3
rd leaf, the annual yields of „Kalei‟
trees on MM.102 tended to be lower than for the other three rootstocks (Table 3.2). Overall, there was
little difference in the annual yields produced by trees on MM.106, M.26 and M.9 rootstocks.
As referred to in experiment 1, improved knowledge of how to manage „Kalei‟ trees was gained from
experience in these experiments. By 2012 it was considered that trees had been over-thinned in
previous years, so where possible, higher crop loads were retained (Table 3.3). The large average fruit
weights produced by the trees in all cropping years (Table 3.4) also suggested that the strategy of
thinning to singles and spacing apples evenly throughout the canopies was too strictly adhered to, and
required modification. The significant differences in fruit numbers per tree between the four
rootstocks (Table 3.3) were a consequence of this thinning strategy, in setting crop loads based on
TCSA and canopy volume, rather than the yield potential of the variety.
It should be noted that in 2010 and 2011, yields were also compromised by the use of these trees as
part of the PIPS project AP09031 to study the impact of “Artificial Spur Extinction” on the
productivity of „Kalei‟. The crop loads of 3, 4 and 5 fruit per cm2 TCSA standardised for the PIPS
sites across Australia were far lower crop loads than what the „Kalei‟ trees in this experiment could
have potentially carried. As a result, significantly more fruitlets were removed when hand thinning
these trees than what would normally have been removed, with consequential effect on reducing
potential yield.
Despite this, the cumulative yields for „Kalei‟ trees on all four rootstocks exceeded 230 t/ha by their
8th leaf (Table 3.5), and for MM.106, M.26 and M.9 rootstocks, averaged 50 t/ha/annum for the four
years 2009-2012 (5th to 8
th leaf).
The packouts of first grade apples were consistently high in all years, and there was little difference in
the „Kalei‟ fruit quality produced from all rootstocks (Table 3.6). The 8th leaf packouts of first grade
apples were ≥ 98% in 2012 for M.9, M.26 and MM.102, which was exceptional. The highest
proportion of reject fruit occurred in 2007 (3rd
leaf), when 13-14% of the yield from M.26 and
MM.106 rootstocks was of poor quality. This was primarily due to poorly coloured apples within
small zones of upright, dense canopy prior to limbs being tied down, and to watercore.
Annual trunk cross-sectional area measurements (Table 3.7) show the relative vigour of „Kalei‟ trees
on the four rootstocks. Trees on MM.106 were the most vigorous, and trees on the dwarfing M.9
rootstock the least vigorous. With similar yields produced by the four rootstocks, M.9 was the most
yield efficient rootstock, MM.106 the least yield efficient, and M.26 and MM.102 of intermediate
efficiency (Table 3.8).
Experience gained in managing the higher vigour trees on MM.106 rootstock in experiment 1 was
used to advantage in controlling the vigour of trees on this rootstock in experiment 2. The bending
and tying down of tree branches was done more intensively in experiment 2, and in particular helped
settle the „Kalei‟ trees on MM.106 rootstock.
Experiment 2 effectively demonstrated the suitability of MM.106, M.9 and M.26 as appropriate
rootstocks for „Kalei‟, albeit with trees on MM.106 requiring more work than the other two
rootstocks.
24
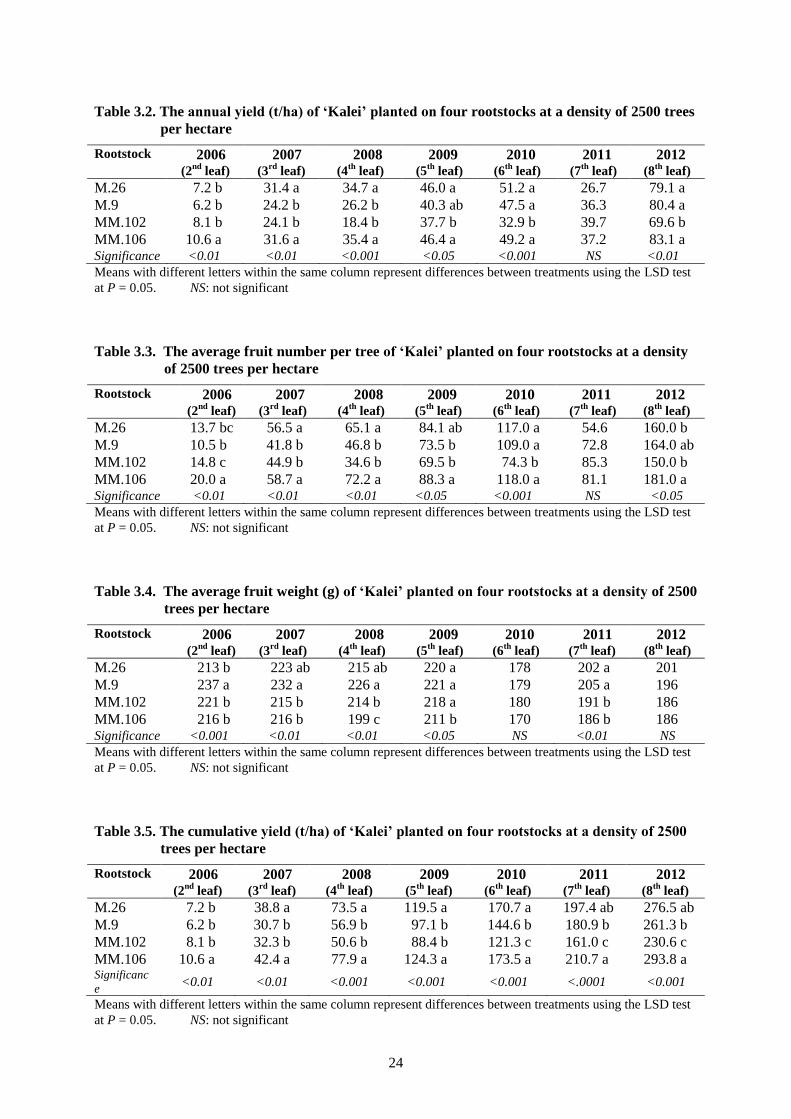
Table 3.2. The annual yield (t/ha) of ‘Kalei’ planted on four rootstocks at a density of 2500 trees
per hectare
Rootstock 2006 (2
nd leaf)
2007 (3
rd leaf)
2008 (4
th leaf)
2009 (5
th leaf)
2010 (6
th leaf)
2011 (7
th leaf)
2012 (8
th leaf)
M.26 7.2 b 31.4 a 34.7 a 46.0 a 51.2 a 26.7 79.1 a
M.9 6.2 b 24.2 b 26.2 b 40.3 ab 47.5 a 36.3 80.4 a
MM.102 8.1 b 24.1 b 18.4 b 37.7 b 32.9 b 39.7 69.6 b
MM.106 10.6 a 31.6 a 35.4 a 46.4 a 49.2 a 37.2 83.1 a Significance <0.01 <0.01 <0.001 <0.05 <0.001 NS <0.01
Means with different letters within the same column represent differences between treatments using the LSD test
at P = 0.05. NS: not significant
Table 3.3. The average fruit number per tree of ‘Kalei’ planted on four rootstocks at a density
of 2500 trees per hectare
Rootstock 2006 (2
nd leaf)
2007 (3
rd leaf)
2008 (4
th leaf)
2009 (5
th leaf)
2010 (6
th leaf)
2011 (7
th leaf)
2012 (8
th leaf)
M.26 13.7 bc 56.5 a 65.1 a 84.1 ab 117.0 a 54.6 160.0 b
M.9 10.5 b 41.8 b 46.8 b 73.5 b 109.0 a 72.8 164.0 ab
MM.102 14.8 c 44.9 b 34.6 b 69.5 b 74.3 b 85.3 150.0 b
MM.106 20.0 a 58.7 a 72.2 a 88.3 a 118.0 a 81.1 181.0 a Significance <0.01 <0.01 <0.01 <0.05 <0.001 NS <0.05 Means with different letters within the same column represent differences between treatments using the LSD test
at P = 0.05. NS: not significant
Table 3.4. The average fruit weight (g) of ‘Kalei’ planted on four rootstocks at a density of 2500
trees per hectare
Rootstock 2006 (2
nd leaf)
2007 (3
rd leaf)
2008 (4
th leaf)
2009 (5
th leaf)
2010 (6
th leaf)
2011 (7
th leaf)
2012 (8
th leaf)
M.26 213 b 223 ab 215 ab 220 a 178 202 a 201
M.9 237 a 232 a 226 a 221 a 179 205 a 196
MM.102 221 b 215 b 214 b 218 a 180 191 b 186
MM.106 216 b 216 b 199 c 211 b 170 186 b 186 Significance <0.001 <0.01 <0.01 <0.05 NS <0.01 NS
Means with different letters within the same column represent differences between treatments using the LSD test
at P = 0.05. NS: not significant
Table 3.5. The cumulative yield (t/ha) of ‘Kalei’ planted on four rootstocks at a density of 2500
trees per hectare
Rootstock 2006 (2
nd leaf)
2007 (3
rd leaf)
2008 (4
th leaf)
2009 (5
th leaf)
2010 (6
th leaf)
2011 (7
th leaf)
2012 (8
th leaf)
M.26 7.2 b 38.8 a 73.5 a 119.5 a 170.7 a 197.4 ab 276.5 ab
M.9 6.2 b 30.7 b 56.9 b 97.1 b 144.6 b 180.9 b 261.3 b
MM.102 8.1 b 32.3 b 50.6 b 88.4 b 121.3 c 161.0 c 230.6 c
MM.106 10.6 a 42.4 a 77.9 a 124.3 a 173.5 a 210.7 a 293.8 a Significanc
e <0.01 <0.01 <0.001 <0.001 <0.001 <.0001 <0.001
Means with different letters within the same column represent differences between treatments using the LSD test
at P = 0.05. NS: not significant

25
Table 3.6. The mean % first grade, second grade and reject apples of ‘Kalei’ produced by trees
on four rootstocks planted at a density of 2500 trees per hectare
Rootstock 2006 (2
nd leaf)
2007 (3
rd leaf)
2008 (4
th leaf)
2009 (5
th leaf)
2010 (6
th leaf)
2011 (7
th leaf)
2012 (8
th leaf)
*First grade fruit (%)
M.26 90.1 b 77.6 b 90.1 a 97.4 bc 86.7 91.6 b 98.3 a
M.9 91.6 b 92.1 a 93.1 a 98.3 ab 91.3 97.4 a 98.5 a
MM.102 94.4 a 89.9 a 92.5 a 98.5 a 87.9 97.4 a 98.0 a
MM.106 94.2 a 81.3 b 82.9 b 97.2 c 85.6 91.5 b 94.8 b Significance <0.01 <0.01 <0.001 <0.05 NS <0.01 <0.01
**Second grade fruit (%)
M.26 0.0 9.1 a 2.4 0.2 6.9 6.9 a 1.1 b
M.9 0.0 2.4 b 3.7 0.3 4.4 1.9 b 1.1 b
MM.102 0.0 3.4 b 3.7 0.4 5.9 1.6 b 1.7 b
MM.106 0.0 4.6 ab 4.6 0.4 7.9 6.2 a 3.6 a Significance NS <0.05 NS NS NS <0.01 <0.01
***Reject fruit (%)
M.26 9.9 a 13.3 a 7.5 b 2.4 ab 6.4 1.5 0.6 b
M.9 8.4 ab 5.5 b 3.2 c 1.4 bc 4.3 0.7 0.4 b
MM.102 5.6 b 6.7 b 3.8 c 1.1 c 6.2 1.0 0.3 b
MM.106 5.8 b 14.1 a 12.5 a 2.4 a 6.5 2.3 1.6 a Significance <0.01 <0.01 <0.001 <0.05 NS NS <0.01
Means with different letters within the same column represent differences between treatments using the LSD test
at P = 0.05. NS: not significant
* First grade fruit % (by weight) apple weight ≥ 120 g and colour rating 3 on a 1-3 scale.
** Second grade fruit % (by weight) apple weight 100-119 g and/or colour rating 2 on a 1-3 scale.
*** Reject grade fruit % (by weight) apple weight < 100 g and/or colour rating 1 on a 1-3 scale.
Table 3.7. The average trunk cross-sectional area (TCSA cm2/tree) of ‘Kalei’ trees planted on
four rootstocks at a density of 2500 trees per hectare
Rootstock 2004 (plant)
2005 (1st leaf)
2006 (2nd leaf)
2007 (3rd leaf)
2008 (4th leaf)
2009 (5th leaf)
2010 (6th leaf)
2011 (7th leaf)
M.26 2.7 b 4.5 c 9.2 b 14.9 b 21.2 b 25.2 b 28.2 b 35.5 a
M.9 2.1 c 3.5 d 6.4 c 9.5 d 13.9 c 16.6 d 18.6 c 22.2 c
MM.102 4.2 a 5.9 b 9.0 b 12.0 c 18.7 b 22.0 c 25.2 b 29.1 b
MM.106 4.0 a 6.8 a 11.5 a 17.7 a 25.1 a 30.4 a 34.3 a 40.8 a
Significance <0.001 <0.001 <0.001 <0.001 <0.001 <0.001 <0.001 <0.001
Means with different letters within the same column represent differences between treatments using the LSD test
at P = 0.05.
Table 3.8. The yield efficiency (kg fruit.tree-1
/TCSA cm2) of ‘Kalei’ trees planted on four
rootstocks at a density of 2500 trees per hectare
Rootstock 2006 (2
nd leaf)
2007 (3
rd leaf)
2008 (4
th leaf)
2009 (5
th leaf)
2010 (6
th leaf)
2011 (7
th leaf)
2012 (8
th leaf)
M.26 0.63 1.40 a 0.97 ab 0.90 b 0.84 b 0.38 b 0.93 bc
M.9 0.71 1.54 a 1.16 a 1.22 a 1.16 a 0.82 a 1.51 a
MM.102 0.57 1.08 b 0.62 c 0.82 b 0.60 c 0.63 ab 0.98 b
MM.106 0.62 1.10 b 0.82 bc 0.75 b 0.65 c 0.45 b 0.84 c Significance NS <0.001 <0.01 <0.001 <0.001 <0.05 <0.001
Means with different letters within the same column represent differences between treatments using the LSD test
at P = 0.05. NS: not significant
26
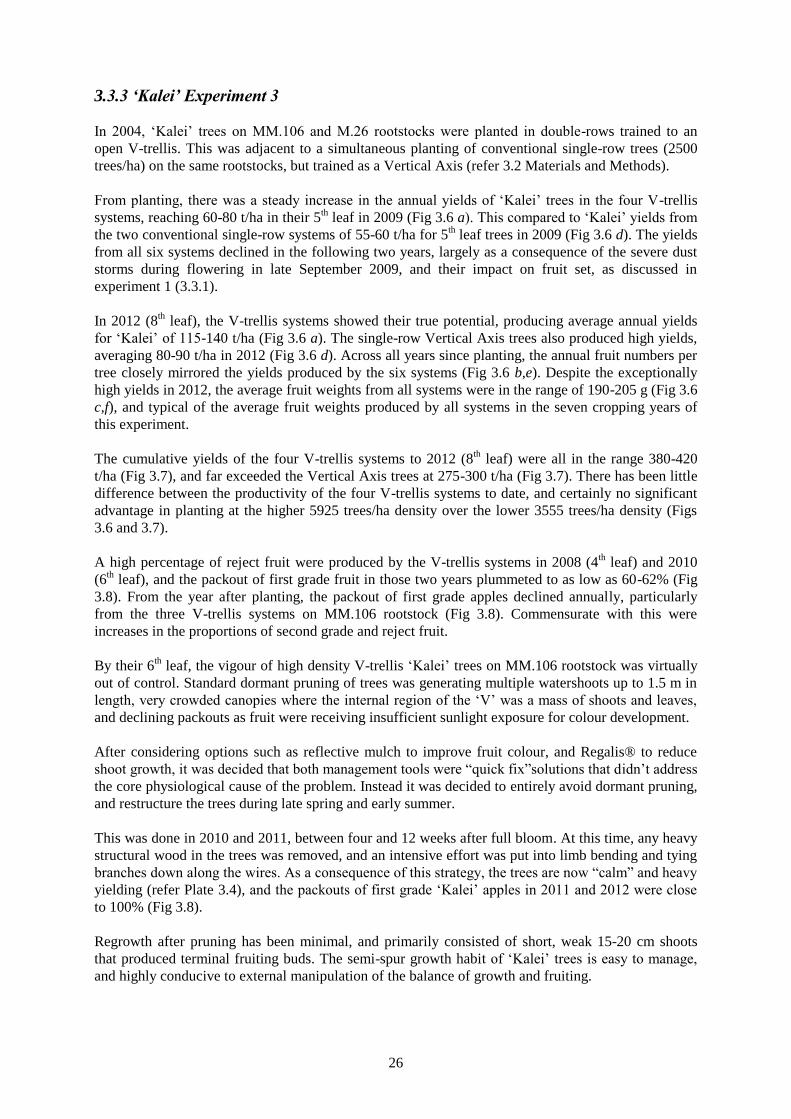
3.3.3 ‘Kalei’ Experiment 3
In 2004, „Kalei‟ trees on MM.106 and M.26 rootstocks were planted in double-rows trained to an
open V-trellis. This was adjacent to a simultaneous planting of conventional single-row trees (2500
trees/ha) on the same rootstocks, but trained as a Vertical Axis (refer 3.2 Materials and Methods).
From planting, there was a steady increase in the annual yields of „Kalei‟ trees in the four V-trellis
systems, reaching 60-80 t/ha in their 5th leaf in 2009 (Fig 3.6 a). This compared to „Kalei‟ yields from
the two conventional single-row systems of 55-60 t/ha for 5th leaf trees in 2009 (Fig 3.6 d). The yields
from all six systems declined in the following two years, largely as a consequence of the severe dust
storms during flowering in late September 2009, and their impact on fruit set, as discussed in
experiment 1 (3.3.1).
In 2012 (8th leaf), the V-trellis systems showed their true potential, producing average annual yields
for „Kalei‟ of 115-140 t/ha (Fig 3.6 a). The single-row Vertical Axis trees also produced high yields,
averaging 80-90 t/ha in 2012 (Fig 3.6 d). Across all years since planting, the annual fruit numbers per
tree closely mirrored the yields produced by the six systems (Fig 3.6 b,e). Despite the exceptionally
high yields in 2012, the average fruit weights from all systems were in the range of 190-205 g (Fig 3.6
c,f), and typical of the average fruit weights produced by all systems in the seven cropping years of
this experiment.
The cumulative yields of the four V-trellis systems to 2012 (8th leaf) were all in the range 380-420
t/ha (Fig 3.7), and far exceeded the Vertical Axis trees at 275-300 t/ha (Fig 3.7). There has been little
difference between the productivity of the four V-trellis systems to date, and certainly no significant
advantage in planting at the higher 5925 trees/ha density over the lower 3555 trees/ha density (Figs
3.6 and 3.7).
A high percentage of reject fruit were produced by the V-trellis systems in 2008 (4th leaf) and 2010
(6th leaf), and the packout of first grade fruit in those two years plummeted to as low as 60-62% (Fig
3.8). From the year after planting, the packout of first grade apples declined annually, particularly
from the three V-trellis systems on MM.106 rootstock (Fig 3.8). Commensurate with this were
increases in the proportions of second grade and reject fruit.
By their 6th leaf, the vigour of high density V-trellis „Kalei‟ trees on MM.106 rootstock was virtually
out of control. Standard dormant pruning of trees was generating multiple watershoots up to 1.5 m in
length, very crowded canopies where the internal region of the „V‟ was a mass of shoots and leaves,
and declining packouts as fruit were receiving insufficient sunlight exposure for colour development.
After considering options such as reflective mulch to improve fruit colour, and Regalis® to reduce
shoot growth, it was decided that both management tools were “quick fix”solutions that didn‟t address
the core physiological cause of the problem. Instead it was decided to entirely avoid dormant pruning,
and restructure the trees during late spring and early summer.
This was done in 2010 and 2011, between four and 12 weeks after full bloom. At this time, any heavy
structural wood in the trees was removed, and an intensive effort was put into limb bending and tying
branches down along the wires. As a consequence of this strategy, the trees are now “calm” and heavy
yielding (refer Plate 3.4), and the packouts of first grade „Kalei‟ apples in 2011 and 2012 were close
to 100% (Fig 3.8).
Regrowth after pruning has been minimal, and primarily consisted of short, weak 15-20 cm shoots
that produced terminal fruiting buds. The semi-spur growth habit of „Kalei‟ trees is easy to manage,
and highly conducive to external manipulation of the balance of growth and fruiting.

27
Plate 3.4. ‘Kalei’ trees trained to an open V-trellis. Yields were 100 t/ha with close to 100% packout
The comparative trunk cross-sectional areas (TCSA) of the six systems in this experiment followed
the expected pattern as determined by tree size and canopy volume. The TCSA of „Kalei‟ trees on
M.26 was lower than on MM.106 rootstock, and the TCSA of trees on MM.106 trained to the open V-
trellis decreased as density increased from 3555 to 5925 trees/ha (Fig 3.9). Consequently, for both the
single-row Vertical Axis and the double-row V-trellis, yield efficiency of trees on semi-dwarfing
M.26 rootstock was consistently higher than the yield efficiency of „Kalei‟ trees on MM.106 (Fig
3.10).
It must be mentioned that „Kalei‟ is an apple variety that colours up very late on the tree. Full colour
development only occurs during the three to four weeks immediately prior to harvest. This will make
it easy for growers to instruct seasonal workers on when to harvest „Kalei‟ at optimum maturity.
Simplistically, if apples are red they can be picked; if not, leave them on the tree. In addition, „Kalei‟
is not prone to pre-harvest drop, so fruit can be safely left on the tree to develop colour, without fear
of the crop prematurely falling onto the ground.
„Kalei‟ apples sized rapidly during the six to eight weeks immediately after full bloom (Fig 3.11 a-c).
Increases in fruit diameter tapered off during midseason (late Nov - Jan), and plateaued after that, at a
timing dependent on seasonal conditions and tree management. This basic seasonal pattern of fruit
diameter increase for „Kalei‟ apples was consistent between M.9, M.26 and MM.106 rootstocks and
across seasons (Fig 3.11).

28
The higher water availability for the „Kalei‟ trees in 2007-08 (through both irrigation and rainfall)
compared to the following two seasons, is evident in the fruit growth curves for M.26 and MM.106
rootstocks. The dry 2009-10 season saw very little incremental growth in fruit diameter between
February and harvest (Fig 3.11 b,c). The fruit growth curves in Fig 3.11 therefore highlight scope to
manipulate the potential size of „Kalei‟ apples at harvest through water management.
The relationship between fruit diameter and fruit weight was almost identical for „Kalei‟ on all three
rootstocks (Fig 3.11 d-f). „Kalei‟ has the genetic potential to be a large to very large apple, and at least
50% of the apples monitored and measured in developing the graphs in Fig 3.11 were > 200 g.
„Kalei‟ is a dense apple of high weight:diameter ratio. For example, „Kalei‟ apples of 70 mm diameter
weigh 160-170 g, and at 75 mm diameter weigh approximately 200 g (Fig 3.11). What this means for
growers, is that „Kalei‟ apples of a given diameter weigh more than apples of most other varieties of
the same diameter. This could be an economically significant characteristic, especially in selling small
„Kalei‟ apples at a price per kilogram.
The „Kalei‟ fruit growth curves in Fig 3.11 are a precursor to defining target fruit diameters required
at different stages of the growing season to achieve a desired fruit size at harvest. Such a tool would
allow growers to monitor the seasonal fruit size development of „Kalei‟, and adjust orchard
management practices (eg. crop load, irrigation) as appropriate, to ensure that specific fruit size
specifications of markets are closely met.

29
Yie
ld (
tonne
s/h
a)
2004 2006 2008 2010 2012
Me
an f
ruit w
eig
ht (g
)
100
120
140
160
180
200
220
240
Year
2004 2006 2008 2010 2012
0
20
40
60
80
100
120
140
160M
ean f
ruit n
um
be
r p
er
tre
e
0
50
100
150
200
(a)
(b)
(c)
(d)
(e)
(f)
Fig 3.6. (a,d) The yield (t/ha), (b,e) mean fruit number per tree and (c,f) mean fruit weight (g)
of ‘Kalei’ for: (a-c) open V-trellis M.26 rootstock planted at 4444 () trees/ha and MM.106
rootstock at 3555 (), 4444 () and 5925 () trees/ha; and (d-f) Vertical Axis trees on M.26
() and MM.106 () rootstocks at 2500 trees/ha. ANOVA undertaken for each year 2005-2012
(1st to 8
th leaf) of cropping; vertical bars represent LSD’s for comparison between treatments
within years where there is a significant effect of treatment (P < 0.05).

30
Cum
mula
tive
yie
ld (
tonne
s/h
a)
0
100
200
300
400
500
Year
2004 2006 2008 2010 2012
0
100
200
300
400
500
(a)
(b)
Fig 3.7. The cumulative yield (t/ha) of ‘Kalei’ for (a) open V-trellis M.26 rootstock planted at
4444 () trees/ha and MM.106 rootstock at 3555 (), 4444 () and 5925 () trees/ha; and (b)
Vertical Axis trees on M.26 () and MM.106 () rootstocks at 2500 trees/ha. ANOVA
undertaken for each year 2005-2012 (1st to 8
th leaf) of cropping; vertical bars represent LSD’s
for comparison between treatments within years where there is a significant effect of treatment
(P < 0.05).

31
F
irst g
rad
e f
ruit (
%)
50
60
70
80
90
100
110
Se
co
nd
gra
de
fru
it (
%)
0
5
10
15
20
25
2004 2006 2008 2010 2012
Re
ject fr
uit (
%)
0
10
20
30
Year
2004 2006 2008 2010 2012
(a)
(b)
(c)
(d)
(e)
(f)
Fig 3.8. The mean % (a,d) first grade fruit, (b,e) second grade fruit and (c,f) reject fruit of
‘Kalei’ for: (a-c) open V-trellis M.26 rootstock planted at 4444 () trees/ha and MM.106
rootstock at 3555 (), 4444 () and 5925 () trees/ha; and (d-f) Vertical Axis trees on M.26
() and MM.106 () rootstocks at 2500 trees/ha. ANOVA undertaken for each year the trial
2005-2012 (1st to 8
th leaf) of cropping; vertical bars represent LSD’s for comparison between
treatments within years where there is a significant effect of treatment (P < 0.05).

32
TC
SA
(cm
2)
0
10
20
30
40
50
Year
2004 2006 2008 2010 2012
0
10
20
30
40
50
(a)
(b)
Fig 3.9. The trunk cross-sectional area (TCSA cm
2/tree) of ‘Kalei’ for: (a) open V-trellis M.26
rootstock planted at 4444 () trees/ha and MM.106 rootstock at 3555 (), 4444 () and 5925
() trees/ha; and (b) Vertical Axis trees on M.26 () and MM.106 () rootstocks at 2500
trees/ha. ANOVA undertaken for each year 2004-2011 (planting to completion of 7th
leaf);
vertical bars represent LSD’s for comparison between treatments within years where there is a
significant effect of treatment (P < 0.05).

33
Me
an y
ield
eff
icie
ncy (
kg
.tre
e-1
/cm
2 T
CS
A)
0.0
0.5
1.0
1.5
Year
2004 2006 2008 2010 2012
0.0
0.5
1.0
1.5
(a)
(b)
Fig 3.10. The yield efficiency (kg fruit.tree
-1/cm
2 TCSA) of ‘Kalei’ for: (a) open V-trellis M.26
rootstock planted at 4444 () trees/ha and MM.106 rootstock at 3555 (), 4444 () and 5925
() trees/ha; and (b) Vertical Axis trees on M.26 () and MM.106 () rootstocks at 2500
trees/ha. ANOVA undertaken for each year 2005-2012 (1st to 8
th leaf) of cropping; vertical bars
represent LSD’s for comparison between treatments within years where there is a significant
effect of treatment (P < 0.05).

34
0
20
40
60
80
Fru
it d
iam
ete
r (m
m)
0
20
40
60
80
(a) M.26
(b) MM.106
Date
Sep Nov Jan Mar May
0
20
40
60
80 (c) M.9
100
150
200
250
300
y = e(-b + a.ln(x))
Fru
it w
eig
ht (g
)
100
150
200
250
300
(d) M.26
(e) MM.106
Fruit diameter (mm)
60 65 70 75 80 85 90
100
150
200
250
300(f) M.9
y = a . e (b . - e
(x . - c))
Fig. 3.11. (a-c) The seasonal increase in fruit diameter of ‘Kalei’ apples in 2007-08 (), 2008-09
() and 2009-10 (); and (d-f) the relationship between fruit diameter and fruit weight for
(a,d) M.26, (b,e) MM.106 and (c,f) M.9 rootstocks. Symbols represent collected data and lines
represent predictions from non-linear regression analysis for the increase in fruit diameter
across the season (a-c); and from linear regression analysis (log transformed axes) for the
relationship between fruit diameter and fruit weight (d-f).

35
3.4 Conclusions
Intensive plantings of „Kalei‟ (synonym „RS103-130‟) on M.9, M.26 and MM.106 rootstocks have
very high yield and packout potential. Yields of at least 60-70 t/ha/annum can be expected from well-
managed, fully mature trees.
Care must be taken to ensure adequate sunlight reaches all levels of the tree canopy for „Kalei‟ apples
to develop full colour. Fortunately, the semi-spur growth habit of „Kalei‟ trees is easy to manage and
manipulate, trees respond well to shoot and limb bending, and „Kalei‟ by nature is a large apple.
„Kalei‟ is suitable to grow in conventional and organic apple production systems. M.26 and M.9
rootstocks are recommended for high density conventional production. MM.106 rootstock, which is
resistant to woolly apple aphid (Eriosoma lanigerum), is suggested for organic production of „Kalei‟.
The potentially high vigour of trees on MM.106 rootstock can be controlled by branch tying and
judicious minimal pruning.
The yield and fruit quality data for „Kalei‟ presented in this report is very detailed and exhaustive.
With the commercial release of this new scab-resistant variety, it is important that as much
information as possible is collated for future use and reference by industry and other parties. Although
this report is confidential, the information about „Kalei‟ can be publically released.
Therefore, as an adjunct to the final report for project AP08041, due in May 2013, a report specific to
„Kalei‟ is to be prepared. This will combine information from both projects AP08008 and AP08041,
and be a publically available document. The timing of May/June 2013 for the release of this
information will coincide with the first trees of „Kalei‟ being available for commercial growers to
plant.

36
4. The productivity and performance of ‘Selection 1’ in high
density planting systems
4.1 Introduction
„Selection 1‟ (Plate 4.1) is a red apple with a dark red over-stripe on yellow-green ground, and
matures two to three weeks after „Royal Gala‟. Over the duration of this project, the first harvest of
„Selection 1‟ has consistently coincided with the last harvest of „Royal Gala‟. „Selection 1‟ has a
balanced, sweet flavour, fine melting texture and is crisp and juicy. Fruit shape is flat round.
Trees of „Selection 1‟ are of medium vigour and spreading growth habit (Plate 4.1). Fruit mature over
a three week period, during which two to three harvests are required.
An Australian Plant Breeder‟s Rights application is currently being prepared for „Selection 1‟, which
has excellent potential as either a conventionally or an organically produced apple.
Plate 4.1. ‘Selection 1’ scab-resistant apple
4.2 Materials and Methods
Experiment 1
A rootstock trial was planted in August 2005 to compare the productivity of „Selection 1‟ on
MM.106, MM.102, M.26, Ottawa 3 and M.9 rootstocks. The trees were planted at 3.7 m x 1.0 m
(2702 trees/ha) and trained as a Vertical Axis to a 6-wire vertical trellis. Trial design was a
randomised complete block with five rootstocks x four replicates x five trees per replicate. The trees
were in their 7th leaf in 2011/12.

37
Linear mixed models fitted using asreml-R software were used to determine the effect of rootstock
(fixed effect) on yield and fruit quality data sets, with block included as a random effect.
Experiment 2
A second rootstock trial for „Selection 1‟ was also planted in August 2005. This trial was planted as a
split plot, with rootstocks at the whole plot level, and planting density at the subplot level.
The experiment was a randomised complete block design, with trees planted at spacings of 3.7 m x
0.75 m (3603 trees/ha) and 3.7 m x 0.625 m (4324 trees/ha). At each of the two spacings there were
five rootstocks (MM.106, MM.102, M.26, Ottawa 3 and M.9) x three replicates x four trees per
replicate. All trees were trained as a Vertical Axis to a 6-wire trellis, and were in their 7th leaf in
2011/12.
Linear mixed models fitted using asreml-R software were used to determine the effects of rootstock
and planting density (fixed effects) on yield and fruit quality data sets. The experiment was analysed
as a split plot, with planting density nested within rootstock and block, and whole plot and sub-plot
included as random effects.
Experiment 3
„Selection 1‟ tends to be a small apple, so a thinning experiment was conducted in 2011/12 to study
the effect of time of thinning on fruit size. „Selection 1‟ trees were hand thinned (November to
December 2011) at either 5, 6½, 8 or 9½ weeks after full bloom to a projected crop load, where
possible, equivalent to 60 t/ha at harvest in March 2012.
Experimental design was a split plot, as for experiment 2. Thinning time treatments were nested
within the planting density strata (subplot). There were two tree densities (3603 and 4324 trees/ha) x
five rootstocks (MM.106, MM.102, M.26, Ottawa 3 and M.9) x three blocks x single tree replicates in
each block.
Linear mixed models fitted using asreml-R software were used to determine the effects of rootstock,
planting density, thinning time and their interaction (fixed effects) on mean fruit size and percentage
first grade fruit. The experiment was analysed as a split plot with planting density nested within
rootstock, and thinning time nested within planting density. Block, whole plot, and sub plot were
included as random effects.
Measurements Annual measurements of yield, individual fruit weights, fruit colour and TCSA were made on all trees
in experiments 1, 2 and 3, as per the „Materials and Methods‟ page 10. Apple fruit colour was
assessed visually on a scale of 1-3 as shown below in Plate 4.2.

38
Plate 4.2. Rating classes (1-3) used to visually assess the colour of ‘Selection 1’ apples
4.3 Results and Discussion
4.3.1 ‘Selection 1’ Experiment 1
The annual yields harvested from „Selection 1‟ trees planted at 2702 trees/ha peaked at 56-63 t/ha in
2012 (7th leaf), with no significant effect of rootstock on the tonnages of apples produced by the trees
in their 6th and 7
th leaf (Table 4.1). Prior to this there was also little difference in the yields produced
by trees on the five rootstocks tested, although trees in their 3rd
to 5th leaf on MM.102 rootstock were
consistently less productive than those on the other rootstocks.
The 4th, 5
th and 6
th leaf yields ranged from 20-38 t/ha (Table 4.1) and were lower than desirable. The
severe dust storms of September 2009 that impacted on the subsequent yields of „Kalei‟ (Chapter 3),
also coincided with the peak flowering period of „Selection 1‟ in that year. Despite strong bud
development and a heavy blossom, the thick layer of dust that coated the flowers made pollination by
bees very difficult. Fruit set was low as a consequence of this. The dust was caked onto some buds for
up to two years, leading to poor bud strength coming into the 2010-11 season, and also reducing the
2011 yields. It was only following significant new shoot growth and the formation of strong new
fruiting sites that yields were able to reach an acceptable level in 2012.
The crop loads of „Selection 1‟ trees on the five rootstocks were consistently similar in each year
(Table 4.2). It was only 3rd
and 4th leaf trees on MM.102 rootstock that had significantly and notably
lower crop loads than the other rootstocks, due to the slow development of the canopies of trees on
MM.102 early in the lifetime of the planting. Trees on the other four rootstocks in this experiment
were relatively uniform in terms of their canopy volume. The hand thinning of trees was standardised
across rootstocks, with fruit clusters thinned to singles and evenly spaced throughout the canopies. As
a result, with few exceptions, the crop loads of all trees were alike.

39
The consistency of hand thinning of the „Selection 1‟ trees is also borne out in the annual average
fruit weights (Table 4.3), which in most years were similar for all rootstocks. In those years where
there was a significant difference in average fruit weight between trees on the different rootstocks,
M.9 tended to produce marginally larger apples (Table 4.3).
„Selection 1‟ is a smaller apple than „Kalei‟, and has a much shorter growing season, maturing
approximately four to six weeks earlier. Nevertheless, a target average fruit weight of 150 g was
achieved by the majority of trees in their 2nd
, 3rd
, 4th and 6
th leaf. Modification of pruning and crop
load management in future years is anticipated to annually deliver average fruit weights of ≥ 150 g.
In hindsight, and now armed with a greater knowledge of how to manage „Selection 1‟ as gained
during this project, the „Selection 1‟ trees have likely been over-thinned in most years. The average
fruit weights of „Selection 1‟ apples produced by trees in their 7th leaf differed little to the average
fruit weights of the two previous years (Table 4.3), despite the significantly higher crop loads in 2012.
Observations over the past two seasons have confirmed the larger size of „Selection 1‟ apples borne
on terminal buds (data not presented). At hand thinning in spring 2011, apples were retained as
doubles at terminal bud sites that set fruit, and even as pairs these were amongst the largest apples
harvested in 2012.
The potential over-thinning of trees has also likely compromised the yields to date (Tables 4.1 and
4.4). The cumulative yields of 7th leaf trees for all rootstocks are still under 200 t/ha (Table 4.4), and
well short of what comparably aged „Kalei‟ trees have produced (Chapter 3). The genetic
predisposition of „Selection 1‟ to be a small to medium sized apple makes it more difficult to achieve
high yields, however changes in tree management (eg. pruning to develop short shoots and the
retention of fruit borne by terminal buds) provide scope for a modest 15-20% increase in average fruit
weight, and commensurate yield improvements. To date, „Selection 1‟ trees on M.9 rootstock have
produced the highest cumulative yields (Table 4.4).
An outstanding feature of „Selection 1‟ is the high marketable yields produced by trees of this scab-
resistant apple (Table 4.5). The proportion of reject fruit (by weight) was never above 5.5% (5th leaf
trees on MM.102), and 90-95% packouts of first grade apples were common. When there were
significant differences in the packouts of first grade fruit between the rootstocks, M.9 and M.26
generally out-performed MM.106, MM.102 and Ottawa 3 (Table 4.5).
Fruit rejections were primarily due to poor size. Apples developed their characteristic 70-80% red
blush coverage even in relatively shaded lower regions of the canopy, and only a few apples
(primarily on MM.106 and Ottawa 3 rootstocks) were rejected on the basis of inadequate colour. The
spreading, medium vigour of „Selection 1‟ trees is relatively easy to manage, and trees responded well
to limb bending.
The block of trees in this experiment was relatively uniform, and by their 7th leaf there were still no
significant differences in the trunk cross-sectional areas of trees on the five rootstocks (Table 4.6),
despite the intrinsic vigour of the rootstocks ranging from semi-vigorous (MM.106) to dwarfing
(M.9). This somewhat reflected the standardised management of the „Selection 1‟ trees at the single
planting density, and the medium vigour that was easy to contain within the identical 3.7 m2 orchard
floor area allocated to each tree.
With the trees of reasonably similar size and TCSA across all rootstocks, and M.9 producing
marginally greater yields than the other rootstocks in most years, the yield efficiency of the dwarfing
M.9 rootstock was consistently high (Table 4.7). In their 5th leaf, the yield efficiency of trees on M.9
was significantly superior to all other rootstocks, and in their 7th leaf was significantly greater than all
other rootstocks except Ottawa 3 (Table 4.7).

40
The potentially high yield efficiency of dwarfing rootstocks is a characteristic that makes them
attractive in high density planting systems, provided their canopy volume is sufficiently large to fill
the allotted tree space in the orchard to thereby ensure the production of high fruit tonnages.
Table 4.1. The annual yield (t/ha) of ‘Selection 1’ trees on five rootstocks planted at a density of
2702 trees per hectare
Rootstock 2007 (2
nd leaf)
2008 (3
rdleaf)
2009 (4
th leaf)
2010 (5
thleaf)
2011 (6
th leaf)
2012 (7
th leaf)
M.26
3.0
15.1 b
26.8a
35.3 ab
29.0
60.4
M.9 3.9 12.5 b 28.6 a 38.3 a 34.4 63.1
MM.102 2.4 7.4 c 19.9 b 29.5 c 28.8 56.0
MM.106 2.4 12.4 b 26.4 a 31.8 bc 22.2 58.4
Ottawa 3 1.9 18.5 a 29.9 a 32.9 bc 24.2 56.7
Significance NS <0.001 <0.01 <0.01 NS NS
Means with different letters within the same column represent differences between treatments using the LSD test
at P = 0.05. NS: Not Significant
Table 4.2. The average fruit number per tree of ‘Selection 1’ trees on five rootstocks planted at
a density of 2702 trees per hectare
Rootstock 2007 (2
nd leaf)
2008 (3
rdleaf)
2009 (4
th leaf)
2010 (5
thleaf)
2011 (6
th leaf)
2012 (7
th leaf)
M.26
7.1
35.8 ab
64.0 a
95.1
74.3
159.0
M.9 8.6 29.0 b 69.5 a 101.0 89.8 163.9
MM.102 5.8 17.5 c 47.6 b 84.5 75.4 157.8
MM.106 5.5 30.0 b 66.1 a 88.5 57.3 163.6
Ottawa 3 4.0 42.4 a 74.0 a 89.0 64.5 163.1
Significance NS <0.001 <0.01 NS NS NS
Means with different letters within the same column represent differences between treatments using the LSD test
at P = 0.05. NS: Not Significant
Table 4.3. The average fruit weight (g) of ‘Selection 1’ apples produced by trees on five
rootstocks planted at a density of 2702 trees per hectare
Rootstock 2007 (2
nd leaf)
2008 (3
rdleaf)
2009 (4
th leaf)
2010 (5
thleaf)
2011 (6
th leaf)
2012 (7
th leaf)
M.26
160 b
157
155
138 ab
152
142 ab
M.9 167 ab 160 153 141 a 146 144 a
MM.102 150 c 158 156 130 c 147 132 c
MM.106 165 b 154 148 135 bc 149 134 bc
Ottawa 3 179 a 161 151 138 ab 146 129 c
Significance <0.01 NS NS <0.01 NS <0.05
Means with different letters within the same column represent differences between treatments using the LSD test
at P = 0.05. NS: Not Significant

41
Table 4.4. The cumulative yield (t/ha) of ‘Selection 1’ trees on five rootstocks planted at a
density of 2702 trees per hectare
Rootstock 2007 (2
nd leaf)
2008 (3
rdleaf)
2009 (4
th leaf)
2010 (5
thleaf)
2011 (6
th leaf)
2012 (7
th leaf)
M.26
3.0
18.1 ab
44.9 ab
80.2 ab
109.2 a
169.6 ab
M.9 3.9 16.4 b 45.0 ab 83.3 ab 117.8 a 180.8 a
MM.102 2.4 9.7 c 29.6 c 59.0 c 87.8 c 143.8 c
MM.106 2.4 14.8 b 41.2 b 73.1 b 95.3 bc 153.7 bc
Ottawa 3 1.9 20.4 a 50.3 a 83.2 a 107.0 ab 164.1 b
Significance NS <0.001 <0.001 <0.001 <0.01 <0.01
Means with different letters within the same column represent differences between treatments using the LSD test
at P = 0.05. NS: Not Significant
Table 4.5. The mean % first grade, second grade and reject apples of ‘Selection 1’ produced
from trees on five rootstocks planted at a density of 2702 trees per hectare
Rootstock 2007 (2nd
leaf) 2008 (3
rdleaf)
2009 (4
th leaf)
2010 (5
thleaf)
2011 (6
th leaf)
2012 (7
th leaf)
*First grade fruit (%)
M.26
96.9
89.5 b
94.4 a
87.5 ab
95.2
90.2 ab
M.9 97.6 93.7 ab 94.3 a 91.0 a 94.7 92.9 a
MM.102 95.0 98.0 a 92.8 ab 80.0 c 93.1 83.1 b
MM.106 97.5 91.8 b 94.0 a 85.6 b 94.0 83.4 b
Ottawa 3 93.6 92.8 b 90.5 b 87.3 ab 91.2 83.8 b
Significance
NS
<0.05
<0.05
<0.001
NS
<0.05
**Second grade fruit (%)
M.26
2.4
7.4 a
4.9 b
9.3 b
3.8
7.6 ab
M.9 0.0 4.4 bc 4.6 b 6.7 c 4.4 5.6 b
MM.102 5.0 1.6 c 6.5 b 14.5 a 5.7 12.5 a
MM.106 2.5 5.6 ab 5.5 b 10.7 b 5.3 12.1 a
Ottawa 3 6.4 4.3 bc 8.7 a 8.2 bc 6.9 12.6 a
Significance
NS
<0.05
<0.01
<0.001
NS
<0.05
***Reject fruit (%)
M.26
0.7
3.1
0.7
3.2 b
1.0
2.2
M.9 2.4 1.9 1.1 2.3 b 0.9 1.5
MM.102 0.0 0.4 0.7 5.5 a 1.2 4.4
MM.106 0.0 2.6 0.5 3.7 ab 0.7 4.5
Ottawa 3 0.0 2.9 0.8 4.5 ab 1.9 3.6
Significance
NS
NS
NS
<0.05
NS
NS
Means with different letters within the same column represent differences between treatments using the LSD test
at P = 0.05. NS: Not Significant
* First grade fruit % (by weight) apple weight ≥ 110 g and colour rating 3 on a 1-3 scale.
** Second grade fruit % (by weight) apple weight 95-109 g and/or colour rating 2 on a 1-3 scale.
*** Reject grade fruit % (by weight) apple weight < 95g and/or colour rating 1 on a 1-3 scale.

42
Table 4.6. The average trunk cross-sectional area (TCSA cm2/tree) of ‘Selection 1’ trees on five
rootstocks planted at a density of 2702 trees per hectare
Rootstock 2005 2006
(1stleaf)
2007
(2nd
leaf)
2008
(3rd
leaf)
2009
(4th
leaf)
2010
(5th
leaf)
2011
(6th
leaf)
M.26
1.2
2.6 a
7.1
11.6
15.9
18.1
23.5
M.9 1.0 2.3 b 5.8 10.2 14.0 16.3 20.8
MM.102 1.1 2.2 bc 5.9 11.2 15.8 18.2 23.3
MM.106 0.9 2.1 bc 5.8 11.3 15.8 18.2 25.1
Ottawa 3 0.9 2.0 c 5.7 9.9 14.1 16.0 21.7
Significance NS <0.001 NS NS NS NS NS Means with different letters within the same column represent differences between treatments using the LSD test
at P = 0.05. NS: not significant
Table 4.7. The yield efficiency (kg fruit.tree-1
/cm2 TCSA) of ‘Selection 1’ trees on five
rootstocks planted at a density of 2702 trees per hectare
Rootstock 2007 (2
nd leaf)
2008 (3
rdleaf)
2009 (4
th leaf)
2010 (5
thleaf)
2011 (6
th leaf)
2012 (7
th leaf)
M.26
0.43
0.82 b
0.88 b
0.85 bc
0.59
0.97 b
M.9 0.63 0.81 b 1.06 ab 1.05 a 0.82 1.16 a
MM.102 0.41 0.49 c 0.66 c 0.70 c 0.59 0.90 b
MM.106 0.43 0.79 b 0.86 b 0.76 bc 0.46 0.86 b
Ottawa 3 0.36 1.22 a 1.14 a 0.88 b 0.59 1.00 ab
Significance NS <0.001 <0.001 <0.01 NS <0.05
Means with different letters within the same column represent differences between treatments using the LSD test
at P = 0.05. NS: Not Significant

43
4.3.2 ‘Selection 1’ Experiment 2
When „Selection 1‟ trees on the same five rootstocks as experiment 1 were planted at the higher
densities of 3603 and 4324 trees/ha, there was only marginal improvement in the annual yields
produced (compare Tables 4.1 and 4.8). The most noticeable difference was when trees were in their
5th leaf in 2010, when „Selection 1‟ yields across the five rootstocks averaged 33.5 t/ha at 2702
trees/ha (Table 4.1), 43.2 t/ha at 3603 trees/ha and 45.9 t/ha at 4324 trees/ha (Table 4.8).
In experiment 2 there were no significant rootstock x planting density interaction effects on yield,
fruit quality, crop load, average fruit weight or TCSA. Therefore for clarity and ease of
comprehension, the comparative rootstock means in Tables 4.8 - 4.12 combine data from the 3603 and
4324 trees/ha densities. Similarly, the tree density means combine the data from all five rootstocks.
There was no significant effect of rootstock on the annual yields (Table 4.8) or cumulative yields
(Table 4.11) produced by „Selection 1‟ trees at the 3603 and 4324 trees/ha densities. Similarly, the
average fruit numbers per tree (Table 4.9) and the average fruit weights (Table 4.10) did not vary
between rootstocks. As in experiment 1, the block of trees in experiment 2 was very uniform for tree
size and TCSA. Coupled with the standardisation of hand thinning as per the strategy used in
experiment 1, the similar canopy volumes of trees across all rootstocks and both planting densities
meant that in each year, the crop loads were virtually identical for all trees (Table 4.9).
Trees planted at the higher density (4324 trees/ha) produced significantly greater yields in their 7th
leaf (Table 4.8), and greater cumulative yields to their 6th and 7
th leaf (Table 4.11), than „Selection 1‟
trees at the lower 3603 trees/ha density. The yield difference between the two densities was minor,
and insufficient to justify planting at the higher 4324 trees/ha density. The comparable yield and
marginally higher packouts of trees planted at 2702 trees/ha (experiment 1) show that this is an
appropriate density at which to plant „Selection 1‟ trees.
The packouts of first grade apples of „Selection 1‟ were again high in experiment 2 (Table 4.12), and
between 3rd
leaf and 7th leaf there was no difference in the packouts between the five rootstocks. The
proportion of reject apples (by weight) was always low, and peaked at just 5.2 % and 6.1% for 5th leaf
trees on MM.106 and MM.102 rootstocks respectively (Table 4.12).
There was no significant difference in the packouts of „Selection 1‟ apples produced at densities of
3603 and 4324 trees/ha (data not shown). Hence even at the very high tree 4324 trees/ha density, there
was insufficient shading within trees of any of the rootstocks to significantly reduce apple size and
red colour development.
In experiment 2 there was no effect of tree density or rootstock on the trunk cross-sectional area of
trees to their 7th leaf (data not shown). Similarly, there was no difference in the yield efficiency (kg
fruit.tree-1
/cm2 TCSA) between trees of the five rootstocks and the two planting densities (data not
shown). As in experiment 1, this was a consequence of the uniformity of tree size, TCSA, crop load
and yield of all trees in experiment 2.
It should be noted that although there was little significant difference in the yields, fruit quality and
packouts of „Selection 1‟ trees on the five rootstocks tested in experiments 1 and 2, the trees on M.9
rootstock were particularly easy to manage. Compared to MM.106 and M.26 rootstocks, trees on M.9
required less pruning and limb bending to control their vigour and confine their canopies to the
allocated space in the orchard for each tree.
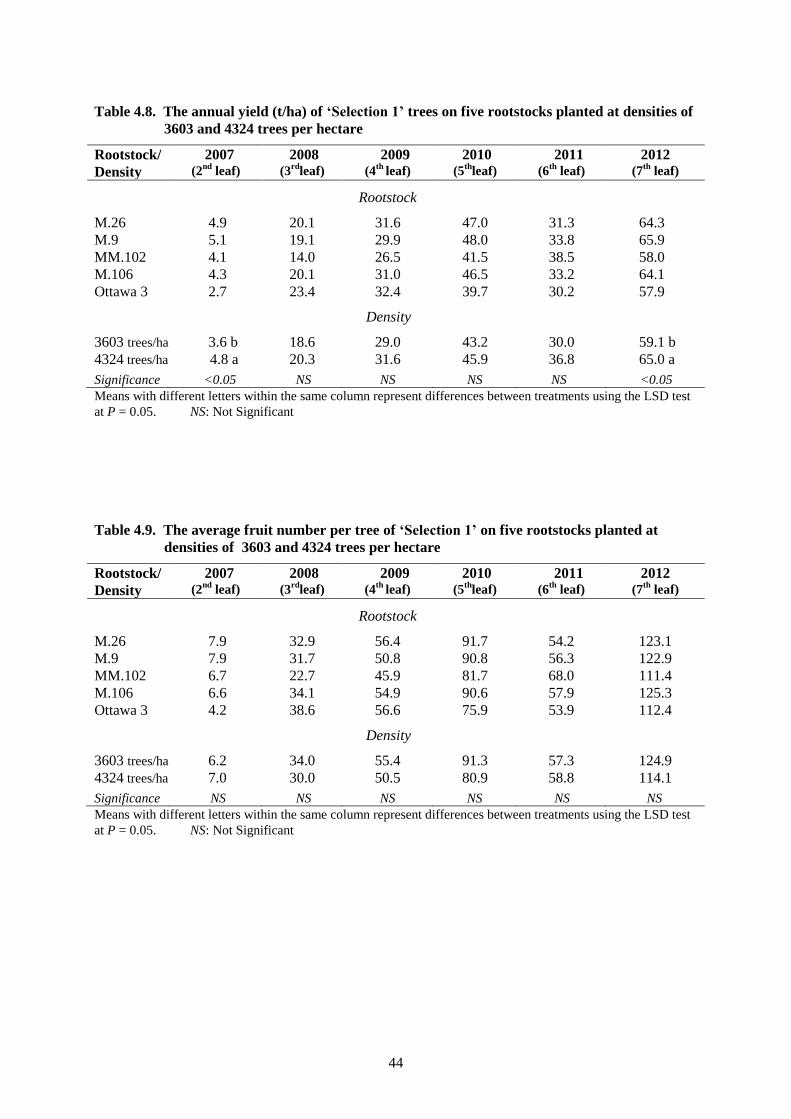
44
Table 4.8. The annual yield (t/ha) of ‘Selection 1’ trees on five rootstocks planted at densities of
3603 and 4324 trees per hectare
Rootstock/
Density
2007 (2
nd leaf)
2008 (3
rdleaf)
2009 (4
th leaf)
2010 (5
thleaf)
2011 (6
th leaf)
2012 (7
th leaf)
Rootstock
M.26
4.9
20.1
31.6
47.0
31.3
64.3
M.9 5.1 19.1 29.9 48.0 33.8 65.9
MM.102 4.1 14.0 26.5 41.5 38.5 58.0
M.106 4.3 20.1 31.0 46.5 33.2 64.1
Ottawa 3 2.7 23.4 32.4 39.7 30.2 57.9
Density
3603 trees/ha
3.6 b
18.6
29.0
43.2
30.0
59.1 b
4324 trees/ha 4.8 a 20.3 31.6 45.9 36.8 65.0 a
Significance <0.05 NS NS NS NS <0.05
Means with different letters within the same column represent differences between treatments using the LSD test
at P = 0.05. NS: Not Significant
Table 4.9. The average fruit number per tree of ‘Selection 1’ on five rootstocks planted at
densities of 3603 and 4324 trees per hectare
Rootstock/
Density
2007 (2
nd leaf)
2008 (3
rdleaf)
2009 (4
th leaf)
2010 (5
thleaf)
2011 (6
th leaf)
2012 (7
th leaf)
Rootstock
M.26
7.9
32.9
56.4
91.7
54.2
123.1
M.9 7.9 31.7 50.8 90.8 56.3 122.9
MM.102 6.7 22.7 45.9 81.7 68.0 111.4
M.106 6.6 34.1 54.9 90.6 57.9 125.3
Ottawa 3 4.2 38.6 56.6 75.9 53.9 112.4
Density
3603 trees/ha
6.2
34.0
55.4
91.3
57.3
124.9
4324 trees/ha 7.0 30.0 50.5 80.9 58.8 114.1
Significance NS NS NS NS NS NS
Means with different letters within the same column represent differences between treatments using the LSD test
at P = 0.05. NS: Not Significant

45
Table 4.10. The average fruit weight (g) of ‘Selection 1’ apples produced by trees on five
rootstocks planted at densities of 3603 and 4324 trees per hectare
Rootstock/
Density
2007 (2
nd leaf)
2008 (3
rdleaf)
2009 (4
th leaf)
2010 (5
thleaf)
2011 (6
th leaf)
2012 (7
th leaf)
Rootstock
M.26
155
157
143
134
147
132
M.9 166 161 149 134 153 136
MM.102 154 158 147 129 144 133
M.106 161 149 144 130 149 129
Ottawa 3 165 155 146 135 144 131
Density
3603 trees/ha
162
154
146
132
148
133
4324 trees/ha 158 159 145 133 147 132
Significance NS NS NS NS NS NS
Means with different letters within the same column represent differences between treatments using the LSD test
at P = 0.05. NS: Not Significant
Table 4.11. The cumulative yield (t/ha) of ‘Selection 1’ trees on five rootstocks planted at
densities of 3603 and 4324 trees per hectare
Rootstock/
Density
2007 (2
nd leaf)
2008 (3
rdleaf)
2009 (4
th leaf)
2010 (5
thleaf)
2011 (6
th leaf)
2012 (7
th leaf)
Rootstock
M.26
4.9
25.0
56.6
103.5
134.8
199.1
M.9 5.1 25.0 54.9 102.8 136.6 202.6
MM.102 4.1 18.1 44.7 86.1 124.7 182.7
M.106 4.3 24.3 55.4 101.8 135.1 199.2
Ottawa 3 2.7 26.1 58.4 98.2 128.4 186.3
Density
3603 trees/ha
3.6 b
22.3
51.3
94.5
124.5 b
183.6 b
4324 trees/ha 4.8 a 25.1 56.7 102.6 139.3 a 204.3 a
Significance <0.05 NS NS NS <0.05 <0.05
Means with different letters within the same column represent differences between treatments using the LSD test
at P = 0.05. NS: Not Significant

46
Table 4.12. The mean % first grade, second grade and reject apples of ‘Selection 1’ produced
from trees on five rootstocks planted at densities of 3603 and 4324 trees per hectare
Rootstock 2007 (2nd
leaf) 2008 (3
rdleaf)
2009 (4
th leaf)
2010 (5
thleaf)
2011 (6
th leaf)
2012 (7
th leaf)
*First grade fruit (%)
M.26
93.0 bc
92.7
93.1
85.8
95.4
87.8
M.9 97.3 ab 91.7 90.9 88.2 97.6 91.5
MM.102 97.7 ab 95.6 88.4 81.6 93.9 87.8
MM.106 92.1 c 93.3 91.4 82.1 95.2 83.9
Ottawa 3 99.1 a 91.3 90.4 86.2 93.2 86.3
Significance
<0.05
NS
NS
NS
NS
NS
**Second grade fruit (%)
M.26
4.3
5.1
6.3
10.8
3.7
9.9
M.9 1.8 5.8 8.1 8.4 2.0 6.9
MM.102 2.1 3.3 9.4 12.3 5.1 9.8
MM.106 7.4 5.2 7.8 12.7 3.6 12.5
Ottawa 3 0.9 6.4 8.4 10.0 5.6 10.4
Significance
NS
NS
NS
NS
NS
NS
***Reject fruit (%)
M.26
2.7
2.2
0.6
3.4
0.9
2.3
M.9 0.9 2.5 1.0 3.4 0.4 1.6
MM.102 0.2 1.1 2.2 6.1 1.0 2.4
MM.106 0.5 1.5 0.8 5.2 1.2 3.6
Ottawa 3 0.0 2.3 1.2 3.8 1.2 3.1
Significance
NS
NS
NS
NS
NS
NS
Means with different letters within the same column represent differences between treatments using the LSD test
at P = 0.05. NS: Not Significant
* First grade fruit % (by weight) apple weight ≥ 110 g and colour rating 3 on a 1-3 scale.
** Second grade fruit % (by weight) apple weight 95-109 g and/or colour rating 2 on a 1-3 scale.
*** Reject grade fruit % (by weight) apple weight < 95g and/or colour rating 1 on a 1-3 scale.
47
4.3.3 ‘Selection 1’ Experiment 3
With a short growing season relative to later maturing varieties such as „Kalei‟ and „Pink Lady‟TM
,
and as a genetically small to medium sized apple, it is important that the management of „Selection 1‟
trees maximises seasonal fruit size potential, and hence yield.
Fruitlet thinning of „Selection 1‟ apples should therefore occur as soon as practicable after
blossoming. An experiment commenced in spring 2011 using trees from experiment 2 on MM.106,
MM.102, M.26, M.9 and Ottawa 3 rootstocks, to study the effect of the time of hand thinning of
„Selection 1‟ trees on average fruit weight, packout, return bloom and biennial bearing.
As per the Materials and Methods (Chapter 2), „Selection 1‟ trees were hand thinned at either 5, 6½, 8
or 9½ weeks after full bloom to projected crop loads equivalent to 60 t/ha at harvest in March 2012.
The timing of thinning between 5 and 9½ weeks after full bloom (wafb) had a significant impact on
the average fruit weight and the proportion of first grade fruit at harvest in 2012 (Fig 4.1). Thinning at
9½ wafb reduced average fruit weight by 10 g relative to thinning at 5 wafb. In addition, thinning at
9½ wafb reduced the average packout of first grade fruit from the 92% achieved by thinning 5 wafb,
down to 83%, primarily through the increased production of smaller apples. Each week that thinning
was delayed, saw a steady decline in the average fruit weights and first grade packouts at harvest (Fig
4.1).
The effect of timing of thinning on the return bloom and biennial bearing of „Selection 1‟ trees in this
experiment won‟t be known until 2012-13, however the importance of thinning „Selection 1‟ trees as
early as possible in spring is already evident.
One issue with „Selection 1‟ is that it is common for flower clusters, particularly those arising from
spurs, to set six or seven fruit. If hand thinning is delayed much beyond 5-6 wafb, the short stalk of
„Selection 1‟ makes it very difficult to thin these clusters without either accidentally removing all the
fruitlets, or bruising or damaging the fruitlets that are retained. This is not a problem with „Selection
1‟ fruit that are borne on terminal buds.
The growth pattern of „Selection 1‟ apples was consistent between seasons, as shown in Fig 4.2 (a-c)
for fruit harvested in 2008, 2009 and 2010 from trees on M.26, MM.106 and M.9 rootstocks. In spring
2009, the full bloom of „Selection 1‟ trees was two weeks earlier than in 2008 (refer to dates of 0 mm
fruit diameter in Fig 4.2 a-c). Hence the apples in 2009-10 were consistently larger than at the same
calendar date in 2008-09, particularly in the early part of the season. By the time of harvest in March,
the fruit size differences between years were minimal.
The relationship between fruit diameter and fruit weight was almost identical for all three rootstocks
(Fig 4.2 d-f). A target fruit weight of 150 g per apple consistently equated to 70 mm diameter (Fig 4.2
d-f). Unlike „Kalei‟ and „Selection 3‟ (Chapter 6), many apples of „Selection 1‟ did not achieve the
desired fruit size. The data for „Selection 1‟ in Fig 4.2 provides a good starting point from which to
develop predictive fruit growth curves for use by orchardists in managing „Selection 1‟ trees. This
requires defining target fruit diameters to aim for at different times during the growing season (eg. 40
mm at 10 weeks afb) that will ensure a defined fruit size is achieved at harvest.
Artificial Spur Extinction (ASE) using Centrifugal Training as described by Tustin et al. (2011), is a
tree management tool with potential to increase „Selection 1‟ fruit size, through early season
regulation of bud density and the floral bud types allowed to produce fruit in the tree. ASE, pruning
strategy and the timing of thinning provide three future options to explore in improving the yields and
fruit size of „Selection 1‟.
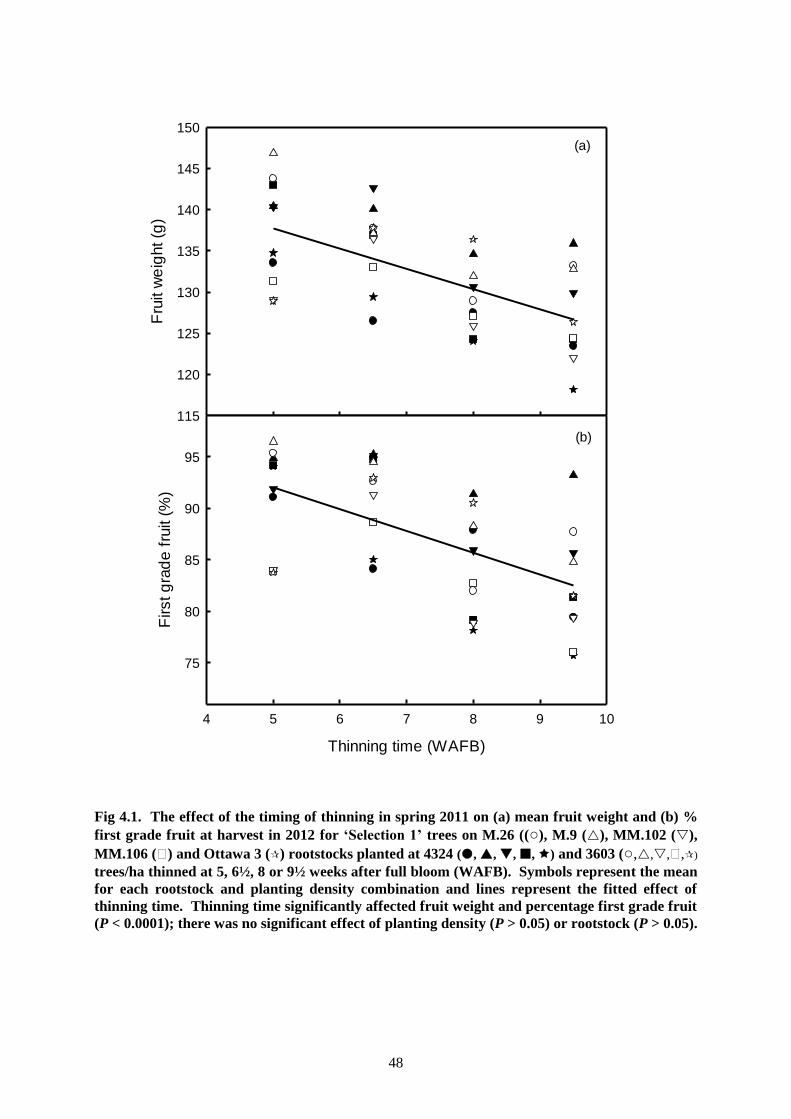
48
Fru
it w
eig
ht (g
)
115
120
125
130
135
140
145
150
Thinning time (WAFB)
4 5 6 7 8 9 10
First g
rad
e f
ruit (
%)
75
80
85
90
95
(a)
(b)
Fig 4.1. The effect of the timing of thinning in spring 2011 on (a) mean fruit weight and (b) %
first grade fruit at harvest in 2012 for ‘Selection 1’ trees on M.26 ((○), M.9 (), MM.102 (),
MM.106 () and Ottawa 3 () rootstocks planted at 4324 (, , , , ) and 3603 (○,,,,)
trees/ha thinned at 5, 6½, 8 or 9½ weeks after full bloom (WAFB). Symbols represent the mean
for each rootstock and planting density combination and lines represent the fitted effect of
thinning time. Thinning time significantly affected fruit weight and percentage first grade fruit
(P < 0.0001); there was no significant effect of planting density (P > 0.05) or rootstock (P > 0.05).

49
0
20
40
60
80
Fru
it d
iam
ete
r (m
m)
0
20
40
60
80
Date
Sep Oct Nov Dec Jan Feb Mar Apr
0
20
40
60
80
(a) M.26
(b) MM.106
(c) M.9
100
150
200
250
Fru
it w
eig
ht (g
)
100
150
200
250
Fruit diameter (mm)
60 65 70 75 80
100
150
200
250
(d) M.26
(e) MM.106
(f) M.9
Fig 4.2. (a-c) The seasonal increase in fruit diameter of ‘Selection 1’ apples in 2007-08 (●),
2008-09 (○) and 2009-10 (); and (d-f) the relationship between fruit diameter and fruit weight
for (a,d) M.26, (b,e) MM.106 and (c,f) M.9 rootstocks. Symbols represent collected data and
lines represent predictions from non-linear regression analysis for the increase in fruit diameter
across the season (a-c); and from linear regression analysis (log transformed axes) for the
relationship between fruit diameter and fruit weight (d-f).

50
4.4 Conclusions
Trees of „Selection 1‟ are of medium vigour and well-adapted to high density planting systems. They
produce exceptionally high packouts of first grade fruit, even within relatively shaded parts of the tree
canopy.
„Selection 1‟ has rated very highly in consumer evaluations in Brisbane (project AP08041). Apple
growers attending farm walks at the orchard site in this project have also been enthusiastic about
„Selection 1‟ after seeing the cropping trees and tasting the fruit. „Selection 1‟ has particular potential
as an organic scab-resistant „Gala‟ style of apple.
A Plant Breeder‟s Rights application for Australian PBR protection of „Selection 1‟ is currently being
prepared, and „Selection 1‟ will be the second scab-resistant apple to be released from the DAFF, Qld
breeding program.
„Selection 1‟ is a small, sweet apple well suited to children‟s lunchboxes, yet still has the capacity to
be a larger apple if trees are appropriately managed. Future work with „Selection 1‟ should consider
the use of Artificial Spur Extinction as a strategy to increase the fruit size, and hence yield, of this
selection.

51
5. The light interception of intensive orchard systems for ‘Kalei’
and ‘Selection 1’
5.1 Introduction
Sunlight intercepted by leaves provides the energy to drive the process of photosynthesis. The light
used by plants in photosynthesis is also known as PAR (photosynthetically active radiation) and is of
wavelengths 400-700 nm.
Without the capture of this sunlight, trees cannot manufacture the carbohydrates and food required to
produce high yields of good size, well-coloured, high quality apples.
Apple orchard yields increase as light interception increases (Jackson 1978), however a level of light
interception can be reached beyond which the leaf area index (LAI) is excessively high and leads to
reduced orchard productivity (Jackson 1980). This occurs when the tree canopy becomes too dense,
and/or excessive tree spread and height lead to severe shading effects, with subsequent declines in
yield and fruit quality. Poor tree pruning strategies and/or the inappropriate choice of rootstock for the
planting density used are common causes of this.
Middleton et al. (2002) demonstrated that in all apple-producing regions of Australia, apple orchard
system design for highest yields and fruit quality should aim for 60% diurnal (daily) light
interception, with leaf area index (LAI) close to 2.0. When LAI increased significantly beyond 2.0
there was greater potential for reduced orchard productivity, particularly through poor fruit colour
development and fruit size. When LAI was significantly lower than 2.0, there was insufficient tree
canopy volume to capture the available sunlight and maximise orchard yield potential.
Leaf area index is calculated as m2 leaf/m
2 orchard floor surface area. For example, an orchard system
planted at a density of 2500 trees/hectare (4 m2 orchard floor/tree) and consisting of trees with an
average leaf area of 10 m2 /tree, has an LAI of 2.50 (10/4).
Trunk cross-sectional area (TCSA) is commonly used as an indicator of apple tree size (Perry, 1997;
Marini, 2002), as it is quick and easy to measure. Leaf Area Index (LAI), however, gives a more
accurate representation of tree size and vigour, especially on young trees (Palmer, 1987).
Unfortunately, the total leaf area of trees can be very time-consuming and tedious to calculate.
Nevertheless, the LAI of „Kalei‟ and „Selection 1‟ trees has been measured to accurately quantify
their canopy size, and as a reference to understand and further improve the productivity of these two
new apple varieties.
5.2 Materials and Methods
The light interception and LAI of all the high density planting systems for „Kalei‟ and „Selection 1‟ in
this project (Chapters 3 and 4) were measured during summer 2012. This was done to (a) determine
how closely these systems approached 60% light interception and LAI 2.0, and (b) provide a guide as
to whether the productivity of these systems could be further improved through modifications in tree
management to optimise light interception and LAI.
Light interception (PAR) was measured with an AccuPAR linear ceptometer (model SF-80, Decagon
Devices, Pullman, USA), using a procedure as described by Wünsche et al. (1995). The
measurements were completed in January - February 2012, under clear sky conditions. At this time in
mid-summer, the trees were at their maximum seasonal canopy development.

52
During the course of a day the sun moves in an arc across the sky, leading to changes in canopy light
interception between sunrise and sunset. For each orchard system, measurements of light interception
were therefore made at up to five times throughout a day (solar noon; mid morning and/or mid
afternoon; early morning and/or late afternoon).
To avoid interference from adjacent orchard systems, the earliest in the morning or latest in the
afternoon that measurements could be taken was determined by the earliest/latest time in the day that
the shadows from the tree canopies of neighbouring orchard systems were not impinging on each
other. This meant that measurements of light interception were made at intervals of 1.5 and 3 hours
either side of solar noon, which at Applethorpe equated to 9:05am, 10:35am, 12:05pm (solar noon),
1:35pm and 3:05pm.
The ceptometer consisted of an 80 cm long probe to measure sunlight (PAR) received along this
length when the instrument was positioned above or beneath the tree canopy. With an alley width of
four metres and a probe length of 80 cm, five transects of measurements parallel to the tree row were
required to fully sample the orchard floor area beneath the trees and across the alleyway of each
rootstock x tree density combination for the standard Vertical Axis systems. Six parallel transects
were needed to adequately sample the orchard floor beneath the open V-trellis plantings (Plate 5.1).
Plate 5.1. The measurement of light levels beneath ‘Kalei’ trees trained to an open V-trellis

53
Ceptometer readings were taken at a height of 10 cm above the orchard floor. For the Vertical Axis
systems, each transect of ceptometer readings extended along the row for two to three trees per
orchard system, and for up to six trees per orchard system for the open V-trellis systems. This
corresponded to 9 measurements along the tree row for each of the five or six parallel transects.
Therefore at each measurement time, either 45 (Vertical Axis) or 54 (open V-trellis) separate
ceptometer readings were taken beneath each orchard system.
Percentage light interception from these measurements was calculated in relation to above canopy
readings taken immediately before and after each set of orchard floor measurements.
Light interception was always measured under sunny, clear skies to allow direct comparison of the
light interception of the different planting systems. Variable sunlight conditions due to intermittent
cloud cover can severely confound measurements, and such conditions had to therefore be avoided.
For example, above canopy PAR levels in the middle of the day in mid-summer exceeded 2000 mol
m-2
s-1
, but could decline to less than 200 mol m-2
s-1
under heavy cloud cover.
The leaf area index (LAI) of each orchard system was calculated from leaf counts and average
individual leaf areas (cm2). All of the leaves on at least two trees per plot were counted. Spur leaves
and shoot leaves were counted separately. Individual leaf areas were measured non-destructively in
the field with a perspex grid as described by Freeman and Bolas (1956), using a random sample of up
to thirty spurs per tree for spur leaves, and fifteen extension shoots per tree for shoot leaves.
The individual leaf areas estimated from the grid were highly correlated (r2 > 0.90) with measures of
leaf areas made in the laboratory with a Licor LI-3000 leaf area meter (Licor Instrument Co., Lincoln,
Nebraska, USA).
LAI was calculated as m2 leaf per tree/m
2 orchard floor surface area per tree.
5.3 Results and Discussion
5.3.1 The light interception and LAI of ‘Kalei’ orchard systems
The mid-summer light interception of high density orchard systems for „Kalei‟ (Table 5.1) shows that
12 of the 17 systems intercepted close to or above the target of 60% diurnal light interception. The
five systems not to attain this level of light interception were the lower density trees (1666 and 2000
trees/ha) on M.26 rootstock in experiment 1; the lower vigour trees on M.9 and MM.102 rootstocks in
experiment 2; and the trees on M.26 rootstock planted at 2500 trees/ha in experiment 3.
The LAI of these five systems was also the lowest (Table 5.2). The „Kalei‟ trees planted at 1666 and
2000 trees/ha on M.26 rootstock in experiment 1 had LAI well short of the target 2.0 minimum. At
LAIs of 1.63 and 1.32 respectively, the diurnal light interception of these two systems was just 47-
48% (Table 5.1). Similarly, the LAI of 1.90 and diurnal light interception of 49% for trees on M.26
rootstock at 2500 trees/ha (experiment 3) was too low to achieve maximum potential productivity.
Although the LAIs of the 8th leaf trees on MM.102 (LAI 2.13) and M.9 (LAI 2.50) rootstocks in
experiment 2 were above 2.0 (Table 5.2), the diurnal light interception of these two systems was only
48-51% (Table 5.1). This suggests there is capacity to improve the productivity of these systems
through tree management to increase LAI eg. removal of less wood in pruning.
The light interception of all systems was lowest at solar noon, steadily increased towards mid-
morning/mid-afternoon, and was highest in early morning/late afternoon (Table 5.1). This trend was

54
to be expected. At solar noon, the sun is at its highest elevation in the sky and sunlight passes from
above the trees almost vertically through their canopies, with the alleyways receiving full sunlight.
Light interception at solar noon is very clearly defined by canopy dimensions and leaf area.
Under clear sky conditions, the light interception by orchard systems is highest early and late in the
day, as the trees cast long shadows due to low solar elevation and azimuth. There is relatively little
difference in the light interception of orchard systems at this time. As the sun tracks higher in the sky,
cast shadows shorten, light interception declines and the light interception of different systems
becomes increasingly determined by tree vigour, leaf area and tree dimensions.
The highest diurnal light interception of 68.9% was measured for vigorous „Kalei‟ trees on MM.106
rootstock planted at 1428 trees/ha in experiment 1 (Table 5.1). The yields produced by this system
averaged 100 t/ha/annum across their 9th and 10
th leaf in 2011 and 2012 (Chapter 3, Fig 3.1), however
the 80% packout of first grade fruit in 2012 (Chapter 3, Fig 3.5) was significantly lower than that of
the other systems in that experiment.
The LAI of 3.23 (Table 5.2) for the MM.106 1428 trees/ha system was becoming too high, and
internal shading was starting to impact on fruit colour. Although the proportion of reject fruit
harvested from this system in 2012 was still low (5%), the 15% production of second grade fruit
suggested that a further increase in LAI above 3.23 would significantly increase the proportion of
poorer quality apples.
„Kalei‟ trees on M.26 rootstock at 2500 trees/ha and trained as a Vertical Axis yielded 80 t/ha in 2012
in all three experiments (refer Chapter 3). In both experiments 1 and 2, this system intercepted 60-
63% of diurnal sunlight, with LAI of 2.89 (experiment 1) and 3.32 (experiment 2). In experiment 3,
this system had a low LAI < 2.0 (Table 5.2) and only intercepted 49% of diurnal sunlight (Table 5.1),
yet still produced 80 t/ha in 2012. A further yield increase from these trees could be expected if their
LAI was higher.
The „Kalei‟ trees in experiment 2 were very well-structured. They had a well-defined central leader,
distinct gaps between the trees at heights above 2.0 m, and a Christmas tree shape. These
characteristics ensured that adequate sunlight penetrated to all cropping zones of the trees. Bending of
limbs and shoots to well below horizontal is an effective technique to control shoot growth and
encourage the development of fruiting spurs (Österreicher, 2004), and this strategy of tree
management was adopted with discipline in experiment 2.
As a consequence of such close attention to tree management and training, the light interception of
„Kalei‟ trees on M.26 and MM.106 rootstocks in experiment 2 was close to optimum at 59-60%
(Table 5.1), yet was achieved with LAIs that exceeded 3.0 (Table 5.2). Such high LAIs were possible
without reducing tree productivity, because a large proportion of the canopy leaf area of these trees
was comprised of spur leaves (72% for MM.106 and 87% for M.26), rather than shoot leaves (Table
5.2), the latter indicative of upright vigorous growth producing shade. This demonstrated the success
of limb bending to calm tree growth, even on semi-vigorous MM.106 rootstock.
In experiment 1, where less attention had been paid to branch bending, the ratio of shoot leaf area to
spur leaf area was closer to 50:50 for most systems (Table 5.2). This was desirable for the two
systems on M.26 rootstock at 1666 and 2000 trees/ha, where trees are now being managed to increase
their LAI above 2.0.
The average height of all trees in the block was reasonably consistent between systems (Table 5.2),
and to a large extent was defined by the height of the hail netting (4.8 m). Trees on M.26 rootstock
tended to be shorter, and required less work to maintain at a 4.0 m height than trees on MM.106
rootstock. The latter frequently grew to the height of the hail netting, and required some judicious
pruning in summer to keep the tree tops out of the netting.

55
The four highly productive V-trellis systems (experiment 3) all intercepted 61-65% of diurnal sunlight
(Table 5.1), and had LAIs between 2.70 and 3.60 (Table 5.2). As in experiment 2, the high
productivity of the V-trellis systems can be attributed to their well-defined tree structure and the
excellent control of vigour. The shoot leaves only contributed 10-28% of the total leaf area of the
trees in these systems (Table 5.2), demonstrating the success of the late spring/early summer pruning
strategy used since 2010 to manage these trees.
At solar noon, the light interception of the open V-trellis systems was consistently higher than all
systems planted as single-rows, with the exception of the very vigorous trees in experiment 1 on
MM.106 rootstock at 1428 trees/ha (Table 5.1). Compared to single-row systems, the angle of trees
positioned in the open V-trellis systems permits a broader spread of tree canopy, and hence leaf area,
across a greater orchard floor area. Provided tree vigour is adequately controlled and a narrow canopy
depth is maintained, this produces a dispersed canopy that can accommodate a higher LAI than single-
row systems, thereby facilitating high light interception and the production of large tonnages of first
grade fruit.
Table 5.1. The light interception in Jan-Feb 2012 (mid-summer) of 16 orchard systems
for ‘Kalei’ at Applethorpe, Qld (28° 37’S)
% Light Interception (LI)
Rootstock Density Early AM/ Mid AM/ Solar *Diurnal
(trees/ha) Late PM Mid PM Noon % LI
Experiment 1 (10th
leaf)
M.26 1666 58.9 46.1 31.2 48.2
M.26 2000 62.0 45.4 22.4 47.4
M.26 2500 73.1 61.8 43.7 62.7
M.26 5000 77.3 66.2 40.3 65.4
MM.106 1428 79.0 67.6 51.0 68.9
MM.106 1666 74.9 60.2 44.8 63.0
Experiment 2 (8th
leaf)
M.9 2500 64.7 38.7 32.4 47.8
MM.102 2500 62.2 46.8 37.7 51.1
M.26 2500 79.2 51.5 40.0 60.3
MM.106 2500 76.5 50.1 41.3 58.9
Experiment 3 (8th
leaf)
M.26 2500 67.6 40.2 30.4 49.2
MM.106 2500 70.2 52.8 43.6 57.9
M.26 4444 V 72.7 56.5 49.2 61.5
MM.106 3555 V 76.1 57.6 50.7 63.6
MM.106 4444 V 78.3 62.1 45.7 65.3
MM.106 5925 V 75.7 56.9 58.5 64.7
* Diurnal light interception was measured between 9:05am and 3:05pm (central 6 hours of the day).
- Light interception was measured at 9:05am (Early AM); 10:35am (Mid AM); 12:05pm (Solar Noon);
1:35pm (Mid PM) and 3:05pm (Late PM).
- % Light interception for Early AM/Late PM was the mean of 9:05am & 3:05pm readings.
- % Light interception for Mid AM/Mid PM was the mean of 10:35am & 1:35pm readings.

56
Table 5.2. The leaf area per tree, tree height and leaf area index (LAI) in March 2012 of 16
orchard systems for ‘Kalei’ at Applethorpe, Qld (28° 37’S)
Rootstock Density Leaf Area/Tree (m2) % Shoot Tree Height LAI
(trees/ha) Spur Shoot Total Leaf* (m)
Experiment 1 (10th
leaf)
M.26 1666 4.8 5.0 9.8 51.0 4.0 1.63
M.26 2000 3.3 3.3 6.6 50.0 3.6 1.32
M.26 2500 7.9 3.6 11.5 31.0 3.8 2.89
M.26 5000 2.2 2.1 4.3 48.8 4.1 2.13
MM.106 1428 11.7 10.9 22.6 48.2 4.7 3.23
MM.106 1666 11.4 8.3 19.7 42.1 4.6 3.28
Experiment 2 (8th
leaf)
M.9 2500 7.3 2.7 10.0 27.0 4.3 2.50
MM.102 2500 6.0 3.3 9.3 35.5 4.2 2.13
M.26 2500 12.0 1.8 13.8 13.0 4.5 3.32
MM.106 2500 9.7 3.8 13.5 28.1 4.6 3.37
Experiment 3 (8th
leaf)
M.26 2500 5.4 2.0 7.4 27.0 4.4 1.90
MM.106 2500 9.0 3.9 12.9 30.2 4.6 3.20
M.26 4444 V 4.7 1.8 6.5 27.7 4.0 2.90
MM.106 3555 V 9.0 1.0 10.0 10.0 4.5 3.60
MM.106 4444 V 5.2 0.9 6.1 14.8 4.4 2.70
MM.106 5925 V 4.7 0.6 5.3 11.3 4.5 3.10
* The percentage of the total leaf area per tree that consisted of shoot leaves

57
5.3.2 The light interception and LAI of ‘Selection 1’ orchard systems
The light interception of „Selection 1‟ trees in their 7th leaf (Table 5.3) tended to be lower than for the
„Kalei‟ trees. This was not surprising, as trees of „Selection 1‟ are of relatively medium vigour. In
addition, the „Selection 1‟ trees were also one to three years younger than the „Kalei‟ trees.
Despite planting densities of 2702, 3603 and 4324 trees/ha, and rootstocks of vigour from semi-
vigorous (MM.106) to dwarfing (M.9), the light interception of all 15 systems for „Selection 1‟ was
very similar, and ranged from 45-57%. This reflected the uniformity of the block of trees, and the
attention paid to branch bending and crop load manipulation across all systems.
The light interception of all systems was strongly determined by their LAI. Trees on MM.102
rootstock were of lowest LAI (Table 5.4) and intercepted 45-49% of diurnal sunlight. The highest
light interception was by trees on Ottawa 3 (51-57%) and MM.106 (52-55%) rootstocks; with LAIs of
2.53-2.72 (Ottawa 3) and 2.26-2.53 (MM.106). The light interception by trees on M.9 rootstock at
2702 and 4324 trees/ha was also in this higher range (Table 5.3), as was their LAI (Table 5.4).
By their 7th leaf, no systems had yet reached the desired level of 60% light interception. It is likely
that most systems will do so in their 8th leaf in 2013. This also indicates the potential for the
„Selection 1‟ trees to further increase their yields over the 2012 levels of 57-63 t/ha (Chapter 4, Table
4.1).
Although in many cases the LAIs of the different systems appear high (Table 5.4), the close attention
paid to tree training has produced calm trees and meant that reject fruit have comprised < 5% of the
annual tonnages of apples produced (Chapter 4, Table 4.5). „Selection 1‟ is a small to medium sized
apple, and downgrading of fruit to reject or second grade standard was primarily due to small size. As
for „Kalei‟, the well-defined canopies of the „Selection 1‟ trees permitted good light penetration
throughout the trees, and very few fruit were of poor colour.
There is therefore significant potential for the yield of these trees to increase in the future as the
canopies are allowed to more fully develop and intercept more sunlight. The contribution of the shoot
leaf canopy to the total leaf area of the „Selection 1‟ trees in 2012 was generally low (Table 5.4), and
the majority of the canopies were made up of spur leaves feeding developing fruit and buds. These
younger spurs will contribute more significantly to yield as they age in the next one to two years. At
3.8 - 4.6 m high (Table 5.4), the trees will be maintained at or below their current height.
The incident sunlight (PAR) levels recorded above the hail netting during the middle of the day in
January were consistently 2100–2200 µmol m-2
s-1
. The reduction in sunlight levels caused by hail
netting saw the incident PAR reaching the trees reduced to 1800-1900 µmol m-2
s-1
. This is still
significantly higher than the incident sunlight levels occurring in mid-summer in many other apple
growing regions of the world.
Hailstorms are an annual occurrence on the Granite Belt, so the hail netting of apple orchards is
essential. Provided tree vigour is controlled, the more moderate environment beneath hail netting has
the potential to improve fruit quality and tree productivity over unprotected trees (Middleton and
McWaters, 2002). Hail netting can also reduce fruit set (Middleton and McWaters, 2002) and can be
beneficial in reducing the need for thinning. Hives of honeybees must be brought into netted orchards
to ensure adequate pollination of flowers. It should be cautioned that excessive fruitlet shedding may
occur on over-vigorous trees under hail netting, due to shading effects on bud strength.

58
Table 5.3. The light interception in Jan-Feb 2012 (mid-summer) of 15 orchard systems
for ‘Selection 1’ (7th
leaf) at Applethorpe, Qld (28° 37’S)
% Light Interception (LI)
Rootstock Density Early AM/ Mid AM/ Solar *Diurnal
(trees/ha) Late PM Mid PM Noon % LI
MM.102 2702 66.8 36.5 37.8 48.9
3603 61.7 35.7 28.7 44.7
4324 60.2 39.3 29.9 45.8
M.9 2702 68.1 45.3 34.1 52.2
3603 70.5 36.7 29.3 48.8
4324 74.7 52.4 27.2 56.3
M.26 2702 70.7 45.6 32.4 53.0
3603 74.1 37.7 34.3 51.6
4324 62.0 36.3 39.0 47.1
Ottawa 3 2702 74.6 40.8 31.7 52.5
3603 70.8 37.0 36.6 50.5
4324 73.6 54.3 28.6 56.9
MM.106 2702 77.0 44.1 32.5 54.9
3603 70.1 39.6 38.2 51.5
4324 70.0 46.3 33.8 53.3
* Diurnal light interception was measured between 9:05am and 3:05pm (central 6 hours of the day).
- Light interception was measured at 9:05am (Early AM); 10:35am (Mid AM); 12:05pm (Solar Noon);
1:35pm (Mid PM) and 3:05pm (Late PM).
- % Light interception for Early AM/Late PM was the mean of 9:05am & 3:05pm readings.
- % Light interception for Mid AM/Mid PM was the mean of 10:35am & 1:35pm readings.

59
Table 5.4. The leaf area per tree, tree height and leaf area index (LAI) in March 2012 of 15
orchard systems for ‘Selection 1’ (7th leaf) at Applethorpe, Qld (28° 37’S)
Rootstock Density Leaf Area/Tree (m2) % Shoot Tree Height LAI
(trees/ha) Spur Shoot Total Leaf* (m)
MM.102 2702 5.1 3.3 8.4 39.3 4.0 2.26
MM.102 3603 3.6 1.3 4.9 27.1 3.8 1.74
MM.102 4324 3.0 1.0 3.9 25.6 4.0 1.70
M.9 2702 6.0 4.4 10.4 42.3 4.2 2.82
M.9 3603 3.8 2.6 6.4 40.6 4.0 2.29
M.9 4324 4.1 2.2 6.3 35.0 4.1 2.70
M.26 2702 4.7 4.2 8.9 47.2 4.1 2.39
M.26 3603 5.1 2.3 7.4 31.1 4.4 2.65
M.26 4324 3.8 1.5 5.3 28.3 4.1 2.30
Ottawa 3 2702 4.6 4.7 9.3 50.5 4.5 2.53
Ottawa 3 3603 5.2 2.4 7.6 32.0 4.3 2.72
Ottawa 3 4324 4.4 1.8 6.2 29.0 4.0 2.68
MM.106 2702 5.9 3.4 9.3 36.6 4.6 2.51
MM.106 3603 4.8 2.2 7.0 31.4 4.1 2.53
MM.106 4324 3.3 1.9 5.2 36.5 4.6 2.26
* The percentage of the total leaf area per tree that consisted of shoot leaves
5.4 Conclusions
Apple orchard light interception and distribution are the keys to high orchard system productivity.
The most productive systems for „Kalei‟ and „Selection 1‟ consistently intercepted at or near 60% of
diurnal sunlight in mid-summer. The high productivity of these systems was achieved through close
attention to tree training and the maintenance of a well-defined tree structure, brought about by
branch bending and tying.
The LAI of many of these systems was well above 2.0. The high LAI of such systems did not reduce
yield and fruit quality, as the bulk of the contribution to canopy LAI came from spur leaf clusters,
rather than from leaves on upright vigorous shoots.
Measurements of the light interception and LAI of high density planting systems for „Kalei‟ and
„Selection 1‟ have provided the conceptual framework for the future management of these new scab-
resistant apple varieties to maximise their potential productivity.

60
6. The productivity and performance of ‘Selection 3’ in high
density planting systems
6.1 Introduction
„Selection 3‟ (Plate 6.1) is a large to very large, red-purple apple with a 90-100% solid block
foreground colour over a yellow green background. It has a broken dark red stripe and small,
prominent lenticels. The red over-colour darkens as fruit remain longer on the tree. It is a medium
textured, sweet apple of flat round to round shape. Flesh is white to off-white, has a medium-coarse
texture and a sweet, low acid flavour.
At ARS, „Selection 3‟ is consistently harvested in mid to late April, just prior to „Pink Lady‟TM
. Trees
are vigorous, set heavy crops of large fruit and can be strip-picked in most years.
Plate 6.1. ‘Selection 3’ scab-resistant apple
6.2 Materials and Methods
A high density planting systems trial for „Selection 3‟ was planted at ARS in October 2003 as a
randomised block design. The trial included the following rootstock x spacing treatments (four
replicates x six trees per replicate): MM.106 rootstock at 4.0 m x 1.5 m (1666 trees/ha), 4.0 m x 1.25
m (2000 trees/ha) and 4.0 m x 1.0 m (2500 trees/ha); M.26 rootstock at 4.0 m x 1.25 m (2000
trees/ha), 4.0 m x 1.0 m (2500 trees/ha), 4.0 m x 0.75 m (3333 trees/ha) and 4.0 m x 0.5 m (5000
trees/ha); and Ottawa 3 rootstock at 4.0 m x 1.0 m (2500 trees/ha). The trees were trained as a
Vertical Axis to a 6-wire trellis, and were in their 9th leaf in 2011/12. Trees planted at 5000 trees/ha
were trained as tall Slender Spindles, with long laterals removed to prevent over-crowding between
trees.

61
Annual measurements of yield, fruit quality and TCSA (winter) were made on all trees as per the
„Materials and Methods‟ page 10. At harvest, apples were graded in the field as either marketable
(full colour development, size ≥ 120 g) or reject (failing to meet either of these standards).
Linear mixed models fitted using asreml-R software were used to determine the effect of rootstock
and planting density treatment combinations (fixed effect) on yield and fruit quality data sets, with
block included as a random effect.
6.3 Results and Discussion
With the exception of trees on MM.106 rootstock planted at 1666 trees/ha, all systems for „Selection
3‟ yielded 40-60 t/ha/annum by their 4th leaf, and 55-85 t/ha/annum by their 6
th leaf (Fig 6.1 a). Trees
planted at 5000 trees/ha consistently yielded above 60 t/ha/annum from their 4th leaf onwards, peaking
at 140 t/ha in 2012 (9th leaf). By contrast, „Selection 3‟ trees on MM.106 rootstock at 1666 trees/ha,
the lowest planting density in this experiment, failed to produce an annual yield of 60 t/ha until their
9th leaf, when all six systems yielded close to or well above 100 t/ha (Fig 6.1 a).
There were significant differences in the crop load of trees in the six systems in most years (Fig 6.1
b), which was a reflection of the allotted orchard space (and hence canopy volume) available for each
tree at the different planting densities. For example, at 5000 trees/ha trees are restricted to an allotted
orchard space of 2 m2 (including alleyway) in which to grow, whereas at 2500 trees/ha there is double
this potential area (4 m2) in which the tree canopy can develop.
A standardised hand thinning strategy was used across all systems, where final crop load was
determined by tree canopy volume. Clusters setting fruit were thinned to singles or doubles, and
spaced to allow sufficient room for fruitlets to develop to full size. This ensured that each system was
cropped to maximum potential, and hence led to differences in individual tree crop loads.
The average fruit weight in all systems was consistently large (Fig 6.1 c), and the lack of significant
differences in average fruit weight between any of the systems in all years demonstrates the
consistency of the annual thinning strategy used. „Selection 3‟ apples were exceptionally large when
trees were in their 3rd
and 4th leaf (Fig 6.1 c 2006 and 2007), however in the subsequent dry years of
2008, 2009 and 2010 when trees were also irrigated less to reduce fruit size, the average fruit weights
were still high, and never fell below 200 g. Even when trees were cropped at upwards of 100 t/ha in
2012, the average fruit weights were still too high at 230 g to 250 g in all six systems (Fig 6.1 c).
Significant differences in the cumulative yields produced by the six systems began to occur from the
3rd
leaf (2006) onwards (Fig 6.2). By the time trees were in their 6th leaf in 2009, through to their 9
th
leaf in 2012, the relationship between cumulative yield and planting density was very strong, with
larger cumulative yields produced as planting density increased. In their 9th leaf, the cumulative yield
of „Selection 3‟ trees on M.26 rootstock planted at 5000 trees/ha had reached 520 t/ha (Fig 6.2),
exceeding M.26 at 3333 trees/ha (450 t/ha), MM.106 and M.26 at 2500 trees/ha (390 and 380 t/ha
respectively), M.26 at 2000 trees/ha (330 t/ha) and MM.106 at 1666 trees/ha (285 t/ha). All systems
planted at densities of 2500 trees/ha or above produced acceptably high tonnages of apples.
The marketable yields (% of total tonnage) produced by all systems were very high, and over 90% in
all years (Fig 6.3). This is not surprising, as „Selection 3‟ is a very highly coloured apple. Even in
densely shaded regions of the tree canopy, apples of „Selection 3‟ will usually develop their full,
intense red/purple colour. As a very large apple, very few „Selection 3‟ fruit were unmarketable due to
small size.
Significant differences in the trunk cross-sectional area (TCSA) of „Selection 3‟ trees were evident as
early as the completion of 2nd
leaf in winter 2006 (Fig 6.4). These differences in tree TCSA between

62
systems became greater in subsequent years, and were driven by both rootstock and planting density.
By the completion of 8th leaf in 2011, the TCSA of „Selection 3‟ trees on MM.106 rootstock was
clearly greater than for trees on M.26 rootstock (Fig 6.4).
Similarly, there was a planting density effect on TCSA, with TCSA highest for trees planted at the
lowest density (1666 trees/ha), and lowest for trees planted at the highest density (5000 trees/ha).
There was no difference in TCSA for trees on M.26 at the intermediate 2000, 2500 and 3333 trees/ha
densities (Fig 6.4). Although both factors influenced TCSA, the effect of rootstock on TCSA was
stronger than the effect of planting density. The higher TCSA of trees on MM.106 is to be expected as
this rootstock is significantly more vigorous than M.26.
TCSA is not always a good indicator of tree vigour, however in this experiment, it gave a true
indication of the comparative vigour of the „Selection 3‟ trees in all six planting systems, and is a
much quicker and easier measurement to make than alternative measures of vigour such as LAI.
The yield efficiency of „Selection 3‟ trees (Fig 6.5) peaked in 2007 (3rd
leaf) and 2012 (8th leaf) for all
rootstock x spacing combinations, and in 2008 (4th leaf) for trees on M.26 rootstock at 2500 and 3333
trees/ha. When yield efficiency is expressed as kg fruit/tree/cm2 TCSA, higher and higher tonnages of
fruit need to be produced each year, as the trees grow, to maintain yield efficiencies achieved when
trees are younger. Hence, yields of 100 t/ha and above were required in 2012 (8th leaf) to equate to
similar yield efficiencies in 2007 and 2008 (3rd
and 4th leaf) realised with harvests of 40-60 t/ha.
This demonstrates a deficiency in expressing yield efficiency in terms of TCSA as an index of tree
vigour. Unlike TCSA, which will keep increasing over the lifetime of a tree regardless of the level of
pruning and variations in the canopy volume from season to season, yield efficiency expressed in
terms of either light interception or leaf area is likely to provide a more accurate representation of the
yield potential and efficiency of an orchard system.
Nevertheless, yield efficiency in terms of TCSA is commonly measured (Costa et al., 1996; Sansavini
and Corelli-Grappadelli, 1996), and is certainly a valid means of comparing the productivity of
rootstocks. In 2006 (2nd
leaf), 2008 (4th leaf) and 2010 (6
th leaf), „Selection 3‟ trees on M.26 rootstock
had significantly higher yield efficiency than trees on MM.106 rootstock (Fig 6.5), demonstrating the
propensity of the more dwarfing M.26 rootstock to produce higher yields per unit leaf area/tree
volume than the more vigorous MM.106 rootstock.
The growth pattern of „Selection 3‟ apples was consistent between seasons, as shown in Fig 6.6 (a-b)
for fruit harvested in 2008, 2009 and 2010 from trees on M.26 and MM.106 rootstocks. 2007-08 was
wetter than the two subsequent seasons, and, with comparable crop loads at harvest in 2008 and 2010
(Fig 6.1), apples were larger in 2008 than 2010 (Fig 6.1; Fig 6.6). Despite the differences in weather
conditions, the seasonal pattern of increase in fruit diameter was almost identical. In all three seasons,
few apples harvested were smaller than 80 mm diameter.
Similarly, the relationship between fruit diameter and fruit weight was almost identical for both
rootstocks in 2008 and 2009 (Fig 6.6 c-d). A target fruit size of 70-75 mm diameter was achieved by
late February in all years (Fig 6.6). This was four to six weeks prior to harvest, and occurred despite
reduced water in 2009-10. With a high proportion of the apples harvested each year weighing 230-300
g, the high marketable yields (Fig 6.3) would be reduced by 20-30% across all systems if the
excessively large fruit were also included as rejects.

63
Yie
ld (
tonne
s/h
a)
0
20
40
60
80
100
120
140
160
(a)
Me
an f
ruit n
um
be
r p
er
tre
e
0
50
100
150
200
250
300
(b)
Year
2004 2006 2008 2010 2012
Me
an f
ruit w
eig
ht (g
)
200
220
240
260
280
300
320
(c)
Fig 6.1. (a) The yield (t/ha), (b) mean fruit number per tree and (c) mean fruit weight (g) of
‘Selection 3’ on M.26 rootstock planted at 2000 (), 2500 (), 3333 () and 5000 () trees/ha,
and on MM.106 rootstock at 1666 () and 2500 () trees/ha. ANOVA undertaken for each year
2005-2012 (2nd
to 9th
leaf) of the trial; vertical bars represent LSD’s for comparison between
treatments within years where there is a significant effect of treatment (P < 0.05).
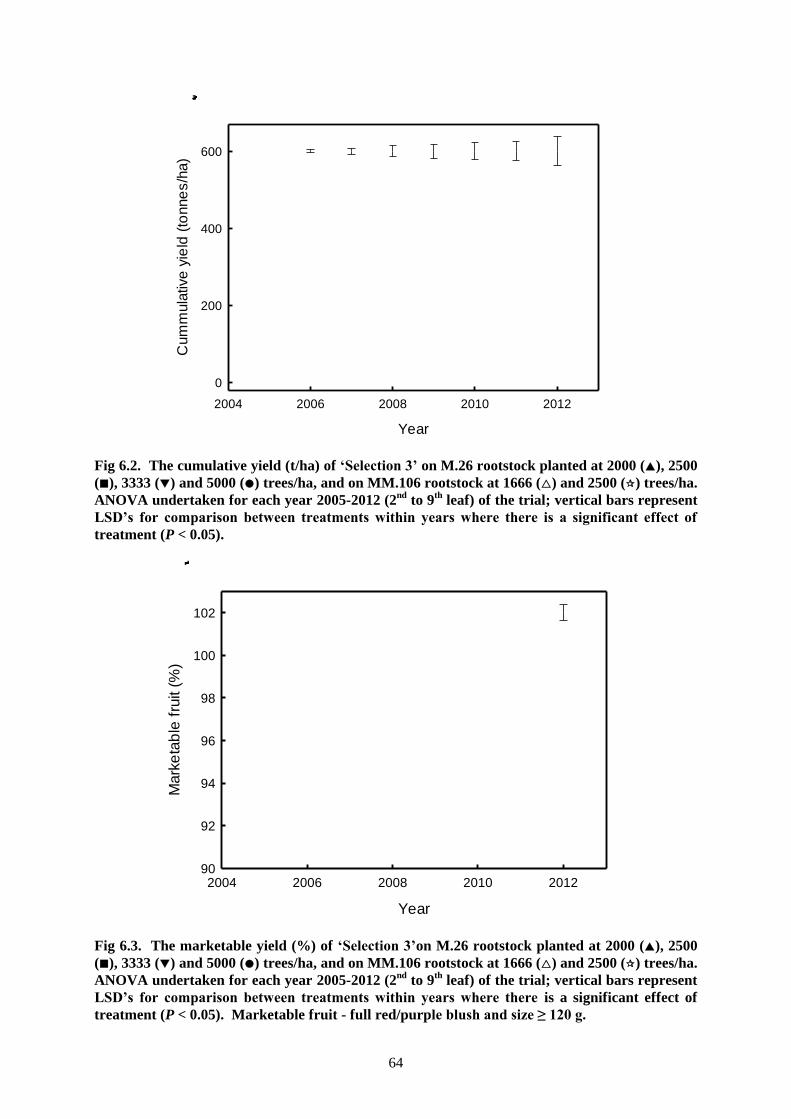
64
Year
2004 2006 2008 2010 2012
Cum
mula
tive
yie
ld (
tonne
s/h
a)
0
200
400
600
Fig 6.2. The cumulative yield (t/ha) of ‘Selection 3’ on M.26 rootstock planted at 2000 (), 2500
(), 3333 () and 5000 () trees/ha, and on MM.106 rootstock at 1666 () and 2500 () trees/ha.
ANOVA undertaken for each year 2005-2012 (2nd
to 9th
leaf) of the trial; vertical bars represent
LSD’s for comparison between treatments within years where there is a significant effect of
treatment (P < 0.05).
Year
2004 2006 2008 2010 2012
Mark
eta
ble
fru
it (
%)
90
92
94
96
98
100
102
Fig 6.3. The marketable yield (%) of ‘Selection 3’on M.26 rootstock planted at 2000 (), 2500
(), 3333 () and 5000 () trees/ha, and on MM.106 rootstock at 1666 () and 2500 () trees/ha.
ANOVA undertaken for each year 2005-2012 (2nd
to 9th
leaf) of the trial; vertical bars represent
LSD’s for comparison between treatments within years where there is a significant effect of
treatment (P < 0.05). Marketable fruit - full red/purple blush and size ≥ 120 g.

65
Year
2004 2006 2008 2010 2012
TC
SA
(cm
2)
0
10
20
30
40
50
60
Fig 6.4. The trunk cross-sectional area (TCSA cm
2/tree) of ‘Selection 3’ trees on M.26 rootstock
planted at 2000 (), 2500 (), 3333 () and 5000 () trees/ha, and on MM.106 rootstock at 1666
() and 2500 () trees/ha. ANOVA undertaken for each year 2004-2011 (completion of 1st leaf
to completion of 8th
leaf); vertical bars represent LSD’s for comparison between treatments
within years where there is a significant effect of treatment (P < 0.05).
Year
2004 2006 2008 2010 2012
Yie
ld e
ffic
iency (
kg
.tre
e-1
/cm
2 T
CS
A)
0.0
0.5
1.0
1.5
2.0
Fig 6.5. The yield efficiency (kg fruit.tree
-1/cm
2 TCSA) of ‘Selection 3’ trees on M.26 rootstock
planted at 2000 (), 2500 (), 3333 () and 5000 () trees/ha, and on MM.106 rootstock at 1666
() and 2500 () trees/ha. ANOVA undertaken for each year 2005-2012 (2nd
to 9th
leaf) of the
trial; vertical bars represent LSD’s for comparison between treatments within years where
there is a significant effect of treatment (P < 0.05).

66
0
20
40
60
80
Date
Sep Nov Jan Mar May
Fru
it d
iam
ete
r (m
m)
0
20
40
60
80
(a) M.26
(b) MM.106
Fru
it w
eig
ht (g
)
200
250
300
350
400
Fruit diameter (mm)
75 80 85 90 95 100 105
200
250
300
350
400
(c) M.26
(d) MM.106
Fig 6.6. (a-b) The seasonal increase in fruit diameter of ‘Selection 3’ apples in 2007-08 (●), 2008-
09 (○) and 2009-10 (); and (c-d) the relationship between fruit diameter and fruit weight for
(c) M.26 and (d) MM.106 rootstocks. Symbols represent collected data and lines represent
predictions from non-linear regression analysis for the increase in fruit diameter across the
season (a-b); and from linear regression analysis (log transformed axes) for the relationship
between fruit diameter and fruit weight (c-d).
6.4 Conclusions
The „Selection 3‟ trees have produced high yields and packouts in all six systems, however the apples
are excessively large, even on heavily cropped trees yielding over 100 t/ha, and when water supply is
restricted.
In addition, „Selection 3‟ is of poorer texture than „Kalei‟, „Selection 1‟ and „Selection 2‟. It is
therefore not considered suitable as a scab-resistant apple for commercialisation in Australia.
„Selection 3‟ may, however, have adaptation as a high yielding apple variety in dry environments
where there is limited water. Trees are easy to manage and the apples develop full colour, even in
shaded regions of the tree canopy. „Selection 3‟ could be an appropriate “minimal management” scab-
resistant apple variety for local production and consumption in a third world country.

67
7. The productivity and performance of ‘Selection 4’ in high
density planting systems
7.1 Introduction
„Selection 4‟ (Plate 7.1) is a large, brightly coloured block red to purple apple with a pale yellow
background. It is crisp, sweet, medium textured and of flat round to round conical shape. The
balanced sweet flavour of „Selection 4‟ apples develops slowly on the tree, and well after full colour
development.
Trees of „Selection 4‟ are spreading and of high vigour. At ARS, fruit mature in late February to early
March, overlapping with the end of „Gala‟ harvest and the commencement of „Red Delicious‟ harvest.
„Selection 4‟ trees required two harvests (a small first pick) in most years.
Plate 7.1. ‘Selection 4’ scab-resistant apple, and heavy infection of leaves with Alternaria

68
7.2 Materials and Methods
A rootstock trial to evaluate the productivity of a semi-commercial planting of „Selection 4‟ trees was
established in September 2004. Trial design was a randomised complete block with five rootstocks
(MM.106, MM.102, M.26, Ottawa 3, M.9) x four replicates x five trees per replicate. The trees were
planted at 3.6 m x 1.0 m (2777 trees/ha), and trained as a Vertical Axis to a 6-wire trellis. The trees
were in their 8th leaf in 2011/12.
Annual measurements of yield, fruit quality and TCSA were made on all trees as per the „Materials
and Methods‟ page 10. At harvest, apples were graded in the field as either marketable (full colour
development, size ≥ 120 g) or reject (failing to meet either of these standards).
Linear mixed models fitted using asreml-R software were used to determine the effect of rootstock
(fixed effect) on yield and fruit quality data sets, with block included as a random effect.
7.3 Results and Discussion
In stark contrast to „Selection 3‟, the yields produced by trees of „Selection 4‟ were unacceptably low
(Table 7.1). Even in their 8th leaf, the highest yield was just 39.7 t/ha for trees on MM.106 rootstock.
The primary cause of the low productivity of „Selection 4‟ was the high susceptibility of this selection
to Alternaria (Plates 7.1 and 7.2). Extreme leaf drop as a consequence of Alternaria infection
occurred in all years. This commonly saw 50% leaf fall by February, still several weeks before
harvest. Delan® sprays in 2011-12 had some impact on the level of Alternaria infection, but the effect
of the disease on leaf drop was still high.
Plate 7.2. Severe Alternaria infection of ‘Selection 4’ trees (left). ‘Kalei’ trees on the right are
unaffected. Photo taken in March 2010.

69
Despite a snowball blossom in spring 2011, a heavy initial set of fruit, and very light hand thinning,
the trees could still only manage to retain an average of 62-81 apples through to harvest in 2012
(Table 7.3). The apples picked in all years were medium to large (Table 7.2), due to low crop loads.
The cumulative yields (Table 7.4) reflect the consistently low annual yields produced by all trees to
their 8th leaf. M.26, MM.106 and MM.102 rootstocks produced marginally higher cumulative yields
than Ottawa 3 and M.9, but still far short of acceptable tonnages for commercial production.
The packouts of marketable fruit were generally high in most years (Table 7.5), with no significant
differences between rootstocks. Most apples that were retained on the trees to harvest were of good
size (Table 7.2), and the partial defoliation of trees by Alternaria meant that all apples were exposed
to adequate sunlight for full colour development.
The low marketable yields in 2010 (Table 7.5) were primarily due to excessive fruit drop before
harvest. The 2009-2010 season was dry, and the trees had insufficient leaf canopy to adequately
support the crop through to harvest. Excessive fruit drop of „Selection 4‟ was not only restricted to
2010, but also occurred in 2009 and 2011. The 2010-11 season was exceptionally wet, and the 2011
harvest was delayed to give the apples a chance to develop their characteristic sweet, balanced
flavour. Consequently there was a high fruit drop before the sugars in the fruit were able to fully
develop.
The TCSA of trees accurately reflected their vigour on the five different rootstocks (Table 7.6). Trees
on semi-vigorous MM.106 rootstock were largest, and smallest on the dwarfing M.9 rootstock, with
those on Ottawa 3, M.26 and MM.102 of intermediate vigour. Without the impact of Alternaria
disease on leaf fall, all rootstocks produced trees of adequate vigour for high potential productivity.
Significant differences in the yield efficiency of the rootstocks occurred from the 6th leaf onwards
Table 7.7), and in 2012 was highest for the dwarfing M.9 rootstock and lowest for MM.106.
Potential rootstock impacts on the productivity of „Selection 4‟ trees were over-ridden by the severe
impact of Alternaria on the canopies. Without sufficient leaf, the trees would have been unable to
produce the photosynthates necessary for normal bud development, fruit set and crop development.

70
Table 7.1. The annual yield (t/ha) of ‘Selection 4’ planted on five rootstocks at a density of 2777
trees per hectare
Rootstock 2006 (2
nd leaf)
2007 (3
rd leaf)
2008 (4
th leaf)
2009 (5
th leaf)
2010 (6
th leaf)
2011 (7
th leaf)
2012 (8
th leaf)
M.26
0.2
9.4
21.4 b
22.8
20.8
19.3 ab
31.7
M.9 0.1 6.6 13.4 a 18.9 15.3 13.7 bc 32.0
MM.102 0.0 6.3 13.9 a 25.2 13.9 20.9 a 39.7
MM.106 0.1 7.0 17.7 ab 26.9 17.9 20.6 a 34.1
Ottawa 3 0.8 9.6 18.2 ab 21.2 17.7 12.6 c 32.0
Significance NS NS <0.05 NS NS <0.05 NS
Means with different letters within the same column represent differences between treatments using the LSD test
at P = 0.05. NS: not significant
Table 7.2. The average fruit weight (g) of ‘Selection 4’ planted on five rootstocks at a density of
2777 trees per hectare
Rootstock 2006 (2
nd leaf)
2007 (3
rd leaf)
2008 (4
th leaf)
2009 (5
th leaf)
2010 (6
th leaf)
2011 (7
th leaf)
2012 (8
th leaf)
M.26
225
217 a
187
209
173
175
188
M.9 164 202 b 183 215 170 173 185
MM.102 - 184 c 179 202 173 170 179
MM.106 165 190 bc 181 209 172 164 191
Ottawa 3 282 193 bc 176 209 167 165 185
Significance - <0.01 NS NS NS NS NS
Means with different letters within the same column represent differences between treatments using the LSD test
at P = 0.05. NS: not significant
Table 7.3. The average fruit number per tree of ‘Selection 4’ planted on five rootstocks at a
density of 2777 trees per hectare
Rootstock 2006 (2
nd leaf)
2007 (3
rd leaf)
2008 (4
th leaf)
2009 (5
th leaf)
2010 (6
th leaf)
2011 (7
th leaf)
2012 (8
th leaf)
M.26
0.3
15.9
41.4 a
39.5
43.1
39.9 ab
62.0
M.9 0.1 11.6 26.3 c 31.7 32.5 28.3 b 62.8
MM.102 0.0 12.4 28.4 bc 45.2 28.7 44.5 a 81.0
MM.106 0.1 13.2 35.3 abc 46.7 37.1 45.4 a 64.6
Ottawa 3 1.1 17.9 37.2 ab 36.6 38.2 27.9 b 63.7
Significance NS NS <0.05 NS NS <0.05 NS
Means with different letters within the same column represent differences between treatments using the LSD test
at P = 0.05. NS: not significant

71
Table 7.4. The cumulative yield (t/ha) of ‘Selection 4’ planted on five rootstocks at a density of
2777 trees per hectare
Rootstock 2006 (2
nd leaf)
2007 (3
rd leaf)
2008 (4
th leaf)
2009 (5
th leaf)
2010 (6
th leaf)
2011 (7
th leaf)
2012 (8
th leaf)
M.26
0.2
9.6
31.1 a
53.9 a
74.7 a
94.1 a
125.7 a
M.9 0.1 6.7 20.0 c 38.7 c 54.2 c 67.7 c 99.8 b
MM.102 0.0 6.3 20.3 c 45.5 bc 59.4 bc 80.3 b 120.0 a
MM.106 0.1 7.1 24.8 bc 51.7 ab 69.5 a 90.2 ab 124.2 a
Ottawa 3 0.8 10.4 28.6 ab 49.8 ab 67.5 ab 80.1 b 112.1 ab
Significance NS NS <0.01 <0.05 <0.01 <0.01 <0.05
Means with different letters within the same column represent differences between treatments using the LSD test
at P = 0.05. NS: not significant
Table 7.5. The marketable yield (%) of ‘Selection 4’ planted on five rootstocks at a density of
2777 trees per hectare
Rootstock 2006 (2
nd leaf)
2007 (3
rd leaf)
2008 (4
th leaf)
2009 (5
th leaf)
2010 (6
th leaf)
2011 (7
th leaf)
2012 (8
th leaf)
M.26
100
99.7
95.3
89.1
63.7
83.6
93.1
M.9 100 98.6 93.2 85.1 59.2 80.1 92.4
MM.102 - 99.0 95.1 89.7 52.1 84.3 92.5
MM.106 100 99.6 93.6 92.3 60.1 83.0 91.8
Ottawa 3 100 99.8 94.9 87.4 58.6 79.4 90.9
Significance NS NS NS NS NS NS NS
Means with different letters within the same column represent differences between treatments using the LSD test
at P = 0.05. Marketable fruit: Full red/purple blush and size ≥ 120 g. NS: not significant
Table 7.6. The average trunk cross-sectional area (TCSA cm2/tree) of ‘Selection 4’ trees planted
on five rootstocks at a density of 2777 trees per hectare
Rootstock 2004 2005
(1st leaf)
2006
(2nd
leaf)
2007
(3rd
leaf)
2008
(4th
leaf)
2009
(5th
leaf)
2010
(6th
leaf)
2011
(7th
leaf)
M.26
0.6
1.2
3.8
6.7 b
9.5 bc
12.5 bc
14.6 bc
18.9 bc
M.9 0.5 1.0 3.1 5.4 c 7.5 c 9.5 c 11.2 c 14.9 c
MM.102 0.6 1.1 4.1 7.2 b 11.2 b 14.6 b 18.3 b 23.2 b
MM.106 0.5 1.1 4.3 8.6 a 14.0 a 18.8 a 22.9 a 29.4 a
Ottawa 3 1.1 1.6 4.3 7.3 ab 11.2 b 15.0 b 17.7 b 23.5 b
Significance NS NS NS <0.01 <0.01 <0.001 <0.001 <0.001 Means with different letters within the same column represent differences between treatments using the LSD test
at P = 0.05. NS: not significant

72
Table 7.7. The yield efficiency (kg fruit.tree-1
/cm2 TCSA) of ‘Selection 4’ trees planted on five
rootstocks at a density of 2777 trees per hectare
Rootstock 2006 (2
nd leaf)
2007 (3
rd leaf)
2008 (4
th leaf)
2009 (5
th leaf)
2010 (6
th leaf)
2011 (7
th leaf)
2012 (8
th leaf)
M.26
0.05
0.93
1.19
0.90
0.62 a
0.52 a
0.65 b
M.9 0.02 0.81 0.92 0.90 0.61 a 0.44 ab 0.78 a
MM.102 - 0.58 0.73 0.86 0.34 b 0.43 ab 0.62 bc
MM.106 0.01 0.59 0.75 0.71 0.34 b 0.33 bc 0.43 d
Ottawa 3 0.09 0.79 0.91 0.68 0.44 ab 0.26 c 0.51 cd
Significance NS NS NS NS <0.05 <0.05 <0.001
Means with different letters within the same column represent differences between treatments using the LSD test
at P = 0.05. NS: not significant
7.4 Conclusions
Although „Selection 4‟ is an attractive scab-resistant apple with a balanced, sweet flavour, it cannot be
seriously considered as a commercially viable proposition unless reliable control measures for
Alternaria are found.
The heavy leaf drop that can occur quite early in the season as a consequence of Alternaria infection
has led to very poor yields of this selection in high density planting systems. Excessive pre-harvest
drop and problems in developing fruit sugars in some seasons are other issues impacting on the
suitability of „Selection 4‟ as a commercial variety.
With its very high susceptibility to Alternaria, „Selection 4‟ is not considered suitable for organic
production.

73
8. The productivity and performance of ‘Selection 2’ grown as
open V-trellis systems
8.1 Introduction
„Selection 2‟ (Plate 8.1) is a medium size, attractive pinkish red apple with 60% foreground blush on
a yellow background. It is crisp, sweet, and medium textured with low acidity and a round conical
shape. The balanced, sweet flavour of „Selection 2‟ apple is still evident after 14 days at room
temperature.
Trees of „Selection 2‟ are spreading and of medium vigour (Plate 8.1). At ARS, fruit mature during
March, overlapping with „Red Delicious‟. Two to three harvests over a three week period are
required.
Plate 8.1. ‘Selection 2’ scab-resistant apple
8.2 Materials and Methods
An experiment to evaluate the productivity of „Selection 2‟ trees grown as double-row open V-trellis
systems (rows 0.5 m apart) was planted in September 2005. The trial was planted using a completely
randomised design consisting of four open V-trellis systems (different rootstock/planting density
combinations) x four replicates x five trees per replicate. The four systems were MM.106 rootstock at
3555 trees/ha; MM.106 at 4444 trees/ha; Ottawa 3 at 4444 trees/ha and Ottawa 3 at 5925 trees/ha.
The trees were in their 7th leaf in 2011/12.

74
The V-trellis consisted of a 5-wire trellis with wires spaced at heights of 1.1 m, 1.6 m, 2.1 m, 2.6 m
and 2.9 m above ground level. Each side of the V-trellis was angled at 20° from the vertical. The
entire trees in each row were leaned to either the east or west side of the trellis, as appropriate for the
row they were in, and trained as tall Slender Spindles. Lateral branches were tied to the wires along
the row, and upright vigorous shoots removed.
Annual measurements of yield, fruit quality and TCSA were made on all trees as per the „Materials
and Methods‟ page 10. At harvest, apples were graded in the field as either marketable (full colour
development, size ≥ 120 g) or reject (failing to meet either of these standards).
Linear models were fitted using asreml-R software to determine the effect of rootstock and planting
density treatment combinations.
8.3 Results and Discussion
There was little difference in the annual yields of „Selection 2‟ produced by the V-trellis systems
(Table 8.1), and all four systems peaked at 68-75 t/ha in 2012 (7th leaf). „Selection 2‟ trees on Ottawa
3 rootstock produced higher earlier yields (2nd
, 3rd
and 4th leaf) than trees on MM.106 rootstock, but
there was no significant difference in the annual tonnages produced by the two rootstocks and three
planting densities in subsequent years (Table 8.1).
With the exception of 3rd
leaf MM.106 trees at a density of 3555 trees/ha, the systems produced
acceptable yields (20-47 t/ha) in their 3rd
and 4th leaf. The yields from trees in their 4
th leaf did not
satisfactorily increase in the two subsequent years, and it was only in their 7th leaf that trees again
produced acceptable yields. Conditions were dry when trees were in their 5th leaf in 2010, and
exceptionally wet in their 6th leaf in 2011; leading to poor tree growth and excessive pre-harvest fruit
drop in both seasons.
In 2010-2011 a combined strategy of hard pruning in winter 2010 and early hand thinning in 2010 and
2011 reduced the crop load, encouraged shoot growth and allowed the trees to more adequately fill
their allotted spaces. The benefits of this were seen in 2012, when yields improved dramatically
(Table 8.1) to a level that was more commercially viable. New branches developed as a consequence
of winter 2010 pruning were subsequently tied down in 2011 to encourage fruit bud development, and
it is expected that the 7th leaf yields will be maintained and improved on in future years. The V-trellis
system on which the trees have been grown is relatively short (2.9m), and an extra 0.5m height could
be expected to increase yields by a further 15%.
„Selection 2‟ is a medium to large sized apple, and trees in their 5th to 8
th leaf in particular yielded
optimally sized fruit, with no significant difference in the average fruit weight produced by the four
systems (Table 8.2). This also reflected how the crop load in each year was standardised according to
the tree volume of each tree. When trees had still not filled their allotted spaces, there was no
difference in average fruit numbers per tree between the four systems in their 4th to 6
th leaf (Table
8.3), and little difference between them in their 2nd
and 3rd
leaf.
It was only following the hard pruning in winter 2010 and subsequent bending and tying of new
lateral branches, that the canopies of trees in the different systems filled their allotted spaces. Hence it
was their 7th leaf before the crop loads of trees showed higher fruit numbers per tree at the wider 3555
trees/ha spacing, intermediate fruit numbers at 4444 trees/ha and lower fruit numbers per tree at the
higher 5925 trees/ha density (Table 8.3). This trend is expected to continue in future years.
The cumulative yields of „Selection 2‟ trees to their 7th leaf showed increased orchard system
productivity as planting density increased (Table 8.4), and no difference in the cumulative yields
produced to 2012 by trees on MM.106 and Ottawa 3 at the same 4444 trees/ha density. The relatively

75
low annual and cumulative yields produced by „Selection 2‟ trees on MM.106 rootstock at 3555
trees/ha can be attributed to the inadequate canopy volume of these trees prior to the management
changes that were implemented in 2010-11 to increase tree growth. The cumulative yield of trees on
Ottawa 3 at the high 5925 trees/ha density were not sufficiently better than at 4444 trees/ha to warrant
the cost of planting an additional 1480 trees/ha.
Over the past four years, trees of „Selection 2‟ have shown moderate susceptibility to Alternaria and
powdery mildew (caused by Podosphaera leucotricha). Alternaria infection of leaves has induced
premature leaf drop of up to 20% in two seasons.
The % packouts of marketable fruit were high in all years except 2009 (4th leaf), and there was no
difference between the four systems in the marketable fruit packouts of mature bearing trees in their
5th to 7
th leaf (Table 8.5). „Selection 2‟ apples need good exposure to sunlight to colour adequately,
and fruit in shaded regions of the canopy fail to develop the characteristic pink/red blush.
No branch tying was done until winter 2009. Even with a relatively small canopy volume and leaf
area, upright shoot growth within trees impacted on fruit colour development as early as the 4th leaf.
Over-vigorous upright shoots especially occurred within „Selection 2‟ trees on Ottawa 3 rootstock. It
was only following branch tying that the packouts improved in subsequent years (Table 8.5).
„Selection 2‟ trees respond well to limb bending, and the restructuring of trees since 2010 has seen the
canopy volumes increased, improved sunlight penetration to all regions of the trees, and a high
proportion of the crop borne in outer zones of the canopy. This has led to the high yields and packouts
in 2012.
The trunk cross-sectional area of „Selection 2‟ trees was significantly higher on MM.106 rootstock
than on Ottawa 3 rootstock (Table 8.6). This difference in TCSA between the rootstocks was evident
as early as the 2nd
leaf. Although TCSA accurately reflected the vigour potential of the two rootstocks,
the use of TCSA as a simple, rapidly measurable index of tree size did not account for the variations
in canopy volume and leaf area observed between trees, or for the presence of excessive upright
shoots that impacted on fruit colour in trees on Ottawa 3.
Based on TCSA, the yield efficiency of „Selection 2‟ trees on the more dwarfing Ottawa 3 rootstock
was consistently superior to that of trees on MM.106 (Table 8.7). Unfortunately, the productivity and
yield efficiency of „Selection 2‟ trees on the highly productive rootstocks M.26 (semi-dwarf) and M.9
is unknown.

76
Table 8.1. The annual yield (t/ha) of four systems for ‘Selection 2’ trained as an open V-trellis
Open V-trellis
system
2007 (2
nd leaf)
2008 (3
rd leaf)
2009 (4
th leaf)
2010 (5
th leaf)
2011 (6
th leaf)
2012 (7
th leaf)
MM.106 3555 trees/ha
1.4 b
14.7 d
31.1 c
25.6
24.5
69.1
MM.106 4444 trees/ha
1.8 b
20.0 c
38.2 b
39.6
26.8
75.4
Ottawa 3 4444 trees/ha
4.2 a
26.3 b
44.1 a
35.0
32.0
68.4
Ottawa 3 5925 trees/ha
2.9 ab
35.9 a
46.8 a
46.7
24.1
67.7
Significance level <0.05 <0.001 <0.001 NS NS NS
Means with different letters within the same column represent differences between treatments using the
LSD test at P = 0.05. NS: not significant
Table 8.2. The average fruit weight (g) of ‘Selection 2’ produced by four open V-trellis systems
Open V-trellis
system
2007 (2
nd leaf)
2008 (3
rd leaf)
2009 (4
th leaf)
2010 (5
th leaf)
2011 (6
th leaf)
2012 (7
th leaf)
MM.106 3555 trees/ha
224
174
194
153
171
165
MM.106 4444 trees/ha
218
165
211
155
172
162
Ottawa 3 4444 trees/ha
221
177
209
170
164
169
Ottawa 3 5925 trees/ha
223
167
208
168
165
170
Significance level NS NS NS NS NS NS
Means with different letters within the same column represent differences between treatments using the
LSD test at P = 0.05. NS: not significant
Table 8.3. The average fruit number per tree of four systems for ‘Selection 2’ trained as an
open V-trellis
Open V-trellis
system
2007 (2
nd leaf)
2008 (3rd
leaf) 2009
(4th
leaf) 2010
(5th
leaf) 2011
(6th
leaf) 2012
(7th
leaf)
MM.106 3555 trees/ha
1.75 b
24.0 c
45.6
45.9
40.4
118.4 a
MM.106 4444 trees/ha
1.94 b
27.6 bc
41.2
57.6
35.1
105.3 ab
Ottawa 3 4444 trees/ha
4.38 a
33.6 ab
47.6
47.5
45.1
92.8 b
Ottawa 3 5925 trees/ha
2.19 b
36.4 a
37.8
48.4
25.3
69.0 c
Significance level <0.05 <0.05 NS NS NS <0.001
Means with different letters within the same column represent differences between treatments using the
LSD test at P = 0.05. NS: not significant

77
Table 8.4. The cumulative yield (t/ha) of four systems for ‘Selection 2’ trained as an open
V-trellis
Open V-trellis
system
2007 (2
nd leaf)
2008 (3
rd leaf)
2009 (4
th leaf)
2010 (5
th leaf)
2011 (6
th leaf)
2012 (7
th leaf)
MM.106 3555 trees/ha
1.4 b
16.1 d
47.2 d
72.7 c
97.2 d
166.3 c
MM.106 4444 trees/ha
1.8 b
21.8 c
60.0 c
99.6 b
126.4 c
201.8 b
Ottawa 3 4444 trees/ha
4.2 a
30.5 b
74.6 b
109.7 b
141.7 b
210.1 ab
Ottawa 3 5925 trees/ha
2.9 ab
38.8 a
85.6 a
132.3 a
156.4 a
224.1 a
Significance level <0.05 <0.001 <0.001 <0.001 <0.001 <0.001 Means with different letters within the same column represent differences between treatments using the
LSD test at P = 0.05.
Table 8.5. The marketable yield (%) of ‘Selection 2’ produced by four open V-trellis systems
Open V-trellis
system
2007 (2
nd leaf)
2008 (3
rd leaf)
2009 (4
th leaf)
2010 (5
th leaf)
2011 (6
th leaf)
2012 (7
th leaf)
MM.106 3555 trees/ha
100
98.0 a
86.5 a
89.9
95.0
97.5
MM.106 4444 trees/ha
100
93.3 b
88.9 a
93.6
93.7
98.5
Ottawa 3 4444 trees/ha
100
92.3 b
74.3 b
92.1
91.9
97.4
Ottawa 3 5925 trees/ha
100
88.2 c
67.1 b
92.2
88.8
97.3
Significance level NS <0.01 <0.05 NS NS NS
Means with different letters within the same column represent differences between treatments using the
LSD test at P = 0.05. Marketable fruit: Full pink/red blush and size ≥ 120 g. NS: not significant
Table 8.6. The average trunk cross-sectional area (TCSA cm2/tree) of ‘Selection 2’ trees in four
open V-trellis systems
Open V-trellis
system
2005 2006 (1
st leaf)
2007 (2
nd leaf)
2008 (3
rd leaf)
2009 (4
th leaf)
2010 (5
th leaf)
2011 (6
th leaf)
MM.106 3555 trees/ha
0.7 b
2.7 b
7.4 a
11.5 a
15.1 a
19.0 a
23.8 a
MM.106 4444 trees/ha
0.9 a
3.1 a
8.5 a
12.0 a
15.3 a
18.3 a
21.9 a
Ottawa 3 4444 trees/ha
0.5 c
1.8 c
4.8 b
6.6 b
8.6 b
11.1 b
13.0 b
Ottawa 3 5925 trees/ha
0.5 c
1.7 c
4.7 b
6.1 b
7.8 b
9.7 b
11.6 b
Significance <0.001 <0.001 <0.001 <0.05 <0.05 <0.05 <0.05 Means with different letters within the same column represent differences between treatments using the LSD test
at P = 0.05.

78
Table 8.7. The yield efficiency (kg fruit.tree-1
/cm2 TCSA) of four systems for ‘Selection 2’
trained as an open V-trellis
Open V-trellis
system
2007 (2
nd leaf)
2008 (3
rd leaf)
2009 (4
th leaf)
2010 (5
th leaf)
2011 (6
th leaf)
2012 (7
th leaf)
MM.106 3555 trees/ha
0.15 b
0.57 b
0.85 b
0.43 b
0.44
0.92 b
MM.106 4444 trees/ha
0.14 b
0.53 b
0.73 b
0.59 b
0.34
0.79 b
Ottawa 3 4444 trees/ha
0.55 a
1.25 a
1.50 a
0.90 a
0.68
1.21 a
Ottawa 3 5925 trees/ha
0.28 b
1.30 a
1.35 a
1.02 a
0.42
1.00 a
Significance level <0.01 <0.001 <0.001 <0.001 NS <0.05
Means with different letters within the same column represent differences between treatments using the
LSD test at P = 0.05. NS: not significant
8.4 Conclusions
Experience with „Selection 2‟ demonstrates the importance of evaluating the productivity of new
selections prior to their potential commercial release; firstly to know if they have the genetic capacity
to produce high yields and packouts under a range of seasonal conditions, and secondly to gain an
understanding of how best to manage trees of each selection, particularly in terms of crop load and
tree training, to maximise their productivity.
„Selection 2‟ has rated highly with consumers (project AP08041), but tree growth must be managed to
ensure exposure of fruit to adequate sunlight for colour development. „Selection 2‟ is also susceptible
to Alternaria and powdery mildew, so it is unlikely to be suitable for organic production.
If appropriate control measures are found for Alternaria, and the yields and packouts achieved in
2012 can be repeated and increased in future years, „Selection 2‟ may prove to be a suitable scab-
resistant apple variety for commercialisation.
The productivity and performance of „Selection 2‟ grown semi-commercially on M.26 and M.9
rootstocks is unknown, and should be investigated. This will likely provide the key to its potential for
future release.

79
9. The productivity and performance of ‘Selection 5’ grown as
open V-trellis systems
9.1 Introduction
„Selection 5‟ (Plate 9.1) is an attractive red apple with a light stripe in almost solid 100% foreground
colour. It is a large apple of round conical shape, and is crisp, sweet, medium textured and low acid.
Trees of „Selection 5‟ are spreading and of medium vigour (Plate 9.1). The apples are largely borne
on spurs, and at Applethorpe, mature in early March, overlapping with „Red Delicious‟. In most years
only a single harvest is required.
Plate 9.1. ‘Selection 5’ scab-resistant apple
9.2 Materials and Methods
An experiment to evaluate the productivity of „Selection 5‟ trees grown as double-row open V-trellis
systems (rows 0.5 m apart) was planted in September 2005. The trial was planted as a completely
randomised design, consisting of four open V-trellis systems (different rootstock/planting density
combinations) x four replicates x five trees per replicate. The four systems were MM.106 rootstock at
3555 trees/ha; MM.106 at 4444 trees/ha; Ottawa 3 at 4444 trees/ha and Ottawa 3 at 5925 trees/ha.
The trees were in their 7th leaf in 2011/12.
The V-trellis consisted of a 5-wire trellis with wires spaced at heights of 1.1 m, 1.6 m, 2.1 m, 2.6 m
and 2.9 m above ground level. Each side of the V-trellis was angled at 20° from the vertical. The
entire trees in each row were leaned to either the east or west side of the trellis, as appropriate for the
row they were in, and trained as tall Slender Spindles. Lateral branches were tied to the wires along
the row, and upright vigorous shoots removed.

80
Annual measurements of yield, fruit quality and TCSA were made on all trees as per the „Materials
and Methods‟ page 10. At harvest, apples were graded in the field as either marketable (full colour
development, size ≥ 120 g) or reject (failing to meet either of these standards).
Linear models were fitted using asreml-R software to determine the effect of rootstock and planting
density treatment combinations.
9.3 Results and Discussion
The annual yields of „Selection 5‟ trees when trained as open V-trellis systems were disappointing
(Table 9.1), and only reached an acceptable 53-64 tonnes/hectare in 2012, when the trees were in their
7th leaf. Following promising yields of 27-42 t/ha across all systems in their 3
rd leaf, the yields of 22-
39 t/ha/annum for 4th to 6
th leaf trees were not acceptable for commercial production, especially given
the high densities (3555, 4444, 5925 trees/ha) at which the trees were planted.
The dry conditions in 2010 and the continuous wet of the 2011 season led to poor tree growth and
canopy development, contributing to the low yields produced by „Selection 5‟ trees in their 5th and 6
th
leaf (Table 9.1). As with „Selection 2‟ (Chapter 8), hard pruning of „Selection 5‟ trees in winter 2010
encouraged shoot growth and allowed the trees to develop more adequate canopies. Yields improved
in 2012 (Table 9.1), but not to the same extent as achieved with the „Selection 2‟ trees (Table 8.1).
„Selection 5‟ trees were not as vigorous as „Selection 2‟, and are still yet to satisfactorily fill their
allotted spaces in the orchard. An extra 0.5m height added to the relatively short (2.9m) V-trellis to
which the trees have been trained may improve their yield, but there is no guarantee of this as the
trees still lack the vigour required to take full yield advantage of the V-trellis at its current height.
From the 3rd
leaf onwards there was no significant difference in the average fruit weight of apples
produced by the four systems (Table 9.2). „Selection 5‟ is a relatively large apple, and in the wet 2011
season was excessively large, averaging ≥ 207 g in all systems (Table 9.2).
The failure of tree canopies to adequately develop in the five years immediately after planting,
combined with standardised hand thinning to space apples evenly throughout the trees, saw little
difference in the crop loads per tree between the four systems until their 6th leaf (Table 9.3). Only
with the encouragement of tree growth and fruit bud development through hard pruning in winter
2010, followed by progressive limb bending and tying, did trees produce fruitful canopies of
sufficient volume to show up expected planting density effects on tree crop loads. This occurred in
their 6th and 7
th leaf (Table 9.3), with declining fruit numbers per tree as density increased.
There was no significant difference in the cumulative yields produced to 2012 (7th leaf) by the V-
trellis systems (Table 9.4). The cumulative yields of 170-184 t/ha to 7th leaf (averaging 34-42
t/ha/annum across 5th, 6
th and 7
th leaf for the four systems) were too low for economically viable
commercial production at such high tree densities, and are not likely to significantly increase in future
years.
The packouts of marketable fruit (Table 9.5) were consistently high. This was to be expected as the
tree canopies were relatively sparse and well-defined in the V-trellis systems. Hence all apples were
exposed to adequate sunlight for size and colour development. In addition, „Selection 5‟ is a large
apple (Table 9.2) with a 90-100% full red over-colour, and crop loads were low (Table 9.3), so apples
did not impinge on the space of others and prevent them from sizing or colouring.
Since planting, the trunk cross-sectional area of „Selection 5‟ trees was significantly higher on semi-
vigorous MM.106 rootstock than on semi-dwarfing Ottawa 3 rootstock (Table 9.6). The higher TCSA

81
of trees on MM.106 rootstock was not evidenced by observations of larger canopy volume or tree size
until the trees reached their 6th leaf.
There was little difference in the yield efficiency of the four systems (kg fruit.tree-1
/cm2
TCSA),
although trees of „Selection 5‟ in their 3rd
, 5th and 7
th leaf (4444 trees/ha only) on Ottawa 3 rootstock
were significantly more efficient producers of fruit in those years than trees on the more vigorous
MM.106 rootstock (Table 9.7).
A tree management problem noted with „Selection 5‟ was that fruitlets tended to set in clusters of
three, four or five, or not at all. If hand thinning was done later than six weeks after full bloom (as is
common commercial practice), the attempted removal of one or two fruitlets in a cluster often saw all
apples fall from that cluster. This was a contributory factor to the low „Selection 5‟ yields. When hand
thinning of clusters was minimised in spring 2011, the trees produced more acceptable yields in 2012.
A second contributory factor to low yields was that as harvest maturity of „Selection 5‟ approached,
even a gentle touch of fruit could easily knock the apples off the tree, with significant pre-harvest
drop occurring in most years.
Table 9.1. The annual yield (t/ha) of four systems for ‘Selection 5’ trained as an open V-trellis
Open V-trellis
system
2007 (2
nd leaf)
2008 (3
rd leaf)
2009 (4
th leaf)
2010 (5
th leaf)
2011 (6
th leaf)
2012 (7
th leaf)
MM.106 3555 trees/ha
1.1
26.9 a
26.6
20.0
39.6
56.0
MM.106 4444 trees/ha
1.3 30.2 ab 27.5 21.5 39.1 64.3
Ottawa 3 4444 trees/ha
1.3 33.9 b 25.6 26.9 35.4 53.6
Ottawa 3 5925 trees/ha
3.2 42.3 c 22.6 30.4 29.2 52.8
Significance level NS <0.01 NS NS NS NS
Means with different letters within the same column represent differences between treatments using the
LSD test at P = 0.05. NS: not significant
Table 9.2. The average fruit weight (g) of ‘Selection 5’ produced by four open V-trellis systems
Open V-trellis
system
2007 (2
nd leaf)
2008 (3
rd leaf)
2009 (4
th leaf)
2010 (5
th leaf)
2011 (6
th leaf)
2012 (7
th leaf)
MM.106 3555 trees/ha
177 b
179
184
198
213
168
MM.106 4444 trees/ha
224 a
170
187
190
215
175
Ottawa 3 4444 trees/ha
177 b
184
193
185
218
174
Ottawa 3 5925 trees/ha
184 b
184
190
182
207
171
Significance level <0.05 NS NS NS NS NS
Means with different letters within the same column represent differences between treatments using the
LSD test at P = 0.05. NS: not significant

82
Table 9.3. The average fruit number per tree of four systems for ‘Selection 5’ trained as an
open V-trellis
Open V-trellis
system
2007 (2
nd leaf)
2008 (3
rd leaf)
2009 (4
th leaf)
2010 (5
th leaf)
2011 (6
th leaf)
2012 (7
th leaf)
MM.106 3555 trees/ha
1.6
42.6
41.0 a
29.1
52.3 a
95.2 a
MM.106 4444 trees/ha
1.3
40.1
33.9 a
25.8
41.6 ab
83.4 ab
Ottawa 3 4444 trees/ha
1.6
41.6
29.6 ab
32.7
37.3 b
69.5 b
Ottawa 3 5925 trees/ha
2.8
39.5
20.1 b
29.2
23.7 c
52.4 c
Significance level NS NS <0.05 NS <0.01 <0.001
Means with different letters within the same column represent differences between treatments using the
LSD test at P = 0.05. NS: not significant
Table 9.4. The cumulative yield (t/ha) of four systems for ‘Selection 5’ trained as an open
V-trellis
Open V-trellis
system
2007 (2
nd leaf)
2008 (3
rd leaf)
2009 (4
th leaf)
2010 (5
th leaf)
2011 (6
th leaf)
2012 (7
th leaf)
MM.106 3555 trees/ha
1.1
28.0 a
54.7
74.6 a
114.2
170.2
MM.106 4444 trees/ha
1.3
31.5 a
59.0
80.5 a
119.7
184.0
Ottawa 3 4444 trees/ha
1.2
35.1 a
60.7
87.6 ab
122.9
176.6
Ottawa 3 5925 trees/ha
3.2
45.5 b
68.2
98.6 b
127.8
180.6
Significance level NS <0.01 NS <0.05 NS NS
Means with different letters within the same column represent differences between treatments using the
LSD test at P = 0.05. NS: not significant
Table 9.5. The marketable yield (%) of ‘Selection 5’ produced by four open V-trellis systems
Open V-trellis
system
2007 (2
nd leaf)
2008 (3
rd leaf)
2009 (4
th leaf)
2010 (5
th leaf)
2011 (6
th leaf)
2012 (7
th leaf)
MM.106 3555 trees/ha
100
98
95
97
99
98
MM.106 4444 trees/ha
100
99
96
97
99
98
Ottawa 3 4444 trees/ha
100
99
95
97
98
98
Ottawa 3 5925 trees/ha
100
100
94
98
99
97
Significance level NS NS NS NS NS NS
Means with different letters within the same column represent differences between treatments using the
LSD test at P = 0.05. Marketable fruit: Full red blush and size ≥ 120 g. NS: not significant

83
Table 9.6. The average trunk cross-sectional area (TCSA cm2/tree) of ‘Selection 5’ trees in four
open V-trellis systems
Open V-
trellis system
2005 2006 (1
st leaf)
2007 (2
nd leaf)
2008 (3
rd leaf)
2009 (4
th leaf)
2010 (5
th leaf)
2011 (6
th leaf)
MM.106 3555 trees/ha
1.0 a
3.7 a
8.4 a
11.0 a
13.7 a
17.4 a
20.0 a
MM.106 4444 trees/ha
0.8 b
3.3 b
7.5 b
9.8 b
12.3 a
15.9 a
18.3 a
Ottawa 3 4444 trees/ha
0.6 c
2.1 c
4.7 c
5.8 c
7.5 b
9.3 b
11.0 b
Ottawa 3 5925 trees/ha
0.6 c
2.1 c
4.6 c
5.4 c
7.2 b
8.7 b
9.8 b
Significance <0.001 <0.001 <0.001 <0.001 <0.001 <0.001 <0.001 Means with different letters within the same column represent differences between treatments using the LSD test
at P = 0.05.
Table 9.7. The yield efficiency (kg fruit.tree-1
/cm2 TCSA) of four systems for ‘Selection 5’
trained as an open V-trellis
Open V-trellis
system
2007 (2
nd leaf)
2008 (3
rd leaf)
2009 (4
th leaf)
2010 (5
th leaf)
2011 (6
th leaf)
2012 (7
th leaf)
MM.106 3555 trees/ha
0.08 a
0.90 a
0.68
0.42 a
0.66
0.80 a
MM.106 4444 trees/ha
0.08 a
0.92 a
0.64
0.40 a
0.57
0.80 a
Ottawa 3 4444 trees/ha
0.14 ab
1.61 b
1.01
0.80 b
0.88
1.11 b
Ottawa 3 5925 trees/ha
0.26 b
1.56 b
0.71
0.71 b
0.58
0.92 a
Significance level <0.05 <0.001 NS <0.01 NS <0.01
Means with different letters within the same column represent differences between treatments using the
LSD test at P = 0.05. NS: not significant
9.4 Conclusions
The yields of high density „Selection 5‟ trees on open V-trellis were not sufficiently large to guarantee
the commercial viability of this selection. Although the marketable packouts of „Selection 5‟ apples
were high, and there is also some scope to increase the yields beyond what has been achieved to date,
excessive pre-harvest drop can be an issue. Fruitlets must also be thinned very soon after setting to
ensure entire clusters of apples are not accidentally removed in hand thinning.
Consumer sentiment about „Selection 5‟ has been mixed (project AP08041). Coupled with the results
in this project, it is therefore unlikely that „Selection 5‟ will be commercialised.

84
10. Technology Transfer
Grower farm walks and seminars
A heavy focus of the project was the dissemination of information to growers through regular farm
walks at the site, particularly during the harvest period. Discussions primarily centred on the
management and training of trees in high density planting systems, and in particular, the productivity
and performance of „Kalei‟ and „Selection 1‟ when grown at high densities.
For growers to see heavily cropped trees of „Kalei‟ producing consistently high quality apples in hdp
systems has been a very effective means of promoting this new scab-resistant apple variety. This has
helped generate a high industry demand for „Kalei‟ trees. In addition, it has encouraged the adoption
of intensive planting systems, with growers able to see the high yields and fruit quality that can be
achieved from such systems.
The site has also been used as a grower resource and link to „Future Orchards 2012‟, and been made
continuously available for ad hoc visits by individual growers.
International growers, researchers and nurserymen from France, Germany, the Netherlands, New
Zealand and Italy have visited the site, in addition to regular visits from interstate growers.
Farm walks were held at the site on:
- 18 February 2009
- 6 April 2009
- 14 April 2009
- 15 June 2009 (linked with „Future Orchards 2012‟)
- 9 November 2009
- 12 November 2009 (linked with „Future Orchards 2012‟)
- 11-19 February 2010 *
- 25 March 2010
- 25 June 2010 (linked with „Future Orchards 2012‟)
- 11-29 April 2011 *
- 29 March - 20 April 2012 *
* These farm walks were conducted as open ended events, where growers could visit at any time
between these dates. This strategy worked very well, as growers could see the cropping trees when it
best suited them during this busy period of the harvest season, and were also able to discuss specific
issues affecting their individual orchards. This helped maximise the number of people able to view the
high density plantings and heavily cropping „Kalei‟ trees. Dr Middleton was available at all times
during these periods to discuss the project results.
As „Future Orchards 2012‟ guest speaker, Dr Middleton presented project results to growers in
seminars and farm walks at Orange, NSW (29 March 2010), Batlow, NSW (30 March 2010) and
Shepparton, Vic (1 April 2010). Samples of „Kalei‟ and „Selection 1‟ apples were provided at each
location so that interstate growers could see and taste these scab-resistant selections.

85
„Kalei‟ apples were also taken to the national Apple and Pear Conference in Adelaide in August 2011,
for growers and industry representatives from all states of Australia to view and sample.
Industry articles
Middleton, S. (2010). Queensland high density planting system trials for new scab-resistant apples.
APAL website. 9pp.
Middleton, S. (2010). Measurement of light interception and light levels within apple tree canopies.
„Future Orchards 2012‟ handout.
Reppel, B. journalist (2010). Is this the world‟s best apple? The Furrow. 3: 24-25.
Conference presentations
Middleton, S., Smyth, H., McWaters, A., Wilkie, J. and Reid, C. (2010). „RS103-130‟ scab-resistant
apple – from orchard to consumer. International Horticulture Congress, Lisbon, Portugal. 22-27
August, 2010.
Middleton, S.G. (2011). Apple tree performance under netting. Australian Apple and Pear
Conference. 4 August 2011. Adelaide, SA.
Media publicity
There have been two intensive periods of mainstream media coverage of „Kalei‟ apple during the
course of this project.
November/December 2009
Widespread national and international media coverage of „RS103-130‟ (synonym „Kalei‟) at this time
included television interviews by Dr Middleton with all four major Australian networks (7, 9, 10,
ABC) and radio interviews with stations in Qld, NSW, ACT, Vic and ACRN (Australian Community
Rural Network), which provided the recorded interview to 120 radio stations across Australia. Press
coverage included Brisbane Courier Mail, Sydney Morning Herald, Melbourne Age and regional
newspapers. The editorial value of this was calculated at over $600 000.
International television coverage included BBC London, CBS New York and CBC Moscow (100
million viewers). Articles about „RS103-130‟ were published in newspapers including UK Telegraph,
London Independent, New York Daily News and Die Welt (Germany).
April/May 2012
Media publicity on this occasion centred on the public release of „RS103-130‟ as the variety „Kalei‟.
Again, all four major television networks (7, 9, 10, ABC) aired the story and interviews in their news
bulletins, with additional coverage on Morning Sunrise (Ch 7). Radio interviews (ABC and
commercial) were also conducted by Dr Middleton and by the Minister for Agriculture, Fisheries and
Forestry, Qld, Hon John McVeigh. Published newspaper articles included Sydney Morning Herald,
The Australian, Herald Sun and Brisbane Courier Mail.
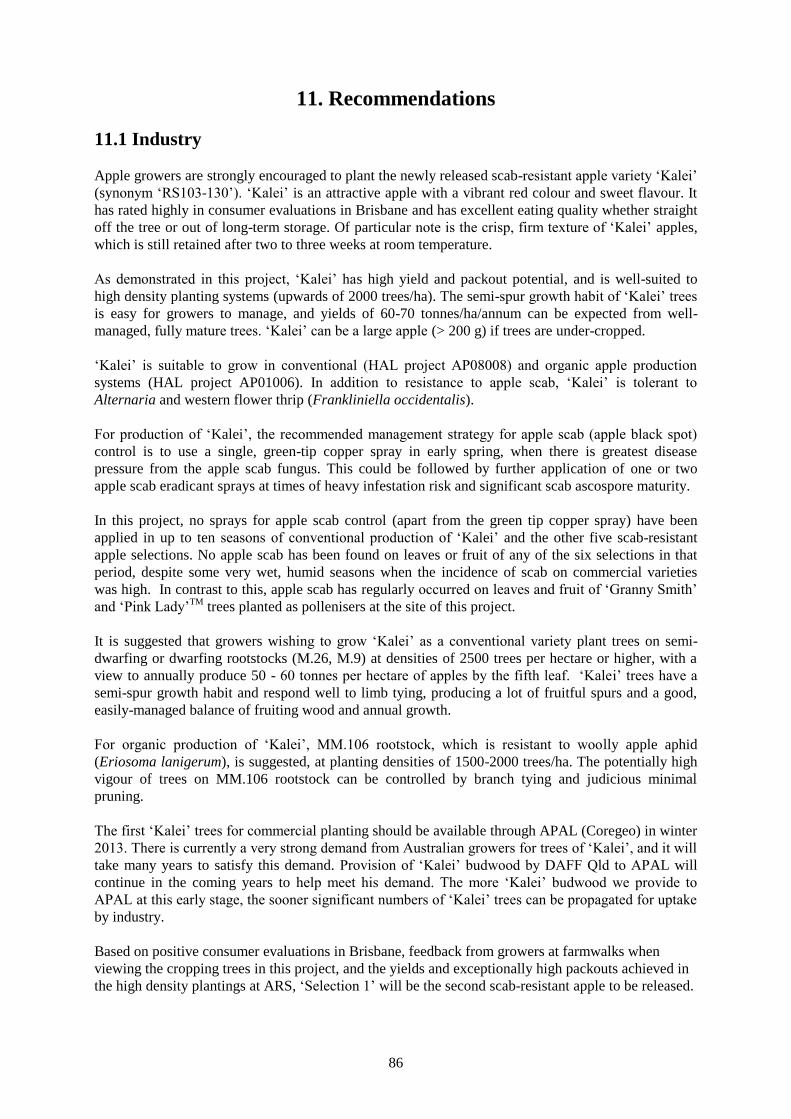
86
11. Recommendations
11.1 Industry
Apple growers are strongly encouraged to plant the newly released scab-resistant apple variety „Kalei‟
(synonym „RS103-130‟). „Kalei‟ is an attractive apple with a vibrant red colour and sweet flavour. It
has rated highly in consumer evaluations in Brisbane and has excellent eating quality whether straight
off the tree or out of long-term storage. Of particular note is the crisp, firm texture of „Kalei‟ apples,
which is still retained after two to three weeks at room temperature.
As demonstrated in this project, „Kalei‟ has high yield and packout potential, and is well-suited to
high density planting systems (upwards of 2000 trees/ha). The semi-spur growth habit of „Kalei‟ trees
is easy for growers to manage, and yields of 60-70 tonnes/ha/annum can be expected from well-
managed, fully mature trees. „Kalei‟ can be a large apple (> 200 g) if trees are under-cropped.
„Kalei‟ is suitable to grow in conventional (HAL project AP08008) and organic apple production
systems (HAL project AP01006). In addition to resistance to apple scab, „Kalei‟ is tolerant to
Alternaria and western flower thrip (Frankliniella occidentalis).
For production of „Kalei‟, the recommended management strategy for apple scab (apple black spot)
control is to use a single, green-tip copper spray in early spring, when there is greatest disease
pressure from the apple scab fungus. This could be followed by further application of one or two
apple scab eradicant sprays at times of heavy infestation risk and significant scab ascospore maturity.
In this project, no sprays for apple scab control (apart from the green tip copper spray) have been
applied in up to ten seasons of conventional production of „Kalei‟ and the other five scab-resistant
apple selections. No apple scab has been found on leaves or fruit of any of the six selections in that
period, despite some very wet, humid seasons when the incidence of scab on commercial varieties
was high. In contrast to this, apple scab has regularly occurred on leaves and fruit of „Granny Smith‟
and „Pink Lady‟TM
trees planted as pollenisers at the site of this project.
It is suggested that growers wishing to grow „Kalei‟ as a conventional variety plant trees on semi-
dwarfing or dwarfing rootstocks (M.26, M.9) at densities of 2500 trees per hectare or higher, with a
view to annually produce 50 - 60 tonnes per hectare of apples by the fifth leaf. „Kalei‟ trees have a
semi-spur growth habit and respond well to limb tying, producing a lot of fruitful spurs and a good,
easily-managed balance of fruiting wood and annual growth.
For organic production of „Kalei‟, MM.106 rootstock, which is resistant to woolly apple aphid
(Eriosoma lanigerum), is suggested, at planting densities of 1500-2000 trees/ha. The potentially high
vigour of trees on MM.106 rootstock can be controlled by branch tying and judicious minimal
pruning.
The first „Kalei‟ trees for commercial planting should be available through APAL (Coregeo) in winter
2013. There is currently a very strong demand from Australian growers for trees of „Kalei‟, and it will
take many years to satisfy this demand. Provision of „Kalei‟ budwood by DAFF Qld to APAL will
continue in the coming years to help meet his demand. The more „Kalei‟ budwood we provide to
APAL at this early stage, the sooner significant numbers of „Kalei‟ trees can be propagated for uptake
by industry.
Based on positive consumer evaluations in Brisbane, feedback from growers at farmwalks when
viewing the cropping trees in this project, and the yields and exceptionally high packouts achieved in
the high density plantings at ARS, „Selection 1‟ will be the second scab-resistant apple to be released.

87
The future of the other four apple selections in this project is less clear. „Selection 2‟ is well-liked by
consumers, but trees are not as easy to manage for high yields and packouts as „Kalei‟ is. „Selection 2‟
is also susceptible to Alternaria and powdery mildew (caused by Podosphaera leucotricha).
The yields of high density „Selection 5‟ trees on V-trellis have been disappointing, and consumer
sentiment about this apple selection has been mixed.
„Selection 3‟ trees have consistently produced exceptionally high yields and packouts in the high
density systems, however the apples are very large, even on heavily cropped trees, and are of poorer
texture than „Kalei‟, „Selection 1‟ and „Selection 2‟.
The very high susceptibility of „Selection 4‟ to Alternaria will likely exclude this apple selection from
serious consideration for commercial release. The heavy leaf drop that can occur quite early in the
season as a consequence of Alternaria infection has led to very poor yields of this selection in hdp
systems.
A report specific to „Kalei‟, combining information from projects AP08008 and AP08041, is to be
written for grower and public release at the conclusion of project AP08041 in May 2013. This will
coincide with the first release of „Kalei‟ trees from APAL for planting by growers in winter 2013.
The high density planting systems trial site in this project has been a key R, D and E resource for
growers, as well as linking in with “Future Orchards 2012” as appropriate. It is important that this site
continues to be maintained and made available to growers and other interested parties to visit.
The two key functions of this site into the future are (a) help facilitate the adoption of intensive
production systems and the development of grower skills and confidence in managing these systems
and (b) promote the adoption of „Kalei‟ and „Selection 1‟ by industry, through the availability of the
site for growers to view high density plantings of trees of these two scab-resistant apple varieties,
especially at harvest when the high yields and packouts of these varieties are most evident.
11.2 Scientific
The scab resistance of „Kalei‟ and the other five apple selections in this project has proven robust in
the field. No apple scab has occurred on trees or fruit of the scab-resistant apples since planting,
despite the presence of the disease on leaves and fruit of „Granny Smith‟ and „Pink Lady‟TM
polleniser
trees. „Kalei‟ should also be ideally suited to conventional and organic production systems in other
apple producing regions of Australia, particularly those areas which do not have spring and summer
rainfall, as occurs in Queensland.
Whilst „Kalei‟ is resistant to apple scab, and control sprays for this disease are not needed, the apple
scab resistance is conferred by a single major gene complex (Vf derived from Malus floribunda) that
appears to be simply inherited when varieties with this gene are used in a conventional cross-breeding
program. Caution is therefore warranted to avoid exposure of resistant varieties to excessive pressure
from apple scab in field situations. For this reason, the management strategy for apple scab
recommended in growing „Kalei‟ is to use a single, green-tip copper spray in early spring, when there
is greatest disease pressure from the apple scab fungus. This could be followed by one or two
applications of an apple scab eradicant spray at times of heavy infestation risk and significant scab
ascospore maturity.
The genotyping of „Kalei‟ and 15 other scab-resistant selections (including „Selection 1‟) is currently
underway in project AP08041 to confirm if the scab-resistance is conferred by the Vf gene, or is
polygenic. Preliminary results suggest that for some of our superior apple selections, the scab-
resistance is polygenic.

88
With the public release of „Kalei‟ in May 2012 and the first availability of „Kalei‟ trees to industry for
planting in winter 2013, it is appropriate that a future project consider the development of appropriate
maturity standards for this new variety, ready for industry adoption when the first commercially
produced „Kalei‟ apples are harvested and marketed in 2015. Projects AP08008 and AP08041 show
that unlike some other apple varieties, „Kalei‟ has exceptional long-term storage potential, even when
fruit are harvested eating ripe.
In preparation for the future release of „Selection 1‟, a Plant Breeder‟s Rights application for
Australian PBR protection of this selection is currently being prepared. „Selection 1‟ matures
immediately after „Gala‟ and has particular potential as an organic scab-resistant „Gala‟ style of apple.
„Selection 1‟ tends to be a small apple. Future work with „Selection 1‟ should consider the use of
“Artificial Spur Extinction”, as per the current PIPS Tree Structure project AP09031, as a
management strategy to increase the fruit size, and hence orchard productivity, of this selection.
If suitable strategies for the control of Alternaria can be identified, „Selection 2‟ could be considered
as a potential scab-resistant variety for commercialisation. The productivity and performance of
„Selection 2‟ grown semi-commercially on M.26 and M.9 rootstocks is unknown, and should be
investigated. This will likely provide the key to its potential for future release.
Based on results in this project, „Selection 5‟ and „Selection 4‟ are unlikely to be commercialised.
„Selection 3‟ presents something of a conundrum. It is not considered an appropriate scab-resistant
apple for Australia, however it does have some desirable traits. It is an excessively large apple with
possible adaptation to regions where water is limiting. „Selection 3‟ trees are high yielding and the
fruit develops a full deep red blush even when trees are shaded. It may therefore have potential as a
minimally managed scab-resistant apple for local consumption in a third world country where grower
knowledge of tree management is limited and conditions are unsuitable for other apple varieties.
The high density apple plantings at ARS in this project are the only statistically replicated trials of
their type in Australia. Hence the site is a particularly important resource for the Australian apple
industry from both research and industry development perspectives. With statistical replication, the
comparisons of yield, fruit quality and tree management between the hdp systems have robust
scientific validity. In addition, the site has proved invaluable as a focal point for farmwalks, practical
demonstrations, grower discussions and as a catalyst for industry change to efficient hdp systems.
The site consists of the only mature bearing trees of „Kalei‟ and „Selection 1‟currently in existence. It
is therefore important that it continues to be maintained and that data is collected from the „Kalei‟ and
„Selection 1‟ experiments as the trees become older. This is necessary to ensure that the Australian
apple industry has the most up to date information on appropriate tree management for these varieties,
as commercial plantings of „Kalei‟ and „Selection 1‟ trees are made into the future.
This project provided important information on the yield and packout potential of hdp systems for
„Kalei‟, thereby giving APAL the confidence to commercialise „Kalei‟ as a scab-resistant apple
appropriate for Australia.
The evaluation of the orchard productivity of potential varietal releases in semi-commercial hdp
plantings has identified significant issues of concern regarding some selections. For example, the high
susceptibility of „Selection 4‟ to Alternaria and the low productivity of „Selection 5‟ now largely
preclude their serious consideration for future commercialisation. It is critical that such issues are
identified prior to going down the expensive commercialisation path. Where practicable, such
research should be done for other scab-resistant apple selections considered strong candidates for
commercialisation.

89
12. Bibliography
APAL (2010). Apple and Pear Industry Research, Development & Extension Investment Plan 2010-
2015. “Innovation making a difference.” Apple and Pear Australia Ltd. October 2010. 57pp.
Barritt, B.H. (1992). Intensive orchard management. Washington State Fruit Commission, USA. ISBN
0-9630659-1-2. 211pp.
Barritt, B.H., Rom, C.R., Guelich, K.R., Drake, S.R. and Dilley, M.A. (1987). Canopy position and
light effects on spur, leaf and fruit characteristics of „Delicious‟ apple. HortScience 22: 402-405.
Blanpied, G.D. and Silsby, K.J. (1992). Predicting harvest date windows for apples. Information
Bulletin 221. Cornell Cooperative Extension Publication. Cornell University, Ithaca, NY, USA. 18pp.
Campbell, J.E. (1997). High density production systems for apples. Final Report. Project AP432.
Australian Horticultural Research and Development Corporation.
Christensen, J.V. (1979). Effects of density, rectangularity and row orientation on apple trees,
measured in a multivariated experimental design. Scientia Horticulturae 10: 155-165.
Costa, G., Beltrame, E., Zerbini, P. and Pianezolla, A. (1996). High density planted apple orchards:
effects on yield, performance and fruit quality. Acta Horticulturae 451: 505-512.
Freeman, G.H. and Bolas, B.D. (1956). A method for the rapid determination of leaf areas in the field.
Report of East Malling Research Station for 1955. p. 104-107.
Jackson, J.E. (1978). Utilization of light resources by high density planting systems. Acta
Horticulturae 65: 61-70.
Jackson, J.E. (1980). Light interception and utilization by orchard systems. p. 208-267. In J. Janick
(ed.). Horticultural Reviews Volume 2. AVI Publishing, Wesport, Connecticut, USA.
Jackson, J.E. (1997). Light interception and canopy characteristics at low latitudes in relation to
orchard system design. Acta Horticulturae 451: 417-425.
James, P. (1997). Performance of three apple cultivars on six rootstocks during the first six seasons, at
Lenswood, South Australia. Acta Horticulturae 451: 163-169.
James, P.A. and Middleton, S.G. (2001). Apple cultivar and rootstock performance at Lenswood,
South Australia. Acta Horticulturae 557: 69-76.
Jonkers, H. (1979). Biennial bearing in apple and pear: a literature survey. Scientia Horticulturae 11:
303-317.
Jotic, P. and Oakford, M. (2003). Intensive apple growing systems. Final Report. Project AP98022.
Horticulture Australia Limited. December 2003.
Mantinger, H. (2000). The south Tyrolean apple plantating system. Acta Horticulturae 513: 279-286.
Marini, R.P. (2002). Performance of four semi-dwarf apple rootstocks after five years at 24 locations.
Compact Fruit Tree 35(1): 6-7.
Middleton, S.G. and McWaters, A.D. (1997). Apple orchard system design and productivity. Final
Report. Project AP401. Australian Horticultural Research and Development Corporation. Dec 1997.

90
Middleton, S.G. and McWaters, A.D. (2001). Increasing the yield and fruit quality of Australian apple
orchards. Final Report. Project AP97010. Horticulture Australia Limited. October 2001.
Middleton, S. and McWaters, A. (2002). Hail netting of apple orchards – Australian experience.
Compact Fruit Tree 35(2): 51-55.
Middleton, S., McWaters, A., James, P., Jotic, P., Sutton, J. and Campbell, J. (2002). The productivity
and performance of apple orchard systems in Australia. Compact Fruit Tree 35(2): 43-47.
Middleton, S.G., Zeppa, A.G., Nimmo, P.R. and Horlock, C.M. (2007). Organic production of a new
Australian-bred scab resistant apple in Queensland, Australia. Acta Horticulturae 737: 139-145.
Mika, A. and Piatkowski, M. (1986). Results of a 10-year trial of high-density planting of McIntosh
and Macspur apple trees. Acta Horticulturae 160: 293-304.
Österreicher, J. (2004). Achieving a balance of growth and cropping – practical considerations of how
to obtain a calm tree. Compact Fruit Tree 37(1): 19-20.
Palmer, J.W. (1987). The measurement of leaf area in apple trees. Journal of Horticultural Science
62: 5-10.
Palmer, J.W. and Warrington, I.J. (2000). Underlying principles of successful apple planting systems.
Acta Horticulturae 513: 357-363.
Palmer, J.W. and Wertheim, S.J. (1980). Effects of tree density on fruit quality. Acta Horticulturae
114: 139.
Parry, M.S. (1978). Integrated effects of planting density on growth and cropping. Acta Horticulturae
65: 91-100.
Parry, M.S. (1981). A comparison of hedgerow and bush tree orchard systems at different within-row
spacings with four apple cultivars. Journal of Horticultural Science 56: 219-235.
Perry, R. (1997). The performance of „Jonagold‟ and „Empire‟ apple in an NC-140 rootstock and
orchard systems trial in Michigan. Acta Horticulturae 451: 453-458.
Robinson, T.L. (2000). V-shaped apple planting systems. Acta Horticulturae 513: 337-347.
Robinson, T.L. and Hoying, S.A. (2002). What we have learned from our latest orchard planting
systems trial in New York state. Compact Fruit Tree 35(4): 103-106.
Sansavini, S., Bassi, D. and Giunchi, L. (1980). Tree efficiency and fruit quality in high-density apple
orchards. Acta Horticulturae 114: 114-136.
Sansavini, S. and Corelli-Grappadelli, L. (1996). Yield and light efficiency for high quality fruit in
apple and peach high density planting. Acta Horticulturae 451: 559-568.
Tustin, D.S., Dayatilake, G.A., Henriod, R.E., Breen, K.C. and Oliver, M. (2011). Changes in fruiting
behaviour and vegetative development of „Scifresh‟ apple in response to artificial spur extinction
using centrifugal training. Acta Horticulturae 903: 603-610.
Wertheim, S.J. (1985). Productivity and fruit quality of apple in single-row and full-field planting
systems. Acta Horticulturae 26: 191-208.

91
Wills, A.K. (1976). The granite and traprock area of south east Queensland. A land inventory and
land utilisation study, Technical Bulletin no.13, Division of Land Utilisation, Queensland Department
of Primary Industries, Brisbane.
Wünsche, J.N., Lakso, A.N. and Robinson, T.L. (1995). Comparison of four methods for estimating
total light interception by apple trees of varying forms. HortScience 30 (2): 272-276.
Zeppa, A., Dullahide, S., McWaters, A. and Middleton, S. (2002). Status of breeding for apple scab
resistance in Australia. Acta Horiculturae 595: 33-41.
Zeppa, A., Middleton, S., McWaters, A., Bell, G., Forrest, A. and Smyth, H. (2006). Consumers enjoy
new black spot resistant apple. Tree Fruit. Nov 2006. pp. 16-17, 19.
Zeppa, A., Middleton, S., McWaters, A., Bell, G., Forrest, A. and Smyth, H. (2007). Apple scab
resistance breeding in Australia. Compact Fruit Tree 40(7): 27-29.

92
Appendix. Overview of hdp systems planted at Applethorpe
Research Station
H
IGH
DE
NS
ITY
SY
ST
EM
S T
RIA
LS
-
AP
PL
ET
HO
RP
E R
ES
EA
RC
H S
TA
TIO
N
RO
WS
EL
EC
TIO
NA
GE
TR
EL
LIS
RO
OT
ST
OC
KS
PA
CIN
GS
DE
NS
ITIE
S
(201
1/1
2)
(in
tra-r
ow
)(t
rees
/ha
)
6N
ort
hK
ale
i8
th le
af
Op
en
VM
M.1
06
1.2
5m
, 0.7
5m
3555, 5925
So
uth
Ka
lei
7th
le
af
Op
en
VM
.9, M
.26
1.0
m4444
7N
ort
hK
ale
i8
th le
af
Op
en
VM
M.1
06, M
.26
1.0
m4444
So
uth
RS
103
-11
08
th le
af
Op
en
VM
.26
1.0
m4444
So
uth
RS
103
-56
8th
le
af
Op
en
VM
.26
1.0
m4444
8N
ort
hK
ale
i8
th le
af
Sta
nd
ard
MM
.106, M
.26
1.0
m2500
So
uth
RS
103
-11
08
th le
af
Sta
nd
ard
M.2
61.0
m2500
So
uth
RS
103
-56
8th
le
af
Sta
nd
ard
M.2
61.0
m2500
9R
S1
03
-56
8th
le
af
Sta
nd
ard
MM
.106, M
.26
1.5
m,
1.2
5m
, 1.0
m1666, 2000, 2500
0.7
5m
, 0.5
m3333, 5000
10
RS
103
-56
9th
le
af
Sta
nd
ard
MM
.106, M
.26
1.5
m,
1.2
5m
, 1.0
m1666, 2000, 2500
O.3
0.7
5m
, 0.5
m3333, 5000
11
Ka
lei
10th
le
af
Sta
nd
ard
MM
.106, M
.26
1.7
5m
, 1.5
m,
1.2
5m
1428, 1666, 2000
1.0
m,
0.7
5m
, 0.5
m2500, 3333, 5000
12
Ka
lei
10th
le
af
Sta
nd
ard
MM
.106, M
.26
1.7
5m
, 1.5
m,
1.2
5m
1428, 1666, 2000
1.0
m,
0.7
5m
, 0.5
m2500, 3333, 5000

93
H
IGH
DE
NS
ITY
SY
ST
EM
S T
RIA
LS
T1
6
- A
PP
LE
TH
OR
PE
RE
SE
AR
CH
ST
AT
ION
RO
WS
EL
EC
TIO
NA
GE
TR
EL
LIS
RO
OT
ST
OC
KS
PA
CIN
GS
DE
NS
ITIE
S
(2011/1
2)
(in
tra
-ro
w)
(tre
es/h
a)
13
Kale
i8th
leaf
Sta
ndard
MM
.106, M
M.1
02
1.0
m2500
M.2
6, O
.3, M
.9
14
Kale
i8th
leaf
Sta
ndard
MM
.106, M
M.1
02
1.0
m2500
M.2
6, O
.3, M
.9
15
3.6
m a
lley
FB
22-4
78th
leaf
(N)
Sta
ndard
MM
.106, M
M.1
02
1.0
m2777
7th
leaf
(S)
M.2
6, O
.3, M
.91.2
5m
, 0.9
m, 0.7
5m
2222, 3086, 3703
16
3.6
m a
lley
FB
22-4
78th
leaf
(N)
Sta
ndard
MM
.106, M
M.1
02
1.0
m2777
7th
leaf
(S)
M.2
6, O
.3, M
.91.2
5m
, 0.9
m, 0.7
5m
2222, 3086, 3703
17
3.7
m a
lley
RS
103-1
10
7th
leaf
Sta
ndard
MM
.106, M
M.1
02
1.2
5m
,1.0
m
2162,
2702
M.2
6, O
.3, M
.90.7
5m
, 0.6
25m
3603, 4324
18
3.7
m a
lley
RS
103-1
10
7th
leaf
Sta
ndard
MM
.106, M
M.1
02
1.2
5m
,1.0
m
2162,
2702
M.2
6, O
.3, M
.90.7
5m
, 0.6
25m
3603, 4324
19
3.7
m a
lley
RS
103-1
10
7th
leaf
Sta
ndard
MM
.106, M
M.1
02
1.5
m, 1.2
5m
,1.0
m
1818, 2162,
2702
M.2
6, O
.3, M
.90.7
5m
, 0.6
25m
3603, 4324