FINAL - Evaluation of the Texas Vehicle Emissions Inspection ...
152
FINAL Evaluation of the Texas Vehicle Emissions Inspection and Maintenance Program in the Dallas-Fort Worth and Houston-Galveston- Brazoria Nonattainment Areas Prepared for: Texas Commission on Environmental Quality Prepared by: Eastern Research Group, Inc. June 30, 2022
-
Upload
khangminh22 -
Category
Documents
-
view
2 -
download
0
Transcript of FINAL - Evaluation of the Texas Vehicle Emissions Inspection ...

FINAL
Evaluation of the Texas Vehicle Emissions Inspection and Maintenance Program in the Dallas-Fort Worth and Houston-Galveston-Brazoria Nonattainment Areas
Prepared for:
Texas Commission on Environmental Quality
Prepared by:
Eastern Research Group, Inc.
June 30, 2022

ERG No.: 0433.00.007.002
EVALUATION OF THE TEXAS VEHICLE EMISSIONS INSPECTION AND MAINTENANCE PROGRAM IN THE DALLAS-FORT WORTH AND HOUSTON-
GALVESTON-BRAZORIA NONATTAINMENT AREAS
Prepared for:
Edgar Gilmore Texas Commission on Environmental Quality
12100 Park 35 Circle Austin, TX 78753
Prepared by:
Cindy Palacios Jim Lindner
Sandeep Kishan
Eastern Research Group, Inc. 3508 Far West Blvd., Suite 210
Austin, TX 78731
Rob Klausmeier dKC de la Torre Klausmeier Consulting
1401 Foxtail Cove Austin, TX 78704
June 30, 2022

Evaluation of the Texas Vehicle Emissions Inspection and Maintenance Program in the Dallas-Fort Worth and Houston-Galveston-Brazoria Nonattainment Areas Final – June 2022
Table of Contents
Executive Summary .................................................................................................................................... 8 A. Coverage .............................................................................................................................. 8
B. Inspection............................................................................................................................ 9
C. Repair ................................................................................................................................. 10
D. I/M Emissions Benefits ................................................................................................... 11
E. Measures for Evaluating Station Performance .......................................................... 11
F. Recommendations........................................................................................................... 12
I. Introduction................................................................................................................................... 15 A. Evaluation Analysis Approach...................................................................................... 15
B. Structure of the Report .................................................................................................. 16
II. Coverage......................................................................................................................................... 17
III. Inspection....................................................................................................................................... 19 A. Check Major Data Fields for Appropriateness .......................................................... 19
B. Inspection Statistics: Number of Vehicles Inspected............................................... 20
C. Repeat I/M Failure Patterns........................................................................................... 26
D. OBD Inspection Analyzer Communication Performance........................................ 28
E. TIMS Handling of OBD Codes ....................................................................................... 33
IV. Repair .............................................................................................................................................. 40 A. Number and Types of Repairs ...................................................................................... 40
B. Success of Repairs to Vehicles Failing OBD............................................................... 41
C. Average repair costs ....................................................................................................... 51
V. Estimates of I/M Benefits........................................................................................................... 56 A. Estimate of the Annual I/M Benefit from Paired I/M and RS Data ....................... 56
B. Calculation of the Annual I/M Benefit using the Comprehensive Method ......... 58
C. Calculation of the Annual I/M Benefit- Reference Method..................................... 77
VI. Measures for Evaluating Station Performance..................................................................... 81 A. OBD Data Checks for Evidence of Station Fraud ...................................................... 82
B. Additional Inspection Manipulation............................................................................ 96
C. Compilation of Percentile Rankings ..........................................................................105
VII. References....................................................................................................................................114
Appendix A - DTC Groups
Appendix B - OBD Communication Rates by Vehicle Model Code for Elevated Miscommunications
iii

Evaluation of the Texas Vehicle Emissions Inspection and Maintenance Program in the Dallas-Fort Worth and Houston-Galveston-Brazoria Nonattainment Areas Final – June 2022
List of Tables
Table II-1. Count of Unique I/M-Eligible RS Vehicles Registered in Texas I/M Program Areas by Calendar Year ................................................................................................................................ 17
Table II-3. Count of Unique I/M Eligible RS Vehicles Paired with Unique I/M-Compliant
Table III-9. OBD Communication Rates by Vehicle Model Code for Elevated
Table III-13. Comparison of Inspector-Entered MIL Illumination Status (Engine Running,
Table III-14. Comparison of Downloaded MIL Command Status with Inspector- Entered
Table III-15. Comparison of Downloaded MIL Command Status with Overall OBD Test
Table IV-3. Comparison of OBD Evaporative Emission Control System Test Results with
Table V-1. Number of Vehicles in Each I/M Sequence Category for the Dataset of RS Events
Table V-2. RS Averages Before and After an I/M Test for HGB and DFW for I/M Sequence
Table II-2. Count of Unique I/M-Compliant Vehicles in Texas I/M Program Areas......................... 17
Vehicles in Texas I/M Program Areas by Calendar Year ....................................................................... 18
Table III-1. Number of Inspections for DFW Passenger Cars ............................................................... 21
Table III-2. Number of Inspections for DFW Light Trucks .................................................................... 22
Table III-3. Number of Inspections for HGB Passenger Cars................................................................ 22
Table III-4. Number of Inspections for HGB Light Trucks .................................................................... 23
Table III-5. Frequency Distribution of Test Sequences .......................................................................... 27
Table III-6. OBD Communication Rates by Vehicle Model Year ........................................................... 29
Table III-7. OBD Communication Rates by Equipment Manufacturer ................................................ 31
Table III-8. OBD Communication Rates by Vehicle Make ...................................................................... 31
Miscommunications ...................................................................................................................................... 32
Table III-10. Comparison of DLC Communication Status with Overall OBD Test Results ........... 34
Table III-11. Comparison of OBD Test Result with Overall Test Result............................................. 35
Table III-12. Comparison of KOEO MIL Bulb Check Result with Overall OBD Test Result ........... 35
KOER) with Overall OBD Test Result ......................................................................................................... 36
MIL Illumination Status (Engine Running, KOER) ................................................................................... 36
Result................................................................................................................................................................ 36
Table III-16. Unset Monitors vs. Test Readiness Status for Inspections............................................ 37
Table III-17. Unset Monitors vs. Test Readiness Status for Inspections by Model Year ............... 38
Table III-18. Comparison of Readiness Status Field with Overall OBD Test Result ........................ 39
Table IV-1. Repairs Listed in the TIMS ...................................................................................................... 41
Table IV-2. System Specific Repair Analysis for Vehicles ..................................................................... 45
Gas Cap Test Results..................................................................................................................................... 46
Table IV-4. 10 Most Common Repair Slates ............................................................................................. 46
Table IV-5. Most Common OBD DTCs and Associated Repairs ........................................................... 48
Table IV-6. TIMS Records with a Repair Cost of Zero by Category ..................................................... 51
Table IV-7. Average Repair Costs ............................................................................................................... 53
Matched with I/M Tests ................................................................................................................................ 63
Category = FP .................................................................................................................................................. 74
iv

Evaluation of the Texas Vehicle Emissions Inspection and Maintenance Program in the Dallas-Fort Worth and Houston-Galveston-Brazoria Nonattainment Areas Final – June 2022
List of Tables (Continued)
Table V-3. RS Averages Before and After an I/M Test for HGB and DFW for I/M Sequence Category = 1P.................................................................................................................................................. 74
Table VI-1. Rates of OBD-Downloaded and Inspector-Entered VIN Discrepancies by Model
Table VI-6. Stations with Highest Percent of Electronic Profile and Readiness Profile
Table V-4. Model Year Distributions for RS-Matched-to-I/M Fleet and I/M Tested Fleet ............... 75
Table V-5. RS Average Concentrations to Evaluate the Annual I/M Benefit ..................................... 76
Year ................................................................................................................................................................... 83
Table VI-2. Stations with Highest Rates of OBD and Entered VIN Mismatches................................ 85
Table VI-3. Rates of OBD Inspections without eVIN by Model Year ................................................... 85
Table VI-4. Stations with Highest Rates of Inspections without Downloaded eVINs ..................... 87
Table VI-5. Percentages of Tests with Various OBD Fraud Indicators ............................................... 90
Mismatches...................................................................................................................................................... 92
Table VI-7. OBD Communications Protocol Codes ................................................................................. 93
Table VI-8. Rates of Communication Protocol Mismatches by Model Year ...................................... 94
Table VI-9. Stations with Highest Percent of Communication Protocol Mismatches...................... 95
Table VI-10. Number of Close-in-Time Retests per Station .................................................................. 97
Table VI-11. Percent of Close-In-Time Retest Inspections for 10 Highest Ranking Stations ........ 98
Table VI-12. Rate of Safety-Only Inspections for 10 Highest Ranking Stations.............................102
Table VI-13. Percent of Retest Inspections Switched from Light-Duty to Heavy-Duty for 10 Highest Ranking Stations ...........................................................................................................................103
Table VI-14. Stations with Highest OBD Failure Rates.........................................................................104
Table VI-15. Stations with Lowest OBD Failure Rates ..........................................................................105
Table VI-16. Top 50 Most Suspicious Stations for Potentially Fraudulent Inspections ...............108
Table VI-17. 50 Mid-Range Stations for Potentially Fraudulent Inspections ..................................110
v

Evaluation of the Texas Vehicle Emissions Inspection and Maintenance Program in the Dallas-Fort Worth and Houston-Galveston-Brazoria Nonattainment Areas Final – June 2022
List of Figures
Figure ES-1. Initial Inspection Failure Rates by, MY and I/M Program Area ........................................9
Figure III-1. Number of Inspections by Model Year and I/M Program Area...................................... 24
Figure III-2. Number of Inspections by Year and Month of Inspection.............................................. 25
Figure III-3. Initial Inspection Failure Rate by Model Year and I/M Program Area.......................... 25
Figure IV-1. Repairs with Cost Greater than or Equal $2,000 .............................................................. 52
Figure IV-2. Mean Repair Costs by Model Year and Inspection Year (Unedited Dataset) .............. 53
Figure IV-3. Mean Repair Costs by Model Year and Inspection Year (Edited Dataset) ................... 54
Figure IV-4. Distribution of Repair Costs by Category (Unedited Dataset) ....................................... 55
Figure IV-5. Distribution of Repair Costs by Category (Edited Dataset) ............................................ 55
Figure V-1. Average RS HC vs. Month from the I/M Test RS Readings from the HGB Program Area.................................................................................................................................................. 59
Figure V-2. Average RS CO vs. Month from the I/M Test RS Readings from the HGB Program Area.................................................................................................................................................. 60
Figure V-3. Average RS NOX vs. Month from the I/M Test RS Readings from the HGB Program Area.................................................................................................................................................. 60
Figure V-4. Average RS HC vs. Month from the I/M Test RS Readings from the DFW Program Area.................................................................................................................................................. 61
Figure V-5. Average RS CO vs. Month from the I/M Test RS Readings from the DFW Program Area.................................................................................................................................................. 61
Figure V-6. Average RS NOX vs. Month from the I/M Test RS Readings from the DFW Program Area.................................................................................................................................................. 62
Figure V-7. Average RS HC vs. Month After the I/M Test for DFW Vehicles with I/M Sequence Category = 1P................................................................................................................................ 64
Figure V-8. Average RS HC vs. Month After the I/M Test for DFW Vehicles with I/M Sequence Category = FP................................................................................................................................ 64
Figure V-9. Average RS CO vs. Month After the I/M Test for DFW Vehicles with I/M Sequence Category = 1P................................................................................................................................ 65
Figure V-10. Average RS CO vs. Month After the I/M Test for DFW Vehicles with I/M Sequence Category = FP................................................................................................................................ 65
Figure V-11. Average RS NOX vs. Month After the I/M Test for DFW Vehicles with I/M Sequence Category = 1P................................................................................................................................ 66
Figure V-12. Average RS NOX vs. Month After the I/M Test for DFW Vehicles with I/M Sequence Category = FP................................................................................................................................ 66
Figure V-13. Average 1P RS HC by Model Year Group Before and After I/M Test for DFW Vehicles ............................................................................................................................................................ 68
Figure V-14. Average FP RS HC by Model Year Group Before and After I/M Test for DFW Vehicles ............................................................................................................................................................ 68
Figure V-15. Average 1P RS HC by Model Year Group Before and After I/M Test for HGB Vehicles ............................................................................................................................................................ 69
Figure V-16. Average FP RS HC by Model Year Group Before and After I/M Test for HGB Vehicles ............................................................................................................................................................ 69
vi

Evaluation of the Texas Vehicle Emissions Inspection and Maintenance Program in the Dallas-Fort Worth and Houston-Galveston-Brazoria Nonattainment Areas Final – June 2022
Figure V-17. Average 1P RS CO by Model Year Group Before and After I/M Test for DFW Vehicles ............................................................................................................................................................ 70
Figure V-18. Average FP RS CO by Model Year Group Before and After I/M Test for DFW
Figure V-19. Average 1P RS CO by Model Year Group Before and After I/M Test for HGB
Figure V-20. Average FP RS CO by Model Year Group Before and After I/M Test for HGB
Figure V-21. Average 1P RS NOX by Model Year Group Before and After I/M Test for DFW
Figure V-22. Average FP RS NOX by Model Year Group Before and After I/M Test for DFW
Figure V-23. Average 1P RS NOX by Model Year Group Before and After I/M Test for HGB
Figure V-24. Average FP RS NOX by Model Year Group Before and After I/M Test for HGB
Figure V-25. Number of Remote Sensing Vehicles (linear scale) by Model Year and I/M
Figure VI-1. Rates of OBD-Downloaded and Inspector-Entered VIN Discrepancies by
Figure VI-3. Rates of Retest Discrepancies in OBD Computer and Readiness Information,
Figure VI-8. Rates of Safety-Only Tests Vehicles 12-24 Years Old for Stations and
Figure VI-11. Fraction of Stations from the DFW Program Area by Rank Decile for Potential
Vehicles ............................................................................................................................................................ 70
Vehicles ............................................................................................................................................................ 71
Vehicles ............................................................................................................................................................ 71
Vehicles ............................................................................................................................................................ 72
Vehicles ............................................................................................................................................................ 72
Vehicles ............................................................................................................................................................ 73
Vehicles ............................................................................................................................................................ 73
Area................................................................................................................................................................... 78
Figure V-26. Number of Remote Sensing Vehicles (log scale) by Model Year and I/M Area ......... 78
Figure V-27. Average RS HC by Model Year and I/M Area .................................................................... 79
Figure V-28. Average RS CO by Model Year and I/M Area .................................................................... 80
Figure V-29. Average RS NOx by Model Year and I/M Area .................................................................. 80
Station and Inspector.................................................................................................................................... 84
Figure VI-2. Rates of OBD Inspections without eVIN by Station and Inspector ............................... 86
by Station and Inspector .............................................................................................................................. 92
Figure VI-4. Rates of Communication Protocol Mismatches by Station and Inspector .................. 95
Figure VI-5. Number and Percent of Emissions and Safety-Only Inspections 2020........................ 99
Figure VI-6. Number and Percent of Emissions and Safety-Only Inspections 2021........................ 99
Figure VI-7. Percent of Inspections that Were Safety-Only, by Calendar Year ...............................100
Inspectors ......................................................................................................................................................101
Figure VI-9. Rates of Safety-Only Tests Vehicles 0-24 Years Old by Station ..................................102
Figure VI-10. Distribution of Results and Percentiles for Errors of Commission..........................106
Inspection Fraud Indicators.......................................................................................................................113
vii

Evaluation of the Texas Vehicle Emissions Inspection and Maintenance Program in the Dallas-Fort Worth and Houston-Galveston-Brazoria Nonattainment Areas Final – June 2022
Executive Summary
This report documents the evaluation of the Texas Vehicle Emissions Inspection and Maintenance (I/M) program for the 2020 and 2021 biennial period. Eastern Research Group (ERG) performed this evaluation for the Texas Commission on Environmental Quality (TCEQ) using the Texas Information Management System (TIMS) database and Remote Sensing (RS) data from January 1, 2020, through December 31, 2021. A significant change occurred in the program since the last program evaluation. Beginning in January of 2020 tailpipe testing was eliminated; therefore, many analyses that were in past program evaluation reports are no longer necessary.
This evaluation generally follows the United States Environmental Protection Agency (EPA) draft guidance on using in-program data for the evaluation of the Texas I/M program performance [EPA, 2001] and the EPA guidance on the use of RS for the evaluation of I/M program performance [EPA, 2004]. 1 This study focuses on program coverage, the inspection process, and the repair process. Additionally, program benefits were estimated on an annual basis. However, beginning January 1, 2020, tailpipe testing was no longer part of the I/M process as the program became On-board Diagnostics (OBD)-only, testing model year (MY) 1996 and newer vehicles. Therefore, many analyses that were in previous program evaluation reports are not presented in this report.
Overall, the results for the Texas I/M program were positive. However, ERG found that improvements could be made in a few areas, and a list of specific recommendations for improvements in the program is provided in the last section of this Executive Summary. Some of the suggestions will be helpful for future biennial evaluations and will make the results more reflective of overall program performance.
A. COVERAGE
The results of the coverage analysis using out-of-program RS data revealed a consistent, high rate of participation in the Texas I/M program.
Participation Rates (Section II.A) – The program participation rates were estimated by determining the fraction of vehicles seen on the road during RS studies that had recent records in the TIMS. This analysis found that in the Dallas-Fort Worth (DFW) program area, the participation rate was 91.2% in 2020 and 94.0% in 2021. In the Houston-Galveston-Brazoria (HGB) program area, the 2020 and 2021 participation rates were 92.4% and 94.0%, respectively. The overall program participation rates were 91.8% in 2020 and 94.0% in 2021.
1 Citations for references are given in Section 7.
8

Evaluation of the Texas Vehicle Emissions Inspection and Maintenance Program in the Dallas-Fort Worth and Houston-Galveston-Brazoria Nonattainment Areas Final – June 2022
B. INSPECTION
Appropriateness of Major TIMS Fields (Section III.A) – The TIMS was used to document the Texas I/M program inspection process. This analysis checked the major fields in the TIMS using a series of basic data checks to demonstrate the accuracy and completeness of the data in the TIMS. ERG produced frequency distributions of almost all database variables to examine field values for in-range values, out-of-range values, and missing values. The following summarizes the major findings of this analysis.
Inspection Statistics (Section III.B) – Analysis of the TIMS data indicated that during the evaluation period, over 18.8 million OBD tests were performed on 1996 and newer MY light-duty passenger cars and trucks, resulting in approximately 8 million unique vehicle OBD tests. The DFW and HGB program areas initial inspection rates were similar and are illustrated in the figure below.
Figure ES-1. Initial Inspection Failure Rates by, MY and I/M Program Area
Repeat I/M Failure Patterns (Section III.C) – ERG examined the TIMS data to determine the relative frequencies of the I/M pass/fail patterns during each vehicle’s inspection cycle.
In 99.2% of the test sequences, a verified initial test or an initial test that could reasonably be assumed to be a true initial test was confirmed, and a final test certified.
9

Evaluation of the Texas Vehicle Emissions Inspection and Maintenance Program in the Dallas-Fort Worth and Houston-Galveston-Brazoria Nonattainment Areas Final – June 2022
OBD Inspection Analyzer Communication Performance (Section III.D) – Overall, OBD communication rates between vehicle computers and program analyzers were greater than 99%.
TIMS Handling of OBD Codes (Section III.E) – It appears that the OBD inspection logic used in Texas for light-duty gasoline-powered vehicles agrees with EPA policies. For the very few cases where this was found not to be true, ERG believes these instances were due solely to a minor oversight such as operator error or analyzers not having the latest software update for a brief period that resulted in a small percentage of errors.
C. REPAIR
Number and Types of Repairs (Section IV.A) – During the evaluation period, analysis of the TIMS data indicated that 95,218 repairs were made to vehicles to bring them into compliance with the Texas I/M program. The program requires reporting repair types according to five categories: fuel system, ignition electrical system, emissions system, engine mechanical, and miscellaneous. The fractions of total repairs in these five categories were approximately 39%, 8%, 16%, 1%, and 36%, respectively.
OBD Repair Effectiveness (Section IV.B) – ERG’s analyses indicated approximately 81% of OBD tests that initially fail for an illuminated malfunction indicator light (MIL) with stored diagnostic trouble codes (DTCs) eventually receive a passing inspection. And within that cohort, 62.1% of the MIL-On failures passed with confirmed repairs and their monitors reset, and 17.5% passed after being repaired but without failure mode monitors reset. As seen in the earlier studies, when evaluating repairs by failure category (i.e., evaporative emissions control system, O2 Sensor, Exhaust Gas Recirculation (EGR) System, air injection system, and catalytic converter), unset readiness monitors were seen to potentially “hide” malfunctions in 2% to 35% of “repaired” vehicles. This large range is consistent with the findings in previous program evaluation reports and reflects the uncertainty in identifying cases where unset readiness monitors are masking MIL illumination in repaired vehicles.
Average Repair Costs (Section IV.C) – The analysis of the TIMS repair cost data with repair costs of zero and greater than $2,000 removed indicate that Texas motorists spent approximately $5.6 million during this evaluation period performing 35,000 repairs so that they would be in compliance with the Texas I/M program. It should be noted that repair costs are hand-entered by the vehicle emissions inspectors, which can lead to transcription errors.
As in the previous studies, a large percentage (61.7%) of the repair costs in the TIMS were recorded as zero. Again, with zero repair costs and those over $2,000 removed, the median and mean repair costs ranged from $20 to $241 and $37 to $398.
10

Evaluation of the Texas Vehicle Emissions Inspection and Maintenance Program in the Dallas-Fort Worth and Houston-Galveston-Brazoria Nonattainment Areas Final – June 2022
D. I/M EMISSIONS BENEFITS
The annual emissions benefit of an I/M program (I/M benefit) can be measured by the decrease in emissions for the I/M fleet at the time of vehicle repairs. The annual I/M benefit was estimated by looking at before and after repair emissions and by pairing TIMS data with RS data.
Calculation of the Annual I/M Benefit using Comprehensive Method (Section V.B) – The analysis of RS data, which is out-of-program data, provides a different view of the annual I/M benefit of the Texas I/M program. The average RS emissions from 30 to 90 days before I/M inspections were compared to the average RS emissions from 1 to 90 days after the I/M inspections. About 96% of the vehicles measured by RS had I/M sequences produced by passing their initial inspections, while a little over 3% had a Fail-Pass I/M test sequence. Initial pass vehicles had RS emissions changes of +4.1% for hydrocarbon (HC), +6.4% increase for carbon monoxide (CO), and +3.4% increase for nitrogen oxides (NOx), while the Fail-Pass vehicles had RS emissions changes of +0.6% for HC, -2.1% for CO, and a -4.5% increase for NOx.
Remote Sensing Analysis of I/M and non-I/M Vehicles (Section V.C) – The vehicles observed by RS were divided into two groups: vehicles that have never been in the I/M program prior to the RS observation, and vehicles that have been in the I/M program prior to the RS observation. This provided a four-year period before the 2020/2021 analysis years, and a sufficiently large sample size to compare the I/M fleet to the no-I/M fleet. A slight HC benefit and a larger NOx benefit were observed for the I/M fleet; however, the I/M CO fleet average was higher than that of the no-I/M fleet.
E. MEASURES FOR EVALUATING STATION PERFORMANCE
(Section VI) – This section strives to consolidate the analyses performed that pertain to the evaluation of station performance. Distinctions between errors of commission vs. errors of omission were also identified whenever possible, with the former viewed as more likely attempts at committing a fraudulent test, while the latter could be viewed somewhat more leniently. An example of an error of commission would be a Vehicle Identification Number (VIN) mismatch, where the electronic VIN (eVIN) does not correspond to the hand-entered VIN. In the benign case, the discrepancies are basically random. In a highly suspicious case, the exact same eVIN may be found in a large number of tests, which seems to indicate a clear case of attempted clean-scanning. An example of an error of omission metric is a zero-value repair cost, as this will not result in falsely passing or failing the I/M test. In all, there were nine error-of-commission metrics and three error-of-omission metrics developed, and station rankings were developed for the error of commission category.
11

Evaluation of the Texas Vehicle Emissions Inspection and Maintenance Program in the Dallas-Fort Worth and Houston-Galveston-Brazoria Nonattainment Areas Final – June 2022
F. RECOMMENDATIONS
As a result of performing this biennial evaluation of the Texas I/M program, ERG developed a list of recommendations the TCEQ may consider implementing. As in the earlier reports, the purpose of most of these recommendations is to improve the program, but some also are intended to improve future biennial I/M program evaluations. For each recommendation, ERG provided an importance rating of High (***), Medium (**), or Low (*). These ratings are provided to assist the TCEQ in prioritizing efforts to improve the Texas I/M program.
TIMS Recommendations
TIMS Recommendation 1 (***): Increase number of repair categories. The TIMS repair data include only five different repair types, and these types are too general to permit a detailed analysis of the data. These types include fuel system, ignition/electrical system, emissions system, engine mechanical, and miscellaneous. “Miscellaneous” repairs make up almost 40% of the reported repairs. It is recommended that the TCEQ consider increasing the number of repair categories in the analyzer software and eliminating the “miscellaneous” category since that does not provide any useful information. Ideally, the repair choices that inspectors see and choose from would be only those that apply to the technology of the vehicle being inspected, although that does involve an increase in programming complexity. Another problem is that a large number of repairs with a cost of zero exist in the dataset, along with some extremely high (e.g., greater than $2,000) costs as well. The source of these errors is not clear, but the erroneous costs make it difficult to comprehensively assess costs across the entire dataset. It is possible that some zero cost repairs could be warranty repairs, so including a “Warranty” choice in the cost options could help track this.
OBD Recommendations
OBD Recommendation 1 (***): Investigate requiring a “set” status for certain monitors to prevent hiding malfunctions. Our analysis found that in 2% to 35% of instances when a vehicle received an initial fail for a certain monitored component, the retest OBD result, which follows a repair, could be hidden by an “unset” readiness status for that monitor. This opens the possibility that malfunctioning emissions control components could remain unrepaired even though the follow-up OBD test received a “pass.” ERG recommends that the TCEQ investigate implementing a software change that would require certain monitors to have a “set” readiness status on an OBD retest that follows certain types of initial failures. This software change was also recommended in the previous program evaluation report.
OBD Recommendation 2 (***): Review the OBD exemption list. Review the current list of vehicles on the OBD readiness exemption list to ensure it is up to date. This may
12

Evaluation of the Texas Vehicle Emissions Inspection and Maintenance Program in the Dallas-Fort Worth and Houston-Galveston-Brazoria Nonattainment Areas Final – June 2022
have been done recently, but the document does not indicate when the last update was performed.
OBD Recommendation 3 (***): Expand Trigger Reports. The TCEQ should work with the Texas Department of Public Safety (DPS) and expand the number and frequency of trigger reports.
OBD Recommendation 4 (*): Diesel OBD and Heavy-duty Gasoline OBD. Per the EPA guidance, Texas does not perform testing on OBD l heavy-duty; however, this topic continues to be discussed in the I/M community. California will begin implementing a heavy-duty diesel I/M program in January of 2023. ERG suggests the TCEQ stay abreast of any developments in this area.
OBD Recommendation 5 (*): Key-on-Engine-Running. The MIL Illumination Status appears to be well enforced as a condition for OBD failure as no inspections were recorded with a MIL Illumination Status of “N” and an overall OBD result of “P.” However, the Key-On-Engine-Running (KOER) MIL Illumination Status is manually entered by the inspector, and the accuracy of this entry is not automatically enforced by the analyzer. Therefore, the TCEQ may want to consider a specification change where passing MIL Status would result in a passing OBD result despite a KOER result of fail.
OBD Recommendation 6 (*): Collect Additional OBD Data. The TCEQ may want to explore collecting additional OBD data that may now be available such as Permanent DTCs, Pending DTCs, Fuel Consumption, Run Time, and Traveled Distance.
RS Recommendations
Recommendation 1 (***): Volume of RS data collected in DFW and HGB. The Comprehensive RS Method has been used to evaluate the RS component of the I/M program, as discussed in Section V. This method has been used in previous program evaluation reports ERG has done for the TCEQ. The number of RS records collected each year increased through calendar year 2013 but has declined each year since then. In the 2018 report, there were 650,000 and 660,000 RS records for DFW and HGB, respectively, and in the 2020 report, those numbers are 409,000 and 344,000. For this 2022 report, 470,000 RS records were collected for DFW and 400,000 for HGB. As all vehicles now receive OBD inspections instead of tailpipe inspections, the RS records are the only data source available to track actual fleet emissions levels over time; therefore, maintaining a robust RS dataset, with a high volume of records, continues to be of great value for future program evaluations.
Recommendation 2 (**): Collect RS data in San Antonio. In the 2009 Report, ERG was able to use RS data from San Antonio to analyze the DFW/HGB RS fleet data using the Reference Method. The Reference Method for evaluating I/M programs compares RS readings from a non-I/M area like San Antonio to the RS readings from an I/M area to
13

Evaluation of the Texas Vehicle Emissions Inspection and Maintenance Program in the Dallas-Fort Worth and Houston-Galveston-Brazoria Nonattainment Areas Final – June 2022
identify trends, benefits, and calculate effectiveness of implementing an I/M program. If possible, efforts should continue to obtain RS data from a non-I/M area for future evaluations.
Repair Tracking Recommendations
Regardless of how malfunctioning vehicle emission control systems are detected, improvements can be made to the system of recording the repairs that are made to vehicles. The repairs, not the inspections, keep vehicle emission control systems operating properly and, in turn, maintain low vehicle emissions.
Repair Tracking Recommendation 1 (***). Use a more detailed, but short list of repairs for I/M inspectors to choose from. Because all vehicles are now getting OBD tests, the repair groupings can be based on the DTC, and this would be a good opportunity to revamp the repair categories. Currently, the TIMS provides inspectors with five general repair categories for reporting I/M-induced repairs, and these categories appear to be too broad to be useful. ERG recommends the repair tracking system be redesigned so that it provides inspectors a list of the five to 10 most effective repairs for each vehicle technology. ERG performed a study in 2015 for the Maryland Department of the Environment that identified a list of legitimate repairs for a given OBD DTC [ERG 2015]. This approach would provide a convenient, short list of repairs for inspectors that would make the inspectors’ task simpler while recording valuable repair information that is most important for the I/M program.
Providing more standardized menu options would also help improve the accuracy of these data by standardizing the entries as well as making it more onerous for the technician to enter incorrect data than to enter real data. If it becomes more difficult to input false data than the real data, then technicians would be motivated to be more accurate when completing these electronic entry forms.
Repair Tracking Recommendation 2 (***). Recording Repair Costs. A large number of repair costs are either zero or greater than $2,000. It might be worthwhile to consider a software change that would require the inspector to input repair information within set limits of price and from a menu selection of repair choices. For example, repair costs of zero would not be accepted, and any repairs above a certain threshold (e.g., $1,000), would have to be validated by re-entering the data.
14

Evaluation of the Texas Vehicle Emissions Inspection and Maintenance Program in the Dallas-Fort Worth and Houston-Galveston-Brazoria Nonattainment Areas Final – June 2022
I. INTRODUCTION
The purpose of this report is to fulfill a federal requirement to evaluate the effectiveness of the state’s I/M program operating in the DFW and HGB areas. Title 40 Code of Federal Regulations (CFR) §51.353 (c), Network Type and Program Evaluation, requires all states subject to an enhanced I/M program to evaluate the effectiveness of their program and submit a program evaluation report to the EPA every two years. The last program evaluation report was issued on June 30, 2020. The DFW and HGB areas are evaluated because only the enhanced programs are required to be evaluated every two years. The Austin-Round Rock and El Paso programs are not enhanced programs; therefore, those programs are not part of this study.
The DFW and HGB enhanced I/M programs were implemented on May 1, 2002, by the TCEQ and the DPS. These programs incorporated vehicle emissions inspections using OBD computer testing and Acceleration Simulation Mode (ASM) dynamometer testing in Collin, Dallas, Denton, and Tarrant Counties of the DFW area and Harris County of the HGB area. In May 2003, the enhanced I/M program was expanded to include Ellis, Johnson, Kaufman, Parker, and Rockwall Counties of the DFW area, and Brazoria, Fort Bend, Galveston, and Montgomery Counties of the HGB area. On January 1, 2020, the tailpipe test was eliminated from the program and now only OBD testing is performed on MY 1996 and newer vehicles.
Beginning in 2004, the TCEQ contracted with ERG to research options for evaluating the DFW and HGB I/M programs, and ERG developed the Texas I/M Program Evaluation Plan [ERG, 2004]. This report detailed numerous potential methods and measures for evaluating the I/M program. Working closely with ERG, the TCEQ selected a set of measures that provide qualitative and quantitative assessments of the four major evaluation elements as described in the EPA’s Guidance on Use of In-Program Data for Evaluation of I/M Program Performance, along with several measures that assess actual emissions benefits, as described in the Texas I/M Program Evaluation Plan and the EPA’s Guidance on Use of Remote Sensing for Evaluation of I/M Program Performance. This evaluation is required to be conducted in accordance with the TCEQ-selected measures.
A. EVALUATION ANALYSIS APPROACH
The Clean Air Act requires that states evaluate their I/M programs every two years. The Sierra Method was initially used to evaluate the Texas I/M program in 2000 [ERG 2003], and later ERG used the updated EPA guidance [EPA 2001, EPA 2004] as a framework for an evaluation performed in 2006 [ERG 2006]. Since then, ERG performed evaluations in 2009 [ERG, 2009], 2012 [ERG 2012], 2014 [ERG 2014], 2016 [ERG 2016], 2018 [ERG 2018], and 2020 [ERG 2020] using the same approach as the 2006 Report.
15

Evaluation of the Texas Vehicle Emissions Inspection and Maintenance Program in the Dallas-Fort Worth and Houston-Galveston-Brazoria Nonattainment Areas Final – June 2022
This 2022 report follows the same general methodology, analyzing and evaluating data to assess program coverage, the vehicle inspection process, the vehicle repair process, program air quality benefits, and station performance. These areas were chosen to provide the most useful information at a reasonable cost as well as an objective assessment on the overall status of the Texas I/M program, with the intent of identifying both areas that may be improved and those that are performing well.
B. STRUCTURE OF THE REPORT
As previously stated, this report follows the same outline as past reports. Section II investigates coverage by comparing vehicle license plates read during RS measurements with the vehicles seen in the Texas I/M program TIMS database.
Section III investigates the inspection process in various ways using the TIMS data for the evaluation period, but now is only focused on OBD equipped vehicles. For example, TIMS data fields were checked for appropriateness, the various failure patterns were counted, and OBD communication rates and test outcomes were examined.
In Section IV, the TIMS data were analyzed with a focus on the repair data to examine the types of repairs, the cost of repairs, and the success of these repairs by analyzing the reported OBD readiness and diagnostic data.
Section V provides emission benefits estimates based on the RS data, and Section VI is a detailed analysis of station performance based on TIMS data. It covers a variety of inspection details that could indicate that fraudulent inspections are being performed, such as “clean-scanning” with the eVIN missing or not matching the VIN of record, and other anomalous test results.
16

Evaluation of the Texas Vehicle Emissions Inspection and Maintenance Program in the Dallas-Fort Worth and Houston-Galveston-Brazoria Nonattainment Areas Final – June 2022
II. COVERAGE
An important component of an I/M program is the level of fleet coverage, or the vehicle compliance rate. In this section, coverage is evaluated by estimating the fraction of vehicles observed on the road using RS data that also have a current and valid Texas I/M program TIMS record.
Estimates of the participation rate of vehicles subject to I/M in the DFW program area and in the HGB program area were made through a comparison of RS data and TIMS data. The RS data provide a sample of vehicles that were driven on the road, and if these vehicles were eligible for I/M, they should have an I/M test record in the TIMS database.
To perform this analysis, ERG first created a dataset of I/M-eligible vehicles captured on the road by RS at least once. To create this dataset, RS data were merged with Texas registration records by license plate. This dataset does not include vehicles from out-of-state or registered in non-I/M counties. It only consists of I/M-eligible model years. Therefore, vehicles newer than two years and older than 24 years, at the time of the RS measurement, were excluded from the analysis. Table II-1 shows the counts of unique I/M-eligible vehicles from the DFW or HGB program areas that were measured by RS between January 1, 2020, and December 31, 2021.
Table II-1. Count of Unique I/M-Eligible RS Vehicles Registered in Texas I/M Program Areas by Calendar Year
Registered at Time of RS Unique RS-Captured Vehicles by Calendar Year 2020 2021 Total
DFW 112,059 107,599 219,658 HGB 102,608 87,636 190,244 Total 214,667 195,235 409,902
Next, the number of unique I/M-compliant vehicles (i.e., vehicles that were tested and ultimately passed or received a waiver) in each of the Texas I/M program areas during that same time frame was determined. Table II-2 shows the overall counts for the I/M tests in the DFW and HGB program areas.
Table II-2. Count of Unique I/M-Compliant Vehicles in Texas I/M Program Areas
I/M Area where Test Performed Unique I/M-Tested Vehicles DFW 5,761,125 HGB 4,967,331 Total 10,728,456
The I/M tests were then matched to the RS/registration dataset by VIN. If an I/M test occurred any time between January 1, 2020, and December 31, 2021, and was found to have a corresponding VIN with a RS measurement taken any time during the same period, this was a matched pair. Table II-3 summarizes these results for the DFW and
17

Evaluation of the Texas Vehicle Emissions Inspection and Maintenance Program in the Dallas-Fort Worth and Houston-Galveston-Brazoria Nonattainment Areas Final – June 2022
HGB program areas. These values were then divided by their respective values for each program area in Table II-1 to obtain an estimate for the Texas I/M program participation rate (e.g., in 2020 the DFW program area participation rate was calculated as ((102,186/112,059) x 100). Table II-3 shows that the participation rate did increase slightly overall from 2020 to 2021.
Table II-3. Count of Unique I/M Eligible RS Vehicles Paired with Unique I/M-Compliant Vehicles in Texas I/M Program Areas by Calendar Year
I/M Program Area where Test Performed Paired RS and TIMS VIN Matches Participation Rate
2020 2021 2020 2021 DFW 102,186 101,176 91.2% 94.0% HGB 94,835 82,391 92.4% 94.0% Total 197,021 183,567 91.8% 94.0%
18

Evaluation of the Texas Vehicle Emissions Inspection and Maintenance Program in the Dallas-Fort Worth and Houston-Galveston-Brazoria Nonattainment Areas Final – June 2022
III. INSPECTION
A. CHECK MAJOR DATA FIELDS FOR APPROPRIATENESS
The goal of this section was to analyze the ranges and values of the primary variables that make up the TIMS database. This analysis provides an indication of the ability of the Texas I/M program’s analyzers and database system to accurately record the activities of the Texas I/M program. If any variables have values that are out of range or missing for unexplained reasons, it suggests that the Texas I/M program activities are not being conducted properly or monitored adequately. An iterative series of steps was used to evaluate the accuracy and completeness of the data in the database. Within the database, each record or row was a test entry that contained columns of variables or data fields. The first set of basic filters applied was to remove unusual or incomplete inspections from the dataset (e.g., aborted inspections, covert audits, etc.). Then, a frequency distribution was performed on nearly all database variables to evaluate the accuracy and completeness of data fields (excluding variables with unique information for each record, such as those for VIN, license plate, or test date, and excluding variables not relevant to this analysis such as TX96_STIK_COND, TX96_INSUR_CONFIRM, or TX96_SOFTWARE_VERSION). Additional records with obvious problems were tallied and removed from the dataset (such as invalid/undefined characters stored for a coded categorical variable, or dramatically out-of-range numerical results). Finally, combinations of variables were evaluated for consistency. These steps are described in detail below.
Initial filters and frequency distributions
The following criteria were used to delete records from the full database containing approximately 27 million inspection records to get a set of successful inspections. This deletion covered:
• Out-of-area inspections (not from HGB or DFW areas);
• Aborted inspections (TX96_ABORT = “J”, “A”);
• Safety-only or visual-only inspections (TX96_TEST_TYPE=”H”, “P”);
• Inspections that were covert audits (TX96_covert_FL not “N”);
• Out-of-program model years, older than 1996 or newer than 2021;
• Inspections with invalid VINs, either fewer than 17 characters, including invalid characters (such as “!”, “@”, etc.), or flagged (TX96_VIN_FL= “B”); and
• Any remaining inspections with TX96_TEST_SEQUENCE less than 1.
In total, these deletions removed about 7.8 million records from the dataset (mostly for safety-only inspections and out-of-area inspections), leaving about 18.9 million potentially valid emissions inspections in the dataset.
19

Evaluation of the Texas Vehicle Emissions Inspection and Maintenance Program in the Dallas-Fort Worth and Houston-Galveston-Brazoria Nonattainment Areas Final – June 2022
Almost every database variable that stores a categorical result was checked for completeness and appropriateness of information. As mentioned above, variables such as TX96_STIK_COND, TX96_INSUR_CONFIRM, or TX96_SOFTWARE_VERSION that have little relevance to emissions inspection impacts are examples of those that were ignored. Most of the variables in the dataset contained the expected information, but after the record deletions described above, a few variables that still contained anomalous information included:
• 6,718 records with an overall inspection cost greater than $100 (TX96_OVERALL_COST>100);
• 176 records with a repair cost greater than $2,000 (TX96_REP_OVERALL_COST>2000); and
• Various other variables that had a small number of missing value results or otherwise odd results that did not appear to be significant.
The anomalous records described in the list above were counted and listed but were not deleted from the dataset. Most of the anomalies were investigated, and the results of those investigations are discussed in further detail in other areas of the report.
B. INSPECTION STATISTICS: NUMBER OF VEHICLES INSPECTED
As a basic summary of the emissions inspections being performed under the Texas I/M program, a number of inspection statistics were calculated. The following tables have changed substantially since the prior I/M Program Evaluation was performed and reported in 2020. The first major change is that a single inspection type, the OBD inspection, is now reported, since the ASM and two-speed idle (TSI) tailpipe inspections have been phased out of the Texas I/M program. Also, new guidance from EPA’s Office of Transportation and Air Quality (OTAQ) requires more detailed reporting of inspection results by model year, vehicle type, and final inspection result, so the following tables are much larger than in prior I/M evaluation reports. 2
Table III-1 shows the inspection statistics for passenger cars in the DFW area. The table includes results for every vehicle tested, beginning with the initial inspection, and continuing through to report the breakdown in the disposition of the initial inspections, as either a passed inspection, a waiver, or a vehicle with no known final outcome. The first column on the left counts every inspection in the dataset, for the two-year period. This will include two annual inspections for most of the vehicles, as well as any retests that are needed to pass the inspection after initially failing it. The total number of initial inspections is given in the second column. A vehicle may be in this column two times (once for an initial inspection in 2020, and once for an initial inspection in 2021), but only two times – retests are not included. The first two
2 “Guidance on Vehicle Inspection and Maintenance (I/M) Test Data Statistics as Part of Annual I/M Reporting Requirements”, EPA OTAQ Transportation and Climate Division, May 2020, EPA-420-B-20-033.
20

Evaluation of the Texas Vehicle Emissions Inspection and Maintenance Program in the Dallas-Fort Worth and Houston-Galveston-Brazoria Nonattainment Areas Final – June 2022
columns are provided for use by TCEQ; they are not required by the OTAQ guidance. The information requested by OTAQ begins at the third column, the number of inspections of unique vehicles. This includes only one count per VIN, i.e., one count for every unique vehicle in the Texas I/M fleet. The columns to the right of that third column continue to subdivide the count of unique vehicles according to their test disposition.
Table III-2 shows the same information for light trucks in DFW. Table III-3 and Table III-4 show the same information for the HGB area.
Table III-1. Number of Inspections for DFW Passenger Cars
Model Year
Total Tests
Total Initial Tests
Total Tested Unique
Veh.
Divide Total Tested Vehicles into: Divide Initially Failing Unique Vehicles into:
Initial Pass
Initial Fail
Initial Fail / Ultimate Pass
Initial Fail / Waiver
Initial Fail / No Final Outcome
Num. Pct. Num. Pct. Num. Pct. 1996 7,817 7,335 4,445 4,074 371 268 72.2% 1 0.3% 102 27.5% 1997 20,199 18,887 8,965 8,193 772 641 83.0% 3 0.4% 128 16.6% 1998 27,831 26,082 11,990 11,037 953 822 86.3% 1 0.1% 130 13.6% 1999 37,731 35,361 16,308 14,975 1,333 1,162 87.2% 1 0.1% 170 12.8% 2000 52,830 49,606 22,556 20,644 1,912 1,679 87.8% 2 0.1% 231 12.1% 2001 61,559 56,005 25,640 22,660 2,980 2,618 87.9% 3 0.1% 359 12.0% 2002 74,894 68,704 31,486 28,156 3,330 2,921 87.7% 3 0.1% 406 12.2% 2003 91,000 84,131 38,166 34,516 3,650 3,169 86.8% 3 0.1% 478 13.1% 2004 105,155 97,524 43,924 39,855 4,069 3,599 88.4% 1 0.0% 469 11.5% 2005 136,370 127,200 56,888 52,038 4,850 4,356 89.8% 3 0.1% 491 10.1% 2006 169,156 158,461 70,194 64,608 5,586 5,007 89.6% 6 0.1% 573 10.3% 2007 208,596 197,283 86,768 80,862 5,906 5,317 90.0% 3 0.1% 586 9.9% 2008 222,074 210,642 91,971 86,115 5,856 5,306 90.6% 1 0.0% 549 9.4% 2009 186,549 177,604 76,678 72,139 4,539 4,166 91.8% 0 0.0% 373 8.2% 2010 221,885 211,680 91,113 86,105 5,008 4,578 91.4% 5 0.1% 425 8.5% 2011 232,319 221,800 95,179 89,969 5,210 4,781 91.8% 1 0.0% 428 8.2% 2012 322,938 309,413 132,649 125,830 6,819 6,233 91.4% 0 0.0% 586 8.6% 2013 368,604 355,073 153,199 146,509 6,690 6,090 91.0% 1 0.0% 599 9.0% 2014 383,936 371,357 159,057 152,757 6,300 5,710 90.6% 0 0.0% 590 9.4% 2015 411,032 398,299 171,639 165,365 6,274 5,705 90.9% 1 0.0% 568 9.1% 2016 390,292 379,564 163,809 158,536 5,273 4,795 90.9% 0 0.0% 478 9.1% 2017 395,893 385,650 168,443 163,184 5,259 4,732 90.0% 1 0.0% 526 10.0% 2018 359,028 351,110 176,366 171,528 4,838 4,274 88.3% 0 0.0% 564 11.7% 2019 188,864 185,413 156,738 153,473 3,265 2,774 85.0% 0 0.0% 491 15.0% 2020 20,905 20,613 19,216 18,837 379 249 65.7% 0 0.0% 130 34.3% Total 4,697,457 4,504,797 2,073,387 1,971,965 101,422 90,952 89.7% 40 0.0% 10,430 10.3%
21

Evaluation of the Texas Vehicle Emissions Inspection and Maintenance Program in the Dallas-Fort Worth and Houston-Galveston-Brazoria Nonattainment Areas Final – June 2022
Table III-2. Number of Inspections for DFW Light Trucks
Model Year
Total Tests
Total Initial Tests
Total Tested Unique
Veh.
Divide Total Tested Vehicles into: Divide Initially Failing Unique Vehicles into:
Initial Pass
Initial Fail
Initial Fail / Ultimate Pass
Initial Fail / Waiver
Initial Fail / No Final
Outcome Num. Pct. Num. Pct. Num. Pct.
1996 13,628 12,798 7,650 7,060 590 450 76.3% 1 0.2% 139 23.6% 1997 39,148 36,726 16,079 14,852 1,227 1,055 86.0% 2 0.2% 170 13.9% 1998 47,231 44,321 19,224 17,824 1,400 1,219 87.1% 2 0.1% 179 12.8% 1999 68,436 64,719 27,594 25,806 1,788 1,594 89.1% 3 0.2% 191 10.7% 2000 90,406 85,962 36,367 34,205 2,162 1,952 90.3% 0 0.0% 210 9.7% 2001 119,338 110,630 46,467 42,514 3,953 3,538 89.5% 3 0.1% 412 10.4% 2002 141,100 131,883 55,392 51,089 4,303 3,885 90.3% 0 0.0% 418 9.7% 2003 160,436 150,673 63,531 59,035 4,496 4,094 91.1% 2 0.0% 400 8.9% 2004 187,744 176,497 74,049 68,835 5,214 4,727 90.7% 2 0.0% 485 9.3% 2005 184,967 173,929 72,446 67,294 5,152 4,642 90.1% 3 0.1% 507 9.8% 2006 193,698 182,716 75,578 70,667 4,911 4,503 91.7% 2 0.0% 406 8.3% 2007 255,766 242,244 99,601 93,480 6,121 5,620 91.8% 1 0.0% 500 8.2% 2008 255,437 242,906 99,044 93,483 5,561 5,148 92.6% 0 0.0% 413 7.4% 2009 150,549 143,048 58,677 55,417 3,260 3,038 93.2% 1 0.0% 221 6.8% 2010 204,303 195,087 79,706 75,754 3,952 3,675 93.0% 2 0.1% 275 7.0% 2011 255,382 245,039 100,047 95,543 4,504 4,187 93.0% 0 0.0% 317 7.0% 2012 265,976 256,186 104,266 99,905 4,361 4,054 93.0% 1 0.0% 306 7.0% 2013 334,080 322,727 130,648 125,749 4,899 4,532 92.5% 0 0.0% 367 7.5% 2014 369,525 357,938 144,522 139,567 4,955 4,590 92.6% 0 0.0% 365 7.4% 2015 429,016 417,665 169,549 164,567 4,982 4,625 92.8% 0 0.0% 357 7.2% 2016 448,058 437,504 176,055 171,537 4,518 4,156 92.0% 1 0.0% 361 8.0% 2017 495,358 484,116 196,816 191,643 5,173 4,645 89.8% 0 0.0% 528 10.2% 2018 450,166 440,502 196,606 191,775 4,831 4,261 88.2% 0 0.0% 570 11.8% 2019 247,872 243,493 196,021 192,561 3,460 3,015 87.1% 0 0.0% 445 12.9% 2020 28,809 28,318 25,993 25,479 514 359 69.8% 0 0.0% 155 30.2% Total 5,436,429 5,227,627 2,271,928 2,175,641 96,287 87,564 90.9% 26 0.0% 8,697 9.0%
Table III-3. Number of Inspections for HGB Passenger Cars
Model Year
Total Tests
Total Initial Tests
Total Tested Unique
Veh.
Divide Total Tested Vehicles into: Divide Initially Failing Unique Vehicles into:
Initial Pass
Initial Fail
Initial Fail / Ultimate Pass
Initial Fail / Waiver
Initial Fail / No Final Outcome
Num. Pct. Num. Pct. Num. Pct. 1996 5,972 5,545 3,244 2,943 301 229 76.1% 1 0.3% 71 23.6% 1997 15,205 14,128 6,617 6,024 593 482 81.3% 0 0.0% 111 18.7% 1998 21,095 19,613 8,976 8,134 842 708 84.1% 3 0.4% 131 15.6% 1999 28,246 26,288 11,987 10,871 1,116 938 84.1% 2 0.2% 176 15.8% 2000 39,734 36,902 16,715 15,173 1,542 1,321 85.7% 2 0.1% 219 14.2% 2001 46,829 42,436 19,424 17,044 2,380 2,070 87.0% 2 0.1% 308 12.9% 2002 57,721 52,597 23,799 21,104 2,695 2,348 87.1% 4 0.1% 343 12.7% 2003 69,504 63,938 28,948 25,980 2,968 2,615 88.1% 5 0.2% 348 11.7% 2004 78,726 72,543 32,722 29,401 3,321 2,899 87.3% 2 0.1% 420 12.6% 2005 105,347 97,555 43,347 39,276 4,071 3,600 88.4% 2 0.0% 469 11.5% 2006 131,495 121,955 54,387 49,364 5,023 4,450 88.6% 2 0.0% 571 11.4% 2007 163,023 153,109 67,725 62,545 5,180 4,662 90.0% 1 0.0% 517 10.0% 2008 173,505 163,423 71,777 66,535 5,242 4,688 89.4% 2 0.0% 552 10.5%
22

Evaluation of the Texas Vehicle Emissions Inspection and Maintenance Program in the Dallas-Fort Worth and Houston-Galveston-Brazoria Nonattainment Areas Final – June 2022
Model Year
Total Tests
Total Initial Tests
Total Tested Unique
Veh.
Divide Total Tested Vehicles into: Divide Initially Failing Unique Vehicles into:
Initial Pass
Initial Fail
Initial Fail / Ultimate Pass
Initial Fail / Waiver
Initial Fail / No Final Outcome
Num. Pct. Num. Pct. Num. Pct. 2009 150,141 141,789 61,892 57,764 4,128 3,764 91.2% 1 0.0% 363 8.8% 2010 174,264 165,078 71,612 67,038 4,574 4,201 91.8% 2 0.0% 371 8.1% 2011 183,709 174,221 75,043 70,408 4,635 4,214 90.9% 1 0.0% 420 9.1% 2012 248,262 236,350 101,465 95,648 5,817 5,336 91.7% 0 0.0% 481 8.3% 2013 291,183 278,609 119,792 113,731 6,061 5,583 92.1% 1 0.0% 477 7.9% 2014 309,627 297,943 127,098 121,483 5,615 5,182 92.3% 0 0.0% 433 7.7% 2015 335,686 323,897 138,976 133,414 5,562 5,142 92.4% 1 0.0% 419 7.5% 2016 307,932 298,281 129,075 124,592 4,483 4,124 92.0% 1 0.0% 358 8.0% 2017 317,085 308,086 135,796 131,450 4,346 4,005 92.2% 0 0.0% 341 7.8% 2018 293,230 286,607 141,570 137,874 3,696 3,361 90.9% 0 0.0% 335 9.1% 2019 159,696 156,481 125,548 122,801 2,747 2,362 86.0% 0 0.0% 385 14.0% 2020 24,609 24,132 21,705 21,160 545 386 70.8% 0 0.0% 159 29.2% Total 3,731,826 3,561,506 1,639,240 1,551,757 87,483 78,670 89.9% 35 0.0% 8,778 10.0%
Table III-4. Number of Inspections for HGB Light Trucks
Model Year
Total Tests
Total Initial Tests
Total Tested Unique
Veh.
Divide Total Tested Vehicles into: Divide Initially Failing Unique Vehicles into:
Initial Pass
Initial Fail
Initial Fail / Ultimate Pass
Initial Fail / Waiver
Initial Fail / No Final Outcome
Num. Pct. Num. Pct. Num. Pct. 1996 10,612 9,862 5,704 5,190 514 393 76.5% 0 0.0% 121 23.5% 1997 31,766 29,417 12,992 11,779 1,213 1,037 85.5% 2 0.2% 174 14.3% 1998 39,657 36,888 15,856 14,505 1,351 1,191 88.2% 3 0.2% 157 11.6% 1999 56,117 52,625 22,280 20,515 1,765 1,552 87.9% 0 0.0% 213 12.1% 2000 76,893 72,214 30,354 28,180 2,174 1,959 90.1% 0 0.0% 215 9.9% 2001 102,448 94,190 39,503 35,681 3,822 3,398 88.9% 2 0.1% 422 11.0% 2002 123,138 114,144 47,716 43,470 4,246 3,777 89.0% 1 0.0% 468 11.0% 2003 137,326 127,842 53,778 49,245 4,533 4,099 90.4% 0 0.0% 434 9.6% 2004 158,071 147,463 61,895 56,848 5,047 4,549 90.1% 1 0.0% 497 9.8% 2005 162,346 151,695 63,449 58,501 4,948 4,462 90.2% 2 0.0% 484 9.8% 2006 180,841 169,671 70,088 64,955 5,133 4,669 91.0% 1 0.0% 463 9.0% 2007 229,423 215,924 89,550 83,361 6,189 5,664 91.5% 1 0.0% 524 8.5% 2008 235,979 222,598 90,750 84,802 5,948 5,491 92.3% 2 0.0% 455 7.6% 2009 140,978 133,071 54,434 50,936 3,498 3,229 92.3% 1 0.0% 268 7.7% 2010 183,428 174,060 70,805 66,717 4,088 3,820 93.4% 2 0.0% 266 6.5% 2011 234,171 223,125 90,183 85,426 4,757 4,425 93.0% 1 0.0% 331 7.0% 2012 246,516 235,880 94,548 89,972 4,576 4,234 92.5% 0 0.0% 342 7.5% 2013 311,026 298,940 119,482 114,331 5,151 4,801 93.2% 0 0.0% 350 6.8% 2014 350,607 338,083 135,045 129,849 5,196 4,849 93.3% 0 0.0% 347 6.7% 2015 413,100 400,907 161,095 155,941 5,154 4,820 93.5% 2 0.0% 332 6.4% 2016 400,819 390,346 156,445 152,081 4,364 4,098 93.9% 1 0.0% 265 6.1% 2017 454,213 443,545 181,288 176,860 4,428 4,124 93.1% 0 0.0% 304 6.9% 2018 431,433 422,104 185,714 181,599 4,115 3,823 92.9% 0 0.0% 292 7.1% 2019 240,532 235,960 182,789 179,357 3,432 3,038 88.5% 1 0.0% 393 11.5% 2020 36,556 35,741 31,712 30,912 800 594 74.3% 0 0.0% 206 25.8% Total 4,987,996 4,776,295 2,067,455 1,971,013 96,442 88,096 91.3% 23 0.0% 8,323 8.6%
23

Evaluation of the Texas Vehicle Emissions Inspection and Maintenance Program in the Dallas-Fort Worth and Houston-Galveston-Brazoria Nonattainment Areas Final – June 2022
Inspection counts by model year are presented in the figures below. Figure III-1 shows the number of inspections by model year for the DFW and HGB program areas. The number of inspections by month of inspection is shown in Figure III-2. Finally, the failure rate by model year is shown in Figure III-3 for the DFW and HGB program areas. Only initial inspections are included, but retests are excluded. In general, the trends shown are as expected: more vehicles of newer model years are inspected than vehicles of older model years, and failure rates are considerably higher for older vehicles. The pass-fail rate jumps up for the 2020 and 2021 models; most of the failures for these models are for readiness. This happens because new vehicles usually have a readiness status of not ready for many non-continuous monitors.
Figure III-1. Number of Inspections by Model Year and I/M Program Area
24

Evaluation of the Texas Vehicle Emissions Inspection and Maintenance Program in the Dallas-Fort Worth and Houston-Galveston-Brazoria Nonattainment Areas Final – June 2022
Figure III-2. Number of Inspections by Year and Month of Inspection
Figure III-3. Initial Inspection Failure Rate by Model Year and I/M Program Area
25

Evaluation of the Texas Vehicle Emissions Inspection and Maintenance Program in the Dallas-Fort Worth and Houston-Galveston-Brazoria Nonattainment Areas Final – June 2022
C. REPEAT I/M FAILURE PATTERNS
ERG examined the TIMS data to determine the patterns of repeat I/M failures. This illustrates the extent and characteristics of repairs related to the Texas I/M program. This analysis was based on the two-year evaluation period, including all of 2020 and 2021. Initial and retest inspections were not determined using the TX96_TEST_SEQUENCE or TX96_TEST_TYPE variables. These database variables are intended to store the number of inspections in an inspection sequence and indicate whether an inspection is an initial or a retest inspection. However, many factors can affect the information stored in these variables, such as the time span between an initial and a retest inspection, whether the motorist chose a different inspection station for the retest, or whether a safety-only inspection was performed at some point. For the purposes of this section and this report, ERG made new initial/retest assignments. The first inspection for a VIN was labeled an initial inspection. Additional inspections to that VIN were labeled as retests until an inspection was passed or a waiver was granted. The next inspection following a passed inspection, or a waiver was labeled an initial inspection. For identifying initial inspections, inspection cycles that appeared to begin in the first four months of 2020 were excluded from the counts as they could have been preceded by additional inspections in 2019. 3 Also, for the purpose of identifying final inspections, any inspection cycles that appeared to end in the last four months of 2021 were excluded as there could be additional inspections in early 2022.
An “inspection sequence” is the series of inspections a vehicle receives as it moves through the Texas I/M program requirements. By far, the most common sequence is a single passed inspection. The second most common sequence is a failed inspection, followed by repair and a passed retest. Additional sequences might include additional failed inspections before the ultimately passed inspection. Sequences should not be found where additional retest inspections follow a passed inspection as these indicate that the measurements and efficacy of the repairs made to the vehicles in the program are less than ideal. For example, a sequence that is fail, fail, fail, fail, pass might indicate either that the motorist is “shopping around” for a passing result, that no repairs were made to the vehicle, that the repairs done to the vehicle were inadequate, or that the test was inaccurate.
Each vehicle was tested at an I/M inspection station on one or more occasions. The dataset contains a variable that gives the type of test (Initial or Retest) and a variable that gives the result of the emissions test (Pass or Fail). Failed inspections were designated with an “F” and passes with a “P.” Inspections that resulted in a waiver were designated with a “W.” For each unique VIN in the dataset, the designators were concatenated in chronological order to create a sequence that describes the test
3 In previous years, ERG used a three-month period instead of four. However, the 2020 OTAQ guidance referred to in footnote 1 suggested a change to a four-month period, and ERG has made that change for this document.
26

Evaluation of the Texas Vehicle Emissions Inspection and Maintenance Program in the Dallas-Fort Worth and Houston-Galveston-Brazoria Nonattainment Areas Final – June 2022
pattern that each vehicle experienced during an I/M testing cycle. For example, for a vehicle that initially failed and then passed on a retest, the test sequence would be “FP.” The frequency distribution of the resulting test sequences is shown in Table III-5, with results for the DFW and HGB program areas shown separately. The infrequent waiver inspections are included in the “Other” category.
Table III-5. Frequency Distribution of Test Sequences
DFW HGB Inspection Sequence
Number of Vehicles
Percent of Vehicles
Inspection Sequence
Number of Vehicles
Percent of Vehicles
P 7,981,229 95.9% P 6,763,066 95.5% FP 280,098 3.4% FP 264,885 3.7% F 28,491 0.3% F 26,075 0.4% FFP 21,002 0.3% FFP 19,639 0.3% FFFP 3,609 0.0% FFFP 3,149 0.0% FF 2,375 0.0% FF 2,258 0.0% FFFFP 840 0.0% FFFFP 800 0.0% FFF 524 0.0% FFF 494 0.0% Other 707 0.0% Other 639 0.0%
In Table III-5, the top two rows, which represent the two “ideal” inspection sequences, comprise about 99% of the total distribution, both in the DFW and HGB program areas. However, some of the other sequences raise questions, such as, what becomes of the vehicles that fail an inspection and do not receive a passing retest? One check that was performed for this set of vehicles was to make sure that they are not being affected by sequences that start near the end of the dataset and might have later retests. It was found that the sequences that end with a failed inspection are distributed fairly uniformly over all months of 2020 and 2021, although some increase is seen in the later months of the dataset. The vehicles that did not complete their inspection sequences and ended with no final passed inspection (NFP), may have moved (or have been re-registered) out of the I/M program area, and therefore may no longer be required to participate in the I/M program. However, some of the NFP vehicles were observed in the I/M program area by RS after their incomplete inspection cycle. These non-compliant vehicles were observed at approximately half the frequency as compliant vehicles. There were 28,491 NFP vehicles in the DFW area, accounting for 8.5% of all failing vehicles, and there were 26,075 NFP vehicles in the HGB area, accounting for 8.2% of all failing vehicles.
Several hundred less common sequences accounted for the remaining 0.01-0.02% of the tested fleets. Many of these remaining sequences seem to be unlikely, involving numerous failed inspections and/or multiple passed inspections. Some of these could be the result of resale vehicles, unidentified covert audit vehicles, or possibly test classification errors instead of real situations. While it might be possible to reduce the occurrence of these unlikely test sequences, the problem is relatively uncommon.
27

Evaluation of the Texas Vehicle Emissions Inspection and Maintenance Program in the Dallas-Fort Worth and Houston-Galveston-Brazoria Nonattainment Areas Final – June 2022
D. OBD INSPECTION ANALYZER COMMUNICATION PERFORMANCE
ERG analyzed TIMS OBD data to look for proper analyzer communication, as it is possible that certain models of analyzers cannot communicate with certain model year, make, and model vehicles. The objective of this task was to analyze TIMS data to determine if certain manufacturers of OBD inspection analyzers appear to have communication problems with certain makes, models, or model year vehicles, which would result in elevated failure to communicate rates for those vehicle groups.
For this task, ERG reviewed OBD inspection records to identify all tests with a result other than “P” in the “OBD2_DLC_RES” field of the test record. For these records, analysis was performed to identify rates of failure to communicate by:
• vehicle model year;
• analyzer manufacturer;
• vehicle make; and
• vehicle model.
Results are presented for each of these four groups.
Three of the 18,889,565 OBD test records had no information stored in the OBD communication result field. These records all had null values for ready result, fault code result, downloaded MIL status, and OBD pass/fail result, and all three had an overall passing result (a "P" in the "OVERALL_RESULTS" field). There were also 522,305 records for vehicles of unknown gross vehicle weight rating (GVWR) or heavy-duty (HD) vehicles (i.e., >8,500 lbs. GVWR). All these records were excluded from the results, leaving 18,367,257 OBD records in the dataset.
Communication Rates by Vehicle Model Year - Table III-6 provides a summary of communication rates by model year of vehicles tested in the program.
The “MODEL_YEAR” field from the vehicle test result tables was used to determine model year. Values and percentages shown in the table are listed by model year. For example, 101,278 OBD tests were conducted on model year 1997 vehicles, and only 138 of these had an OBD fail to communicate status. Overall, very low numbers were seen for “failure to communicate” test results, and the overall “failure to communicate” rates were very low. In addition, most tests with a “failure to communicate” result were followed by a subsequent test of the same vehicle in which OBD communication was successfully established. The overall program-wide communication rate between vehicles and analyzers, excluding the inspections that were removed from the data set as described in Section III.A, is 99.9%.
28

Evaluation of the Texas Vehicle Emissions Inspection and Maintenance Program in the Dallas-Fort Worth and Houston-Galveston-Brazoria Nonattainment Areas Final – June 2022
Table III-6. OBD Communication Rates by Vehicle Model Year
Model Year
DLC is Damaged, Inaccessible, or Cannot
be Found
Vehicle will not Communicate with
Analyzer
Vehicle Successfully Communicates with
Analyzer Total Count of Tests by Model YearCount Percent Count Percent Count Percent
1996 15 0.04% 89 0.25% 36,100 99.71% 36,204 1997 48 0.05% 190 0.19% 101,040 99.77% 101,278 1998 36 0.03% 254 0.19% 130,067 99.78% 130,357 1999 55 0.03% 338 0.19% 180,068 99.78% 180,461 2000 76 0.03% 491 0.20% 245,635 99.77% 246,202 2001 92 0.03% 593 0.19% 311,972 99.78% 312,657 2002 86 0.02% 704 0.18% 380,008 99.79% 380,798 2003 117 0.03% 789 0.18% 437,389 99.79% 438,295 2004 137 0.03% 890 0.17% 508,808 99.80% 509,835 2005 147 0.03% 953 0.17% 568,834 99.81% 569,934 2006 165 0.03% 946 0.15% 651,230 99.83% 652,341 2007 178 0.02% 946 0.11% 833,682 99.87% 834,806 2008 135 0.02% 887 0.10% 859,452 99.88% 860,474 2009 93 0.02% 589 0.10% 611,943 99.89% 612,625 2010 112 0.01% 729 0.09% 770,348 99.89% 771,189 2011 144 0.02% 844 0.10% 882,633 99.89% 883,621 2012 141 0.01% 971 0.09% 1,057,454 99.89% 1,058,566 2013 153 0.01% 979 0.08% 1,279,559 99.91% 1,280,691 2014 137 0.01% 1,010 0.07% 1,389,234 99.92% 1,390,381 2015 161 0.01% 1,170 0.08% 1,548,894 99.91% 1,550,225 2016 142 0.01% 1,197 0.08% 1,508,209 99.91% 1,509,548 2017 138 0.01% 1,252 0.08% 1,621,383 99.91% 1,622,773 2018 126 0.01% 1,169 0.08% 1,501,434 99.91% 1,502,729 2019 93 0.01% 781 0.10% 810,674 99.89% 811,548 2020 26 0.02% 251 0.23% 106,559 99.74% 106,836 2021 11 0.09% 71 0.58% 12,243 99.33% 12,325 2022 2 0.36% 2 0.36% 554 99.28% 558 Total 2,766 0.02% 19,085 0.10% 18,345,406 99.88% 18,367,257
29

Evaluation of the Texas Vehicle Emissions Inspection and Maintenance Program in the Dallas-Fort Worth and Houston-Galveston-Brazoria Nonattainment Areas Final – June 2022
Communication Rates by Equipment Manufacturer –Table III-7 provides results of communication rates among the various analyzer manufacturers. Opus Inspection makes Environmental Systems Products (ESP)-branded analyzers. Records in the TIMS data from ESP analyzers are identified by their a two-letter designation, ES. Similarly, Worldwide Environmental Products makes self-branded analyzers whose records use WW as their two-letter designation. There are very few Snap-On (SE) entries because these analyzers were phased out of the program in early 2020. Also, a small number of analyzers identified as “TX” were found to be ESP analyzers; therefore, they have been included in the ESP total.
Again, the percentages shown for the “damaged, inaccessible, or cannot be found,” the “will not communicate,” and the “successfully communicates” columns pertain to all tests conducted by each type of analyzer (not percentage of all tests). The two rightmost columns provide counts of tests and percentages of tests by each analyzer manufacturer relative to the total number of tests. For the most part, the rate of communication problems was consistently low for each manufacturer.
Communication Rates by Vehicle Make - To assess communication rates by vehicle make, vehicle registration records were merged with vehicle test records by VIN. Makes that were represented by 100 or fewer vehicles were removed from the table since sample sizes would be too small to provide meaningful results.
Table III-8 provides a summary of communication rates among the various vehicle makes. The incident rates for “damaged, inaccessible, or cannot be found” or “no communication” were very low.
Communication Rates by Vehicle Model - To assess communication rates by vehicle models, the model codes and model names (series) as reported in the vehicle test results tables were used. Table III-9 lists communication rates for each vehicle model code. Records for the more uncommon series, i.e., less than 100 inspection records, were excluded. Because Table III-9 is very long, in the text below, only vehicle makes through Audi are listed. The full table is provided in Appendix A.
It can be seen from the table that no model codes/vehicle series had “damaged, inaccessible, or cannot be found” or “no communication” rates that were greater than 1%, and all were below 0.8% except for Winnebago and Aston Martin. All other vehicles were below 0.5%.
30

Evaluation of the Texas Vehicle Emissions Inspection and Maintenance Program in the Dallas-Fort Worth and Houston-Galveston-Brazoria Nonattainment Areas Final – June 2022
Table III-7. OBD Communication Rates by Equipment Manufacturer
Equipment Manufacturer
DLC is Damaged, Inaccessible, or
Cannot be Found
Vehicle will not Communicate with
Analyzer
Vehicle Successfully Communicates with
Analyzer
Total Count of Tests by EM
(EM) Count Percent Count Percent Count Percent Count Percent ESP 2,187 0.02% 14,743 0.11% 14,010,519 99.88% 14,027,459 76.40% SE 19 0.08% 37 0.15% 24,315 99.77% 24,371 0.10%
WW 560 0.01% 4,305 0.10% 4,310,572 99.89% 4,315,437 23.50% Total 2,766 0.02% 19,085 0.10% 18,345,406 99.88% 18,367,257 100.0%
Table III-8. OBD Communication Rates by Vehicle Make
Vehicle Make
DLC is Damaged, Inaccessible, or
Cannot be Found
Vehicle will not Communicate with
Analyzer
Vehicle Successfully Communicates with
Analyzer
Total Count of Tests by Make
Count Percent Count Percent Count Percent Count Percent
ACURA 29 0.01% 175 0.07% 241,760 99.92% 241,964 1.37%
ASTON MARTIN 1 0.05% 6 0.33% 1,830 99.62% 1,837 0.01%
AUDI 13 0.01% 166 0.10% 158,155 99.89% 158,334 0.89%
BENTLEY 3 0.08% 2 0.05% 3,841 99.87% 3,846 0.02%
BMW 65 0.02% 511 0.15% 350,233 99.84% 350,809 1.98%
BUICK 21 0.01% 171 0.09% 184,680 99.90% 184,872 1.04%
CADILLAC 38 0.01% 337 0.12% 289,731 99.87% 290,106 1.64%
CHEVROLET 371 0.02% 2,545 0.11% 2,354,111 99.88% 2,357,027 13.31%
CHRYSLER 34 0.02% 210 0.09% 223,972 99.89% 224,216 1.27%
DODGE 142 0.02% 781 0.10% 752,678 99.88% 753,601 4.25%
FERRARI 4 0.12% 6 0.18% 3,252 99.69% 3,262 0.02%
FIAT 4 0.02% 32 0.15% 20,916 99.83% 20,952 0.12%
FORD 440 0.02% 3,247 0.13% 2,450,126 99.85% 2,453,813 13.85%
GENS 1 0.03% 1 0.03% 3,586 99.94% 3,588 0.02%
GMC 73 0.01% 592 0.10% 574,107 99.88% 574,772 3.24%
HONDA 209 0.01% 1,210 0.08% 1,554,760 99.91% 1,556,179 8.78%
HUMMER 6 0.05% 30 0.24% 12,246 99.71% 12,282 0.07%
HYUNDAI 67 0.01% 467 0.08% 559,694 99.90% 560,228 3.16%
INFINITI 22 0.01% 186 0.07% 259,600 99.92% 259,808 1.47%
ISUZU 3 0.03% 27 0.29% 9,195 99.67% 9,225 0.05%
JAGUAR 1 0.00% 58 0.15% 38,780 99.85% 38,839 0.22%
JEEP 87 0.01% 638 0.11% 586,256 99.88% 586,981 3.31%
KIA 26 0.01% 285 0.06% 454,901 99.93% 455,212 2.57%
LAND ROVER 6 0.01% 73 0.10% 72,790 99.89% 72,869 0.41%
LEXUS 66 0.01% 487 0.08% 613,206 99.91% 613,759 3.46%
31

Evaluation of the Texas Vehicle Emissions Inspection and Maintenance Program in the Dallas-Fort Worth and Houston-Galveston-Brazoria Nonattainment Areas Final – June 2022
Vehicle Make
DLC is Damaged, Inaccessible, or
Cannot be Found
Vehicle will not Communicate with
Analyzer
Vehicle Successfully Communicates with
Analyzer
Total Count of Tests by Make
Count Percent Count Percent Count Percent Count Percent
LINCOLN 37 0.03% 260 0.18% 144,306 99.79% 144,603 0.82%
MASERATI 3 0.03% 12 0.13% 9,172 99.84% 9,187 0.05%
MAZDA 61 0.02% 683 0.23% 298,798 99.75% 299,542 1.69%
MERCEDES 15 0.03% 85 0.16% 53,509 99.81% 53,609 0.30%
MERCURY 62 0.01% 500 0.12% 423,633 99.87% 424,195 2.39%
MITSUBISHI 24 0.02% 262 0.24% 107,369 99.73% 107,655 0.61%
MINI 6 0.01% 47 0.10% 45,431 99.88% 45,484 0.26%
NISSAN 234 0.02% 1,178 0.08% 1,466,781 99.90% 1,468,193 8.29%
OLDSMOBILE 2 0.03% 16 0.27% 5,836 99.69% 5,854 0.03%
PONTIAC 14 0.02% 116 0.19% 59,939 99.78% 60,069 0.34%
PORSCHE 22 0.03% 216 0.33% 64,661 99.63% 64,899 0.37%
RAM 15 0.01% 173 0.11% 156,812 99.88% 157,000 0.89%
SAAB 2 0.04% 10 0.22% 4,444 99.73% 4,456 0.03%
SATURN 6 0.01% 77 0.19% 40,207 99.79% 40,290 0.23%
SCION 4 0.01% 56 0.09% 65,333 99.91% 65,393 0.37%
SUBARU 15 0.01% 188 0.12% 159,225 99.87% 159,428 0.90%
SUZUKI 8 0.06% 38 0.28% 13,643 99.66% 13,689 0.08%
TOYOTA 337 0.01% 2,004 0.08% 2,459,800 99.90% 2,462,141 13.90%
VOLKSWAGEN 61 0.02% 383 0.15% 260,346 99.83% 260,790 1.47%
VOLVO 9 0.01% 64 0.08% 79,793 99.91% 79,866 0.45%
OTHER 95 0.01% 449 0.07% 635,108 99.91% 635,652 3.59%
Total 2,669 0.02% 18,611 0.11% 17,693,444 99.88% 17,714,724 100.00%
Table III-9. OBD Communication Rates by Vehicle Model Code for Elevated Miscommunications
Make/Model
DLC is Damaged, Inaccessible, or
Cannot be Found
Vehicle will not Communicate with Analyzer
Vehicle Successfully Communicates with
Analyzer Total Count of Tests by Make
Count Percent Count Percent Count Percent Count Percent ACUR
3.2TL 1 0.03% 5 0.14% 3,673 99.84% 3,679 0.02% ILX 20 2 0.04% 3 0.05% 5,469 99.91% 5,474 0.04% MDX 7 0.01% 32 0.05% 64,221 99.94% 64,260 0.42% RDX 4 0.01% 29 0.07% 43,798 99.92% 43,831 0.29% RL 1 0.04% 3 0.12% 2,604 99.85% 2,608 0.02% RSX 1 0.04% 6 0.23% 2,652 99.74% 2,659 0.02%
32

Evaluation of the Texas Vehicle Emissions Inspection and Maintenance Program in the Dallas-Fort Worth and Houston-Galveston-Brazoria Nonattainment Areas Final – June 2022
Make/Model
DLC is Damaged, Inaccessible, or
Cannot be Found
Vehicle will not Communicate with Analyzer
Vehicle Successfully Communicates with
Analyzer Total Count of Tests by Make
Count Percent Count Percent Count Percent Count Percent TL 6 0.02% 32 0.09% 36,340 99.90% 36,378 0.24% TSX 3 0.01% 15 0.06% 24,482 99.93% 24,500 0.16%
AUDI A4 1 0.00% 22 0.08% 25,929 99.91% 25,952 0.17% A5 Cabriolet 1 0.03% 2 0.05% 3,847 99.92% 3,850 0.03% A6 4 0.02% 16 0.08% 20,472 99.90% 20,492 0.14% Q3 1 0.01% 9 0.11% 8,002 99.88% 8,012 0.05%
Golf/GTI 3 0.02% 20 0.15% 13,022 99.82% 13,045 0.09% Golf/GTI/Jetta/ Jetta Sportage 2 0.01% 33 0.11% 30,043 99.88% 30,078 0.20%
Again, the full table can be found in Appendix A.
E. TIMS HANDLING OF OBD CODES
ERG analyzed TIMS OBD data to evaluate the accuracy of OBD data collected in the Texas I/M program. This is a process-based measure for inspection effectiveness. The handling of OBD readiness, diagnostic trouble codes, and communication failures varies among I/M programs. The objective of this task was to analyze OBD inspection records to ensure OBD test results are appropriate for various OBD test dispositions, such as a vehicle with too many OBD monitors “not ready,” a vehicle with “pending” DTCs, or a vehicle that fails to communicate with the analyzer.
Program Description and Results of Analysis
Proper handling of various OBD test scenarios is defined in Parts 85.2207 and 85.2222 of Title 40 of the CFR and also in various OBD implementation guidance documents issued by the EPA. Appropriate responses to the various test scenarios are summarized here and serve as the basis for analysis in this task. The dataset for this analysis included records for OBD inspections between January 1, 2020, and December 31, 2021. Records for inspections that were aborted were excluded from the dataset, as were records for which either the OBD result or the overall result was not “P” (pass) or “F” (fail). Because this analysis was performed with the goal of determining whether OBD inspection guidelines are enforced, only records for light-duty vehicles were used. Downloaded OBD test pass/fail results are not enforced for HD vehicles (i.e., vehicles with a GVWR greater than 8,500 pounds); therefore, these vehicles were removed from the dataset. HD vehicles were identified as those with the tx96_type field equal to one and the tx96_gvw_actual field between zero and 8,501. Vehicles with no GVWR given were also removed since these might be HD vehicles. Following these removals, 18,366,662 records remained in the dataset.
33

Evaluation of the Texas Vehicle Emissions Inspection and Maintenance Program in the Dallas-Fort Worth and Houston-Galveston-Brazoria Nonattainment Areas Final – June 2022
Diagnostic Link Connector Communication Status – According to federal guidelines, a diagnostic link connector (DLC) that is missing, tampered, or otherwise inoperable is a basis for failure, but the vehicle may be “rejected” for a DLC that is inaccessible or cannot be located. Failure to communicate with an OBD analyzer is also a basis for failure. To perform this analysis, the result stored in the “OBD2_DLC_RES” field was compared with that in the “OBD2_PF_FLAG” field. No test results with a “D” (damaged), “N” (connected but will not communicate), “L” (inspector cannot find DLC), or “I” (DLC is inaccessible) in the “OBD2_DLC_RES” should have a “P” in the “OBD2_PF_FLAG”. Results of this analysis are shown in Table III-10.
Table III-10. Comparison of DLC Communication Status with Overall OBD Test Results
DLC Communication Status Overall OBD Test Results
Fail Pass “D” (damaged) 1,134 0 “I” (DLC is inaccessible) 608 1 “L” (inspector cannot find DLC) 1,002 17 "N" (connected but will not communicate) 19,082 1 Sub-Total count of “D”, “I”, “L”, and “N” Tests 21,826 19 “P” (communication successful) 647,851 17,696,966 Total 669,677 17,696,985
As can be seen in the table, 19 test records have a DLC communication status of “D”, “I”, “L”, or “N,” yet have an OBD test result of “pass.” For these records, it was noted that no result was given for monitor readiness (which should have been a “pass” in order to pass the OBD inspection). It is not clear what led to the passing result for those records. In conclusion, the DLC failure to communicate was enforced on the vast majority of OBD tests conducted on light-duty vehicles during the period of evaluation.
Because successful communication with the inspection analyzer is critical for all other OBD results, the OBD records with OBD2_DLC_RES results other than “P” were removed from the dataset for the other analyses that comprise the remainder of this section. This left 18,344,817 records in the dataset.
Agreement between OBD test result and overall test result – A vehicle that fails the OBD inspection should fail the overall inspection. To determine if OBD failures were properly recorded in the overall inspection disposition, a query was performed to quantify the number of vehicles that failed the OBD portion of the test (“F” in the “OBD2_PF_FLAG” field) but passed the overall OBD test (“P” in the “OVERALL_RESULTS” field). Table III-11 shows that no tests were recorded with a “fail” in the OBD portion of the test and a “pass” for the overall test
34

Evaluation of the Texas Vehicle Emissions Inspection and Maintenance Program in the Dallas-Fort Worth and Houston-Galveston-Brazoria Nonattainment Areas Final – June 2022
Table III-11. Comparison of OBD Test Result with Overall Test Result
Result of Overall Test Result Total OBD Test Fail Pass
Fail 647,851 100.0% 0 0.0% 647,851 3.5% Pass 206,124 1.2% 17,490,842 98.8% 17,696,966 96.5% Total 853,975 4.7% 17,490,842 95.3% 18,344,817 100.0%
Inspector-Entered MIL bulb check - This is also referred to as the Key On / Engine Off (KOEO) check. The inspector is instructed to turn the vehicle’s ignition key to the “on” position, but not start the vehicle, to illuminate the MIL. Results are manually entered into the analyzer (via keyboard) by the inspector. If the MIL does not illuminate, the vehicle should fail the OBD portion of the inspection.
To perform this analysis, the results for the inspector keyboard-entered MIL bulb check (“OBD2_MIL_CHECK” field of the test record) were compared with results of the overall OBD test result (“OBD2_PF_FLAG” field), to ensure that a MIL bulb check failure always results in an OBD test failure. The “OBD2_MIL_CHECK” results are “Y” or “K”, which is a pass (yes, the MIL did illuminate or keyless ignition), and “N”, which is a fail (no, the MIL did not illuminate). There were no records where a KOEO MIL result of “N” (fail) did not receive a failing OBD result. This is a new and positive result as prior I/M evaluation reports had observed at least a few dozen records where the “N” result did not receive a failing OBD result. The 65 inspections for which no KOEO result was available also received a failing result. The results are presented in Table III-12 below.
Table III-12. Comparison of KOEO MIL Bulb Check Result with Overall OBD Test Result
Result of KOEO MIL Bulb Check Overall OBD Test Result
Total Fail Pass (missing result) 65 0 65
N (fail) 13,771 0 13,771 K (pass) 49,161 2,291,954 2,341,115 Y (pass) 584,854 15,405,012 15,989,866
Total 647,851 17,696,966 18,344,817
Inspector-Entered Engine-Running MIL Illumination Status – The KOER result manually entered by the inspector is a basis for failure. No vehicle with an “F” in the “OBD2_MIL_ON_RUN” field should have a “P” in the “OBD2_PF_FLAG” field of the OBD test record. The “OBD2_MIL_ON_RUN” results are “Y,” which is a pass (Y = MIL turned off after the vehicle was started) or “N,” which is a fail (N = MIL stayed illuminated after the vehicle was started). Table III-13 shows that the MIL Illumination Status appears to be enforced as a condition for OBD failure: no inspections were recorded with a MIL Illumination status of “N” and an overall OBD result of “P.” However, since the KOER MIL Illumination Status is manually entered by the inspector, accuracy of this entry is not automatically enforced by the analyzer. As shown in Table III-14, in 171,707 inspections a “pass” result was manually entered when the downloaded MIL
35

Evaluation of the Texas Vehicle Emissions Inspection and Maintenance Program in the Dallas-Fort Worth and Houston-Galveston-Brazoria Nonattainment Areas Final – June 2022
status indicated a “fail” result, and a “fail” result was entered 7,618 times when the MIL status indicated a “pass” result. These latter cases are possible false failures; TCEQ should consider a specification change where passing MIL Status would result in a passing OBD result despite a KOER result of fail.
Table III-13. Comparison of Inspector-Entered MIL Illumination Status (Engine Running, KOER) with Overall OBD Test Result
Result of MIL Illumination Status Overall OBD Test Result
Total Fail Pass (missing result) 65 0 65
N (Fail) 25,872 0 25,872 Y (Pass) 621,914 17,696,966 18,318,880
Total 647,851 17,696,966 18,344,817
Table III-14. Comparison of Downloaded MIL Command Status with Inspector-Entered MIL Illumination Status (Engine Running, KOER)
Result of Downloaded MIL Status Result of MIL Illumination Status
Total (missing result) Fail Pass (missing result) 2 0 0 2
Fail 0 18,254 171,707 189,961 Pass 63 7,618 18,147,173 18,154,854 Total 65 25,872 18,318,880 18,344,817
MIL Commanded On – A vehicle with the MIL commanded on and with stored emissions-related DTCs should fail the OBD inspection, regardless of readiness status. The TIMS software ignores manufacturer-specific (non-generic) DTCs in this pass/fail determination. To perform this analysis, all OBD test records were reviewed to determine the overall OBD pass/fail status in comparison with the downloaded MIL command status results. Specifically, any vehicle with “F” in the “OBD2_MIL_STATUS” should also have “F” in the “OBD2_PF_FLAG” field (if DTCs are present). Table III-15 provides the results of this review.
Table III-15. Comparison of Downloaded MIL Command Status with Overall OBD Test Result
Result of Overall OBD Test Result
Total Downloaded MIL
Status Fail Pass Fail 126,904 19.6% 63,057 0.4% 189,961 1.0% Pass 520,945 80.4% 17,633,909 99.6% 18,154,854 99.0% Total 647,849 100.0% 17,696,966 100.0% 18,344,815 100.0%
From Table III-15, it can be seen that 63,057 test records (0.4% of all OBD “pass” test records) have a MIL commanded on status yet receive an overall OBD pass result. However, 62,953 of the 63,057 tests had no stored DTCs, in which case it is appropriate to pass the test. The 104 remaining inspections had one or more DTCs stored, and should have resulted in a failed OBD result, since the MIL was commanded
36

Evaluation of the Texas Vehicle Emissions Inspection and Maintenance Program in the Dallas-Fort Worth and Houston-Galveston-Brazoria Nonattainment Areas Final – June 2022
on. In conclusion, the downloaded OBD MIL command status was enforced for almost all OBD tests conducted on light-duty vehicles (≤ 8500 lbs. GVWR) with stored DTCs during the period of evaluation.
Readiness Evaluation – Federal guidelines recommend two or fewer unset non-continuous monitors be allowed for MY 1996 through 2000 vehicles and only one (or none) unset non-continuous monitors be allowed for MY 2001 and newer vehicles. Vehicles with higher counts of unset non-continuous monitors should not receive a pass result. They should be failed or rejected based on the OBD system’s readiness status.
To perform this analysis, the OBD readiness status of test records was compared on a model-year basis to evaluate conformance with the readiness guidelines. Vehicles of model years 1996 through 2000 with three or more “not ready” non-continuous monitors should have an OBD readiness failure (“F” in the “OBD2_READY_RES” field of the test record) and an OBD test result of fail (“F” in the “OBD2_PF_FLAG” field of the test record). Vehicles with two or fewer “not ready” non-continuous monitors should have an OBD readiness result of pass (“P” in the “OBD2_READY_RES” of the test record). The 2001 and newer vehicles with two or more “not ready” non-continuous monitors should have an OBD readiness failure (“F” in the “OBD2_READY_RES” of the test record) and an OBD test record result of fail (“F” in the “OBD2_PF_FLAG” field of the test record), while 2001 and newer vehicles with one or fewer “not ready” non-continuous monitors should have an OBD readiness result of pass (“P” in the “OBD2_READY_RES” field of the test record).
Table III-16 compares OBD readiness status with the number of unset monitors for all OBD tests. Only non-continuous and “enabled” monitors are presented in this comparison.
Table III-16. Unset Monitors vs. Test Readiness Status for Inspections
Count of Unset Non-Continuous
Counts of Tests of Vehicles Model Year 1996 through 2000
Counts of Tests of Vehicles Model Year 2001 and newer
Monitors OBD “Not Ready” OBD “Ready” OBD “Not Ready” OBD “Ready” 0 1 418,263 81 15,231,701 1 0 192,138 8 1,915,003 2 11 53,454 220,824 492 3 13,451 0 142,446 1 4 8,264 0 100,980 0 5 5,335 0 35,907 0 6 198 0 1,618 0 8 0 0 11 0
Total 27,260 663,855 501,875 17,147,197
Results in Table III-16 show that a small number of tests (a total of 82) appear to have received an OBD “not ready” status despite having no unset monitors and another 19 not ready despite fewer monitors below the limit. Also, 492 vehicles of model year
37

Evaluation of the Texas Vehicle Emissions Inspection and Maintenance Program in the Dallas-Fort Worth and Houston-Galveston-Brazoria Nonattainment Areas Final – June 2022
2001 or newer with two unset readiness monitors still received a readiness result of “pass.” The majority of these were tested using the ESP equipment.
Table III-17 shows these data in greater detail, separated by model year.
Table III-17. Unset Monitors vs. Test Readiness Status for Inspections by Model Year
Model Year
Count of Unset Non-Continuous Monitors
0 1 2 3 or more
OBD Not Ready OBD Ready
OBD Not
Ready
OBD Ready
OBD Not
Ready
OBD Ready
OBD Not Ready
OBD Ready
1996 0 20,689 0 10,541 0 3,001 1,633 0
1997 1 57,497 0 30,154 0 8,430 4,133 0
1998 0 77,985 0 35,809 0 10,395 5,325 0
1999 0 108,466 0 50,406 0 13,781 7,327 0
2000 0 153,626 0 65,228 11 17,847 8,830 0
2001 0 201,200 0 88,914 11,403 54 10,269 0
2002 3 256,781 0 100,404 11,168 48 11,462 0
2003 1 293,928 0 119,558 12,199 55 11,472 0
2004 1 356,824 0 125,525 13,230 82 12,923 1
2005 0 414,079 0 126,156 13,334 56 15,027 0
2006 1 483,164 0 137,445 14,096 49 16,258 0
2007 4 640,346 1 159,714 14,388 40 18,931 0
2008 2 687,588 2 139,603 14,667 31 17,294 0
2009 1 504,498 0 85,455 9,904 16 11,918 0
2010 3 653,328 0 91,531 10,722 13 14,606 0
2011 5 757,439 0 97,802 11,773 10 15,459 0
2012 10 926,453 0 101249 12,120 14 17,450 0
2013 8 1,145,642 2 102442 12,103 7 19,213 0
2014 4 1,260,024 0 99,137 11,004 8 18,915 0
2015 11 1,429,606 2 90,402 11,243 6 17,495 0
2016 7 1,409,715 0 73,903 9,724 0 14,771 0
2017 11 1,520,171 0 74,254 11,379 2 15,491 0
2018 7 1,422,325 1 55,858 9,802 0 13,373 0
2019 2 759,296 0 39,223 5,163 1 6,958 0
2020 0 98,469 0 5,561 1,152 0 1,376 0
2021 0 10,825 0 867 250 0 301 0
Total 82 15,649,964 8 2,107,141 220,835 53,946 308,210 1
38

Evaluation of the Texas Vehicle Emissions Inspection and Maintenance Program in the Dallas-Fort Worth and Houston-Galveston-Brazoria Nonattainment Areas Final – June 2022
Comparison of readiness result with overall pass/fail result – The pass/fail disposition of the readiness result field of the test record was compared with the overall OBD test disposition to see if any vehicles with a “not ready” status (as determined automatically by the analyzer) received an overall OBD test result of “pass.” To perform this analysis, the “OBD2_READY_RES” field was compared to the “OBD2_PF_FLAG” fields in the analyzer OBD test records. These records with transitional vehicles were excluded from this analysis of readiness to prevent any confusion in the results, leaving 18,343,284 records in the dataset for this analysis. The results are shown in Table III-18.
Table III-18. Comparison of Readiness Status Field with Overall OBD Test Result
Readiness Status Overall OBD Test Result Total Check Fail Pass
(Missing result) 6 0.0% 3,091 0.0% 3,097 0.0% Fail (Not Ready) 526,906 81.3% 2,229 0.0% 529,135 2.9% Pass (Ready) 120,864 18.7% 17,690,188 100.0% 17,811,052 97.1% Total 647,776 100.0% 17,695,508 100.0% 18,343,284 100.0%
As can be seen in Table III-18, 2,229 of the vehicles with a “not ready” status received an overall “pass” result for the OBD portion of the test. This represents less than 0.013%; therefore, the value in Table III-18 is shown as 0.0%. This indicates that the OBD readiness status (as determined by the analyzer and stored in the OBD2_READY_RES” field of the test record) was almost always enforced for OBD tests performed during the period of evaluation. Note that the first row of the table, for 3,097 records with a missing result for the readiness status check, is a new addition for 2022. It is not clear why these records were able to receive mostly passing inspections, without having received a readiness result.
39

Evaluation of the Texas Vehicle Emissions Inspection and Maintenance Program in the Dallas-Fort Worth and Houston-Galveston-Brazoria Nonattainment Areas Final – June 2022
IV. REPAIR
ERG used TIMS data from January 1, 2020, through December 31, 2021, to analyze repair activities to demonstrate the extent and effectiveness of repairs directed by the Texas I/M program. This task will cover process-based measures for repair effectiveness.
There are several issues with the repair data contained in the TIMS dataset that make analysis difficult. Future changes in the way data are collected and stored may alleviate many of these issues. These issues are described below and are very similar to those listed in previous reports.
Repair data in the TIMS are entered by the inspector performing the inspection; however, the motorist often does not bring the vehicle repair form for the re-inspection, and this leads to the inspector leaving this information blank. Most repair entries in the TIMS are made by inspectors who either work in the same facility where the re-inspection takes place or make the repairs themselves.
The TIMS repair data include only five different repair types, and these types are too general to permit a detailed analysis of the data. These types include fuel system, ignition/electrical system, emissions system, engine mechanical, and miscellaneous. As listed in Table IV-1, below, “miscellaneous” repairs make up almost 40% of the reported repairs. The addition of more detailed repair types during the collection of data would allow for more specificity in analysis. Previously, the Texas I/M program did have a more detailed list of repair types. However, because the TCEQ believed that a large fraction of inspectors did not fill out the repair list correctly, the TCEQ adopted the simpler list that been used for many years. Accuracy and completeness of repair data are common issues in I/M programs that attempt to collect repair data.
It is recommended that the TCEQ consider increasing the number of repair categories in the analyzer software and eliminating the “Miscellaneous” category since that does not provide any useful information. Ideally, the repair choices that inspectors see and choose from would be only those that apply to the technology of the vehicle being inspected, although that does involve an increase in program complexity.
Another problem, described in the costs section below, exists in the reported values of repair costs. Many repairs with a cost of zero exist in the dataset, along with some extremely high (e.g., greater than $2,000) costs as well. The source of these zero cost entries is not clear, but their presence makes it difficult to comprehensively assess costs across the entire dataset because they skew the results downward.
A. NUMBER AND TYPES OF REPAIRS
ERG performed analysis on the number and types of repairs for the two years of TIMS data. The inspectors at Texas I/M stations have an opportunity to enter vehicle repair
40

Evaluation of the Texas Vehicle Emissions Inspection and Maintenance Program in the Dallas-Fort Worth and Houston-Galveston-Brazoria Nonattainment Areas Final – June 2022
information into the inspection analyzer prior to conducting an emissions retest. A simple count of the number of repairs entered and stored in the TIMS and a distribution of the repair types suggests the Texas I/M program is resulting in vehicles being repaired.
General I/M Repairs
As noted above, the TIMS database, provided by the TCEQ for this analysis, contained many repair entries but relatively little detail on the nature of repairs performed. The five repair categories listed in the TIMS, along with the corresponding number of performed repairs, are presented in Table IV-1 by model year group.
Table IV-1. Repairs Listed in the TIMS
Repair Type Model Year Number of Repairs % of Repair Type % of Total Fuel System 1996–1999 1,962 5.2% 2.1%
2000–2006 13,556 36.1% 14.2% post-2007 22,079 58.7% 23.2% Total 37,597 100.0% 39.5%
Ignition / Electrical System 1996–1999 476 6.4% 0.5% 2000–2006 2,768 36.9% 2.9% post-2007 4,252 56.7% 4.5% Total 7,496 100.0% 7.9%
Emissions System 1996–1999 966 6.4% 1.0% 2000–2006 5,549 37.0% 5.8% post-2007 8,467 56.5% 8.9% Total 14,982 100.0% 15.7%
Engine Mechanical 1996–1999 80 7.6% 0.1% 2000–2006 373 35.5% 0.4% post-2007 598 56.9% 0.6% Total 1,051 100.0% 1.1%
Miscellaneous 1996–1999 1,947 5.7% 2.0% 2000–2006 12,301 36.1% 12.9% post-2007 19,844 58.2% 20.8% Total 34,092 100.0% 35.8% Grand Total 95,218 100.0%
B. SUCCESS OF REPAIRS TO VEHICLES FAILING OBD
The objective of this task was to determine whether vehicles failing the OBD inspection were being properly repaired. ERG performed an analysis of the TIMS data for OBD failures and the presence of an illuminated MIL and DTCs followed by an OBD pass (readiness criteria met, MIL commanded off and no DTCs) as an indicator that the I/M program is resulting in OBD repairs. In this analysis, it is assumed that an OBD fail result followed by an OBD pass result is due to vehicle repairs, although it is possible that some of the OBD fails followed by an OBD pass could result from intermittent problems, self-correcting problems (such as a loose gas cap that is tightened upon a vehicle refuel) or an OBD problem that is masked by unset readiness monitors (e.g.,
41

Evaluation of the Texas Vehicle Emissions Inspection and Maintenance Program in the Dallas-Fort Worth and Houston-Galveston-Brazoria Nonattainment Areas Final – June 2022
through a battery disconnect) on a subsequent passing retest. For example, after DTCs are cleared, it might be possible to pass a retest if the monitor associated with the DTC has not reset to ready. This “masking” issue is analyzed later in this section.
Since the electronic OBD information is not used to determine the pass or fail status of HD vehicles during OBD inspections, the records from their inspections were excluded from this analysis. This left a dataset of 18,345,242 OBD inspection records available for the analysis.
Overall Success of Repairs to Vehicles Failing OBD
For this task, ERG analyzed vehicle inspection records to identify tests with OBD failures and then determined how many of those failures were subsequently corrected. In addition, ERG created very specific definitions of OBD “fail” and “pass” to exclude initial test failures associated with readiness, failures due to OBD/analyzer communication problems, OBD test failures associated with inspector-entry, and bulb-illumination checks. An OBD test failure was defined to be any test record with one or more stored DTCs, coinciding with the OBD MIL command status of “on.” A passing result for an OBD test was defined as a downloaded OBD MIL commanded status of “off.” These definitions were needed in order to fully control the analysis of MIL status, but they did leave some inspections that did not qualify as either a full “fail” or a full “pass” (i.e., OBD test was passed but overall, I/M test was failed, etc.).
Next, all individual vehicle I/M cycles that contained at least one failed OBD test were identified. I/M cycles were defined to be a single test, or a series of tests, performed on a vehicle until the vehicle either passed the overall inspection or received a waiver. Thus, if a vehicle failed the initial OBD test, the I/M cycle for that vehicle would be the initial failure and any and all subsequent tests, until the vehicle passed its inspection or received a waiver, or the evaluation period ended. Once the vehicle passed its inspection, its next test (most likely for the following year’s I/M inspection) would be a new I/M cycle. Any I/M cycles that began on or after September 1, 2021, were excluded from the analysis, since it would be possible that cycles starting so near the end of the date range of the dataset could have included additional re-inspections after December 31, 2021, and there would be no information for those inspections. Using these criteria, the dataset contained 14,823,813 OBD I/M cycles (including single-OBD-test passes) that started before September 1, 2021.
After grouping by I/M cycle for vehicles with OBD failures (as previously defined), 95,897 I/M cycles were seen to include at least one failed OBD test. Of these cycles, 77,462 (81%) had a final OBD test disposition of “pass,” which for purposes of this analysis was defined as a test with a commanded MIL status of “pass” (MIL commanded off) and an OBD test disposition of “pass.” Of the remaining vehicles that never passed a subsequent OBD test, 199 received waivers, but the majority simply failed to report for additional inspections to complete the program requirements, although additional re-inspections may have occurred after December 31, 2021, which
42

Evaluation of the Texas Vehicle Emissions Inspection and Maintenance Program in the Dallas-Fort Worth and Houston-Galveston-Brazoria Nonattainment Areas Final – June 2022
would increase the overall “repaired” numbers. Note that this indicates a higher “no-final-pass” rate than that reported above in Section III. The results here are using stricter criteria for passing the test and are therefore different than the results in Section III that were simply based on the recorded pass/fail result.
It should be noted that the two allowed unset monitors could mask existing malfunctions in some of these repaired outcomes. The influence of this masking is explored later in this section.
Success of Repairs to Specific Emission Control Systems Failing OBD
For this analysis, DTCs were categorized based on the type of monitored system, and using this categorization, ERG performed an analysis of repairs based on component categories to determine if the program was resulting in effective emission control system repairs. This task was performed as a continuation of the analysis in Section C. It uses combinations of vehicles and I/M cycles defined in that section. However, for this task, failure modes were assigned based on the DTCs contained in the failed test records.
Specifically, the analysis was performed on vehicles with DTC failures associated with oxygen sensors (O2 Sensor), exhaust gas recirculation systems (EGR System), secondary air injection systems (AI System), catalytic converter efficiency (Catalyst), and evaporative emissions control system (Evap System) components.4 The O2 Sensor, EGR System, AI System, and Catalyst were included with this analysis because the readiness status of these systems, as well as the evaporative system, are specifically monitored by non-continuous monitors, and therefore the extent to which malfunctions may be masked by unset readiness monitors during a retest (which could result in a false pass) can be quantified. In this analysis, the extent of this potential masking is quantified along with the overall repair rates as indicated by a “fail” test followed by a “pass” test.
For each of the failure categories, a failed inspection is defined as any inspection that contains at least one test record with stored DTCs, a downloaded OBD MIL commanded status of “on,” an OBD test disposition of “fail,” and an overall test disposition of “fail.” Passed inspections were those that had a final test in that I/M cycle with a downloaded MIL status of “pass” (not commanded on) and an OBD test disposition of “pass.”
To quantify the upper limit to which readiness may be masking unrepaired malfunctions during OBD retests, the following distinctions of “repaired” vehicles were made:
4 A list of DTCs that were included in each of these groups is given in Appendix B.
43

Evaluation of the Texas Vehicle Emissions Inspection and Maintenance Program in the Dallas-Fort Worth and Houston-Galveston-Brazoria Nonattainment Areas Final – June 2022
• Total Repaired – This is the count of all vehicles that had at least one “fail” test with the final test classified as “repaired.” No regard is given to which (if any) monitors remain unset.
• Repaired with Unset Monitors – This is the count of all “repaired” vehicles that have an unset monitor that may be masking the failure mode seen in the initial “fail” test. For example, if a vehicle fails for an evaporative system malfunction, then the evaporative system monitor is unset on the final “pass” test for this vehicle, thereby possibly masking an unrepaired evaporative system malfunction. Once this monitor becomes “ready,” any unrepaired malfunction would result in a stored evaporative system DTC and MIL re-illumination.
• Confirmed Repaired – These are the vehicles whose monitors for which the initial failure occurred are “ready” in the final test, indicating that specific type of failure is not being masked by a “not-ready” monitor. Therefore, there is much higher confidence that these “confirmed repaired” vehicles are indeed properly repaired.
During this analysis of readiness status, some vehicles that failed for a certain system (e.g., EGR) were found to have a “not monitored” status for that monitored system (e.g., EGR not monitored). This might have been due to DTCs being generated by a continuous monitor; however, by definition, this should not be possible since a system with a stored code must be monitored. Therefore, this subset of results was classified as “ready.” Because this subset of inspections was failed, it seems that incorrect reporting of monitor status is truly the cause as opposed to potential inspection fraud through “clean-scanning.”
Regarding criteria used for categorizing “pass” and “fail” tests, it should also be noted that historical or permanent DTCs without MIL illumination are trouble codes for previous malfunctions that do not necessarily indicate a current malfunction. In accordance with the EPA guidance, vehicles are not failed for historical or non-MIL permanent DTCs, that is, stored DTCs but no MIL. Pending DTCs or permanent DTCs are not collected in the Texas I/M program.5 Results from this repair analysis, therefore, only defines tests with MIL illumination and stored DTCs as “fail” tests, and only considers MIL illumination (without regard to stored DTCs) in determining whether a vehicle is successfully repaired.
Finally, it is worthwhile to note that a failed OBD test record could contain more than one DTC. In the Texas I/M program, up to 10 DTCs may be stored in the test record, and all stored DTCs were used for this analysis. Therefore, some vehicles were included in more than one set of results. For example, repair results for vehicles with both oxygen sensor DTCs and catalytic converter DTCs were included in both the oxygen sensor repair analysis and the catalytic converter repair analysis. Because of
5 To ERG’s knowledge, no state I/M program collects pending DTC data per Mode $07 or permanent DTC data per Mode $0A of SAE J1979. States typically only use Mode $03 and DTCs read via Mode $03 are associated to MIL status, i.e., a DTC + MIL commanded on with a confirmed DTC.
44

Evaluation of the Texas Vehicle Emissions Inspection and Maintenance Program in the Dallas-Fort Worth and Houston-Galveston-Brazoria Nonattainment Areas Final – June 2022
the inter-dependence of the various systems (e.g., an oxygen sensor failure may lead to a future catalytic converter failure), distinctions were not made regarding the number or types of DTCs in the original OBD-fail records. Rather, vehicles were categorized as “repaired” when the MIL was extinguished and the analyzer assigned an overall OBD “pass” result, regardless of the number or type of DTCs seen in the initial test failure.
Table IV-2 provides a summary of vehicle repairs (as indicated by OBD-fails followed by OBD-passes) performed over the period of evaluation. Since this analysis was performed on I/M data collected from January 1, 2020, through December 31, 2021, it is possible that some of the unrepaired vehicles were repaired in 2022. This would increase the “repaired” counts from the numbers shown in this table.
These data show that roughly 80% of vehicles that failed an OBD test received a passing OBD test. As previously indicated, many vehicles were failed with more than one DTC. Therefore, Table IV-2 may contain vehicles included in more than one DTC category. Also, only categories directly monitored with non-continuous monitors are tabulated in Table IV-2. Other failure categories for which readiness status would be more difficult to assess are excluded from the table. Table IV-2 indicates that readiness status may be masking malfunctions of 2% to 35% of vehicles that pass OBD retests based on MIL status with these types of failures. I/M program modifications that would require confirmation of specific failure-mode monitors being set to “ready” would likely reduce the extent of potential false passes but at the expense of a potential increase in motorist inconvenience, especially for difficult to set monitors.
A comparison was also made between OBD evaporative system results and gas cap test results, on a by-test basis, for all OBD tests conducted during the period of evaluation. Table IV-3 presents a summary of these results.
Table IV-2. System Specific Repair Analysis for Vehicles
Type of Failure (DTC
Category)
Total Vehicles Failed (with
Indicated Failure Mode
DTCs) Total Repaired
Vehicles (MIL Off)
Repaired Vehicles with Failure Mode Monitors
Not Yet Set
Confirmed Repairs (Failure Mode Monitors
Set) Evap System 26,654 21,730 81.5% 9,376 35.2% 12,354 46.3% O2 Sensor 13,938 10,881 78.1% 273 2.0% 10,608 76.1% EGR System 4,257 3,266 76.7% 188 4.4% 3,078 72.3% AI System 904 668 73.9% 62 6.9% 606 67.0% Catalyst 19,773 15,647 79.1% 1,594 8.1% 14,053 71.1% Totals 65,526 52,192 79.7% 11,493 17.5% 40,699 62.1%
45

Evaluation of the Texas Vehicle Emissions Inspection and Maintenance Program in the Dallas-Fort Worth and Houston-Galveston-Brazoria Nonattainment Areas Final – June 2022
Table IV-3. Comparison of OBD Evaporative Emission Control System Test Results with Gas Cap Test Results
OBD Evap System Test Gas Cap Test Result Total Results Pass Fail
Pass 15,148,498 98.74% 52,929 0.34% 15,201,427 Fail 139,376 0.91% 1,344 0.01% 140,720
Total 15,287,874 99.65% 54,273 0.35% 15,342,147
As can be seen in Table IV-3, approximately 0.91% of the tests had failed the OBD portion of the test with evaporative system DTCs, and gas cap failures were seen in 0.35% of the tests. The OBD evaporative system monitoring is designed to be a more comprehensive test since it assesses the integrity of the entire evaporative control system, but the OBD evaporative emissions control system fail rate may be lowered in part by unset evaporative system readiness monitors. Evaporative emissions control systems generally require a complex series of vehicle operating conditions before this monitor is set. Although most vehicles passed both tests, very few vehicles, less than 1%, failed both tests. Allowable pressure decay limits and enhanced OBD evaporative emissions control system test criteria may contribute to differences in fail rates of the two tests and the slight discrepancy in overlap between the two tests.
Overall OBD Repair Slates
The most common repair slates for vehicles receiving OBD inspections were also identified. The top 10 slates are listed in Table IV-4. The table also gives the total number of vehicles that received repairs, i.e., received one of the top 10 repairs or some other repair.
Table IV-4. 10 Most Common Repair Slates
Repair Description OBD
Count Percent Fuel System 31,117 39.0% Miscellaneous 28,079 35.2% Emissions System 12,594 15.8% Ignition/Electrical System 6,229 7.8% Engine/Mechanical 847 1.1% Fuel System & Miscellaneous 442 0.6% Emissions & Fuel Systems 199 0.2% Emissions System & Miscellaneous 152 0.2% Fuel System & Ignition/Electrical 62 0.1% Ignition/Electrical & Emissions Systems 43 0.1% Other 112 0.1% Total 79,876 100.0%
For OBD inspections, a failed inspection includes one or more DTCs that are set and the DTCs give information about what type of problem(s) the vehicle has that may necessitate repairs. When an OBD inspection is passed, no DTCs will be set. Therefore, the DTCs that are initially set and then finally unset (turned off) were compared to the
46

Evaluation of the Texas Vehicle Emissions Inspection and Maintenance Program in the Dallas-Fort Worth and Houston-Galveston-Brazoria Nonattainment Areas Final – June 2022
repairs for OBD vehicles. Since there are far too many possible combinations of DTCs to create a “DTC slate” analogous to the repair slates, where all DTCs that were turned on during an inspection sequence are considered as a group, and the analysis is done on these groups, repairs were correlated with DTCs on an individual basis rather than as slates for the OBD repair analysis.
In Table IV-5, the five repair types are listed horizontally across the header row and each row of the table represents one DTC. The number of times that each DTC was “turned off” in the same inspection cycle as each repair is given in the cells of the table. For example, in row one of the table, DTC P0420 (a catalyst system DTC) was turned off most frequently by “Fuel System” repairs (1,034 times), followed by “Emissions System” repairs (875 times), and then by “Miscellaneous” repairs (689 times). Rows with DTCs that relate to similar components or problems are grouped together in the table. The DTCs listed in Table IV-5 are the most commonly recorded DTCs, representing about two-thirds of the total DTC repair counts. In some cases, the inspectors are not choosing the correct repair type. For example, most misfire DTCs should involve ignition system repairs.
47

Evaluation of the Texas Vehicle Emissions Inspection and Maintenance Program in the Dallas-Fort Worth and Houston-Galveston-Brazoria Nonattainment Areas Final – June 2022
Table IV-5. Most Common OBD DTCs and Associated Repairs
DTC Name DTC Description
Repair Type
Total Fuel System Ignition/
Electrical System Emissions System Engine
Mechanical Miscellaneous
Count Percent Count Percent Count Percent Count Percent Count Percent Count
P0420 Catalyst System Efficiency Below Threshold (Bank 1) 1,034 38% 126 5% 875 32% 31 1% 689 25% 2,755
P0430 Catalyst System Efficiency Below Threshold (Bank 2) 449 40% 51 5% 326 29% 19 2% 266 24% 1,111
P0300 Random/Multiple Cylinder Misfire Detected 451 39% 194 17% 213 18% 20 2% 289 25% 1,167
P0301 Cylinder 1 Misfire Detected 223 39% 126 22% 94 16% 11 2% 118 21% 572
P0302 Cylinder 2 Misfire Detected 229 40% 118 20% 78 14% 12 2% 139 24% 576
P0303 Cylinder 3 Misfire Detected 215 40% 101 19% 95 18% 11 2% 118 22% 540
P0304 Cylinder 4 Misfire Detected 227 37% 117 19% 90 15% 15 2% 158 26% 607
P0305 Cylinder 5 Misfire Detected 128 38% 73 22% 68 20% 1 0% 66 20% 336
P0306 Cylinder 6 Misfire Detected 127 39% 82 25% 51 16% 6 2% 58 18% 324
P0441 Evaporative Emission Control System Incorrect Purge Flow 206 34% 33 5% 190 31% 6 1% 171 28% 606
P0442 Evaporative Emission Control System Leak Detected (small leak)
358 38% 40 4% 278 29% 18 2% 255 27% 949
P0446 Evap Emiss Control Sys. Vent Control Circuit Malfunction 214 36% 33 6% 188 32% 10 2% 150 25% 595
48

Evaluation of the Texas Vehicle Emissions Inspection and Maintenance Program in the Dallas-Fort Worth and Houston-Galveston-Brazoria Nonattainment Areas Final – June 2022
DTC Name DTC Description
Repair Type
Total Fuel System Ignition/
Electrical System Emissions System Engine
Mechanical Miscellaneous
Count Percent Count Percent Count Percent Count Percent Count Percent Count
P0455 Evaporative Emiss Control Sys. Leak Detected (gross leak)
464 36% 62 5% 353 28% 13 1% 390 30% 1,282
P0456 Evaporative Emiss System Leak Detected (very small leak)
330 37% 46 5% 242 27% 13 1% 258 29% 889
P0457 Evaporative Emission System Leak Detected (fuel cap loose/off)
122 37% 17 5% 86 26% 6 2% 99 30% 330
P0401 Exhaust Gas Recirculation Flow Insufficient Detected 192 37% 27 5% 165 32% 8 2% 131 25% 523
P0171 Fuel System too Lean (Bank 1) 702 41% 143 8% 374 22% 27 2% 457 27% 1,703
P0172 Fuel System too Rich (Bank 1) 89 40% 18 8% 41 19% 4 2% 68 31% 220
P0174 Fuel System too Lean (Bank 2) 416 42% 90 9% 218 22% 15 1% 262 26% 1,001
P0101 Mass Air Flow (MAF) Circuit Range/Performance 136 37% 25 7% 87 24% 5 1% 116 31% 369
P0102 Mass or Volume Air Flow Circuit Low Input 81 37% 15 7% 51 24% 3 1% 67 31% 217
P0139 O2 Sensor Circuit Slow Response Bank 1 Sensor 2 29 50% 1 2% 11 19% 1 2% 16 28% 58
49

Evaluation of the Texas Vehicle Emissions Inspection and Maintenance Program in the Dallas-Fort Worth and Houston-Galveston-Brazoria Nonattainment Areas Final – June 2022
DTC Name DTC Description
Repair Type
Total Fuel System Ignition/
Electrical System Emissions System Engine
Mechanical Miscellaneous
Count Percent Count Percent Count Percent Count Percent Count Percent Count
P0325 Knock Sensor 1 Circuit Malfunction (Bank 1 or Single Sensor2)
105 44% 26 11% 43 18% 9 4% 57 24% 240
P0011 Camshaft Position Timing Over-Advanced (Bank 1) 79 42% 12 6% 35 19% 19 10% 41 22% 186
P0014 Exhaust Camshaft Timing Over-Advanced (Bank 1) 77 43% 14 8% 33 18% 16 9% 40 22% 180
P0106 Manifold Absolute Pressure/BARO Sensor Range/Performance
50 43% 7 6% 22 19% 2 2% 34 30% 115
P0113 Intake Air Temperature Sensor 1 Circuit High Input 96 43% 19 9% 48 22% 4 2% 56 25% 223
P0121 Throttle Position Sensor/Switch A Circuit Malfunction
86 41% 14 7% 39 19% 8 4% 62 30% 209
P0128 Coolant Temperature Below Thermostat Regulating Temp. 332 35% 50 5% 169 18% 22 2% 384 40% 957
P0700 Transmission Control System Malfunction 113 43% 13 5% 38 14% 8 3% 92 35% 264
50

Evaluation of the Texas Vehicle Emissions Inspection and Maintenance Program in the Dallas-Fort Worth and Houston-Galveston-Brazoria Nonattainment Areas Final – June 2022
C. AVERAGE REPAIR COSTS
The TIMS dataset contains manually entered costs for I/M program repairs. This information was analyzed to provide a rough estimate of the cost of vehicle repairs because of the Texas I/M program.
To estimate repair costs based on type of repair, repair categories were developed for each vehicle for a given I/M cycle. A repair category is a concatenation of the set of repair types performed in a repair event. The five different repair types listed in Table IV-1 were combined to produce the seven most common repair categories, which account for approximately 99.5% of all vehicle and I/M cycle combinations. These categories are presented in Table IV-6.
Almost two-thirds (61.7%) of the repair costs in the TIMS were recorded as zero. There are several possible reasons for this, including repairs under warranty, inaccurate repair data entry during a vehicle re-inspection; motorists performing their own repairs; lack of repair data available during a vehicle re-inspection; or vehicles receiving a retest without receiving repairs, such as vehicles that fail due to a readiness monitor and need to simply be driven until the monitors pass their readiness tests. Because of the large number of repair records affected, no attempt was made to correct the costs as part of this analysis. Nonetheless, the existence of so many repair costs with a value of zero significantly affected the average and median repair values calculated. Table IV-6 presents the number of records with a cost of zero by repair category. It was observed that some categories listed contained about 20–40% with zero repair costs, but the most common repair types of emissions system, fuel system, and miscellaneous repairs contained a much higher percentage, at 50% or more. However, all these percentages are comparable to those in the 2014, 2016, 2018, and 2020 reports.
It was also noted than many of the repair costs seemed to be unusually large; many records were more than $2,000, with some as high as $100,000. It is suspected that these repair costs reflect invalid data entry by inspectors during vehicle re-inspections. Figure IV-1 presents a histogram of repairs that cost $2,000 or more.
Table IV-6. TIMS Records with a Repair Cost of Zero by Category
Repair Category Cost > $0 Cost = $0 Total % of Cost = $0 Fuel System and Emissions System 132 89 221 40.3% Emissions System & Miscellaneous 244 268 512 52.3% Engine Mechanical 676 301 977 30.8% Ignition / Electrical System 4,500 2,654 7,154 37.1% Fuel System 7,101 6,989 14,090 49.6% Miscellaneous 9,812 22,446 32,258 69.6% Emissions System 12,359 23,436 35,795 65.5% Total 34,824 56,183 91,007 61.7%
51

Evaluation of the Texas Vehicle Emissions Inspection and Maintenance Program in the Dallas-Fort Worth and Houston-Galveston-Brazoria Nonattainment Areas Final – June 2022
Table IV-7 presents median and mean repair costs for each of the repair types specified in the TIMS. Mean and median are calculated twice – once including the zero dollar amount and >$2,000 repair costs found in the dataset (unedited), and once without (edited). According to the unedited dataset, vehicle owners performed 90,000 repairs while spending approximately $7.2 million. According to the edited dataset, which leaves out zero cost and greater than $2,000 cost observations, vehicle owners performed 35,000 repairs while spending approximately $5.6 million. These numbers are notably lower than the numbers for previous I/M evaluations, both for the numbers of repairs, and the total costs.
Figure IV-2 and Figure IV-3 present mean repair costs by inspection year and model year, for both the unedited and edited TIMS datasets. There is a significant amount of variability in the unedited data when compared to the edited data. As shown by these plots, entered repair costs have not increased from year to year. Due to the limited control in repair data entry and the large number of suspect values in the TIMS repair data, these results may be significantly different from true repair costs resulting from the Texas I/M program.
Figure IV-1. Repairs with Cost Greater than or Equal $2,000
52

Evaluation of the Texas Vehicle Emissions Inspection and Maintenance Program in the Dallas-Fort Worth and Houston-Galveston-Brazoria Nonattainment Areas Final – June 2022
Table IV-7. Average Repair Costs
Year of Inspection Repair Category
Original Dataset Costs Between $0 and $2,000 Number
of Repairs
Median Repair Cost
Mean Repair Cost
Number of
Repairs
Median Repair Cost
Mean Repair Cost
2020 Fuel System and Emissions System 114 $60 $208 74 $226 $245 2020 Emissions System & Miscellaneous 94 $241 $295 81 $260 $342 2020 Engine Mechanical 569 $115 $241 366 $218 $294 2020 Ignition / Electrical System 3,923 $75 $115 2,422 $145 $183 2020 Fuel System 8,142 $0 $143 3,883 $200 $260 2020 Emissions System 17,015 $0 $76 5,568 $100 $137 2020 Miscellaneous 17,400 $0 $37 5,106 $45 $93 2021 Fuel System and Emissions System 107 $25 $252 54 $215 $302 2021 Emissions System & Miscellaneous 75 $220 $309 54 $288 $336 2021 Engine Mechanical 408 $160 $398 291 $240 $323 2021 Ignition / Electrical System 3,231 $89 $140 2,069 $149 $195 2021 Fuel System 5,948 $20 $152 3,168 $200 $266 2021 Emissions System 18,780 $0 $68 6,735 $120 $141 2021 Miscellaneous 14,858 $0 $43 4,671 $37 $93
Figure IV-2. Mean Repair Costs by Model Year and Inspection Year (Unedited Dataset)
53

Evaluation of the Texas Vehicle Emissions Inspection and Maintenance Program in the Dallas-Fort Worth and Houston-Galveston-Brazoria Nonattainment Areas Final – June 2022
Figure IV-3. Mean Repair Costs by Model Year and Inspection Year (Edited Dataset)
Figure IV-4 and Figure IV-5 present the percentile distribution of repair costs for the most common TIMS repair categories, for both the unedited and edited datasets. The unedited dataset contains repairs with an average cost of zero for all repair slates, but miscellaneous repairs costing zero extend close to the 70th percentile, which is considerably more than the other categories.
For both datasets, the range of average costs was most limited for miscellaneous repairs, while the greatest variation in average costs was visible in repairs performed on both the fuel and emissions systems.
54

Evaluation of the Texas Vehicle Emissions Inspection and Maintenance Program in the Dallas-Fort Worth and Houston-Galveston-Brazoria Nonattainment Areas Final – June 2022
Figure IV-4. Distribution of Repair Costs by Category (Unedited Dataset)
Figure IV-5. Distribution of Repair Costs by Category (Edited Dataset)
55
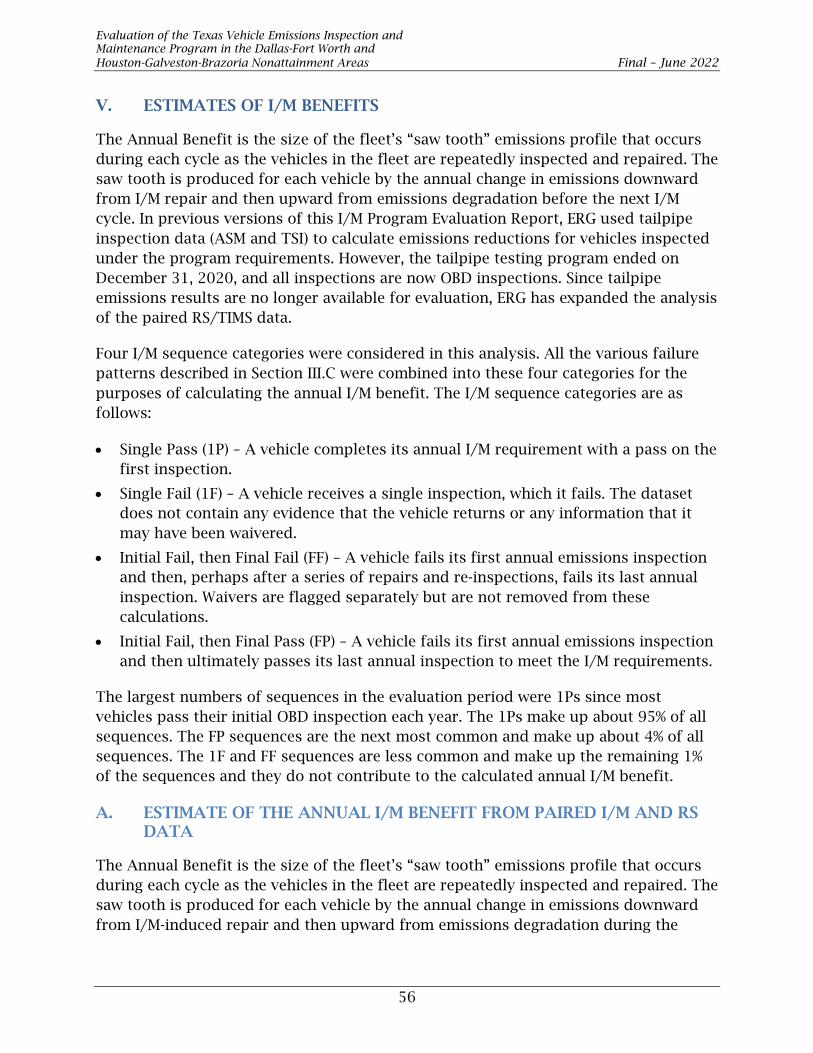
Evaluation of the Texas Vehicle Emissions Inspection and Maintenance Program in the Dallas-Fort Worth and Houston-Galveston-Brazoria Nonattainment Areas Final – June 2022
V. ESTIMATES OF I/M BENEFITS
The Annual Benefit is the size of the fleet’s “saw tooth” emissions profile that occurs during each cycle as the vehicles in the fleet are repeatedly inspected and repaired. The saw tooth is produced for each vehicle by the annual change in emissions downward from I/M repair and then upward from emissions degradation before the next I/M cycle. In previous versions of this I/M Program Evaluation Report, ERG used tailpipe inspection data (ASM and TSI) to calculate emissions reductions for vehicles inspected under the program requirements. However, the tailpipe testing program ended on December 31, 2020, and all inspections are now OBD inspections. Since tailpipe emissions results are no longer available for evaluation, ERG has expanded the analysis of the paired RS/TIMS data.
Four I/M sequence categories were considered in this analysis. All the various failure patterns described in Section III.C were combined into these four categories for the purposes of calculating the annual I/M benefit. The I/M sequence categories are as follows:
• Single Pass (1P) – A vehicle completes its annual I/M requirement with a pass on the first inspection.
• Single Fail (1F) – A vehicle receives a single inspection, which it fails. The dataset does not contain any evidence that the vehicle returns or any information that it may have been waivered.
• Initial Fail, then Final Fail (FF) – A vehicle fails its first annual emissions inspection and then, perhaps after a series of repairs and re-inspections, fails its last annual inspection. Waivers are flagged separately but are not removed from these calculations.
• Initial Fail, then Final Pass (FP) – A vehicle fails its first annual emissions inspection and then ultimately passes its last annual inspection to meet the I/M requirements.
The largest numbers of sequences in the evaluation period were 1Ps since most vehicles pass their initial OBD inspection each year. The 1Ps make up about 95% of all sequences. The FP sequences are the next most common and make up about 4% of all sequences. The 1F and FF sequences are less common and make up the remaining 1% of the sequences and they do not contribute to the calculated annual I/M benefit.
A. ESTIMATE OF THE ANNUAL I/M BENEFIT FROM PAIRED I/M AND RS DATA
The Annual Benefit is the size of the fleet’s “saw tooth” emissions profile that occurs during each cycle as the vehicles in the fleet are repeatedly inspected and repaired. The saw tooth is produced for each vehicle by the annual change in emissions downward from I/M-induced repair and then upward from emissions degradation during the
56

Evaluation of the Texas Vehicle Emissions Inspection and Maintenance Program in the Dallas-Fort Worth and Houston-Galveston-Brazoria Nonattainment Areas Final – June 2022
period before the next I/M cycle. The analysis presented in this section estimates annual benefits based on pairing the TIMS data with RS data.
Although the effect of the Texas I/M program is to reduce emissions by repairing vehicles that fail an emissions test, these vehicles will then likely have increasing emissions until their next I/M test, and this is also true for passing vehicles. RS data allow this slow increase in emissions to be observed as initially passing vehicles (95% of the fleet) go through the Texas I/M program and their emissions gradually increase each year. This is often called emission creep or deterioration. Eventually, when their emissions have increased over the years to a high enough level, the vehicle fails the I/M inspection, repairs are performed, and emissions should be reduced. During those previous years, the emissions of initially-passing vehicles have gradually increased.
ERG used RS data taken in the I/M program areas to determine the annual I/M benefit produced by the Texas I/M program. This was done by pairing RS data with the TIMS inspection data by vehicle license plate and comparing the before-I/M and after-I/M RS levels.
A vehicle can be measured by RS at any time before or after its annual I/M inspection. By aligning all the RS measurements with respect to the time of I/M test with the assumption that failing vehicles receive any necessary repairs, the average of the RS measurements will reveal the change in emissions produced by the Texas I/M program and the rate of emissions degradation between I/M inspections. However, it is important to understand that the set of vehicles with RS measurements before the I/M inspection does not contain the same vehicles as those with RS measurements after the I/M inspection. Because of the large emissions variability of RS emissions measurements, the average RS emissions vs. time before and after I/M inspection will have a considerable amount of variability even when millions of RS observations are used. Nevertheless, the calculation provides an estimate of the benefits of the Texas I/M program that is independent of the program itself.
Preparation of RS Data
In this task, the RS data were collected in the DFW and HGB program areas to evaluate the annual I/M benefit. The goal was to use the RS data already being collected by the DPS as an independent means of measuring the benefit. The RS data provided by DPS started with about 2.5 million records, collected between July 1, 2019 and February 28, 2022, with about 1.3 million records coming from the HGB area and about 1.2 million records coming from the DFW area.
The RS contractor matched the RS records to registration records in the weeks after they were collected, so that matching process did not have to be performed for this analysis. This match of RS records to registration records allowed ERG to match the record to the I/M test in the TIMS dataset whenever a successful match was made. The RS records provided to ERG also contained vehicle information from the match to the
57

Evaluation of the Texas Vehicle Emissions Inspection and Maintenance Program in the Dallas-Fort Worth and Houston-Galveston-Brazoria Nonattainment Areas Final – June 2022
registration dataset, including model year, make, and model. This information, in addition to the vehicle information in the TIMS dataset, can be used to characterize the on-road fleet for the Comprehensive Method [EPA, 2004] calculations.
The RS records provided to ERG by the DPS were already checked for validity by the RS data collection contractor. Therefore, there was no additional check made for the validity of the values within each of the RS data fields. However, a filter on the vehicle specific power (VSP) was applied to remove vehicles that happened to be observed while under very high or very low loads. Any records with a VSP outside the range of 0-35 kilowatt per ton were removed from the dataset. This left approximately 870,000 records in the dataset: 470,000 records in the DFW program area and 400,000 records in the HGB program area.
The number of RS observations collected per year has decreased dramatically over the last several years, beginning in 2014, and continuing to decrease through 2018, although record counts for 2019 saw a substantial increase. In 2020 and 2021, the counts were less than those in 2019, but greater than in 2018 and 2017. Decreases in the number of available RS observations result in much smaller groups of vehicles when the RS observations are paired with close-in-time I/M inspections.
B. CALCULATION OF THE ANNUAL I/M BENEFIT USING THE COMPREHENSIVE METHOD
The calculation of the annual I/M benefit was done using the Comprehensive Method outlined by the EPA [EPA, 2004]. In this method, RS data taken in the I/M area is paired with I/M inspections, by vehicle.
ERG calculated the time between the RS reading and the I/M test and placed each observation into a month bin. For example, one month before the initial test, two months before the initial test, three months before the initial test, one month after the final test, two months after the final test, three months after the final test, etc. Any RS readings that occurred within the I/M cycle, that is, between the initial test and the final test, were removed from the analysis, because for these mid-cycle observations it was not possible to assume the state of repair of the vehicle at the time of the RS measurement.
ERG also created a variable to describe the sequence of I/M inspection results for each vehicle inspected. There were four I/M sequence categories outlined in the EPA’s description of the Comprehensive Method calculations:
1. Vehicles that passed their initial I/M tests (1P),
2. Vehicles that failed their initial I/M test and then eventually passed (FP),
3. Vehicles that failed their I/M test and did not come back for another test (1F), and
58

Evaluation of the Texas Vehicle Emissions Inspection and Maintenance Program in the Dallas-Fort Worth and Houston-Galveston-Brazoria Nonattainment Areas Final – June 2022
4. Vehicles that failed their I/M test and failed all other subsequent I/M tests (FF).
The average RS concentrations for HC, CO, and NOX by month bin, by I/M sequence category, and by model year group were examined. Because the Texas I/M program is an annual program, the plots were limited to only the RS matches that happened up to six months before and six months after the I/M test. The HC, CO, and NOx plots for the entire dataset are shown in Figure V-1 through Figure V-3 for the DFW program area and in Figure V-4 through Figure V-6 for the HGB program area. These figures show the RS averages (indicated by the dots) and the uncertainties associated with these averages at a 95% confidence level (indicated by the lines).
Figure V-1. Average RS HC vs. Month from the I/M Test RS Readings from the HGB Program Area
59

Evaluation of the Texas Vehicle Emissions Inspection and Maintenance Program in the Dallas-Fort Worth and Houston-Galveston-Brazoria Nonattainment Areas Final – June 2022
Figure V-2. Average RS CO vs. Month from the I/M Test RS Readings from the HGB Program Area
Figure V-3. Average RS NOX vs. Month from the I/M Test RS Readings from the HGB Program Area
60

Evaluation of the Texas Vehicle Emissions Inspection and Maintenance Program in the Dallas-Fort Worth and Houston-Galveston-Brazoria Nonattainment Areas Final – June 2022
Figure V-4. Average RS HC vs. Month from the I/M Test RS Readings from the DFW Program Area
Figure V-5. Average RS CO vs. Month from the I/M Test RS Readings from the DFW Program Area
61

Evaluation of the Texas Vehicle Emissions Inspection and Maintenance Program in the Dallas-Fort Worth and Houston-Galveston-Brazoria Nonattainment Areas Final – June 2022
Figure V-6. Average RS NOX vs. Month from the I/M Test RS Readings from the DFW Program Area
It is difficult to assess the impact of I/M testing from these figures as the HC readings are relatively constant around 20 parts per million (ppm) for both program areas, the CO readings are also similar in the HGB and DFW program areas near 0.15%, and the NOx values are similar around 120 ppm. However, when the plots are done on a dataset that has been stratified by the I/M sequence category, some I/M benefits start to become evident.
Table V-1 shows the number of records in the RS-matched-with-TIMS dataset for both HGB and DFW program areas that fall into each I/M sequence category. The sample sizes are for the total number of I/M vehicles matched to RS records, but they are not necessarily the same vehicle before and after the I/M test. The table clearly demonstrates that the 1P and FP I/M sequence categories dominate the Texas I/M program vehicles that are observed on the road. Few vehicles that fail and never pass (1F and FF) are observed by remote sensing.
62

Evaluation of the Texas Vehicle Emissions Inspection and Maintenance Program in the Dallas-Fort Worth and Houston-Galveston-Brazoria Nonattainment Areas Final – June 2022
Table V-1. Number of Vehicles in Each I/M Sequence Category for the Dataset of RS Events Matched with I/M Tests
I/M Sequence Category HGB DFW
Number of Vehicles Percent Number of Vehicles Percent Pass Initial (1P) 157,055 96.3% 140,697 96.2% Fail Initial (1F) 385 0.2% 392 0.3% Fail Initial, Fail Final (FF) 38 0.0% 38 0.0% Fail Initial, Pass Final (FP) 5,535 3.4% 5,183 3.5% Other Misc. Sequences 4 0.0% 9 0.0% Total 163,017 100.0% 146,319 100.0%
The plots of mean RS concentrations vs. time from I/M inspection were repeated, this time separately for the 1P and FP categories. Figure V-7, Figure V-9, and Figure V-11 show the time trend of the monthly average RS HC, CO, and NOx for the DFW program area for vehicles that passed initially (1P). Below these figures are Figure V-8, Figure V-10, and Figure V-12 for the corresponding vehicles that failed initially and then ultimately passed (FP).
The 1P plots, which describe 96.3% of the vehicles in the DFW program area, show small emission increases from the month before to the month after the I/M test. There is no evidence of a decrease in emissions in the two months before the I/M inspection that could be attributed to pre-inspection repairs. If anything, the long-term time trend is generally upward, which may be attributed to the general long-term emissions deterioration of these vehicles.
The FP plots, which describe 3.4% of the vehicles in the DFW program area, show downward jogs in the emissions at the time of the I/M inspection, or just following the inspection. Examining the overall trend of each plot shows that downward jogs at the I/M inspection interrupts the generally upward trend of emissions creep, which is what the Texas I/M program is designed to do.
Grouping vehicles of all I/M sequence categories results in a slightly increasing trend from before to after I/M as was seen in
Figure V-2 and Figure V-3. This is because although the FP vehicles show substantial emissions decreases, they make up only 3.4% of the DFW fleet. An additional 96.3% of the fleet is made up of 1P vehicles that have slight emissions increases, as an expected result of general long-term emission creep. There was no discernible difference in the plots for the emissions in the HGB program area; therefore, they were not included here to conserve space.
63

Evaluation of the Texas Vehicle Emissions Inspection and Maintenance Program in the Dallas-Fort Worth and Houston-Galveston-Brazoria Nonattainment Areas Final – June 2022
Figure V-7. Average RS HC vs. Month After the I/M Test for DFW Vehicles with I/M Sequence Category = 1P
Figure V-8. Average RS HC vs. Month After the I/M Test for DFW Vehicles with I/M Sequence Category = FP
64

Evaluation of the Texas Vehicle Emissions Inspection and Maintenance Program in the Dallas-Fort Worth and Houston-Galveston-Brazoria Nonattainment Areas Final – June 2022
Figure V-9. Average RS CO vs. Month After the I/M Test for DFW Vehicles with I/M Sequence Category = 1P
Figure V-10. Average RS CO vs. Month After the I/M Test for DFW Vehicles with I/M Sequence Category = FP
65

Evaluation of the Texas Vehicle Emissions Inspection and Maintenance Program in the Dallas-Fort Worth and Houston-Galveston-Brazoria Nonattainment Areas Final – June 2022
Figure V-11. Average RS NOX vs. Month After the I/M Test for DFW Vehicles with I/M Sequence Category = 1P
Figure V-12. Average RS NOX vs. Month After the I/M Test for DFW Vehicles with I/M Sequence Category = FP
66

Evaluation of the Texas Vehicle Emissions Inspection and Maintenance Program in the Dallas-Fort Worth and Houston-Galveston-Brazoria Nonattainment Areas Final – June 2022
To quantify the annual I/M benefit, the month bins were combined to obtain a single average RS concentration before the I/M test and another average RS concentration after the I/M test. The ‘before’ bin consists of all RS measurements that happened between 31 and 120 days prior to the initial I/M test. The RS measurements that happened from one to 30 days prior to the I/M test were not included in the bin to minimize the effect of pre-inspection repairs on the before average. This binning methodology was suggested by the EPA in the documentation for the Comprehensive Method. The ‘after’ bin contains all RS tests that happened between one and 120 days following the final I/M test.
The calculations for the before and after I/M RS averages were done for the entire RS-matched TIMS dataset for each of the two major I/M sequence categories, FP and 1P, and averages were calculated separately by model year group. At the beginning of this analysis, when the fleet characteristics of the I/M fleet were compared to the fleet characteristics of the matched set of RS vehicles, the RS-matched fleet was found to contain a larger percentage of new vehicles. Therefore, each of the I/M category bins was also separated by model year group. The benefit for each model year group could be weighted by the percentage of vehicles in each model year group in the I/M fleet to translate the benefits observed in the RS-matched fleet to the I/M fleet.
These before and after I/M average RS measurements for the FP vehicles and the 1P vehicles were plotted for both the DFW and HGB program areas in Figure V-13 through Figure V-24. The graphs show the mean emissions levels, and the error bars show the 95% confidence level uncertainties for the respective averages, with the number of observations. There are two groups of vehicles shown on each plot. The first labeled “1 RSD Before I/M” is comprised of vehicles that were observed by RS prior to their I/M inspection, and the second, “2 RSD After I/M” is comprised of those vehicles that were observed by RS after their I/M inspection.
The plots for the FP vehicles show that in most cases the emissions of FP vehicles decrease, especially for the older model year groups; however, in many cases the decrease is not statistically significant – even with thousands of RS observations in the FP category. The plots for the 1P vehicles show that in some cases the emissions of 1P vehicles increase across the I/M inspections; however, in many cases the increase is not statistically significant even with tens of thousands of RS observations in the 1P category.
67

Evaluation of the Texas Vehicle Emissions Inspection and Maintenance Program in the Dallas-Fort Worth and Houston-Galveston-Brazoria Nonattainment Areas Final – June 2022
Figure V-13. Average 1P RS HC by Model Year Group Before and After I/M Test for DFW Vehicles
Figure V-14. Average FP RS HC by Model Year Group Before and After I/M Test for DFW Vehicles
68

Evaluation of the Texas Vehicle Emissions Inspection and Maintenance Program in the Dallas-Fort Worth and Houston-Galveston-Brazoria Nonattainment Areas Final – June 2022
Figure V-15. Average 1P RS HC by Model Year Group Before and After I/M Test for HGB Vehicles
Figure V-16. Average FP RS HC by Model Year Group Before and After I/M Test for HGB Vehicles
69

Evaluation of the Texas Vehicle Emissions Inspection and Maintenance Program in the Dallas-Fort Worth and Houston-Galveston-Brazoria Nonattainment Areas Final – June 2022
Figure V-17. Average 1P RS CO by Model Year Group Before and After I/M Test for DFW Vehicles
Figure V-18. Average FP RS CO by Model Year Group Before and After I/M Test for DFW Vehicles
70

Evaluation of the Texas Vehicle Emissions Inspection and Maintenance Program in the Dallas-Fort Worth and Houston-Galveston-Brazoria Nonattainment Areas Final – June 2022
Figure V-19. Average 1P RS CO by Model Year Group Before and After I/M Test for HGB Vehicles
Figure V-20. Average FP RS CO by Model Year Group Before and After I/M Test for HGB Vehicles
71

Evaluation of the Texas Vehicle Emissions Inspection and Maintenance Program in the Dallas-Fort Worth and Houston-Galveston-Brazoria Nonattainment Areas Final – June 2022
Figure V-21. Average 1P RS NOX by Model Year Group Before and After I/M Test for DFW Vehicles
Figure V-22. Average FP RS NOX by Model Year Group Before and After I/M Test for DFW Vehicles
72

Evaluation of the Texas Vehicle Emissions Inspection and Maintenance Program in the Dallas-Fort Worth and Houston-Galveston-Brazoria Nonattainment Areas Final – June 2022
Figure V-23. Average 1P RS NOX by Model Year Group Before and After I/M Test for HGB Vehicles
Figure V-24. Average FP RS NOX by Model Year Group Before and After I/M Test for HGB Vehicles
73

Evaluation of the Texas Vehicle Emissions Inspection and Maintenance Program in the Dallas-Fort Worth and Houston-Galveston-Brazoria Nonattainment Areas Final – June 2022
The RS average concentrations shown in the figures above are summarized in Table V-2 and Table V-3. The values in Table V-2 show that for vehicles that failed and then passed, HC, CO, and NOX emissions were substantially reduced for some model year groups, while other model year groups remained constant from before to after the I/M inspection. Table V-3 shows that for 1P vehicles, there was some variability of increases or decreases in RS average concentrations. However, looking back at Figure V-13 through Figure V-18, the changes are almost always within the error bars, and therefore, not statistically significant.
Table V-2. RS Averages Before and After an I/M Test for HGB and DFW for I/M Sequence Category = FP
MY Group
RS HC (ppm) RS CO (%) RS NOx (ppm) Before
I/M After I/M
Before I/M
After I/M
Before I/M
After I/M
DFW Program Area 1996–1999 106.7 52.0 0.673 0.289 663 643 2000–2006 42.5 24.9 0.239 0.240 423 317 2007–2020 7.2 10.2 0.188 0.189 76 81
HGB Program Area 1996–1999 87.7 104.6 0.752 0.463 976 606 2000–2006 37.6 43.0 0.197 0.217 285 301 2007–2020 10.8 12.8 0.157 0.159 56 59
Table V-3. RS Averages Before and After an I/M Test for HGB and DFW for I/M Sequence Category = 1P
DFW Program Area
MY Group
RS HC (ppm) RS CO (%) RS NOx (ppm) Before
I/M After I/M
Before I/M
After I/M
Before I/M
After I/M
1996–1999 96.1 88.9 0.392 0.433 762 801 2000–2006 35.8 35.5 0.233 0.248 358 345 2007–2020 7.1 7.7 0.144 0.154 56 56
HGB Program Area
MY Group
RS HC (ppm) RS CO (%) RS NOx (ppm) Before
I/M After I/M
Before I/M
After I/M
Before I/M
After I/M
1996–1999 95.9 108.5 0.385 0.408 718 722 2000–2006 39.6 38.9 0.217 0.253 312 315 2007–2020 8.4 8.2 0.113 0.115 43 46
The results in Table V-2 and Table V-3 show the difference in average RS concentrations between before and after I/M observations for different model year groups. These results are then combined to calculate the net overall effect on emissions of the I/M program. Because RS measurements are primarily taken on freeway on-ramps, it is generally assumed newer vehicles are driven on the highways; therefore, the average vehicle observed by RS is somewhat newer than the average
74

Evaluation of the Texas Vehicle Emissions Inspection and Maintenance Program in the Dallas-Fort Worth and Houston-Galveston-Brazoria Nonattainment Areas Final – June 2022
vehicle in the I/M fleet. This difference is shown in Table V-4, which contains the distribution of vehicles among the model year groups for the RS measurements-matched-to-I/M fleet, and for the I/M fleet. The fact that this difference exists (i.e., that the RS measurements-matched-to-I/M fleet is somewhat newer than the I/M fleet) should be kept in mind when considering overall fleet results. The overall fleet results for the annual I/M benefit are shown in Table V-5. It should be noted that in the absence of an I/M program, fleet emissions are expected to increase as motorists are less likely to make emission repairs to pass an upcoming I/M test; therefore, the actual emission reductions are likely greater than those reported below.
Table V-4. Model Year Distributions for RS-Matched-to-I/M Fleet and I/M Tested Fleet
Model Year
DFW HGB RS-Matched-to-I/M
Fleet I/M Tested Fleet RS-Matched-to-I/M
Fleet I/M Tested Fleet Group Number Percent Number Percent Number Percent Number Percent
1996–1999 2,574 1.6% 213,622 2.5% 1,726 1.2% 167,017 2.3% 2000–2006 23,578 14.5% 1,472,667 17.0% 16,918 11.6% 1,206,675 16.3% 2007–2020 136,865 84.0% 6,974,331 80.5% 127,675 87.3% 6,031,232 81.4%
Total 163,017 100.0% 8,660,620 100.0% 146,319 100.0% 7,404,924 100.0%
75

Evaluation of the Texas Vehicle Emissions Inspection and Maintenance Program in the Dallas-Fort Worth and Houston-Galveston-Brazoria Nonattainment Areas Final – June 2022
Table V-5. RS Average Concentrations to Evaluate the Annual I/M Benefit
I/M
Pro
gram
Ar
ea
I/M
Seq
uenc
e
RS w
rt*
I/M
Num
ber o
fO
bs**
RS HC (ppm) RS CO (%) RS NOx (ppm)
Mea
n
UCL
M**
*
LCLM
***
Chan
ge (%
)
Mea
n
UCL
M**
*
LCLM
***
Chan
ge (%
)
Mea
n
UCL
M**
*
LCLM
***
Chan
ge (%
)
DFW
+HGB
1P+FP Before 83,163 12.7 13.5 11.9 0.146 0.149 0.143 96 99 94
1P+FP After 103,273 13.2 13.8 12.6 4.1% 0.155 0.158 0.152 6.1% 100 102 97 3.2%
1P Before 80,389 12.5 13.3 11.7 0.145 0.148 0.142 95 97 92
1P After 99,539 13.0 13.6 12.4 4.1% 0.154 0.157 0.151 6.4% 98 100 96 3.4%
FP Before 2,774 17.9 24.5 11.2 0.195 0.215 0.176 147 167 126
FP After 3,734 18.0 21.3 14.7 0.6% 0.191 0.207 0.175 -2.1% 140 153 127 -4.5%
DFW 1P+FP Before 44,343 12.6 13.7 11.5 0.162 0.166 0.157 110 114 107
1P+FP After 53,496 13.1 13.9 12.2 4.0% 0.173 0.178 0.169 7.2% 111 114 108 1.0%
HGB 1P+FP Before 38,820 12.8 13.9 11.7 0.129 0.133 0.125 81 84 78
1P+FP After 49,777 13.3 14.2 12.5 4.1% 0.136 0.140 0.132 5.6% 87 89 84 7.5%
DFW
1P Before 42,916 12.4 13.4 11.3 0.160 0.165 0.155 108 111 105
1P After 51,590 13.0 13.9 12.1 5.0% 0.172 0.177 0.168 7.6% 110 113 107 1.4%
FP Before 1,427 18.5 30.6 6.4 0.214 0.245 0.183 176 211 141
FP After 1,906 15.2 18.7 11.8 -17.6% 0.205 0.229 0.181 -4.1% 159 178 140 -9.3%
HGB
1P Before 37,473 12.6 13.7 11.5 0.127 0.131 0.123 79 82 77
1P After 47,949 13.0 13.9 12.2 3.1% 0.134 0.138 0.131 5.8% 86 88 83 7.6%
FP Before 1,347 17.2 22.1 12.3 0.175 0.199 0.152 116 135 97
FP After 1,828 20.9 26.5 15.2 21.1% 0.176 0.199 0.154 0.7% 120 137 103 3.4%
* - wrt- with respect to
** - Obs- observations
*** - UCLM/LCLM- upper/lower confidence limit
76

Evaluation of the Texas Vehicle Emissions Inspection and Maintenance Program in the Dallas-Fort Worth and Houston-Galveston-Brazoria Nonattainment Areas Final – June 2022
C. CALCULATION OF THE ANNUAL I/M BENEFIT- REFERENCE METHOD
The remote sensing data used for this analysis were collected in the DFW and HGB areas. Most vehicles in these areas are participating in the I/M program. However, commuter vehicles that drive into the I/M area but are not registered in the I/M area may not be required to participate, as well as very new vehicles in their two-year exemption period, or vehicles that are otherwise avoiding program compliance. Unregistered vehicles cannot be included in the remote sensing dataset, because if the observed license plate is not linked to a registered vehicle, then the remote sensing record does not contain any vehicle information and isn’t used for any analysis.
For this analysis, the vehicles observed by RS are divided into two groups: vehicles that have never been in the I/M program prior to the RS observation, and vehicles that have been in the I/M program prior to the RS observation. (The cutoff point for looking back in time for prior I/M inspections was January 1, 2016. This provides a four-year period before the 2020/2021 analysis years begin, and it should be sufficient to identify vehicles that are essentially in a no-I/M condition at the beginning of 2020.)
The number of vehicles available for the analysis is shown in Figure V-25, and again in Figure V-26. The first figure uses a linear scale for the vertical axis, while the second figure uses a logarithmic scale, to allow the smaller counts to be seen. The figures show that the group of no-I/M vehicles (red) is dominated by vehicles in their new-vehicle exemption period. However, for all model years 2001 and newer, there are at least 1,000 no-I/M vehicles, and that will provide a large enough sample for this analysis.
77

Evaluation of the Texas Vehicle Emissions Inspection and Maintenance Program in the Dallas-Fort Worth and Houston-Galveston-Brazoria Nonattainment Areas Final – June 2022
Figure V-25. Number of Remote Sensing Vehicles (linear scale) by Model Year and I/M Area
Figure V-26. Number of Remote Sensing Vehicles (log scale) by Model Year and I/M Area
78

Evaluation of the Texas Vehicle Emissions Inspection and Maintenance Program in the Dallas-Fort Worth and Houston-Galveston-Brazoria Nonattainment Areas Final – June 2022
Figure V-27, Figure V-28, and Figure V-29 show the average RS HC, CO, and NOx, for the DFW, HGB, and no-I/M areas.6 In Figure V-27, the no-I/M HC averages are higher than the DFW or HGB HC averages for model years 2004-2017. For model years older and newer than that range, the no-I/M HC averages are very similar to the HGB and DFW averages. The no-IM CO averages shown in the Figure V-28 are lower than the HGB and DFW averages for model years 2012 and older. The no-I/M CO averages are similar to those for HGB and DFW for model years newer than 2012. Finally, Figure V-29 shows that the NOx averages for the no-I/M fleet are substantially higher than the averages for the HGB and DFW areas. This figure indicates that the I/M program’s most significant impact is on NOx emissions. This is important since NOx plays a major role in ozone formation.
Figure V-27. Average RS HC by Model Year and I/M Area
6 These figures were also examined as bar charts with confidence intervals. Due to the large sample sizes in the dataset, the confidence intervals were very small. Therefore, since the overall trends are much easier to see in the line plots, the bar charts are not used here.
79

Figure V-28. Average RS CO by Model Year and I/M Area
Evaluation of the Texas Vehicle Emissions Inspection and Maintenance Program in the Dallas-Fort Worth and Houston-Galveston-Brazoria Nonattainment Areas Final – June 2022
Figure V-29. Average RS NOx by Model Year and I/M Area
80

Evaluation of the Texas Vehicle Emissions Inspection and Maintenance Program in the Dallas-Fort Worth and Houston-Galveston-Brazoria Nonattainment Areas Final – June 2022
VI. MEASURES FOR EVALUATING STATION PERFORMANCE
For an I/M program to function as designed, it is critical that each I/M inspection station follow the procedures and regulations that have been created to ensure that inspections are consistently performed properly. In this section, data from the TIMS database were used to explore a range of ways in which individual I/M stations and inspectors may be circumventing procedures or regulations. In past reports, these offenses were broken into two different levels: errors of commission: intentional breaking of rules to manipulate inspection results, and errors of omission: failure to routinely follow regulated procedures. However, errors of omission have become much less useful in detecting fraud now that only OBD testing is performed. Therefore, errors of omission are no longer included as a measure for evaluating station performance. The error of commission items are now broken into two different levels: a tampering with the conduct of the OBD inspection (Section VI.A), and a tampering with the overall inspection process (Section VI.B).
• OBD fraud checks for potential clean-scanning (Section VI.A)
o VIN from vehicle does not match eVIN (VI.A.1)
o eVIN is missing (VI.A.2)
o Powertrain Control Module (PCM), Parameter ID (PID), VIN, and/or not ready status changes between inspections (VI.A.3)
o Communications Protocol differs from expected (VI.A.4)
• Additional Inspection Manipulation (Section VI.B)
o Retest too soon to have performed repairs: a passing retest follows a failed inspection within only a few minutes (VI.B.1)
o Stations with very high safety-only inspection rates (VI.B.2)
o Switching from light-duty (LD) (<8,500 GVWR) to HD (≥8,500 GVWR) in order to pass inspection (VI.B.3)
o Stations with an average very high or very low fail rates relative to peers (VI.B.4)
Obviously, many stations will have the occasional inspection where the VIN was accidentally entered incorrectly and did not match the eVIN, the downloaded VIN did not match the entered VIN (which can legitimately happen for several reasons), etc. However, the goal of this section is to identify those stations where these events are frequent (search for statistical outliers), suggesting that their occurrence is not accidental, and these events are much more common than at other stations.
A percentile rank was assigned to each station for its performance on each bullet in the previous list. Using a ranking of the stations for each measure permits the comparison of one measure to another measure even if the two have different types of results. The final results were a compilation of the ranks for each station on each of
81

Evaluation of the Texas Vehicle Emissions Inspection and Maintenance Program in the Dallas-Fort Worth and Houston-Galveston-Brazoria Nonattainment Areas Final – June 2022
the measures potential inspection fraud. These compiled ranks are discussed in Section VI.C.
Inspection stations that are operated by the state tend to exhibit a substantially different range of results than the majority of privately operated stations, skewing the distribution of the results. These stations may be identified by the “G” within the station identification number and were excluded from all of the following analysis. Fleet inspection stations may also exhibit a different range of results than public stations, but since it is possible that a fleet might have incentive to perform clean-scanned inspections, the fleet inspection stations were retained for this analysis.
A. OBD DATA CHECKS FOR EVIDENCE OF STATION FRAUD
For a vehicle receiving an OBD inspection, “clean-scanning” refers to using a vehicle with no MIL illumination in place of a vehicle with MIL illumination in an attempt to receive a passing test result. Information downloaded from the OBD system during an inspection may be used to identify possible clean-scanning activities. Parameters collected during an OBD inspection establish an electronic signature. If test parameters do not match the parameters expected for the vehicle under test, it’s possible that clean-scanning has occurred.
Mismatch Between Inspector-Entered VIN and Vehicle-Downloaded eVIN
A majority of the vehicles receiving OBD tests report the VIN electronically. These VINs downloaded with a Mode $09 request from the engine control module are referred to as eVINs. All light-duty 2005 and newer vehicles are required to report eVINs, most 2002 to 2004 vehicles also report eVINs, and some 1996 to 2001 vehicles do as well. A comparison of the inspector-entered VIN against the eVIN via the OBD connection can help verify that all OBD inspections are performed on the correct vehicle. Both the inspector-entered VIN and the eVIN are recorded in each vehicle inspection record of the TIMS.
For this analysis, only those OBD inspection records that contained a valid eVIN were used (valid eVINs were confirmed using the check digit for the eVIN). This left about 14.3 million records in the dataset. For each of these records, the eVIN was compared with the VIN entered (either via keyboard or barcode scan) during the vehicle inspection. Of these, approximately 1% (136,507 records) were found to have VIN-to-eVIN discrepancies. An investigation of the VIN discrepancies, shown in Table VI-1, revealed that vehicles from the early years of OBD (1996 to 1999) had very high rates of discrepancies, with around 60% of vehicle records containing a discrepancy. Rates were very low for the later model years, largely due to federal requirements for the OBD system to provide the OBD eVIN on model year 2005 and newer vehicles. However, it should be noted that the vehicles that benefit from clean-scanning are those that fail an inspection, and that group would likely be dominated by the early model-year vehicles rather than the newer vehicles.
82

Evaluation of the Texas Vehicle Emissions Inspection and Maintenance Program in the Dallas-Fort Worth and Houston-Galveston-Brazoria Nonattainment Areas Final – June 2022
Table VI-1. Rates of OBD-Downloaded and Inspector-Entered VIN Discrepancies by Model Year
Model Year
Number of OBD Inspections with
valid eVIN but VIN Mismatch
Percent of OBD Inspections with
VIN Mismatch Total Inspections With valid eVINs
1996 401 61.5% 652 1997 1,280 60.7% 2,108 1998 1,537 63.1% 2,434 1999 2,072 59.2% 3,501 2000 3,239 12.3% 26,229 2001 4,886 4.6% 107,378 2002 5,646 4.0% 142,266 2003 6,519 3.8% 173,668 2004 7,082 3.1% 227,864 2005 8,765 2.1% 427,103 2006 9,658 1.9% 505,531 2007 10,667 1.6% 660,216 2008 9,648 1.4% 713,939 2009 6,077 1.2% 522,790 2010 6,409 0.9% 675,491 2011 6,630 0.8% 793,380 2012 7,182 0.7% 971,807 2013 7,197 0.6% 1,195,865 2014 6,843 0.5% 1,314,016 2015 6,596 0.4% 1,499,318 2016 5,704 0.4% 1,478,341 2017 5,476 0.3% 1,607,668 2018 5,231 0.4% 1,493,802 2019 3,121 0.4% 814,447 2020 525 0.5% 107,796 2021 87 0.7% 12,707 2022 4 0.7% 589 Total 138,482 0.9% 15,480,906
The rate at which VIN discrepancies were recorded was calculated for each station that performed OBD inspections, and for each inspector. These are compared graphically in Figure VI-1. The horizontal axis shows the fraction of OBD inspections that contained a VIN discrepancy for each station, while the vertical axis shows the fraction of OBD inspections with a VIN discrepancy for each inspector. To reduce errors due to small sample size, stations or inspectors that performed fewer than 100 inspections were excluded from the plot. The large cluster of points at the bottom left corner of the plot includes most stations and inspections: these had a near-zero rate of VIN discrepancies. The points closer to one on the horizontal or vertical axis indicate stations or inspectors that almost always produced OBD records with a VIN
83

Evaluation of the Texas Vehicle Emissions Inspection and Maintenance Program in the Dallas-Fort Worth and Houston-Galveston-Brazoria Nonattainment Areas Final – June 2022
discrepancy. These very-high rates could in part result from practices other than clean-scanning, such as careless data entry when the VIN is manually entered, or vehicles with an invalid eVIN (earlier model years or PCM replacements).
Figure VI-1. Rates of OBD-Downloaded and Inspector-Entered VIN Discrepancies by Station and Inspector
One additional factor that was calculated for each station was the number of times the same VIN was downloaded in different OBD inspections. If clean-scanning is taking place, there is a good chance that the “clean” vehicle would be used repeatedly, and its VIN would be downloaded numerous times, whereas VIN typos would vary with each inspection. This analysis identified that some stations were downloading the same eVIN during different OBD inspections and revealed a single station had downloaded the same eVIN in over 3,904 inspections.
These VIN mismatch findings were condensed into a rank for each station, based on the fraction of inspections that revealed a disagreement between the entered VIN and the downloaded VIN. Stations that performed fewer than 100 OBD inspections over the two-year period were again excluded from the results due to the possibility of spurious results from the small sample size. As an example of the findings, the VIN mismatch rates for the 10 worst offending stations are listed below in Figure VI-2. The table shows the rate at which there was a disagreement between the entered VIN and the eVIN, out of all inspections at that station that included a 17-digit VIN in both fields. The table also shows the maximum number of times a single VIN was tested at each station.
84

Evaluation of the Texas Vehicle Emissions Inspection and Maintenance Program in the Dallas-Fort Worth and Houston-Galveston-Brazoria Nonattainment Areas Final – June 2022
Table VI-2. Stations with Highest Rates of OBD and Entered VIN Mismatches
Station ID
Percent of Inspections Where VIN Did Not Match
Total Number of Inspections
Performed at Station
Maximum Number of Tests on a Single
VIN Percentile Rank for
Station 10 worst stations:
1 99.8% 1,147 1,145 100.0 2 99.5% 639 575 100.0 3 99.1% 1,172 1,092 100.0 4 98.7% 394 371 99.9 5 90.4% 4,496 3,904 99.9 6 89.2% 1,571 504 99.9 7 86.5% 513 200 99.9 8 84.5% 187 99 99.9 9 84.1% 4,133 2,790 99.9
10 82.6% 172 73 99.8
eVIN is Missing
Vehicles of model years 2005 and newer are required to provide an eVIN that is downloaded during every OBD inspection. For this analysis, approximately 14.7 million inspection records for 2005 and newer vehicles that received OBD inspections during the two-year evaluation period were used. For each of these records, the eVIN was checked and the record flagged if the eVIN was missing. Of the OBD inspections for 2005 and newer vehicles, about 1.3 million inspections had a missing eVIN (entirely blank or entered as “N/A”). The counts by model year are given in Table VI-3. Rates are low for the newest model years, and much higher for the older model years, indicating that clean-scanning may be occurring.
Table VI-3. Rates of OBD Inspections without eVIN by Model Year
Model Year
Number of OBD Inspections with
Missing eVIN
Percent of OBD Inspections with
Missing eVIN Total OBD Inspections 2005 158,123 26.8% 589,060 2006 166,749 24.7% 675,084 2007 194,160 22.7% 856,145 2008 169,828 19.2% 885,432 2009 102,239 16.3% 625,982 2010 105,452 13.5% 781,950 2011 110,031 12.2% 904,568 2012 109,482 10.1% 1,082,340 2013 105,155 8.1% 1,302,213 2014 95,829 6.8% 1,410,858 2015 85,909 5.4% 1,586,178 2016 63,510 4.1% 1,542,373 2017 52,018 3.1% 1,660,047 2018 35,770 2.3% 1,529,767
85

Evaluation of the Texas Vehicle Emissions Inspection and Maintenance Program in the Dallas-Fort Worth and Houston-Galveston-Brazoria Nonattainment Areas Final – June 2022
Model Year
Number of OBD Inspections with
Missing eVIN
Percent of OBD Inspections with
Missing eVIN Total OBD Inspections 2019 19,523 2.3% 834,031 2020 2,599 2.4% 110,398 2021 698 5.2% 13,405 2022 55 8.5% 644 Total 1,577,130 9.6% 16,390,475
The rate at which eVINs were missing was calculated for each station that performed OBD inspections, and for each inspector. These are compared graphically in Figure VI-1. The horizontal axis shows the fraction of OBD inspections that contained no eVIN for each station, while the vertical axis shows the fraction of OBD inspections that contained no eVIN for each inspector. To reduce errors due to small sample size, stations or inspectors that performed fewer than 100 inspections were excluded from the plot. The large cluster of points at the bottom left corner of the plot includes most stations and inspections: these OBD inspections almost always included an eVIN. The points closer to one on the horizontal or vertical axis indicate stations or inspectors that almost never performed OBD inspections that contained an eVIN.
Figure VI-2. Rates of OBD Inspections without eVIN by Station and Inspector
These findings of missing eVINs were condensed into a rank for each station based on the fraction of inspections that did not include an eVIN. Stations that performed fewer than 100 OBD inspections over the two-year period were again excluded from the results, due to the possibility of spurious results from the small sample size. As an example of the findings, the missing-eVIN rates for the 10 worst offending stations are
86

Evaluation of the Texas Vehicle Emissions Inspection and Maintenance Program in the Dallas-Fort Worth and Houston-Galveston-Brazoria Nonattainment Areas Final – June 2022
listed below in Table VI-4. The table shows the rate at which the eVIN was missing from OBD inspections performed on model year 2005 and newer vehicles at the station.
Table VI-4. Stations with Highest Rates of Inspections without Downloaded eVINs
Station ID7 Percent of Inspections
Without eVIN Total Number of Inspections
Performed at Station Percentile Rank for
Station 10 worst stations:
1 100.0% 349 100.0 2 100.0% 441 100.0 3 100.0% 5,580 100.0 4 100.0% 1,852 99.9 5 100.0% 2,796 99.9 6 100.0% 3,122 99.9 7 100.0% 1,369 99.9 8 100.0% 2,217 99.9 9 100.0% 531 99.9
10 100.0% 18,128 99.8
Comparison of Vehicle-Specific Information between the First Test and Subsequent Tests
The purpose of this analysis was to compare OBD-downloaded information for a given vehicle on its first inspection, to OBD-downloaded information on retests of that same vehicle. Certain types of OBD information may be combined to create unique “electronic profiles” for each vehicle, and the electronic profile should be the same at the initial inspection and at subsequent inspections. If the electronic profile changes from one inspection to the next, inspection fraud may be suspected. For this analysis, only those vehicle inspection cycles that included an initial test and at least one retest were used, and only records where readiness monitor values were present were used, reducing the dataset from about 18 million OBD inspections to about 1.9 million inspections. This includes 688,000 initial inspections, and 760,000 retests.
In earlier years of performing this I/M Program Evaluation (2016 and earlier), three variables were used to create the first “electronic profile” for each vehicle: the eVIN, the PCM ID, and the PID Count. Beginning with the 2018 analysis, three additional variables are added: the Communications Protocol (COMM_PROT), the calibration ID (CAL_ID) and the CVN (calibration verification number). The downloaded values for these six variables from all OBD tests conducted over the two-year audit period are summarized below:
• eVIN: eVINs (valid or invalid) were only available in 81% of the test records. The eVIN or the manually entered VIN was missing in the remaining 19% of the OBD test records. The 19% that did not download correctly could be due to factors other than inspection fraud, including the vehicles age, i.e., older vehicles with non-
87

Evaluation of the Texas Vehicle Emissions Inspection and Maintenance Program in the Dallas-Fort Worth and Houston-Galveston-Brazoria Nonattainment Areas Final – June 2022
standard eVINs. Because of this, use of the eVIN alone would not be sufficient to positively identify clean-scanning.
• PCM ID: The PCM ID was available in all but 861 of the test records. Sixty-two unique PCM IDs were seen, but 52% of all PCM IDs had a value of “E8” and 27% had a value of “10.” Two other PCM IDs each represented another 4% of records, four other PCM IDs each comprised an additional 1% of the test records, and the remaining test records were distributed among the other PCM IDs. Because of this, as with the eVIN, use of PCM ID alone would not be sufficient to positively identify clean-scanning (a substituted vehicle could easily have a value of “E8” or one of the other most common PCM IDs).
• PID Count: There were 89 unique PID Count values, and all but 2,006 OBD test records contained a value for PID Count. Eight PID Count values were seen in 57% of all OBD test records, while the remaining test records contained one of the remaining PID Count values. Therefore, the use of the PID Count alone would not be sufficient to positively identify clean-scanning.
• COMM_PROT: There were seven unique values, and all but one OBD test records contained a value for the COMM_PROT. Two COMM_PROT values were used for 76% of records, so the use of COMM_PROT along would not be sufficient to positively identify clean-scanning.
• CVN and CAL_ID each contain hundreds of unique values. These variables could be quite specific for identifying changes from one inspection to the next, except that they are only populated for about 60% of the OBD records, meaning that the other 40% of OBD records have the same values (missing) for these variables, and the CVN and CAL_ID combination alone would not be sufficient to positively identify clean-scanning.
• When the PCM ID, PID Count, COMM_PROT, CAL_ID, and CVN are looked at in combination, the five most common combinations of these variables comprise between 2.5% and 1% of inspections, with many hundreds of combinations each making up less than 1% of the remainder of inspections. Thus, the combination of these five variables is highly variable and may be a good indicator for identifying when a different vehicle is being substituted for the test.
The second electronic profile that was created was an “enabled profile.” For this analysis, OBD readiness monitors were identified that are commonly found to be both “monitored” and “not monitored,” depending on the make/model/model year of vehicle being inspected. For example, very few vehicles have monitored positive crankcase ventilation or air conditioning systems, so these would be poor indicators of potential clean-scanning since the monitored status is almost surely the same for two different vehicles. Similarly, catalysts and oxygen sensors are almost always monitored, so these too would be poor indicators of potential clean-scanning. Again, two different vehicles will likely both have these monitored. As shown below, EGR systems, evaporative systems, and to a lesser extent heated oxygen sensor systems and
88

Evaluation of the Texas Vehicle Emissions Inspection and Maintenance Program in the Dallas-Fort Worth and Houston-Galveston-Brazoria Nonattainment Areas Final – June 2022
secondary air injection systems were seen to have significant percentages of vehicles with both “monitored” and “not monitored” status:
• EGR systems: There were 27% not monitored, 73% monitored;
• Evaporative systems: There were 2% not monitored, 98% monitored;
• Heated O2 systems: There were 2% not monitored, 98% monitored; and
• Secondary air systems: There were 94% not monitored, 6% monitored.
When the status of the four monitors is looked at together, two combinations of monitor status dominated the dataset, with 69% and 22% of vehicles. Smaller numbers of vehicles comprised the remaining 14 combinations and 9% of vehicles. Since the combined monitored status of these four monitors could provide a distinguishing and characteristic profile from vehicle to vehicle, these four monitors were used for this analysis.
An electronic profile and a monitored-status profile were created for each vehicle, for its initial inspection and for any re-inspections. Any tests where either profile differed from inspection to inspection were flagged. Tests where both the electronic profile and the monitored-status profiles changed would be an indicator that a different vehicle was being substituted for the test. Note that for any individual vehicle, these downloaded values may vary among analyzer manufacturers (in particular the PID Count), so the analysis was based on vehicle/analyzer combinations. All inspections where the initial inspection took place on a different type of analyzer than that used for the retest inspection were excluded from the analysis.
Occasionally, analyzer hardware upgrades or software updates could result in OBD system PID count mismatches between multiple tests on the same vehicle, and the eVIN could be mismatched on multiple tests from the same vehicle in extremely rare instances where the PCM on the vehicle was improperly reprogrammed in an attempt to repair the vehicle. An assessment of the likelihood of fraud is provided for each of the scenarios listed below. It is also worthwhile to note that since each vehicle’s OBD system “profile” was assigned based on the information collected during the vehicle’s first test, this analysis would not identify any tests where a vehicle was substituted (i.e., clean-scanned) during the initial inspection.
As described above, the dataset included approximately 688,000 initial inspections and 760,000 retests. Retests that took place on an analyzer from a different manufacturer than the initial test were excluded from the results, leaving approximately 692,000 retests for analysis. The results of the analysis were:
• There were 563,612 (81.4%) retests that had matches for both the electronic profile and the readiness profile between initial test and subsequent retests on the same analyzer. These tests very likely indicate compliant testing.
89

Evaluation of the Texas Vehicle Emissions Inspection and Maintenance Program in the Dallas-Fort Worth and Houston-Galveston-Brazoria Nonattainment Areas Final – June 2022
• There were 33,485 (4.8%) retests that had a mismatch for both the electronic profile info and the readiness profile, between the initial test and at least one retest on the same analyzer. Test pairs where both PCM ID information and readiness profile differ are likely to be performed on two different vehicles (i.e., an indication of clean-scanning).
• There were 312 (<0.1%) retests that had a “readiness profile” mismatch between the initial test and at least one retest on the same analyzer, but the electronic profile matched between the initial test and all subsequent retests on the same analyzer. This scenario is difficult to interpret, since the readiness profile is based on “monitored versus unmonitored” status of various systems, as opposed to ready/not ready status, and therefore should never change for a vehicle despite the vehicle’s state of readiness. Similarly, the computer ID information should be static for any one vehicle except for the case when PCM reprogramming is part of the repair process. Because of these difficulties in interpreting these results, the scenario of a readiness profile mismatch with a computer ID info match is not considered to be a strong indicator of non-compliant testing.
• There were 94,738 (13.7%) retests that had an electronic profile mismatch info between the initial test and at least one retest on the same analyzer, but the “readiness profile” matched between the initial test and all subsequent retests on the same analyzer. Since the computer ID serves as a unique identifier for any vehicle, this information should always match for retests on the same vehicle. A mismatch could occur only if another vehicle was substituted for a retest (clean-scanning), if an anomaly in the analyzer software interpreted the computer ID information two different ways on subsequent retests for the same vehicle, or if a vehicle repair was performed in which the vehicle’s PCM was re-programmed with new ID information as a part of a repair. Although the last two scenarios are unlikely, it was not possible to quantify the likelihood of this occurring in this analysis. It is possible for two different vehicles to have common readiness profiles, so a readiness profile match does not confirm that clean-scanning did not occur. Therefore, this scenario (computer ID mismatch) is thought to be a good indicator of clean-scanning.
A summary of this information is provided in Table VI-5.
Table VI-5. Percentages of Tests with Various OBD Fraud Indicators
Retest Match Scenario Retest-only Dataset All match (compliant) 81.4% Readiness mismatch (ambiguous) <0.1% PCM ID info mismatch (fraud likely) 13.7% Both mismatch (fraud very likely) 4.8% Estimated % of clean-scanning 5% to 19%
90

Evaluation of the Texas Vehicle Emissions Inspection and Maintenance Program in the Dallas-Fort Worth and Houston-Galveston-Brazoria Nonattainment Areas Final – June 2022
Next, using the complete dataset, which includes tests classified as initial tests, the following general statistics were seen for stations and inspectors with computer ID information or “readiness profile” mismatches.
• From January 1, 2020 through December 31, 2021, 91% of the 5,790 inspection stations had at least one test record with either a readiness profile or computer ID information mismatch between an initial test and a subsequent test for the same vehicle (tested using the same analyzer as the initial test). The maximum number of mismatch retest records for any one station was 4,188 records over the two-year period, and another 70 stations had more than 200 records with a mismatch. Some stations had mismatch rates as high as 94%, meaning 94% of the retest inspections performed at the station showed a mismatch in the readiness profile or computer ID information. These stations are almost certainly using clean-scanning to help failing vehicles to pass the retest.
• From January 1, 2020 through December 31, 2021, 47% of the 29,011 inspectors had at least one test record with either a readiness profile or computer ID information mismatch between an initial test and a subsequent test on the same vehicle using the same analyzer. The maximum number of mismatch retest records for any one inspector was 3,538 records over the two-year period, while an additional 31 inspectors had more than 200 mismatch retest records. Inspector mismatch rates as high as 98% were identified.
The distribution of station and inspector mismatch rates is shown in Figure VI-3. The horizontal axis shows the fraction of retest records that contained an electronic profile or readiness profile mismatch for each station. The vertical axis shows the fraction for each inspector. The large concentration of data points in the lower left corner are stations and inspectors that produced retest records that rarely had a mismatch when compared to the information from the initial inspection. In contrast, the stations/inspectors in the upper right-hand portion of the chart are those that are most likely to be clean-scanning.
91

Evaluation of the Texas Vehicle Emissions Inspection and Maintenance Program in the Dallas-Fort Worth and Houston-Galveston-Brazoria Nonattainment Areas Final – June 2022
Figure VI-3. Rates of Retest Discrepancies in OBD Computer and Readiness Information, by Station and Inspector
These results were condensed into a rank for each station, based on the fraction of retest inspections performed at that station that included both an electronic profile mismatch and a readiness profile mismatch. Stations with fewer than 100 OBD retest inspections over the two-year period were excluded from the results, due to the possibility of spurious results from the small sample size. The 10 stations with the highest rates of profile mismatches are listed in Table VI-6. Some electronic profile and/or readiness mismatches are to be expected, and as mentioned above, 91% of stations had at least one case of a mismatch. However, most of those stations had only one or a few mismatches. Overall, about 4.8% of retest inspections resulted in a readiness profile and electronic profile mismatch. When stations with a mismatch in more than 90% of their inspections are seen, it suggests fraudulent testing is being performed.
Table VI-6. Stations with Highest Percent of Electronic Profile and Readiness Profile Mismatches
Station ID
Percent of Re-inspections with BOTH Electronic & Readiness
Mismatch
Number of Re-inspections
at Station Percentile Rank for
Station 10 worst stations:
1 94.1% 320 100.0 2 92.2% 204 100.0 3 88.2% 289 99.9 4 87.1% 278 99.9
92

Evaluation of the Texas Vehicle Emissions Inspection and Maintenance Program in the Dallas-Fort Worth and Houston-Galveston-Brazoria Nonattainment Areas Final – June 2022
Station ID
Percent of Re-inspections with BOTH Electronic & Readiness
Mismatch
Number of Re-inspections
at Station Percentile Rank for
Station 10 worst stations:
5 84.1% 591 99.8 6 83.3% 174 99.8 7 82.8% 151 99.7 8 80.1% 256 99.7 9 79.6% 147 99.6
10 75.3% 361 99.6
Comparison of Downloaded and Expected Communication Protocol
As was done in the last program evaluation report, the OBD communications protocol indicator (TX96_COMM_PROT) was evaluated. This variable will have one of seven values, representing the six EPA approved communications protocols for vehicles sold in the U.S., or none as shown in Table VI-7.
Table VI-7. OBD Communications Protocol Codes
Code Protocol
C Controller Area Network (CAN)
D CAN P PWM (Pulse Width Modulation)
I ISO (International Organization for Standardization)
V VPW (Variable Pulse Width)
K KWP (Key Word Protocol)
N (none found)
In theory, each type of vehicle that is manufactured uses one of the protocols, and all vehicles of the same type use the same protocol.7
ERG’s subcontractor, de la Torre Klausmeier Consulting, Inc. (dKC) has worked extensively with comparisons of expected communication protocols with the communication protocols recorded during the OBD test, for various I/M areas. For such comparisons, dKC constructed a look-up table of communication protocols by VIN stem (comprised of VIN digits in positions 1–8, 10, and 11), using reliable data from a highly controlled, centralized I/M program.
ERG was able to match about 2/3 of the 1996 through 2009 model year vehicles in the dataset using the dKC look-up table. Because almost all vehicles after 2010 use the CAN protocol, the dKC look-up table stops with the 2009 vehicle model year. Results by model year are shown in Table VI-8. The overall mismatch rate was much higher for
7 It is known that Chrysler vehicles from model years 1999–2005 have exhibited unreliable communications protocol values, so 1999–2005 Dodge, Jeep, and Chrysler makes were excluded from analysis in this section.
93

Evaluation of the Texas Vehicle Emissions Inspection and Maintenance Program in the Dallas-Fort Worth and Houston-Galveston-Brazoria Nonattainment Areas Final – June 2022
passing tests than failing tests: 19% vs. 1%. The mismatch rate is very high for vehicles of older model years where inspection fraud might be used to help the vehicle pass the inspection.
Table VI-8. Rates of Communication Protocol Mismatches by Model Year
Model Year
Mismatches: Failed Inspections Mismatches: Passed Inspections
Number of Fails with Mismatch
Percent of Fails that had
Mismatch
Number of Passes with Mismatch
Percent of Passes that had
Mismatch 1996 27 1.5% 5,788 25.7% 1997 40 0.8% 15,128 23.4% 1998 60 1.1% 16,510 19.3% 1999 68 1.1% 18,672 19.6% 2000 91 1.0% 32,348 21.2% 2001 186 1.1% 43,586 23.5% 2002 187 1.1% 42,595 20.4% 2003 207 1.1% 49,123 18.9% 2004 244 1.2% 55,195 18.1% 2005 187 0.9% 57,752 17.5% 2006 296 1.1% 81,192 19.2% 2007 288 1.1% 92,575 18.6% 2008 258 1.0% 97,763 18.2% 2009 156 0.9% 60,379 15.4% Total 2,295 1.0% 668,606 18.8%
The rate at which communication protocol mismatches were recorded was calculated for each station that performed OBD inspections and for each inspector. These are compared graphically in Figure VI-4. The horizontal axis shows the fraction of OBD inspections that contained a communication protocol mismatch for each station, while the vertical axis shows the fraction of OBD inspections with a mismatch for each inspector. To reduce errors due to small sample size, stations or inspectors that performed fewer than 100 inspections were excluded from the plot. The large cluster of points at the bottom left corner of the plot includes most stations and inspections: these had a very low rate of communication protocol discrepancies. The points closer to one on the horizontal or vertical axis indicate stations or inspectors that almost always produced OBD records with a communication protocol discrepancy.
94

Evaluation of the Texas Vehicle Emissions Inspection and Maintenance Program in the Dallas-Fort Worth and Houston-Galveston-Brazoria Nonattainment Areas Final – June 2022
Figure VI-4. Rates of Communication Protocol Mismatches by Station and Inspector
These results were condensed into a rank for each station, based on the fraction of inspections at that station that included a communication protocol mismatch. Stations with fewer than 100 OBD test inspections over the two-year period were excluded from the results, due to the possibility of spurious results from the small sample size. The 10 stations with the highest rates of mismatches are listed in Table VI-9. Some mismatches are to be expected, and most stations had at least one case of a mismatch. However, most of those stations had only one or a few mismatches. Overall, about 16% of inspections resulted in a communication protocol mismatch. As stated earlier, when stations have this high a level of mismatch it suggests fraudulent testing.
Table VI-9. Stations with Highest Percent of Communication Protocol Mismatches
Station ID Percent of Inspections with
Communication Protocol Mismatch Number of Inspections
at Station Percentile Rank for
Station 10 worst stations:
1 96.7% 5,883 100.0 2 94.7% 1,250 100.0 3 94.6% 7,858 100.0 4 94.1% 1,367 99.9 5 94.1% 727 99.9 6 93.2% 11,482 99.9 7 92.7% 1,160 99.9 8 92.6% 593 99.9 9 92.4% 448 99.9
10 92.0% 879 99.8
95

Evaluation of the Texas Vehicle Emissions Inspection and Maintenance Program in the Dallas-Fort Worth and Houston-Galveston-Brazoria Nonattainment Areas Final – June 2022
B. ADDITIONAL INSPECTION MANIPULATION
Unlike OBD inspections, tailpipe emissions inspections do not include the download of vehicle-specific information that remains unchanged from an initial inspection to a re-inspection. However, several different types of inspection results have been identified that may provide good indicators that tailpipe emissions inspection fraud may be occurring at a given station. Several of these are extremely uncommon in the TIMS dataset overall but are relatively common for a handful of stations.
• Short Time Interval Between Inspections: Sometimes, a failing inspection is followed by a passing inspection only a few minutes later. This could indicate the occasional warm-up or easy repair when it happens once or twice for each station, but when it occurs many times at only a few stations, it is more likely to indicate clean-piping or clean-scanning.
• Safety-Only Inspection Rate: Vehicles that are between two and 24 years old are required to participate in the emissions inspection program by receiving OBD inspections. Vehicles older than 24 years are only required to receive a safety inspection, so it can be easier for them to pass their inspection. This can sometimes result for misclassification at the time of the inspection, but it happens more frequently at some stations than at others.
• Changing from Light-Duty to Heavy-Duty to Pass: Similarly, an initial failed inspection of a light-duty vehicle (GVWR<8,500 lbs.) is sometimes followed by a passed inspection of that vehicle as a heavy-duty vehicle. Cutpoints OBD pass/fail stringency is lower for HD vehicles, making the inspection easier to pass. This happens very infrequently in the dataset, but much more frequently at some stations.
• Pass/Fail Outliers: The overall failure rate at a station can be used as an indicator of whether fraud is occurring. Unusually high or unusually low failure rates may both be a cause for concern. This factor can be difficult to analyze since it is known that different areas with a different type of fleet (or a different socio-economic status) often have real differences in failure rates.
Each of these factors is discussed in more detail in the following sections, and a ranking is assigned to each station for each factor.
Short Time Interval Between Inspections
For inspection cycles that begin with a failing inspection, a retest (or retests) usually follows a day or several days after the initial failed inspection. Presumably, repairs are performed during that interval between inspections. However, some failing inspections are followed by a passing inspection within minutes, raising concern as to how the vehicle was successfully repaired so quickly, or if instead clean-scanning occurred for the passing retest. The dataset shows that many stations have one or a few cases of a passing retest following a failing initial test within a short time. These occasional cases
96

Evaluation of the Texas Vehicle Emissions Inspection and Maintenance Program in the Dallas-Fort Worth and Houston-Galveston-Brazoria Nonattainment Areas Final – June 2022
may be the real result of a simple fix: a reconnection of a loose line or wire or other simple change. However, some stations show a much more frequent occurrence of initial inspections being quickly followed by passing inspections when compared to the majority of stations. In these cases, there may be cause for a suspicion of inspection fraud.
For this analysis, any inspections that were aborted or had dilution problems were deleted from the dataset. This left approximately 18.8 million observations in the dataset. In addition, only time differences on retest inspections that were conducted at the same inspection station as the initial inspection were used. This resulted in a dataset of about 589,000 retest observations.
The distribution of the number of times that a failed initial inspection was followed by a passing retest within 15 minutes at a given station over a two-year period is listed in Table VI-10. The table shows that this happened rarely or never for most stations. However, for 126 stations, it happened 20 or more times (up to 144 times for the highest station, not shown in the table).
Table VI-10. Number of Close-in-Time Retests per Station
Number of Close-In-Time Retests Number of Stations Percent of Stations
0 2,090 36.4% 1 1,118 19.5% 2 672 11.7% 3 437 7.6% 4 326 5.7% 5 231 4.0% 6 160 2.8% 7 115 2.0% 8 86 1.5% 9 84 1.5%
10 59 1.0% 11 43 0.8% 12 53 0.9% 13 33 0.6% 14 23 0.4% 15 27 0.5% 16 12 0.2% 17 13 0.2% 18 23 0.4% 19 10 0.2%
20 or more 126 2.2% Total 5,741 100.0%
The 10 stations with the highest rate of close-in-time retests are listed in Table VI-11. The percentage was calculated from the number of close-in-time retests and the total
97

Evaluation of the Texas Vehicle Emissions Inspection and Maintenance Program in the Dallas-Fort Worth and Houston-Galveston-Brazoria Nonattainment Areas Final – June 2022
number of retests at that station. Stations that performed fewer than 100 retest inspections over the two-year period are excluded from the results. From the Table VI-11, the highest ranked stations performed a third of their retest inspections within the short time period of 15 minutes or less after the initial passed inspection.
Table VI-11. Percent of Close-In-Time Retest Inspections for 10 Highest Ranking Stations
Station ID Percent of Close-In-
Time Retests Number of Close-In-Time Retests
Total Number of Retest Inspections
Percentile Rank for Station
1 86.5% 90 104 100.0 2 41.5% 112 270 99.9 3 36.2% 144 398 99.9 4 34.7% 50 144 99.8 5 26.5% 58 219 99.8 6 25.8% 60 233 99.7 7 25.0% 25 100 99.7 8 23.5% 55 234 99.6 9 22.5% 60 267 99.5
10 21.2% 22 104 99.5
Safety-Only Inspection Rate
Another way that a station can help a vehicle to pass an inspection, even with high emissions, is to perform a safety-only inspection, instead of performing both the safety and the emissions inspection. Safety-only inspections are, in fact, found in the database, for vehicles in the age-range for emissions testing.
The performance of safety-only inspections is shown in Figure VI-5 and Figure VI-6. The figures include a green line for the number of safety-only inspections and a purple line for the number of emissions inspections, which both refer to the left vertical axis. The red line represents the percent of total inspections that were safety-only and refers to the right vertical axis. The figures focus on the older vehicle ages, 12 years and older, so that the differences can best be observed. Each figure is for one program year, either 2020 or 2021. The rate at which safety-only inspections were performed over the years is compared in Figure VI-7. This figure takes the line for the percent of total inspections that were safety-only and compares calendar years from 2016 through 2021. From Figure VI-7, it appears that the rates of safety-only inspections for the oldest model years have decreased in 2020 and 2021, compared to the prior years.
98

Evaluation of the Texas Vehicle Emissions Inspection and Maintenance Program in the Dallas-Fort Worth and Houston-Galveston-Brazoria Nonattainment Areas Final – June 2022
Figure VI-5. Number and Percent of Emissions and Safety-Only Inspections 2020
Figure VI-6. Number and Percent of Emissions and Safety-Only Inspections 2021
99

Evaluation of the Texas Vehicle Emissions Inspection and Maintenance Program in the Dallas-Fort Worth and Houston-Galveston-Brazoria Nonattainment Areas Final – June 2022
Figure VI-7. Percent of Inspections that Were Safety-Only, by Calendar Year
Overall, the rates of safety-only inspections are fairly low. However, they could be a possible indicator of inspection fraud if the station or inspector helped the vehicle to pass the inspection by avoiding the emissions component. If some stations show a more frequent rate of safety-only inspections than do others, then there might be cause for a suspicion of inspection fraud.
Rates of safety-only inspections were examined for all vehicles aged 12 to 24 years at the time of inspection. The data did show that some stations show a much more frequent rate of safety-only inspections than other stations: a few stations report thousands of safety-only inspections, while most stations report only one or a few. In these cases, there may be cause for a suspicion of inspection fraud.
The rate at which safety-only inspections were performed was calculated for each station that performed I/M inspections, and for each inspector. All inspections for vehicles 12 to 24 years old were used for the graph. Vehicles between two and 12 years old were omitted from the figure because the data for this cohort is essentially the same as for those vehicles between 12 and 17 years old, i.e., fairly constant around 5%. The safety-only inspection rates are compared graphically in Figure VI-8. The horizontal axis shows the fraction of inspections that were safety-only for each station, while the vertical axis shows the fraction of inspections that were safety-only for each inspector. To reduce errors due to small sample size, stations or inspectors that
100

Evaluation of the Texas Vehicle Emissions Inspection and Maintenance Program in the Dallas-Fort Worth and Houston-Galveston-Brazoria Nonattainment Areas Final – June 2022
performed fewer than 100 inspections were excluded from the plot. The large cluster of points at the bottom left corner of the plot includes most stations and inspections: these had a very low rate of safety-only inspections. The points closer to one on the horizontal or vertical axis indicate stations or inspectors that almost always produced inspection records with a safety-only test.
Figure VI-8. Rates of Safety-Only Tests Vehicles 12-24 Years Old for Stations and Inspectors
The 10 stations with the highest rate of safety-only inspections are listed in Table VI-12. Inspections for vehicles 12 years old and older, in 2020 or 2021, were used for these results: i.e., new vehicles were included, so two-year safety inspections of very new vehicles would not be included in these percentages. The percentage was calculated from the number of safety-only inspections and the total number of inspections (safety plus emissions) at that station. Stations that performed fewer than 100 inspections over the two-year period are excluded from the results. It can be seen from the table that the stations at the top of the list performed safety-only inspections on almost all of 12+ aged vehicles that they tested. It is notable that several “fleet” inspection facilities (with “F” in the second position of the station ID) made it into this top-10 list; the fleet facilities are not represented on the lists for many of the other analyses in this analysis of potentially fraudulent emissions inspections.
101

Evaluation of the Texas Vehicle Emissions Inspection and Maintenance Program in the Dallas-Fort Worth and Houston-Galveston-Brazoria Nonattainment Areas Final – June 2022
Table VI-12. Rate of Safety-Only Inspections for 10 Highest Ranking Stations
Station ID Safety-Only Percent Number of Safety-Only Inspections
Total Number of Inspections
Percentile Rank for Station
1 1.0% 105 105 100 2 1.0% 102 102 100 3 1.0% 151 150 100 4 1.0% 124 123 100 5 1.0% 1,075 1,046 100 6 0.9% 292 277 100 7 0.9% 108 102 100 8 0.9% 678 638 100 9 0.9% 7,048 6,560 100
10 0.9% 127 118 100
Because the rates of safety-only inspections are so high for some of the stations listed in Table VI-12, some of the dominant stations with the greatest numbers of safety-only inspections were investigated further. In Figure VI-9, the rate at which safety-only inspections were performed at a handful of stations are shown, each in their own color. This figure includes gasoline and non-gasoline fueled vehicles. The horizontal axis shows vehicle ages zero through 24, and it can be seen that these stations are performing safety-only inspections almost exclusively for the oldest vehicles, and a rate of 60% or more safety-only inspections for new vehicles, starting with two-year old vehicles.
Figure VI-9. Rates of Safety-Only Tests Vehicles 0-24 Years Old by Station
102

Evaluation of the Texas Vehicle Emissions Inspection and Maintenance Program in the Dallas-Fort Worth and Houston-Galveston-Brazoria Nonattainment Areas Final – June 2022
Changing Vehicle Type from Light-Duty to Heavy-Duty to Pass Vehicle
Given that inspection standards are less stringent for heavy-duty vehicles than for light-duty vehicles, ERG investigated whether switching a vehicle from having a light-duty GVWR (less than or equal to 8,500 lbs.) to a heavy-duty GVWR was ever used to manipulate emissions inspection results. The vehicle GVWR is an inspector-entered field in the inspection record.
For this analysis, any inspections that were aborted were deleted from the dataset. This resulted in a dataset of approximately 18.8 million inspection records. Only inspection cycles where the initial inspection and the retest inspection were conducted at the same station were used. This left about 589,000 retest inspections in the dataset.
Overall, it was found that only 0.24% of inspections (about 1,400 inspections) that were initially failed as a light-duty vehicle were followed by a passing retest as a heavy-duty vehicle. However, these inspections were clustered at a handful of stations, shown below in Table VI-13. The table shows the 10 inspection stations with the highest frequency of retests that involved a vehicle that failed as a light-duty vehicle on the initial inspection followed by a passed retest of the same vehicle as a heavy-duty vehicle. At the first station on the list, about 21% of vehicles that failed as a light-duty vehicle passed the retest when the inspector entered it as a heavy-duty vehicle.
Table VI-13. Percent of Retest Inspections Switched from Light-Duty to Heavy-Duty for 10 Highest Ranking Stations
Station ID
Percent of Retests Switched from LD
to HD Number of
Switched Retests Total Number of
Retest Inspections Percentile Rank for
Station 1 21.2% 32 151 100.0 2 11.0% 13 118 99.9 3 9.3% 10 107 99.9 4 9.0% 24 266 99.8 5 8.7% 12 138 99.8 6 7.7% 18 233 99.7 7 6.8% 18 264 99.7 8 6.5% 9 139 99.6 9 5.8% 6 104 99.5
10 5.7% 12 209 99.5
Pass/Fail Outliers
Stations can also be evaluated based upon the percentage of vehicles that they pass or fail. Extremely high rates of either passing or failing vehicles may warrant further scrutiny by the DPS.
103

Evaluation of the Texas Vehicle Emissions Inspection and Maintenance Program in the Dallas-Fort Worth and Houston-Galveston-Brazoria Nonattainment Areas Final – June 2022
It is recognized that differences in inspection failure rates among stations are often due to factors other than fraud. For instance, the age and maintenance level of the fleet tested at each station may vary widely. However, evaluation of the fleet quality and/or socio-economic status of the area for each station is beyond the scope of this evaluation, and only overall pass/fail rates for each station are considered here.
Since it was necessary to identify both very low and very high failure rates, the stations were divided into two groups: stations with a failure rate that was above the mean failure rate over all stations and stations with a failure rate that was below the mean failure rate over all stations. The stations with a failure rate that was above the mean were ranked with the 0% rank for the station at the mean and the 100% rank for the station with the highest failure rate. The stations with a failure rate that was below the mean were ranked with the 0% rank for the station at the mean, and the 100% rank for the station with the lowest failure rate. Thus, each station gets one rank, either for being high or being low. The highest OBD failure rate stations are listed in Table VI-14, and the lowest failure rate stations are listed in Table VI-15. Stations with fewer than 100 inspections are excluded from the results.
Table VI-14. Stations with Highest OBD Failure Rates
Station ID Failure Rate (%) Number of Failed
Inspections Total Number of
Inspections Percentile Rank for
Station 1 26.3% 74 281 100.0 2 25.6% 1,005 3,927 100.0 3 25.2% 31 123 99.9 4 24.8% 27 109 99.9 5 23.5% 31 132 99.8 6 22.1% 25 113 99.8 7 21.5% 108 503 99.7 8 21.2% 28 132 99.7 9 20.6% 52 253 99.7 10 20.4% 22 108 99.6
104

Evaluation of the Texas Vehicle Emissions Inspection and Maintenance Program in the Dallas-Fort Worth and Houston-Galveston-Brazoria Nonattainment Areas Final – June 2022
Table VI-15. Stations with Lowest OBD Failure Rates
Station ID Failure Rate (%) Number of Failed
Inspections Total Number of
Inspections Percentile Rank for
Station 1 0.0% 0 121 100.0 2 0.0% 0 932 100.0 3 0.0% 0 839 99.9 4 0.0% 0 2,406 99.9 5 0.0% 0 189 99.9 6 0.0% 0 107 99.8 7 0.0% 0 478 99.8 8 0.0% 0 104 99.8 9 0.0% 0 699 99.8 10 0.0% 0 137 99.7
C. COMPILATION OF PERCENTILE RANKINGS
After a separate ranking was assigned for each of the measures of potential inspection fraud, the ranks were used to score the stations and identify the stations with the highest likelihood of inspection fraud.
Some of the details of the ranking procedure and the resulting ranks make it challenging to combine the ranks for an overall score. First, many stations did not perform enough inspections to receive a rank for all measures. Secondly, it is known from the measures listed in the previous sections that the range of results was not the same for each measure. For example, for the eVIN mismatch section, about 80% of stations had very low VIN mismatch rates. The remaining 20% had VIN mismatch rates that might be cause for concern, or about the top 20 percentiles in the ranking. In contrast, for the high OBD inspection failure rates, at least 90% of stations had reasonably low rates, and only the top 10% of stations would lead one to suspect possible fraud. Figure VI-10 shows the distribution of the results and the rankings that were created from those results for each of the measures of errors of commission (from sub-sections VI.A and VI.B).
The green line for the eVIN mismatch shows that the stations from zero to the 80th percentile had a very low percentage of mismatches. Above the 80th percentile, the mismatch rate quickly increases. Similarly, the blue line for the OBD electronic readiness profile shows that stations up to the 80th percentile had a low rate of mismatches. For the other measures, missing eVIN, rate of OBD communication protocol mismatch, the rate of overly close in time inspections, and retests switched from light-duty to heavy-duty, the stations below about the 80th percentile also had very low results. Above the 80th percentile, the rate of potentially fraudulent results rapidly increases. The red and purple lines show the rankings for OBD inspection failure rates. For both of those lines, the 0th percentile is the mean failure rate over all
105

Evaluation of the Texas Vehicle Emissions Inspection and Maintenance Program in the Dallas-Fort Worth and Houston-Galveston-Brazoria Nonattainment Areas Final – June 2022
stations. The percentiles for the red line increase as the failure rate increases further above the mean, while the percentiles for the purple line increase as the failure rate decreases further below the mean. For both of these, one sees a “break” at about the 90th percentile, where the OBD fail rate starts to change rapidly as the percentile continues to increase.
Figure VI-10. Distribution of Results and Percentiles for Errors of Commission
At percentiles below the “break” (the percentile above which the results rapidly worsen) in each line on Figure VI-10, it is probably not likely that the station is performing the type of fraudulent activity that can be detected through this analysis. At percentiles above the break, there is evidence for suspicion of fraud. Thus, the visual results of the location of the break were used to create an indicator flag for each of the measures. Stations above the break for the given measure were flagged. Then, the total number of flags that each station received was determined. The stations were then sorted in descending order according to the number of flags received to create a final list ordered from most suspicious to least suspicious. The results for the top 50 most suspicious stations are given in Table VI-16. Table VI-17 gives the results for an additional 50 stations from near the middle of the range of results for comparison purposes.
106

Evaluation of the Texas Vehicle Emissions Inspection and Maintenance Program in the Dallas-Fort Worth and Houston-Galveston-Brazoria Nonattainment Areas Final – June 2022
Some of the first lines in the table show stations that should be investigated (if they have not already been, as a result of other analysis tools or audits). For example, the first station in the first row of the table had a very high rate of eVIN mismatches, high rates of OBD readiness and electronic profile mismatches, and a high rate of OBD communication protocol mismatches. This indicates a high possibility of OBD inspection fraud. This station also had a high rate of close-in-time retests, as well as a very low OBD inspection failure rate. This station is likely clean-scanning, and would be a good candidate for an investigation.
If this table were to be used for identifying stations for investigations, audits, etc., the user would have to review the tables to identify the stations with the clearest combination of factors for the type of fraud being considered. The entire table with all stations is available in electronic format.
107

Evaluation of the Texas Vehicle Emissions Inspection and Maintenance Program in the Dallas-Fort Worth and Houston-Galveston-Brazoria Nonattainment Areas Final – June 2022
Table VI-16. Top 50 Most Suspicious Stations for Potentially Fraudulent Inspections
Station ID
Sum of Rank Flags
Max Rank for Station
Individual Ranks
eVIN Mismatch
OBD eVIN Missing
OBD Profile/ Readiness
OBD Communication
Protocol Mismatch
Close-In-Time
Safety-Only Test
Switch LD to
HD
OBD High Fail
Rate
OBD Low Fail
Rate 1 6 100.0 100.0 98.6 98.1 98.7 99.5 11.2 31.9 98.0 2 6 99.9 99.9 97.4 97.7 97.6 99.9 6.1 32.4 94.7 3 6 98.8 96.9 87.9 95.0 88.5 98.8 85.7 97.4 62.5 4 6 97.6 97.6 81.2 92.7 84.9 96.8 62.4 93.5 2.0 5 6 96.2 96.2 81.3 87.9 84.8 92.3 68.9 90.5 66.6 6 6 96.2 92.7 85.4 90.2 85.9 96.2 13.2 95.8 70.8 7 6 95.5 91.4 89.3 95.5 89.2 95.1 55.5 90.7 52.1 8 5 100.0 100.0 98.3 98.9 99.0 12.0 97.3 9 5 100.0 100.0 97.3 98.4 99.1 69.8 93.9
10 5 100.0 98.8 98.3 96.8 100.0 49.9 93.7 11 5 99.9 99.9 98.2 97.7 99.0 52.3 93.8 12 5 99.9 99.8 97.9 95.9 99.9 37.5 95.7 13 5 99.9 94.6 93.2 93.7 93.0 99.9 9.8 52.9 56.4 14 5 99.9 80.1 97.7 99.9 99.1 14.0 91.7 15 5 99.8 86.3 98.0 82.5 99.8 25.0 44.0 73.0 96.6 16 5 99.8 99.8 97.4 96.6 99.7 9.6 95.6 17 5 99.8 95.9 98.0 99.8 98.6 18.9 91.7 18 5 99.6 96.5 98.2 95.5 99.6 20.8 97.0 19 5 99.6 91.0 98.8 99.6 99.2 11.5 97.9 20 5 99.5 92.7 96.7 96.2 96.4 99.5 4.8 23.8 81.6 21 5 99.2 73.4 93.0 98.3 92.8 99.2 91.1 51.0 83.3 22 5 99.2 99.2 98.3 99.0 97.3 9.3 94.8 23 5 99.1 88.0 87.4 94.0 87.3 99.1 47.3 35.9 61.1 24 5 99.1 99.1 95.4 95.4 96.1 98.6 21.9 60.3 78.9 25 5 99.0 91.3 98.2 90.0 99.0 10.6 95.6 26 5 99.0 97.1 98.1 99.0 97.4 18.7 94.2 27 5 98.9 93.8 81.0 67.7 76.9 87.2 90.7 98.9 83.6 28 5 98.7 93.7 89.9 88.7 93.2 36.1 98.7 29 5 98.7 85.2 97.7 98.7 96.9 4.1 94.0 30 5 98.7 98.7 97.6 97.7 96.5 91.2
108

Evaluation of the Texas Vehicle Emissions Inspection and Maintenance Program in the Dallas-Fort Worth and Houston-Galveston-Brazoria Nonattainment Areas Final – June 2022
Station ID
Sum of Rank Flags
Max Rank for Station
Individual Ranks
eVIN Mismatch
OBD eVIN Missing
OBD Profile/ Readiness
OBD Communication
Protocol Mismatch
Close-In-Time
Safety-Only Test
Switch LD to
HD
OBD High Fail
Rate
OBD Low Fail
Rate 31 5 98.6 98.6 96.3 96.5 96.6 94.8 8.9 72.6 77.4 32 5 98.6 90.1 95.5 93.1 95.3 98.6 28.4 57.4 61.3 33 5 98.5 78.8 94.7 88.7 94.9 98.5 15.1 84.9 92.1 34 5 98.4 93.3 98.2 97.0 98.4 7.0 90.4 35 5 98.3 86.8 97.9 98.3 97.2 11.3 90.7 36 5 98.0 81.8 93.8 92.9 93.7 98.0 18.7 61.6 0.2 37 5 97.8 91.2 81.1 83.7 77.8 95.2 35.0 97.8 13.4 38 5 97.8 97.8 84.1 97.3 90.5 19.2 90.8 39 5 97.7 96.2 81.8 83.3 97.7 97.4 40 5 97.5 96.8 91.0 97.5 91.5 77.1 26.6 95.1 20.0 41 5 97.4 77.6 83.0 81.5 82.5 97.4 85.4 51.0 93.1 42 5 97.3 97.3 71.4 88.3 82.8 28.2 95.8 29.7 97.1 43 5 97.2 97.2 87.4 92.5 88.2 91.4 29.6 75.7 8.1 44 5 96.9 90.8 96.4 96.9 96.4 . 12.0 94.6 45 5 96.6 96.6 89.1 92.2 85.7 84.5 79.3 45.4 71.8 46 5 96.5 80.6 96.5 85.8 95.9 0.0 26.1 71.8 93.9 47 5 96.3 83.6 86.2 90.5 86.5 62.0 96.3 89.6 11.6 48 5 95.9 65.1 90.8 88.1 91.1 85.0 62.3 62.8 95.9 49 5 95.7 80.6 92.7 95.7 93.2 93.7 45.9 50 5 95.0 88.2 80.6 81.0 80.5 56.8 52.8 95.0 20.0
109

Evaluation of the Texas Vehicle Emissions Inspection and Maintenance Program in the Dallas-Fort Worth and Houston-Galveston-Brazoria Nonattainment Areas Final – June 2022
Table VI-17. 50 Mid-Range Stations for Potentially Fraudulent Inspections
Station ID
Sum of Rank Flags
Max Rank for Station
Individual Ranks
eVIN Mismatch
OBD eVIN Missing
OBD Profile/
Readiness
OBD Communication
Protocol Mismatch
Close-In-Time
Safety-Only Test
Switch LD to HD
OBD High Fail
Rate
OBD Low Fail
Rate 3285 0 80.8 29.6 43.6 46.4 80.8 45.4 . 3286 0 80.8 41.9 7.0 28.3 80.8 69.9 3287 0 80.8 48.5 58.3 33.9 80.8 68.2 3288 0 80.8 21.5 35.7 11.2 22.7 10.7 74.2 80.8 1.4 3289 0 80.8 40.3 29.9 0.3 80.8 3290 0 80.7 29.5 21.4 69.9 7.2 80.7 3291 0 80.7 3.8 71.0 80.7 3292 0 80.7 16.8 37.8 40.6 80.7 41.7 3293 0 80.7 53.7 65.9 70.8 65.3 34.4 80.7 10.5 60.0 3294 0 80.7 18.3 32.4 11.7 22.6 10.7 80.7 17.2 40.7 3295 0 80.7 52.8 43.0 36.3 38.9 . . 80.7 3296 0 80.7 39.6 64.8 43.0 51.3 32.5 78.1 80.7 33.3 . 3297 0 80.6 12.1 14.7 12.4 80.6 3298 0 80.6 44.1 59.0 49.7 62.1 62.9 37.9 80.6 61.8 3299 0 80.6 3.7 51.9 64.8 18.8 80.6 3300 0 80.6 68.7 36.6 74.0 80.6 1.7 3301 0 80.6 63.7 15.6 66.9 42.2 51.2 80.6 77.1 18.1 3302 0 80.6 48.1 53.6 43.1 42.9 62.5 70.9 80.6 52.9 3303 0 80.5 27.9 65.1 9.6 80.5 3304 0 80.5 65.2 52.0 38.7 57.5 60.9 64.0 80.5 78.4 . 3305 0 80.5 35.1 17.2 48.5 41.1 68.7 80.5 52.1 17.8 3306 0 80.5 18.2 76.5 15.3 80.5 3307 0 80.5 42.8 14.2 22.0 18.5 69.4 80.5 3308 0 80.4 51.6 70.0 58.3 47.4 67.8 41.0 80.4 36.8 3309 0 80.4 5.5 49.1 8.5 80.4 3310 0 80.4 21.9 23.5 16.7 12.1 . 80.4 3311 0 80.4 46.8 14.2 68.1 17.6 61.7 80.4 5.6 54.1 3312 0 80.4 37.3 20.8 35.0 80.4 7.8 3313 0 80.3 35.5 58.6 68.5 47.3 39.6 8.8 80.3 48.8 3314 0 80.3 21.0 68.6 . 43.3 51.2 80.3
110

Individual Ranks OBD OBD
Station ID
Sum of Rank Flags
Max Rank for
Station eVIN
Mismatch OBD eVIN
Missing
OBD Profile/
Readiness
Communication Protocol Mismatch
Close-In-Time
Safety-Only Test
Switch LD to
HD
OBD High Fail
Rate
Low Fail Rate
3315 0 80.3 62.2 19.6 28.5 5.7 80.3 3316 0 80.3 46.3 51.2 68.7 40.4 53.8 80.3 67.3 42.3 3317 0 80.3 22.0 67.2 20.2 40.4 67.7 53.9 31.9 80.3 3318 0 80.2 1.9 58.7 57.9 56.8 80.2 3319 0 80.2 36.9 33.1 6.0 23.4 55.8 72.8 80.2 46.3 3320 0 80.2 20.9 62.8 16.4 80.2 3321 0 80.2 79.9 3.1 6.6 80.2 51.5 3322 0 80.2 25.6 59.0 50.1 80.2 80.1 3323 0 80.2 17.3 73.3 20.3 80.2 40.5 3324 0 80.2 34.1 73.2 31.4 45.9 0.0 80.2 55.9 68.9 3325 0 80.2 9.1 43.2 24.9 16.7 0.0 57.8 41.2 80.2 3326 0 80.2 7.1 5.4 51.5 80.2 3327 0 80.2 51.2 68.8 27.7 25.3 34.3 29.8 80.2 64.2 3328 0 80.1 42.1 7.8 56.2 6.1 80.1 3329 0 80.1 18.9 42.2 59.0 9.0 80.1 3330 0 80.1 18.3 12.9 21.5 80.1 69.2 3331 0 80.1 79.3 58.5 4.0 80.1 40.3 3332 0 80.1 24.9 12.0 5.3 80.1 50.9 3333 0 80.1 58.9 71.6 38.5 80.1 14.4 3334 0 80.1 38.0 28.5 29.7 80.1 61.2
Evaluation of the Texas Vehicle Emissions Inspection and Maintenance Program in the Dallas-Fort Worth and Houston-Galveston-Brazoria Nonattainment Areas Final – June 2022
111

Evaluation of the Texas Vehicle Emissions Inspection and Maintenance Program in the Dallas-Fort Worth and Houston-Galveston-Brazoria Nonattainment Areas Final – June 2022
Finally, one additional investigation for this section is a comparison of the potential-fraud rates by I/M program area. If fraud rates were higher in one area than the other, it might be possible that this would result in the Texas I/M program having a different degree of impact in the two program areas. The result of the investigation is shown below in Figure VI-11. Each of the eight different types of errors of commission is shown on the plot (this is the same group of categories as was shown in Figure VI-10). However, the plot now shows the fraction of stations that are from the DFW program area, for each decile of the ranks. For example, looking at the green dots on the green line (VIN/eVIN mismatch), we can see that at the zero-percentile group, the fraction of stations in that group is 60% DFW (and by inference, 40% HGB). At the 10th decile group, we see about 64% of stations are from the DFW program area (and so 36% from the HGB program area). By contrast, at the 90th decile groups, the percentage of stations from the DFW program area is about 42% (so the HGB program area would be 68%). This indicates that at the low end of the ranks (where fraud of this type is unlikely), there are more DFW stations, and at the high end of the ranks (where fraud of this type is much more likely) there are more HGB stations. A similar, and even more significant, trend can be seen for the squares on the dark blue line, for the OBD electronic profile comparisons, and on the light blue line, for the OBD communication protocol mismatches. For the other measures, it is much more difficult to see any sort of meaningful trend. However, it does appear that for the three major OBD fraud checks, the VIN/eVIN, the electronic profile, and the communication protocol, more stations are potentially committing fraudulent inspections in the HGB program area than in the DFW program area. Since OBD vehicles now dominate the fleet, fraudulent OBD inspections could significantly undermine the Texas I/M program’s effectiveness.
112

Evaluation of the Texas Vehicle Emissions Inspection and Maintenance Program in the Dallas-Fort Worth and Houston-Galveston-Brazoria Nonattainment Areas Final – June 2022
Figure VI-11. Fraction of Stations from the DFW Program Area by Rank Decile for Potential Inspection Fraud Indicators
113

Evaluation of the Texas Vehicle Emissions Inspection and Maintenance Program in the Dallas-Fort Worth and Houston-Galveston-Brazoria Nonattainment Areas Final – June 2022
VII. REFERENCES
1. Draft Guidance on Use of In-Program Data for Evaluation of I/M Program Performance, EPA420-P-01-003, August 2001.
2. Guidance on Use of Remote Sensing for Evaluation of I/M Program Performance, EPA420-B-04-010, July 2004.
3. Assessment of Vehicle Repair Activities, Final Report, Eastern Research Group, June 23, 2015.
4. T.H. DeFries, Texas I/M Program Evaluation Plan, Final Report, Eastern Research Group, August 29, 2004.
5. Evaluation of the Texas Inspection and Maintenance Programs in the Dallas/Fort Worth and Houston-Galveston-Brazoria Nonattainment Areas”, Final Report, Eastern Research Group November 30, 2006.
6. Evaluation of the Texas Inspection and Maintenance Programs in the Dallas/Fort Worth and Houston-Galveston-Brazoria Nonattainment Areas”, Final Report, Eastern Research Group November 30, 2009.
7. Evaluation of the Texas Inspection and Maintenance Programs in the Dallas/Fort Worth and Houston-Galveston-Brazoria Nonattainment Areas”, Final Report, Eastern Research Group July 31, 2012.
8. Evaluation of the Texas Inspection and Maintenance Programs in the Dallas/Fort Worth and Houston-Galveston-Brazoria Nonattainment Areas”, Final Report, Eastern Research Group November 7, 2014.
9. Evaluation of the Texas Inspection and Maintenance Programs in the Dallas/Fort Worth and Houston-Galveston-Brazoria Nonattainment Areas”, Final Report, Eastern Research Group June 30, 2016.
10. Evaluation of the Texas Inspection and Maintenance Programs in the Dallas/Fort Worth and Houston-Galveston-Brazoria Nonattainment Areas”, Final Report, Eastern Research Group June 29, 2018.
11.T.H. DeFries, A.D. Burnette, S. Kishan, Y. Meng, “Evaluation of the Texas Motorist’s Choice Program,” ERG Report No. TNRCC-000531, May 31, 2000.
114

Evaluation of the Texas Vehicle Emissions Inspection and Maintenance Program in the Dallas-Fort Worth and Houston-Galveston-Brazoria Nonattainment Areas Final – June 2022
Appendix A-DTC Groups

Evaluation of the Texas Vehicle Emissions Inspection and Maintenance Program in the Dallas-Fort Worth and Houston-Galveston-Brazoria Nonattainment Areas Final – June 2022
Table A-1. Evap DTCs
DTC DTC Description DTC DTC Description P0093 Fuel System Leak Detected - Large Leak P0496 Evap High Purge Flow P0094 Fuel System Leak Detected - Small Leak P0497 Evap Low Purge Flow P0440 Evap Malfunction P0498 Evap Vent Valve Control Circuit Low P0441 Evap Incorrect Purge Flow P0499 Evap Vent Valve Control Circuit High P0442 Evap Leak Detected (small leak) P2024 Evap Fuel Vapor Temperature Sensor Circuit P0443 Evap Purge Control Valve Circuit P2025 Evap Fuel Vapor Temperature Sensor
Performance P0444 Evap Purge Control Valve Circuit Open P2026 Evap Fuel Vapor Temperature Sensor Circuit
Low Voltage P0445 Evap Purge Control Valve Circuit
Shorted P2027 Evap Fuel Vapor Temperature Sensor Circuit
High Voltage P0446 Evap Vent Control Circuit Malfunction P2028 Evap Fuel Vapor Temperature Sensor Circuit
Intermittent P0447 Evap Vent Control Circuit Open P2400 Evap Leak Detection Pump Control
Circuit/Open P0448 Evap Vent Control Circuit Shorted P2401 Evap Leak Detection Pump Control Circuit
Low P0449 Evap Vent Valve/Solenoid Circuit
Malfunction P2402 Evap Leak Detection Pump Control Circuit
High P0450 Evap Pressure Sensor Malfunction P2403 Evap Leak Detection Pump Sense
Circuit/Open P0451 Evap Pressure Sensor
Range/Performance P2404 Evap Leak Detection Pump Sense Circuit
Range/Performance P0452 Evap Pressure Sensor Low Input P2405 Evap Leak Detection Pump Sense Circuit Low P0453 Evap Pressure Sensor High Input P2406 Evap Leak Detection Pump Sense Circuit
High P0454 Evap Pressure Sensor Intermittent P2407 Evap Leak Detection Pump Sense Circuit
Intermittent/Erratic P0455 Evap Leak Detected (gross leak) P2408 Fuel Cap Sensor/Switch Circuit P0456 Evap Leak Detected (very small leak) P2409 Fuel Cap Sensor/Switch Circuit
Range/Performance P0457 Evap Leak Detected (fuel cap loose/off) P2410 Fuel Cap Sensor/Switch Circuit Low P0458 Evap Purge Control Valve Circuit Low P2411 Fuel Cap Sensor/Switch Circuit High P0459 Evap Purge Control Valve Circuit High P2412 Fuel Cap Sensor/Switch Circuit
Intermittent/Erratic P0465 Purge Flow Sensor Circuit Malfunction P2418 Evap Switching Valve Control Circuit / Open P0466 Purge Flow Sensor Circuit
Range/Performance P2419 Evap Switching Valve Control Circuit Low
P0467 Purge Flow Sensor Circuit Low Input P2420 Evap Switching Valve Control Circuit High P0468 Purge Flow Sensor Circuit High Input P2421 Evap Vent Valve Stuck Open P0469 Purge Flow Sensor Circuit Intermittent P2422 Evap Vent Valve Stuck Closed
A-1

Evaluation of the Texas Vehicle Emissions Inspection and Maintenance Program in the Dallas-Fort Worth and Houston-Galveston-Brazoria Nonattainment Areas Final – June 2022
Table A-2. Catalyst DTCs8
DTC DTC Description DTC DTC Description
P0420 Catalyst System Efficiency Below Threshold P0431
Warm Up Catalyst Efficiency Below Threshold
P0421 Warm Up Catalyst Efficiency Below Threshold P0432 Main Catalyst Efficiency Below Threshold
P0422 Main Catalyst Efficiency Below Threshold P0433 Heated Catalyst Efficiency Below Threshold
P0423 Heated Catalyst Efficiency Below Threshold P0434
Heated Catalyst Temperature Below Threshold
P0424 Heated Catalyst Temperature Below Threshold P0435 Catalyst Temperature Sensor
P0425 Catalyst Temperature Sensor P0436 Catalyst Temperature Sensor Range/Performance
P0426 Catalyst Temperature Sensor Range/Performance P0437 Catalyst Temperature Sensor Low
P0427 Catalyst Temperature Sensor Low P0438 Catalyst Temperature Sensor High P0428 Catalyst Temperature Sensor High P0439 Catalyst Heater Control Circuit
P0429 Catalyst Heater Control Circuit P2423 HC Adsorption Catalyst Efficiency Below Threshold
P0430 Catalyst System Efficiency Below Threshold P2424
HC Adsorption Catalyst Efficiency Below Threshold
Table A-3. EGR DTCs
DTC DTC Description DTC DTC Description P0400 EGR Flow P0489 EGR Control Circuit Low P0401 EGR Flow Insufficient Detected P0490 EGR Control Circuit High P0402 EGR Flow Excessive Detected P2141 EGR Throttle Control Circuit Low P0403 EGR Control Circuit P2142 EGR Throttle Control Circuit High P0404 EGR Control Circuit Range/Performance P2143 EGR Vent Control Circuit/Open P0405 EGR Sensor "A" Circuit Low P2144 EGR Vent Control Circuit Low P0406 EGR Sensor "A" Circuit High P2145 EGR Vent Control Circuit High P0407 EGR Sensor "B" Circuit Low P2413 EGR System Performance P0408 EGR Sensor "B" Circuit High P2425 EGR Cooling Valve Control Circuit/Open P0409 EGR Sensor "A" Circuit P2426 EGR Cooling Valve Control Circuit Low P0486 EGR Sensor "B" Circuit P2427 EGR Cooling Valve Control Circuit High P0487 EGR Throttle Position Control Circuit P2428 Exhaust Gas Temperature Too High P0488 EGR Throttle Position Control Range/Perf P2429 Exhaust Gas Temperature Too High
8 Includes heated catalyst DTCs, although none were present in the data analyzed for this study.
A-2

Evaluation of the Texas Vehicle Emissions Inspection and Maintenance Program in the Dallas-Fort Worth and Houston-Galveston-Brazoria Nonattainment Areas Final – June 2022
Table A-4. O2 System DTCs9
DTC DTC Description DTC DTC Description P0030 HO2S Heater Control Circuit P0166 O2 Sensor Circuit No Activity Detected P0031 HO2S Heater Control Circuit Low P0167 O2 Sensor Heater Circuit P0032 HO2S Heater Control Circuit High P2195 O2 Sensor Signal Stuck Lean P0036 HO2S Heater Control Circuit P2196 O2 Sensor Signal Stuck Rich P0037 HO2S Heater Control Circuit Low P2197 O2 Sensor Signal Stuck Lean P0038 HO2S Heater Control Circuit High P2198 O2 Sensor Signal Stuck Rich P0040 O2 Sensor Signals Swapped B1 S1/ B2 S1 P2231 O2 Sensor Signal Circuit Shorted to Heater Circuit P0041 O2 Sensor Signals Swapped B1 S2/ B2 S2 P2232 O2 Sensor Signal Circuit Shorted to Heater Circuit P0042 HO2S Heater Control Circuit P2233 O2 Sensor Signal Circuit Shorted to Heater Circuit P0043 HO2S Heater Control Circuit Low P2234 O2 Sensor Signal Circuit Shorted to Heater Circuit P0044 HO2S Heater Control Circuit High P2235 O2 Sensor Signal Circuit Shorted to Heater Circuit P0050 HO2S Heater Control Circuit P2236 O2 Sensor Signal Circuit Shorted to Heater Circuit P0051 HO2S Heater Control Circuit Low P2237 O2 Sensor Positive Current Control Circuit/Open P0052 HO2S Heater Control Circuit High P2238 O2 Sensor Positive Current Control Circuit Low P0053 HO2S Heater Resistance P2239 O2 Sensor Positive Current Control Circuit High P0054 HO2S Heater Resistance P2240 O2 Sensor Positive Current Control Circuit/Open P0055 HO2S Heater Resistance P2241 O2 Sensor Positive Current Control Circuit Low P0056 HO2S Heater Control Circuit P2242 O2 Sensor Positive Current Control Circuit High P0057 HO2S Heater Control Circuit Low P2243 O2 Sensor Reference Voltage Circuit/Open P0058 HO2S Heater Control Circuit High P2244 O2 Sensor Reference Voltage Performance P0059 HO2S Heater Resistance P2245 O2 Sensor Reference Voltage Circuit Low P0060 HO2S Heater Resistance P2246 O2 Sensor Reference Voltage Circuit High P0061 HO2S Heater Resistance P2247 O2 Sensor Reference Voltage Circuit/Open P0062 HO2S Heater Control Circuit P2248 O2 Sensor Reference Voltage Performance P0063 HO2S Heater Control Circuit Low P2249 O2 Sensor Reference Voltage Circuit Low P0064 HO2S Heater Control Circuit High P2250 O2 Sensor Reference Voltage Circuit High P0130 O2 Sensor Circuit P2251 O2 Sensor Negative Current Control Circuit/Open P0131 O2 Sensor Circuit Low Voltage P2252 O2 Sensor Negative Current Control Circuit Low` P0132 O2 Sensor Circuit High Voltage P2253 O2 Sensor Negative Current Control Circuit High P0133 O2 Sensor Circuit Slow Response P2254 O2 Sensor Negative Current Control Circuit/Open P0134 O2 Sensor Circuit No Activity Detected P2255 O2 Sensor Negative Current Control Circuit Low P0135 O2 Sensor Heater Circuit P2256 O2 Sensor Negative Current Control Circuit High P0136 O2 Sensor Circuit P2270 O2 Sensor Signal Stuck Lean P0137 O2 Sensor Circuit Low Voltage P2271 O2 Sensor Signal Stuck Rich P0138 O2 Sensor Circuit High Voltage P2272 O2 Sensor Signal Stuck Lean P0139 O2 Sensor Circuit Slow Response P2273 O2 Sensor Signal Stuck Rich P0140 O2 Sensor Circuit No Activity Detected P2274 O2 Sensor Signal Stuck Lean P0141 O2 Sensor Heater Circuit P2275 O2 Sensor Signal Stuck Rich P0142 O2 Sensor Circuit P2276 O2 Sensor Signal Stuck Lean P0143 O2 Sensor Circuit Low Voltage P2277 O2 Sensor Signal Stuck Rich P0144 O2 Sensor Circuit High Voltage P2278 O2 Sensor Signals Swapped B1 S3 / B2 S3 P0145 O2 Sensor Circuit Slow Response P2297 O2 Sensor Out of Range During Deceleration P0146 O2 Sensor Circuit No Activity Detected P2298 O2 Sensor Out of Range During Deceleration P0147 O2 Sensor Heater Circuit P2414 O2 Sensor Exhaust Sample Error P0150 O2 Sensor Circuit P2415 O2 Sensor Exhaust Sample Error P0151 O2 Sensor Circuit Low Voltage P2416 O2 Sensor Signals Swapped B1 S2 / B1 S3
9 Includes oxygen sensor and oxygen sensor heater.
A-3

Evaluation of the Texas Vehicle Emissions Inspection and Maintenance Program in the Dallas-Fort Worth and Houston-Galveston-Brazoria Nonattainment Areas Final – June 2022
DTC DTC Description DTC DTC Description P0152 O2 Sensor Circuit High Voltage P2417 O2 Sensor Signals Swapped B2 S2 / B2 S3 P0153 O2 Sensor Circuit Slow Response P2626 O2 Sensor Pumping Current Trim Circuit/Open P0154 O2 Sensor Circuit No Activity Detected P2627 O2 Sensor Pumping Current Trim Circuit Low P0155 O2 Sensor Heater Circuit P2628 O2 Sensor Pumping Current Trim Circuit High P0156 O2 Sensor Circuit P2629 O2 Sensor Pumping Current Trim Circuit/Open P0157 O2 Sensor Circuit Low Voltage P2630 O2 Sensor Pumping Current Trim Circuit Low P0158 O2 Sensor Circuit High Voltage P2631 O2 Sensor Pumping Current Trim Circuit High P0159 O2 Sensor Circuit Slow Response P2A00 O2 Sensor Circuit Range/Performance P0160 O2 Sensor Circuit No Activity Detected P2A01 O2 Sensor Circuit Range/Performance P0161 O2 Sensor Heater Circuit P2A02 O2 Sensor Circuit Range/Performance P0162 O2 Sensor Circuit P2A03 O2 Sensor Circuit Range/Performance P0163 O2 Sensor Circuit Low Voltage P2A04 O2 Sensor Circuit Range/Performance P0164 O2 Sensor Circuit High Voltage P2A05 O2 Sensor Circuit Range/Performance P0165 O2 Sensor Circuit Slow Response
A-4

Evaluation of the Texas Vehicle Emissions Inspection and Maintenance Program in the Dallas-Fort Worth and Houston-Galveston-Brazoria Nonattainment Areas Final – June 2022
Table A-5. Secondary Air Intake System DTCs
DTC DTC Description DTC DTC Description
P0410 Secondary Air Injection System P2431 Secondary Air Injection System Air Flow/Pressure Sensor Circuit Range/Performance
P0411 Secondary Air Injection System Incorrect Flow Detected
P2432 Secondary Air Injection System Air Flow/Pressure Sensor Circuit Low
P0412 Secondary Air Injection System Switching Valve "A" Circuit
P2433 Secondary Air Injection System Air Flow/Pressure Sensor Circuit High
P0413 Secondary Air Injection System Switching Valve "A" Circuit Open
P2434 Secondary Air Injection System Air Flow/Pressure Sensor Circuit Intermittent/Erratic
P0414 Secondary Air Injection System Switching Valve "A" Circuit Shorted
P2435 Secondary Air Injection System Air Flow/Pressure Sensor Circuit
P0415 Secondary Air Injection System Switching Valve "B" Circuit
P2436 Secondary Air Injection System Air Flow/Pressure Sensor Circuit Range/Performance
P0416 Secondary Air Injection System Switching Valve "B" Circuit Open
P2437 Secondary Air Injection System Air Flow/Pressure Sensor Circuit Low
P0417 Secondary Air Injection System Switching Valve "B" Circuit Shorted
P2438 Secondary Air Injection System Air Flow/Pressure Sensor Circuit High
P0418 Secondary Air Injection System Control "A" Circuit
P2439 Secondary Air Injection System Air Flow/Pressure Sensor Circuit Intermittent/Erratic
P0419 Secondary Air Injection System Control "B" Circuit
P2440 Secondary Air Injection System Switching Valve Stuck Open
P0491 Secondary Air Injection System Insufficient Flow
P2441 Secondary Air Injection System Switching Valve Stuck Closed
P0492 Secondary Air Injection System Insufficient Flow
P2442 Secondary Air Injection System Switching Valve Stuck Open
P2257 Secondary Air Injection System Control "A" Circuit Low
P2443 Secondary Air Injection System Switching Valve Stuck Closed
P2258 Secondary Air Injection System Control "A" Circuit High
P2444 Secondary Air Injection System Pump Stuck On
P2259 Secondary Air Injection System Control "B" Circuit Low
P2445 Secondary Air Injection System Pump Stuck Off
P2260 Secondary Air Injection System Control "B" Circuit High
P2446 Secondary Air Injection System Pump Stuck On
P2430 Secondary Air Injection System Air Flow/Pressure Sensor Circuit
P2447 Secondary Air Injection System Pump Stuck Off
A-5

Evaluation of the Texas Vehicle Emissions Inspection and Maintenance Program in the Dallas-Fort Worth and Houston-Galveston-Brazoria Nonattainment Areas Final – June 2022
Appendix B-OBD Communication Rates by Vehicle
Model Code for Elevated Miscommunications

Evaluation of the Texas Vehicle Emissions Inspection and Maintenance Program in the Dallas-Fort Worth and Houston-Galveston-Brazoria Nonattainment Areas Final – June 2022
Table B-1. OBD Communication Rates by Vehicle Model Code for Elevated Miscommunications
Make/Model
DLC is Damaged, Inaccessible, or Cannot
be Found
Vehicle will not Communicate with
Analyzer
Vehicle Successfully Communicates with
Analyzer Total Count of Tests by
Make Count Percent Count Percent Count Percent Count Percent
ACUR 3.2TL 1 0.03% 5 0.14% 3,673 99.84% 3,679 0.02% ILX 20 2 0.04% 3 0.05% 5,469 99.91% 5,474 0.04% MDX 7 0.01% 32 0.05% 64,221 99.94% 64,260 0.42% RDX 4 0.01% 29 0.07% 43,798 99.92% 43,831 0.29% RL 1 0.04% 3 0.12% 2,604 99.85% 2,608 0.02% RSX 1 0.04% 6 0.23% 2,652 99.74% 2,659 0.02% TL 6 0.02% 32 0.09% 36,340 99.90% 36,378 0.24% TSX 3 0.01% 15 0.06% 24,482 99.93% 24,500 0.16%
AUDI A4 1 0.00% 22 0.08% 25,929 99.91% 25,952 0.17%
A5 Cabriolet A6 4 0.02% 16 0.08% 20,472 99.90% 20,492 0.14% Q3 1 0.01% 9 0.11% 8,002 99.88% 8,012 0.05% Q5 1 0.01% 16 0.08% 19,679 99.91% 19,696 0.13% Q5/SQ5 3 0.02% 17 0.11% 16,051 99.88% 16,071 0.11% Q7 1 0.01% 20 0.10% 19,841 99.89% 19,862 0.13% TT 1 0.03% 10 0.34% 2,974 99.63% 2,985 0.02% BMW 228i 1 0.08% 2 0.15% 1,294 99.77% 1,297 0.01% 320i 1 0.01% 7 0.09% 7,826 99.90% 7,834 0.05% 320i xDrive 1 0.10% 4 0.40% 1,005 99.50% 1,010 0.01% 325i 1 0.02% 12 0.19% 6,145 99.79% 6,158 0.04% 328i 11 0.03% 43 0.12% 36,247 99.85% 36,301 0.24%
B-1

Evaluation of the Texas Vehicle Emissions Inspection and Maintenance Program in the Dallas-Fort Worth and Houston-Galveston-Brazoria Nonattainment Areas Final – June 2022
Make/Model
DLC is Damaged, Inaccessible, or Cannot
be Found
Vehicle will not Communicate with
Analyzer
Vehicle Successfully Communicates with
Analyzer Total Count of Tests by
Make Count Percent Count Percent Count Percent Count Percent
328i SA 2 0.02% 12 0.14% 8,538 99.84% 8,552 0.06% 328i xDrive 1 0.02% 4 0.10% 4,160 99.88% 4,165 0.03% 330Ci 3 0.11% 6 0.22% 2,739 99.67% 2,748 0.02% 330i 1 0.01% 6 0.08% 7,076 99.90% 7,083 0.05% 335i 7 0.07% 31 0.31% 9,935 99.62% 9,973 0.07% 428i 1 0.02% 11 0.17% 6,441 99.81% 6,453 0.04% 528i 6 0.03% 32 0.17% 18,381 99.79% 18,419 0.12% 528i xDrive 2 0.16% 4 0.33% 1,217 99.51% 1,223 0.01% 530i 1 0.01% 1 0.01% 6,713 99.97% 6,715 0.04% 535i xDrive 1 0.06% 2 0.12% 1,629 99.82% 1,632 0.01% 550i 1 0.03% 8 0.22% 3,553 99.75% 3,562 0.02% 740iL (Auto) 2 0.34% 2 0.34% 578 99.31% 582 0.00% i3 1 0.22% 5 1.12% 439 98.65% 445 0.00% X3 2 0.01% 36 0.13% 28,744 99.87% 28,782 0.19% X3 3.0i 2 0.11% 5 0.27% 1,847 99.62% 1,854 0.01% X5 2 0.01% 43 0.11% 37,695 99.88% 37,740 0.25% X5 3.0i 1 0.03% 8 0.25% 3,189 99.72% 3,198 0.02% X6 1 0.02% 7 0.12% 5,600 99.86% 5,608 0.04% Z4 2 0.10% 13 0.64% 2,011 99.26% 2,026 0.01%
BUIC Enclave 4 0.01% 14 0.03% 40,564 99.96% 40,582 0.27% Encore 2 0.01% 17 0.06% 29,195 99.93% 29,214 0.19% LaCrosse CX 1 0.02% 10 0.17% 5,909 99.81% 5,920 0.04% LaCrosse CXL 2 0.06% 4 0.11% 3,508 99.83% 3,514 0.02% LaCrosse CXS 1 0.03% 1 0.03% 3,222 99.94% 3,224 0.02%
B-2

Evaluation of the Texas Vehicle Emissions Inspection and Maintenance Program in the Dallas-Fort Worth and Houston-Galveston-Brazoria Nonattainment Areas Final – June 2022
Make/Model
DLC is Damaged, Inaccessible, or Cannot
be Found
Vehicle will not Communicate with
Analyzer
Vehicle Successfully Communicates with
Analyzer Total Count of Tests by
Make Count Percent Count Percent Count Percent Count Percent
LeSabre Custom 4 0.04% 21 0.22% 9,579 99.74% 9,604 0.06% Lucerne CXL 1 0.02% 2 0.03% 6,102 99.95% 6,105 0.04% Regal Gran Sport 1 0.24% 1 0.24% 417 99.52% 419 0.00% Regal LS 1 0.06% 1 0.06% 1,801 99.89% 1,803 0.01% Regal Premium I 1 0.05% 4 0.18% 2,171 99.77% 2,176 0.01% Rendezvous 2WD 1 0.02% 18 0.42% 4,218 99.55% 4,237 0.03% Verano 1 0.01% 7 0.07% 10,121 99.92% 10,129 0.07%
CADI 1500 Suburban 4WD Luxury 1 0.06% 8 0.46% 1,742 99.49% 1,751 0.01% ATS Luxury 1 0.01% 5 0.05% 9,677 99.94% 9,683 0.06% CTS 3 0.03% 3 0.03% 9,492 99.94% 9,498 0.06% CTS Auto RWD 1 0.02% 3 0.07% 4,156 99.90% 4,160 0.03% CTS Luxury 2 0.02% 8 0.06% 13,240 99.92% 13,250 0.09% CTS Standard 1 0.05% 5 0.24% 2,064 99.71% 2,070 0.01% CTS V6 1 0.02% 3 0.06% 5,397 99.93% 5,401 0.04% DeVille 1 0.01% 18 0.24% 7,625 99.75% 7,644 0.05% Escalade 2 0.01% 37 0.14% 26,404 99.85% 26,443 0.17% Escalade 1500 2WD 3 0.05% 24 0.42% 5,628 99.52% 5,655 0.04% Escalade 1500 2WD Luxury 3 0.07% 15 0.33% 4,543 99.61% 4,561 0.03% Escalade 1500 4WD 5 0.05% 36 0.37% 9,593 99.57% 9,634 0.06% Escalade 1500 4WD Luxury 1 0.01% 25 0.36% 6,831 99.62% 6,857 0.05% Escalade ESV 1 0.01% 15 0.09% 16,847 99.91% 16,863 0.11% Escalade EXT 1 0.04% 1 0.04% 2,328 99.91% 2,330 0.02% SRX 5 0.01% 36 0.07% 52,815 99.92% 52,856 0.35% SRX RWD 1 0.06% 1 0.06% 1,626 99.88% 1,628 0.01%
B-3

Evaluation of the Texas Vehicle Emissions Inspection and Maintenance Program in the Dallas-Fort Worth and Houston-Galveston-Brazoria Nonattainment Areas Final – June 2022
Make/Model
DLC is Damaged, Inaccessible, or Cannot
be Found
Vehicle will not Communicate with
Analyzer
Vehicle Successfully Communicates with
Analyzer Total Count of Tests by
Make Count Percent Count Percent Count Percent Count Percent
XLR 1 0.14% 3 0.43% 686 99.42% 690 0.00% CHEV
1500 2WD 30 0.02% 214 0.12% 183,024 99.87% 183,268 1.21% 1500 4WD 5 0.02% 33 0.11% 30,248 99.87% 30,286 0.20% 2500 2WD 3 0.01% 25 0.11% 23,185 99.88% 23,213 0.15% 2500 4WD 1 0.02% 4 0.08% 4,787 99.90% 4,792 0.03% 3500 2WD 2 0.04% 6 0.13% 4,745 99.83% 4,753 0.03% Astro 2WD 2 0.03% 27 0.37% 7,218 99.60% 7,247 0.05% Avalanche LT 1 0.03% 2 0.06% 3,584 99.92% 3,587 0.02% Aveo LS 1 0.45% 1 0.45% 222 99.11% 224 0.00% Blazer / Trailblazer 2WD 7 0.04% 41 0.21% 19,339 99.75% 19,387 0.13% Blazer / Trailblazer 4WD 4 0.09% 11 0.26% 4,250 99.65% 4,265 0.03% C1500 Pickup 2WD 21 0.02% 179 0.19% 95,898 99.79% 96,098 0.63% C1500 Silverado 2WD 25 0.04% 141 0.25% 56,453 99.71% 56,619 0.37% C1500 Suburban 2WD 16 0.03% 110 0.24% 46,119 99.73% 46,245 0.31% C2500 Pickup 2WD 5 0.10% 7 0.14% 4,995 99.76% 5,007 0.03% C3500 Pickup 2WD 2 0.22% 1 0.11% 906 99.67% 909 0.01% Camaro 1LT 5 0.03% 8 0.05% 17,136 99.92% 17,149 0.11% Camaro LT 2 0.02% 5 0.04% 12,836 99.95% 12,843 0.08% Camaro Sport 2 0.04% 10 0.20% 5,102 99.77% 5,114 0.03% Cavalier 5 0.06% 10 0.12% 8,381 99.82% 8,396 0.06% Cobalt 4 0.02% 33 0.17% 19,514 99.81% 19,551 0.13% Colorado / Trailblazer 2WD 3 0.03% 7 0.08% 9,075 99.89% 9,085 0.06% Colorado Work Truck 2 0.02% 19 0.15% 12,818 99.84% 12,839 0.08% Corvette 6 0.02% 48 0.19% 24,790 99.78% 24,844 0.16%
B-4

Evaluation of the Texas Vehicle Emissions Inspection and Maintenance Program in the Dallas-Fort Worth and Houston-Galveston-Brazoria Nonattainment Areas Final – June 2022
Make/Model
DLC is Damaged, Inaccessible, or Cannot
be Found
Vehicle will not Communicate with
Analyzer
Vehicle Successfully Communicates with
Analyzer Total Count of Tests by
Make Count Percent Count Percent Count Percent Count Percent
Equinox 2 0.01% 19 0.06% 32,573 99.94% 32,594 0.22% Equinox / Captiva FWD 1 0.03% 3 0.10% 3,058 99.87% 3,062 0.02% Equinox 1LT 3 0.01% 26 0.06% 42,248 99.93% 42,277 0.28% Equinox 2LT 1 0.00% 14 0.05% 26,999 99.94% 27,014 0.18% Equinox 2WD 1 0.01% 1 0.01% 7,424 99.97% 7,426 0.05% Equinox LS 2 0.01% 12 0.05% 22,128 99.94% 22,142 0.15% Express 1500 1 0.02% 5 0.08% 5,893 99.90% 5,899 0.04% Express 1500 2WD 3 0.03% 18 0.15% 11,755 99.82% 11,776 0.08% Express 2500 1 0.04% 12 0.46% 2,571 99.50% 2,584 0.02% Express 2500 2WD 3 0.09% 13 0.37% 3,508 99.55% 3,524 0.02% Express 3500 2 0.14% 3 0.21% 1,452 99.66% 1,457 0.01% Express 3500 2WD 2 0.10% 2 0.10% 2,029 99.80% 2,033 0.01% G1500 Van 2WD 1 0.06% 3 0.17% 1,780 99.78% 1,784 0.01% HHR 3 0.02% 26 0.17% 14,967 99.81% 14,996 0.10% Impala 5 0.05% 14 0.13% 10,401 99.82% 10,420 0.07% Impala LS 1 0.01% 3 0.02% 12,260 99.97% 12,264 0.08% Impala LS Sedan 3 0.02% 11 0.09% 12,655 99.89% 12,669 0.08% Impala LT 1 0.00% 11 0.05% 22,066 99.95% 22,078 0.15% Impala LT Sedan 2 0.01% 9 0.06% 14,233 99.92% 14,244 0.09% Impala Police Sedan 1 0.10% 2 0.19% 1,046 99.71% 1,049 0.01% Impala SS Sedan 2 0.06% 1 0.03% 3,133 99.90% 3,136 0.02% K1500 Pickup 4WD 6 0.03% 32 0.17% 18,638 99.80% 18,676 0.12% K1500 Silverado 4WD 3 0.04% 8 0.11% 7,048 99.84% 7,059 0.05% K1500 Suburban 4WD 2 0.02% 23 0.21% 11,034 99.77% 11,059 0.07% Malibu 1LS 2 0.04% 11 0.25% 4,471 99.71% 4,484 0.03%
B-5

Evaluation of the Texas Vehicle Emissions Inspection and Maintenance Program in the Dallas-Fort Worth and Houston-Galveston-Brazoria Nonattainment Areas Final – June 2022
Make/Model
DLC is Damaged, Inaccessible, or Cannot
be Found
Vehicle will not Communicate with
Analyzer
Vehicle Successfully Communicates with
Analyzer Total Count of Tests by
Make Count Percent Count Percent Count Percent Count Percent
Malibu 1LT 3 0.08% 6 0.15% 3,944 99.77% 3,953 0.03% Malibu 2LT 2 0.01% 20 0.12% 16,246 99.86% 16,268 0.11% Malibu LS 3 0.01% 55 0.16% 34,330 99.83% 34,388 0.23% Malibu LT 7 0.02% 33 0.10% 34,171 99.88% 34,211 0.23% Malibu LTZ 2 0.02% 4 0.05% 8,145 99.93% 8,151 0.05% NV200 2 0.10% 5 0.25% 1,992 99.65% 1,999 0.01% S Series Pickup 2WD 1 0.01% 28 0.27% 10,247 99.72% 10,276 0.07% S Series Pickup 4WD 1 0.23% 1 0.23% 436 99.54% 438 0.00% S10 Pickup 2WD 2 0.03% 12 0.18% 6,655 99.79% 6,669 0.04% Sierra 1500 1 0.03% 4 0.10% 3,992 99.87% 3,997 0.03% Silverado 4 0.02% 17 0.08% 21,772 99.90% 21,793 0.14% Silverado 1500 28 0.01% 201 0.06% 339,026 99.93% 339,255 2.24% Silverado 3500 2 0.35% 1 0.18% 568 99.47% 571 0.00% Silverado LS 2 0.01% 18 0.13% 13,880 99.86% 13,900 0.09% Spark 1LT 1 0.02% 4 0.07% 5,769 99.91% 5,774 0.04% SSR / Colorado / Trailblazer 6 0.03% 38 0.19% 19,575 99.78% 19,619 0.13% Suburban LT 1 0.00% 18 0.07% 25,007 99.92% 25,026 0.17% Suburban LTZ 1 0.01% 11 0.09% 11,589 99.90% 11,601 0.08% Tahoe 2WD 16 0.02% 173 0.19% 90,197 99.79% 90,386 0.60% Tahoe 4WD 7 0.03% 58 0.23% 25,163 99.74% 25,228 0.17% Tahoe LS 3 0.01% 16 0.07% 23,448 99.92% 23,467 0.16% Tahoe LT 3 0.01% 33 0.06% 59,727 99.94% 59,763 0.39% Tahoe LTX 3 0.04% 7 0.09% 7,387 99.86% 7,397 0.05% Tahoe LTZ 3 0.01% 9 0.04% 22,784 99.95% 22,796 0.15% Tracker ZR2 Sport 1 0.76% 1 0.76% 129 98.47% 131 0.00%
B-6

Evaluation of the Texas Vehicle Emissions Inspection and Maintenance Program in the Dallas-Fort Worth and Houston-Galveston-Brazoria Nonattainment Areas Final – June 2022
Make/Model
DLC is Damaged, Inaccessible, or Cannot
be Found
Vehicle will not Communicate with
Analyzer
Vehicle Successfully Communicates with
Analyzer Total Count of Tests by
Make Count Percent Count Percent Count Percent Count Percent
Trailblazer 2WD 1 0.02% 12 0.21% 5,730 99.77% 5,743 0.04% Traverse 2LT 2 0.01% 2 0.01% 16,474 99.98% 16,478 0.11% Traverse LT/Traverse 1LT 2 0.01% 23 0.08% 30,532 99.92% 30,557 0.20% Venture 2WD 1 0.04% 7 0.29% 2,427 99.67% 2,435 0.02% Venture 2WD Extended Van 1 0.32% 2 0.64% 309 99.04% 312 0.00% Venture/Uplander EXT LS 1 0.15% 1 0.15% 661 99.70% 663 0.00%
CHRY 300 1 0.02% 3 0.06% 5,443 99.93% 5,447 0.04% 200 Limited 3 0.01% 21 0.10% 20,287 99.88% 20,311 0.13% 200 Touring 1 0.01% 5 0.06% 8,332 99.93% 8,338 0.06% 200S 2 0.05% 5 0.12% 4,298 99.84% 4,305 0.03% 300 Touring 3 0.02% 9 0.05% 16,739 99.93% 16,751 0.11% 300C 4 0.03% 11 0.08% 13,975 99.89% 13,990 0.09% 300S 1 0.01% 4 0.04% 10,423 99.95% 10,428 0.07% PT Cruiser Classic LHD 1 0.02% 10 0.15% 6,588 99.83% 6,599 0.04% PT Cruiser GT LHD 2 0.45% 4 0.89% 442 98.66% 448 0.00% Sebring Limited 1 0.08% 1 0.08% 1,330 99.85% 1,332 0.01% Sebring LX 2 0.07% 6 0.21% 2,911 99.73% 2,919 0.02% Sebring Touring 1 0.02% 10 0.18% 5,703 99.81% 5,714 0.04% Town & Country 1 0.00% 17 0.08% 20,429 99.91% 20,447 0.14% Town & Country FWD LHD 1 0.02% 6 0.12% 4,981 99.86% 4,988 0.03% Town & Country FWD LWB & SWB 2 0.04% 6 0.13% 4,567 99.83% 4,575 0.03% Town & Country LX FWD 1 0.08% 4 0.30% 1,308 99.62% 1,313 0.01%
DODG 1500 1 0.01% 19 0.10% 19,252 99.90% 19,272 0.13%
B-7

Evaluation of the Texas Vehicle Emissions Inspection and Maintenance Program in the Dallas-Fort Worth and Houston-Galveston-Brazoria Nonattainment Areas Final – June 2022
Make/Model
DLC is Damaged, Inaccessible, or Cannot
be Found
Vehicle will not Communicate with
Analyzer
Vehicle Successfully Communicates with
Analyzer Total Count of Tests by
Make Count Percent Count Percent Count Percent Count Percent
Avenger R/T 1 0.03% 4 0.10% 3,925 99.87% 3,930 0.03% Avenger SE 8 0.03% 14 0.06% 24,434 99.91% 24,456 0.16% Caliber Mainstreet 1 0.06% 2 0.11% 1,792 99.83% 1,795 0.01% Caliber SXT 1 0.01% 5 0.07% 6,917 99.91% 6,923 0.05% Caravan / Grand Caravan SE 2 0.05% 8 0.21% 3,762 99.73% 3,772 0.02% Caravan / Grand Caravan SXT FW 4 0.05% 10 0.13% 7,661 99.82% 7,675 0.05% Caravan C/V FWD 1 0.01% 6 0.08% 7,657 99.91% 7,664 0.05% Caravan SE / Grand Caravan SE 1 0.07% 8 0.54% 1,473 99.39% 1,482 0.01% Caravan Sport FWD 1 0.07% 1 0.07% 1,504 99.87% 1,506 0.01% Challenger 1 0.01% 11 0.07% 16,630 99.93% 16,642 0.11% Challenger R/T 1 0.01% 19 0.14% 13,564 99.85% 13,584 0.09% Challenger SCAT Pack 2 0.05% 4 0.09% 4,209 99.86% 4,215 0.03% Challenger SRT Hellcat 1 0.06% 1 0.06% 1,639 99.88% 1,641 0.01% Challenger SXT 5 0.04% 8 0.06% 14,182 99.91% 14,195 0.09% Charger 4 0.02% 13 0.06% 22,608 99.92% 22,625 0.15% Charger (RWD) 4 0.03% 15 0.11% 14,153 99.87% 14,172 0.09% Charger R/T 2 0.01% 28 0.14% 19,955 99.85% 19,985 0.13% Charger SE 1 0.01% 8 0.10% 7,812 99.88% 7,821 0.05% Charger SXT 6 0.02% 32 0.11% 29,203 99.87% 29,241 0.19% Dakota 2WD 5 0.06% 17 0.22% 7,851 99.72% 7,873 0.05% Dakota 4WD 1 0.09% 1 0.09% 1,090 99.82% 1,092 0.01% Dakota SLT 2WD 2 0.03% 14 0.20% 7,068 99.77% 7,084 0.05% Dart SXT 1 0.01% 7 0.06% 11,735 99.93% 11,743 0.08% Durango 2WD 1 0.03% 3 0.10% 3,011 99.87% 3,015 0.02% Durango 4WD 2 0.10% 9 0.47% 1,906 99.43% 1,917 0.01%
B-8

Evaluation of the Texas Vehicle Emissions Inspection and Maintenance Program in the Dallas-Fort Worth and Houston-Galveston-Brazoria Nonattainment Areas Final – June 2022
Make/Model
DLC is Damaged, Inaccessible, or Cannot
be Found
Vehicle will not Communicate with
Analyzer
Vehicle Successfully Communicates with
Analyzer Total Count of Tests by
Make Count Percent Count Percent Count Percent Count Percent
Durango SLT 2WD 2 0.03% 3 0.04% 7,415 99.93% 7,420 0.05% Durango Sport 2WD 1 0.16% 1 0.16% 634 99.69% 636 0.00% Durango SXT 3 0.02% 11 0.07% 15,404 99.91% 15,418 0.10% Grand Caravan GT 2 0.03% 6 0.09% 6,942 99.88% 6,950 0.05% Grand Caravan SE 3 0.02% 15 0.11% 14,057 99.87% 14,075 0.09% Grand Caravan SXT 1 0.01% 14 0.08% 17,328 99.91% 17,343 0.11% Journey Crossroad 2 0.02% 3 0.03% 8,792 99.94% 8,797 0.06% Journey SE 4 0.02% 20 0.10% 20,920 99.89% 20,944 0.14% Journey SXT 1 0.01% 20 0.10% 19,685 99.89% 19,706 0.13% Magnum / Magnum SXT 3 0.10% 1 0.03% 2,940 99.86% 2,944 0.02% Neon 1 0.16% 1 0.16% 625 99.68% 627 0.00% Neon SXT 2 0.10% 2 0.10% 1,957 99.80% 1,961 0.01% ProMaster City 1 0.07% 7 0.48% 1,455 99.45% 1,463 0.01% RAM 1500 1 0.01% 3 0.03% 8,594 99.95% 8,598 0.06% Ram Pickup 1 0.06% 2 0.12% 1,641 99.82% 1,644 0.01% Ram Pickup 1500 2WD 15 0.01% 96 0.08% 117,737 99.91% 117,848 0.78% Ram Pickup 1500 4WD 1 0.01% 15 0.11% 14,226 99.89% 14,242 0.09% Ram Pickup 2500 2WD 2 0.32% 1 0.16% 624 99.52% 627 0.00% Ram Pickup 2WD 15 0.06% 114 0.43% 26,132 99.51% 26,261 0.17% Ram Pickup 4WD 1 0.03% 17 0.45% 3,760 99.52% 3,778 0.02% RAM PK Light Duty 1500 2 0.01% 14 0.08% 17,711 99.91% 17,727 0.12% Stratus SE 1 0.14% 1 0.14% 730 99.73% 732 0.00%
FERR 360 Spider 1 0.74% 2 1.47% 133 97.79% 136 0.00%
FIAT
B-9

Evaluation of the Texas Vehicle Emissions Inspection and Maintenance Program in the Dallas-Fort Worth and Houston-Galveston-Brazoria Nonattainment Areas Final – June 2022
Make/Model
DLC is Damaged, Inaccessible, or Cannot
be Found
Vehicle will not Communicate with
Analyzer
Vehicle Successfully Communicates with
Analyzer Total Count of Tests by
Make Count Percent Count Percent Count Percent Count Percent
500 Pop 1 0.02% 5 0.08% 6,382 99.91% 6,388 0.04% FORD
500 SE FWD 1 0.11% 1 0.11% 947 99.79% 949 0.01% Bronco 4WD 2 0.63% 2 0.63% 315 98.75% 319 0.00% C-Max SE FHEV 1 0.08% 1 0.08% 1,187 99.83% 1,189 0.01% Crown Victoria 1 0.08% 2 0.16% 1,251 99.76% 1,254 0.01% Crown Victoria Police Intercep 1 0.04% 3 0.12% 2,600 99.85% 2,604 0.02% E150 2WD 6 0.07% 22 0.26% 8,321 99.66% 8,349 0.06% E250 2WD 1 0.04% 3 0.11% 2,738 99.85% 2,742 0.02% E250 Cargo Van 1 0.31% 1 0.31% 322 99.38% 324 0.00% E350 2WD 2 0.12% 4 0.25% 1,596 99.63% 1,602 0.01% Econoline E350 1 0.08% 3 0.25% 1,203 99.67% 1,207 0.01% Ecosport SE 1 0.06% 1 0.06% 1,604 99.88% 1,606 0.01% Edge SE FWD 2 0.06% 1 0.03% 3,330 99.91% 3,333 0.02% Edge SEL 1 0.01% 16 0.09% 17,577 99.90% 17,594 0.12% Edge Sport 1 0.04% 2 0.07% 2,760 99.89% 2,763 0.02% Edge Titanium 1 0.01% 26 0.16% 15,795 99.83% 15,822 0.10% Escape 12 0.02% 48 0.07% 72,405 99.92% 72,465 0.48% Escape S 3 0.02% 33 0.20% 16,245 99.78% 16,281 0.11% Escape SE 8 0.02% 86 0.21% 41,675 99.77% 41,769 0.28% Escape SEL 3 0.06% 43 0.90% 4,750 99.04% 4,796 0.03% Escape Titanium 4 0.02% 31 0.16% 19,229 99.82% 19,264 0.13% Escape XLS 2WD 2 0.02% 1 0.01% 10,779 99.97% 10,782 0.07% Escape XLT 2WD 2 0.01% 21 0.10% 21,134 99.89% 21,157 0.14% Excursion XLT 2WD 2 0.79% 1 0.40% 249 98.81% 252 0.00%
B-10

Evaluation of the Texas Vehicle Emissions Inspection and Maintenance Program in the Dallas-Fort Worth and Houston-Galveston-Brazoria Nonattainment Areas Final – June 2022
Make/Model
DLC is Damaged, Inaccessible, or Cannot
be Found
Vehicle will not Communicate with
Analyzer
Vehicle Successfully Communicates with
Analyzer Total Count of Tests by
Make Count Percent Count Percent Count Percent Count Percent
Expedition 3 0.01% 24 0.06% 40,598 99.93% 40,625 0.27% Expedition Eddie Bauer 2WD 9 0.03% 44 0.12% 35,782 99.85% 35,835 0.24% Expedition XLT 2WD 6 0.02% 30 0.11% 28,103 99.87% 28,139 0.19% Expedition XLT 4WD 1 0.03% 6 0.18% 3,400 99.79% 3,407 0.02% Explorer 15 0.02% 60 0.08% 73,758 99.90% 73,833 0.49% Explorer Limited 4 0.02% 34 0.13% 26,031 99.85% 26,069 0.17% Explorer LTD 2WD 1 0.04% 12 0.43% 2,785 99.54% 2,798 0.02% Explorer Platinum 1 0.02% 5 0.11% 4,701 99.87% 4,707 0.03% Explorer Sport 1 0.01% 15 0.13% 11,226 99.86% 11,242 0.07% Explorer Sport 2WD 2 0.05% 6 0.16% 3,854 99.79% 3,862 0.03% Explorer Sport Trac 2WD 2 0.01% 29 0.21% 14,112 99.78% 14,143 0.09% Explorer XL 1 0.01% 11 0.15% 7,506 99.84% 7,518 0.05% Explorer XLS 2WD 2 0.02% 13 0.13% 9,847 99.85% 9,862 0.07% Explorer XLT 4 0.01% 42 0.09% 45,483 99.90% 45,529 0.30% Explorer XLT 2WD 1 0.00% 36 0.17% 20,854 99.82% 20,891 0.14% F150 69 0.01% 646 0.11% 601,882 99.88% 602,597 3.98% F150 2WD 30 0.03% 200 0.18% 108,459 99.79% 108,689 0.72% F150 2WD Super Crew 22 0.02% 144 0.14% 103,438 99.84% 103,604 0.68% F150 4WD 8 0.06% 21 0.15% 14,122 99.80% 14,151 0.09% F150 4WD Super Crew 8 0.02% 38 0.12% 32,570 99.86% 32,616 0.22% F150 Heritage 2WD 2 0.08% 6 0.23% 2,605 99.69% 2,613 0.02% F150 Regular Cab 2 0.15% 6 0.46% 1,297 99.39% 1,305 0.01% F150 Regular Cab Styleside 1 0.01% 7 0.09% 7,986 99.90% 7,994 0.05% F150 Super Cab 1 0.20% 3 0.59% 502 99.21% 506 0.00% F150 Super Cab Flareside 4 0.06% 3 0.04% 6,903 99.90% 6,910 0.05%
B-11

Evaluation of the Texas Vehicle Emissions Inspection and Maintenance Program in the Dallas-Fort Worth and Houston-Galveston-Brazoria Nonattainment Areas Final – June 2022
Make/Model
DLC is Damaged, Inaccessible, or Cannot
be Found
Vehicle will not Communicate with
Analyzer
Vehicle Successfully Communicates with
Analyzer Total Count of Tests by
Make Count Percent Count Percent Count Percent Count Percent
F150 Super Cab Styleside 1 0.00% 18 0.08% 21,794 99.91% 21,813 0.14% F150 Super Cab Styleside 4WD 1 0.04% 2 0.08% 2,602 99.88% 2,605 0.02% F150 Super Crew 2WD 9 0.02% 92 0.22% 42,018 99.76% 42,119 0.28% F150 Super Crew 4WD 1 0.01% 32 0.33% 9,700 99.66% 9,733 0.06% F250 2 0.05% 6 0.15% 3,876 99.79% 3,884 0.03% F250 SRW 1 0.26% 2 0.53% 376 99.21% 379 0.00% F250 Super Cab 7 0.78% 5 0.55% 890 98.67% 902 0.01% F350 2 0.29% 2 0.29% 674 99.41% 678 0.00% Fiesta S 2 0.04% 8 0.15% 5,164 99.81% 5,174 0.03% Fiesta SE 5 0.02% 25 0.10% 23,954 99.87% 23,984 0.16% Focus LX 1 0.08% 1 0.08% 1,314 99.85% 1,316 0.01% Focus S 3 0.03% 13 0.12% 10,752 99.85% 10,768 0.07% Focus SE 3 0.00% 62 0.08% 76,310 99.91% 76,375 0.50% Focus SEL 2 0.02% 7 0.08% 8,823 99.90% 8,832 0.06% Focus SES 1 0.01% 9 0.10% 8,698 99.89% 8,708 0.06% Focus ST 1 0.02% 5 0.11% 4,555 99.87% 4,561 0.03% Freestar Sport 2 0.48% 2 0.48% 416 99.05% 420 0.00% Fusion Hybrid 2 0.07% 8 0.29% 2,714 99.63% 2,724 0.02% Fusion S 7 0.03% 27 0.13% 20,706 99.84% 20,740 0.14% Fusion SE 30 0.03% 216 0.21% 101,680 99.76% 101,926 0.67% Fusion SE Hybrid 1 0.01% 24 0.21% 11,477 99.78% 11,502 0.08% Fusion SEL 6 0.03% 80 0.45% 17,569 99.51% 17,655 0.12% Fusion Titanium PHEV 2 0.14% 2 0.14% 1,424 99.72% 1,428 0.01% GT 5 2.49% 12 5.97% 184 91.54% 201 0.00% Mustang 12 0.03% 67 0.17% 38,760 99.80% 38,839 0.26%
B-12

Evaluation of the Texas Vehicle Emissions Inspection and Maintenance Program in the Dallas-Fort Worth and Houston-Galveston-Brazoria Nonattainment Areas Final – June 2022
Make/Model
DLC is Damaged, Inaccessible, or Cannot
be Found
Vehicle will not Communicate with
Analyzer
Vehicle Successfully Communicates with
Analyzer Total Count of Tests by
Make Count Percent Count Percent Count Percent Count Percent
Mustang Cobra GT 2 0.26% 1 0.13% 753 99.60% 756 0.00% Mustang GT 6 0.01% 78 0.14% 55,476 99.85% 55,560 0.37% Mustang I4 3 0.01% 24 0.11% 21,858 99.88% 21,885 0.14% Mustang Shelby 1 0.03% 2 0.07% 2,881 99.90% 2,884 0.02% Mustang Shelby GT500 2 0.12% 3 0.18% 1,681 99.70% 1,686 0.01% Mustang V6 5 0.02% 15 0.05% 29,962 99.93% 29,982 0.20% Ranger 5 0.04% 23 0.20% 11,706 99.76% 11,734 0.08% Ranger 2WD 15 0.03% 86 0.18% 47,902 99.79% 48,003 0.32% Ranger Regular Cab 2WD 1 0.01% 13 0.19% 6,746 99.79% 6,760 0.04% Ranger Super Cab 2WD 1 0.01% 20 0.26% 7,623 99.73% 7,644 0.05% Sport Trac 1 0.09% 1 0.09% 1,115 99.82% 1,117 0.01% Taurus SE 1 0.01% 12 0.07% 16,064 99.92% 16,077 0.11% Taurus SE Comfort 2 0.04% 9 0.17% 5,194 99.79% 5,205 0.03% Taurus SE SVG 1 0.15% 1 0.15% 647 99.69% 649 0.00% Taurus SEL 3 0.02% 13 0.08% 15,422 99.90% 15,438 0.10% Taurus SES 1 0.02% 3 0.06% 4,795 99.92% 4,799 0.03% Taurus SHO 1 0.05% 2 0.11% 1,839 99.84% 1,842 0.01% Transit Connect 6 0.03% 42 0.20% 20,443 99.77% 20,491 0.14% Transit T150 1 0.11% 6 0.67% 894 99.22% 901 0.01% Windstar SEL 1 0.21% 2 0.43% 466 99.36% 469 0.00%
GMC 1500 2WD 9 0.02% 38 0.08% 45,359 99.90% 45,406 0.30% 1500 Suburban 2WD 1 0.01% 24 0.21% 11,493 99.78% 11,518 0.08% 1500 Suburban 4WD 1 0.04% 3 0.13% 2,317 99.83% 2,321 0.02% 2500 2WD 1 0.02% 3 0.05% 5,777 99.93% 5,781 0.04%
B-13

Evaluation of the Texas Vehicle Emissions Inspection and Maintenance Program in the Dallas-Fort Worth and Houston-Galveston-Brazoria Nonattainment Areas Final – June 2022
Make/Model
DLC is Damaged, Inaccessible, or Cannot
be Found
Vehicle will not Communicate with
Analyzer
Vehicle Successfully Communicates with
Analyzer Total Count of Tests by
Make Count Percent Count Percent Count Percent Count Percent
Acadia SLE2 1 0.01% 5 0.05% 9,668 99.94% 9,674 0.06% Acadia SLT(1) FWD 1 0.03% 1 0.03% 3,052 99.93% 3,054 0.02% Canyon / Envoy 2WD 1 0.02% 14 0.21% 6,563 99.77% 6,578 0.04% Envoy/Envoy XL SLE 2WD 1 0.01% 16 0.17% 9,671 99.82% 9,688 0.06% Full Size Truck 1500 4WD 1 0.07% 3 0.21% 1,410 99.72% 1,414 0.01% Full Size Truck 4WD 1500 1 0.12% 5 0.62% 802 99.26% 808 0.01% Safari 2WD 2 0.14% 4 0.28% 1,431 99.58% 1,437 0.01% Savanna 1500 2WD 1 0.06% 2 0.11% 1,798 99.83% 1,801 0.01% Savanna 3500 2WD 1 0.64% 1 0.64% 154 98.72% 156 0.00% Sierra 1500 10 0.01% 104 0.07% 138,837 99.92% 138,951 0.92% Sierra 1500 2WD 7 0.03% 53 0.19% 27,679 99.78% 27,739 0.18% Sierra 1500 Pickup 2WD 4 0.04% 21 0.21% 9,931 99.75% 9,956 0.07% Sierra 1500 Pickup 4WD 1 0.02% 12 0.20% 5,947 99.78% 5,960 0.04% Sierra 2500 Pickup 2WD 2 0.22% 1 0.11% 920 99.67% 923 0.01% Sierra Denali / Yukon 1500 4WD 1 0.02% 5 0.08% 6,055 99.90% 6,061 0.04% Sierra SL 1 0.03% 3 0.09% 3,292 99.88% 3,296 0.02% Sierra SLE 1 0.02% 2 0.04% 4,581 99.93% 4,584 0.03% Terrain SLE1 1 0.01% 12 0.07% 16,379 99.92% 16,392 0.11% Terrain SLE2 2 0.02% 2 0.02% 9,249 99.96% 9,253 0.06% Terrain SLT 1 0.01% 6 0.08% 7,397 99.91% 7,404 0.05% Terrain SLT1 1 0.01% 2 0.03% 7,650 99.96% 7,653 0.05% Yukon 2WD 6 0.03% 52 0.23% 22,169 99.74% 22,227 0.15% Yukon 4WD Luxury 6 0.18% 12 0.36% 3,270 99.45% 3,288 0.02% Yukon Denali 1 0.00% 18 0.07% 25,279 99.92% 25,298 0.17% Yukon SLT 2 0.01% 14 0.07% 19,352 99.92% 19,368 0.13%
B-14

Evaluation of the Texas Vehicle Emissions Inspection and Maintenance Program in the Dallas-Fort Worth and Houston-Galveston-Brazoria Nonattainment Areas Final – June 2022
Make/Model
DLC is Damaged, Inaccessible, or Cannot
be Found
Vehicle will not Communicate with
Analyzer
Vehicle Successfully Communicates with
Analyzer Total Count of Tests by
Make Count Percent Count Percent Count Percent Count Percent
Yukon XL Denali 2 0.01% 7 0.04% 15,883 99.94% 15,892 0.10% HOND
Accord 10 0.04% 22 0.09% 23,556 99.86% 23,588 0.16% Accord DX Value Pkg 1 0.06% 1 0.06% 1,594 99.87% 1,596 0.01% Accord EX 24 0.02% 83 0.08% 102,002 99.90% 102,109 0.67% Accord EX L 1 0.01% 18 0.12% 15,364 99.88% 15,383 0.10% Accord EX L V6 1 0.01% 13 0.11% 11,733 99.88% 11,747 0.08% Accord EX-L 1 0.00% 23 0.06% 40,656 99.94% 40,680 0.27% Accord EX-L Sensing 1 0.03% 4 0.13% 3,167 99.84% 3,172 0.02% Accord EX-L V6 7 0.02% 14 0.04% 33,641 99.94% 33,662 0.22% Accord EX-ULEV 1 0.11% 1 0.11% 875 99.77% 877 0.01% Accord LX 17 0.01% 116 0.10% 121,657 99.89% 121,790 0.80% Accord LX Premium 2 0.02% 3 0.03% 8,713 99.94% 8,718 0.06% Accord SE 5 0.02% 15 0.07% 22,108 99.91% 22,128 0.15% Accord Sport 8 0.02% 24 0.05% 51,494 99.94% 51,526 0.34% Accord Sport SE 2 0.04% 1 0.02% 4,470 99.93% 4,473 0.03% Accord Touring 2 0.02% 7 0.06% 11,368 99.92% 11,377 0.08% Accrod EX-L 4 0.03% 8 0.05% 14,915 99.92% 14,927 0.10% Civic 4 0.03% 19 0.13% 14,054 99.84% 14,077 0.09% Civic EX 8 0.01% 65 0.07% 90,675 99.92% 90,748 0.60% Civic EX HS 1 0.05% 3 0.16% 1,875 99.79% 1,879 0.01% Civic EX L 1 0.03% 1 0.03% 3,726 99.95% 3,728 0.02% Civic EX-L 1 0.01% 8 0.06% 12,729 99.93% 12,738 0.08% Civic EX-TL 1 0.02% 3 0.05% 5,552 99.93% 5,556 0.04% Civic Hybrid 1 0.01% 5 0.07% 7,599 99.92% 7,605 0.05%
B-15

Evaluation of the Texas Vehicle Emissions Inspection and Maintenance Program in the Dallas-Fort Worth and Houston-Galveston-Brazoria Nonattainment Areas Final – June 2022
Make/Model
DLC is Damaged, Inaccessible, or Cannot
be Found
Vehicle will not Communicate with
Analyzer
Vehicle Successfully Communicates with
Analyzer Total Count of Tests by
Make Count Percent Count Percent Count Percent Count Percent
Civic LX 26 0.01% 125 0.07% 173,292 99.91% 173,443 1.15% Civic LX-S 1 0.04% 1 0.04% 2,406 99.92% 2,408 0.02% Civic Si 1 0.01% 6 0.05% 11,793 99.94% 11,800 0.08% Civic Sport 1 0.01% 1 0.01% 6,730 99.97% 6,732 0.04% Civic Touring 1 0.02% 7 0.13% 5,241 99.85% 5,249 0.03% CR-V 17 0.01% 147 0.07% 214,539 99.92% 214,703 1.42% CR-V EX 3 0.05% 9 0.15% 6,140 99.80% 6,152 0.04% CR-V EX 2WD 1 0.02% 6 0.12% 5,099 99.86% 5,106 0.03% CR-V EX 4WD 1 0.03% 3 0.08% 3,578 99.89% 3,582 0.02% CR-V EX-L 2WD 1 0.01% 4 0.05% 8,442 99.94% 8,447 0.06% CR-V LX 4 0.04% 6 0.06% 10,390 99.90% 10,400 0.07% CR-V LX 2WD 1 0.01% 7 0.07% 10,690 99.93% 10,698 0.07% CR-V LX 4WD 1 0.07% 1 0.07% 1,388 99.86% 1,390 0.01% Element 3 0.02% 22 0.16% 13,794 99.82% 13,819 0.09% Fit DX-A (Canada) 1 0.16% 1 0.16% 613 99.67% 615 0.00% FIT HB Sport 1 0.01% 11 0.14% 7,824 99.85% 7,836 0.05% Fit Sport 2 0.02% 5 0.06% 8,532 99.92% 8,539 0.06% Odyssey 12 0.01% 117 0.08% 144,955 99.91% 145,084 0.96% Passport 2WD 2 0.21% 3 0.31% 959 99.48% 964 0.01% Pilot 18 0.01% 112 0.07% 150,780 99.91% 150,910 1.00% Ridgeline 3 0.02% 19 0.10% 19,395 99.89% 19,417 0.13% S2000 2 0.06% 10 0.30% 3,291 99.64% 3,303 0.02%
HUMM H3 - SUV 4WD 3 0.08% 13 0.37% 3,525 99.55% 3,541 0.02%
HYUN
B-16

Evaluation of the Texas Vehicle Emissions Inspection and Maintenance Program in the Dallas-Fort Worth and Houston-Galveston-Brazoria Nonattainment Areas Final – June 2022
Make/Model
DLC is Damaged, Inaccessible, or Cannot
be Found
Vehicle will not Communicate with
Analyzer
Vehicle Successfully Communicates with
Analyzer Total Count of Tests by
Make Count Percent Count Percent Count Percent Count Percent
Accent 3 0.01% 27 0.08% 33,020 99.91% 33,050 0.22% Elantra 11 0.01% 74 0.06% 120,236 99.93% 120,321 0.79% Genesis / Equus 1 0.01% 8 0.04% 18,584 99.95% 18,593 0.12% Genesis Coupe 1 0.01% 1 0.01% 8,857 99.98% 8,859 0.06% Santa Fe 12 0.01% 76 0.08% 96,839 99.91% 96,927 0.64% Sonata 25 0.02% 141 0.10% 140,289 99.88% 140,455 0.93% Tucson 3 0.01% 30 0.07% 44,496 99.93% 44,529 0.29% Veloster 2 0.01% 6 0.04% 15,111 99.95% 15,119 0.10% Veracruz 1 0.02% 6 0.14% 4,377 99.84% 4,384 0.03%
INFI Cube 1 0.01% 8 0.06% 13,063 99.93% 13,072 0.09% EX35 1 0.02% 2 0.05% 4,047 99.93% 4,050 0.03% FX35/FX50 1 0.02% 3 0.06% 4,781 99.92% 4,785 0.03% G25/G37 Coupe 3 0.02% 13 0.08% 15,653 99.90% 15,669 0.10% G35 1 0.01% 22 0.13% 16,718 99.86% 16,741 0.11% G35 Coupe 1 0.01% 9 0.06% 14,904 99.93% 14,914 0.10% G37 1 0.01% 12 0.09% 13,458 99.90% 13,471 0.09% I30 1 0.04% 1 0.04% 2,256 99.91% 2,258 0.01% Murano 2 0.01% 7 0.04% 19,864 99.95% 19,873 0.13% Q40 / Q60 1 0.04% 3 0.12% 2,400 99.83% 2,404 0.02% Q50 2 0.01% 14 0.07% 19,966 99.92% 19,982 0.13% QX50 2 0.02% 14 0.12% 11,742 99.86% 11,758 0.08% QX56 1 0.01% 2 0.03% 7,680 99.96% 7,683 0.05% QX60 3 0.01% 20 0.05% 40,976 99.94% 40,999 0.27%
ISU
B-17

Evaluation of the Texas Vehicle Emissions Inspection and Maintenance Program in the Dallas-Fort Worth and Houston-Galveston-Brazoria Nonattainment Areas Final – June 2022
Make/Model
DLC is Damaged, Inaccessible, or Cannot
be Found
Vehicle will not Communicate with
Analyzer
Vehicle Successfully Communicates with
Analyzer Total Count of Tests by
Make Count Percent Count Percent Count Percent Count Percent
Axiom 2WD 1 0.28% 1 0.28% 361 99.45% 363 0.00% Rodeo 2WD 2 0.06% 9 0.29% 3,081 99.64% 3,092 0.02%
JEEP Cherokee 12 0.02% 59 0.10% 57,872 99.88% 57,943 0.38% Cherokee 2WD 4 0.09% 23 0.54% 4,240 99.37% 4,267 0.03% Cherokee 4WD 1 0.03% 6 0.18% 3,249 99.79% 3,256 0.02% Compass 2 0.02% 17 0.19% 9,090 99.79% 9,109 0.06% Compass Rallye LHD FWD 1 0.04% 2 0.09% 2,246 99.87% 2,249 0.01% Compass Sport 1 0.03% 2 0.05% 3,760 99.92% 3,763 0.02% Compass/Reneade 3 0.01% 43 0.16% 26,814 99.83% 26,860 0.18% Grand Cherokee 8 0.01% 80 0.07% 111,767 99.92% 111,855 0.74% Grand Cherokee 2WD 2 0.04% 14 0.26% 5,448 99.71% 5,464 0.04% Grand Cherokee Laredo 2WD 1 0.01% 9 0.07% 12,943 99.92% 12,953 0.09% Grand Cherokee Laredo 4WD 1 0.02% 8 0.13% 5,950 99.85% 5,959 0.04% Grand Cherokee Limited 2WD 1 0.03% 4 0.13% 3,055 99.84% 3,060 0.02% Grand Cherokee Limited 4WD 1 0.03% 2 0.06% 3,548 99.92% 3,551 0.02% Liberty Limited 2WD 2 0.04% 9 0.18% 4,922 99.78% 4,933 0.03% Liberty Limited 4WD 1 0.04% 7 0.29% 2,434 99.67% 2,442 0.02% Liberty Sport 2WD 2 0.02% 8 0.09% 9,100 99.89% 9,110 0.06% Patriot 7 0.02% 36 0.11% 33,318 99.87% 33,361 0.22% Patriot LHD FWD 1 0.03% 2 0.05% 3,846 99.92% 3,849 0.03% Renegade 4 0.02% 25 0.10% 23,819 99.88% 23,848 0.16% Wrangler 13 0.01% 124 0.10% 130,169 99.89% 130,306 0.86% Wrangler 4WD 2 0.01% 34 0.25% 13,390 99.73% 13,426 0.09% Wrangler Rubicon 4WD 1 0.04% 3 0.12% 2,430 99.84% 2,434 0.02%
B-18

Evaluation of the Texas Vehicle Emissions Inspection and Maintenance Program in the Dallas-Fort Worth and Houston-Galveston-Brazoria Nonattainment Areas Final – June 2022
Make/Model
DLC is Damaged, Inaccessible, or Cannot
be Found
Vehicle will not Communicate with
Analyzer
Vehicle Successfully Communicates with
Analyzer Total Count of Tests by
Make Count Percent Count Percent Count Percent Count Percent
Wrangler Rubicon/Unlimited Rub 1 0.05% 3 0.14% 2,098 99.81% 2,102 0.01% Wrangler Sahara / Unlimited Sa 1 0.02% 4 0.08% 5,326 99.91% 5,331 0.04% Wrangler SE 4WD 1 0.10% 3 0.30% 1,005 99.60% 1,009 0.01% Wrangler Sport 2 0.05% 6 0.15% 3,909 99.80% 3,917 0.03% Wrangler Sport 4WD 4 0.08% 10 0.21% 4,802 99.71% 4,816 0.03% Wrangler Unlimited XS / Sport 1 0.03% 3 0.09% 3,231 99.88% 3,235 0.02% Wrangler X / Wrangler Willys 1 0.03% 10 0.27% 3,694 99.70% 3,705 0.02%
KIA Amanti 2 0.14% 3 0.21% 1,427 99.65% 1,432 0.01% Borrego 2WD 1 0.07% 1 0.07% 1,504 99.87% 1,506 0.01% Borrego/Sorento 1 0.01% 7 0.07% 10,693 99.93% 10,701 0.07% Cadenza 1 0.05% 1 0.05% 1,855 99.89% 1,857 0.01% Optima 1 0.01% 4 0.05% 8,435 99.94% 8,440 0.06% Optima / Optima Hybrid 6 0.01% 38 0.05% 76,970 99.94% 77,014 0.51% Rio 2 0.01% 19 0.08% 23,904 99.91% 23,925 0.16% Sedona VQ 2 0.04% 4 0.09% 4,517 99.87% 4,523 0.03% Sorento 2 0.01% 15 0.05% 29,684 99.94% 29,701 0.20% Sorento 2WD 1 0.01% 12 0.10% 11,936 99.89% 11,949 0.08% Sorento/Sportage 1 0.00% 29 0.06% 49,719 99.94% 49,749 0.33% Soul/Tucson 2 0.00% 41 0.05% 87,210 99.95% 87,253 0.58% Spectra 3 0.02% 14 0.08% 17,733 99.90% 17,750 0.12%
LEXS CT 200h 3 0.04% 8 0.11% 7,082 99.84% 7,093 0.05% ES 350 3 0.00% 40 0.06% 70,524 99.94% 70,567 0.47% ES300 4 0.03% 28 0.18% 15,455 99.79% 15,487 0.10%
B-19

Evaluation of the Texas Vehicle Emissions Inspection and Maintenance Program in the Dallas-Fort Worth and Houston-Galveston-Brazoria Nonattainment Areas Final – June 2022
Make/Model
DLC is Damaged, Inaccessible, or Cannot
be Found
Vehicle will not Communicate with
Analyzer
Vehicle Successfully Communicates with
Analyzer Total Count of Tests by
Make Count Percent Count Percent Count Percent Count Percent
ES330 5 0.04% 12 0.09% 13,519 99.87% 13,536 0.09% ES350 3 0.01% 22 0.09% 24,715 99.90% 24,740 0.16% GS 350 7 0.03% 20 0.09% 21,476 99.87% 21,503 0.14% GS300 1 0.02% 2 0.04% 5,172 99.94% 5,175 0.03% GS300/GS450 1 0.02% 5 0.12% 4,312 99.86% 4,318 0.03% GX470 4 0.03% 8 0.07% 11,765 99.90% 11,777 0.08% IS 250 3 0.01% 26 0.10% 25,387 99.89% 25,416 0.17% IS250 4 0.03% 13 0.08% 15,511 99.89% 15,528 0.10% LS 460 1 0.01% 13 0.10% 12,578 99.89% 12,592 0.08% LS430 1 0.02% 7 0.11% 6,596 99.88% 6,604 0.04% LX 570 1 0.01% 3 0.04% 7,178 99.94% 7,182 0.05% LX450 1 0.34% 1 0.34% 295 99.33% 297 0.00% LX470 2 0.05% 4 0.10% 3,966 99.85% 3,972 0.03% NX 200t 1 0.00% 20 0.09% 23,193 99.91% 23,214 0.15% RX 350 5 0.00% 72 0.05% 138,699 99.94% 138,776 0.92% RX300 1 0.01% 10 0.09% 11,472 99.90% 11,483 0.08% RX330 2 0.01% 29 0.18% 16,405 99.81% 16,436 0.11% RX350 10 0.04% 33 0.14% 22,860 99.81% 22,903 0.15% RX400h 1 0.02% 7 0.17% 4,091 99.80% 4,099 0.03% SC300 1 0.25% 3 0.74% 404 99.02% 408 0.00%
LINC Aviator 1 0.03% 13 0.43% 3,030 99.54% 3,044 0.02% Continental Reserve 1 0.10% 1 0.10% 985 99.80% 987 0.01% LS 2 0.07% 8 0.28% 2,893 99.66% 2,903 0.02% Mark LT 2WD SpuerCrew 1 0.04% 5 0.18% 2,705 99.78% 2,711 0.02%
B-20

Evaluation of the Texas Vehicle Emissions Inspection and Maintenance Program in the Dallas-Fort Worth and Houston-Galveston-Brazoria Nonattainment Areas Final – June 2022
Make/Model
DLC is Damaged, Inaccessible, or Cannot
be Found
Vehicle will not Communicate with
Analyzer
Vehicle Successfully Communicates with
Analyzer Total Count of Tests by
Make Count Percent Count Percent Count Percent Count Percent
Mark LT 4WD SuperCrew 1 0.10% 1 0.10% 979 99.80% 981 0.01% MKS 1 0.01% 6 0.08% 7,145 99.90% 7,152 0.05% MKX FWD 1 0.02% 4 0.09% 4,388 99.89% 4,393 0.03% MKZ 2 0.01% 26 0.15% 16,858 99.83% 16,886 0.11% Navigator 2WD 4 0.03% 37 0.27% 13,921 99.71% 13,962 0.09% Navigator 4WD 1 0.03% 5 0.17% 2,890 99.79% 2,896 0.02% Town Car Executive 4 0.08% 18 0.38% 4,685 99.53% 4,707 0.03% Town Car Signature 5 0.06% 31 0.37% 8,269 99.57% 8,305 0.05% Town Car Signature Limited 5 0.09% 11 0.19% 5,772 99.72% 5,788 0.04% Town Car Ultimate 1 0.11% 1 0.11% 930 99.79% 932 0.01%
LNDR Range Rover 6 0.01% 73 0.10% 72,731 99.89% 72,810 0.48%
MASE Ghibli 1 0.02% 5 0.12% 4,279 99.86% 4,285 0.03%
MAZD 3 3 0.01% 44 0.22% 20,214 99.77% 20,261 0.13% 5 1 0.03% 11 0.36% 3,036 99.61% 3,048 0.02% 6 6 0.06% 78 0.72% 10,711 99.22% 10,795 0.07% 626 2 0.13% 14 0.94% 1,473 98.93% 1,489 0.01% CX-5 1 0.00% 28 0.05% 51,287 99.94% 51,316 0.34% CX-7 5 0.04% 80 0.69% 11,529 99.27% 11,614 0.08% CX-9 2 0.01% 7 0.04% 17,652 99.95% 17,661 0.12% CX-9 GS 1 0.02% 2 0.04% 4,497 99.93% 4,500 0.03% Mazda 2 1 0.03% 16 0.43% 3,734 99.55% 3,751 0.02% Mazda 3 10 0.03% 129 0.39% 32,722 99.58% 32,861 0.22%
B-21

Evaluation of the Texas Vehicle Emissions Inspection and Maintenance Program in the Dallas-Fort Worth and Houston-Galveston-Brazoria Nonattainment Areas Final – June 2022
Make/Model
DLC is Damaged, Inaccessible, or Cannot
be Found
Vehicle will not Communicate with
Analyzer
Vehicle Successfully Communicates with
Analyzer Total Count of Tests by
Make Count Percent Count Percent Count Percent Count Percent
Mazda 5 1 0.12% 2 0.25% 807 99.63% 810 0.01% Mazda 5 Sport 1 0.04% 10 0.36% 2,766 99.60% 2,777 0.02% Mazda 6 8 0.09% 62 0.72% 8,512 99.18% 8,582 0.06% Mazda 6 Touring 1 0.01% 2 0.02% 8,398 99.96% 8,401 0.06% Mazda3 3 0.02% 8 0.06% 13,978 99.92% 13,989 0.09% MazdaSpeed 3 1 0.09% 4 0.37% 1,070 99.53% 1,075 0.01% MPV 1 0.03% 27 0.91% 2,931 99.05% 2,959 0.02% MX5 Miata 6 0.26% 14 0.60% 2,304 99.14% 2,324 0.02% MX-5 Miata 1 0.01% 22 0.32% 6,857 99.67% 6,880 0.05% Protege 2 0.05% 23 0.52% 4,400 99.44% 4,425 0.03% RX-8 1 0.06% 11 0.63% 1,734 99.31% 1,746 0.01% Tribute I / Low 2WD 1 0.06% 1 0.06% 1,644 99.88% 1,646 0.01%
MERC Grand Marquis GS 6 0.06% 21 0.22% 9,593 99.72% 9,620 0.06% Grand Marquis LS 4 0.03% 27 0.17% 15,560 99.80% 15,591 0.10% Mountaineer 1 0.13% 1 0.13% 768 99.74% 770 0.01% Mountaineer 2WD 1 0.03% 3 0.10% 3,047 99.87% 3,051 0.02% Sable LS 1 0.15% 3 0.45% 667 99.40% 671 0.00%
MERZ C240 2 0.08% 9 0.34% 2,602 99.58% 2,613 0.02% C250 2 0.01% 28 0.14% 20,197 99.85% 20,227 0.13% C300 5 0.02% 34 0.13% 26,513 99.85% 26,552 0.18% CLA250 3 0.02% 7 0.04% 16,325 99.94% 16,335 0.11% CLK350 3 0.09% 6 0.19% 3,189 99.72% 3,198 0.02% CLK430 1 0.11% 1 0.11% 879 99.77% 881 0.01%
B-22

Evaluation of the Texas Vehicle Emissions Inspection and Maintenance Program in the Dallas-Fort Worth and Houston-Galveston-Brazoria Nonattainment Areas Final – June 2022
Make/Model
DLC is Damaged, Inaccessible, or Cannot
be Found
Vehicle will not Communicate with
Analyzer
Vehicle Successfully Communicates with
Analyzer Total Count of Tests by
Make Count Percent Count Percent Count Percent Count Percent
CLS 500 1 0.09% 3 0.28% 1,060 99.62% 1,064 0.01% CLS550 1 0.02% 2 0.04% 4,657 99.94% 4,660 0.03% E300 1 0.01% 16 0.14% 11,233 99.85% 11,250 0.07% E320 2 0.11% 1 0.06% 1,815 99.83% 1,818 0.01% E350 6 0.01% 45 0.10% 44,824 99.89% 44,875 0.30% E63 AMG 1 0.29% 2 0.58% 343 99.13% 346 0.00% GL450 1 0.01% 16 0.12% 12,947 99.87% 12,964 0.09% GL550 1 0.03% 4 0.12% 3,429 99.85% 3,434 0.02% GLA250 2 0.02% 22 0.17% 13,024 99.82% 13,048 0.09% GLB250 1 0.35% 1 0.35% 281 99.29% 283 0.00% GLC300 2 0.01% 29 0.12% 23,950 99.87% 23,981 0.16% GLE350 2 0.01% 19 0.09% 20,414 99.90% 20,435 0.14% GLE43 AMG 1 0.04% 2 0.08% 2,457 99.88% 2,460 0.02% GLK350 4 0.02% 9 0.05% 16,682 99.92% 16,695 0.11% ML320 1 0.04% 4 0.16% 2,467 99.80% 2,472 0.02% ML350 3 0.01% 26 0.09% 28,818 99.90% 28,847 0.19% S500V 1 0.06% 4 0.24% 1,649 99.70% 1,654 0.01% S550 3 0.02% 8 0.04% 18,872 99.94% 18,883 0.12% SLK230 2 0.14% 3 0.21% 1,430 99.65% 1,435 0.01%
MITS Eclipse GS 2 0.07% 16 0.56% 2,836 99.37% 2,854 0.02% Eclipse GS Special 1 0.30% 2 0.60% 328 99.09% 331 0.00% Endeavor LS FWD 1 0.04% 5 0.22% 2,229 99.73% 2,235 0.01% Galant ES / GTZ / LS 1 0.05% 5 0.24% 2,080 99.71% 2,086 0.01% Galant FE 8 0.34% 16 0.69% 2,296 98.97% 2,320 0.02%
B-23

Evaluation of the Texas Vehicle Emissions Inspection and Maintenance Program in the Dallas-Fort Worth and Houston-Galveston-Brazoria Nonattainment Areas Final – June 2022
Make/Model
DLC is Damaged, Inaccessible, or Cannot
be Found
Vehicle will not Communicate with
Analyzer
Vehicle Successfully Communicates with
Analyzer Total Count of Tests by
Make Count Percent Count Percent Count Percent Count Percent
Lancer GTS 1 0.06% 1 0.06% 1,751 99.89% 1,753 0.01% Mirage DE 1 0.04% 7 0.25% 2,808 99.72% 2,816 0.02% Montero Limited 1 0.09% 7 0.63% 1,099 99.28% 1,107 0.01% Montero Sport 2WD 2 0.07% 5 0.17% 2,942 99.76% 2,949 0.02% Outlander GT AWC 1 0.14% 3 0.42% 717 99.45% 721 0.00% Outlander SE FWD 2 0.02% 15 0.17% 8,661 99.80% 8,678 0.06%
MNNI Cooper 2 0.04% 7 0.12% 5,681 99.84% 5,690 0.04% Cooper S 1 0.02% 10 0.23% 4,296 99.74% 4,307 0.03% Mini Cooper S Countryman 2 0.03% 3 0.05% 5,769 99.91% 5,774 0.04%
NISS Altima 61 0.02% 322 0.09% 365,599 99.90% 365,982 2.42% Armada/Titan 1 0.01% 11 0.06% 17,982 99.93% 17,994 0.12% Cube 1 0.03% 6 0.16% 3,698 99.81% 3,705 0.02% Frontier 7 0.01% 63 0.08% 83,531 99.92% 83,601 0.55% GT-R 1 0.10% 1 0.10% 1,017 99.80% 1,019 0.01% I30 1 0.02% 9 0.14% 6,358 99.84% 6,368 0.04% Juke 1 0.00% 19 0.08% 23,017 99.91% 23,037 0.15% Kicks 1 0.02% 7 0.12% 5,611 99.86% 5,619 0.04% Maxima 10 0.01% 51 0.07% 72,188 99.92% 72,249 0.48% Murano 12 0.01% 65 0.07% 95,850 99.92% 95,927 0.63% NV200 2 0.03% 11 0.16% 7,040 99.82% 7,053 0.05% Pathfinder 16 0.02% 57 0.06% 91,961 99.92% 92,034 0.61% Pathfinder Armada 5 0.03% 18 0.11% 15,846 99.86% 15,869 0.10% Pickup Crew Cab 1 0.01% 5 0.06% 7,823 99.92% 7,829 0.05%
B-24

Evaluation of the Texas Vehicle Emissions Inspection and Maintenance Program in the Dallas-Fort Worth and Houston-Galveston-Brazoria Nonattainment Areas Final – June 2022
Make/Model
DLC is Damaged, Inaccessible, or Cannot
be Found
Vehicle will not Communicate with
Analyzer
Vehicle Successfully Communicates with
Analyzer Total Count of Tests by
Make Count Percent Count Percent Count Percent Count Percent
Pickup King Cab 4 0.04% 13 0.12% 10,897 99.84% 10,914 0.07% Quest 3 0.02% 8 0.06% 12,364 99.91% 12,375 0.08% Rogue 21 0.01% 120 0.06% 198,495 99.93% 198,636 1.31% Rogue Select 2 0.01% 10 0.07% 13,698 99.91% 13,710 0.09% Rogue Sport 1 0.01% 8 0.05% 15,507 99.94% 15,516 0.10% Sentra 35 0.02% 153 0.09% 179,716 99.90% 179,904 1.19% Titan 11 0.03% 36 0.08% 43,741 99.89% 43,788 0.29% Truck Regular Bed 2 0.05% 5 0.12% 4,107 99.83% 4,114 0.03% Versa 20 0.02% 67 0.08% 80,714 99.89% 80,801 0.53% Versa Note 1 0.01% 13 0.07% 19,178 99.93% 19,192 0.13% Xterra 4 0.01% 38 0.13% 29,427 99.86% 29,469 0.19%
OLDS Aurora 1 0.23% 2 0.46% 432 99.31% 435 0.00%
OTHR 1500 3 0.05% 4 0.07% 5,667 99.88% 5,674 0.04% Accord LX 1 0.04% 1 0.04% 2,803 99.93% 2,805 0.02% Altima 2 0.02% 5 0.05% 9,508 99.93% 9,515 0.06% BRZ 1 0.45% 1 0.45% 218 99.09% 220 0.00% Challenger R/T 1 0.22% 1 0.22% 444 99.55% 446 0.00% Civic EX 1 0.04% 1 0.04% 2,789 99.93% 2,791 0.02% Civic LX 1 0.03% 1 0.03% 3,069 99.93% 3,071 0.02% Corolla 2 0.02% 7 0.07% 9,423 99.90% 9,432 0.06% E300 1 0.07% 1 0.07% 1,456 99.86% 1,458 0.01% Elantra 1 0.02% 2 0.03% 5,878 99.95% 5,881 0.04% Explorer 1 0.07% 1 0.07% 1,382 99.86% 1,384 0.01%
B-25

Evaluation of the Texas Vehicle Emissions Inspection and Maintenance Program in the Dallas-Fort Worth and Houston-Galveston-Brazoria Nonattainment Areas Final – June 2022
Make/Model
DLC is Damaged, Inaccessible, or Cannot
be Found
Vehicle will not Communicate with
Analyzer
Vehicle Successfully Communicates with
Analyzer Total Count of Tests by
Make Count Percent Count Percent Count Percent Count Percent
Explorer Limited 2 0.10% 4 0.20% 1,957 99.69% 1,963 0.01% F150 2 0.01% 10 0.04% 23,111 99.95% 23,123 0.15% Forester 1 0.02% 2 0.04% 4,481 99.93% 4,484 0.03% Fusion SE 1 0.03% 2 0.06% 3,181 99.91% 3,184 0.02% Grand Caravan SE 1 0.04% 1 0.04% 2,291 99.91% 2,293 0.02% Mustang GT 1 0.06% 3 0.17% 1,717 99.77% 1,721 0.01% Odyssey 3 0.02% 16 0.08% 19,359 99.90% 19,378 0.13% Passat 1 0.06% 2 0.12% 1,603 99.81% 1,606 0.01% Pathfinder 1 0.03% 1 0.03% 3,302 99.94% 3,304 0.02% Patriot 1 0.17% 3 0.50% 598 99.34% 602 0.00% RAV4 XLE 1 0.02% 3 0.07% 4,256 99.91% 4,260 0.03% Rogue 2 0.02% 7 0.06% 11,513 99.92% 11,522 0.08% Rogue Sport 2 0.09% 3 0.13% 2,239 99.78% 2,244 0.01% Santa Fe 1 0.02% 4 0.08% 5,035 99.90% 5,040 0.03% Sentra 2 0.03% 5 0.07% 6,965 99.90% 6,972 0.05% Sienna XLE 1 0.02% 2 0.05% 4,030 99.93% 4,033 0.03% Silverado 1500 1 0.01% 6 0.04% 15,630 99.96% 15,637 0.10% Town & Country 1 0.04% 3 0.13% 2,265 99.82% 2,269 0.01% Town & Country Touring FWD 1 0.22% 2 0.43% 459 99.35% 462 0.00% Tundra Ltd 1 0.16% 2 0.31% 641 99.53% 644 0.00% Wrangler 2 0.03% 6 0.09% 6,976 99.89% 6,984 0.05% XTS 1 0.02% 1 0.02% 4,005 99.95% 4,007 0.03%
PONT Firebird 1 0.08% 7 0.55% 1,276 99.38% 1,284 0.01% Formula / Trans Am 1 0.03% 5 0.15% 3,227 99.81% 3,233 0.02%
B-26

Evaluation of the Texas Vehicle Emissions Inspection and Maintenance Program in the Dallas-Fort Worth and Houston-Galveston-Brazoria Nonattainment Areas Final – June 2022
Make/Model
DLC is Damaged, Inaccessible, or Cannot
be Found
Vehicle will not Communicate with
Analyzer
Vehicle Successfully Communicates with
Analyzer Total Count of Tests by
Make Count Percent Count Percent Count Percent Count Percent
G6 SE1 4 0.05% 14 0.19% 7,479 99.76% 7,497 0.05% Grand Am SE1 1 0.05% 10 0.54% 1,842 99.41% 1,853 0.01% Sunfire 1 0.05% 5 0.27% 1,820 99.67% 1,826 0.01% Vibe 3 0.05% 10 0.15% 6,628 99.80% 6,641 0.04%
PORS 911 5 0.03% 72 0.44% 16,402 99.53% 16,479 0.11% 986 Boxster 1 0.03% 20 0.67% 2,950 99.29% 2,971 0.02% Boxster / Cayman 2 0.03% 19 0.32% 5,850 99.64% 5,871 0.04% Cayenne 3 0.02% 26 0.16% 16,498 99.82% 16,527 0.11% Cayman / Boxster 1 0.04% 16 0.63% 2,531 99.33% 2,548 0.02% Macan 5 0.05% 10 0.09% 10,789 99.86% 10,804 0.07% Panamera 5 0.06% 41 0.48% 8,537 99.46% 8,583 0.06%
RAM 1500 3 0.01% 56 0.10% 53,834 99.89% 53,893 0.36% ProMaster City 1 0.04% 18 0.81% 2,215 99.15% 2,234 0.01% RAM 1500 2 0.01% 10 0.07% 14,136 99.92% 14,148 0.09%
SAA 9/3/2022 1 0.04% 7 0.25% 2,847 99.72% 2,855 0.02% SCIO Scion tC 2 0.01% 10 0.06% 16,795 99.93% 16,807 0.11% Scion xA 1 0.03% 5 0.14% 3,518 99.83% 3,524 0.02%
STRN
B-27
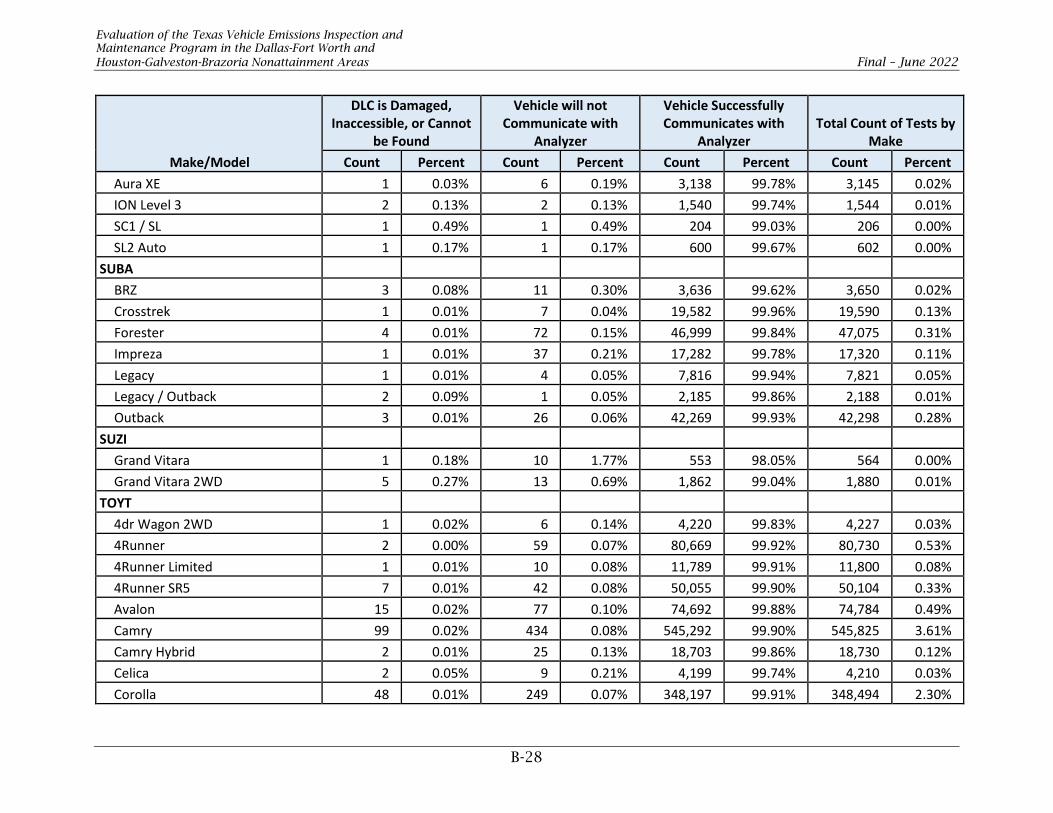
Evaluation of the Texas Vehicle Emissions Inspection and Maintenance Program in the Dallas-Fort Worth and Houston-Galveston-Brazoria Nonattainment Areas Final – June 2022
Make/Model
DLC is Damaged, Inaccessible, or Cannot
be Found
Vehicle will not Communicate with
Analyzer
Vehicle Successfully Communicates with
Analyzer Total Count of Tests by
Make Count Percent Count Percent Count Percent Count Percent
Aura XE 1 0.03% 6 0.19% 3,138 99.78% 3,145 0.02% ION Level 3 2 0.13% 2 0.13% 1,540 99.74% 1,544 0.01% SC1 / SL 1 0.49% 1 0.49% 204 99.03% 206 0.00% SL2 Auto 1 0.17% 1 0.17% 600 99.67% 602 0.00%
SUBA BRZ 3 0.08% 11 0.30% 3,636 99.62% 3,650 0.02% Crosstrek 1 0.01% 7 0.04% 19,582 99.96% 19,590 0.13% Forester 4 0.01% 72 0.15% 46,999 99.84% 47,075 0.31% Impreza 1 0.01% 37 0.21% 17,282 99.78% 17,320 0.11% Legacy 1 0.01% 4 0.05% 7,816 99.94% 7,821 0.05% Legacy / Outback 2 0.09% 1 0.05% 2,185 99.86% 2,188 0.01% Outback 3 0.01% 26 0.06% 42,269 99.93% 42,298 0.28%
SUZI Grand Vitara 1 0.18% 10 1.77% 553 98.05% 564 0.00% Grand Vitara 2WD 5 0.27% 13 0.69% 1,862 99.04% 1,880 0.01%
TOYT 4dr Wagon 2WD 1 0.02% 6 0.14% 4,220 99.83% 4,227 0.03% 4Runner 2 0.00% 59 0.07% 80,669 99.92% 80,730 0.53% 4Runner Limited 1 0.01% 10 0.08% 11,789 99.91% 11,800 0.08% 4Runner SR5 7 0.01% 42 0.08% 50,055 99.90% 50,104 0.33% Avalon 15 0.02% 77 0.10% 74,692 99.88% 74,784 0.49% Camry 99 0.02% 434 0.08% 545,292 99.90% 545,825 3.61% Camry Hybrid 2 0.01% 25 0.13% 18,703 99.86% 18,730 0.12% Celica 2 0.05% 9 0.21% 4,199 99.74% 4,210 0.03% Corolla 48 0.01% 249 0.07% 348,197 99.91% 348,494 2.30%
B-28

Evaluation of the Texas Vehicle Emissions Inspection and Maintenance Program in the Dallas-Fort Worth and Houston-Galveston-Brazoria Nonattainment Areas Final – June 2022
Make/Model
DLC is Damaged, Inaccessible, or Cannot
be Found
Vehicle will not Communicate with
Analyzer
Vehicle Successfully Communicates with
Analyzer Total Count of Tests by
Make Count Percent Count Percent Count Percent Count Percent
Corolla/Matrix 13 0.02% 68 0.12% 55,334 99.85% 55,415 0.37% FJ Cruiser 3 0.02% 15 0.08% 18,015 99.90% 18,033 0.12% Highlander 8 0.01% 60 0.08% 71,869 99.91% 71,937 0.48% Highlander LE 4 0.02% 15 0.08% 18,065 99.89% 18,084 0.12% Highlander Ltd 2 0.01% 8 0.04% 18,652 99.95% 18,662 0.12% Highlander SE/XLE 4 0.02% 21 0.10% 21,455 99.88% 21,480 0.14% Highlander XLE 2 0.01% 6 0.03% 17,653 99.95% 17,661 0.12% Land Cruiser 1 0.02% 6 0.10% 6,012 99.88% 6,019 0.04% Land Cruiser VX-R 1 0.06% 4 0.23% 1,699 99.71% 1,704 0.01% Matrix 4 0.04% 12 0.12% 10,093 99.84% 10,109 0.07% Prius 3 0.02% 25 0.15% 16,638 99.83% 16,666 0.11% Prius C Hybrid 1 0.01% 6 0.08% 7,833 99.91% 7,840 0.05% Prius Hybrid 3 0.01% 37 0.08% 45,863 99.91% 45,903 0.30% Prius V Hybrid 2 0.03% 4 0.06% 7,026 99.91% 7,032 0.05% RAV4 4 0.01% 41 0.07% 54,899 99.92% 54,944 0.36% RAV4 4dr 4WD 1 0.24% 1 0.24% 414 99.52% 416 0.00% RAV4 LE 9 0.01% 36 0.06% 61,389 99.93% 61,434 0.41% RAV4 XLE 3 0.00% 55 0.09% 64,443 99.91% 64,501 0.43% Sequoia / Highlander 2 0.02% 14 0.16% 8,564 99.81% 8,580 0.06% Sequoia Limited 2 0.02% 10 0.08% 11,790 99.90% 11,802 0.08% Sequoia SR5 1 0.01% 12 0.08% 15,754 99.92% 15,767 0.10% Sienna 2 0.02% 4 0.04% 9,679 99.94% 9,685 0.06% Sienna 5dr 1 0.04% 1 0.04% 2,365 99.92% 2,367 0.02% Sienna LE 14 0.02% 41 0.07% 56,627 99.90% 56,682 0.37% Sienna Ltd 2 0.01% 19 0.08% 24,382 99.91% 24,403 0.16%
B-29

Evaluation of the Texas Vehicle Emissions Inspection and Maintenance Program in the Dallas-Fort Worth and Houston-Galveston-Brazoria Nonattainment Areas Final – June 2022
Make/Model
DLC is Damaged, Inaccessible, or Cannot
be Found
Vehicle will not Communicate with
Analyzer
Vehicle Successfully Communicates with
Analyzer Total Count of Tests by
Make Count Percent Count Percent Count Percent Count Percent
Sienna XLE 4 0.02% 21 0.10% 20,734 99.88% 20,759 0.14% Solara 3 0.02% 20 0.13% 15,742 99.85% 15,765 0.10% Tacoma 8 0.01% 42 0.08% 55,098 99.91% 55,148 0.36% Tacoma Deluxe 5 0.02% 37 0.14% 26,938 99.84% 26,980 0.18% Tacoma DLX 5 0.01% 34 0.08% 45,042 99.91% 45,081 0.30% Tacoma Ltd 2 0.05% 6 0.15% 3,931 99.80% 3,939 0.03% Tacoma PreRunner XTRACAB 1 0.03% 2 0.07% 3,015 99.90% 3,018 0.02% Tacoma Regular Cab 2WD 2 0.08% 1 0.04% 2,432 99.88% 2,435 0.02% Tacoma SR/SR5/TRD 2 0.01% 12 0.07% 16,363 99.91% 16,377 0.11% Tacoma SR5 1 0.02% 10 0.18% 5,609 99.80% 5,620 0.04% Tacoma SR5/TRD 2 0.02% 8 0.06% 13,149 99.92% 13,159 0.09% Tacoma XTRACAB 2WD 2 0.05% 10 0.27% 3,748 99.68% 3,760 0.02% Tundra 2 0.01% 8 0.04% 18,407 99.95% 18,417 0.12% Tundra SR/SR5 4 0.01% 24 0.05% 45,137 99.94% 45,165 0.30% Tundra Platinum 1 0.01% 10 0.06% 16,242 99.93% 16,253 0.11% Tundra SR5 8 0.01% 104 0.10% 108,927 99.90% 109,039 0.72% Tundra SR5/TRD 7 0.03% 11 0.04% 24,900 99.93% 24,918 0.16% Yaris 2 0.01% 16 0.06% 24,656 99.93% 24,674 0.16%
VOLK Beetle 1 0.01% 15 0.10% 15,108 99.89% 15,124 0.10% Eos 4 0.12% 5 0.14% 3,468 99.74% 3,477 0.02% Golf / GTI / Jetta Wagon 2 0.10% 4 0.20% 2,040 99.71% 2,046 0.01% Golf/Golf R/GTI/Jetta/Jetta Sp 2 0.02% 4 0.04% 10,876 99.94% 10,882 0.07% Golf/GTI 3 0.02% 20 0.15% 13,022 99.82% 13,045 0.09% Golf/GTI/Jetta/Jetta Sportwage 2 0.01% 33 0.11% 30,043 99.88% 30,078 0.20%
B-30

Evaluation of the Texas Vehicle Emissions Inspection and Maintenance Program in the Dallas-Fort Worth and Houston-Galveston-Brazoria Nonattainment Areas Final – June 2022
Make/Model
DLC is Damaged, Inaccessible, or Cannot
be Found
Vehicle will not Communicate with
Analyzer
Vehicle Successfully Communicates with
Analyzer Total Count of Tests by
Make Count Percent Count Percent Count Percent Count Percent
Jetta 11 0.03% 64 0.15% 43,059 99.83% 43,134 0.28% Jetta/Golf/GTI 1 0.10% 10 1.01% 979 98.89% 990 0.01% Jetta/Rabbit/GTI 5 0.03% 37 0.21% 17,505 99.76% 17,547 0.12% New Beetle 7 0.11% 22 0.34% 6,359 99.55% 6,388 0.04% New Beetle Convertible 1 0.03% 12 0.38% 3,163 99.59% 3,176 0.02% Passat 13 0.03% 81 0.17% 47,750 99.80% 47,844 0.32% Tiguan 3 0.01% 41 0.13% 32,264 99.86% 32,308 0.21% Touareg 4 0.10% 1 0.02% 4,049 99.88% 4,054 0.03%
VOLV S40 / V40 1 0.25% 1 0.25% 395 99.50% 397 0.00% S40 / V50 1 0.02% 4 0.09% 4,256 99.88% 4,261 0.03% S70 / V70 2 0.21% 2 0.21% 957 99.58% 961 0.01% V70 / XC70 AWD 1 0.05% 2 0.10% 1,946 99.85% 1,949 0.01% XC60 1 0.01% 9 0.05% 17,308 99.94% 17,318 0.11% XC90 1 0.00% 21 0.10% 21,891 99.90% 21,913 0.14%
Grand Total 2,639 0.02% 15,813 0.10% 15,117,440 99.88% 15,135,892 100.00%
B-31