Final Consultants Report - gms-eoc.org
260
Risks and Adaptation to Climate Change in BCI Pilot Sites in PRC, Thailand and Viet Nam TA 6289(REG): Greater Mekong Subregion – Core Environment Program (CEP) and Biodiversity Conservation Corridors Initiative (BCI) Phase 1 (2006 – 2009) - Risks and Adaptation to Climate Change in BCI Pilot Sites in PRC, Thailand and Viet Nam July 2010 Final Consultants Report
-
Upload
khangminh22 -
Category
Documents
-
view
4 -
download
0
Transcript of Final Consultants Report - gms-eoc.org

i
Risks and Adaptation to Climate Change in BCI Pilot Sites in PRC, Thailand and Viet Nam
TA 6289(REG): Greater Mekong Subregion – Core Environment Program (CEP) and Biodiversity Conservation Corridors Initiative (BCI) Phase 1 (2006 – 2009) - Risks and
Adaptation to Climate Change in BCI Pilot Sites in PRC, Thailand and Viet Nam
July 2010
Final Consultants Report

Risks and Adaptation to Climate Change in BCI Pilot Sites in PRC, Thailand and Viet Nam Final consultant report, July 2010
ii
Copies of the policy brief and the full technical report are available online free of charge at: http://cleanairinitiative.org/portal/projects/Impacts of Climate Change and Air Pollution in the GMS
Contact: [email protected]
This publication was based on results of the Technical Assistance for the Greater Mekong Subregion – Core Environment Program (CEP) and Biodiversity Conservation Corridors Initiative, funded by the Asian Development Bank (ADB).
Neither ADB nor Murdoch University guarantee the accuracy of the data included in this publication and neither ADB nor Murdoch University accept responsibility for any consequence of their use.
Use of the term "country" does not imply any judgment by the ADB as to the legal or other status of any territorial entity.
The following individuals completed research that contributed to this document, but the stated views are those of the editors, not necessarily the contributors, their affiliated organizations, ADB, its Board of Governors, the governments they represent, or Murdoch University:
Sophie Punte, May Ajero and Gianina Panopio of the Clean Air Initiative for Asian Cities, Manila;
Professor N. T. Kim Oanh, Mr. Didin Permadi, Ms. Do Thanh Canh and Mr. Asif Iqbal of the Asian Institute of Technology, Thailand;
Mr. Suppakorn Chinvanno, South East Asian START and Chulalongkorn University, Thailand;
Dr. Louis Lebel, Unit for Social and Environmental Research, Faculty of Social Sciences, Chiang Mai University, Thailand;
Dr. Hathairatana Garivait of the Environmental Research and Training Center, Thailand;
Dr. Apipong Lamsam, UNEP Regional Resource Center for Asia and the Pacific, Thailand;
Dr. Nguyen Lanh of the Institute of Strategy and Policy on Natural Resources and Environment, Ministry of Natural Resources and Environment, Viet Nam;
Mr. Kim Van Chinh, Hanoi University of Science, Viet Nam;
Professor Yinlong Xu, Institute of Environment and Sustainable Development in Agriculture, Chinese Academy of Agricultural Sciences, People’s Republic of China (PRC);
Professor Qingxian Gao, Center for Climate Impact Research, Ministry for Environmental Protection, PRC;
Mr. Guoqing Xie, Yunnan Climate Center, Yunnan Meteorological Bureau, Kunming, PRC; and
Ms. Kuang Zhaomin, Institute of Meteorological Disaster Reduction, Guangxi Meteorological Bureau, PRC.
Edited by Assoc. Professor Frank Murray of Murdoch University, Perth, Australia, May Ajero and Gianina Panopio of the Clean Air Initiative for Asian Cities, Manila. Advice, support and materials were provided by Dr. Sumit Pokrel and Dr. Chonchinee Amawatana of the GMS Environment Operations Center (EOC).
Cover Design & Layout: Design Muscle Inc.
© 2010 Asian Development Bank and Murdoch University All rights reserved. Published 2010.

Risks and Adaptation to Climate Change in BCI Pilot Sites in PRC, Thailand and Viet Nam Final consultant report, July 2010
iii
ABBREVIATIONS
ADB – Asian Development Bank AIT – Asian Institute of Technology AR4 – Fourth Assessment Report ASEAN – Association of Southeast Asian Nations BAU – business as usual BCI – Biodiversity Conservation Corridors Initiative BMR – Bangkok Metropolitan Region CEP – Core Environment Program CGRER – Center for Global and Regional Environmental Research CH3Hg – methyl mercury CH4 – methane CNG – compressed natural gas CO – Carbon monoxide CO2 – Carbon dioxide CSIRO – Commonwealth Scientific and Industrial Research Organization DEFRA – Department for Environment, Food and Rural Affairs DN – Da Nang EANET – Acid Deposition Monitoring Network in East Asia EEA – European Environment Agency EIA – Environment Impact Assessment ENSO – El Nino-Southern Oscillation ERTC – Environmental Research and Training Center GCM – global general circulation model GDP – Gross domestic product GEF – Global Environment Facility GHG – Greenhouse gases GMS – Greater Mekong Subregion HC – Hydrocarbons H2SO4 – Sulfuric acid HNO3 – Nitric Acid IES – Integrated Environmental Strategies IPCC – Intergovernmental Panel on Climate Change IRRI – International Rice Research Institute ISPONRE – Institute of Strategy and Policy on Natural Resources and
Environment IUCN – World Conservation Union KP – Kyoto Protocol MARD – Ministry of Agriculture and Rural Development MONRE – Ministry of Natural Resources and Environment MTBE – Methyl Tertiary Butyl Ether N2O – Nitrous oxide NAAQS – National Ambient Air Quality Standards NMHC – non-methane hydrocarbons NMVOC – Non-methane volatile organic compounds NOx – oxides of Nitrogen/Nitrogen oxides NTFPs – non-timber forest products NTP – Vietnamese National Target Program to Respond to Climate
Change O3 – Ozone Pb – Lead PCD – Pollution Control Department PDR – People’s Democratic Republic

Risks and Adaptation to Climate Change in BCI Pilot Sites in PRC, Thailand and Viet Nam Final consultant report, July 2010
iv
PM – particulate matter PM10 – particulate matter with diameter of 10 microns and lower PRC – People’s Republic of China QA/QC – quality assurance/quality control RCM – regional climate model RMB – Renminbi/ Chinese yuan SEA – Southeast Asia SO2 – Sulfur dioxide SO4
2- – Sulfates SOx – oxides of Sulfur/Sulfur oxides ST – Song Thanh TSP – total suspended particulates UNFCCC – United Nations Framework Convention on Climate Change USD – US Dollars US EPA – United States Environmental Protection Agency UV – ultraviolet VOC – Volatile organic compounds VOCs – volatile organic compounds WHO – World Health Organization WMO/GAW – World Meteorological Organization/Global Atmosphere Watch
WEIGHTS AND MEASURES
C – degrees Centigrade/degrees Celcius /10a – per ten years or per decade mm – millimeter /a – per annum km2 – square kilometers sq.km – square kilometers m – meters m3 – cubic meters Tg – teragrams ppb – parts per billion ppbv – parts per billion by volume ha – hectares hrs/month – hours per month g S/m2/year – grams of sulfur per square meter per year µm – micrometers, microns Yuan – Chinese Yuan, Renminbi dollars – United States Dollars Baht – Thailand Baht

Risks and Adaptation to Climate Change in BCI Pilot Sites in PRC, Thailand and Viet Nam Final consultant report, July 2010
v
ACKNOWLEDGEMENTS
This project is a partnership to build capacity and a knowledge base to adapt to climate change by using modelling, assessment and analysis relevant to local circumstances. The project was developed and implemented through close partnerships with institutions in the PRC, Thailand and Viet Nam.
Murdoch University is the project implementation agency. Among the key project partners are:
Sophie Punte, May Ajero and Gianina Panopio of the Clean Air Initiative for Asian Cities, Manila;
Professor N. T. Kim Oanh of the Asian Institute of Technology, Thailand Dr. Anond Snidvongs and Suppakorn Chinvanno, South East Asian START and
Chulalongkorn University, Thailand; Dr. Louis Lebel, Unit for Social and Environmental Research Faculty of Social
Sciences, Chiang Mai University, Thailand; Dr. Hathairatana Garivait of the Environmental Research and Training Center,
Thailand; Dr. Nguyen Lanh of the Institute of Strategy and Policy on Natural Resources and
Environment, Ministry of Natural Resources and Environment, Viet Nam; Dr. Luong Huy, International Union for the Conservation of Nature, Viet Nam Kim Van Chinh, Hanoi University of Science, Viet Nam; Professor Yinlong Xu Institute of Environment and Sustainable Development in
Agriculture (IEDA), Chinese Academy of Agricultural Sciences (CAAS), PRC; Professor Qingxian Gao, Center for Climate Impact Research, Ministry for
Environmental Protection, PRC; Mr. Guoqing Xie, Yunnan Climate Center, Yunnan Meteorological Bureau,
Kunming, PRC; and Ms. Kuang Zhaomin, Institute of Meteorological Disaster Reduction, Guangxi
Meteorological Bureau, PRC.
The project has also been strongly supported by: Ms. Mai, Ministry of Natural Resources and Environment, Viet Nam Mr. Wang Xin, FECO, Ministry for Environmental Protection, PRC Mr. Kiti Tanhan, Office of Natural and Environmental Policy and Planning, Ministry
of Natural Resources and Environment, Thailand the staff at the GMS-EOC
Regional profiles of impacts and adaptation to climate change in Viet Nam, Thailand and Yunnan Province and Guangxi AR of the PRC were drafted as follows:
Future climate change projections and scenarios for the lower GMS countries were prepared by Suppakorn Chinvanno, SEA START, Bangkok.
A report on impacts and adaptation to climate change in Viet Nam was prepared by Dr. Nguyen Lanh, Dept. of Climate Change, Marine & Islands, ISPONRE, MONRE, Viet Nam.
A report on impacts and adaptation to climate change in Thailand was prepared by Dr. Louis Lebel, Unit for Social and Environmental Research (USER), Chang Mai University, Thailand.

Risks and Adaptation to Climate Change in BCI Pilot Sites in PRC, Thailand and Viet Nam Final consultant report, July 2010
vi
A report on impacts and adaptation to climate change in Yunnan Province and Guangxi AR of the PRC was prepared by Professor Yinlong Xu, IEDA, CAAS, Beijing, Mr. Guoqing Xie, Yunnan Climate Center, Yunnan Meteorological Bureau, Yunnan Province and Ms. Kuang Zhaomin of the Institute of Meteorological Disaster Reduction, Guangxi Meteorological Bureau, Guangxi, P. R. China.
An assessment of current levels of ozone in Viet Nam, Thailand and Yunnan Province and Guangxi AR of the PRC was prepared by Professor NT Kim Oanh and Mr. Didin Permadi of the Asian Institute of Technology (AIT), Thailand.
An assessment of current levels of acid deposition in Viet Nam, Thailand and Yunnan Province and Guangxi AR of the PRC was prepared by Professor NT Kim Oanh and Mr. Asif Iqbal, AIT, Thailand.
Results of air quality monitoring in the central part of Viet Nam were prepared by Professor NT Kim Oanh, AIT, Thailand and Mr. Kim Van Chinh of Hanoi University of Science, Viet Nam.
Results of air quality monitoring in Kanchanaburi were prepared by Dr. Hathairatana Garivait, ERTC, DEQP, Thailand.
Modelling of future levels of ozone and acid rain in Viet Nam, Thailand and Yunnan Province and Guangxi AR of the PRC was undertaken by Professor NT Kim Oanh, AIT, Thailand.
This collaborative study was led by Frank Murray of Murdoch University, Perth, Australia and superbly supported by May Ajero and Gianina Panopio of the Clean Air Initiative for Asian Cities, Manila. Four workshops were held in Bangkok and Hanoi in 2008 and 2009 to plan the study and to exchange views on background papers and draft chapters of the report, administered by May Ajero and Gianina Panopio. It was conducted with the support of the GMS EOC under the overall guidance of Javed Mir (ADB), Hasan Moinuddin, Sumit Pokrel, Chonchinee Amawatana and Sompongse Somsookh.
Frank Murray was overall editor and drafted Chapter 1 (Introduction), and the executive summary. Gianina Panopio formatted and coordinated the production of the report.

Risks and Adaptation to Climate Change in BCI Pilot Sites in PRC, Thailand and Viet Nam Final consultant report, July 2010
i
CONTENTS
Page
EXECUTIVE SUMMARY vii
I. INTRODUCTION 1 By Frank Murray, Murdoch University
II. GMS ECONOMIC COOPERATION PROGRAM AND 6 CLIMATE CHANGE
III. FUTURE CLIMATE PROJECTION FOR THAILAND AND 11 SURROUNDING COUNTRIES: CLIMATE CHANGE SCENARIO OF 21st CENTURY
By Suppakorn Chinvanno, Southeast Asia START Regional Center
IV. IMPACTS OF CLIMATE CHANGE AND ADAPTATION ON 25 BIODIVERSITY, AGRICULTURE, WATER RESOURCE AND LIVELIHOOD IN YUNNAN PROVINCE OF CHINA
By Xu Yinlong, Institute of Environment and Sustainable Development in Agriculture, Xie Guoqing, Yunnan Meteorological Bureau and Kuang Zhaomin, Institute of Meteorological Disaster Reduction, Guangxi Meteorological Bureau
V. IMPACTS OF VULNERABILITY AND ADAPTATION OPTIONS 40
TO CLIMATE CHANGE IN GUANGXI
By Xu Yinlong, Institute of Environment and Sustainable Development in Agriculture, Kuang Zhaomin, Institute of Meteorological Disaster Reduction, Guangxi Meteorological Bureau, and Xie Guoqing, Yunnan Meteorological Bureau
VI. IMPACTS OF AND ADAPTATION TO CLIMATE CHANGE 55 IN THAILAND
By Louis Lebel, USER, Chang Mai University
VII. CLIMATE CHANGE IMPACTS AND ADAPTATION MEASURES 76 OF VIET NAM
By Nguyen Lanh, Institute of Strategy and Policy on Natural Resources and Environment (ISPONRE), Ministry of Natural Resources and Environment (Vietnam)
VIII. LINKS BETWEEN CLIMATE CHANGE AND AIR POLLUTION 103
By Frank Murray, Murdoch University

Risks and Adaptation to Climate Change in BCI Pilot Sites in PRC, Thailand and Viet Nam Final consultant report, July 2010
ii
IX. OVERVIEW OF GROUND-LEVEL OZONE POLLUTION IN THE 113 GREATER MEKONG SUBREGION (GMS)
By Nguyen Thi Kim Oanh and Didin Agustian Permadi, Environmental Engineering and Management, SERD, Asian Institute of Technology
X. OVERVIEW ON ACID DEPOSITION IN GREATER MEKONG 130 SUBREGION: CURRENT STATUS, TRENDS AND POLICIES
By Nguyen Thi Kim Oanh, Asian Institute of Technology, Asif Iqbal, Asian Institute of Technology, and Apipong Lamsam, UNEP Regional Resource Center for Asia and the Pacific (RRC.AP)
XI. AIR QUALITY MONITORING IN THE CENTRAL PART OF VIET NAM 151
By Nguyen Thi Kim Oanh, Kim Van Chinh, Do Thanh Canh, Asian Institute of Technology
XII. CHEMICAL CHARACTERISTIC OF ACID DEPOSITION IN 163 KANCHANABURI, THE WESTERN FOREST COMPLEX OF THAILAND
By Hathairatana Garivait, Environmental Research and Training Center
XIII. FUTURE GROUND LEVEL OZONE POLLUTION AND ACID 183 DEPOSITION IN GMS REGION SIMULATED BY CMAQ-MM5 SYSTEM
By Nguyen Thi Kim Oanh and Didin Agustian Permadi, Environmental Engineering and Management, SERD, Asian Institute of Technology
XIV. POLICY BRIEF ON GROUND LEVEL OZONE POLLUTION 206 AND ACID DEPOSITION IN GMS By Nguyen Thi Kim Oanh, Asian Institute of Technology
XV. REFERENCES 208
XVI. GLOSSARY 238

Risks and Adaptation to Climate Change in BCI Pilot Sites in PRC, Thailand and Viet Nam Final consultant report, July 2010
iii
EXECUTIVE SUMMARY
This report outlines the impacts of climate change and air pollution on biodiversity, water resources, agriculture, and rural livelihoods in Guangxi and Yunnan Provinces of the PRC, Thailand and Viet Nam, and it provides suggestions on adaptation to the impacts of climate change and air pollution. This report uses modelling, assessment and analysis relevant to local and immediate needs in partnership with local institutions in the GMS countries.
1. Increasing CO2 and air pollutant emissions in the GMS
The spectacular economic growth in the Greater Mekong Sub-region (GMS) in the last two decades has led to substantial growth in emissions to the atmosphere. Energy demand in the Asia Pacific region grew 9.7% per year between 2000 and 2007 and greenhouse gas emissions rose by nearly 8% per year over the same period (Lohani, 2009). Subsequently, Asia’s share of global energy-related carbon dioxide emissions grew from 8.7% in 1973 to 30% in 2006 (IEA, 2008). If current energy consumption patterns continue, carbon dioxide concentrations in the atmosphere are expected to exceed 700ppm and global average temperatures will rise by between 1.8 and 4.0oC by 2100 (IPCC, 2007). Emissions of most air pollutants in the GMS region have also increased by similar percentages.
Recent research has shown that climate change and air pollution are two sides of the same coin. A remarkable finding is that nearly 50% of the emissions causing global warming are from air pollutants other than carbon dioxide including black carbon, methane, and ground level ozone (UNEP, 2009). The sources of emissions are very similar, and include fossil fuel combustion, industrial emissions, vehicle emissions, etc. Consequently, most measures to reduce air pollution will help combat climate change and vice versa.
2. Climate change impacts for GMS and individual countries
The future climate of the GMS is likely to be warmer and wetter with more frequent extreme weather events. Models of the regional climate of the region to the end of this century summarised in Chapter 4 of this report suggest that the climate will be slightly warmer, but the daily and seasonal warm periods will become much longer in the future, especially in the latter half of the century. Both daily maximum temperature and daily minimum temperatures will increase. In addition, the hot season will become longer, and expand to a wider area of the region. Precipitation is likely to fluctuate in the first half of the century but in the latter half of the century higher precipitation is likely throughout the region.
The changes caused by climate change will increasingly affect national development for the countries of the GMS and poor people are most vulnerable. Global warming poses significant risks to the socio-economic development and the environment of the GMS through expected impacts on temperature, seasonal rainfall patterns, extreme weather events, flooding, droughts, increase in sea levels, with potentially severe impacts on biodiversity, agriculture, water resources and livelihoods. An Asian Development Bank (ADB) study of the economic impacts of climate change suggests that Southeast Asia as a region is likely to suffer more from climate change than

Risks and Adaptation to Climate Change in BCI Pilot Sites in PRC, Thailand and Viet Nam Final consultant report, July 2010
iv
the global average, with economy-wide costs of climate change for Thailand and Viet Nam of 6.7% of GDP per year by 2100 (ADB 2009). Likewise, a recent World Bank study suggests that the East Asia and Pacific Region would have the highest cost of adaptation in both wetter and drier scenarios (World Bank, 2009). Adaptation for agriculture and coastal zones will cost US$5 billion per year by 2020 for Indonesia, Thailand, Philippines and Viet Nam (Lohani, 2009). The region is the most vulnerable in the world to natural disasters resulting from climate change. Bangladesh, India, the Philippines, and Viet Nam top the list with cumulative losses of nearly US$20 billion in the last decade as a result of natural disasters. Economy-wide GDP loss for Indonesia, the Philippines, Thailand, and Viet Nam is estimated at 6.7% of GDP per year by 2100 (Lohani, 2009).
The average losses caused by meteorological disasters in Yunnan may account for 6% of the provincial GDP, even 10.0% in the most serious disaster year. From 1961 to 2006 the annual average temperature in Yunnan Province, PRC, increased by 0.640C. Climate change and habitat destruction caused by irrational development and land use patterns, biological invasions and other factors have led to a reduction in biodiversity as discussed in Chapter 5 of this report. Climate change has resulted in increased effects of extreme weather events on agricultural production, reduced water resources and drought in Yunnan.
Climate change is also affecting Guangxi, PRC, as discussed in Chapter 6 of this report, with rising temperature, changed rainfall distribution, rising sea levels, increasing frequency and intensity of extreme weather events leading to massive flooding, landslides and drought causing extensive damage to property and human life. Climate change is exacerbating water stress, affecting agriculture production and food security, and increasing the area of rock desertification, worsening rural livelihoods, degrading forests and damaging coastal marine resources.
Guangxi and Yunnan Provinces need to take timely action to adapt to climate change, build resilience, and minimize losses caused by climate change. Key options include adapting agricultural practices to changes in temperature and precipitation; adapting water management to greater risk of floods and droughts; and adapting coastal zone management to higher sea levels.
In Thailand, risks to biodiversity are invariably compounded by other pressures arising from human activities, in particular, those resulting in habitat modification. Droughts, floods and storms already have major impacts in Thailand. More systematic learning from these experiences could help to address future climate variability as discussed in Chapter 7 of this report.
Food security in Thailand is closely related to agricultural production and food prices, which depend on allocation of water resources and, increasingly, fossil fuel prices. In the short to medium term and at the national level Thailand appears to be relatively food secure. As the risks of climate instability increase with global warming, this food security becomes undermined, especially at local levels where other factors also affect household access to food. Farmers of rain-fed rice may be among the most vulnerable groups to climate change. Diversification of livelihood strategies may be a key to maintaining resilience and may include off-site migration.

Risks and Adaptation to Climate Change in BCI Pilot Sites in PRC, Thailand and Viet Nam Final consultant report, July 2010
v
Climate change is now threatening Vietnamese people directly and affecting the safety and the economy of the country. If the temperature increases 2oC, about 22 million people in Viet Nam would be affected by losing their houses, and 45% of the land used for agriculture in the Mekong Delta, the granary of Viet Nam, will be under threat of inundation. In recent years, there are growing evidence of climate change in Viet Nam, reflected by the increasing number of storms, major rain events and serious flooding and drought as summarised in Chapter 8 of this report. An urgent task is to develop “Action Plans” to adapt to climate change and implement these plans in vulnerable regions. The Government of Viet Nam is paying special attention to adaptation in the agricultural sector, especially to rice production, as it is the world’s second largest exporter, and a major goal is to ensure food security for the country.
3. Air pollution impacts in the GMS region
Emissions of air pollutants have major impacts on human health and the environment in the GMS. Most notably, fine particles in air are estimated to cause 520,000 premature deaths annually in Asia (Cohen et al, 2005). In addition the projected increases in ground level ozone and acid deposition modelled in this report are expected to lead to significant crop losses and damage to biodiversity in the GMS in the coming years.
If no adequate control measures are taken in the near future, increases in ground level ozone in the GMS will have significant economic effects, with up to 35% reduction in agricultural crop yield by 2020. Ground level ozone has harmful effects on human health, materials and plants, as well as having a global warming effect. Major sources of ozone precursors include industry, motor vehicles, gasoline evaporation, and chemical solvents. Measured levels of ozone in the region are high and adverse effects of ozone may already be significant as discussed in Chapter 9 of this report. In particular, many agricultural crops in the GMS (including rice, wheat, peanut, and soybean, etc.) are sensitive to ozone toxicity. Being a greenhouse gas, a strategy for ozone pollution reduction is a win-win solution leading to air quality and climate co-benefits.
There is a significant risk of damage from acid rain in the GMS in the near future. Acid deposition refers to deposition of acidic particles and gases from the atmosphere to the earth’s surface that can cause harmful effects to terrestrial and aquatic ecosystems, materials and human health as discussed in Chapter 10 of this report. Combustion of fossil fuels (in power plants, transportation, industries and residential cooking) is the major man-made activity releasing acidic gases. Measured concentrations of acidic gases and acid deposition in the GMS are increasing and already exceed the buffering capacity of soil in some areas of the GMS with significant damage expected. In the future an even larger area of the GMS is at risk. Cooperation between GMS countries would enhance the region’s capacity to mitigate emission and acid deposition effects.
Levels of air pollutants at a BCI site at Song Thanh are low. Monthly sampling for ambient air pollutants including ozone, NOx, NO2 and SO2 at a site in the remote area of Song Thanh (Quang Nam Province) and in the urban area of Danang city shows low levels of air pollutants in Song Thanh with monthly ozone generally below 11 ppb, and other pollutants were below 1 ppb as summarised in Chapter 11 of this report. In Danang, significantly higher levels of ozone were observed, 11 to 34 ppb with remarkably higher levels in dry season (January-February, and September-November). NOx and NO2 in Danang were also higher than Song Thanh but still generally below 1.6 ppb.

Risks and Adaptation to Climate Change in BCI Pilot Sites in PRC, Thailand and Viet Nam Final consultant report, July 2010
vi
Levels of air pollutants at a BCI site at Vachiralongkorn Dam are generally low but levels of ozone could cause damage. The chemical composition of rainfall at Vachiralongkorn Dam, Kanchanaburi, Thailand, showed that the variation of pH ranged from 4.7 to 6.1 and the volume weighted average pH was 5.5 and the data indicate an emissions origin of natural sources as summarised in Chapter 12 of this report. Low concentrations were also found for gaseous pollutants, however, the levels of ozone concentrations may cause damage to vegetation and rubber materials. The acid deposition and air quality in this western forest complex area of Thailand has not yet reached a critical stage.
Modeling of future ozone and acid deposition rates indicate higher levels and larger affected areas in the GMS region due to increasing emissions of air pollutants. Simulation of ground level ozone and acid deposition in the GMS region as summarised in Chapter 13 of this report shows that the maximum hourly concentrations of ozone in January 2006 were about 60-65 ppb and occur over Bangkok but by January 2020 the corresponding maximum values would be as high as 120 – 180 ppb and would reach as far as Northeast Thailand. This would lead to increased adverse effects on health and crops unless measures are taken. The total acid deposition load in 2006 exceeded the critical load value of acid deposition in the GMS. An increase of deposition load by around 1.3 times by 2020 is expected which suggests an even greater threat.
4. Adaptation
Even if CO2 emissions stopped, warming is expected to continue for 1000 years, thus efforts to limit CO2 emissions alone will not prevent dangerous climate change. Fast-acting strategies are needed to complement reductions in emissions of CO2. Taken together non-CO2 human-induced air pollutants account for 40-50% of anthropogenic global warming and strategies to limit emissions of methane, black carbon, ground level ozone precursors and hydrofluorocarbons will have rapid impacts to reduce global warming (Molina et al. 2009).
There are potential co-benefits from integrating climate change policy and air quality legislation for certain pollutants. An integrated approach can reduce the costs of controlling emissions and avoid irreversible impacts on the economy and the environment (UNEP, 2009). An integrated approach could also increase the political acceptance of policy measures and allow targets to be achieved at lower costs than separate policies for climate change and air pollution.
The priorities for measures to adapt to the increasing impacts of climate change and air pollution in the GMS should be those to enable coping with uncertainty, learning from experiences, building adaptive capacities, and integrated with national development. Substantial investments are needed to adapt to climate change to conserve biodiversity, manage water resources effectively, maintain food security, and to sustain rural livelihoods (Lebel, Chapter 7). Understanding the costs and benefits of adaptation to increasing impacts of climate change and air pollution is important for national development planning. Existing cost estimates vary considerably from one study to another with UNFCCC, UNDP and World Bank making various estimates of costs of adaptation in developing countries ranging from US$9–US$109 billion per year (Lohani, 2009).

Risks and Adaptation to Climate Change in BCI Pilot Sites in PRC, Thailand and Viet Nam Final consultant report, July 2010
vii
Many of the actions to address adaptation to increasing impacts of climate change and air pollution will require regional cooperation within the GMS. This may vary from sharing of critical information and lessons within the GMS through to, for example, joint major capital intensive infrastructure projects to share water resources, generate hydroelectric power, irrigation, develop agriculture, renew coastal infrastructure and reduce poverty. A recent ADB study shows the value of regional cooperation for poverty reduction (ADB 2009). The 1997 Asian financial crisis and the 2008 global financial crisis exposed the vulnerability of infrastructure projects and the need to protect critical infrastructure projects that lose funding support as credit dries up. Regional cooperation can help address these issues.
Table 1: Adaptation measures compiled from this report and common to all GMS countries. Some of these measures are already being implemented in some GMS countries. Many of these measures could be more efficiently developed by international cooperation within the GMS countries than by national approaches
Agriculture Water resources Biodiversity Rural livelihoods
Amend the cropping calendar & pattern
Improve irrigation and drainage facilities and provide more efficient water distribution
Select and monitor local indicators of ecosystem health
Encourage and provide more diverse rural income sources
Adapt agricultural practices to changing temperature and rainfall patterns
Promote small scale irrigation schemes
Plan and implement species protection techniques
Prepare for and manage disasters and reduce risks
Use climate resilient varieties
Improve flood warning and flood control systems
Implement species recovery plans and ecosystem restoration
Strengthening the resilience of infrastructure
Diversify crops
Develop multi-purpose reservoirs, dams
Establish biodiversity conservation priorities in climate sensitive areas
Strengthen measures to reduce risks from droughts and floods
Improve long range weather forecasting
Promote rain harvesting and storage technologies
Maintain connections within biodiversity conservation corridors
Build public awareness of climate risks and adaptation measures
Develop more flexible and suitable risk sharing and climate insurance schemes
Reclaim used water & encourage water conservation
Protect natural forests and prevent and manage forest fires
Improve coordination of government services to support adaptation in rural communities
Improve the water efficiency of irrigation techniques
Review integrated river basin and water catchment development policies to adapt to a changing climate
Implement programs for communities based on sustainable use of forest resources, biodiversity conservation, restoring forests and climate
Identify high risk areas and more effectively use land use planning with the participation of the local communities

Risks and Adaptation to Climate Change in BCI Pilot Sites in PRC, Thailand and Viet Nam Final consultant report, July 2010
viii
change
Improve and use early warning of food shortages and expanding food reserves
Develop more systematic learning from local experiences with droughts and floods
Develop early warning and communications systems for extreme events
Develop and implement scientific techniques to adapt to climate change in agriculture
Review water rights and pricing and community-based management
Adapt environmental impact assessment to assess impacts of development projects in relation to climate change issues

1
CHAPTER I
INTRODUCTION
By Frank Murray
Murdoch University
1. The project, “Risks and Adaptation to Climate Change in BCI Pilot Sites in PRC, Thailand and Viet Nam” is a partnership to build capacity and knowledge base to adapt to climate change by using modelling, assessment and analysis relevant to local circumstances. The project was developed and implemented through close partnerships with institutions in the PRC, Thailand and Viet Nam.
2. The project is important because under some recently published climate change scenarios, climate change poses a greater threat of species extinction than deforestation or habitat destruction, and it represents a critical threat to achieving the aims of the Core Environment Program (CEP) and Biodiversity Conservation Corridors Initiative (BCI). For rural economies in the GMS the additional stress imposed by climate change, particularly as it affects the impacts of natural hazards, could threaten goals of poverty alleviation. In cities, water supply difficulties may be further aggravated by changes in rainfall regimes and hydrology, threatening economic development. Among the critical issues for the GMS is the likely increase in the intensity and frequency of extreme weather events, such as floods and droughts, and their impacts on communities, food security and economic development.
3. The Letter of Agreement with the Asian Development Bank was signed on 4 October 2007. The project will be completed in March 2010.
Objective
The project aims to build capacity and a knowledge base to adapt to climate change by using modelling, assessment and analysis relevant to local and immediate needs, developed in partnerships with local institutions in the PRC, Thailand and Viet Nam.
4. Partners
Murdoch University is the project implementation agency. Among the key project partners are:
Sophie Punte, May Ajero and Gianina Panopio of the Clean Air Initiative for Asian Cities
Professor N. T. Kim Oanh of the Asian Institute of Technology, Thailand Dr. Anond Snidvongs and Suppakorn Chinvanno, South East Asian START and
Chulalongkorn University, Thailand Dr. Louis Lebel, Unit for Social and Environmental Research Faculty of Social
Sciences, Chiang Mai University, Dr. Hathairatana Garivait of the Environmental Research and Training Center,
Thailand

Risks and Adaptation to Climate Change in BCI Pilot Sites in PRC, Thailand and Viet Nam Final consultant report, July 2010
2
Dr. Nguyen Lanh of the Institute of Strategy and Policy on Natural Resources and Environment, Ministry of Natural Resources and Environment, Viet Nam
Dr. Luong Huy, International Union for the Conservation of Nature, Viet Nam Kim Van Chinh, Hanoi University of Science, Viet Nam Professor Yinlong Xu Institute of Environment and Sustainable Development in
Agriculture (IEDA), Chinese Academy of Agricultural Sciences (CAAS), Beijing, PRC
Professor Qingxian Gao, Center for Climate Impact Research, Ministry for Environmental Protection, PRC
Mr. Guoqing Xie, Yunnan Climate Center, Yunnan Meteorological Bureau, Kunming, PRC
Ms. Kuang Zhaomin, Institute of Meteorological Disaster Reduction, Guangxi Meteorological Bureau, PRC
The project has also been strongly supported by: Ms. Mai, Ministry of Natural Resources and Environment, Viet Nam Mr. Wang Xin, FECO, Ministry for Environmental Protection, PRC Mr. Kiti Tanhan, Office of Natural and Environmental Policy and Planning, Ministry
of Natural Resources and Environment, Thailand the staff at the GMS-EOC
5. Location
The focus of the project is BCI Pilot Sites in PRC, Thailand and Viet Nam. Much of the work of the project is being conducted at the BCI Pilot sites in the Tenasserim – Western Forest Complex in Thailand, and Song Thanh in Quang Nam Province in Viet Nam. Climate change assessments include BCI Pilot Sites in PRC, Thailand and Viet Nam.
6. Activities
A. Regional Workshops
Workshop Number
Purpose Date Location
1 Regional Training on Air Pollution Monitoring and Assessment
8-10 October 2008
Bangkok
2
Regional Workshop on Impacts and Adaptation to Climate Change
24-26 February 2009
Hanoi
3 Regional meeting of technical experts
8 & 9 September 2009
Bangkok
4 Regional meeting of scientists and policy makers
24 November 2009
Bangkok
1. Regional workshop 1
8. Subject: Air pollution in the GMS BCI. Location: Bangkok. Date: 8-10 October 2008: Purpose: capacity building and discussions
9. Workshop 1 was mostly attended by people involved with air pollution in the region but some of the climate change partners also participated.

Risks and Adaptation to Climate Change in BCI Pilot Sites in PRC, Thailand and Viet Nam Final consultant report, July 2010
3
2. Regional workshop 2
10. Subject: Climate change impacts, vulnerability and adaptation. Location: Hanoi. Date: 24-26 February 2009: Purpose: capacity building and discussions.
11. Workshop 2 was mostly be attended by government officers from Viet Nam, Thailand and PRC involved with adaptation to climate change.
3. Regional workshop 3
12. Subject: Regional meeting of technical experts. Location: Bangkok. Date: 8 & 9 September 2009: Purpose: to discuss a draft assessment report.
13. Workshop 3 was a regional meeting of technical experts to be attended by experts on air pollution, climate change or both. Experts with a high level of knowledge about air pollution, climate change or both contributed their knowledge towards improving the draft assessment report.
4. Regional workshop 4
14. Subject: Regional meeting of scientists and policy makers. Location: Bangkok. Date: 24 November 2009: Purpose: to discuss policy implications and amend draft assessment report.
15. Workshop 4 was a regional meeting of scientists and policy makers, including some of the technical experts from workshop 3.
16. In summary, there is crossover between the four workshops but the content and aims of the four workshops are different and the participants invited reflect the content and aims of each. Participants are predominantly from PRC, Viet Nam and Thailand. The workshops involve about 20-25 people to provide for interactive discussions and sharing of regional perspectives. The leaders include:
Suppakorn Chinvanno SEA START, Thailand Climate change
Professor Kim Oanh AIT, Thailand Regional air pollution
Dr. Hathairatana Garivait ERTC, DEQP, Thailand Regional air pollution
Professor Gao Qingxian Centre for Climate Impact Research, MEP, China
Climate change
Professor Yinlong Xu CASS, China Climate change
Dr. Louis Lebel USER, Chiang Mai University, Thailand Climate change
Dr. Luong Huy IUCN, Viet Nam Climate change
Dr. Nguyen Lanh ISPONRE, MONRE, Viet Nam
Climate change
Assoc. Professor Frank Murray
Murdoch University Project leader
May Ajero and Gianina Panopio
CAI-Asia Workshop organisers

Risks and Adaptation to Climate Change in BCI Pilot Sites in PRC, Thailand and Viet Nam Final consultant report, July 2010
4
B. Monitoring at field sites in the Tenasserim – Western Forest Complex in Thailand, and in Quang Nam Province in Viet Nam
17. In collaboration with partners in Thailand and Viet Nam, work commenced on the identification of specific field sites in Thailand and Viet Nam for the collection of samples and monitoring. By exchanges of letters and a meeting in April 2008, an agreement was reached with the Director General of the Department of Environmental Quality Promotion, Thailand, involving the collaboration of the Environmental Research and Training Center with the project in relation to identification of field sites, sample collection and monitoring at BCI sites in Thailand.
18. Dr. Hathairatana Garivait of the Environmental Research and Training Center of the Department of Environmental Quality Promotion, Thailand, visited Kanchanaburi province in late 2008 to conduct surveys and site selection as part of this project. She and her team installed a site at Vachiralongkorn Dam, a BCI site, during December 10-12, 2008. The sampling site consists of three sets of Ogawa passive samplers (SO2, NO2, NOx, Blank NOx and O3) and two bulk precipitation samplers. The techniques used were selected to be identical or harmonised with those of EANET to ensure comparability of results and to gain leverage from the established procedures and long-standing database of monitoring data held by EANET.
19. Professor NT Kim Oanh of the Asian Institute of Technology, Thailand, and Mr. Kim Van Chinh of Hanoi University of Science are collaborating in Song Thanh BCI site in Quang Nam Province and Da Nang, Viet Nam, for this project. They monitored at a monthly frequency of O3, SO2, and NOx in two different locations in Song Thanh using Ogawa passive samplers identical to those used in Thailand for this project, and also used by EANET.
20. The Ministry for Environmental Protection of PRC informed this project at a meeting held in Beijing in April 2008 that there are considerable amounts of data already available for Yunnan Province and Guangxi AR of the PRC and that additional monitoring is unnecessary. The WGE focal point in the PRC warmly welcomed the project especially the capacity building and climate change elements of it.
C. Regional profile reports
21. Regional profiles of impacts and adaptation to climate change in Viet Nam, Thailand and Yunnan Province and Guangxi AR of the PRC have been drafted as follows:
Future climate change projections and scenarios for the lower GMS countries has prepared by Suppakorn Chinvanno, SEA START, Bangkok.
A report on impacts and adaptation to climate change in Viet Nam has been prepared by Dr. Nguyen Lanh, Acting Head, Dept. of Climate Change, Marine & Islands, Institute of Strategy and Policy on Natural Resources & Environment, MONRE, Viet Nam.
A report on impacts and adaptation to climate change in Thailand has been prepared by Dr. Louis Lebel, Unit for Social and Environmental Research (USER), Chang Mai University, Thailand.
A report on impacts and adaptation to climate change in Yunnan Province and Guangxi AR of the PRC is being prepared Professor Yinlong Xu, Professor of Climate Change, Institute of Environment and Sustainable Development in Agriculture (IEDA), Chinese Academy of Agricultural Sciences (CAAS), Beijing, Mr. Guoqing Xie, Deputy Director of the Yunnan Climate Center, Yunnan Meteorological Bureau, Yunnan Province and Ms

Risks and Adaptation to Climate Change in BCI Pilot Sites in PRC, Thailand and Viet Nam Final consultant report, July 2010
5
Kuang Zhaomin of the Institute of Meteorological Disaster Reduction, Guangxi Meteorological Bureau, Guangxi Zhuang Autonomous Region, P. R. China.
An assessment of current levels of ozone in Viet Nam, Thailand and Yunnan Province and Guangxi AR of the PRC has been prepared by Professor NT Kim Oanh and Mr. Didin Permadi of the Asian Institute of Technology, Thailand.
An assessment of current levels of acid deposition in Viet Nam, Thailand and Yunnan Province and Guangxi AR of the PRC has been prepared by Professor NT Kim Oanh and Mr. Asif Iqbal of the Asian Institute of Technology, Thailand.
Modelling of future levels of ozone and acid rain in Viet Nam, Thailand and Yunnan Province and Guangxi AR of the PRC was undertaken by Professor NT Kim Oanh of the Asian Institute of Technology, Thailand.
Results of air quality monitoring in the central part of Viet Nam including Song Thanh of Quang Nam province were prepared by Professor NT Kim Oanh of the Asian Institute of Technology, Thailand and Mr. Kim Van Chinh of Hanoi University of Science, Viet Nam.
Results of air quality monitoring in Kanchanaburi were prepared by Dr. Hathairatana Garivait, Director of Air Research and Development, Environmental Research and Training Center, Department of Environmental Quality Promotion, Thailand.

Risks and Adaptation to Climate Change in BCI Pilot Sites in PRC, Thailand and Viet Nam Final consultant report, July 2010
6
CHAPTER II
GMS ECONOMIC COOPERATION PROGRAM AND CLIMATE CHANGE
A. The GMS Economic Cooperation Program 22. The Greater Mekong Sub-region (GMS) Economic Cooperation Program was initiated in 1992 by the Asian Development Bank (ADB), in close collaboration with the six GMS countries: Cambodia, People’s Republic of China (Yunnan and Guangxi Provinces), Lao PDR, Myanmar, Thailand and Viet Nam.
23. A 10-year Strategic Framework of the Greater Mekong Subregion (GMS–SF) Economic Cooperation Program (GMS Program) was endorsed by the heads of the GMS member governments in 2002 envisioning “a GMS that is more integrated, prosperous, and equitable,” with the aim that the “GMS program will contribute to realizing the potential of the subregion through (i) an enabling policy environment and effective infrastructure linkages that will facilitate cross-border trade, investment, tourism, and other forms of economic cooperation; and (ii) the development of human resources and skills competencies.”
24. The vision and goals of the GMS Program have been pursued through development of a regional cooperation strategy and program updates to maintain its relevance in a rapidly changing global and regional context through the pursuit of four strategic pillars:
strengthening connectivity and facilitating cross-border movement and
tourism;
integrating national markets to promote economic efficiency and private
sector development;
addressing health and other social, economic, and capacity building issues
associated with subregional linkages; and
managing the environment and shared natural resources to help ensure
sustainable development and conservation of natural resources.
25. The GMS Program promotes investment in the priority sectors of transport, energy, telecommunications and tourism to maximize the pace of economic growth and development in spatially focused economic corridors. From 1992 – 2008, infrastructure projects worth about $11 billion have been or are being implemented. Some 40 additional projects, in the range of $10-15 billion, are scheduled for the coming 10 years.
26. There is an emerging risk of unexpected social and environmental challenges that could compromise the achievement of the goals of the GMS Program. To address sustainable development of the GMS, the GMS countries launched the 10-year Core

Risks and Adaptation to Climate Change in BCI Pilot Sites in PRC, Thailand and Viet Nam Final consultant report, July 2010
7
Environmental Program (CEP) as the central program to address the subregion’s environmental challenges.
B. Core Environment Program and Biodiversity Conservation Corridors Initiative (CEP-BCI)
27. The GMS Core Environment Program and Biodiversity Conservation Corridors Initiative (CEP-BCI) was endorsed at the Environment Ministers’ Meeting in Shanghai, May 2005 and by the leaders at the Second GMS Summit in Kunming, PRC, in July 2005. It presents a vision for a poverty-free and ecologically rich GMS. The CEP-BCI is an attempt to develop a systematic and integrated approach to enhance ecosystem services and poverty reduction in the GMS by increasing the development potential, performance and impact of the GMS Economic Cooperation Program. Over 10 years (2005 – 2015), the program focuses on mainstreaming environmental management to ensure the sustainability of GMS economic development. The CEP-BCI aims to:
integrate environment into sector and area based planning;
avoid ecosystem fragmentation and diversify livelihoods thorough
institutionalization of biodiversity conservation corridors;
adapt, adopt and apply environmental performance indicators to measure
progress in shifting development to a sustainable path and integrating
environment into national and sub regional development planning;
develop institutional and human resource capacity to deliver sustainable
development vision; and,
define and implement sustainable financing strategies to conserve the
natural systems.
1. Climate Change
28. "Climate change impacts threaten to reverse decades of progress in poverty reduction in Asia and the Pacific.” Ursula Schaefer-Preuss, ADB Vice-President for Knowledge Management and Sustainable Development
29. Climate change has been identified as one of the priority area for program development by the GMS Working Group on the Environment (WGE).
2. Land use change and greenhouse gas (GHG) emissions
30. A study by ADB on the economics of climate change in Southeast Asia has identified that the land use and forestry sector has been the largest source of GHG emissions from the region, contributing 75% of the total in 2000 (ADB, 2009). Similarly, GMS per capita contribution to GHG emissions, especially CO2, is close to the global average, largely due to the major destruction of biomass in recent years from the region’s forests (ADB, 2009).
3. Need for Climate Resilient Society
31. Climate change is likely to add to existing pressures on ecosystem services by increasing weather variability and the frequency of extreme weather events. By shifting agricultural and ecological zones it likely to increase vulnerability of ecosystem services

Risks and Adaptation to Climate Change in BCI Pilot Sites in PRC, Thailand and Viet Nam Final consultant report, July 2010
8
and amplify impacts on climate-dependent poor communities. Some major development investments (e.g. coastal infrastructure, irrigation and hydro-power) are also vulnerable to impacts of climate change. Measures to adapt to climate change and strengthen climate resilience are already being taken by GMS countries, often based upon local action plans in consultation with local communities and making use of local knowledge and experience as discussed in this report.
4. Income Generation
32. During the UNFCC’s 15th Conference of Parties (COP-15) participating countries agreed on an accord aiming to limit temperature rises to less than 20C and promised to deliver US$30 billion in aid funds for developing nations over the next three years. It outlined a goal of providing US$100 billion per year by 2020 to help poor countries cope with the impacts of climate change. The accord recognized the "crucial role" of reducing emissions from deforestation and forest degradation (REDD/REDD-plus).
33. Estimates indicate that achieving a 50% reduction in deforestation would generate US$45 billion in carbon market transfers annually by 2020 and help protect biodiversity. In addition to mitigation potential, REDD will encourage public–private partnerships for reforestation and afforestation, provide employment, and help protect cultures, traditional land tenure and indigenous peoples’ rights to forested territories (Lohani, 2009).
34. Climate change is emerging as a cross-cutting thematic area in CEP-BCI. Climate change related activities have received special attention from the GMS countries, especially on policy dialogues and capacity development activities, some of which are discussed in this report. There is need to strengthen capacity to allow the countries to better understand the science of climate change and its impacts on life, livelihoods and investments, and policy response to promote climate resilient development processes.
35. The focus of CEP-BCI is on:
strengthening risk and vulnerability assessment capacity especially
ecosystems services, livelihood, and productive sectors such as
agriculture, energy, infrastructure and tourism;
implementation of activities to reduce CO2 emissions from land use
changes and sectors such as energy and transport;
integration of climate change within CEP-BCI programmatic components
(SEA, BCI, and EPA); and,
facilitation of cross-institutional coordination to synergize responses.
5. Connectivity and competitiveness
36. Responses to climate change can have synergistic or antagonistic relationships with the GMS Economic Cooperation Program strategic approach. The goal of connectivity and competitiveness could be challenged by the vulnerability of infrastructure investments to climate change. For example, as discussed later in this report, investments in hydropower and irrigation are vulnerable to climate-induced reductions in river flows, coastal infrastructure including roads, railways, buildings and dykes are vulnerable to sea level rise, and an increased frequency of major storms and

Risks and Adaptation to Climate Change in BCI Pilot Sites in PRC, Thailand and Viet Nam Final consultant report, July 2010
9
cyclones, etc. It is critically important that climate impacts and resilience is taken into account when planning new investments in infrastructure.
37. In contrast many of the actions to address adaptation to increasing impacts of climate change will require regional cooperation and connectivity within the GMS and will help improve international competiveness. This may vary from sharing of critical information and lessons within the GMS through to, for example, joint major capital intensive infrastructure projects to share water resources, generate hydroelectric power, irrigation, develop agriculture, renew coastal infrastructure and reduce poverty. A recent ADB study shows the value of regional cooperation for poverty reduction (ADB 2009). The 1997 Asian financial crisis and 2008 Global Financial Crisis exposed the vulnerability of infrastructure projects and the need to protect critical infrastructure projects that lose funding support as credit dries up. Regional cooperation can help address these issues.
6. Community
38. Changes in climate will directly and indirectly affect agriculture, ecosystems and ecosystem services (e.g. disaster prevention) with subsequent effects on subsistence livelihoods and local communities. Actions to reduce vulnerabilities include building adaptive capacities integrated with national development, increasing diversity of income flows, and learning from local knowledge and experience. Substantial investments are needed to adapt to climate change to conserve biodiversity, maintain food security, and to sustain rural livelihoods and communities.
C. GMS ECP and CEP-BCI
39. The GMS ECP and CEP-BCI are addressing the complex challenges of climate change, development and environmental priorities by:
Improving development efficiencies by mitigating environmental
externalities including climate change;
Building cross border institutional and human resource capacity;
Enhancing institutional coordination and collaboration in key sectors of the
economy; and,
Promoting public-private partnerships to address these challenges
(Ramachandran, 2009).
40. The GMS ECP and CEP-BCI are responding to climate change challenges by working to improve understanding and the economics of risks and vulnerability of climate change, including weather variability, sea level rise and its impact on connectivity, competitiveness and community. Other initiatives include assisting with:
Developing climate change assessment and monitoring capacity;
Integrating climate change considerations into national and sectoral
planning processes;
Strategic response and securing of investments to build climate resilient
communities; and,

Risks and Adaptation to Climate Change in BCI Pilot Sites in PRC, Thailand and Viet Nam Final consultant report, July 2010
10
Ensuring energy and food security—prerequisites for resilient communities
are both dependent on ability to maintain ecosystem and its services
(Ramachandran, 2009).
41. The GMS ECP and CEP-BCI are further responding to climate change challenges by promoting:
Carbon sequestration in GMS Economic Corridors (greening of corridors);
Incentives for reduction of emissions from deforestation and land
degradation (REDD);
Efficient engines for freight traffic reducing emissions on the North South
and East West Corridors in the GMS;
Second generation and biomass-based biofuels; and,
Renewable and Clean Development Mechanisms (Pokhrel, 2009).

Risks and Adaptation to Climate Change in BCI Pilot Sites in PRC, Thailand and Viet Nam Final consultant report, July 2010
11
CHAPTER III
FUTURE CLIMATE PROJECTION FOR THAILAND AND SURROUNDING COUNTRIES: CLIMATE CHANGE SCENARIO OF
21ST CENTURY
By Suppakorn Chinvanno
Southeast Asia Start Regional Center
A. Abstract 42. Climate change, which is induced by global warming, is a slow and complex process. It needs long term projection to detect the direction, magnitude and pattern of change. This study focused on the projection of future climate for Thailand and surrounding countries upto the end of 21st century based on dynamic downscaling of global climate change scenarios generated by ECHAM4 GCM A2 scenario by using the PRECIS regional climate model from the Hadley Centre, The Meteorological Office of the United Kingdom. The preliminary analysis on the result of the regional climate model shows that the regional climate model tends to underestimates precipitation and overestimates the maximum temperature for the region. The rescaling technique, which uses the observed weather data to rescale the result from regional climate model, was applied in the post-processing stage. Rescaled results of the regional climate model shows that Southeast Asia region tends to be slightly warmer, but the duration of the warm period will extend much longer in the future, especially in the latter half of the century. The warming up of temperature is detected for both daily maximum temperature and daily minimum temperature. In addition, the area that will be warmer will also expand to wider coverage. Precipitation tends to be fluctuating in the first half of century but shows an increasing trend, which will be clearly seen in latter half of the century where there will be higher precipitation throughout the region.
B. Introduction
43. Climate change, which is induced by global warming, has become a global concern as it may have many consequences on various systems and sectors that may threaten human wellbeing (IPCC, 2001). Understanding climate change would be a foundation for proper planning on adaptation measures to cope with future risk. However, global warming is a slow process and it would need rather long-term future climate projection to be able to clearly detect the change in future climate pattern (IPCC, 2007), therefore, long-term future climate projection is a basis for assessment of climate change impacts on certain sectors in specific areas, particularly at the local scale. Global circulation models (GCMs) have been developed and are used to simulate future climate condition, but most of the simulation results available today were conducted at a coarse scale due to a limitation in the technology and not quite effective for use in climate change impact assessment at a local scale. Therefore, regional climate change

Risks and Adaptation to Climate Change in BCI Pilot Sites in PRC, Thailand and Viet Nam Final consultant report, July 2010
12
projection in high resolution is developed based on various techniques to serve the requirement in climate change impact assessment process. Typically, there are three types of technique for obtaining high resolution regional climate change projections: statistical, dynamical and hybrid (statistical-dynamical) techniques. The use of Regional Climate Model or RCMs falls into the dynamical category (Jones et al, 2004). This paper discusses the approach in dynamic downscaling of GCM data using regional climate model to develop future climate projection for Thailand and surrounding countries over the 21st century.
Methodology 1. Dynamic downscaling using regional climate model
44. A regional climate model (RCM) is a downscaling tool that adds fine scale (high resolution) information to the large-scale projections of a global general circulation model (GCM). GCMs are typically run with horizontal scales of few hundred kilometers; regional models can resolve features down to much more smaller scale, e.g. 50km or less. This makes for a more accurate representation of many surface features, such as complex mountain topographies and coastlines. It also allows small islands and peninsulas to be represented realistically, where in a global model their size would mean their climate would be that of the surrounding ocean. RCMs are full climate models, and as such are physically based. They represent most if not all of the processes, interactions and feedbacks between climate system components represented in GCMs. They produce a comprehensive set of output data over the model domain. This study used regional climate model called PRECIS for downscaling coarse scale GCM to get the climate change scenarios for Thailand and surrounding countries. (Jones et al, 2004).
45. PRECIS is a regional climate model that was developed by the Hadley Centre for Climate Prediction and Research and is based on the Hadley Centre's regional climate modelling system. It can be used as a downscaling tool that adds fine scale (high resolution) information to the large-scale projections of a global general circulation model (GCM). It has been ported to run on a PC (under Linux) with a simple user interface, so that experiments can easily be set up over any region. PRECIS was developed in order to help generate high-resolution climate change information for as many regions of the world as possible. These scenarios can be used in impact, vulnerability and adaptation studies. (Simson et al, 2006).
46. As key influence of global warming is the increasing of atmospheric GHG in the future, this study used PRECIS RCM GCM data, which is based on SRES A2 GHG scenario (IPCC, 2000).
47. The downscaling to downscale ECHAM41 process was set to a resolution of .220 and output was rescaled to 20x20km resolution. The domain coverage is lat. 0-350N and lon. 900-1120E. The period of simulation covers baseline condition during 1970-1999 and future projection during 2010-2100. The simulation provides output with daily time step throughout the simulating period.

Risks and Adaptation to Climate Change in BCI Pilot Sites in PRC, Thailand and Viet Nam Final consultant report, July 2010
13
Figure 4.1: Domain of the future climate projection
Source: Southeast Asia START Regional Center
2. Rescaling regional climate model output 28. The results from the PRECIS regional climate model were verified by comparison against data from observation stations and the period of 1980s was selected as the baseline for verification. The comparison shows that the result of RCM is somewhat differ from the observed weather data. The PRECIS model tends to overestimate temperature and underestimate precipitation in many areas. A rescaling technique was developed and applied to the simulation result from PRECIS Model in order to adjust the simulated data to better match real condition based on observation data. 29. The rescale technique, which was developed and used in this study, is based on the difference of key climate parameters, i.e. temperature and precipitation, between the simulated and observation data from 130 weather observation stations in Thailand, China, India, Myanmar, Lao PDR, Viet Nam, Malaysia and Indonesia. The rescaling process is the process to ‘suppress’ and ‘lift’ the simulated data throughout the simulation domain by using coefficient value that was calculated from different of average values of key weather parameters between simulated and observation data during 1980s at number of station grids in the simulation domain and those values at the station grids were interpolated using kriging technique to get the coefficient value for every grids that will be used to rescale the simulated result of each climate grid throughout the simulation domain over the period of the simulation. 30. By applying this technique, simulated data of key climate parameters from the simulation were rescaled to be closer to the observation value. The figures below show the comparison of maximum temperature (Figure 4.2) and precipitation (Figure 4.3) between PRECIS RCM simulation and observation at various locations where observation stations are located (A), the coefficient value for rescaling (B) and comparison after the rescaling process (C).

14
Figure 4.2: Maximum temperature rescaling process
(A) Comparison between simulation result and observation, (B) scaling coefficient from interpolation of values from comparison in (A), (C) Comparison between rescaled simulation result and observation
Source: Southeast Asia START Regional Center

Risks and Adaptation to Climate Change in BCI Pilot Sites in PRC, Thailand and Viet Nam Final consultant report, July 2010
15
Figure 4.3: Annual precipitation rescaling process (A) Comparison between simulation result and observation, (B) scaling coefficient from interpolation of values from comparison in (A),
(C) Comparison between rescaled simulation result and observation
Source: Southeast Asia START Regional Center

16
31. Output from the rescaling process, as shown in Figure 4.2 and Figure 4.3, shows an improved comparison result between the rescaled simulation result and observation data. The rescaled maximum temperature is more realistic when compare to observed data, which the different from the observation falls into the range of +/- 10C and different in annual precipitation falls within the range of +/- 50mm per annum. This rescale coefficient pattern was used to rescale future maximum temperature throughout the simulation period.
32. The regional climate model also overestimates minimum temperature and a rescale process was also applied to the minimum temperature simulation data. However, the rescale process for minimum temperature is based on the rescaled result of maximum temperature. The different value between simulated maximum and minimum temperature of each grid from regional climate model output was applied to the rescaled result of maximum temperature to get rescaled minimum temperature. The rescaled minimum temperature is still slightly underestimated in some area, especially in the in-land area of the simulation domain, and overestimated in the area near the coastline (Figure 4.4).
Figure 4.4: Minimum temperature (A) Comparison between simulation result and observation and (B) Comparison between rescaled
simulation result and observation
Source: Southeast Asia START Regional Center

Risks and Adaptation to Climate Change in BCI Pilot Sites in PRC, Thailand and Viet Nam Final consultant report, July 2010
17
Results and Discussion 1. Climate change in Thailand and surrounding countries in 21st century 33. Simulation results from the PRECIS regional climate model, after the rescaling process, show that average maximum temperature as well as average minimum temperature in Thailand and Southeast Asia region in the future will increase and tend to be more prominent from the middle of the century onward. The trend of warming temperature is clearly seen in the central plain of Thailand and most parts of Cambodia. The range of temperature increase in the future is approximately 2-30C during the middle of the century and an increasing trend continues until the end of the century when most parts of the region will be warmer (Figures 4.5 & 4.6).

18
Figure 4.5: Average daily maximum temperature
Source: Southeast Asia START Regional Center

Risks and Adaptation to Climate Change in BCI Pilot Sites in PRC, Thailand and Viet Nam Final consultant report, July 2010
19
Figure 4.6: Average daily minimum temperature
Source: Southeast Asia START Regional Center

20
34. In addition to the change in magnitude the change in future temperature also occurs in a temporal aspect. Southeast Asia region tends to have longer hot period during the year. This temporal change can be seen in the change in the annual number of hot days each year. The number of ‘hot days’ is defined in this study is the number of days with a maximum temperature is 350C or higher will be higher in the future. The simulation result from the PRECIS model shows that during the baseline period most parts of north and northeastern region of Thailand have a hot period of 3-4 months over the year, while the central plain and southern region have a slightly longer summertime. In the future by the middle of this century, the hot period over the year would extend longer by a few months in most regions in Thailand as well as other surrounding countries and the trend of change will be more prominent at the end of the century when the hot period will become even longer (Figure 4.7).

21
Figure 4.7: Length of hot period over the year (days): number of days with maximum temperature >350C
Source: Southeast Asia START Regional Center

Risks and Adaptation to Climate Change in BCI Pilot Sites in PRC, Thailand and Viet Nam Final consultant report, July 2010
22
The PRECIS result also shows a slight trend of change on the ‘cool period’, or number of days in the year that the minimum temperature is 160C or below. Cool period, or in other word - wintertime, in Thailand and surrounding countries will become shorter than baseline climate pattern, even though not as prominent as the trend of change on the ‘hot period’ (Figure 4.8).
Figure 4.8: Length of cool period over the year (days): number of days with minimum temperature <160C
Source: Southeast Asia START Regional Center

Risks and Adaptation to Climate Change in BCI Pilot Sites in PRC, Thailand and Viet Nam Final consultant report, July 2010
23
35. The annual total precipitation may be fluctuate in the early decades of the century, but the simulation result shows a trend of higher precipitation throughout the Southeast Asia region in the future, especially toward the end of the century. Most parts of Thailand may have higher precipitation by 25% or as high as 50% in some areas (Figure 4.9).
Figure 4.9: Annual precipitation (mm) and future change compare to 1980s
Source: Southeast Asia START Regional Center

24
2. Key concerns in using future climate projection: Understanding uncertainty and climate change in multiple dimensions 37. This long-term climate projection can be used to assess impacts of climate change in various sectors as well as to support long-term planning. However, it is a scenario and cannot be taken as long-term forecast. There is certain degree of uncertainty in the simulation result; however, it can still be used for strategic planning purposes. One way to cope with the uncertainty of long-term climate projection is the use of multiple scenarios, which are developed using various climate models and/or under different conditions. The use of multiple scenarios in strategic planning or long-term policy planning also requires change in thinking paradigm of policy planners to familiarize them with the use of multiple climate datasets for strategic planning. A typical approach of planning that requires a climate component, uses only a single dataset which is based on observation data. However, the approach in using such a dataset may not be applicable in planning processes under a climate change context, as the future climate may not be the same pattern as it has been in the past due to the influence of global warming. Climate scenarios, which are simulated bases on future changes in the earth system, should be used as a foundation for such planning exercises. The use of multiple scenarios is not a matter of putting effort into seeking the ‘best’ scenario to be selected for the planning exercise; but the planning process should be based on a wide range of scenarios and examine whether the plan for the future provides resilience to various future conditions under climate change influence. 38. Another concern in using long-term climate projection for strategic planning to cope with climate change impacts is that future changes in climate pattern involve various aspects, all of which need to be taken into consideration. In many cases, the change in mean value is used to explain climate change of any region, but that only gives a broad idea on what future climate change might involve. In the planning process, policy planners need to take changes in other aspects into consideration, especially change in the extreme value of any climate parameters and also the temporal aspect of change, e.g. change in the length of season and shifting of season, etc.
Conclusion 39. In brief, the future climate of Thailand and surrounding countries tends to be warmer with a longer summertime and heavier rainfall during the rainy season with higher annual total precipitation. These changes are unlikely to be irreversible and would have impacts on various systems and sectors. However, this future climate projection is just one plausible future which was simulated by a single climate model and single initial dataset. Additional climate change scenarios need to be further developed to address the uncertainty of the long-term climate projection. Moreover, inter-comparison among other climate models is required to evaluate the results of this experiment that would lead to improvement in future regional climate scenario simulation in the future.

Risks and Adaptation to Climate Change in BCI Pilot Sites in PRC, Thailand and Viet Nam Final consultant report, July 2010
25
CHAPTER IV
IMPACTS OF CLIMATE CHANGE AND ADAPTATION ON BIODIVERSITY, AGRICULTURE, WATER RESOURCE AND
LIVELIHOOD IN YUNNAN PROVINCE OF CHINA
By Xu Yinlonga , Xie Guoqingb and Kuang Zhaominc
a Institute of Environment and Sustainable Development in Agriculture bYunnan Meteorological Bureau
c Institute of Meteorological Disaster Reduction, Guangxi Meteorological Bureau
A. Abstract 40. Yunnan has a total area of 394 thousand square kilometers and a population in 2008 of 45.43 million. The upper reach of the Mekong River is called the Lancang River in Yunnan Province.
41. From 1961 to 2006 (46 years), the annual average temperature in Yunnan increased by 0.640C. The annual precipitation in Yunnan during 1961-2006 showed only a weak decreasing trend, mainly inter-annual oscillation. The decrease of annual rainfall for 46 years in Yunnan is only 20mm.
42. Climate change and habitat destruction caused by irrational development and land use patterns and biological invasions and other factors have led to some reduction in the number of animals and extinctions. The biodiversity conservation strategies for future adaptation to climate change involves the following priority issues:
(1) Select Rhinopithecus bieti and Hylobates hoolock as forest ecosystem health indicators to assess the impacts of climate change, and propose species protection technology;
(2) Determine priority areas for biodiversity conservation in Yunnan Province and climate change sensitive areas;
(3) Set up nature reserve monitoring system and supervise the relationship between species/ ecosystem and climate;
(4) Establish biodiversity restoration and reconstruction models in Northwestern Yunnan.
43. Adverse effects of climate change have been observed resulting in increases in effects of extreme weather and climate events on agricultural production. The average losses caused by meteorological disasters may account for 6% of the provincial GDP, even 10.0% in the most serious disaster year.
44. Priority issues of adaptation are:
(1) Study food security vulnerability and adaptation strategies and measures;
(2) Study impacts of climate change on crop diseases and pests (migratory insects, rice plant hopper) and adaptation strategies & measures;
(3) Enhance studies about impacts of climate extreme events on food security;
(4) Develop integrated assessment models of the impact of climate change on agriculture.

Risks and Adaptation to Climate Change in BCI Pilot Sites in PRC, Thailand and Viet Nam Final consultant report, July 2010
26
45. In Yunnan, it has been observed that water volume is reduced under the circumstances of climate change. Reduction of water resources leads to increasing drought and flooded area. Priority adaptation issues are:
(1) Assess impacts of climate change on extreme hydrological events, water quality and water environment;
(2) Assess water resources vulnerability and adaptability. Adverse effects of climate change on the rural livelihood in Yunnan Province have been observed. Climate change is mainly reflected in the more frequent chilling, drought, floods, landslides, mudslides, soil erosion and other natural disasters.
(3) Strengthen studies about impact and vulnerability of livelihoods to climate change;
(4) Strengthen studies on the relationship between climate change and infectious diseases.
B. Introduction 46. Climate change is the global issue of common concern in today's international community. Show that in the last 50 years Yunnan's climate has changed.
47. Climate change affects not only the living environment of mankind, but also the regional economic development and social progress. Yunnan is a region vulnerable to climate change. Yunnan’s biodiversity, food security, water resources and livelihoods have been adversely affected by climate change. Also, because of Yunnan's special geographical location and unique cultural & natural conditions, the future impact will be unavoidable and much more serious. This has aroused the concern of the international community, resulting in studies of the impact of climate change on Yunnan and adaptation measures.
48. This report summarizes the results of scientific research on climate change in Yunnan, and pointed out the direction for future research.
49. This report attempts to integrative and comprehensively summarise scientific research achievements in the field of climate change in Yunnan, and the important scientific findings. Based on this, it puts forward the necessity to continue efforts for carrying out scientific research in the direction and the need to settle the major scientific issues.
50. The first part of this report, "socio-economic profiles described in Yunnan", which described some of the major Yunnan's geographical location, area, population, economic, ethnic, and position in the Mekong River drainage area and so on.
51. The second part, "Yunnan overview of climate change", describes the basic facts of climate change in the past 50 years in Yunnan. The 21st century trend forecasts for climate change in Yunnan have been summarised.
52. The third part, "impact of climate change on biodiversity in Yunnan and adaptation measures", presents an overview of biodiversity and characteristics in Yunnan, describes the existing impact on biodiversity by climate change in Yunnan and adaptation measures taken, proposes biodiversity conservation strategies for future adaptation to climate change, and priority issues.
53. The next parts assess the impact of climate change on Yunnan food security, water resources and livelihoods, and proposes adaptation measures and corresponding priority issues.

Risks and Adaptation to Climate Change in BCI Pilot Sites in PRC, Thailand and Viet Nam Final consultant report, July 2010
27
C. Yunnan Socio-Economic Profiles 54. Yunnan is located at latitude 21 ° 9'~29 ° 15 ' N and longitude 97 ° 31'~106 ° 12' E. The maximum east-west distance is 864.9 kilometers, the longest longitudinal distance is 990 kilometers from north to south. The total area is 39.4 million square kilometers. There are northern tropical, subtropical, temperate zone, alpine tundra and snow-capped mountains and ice desert climates in Yunnan Province from south to north.
55. Yunnan’s population in 2008 is 45.43 million, and GDP 570.10 billion Yuan. According to the national census in 2000, the Han nationality in Yunnan is 28.206 million, accounting for 66.59% of the total population. The 25 ethnic groups’ minority population is 14.159 million, covering 33.41% of the total population.
56. The upper reach of the Mekong River in Yunnan Province, is called the Lancang River (Figure 5.1).
Figure 5.1: Geographical location of Yunnan
D. History and Future Trend of Climate Change in Yunnan 57. Since the beginning of the 1990’s, the scientists have conducted analysis of observed facts of climate change in Yunnan for the recent 50 years and obtained a great amount of information. This report makes utilization of analysis results from 113 meteorologic stations in the whole province.

Risks and Adaptation to Climate Change in BCI Pilot Sites in PRC, Thailand and Viet Nam Final consultant report, July 2010
28
1. Observed Climate Change in Recent 50 Years
a. Air Temperature
58. It can be seen from Figure 5.1 that in Yunnan Province, the average inter-annual changes in temperature shows a gradual warming trend. Its annual average temperature has risen by 0.640C with an average warming rate of 0.140C per decade in the last 46 years.
Figure 5.2: 1961~2006 annual average temperature anomalies in Yunnan
59. In1961-2006, in spring (March-May), summer (June-August), autumn (September-November) and winter (December to February) based on the mean temperature anomaly variation, the average temperature in each season is increasing.
60. Among four seasons, the most significant upward trend is in winter, with an increasing rate of 0.260C per decade; the next in autumn, change rate of 0.140C per decade; in summer, change rate of 0.120C per decade; in spring, the smallest change rate of 0.070C per decade. In 46 years, average temperature increased 1.150C in winter, 0.650C in autumn, 0.530C in summer and 0.310C in spring.
b. Precipitation
61. It can be seen from Figure 5.2 that the trend of changes in annual precipitation in Yunnan is not distinct, but it mainly shows inter-annual oscillation. The average precipitation is 1,095mm, the maximum precipitation was in 2001 (1,258mm) and the minimum was 1992 (933mm).The inter-annual difference is quite obvious.
62. The average annual precipitation in Yunnan for 1961~2006 shows only a weak decreasing trend, mainly showing inter-annual oscillation. In this46 years, the decrease of annual rainfall is only 20mm in Yunnan. This change is the opposite to the overall change in precipitation in recent 50 years in China.

Risks and Adaptation to Climate Change in BCI Pilot Sites in PRC, Thailand and Viet Nam Final consultant report, July 2010
29
Figure 5.3: Yunnan annual precipitation anomalies changes (1961-2006)
2. Future Climate Change Scenarios of Yunnan
63. Under the scenarios of IPCC SRES A2 emission the predicted results of climate change showed that:
64. IPCC SRES A2 emission scenarios in 2010-2099, Yunnan’s annual average temperature would continue to rise while the annual average precipitation would continue to decrease. The rate of temperature increase is 0.1260Cper decade (Figure 4.4) and the decrease in of average annual precipitation is 1.82mm per year (Figure 5.5).
Figure 5.4: Annual Average Temperature Change in Yunnan (1961-2099)

Risks and Adaptation to Climate Change in BCI Pilot Sites in PRC, Thailand and Viet Nam Final consultant report, July 2010
30
Figure 5.5: Average annual precipitation change in Yunnan (1961-2099)
E. Impacts of and Adaptation to Climate Change on Biodiversity 1. Impacts of Climate Change on Biological Diversity
65. Biodiversity includes genetic (gene) diversity, species diversity, ecosystem diversity, etc. Impacts of climate change on biodiversity include: habitat degradation and loss, changes in species distribution, changes of phenological period, life habits and behavior of creature, etc.
2. Impacts Caused by Climate Change on Biodiversity and Adaptation Measures
66. Impacts of Climate change on wildlife are mainly embodied in suitable habitat change, fragmentation of natural habitats, reduction of food resources, habitat drought and the reduction of availability of resources.
a. Direct Impacts of climate warming on biodiversity
67. From north to south and from high altitude to low altitude, 105 major types of forest are distributed from the alpine coniferous forest to tropical rain forest. Throughout the country, few provinces have so many forest types as Yunnan does.
68. Another characteristic of wild animals in Yunnan Province is that except for a few species, there are relatively low densities and small populations for most species. Also, there are species that have restricted distributions so many of them are vulnerable. Due to habitat destruction, fragmentation caused by climate change and other factors, population reductions and extinctions have happened to animal species.
69. The pressure of climate change presents a threat to the conservation of biodiversity in Yunnan.
b. Impact of change of land use and cover on biodiversity
70. Due to population growth, land use change, agricultural land expansion and the rise of mining and smelting, the areas of forests continue to shrink to the far mountains and border areas. Some forest areas were fragmented by developments, leading to a great threat to the survival of many wild animals, resulting in threats of extinction to some species. Studies suggest that 188 species of vertebrates in Yunnan are endangered. After the 1980s, the government has taken various measures to protect the forest, but conversion of natural forest to plantations continues and the habitat of many animals is still endangered.

Risks and Adaptation to Climate Change in BCI Pilot Sites in PRC, Thailand and Viet Nam Final consultant report, July 2010
31
71. Due to excessive logging, cropping, grazing, desertification, soil erosion, shrinkage of wetlands and other factors, many natural habitats of wild animals and plants are damaged.
72. Biodiversity has been impacted by "island" reserves and "habitat fragmentation". As early as 1986, the World Conservation Union pointed out that the original wildlife habitat loss rate in the Yunnan tropical region was as high as 61%.
73. As an example of habitat change, promotion of tropical cash crops such as rubber, sugar cane, tropical fruits, etc. has destroyed large-scale tropical forests, so that many tropical rare species have disappeared in southern Yunnan.
74. Unreasonable land exploitation and utilization and rapid population growth, have increased the consumption of natural resources. Irrational exploitation and utilization patterns have intensified the destruction of biodiversity.
c. Impact of biological invasion on biodiversity
75. Biological invasion has reduced local biodiversity through resource competition, allelopathic suppression and other ways of competition.
76. As an example, the invasive species crofton weed (Eupatorium) and fragrant eupatorium (Eupatoriumodoratum) advance northward and to higher altitudes every year due to climate warming.
3. Adaptation measures and priority issues to address climate change in the future
77. The Yunnan snub-nosed monkey (Rhinopithecus bieti) and Hylobates hoolock should be used as health indicators of forest ecosystem, to assess the impacts of climate change, and to assess proposed species protection technology(Figure 5.6)
78. China has many primate species and they are sensitive to ecosystem health. Therefore, selecting these rare and endangered primates as indicator species can help monitor the ecosystem status.
Figure 5.6: Yunnan snub-nosed monkey (Rhinopithecus bieti) and Hylobates hoolock
79. Rhinopithecus bieti only lives in Yunnan. Rhinopithecus bieti is an endemic, rare and endangered animal in China, and is considered as a state I-class protected animal. In the plan named "China Biodiversity, Conservation Action", it is listed as a priority to protection of the species as well as in serious danger to of extinction,. In biodiversity conservation, Rhinopithecus bieti is an internationally important species in need of protection.

Risks and Adaptation to Climate Change in BCI Pilot Sites in PRC, Thailand and Viet Nam Final consultant report, July 2010
32
80. Hylobates hoolock is listed as a first-class nationally protected wild animal and an endangered animal species in China. Therefore, it is necessary to monitor the food situation, habitat environment and species distribution of Rhinopithecus bieti and Hylobates hoolock. To determine the impact of climate change on the distribution and population viability is an important priority strategy.
81. The priority areas for biodiversity conservation in Yunnan Province that are also sensitive to climate change should be identified.
82. These vulnerable areas of biodiversity rich regions in Yunnan, and their ecological zones or natural geographic unit should be used as the basic starting point for systematic protection planning for climate change. Protection planning should include response plan methods, in situ conservation of biological diversity, and the establishment of a network of nature reserves to cope with global warming and protect biodiversity. In addition there is a need for systematic conservation planning, new nature reserves and nature reserves corridors, and a network of nature reserves to cope with climate change.
83. A nature reserve area monitoring system and the development of a monitoring relationship between species/ecosystem and climate is needed.
84. A unified standard methodology should be specified and comprehensive data on the impact of climate change on biological diversity and ecological processes at different scales and ecological function should be collected.
85. Biological diversity restoration and a reconstruction model is needed in Northwestern Yunnan
Northwestern Yunnan is the one of world's priority biodiversity areas, and it is rich in endemic species. Restoring and reconstructing a habitat of selected indicator species of impacts of climate change would aim to achieve the overall conservation of biological diversity.
F. Impacts of and Adaptation to Climate Change on Food Security 86. Yunnan is sensitively to climate change, and under the circumstances of climate change, annual rainfall, annual temperature and any other climatic factors have changed since 1950, affecting not only agriculture, cropping systems, crop varieties, yield and quality, but also affecting management of agriculture and people's survival.
1. Basic situation of grain production and agriculture in Yunnan Province
87. The summer-harvest grains in Yunnan Province are mainly wheat and horse bean, which are sowed in October the year before and harvested in April-May. The harvest grains in autumn are mainly rice, corn and potato. The major food crops are rice and corn. Rice is planted in March, transplanted in April-May, and harvested at the end of September and early October. Corn is sown in April-May, and harvested at the end of September and early October.
88. The main climatic factors impacting food production in Yunnan Province are winter drought, February-March spring chilling injury, May drought, July drought, August cold damage and inadequate accumulated temperature.
89. Agriculture is important in Yunnan Province, but restricted by processes such as management systems, mountain growth status, complicated hydrothermal conditions, poor agricultural infrastructure, insufficient funds and backward technology, so it is still developing and the ability to adapt to climate change is extremely limited. Farmers are a vulnerable group to climate change.

Risks and Adaptation to Climate Change in BCI Pilot Sites in PRC, Thailand and Viet Nam Final consultant report, July 2010
33
2. Observed impacts of climate change on agriculture
a. Climate Change Impacts on Agriculture
90. Due to climate warming, the climate zone has advanced to the north and to higher altitudes. During the period 1960-2000, the northern tropical and subtropical climatic zone area increased from 71.8 × 10³km2 to 87.1 × 10³km2, an increase in area of 21.3%. The area of the tropical north increased from 7.8 × 10³km2 to 14.9 × 10³km2, an increase in area of 90.2%. The total area of the northern temperate zone, mid temperate zone and southern temperate zone reduced from 128.8×10³km2 to 114.9×10³km2, a reduction of 10.8%. The sharpest declines was in the southern temperate zone with a reduction in the area of 12.5%. In contrast the northern subtropical area showed the smallest changes. The cropping area advanced to the north and to high altitude. The highest altitude of rice cultivation went from1350m to 1480m in the western region and from 1200m to 1350m in the eastern region in Yunnan.
b. Climate Change Impact on Agricultural Production
91. The trend of warmer winters extends the growing season of spring crops accelerating development of crops. For example, winter wheat growing period has advanced, and the normal harvest time in Wenshan Prefecture in late January is 15 to 20 days earlier than usual, Harvests in Qujing, Chuxiong, Yuxi and other places are10 to 15 days earlier and about 20 -25 days earlier in Kunming. Advancement of the development period will lead to advances in the low-temperature sensitive period of wheat, beans and other crops. Therefore, increasing winter temperatures makes the low-temperature sensitive period for crops close to the middle of winter, so the probability of chilling injury increases. Meanwhile, due to the early winter higher temperatures, the pre-adaptation period of crops is too short, causing cold tolerance to decline. If cool weather comes at the wrong time, even if the minimum temperature is not too low, this lack of development of cold tolerance tends to cause cold damage, resulting in empty seeds, and decreased yield. Therefore, the instability of agricultural production, volatility of output, production costs and investment will largely increase.
92. Since the 21st century, the frequency of high temperature and drought events have increased in Yunnan Province, from once in 2-3 year to once in 1-2 year. According to official statistics, 1996-2000 cumulative losses of meteorological disasters in Yunnan is 38.571 billion Yuan, accounting for 4% of the provincial GDP, and in 1988 it reaches 6.8%.
c. Crop Pests and Diseases Significantly Increased
93. The northern boundary of crop pests and diseases has extended northward. In recent years, Yunnan, like other Greater Mekong Sub-region countries, has experienced the incidence of rice plant hopper insects reaching alarming proportions. Since the 1990s in a substantial part of Yunnan, the area of the occurrence of pests and diseases has significantly increased, and in some areas the frequency of serious pests and diseases is increasing.
3. Projected Impact of Climate Change on Agriculture
94. Predicted results show that climate change is expected to increase the variability of grain output, the decline in yield and quality, and increase the risk of agro-meteorological disasters as well as the cost and investment. The loss caused by meteorological disasters may account for 6% of the provincial GDP, and in a serious year it may be more than 10.0%.

Risks and Adaptation to Climate Change in BCI Pilot Sites in PRC, Thailand and Viet Nam Final consultant report, July 2010
34
a. Decline in Yield and Quality
95. According to model estimates, global warming will increase the multiple cropping index in Yunnan, but the increase in water consumption will lead to more crop water stress, growing season and production decline.
96. Climate change may also impact on agriculture in Yunnan by increasing land degradation. A reduction in the number of rainfall days and the strong increase in the number of precipitation days will increase the area and severity of rock desertification thereby affecting the crop yield and quality in Yunnan.
97. Higher temperatures lead to an increase in the severity of crop pests and diseases and the expansion of the impact region, thus causing adverse impacts on crop yield and quality.
b. Increase the Risk of Agro-meteorological Disasters
98. Future climate change could increase the agro-meteorological disaster risk. The results show that, due to global warming, the number of rainy days will gradually reduce heavy rain frequency will change a little, while the frequency of heavy rain and heavy rainstorm will increase, and high temperature and drought events will also increase.
99. Climate change may also cause more abnormal weather, thus hail and other events effects on agriculture will increase. In the past 10 years, the number of snow, snowfall and snow range will increase in Yunnan.
c. Cost and Investment in Agriculture will also Increase Dramatically
100. With climate warming, the rate of soil organic matter microbial decomposition will be accelerated, resulting in decreased soil fertility. To deal with these problems, it’s necessary to increase the amount of fertilizer and pesticide application, which results in the increase of agricultural production inputs and costs.
4. Adaptation measures that have been taken
101. New "cooperation" crop species to adapt to climate warming are being selected. The breeding of rice varieties previously took "cold-resistant, disease-resistant and high-yield" as the goal. Now it is turned to "disease-resistant, high-yielding quality". Wheat breeding takes "drought-resistant, high-yield" as the goal.
102. In recent years, there is an increased investment in agricultural infrastructure construction of Yunnan Province. Many reservoirs have been built, and every family in the arid region has a small water cellar.
103. Hot zone agro-climatic resources development has increased.
104. As a result of these adaptation measures, grain yield has not declined in recent years, but it is rising every year.
105. Through adaptation measures, climate change can also bring beneficial effects to Yunnan.
106. Because of warming, cold damage in August is evidently reduced, and the cultivated area of late maturing high-yielding crop varieties has expanded. Yunnan autumn harvest crop yields have increased year after year, representing a benefit from measures to adapt to climate warming. Due to climate warming, August cold damage to crops rarely occurs. In summer and autumn, seeding and harvest time are no longer tight.
107. In recent years, there is early start to the rainy season, which has resulted in a marked increase in the area of rice cultivation.

Risks and Adaptation to Climate Change in BCI Pilot Sites in PRC, Thailand and Viet Nam Final consultant report, July 2010
35
108. Climate warming has brought opportunities for increases in the use of multi-cropping systems, and winter agricultural development in Yunnan Province.
5. Future Countermeasures in Adaptation to Climate Change and Corresponding Priority Issues
109. Adjustments to the agricultural structure and cropping systems are needed. Regulate management measures. Strengthen the agricultural infrastructure.
110. Breeding of new varieties of crops to adapt climate change is needed.
111. Policies for agricultural development need to be reviewed to take into account climate change opportunities, risks, and adaptation.
112. Adaptation priority issues are:
(1) Study food security vulnerability and adaptation strategies and measures;
(2) Study impacts of climate change on crop diseases and pests (migratory insects, rice plant hopper) and adaptation strategies & measures
(3) Enhance studies about impacts of climate extreme events on food security;
(4) Develop integrated assessment models of the impact of climate change on agriculture.
G. Impacts of and Adaptation to Climate Change on Water Resources 1. Survey of Water Resources
113. In Yunnan Province, mean annual precipitation is 482.08 billion cubic meters, equivalent to about 1.258 meters annual precipitation. Self-produced water is about 222.2 billion cubic meters annually, accounting for 1 / 7 of total water resources of China.
2. Impacts of Climate Change on Water Resources
114. During1961-2006, changes in annual precipitation in Yunnan Province showed only a small decrease. Annual precipitation decreases 22mm in 46 years, in contrast to the increasing trend in precipitation in China.
115. Drought is the most severe climatic disaster in Yunnan Province, especially in the last 50 years, and there is an obvious increasing trend of arid areas in Yunnan (Figure 4.6), mostly due to the increase of grain acreage and decrease of the precipitation. Floods areas also present an increasing tendency (Figure 5.7).

Risks and Adaptation to Climate Change in BCI Pilot Sites in PRC, Thailand and Viet Nam Final consultant report, July 2010
36
Figure 5.7: Annual drought disaster area in Yunnan Province
Figure 5.8: Annual Floods Disaster Area in Yunnan Province
3. Prospective Impact
116. In the IPCC SRES A2E mission scenarios, annual average temperature will continue to rise while annual average rainfall will continue to decline in the next 100 years (2010-1099) in Yunnan provinces. Water resource will be reduced.
117. The area of agricultural land affected by drought is expected to further increase. Due to climate warming, the crop cultivation area will expand, growing period of the same crops in same regions will become shorter, and the increase in water requirements will lead to a serious gap in water supply.
118. The areas of flooding are expected to increase. Concentration of heavy rain or prolonged rainfall may cause flooding. According to the research, the number of heavy rain days in Yunnan Province shows an increasing trend, but even a small increase will induce multiple floods.

Risks and Adaptation to Climate Change in BCI Pilot Sites in PRC, Thailand and Viet Nam Final consultant report, July 2010
37
4. Adaptation Measures
119. The “five small and one change” pattern of dry-land agriculture is being promoted. The “five small and one change” pattern involves, a small pool, small ditch, small pond, small cellar and small water pumping station together with dry slope reclamation.
120. Water-saving agriculture and novel technologies, new products and new materials are being promoted.
121. Six water-saving farming methods are being promoted. These involve conversions from gradient to terraced land, efficient rainwater harvesting projects focused on water-saving irrigation techniques, U-shaped seepage-proof groove made of concrete, gravity irrigation system with high water storage and PE cannula equidistant layout, FRP Cellar in mountain-PE cannula water-saving irrigation technology and some other methods such as gush, drop and spray , etc.
5. Adaptation Measures and Priority Issues to Climate Change in the Future
122. It is necessary to:
Establish and improve laws and regulations about water resources management, and cross-border international river management legislation.
Build up a water-conserving society.
Strengthen water conservancy construction and enhance adaptability.
Improve ecological protection.
Improve scientific and technological research related to water resources.
123. The priority adaptation issues are:
(1) Study the impacts of climate change on extreme hydrological events, water quality and water environment;
(2) Study the vulnerability and adaptability of water resources to climate change.
H. Impacts and Adaptation Measures of Climate Change on Livelihood 1. Impacts Already Occurred
124. Elevation differences and complex terrain are the main geographical features of Yunnan. Among the 390,000km2 of land areas, 94% are mountainous. 13.3% of the cultivated land has a slope of more than25 degrees. Climate change and natural disasters can easily destroy agricultural production. Inhomogeneous distribution of crop lands, high rates of water run off, traditional agricultural production systems, poor water conservation measures and inadequate use of the water resources, make the basic livelihood of local farmers in mountainous areas highly dependent on climatic conditions.
125. Among the 2.484 million population in Yunnan living in poverty, 87.1% or 2.164 millions live in mountainous areas. The poor live in the mountains and mid-level mountain areas which account for 97.2% of the area of Yunnan province. Cold, drought, floods, landslides, mudslides, soil erosion and other natural disasters occur frequently because of climate change. For example, there were large mud-rock flows in Nujiang Lisu Minority Autonomous Prefecture in 1989, which caused 30% of the cropping area to be inundated, more than 480 buildings destroyed, and more than100 deaths, soil was washed away, rock was exposed, and farmers lost their production base. Another disaster occurred in

Risks and Adaptation to Climate Change in BCI Pilot Sites in PRC, Thailand and Viet Nam Final consultant report, July 2010
38
February 2009, when winter drought affected 13 million acres of spring crops, with 260,000 acres of crops destroyed, and 1.6 million people suffered a shortage of drinking water.
2. Prospective Impacts
126. People are affected by the climate change, even though it is a gradual and incremental process, but the impact of extreme weather events might be sudden and sharp.
127. First of all, drought, floods, hurricane, geological disasters and any other natural disasters happen more frequently in some areas. In the north, especially in northeastern and northwestern Yunnan, a decrease in the precipitation may directly impact on the growth of crops, cause difficulty with drinking water, and livestock may die, mean while it may exacerbate soil desertification, and cause soil erosion and geological disasters. Most farmers in these areas live close to the poverty line, they have no enough capacity to withstand natural disasters. Once natural disasters happen, they immediately suffer poverty.
128. Because of the increased incidence of floods and droughts, infectious diseases and malnutrition become prevalent. For example, the incidence of infectious diarrhea increases after floods, and the availability and quality of drinking water is deeply affected by drought, leading to diseases.
129. Infectious diseases, such as malaria, which are sensitive to climate change, may be increased in distribution. Modelling shows that temperatures will rise 1.7 - 2.0 0C in 2050 in Yunnan, while malaria-affected areas will extend to higher latitudes and higher elevations. Climate warming could also lead to extreme hot weather, increasing heat wave weather-related illness and mortality. Hot weather not only makes people feel uncomfortable and reduce efficiency, but it also induces heat stroke, intestinal infectious and cardiovascular diseases, affecting psychological and emotional health. Continued mild winter in many areas will make people less tolerant of the cold, and when extremely cold weather comes in winter, they will lose immunity to some of the diseases.
3. Adaptation Measures
130. In order to protect the environment, mechanisms for compensation has been developed for forest and water resources
131. The Government has already proposed many policies to intensify the construction of farmland water conservancy facilities, through slope reclamation, the diversion of irrigation and a variety of measures to enhance the effectiveness of irrigation. By 2010, measures for the protection of stable production will guarantee farmers own 1-1.5 acre field allocations and thus ensure the basic food needs of farmers.
4. Adaptation Measures and Priority Issues to Climate Change in the Future
132. To adapt to climate change, the existing anti-poverty policies in different ecologically fragile zones will need to be adjusted to;
133. Enhance responses to climate change in poor areas, increase the capacity to adapt to natural disasters;
134. Speed up the development of laws and regulations, attaching importance to environmental issues in the process of anti-poverty policies, ensure appropriate development, and to continue to improve infrastructure in the economically deprived areas;
135. Reinforce studies about climate change and, release special funds for adaptation to climate change;

Risks and Adaptation to Climate Change in BCI Pilot Sites in PRC, Thailand and Viet Nam Final consultant report, July 2010
39
136. Additional measures should be taken to ensure public participation, strengthen early-warning technology and disaster prevention, adjust industrial structure, and enhance the ability of workers to adapt to climate change;
137. Implement human-oriented, set up and improve the health security system;
138. Strengthen education and improve people's awareness and ability to respond to climate warming.
5. Priority Adaptation Issue
139. Enhance studies about impact of climate change vulnerability on livelihoods.
140. Strengthen studies about the relationship between infectious diseases in the Greater Mekong sub-region and climate change.

Risks and Adaptation to Climate Change in BCI Pilot Sites in PRC, Thailand and Viet Nam Final consultant report, July 2010
40
CHAPTER V
IMPACTS OF VULNERABILITY AND ADAPTATION OPTIONS TO CLIMATE CHANGE IN GUANGXI
By
Xu Yinlonga, Kuang Zhaominb and Xie Guoqingc aInstitute of Environment and Sustainable Development in Agriculture
bInstitute of Meteorological Disaster Reduction, Guangxi Meteorological Bureau cYunnan Meteorological Bureau
A. Abstract 141. The report involves reviewing and scoping of existing climate change studies in Guangxi Zhuang Autonomous Region. It examines how vulnerable Guangxi is, especially Northwest Guangxi; how climate change is impacting on agriculture, food security, bio-diversities, water resources and rural livelihood; what adaptation options have been taken by Guangxi to date; how Guangxi can step up adaptation and mitigation efforts, and what the topic priorities are.
142. The study found that climate change is already affecting Guangxi, with rising temperature, changed rainfall distribution, rising sea levels, increasing frequency and intensity of extreme weather events leading to massive flooding, landslides and drought causing extensive damage to property, assets, and human life. Climate change is also exacerbating the problem of water stress, affecting agriculture production and food security, and increasing the area of rock desertification, worsening the rural livelihoods, degrading forests and damaging coastal marine resources.
143. The report urges that Guangxi should take more adaptation options to adapt to and mitigate the climate change for sustainable development. Its key elements include: adapting agricultural practices to changes in temperature and precipitation; adapting water management to greater risk of floods and droughts; adapting coastal zone management to higher sea levels. Guangxi needs to take timely action to adapt to climate change, build resilience, and minimize the losses caused by the impacts of climate change.
144. The report suggests that adaptation actions in Guangxi should put priority on the adaptation options to the New Southeast Guangxi heavy drought region which is the major producer of agricultural crops, strengthen the quantitative and deep study of impacts of climate change to agricultural production, study the triggering cause of rocky desertification, especially the relationship of rocky desertification and climate driving factors, enhance research of climate change and other related science, and improve land and water resources management in the agricultural sector and drought area.
B. Preface 145. The Guangxi Zhuang Autonomous Region, which includes southern sub-tropical and the middle sub-tropical and the northern tropical zones, is located in the south of China, and is one of the major producers of tropical fruits and sub-tropical fruits and

Risks and Adaptation to Climate Change in BCI Pilot Sites in PRC, Thailand and Viet Nam Final consultant report, July 2010
41
vegetables in China. In recent years, there has been increased interest in the impacts of the global climate warming on the social economy of the world. Climate change would affect everyone but the people that live in the hostile environment in Guangxi will get hardest and fastest impacts, and have the least capacity to respond. Guangxi is particularly vulnerable to the impacts of climate change with its extensive, heavily populated rock desertification area, large agricultural sectors and large sections of the population living in poor and hostile circumstances.
146. This study is intended to enrich the debate on the impacts of climate change that includes agricultural and food security, water resources, bio-diversity, and rural livelihoods. It seeks to raise people’s awareness of the urgency of the grave challenges facing the region, and to build consensus of the local governments, business sectors, and society on the need for incorporating adaptation and mitigation measures into local development planning processes.
147. Although organizations in Guangxi have made significant progress on their own in addressing climate-related issues, it is still necessary to do more to fully integrate climate change concerns into their sustainable development policies. And further steps need to be taken to encourage all sectors in mitigation and adaptation efforts. If not addressed adequately, climate change would have serious negative impacts on the region’s sustainable development and poverty eradication.
C. A Brief Introduction to the Socio-economic Condition of Guangxi 148. The Guangxi Zhuang Autonomous Region, which includes the southern sub-tropical and the middle sub-tropical and the northern tropical regions, is located in Southern China at E104°26'112°04', N20°54'26°24', and it is to the Eastern boundary of the Greater Mekong Sub-region and to the North East of Viet Nam (Figure 6.1).
149. The location of the Guangxi Zhuang Autonomous Region adjoins Guangdong in the east, Yunnan in the west, Guizhou in the Northwest, and borders Beibu Bay in the south.

Risks and Adaptation to Climate Change in BCI Pilot Sites in PRC, Thailand and Viet Nam Final consultant report, July 2010
42
Figure 6.1: Geographical location of Guangxi
150. Guangxi has become an important sea-land passage which links up China and Southeast Asia. The whole land area of Guangxi is about 23.75 million hectares, accounting for 3.47% of China’s whole area, which is the ninth largest province in China. Guangxi is typically characterized by a diversified land type. Of the land area, 80%is mountains, 10% is fields and 10% is water.
151. Guangxi is a provincial-level autonomous region of with ethnic minorities. Zhuang is the main and the most populous ethnic minority in the province inhabited by the Zhuang, Han, Yao and other 12 ethnic clans. There was a50.49 million population at the end of 2008, the tenth most populous province in China, and among the population the ethnic minorities account for 38.4% and Zhuang's population accounts for 32.5%.
152. On the whole, the economy of Guangxi maintains a steady and very fast growth rate. The GDP of Guangxi reached 595,600 million RMB in 2007, and 15.1% growth rate, 2.1 percentage higher than the national level of 13.0%. The whole district per capita GDP increases rapidly too, from 5058 RMB in 2001 to 12,555 RMB in 2007, but was still lower than the per capita share of 18,934 RMB in 2007 of the whole nation.
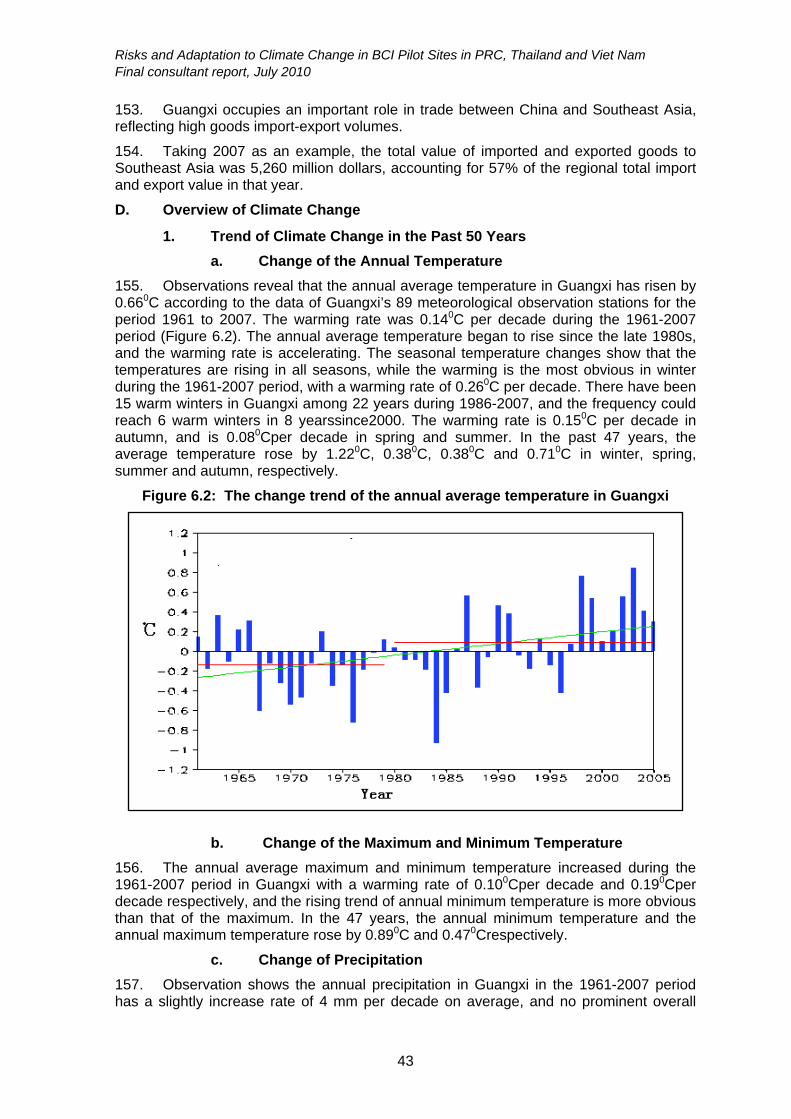
Risks and Adaptation to Climate Change in BCI Pilot Sites in PRC, Thailand and Viet Nam Final consultant report, July 2010
43
153. Guangxi occupies an important role in trade between China and Southeast Asia, reflecting high goods import-export volumes.
154. Taking 2007 as an example, the total value of imported and exported goods to Southeast Asia was 5,260 million dollars, accounting for 57% of the regional total import and export value in that year.
D. Overview of Climate Change 1. Trend of Climate Change in the Past 50 Years
a. Change of the Annual Temperature
155. Observations reveal that the annual average temperature in Guangxi has risen by 0.660C according to the data of Guangxi’s 89 meteorological observation stations for the period 1961 to 2007. The warming rate was 0.140C per decade during the 1961-2007 period (Figure 6.2). The annual average temperature began to rise since the late 1980s, and the warming rate is accelerating. The seasonal temperature changes show that the temperatures are rising in all seasons, while the warming is the most obvious in winter during the 1961-2007 period, with a warming rate of 0.260C per decade. There have been 15 warm winters in Guangxi among 22 years during 1986-2007, and the frequency could reach 6 warm winters in 8 yearssince2000. The warming rate is 0.150C per decade in autumn, and is 0.080Cper decade in spring and summer. In the past 47 years, the average temperature rose by 1.220C, 0.380C, 0.380C and 0.710C in winter, spring, summer and autumn, respectively.
Figure 6.2: The change trend of the annual average temperature in Guangxi
b. Change of the Maximum and Minimum Temperature
156. The annual average maximum and minimum temperature increased during the 1961-2007 period in Guangxi with a warming rate of 0.100Cper decade and 0.190Cper decade respectively, and the rising trend of annual minimum temperature is more obvious than that of the maximum. In the 47 years, the annual minimum temperature and the annual maximum temperature rose by 0.890C and 0.470Crespectively.
c. Change of Precipitation
157. Observation shows the annual precipitation in Guangxi in the 1961-2007 period has a slightly increase rate of 4 mm per decade on average, and no prominent overall

Risks and Adaptation to Climate Change in BCI Pilot Sites in PRC, Thailand and Viet Nam Final consultant report, July 2010
44
variation change (Figure 6.3). The decadal periodical change of precipitation is more obvious, with shortage of rain in 1961-1967, 1984-1992, and 2003-2007, and an abundance of rain in 1968-1983 and 1993-2002 periods. The seasonal variation of the precipitation, show a tendency to reduce in spring and autumn, which is - 2.8 mm per decade and - 15.3 mm/per decade respectively; and in winter and summer it show a tendency to increase, which is 5.4 mm/per decade and 16.3 mm per decade.
Figure 6.3: The Change Trend of the Annual Precipitation in China
d. Extreme Weather/Climate Events
158. Consistent with a scenario of global warming, the frequency and intensity of extreme weather events presents an obvious change in Guangxi. The drought is further aggravated and the area of drought presents a rising trend in the past 50 years in Guangxi. The disaster area was small in the 60s and the 70s of the 20th century, but enlarged in the eighties, when the area was more than 1 million hectares, 90% occurring in the late 80saccording to the Guangxi Agriculture Department).
159. The incidence of heavy precipitation events increased and floods become more frequent. The statistics show that the number of stations with extreme precipitation events increased by 4 per decade on average over the past 50 year in Guangxi. Especially in 1990s, the extreme precipitation events become increasingly frequent, and the annual number of stations with extreme precipitation events reached 84 on average, which is the most ever recorded. The floods are occurring more frequently in Guangxi. Especially since entering the later stage of the eighties of the 20th century, the frequency of heavy flood events has obviously increased. Among the10 most serious flood events in the past 50 years, seven occurred in the late 1980s.
160. The number of tropical cyclones has slightly reduced but the impacts are more serious. The number of tropical cyclones influencing Guangxi shows a slight downward tendency in past 50 years, reducing by 0.7per decade on average. But the impacts of the tropical cyclones cannot be ignored. For example, Zuo River, You River, Yong River, Yu River, and Xun River flooded during the extreme precipitation event caused by a typhoon in July 2001,The flood overflowed, which is the largest flood in Baise city, and is the heaviest flood since 1913 in Nanning city, and is the most severe flood on hydrology record in Guigang city. 24 persons died in this disaster, the direct economic losses reached more than 15,900 million RMB in Guangxi, accounting for about 7.2 % of Guangxi GDP in 2001.

Risks and Adaptation to Climate Change in BCI Pilot Sites in PRC, Thailand and Viet Nam Final consultant report, July 2010
45
161. The frequency of hot temperature events has obviously increased. The annual number of hot-temperature weather days shows an increasing trend, with the rate of 38 days per decade in the past 50 years in Guangxi. The annual number of hot-temperature weather days had a tendency to reduce from the 60s of the 20th century to the 70s, and started to rise after the 80s.The all time highest annual number of hot-temperature weather days was in 2001-2007. Especially since the late eighties of the 20th century, the number of hot-temperature events has increased, and among the severest 10 events in the past 50 years70%occurred at this period according to the data of Guangxi’s 89 meteorological observation stations in 1961-2007 period.
162. Chilling damage to crops has been reducing in recent years (Figure 6.4). With global warming, chilling damage shows a tendency to reduce, with the annual number of frost days and frozen days in the whole district reducing on average by 42-52 days per decade, and the annual number of snowfall days and sleet days of the whole district has reduced by an average of 7-19 days per decade.
Figure 6.4: The change of the number of freezing damage stations in Guangxi
163. The disaster losses caused by extreme weather events has increased. Because the extreme weather events happen frequently, the losses caused by meteorological disasters has greatly increased, especially after the 1990s. With the frequency of disaster weather events increasing, the disaster losses have increased. From 1993to 2007, the annual direct economic losses caused by meteorological disasters reached 15 billion RMB, over 35 billion RMB in 1994 and 1996 and about 20 billion in 2001.
2. The Climate Change Scenario for Guangxi
164. According to the Global Climate Model, under the B2 scenario, the climate in Guangxi will continue with warming in the future. The annual average temperature of Guangxi may rise up to 1.90C by 2050, and by 3.30C by 2100; the annual average precipitation may increase by about 3% by 2050 and 9% by 2100; the extreme weather/events may more frequently occur and the economic losses would be increased.
E. Climate Change Impacts 1. Made Impacts
a. Impacts of Climate Change on Agriculture and Food Security
165. Guangxi is an important agricultural province in China. Climate change increases the instability of agricultural production, as crop yields fluctuate, agriculture production distribution and structures change, agricultural working conditions change, and agricultural costs and investment increase greatly.

Risks and Adaptation to Climate Change in BCI Pilot Sites in PRC, Thailand and Viet Nam Final consultant report, July 2010
46
166. Because agricultural and rural infrastructures are weak in Guangxi, it is difficult to resist natural disasters. Water facilities wear out, the effective irrigated area increases slowly, and droughts and floods occur frequently. The area of cultivated land shows a tendency to reduce year by year, and the proportion of the middle-and-low-yielding lands increase in proportion to high-yielding lands.
i. Agriculture
167. Consistent with the scenario of climate change, agricultural losses due to extreme weather events in Guangxi shows an increasing trend. The area of crops affected by weather-related events in 2007 in Guangxi reached 1,125,700 hectares for meteorological disasters, and area of crop failures was 95,600 hectares according to the Guangxi Agriculture Department.
ii. Sugarcane
168. Guangxi is the major producer and exporter of sucrose in China. Because most sugarcane are planted in arid fields without irrigation and crops are rain fed, with the temperature warming and the changes in precipitation, drought and flood occur more frequently, which cause reductions in yield. The intensity of the extreme climate events made large impacts on sugarcane production and rural livelihoods. For example, the severe freezing and cold injury events in Southern China in early 2008 caused great losses in sugarcane, including a reduction of about 20% in yield according to the Guangxi Agriculture Department.
iii. Rice
169. Rice growth is sensitive to temperature and precipitation. With temperature increasing, the date of sowing has become earlier and the date of harvesting later, which results in an expansion of growing season and growing area of rice. The vulnerability of rice to climate change mainly manifests itself in a weak resilience to drought and flood, which cause lower yields.
iv. Litchi and Longan
170. Litchi and longan have strict temperature requirements, which need a relative low daily average temperature and minimum temperature in winter. At present, the planting boundary is spreading northward.
b. Impacts of Climate Change on Water Resources
i. The Spatial Distribution of Precipitation Differs Greatly
171. According to hydrological data and statistical analysis, the rainfall and its spatial distribution have changed greatly in recent years in Guangxi. Compared with average values in the same term, the precipitation increased by 54.8% in July 2006, and decreased by 45% in July 2007 in Guangxi. From December 2008 to February 2009, the rainfall was only 43 mm in Guangxi, a decrease of 67% on average according to the data from Guangxi’s 89 meteorological observation stations in the period 2006-2008.
172. The distribution and quantity of water resources are irregular in Guangxi. Influenced by climatic change, the distribution of rainfall in recent years has changed. Impacted by factors such as topography, geology and economic development, etc., the extent of development and utilization of water resources is relatively low, and the existing water supply projects distribute water irregularly, so the imbalance between supply and demand of water resource is still relatively substantial.
173. Because topography is comparatively complicated in Guangxi, extreme climate events such as extreme precipitation events, etc. are liable to cause serious flooding in river basins, flooding in cities and geological disasters caused by mountain torrents.

Risks and Adaptation to Climate Change in BCI Pilot Sites in PRC, Thailand and Viet Nam Final consultant report, July 2010
47
ii. Floods and Droughts Occur Frequently
174. Because of the changes in rainfall distribution in recent years, floods and droughts take place frequently in Guangxi. The losses caused by droughts exceed the losses caused by floods in the south, the west and the middle of Guangxi. However, the drought in autumn exceeds the spring drought in Eastern Guangxi; the damage caused by flood exceeds the drought in Northeast Guangxi; the drought in spring is more severe in Western Guangxi, and the drought in autumn takes place frequently in the middle part of Guangxi.
175. It is reported that the 4 years shifting average curve of the annual drought frequency is consistent with the annual average temperature (Figure 6.5), especially since the 1980s, the correlation is 0.747 in Nanning city of Guangxi.
Figure 6.5: Annual average temperature and 4 years shifting Average curve of annual drought frequency
176. In recent years, basin-wide great flood events, geological calamities and severe urban floods are increasingly frequent and the disaster losses are growing. In the extreme flood event which took place in June 1998 in Wuzhou city, the dam of the Xijian River was destroyed, which was built to the standard of a once-in-a-hundred-year event. The near once-in-a-hundred-year extreme massive flood happened again in June 2005. More than 200 sudden mountain torrents happened in succession in Guangxi in 2006. From June to September 2007, 5 severe floods took place in Guangxi.
177. Since the 1990s, the disaster weather events have increased and the losses have grown. During the period1993~2007, the annual average direct economic losses reached 15 billion for the impacts of meteorological disasters; including more than 35 billion in 1994 and 1996, about 20 billion in 2001, accounting for about 30%, 19% and 9% of Guangxi’s annual GDP respectively.
iii. Developed A New Heavy-Drought Area
178. Compared with research results using data from 1961-2000, results show an expansion of autumn drought area in Guangxi and increase of fall drought frequencies in Southeast Guangxi by using data from 1961-2007, especially in Wuzhou city and Yulin city and Guigang city of Guangxi adjoining Leizhou Peninsula of Guangdong (Figure 6.6). Only taking about 7 years did it to develop a new heavy-drought area in this area. As this area is the major rice producer of Guangxi, it severely harmed the local social economy and rural livelihood.

Risks and Adaptation to Climate Change in BCI Pilot Sites in PRC, Thailand and Viet Nam Final consultant report, July 2010
48
Figure 6.6: Distribution of fall drought frequency of Guangxi
iv. The Area of Rock Desertification Increase
179. Rock desertification refers to the processes which transform a karst area that was covered by vegetation and soil into a rocky landscape almost devoid of soil and vegetation.
180. The results show the area rock desertification increased. The area of drought and rock desertification decreased firstly from 1985~1990, after that it increased from 1990~2000. Precipitation is the major factor resulting in the development of rock desertification. Figure 6.7 indicates the correlation of potential and slight rocky desertification with temperature.
Figure 6.7 Correlation of potential and slight rocky desertification and temperature

Risks and Adaptation to Climate Change in BCI Pilot Sites in PRC, Thailand and Viet Nam Final consultant report, July 2010
49
c. Impacts of Climate Change on Ecosystems and Biodiversity
181. Guangxi is one of the provinces with the most abundant ecosystem types in China. The types of ecosystems are not only varied, but also very complicated in structure and variety, which is an important ecological protective screen of Southwest and South China. Climate change has exerted obvious impacts on the ecological environment in Guangxi. As natural disasters are frequent, forest vegetation quality is falling, biodiversity is damaged and soil erosion and rock desertification are becoming increasingly serious.
d. Impacts of Climate Change on Rural Livelihoods
182. Most of the people of Northwest Guangxi are struggling with poverty. A shortage of soil and water leads to rock desertification. Only some drought-resisted crops such as maize can be planted in rock desertification areas, the yield of maize is low as it suffers from drought and flood which occur more frequently and severely than in other non-Karst areas, and the peasants live in poverty and have insufficient food to survive by themselves.
e. Insect Pest and Diseases
183. With climate warming, diseases, insect pests and weeds are intensified and expand, and the wintering boundary is spreading northward for insect pests. Especially since the 90s, the area of vegetable disease and insect pests in Guangxi has become increasingly serious.
2. The Future Impacts
a. Agriculture and Food Security
184. The rising temperature caused by climate change causes an earlier date of sowing and a later date of harvesting of rice and maize in Guangxi, and are conducive to higher yield.
185. With climate warming, crop and breeding plans are going to be changed and cropping systems will be amended. The northern planting boundary of cropping is spreading further north and maximum cropping altitudes are generally increasing. This is beneficial to the agricultural development in north Guangxi and mountainous areas. However because of climate warming, the instability in agricultural production is fluctuating more than ever. Higher temperature scan lead to a decrease in crop quality and yield. At the same time, when the climate warms diseases, insect pests and weeds are intensified, drought and waterlogged soils as well as agro-meteorological disasters are increased.
b. Water Resources
186. Because the Southwest Guangxi limestone regions are more sensitive to climate change, prolonged drought is likely to exacerbate local rock desertification further, and cause changes in wildlife population dynamics. Drinking water will be in short supply for people and flocks and herds in the drought areas.
c. Biodiversity
187. Guangxi extends across tropical and subtropical zones, so species composition is complicated. Climate change will cause tremendous impacts on distribution, structure and species of the wild animals in Guangxi. Firstly, the tropical species will occupy the ecological location of the subtropical species in Guangxi by competition: some outside species that once lived in the tropical area will invade and spread northwards. That will make it possible that the characteristic species in Guangxi become extinct.
188. Secondly, long-term change of the factors relating to phenology such as temperature, precipitation, humidity of soil, sunshine hours, etc., will lead to change of

Risks and Adaptation to Climate Change in BCI Pilot Sites in PRC, Thailand and Viet Nam Final consultant report, July 2010
50
phenology too, influencing the reproductive ability, competitive ability and interaction among the species.
189. Third, the increase of temperature caused by climate change will make earlier the date of butterfly emergence, egg-producing and reproduction timing of amphibian animal, and migration date of birds. Some wintering birds in Guangxi may reduce the distance of wintering and migrating, wintering to the north of Guangxi.
190. Climate change reduces biodiversity, and increased frequency of extreme weather events directly leads to death of a large number of species, which will change the age structure of populations of wild animals and sex ratio, and impact the stability of animal populations.
d. Rural Livelihood
191. It is estimated that in the next 30 years, the sea level of Guangxi will rise by 70-110 mm relative to 2008. It will cause the coastline of Guangxi to retreat where the sea level rises. In 2005, there were 4.2 sq. km land area flooded, which caused more than 100 villagers to migrate in Shaluoliao village, Guangpo town, Gangkou district, Fangchenggang city, Guangxi according to the Guangxi Agriculture Department).
e. Insect Pest and Disease
192. The minimum temperature usually plays a more important role than the maximum temperature for the distribution of insects. At present some varieties that are controlled by the minimum temperature, could overwinter in higher latitude, and at the same time some varieties could migrate to higher elevation areas. With the climate warming, most parts of Southern Guangxi could become a climate zone suitable for the growth of rice plant hopper from the current overwintering climate zones. Middle and Northern Guangxi (except the Northeastern Guangxi) would change into overwintering climate zones of rice plant hopper, and the northern border will expand from 22ºN northward to about 24ºN.
F. Implemented Adaptation Options to Climate Change
1. Agriculture
193. In recent years, Guangxi has taken a series of policies and measures to accelerate agricultural, scientific and technological progress, involving agricultural system innovation, strengthening agricultural research techniques, popularizing agricultural research results, strengthening the skills of agricultural and rural personnel etc.. Meanwhile, the development of sustainable agriculture is being promoted in a more cost-effective manner by accelerating the development of the water-saving irrigation in Guangxi. The area of new irrigation has increased by 4,350 hectares, and the in the area of water-efficient irrigated area has increased by 15,480 hectares. Various kinds of ecological agriculture aim to improve the productive condition and eco-condition of land by developing water resources of the Karst rock desertification area and to encourage irrigated agriculture and water-saving agriculture etc.
2. Water Resources
a. Building of Water Ponds Near Farmland
194. Pioneering work to build water ponds near farmland in Karst rock desertification areas of Guangxi, may alleviate a shortage of drinking water for people, flocks and herds, but also irrigate the drought-prone fields, and improve the poor agriculture production conditions, increasing peasant income and protecting the environment.
b. No-Tillage with Mulch Technology
195. No-tillage with mulch technology can promote more efficient use water by crops. Comparing with the traditional cultivation methods, the efficiency of water use can enhance 13.24% by no-tillage with mulch technology. It can decrease by 50% the losses

Risks and Adaptation to Climate Change in BCI Pilot Sites in PRC, Thailand and Viet Nam Final consultant report, July 2010
51
of soil by erosion and water by evaporation, and improve the efficiency of water use by 7.24% for one hectare of field crops.
c. Demonstration Project of the Prevention and Recovery of Rock Desertification
196. In recent years, some counties have been selected as demonstration project sites for the prevention and recovery of rock desertification in Guangxi. For instance, the Pingguo county is one of these sites, and the project achieved satisfying effects. Figures 6.8 and 6.9 show the dynamics of the development process of rock desertification in Pingguo county, Guangxi province.
Figure 6.8: Temporal-spatial change of rock desertification in Guangxi Pingguo county based on satellite data
(The area of purple and tawny and yellow is heavy and middle and light rock desertification respectively, and the green area is vegetation)
Figure 6.9: The demonstration project on the prevention and recovery of rock desertification

Risks and Adaptation to Climate Change in BCI Pilot Sites in PRC, Thailand and Viet Nam Final consultant report, July 2010
52
d. The Project to Convert Farmland into Forest
197. In this re-afforestation project, the total areas of re-afforestation reached 770,000 hectares during 2001-2006 in Guangxi, and the total investment was 3.7865 billion. The average income per person increases by 148 RMB/head for 3.61 million peasants, and the economic value of wood reserves reached 22.196 billion RMB in this project.
3. Ecosystem and Biodiversities
198. To strengthen ecological protection, the government issues and implements programs of zoning for ecological functions in Guangxi, and initiated key ecological conservation zone planning and conservation work. Guangxi has already set up 77 nature reserve areas, and15 national-level nature reserves, It is also actively strengthening protection of resources and management of species protection.
199. To continually implement ecological restoration. The government is finishing the restoration of 18 small rock desertification areas in 12 counties. The area of soil erosion is 1020 sq. km. It is also participating in the United Nations Environment Programme global environmental fund project to protect the South Sea of China and the Thai gulf environment.
200. To demonstrate ecological initiatives the government has named 22 counties,2 towns and a village asnational-level ecological demonstration areas.
4. Livelihood
201. Due to the impacts of frost and cold extreme weather in early 2008 in Guangxi, 76000 hectares or re-afforestation project land was damaged, accounting for 9.9% of the total area of re-afforestation, which caused considerable difficulties for the livelihood of some peasants who inhabit the rock desertification area in this poor productive condition region.
G. Future Adaptation Options to Climate Change
1. Agriculture and Food Security
a. Build a System for Agricultural Disaster Prevention and Reduction.
202. In order to deal with climate change, Guangxi should increase agricultural productivity by implementing water-saving irrigation technology in key irrigation areas, strengthening the system of agricultural disaster prevention and reduction, enhance the ability of agriculture to deal with climatic change, foster agricultural scientific and technological progress, improve agricultural productivity, and strengthen agricultural infrastructure construction.
b. Breeding Resistant Varieties of Crops and Adjust the Planting Season
203. In order to positively respond to the adverse impacts of climate change some measures should be adopted such as breeding more resistant varieties, adjusting the planting season strengthening pest and disease control� establishing a sustainable agriculture system and strengthening agricultural meteorological monitoring and prediction.
2. Water Resources
204. Scientific research into soil erosion in the Karst areas should be enhanced, not only to study the rates of water and soil loss in the Karst areas, but also to study the special engineering and biological initiatives in the Karst areas, especially ways of natural rehabilitation of the Karst rocky desertification areas.

Risks and Adaptation to Climate Change in BCI Pilot Sites in PRC, Thailand and Viet Nam Final consultant report, July 2010
53
205. It is necessary to strengthen the system of preventing and controlling drought and flood. The economic losses could be reduced by using programs, such as hydrology monitoring, disaster early warning, soil moisture content monitoring etc., which could enhance the ability to adapt to climate change.
206. The application of agricultural water-saving irrigation and water-saving agricultural technology, and an acceleration of construction of water reserves in hilly regions and drought areas would help adapt to climate change. The continued use of water-saving irrigation demonstration projects in the main production region for crops, then disseminating them to other drought areas would also assist with adaptation.
3. Ecosystems and Biodiversity
a. Promotion of Sustainable Agriculture and Eco-migration Projects
207. Eco-migration, eco-compensation, and promotion of sustainable agriculture according to the local environment and production conditions is needed.
b. Improve Management of Risk and Reduction of the Impacts of Extreme Climate Events
208. Strengthening capacity in monitoring and early warning and emergency management of major natural disasters should be a high priority.
c. Developing Eco-tourism
209. There are unique and abundant tourist resources in the Karst region such as Karst caves, forests, mountains, water-falls, national culture and folk customs. Through tourism development, the tourist resources can be transformed into tourist products. Thus, the so called barren mountains and unruly rivers and the remote and backward places in the Karst region may become valuable eco-tourist resources as natural landscape and folk customs. These not only meet the demands of the contemporary society but also make use of the potential of the local resources.
210. On the other hand, in order to sustainably maintain the value of these resources, the original ecology and the native culture should be preserved. Thereby, the economic foundation of environmental protection and cultural preservation will be maintained, conservation and development will be balanced and the “poverty trap” will be escaped.
4. Rural Livelihood
211. In the Karst areas of the Northwestern Guangxi, it is necessary to implement a state project for the comprehensive control of soil erosion by the government. In the project, at demonstration sites, control of soil erosion combined with improved production and life conditions of local farmers, should be established first, and then introduced to all Karst rocky desertification areas. Meanwhile, some policies for soil and water conservation, ecological compensation and ecological emigration should be strengthened.
212. Development of eco-tourism in the region and eco-resorts around ethnic culture and natural scenery will help improve rural livelihoods and conserve ecosystems.
213. Strengthened capacity by technology training in areas such as such as sustainable agriculture and water-saving agricultural techiques will to enhance the skills of local agricultural workers.

Risks and Adaptation to Climate Change in BCI Pilot Sites in PRC, Thailand and Viet Nam Final consultant report, July 2010
54
H. The Future Adaptation Options to Climate Change
1. Research in Adaptation Options in the Drought-Prone Agricultural Region of Southeast Guangxi
214. Increased research is needed on the impacts of climate change on agriculture and food security. The results show that the southeast Guangxi has developed a new severe drought-affected area due to climate change. Moreover, this region is the major producer of crops, so it is a tremendous challenge to adapt to the climate change to ensure food security in Guangxi.
2. Strengthen Research on the Impacts of Climate Change on Agricultural Production
215. Research on the quantitative relationship between climate change and agricultural production by introducing new models may enhance the accuracy of assessments.
3. Enhance Study of the Cause and Mechanism of Rocky Desertification and Establish a Database of Rock Desertification and Models
216. Studies of the cause and mechanism of rocky desertification, especially the relationship between rocky desertification and climate driving factors are needed.
217. A database of rock desertification and models of the development, monitoring, prevention and control of rock desertification and assessment of recovery is needed to instruct and deploy resources for recovery and control of rock desertification consistent with the distribution pattern of rock desertification.
4. Strengthen Research into Climate Change in Guangxi
218. Research into climate change in Guangxi, its impacts on the population, economy, traffic and energy at a regional scale, and the impacts of climate change on regional economy and society security and its adaptation options is needed. Research of impacts of climate change on human healthy is also important.

Risks and Adaptation to Climate Change in BCI Pilot Sites in PRC, Thailand and Viet Nam Final consultant report, July 2010
55
CHAPTER VI
IMPACTS OF AND ADAPTATION TO CLIMATE CHANGE
IN THAILAND
By Louis Lebel USER, Chang Mai University
A. Abstract 219. This report reviews what is known about the potential impacts of climate change on biodiversity, water resources, food security and rural livelihoods in Thailand. It draws on previously published literature focusing wherever possible on analyses and findings specific to Thailand where these are available. Climate changes arising from global warming pose significant, but still highly uncertain risks.
220. In the case of biodiversity risks are invariably compounded by other pressures arising from human activities, in particular, those resulting in habitat modification. Detailed understanding of the vulnerability of individual species or assemblages to climate change appears to be critical to designing effective management responses, but unfortunately is rare in Thailand.
221. For water resources the challenges are substantial and strongly influenced by land- and water-use. Droughts, floods and storms already have major impacts in Thailand. More systematic learning from these experiences could be highly relevant to dealing with future climate variability. The diversity of interests among different water users makes interventions to alter flow regimes complex. Public deliberation will increasingly be critical to negotiating sustainable solutions.
222. Food security in the Thai context is closely related to agricultural production and food prices, which in turn, depends on allocation of water resources and, increasingly, fossil fuel prices. In the short to medium term and at the national level Thailand would appear to be relatively food secure. As the risks of climate surprises widen with global warming, insecurities become more and more apparent, especially at more local levels where other factors also affect household access to food.
223. Rural livelihoods are often dependent on access to water for agricultural production and associated services like fisheries. These pathways are sensitive to climate. Farmers of rain fed rice may be among the most vulnerable groups to climate change. Diversification of livelihood strategies appear key to maintaining resilience and often include off-site migration. Climate change related impacts on health are another area of concern especially for poor populations that may migrate to and from areas with poor living standards in urban areas for part of the year for employment.
224. Robust adaptation measures to climate change are those which enable coping with uncertainty, learning from experiences, building adaptive capacities, and integrating with normal development. Substantial investments to improve the capacity of Thai society to adapt to climate change are needed to conserve biodiversity, manage water resources effectively, maintain food production and ensure food security, and to sustain rural livelihoods. The investments needed are likely to be substantial and on-going.

Risks and Adaptation to Climate Change in BCI Pilot Sites in PRC, Thailand and Viet Nam Final consultant report, July 2010
56
B. Introduction 225. Global warming poses significant risks and burdens to development and the environment in the Greater Mekong Sub-region through its expected impacts on temperature, seasonal rainfall patterns and extreme events. An ADB (2009b) study of the economic impacts of climate change suggested that Southeast Asia as a region was likely to suffer more from climate change than the global average. Likewise a recent World Bank (2009) study suggests that the East Asia and Pacific Region would have the highest cost of adaptation in both wetter and drier scenarios. Significant impacts are anticipated in many domains (IPCC 2007a). Ecosystems and biodiversity are often already under severe pressure from human activities and climate change is likely to make their management even more difficult. Agriculture is crucial to both economic development and security and sensitive to changes in both water availability and temperature. Many of the risks from climate change are likely to be exacerbated by water insecurities, which in a monsoonal climate, can mean both too much and too little depending on the time of year, with impacts on both rural and urban livelihoods. New frameworks, policies and programs need to be launched now to ensure successful adaptation to climate change.
226. This report is a review of what is known about the potential impacts of climate change on Thailand and suggestions about the highest priority adaptation measures. The purpose, put succinctly, is to answer two questions:
What are likely to be the major implications of climate change for biodiversity, food security, water resources and rural livelihoods for Thailand?
What are the highest priority adaptation measures applicable in a local context for biodiversity, food security, water resources and rural livelihoods in Thailand?
227. This report draws on previously published literature focusing wherever possible on analyses and findings specific to Thailand but where these are not available also considering authoritative global or regional analyses. Before reviewing understanding about impacts and their implications it worth briefly summarizing the state of the science with respect to observed and expected future changes in climate for Thailand.
C. Climate change observations and projections 228. A fair amount is known about recent changes in climate at larger scales across Asia (IPCC 2007b). There is overwhelming evidence for warming: annual mean temperatures have increased in many locations, there are more hot days and warm nights, glaciers are retreating, and snow-cover is decreasing (IPCC 2007b). Observed trends in precipitation are more complex and uncertain, but include drying trends, changes among seasons, and more intense rainfall events (IPCC 2007b).
229. Across monsoon Asia the diurnal temperature range has decreased due to higher daily minimum temperatures (Hsu and Chen 2009). Trends in precipitation at the larger regional scale are complicated. Overall evidence suggests weakening of the Asian monsoon between 1948 and 2003 (Hsu and Chen 2009). Manton and colleagues (2001) found evidence of a decreasing trend in number of rainy days across Southeast Asia between 1961 and 1998. According to some analyses the extreme precipitation events have become less frequent in parts of the Southeast Asia region including Thailand (Easterling et al. 2000, Manton et al. 2001). An ADB report suggested floods, droughts, landslides and storm surges have become more frequent, whereas storms have become more intense but not more frequent (ADB 2009b: 31). Some differences in conclusions

Risks and Adaptation to Climate Change in BCI Pilot Sites in PRC, Thailand and Viet Nam Final consultant report, July 2010
57
can arise from how ‘extreme events’ are defined and the quality of datasets used for statistical analysis.
230. Some clear trends have been recorded in Thailand. For example data from six stations in central Thailand indicate that annual rainfall between 1951 and 2001 declined 180mm (Singhrattna et al. 2005). For these same stations average temperatures decreased over the same period by 0.4C. An ADB review citing an unpublished report concluded that temperatures for Thailand increased 0.10 to 0.18C per decade over a similar fifty year period (ADB 2009b: 25). Two recent studies focused on urban and coastal Thailand give evidence of more intense daily rainfall (Atsamon et al. 2009, Limjirakan et al. 2009). Again differences in conclusions illustrate sensitivity to which datasets are used and variability among places with local trends sometimes going in different directions. Aggregating observations over much wider region hides some of this internal variation which can be due to, for example, changes in land-cover; an extreme example of which is the heat island effects around large metropolitan areas like Bangkok (Kataoka et al. 2009). At more local scales patterns are much more diverse and uncertain as local climate is affected by many factors (Lebel 2008). Precipitation is usually high on the windward side of steep terrain (Hsu and Chen 2009). Concrete and bitumen make cities warmer. Air pollution from burning fossil fuels and land fires can alter regional rainfall and the amount of sunlight reaching crops and the ocean (Ramanathan et al. 2002, Ramanathan et al. 2007). Large-scale changes to tree cover affect the roughness and reflectance of the land-surface (Hsu and Chen 2009).
231. The future of precipitation over Thailand under global warming remains highly uncertain. The most common and best supported expectations usually based on wider regional analysis are: more intense precipitation events; increased tropical cyclone intensities; increased droughts and floods associated with El Nino-Southern Oscillation events; increased Asian summer monsoon precipitation variability (Zhao et al. 2005, IPCC 2007b). But exactly how global warming will affect climate processes important for rainfall patterns in Thailand like tropical cyclones, ENSO and the Asian monsoon, is still the subject of intense research and debate (Singhrattna et al. 2005, IPCC 2007b, Ray et al. 2007, Hsu and Chen 2009). Since 1980 the relationship between summer monsoon rainfall over Thailand and the El Nino-Southern Oscillation (ENSO) has strengthened (Singhrattna et al. 2005). ENSO signals vary across Thailand and appear to be strongest in northeast. In the dry phase 1997-1998 period, for example, rainfall for year in northeast Thailand was 5% and 14% below normal, but in La Nina year of 1999 about 25% above normal (Nounmusig et al. 2006). Moreover the possibility of climate surprise cannot be discounted especially if global emissions continue to rise rapidly (Schellnhuber et al. 2006, IPCC 2007b). These knowledge uncertainties are unlikely to disappear and need to be considered as part of responses to climate change in Thailand.
232. Given these important uncertainties about future climate of Thailand studies about impacts and adaptation responses must use a variety of indirect approaches and take care in making assumptions and final interpretations. At a very general level the IPCC has summarized some of the expected impacts for Asia (Table 7.1). Impacts on human settlements will not be considered further in this report although they are clearly of great importance and deserve a full analysis in their own right (McGranahan et al. 2007). Even without more detailed understanding of trends in climate more detailed and nuanced assessments of potential impacts and plausible adaptation responses is often possible by drawing on local understanding of how different sectors, ecosystems or human activities interact with current climate variability. Indeed some of these process oriented studies, by improving understanding of climate sensitivities, may be of more long-term value to understanding and managing vulnerabilities and risks from climate change than much more comment efforts to project impacts with high spatial resolution using simplified statistical assumptions and lacking biophysical detail and social insight.

Risks and Adaptation to Climate Change in BCI Pilot Sites in PRC, Thailand and Viet Nam Final consultant report, July 2010
58
233. The rest of the report is organized as follows. The next four sections of the report deal with the implications of climate change for biodiversity, water resources, food security and rural livelihoods. This is followed by an integrative section reviewing adaptation measures that have been observed or suggested with recommendations on priorities for action and further research.
Table 7.1: Likely impacts of climate change in Asia. Summarized and modified after IPCC reports by the author (Lebel 2007)
Trend Impacts on agriculture
Impacts on ecosystems
Impact on water
Impact on settlements
Warmer days and nights
Decreased yields in warm environments; increased in colder
Disease vector shifts; species range shifts.
Where depend on snowmelt
More demand for energy to cool; less to warm. Poorer air quality.
More frequent heat waves
Reduced yields in warm regions
Coral bleaching. Wildfire risks
Increased water demand
Lower quality of life in warm areas. Increased heat-related mortality
More frequent episodes of heavy rain
Damage to crops, soil erosion
Landslides and soil erosion
Lower surface and groundwater quality
Flood-related disruption and losses
More intense tropical cyclones
Damage to crops and trees
Altered community composition
Disruption of public water supplies
Damage and losses from wind and floods. Harder to insure in vulnerable areas
Increased high sea level events
Salinization of irrigation water
Coastal ecosystem shifts
Saltwater intrusion reducing freshwater availability
Costs of coastal protection or re-location
Areas affected by more drought
Land degradation; crop and livestock losses. More fires.
Species range shifts
Water stress Water shortages. Less hydropower. Migration responses.
D. Biodiversity 234. Climate change has potentially significant implications for biodiversity in Thailand, especially given the often tremendous pressure native species populations are under already, as a result of other human activities, in particular, habitat modification. Most of the detailed understanding of possible impacts within Thailand comes from studies of forest trees.

Risks and Adaptation to Climate Change in BCI Pilot Sites in PRC, Thailand and Viet Nam Final consultant report, July 2010
59
1. Forest trees
235. Globally climate change is already having an impact on biodiversity and is expected to exacerbate challenges arising from other human activities like changes in land-use, pollution, habitat loss and fragmentation and introductions of non-native species (Gitay et al. 2002). Changes in phenology have already been observed. The habitats of many species will move to higher elevations or poleward; whether they can migrate or not depends on rates of change and species attributes. Species with restricted ranges, for example, on islands or mountaintops will often be at even greater risk of extinction (Gitay et al. 2002).
236. In Thailand, the monsoon has major influence on current distributions of forest trees and plants. Shifts in amounts and patterns of rainfall could have major implications for species which often now have restricted ranges because of impacts of human land-uses, for instance, conversion to agriculture.
237. The first quantitative study on the potential impacts of climate change on forests of Thailand used the results of three general circulation models and Holdridge’s Life Zone classification to estimate how areas of six forest types might change (Boonpragob and Santisirisomboon 1996). The authors suggested huge changes among life zones with tropical dry forest extending into areas previously covered by subtropical moist forest, especially in upper-half of the country. They argue that reforestation projects should take future climate into account, for example, by selecting more drought-adapted species for the northeast and north (Boonpragob and Santisirisomboon 1996).
238. Baltzer and colleagues (2008) used differences in desiccation tolerance of seedlings to explain distributions in the Malay-Thai peninsula which span transition from a seasonal to seasonally dry climate: widespread species in seasonally dry forests had seedlings that could maintain tissue at lower relative water content and more negative water potentials. Climate appears to have played a major role in tree distributions and thus climate change could be expected to effect species distributions and community composition (Baltzer et al. 2008). Studies elsewhere in the tropics also suggest varying sensitivity to drought helps explain distribution patterns of forest species (Engelbrecht et al. 2007).
239. Trisurat and colleagues (2009) studied the potential impacts of climate change on six evergreen and 16 deciduous tree species by comparing their distributional niches under current and future climate as projected by the HadCM3 model for northern Thailand in 2050. Both losses and gains of suitable niches were projected. Evergreen species were expected to shift northward where lower temperatures predominate whereas deciduous species would expand their distribution ranges. Extreme climate variables, like minimum temperatures in coldest month, and precipitation in driest and coldest quarters had largest influence on species distribution models.
240. Using maps of current distributions and information about climate variables researchers have inferred how ranges of tropical pines like Pinus kesiya and P. merkussii might shift with a changing climate (van Zonneveld et al. 2009). Their models of climate envelopes enable researchers to predict potential occurrence of species and compare these with locations could potentially occur in a changed climate, for example, as projected by global circulation models. These analysis suggest that few new areas are likely to become suitable while lowland stands of P. merkusii in eastern Thailand already near maximum temperature tolerances are threatened by climate changes (van Zonneveld et al. 2009).

Risks and Adaptation to Climate Change in BCI Pilot Sites in PRC, Thailand and Viet Nam Final consultant report, July 2010
60
241. Dry season conditions might be an important factor in successful recruitment of tree species in dry forests. A careful analysis of climate and recruitment data for P. merkussii and P. kesiya found suggestive evidence that mild dry seasons may be associated with greater potential for recruitment but variability was high suggesting dry season climate itself was not the primary factor limiting recruitment (Zimmer and Baker 2009).
242. Although potential range is large actual distributions is very patchy as are result of logging and other factors so P. merkussi is already listed as “vulnerable” by the World Conservation Union. Future conditions for the species outside Thailand, vary, for example, with opportunities for plantation development in the Malay Archipelago (van Zonneveld et al. 2009). In a separate study using models for plant growth and gas exchange (Koskela 2001) suggested that P. merkussii seedlings would grow faster under changed climate primarily as a consequence of fertilizing effects of increasing CO2 concentration, but also noted that much depended on how rainfall changes as prolonged droughts would counter the effect.
243. One area that may be particularly vulnerable to changes in climate is biologically diverse Tennassarim-Western Forest Complex that spans a system of 19 national parks and wildlife sanctuaries in Thailand and Myanmar/Burma. Covering over 18,700 km2 of both lowlands and high mountains it is one of the most important protected areas in Southeast Asia, especially for larger mammals. Maintaining the connections could be important for coping with impacts of climate change (WCS and ADB 2008).
244. Understanding of how tropical rain forest canopies respond to increased carbon dioxide levels and climate-related stresses is still relatively scant as, unlike for temperate regions, few large scale experiments have so far been conducted (Stork et al. 2007).
245. Understanding how climate change might impact forests and forest hydrology processes depends on learning more about evapo-transpiration of trees in response to soil water stress (Kume et al. 2007). Larger trees with deeper roots, for example, may not be as affected by soil drought and continue to transpire through to end of dry season. The seasonally dry forests of Thailand vary in how they respond to seasonal and inter-annual variation in rainfall (Tanaka et al. 2008). Two evergreen forest types studied increased evapo-transpiration substantially in dry season, but another, like two deciduous forest types, did not. These differences have major implications for how forests respond to inter-annual variation in climate (Tanaka et al. 2008) and thus, climate change. Either way more research is needed on water and energy exchanges between tropical monsoon forests and the atmosphere.
246. Finally, climate change could alter disturbance regimes, for example, the frequency and intensity of fires or pest outbreaks (Gitay et al. 2002). In Thailand, tropical dry forests natural fire regimes are already affected by human fire management and land-use practices as well as landscape fragmentation and conversion (Stott 1996, Murdiyarso and Lebel 2007). The interactions between climate change and fires may result in relatively rapid vegetation changes but are hard to predict because of complexity (Gitay et al. 2002).
2. Mammals and birds
247. Changes in distribution of major tree species or vegetation types can be expected to strongly influence distribution of other organisms. Historical evidence from Thailand, however, suggests that climate influences do not act in isolation.
248. Pleistocene-related climate changes that affected sea-levels, land areas in the Sunda region of Southeast Asia, and ratios of forest to open habitat might be expected to effect species distributions. Using genetic techniques a study of four fruit bats of the genus, Cynopterus, with distributions from Singapore to southern Thailand found evidence of both stable demographic and expansion histories in forest and open-habitat

Risks and Adaptation to Climate Change in BCI Pilot Sites in PRC, Thailand and Viet Nam Final consultant report, July 2010
61
species (Campbell et al. 2006). Other factors apart from climate change, like contemporary land-use changes and inter-specific interactions appear to be needed to fully explain distributions and demographic histories.
249. Studies of how local climate changes might be affecting current distributions of vertebrates in Thailand are rare. One 25-year long study of Lophura pheasants in Khao Yai National Park suggest that changes in population numbers of a lowland species relative to a higher elevation species might be explained by changes in climate that support expansion of the drier lowland habitat (Round and Gale 2008).
3. Wetlands and aquatic ecosystems
250. Hydrological regimes of wetlands are sensitive to changes in climate with impacts on individual species and ecosystem productivity (Gitay et al. 2002). Seasonality produces changes not only in water volumes but also water quality in wetland ecosystems that are important for ecological structure and function. In the Songkram wetlands, for example, pH, dissolved oxygen and conductivity increase with falling water levels in dry (and cooler) season (Satrawaha et al. 2009). Similar patterns have been reported for the lower Mekong River (Prathumratana et al. 2008). Changes in temperature and precipitation due to climate change would alter these relationships.
251. Comparisons of life cycles across species distribution of three wide ranging frog species from Singapore to Thailand suggest that the frogs can compensate for shortened breeding time by producing larger clutches per breeding episode (Sheridan 2008). This suggests some species could adjust reproductive aspects of life cycle in response to climate change. On the other hand for the tropical frog species studied, unlike temperate counterparts, tadpoles had no capacity to accelerate development in response to drying of aquatic habitat (Sheridan 2008).
252. Research in Europe has suggested that one of the consequences of agricultural intensification is greater landscape homogeneity and that this, in turn, increases the vulnerability of frog populations to climate extremes as it removes places which can serve as sources of population recovery post-disturbance (Piha et al. 2007)
253. Likely effects of mean global temperature increase on freshwater systems include higher water temperatures, lower dissolved oxygen levels and higher toxicity of pollutants. Freshwater fish life histories have evolved to particular flow regimes and temperatures and thus likely to be impacted (Ficke et al. 2007). Typical adaptation measures, for instance, water storage and diversion, could make challenge of shifting ranges and otherwise coping even more difficult.
4. Coastal and marine ecosystems
254. The impacts of climate change on fisheries and aquaculture are likely to be significant with both positive and negative impacts (FAO 2008). At a 2007 workshop of the Network of Aquaculture Centres in Asia-Pacific on future research needs climate change and sea-level rise were highlighted as having major impacts on aquaculture and related livelihoods. Apart from general concerns about severe weather and storm surges more industry specific impact pathways of concern included on brood stock supplies, temperature regimes in inland waters, and salt water intrusion (NACA 2007). Impacts on fisheries, because of importance in feeds, would also impact aquaculture. Understanding of vulnerabilities to climate changes on aquatic ecosystems is limited making prioritization of some kinds of specific adaptive strategies difficult (FAO 2008).
255. Mangroves forests are resilient in part because of large below-ground nutrient stores, rapid rates of decomposition and nutrient flux, functional redundancies, and many self-organizing feedbacks (Alongi 2008). Mangroves successfully responded to changes in sea-level and shoreline movements during the Holocene and appear to be keeping up with current changes in sea-level. Mangrove forests recover from natural disturbances

Risks and Adaptation to Climate Change in BCI Pilot Sites in PRC, Thailand and Viet Nam Final consultant report, July 2010
62
like severe storms, cyclones and tsunamis. The main threat remains deforestation and habitat conversion (Alongi 2008). Earlier reports from Southeast Asia more broadly suggested that mangroves may be vulnerable to sea-level rise especially when considering the combined effects of other human activities leading to conversion and degradation (Watson et al. 1997).
256. Moreover, observational evidence from studies within Thailand about sea-level changes, it should be noted, are in disagreement with some studies reporting observable rises (ADB 2009b: 33) and others suggesting no change or slight falls (Vongvisessomjai 2009). The reason is other factors, like land subsidence, strengths of tides and latitude also influence sea-levels and these effects may be larger than those due to global warming in some locations (Vongvisessomjai 2009).
257. A key conclusion from this review is that, for biodiversity, understanding the physiological and ecological mechanisms underlying vulnerability of species, habitats and key ecological processes is likely to be crucial to designing effective responses to the challenges posed by climate change.
D. Water Resources 258. For water resources the challenges are substantial and strongly influenced by land- and water-use. Droughts, floods and storms already have major impacts in Thailand. More systematic learning from these experiences could be highly relevant to dealing with future climate variability. The diversity of interests among different water users makes interventions to alter flow regimes complex. Public deliberation appears to often be critical to negotiating sustainable solutions.
1. Floods and droughts
259. Globally, both observational records and modeled projections imply water resources are vulnerable and likely to be impacted by climate change (Bates et al. 2008). Increased frequency of intense precipitation events will result in more floods (Kundzewicz and Schellnhuber 2004, Kundzewicz et al. 2007). One of the main impacts of increased frequency of intense rainfall events on water resources will be degradation in quality, through for example, contamination (Bates et al. 2008). Higher temperatures as well as extremes, both floods and droughts, also imply more problems with water pollution. Growth in water demand combined with changes in climate will challenge the effectiveness of current water infrastructure and water management practices (Kundzewicz et al. 2007, Bates et al. 2008, Aeerts and Droogers 2009).
260. Droughts, floods and storms already have major impacts in Thailand. Changes in rainfall could easily exacerbate water resource management challenges (Boonprakrob and Hattirat 2006). Experiences in dealing with flood events may be high relevant to dealing with future climate. Unfortunately effective systems for evaluating disaster management responses and thus learning from past events and responses are frequently weak (Manuta et al. 2006) reducing opportunities to learn. An over-emphasis on emergency response in much disaster management work is, institutionally, another limitation (Lebel et al. 2006).
261. Floods are a problem when they are unusual in timing or severity. Global warming is likely to cause changes to flood regimes that depend on flood type and interact with land and water-use changes (Lebel et al. 2009). Farmers for example may respond to changes in flood regimes with adjustments of their own in watering patterns, crop choices, and micro-infrastructure affecting return flow to rivers from their fields and groundwater recharge (Lebel et al. 2009). Changes in risk unfold in a dynamic context in which other factors like access to resources and wealth are also shifting. The combined effects may work to cancel each other out or exacerbate problems for some social groups.

Risks and Adaptation to Climate Change in BCI Pilot Sites in PRC, Thailand and Viet Nam Final consultant report, July 2010
63
262. In the Initial Communication to UNFCCC several studies about water resources in dams are referred to pointing to possible negative impacts (OEPP 2000: 17). The limitations of this initial assessment are acknowledged with calls for more research. Since then there has been some important technical advances. For example, a method to disaggregate and correct for biases in outputs of GCM precipitation scenarios have been developed and were tested and validated for the upper Ping River basin (Sharma et al. 2007). Results from using this promising approach for climate change impact studies in water resources sector have so far not been published.
263. Impacts of climate change on monthly potential evapo-transpiration from paddy field were studied using statistically downscaled results of several GCM models and scenarios and standard equations (Chaowiwat and Likitdecharote 2008). Authors found that increases in minimum and maximum temperatures and decreases in relative humidity imply large increases in potential evapo-transpiration (Chaowiwat and Likitdecharote 2008). This is consistent with global analysis that predict widespread increases in potential evapo-transpiration (Bates et al. 2008). These changes would impact on runoff, soil moisture, water in reservoirs and groundwater table.
264. In Thailand groundwater levels and recharge rates are not well known and groundwater-surface interactions are under-studied. As a consequence not much is known about impacts of climate change on groundwater (Bates et al. 2008). An exception is around Bangkok. Urban heat island effect around Bangkok significantly increases temperature of groundwater (Taniguchi et al. 2009) where subsurface has been degraded and land subsidence is widespread (Babel et al. 2006).
265. An assessment made of the Mekong River basin to 2030 projected that dry season rainfall would increase in northern and decrease in eastern Thailand (Eastham et al. 2008). Overall annual precipitation was expected to increase because of higher wet season rainfall. Run-off and floods were expected to increase. A strong feature of this study was the use of a subset of 11 global climate models that could capture current seasonal patterns adequately (Eastham et al. 2008). The output of multiple models provided capacity to consider both central tendency and uncertainty estimates. Uncertainties around future annual precipitation over entire basin varied from 0.03-0.36m with mean increase of 0.2m or 13%. Irrigated rice yields would likely fall as potential evaporation increases or alternatively there would be increased demand for water to meet historical yield patterns (Eastham et al. 2008). The authors estimated irrigation requirements could be 1.6-3.4% higher under median conditions and up to 8% higher in more extreme climate scenarios.
266. Shifting interactions among different water uses could be one of the major types of challenges for water resource management arising from climate change. In the central plans and eastern region of Thailand water shortages in 2004-2005 resulted in low rice yields. Major industries in the Map Ta Phut faced severe water shortages. In response government promised various storage and diversions projects for the eastern seaboard but these were contested heatedly by farmers who would loose out in the re-allocations (Molle and Floch 2008). Authors of a report for Greenpeace discussing this drought said “one of the main causes of the current prolonged drought in Thailand can be attributed to global warming” (Boonprakrob and Hattirat 2006: 11). Attributing individual events to global warming without even considering changes in demand or natural variability in rainfall, however, may be counter-productive to solving such water management challenges as they shift policy attention away from serious internal challenges of growing demand and allocation trade-offs to focusing on ‘supply-side’ issues which may ultimately reduce resilience to climate changes.
2. Interactions with land-use and –cover

Risks and Adaptation to Climate Change in BCI Pilot Sites in PRC, Thailand and Viet Nam Final consultant report, July 2010
64
267. Climate drives regional hydrological cycle and land-surface hydrology (Chen and Chappell 2009). Interactions between storm and longer-term climate with land-uses influence flows of water and sediments to river (Xi and Higgitt 2009), and in turn, are impacted by dams and diversions (Kummu et al. 2009).
268. Changes in land surface characteristics, such as loss of forest cover, may have regional-scale consequences for recycling of water into the boundary layer and thus on precipitation and water resources (Bates et al. 2008). Declining regional precipitation over Northeast Thailand due to deforestation is predicted by many simulation models but only observable in September when strong Monsoon winds, that bring substantial moisture from the west and over the Indochina Peninsula, peter out (Kanae et al. 2001). Deforestation has been linked to declines in rainfall in various regions but large uncertainties about processes remain and are not yet well captured in global climate models (Sheil and Murdiyarso 2009). A common assumption, for example, is that deforestation results in conversion to grassland with much higher albedo, but in some areas, like northern Thailand, a complex mosaic of secondary vegetation is much more common. As a consequence effects on albedo are much less pronounced and model parameters need to be adjusted (Giambelluca et al. 1999).
269. Orographic effects are also important and easily confound lay observations about associations between rainfall and vegetation. Using a dense network of observations in mountainous region in northwestern Thailand (Dairaku et al. 2004) found rainfall increases strongly with elevation. This was due to longer and more frequent rather than more intense rainfall.
270. Contrary to common perceptions about relationships between upstream and downstream water use a modeling study in Mae Chaem found that future scenarios with plausible expansion of crops at the expense of forests in the uplands led to slightly higher annual and wet-season water yields compared to similar expansion in the lowland-midland zone (Thanapakpawin et al. 2006). Downstream water availability was sensitive to irrigation diversions. Although this study was not focused on assessing climate impacts the modeling tools developed would be highly appropriate for exploring water allocations issues under different future assumptions of land-use, water-use and climate change.
271. Using a similar modeling framework such work has been done at large scales for the Mekong River Basin including territory in northeast Thailand (Costa-Cabral et al. 2007). This underlines the importance of considering all major factors affecting flows together. Changes in climate, land use and regulation of stream flow by dams interact with each other in complex ways. By combining the VIC hydrologic model with another model of reservoir operations to explore effects of dams these interactions could be demonstrated. Scenarios for climate came from general circulation model outputs whereas those for land-use from historical remote sensing studies. Large-scale changes to land-use through their impacts on soils and land over also can have major impacts on hydrology confounding and interacting with climate-related changes (Costa-Cabral et al. 2007). The retention of water in irrigation paddies, for example, is a crucial process to hydrological responses in this landscape.
E. Food Security 272. Thailand is a major producer and exporter of food. At the national level Thailand is likely to remain food secure for the foreseeable future, even though more locally impacts of environmental changes and policies may be much more variable (Nicro and Markopoulus 2008). The vulnerability of agricultural production to changes in climate, nevertheless, may be quite high. Small increases in temperature are often predicted to cause reduces in yield as many crops are already grown at near their thermal optimum. Changes in precipitation and sea-level rise also pose important risks. This section

Risks and Adaptation to Climate Change in BCI Pilot Sites in PRC, Thailand and Viet Nam Final consultant report, July 2010
65
focuses on agricultural production and trade. Related issues of livelihood security in rural areas are dealt with in the next major section.
1. Rice
273. Most agriculture in Thailand, especially outside the central plains irrigation region, is rain fed. Rice farming is particularly sensitive to climate variability.
274. Rice farming in northeast Thailand is commercial with a single crop each year grown for domestic and international markets. Rice is main household income. Rain fed rice yields are sensitive to rainfall and temperature. At the regional level the period for sowing and transplanting is wide due to variable water, soil conditions and topo sequence; in contrast the period for heading and harvesting is narrow due to widespread use of similar photosensitive varieties (Sawano et al. 2008). Combining knowledge of the crop calendar with crop growth model it is possible to accurately estimate regional yields over the past twenty five years of variable climate and its impacts on water availability (Hasegawa et al. 2008). In a subsequent study the effects of delays in onset of rainy season on yields were explored and it was found that a 20 day delay resulted in yield drops of about 20% due to reduced day length (Hayano et al. 2008). Impacts on rice market were also considered taking into account how farmers would respond to price rises in subsequent years and underline the importance of multi-year effects (Hayano et al. 2008).
275. The vulnerability of rice to climate change for example through droughts, floods, changes in rainfall and salinity intrusion from sea-level rise was acknowledged early (Chantanakome and Onchan 2000) although resilience of agriculture to severe floods in mid-90’s was also noted (Chantanakome and Onchan 2000). In the Initial Communication to UNFCCC one study on rice and maize cited suggested large but uneven impacts on yields (OEPP 2000: 17). Uncertainty in future climate was acknowledged as a major limitation to analyses.
276. One of the early studies of potential impacts of climate change on rice production in Thailand noted higher temperatures might allows some expansion of rice growing areas and growing season especially in seasonally cooler north (Bachelet et al. 1992). Higher CO2 levels, it was also speculated might increase water-use efficiency and make dry land rice areas less vulnerable (Bachelet et al. 1992). As predictions for rainfall from the four GCM used in the study varied hugely and did not fit current monthly rainfall well, however, the authors could not say much about water-related factors.
277. Explorations of climate futures to 2030 for the Mekong River basin discussed earlier suggest that productivity of rain fed rice would increase, but those for upland rice would stay same or slightly decrease (Eastham et al. 2008). As in many other studies the impacts of flooding were not included in these analyses. These could have substantial impacts in some locations as recognized by the authors (Eastham et al. 2008).
278. Using the CCAM regional climate model with 10km2 resolution Chinvanno and colleagues (2008a) studied impacts on rice yields and vulnerabilities in Thailand and Lao PDR. The Thai part of study focused taking regional results into 18 villages in Ubon Ratchathani province. The climate scenarios included baseline, 1.5 times and double CO2 and projected increased precipitation. At 1.5 times the region would get slightly cooler but at 2 times a warming of just under 1C on average was modeled. The scenarios used, in short, were cooler than other projections made for the region by the IPCC (2007b). The simulations with DSSAT crop model suggest mild positive impacts on average climate due to elevated CO2, increased rainfall and modest projected temperature increases. Taking into account flooding and timing of rainfall, as risks farmers are concerned about, suggest that more mixed outcomes (Chinvanno et al. 2008a).

Risks and Adaptation to Climate Change in BCI Pilot Sites in PRC, Thailand and Viet Nam Final consultant report, July 2010
66
279. Interviews with 560 farm households in Ubon Ratchathani were done to measure risk based on the sensitivity to climate variation and changes, exposure to climate stresses, and capacity to cope with climate impacts (Chinvanno et al. 2008a). Vulnerability to changes in climate extremes is much greater than to average climate. Households with low climate risk have high coping capacity. As dependence on rice production in this area is high and many households are poor coping capacities were often low.
280. The two most important climate risks according to farmers are prolonged midseason dry spells after sowing or transplanting seedlings and flooding near harvest time (Chinvanno et al. 2008b). Rice farmers in Ubon Ratchathani use standard rather than local varieties and have relatively limited scope to adjust crop calendars. Off-farm income, in particular, through seasonal or more permanent migration with remittances back, is the primary household measure to deal with climate risks. Chinvanno and colleagues (2008b) argue that community-level measures have declined whereas national level responses are still relevant but often insufficient. One example is state support for livestock rearing and diversification to less climate-sensitive crops like rubber. Despite these adaptive capacities many farm households remain vulnerable to current climate variability. This experience to manage climate risks provide a foundation on which to consider options for adapting to climate change (Chinvanno et al. 2008b), but clearly much more also needs to be done.
281. Another recent study that links crop growth and economic models suggests that rice farmers may cope with or even benefit from small increases in rainfall whereas more extreme changes have clear adverse impacts on yields (Felkner et al. 2009). Poor farmers are less able to adjust inputs to cope. In this latter study the researchers used the mean output of multiple GCMS reported by the IPCC (Cruz et al. 2007) and compared high and low emission scenarios (Felkner et al. 2009). The study also suggested there may be a trade-off between reducing risks of crop failure and maintaining high yields (Felkner et al. 2009).
2. Other crops and livestock
282. Boonklong and colleagues (2006) studied fifty years of climate time series data for three regions of Thailand where mangosteen are grown. No evidence of trends in rainy days, dry days, minimum and maximum temperatures were found in southern and north-eastern regions, but in the eastern region there was a trend of increasing minimum temperatures, more dry days and fewer rainy days. They also found that Mangosteen production in the southern and eastern region increased as the drought period before flowering increased (Boonklong et al. 2006).
283. Kuneepong and colleagues (2001) used climate scenarios from four GCM and crop growth models for ice and maize to study effects of climate change on yields. Results varied across models, sites and crops. For example positive CO2 fertilization effect appeared to more important with unfertilized crops. Uncertainties remained high. A more thorough study by CSRIO and MRC gives more insights. Explorations of climate futures to 2030 for the Mekong River basin discussed earlier suggest that changes in yields for sugarcane, maize and soybean would be very small (Eastham et al. 2008).
284. Potential impacts of climate change on livestock are under-studied. Indirect influences, for example, on growth of feedstock like maize maybe important (Zhao et al. 2005). A Greenpeace report speculated that livestock production could decline due to heat stress, reductions in food quality or increased disease outbreaks (Boonprakrob and Hattirat 2006). One study from northeast Thailand used a temperature-humidity index to identify the southern region as being at highest risks of production losses due to hot and dry climate (Somparn et al. 2004). In this part of Thailand the number of days exceeding a temperature-humidity index (THI) threshold of 84 is highest under current climate

Risks and Adaptation to Climate Change in BCI Pilot Sites in PRC, Thailand and Viet Nam Final consultant report, July 2010
67
variability. Most risk occurs in a 1-2 month period and lasts for several days. The dry El Nino year of 1998 was the worst season in the decade studied.
3. From agriculture production to food security
285. The central place of rain fed rice in the economy and culture of Thailand implies that any significant changes arising from climate change could have major impacts on food production, rural incomes and thus security more broadly (Boonprakrob and Hattirat 2006). Food security at the national level would require large shifts in climate to be seriously challenged given Thailand is currently a major producer and exporter of food (Nicro and Markopoulus 2008).
286. Projected increases in frequency of extreme events is one of the main sources of concern about future food security (Boonprakrob and Hattirat 2006, Easterling et al. 2007). Increased intense precipitation events would have many implications for agriculture with increased risks of floods, landslides and soil erosion. Longer dry periods would also have important impacts on crop yields. Whether changes in production in particular places or regions translate into impacts on food security at those or higher levels depends on a lot of other factors relating to the distribution of resources, allocation of aid and compensation to farmers and poor households, as well as international trade options (Lebel 2008). High world market prices for staple like rice combined with local crop failures could make many rural households food insecure (Naylor et al. 2007). In urban areas other factors affecting employment and poverty will modify risks of food insecurity.
287. Studies elsewhere suggest that maintaining food security in face of climate change may have some adverse side-effects. For example increased inputs of agricultural chemicals to offset effects of climate change could result in higher health risks to humans (Boxall et al. 2009). Such shifts should, however, be manageable with appropriate policy changes.
288. Food security may affected by competition for water between agriculture and other sectors. Global analysis are important for assessing food security because they can take into account both local impacts of climate change on production in particular places and consumption processes including international trade (Rosegrant et al. 2002). One such comprehensive study suggests that overall the impacts of climate change given current socio-economic structures will increase the gaps between developed and developing world (Fischer et al. 2005). In Southeast Asia the lack of much further land for cultivation is a key constraint on production in the model results. Agricultural land constraints in Thailand, however, are not as serious a problem as in some neighboring countries (Nicro and Markopoulus 2008). Other factors driving increases in food production and related to rising living standards and growing populations regionally, will continue to have major impact on agricultural systems and the natural resources they draw upon over the coming decades (IWMI and World Fish 2009, Thongbai 2009). The risks and impacts associated to agricultural production from climate change will grow with time and become increasingly severe.
G. Rural Livelihoods 289. Rural livelihoods are often dependent on access to water for agricultural production and associated services like fisheries. These pathways are sensitive to climate. Farmers of rain fed rice may be among the most vulnerable groups to climate change as they do not have many adaptation options available if climate variability goes beyond their range of coping mechanisms to the monsoon. Diversification of livelihood strategies appears key to maintaining resilience and often includes off-site migration. Climate change related impacts on health are another area of concern especially for poor populations that may migrate to and from areas with poor living standards in urban areas for part of the year for employment.

Risks and Adaptation to Climate Change in BCI Pilot Sites in PRC, Thailand and Viet Nam Final consultant report, July 2010
68
1. Vulnerabilities
290. Social groups whose adaptation options are most limited, like subsistence farmers or fishers, are likely to suffer most impacts from climate change (Easterling et al. 2007). Livelihoods of natural resource-dependent people is threatened by combined effects of habitat losses from land-use change and climate changes (Gitay et al. 2002).
291. Farmers of rain fed rice are among most vulnerable groups to climate change (Chinvanno et al. 2008a). They are poor and often have relatively few alternative adaptation options or access to resources (Chinvanno et al. 2008b). On the other hand they also have a range of traditional practices and local experiences with monsoon related variability that could be very valuable to adaptation strategies.
292. Only a few integrated (i.e. multi-sector) place-based studies of impacts of climate change have so far been carried out in Thailand. These give some important initial insights into how rural livelihoods might be affected by climate change.
293. An integrated study of the impacts of climate change on Krabi province in southern Thailand used the ECHAM GCM to generate scenarios of future climate 10 and 25 years in the future and then downscaled results to 25km2 grid using the PRECIS model (SEA START RC and WWF 2008). The climate scenarios indicate significant changes in rainfall with monsoon shorter by two weeks by 2018 and four weeks by 2033 resulting in total decrease of 10% after 25 years. Temperature changes were modeled to increase by about 1C in inland areas and less in coastal areas. Fewer intense tropical storms were expected due to warming of Andaman Sea. Sea-level rise of around 25cm was expected. These findings were compared with provincial planning documents and discussed in interviews with a range of stakeholders to assess potential impacts and responses (SEA START RC and WWF 2008).
294. In their assessment with stakeholders coastal villages were found be most vulnerable because of proximity to sea and limited agricultural land (SEA START RC and WWF 2008). Sea-level rise and reduced freshwater inputs would adversely affect the mangrove and estuary ecosystems upon which these semi-subsistence communities depend. Coastal aquaculture was not considered vulnerable because of good access to technologies and capital. Upland communities mostly growing rubber may benefit from climate change as rainfall would still be adequate for tree growth but more dry days would allow more days of tapping. The impacts on oil palm which is grown in wetter areas are uncertain but may be adverse as a result of longer dry periods and warmer temperatures. These two main forms of inland agriculture have substantial investment and technological capacity and so are not very vulnerable (SEA START RC and WWF 2008).
295. Rural-urban linkages in Krabi are strong as a result of tourism. The main concern identified for urban areas in this study was water shortages that could be exacerbated by increased demand from tourism. Tourism itself would benefit from a shorter rain monsoon period and with large financial resources would have low vulnerability (SEA START RC and WWF 2008).
296. One of the limitations of the above integrated study was use of a single scenario (IPCC, A2). As a consequence notions of uncertainty in climate were not explored and stakeholders tended to focus on whether, 10 or 25 years in future, they could cope with a specific set of expected changes. They found they could. The real decision-making problem, however, has the added dimension of uncertainty: changes could be less or substantially larger.
297. In the Songkram River wetlands the majority of residents still view flood events as positive (Friend 2007). Nevertheless, more extreme floods can damage paddy rice crops and effect drinking water supplies. Serious events may also damage houses or livestock shelters. In exploring climate change possibilities, overall droughts are expected to have more adverse impacts than floods (MWBP 2005). Droughts create financial burdens as

Risks and Adaptation to Climate Change in BCI Pilot Sites in PRC, Thailand and Viet Nam Final consultant report, July 2010
69
families must buy food and water. Resilience to changing climate in the society comes from diversification of livelihood including off-site income sources (MWBP 2005). Some migrate more permanently. Regular communication with government and non-government organizations helps improve resilience both during climate-related disasters and in recovery phase (MWBP 2005).
2. Societal responses
298. Longer-term historical studies provide different sort of evidence about past climate change and societal responses. Studies of pollen and phytolith in a 20,000 year old lake core in Southern Thailand give some insights into historical changes in climate, forest distributions, and combined with anthropological research, how early societies might have responded (Kealhofer 2003). In the Pleistocene the Sunda shelf was largely dry land. In the last glacial maximum the Malay Peninsula was cooler and drier than present. Early hunter-gatherers expanded into new tropical forests areas, possibly by using forest gaps to concentrate productive activities (Kealhofer 2003). Palynological data from a lake in Sakon Nakhon basin in northeast Thailand indicate that 6400-6600 years ago there was a substantial increase in forest disturbance and fires (Penny 1999). In this case, however, the changes don’t correspond to paleoclimatic data but rather are better explained as a result of human activities.
299. Another archaeological study from the northeast, in the upper Mun River floodplain, suggests that several larger communities were able to adapt with active water management with channels in a drying climate for millennia (4000-1400 BP) but ultimately the engineering solution failed to maintain an adequate and reliable water supply as environmental conditions deteriorated further (Boyd 2008). The settlements and landscapes were then abandoned. Vegetation changes as the shift from a well-watered plain to relatively dry conditions may have also played a role.
300. How other contemporary social processes might be impacted by climate change has been little explored and what has been done remains highly speculative. An examples is the study of Jasparro and Taylor (Jasparro and Taylor 2008) which explores how climate change might impact vulnerabilities to non-state and transnational security threats across Southeast Asia. These authors for example expect pressures on livelihood and social systems will lead to new incentives and opportunities for crime, terrorism and trafficking (Jasparro and Taylor 2008). Although not strictly rural part of their argument rests on the expectation that the state will invest and protect national core areas living the peripheries marginalized and vulnerable.
3. Health
301. Changing rates and patterns of epidemics of dengue is potentially one of the more important health impacts from climate change in Thailand. Climate change may also increase risk of food and water-borne diseases (Boonprakrob and Hattirat 2006). Flooding may be of particular concern in areas with poor sanitation.
302. The dynamics of dengue fever epidemics is complex with weather and climate having important roles. An analysis of Thai provincial level data on dengue cases and monthly climate variables between 1978 and 1997 found differences among regions (Thammapalo et al. 2005). Dengue incidence was negatively associated with extra rainfall in the southern region, but positively associated with elevated temperatures in the north and central regions (Thammapalo et al. 2005). Most of the variability in incidence, was explained by trend and cyclic changes (Thammapalo et al. 2005).
303. Strong relationships with season with dengue most prevalent in wet season are overlain by inter-annual variability. Thus, monthly dengue incidence in Thailand in some periods is closely associated with El Nino – Southern Oscillation, but not always as other factors driving epidemic can also dominate (Cazelles et al. 2005). Peri-urban populations

Risks and Adaptation to Climate Change in BCI Pilot Sites in PRC, Thailand and Viet Nam Final consultant report, July 2010
70
are most affected by dengue because of the provision of mosquito habitat and proximity of people. The ENSO-related associations are not surprisingly strongest around Bangkok.
304. There is also evidence that prevalence of malaria in Thailand is also associated with rainfall (Wiwanitkit 2006) At practical level this means surveillance and control activities need to be enhanced during periods with high rainfall. Studies in northern Thailand suggest that land-use changes are important for both dengue and malaria because they impact on mosquito habitat, and how humans and mosquitoes interact (Vanwambeke et al. 2007). Current patterns of land-use change increase populations of some species, but decrease those of others. For example, the conversion of forests to orchards favours the dengue vector Ae. Ablopictus. How climate change might interact with these land-use related effects is an outstanding research challenge (Vanwambeke et al. 2007).
305. Overall, the extent and significance of impacts of climate change on distribution of infectious diseases remains contentious, especially when consideration of effects relative to, and interactions with, other factors are taken into account (Lafferty 2009, Ostfeld 2009).
H. Adaptation Measures 306. Robust adaptation measures to climate change are those which enable coping with uncertainty, learning from experiences, building adaptive capacities, and integrating with development. Coping with uncertainty will place demands on policy-making to become more creative, increasingly adopting strategies that are safe-to-fail rather than fail-safe, which are reversible and can be updated. Learning from experience will require increased public participation and monitoring of interventions given outstanding uncertainties for the impacts of both climate change and many adaptation options. Building adaptive capacity will require giving attention to existing institutions, knowledge and capacities both within and outside government. Mainstreaming adaptation to climate change into various areas of normal development appears to be the most appropriate solution, but will require pro-active analysis and efforts at integration. The investments needed for successful adaptation are likely to be substantial and on-going (ADB 2009b, World Bank 2009).
1. Coping with uncertainty
307. Thailand’s Initial Communication to UNFCCC was very cautious in considering adaptation options. Uncertainties were clearly viewed as hindering responses: “The high level of uncertainty in vulnerability studies hinders the advancement of adaptation analysis that can lead to more meaningful policy recommendations.” (OEPP 2000: 74). The solution was seen as technical capacity building to improve quality of vulnerability assessments through better use of global climate models and development of more relevant regional models. The need for better analytical models in various sectors was also noted.
308. Although there are have been several intriguing studies it is not yet fully clear how global warming will affect tropical cyclones, ENSO and the Asian monsoon, climate processes critical to Thailand. Moreover the possibility of additional climate surprises cannot be discounted (IPCC 2007b). Taken together this suggests that important large uncertainties are unlikely to disappear and so should be taken into account in considering adaptation options now.
309. For instance, current water infrastructure and practices have been designed based on experiences of past climate and water flows. Many current projects and investments in planning have not taken into account climate change. Under a future and uncertain climate such strategies will need to be revised (Bates et al. 2008). Possible structural measures include: infrastructure design, land-use, and expansion of irrigation.

Risks and Adaptation to Climate Change in BCI Pilot Sites in PRC, Thailand and Viet Nam Final consultant report, July 2010
71
Costs are high, therefore need multiple benefits, that are short and longer-term, and are flexible enough to cope with changes associated with global warming (Chuangchote 2007). Side effects of infrastructure will also need to be considered (Lebel and Sinh 2009). In some case instance infrastructure may need to be removed and wetlands and riparian vegetation restored (Palmer et al. 2008).
310. The problem is not just one of being “unsure” how much change to expect but also that the amount of change is itself becoming more uncertain as emissions continue to rise further and further (Schellnhuber et al. 2006). Uncertainties about future climate in Thailand may even increase further with time rather than be reduced, as some hope, through better science. The implications of persistent large uncertainties for policy-making and investments in adaptation are profound and demand new strategies (Hallegatte 2009). Some which have been explored include: no regrets which yield benefits even if climate does not change; buying safety margins in new investments; favouring reversible and flexible options, promoting soft strategies, and reducing decision time horizons (Hallegatte 2009). Having to deal with uncertainties in future climate may push costs of adaptation even higher (World Bank 2009).
311. The problem of defining what exactly it is we are supposed to adapt to, does not end with uncertainties in future annual rainfall. Consideration of ecological and social responses imply that changes in variability, seasonality, spatial distribution and extremes may matter even more than means which in case of Thailand, are forecast to be fairly modest, relative to, for instance variability associated with latitudes or elevations. Uncertainties are important and cannot be ignored. Policy responses should take uncertainties into account.
312. Finally, and most importantly, climate change is a confounder. It is experienced as an added pressure to social-ecological systems often already disturbed by over-exploitation and pollution (Watson et al. 1997). Thus, one of the main conclusions of the IPCC Fourth Assessment report for Asia is that that climate change will add to existing multiple stresses on sustainable development (Cruz et al. 2007). In Thailand, many studies, make the same point, underlining the care needed not to overemphasize climate change on the one hand, and not to ignore, its compounding effects, on the other. Coping with complexity and uncertainty will require new strategies of linking science and practice and improved principles to guide policy-making.
2. Learning from experience
313. Many livelihood systems are sensitive to climate and societies have over time built and maintained a certain level of resilience to seasonal and inter-annual climate variability (Section 6). In lowland areas adaptive measures undertaken to cope with floods and storms include raising buildings on stilts, seasonal shifts in livelihoods and even migration. There is clearly a substantial amount of local knowledge about managing climate risks and thus likely to be useful for adaptation (Chinvanno et al. 2008b, Resurreccion et al. 2008).
314. This will undoubtedly be important, but is unlikely to be sufficient to secure rural livelihoods without real commitments to meaningful public participation. This is the only way appropriate local knowledge and experiences can be brought to bear on new climate risk management problems.
315. At the policy level a key difficulty is that many analyses about climate change focus on impacts and lack saliency that guide responses. Generalizations about problems and possible responses for “Asia” abound while quality information sufficiently specific to the Thai context is relatively scant. The transferability of findings from wider regional analyses is likely to vary depending on specifics of problem under consideration and sometimes is not known. More and better research focused on Thai ecosystems and societies is ultimately needed as a foundation for joint assessments and policy analyses.

Risks and Adaptation to Climate Change in BCI Pilot Sites in PRC, Thailand and Viet Nam Final consultant report, July 2010
72
316. Local practices may also provide important insights. Agricultural biodiversity in tropical Southeast Asia was traditionally very high (Thomas et al. 2000) In Thailand most lowland agriculture is now intensified monoculture. In upland areas there is a more complex mixture of modern cash cropping and much more diverse practices including agro-forestry, remnant swidden cultivation and poly culture. Upland rice varieties for example are very diverse. Community forests are still important sources of food and other products in some areas. Very little is known about the vulnerability of biodiversity in these mosaic landscapes to changes in climate. Some studies suggest agro-forestry systems, for instance, may be very helpful to both adaptation and mitigation efforts (Verchot et al. 2007) and refuge for biodiversity (Bhagwat et al. 2008). In northern Thailand complex land-use systems outside protected area system could turn out to be quite important to long-term conservation in this region.
317. Learning from experiences will require increased participation of vulnerable people in exploring and formulating adaptation policies at local level and ensuring such expertise and views are part of deliberations at higher levels. Interventions as projects or policies will require careful monitoring to evaluate whether they meet their climate adaptation objectives as well as for other beneficial and adverse impacts they may have on the environment and development.
3. Building adaptive capacities
318. A focus on adaptive capacity is also warranted and would be served by general strategies like: raising public awareness, more research, better coordination across sectors and levels of government, and more financial resources (ADB 2009b: 92-95). What is less clear is to what extent economic and social development has substituted these traditional sources of adaptive capacity with new ones, for example, related to new convertible assets, off-farm income, higher education and so on. Enhanced capacities to communicate, respond and access financial resources are likely to improve resilience.
319. Specific attention can be placed on capacities to use climate information, with medium-term climate or seasonal forecasting an area with promise for benefits to some groups in shorter-term but also developing the sorts of skills which could be useful for dealing with longer-term trends in climate. Close, two-way, engagement between scientists and practitioners or decision-makers, however, is crucial (Cash et al. 2006, Moser and Leurs 2008). Such approaches go beyond conventional training of local leaders (e.g. Chuangchote 2007) and start more with local decision needs, knowledge and capabilities.
320. Another areas where improved capacities could yield multiple benefits are in the conduct of adaptation assessments themselves as in the coming decades such skills are likely to be in demand in a wide range of sectors and often those best at carrying them out with an ultimate aim of mainstreaming are those already involved in policy-making and strategizing in those areas. One example of such an initiative at the regional level in which Thailand could be a key player is the Mekong River Commissions proposal as part of its Climate Change Adaptation Initiative to form an independent expert body known as the Mekong Panel on Climate Change (MRC 2009). The proposal is for the Panel to analyze and report on the state of climate change and adaptation in the Mekong region every three years. When exploring policy responses it may be best to begin with existing alternative policies many of which were not formulated with adaptation to climate change in mind (Dovers 2009).
4. Integrating with development

Risks and Adaptation to Climate Change in BCI Pilot Sites in PRC, Thailand and Viet Nam Final consultant report, July 2010
73
321. A commonly expressed expectation is that mainstreaming climate change adaptation into various other aspects of development, in particular, infrastructure planning, poverty reduction, and disaster risk management, will be a key strategy (ADB 2009b). This will take a shift in perspective: Government conventionally has seen climate change as a discrete issue rather than an additional consideration in managing risks in development. Climate change is more likely to be included as an added consideration when it is perceived that the impacts impinge significantly on other development objectives – for instance, alleviating rural poverty.
322. In all four domains reviewed in this report there are needs for integration of specific strategies with wider development concerns.
323. Recommendations for natural forests in the Initial Communication by Thailand to the UNFCCC in 2000 included reforestation with drought and heat tolerant species, conservation areas for vulnerable species, and gene banks (OEPP 2000: 17). The communication also called for capacity building and further research. The current protected area system may be inadequate to protect biodiversity from climate change. Key national parks and wildlife sanctuaries coincide with hot spots of expected temperature and rainfall changes based on an unpublished analysis of a single climate change scenario reproduced in a Greenpeace report (Boonprakrob and Hattirat 2006). Cooler areas in the north may be particularly vulnerable to warming trends (Boonprakrob and Hattirat 2006). Several options for adaptation to reduce impacts of climate change on biodiversity and ecosystems have been suggested in IPCC reports (Gitay et al. 2002) that are relevant to Thailand. For example, it has been suggested that corridors which link reserves could assist migration as climate shifts. Obviously such a strategy is only possible if regional land-use planning and development incorporates such ideas well in advance.
324. Captive breeding may be necessary for some species which are unlikely to maintain viable populations in the wild (Gitay et al. 2002). The Fourth Assessment Report state that protection from fires, insects and diseases could reduce vulnerability of forests to climate change (Cruz et al. 2007). The report also argues for more sustainable logging practices including longer rotational cycles, reduced waste and minimizing impact on remaining trees (Cruz et al. 2007). Prioritization of conservation efforts depends on understanding of vulnerabilities to climate change. An integrated framework for assessing vulnerabilities which takes into account species traits (like thermal tolerance), regional and local factors that influence exposure to climate change, and potential for ecological and evolutionary responses and plausibility of active management has been proposed (Williams et al. 2008).
325. In the water sector advice offered by the Initial Communication of Thailand included: demand-side management through water pricing and rights, integrated watershed management, community-based management and water conservation in agriculture (OEPP 2000). Ensuring current climate variability is taken into account in designing water infrastructure and operational management will make adaptation to future climate easier (Kundzewicz et al. 2007). Both demand and supply-side strategies are needed (Bates et al. 2008) to increase resilience. Again, integration of climate change consideration with a variety of development activities in different sectors is essential. In global and regional assessments of adaptation costs water supply and flood management rank high (IPCC 2007a, ADB 2009b, World Bank 2009).
326. Climate change and its impacts on flood regimes may provide opportunities for international cooperation at least in assessment activities. The Mekong River Commission has promised to integrate flood management considerations in its new Climate Change Adaptation Initiative (MRC 2009).

Risks and Adaptation to Climate Change in BCI Pilot Sites in PRC, Thailand and Viet Nam Final consultant report, July 2010
74
327. The Initial Communication by Thailand offered the following for the agricultural sector: conserving and developing drought-resistant crop varieties, promoting crop diversification, and water conservation (OEPP 2000). Local initiatives to improve soil and water management, including water harvesting and storage for climate-vulnerable groups should be considered (Lebel 2008). Private investments in drought- and flood-tolerant crop varieties and water-saving technologies should be encouraged, where appropriate, in partnership with public research and extension agencies. Building climate resilience in the Thai agricultural sector will require shifts investments (ADB 2009a). Maintaining or increasing levels of food production will be an important way to deal with issues of food security, not just nationally, but also regionally, as Thailand is key exporter. This will imply shifts in investment that take into account new risks (ADB 2009a).
328. Another important area will be developing insurance schemes for farmers (Boonprakrob and Hattirat 2006). Climate insurance instruments have been recommended under the United Nations Framework Convention on Climate Change but have not yet progressed very far (Linnerooth-Bayer and Mechler 2006). An important exception is the World Bank pilot project in Pak Chong district of Nakhon Ratchasima province. The project was carried out with maize farmers and implemented in full first in 2007 to handle risk from drought (Hellmuth et al. 2009). Several factors were relevant to initial success. First there was high quality historical weather data that could be used as basis for contracts and premiums. Second the Bank for Agriculture and Agricultural Cooperatives (BAAC) was the key operational partner; farmers were motivated to join the scheme because of their trust in (and long term relationships with) BAAC, which acted as an intermediary for nine other national insurance companies. Third significant effort was put into communication and learning activities. For instance the initial contract designed by World Bank team was modified based on feedback from farmers, BAAC, insurance companies and other stakeholders. In addition a test run of the scheme was done in 2006 leading to adjustments in rainfall data used (Hellmuth et al. 2009). In 2008 the scheme was expanded further. Activities like these should be an integral part of a wider package of business risk management tools that could help smaller farms deal with risks from variable and changing climates (Lebel 2008).
329. Reducing the vulnerability of disadvantaged rural groups will require analyses of the benefits, burdens and risks of alternative development pathways that take into account the often distinct interests, capabilities and needs of such groups. Issues of rights to water, land, fish and forest resources are often particular critical for such people even as with development they move to take advantage of opportunities for employment in urbanizing regions as well. Diversification of income sources for rural households often contributes to resilience and might be encouraged by investments in training and improved access to credit.
330. A focus on improving livelihood security will need to also give critical attention to the impacts of proposed adaptation measures themselves. The scenario analysis in the Millennium Ecosystem Assessment suggested significant tradeoffs among food security and environmental outcomes like water scarcity and biodiversity losses (Ringler 2008). Public deliberation is likely to be very important, especially for larger infrastructure projects with long-term implications for water, land use and social development (Lebel et al. 2007, Molle et al. 2009).
331. The emphasis in the current Thailand National Strategy on Climate Change (ONEP 2007) is on capacity building, from research through public awareness and in the bureaucracy. Greater emphasis also needs to be placed on cooperation among government ministries and departments as there is a tendency to compartmentalize climate change analyses and reactions, whereas most research-based evidence underlines its’ cross-cutting nature. Policy integration is also an important option to deal with inter-sectoral side-effects of narrowly articulated adaptation policies.

Risks and Adaptation to Climate Change in BCI Pilot Sites in PRC, Thailand and Viet Nam Final consultant report, July 2010
75
I. Conclusions 332. Climate changes arising from global warming pose significant and uncertain risks to ecosystems, natural resources and people in rural Thailand. Robust adaptation measures to climate change are those which enable coping with uncertainty, learning from experiences, and integrating with development. Substantial investments to improve the capacity of Thai society to adapt to climate change are needed to conserve biodiversity, manage water resources effectively, maintain food production and ensure food security, and to sustain rural livelihoods. The investments needed are likely to be substantial and on-going.

Risks and Adaptation to Climate Change in BCI Pilot Sites in PRC, Thailand and Viet Nam Final consultant report, July 2010
76
CHAPTER VII
CLIMATE CHANGE IMPACTS AND ADAPTATION
MEASURES OF VIET NAM
By
Nguyen Lanh
Institute of Strategy and Policy on Natural Resources and Environment (ISPONRE), Ministry of Natural Resources and Environment
A. Abstract 333. In recent decades, there have been increasingly reliable evidence of global warming with noticeable sea level rise. According to the Inter-governmental Panel on Climate Change (IPCC), global warming is not only an environmental disaster but also a hazard that can threaten the global sustainable development process.
334. As a peninsula in monsoon tropical Southeast Asia, Viet Nam is specified as one of the nations with a high potential of being influenced by negative impacts of climate change. In fact, Viet Nam has experienced manifestations of climate change in terms of fundamental climatic factors (temperature, precipitation…) as well as extreme weather phenomena (storms, heavy rains, drought…).
335. Viet Nam Agenda 21 promulgated in 2004 and the “National Strategy for Environment Protection by 2010 and Vision to 2020” have mentioned Viet Nam’s strategy for dealing with climate change. Viet Nam has implemented a number of activities to fulfill its responsibility under the United Nations Framework Convention on Climate Change (UNFCCC) and the Kyoto Protocol (KP).
336. In recent years, a number of human, material and financial resources have been mobilized in service of realizing the UNFCCC and KP, including sources from the government as well as international organizations. However, until present, achievements obtained based on Viet Nam’s strategy for dealing with climate change are regarded as initial results only.
337. This report on climate change and adaptation measures in Viet Nam was compiled in the framework of the ADB supported GMS project for Viet Nam, Thailand and Yunan & QuangXi provinces of China. The main contents of the report are presented in four sections with a final remark. Brief description of each section is provided below.
Section 1: Overview of Viet Nam’s Climate Features
338. The first Section presents an overview of the basic features of Viet Nam’s geographical conditions and climate characteristics. Besides providing information of general Viet Nam’s climate features, it also informs of the seven climate regions of Viet Nam, that have been officially recognized in the national climate system. The main content of this Section is extracted from the report of ISPONRE on climate change in Viet Nam.

Risks and Adaptation to Climate Change in BCI Pilot Sites in PRC, Thailand and Viet Nam Final consultant report, July 2010
77
Section 2: Climate Change Scenarios for Viet Nam
339. This section summarises the process of the development of climate change scenarios for Viet Nam since 1994 up to now. The target of this section is to provide the latest result of the scenario selection which will be used officially for national planning of development in different sectors of economy and the society, as well as bases and criteria for selection of the national scenarios. The source of reference for this part comes from IMHEN, 2009.
Section 3: Impacts of Climate Change in Viet Nam
340. Section 3 briefly presents the impacts of climate change on major fields as required by the project, namely: biodiversity, food security, water resources and rural livelihoods in Viet Nam. The basic content of the section includes analysis of possible impacts that climate change may cause for each of the above areas and the most probable impacts that may occur in future. The conclusions in this section also include in summarized form the latest results of researches at different institutions of Viet Nam in the recent years and have been reported widely in various workshops.
Section 4: Adaptation Measures to Climate Change
341. This chapter provides basic adaptation measures to each impacts that Viet Nam needs to perform in order to minimize those hazardous impacts. There are usually two kinds of measures: one is concerning the legal basis for promoting and performing adaptation activities and the other is the detailed technical measures that need to be followed or deployed as planned. Adaptation measures presented in this chapter are mostly the results of research that have been carried out during the past years by various organizations and reported recently.
342. The final remarks summarise further information concerning activities in response to climate change in Viet Nam but outside the scope of the four adaptation areas of the report. This can be considered as a complimentary part to the panorama of Viet Nam’s efforts in fighting the phenomena of global warming towards a sustainable socio-economic development in the future.
B. Overview of Viet Nam’s Climate Features 1. Geographical conditions
343. Stretching across 15 latitudes, being situated completely in the interior tropical zone of the Northern Hemisphere, closer to the tropic than the equator and heavily influenced by the South China Sea, Viet Nam has the monsoon tropical climate of a peninsula in the South-East of the European - Asian continent. Vietnamese territory includes the mainland, the area of which is 332,000 km2 and the marine areas that are several times larger than the mainland with thousands of islands of various sizes in the South China Sea.
344. There are seven forms of mountainous terrain groups: Over-2,500 meter-high mountains, concentrating in the Northwest; Average mountains, from 1,500 to 2,500 meters high, concentrating in the Northeast, Northwest, Northern Central Part, Southern, Central Part; low mountains, from 500 to 1,000 meters high, scattering all over the territory; mountainous plateau, concentrating in the Central Highlands and the Northwest; highlands distributed mostly in the Central Highlands while most of hills are concentrating in the Northeast; and semi-plains which are normally found in the midland of the North and the South.
345. There are three forms of agglomerated deltas: Horizontally narrow mountain- valley deltas in the Central Part; eroded-agglomerated or agglomerated-eroded terraced deltas; and deltas consolidated by rivers in the North (Red River delta) and the South (Mekong river delta).

Risks and Adaptation to Climate Change in BCI Pilot Sites in PRC, Thailand and Viet Nam Final consultant report, July 2010
78
346. Water bodies include river systems and the South China Sea. From the North to the South, there are 9 major river systems with the basin area of over 10,000 km2 each, in North-South order: Bang Giang-Ky Cung; Thai Binh; Red river, Ma river, Ca river, Thu Bon, Ba river, Dong Nai - Vam Co and Mekong. The total sea water area of Viet Nam is 3.928 million km2, consisting of two large gulfs: the Tonkin gulf (150,000 km2) and the Thailand gulf (462,000 km2).
347. Based on geographical conditions, it is possible to specify seven different regions as factors determining the climate: the Northwest, the Northeast, the Red River Delta, the North of Central Part, the South of Central Part, the Central Highlands and the South.
2. Climate Conditions
348. According to data collected at weather stations, the average temperature of Viet Nam fluctuates between 27.70C (in Southern part) and 12.80C (in Hoang Lien Son – Northern mountainous region). Because the altitude-depending temperature gradient in Viet Nam is about 0.5 degree/100m of elevation, the annual average temperature in the highest point in Hoang Lien Son Range is only 80C.
349. The temperature is relatively low in winter and reaches a minimum in January, while it is relatively high in summer and reaching a maximum in July. If including uplands, the average temperature of January in Viet Nam is from 2 to 260C and decreases gradually from the South to the North, from the low lands to the high lands. Meanwhile, the average temperature in July is from 10 - 300C, rather equally by latitudes among both Northern and Southern, but decreases rapidly for higher geographical altitudes.
350. The coldness in winter is the effect of not only the radiation conditions, but mainly of the Northeast monsoon. In many Northern mountainous places, the subzero temperatures have been recorded, the lowest of which is minus 3.70C specified in Hoang Lien Son on December 14, 1975. Meanwhile, the temperature in Spratly Islands never goes under 210C.
351. The highest temperature normally appears in March, April and May in Southern areas, and May, June, and July in Northern areas.
352. The record high temperature is 42.70C (in Tuong Duong, Nghe An province in May 12 1966). The temperature of over 400C has been recorded in almost all areas. However, the value of this indicator has never reached 300C in Sapa or Dalat.
353. The temperature is one among very few factors which not only have daily periodical fluctuation but also annual periodical fluctuation.
354. The daily histogram of temperature is nearly the same among geographical areas: it reaches the lowest point in the early morning or at dawn, increases gradually and reaches its peak by midday or late midday, then decreases gradually until night. In general, the daily amplitude of the temperature is always above 60C, except in some mountainous areas and islands.
355. The annual histogram of temperature is not the same among geographical areas as the daily histogram. The temperature reaches its lowest points in December and January all over the country. In February and March, the temperature slightly increases in Northern areas due to the impacts of drizzly weather, while sharply increasing in Southern areas. As the result, the temperature in many Southern places reaches the peak in late winter months. From April, May to July, August, the temperature increases and reaches its highest point in Northern areas and remains high in Southern areas. Since September, it gradually decreases until mid-winter.
356. With the above annual histogram, the Northeast monsoon season is also the cold season across many Northern latitudes. With the stable average temperature less than 200C, the cold season lasts 4 - 5 months in the Red River Delta and 1 - 3 months in

Risks and Adaptation to Climate Change in BCI Pilot Sites in PRC, Thailand and Viet Nam Final consultant report, July 2010
79
Northern Central Part. In Southern Central Part, Central Highlands, and the South, except the high mountainous areas, there is almost no month that meets the standards of the cold season.
357. In medium and high mountainous areas, the cold season lasts longer, begins earlier and ends later. The temperature in areas at the altitude of 1,500 m and above meets the standards of the cold season for almost whole year.
358. The hot season lasts 4 - 5 months in the North, 9 - 10 months in Southern Central Part and even longer in the South. In contrary, in medium and high mountainous areas, the hot season lasts a shorter time, as it begins later and ends earlier. The hot season nearly does not exist in areas with an altitude of 1,000 m and above.
359. The annual rainfall in Viet Nam ranges between 700 – 5,000mm. The most common numeric value of rainfall is about 1,400 – 2,400mm. In general, the annual rainfall in the North is higher than that in the South. The terrain, especially large mountain systems, plays an extremely important role in the annual rainfall distribution. In addition, the annual rainfall distribution also has an inconsistent relation with the island features. Most islands in the North and Northern Central Part have the lower rainfall than adjacent main lands, while islands in the Southern Central Part and the South, such as Phu Quoc or Spratly islands, have the higher rainfall than adjacent main lands in the same regions.
360. The annual histogram of rainy days is similar to that of rainfall. However, because drizzling rains regularly appear in late winter, an additional maximum of rainy days has appeared in many places in the North and Northern Central Part in February and March. Regarding YenBai province alone, the number of rainy days in months of prevalent drizzling rains is even higher than that in the main rainy season.
361. The majority of rainy days only have the rainfall of less than 5 mm/day. The popular annual average number of rainy days with high rainfall (equal to and above 50 mm/day) is between 5 and 15. The highest number does not exceed 30, while the lowest is not less than 2.
362. The rainy season, defined as the time with the monthly average rainfall of over 100 mm, is specified as follows:
Northwest, Northeast: The rainy season begins in April and May, reaches its peak in July and August, and ends in September and October.
Red River Delta: The rainy season begins in April and May, reaches its peak in July and August, and ends in October and November.
Northern Central Part: The rainy season begins in May and June, becomes especially unstable in July and the first half of August, reaches its peak in September and October, and ends in November and December.
Southern Central Part: The rainy season begins in August and September, reaches its peak in October and November, and ends in December.
Extreme Southern Central: The rainy season begins in April and May, reaches its peak in August, and ends in November.
Central Highlands: The rainy season begins in April and May, reaches its peak in August, and ends in October and November.
The South: The rainy season begins in May, reaches its peak in September and October, and ends in November

Risks and Adaptation to Climate Change in BCI Pilot Sites in PRC, Thailand and Viet Nam Final consultant report, July 2010
80
3. Climatic Regions of Viet Nam
363. As mentioned above, there are seven climatic regions of Viet Nam. The classification is based on the geographical characteristics of each regions and they are listed with their specific climatic features as below:
a. The B1 climatic region (Northwest)
364. The B1 climatic region is situated in the Northwest, including Lai Chau, Son La and Dien Bien provinces with the most common geographical altitude from 100 to 800 m.
365. General climatic features of B1 region are: A cold winter with a large amount of sunlight, the occurrence of hoarfrost from time to time, little amount of drizzly rain, hot summer, a high frequency of dry and hot West wind, not directly influenced by storms and tropical low pressures, high rainfall, and the nearly coincidence between the rainy season and the hot season.
b. The B2 climatic region (Northeast)
366. The B2 climatic region mainly includes Mid-Northern and Northeastern provinces, namely: Lao Cai, Yen Bai, Hoa Binh, Ha Giang, Tuyen Quang, Phu Tho, Cao Bang, Lang Son, Bac Kan, Thai Nguyen and Quang Ninh, with the common geographical altitude from 50 to 500 m.
367. General climatic features of B2 region are: A cold winter with a small amount of sunlight; the occurrence of hoarfrost, a large amount of drizzly rain, hot summer, a low frequency of dry and hot West wind, being directly influenced by a number of tropical low pressures, especially in the Northeast, high rainfall, and the close coincidence between the rainy season and the hot season.
c. The B3 climatic region (Red River Delta)
368. The B3 climatic region mainly includes Red River Delta provinces and adjacent midland provinces, namely: Phu Tho, Vinh Phuc, Bac Giang, Bac Ninh, Ha Noi, Hai Phong, Ha Tay, Hai Duong, Hung Yen, Ha Nam, Nam Đinh, Thai Binh and Ninh Binh, with the most common geographical altitude of under 50 m.
369. General climatic features of B3 region are: A cold winter with a small amount of sunlight; the occurrence of hoarfrost only in certain years, a large amount of drizzly rain, hot summer, a low frequency of dry and hot West wind, directly influenced by tropical low pressures, high rainfall, and the close coincidence between the rainy season and the hot season.
d. The B4 climatic region (Northern Central Part)
370. The B4 climatic region mainly includes Thanh Hoa, Nghe An, Ha Tinh, Quang Binh, Quang Tri and Thua Thien - Hue provinces, with the most common geographical altitude of under 100 m.
371. General climatic features of B4 region are: A relatively cold winter with a relatively small amount of sunlight; the occurrence of hoarfrost in certain years in several areas, drizzly rains, a high frequency of dry and hot West wind in summer, high temperature, high rainfall in the second six months, and no coincidence between the rainy season and the hot season.
e. The N1 climatic region (Southern Central Part)
372. The N1 climatic region includes Da Nang city and Quang Nam, Quang Ngai, Binh Đinh, Phu Yen, Khanh Hoa, Ninh Thuan and Binh Thuan provinces, with the most common geographical altitude of under 100 m.

Risks and Adaptation to Climate Change in BCI Pilot Sites in PRC, Thailand and Viet Nam Final consultant report, July 2010
81
373. General climatic features of the Southern Central Part are: A warm winter with a high amount of sunlight and a high frequency of dry and hot West wind in summer. The rainy season happens in late summer and early winter. The rainfall is especially low while the amount of sunlight is especially high in the Southern part (the Southern Central Part Pole).
Figure 8.1: Climatic Regions of Viet Nam
f. The N2 climatic region (Central Highlands)
374. The N2 climatic region includes Kon Tum, Gia Lai, Dak Lak, Dak Nong and Lam Dong province, with the most common geographical altitude from 100 to 800 m.
375. Prominent climatic features of the Central Highlands climatic region are: a relatively low temperature foundation (in comparison with adjacent regions, due to the influences of the geographical altitude) which decreases remarkably (to below 20 degrees Celsius) in mid winter (December and January), then swiftly increases and reaches the peak in transitional months from winter to summer (April - May); high rainfall in summer,

Risks and Adaptation to Climate Change in BCI Pilot Sites in PRC, Thailand and Viet Nam Final consultant report, July 2010
82
very low rainfall in winter, extreme drought in months with high temperature in late winter and early summer. Like the South, the Central Highlands has a much clearer contrast in rainy season and in hot season.
g. The N3 climatic region (The South)
376. The N3 climatic region includes Southwestern and Southeastern provinces and slightly stretches to Binh Thuan province, with the most common geographical altitude of less than 50 m.
377. General climatic features of the South climatic region are: a large amount of sunlight and high temperature all year-round; the rainy season basically coincides with the summer, while the dry season mainly includes middle and late winter and early summer months. The contrast is much clearer between the rainy season and the hot season.
C. Climate Change Scenarios for Viet Nam 378. Climate change scenario is the description of the climate in future, and in a narrower meaning, it means the description of the global warming due to increasing of GHG in the atmosphere as the results of the development process. GHG may come from different sources, such as: energy production, transportation, deforestation, agricultural farming, etc.
379. In 1994, based on a climate change scenario of Australia's Commonwealth Scientific and Industrial Research Organisation (CSIRO), the experts participating in the project “Climate Change in Asia” has proposed the first climate change scenario for Viet Nam, called “Climate Change Scenario 1994”.
380. Later on, with the emerging of sophisticated tools for modeling and simulation for predicting future global climate, there is a requirement to reassess the results of 1994 scenario. In 1998 Viet Nam developed climate change scenario for three main factors: temperature, rainfall and sea level rise for three mile-stones: 2010, 2050 and 2070.
381. Recently, with technical support from developed countries, especially UK and Japan, Vietnamese experts has been using modern simulation tools to develop several climate change scenarios for a more detailed scale of Viet Nam according to different assumptions of global GHG emissions and come to a set of basic climate change scenarios. One of the important results is the set of scenarios of climate change for Viet Nam until 2100 that have been created in 2007 for each of climate regions in the country. This is a good foundation for examination, selection and further setting up the more reliable scenario of climate change for Viet Nam for the coming years.
1. Basis for Climate Change Scenarios for Viet Nam
382. The latest climate change scenario for Viet Nam was developed based on research and analysis that have been performed in previous works, both from international researches and in the country. Typically,
a. From abroad:
Third and Fourth Assessment Reports of the IPCC,
Results of the Global Climate Model with 20 km resolution of the Meteorological Research Institute of Japan Development of Meteorology (MRI-AGCM) for Vietnam territory at the medium emission scenario,
Report on Climate Change scenarios for Viet Nam by research group of the Oxford University, UK,

Risks and Adaptation to Climate Change in BCI Pilot Sites in PRC, Thailand and Viet Nam Final consultant report, July 2010
83
IPCC summary on sea level rise scenarios for the 21st century, in Assessment Reports in 2001 and 2007.
b. In the country:
Climate Change Scenario 1994 in the report on climate change in Asia, a project funded by the Asian Development Bank (ADB);
Climate Change Scenario in Vietnam developed for the Initial Report of Viet Nam to submit to UNFCCC, 2003;
Climate Change Scenarios developed by the Institute of Hydro-Meteorology and Environment in the years of 2005, 2006 by using the software of MAGICC/ SCENGEN 4.1 and method of Statistical Downscaling;
Climate Change Scenarios developed by the Institute of Hydro-Meteorology and Environment in 2007 for the Second Report of Viet Nam to UNFCCC;
Climate Change Scenarios developed by the Institute of Hydro-Meteorology and Environment for provinces of Viet Nam, such as Lao Cai, Thua Thien-Hue, Red-River Delta in 2007 and 2008;
Climate Change Scenario developed by the Institute of Hydro-Meteorology and Environment in 2008 by using the software of MAGICC/ SCENGEN 5.3 and method of Statistical Downscaling;
Application of PRECIS model for computation and development of Climate Change Scenario for the Region and Viet Nam by the Institute of Hydro-Meteorology and Environment in cooperation with SEASTART and Hadley Centre of UK Meteorology Agency. The work was done in 2008.
Tidal gauges data at Vietnam coastal stations.
Vietnam studies on sea level rise such as East Sea Tides and Water Level Rise along Vietnam Coast; Assessment of sea level rise–induced damages, etc, carried out by the Marine Center (General Department of Sea and Island, MONRE).
2. Climate Change Scenarios for Viet Nam
383. Criteria for selection of climate change scenario for Viet Nam include the following requirements:
Reliability of the original scenarios, and method of development;
The details of the climate change scenarios: must be detailed enough for serving the assessment of climate change impacts in each regional climate areas;
Inheritability: inherit and update information of the Initial Report on climate change of Viet Nam, as well as draft second national report on climate change;

Risks and Adaptation to Climate Change in BCI Pilot Sites in PRC, Thailand and Viet Nam Final consultant report, July 2010
84
In accordance with the latest researches in this topic, emphasizing the results of AR4/IPCC 2007;
In good agreement with the local climate events (temperature, precipitation) in Viet Nam;
Completeness: including scenarios for all cases of high, medium and low emissions and development situations.
384. Two scenarios of GHG emission have been selected for evaluation, that are the medium of the group of high emission scenarios (A2 scenarios) and the medium of the group of medium emission scenarios (B2 scenarios). The climate change scenarios for temperature and precipitation have been developed for seven climate regions of Viet Nam, namely: North-West, North-East, Red-river Delta, North-Middle region, South-Middle region, Highland region, and Mekong delta region. The period of 1980 – 1999 is used as baseline period for reference that is also the baseline used in the AR4/IPCC.
a. Temperature
385. The temperature may rise quickly in all regions, and the rise in winters will be higher than in summers. The temperature rise in the North will be higher than in the South.
386. According to the high scenario (A2): by the end of the 21st century, the yearly mean temperature in climate regions of the North may increase in the range between 3.10C - 3.60C compared with that in the period of 1980 – 1999, while the rise in North-West will be 3.30C, the North-East: 3.20C, the Red River Delta: 3.10C, North of the Middle: 3.60C. The average temperature rise in the South will be 2.40C, while the rise in the Highland will be 2.10C and in the Mekong Delta will be 2.60C.
387. According to the medium scenario (B2): by the end of the 21st century, the yearly mean temperature may rise up to 2.60C in North-West, 2.50C in the North-East, 2.40C in the Red river Delta, 2.80C in the North of the Middle, 1.9 in the South of the Middle, 1.60C in the Highland and 2.00C in the Mekong Delta as compared with the period of 1980 – 1999.
b. Precipitation
388. In general, precipitation increases in the rainy season (September to November) and decreases in the dry season (July, and August). This may result in more flooding in different places during the rainy seasons and more severe drought elsewhere in dry seasons. However, the tendency is not the same for all climate regions of the country. Heavy rains and severe floods may happen in more frequently in Central and Southern Viet Nam, while drought will probably happen in every region of the country. The precipitation in dry seasons would decrease in most of climate regions of the country, especially in the South. However, the overall precipitation of the years and yearly precipitation will increase in all climate regions.
389. According to the high scenario (A2): by the end of the 21st century, the annual precipitation may increase around 9 – 10% in the regions of North-West and the North-East, about 10% in the Red River Delta and North of the Middle, about 4 – 5% in the South of the Middle, and more than 2% in the Mekong Delta as compared with the period of 1980 - 1999.
390. According to the medium scenario (B2): by the end of the 21st century, the annual precipitation may increase around 7 – 8% in the regions of North-West, North-East, Red River Delta and North of the Middle, about 2 – 3% in the South of the Middle, the Highland and the Mekong Delta as compared with the period of 1980 - 1999.

Risks and Adaptation to Climate Change in BCI Pilot Sites in PRC, Thailand and Viet Nam Final consultant report, July 2010
85
c. Sea level rise
391. The sea level has been rising over the whole of the 20th century at a never increasing rate. The two main reasons for the sea level rise are thermal expansion of the ocean water and the melting of the glaciers. The monitoring data during the period of 1961 – 2003 revealed that the global sea level has been rising with the rate about 1.8 ± 0.5 mm/year, among that, the rise due to thermal expansion is 0.42 ± 0.12 mm/year, and glacier melting contributed 0.7 ± 0.5 mm/year.
392. The monitoring data from the TOPEX/Poseidon satellite for the period of 1993 – 2003 showed that the rate of sea level rise was becoming higher than before, up to 3.1 ± 0.7 mm/year.
393. In all scenarios of IPCC, the global sea level is expected to rise in the whole 21st century at a rate about 3.8 mm/year, much higher than that in the previous period of 1993 – 2003 (3.1 mm/y).
394. However, according to the latest research, the global sea level may rise much higher, somewhere between 0.5 – 1.4 m by 2100. The main reason for the low estimation in IPCC reports is that the problem of glacier melting was underestimated.
395. The monitoring data at the Viet Nam’s coastal monitoring stations showed that the average rate of sea level rise in Viet Nam’s coasts was about 3 mm/year for the period of 1993 – 2008, similar to the average value of the world. In general, the sea level has risen about 20 cm during the last 50 years in Viet Nam.
396. There have been several scenarios of sea level rise according to different scenarios of GHG emission developed by IPCC and other research institutions around the World. However, taking into account the importance of glacier melting which has been emphasized recently, the scenarios for sea level rise in the 21st century for Viet Nam have been suggested by the Institute of Meteorology, Hydrology and Environment on bases of the basic scenarios of climate change of high and medium emission of GHG. The detailed scenarios for each moment in the timescale of the 21st century is given below:
Table 8.1: Detailed Sea Level Rise Forecast in cm in the 21st Century Relative to the Period of 1980 - 1999
Scenarios of Emission
Decades in the 21st century
2020 2030 2040 2050 2060 2070 2080 2090 2100
High (A1F1) 12 17 24 33 44 57 71 86 100
Medium (B2) 12 17 23 30 37 46 54 64 75
Low (B1) 11 17 23 28 35 42 50 57 65
397. Among the three scenarios above, taking into account the world efforts at reducing GHG emission by the progressive improvement in the application of clean and renewable energy, conservation of natural resources, etc., the scenario of medium emission (B2) is considered to be the basis for all future planning activities for socio-economic development of the country.
D. Impacts of Climate Change in Viet Nam 398. Climate change is now threatening Vietnamese people directly and affecting the safety and the economy of the country. In principle, climate change may have impacts on many sectors of the life, economy, natural resources, environment, and livelihood, such

Risks and Adaptation to Climate Change in BCI Pilot Sites in PRC, Thailand and Viet Nam Final consultant report, July 2010
86
as, agriculture, water resources, forestry, fisheries, energy, transport, tourism, livelihood and health, ecosystems, etc.
399. As indicated in the human development report 2007 – 2008 of the UNDP, if the temperature on the Earth increases 2oC, about 22 million of the population in Viet Nam would be affected by losing their houses, and 45% of the land used for agriculture in the Mekong Delta, the granary of Viet Nam, will be under threat of inundation.
400. The summary of potential impacts of climate change in Viet Nam classified in term of time, from short to long time would be such as follows:
Short-term
401. Increased number and severity of typhoons striking Viet Nam annually lead to large-scale damage to lives and agricultural and fisheries production in the coastal areas
402. Floods and inundation flooding will occur more frequently, with higher severity, which also leads to large-scale negative impacts on people’s production in mountainous and delta areas.
Medium-term
403. Climate change and disasters can lead to outbreaks of old and new diseases, and also increase the speed of spread of these diseases
404. Increased temperature, desertification, sea-level rise will lead to more salinity intrusion, which adds to the problem of surface and ground water shortages, or being seriously contaminated
Long-term:
405. Sea-level rise will cause several areas to “disappear” under the sea
406. Large-scale desertification will lead to great losses of land for cultivation and aquaculture
407. Increased temperature will lead to changes in the ecosystems and difficulties for agricultural and fisheries production
408. In more details, typical impacts in each concrete areas of biodiversity, food security, water resources, and rural livelihood would be as follows:
1. Impacts on Eco-systems and Biodiversity
409. Viet Nam is home to approximately 3% of globally threatened species. While biodiversity remains high for the moment, the total numbers of many species are low, and in some cases may have dropped below long-term viable levels. The percentages of populations of globally threatened species that are conserved within protected areas are generally low (IUCN, 2005).
410. Predicted climate change scenarios are likely to exacerbate the existing pressures on forests and biodiversity. Currently, it is estimated that 5 million ha of forests are susceptible to forest fires regardless of the season, while 5.6 million ha are at risk during the dry season. Annually, between 20,000 and 30,000 ha of forest are lost to fire. Considering that the duration and intensity of the dry season is predicted to increase by 2050, it appears unavoidable that a corresponding increase in the incidences of forest fires will follow. Compounding this situation is the probability of increased pest infestations, which contribute to weakening the resilience of forest ecosystems to climate change.

Risks and Adaptation to Climate Change in BCI Pilot Sites in PRC, Thailand and Viet Nam Final consultant report, July 2010
87
411. Climate change would create great impacts on nature, biodiversity and society both directly and indirectly. Those impacts can be seen in various aspects.
Concerning biodiversity, some species such as those are recorded in the IUCN Red Book, especially species in danger in some specific location may become extinct. Reducing ecosystems and habitats, that are essential for migration species, especially those in danger with narrow living areas would make the population of those species reduced or even become extinct.
Sea level rise would damage the current mangrove forest and it is expected that the mangrove area would decrease, and adversely affect flooded indigo forests and forest planted on the sulfated land of provinces in the South of Viet Nam. A considerable area of the deltas of the Red and Mekong rivers will be inundated due to sea level rise, and saline intrusion affecting the habitat of many species.
With global warming, tropical crop species (adapted to hot climates) will expand while the subtropical species (adapted to cooler climates) will be reduced (and move toward the higher altitudes). The distribution boundary of plants will likely move to the North, forest structure (between primitive and secondary forests) may change considerably, some precious plants may disappear. For instance, oleaginous trees would expand towards Northwards and to the higher altitudes. Deciduous forest with drought resistant varieties would expand in distribution.
The higher temperature in combination with abundant solar radiation would promote photosynthesis process that leads to an acceleration of assimilation processes of verdurous trees. However, due to the increase of evaporation, soil moisture would decrease, then the biomass growth index of forest trees would also decrease.
The threat of extinction of animal and plant species would increase, and some important plants in forests like aloe wood, boxwood, etc., would be likely to become extinct with a loss of biodiversity.
The increased temperature and drought would lead to an increasing danger of forest fire, and the development and spreading of plant pests and diseases.
412. Concerning aquatic ecosystems, the changes due to saline intrusion into the delta from the sea would be such as:
The habitat of fresh water living creatures would become smaller due to the intrusion of saline water.
Mangrove forests would be reduced in area affecting ecosystems of some aquatic species.
The organic-matter-fixing capacity of seaweed ecological systems would reduce, resulting in decreasing sources of photosynthesis products and nutrition for living creatures in sea-, river-beds. Thus, the quality of habitat of various aquatic organisms would deteriorate.
413. The increase in water temperature would lead to
Climate change will also increase the temperature of freshwater bodies, which could speed up eutrophication (oxygen deficiency) processes (IPCC 4th Assessment Report, 2007). The impact on aquatic

Risks and Adaptation to Climate Change in BCI Pilot Sites in PRC, Thailand and Viet Nam Final consultant report, July 2010
88
habitats would be substantial, leading to reduction in fish stocks and possibly driving some species to extinction.
With increasing temperature, some species would move Northwards or to deeper depths that would change the vertical distribution structure of aquatic organisms.
Increasing temperature would also accelerate mineralization and organic decomposition processes and affect food system of organisms. The biota should consume more energy for respiration, as well as for other metabolic activities that reduce the productivity and commercial quality of aquaculture and sea products.
Degeneration or destruction of coral reef; change physiological, bio-chemical processes occurring in interaction between coral reef and algae.
Due to increased rainfall intensity, the salt concentration of seawater would reduce by 10 - 20% during a long period (it could prolong from some days to some weeks). As a result, brackish water and coastal biota, especially, bivalve mollusks (like arca, oyster, etc.) would suffer widespread deaths due to shocks of changes in salt concentration.
2. Impact on Agriculture and Food Security
414. Agricultural and forest lands of Viet Nam accounted for 74% of total natural areas, with the rural population accounted for 73% of total population. However, the total sector’s production accounts for only 20% of national GDP. Consequently, agriculture and rural development would be most affected by climate change.
415. There are 18 main crops cultivated in Viet Nam, of which rice, tea, coffee, rubber, peanut, cashew nut and black pepper make up the main exports. Its main export is rice, making Viet Nam the 2nd largest exporter of rice globally. Some 82% of the arable land, constituting 6.7 million ha, is cultivated with rice. Rice also provides 80% of carbohydrate and 40% of protein intake of the average Vietnamese. Rice production accounted for 43% of the gross value of agricultural products in 2007 (IRRI, 2007). For many of the rural poor, the following crops are of equal importance: corn, sweet potato, cassava, vegetables, beans, and fruits.
416. Most of the rice is grown in the Red River and Mekong River Deltas and is irrigated. Standard crop rotations are two per year. In the Mekong River Delta, however, farmers in some irrigated areas grow three crops a year. More than 60% of the South’s rice lands are rain-fed, however. Upland rice is grown on about 100,000 ha in the South-Eastern region, Central and Northern highlands
417. As a result of climate change and its impacts, most food crops will be more difficult to cultivate. According to IRRI, if temperatures stay above 35oC for one hour while rice is flowering, the heat will sterilize the pollen (IRRI, 2007). IRRI also offers evidence to show that with every degree of warming, rice yield will fall by 10%. Currently, many rice cultivars are already close to their heat threshold, and 1oC increase in temperature will lead to widespread mortality (IPCC, 2007).
418. As rainfall patterns will also change, resulting in hotter, longer and more arid dry seasons and in the other hand, causing more serious flooding and/or water clogging during the rainy seasons, cultivation as well as farming in general, would suffer great losses.
419. Sea level rise and saline intrusion is also an issue that needs special care and appropriate actions in order to minimize that impact.

Risks and Adaptation to Climate Change in BCI Pilot Sites in PRC, Thailand and Viet Nam Final consultant report, July 2010
89
420. Another anticipated problem is the damage to irrigation systems and other agricultural infrastructure as a result of flooding during the rainy season. The costs associated with these changes are experienced as reductions in yields and damage to infrastructure, have not been projected. However, examination of current scenarios in the central and central highlands for drought alone provides some indication. Statistics for the two regions show that between 1997 and 1998, USD 87.5 million was lost to drought (Ministry of Agriculture and Rural Development - MARD, 2008)
421. Concerning the impacts of climate change to agriculture and food security, the issues can be summarized as follows:
With the warming in the country, the adaptation time of tropical crops would extend: the planting boundary of tropical trees/crops would move towards higher mountainous region and Northwards. On the other hand, the adaptation area of subtropical plants would become narrower. By 2070s, in the mountains tropical trees would be able to grow at the altitude of 100-550 meters higher and spread 100-200 km northwards in comparison with the present boundary. The consequence is that the farmers may have to change their traditional crop or the crop yield may be reducing due to climate change.
Due to abnormal changes of rainfall intensity, flood inundation during flooding time would last longer and drought in dry seasons would occur more frequently, flood and drought will happen with higher frequency and intensity, and that will affect the crop yields.
Sea level rise will reduce areas of mangrove forest, causing negative impacts on forests growing on alkaline soil in coastal areas, especially the Southern areas, thus threaten the sources of food for farmers. Significant cultivation areas in the Mekong and Red River deltas would be reduced by salt water intrusion due to sea level rise and the cultivation in those lands will be seriously affected.
High temperature and drought may cause wild fires that destroy forests and the livelihood of rural people. At the same time, fluctuating weather stimulates the development of pests and diseases.
Heavy rains and unexpected flooding may cause short-term salinity shocks that may kill some species of mollusks, affecting the livelihood of rural people.
3. Impact on Water Resources
422. In Viet Nam, water resources systems, beside for irrigation, are responsible for drainage of the whole land area, and water supply for other sectors. Agriculture, forestry, water resources and aquaculture are dependent on natural conditions, and significantly affected by any changes of those conditions.
423. Viet Nam has rich and abundant surface water resources. However, upstream diversions, droughts and seasonal variations in river flows, resulting from climate change, are reducing per capita water availability in some areas. Regarding surface water quality, upstream water quality of most rivers is good for sustaining freshwater ecosystems and for domestic purposes. Downstream water quality is generally poor, however, unsuitable for domestic purposes and causing freshwater ecosystem decline. Water quality is poorest in urban areas, which tend to be in downstream areas and are exposed to industrial and domestic wastewater discharges.

Risks and Adaptation to Climate Change in BCI Pilot Sites in PRC, Thailand and Viet Nam Final consultant report, July 2010
90
424. Over the past years, the rainfall variations experienced indicate that erratic changes are taking place. As the result of climate change, rainfall patterns are expected to change, creating hotter, longer and more arid dry seasons and more intense downpours during the rainy season. While annual rainfall will increase, it will not arrive at the required time or in the quantities expected.
425. Viet Nam is located downstream of two big international rivers: the Mekong and Red Rivers. The Mekong river basin area is about 795,000 km2 (including Tonlesap and its delta in Cambodia), and annual water runoff to the South China Sea is 505 billion m3. The Red River has a basin of 169.000 km2; annually it transports to the East Sea 138 billion m3 of water. Based on predicted climate change scenarios, it is expected that the total flow will change substantially. The estimated change in water runoff of the Red River and Mekong river will be as follow:
Compared with present, in 2070, the total annual run-off will be changed from +5.8 to -19.0% for the Red River and from +4.2% to -14.5% for the Mekong River;
Low-flow in the dry season will change in the range from -10.3 to -14.5% for the Red River and from -2.0 to -24.0% for the Mekong River,
The flood maximum flow will be changed in the range from +12.0 to -5.0% for the Red River and from +15.0 to -7% for the Mekong River.
426. In summary, in both river systems, a shortage of water could be more likely to happen in dry seasons while higher flow is expected in flood seasons, and that may cause long-term inundation or water clogging.
427. In the medium and small rivers, annual flows could fluctuate with similar or higher volumes of water.
428. Due to extreme events, the following impacts could be observed in the future due to climate change:
Drought may become more serious in mountainous areas due to a shortage of water, especially in dry seasons.
High seasonal fluctuation in rivers, causing floods and water scarcity in different time of the years, hence, affecting agriculture, aquaculture, and livelihood in general of the rural people.
Pollution from different sources such as industry, farming, household discharges, in dry seasons can make the water in some rivers or reservoirs unusable for various purposes, thus exaggerate water scarcity in dry seasons!
429. Thus, for many reasons, water supplies for irrigation and household use would be significantly reduced, especially in dry seasons. Besides the scarcity due to limited supply from the rainfalls and rivers, saline water intrusion contributes to exacerbate the water supply shortages for both irrigation and for household use. Given these predicted fluctuations in water quality and availability, agricultural production systems will require significant adaptations if they are to contend with climate change impacts. In Viet Nam, agriculture consumes the highest volume of water (more than 70% of water use).
4. Impacts on Rural Livelihood
430. The rural population in Viet Nam accounts for 73% of the total national population. The total products of agriculture and forestry in Viet Nam accounted for 20% of national GDP. Most of poor Vietnamese population live in rural areas. Thus, in Viet Nam, the links between poverty and environment for rural livelihood are becoming more evident as a result of climate change. Climate change poses a threat to the dozen of millions of

Risks and Adaptation to Climate Change in BCI Pilot Sites in PRC, Thailand and Viet Nam Final consultant report, July 2010
91
Vietnamese people who rely on agricultural production and exploitation of forest resource for their survival. Deforestation and forest degradation caused by conversion of forests into agriculturally cultivated land and over-exploitation of timber and non-timber forest products (NTFPs).
431. Climate change affects the livelihood of rural people in various aspects, such as:
Sea-water level rising increases the occurrence of floods and loss of agriculturally cultivated land;
Droughts and other extreme climate events reduce land productivity and loss of harvest
Increase of epidemic diseases
432. The dimension and level of impacts different from region to region.
433. Besides that, the poor people usually suffer more. The following points illustrate the vulnerability of poor communities to environmental degradation in general:
high concentrations of rural poor living in disaster-prone areas (northern mountainous region, central highlands and Mekong Delta) with degraded land or low-quality environmental conditions and depleted natural resources;
high dependency on the environment and natural resources for supporting livelihood options - more than three-quarter of Vietnamese people earn their living from the land;
high dependence on non-timber forest products (NTFPs) to augment both caloric intake and income generation; and
high risk to health as a result of low caloric intake coupled with increased incidences of disease.
434. Impacts of climate change on income from sea products and fisheries: In general, climate change will increase threats to the habitat of some aquatic species that affect the livelihood of rural population. Climate change will influence marine ecosystems and disturb marine habitats and fish sources, therefore it also affects livelihood of fishing communities in coastal areas directly.
Due to sea level rise, hydro-physical hydro-biological and hydro-chemical regimes would be degraded, and as a result, the existing aquatic population would change its structure and components, and their reserve would reduce seriously.
Climate change can also cause massive coral bleaching, migration of aquatic species, affecting the livelihood of coastal population nearby the coral reefs.
Due to increasing temperature, the benefit of resources distribution would be more dispersed. Meanwhile, the number of tropical fishes with low commercial value would increase. The number of sub-tropical fishes with high commercial value would decrease or even disappear. Most fish in coral reef areas would vanish.
Phyto-plankton represent the first link of the food chain for plankton and juvenile fish and would be destroyed leading to the sharp decreases of plankton - the main flood source for aquatic species and fishes in the middle and above layers, which affect directly the sources of aquatic products and the harvest of the rural population.

Risks and Adaptation to Climate Change in BCI Pilot Sites in PRC, Thailand and Viet Nam Final consultant report, July 2010
92
435. Most of the poor people live in rural areas, where farming constitutes the main economic activity and only limited physical and social infrastructure is available. Many of them only have small landholdings or are landless. More than three-quarters of the country’s population is dependent on rain-fed or irrigated agriculture and lives alongside waterways, in low-lying deltaic regions or in the coastal zone, which are prone to seasonal flooding. More frequent drought and floods (flashflood and water inundation) will make the situation worse, especially for the poor people. Patterns of inequality determine the distribution of vulnerability to climate change within these areas. Considering the location of poorer areas, their vulnerability to extreme climatic events is higher, and they are also less able to recover from these events.
436. Access to resources is a critical determinant of vulnerability, and is frequently mediated by the allocation of agricultural and forest lands. Constraints in land-use rights, lack of access to market and extension services, and limited credit seriously disadvantage Viet Nam’s poor (consisting of a disproportionate number of ethnic minorities). Among the poor, as in most parts of the developing world, women are particularly marginalized by significant barriers to achieving economic self-sufficiency. Furthermore, given that 30% of the population is under 15 years of age, the pressure for access to land and other resources cannot but increase over time.
437. Predicted climate change scenarios for Viet Nam do not bode well for the population as a whole, and even less so for the poorer segments of society. The processes of climate change will intensify the degradation of land and its resources, and will undermine the very basis of poorer communities’ ability to cope. The negative impact on agricultural productivity and forest health will result in food insecurity and increased disease-related problems for the poor. Currently, migration to urban areas has become an attractive coping mechanism for many of the rural poor, bringing with it a unique set of problems. Considering that some 12.5 million of Viet Nam’s population is below the poverty line, it is imperative that appropriate policy responses are developed to mitigate their vulnerability to climate change impacts.
E. National Response to Climate Change 438. In recent years, the Viet Nam government has been well aware of the impacts of climate change on socio-economic life of Viet Nam and has set up measures to cope with it. First of all, two major kinds of impacts have been identified such as:
The current and immediate impacts are the increasing frequency of natural disasters, a form of short term impact of climate change affecting the country; and
The other gradual impacts of climate change such as saline intrusion in coastal and low land of the Mekong deltas, increasing drought in arid areas (typically mountainous areas), sea level rise, change of precipitation, etc.
439. In order to build capacity to cope with such impacts, the response of Viet Nam is expressing in the following manner:
The government is currently placing high priorities on short-term impacts, i.e. to build resilience capacity against significant natural disasters: storms and inundation in population centers, floods (in Mekong delta), flash-floods in mountainous areas, etc.
Gradually build up capacity of adaptation to medium- and long-term impacts of climate change such as saline intrusion, drought, sea level rise, global warming and change of rainfall, etc.

Risks and Adaptation to Climate Change in BCI Pilot Sites in PRC, Thailand and Viet Nam Final consultant report, July 2010
93
440. Following such principles, the government of Viet Nam has performed the following activities in the recent years by issuing:
The National Strategy for Natural Disaster Prevention, Response and Mitigation, which was approved by the Prime Minister in 11/2007 with Provincial and Ministerial action plans to implement the National Strategy.
The Vietnamese National Target Program to Respond to Climate Change (NTP), which was approved by the Prime Minister in December 2008 under Decision No. 158/2008/QD-TTg,
441. The National Strategy for Disaster Mitigation aims to include solutions for major issues of disaster management of the country in different regions such as:
In the Northern and Northern Central deltas: complete flood prevention, which includes principles such as:
→ Enhance flood prevention capacities for river dyke systems: plan; review and revise plans; construct, reinforce, and improve disaster preparedness structures.
→ Construct and operate large reservoirs in upstream areas, preparing reservoir operating procedures for flood control and regulation; plant and protect upstream forests.
→ Improve flood discharge capacity of rivers.
→ For coastal provinces, implement programs on sea dyke recovery and improvement, wave shield tree planting and protective forest planting
In the Mekong delta: to follow the principle of “living with flood” to ensure the safety and sustainable development, namely:
→ Flood control, proactive prevention, relevant usage of land and forest resources, and natural conditions.
→ Development of residential clusters, flood overcoming infrastructure; enhancement of flood discharge capacities; development of sea dykes, estuary dykes, bordering dykes, walls, saline intrusion prevention structures.
→ Proactively make use of flood advantages.
→ Enhance international cooperation with regional countries for enhancing flood control capacities.
In coastal areas and islands follows the principle of “proactively prevent and adapt for development”, which is expressed by the following issues:
→ Land use planning.
→ Plantation and husbandry restructuring.
→ Sea dyke construction and reinforcement, natural sand dune preservation; reservoir construction; forest planting; erosion prevention; channel dredging; safety harbour development; coastal information station improvement and development.
→ Ensure safety in constructing houses, infrastructure against disaster.

Risks and Adaptation to Climate Change in BCI Pilot Sites in PRC, Thailand and Viet Nam Final consultant report, July 2010
94
→ Promote researches and proposals for river mouth filling prevention, enhancing flood discharge capacities.
In mountainous areas and highland priorities are given to proactive prevention of flash-flood and drought, focusing on the tasks such as:
→ Create maps for and localize areas with high risk of flash flood, landslide; residential planning; land use planning; relevant forest plantation and exploitation, plantation restructuring.
→ Develop early warning systems and communication systems to a village level; construct works to prevent erosion and flash flood; clear discharging ways, expand flood discharging openings of bridge and sluice systems, develop reservoir systems in combination with flood and drought prevention purposes.
In offshore areas dominated fishing activities the priorities for disaster management are proactive prevention & avoidance. The issues of importance are:
→ Manage the exploitation of sea resources, develop management systems for vehicles operating on the sea.
→ Build and construct communication system in combination with warning and forecasting purposes. Develop professional search and rescue forces, improve relief and rescue capacities for semi-specialized forces and the community.
→ Enhance cooperation with countries and territories in the region in forecasting, warning, communication, search and rescue.
The Viet Nam National Target Program (NTP) to respond to climate change includes principles such as:
→ To identify the extent of climate change in Viet Nam due to global climate change and assess climate change impacts on every sector, area and locality.
→ To identify measures to respond to climate change.
→ To promote scientific and technological activities to establish the scientific and practical basis for climate change response measures.
→ To consolidate and enhance the organizational structure, institutional capacity and the development and implementation of policies to respond to climate change.
→ To enhance public awareness, responsibility and participation; and develop human resources to respond to climate change.
→ To promote international cooperation to obtain external support in response to climate change.
→ To mainstream climate change issues into socio�economic (sectoral and local) development strategies, plans and planning.
→ To develop and implement action plans of all ministries, sectors and localities to respond to climate change; to implement projects, and first of all pilot projects to respond to climate change.
442. In each area of concern in biodiversity, food security, water resources, and rural livelihood, the measures to be performed are described in more detailed as follows:

Risks and Adaptation to Climate Change in BCI Pilot Sites in PRC, Thailand and Viet Nam Final consultant report, July 2010
95
F. Basic Adaptation Measures to Climate Change 443. In recent years, Viet Nam has been developing and implementing various programs with support from foreign partners for dealing with climate change and managing the risks of natural disasters. Key policies in the adaptation programs emphasize the utilization of water resources in scientific manner, for higher efficiency and cost-effectively, to maintain sustainable agricultural production in spite of negative impacts of climate change, further expanding forest coverage to support environmental safety, promoting rural livelihoods and to mitigate natural disasters. The guideline for such activities have been demonstrated in the Nation Target Programme to Respond to Climate Change was been launched by the end of 2008. Adaptation measures for each of concrete areas are given in separate parts below.
1. Adaptation Measures for Biodiversity
444. Biodiversity is always closely associated with forests and protection/preserved areas, both in land and in water. Consequently most policies and measures concerning biodiversity in Viet Nam deal with forests and protection/preserved areas and biodiversity is usually mentioned indirectly. Forest and forestland account for 48% of Viet Nam’s territory (16.2 million ha) with various ecosystems with high biodiversity in different kinds of forests, such as, tropical rain forest, sub-tropical forest, mangrove forest, peat land forest. So, issues of biodiversity in response to climate change are also partly reflected in policies and measures to respond to climate change in forested areas.
445. As a way to contribute to maintaining and improving biodiversity, the 10 year Comprehensive Poverty Reduction and Growth Strategy, approved by the Prime Minister in 2001, has set up objectives to ensure a sustainable environment in general and sustainable biodiversity in particular with the criteria, such as:
Up to 2010, enhance afforestation in watershed areas, with 50% deforested watershed forests tobe recovered; improve forest quality and encourage local people to afforest, revegetate bare lands and hills, protect and expand mangrove forestand increase forest cover, especially in watersheds and mangrove forest.
Increase forest coverage from 37% in 2005 to 42.6% in 2010 and 47% in 2020. Increase the proportion of nature conservation areas in total natural land to 11.5%, especially sea and wetland conservation areas.
Protect natural forest and gradually prohibit exploitation of natural forests, prevent forest fire.
Promote biodiversity in poor, sandy, desert and marsh areas; to ensure sufficient resources for production activities of local people, especially the poor.
Improve poor ecosystems, increase stability of ecosystems in sensitive areas such as sandy coast, tidal flat, treeless areas and ball hill, etc.
Select and develop plant varieties suitable to natural conditions taking climate change into account.
446. In order to minimize the impacts of climate change on biodiversity, the following measures should be applied:
Develop and improve policies on biodiversity for suitable implementation.
Establish species recovery and reserved areas to protect species that are in danger of extinction due to climate change.

Risks and Adaptation to Climate Change in BCI Pilot Sites in PRC, Thailand and Viet Nam Final consultant report, July 2010
96
Set up detailed programs to improve knowledge and understanding of biodiversity conservation for specific communities.
Strengthen international cooperation on biodiversity conservation in response to global climate change.
447. With support from both Government and foreign donors many projects have been developed and implemented in these directions.
448. In a project of the Red-Cross Viet Nam to conserve nature and biodiversity, during the past years, 12,000 ha of mangrove have been planted to protect 110 km of sea dykes. The cost for planting and growing those mangrove forests is about 1.1 million USD, but in return, it helped to save about 7.3 million USD/year as the maintenance cost for those sea dykes and it protected 7,750 households behind those dykes.
2. Adaptation Measures in Agriculture and Food Security
449. It is well known that, agriculture, forestry, water resources and aquaculture are very dependent on natural conditions, and significantly affected by any changes of those conditions. Consequently agriculture and rural development will be significantly impacted by climate change. To ensure food security, priorities must be directed into all relating areas, such as:
Irrigation, water supply, drainage and flood control: dyke systems, saltwater intrusion control, dam safety.
Agriculture: crop & livestock varieties, yield and production, new farming practices, cropping pattern.
Forestry: impacts of climate change on forestry, reforestation.
Aquaculture: impacts on aquatic resources, yield, sustainable aquaculture.
450. As the rule, there are always two ways of thinking in relation to agricultural production and food security: the first way of thinking is about the policies, mechanisms and institutional measures, while the other way of thinking is about technical issues that can solve the urgent problems in the most reasonable way. Issues of policies to respond to climate change of the agricultural production and food security include:
Development of agriculture that is diverse, sustainable, with effective application of scientific advances; new and high technologies and competitive in local and international markets.
Construct new rural areas with developed and modernized infrastructure with relevant economic structure of three components: agriculture-industry-services.
Ensure adequate employment, hunger eradication and poverty reduction in rural areas.
Ensure food security in balance with a sustainable environment and biodiversity.
Develop and improve the framework of legal documents, laws and circulars to protect the agriculture, biodiversity and sustainable development.
Amend and improve policies and mechanisms to support the application of new technologies, modern scientific and technical solutions to change crops pattern, livestock and new farming techniques suitable with climate change conditions.

Risks and Adaptation to Climate Change in BCI Pilot Sites in PRC, Thailand and Viet Nam Final consultant report, July 2010
97
Develop and implement scientific and technical activities to adapt to climate change in the agricultural sector;
Effective use of agricultural land and water for fisheries in consideration of immediate and potential impacts of climate change to ensure sustainable agricultural production.
451. Concrete measures in terms of agricultural technology in those areas include:
Select and develop a suitable crop mix. This is considered a way to adapt to changes in climate conditions as well as water availability for each cultivation areas for the optimal income.
Change the farming pattern in some inundated areas, from pure paddy rice cultivation to shift between rice cultivation and aquaculture.
Reclaiming areas, especially in hilly midland areas in the North of Viet Nam, for agricultural production.
Develop aquaculture for brackish water areas, especially in the Middle of Viet Nam; establish natural ecological protection areas, especially at the coral reefs.
Planning and optimization of water use for irrigation.
Develop irrigation system as necessary. However, this measure can be applied only for some high-value crop plants in a goods production manner.
Breeding new high resistant crop species so that they can be planted in all other areas, providing food for majority of people in arid areas.
Develop new farming technology appropriate to climate change conditions.
3. Adaptation Measures in Water Resources
452. A key policy to respond to climate change is to exploit and use water scientifically, properly and cost-effectively. Concerning issues of policies, legislative regulations and organization in management and exploitation of water resources in context of climate change, the following items must be prioritized in the near future:
Develop and improve a legal framework including laws and regulations, circulars, and amended policies for effective management of water resources and efficient use of water for different purposes;
Strengthen management mechanism for water resources at different levels to ensure that the laws and regulations are applicable in practice;
Develop and implement policies, plans, programs to respond to climate change at all sectors and all levels;
Identify suitable scientific and technical solutions (overall plan for river basins, change specifications for water use and exploitation projects, methods for cost-effective use of water sources, protection and preservation of water sources, water pollution control;
Raise community awareness.

Risks and Adaptation to Climate Change in BCI Pilot Sites in PRC, Thailand and Viet Nam Final consultant report, July 2010
98
453. Concerning the technical work, the most urgent activities that need to be done in the near future include:
Building reservoirs with the total additional capacity of 15-20 billion m3 in order to keep water for drainage in flooding times and for irrigation and other uses in dry seasons.
Upgrading and raising the scale of drainage system.
Upgrading existing sea and river-mouth dykes, and step by step building new sea dykes.
Limiting the population growth rate and organizing new resettlement areas in coastal area.
Using water scientifically and effectively.
Exploiting while protecting water sources.
Conducting studies in long-term of water resources exploration and planning for effective use of water resources.
4. Adaptation Measures in Rural Livelihood
454. For the fisheries, the prioritized measures include:
Changing farming structure in some wetland areas from rice monoculture to fish-rice rotation system. This is a way to adapt to long-term inundation or water logging.
Taking into account sea level rise and increase of temperature while building infrastructures, quays, ports, store houses, etc.
Developing a plan for brackish water aquaculture for Central Viet Nam with 2000 km of coast and sandy land to create an effective and multiform business without affecting agricultural land.
Building back-up dykes behind sea dykes to create transitional belts between agricultural land and sea.
Building storm shelter port systems along the coast as well as in islands.
Establishing natural ecological reserves, especially coral reefs and atolls
455. For coastal disaster risk management and reduction, the strategic options include:
Full protection: implement all-sided protection measures to maintain the present situation and effectively respond to sea level rise.
Adaptation: reform infrastructure and the habits of the people living in the coastal zone to adapt to sea level rise.
Withdrawal: Avoid natural impacts of sea level rise by resettlement, moving houses, and infrastructure from threatened areas.
456. Concrete measures in each options may include some of the following items:
Establish early warning system for storms and floods; Develop storm and flood prevention and rescue plans; implement integrated coastal zone management with a community-based approach.
Taking into account sea level rise in the design and construction of harbors, ports, ship docks, wharfs, reconstruct infrastructure and adjust

Risks and Adaptation to Climate Change in BCI Pilot Sites in PRC, Thailand and Viet Nam Final consultant report, July 2010
99
economic structures and traditional production practices to adapt to sea level rise.
Estimate the expenses and conduct pilot re-settlement projects, relocation of houses and infrastructures out of high-risk areas. Develop plans to upgrade sea dykes and dykes at river mouths to protect agricultural and aquaculture areas, ensuring complete protection to cope with sea level rise effectively
Develop shelter places for boats and ships along the coasts and at the islands
Change the customs and habits of the population to suit the new conditions of sea level rise
Reinforce research on the function of coastal ecological systems (wetland, mangrove, coral reef, etc.) and the impacts of the climate change and their adaptation capacity.
457. For forestry, priority is given to:
Improve plantation and production forest quality; to increase socio – economic and environment values of forest land.
Enhancing reforestation, firstly in watershed, re-vegetation of bare lands and hills, protecting and developing mangrove forest.
Protecting natural forest and in the future, preventing forest exploitation and preventing forest fire.
Establishing bank of seeds of natural forest trees in order to protect some valuable varieties.
Enhancing timber processing efficiency and limiting the use of wood as a material.
Breeding new plant species of high resistance to conditions of climate change, thus improve the productivity of the production forestry and so improve the livelihood of the population of rural and mountainous areas.
G. Recommendations for Policy Makers 458. In order to implement key programs to respond to climate change successfully, it is necessary to place higher attention to the issues below:
Concerning the implementation of the National Target Program (NTP) for Response to the Climate Change, it is necessary to effectively implement the issue of “Integrating or mainstreaming the issue of climate change in the programs and strategy of socio-economic development at all national and/or regional levels”. Typically, it is necessary to:
→ Take into account the possibility of disaster risk management (as a specific impact of climate change) in the process of reviewing all development plans in disaster prone areas before providing approval for implementation,
→ Consider setting up a suitable national procedure to assess the impact of climate change for all national and regional socio-economic development programs in away similar to the well-known

Risks and Adaptation to Climate Change in BCI Pilot Sites in PRC, Thailand and Viet Nam Final consultant report, July 2010
100
‘environmental impact assessment’ (EIA) that is currently applied for all big projects
Requirements to complement the NTP include:
→ A clearer role for local governments in the process of response to climate change in localities, andto mainstreaming issues of climate change adaptation in all local governments socio-economic development programs, especially programs relating to planning of land-use change,
→ The importance of non-engineering measures in adaptation to climate change (mostly to the expected impacts of disasters in the disaster-prone areas) and the role of local communities in this process.
Move gradually to green development: at the moment, Viet Nam is under pressure due to the demand to develop at a high growth-rate. Many current priorities of the government are encouraging wastage of energy and excessive emissions of GHG, that should be adjusted in future. Recommendations to be considered are to gradually develop suitable policies to:
→ Remove subsidized coal prices for local industries: at the moment, Viet Nam is keeping low price of coal for big domestic industrial consumers (electricity generation, cement production, etc). Such subsidization discourages energy efficiency and harms the development of clean/green technologies,
→ Create a fund for green technologies from foreign official development assistance (ODA) sources and impose a suitable tax on fossil fuel use as a basis to favor conditions for green technologies to encourage sustainable development in the future.
H. Final Remarks 459. In recent years, there are growing amounts of evidence of climate change in Viet Nam, that is reflected by the increasing number of storms, major rain events and serious flooding and drought. Some of the expected consequences of climate change are also noticed such as saline intrusion, soil erosion and landslides.
460. Line ministries/sectors are trying to develop programs to adapt to climate change within their sectors. The main activities include:
Development of adaptation strategies on the basis of reviewing sectors’ activities and adjust laws, regulations, rules, norms and procedures;
Development of plans to apply advanced technologies adaptable to climate change in order to protect safe and sustainable development of the economic sectors;
Development of and implementation of plans to raise community awareness of climate change within their areas of responsibility.
461. It is also noticed that climate change impacts are different from region to region due to specific geographic location factors and different conditions of nature and socio-economic development. Consequently it is necessary to develop an adaptation strategy for each region. One of the urgent tasks is to develop “Action Plans” to cope with climate change and implement the Plans for more vulnerable regions.

Risks and Adaptation to Climate Change in BCI Pilot Sites in PRC, Thailand and Viet Nam Final consultant report, July 2010
101
462. Some of the recent activities to respond to climate change in Viet Nam by the Ministry of Agriculture and Rural Development (MARD) include:
Develop and implement a strategy to protect biodiversity and to prevent and eliminate impacts of climatic extremes induced by climate change;
Protect, maintain and expand vegetation coverage in watershed areas, in high mountains, and in regional protection areas;
Strengthen communication and information dissemination in communities of ethnic groups, and improve living conditions of those ethnic communities whose life closely depends on forests;
Enhance integration of agro-forestry, and encourage reasonable exploitation of land resources for commodity production; step by step overcome the self-provision state.
Develop irrigation system towards sustainable water supply (domestic use, agriculture production, and other purposes).
463. The Government of Viet Nam is paying special attention to adaptation in the agriculture sector, with specific reference to rice production, considering that it is the world’s second largest exporter, and the major goal is to ensure food security for the country. In this regard, MARD has initiated a process for developing a Climate Change Mitigation and Adaptation Action Plan for the Agricultural and Rural Development Sector. The development of a Climate Change Mitigation and Adaptation Action Plan for the Agricultural and Rural Development Sector is a demonstration of the Government of Viet Nam’s commitment to ensuring the protection of this sector from climate change. It is a national priority to ensure the continued strengthening of the agriculture sector, and this has become an even higher priority given the current food shortages globally and the unprecedented rise in the price of rice.
464. At the same time, some of the adaptation activities and measures to respond to climate change in terms of disaster risk management for improving livelihoods for rural populations have been deployed in several provinces of Viet Nam with initially promising results. An important lesson learned from those activities is the need for the participation of the community in all adaptation programs with the guidance of governmental organizations. That is the reason the government of Viet Nam considers response to climate change is the task of the whole society, including line ministries, branches, organizations and the community as the whole.
465. Another important work of MARD in this aspect is development of forestry. The overall objective of forest development in the next 20 year is to develop the socialized forestry, forestry protection, forest rehabilitation and development to ensure the environmental protection capacity of the forestry; conservation of natural forestry area; protection of biodiversity; wide application of new and advanced scientific technologies and make forestry commercial to meet the demands of the economic sector; contribute to hunger alleviation and poverty reduction; gradually improve the living condition of ethnic minorities who live in and next to the forest, create a sustainable foundation for national security.
466. Forestry development needs to take into account GHG mitigation in Viet Nam based on the Forestry Development Strategy for 2001 - 2020 of Viet Nam, by implementing activities to mitigate emissions, and enhance GHG sinks. Priorities stated in this Strategy include:

Risks and Adaptation to Climate Change in BCI Pilot Sites in PRC, Thailand and Viet Nam Final consultant report, July 2010
102
To promote the implementation of a program to plant 5 million hectares of forest effectively in order to increase the forest coverage to 43% by 2010 to 2020;
To conserve and restore the existing forest;
To rehabilitate the degraded forest;
To prevent forest fire.
467. GHG Reduction Orientation in Agriculture
468. Another purpose of agriculture and forestry of Viet Nam is to assist climate change mitigation using the CDM methodologies as this has a big potential for Viet Nam.
469. During the last two decades, high rates of economic growth in Viet Nam have led to growing energy demands and consequent increases in GHG emissions. Based on a business-as-usual (BAU) scenario, total GHG emissions are projected to increase from about 140 million tCO2e in 1994 to about 233 million tCO2e by 2020 - agricultural emissions are predicted to grow and continue to make up more than 50% of national emissions in 2020.
470. The objectives of Viet Nam agricultural strategy in first 20 years of the 21st century is to develop the agricultural sector with variety of goods, sustainable development technologies, and to apply new scientific achievements and advanced technologies which can compete in the national and international markets and meet the food requirements of citizens and export purposes.
471. Agricultural development orientations taking into account GHG mitigation of Viet Nam include:
Development and application of sustainable agricultural farming techniques to enhance agricultural production and to mitigate GHG emissions.
Improvement of irrigation-drainage management in rice fields.
Strengthening the capacities of agriculture research institutions.
Improving meal and eating tradition of the people so that the meal include not only rice but diversified with other kinds of foods.

Risks and Adaptation to Climate Change in BCI Pilot Sites in PRC, Thailand and Viet Nam Final consultant report, July 2010
103
CHAPTER VIII
LINKS BETWEEN CLIMATE CHANGE AND AIR POLLUTION
By Frank Murray
Murdoch University
A. Abstract 48. This paper provides a background on the links between climate change and air pollution, and why this issue is important to policy makers.
49. There are numerous well-documented linkages between air pollution and climate change both in sources and effects. There is also considerable evidence of substantial potential benefits and synergies from integrated strategies to address both issues together to achieve ‘co-benefits’. However, both the climate change and air pollution issues have until now been considered in separate policy and science arenas. Both climate change and air pollution pose major threats to a pathway to sustainable development that enables nations and societies to climb out of poverty.
50. As knowledge has advanced, it has become clear that air pollution and climate change are intimately interlinked. They have similar sources, atmospheric processes and effects. Despite these similarities, strategies to reduce emissions of traditional air pollutants may increase or decrease emissions of greenhouse gases. Likewise, strategies to reduce greenhouse gases can have positive or negative effects on air pollution.
51. Methane is an ozone precursor as well as the second most important greenhouse gas. Therefore, reducing methane emissions will have a rapidly beneficial effect on global warming and urban air pollution, which would quickly become apparent due to the relatively short residence time of methane in the atmosphere.
52. Ground-level ozone has the third largest positive global warming effect after carbon dioxide and methane. As ground level ozone contributes to global warming, crop yield losses, health and ecosystem impacts, there is a clear justification for measures that reduce ozone for the benefit of the global climate, crop yields and human health.
53. There are uncertainties concerning the impact of some particles in the atmosphere on global warming, but the adverse impacts of particles on human health are clear. The reduction of emissions of black carbon from some sources (e.g. diesel vehicles) will result in reductions in both global warming and human health impacts. Because of the short atmospheric lifetime of black carbon particles, the impact of emission reductions is instantaneous. Even if CO2 emissions stopped, warming is expected to continue for 1000 years, so efforts to limit CO2 emissions alone will not prevent dangerous climate change. Increasingly there are callS from governments for

Risks and Adaptation to Climate Change in BCI Pilot Sites in PRC, Thailand and Viet Nam Final consultant report, July 2010
104
fast-acting strategies to complement reductions in emissions of CO2. Taken together non-CO2 anthropogenic emissions account for 40-50% of anthropogenic radiative forcing and strategies to limit emissions of methane, black carbon, troposphericozone precursors and hydrofluorocarbons will have rapid impacts to reduce radiative forcing (Molina et al. 2009).
54. There is intense pressure to reduce particulate matter concentrations, including sulfate, and black carbon components. The reduction of sulfate concentrations in the atmosphere due to impacts on human health and effects of acid rain on ecosystems will reduce the cooling effect of sulfate on the atmosphere, thus putting increased pressure on the need for abatement of the greenhouse gases.
55. There is uncertainty about the net effect on global warming from the burning of biomass due to the lack of knowledge about the balance of emissions of black carbon (warming effect) and organic carbon (cooling effect) from these sources. However, the imperative to reduce health impacts, especially of the poor will entail pressure to reduce emissions from these sources.
56. In the Greater Mekong Sub-region, a combined approach to deal with both climate change and air pollution can therefore have a number of positive synergistic effects. Because many GMS countries are in the early stages of considering or adopting policies and programs to address either air pollution or climate, some excellent opportunities exist to build in strategies that address both issues in a cost-effective way.
57. The Intergovernmental Panel on Climate Change (IPCC) has stated that warming of the climate is unequivocal, and it is very likely that most of the increase in global average temperatures since the mid 20th century is due to increases in human-induced emissions of greenhouse gases (IPCC, 2007). At the same time, the health and environmental impacts of air pollution are so significant that there are urgent efforts to promote more effective systems for addressing these emissions, particularly in developing nations.
58. The IPCC has reported that global atmospheric concentrations of carbon dioxide (CO2), methane (CH4) and nitrous oxide (N2O) have greatly increased as a result of human activities since 1750 and now far exceed pre-industrial values over the last 650,000 years (IPCC, 2007). The IPCC also found that warmer temperatures and rising sea levels "would continue for centuries" even if greenhouse gas levels are stabilized, although the likely amount of temperature and sea level rise varies greatly depending on rate of greenhouse gas emissions during the next several decades.
59. The World Health Organization (WHO) estimates that over 800,000 premature deaths occur each year as the result of outdoor air pollution. Air pollution is responsible for tens of millions of cases of respiratory and other illnesses, severely affecting quality of life, reducing economic activity and affecting the disadvantaged and poorest most severely. Overwhelmingly, the main impacts now occur in developing countries where increased health costs, reductions in crop yields, and other impacts significantly reinforce the poverty trap.
60. Many countries, especially in Asia, have experienced the benefits of the implementation of comprehensive air pollution policies. Many countries have reduced air pollution over the past decades and, in the process, have developed an extensive scientific, technical and legal basis on which to implement air pollution policies. Much of this experience is required to address climate change. However, the experience with air

Risks and Adaptation to Climate Change in BCI Pilot Sites in PRC, Thailand and Viet Nam Final consultant report, July 2010
105
pollution policies as a guide to addressing climate change has rarely been considered until recent years.
B. Interactions between climate change and air pollution
61. Climate change and air pollution have been treated as two separate and distinct policy issues. Air pollution control strategies have traditionally been focused on reducing emissions of those air pollutants that are harmful to human health or the environment such as particulate matter (PM), ozone (O3), sulfur dioxide (SO2), nitrogen oxides (NOx), toxic air pollutants, and heavy metals. Climate change policy has focused on reducing emissions of carbon dioxide primarily, but also methane and nitrous oxide.
62. Fossil fuel combustion is a major source of both traditional air pollutants and GHGs. The combustion of fossil fuel results in the emissions of greenhouse gases including carbon dioxide, methane and nitrous oxide. Burning fossil fuels also emits a range of air pollutants, including carbon monoxide, carbon particles (“soot”), nitrogen oxides and sulfur dioxide. Some of these compounds react in the atmosphere to form secondary pollutants including ozone, particulate sulfate, nitrate and carbon compounds. Air pollutants may also influence climate change and it has become clear that air pollution can affect greenhouse gas cycles, and climate change influences the emissions, transport, chemical behaviour and impacts of atmospheric pollutants.
63. Air pollutants including ozone and particles contribute to climate impacts, though the timescales of these impacts (days to months) are generally far less than those of the global pollutants (decades to centuries). For example, ground-level ozone has the third largest positive global warming effect after carbon dioxide, and methane (IPCC, 2007). Because ozone plays an important role as a GHG, altering the emissions of ozone precursors such as nitrogen oxides and volatile organic compounds has implications for climate.
64. Changes to climate such as shifts in rainfall patterns also arise from the presence of particles in the atmosphere, including the ‘Atmospheric Brown Cloud’ effect (Ramanathan et al., 2002), alongside the climatic changes induced by global warming. The impacts of climate change and air pollution together with elevated carbon dioxide concentrations often interact, in some cases augmenting each other and in others reducing overall impacts.
65. Emissions of sulfur dioxide lead to the formation of sulfate particles in the atmosphere, which reflect incoming solar radiation, thereby reducing air temperatures. Sulfate particles also increase the reflectivity of clouds (albedo effect) reducing the temperature at the earth’s surface.
66. A large fraction of anthropogenic particles consists of sulfate, which forms through chemical oxidation from sulfur dioxide, emitted jointly with carbon dioxide in fossil fuel combustion. In many regions of Earth, the sulfate particle concentration has declined in recent decades after pollution-reduction legislation was introduced (Kuylenstierna et al, 2007). Because sulfate particles remain in the atmosphere for days, whereas carbon dioxide remains there for a century or more, the greenhouse-gas effect accumulates, whereas cooling caused by particles is tightly linked to current emissions. Cooling caused by particles thus offsets part of the greenhouse-gas warming. This a masking effect that may be removed suddenly when fossil fuel combustion emissions are reduced or fuel combustion is eliminated (Brasseur and Roeckner, 2005). Since preindustrial times, the soot particle concentration increased much more than did the rest of the particles.

Risks and Adaptation to Climate Change in BCI Pilot Sites in PRC, Thailand and Viet Nam Final consultant report, July 2010
106
67. Most particles mainly scatter sunlight, but soot also strongly absorbs solar radiation. In both cases, the effect at the Earth’s surface is less incoming radiation. However, at the top of the atmosphere, where the Earth system’s energy balance is determined, scattering has a cooling effect, whereas absorption has a warming effect. If particle concentrations increase more than does scattering, the cooling caused by particles of the Earth system is smaller than it would otherwise be.
C. Policy Interventions
68. Interventions designed to improve local air quality or to reduce GHG emissions often have important and complex inter-linkages. Methane, for example, is both an ozone precursor and a GHG, so successful methane abatement programs will have positive impacts on both climate and air pollution, and some measures may be highly cost-effective. In contrast, the further abatement of sulfur dioxide emissions may lead to enhanced global warming.
69. Increases in particle emissions into the atmosphere may lead to a strong greenhouse gas warming response. For example, Shindell and Faluvegi (2009) have suggested that decreasing sulfate particle concentrations and increasing black carbon particle concentrations have contributed to the rapid Arctic warming in recent decades.
70. Programs to reduce emissions of greenhouse gases can have important effects on air pollution. For example, demand-side management programs and certain renewable energy policies will not only reduce emissions of greenhouse gases, but will also have significant air pollution benefits. The IPCC reported that mitigation strategies aimed at moderate reductions of carbon emissions in the next 10 to 20 years (typically involving carbon dioxide reductions between 10 to 20% compared to the business as usual baseline) also reduce sulfur dioxide emissions by 10 to 20%, and nitrogen oxides and particle emissions by 5 to 10% (IPCC, 2007). The IPCC reported that several tens of thousands of cases of premature deaths could be avoided annually as a side-effect of moderate carbon dioxide mitigation strategies.
71. In contrast, some GHG mitigation strategies can adversely affect air pollution. For example, increasing the proportion of diesel-fuelled vehicles instead of petrol-fuelled vehicles can reduce emissions of carbon dioxide, but increase emissions of cancer-causing particles. Expanding the use of biofuels can reduce emissions of carbon dioxide, but increase emissions of nitrogen oxides and particles over their life cycle compared with petrol and diesel-fuelled vehicles (Air Quality Expert Group, 2007).
72. Recent modeling studies (Levy, et al., 2008; Shindell et al., 2008; Kloster et al., 2009) have shown that changes in pollutant and precursor emissions, atmospheric burden, and global warming are not necessarily proportional. Furthermore, current models do not capture many of the complex atmospheric processes involving particles and reactive trace gases (Shindell et al., 2009). The idea that air pollution control could help to mitigate climate change, buying time until greenhouse gas reductions take effect, seems attractive, because air pollutants are short-lived in the atmosphere compared with carbon dioxide and other greenhouse gases. The warming effect of these short-lived species is uncertain but may be large. The contribution of anthropogenic ozone to global warming may be twice the mean Intergovernmental Panel on Climate Change (IPCC) value of +0.35 W m-2 (IPCC, 2007). Ramanathan and Carmichael (2008) have inferred a warming effect for current black carbon levels of more than half the value of the current carbon dioxide warming effect.

Risks and Adaptation to Climate Change in BCI Pilot Sites in PRC, Thailand and Viet Nam Final consultant report, July 2010
107
73. Assuming a climate sensitivity of 2° to 4°C for a doubling of carbon dioxide, elimination of black carbon emissions could decrease global surface temperature by 0.5° to 1°C (Ramanathan and Carmichael 2008). Alternatively, pollution control could accelerate climate change if reduction of short-lived pollutants with cooling effects, especially sulfate particles, outweigh reduction of those with warming effects (Andreae et al, 2005). Climate sensitivity analysis suggests temperature increases well above IPCC estimates for all but the lowest estimates of net particle temparature effects (Andreae et al, 2005).
74. Changing particle concentrations may alter local and regional cloud cover and precipitation, change the intensity or timing of the monsoon circulation, and even shift precipitation across national borders (Rosenfeld et al., 2008; Andreae et al., 2004). Changes in cloud cover and precipitation will also feed back on the photochemistry and rainout of short-lived species (Kloster et al., 2009). These issues must be considered if particle emissions are to become part of climate policy. Given the toxicity of pollutants, the question is not whether ever stricter air pollution controls will be implemented, but when and where (Parrish, 2009).
D. Why joint approaches are important in the GMS
75. In the GMS, efforts to reduce poverty and grow employment and economies are the major goals of nations. In the traditional model, economic growth would lead to increases in emissions of GHG and air pollutants. However there are a number of policies that can provide for economic growth and increasing employment while reducing emissions of air pollutants and greenhouse gases for example use of clean fuels, fuel switching, and energy efficiency measures.
76. In the GMS, a combined approach to deal with both climate change and air pollution can therefore have a number of positive synergistic effects. Because many GMS countries are in the early stages of considering or adopting policies and programs to address either air pollution or climate, some excellent opportunities exist to build in strategies that address both issues in a cost-effective way.
77. Firm commitments to major measures to address climate change seem unlikely in some GMS countries unless other benefits can also be identified. In addition, there remains a suspicion of climate change policies in many developing countries where policies to address air pollution are being implemented. Carefully selected policies can achieve immediate positive benefits for improving air quality in cities while also helping to provide climate change mitigation.
E. Policy linkages
78. Integrating climate change and air pollution policies will allow benefits to be optimized and will avoid them working against each other. Analyzing and designing air quality and climate change strategies independently can result in a number of risks: a failure to spot trade-offs early enough; an incomplete assessment of benefits; a double-counting of costs; an incomplete assessment of the mitigation potential; and the possibility of overlooking the best overall option in favor of one focusing on only one of the issues. Assessments and design of strategies therefore are being brought together in a number of countries. A framework that has been used in various Asian countries to examine air pollution/climate trade-offs and cost-effective solutions is the U.S. Environmental Protection Agency’s Integrated Environmental Strategies (IES) program.

Risks and Adaptation to Climate Change in BCI Pilot Sites in PRC, Thailand and Viet Nam Final consultant report, July 2010
108
79. The Indian Prime Minister Manmohan Singh announced on 30 June 2008 the National Climate Action Plan for India which outlines eight national missions intended to redirect economic development down a more sustainable path. It specifically outlines a co-benefits approach designed to achieve development goals and climate goals simultaneously. This type of high-level political support is necessary to focus on policies that capture multiple benefits. It signals the potential access to additional resources for such an approach, encourages (and may mandate) officials to adopt this approach and it coordinates action among jurisdictions that may not be coordinated otherwise.
F. Developing and Applying Integrated Strategies
1. Combining climate and air pollution goals
80. Climate and air quality issues are regulated in the UK by the Department for Environment, Food and Rural Affairs and tradeoffs between climate and non-climate goals are negotiated. When a policy choice requires a tradeoff climate and air quality officers negotiate a solution that achieves their respective goals in the long term (AEAT, 2007).
In the State of California, the Air Resources Board has historically been responsible for regulating emissions to protect public health. It is now responsible for planning and implementing the state’s climate change mitigation plan. The agency pursues the two objectives simultaneously, but its historic role in regulating emissions of air pollutants remains its defining characteristic. The balance between these two objectives will undoubtedly change with time and political priorities but the strategic vision of bringing these two issues together has been recognized.
2. Limited scientific or technical information
81. The development of appropriate policies begins with an adequate scientific understanding of the issues, causes, effects, and consequences of each of the major intervention options. This includes a quantitative understanding of the role of gases and particles in changing the earth’s climate, impacts on health and the environment, and consequences of climate change. However, many of these processes are complex and involve feedback functions that are not fully understood. This lack of a complete understanding may provide an impediment to policy development. However, the precautionary principle may be relevant in stating that if there are threats of serious or irreversible environmental damage, lack of full scientific certainty should not be used as a reason for postponing measures to prevent environmental degradation. In this case the assessments of IPCC, Stern and others suggest major adverse consequences of delaying measures to prevent climate change. Clearly decision-making should be guided by careful evaluation of the risk-weighted consequences of the options and be guided by an assessment of costs, benefits and effectiveness of options.
G. Sources of emissions
1. Emissions from energy use
82. Energy use, especially from the use of fossil fuel, is a driver of most air pollutants and GHG emissions. Residential buildings and the industrial sector together account for 60% of global electricity consumption.This has been partly decoupled from the growth of GDP due to increased efficiency in energy and electricity production, improved production processes and a reduction in material intensity, (IPCC, 2007). The global primary energy supply has increased by 4% annually between 1987 and 2004 and fossil fuel supplies

Risks and Adaptation to Climate Change in BCI Pilot Sites in PRC, Thailand and Viet Nam Final consultant report, July 2010
109
more than 80% of energy needs (IEA 2007). By 2015 55% of global GHG emissions will come from cities in Asia (Lohani 2009).
83. Developed nations are the main per capita user of fossil fuel and the main emitter of greenhouse gases. However, in many developing countries the use of long-lived, outdated and polluting technology exposes vulnerable communities to the adverse health effects caused by air pollution and at the same time this inefficiency leads to high costs and high emissions of GHG (IPCC 2007b).
84. Among the factors that define the level of emissions from the energy sector are fuel quality, technology, emission control measures, and operation and maintenance practices. Energy efficiency improvements and energy conservation are given high priority in the energy development strategies of both developed and developing countries. High efficiency and clean technology and security of supply will be crucial to achieve a low-emission development path for both GHGs and air pollutants. Energy efficiency can reduce GHG emissions by between 45 and 53% (Lohani, 2009).
85. The use of cleaner fuels, end-of-pipe controls, closure of inefficient sources and promotion of more efficient energy use have reduced emissions from large stationary sources in many countries. In many developing countries such measures have the potential to rapidly reduce emissions. Industrial sources that use obsolete technology, lack emission controls and are not subject to effective enforcement measures, contribute significantly to emissions of both greenhouse gases and air pollutants (Kuylenstierna et al, 2007). For example, a recent study by the ADB on Building a Sustainable Energy Future for the Greater Mekong Subregion a simulated modelling of discounted total costs of power generation indicates that the GMS-integrated scenario would be around 19% lower in cost than the existing agreements and project investments, and is estimated to be an equivalent of US$200 billion in cost savings. Regional integration will also reduce overall energy dependence by as much as 5.5 per cent of total energy consumption. Further, analysis shows that when the external environment and social costs of energy choices are included in the base case scenario, the discounted total cost will equal to the cost of a low-carbon scenario. This makes a low-carbon economy viable (Lohani, 2009)
2. Transport sector emissions
86. Atmospheric emissions from the transport sector depend upon factors including the number of vehicles, their age, technology, fuel quality, vehicle kilometres travelled and driving modes. Shifting from public transport systems to private car use increases congestion, greenhouse gases and atmospheric emissions. Poor urban land-use planning, which leads to low density urban land use, results in increasedcar travel and energy consumption. Air transport is increasing in use and it is also one of most greenhouse gas intensive modes of transport. Air transport has increased by 80% in kilometres flown between 1990 and 2003 (UNSD 2007) encouraged by growing affluence and lower prices.
87. Economic factors are leading to improvements in energy efficiency, and new commercial aircraft are claimed to use up to 20 % less fuel than those sold 10 years ago (IATA 2007). Aviation emissions account for around 3.5% of human contribution to global warming from fossil fuel use. By 2050, this percentage could grow to between 4-15% (IPCC, 2007). In addition, the climate impact of aircraft emissions at high altitude is three times more damaging than carbon dioxide emitted at ground level.

Risks and Adaptation to Climate Change in BCI Pilot Sites in PRC, Thailand and Viet Nam Final consultant report, July 2010
110
3. Industrial processes
88. Manufacturing processes can also cause direct emissions, depending on the fuel used and the pollutants or the technology applied. The shift in industrial production from developed countries to developing countries in the last two decades and the growth of powerful industrial production sectors in China, India and elsewhere has enormous implications for emissions of greenhouse gases and air pollutants. China is now the world’s largest emission source of carbon dioxide and sulfur dioxide and it is making serious attempts to control these emissions despite a rapidly growing economy. Developing countries have the capacity to reduce emissions from industrial processes by using more efficient processes, cleaner fuels, reduction in material and energy intensity and replacement of antiquated production facilities, but support for technology transfer may be needed in some cases.
4. Biomass and land use practices
89. The clearance of forested land, and its subsequent use for cattle and crop production, releases carbon stored in the trees and soils, and depletes its potential as a carbon dioxide sink. It may also increase methane, ammonia and nitrogen oxide emissions. Deforestation is known to have contributed about 20% to annual atmospheric emissions of carbon dioxide during the 1990s (IPCC 2007a). Normal agricultural land-use practices, such as burning crop residues and other intentional fires, increase emissions of carbon dioxide, particulate matter and other pollutants. Wildfires and forest fires used for land clearance also release very high levels of particulates. Land clearing activities in Indonesia causes a period of haze in South East Asian in 1997 that cost the people of the region an estimated US$1.4 billion mostly in short-term health costs caused by smoke particles (ADB, 2001).
90. Various agricultural practices can lead to emission of atmospheric pollutants and greenhouse gases including carbon dioxide, particulate matter, ammonia, nitrogen oxides, sulfur dioxide, and volatile organic compounds. Black carbon particles emitted from vegetation burning contributes to global warming, but the organic or white carbon particles lead to surface cooling. Regular burning contributes to the Atmospheric Brown Cloud (Ramanathan et al, 2002).
5. Domestic sector
91. The domestic sector is responsible for much of the demand for goods and services such as electricity that increase emissions of both GHGs and air pollutants. Practices in the home also give rise to emissions and indoor air pollution. This is a particular issue in poor households of Africa and Asia where biomass is used for cooking, often in primitive stoves with poor ventilation. This causes indoor air pollution with particularly severe health impacts on women and children most exposed to smoke particles but it also can lead to significant levels of outdoor air pollution. The black carbon emitted from these indoor sources is significant in parts of the world such as South Asia. The burning of biomass also gives rise to black carbon emissions and the atmospheric brown cloud (Kuylenstierna et al, 2007).
6. Urbanisation
92. Emissions in densely populated areas can be high due to the total level of emission-related activity, even though the per capita emissions are reduced by higher energy efficiency and generally short travel distances. In combination with poor dispersion conditions, this can result in exposure of large populations to poor air quality.

Risks and Adaptation to Climate Change in BCI Pilot Sites in PRC, Thailand and Viet Nam Final consultant report, July 2010
111
Urbanization, seen in such forms as urban population growth, is continuing as a result of a combination of social and economic drivers. Urban areas concentrate energy demands for transport, heating, cooking, air conditioning, lighting and housing (Kuylenstierna et al, 2007).
7. Technology
93. Technological innovation, coupled with technology transfer and deployment, is essential for reducing emissions. A broad portfolio of technologies is necessary, as no single technology will be adequate to achieve the desired level of emissions. Improved efficiency, use of cleaner fuels, desulphurization technologies, low nitrogen burners and end-of-pipe particulate capture devices are examples of technologies that have contributed to emission reduction. However, some technologies, such as flue gas desulfurisation, while effectively reducing sulfur emissions by more than 90%, also lead to increased carbon dioxide emissions per unit electricity produced (Kuylenstierna et al, 2007). A number of technologies may play key roles in reducing GHG emissions. They include those for improved energy efficiency, renewable energy, carbon capture and storage and carbon sequestration.
H. Role of particles
94. Small particles suspended in the air, play a substantial role in the radiation balance of the earth, mostly through scattering and absorption process (EEA 2004). They produce brighter clouds that are less efficient at releasing precipitation and lead to large reductions in the amount of solar irradiance reaching the Earth’s surface, a corresponding increase in solar heating of the atmosphere, changes in the atmospheric temperature structure, suppression of rainfall, and less efficient removal of pollutants. This has direct implications to availability and quality of freshwater (Ramanathan et al, 2001). Sulfate aerosols, formed from the oxidation of sulfur dioxide in the atmosphere, reflect solar radiation and cause a cooling effect, masking much of the current warming effect. Organic aerosols also cool but black carbon heats the atmosphere through absorption of radiation (EEA 2004). As elemental carbon particles (soot or “black carbon”) contribute to global warming while also contributing to local air pollution, reducing concentrations of black carbon will be beneficial for both climate change and health effects.
95. Uncertainty still exists concerning the magnitude of the warming effect of particles. IPCC (2007) reported that the human induced particles together produced a net cooling effect and observations and model calculations have shown that the particles in the atmosphere are delaying the global warming expected from the increase in greenhouse gases.
96. Whilst most studies have characterised carbon from biomass burning as ‘black’ or ‘organic’, analysis of particles over Asia suggest that some particles belong to a category of ‘brown carbon’ which makes a contribution to global warming (Duncan et al., 2008).
97. Ground-level ozone formation is affected by the climate, especially temperature, as well as irradiance levels, both of which are affected by global climate change. Ozone is a potent pollutant affecting vegetation, crop yields and human health and it is also the third most important greenhouse gas. Methane is an important compound for the formation of ozone and, of course is the second most important greenhouse gas. Any reduction in ozone concentrations will result in reduced pollutant impact and warming.

Risks and Adaptation to Climate Change in BCI Pilot Sites in PRC, Thailand and Viet Nam Final consultant report, July 2010
112
98. Many air pollutants can be seen as short-lived ‘greenhouse gases’ (or rather compounds) and control of these compounds will therefore result in a faster response of the climate system than the control of traditional greenhouse gases that tend to be long-lived (e.g. about 20% of carbon dioxide remains in the atmosphere after a millennium (IPCC 2007a).
I. Conclusions
99. There are many significant barriers to enacting substantial global reductions of climate forcing emissions. Strategies that integrate climate with air pollution controls can offer options for policy makers to help overcome these barriers and achieve more rapid greenhouse emission reductions than might otherwise be possible.
100. To date, there have been mostly limited efforts to integrate climate and air pollution policy. Current policy frameworks for air pollution and climate change are often not well suited to cooperation and integrated approaches. For example, air pollution control strategies are often undertaken at local levels and do not include the 50-year planning horizons in which strategic options for climate mitigation are regularly addressed. There are also a variety of other institutional, cultural and technical challenges to successfully integrating climate and air pollution policies at various scales. These include potential conflicts between climate and air pollution goals in certain cases, organizational and bureaucratic constraints, lack of political support and poor communication.
J. Acknowledgement
101. This paper makes considerable use of discussions and publications from a wide number of sources, including a small number of discussion papers of unstated authorship prepared for a meeting of the Global Atmospheric Pollution Forum.

Risks and Adaptation to Climate Change in BCI Pilot Sites in PRC, Thailand and Viet Nam Final consultant report, July 2010
113
CHAPTER IX
OVERVIEW OF GROUND-LEVEL OZONE POLLUTION IN THE GREATER MEKONG SUBREGION (GMS)
By
Nguyen Thi Kim Oanh and Didin Agustian Permadi Environmental Engineering and Management, SERD
Asian Institute of Technology
A. Abstract 472. Unlike stratospheric ozone (in the ozone layer) that protects the earth from harmful levels of ultraviolet radiation, troposheric ozone or ground level ozone has harmful effects on human health, materials and plants, as well as having a global warming effect. Ozone is not directly emitted into the atmosphere. It is formed in photochemical reactions involving ozone precursors, nitrogen oxides (NOx), carbon monoxide (CO) and hydrocarbons (HC) in the presence of sunlight. Major anthropogenic sources of the precursors include industry, motor vehicles, gasoline evaporation, and chemical solvents. The Greater Mekong Sub-region commonly has meteorological conditions of a hot and sunny climate favorable for ozone formation. Measured levels of ozone in the region are high and adverse effects of ozone may already be significant. In particular, many agricultural crops in GMS (rice, wheat, peanut, lettuce, soybean, etc.) are sensitive to ozone toxicity hence and ozone-induced reduction in production yield would be significant. If no proper control measures are taken promptly for precursor emission reduction the near future increase in ground level ozone in GMS would cause significant economic effects, i.e. from a few percents to 35% reduction in agricultural crop yield by 2020.
B. Introduction 1. Ground level ozone pollution
a. Ozone in the atmosphere: ground level vs. stratospheric ozone
473. Ozone is an oxidant gas that can exist in two layers of the atmosphere: stratosphere (upper layer) and troposphere (ground level). In the stratosphere, ozone is considered as “good” as it protects life on Earth from the sun's harmful ultraviolet (UV) radiation. In contrast, at the ground level, it is an air pollutant that is harmful to human health and phytotoxic to the ecosystem (Jenkin and Clemitshaw, 2000; Sillman et al., 1999). Due to its greenhouse effect and toxicity, tropospheric ozone is also known as “bad ozone”. In the stratosphere ozone is produced naturally as the result of energy photons attacking molecular oxygen, while the ground level ozone is formed by a series of photochemical reactions (ADORC, 2006).
b. Ground level ozone formation
474. The sources of tropospheric ozone are (1) influx from the stratosphere and (2) generation by photochemical reactions in the troposphere. The influx of ozone from the stratosphere takes place mainly in middle and high latitudes and is most active in early

Risks and Adaptation to Climate Change in BCI Pilot Sites in PRC, Thailand and Viet Nam Final consultant report, July 2010
114
spring (ADORC, 2006). The generation of ozone in the troposphere (i.e. ground level ozone) is most active in the hot and sunny period since it is caused by photochemical reactions involving nitrogen oxides (NOx), carbon monoxide (CO), and volatile organic compounds (VOCs) in the presence of sunlight. The precursors are emitted by natural and major anthropogenic sources such as industry, motor vehicle exhaust, gasoline vapors, and chemical solvents. The ozone residence time in the atmosphere is a few days to a few weeks which enables intensive exposure and long-range transport phenomena. Normally, high ozone days are characterized by more intense solar radiation, higher temperature, and lighter surface wind which are favorable for photochemical production and build up of O3 (Permadi and Kim Oanh, 2008).
c. Effects of ground level ozone on human health and ecosystem
475. Surface ozone effects on human health have been investigated since the occurrence of Los Angeles photochemical smog episodes in summer 1943. Ozone is well recognized as a strong irritant. Through constriction of the airways, it may increase airway resistance of the lung for air and then further force the respiratory system to work harder to provide enough oxygen. Chest pain, dry throat, headache, nausea, and eye irritation are also among the symptoms of ozone exposure. Damage to deep portions of the lungs is expected even after symptoms such as coughing or a sore throat disappear. Exposure to high ozone levels is linked to the aggravation of respiratory diseases such as emphysema, bronchitis and asthma. Ozone may also reduce resistance to bacterial infection and increase fatigue. Generally, an increase in ozone is associated with respiratory symptoms and hospital visits (Wark et al., 1998). The relationship between ozone exposure concentration, duration of exposure and expected effects is presented in Table 9.1.
Table 9.1: Various effects of ozone in different exposure durations and concentration
Concentration (ppb)
Duration of exposure
(hrs)
Effects
20 1 Cracked, stretched rubber
30 8 Vegetation damage
70 8 Above 15% FEV decrement in 3% of children exposed
80 8 Decreased pulmonary function of exercising adult and increased susceptibility to respiratory infections
100 1 Increased airway resistance
120 1 Above 15% FEV decrement in 8.3% of children exposed
2000 2 Severe cough
Source: extracted from Wark et al., (1998)
FEV: forced expiratory volume of lung

Risks and Adaptation to Climate Change in BCI Pilot Sites in PRC, Thailand and Viet Nam Final consultant report, July 2010
115
476. The impacts of ozone on vegetation have been intensively investigated during the last few decades. Assessment of ozone effects on various crops such as soybeans, corn, wheat, cotton, rice, tobacco, and spinach using smog chamber studies has been conducted worldwide (Emberson et al., 2003). It is known that ozone can damage the leaf, reduce growth, productivity, and the reproduction system. Therefore, ground level O3 can cause harmful effects to forestry and agricultural production and its phytotoxicity has been relatively well documented (Heck et al. 1982; Aunan et al. 2000; Emberson et al. 2003). In the USA, O3 in combination with sulfur dioxide and nitrogen dioxide was found to be responsible for up to 90% of the crop losses due to air pollution (Heck et al. 1982). The estimated crop loss in China due to the predicted excess O3 levels in 2002 is 3.7-4.5% for rice, and 20.9% for soybean (Aunan et al. 2000).
477. A number of important crops in the GMS are potentially affected due to exposure to ozone pollution. Some crops are more sensitive to ozone than others. Rice, a common crop in GMS, is moderately sensitive to ozone pollution. Experimental data for agricultural crops in Viet Nam (see Figure 9.1) shows that every 10 ppb increase of O3 would result in the yield reduction of 4 - 5% for rice (Van et al, 2008) and about the same for peanut (Van and Kim Oanh, 2009).
Figure 9.1: Rice yield at different ozone exposure
Source: Van et al. (2008).
2. The Geography of GMS
478. Greater Mekong Sub-region (GMS) covers 6 (six) countries in continental Southeast Asia region including Thailand, Myanmar, Lao PDR, Cambodia, Viet Nam and the Guangxi and Yunnan provinces of China.
C. Emission Sources of Ozone Precursors in the GMS 1. Emissions
479. Asian countries have experienced rapid economic growth during the last few decades with a continuously increasing trend. Shah et al., (2000) predicted that due to
y = -29.614x + 8069.6R2 = 0.8333
y = -22.412x + 5471.1
R2 = 0.9558
0
1,000
2,000
3,000
4,000
5,000
6,000
7,000
8,000
9,000
10,000
0 20 40 60 80 100 120
Ozone concentrations (ppb)
Yield (kg/ha)
Grain yield
Straw yield

Risks and Adaptation to Climate Change in BCI Pilot Sites in PRC, Thailand and Viet Nam Final consultant report, July 2010
116
continued high population growth and expanding economies, energy consumption in Asia is projected to share 30% of the World total by 2015. In the last decade, emissions of NOx, a critical precursor of O3, have rapidly increased in Asia in contrast to the significant decrease in Europe and little change in Japan (Kato and Akimoto, 2004). Emission inventories generally show motor vehicle emissions to be the important source while industrial and biogenic sources (emission from vegetation) are also significant. As fossil fuels are the dominant energy source, emissions of greenhouse gases and air pollutants such as sulfur and nitrogen oxides and particulates are also projected to dramatically increase. As a consequence, the impacts of Asian growth on emissions may include photochemical smog pollution and acid precipitation problems in the region. Along with the regional trend, the GMS is now becoming one of the world’s fastest growing sub-regions where emissions are also expected to increase. As it is a tropical region, high ozone levels may be expected due to a high rate of precursors emissions from both anthropogenic and biogenic sources coupled with high sunlight intensity.
480. There is quite limited country specific emission database developed for the GMS. However, a few global and regional emission databases are available. In this report, we extracted the precursor’s emissions (NOx, NMVOC and CO) and also SO2 from the main anthropogenic sources provided by the Center for Global and Regional Environmental Research (CGRER) (http://www.cgrer.uiowa.edu/EMISSION_DATA_new/index_16.html) at the University of Iowa. These are presented in Table 9.2.
481. Note that, no updated emission is given for biomass burning emissions for 2006. Thus, the biomass burning emissions data for 2000 are used for total emission in the year of 2006 as presented in Table 8.2 in order to get a consistent emission inventory. Also, due to the lack of emission data for Yunnan province alone the data for the whole of China are presented and discussed. Overall, the emissions show an increasing trend. NOx emissions in China almost doubled during the period (2000 – 2006) while in Thailand and Viet Nam they increased by around 1.3-1.6 times. A slower increase is observed in Myanmar which was around 1.1 times during the period. Non-methane volatile organic compounds (NMVOC) emissions in China and Viet Nam increased by 1.5 – 1.6 times while in Thailand and Myanmar the increase was around 1.2 times. The CO emissions increase rate in China and Viet Nam was 1.5 times while that in Myanmar and Thailand was of around 1.1 – 1.2 times. A faster SO2 emission increase was observed in Thailand, China, Myanmar and Viet Nam, by 1.3 – 2 times. The emissions of all pollutants in Cambodia and Lao PDR were reported to be almost unchanged during the period which may be due to the uncertainty of this emission inventory. Among the countries presented in Table 9.2, China has the highest emission of all the precursors considered followed by Thailand, Viet Nam, Myanmar, Cambodia and Lao PDR.
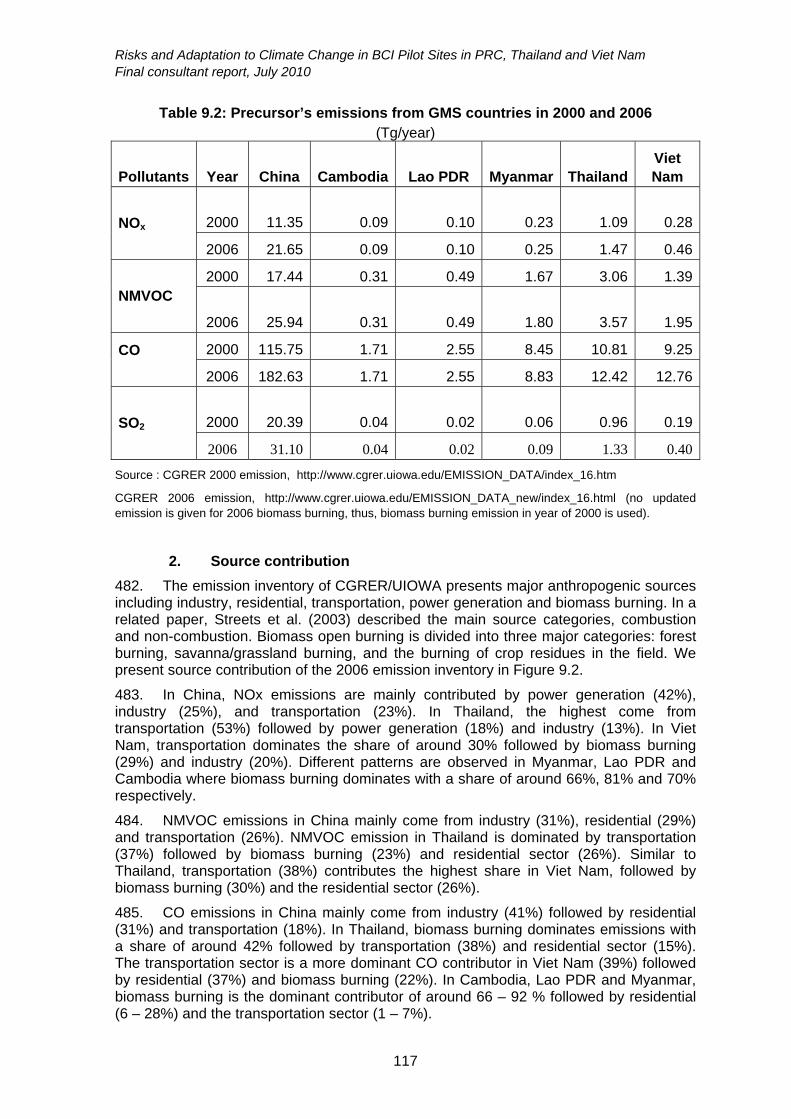
Risks and Adaptation to Climate Change in BCI Pilot Sites in PRC, Thailand and Viet Nam Final consultant report, July 2010
117
Table 9.2: Precursor’s emissions from GMS countries in 2000 and 2006 (Tg/year)
Pollutants Year China Cambodia Lao PDR Myanmar Thailand Viet Nam
NOx
2000
11.35 0.09 0.10 0.23 1.09
0.28
2006 21.65 0.09 0.10 0.25 1.47 0.46
NMVOC
2000 17.44 0.31 0.49 1.67 3.06 1.39
2006
25.94 0.31 0.49 1.80 3.57 1.95
CO
2000 115.75 1.71 2.55 8.45 10.81 9.25
2006 182.63 1.71 2.55 8.83 12.42 12.76
SO2
2000
20.39 0.04 0.02 0.06 0.96 0.19
2006 31.10 0.04 0.02 0.09 1.33 0.40
Source : CGRER 2000 emission, http://www.cgrer.uiowa.edu/EMISSION_DATA/index_16.htm
CGRER 2006 emission, http://www.cgrer.uiowa.edu/EMISSION_DATA_new/index_16.html (no updated emission is given for 2006 biomass burning, thus, biomass burning emission in year of 2000 is used).
2. Source contribution
482. The emission inventory of CGRER/UIOWA presents major anthropogenic sources including industry, residential, transportation, power generation and biomass burning. In a related paper, Streets et al. (2003) described the main source categories, combustion and non-combustion. Biomass open burning is divided into three major categories: forest burning, savanna/grassland burning, and the burning of crop residues in the field. We present source contribution of the 2006 emission inventory in Figure 9.2.
483. In China, NOx emissions are mainly contributed by power generation (42%), industry (25%), and transportation (23%). In Thailand, the highest come from transportation (53%) followed by power generation (18%) and industry (13%). In Viet Nam, transportation dominates the share of around 30% followed by biomass burning (29%) and industry (20%). Different patterns are observed in Myanmar, Lao PDR and Cambodia where biomass burning dominates with a share of around 66%, 81% and 70% respectively.
484. NMVOC emissions in China mainly come from industry (31%), residential (29%) and transportation (26%). NMVOC emission in Thailand is dominated by transportation (37%) followed by biomass burning (23%) and residential sector (26%). Similar to Thailand, transportation (38%) contributes the highest share in Viet Nam, followed by biomass burning (30%) and the residential sector (26%).
485. CO emissions in China mainly come from industry (41%) followed by residential (31%) and transportation (18%). In Thailand, biomass burning dominates emissions with a share of around 42% followed by transportation (38%) and residential sector (15%). The transportation sector is a more dominant CO contributor in Viet Nam (39%) followed by residential (37%) and biomass burning (22%). In Cambodia, Lao PDR and Myanmar, biomass burning is the dominant contributor of around 66 – 92 % followed by residential (6 – 28%) and the transportation sector (1 – 7%).

Risks and Adaptation to Climate Change in BCI Pilot Sites in PRC, Thailand and Viet Nam Final consultant report, July 2010
118
486. SO2 emissions in China mainly come from power generation and industry with a share of around 59% and 31%, respectively. In Thailand, more SO2 is released from industry (58%) than power generation (35%). In Viet Nam, industry contributes of around 52% of SO2 emissions followed by residential (24%) and power generation (14%) sectors. In Cambodia industry is the main contributor (34%) followed by residential (19%) and power generation sectors (17%). In Myanmar and Lao PDR, biomass burning is the main contributor of around 40 – 62%.
Figure 9.2: Emission sources shares (%) in 2006
Note: values above each bar indicates total emission in Tg/year
a). NOx
0%
20%
40%
60%
80%
100%
China Cambodia Lao PDR Myanmar Thailand Vietnam
b). NMVOC
0%
20%
40%
60%
80%
100%
China Cambodia Lao PDR Myanmar Thailand Vietnam
d). SO2
0%
20%
40%
60%
80%
100%
China Cambodia Lao PDR Myanmar Thailand Vietnam
c). CO
0%
20%
40%
60%
80%
100%
China Cambodia Lao PDR Myanmar Thailand Vietnam
21.6 0.09 0.1 0.25 1.5 0.46
25.9 0.31 0.5 1.8 3.6 1.95
182 1.71 2.55 8.83 12.4 12.7
31.1 0.04 0.02 0.09 1.33 0.40

Risks and Adaptation to Climate Change in BCI Pilot Sites in PRC, Thailand and Viet Nam Final consultant report, July 2010
119
487. Combustion of fossil fuel and biofuel in the power generation, transportation, residential and industrial sectors is the major source of NOx, NMVOC and CO. Fossil fuel used in the region is a mix of coal, diesel oil, gasoline with a smaller amount of natural gas. In China and other countries, coal-fired power plants are still commonly found. The rural population still relies mainly on solid fuels (biomass and coal) for cooking and household space heating. Transportation modes are characterized by a large variation in degrees of control and specific feature of modes which may affect the emissions. As an example, 4-stroke motorcycles are commonly seen in Hanoi and Ho Chi Minh City while in Thailand two-stroke motorcycles are still common in the streets. Biomass burning, including both open and contained burning, is also considered as a main contributor of ozone precursor emissions (Yan et al., 2006). Biomass burning is obviously observed in the GMS countries which are agriculture-based economies. Note that control of this open burning activity is more difficult than fuel combustion emission. Biomass burning is widely practiced as it is the cheapest way to remove straw and stubble waste or to convert forest to agricultural land.
488. For ozone formation, it is also important to consider biogenic volatile organic compounds (VOC) which is not included in the above mentioned global emission inventory. These VOC are naturally emitted from various kind of vegetation. With an estimated global emission rate of 1,150 Tg per year, biogenic emissions dominate over those from anthropogenic sources by one order of magnitude (Guenther et al., 1995). The compounds released include isoprene (C5H8), monoterpenes (C10H16) and several oxygenated species (Komenda et al., 2001). They have a significant impact on photochemical processes that lead to the formation of ozone.
D. Ozone Pollution in GMS 1. Monitoring networks and data availability
489. Ground level ozone has been monitored in some Asian countries for several years. Ozone monitors are available in most of the ambient air quality monitoring stations operated by local Environmental Protection Agencies. However, these are normally located in big cities. The Acid Deposition Monitoring Network in East Asia (EANET), in which the GMS countries also participate, and the World Meteorological Organization/Global Atmosphere Watch (WMO/GAW) also monitors surface ozone in remote sites. Ozone monitoring networks in GMS countries are presented in Table 9.3. It seems that ozone monitoring stations are still scarce among GMS countries. Some automatic stations are available in Thailand, Viet Nam and China but no specific data are available for Guangxi or Yunnan Provinces. Currently, no information on monitoring stations in Lao PDR, Cambodia and Myanmar has been reported.

Risks and Adaptation to Climate Change in BCI Pilot Sites in PRC, Thailand and Viet Nam Final consultant report, July 2010
120
Table 9.3: Ground level ozone monitoring network in GMS countries
GMS countries Urban air quality monitoring network
EANETc WMO/GAWd
Thailand 41 (53) stationsa 3 (5) stations na (2 ) stations
Lao PDR na na (1) station na
Cambodia na na (1) station na
Myanmar na na na
China 474 na (4) stations 3 (5) stations
Viet Nam 9 (17) stationsb na (2) stations na (2) stations
Note: Only stations with O3 data are listed, in parenthesis is number of total monitoring stations
na: not available
a PCD (2009) at http://www.aqnis.pcd.go.th/station/allstation.htm
b Kim Oanh (2006)
c http://www.eanet.cc/product.html
d http://gaw.empa.ch/gawsis/
a. Urban ozone monitoring network
490. In Thailand, there are 53 stations throughout the country with 41 stations which monitor surface ozone (PCD, 2009). There are 13 continuous automatic ambient air quality monitoring stations in Bangkok city alone and 5 stations in the surrounding provinces of the Bangkok Metropolitan Region (BMR). The stations in Bangkok are divided into two categories, the general ambient air quality monitoring stations (15 stations) and the curbside street-level ambient air quality monitoring stations (3 stations). General ambient stations are placed in residential, commercial, industrial, and mixed areas. All monitoring stations are operated automatically with remote control from the central computers located at the PCD. The stations are generally equipped to monitor CO, TSP, PM10, Pb, SO2, NOx, O3, CH4 and NMHC. The necessary QA/QC is in place to ensure good data quality (Supat, 1999).
491. In Viet Nam, ozone is mainly monitored in big cities such as the capital city of Hanoi and Ho Chi Minh City. In Hanoi, the Ministry of Natural Resources and Environment (MONRE) manages 4 automatic fixed and 1 mobile air quality monitoring station since 1999-2000. The stations monitor CO, NO, NO2, SO2, O3, CH4, NMHC, and meteorological parameters (Long, 2006). In Ho Chi Minh City, one mobile station and nine automatic monitoring stations are operated by Ho Chi Minh City Department of Natural Resources, Environment and Housing (DONRE) (Huy, 2007). In China, 474 automated air monitoring systems have been installed in 179 cities by June 2002 which monitor CO, NO, NO2, SO2, O3, CH4, NMHC, and meteorology. Special stations are also available to monitor sandstorms which commonly occur in the country (OECD, 2007).
492. There is no report on the availability of fixed air monitoring station in Cambodia, Laos PDR and Myanmar. In Cambodia, monitoring efforts of ambient air for CO, SO2 and NO2 were conducted by using passive samplers. From 2000-2002, The Air Pollution Control Office had cooperated with Yokohama University to conduct monitoring every 2 months each year (Sothea, 2007) but, ozone is not included. No data have been reported for Myanmar and Lao PDR.
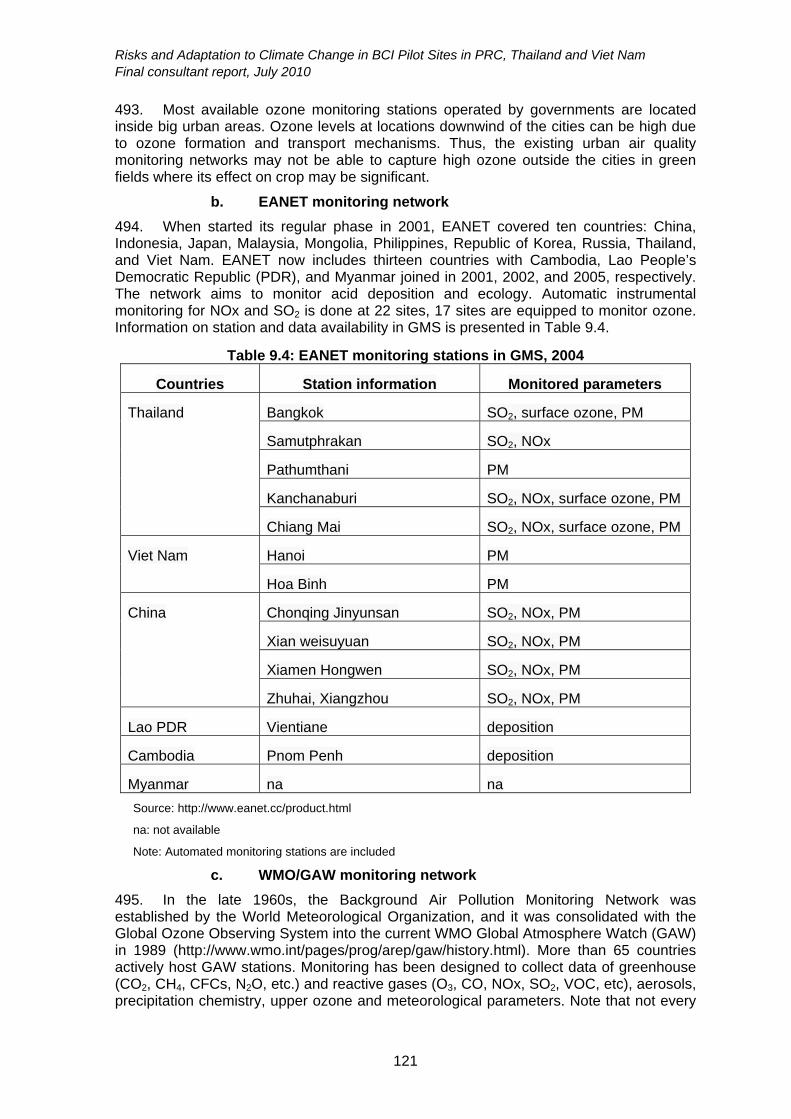
Risks and Adaptation to Climate Change in BCI Pilot Sites in PRC, Thailand and Viet Nam Final consultant report, July 2010
121
493. Most available ozone monitoring stations operated by governments are located inside big urban areas. Ozone levels at locations downwind of the cities can be high due to ozone formation and transport mechanisms. Thus, the existing urban air quality monitoring networks may not be able to capture high ozone outside the cities in green fields where its effect on crop may be significant.
b. EANET monitoring network
494. When started its regular phase in 2001, EANET covered ten countries: China, Indonesia, Japan, Malaysia, Mongolia, Philippines, Republic of Korea, Russia, Thailand, and Viet Nam. EANET now includes thirteen countries with Cambodia, Lao People’s Democratic Republic (PDR), and Myanmar joined in 2001, 2002, and 2005, respectively. The network aims to monitor acid deposition and ecology. Automatic instrumental monitoring for NOx and SO2 is done at 22 sites, 17 sites are equipped to monitor ozone. Information on station and data availability in GMS is presented in Table 9.4.
Table 9.4: EANET monitoring stations in GMS, 2004
Countries Station information Monitored parameters
Thailand Bangkok SO2, surface ozone, PM
Samutphrakan SO2, NOx
Pathumthani PM
Kanchanaburi SO2, NOx, surface ozone, PM
Chiang Mai SO2, NOx, surface ozone, PM
Viet Nam Hanoi PM
Hoa Binh PM
China Chonqing Jinyunsan SO2, NOx, PM
Xian weisuyuan SO2, NOx, PM
Xiamen Hongwen SO2, NOx, PM
Zhuhai, Xiangzhou SO2, NOx, PM
Lao PDR Vientiane deposition
Cambodia Pnom Penh deposition
Myanmar na na
Source: http://www.eanet.cc/product.html
na: not available
Note: Automated monitoring stations are included
c. WMO/GAW monitoring network
495. In the late 1960s, the Background Air Pollution Monitoring Network was established by the World Meteorological Organization, and it was consolidated with the Global Ozone Observing System into the current WMO Global Atmosphere Watch (GAW) in 1989 (http://www.wmo.int/pages/prog/arep/gaw/history.html). More than 65 countries actively host GAW stations. Monitoring has been designed to collect data of greenhouse (CO2, CH4, CFCs, N2O, etc.) and reactive gases (O3, CO, NOx, SO2, VOC, etc), aerosols, precipitation chemistry, upper ozone and meteorological parameters. Note that not every

Risks and Adaptation to Climate Change in BCI Pilot Sites in PRC, Thailand and Viet Nam Final consultant report, July 2010
122
station is equipped with a complete set of sensors to monitor all those parameters also the establishment year of each station varies among the stations. The detail on the stations and collected information are presented in Table 9.5.
Table 9.5: WMO/GAW stations in GMS
Countries Station information Monitored parameters
Thailand Bangna, Bangkok Meteorology, aerosol, total ozone column, precipitation chemistry, radiation
Songkhla Meteorology, aerosol, total ozone column, radiation
Viet Nam Cuc Phuong Not operated
Hanoi Not operated
China Linan Meteorology, CH4, CO2, surface ozone, total ozone column, NOx
Long feng shan CH4, CO2, total ozone column, NOx
Mt Waliquan Meteorology, CH4, CO2, surface ozone, total ozone column, NOx, CO, H2, SO2, aerosol, precipitation chemistry, radiation
Shangdianzi Meteorology, CH4, CO2, surface ozone, NOx, CO, SO2
Yuen Ng Fun Aerosol, precipitation chemistry
Source: http://gaw.empa.ch/gawsis/
2. Trend and status of ozone pollution in GMS
496. Tropospheric ozone concentrations have been reported to increase globally both in urban and rural areas in many regions. In Tokyo metropolitan area, daytime concentrations of photochemical oxidants were reported to increase by 5.6 ppb from 1990 to 2002 while the number of days of photochemical smog warnings per year has been also increasing (ADORC, 2006). Ozone levels, trend and status, mostly from South China (Yunnan province) and some Southeast Asian cities (Bangkok, Hanoi and Ho Chi Minh) are discussed in this section. The trend of annual averaged ozone of the cities are presented in Figure 9.3 while number of hours exceeding the respective ozone National Ambient Air Quality Standard (NAAQS) is summarized in Table 8.6. The monitoring data are collected from automatic ambient monitoring stations operated by the local municipalities. There has been no published report on ozone monitoring data in Myanmar, Cambodia and Lao PDR.
497. In Thailand, the trend of ozone pollution in Bangkok city from 1996 to 2004, averaged for 8 general ambient stations, is presented in Figure 9.3. The year of 1997 was characterized by the highest total number of hours exceeding hourly air quality standard (100 ppb) from the stations in Bangkok, 314 h, as well as the maximum hourly ozone concentration, 370 ppbv (Table 9.6 and Figure 9.3). High ozone pollution observed in BMR in 1997 was most likely related to the ozone enhancement in Southeast Asia due to abnormal meteorology related to strong El Nino in the year and the forest fire in the

Risks and Adaptation to Climate Change in BCI Pilot Sites in PRC, Thailand and Viet Nam Final consultant report, July 2010
123
region (Zhang and Kim Oanh, 2002). Both average and 95 percentile values indicate a slight increase of ozone since 1998 to 2004. Pochanart (2001) reports surface ozone measurements conducted at two rural/remote sites in Northern Thailand for the period April 1996-March 1998 which shows the annual average levels of 26-29 ppb. Leong (2008) reports the results of ozone monitoring activities under EANET project which also include two sites of GMS. The trend of annual average values for Kanchanaburi, the remote site, peaked at 22 ppb in 2004 and decreasing during the period of 2005-2005. In Chiangmai (rural site) the highest average concentration was found in 2007 of around 23 ppb while the lowest of around 12 ppb was in 2004.
498. In Viet Nam, the available records on ozone in Ho Chi Minh City for the analysis is for the period of 2002-2005 which shows that both maximum and average values during were high. Highest daily maximum hourly ozone concentration occurred in December 2002 of about 153 ppb which was well above the NAAQS of ozone (90 ppb). The number of hours and days when ozone concentration exceeded the 1-hr NAAQS increased from 2002 to 2005. The highest exceedance of NAAQS was observed in 2005, i.e. 321 hours and 129 days, while the lowest was in 2002. However, the incompleteness in the recorded data (missing data) may cause bias in the trend analysis. In Hanoi, the maximum, average and 95 percentile reduced from 2002 to 2004 but there was a sudden increase in 2005. The monitoring data were also reported for Haiphong and Cuc phuong national park, where the max daytime hourly average concentration was around 90 ppb in January 2003 and April 2003 (Long, 2006).
499. For Yunan, China, there has been no reported information on the ozone trend. The TAPTO-China (Transport of Air Pollutants and Tropospheric Ozone over China) campaign provides monitoring data on surface ozone in Tengchong, Yunan province for 2004. The surface ozone average concentrations during spring time was around 26 ppb while in summer was 59 ppb (Wong and Chan, 2006). The backward air trajectory analysis and the fire map suggest that the photochemical ozone formation and accumulation in the province are related to transboundary transport of ozone precursors emitted from biomass burning in the upwind regions under favorable meteorological conditions.

Risks and Adaptation to Climate Change in BCI Pilot Sites in PRC, Thailand and Viet Nam Final consultant report, July 2010
124
Figure 9.3: Trend of ground level ozone in selected GMS locations
a) Bangkok, Thailand: based on 12 monitoring stations (Nghiem, 2007); b) EANET sites in Thailand: average
value from 2 (two) monitoring sites (Kanchanaburi and Chiangmai). Maximum value and 95 percentile is not
reported (Leong, 2008); c) Ho Chi Minh City, Viet Nam: based on 6 monitoring stations, 95 percentile is not
reported (Huy, 2007); d) Hanoi, Viet Nam: based on 1 monitoring station (Long, 2006).

Risks and Adaptation to Climate Change in BCI Pilot Sites in PRC, Thailand and Viet Nam Final consultant report, July 2010
125
Table 9.6: Status of ozone pollution in selected cities in GMS
Year Number of hours on which O3 exceeds the standard
Bangkoka Hanoib Ho Chi Minhc
1996 47 (37) nr nr
1997 314 (163) nr nr
1998 185 (86) nr nr
1999 84 (46) nr nr
2000 242 (115) nr nr
2001 nr nr nr
2002 nr (100) 29 (21)
2003 nr (75) 159 (72)
2004 nr (90) 109 (46)
2005 nr (65) 321 (129)
Note: in parenthesis is value of days that contain number of hours exceed NAAQS a Collected from 18 automatic monitoring stations in BMR b Collected only from 1 automatic monitoring station (Lang station) c Collected from 5 automatic monitoring stations
nr: not reported
3. Future projection of ozone and its impacts
500. Limited available information shows significant effects of ozone on agricultural crops in the GMS. Zheng et al. (1998) conducted studies into the potential effects of ozone on crop plants of Chongqing, China and showed that ozone exposures across the region commonly approached (or exceeded) UN-ECE and WHO short-term guidelines for the protection of crops. The levels of ozone in Asia are expected to rise as anthropogenic emissions (i.e. ozone precursors) are expected to rapidly increase in the future (Akimoto 2003; Ohara et al. 2007). Modeling studies especially in East Asia reveal the impacts of higher emissions on surface ozone air quality and agriculture production (Wang and Mauzerall, 2004; Takigawa et al., 2009). Figure 9.4 shows monthly means of daily 12-h average O3 concentrations simulated by MOZART-2 (Model of Ozone and Related Chemical Tracers, Version 2) for 1990 and 2020. 1990 emission is taken from EDGAR version 2 while 2020 emissions are obtained by scaling the spatially and temporally varying global 1990 anthropogenic emissions by the ratio of 2020/1990 total regional emissions specified in the Intergovernmental Panel on Climate Change (IPCC) B2-Message scenario (IPCC, 2000). Surface ozone concentrations tend to increase substantially of around 5 – 10 ppb (April) and 5 – 15 ppb (October) for China, Japan and Korea. In the GMS, ozone levels would increase of around 10 ppb in April and 15 ppb by October 2020. These increases in ground levels have substantial implication for human health, forestry and agriculture. In particular, exposure indices show that grain loss due to increased levels of O3 pollution is projected to increase to 2–16% for wheat, rice and corn and 28–35% for soybeans from the base year of 1990 (Wang and Mauzerall, 2004). Another study using the Chemical Transport Model (CTM) shows that the ozone increase

Risks and Adaptation to Climate Change in BCI Pilot Sites in PRC, Thailand and Viet Nam Final consultant report, July 2010
126
between 2000 and 2020 would be of 5 – 20 ppb. Estimations show that crop yield loss might increase from 7 to 15% in East Asia (Takigawa et al., 2009). Thus, increased surface ozone gives cause for concern regarding the prospects for GMS agriculture. It is clearly seen that ozone effects on crop yield will be severe and crop production may be substantially reduced in the future due to elevated ozone concentrations.
Figure 9.4: MOZART-2 simulated monthly mean surface O3 concentrations (ppb) derived from 12-h daily averages over East Asia in 1990, 2020 and the difference
between the 2 years (2020-1990)
E.
F.
G.
H.
I.
J.
K.
L. 3.4 Policies to mitigate ozone pollution
M.
N.
O.
Source: Wang and Mauzerall (2004)
4. Policies to mitigate ozone pollution
a. How precursor change affects ozone levels
501. Ozone is a secondary pollutant that is formed in the atmosphere through complex photochemical reactions of precursors (NOx, VOC). The relationship between ozone and precursors concentration is not linear. For example, in one situation ozone increases if VOC increases and in other situation the opposite is observed. The VOC sensitive regime refers to situations in which a given reduction (%) in VOC emission would result in a significantly greater ozone decrease than that caused by the same reduction in NOx. The NOx sensitive regime refers to the opposite situations (Sillman, 1999). This greatly complicates the policy formulation to mitigate the ground level ozone pollution. Commonly, a modeling tool can be used to scientifically investigate how the reduction of NOx and VOC can affect the ozone air quality in an urban area. This sensitivity analysis is conducted to formulate effective air quality management strategies. It explains the relationship between the changes in ozone concentrations with the variations in VOC and NOx emissions. Ozone isopleth plot is often constructed based on modeling results for uniform changes in anthropogenic VOC and NOx emissions over the domain.

Risks and Adaptation to Climate Change in BCI Pilot Sites in PRC, Thailand and Viet Nam Final consultant report, July 2010
127
0.0 0.1 0.2 0.3 0.4 0.5 0.6 0.7 0.8 0.9 1.0
VOC emission fraction of base case
0.0
0.1
0.2
0.3
0.4
0.5
0.6
0.7
0.8
0.9
1.0
NO
x em
issi
on fr
actio
n of
bas
e ca
se
(a)
Figure 9.5: Model predicted response of maximum peak ozone concentrations (ppb) over Bangkok with PCD original database (Kim Oanh and Zhang, 2004)
502. Kim Oanh and Zhang (2004) conducted a sensitivity analysis for the Bangkok Metropolitan Region using a photochemical smog model (UAM-V) and the results are shown in Figure 9.5. It appears that O3 in the Bangkok Metropolitan Region is more sensitive to changes in VOC than changes in NOx. Thus, in order to ensure that the highest ozone concentrations in the area remain below the NAAQS of 100 ppb, VOC levels should be at least reduced by 50%. In the situation of the Bangkok Metropolitan Region, NOx reduction (by less than 80%) would result in an increase in the ozone pollution. Studies in other cities show that VOC sensitive chemistry is most likely to occur in central locations in large cities, such as in Los Angeles (Miford et al., 1989; Sillman et al., 1997), New York (Sistla et al., 1996), Chicago (Hanna et al., 1996), and Milan (Prevot et al., 1997) while NOx sensitive chemistry is possible in rural areas (Sillman, 1999). The NOx sensitive ozone regime was also found in Ho Chi Minh City by Huy (2007) who conducted the sensitivity analysis using a photochemical smog model (CAMx).
b. Policy impact study
503. To reduce ozone air pollution, control of precursor emissions can be done from key sources such as on-road vehicles, industry, and biomass open burning. In GMS region, Thailand is a leading country which has introduced several policies to abate air pollution. Photochemical smog model application is also relatively widely introduced through various research projects. Kim Oanh and Zhang (2004) applied a photochemical smog model (UAM-V) to evaluate the impacts of different control measures on ozone air quality of the Bangkok Metropolitan Region. The following scenarios have been tested (1) Stage I and Stage II control for evaporative HC from fuel distribution and service stations, (2) phasing out 2-stroke motorcycles, (3) 100% gas fired power plant in the Bangkok Metropolitan Region, (4) 100% CNG heavy duty buses, and (5) MTBE replacement by ethanol in gasoline. The implications of each scenario to the change of emission input are described in Table 9.7.

Risks and Adaptation to Climate Change in BCI Pilot Sites in PRC, Thailand and Viet Nam Final consultant report, July 2010
128
Table 9.7: Precursor changes in various modeled emission scenarios for BMR
Scenarios Change to precursors
NOx VOC CO
Scenario (1) - reduce -
Scenario (2) increase reduce reduce
Scenario (3) reduce - -
Scenario (4) reduce - -
Scenario (5) increase increase reduce
504. Figure 9.6 shows that the HC evaporative emission control (stage I and stage II) would decrease the peak ozone level of around 2 – 5%. Two-stroke motorcycle phasing out program may reduce the peak ozone of around 25 – 28%. It seems that fuel shifting from heavy oil to natural gas in power plants with the NOx control technology (SCR, SNCR) will increase peak ozone level by 7-9%. CNG bus and replacement of MTBE by ethanol in gasoline would also cause an increase in ozone level by 8 and 18%, respectively. In the Bangkok Metropolitan Region, these measures have been initiated for a few years. Thus, effects on ozone air quality may be both negative and positive. Furthermore, the Thai government has also banned open burning including crop residue open burning in the area surrounding of the Bangkok Metropolitan Region (Phuong, 2006) that, if strictly implemented, can further reduce the VOC emission and improve ozone air quality.
Figure 9.6: Simulated percentage change of peak hourly O3 associated with different emission control scenarios in Bangkok using UAM-V/SAIMM
Source: Kim Oanh and Zhang, 2004
505. In Viet Nam, phasing out of leaded gasoline was successfully implemented in 2001. Several other measures have been introduced recently which may also improve the air quality such as restriction of motorcycle registrations, EURO standard implementation, vehicle inspection and maintenance program, and gasoline/diesel quality improvement. It was reported that more than 44,500 old cars of all types have been scrapped. The government has also approved a roadmap for application of emission standards to road motor vehicles (CAI Asia, 2008). Modeling works for ozone air quality in Hanoi and Ho

Risks and Adaptation to Climate Change in BCI Pilot Sites in PRC, Thailand and Viet Nam Final consultant report, July 2010
129
Chi Minh City were conducted through various research projects within the framework of AIRPET (http://www.serd.ait.ac.th/airpet).
506. No specific published record is found for ozone air pollution control measures implemented in Lao PDR, Cambodia and Myanmar. As ozone pollution is commonly increased accompanying the urbanization these countries may also face the ozone pollution problem in the near future. Currently, the transboundary transport of ozone and its precursors from upwind regions may contribute to ozone pollution in the downwind countries. Differences in major sources of precursors, ozone formation sensitivity and natural conditions should require different mitigation policy directions for different countries of the GMS.
E. Summary: Current Activities and Problem Remaining 507. Ozone is a secondary pollutant which is formed by series of complex photochemical reactions between the precursors (NOx, VOC, CO) under the presence of sunlight. Ozone is harmful to human health, forestry and agricultural crops, and a strong greenhouse gas. Available monitoring data of ozone show high levels in most of big cities of Thailand and Viet Nam which frequently exceed the national air quality standards. Ozone levels in the GMS are of concern as it has a population ofabout266 million people with an agriculture-based economy. Fossil fuel and biofuel combustion in various sectors, and biomass open burning are common sources of ozone precursors in the region. With the present increasing trend in the precursor emission rate ozone levels are expected to increase rapidly in the near future. To prevent the increase in adverse effects due to high ozone pollution the precursor emission should be reduced within the GMS and also in nearby territories. Being a greenhouse gas, the strategy for ozone pollution reduction will lead to air quality and climate co-benefit which is a win-win solution. The gap in the ozone air quality management capacity in the GMS calls for more international collaborations to abate both local and transboundary precursors emission.

Risks and Adaptation to Climate Change in BCI Pilot Sites in PRC, Thailand and Viet Nam Final consultant report, July 2010
130
CHAPTER X
OVERVIEW ON ACID DEPOSITION IN GREATER MEKONG SUBREGION: CURRENT STATUS, TRENDS
AND POLICIES
BY
Nguyen Thi Kim Oanha, Asif Iqbala and Apipong Lamsamb aAsian Institute of Technology
bUNEP Regional Resource Center for Asia and the Pacific (RRC.AP)
A. Abstract 508. Acid deposition refers to a mixture of wet (with rain) and dry (without rain) deposition of acidic particles and gases from the atmosphere to the earth surface. The deposit materials can cause harmful effects to terrestrial and aquatic ecosystems, construction materials, art treasures and human health. Combustion of fossil fuel (in power plants, transportation, industries and residential cooking) is the major man-made activity releasing acidic gases (sulfur oxides and nitrogen oxides) that are the precursors of acid deposition. In GMS, the acid precursors may originate both within and outside the country of concern. Due to the unsustainable economic development the emission of these precursors into the atmosphere increases rapidly with time in the region. Accordingly, at present the measured concentrations of acidic gases in the atmosphere as well as the acid deposition to the earth surface show an increasing trend with time. Large amount of acid deposition already exceeds the handling capacity of soil in some areas of GMS hence significant damages, for example on agriculture, are expected. With the continuous increasing trend of precursor emissions the future deposition is projected to increase hence even larger area of GMS would be at risk. Actions should be taken to reduce emission in the region hence reduce the damaging effects associated with acid deposition. Cooperation between GMS countries would enhance the region capacity to mitigate emission and acid deposition effects.
B. Introduction 1. Basic Concepts of Acid Deposition
509. Rainfall is naturally slightly acidic due to the presence of carbon dioxide in the atmosphere which combines with rainwater to form weak carbonic acid (ARIC, 1999). The general meaning of acid rain is that precipitation with unusual acidic property in comparison to the natural rainfall. However, the concept of acid rain does not encompass the dry acidic particles which can settle out of atmosphere, and acidic vapors can interact with plants and structures at the earth's surface directly. To broaden the concept beyond acid rain, the term acid deposition has been introduced to include both wet and dry deposition (of particles) and capture of acidic vapors at the Earth's surface (ISU, 2006). Thus, "Acid deposition" is a broad term referring to a mixture of wet and dry deposition (deposited material) from the atmosphere containing a higher acidity than normal (US EPA, 2008).
510. The major precursors of acid rain formation include SO2 and NOx that are released from both natural sources (volcanoes and decaying vegetation) and man-made

Risks and Adaptation to Climate Change in BCI Pilot Sites in PRC, Thailand and Viet Nam Final consultant report, July 2010
131
sources. Anthropogenic precursors are mainly released from fossil fuel combustion in both stationary and mobile sources. Acid rain precursors from the sources can be transported by prevailing winds across state and national borders, sometimes over thousands of kilometers. In the atmosphere, these pollutants can be transformed to other compounds, as well as can change their states. For instance, SO2 is a gas emitted as a byproduct from burning coal containing sulfur that leads to the formation of H2SO4 (sulfuric acid) and further to sulfate (SO4
2-) particles in the atmosphere. Oxides of nitrogen (NO, NO2) are gases produced by high-temperature combustion from, for instance, automobiles and power plants, which lead to formation of nitric acid and nitrate particles in the atmosphere. These substances may be removed from the atmosphere either as dry or moist particles, or they may be rained out or snowed out with naturally occurring precipitation (ISU, 2006). The total process describing the acid deposition phenomena, from the sources to receptors, is shown in Figure 10.1.
Figure 10.1: Diagram showing the acid deposition phenomena
Source: ISU, 2006
511. Wet deposition refers to the acid chemicals in the air that are deposited in the form of rain, snow, fog, or mist. Wet deposition or acid rain is normally a mild solution of sulfuric acid and nitric acid. The level of acidity in the acid rain can be very high with pH level ranging from 1 to 4 (EC, 2009). The comparison of acid rain acidity with other solutions is shown diagrammatically in Figure 10.2.
Figure 10.2: Comparison of acid rain with other solutions in terms of pH level

Risks and Adaptation to Climate Change in BCI Pilot Sites in PRC, Thailand and Viet Nam Final consultant report, July 2010
132
Source: EC, 2009
512. When the weather is dry, the acid chemicals may become incorporated into dust or smoke particles and fall to the ground through dry deposition, sticking to the soil, buildings, homes, cars, and trees. Dry deposited gases and particles can be washed out by rainstorms leading to increased acidity of runoff, which makes the resulting mixture more acidic. Dry deposition contributes fall back of about half of the acidity in the atmosphere (US EPA, 2008). In the GMS, northeast monsoons are prevalent during the six months of the dry season. During this period, the dry deposition may be significant, because the dominant wind can transport the precursors from the upwind sources in other regions.
2. Formation of Acid Rain: Basic Equations
513. Naturally, nitric oxide (NO) is formed during lightning storms by the reaction of nitrogen and oxygen, two common atmospheric gases (Equation 1). However, majority of NO in the atmosphere is released from the high temperature combustion of fuels in both stationary and mobile sources. In the air, NO is oxidized to nitrogen dioxide (NO2) (Equation 2), which in turn reacts with water to give nitric acid (HNO3) (Equation 3).
)()(2)(2 2 gTempHigh
gg NOON ---------------------------------- (1)
)(2)(2)( 2
1ggg NOONO
----------------------------------- (2)
)()(32)(2 23 gaqg NOHNOOHNO ---------------------------------- (3)
514. Similarly, burning fossil fuels containing sulfur releases a significant amount of SO2 in to the atmosphere. For example, the SO2 concentration in unpolluted atmosphere is normally below 0.01 ppm while that in polluted urban air could be 0.1 to 2 ppm. The sulfur dioxide pathway to form sulfuric acid is shown in Equation 4.
42)(3)(222 SOHSOSO OH
gO
g ----------------------------------- (4)
515. Both nitric acid and sulfuric acid are strong acids. They readily dissociate in water to yield hydrogen ions, and nitrate and sulfate ions, respectively, hence lowering the pH of the solution. For example, when sulfuric acid dissociates in water, it gives an H+ ion and an HSO4- ion (Equation 5). The HSO4- ion may further dissociate to give H+ and SO4
2- (Equation 6). Thus, the presence of H2SO4 causes the concentration of H+ ions to increase dramatically, and so the pH of the rainwater drops to harmful levels. The total process of acid rain formation is shown schematically in Figure 10.3.
HHSOSOH 442 ------------------------------------- (5)

Risks and Adaptation to Climate Change in BCI Pilot Sites in PRC, Thailand and Viet Nam Final consultant report, July 2010
133
HSOHSO 244 ------------------------------------- (6)
Figure 10.3: Acid deposition mechanisms along with the reactions in the atmosphere
Source: Anonymous, 2009
3. Effects of Acid Deposition
516. Once deposited, acidic materials flow over and through the ground and affect a variety of plants and animals (US EPA, 2008). The severity of the effects depends on several factors, including acidity of the water, the soil chemistry and buffering capacity and the presence of living species that rely on the water (US EPA, 2008). The buffering capacity is very low in granite-rich soils and sandy soils with little carbonate. In contrast, calcium carbonate-rich soils have a very large buffering capacity. For surface water, the soil surrounding the water body determines the effect (Slanina, 2008). The impact of acid deposition on an ecosystem depends on the ecosystem’s ability to assimilate the substances. Biotic communities respond to the acid deposition hence can generally be used as an indicator of the sensitivity of an area. The sensitivity of an ecosystem thus depends upon bedrock lithology, soil type, land use, and rainfall (Kuylenstierna et al., 1989). Experiments showed that generally obvious detrimental effects of acid deposition would be produced in aquatic ecosystems at pH 4.0 and in terrestrial systems at pH<3.0 (Anonymous, 2003; US EPA, 2008).
a. Effects on aquatic ecosystem
517. Accumulation of acidic compounds in surface waters results in an acidification process which alters thousands of water bodies in the world. Effects on aquatic plants and animals may be direct or indirect i.e. through release of metals in sediments and soils at low pH. When pH<5 many species of fish die and ecosystem changes dramatically (US EPA, 2008).
i. Effects through the change of metal concentrations in water

Risks and Adaptation to Climate Change in BCI Pilot Sites in PRC, Thailand and Viet Nam Final consultant report, July 2010
134
518. Metals are released from lake sediments to water at pH = 5-6 as a result of ion exchange processes. Concentration of metals tends to be higher with decreasing pH of water. Most notable is aluminum (Al) whose concentration is a function of pH, sulfate and nitrate. At pH>5.5 aluminum forms precipitated complexes, when pH<5 several weak acidic species of Al predominate. Dissolved aluminum may affect other substances in water. For example, it causes precipitation of suspended solids, hence, increases transparency of water. Consequently, sunlight can penetrate at greater depth for phytoplankton to grow. On the other hand, toxicity of Al to organisms is high at low pH and Al becomes most toxic in the pH range 4.5-5.0. Other toxic metals such as Zn, Ni, Pb, Cd, etc. are also washed from acidified soils into lakes with increasing rates as pH decreases. In particular, the transformation of mercury deposited in lakes into highly toxic methyl mercury (CH3Hg) by bacteria is enhanced by sulfate in acid rains. CH3Hg can be easily uptaken by fish to cause toxic effects. Soluble toxic metals in water can cause biochemical deterioration of fish gills leading to the death via suffocation (US EPA, 2008; Anonymous, 2003; Green and Smith, 1983).
ii. Direct effects on fish and the aquatic food web
519. Acidification changes in aquatic population composition and reduces biodiversity. Loss of living components of aquatic ecosystems, both floral (bacteria, algae, diatoms, and macrophytic plants) and faunal (micro-decomposers, zooplankton, benthos, and fish), results in food web changes. Aquatic invertebrates are very sensitive to low pH: few if any species are tolerated with pH<5 (US EPA, 2008). Acidified waters may prevent fish eggs from hatching, damage fish larvae, and lower immunity factors in adult fish, which result in fishery losses.
b. Effects on terrestrial ecosystem
520. Effects of acid rains on plants may be direct or indirect through altering soil properties. Forest damage was a common issue in central Europe, Scandinavian countries, Germany, Czechoslovakia, and Eastern North America. Acid deposition is one of the suggested reasons for forest die back (Anonymous, 2003).
i. Effects on soil
521. Acid deposition upsets natural balance of soil, effects on soil chemistry, leaching and microbiological processes. Some of consequences are soil acidification, calcium removal, aluminum and manganese solubilization. Besides, useful soil microorganisms may be eliminated, which results in inhibition of several microbiological processes, such as, nitrogen fixation, mineralization of forest litter, or nitrification. Altogether, these processes cause a pollution-induced nutrient depletion, which accelerates the natural forest ageing. Metals are released from soil at low pH. Mobilization of metals in acidified soils is also altered (Anonymous, 2003; Green and Smith, 1983). As a result, nutrient flux and status in soil are changed affecting the plant growth.
ii. Direct effects on plant and forests
522. The direct effects of acid deposition on vegetation can be significant. Acid deposition leads to acidification of groundwater, where at pH level below 5, hydronium ions (H+) free aluminum ions from silicates in the soil. Unlike their bounded form, unbound aluminum ions have a very toxic effect on many species of vegetation. Trees thus exposed to high level of aluminum concentrations become very vulnerable to drought and diseases (Anonymous, 2005; Green and Smith, 1983).
523. In total, acidification can reduce tree growth, increase mortality of forest trees and reduce both crop quality and quantity. However, effects of acid rains on forest productivity, as mentioned earlier, depend on soil type, nutrient status, and amount of atmospheric acid input. If cation nutrients in soil are abundant and S, N are at deficiency

Risks and Adaptation to Climate Change in BCI Pilot Sites in PRC, Thailand and Viet Nam Final consultant report, July 2010
135
then moderate acid input results in less damage to forest or even a growth; in opposite case, a reduction of forest productivity is expected.
Figure 10.4: Plant response to different soil acidity level
Source: Anonymous, 2005
c. Effects on ground water
524. Reduction of water quality is a result of increased mineralization. Acid ground water was detected in some places in southwestern part of Sweden which may be due to more acid precipitation and also shallow aquifers in this part of the country. Besides, acidified water can dissolve more heavy metals e.g. lead and toxic substances from soil, rocks, pipes, etc., and transport them into drinking water systems. Monitor and mitigate this toxicity in well water in rural areas is more difficult than in municipal water supplies systems.
d. Effects on materials
525. Deterioration of many economically important materials is accelerated with acid deposition through corrosion or dissolution. It can cause damage to materials made of iron, steel, zinc, paint and stone, which may result in a significant economical loss. NOx are known to have effects on textile dyes. Much of material damage could be caused by locally emitted pollutants. Thus, industrial areas and cities are at higher risk than rural and unpolluted areas. Quantification of pollution-induced damage is, however, difficult since it is not readily distinguished from the weathering effects of natural processes.

Risks and Adaptation to Climate Change in BCI Pilot Sites in PRC, Thailand and Viet Nam Final consultant report, July 2010
136
Figure 10.5: Acid rain effects on sculptures
Source: Anonymous, 2003
e. Effects on human health
526. Sulfate and nitrate particles are of fine size and very toxic to human health. At high levels sulfates can aggravate existing heart and lung conditions such as asthma. Inhalation of SO2 alone or in combination with sulfate particles, which are mostly <1 µm, can cause short-term respiratory irritation and may be partly responsible for long-term health problems. Indirect effects of acid deposition on health are related to acidified surface and ground water supplies.
C. Emission Sources of Acid Precursors in GMS 527. The acid precursors may originate both within the country and outside the country of concern. Long range transport of precursors from different locations in the East Asian region and may contribute to acid deposition in the GMS. The major flow directions (Figure 10.6) demonstrate that, during the wet season, under the influence of the SW monsoon emission from the territories on the west would affect the GMS. During dry season, the north-eastern countries would contribute to the acid deposition in GMS.

Risks and Adaptation to Climate Change in BCI Pilot Sites in PRC, Thailand and Viet Nam Final consultant report, July 2010
137
Figure 10.6: Upper wind movement during wet season and dry season in South and East Asian region
(a) Wet season, June-September (b) Dry season, December-March Source: Ramanathan et al., 2008
528. There is quite limited emission inventory (EI) data available for the region. In the best case, fragmented emission inventory for some big cities are available from the government efforts (Bangkok, Chiangmai) or from the research projects (Hochiminh City, Hanoi). Therefore to gain an overview of the emission for the whole GMS, the emission data presented here is extracted from a global emission inventory provided by CGRER (CGRER, 2009) for the year 2006, as it provides sector specific emission inventory for different countries in the region. The emissions from biomass burning are not included in the database. Thus the database may not be appropriate for total emission inventory but can be used to compare the emissions from other major sources among different countries. There is no specific EI for Yunnan province of China hence the EI of whole China is discussed when necessary assuming the similarity in the source contributions between the province and the whole country.
529. Accordingly, the most important identified anthropogenic sources of acid rain precursors in GMS are power plants, transportation, industries and residential activities. The industries are of different scales and many are unidentified in the emission inventory. Contribution from different sources to the total emission of different countries in GMS is shown in Figure 10.7. Thailand and Viet Nam are the two major emitters in GMS, where industrial sector being the main sources of SO2 emissions followed by power sector. Residential and transportation activities also contribute to SO2 emission but are quite low comparing to the other sources.

Risks and Adaptation to Climate Change in BCI Pilot Sites in PRC, Thailand and Viet Nam Final consultant report, July 2010
138
0
200
400
600
800
1000S
O2
Em
iss
ion
fro
m d
iffe
ren
t s
ec
tors
in G
MS
(Gg
/yr)
Pow er
Industry
Residential
Transportation
Power 0 0 0.6 466.4 57.9
Industry 13.7 2.6 19.1 775.6 210
Residential 7.6 2.4 29.5 27.1 94.8
Transportation 6.1 2.9 1.9 30.3 22.6
Cambodia Laos Myanmar Thailand Vietnam
0
200
400
600
800
1000
NO
x E
mis
sio
n f
rom
dif
fere
nt
se
cto
rs in
GM
S(G
g/y
r)
Pow er
Industry
Residential
Transportation
Power 3.6 0.1 13.9 266.5 46.6
Industry 5.8 0.3 10 194.5 91.1
Residential 3.2 2.3 19.5 39.1 51.7
Transportation 14.3 15.4 41.6 778.1 140.9
Cambodia Laos Myanmar Thailand Vietnam
Figure 10.7: SO2 contribution from different sources from different countries in GMS in 2006
Source: extracted from CGRER, 2009
530. Transportation is the main source of NOx in every country of GMS (Figure 10.8) while industrial activities and power plants are also contributing a considerable amount. Residential activities contribute less NOx but are also significant sources in Viet Nam, Thailand and Myanmar.
Figure 10.8: NOx contribution from different sources from different countries in GMS in 2006
Source: extracted from CGRER, 2009
531. Nevertheless, the emission contribution from GMS (not including Yunnan of China) constitutes only a small fraction of the total emission of Southeast Asia (SEA: Brunei, Cambodia, Indonesia, Lao PDR, Malaysia, Myanmar, Philippines, Singapore, Thailand and Viet Nam) (Figure 10.9). Thus, the acid deposition in these GMS countries may be strongly influenced by the emission from other upwind countries in SEA as well as China as mentioned earlier.

Risks and Adaptation to Climate Change in BCI Pilot Sites in PRC, Thailand and Viet Nam Final consultant report, July 2010
139
0% 25% 50% 75% 100%
Power
Industry
Residential
Transportation
Relative contribution of SO2 from GMS to SEA
SEA
GMS
0% 25% 50% 75% 100%
Power
Industry
Residential
Transportation
Relative contribution of NOx from GMS to SEA
SEA
GMS
Figure 10.9: Relative contribution of (a) SO2 and (b) NOx from GMS to SEA
(a)
(b)
Source: extracted from CGRER, (2009)
532. It worth mentioning that the emission of SOx and NOx from natural sources is also significant but no quantitative estimate is available for analysis. In particular, the geological formation of some areas in GMS may be quite acidic which should be considered while assessing the sources and effects of acid deposition.
D. Acid Deposition in GMS 1. Monitoring Network Covering GMS
533. In the GMS countries, the efforts to tackle acid deposition problems have been initiated. The GMS countries have participated in the Acid Deposition Monitoring Network in East Asia (EANET). EANET has been established as an intergovernmental network which employs a common methodology to monitor acid deposition in East Asia. EANET started its regular phase operation since 2001. Table 10.1 provides details on the locations of the EANET monitoring stations in the GMS countries.

Risks and Adaptation to Climate Change in BCI Pilot Sites in PRC, Thailand and Viet Nam Final consultant report, July 2010
140
Table 10.1: Location of EANET wet and dry deposition monitoring sites
Country Name of sites Characteristics
of sites
Latitude Longitude Ht. above
sea level (m)
Cambodia Phnom Penh Urban 11° 33’N 104° 50’E 10
Lao PDR Vientiane Urban 17 ° N 102° E
Myanmar Yangon Urban 16° 30’ N 96° 07’ E 22
Thailand Bangkok Urban 13° 46’ N 100° 32’ E 2
Samutprakarn Urban 13° 44’ N 100° 34’ E 2
Patumthani Rural 14° 02’ N 100° 46’ E 2
Khanchanaburi Remote 14° 46’ N 98° 35’ E 170
(Vachiralongkorn Dam)
Chiang Mai (Mae Hia) Rural 18° 46’ N 98° 56’ E 350
Nakhon Ratchasima Remote 14° 27’ N 101° 53’ E 418
Viet Nam Hanoi Urban 21° 01’ N 105° 51’ E 5
Hoa Binh Rural 20° 49’ N 105° 20’ E 23
Source: extracted from EANET, 2006 and EANET, 2007
534. The monitoring stations of EANET measure wet deposition (not bulk deposition). Only the ambient air concentrations are reported under the dry deposition which include the particulate matter (PM), ozone and gaseous of SO2 and NOx. Table 10.2 shows the outline of the monitoring parameters at the sites.
Table 10.2: Outline of wet and dry deposition monitoring in EANET
Country Name of sites Characteristics
of sites
Wet
Dep.
Dry Deposition (air conc.)
Automatic Filter
SO2, NOx O3 PM Pack
Cambodia Phnom Penh Urban Y N N N N
Lao PDR Vientiane Urban Y N N N N
Myanmar Yangon Urban Y N N N N
Thailand Bangkok Urban Y Y N Y Y
Samutprakarn Urban Y Y Y N N
Patumthani Rural Y N N N Y
Khanchanaburi
(Vachiralongkorn Dam)
Remote Y Y Y Y Y
Chiang Mai (Mae Hia) Rural Y Y Y Y Y
Nakhon Ratchasima Remote Y N N N Y
Viet Nam Hanoi Urban Y N N N Y
Hoa Binh Rural Y N N N Y
Source: EANET, 2006 and EANET, 2007

Risks and Adaptation to Climate Change in BCI Pilot Sites in PRC, Thailand and Viet Nam Final consultant report, July 2010
141
535. Although, China is one of the participating countries of EANET, there is no EANET monitoring site in Yunnan province of China, which is a part of the GMS In this regard, the data from the neighboring province of Chongqing (Southern China) are used to analyze the scenario.
2. Acid Deposition Trends and Status in the GMS Countries
a. Wet deposition
536. The analysis is done based on the wet deposition monitoring data of SO42- and
NO3-, provided by EANET. A similar increasing trend of wet deposition was observed in
all countries. The trends of wet deposition for different countries from 2001-2007 are shown in Figure 10.10.
Figure 10.10: Trend of wet deposition in for SO42- and NO3
- in the GMS
0
10
20
30
40
50
60
2000 2001 2002 2003 2004 2006 2007
year
ma
xim
um
an
nu
al d
ep
osi
tion
(m
mo
l/m2
-yr)
SO4
NO3
(a) Thailand
0
10
20
30
40
50
60
70
2000 2001 2002 2003 2004 2006 2007
year
ma
xim
um
an
nu
al d
ep
osi
tion
(m
mo
l/m2
-yr)
SO4
NO3
(b) Viet Nam

Risks and Adaptation to Climate Change in BCI Pilot Sites in PRC, Thailand and Viet Nam Final consultant report, July 2010
142
0
5
10
15
20
25
30
35
2004 2006 2007
year
ma
xim
um
an
nu
al d
ep
osi
tion
(m
mo
l/m2
-yr)
SO4
NO3
(c) Cambodia
0
50
100
150
200
250
2000 2001 2002 2003 2004 2006 2007
year
ma
xim
um
an
nu
al d
ep
osi
tion
(m
mo
l/m2
-yr)
SO4
NO3
(d) Southern China
0
2
4
6
8
10
12
2006 2007
year
ma
xim
um
an
nu
al d
ep
osi
tion
(m
mo
l/m2
-yr)
SO4
NO3
(e) Laos
Source: extracted from EANET, 2007

Risks and Adaptation to Climate Change in BCI Pilot Sites in PRC, Thailand and Viet Nam Final consultant report, July 2010
143
537. Figure 10.10 revels that both nitrogen and sulfur deposition have general increasing trends. Nitrogen deposition appears to increase faster than sulfur in some countries such as Laos, Southern China and Thailand. Note that no wet deposition data is available in Myanmar for comparison. The trend in the Southern China was analyzed using the EANET monitoring station data of Chongqing province, which is a neighboring province of Yunnan, as mentioned above.
b. Dry deposition
538. No dry deposition data have yet been reported for the EANET monitoring sites. Data on the air concentrations of different precursors are monitored in some stations of GMS. Thus, the true dry deposition data is not yet available for the region, other than the individual research results.
539. For example, the dry deposition of acidic particles in Bangkok Metropolitan Region (BMR) was monitored by Bridhikitti (2004) and Ha (2006) which gave the dry season average of acidic substance flux to the soil in Thailand (Figure 10.11). The dry deposition measured at ERTC site (suburban of Bangkok) in Thailand could be as high as 10mmol/m2-month for NO3
- and 3.1 mmol/m2-month for SO42-. At the polluted urban site of
Din Daeng in Bangkok, lower deposition fluxes of NO3- and SO4
2- was observed at 0.97 and 1.34 mmol/m2-month, respectively. If 6 month of the dry season is considered the dry deposition flux was almost of the same magnitude as the wet deposition presented above.
Figure 10.11: Dry season monthly average acid deposition flux in BMR of Thailand in 2004
10.10
0.97
3.11
1.34
0 2 4 6 8 10 12
ERTC
Din Daeng
Sit
e o
f m
ea
su
rem
en
ts
Net dry deposition fluxes, mmol/m2-month
SO4
NO3
Source: Bridhikitti, 2004
c. Ambient concentration
540. In Thailand the SO2 concentration in ambient air was slightly increasing from 2002 to 2006 and dropped in 2007 while the NOx concentration is in slightly increasing trend from 2004-2007. For Viet Nam, the scenario is quite different. It shows a noticeable decreasing of SO2 concentration in 2007, while HNO3 concentration (no NOx data are reported) reduced significantly from 2002-2006 and then slightly increased in 2007. The concentration trends of SO2 and NOx/HNO3 (between 2001 and 2007) in Thailand and Viet Nam are shown in Figure 10.12 and Figure 10.13.

Risks and Adaptation to Climate Change in BCI Pilot Sites in PRC, Thailand and Viet Nam Final consultant report, July 2010
144
Figure 10.12: Trend of ground level ambient air concentration in Thailand
(a) SO2, Thailand (b) NOx, Thailand
Source: EANET, 2007
Figure 10.13: Trend of ground level ambient air concentration in Viet Nam
(a) SO2, Viet Nam (b) HNO3, Viet Nam
Source: EANET, 2007
d. Status of acid deposition in comparison with critical levels
i. pH of rain water
541. In 2007, the annual average pH level in the precipitation over the GMS region was below 5 in South China, around 5 for Thailand and below 6 for most of other countries (Figure 10.14). Note that pH of 5 is the WHO (2000) specified value at which the ecosystem would response to the acidity. The increasing trend of acid deposition would lower pH and could lead to ecological damages.
0
2
4
6
8
10
12
14
2001 2002 2004 2006 2007
year
Ma
xim
um
an
nu
al c
on
ce
ntr
ati
on
(S
O2
)
ppb
0
10
20
30
40
50
60
70
80
90
2001 2002 2004 2006 2007
year
Ma
xim
um
an
nu
al c
on
ce
ntr
ati
on
(N
Ox
)
ppb
0
1
2
3
4
5
6
2001 2002 2004 2006 2007
year
Ma
xim
um
an
nu
al c
on
ce
ntr
ati
on
(S
O2
)
ppb
0
0.5
1
1.5
2
2.5
3
3.5
2001 2002 2004 2006 2007
year
Ma
xim
um
an
nu
al c
on
ce
ntr
ati
on
(H
NO
3)
ppb

Risks and Adaptation to Climate Change in BCI Pilot Sites in PRC, Thailand and Viet Nam Final consultant report, July 2010
145
Figure 10.14: pH level in precipitation (annual average) over the GMS for the year 2007 in comparison to ecosystem response
0
1
2
3
4
5
6
7
8
Ca
mb
od
ia
So
uth
Ch
ina
La
o
My
an
ma
r
Th
aila
nd
Vie
tna
m
pH
lev
el
pH values
Ecosystemresponse to acidity
Source: EANET, 2007
ii. Deposition flux and critical load
542. The critical deposition load for an ecosystem is the highest deposition of substances that does not cause any long term damages to ecosystem (WHO, 2000). Depending on the response to acidic precursors and acids, the critical load of acid deposition which cause damage to the vegetation was determined (Table 10.3).
Table 10.3: Critical load values for vegetation in soil
Critical load (eq/ha/yr) a
pH level b
Visible injury Response to acidity
250-1034 3 5
Source: a IIASA, 1994; b WHO, 2000
543. The wet deposition flux data provided by EANET (2007) can be converted to a consistent unit of eq/ha/yr. The results reveals that the deposition flux in Thailand, Viet Nam and Southern China, were around 1000 eq/ha/yr, 1500 eq/ha/yr and 3600 eq/ha/yr, respectively. Thus, for Thailand it is about the same as critical load, while for Viet Nam and China the fluxes exceeded the critical load presented in Table 10.3. However, the potential damages to the ecosystem would depend on its buffering capacity as mentioned earlier.
544. In fact, the acid deposition may already cause serious effects in China. Back in 1995 ECCEY (1998) estimated that the total economic losses resulting from acid rain and SO2 amounted to 110 billion Chinese yuan (13 Billion USD) which is equivalent to 2% of Gross National product.

Risks and Adaptation to Climate Change in BCI Pilot Sites in PRC, Thailand and Viet Nam Final consultant report, July 2010
146
iii. Status and future of acid deposition in the GMS
545. The modeling study can provide some insight into the status and potential acid deposition in GMS in the future. Hicks et al. (2008) simulated future acid deposition for different emission scenarios and results are presented Figure 10.15. The Intergovernmental Panel on Climate Change (IPCC) scenario (Figure 10.15a) is used to illustrate the situation of rapid economic growth with no further control on air pollutant emissions. Figure 10.15b depicts the situation under the IPCC projected emission but with reduced S and N retention capacity of soil. The emission scenario projected by the International Institute for Applied Systems Analysis (IIASA) under Current Legislation (CLE), i.e. with emission control, is also simulated (Figure 10.15c). The latter reflects the situation in which a number of countries issued legislations on advanced emission controls in the early 2000s which could significantly cap the air pollution emissions at regional and global scales.
546. Thus, for a rapid economic growth, which is the characteristic of this region, with no emission control simulated in the IPCC emission scenario (a), within 25 years most of the places of GMS will be affected by acid deposition that exceed the critical load, and within 50 years all the places will be affected. Further, for reduced soil retention capacity, all the places of GMS will be affected badly within 25 years. Only when emission control is in place (scenario c) can the risk be reduced. However, even in this scenario, many places in GMS would be affected significantly within less than 25 years.
Figure 10.15: Potentially affected areas by acid deposition in south and south east Asia under different emission scenarios:
(a) IIASA CLE emission scenario, (b) IPCC emission scenario, (c) IPCC scenario with reduced S and N retention capacity of soil
(a)

Risks and Adaptation to Climate Change in BCI Pilot Sites in PRC, Thailand and Viet Nam Final consultant report, July 2010
147
(b)
(c)
Source: Hicks, et al., 2008
3. Policies to Mitigate Acid Deposition in GMS
547. The countries in GMS have participated in EANET activities for assessment of acid deposition. Thus the common monitoring methodology is used in all the countries in the network to gain the valid data. To mitigate the impacts of acid deposition, reduction of precursor emission is important and should be considered. Accordingly, each participating country of EANET is adopting different policies and practices to mitigate acid deposition (Table 10.4).

Risks and Adaptation to Climate Change in BCI Pilot Sites in PRC, Thailand and Viet Nam Final consultant report, July 2010
148
Table 10.4: Country policies to mitigate acid deposition in GMS
Existing Policies Areas of improvement
Cambodia Acid deposition problem is in early stage of identification in Cambodia and negative impacts are yet not identified. The programs related to atmospheric pollution and acid deposition issues implemented in Cambodia are:
National Climate Change Project have been implemented;
Cleaner Production Project have been set up and operated by Ministry of Industry, Mine and Energy;
Sub-degree (regulation) on Air Pollution and Noise Disturbance Control has been implementing.
The National environment policy and Strategy was developed.
The public awareness activities on environment and acid deposition have been conducting.
Only wet deposition monitoring is in the early stage and dry deposition monitoring not conducted.
Lack of funds, equipments, reagents, skilled staff, and relevant organizations /agency to deal with this matter is the problem in mitigation.
China The Chinese part in GMS is not included in the monitoring sites of EANET. Thus specific policies of China towards GMS are absent. However, China has its “National Plan for Environmental Protection” for every five year period. To mitigate acid deposition problem in China-
The administration has pledged to reduce the emission of sulfur dioxide in China, which is the main cause of acid rain, by 10 percent from its 2000 level by 2005
No coal-fueled power plants will be built or expanded in big and medium-sized cities and in the remaining areas, power plants are required to be equipped with devices to reduce sulfur dioxide emission.
According to SEPA’s five-year plan from 2000 to 2005 to cope with acid rain and sulfur dioxide, 137 large coal-fueled power plants must equip devices to reduce the emission of sulfur dioxide.
For the large country, the monitoring stations are not sufficient to monitor all the regions. The Southern part of China is remaining unmonitored which needs to be taken into consideration for regional cooperation through GMS.
Lao PDR Acid deposition issues are a fairly new phenomenon for Lao PDR and the interest in the prevention of this problem is still gaining momentum. Acid deposition is not evident in the Lao PDR at the present time. However, the implemented program to deal with acid deposition in Lao PDR are:
National Greenhouse Gas Inventory Project have been implemented;
Cleaner Production Project have been set up and operated by Ministry of industry and Handicraft;
Develop the National Ambient and Emission Standards;
Regarding to acid deposition monitoring only a few parameters have been monitored due to lack of funds, equipment, instruments and skilled staff to deal with this matter.
To strengthen the national capacity building at national level, including government and the private sector, there is a need for capacity building and an appropriate legal

Risks and Adaptation to Climate Change in BCI Pilot Sites in PRC, Thailand and Viet Nam Final consultant report, July 2010
149
Develop the Ambient Air Quality and Emission Monitoring Programme for Vientiane Capital City the year 2006-2010;
The Ministry of Communication, Transportation, Post and Construction together with STEA is formulating the Sustainable Transport Strategy up to the year 2020; and
The National environment Strategy up to the year 2020 and National Environment policy was developed.
framework needs to be established, particularly to control industrial processes.
It is also necessary to establish the environment quality standard at the national level. Promotion of public awareness is also necessary.
Myanmar Myanmar has joined EANET since 2005, however the monitoring activities did not start until January 2007. During the time this document was published, the information was not yet available.
Thailand The Pollution Control Department (PCD) in cooperated with the Japanese International Cooperation Agency (JICA) has conducted a control strategy study on acid deposition in Thailand. The integrated control strategy proposed under the cooperation are:
Shift to natural gas by vehicles and stationary sources;
Introduction of substantial compliance with the emission standard (Real-Euro), low emission vehicle promotion (LEV), and over age vehicle retirement (OVR); and
Acid deposition and air pollution management, Enhancement of Environmental Management
Implementation of the policy and monitoring all the activities are important in achieving the total environmental management. Detailed emission inventory and key sectors of emissions are required to be developed for extended management.
Viet Nam In Viet Nam, acid deposition is mostly composed of nss-S origin. The deposition of nitrogen compounds is less than that of sulfur, therefore, the major measures against acid deposition is to reduce SO2 emission.
Viet Nam joined some international conventions on emission reduction of SO2 and other air pollutants such as: United Nation Frame Convention of Climate Change (UNFCCC); Kyoto Protocol on Emission reduction of greenhouse gases; etc. Viet Nam has also strived for reducing air pollutant emission in industries as applying ISO 14000 Environmental System Management Standards; cleaner production technology.
The preliminary national emission inventory for Viet Nam is currently under development.
Integrated approach is missing in National level.
More monitoring stations are required to monitor whole Viet Nam.
Funding source is required for Viet Nam to carry out research on acid deposition.
Source: EANET, 2006

Risks and Adaptation to Climate Change in BCI Pilot Sites in PRC, Thailand and Viet Nam Final consultant report, July 2010
150
E. Summary Remarks
548. The acid deposition has already reached the critical stage in some parts of GMS. With the current trend in the emission of precursors, associated with the rapid economic and technological development, the problems and impacts of acid deposition are expected to be more serious in the near future. Besides, GMS may be affected by the long range transboundary emission from the upwind regional sources, which could further worsen the situation. There are no intensive monitoring activities in GMS thus in most of the cases only the wet deposition data are available for those countries participating in EANET. More monitoring sites for wet deposition are required in GMS and the dry deposition monitoring should be initiated to provide a better picture of the total acid deposition status. Strengthening the regional cooperation would enhance regional capacity to combat acid deposition and its consequences. This should include, but not limited to, the harmonization of the regional policies to deal with the acid deposition, joint research activities to assess impacts though data sharing, monitoring and modeling efforts.

Risks and Adaptation to Climate Change in BCI Pilot Sites in PRC, Thailand and Viet Nam Final consultant report, July 2010
151
CHAPTER XI
AIR QUALITY MONITORING IN THE CENTRAL PART OF VIET NAM
By
Nguyen Thi Kim Oanh, Kim Van Chinh, and Do Thanh Canh Asian Institute of Technology
A. Abstract
549. Monthly sampling for ambient air pollutants including ozone, NOx, NO2 and SO2 was carried out in the central part of Vietnam using Ogawa passive samplers in 2009. The sampling was done at two locations: the remote area of Song Thanh (Preservation Forest of Quang Nam province) and urban area of Danang city. In Song Thanh two sampling sites (ST1 and ST2), located at 700 m from each other, were deployed whereas in Danang city the sampling site was located in a residential area. The monitoring for Song Thanh was done to assess potential effects of current air pollution to the forest while the Danang site was used for comparison. Necessary QA/QC measures were taken at every sampling and analytical step to ensure data quality. In general, low levels of pollutants were observed in Song Thanh with monthly ozone generally below 12 ppb, and other pollutants were below 3 ppb. In Danang, significantly higher levels of ozone were observed, 11 to 34 ppb with remarkably higher levels in dry season (January and April, and September-November). NOx and NO2 in Danang were also higher than Song Thanh but still generally below 11 ppb. SO2 in Danang fluctuated and in September reached 96 ppb suggesting influence of local sources and/or regional transport of the pollutants. Longer monitoring periods and at more locations are desired to better characterize the air pollution levels in the area and potential effects on the forest and ecosystem. As ozone has a clear daily pattern with a maximum in the afternoon online hourly monitoring should be deployed to capture the maxima and would provide better assessment on forest damages. B. Introduction
550. Rapid economic growth, industrialization, urbanization, and motorization with land use changes have been observed in the past decades in Asia. As a result high air pollutant levels in many countries are observed that may cause multiple effects on human health, ecosystem and climate. In urban areas of developing countries, 2-5% of total deaths are estimated to be caused by exposure to high levels of particulates. High levels of air pollution also have impacts on economics due to increased mortality and morbidity, as well as damage to property and crops, and tourism loss. Among the phytotoxic pollutants sulfur dioxide, nitrogen oxides,and ozone are of the most concern due to their high levels in the ambient air.
551. It is important to assess the levels of these pollutants in the atmosphere to assess the risks to the ecosystem. This project involved monitoring air pollutants at a forest conservation area in the central part of Vietnam for this purpose. This final chapter presents the results of a 12 month monitoring program (January 2009 – January 2010) of gaseous pollutants including NOx (NO, NO2), sulfur dioxide (SO2) and ozone (O3) using Ogawa passive sampling devices.

Risks and Adaptation to Climate Change in BCI Pilot Sites in PRC, Thailand and Viet Nam Final consultant report, July 2010
152
C. Methodology
1. Study area
a. General description
552. Quang Nam province is located in the central part of Vietnam (Figure 11.1). The province has abundant natural resources (i.e. Song Thanh reservation forest, Thu Bon river system and gold mineral) and historical monuments. Quang Nam landuse (Table 11.1) mainly consists of forestry land (53%) and cultivation (11%). Danang, a state city, is located in the center of Quang Nam province and is a center of economic, tourism, industry and international transportation in the central coastal zone of Vietnam. The topography of Quang Nam is a combination of high mountains in the north, northeast (Danang) and west (Quang Nam), a midland in the center and narrow coastal plains in the east (Quang Nam & Danang websites, 2009). Quang Nam has a population of 438,800 with a population density of 138 people km-2 that are significantly lower than the population and density of Danang city (876,545 people, 690 people km-2).
Table 11.1: Land use in Da Nang city and Quang Nam province, in thousand ha, as 1 Jan 2007
Total area Agricultural
land Forestry
land Other land use types*
Homestead land
Fallow
Danang city
125.7 9.2 61.0 38.5 5.6 11.4
100% 7% 49% 31% 4% 9%
Quang Nam
1043.8 111.9 553.4 24.6 20.6 333.3
100% 11% 53% 2% 2% 32%*: land for industry, construction, irrigation, storage and Military use Source: GSO, 2007

Risks and Adaptation to Climate Change in BCI Pilot Sites in PRC, Thailand and Viet Nam Final consultant report, July 2010
153
Figure 11.1: Sampling Location
b. Meteorological condition
553. Quang Nam (and Danang) is located in a typical tropical monsoon zone with relatively high and stable temperature. There are two seasons: the wet season from August to December and the dry season from January to July. The annual average temperature is about 26ºC, the highest is 29-30ºC in June, July and August and the lowest is 22-23ºC in December, January and February. Average rainfall is 2,084 mm per year that is highest during October (580mm) and November (438 mm). The annual average humidity is about 82%. The annual average sunshine hours are 2068 hours with the maximum in May and June of 253 - 255 hrs/month and the minimum in December and January of 80 - 111 hrs/month (Table 11.2).
oQuang Nam
DNST2
ST1
14D road
Song Thanh Nature Reserve
a)
b)
c)
N-S railway
Scale 1: 200000
Scale 1: 60000
Scale 1: 1,000,000

Risks and Adaptation to Climate Change in BCI Pilot Sites in PRC, Thailand and Viet Nam Final consultant report, July 2010
154
Table 11.2: Monthly average meteorological variables at Da Nang International Airport (2002-2007)
Items Jan Feb Mar Apr May Jun Jul Aug Sep Oct Nov Dec Annual
Avg. Temperature 22 23 24 27 28 30 29 29 27 26 25 23 26
Avg. Humidity (%) 85 85 85 83 79 75 77 79 84 85 84 86 82
Total Rainfall (mm) 72 22 25 37 73 61 95 207 364 580 438 183 2084
Total Sunshine hours 111 160 144 217 253 255 231 190 161 142 124 80 2068 Source: GSO, 2007
554. The meteorological conditions during the monitoring period from January to December 2009 are shown in Figure 11.2 and summarized in Table 11.3.
Figure 11.2: Monthly Variations of Temperature and Precipitation in Da Nang in 2009
15
20
25
30
35
0
300
600
900
1200
1500
Jan Feb Mar Apr May Jun Jul Aug Sep Oct Nov Dec
Monthly variationTemperature and Precipitation Da Nang 2009
Precipitationmm ºC

Risks and Adaptation to Climate Change in BCI Pilot Sites in PRC, Thailand and Viet Nam Final consultant report, July 2010
155
Table 11.3: Monthly average meteorological variables in Da Nang, 2009
Temperature Humidity (%) Total Precipitation (mm) Wind speed (Km/h)
Jan
min 14 65 2
max 27 98 23
avg 20.5 82 155 10
Feb
min 16.8 79 4
max 32.5 95 16
avg 23.8 85 23 8
Mar
min 18 71 7
max 34 88 20
avg 25.4 81 23 10
Apr
min 21 64 5
max 38.3 93 14
avg 26.8 80 179 9
May
min 20.5 72 2
max 35 90 14
avg 27.5 80 66 9
Jun
min 24 53 6
max 38 82 11
avg 30.5 66 36 8
Jul
min 23 58 5
max 37 85 12
avg 29.1 71 179 8
Aug
min 22 61 5
max 36 85 14
avg 29.0 73 129 8
Sep
min 23 71 5
max 35 96 56
avg 27.2 82 1375 11
Oct
min 21.5 64 5
max 32.8 94 13
avg 26.5 79 455 8
Nov
min 17 71 4
max 34.2 91 36
avg 24.3 81 196 11
Dec
min 18 75 4
max 29 93 18
avg 23 83.7 165 8 Source: http://www.tutiempo.net/en/Climate/Da_Nang/

Risks and Adaptation to Climate Change in BCI Pilot Sites in PRC, Thailand and Viet Nam Final consultant report, July 2010
156
c. Sampling sites 555. Two sampling sites (ST1 and ST2) were located in Song Thanh Reservation Forest of Quang Nam province and one site in the Danang city (DN) was selected for passive sampling of the selected pollutants. The locations of sampling sites are shown in Figure 11.1 and Table 11.4.
Table 11.4: Sampling site information
Sites Location Description
DN 16 04’ 35.93” N
108 09’ 26.62” E
At a residential site in Lien Chieu district, Danang Ground: 7.3 m above sea level Samples: 8 m above the ground
ST1 15 39’ 20.36” N
10739’ 20.36” E
In Song Thanh reservation forest, Quang Nam 1km southwest from 14D highway Ground: 291m above sea level Samples: 3.5 m from the ground
ST2 15 39’ 45.32” N
10739’ 44.37” E
In Song Thanh reservation forest, Quang Nam 1km southwest from 14D highway Ground: 292m above sea level Samples: 4 m above the ground
556. ST1 and ST2 are located in Song Thanh reservation forest which is 85 km southwest from Danang City (DN site). ST1 is about 700 m away from ST2 and they are approximately 1 km southwest to the 14D highway connecting Sa Kong (Lao) and Quang Nam (Vietnam). The DN monitoring site is located in a residential site in Lien Chieu district of Danang city. This monitoring point is about 2 km southeast of HoaKhanh and 7.3 km south of Lien Chieu industrial zones, 5 km northwest of Danang International Airport, 7 km west of Song Han port and 8.2 km southwest of Tien Sa port, 300 m east of North-south railway and 1 km east of No.1A highway as defined on Google Earth Map. Therefore, this site is expected to be affected by the emissions from the industrial, mobile, residential activities as well as other urban sources.
2. Sampling Methods
557. In this study, Ogawa passive air samplers were used for monitoring O3, SO2, NOx and NO2. The procedures of field operations, sample preservation, analysis as well as calculations for this study followed the sampling protocol of the Ogawa passive sampler (Ogawa & Co., 2001).
Figure 11.3: Passive sampler with protective shelter for Ozone (a) and SO2, NOx and NO2 (b) sampling
(a) (b)

Risks and Adaptation to Climate Change in BCI Pilot Sites in PRC, Thailand and Viet Nam Final consultant report, July 2010
157
558. At each site, four passive Ogawa samplers were deployed to collect monthly samples. A metallic “cage” was used at ST1 and ST2 to protect the samplers from animals. The cage was hung on a tree at a height of about 3.5 - 4 m above the ground while at DN the sampler was fixed on a rooftop of a residence at about 8 m above the ground.
Figure 11.4: Passive sampler at ST1 (a) and DN (b) monitoring points
559. Ogawa samplers contain different filter pads coated with various chemicals to selectively retain the pollutant of interest. Blank samples including lab blanks, transport blanks and field blanks (non-exposed filters) were also used as the necessary QA/QC elements. The lab blanks were only kept in a refrigerator; the transport blanks were transported together with real sample filters to the field; and the field blanks were treated in a similar way to the transport blanks but were kept in an aluminum foil-covered glass container then hung together with the exposed sample filter in the field (Figure 11.4).
560. During the sampling period from 1 January to 31 May 2009, the monitoring was conducted mainly at ST1 and DN whereas ST2 was exposed in January and April only. Starting from June 2009 the sampling was conducted at all 3 sites regularly. A total of 255 filter samples of O3, SO2, NOx and NO2 including 31, 32, 31 and 31 real samples and 38, 28, 32 and 32 QA/QC samples (blanks) was collected during January 2009 - December 2009. After sampling, each exposed filter was placed into an air-tight plastic bag, kept in an ice box and transported, together with blanks, to a laboratory in the Danang city where the filters were preserved in a refrigerator before sending to AIT laboratory for chemical analysis. The exposure period of each sample was about 1 month (Table 11.5) except for August when a longer sampling time was used due to a delay in obtaining replacement filters from abroad.
a) b) Field blanks
OGAWA passive sampler
Field blanks

Risks and Adaptation to Climate Change in BCI Pilot Sites in PRC, Thailand and Viet Nam Final consultant report, July 2010
158
Table 11.5: Exposure time as minutes for samplers during January-December 2009
Month Site Start date Start time Stop date Stop time Sampling time,
Minutes
Jan ST1, 2 1-Jan 9h 31-Jan 11h 43,320
DN 1-Jan 9h 30-Jan 17h 42,240
Feb
ST1 1-Feb 17h 28-Feb 8h 38,340
ST2 na
DN 1-Feb 9h 28-Feb 11h30 39,030
Mar
ST1 28-Feb 17h 28-Mar 15h 40,200
ST2 na
DN 28-Feb 18h 29-Mar 10h 41,280
Apr ST1, 2 29-Mar 7h15 30-Apr 7h45 46,110
DN 29-Mar 10h 29-Apr 19h15 46,635
May
ST1 30-Apr 12h 30-May 8h40 43,000
ST2 na
DN 30-Apr 20h 30-May 15h 42,900
Jun ST1, 2 30-May 16h 30-Jun 6h45 42,645
DN 1-Jun 10h 30-Jun 8h 41,640
Jul ST1, 2 1-Jul 7h 31-Jul 13h30 43,590
DN 1-Jul 18h 30-Jul 6h30 41,070
Aug ST1, 2 2-Aug 14h20 15-Sep 11h05 63,165
DN 31-Jul 7h05 15-Sep 20h40 67,055
Sep ST1, 2 16-Sep 14h40 9-Oct 10h45 32,885
DN 15-Sep 7h30 8-Oct 20h10 33,880
Oct ST1, 2 9-Oct 11h 5-Nov 15h30 39,150
DN 9-Oct 7h 4-Nov 20h10 38,230
Nov ST1, 2 5-Nov 16h40 2-Dec 7h20 38,320
DN 5-Nov 6h30 3-Dec 16h40 40,930
Dec ST1, 2 2-Dec 16h 1-Jan 8h 46,130
DN 5-Dec 8h10 6-Jan 9h 42,720 na: No measurement
3. Analytical Methods 561. The analytical method for each parameter followed the procedure of Ogawa (Ogawa & Co., 2001). Basically, the sampled filters were extracted with MiliQ water. For SO2 analysis, an amount of 0.2 mL of H2O2 (1.75%) was added into the extracted solution while for NOx and NO2 extraction a color-producing reagent was used. O3 and SO2 were analyzed by ion chromatography whereas NOx and NO2 were measured by

Risks and Adaptation to Climate Change in BCI Pilot Sites in PRC, Thailand and Viet Nam Final consultant report, July 2010
159
spectrophotometry. QA/QC blank filters were also extracted and analyzed by the same procedure as the exposed filters (Figure 11.5).
Figure 11.5: Analytical flowchart for SO2 (a), O3 (b) and NO2 & NOx (c)
Source: Ogawa & Co. (2001)
D. Results
562. The results of O3, NOx and NO2 levels at sampled sites are presented in Table 11.6, and Figure 11.6 (ozone) and Figure 11.7 (other gases). In general, O3, NOx and NO2 concentrations observed in the forest were relatively low and stable reflecting the background level whereas these values in Danang were generally higher and strongly fluctuating that could be related to the diverse urban activities. As expected, the levels at ST1 and ST2 were quite similar.
563. All analytical results of SO2 at three sites during January to May were below the ion chromatograph detection limit of 0.15 g/mL which corresponds to 1.1 ppb for a monthly sampling period hence cannot be detected. Note that the SO2 filter samples collected in January, February and March were extracted with 8 mL of MiliQ water following the Ogawa protocol but no signals were detected (nd). Therefore, to increase the concentration in the extract only 4 mL solvent were used for samples collected from April onward. However, the signals either were not shown or too low to quantify (nq) for all the samples collected in the first period (January to May) and some samples collected during the second period (June to December). At both ST1 and ST2 sites, SO2 levels were consistently low (~ 1ppb) while those in DN were higher but strongly fluctuating. The maximum level in the city was observed in September of 96.3 ppb and second highest in November of 14.6 ppb. Further analysis for local sources, meteorology as well as regional transport of SO2 to the measurement site should be done for better understanding.

Risks and Adaptation to Climate Change in BCI Pilot Sites in PRC, Thailand and Viet Nam Final consultant report, July 2010
160
Figure 11.6. Monthly variation of ambient levels of O3 in Song Thanh (ST1 and ST2) and Da Nang (DN), Vietnam in 2009
0
5
10
15
20
25
30
35
40
Jan Feb Mar Apr May Jun July Aug Sep Oct Nov Dec
pp
bV
Monthly ozone level during 2009
DN ST1 ST2
Table 11.6: A summary of air monitoring results for O3, NOx, NO2 and SO2, ppb
Gas Sites Jan. Feb. Mar. Apr. May Jun Jul. Aug. Sep. Oct. Nov. Dec.
O3
ST1 11.5 8.8 9.5 10.1 10.1 5.4 5.4 2.8 5.3 5.8 0.39 nd
ST2 10.4 na na 11.3 na 7.3 4.7 2.7 5.1 5.4 0.47 nd
DN 34.4 23.1 19.1 27.9 16.1 19.3 15.5 11.2 31.4 26.7 28.8 14.3
NOx
ST1 3.34 2.78 1.99 2.36 0.45 1.27 0.84 0.86 1.71 1.58 1.25 1.52
ST2 2.23 na na 2.2 na 1.21 0.78 0.74 1.22 1.93 1.47 1.16
DN 3.86 11 9.33 7.17 6.19 4.98 3.87 3.53 1.53 5.12 5.48 5.29
NO2
ST1 0.7 0.46 0.6 0.35 0.39 0.65 0.85 0.54 0.21 0.99 0.42 0.42
ST2 0.5 na na 0.29 na 0.71 0.9 0.58 0.27 1.07 0.36 0.42
DN 0.4 6.93 5.51 6.4 5.97 5.44 4.59 2.9 3.46 0.72 6.19 4.71
Gas Sites Jan. Feb. Mar. Apr. May Jun Jul. Aug. Sep. Oct. Nov. Dec.
SO2
ST1
ST2 nd or nq
DN
nq nq 0.5 nq 0.8 nq 0.8
0.9 nq nq 1.8 0.9 nq 0.6
0.8 0.6 5.3 96.3 1.6 14.6 0.8 na: no measurement nd: not detectable nq: not quantified
564. The monthly O3 levels in the forest area range from non detectable (December) to 11.5 ppb while the levels in DN were from 11.2 ppb to 34.4 ppb. Higher O3 levels were observed in the Danang dry season (January-February, September-November) which is similar to the fluctuation observed in Bangkok (Zhang and Kim Oanh, 2002), Hanoi (An, 2005) and Ho Chi Minh City (Huy, 2008). In general, the monthly ozone levels in Danang are comparable to these other Asian cities. In ST sites ozone levels were lower and the seasonal trend was not as clear as for DN. SO2, NO2 and NOx were also higher in DN than in the Song Thanh sites.

Risks and Adaptation to Climate Change in BCI Pilot Sites in PRC, Thailand and Viet Nam Final consultant report, July 2010
161
565. Because the Ogawa sampling procedure used in this work has been designed to trap NOx and NO2, the subtraction of NO2 from the total NOx would yield NO. However, in 4 samples in DN (June, July, September and November) the NO2 levels were slightly above NOx levels. This may be a result of the sampling and analytical methods when low analyte levels are present.
Figure 11.7: Monthly variation of ambient levels of NOx and NO2 in Song Thanh (ST1, ST2) and Da Nang (DN), Vietnam in 2009
0
2
4
6
8
10
12
Jan Feb Mar Apr May Jun Jul Aug Sep Oct Nov Dec
NOx and NO2 during 2009
NOx‐ST1
NO2‐ST1
NOx‐ST2
NO2‐ST2
NOx‐DN
NO2‐DN
ppb
566. As mentioned above, three types of QA/QC blanks were conducted together with the exposed filters (Table 11.7). In general, low levels of blanks, 0.2 ppb, were obtained. For NO2 the blanks were below 10% of the real sample in DN whereas the blanks were relatively higher in ST (up to 70%) mostly due to the low concentrations in these ST samples. Blanks for NOx were also similar, i.e. lower for DN (< 23%) and higher for ST samples (53%). In both DN and ST most of the blanks for O3 were below 2% of the sample concentrations except one transportation blank in ST (in February) which was 15 % and one field blank in DN (in May) which was 11% of the ozone concentration. For SO2, all blanks were lower than the IC method detection limit. The reported data are not corrected for the blanks.

Risks and Adaptation to Climate Change in BCI Pilot Sites in PRC, Thailand and Viet Nam Final consultant report, July 2010
162
Table 11.7: Results of blank samples for O3, NOx, NO2 and SO2
ST1 ST2 DN ST1 ST2 DN ST1 ST2 DN ST1 ST2 DN ST1 ST2 DN ST1 ST2 DN
Lab blank
Trans.blank nd nd nd
Field blank nd 0.09 0.06 0.08 nd nd 0.245 (11%) nq 0.06 0.06
Lab blank
Trans.blank 0.043 0.027 0.008
Field blank 0.004 0.022 0 0.034 0.005 0.01 0.029 0.004 0.055
Lab blank
Trans.blank 0 0.008 0.012 0
Field blank 0 0 0 0.003 0 0.002 0.013 0 0 0
Lab blank
Trans.blank
Field blank
ST1 ST2 DN ST1 ST2 DN ST1 ST2 DN ST1 ST2 DN ST1 ST2 DN ST1 ST2 DN
Lab blank
Trans.blank 0.09 0.09 0.06 nd
Field blank 0.09 nq 0.07 0.09 0.06 0.07 nd nd nd
Lab blank
Trans.blank 0.11 0.22
Field blank 0.08 0.09 0.19 0.19 0.19 0.23 (23%)
Lab blank
Trans.blank 0.07 0.05
Field blank 0.09 0.07 0.07 0.07 0.06 0.06
Lab blank
Trans.blank
Field blank
Jan. Feb. Mar. Apr.
0.143 (15%)
nd
nd
May. Jun.
Jul. Aug. Sep. Oct. Nov. Dec.
nd
nd
nd
nd
0.06 nd
0
0
nd
nd
0.033 (53%)
0.022
0
0
nd nd
nd
0.03
0.034 0.003
0.011
0.009
0
0 0.008
0.01
0.004
0.06
0.07
0.07 (70%)
0.06
all samples were not detectable
all samples were not detectable
0.09
0.09
0.2
0.23
NO2, ABS
SO2, ug/ml
O3, ug/ml
NOx, ABS
NO2, ABS
SO2, ug/ml
O3, ug/ml
NOx, ABS
Blue highlighted: no blanks; nd: not detectable; nq: not quantified; ABS: absorbance

Risks and Adaptation to Climate Change in BCI Pilot Sites in PRC, Thailand and Viet Nam Final consultant report, July 2010
163
CHAPTER XII
CHEMICAL CHARACTERISTIC OF ACID DEPOSITION IN KANCHANABURI, THE WESTERN FOREST COMPLEX OF
THAILAND
By Hathairatana Garivait
Environmental Research and Training Center
A. Abstract
567. Within the framework of the joint research project on “Risks and Adaptation from Climate Change in BCI Pilot Sites in PRC, Thailand and Vietnam”, Environmental Research and Training Center collaborated to measure air quality and acid deposition in a western forest complex of Thailand. This is to better understand the link of climate change problem to the local environmental issues. The study aims to help clarifying some aspects of serious consequences on livelihoods of populations in the Biodiversity Corridor landscapes where such approach is very limited in the tropical region.
568. Vajiralongkorn Dam in Kanchanaburi province, because of its ecological characteristic, is selected for sampling site representative for acid deposition monitoring in the western forest complex of Thailand. Monthly sampling of SO2, NOx, NO2, and O3 using Ogawa passive samplers and rainfall have been collected during January to December 2009 to understand status of air quality and to assess strength of wet deposition in the area. The ionic abundance in rainfall (mmol/m2) showed the general trend NH4+ > Cl- > Na+ > Ca2+ > NO3- > H+ > SO4
2- > K+> Mg2+ with the deposition amounts of 36.3, 21.9, 18.4, 12.7, 11.5, 9.7, 9.2, 5.8 and 4.4, respectively. The variation of pH during January to December 2009 ranged from 4.7 to 7.3 with the volume weighted average pH is 5.52 showed natural ecosystems. As for the concentration of acidifying gases such as SO2 and NO2 during the sampling period were 0.01–0.22 ppbv and 0.06-1.07 ppbv, respectively. It is obvious that these concentrations are far below the National Ambient Air Quality Standard (NAAQS) of SO2 (40 ppbv) and NO2 (30 ppbv) indicated the remote characteristic of the sampling site. Ozone is known as secondary air pollutant which if formed by series of complex photochemical reactions between oxides of nitrogen (NOx) and volatile organic compounds (VOCs) under the present of sunlight. The monthly concentration of O3 during the sampling period ranges from 22-46 ppbv with the maximum concentration in hot season. The acid deposition and air quality in this western forest complex area of Thailand has not yet reached the critical stage according to the data obtain in this study, however, the level of ozone found in this study may cause damage to vegetation and rubber materials. The findings in Thailand will be integrated at regional level with PRC and Vietnam to assess risks and adaptation from climate change in the BCI pilot sites. The adaptation measures applicable for the area will be proposed according to the findings of the study.

Risks and Adaptation to Climate Change in BCI Pilot Sites in PRC, Thailand and Viet Nam Final consultant report, July 2010
164
B. Background
569. Within the framework of the joint research project on “Risks and Adaptation from Climate Change in BCI Pilot Sites in PRC, Thailand and Vietnam”, the Environmental Research and Training Center (ERTC) Department of Environmental Quality Promotion, has cooperated in the project as one of the research partners from Thailand since 2008.
570. It is recognized that the Asian region is experiencing a considerable increase in pollution issues because of a rapid growth in population, economic development and industrial productivity. As the region strives to become industrialized, the environment receives inadequate management. The problems may be exacerbated by climate change. The Intergovernmental Panel on Climate Change (IPCC) states that observed changes in climate have already affected ecological, social, and economic systems, and sustainable development is threatened by climate change. Extreme weather and climate events are occurring more often in the Southeast Asian region. For example, Myanmar, Taiwan and China have experienced serious storms and flooding, and in Thailand, droughts and floods, caused by strong monsoon and changes in rainfall regimes are occurring more frequently which seriously damages wide areas of agriculture every year. Preliminary results from the Composition and Acidity of Asian Precipitation (CAAP) workshop held in Bangkok, in November 1998 (www.rapidc.org) have clearly indicated that air pollution is severe in several areas of Asia and the levels of acid deposition in some areas may exceed the carrying capacity to their soils. This can lead to general reduction on crop yields, decreased water availability, shifts in plant and animal distribution ranges and increased exposure to vector-borne and water-borne diseases in many tropical and sub-tropical regions. Therefore, human-induced pollution with the climate change is a serious environmental issue with implications for biodiversity, food security, and water.
571. Acid deposition is considered to be one of the major issues of trans-boundary air pollution in the region. The rapid increase in development of human activities has given rise to increased emissions of atmospheric pollutants which have affected the natural ecosystems severely, for example forest decline (EANET, 2008). Sulfur dioxide (SO2) and oxides of nitrogen (NOx) are the major pollutants in industrial areas, principally as causative agents of acid deposition. Their emissions from industries, power plants and mobile sources cause the formation of H2SO4 and HNO3 in precipitation (Menz and Seip, 2004) and thus affect ecosystem by means of wet and dry deposition.
572. For Thailand, the relative contribution from national emission sources to the potential acidification problem has been studied in the cooperative project between Environmental Research and Training Center, Thailand and the Swedish Environmental Research Institute (IVL) and Swedish Meteorological and Hydrological Institute (SMHI) during 2001-2003 (Technical Report on the study of possible acidification in Thailand 2003). Based on the measurement and modeling results generated in this study, we concluded that 70-80% of the anthropogenic total sulfur and oxidized nitrogen deposition in Thailand arose from sources within Thailand itself. Additionally it is clear that, in comparison with other parts of Thailand, the maximum amount of sulfur depositions of 3-10 g S/m2/year was occurred in the Bangkok Metropolitan Area and its vicinity (covering an area of ca. 200 x 200 km2). Besides, world sensitivity mapping on acid deposition in 1996 has shown that soil in large parts of the country are sensitive to acidic pollution (Kuylenstierna et al., 1998). However, the causes and consequences of acid deposition in the affected areas remain unclear. The direct effects of acidification on the environment and other resources through impacts on forest ecosystems, agricultural productivity, aquatic ecosystems, human health, historical monuments materials and buildings in the region are unclear. Furthermore, information on probable synergistic effects caused by climate change to these impacts is still scarce in this region.

Risks and Adaptation to Climate Change in BCI Pilot Sites in PRC, Thailand and Viet Nam Final consultant report, July 2010
165
573. Although, ERTC has got a long experience in acid deposition monitoring under the cooperation with Acid Deposition Monitoring Network in East Asia (EANET), the additional stress imposed by climate change, particularly as it affects the characteristics of natural hazards is still not emphasized. Therefore, this joint project is timely and will strengthen knowledge on the links between climate change and the local environmental issues. The study aims to help clarifying some aspects of serious consequences on livelihoods of populations in the Biodiversity Corridor landscapes where such approach is very limited in Thailand as well as tropical region.
1. Objective of the study
574. The cooperation aims to build capacity and a knowledge base to adapt to climate change and regional air pollution by using modeling, assessment and analysis relevant to local and immediate needs, developed in partnerships with local institutions in the Greater Mekong Sub-region (GMS) countries.
575. ERTC, as an implementation partner for Thailand, aims to study the level of acid deposition in the western forest complex of Thailand where a great threat for biodiversity may be posed by climate change in the region (UN report 2005).
2. Scope of the study
576. Specific field sites were identified for collection of samples and monitoring of ambient air and rainfall. ERTC selected one of the ecological sites which contribute to EANET, namely Vajiralongkorn Dam, located in Kanchanaburi province in the western part of Thailand. To understand the status of air quality in the western forest complex in Thailand, monthly data collection of the following parameters were conducted for 12 months monitoring (January to December 2009).
a. Gaseous pollutants: SO2, NOx, NO2, and O3 for the assessment of dry deposition and the air quality.
b. Bulk precipitation was collected for the analysis of EC, pH, cation and anion species for the assessment of wet deposition.
577. The deposition data collected in this study was discussed at a regional level with PRC and Vietnam to assess risks and adaptation from climate change. The implication for biodiversity, food security, water resources and livelihoods in the BCI pilot sites were evaluated in order to recommend adaptation measures applicable under the local context.
3. Expected outcome
578. The outcomes of this project were to evaluate the impacts of acid deposition on terrestrial ecosystems in the Greater Mekong Subregion (GMS), especially the impact on ecological areas. The findings in Thailand will be integrated at a regional level with PRC and Vietnam to assess risks and adaptation from climate change in the BCI pilot sites.
C. Methodology
579. The chemistry of deposition plays an important role in the sampling design and the analysis as the amount and quantity of rain differ according to the precise siting of the sampler in relation to topography, altitude and wind exposure. The chemistry of deposition also varies in relation to conditions in the atmosphere which may not be known. Furthermore, the analysis is difficult due to the very dilute nature of the samples, especially with regard to acidity and the instability of nitrate and ammonium ions, which are important constituents of the ion balance even at low concentrations. Therefore, these variabilities are overcome by long term observation at a single site over a period of time. The chemistry of deposition is summarised in this section for basic information prior to describe the methodology used in this study.

Risks and Adaptation to Climate Change in BCI Pilot Sites in PRC, Thailand and Viet Nam Final consultant report, July 2010
166
1. Chemistry of deposition
580. Two principal mechanisms are responsible for the removal of atmospheric contaminants - dry deposition and wet deposition. Materials present as gases and partially oxidized aerosols are deposited dry, whereas the fully oxidized materials are more soluble and deposit during rain episodes. Some aerosols may be entrained in rain as it falls, and dry particulates deposit on to surfaces of rain samplers between rain events, and influence the composition and acidity of such “bulk” rain samples. Thus both dry and wet deposition are important routes for atmospheric fallout but their relative proportions depend on the time and distance from source, as well as seasonal atmospheric conditions.
581. Pollutants emissions leading to acid deposition are predominantly the oxides of sulfur and nitrogen. Sulfur dioxide (SO2) is formed by the oxidation of sulfur present in fossil fuels, the sulfur initially formed by biological activity, as well as some from geological materials. Whereas nitrogen oxides (NOx: NO and NO2) are generated during the process of combustion by oxidation of nitrogen present in air. The degree to which this occurs is dependent on combustion temperature. Some nitrogen oxides gases are also generated from the chemical industry. The nitrogen content of combusted materials (e.g. organic wastes) also contributes to NOx emissions. In addition, ammonia (NH3) is also important; it is alkaline in rain but with its subsequent conversion to ammonium (NH4
+) and nitrate (NO3-) in water, it adds acidity to soil and surface waters. The principal chemical reactions of sulfur and nitrogen gases emitted to the atmosphere are described below.
a. Generation of oxidants NO is the major nitrogen oxide from combustion:
NO + O3 ---------> NO2 + O2
In sunlight, where the rate depends on the solar intensity:
NO2 + h ---------> NO + O
O2 + O ---------> O3
In the presence of hydrocarbons:
RH + 2NO + 2O2 ---------> carbonyl + 2NO2 + H2O
Photolysis of ozone in presence of water vapor produces hydroxyl radicals (OH), and of carbonyl in presence of NO produces HO2; recombination of hydroxyl radicals produces hydrogen peroxide:
HO2 + HO2 ---------> H2O2 + O2
b. Dry oxidation of S and N oxides Sulfur dioxide reacts with OH radicals:
SO2 + OH ---------> HSO3
HSO3 + O2 ---------> HO2 + SO3
Nitrogen dioxide reacts with OH:
NO2 + OH ---------> HNO3
(this is ten times faster than the S reaction).

Risks and Adaptation to Climate Change in BCI Pilot Sites in PRC, Thailand and Viet Nam Final consultant report, July 2010
167
c. Wet oxidation of sulfur SO2 dissolves in rain as bisulphite and H+:
SO2.H2O ---------> HSO3 + H+
Oxidation proceeds to sulfate and more H+:
HSO3 ---------> SO4 + H+
This is slow, but is catalyzed by oxidants and transition metals.
582. When acidifying gases are generated they are dispersed and diluted downwind of the source: chemical oxidation in the atmosphere proceeds during this process. These reactions convert the oxides of sulfur and nitrogen to sulfuric and nitric acid; the oxidizing agents are varied. In dry air, SO2 gas is converted to SO4 by OH radicals, while the moist air, the sulfate forms cloud droplets which may be washed out by rain. Similarly NOx reactions differ between night and day. The atmospheric oxidation process is complex, limited by the oxidants present, and is influenced by light and moisture; it is often slow, so that removal of the atmospheric burden by rainfall may be at some considerable distance from the emission sources. A generalized scheme of reactions and processes in the atmosphere is shown in Figure 12.1. Figure 12.1: Mechanism of acid deposition in the atmosphere
583. Atmospheric deposition studies provide valuable information for the understanding of the entire atmospheric cycle: emissions, transport, transformations and deposition. The composition of wet deposition actually reflects the composition of the atmosphere through which it falls. Therefore, rainwater chemistry data can be used to explain the composition and chemistry of ambient air, cloud droplets and air-sea exchange. Incorporation of sulfur and nitrogen oxides to wet deposition is particularly important as there are the precursors of major acids (H2SO4 and HNO3) (Jacobson, 2002). For example, precursors of acid deposition such as sulfur dioxide (SO2) and nitrogen oxides (NOx) are emitted from a variety of sources including industries, vehicles, biomass burning, etc., and undergo atmospheric transport and transformation under varying meteorological conditions. The resulting strong acids may be neutralized by ammonia and calcium carbonate, which

Risks and Adaptation to Climate Change in BCI Pilot Sites in PRC, Thailand and Viet Nam Final consultant report, July 2010
168
arise from agricultural activities, windblown dust and biomass burning. The extent of acidification and neutralization is dependent on the residence time of primary as well as secondary pollutants and on the oxidizing capacity of the atmosphere.
2. Sampling site selection
584. A site was selected in a western forest area in Thailand. The study site was installed at Vajiralongkorn Dam in Kanchanaburi province from December 2008. Kanchanaburi is located between 14.02°N and 99.53°E in the western part of Thailand. The area of the province is approximately 19,500 km2 with a population about 826,000. The province is surrounded by forest and mountainous areas. The main economic activities are agriculture and industry related to food products. The Gross Provincial Product (GPP) is approximately 45,000 million Baht per year.
585. Vajiralongkorn Dam was selected as the sampling site in this study because of its ecological characteristic for acid deposition monitoring according to the EANET site classification guideline. The regulation for the minimum distances to emission and contamination sources for an ecological site includes that regions within 50 km of large pollution sources such as cities, thermal power plants, and major motorways should be excluded. The Dam is far from the city of Kanchanaburi about 120 km to the northwest and about 80 km from the border with Myanmar. The sampling site was also selected to meet with the local criteria for placement of collectors in the EANET guideline, which are as follows.
An open, flat, grassy area far enough from trees, hills, and other obstructions to avoid effects on sampling. No objects should be within a few meters of the collector, and no object should shade the collector.
The horizontal distance between a large obstruction and the collector should be at least twice the obstruction height, or the top of an obstruction as view from the collector should be less than 30° above the horizon.
The collector should be free from local emission and contamination sources such as waste disposal sites, incinerators, parking lots, open storage of agricultural products, and domestic heating. Regions within 100 m of these emission and contamination sources should be excluded.
The horizontal distance between collectors should be greater than 2 meters.
586. We installed triplicates of passive sample poles and duplicates of bulk precipitation collectors to represent acid deposition in the area. The placement of all collectors met with EANET guidelines. The location of the sampling site is shown in Figure 12.2.

Risks and Adaptation to Climate Change in BCI Pilot Sites in PRC, Thailand and Viet Nam Final consultant report, July 2010
169
Sampling site
Figure 12.2: The location of the sampling site in Vajiralongkorn Dam
3. Sampling methods
587. The integrated monitoring of rainfall or bulk precipitation and passive sampler for gaseous pollutant was performed on a monthly basis at the sampling site. As appropriate low cost sampling methods were used in this study, the sampling has to be done with care. Therefore, all sample collection was performed by the staff of ERTC every month. The detail of each sampling method is given below.
a. Rainfall or bulk precipitation
588. A polyethylene (PE) bottle of 20 liters was connected to a PE funnel with diameter of 20.0 cm by a PE tube and used to collect rainfall at the sampling site. Aluminum foil was used to wrap the whole collector except the funnel to prevent evaporation of the rain sample during the sampling period of one month. The length of the PE tube (about 1.5 meters long) was used to connect the bottle and the funnel for the same reason. In order to assess completeness of the rainfall amount, co-sampling was performed for bulk sampling at the same sampling site. The amount of rainfall of both collectors was calculated based on the known diameter of funnel. Since the density of rain water is approximately 1.0 g/ml at 20C, the weight of the sample can be taken to equal its volume. Figure 12.3 describes the specification of the rainfall collector.

Risks and Adaptation to Climate Change in BCI Pilot Sites in PRC, Thailand and Viet Nam Final consultant report, July 2010
170
Figure 12.3 Rainfall collector
b. Measurement of concentrations of air pollutants
589. Passive samplers are useful to estimate average air concentrations as well as dry deposition fluxes at remote sites without an electric supply. However, it is still necessary to check their reliability, especially in tropical regions. In this study, measurements of four air pollutants, SO2, NO2, NOx and O3 were performed using Ogawa passive samplers specifically to each pollutant. The structure of an Ogawa passive sampler is described in Figure 12.4. The holder of the passive sampler of the four target gases was put on an iron pole of three meters height above the ground as shown in Figure 12.5. In order to assess completeness of the gaseous concentration, triplicate sampling was performed for passive sampler holders at the same sampling site. Measurement of meteorological data is essential in order to calculate air concentration measured by passive samplers in units of part per billion by volume (ppbv). Meteorological data were collected from the nearest meteorological station, Thong- phaphume, at the distance of about 5-10 km from the Dam. Data on the amount of precipitation, temperature, humidity and wind speed were collected. The sampling method for acid deposition measurement at the Vajiralongkorn Dam is shown in Figure 12.6.

Risks and Adaptation to Climate Change in BCI Pilot Sites in PRC, Thailand and Viet Nam Final consultant report, July 2010
171
Figure 12.4: Ogawa passive sampler
Source: Ogawa & Company USA, Inc. 1998
The sampler has two chambers, and one sampler can measure two pollutants at the same time.
Figure 12.5: Gas measurements by Ogawa passive samplers

Risks and Adaptation to Climate Change in BCI Pilot Sites in PRC, Thailand and Viet Nam Final consultant report, July 2010
172
Passive sampler measurement
Rainfall measurement
Figure 12.6: Measurement methods at the sampling site (Vajiralongkorn Dam)
4. Chemical analysis
a. Bulk deposition The pH and EC were determined before filtration of the sample.
→ pH: pH meter with the glass electrode → EC: Electro-conductivity meter
Concentrations of anions (SO42-, NO3-, Cl-) and cations
(Ca2+, Mg2
+, K+, Na+, and NH4+) were determined using ion
chromatographs after filtration (pore size, 0.45 μm). The EANET Technical Manual for Wet Deposition Monitoring was used for the reference for chemical analysis in rainfall samples.
b. Air concentration Plastic gloves were used for handling the samplers. Air pollutants absorbed on the filters were dissolved in the ionized water and analyzed according to the instructions of the respective samplers. In case of SO2, it was oxidized to SO4
2- by using H2O2 before analysis (Ogawa & Company USA, Inc, 1998). Three blank filters for the respective pollutants were extracted in the same way. SO2, O3 NO2 and NOX (NO + NO2) were analyzed using ion chromatograph as SO4
2- and NO3- respectively. The instructions of Ogawa Co. Ltd. and the sampling protocol for Ogawa passive sampler monitoring were followed. The analysis by the ion chromatography was carried out according to the EANET manual for wet deposition monitoring.

Risks and Adaptation to Climate Change in BCI Pilot Sites in PRC, Thailand and Viet Nam Final consultant report, July 2010
173
D. Measurement Results of atmospheric deposition at Vajiralongkorn Dam, Kanchanaburi
590. The results of the measurements are described as follows.
1. Meteorological condition of the sampling site
591. Meteorological data for the sampling site were retrieved from the nearest meteorological station, Thongphaphume, at the distance of about 5-10 km from the Vachiralongkorn Dam. The meteorological parameters such as precipitation amount, temperature, humidity, wind speed and wind direction were downloaded from the website of Thailand Meteorological Department (www.tmd.go.th). The meteorological data at Thongphaphume during January 2001-June 2009 (see Tables 12.1 and 12.2) showed that prevailing wind direction is Southwest for most of the time from February through October and Southeast from November through January. The monthly mean wind speed in the same period showed moderate wind speed ranged from 3.6 to 5.7 m/s in which strong winds are usually found in the dry season (November – April). The monthly average temperature and relative humidity during January 2001 to June 2009 was between 18.1C – 33.4C and 51% -86%, respectively. Considering the meteorological condition, the air quality at the sampling site is quite clean and not so influenced by the air mass from the city of Kanchanaburi.
Table 12.1: Wind direction at Thongphaphume meteorological station, Kanchanaburi 2001-2009
Average wind derection (degree)
2001 2002 2003 2004 2005 2006 2007 2008 2009
Jan 230 142 201 187 245 208 217 182 160
Feb 265 229 234 212 305 223 195 224 261
Mar 266 294 274 250 235 226 287 204 229
Apr 248 295 280 276 283 274 235 228 213
May 274 289 258 216 309 232 192 241 195
Jun 271 262 303 272 307 248 247 270 231
Jul 277 300 293 302 304 302 210 280
Aug 280 303 309 295 309 308 297 194
Sep 273 291 282 281 310 305 298 278
Oct 200 198 185 200 260 207 176 205
Nov 132 191 160 212 247 197 135 138
Dec 167 146 135 254 201 183 149 176

Risks and Adaptation to Climate Change in BCI Pilot Sites in PRC, Thailand and Viet Nam Final consultant report, July 2010
174
Table 12.2: Wind speed at Thongphaphume meteorological station, Kanchanaburi 2001-2009
Average wind speed (m/s)
2001 2002 2003 2004 2005 2006 2007 2008 2009
Jan 4.68 4.68 4.16 3.64 4.16 4.16 4.16 4.16 4.16
Feb 4.16 4.16 4.68 4.16 4.16 4.16 4.16 4.16 4.16
Mar 5.2 5.2 5.2 5.2 4.16 4.68 4.68 4.68 4.68
Apr 5.2 5.72 4.68 4.68 4.68 4.16 4.68 5.2 4.68
May 4.16 4.68 4.68 5.2 4.16 4.16 4.16 4.68 4.16
Jun 4.16 4.16 4.16 4.68 3.64 4.68 4.16 4.16 4.16
Jul 4.16 4.16 4.16 4.16 3.64 3.64 4.16 4.16
Aug 4.16 5.2 4.16 4.16 3.64 4.16 3.64 4.16
Sep 4.68 4.16 4.16 4.16 4.16 4.16 3.64 3.64
Oct 4.16 4.68 4.16 3.64 4.16 3.64 4.16 3.64
Nov 4.68 4.68 3.64 3.64 4.16 4.16 4.16 4.16
Dec 4.68 4.16 4.68 3.64 4.68 4.68 4.16 3.64
2. Rainfall
592. The amount of rainfall between two collectors has good consistency. Unfortunately, we have no standard rain gauge to measure rainfall amount at the sampling site. Therefore, rainfall amount of the bulk precipitation samplers was obtained by calculation based on funnel’s diameter of the collectors. In order to assess the rainfall amount, comparison of rainfall amounts between two samplers and the rainfall data from the nearest meteorological station (Thongphaphume) were assessed as shown in the Figure 12.7.

Risks and Adaptation to Climate Change in BCI Pilot Sites in PRC, Thailand and Viet Nam Final consultant report, July 2010
175
Figure 12.7: Comparison of rainfall amounts between two samplers and Thongphaphum data
593. However, when we compare the rainfall amount collected by standard rain gauge at Thongphaphume meteorological station, the nearest meteorological station at 5-10 km away from the sampling site, they are different for most of the time. This is a usual case for tropical climates where rain falls in different places in the same area. Nevertheless, the same variation trend of monthly rainfall amount was found. The monthly variation of rainfall amount during January-December 2009 is shown in Figure 12.8 which characterizes well wet season (May-October) and dry season (November-April). There was no rainfall from December to February at the sampling site. The total rainfall amount during the sampling period was 2,115 mm, an average rainfall amount in this tropical area.
Figure 12.8: Monthly variation of rainfall amount during January-December 2009

Risks and Adaptation to Climate Change in BCI Pilot Sites in PRC, Thailand and Viet Nam Final consultant report, July 2010
176
3. Variation of EC and pH
594. The acidity of rainwater depends on the concentration of cationic and anionic species. Acidic pH reveals the presence of strong acids, such as SO4
2- and NO3-, while neutral or alkaline pH values indicate neutralization of acids by NH4
+ and soil dust. At Vachiralongkorn Dam, the pH during January to August 2009 ranged from 4.7 to 7.3 with the volume weighted average pH is 5.52. The minimum value of pH was found in April, end of dry season with a little rainfall amount. As for EC value, the variation was more or less steady and ranged between 0.6-2.2 mS/m in which the value was slightly higher in the dry season (January-April). Figure 12.9 shows the monthly variation of EC and pH in the rainfall samples.
Figure 12.9: Monthly variation of EC and pH in rainfall at Vachiralongkorn Dam
4. Chemical composition of rainfall
595. The ionic abundance in rainfall (moleq/ha) showed the general trend NH4+ > Cl- >
Na+ > Ca2+ > NO3- > H+ > SO42- > K+> Mg2+. As seen from Figure 12.10, about 67% of
average ionic composition is formed by cations whereas the remaining 33% is formed by anions. Ammonium (NH4
+) shows the maximum contribution (28%), followed by Cl- (17%). The minimum contribution is from K+ (4%) and Mg2+ (3%). High concentrations of NH4
+ are expected due to the agricultural activities. Na+ and Cl-, which contributed about 31%, indicate marine or natural source influence. In order to determine the marine contribution in rainwater composition, the sea salt ratios were calculated considering the Na as a sea salt tracer, assuming all the Na to be of marine origin. The calculated ratios for rainwater deviated considerably from the seawater ratios (see Table 12.3), indicating a modification of the sea salt constituents along the trajectory of the air masses. Although seawater was considered to be the major source of Na+ and Cl-, they may also be emitted from other natural and industrial sources such as soil dust, sea salt, refuse incineration, open burning and chemical industry (Safai et al., 2004). In case of Vachiralongkorn Dam, Na+ and Cl- may principally come from natural sources as the sampling site location is far away from any anthropogenic sources. It is expected that Na+ and Cl- come from the same source in view the close relationship between these two ions. The correlation coefficient between Na+ and Cl- was found to be 0.986, as shown in Figure 12.10. The observed Cl/Na ratio (1.19) is similar to that of seawater ratio (1.16), indicating some contributions of marine or soil dust sources to this area. Similarly, the elevated K/Na,

Risks and Adaptation to Climate Change in BCI Pilot Sites in PRC, Thailand and Viet Nam Final consultant report, July 2010
177
Mg/Na, Ca/Na, and SO4/Na ratios indicate the possible contribution of other sources, probably the soil and agricultural activity. When compared, the marine contribution in this area with those of Bangkok and Chiangmai, it is obviously seen that the marine contribution is highest with the nearest distance to the sea. Bangkok is located about 20 km from the Gulf of Thailand, while Pathumthani and Chiangmai are about 60 and 700 Km from the sea, respectively. Besides, SO4
2-and NO3- together contributed only about 20%, which confirm the remote area characteristic of the selected sampling site. Thus, the rain water composition at Vachiralongkorn Dam was predominantly influenced by natural sources and some marine origin. Low contributions of anthropogenic sources to the sampling site can be observed according to the low deposition of sulfate and nitrate in the rainfall samples.
Table 12.3: Average ratio of the ions SO42-, Cl-, Ca2+, K+ and Mg2+ with Na+ at
different cities in Thailand compared with those of seawater
SO42-/Na+
Cl-/Na+
Ca2+/Na+
K+/Na+
Mg2+/Na+
Seawatera 0.06 1.16 0.02 0.02 0.11
Vachiralongkorn Dam, Kanchanaburi
0.50 1.19 0.69 0.32 0.24
Pathumthani 1.93 1.28 2.09 0.25 0.27
Bangkokb
1.63 1.16 1.40 0.37 0.32
ChiangMaib
0.82 1.26 1.96 0.78 0.42
a Seawater ratio was calculated based on the salt concentration of standard seawater (total salt mass of 35g per 1Kg of seawater).
b Thephanondh, S. 2005 (personal communication)
Table 12.4: Chemical composition of total deposition in rainfall (mmol/m2) at Vachiralongkorn Dam during January-December 2009
SO42- NO3- Cl- NH4+ Na+ K+ Ca2+ Mg2+ H+
9.2 11.5 21.9 36.3 18.4 5.8 12.7 4.4 9.7

Risks and Adaptation to Climate Change in BCI Pilot Sites in PRC, Thailand and Viet Nam Final consultant report, July 2010
178
Figure 12.10: The segregation of chemical composition in rainfall according to the total deposition during January-December 2009 at Vachiralongkorn Dam
Figure 12.11: Relationship between Na+ and Cl- in the rainfall at Vachiralongkorn Dam
596. The major anions in rainfall were Cl-, NO3- and SO42-. These three ions were the
predominate ions deposited during the wet season especially in June and August when maximum rainfall occurs. The prevailing wind direction during that time is from the west and northwest, showing some influence from the air mass transported through the

Risks and Adaptation to Climate Change in BCI Pilot Sites in PRC, Thailand and Viet Nam Final consultant report, July 2010
179
Andaman Sea. Moderate rainfall was found in other months when chloride, nitrate and sulfate ions concentrations were distributed at nearly the same level. The major cations in rainfall samples were NH4
+, Na+, Ca2+ and H+. The NH4+ and Ca2+ play an important role
as neutralization factors in wet deposition so that the pH value of rainfall was kept between 5.0 to 6.0 characteristic of remote areas far away from anthropogenic emission sources. NH4
+ was especially high in April and showed a contribution from agricultural activities during the transition from dry to wet seasons. The monthly variation of the major anions and cations are shown in Figure 12.12 and 12.13, respectively.
Figure 12.12: Monthly variations of major anions in the rainfall samples
Figure 12.13: Monthly variations of major cations in the rainfall samples

Risks and Adaptation to Climate Change in BCI Pilot Sites in PRC, Thailand and Viet Nam Final consultant report, July 2010
180
5. SO2, NOx, NO2, and O3 concentrations
597. The pollutant emissions that lead to acid rain are predominantly the oxides of sulfur and nitrogen. When acidifying gases are generated they are dispersed and diluted downwind of the source; chemical oxidation in the atmosphere proceeds during this process. These reactions convert the oxides of sulfur and nitrogen to sulfuric and nitric acid. Sulfur dioxide (SO2) is formed by the oxidation of sulfur present in fossil fuels. The sulfur initially formed by biological activity, as well as some from geological materials. Together with emissions from biological processes, such as the production of dimethyl sulphide and hydrogen sulphide, these contribute 1-5% to atmospheric emissions in the United States (Irving, 1991). In Thailand, EANET data show that SO2 concentrations in ambient air slightly increasing from 2002 to 2006 and decreased in 2007. The maximum annual concentration of SO2 ranged from 10 ppb to 13 ppb which is far below the national ambient air quality standard (NAAQS) of 40 ppb as an annual mean.
598. Nitrogen oxides (NO and NO2, usually expressed as NOx) are generated during the process of combustion by oxidation of nitrogen present in air. The nitrogen content of the combusted materials (e.g., organic wastes) also contributes to the NOx emission. Natural phenomena, such as N fixation during electrical storms, or biological N fixation followed by denitrification, contribute significant quantities. In North America, these natural sources are about 11% of the total N emissions and it is expected that they are greater in summer due to higher rate of biological activity (Irving, 1991). In Thailand, the study of emission inventories of N emissions is still scarce and very limited. However, EANET data showed NOx concentration slightly increased from 2004 – 2007 with its maximum annual concentration ranging from 65 to 85 ppb. The range of this maximum annual concentration of NOx is 2-3 times higher than the NAAQS of NO2 which is 30 ppb as an annual mean. In this study, the ambient concentrations of SO2, NO2 and NOx at Vachiralongkorn Dam during January-December 2009 are shown in Figure 12.14. It is obvious that the concentrations are higher in the dry season compared with the wet season. This is consistent with the fact that acidic gases can dissolve easily in water and thus be removed by wet deposition. The concentration ranges of SO2, NO2 and NOx during the sampling period were 0.01–0.22 ppbv, 0.06-1.07 ppbv and 0.06-1.32 ppbv, respectively. It is obvious that these concentrations are far below the NAAQS of SO2 (40 ppbv for annual mean standard) and NO2 (30 ppbv for annual mean standard) indicating the remote characteristic of the sampling site.
599. Ozone is a secondary air pollutant which is formed by series of complex photochemical reactions between oxides of nitrogen (NOx) and volatile organic compounds (VOCs) in the present of sunlight. Fossil fuels combustion, biomass burning and petrochemical industries are common sources of ozone precursors. Ozone is well recognized as a strong irritant. Through constriction of the airways, it may reduce the capacity of human lung system. When expose to high concentrations of ozone symptoms such as chest pain, dry throat, headache, nausea, and eyes irritation may be experienced. In this study, the monthly ambient concentration of O3 at Vachiralongkorn Dam is shown in Figure 12.15. The monthly concentration of O3 during the sampling period ranged from 22-46 ppbv where the elevated value was found in the hot dry season (February-April 2009) with the maximum concentration in March. The ozone level found in this study is still a moderate concentration which may not cause any health effect. However, this ozone level can cause damage to vegetation and rubber materials (SEI, 2008 ; Wark et al., 1998).

Risks and Adaptation to Climate Change in BCI Pilot Sites in PRC, Thailand and Viet Nam Final consultant report, July 2010
181
Figure 12.14: Monthly ambient concentration of SO2, NO2 and NOx at Vachiralongkorn Dam
Figure 12.15: Monthly ambient concentration of O3 at Vachiralongkorn Dam

Risks and Adaptation to Climate Change in BCI Pilot Sites in PRC, Thailand and Viet Nam Final consultant report, July 2010
182
E. Conclusion
600. An investigation of the chemical composition of rainfall at Vachiralongkorn Dam, Kanchanaburi was carried out from January-December 2009. The results showed that the variation of pH during January to December 2009 ranged from 4.7 to 6.1 with a volume weighted average pH of 5.5. The variation of pH and EC had no relationship with the amount of rainfall. The NH4
+, Ca2+, Cl-, Na+, SO42-and NO3- were major ionic species in
the rainfall samples which indicates an emissions origin of natural sources. Low concentrations were also found for gaseous pollutants, however, the levels of ozone concentrations may cause damage to vegetation and rubber materials.
601. The acid deposition and air quality in this Western Forest Complex area of Thailand has not yet reached a critical stage according to the data obtain in this study. However, the link between climate change and air pollution is a complex issue due to their transboundary in nature. Therefore, continuous surveillance and regional cooperation are needed to prevent any adverse impacts on the ecosystems and biodiversity in the region.

Risks and Adaptation to Climate Change in BCI Pilot Sites in PRC, Thailand and Viet Nam Final consultant report, July 2010
183
CHAPTER XIII
FUTURE GROUND LEVEL OZONE POLLUTION AND ACID DEPOSITION IN GMS REGION SIMULATED BY CMAQ-
MM5 SYSTEM
By
Nguyen Thi Kim Oanh and Didin Agustian Permadi Environmental Engineering and Management, SERD
Asian Institute of Technology
A. Abstract
602. This report presents simulation of ground level ozone and acid deposition over the Greater Mekong Sub-region (GMS) using the Mesoscale Meteorological Model (MM5) - Community Multi-Scale Air Quality (CMAQ) model system. The simulation was conducted for the month of January 2006 (base case) and January 2020 (projection). January was selected as it is a month of high ozone concentrations in the region. This is also the month of a strong influence of the Northeast monsoon when the GMS is downwind of regions with large emission sources that may provide long range transport of emissions. The most recent Asian emission data base of 2006, available from the Center for Global and Regional Environmental Research (CGRER) at the University of Iowa, with 0.5° x 0.5° resolution, was used. The model outputs for both ozone and acid deposition (dry and wet) were for 0.5° x 0.5° grids. Two emission scenarios were simulated: 1) based on average Gross Domestic Product (GDP) growth, and 2) the Intergovernmental Panel on Climate Change (IPCC) SRES-A2 scenario. For ozone, the base case simulation revealed that the maximum values of hourly concentration averaged in January 2006 would be around 60-65 ppb and occur over Bangkok. In January 2020, the corresponding maximum values would be as high as 120 – 180 ppb and would shift to Northeast Thailand. This would lead to higher adverse effects on health while crop loss would also be substantial due to high AOT-40 values if no measures are taken. For acid deposition, the highest average dry depositions in January 2006 of total sulfur, total nitrate and total ammonium were estimated to be about 1,900; 2,200 and 9 mg/m2/month, respectively. These values are higher than the respective wet deposition rates as January is a dry month. The total acid deposition load in 2006 was as high as 40,000 eq/ha/year and would exceed the critical load value of acid deposition for vegetation in GMS soil. In 2020, an increase of deposition load by around 1.3 times would occur which suggests an even greater threat. The simulation study shows that both future ozone and acid deposition rates indicate higher levels and larger affected areas in the GMS region due to increasing emissions of air pollutants. Further simulation should be conducted to obtain data on annual fluctuations of the target pollutants and for a greater range of emission scenarios.
B. Introduction
600. An increase in fossil fuel combustion has been observed in most parts of the world resulting in an increase in the occurrence of various air pollution impacts. Ozone pollution and acid rain are among the world’s most recognized air pollution issues. Ozone is an oxidant which can cause adverse effects on human health (Lippmann,

Risks and Adaptation to Climate Change in BCI Pilot Sites in PRC, Thailand and Viet Nam Final consultant report, July 2010
184
1991; Weisel, et al., 1995; Smith et al., 2000), materials and the ecosystem (Wark et al., 1998). It also damages vegetation and consequently reduces growth and yield of agricultural crops and forests (Hogsett et al., 1997; Orendovici et al., 2003; Novak et al., 2003; Emberson et al., 2003) while acidic compounds, once deposited to the Earth surface can flow over and through the soil surfaces and affect plants and animals (US EPA, 2008). In Asia, problems of high ground-level O3 concentrations and acid deposition are encountered in many areas. Daily maximum hourly ozone levels often exceed the respective National Ambient Air Quality Standard (NAAQS) (Lee et al., 2002; Tu et al., 2007; Shiu et al., 2007; Zhang and Oanh, 2002). Total nitrogen and sulfur deposition have general shown increasing trends (EANET, 2006). Past observations and modeling studies have shown that ozone and its precursors, as well as acid deposition precursors are transported over a large region, even from one continent to another. The complexity of photochemical air pollution and acid deposition issues is associated with complex processes in the atmosphere and presents a real challenge in air quality management. The modeling tool, in particular, plays a central role in scientific investigation of how these pollution phenomena evolve in the atmosphere (Russell and Dennis, 2000; Kim Oanh and Agustian, 2008).
601. In Southeast Asia (SEA), model applications on the regional scale are still very limited (Kim Oanh and Zhang, 2004; Nghiem and Kim Oanh, 2008). A few acid deposition modeling studies have been reported, mostly in East Asia, under the Model Inter-Comparison Study for Asia (MICS-Asia) campaign. There is no published record of emission projection for future ozone and acid deposition modeling studies. A regional-scale study for photochemical smog modeling performance on selected smog episodes in 2004 has been reported to satisfactorily meet the U.S. Environmental Protection Agency criteria for ozone using MM5-CMAQ model system (Nghiem and Kim Oanh, 2008). Using the same modeling scheme, this study attempts to simulate the 2020 emission projection to assess future ozone concentration and acid deposition as compared to the base year of 2006 in GMS region. An Asian emission dataset for 2006 was taken from the Center for Global and Regional Environmental Research (CGRER) at the University of Iowa. This CGRER emission inventory was conducted to support the Intercontinental Chemical Transport Experiment-Phase B (INTEXB) project (Zhang et al., 2009). Thus, this current study would be among the first attempts to apply the most recent global emission inventory dataset for GMS simulation. Meteorological fields produced by MM5 for January 2006 were used to simulate projected emission in 2020. January 2006 was a month of high ozone concentrations in South East Asia as discussed in Nghiem and Kim Oanh (2008). Two emission projections were developed and used in the simulation: 1) based on average GDP growth in member countries of the GMS and 2) the Intergovernmental Panel on Climate Change (IPCC) Special Report on Emission Scenarios (SRES), scenario A2.
C. Model domain and input data
1. The modeling system (MM5-CMAQ)
602. The Model-3 CMAQ version 4.3 was used in this study. This is an Eulerian-type model developed by the U.S. Environmental Protection Agency (EPA) to simulate tropospheric O3 and a range of other atmospheric phenomena (Byun and Ching, 1999). In this study, the Carbon Bond Mechanism IV (CBM-IV) was used with updated reaction rates. CMAQ was coupled with the Fifth-Generation Pennsylvania State University/National Center for Atmospheric Research (PSU/NCAR) MM5, 19 versions 3.6.2, to generate meteorological field input.

Risks and Adaptation to Climate Change in BCI Pilot Sites in PRC, Thailand and Viet Nam Final consultant report, July 2010
185
2. Domain, initial and boundary conditions
603. Simulation was conducted for January 2006 as a base case. A single domain for CMAQ was simulated with a modeling set up similar to that presented in earlier study (Nghiem and Kim Oanh, 2008). The model domains used in this study covered the continental Southeast Asia (CSEA) region as shown in Figure 12.1. For the simulation, the MM5 domain of 56 x 56 grid cells extended from 87 oE to 115 oE and from 1 oN to 29 oN, whereas the CMAQ domain of 40 x 40 grid cells extended from 91 °E to 111 °E and from 5 °N to 25 °N. The horizontal grid size of 56 km (0.5 x 0.5°) is similar for both CMAQ and MM5. Vertically, the domains extended from the mean sea level (0 m) to approximately 16,000 m. The MM5 has 30 vertical layers whereas the CMAQ has 15 layers in the sigma coordinate system. The CMAQ domains have the values at layer boundaries of 1.00, 0.998, 0.995, 0.99, 0.985, 0.98, 0.97, 0.96, 0.84, 0.7, 0.5, 0.4, 0.3, 0.2, 0.1, and 0.
604. Clean air over CSEA was used as the initial conditions, thus each CMAQ run was started with clean air conditions in the beginning of the simulation period. The boundary conditions of the CSEA domain were developed based on monthly mean concentrations of ozone (O3), nitrogen dioxide (NO2), carbon monoxide (CO), peroxyacetyl nitrate, methane (CH4), ethane (C2H6), formaldehyde (HCHO), and nitric acid (HNO3) taken from the global Model of Ozone and Related Tracers, version 2 (MOZART-2) (Horowitz et al., 2003). The boundary conditions for other species in the CBM-IV mechanism are set to zero and allowed to evolve during the simulation.
Figure 13.1: Model domains of MM5 and CMAQ

Risks and Adaptation to Climate Change in BCI Pilot Sites in PRC, Thailand and Viet Nam Final consultant report, July 2010
186
605. Meteorological fields were obtained from MM5 run with Lambert Conformal projection centered at 15 °N and 101 °E (in central of Thailand). MM5 used the terrain databases derived from the U.S. Geological Survey (USGS) and the Global 25-category data of vegetation type and land-use data, with a resolution of 5 min. MM5 was exercised in four dimensional data assimilation (FDDA) mode using 3-dimensional grid and surface nudging over the entire modeling period. The input meteorological data used for the MM5 initialization included global reanalysis data, as well as global surface and upper air observation data obtained from the Data Support Section at the National Center for Atmospheric Research (NCAR-DSS) at ftp://dss.ucar.edu/ datasets. The MM5 output files were processed with the Meteorology Chemistry Interface Processor Version 2.2 (MCIP2.2) for the subsequent chemical transport simulations by CMAQ.
3. Emission input data
a. Base case emission (2006)
606. The anthropogenic emissions of NOx, CO, VOCs, SO2, PM10, PM2.5, BC and OC of 2006 were obtained from the last update of the regional anthropogenic annual emission inventory of 0.5° x 0.5° for Asia, which were prepared by the CGRER at the University of Iowa (Wang et al., 2008). The monthly global inventory of biogenic emissions of NOx and VOC were obtained from Global Emissions Inventory Activity (GEIA - www.geiacenter.org) with a spatial resolution of 1° x 1°. The biogenic emission inventory was extracted for the month of January 2006, the target simulation month. The emissions were then interpolated to 0.5° x 0.5° grids and used for the simulation over the CSEA domain. The emissions of selected pollutants for the GMS countries are presented in Table 13.1. Note that, emission of biomass open burning in 2006 was not available at CGRER website hence the data for 2000 was used.
607. Temporal variation of emissions was prepared following the methods proposed by Nghiem and Kim Oanh (2008) to obtain both anthropogenic and biogenic emissions for January 2006. Briefly, monthly emission of modeled species (SO2, CO, NO, NO2, and VOCs) for January 2006 was estimated based on the monthly fraction of the annual emission of the combustion related species suggested by Street et al., (2003). Hourly emission variation was made according to the CO concentration profile (Nghiem and Kim Oanh, 2008). Finally, the hourly anthropogenic and biogenic VOC emissions were aggregated among the lumped hydrocarbons used in CBM-IV using the respective VOC profiles presented in Fu et al., (2004).
Table 13.1: Annual emissions from GMS countries in 2006 (Tg/year)
Pollutants Cambodia Lao PDR Myanmar Thailand Vietnam
NOx 0.09 0.10 0.25 1.47 0.46
NMVOC 0.31 0.49 1.80 3.57 1.95
CO 1.71 2.55 8.83 12.42 12.76
SO2 0.04 0.02 0.09 1.33 0.40
BC 0.014 0.017 0.069 0.084 0.11
Source : CGRER 2000 emission, http://www.cgrer.uiowa.edu/EMISSION_DATA/index_16.htm
CGRER 2006 emission, http://www.cgrer.uiowa.edu/EMISSION_DATA_new/index_16.html (no updated emission is given for 2006 biomass burning, thus, biomass burning emission in year of 2000 is used).

Risks and Adaptation to Climate Change in BCI Pilot Sites in PRC, Thailand and Viet Nam Final consultant report, July 2010
187
b. Projected emission (2020)
608. Two emission scenarios were considered; 1) an emission projection based on average GDP growth and 2) an emission projection based on the IPCC SRES A2 emission scenario. The first option (Scenario 1) was selected due to the rapid economic growth and emission increase in the region. It is expected that the anthropogenic emissions would proportionally increase with the economical growth. Attempt was made to project the anthropogenic emissions over the 14-yr period using the economic development of the CSEA region, which had an average GDP growth rate of 10.17 %/yr in 2006 (ADB 2007). With the hypothesis that the projected growth in emissions for the region during the period considered is the same as the average GDP growth rate, the emissions in 2020 would be approximately 247% of emissions in 2006. Note that this is a conservative scenario as it does not consider the recent economical recession in 2009 as well as the technology intervention in emission reduction that may take place in the near future in the GMS.
609. For the second option (scenario 2), the results of the large scale energy model of The Atmospheric Stabilization Framework (ASF) for the Asian region (http://sres.ciesin.org/final_data.html) was used. This SRES framework estimates emissions of greenhouse gases and other pollutants for the period of 1990 – 2100. In this study the emission increase from 2006 to 2020 was estimated proportionally to the simulation period (14 years) and then added to the prepared base year emission of 2006 presented above. The summary of emission increase between 2020 – 2006 in both scenarios is presented in Table 13.2. Thus, the IPCC SRES A2 scenario projects a slower increase in emissions than the conservative scenario 1 which is expected. The ratio of annual emission increases for both scenarios were also applied for January emission increase.
Table 13.2: Ratio of emission increases for both scenario
Ratio of
2020/2006 GDP growthIPCC
SRES A2
SO2 2.47 1.548
CO 2.47 1.230
NMVOC 2.47 1.153
NOx 2.47 1.670
BC 2.47 1.7
OC 2.47 1.7
PM2.5 2.47 1.7
PM10 2.47 1.7
610. Note that the month of January was selected (1st – 31st January 2006 for the base case and January 2020 for the projection) because it is a month of high ozone reported in many places in this region such as Bangkok, Hanoi and Hochiminh city (Zhang and Kim Oanh, 2002; Nghiem and Kim Oanh, 2008; An, 2005; Huy, 2008). January is also a month strongly influenced by the Northeast monsoon enabling long range transport of acid rain precursors emitted from the upwind regions to the GMS.

Risks and Adaptation to Climate Change in BCI Pilot Sites in PRC, Thailand and Viet Nam Final consultant report, July 2010
188
D. Results and discussion
1. Ozone pollution projection
611. The modeling results (monthly average) between base-year of 2006 and the projected year of 2020 were comparably analyzed. The model system performance has been tested by Nghiem and Kim Oanh (2008) and shown satisfactory results. Thus, the modeling performance analysis is not discussed in this report. Further, current and future potential impacts of ozone on crops and vegetation were analyzed using an exposure index called AOT-40 (EEA, 2003). Only a one month period of data (January) were used to calculate this index using the following equation:
Mi
n
j Hktijk CCAOT
1
40
612. Where, Cijk is the hourly ozone concentration predicted for the ith month, jth day and kth hour; Ct is the threshold concentration of 40 ppb; M is the set of months representing the growth season of crops; H is the daylight hours; and n is the number of days in a month.
a. Spatial distribution of ozone over GMS
613. The spatial distributions of monthly average O3 concentrations calculated from hourly simulation for the lowest modeling layer (38 m) over the CSEA domain for January 2006 and January 2020 under scenarios 1 and 2 are presented in Figure 13.2. The increase of ozone concentrations in 2020 as compared to 2006 is remarkable in both scenarios. In 2006, the highest monthly average concentration was observed in Bangkok Metropolitan Region (BMR) and surrounding areas of around 60-65 ppb. The main urban areas of the domain such as BMR and HCMC generally showed high O3 concentrations, which were most likely due to the high urban anthropogenic emissions. In 2020, under scenario 1 (emission projection using average GDP), the highest monthly average of hourly ozone concentration in the GMS of around 180 ppb was found, i.e. much higher than 120 ppb under scenario 2 (emission projection using IPCC A2). In particular, the spatial variations of ozone concentration of all simulations are typical which show the highest concentrations observed above the central and Northeastern parts of Thailand. Especially, the projected ozone in 2020 is high over a large area extending over the entire Northern Thailand region. In general, the ozone plume moves to the Southwest following the northeast monsoon in most parts of the domain which is the typical monsoon direction found in January. The increase of ozone concentrations in both scenarios was as high as about 100 – 150% as compared to the base case.
614. Wang and Mauzerall (2004) reported the increase of ozone concentration from 1990 – 2020 of around 27 – 35% by using the global chemistry model MOZART based on 12-h daily average (April, July and October). The high ozone increase obtained in this study may be a resulted of several factors including difference in the projected emissions, different model set up and difference in grid sizes, etc. Note also that, in this study the simulation was done for January when ozone is high in GMS and also the meteorological fields used in this simulation were of episodic ozone in January 2006. The plume patterns observed imply that regional transport of O3 within the GMS is likely and may cause elevated concentrations in remote areas downwind of emission regions. This in turn can cause damage to human health and ecosystems, including agricultural crops in the surrounding areas of large cities and can be even worse in the future.

Risks and Adaptation to Climate Change in BCI Pilot Sites in PRC, Thailand and Viet Nam Final consultant report, July 2010
189
Figure 13.2: Monthly average of ozone (ppb) calculated from hourly simulation a) Base-year of 2006; b) 2020 (Scenario 1-GDP); and c) 2020 (Scenario 2-IPCC A2)
92 94 96 98 100 102 104 106 108 110
6
8
10
12
14
16
18
20
22
24
0
5
10
15
20
25
30
35
40
45
50
55
60
65
ppb
92 94 96 98 100 102 104 106 108 110
6
8
10
12
14
16
18
20
22
24
0
20
40
60
80
100
120
140
160
180
ppb
a)
b)

Risks and Adaptation to Climate Change in BCI Pilot Sites in PRC, Thailand and Viet Nam Final consultant report, July 2010
190
92 94 96 98 100 102 104 106 108 110
6
8
10
12
14
16
18
20
22
24
0
15
30
45
60
75
90
105
120
ppb
Figure 13.3: Maximum simulated hourly ozone (ppb) in GMS a) Base-year of 2006 (13 January 2006, 13:00:00) ; b) 2020 Scenario 1-GDP (12 January 2020,
10:00:00); and c) 2020 Scenario 2-IPCC A2 (15 January 2020, 11:00:00)
92 94 96 98 100 102 104 106 108 110
6
8
10
12
14
16
18
20
22
24
0
20
40
60
80
100
120
140
160
ppb
c)
a)

Risks and Adaptation to Climate Change in BCI Pilot Sites in PRC, Thailand and Viet Nam Final consultant report, July 2010
191
92 94 96 98 100 102 104 106 108 110
6
8
10
12
14
16
18
20
22
24
0
40
80
120
160
200
240
280
320
360
400
440
480
ppb
92 94 96 98 100 102 104 106 108 110
6
8
10
12
14
16
18
20
22
24
0
40
80
120
160
200
240
ppb
615. The maximum hourly ozone concentrations over the entire January month estimated for different grids of GMS is presented in Figure 12.3 (one value in one grid). The increase in maximum ozone concentration in different scenarios is consistent with the results of monthly average levels presented above. The maximum simulated hourly concentration of 167 ppb was found on 13 January 2006 at 13:00 LST at a location in Bangkok. This value is close to the daily maximum O3 concentration taken from available measurement results of around 152 ppb in the same day for the area (Nghiem and Kim Oanh, 2008). Scenario 2 (IPCC-A2) produced a maximum hourly ozone of around 271 ppb while scenario 1 (GDP) produced the highest level of around 480 ppb. It is noted that
b)
c)

Risks and Adaptation to Climate Change in BCI Pilot Sites in PRC, Thailand and Viet Nam Final consultant report, July 2010
192
the locations of the highest concentrations were shifted to Northeastern area of Thailand. The shift of maximum ozone location may be related to non-linear ozone chemistry, which needs further investigation.
b. Current and future AOT-40
616. To assess potential impacts of surface ozone on agricultural crops for the selected sub-region caused by current and future ozone levels, an attempt was made to calculate the AOT-40 exposure index. This exposure index cannot be estimated by using observation data alone due to the limited number of monitoring stations in the GMS which are mostly concentrated in a few urban areas. This study attempted to estimate AOT-40 by using the simulated ozone results for January 2006 and January 2020 under different emission scenarios.
617. The maps of 1-month AOT40 distribution over the GMS region based on modeled results computed for January 2006 and 2020 are shown in Figure 13.4. In 2006, the CMAQ model produced the highest AOT-40 values over the central area of Thailand which may be due to the proximity of the large urban source of ozone precursors of the Bangkok Metropolitan Region (BMR). Figure 13.4 also reveals that the Central and Northern regions of Thailand have the highest AOT-40 values in the GMS ranging from 4,000 to 5,500 ppbh. The World Health Organization (WHO, 2000) recommends that the AOT40 calculated as the highest running 3-month sum, should not exceed a critical level of 3,000 pph for protection of crops and semi-natural vegetation. In this study the AOT-40 for only January month was already well above the recommended critical level of 3,000 ppbh. Note that, the 3 month accumulated values reported for China was 12,000 – 15,000 pbbh (Aunan et al., 2000) and in most regions of Europe was of 15,000 – 25,000 ppbh (Zlatev et al., 2001) which are comparable to the 3 times of our January value.
618. As expected, the AOT-40 based on simulated ozone for 2020 are much higher than the base case of 2006. The high AOT-40 with the highest values of almost 3 – 5 times higher than in 2006. The exposure risk of high monthly AOT-40 values (>3,000 ppbh) extended to all of GMS members including Myanmar, Laos, Cambodia, and Yunnan province in the Southern region of China. Thus, by 2020, the model predicted that there will be larger areas covering all GMS members which are strongly affected by ozone exposure. Health effects as well as crops production reduction are expected to be more serious in the future if measures are not taken.

Risks and Adaptation to Climate Change in BCI Pilot Sites in PRC, Thailand and Viet Nam Final consultant report, July 2010
193
Figure 13.4: Modeled AOT-40 map for January (ppbh): a) Base-year of 2006; b) 2020 Scenario 1-GDP); and c) 2020 Scenario 2-IPCC A2
92 94 96 98 100 102 104 106 108 110
6
8
10
12
14
16
18
20
22
24
0
500
1000
1500
2000
2500
3000
3500
4000
4500
5000
5500
ppbh
92 94 96 98 100 102 104 106 108 110
6
8
10
12
14
16
18
20
22
24
0
4000
8000
12000
16000
20000
24000
ppbh
a)
b)

Risks and Adaptation to Climate Change in BCI Pilot Sites in PRC, Thailand and Viet Nam Final consultant report, July 2010
194
92 94 96 98 100 102 104 106 108 110
6
8
10
12
14
16
18
20
22
24
0
2000
4000
6000
8000
10000
12000
14000
16000
ppbh
2. Acid deposition projection
619. Regional acid deposition risk assessment based on observations is not possible due to the limited number of measurements in the GMS. This section attempts to assess the current and future acid deposition in GMS region by using modeling approach. The CMAQ model produces deposition files which are separated into two deposition types: 1) dry deposition (DD), and 2) wet deposition (WD). Total Sulfur (TS), Total Nitrate (TN) and Total Ammonium (TA) deposition for both DD and WD are presented in this report. In dry deposition, TS means the sum of SO2, SO4
2-, and aerosol sulfate. In wet deposition, it means the sum of SO4
2- and aerosol sulfate. HNO3 and aerosol nitrate are summed up for DD, and NO3- and aerosol nitrate for WD. TA is calculated by summing up NH3 and aerosol ammonium. The units are converted from the original model unit output (kg/ha/hr) to mg/m2/month.
a. Dry deposition
620. TS and TN dry deposition of January 2006 and 2020 are presented in Figure 13.5. It is revealed that in January 2006 the highest TS dry deposition would occur in the northern region of Thailand at about 1,500 mg/m2/month and it mainly coincides with the Maemoh power plant location. In the BMR region highest TS dry deposition was about 400 – 500 mg/m2/month. Relatively high DD was also simulated for the North Vietnam and Southern China where DD was about 600 mg/m2/month. A high spot was also predicted in the Andaman Sea that would need further investigation. In January 2020 under scenario 1 (GDP), the model produced the highest maximum DD value of around 2,200 mg/m2/month which would mostly be in Northern part of Vietnam and Southern part of China (Yunnan and Guangxi provinces). The increase in the SO2 emission rate to almost triple 2006 rates in this scenario seems to be the main cause. Under scenario 2 (IPCC-A2) the DD was lower than scenario 1 but still significantly higher than the base case of 2006. The maximum TS deposition in scenario 2 was mainly observed over Northern Vietnam.
c)

Risks and Adaptation to Climate Change in BCI Pilot Sites in PRC, Thailand and Viet Nam Final consultant report, July 2010
195
621. In January 2006, the highest TN dry deposition was observed in Northern Vietnam and Southern China of around 2,200 mg/m2/month. Under scenario 1, the model simulation for 2020 produced high values over Thailand and on the border between Thailand and other countries. The highest value, of around 3,200 mg/m2/month is observed in a location between Thailand and Cambodia. High values were also observed in Northern Thailand, Myanmar and North Vietnam. Scenario 2 produced lower TN dry deposition than scenario 1 but the still significantly higher than the base case.
622. Monthly average dry deposition of TA is presented in Figure 13.7 with significantly lower values than TS and TN. The highest TA DD was observed in central Thailand at about 9 mg/m2/month in January 2006. Both scenarios gave reduced values of maximum monthly deposition of around 5 mg/m2/month (scenario 1) and 2.7 mg/m2/month (scenario 2) at almost the same location (central Thailand). Note that aerosol NH4 and NH3 gas were summed to obtain DD of TA. Being neutralizing agents, low TA deposition also suggests that the potential effects of acidic deposition would be even higher.
b. Wet deposition
623. TS and TN wet deposition of January 2006 and 2020 are presented in Figure 13.6. In 2006, the highest TS wet deposition was estimated to be about 300-400 mg/m2/month while the TN highest deposition was estimated to be about 90 mg/m2/month. Both are in the Guangxi province of China. Note that the wet deposition rate of both TS and TN was lower than the dry deposition rate which may be linked to less precipitation occurring in the month of January. Note that January is a dry month when the NE monsoon is strong hence high DD would be expected.
624. In 2020, the scenario 1 simulation results show higher deposition rates of about 2,100 mg/m2/month for TS occurring in Northern Vietnam. For TN in 2020, the maximum wet deposition in the GMS increased to 400 – 600 mg/m2/month observed in Northern Cambodia and Guangxi Province, China.
625. The monthly average of TA wet deposition calculated from hourly simulation is presented in Figure 13.7. Overall the wet deposition rate of TA is much smaller than TS and TN. Note that the WD of NH3 was mostly zero over the GMS thus only aerosol NH4 was involved in the calculation. The highest TA WD was observed in the Northern Vietnam at about 4.5 mg/m2/month in January 2006. Some decrease was predicted in TA DD for 2020, which showed values of 2.1 mg/m2/month (scenario 1), and 1 mg/m2/month (scenario 2). In 2020, the maximum values for both scenarios were observed in the Northern Vietnam. Probably, the fine rain that is normally observed in Northern Vietnam during the winter months would bring more wet deposition in this part of domain.
626. Overall, model results indicate the potential of higher deposition of TS and TN in GMS in the future would bring larger impacts to the region. The small TA deposition in the base case and even smaller values predicted for 2020 suggest that less neutralizing agents are available and even higher effects of acidic deposition would occur.
627. To compare with the critical load, the total maximum annual deposition load (TS+TN) for 2006 was calculated from model results. These show a value of 40,000 eq/ha/year that exceeds the critical load value of acid deposition for vegetation in the soils of the GMS of ranging from 250 – 1,034 eq/ha/year (IASA, 1994). Scenario 1, suggests an increase by 2020 of about 1.3 times the deposition flux in 2006 which suggests even greater threat to the ecosystems of the GMS.

Risks and Adaptation to Climate Change in BCI Pilot Sites in PRC, Thailand and Viet Nam Final consultant report, July 2010
196
Figure 13.5: Dry deposition of Total Sulfur (TS) and Nitrate (TN) in January 2006 and 2020 in different scenarios
92 94 96 98 100 102 104 106 108 110
6
8
10
12
14
16
18
20
22
24
0
100
200
300
400
500
600
700
800
900
1000
1100
1200
1300
1400
1500
mg/m2/month
92 94 96 98 100 102 104 106 108 110
6
8
10
12
14
16
18
20
22
24
0
200
400
600
800
1000
1200
1400
1600
1800
2000
2200
mg/m2/month
a.1) TS Jan 2006 b.1) TN Jan 2006
1 500
2 200

Risks and Adaptation to Climate Change in BCI Pilot Sites in PRC, Thailand and Viet Nam Final consultant report, July 2010
197
92 94 96 98 100 102 104 106 108 110
6
8
10
12
14
16
18
20
22
24
0
400
800
1200
1600
2000
2400
2800
3200
mg/m2/month
92 94 96 98 100 102 104 106 108 110
6
8
10
12
14
16
18
20
22
24
0
200
400
600
800
1000
1200
1400
1600
1800
2000
2200
mg/m2/month
a.2) TS Jan 2020 (GDP) b.2) TN Jan 2020 (GDP)
2 200
3 200

Risks and Adaptation to Climate Change in BCI Pilot Sites in PRC, Thailand and Viet Nam Final consultant report, July 2010
198
92 94 96 98 100 102 104 106 108 110
6
8
10
12
14
16
18
20
22
24
0
200
400
600
800
1000
1200
1400
1600
mg/m2/month
92 94 96 98 100 102 104 106 108 110
6
8
10
12
14
16
18
20
22
24
0
100
200
300
400
500
600
700
800
mg/m2/month
a.3) TS Jan 2020 (IPCC A2) b.3) TN Jan 2020 (IPCC A2)
800

Risks and Adaptation to Climate Change in BCI Pilot Sites in PRC, Thailand and Viet Nam Final consultant report, July 2010
199
Figure 13.6: Wet deposition of Total Sulfur (TS) and Nitrate (TN) in January 2006 and 2020 in different scenarios
92 94 96 98 100 102 104 106 108 110
6
8
10
12
14
16
18
20
22
24
0
10
20
30
40
50
60
70
80
90
mg/m2/month
92 94 96 98 100 102 104 106 108 110
6
8
10
12
14
16
18
20
22
24
0
100
200
300
400
500
600
700
800
mg/m2/month
a.1) TS Jan 2006 b.1) TN Jan 2006

Risks and Adaptation to Climate Change in BCI Pilot Sites in PRC, Thailand and Viet Nam Final consultant report, July 2010
200
92 94 96 98 100 102 104 106 108 110
6
8
10
12
14
16
18
20
22
24
0
350
700
1050
1400
1750
2100
mg/m2/month
92 94 96 98 100 102 104 106 108 110
6
8
10
12
14
16
18
20
22
24
0
70
140
210
280
350
420
mg/m2/month
a.2) TS Jan 2020 (GDP) b.2) TN Jan 2020 (GDP)

Risks and Adaptation to Climate Change in BCI Pilot Sites in PRC, Thailand and Viet Nam Final consultant report, July 2010
201
92 94 96 98 100 102 104 106 108 110
6
8
10
12
14
16
18
20
22
24
0
2
4
6
8
10
12
14
16
18
20
22
24
26
28
mg/m2/month
92 94 96 98 100 102 104 106 108 110
6
8
10
12
14
16
18
20
22
24
0
80
160
240
320
400
480
560
640
mg/m2/month
b.3) TN Jan 2020 (IPCC A2) a.3) TS Jan 2020 (IPCC A2)

Risks and Adaptation to Climate Change in BCI Pilot Sites in PRC, Thailand and Viet Nam Final consultant report, July 2010
202
Figure 13.7: Dry and wet deposition of Total Ammonium (TA) for in January 2006 and 2020 in different scenarios
92 94 96 98 100 102 104 106 108 110
6
8
10
12
14
16
18
20
22
24
0
0.5
1
1.5
2
2.5
3
3.5
4
4.5
5
5.5
6
6.5
7
7.5
8
8.5
9
mg/m2/month
92 94 96 98 100 102 104 106 108 110
6
8
10
12
14
16
18
20
22
24
0
0.5
1
1.5
2
2.5
3
3.5
4
4.5
mg/m2/month
a.1) TA Jan 2006 DD b.1) TA Jan 2006 WD

Risks and Adaptation to Climate Change in BCI Pilot Sites in PRC, Thailand and Viet Nam Final consultant report, July 2010
203
92 94 96 98 100 102 104 106 108 110
6
8
10
12
14
16
18
20
22
24
0
0.5
1
1.5
2
2.5
3
3.5
4
4.5
5
mg/m2/month
92 94 96 98 100 102 104 106 108 110
6
8
10
12
14
16
18
20
22
24
0
3
6
9
12
15
18
21
mg/m2/month
a.2) TA Jan 2020 (GDP) DD b.2) TA Jan 2020 (GDP) WD

Risks and Adaptation to Climate Change in BCI Pilot Sites in PRC, Thailand and Viet Nam Final consultant report, July 2010
204
92 94 96 98 100 102 104 106 108 110
6
8
10
12
14
16
18
20
22
24
0
1
2
3
4
5
6
7
8
9
10
mg/m2/month
92 94 96 98 100 102 104 106 108 110
6
8
10
12
14
16
18
20
22
24
0
0.3
0.6
0.9
1.2
1.5
1.8
2.1
2.4
2.7
mg/m2/month
a.3) TA Jan 2020 (IPCC A2) DD
b.3) TA Jan 2020 (IPCC A2) WD

Risks and Adaptation to Climate Change in BCI Pilot Sites in PRC, Thailand and Viet Nam Final consultant report, July 2010
205
E. Conclusions and Recommendations
628. The MM5-CMAQ modeling system was applied to simulate ozone and acid deposition in the GMS for the base case of January 2006 and it projected the levels in 2020 under two different emission scenarios. In scenario 1 the GMS emission was projected to increase with the GDP and is a more conservative than scenario 2 which was based on IPCC-A2. For ozone in January 2006 the modeling results revealed the highest monthly average hourly concentration to be about 60-65 ppb, and it occurred in the BMR and surrounding areas. In January 2020, the corresponding highest values of ozone are projected to be about 120 – 180 ppb and most of the GMS would be affected by high levels of ozone exposure. Monthly AOT-40 values in large area of the GMS even exceeded the WHO guideline of 3000 ppbh for 3 months of growing season. This suggests a risk of high loss of crop production in the region if measures are not taken.
629. Modeled rates of acid deposition in January 2006 shows the highest average dry deposition of TS; TN and TA of 1,900; 2,200 and 9 mg/m2/month, respectively which would mostly occur in Northeast Thailand, Southern China and Northern Vietnam. Lower wet acid deposition rates were found in January which is most probably due to lower precipitation in this month. The highest wet acid deposition rates of TS, TN and TA were estimated to be about 900, 90 and 4.5 mg/m2/month respectively in January 2006. In 2020, higher rates of acid deposition are predicted to occur and larger areas in GMS region would be affected by acid deposition. The estimated maximum annual deposition load (TS+TN) in the GMS for 2006 of 40,000 eq/ha/year has already exceeded the critical load for the region thus the increase by 1.3 times by 2020 suggests an even greater threat to the ecosystems of the GMS. The low rates of TA deposition as compared to TS and TN also suggest an increased risk as less acid-neutralizing agents are present.
630. Future simulation studies should be conducted based on a revised emission data base and refined emission projections. Important natural sources, for example SO2 emissions from volcano activity, should be included. Realistic emission scenarios need to be developed taking into account the technology and policy interventions. A longer simulation period, preferably one year, should be conducted to obtain estimates of the monthly variations in ozone and acid deposition in the GMS to enable improved impact assessment. In particular, the model performance in acid deposition simulation should be evaluated with actual measurement data once they are available.

Risks and Adaptation to Climate Change in BCI Pilot Sites in PRC, Thailand and Viet Nam Final consultant report, July 2010
206
CHAPTER XIV
POLICY BRIEF ON GROUND LEVEL OZONE POLLUTION
AND ACID DEPOSITION IN GMS
By
Nguyen Thi Kim Oanh
Asian Institute of Technology
A. Air pollution emission in GMS
631. Air pollution emissions in Asia, in general, and in GMS, in particular, have continuously increased during the last few decades. This is because of the increase in fuel combustion in various economic sectors, and intensive biomass open burning. Pollutants such as particulate matter (PM), carbon monoxide (CO), nitrogen oxides (NOx), hydrocarbons (HC) and sulfur oxides (SOx) emitted from these sources build up to high levels in the air, especially in large urban areas. They are toxic to human health and can cause harmful effects to the ecosystem (forestry, crops), atmosphere and climate. These pollutants also react with different atmospheric constituents to form other toxic pollutants such as tropospheric ozone (with NOx, HC, CO as main precursors) and acid rain (with SOx and NOx as main precursors). The increase in emission of selected pollutants from 2000-2006 in the GMS is presented in Figure 14.1. This increasing trend seems likely to continue in the near future. Thus, there is a high risk of impacts due to the high levels of pollutants and acid rain in the GMS countries.
Figure 14.1: Emission of major pollutants in 6 GMS countries (including whole China) in 2000 and 2006
Source: IOWA, 2009

Risks and Adaptation to Climate Change in BCI Pilot Sites in PRC, Thailand and Viet Nam Final consultant report, July 2010
207
B. Ozone air pollution and effects
632. Ozone can exist in two layers of the atmosphere. Ozone in the upper layer of the atmosphere (stratospheric ozone with an altitude centered around 25 km) protects the life on the Earth by absorbing the harmful ultraviolet (UV) solar radiation. This is the good ozone and we need to protect the ozone layer. In contrast, when ozone is present in the lower layer of the atmosphere, at ground level, it is a toxic air pollutant to human health crops and forestry. It is also a greenhouse gas (GHG) that causes a climate warming effect. Experimental data for local rice and peanut species in Vietnam show that the yields of these crops reduced 4 - 5% for every 10 ppb (parts per billion) increase in O3 levels. Thus, ground level ozone is “bad ozone” that should be reduced.
633. At present the ground level ozone concentrations are already high in urban areas of GMS (maximum 1-h ozone of 90-100 ppb are observed in Hanoi and Ho Chi Minh cities, and above 100 ppb in Bangkok and other big cities in Thailand). In the future, the ozone pollution level in the region will increase, i.e. in 2020 the ozone levels will increase by 10 – 15 ppb as compared to 1990 as predicted under the IPCC-B2-scenario (moderate emission projection). This may bring severe adverse effects on agricultural crops with the predicted loss rage from a few percent to 35% for different crops.
C. Acid deposition and effects:
634. Acid deposition is the deposition of acidic particles and gases from the atmosphere to the earth surface with rain (wet deposition) and without rain (dry deposition). Acid deposition can cause direct harmful effects to ecosystems (terrestrial and aquatic). Accumulation of acidic compounds in surface waters results in an acidification process which alters thousands of water bodies in the world and lead to reduction in biodiversity and fishery losses. Acid deposition cause damages to crops and forestry, building materials and art treasures. Further, the acid deposition would reduce pH and lead to release of heavy metals from into water. These metals are toxic to aquatic life and through the food chain will cause effects to the human health.
635. Acid deposition has already reached the critical stage in some parts of GMS at present. There is an increasing trend of acidity measured in rain water in all countries. In China, Thailand and Vietnam, the deposition flux in some areas is already very high that could damage both terrestrial and aquatic life hence affecting the food production in the region. Modeling studies shows that under the IPCC scenario (rapid economic growth with no further control on air pollutant emissions) most of the GMS countries will be at risk due to acid deposition in the near future.
D. Mitigation of ground level ozone and acid rain in GMS
636. Intensive and uncontrolled combustion of fossil fuel (in power plants, transportation, industries) and other urban activities are the major man-made sources releasing precursors of acid deposition and ground level ozone in GMS. Current effects are already substantial to justify the applications of immediate control measures. Thus, there is urgent need to air pollution control emission of the precursors in the region. Regional and national management action plans should be developed to combat the pollution and consequences. Strengthening the regional cooperation would enhance the overall capacity to deal with these urgent problems.

Risks and Adaptation to Climate Change in BCI Pilot Sites in PRC, Thailand and Viet Nam Final consultant report, July 2010
208
REFERENCES
ADB. 2009a. Building climate resilience in the agriculture sector of Asia and the
Pacific. Asian Development Bank, Manila.
ADB. 2009b. The economics of climate change in Southeast Asia: A regional
review. Asian Development Bank, Manila.
ADORC (2006). Tropospheric ozone: A growing threat. Acid Deposition and
Oxidant Research Center, J Niigata, Japan.
Aeerts, J., and P. Droogers. 2009. Adapting to climate change in the water sector.
Pages 87-107 in F. Ludwig, P. Kabat, H. van Schaik, and M. van der Valk, editors.
Climate change adaptation in the water sector. Earthscan, London.
Air Quality Expert Group (2007). Air Quality and Climate Change: A UK
Perspective. DEFRA, London.
Akimoto, H., 2003. Global air quality and pollution. Science, 302, 1716-1719.
Alongi, D. M. 2008. Mangrove forests: resilience, protection from tsunamis, and
responses to global climate change. Estuarine, Coastal and Shelf Science 76:1-
13.
An, D,D., (2005). Photochemical smog modeling for air quality management in the
Hanoi Metropolitan Region, Vietnam. Thesis, Asian Institute of Technology,
Thailand.
Andreae M.O, et al., Science 303, 1337 (2004).
Andreae M.O, Jones, C. D. Cox, P. M. Nature 435, 1187 (2005).
Anonymous (2003). Acid rain effects on sculptures. Virtual chembook.
www.elmhurst.edu/~chm/vchembook. Accessed 13/08/09
Anonymous (2005). Sugar, photosynthesis and pH tests reveal inhibitory effects of
acid rain on Hedera Helix L.
www.msu.edu/course/lbs/inquiriesS2005/streamI/FlyingHellfish/hellfish.html.
Accessed 13/08/09.
Anonymous (2009). http://www.globalchange.umich.edu/..../pollution2.jpg Accessed
13/08/09
Araujo MB, Rahbek C. How does climate change affect biodiversity?. SCIENCE,

Risks and Adaptation to Climate Change in BCI Pilot Sites in PRC, Thailand and Viet Nam Final consultant report, July 2010
209
2006, 313(5792): 1396-1397.
ARIC (1999). Atmospheric Resource Information Center (ARIC). ACE information
programme: Air quality and acid rain fact sheets. Manchester Metropolitan
University
Atsamon, L., L. Sangchan, and S. Thavivongse. 2009. Assessment of extreme
weather events along the coastal areas of Thailand. Pages J21.22 in 89th
American Meteorological Society Annual Meeting.
Aunan, K., Berntsen, T.K. & Seip, H. M., 2000. Surface ozone in China and its
possible impact on agricultural crop yields. Journal of Human Environment, 29 (6),
294-301.
Aunan, K., Fang, J., Vennemo, H., Oye, K., Seip, H. M. 2004. Co-benefits of climate
policy—lessons learned from a study in Shanxi, China. Energy Policy 32, 567–
581.
Averyt, K.B., Tignor, M. and Miller, H.L.). Cambridge University Press, Cambridge,
UK and New York, NY, USA.
Babel, M. S., A. D. Gupta, and N. D. S. Domingo. 2006. Land Subsidence: A
Consequence of Groundwater Over-Exploitation in Bangkok, Thailand.
International Review for Environmental Strategies 6:307-327.
Bachelet, D., D. Brown, M. Bohm, and P. Russell. 1992. Climate change in Thailand
and its potential impact on rice yield. Climatic Change 21:347-366.
Baltzer, J., S. Davies, S. Bunyavechewin, and N. Noor. 2008. The role of
desiccation tolerance in determining tree species distributions along the Malay-
Thai peninsula. Functional Ecology 22:221-231.
Bates, B., Z. W. Kundzewicz, S. Wu, and J. Palutikof, editors. 2008. Climate change
and water. Technical Paper VI of the Intergovernmental Panel on Climate
Change. IPCC Secretariat, Geneva.
Bentai, Wan., 2002. Ambient air quality monitoring in PRC. Paper presented in BAQ
2002, Hong Kong.
Bhagwat, S., K. Willis, H. J. B. Birks, and R. Whittaker. 2008. Agroforestry: a refuge
for tropical biodiversity? Trends in Ecology and Evolution 23:261-267.
Bhattacharya, A., Mudgal, R. and Taneja, A. (2004). Acid deposition and critical
load analysis in Agra, India. Journal of Hazardous materials. 106(B). 157-160.

Risks and Adaptation to Climate Change in BCI Pilot Sites in PRC, Thailand and Viet Nam Final consultant report, July 2010
210
Boonklong, O., M. Jaroensutasinee, and K. Jaroensutasinee. 2006. Effects of
climate change on mangosteen production in Thailand. WSEAS Transactions on
Environment and Development 2:1117-1124.
Boonpragob, K., and J. Santisirisomboon. 1996. Modeling potential changes of
forest area in Thailand under climate change. Water, Air and Soil Pollution
92:107-117.
Boonprakrob, K., and S. Hattirat. 2006. Crisis or Opportunity: Climate Change
Impacts and Thailand. . Greenpeace Southeast Asia.
Boxall, A., A. Hardy, S. Beulke, T. Boucard, L. Burgin, P. Falloon, P. Haygarth, T.
Hutchinson, R. Kovats, G. Leonardi, L. Levy, G. Nichols, S. Parsons, L. Potts, D.
Stone, E. Topp, D. Turley, K. Walsh, E. Wellington, and R. Williams. 2009.
Impacts of climate change on indirect human exposure to pathogens and
chemicals from agriculture. Environmental Health Perspectives 117:508-514.
Boyd, W. 2008. Social change in late Holocene mainland SE Asia: a response to
gradual climate change or a critical climatic event? Quaternary International
184:11-23.
Brasseur G. P., Roeckner, E. Geophys. Res. Lett. 32, L23704 (2005).
Bridhikitti, A. (2004). Atmospheric deposition fluxes of selected air pollutants on to
surface water and land in a tropical climate. Asian Institute of Technology. Thesis
2004.
Byun, D.W., and Ching, J.K.S. Science Algorithms of the EPA Model-3 Community
Multi-Scale Air Quality (CMAQ) Modeling System; National Energy Research
Laboratory: Research Triangle Park, NC, 1999.
CAI Asia, 2008. Clean Air in Viet Nam: Summary of progress on improving air
quality, CAI Asia, Manila, 2008.
CAI Yunlong. Eco-tourism An approach to escaping ‘Poverty Trap’ in Karst
mountains of Southwestern China. CHINA POPULATION·RESOURCES AND
ENVIROMENT � 2006, l6(l): 113-116. (� � � .
� � � � � � � � � � � � � � � � � � � � � � � � � � � � � �“ " [J] · , 2006, l6(l): 113-116.)
Campbell, P., C. Schneider, A. Adnan, A. Zubaid, and T. Kunz. 2006. Comparative
population structure of Cynopterus fruit bats in peninsular Malaysia and southern

Risks and Adaptation to Climate Change in BCI Pilot Sites in PRC, Thailand and Viet Nam Final consultant report, July 2010
211
Thailand. Molecular Ecology 15:29-47.
Cash, D. W., J. C. Borck, and A. G. Patt. 2006. Countering the loading-dock
approach to linking science and decision making. Science, Technology and
Human Values 31:465-494.
Cazelles, B., M. Chavez, A. J. McMichael, and S. Hales. 2005. Non-stationary
influence of El Nino on the synchronous dengue epidemics in Thailand. PLoS
Medicine 2:313-318.
CGRER (2009). Center for Global and Regional Environmental Research (CGRER).
(www.cgrer.uiowa.edu)
Chantanakome, W., and T. Onchan. 2000. Review of National Communication: a
case of Thailand's Climate Change Action Plan. Woods Hole Research Center.
Chaowiwat, W., and K. Likitdecharote. 2008. Effect of climate change on potential
evapotranspiration case study: Lower Chaopraya basin. Pages 75-83 in 1st NPRU
Academic Conference. Nakhon Pathom Rajabhat University, Nakhon Pathom.
CHE Zhimin.Yunnan Development Research (2003) [M]. Kunming, Yunnan
Nationalities Publishing House, 2004.2.
CHEN Guochen, CHEN Aina, FENG Liping. New varieties of yield bean - Feng Dou
12. Agricultural science and technology communications, 2008, (5):167.
Chen Mingcai, Liu Yongxian., Nong Mengling, et al. Journal of Guangxi Agriculture.
2008, 23(1): 43-45. (� � � � � � � , � � � � �
.� � � � � � � � � � � � � � � � � � � � � � �. .2008, 23(1): 43-45.)
CHEN Zongyu. Yunnan Climate remarks. Meteorological Press. 2001.
Chen, Y. D., and N. Chappell. 2009. Climate regulation of Southeast Asian
hydrology. Pages 205-220 in L. Lebel, A. Snidvongs, C. Chen, and R. Daniel,
editors. Critical states: Environmental challenges to development in monsoon
Southeast Asia. SIRD/Gerakbudaya, Selangor.
CHENG Jiangang, WANG Xuefeng, FAN Lizhang.Variations of Yunnan Climatic
Zones in Recent 50 Years. Progress in Geography, 2009,28(1):18-24.
CHENG Jiangang, XIE Mingen. The Analysis of Regional Climate Change Features
over Yunnan in Recent 50 Year s. PROGRESS IN GEOGRAPHY, 2008, 27
(5):19~26.(� � � � � � � � � � � � � � � � � � � � � � � � � �, . 50 . , 2008,
27(5):19~26.)

Risks and Adaptation to Climate Change in BCI Pilot Sites in PRC, Thailand and Viet Nam Final consultant report, July 2010
212
Chinvanno, S., S. Souvannalath, B. Lersupavithnapa, V. Kerdsuk, and N. T. H.
Thuan. 2008a. Climate risks and rice farming in the lower Mekong River countries.
Pages 228-246 in N. Leary, J. Adejuwon, V. Barros, I. Burton, J. Kulkarni, and R.
Lasco, editors. Climate change and vulnerability. Earthscan, London.
Chinvanno, S., S. Souvannalath, B. Lersupavithnapa, V. Kerdsuk, and N. T. H.
Thuan. 2008b. Strategies for managing climate risks in the Lower Mekong River
Basin: a place-based approach. Pages 228-246 in N. Leary, J. Adejuwon, V.
Barros, I. Burton, J. Kulkarni, and R. Lasco, editors. Climate change and
adaptation. Earthscan, London.
Chuangchote, C. 2007. Climate Change: Mitigation and Adaptation. Workshop
Report [in Thai]. National Economic and Social Development Board (NESDB),
Bangkok.
Climate Change 2007: The Physical Science Basis. Contribution of Working Group I
to the Fourth Assessment Report of the Intergovernmental Panel on Climate
Change [Solomon, S., D. Qin, M. Manning, Z. Chen, M. Marquis, K.B. Averyt,
M.Tignor and H.L. Miller (eds.)]. Cambridge University Press, Cambridge, United
Kingdom and New York, NY, USA.
Costa-Cabral, M., J. Richey, G. Goteti, D. Laettenmaier, C. Feldkotter, and A.
Snidvongs. 2007. Landscape structure and use, climate, and water movement in
the Mekong River basin. Hydrological Processes DOI: 10.1002/hyp.
Cruz, R. V., H. Harasawa, M. Lal, S. Wu, Y. Anokhin, B. Punsalmaa, Y. Honda, M.
Jafari, C. Li, and N. H. Ninh. 2007. Asia. Pages 469-506 in M. L. Parry, O. F.
Canziani, J. P. Palutikof, P. van der Linden, and C. E. Hanson, editors. Climate
Change 2007: Impacts, Adaptation and Vulnerability. Contribution of Working
Group II to the Fourth Assessment Report of the Intergovernmental Panel on
Climate Change Cambridge University Press, Cambridge, UK.
Da Nang government website, accessed 2009 at http://www.danang.org.vn
Dam Duy An (2005), “Photochemical Smog Modeling for Air Quality Management in
Hanoi Metropolitan Region”, Thesis No. EV - 05 – 7, Asian Institute of
Technology, Thailand.
Dairaku, K., S. Emori, and T. Oki. 2004. Rainfall Amount, Intensity, Duration, and
Frequency Relationships in the Mae Chaem Watershed in Southeast Asia.

Risks and Adaptation to Climate Change in BCI Pilot Sites in PRC, Thailand and Viet Nam Final consultant report, July 2010
213
Journal of Hydrometeorology 5:458-470.
Dinh Thi Hai Van and Nguyen Thi Kim Oanh., 2009. Open top chamber experiment
study to assess effects of ground level ozone on local peanut cultivar in Viet Nam.
International Journal for Environmental Studies. V 66 (1) 101 - 111.
Dinh Thi Hai Van, Ishii Satoshi and Nguyen Thi Kim Oanh., 2008. Assessment of
Ozone Effects on Local Rice Cultivar by Portable Ozone Fumigation System in
Hanoi, Viet Nam. Journal of Environmental Monitoring and Assessment.
http://dx.doi.org/10.1007/s10661-008-0456-6 (IF: 0.793)
Dovers, S. R. 2009. Normalizing adaptation. Global Environmental Change 19:4-6.
Duncan, T.L. Alexander, L, Crozier, P.A., and Anderson, J.R. 2008. Brown carbon
spheres in east Asian outflow and their optical properties. Science 321, 833-36
Duong Hong Son., 2008. Ground level ozone concentration in Viet Nam. Presented
at the First Workshop on Air pollution and Climate Change in the GMS, Bangkok,
2008.
EANET. 2000. Technical Documents for Wet Deposition Monitoring in East Asia,
Acid Deposition and Oxidant Research Center, Niigata, Japan.
EANET (2006). Periodic Report on the state of Acid Deposition in East Asia.
Network Center for EANET, Acid Deposition and Oxidant Research Center,
Niigata, Japan.
EANET (2007). Data Report for the year 2000 to 2007. Acid Deposition Monitoring
Network in East Asia. www.eanet.cc
Easterling, D., J. Evans, P. Groisman, T. Karl, K. Kunkel, and P. Ambenje. 2000.
Observed varaibility and trends in extreme climate events. Bulletin of the
American Meteorological Society 81:417-425.
Easterling, W. E., P. K. Aggarwal, P. Batima, K. M. Brander, L. Erda, S. M. Howden,
A. Kirilenko, J. Morton, J.-F. Soussana, J. Schmidhuber, and F. N. Tubiello. 2007.
Food, fibre and forest products. Pages 273-313 in M. L. Parry, O. F. Canziani, J.
P. Palutikof, P. van der Linden, and C. E. Hanson, editors. Climate Change 2007:
Impacts, Adaptation and Vulnerability. Contribution of Working Group II to the
Fourth Assessment Report of the Intergovernmental Panel on Climate Change.
Cambridge University Press, Cambridge.

Risks and Adaptation to Climate Change in BCI Pilot Sites in PRC, Thailand and Viet Nam Final consultant report, July 2010
214
Eastham, J., F. Mpelaskoka, M. Mainuddin, Ticehurst C, P. Dyce, G. Hodgson, R.
Ali, and M. Kirby. 2008. Mekong River Basin Water Resources Assessment:
Impacts of Climate Change. CSIRO: Water for a Healthy Country National
Research Flagship.
EC (2009). Environment Canada. http://www.ns.ec.gc.ca
ECCEY 1998. Editing Committee of China Environmental Yearbook 1998. China
Environmental Yearbook 1998. China Environmental Yearbook Press, Beijing
ECMWF Atmospheric General Circulation Model coupled with University of
Hamburg Ocean Circulation Model)
(http://www.ipccdata.org/is92/echam4_info.html)
EEA (2004). Air Pollution and Climate Change Policies in Europe: Exploring
Linkages and the Added Value of an Integrated Approach. European
Environmental Agency No5/ 2004. Copenhagen.
Emberson, L., Ashmore, M., Murray, F., 2003. Air Pollution Impacts on Crops and
Forests. A Global Assessment. Imperial College Press, London, U.K.
Engelbrecht, B., L. Comita, R. Condit, T. Kursar, M. Tyree, B. Turner, and S.
Hubbell. 2007. Drough sensitivity shapes species distribution patterns in tropical
forests. Nature 447:80-82.
European Environment Agency (2003). Tropospheric Ozone in the European Union
- The Consolidated Report Topic Report No.8/1998. Retrieved from
http://reports.eea.eu.int/TOP08-98/en/page001.html.
FAO. 2008. Climate change for fisheries and aquaculture. Technical background
document from the expert consultation held on 7-9 April 2008, Rome. Food and
Agricultural Organization of the United Nations, Rome.
Felkner, J., K. Tazhibayeva, and R. Townsend. 2009. Impact of climate change on
rice production in Thailand. American Economic Review 99:205-210.
Ficke, A., C. Myrick, and L. Hansen. 2007. Potential impacts of global climate
change on freshwater fisheries. Rev. Fish. Biol. Fisheries 17:581-613.
Fischer, G., M. Shah, F. Tubiello, and H. van Velhuizen. 2005. Socio-economic and
climate change impacts on agriculture: an integrated assessment, 1990-2080.
Phil. Trans. R. Soc. B 360:2067-2083.

Risks and Adaptation to Climate Change in BCI Pilot Sites in PRC, Thailand and Viet Nam Final consultant report, July 2010
215
Forster, P., V. Ramaswamy, P. Artaxo, T. Berntsen, R. Betts, D.W. Fahey, J.
Haywood, J. Lean, D.C. Lowe, G. Myhre, J. Nganga, R. Prinn, G. Raga, M. Schulz
and R. Van Dorland, 2007: Changes in Atmospheric Constituents and in Radiative
Forcing. In: Fourth Assessment Report of the Intergovernmental Panel on Climate
Change. Cambridge University Press, Cambridge.
Friend, R. 2007. Securing sustainable livelihoods through wise use of wetland
resources: reflections on the experience of the Mekong Wetlands Biodiversity
Conservation and Sustainable Use Programme (MWBP). Mekong Wetlands
Biodiversity Conservation and Sustainable Use Programme, Vientianne, Lao
PDR.
Giambelluca, T. W., J. Fox, S. Yarnasarn, P. Onibutr, and M. A. Nullet. 1999. Dry-
season radiation balance of land covers replacing forest in northern Thailand.
Agricultural and Forest Meteorology 95:53-65.
Gitay, H., A. Suarez, R. Watson, and D. DJ, editors. 2002. Climate change and
biodiversity. Technical Paper V of the Intergovernmental Panel on Climate
Change. IPCC Secretariat, Geneva.
Greater Mekong Sub-region - Core Environment Program Capacity Development
Workshop, Bangkok, 2008.
Green, A.E.S. and Smith, W.H. (1983). Acid Deposition Causes and Effects - A
State Assessment Model. Proceedings of a Workshop. March 23-24, 1983.
University of Florida.
Guang Yaohua, Guo chunqing, Li Wenqing, et al. Inner flood study in Karst area
[M]. Guilin: Guangxi teacher university press. 2001.
(� � � � � � � � � � � � � � � � � � � � � � � � � � � � � � � � � � � � � �[M] 2001)
Guangxi nation economic and social development report of 1993� 2007.
Guangxi nation economic and social development report of 2001� 2007.
Guenther, A., Hewitt, C.N., Erickson, D., Fall, R., Geron, C., Graedel, T., Harley, P.,
Klinger, L., Lerdau, M., McKay, W.A., Pierce, T., Scholes, B., Steinbrecher, R.,
Tallamraju, R., Taylor, J., Zimmerman, P., 1995. A global model of natural volatile
organic compound emissions. Journal of Geophysical Research, 100 (D5), 8873-
8892.

Risks and Adaptation to Climate Change in BCI Pilot Sites in PRC, Thailand and Viet Nam Final consultant report, July 2010
216
Guo Jianping, Gao Suhua, Liuling. An Experimental Study of the Impacts of
Meteorological Condition on Crops Qualities and Yield. Climatic and
Environmental Research, 2001� �6(3) 361-367.
(� � � � � � � � � � � � � � � � � � � � � � � � � � � � � � [J].
� � � � � � � � � �2001 6(3) 361-367.)
Gwyneth, H. (1995). Acid rain and acid waters, Second edition.
Ha, D. T. N. (2006). Atmospheric deposition fluxes of air pollutants on to the earth
surface in a tropical climate. Asian Institute of Technology. Thesis 2006.
Hallegatte, S. 2009. Strategies to adapt to an uncertain climate change. Global
Environmental Change 19:240-247.
Hanna, S.R., Morre, G.E., and Fernau, M.E., 1996. Evaluation of Photochemical
Grid Models (UAM-IV, UAM-V, and the ROM/UAM-IV couple) Using Data from the
Lake Michigan ozone Study (LMOS), Atmospheric Environment, 30, 3265-3279.
Hasegawa, T., S. Sawano, S. Goto, P. Konghakote, A. Polthanee, Y. Ishigooka, T.
Kuwagata, H. Toritani, and J. Furuya. 2008. A model driven by crop water use and
nitrogen supply for stimulating changes in the regional yield of rain-fed lowland
rice in Northeast Thailand. Paddy and Water Environment 6:73-82.
Hayano, M., N. Horikawa, T. Kuwagata, J. Furuya, Y. Ishigooka, T. Hasegawa, T.
Taniguchi, A. Shimizu, H. Toritani, M. Tada, and T. Masumoto. 2008. Features of
the AFFRC model for evaluating the relationship between the water cycle and rice
production. Paddy and Water Environment 6:15-23.
Heck, W.W., Taylor, O.C., Adams R., Bingham G., Miller J., Preston E. & Weinstein
L., 1982. Assessment of crop loss from ozone. Journal of the Air Pollution Control
Association, 32(4), 353-361.
Hellmuth, M., D. Osgood, U. Hess, A. Moorhead, and H. Bhojwani. 2009. Index
insurance and climate risk: Prospects for development and disaster management.
International Research Institute for Climate and Society, Columbia University,
New York.
Hicks, W. K., Kuylenstierna, C. I., Owen, A., Dentener, F., Seip, H. and Rodhe, H.
(2008). Soil sensitivity to acid deposition in Asia: Status and prospects. Ambio,
37(4). Royal Swedish Academy of Science.
Hogsett, W.E. Weber, J.E. Tingey, D.T. Herstrom, A.A., Lee, E.H., Laurence, J.A.
(1997). An approach for characterizing tropospheric ozone risk to forests.

Risks and Adaptation to Climate Change in BCI Pilot Sites in PRC, Thailand and Viet Nam Final consultant report, July 2010
217
Environmental Management. 21 : 105–120.
Horowitz, L.W. Walters, S. Mauzerall, D. Emmons, L. Rasch, P. Granier, C. Tie, X.
Lamarque, J. Schultz, M., Brasseur, G. (2003). A global simulation of tropospheric
ozone and related tracers: description and evaluation of MOZART. Journal of
Geophysical Research. 108 : 4784.
Hsu, H.-H., and C.-T. Chen. 2009. Stability and change in the monsoon climate-
atmosphere system. Pages 97-111 in L. Lebel, A. Snidvongs, C. Chen, and R.
Daniel, editors. Critical states: Environmental challenges to development in
monsoon Southeast Asia. SIRD/Gerakbudaya, Selangor.
http://www.adb.org/documents/books/economics-climate-change-sea/default.asp
http://www.aqnis.pcd.go.th/station/allstation.htm
http://www.eanet.cc/product.html
http://gaw.empa.ch/gawsis/
http://www.gms-eoc.org/CEP/Comp4/docs/ISDP/CC_Impacts.pdf
http://www.gms-eoc.org/WGE/Meeting/docs/WGESAM4/ClimaticScience_GMS
EconomicCooperationProgram.pdf
http://www.ipcc.ch/publications_and_data/publications_and_data_glossary.htm
http://www.ogawausa.com/pdfs/prono-noxno2so206.pdf
http://www.ogawausa.com/pdfs/proozone.pdf
http://www.tutiempo.net/en/Climate/Da_Nang/488550.htm
http://www.yn.gov.cn/yunnan,china/74590868828323840/index.html
Huang Junjun, Lan Xueqiong. Impacts of the plant construction change to vegetable
pest and disasters and its countermeasures of control and prevention in
Guangxi[J]. Guangxi Agriculture Science. 2002(2)� 104-105.
(� � � � � � � � � � � � � � � � � � � � � � � � � � � � � � � � � � � � � � � � �[J] 2002(2) 1
04-105.)
Huang Meili, Lin Zhenmin, Qiu Pingzhu, et al. Global warming and its influences on
agriculture in Guangxi. Journal of Mountain Agriculture and Biology.
2008,27(3)� 200-206. (� � � � � � � � � � � � � � � � � � � � � � � � �, , . .
� � � � � � � � �, 2008,27(3) 200-206.)
Huang Renyue. Several issues of Yunnan Agricultural Development. agricultural

Risks and Adaptation to Climate Change in BCI Pilot Sites in PRC, Thailand and Viet Nam Final consultant report, July 2010
218
education research.2008,1.
Huy, Q.T.N. (2008), Photochemical smog modeling for ozone air quality
management in Ho Chi Minh city. Thesis, Asian Institute of Technology, Thailand.
IATA (2007). Fuel Efficiency. International Air Transport Association, Montreal and
Geneva http://www.iata.org/whatwedo/environment/fuel_efficiency.htm
IEA (2007). Energy Balances of OECD Countries and Non-OECD Countries 2006
edition. International Energy Agency, Paris (in GEO Data Portal).
IFAD, Mitigating the Impact of Climate Change and Land Degradation through IFAD
COSOP for Viet Nam, May 2008
IIASA (1994). RAINS (Regional Air Pollution Information and Simulation)-Asia.
International Institute for Applied Systems Analysis, www.iiasa.ac.at
IMHEN (Institute of Meteorology, Hydrology and Environment), Apr. 2009, Summary
Report on Scenarios of Climate Change and Sea Level Rise
IMHEN, Toward Climate Change Adaptation and Mitigation in Viet Nam, Paper
presented in the South East Asian Workshop on Development of Climate Change
Scenarios, Hà Nội, 16 Mar. 2009
IPCC, 2000. Emission Scenarios, In: Intergovernmental Panel on Climate Change
(IPCC) (Ed.). Special Report on Emission Scenarios.
IPCC, 2007a: Climate Change 2007: The Physical Science Basis. Contribution of
Working Group I to the Fourth Assessment Report of the Intergovernmental Panel
on Climate Change. (Eds. Solomon, S., Qin, D., Manning, M., Chen, Z., Marquis,
M.,
IPCC, 2007b: Summary for Policymakers. In: Climate Change 2007: Mitigation.
Contribution of Working Group III to the Fourth Assessment Report of the
Intergovernmental Panel on Climate Change [B. Metz, O.R. Davidson, P.R.
Bosch, R. Dave, L.A. Meyer (eds)], Cambridge University Press, Cambridge,
United Kingdom and New York, NY, USA.
IPCC. (2001). Climate Change 2001: Impacts, Adaptation and Vulnerability.
Contribution of Working Group II to the Third Assessment Report of the
Intergovernmental Panel on Climate Change (IPCC). Cambridge University Press,
Cambridge, UK.

Risks and Adaptation to Climate Change in BCI Pilot Sites in PRC, Thailand and Viet Nam Final consultant report, July 2010
219
IPCC. 2007a. Climate Change 2007: Impacts, Adaptation and Vulnerability.
Contribution of Working Group II to the Fourth Assessment Report of the IPCC.
Cambridge University Press, Cambridge, UK.
Irving P. (editor) (1991) Acidic Deposition: State of Science and Technology,
Summary Report of the NAPAP, Washington, DC, 265 pp.
ISPONRE (Institute of Strategy and Policy on Natural Resources and Environment),
Viet Nam Assessment Report on Climate Change, 2008
ISU (2006). IOWA State University- Global Change Course. Distance Education,
http://www.geology.iastate.edu/gccourse/acid/sulfur.html
IUCN 2005, IUCN Red List of Threatened Species 2005, International Union for
Conservation of Nature, Gland, Switzerland
Iverfeldt, A., Sjoberg, K., Engardt, M., Garivait, H., Robertson, L., Andersson, I.,
Peterson, K., and Ferm, M. Study of Possible Acidification in Thailand, Technical
Report (2003). Thai-Swedish Cooperative Project. Organized by Environmental
Research and Training Center, Department of Environmental Quality Promotion.
Supported by Swedish International Development Agency.
IWMI, and World Fish. 2009. Scoping study on natural resources and climate
change in Southeast Asia with a focus on agriculture. Final Report to Swedish
International Development Cooperation Agency. International Water Management
Institute, Southeast Asia, Vientiane.
Jasparro, C., and J. Taylor. 2008. Climate change and regional vulnerability to
transnational security threats in Southeast Asia. Geopolitics 13:232-256.
Jenkin, M.E., and Clemitshaw, K.C., 2000. Ozone and Other Secondary
Photochemical Pollutants: Chemical Processes Governing Their Formation in the
Planetary Boundary Layer, Atmospheric Environment, 34, 2499-2527.
Jiang Zhongchen, Cao Jianhua, Yang Desheng, et al. Current status and
comprehensive countermeasures of soil erosion for Karst rocky desertification
areas in the Southwestern China[J]. Science of Soil and Water Conservation.
2008, 6(1): 37-42. (� � � � � � � � � � � � � � � � � � � � � � � � � � � � � � �, , , . [J].
� � � � � � � � . 2008, 6(1): 37-42.)
Jones, R.G., M. Noguer, D.C. Hassell, D. Hudson, S. Wilson, G. Jenkins and J.F.B.

Risks and Adaptation to Climate Change in BCI Pilot Sites in PRC, Thailand and Viet Nam Final consultant report, July 2010
220
Mitchell (2004) Generating high resolution climate change scenarios using
PRECIS, Met Office Hadley Centre, Exeter, UK, 40pp, April 2004
Kamari, J. (1989). Sensitivity, load and time: Aspects of determining a target load
for lake regions, In Kaman, J., D. F. Brakke, A. Jenkins, S. A. Norton, and R. F.
Wright (Eds.) Regional Acidification Models. (pp306). Springer-Verlag.
Kanae, S., T. Oki, and K. Musiake. 2001. Impact of deforestation on regional
precipitation over the Indochina peninsula. Journal of Hydrometeorology 2:51-70.
Kataoka, K., F. Masumot, T. Ichinose, and M. Taniguchi. 2009. Urban warming
trends in several large Asian cities over the last 100 years. Science of the Total
Environment 407:3112-3119.
Kato, N., and Akimoto, H., 2004. Anthropogenic emissions of SO2 and NOx in Asia:
emission inventories, Atmospheric Environment, 26A, 2997 – 3017.
Kealhofer, L. 2003. Looking into the gap: Land use and the tropical forests of
southern Thailand. Asian Perspectives 42:72-95.
Kim Oanh, N.T. and Zhang, B.N., 2004. Photochemical smog modeling for
assessment of potential impacts of different management strategies on air quality
of the Bangkok Metropolitan Region, Thailand, J. Air & Waste Manage. Assoc, 54,
1321 – 1338.
Kim Oanh, N.T., 2006. Ozone and Acid Deposition in GMS: What Do We Know?,
presented at Better Air Quality 2006, Jogjakarta, December, 2006.
Kim Oanh N. T. and Agustian D. P. (2008). Photochemical smog modeling for
ozone air quality management, Chapter 12, in Modelling of Pollutants in Complex
Environmental Systems, Volume I, edited by Grady Hanrahan. ILM Publications,
2009.
Kloster S. et al., Clim. Dyn., 10.1007/s00382-009- 0573-0 (2009).
Komenda, M., Parusel, E., Wedel, A., Koppmann, R., 2001. Measurements of
biogenic VOC emissions: sampling, analysis and calibration, Atmospheric
Environment, 35, 2069-2080.
Koskela, J. 2001. Responses of gas exchange and growth in Merkus pine seedlings
to expected climatic changes in Thailand. Global Change Biology 7:641-656.
Kume, T., H. Takizawa, N. Yoshifuji, K. Tanaka, C. Tantasirin, N. Tanaka, and M.
Suzuki. 2007. Impact of soil drought on sap flow and water status of evergreen

Risks and Adaptation to Climate Change in BCI Pilot Sites in PRC, Thailand and Viet Nam Final consultant report, July 2010
221
trees in a tropical monsoon forest in northern Thailand. Forest Ecology and
Management 238:220-230.
Kummu, M., O. Varis, and J. Sarkkula. 2009. Impacts of land surface changes on
regional hydrology in mainland Southeast Asia. Pages 221-238 in L. Lebel, A.
Snidvongs, C. Chen, and R. Daniel, editors. Critical states: Environmental
challenges to development in monsoon Southeast Asia. SIRD/Gerakbudaya,
Selangor.
Kundzewicz, Z. W., and H.-J. Schellnhuber. 2004. Floods in the IPCC TAR
perspective. Natural Hazards 31:111-128.
Kundzewicz, Z. W., L. Mata, N. W. Arnell, P. Döll, P. Kabat, B. Jiménez, K. A. Miller,
T. Oki, Z. Sen, and I. A. Shiklomanov. 2007. Freshwater resources and their
management. Pages 173-210 in M. L. Parry, O. F. Canziani, J. P. Palutikof, P. van
der Linden, and C. E. Hanson, editors. Climate Change 2007: Impacts, Adaptation
and Vulnerability. Contribution of Working Group II to the
Kuneepong, P., S. Kongton, V. Wangwachrakul, and S. Sumdin. 2001. Modelling
economic crop yield and climate change in Thailand. Pages 709-714 in ModSim 1.
International Congress on Modelling and Simulation. 10-13 December 2001.
Modelling and Simulation Society of Australia and New Zealand, Canberra,
Australia.
Kuylenstierna, J. C. I. and Chadwick, M. J. (1989). The relative sensitivity of
ecosystems in Europe to the indirect effects of acidic depositions, In J., Kaman, D.
F. Brakke, A. Jenkins, S. A. Norton, and R. F. Wright (Eds.) Regional Acidification
Models. Springer-Verlag.
Kuylenstierna, J.C.I., Panwar, T.S., Ashmore, M., Brack, D., Eerens, H., Feresu, S.
Jiang, K. Jorquera, H., Kartha, S., Meslmani, Y., Molina, L.T., Murray, F.,
Persson, L., Schwela, D., Seip, H-M., Srinivasan, A., Wang, B. (2007). Chapter
2, Atmosphere. In: Global Environment Outlook 4, GEO-4: Environment for
development: Chapter 2, p. 71-112. UNEP. Kenya.
Lafferty, K. 2009. The ecology of climate change and infectious diseases. Ecology
90:888-900.
Lebel, L. 2007. Adapting to climate change. Global Asia 2:15-21.
Lebel, L. 2008. Climate change, water insecurities and food systems in Monsoon
Asia. . Pages 88-99 in C. Loh, A. Stevenson, and S. Tay, editors. Climate change

Risks and Adaptation to Climate Change in BCI Pilot Sites in PRC, Thailand and Viet Nam Final consultant report, July 2010
222
negotiations: can Asia change the game? Civic Exchange, Hong Kong.
Lebel, L., and B. Sinh. 2009. Risk reduction or redistribution? Flood management in
the Mekong region. Asian Journal of Environment and Disaster Management
1:23-39.
Lebel, L., E. Nikitina, and J. Manuta. 2006. Flood disaster risk management in Asia:
an institutional and political perspective. Science and Culture 72:2-9.
Lebel, L., J. Dore, R. Daniel, and Y. S. Koma, editors. 2007. Democratizing water
governance in the Mekong region. Mekong Press, Chiang Mai.
Lebel, L., T. Foran, P. Garden , and B. J. Manuta. 2009. Adaptation to climate
change and social justice: challenges for flood and disaster management in
Thailand. . Pages 125-141 in F. Ludwig, P. Kabat, H. van Schaik, and M. van der
Valk, editors. Climate change adaptation in the water sector. Earthscan, London.
Lee, Y.C, Calori, G. and Carmichael, G.r. (2002). Ozone episodes in urban Hong
Kong 1994–1999. Atmospheric Environment. 36 : 1957 – 1968.
Leong Chow Peng. 2008. Results from the ozone monitoring activities. Acid
Deposition Monitoring Network in East Asia (EANET).
Levy, H, M. D. Schwarzkopf, L. Horowitz, V. Ramaswamy, K. L. Findell, J. Geophys.
Res. 113, D06102 (2008).
Li Shizhong, Tang Wubian, Tangxin. Influence of Climate Condition on Change of
Phenophase of Barn Swallow[J] . Journal of Anhui A � � � �Sci 2009 37(18) 8531—
8532� � � � � � � � � � � � � � � � � � � � � � � � �8640. ( [J], 2009 37(18) 8531-
8532� 8640.)
Li Shizhong, Tangxin. Response of the phenology of cricket in north Guangxi to
climate warming[J]. Journal of Anhui A � � �Sci 20O9 37(17):8017-8019.
(� � � � � � � � � � � � � � � � � � � � � � � �[J]. 20O9 37(17): 8017-8019.)
Li Shuhua. Potential impacts of climate warming on disaster and insect pest of
crops in China and its perspective. Journal of Chinese agro-meteorology.
1992� �13(2) 46-49.
(� � � � � � � � � � � � � � � � � � � � � � � � � � � � � � � � � � � � � � � � �[J] 1992 13(2
)� 46-49.)
Li Shuhua. The Relationship Between Climate Change and Pest Generation
Reproduction Overwintering and Migration Flight[J] . Aeta Agricultural Boreall
Simica. 1994� �9(2) 110-114�

Risks and Adaptation to Climate Change in BCI Pilot Sites in PRC, Thailand and Viet Nam Final consultant report, July 2010
223
(� � � � � � � � � � � � � � � � � � � � � � � � � � � � � � �[J] 1994 9(2) 110-114� )
Li Shuhua. � � � � � � � � � � � � � � � � � � � � � � � � � � � � � �[J] 1993 14(1) 41—44�
Li Xiucun, Yi Yanming, Su Zhi. Climatic diagnostic analysis of winter freezing
damage in Guangxi [J]. Tropical Geography. 2003, 23 (2): 123-126. (� � � � � �, ,
� � � � � � � � � � � � � � � � � � � � � � �. [J] , 2003, 23(2): 123-126.
Li Yuzhong. Cause Analysis of the Autumn Drought in Guangxi [D].Zhongshan
University, Master Dissertation, 2008.
Limjirakan, S., A. Limsakul, and T. Sriburi. 2009. Increasing trend of extreme rain
events over Bangkok metropolitan area. Pages 13B.12 in 89th American
Metoerological Society Annual Meeting.
Linnerooth-Bayer, J., and R. Mechler. 2006. Insurance for assisting adaptation to
climate change in developing countries: a proposed strategy. Climate Policy
6:621-636.
Lippmann, M. (1991). Health effects of tropospheric ozone. Enviromental Science
and Technology. 25 : 1954-1966.
Lohani, B. 2009. Climate change priority agenda for policy makers and
opportunities for business in emerging markets in Asia. Global Journal of
Emerging Market Economies, 1, 339-350.
LONG Hong. Impact of climate warming on winter crops in Yunnan Province.
Yunnan Agricultural Science and Technology, 2006, (5):9-11.
LONG Yongcheng and so on. 1995. Yunnan snub-nosed monkey (Rhinopithecus
bieti) protection measures study. Primate research and conservation: 157-163.
China Forestry Publishing House.
LONG Yongcheng, Craig Kirkpatrick, ZHONG Tai. Status and conservation strategy
of the Yunnan snub-nosed monkey. Chinese Biodiversity.1996, 4(3): 145-152.
LONG Yongcheng, Zhong Tai, XIAO Li. Study on Geographical Distribution and
Population Of the YUNNAN Snub—nosed Monkey. Zoological Research.
1996,17(4): 437-441.
Long, D.H., 2006. Quality assurance and quality control for ambient air pollution
data produced by automatic monitoring network in Hanoi, Viet Nam, (Master
Thesis, Asian Institute of Technology, 2007). Bangkok: Asian Institute of
Technology.

Risks and Adaptation to Climate Change in BCI Pilot Sites in PRC, Thailand and Viet Nam Final consultant report, July 2010
224
Luo Le, Yao Furong, Tang Hualei. 2008. Study on the development and
countermeasures of ecological agriculture in Guizhou and Guangxi. 12� � �9 162-
165. (� � � � � � � � � � � � � � � � � � � � � � � � �. [J].
� � � � � � � � � � �2008 12 9 162-165.)
Manton, M. J., P. Della-Marta, M. Haylock, K. Hennessy, N. Nicholls, L. Chambers,
D. Collins, G. Daw, A. Finet, D. Gunawan, K. Inape, H. Isobe, T. Kestin, P. Lefale,
C. Leyu, T. Lwin, L. Maitrepierre, N. Ouprasitwong, C. Page, J. Pahalad, N.
Plummer, M. Salinger, R. Suppiah, V. Tran, B. Trewin, I. Tibig, and D. Yee. 2001.
Trends in Extreme Daily Rainfall and Temperature in Southeast Asia and the
South Pacific (1961–1998). International Journal of Climatology 21:269-284.
Manuta, J., S. Khrutmuang, D. Huaisai, and L. Lebel. 2006. Institutionalized
incapacities and practice in flood disaster management in Thailand. Science and
Culture 72:10-22.
MARD (Ministry of Agriculture and Rural Development), Climate Change Impacts on
Agriculture and Rural Area, and MARD Direction for Mitigation and Adaptation
Activities, Paper presented in the South East Asian Workshop on Development of
Climate Change Scenarios, Hà Nội, 16 Mar. 2009
McGranahan, G., D. Balk, and B. Anderson. 2007. The rising tide: assessing the
risks of climate change and human settlements in low elevation coastal zones.
Environment & Urbanization 19:17-37.
Milford, J.B., Russell, A.G., and McRae, G.J., 1989. A New Approach to
Photochemical Pollution Control: Implications of Spatial Patterns in Pollutant
Responses to Reductions in Nitrogen Oxides and Reactive Organic Gas
Emissions, Environmental Science and Technology, 23, 1290-1301.
Molina M, Zaelke D,,Sarma, KM, Andersen SO,, Ramanathan V,,and Kaniaru D.
2009. Reducing abrupt climate change risk usingthe Montreal Protocol and other
regulatoryactions to complement cuts in CO2emissions. PNAS 106, 20616-20621.
Molle, F., and P. Floch. 2008. Megaprojects and social and environmental changes:
the case of the Thai "water grid". Ambio 37:199-204.
Molle, F., T. Foran, and M. Kakonen, editors. 2009. Contested waterscapes in the
Mekong Region: Hydropower, Livelihoods and Governance. Earthscan, London.
MONRE, National Target Programme to Respond to Climate Change, Hà Nội, Jul.

Risks and Adaptation to Climate Change in BCI Pilot Sites in PRC, Thailand and Viet Nam Final consultant report, July 2010
225
2008
Monthly climate of Da Nang, accessed 2009 at http://www.wunderground.com/cgi-
bin/findweather/getForecast?query=da%20nang&wuSelect=WEATHER
Moser, S. C., and A. L. Leurs. 2008. Managing climate risks in California: the need
to engage resource managers for successful adaptation to change. Climatic
Change 87:S309-S322.
MRC. 2009. Climate Change and Adaptation Initiative: Framework document for
implementation and management. Version: 12 June 2009. Mekong River
Commission, Vientiane.
Murdiyarso, D., and L. Lebel. 2007. Southeast Asian fire regimes and land
development policy. Pages 261-271 in J. Canadell, editor. GCTE Synthesis.
Springer-Verlag.
MWBP. 2005. Vulnerability assessment of climate risks in the lower Songkhram
River Basin, Thailand. Mekong Wetlands Biodiversity Conservation and
Sustainable Use Programme, Vientiane, Lao PDR.
NACA. 2007. Research needs in sustaining aquaculture sector in Asia-Pacific to
Year 2025 and beyond. Workshop report, 4-7 June 2007, Rayong, Thailand.
Network of Aquaculture Centres in Asia-Pacific, Bangkok.
Naylor, R. L., D. S. Battisti, D. J. Vimont, W. P. Falcon, and M. B. Burke. 2007.
Assessing risks of climate variability and climate change for Indonesian rice
agriculture. PNAS 104:7752-7757.
Nghiem, L.H., 2007. Photochemical modeling for prediction of ground level ozone
over the continental Southeast Asia region to assess impacts on agricultural
crops, (Doctoral Dissertation, Asian Institute of Technology, 2000). Bangkok:
Asian Institute of Technology.
Nghiem, L.H and Kim Oanh, N.T., (2008). Evaluation of the Mesoscale
Meteorological Model (MM5) - Community Multi-Scale Air Quality Model (CMAQ)
Performance in Hindcast and Forecast of Ground-Level Ozone, J. Air & Waste
Manage. Assoc. 58,1341 – 1350.
Nguyen Xuan Dieu, MARD, National Implementation Plan of the National Strategy
for Natural Disaster Prevention, Response and Mitigation to 2020, Paper
presented in the National Forum on Disaster Risk Reduction and Climate Change
Adaptation, Hanoi, 7 Nov. 2009

Risks and Adaptation to Climate Change in BCI Pilot Sites in PRC, Thailand and Viet Nam Final consultant report, July 2010
226
Nicro, S., and M. Markopoulus. 2008. Environmental security in Thailand: An
assessment of food, water, air and energy sustainability. Thailand Environment
Institute, Nonthaburi.
Nounmusig, W., P. Wongwises, M. Zhang, D. Sukawat, and A. Chidthaisong. 2006.
Effects of ENSO on precipitation over northeast Thailand during rainy season
1997-1999. The 2nd Joint International Conference on "Sustainable Energy and
Enviroment". 21-23 November 2006, Bangkok.
Novak, K. Skelly, J.M. Schaub, M. Kräuchi, N. Hug, C. Landolt, W. and Bleuler, P.
(2003). Ozone air pollution and foliar injury development on native plants of
Switzerland. Environmental Pollution. 125 : 41-52.
OECD, 2007. OECD Environmental Performance Reviews: China, Organization for
Economic Co-operation and Development, USA, 2007.
OEPP. 2000. Thailand's initial National Communication under the United Nations
Framework Convention on Climate Change. Office of Environmental Policy and
Planning, Ministry of Science, Technology and Environment, Bangkok.
Ogawa & Co, 2001a. Protocol for O3 measurement using the Ogawa passive
sampler
Ogawa & Co, 2001b. Protocol for SO2 and NOx measurement using the Ogawa
passive
Ohara, T., Akimoto, H., Kurokawa, J., 2007. Asian emission inventory for
anthropogenic emission sources during the period 1980-2020. Atmos. Chem.
Phys., 7, 4419-4444.
ONEP. 2007. Five-year Strategy on Climate Change (2008-12). Office of Natural
Resources and Environmental Policy and Planning, Ministry of Natural Resources
and the Environment.
Orendovici, T. Skelly, J.M. Ferdinand, J. A. Savage, J. E. Sanz, M.J. and Smith, G.
C. (2003). Response of native plants of northeastern United States and southern
Spain to ozone exposures; determining exposure/response relationships.
Environmental Pollution. 125: 31-40.
Ostfeld, R. 2009. Climate change and the distribution and intensity of infectious
diseases. Ecology 90:903-905.

Risks and Adaptation to Climate Change in BCI Pilot Sites in PRC, Thailand and Viet Nam Final consultant report, July 2010
227
Palmer, M. A., C. Liermann, C. Nilsson, M. Florke, J. Alcamo, P. S. Lake, and N.
Bond. 2008. Climate change and the world's river basins: anticipating
management options. Frontiers in Ecology and Environment 6:81-89.
Parmesan, C., Yohe, G., A globally coherent fingerprint of climate change impacts
across natural systems. Nature 2003,421, 37–42.
Parrish, D.D and Zhu, T., Science 326, 674 (2009).
PCD, 2009. Monitoring stations in Thailand, retrieved on 22 August 2009 from:
http://www.aqnis.pcd.go.th/station/allstation.htm.
PENG Guifen, L IU Yu. Climatic Characteristic and Change of Rain Day for Different
Intensities in Yunnan. PLA TEAU METEOROLOGY, 2009, 28(1):214-219.
(� � � �, � � � � � � � � � � � � � � � � � � � �, . , 2009, 28(1):214-219.)
Penny, D. 1999. Palaeo environmental analysis of the Sakon Nakhon basin,
northeast Thailand: palynological perspectives on climate change and human
occupation. Indo-Pacific Prehistory Association Bulletin 18:139-150.
Permadi, D.A. and Kim Oanh, N.T. (2008). Episodic ozone air quality in Jakarta in
relation to meteorological conditions, Atmospheric Environment, 42, 6806-6815.
Pham Manh Cuong, Dept. of Forestry, MARD, Impacts of Climate Change on
Forestry, Paper presented in the South East Asian Workshop on Development of
Climate Change Scenarios, Hà Nội, 16 Mar. 2009
Piha, H., M. Luoto, M. Piha, and J. Merila. 2007. Anuran abundance and
persistence in agricultural landscapes during a climatic extreme. Global Change
Biology 13:300-311.
Pochanart, P. Kreasuwun, J. Sukasem, P. Geeratithadaniyom, W. Tabucanon, M.S.
Hirokawa, J. and Kajii, Y. Akimoto, H. (2001). Tropical tropospheric ozone
observed in Thailand, Atmospheric Environment, 35, 2657-2668.
Pokhrel, S. 2009. Climate change (CC) impacts on productive sector plans
and investments in the GMS
Prathumratana, L., S. Sthiannopkao, and K. Kim. 2008. The relationship of climatic
and hydrological parameters to surface water quality in the lower Mekong River.
Environment International 34:860-866.

Risks and Adaptation to Climate Change in BCI Pilot Sites in PRC, Thailand and Viet Nam Final consultant report, July 2010
228
Prevot, A.S.H., Staehelin, J., Kok, G.L., Schillawski, R.D., Neininger, B.,
Staffelbach, T., Neftel, A., Wernli, H., and Dommen, J., 1997. The Milan
Photooxidant Plume, Journal of Geophysical Research, 102, 23375-23388.
QI Na. Yunnan Water Resources and develop water-saving agriculture problems
and countermeasures. Water-saving irrigation .2008(9): 44- 49.
Qin Dahe. Climate and environment develop of China—Development and prediction
of climate and environment.
Qiu Xiaojun, Wang Hongzhi. Divisions of Guangxi climate and its appliance [J].
Guangxi Forestry Science. 2006, 35 (2): 102-104.
(� � � � � � � � � � � � � � � � � � � � � � � � � � �. . , 2006, 35(2): 102-104.)
Quang Nam government website, accessed 2009 at http://www.quangnam.org.vn
Ramanathan V, Carmichael, G. Nat. Geosci. 1, 221 (2008).
Ramanathan, V., Akimoto, H., Bonasoni, P., Brauer, M., Carmichael, G., Chung, C.
E., Feng, Y., Fuzzi, S., Hasnain, S. I., Iyngararasan, M., Jayaraman, A.,
Lawrence, M. G., Nakajima, T., Panwar, T. S., Ramana, M. V., Rupakheti, M.,
Weidemann, S., Yoon, S.C., Zhang, Y. and Zhu, A. (2008). Atmospheric Brown
Clouds and Regional Climate Change, Part I: Regional assessment report with
focus on Asia. Atmospheric Brown Cloud Project, United National Environment
Programme. Nairobi, Kenya.
Ramanathan, V., Crutzen, P.J., Kiehl, J.T. and Rosenfeld, D. (2001). Aerosols,
climate, and the hydrological cycle Science 294, 2119-24.
Ramanathan, V., Crutzen, P.J., Mitra, A.P and Sikka, D. (2002). The Indian Ocean
Experiment and the Asian Brown Cloud. Current Science 83, 947-55.
Ramanathan, V., M. V. Ramana, G. Roberts, D. Kim, G. Corrigan, C. Chung, and D.
Winker. 2007. Warming trends in Asia amplified by brown cloud solar absorption.
Nature 448:575-579.
Ramachandran, P. 2009. GMS Economic Cooperation Program. Presentation to the
GMS WGE SAM4.
Ray, A. J., G. M. Garfin, M. Wilder, M. Vásquez-León, M. Lenart, and A. C. Comrie.
2007. Applications of Monsoon Research: Opportunities to Inform Decision
Making and Reduce Regional Vulnerability. Journal of Climate 20:1608-1627.

Risks and Adaptation to Climate Change in BCI Pilot Sites in PRC, Thailand and Viet Nam Final consultant report, July 2010
229
Resurreccion, B. P., E. E. Sajor, and E. Fajber. 2008. Climate adaptation in Asia:
knowledge gaps and research issues in South East Asia. ISET-International,
Kathmandu.
Ringler, C. 2008. The Millennium Ecosystem Assessment: Tradeoffs between food
security and the environment. Turk J Agric For 32:147-157.
Rosegrant, M., X. Cai, and S. Cline. 2002. World water and food to 2025: Dealing
with scarcity. International Food Policy Research Institute, Washington, D.C.
Rosenfeld D. et al., Science 321, 1309 (2008).
Round, P., and G. Gale. 2008. Changes in the status of Lophura pheasants in Khao
Yai National Park, Thailand: A response to warming climate? Biotropica 40:225-
230.
Russel, A. Dennis, R. (2000). NARSTO critical review of photochemical models and
modeling. Atmospheric Environment. 34 : 2283-2324.
Satrawaha, R., P. Prathepha, R. N. L. Andrews, and T. Petney. 2009. Fundamental
hydrochemical parameters of the Songkhram River in Northeast Thailand:
foundation data for the study of an endangered tropical wetland ecosystem.
Limnology 10:7-15.
Sawano, S., T. Hasegawa, S. Goto, P. Konghakote, A. Polthanee, Y. Ishigooka, T.
Kuwagata, and H. Toritani. 2008. Modeling the dependence of the crop calendar
for rain-fed rice on precipitation in Northeast Thailand. Paddy and Water
Environment 6:83-90.
Schellnhuber, H. J., W. Cramer, N. Nakicenovic, T. Wigley, and G. Yohe, editors.
2006. Avoiding dangerous climate change. Cambridge University Press,
Cambridge, UK.
SEA START RC, and WWF. 2008. Climate change impacts in Krabi province,
Thailand: a study of environmental, social, and economic challenges. Southeast
Asia START Regional Center, World Wildlife Fund, Bangkok.
Shah J. et al, 2000. Integrated analysis for acid rain in Asia. Policy implications and
results of RAINS-Asia model, Annual Review of Energy and Environment, 25,
339-375.

Risks and Adaptation to Climate Change in BCI Pilot Sites in PRC, Thailand and Viet Nam Final consultant report, July 2010
230
Sharma, D., A. D. Gupta, and M. S. Babel. 2007. Spatial disaggregation of bias-
corrected GCM precipitation for improved hydrologic simulation: Ping River Basin,
Thailand. . Hydrology and Earth System Sciences Discussions 4:35-74.
Sheil, D., and D. Murdiyarso. 2009. How forests attract rain: an examination of a
new hypothesis. Bioscience 59:341-347.
Sheridan, J. 2008. Variation in Southeast Asian Anurans. University of California,
San Diego.
Shindell D. T. and Faluvegi, G Nat. Geosci. 2, 294 (2009).
Shindell D. T. et al., J. Geophys. Res. 113, D11109 (2008).
Shindell D. T. et al., Science 326, 716 (2009).
Shine K. P., Sturges, W. T. Science 315, 1804 (2007).
Shiu, C.J. Liu, S.C. Chang, C.C. Chen, J.P. Chou, C.K. Lin, C.Y. and Young, C.Y.
(2007). Photochemical production of ozone and control strategy for Southern
Taiwan. Atmospheric Environment. 41 : 9324 – 9340.
Sillman, S., 1999. The Relation between Ozone, NOx and Hydrocarbons in Urban
and Polluted rural Environments, Atmospheric Environment, 33, 1821-1845.
Sillman, S., He, D., Cardelino, C., and Imhoff, R.E., 1997. The Use of
Photochemical Indicators to Evaluate Ozone-NOx-Hydrocarbon Sensitivity: Case
Studies from Atlanta, New York and Los Angeles, Journal of Air and Waste
management Association, 47, 1030-1040.
Simson, W., D. Hassell., D. Hein, R. Jones. and R. Taylor. 2006. Installing using the
Hadley Centre regional climate modeling system, PRECIS: version 1.4.6. Met
Office Hadley Centre, Exeter, UK.
Singhrattna, N., B. Rajagopalan, K. K. Kumar, and M. Clark. 2005. Inter annual and
inter decadal variability of Thailand summer monsoon season. Journal of Climate
18:1697-1708.
Sistla, G., Zhou, N., Hou, W., Ku, J.-Y., Rao, S.T., Bornstein, R., Freedman, F., and
Thuns, P., 1996. Effects of Uncertainties in Meteorological Inputs on Urban Air
shed Model Predictions and Ozone Control Strategies, Atmospheric Environment,
30, 2011-2025.

Risks and Adaptation to Climate Change in BCI Pilot Sites in PRC, Thailand and Viet Nam Final consultant report, July 2010
231
Slanina, S. (2008). Impact and abatement of acid deposition and eutrophication. In:
Cutler J. Cleveland (Eds.), Encyclopedia of Earth. Washington, D.C.:
Environmental Information Coalition, National Council for Science and the
Environment.
http://www.eoearth.org/article/Impact_and_abatement_of_acid_deposition_and_e
utrophication
Smith-Doiron, M. Stieb, D. Raizenne, M., Brook, J. Dales, R., Leech, J. Cakmak, S.
Krewski, D. (2000). Association between ozone and hospitalization for acute
respiratory diseases in children less than two years of age. American Journal of
Epidemiology. 153 : 444 – 452.
Somparn, P., M. Gibb, M. Markvichitr, N. Chaiyabutr, S. Thummabood, and C.
Vajrabukka. 2004. Analysis of climatic risk for cattle and buffalo production in
northeast Thailand. Int. J. Biometeorol. 49:59-64.
Sothea, 2007. Emission Inventory and Modeling for. Air Quality Management for
Phnom Penh city, Cambodia, (Master Thesis, Asian Institute of Technology,
2007). Bangkok: Asian Institute of Technology.
Stockholm Environment Institute (2008) Ozone: a threat to food security in South
Asia. http://www.sei.se
Stork, N., B. J, G. Farquhar, P. Franks, J. Holtom, and M. Liddell. 2007. Tropical
rainforest canopies and climate change. Austral Ecology 32:105-112.
Stott, P. 1996. The spatial pattern of dry season fires in the savanna forests of
Thailand. J. Biogeog 13:345-358.
Streets, D.G., T.C. Bond, G.R. Carmichael, S.D. Fernandes, Q. Fu, D. He, Z.
Klimont, S.M. Nelson, N.Y. Tsai, M.Q. wang, J.-H. Woo, and K.F. Yarber, 2003.
An inventory of gaseous and primary aerosol emissions in Asia in the year 2000,
Journal of Geophysical Research, 108, NO. D21, 8809,
doi:10.1029/2002JD003039, 2003.
Summary Report of the NAPAP, Washington, DC, 265 pp.
Sun Chong-zhi� Zheng Fengqin, Huang Haihong, et al. Response of Ecological
Security Evolution to Climatic W arming in Nanning City Based on Ecological
Footprint [J]. Journal of Auhui A � �Sci 2009. 37(4): 1665-1667.
(� � � � � � � � � � � � � .

Risks and Adaptation to Climate Change in BCI Pilot Sites in PRC, Thailand and Viet Nam Final consultant report, July 2010
232
� � � � � � � � � � � � � � � � � � � � � � � � [J],� � � � � � � 2009. 37(4):1665-1667.)
Supat, W., 1999. Air pollution control strategies in Thailand. Paper presented at
International Urban Environmental Infrastructure Forum, AWMA 92nd annual
meeting and exhibition. America Center, St. Louis, Missouri, USA, June 20-24,
1999.
Takigawa, M., Akimoto, H., Takahashi, M., and Kobayashi, K., 2009. Future
projection of surface ozone and its impact on crop yield loss over East Asia in
2020. 10th annual WRF users workshop, June 23-26, 2009.
Tanaka, N., T. Kume, N. Yoshifuji, K. Tanaka, H. Takizawa, K. Shiraki, C.
Tantasirin, N. Tangtham, and M. Suzuki. 2008. A review of evapo-transpiration
estimates from tropical forests in Thailand and adjacent regions. Agricultural and
Forest Meteorology 148:807-819.
Taniguchi, M., J. Shimada, Y. Fukuda, M. Yamano, S.-i. Onodera, S. Kaneko, and
A. Yoshikoshi. 2009. Anthropogenic effects on the subsurface thermal and
groundwater environments in Osaka, Japan and Bangkok, Thailand. Science of
the Total Environment 407:3153-3164.
TAO Yun , HE Qun. The temporal and spatial distribution of precipitation over
Yunnan province and it s response to global warming. Journal of Yunnan
University, 2008 , 30 ( 6) : 587-595.( � � �, � .
� � � � � � � � � � � � � � � � � � � � � � � � � � � � � �. ( ) , 2008 , 30 ( 6) : 587-595.)
Thammapalo, S., V. Chongsuwiwatwong, D. McNeil, and A. Geater. 2005. The
climatic factors influencing the occurrence of dengue hemorrhagic fever in
Thailand. Southeast Asian Journal of Tropical Medicine and Public Health 36:191-
196.
Thanapakpawin, P., J. Richey, D. E. Thomas, S. Rodda, B. Campbell, and M.
Logsdon. 2006. Effects of landuse change on the hydrologic regime of the Mae
Chaem river basin, NW Thailand. Journal of Hydrology 334:215-230.
The IPCC Data Distribution Centre: ECHAM4/OPYC3 Description [on-line].
Available at http://cera-www.dkrz.de/IPCC_DDC/IS92a/Max-Planck-
Institut/echa4opyc3.html. Accessed on 20 April 2009.
The IPCC Data Distribution Centre: HadCM3 Description [on-line]. Available at:
http://cera-www.dkrz.de/IPCC_DDC/IS92a/HadleyCM3/hadcm3.html. Accessed
on 20 April 2009.

Risks and Adaptation to Climate Change in BCI Pilot Sites in PRC, Thailand and Viet Nam Final consultant report, July 2010
233
Thomas, C.D., Cameron, A., Green, R.E. Extinction risk from climate change.
Nature, 2004, 427, 145–148.
Thomas, D., H. Weyerhaeuser, P. Saipothong, and T. Onraphai. 2000. Negotiated
land use patterns to meet local and societal needs. Pages 414-433 in X. Jianchu,
A. Wilkes, H. Tilmann, M. Salas, T. Grinter, and Y. Shaoting, editors. Links
between cultures and biodiversity: proceedings of the cultures and Biodiversity
Congress 2000, 20-23 July 2000. Yunnan Science and Technology Press,
Yunnan, P.R. of China.
Thongbai, P. 2009. Agricultural expansion and intensification. Pages 156-174 in L.
Lebel, A. Snidvongs, C. Chen, and R. Daniel, editors. Critical states:
Environmental challenges to development in monsoon Southeast Asia.
SIRD/Gerakbudaya, Selangor.
Thuiller W. Biodiversity - Climate change and the ecologist. NATURE, 2007, 448:
550-552.
TMD (2009). Thai Meteorological Department. www.tmd.go.th/en/
Trisurat, Y., R. Alkemade, and E. Arets. 2009. Projecting forest tree distributions
and adaptation to climate change in northern Thailand. Journal of Ecology and
Natural Environment 1:55-63.
Tu, J. et al, (2007). Temporal variations in surface ozone and its precursors and
meteorological effects at an urban site in China. Atmospheric research.
Doi:10.1016/j.atmosres.2007.02.003.
UNCCD National Action Programme of Viet Nam 2007, National Action Programme
to Combat Desertification for the Period 2006-2010 and Orientation to 2020
UNSD (2007). International Civil Aviation Yearbook: Civil Aviation Statistics of the
World.
US EPA (2008). US Environmental Protection Agency, www.epa.gov
van Zonneveld, M., J. Koskela, B. Vinceti, and A. Jarvis. 2009. Impact of climate
change on the distribution of tropical pines in Southeast Asia. Unasylva 60:24-29.
Vanwambeke, S., E. Lambin, M. Eichhorn, S. Flasse, R. Harbach, L. Oskam, P.
Somboon, S. van Beers, B. van Benthem, C. Walton, and R. Butlin. 2007. Impact
of land-use change on dengue and malaria in northern Thailand. EcoHealth 4:37-

Risks and Adaptation to Climate Change in BCI Pilot Sites in PRC, Thailand and Viet Nam Final consultant report, July 2010
234
51.
Verchot, L., M. van Noordwijk , S. Kandji, T. Tomich, C. Ong, A. Albrecht, J.
Mackensen, C. Bantilan, K. Anupama, and C. Palm. 2007. Climate change: linking
adaptation and mitigation through agroforestry. Mitigation and Adaptation
Strategies for Global Change 12:1381-1386.
Viet Nam general statistic office (GSO), accessed in 2007. Available on
www.gso.gov.vn/Modules/Doc_Download.aspx?DocID=8145
Vongvisessomjai, S. 2009. Will sea-level really fall in the Gulf of Thailand? Southern
Thailand Environment Management 1:33-55.
Walther, G.R., Berger, S., Sykers, M.T., An ecological “footprint” of climate change.
Proc. Roy. Soc. London B, 2005, 272, 1427-1432.
Wang Chunyi, Guo Jianping,Wang Xiulan, et al. The Experimental Study of the
Effects 0f C02 Concentration Enrichment on Physiological Feature of C3 and C4
Crops. ACTA AGRONOM ICA SI ICA. 2000. 26(6): 813-817.
(� � � � � � � � � � � � � � � � � � �CO2 C3� C4
� � � � � � � � � � � � � � � � � � �[J] 2000. 26(6):813-817.)
Wang Shijie. Concept deduction and connotation of Karst rocky desertification [J]
Carsologica Sinica. 2002. 21(2): 101-105.
(� � � � � � � � � � � � � � � � � � � � � � � � � � � � �[J] 2002.21(2): 101-105)
Wang, X., and Mauzerall., D.L., 2004. Characterizing distributions of surface ozone
and its impact on grain production in China, Japan and South Korea: 1990 and
2020. Atmospheric Environment, 38, 4383–4402.
Wark, K., Warner, C.F., and Davis, W. T., 1998. Air pollution: Its Origin and Control.
pp. 471-485. Addison Wesley Longman, Inc, USA.
Watson, R., M. Zinyowera, and R. Moss, editors. 1997. The regional impacts of
climate change: an assessment of vulnerability. Cambridge University Press.
WCS, and ADB. 2008. Restoring Tenasserim corridor for living connectivity. Wildlife
Conservation Society Bangkok.
Wei Maofan. 2002. Study of rock desertification and its countermeasures in
Guangxi. Journal of Guangxi University (Philosophy and Social Science). 24(2):
42-47. (� � � � � � � � � � � � � � � � � � � � � � � � �. . ( ). 2002, 24(2): 42-47.)

Risks and Adaptation to Climate Change in BCI Pilot Sites in PRC, Thailand and Viet Nam Final consultant report, July 2010
235
Weisel, C. P. Cody, R. P. Lioy, P. J., (1995). Relationship between summertime
ambient ozone levels and emergency department visits for asthma in central New
Jersey. Environmental Health Perspectives. 103 : 97-102.
WHO (2000). Effects of sulfur dioxide on vegetation: critical levels. Air quality
guidelines- Second edition, Chapter 10. WHO regional office for Europe.
Denmark.
Williams, S., L. Shoo, J. Isaac, A. A. Hoffman, and G. Langham. 2008. Towards an
integrated framework for assessing the vulnerability of species to climate change.
PLoS Biology 6:2621-2626.
Wiwanitkit, V. 2006. Correlation between rainfall and the prevalence of malaria in
Thailand. Journal of Infection 52:227-230.
Wong and Chan., 2006. Transport of Air Pollution and Tropospheric Ozone over
China (TAPTO- China) during the Spring of 2004. Proceedings of the 5th WSEAS
International Conference on Environment, Ecosystems and Development, Venice,
Italy, November 20-22, 2006.
World Bank, 1998. Ground- level Ozone. Iin Pollution Presentation and Abatement
Handbook, pp 227- 230. Work Bbank Ggroup, Washington.
World Bank. 2009. The costs to developing countries of adapting to climate change:
New methods and estimates. The Global report of the Economics of Adaptation to
Climate Change Study. Consultation Draft. September 2009. World Bank,
Washington, D.C.
WU Wei, Li Xuelin. Yunnan Agricultural and rural economic development issues.
Yunnan Agricultural Science and Technology 2006, 2. (� � � � � � .
� � � � � � � � � � � � � � � � � � � � �. .2006, 2.)
Xi, L. X., and D. Higgitt. 2009. Soil erosion, landslides and sediment yields. Pages
253-267 in L. Lebel, A. Snidvongs, C. Chen, and R. Daniel, editors. Critical states:
Environmental challenges to development in monsoon Southeast Asia.
SIRD/Gerakbudaya, Selangor.
Yan, X, Ohara, T, Akimoto, H., 2006. Bottom-up estimate of biomass burning in
mainland China, Atmospheric Environment, 40, 5262–5273.

Risks and Adaptation to Climate Change in BCI Pilot Sites in PRC, Thailand and Viet Nam Final consultant report, July 2010
236
Yang Qingqing� �Wang KeLinl Yue YueMin. Spatial distribution of rocky
desertification and its difference between scales in northwest Guangxi [J]. ACTA
ECOlOGICA SINICA. 2009, 29(7): 3629-3640. (� � � � � � � � � � � .
� � � � � � � � � � � � � � � � � � � �[J]. .2009 29(7) :3629-3640.)
Yang Xiaolan. Study of turning farmland to forest of Guangxi [J]. Guangxi Forestry.
2008, (6): 21-22. (� � � � � � � � � � � � � � � � � � � � �. [J]. 2008(6): 21-22.)
YANG Yuming, WANG Juan, WANG Jianhao. Study on biodiversity and its
protection in Yunnan. Science Press. 2008.
YE Changrong, MI Yanhua , YU Tengqiong. Crop Genetic Resources Diversity and
Sustainable Agriculture in Yunnan Province. Journal of Yunnan Agricultural
University, 2002, 17(1):99-103.
YOU Weihong, HE Daming, SUO Miaoqing. Transboundary Flow Change of the
Langcang River and its Response to the Variation of Precipitation Field over
Yunnan. Journal of Natural Resources,2005,20(3):361-369.
Yuan D X. Environmental change and human impact on Karst in South China [A].
Karst terrains environmental change and human impact [M]. Cremlingen. Catena
supplement.1993, 99-107.
Yuan D X. Karst of China [M]. Beijing. Geological Publishing House.199l.
Yuan D X. Rock desertification in the subtropical Karst of south China [J].
Geomorph. 1997. 108: 81-90.
Yunnan Bureau of Statistics. Yunnan Statistical Yearbook [M], China Statistics
Press.1971-2007.
Yunnan Statistical Yearbook, China Statistics Press.2007.
Zhang Mingyang, Wang Kelin, Liu Huiyu, et al. The characteristic of land changes in
ecologically fragile Kast Areas: a case study in Northwest Guangxi [J], China.
ACTA ECOLOGICA SINICA. 2009. 29(6): 3105-3117. (� � � � � � � � � �, , , .
� � � � � � � � � � � � � � � � � � � � �[J]. . 2009 29(6) :3105-3117.)
Zhang Runjie, He Xinfeng. Potential impacts of climate change on agriculture insect
pest [J]. Chinese Journal of ecology. 1997. 16(6): 36-40.
(� � � � � � � � � � � � � � � � � � � � � � � � � �[J] � � � 1997. 16(6):36-40.)

Risks and Adaptation to Climate Change in BCI Pilot Sites in PRC, Thailand and Viet Nam Final consultant report, July 2010
237
ZHANG Shibao, PU Wenfa, LI Shuyun. Studies of Crop Systems for Yunnan South
Subtropical Region. Journal of Yunnan Agricultural University, 2000,15(2):161-
164.
Zhang Wei, Qin Xiaoqun, Yi Lianxing, et al. Development and tap of water
resources of Karst area in Yunnan and GuiZhou and Sichuan [M]. Wuhan: China
University of Geosciences Press. 2004, 1: 334.
(� � � � � � � � � � � � � � � � � � � � � � � � � � � � � � � � � � � � � � � �[M] 2004, 1:
334.)
Zhang, B.N. and Kim Oanh, N.T., 2002. Photochemical smog pollution in the
Bangkok Metropolitan Region of Thailand in relation to O3 precursor
concentrations and meteorological conditions, Atmospheric Environment, 36:
4211-4222.
Zhang, Q., Streets, D.G., Carmichael, G.R., He, K.B., Huo, H., Kannari, A., Klimont,
Z., Park, S., Reddy, S., Fu, J.S., Chen, D., Duan, L., Lei, Y., Wang, L.T., and Yao,
Z.L., (2009). Asian emissions in 2006 for the NASA INTEX-B emission, Atmos.
Chem. Phys., 9, 5131–5153, 2009.
Zhao, Y., C. Wang, S. Wang, and L. Tibig. 2005. Impacts of present and future
climate variability on agriculture and forestry in the humid and sub-humid tropics.
Climatic Change 70:73-116.
Zhen Weikuan. Study of climate change of last six hundred years in Guangxi [J].
Social Science Study. 2005. (6):155-160. (� � � .
� � � � � � � � � � � � � � �[J] � � � � � � 2005. 6:155-160.)
Zheng, Y., Stevenson K.J., Barrowcliffe, R., Chen, S., Wang, H., Barnes, J.D. 1998.
Ozone levels in Chongqing: a potential threat to crop plants commonly grown in
the region?, Environmental Pollution, 99, 299-308.
Zhong Shiquang. Guangxi eco-environment monitoring assess report.
Zhong Siqiang, Su Weijia, Mo Bingquan. Analysis of agro-meteorological factors
causing great losses of Longan and Li Chi yield [J]. Journal of Guangxi
Meteorology. 1997.18 (3): 37-40. (� � � � � � � � � � � � 1993-1996
� � � � � � � � � � � � � � � � � � � � � � � � � � �[J] 1997.18(3):37-40.)
Zimmer, H., and P. Baker. 2009. Climate and historical stand dynamics in tropical
pine forests of northern Thailand. Forest Ecology and Management 257:190-198.

Risks and Adaptation to Climate Change in BCI Pilot Sites in PRC, Thailand and Viet Nam Final consultant report, July 2010
238
GLOSSARY
This glossary is compiled from citations in different chapters, and draws from glossary available on the website of the Intergovernmental Panel on Climate Change (IPCC) Fourth Assessment Report (http://www.ipcc.ch/publications_and_data/publications_and_data_glossary.htm)
Adaptive capacity: The whole of capabilities, resources and institutions of a country or region to implement effective adaptation measures. Aerosols: A collection of airborne solid or liquid particles, with a typical size between 0.01 and 10 micrometer (a millionth of a meter) that reside in the atmosphere for at least several hours. Afforestation: Planting of new forests on lands that historically have not contained forests (for at least 50 years). Adaptation: Initiatives and measures to reduce the vulnerability of natural and human systems against actual or expected climate change effects. Adaptation costs: Costs of planning, preparing for, facilitating, and implementing adaptation measures, including transition costs. Albedo: The fraction of solar radiation reflected by a surface or object, often expressed as a percentage. Alpine: The biogeographic zone made up of slopes above the tree line, characterized by the presence of rosette-forming herbaceous plants and low shrubby slowgrowing woody plants. Anthropogenic: Resulting from or produced by human beings. Anthropogenic emissions: Emissions of greenhouse gases, greenhouse gas precursors, and aerosols associated with human activities, including the burning of fossil fuels, deforestation, land-use changes, livestock, fertilisation, etc. Arid region: A land region of low rainfall, where low is widely accepted to be <250 mm precipitation per year. Barrier: Any obstacle to reaching a goal, adaptation or mitigation potential that can be overcome or attenuated by a policy, programme, or measure. Baseline: Reference for measurable quantities from which an alternative outcome can be measured. Basin: The drainage area of a stream, river, or lake. Biodiversity: The total diversity of all organisms and ecosystems at various spatial scales (from genes to entire biomes). Biofuel: A fuel produced from organic matter or combustible oils produced by plants.

Risks and Adaptation to Climate Change in BCI Pilot Sites in PRC, Thailand and Viet Nam Final consultant report, July 2010
239
Biomass: The total mass of living organisms in a given area or volume. Carbon (Dioxide) Capture and Storage (CCS): A process consisting of separation of carbon dioxide from industrial and energy-related sources, transport to a storage location, and long-term isolation from the atmosphere. Carbon dioxide (CO2): A naturally occurring gas, also a by-product of burning fossil fuels from fossil carbon deposits, such as oil, gas and coal, of burning biomass and of land use changes and other industrial processes. Carbon sequestration: See Uptake Climate: Climate in a narrow sense is usually defined as the average weather, or more rigorously, as the statistical description in terms of the mean and variability of relevant quantities over a period of time ranging from months to thousands or millions of years. Climate change: Climate change refers to a change in the state of the climate that can be identified (e.g., by using statistical tests) by changes in the mean and/or the variability of its properties, and that persists for an extended period, typically decades or longer. Climate model: A numerical representation of the climate system based on the physical, chemical and biological properties of its components, their interactions and feedback processes, and accounting for all or some of its known properties. Climate prediction: A climate prediction or climate forecast is the result of an attempt to produce an estimate of the actual evolution of the climate in the future. Climate projection: A projection of the response of the climate system to emission or concentration scenarios of greenhouse gases and aerosols, or radiative forcing scenarios, often based upon simulations by climate models. Climate scenario: A plausible and often simplified representation of the future climate, based on an internally consistent set of climatological relationships that has been constructed for explicit use in investigating the potential consequences of anthropogenic climate change, often serving as input to impact models. Climate sensitivity: In IPCC reports, equilibrium climate sensitivity refers to the equilibrium change in the annual mean global surface temperature following a doubling of the atmospheric equivalent carbon dioxide concentration. Climate shift: An abrupt shift or jump in mean values signalling a change in climate regime. Climate system: The climate system is the highly complex system consisting of five major components: the atmosphere, the hydrosphere, the cryosphere, the land surface and the biosphere, and the interactions between them. Climate variability: Climate variability refers to variations in the mean state and other statistics (such as standard deviations, the occurrence of extremes, etc.) of the climate on all spatial and temporal scales beyond that of individual weather events. Co-benefits: The benefits of policies implemented for various reasons at the same time, acknowledging that most policies designed to address greenhouse gas mitigation have other, often at least equally important, rationales (e.g., related to objectives of development, sustainability, and equity).

Risks and Adaptation to Climate Change in BCI Pilot Sites in PRC, Thailand and Viet Nam Final consultant report, July 2010
240
Compliance: Compliance is whether and to what extent countries do adhere to the provisions of an accord. Coral: The term coral has several meanings, but is usually the common name for the Order Scleractinia, all members of which have hard limestone skeletons, and which are divided into reef-building and non-reef-building, or cold- and warm-water corals. See Coral bleaching; Coral reefs Coral bleaching: The paling in colour which results if a coral loses its symbiotic, energyproviding, organisms. Coral reefs: Rock-like limestone structures built by corals along ocean coasts (fringing reefs) or on top of shallow, submerged banks or shelves (barrier reefs, atolls), most conspicuous in tropical and subtropical oceans. Cost: The consumption of resources such as labour time, capital, materials, fuels, etc. as a consequence of an action. Deforestation: Conversion of forest to non-forest. Demand-side management (DSM): Policies and programmes for influencing the demand for goods and/or services. Development path or pathway: An evolution based on an array of technological, economic, social, institutional, cultural, and biophysical characteristics that determine the interactions between natural and human systems, including production and consumption patterns in all countries, over time at a particular scale. Drought: In general terms, drought is a ‘prolonged absence or marked deficiency of precipitation’, a ‘deficiency that results in water shortage for some activity or for some group’, or a ‘period of abnormally dry weather sufficiently prolonged for the lack of precipitation to cause a serious hydrological imbalance. Ecosystem: A system of living organisms interacting with each other and their physical environment. El Nińo-Southern Oscillation (ENSO): The term El Niño was initially used to describe a warm-water current that periodically flows along the coast of Ecuador and Perú, disrupting the local fishery. It has since become identified with a basinwide warming of the tropical Pacific east of the dateline. Emission scenario: A plausible representation of the future development of emissions of substances that are potentially radiatively active (e.g., greenhouse gases, aerosols), based on a coherent and internally consistent set of assumptions about driving forces (such as demographic and socioeconomic development, technological change) and their key relationships. Energy: The amount of work or heat delivered. Energy balance: The difference between the total incoming and total outgoing energy in the climate system. If this balance is positive, warming occurs; if it is negative, cooling occurs.

Risks and Adaptation to Climate Change in BCI Pilot Sites in PRC, Thailand and Viet Nam Final consultant report, July 2010
241
Energy efficiency: Ratio of useful energy output of a system, conversion process or activity, to its energy input. Energy intensity: Energy intensity is the ratio of energy use to economic or physical output. Erosion: The process of removal and transport of soil and rock by weathering, mass wasting, and the action of streams, glaciers, waves, winds, and underground water. Extinction: The complete disappearance of an entire biological species. Extreme weather event: An event that is rare at a particular place and time of year. Food security: A situation that exists when people have secure access to sufficient amounts of safe and nutritious food for normal growth, development and an active and healthy life. Forest: A vegetation type dominated by trees. Fossil fuels: Carbon-based fuels from fossil hydrocarbon deposits, including coal, peat, oil, and natural gas. Fuel switching: In general this is substituting fuel A for fuel B. In the climate change discussion it is implicit that fuel A has a lower carbon content than fuel B, e.g. natural gas for coal. Glacier: A mass of land ice which flows downhill under gravity (through internal deformation and/or sliding at the base) and is constrained by internal stress and friction at the base and sides. A glacier is maintained by accumulation of snow at high altitudes, balanced by melting at low altitudes or discharge into the sea. Global surface temperature: The global surface temperature is an estimate of the global mean surface air temperature. Greenhouse effect: Greenhouse gases effectively absorb thermal infrared radiation, emitted by the Earth’s surface, by the atmosphere itself due to the same gases, and by clouds. Greenhouse gas (GHG): Greenhouse gases are those gaseous constituents of the atmosphere, both natural and anthropogenic, that absorb and emit radiation at specific wavelengths within the spectrum of thermal infrared radiation emitted by the Earth’s surface, the atmosphere itself, and by clouds. Gross Domestic Product (GDP): Gross Domestic Product (GDP) is the monetary value of all goods and services produced within a nation. Hydrofluorocarbons (HFCs): One of the six greenhouse gases or groups of greenhouse gases to be curbed under the Kyoto Protocol. They are produced commercially as a substitute for chlorofluorocarbons. HFCs largely are used in refrigeration and semiconductor manufacturing. Hydrological cycle: The cycle in which water evaporates from the oceans and the land surface, is carried over the Earth in atmospheric circulation as water vapour, condensates to form clouds, precipitates again as rain or snow, is intercepted by trees and vegetation,

Risks and Adaptation to Climate Change in BCI Pilot Sites in PRC, Thailand and Viet Nam Final consultant report, July 2010
242
provides runoff on the land surface, infiltrates into soils, recharges groundwater, discharges into streams, and ultimately, flows out into the oceans, from which it will eventually evaporate again. Implementation: Implementation describes the actions taken to meet commitments under a treaty and encompasses legal and effective phases. Indigenous peoples: No internationally accepted definition of indigenous peoples exists. Common characteristics often applied under international law, and by United Nations agencies to distinguish indigenous peoples include: residence within or attachment to geographically distinct traditional habitats, ancestral territories, and their natural resources; maintenance of cultural and social identities, and social, economic, cultural and political institutions separate from mainstream or dominant societies and cultures; descent from population groups present in a given area, most frequently before modern states or territories were created and current borders defined; and self-identification as being part of a distinct indigenous cultural group, and the desire to preserve that cultural identity. Infectious disease: Any disease caused by microbial agents that can be transmitted from one person to another or from animals to people. This may occur by direct physical contact, by handling of an object that has picked up infective organisms, through a disease carrier, via contaminated water, or by spread of infected droplets coughed or exhaled into the air. Infrastructure: The basic equipment, utilities, productive enterprises, installations, and services essential for the development, operation, and growth of an organization, city, or nation. Integrated assessment: A method of analysis that combines results and models from the physical, biological, economic and social sciences, and the interactions between these components in a consistent framework to evaluate the status and the consequences of environmental change and the policy responses to it. Kyoto Protocol: The Kyoto Protocol to the United Nations Framework Convention on Climate Change (UNFCCC) was adopted in 1997 in Kyoto, Japan, at the Third Session of the Conference of the Parties (COP) to the UNFCCC. It contains legally binding commitments, in addition to those included in the UNFCCC. Countries included agreed to reduce their anthropogenic greenhouse gas emissions (carbon dioxide, methane, nitrous oxide, hydrofluorocarbons, perfluorocarbons, and sulphur hexafluoride) by at least 5% below 1990 levels in the commitment period 2008 to 2012. The Kyoto Protocol entered into force on 16 February 2005. Land use and Land-use change: Land use refers to the total of arrangements, activities and inputs undertaken in a certain land cover type (a set of human actions). Malaria: Endemic or epidemic parasitic disease caused by species of the genus Plasmodium (Protozoa) and transmitted to humans by mosquitoes of the genus Anopheles; produces bouts of high fever and systemic disorders, affects about 300 million and kills approximately 2 million people worldwide every year. Mean Sea Level: Mean sea level is normally defined as the average relative sea level over a period, such as a month or a year, long enough to average out transients such as waves and tides. Relative sea level is sea level measured by a tide gauge with respect to the land upon which it is situated.

Risks and Adaptation to Climate Change in BCI Pilot Sites in PRC, Thailand and Viet Nam Final consultant report, July 2010
243
Measures: Measures are technologies, processes, and practices that reduce greenhouse gas emissions or effects below anticipated future levels. Methane (CH4): Methane is one of the six greenhouse gases to be mitigated under the Kyoto Protocol and is the major component of natural gas and associated with all hydrocarbon fuels, animal husbandry and agriculture. Coal-bed methane is the gas found in coal seams. Mitigation: Technological change and substitution that reduce resource inputs and emissions per unit of output. Mitigation Potential: In the context of climate change mitigation, the mitigation potential is the amount of mitigation that could be – but is not yet – realised over time. Monsoon: A monsoon is a tropical and subtropical seasonal reversal in both the surface winds and associated precipitation, caused by differential heating between a continental-scale land mass and the adjacent ocean. Monsoon rains occur mainly over land in summer. Morbidity: Rate of occurrence of disease or other health disorder within a population, taking account of the age-specific morbidity rates. Morbidity indicators include chronic disease incidence/ prevalence, rates of hospitalisation, primary care consultations, disability-days (i.e., days of absence from work), and prevalence of symptoms. Mortality: Rate of occurrence of death within a population; calculation of mortality takes account of age-specific death rates, and can thus yield measures of life expectancy and the extent of premature death. Nitrous oxide (N2O): One of the six types of greenhouse gases to be curbed under the Kyoto Protocol. The main anthropogenic source of nitrous oxide is agriculture (soil and animal manure management), but important contributions also come from sewage treatment, combustion of fossil fuel, and chemical industrial processes. Nitrous oxide is also produced naturally from a wide variety of biological sources in soil and water, particularly microbial action in wet tropical forests. Ozone (O3): Ozone, the tri-atomic form of oxygen, is a gaseous atmospheric constituent. In the troposphere, ozone is created both naturally and by photochemical reactions involving gases resulting from human activities (smog). Troposphere ozone acts as a greenhouse gas. In the stratosphere, ozone is created by the interaction between solar ultraviolet radiation and molecular oxygen (O2). Stratospheric ozone plays a dominant role in the stratospheric radiative balance. Its concentration is highest in the ozone layer. Percentile: A percentile is a value on a scale of zero to one hundred that indicates the percentage of the data set values that is equal to or below it. The percentile is often used to estimate the extremes of a distribution. pH: pH is a dimensionless measure of the acidity of water (or any solution). Pure water has a pH=7. Acid solutions have a pH smaller than 7 and basic solutions have a pH larger than 7. pH is measured on a logarithmic scale. Thus, a pH decrease of 1 unit corresponds to a 10-fold increase in the acidity. Phenology: The study of natural phenomena in biological systems that recur periodically (e.g., development stages, migration) and their relation to climate and seasonal changes.

Risks and Adaptation to Climate Change in BCI Pilot Sites in PRC, Thailand and Viet Nam Final consultant report, July 2010
244
Photosynthesis: The process by which green plants, algae and some bacteria take carbon dioxide from the air (or bicarbonate in water) to build carbohydrates. Plankton: Micro-organisms living in the upper layers of aquatic systems. A distinction is made between phytoplankton, which depend on photosynthesis for their energy supply, and zooplankton, which feed on phytoplankton. Projection: A potential future evolution of a quantity or set of quantities, often computed with the aid of a model. Radiative forcing: Radiative forcing is the change in the net, downward minus upward, irradiance (expressed in Watts per square metre, W/m2) at the tropopause due to a change in an external driver of climate change, such as, for example, a change in the concentration of carbon dioxide or the output of the Sun. Reforestation: Planting of forests on lands that have previously contained forests but that have been converted to some other use. Region: A region is a territory characterised by specific geographical and climatological features. The climate of a region is affected by regional and local scale forcings like topography, land-use characteristics, lakes etc., as well as remote influences from other regions. Resilience: The ability of a social or ecological system to absorb disturbances while retaining the same basic structure and ways of functioning, the capacity for self-organisation, and the capacity to adapt to stress and change. Runoff: That part of precipitation that does not evaporate and is not transpired, but flows over the ground surface and returns to bodies of water. Saltwater intrusion: Displacement of fresh surface water or groundwater by the advance of saltwater due to its greater density. Scenario: A plausible and often simplified description of how the future may develop, based on a coherent and internally consistent set of assumptions about driving forces and key relationships. Sea level rise: Sea level can change, both globally and locally, due to (i) changes in the shape of the ocean basins, (ii) changes in the total mass of water and (iii) changes in water density. Factors leading to sea level rise under global warming include both increases in the total mass of water from the melting of land-based snow and ice, and changes in water density from an increase in ocean water temperatures and salinity changes. Sensitivity: Sensitivity is the degree to which a system is affected, either adversely or beneficially, by climate variability or climate change. Sink: Any process, activity or mechanism which removes a greenhouse gas, an aerosol or a precursor of a greenhouse gas or aerosol from the atmosphere.

Risks and Adaptation to Climate Change in BCI Pilot Sites in PRC, Thailand and Viet Nam Final consultant report, July 2010
245
Solar radiation: Electromagnetic radiation emitted by the Sun. It is also referred to as shortwave radiation. Solar radiation has a distinctive range of wavelengths (spectrum) determined by the temperature of the Sun, peaking in visible wavelengths. Stakeholder: A person or an organisation that has a legitimate interest in a project or entity, or would be affected by a particular action or policy. Standards: Set of rules or codes mandating or defining product performance (e.g., grades, dimensions, characteristics, test methods, and rules for use). Storm surge: The temporary increase, at a particular locality, in the height of the sea due to extreme meteorological conditions (low atmospheric pressure and/or strong winds). The storm surge is defined as being the excess above the level expected from the tidal variation alone at that time and place. Stratosphere: The highly stratified region of the atmosphere above the troposphere extending from about 10 km (ranging from 9 km in high latitudes to 16 km in the tropics on average) to about 50 km altitude. Sustainable Development (SD): The concept of sustainable development was introduced in the World Conservation Strategy (IUCN 1980) and had its roots in the concept of a sustainable society and in the management of renewable resources. Adopted by the WCED in 1987 and by the Rio Conference in 1992 as a process of change in which the exploitation of resources, the direction of investments, the orientation of technological development, and institutional change are all in harmony and enhance both current and future potential to meet human needs and aspirations. SD integrates the political, social, economic and environmental dimensions. Technology: The practical application of knowledge to achieve particular tasks that employs both technical artefacts (hardware, equipment) and (social) information (‘software’, know-how for production and use of artefacts). Technology transfer: The exchange of knowledge, hardware and associated software, money and goods among stakeholders that leads to the spreading of technology for adaptation or mitigation. The term encompasses both diffusion of technologies and technological cooperation across and within countries. Thermal expansion: In connection with sea-level rise, this refers to the increase in volume (and decrease in density) that results from warming water. A warming of the ocean leads to an expansion of the ocean volume and hence an increase in sea level. Troposphere: The lowest part of the atmosphere from the surface to about 10 km in altitude in mid-latitudes (ranging from 9 km in high latitudes to 16 km in the tropics on average), where clouds and weather phenomena occur. In the troposphere, temperatures generally decrease with height. Uncertainty: An expression of the degree to which a value (e.g., the future state of the climate system) is unknown. Uncertainty can result from lack of information or from disagreement about what is known or even knowable.

Risks and Adaptation to Climate Change in BCI Pilot Sites in PRC, Thailand and Viet Nam Final consultant report, July 2010
246
United Nations Framework Convention on Climate Change (UNFCCC): The Convention was adopted on 9 May 1992 in New York and signed at the 1992 Earth Summit in Rio de Janeiro by more than 150 countries and the European Community. Its ultimate objective is the “stabilisation of greenhouse gas concentrations in the atmosphere at a level that would prevent dangerous anthropogenic interference with the climate system”. It contains commitments for all Parties. Under the Convention, Parties included aim to return greenhouse gas emissions not controlled by the Montreal Protocol to 1990 levels by the year 2000. The Convention entered in force in March 1994. See Kyoto Protocol. Uptake: The addition of a substance of concern to a reservoir. The uptake of carbon containing substances, in particular carbon dioxide, is often called (carbon) sequestration. Urbanisation: The conversion of land from a natural state or managed natural state (such as agriculture) to cities; a process driven by net rural-to-urban migration through which an increasing percentage of the population in any nation or region come to live in settlements that are defined as urban centres. Vector: An organism, such as an insect, that transmits a pathogen from one host to another. Vulnerability: Vulnerability is the degree to which a system is susceptible to, and unable to cope with, adverse effects of climate change, including climate variability and extremes. Vulnerability is a function of the character, magnitude, and rate of climate change and variation to which a system is exposed, its sensitivity, and its adaptive capacity. Water consumption: Amount of extracted water irretrievably lost during its use (by evaporation and goods production). Water consumption is equal to water withdrawal minus return flow. Water stress: A country is water stressed if the available freshwater supply relative to water withdrawals acts as an important constraint on development. Zooplankton: See Plankton