Quality service of ISO 9000 consultants
16
IJQRM 19,8/9 998 InternationalJournal of Quality & Reliability Management, Vol. 19 No. 8/9, 2002, pp. 998-1013. # MCB UP Limited, 0265-671X DOI 10.1108/02656710210438096 Received July 2001 Revised February 2002 Quality service of ISO 9000 consultants Martõ Â Casadesu Âs Departament d’Organitzacio Â, Sestio Empresarial i D. Producte, Universitat de Girona, Girona, Spain Frederic Mariron Viadiu Universitat International de Catalunya, Barcelona, Spain, and In Ä Â aki Heras Saizarbitoria Departamento Organizacion de Empresas, Universidad del Pais Vasco, San Sebastian, Spain Keywords Quality, ISO 9000, Consultancy, Service quality, Spain Abstract This paper aims to assess the quality of the service offered by quality consultancies. To this end, an empirical study, using SERVQUAL methodology, was carried out on Spanish companies that had used consultants when introducing their quality system in keeping with the ISO 9000 standards. Company representatives were asked about their previous expectations of the service and about the real benefits obtained from the consultants. This research study, after a factorial analysis, establishes a series of indicators designed to measure the input of the consultant in setting up the quality system. A gap was detected between the previous expectations of the service and the actual benefits obtained therefrom. Findings could be used for practitioners to improve their service. Introduction In the business field there is full awareness of the increase in the two basic aspects of quality management: on the one hand, the introduction of quality assurance systems and, on the other, the setting-up of models for overall quality management. Observers note that quality assurance systems in keeping with the prevailing ISO 9000 standards are being introduced all over Europe at a growing rate (ISO, 2000). In a parallel fashion, there has been a notable growth in demand for the specialist services of quality management consultants. In recent years, the academic field has carried out much in-depth, empirical research into the phenomenon of the introduction of ISO 9000 quality systems at national and international level. Among other considerations, these research studies have attempted to analyse why companies decide to introduce ISO 9000, along with the difficulties involved and the benefits derived therefrom. All these studies confirm the importance of the consultant services engaged by companies in order to introduce the new ruling, but the actual influence of these services has not been fully analysed. Nevertheless, obvious questions on the subject spring to mind: What contribution have the consultant services brought to companies that are involved in introducing ISO 9000? Has the consultant service proved beneficial? Are the companies satisfied with the quality consultants? Have the consultants lived up to the expectations of their clients? What benefits are involved? The research register for this journal is available at http://www.emeraldinsight.com/researchregisters The current issue and full text archive of this journal is available at http://www.emeraldinsight.com/0265-671X.htm
-
Upload
independent -
Category
Documents
-
view
0 -
download
0
Transcript of Quality service of ISO 9000 consultants

IJQRM1989
998
International Journal of Quality ampReliability ManagementVol 19 No 89 2002 pp 998-1013 MCB UP Limited 0265-671XDOI 10110802656710210438096
Received July 2001Revised February 2002
Quality service of ISO 9000consultants
MartotildeAcirc CasadesuAcircsDepartament drsquoOrganitzacioAcirc Sestio Empresarial i D Producte
Universitat de Girona Girona Spain
Frederic Mariron ViadiuUniversitat International de Catalunya Barcelona Spain and
InAumlAcircaki Heras SaizarbitoriaDepartamento Organizacion de Empresas Universidad del Pais Vasco
San Sebastian Spain
Keywords Quality ISO 9000 Consultancy Service quality Spain
Abstract This paper aims to assess the quality of the service offered by quality consultanciesTo this end an empirical study using SERVQUAL methodology was carried out on Spanishcompanies that had used consultants when introducing their quality system in keeping with theISO 9000 standards Company representatives were asked about their previous expectations ofthe service and about the real benefits obtained from the consultants This research study after afactorial analysis establishes a series of indicators designed to measure the input of theconsultant in setting up the quality system A gap was detected between the previous expectationsof the service and the actual benefits obtained therefrom Findings could be used for practitionersto improve their service
IntroductionIn the business field there is full awareness of the increase in the two basicaspects of quality management on the one hand the introduction of qualityassurance systems and on the other the setting-up of models for overall qualitymanagement Observers note that quality assurance systems in keeping with theprevailing ISO 9000 standards are being introduced all over Europe at a growingrate (ISO 2000) In a parallel fashion there has been a notable growth in demandfor the specialist services of quality management consultants
In recent years the academic field has carried out much in-depth empiricalresearch into the phenomenon of the introduction of ISO 9000 quality systemsat national and international level Among other considerations these researchstudies have attempted to analyse why companies decide to introduce ISO9000 along with the difficulties involved and the benefits derived therefrom
All these studies confirm the importance of the consultant services engagedby companies in order to introduce the new ruling but the actual influence ofthese services has not been fully analysed Nevertheless obvious questions onthe subject spring to mind What contribution have the consultant servicesbrought to companies that are involved in introducing ISO 9000 Has theconsultant service proved beneficial Are the companies satisfied with thequality consultants Have the consultants lived up to the expectations of theirclients What benefits are involved
T h e r e s e a r c h r e g is t e r f o r t h is jo u r n a l i s a v a i la b le a t
httpwwwemeraldinsightcomresearchregisters
T h e c u r r e n t is s u e a n d f u l l te x t a rc h iv e o f th is jo u r n a l i s a v a i la b le a t
httpwwwemeraldinsightcom0265-671X htm
Quality serviceof ISO 9000consultants
999
These questions are obviously of interest to the companies involved but alsoto consultants eager to determine the degree of client satisfaction on whichtheir very future depends Moreover the analysis of these questions is evenmore relevant in the present situation where companies are involved in aprocess of adaptation to the new ISO 90002000 standards For all the abovereasons and in order to resolve the issues thereby raised the present empiricalstudy was carried out on companies that have used consultancy services tointroduce their ISO 9000 quality systems
AntecedentsMost research into quality management at a world-wide level refers to themotivation of companies to introduce quality systems (Meegan and Taylor1997) to the benefits derived from the introduction of such systems (LloydrsquosRegister Quality Assurance 1994 Vanguard Consulting 1994 Brown and Vander Wiele 1995 Buttle 1997 Jones et al 1997 CasadesuAcircs and GimeAcircnez 2000)or to the importance of the human factor in quality management (Vloeberghsand Bellens 1996)
Many studies mention the importance of the support lent by consultantservices for the introduction of the ruling In this country previous researchshowed that approximately 80 percent of 286 Spanish companies surveyed useexternal consultant services (CasadesuAcircs 1998) This can be seen in Figure 1The services provided range from in-service training prior to introducing aquality system to maintenance auditing of the system after certification Theservice can also include producing the quality manual and drawing upprocedures for the quality assurance systems
In like manner some research studies mention the relative importance ofcompanies that have used external consultancies compared with those thathave not (Vloeberghs and Bellens 1996) but no study has assessed the realquality of the services offered by the consultancies or whether this service wasreally what the client company expected Some considerations on thecontributions of consultant firms can be found (including factors such asemployee training information and motivation) but no studies have been made
Figure 1Percentage of companies
that have usedconsultant services
when introducingquality systems
IJQRM1989
1000
on issues of such crucial interest as the following to what extent does theengagement of a consultant service provide benefits to the firm Can thesebenefits be measured Are the benefits of an intangible nature that is hard toexpress in monetary terms This is a complex issue indeed as has already beenpointed out in the literature on the subject (Nachum 1999) where some authorshave put forward their own methodology for calculating the yield from aninvestment in consultation services (Phillips 2000)
The present paper aims to summarise the main conclusions drawn from aresearch study that analyses the expectations and fulfilment of expectationsamong client companies that have used consultancy services to introduce ISO9000 quality assurance systems The paper also analyses the benefits obtainedby the companies as a result of the introduction of the ruling following advicegiven by professional consultants
MethodologyAn empirical research study has been recently carried out with the aim ofanalysing and attempting to provide an answer to these questions A samplewas taken of companies that had used consultant services for implementingquality assurance systems in keeping with the ISO 9000 standards on thesubject This model or type of quality management was chosen because it isundoubtedly the most widely used in Spain and also because field work ismade easier by the existence of registers of all the companies that have beenissued with the ISO 9000 certificate In more specific terms the research wascarried out within the industrial area of Catalonia and focuses on companiesthat were certified in 1997 1998 and 1999
The companies in the sample were sent a questionnaire adapted from thewidespread SERVQUAL model drawn up by Zeithaml et al (1993) forconsulting services in Spain This is a model whereby the quality of a givenservice is assessed on the basis of the expectations and perceptions of theclients This is considered to be the best known system presently used formeasuring service quality
In short the questionnaire was designed to gather information about the qualityof the consultancy service as perceived by companies that engaged the service tointroduce ISO 9000 and about the expectations of this type of service that werepreviously held by the company With this information the questionnaire thenattempts to find out the benefits that were obtained by the company as a result ofengaging the service Each of these aspects will be considered in the followingparagraphs It must be borne in mind however that the responses to thesequestions have been compiled on a Likert scale The questionnaire was completedby the addition of extra questions designed to obtain general information about thecompany and about the consultancy that was employed
The questionnaire was delivered via ordinary mail to 483 managers who areresponsible for ISO 9000 After that these people were contacted by telephoneto explain the purpose of the study and a fax or electronic mail was deliveredagain to those who agreed to participate A total of 87 valid questionnaires
Quality serviceof ISO 9000consultants
1001
were obtained representing a response rate of 18 percent of which 65 camefrom companies that had used consultancies to introduce their quality systemThe population on which the research was carried out is less than 1670companies this being the total number of certificates issued over the sampleperiod in Catalonia It must also be borne in mind that many companies holdmore than one certificate For these reasons with a confidence interval of 95percent (working on the hypothesis that p = q = 05) the margin of error for thesample is 1025 percent Likewise for the companies that employedconsultancies taking the same population into consideration the margin oferror for the sample is less than 119 percent
Perceived quality of the quality consultant servicesIn their well-known model the authors Zeithaml et al (1993) distinguish fivedifferent dimensions that define the quality of a given service
(1) Tangibles appearance of the physical facilities equipment personneland communication equipment
(2) Reliability ability to perform the promised service dependably andaccurately
(3) Responsiveness willingness to help clients and provide prompt service
(4) Assurance knowledge and courtesy of employees and their ability toinspire trust and confidence
(5) Empathy caring individualised attention the firm offers its clients
The quality of the service as perceived by clients will be derived fromcomparing their prior expectations of the service with their appreciation of theactual service provided in such a way that a given service will be consideredexcellent for the client when the benefit exceeds prior expectations acceptablewhen the benefit lives up to the clientrsquos expectations and deficient when theservice is poorer than expected
In order to determine the perceived quality in each dimension theSERVQUAL questionnaire was used with a total of 14 questions in all Itshould be noted however that we adapted these questions to ourcircumstances following guidelines laid down by different questionnaires usedin other empirical studies To this end the following studies should bementioned research by Samson and Parker (1994) into the engineeringconsultancy industry in Australia research by Ribeiro (1996) into theconsultancy sector in Valencia the study by CasadesuAcircs (1998) of theintroduction of ISO 9000 into Catalonia and a paper by Escanciano (2000) onquality systems in Spain Table I shows the grouping of the different questionsor items in each of the dimensions of the survey This aggregation was made ` apriorirsquorsquo although there was no mention of dimensions in the questionnaire
The reliability of the data was examined for the 14 perception-item using thealpha of Cronbach the standard value is 09355 and the 14 alphas obtainedwhen one of the items is deleted are all between 09271 and 09356 (Table I)
IJQRM1989
1002
The data collected during field work referring to the quality of the consultancyservices as perceived by the companies were analysed following the principalcomponents method Although it is known that from the statistical point ofview it has the weakness of the size of data it has a great power when it is usedto compare with the Zeithaml et al (1993) model
In this way after the varimax rotation method was applied only three factorswith eigenvalues greater than 1 were obtained (Appendix 1) The contrastanalysis is correct the determinant of the correlation matrix is 1055E-5 and theKaiser-Meyer-Olkin measure is 0834 These three factors combine to explain the723 percent of the total of the variance Inter-item analysis was used to check thescales for internal consistency Analysis calculated a Cronbach coefficient alphaon the items within each factor The three factors have Cronbach alphas above075 and the standardized item alphas range from 076 to 093 These threeconstructs demonstrate good reliability
It can be deduced from the grouping of questions about perceived qualitysuggested by the factor analysis that a relative similitude exists to the genericmodel by Zeithaml et al (1993) Table II shows the dimensions of the Zeithamlet al model in the column headings The factors determined by the factoranalysis figure in the rows underneath Analysis of this Table shows therelationship between both forms of grouping the 14 questions on perceivedquality that figure on the questionnaire
Factor Description of items
1 Tangibles Personal appearance of staffVisual attractiveness of equipment in the consultancyClient-friendly software
2 Reliability Ability to perform the promised serviceFulfilment of commitments within the established time limitsCo-ordination between different company departmentsDetailed specification of aims of time limits
3 Responsiveness Willingness to help clientsEnthusiasm and involvement in the project
4 Assurance Ability to inspire trust and confidenceProfessional knowledge and expertise of consultants
5 Empathy Company concern for the best interests of the clientCommunication and interpersonal skills of the consultantClient satisfaction with consultation
Table IDistribution of the 14items surveyed inrelation to the differentdimensions of themodel proposed byZeithaml et al (1993)
Tangibles Reliability Responsiveness Assurance Empathy
1 2 3 4 5 6 7 8 9 10 11 12 13 14
Factor 1 X X X X X X X XFactor 2 X X XFactor 3 X X X
Table IIHigh saturations of thethree factors with theprincipal componentmethod with varimax
Quality serviceof ISO 9000consultants
1003
The three factors that define the perceived quality of ISO 9000 consultancyservice are the following
(1) Factor 1 Customer service assurance and empathy This factor refers toa set of aspects such as the consultantrsquos knowledge of the rulinginvolvement of the consultant in the client companyrsquos interests care andindividualised attention given by the consultant to the company theconsultantrsquos willingness to help and the climate of trust and confidencethat is transmitted to the client This first quality perception factor isgiven an average rating of 389 on a scale of 1 to 5
(2) Factor 2 Scheduling The scheduling factor represents the skills of theconsultants in completing the work within the agreed time periods Itrefers thus to the result of the service ie the obtaining of the certificatewithin the established budget and time period This factor should be asine qua non condition for good service because it is assumed that theproviders of a service must fulfil their promises On the whole clients donot give any extra credit to companies that honour their obligations butwhen this is not the case poorer quality in the service is detected herewith a 350 on the same scale This is an indication that this aspect of theservice should be significantly improved
(3) Factor 3 Tangibles This last factor refers to the office appearance tothe equipment used therein and even to the personal appearance of theconsultants The perception detected in this factor is rated at 362
A first conclusion to be drawn from the results is that the quality of the serviceis good Several additional factors also exist to bear out this statement
The arithmetic mean of the Likert scale ratings corresponding to the setof 14 questions on perceived quality is 375 This is considerably higherthan 3 the central value of the scale This can be taken as an indicator ofa good perception of quality while still however allowing forimprovement This assessment fully coincides with a question on` overall perception of the quality of the servicersquorsquo that received an averagerating of 369 thereby validating the results obtained
The statement `working with the consultant was a worthwhile experiencersquorsquois rated with an average of 380 This is not a direct question on qualitybut gives us an idea of the degree of satisfaction with the service received
The statement ` If I were to reinitiate the process I would choose thesame consultantrsquorsquo was rated at 355 It must be borne in mind here that 55percent of the companies have in fact returned to the same consultantafter receiving their certificate (not necessarily for quality-related tasks)This is a high index considering that the specific purpose of theintroduction process is fulfilled on obtaining certification If thecompanies continue to use the consultant after this point it would seemto indicate a high degree of satisfaction
IJQRM1989
1004
Another index of satisfaction with the service received is the intention touse the same consultant to adapt the company system to the new ISO90002000 standards A total of 77 per cent of the companies that intend touse a consultancy to update their systems will reuse the same service
Expectations of service given by quality consultantsCompany expectations of the services given by consultants were researched usingthe same methodology and analysing the same aspects and equivalent sets ofquestions to those already used to assess perceived quality in the same services
In the questionnaire a section was included in which 100 points should beassigned to the five dimensions balancing the importance of them
From the results obtained it can be observed that the most important of thefive dimensions defined by the Zeithaml et al model (1993) is considered to be` Reliabilityrsquorsquo (in which the consultant delivers the agreed service in an accurateand trustworthy manner) From a total of 100 points for all five dimensions` Reliabilityrsquorsquo received 28 points whereas `Tangiblesrsquorsquo were considered of lesserimportance and were only awarded 12 points However this same ` Reliabilityrsquorsquodimension most closely related to the ` Schedulingrsquorsquo factor coincides exactlywith the lowest rated factor in terms of service quality This points to an urgentneed for the consultants to improve this factor
On quantifying the level of quality expected from these services usinganother set of 14 questions equivalent to the previous set (on the same scale) thearithmetic mean is found to be 435 Thus expectations of the service are muchhigher than perceived quality of the same In short it is clear that the differencegenerated between the arithmetic mean of perceived quality of the service andexpectations of the same is ndash061 (ndash12 percent) Thus although a high perceptionof quality for services rendered by quality consultants was detected in theprevious section prior expectations of the same services were even higher
If we analyse the gap between expected quality and the quality that isactually perceived on the basis of the factors that define service quality asseen above it can be observed from Figure 2 that the gap is greatest in the` Schedulingrsquorsquo factor and least significant in the ` Tangiblesrsquorsquo factor
Figure 2Perceived qualityexpected quality and thegap betweenexpectations and qualityin each of the threefactors used to defineservice quality
Quality serviceof ISO 9000consultants
1005
In a nutshell we can conclude this part of the analysis by stating that althoughthe companies hold a good opinion of the quality of the advisory servicesreceived prior expectations of the same were considerably higher Thisconclusion shows that there is still room for improvement of the service offeredby quality consultants
Benefits obtained by clients of quality consultant servicesAfter analysing the quality offered by consultants and the expectations raised bythis type of service an analysis is made of the clientsrsquo perception of the benefitsdirectly derived from the consultantrsquos intervention Although it must beconsidered a priori that clients are not usually very sure about the value of theservice that they are engaging or the price that they are prepared to pay for it itcan be said that if this type of consultancy exists it is because clients think thatthey can obtain some benefits for which they are prepared to pay a fee Thesebenefits have been assessed by a set of 13 questions likewise answered on theLikert scale [15] as compiled in Table III The benefits considered are not merelyof an economic nature but include diverse factors such as increased motivation inworkers and improved relationships with customers and suppliers
Assessment of the results obtained shows that the arithmetic mean of allthese benefits is only 305 An overall assessment of the benefits gained fromuse of a consultant was obtained from one single question the response towhich gave the similar result of 317 In short both indicators coincide inhighlighting the fact that the companies did not perceive any benefits from theinput of the consultant
Items
Better understanding of quality as a result of working with an external consultant
Satisfaction with the skills provided by the consultants
Increased company motivation after working with external consultants
Adaptation of ethical approach after working with an external consultant
Definition and aims of quality policy following advice from the consultant
Definition of and approach to process following advice from the consultant
Improved approach to customers following advice from the consultant
Setting-up of beneficial relationships with customers andor suppliers following advice fromthe consultant
Setting-up of customer satisfaction control measures following advice from the consultant
Ideas for growth of company yield following advice from the consultant
Setting-up of continuous improvement scheme in the company following advice from theconsultant
Improved understanding of the relationship between the different processes and how tomanage the same in terms of a system
Improved decision taking based on data analysis following advice from the consultant
Table IIIItems analysed to assessthe benefits of workingwith a consultant when
introducing a qualitysystem
IJQRM1989
1006
From a factor analysis on extracting factors with the principal componentsand varimax rotation method two factors with eigenvalues higher than 1 areobtained (Appendix 2) The analysis is correct The determinant of thecorrelation matrix is 7162E-06 and the KMO measure is 0881 Moreover thetwo factors account for 70 percent of the variability of the sample
From the variables with the highest saturations in each factor we decided tocall the first factor ` Client approachrsquorsquo and the second factor ` Before the ruling isintroducedrsquorsquo This second factor includes all the benefits derived from the stepsprior to introduction definition of quality policy identification of aimsdefinition of procedures and improved understanding of quality
Table IV shows the grouping of the items related to benefits derived fromworking with a quality consultant
Relationship between perceived quality and benefits provided bythe consultantThe next step consisted of establishing the relationship between perceivedquality and the benefits obtained from using the service of a consultant Theresearch study detected and confirmed the relationship existing between thetwo concepts with different sets of statistics To summarise this relationshipwas analysed in two different ways first from questions eliciting an overallassessment on quality and benefits ie the analysis of the contingency tableresulting from the crossing of the two variables and second from the analysisof the relationship between the variables of mean quality and mean benefitscalculated as a mean from the corresponding sets of questions
Contingency Table V relating the two overall assessment variables on theLikert scale [15] is a 5 pound 5 square table In this respect the Pearson chi-squarestatistics and the likelihood ratio indicate the existence of a relationship
1 2 3 4 5 6 7 8 9 10 11 12 13
Factor 1 X X X X X X X X XFactor 2 X X X X
Table IVHigh saturation of thetwo factors with thePAF method withvarimax rotation
Value Freedom degree(Bilateral)
asymptotic sig
Pearsonrsquos chi-square 52979a 16 0000
Likelihood ratio 45709 16 0000
Linear by linear association 2712 1 0000
Number of valid cases 62
Note a22 cells (880 percent) have an expected frequency of less than 5 The minimumexpected frequency is 024
Table VContingency tablestatistic betweenoverall perceivedquality and overallbenefits
Quality serviceof ISO 9000consultants
1007
The association measurements that are normally used on an ordinal scale(Gamma = 0759 Kendallrsquos tau-b = 0563 and Somersrsquo d = 0562 each with a pvalue of 0000 in every case) also detect a relationship between the differentvariables A log-linear model was set up to explain the frequencies in thecontingency table cells and the saturated model was found to be the most suitablefor the purpose This model includes the interaction between the two variables
To sum up it has been statistically shown that the variables have a clearpositive correlation The higher the perceived quality the higher the benefitsand vice versa On the other hand and as a second way of detecting anddefining a relationship a linear regression was made between two variablesthat were calculated as the mean from the set of questions on perception andthe mean from the questions on benefits The analysis indicates that thevariables are correlated although the Pearson correlation coefficient is 0588with zero significance level (Figure 3)
Proceeding logically the very design of the variables enables the rank inboth cases to be [15] Both cases present variables of a linear combination ofseveral questions answered on the Likert scale [15] The relationship betweenthe variables can be clearly seen in Figure 3 Leaving the mean perceivedbenefit as an independent variable the linear regression has been calculated as
Mean Arithmetic Benefit ˆ 0456 Dagger 0702currenMean Perceived Quality
The slope of the regression is positive but less than the unit A unitary increasein quality does not result in a unitary increase in benefits but only in anincrease of seven-tenth The regression coefficient associated with thedependent variable obtained a zero significance level
Figure 3Scatter diagram of the
variables `meanperceived qualityrsquorsquo and
`mean benefitsrsquorsquo
IJQRM1989
1008
In summary the analyses point to the existence of a significant relationshipbetween the efforts of the consultant to provide a better quality service and theclientrsquos perception of improved benefits
Quality of consultant companies in relation to their sizeA study of the performance of consultant companies in relation to their sizewas made on the basis of the collected data The sample was divided into fourcategories companies that engaged the services of a single independentconsultant companies that used consultancies with a staff of between twoand five consultants companies that used consultancies with a staff ofbetween six and 50 consultants and lastly companies that used consultancieswith a staff of over 50 consultants The results of this segmentation can beseen in Figure 4
It was observed that the quality of the service is related to the size of theconsultant company the larger the company the better the service The bigconsultant companies obtain a significantly higher quality rating than thesmaller companies Whereas small companies (with two to fiveconsultants) obtain an average rating of 339 the average rating of theconsultancies with a staff of over 50 employees stands at 443 Thisrepresents a large difference of over one point It is noteworthy howeverthat professional consultants working independently offer a high qualityservice and score a rating that is closer to that of the large consultanciesthan the small ones
There also seems to be a negative relationship between the expectations ofthe client company and the number of workers employed by the consultantcompany However this does not carry any statistical significance
In the case of consultants working alone as independent professionalsexpectations of the service and perceived quality of the same are both veryhigh On the other hand although their clients have lower expectations thelarge consultant companies offer the best quality service In this case indeedperceived quality is higher than expectations
Figure 4Perceived qualityexpectations gap andbenefits in relation to thesize of the consultancy
Quality serviceof ISO 9000consultants
1009
On the other hand similar results are found when the benefits from using aconsultant are analysed according to the size of the consultant company Smallcompanies (between two and five consultants) provide the fewest benefits fortheir clients with an average rating of 288 whereas the large companies obtainan average rating of 313 Once again it is noted that independent professionalconsultants follow a different pattern and obtain the highest ratings of all Allthese relationships are statistically significant as shown by the Kruskal-Wallistest carried out by grouping the variables according to the size of theconsultant companies (Table VI)
The perceived quality and the gap between expectations and perceptionboth present significantly different averages with a significance level of 005
In a parallel manner the performance of the variables of qualityexpectations and benefits was analysed in relation to the size of the clientcompany In short no statistically significant relationship was detectedbetween these variables and the size of the client company in terms of numberof employees
Cost of consultant servicesIt is difficult to assess the benefits obtained from a consultant service withouttaking into consideration the cost of the same For this reason it wasconsidered appropriate to analyse the questionnaire data in terms of the costsinvolved In brief it can be concluded from an analysis of the data that theseservices are not expensive An assessment of the fees charged gives thelowest rating of the whole questionnaire data ie 272 This value is lowerthan the average value of the scale thus indicating a slight variance with theabove statement
Companies invested few resources in the introduction of the ruling It wasfound that 62 percent of the sample invested less than 15000 Euro Among thecompanies that engaged the services of a consultant the corresponding feesamounted to 48 percent of the total cost of introduction In most cases (77percent) the consultantrsquos fees are stipulated right from the beginning It can beassumed that the consultancies are so familiar with their service that they canmake an initial estimate of the cost of introducing the ruling with a high degreeof precision This type of service has been steadily growing ever since it was
Mean perceived
quality
Mean
expectations
Non-weighted
quality gap
Arithmetic mean
benefits 13 items
Chi-square 1465 1913 1411 1890
Freedom degree 3 3 3 3
Asymptotic sig 0002 0591 0003 0596
Notes aKruskal-Wallis test bGrouping variable number of consultants
Table VIKruskal-Wallis test
statistics for thevariables `perceived
qualityrsquorsquo ` expectationsrsquorsquo` gap between
expectations andperceived qualityrsquorsquo and`mean benefitsrsquorsquo when
grouped by ` number ofconsultantsrsquorsquo
IJQRM1989
1010
started a decade ago and can therefore be considered as standard (MartotildeAcircnez etal 2000) Moreover it is interesting to note that the offer of the service has alsoincreased which has resulted in a corresponding price adjustment
ConclusionsOne of the characteristics that differentiates a service from a product ormaterial goods is that the service is sold first and later `manufacturedrsquorsquoMoreover the production and consumption of the service are simultaneous iea service cannot be stored Thus the overall assessment of the client springsfrom two sources the end result of the service and the very process by whichthe service is provided (Berry 1995)
For these reasons the assessment of the quality of a service is not an easytask and as pointed out by Groth and Dye (1999) the providers of a serviceshould bear in mind this dual aspect by which a service is appraised Thereforethey should be able to recognise the different degrees by which the service itselfand the provision of the service are being assessed Despite this we consider itimportant to assess these services from the point of view of the client companyas has been done in the present research study
From all this we can draw the overall conclusion that the ISO 9000 advisoryservices are favourably regarded on the whole However it should also benoted that clients expect an even higher quality In short the client companiesexpect a higher quality from the service than that which is actually provided
It has been shown that the concept of quality can be broken down intothree factors one of which is the skill of the consultant in introducing theruling within the agreed time period and this is the aspect of the service thatobtains the poorest quality rating This factor is closely linked to thereliability factor which is considered to be of the highest importance by theclient companies For this reason the most reiterated request forimprovement by the clients is that the consultants perform the required taskswithin the agreed time periods
Moreover the results of the study show that the performance of independentprofessional consultants is very different from that of small consultantcompanies Independent consultants offer a high quality service that lives up tothe very high expectations of their clients The benefits that these clients gainfrom working with a consultant are also perceived as very high
During this work it has been noted that the quality offered by consultantcompanies that employ a staff of professionals varies according to the sizeof the company The benefits perceived by their clients are very similar tobut are slightly higher than those perceived by companies employing largeconsultancies
Finally although we realise that our study relates to only one region ofEurope we believe that our findings have broader implications for researchersand practitioners Thus we guess that it would be interesting to carry outsimilar surveys in other European and US regions For practitioners ourfindings should give pause for thought We guess that these findings are very
Quality serviceof ISO 9000consultants
1011
interesting in order to improve their service and that they should somehowmeasure and control their service quality We really think that for all theprofessionals working in the quality field a quality service should be a realNo 1 purpose
References
Berry L (1995) MaAcircs allaAcirc de la excelencia en el servicio Un plan para la accioAcircn DeustoPublications
Brown A and Van der Wiele T (1995) ` Industry experience with ISO 9000rsquorsquo Asia PacificJournal of Quality Management Vol 4 No 2 pp 8-17
Buttle F (1997) ` ISO 9000 marketing motivations and benefitsrsquorsquo International Journal of Qualityamp Reliability Management Vol 14 No 9 pp 936-47
CasadesuAcircs M (1998) ` La normativa de aseguramiento de la calidad ISO 9000 en CatalunAumlaexpectativas y efectos Estudio empotildeAcircricorsquorsquo Research project CICYT Reference SEC96-1005
CasadesuAcircs M and GimeAcircnez G (2000) ` The benefits of the implementation of the ISO 9000standard empirical researchin 288 Spanish companiesrsquorsquo The TQM Magazine Vol 12 No 6
Escanciano C (2000) ` Influencia de la certificacioAcircn ISO 9000 en el avance de la empresa espanAumlolahacia la calidad totalrsquorsquo paper presented at the 1st World Conference on Production andOperations Management (POM) Seville
Groth JC and Dye RT (1999) ` Service quality perceived value expectations shortfalls andbonusesrsquorsquo Managing Service Quality Vol 9 No 4
ISO (2000) available at wwwisochisoeniso9000-14000pdfsurvey9pdf
Jones R Arndt G and Kustin R (1997) ` ISO 9000 among Australian companies impact of timeand reasons for seeking certification on perceptions of benefits receivedrsquorsquo InternationalJournal of Quality amp Reliability Management Vol 14 No 7
Lloydrsquos Register Quality Assurance Ltd (1994) BS 5750 ISO 9000 ndash Setting Standards forBetter Business Lloydrsquos Register Quality Assurance Services Ltd Croydon
MartotildeAcircnez C et al (2000) `Analysis of the implementation of ISO 9000 quality assurancesystemsrsquorsquo Work Study Vol 49 No 6
Meegan ST and Taylor WA (1997) ` Factors influencing a successful transition from ISO 9000to TQM The influence of understanding and motivationrsquorsquo International Journal of Qualityamp Reliability Management Vol 14 No 2
Nachum L (1999) `Measurement of productivity of professional services an illustration ofSwedish management consulting firmsrsquorsquo International Journal of Operations amp ProductionManagement Vol 19 No 9
Phillips J (2000) The Consultantrsquos Scorecard McGraw Hill New York NY
Ribeiro D (1996) ` ConsultorotildeAcirca para la direccioAcircn en organizacioAcircn calidad marketing yestrategiarsquorsquo doctoral thesis University of Valencia Valencia
Samson D and Parker R (1994) ` Service quality the gap in the Australian consulting engineeringindustryrsquorsquo International Journal of Quality amp Reliability Management Vol 11 No 7
Vanguard Consulting Ltd (1994) `BS 5750ISO 9000EN 29000 1987 a positive contribution tobetter businessrsquorsquo The TQM Magazine Vol 11 No 2 p 60
Vloeberghs D and Bellens J (1996) ` Implementing the ISO 9000 standardsrsquorsquo Quality ProgressVol 29 No 6 pp 43-8
Zeithaml VA Parasuraman A and Berry L (1993) Calidad total en la gestioAcircn de los serviciosDotildeAcircaz de Santos
IJQRM1989
1012
Appendix 1
Tot
alvar
iance
expla
ined
Init
ial
eigen
val
ues
Extr
acti
onsu
ms
ofsq
uar
edlo
adin
gs
Rot
atio
nsu
ms
ofsq
uar
edlo
adin
gs
Com
pon
ents
Tot
alP
erce
nt
ofvar
iance
Cum
ula
tive
per
cent
Tot
alP
erce
nt
ofvar
iance
Cum
ula
tive
per
cent
Tot
alP
erce
nt
ofvar
iance
Cum
ula
tive
per
cent
17
7255
20
552
07
7255
20
552
04
8434
58
345
82
136
971
649
21
369
7164
92
306
219
156
50
31
037
3972
31
103
739
723
12
2115
81
723
14
073
521
775
25
068
486
823
86
061
435
867
47
039
279
895
38
035
255
920
99
031
224
943
310
022
162
959
511
019
137
973
312
015
107
984
013
014
105
994
614
007
053
100
0
Note
sE
xtr
acti
onm
ethod
P
rinci
pal
com
pon
ent
anal
ysi
sC
ompon
ent
Rot
ated
com
pon
ent
mat
rix
a
12
3b12
084
10
264
b11
079
60
346
b13
079
00
407
b10
076
80
383
025
1b8
075
30
340
b9
072
40
426
b14
061
70
446
029
7b4
060
80
470
032
0b6
085
1b5
079
4b7
034
40
573
034
3b1
086
7b3
042
50
415
063
5b2
025
30
513
057
2
Note
sE
xtra
ctio
nm
etho
dpr
inci
pal
com
pone
ntan
alys
isR
otat
ion
met
hod
Var
imax
with
Kai
ser
norm
aliz
atio
naR
otat
ion
conv
erge
din
six
inte
ratio
ns
Table AIFactorial analysis ofthe perceived qualityPrincipal componentsmethod with varimaxrotation
Quality serviceof ISO 9000consultants
1013
Appendix 2T
otal
var
iance
expla
ined
Init
ial
eigen
val
ues
Extr
acti
onsu
ms
ofsq
uar
edlo
adin
gs
Rot
atio
nsu
ms
ofsq
uar
edlo
adin
gs
Com
pon
ents
Tot
alP
erce
nt
ofvar
iance
Cum
ula
tive
per
cent
Tot
alP
erce
nt
ofvar
iance
Cum
ula
tive
per
cent
Tot
alP
erce
nt
ofvar
iance
Cum
ula
tive
per
cent
18
219
632
2263
222
821
963
222
632
225
245
403
4940
349
20
894
687
570
097
089
46
875
700
973
867
297
4870
097
30
791
608
876
185
40
746
573
581
920
50
483
371
385
633
60
410
315
588
788
70
337
259
491
383
80
319
245
093
833
90
236
181
495
647
100
182
140
197
048
110
158
121
798
265
120
149
114
399
408
130
077
059
210
00
Note
sE
xtr
acti
onm
ethod
P
rinci
pal
com
pon
ent
anal
ysi
sC
ompon
ent
Rot
ated
com
pon
ent
mat
rix
a
12
d9
091
1d8
079
40
288
d3
073
60
375
d10
071
50
418
d11
069
00
523
d7
067
60
462
d13
063
50
484
d2
061
40
523
d12
057
50
560
d1
085
4d6
037
70
767
d5
040
30
675
d4
060
40
608
Note
sE
xtra
ctio
nm
etho
dpr
inci
pal
com
ponen
tan
alys
isR
otat
ion
met
hod
Var
imax
with
Kai
ser
norm
aliz
atio
naR
otat
ion
conv
erge
din
thre
eiter
atio
n
Table AIIFactoral analysis of the
obtained benefitsPrincipal componentsmethod with varimax
rotation

Quality serviceof ISO 9000consultants
999
These questions are obviously of interest to the companies involved but alsoto consultants eager to determine the degree of client satisfaction on whichtheir very future depends Moreover the analysis of these questions is evenmore relevant in the present situation where companies are involved in aprocess of adaptation to the new ISO 90002000 standards For all the abovereasons and in order to resolve the issues thereby raised the present empiricalstudy was carried out on companies that have used consultancy services tointroduce their ISO 9000 quality systems
AntecedentsMost research into quality management at a world-wide level refers to themotivation of companies to introduce quality systems (Meegan and Taylor1997) to the benefits derived from the introduction of such systems (LloydrsquosRegister Quality Assurance 1994 Vanguard Consulting 1994 Brown and Vander Wiele 1995 Buttle 1997 Jones et al 1997 CasadesuAcircs and GimeAcircnez 2000)or to the importance of the human factor in quality management (Vloeberghsand Bellens 1996)
Many studies mention the importance of the support lent by consultantservices for the introduction of the ruling In this country previous researchshowed that approximately 80 percent of 286 Spanish companies surveyed useexternal consultant services (CasadesuAcircs 1998) This can be seen in Figure 1The services provided range from in-service training prior to introducing aquality system to maintenance auditing of the system after certification Theservice can also include producing the quality manual and drawing upprocedures for the quality assurance systems
In like manner some research studies mention the relative importance ofcompanies that have used external consultancies compared with those thathave not (Vloeberghs and Bellens 1996) but no study has assessed the realquality of the services offered by the consultancies or whether this service wasreally what the client company expected Some considerations on thecontributions of consultant firms can be found (including factors such asemployee training information and motivation) but no studies have been made
Figure 1Percentage of companies
that have usedconsultant services
when introducingquality systems
IJQRM1989
1000
on issues of such crucial interest as the following to what extent does theengagement of a consultant service provide benefits to the firm Can thesebenefits be measured Are the benefits of an intangible nature that is hard toexpress in monetary terms This is a complex issue indeed as has already beenpointed out in the literature on the subject (Nachum 1999) where some authorshave put forward their own methodology for calculating the yield from aninvestment in consultation services (Phillips 2000)
The present paper aims to summarise the main conclusions drawn from aresearch study that analyses the expectations and fulfilment of expectationsamong client companies that have used consultancy services to introduce ISO9000 quality assurance systems The paper also analyses the benefits obtainedby the companies as a result of the introduction of the ruling following advicegiven by professional consultants
MethodologyAn empirical research study has been recently carried out with the aim ofanalysing and attempting to provide an answer to these questions A samplewas taken of companies that had used consultant services for implementingquality assurance systems in keeping with the ISO 9000 standards on thesubject This model or type of quality management was chosen because it isundoubtedly the most widely used in Spain and also because field work ismade easier by the existence of registers of all the companies that have beenissued with the ISO 9000 certificate In more specific terms the research wascarried out within the industrial area of Catalonia and focuses on companiesthat were certified in 1997 1998 and 1999
The companies in the sample were sent a questionnaire adapted from thewidespread SERVQUAL model drawn up by Zeithaml et al (1993) forconsulting services in Spain This is a model whereby the quality of a givenservice is assessed on the basis of the expectations and perceptions of theclients This is considered to be the best known system presently used formeasuring service quality
In short the questionnaire was designed to gather information about the qualityof the consultancy service as perceived by companies that engaged the service tointroduce ISO 9000 and about the expectations of this type of service that werepreviously held by the company With this information the questionnaire thenattempts to find out the benefits that were obtained by the company as a result ofengaging the service Each of these aspects will be considered in the followingparagraphs It must be borne in mind however that the responses to thesequestions have been compiled on a Likert scale The questionnaire was completedby the addition of extra questions designed to obtain general information about thecompany and about the consultancy that was employed
The questionnaire was delivered via ordinary mail to 483 managers who areresponsible for ISO 9000 After that these people were contacted by telephoneto explain the purpose of the study and a fax or electronic mail was deliveredagain to those who agreed to participate A total of 87 valid questionnaires
Quality serviceof ISO 9000consultants
1001
were obtained representing a response rate of 18 percent of which 65 camefrom companies that had used consultancies to introduce their quality systemThe population on which the research was carried out is less than 1670companies this being the total number of certificates issued over the sampleperiod in Catalonia It must also be borne in mind that many companies holdmore than one certificate For these reasons with a confidence interval of 95percent (working on the hypothesis that p = q = 05) the margin of error for thesample is 1025 percent Likewise for the companies that employedconsultancies taking the same population into consideration the margin oferror for the sample is less than 119 percent
Perceived quality of the quality consultant servicesIn their well-known model the authors Zeithaml et al (1993) distinguish fivedifferent dimensions that define the quality of a given service
(1) Tangibles appearance of the physical facilities equipment personneland communication equipment
(2) Reliability ability to perform the promised service dependably andaccurately
(3) Responsiveness willingness to help clients and provide prompt service
(4) Assurance knowledge and courtesy of employees and their ability toinspire trust and confidence
(5) Empathy caring individualised attention the firm offers its clients
The quality of the service as perceived by clients will be derived fromcomparing their prior expectations of the service with their appreciation of theactual service provided in such a way that a given service will be consideredexcellent for the client when the benefit exceeds prior expectations acceptablewhen the benefit lives up to the clientrsquos expectations and deficient when theservice is poorer than expected
In order to determine the perceived quality in each dimension theSERVQUAL questionnaire was used with a total of 14 questions in all Itshould be noted however that we adapted these questions to ourcircumstances following guidelines laid down by different questionnaires usedin other empirical studies To this end the following studies should bementioned research by Samson and Parker (1994) into the engineeringconsultancy industry in Australia research by Ribeiro (1996) into theconsultancy sector in Valencia the study by CasadesuAcircs (1998) of theintroduction of ISO 9000 into Catalonia and a paper by Escanciano (2000) onquality systems in Spain Table I shows the grouping of the different questionsor items in each of the dimensions of the survey This aggregation was made ` apriorirsquorsquo although there was no mention of dimensions in the questionnaire
The reliability of the data was examined for the 14 perception-item using thealpha of Cronbach the standard value is 09355 and the 14 alphas obtainedwhen one of the items is deleted are all between 09271 and 09356 (Table I)
IJQRM1989
1002
The data collected during field work referring to the quality of the consultancyservices as perceived by the companies were analysed following the principalcomponents method Although it is known that from the statistical point ofview it has the weakness of the size of data it has a great power when it is usedto compare with the Zeithaml et al (1993) model
In this way after the varimax rotation method was applied only three factorswith eigenvalues greater than 1 were obtained (Appendix 1) The contrastanalysis is correct the determinant of the correlation matrix is 1055E-5 and theKaiser-Meyer-Olkin measure is 0834 These three factors combine to explain the723 percent of the total of the variance Inter-item analysis was used to check thescales for internal consistency Analysis calculated a Cronbach coefficient alphaon the items within each factor The three factors have Cronbach alphas above075 and the standardized item alphas range from 076 to 093 These threeconstructs demonstrate good reliability
It can be deduced from the grouping of questions about perceived qualitysuggested by the factor analysis that a relative similitude exists to the genericmodel by Zeithaml et al (1993) Table II shows the dimensions of the Zeithamlet al model in the column headings The factors determined by the factoranalysis figure in the rows underneath Analysis of this Table shows therelationship between both forms of grouping the 14 questions on perceivedquality that figure on the questionnaire
Factor Description of items
1 Tangibles Personal appearance of staffVisual attractiveness of equipment in the consultancyClient-friendly software
2 Reliability Ability to perform the promised serviceFulfilment of commitments within the established time limitsCo-ordination between different company departmentsDetailed specification of aims of time limits
3 Responsiveness Willingness to help clientsEnthusiasm and involvement in the project
4 Assurance Ability to inspire trust and confidenceProfessional knowledge and expertise of consultants
5 Empathy Company concern for the best interests of the clientCommunication and interpersonal skills of the consultantClient satisfaction with consultation
Table IDistribution of the 14items surveyed inrelation to the differentdimensions of themodel proposed byZeithaml et al (1993)
Tangibles Reliability Responsiveness Assurance Empathy
1 2 3 4 5 6 7 8 9 10 11 12 13 14
Factor 1 X X X X X X X XFactor 2 X X XFactor 3 X X X
Table IIHigh saturations of thethree factors with theprincipal componentmethod with varimax
Quality serviceof ISO 9000consultants
1003
The three factors that define the perceived quality of ISO 9000 consultancyservice are the following
(1) Factor 1 Customer service assurance and empathy This factor refers toa set of aspects such as the consultantrsquos knowledge of the rulinginvolvement of the consultant in the client companyrsquos interests care andindividualised attention given by the consultant to the company theconsultantrsquos willingness to help and the climate of trust and confidencethat is transmitted to the client This first quality perception factor isgiven an average rating of 389 on a scale of 1 to 5
(2) Factor 2 Scheduling The scheduling factor represents the skills of theconsultants in completing the work within the agreed time periods Itrefers thus to the result of the service ie the obtaining of the certificatewithin the established budget and time period This factor should be asine qua non condition for good service because it is assumed that theproviders of a service must fulfil their promises On the whole clients donot give any extra credit to companies that honour their obligations butwhen this is not the case poorer quality in the service is detected herewith a 350 on the same scale This is an indication that this aspect of theservice should be significantly improved
(3) Factor 3 Tangibles This last factor refers to the office appearance tothe equipment used therein and even to the personal appearance of theconsultants The perception detected in this factor is rated at 362
A first conclusion to be drawn from the results is that the quality of the serviceis good Several additional factors also exist to bear out this statement
The arithmetic mean of the Likert scale ratings corresponding to the setof 14 questions on perceived quality is 375 This is considerably higherthan 3 the central value of the scale This can be taken as an indicator ofa good perception of quality while still however allowing forimprovement This assessment fully coincides with a question on` overall perception of the quality of the servicersquorsquo that received an averagerating of 369 thereby validating the results obtained
The statement `working with the consultant was a worthwhile experiencersquorsquois rated with an average of 380 This is not a direct question on qualitybut gives us an idea of the degree of satisfaction with the service received
The statement ` If I were to reinitiate the process I would choose thesame consultantrsquorsquo was rated at 355 It must be borne in mind here that 55percent of the companies have in fact returned to the same consultantafter receiving their certificate (not necessarily for quality-related tasks)This is a high index considering that the specific purpose of theintroduction process is fulfilled on obtaining certification If thecompanies continue to use the consultant after this point it would seemto indicate a high degree of satisfaction
IJQRM1989
1004
Another index of satisfaction with the service received is the intention touse the same consultant to adapt the company system to the new ISO90002000 standards A total of 77 per cent of the companies that intend touse a consultancy to update their systems will reuse the same service
Expectations of service given by quality consultantsCompany expectations of the services given by consultants were researched usingthe same methodology and analysing the same aspects and equivalent sets ofquestions to those already used to assess perceived quality in the same services
In the questionnaire a section was included in which 100 points should beassigned to the five dimensions balancing the importance of them
From the results obtained it can be observed that the most important of thefive dimensions defined by the Zeithaml et al model (1993) is considered to be` Reliabilityrsquorsquo (in which the consultant delivers the agreed service in an accurateand trustworthy manner) From a total of 100 points for all five dimensions` Reliabilityrsquorsquo received 28 points whereas `Tangiblesrsquorsquo were considered of lesserimportance and were only awarded 12 points However this same ` Reliabilityrsquorsquodimension most closely related to the ` Schedulingrsquorsquo factor coincides exactlywith the lowest rated factor in terms of service quality This points to an urgentneed for the consultants to improve this factor
On quantifying the level of quality expected from these services usinganother set of 14 questions equivalent to the previous set (on the same scale) thearithmetic mean is found to be 435 Thus expectations of the service are muchhigher than perceived quality of the same In short it is clear that the differencegenerated between the arithmetic mean of perceived quality of the service andexpectations of the same is ndash061 (ndash12 percent) Thus although a high perceptionof quality for services rendered by quality consultants was detected in theprevious section prior expectations of the same services were even higher
If we analyse the gap between expected quality and the quality that isactually perceived on the basis of the factors that define service quality asseen above it can be observed from Figure 2 that the gap is greatest in the` Schedulingrsquorsquo factor and least significant in the ` Tangiblesrsquorsquo factor
Figure 2Perceived qualityexpected quality and thegap betweenexpectations and qualityin each of the threefactors used to defineservice quality
Quality serviceof ISO 9000consultants
1005
In a nutshell we can conclude this part of the analysis by stating that althoughthe companies hold a good opinion of the quality of the advisory servicesreceived prior expectations of the same were considerably higher Thisconclusion shows that there is still room for improvement of the service offeredby quality consultants
Benefits obtained by clients of quality consultant servicesAfter analysing the quality offered by consultants and the expectations raised bythis type of service an analysis is made of the clientsrsquo perception of the benefitsdirectly derived from the consultantrsquos intervention Although it must beconsidered a priori that clients are not usually very sure about the value of theservice that they are engaging or the price that they are prepared to pay for it itcan be said that if this type of consultancy exists it is because clients think thatthey can obtain some benefits for which they are prepared to pay a fee Thesebenefits have been assessed by a set of 13 questions likewise answered on theLikert scale [15] as compiled in Table III The benefits considered are not merelyof an economic nature but include diverse factors such as increased motivation inworkers and improved relationships with customers and suppliers
Assessment of the results obtained shows that the arithmetic mean of allthese benefits is only 305 An overall assessment of the benefits gained fromuse of a consultant was obtained from one single question the response towhich gave the similar result of 317 In short both indicators coincide inhighlighting the fact that the companies did not perceive any benefits from theinput of the consultant
Items
Better understanding of quality as a result of working with an external consultant
Satisfaction with the skills provided by the consultants
Increased company motivation after working with external consultants
Adaptation of ethical approach after working with an external consultant
Definition and aims of quality policy following advice from the consultant
Definition of and approach to process following advice from the consultant
Improved approach to customers following advice from the consultant
Setting-up of beneficial relationships with customers andor suppliers following advice fromthe consultant
Setting-up of customer satisfaction control measures following advice from the consultant
Ideas for growth of company yield following advice from the consultant
Setting-up of continuous improvement scheme in the company following advice from theconsultant
Improved understanding of the relationship between the different processes and how tomanage the same in terms of a system
Improved decision taking based on data analysis following advice from the consultant
Table IIIItems analysed to assessthe benefits of workingwith a consultant when
introducing a qualitysystem
IJQRM1989
1006
From a factor analysis on extracting factors with the principal componentsand varimax rotation method two factors with eigenvalues higher than 1 areobtained (Appendix 2) The analysis is correct The determinant of thecorrelation matrix is 7162E-06 and the KMO measure is 0881 Moreover thetwo factors account for 70 percent of the variability of the sample
From the variables with the highest saturations in each factor we decided tocall the first factor ` Client approachrsquorsquo and the second factor ` Before the ruling isintroducedrsquorsquo This second factor includes all the benefits derived from the stepsprior to introduction definition of quality policy identification of aimsdefinition of procedures and improved understanding of quality
Table IV shows the grouping of the items related to benefits derived fromworking with a quality consultant
Relationship between perceived quality and benefits provided bythe consultantThe next step consisted of establishing the relationship between perceivedquality and the benefits obtained from using the service of a consultant Theresearch study detected and confirmed the relationship existing between thetwo concepts with different sets of statistics To summarise this relationshipwas analysed in two different ways first from questions eliciting an overallassessment on quality and benefits ie the analysis of the contingency tableresulting from the crossing of the two variables and second from the analysisof the relationship between the variables of mean quality and mean benefitscalculated as a mean from the corresponding sets of questions
Contingency Table V relating the two overall assessment variables on theLikert scale [15] is a 5 pound 5 square table In this respect the Pearson chi-squarestatistics and the likelihood ratio indicate the existence of a relationship
1 2 3 4 5 6 7 8 9 10 11 12 13
Factor 1 X X X X X X X X XFactor 2 X X X X
Table IVHigh saturation of thetwo factors with thePAF method withvarimax rotation
Value Freedom degree(Bilateral)
asymptotic sig
Pearsonrsquos chi-square 52979a 16 0000
Likelihood ratio 45709 16 0000
Linear by linear association 2712 1 0000
Number of valid cases 62
Note a22 cells (880 percent) have an expected frequency of less than 5 The minimumexpected frequency is 024
Table VContingency tablestatistic betweenoverall perceivedquality and overallbenefits
Quality serviceof ISO 9000consultants
1007
The association measurements that are normally used on an ordinal scale(Gamma = 0759 Kendallrsquos tau-b = 0563 and Somersrsquo d = 0562 each with a pvalue of 0000 in every case) also detect a relationship between the differentvariables A log-linear model was set up to explain the frequencies in thecontingency table cells and the saturated model was found to be the most suitablefor the purpose This model includes the interaction between the two variables
To sum up it has been statistically shown that the variables have a clearpositive correlation The higher the perceived quality the higher the benefitsand vice versa On the other hand and as a second way of detecting anddefining a relationship a linear regression was made between two variablesthat were calculated as the mean from the set of questions on perception andthe mean from the questions on benefits The analysis indicates that thevariables are correlated although the Pearson correlation coefficient is 0588with zero significance level (Figure 3)
Proceeding logically the very design of the variables enables the rank inboth cases to be [15] Both cases present variables of a linear combination ofseveral questions answered on the Likert scale [15] The relationship betweenthe variables can be clearly seen in Figure 3 Leaving the mean perceivedbenefit as an independent variable the linear regression has been calculated as
Mean Arithmetic Benefit ˆ 0456 Dagger 0702currenMean Perceived Quality
The slope of the regression is positive but less than the unit A unitary increasein quality does not result in a unitary increase in benefits but only in anincrease of seven-tenth The regression coefficient associated with thedependent variable obtained a zero significance level
Figure 3Scatter diagram of the
variables `meanperceived qualityrsquorsquo and
`mean benefitsrsquorsquo
IJQRM1989
1008
In summary the analyses point to the existence of a significant relationshipbetween the efforts of the consultant to provide a better quality service and theclientrsquos perception of improved benefits
Quality of consultant companies in relation to their sizeA study of the performance of consultant companies in relation to their sizewas made on the basis of the collected data The sample was divided into fourcategories companies that engaged the services of a single independentconsultant companies that used consultancies with a staff of between twoand five consultants companies that used consultancies with a staff ofbetween six and 50 consultants and lastly companies that used consultancieswith a staff of over 50 consultants The results of this segmentation can beseen in Figure 4
It was observed that the quality of the service is related to the size of theconsultant company the larger the company the better the service The bigconsultant companies obtain a significantly higher quality rating than thesmaller companies Whereas small companies (with two to fiveconsultants) obtain an average rating of 339 the average rating of theconsultancies with a staff of over 50 employees stands at 443 Thisrepresents a large difference of over one point It is noteworthy howeverthat professional consultants working independently offer a high qualityservice and score a rating that is closer to that of the large consultanciesthan the small ones
There also seems to be a negative relationship between the expectations ofthe client company and the number of workers employed by the consultantcompany However this does not carry any statistical significance
In the case of consultants working alone as independent professionalsexpectations of the service and perceived quality of the same are both veryhigh On the other hand although their clients have lower expectations thelarge consultant companies offer the best quality service In this case indeedperceived quality is higher than expectations
Figure 4Perceived qualityexpectations gap andbenefits in relation to thesize of the consultancy
Quality serviceof ISO 9000consultants
1009
On the other hand similar results are found when the benefits from using aconsultant are analysed according to the size of the consultant company Smallcompanies (between two and five consultants) provide the fewest benefits fortheir clients with an average rating of 288 whereas the large companies obtainan average rating of 313 Once again it is noted that independent professionalconsultants follow a different pattern and obtain the highest ratings of all Allthese relationships are statistically significant as shown by the Kruskal-Wallistest carried out by grouping the variables according to the size of theconsultant companies (Table VI)
The perceived quality and the gap between expectations and perceptionboth present significantly different averages with a significance level of 005
In a parallel manner the performance of the variables of qualityexpectations and benefits was analysed in relation to the size of the clientcompany In short no statistically significant relationship was detectedbetween these variables and the size of the client company in terms of numberof employees
Cost of consultant servicesIt is difficult to assess the benefits obtained from a consultant service withouttaking into consideration the cost of the same For this reason it wasconsidered appropriate to analyse the questionnaire data in terms of the costsinvolved In brief it can be concluded from an analysis of the data that theseservices are not expensive An assessment of the fees charged gives thelowest rating of the whole questionnaire data ie 272 This value is lowerthan the average value of the scale thus indicating a slight variance with theabove statement
Companies invested few resources in the introduction of the ruling It wasfound that 62 percent of the sample invested less than 15000 Euro Among thecompanies that engaged the services of a consultant the corresponding feesamounted to 48 percent of the total cost of introduction In most cases (77percent) the consultantrsquos fees are stipulated right from the beginning It can beassumed that the consultancies are so familiar with their service that they canmake an initial estimate of the cost of introducing the ruling with a high degreeof precision This type of service has been steadily growing ever since it was
Mean perceived
quality
Mean
expectations
Non-weighted
quality gap
Arithmetic mean
benefits 13 items
Chi-square 1465 1913 1411 1890
Freedom degree 3 3 3 3
Asymptotic sig 0002 0591 0003 0596
Notes aKruskal-Wallis test bGrouping variable number of consultants
Table VIKruskal-Wallis test
statistics for thevariables `perceived
qualityrsquorsquo ` expectationsrsquorsquo` gap between
expectations andperceived qualityrsquorsquo and`mean benefitsrsquorsquo when
grouped by ` number ofconsultantsrsquorsquo
IJQRM1989
1010
started a decade ago and can therefore be considered as standard (MartotildeAcircnez etal 2000) Moreover it is interesting to note that the offer of the service has alsoincreased which has resulted in a corresponding price adjustment
ConclusionsOne of the characteristics that differentiates a service from a product ormaterial goods is that the service is sold first and later `manufacturedrsquorsquoMoreover the production and consumption of the service are simultaneous iea service cannot be stored Thus the overall assessment of the client springsfrom two sources the end result of the service and the very process by whichthe service is provided (Berry 1995)
For these reasons the assessment of the quality of a service is not an easytask and as pointed out by Groth and Dye (1999) the providers of a serviceshould bear in mind this dual aspect by which a service is appraised Thereforethey should be able to recognise the different degrees by which the service itselfand the provision of the service are being assessed Despite this we consider itimportant to assess these services from the point of view of the client companyas has been done in the present research study
From all this we can draw the overall conclusion that the ISO 9000 advisoryservices are favourably regarded on the whole However it should also benoted that clients expect an even higher quality In short the client companiesexpect a higher quality from the service than that which is actually provided
It has been shown that the concept of quality can be broken down intothree factors one of which is the skill of the consultant in introducing theruling within the agreed time period and this is the aspect of the service thatobtains the poorest quality rating This factor is closely linked to thereliability factor which is considered to be of the highest importance by theclient companies For this reason the most reiterated request forimprovement by the clients is that the consultants perform the required taskswithin the agreed time periods
Moreover the results of the study show that the performance of independentprofessional consultants is very different from that of small consultantcompanies Independent consultants offer a high quality service that lives up tothe very high expectations of their clients The benefits that these clients gainfrom working with a consultant are also perceived as very high
During this work it has been noted that the quality offered by consultantcompanies that employ a staff of professionals varies according to the sizeof the company The benefits perceived by their clients are very similar tobut are slightly higher than those perceived by companies employing largeconsultancies
Finally although we realise that our study relates to only one region ofEurope we believe that our findings have broader implications for researchersand practitioners Thus we guess that it would be interesting to carry outsimilar surveys in other European and US regions For practitioners ourfindings should give pause for thought We guess that these findings are very
Quality serviceof ISO 9000consultants
1011
interesting in order to improve their service and that they should somehowmeasure and control their service quality We really think that for all theprofessionals working in the quality field a quality service should be a realNo 1 purpose
References
Berry L (1995) MaAcircs allaAcirc de la excelencia en el servicio Un plan para la accioAcircn DeustoPublications
Brown A and Van der Wiele T (1995) ` Industry experience with ISO 9000rsquorsquo Asia PacificJournal of Quality Management Vol 4 No 2 pp 8-17
Buttle F (1997) ` ISO 9000 marketing motivations and benefitsrsquorsquo International Journal of Qualityamp Reliability Management Vol 14 No 9 pp 936-47
CasadesuAcircs M (1998) ` La normativa de aseguramiento de la calidad ISO 9000 en CatalunAumlaexpectativas y efectos Estudio empotildeAcircricorsquorsquo Research project CICYT Reference SEC96-1005
CasadesuAcircs M and GimeAcircnez G (2000) ` The benefits of the implementation of the ISO 9000standard empirical researchin 288 Spanish companiesrsquorsquo The TQM Magazine Vol 12 No 6
Escanciano C (2000) ` Influencia de la certificacioAcircn ISO 9000 en el avance de la empresa espanAumlolahacia la calidad totalrsquorsquo paper presented at the 1st World Conference on Production andOperations Management (POM) Seville
Groth JC and Dye RT (1999) ` Service quality perceived value expectations shortfalls andbonusesrsquorsquo Managing Service Quality Vol 9 No 4
ISO (2000) available at wwwisochisoeniso9000-14000pdfsurvey9pdf
Jones R Arndt G and Kustin R (1997) ` ISO 9000 among Australian companies impact of timeand reasons for seeking certification on perceptions of benefits receivedrsquorsquo InternationalJournal of Quality amp Reliability Management Vol 14 No 7
Lloydrsquos Register Quality Assurance Ltd (1994) BS 5750 ISO 9000 ndash Setting Standards forBetter Business Lloydrsquos Register Quality Assurance Services Ltd Croydon
MartotildeAcircnez C et al (2000) `Analysis of the implementation of ISO 9000 quality assurancesystemsrsquorsquo Work Study Vol 49 No 6
Meegan ST and Taylor WA (1997) ` Factors influencing a successful transition from ISO 9000to TQM The influence of understanding and motivationrsquorsquo International Journal of Qualityamp Reliability Management Vol 14 No 2
Nachum L (1999) `Measurement of productivity of professional services an illustration ofSwedish management consulting firmsrsquorsquo International Journal of Operations amp ProductionManagement Vol 19 No 9
Phillips J (2000) The Consultantrsquos Scorecard McGraw Hill New York NY
Ribeiro D (1996) ` ConsultorotildeAcirca para la direccioAcircn en organizacioAcircn calidad marketing yestrategiarsquorsquo doctoral thesis University of Valencia Valencia
Samson D and Parker R (1994) ` Service quality the gap in the Australian consulting engineeringindustryrsquorsquo International Journal of Quality amp Reliability Management Vol 11 No 7
Vanguard Consulting Ltd (1994) `BS 5750ISO 9000EN 29000 1987 a positive contribution tobetter businessrsquorsquo The TQM Magazine Vol 11 No 2 p 60
Vloeberghs D and Bellens J (1996) ` Implementing the ISO 9000 standardsrsquorsquo Quality ProgressVol 29 No 6 pp 43-8
Zeithaml VA Parasuraman A and Berry L (1993) Calidad total en la gestioAcircn de los serviciosDotildeAcircaz de Santos
IJQRM1989
1012
Appendix 1
Tot
alvar
iance
expla
ined
Init
ial
eigen
val
ues
Extr
acti
onsu
ms
ofsq
uar
edlo
adin
gs
Rot
atio
nsu
ms
ofsq
uar
edlo
adin
gs
Com
pon
ents
Tot
alP
erce
nt
ofvar
iance
Cum
ula
tive
per
cent
Tot
alP
erce
nt
ofvar
iance
Cum
ula
tive
per
cent
Tot
alP
erce
nt
ofvar
iance
Cum
ula
tive
per
cent
17
7255
20
552
07
7255
20
552
04
8434
58
345
82
136
971
649
21
369
7164
92
306
219
156
50
31
037
3972
31
103
739
723
12
2115
81
723
14
073
521
775
25
068
486
823
86
061
435
867
47
039
279
895
38
035
255
920
99
031
224
943
310
022
162
959
511
019
137
973
312
015
107
984
013
014
105
994
614
007
053
100
0
Note
sE
xtr
acti
onm
ethod
P
rinci
pal
com
pon
ent
anal
ysi
sC
ompon
ent
Rot
ated
com
pon
ent
mat
rix
a
12
3b12
084
10
264
b11
079
60
346
b13
079
00
407
b10
076
80
383
025
1b8
075
30
340
b9
072
40
426
b14
061
70
446
029
7b4
060
80
470
032
0b6
085
1b5
079
4b7
034
40
573
034
3b1
086
7b3
042
50
415
063
5b2
025
30
513
057
2
Note
sE
xtra
ctio
nm
etho
dpr
inci
pal
com
pone
ntan
alys
isR
otat
ion
met
hod
Var
imax
with
Kai
ser
norm
aliz
atio
naR
otat
ion
conv
erge
din
six
inte
ratio
ns
Table AIFactorial analysis ofthe perceived qualityPrincipal componentsmethod with varimaxrotation
Quality serviceof ISO 9000consultants
1013
Appendix 2T
otal
var
iance
expla
ined
Init
ial
eigen
val
ues
Extr
acti
onsu
ms
ofsq
uar
edlo
adin
gs
Rot
atio
nsu
ms
ofsq
uar
edlo
adin
gs
Com
pon
ents
Tot
alP
erce
nt
ofvar
iance
Cum
ula
tive
per
cent
Tot
alP
erce
nt
ofvar
iance
Cum
ula
tive
per
cent
Tot
alP
erce
nt
ofvar
iance
Cum
ula
tive
per
cent
18
219
632
2263
222
821
963
222
632
225
245
403
4940
349
20
894
687
570
097
089
46
875
700
973
867
297
4870
097
30
791
608
876
185
40
746
573
581
920
50
483
371
385
633
60
410
315
588
788
70
337
259
491
383
80
319
245
093
833
90
236
181
495
647
100
182
140
197
048
110
158
121
798
265
120
149
114
399
408
130
077
059
210
00
Note
sE
xtr
acti
onm
ethod
P
rinci
pal
com
pon
ent
anal
ysi
sC
ompon
ent
Rot
ated
com
pon
ent
mat
rix
a
12
d9
091
1d8
079
40
288
d3
073
60
375
d10
071
50
418
d11
069
00
523
d7
067
60
462
d13
063
50
484
d2
061
40
523
d12
057
50
560
d1
085
4d6
037
70
767
d5
040
30
675
d4
060
40
608
Note
sE
xtra
ctio
nm
etho
dpr
inci
pal
com
ponen
tan
alys
isR
otat
ion
met
hod
Var
imax
with
Kai
ser
norm
aliz
atio
naR
otat
ion
conv
erge
din
thre
eiter
atio
n
Table AIIFactoral analysis of the
obtained benefitsPrincipal componentsmethod with varimax
rotation

IJQRM1989
1000
on issues of such crucial interest as the following to what extent does theengagement of a consultant service provide benefits to the firm Can thesebenefits be measured Are the benefits of an intangible nature that is hard toexpress in monetary terms This is a complex issue indeed as has already beenpointed out in the literature on the subject (Nachum 1999) where some authorshave put forward their own methodology for calculating the yield from aninvestment in consultation services (Phillips 2000)
The present paper aims to summarise the main conclusions drawn from aresearch study that analyses the expectations and fulfilment of expectationsamong client companies that have used consultancy services to introduce ISO9000 quality assurance systems The paper also analyses the benefits obtainedby the companies as a result of the introduction of the ruling following advicegiven by professional consultants
MethodologyAn empirical research study has been recently carried out with the aim ofanalysing and attempting to provide an answer to these questions A samplewas taken of companies that had used consultant services for implementingquality assurance systems in keeping with the ISO 9000 standards on thesubject This model or type of quality management was chosen because it isundoubtedly the most widely used in Spain and also because field work ismade easier by the existence of registers of all the companies that have beenissued with the ISO 9000 certificate In more specific terms the research wascarried out within the industrial area of Catalonia and focuses on companiesthat were certified in 1997 1998 and 1999
The companies in the sample were sent a questionnaire adapted from thewidespread SERVQUAL model drawn up by Zeithaml et al (1993) forconsulting services in Spain This is a model whereby the quality of a givenservice is assessed on the basis of the expectations and perceptions of theclients This is considered to be the best known system presently used formeasuring service quality
In short the questionnaire was designed to gather information about the qualityof the consultancy service as perceived by companies that engaged the service tointroduce ISO 9000 and about the expectations of this type of service that werepreviously held by the company With this information the questionnaire thenattempts to find out the benefits that were obtained by the company as a result ofengaging the service Each of these aspects will be considered in the followingparagraphs It must be borne in mind however that the responses to thesequestions have been compiled on a Likert scale The questionnaire was completedby the addition of extra questions designed to obtain general information about thecompany and about the consultancy that was employed
The questionnaire was delivered via ordinary mail to 483 managers who areresponsible for ISO 9000 After that these people were contacted by telephoneto explain the purpose of the study and a fax or electronic mail was deliveredagain to those who agreed to participate A total of 87 valid questionnaires
Quality serviceof ISO 9000consultants
1001
were obtained representing a response rate of 18 percent of which 65 camefrom companies that had used consultancies to introduce their quality systemThe population on which the research was carried out is less than 1670companies this being the total number of certificates issued over the sampleperiod in Catalonia It must also be borne in mind that many companies holdmore than one certificate For these reasons with a confidence interval of 95percent (working on the hypothesis that p = q = 05) the margin of error for thesample is 1025 percent Likewise for the companies that employedconsultancies taking the same population into consideration the margin oferror for the sample is less than 119 percent
Perceived quality of the quality consultant servicesIn their well-known model the authors Zeithaml et al (1993) distinguish fivedifferent dimensions that define the quality of a given service
(1) Tangibles appearance of the physical facilities equipment personneland communication equipment
(2) Reliability ability to perform the promised service dependably andaccurately
(3) Responsiveness willingness to help clients and provide prompt service
(4) Assurance knowledge and courtesy of employees and their ability toinspire trust and confidence
(5) Empathy caring individualised attention the firm offers its clients
The quality of the service as perceived by clients will be derived fromcomparing their prior expectations of the service with their appreciation of theactual service provided in such a way that a given service will be consideredexcellent for the client when the benefit exceeds prior expectations acceptablewhen the benefit lives up to the clientrsquos expectations and deficient when theservice is poorer than expected
In order to determine the perceived quality in each dimension theSERVQUAL questionnaire was used with a total of 14 questions in all Itshould be noted however that we adapted these questions to ourcircumstances following guidelines laid down by different questionnaires usedin other empirical studies To this end the following studies should bementioned research by Samson and Parker (1994) into the engineeringconsultancy industry in Australia research by Ribeiro (1996) into theconsultancy sector in Valencia the study by CasadesuAcircs (1998) of theintroduction of ISO 9000 into Catalonia and a paper by Escanciano (2000) onquality systems in Spain Table I shows the grouping of the different questionsor items in each of the dimensions of the survey This aggregation was made ` apriorirsquorsquo although there was no mention of dimensions in the questionnaire
The reliability of the data was examined for the 14 perception-item using thealpha of Cronbach the standard value is 09355 and the 14 alphas obtainedwhen one of the items is deleted are all between 09271 and 09356 (Table I)
IJQRM1989
1002
The data collected during field work referring to the quality of the consultancyservices as perceived by the companies were analysed following the principalcomponents method Although it is known that from the statistical point ofview it has the weakness of the size of data it has a great power when it is usedto compare with the Zeithaml et al (1993) model
In this way after the varimax rotation method was applied only three factorswith eigenvalues greater than 1 were obtained (Appendix 1) The contrastanalysis is correct the determinant of the correlation matrix is 1055E-5 and theKaiser-Meyer-Olkin measure is 0834 These three factors combine to explain the723 percent of the total of the variance Inter-item analysis was used to check thescales for internal consistency Analysis calculated a Cronbach coefficient alphaon the items within each factor The three factors have Cronbach alphas above075 and the standardized item alphas range from 076 to 093 These threeconstructs demonstrate good reliability
It can be deduced from the grouping of questions about perceived qualitysuggested by the factor analysis that a relative similitude exists to the genericmodel by Zeithaml et al (1993) Table II shows the dimensions of the Zeithamlet al model in the column headings The factors determined by the factoranalysis figure in the rows underneath Analysis of this Table shows therelationship between both forms of grouping the 14 questions on perceivedquality that figure on the questionnaire
Factor Description of items
1 Tangibles Personal appearance of staffVisual attractiveness of equipment in the consultancyClient-friendly software
2 Reliability Ability to perform the promised serviceFulfilment of commitments within the established time limitsCo-ordination between different company departmentsDetailed specification of aims of time limits
3 Responsiveness Willingness to help clientsEnthusiasm and involvement in the project
4 Assurance Ability to inspire trust and confidenceProfessional knowledge and expertise of consultants
5 Empathy Company concern for the best interests of the clientCommunication and interpersonal skills of the consultantClient satisfaction with consultation
Table IDistribution of the 14items surveyed inrelation to the differentdimensions of themodel proposed byZeithaml et al (1993)
Tangibles Reliability Responsiveness Assurance Empathy
1 2 3 4 5 6 7 8 9 10 11 12 13 14
Factor 1 X X X X X X X XFactor 2 X X XFactor 3 X X X
Table IIHigh saturations of thethree factors with theprincipal componentmethod with varimax
Quality serviceof ISO 9000consultants
1003
The three factors that define the perceived quality of ISO 9000 consultancyservice are the following
(1) Factor 1 Customer service assurance and empathy This factor refers toa set of aspects such as the consultantrsquos knowledge of the rulinginvolvement of the consultant in the client companyrsquos interests care andindividualised attention given by the consultant to the company theconsultantrsquos willingness to help and the climate of trust and confidencethat is transmitted to the client This first quality perception factor isgiven an average rating of 389 on a scale of 1 to 5
(2) Factor 2 Scheduling The scheduling factor represents the skills of theconsultants in completing the work within the agreed time periods Itrefers thus to the result of the service ie the obtaining of the certificatewithin the established budget and time period This factor should be asine qua non condition for good service because it is assumed that theproviders of a service must fulfil their promises On the whole clients donot give any extra credit to companies that honour their obligations butwhen this is not the case poorer quality in the service is detected herewith a 350 on the same scale This is an indication that this aspect of theservice should be significantly improved
(3) Factor 3 Tangibles This last factor refers to the office appearance tothe equipment used therein and even to the personal appearance of theconsultants The perception detected in this factor is rated at 362
A first conclusion to be drawn from the results is that the quality of the serviceis good Several additional factors also exist to bear out this statement
The arithmetic mean of the Likert scale ratings corresponding to the setof 14 questions on perceived quality is 375 This is considerably higherthan 3 the central value of the scale This can be taken as an indicator ofa good perception of quality while still however allowing forimprovement This assessment fully coincides with a question on` overall perception of the quality of the servicersquorsquo that received an averagerating of 369 thereby validating the results obtained
The statement `working with the consultant was a worthwhile experiencersquorsquois rated with an average of 380 This is not a direct question on qualitybut gives us an idea of the degree of satisfaction with the service received
The statement ` If I were to reinitiate the process I would choose thesame consultantrsquorsquo was rated at 355 It must be borne in mind here that 55percent of the companies have in fact returned to the same consultantafter receiving their certificate (not necessarily for quality-related tasks)This is a high index considering that the specific purpose of theintroduction process is fulfilled on obtaining certification If thecompanies continue to use the consultant after this point it would seemto indicate a high degree of satisfaction
IJQRM1989
1004
Another index of satisfaction with the service received is the intention touse the same consultant to adapt the company system to the new ISO90002000 standards A total of 77 per cent of the companies that intend touse a consultancy to update their systems will reuse the same service
Expectations of service given by quality consultantsCompany expectations of the services given by consultants were researched usingthe same methodology and analysing the same aspects and equivalent sets ofquestions to those already used to assess perceived quality in the same services
In the questionnaire a section was included in which 100 points should beassigned to the five dimensions balancing the importance of them
From the results obtained it can be observed that the most important of thefive dimensions defined by the Zeithaml et al model (1993) is considered to be` Reliabilityrsquorsquo (in which the consultant delivers the agreed service in an accurateand trustworthy manner) From a total of 100 points for all five dimensions` Reliabilityrsquorsquo received 28 points whereas `Tangiblesrsquorsquo were considered of lesserimportance and were only awarded 12 points However this same ` Reliabilityrsquorsquodimension most closely related to the ` Schedulingrsquorsquo factor coincides exactlywith the lowest rated factor in terms of service quality This points to an urgentneed for the consultants to improve this factor
On quantifying the level of quality expected from these services usinganother set of 14 questions equivalent to the previous set (on the same scale) thearithmetic mean is found to be 435 Thus expectations of the service are muchhigher than perceived quality of the same In short it is clear that the differencegenerated between the arithmetic mean of perceived quality of the service andexpectations of the same is ndash061 (ndash12 percent) Thus although a high perceptionof quality for services rendered by quality consultants was detected in theprevious section prior expectations of the same services were even higher
If we analyse the gap between expected quality and the quality that isactually perceived on the basis of the factors that define service quality asseen above it can be observed from Figure 2 that the gap is greatest in the` Schedulingrsquorsquo factor and least significant in the ` Tangiblesrsquorsquo factor
Figure 2Perceived qualityexpected quality and thegap betweenexpectations and qualityin each of the threefactors used to defineservice quality
Quality serviceof ISO 9000consultants
1005
In a nutshell we can conclude this part of the analysis by stating that althoughthe companies hold a good opinion of the quality of the advisory servicesreceived prior expectations of the same were considerably higher Thisconclusion shows that there is still room for improvement of the service offeredby quality consultants
Benefits obtained by clients of quality consultant servicesAfter analysing the quality offered by consultants and the expectations raised bythis type of service an analysis is made of the clientsrsquo perception of the benefitsdirectly derived from the consultantrsquos intervention Although it must beconsidered a priori that clients are not usually very sure about the value of theservice that they are engaging or the price that they are prepared to pay for it itcan be said that if this type of consultancy exists it is because clients think thatthey can obtain some benefits for which they are prepared to pay a fee Thesebenefits have been assessed by a set of 13 questions likewise answered on theLikert scale [15] as compiled in Table III The benefits considered are not merelyof an economic nature but include diverse factors such as increased motivation inworkers and improved relationships with customers and suppliers
Assessment of the results obtained shows that the arithmetic mean of allthese benefits is only 305 An overall assessment of the benefits gained fromuse of a consultant was obtained from one single question the response towhich gave the similar result of 317 In short both indicators coincide inhighlighting the fact that the companies did not perceive any benefits from theinput of the consultant
Items
Better understanding of quality as a result of working with an external consultant
Satisfaction with the skills provided by the consultants
Increased company motivation after working with external consultants
Adaptation of ethical approach after working with an external consultant
Definition and aims of quality policy following advice from the consultant
Definition of and approach to process following advice from the consultant
Improved approach to customers following advice from the consultant
Setting-up of beneficial relationships with customers andor suppliers following advice fromthe consultant
Setting-up of customer satisfaction control measures following advice from the consultant
Ideas for growth of company yield following advice from the consultant
Setting-up of continuous improvement scheme in the company following advice from theconsultant
Improved understanding of the relationship between the different processes and how tomanage the same in terms of a system
Improved decision taking based on data analysis following advice from the consultant
Table IIIItems analysed to assessthe benefits of workingwith a consultant when
introducing a qualitysystem
IJQRM1989
1006
From a factor analysis on extracting factors with the principal componentsand varimax rotation method two factors with eigenvalues higher than 1 areobtained (Appendix 2) The analysis is correct The determinant of thecorrelation matrix is 7162E-06 and the KMO measure is 0881 Moreover thetwo factors account for 70 percent of the variability of the sample
From the variables with the highest saturations in each factor we decided tocall the first factor ` Client approachrsquorsquo and the second factor ` Before the ruling isintroducedrsquorsquo This second factor includes all the benefits derived from the stepsprior to introduction definition of quality policy identification of aimsdefinition of procedures and improved understanding of quality
Table IV shows the grouping of the items related to benefits derived fromworking with a quality consultant
Relationship between perceived quality and benefits provided bythe consultantThe next step consisted of establishing the relationship between perceivedquality and the benefits obtained from using the service of a consultant Theresearch study detected and confirmed the relationship existing between thetwo concepts with different sets of statistics To summarise this relationshipwas analysed in two different ways first from questions eliciting an overallassessment on quality and benefits ie the analysis of the contingency tableresulting from the crossing of the two variables and second from the analysisof the relationship between the variables of mean quality and mean benefitscalculated as a mean from the corresponding sets of questions
Contingency Table V relating the two overall assessment variables on theLikert scale [15] is a 5 pound 5 square table In this respect the Pearson chi-squarestatistics and the likelihood ratio indicate the existence of a relationship
1 2 3 4 5 6 7 8 9 10 11 12 13
Factor 1 X X X X X X X X XFactor 2 X X X X
Table IVHigh saturation of thetwo factors with thePAF method withvarimax rotation
Value Freedom degree(Bilateral)
asymptotic sig
Pearsonrsquos chi-square 52979a 16 0000
Likelihood ratio 45709 16 0000
Linear by linear association 2712 1 0000
Number of valid cases 62
Note a22 cells (880 percent) have an expected frequency of less than 5 The minimumexpected frequency is 024
Table VContingency tablestatistic betweenoverall perceivedquality and overallbenefits
Quality serviceof ISO 9000consultants
1007
The association measurements that are normally used on an ordinal scale(Gamma = 0759 Kendallrsquos tau-b = 0563 and Somersrsquo d = 0562 each with a pvalue of 0000 in every case) also detect a relationship between the differentvariables A log-linear model was set up to explain the frequencies in thecontingency table cells and the saturated model was found to be the most suitablefor the purpose This model includes the interaction between the two variables
To sum up it has been statistically shown that the variables have a clearpositive correlation The higher the perceived quality the higher the benefitsand vice versa On the other hand and as a second way of detecting anddefining a relationship a linear regression was made between two variablesthat were calculated as the mean from the set of questions on perception andthe mean from the questions on benefits The analysis indicates that thevariables are correlated although the Pearson correlation coefficient is 0588with zero significance level (Figure 3)
Proceeding logically the very design of the variables enables the rank inboth cases to be [15] Both cases present variables of a linear combination ofseveral questions answered on the Likert scale [15] The relationship betweenthe variables can be clearly seen in Figure 3 Leaving the mean perceivedbenefit as an independent variable the linear regression has been calculated as
Mean Arithmetic Benefit ˆ 0456 Dagger 0702currenMean Perceived Quality
The slope of the regression is positive but less than the unit A unitary increasein quality does not result in a unitary increase in benefits but only in anincrease of seven-tenth The regression coefficient associated with thedependent variable obtained a zero significance level
Figure 3Scatter diagram of the
variables `meanperceived qualityrsquorsquo and
`mean benefitsrsquorsquo
IJQRM1989
1008
In summary the analyses point to the existence of a significant relationshipbetween the efforts of the consultant to provide a better quality service and theclientrsquos perception of improved benefits
Quality of consultant companies in relation to their sizeA study of the performance of consultant companies in relation to their sizewas made on the basis of the collected data The sample was divided into fourcategories companies that engaged the services of a single independentconsultant companies that used consultancies with a staff of between twoand five consultants companies that used consultancies with a staff ofbetween six and 50 consultants and lastly companies that used consultancieswith a staff of over 50 consultants The results of this segmentation can beseen in Figure 4
It was observed that the quality of the service is related to the size of theconsultant company the larger the company the better the service The bigconsultant companies obtain a significantly higher quality rating than thesmaller companies Whereas small companies (with two to fiveconsultants) obtain an average rating of 339 the average rating of theconsultancies with a staff of over 50 employees stands at 443 Thisrepresents a large difference of over one point It is noteworthy howeverthat professional consultants working independently offer a high qualityservice and score a rating that is closer to that of the large consultanciesthan the small ones
There also seems to be a negative relationship between the expectations ofthe client company and the number of workers employed by the consultantcompany However this does not carry any statistical significance
In the case of consultants working alone as independent professionalsexpectations of the service and perceived quality of the same are both veryhigh On the other hand although their clients have lower expectations thelarge consultant companies offer the best quality service In this case indeedperceived quality is higher than expectations
Figure 4Perceived qualityexpectations gap andbenefits in relation to thesize of the consultancy
Quality serviceof ISO 9000consultants
1009
On the other hand similar results are found when the benefits from using aconsultant are analysed according to the size of the consultant company Smallcompanies (between two and five consultants) provide the fewest benefits fortheir clients with an average rating of 288 whereas the large companies obtainan average rating of 313 Once again it is noted that independent professionalconsultants follow a different pattern and obtain the highest ratings of all Allthese relationships are statistically significant as shown by the Kruskal-Wallistest carried out by grouping the variables according to the size of theconsultant companies (Table VI)
The perceived quality and the gap between expectations and perceptionboth present significantly different averages with a significance level of 005
In a parallel manner the performance of the variables of qualityexpectations and benefits was analysed in relation to the size of the clientcompany In short no statistically significant relationship was detectedbetween these variables and the size of the client company in terms of numberof employees
Cost of consultant servicesIt is difficult to assess the benefits obtained from a consultant service withouttaking into consideration the cost of the same For this reason it wasconsidered appropriate to analyse the questionnaire data in terms of the costsinvolved In brief it can be concluded from an analysis of the data that theseservices are not expensive An assessment of the fees charged gives thelowest rating of the whole questionnaire data ie 272 This value is lowerthan the average value of the scale thus indicating a slight variance with theabove statement
Companies invested few resources in the introduction of the ruling It wasfound that 62 percent of the sample invested less than 15000 Euro Among thecompanies that engaged the services of a consultant the corresponding feesamounted to 48 percent of the total cost of introduction In most cases (77percent) the consultantrsquos fees are stipulated right from the beginning It can beassumed that the consultancies are so familiar with their service that they canmake an initial estimate of the cost of introducing the ruling with a high degreeof precision This type of service has been steadily growing ever since it was
Mean perceived
quality
Mean
expectations
Non-weighted
quality gap
Arithmetic mean
benefits 13 items
Chi-square 1465 1913 1411 1890
Freedom degree 3 3 3 3
Asymptotic sig 0002 0591 0003 0596
Notes aKruskal-Wallis test bGrouping variable number of consultants
Table VIKruskal-Wallis test
statistics for thevariables `perceived
qualityrsquorsquo ` expectationsrsquorsquo` gap between
expectations andperceived qualityrsquorsquo and`mean benefitsrsquorsquo when
grouped by ` number ofconsultantsrsquorsquo
IJQRM1989
1010
started a decade ago and can therefore be considered as standard (MartotildeAcircnez etal 2000) Moreover it is interesting to note that the offer of the service has alsoincreased which has resulted in a corresponding price adjustment
ConclusionsOne of the characteristics that differentiates a service from a product ormaterial goods is that the service is sold first and later `manufacturedrsquorsquoMoreover the production and consumption of the service are simultaneous iea service cannot be stored Thus the overall assessment of the client springsfrom two sources the end result of the service and the very process by whichthe service is provided (Berry 1995)
For these reasons the assessment of the quality of a service is not an easytask and as pointed out by Groth and Dye (1999) the providers of a serviceshould bear in mind this dual aspect by which a service is appraised Thereforethey should be able to recognise the different degrees by which the service itselfand the provision of the service are being assessed Despite this we consider itimportant to assess these services from the point of view of the client companyas has been done in the present research study
From all this we can draw the overall conclusion that the ISO 9000 advisoryservices are favourably regarded on the whole However it should also benoted that clients expect an even higher quality In short the client companiesexpect a higher quality from the service than that which is actually provided
It has been shown that the concept of quality can be broken down intothree factors one of which is the skill of the consultant in introducing theruling within the agreed time period and this is the aspect of the service thatobtains the poorest quality rating This factor is closely linked to thereliability factor which is considered to be of the highest importance by theclient companies For this reason the most reiterated request forimprovement by the clients is that the consultants perform the required taskswithin the agreed time periods
Moreover the results of the study show that the performance of independentprofessional consultants is very different from that of small consultantcompanies Independent consultants offer a high quality service that lives up tothe very high expectations of their clients The benefits that these clients gainfrom working with a consultant are also perceived as very high
During this work it has been noted that the quality offered by consultantcompanies that employ a staff of professionals varies according to the sizeof the company The benefits perceived by their clients are very similar tobut are slightly higher than those perceived by companies employing largeconsultancies
Finally although we realise that our study relates to only one region ofEurope we believe that our findings have broader implications for researchersand practitioners Thus we guess that it would be interesting to carry outsimilar surveys in other European and US regions For practitioners ourfindings should give pause for thought We guess that these findings are very
Quality serviceof ISO 9000consultants
1011
interesting in order to improve their service and that they should somehowmeasure and control their service quality We really think that for all theprofessionals working in the quality field a quality service should be a realNo 1 purpose
References
Berry L (1995) MaAcircs allaAcirc de la excelencia en el servicio Un plan para la accioAcircn DeustoPublications
Brown A and Van der Wiele T (1995) ` Industry experience with ISO 9000rsquorsquo Asia PacificJournal of Quality Management Vol 4 No 2 pp 8-17
Buttle F (1997) ` ISO 9000 marketing motivations and benefitsrsquorsquo International Journal of Qualityamp Reliability Management Vol 14 No 9 pp 936-47
CasadesuAcircs M (1998) ` La normativa de aseguramiento de la calidad ISO 9000 en CatalunAumlaexpectativas y efectos Estudio empotildeAcircricorsquorsquo Research project CICYT Reference SEC96-1005
CasadesuAcircs M and GimeAcircnez G (2000) ` The benefits of the implementation of the ISO 9000standard empirical researchin 288 Spanish companiesrsquorsquo The TQM Magazine Vol 12 No 6
Escanciano C (2000) ` Influencia de la certificacioAcircn ISO 9000 en el avance de la empresa espanAumlolahacia la calidad totalrsquorsquo paper presented at the 1st World Conference on Production andOperations Management (POM) Seville
Groth JC and Dye RT (1999) ` Service quality perceived value expectations shortfalls andbonusesrsquorsquo Managing Service Quality Vol 9 No 4
ISO (2000) available at wwwisochisoeniso9000-14000pdfsurvey9pdf
Jones R Arndt G and Kustin R (1997) ` ISO 9000 among Australian companies impact of timeand reasons for seeking certification on perceptions of benefits receivedrsquorsquo InternationalJournal of Quality amp Reliability Management Vol 14 No 7
Lloydrsquos Register Quality Assurance Ltd (1994) BS 5750 ISO 9000 ndash Setting Standards forBetter Business Lloydrsquos Register Quality Assurance Services Ltd Croydon
MartotildeAcircnez C et al (2000) `Analysis of the implementation of ISO 9000 quality assurancesystemsrsquorsquo Work Study Vol 49 No 6
Meegan ST and Taylor WA (1997) ` Factors influencing a successful transition from ISO 9000to TQM The influence of understanding and motivationrsquorsquo International Journal of Qualityamp Reliability Management Vol 14 No 2
Nachum L (1999) `Measurement of productivity of professional services an illustration ofSwedish management consulting firmsrsquorsquo International Journal of Operations amp ProductionManagement Vol 19 No 9
Phillips J (2000) The Consultantrsquos Scorecard McGraw Hill New York NY
Ribeiro D (1996) ` ConsultorotildeAcirca para la direccioAcircn en organizacioAcircn calidad marketing yestrategiarsquorsquo doctoral thesis University of Valencia Valencia
Samson D and Parker R (1994) ` Service quality the gap in the Australian consulting engineeringindustryrsquorsquo International Journal of Quality amp Reliability Management Vol 11 No 7
Vanguard Consulting Ltd (1994) `BS 5750ISO 9000EN 29000 1987 a positive contribution tobetter businessrsquorsquo The TQM Magazine Vol 11 No 2 p 60
Vloeberghs D and Bellens J (1996) ` Implementing the ISO 9000 standardsrsquorsquo Quality ProgressVol 29 No 6 pp 43-8
Zeithaml VA Parasuraman A and Berry L (1993) Calidad total en la gestioAcircn de los serviciosDotildeAcircaz de Santos
IJQRM1989
1012
Appendix 1
Tot
alvar
iance
expla
ined
Init
ial
eigen
val
ues
Extr
acti
onsu
ms
ofsq
uar
edlo
adin
gs
Rot
atio
nsu
ms
ofsq
uar
edlo
adin
gs
Com
pon
ents
Tot
alP
erce
nt
ofvar
iance
Cum
ula
tive
per
cent
Tot
alP
erce
nt
ofvar
iance
Cum
ula
tive
per
cent
Tot
alP
erce
nt
ofvar
iance
Cum
ula
tive
per
cent
17
7255
20
552
07
7255
20
552
04
8434
58
345
82
136
971
649
21
369
7164
92
306
219
156
50
31
037
3972
31
103
739
723
12
2115
81
723
14
073
521
775
25
068
486
823
86
061
435
867
47
039
279
895
38
035
255
920
99
031
224
943
310
022
162
959
511
019
137
973
312
015
107
984
013
014
105
994
614
007
053
100
0
Note
sE
xtr
acti
onm
ethod
P
rinci
pal
com
pon
ent
anal
ysi
sC
ompon
ent
Rot
ated
com
pon
ent
mat
rix
a
12
3b12
084
10
264
b11
079
60
346
b13
079
00
407
b10
076
80
383
025
1b8
075
30
340
b9
072
40
426
b14
061
70
446
029
7b4
060
80
470
032
0b6
085
1b5
079
4b7
034
40
573
034
3b1
086
7b3
042
50
415
063
5b2
025
30
513
057
2
Note
sE
xtra
ctio
nm
etho
dpr
inci
pal
com
pone
ntan
alys
isR
otat
ion
met
hod
Var
imax
with
Kai
ser
norm
aliz
atio
naR
otat
ion
conv
erge
din
six
inte
ratio
ns
Table AIFactorial analysis ofthe perceived qualityPrincipal componentsmethod with varimaxrotation
Quality serviceof ISO 9000consultants
1013
Appendix 2T
otal
var
iance
expla
ined
Init
ial
eigen
val
ues
Extr
acti
onsu
ms
ofsq
uar
edlo
adin
gs
Rot
atio
nsu
ms
ofsq
uar
edlo
adin
gs
Com
pon
ents
Tot
alP
erce
nt
ofvar
iance
Cum
ula
tive
per
cent
Tot
alP
erce
nt
ofvar
iance
Cum
ula
tive
per
cent
Tot
alP
erce
nt
ofvar
iance
Cum
ula
tive
per
cent
18
219
632
2263
222
821
963
222
632
225
245
403
4940
349
20
894
687
570
097
089
46
875
700
973
867
297
4870
097
30
791
608
876
185
40
746
573
581
920
50
483
371
385
633
60
410
315
588
788
70
337
259
491
383
80
319
245
093
833
90
236
181
495
647
100
182
140
197
048
110
158
121
798
265
120
149
114
399
408
130
077
059
210
00
Note
sE
xtr
acti
onm
ethod
P
rinci
pal
com
pon
ent
anal
ysi
sC
ompon
ent
Rot
ated
com
pon
ent
mat
rix
a
12
d9
091
1d8
079
40
288
d3
073
60
375
d10
071
50
418
d11
069
00
523
d7
067
60
462
d13
063
50
484
d2
061
40
523
d12
057
50
560
d1
085
4d6
037
70
767
d5
040
30
675
d4
060
40
608
Note
sE
xtra
ctio
nm
etho
dpr
inci
pal
com
ponen
tan
alys
isR
otat
ion
met
hod
Var
imax
with
Kai
ser
norm
aliz
atio
naR
otat
ion
conv
erge
din
thre
eiter
atio
n
Table AIIFactoral analysis of the
obtained benefitsPrincipal componentsmethod with varimax
rotation
Quality serviceof ISO 9000consultants
1001
were obtained representing a response rate of 18 percent of which 65 camefrom companies that had used consultancies to introduce their quality systemThe population on which the research was carried out is less than 1670companies this being the total number of certificates issued over the sampleperiod in Catalonia It must also be borne in mind that many companies holdmore than one certificate For these reasons with a confidence interval of 95percent (working on the hypothesis that p = q = 05) the margin of error for thesample is 1025 percent Likewise for the companies that employedconsultancies taking the same population into consideration the margin oferror for the sample is less than 119 percent
Perceived quality of the quality consultant servicesIn their well-known model the authors Zeithaml et al (1993) distinguish fivedifferent dimensions that define the quality of a given service
(1) Tangibles appearance of the physical facilities equipment personneland communication equipment
(2) Reliability ability to perform the promised service dependably andaccurately
(3) Responsiveness willingness to help clients and provide prompt service
(4) Assurance knowledge and courtesy of employees and their ability toinspire trust and confidence
(5) Empathy caring individualised attention the firm offers its clients
The quality of the service as perceived by clients will be derived fromcomparing their prior expectations of the service with their appreciation of theactual service provided in such a way that a given service will be consideredexcellent for the client when the benefit exceeds prior expectations acceptablewhen the benefit lives up to the clientrsquos expectations and deficient when theservice is poorer than expected
In order to determine the perceived quality in each dimension theSERVQUAL questionnaire was used with a total of 14 questions in all Itshould be noted however that we adapted these questions to ourcircumstances following guidelines laid down by different questionnaires usedin other empirical studies To this end the following studies should bementioned research by Samson and Parker (1994) into the engineeringconsultancy industry in Australia research by Ribeiro (1996) into theconsultancy sector in Valencia the study by CasadesuAcircs (1998) of theintroduction of ISO 9000 into Catalonia and a paper by Escanciano (2000) onquality systems in Spain Table I shows the grouping of the different questionsor items in each of the dimensions of the survey This aggregation was made ` apriorirsquorsquo although there was no mention of dimensions in the questionnaire
The reliability of the data was examined for the 14 perception-item using thealpha of Cronbach the standard value is 09355 and the 14 alphas obtainedwhen one of the items is deleted are all between 09271 and 09356 (Table I)
IJQRM1989
1002
The data collected during field work referring to the quality of the consultancyservices as perceived by the companies were analysed following the principalcomponents method Although it is known that from the statistical point ofview it has the weakness of the size of data it has a great power when it is usedto compare with the Zeithaml et al (1993) model
In this way after the varimax rotation method was applied only three factorswith eigenvalues greater than 1 were obtained (Appendix 1) The contrastanalysis is correct the determinant of the correlation matrix is 1055E-5 and theKaiser-Meyer-Olkin measure is 0834 These three factors combine to explain the723 percent of the total of the variance Inter-item analysis was used to check thescales for internal consistency Analysis calculated a Cronbach coefficient alphaon the items within each factor The three factors have Cronbach alphas above075 and the standardized item alphas range from 076 to 093 These threeconstructs demonstrate good reliability
It can be deduced from the grouping of questions about perceived qualitysuggested by the factor analysis that a relative similitude exists to the genericmodel by Zeithaml et al (1993) Table II shows the dimensions of the Zeithamlet al model in the column headings The factors determined by the factoranalysis figure in the rows underneath Analysis of this Table shows therelationship between both forms of grouping the 14 questions on perceivedquality that figure on the questionnaire
Factor Description of items
1 Tangibles Personal appearance of staffVisual attractiveness of equipment in the consultancyClient-friendly software
2 Reliability Ability to perform the promised serviceFulfilment of commitments within the established time limitsCo-ordination between different company departmentsDetailed specification of aims of time limits
3 Responsiveness Willingness to help clientsEnthusiasm and involvement in the project
4 Assurance Ability to inspire trust and confidenceProfessional knowledge and expertise of consultants
5 Empathy Company concern for the best interests of the clientCommunication and interpersonal skills of the consultantClient satisfaction with consultation
Table IDistribution of the 14items surveyed inrelation to the differentdimensions of themodel proposed byZeithaml et al (1993)
Tangibles Reliability Responsiveness Assurance Empathy
1 2 3 4 5 6 7 8 9 10 11 12 13 14
Factor 1 X X X X X X X XFactor 2 X X XFactor 3 X X X
Table IIHigh saturations of thethree factors with theprincipal componentmethod with varimax
Quality serviceof ISO 9000consultants
1003
The three factors that define the perceived quality of ISO 9000 consultancyservice are the following
(1) Factor 1 Customer service assurance and empathy This factor refers toa set of aspects such as the consultantrsquos knowledge of the rulinginvolvement of the consultant in the client companyrsquos interests care andindividualised attention given by the consultant to the company theconsultantrsquos willingness to help and the climate of trust and confidencethat is transmitted to the client This first quality perception factor isgiven an average rating of 389 on a scale of 1 to 5
(2) Factor 2 Scheduling The scheduling factor represents the skills of theconsultants in completing the work within the agreed time periods Itrefers thus to the result of the service ie the obtaining of the certificatewithin the established budget and time period This factor should be asine qua non condition for good service because it is assumed that theproviders of a service must fulfil their promises On the whole clients donot give any extra credit to companies that honour their obligations butwhen this is not the case poorer quality in the service is detected herewith a 350 on the same scale This is an indication that this aspect of theservice should be significantly improved
(3) Factor 3 Tangibles This last factor refers to the office appearance tothe equipment used therein and even to the personal appearance of theconsultants The perception detected in this factor is rated at 362
A first conclusion to be drawn from the results is that the quality of the serviceis good Several additional factors also exist to bear out this statement
The arithmetic mean of the Likert scale ratings corresponding to the setof 14 questions on perceived quality is 375 This is considerably higherthan 3 the central value of the scale This can be taken as an indicator ofa good perception of quality while still however allowing forimprovement This assessment fully coincides with a question on` overall perception of the quality of the servicersquorsquo that received an averagerating of 369 thereby validating the results obtained
The statement `working with the consultant was a worthwhile experiencersquorsquois rated with an average of 380 This is not a direct question on qualitybut gives us an idea of the degree of satisfaction with the service received
The statement ` If I were to reinitiate the process I would choose thesame consultantrsquorsquo was rated at 355 It must be borne in mind here that 55percent of the companies have in fact returned to the same consultantafter receiving their certificate (not necessarily for quality-related tasks)This is a high index considering that the specific purpose of theintroduction process is fulfilled on obtaining certification If thecompanies continue to use the consultant after this point it would seemto indicate a high degree of satisfaction
IJQRM1989
1004
Another index of satisfaction with the service received is the intention touse the same consultant to adapt the company system to the new ISO90002000 standards A total of 77 per cent of the companies that intend touse a consultancy to update their systems will reuse the same service
Expectations of service given by quality consultantsCompany expectations of the services given by consultants were researched usingthe same methodology and analysing the same aspects and equivalent sets ofquestions to those already used to assess perceived quality in the same services
In the questionnaire a section was included in which 100 points should beassigned to the five dimensions balancing the importance of them
From the results obtained it can be observed that the most important of thefive dimensions defined by the Zeithaml et al model (1993) is considered to be` Reliabilityrsquorsquo (in which the consultant delivers the agreed service in an accurateand trustworthy manner) From a total of 100 points for all five dimensions` Reliabilityrsquorsquo received 28 points whereas `Tangiblesrsquorsquo were considered of lesserimportance and were only awarded 12 points However this same ` Reliabilityrsquorsquodimension most closely related to the ` Schedulingrsquorsquo factor coincides exactlywith the lowest rated factor in terms of service quality This points to an urgentneed for the consultants to improve this factor
On quantifying the level of quality expected from these services usinganother set of 14 questions equivalent to the previous set (on the same scale) thearithmetic mean is found to be 435 Thus expectations of the service are muchhigher than perceived quality of the same In short it is clear that the differencegenerated between the arithmetic mean of perceived quality of the service andexpectations of the same is ndash061 (ndash12 percent) Thus although a high perceptionof quality for services rendered by quality consultants was detected in theprevious section prior expectations of the same services were even higher
If we analyse the gap between expected quality and the quality that isactually perceived on the basis of the factors that define service quality asseen above it can be observed from Figure 2 that the gap is greatest in the` Schedulingrsquorsquo factor and least significant in the ` Tangiblesrsquorsquo factor
Figure 2Perceived qualityexpected quality and thegap betweenexpectations and qualityin each of the threefactors used to defineservice quality
Quality serviceof ISO 9000consultants
1005
In a nutshell we can conclude this part of the analysis by stating that althoughthe companies hold a good opinion of the quality of the advisory servicesreceived prior expectations of the same were considerably higher Thisconclusion shows that there is still room for improvement of the service offeredby quality consultants
Benefits obtained by clients of quality consultant servicesAfter analysing the quality offered by consultants and the expectations raised bythis type of service an analysis is made of the clientsrsquo perception of the benefitsdirectly derived from the consultantrsquos intervention Although it must beconsidered a priori that clients are not usually very sure about the value of theservice that they are engaging or the price that they are prepared to pay for it itcan be said that if this type of consultancy exists it is because clients think thatthey can obtain some benefits for which they are prepared to pay a fee Thesebenefits have been assessed by a set of 13 questions likewise answered on theLikert scale [15] as compiled in Table III The benefits considered are not merelyof an economic nature but include diverse factors such as increased motivation inworkers and improved relationships with customers and suppliers
Assessment of the results obtained shows that the arithmetic mean of allthese benefits is only 305 An overall assessment of the benefits gained fromuse of a consultant was obtained from one single question the response towhich gave the similar result of 317 In short both indicators coincide inhighlighting the fact that the companies did not perceive any benefits from theinput of the consultant
Items
Better understanding of quality as a result of working with an external consultant
Satisfaction with the skills provided by the consultants
Increased company motivation after working with external consultants
Adaptation of ethical approach after working with an external consultant
Definition and aims of quality policy following advice from the consultant
Definition of and approach to process following advice from the consultant
Improved approach to customers following advice from the consultant
Setting-up of beneficial relationships with customers andor suppliers following advice fromthe consultant
Setting-up of customer satisfaction control measures following advice from the consultant
Ideas for growth of company yield following advice from the consultant
Setting-up of continuous improvement scheme in the company following advice from theconsultant
Improved understanding of the relationship between the different processes and how tomanage the same in terms of a system
Improved decision taking based on data analysis following advice from the consultant
Table IIIItems analysed to assessthe benefits of workingwith a consultant when
introducing a qualitysystem
IJQRM1989
1006
From a factor analysis on extracting factors with the principal componentsand varimax rotation method two factors with eigenvalues higher than 1 areobtained (Appendix 2) The analysis is correct The determinant of thecorrelation matrix is 7162E-06 and the KMO measure is 0881 Moreover thetwo factors account for 70 percent of the variability of the sample
From the variables with the highest saturations in each factor we decided tocall the first factor ` Client approachrsquorsquo and the second factor ` Before the ruling isintroducedrsquorsquo This second factor includes all the benefits derived from the stepsprior to introduction definition of quality policy identification of aimsdefinition of procedures and improved understanding of quality
Table IV shows the grouping of the items related to benefits derived fromworking with a quality consultant
Relationship between perceived quality and benefits provided bythe consultantThe next step consisted of establishing the relationship between perceivedquality and the benefits obtained from using the service of a consultant Theresearch study detected and confirmed the relationship existing between thetwo concepts with different sets of statistics To summarise this relationshipwas analysed in two different ways first from questions eliciting an overallassessment on quality and benefits ie the analysis of the contingency tableresulting from the crossing of the two variables and second from the analysisof the relationship between the variables of mean quality and mean benefitscalculated as a mean from the corresponding sets of questions
Contingency Table V relating the two overall assessment variables on theLikert scale [15] is a 5 pound 5 square table In this respect the Pearson chi-squarestatistics and the likelihood ratio indicate the existence of a relationship
1 2 3 4 5 6 7 8 9 10 11 12 13
Factor 1 X X X X X X X X XFactor 2 X X X X
Table IVHigh saturation of thetwo factors with thePAF method withvarimax rotation
Value Freedom degree(Bilateral)
asymptotic sig
Pearsonrsquos chi-square 52979a 16 0000
Likelihood ratio 45709 16 0000
Linear by linear association 2712 1 0000
Number of valid cases 62
Note a22 cells (880 percent) have an expected frequency of less than 5 The minimumexpected frequency is 024
Table VContingency tablestatistic betweenoverall perceivedquality and overallbenefits
Quality serviceof ISO 9000consultants
1007
The association measurements that are normally used on an ordinal scale(Gamma = 0759 Kendallrsquos tau-b = 0563 and Somersrsquo d = 0562 each with a pvalue of 0000 in every case) also detect a relationship between the differentvariables A log-linear model was set up to explain the frequencies in thecontingency table cells and the saturated model was found to be the most suitablefor the purpose This model includes the interaction between the two variables
To sum up it has been statistically shown that the variables have a clearpositive correlation The higher the perceived quality the higher the benefitsand vice versa On the other hand and as a second way of detecting anddefining a relationship a linear regression was made between two variablesthat were calculated as the mean from the set of questions on perception andthe mean from the questions on benefits The analysis indicates that thevariables are correlated although the Pearson correlation coefficient is 0588with zero significance level (Figure 3)
Proceeding logically the very design of the variables enables the rank inboth cases to be [15] Both cases present variables of a linear combination ofseveral questions answered on the Likert scale [15] The relationship betweenthe variables can be clearly seen in Figure 3 Leaving the mean perceivedbenefit as an independent variable the linear regression has been calculated as
Mean Arithmetic Benefit ˆ 0456 Dagger 0702currenMean Perceived Quality
The slope of the regression is positive but less than the unit A unitary increasein quality does not result in a unitary increase in benefits but only in anincrease of seven-tenth The regression coefficient associated with thedependent variable obtained a zero significance level
Figure 3Scatter diagram of the
variables `meanperceived qualityrsquorsquo and
`mean benefitsrsquorsquo
IJQRM1989
1008
In summary the analyses point to the existence of a significant relationshipbetween the efforts of the consultant to provide a better quality service and theclientrsquos perception of improved benefits
Quality of consultant companies in relation to their sizeA study of the performance of consultant companies in relation to their sizewas made on the basis of the collected data The sample was divided into fourcategories companies that engaged the services of a single independentconsultant companies that used consultancies with a staff of between twoand five consultants companies that used consultancies with a staff ofbetween six and 50 consultants and lastly companies that used consultancieswith a staff of over 50 consultants The results of this segmentation can beseen in Figure 4
It was observed that the quality of the service is related to the size of theconsultant company the larger the company the better the service The bigconsultant companies obtain a significantly higher quality rating than thesmaller companies Whereas small companies (with two to fiveconsultants) obtain an average rating of 339 the average rating of theconsultancies with a staff of over 50 employees stands at 443 Thisrepresents a large difference of over one point It is noteworthy howeverthat professional consultants working independently offer a high qualityservice and score a rating that is closer to that of the large consultanciesthan the small ones
There also seems to be a negative relationship between the expectations ofthe client company and the number of workers employed by the consultantcompany However this does not carry any statistical significance
In the case of consultants working alone as independent professionalsexpectations of the service and perceived quality of the same are both veryhigh On the other hand although their clients have lower expectations thelarge consultant companies offer the best quality service In this case indeedperceived quality is higher than expectations
Figure 4Perceived qualityexpectations gap andbenefits in relation to thesize of the consultancy
Quality serviceof ISO 9000consultants
1009
On the other hand similar results are found when the benefits from using aconsultant are analysed according to the size of the consultant company Smallcompanies (between two and five consultants) provide the fewest benefits fortheir clients with an average rating of 288 whereas the large companies obtainan average rating of 313 Once again it is noted that independent professionalconsultants follow a different pattern and obtain the highest ratings of all Allthese relationships are statistically significant as shown by the Kruskal-Wallistest carried out by grouping the variables according to the size of theconsultant companies (Table VI)
The perceived quality and the gap between expectations and perceptionboth present significantly different averages with a significance level of 005
In a parallel manner the performance of the variables of qualityexpectations and benefits was analysed in relation to the size of the clientcompany In short no statistically significant relationship was detectedbetween these variables and the size of the client company in terms of numberof employees
Cost of consultant servicesIt is difficult to assess the benefits obtained from a consultant service withouttaking into consideration the cost of the same For this reason it wasconsidered appropriate to analyse the questionnaire data in terms of the costsinvolved In brief it can be concluded from an analysis of the data that theseservices are not expensive An assessment of the fees charged gives thelowest rating of the whole questionnaire data ie 272 This value is lowerthan the average value of the scale thus indicating a slight variance with theabove statement
Companies invested few resources in the introduction of the ruling It wasfound that 62 percent of the sample invested less than 15000 Euro Among thecompanies that engaged the services of a consultant the corresponding feesamounted to 48 percent of the total cost of introduction In most cases (77percent) the consultantrsquos fees are stipulated right from the beginning It can beassumed that the consultancies are so familiar with their service that they canmake an initial estimate of the cost of introducing the ruling with a high degreeof precision This type of service has been steadily growing ever since it was
Mean perceived
quality
Mean
expectations
Non-weighted
quality gap
Arithmetic mean
benefits 13 items
Chi-square 1465 1913 1411 1890
Freedom degree 3 3 3 3
Asymptotic sig 0002 0591 0003 0596
Notes aKruskal-Wallis test bGrouping variable number of consultants
Table VIKruskal-Wallis test
statistics for thevariables `perceived
qualityrsquorsquo ` expectationsrsquorsquo` gap between
expectations andperceived qualityrsquorsquo and`mean benefitsrsquorsquo when
grouped by ` number ofconsultantsrsquorsquo
IJQRM1989
1010
started a decade ago and can therefore be considered as standard (MartotildeAcircnez etal 2000) Moreover it is interesting to note that the offer of the service has alsoincreased which has resulted in a corresponding price adjustment
ConclusionsOne of the characteristics that differentiates a service from a product ormaterial goods is that the service is sold first and later `manufacturedrsquorsquoMoreover the production and consumption of the service are simultaneous iea service cannot be stored Thus the overall assessment of the client springsfrom two sources the end result of the service and the very process by whichthe service is provided (Berry 1995)
For these reasons the assessment of the quality of a service is not an easytask and as pointed out by Groth and Dye (1999) the providers of a serviceshould bear in mind this dual aspect by which a service is appraised Thereforethey should be able to recognise the different degrees by which the service itselfand the provision of the service are being assessed Despite this we consider itimportant to assess these services from the point of view of the client companyas has been done in the present research study
From all this we can draw the overall conclusion that the ISO 9000 advisoryservices are favourably regarded on the whole However it should also benoted that clients expect an even higher quality In short the client companiesexpect a higher quality from the service than that which is actually provided
It has been shown that the concept of quality can be broken down intothree factors one of which is the skill of the consultant in introducing theruling within the agreed time period and this is the aspect of the service thatobtains the poorest quality rating This factor is closely linked to thereliability factor which is considered to be of the highest importance by theclient companies For this reason the most reiterated request forimprovement by the clients is that the consultants perform the required taskswithin the agreed time periods
Moreover the results of the study show that the performance of independentprofessional consultants is very different from that of small consultantcompanies Independent consultants offer a high quality service that lives up tothe very high expectations of their clients The benefits that these clients gainfrom working with a consultant are also perceived as very high
During this work it has been noted that the quality offered by consultantcompanies that employ a staff of professionals varies according to the sizeof the company The benefits perceived by their clients are very similar tobut are slightly higher than those perceived by companies employing largeconsultancies
Finally although we realise that our study relates to only one region ofEurope we believe that our findings have broader implications for researchersand practitioners Thus we guess that it would be interesting to carry outsimilar surveys in other European and US regions For practitioners ourfindings should give pause for thought We guess that these findings are very
Quality serviceof ISO 9000consultants
1011
interesting in order to improve their service and that they should somehowmeasure and control their service quality We really think that for all theprofessionals working in the quality field a quality service should be a realNo 1 purpose
References
Berry L (1995) MaAcircs allaAcirc de la excelencia en el servicio Un plan para la accioAcircn DeustoPublications
Brown A and Van der Wiele T (1995) ` Industry experience with ISO 9000rsquorsquo Asia PacificJournal of Quality Management Vol 4 No 2 pp 8-17
Buttle F (1997) ` ISO 9000 marketing motivations and benefitsrsquorsquo International Journal of Qualityamp Reliability Management Vol 14 No 9 pp 936-47
CasadesuAcircs M (1998) ` La normativa de aseguramiento de la calidad ISO 9000 en CatalunAumlaexpectativas y efectos Estudio empotildeAcircricorsquorsquo Research project CICYT Reference SEC96-1005
CasadesuAcircs M and GimeAcircnez G (2000) ` The benefits of the implementation of the ISO 9000standard empirical researchin 288 Spanish companiesrsquorsquo The TQM Magazine Vol 12 No 6
Escanciano C (2000) ` Influencia de la certificacioAcircn ISO 9000 en el avance de la empresa espanAumlolahacia la calidad totalrsquorsquo paper presented at the 1st World Conference on Production andOperations Management (POM) Seville
Groth JC and Dye RT (1999) ` Service quality perceived value expectations shortfalls andbonusesrsquorsquo Managing Service Quality Vol 9 No 4
ISO (2000) available at wwwisochisoeniso9000-14000pdfsurvey9pdf
Jones R Arndt G and Kustin R (1997) ` ISO 9000 among Australian companies impact of timeand reasons for seeking certification on perceptions of benefits receivedrsquorsquo InternationalJournal of Quality amp Reliability Management Vol 14 No 7
Lloydrsquos Register Quality Assurance Ltd (1994) BS 5750 ISO 9000 ndash Setting Standards forBetter Business Lloydrsquos Register Quality Assurance Services Ltd Croydon
MartotildeAcircnez C et al (2000) `Analysis of the implementation of ISO 9000 quality assurancesystemsrsquorsquo Work Study Vol 49 No 6
Meegan ST and Taylor WA (1997) ` Factors influencing a successful transition from ISO 9000to TQM The influence of understanding and motivationrsquorsquo International Journal of Qualityamp Reliability Management Vol 14 No 2
Nachum L (1999) `Measurement of productivity of professional services an illustration ofSwedish management consulting firmsrsquorsquo International Journal of Operations amp ProductionManagement Vol 19 No 9
Phillips J (2000) The Consultantrsquos Scorecard McGraw Hill New York NY
Ribeiro D (1996) ` ConsultorotildeAcirca para la direccioAcircn en organizacioAcircn calidad marketing yestrategiarsquorsquo doctoral thesis University of Valencia Valencia
Samson D and Parker R (1994) ` Service quality the gap in the Australian consulting engineeringindustryrsquorsquo International Journal of Quality amp Reliability Management Vol 11 No 7
Vanguard Consulting Ltd (1994) `BS 5750ISO 9000EN 29000 1987 a positive contribution tobetter businessrsquorsquo The TQM Magazine Vol 11 No 2 p 60
Vloeberghs D and Bellens J (1996) ` Implementing the ISO 9000 standardsrsquorsquo Quality ProgressVol 29 No 6 pp 43-8
Zeithaml VA Parasuraman A and Berry L (1993) Calidad total en la gestioAcircn de los serviciosDotildeAcircaz de Santos
IJQRM1989
1012
Appendix 1
Tot
alvar
iance
expla
ined
Init
ial
eigen
val
ues
Extr
acti
onsu
ms
ofsq
uar
edlo
adin
gs
Rot
atio
nsu
ms
ofsq
uar
edlo
adin
gs
Com
pon
ents
Tot
alP
erce
nt
ofvar
iance
Cum
ula
tive
per
cent
Tot
alP
erce
nt
ofvar
iance
Cum
ula
tive
per
cent
Tot
alP
erce
nt
ofvar
iance
Cum
ula
tive
per
cent
17
7255
20
552
07
7255
20
552
04
8434
58
345
82
136
971
649
21
369
7164
92
306
219
156
50
31
037
3972
31
103
739
723
12
2115
81
723
14
073
521
775
25
068
486
823
86
061
435
867
47
039
279
895
38
035
255
920
99
031
224
943
310
022
162
959
511
019
137
973
312
015
107
984
013
014
105
994
614
007
053
100
0
Note
sE
xtr
acti
onm
ethod
P
rinci
pal
com
pon
ent
anal
ysi
sC
ompon
ent
Rot
ated
com
pon
ent
mat
rix
a
12
3b12
084
10
264
b11
079
60
346
b13
079
00
407
b10
076
80
383
025
1b8
075
30
340
b9
072
40
426
b14
061
70
446
029
7b4
060
80
470
032
0b6
085
1b5
079
4b7
034
40
573
034
3b1
086
7b3
042
50
415
063
5b2
025
30
513
057
2
Note
sE
xtra
ctio
nm
etho
dpr
inci
pal
com
pone
ntan
alys
isR
otat
ion
met
hod
Var
imax
with
Kai
ser
norm
aliz
atio
naR
otat
ion
conv
erge
din
six
inte
ratio
ns
Table AIFactorial analysis ofthe perceived qualityPrincipal componentsmethod with varimaxrotation
Quality serviceof ISO 9000consultants
1013
Appendix 2T
otal
var
iance
expla
ined
Init
ial
eigen
val
ues
Extr
acti
onsu
ms
ofsq
uar
edlo
adin
gs
Rot
atio
nsu
ms
ofsq
uar
edlo
adin
gs
Com
pon
ents
Tot
alP
erce
nt
ofvar
iance
Cum
ula
tive
per
cent
Tot
alP
erce
nt
ofvar
iance
Cum
ula
tive
per
cent
Tot
alP
erce
nt
ofvar
iance
Cum
ula
tive
per
cent
18
219
632
2263
222
821
963
222
632
225
245
403
4940
349
20
894
687
570
097
089
46
875
700
973
867
297
4870
097
30
791
608
876
185
40
746
573
581
920
50
483
371
385
633
60
410
315
588
788
70
337
259
491
383
80
319
245
093
833
90
236
181
495
647
100
182
140
197
048
110
158
121
798
265
120
149
114
399
408
130
077
059
210
00
Note
sE
xtr
acti
onm
ethod
P
rinci
pal
com
pon
ent
anal
ysi
sC
ompon
ent
Rot
ated
com
pon
ent
mat
rix
a
12
d9
091
1d8
079
40
288
d3
073
60
375
d10
071
50
418
d11
069
00
523
d7
067
60
462
d13
063
50
484
d2
061
40
523
d12
057
50
560
d1
085
4d6
037
70
767
d5
040
30
675
d4
060
40
608
Note
sE
xtra
ctio
nm
etho
dpr
inci
pal
com
ponen
tan
alys
isR
otat
ion
met
hod
Var
imax
with
Kai
ser
norm
aliz
atio
naR
otat
ion
conv
erge
din
thre
eiter
atio
n
Table AIIFactoral analysis of the
obtained benefitsPrincipal componentsmethod with varimax
rotation

IJQRM1989
1002
The data collected during field work referring to the quality of the consultancyservices as perceived by the companies were analysed following the principalcomponents method Although it is known that from the statistical point ofview it has the weakness of the size of data it has a great power when it is usedto compare with the Zeithaml et al (1993) model
In this way after the varimax rotation method was applied only three factorswith eigenvalues greater than 1 were obtained (Appendix 1) The contrastanalysis is correct the determinant of the correlation matrix is 1055E-5 and theKaiser-Meyer-Olkin measure is 0834 These three factors combine to explain the723 percent of the total of the variance Inter-item analysis was used to check thescales for internal consistency Analysis calculated a Cronbach coefficient alphaon the items within each factor The three factors have Cronbach alphas above075 and the standardized item alphas range from 076 to 093 These threeconstructs demonstrate good reliability
It can be deduced from the grouping of questions about perceived qualitysuggested by the factor analysis that a relative similitude exists to the genericmodel by Zeithaml et al (1993) Table II shows the dimensions of the Zeithamlet al model in the column headings The factors determined by the factoranalysis figure in the rows underneath Analysis of this Table shows therelationship between both forms of grouping the 14 questions on perceivedquality that figure on the questionnaire
Factor Description of items
1 Tangibles Personal appearance of staffVisual attractiveness of equipment in the consultancyClient-friendly software
2 Reliability Ability to perform the promised serviceFulfilment of commitments within the established time limitsCo-ordination between different company departmentsDetailed specification of aims of time limits
3 Responsiveness Willingness to help clientsEnthusiasm and involvement in the project
4 Assurance Ability to inspire trust and confidenceProfessional knowledge and expertise of consultants
5 Empathy Company concern for the best interests of the clientCommunication and interpersonal skills of the consultantClient satisfaction with consultation
Table IDistribution of the 14items surveyed inrelation to the differentdimensions of themodel proposed byZeithaml et al (1993)
Tangibles Reliability Responsiveness Assurance Empathy
1 2 3 4 5 6 7 8 9 10 11 12 13 14
Factor 1 X X X X X X X XFactor 2 X X XFactor 3 X X X
Table IIHigh saturations of thethree factors with theprincipal componentmethod with varimax
Quality serviceof ISO 9000consultants
1003
The three factors that define the perceived quality of ISO 9000 consultancyservice are the following
(1) Factor 1 Customer service assurance and empathy This factor refers toa set of aspects such as the consultantrsquos knowledge of the rulinginvolvement of the consultant in the client companyrsquos interests care andindividualised attention given by the consultant to the company theconsultantrsquos willingness to help and the climate of trust and confidencethat is transmitted to the client This first quality perception factor isgiven an average rating of 389 on a scale of 1 to 5
(2) Factor 2 Scheduling The scheduling factor represents the skills of theconsultants in completing the work within the agreed time periods Itrefers thus to the result of the service ie the obtaining of the certificatewithin the established budget and time period This factor should be asine qua non condition for good service because it is assumed that theproviders of a service must fulfil their promises On the whole clients donot give any extra credit to companies that honour their obligations butwhen this is not the case poorer quality in the service is detected herewith a 350 on the same scale This is an indication that this aspect of theservice should be significantly improved
(3) Factor 3 Tangibles This last factor refers to the office appearance tothe equipment used therein and even to the personal appearance of theconsultants The perception detected in this factor is rated at 362
A first conclusion to be drawn from the results is that the quality of the serviceis good Several additional factors also exist to bear out this statement
The arithmetic mean of the Likert scale ratings corresponding to the setof 14 questions on perceived quality is 375 This is considerably higherthan 3 the central value of the scale This can be taken as an indicator ofa good perception of quality while still however allowing forimprovement This assessment fully coincides with a question on` overall perception of the quality of the servicersquorsquo that received an averagerating of 369 thereby validating the results obtained
The statement `working with the consultant was a worthwhile experiencersquorsquois rated with an average of 380 This is not a direct question on qualitybut gives us an idea of the degree of satisfaction with the service received
The statement ` If I were to reinitiate the process I would choose thesame consultantrsquorsquo was rated at 355 It must be borne in mind here that 55percent of the companies have in fact returned to the same consultantafter receiving their certificate (not necessarily for quality-related tasks)This is a high index considering that the specific purpose of theintroduction process is fulfilled on obtaining certification If thecompanies continue to use the consultant after this point it would seemto indicate a high degree of satisfaction
IJQRM1989
1004
Another index of satisfaction with the service received is the intention touse the same consultant to adapt the company system to the new ISO90002000 standards A total of 77 per cent of the companies that intend touse a consultancy to update their systems will reuse the same service
Expectations of service given by quality consultantsCompany expectations of the services given by consultants were researched usingthe same methodology and analysing the same aspects and equivalent sets ofquestions to those already used to assess perceived quality in the same services
In the questionnaire a section was included in which 100 points should beassigned to the five dimensions balancing the importance of them
From the results obtained it can be observed that the most important of thefive dimensions defined by the Zeithaml et al model (1993) is considered to be` Reliabilityrsquorsquo (in which the consultant delivers the agreed service in an accurateand trustworthy manner) From a total of 100 points for all five dimensions` Reliabilityrsquorsquo received 28 points whereas `Tangiblesrsquorsquo were considered of lesserimportance and were only awarded 12 points However this same ` Reliabilityrsquorsquodimension most closely related to the ` Schedulingrsquorsquo factor coincides exactlywith the lowest rated factor in terms of service quality This points to an urgentneed for the consultants to improve this factor
On quantifying the level of quality expected from these services usinganother set of 14 questions equivalent to the previous set (on the same scale) thearithmetic mean is found to be 435 Thus expectations of the service are muchhigher than perceived quality of the same In short it is clear that the differencegenerated between the arithmetic mean of perceived quality of the service andexpectations of the same is ndash061 (ndash12 percent) Thus although a high perceptionof quality for services rendered by quality consultants was detected in theprevious section prior expectations of the same services were even higher
If we analyse the gap between expected quality and the quality that isactually perceived on the basis of the factors that define service quality asseen above it can be observed from Figure 2 that the gap is greatest in the` Schedulingrsquorsquo factor and least significant in the ` Tangiblesrsquorsquo factor
Figure 2Perceived qualityexpected quality and thegap betweenexpectations and qualityin each of the threefactors used to defineservice quality
Quality serviceof ISO 9000consultants
1005
In a nutshell we can conclude this part of the analysis by stating that althoughthe companies hold a good opinion of the quality of the advisory servicesreceived prior expectations of the same were considerably higher Thisconclusion shows that there is still room for improvement of the service offeredby quality consultants
Benefits obtained by clients of quality consultant servicesAfter analysing the quality offered by consultants and the expectations raised bythis type of service an analysis is made of the clientsrsquo perception of the benefitsdirectly derived from the consultantrsquos intervention Although it must beconsidered a priori that clients are not usually very sure about the value of theservice that they are engaging or the price that they are prepared to pay for it itcan be said that if this type of consultancy exists it is because clients think thatthey can obtain some benefits for which they are prepared to pay a fee Thesebenefits have been assessed by a set of 13 questions likewise answered on theLikert scale [15] as compiled in Table III The benefits considered are not merelyof an economic nature but include diverse factors such as increased motivation inworkers and improved relationships with customers and suppliers
Assessment of the results obtained shows that the arithmetic mean of allthese benefits is only 305 An overall assessment of the benefits gained fromuse of a consultant was obtained from one single question the response towhich gave the similar result of 317 In short both indicators coincide inhighlighting the fact that the companies did not perceive any benefits from theinput of the consultant
Items
Better understanding of quality as a result of working with an external consultant
Satisfaction with the skills provided by the consultants
Increased company motivation after working with external consultants
Adaptation of ethical approach after working with an external consultant
Definition and aims of quality policy following advice from the consultant
Definition of and approach to process following advice from the consultant
Improved approach to customers following advice from the consultant
Setting-up of beneficial relationships with customers andor suppliers following advice fromthe consultant
Setting-up of customer satisfaction control measures following advice from the consultant
Ideas for growth of company yield following advice from the consultant
Setting-up of continuous improvement scheme in the company following advice from theconsultant
Improved understanding of the relationship between the different processes and how tomanage the same in terms of a system
Improved decision taking based on data analysis following advice from the consultant
Table IIIItems analysed to assessthe benefits of workingwith a consultant when
introducing a qualitysystem
IJQRM1989
1006
From a factor analysis on extracting factors with the principal componentsand varimax rotation method two factors with eigenvalues higher than 1 areobtained (Appendix 2) The analysis is correct The determinant of thecorrelation matrix is 7162E-06 and the KMO measure is 0881 Moreover thetwo factors account for 70 percent of the variability of the sample
From the variables with the highest saturations in each factor we decided tocall the first factor ` Client approachrsquorsquo and the second factor ` Before the ruling isintroducedrsquorsquo This second factor includes all the benefits derived from the stepsprior to introduction definition of quality policy identification of aimsdefinition of procedures and improved understanding of quality
Table IV shows the grouping of the items related to benefits derived fromworking with a quality consultant
Relationship between perceived quality and benefits provided bythe consultantThe next step consisted of establishing the relationship between perceivedquality and the benefits obtained from using the service of a consultant Theresearch study detected and confirmed the relationship existing between thetwo concepts with different sets of statistics To summarise this relationshipwas analysed in two different ways first from questions eliciting an overallassessment on quality and benefits ie the analysis of the contingency tableresulting from the crossing of the two variables and second from the analysisof the relationship between the variables of mean quality and mean benefitscalculated as a mean from the corresponding sets of questions
Contingency Table V relating the two overall assessment variables on theLikert scale [15] is a 5 pound 5 square table In this respect the Pearson chi-squarestatistics and the likelihood ratio indicate the existence of a relationship
1 2 3 4 5 6 7 8 9 10 11 12 13
Factor 1 X X X X X X X X XFactor 2 X X X X
Table IVHigh saturation of thetwo factors with thePAF method withvarimax rotation
Value Freedom degree(Bilateral)
asymptotic sig
Pearsonrsquos chi-square 52979a 16 0000
Likelihood ratio 45709 16 0000
Linear by linear association 2712 1 0000
Number of valid cases 62
Note a22 cells (880 percent) have an expected frequency of less than 5 The minimumexpected frequency is 024
Table VContingency tablestatistic betweenoverall perceivedquality and overallbenefits
Quality serviceof ISO 9000consultants
1007
The association measurements that are normally used on an ordinal scale(Gamma = 0759 Kendallrsquos tau-b = 0563 and Somersrsquo d = 0562 each with a pvalue of 0000 in every case) also detect a relationship between the differentvariables A log-linear model was set up to explain the frequencies in thecontingency table cells and the saturated model was found to be the most suitablefor the purpose This model includes the interaction between the two variables
To sum up it has been statistically shown that the variables have a clearpositive correlation The higher the perceived quality the higher the benefitsand vice versa On the other hand and as a second way of detecting anddefining a relationship a linear regression was made between two variablesthat were calculated as the mean from the set of questions on perception andthe mean from the questions on benefits The analysis indicates that thevariables are correlated although the Pearson correlation coefficient is 0588with zero significance level (Figure 3)
Proceeding logically the very design of the variables enables the rank inboth cases to be [15] Both cases present variables of a linear combination ofseveral questions answered on the Likert scale [15] The relationship betweenthe variables can be clearly seen in Figure 3 Leaving the mean perceivedbenefit as an independent variable the linear regression has been calculated as
Mean Arithmetic Benefit ˆ 0456 Dagger 0702currenMean Perceived Quality
The slope of the regression is positive but less than the unit A unitary increasein quality does not result in a unitary increase in benefits but only in anincrease of seven-tenth The regression coefficient associated with thedependent variable obtained a zero significance level
Figure 3Scatter diagram of the
variables `meanperceived qualityrsquorsquo and
`mean benefitsrsquorsquo
IJQRM1989
1008
In summary the analyses point to the existence of a significant relationshipbetween the efforts of the consultant to provide a better quality service and theclientrsquos perception of improved benefits
Quality of consultant companies in relation to their sizeA study of the performance of consultant companies in relation to their sizewas made on the basis of the collected data The sample was divided into fourcategories companies that engaged the services of a single independentconsultant companies that used consultancies with a staff of between twoand five consultants companies that used consultancies with a staff ofbetween six and 50 consultants and lastly companies that used consultancieswith a staff of over 50 consultants The results of this segmentation can beseen in Figure 4
It was observed that the quality of the service is related to the size of theconsultant company the larger the company the better the service The bigconsultant companies obtain a significantly higher quality rating than thesmaller companies Whereas small companies (with two to fiveconsultants) obtain an average rating of 339 the average rating of theconsultancies with a staff of over 50 employees stands at 443 Thisrepresents a large difference of over one point It is noteworthy howeverthat professional consultants working independently offer a high qualityservice and score a rating that is closer to that of the large consultanciesthan the small ones
There also seems to be a negative relationship between the expectations ofthe client company and the number of workers employed by the consultantcompany However this does not carry any statistical significance
In the case of consultants working alone as independent professionalsexpectations of the service and perceived quality of the same are both veryhigh On the other hand although their clients have lower expectations thelarge consultant companies offer the best quality service In this case indeedperceived quality is higher than expectations
Figure 4Perceived qualityexpectations gap andbenefits in relation to thesize of the consultancy
Quality serviceof ISO 9000consultants
1009
On the other hand similar results are found when the benefits from using aconsultant are analysed according to the size of the consultant company Smallcompanies (between two and five consultants) provide the fewest benefits fortheir clients with an average rating of 288 whereas the large companies obtainan average rating of 313 Once again it is noted that independent professionalconsultants follow a different pattern and obtain the highest ratings of all Allthese relationships are statistically significant as shown by the Kruskal-Wallistest carried out by grouping the variables according to the size of theconsultant companies (Table VI)
The perceived quality and the gap between expectations and perceptionboth present significantly different averages with a significance level of 005
In a parallel manner the performance of the variables of qualityexpectations and benefits was analysed in relation to the size of the clientcompany In short no statistically significant relationship was detectedbetween these variables and the size of the client company in terms of numberof employees
Cost of consultant servicesIt is difficult to assess the benefits obtained from a consultant service withouttaking into consideration the cost of the same For this reason it wasconsidered appropriate to analyse the questionnaire data in terms of the costsinvolved In brief it can be concluded from an analysis of the data that theseservices are not expensive An assessment of the fees charged gives thelowest rating of the whole questionnaire data ie 272 This value is lowerthan the average value of the scale thus indicating a slight variance with theabove statement
Companies invested few resources in the introduction of the ruling It wasfound that 62 percent of the sample invested less than 15000 Euro Among thecompanies that engaged the services of a consultant the corresponding feesamounted to 48 percent of the total cost of introduction In most cases (77percent) the consultantrsquos fees are stipulated right from the beginning It can beassumed that the consultancies are so familiar with their service that they canmake an initial estimate of the cost of introducing the ruling with a high degreeof precision This type of service has been steadily growing ever since it was
Mean perceived
quality
Mean
expectations
Non-weighted
quality gap
Arithmetic mean
benefits 13 items
Chi-square 1465 1913 1411 1890
Freedom degree 3 3 3 3
Asymptotic sig 0002 0591 0003 0596
Notes aKruskal-Wallis test bGrouping variable number of consultants
Table VIKruskal-Wallis test
statistics for thevariables `perceived
qualityrsquorsquo ` expectationsrsquorsquo` gap between
expectations andperceived qualityrsquorsquo and`mean benefitsrsquorsquo when
grouped by ` number ofconsultantsrsquorsquo
IJQRM1989
1010
started a decade ago and can therefore be considered as standard (MartotildeAcircnez etal 2000) Moreover it is interesting to note that the offer of the service has alsoincreased which has resulted in a corresponding price adjustment
ConclusionsOne of the characteristics that differentiates a service from a product ormaterial goods is that the service is sold first and later `manufacturedrsquorsquoMoreover the production and consumption of the service are simultaneous iea service cannot be stored Thus the overall assessment of the client springsfrom two sources the end result of the service and the very process by whichthe service is provided (Berry 1995)
For these reasons the assessment of the quality of a service is not an easytask and as pointed out by Groth and Dye (1999) the providers of a serviceshould bear in mind this dual aspect by which a service is appraised Thereforethey should be able to recognise the different degrees by which the service itselfand the provision of the service are being assessed Despite this we consider itimportant to assess these services from the point of view of the client companyas has been done in the present research study
From all this we can draw the overall conclusion that the ISO 9000 advisoryservices are favourably regarded on the whole However it should also benoted that clients expect an even higher quality In short the client companiesexpect a higher quality from the service than that which is actually provided
It has been shown that the concept of quality can be broken down intothree factors one of which is the skill of the consultant in introducing theruling within the agreed time period and this is the aspect of the service thatobtains the poorest quality rating This factor is closely linked to thereliability factor which is considered to be of the highest importance by theclient companies For this reason the most reiterated request forimprovement by the clients is that the consultants perform the required taskswithin the agreed time periods
Moreover the results of the study show that the performance of independentprofessional consultants is very different from that of small consultantcompanies Independent consultants offer a high quality service that lives up tothe very high expectations of their clients The benefits that these clients gainfrom working with a consultant are also perceived as very high
During this work it has been noted that the quality offered by consultantcompanies that employ a staff of professionals varies according to the sizeof the company The benefits perceived by their clients are very similar tobut are slightly higher than those perceived by companies employing largeconsultancies
Finally although we realise that our study relates to only one region ofEurope we believe that our findings have broader implications for researchersand practitioners Thus we guess that it would be interesting to carry outsimilar surveys in other European and US regions For practitioners ourfindings should give pause for thought We guess that these findings are very
Quality serviceof ISO 9000consultants
1011
interesting in order to improve their service and that they should somehowmeasure and control their service quality We really think that for all theprofessionals working in the quality field a quality service should be a realNo 1 purpose
References
Berry L (1995) MaAcircs allaAcirc de la excelencia en el servicio Un plan para la accioAcircn DeustoPublications
Brown A and Van der Wiele T (1995) ` Industry experience with ISO 9000rsquorsquo Asia PacificJournal of Quality Management Vol 4 No 2 pp 8-17
Buttle F (1997) ` ISO 9000 marketing motivations and benefitsrsquorsquo International Journal of Qualityamp Reliability Management Vol 14 No 9 pp 936-47
CasadesuAcircs M (1998) ` La normativa de aseguramiento de la calidad ISO 9000 en CatalunAumlaexpectativas y efectos Estudio empotildeAcircricorsquorsquo Research project CICYT Reference SEC96-1005
CasadesuAcircs M and GimeAcircnez G (2000) ` The benefits of the implementation of the ISO 9000standard empirical researchin 288 Spanish companiesrsquorsquo The TQM Magazine Vol 12 No 6
Escanciano C (2000) ` Influencia de la certificacioAcircn ISO 9000 en el avance de la empresa espanAumlolahacia la calidad totalrsquorsquo paper presented at the 1st World Conference on Production andOperations Management (POM) Seville
Groth JC and Dye RT (1999) ` Service quality perceived value expectations shortfalls andbonusesrsquorsquo Managing Service Quality Vol 9 No 4
ISO (2000) available at wwwisochisoeniso9000-14000pdfsurvey9pdf
Jones R Arndt G and Kustin R (1997) ` ISO 9000 among Australian companies impact of timeand reasons for seeking certification on perceptions of benefits receivedrsquorsquo InternationalJournal of Quality amp Reliability Management Vol 14 No 7
Lloydrsquos Register Quality Assurance Ltd (1994) BS 5750 ISO 9000 ndash Setting Standards forBetter Business Lloydrsquos Register Quality Assurance Services Ltd Croydon
MartotildeAcircnez C et al (2000) `Analysis of the implementation of ISO 9000 quality assurancesystemsrsquorsquo Work Study Vol 49 No 6
Meegan ST and Taylor WA (1997) ` Factors influencing a successful transition from ISO 9000to TQM The influence of understanding and motivationrsquorsquo International Journal of Qualityamp Reliability Management Vol 14 No 2
Nachum L (1999) `Measurement of productivity of professional services an illustration ofSwedish management consulting firmsrsquorsquo International Journal of Operations amp ProductionManagement Vol 19 No 9
Phillips J (2000) The Consultantrsquos Scorecard McGraw Hill New York NY
Ribeiro D (1996) ` ConsultorotildeAcirca para la direccioAcircn en organizacioAcircn calidad marketing yestrategiarsquorsquo doctoral thesis University of Valencia Valencia
Samson D and Parker R (1994) ` Service quality the gap in the Australian consulting engineeringindustryrsquorsquo International Journal of Quality amp Reliability Management Vol 11 No 7
Vanguard Consulting Ltd (1994) `BS 5750ISO 9000EN 29000 1987 a positive contribution tobetter businessrsquorsquo The TQM Magazine Vol 11 No 2 p 60
Vloeberghs D and Bellens J (1996) ` Implementing the ISO 9000 standardsrsquorsquo Quality ProgressVol 29 No 6 pp 43-8
Zeithaml VA Parasuraman A and Berry L (1993) Calidad total en la gestioAcircn de los serviciosDotildeAcircaz de Santos
IJQRM1989
1012
Appendix 1
Tot
alvar
iance
expla
ined
Init
ial
eigen
val
ues
Extr
acti
onsu
ms
ofsq
uar
edlo
adin
gs
Rot
atio
nsu
ms
ofsq
uar
edlo
adin
gs
Com
pon
ents
Tot
alP
erce
nt
ofvar
iance
Cum
ula
tive
per
cent
Tot
alP
erce
nt
ofvar
iance
Cum
ula
tive
per
cent
Tot
alP
erce
nt
ofvar
iance
Cum
ula
tive
per
cent
17
7255
20
552
07
7255
20
552
04
8434
58
345
82
136
971
649
21
369
7164
92
306
219
156
50
31
037
3972
31
103
739
723
12
2115
81
723
14
073
521
775
25
068
486
823
86
061
435
867
47
039
279
895
38
035
255
920
99
031
224
943
310
022
162
959
511
019
137
973
312
015
107
984
013
014
105
994
614
007
053
100
0
Note
sE
xtr
acti
onm
ethod
P
rinci
pal
com
pon
ent
anal
ysi
sC
ompon
ent
Rot
ated
com
pon
ent
mat
rix
a
12
3b12
084
10
264
b11
079
60
346
b13
079
00
407
b10
076
80
383
025
1b8
075
30
340
b9
072
40
426
b14
061
70
446
029
7b4
060
80
470
032
0b6
085
1b5
079
4b7
034
40
573
034
3b1
086
7b3
042
50
415
063
5b2
025
30
513
057
2
Note
sE
xtra
ctio
nm
etho
dpr
inci
pal
com
pone
ntan
alys
isR
otat
ion
met
hod
Var
imax
with
Kai
ser
norm
aliz
atio
naR
otat
ion
conv
erge
din
six
inte
ratio
ns
Table AIFactorial analysis ofthe perceived qualityPrincipal componentsmethod with varimaxrotation
Quality serviceof ISO 9000consultants
1013
Appendix 2T
otal
var
iance
expla
ined
Init
ial
eigen
val
ues
Extr
acti
onsu
ms
ofsq
uar
edlo
adin
gs
Rot
atio
nsu
ms
ofsq
uar
edlo
adin
gs
Com
pon
ents
Tot
alP
erce
nt
ofvar
iance
Cum
ula
tive
per
cent
Tot
alP
erce
nt
ofvar
iance
Cum
ula
tive
per
cent
Tot
alP
erce
nt
ofvar
iance
Cum
ula
tive
per
cent
18
219
632
2263
222
821
963
222
632
225
245
403
4940
349
20
894
687
570
097
089
46
875
700
973
867
297
4870
097
30
791
608
876
185
40
746
573
581
920
50
483
371
385
633
60
410
315
588
788
70
337
259
491
383
80
319
245
093
833
90
236
181
495
647
100
182
140
197
048
110
158
121
798
265
120
149
114
399
408
130
077
059
210
00
Note
sE
xtr
acti
onm
ethod
P
rinci
pal
com
pon
ent
anal
ysi
sC
ompon
ent
Rot
ated
com
pon
ent
mat
rix
a
12
d9
091
1d8
079
40
288
d3
073
60
375
d10
071
50
418
d11
069
00
523
d7
067
60
462
d13
063
50
484
d2
061
40
523
d12
057
50
560
d1
085
4d6
037
70
767
d5
040
30
675
d4
060
40
608
Note
sE
xtra
ctio
nm
etho
dpr
inci
pal
com
ponen
tan
alys
isR
otat
ion
met
hod
Var
imax
with
Kai
ser
norm
aliz
atio
naR
otat
ion
conv
erge
din
thre
eiter
atio
n
Table AIIFactoral analysis of the
obtained benefitsPrincipal componentsmethod with varimax
rotation
Quality serviceof ISO 9000consultants
1003
The three factors that define the perceived quality of ISO 9000 consultancyservice are the following
(1) Factor 1 Customer service assurance and empathy This factor refers toa set of aspects such as the consultantrsquos knowledge of the rulinginvolvement of the consultant in the client companyrsquos interests care andindividualised attention given by the consultant to the company theconsultantrsquos willingness to help and the climate of trust and confidencethat is transmitted to the client This first quality perception factor isgiven an average rating of 389 on a scale of 1 to 5
(2) Factor 2 Scheduling The scheduling factor represents the skills of theconsultants in completing the work within the agreed time periods Itrefers thus to the result of the service ie the obtaining of the certificatewithin the established budget and time period This factor should be asine qua non condition for good service because it is assumed that theproviders of a service must fulfil their promises On the whole clients donot give any extra credit to companies that honour their obligations butwhen this is not the case poorer quality in the service is detected herewith a 350 on the same scale This is an indication that this aspect of theservice should be significantly improved
(3) Factor 3 Tangibles This last factor refers to the office appearance tothe equipment used therein and even to the personal appearance of theconsultants The perception detected in this factor is rated at 362
A first conclusion to be drawn from the results is that the quality of the serviceis good Several additional factors also exist to bear out this statement
The arithmetic mean of the Likert scale ratings corresponding to the setof 14 questions on perceived quality is 375 This is considerably higherthan 3 the central value of the scale This can be taken as an indicator ofa good perception of quality while still however allowing forimprovement This assessment fully coincides with a question on` overall perception of the quality of the servicersquorsquo that received an averagerating of 369 thereby validating the results obtained
The statement `working with the consultant was a worthwhile experiencersquorsquois rated with an average of 380 This is not a direct question on qualitybut gives us an idea of the degree of satisfaction with the service received
The statement ` If I were to reinitiate the process I would choose thesame consultantrsquorsquo was rated at 355 It must be borne in mind here that 55percent of the companies have in fact returned to the same consultantafter receiving their certificate (not necessarily for quality-related tasks)This is a high index considering that the specific purpose of theintroduction process is fulfilled on obtaining certification If thecompanies continue to use the consultant after this point it would seemto indicate a high degree of satisfaction
IJQRM1989
1004
Another index of satisfaction with the service received is the intention touse the same consultant to adapt the company system to the new ISO90002000 standards A total of 77 per cent of the companies that intend touse a consultancy to update their systems will reuse the same service
Expectations of service given by quality consultantsCompany expectations of the services given by consultants were researched usingthe same methodology and analysing the same aspects and equivalent sets ofquestions to those already used to assess perceived quality in the same services
In the questionnaire a section was included in which 100 points should beassigned to the five dimensions balancing the importance of them
From the results obtained it can be observed that the most important of thefive dimensions defined by the Zeithaml et al model (1993) is considered to be` Reliabilityrsquorsquo (in which the consultant delivers the agreed service in an accurateand trustworthy manner) From a total of 100 points for all five dimensions` Reliabilityrsquorsquo received 28 points whereas `Tangiblesrsquorsquo were considered of lesserimportance and were only awarded 12 points However this same ` Reliabilityrsquorsquodimension most closely related to the ` Schedulingrsquorsquo factor coincides exactlywith the lowest rated factor in terms of service quality This points to an urgentneed for the consultants to improve this factor
On quantifying the level of quality expected from these services usinganother set of 14 questions equivalent to the previous set (on the same scale) thearithmetic mean is found to be 435 Thus expectations of the service are muchhigher than perceived quality of the same In short it is clear that the differencegenerated between the arithmetic mean of perceived quality of the service andexpectations of the same is ndash061 (ndash12 percent) Thus although a high perceptionof quality for services rendered by quality consultants was detected in theprevious section prior expectations of the same services were even higher
If we analyse the gap between expected quality and the quality that isactually perceived on the basis of the factors that define service quality asseen above it can be observed from Figure 2 that the gap is greatest in the` Schedulingrsquorsquo factor and least significant in the ` Tangiblesrsquorsquo factor
Figure 2Perceived qualityexpected quality and thegap betweenexpectations and qualityin each of the threefactors used to defineservice quality
Quality serviceof ISO 9000consultants
1005
In a nutshell we can conclude this part of the analysis by stating that althoughthe companies hold a good opinion of the quality of the advisory servicesreceived prior expectations of the same were considerably higher Thisconclusion shows that there is still room for improvement of the service offeredby quality consultants
Benefits obtained by clients of quality consultant servicesAfter analysing the quality offered by consultants and the expectations raised bythis type of service an analysis is made of the clientsrsquo perception of the benefitsdirectly derived from the consultantrsquos intervention Although it must beconsidered a priori that clients are not usually very sure about the value of theservice that they are engaging or the price that they are prepared to pay for it itcan be said that if this type of consultancy exists it is because clients think thatthey can obtain some benefits for which they are prepared to pay a fee Thesebenefits have been assessed by a set of 13 questions likewise answered on theLikert scale [15] as compiled in Table III The benefits considered are not merelyof an economic nature but include diverse factors such as increased motivation inworkers and improved relationships with customers and suppliers
Assessment of the results obtained shows that the arithmetic mean of allthese benefits is only 305 An overall assessment of the benefits gained fromuse of a consultant was obtained from one single question the response towhich gave the similar result of 317 In short both indicators coincide inhighlighting the fact that the companies did not perceive any benefits from theinput of the consultant
Items
Better understanding of quality as a result of working with an external consultant
Satisfaction with the skills provided by the consultants
Increased company motivation after working with external consultants
Adaptation of ethical approach after working with an external consultant
Definition and aims of quality policy following advice from the consultant
Definition of and approach to process following advice from the consultant
Improved approach to customers following advice from the consultant
Setting-up of beneficial relationships with customers andor suppliers following advice fromthe consultant
Setting-up of customer satisfaction control measures following advice from the consultant
Ideas for growth of company yield following advice from the consultant
Setting-up of continuous improvement scheme in the company following advice from theconsultant
Improved understanding of the relationship between the different processes and how tomanage the same in terms of a system
Improved decision taking based on data analysis following advice from the consultant
Table IIIItems analysed to assessthe benefits of workingwith a consultant when
introducing a qualitysystem
IJQRM1989
1006
From a factor analysis on extracting factors with the principal componentsand varimax rotation method two factors with eigenvalues higher than 1 areobtained (Appendix 2) The analysis is correct The determinant of thecorrelation matrix is 7162E-06 and the KMO measure is 0881 Moreover thetwo factors account for 70 percent of the variability of the sample
From the variables with the highest saturations in each factor we decided tocall the first factor ` Client approachrsquorsquo and the second factor ` Before the ruling isintroducedrsquorsquo This second factor includes all the benefits derived from the stepsprior to introduction definition of quality policy identification of aimsdefinition of procedures and improved understanding of quality
Table IV shows the grouping of the items related to benefits derived fromworking with a quality consultant
Relationship between perceived quality and benefits provided bythe consultantThe next step consisted of establishing the relationship between perceivedquality and the benefits obtained from using the service of a consultant Theresearch study detected and confirmed the relationship existing between thetwo concepts with different sets of statistics To summarise this relationshipwas analysed in two different ways first from questions eliciting an overallassessment on quality and benefits ie the analysis of the contingency tableresulting from the crossing of the two variables and second from the analysisof the relationship between the variables of mean quality and mean benefitscalculated as a mean from the corresponding sets of questions
Contingency Table V relating the two overall assessment variables on theLikert scale [15] is a 5 pound 5 square table In this respect the Pearson chi-squarestatistics and the likelihood ratio indicate the existence of a relationship
1 2 3 4 5 6 7 8 9 10 11 12 13
Factor 1 X X X X X X X X XFactor 2 X X X X
Table IVHigh saturation of thetwo factors with thePAF method withvarimax rotation
Value Freedom degree(Bilateral)
asymptotic sig
Pearsonrsquos chi-square 52979a 16 0000
Likelihood ratio 45709 16 0000
Linear by linear association 2712 1 0000
Number of valid cases 62
Note a22 cells (880 percent) have an expected frequency of less than 5 The minimumexpected frequency is 024
Table VContingency tablestatistic betweenoverall perceivedquality and overallbenefits
Quality serviceof ISO 9000consultants
1007
The association measurements that are normally used on an ordinal scale(Gamma = 0759 Kendallrsquos tau-b = 0563 and Somersrsquo d = 0562 each with a pvalue of 0000 in every case) also detect a relationship between the differentvariables A log-linear model was set up to explain the frequencies in thecontingency table cells and the saturated model was found to be the most suitablefor the purpose This model includes the interaction between the two variables
To sum up it has been statistically shown that the variables have a clearpositive correlation The higher the perceived quality the higher the benefitsand vice versa On the other hand and as a second way of detecting anddefining a relationship a linear regression was made between two variablesthat were calculated as the mean from the set of questions on perception andthe mean from the questions on benefits The analysis indicates that thevariables are correlated although the Pearson correlation coefficient is 0588with zero significance level (Figure 3)
Proceeding logically the very design of the variables enables the rank inboth cases to be [15] Both cases present variables of a linear combination ofseveral questions answered on the Likert scale [15] The relationship betweenthe variables can be clearly seen in Figure 3 Leaving the mean perceivedbenefit as an independent variable the linear regression has been calculated as
Mean Arithmetic Benefit ˆ 0456 Dagger 0702currenMean Perceived Quality
The slope of the regression is positive but less than the unit A unitary increasein quality does not result in a unitary increase in benefits but only in anincrease of seven-tenth The regression coefficient associated with thedependent variable obtained a zero significance level
Figure 3Scatter diagram of the
variables `meanperceived qualityrsquorsquo and
`mean benefitsrsquorsquo
IJQRM1989
1008
In summary the analyses point to the existence of a significant relationshipbetween the efforts of the consultant to provide a better quality service and theclientrsquos perception of improved benefits
Quality of consultant companies in relation to their sizeA study of the performance of consultant companies in relation to their sizewas made on the basis of the collected data The sample was divided into fourcategories companies that engaged the services of a single independentconsultant companies that used consultancies with a staff of between twoand five consultants companies that used consultancies with a staff ofbetween six and 50 consultants and lastly companies that used consultancieswith a staff of over 50 consultants The results of this segmentation can beseen in Figure 4
It was observed that the quality of the service is related to the size of theconsultant company the larger the company the better the service The bigconsultant companies obtain a significantly higher quality rating than thesmaller companies Whereas small companies (with two to fiveconsultants) obtain an average rating of 339 the average rating of theconsultancies with a staff of over 50 employees stands at 443 Thisrepresents a large difference of over one point It is noteworthy howeverthat professional consultants working independently offer a high qualityservice and score a rating that is closer to that of the large consultanciesthan the small ones
There also seems to be a negative relationship between the expectations ofthe client company and the number of workers employed by the consultantcompany However this does not carry any statistical significance
In the case of consultants working alone as independent professionalsexpectations of the service and perceived quality of the same are both veryhigh On the other hand although their clients have lower expectations thelarge consultant companies offer the best quality service In this case indeedperceived quality is higher than expectations
Figure 4Perceived qualityexpectations gap andbenefits in relation to thesize of the consultancy
Quality serviceof ISO 9000consultants
1009
On the other hand similar results are found when the benefits from using aconsultant are analysed according to the size of the consultant company Smallcompanies (between two and five consultants) provide the fewest benefits fortheir clients with an average rating of 288 whereas the large companies obtainan average rating of 313 Once again it is noted that independent professionalconsultants follow a different pattern and obtain the highest ratings of all Allthese relationships are statistically significant as shown by the Kruskal-Wallistest carried out by grouping the variables according to the size of theconsultant companies (Table VI)
The perceived quality and the gap between expectations and perceptionboth present significantly different averages with a significance level of 005
In a parallel manner the performance of the variables of qualityexpectations and benefits was analysed in relation to the size of the clientcompany In short no statistically significant relationship was detectedbetween these variables and the size of the client company in terms of numberof employees
Cost of consultant servicesIt is difficult to assess the benefits obtained from a consultant service withouttaking into consideration the cost of the same For this reason it wasconsidered appropriate to analyse the questionnaire data in terms of the costsinvolved In brief it can be concluded from an analysis of the data that theseservices are not expensive An assessment of the fees charged gives thelowest rating of the whole questionnaire data ie 272 This value is lowerthan the average value of the scale thus indicating a slight variance with theabove statement
Companies invested few resources in the introduction of the ruling It wasfound that 62 percent of the sample invested less than 15000 Euro Among thecompanies that engaged the services of a consultant the corresponding feesamounted to 48 percent of the total cost of introduction In most cases (77percent) the consultantrsquos fees are stipulated right from the beginning It can beassumed that the consultancies are so familiar with their service that they canmake an initial estimate of the cost of introducing the ruling with a high degreeof precision This type of service has been steadily growing ever since it was
Mean perceived
quality
Mean
expectations
Non-weighted
quality gap
Arithmetic mean
benefits 13 items
Chi-square 1465 1913 1411 1890
Freedom degree 3 3 3 3
Asymptotic sig 0002 0591 0003 0596
Notes aKruskal-Wallis test bGrouping variable number of consultants
Table VIKruskal-Wallis test
statistics for thevariables `perceived
qualityrsquorsquo ` expectationsrsquorsquo` gap between
expectations andperceived qualityrsquorsquo and`mean benefitsrsquorsquo when
grouped by ` number ofconsultantsrsquorsquo
IJQRM1989
1010
started a decade ago and can therefore be considered as standard (MartotildeAcircnez etal 2000) Moreover it is interesting to note that the offer of the service has alsoincreased which has resulted in a corresponding price adjustment
ConclusionsOne of the characteristics that differentiates a service from a product ormaterial goods is that the service is sold first and later `manufacturedrsquorsquoMoreover the production and consumption of the service are simultaneous iea service cannot be stored Thus the overall assessment of the client springsfrom two sources the end result of the service and the very process by whichthe service is provided (Berry 1995)
For these reasons the assessment of the quality of a service is not an easytask and as pointed out by Groth and Dye (1999) the providers of a serviceshould bear in mind this dual aspect by which a service is appraised Thereforethey should be able to recognise the different degrees by which the service itselfand the provision of the service are being assessed Despite this we consider itimportant to assess these services from the point of view of the client companyas has been done in the present research study
From all this we can draw the overall conclusion that the ISO 9000 advisoryservices are favourably regarded on the whole However it should also benoted that clients expect an even higher quality In short the client companiesexpect a higher quality from the service than that which is actually provided
It has been shown that the concept of quality can be broken down intothree factors one of which is the skill of the consultant in introducing theruling within the agreed time period and this is the aspect of the service thatobtains the poorest quality rating This factor is closely linked to thereliability factor which is considered to be of the highest importance by theclient companies For this reason the most reiterated request forimprovement by the clients is that the consultants perform the required taskswithin the agreed time periods
Moreover the results of the study show that the performance of independentprofessional consultants is very different from that of small consultantcompanies Independent consultants offer a high quality service that lives up tothe very high expectations of their clients The benefits that these clients gainfrom working with a consultant are also perceived as very high
During this work it has been noted that the quality offered by consultantcompanies that employ a staff of professionals varies according to the sizeof the company The benefits perceived by their clients are very similar tobut are slightly higher than those perceived by companies employing largeconsultancies
Finally although we realise that our study relates to only one region ofEurope we believe that our findings have broader implications for researchersand practitioners Thus we guess that it would be interesting to carry outsimilar surveys in other European and US regions For practitioners ourfindings should give pause for thought We guess that these findings are very
Quality serviceof ISO 9000consultants
1011
interesting in order to improve their service and that they should somehowmeasure and control their service quality We really think that for all theprofessionals working in the quality field a quality service should be a realNo 1 purpose
References
Berry L (1995) MaAcircs allaAcirc de la excelencia en el servicio Un plan para la accioAcircn DeustoPublications
Brown A and Van der Wiele T (1995) ` Industry experience with ISO 9000rsquorsquo Asia PacificJournal of Quality Management Vol 4 No 2 pp 8-17
Buttle F (1997) ` ISO 9000 marketing motivations and benefitsrsquorsquo International Journal of Qualityamp Reliability Management Vol 14 No 9 pp 936-47
CasadesuAcircs M (1998) ` La normativa de aseguramiento de la calidad ISO 9000 en CatalunAumlaexpectativas y efectos Estudio empotildeAcircricorsquorsquo Research project CICYT Reference SEC96-1005
CasadesuAcircs M and GimeAcircnez G (2000) ` The benefits of the implementation of the ISO 9000standard empirical researchin 288 Spanish companiesrsquorsquo The TQM Magazine Vol 12 No 6
Escanciano C (2000) ` Influencia de la certificacioAcircn ISO 9000 en el avance de la empresa espanAumlolahacia la calidad totalrsquorsquo paper presented at the 1st World Conference on Production andOperations Management (POM) Seville
Groth JC and Dye RT (1999) ` Service quality perceived value expectations shortfalls andbonusesrsquorsquo Managing Service Quality Vol 9 No 4
ISO (2000) available at wwwisochisoeniso9000-14000pdfsurvey9pdf
Jones R Arndt G and Kustin R (1997) ` ISO 9000 among Australian companies impact of timeand reasons for seeking certification on perceptions of benefits receivedrsquorsquo InternationalJournal of Quality amp Reliability Management Vol 14 No 7
Lloydrsquos Register Quality Assurance Ltd (1994) BS 5750 ISO 9000 ndash Setting Standards forBetter Business Lloydrsquos Register Quality Assurance Services Ltd Croydon
MartotildeAcircnez C et al (2000) `Analysis of the implementation of ISO 9000 quality assurancesystemsrsquorsquo Work Study Vol 49 No 6
Meegan ST and Taylor WA (1997) ` Factors influencing a successful transition from ISO 9000to TQM The influence of understanding and motivationrsquorsquo International Journal of Qualityamp Reliability Management Vol 14 No 2
Nachum L (1999) `Measurement of productivity of professional services an illustration ofSwedish management consulting firmsrsquorsquo International Journal of Operations amp ProductionManagement Vol 19 No 9
Phillips J (2000) The Consultantrsquos Scorecard McGraw Hill New York NY
Ribeiro D (1996) ` ConsultorotildeAcirca para la direccioAcircn en organizacioAcircn calidad marketing yestrategiarsquorsquo doctoral thesis University of Valencia Valencia
Samson D and Parker R (1994) ` Service quality the gap in the Australian consulting engineeringindustryrsquorsquo International Journal of Quality amp Reliability Management Vol 11 No 7
Vanguard Consulting Ltd (1994) `BS 5750ISO 9000EN 29000 1987 a positive contribution tobetter businessrsquorsquo The TQM Magazine Vol 11 No 2 p 60
Vloeberghs D and Bellens J (1996) ` Implementing the ISO 9000 standardsrsquorsquo Quality ProgressVol 29 No 6 pp 43-8
Zeithaml VA Parasuraman A and Berry L (1993) Calidad total en la gestioAcircn de los serviciosDotildeAcircaz de Santos
IJQRM1989
1012
Appendix 1
Tot
alvar
iance
expla
ined
Init
ial
eigen
val
ues
Extr
acti
onsu
ms
ofsq
uar
edlo
adin
gs
Rot
atio
nsu
ms
ofsq
uar
edlo
adin
gs
Com
pon
ents
Tot
alP
erce
nt
ofvar
iance
Cum
ula
tive
per
cent
Tot
alP
erce
nt
ofvar
iance
Cum
ula
tive
per
cent
Tot
alP
erce
nt
ofvar
iance
Cum
ula
tive
per
cent
17
7255
20
552
07
7255
20
552
04
8434
58
345
82
136
971
649
21
369
7164
92
306
219
156
50
31
037
3972
31
103
739
723
12
2115
81
723
14
073
521
775
25
068
486
823
86
061
435
867
47
039
279
895
38
035
255
920
99
031
224
943
310
022
162
959
511
019
137
973
312
015
107
984
013
014
105
994
614
007
053
100
0
Note
sE
xtr
acti
onm
ethod
P
rinci
pal
com
pon
ent
anal
ysi
sC
ompon
ent
Rot
ated
com
pon
ent
mat
rix
a
12
3b12
084
10
264
b11
079
60
346
b13
079
00
407
b10
076
80
383
025
1b8
075
30
340
b9
072
40
426
b14
061
70
446
029
7b4
060
80
470
032
0b6
085
1b5
079
4b7
034
40
573
034
3b1
086
7b3
042
50
415
063
5b2
025
30
513
057
2
Note
sE
xtra
ctio
nm
etho
dpr
inci
pal
com
pone
ntan
alys
isR
otat
ion
met
hod
Var
imax
with
Kai
ser
norm
aliz
atio
naR
otat
ion
conv
erge
din
six
inte
ratio
ns
Table AIFactorial analysis ofthe perceived qualityPrincipal componentsmethod with varimaxrotation
Quality serviceof ISO 9000consultants
1013
Appendix 2T
otal
var
iance
expla
ined
Init
ial
eigen
val
ues
Extr
acti
onsu
ms
ofsq
uar
edlo
adin
gs
Rot
atio
nsu
ms
ofsq
uar
edlo
adin
gs
Com
pon
ents
Tot
alP
erce
nt
ofvar
iance
Cum
ula
tive
per
cent
Tot
alP
erce
nt
ofvar
iance
Cum
ula
tive
per
cent
Tot
alP
erce
nt
ofvar
iance
Cum
ula
tive
per
cent
18
219
632
2263
222
821
963
222
632
225
245
403
4940
349
20
894
687
570
097
089
46
875
700
973
867
297
4870
097
30
791
608
876
185
40
746
573
581
920
50
483
371
385
633
60
410
315
588
788
70
337
259
491
383
80
319
245
093
833
90
236
181
495
647
100
182
140
197
048
110
158
121
798
265
120
149
114
399
408
130
077
059
210
00
Note
sE
xtr
acti
onm
ethod
P
rinci
pal
com
pon
ent
anal
ysi
sC
ompon
ent
Rot
ated
com
pon
ent
mat
rix
a
12
d9
091
1d8
079
40
288
d3
073
60
375
d10
071
50
418
d11
069
00
523
d7
067
60
462
d13
063
50
484
d2
061
40
523
d12
057
50
560
d1
085
4d6
037
70
767
d5
040
30
675
d4
060
40
608
Note
sE
xtra
ctio
nm
etho
dpr
inci
pal
com
ponen
tan
alys
isR
otat
ion
met
hod
Var
imax
with
Kai
ser
norm
aliz
atio
naR
otat
ion
conv
erge
din
thre
eiter
atio
n
Table AIIFactoral analysis of the
obtained benefitsPrincipal componentsmethod with varimax
rotation

IJQRM1989
1004
Another index of satisfaction with the service received is the intention touse the same consultant to adapt the company system to the new ISO90002000 standards A total of 77 per cent of the companies that intend touse a consultancy to update their systems will reuse the same service
Expectations of service given by quality consultantsCompany expectations of the services given by consultants were researched usingthe same methodology and analysing the same aspects and equivalent sets ofquestions to those already used to assess perceived quality in the same services
In the questionnaire a section was included in which 100 points should beassigned to the five dimensions balancing the importance of them
From the results obtained it can be observed that the most important of thefive dimensions defined by the Zeithaml et al model (1993) is considered to be` Reliabilityrsquorsquo (in which the consultant delivers the agreed service in an accurateand trustworthy manner) From a total of 100 points for all five dimensions` Reliabilityrsquorsquo received 28 points whereas `Tangiblesrsquorsquo were considered of lesserimportance and were only awarded 12 points However this same ` Reliabilityrsquorsquodimension most closely related to the ` Schedulingrsquorsquo factor coincides exactlywith the lowest rated factor in terms of service quality This points to an urgentneed for the consultants to improve this factor
On quantifying the level of quality expected from these services usinganother set of 14 questions equivalent to the previous set (on the same scale) thearithmetic mean is found to be 435 Thus expectations of the service are muchhigher than perceived quality of the same In short it is clear that the differencegenerated between the arithmetic mean of perceived quality of the service andexpectations of the same is ndash061 (ndash12 percent) Thus although a high perceptionof quality for services rendered by quality consultants was detected in theprevious section prior expectations of the same services were even higher
If we analyse the gap between expected quality and the quality that isactually perceived on the basis of the factors that define service quality asseen above it can be observed from Figure 2 that the gap is greatest in the` Schedulingrsquorsquo factor and least significant in the ` Tangiblesrsquorsquo factor
Figure 2Perceived qualityexpected quality and thegap betweenexpectations and qualityin each of the threefactors used to defineservice quality
Quality serviceof ISO 9000consultants
1005
In a nutshell we can conclude this part of the analysis by stating that althoughthe companies hold a good opinion of the quality of the advisory servicesreceived prior expectations of the same were considerably higher Thisconclusion shows that there is still room for improvement of the service offeredby quality consultants
Benefits obtained by clients of quality consultant servicesAfter analysing the quality offered by consultants and the expectations raised bythis type of service an analysis is made of the clientsrsquo perception of the benefitsdirectly derived from the consultantrsquos intervention Although it must beconsidered a priori that clients are not usually very sure about the value of theservice that they are engaging or the price that they are prepared to pay for it itcan be said that if this type of consultancy exists it is because clients think thatthey can obtain some benefits for which they are prepared to pay a fee Thesebenefits have been assessed by a set of 13 questions likewise answered on theLikert scale [15] as compiled in Table III The benefits considered are not merelyof an economic nature but include diverse factors such as increased motivation inworkers and improved relationships with customers and suppliers
Assessment of the results obtained shows that the arithmetic mean of allthese benefits is only 305 An overall assessment of the benefits gained fromuse of a consultant was obtained from one single question the response towhich gave the similar result of 317 In short both indicators coincide inhighlighting the fact that the companies did not perceive any benefits from theinput of the consultant
Items
Better understanding of quality as a result of working with an external consultant
Satisfaction with the skills provided by the consultants
Increased company motivation after working with external consultants
Adaptation of ethical approach after working with an external consultant
Definition and aims of quality policy following advice from the consultant
Definition of and approach to process following advice from the consultant
Improved approach to customers following advice from the consultant
Setting-up of beneficial relationships with customers andor suppliers following advice fromthe consultant
Setting-up of customer satisfaction control measures following advice from the consultant
Ideas for growth of company yield following advice from the consultant
Setting-up of continuous improvement scheme in the company following advice from theconsultant
Improved understanding of the relationship between the different processes and how tomanage the same in terms of a system
Improved decision taking based on data analysis following advice from the consultant
Table IIIItems analysed to assessthe benefits of workingwith a consultant when
introducing a qualitysystem
IJQRM1989
1006
From a factor analysis on extracting factors with the principal componentsand varimax rotation method two factors with eigenvalues higher than 1 areobtained (Appendix 2) The analysis is correct The determinant of thecorrelation matrix is 7162E-06 and the KMO measure is 0881 Moreover thetwo factors account for 70 percent of the variability of the sample
From the variables with the highest saturations in each factor we decided tocall the first factor ` Client approachrsquorsquo and the second factor ` Before the ruling isintroducedrsquorsquo This second factor includes all the benefits derived from the stepsprior to introduction definition of quality policy identification of aimsdefinition of procedures and improved understanding of quality
Table IV shows the grouping of the items related to benefits derived fromworking with a quality consultant
Relationship between perceived quality and benefits provided bythe consultantThe next step consisted of establishing the relationship between perceivedquality and the benefits obtained from using the service of a consultant Theresearch study detected and confirmed the relationship existing between thetwo concepts with different sets of statistics To summarise this relationshipwas analysed in two different ways first from questions eliciting an overallassessment on quality and benefits ie the analysis of the contingency tableresulting from the crossing of the two variables and second from the analysisof the relationship between the variables of mean quality and mean benefitscalculated as a mean from the corresponding sets of questions
Contingency Table V relating the two overall assessment variables on theLikert scale [15] is a 5 pound 5 square table In this respect the Pearson chi-squarestatistics and the likelihood ratio indicate the existence of a relationship
1 2 3 4 5 6 7 8 9 10 11 12 13
Factor 1 X X X X X X X X XFactor 2 X X X X
Table IVHigh saturation of thetwo factors with thePAF method withvarimax rotation
Value Freedom degree(Bilateral)
asymptotic sig
Pearsonrsquos chi-square 52979a 16 0000
Likelihood ratio 45709 16 0000
Linear by linear association 2712 1 0000
Number of valid cases 62
Note a22 cells (880 percent) have an expected frequency of less than 5 The minimumexpected frequency is 024
Table VContingency tablestatistic betweenoverall perceivedquality and overallbenefits
Quality serviceof ISO 9000consultants
1007
The association measurements that are normally used on an ordinal scale(Gamma = 0759 Kendallrsquos tau-b = 0563 and Somersrsquo d = 0562 each with a pvalue of 0000 in every case) also detect a relationship between the differentvariables A log-linear model was set up to explain the frequencies in thecontingency table cells and the saturated model was found to be the most suitablefor the purpose This model includes the interaction between the two variables
To sum up it has been statistically shown that the variables have a clearpositive correlation The higher the perceived quality the higher the benefitsand vice versa On the other hand and as a second way of detecting anddefining a relationship a linear regression was made between two variablesthat were calculated as the mean from the set of questions on perception andthe mean from the questions on benefits The analysis indicates that thevariables are correlated although the Pearson correlation coefficient is 0588with zero significance level (Figure 3)
Proceeding logically the very design of the variables enables the rank inboth cases to be [15] Both cases present variables of a linear combination ofseveral questions answered on the Likert scale [15] The relationship betweenthe variables can be clearly seen in Figure 3 Leaving the mean perceivedbenefit as an independent variable the linear regression has been calculated as
Mean Arithmetic Benefit ˆ 0456 Dagger 0702currenMean Perceived Quality
The slope of the regression is positive but less than the unit A unitary increasein quality does not result in a unitary increase in benefits but only in anincrease of seven-tenth The regression coefficient associated with thedependent variable obtained a zero significance level
Figure 3Scatter diagram of the
variables `meanperceived qualityrsquorsquo and
`mean benefitsrsquorsquo
IJQRM1989
1008
In summary the analyses point to the existence of a significant relationshipbetween the efforts of the consultant to provide a better quality service and theclientrsquos perception of improved benefits
Quality of consultant companies in relation to their sizeA study of the performance of consultant companies in relation to their sizewas made on the basis of the collected data The sample was divided into fourcategories companies that engaged the services of a single independentconsultant companies that used consultancies with a staff of between twoand five consultants companies that used consultancies with a staff ofbetween six and 50 consultants and lastly companies that used consultancieswith a staff of over 50 consultants The results of this segmentation can beseen in Figure 4
It was observed that the quality of the service is related to the size of theconsultant company the larger the company the better the service The bigconsultant companies obtain a significantly higher quality rating than thesmaller companies Whereas small companies (with two to fiveconsultants) obtain an average rating of 339 the average rating of theconsultancies with a staff of over 50 employees stands at 443 Thisrepresents a large difference of over one point It is noteworthy howeverthat professional consultants working independently offer a high qualityservice and score a rating that is closer to that of the large consultanciesthan the small ones
There also seems to be a negative relationship between the expectations ofthe client company and the number of workers employed by the consultantcompany However this does not carry any statistical significance
In the case of consultants working alone as independent professionalsexpectations of the service and perceived quality of the same are both veryhigh On the other hand although their clients have lower expectations thelarge consultant companies offer the best quality service In this case indeedperceived quality is higher than expectations
Figure 4Perceived qualityexpectations gap andbenefits in relation to thesize of the consultancy
Quality serviceof ISO 9000consultants
1009
On the other hand similar results are found when the benefits from using aconsultant are analysed according to the size of the consultant company Smallcompanies (between two and five consultants) provide the fewest benefits fortheir clients with an average rating of 288 whereas the large companies obtainan average rating of 313 Once again it is noted that independent professionalconsultants follow a different pattern and obtain the highest ratings of all Allthese relationships are statistically significant as shown by the Kruskal-Wallistest carried out by grouping the variables according to the size of theconsultant companies (Table VI)
The perceived quality and the gap between expectations and perceptionboth present significantly different averages with a significance level of 005
In a parallel manner the performance of the variables of qualityexpectations and benefits was analysed in relation to the size of the clientcompany In short no statistically significant relationship was detectedbetween these variables and the size of the client company in terms of numberof employees
Cost of consultant servicesIt is difficult to assess the benefits obtained from a consultant service withouttaking into consideration the cost of the same For this reason it wasconsidered appropriate to analyse the questionnaire data in terms of the costsinvolved In brief it can be concluded from an analysis of the data that theseservices are not expensive An assessment of the fees charged gives thelowest rating of the whole questionnaire data ie 272 This value is lowerthan the average value of the scale thus indicating a slight variance with theabove statement
Companies invested few resources in the introduction of the ruling It wasfound that 62 percent of the sample invested less than 15000 Euro Among thecompanies that engaged the services of a consultant the corresponding feesamounted to 48 percent of the total cost of introduction In most cases (77percent) the consultantrsquos fees are stipulated right from the beginning It can beassumed that the consultancies are so familiar with their service that they canmake an initial estimate of the cost of introducing the ruling with a high degreeof precision This type of service has been steadily growing ever since it was
Mean perceived
quality
Mean
expectations
Non-weighted
quality gap
Arithmetic mean
benefits 13 items
Chi-square 1465 1913 1411 1890
Freedom degree 3 3 3 3
Asymptotic sig 0002 0591 0003 0596
Notes aKruskal-Wallis test bGrouping variable number of consultants
Table VIKruskal-Wallis test
statistics for thevariables `perceived
qualityrsquorsquo ` expectationsrsquorsquo` gap between
expectations andperceived qualityrsquorsquo and`mean benefitsrsquorsquo when
grouped by ` number ofconsultantsrsquorsquo
IJQRM1989
1010
started a decade ago and can therefore be considered as standard (MartotildeAcircnez etal 2000) Moreover it is interesting to note that the offer of the service has alsoincreased which has resulted in a corresponding price adjustment
ConclusionsOne of the characteristics that differentiates a service from a product ormaterial goods is that the service is sold first and later `manufacturedrsquorsquoMoreover the production and consumption of the service are simultaneous iea service cannot be stored Thus the overall assessment of the client springsfrom two sources the end result of the service and the very process by whichthe service is provided (Berry 1995)
For these reasons the assessment of the quality of a service is not an easytask and as pointed out by Groth and Dye (1999) the providers of a serviceshould bear in mind this dual aspect by which a service is appraised Thereforethey should be able to recognise the different degrees by which the service itselfand the provision of the service are being assessed Despite this we consider itimportant to assess these services from the point of view of the client companyas has been done in the present research study
From all this we can draw the overall conclusion that the ISO 9000 advisoryservices are favourably regarded on the whole However it should also benoted that clients expect an even higher quality In short the client companiesexpect a higher quality from the service than that which is actually provided
It has been shown that the concept of quality can be broken down intothree factors one of which is the skill of the consultant in introducing theruling within the agreed time period and this is the aspect of the service thatobtains the poorest quality rating This factor is closely linked to thereliability factor which is considered to be of the highest importance by theclient companies For this reason the most reiterated request forimprovement by the clients is that the consultants perform the required taskswithin the agreed time periods
Moreover the results of the study show that the performance of independentprofessional consultants is very different from that of small consultantcompanies Independent consultants offer a high quality service that lives up tothe very high expectations of their clients The benefits that these clients gainfrom working with a consultant are also perceived as very high
During this work it has been noted that the quality offered by consultantcompanies that employ a staff of professionals varies according to the sizeof the company The benefits perceived by their clients are very similar tobut are slightly higher than those perceived by companies employing largeconsultancies
Finally although we realise that our study relates to only one region ofEurope we believe that our findings have broader implications for researchersand practitioners Thus we guess that it would be interesting to carry outsimilar surveys in other European and US regions For practitioners ourfindings should give pause for thought We guess that these findings are very
Quality serviceof ISO 9000consultants
1011
interesting in order to improve their service and that they should somehowmeasure and control their service quality We really think that for all theprofessionals working in the quality field a quality service should be a realNo 1 purpose
References
Berry L (1995) MaAcircs allaAcirc de la excelencia en el servicio Un plan para la accioAcircn DeustoPublications
Brown A and Van der Wiele T (1995) ` Industry experience with ISO 9000rsquorsquo Asia PacificJournal of Quality Management Vol 4 No 2 pp 8-17
Buttle F (1997) ` ISO 9000 marketing motivations and benefitsrsquorsquo International Journal of Qualityamp Reliability Management Vol 14 No 9 pp 936-47
CasadesuAcircs M (1998) ` La normativa de aseguramiento de la calidad ISO 9000 en CatalunAumlaexpectativas y efectos Estudio empotildeAcircricorsquorsquo Research project CICYT Reference SEC96-1005
CasadesuAcircs M and GimeAcircnez G (2000) ` The benefits of the implementation of the ISO 9000standard empirical researchin 288 Spanish companiesrsquorsquo The TQM Magazine Vol 12 No 6
Escanciano C (2000) ` Influencia de la certificacioAcircn ISO 9000 en el avance de la empresa espanAumlolahacia la calidad totalrsquorsquo paper presented at the 1st World Conference on Production andOperations Management (POM) Seville
Groth JC and Dye RT (1999) ` Service quality perceived value expectations shortfalls andbonusesrsquorsquo Managing Service Quality Vol 9 No 4
ISO (2000) available at wwwisochisoeniso9000-14000pdfsurvey9pdf
Jones R Arndt G and Kustin R (1997) ` ISO 9000 among Australian companies impact of timeand reasons for seeking certification on perceptions of benefits receivedrsquorsquo InternationalJournal of Quality amp Reliability Management Vol 14 No 7
Lloydrsquos Register Quality Assurance Ltd (1994) BS 5750 ISO 9000 ndash Setting Standards forBetter Business Lloydrsquos Register Quality Assurance Services Ltd Croydon
MartotildeAcircnez C et al (2000) `Analysis of the implementation of ISO 9000 quality assurancesystemsrsquorsquo Work Study Vol 49 No 6
Meegan ST and Taylor WA (1997) ` Factors influencing a successful transition from ISO 9000to TQM The influence of understanding and motivationrsquorsquo International Journal of Qualityamp Reliability Management Vol 14 No 2
Nachum L (1999) `Measurement of productivity of professional services an illustration ofSwedish management consulting firmsrsquorsquo International Journal of Operations amp ProductionManagement Vol 19 No 9
Phillips J (2000) The Consultantrsquos Scorecard McGraw Hill New York NY
Ribeiro D (1996) ` ConsultorotildeAcirca para la direccioAcircn en organizacioAcircn calidad marketing yestrategiarsquorsquo doctoral thesis University of Valencia Valencia
Samson D and Parker R (1994) ` Service quality the gap in the Australian consulting engineeringindustryrsquorsquo International Journal of Quality amp Reliability Management Vol 11 No 7
Vanguard Consulting Ltd (1994) `BS 5750ISO 9000EN 29000 1987 a positive contribution tobetter businessrsquorsquo The TQM Magazine Vol 11 No 2 p 60
Vloeberghs D and Bellens J (1996) ` Implementing the ISO 9000 standardsrsquorsquo Quality ProgressVol 29 No 6 pp 43-8
Zeithaml VA Parasuraman A and Berry L (1993) Calidad total en la gestioAcircn de los serviciosDotildeAcircaz de Santos
IJQRM1989
1012
Appendix 1
Tot
alvar
iance
expla
ined
Init
ial
eigen
val
ues
Extr
acti
onsu
ms
ofsq
uar
edlo
adin
gs
Rot
atio
nsu
ms
ofsq
uar
edlo
adin
gs
Com
pon
ents
Tot
alP
erce
nt
ofvar
iance
Cum
ula
tive
per
cent
Tot
alP
erce
nt
ofvar
iance
Cum
ula
tive
per
cent
Tot
alP
erce
nt
ofvar
iance
Cum
ula
tive
per
cent
17
7255
20
552
07
7255
20
552
04
8434
58
345
82
136
971
649
21
369
7164
92
306
219
156
50
31
037
3972
31
103
739
723
12
2115
81
723
14
073
521
775
25
068
486
823
86
061
435
867
47
039
279
895
38
035
255
920
99
031
224
943
310
022
162
959
511
019
137
973
312
015
107
984
013
014
105
994
614
007
053
100
0
Note
sE
xtr
acti
onm
ethod
P
rinci
pal
com
pon
ent
anal
ysi
sC
ompon
ent
Rot
ated
com
pon
ent
mat
rix
a
12
3b12
084
10
264
b11
079
60
346
b13
079
00
407
b10
076
80
383
025
1b8
075
30
340
b9
072
40
426
b14
061
70
446
029
7b4
060
80
470
032
0b6
085
1b5
079
4b7
034
40
573
034
3b1
086
7b3
042
50
415
063
5b2
025
30
513
057
2
Note
sE
xtra
ctio
nm
etho
dpr
inci
pal
com
pone
ntan
alys
isR
otat
ion
met
hod
Var
imax
with
Kai
ser
norm
aliz
atio
naR
otat
ion
conv
erge
din
six
inte
ratio
ns
Table AIFactorial analysis ofthe perceived qualityPrincipal componentsmethod with varimaxrotation
Quality serviceof ISO 9000consultants
1013
Appendix 2T
otal
var
iance
expla
ined
Init
ial
eigen
val
ues
Extr
acti
onsu
ms
ofsq
uar
edlo
adin
gs
Rot
atio
nsu
ms
ofsq
uar
edlo
adin
gs
Com
pon
ents
Tot
alP
erce
nt
ofvar
iance
Cum
ula
tive
per
cent
Tot
alP
erce
nt
ofvar
iance
Cum
ula
tive
per
cent
Tot
alP
erce
nt
ofvar
iance
Cum
ula
tive
per
cent
18
219
632
2263
222
821
963
222
632
225
245
403
4940
349
20
894
687
570
097
089
46
875
700
973
867
297
4870
097
30
791
608
876
185
40
746
573
581
920
50
483
371
385
633
60
410
315
588
788
70
337
259
491
383
80
319
245
093
833
90
236
181
495
647
100
182
140
197
048
110
158
121
798
265
120
149
114
399
408
130
077
059
210
00
Note
sE
xtr
acti
onm
ethod
P
rinci
pal
com
pon
ent
anal
ysi
sC
ompon
ent
Rot
ated
com
pon
ent
mat
rix
a
12
d9
091
1d8
079
40
288
d3
073
60
375
d10
071
50
418
d11
069
00
523
d7
067
60
462
d13
063
50
484
d2
061
40
523
d12
057
50
560
d1
085
4d6
037
70
767
d5
040
30
675
d4
060
40
608
Note
sE
xtra
ctio
nm
etho
dpr
inci
pal
com
ponen
tan
alys
isR
otat
ion
met
hod
Var
imax
with
Kai
ser
norm
aliz
atio
naR
otat
ion
conv
erge
din
thre
eiter
atio
n
Table AIIFactoral analysis of the
obtained benefitsPrincipal componentsmethod with varimax
rotation

Quality serviceof ISO 9000consultants
1005
In a nutshell we can conclude this part of the analysis by stating that althoughthe companies hold a good opinion of the quality of the advisory servicesreceived prior expectations of the same were considerably higher Thisconclusion shows that there is still room for improvement of the service offeredby quality consultants
Benefits obtained by clients of quality consultant servicesAfter analysing the quality offered by consultants and the expectations raised bythis type of service an analysis is made of the clientsrsquo perception of the benefitsdirectly derived from the consultantrsquos intervention Although it must beconsidered a priori that clients are not usually very sure about the value of theservice that they are engaging or the price that they are prepared to pay for it itcan be said that if this type of consultancy exists it is because clients think thatthey can obtain some benefits for which they are prepared to pay a fee Thesebenefits have been assessed by a set of 13 questions likewise answered on theLikert scale [15] as compiled in Table III The benefits considered are not merelyof an economic nature but include diverse factors such as increased motivation inworkers and improved relationships with customers and suppliers
Assessment of the results obtained shows that the arithmetic mean of allthese benefits is only 305 An overall assessment of the benefits gained fromuse of a consultant was obtained from one single question the response towhich gave the similar result of 317 In short both indicators coincide inhighlighting the fact that the companies did not perceive any benefits from theinput of the consultant
Items
Better understanding of quality as a result of working with an external consultant
Satisfaction with the skills provided by the consultants
Increased company motivation after working with external consultants
Adaptation of ethical approach after working with an external consultant
Definition and aims of quality policy following advice from the consultant
Definition of and approach to process following advice from the consultant
Improved approach to customers following advice from the consultant
Setting-up of beneficial relationships with customers andor suppliers following advice fromthe consultant
Setting-up of customer satisfaction control measures following advice from the consultant
Ideas for growth of company yield following advice from the consultant
Setting-up of continuous improvement scheme in the company following advice from theconsultant
Improved understanding of the relationship between the different processes and how tomanage the same in terms of a system
Improved decision taking based on data analysis following advice from the consultant
Table IIIItems analysed to assessthe benefits of workingwith a consultant when
introducing a qualitysystem
IJQRM1989
1006
From a factor analysis on extracting factors with the principal componentsand varimax rotation method two factors with eigenvalues higher than 1 areobtained (Appendix 2) The analysis is correct The determinant of thecorrelation matrix is 7162E-06 and the KMO measure is 0881 Moreover thetwo factors account for 70 percent of the variability of the sample
From the variables with the highest saturations in each factor we decided tocall the first factor ` Client approachrsquorsquo and the second factor ` Before the ruling isintroducedrsquorsquo This second factor includes all the benefits derived from the stepsprior to introduction definition of quality policy identification of aimsdefinition of procedures and improved understanding of quality
Table IV shows the grouping of the items related to benefits derived fromworking with a quality consultant
Relationship between perceived quality and benefits provided bythe consultantThe next step consisted of establishing the relationship between perceivedquality and the benefits obtained from using the service of a consultant Theresearch study detected and confirmed the relationship existing between thetwo concepts with different sets of statistics To summarise this relationshipwas analysed in two different ways first from questions eliciting an overallassessment on quality and benefits ie the analysis of the contingency tableresulting from the crossing of the two variables and second from the analysisof the relationship between the variables of mean quality and mean benefitscalculated as a mean from the corresponding sets of questions
Contingency Table V relating the two overall assessment variables on theLikert scale [15] is a 5 pound 5 square table In this respect the Pearson chi-squarestatistics and the likelihood ratio indicate the existence of a relationship
1 2 3 4 5 6 7 8 9 10 11 12 13
Factor 1 X X X X X X X X XFactor 2 X X X X
Table IVHigh saturation of thetwo factors with thePAF method withvarimax rotation
Value Freedom degree(Bilateral)
asymptotic sig
Pearsonrsquos chi-square 52979a 16 0000
Likelihood ratio 45709 16 0000
Linear by linear association 2712 1 0000
Number of valid cases 62
Note a22 cells (880 percent) have an expected frequency of less than 5 The minimumexpected frequency is 024
Table VContingency tablestatistic betweenoverall perceivedquality and overallbenefits
Quality serviceof ISO 9000consultants
1007
The association measurements that are normally used on an ordinal scale(Gamma = 0759 Kendallrsquos tau-b = 0563 and Somersrsquo d = 0562 each with a pvalue of 0000 in every case) also detect a relationship between the differentvariables A log-linear model was set up to explain the frequencies in thecontingency table cells and the saturated model was found to be the most suitablefor the purpose This model includes the interaction between the two variables
To sum up it has been statistically shown that the variables have a clearpositive correlation The higher the perceived quality the higher the benefitsand vice versa On the other hand and as a second way of detecting anddefining a relationship a linear regression was made between two variablesthat were calculated as the mean from the set of questions on perception andthe mean from the questions on benefits The analysis indicates that thevariables are correlated although the Pearson correlation coefficient is 0588with zero significance level (Figure 3)
Proceeding logically the very design of the variables enables the rank inboth cases to be [15] Both cases present variables of a linear combination ofseveral questions answered on the Likert scale [15] The relationship betweenthe variables can be clearly seen in Figure 3 Leaving the mean perceivedbenefit as an independent variable the linear regression has been calculated as
Mean Arithmetic Benefit ˆ 0456 Dagger 0702currenMean Perceived Quality
The slope of the regression is positive but less than the unit A unitary increasein quality does not result in a unitary increase in benefits but only in anincrease of seven-tenth The regression coefficient associated with thedependent variable obtained a zero significance level
Figure 3Scatter diagram of the
variables `meanperceived qualityrsquorsquo and
`mean benefitsrsquorsquo
IJQRM1989
1008
In summary the analyses point to the existence of a significant relationshipbetween the efforts of the consultant to provide a better quality service and theclientrsquos perception of improved benefits
Quality of consultant companies in relation to their sizeA study of the performance of consultant companies in relation to their sizewas made on the basis of the collected data The sample was divided into fourcategories companies that engaged the services of a single independentconsultant companies that used consultancies with a staff of between twoand five consultants companies that used consultancies with a staff ofbetween six and 50 consultants and lastly companies that used consultancieswith a staff of over 50 consultants The results of this segmentation can beseen in Figure 4
It was observed that the quality of the service is related to the size of theconsultant company the larger the company the better the service The bigconsultant companies obtain a significantly higher quality rating than thesmaller companies Whereas small companies (with two to fiveconsultants) obtain an average rating of 339 the average rating of theconsultancies with a staff of over 50 employees stands at 443 Thisrepresents a large difference of over one point It is noteworthy howeverthat professional consultants working independently offer a high qualityservice and score a rating that is closer to that of the large consultanciesthan the small ones
There also seems to be a negative relationship between the expectations ofthe client company and the number of workers employed by the consultantcompany However this does not carry any statistical significance
In the case of consultants working alone as independent professionalsexpectations of the service and perceived quality of the same are both veryhigh On the other hand although their clients have lower expectations thelarge consultant companies offer the best quality service In this case indeedperceived quality is higher than expectations
Figure 4Perceived qualityexpectations gap andbenefits in relation to thesize of the consultancy
Quality serviceof ISO 9000consultants
1009
On the other hand similar results are found when the benefits from using aconsultant are analysed according to the size of the consultant company Smallcompanies (between two and five consultants) provide the fewest benefits fortheir clients with an average rating of 288 whereas the large companies obtainan average rating of 313 Once again it is noted that independent professionalconsultants follow a different pattern and obtain the highest ratings of all Allthese relationships are statistically significant as shown by the Kruskal-Wallistest carried out by grouping the variables according to the size of theconsultant companies (Table VI)
The perceived quality and the gap between expectations and perceptionboth present significantly different averages with a significance level of 005
In a parallel manner the performance of the variables of qualityexpectations and benefits was analysed in relation to the size of the clientcompany In short no statistically significant relationship was detectedbetween these variables and the size of the client company in terms of numberof employees
Cost of consultant servicesIt is difficult to assess the benefits obtained from a consultant service withouttaking into consideration the cost of the same For this reason it wasconsidered appropriate to analyse the questionnaire data in terms of the costsinvolved In brief it can be concluded from an analysis of the data that theseservices are not expensive An assessment of the fees charged gives thelowest rating of the whole questionnaire data ie 272 This value is lowerthan the average value of the scale thus indicating a slight variance with theabove statement
Companies invested few resources in the introduction of the ruling It wasfound that 62 percent of the sample invested less than 15000 Euro Among thecompanies that engaged the services of a consultant the corresponding feesamounted to 48 percent of the total cost of introduction In most cases (77percent) the consultantrsquos fees are stipulated right from the beginning It can beassumed that the consultancies are so familiar with their service that they canmake an initial estimate of the cost of introducing the ruling with a high degreeof precision This type of service has been steadily growing ever since it was
Mean perceived
quality
Mean
expectations
Non-weighted
quality gap
Arithmetic mean
benefits 13 items
Chi-square 1465 1913 1411 1890
Freedom degree 3 3 3 3
Asymptotic sig 0002 0591 0003 0596
Notes aKruskal-Wallis test bGrouping variable number of consultants
Table VIKruskal-Wallis test
statistics for thevariables `perceived
qualityrsquorsquo ` expectationsrsquorsquo` gap between
expectations andperceived qualityrsquorsquo and`mean benefitsrsquorsquo when
grouped by ` number ofconsultantsrsquorsquo
IJQRM1989
1010
started a decade ago and can therefore be considered as standard (MartotildeAcircnez etal 2000) Moreover it is interesting to note that the offer of the service has alsoincreased which has resulted in a corresponding price adjustment
ConclusionsOne of the characteristics that differentiates a service from a product ormaterial goods is that the service is sold first and later `manufacturedrsquorsquoMoreover the production and consumption of the service are simultaneous iea service cannot be stored Thus the overall assessment of the client springsfrom two sources the end result of the service and the very process by whichthe service is provided (Berry 1995)
For these reasons the assessment of the quality of a service is not an easytask and as pointed out by Groth and Dye (1999) the providers of a serviceshould bear in mind this dual aspect by which a service is appraised Thereforethey should be able to recognise the different degrees by which the service itselfand the provision of the service are being assessed Despite this we consider itimportant to assess these services from the point of view of the client companyas has been done in the present research study
From all this we can draw the overall conclusion that the ISO 9000 advisoryservices are favourably regarded on the whole However it should also benoted that clients expect an even higher quality In short the client companiesexpect a higher quality from the service than that which is actually provided
It has been shown that the concept of quality can be broken down intothree factors one of which is the skill of the consultant in introducing theruling within the agreed time period and this is the aspect of the service thatobtains the poorest quality rating This factor is closely linked to thereliability factor which is considered to be of the highest importance by theclient companies For this reason the most reiterated request forimprovement by the clients is that the consultants perform the required taskswithin the agreed time periods
Moreover the results of the study show that the performance of independentprofessional consultants is very different from that of small consultantcompanies Independent consultants offer a high quality service that lives up tothe very high expectations of their clients The benefits that these clients gainfrom working with a consultant are also perceived as very high
During this work it has been noted that the quality offered by consultantcompanies that employ a staff of professionals varies according to the sizeof the company The benefits perceived by their clients are very similar tobut are slightly higher than those perceived by companies employing largeconsultancies
Finally although we realise that our study relates to only one region ofEurope we believe that our findings have broader implications for researchersand practitioners Thus we guess that it would be interesting to carry outsimilar surveys in other European and US regions For practitioners ourfindings should give pause for thought We guess that these findings are very
Quality serviceof ISO 9000consultants
1011
interesting in order to improve their service and that they should somehowmeasure and control their service quality We really think that for all theprofessionals working in the quality field a quality service should be a realNo 1 purpose
References
Berry L (1995) MaAcircs allaAcirc de la excelencia en el servicio Un plan para la accioAcircn DeustoPublications
Brown A and Van der Wiele T (1995) ` Industry experience with ISO 9000rsquorsquo Asia PacificJournal of Quality Management Vol 4 No 2 pp 8-17
Buttle F (1997) ` ISO 9000 marketing motivations and benefitsrsquorsquo International Journal of Qualityamp Reliability Management Vol 14 No 9 pp 936-47
CasadesuAcircs M (1998) ` La normativa de aseguramiento de la calidad ISO 9000 en CatalunAumlaexpectativas y efectos Estudio empotildeAcircricorsquorsquo Research project CICYT Reference SEC96-1005
CasadesuAcircs M and GimeAcircnez G (2000) ` The benefits of the implementation of the ISO 9000standard empirical researchin 288 Spanish companiesrsquorsquo The TQM Magazine Vol 12 No 6
Escanciano C (2000) ` Influencia de la certificacioAcircn ISO 9000 en el avance de la empresa espanAumlolahacia la calidad totalrsquorsquo paper presented at the 1st World Conference on Production andOperations Management (POM) Seville
Groth JC and Dye RT (1999) ` Service quality perceived value expectations shortfalls andbonusesrsquorsquo Managing Service Quality Vol 9 No 4
ISO (2000) available at wwwisochisoeniso9000-14000pdfsurvey9pdf
Jones R Arndt G and Kustin R (1997) ` ISO 9000 among Australian companies impact of timeand reasons for seeking certification on perceptions of benefits receivedrsquorsquo InternationalJournal of Quality amp Reliability Management Vol 14 No 7
Lloydrsquos Register Quality Assurance Ltd (1994) BS 5750 ISO 9000 ndash Setting Standards forBetter Business Lloydrsquos Register Quality Assurance Services Ltd Croydon
MartotildeAcircnez C et al (2000) `Analysis of the implementation of ISO 9000 quality assurancesystemsrsquorsquo Work Study Vol 49 No 6
Meegan ST and Taylor WA (1997) ` Factors influencing a successful transition from ISO 9000to TQM The influence of understanding and motivationrsquorsquo International Journal of Qualityamp Reliability Management Vol 14 No 2
Nachum L (1999) `Measurement of productivity of professional services an illustration ofSwedish management consulting firmsrsquorsquo International Journal of Operations amp ProductionManagement Vol 19 No 9
Phillips J (2000) The Consultantrsquos Scorecard McGraw Hill New York NY
Ribeiro D (1996) ` ConsultorotildeAcirca para la direccioAcircn en organizacioAcircn calidad marketing yestrategiarsquorsquo doctoral thesis University of Valencia Valencia
Samson D and Parker R (1994) ` Service quality the gap in the Australian consulting engineeringindustryrsquorsquo International Journal of Quality amp Reliability Management Vol 11 No 7
Vanguard Consulting Ltd (1994) `BS 5750ISO 9000EN 29000 1987 a positive contribution tobetter businessrsquorsquo The TQM Magazine Vol 11 No 2 p 60
Vloeberghs D and Bellens J (1996) ` Implementing the ISO 9000 standardsrsquorsquo Quality ProgressVol 29 No 6 pp 43-8
Zeithaml VA Parasuraman A and Berry L (1993) Calidad total en la gestioAcircn de los serviciosDotildeAcircaz de Santos
IJQRM1989
1012
Appendix 1
Tot
alvar
iance
expla
ined
Init
ial
eigen
val
ues
Extr
acti
onsu
ms
ofsq
uar
edlo
adin
gs
Rot
atio
nsu
ms
ofsq
uar
edlo
adin
gs
Com
pon
ents
Tot
alP
erce
nt
ofvar
iance
Cum
ula
tive
per
cent
Tot
alP
erce
nt
ofvar
iance
Cum
ula
tive
per
cent
Tot
alP
erce
nt
ofvar
iance
Cum
ula
tive
per
cent
17
7255
20
552
07
7255
20
552
04
8434
58
345
82
136
971
649
21
369
7164
92
306
219
156
50
31
037
3972
31
103
739
723
12
2115
81
723
14
073
521
775
25
068
486
823
86
061
435
867
47
039
279
895
38
035
255
920
99
031
224
943
310
022
162
959
511
019
137
973
312
015
107
984
013
014
105
994
614
007
053
100
0
Note
sE
xtr
acti
onm
ethod
P
rinci
pal
com
pon
ent
anal
ysi
sC
ompon
ent
Rot
ated
com
pon
ent
mat
rix
a
12
3b12
084
10
264
b11
079
60
346
b13
079
00
407
b10
076
80
383
025
1b8
075
30
340
b9
072
40
426
b14
061
70
446
029
7b4
060
80
470
032
0b6
085
1b5
079
4b7
034
40
573
034
3b1
086
7b3
042
50
415
063
5b2
025
30
513
057
2
Note
sE
xtra
ctio
nm
etho
dpr
inci
pal
com
pone
ntan
alys
isR
otat
ion
met
hod
Var
imax
with
Kai
ser
norm
aliz
atio
naR
otat
ion
conv
erge
din
six
inte
ratio
ns
Table AIFactorial analysis ofthe perceived qualityPrincipal componentsmethod with varimaxrotation
Quality serviceof ISO 9000consultants
1013
Appendix 2T
otal
var
iance
expla
ined
Init
ial
eigen
val
ues
Extr
acti
onsu
ms
ofsq
uar
edlo
adin
gs
Rot
atio
nsu
ms
ofsq
uar
edlo
adin
gs
Com
pon
ents
Tot
alP
erce
nt
ofvar
iance
Cum
ula
tive
per
cent
Tot
alP
erce
nt
ofvar
iance
Cum
ula
tive
per
cent
Tot
alP
erce
nt
ofvar
iance
Cum
ula
tive
per
cent
18
219
632
2263
222
821
963
222
632
225
245
403
4940
349
20
894
687
570
097
089
46
875
700
973
867
297
4870
097
30
791
608
876
185
40
746
573
581
920
50
483
371
385
633
60
410
315
588
788
70
337
259
491
383
80
319
245
093
833
90
236
181
495
647
100
182
140
197
048
110
158
121
798
265
120
149
114
399
408
130
077
059
210
00
Note
sE
xtr
acti
onm
ethod
P
rinci
pal
com
pon
ent
anal
ysi
sC
ompon
ent
Rot
ated
com
pon
ent
mat
rix
a
12
d9
091
1d8
079
40
288
d3
073
60
375
d10
071
50
418
d11
069
00
523
d7
067
60
462
d13
063
50
484
d2
061
40
523
d12
057
50
560
d1
085
4d6
037
70
767
d5
040
30
675
d4
060
40
608
Note
sE
xtra
ctio
nm
etho
dpr
inci
pal
com
ponen
tan
alys
isR
otat
ion
met
hod
Var
imax
with
Kai
ser
norm
aliz
atio
naR
otat
ion
conv
erge
din
thre
eiter
atio
n
Table AIIFactoral analysis of the
obtained benefitsPrincipal componentsmethod with varimax
rotation

IJQRM1989
1006
From a factor analysis on extracting factors with the principal componentsand varimax rotation method two factors with eigenvalues higher than 1 areobtained (Appendix 2) The analysis is correct The determinant of thecorrelation matrix is 7162E-06 and the KMO measure is 0881 Moreover thetwo factors account for 70 percent of the variability of the sample
From the variables with the highest saturations in each factor we decided tocall the first factor ` Client approachrsquorsquo and the second factor ` Before the ruling isintroducedrsquorsquo This second factor includes all the benefits derived from the stepsprior to introduction definition of quality policy identification of aimsdefinition of procedures and improved understanding of quality
Table IV shows the grouping of the items related to benefits derived fromworking with a quality consultant
Relationship between perceived quality and benefits provided bythe consultantThe next step consisted of establishing the relationship between perceivedquality and the benefits obtained from using the service of a consultant Theresearch study detected and confirmed the relationship existing between thetwo concepts with different sets of statistics To summarise this relationshipwas analysed in two different ways first from questions eliciting an overallassessment on quality and benefits ie the analysis of the contingency tableresulting from the crossing of the two variables and second from the analysisof the relationship between the variables of mean quality and mean benefitscalculated as a mean from the corresponding sets of questions
Contingency Table V relating the two overall assessment variables on theLikert scale [15] is a 5 pound 5 square table In this respect the Pearson chi-squarestatistics and the likelihood ratio indicate the existence of a relationship
1 2 3 4 5 6 7 8 9 10 11 12 13
Factor 1 X X X X X X X X XFactor 2 X X X X
Table IVHigh saturation of thetwo factors with thePAF method withvarimax rotation
Value Freedom degree(Bilateral)
asymptotic sig
Pearsonrsquos chi-square 52979a 16 0000
Likelihood ratio 45709 16 0000
Linear by linear association 2712 1 0000
Number of valid cases 62
Note a22 cells (880 percent) have an expected frequency of less than 5 The minimumexpected frequency is 024
Table VContingency tablestatistic betweenoverall perceivedquality and overallbenefits
Quality serviceof ISO 9000consultants
1007
The association measurements that are normally used on an ordinal scale(Gamma = 0759 Kendallrsquos tau-b = 0563 and Somersrsquo d = 0562 each with a pvalue of 0000 in every case) also detect a relationship between the differentvariables A log-linear model was set up to explain the frequencies in thecontingency table cells and the saturated model was found to be the most suitablefor the purpose This model includes the interaction between the two variables
To sum up it has been statistically shown that the variables have a clearpositive correlation The higher the perceived quality the higher the benefitsand vice versa On the other hand and as a second way of detecting anddefining a relationship a linear regression was made between two variablesthat were calculated as the mean from the set of questions on perception andthe mean from the questions on benefits The analysis indicates that thevariables are correlated although the Pearson correlation coefficient is 0588with zero significance level (Figure 3)
Proceeding logically the very design of the variables enables the rank inboth cases to be [15] Both cases present variables of a linear combination ofseveral questions answered on the Likert scale [15] The relationship betweenthe variables can be clearly seen in Figure 3 Leaving the mean perceivedbenefit as an independent variable the linear regression has been calculated as
Mean Arithmetic Benefit ˆ 0456 Dagger 0702currenMean Perceived Quality
The slope of the regression is positive but less than the unit A unitary increasein quality does not result in a unitary increase in benefits but only in anincrease of seven-tenth The regression coefficient associated with thedependent variable obtained a zero significance level
Figure 3Scatter diagram of the
variables `meanperceived qualityrsquorsquo and
`mean benefitsrsquorsquo
IJQRM1989
1008
In summary the analyses point to the existence of a significant relationshipbetween the efforts of the consultant to provide a better quality service and theclientrsquos perception of improved benefits
Quality of consultant companies in relation to their sizeA study of the performance of consultant companies in relation to their sizewas made on the basis of the collected data The sample was divided into fourcategories companies that engaged the services of a single independentconsultant companies that used consultancies with a staff of between twoand five consultants companies that used consultancies with a staff ofbetween six and 50 consultants and lastly companies that used consultancieswith a staff of over 50 consultants The results of this segmentation can beseen in Figure 4
It was observed that the quality of the service is related to the size of theconsultant company the larger the company the better the service The bigconsultant companies obtain a significantly higher quality rating than thesmaller companies Whereas small companies (with two to fiveconsultants) obtain an average rating of 339 the average rating of theconsultancies with a staff of over 50 employees stands at 443 Thisrepresents a large difference of over one point It is noteworthy howeverthat professional consultants working independently offer a high qualityservice and score a rating that is closer to that of the large consultanciesthan the small ones
There also seems to be a negative relationship between the expectations ofthe client company and the number of workers employed by the consultantcompany However this does not carry any statistical significance
In the case of consultants working alone as independent professionalsexpectations of the service and perceived quality of the same are both veryhigh On the other hand although their clients have lower expectations thelarge consultant companies offer the best quality service In this case indeedperceived quality is higher than expectations
Figure 4Perceived qualityexpectations gap andbenefits in relation to thesize of the consultancy
Quality serviceof ISO 9000consultants
1009
On the other hand similar results are found when the benefits from using aconsultant are analysed according to the size of the consultant company Smallcompanies (between two and five consultants) provide the fewest benefits fortheir clients with an average rating of 288 whereas the large companies obtainan average rating of 313 Once again it is noted that independent professionalconsultants follow a different pattern and obtain the highest ratings of all Allthese relationships are statistically significant as shown by the Kruskal-Wallistest carried out by grouping the variables according to the size of theconsultant companies (Table VI)
The perceived quality and the gap between expectations and perceptionboth present significantly different averages with a significance level of 005
In a parallel manner the performance of the variables of qualityexpectations and benefits was analysed in relation to the size of the clientcompany In short no statistically significant relationship was detectedbetween these variables and the size of the client company in terms of numberof employees
Cost of consultant servicesIt is difficult to assess the benefits obtained from a consultant service withouttaking into consideration the cost of the same For this reason it wasconsidered appropriate to analyse the questionnaire data in terms of the costsinvolved In brief it can be concluded from an analysis of the data that theseservices are not expensive An assessment of the fees charged gives thelowest rating of the whole questionnaire data ie 272 This value is lowerthan the average value of the scale thus indicating a slight variance with theabove statement
Companies invested few resources in the introduction of the ruling It wasfound that 62 percent of the sample invested less than 15000 Euro Among thecompanies that engaged the services of a consultant the corresponding feesamounted to 48 percent of the total cost of introduction In most cases (77percent) the consultantrsquos fees are stipulated right from the beginning It can beassumed that the consultancies are so familiar with their service that they canmake an initial estimate of the cost of introducing the ruling with a high degreeof precision This type of service has been steadily growing ever since it was
Mean perceived
quality
Mean
expectations
Non-weighted
quality gap
Arithmetic mean
benefits 13 items
Chi-square 1465 1913 1411 1890
Freedom degree 3 3 3 3
Asymptotic sig 0002 0591 0003 0596
Notes aKruskal-Wallis test bGrouping variable number of consultants
Table VIKruskal-Wallis test
statistics for thevariables `perceived
qualityrsquorsquo ` expectationsrsquorsquo` gap between
expectations andperceived qualityrsquorsquo and`mean benefitsrsquorsquo when
grouped by ` number ofconsultantsrsquorsquo
IJQRM1989
1010
started a decade ago and can therefore be considered as standard (MartotildeAcircnez etal 2000) Moreover it is interesting to note that the offer of the service has alsoincreased which has resulted in a corresponding price adjustment
ConclusionsOne of the characteristics that differentiates a service from a product ormaterial goods is that the service is sold first and later `manufacturedrsquorsquoMoreover the production and consumption of the service are simultaneous iea service cannot be stored Thus the overall assessment of the client springsfrom two sources the end result of the service and the very process by whichthe service is provided (Berry 1995)
For these reasons the assessment of the quality of a service is not an easytask and as pointed out by Groth and Dye (1999) the providers of a serviceshould bear in mind this dual aspect by which a service is appraised Thereforethey should be able to recognise the different degrees by which the service itselfand the provision of the service are being assessed Despite this we consider itimportant to assess these services from the point of view of the client companyas has been done in the present research study
From all this we can draw the overall conclusion that the ISO 9000 advisoryservices are favourably regarded on the whole However it should also benoted that clients expect an even higher quality In short the client companiesexpect a higher quality from the service than that which is actually provided
It has been shown that the concept of quality can be broken down intothree factors one of which is the skill of the consultant in introducing theruling within the agreed time period and this is the aspect of the service thatobtains the poorest quality rating This factor is closely linked to thereliability factor which is considered to be of the highest importance by theclient companies For this reason the most reiterated request forimprovement by the clients is that the consultants perform the required taskswithin the agreed time periods
Moreover the results of the study show that the performance of independentprofessional consultants is very different from that of small consultantcompanies Independent consultants offer a high quality service that lives up tothe very high expectations of their clients The benefits that these clients gainfrom working with a consultant are also perceived as very high
During this work it has been noted that the quality offered by consultantcompanies that employ a staff of professionals varies according to the sizeof the company The benefits perceived by their clients are very similar tobut are slightly higher than those perceived by companies employing largeconsultancies
Finally although we realise that our study relates to only one region ofEurope we believe that our findings have broader implications for researchersand practitioners Thus we guess that it would be interesting to carry outsimilar surveys in other European and US regions For practitioners ourfindings should give pause for thought We guess that these findings are very
Quality serviceof ISO 9000consultants
1011
interesting in order to improve their service and that they should somehowmeasure and control their service quality We really think that for all theprofessionals working in the quality field a quality service should be a realNo 1 purpose
References
Berry L (1995) MaAcircs allaAcirc de la excelencia en el servicio Un plan para la accioAcircn DeustoPublications
Brown A and Van der Wiele T (1995) ` Industry experience with ISO 9000rsquorsquo Asia PacificJournal of Quality Management Vol 4 No 2 pp 8-17
Buttle F (1997) ` ISO 9000 marketing motivations and benefitsrsquorsquo International Journal of Qualityamp Reliability Management Vol 14 No 9 pp 936-47
CasadesuAcircs M (1998) ` La normativa de aseguramiento de la calidad ISO 9000 en CatalunAumlaexpectativas y efectos Estudio empotildeAcircricorsquorsquo Research project CICYT Reference SEC96-1005
CasadesuAcircs M and GimeAcircnez G (2000) ` The benefits of the implementation of the ISO 9000standard empirical researchin 288 Spanish companiesrsquorsquo The TQM Magazine Vol 12 No 6
Escanciano C (2000) ` Influencia de la certificacioAcircn ISO 9000 en el avance de la empresa espanAumlolahacia la calidad totalrsquorsquo paper presented at the 1st World Conference on Production andOperations Management (POM) Seville
Groth JC and Dye RT (1999) ` Service quality perceived value expectations shortfalls andbonusesrsquorsquo Managing Service Quality Vol 9 No 4
ISO (2000) available at wwwisochisoeniso9000-14000pdfsurvey9pdf
Jones R Arndt G and Kustin R (1997) ` ISO 9000 among Australian companies impact of timeand reasons for seeking certification on perceptions of benefits receivedrsquorsquo InternationalJournal of Quality amp Reliability Management Vol 14 No 7
Lloydrsquos Register Quality Assurance Ltd (1994) BS 5750 ISO 9000 ndash Setting Standards forBetter Business Lloydrsquos Register Quality Assurance Services Ltd Croydon
MartotildeAcircnez C et al (2000) `Analysis of the implementation of ISO 9000 quality assurancesystemsrsquorsquo Work Study Vol 49 No 6
Meegan ST and Taylor WA (1997) ` Factors influencing a successful transition from ISO 9000to TQM The influence of understanding and motivationrsquorsquo International Journal of Qualityamp Reliability Management Vol 14 No 2
Nachum L (1999) `Measurement of productivity of professional services an illustration ofSwedish management consulting firmsrsquorsquo International Journal of Operations amp ProductionManagement Vol 19 No 9
Phillips J (2000) The Consultantrsquos Scorecard McGraw Hill New York NY
Ribeiro D (1996) ` ConsultorotildeAcirca para la direccioAcircn en organizacioAcircn calidad marketing yestrategiarsquorsquo doctoral thesis University of Valencia Valencia
Samson D and Parker R (1994) ` Service quality the gap in the Australian consulting engineeringindustryrsquorsquo International Journal of Quality amp Reliability Management Vol 11 No 7
Vanguard Consulting Ltd (1994) `BS 5750ISO 9000EN 29000 1987 a positive contribution tobetter businessrsquorsquo The TQM Magazine Vol 11 No 2 p 60
Vloeberghs D and Bellens J (1996) ` Implementing the ISO 9000 standardsrsquorsquo Quality ProgressVol 29 No 6 pp 43-8
Zeithaml VA Parasuraman A and Berry L (1993) Calidad total en la gestioAcircn de los serviciosDotildeAcircaz de Santos
IJQRM1989
1012
Appendix 1
Tot
alvar
iance
expla
ined
Init
ial
eigen
val
ues
Extr
acti
onsu
ms
ofsq
uar
edlo
adin
gs
Rot
atio
nsu
ms
ofsq
uar
edlo
adin
gs
Com
pon
ents
Tot
alP
erce
nt
ofvar
iance
Cum
ula
tive
per
cent
Tot
alP
erce
nt
ofvar
iance
Cum
ula
tive
per
cent
Tot
alP
erce
nt
ofvar
iance
Cum
ula
tive
per
cent
17
7255
20
552
07
7255
20
552
04
8434
58
345
82
136
971
649
21
369
7164
92
306
219
156
50
31
037
3972
31
103
739
723
12
2115
81
723
14
073
521
775
25
068
486
823
86
061
435
867
47
039
279
895
38
035
255
920
99
031
224
943
310
022
162
959
511
019
137
973
312
015
107
984
013
014
105
994
614
007
053
100
0
Note
sE
xtr
acti
onm
ethod
P
rinci
pal
com
pon
ent
anal
ysi
sC
ompon
ent
Rot
ated
com
pon
ent
mat
rix
a
12
3b12
084
10
264
b11
079
60
346
b13
079
00
407
b10
076
80
383
025
1b8
075
30
340
b9
072
40
426
b14
061
70
446
029
7b4
060
80
470
032
0b6
085
1b5
079
4b7
034
40
573
034
3b1
086
7b3
042
50
415
063
5b2
025
30
513
057
2
Note
sE
xtra
ctio
nm
etho
dpr
inci
pal
com
pone
ntan
alys
isR
otat
ion
met
hod
Var
imax
with
Kai
ser
norm
aliz
atio
naR
otat
ion
conv
erge
din
six
inte
ratio
ns
Table AIFactorial analysis ofthe perceived qualityPrincipal componentsmethod with varimaxrotation
Quality serviceof ISO 9000consultants
1013
Appendix 2T
otal
var
iance
expla
ined
Init
ial
eigen
val
ues
Extr
acti
onsu
ms
ofsq
uar
edlo
adin
gs
Rot
atio
nsu
ms
ofsq
uar
edlo
adin
gs
Com
pon
ents
Tot
alP
erce
nt
ofvar
iance
Cum
ula
tive
per
cent
Tot
alP
erce
nt
ofvar
iance
Cum
ula
tive
per
cent
Tot
alP
erce
nt
ofvar
iance
Cum
ula
tive
per
cent
18
219
632
2263
222
821
963
222
632
225
245
403
4940
349
20
894
687
570
097
089
46
875
700
973
867
297
4870
097
30
791
608
876
185
40
746
573
581
920
50
483
371
385
633
60
410
315
588
788
70
337
259
491
383
80
319
245
093
833
90
236
181
495
647
100
182
140
197
048
110
158
121
798
265
120
149
114
399
408
130
077
059
210
00
Note
sE
xtr
acti
onm
ethod
P
rinci
pal
com
pon
ent
anal
ysi
sC
ompon
ent
Rot
ated
com
pon
ent
mat
rix
a
12
d9
091
1d8
079
40
288
d3
073
60
375
d10
071
50
418
d11
069
00
523
d7
067
60
462
d13
063
50
484
d2
061
40
523
d12
057
50
560
d1
085
4d6
037
70
767
d5
040
30
675
d4
060
40
608
Note
sE
xtra
ctio
nm
etho
dpr
inci
pal
com
ponen
tan
alys
isR
otat
ion
met
hod
Var
imax
with
Kai
ser
norm
aliz
atio
naR
otat
ion
conv
erge
din
thre
eiter
atio
n
Table AIIFactoral analysis of the
obtained benefitsPrincipal componentsmethod with varimax
rotation
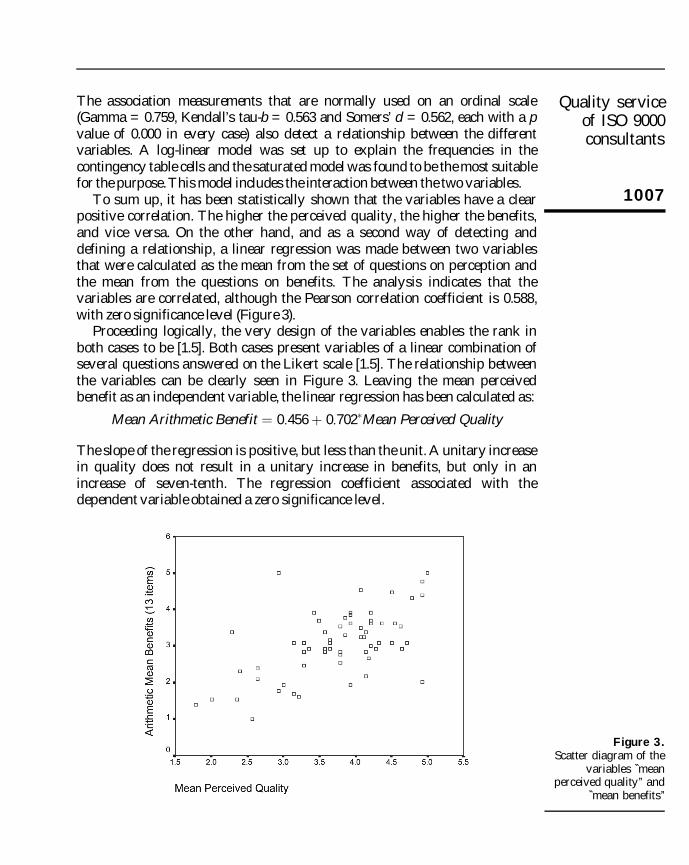
Quality serviceof ISO 9000consultants
1007
The association measurements that are normally used on an ordinal scale(Gamma = 0759 Kendallrsquos tau-b = 0563 and Somersrsquo d = 0562 each with a pvalue of 0000 in every case) also detect a relationship between the differentvariables A log-linear model was set up to explain the frequencies in thecontingency table cells and the saturated model was found to be the most suitablefor the purpose This model includes the interaction between the two variables
To sum up it has been statistically shown that the variables have a clearpositive correlation The higher the perceived quality the higher the benefitsand vice versa On the other hand and as a second way of detecting anddefining a relationship a linear regression was made between two variablesthat were calculated as the mean from the set of questions on perception andthe mean from the questions on benefits The analysis indicates that thevariables are correlated although the Pearson correlation coefficient is 0588with zero significance level (Figure 3)
Proceeding logically the very design of the variables enables the rank inboth cases to be [15] Both cases present variables of a linear combination ofseveral questions answered on the Likert scale [15] The relationship betweenthe variables can be clearly seen in Figure 3 Leaving the mean perceivedbenefit as an independent variable the linear regression has been calculated as
Mean Arithmetic Benefit ˆ 0456 Dagger 0702currenMean Perceived Quality
The slope of the regression is positive but less than the unit A unitary increasein quality does not result in a unitary increase in benefits but only in anincrease of seven-tenth The regression coefficient associated with thedependent variable obtained a zero significance level
Figure 3Scatter diagram of the
variables `meanperceived qualityrsquorsquo and
`mean benefitsrsquorsquo
IJQRM1989
1008
In summary the analyses point to the existence of a significant relationshipbetween the efforts of the consultant to provide a better quality service and theclientrsquos perception of improved benefits
Quality of consultant companies in relation to their sizeA study of the performance of consultant companies in relation to their sizewas made on the basis of the collected data The sample was divided into fourcategories companies that engaged the services of a single independentconsultant companies that used consultancies with a staff of between twoand five consultants companies that used consultancies with a staff ofbetween six and 50 consultants and lastly companies that used consultancieswith a staff of over 50 consultants The results of this segmentation can beseen in Figure 4
It was observed that the quality of the service is related to the size of theconsultant company the larger the company the better the service The bigconsultant companies obtain a significantly higher quality rating than thesmaller companies Whereas small companies (with two to fiveconsultants) obtain an average rating of 339 the average rating of theconsultancies with a staff of over 50 employees stands at 443 Thisrepresents a large difference of over one point It is noteworthy howeverthat professional consultants working independently offer a high qualityservice and score a rating that is closer to that of the large consultanciesthan the small ones
There also seems to be a negative relationship between the expectations ofthe client company and the number of workers employed by the consultantcompany However this does not carry any statistical significance
In the case of consultants working alone as independent professionalsexpectations of the service and perceived quality of the same are both veryhigh On the other hand although their clients have lower expectations thelarge consultant companies offer the best quality service In this case indeedperceived quality is higher than expectations
Figure 4Perceived qualityexpectations gap andbenefits in relation to thesize of the consultancy
Quality serviceof ISO 9000consultants
1009
On the other hand similar results are found when the benefits from using aconsultant are analysed according to the size of the consultant company Smallcompanies (between two and five consultants) provide the fewest benefits fortheir clients with an average rating of 288 whereas the large companies obtainan average rating of 313 Once again it is noted that independent professionalconsultants follow a different pattern and obtain the highest ratings of all Allthese relationships are statistically significant as shown by the Kruskal-Wallistest carried out by grouping the variables according to the size of theconsultant companies (Table VI)
The perceived quality and the gap between expectations and perceptionboth present significantly different averages with a significance level of 005
In a parallel manner the performance of the variables of qualityexpectations and benefits was analysed in relation to the size of the clientcompany In short no statistically significant relationship was detectedbetween these variables and the size of the client company in terms of numberof employees
Cost of consultant servicesIt is difficult to assess the benefits obtained from a consultant service withouttaking into consideration the cost of the same For this reason it wasconsidered appropriate to analyse the questionnaire data in terms of the costsinvolved In brief it can be concluded from an analysis of the data that theseservices are not expensive An assessment of the fees charged gives thelowest rating of the whole questionnaire data ie 272 This value is lowerthan the average value of the scale thus indicating a slight variance with theabove statement
Companies invested few resources in the introduction of the ruling It wasfound that 62 percent of the sample invested less than 15000 Euro Among thecompanies that engaged the services of a consultant the corresponding feesamounted to 48 percent of the total cost of introduction In most cases (77percent) the consultantrsquos fees are stipulated right from the beginning It can beassumed that the consultancies are so familiar with their service that they canmake an initial estimate of the cost of introducing the ruling with a high degreeof precision This type of service has been steadily growing ever since it was
Mean perceived
quality
Mean
expectations
Non-weighted
quality gap
Arithmetic mean
benefits 13 items
Chi-square 1465 1913 1411 1890
Freedom degree 3 3 3 3
Asymptotic sig 0002 0591 0003 0596
Notes aKruskal-Wallis test bGrouping variable number of consultants
Table VIKruskal-Wallis test
statistics for thevariables `perceived
qualityrsquorsquo ` expectationsrsquorsquo` gap between
expectations andperceived qualityrsquorsquo and`mean benefitsrsquorsquo when
grouped by ` number ofconsultantsrsquorsquo
IJQRM1989
1010
started a decade ago and can therefore be considered as standard (MartotildeAcircnez etal 2000) Moreover it is interesting to note that the offer of the service has alsoincreased which has resulted in a corresponding price adjustment
ConclusionsOne of the characteristics that differentiates a service from a product ormaterial goods is that the service is sold first and later `manufacturedrsquorsquoMoreover the production and consumption of the service are simultaneous iea service cannot be stored Thus the overall assessment of the client springsfrom two sources the end result of the service and the very process by whichthe service is provided (Berry 1995)
For these reasons the assessment of the quality of a service is not an easytask and as pointed out by Groth and Dye (1999) the providers of a serviceshould bear in mind this dual aspect by which a service is appraised Thereforethey should be able to recognise the different degrees by which the service itselfand the provision of the service are being assessed Despite this we consider itimportant to assess these services from the point of view of the client companyas has been done in the present research study
From all this we can draw the overall conclusion that the ISO 9000 advisoryservices are favourably regarded on the whole However it should also benoted that clients expect an even higher quality In short the client companiesexpect a higher quality from the service than that which is actually provided
It has been shown that the concept of quality can be broken down intothree factors one of which is the skill of the consultant in introducing theruling within the agreed time period and this is the aspect of the service thatobtains the poorest quality rating This factor is closely linked to thereliability factor which is considered to be of the highest importance by theclient companies For this reason the most reiterated request forimprovement by the clients is that the consultants perform the required taskswithin the agreed time periods
Moreover the results of the study show that the performance of independentprofessional consultants is very different from that of small consultantcompanies Independent consultants offer a high quality service that lives up tothe very high expectations of their clients The benefits that these clients gainfrom working with a consultant are also perceived as very high
During this work it has been noted that the quality offered by consultantcompanies that employ a staff of professionals varies according to the sizeof the company The benefits perceived by their clients are very similar tobut are slightly higher than those perceived by companies employing largeconsultancies
Finally although we realise that our study relates to only one region ofEurope we believe that our findings have broader implications for researchersand practitioners Thus we guess that it would be interesting to carry outsimilar surveys in other European and US regions For practitioners ourfindings should give pause for thought We guess that these findings are very
Quality serviceof ISO 9000consultants
1011
interesting in order to improve their service and that they should somehowmeasure and control their service quality We really think that for all theprofessionals working in the quality field a quality service should be a realNo 1 purpose
References
Berry L (1995) MaAcircs allaAcirc de la excelencia en el servicio Un plan para la accioAcircn DeustoPublications
Brown A and Van der Wiele T (1995) ` Industry experience with ISO 9000rsquorsquo Asia PacificJournal of Quality Management Vol 4 No 2 pp 8-17
Buttle F (1997) ` ISO 9000 marketing motivations and benefitsrsquorsquo International Journal of Qualityamp Reliability Management Vol 14 No 9 pp 936-47
CasadesuAcircs M (1998) ` La normativa de aseguramiento de la calidad ISO 9000 en CatalunAumlaexpectativas y efectos Estudio empotildeAcircricorsquorsquo Research project CICYT Reference SEC96-1005
CasadesuAcircs M and GimeAcircnez G (2000) ` The benefits of the implementation of the ISO 9000standard empirical researchin 288 Spanish companiesrsquorsquo The TQM Magazine Vol 12 No 6
Escanciano C (2000) ` Influencia de la certificacioAcircn ISO 9000 en el avance de la empresa espanAumlolahacia la calidad totalrsquorsquo paper presented at the 1st World Conference on Production andOperations Management (POM) Seville
Groth JC and Dye RT (1999) ` Service quality perceived value expectations shortfalls andbonusesrsquorsquo Managing Service Quality Vol 9 No 4
ISO (2000) available at wwwisochisoeniso9000-14000pdfsurvey9pdf
Jones R Arndt G and Kustin R (1997) ` ISO 9000 among Australian companies impact of timeand reasons for seeking certification on perceptions of benefits receivedrsquorsquo InternationalJournal of Quality amp Reliability Management Vol 14 No 7
Lloydrsquos Register Quality Assurance Ltd (1994) BS 5750 ISO 9000 ndash Setting Standards forBetter Business Lloydrsquos Register Quality Assurance Services Ltd Croydon
MartotildeAcircnez C et al (2000) `Analysis of the implementation of ISO 9000 quality assurancesystemsrsquorsquo Work Study Vol 49 No 6
Meegan ST and Taylor WA (1997) ` Factors influencing a successful transition from ISO 9000to TQM The influence of understanding and motivationrsquorsquo International Journal of Qualityamp Reliability Management Vol 14 No 2
Nachum L (1999) `Measurement of productivity of professional services an illustration ofSwedish management consulting firmsrsquorsquo International Journal of Operations amp ProductionManagement Vol 19 No 9
Phillips J (2000) The Consultantrsquos Scorecard McGraw Hill New York NY
Ribeiro D (1996) ` ConsultorotildeAcirca para la direccioAcircn en organizacioAcircn calidad marketing yestrategiarsquorsquo doctoral thesis University of Valencia Valencia
Samson D and Parker R (1994) ` Service quality the gap in the Australian consulting engineeringindustryrsquorsquo International Journal of Quality amp Reliability Management Vol 11 No 7
Vanguard Consulting Ltd (1994) `BS 5750ISO 9000EN 29000 1987 a positive contribution tobetter businessrsquorsquo The TQM Magazine Vol 11 No 2 p 60
Vloeberghs D and Bellens J (1996) ` Implementing the ISO 9000 standardsrsquorsquo Quality ProgressVol 29 No 6 pp 43-8
Zeithaml VA Parasuraman A and Berry L (1993) Calidad total en la gestioAcircn de los serviciosDotildeAcircaz de Santos
IJQRM1989
1012
Appendix 1
Tot
alvar
iance
expla
ined
Init
ial
eigen
val
ues
Extr
acti
onsu
ms
ofsq
uar
edlo
adin
gs
Rot
atio
nsu
ms
ofsq
uar
edlo
adin
gs
Com
pon
ents
Tot
alP
erce
nt
ofvar
iance
Cum
ula
tive
per
cent
Tot
alP
erce
nt
ofvar
iance
Cum
ula
tive
per
cent
Tot
alP
erce
nt
ofvar
iance
Cum
ula
tive
per
cent
17
7255
20
552
07
7255
20
552
04
8434
58
345
82
136
971
649
21
369
7164
92
306
219
156
50
31
037
3972
31
103
739
723
12
2115
81
723
14
073
521
775
25
068
486
823
86
061
435
867
47
039
279
895
38
035
255
920
99
031
224
943
310
022
162
959
511
019
137
973
312
015
107
984
013
014
105
994
614
007
053
100
0
Note
sE
xtr
acti
onm
ethod
P
rinci
pal
com
pon
ent
anal
ysi
sC
ompon
ent
Rot
ated
com
pon
ent
mat
rix
a
12
3b12
084
10
264
b11
079
60
346
b13
079
00
407
b10
076
80
383
025
1b8
075
30
340
b9
072
40
426
b14
061
70
446
029
7b4
060
80
470
032
0b6
085
1b5
079
4b7
034
40
573
034
3b1
086
7b3
042
50
415
063
5b2
025
30
513
057
2
Note
sE
xtra
ctio
nm
etho
dpr
inci
pal
com
pone
ntan
alys
isR
otat
ion
met
hod
Var
imax
with
Kai
ser
norm
aliz
atio
naR
otat
ion
conv
erge
din
six
inte
ratio
ns
Table AIFactorial analysis ofthe perceived qualityPrincipal componentsmethod with varimaxrotation
Quality serviceof ISO 9000consultants
1013
Appendix 2T
otal
var
iance
expla
ined
Init
ial
eigen
val
ues
Extr
acti
onsu
ms
ofsq
uar
edlo
adin
gs
Rot
atio
nsu
ms
ofsq
uar
edlo
adin
gs
Com
pon
ents
Tot
alP
erce
nt
ofvar
iance
Cum
ula
tive
per
cent
Tot
alP
erce
nt
ofvar
iance
Cum
ula
tive
per
cent
Tot
alP
erce
nt
ofvar
iance
Cum
ula
tive
per
cent
18
219
632
2263
222
821
963
222
632
225
245
403
4940
349
20
894
687
570
097
089
46
875
700
973
867
297
4870
097
30
791
608
876
185
40
746
573
581
920
50
483
371
385
633
60
410
315
588
788
70
337
259
491
383
80
319
245
093
833
90
236
181
495
647
100
182
140
197
048
110
158
121
798
265
120
149
114
399
408
130
077
059
210
00
Note
sE
xtr
acti
onm
ethod
P
rinci
pal
com
pon
ent
anal
ysi
sC
ompon
ent
Rot
ated
com
pon
ent
mat
rix
a
12
d9
091
1d8
079
40
288
d3
073
60
375
d10
071
50
418
d11
069
00
523
d7
067
60
462
d13
063
50
484
d2
061
40
523
d12
057
50
560
d1
085
4d6
037
70
767
d5
040
30
675
d4
060
40
608
Note
sE
xtra
ctio
nm
etho
dpr
inci
pal
com
ponen
tan
alys
isR
otat
ion
met
hod
Var
imax
with
Kai
ser
norm
aliz
atio
naR
otat
ion
conv
erge
din
thre
eiter
atio
n
Table AIIFactoral analysis of the
obtained benefitsPrincipal componentsmethod with varimax
rotation

IJQRM1989
1008
In summary the analyses point to the existence of a significant relationshipbetween the efforts of the consultant to provide a better quality service and theclientrsquos perception of improved benefits
Quality of consultant companies in relation to their sizeA study of the performance of consultant companies in relation to their sizewas made on the basis of the collected data The sample was divided into fourcategories companies that engaged the services of a single independentconsultant companies that used consultancies with a staff of between twoand five consultants companies that used consultancies with a staff ofbetween six and 50 consultants and lastly companies that used consultancieswith a staff of over 50 consultants The results of this segmentation can beseen in Figure 4
It was observed that the quality of the service is related to the size of theconsultant company the larger the company the better the service The bigconsultant companies obtain a significantly higher quality rating than thesmaller companies Whereas small companies (with two to fiveconsultants) obtain an average rating of 339 the average rating of theconsultancies with a staff of over 50 employees stands at 443 Thisrepresents a large difference of over one point It is noteworthy howeverthat professional consultants working independently offer a high qualityservice and score a rating that is closer to that of the large consultanciesthan the small ones
There also seems to be a negative relationship between the expectations ofthe client company and the number of workers employed by the consultantcompany However this does not carry any statistical significance
In the case of consultants working alone as independent professionalsexpectations of the service and perceived quality of the same are both veryhigh On the other hand although their clients have lower expectations thelarge consultant companies offer the best quality service In this case indeedperceived quality is higher than expectations
Figure 4Perceived qualityexpectations gap andbenefits in relation to thesize of the consultancy
Quality serviceof ISO 9000consultants
1009
On the other hand similar results are found when the benefits from using aconsultant are analysed according to the size of the consultant company Smallcompanies (between two and five consultants) provide the fewest benefits fortheir clients with an average rating of 288 whereas the large companies obtainan average rating of 313 Once again it is noted that independent professionalconsultants follow a different pattern and obtain the highest ratings of all Allthese relationships are statistically significant as shown by the Kruskal-Wallistest carried out by grouping the variables according to the size of theconsultant companies (Table VI)
The perceived quality and the gap between expectations and perceptionboth present significantly different averages with a significance level of 005
In a parallel manner the performance of the variables of qualityexpectations and benefits was analysed in relation to the size of the clientcompany In short no statistically significant relationship was detectedbetween these variables and the size of the client company in terms of numberof employees
Cost of consultant servicesIt is difficult to assess the benefits obtained from a consultant service withouttaking into consideration the cost of the same For this reason it wasconsidered appropriate to analyse the questionnaire data in terms of the costsinvolved In brief it can be concluded from an analysis of the data that theseservices are not expensive An assessment of the fees charged gives thelowest rating of the whole questionnaire data ie 272 This value is lowerthan the average value of the scale thus indicating a slight variance with theabove statement
Companies invested few resources in the introduction of the ruling It wasfound that 62 percent of the sample invested less than 15000 Euro Among thecompanies that engaged the services of a consultant the corresponding feesamounted to 48 percent of the total cost of introduction In most cases (77percent) the consultantrsquos fees are stipulated right from the beginning It can beassumed that the consultancies are so familiar with their service that they canmake an initial estimate of the cost of introducing the ruling with a high degreeof precision This type of service has been steadily growing ever since it was
Mean perceived
quality
Mean
expectations
Non-weighted
quality gap
Arithmetic mean
benefits 13 items
Chi-square 1465 1913 1411 1890
Freedom degree 3 3 3 3
Asymptotic sig 0002 0591 0003 0596
Notes aKruskal-Wallis test bGrouping variable number of consultants
Table VIKruskal-Wallis test
statistics for thevariables `perceived
qualityrsquorsquo ` expectationsrsquorsquo` gap between
expectations andperceived qualityrsquorsquo and`mean benefitsrsquorsquo when
grouped by ` number ofconsultantsrsquorsquo
IJQRM1989
1010
started a decade ago and can therefore be considered as standard (MartotildeAcircnez etal 2000) Moreover it is interesting to note that the offer of the service has alsoincreased which has resulted in a corresponding price adjustment
ConclusionsOne of the characteristics that differentiates a service from a product ormaterial goods is that the service is sold first and later `manufacturedrsquorsquoMoreover the production and consumption of the service are simultaneous iea service cannot be stored Thus the overall assessment of the client springsfrom two sources the end result of the service and the very process by whichthe service is provided (Berry 1995)
For these reasons the assessment of the quality of a service is not an easytask and as pointed out by Groth and Dye (1999) the providers of a serviceshould bear in mind this dual aspect by which a service is appraised Thereforethey should be able to recognise the different degrees by which the service itselfand the provision of the service are being assessed Despite this we consider itimportant to assess these services from the point of view of the client companyas has been done in the present research study
From all this we can draw the overall conclusion that the ISO 9000 advisoryservices are favourably regarded on the whole However it should also benoted that clients expect an even higher quality In short the client companiesexpect a higher quality from the service than that which is actually provided
It has been shown that the concept of quality can be broken down intothree factors one of which is the skill of the consultant in introducing theruling within the agreed time period and this is the aspect of the service thatobtains the poorest quality rating This factor is closely linked to thereliability factor which is considered to be of the highest importance by theclient companies For this reason the most reiterated request forimprovement by the clients is that the consultants perform the required taskswithin the agreed time periods
Moreover the results of the study show that the performance of independentprofessional consultants is very different from that of small consultantcompanies Independent consultants offer a high quality service that lives up tothe very high expectations of their clients The benefits that these clients gainfrom working with a consultant are also perceived as very high
During this work it has been noted that the quality offered by consultantcompanies that employ a staff of professionals varies according to the sizeof the company The benefits perceived by their clients are very similar tobut are slightly higher than those perceived by companies employing largeconsultancies
Finally although we realise that our study relates to only one region ofEurope we believe that our findings have broader implications for researchersand practitioners Thus we guess that it would be interesting to carry outsimilar surveys in other European and US regions For practitioners ourfindings should give pause for thought We guess that these findings are very
Quality serviceof ISO 9000consultants
1011
interesting in order to improve their service and that they should somehowmeasure and control their service quality We really think that for all theprofessionals working in the quality field a quality service should be a realNo 1 purpose
References
Berry L (1995) MaAcircs allaAcirc de la excelencia en el servicio Un plan para la accioAcircn DeustoPublications
Brown A and Van der Wiele T (1995) ` Industry experience with ISO 9000rsquorsquo Asia PacificJournal of Quality Management Vol 4 No 2 pp 8-17
Buttle F (1997) ` ISO 9000 marketing motivations and benefitsrsquorsquo International Journal of Qualityamp Reliability Management Vol 14 No 9 pp 936-47
CasadesuAcircs M (1998) ` La normativa de aseguramiento de la calidad ISO 9000 en CatalunAumlaexpectativas y efectos Estudio empotildeAcircricorsquorsquo Research project CICYT Reference SEC96-1005
CasadesuAcircs M and GimeAcircnez G (2000) ` The benefits of the implementation of the ISO 9000standard empirical researchin 288 Spanish companiesrsquorsquo The TQM Magazine Vol 12 No 6
Escanciano C (2000) ` Influencia de la certificacioAcircn ISO 9000 en el avance de la empresa espanAumlolahacia la calidad totalrsquorsquo paper presented at the 1st World Conference on Production andOperations Management (POM) Seville
Groth JC and Dye RT (1999) ` Service quality perceived value expectations shortfalls andbonusesrsquorsquo Managing Service Quality Vol 9 No 4
ISO (2000) available at wwwisochisoeniso9000-14000pdfsurvey9pdf
Jones R Arndt G and Kustin R (1997) ` ISO 9000 among Australian companies impact of timeand reasons for seeking certification on perceptions of benefits receivedrsquorsquo InternationalJournal of Quality amp Reliability Management Vol 14 No 7
Lloydrsquos Register Quality Assurance Ltd (1994) BS 5750 ISO 9000 ndash Setting Standards forBetter Business Lloydrsquos Register Quality Assurance Services Ltd Croydon
MartotildeAcircnez C et al (2000) `Analysis of the implementation of ISO 9000 quality assurancesystemsrsquorsquo Work Study Vol 49 No 6
Meegan ST and Taylor WA (1997) ` Factors influencing a successful transition from ISO 9000to TQM The influence of understanding and motivationrsquorsquo International Journal of Qualityamp Reliability Management Vol 14 No 2
Nachum L (1999) `Measurement of productivity of professional services an illustration ofSwedish management consulting firmsrsquorsquo International Journal of Operations amp ProductionManagement Vol 19 No 9
Phillips J (2000) The Consultantrsquos Scorecard McGraw Hill New York NY
Ribeiro D (1996) ` ConsultorotildeAcirca para la direccioAcircn en organizacioAcircn calidad marketing yestrategiarsquorsquo doctoral thesis University of Valencia Valencia
Samson D and Parker R (1994) ` Service quality the gap in the Australian consulting engineeringindustryrsquorsquo International Journal of Quality amp Reliability Management Vol 11 No 7
Vanguard Consulting Ltd (1994) `BS 5750ISO 9000EN 29000 1987 a positive contribution tobetter businessrsquorsquo The TQM Magazine Vol 11 No 2 p 60
Vloeberghs D and Bellens J (1996) ` Implementing the ISO 9000 standardsrsquorsquo Quality ProgressVol 29 No 6 pp 43-8
Zeithaml VA Parasuraman A and Berry L (1993) Calidad total en la gestioAcircn de los serviciosDotildeAcircaz de Santos
IJQRM1989
1012
Appendix 1
Tot
alvar
iance
expla
ined
Init
ial
eigen
val
ues
Extr
acti
onsu
ms
ofsq
uar
edlo
adin
gs
Rot
atio
nsu
ms
ofsq
uar
edlo
adin
gs
Com
pon
ents
Tot
alP
erce
nt
ofvar
iance
Cum
ula
tive
per
cent
Tot
alP
erce
nt
ofvar
iance
Cum
ula
tive
per
cent
Tot
alP
erce
nt
ofvar
iance
Cum
ula
tive
per
cent
17
7255
20
552
07
7255
20
552
04
8434
58
345
82
136
971
649
21
369
7164
92
306
219
156
50
31
037
3972
31
103
739
723
12
2115
81
723
14
073
521
775
25
068
486
823
86
061
435
867
47
039
279
895
38
035
255
920
99
031
224
943
310
022
162
959
511
019
137
973
312
015
107
984
013
014
105
994
614
007
053
100
0
Note
sE
xtr
acti
onm
ethod
P
rinci
pal
com
pon
ent
anal
ysi
sC
ompon
ent
Rot
ated
com
pon
ent
mat
rix
a
12
3b12
084
10
264
b11
079
60
346
b13
079
00
407
b10
076
80
383
025
1b8
075
30
340
b9
072
40
426
b14
061
70
446
029
7b4
060
80
470
032
0b6
085
1b5
079
4b7
034
40
573
034
3b1
086
7b3
042
50
415
063
5b2
025
30
513
057
2
Note
sE
xtra
ctio
nm
etho
dpr
inci
pal
com
pone
ntan
alys
isR
otat
ion
met
hod
Var
imax
with
Kai
ser
norm
aliz
atio
naR
otat
ion
conv
erge
din
six
inte
ratio
ns
Table AIFactorial analysis ofthe perceived qualityPrincipal componentsmethod with varimaxrotation
Quality serviceof ISO 9000consultants
1013
Appendix 2T
otal
var
iance
expla
ined
Init
ial
eigen
val
ues
Extr
acti
onsu
ms
ofsq
uar
edlo
adin
gs
Rot
atio
nsu
ms
ofsq
uar
edlo
adin
gs
Com
pon
ents
Tot
alP
erce
nt
ofvar
iance
Cum
ula
tive
per
cent
Tot
alP
erce
nt
ofvar
iance
Cum
ula
tive
per
cent
Tot
alP
erce
nt
ofvar
iance
Cum
ula
tive
per
cent
18
219
632
2263
222
821
963
222
632
225
245
403
4940
349
20
894
687
570
097
089
46
875
700
973
867
297
4870
097
30
791
608
876
185
40
746
573
581
920
50
483
371
385
633
60
410
315
588
788
70
337
259
491
383
80
319
245
093
833
90
236
181
495
647
100
182
140
197
048
110
158
121
798
265
120
149
114
399
408
130
077
059
210
00
Note
sE
xtr
acti
onm
ethod
P
rinci
pal
com
pon
ent
anal
ysi
sC
ompon
ent
Rot
ated
com
pon
ent
mat
rix
a
12
d9
091
1d8
079
40
288
d3
073
60
375
d10
071
50
418
d11
069
00
523
d7
067
60
462
d13
063
50
484
d2
061
40
523
d12
057
50
560
d1
085
4d6
037
70
767
d5
040
30
675
d4
060
40
608
Note
sE
xtra
ctio
nm
etho
dpr
inci
pal
com
ponen
tan
alys
isR
otat
ion
met
hod
Var
imax
with
Kai
ser
norm
aliz
atio
naR
otat
ion
conv
erge
din
thre
eiter
atio
n
Table AIIFactoral analysis of the
obtained benefitsPrincipal componentsmethod with varimax
rotation

Quality serviceof ISO 9000consultants
1009
On the other hand similar results are found when the benefits from using aconsultant are analysed according to the size of the consultant company Smallcompanies (between two and five consultants) provide the fewest benefits fortheir clients with an average rating of 288 whereas the large companies obtainan average rating of 313 Once again it is noted that independent professionalconsultants follow a different pattern and obtain the highest ratings of all Allthese relationships are statistically significant as shown by the Kruskal-Wallistest carried out by grouping the variables according to the size of theconsultant companies (Table VI)
The perceived quality and the gap between expectations and perceptionboth present significantly different averages with a significance level of 005
In a parallel manner the performance of the variables of qualityexpectations and benefits was analysed in relation to the size of the clientcompany In short no statistically significant relationship was detectedbetween these variables and the size of the client company in terms of numberof employees
Cost of consultant servicesIt is difficult to assess the benefits obtained from a consultant service withouttaking into consideration the cost of the same For this reason it wasconsidered appropriate to analyse the questionnaire data in terms of the costsinvolved In brief it can be concluded from an analysis of the data that theseservices are not expensive An assessment of the fees charged gives thelowest rating of the whole questionnaire data ie 272 This value is lowerthan the average value of the scale thus indicating a slight variance with theabove statement
Companies invested few resources in the introduction of the ruling It wasfound that 62 percent of the sample invested less than 15000 Euro Among thecompanies that engaged the services of a consultant the corresponding feesamounted to 48 percent of the total cost of introduction In most cases (77percent) the consultantrsquos fees are stipulated right from the beginning It can beassumed that the consultancies are so familiar with their service that they canmake an initial estimate of the cost of introducing the ruling with a high degreeof precision This type of service has been steadily growing ever since it was
Mean perceived
quality
Mean
expectations
Non-weighted
quality gap
Arithmetic mean
benefits 13 items
Chi-square 1465 1913 1411 1890
Freedom degree 3 3 3 3
Asymptotic sig 0002 0591 0003 0596
Notes aKruskal-Wallis test bGrouping variable number of consultants
Table VIKruskal-Wallis test
statistics for thevariables `perceived
qualityrsquorsquo ` expectationsrsquorsquo` gap between
expectations andperceived qualityrsquorsquo and`mean benefitsrsquorsquo when
grouped by ` number ofconsultantsrsquorsquo
IJQRM1989
1010
started a decade ago and can therefore be considered as standard (MartotildeAcircnez etal 2000) Moreover it is interesting to note that the offer of the service has alsoincreased which has resulted in a corresponding price adjustment
ConclusionsOne of the characteristics that differentiates a service from a product ormaterial goods is that the service is sold first and later `manufacturedrsquorsquoMoreover the production and consumption of the service are simultaneous iea service cannot be stored Thus the overall assessment of the client springsfrom two sources the end result of the service and the very process by whichthe service is provided (Berry 1995)
For these reasons the assessment of the quality of a service is not an easytask and as pointed out by Groth and Dye (1999) the providers of a serviceshould bear in mind this dual aspect by which a service is appraised Thereforethey should be able to recognise the different degrees by which the service itselfand the provision of the service are being assessed Despite this we consider itimportant to assess these services from the point of view of the client companyas has been done in the present research study
From all this we can draw the overall conclusion that the ISO 9000 advisoryservices are favourably regarded on the whole However it should also benoted that clients expect an even higher quality In short the client companiesexpect a higher quality from the service than that which is actually provided
It has been shown that the concept of quality can be broken down intothree factors one of which is the skill of the consultant in introducing theruling within the agreed time period and this is the aspect of the service thatobtains the poorest quality rating This factor is closely linked to thereliability factor which is considered to be of the highest importance by theclient companies For this reason the most reiterated request forimprovement by the clients is that the consultants perform the required taskswithin the agreed time periods
Moreover the results of the study show that the performance of independentprofessional consultants is very different from that of small consultantcompanies Independent consultants offer a high quality service that lives up tothe very high expectations of their clients The benefits that these clients gainfrom working with a consultant are also perceived as very high
During this work it has been noted that the quality offered by consultantcompanies that employ a staff of professionals varies according to the sizeof the company The benefits perceived by their clients are very similar tobut are slightly higher than those perceived by companies employing largeconsultancies
Finally although we realise that our study relates to only one region ofEurope we believe that our findings have broader implications for researchersand practitioners Thus we guess that it would be interesting to carry outsimilar surveys in other European and US regions For practitioners ourfindings should give pause for thought We guess that these findings are very
Quality serviceof ISO 9000consultants
1011
interesting in order to improve their service and that they should somehowmeasure and control their service quality We really think that for all theprofessionals working in the quality field a quality service should be a realNo 1 purpose
References
Berry L (1995) MaAcircs allaAcirc de la excelencia en el servicio Un plan para la accioAcircn DeustoPublications
Brown A and Van der Wiele T (1995) ` Industry experience with ISO 9000rsquorsquo Asia PacificJournal of Quality Management Vol 4 No 2 pp 8-17
Buttle F (1997) ` ISO 9000 marketing motivations and benefitsrsquorsquo International Journal of Qualityamp Reliability Management Vol 14 No 9 pp 936-47
CasadesuAcircs M (1998) ` La normativa de aseguramiento de la calidad ISO 9000 en CatalunAumlaexpectativas y efectos Estudio empotildeAcircricorsquorsquo Research project CICYT Reference SEC96-1005
CasadesuAcircs M and GimeAcircnez G (2000) ` The benefits of the implementation of the ISO 9000standard empirical researchin 288 Spanish companiesrsquorsquo The TQM Magazine Vol 12 No 6
Escanciano C (2000) ` Influencia de la certificacioAcircn ISO 9000 en el avance de la empresa espanAumlolahacia la calidad totalrsquorsquo paper presented at the 1st World Conference on Production andOperations Management (POM) Seville
Groth JC and Dye RT (1999) ` Service quality perceived value expectations shortfalls andbonusesrsquorsquo Managing Service Quality Vol 9 No 4
ISO (2000) available at wwwisochisoeniso9000-14000pdfsurvey9pdf
Jones R Arndt G and Kustin R (1997) ` ISO 9000 among Australian companies impact of timeand reasons for seeking certification on perceptions of benefits receivedrsquorsquo InternationalJournal of Quality amp Reliability Management Vol 14 No 7
Lloydrsquos Register Quality Assurance Ltd (1994) BS 5750 ISO 9000 ndash Setting Standards forBetter Business Lloydrsquos Register Quality Assurance Services Ltd Croydon
MartotildeAcircnez C et al (2000) `Analysis of the implementation of ISO 9000 quality assurancesystemsrsquorsquo Work Study Vol 49 No 6
Meegan ST and Taylor WA (1997) ` Factors influencing a successful transition from ISO 9000to TQM The influence of understanding and motivationrsquorsquo International Journal of Qualityamp Reliability Management Vol 14 No 2
Nachum L (1999) `Measurement of productivity of professional services an illustration ofSwedish management consulting firmsrsquorsquo International Journal of Operations amp ProductionManagement Vol 19 No 9
Phillips J (2000) The Consultantrsquos Scorecard McGraw Hill New York NY
Ribeiro D (1996) ` ConsultorotildeAcirca para la direccioAcircn en organizacioAcircn calidad marketing yestrategiarsquorsquo doctoral thesis University of Valencia Valencia
Samson D and Parker R (1994) ` Service quality the gap in the Australian consulting engineeringindustryrsquorsquo International Journal of Quality amp Reliability Management Vol 11 No 7
Vanguard Consulting Ltd (1994) `BS 5750ISO 9000EN 29000 1987 a positive contribution tobetter businessrsquorsquo The TQM Magazine Vol 11 No 2 p 60
Vloeberghs D and Bellens J (1996) ` Implementing the ISO 9000 standardsrsquorsquo Quality ProgressVol 29 No 6 pp 43-8
Zeithaml VA Parasuraman A and Berry L (1993) Calidad total en la gestioAcircn de los serviciosDotildeAcircaz de Santos
IJQRM1989
1012
Appendix 1
Tot
alvar
iance
expla
ined
Init
ial
eigen
val
ues
Extr
acti
onsu
ms
ofsq
uar
edlo
adin
gs
Rot
atio
nsu
ms
ofsq
uar
edlo
adin
gs
Com
pon
ents
Tot
alP
erce
nt
ofvar
iance
Cum
ula
tive
per
cent
Tot
alP
erce
nt
ofvar
iance
Cum
ula
tive
per
cent
Tot
alP
erce
nt
ofvar
iance
Cum
ula
tive
per
cent
17
7255
20
552
07
7255
20
552
04
8434
58
345
82
136
971
649
21
369
7164
92
306
219
156
50
31
037
3972
31
103
739
723
12
2115
81
723
14
073
521
775
25
068
486
823
86
061
435
867
47
039
279
895
38
035
255
920
99
031
224
943
310
022
162
959
511
019
137
973
312
015
107
984
013
014
105
994
614
007
053
100
0
Note
sE
xtr
acti
onm
ethod
P
rinci
pal
com
pon
ent
anal
ysi
sC
ompon
ent
Rot
ated
com
pon
ent
mat
rix
a
12
3b12
084
10
264
b11
079
60
346
b13
079
00
407
b10
076
80
383
025
1b8
075
30
340
b9
072
40
426
b14
061
70
446
029
7b4
060
80
470
032
0b6
085
1b5
079
4b7
034
40
573
034
3b1
086
7b3
042
50
415
063
5b2
025
30
513
057
2
Note
sE
xtra
ctio
nm
etho
dpr
inci
pal
com
pone
ntan
alys
isR
otat
ion
met
hod
Var
imax
with
Kai
ser
norm
aliz
atio
naR
otat
ion
conv
erge
din
six
inte
ratio
ns
Table AIFactorial analysis ofthe perceived qualityPrincipal componentsmethod with varimaxrotation
Quality serviceof ISO 9000consultants
1013
Appendix 2T
otal
var
iance
expla
ined
Init
ial
eigen
val
ues
Extr
acti
onsu
ms
ofsq
uar
edlo
adin
gs
Rot
atio
nsu
ms
ofsq
uar
edlo
adin
gs
Com
pon
ents
Tot
alP
erce
nt
ofvar
iance
Cum
ula
tive
per
cent
Tot
alP
erce
nt
ofvar
iance
Cum
ula
tive
per
cent
Tot
alP
erce
nt
ofvar
iance
Cum
ula
tive
per
cent
18
219
632
2263
222
821
963
222
632
225
245
403
4940
349
20
894
687
570
097
089
46
875
700
973
867
297
4870
097
30
791
608
876
185
40
746
573
581
920
50
483
371
385
633
60
410
315
588
788
70
337
259
491
383
80
319
245
093
833
90
236
181
495
647
100
182
140
197
048
110
158
121
798
265
120
149
114
399
408
130
077
059
210
00
Note
sE
xtr
acti
onm
ethod
P
rinci
pal
com
pon
ent
anal
ysi
sC
ompon
ent
Rot
ated
com
pon
ent
mat
rix
a
12
d9
091
1d8
079
40
288
d3
073
60
375
d10
071
50
418
d11
069
00
523
d7
067
60
462
d13
063
50
484
d2
061
40
523
d12
057
50
560
d1
085
4d6
037
70
767
d5
040
30
675
d4
060
40
608
Note
sE
xtra
ctio
nm
etho
dpr
inci
pal
com
ponen
tan
alys
isR
otat
ion
met
hod
Var
imax
with
Kai
ser
norm
aliz
atio
naR
otat
ion
conv
erge
din
thre
eiter
atio
n
Table AIIFactoral analysis of the
obtained benefitsPrincipal componentsmethod with varimax
rotation

IJQRM1989
1010
started a decade ago and can therefore be considered as standard (MartotildeAcircnez etal 2000) Moreover it is interesting to note that the offer of the service has alsoincreased which has resulted in a corresponding price adjustment
ConclusionsOne of the characteristics that differentiates a service from a product ormaterial goods is that the service is sold first and later `manufacturedrsquorsquoMoreover the production and consumption of the service are simultaneous iea service cannot be stored Thus the overall assessment of the client springsfrom two sources the end result of the service and the very process by whichthe service is provided (Berry 1995)
For these reasons the assessment of the quality of a service is not an easytask and as pointed out by Groth and Dye (1999) the providers of a serviceshould bear in mind this dual aspect by which a service is appraised Thereforethey should be able to recognise the different degrees by which the service itselfand the provision of the service are being assessed Despite this we consider itimportant to assess these services from the point of view of the client companyas has been done in the present research study
From all this we can draw the overall conclusion that the ISO 9000 advisoryservices are favourably regarded on the whole However it should also benoted that clients expect an even higher quality In short the client companiesexpect a higher quality from the service than that which is actually provided
It has been shown that the concept of quality can be broken down intothree factors one of which is the skill of the consultant in introducing theruling within the agreed time period and this is the aspect of the service thatobtains the poorest quality rating This factor is closely linked to thereliability factor which is considered to be of the highest importance by theclient companies For this reason the most reiterated request forimprovement by the clients is that the consultants perform the required taskswithin the agreed time periods
Moreover the results of the study show that the performance of independentprofessional consultants is very different from that of small consultantcompanies Independent consultants offer a high quality service that lives up tothe very high expectations of their clients The benefits that these clients gainfrom working with a consultant are also perceived as very high
During this work it has been noted that the quality offered by consultantcompanies that employ a staff of professionals varies according to the sizeof the company The benefits perceived by their clients are very similar tobut are slightly higher than those perceived by companies employing largeconsultancies
Finally although we realise that our study relates to only one region ofEurope we believe that our findings have broader implications for researchersand practitioners Thus we guess that it would be interesting to carry outsimilar surveys in other European and US regions For practitioners ourfindings should give pause for thought We guess that these findings are very
Quality serviceof ISO 9000consultants
1011
interesting in order to improve their service and that they should somehowmeasure and control their service quality We really think that for all theprofessionals working in the quality field a quality service should be a realNo 1 purpose
References
Berry L (1995) MaAcircs allaAcirc de la excelencia en el servicio Un plan para la accioAcircn DeustoPublications
Brown A and Van der Wiele T (1995) ` Industry experience with ISO 9000rsquorsquo Asia PacificJournal of Quality Management Vol 4 No 2 pp 8-17
Buttle F (1997) ` ISO 9000 marketing motivations and benefitsrsquorsquo International Journal of Qualityamp Reliability Management Vol 14 No 9 pp 936-47
CasadesuAcircs M (1998) ` La normativa de aseguramiento de la calidad ISO 9000 en CatalunAumlaexpectativas y efectos Estudio empotildeAcircricorsquorsquo Research project CICYT Reference SEC96-1005
CasadesuAcircs M and GimeAcircnez G (2000) ` The benefits of the implementation of the ISO 9000standard empirical researchin 288 Spanish companiesrsquorsquo The TQM Magazine Vol 12 No 6
Escanciano C (2000) ` Influencia de la certificacioAcircn ISO 9000 en el avance de la empresa espanAumlolahacia la calidad totalrsquorsquo paper presented at the 1st World Conference on Production andOperations Management (POM) Seville
Groth JC and Dye RT (1999) ` Service quality perceived value expectations shortfalls andbonusesrsquorsquo Managing Service Quality Vol 9 No 4
ISO (2000) available at wwwisochisoeniso9000-14000pdfsurvey9pdf
Jones R Arndt G and Kustin R (1997) ` ISO 9000 among Australian companies impact of timeand reasons for seeking certification on perceptions of benefits receivedrsquorsquo InternationalJournal of Quality amp Reliability Management Vol 14 No 7
Lloydrsquos Register Quality Assurance Ltd (1994) BS 5750 ISO 9000 ndash Setting Standards forBetter Business Lloydrsquos Register Quality Assurance Services Ltd Croydon
MartotildeAcircnez C et al (2000) `Analysis of the implementation of ISO 9000 quality assurancesystemsrsquorsquo Work Study Vol 49 No 6
Meegan ST and Taylor WA (1997) ` Factors influencing a successful transition from ISO 9000to TQM The influence of understanding and motivationrsquorsquo International Journal of Qualityamp Reliability Management Vol 14 No 2
Nachum L (1999) `Measurement of productivity of professional services an illustration ofSwedish management consulting firmsrsquorsquo International Journal of Operations amp ProductionManagement Vol 19 No 9
Phillips J (2000) The Consultantrsquos Scorecard McGraw Hill New York NY
Ribeiro D (1996) ` ConsultorotildeAcirca para la direccioAcircn en organizacioAcircn calidad marketing yestrategiarsquorsquo doctoral thesis University of Valencia Valencia
Samson D and Parker R (1994) ` Service quality the gap in the Australian consulting engineeringindustryrsquorsquo International Journal of Quality amp Reliability Management Vol 11 No 7
Vanguard Consulting Ltd (1994) `BS 5750ISO 9000EN 29000 1987 a positive contribution tobetter businessrsquorsquo The TQM Magazine Vol 11 No 2 p 60
Vloeberghs D and Bellens J (1996) ` Implementing the ISO 9000 standardsrsquorsquo Quality ProgressVol 29 No 6 pp 43-8
Zeithaml VA Parasuraman A and Berry L (1993) Calidad total en la gestioAcircn de los serviciosDotildeAcircaz de Santos
IJQRM1989
1012
Appendix 1
Tot
alvar
iance
expla
ined
Init
ial
eigen
val
ues
Extr
acti
onsu
ms
ofsq
uar
edlo
adin
gs
Rot
atio
nsu
ms
ofsq
uar
edlo
adin
gs
Com
pon
ents
Tot
alP
erce
nt
ofvar
iance
Cum
ula
tive
per
cent
Tot
alP
erce
nt
ofvar
iance
Cum
ula
tive
per
cent
Tot
alP
erce
nt
ofvar
iance
Cum
ula
tive
per
cent
17
7255
20
552
07
7255
20
552
04
8434
58
345
82
136
971
649
21
369
7164
92
306
219
156
50
31
037
3972
31
103
739
723
12
2115
81
723
14
073
521
775
25
068
486
823
86
061
435
867
47
039
279
895
38
035
255
920
99
031
224
943
310
022
162
959
511
019
137
973
312
015
107
984
013
014
105
994
614
007
053
100
0
Note
sE
xtr
acti
onm
ethod
P
rinci
pal
com
pon
ent
anal
ysi
sC
ompon
ent
Rot
ated
com
pon
ent
mat
rix
a
12
3b12
084
10
264
b11
079
60
346
b13
079
00
407
b10
076
80
383
025
1b8
075
30
340
b9
072
40
426
b14
061
70
446
029
7b4
060
80
470
032
0b6
085
1b5
079
4b7
034
40
573
034
3b1
086
7b3
042
50
415
063
5b2
025
30
513
057
2
Note
sE
xtra
ctio
nm
etho
dpr
inci
pal
com
pone
ntan
alys
isR
otat
ion
met
hod
Var
imax
with
Kai
ser
norm
aliz
atio
naR
otat
ion
conv
erge
din
six
inte
ratio
ns
Table AIFactorial analysis ofthe perceived qualityPrincipal componentsmethod with varimaxrotation
Quality serviceof ISO 9000consultants
1013
Appendix 2T
otal
var
iance
expla
ined
Init
ial
eigen
val
ues
Extr
acti
onsu
ms
ofsq
uar
edlo
adin
gs
Rot
atio
nsu
ms
ofsq
uar
edlo
adin
gs
Com
pon
ents
Tot
alP
erce
nt
ofvar
iance
Cum
ula
tive
per
cent
Tot
alP
erce
nt
ofvar
iance
Cum
ula
tive
per
cent
Tot
alP
erce
nt
ofvar
iance
Cum
ula
tive
per
cent
18
219
632
2263
222
821
963
222
632
225
245
403
4940
349
20
894
687
570
097
089
46
875
700
973
867
297
4870
097
30
791
608
876
185
40
746
573
581
920
50
483
371
385
633
60
410
315
588
788
70
337
259
491
383
80
319
245
093
833
90
236
181
495
647
100
182
140
197
048
110
158
121
798
265
120
149
114
399
408
130
077
059
210
00
Note
sE
xtr
acti
onm
ethod
P
rinci
pal
com
pon
ent
anal
ysi
sC
ompon
ent
Rot
ated
com
pon
ent
mat
rix
a
12
d9
091
1d8
079
40
288
d3
073
60
375
d10
071
50
418
d11
069
00
523
d7
067
60
462
d13
063
50
484
d2
061
40
523
d12
057
50
560
d1
085
4d6
037
70
767
d5
040
30
675
d4
060
40
608
Note
sE
xtra
ctio
nm
etho
dpr
inci
pal
com
ponen
tan
alys
isR
otat
ion
met
hod
Var
imax
with
Kai
ser
norm
aliz
atio
naR
otat
ion
conv
erge
din
thre
eiter
atio
n
Table AIIFactoral analysis of the
obtained benefitsPrincipal componentsmethod with varimax
rotation

Quality serviceof ISO 9000consultants
1011
interesting in order to improve their service and that they should somehowmeasure and control their service quality We really think that for all theprofessionals working in the quality field a quality service should be a realNo 1 purpose
References
Berry L (1995) MaAcircs allaAcirc de la excelencia en el servicio Un plan para la accioAcircn DeustoPublications
Brown A and Van der Wiele T (1995) ` Industry experience with ISO 9000rsquorsquo Asia PacificJournal of Quality Management Vol 4 No 2 pp 8-17
Buttle F (1997) ` ISO 9000 marketing motivations and benefitsrsquorsquo International Journal of Qualityamp Reliability Management Vol 14 No 9 pp 936-47
CasadesuAcircs M (1998) ` La normativa de aseguramiento de la calidad ISO 9000 en CatalunAumlaexpectativas y efectos Estudio empotildeAcircricorsquorsquo Research project CICYT Reference SEC96-1005
CasadesuAcircs M and GimeAcircnez G (2000) ` The benefits of the implementation of the ISO 9000standard empirical researchin 288 Spanish companiesrsquorsquo The TQM Magazine Vol 12 No 6
Escanciano C (2000) ` Influencia de la certificacioAcircn ISO 9000 en el avance de la empresa espanAumlolahacia la calidad totalrsquorsquo paper presented at the 1st World Conference on Production andOperations Management (POM) Seville
Groth JC and Dye RT (1999) ` Service quality perceived value expectations shortfalls andbonusesrsquorsquo Managing Service Quality Vol 9 No 4
ISO (2000) available at wwwisochisoeniso9000-14000pdfsurvey9pdf
Jones R Arndt G and Kustin R (1997) ` ISO 9000 among Australian companies impact of timeand reasons for seeking certification on perceptions of benefits receivedrsquorsquo InternationalJournal of Quality amp Reliability Management Vol 14 No 7
Lloydrsquos Register Quality Assurance Ltd (1994) BS 5750 ISO 9000 ndash Setting Standards forBetter Business Lloydrsquos Register Quality Assurance Services Ltd Croydon
MartotildeAcircnez C et al (2000) `Analysis of the implementation of ISO 9000 quality assurancesystemsrsquorsquo Work Study Vol 49 No 6
Meegan ST and Taylor WA (1997) ` Factors influencing a successful transition from ISO 9000to TQM The influence of understanding and motivationrsquorsquo International Journal of Qualityamp Reliability Management Vol 14 No 2
Nachum L (1999) `Measurement of productivity of professional services an illustration ofSwedish management consulting firmsrsquorsquo International Journal of Operations amp ProductionManagement Vol 19 No 9
Phillips J (2000) The Consultantrsquos Scorecard McGraw Hill New York NY
Ribeiro D (1996) ` ConsultorotildeAcirca para la direccioAcircn en organizacioAcircn calidad marketing yestrategiarsquorsquo doctoral thesis University of Valencia Valencia
Samson D and Parker R (1994) ` Service quality the gap in the Australian consulting engineeringindustryrsquorsquo International Journal of Quality amp Reliability Management Vol 11 No 7
Vanguard Consulting Ltd (1994) `BS 5750ISO 9000EN 29000 1987 a positive contribution tobetter businessrsquorsquo The TQM Magazine Vol 11 No 2 p 60
Vloeberghs D and Bellens J (1996) ` Implementing the ISO 9000 standardsrsquorsquo Quality ProgressVol 29 No 6 pp 43-8
Zeithaml VA Parasuraman A and Berry L (1993) Calidad total en la gestioAcircn de los serviciosDotildeAcircaz de Santos
IJQRM1989
1012
Appendix 1
Tot
alvar
iance
expla
ined
Init
ial
eigen
val
ues
Extr
acti
onsu
ms
ofsq
uar
edlo
adin
gs
Rot
atio
nsu
ms
ofsq
uar
edlo
adin
gs
Com
pon
ents
Tot
alP
erce
nt
ofvar
iance
Cum
ula
tive
per
cent
Tot
alP
erce
nt
ofvar
iance
Cum
ula
tive
per
cent
Tot
alP
erce
nt
ofvar
iance
Cum
ula
tive
per
cent
17
7255
20
552
07
7255
20
552
04
8434
58
345
82
136
971
649
21
369
7164
92
306
219
156
50
31
037
3972
31
103
739
723
12
2115
81
723
14
073
521
775
25
068
486
823
86
061
435
867
47
039
279
895
38
035
255
920
99
031
224
943
310
022
162
959
511
019
137
973
312
015
107
984
013
014
105
994
614
007
053
100
0
Note
sE
xtr
acti
onm
ethod
P
rinci
pal
com
pon
ent
anal
ysi
sC
ompon
ent
Rot
ated
com
pon
ent
mat
rix
a
12
3b12
084
10
264
b11
079
60
346
b13
079
00
407
b10
076
80
383
025
1b8
075
30
340
b9
072
40
426
b14
061
70
446
029
7b4
060
80
470
032
0b6
085
1b5
079
4b7
034
40
573
034
3b1
086
7b3
042
50
415
063
5b2
025
30
513
057
2
Note
sE
xtra
ctio
nm
etho
dpr
inci
pal
com
pone
ntan
alys
isR
otat
ion
met
hod
Var
imax
with
Kai
ser
norm
aliz
atio
naR
otat
ion
conv
erge
din
six
inte
ratio
ns
Table AIFactorial analysis ofthe perceived qualityPrincipal componentsmethod with varimaxrotation
Quality serviceof ISO 9000consultants
1013
Appendix 2T
otal
var
iance
expla
ined
Init
ial
eigen
val
ues
Extr
acti
onsu
ms
ofsq
uar
edlo
adin
gs
Rot
atio
nsu
ms
ofsq
uar
edlo
adin
gs
Com
pon
ents
Tot
alP
erce
nt
ofvar
iance
Cum
ula
tive
per
cent
Tot
alP
erce
nt
ofvar
iance
Cum
ula
tive
per
cent
Tot
alP
erce
nt
ofvar
iance
Cum
ula
tive
per
cent
18
219
632
2263
222
821
963
222
632
225
245
403
4940
349
20
894
687
570
097
089
46
875
700
973
867
297
4870
097
30
791
608
876
185
40
746
573
581
920
50
483
371
385
633
60
410
315
588
788
70
337
259
491
383
80
319
245
093
833
90
236
181
495
647
100
182
140
197
048
110
158
121
798
265
120
149
114
399
408
130
077
059
210
00
Note
sE
xtr
acti
onm
ethod
P
rinci
pal
com
pon
ent
anal
ysi
sC
ompon
ent
Rot
ated
com
pon
ent
mat
rix
a
12
d9
091
1d8
079
40
288
d3
073
60
375
d10
071
50
418
d11
069
00
523
d7
067
60
462
d13
063
50
484
d2
061
40
523
d12
057
50
560
d1
085
4d6
037
70
767
d5
040
30
675
d4
060
40
608
Note
sE
xtra
ctio
nm
etho
dpr
inci
pal
com
ponen
tan
alys
isR
otat
ion
met
hod
Var
imax
with
Kai
ser
norm
aliz
atio
naR
otat
ion
conv
erge
din
thre
eiter
atio
n
Table AIIFactoral analysis of the
obtained benefitsPrincipal componentsmethod with varimax
rotation