Fill the Nutrient Gap Timor-Leste Final Report - WFP ...
118
1 Fill the Nutrient Gap Timor-Leste Final Report December 2019
-
Upload
khangminh22 -
Category
Documents
-
view
0 -
download
0
Transcript of Fill the Nutrient Gap Timor-Leste Final Report - WFP ...

1
Fill the Nutrient Gap Timor-Leste
Final Report
December 2019

2

3
Contents Contents ...................................................................................................................................................................................................................................... 3
List of Figures ............................................................................................................................................................................................................................ 4
List of Tables .............................................................................................................................................................................................................................. 7
List of Appendices .................................................................................................................................................................................................................... 7
Acknowledgements ................................................................................................................................................................................................................. 9
Acronyms and abbreviations .............................................................................................................................................................................................. 11
Executive Summary ................................................................................................................................................................................................................ 12
Introduction ............................................................................................................................................................................................................................. 16
Background ........................................................................................................................................................................................................................ 16
FNG in Timor-Leste: Process......................................................................................................................................................................................... 17
Fill the Nutrient Gap: Situation Analysis for Multi-Sectoral Decision-Making on the Prevention of Malnutrition: Overview of FNG
Methods .................................................................................................................................................................................................................................... 19
Collection of Primary Food Price and Availability Data ............................................................................................................................................. 20
Cost of the Diet (CotD) analysis methods ...................................................................................................................................................................... 22
A note on the Findings of the FNG Analysis ................................................................................................................................................................. 23
Key Finding 1: Nutrition has long been recognised as a fundamental human right in Timor-Leste and is incorporated
throughout sector-specific and intersectoral policies. Evidence-based prioritisation of actions is now needed so that feasible,
affordable nutrition interventions can be implemented across sectors. ........................................................................................................ 24
Key Finding 2: Diets are poor and lack diversity; especially for vulnerable groups such as mothers and children. Including a
variety of foods from diverse food groups is essential to meet nutrient requirements. .......................................................................... 28
Key Finding 3: Almost all Timorese households could afford to meet their energy needs. For most households, a nutritious
diet that meets energy, protein and micronutrient needs would be unaffordable. ................................................................................... 33
Key Finding 4: Women are particularly impacted by poor nutrition. This both negatively affects their and their families’ health,
wellbeing and future potential. ................................................................................................................................................................................... 44
Key Finding 5: Improving the nutrition of infants and young children would require small investments in the short term that
could deliver lasting returns over generations. ...................................................................................................................................................... 48
Key Finding 6: Programa Merenda Eskolar provides a valuable entry point to improve nutrition in children, but menus need
to be diverse and include micronutrient-dense foods. ....................................................................................................................................... 51
Key Finding 7: Meeting the nutrient requirements of adolescent girls would cost more than any other member of the family.
They are at high risk of micronutrient deficiencies, but few interventions exist to address their needs and data to inform
programming is limited. ................................................................................................................................................................................................ 56
Key Finding 8: Timor-Leste is a nation with strong participation in the agricultural sector and produces a great diversity of
foods, yet productivity is low. Interventions targeting both the quantity and nutritional quality of foods produced could
improve access to nutritious diets for all. ................................................................................................................................................................ 58
Key Finding 9: Diets across the country are overwhelmingly dependent on staples such as white rice, which provide energy
but are low in essential micronutrients. Exploring the potential for supporting rice fortification could mean greater access to
nutritious diets. ................................................................................................................................................................................................................. 67
Key Finding 10: Social protection has significant potential to improve access to nutritious diets for the most vulnerable, but
only if realistic transfer amounts and nutrition-sensitive packages are provided. ..................................................................................... 68
Final observations: combined impact of household packages ............................................................................................................................... 74
Draft KONSSANTIL Recommendations ........................................................................................................................................................................... 77
References ................................................................................................................................................................................................................................ 80
Appendices ............................................................................................................................................................................................................................... 85

4
List of Figures Figure 1: Overview of the FNG process and Timeline in Timor-Leste ................................................... 18
Figure 2: The Administrative Posts in which Market Data was collected ............................................. 20
Figure 3: Images from the market price survey data collection ........................................................... 21
Figure 4: Municipalities selected for the CotD analysis for the Timor-Leste FNG ................................ 23
Figure 5: FNG Leadership and technical partners ................................................................................. 23
Figure 6: Overview of interventions modelled per group across the life cycle and by sector ............. 27
Figure 7: Percentage of IYC aged 6-23 months per municipality achieving minimum dietary diversity
as per the 2019 IPC report (3) ............................................................................................................... 28
Figure 8: Percentage of energy provided by food group in diets of 6-23mo: Diet A (left) a hypothetical
diet for this target group based on reported dietary patterns (estimate based on qualitative results)
and Diet B (right) the lowest cost, nutritious diet modelled for this target group in the CotD Analysis
(example from Oecusse). ...................................................................................................................... 29
Figure 9: Cumulative percentage of micronutrient requirements met (capped at 100% RNI) by each
additional food group for Breastfed IYC (6-23mo) (Oecusse) using the modelled lowest-cost
Nutritious Diet (CotD Analysis), in order of food group added (based on modelling and not observed
or current diets) .................................................................................................................................... 30
Figure 10: Cumulative Percentage of micronutrient requirements7 met (capped at 100%) by each
additional food group for Lactating Adult Women (Dili) using the lowest-cost Nutritious Diet (CotD
Analysis), in order of food group added ............................................................................................... 31
Figure 11: Cumulative percentage of micronutrient requirements7 met (capped at 100% RNI) by each
additional food group for Adolescent Girls (Ermera) using the lowest-cost Nutritious Diet (CotD
Analysis), in order of food group added ............................................................................................... 32
Figure 12: Cost of the lowest-cost diets that would meet requirements for 1) energy only and 2)
energy, protein and 13 micronutrients (nutritious diet) for the model 5-person household8 in the six
assessment municipalities .................................................................................................................... 34
Figure 13: Daily cost of the energy-only and nutritious diets per household member (average across
municipalities) ....................................................................................................................................... 35
Figure 14: Percentage of household energy target and iron target formed by individual household-
member requirements and nutritious diet cost per household member ............................................ 36
Figure 15: Number of individual foods per food CotD group found to be available in each assessment
municipality for which food price data was collected .......................................................................... 37
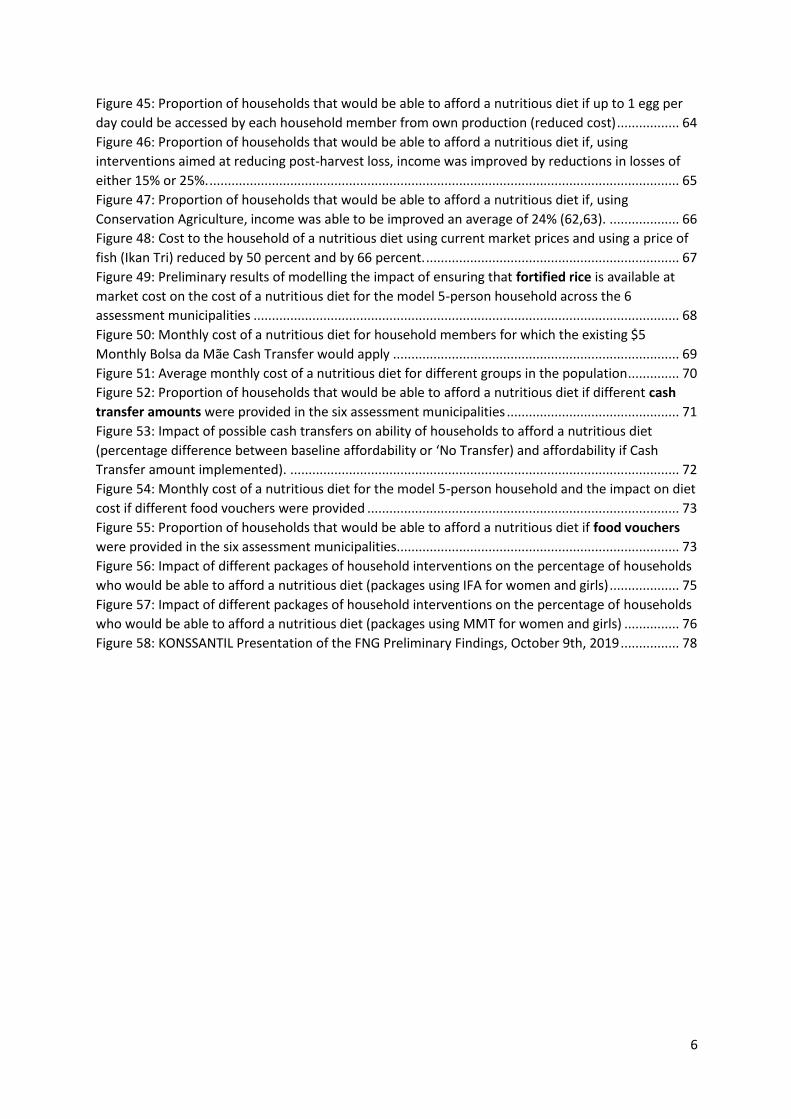
Figure 16: Average cost per 100g of foods from each food group for which price data was collected
per municipality .................................................................................................................................... 38
Figure 17: Average price per 100g per food group and per 100kcal per food group (all 6
municipalities) ....................................................................................................................................... 38
Figure 18: Percentage of households that would be able to afford the energy-only or nutritious diet,
estimated by comparing diet cost to adjusted household food expenditure from the TSLS-SLS ........ 41
Figure 19: Comparison of the distribution of monthly food expenditure for a five-person household in
Oecusse with the estimated costs of an energy-only diet and a nutritious diet and use of intersecting
points to determine proportion of households that could afford either diet ...................................... 42
Figure 20: Percentiles of monthly food expenditure for a five-person household from the 2014-2015
TL-SLS, adjusted to reflect inflation from 2014-2019(6,7) .................................................................... 42
Figure 21: Distribution of estimated monthly food expenditure for five-person households from the
2014-2015 TL-SLS, adjusted to reflect inflation from 2014-2019(6,7) ................................................. 43
Figure 22: Comparison of the mean and median estimated monthly household food expenditure for
2019 using TL-SLS data and the cost of the energy-only and nutritious diets in each municipality .... 43

5
Figure 23: Comparison of the daily cost (to households) of a modelled energy-only diet and a
modelled nutritious diet for Lactating Women and Adult Men by municipality .................................. 44
Figure 24: Prevalence of Anaemia for adult men and women (non-pregnant, non-lactating) by
municipality as per the 2016 DHS (30).................................................................................................. 45
Figure 25: Prevalence of Overweight and Obesity for adult men and women (non-pregnant, non-
lactating) by municipality as per the 2016 DHS (30) ............................................................................. 45
Figure 26: Preliminary results of modelling the impact in CotD of providing alternative nutrition
interventions on the cost of a nutritious diet for lactating adult women across the 6 assessment
municipalities ........................................................................................................................................ 46
Figure 27: Affordability of nutritious diets for adult men (diet cost compared to per-capita food
expenditure) by municipality. ............................................................................................................... 48
Figure 28: Daily cost of the energy-only and Nutritious Diets modelled in CotD for 12-23mo Children
.............................................................................................................................................................. 49
Figure 29: Stunting prevalence as per the 2016 DHS, by municipality (30).......................................... 49
Figure 30: Daily cost (to household) of providing a nutritious diet for 12-23mo IYC, incorporating
supplementation and transfers of nutritious foods ............................................................................. 50
Figure 31: Percentage of daily protein and micronutrient targets for school-age children met by a
school meal of 113 grams per day of unfortified or fortified rice ........................................................ 53
Figure 32: Daily cost (to household) of a nutritious diet for school children at baseline (nutritious
diet) and with the provision of alternative school feeding menu options ........................................... 54
Figure 33: Percentage of daily protein and micronutrient targets (100% RNI) for school-age children
met by different menu options ............................................................................................................. 54
Figure 34: Percentage of daily protein and micronutrient targets (100% RNI) for school-age children
met by an Optimised School Feeding Menu and a Low Nutrient Menu .............................................. 55
Figure 35: Daily cost of a nutrition diet for the School Child with an Optimised School Feeding Menu
(fortified and unfortified) and a Low Nutrient Menu at a budget of $0.25 and $0.50 per child, per day
.............................................................................................................................................................. 55
Figure 36: Proportion of total household diet cost (in an ideal scenario where nutrient requirements
are met) required to provide a nutritious diet for each model household member ........................... 56
Figure 37: Daily cost (to household) of the energy-only and nutritious diets modelled in CotD for
Adolescent Boys and Adolescent Girls in each Municipality ................................................................ 57
Figure 38: Preliminary results of modelling the impact in CotD of providing alternative nutrition
interventions on the cost of a nutritious diet for adolescent girls across the 6 assessment
municipalities ........................................................................................................................................ 57
Figure 39: Cost (to the household) of a nutritious diet for a 5-person household if, using different
intervention scenarios, the household was able to access nutritious foods from home production in
Baucau Municipality ............................................................................................................................. 60
Figure 40: Proportion of households that would be able to afford a nutritious diet if, using different
intervention scenarios, they were able to access nutritious foods from their own production in
Baucau Municipality ............................................................................................................................. 61
Figure 41: Possible impact of home production and consumption of Orange Flesh Sweet Potatoes . 62
Figure 42: Possible impact of household access to 2 eggs per week through own production,
depending on household member/s receiving eggs, Ermera, Manufahi and Oecusse ........................ 63
Figure 43: Possible impact of household access to 2 eggs per week through own production,
depending on household member/s receiving eggs, Baucau, Bobonaro and Dili ................................ 63
Figure 44: Daily cost of a nutritious diet for the model 5-person household and the impact on diet
cost if up to 1 egg per day could be accessed by each household member from own production
(reduced cost) ....................................................................................................................................... 64
6
Figure 45: Proportion of households that would be able to afford a nutritious diet if up to 1 egg per
day could be accessed by each household member from own production (reduced cost) ................. 64
Figure 46: Proportion of households that would be able to afford a nutritious diet if, using
interventions aimed at reducing post-harvest loss, income was improved by reductions in losses of
either 15% or 25%. ................................................................................................................................ 65
Figure 47: Proportion of households that would be able to afford a nutritious diet if, using
Conservation Agriculture, income was able to be improved an average of 24% (62,63). ................... 66
Figure 48: Cost to the household of a nutritious diet using current market prices and using a price of
fish (Ikan Tri) reduced by 50 percent and by 66 percent. ..................................................................... 67
Figure 49: Preliminary results of modelling the impact of ensuring that fortified rice is available at
market cost on the cost of a nutritious diet for the model 5-person household across the 6
assessment municipalities .................................................................................................................... 68
Figure 50: Monthly cost of a nutritious diet for household members for which the existing $5
Monthly Bolsa da Mãe Cash Transfer would apply .............................................................................. 69
Figure 51: Average monthly cost of a nutritious diet for different groups in the population .............. 70
Figure 52: Proportion of households that would be able to afford a nutritious diet if different cash
transfer amounts were provided in the six assessment municipalities ............................................... 71
Figure 53: Impact of possible cash transfers on ability of households to afford a nutritious diet
(percentage difference between baseline affordability or ‘No Transfer) and affordability if Cash
Transfer amount implemented). .......................................................................................................... 72
Figure 54: Monthly cost of a nutritious diet for the model 5-person household and the impact on diet
cost if different food vouchers were provided ..................................................................................... 73
Figure 55: Proportion of households that would be able to afford a nutritious diet if food vouchers
were provided in the six assessment municipalities............................................................................. 73
Figure 56: Impact of different packages of household interventions on the percentage of households
who would be able to afford a nutritious diet (packages using IFA for women and girls) ................... 75
Figure 57: Impact of different packages of household interventions on the percentage of households
who would be able to afford a nutritious diet (packages using MMT for women and girls) ............... 76
Figure 58: KONSSANTIL Presentation of the FNG Preliminary Findings, October 9th, 2019 ................ 78

7
List of Tables Table 1: Nutrition-sensitive national policy documents ............................................................................................. 24
Table 2: KONSSANTIL sector priorities for nutrition outcomes and link with FNG-CotD Intervention
Modelling (round 1), adapted from the table prepared by Heather Grieve for the FIRST Policy
Effectiveness Review (1) ........................................................................................................................................................... 26
Table 3: Limiting Nutrients (average) by target group ................................................................................................ 34
Table 4: Required nutrient density per target group as per FAO/WHO/UNU estimations (36,37) ........... 35
Table 5: Comparison of the energy-only diet (CotD), Food Poverty Basket (TL-SLS) and Nutritious Diet
(CotD) methods and costs ...................................................................................................................................................... 39
Table 6: School Feeding Menu scenarios modelled in the CotD ............................................................................ 52
Table 7: Homestead Food Production intervention scenarios modelled in CotD for Baucau Municipality
........................................................................................................................................................................................................... 59
Table 8: Modelled Nutritious Food Vouchers (Quarterly Transfer) ........................................................................ 72
Table 9: Household intervention packages modelled to show potential combined intervention of
multiple nutrition-sensitive and nutrition-specific interventions across sectors (sector colours shown in
key) ................................................................................................................................................................................................... 74
Table 10: DRAFT recommendations prioritised by KONSSANTIL members for follow-up as the FNG
process continues ....................................................................................................................................................................... 77
List of Appendices Appendix Table 1: Locations of the market price data collection and geographic zone reassignment
categories ...................................................................................................................................................................................... 85
Appendix Table 2: Availability and cost (average across all markets) of foods ................................................. 86
Appendix Table 3: Weekly content and cost of the modelled nutritious diet in BAUCAU Municipality
by Household Member ............................................................................................................................................................ 93
Appendix Table 4: Weekly quantity of each nutrient provided by the edible portions of foods included
in the Weekly Nutritious Household Diet in BAUCAU Municipality ..................................................................... 94
Appendix Table 5: The percentage (%) of each nutrient target provided by the edible portion of foods
selected by the software for the Weekly Nutritious Household Diet in BAUCAU Municipality ................ 95
Appendix Table 6: Weekly content and cost of the modelled nutritious diet in BOBONARO
Municipality by Household Member .................................................................................................................................. 96
Appendix Table 7: Weekly quantity of each nutrient provided by the edible portions of foods included
in the Weekly Nutritious Household Diet in BOBONARO Municipality .............................................................. 97
Appendix Table 8: The percentage (%) of each nutrient target provided by the edible portion of foods
selected by the software for the Weekly Nutritious Household Diet in BOBONARO Municipality ......... 98
Appendix Table 9: Weekly content and cost of the modelled nutritious diet in DILI Municipality by
Household Member .................................................................................................................................................................. 99
Appendix Table 10: Weekly quantity of each nutrient provided by the edible portions of foods
included in the Weekly Nutritious Household Diet in DILI Municipality ........................................................... 100
Appendix Table 11: The percentage (%) of each nutrient target provided by the edible portion of foods
selected by the software for the Weekly Nutritious Household Diet in DILI Municipality ......................... 101
Appendix Table 12: Weekly content and cost of the modelled nutritious diet in ERMERA Municipality
by Household Member .......................................................................................................................................................... 102
Appendix Table 13: Weekly quantity of each nutrient provided by the edible portions of foods
included in the Weekly Nutritious Household Diet in ERMERA Municipality ................................................. 103

8
Appendix Table 14: The percentage (%) of each nutrient target provided by the edible portion of foods
selected by the software for the Weekly Nutritious Household Diet in ERMERA Municipality ............... 104
Appendix Table 15: Weekly content and cost of the modelled nutritious diet in MANUFAHI
Municipality by Household Member ................................................................................................................................ 105
Appendix Table 16: Weekly quantity of each nutrient provided by the edible portions of foods
included in the Weekly Nutritious Household Diet in MANUFAHI Municipality .......................................... 106
Appendix Table 17: The percentage (%) of each nutrient target provided by the edible portion of foods
selected by the software for the Weekly Nutritious Household Diet in MANUFAHI Municipality ........ 107
Appendix Table 18: Weekly content and cost of the modelled nutritious diet in OECUSSE Municipality
by Household Member .......................................................................................................................................................... 108
Appendix Table 19: Weekly quantity of each nutrient provided by the edible portions of foods
included in the Weekly Nutritious Household Diet in OECUSSE Municipality ................................................ 109
Appendix Table 20: The percentage (%) of each nutrient target provided by the edible portion of foods
selected by the software for the Weekly Nutritious Household Diet in OECUSSE Municipality.............. 110
Appendix Table 21: Limiting nutrients by household member and municipality in the CotD modelled
Nutritious diet . ......................................................................................................................................................................... 111
Appendix Table 22: Results of CotD re-analysis to estimate cost by geographic zone instead of
municipality using non-representative data. ............................................................................................................ 112
Appendix Table 23: Results of CotD re-analysis to estimate diet affordability by geographic zone
instead of municipality using non-representative data. ....................................................................................... 113
Appendix Table 24: Comparison of CotD estimated diet costs with the estimated 2019 household food
expenditure to estimate the percentage of households that would be able to afford the energy-only
and nutritious diets in BAUCAU ........................................................................................................................................ 113
Appendix Table 25: Comparison of CotD estimated diet costs with the estimated 2019 household food
expenditure to estimate the percentage of households that would be able to afford the energy-only
and nutritious diets in BOBONARO ................................................................................................................................. 113
Appendix Table 26: Comparison of CotD estimated diet costs with the estimated 2019 household food
expenditure to estimate the percentage of households that would be able to afford the energy-only
and nutritious diets in ERMERA .......................................................................................................................................... 114
Appendix Table 27: Comparison of CotD estimated diet costs with the estimated 2019 household food
expenditure to estimate the percentage of households that would be able to afford the energy-only
and nutritious diets in DILI ................................................................................................................................................... 114
Appendix Table 28: Comparison of CotD estimated diet costs with the estimated 2019 household food
expenditure to estimate the percentage of households that would be able to afford the energy-only
and nutritious diets in MANUFAHI .................................................................................................................................... 115
Appendix Table 29: Comparison of CotD estimated diet costs with the estimated 2019 household food
expenditure to estimate the percentage of households that would be able to afford the energy-only
and nutritious diets in OECUSSE ........................................................................................................................................ 115
Appendix Table 30: Nutrient composition of Orange-Flesh Sweet Potato used for modelling in section
8 ....................................................................................................................................................................................................... 116

9
Acknowledgements
The Fill the Nutrient Gap process in Timor-Leste was led by The National Council on Food
Security, Sovereignty and Nutrition in Timor-Leste (KONSSANTIL) with financial and technical
support from The United Nations World Food Programme (WFP), The Food and Agriculture
Organisation of the United Nations (FAO), The European Union, The United Nations Children's
Fund (UNICEF), The World Health Organisation (WHO), The European Union, Korea
International Cooperation Agency (KOICA) and the USAID Avansa Agriculture Project. The data
collection was led by KONSSANTIL, WFP and the the Universidade Nacional Timor-Lorosa’e
(UNTL) Department of Nutrition. The report was prepared by Frances Knight and Sabrina Kuri
at WFP Headquarters with input from the FNG Technical Working Group, the WFP country
office for Timor-Leste and other stakeholders in Timor-Leste.
We would particularly like to acknowledge the support and inputs of and thank the following
people:
Leticia Jomar da Costa Soares, Fidelio De Jesus Soares, Anita Soares, Remigia Auxiliadora de
Jesus Ximenes, Paulina da Costa do Rosario, Riberto Joma dos Reis Ribeiro who supported the
data collection and Isabel B. Freitas, Sancha Liliana Maria dos Santos, Emilia Duarte Gaspar,
Lucas da Conceicao Carlos Soares who supported the data entry, all students from the UNTL
Department of Nutrition.
Jacinta Maria de Araujo and Ivone S. da C. Lopes from the Ministry of Agriculture -Department
of Food Security, Martinho de Araujo from the Ministry of State Administration, Celestina
Magno Ximenes from the Ministry of Health-Department of Nutrition and Dinis Da Silva from
the Ministry of Social Solidarity and Inclusion – Department of Social Actions for supervising
the data collection.
Rajesh Pandav, Giorgia Paiella, Dongbao Yu, and Imaculada Maia (WHO), Solal Lehec, Paula
Lopes da Cruz and Ligia Parada Maria Rangel (FAO), Faraja Chiwile, Venancio Soares Pinto,
Maria Paulina Goncalves, Scott Whoolery and Denis Muhoza (UNICEF) who formed the group
of UN colleagues providing significant technical support for the FNG.
Dageng Liu, Patrick Teixeira, Seokyeong Lee (Flora), Javeed Khan, Christine Klotz, Crispin da
Costa Araujo, Paulino Pinto, Anastacio Soriano, Denita Baptista, Kelsey Hood-Cattaneo, Inacio
Dos Santos, Francisco Soares, Ninivia Barreito, Elizete Saldanha from the WFP Country Office
in Dili and Angelo Martins, Luis Colo, Agostinho Soares from WFP Timor-Leste sub offices who
supported FNG planning, data collection, analysis and dissemination activities.
Agustinho A. Ximenes - the Food Security Officer from the Department of Agriculture Baucau,
Bonifacio da Costa Freitas - Extensionist for Vemase administrative post, Fernando Ximenes -
Extension Coordinator for Baucau Municipality - Agapito Boavida Pinto - Extensionist for Laga
Administrative post, Manuel Barbosa - Extensionist for the village of Soba in Laga, Zulmira
Guterres - Extensionist for the village of Uilaha in Venilale, Antonio Belo Extensionist for the
village of Bauguia in the administrative post of Quelicai, Tomas de Carvalho Coordinator for

10
extensionist in Baugia, Antonio Maia Lay - Food Security Officer for Bobonaro Municipality,
Aurelio Marques Dos Santos Marques - Director for Agriculture and Fisheries of Manufahi
Municipality, Arlindo Sarmento - Food Security Officer for Manufahi Municipality, Fransisco
Martins - Local Food Security Officer for Ermera Municipality, Rita M. S. Gusmao – Ministry of
Agriculture and Lucas Colo - Food Security Officer for RAEOA-Oecusse, all from the
Government of Timor-Leste, for supporting the data collection in their Municipalities.
Lastly we would like to thank all members of KONSSANTIL for providing political leadership
and technical support for the FNG throughout the entire process, especially D.G. Maria Odete
do Ceu Guterres, Justino dos S. Silva, Rofino Soares Gusmao, and Helder A. Neves from the
Ministry of Agriculture, Ivone S. da C. Lopes, Rita M. S. Gusmao, Adelaide da Costa Nunes, and
Jacinta Maria de Araujo from MAP/DNSAC, Fransisco Pereira do Nascimento, Rosentina da
Costa, Jemi Natalino Rosario, Domingos Antonio da Costa Freitas, Veronica Maria de Fatima,
Ana de Fatima Soares and Ermelinda Fontura from the Ministry of Finance - National
Directorate of Statistics, Elsa Rodrigues Pereira from MTCI, Diniz da Silva and Teotonio M.
Soares from MSSI, D.G. Odete da Silva Viegas Dra. Olina Dos Reis Albino, Olinda Dos Reis
Albino, Bernado S. Dias and Celestina Magno Ximenes from the Ministry of Health, Belchior
Guera from the Ministry of Education, and Martinho de Araujo from the Ministry of State
Administration.
We would also like to thank Gianna Bonnis Profumo from Charles Darwin University and
Heather Grieve for their generosity in giving their time to advise the secondary data review.

11
Acronyms and abbreviations
AG Adolescent girls
AM Adolescent males
CotD Cost of the Diet
CPI Consumer Price Index
FAO The Food and Agriculture Organisation of the United Nations
FNG Fill the Nutrient Gap
GDS The Timor-Leste General Directorate of Statistics
GLV Green Leafy Vegetables
GoTL Government of Timor-Leste
HH Household
IFA Iron and Folic Acid Supplement
IYC Infants and Young Children
Kcal Kilocalories
KOICA Korean International Cooperation Agency
KONSSANTIL The National Council for Food Security, Sovereignty and Nutrition in Timor-
Leste
MAP Ministry of Agriculture and Fisheries
MMT Multiple Micronutrient Tablet
MNP Multiple Micronutrient Powder
NFNSP The National Food and Nutrition Security Policy
NNS National Nutrition Strategy
NPR National Parliamentary Resolution
OFSP Orange-flesh sweet potato
PAN-HAM-TIL The National Zero Hunger Action Plan
PLW Pregnant and Lactating Women
PME Programa Merenda Eskolar
RNI Recommended Nutrient Intake
SAC School-aged children
SBCC Social and Behaviour Change Communication
SF School Feeding
TAG Technical Advisory Group of the FNG
TL-SLS Timor Leste Living Standards Survey
UNICEF The United Nations Children’s Fund
UNTL Universidade Nacional Timor Loros’ae
UNU United Nations University
USAID United States Agency for International Development
USD United States Dollars (official currency of Timor-Leste)
WFP The United Nations World Food Programme
WHO The World Health Organisation
WRA Women of Reproductive Age

12
Executive Summary
The ability of a population to access and consume nutritious, diverse foods in necessary
quantities warrants particular attention as poor diets are a root cause of malnutrition in all its
forms. A number of studies and surveys carried out in Timor-Leste over the past five years have
sought to describe the nutrition situation in the country, identify challenges to ending hunger
and improve nutrition and inform policy and programming both for multisectoral actions and
for key target groups and sectors. One question that could not be answered through existing
research was the extent to which availability of, access to and utilisation of nutritious foods
impact food security and nutrition outcomes in Timor-Leste. As such, a Fill the Nutrient Gap
(FNG) analysis was prioritised to investigate the following:
1. Determine the extent to which local food systems have sufficient diversity and quality
to meet the nutritional needs of Timorese households.
2. Estimate how much it would cost to meet nutrient needs using local foods for individual
population groups and households.
3. Estimate the extent to which households could afford nutritious diets.
4. Explore and compare the possible impact of multisectoral nutrition-specific and -
sensitive programming on diet cost and affordability.
5. Equip KONSSANTIL and stakeholders to jointly prioritise recommendations for
multisectoral programme and policy actions based on the key findings of the FNG
analysis and the country’s existing evidence base.
The FNG in Timor-Leste was led by KONSSANTIL, within the Government of Timor-Leste
(GoTL), with financial and technical support from national and international partners.
Importantly, the process brought together partners from across different sectors affected
by/able to influence nutrition; health, social protection, agriculture, education and governance.
The FNG methodology is centred around diet modelling using the Cost of the Diet (CotD)
analysis but goes beyond ‘diagnosing’ the problem by incorporating current programme and
policy priorities, secondary data and technical support of the GoTL and partner organisations
to model and estimate the impact of a range of multi-sectoral ‘actions’ to address malnutrition
on the cost and affordability of nutritious diets. This FNG analysis aimed to provide further
evidence on the possible effectiveness of already prioritised multi-sectoral nutrition actions in
order to inform prioritisation of specific activities within these action areas in particular and,
overall, contribute towards the review and reformulation of the next National Nutrition
Strategy (NNS). The results will be important to help prioritise actions to guide programmes,
policy and from advocacy. Key findings from the analysis are summarised in this section. These
were considered by members of KONSSANTIL who prioritised a list of recommendations to
take, also summarised below.
Nutrition has long been recognised as a fundamental human right in Timor-Leste and is
incorporated throughout sector-specific and intersectoral policies. Evidence-based
prioritisation of actions is now needed so feasible, affordable nutrition interventions are

13
implemented across sectors. Nutrition Is a government priority in Timor-Leste and there are
strong multi-sector policies that focus on nutrition as well as sector-specific policies that are
nutrition-specific, with significant crossover across sectors. However, these policies need to be
translated into implementation and implementing all listed actions may not be feasible due to
shortages in budget and capacity. Strong evidence is needed to support KONSSANTIL to
prioritise the many actions included in these policies and implement those that will likely have
the greatest impact on improving diets and nutrition. KONSSANTIL sector priority interventions
that were modelled to estimate possible impact on diet cost and affordability included
micronutrient supplementation, provision of supplementary foods (Health) improvement to
school feeding menus and inclusion of fortified rice (Education), the Bolsa da Mae cash transfer
programmes and food vouchers (Social Protection), reduced post-harvest losses, improved
production diversity and availability of nutritious foods (agriculture) and general food
fortification. These interventions modelled span across sectors and lifecycle stages.
Diets are poor and non-diverse across Timor-Leste; especially for vulnerable groups such as
mothers and children. Including a variety of foods from diverse food groups is essential for
meeting nutrient requirements for all target groups. An adequate intake of a number of
nutrients are required by all age and sex groups for physical and cognitive growth and
development and to prevent disease. These nutrient requirements can only be met if nutritious
and diverse diets are consumed. Contrarily, poor diets are a root cause of all forms of
malnutrition, micronutrient deficiencies as well as underweight and obesity. Both the diversity
and quality of diets in Timor-Leste are poor, for all groups in the population. Diets are generally
based on starchy staple foods with low inclusion of vegetables and animal-source foods. This
is especially the case for nutritionally vulnerable population groups such as women and young
children. The FNG was carried out to investigate the extent to which some of this poor dietary
attainment could be explained by the availability, cost of and access to nutritious foods.
Almost all Timorese households can afford to meet their energy needs but a nutritious diet
that met the requirements of energy, protein and 13 micronutrients, would be unaffordable
for most households. The FNG assessment revealed that a diet modelled in the CotD to meet
energy requirements only for a household of five people 1 in the assessment municipalities
would cost between $32-60 per month in Baucau, Bobonaro, Dili, Ermera, Manufahi and
Oecusse. However, meeting nutrient needs would cost a lot more; diets modelled to meet the
needs of energy, protein and 13 micronutrients would cost 4 times as much or $158 to $211
per month for five people. This would be significantly higher than the minimum wage of $115
per month.
The costs of these diets are not just determined by food prices in each municipality but also
by the number and types of foods found in each municipality during the market survey and
the nutritional needs of the model household members. Data on 98-128 foods were collected
in each of the six assessment municipalities. Prices of meat, fish and eggs were generally 2-4
times as expensive as those of grains, legumes and vegetables.
1 The model household consisted of an adult man, a lactating adult woman, an adolescent girl, a primary school aged child and a breastfeeding infant aged 12-23 months.

14
The cost of meeting nutrient needs differed by age and sex groups; revealing the nutritional
vulnerability of particular lifecycle stages. A nutritious diet would cost on average $2.58 for
adolescent girls, $1.63 for lactating women, $0.78 for adult men, $0.41 for school children and
$0.28 for infant children per day. Within this model household, meeting the nutrient needs of
girls and women during adolescence and lactation would make up more than 70% of the total
cost of meeting nutrient needs for the entire 5-person household. This is because there are
particularly high micronutrient requirements for these groups during periods of growth and
development. For example, while energy requirements for adult women and lactating women
were similar, dietary iron requirements for lactating women are twice as high as those of adult
men.
Modelled diet costs were compared to household food expenditure to estimate the extent to
which they would be affordable to households across Timor-Leste. In general, all households
(94%-100%) would be able to afford diets modelled to meet energy requirements only.
However, only few households (15%-37%) could afford nutritious diets. This means that
interventions addressing the availability of and access to nutrients and nutritious foods, as well
as purchasing power are needed to address poor diet access.
A number of interventions from different sectors were modelled in the FNG analysis, those
targeting individual groups (supplementation, targeted food distribution, school feeding) and
those targeting an entire household (agriculture, social protection, fortification).
Pregnant and lactating women (PLW), adolescent girls and infants and young children (IYC) are
at particular risk of malnutrition in Timor-Leste due to high nutrient needs and low nutrient
intake. The impact of the provision of Iron and Folic Acid (IFA) supplements or multiple
micronutrient tablets (MMT) on the cost of meeting nutrient requirements for PLW and
adolescent girls was modelled. The provision of supplements could halve the cost of meeting
nutrient needs for PLW however MMT had a greater impact, reducing cost by an average of
60% on average compared to 40% for IFA, as it provides more nutrients. The potential impact
of providing MMT was even greater for adolescent girls, reducing the cost of meeting nutrient
requirements by an average of 70% compared to 40% for IFA. For IYC, multiple micronutrient
supplements in the form of sprinkles were modelled; providing sprinkles for IYC in the
complementary feeding period could reduce diet costs for this group by 40%. In contrast,
providing a fortified supplementary food, super cereal/super cereal plus could reduce diet
costs by 12% on average for PLW and 18% on average for IYC.
Alternative school meal menus were modelled for primary school children. The results showed
that a greater percentage of nutrient needs could be met by increasing the budget for the
Merenda Eskolar, selecting the most nutritious foods from the School feeding manual and
including fortified rice, reducing the cost to the household of meeting nutrient needs of 65%-
70% on average.
There is an opportunity to improve both the production and consumption of nutritious foods
in Timor-Leste. The FNG modelled the possible impact of improving the production of a variety
of nutritious foods such as eggs, green vegetables, beans and orange-flesh sweet potato and
encouraging households to consume some of these foods instead of just selling them. In

15
Baucau, for example, this could reduce the cost to households of meeting nutrient needs by
25%.
Current social protection transfers were also modelled. At present, the Bolsa da Mae transfer
of $5 per child, per month (up to 3 children) would only cover a half of cost of providing a
nutritious diet for an infant who is also breastfeeding, a third of the cost of a nutritious diet for
a school child and one twentieth of the cost of meeting nutrient needs for an adolescent girl.
This modelling showed that these transfers are too low to have an impact on nutrition at
present and that increased transfer amounts and conditionalities could assist to make them
more nutrition sensitive.
The CotD modelling was also used to examine the combined impact of interventions from
different sectors on overall household diet access. The results showed that it was possible to
increase the percentage of households that would be able to afford a nutritious diet by an
average of 250% if a package of well-designed interventions from multiple sectors (education,
health, social protection and agriculture) were implemented. Conversely, if single interventions
from one sector only were implemented the impact on household-level diet access would be
limited.
These findings highlight that the responsibility for improving nutrition does not lie with one
government sector alone (e.g. health), nutrition is instead something that can only be improved
if all sectors act together, in a coordinated and complementary fashion. Based on the FNG
results and through a process of dissemination workshops, KONSSANTIL members developed
a set of recommendations for interventions to be prioritised across five (?) key sectors, as
summarised in the following table. Given its leadership role in nutrition policy for Timor-Leste
and the upcoming review of the National Nutrition Strategy, it is expected that these findings
and recommendations will contribute to decision-making over the prioritisation of actions
within future programmes.
Sector Prioritised Interventions
Health • Multiple micronutrient supplementation for PLW, IYC and Adolescent
Girls
• Targeted supplementary feeding for PLW and IYC
Social
Protection
• Vouchers for nutritious foods for vulnerable households
• Increase Bolsa da Mae transfer
• Targeted nutrition BCC with transfers
Education • Increase budget for from 25c to 50c per child per day
• Specify inclusion of the most nutritious food options from menu
• Strengthen home grown school feeding
• Include fortified rice in school feeding meals
Agriculture • Support diverse homestead production
• Include nutrition BCC with extension messages
Commerce
and
Industry
• Fortification of staple foods

16
Introduction
Background
The Government of Timor-Leste (GoTL), with support from international donors and agencies,
has made significant progress in recent years in committing, via policy, legislation and
programming, to addressing malnutrition, in all its forms. Nevertheless, the challenges to
achieving this are numerous and evidence-based actions are required across multiple sectors.
Under the leadership of the National Council for Food Security, Sovereignty and Nutrition in
Timor-Leste (KONSSANTIL), a number of actions have already been recommended across
national-level and sector-specific policy documents, prioritising investments in Education,
Social Protection, Health, Agriculture and Fisheries and Commerce and Industry to improve
nutrition outcomes (1). An important next step is the further refinement of these
recommendations and strategic prioritisation of actions to inform the upcoming review of the
National Nutrition Strategy (NNS).
Timor-Leste is fortunate in that recent research and analysis activities led by the GoTL and
partners have explored and defined hunger and nutrition challenges in the country (2–4),
sought to specifically investigate the situation of and inform programming for key target
groups in the population (5) and have strategically explored the Policy and Programme
Environment related to nutrition (1,4). One knowledge gap identified through these valuable
exercises has been the extent to which availability of, access to and utilisation of nutritious
foods impact food security and nutrition outcomes. As such, a Cost of the Diet (CotD) analysis
was prioritised (1) to investigate the extent to which local food systems have sufficient diversity
to meet the nutritional needs of Timorese households, how much it would cost to meet
average needs for energy and recommended intakes of protein, fat and micronutrients using
local foods and the extent to which households can afford nutritious diets.
In response to the GoTL’s prioritisation of actions to improve nutrition outcomes and this
recognised knowledge gap, KONSSANTIL and the World Food Programme (WFP), with the
United Nations Children's Fund (UNICEF) and the Food and Agriculture Organization of the
United Nations (FAO), The World Health Organisation (WHO), KOICA and USAID/Avansa
Agrikultura collaborated to conduct a Fill the Nutrient Gap (FNG) analysis in Timor-Leste 2019.
The FNG process brought together government and non-government stakeholders from a
variety of sectors including health, agriculture, social protection, education, and commerce &
industry. The FNG methodology is centred around CotD analysis but extends beyond
‘diagnosis’ of the problem, incorporating current programme and policy priorities, secondary
data and technical support of the GoTL and partner organisations to model and estimate the
impact of a range of multi-sectoral ‘actions’ to address malnutrition on the cost and
affordability of nutritious diets. This FNG analysis aimed to provide further evidence on the
possible effectiveness of already prioritised multi-sectoral nutrition actions in order to inform
prioritisation of specific activities within these action areas in particular and, overall, contribute
towards the review and reformulation of the next NNS.

17
FNG in Timor-Leste: Process
The FNG process took place across 2019, with inception meetings in January, collection of
market price data in June and validation of preliminary results and development of
recommendations in national technical and political meetings in October. The dissemination
of final results with technical staff and policy influencers will follow.
The analysis comprised a review of existing studies and policy documents in combination with
linear programming (LP) using the CotD software. The aim of the FNG analysis was to identify
policies and intervention packages best suited to improving access to nutritious foods to meet
the specific nutrient needs of vulnerable target groups in Timor-Leste. It analysed the context-
specific barriers to achieving adequate nutritious diets and modelled alternative nutrition-
sensitive and nutrition-specific interventions defined by stakeholders and prioritised in existing
policy.
The FNG assessment was led by KONSSANTIL with technical support from WFP country office,
regional bureau and headquarters in partnership with UNICEF, FAO and WHO (see figure 5).
At the start of the process the Timor-Leste FNG team met with government, non-government,
United Nations (UN), and other development partners to introduce the planned methodology,
plan for the market data collection, collate key secondary data sources and identify
interventions and entry points for CotD analysis and modelling. Stakeholders identified the key
analysis target groups as individuals within the first 1,000 days from conception to a child’s
second birthday, preschool and school-age children, pregnant and breastfeeding women, and
adolescent girls.
During the analysis phase over 70 secondary data sources were reviewed, and stakeholders
were consulted in order to identify specific interventions that had been prioritised by
KONSSANTIL and partner organisations within the sectors of Education, Social Protection,
Health, Agriculture & Fisheries, and Commerce & Industry. Data on the price and availability
of foods at local markets was collected in six different municipalities (Dili, Baucau, Bobonaro,
Ermera, Manufahi and Oecusse SAR).
Linear programming analysis was then conducted to calculate the cost of a nutritious diet and
to estimate the percentage of households that would be unable to afford this diet in each of
the six municipalities. The CotD was then used to model possible interventions, such as
alternate school feeding menus, food distribution, improvement of agricultural production and
micronutrient supplementation. To validate the results, preliminary findings were presented to
partners and stakeholders via bilateral meetings and a national workshop in October 2019.
During this validation phase, stakeholders participated in technical workshops to develop
recommendations based on the FNG findings. Findings and recommendations were and will
continue to be presented in a high-level meeting with policy makers. The detailed FNG process
for Timor-Leste is illustrated in Figure 1.

18
Figure 1: Overview of the FNG process and Timeline in Timor-Leste

19
Fill the Nutrient Gap: Situation Analysis for Multi-
Sectoral Decision-Making on the Prevention of
Malnutrition: Overview of FNG Methods2
Malnutrition has two direct causes: inadequate nutrient intake and disease. As its name
specifies, the Fill the Nutrient Gap (FNG) analysis focuses on gaps in nutrient intake to inform
a country’s national policies on actions that can be taken to improve nutrition among their
population, with a focus on the most vulnerable.
The FNG assesses the extent to which people have choices. It considers the availability,
physical access and affordability of nutritious foods required for adequate nutrient intake. It
seeks to understand why people make the food choices they do. Finally, it identifies context-
appropriate interventions that can be implemented by different sectors to fill nutrient gaps.
The assessment comprises two components:
1. A country-specific review of secondary data and information on factors that reflect or
affect dietary intake. This includes malnutrition trends over time, characteristics of the food
system and food environment, and population behaviour related to food and feeding.
2. An assessment of the extent to which economic barriers prevent adequate nutrient intake.
This uses the Cost of the Diet linear programming software developed by Save the Children
(UK), and includes modelling of the economic impact of possible interventions to increase
nutrient intake.
Malnutrition cannot be addressed by one sector alone. FNG is designed to inform
multisectoral decision-making and therefore engages stakeholders from all sectors including
food, health, agriculture, education, and social protection systems throughout the
assessment.
It is the stakeholders who define the scope and focus of the assessment. They contribute
data and sources of information for identification of context-specific barriers and entry points
and develop a shared understanding of the issues and possible solutions. They then identify
appropriate nutrition-specific and nutrition-sensitive interventions that can be implemented
by different sectors using their existing delivery platforms. These could be social safety nets,
food processing and markets, antenatal care, school feeding programmes and others.
The FNG assessment has been developed by the WFP with technical support from: The
University of California Davis; the International Food Policy Research Institute (IFPRs of
October 2019, the FNG had been conducted in 20 countries and started in another 10.
2 For more information on the concept and the method of the analysis, see Bose I, Baldi G, Kiess L, de Pee S.
The ‘Fill the Nutrient Gap’ Analysis: An approach to strengthen nutrition situation analysis and decision-making toward multisectoral policies and systems change. Matern Child Nutr 2019: DOI: 10.1111/mcn.12793

20
Collection of Primary Food Price and
Availability Data A CotD market survey3 was conducted in 37 markets of six of Timor-Leste’s Municipalities in
June 2019 (see Appendix Table 1 for complete list of markets). The data collection was carried
out by six field teams composed of KONSSANTIL member representatives, WFP Country-Office
and Field Staff and Nutrition Students from the National University of Timor-Leste (UNTL). The
six municipalities; Dili, Baucau, Bobonaro, Ermera, Manufahi and Oecusse SAR, were selected
by KONSSANTIL members to represent distinct geographic and livelihood zones of the
country, chronic food insecurity experience, malnutrition characteristics and
KONSSANTIL/GoTL priorities, in order to develop an understanding of the diversity of the
national situation in respect to access to and availability of nutritious foods. In each
Municipality, the markets selected to visit for data collection included municipal-level markets,
sub-municipal markets and suco markets. Figure 2 shows the location of Data Collection by
Administrative Posts.
Prior to the collection of market data, all individuals involved in the data collection attended a
3-day4 training in CotD data collection methods. The training covered basic nutrition
information, objectives of the assessment, use of market survey instruments and equipment,
including measurement scales, logistics planning, proper conduct with vendors,
troubleshooting and risk management. During the training a comprehensive list of all food
items expected to be available in the municipalities was also developed. This was followed by
two field trials (data not included) where the enumerators practiced data collection methods
in different locations around Dili. Following each trial, the food list was reviewed, and missing
items were added.
Figure 2: The Administrative Posts in which Market Data was collected
3 Using the methods described in the Save the Children UK Cost of the Diet Practitioner’s Guidelines (66) 4 The recommended length for a CotD data collection training in the Practitioners Guide is three days (66)

21
The resulting comprehensive food list was then used to collect data on price and weight in the
remaining markets and included 206 foods. To collect the information needed to estimate the
cost of the diet, market traders were asked the price of the smallest unit of each food item that
they sold (such an individual pineapple, a kilo of rice, a bottle of oil, a pile of tomatoes or a bag
containing two blocks of tofu, see figure 3), assuming that poorer people typically buy foods in
small amounts as they cannot afford bulk purchases, which could be cheaper in the long-run.
Three samples of each food were weighed using electronic scales that had a precision of 1 g.
This information was entered into a food-list questionnaire. At each market, the data collection
team was provided with four questionnaires and asked to fill in weight and price information
for every food they could find from up to four different vendors, if possible.
In each municipality, approval to visit markets and collect data was obtained from the
Municipal Food Security Authority, facilitated by KONSSANTIL. Further, each data collection
team was accompanied by a local food security officer during all market visits. Vendors were
informed of the data collection by the local Food Security Officer and the decision to
participate by sharing food prices and allowing the team to weigh food items was voluntary.
All market price data was entered directly into the CotD software by a trained data entry
team under the supervision of WFP-TL. Data entered from each data collection form was
then double-checked for quality and any outliers. For a final list of the foods included in the
food list for each municipality and their prices, please see appendix table 2.
Figure 3: Images from the market price survey data collection

22
Cost of the Diet (CotD) analysis methods The CotD software uses Linear Programming (LP) to understand the extent to which poverty,
food availability and food prices may affect the ability of people to meet their nutrient needs.
Using price data collected from markets, the software calculates the amount, combination
and cost of local food that is required to provide individuals or households with their average
needs for energy and their recommended intakes of protein, fat and micronutrients5. These
diets are calculated within defined constraints to prevent the inclusion of unrealistic types or
amounts of food and the provision of excessive amounts of nutrients.
The FNG approach defines the Staple Adjusted Nutritious Diet: the lowest cost nutritious diet
that includes the typical staple food and excludes prohibited foods6. This diet is referred to as
the ‘nutritious’ diet throughout this summary. Population expenditure data is compared to
the cost of the nutritious diet and is used to estimate the proportion of the population that
would be able to afford it. This affordability can be estimated and compared across different
geographical areas, seasons or countries.
As part of the FNG process, CotD analysis was undertaken for the six priority municipalities of
Timor Leste, as illustrated in figure 4. Datasets from the 2014-15 Timor-Leste Living
Standards Survey (TSLS-SLS)(6) provided data on the percentiles of per-capita food
expenditure for each municipality. Estimated food expenditures from the 2014-2015 TSLS-
SLS were adjusted using the 2019 Consumer Price Index (CPI) (7) prepared by the Timor-
Leste General Directorate of Statistics (GDS) to account for inflation in food prices and hence
expenditure between 2014 and 2019.
The lowest cost of a nutritious diet was estimated for a model household of five members7
selected to represent nutritionally vulnerable target groups in the population. The
model household includes a breastfeeding child of 12–23 months, a child of 6–7 years, an
adolescent girl of 14–15 years, a breastfeeding adult woman and an adult man. Two portions
of rice per day were included to account for 50 percent of dietary energy from the preferred
staple food. This was done for all household members except the child aged 12–23 months,
who received one rice portion per day.
CotD software was used to model interventions proposed by stakeholders with the objective
of improving the affordability of a nutritious diet for individuals and/or households.
The selection of interventions for modelling was informed by the KONSSANTIL priorities for
nutrition outcomes(1), secondary data review and consultations with the TAG and
stakeholders. It included:
• Increased local production and availability of nutritious foods, inc. animal source foumers.
5 As defined by the Food and Agriculture Organization (FAO) and the World Health Organization (WHO). The
need for 9 vitamins and 4 minerals is included. 6This diet is not intended to reflect what individuals or households are currently eating, nor should it be used
to develop food-based recommendations or dietary guidelines. 7 This model household composition is used to represent a household’s a time of particular nutritional vulnerability, including life stages where nutrient requirements are at their highest. This composition is used as a benchmark across all FNG analyses globally for household ability to access nutritious diets.

23
Figure 4: Municipalities selected for the CotD analysis for the Timor-Leste FNG
A note on the Findings of the FNG Analysis The results from the CotD baseline analysis, intervention modelling and review of relevant
secondary data have been grouped into 10 key findings for this report. This is done with the
intention of linking each finding with existing policy and priority areas to streamline decisions
about resulting recommendations and action points.
In recognition of the fact that there is a rich collection of recent policy and situation analyses
available in Timor-Leste, this report will not provide the background description of
malnutrition characteristics and trends typical in FNG reports from other countries.
Instead the document will focus on linking modelling results directly to actions that have
already been prioritised for nutrition outcomes. For readers interested in a summary of
malnutrition and food security status and trends, please refer to the recently published FAO-
EU FIRST Partnership’s Review (1).
FNG Timor-Leste
KONSSANTILMAP, MOE, MSSI,
MTCI, Statistik, MdS,
WFPTimor-Leste Country office, HQ Nutrition,
RB Bangkok
UN Agencies UNICEF, FAO, WHO
Other Technical and Donor Partners
USAID, Avansa Agrikultura, KOICA,
Mercy Corps
Figure 5: FNG Leadership and technical partners

24
Lastly, the calculations and details behind every CotD diet and intervention model are
numerous. For the full details and model inputs, please see the annexes in this report.
Key Finding 1: Nutrition has long been recognised as a fundamental human right
in Timor-Leste and is incorporated throughout sector-specific and intersectoral
policies. Evidence-based prioritisation of actions is now needed so that feasible,
affordable nutrition interventions can be implemented across sectors.
Nutrition is well-represented across the policy environment in Timor-Leste and the GoTL is
increasingly working to translate this policy into tangible actions. This is especially notable
given the relative newness of different government systems in the country, fiscal constraints
and workforce capacity challenges(1). As explained in detail in the FIRST report, Timor-Leste
has done significant work on developing policy to address and support food security and
nutrition. The three principal multi-sectoral nutrition policies for the country are:
• The National Nutrition Strategy, 2014-2019 (NNS)(8);
• The National Zero Hunger Action Plan, 2014 (PAN-HAM-TIL) (9);
• The 2016 National Parliamentary Resolution (NPR) to prioritize nutrition (10)
• The National Food and Nutrition Security Policy, 2017 (NFNSP) (11).
Additionally, a number of sector-specific policies are ‘nutrition-sensitive’, meaning they seek
to recognise and address, or do no harm to, underlying elements that can cause
malnutrition(12). Some of these sector-specific policies include:
Table 1: Nutrition-sensitive national policy documents
Sector Document
Health National Health Sector Strategic Plan (2011-2030)(13)
Youth National Youth Policy (2016)(14)
Education National Education Strategic Plan 2011-2040(15)
Agriculture and
Fisheries
National Aquaculture Development Strategy (2012-2030) (16)
Agriculture Policy and Strategic Framework (DRAFT) 2017(17)
Social Protection Draft (December 2018) National Social Protection Strategy
2019-2030(18)
Multi-sectoral Timor-Leste Strategic Development Plan 2011-2030(19)
The principal multi-sectoral nutrition policy documents collectively recommend over 200
actions to improve nutrition and food security. There is significant overlap between actions
across these three documents and with the sector-specific policies listed in table 1. It has been
recognised, given the challenges listed previously, that implementing all recommended actions
would be beyond the capacity of the country’s workforce and budget. As such there is a need
to prioritise those that have the most potential to impact nutrition outcomes.
Table 2, adapted from the table developed by Heather Grieve in the 2019 FIRST report (1)
broadly outlines the main KONSSANTIL priorities across these policy documents. These priority
actions were taken as the ‘base modelling plan’ for this FNG analysis. This means that

25
alternative nutrition-specific and -sensitive interventions that could fall within these priority
areas were modelled, with significant input from technical partners, in CotD to estimate their
possible impact on the cost and affordability of nutritious diets. The modelling results are
intended to be used to contribute to discussions about this prioritisation and ultimately inform
the review of the NNS for future planning. A summary of modelling by sector and life
stage/target group is also provided in figure 6.

26
Table 2: KONSSANTIL sector priorities for nutrition outcomes and link with FNG-CotD Intervention Modelling (round 1), adapted from the table prepared by
Heather Grieve for the FIRST Policy Effectiveness Review (1)
Sector Prioritised Action/s Intervention/s modelled
in CotD*
Target
Group/s†
Policy Alignment
NFNSP NNS PAN-
HAM-
TIL
NPR Other
Health Protect, support and promote
appropriate maternal and IYC
nutrition practices, including
(among others):
• Micronutrient
Supplementation
• Multiple Micronutrient Powders (MNP) and Vitamin A
supplementation
• Iron and Folic Acid supplements
• Promotion of nutritious diets
• Multiple Micronutrient tablets (experimental modelling)
• Fortified supplementary foods (experimental modelling)
IYC
PLW, AG
PLW, AG
PLW, AG,
IYC
✔
✔
✔
✔
Social
Protection
•Strengthen Bolsa da Mae
(transfer amount & targeting)
•Strengthen specialised and
general food distribution
• Alternative cash transfer amounts for eligible households
• Nutritionally improved food vouchers
HH
✔
✔
✔
Education
and Youth
Improve the School Feeding (SF)
Programme
• Increase to daily per child budget for SF meals
• Inclusion of locally-sourced nutritious foods in SF meals
• Inclusion of animal-source foods, including fish in SF
• Inclusion of fortified rice in SF meals
All
groups
(SAC,
AG,AM)
✔ ✔ ✔ •MOE Strategic Plan
•Aquaculture Policy
Agriculture
and
Fisheries
•Promote diversification of
homestead food production for
home consumption and income
•Support small livestock
production and consumption
•Promote fish production for
home consumption & income
• Improved market availability of nutritious foods
• Improved household access to nutritious foods from own
production (horticulture, biofortified products, fish, eggs
and other animal-source foods)
HH ✔ ✔ ✔ •Nat. Health Sector
Plan •Agriculture
Policy and Strategic
Framework
•Aquaculture Policy
Commerce
and
Industry
Support mass food fortification
(inc. regulatory framework,
production, quality control,
marketing etc.) to promote the
availability of appropriate,
diverse, nutrient-dense foods
Promote economic
opportunities for women and
youth
• Improve access to fortified rice for each analysis area
• Assume household access to other fortified products such
as fortified oil
• Inclusion of fortified rice in SF meals
• Model possible impact of expected income generation on
household access to nutritious diets
HH
HH
SAC, AG,
AM
HH
✔
✔
✔
✔
✔
✔
✔
*Not all nutrition-sensitive and -specific interventions listed in these policy documents are able to be modelled in CotD. The analysis can only be carried out with interventions that either focus on
improving economic access to nutritious foods (changes to food prices or purchasing power/household food budget) or the availability of nutritious foods themselves (either introducing nutritious
foods to the food system or assuming alterations to nutrient composition via fortification, biofortification). As such, Behaviour Change Communication (BCC) and interventions to improve WASH and
health environment that do not directly impact food access or availability, whilst very important for nutrition, cannot be modelled using CotD. †IYC= Infants and Young Children (in this case aged 6-23mo), SAC= School aged children, AG=Adolescent Girls, AM=Adolescent Males, PLW = Pregnant and lactating women and HH=Household

27
Figure 6: Overview of interventions modelled per group across the life cycle and by sector

28
Key Finding 2: Diets are poor and lack diversity; especially for vulnerable groups
such as mothers and children. Including a variety of foods from diverse food groups
is essential to meet nutrient requirements.
The diversity and quality of diets in Timor-Leste, especially those of vulnerable target groups such as
mothers and children, have been found to be poor across a number of qualitative and quantitative
surveys and studies at national and sub-national levels(20–25). Diets are overly dependent on starchy
staples such as rice and tubers, vegetables are only eaten in small quantities and consumption of
animal source foods and foods is limited(4,20,21,23). Poor diets, in particular poor dietary diversity
and low calorie intake, have been associated with malnutrition indicators, such as childhood
stunting(4,21,26).
Diets of Infants and Young Children
Adequately diverse, nutritious diets are needed to meet requirements for energy, protein, fat and
multiple micronutrients in young children during the complementary feeding period where
breastmilk alone is no longer sufficient. Despite this, it has been reported that the proportion of IYC
aged 6-23 months who consumed diets that met the minimum requirements for dietary diversity
(MDD) (received foods from at least four of a possible seven food groups) was estimated as 28% in
the 2013 TLFNS (21) and 34% in the 2019 IPC analysis report (3). Figure 7 displays the geographic
variance in MDD as per the 2019 IPC; the percentage of IYC meeting MDD ranged from only 12% in
Lautem to 50% in Dili (3).
Figure 7: Percentage of IYC aged 6-23 months per municipality achieving minimum dietary diversity as per the
2019 IPC report (3)
For this 6-23 month age group, breastfeeding is not always practiced for the recommended duration
of up to two years (21,27,28). Further, it is reported that when complementary feeding begins, many
IYC are fed diets based heavily on rice sosoro (porridge), with the occasional addition of green leafy
vegetables such as papaya or cassava leaves (2,4,20,21,27,29). Consumption of animal-source foods
by this group is low; less than half (41%) of IYC consumed eggs, a quarter (27%) ate flesh foods such

29
as meat and less than a quarter (23%) reportedly ate dairy foods in the previous day in the TLFNS(21).
These figures match those found in other surveys and smaller studies(22–25,29).
Figure 8 presents the percentage of energy requirements met by two weekly diets for 6-23mo
children in Timor-Leste; the first a hypothetical diet based on reported(29) usual intake of this target
group, and the second, the nutritious diet modelled for this target group in the CotD analysis, using
Oecusse as an example. Both diets meet 100% of estimated energy requirements but only the diet
on the right meets the requirements for energy, fat and micronutrients. This comparison shows that
a nutritious diet, modelled to meet the requirements of protein, fat and 13 micronutrients in addition
to energy, would be much more diverse than diets that are currently fed to the complementary
feeding aged target group. Additionally, a diet modelled to meet micronutrient needs would have
less reliance on staple grains/roots such as rice and cassava and a greater proportion of local
nutritious foods such as legumes, animal source foods and vegetables.
Still focusing on the CotD nutritious diet modelled for children in the complementary feeding age
group (diet B), figure 9 displays the percentage of the nutrient targets7 for 6-23mo children (based
on recommended nutrient intake or RNI) in Oecusse that were met by each food group when diet B
(the lowest-cost nutritious diet, adjusted for local staple consumption) was modelled in the CotD
analysis. This figure clearly shows that a variety of foods from diverse food groups are required in
order to meet nutrient requirements for this target group. For example, if only the first two food
groups are counted, representing a diet similar to that reported as being the norm for IYC according
to local practices; breastmilk and rice porridge, it is not possible to meet the requirements of any of
the modelled micronutrients. The addition of Vitamin A-rich fruits and vegetables to the diet could
mean that requirements of some micronutrients (vitamins A, C, B6, Pantothenic Acid and Folic Acid)
could be met however the requirements of remaining nutrients would not be able to be met without
the addition of a combination of legumes, animal-source foods (flesh foods) and other fruit and
vegetables in this model.
Breast Milk38%
Vitamin A-rich F + V
5%
Grains, roots & Tubers
57%
Diet A: Energy share of current diet for 6-23mo child(estimate based on qualitative data)
Breastmilk38%
Grains, Roots, Tubers27%
Vitamin A-rich F + V5%
Legumes/nuts
23%
Flesh foods3%
Other F+V4%
Diet B: Energy share of CotD Nutritious diet for 6-23mo child in Oecusse Municipality
Figure 8: Percentage of energy provided by food group in diets of 6-23mo: Diet A (left) a hypothetical diet for this target group based on reported dietary patterns (estimate based on qualitative results) and Diet B (right) the lowest cost, nutritious diet modelled for this target group in the CotD Analysis (example from Oecusse).

30
Figure 9: Cumulative percentage of micronutrient requirements8 met (capped at 100% RNI) by each additional
food group for Breastfed IYC (6-23mo) (Oecusse) using the modelled lowest-cost Nutritious Diet (CotD
Analysis), in order of food group added (based on modelling and not observed or current diets)
Diets of women and adolescent girls
Recent research has indicated that in many areas of Timor-Leste, women’s diets are even poorer than
the already very poor diets of their children (24,25). Dietary intake for women in Timor-Leste has also
been shown to be inadequate in terms of both micro- and macronutrient content across numerous
analyses of both qualitative and quantitative survey data (21,24,25,28,30,31). Diets for mothers in
Timor-Leste are generally dependent on starchy grains and tubers with some inclusion of green
leaves but little consumption of animal-source foods and only occasional inclusion of other nutritious
foods such as legumes (4,29). One national food frequency survey found that, on average, mothers
of IYC <2 years consumed flesh foods less than one time per week, eggs 1.1 time per week and
legumes 1.5 times per week (4,29). Additionally, while quantitative surveys have not yet been used
to assess women’s calorie intake, there is significant concern about not only the micronutrient
content of women’s diet but also whether they meet energy needs, especially during the later stages
of pregnancy (4).
The dietary quality of adolescent girls in Timor-Leste is also concerning, given the particularly high
requirements for micronutrients (5). A recent qualitative study found that adolescents generally
consume the same food as the rest of their households and that diets are often monotonous and
mostly based on rice and green vegetables(5). The reported divergences from household diets are
that adolescents may also skip breakfast and consume snacks purchased at or near their school (5).
The same study also found that adolescents generally have an understanding of which foods are
nutritious and would like to eat more fish, fruit and meat but the barriers to doing so are similar to
8 CotD uses estimated average requirements for energy and recommended intakes for protein and micronutrients based on the FAO-WHO estimates (36,37).
0
10
20
30
40
50
60
70
80
90
100
% o
f N
utr
ien
t Ta
rget
Met
Breastmilk Grains, Roots, Tubers Vit A-rich F + V Legumes/nuts Flesh foods Other F+V

31
those of the wider community; infrastructure, economic access and use of animals for cultural
exchange/sale(5).
In the same style as figure 9, the graphs in figures 10 and 11 present the percentage of nutrient
targets7 that were met by each food group when diet B (the lowest-cost nutritious diet, adjusted for
local staple consumption) was modelled in the CotD analysis for Lactating Women in Dili and
Adolescent Girls in Ermera. These examples again show that a diversity of nutritious foods would be
required to meet nutrient needs for these target groups. If only the micronutrients provided by the
rice and green vegetables in the modelled lowest cost nutritious diet are considered, requirements
of vitamin B1 (thiamin), vitamin B3 (niacin), pantothenic acid (B5), vitamin B12, iron and zinc are not
met. It is not until the nutrient contributions from legumes, animal-source foods and other
vegetables are considered that at least 100% of the requirement of the modelled micronutrients is
achieved. These model results are included to highlight the importance of dietary diversity and
quality for these nutritionally vulnerable target groups and to encourage interventions focussing on
improving access to and demand for diverse, nutritious foods.
Figure 10: Cumulative Percentage of micronutrient requirements7 met (capped at 100%) by each additional
food group for Lactating Adult Women (Dili) using the lowest-cost Nutritious Diet (CotD Analysis), in order of
food group added
0
10
20
30
40
50
60
70
80
90
100
% o
f n
utr
ien
t re
qu
irem
ent
met
Grains, Roots, Tubers Vitamin A-rich F + V Legumes/nuts Flesh foods Other F+V

32
Figure 11: Cumulative percentage of micronutrient requirements7 met (capped at 100% RNI) by each additional
food group for Adolescent Girls (Ermera) using the lowest-cost Nutritious Diet (CotD Analysis), in order of food
group added
Determinants and challenges to dietary improvement
Much of the rich collection of research that has already been carried out in Timor-Leste has sought
to identify factors that contribute to poor dietary attainment for IYC, women and girls. Reported
determinants have included economic access to nutritious, diverse foods; physical access to markets
and infrastructure and production and availability of nutritious foods; knowledge, preferences and
behaviour (3–5,9,29,32).
This FNG analysis focuses on the extent to which the availability, prices of and economic access to,
and use of foods determine the extent to which nutritious diets can be achieved. These factors are
compounded by traditional gender roles and beliefs, which can in turn determine the level of priority
given to nutrition and women’s relative agency in making decisions about food purchases,
production or use of foods purchased/from own production(4). While women are normally
responsible for decision-making about family meals and household budgets, qualitative research
findings suggest they would need to consult with male partners on decisions regarding the use of
more valuable foods, such as animal-source foods(4,24). Further, while there are reports that many
such decisions are ‘shared’, in practice women have limited agency and have been found to report
that they would agree with their partner’s views, giving the husband the final word, in order to avoid
conflict or violence(4,24). It has also been reported that men or other male household members are
often given preference during the distribution of more expensive nutritious foods such as eggs or
meat within the household (4,5). These insights suggest that the solution to poor diets will extend
beyond interventions targeting nutritious food access and demand and will need to acknowledge,
do no harm to and address underlying gender and cultural factors.
0
20
40
60
80
100
% N
utr
ien
t ta
rget
met
(ca
pp
ed
at 1
00
%)
Grains, Roots, Tubers Vitamin A-rich F + V Legumes/nuts Eggs Flesh foods Other F+V

33
Key Finding 3: Almost all Timorese households could afford to meet their energy needs.
For most households, a nutritious diet that meets energy, protein and micronutrient needs
would be unaffordable.
Cost and content of a nutritious diet
The market survey food price and availability data were used in the CotD software to identify the
lowest cost food combinations that would meet nutrient needs for the model household in each of
the six assessment municipalities.
Diets modelled to meet only energy requirements for a 5-person household9 would cost from $32
per month in Baucau to $60 in Dili (figure 12). To meet these energy requirements, the CotD software
selected the lowest-cost, energy-dense foods, such as starchy staples (rice, cassava, etc.) and oil. In
contrast, providing a nutritious diet, that is, a diet meeting the requirements of energy, protein and
13 micronutrients, would cost an average of three times as much as energy only diets. A nutritious
diet would cost between $158 per month in Baucau to $211 per month in Dili (figure 12).
The CotD nutritious diets are composed of foods found to be available from local markets in each
municipality and include a minimum quantity of the local staple food/s. These diets are based on the
lowest cost to meet the nutrient requirements of all five model household members(33). The
nutritious diets however, do not necessarily represent what households are actually eating or would
choose to eat. As such, the cost of a nutritious diet could be higher in reality, if dietary habits and
preferences were considered. However, these diets are not designed to be used to develop food-
based recommendations or dietary guidelines but are intended to act as an economic marker of
nutrition access. For a complete description of the foods selected by the linear programming models
to optimise nutrient content and cost in the nutritious diets in each municipality, as well as costs
associated with including the food in each diet and nutrient provision from foods selected, see
appendix tables 3-20.
For comparative purposes, market data was re-allocated to model diets according to broader
geographic categorisation (Coastal - rural, Mountains -rural, Dili-urban, Urban-other). The results of
this re-analysis are provided in Appendix tables 22-23.
9 The model five-person household consists of a breastfeeding infant, a primary school-aged child, an adolescent girl, a lactating adult woman and an adult man.

34
Figure 12: Cost of the lowest-cost diets that would meet requirements for 1) energy only and 2) energy, protein
and 13 micronutrients (nutritious diet) for the model 5-person household8 in the six assessment municipalities
Table 3: Limiting Nutrients10 (average) by target group
Target
Group
Vitamin
B1
Vitamin
B12 Calcium Iron Zinc
Infant
12-23
months
x x x x x
Adolescent
Girl x x x
Lactating
Adult
Woman
x x x
Limiting nutrients10 were identified in the CotD analysis for each household member (Table 3 and
appendix table 21). These results for key nutritionally-vulnerable target groups indicate that it may
be difficult to meet requirements of Vitamins B1 and B12, calcium, iron and zinc using local foods in
accessible quantities and that there may be a higher likelihood for IYC, adolescent girls and women
to be deficient in these micronutrients. These limiting nutrients are all nutrients that are generally
found in animal source foods, which are likely to be more expensive and less consumed than
vegetable origin foods.
How diet costs are determined
The cost of a nutritious diet is determined by the nutrient requirements for each household member,
the number and diversity of foods available in each municipality and food costs. Figure 13 shows the
average costs per household member of the energy only and nutritious diets across the six
assessment municipalities. While meeting the macro- and micronutrient requirements cost twice as
much as an energy-only diet for an adult man, this cost was 3 times as much for the infant, 3.5 times
as much for the lactating mother and 6.5 times as much for the adolescent girl. These large increases
in diet cost represent not only the difference in the costs of foods that provide calories only (such as
10 Limiting nutrients in the CotD analysis are defined as nutrients for which requirements would be difficult to meet for all or some household members using locally available foods without exceeding the energy threshold.
$32$53 $60
$50$37
$53
$158$168
$211
$162 $159$177
$0
$50
$100
$150
$200
$250
Baucau Bobonaro Dili Ermera Manufahi Oecusse
Mo
nth
ly H
ou
seh
old
Die
t C
ost
to
H
ou
seh
old
(U
SD)
Energy only Nutritious Diet

35
staple foods and oil) and foods that provide a range of nutrients (such as animal-source foods,
legumes and vegetables) but the significant nutrient requirements of particular target groups during
special periods of growth and development.
Figure 13: Daily cost of the energy-only and nutritious diets per household member (average across
municipalities)
During the complementary feeding period (6-23 months), infants and young children have significant
requirements for particular micronutrients but, given their limited gastric capacity, must achieve
these nutrient targets using small quantities of nutrient-dense foods(34,35). As shown in table 4,
even though in terms of total amount per day, the iron requirements of an adult man are higher than
for IYC, the required nutrient density, (micronutrient requirement per 1000kcal) is more than twice
as high as an adult man for 12-23-month-old and 7.4 times as high for 6-11 month-old. Similarly,
required iron nutrient densities for lactating women and adolescent girls are almost three times as
high as those of an adult man.
Table 4: Required nutrient density per target group as per FAO/WHO/UNU estimations (36,37)
Target Group Daily Kcal
Requirement
Daily absorbed
iron
Requirement
Absorbed iron
requirement per 1000
kcal
Adult man 2,420 kcal 1.2mg 0.5mg
Lactating woman 2,370 kcal 3.0mg 1.3mg
Adolescent girl 2,170 kcal 2.8mg 1.3mg
School-aged child 1,500 kcal 0.6mg 0.4mg
12-23mo Child 555 kcal 0.6mg 1.1mg
6-11 mo Child 242 kcal 0.9mg 3.7mg
The disparity between energy and micronutrient requirements are again illustrated in the CotD
results shown in figure 14. The first column shows the percentage of the household energy target
(10366Kcal/day) required to meet the estimated energy needs of each household member. When
looking at energy needs only, the energy needs of an adult man make up more than a quarter of the
total household energy target (27%). However, micronutrient requirements differ greatly from energy
needs and when distributed across the household; using iron requirements as an example, the adult
0.28
0.41
2.58
1.63
0.78
0.09
0.24
0.41
0.46
0.44
0.00 0.50 1.00 1.50 2.00 2.50
Infant12-23mo
SchoolChild
AdolescentGirl
LactatingWoman
AdultMan
Average cost per day ($USD)
Ho
use
ho
ld M
emb
er
Energy Only DietNutritious Diet
1.5 times the cost
3 times the cost
6.5 times the cost
3.5 times the cost
2 times the cost

36
man’s target makes up only 16% of the household total compared to 34% for the lactating woman
and 36% for the adolescent girl. The last column of figure 14 shows the proportion of total household
nutritious diet cost made up by the cost of meeting the nutrient requirements of each household
member. It becomes apparent considering this graph that the distribution of diet costs is much more
closely aligned with micronutrient requirements than energy needs.
Figure 14: Percentage of household energy target and iron target formed by individual household-member
requirements and nutritious diet cost per household member
In addition to household nutrient requirements, the cost of a nutritious diet is also determined by
the availability of nutritious foods in each assessment area. In total, data was collected for 130
discrete foods in Baucau, 105 in Bobonaro, 124 in Dili, 118 in Ermera, 100 in Manufahi and 98 in
Oecusse. These figures are disaggregated by food group in figure 15. The foods groups for which
most different foods were found in markets were staple foods (grains, roots and tubers), legumes,
nuts and seeds, vegetables and fruit. Data was collected for an average of 19 staple foods, 14
legumes, nuts or seeds and 14 animal source foods, not including dairy. Much of the meat, fish and
seafood available was dried and only live chickens or pigs were available in many markets as opposed
to fresh meat. The only dairy products observed were canned, powdered milk or condensed milk,
except in Baucau. An average of 36 different vegetables were found in markets, many of which were
green leaves such as spinach, cassava leaves, kangkong and papaya leaves. Likewise, a diversity of
different fruits, on average 19 types, were observed.
9% 7% 5%
14%7% 8%
24% 36%45%
27%34%
28%
27%16% 15%
0%
10%
20%
30%
40%
50%
60%
70%
80%
90%
100%
Energy Target Iron Target Diet Cost
% o
f H
ou
seh
old
req
uir
emen
t o
r d
iet
cost
Household Member
12-23mo Child School-aged child Adolescent girl Lactating woman Adult man

37
Figure 15: Number of individual foods per food CotD group found to be available in each assessment
municipality for which food price data was collected
The final factor determining the cost of a nutritious diet is the price of nutritious foods available at
local markets. Figure 16 displays the average cost per 100g of foods from each food group per
municipality. This graph clearly shows that the most expensive foods in all municipalities were those
from the different animal-source food groups. Figure 16 also highlights key differences in food prices
between municipalities. Of particular note is the higher prices for foods from almost all food groups
in Dili as well as Baucau and Oecusse for many food groups.
A helpful way of understanding food prices and how they influence the cost of modelled diets is to
compare quantity price with kilocalorie price. Figure 17 contrasts the average price per 100g of each
food group across the 6 municipalities with the average price per 100 kilocalories. This comparison
reveals that the cheapest foods per calorie are energy-dense and micronutrient poor foods such as
staple grains, roots and tubers and fats and oils. For these examples, the price reduces when
kilocalories, not weight, are considered. In sharp contrast are the prices of micronutrient-rich
vegetables and fruit where prices increase when kilocalories are considered. While these foods are
good sources of many essential vitamins and minerals, they are much less energy-dense than other
plant-based foods. This to some extent may explain diet choices made by some households who
select cheaper foods that the know will ‘fill’ their family’s stomachs, even though they are not rich in
micronutrients.
14
10
15
8 7
24
19
3
12
8
16
74
2 2
30
18
4
13
7
16
11
7
2 2
37
21
4
13
7
14
8
42 2
40
22
3
12
6
13
63
1 2
37
14
3
96
12
64
2 2
31
19
4
0
5
10
15
20
25
30
35
40
Grains Roots andtubers
Legumes,nuts, seeds
Meat andoffal
Fish,seafood
Eggs Dairy Vegetables Fruit Oils andfats
Nu
mb
er o
f in
div
idu
al f
oo
ds
for
wh
ich
dat
a w
as c
olle
cted
Food GroupBAUCAU BOBONARO DILI ERMERA MANUFAHI OECUSSE
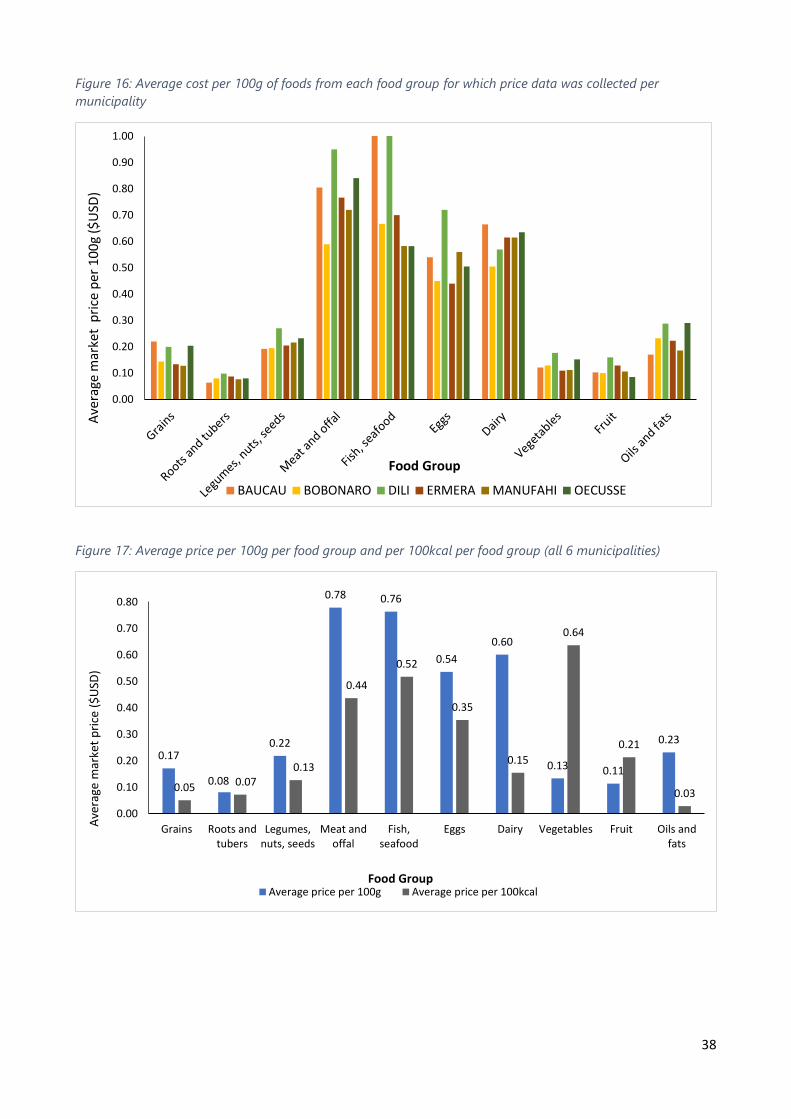
38
Figure 16: Average cost per 100g of foods from each food group for which price data was collected per
municipality
Figure 17: Average price per 100g per food group and per 100kcal per food group (all 6 municipalities)
0.00
0.10
0.20
0.30
0.40
0.50
0.60
0.70
0.80
0.90
1.00
Ave
rage
mar
ket
pri
ce p
er 1
00
g ($
USD
)
Food Group
BAUCAU BOBONARO DILI ERMERA MANUFAHI OECUSSE
0.17
0.08
0.22
0.78 0.76
0.54
0.60
0.13 0.11
0.23
0.05 0.070.13
0.44
0.52
0.35
0.15
0.64
0.21
0.03
0.00
0.10
0.20
0.30
0.40
0.50
0.60
0.70
0.80
Grains Roots andtubers
Legumes,nuts, seeds
Meat andoffal
Fish,seafood
Eggs Dairy Vegetables Fruit Oils andfats
Ave
rage
mar
ket
pri
ce (
$U
SD)
Food GroupAverage price per 100g Average price per 100kcal

39
The consideration of these three elements that determine the cost of a nutritious diet; nutrient
requirements, food availability and diversity and food prices, help to explain the diet costs presented
in figure 12. For example, in the municipality of Baucau, average prices per food group were higher
than in other municipalities (figure 16) yet the cost of a nutritious diet was the lowest out of all
municipalities at $158 per month for a household of five people. This is likely due to the diversity of
foods that were available in this municipality, especially in nutrient-rich food groups such as
vegetables and fish and seafood. This increased diversity means that the linear programming models
in CotD have a greater selection of foods to choose from when optimising the nutritious diet at the
lowest cost. In contrast, food prices were lower on average in Bobonaro compared to Baucau,
however poorer availability of nutritious foods at local markets visited is most likely the reason for a
more expensive nutritious diet ($168 per month). Dili municipality also had a high diversity of
available foods, yet the food prices were significantly higher than other municipalities, leading to the
most expensive nutritious diet at $211 per month. Lastly, the market survey in Oecusse SAR resulted
in the lowest number of foods but high prices for some food groups, leading to the second-highest
nutritious diet at $177 per month per household. The next step in the FNG methodology is to
compare these household diet prices to estimated household food budgets (expenditure data), to
determine whether they would be affordable.
Comparison with the TL-SLS food poverty line
It is important to note that the estimation of the cost of a nutritious diet estimated by the CotD
analysis for the FNG uses different methods to those used to estimate food poverty within the TL-
SLS (6). As shown in the following table, the food poverty line considers a ‘typical local food basket’
that is modelled to meet 2,100 kcal per person – for a standard household. The CotD methods differ.
For the energy-only diet, the typical local food basket is not considered, and the energy needs of five
unique groups are used rather than a standard goal of 2,100kcal, as such, this diet is cheaper than
the poverty line. For the Nutritious Diet, the typical local food basket is only considered to the extent
that local staple foods are included in the diet, otherwise the diet is modelled to meet the energy, as
well as protein and micronutrient requirements of five household members that are nutritionally
vulnerable, meaning they may have higher micronutrient requirements than the national average. As
such, this diet is more expensive. In both cases, diets are more expensive in Dili, reflecting the higher
on average food prices in the nation’s capital and urban areas(6).
Table 5: Comparison of the energy-only diet (CotD), Food Poverty Basket (TL-SLS) and Nutritious
Diet (CotD) methods and costs
FNG/CotD Energy-Only Diet TL-SLS Food
Poverty Basket
FNG/CotD Nutritious Diet
Methods for
estimating
cost
The cost of a food basket
modelled to meet estimated
energy needs, not based on
consumption habits, for each
of the five model household
members, selected to
represent nutritionally
vulnerable population
members (for whom
requirements differ greatly)
The cost of the
typical local food
basket, based on
local consumption
habits, that yields a
nutrient value of
2,100 calories per
person(6)
The cost of a food basket modelled to
meet estimated energy needs and
requirements for protein and 13
micronutrients for each of the five
model household members,
considering local staple food
consumption, selected to represent
nutritionally vulnerable population
members (for whom requirements
differ greatly)

40
Monthly per
Capita Cost
N/A
Instead estimated for
individual nutritionally
vulnerable household
members (national average)
Infant 12-23mo: $2.68
Primary School Child: $7.40
Adolescent Girl: $12.31
Lactating woman: $13.88
Adult Man: $13.22
$25.00
N/A
Instead estimated for individual
nutritionally vulnerable household
members (national average)
Infant 12-23mo: $8.613
Primary School Child: $12.31
Adolescent Girl: $78.48
Lactating woman: $49.45
Adult Man: $23.71
Monthly
Household
Cost
(5 person
Household)
$49.45
$125.0011
(adjusted for a five-
person household)
$172.60
Monthly
DILI Only
Household
Cost (5
person
Household)
$60.19
(Dili only)
$166.0012
(Dili Only)
$211.30
(Dili Only)
Affordability of a nutritious diet
The energy-only diet would be affordable for the majority of households in the assessment
municipalities. The costs of the energy-only diets were compared to inflation-adjusted food
expenditure percentiles from the 2014-15 TL-SLS, as shown in the Oecusse example in figure 19
(please see appendix tables 24-29 for figures from other municipalities). This energy-only diet would
cost less than the estimated food expenditure of (and thus be affordable for) 98% of households in
Dili, 95% in Bobonaro, 94% in Ermera and 95% in Oecusse (figure 18). In Baucau and Manufahi, the
energy-only diet did not cost more than the food expenditure of any households in the TSLS-SLS,
indicating that it would be affordable to meet energy requirements for all households in these
municipalities.
In contrast to the energy-only diet, the nutritious diet would be unaffordable for the majority of
households across the six assessment municipalities. The nutritious diet, modelled to meet the
energy needs and requirements for protein and 13 micronutrients for a five-person household, would
cost more than estimated food expenditure of most households and thus only be affordable for 37%
of households in Baucau, 24% in Dili, 28% in Manufahi, 21% in Bobonaro and Ermera, and 15% in
Oecusse.
11 If adjusted for average 2019 inflation for Food and Non-Alcoholic Beverages, this cost would increase to approximately $126 per month 12 If adjusted for average 2019 inflation for Food and Non-Alcoholic Beverages, this cost would increase to approximately $167.2 per month

41
Figure 18: Percentage of households that would be able to afford the energy-only or nutritious diet, estimated
by comparing diet cost to adjusted household food expenditure from the TSLS-SLS
The affordability of the CotD diets in the FNG is dependent on two different factors; the estimated
cost of a nutritious diet and the purchasing power of households within a geographic area. As shown
in figure 12, a nutritious household diet in Dili cost almost 1.5 times as much as a nutritious diet in
Oecusse. Nonetheless, the estimated percentage of households that would be able to afford a
nutritious diet was lower in Oecusse than in Dili. This is due to difference in the distribution of
household food expenditure data for each municipality and indicates that while food may be more
expensive in Dili, local households have higher purchasing power and thus a greater proportion
would be able to afford the nutritious diet. Figures 20 and 21 display the distribution of estimated
monthly household food expenditures by municipality. As shown in both graphs, more households
in Dili were estimated to be spending >$150 per month on food using the 2014-2015 TL-SLS data(6).
Also, as shown in figure 20, given the relatively flat expenditure curve for the 6 assessment curves,
small changes to diet costs could have significant implications for diet affordability. Figure 22 also
compares the mean and median estimated household food expenditure with the energy-only and
nutritious diet costs per month, showing again that the energy-only diet would be affordable for
most in the population, but the nutritious diet would cost more than what most households currently
spend on food.
A consideration not documented here is the level of access that households have to markets in each
municipality. The CotD analysis assumes that households would be able to access local markets in
order to purchase nutritious diets. Further factors that not able to be considered in the CotD are any
costs associated with transport to markets and fuel for cooking foods. Given that market access,
transport and fuel costs/needs will likely differ within municipalities, the true cost of and level of
access to nutritious diets may be worse than the estimates presented here in reality.
100% 95% 98% 94% 100% 95%
37%
21%24%
21%28%
15%
0%
10%
20%
30%
40%
50%
60%
70%
80%
90%
100%
Baucau Bobonaro Dili Ermera Manufahi Oecusse
% o
f h
ou
seh
old
s th
at w
ou
ld b
e ab
le t
o
affo
rd e
ach
mo
del
ed d
iet
Municipality
Energy only diet Nutritious Diet

42
Figure 19: Comparison of the distribution of monthly food expenditure for a five-person household in Oecusse
with the estimated costs of an energy-only diet and a nutritious diet and use of intersecting points to
determine proportion of households that could afford either diet
Figure 20: Percentiles of monthly food expenditure for a five-person household from the 2014-2015 TL-SLS,
adjusted to reflect inflation from 2014-2019(6,7)
0
100
200
300
400
500
600
7001 4 7
10
13
16
19
22
25
28
31
34
37
40
43
46
49
52
55
58
61
64
67
70
73
76
79
82
85
88
91
94
97
10
0
Esti
mat
ed 2
01
9 m
on
thly
fo
od
exp
end
itu
re f
or
the
5 p
erso
n h
ou
seh
old
($
USD
)
Percentile
OECUSSE Nutritious Diet cost Energy-only Diet Cost
0
100
200
300
400
500
600
700
800
900
1000
1 4 7
10
13
16
19
22
25
28
31
34
37
40
43
46
49
52
55
58
61
64
67
70
73
76
79
82
85
88
91
94
97
10
0
Esti
mat
ed 2
01
9 m
on
thly
fo
od
exp
end
itu
re
for
the
5 p
erso
n h
ou
seh
old
($
USD
)
Percentiles
BAUCAU BOBONARO DILI ERMERA MANUFAHI OECUSSE
Nutritious Diet $177 per month
Energy-only diet $53 per month

43
Figure 21: Distribution of estimated monthly food expenditure for five-person households from the 2014-2015
TL-SLS, adjusted to reflect inflation from 2014-2019(6,7)
Figure 22: Comparison of the mean and median estimated monthly household food expenditure for 2019 using
TL-SLS data and the cost of the energy-only and nutritious diets in each municipality
1 5 17 3 4
23
36
22
39
31
45
35
32
32
29
34
2920
11
17
1316
1186
10
5 94
13 1018
7 7 7
0
10
20
30
40
50
60
70
80
90
100
BAUCAU BOBONARO DILI ERMERA MANUFAHI OECUSSE
Per
cen
tage
of
5 p
erso
n h
ou
seh
old
s in
eac
h e
xpen
dit
ure
b
rack
ed (
esti
mat
ed 2
01
9)
Municipality
<$50 $51-$100 $101-150 $151-$200 $201-$250 >$250
32
5360
5037
53
158168
211
162 159
177
0
50
100
150
200
250
Baucau Bobonaro Dili Ermera Manufahi Oecusse
Mo
nth
ly a
mo
un
t (U
SD)
Municipality
Median Household Food Expenditure Mean Household Food Expenditure
Energy-only diet cost Nutritious Diet Cost

44
Key Finding 4: Women are particularly impacted by poor nutrition. This both
negatively affects their and their families’ health, wellbeing and future potential.
Women, especially pregnant and lactating women, have exceptionally poor diets and are at particular
risk of malnutrition in Timor-Leste. Figure 23 shows that while the cost of meeting energy needs for
lactating women is similar if not the same as that of an adult man across all municipalities, the cost
of a nutritious diet is more than twice as much for the woman in most assessment locations. These
differentials in diet costs represent the significant nutrient needs of women, in comparison to other
household members. Given these high nutrient requirements, women are at much greater risk of
malnutrition than men and other household members.
Figure 23: Comparison of the daily cost (to households) of a modelled energy-only diet and a modelled
nutritious diet for Lactating Women and Adult Men by municipality
Data on nutritional status of men and women are suggestive of a serious gender gap in the
experience of malnutrition in Timor-Leste. Women across the country are more likely than men to
suffer from micronutrient deficiencies(38). In 2016, women of reproductive age (WRA) were almost
twice as likely to be anaemic as adult men (figure 24) (30). Even though the prevalence was is still
low when compared to that of other countries in the region, it was also particularly of note that
women were almost twice as likely as men to be obese or overweight (figure 25)(30). Whilst different
in manifestation and consequences, both of these conditions are indicators of malnutrition in all its
forms and their direct causes include poor diets. As such, improving access to nutritious diets,
especially for the nutritionally vulnerable women target groups, would help in preventing both over-
and under-nutrition and micronutrient deficiencies.
0.29
1.44
0.49
1.64
0.55
2.21
0.46
1.5
0.46
1.51
0.49
1.46
0.29
0.7
0.42
0.8
0.54
1.04
0.44
0.72
0.44
0.74
0.48
0.68
0
0.5
1
1.5
2
2.5
Ener
gy-o
nly
Die
t
Nu
trit
iou
s D
iet
Ener
gy-o
nly
Die
t
Nu
trit
iou
s D
iet
Ener
gy-o
nly
Die
t
Nu
trit
iou
s D
iet
Ener
gy-o
nly
Die
t
Nu
trit
iou
s D
iet
Ener
gy-o
nly
Die
t
Nu
trit
iou
s D
iet
Ener
gy-o
nly
Die
t
Nu
trit
iou
s D
iet
BAU BOB DIL ERM MAN OEC
Dai
ly c
ost
(to
ho
use
ho
ld)
of
the
die
t ($
USD
)
Lactating Woman Adult Man

45
Figure 24: Prevalence of Anaemia for adult men and women (non-pregnant, non-lactating) by municipality
as per the 2016 DHS13 (30)
Figure 25: Prevalence of Overweight and Obesity for adult men and women (non-pregnant, non-lactating)
by municipality as per the 2016 DHS (30)
Poor Nutrition has impacts for the health of future generations but also, immediately, women’s
own health and wellbeing, caring capacity and economic potential. For example, a longitudinal
research project in the country found that maternal height was a strong predictor of child
malnutrition status(39). These findings suggest that mothers who are well-nourished themselves
are more likely to raise well-nourished children. This also reinforces the need to focus on the
13 While it is acknowledged that there are some data quality concerns regarding the anthropometric data in the 2016 Timor-Leste Demographic and Health Survey (DHS), this does not mitigate the severity of the situation in any way; Timor-Leste is severely affected by poor nutrition, and malnutrition remains a serious concern for public health and the social and economic development of the country.
23%
14%16%
30%
20%17%
27%
18%23%
16%
21%
10%
46%
18%
13%
20%
11%10%
17%14%
5%
28%
22%
16%
9%5%
22%
13%
0%
5%
10%
15%
20%
25%
30%
35%
40%
45%
50%
Women of Reproductive Age Adult Men
10%
5%
7%
12%
8%
14%15%
3%
6%
4%
11%
9%
6%
11%
6%
4%3%
4% 4% 3%
12%
5%
3%2%
4%5%
2%
4%
0%
2%
4%
6%
8%
10%
12%
14%
16%
18%
20%
Women of Reproductive Age Adult Men

46
nutrition of children, girls and women throughout the lifecycle and beyond the first 1000 days
spanning pregnancy through to two years of age(39).
Figure 26: Preliminary results of modelling the impact in CotD of providing alternative nutrition interventions
on the cost of a nutritious diet for lactating adult women across the 6 assessment municipalities
Nutrition-specific interventions prioritised by KONSSANTIL and other partners in key policy
documents include the provision of micronutrient supplementation and specialised nutritious food
for women. Super Cereal for PLW, a fortified cereal blend and two alternative micronutrient
supplements; iron and folic acid (IFA) and multiple micronutrient tablets (MMT), were modelled for
lactating women as per WFP and UNICEF technical standards (40,41). Lactating women were selected
as a target group to represent pregnant women and NPNL women given their significant nutrient
requirements during this life stage. Figure 26 displays the preliminary results of this intervention
modelling. Providing Super Cereal for PLW (150g at zero cost to the household per day) reduced the
cost of providing a nutritious diet for a woman by an average of 12% (0-19%), depending on the
municipality. This suggests that providing a special fortified food may be more useful in some
municipalities than others. In contrast supplements reduced the cost of a nutritious diet for women
by more than half in all municipalities. That is, the cost to the household of providing a diet that
would meet energy, protein and micronutrient requirements would be reduced if a supplement was
included as per recommended dosage. In all municipalities, MMT supplement providing multiple
micronutrients14 would have a greater impact on reducing diet cost than iron and folic acid15 only.
Given the high initial cost of nutritious diets for women, interventions that would reduce this cost
could assist families greatly in affordably meeting their nutrient needs. Supplements could be
provided in addition to nutrition-sensitive interventions targeting the household as a whole, such as
14 The MMT contains Vit A, Retinol (800 RE), vit D (200 IU), vit E (10 mg), vit C (70 mg), vit B1 (1.4 mg), vit B2 (1.4 mg), vit B6 (1.9
mg), vit B12 (2.6 mcg), folic acid (400 mcg), niacin (18 mg), zinc (15 mg), copper (2 mg), iron (30 mg), iodine (150 mcg) and selenium (65 mcg) (40)(67). 15 The IFA contains folic acid (400 mcg) and iron (30 mg) (40,67).
1.44
1.64
2.21
1.5 1.51 1.46
1.251.39
2.04
1.331.23
1.46
0.680.79
1.12
0.760.68 0.71
0.560.67
0.83
0.62 0.67 0.62
0
0.5
1
1.5
2
2.5
Baucau Bobonaro Dili Ermera Manufahi Oecusse
Co
ts/d
ay (
to h
ou
seh
old
) o
f a
nu
trit
iou
s d
iet
($U
SD)
Municipality
Nutritious Diet Super Cereal for PLW Iron and Folic Acid Supplement Multiple Micronutrient Tablet

47
agriculture or social-protection strategies. The combined impact of providing such intervention
packages is detailed at the end in this report.
When considering factors influencing and possible interventions to address malnutrition for women,
it is important to consider that biological nutritional differences can also be exacerbated due to
gender factors that determine dietary practices, intra-household food allocation, food purchase and
use and control over assets (42). Such factors in Timor-Leste could include fertility rate and access to
family planning methods, age at first pregnancy, Barlaki or Bride Price, women’s empowerment,
gender-based violence and socio-cultural values regarding women’s nutrition (42–44). In addition to
prioritising evidence-based interventions to address malnutrition in Timor-Leste, there is a need for
Gender-Sensitive programming that considers inequalities and more complex structures that may
influence nutrition in the country.
Malnutrition and access to nutritious diets for men
It is important to note that by focussing key messages from the FNG findings on women, girls, school
children and IYC and highlighting that intra-household food distribution may need to favour these
groups, it could be assumed that the nutrition needs of men are being met. Unfortunately, in Timor-
Leste this is not the case. As shown in the DHS results above, 13% of men in the country were anaemic
in 2016 (30). Further, a quarter of men were found to be underweight and 6% obese or overweight
(30). All these issues are contributed to by poor diets, suggesting that even men are not consuming
adequate amounts of nutrients in the country.
While the cost of nutritious diets for men displayed in figure 23 appear low in comparison to those
of women, these costs are still high in relation to the costs of meeting energy needs only and incomes
in Timor-Leste. Figure 27 displays the affordability of the diets of adult men only, comparing the
nutritious diet costs from figure 23 to per-capita food expenditure from the TL-SLS (6). While only
an estimate, this figure reflects that nutritious diets for men would be affordable for less than half of
the population. As such, while programming to target individual household members shown in
messages 4-7 of this report is important, these should be provided alongside household-level
interventions that can impact diet access for all members of a family, as shown in the key messages
on agriculture, fortification and social protection.

48
Figure 27: Affordability of nutritious diets for adult men (diet cost compared to per-capita food expenditure) by
municipality.
Key Finding 5: Improving the nutrition of infants and young children would require
small investments in the short term that could deliver lasting returns over
generations.
The average cost of a nutritious diet for IYC under two years of $0.30 per day is relatively low when
compared with the diet costs of other household members. However, as shown in figure 28,
providing a nutritious for this target group would still cost between 2.5 and 4 times as much as a
diet that met energy needs only. Further, in this scenario the CotD software assumes that the child is
receiving breastmilk in recommended quantities. If children are not breastfeeding or not receiving
adequate amounts of breastmilk, the cost to the household of providing a nutritious diet would be
higher.
Even though providing an adequate diet for their infant could cost a household as little as $0.22 per
day or $6.70 per month (Oecusse), the prioritisation of food spending and time use for
complementary feeding may not be feasible or acceptable for families. Apart from uneven
distribution of animal-source foods, household members tend to eat similar diets (2,4,5,20). As such,
providing different, more nutritious foods to infants would represent a change from existing
practices. Instead of expecting families to change food spending and preparation for one household
member only, interventions aimed at giving access to nutritious foods for everyone in the household
could both be more realistic and have wider benefits.
54%
44% 44% 45%
53%49%
0%
10%
20%
30%
40%
50%
60%
70%
80%
90%
100%
Baucau Bobonaro Dili Ermera Manufahi Oecusse
% o
f h
ou
seh
old
s th
at w
ou
ld b
e ab
le
to a
ffo
rd a
nu
trit
iou
s d
iet
for
the
adu
lt m
an (
bas
ed o
n e
stim
ated
per
-cap
ita
foo
d e
xpen
dit
ure
)

49
Figure 28: Daily cost of the energy-only and Nutritious Diets modelled in CotD for 12-23mo Children
This likely difficulty in prioritising nutrient intake of IYC to improve diet is reflected in the evidence
of poor dietary quality for IYC and subsequent poor nutritional outcomes. As per the 2019 IPC only
13% of IYC aged 6-23 months nationally were receiving a Minimum Acceptable diet, indicating that
both dietary diversity and feeding frequency are suboptimal across the country (3). As per the most
recent DHS, around 46% of children under five years have low height for age16, an indicator of chronic
malnutrition or stunting and 40% are anaemic, an indicator of micronutrient deficiency(3,30). This
prevalence of malnutrition is experienced differently across the country, as per figure 29.
16 While it is acknowledged that there are some data quality concerns regarding the anthropometric data in the 2016
Timor-Leste Demographic and Health Survey (DHS), this does not mitigate the severity of the situation in any way;
Timor-Leste is severely affected by poor nutrition, and malnutrition remains a serious concern for public health and
the social and economic development of the country.
0.060.09
0.110.09
0.070.09
0.25
0.31
0.40
0.26 0.26
0.22
0
0.05
0.1
0.15
0.2
0.25
0.3
0.35
0.4
0.45
Baucau Bobonaro Dili Ermera Manufahi Oecusse
Dai
ly c
ost
of
the
die
t ($
USD
)
Municipality
Energy-only Diet Nutritious Diet
Figure 29: Stunting prevalence as per the 2016 DHS, by municipality (30)

50
A number of nutrition-specific interventions targeting only IYC have been prioritised in national
policy and partner programmes. These include micronutrient supplementation17 and provision of
nutritious fortified foods and local nutritious foods. The preliminary results of intervention modelling
for this target group are displayed in figure 30. Providing multiple micronutrients powder (MNP), did
significantly reduce the cost of meeting nutrient requirements for households by an average of
almost 40%. Another intervention was the provision of a fortified cereal (Supercereal Plus for IYC)
(60g at zero cost to the household per day) which reduced the cost of providing a nutritious diet by
5% in Oecusse up to 25% in Bobonaro. This difference reflects the diversity of food availability in
each municipality as well as limiting nutrients. While the provision of a fortified cereal may be
effective at reducing diet costs however, the costs associated with implementing such an intervention
would require consideration. Similarly, the last specialised intervention modelled, that of providing
eggs for young children daily, which has recently garnered local and international interest(45), could
reduce diet costs by more than 25%, with strongest impacts in Baucau and Ermera. However, once
again the feasibility and cost of providing such an intervention at scale would require consideration.
Figure 30: Daily cost (to household) of providing a nutritious diet for 12-23mo IYC, incorporating
supplementation and transfers of nutritious foods
17 Provision of a large dose vitamin A supplements twice a year, as per the UNICEF guidelines(68) was not modelled in this assessment as it is not possible to show the impact on a weekly nutritious diet cost.
0.25
0.31
0.4
0.26 0.26
0.22
0.15
0.18
0.25
0.150.16
0.170.19
0.230.21
0.230.21 0.21
0.17
0.25
0.28
0.180.19
0.16
0
0.05
0.1
0.15
0.2
0.25
0.3
0.35
0.4
0.45
Baucau Bobonaro Dili Ermera Manufahi Oecusse
Dai
ly c
ost
(to
ho
use
ho
ld)
of
a n
utr
itio
us
die
t ($
USD
)
Municipality
Nutritious Diet Multiple Micronutrient Powder Super Cereal for IYC 1 Egg per day

51
Key Finding 6: Programa Merenda Eskolar provides a valuable entry point to
improve nutrition in children, but menus need to be diverse and include
micronutrient-dense foods.
The National School Feeding programme (Programa Merenda Eskolar, or PME) is implemented by
the government across all municipalities. Though the programme’s primary goals are to incentivise
school attendance and reduce dropout rates, a sub-goal of improving the nutritional status of
students means there is an increased focus on approaches to make the PME more nutrition-sensitive
(2,15). This nutrition-sensitive approach is reflected in the allocation of resources per student for
school feeding and school meal menus themselves.
The national PME guidelines, as well as the specific guidelines for Oecusse, are under review and
interest has been shown by the government and implementing partners in including fortified rice in
the school meal, increasing the meal budget per student and including nutritious, locally-sourced
foods in the school meal.
From a nutrition and cost standpoint, three aspects can be considered when analysing school menus
in CotD; nutrient content, impact on nutritious diet cost and programme costs. School meal menus
are generally developed with the aim to cover at least 30% of a child’s nutrient requirements,
assuming provision of one out of three ideal daily meals. An exploration of the proportion of RNI
targets for modelled nutrients met by different school menus allows the comparison of nutrient
quality and identification of nutrients which may be difficult to provide or require a special focus.
The second aspect to be considered is the extent to which school meals can decrease the cost of a
child’s nutritious diet for a household. By providing a nutrient-dense school meal, the cost of a
nutritious diet to the household can be materially reduced, as the school meal would cover an
important part of the nutrition needs for the child. On the other hand, if the school meal is high in
energy but low in micronutrients, the reduction in cost to the household may only be minimal, as the
remaining foods that will be modelled in the diet would need to be highly nutritious. Such a scenario
would leave children vulnerable to micronutrient deficiencies as the required quantity would likely
not be able to be provided by home diets.
Finally, the third aspect is the cost to the programme (paid by the Government) of providing students
with a school meal. As in other school feeding programmes, the PME budget allocates a set amount
to spend on school meals per student per day, which then can be applied by schools to different
menu options as per the corresponding guidelines. The Ministry of Education has recently increased
the PME budget for all municipalities from $0.25 per student, per day, with provision of rice to the
school at no cost to $0.50 per child per day, without the provision of free rice.
Given that the CotD software applies linear optimisation, these last two aspects are not necessarily
directly comparable (the reduction in cost to the household is not necessarily the cost of the school
meal per student). Yet, there is a cost-effectiveness element to be considered.
In order to guide initial discussions on programme decision-making and to inform any further
modelling, a number of different school meal scenarios were modelled, as per table 6. The first round
of modelling focuses on comparing the potential benefits of fortified rice to non-fortified rice,
without accounting for nutrients provided by other foods. The next round of modelling compares a

52
‘worst case scenario’ menu (instant noodles and tea) with two examples of menus selected from the
school feeding guidelines to represent more and less nutritious foods. Different versions of these
menus are compared to account for inclusion of fortified rice and an increase from a daily budget
per child of $0.25c (with free rice) to $0.50c (without free rice). The modelling for the $0.50c menu
assumes a 30% labour and logistics cost. The results displayed here are preliminary findings only.
Further modelling can be carried out in the next stage of the FNG if relevant to programming
decisions.
Table 6: School Feeding Menu scenarios modelled in the CotD
Meal Name Foods Included Programme
Cost
Basic Rice meal (unfortified) Unfortified white rice N/A
Basic Rice meal (fortified) Fortified white rice N/A
Poor School Feeding Diet Example Instant Noodles
Sugary Tea
N/A
Optimized Menu
Unfortified
(selection of the most nutrient-rich foods from the school-
feeding guidelines)
Unfortified Rice
Beans
Cassava leaves
Taro greens
Tofu
Fish
Oil
25c Option
+ Free rice
50c Option
(higher
quantities)
Optimized Menu
Fortified
(selection of the most nutrient-rich foods from the school-
feeding guidelines)
Fortified Rice
Beans
Cassava leaves
Taro greens
Tofu
Fish
Oil
25c Option
+ Free rice
50c Option
(increased
quantities)
Low micronutrient menu
Unfortified
(selection of the least nutritious food options from the
school-feeding guidelines)
Unfortified Rice
Cabbage
Potatoes
Tofu
Oil
25c Option
+ Free rice
50c Option
(increased
quantities)
Low micronutrient menu
Fortified
(selection of the least nutritious food options from the
school-feeding guidelines)
Fortified Rice
Cabbage
Potatoes
Tofu
Oil
25c Option
+ Free rice
50c Option
(increased
quantities)
Figure 31 below presents two examples of extremely basic (and not recommended) school feeding
scenarios in which the percentage of nutrient requirements met by a simple meal of plain, unfortified
rice (113g per child daily) is compared to a meal of fortified rice. Neither of these menu options
would provide a minimum of 30% of nutrient requirements of a child. Yet, by changing the white rice
for fortified rice, the full daily requirements of vitamin B1, niacin, vitamin B6, folic acid and vitamin
B12 are met or almost met, in addition to a material improvement in the provision of vitamin A and
iron.
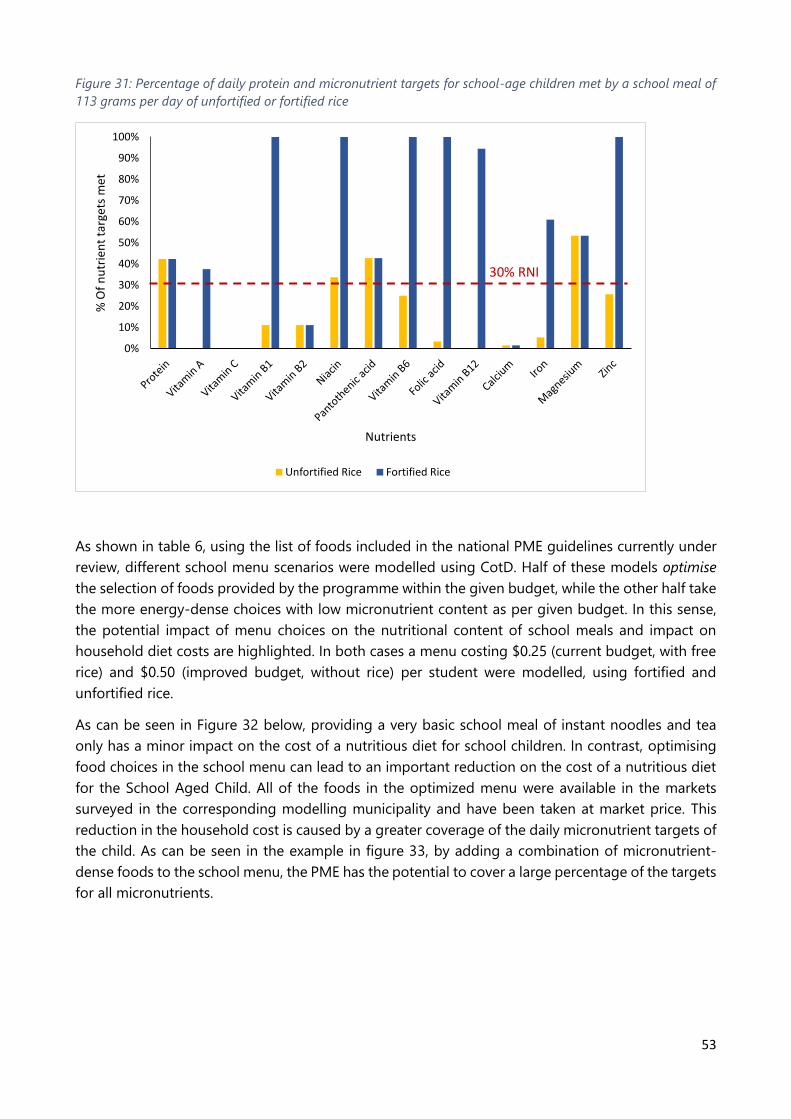
53
Figure 31: Percentage of daily protein and micronutrient targets for school-age children met by a school meal of
113 grams per day of unfortified or fortified rice
As shown in table 6, using the list of foods included in the national PME guidelines currently under
review, different school menu scenarios were modelled using CotD. Half of these models optimise
the selection of foods provided by the programme within the given budget, while the other half take
the more energy-dense choices with low micronutrient content as per given budget. In this sense,
the potential impact of menu choices on the nutritional content of school meals and impact on
household diet costs are highlighted. In both cases a menu costing $0.25 (current budget, with free
rice) and $0.50 (improved budget, without rice) per student were modelled, using fortified and
unfortified rice.
As can be seen in Figure 32 below, providing a very basic school meal of instant noodles and tea
only has a minor impact on the cost of a nutritious diet for school children. In contrast, optimising
food choices in the school menu can lead to an important reduction on the cost of a nutritious diet
for the School Aged Child. All of the foods in the optimized menu were available in the markets
surveyed in the corresponding modelling municipality and have been taken at market price. This
reduction in the household cost is caused by a greater coverage of the daily micronutrient targets of
the child. As can be seen in the example in figure 33, by adding a combination of micronutrient-
dense foods to the school menu, the PME has the potential to cover a large percentage of the targets
for all micronutrients.
0%
10%
20%
30%
40%
50%
60%
70%
80%
90%
100%
% O
f n
utr
ien
t ta
rget
s m
et
Nutrients
Unfortified Rice Fortified Rice
30% RNI

54
Figure 32: Daily cost (to household) of a nutritious diet for school children at baseline (nutritious diet) and with
the provision of alternative school feeding menu options
Figure 33: Percentage of daily protein and micronutrient targets (100% RNI) for school-age children met by
different menu options
Neither the cost reduction nor the high coverage of nutrient targets seen in figures 32 and 33 are
the same in the case of the low micronutrient menu. This menu consists of a combination of rice,
cabbage, potatoes, tofu and oil, and would also be in compliance with the specifications of the PME
guidelines. As shown in figure 34, the proportion of nutrient targets met depends greatly on which
foods are selected from the school feeding menu guidelines, which would in turn influence the cost
of a nutritious diet for households (figure 35). Figure 35 also compares the potential additional
benefit for diet cost of increasing school meal budget or including fortified rice; in all municipalities,
0.4
0.4
0.6
0.4 0.4
0.3
0.4
0.5
0.3 0.3
0.10.2
0.3
0.10.2
0.10.1
0.2
0.10.1
0.0
0.1
0.2
0.3
0.4
0.5
0.6
Baucau Bobonaro Dili Ermera Manufahi
Dai
ly c
ost
of
a n
utr
itio
us
die
t fo
r th
e sc
ho
ol-
aged
ch
ild (
$U
SD)
Municipality
Nutritious Diet Instant Noodles and Tea $0.25c Optimised Menu $0.50c Optimised Menu
0%10%20%30%40%50%60%70%80%90%
100%
% O
f n
uri
ent
targ
et m
et
Nutrients
Instant Noodles + Tea $0.25 Optimised Menu $0.25 Optimised FORTIFIED
$0.50 Optimised Menu $0.50 Optimised FORTIFIED
30% RNI

55
a similar impact on nutritious diet cost could be achieved from adding fortified flour to the 25c diet
as increasing the diet budget to 50c without fortified rice.
While more nuanced software programmes are available for the fine-tuning of school feeding diets,
the CotD modelling presented here displays not only the nutrient content of school meals possible
with added foods or increased budgets, but the potential flow on effect for household access to
nutritious diets.
Figure 34: Percentage of daily protein and micronutrient targets (100% RNI) for school-age children met by an
Optimised School Feeding Menu and a Low Nutrient Menu
Figure 35: Daily cost of a nutrition diet for the School Child with an Optimised School Feeding Menu (fortified
and unfortified) and a Low Nutrient Menu at a budget of $0.25 and $0.50 per child, per day
0%10%20%30%40%50%60%70%80%90%
100%
% N
utr
ien
t Ta
rget
Met
by
mea
l
Nutrients
$0.25 Optimised Menu $0.50 Optimised Menu
$0.25 Less Nutritious Menu $0.50 Less Nutritious Menu
0.4
0.4
0.6
0.4 0.4
0.3
0.3
0.4
0.3 0.30.2
0.3
0.4
0.2 0.2
0.10.2
0.3
0.10.2
0.1
0.2
0.3
0.1 0.10.1 0.1
0.2
0.10.1
0.10.1
0.2
0.1 0.1
0.0
0.1
0.2
0.3
0.4
0.5
0.6
Baucau Bobonaro Dili Ermera Manufahi
Dai
ly c
ost
of
a n
utr
itio
us
die
t ($
USD
)
Municipality
Nutritious Diet
$0.25c Less Nutritious Menu (Unfortified)
$0.50c Less Nutritious Menu (Unfortified)
$0.25c Optimised Menu
30% RNI

56
Key Finding 7: Meeting the nutrient requirements of adolescent girls would cost more
than any other member of the family. They are at high risk of micronutrient
deficiencies, but few interventions exist to address their needs and data to inform
programming is limited.
One quarter of the population of Timor-Leste are adolescents, meaning that there are approximately
324,837 young women and men in the country at present, a figure that is predicted to increase in
coming years (1,5,46). As well as having implications for areas such as education, employment, and
social services, the already significant size and predicted growth of this youth population has
implications for nutrition outcomes. Despite this, to date national surveys have not collected specific
data on the nutritional status and diet quality of adolescents in Timor-Leste. While qualitative
studies(5) have focussed on adolescent nutrition, quantitative data is also needed in order to assess
need and inform targeted programming.
Figure 37 displays the costs of providing an energy-only and nutritious diet for adolescents in each
municipality. While the cost of meeting energy needs is very similar for boys and girls, it costs, on
average, three times as much to provide a nutritious diet for girls as it would for boys. The results
are similar when comparing nutritious diet cost between members of the model household (figure
36); providing a diet that meets nutrient requirements for an adolescent girl costs 45% of the total
household diet cost. This is due to the significant requirements for micronutrients for young women
during this life stage.
Whilst age at first marriage and pregnancy has increased in Timor-Leste in recent years, more than
1 in 20 girls aged 15-19 had begun childbearing as of the last DHS (30). Given the increased
micronutrient requirements during pregnancy and lactation, the cost of providing a nutritious diet
would likely increase further if girls became mothers during adolescence while they are still growing
themselves. Further, early pregnancy is also associated with poor health outcomes for women and
their children (5,30,47). As such, opportunities for using nutrition as further evidence to advocate for
access to family planning services should be explored.
Figure 36: Proportion of total household diet cost (in an ideal scenario where nutrient requirements are met)
required to provide a nutritious diet for each model household member
45.4%
28.7%
7.2%
4.9%
13.7%Adolescent Girl
Lactating Woman
School Child
12-24mo Infant
Adult Man

57
Figure 37: Daily cost (to household) of the energy-only and nutritious diets modelled in CotD for Adolescent
Boys and Adolescent Girls in each Municipality
Young people will provide Timor-Leste’s human capital over the coming decades as well as becoming
parents to the next generation of children(5). Therefore, any investments in the nutrition and
development of this group now can have significant consequences in the long-term. Currently
prioritised nutrition interventions specifically targeting adolescents in Timor-Leste are inclusion of
this age group in micronutrient supplementation with iron and folic acid (IFA), school-feeding, for
those attending school and the Bolsa da Mãe cash transfer. Modelling results for the latter two
interventions are presented under key findings 6 and 10 respectively. The preliminary results of the
modelling of IFA or multiple micronutrient tablet (MMT) supplements as part of interventions that
could be targeted at adolescent girls are presented in Figure 38 below.
Figure 38: Preliminary results of modelling the impact in CotD of providing alternative nutrition interventions
on the cost of a nutritious diet for adolescent girls across the 6 assessment municipalities
0.26
2.45
0.47
2.38
0.48
2.75
0.40
2.50
0.30
2.34
0.42
3.07
0.31
0.78
0.51
0.87
0.63
1.46
0.48
0.76
0.37
0.80
0.520.80
0.00
0.50
1.00
1.50
2.00
2.50
3.00
Ener
gy O
nly
Nu
trit
iou
s D
iet
Ener
gy O
nly
Nu
trit
iou
s D
iet
Ener
gy O
nly
Nu
trit
iou
s D
iet
Ener
gy O
nly
Nu
trit
iou
s D
iet
Ener
gy O
nly
Nu
trit
iou
s D
iet
Ener
gy O
nly
Nu
trit
iou
s D
iet
Baucau Bobonaro Dili Ermera Manufahi Oecusse
Dai
ly c
ost
(to
ho
use
ho
ld)
of
the
die
t ($
USD
)
Municipality and Diet Type
Girl 14-15years Boy 14-15years
2.45 2.38
2.752.50
2.34
3.07
1.38 1.48
1.98
1.451.31
1.72
0.61 0.700.92
0.61 0.66 0.73
0.00
0.50
1.00
1.50
2.00
2.50
3.00
Baucau Bobonaro Dili Ermera Manufahi OecusseDai
ly c
ost
of
a n
utr
itio
us
die
t ($
USD
)
Municipality
Nutritious Diet IFA MMT

58
These preliminary results suggest that providing a supplement of iron and folic acid could almost
halve the nutritious diet cost, reducing the cost of a nutritious diet from $2.60 to $1.60 on average.
Similar to the modelling for women, providing a multiple micronutrient tablet instead of iron and
folic acid would have a much greater impact on diet cost for adolescent girls, reducing it by almost
four times from $2.6 to $0.70 per day.
Despite the fact that adolescents make up a significant proportion of the population and that they
are nutritionally vulnerable group, especially girls, apart from micronutrient supplementation, there
are no other specific nutrition interventions targeting adolescent nutrition at present. Given the
significant role that adolescents will play in the social, economic and educational future of Timor-
Leste, greater guidance and programming to invest in ensuring their access to nutritious diets is
needed.
Key Finding 8: Timor-Leste is a nation with strong participation in the agricultural
sector and produces a great diversity of foods, yet productivity is low. Interventions
targeting both the quantity and nutritional quality of foods produced could
improve access to nutritious diets for all.
A range of fresh, nutritious foods were observed in markets across the six assessment municipalities
however the CotD results suggest that meeting nutrient requirements using these foods would be
mostly unaffordable for local households. There is therefore a role for agriculture in improving the
local production, availability, prices of and consumption of nutritious local foods as well as improving
the yields and nutritional content of foods that are already produced and reducing losses.
The agricultural sector is the largest employer in Timor-Leste, providing direct employment to over
half of the working population (3,24,26,48,49). Most (>80%) households are engaged in some form
of smallholder farming and almost 90% of the rural poor are dependent on agriculture for their
livelihoods (1,49,50). The sector contributes to 17% of non-oil GDP in Timor-Leste (49). In spite of
this, the sector is underfunded at the public-level; only 1% of the total of state budget was allocated
to the Ministry of Agriculture in 2019, a decrease from the 2008 proportion of 3.9% (1).
Timor-Leste produces many nutritious and varied foods yet one of the factors contributing to poor
diets is low agricultural productivity and a focus on staple crop production rather than diversification
towards nutritious foods (26,42). Agricultural productivity in the country is substantially lower than
neighbouring countries with similar conditions and the lowest in the South-East Asian Region (42).
Average rice yields in Timor-Leste are 3 tonnes per hectare compared to 5.1 tonnes in Indonesia and
5.75 tonnes in Vietnam (51). Likewise, maize yields are below average at 2.2 tonnes per hectare and
post-harvest losses ranges from 20-50% for most agricultural products (42,52,53). Private sector
wholesale, retail and processing representatives have reported that the low productivity of
agricultural production means that local produce is often prohibitively expensive and cheaper,
imported products that are produced using less labour and other resources are favoured; thus the
volume of production per labour unit needs to be increased to ensure there is a market for local
produce(42). In addition to crops, livestock productivity in the country is also low as a result of low
input grazing/scavenger systems, low rates of reproduction, slow growth and high mortality of young

59
animals, high disease incidence causing mortality and poor meat quality as well as poor milk and
egg production(42,54,55).
There is significant room for improvement in access to and utilisation of improved practices; less
than 1 in 10 farmers reported using improved technologies or practices18 in the 2015 Population and
Housing Census and less than 2 in 10 reported using improved seeds or organic fertilisers (46). The
application of improved practices could lead to higher yields. Further, in 2016 FAO estimated that
less than half of Timor-Leste’s 800,000 hectares of potential arable land is being used for agricultural
production, also indicating significant room for improvement (42).
The 2017 draft Agriculture Policy and Strategic Framework Towards Nutrition-Sensitive, Climate
Smart Agriculture and Food Systems has identified the “enhancement of innovative and appropriate
climate-smart technologies to increase production and productivity and reduce post-harvest losses
and protection of productive lands” as well as “the diversification of staples (rice, maize and tubers)
to other nutrient-rich foods such as legumes, fruits, vegetables, eggs, meat and dairy products and
creating awareness of preparing healthy foods” as parts of its key policy challenges (17). The
government and partners are responding with a range of projects focussing on production quality
and quantity using improved methods and technology.
Homestead production of diverse, nutritious foods
One approach prioritised by KONSSANTIL for leveraging agriculture to support nutrition has been
the promotion of homestead production and consumption of nutritious foods, including animal-
source foods. An example model from Baucau has been provided below in which a number of
different foods are promoted and available for consumption by the household at a cost that would
be 50% of the market price. Table 7 shows the different scenarios that were modelled, in each it was
assumed that the listed nutritious foods were available to be consumed by the household at 50% of
market price (to represent input costs).
Table 7: Homestead Food Production intervention scenarios modelled in CotD for Baucau Municipality
Option 1: Small
Animal
Production
Option 2:
Vegetable
Production
Option 3: Vegetable
+ Biofortified OFSP
and Beans
Option 4: Production of all
options
Household
production of
eggs (chicken
raising)
Production
of green
leafy
vegetables
Production of
- Green leafy
Vegetables
- Orange Flesh
Sweet Potato
- Beans
Production of
- Green leafy Vegetables
- Orange Flesh Sweet Potato
- Beans
- Eggs
All products were modelled at 50% of market price to represent establishment and
labour costs
Figure 39 displays the impact on household nutritious diet cost if the various scenarios from table 7
were in place. If the household were able to access eggs from own production, the cost of meeting
nutrient needs for the family would be reduced from $5.20 to $4.80. Similarly, the diet cost would be
18 Such as Conservation agriculture, mulching, chemical fertilisers, herbicides, pesticides and irrigation(42,46)
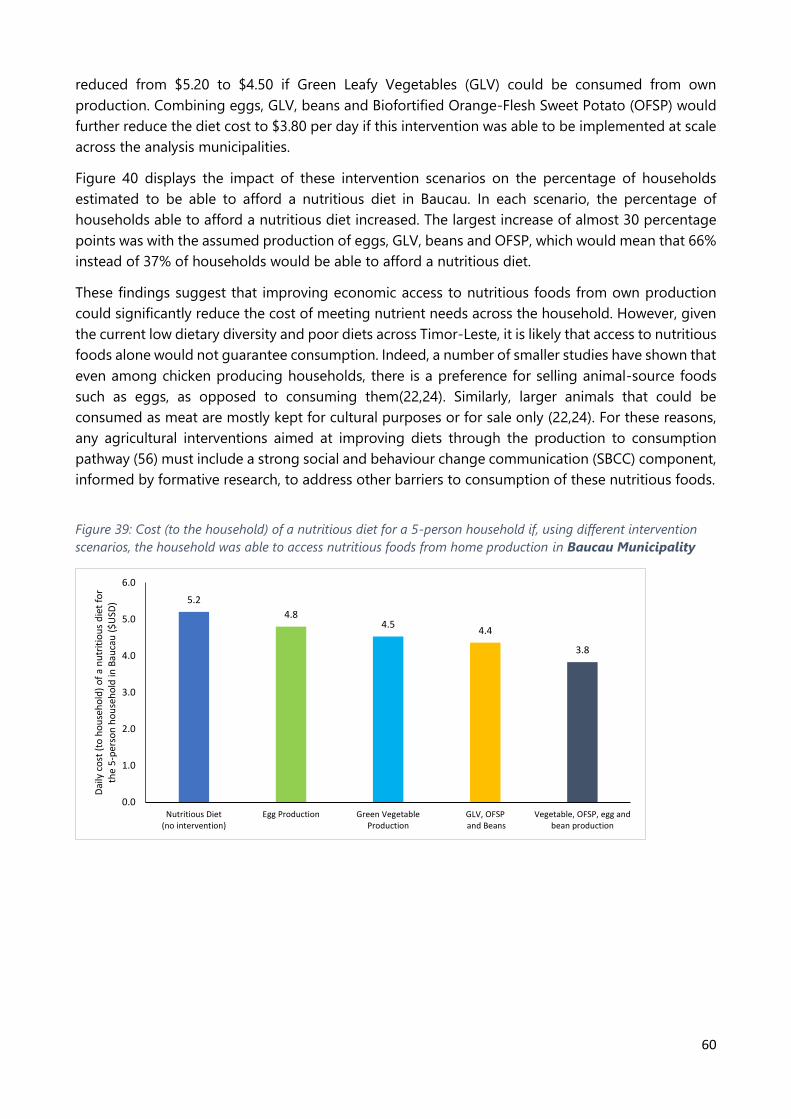
60
reduced from $5.20 to $4.50 if Green Leafy Vegetables (GLV) could be consumed from own
production. Combining eggs, GLV, beans and Biofortified Orange-Flesh Sweet Potato (OFSP) would
further reduce the diet cost to $3.80 per day if this intervention was able to be implemented at scale
across the analysis municipalities.
Figure 40 displays the impact of these intervention scenarios on the percentage of households
estimated to be able to afford a nutritious diet in Baucau. In each scenario, the percentage of
households able to afford a nutritious diet increased. The largest increase of almost 30 percentage
points was with the assumed production of eggs, GLV, beans and OFSP, which would mean that 66%
instead of 37% of households would be able to afford a nutritious diet.
These findings suggest that improving economic access to nutritious foods from own production
could significantly reduce the cost of meeting nutrient needs across the household. However, given
the current low dietary diversity and poor diets across Timor-Leste, it is likely that access to nutritious
foods alone would not guarantee consumption. Indeed, a number of smaller studies have shown that
even among chicken producing households, there is a preference for selling animal-source foods
such as eggs, as opposed to consuming them(22,24). Similarly, larger animals that could be
consumed as meat are mostly kept for cultural purposes or for sale only (22,24). For these reasons,
any agricultural interventions aimed at improving diets through the production to consumption
pathway (56) must include a strong social and behaviour change communication (SBCC) component,
informed by formative research, to address other barriers to consumption of these nutritious foods.
Figure 39: Cost (to the household) of a nutritious diet for a 5-person household if, using different intervention
scenarios, the household was able to access nutritious foods from home production in Baucau Municipality
5.2
4.84.5
4.4
3.8
0.0
1.0
2.0
3.0
4.0
5.0
6.0
Nutritious Diet(no intervention)
Egg Production Green VegetableProduction
GLV, OFSP and Beans
Vegetable, OFSP, egg andbean production
Dai
ly c
ost
(to
ho
use
ho
ld)
of
a n
utr
itio
us
die
t fo
r th
e 5
-per
son
ho
use
ho
ld in
Bau
cau
($
USD
)

61
Figure 40: Proportion of households that would be able to afford a nutritious diet if, using different intervention
scenarios, they were able to access nutritious foods from their own production in Baucau Municipality
An alternative model for considering the impact of homestead food production on diet access is
provided in figure 41. Data from the TOMAK programme has shown that there is an average
production rate of 40 kgs of OFSP per household per season (up to two seasons per year), that can
last for 2-6 months. In the subsequent model, average household production of OFSP was modelled
for two varieties of OFSP; a standard (USDA), naturally high in Vitamin A, and an improved variety
(Harvest Plus and CIP, see appendix 7) that is naturally higher in Vitamin A, Iron and Zinc. Up to 40kgs
of each product was made available to the household at zero cost for consumption over either a 2
or 6-month period. Figure 41 shows that in both instances, the cost of meeting nutrient requirements
was reduced by household access to this nutritious food, but more so when a more micronutrient-
rich variety was used; up to $0.35 per day or almost $11.00 per month.
37%42%
48%52%
66%
0%
10%
20%
30%
40%
50%
60%
70%
80%
90%
100%
No Intervention Egg Production Green VegetableProduction
GLV, OFSP and Beans
Vegetable, OFSP, eggand bean production
% o
f h
ou
seh
old
s th
at w
ou
ld b
e ab
le t
o a
ffo
rd t
he
nu
trit
iou
s d
iet
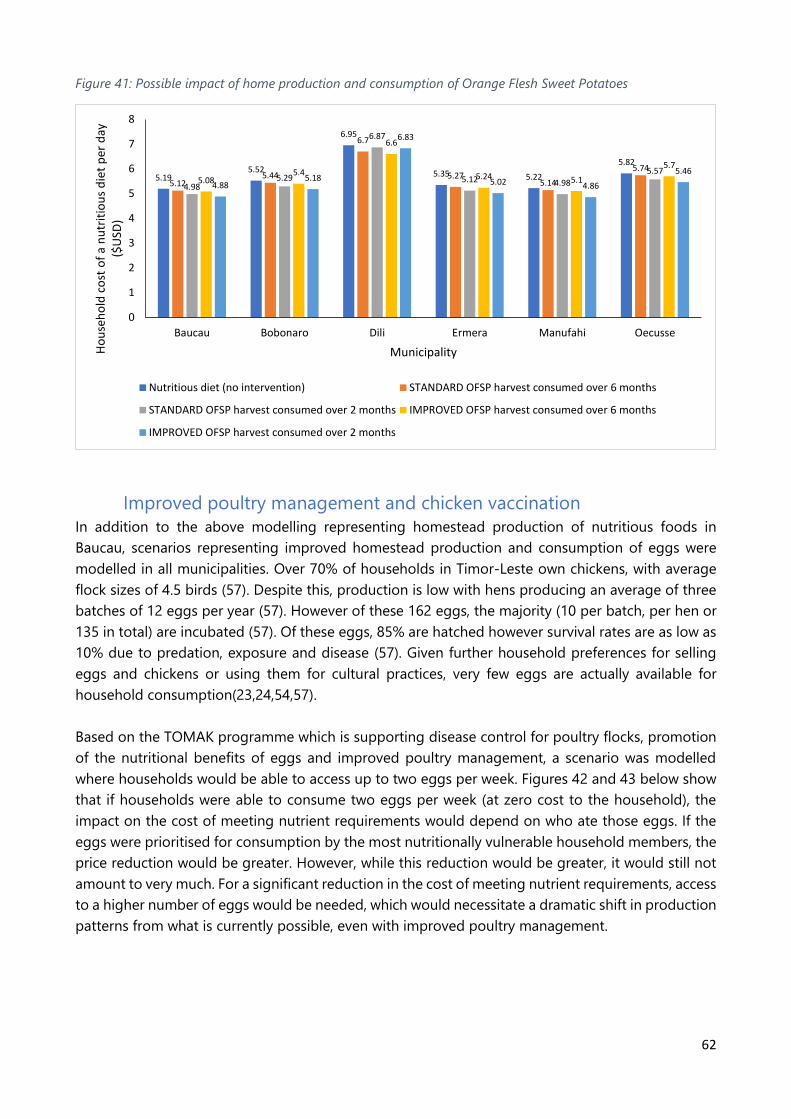
62
Figure 41: Possible impact of home production and consumption of Orange Flesh Sweet Potatoes
Improved poultry management and chicken vaccination
In addition to the above modelling representing homestead production of nutritious foods in
Baucau, scenarios representing improved homestead production and consumption of eggs were
modelled in all municipalities. Over 70% of households in Timor-Leste own chickens, with average
flock sizes of 4.5 birds (57). Despite this, production is low with hens producing an average of three
batches of 12 eggs per year (57). However of these 162 eggs, the majority (10 per batch, per hen or
135 in total) are incubated (57). Of these eggs, 85% are hatched however survival rates are as low as
10% due to predation, exposure and disease (57). Given further household preferences for selling
eggs and chickens or using them for cultural practices, very few eggs are actually available for
household consumption(23,24,54,57).
Based on the TOMAK programme which is supporting disease control for poultry flocks, promotion
of the nutritional benefits of eggs and improved poultry management, a scenario was modelled
where households would be able to access up to two eggs per week. Figures 42 and 43 below show
that if households were able to consume two eggs per week (at zero cost to the household), the
impact on the cost of meeting nutrient requirements would depend on who ate those eggs. If the
eggs were prioritised for consumption by the most nutritionally vulnerable household members, the
price reduction would be greater. However, while this reduction would be greater, it would still not
amount to very much. For a significant reduction in the cost of meeting nutrient requirements, access
to a higher number of eggs would be needed, which would necessitate a dramatic shift in production
patterns from what is currently possible, even with improved poultry management.
5.195.52
6.95
5.35 5.22
5.82
5.125.44
6.7
5.275.14
5.74
4.985.29
6.87
5.12 4.98
5.575.08
5.4
6.6
5.24 5.1
5.7
4.885.18
6.83
5.02 4.86
5.46
0
1
2
3
4
5
6
7
8
Baucau Bobonaro Dili Ermera Manufahi Oecusse
Ho
use
ho
ld c
ost
of
a n
utr
itio
us
die
t p
er d
ay
($U
SD)
Municipality
Nutritious diet (no intervention) STANDARD OFSP harvest consumed over 6 months
STANDARD OFSP harvest consumed over 2 months IMPROVED OFSP harvest consumed over 6 months
IMPROVED OFSP harvest consumed over 2 months

63
Figure 42: Possible impact of household access to 2 eggs per week through own production, depending on
household member/s receiving eggs, Ermera, Manufahi and Oecusse
Figure 43: Possible impact of household access to 2 eggs per week through own production, depending on
household member/s receiving eggs, Baucau, Bobonaro and Dili
Simulating a dramatic increase in egg production of up to 5 eggs per day (1 per family member), an
alternative model was added where daily egg consumption was allowed at 20% of the standard
market price (to represent the need for inputs to sustain this production). Figure 44 shows that
improved home production of eggs to allow all household members up to one egg per day could
reduce the cost of meeting household nutrient needs by an average of 15%. The estimated impact
of such interventions on the percentage of households able to afford a nutritious diet is shown in
figure 45. On average, if eggs were available from own production for all household members, diet
access could increase by an average of 37%. Although it is unlikely households will be able to move
from current low flock and low production numbers to the level needed for daily egg consumption
in the short-term, this model suggests that doing so would be able to have an impact on access to
nutrients and nutritious diets. However, in order to bring about such a change, simultaneous efforts
would need to be made to address current preferences for selling chickens and eggs or dedicating
them to cultural practices only as opposed to keeping them for home consumption(23,24,54,57).
5.35 5.225.82
5.31 5.185.77
5.29 5.165.73
5.31 5.195.77
5.27 5.135.73
$0.00
$1.00
$2.00
$3.00
$4.00
$5.00
$6.00
$7.00
Ermera Manufahi Oecusse
Nutritious diet (no intervention) 2 eggs p/w between family 2 eggs for AG & PLW
2 eggs for U2 & PLW 2 eggs for AG
5.195.52
6.95
5.145.48
6.91
5.125.46
6.89
5.155.48
6.90
5.115.44
6.89
$0.00
$1.00
$2.00
$3.00
$4.00
$5.00
$6.00
$7.00
Baucau Bobonaro Dili
Nutritious diet (no intervention) 2 eggs p/w between family 2 eggs for AG & PLW
2 eggs for U2 & PLW 2 eggs for AG

64
Figure 44: Daily cost of a nutritious diet for the model 5-person household and the impact on diet cost if up to 1
egg per day could be accessed by each household member from own production (reduced cost)
Figure 45: Proportion of households that would be able to afford a nutritious diet if up to 1 egg per day could be
accessed by each household member from own production (reduced cost)
5.195.52
6.95
5.35 5.22
5.82
4.334.76
6.26
4.62 4.465
0.00
1.00
2.00
3.00
4.00
5.00
6.00
7.00
8.00
Baucau Bobonaro Dili Ermera Manufahi Oecusse
Dai
ly c
ost
(to
ho
use
ho
ld)
of
a n
utr
itio
us
die
t ($
USD
)
No Intervention Up to 1 Egg per day for household members (reduced cost)
37%
20%24%
20%
28%
15%
52%
29% 31%28%
40%
20%
0%
10%
20%
30%
40%
50%
60%
70%
80%
90%
100%
Baucau Bobonaro Dili Ermera Manufahi Oecusse
% o
f h
ou
seh
old
s th
at w
ou
ld b
e ab
le t
o
affo
rd t
he
nu
trit
iou
s d
iet
No Intervention Eggs at Reduced Cost

65
Reduction of post-harvest losses
Another key issue affecting agriculture production, incomes and ultimately, access to nutritious diets,
is the loss of yields due to insufficient harvest, packaging, transport and storage practices and
facilities (58). The improvement of post-harvest practices is mentioned across national policies and
has been recognised as a KONSSANTIL priority area for improved nutrition(1). Estimates of the extent
of post-harvest losses for staple production in the country vary considerably, from 13-45% (58–61).
Reducing post-harvest losses by building knowledge and capacity and improving storage facilities
could increase household income and ultimately diet access. Figure 46 demonstrates the impact on
nutritious diet access of improved incomes as a result of reducing post-harvest losses by 15% and
25%19 respectively. If income benefits related to a 15% reduction in post-harvest losses was achieved,
the proportion of households able to afford a nutritious diet could increase by an average of 19%.
Alternatively, income benefits related to a 25% reduction in post-harvest losses would increase
nutritious diet access by 31%. This modelling suggests that agriculture interventions other than those
focused directly on production can also be nutrition-sensitive and have a significant impact on diet
access in Timor-Leste.
Figure 46: Proportion of households that would be able to afford a nutritious diet if, using interventions aimed
at reducing post-harvest loss, income was improved by reductions in losses of either 15% or 25%.
Improved income through the use of Conservation Agriculture
The Ministry of Agriculture and Fisheries (MAP), FAO and the EU set up the Pro-Resilience Project in
2017, aiming to strengthen agricultural resilience in rural communities affected by drought. Through
conservation agriculture techniques consisting of no-burning and zero or minimal tillage, Pro-
19 For all modelling of the impact of income improvement or cash transfer interventions on purchasing power on the affordability of nutritious diets, only 70% of the transfer or income increment is made available for food purchase in the model to simulate a more realistic scenario in which households have other costs and are unlikely to dedicate 100% of their household budget to food purchase. In spite of this, it is appreciated that behaviour change communication would be required to encourage the allocation of income gains or cash transfers to the acquisition of nutritious foods.
37%
21%24%
21%
28%
15%
44%
26% 28% 26%
36%
18%
52%
30% 32% 30%
41%
23%
0%
10%
20%
30%
40%
50%
60%
70%
80%
90%
100%
Baucau Bobonaro Dili Ermera Manufahi Oecusse
% o
f h
ou
seh
old
s th
at w
ou
ld b
e ab
le t
o
affo
rd t
he
nu
trit
iou
s d
iet
Initial Affordability 15% Reduction in post-harvest loss 25% Reduction in post-harvest loss

66
Resilience aims, among other things, to increase crop yields and decrease crop production costs,
ultimately increasing rural households’ income from agriculture (62,63).
An impact evaluation of Pro-Resilience’s conservation agriculture component conducted in 2019
shows, on average, 16 percent higher yields among those farmers that adopted conservation
agriculture. Though dependent on maize variety and location of the farm (as soil conditions and rain
frequency could change), the evaluation found that conservation agriculture techniques would bring
an increase in yields of approximately 1 ton per hectare, all other things equal (62,63).
An increase in yields has the potential to translate into increased income for the household. The
evaluation found that households using conservation agriculture had, on average, a 24% higher
income than households that used traditional agricultural techniques.20 As has been explained
before, affordability of nutritious diets is affected both by the cost of such nutritious diet, as well as
the expenditure on food by the household. Any interventions that aim to raise the income of
households have the potential to, in turn, increase affordability of a nutritious diet. As can be seen in
Figure 47 below, a 24% increase in monthly income from an adoption of conservation agriculture
techniques would, on average, increase affordability of a nutritious diet by 58%.
Figure 47: Proportion of households that would be able to afford a nutritious diet if, using Conservation
Agriculture, income was able to be improved an average of 24% (62,63).
Reduction in the price of fish through Aquaculture interventions
MAP has also established an Aquaculture programme aiming to increase fish production in the
country. Though there is little information on the programme outcomes and performance, it is
reasonable to expect that increased local production of fish through fish ponds could potentially
increase access to fish and decrease its market price. Therefore, using CotD, the impact of a 50%
20 Though the evaluation found that the results regarding increased income were not statistically significant, households using conservation agriculture techniques had an average income of $210 dollars per month, while households in the control group had an income of $170 per month. Though we recognize the lack of statistical significance of these results, for the purposes of FNG modelling, it provides a good example of the impact of an agricultural intervention on income.
37%
21%24%
21%28%
15%
56%
34% 35%32%
43%
24%
0%
10%
20%
30%
40%
50%
60%
70%
80%
90%
100%
Baucau Bobonaro Dili Ermera Manufahi Oecusse% o
f h
ou
seh
old
s th
at w
ou
ld b
e ab
le t
o
affo
rd t
he
nu
trit
iou
s d
iet
No intervention With conservation agriculture(improved income)

67
decrease in market prices of the different fish varieties available in the six modelled municipalities
was modelled. In addition, to further explore the potential of an intervention of this sort, a reduction
to one third of the current market price was modelled (figure 48).
Given the optimisation function in CotD and the limiting nutrients in the modelled nutritious diet,
the reduction in the market price of fish only showed results for one specific variety that has a high
Calcium content. It is important to clarify that a decrease in the cost of other varieties could still make
a nutritious diet more accessible and affordable for many households, even if this is not reflected in
the modelling below.
Figure 48: Cost to the household of a nutritious diet using current market prices and using a price of fish (Ikan
Tri) reduced by 50 percent and by 66 percent.
Key Finding 9: Diets across the country are overwhelmingly dependent on staples
such as white rice, which provide energy but are low in essential micronutrients.
Exploring the potential for supporting rice fortification could mean greater access to
nutritious diets.
Diets in Timor-Leste are overly dependent on unfortified starchy staples such as rice and tubers
(4,20,21,23). The National Nutrition Strategy and Zero Hunger Action Plan have prioritised actions to
support mass food fortification(8,9). Whilst a law mandating the fortification of salt with iodine was
drafted in 2013, there is little guidance and few implementation and monitoring systems to support
the fortification of other food products at the national-level (1,9).
The FNG modelling plan included an intervention in which rice, fortified as per WFP standards(64)
was available on the local market in each assessment municipality in addition to non-fortified rice.
For the purpose of this assessment it was assumed that the fortified rice would be available for the
5.195.52
6.95
5.35 5.22
5.82
5.035.39
6.76
5.30 5.16
5.72
4.965.16
6.51
5.255.09
5.65
$-
$1
$2
$3
$4
$5
$6
$7
$8
Baucau Bobonaro Dili Ermera Manufahi Oecusse
Co
st (
to h
ou
seh
old
) o
f a
nu
trit
iou
s d
iet
for
the
5-p
erso
n h
ou
seh
old
Nutritious Diet Fish (Ikan Tri) at half market price Fish (Ikan Tri) at 1/3 of current market price

68
same price as non-fortified rice. This was done as exact information on the expected price of fortified
rice if provided in high quantities and possibly from national production was not found. It is expected
however that fortified rice would be more expensive than unfortified rice, if this is the case, not all
consumers may decide to purchase it. To ensure that lower income consumers would also have
access to this food, voucher schemes to improve access to a certain amount of fortified rice at a
reduced price could be considered.
Figure 49 shows that when fortified rice was made available for modelling, using the same limits and
price as unfortified rice, the cost of a nutritious diet for the household was reduced by an average of
45%. The magnitude of the effect varied by municipality; reducing diet cost by 40% in Dili up to 50%
in Baucau. These preliminary findings suggest that investing in and supporting rice fortification in
Timor-Leste could have a significant impact on nutritious diet access for the entire household.
Figure 49: Preliminary results of modelling the impact of ensuring that fortified rice is available at market cost
on the cost of a nutritious diet for the model 5-person household across the 6 assessment municipalities
Key Finding 10: Social protection has significant potential to improve access to
nutritious diets for the most vulnerable, but only if realistic transfer amounts and
nutrition-sensitive packages are provided.
Cash Transfers within the National Social Protection Programme
Bolsa da Mãe is a conditional cash transfer that targets vulnerable households with children. The
current transfer provides $5 per month for every child to a maximum of three children per household
and reaches 30% of children nationally (1). Concern has been raised by the government and
international agencies over the low overall budget, transfer amounts and the programme’s limited
potential to achieve a greater impact (1,65). A 2018 UN-ILO/MSS assessment recommended that the
transfer amount be raised to $23 per family per month and that the coverage be increased (1,65).
Further, KONSSANTIL has prioritised improvements of Bolsa da Mãe to better achieve a nutrition
impact (1).
5.25.5
7.0
5.4 5.25.8
2.6
3.3
4.2
2.9 3.0 3.0
0.0
1.0
2.0
3.0
4.0
5.0
6.0
7.0
8.0
Baucau Bobonaro Dili Ermera Manufahi Oecusse
Dai
ly C
ost
to
th
e h
ou
seh
old
($
USD
) o
f a
nu
trit
iou
s d
iet
for
a 5
-per
son
ho
use
ho
ld
Municipality
Nutritious diet with unfortified rice Nutritious diet with Fortified Rice

69
To demonstrate the potential of current and improved transfer amounts to improve access to
nutritious diets, figure 50 compares transfer amounts to the cost of the nutritious diet for IYC, school
children and adolescent girls and boys by municipality. The current $5 per child monthly transfer
would cover on average 60% of the nutritious diet cost for IYC and 40% for school children but only
6% of the diet cost of adolescent girls and 19% of the diet cost for adolescent boys. Increasing the
transfer to $8 per child per month (or roughly $23 for a household of three children) would be able
to cover the cost of a nutritious diet for IYC in Baucau, Ermera, Manufahi and Oecusse but only 85%
of the IYC diet in Bobonaro and 66% in Dili. The $8 transfer would be able to cover an average of
65% of nutritious diet cost for school children but still only 10% for adolescent girls and 30% for
adolescent boys.
Figure 50: Monthly cost of a nutritious diet for household members for which the existing $5 Monthly Bolsa da
Mãe Cash Transfer would apply
Even if the Bolsa da Mae transfers were able to be increased to $23 per household per month, they
would still be less than the $30 monthly old age pension and significantly less than monthly
veterans pension amounts. Figure 51 compares the average cost of nutritious diets for children and
adolescents with the cost of nutritious diets for older men and women (60+ years) in Timor-Leste.
These results show that the cost of meeting nutrient needs for elderly men and women would be
less than the cost of meeting nutrient requirements for adolescents and lactating women.
7.6 9.412.2
7.9 7.9 6.710.9 12.2
16.7
11.2 11.2 11.6
74.572.4
83.6
76.0
71.1
93.3
23.726.4
38.0
23.1 24.3 24.3
0.0
10.0
20.0
30.0
40.0
50.0
60.0
70.0
80.0
90.0
100.0
Baucau Bobonaro Dili Ermera Manufahi Oecusse
Mo
nth
ly C
ost
($
USD
) o
f a
nu
trit
iou
s d
iet
Municipality
IYC School Child Adolescent Girl Adolescent Boy
$8 per month
$5 per month
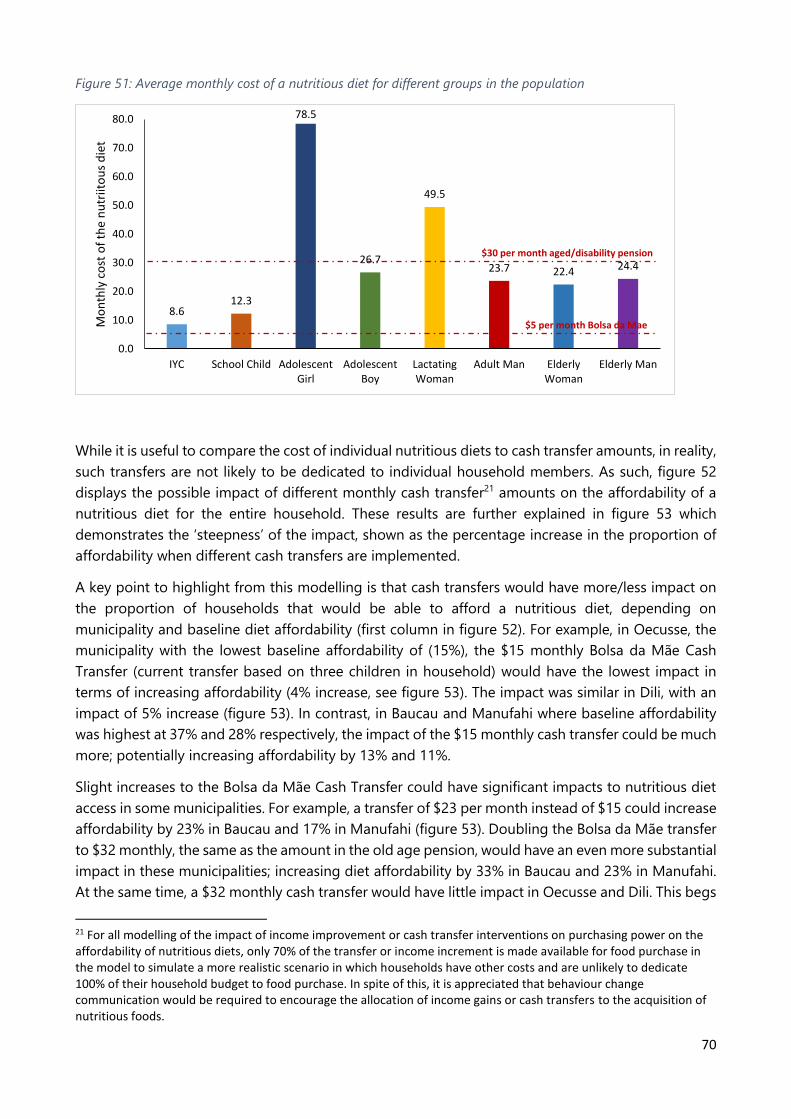
70
Figure 51: Average monthly cost of a nutritious diet for different groups in the population
While it is useful to compare the cost of individual nutritious diets to cash transfer amounts, in reality,
such transfers are not likely to be dedicated to individual household members. As such, figure 52
displays the possible impact of different monthly cash transfer21 amounts on the affordability of a
nutritious diet for the entire household. These results are further explained in figure 53 which
demonstrates the ‘steepness’ of the impact, shown as the percentage increase in the proportion of
affordability when different cash transfers are implemented.
A key point to highlight from this modelling is that cash transfers would have more/less impact on
the proportion of households that would be able to afford a nutritious diet, depending on
municipality and baseline diet affordability (first column in figure 52). For example, in Oecusse, the
municipality with the lowest baseline affordability of (15%), the $15 monthly Bolsa da Mãe Cash
Transfer (current transfer based on three children in household) would have the lowest impact in
terms of increasing affordability (4% increase, see figure 53). The impact was similar in Dili, with an
impact of 5% increase (figure 53). In contrast, in Baucau and Manufahi where baseline affordability
was highest at 37% and 28% respectively, the impact of the $15 monthly cash transfer could be much
more; potentially increasing affordability by 13% and 11%.
Slight increases to the Bolsa da Mãe Cash Transfer could have significant impacts to nutritious diet
access in some municipalities. For example, a transfer of $23 per month instead of $15 could increase
affordability by 23% in Baucau and 17% in Manufahi (figure 53). Doubling the Bolsa da Mãe transfer
to $32 monthly, the same as the amount in the old age pension, would have an even more substantial
impact in these municipalities; increasing diet affordability by 33% in Baucau and 23% in Manufahi.
At the same time, a $32 monthly cash transfer would have little impact in Oecusse and Dili. This begs
21 For all modelling of the impact of income improvement or cash transfer interventions on purchasing power on the affordability of nutritious diets, only 70% of the transfer or income increment is made available for food purchase in the model to simulate a more realistic scenario in which households have other costs and are unlikely to dedicate 100% of their household budget to food purchase. In spite of this, it is appreciated that behaviour change communication would be required to encourage the allocation of income gains or cash transfers to the acquisition of nutritious foods.
8.612.3
78.5
26.7
49.5
23.7 22.4 24.4
0.0
10.0
20.0
30.0
40.0
50.0
60.0
70.0
80.0
IYC School Child AdolescentGirl
AdolescentBoy
LactatingWoman
Adult Man ElderlyWoman
Elderly Man
Mo
nth
ly c
ost
of
the
nu
triit
ou
s d
iet
$30 per month aged/disability pension
$5 per month Bolsa da Mae

71
the question about whether it’s appropriate and effective to implement the same intervention in all
parts of the country or whether tailored programming may be needed.
Even when an unrealistic cash transfer of $50 monthly per household was modelled, it was not
enough to increase the proportion of households able to afford a nutritious diet to 100%. Further
models were run to investigate just how much cash would have to be provided to achieve 100%
affordability. This was only achieved with highly unrealistic monthly cash transfers (not shown and
not intended for policy advice). These findings indicate that cash transfers alone will not improve
access to nutritious diets and that instead combination packages of nutrition sensitive and specific
interventions should be considered. Further, as the youth population ages, more people will likely
find it difficult to enter the workforce and may need to be reliant on social protection. As such, more
permanent solutions are needed for long term sustainability.
Figure 52: Proportion of households that would be able to afford a nutritious diet if different cash transfer
amounts were provided in the six assessment municipalities
25%
37%
20% 20%
28%
15%
29%
45%
26% 26%
36%
18%
30%
50%
29% 28%
39%
20%
33%
55%
32% 31%
43%
23%
37%
64%
39%36%
50%
29%
40%
71%
47%43%
58%
35%
0%
10%
20%
30%
40%
50%
60%
70%
80%
90%
100%
Dili Baucau Bobonaro Ermera Manufahi Oecusse
% H
ou
seh
old
s th
at w
ou
ld b
e ab
le t
o a
ffo
rd a
m
od
elle
d n
utr
itio
us
die
t
Municipality
No Transfer (Baseline) $15 per month (Bolsa da Mae) $23 per month
$32 per month $40 per month $50 per month

72
Figure 53: Impact of possible cash transfers on ability of households to afford a nutritious diet (percentage
difference between baseline affordability or ‘No Transfer) and affordability if Cash Transfer amount
implemented).
Nutritious food vouchers
In addition to cash transfers, the NFNSP, NNS and PAN-HAM-TIL prioritise the distribution of
nutritionally improved food voucher interventions. The use of vouchers means that there is the
oportunity for sourcing foods from local producers. The content of the proposed nutritious food
vouchers is provided in table 8. The options modelled included provision of vouchers for fresh and
dried foods with unfortified or fortified rice.
Table 8: Modelled Nutritious Food Vouchers (Quarterly Transfer)
Unfortified Food Voucher Fortified Rice Food Voucher
White Rice (local) 30000g Fortified Rice 30000g
Milk (imported) 8000g Milk (imported) 8000g
Red beans (local) 10000g Red beans (local) 10000g
Mung beans
(imported)
10000g Mung beans
(imported)
10000g
Eggs (imported) 3600g Eggs (imported) 3600g
Oil (Bimoli) 10000g Oil (Bimoli) 10000g
Figure 54 displays the impact of the different food voucher options on the cost of a nutritious diet
for the model household in each assessment area. In each municipality, the voucher containing
fortified rice and oil had the greatest impact on reducing the cost of a nutritious diet. Similarily,
figure 55 shows the impact that food vouchers could have on the proportion of households that
could afford a nutritious diet. Providing the fortified food voucher could increase the proportion of
households able to afford a nutritious diet to 68% in Baucau but only to 32% in Oecusse.
5%
13%
8% 8%11%
4%
8%
23%
11% 11%
17%
6%
11%
33%
16% 15%
23%
10%
23%
76%
40%
33%
53%
26%
0%
10%
20%
30%
40%
50%
60%
70%
80%
Dili Baucau Bobonaro Ermera Manufahi Oecusse
Incr
ease
(%
) in
est
imat
ed p
rop
ort
ion
of
ho
use
ho
lds
able
to
aff
ord
a n
utr
itio
us
die
t w
ith
cas
h t
ran
sfer
Municipality
$15 per month $23 per month $32 per month $50 per month

73
Figure 54: Monthly cost of a nutritious diet for the model 5-person household and the impact on diet cost if
different food vouchers were provided
Figure 55: Proportion of households that would be able to afford a nutritious diet if food vouchers were
provided in the six assessment municipalities
158168
211
163 159
177
144151
189
145 141
161
113125
163
119112
132
0
50
100
150
200
250
Baucau Bobonaro Dili Ermera Manufahi Oecusse
Mo
nth
ly C
ost
of
a N
utr
itio
us
Die
tfo
r a
mo
del
ho
use
ho
ld
Municipality
Nutritous Diet Food Basket (unfortified) Food Basket (fortified)
37%
20%
24%
20%
28%
15%
44%
27%
31%
26%
37%
18%
68%
41%43%
40%
50%
32%
0%
10%
20%
30%
40%
50%
60%
70%
80%
Baucau Bobonaro Dili Ermera Manufahi Oecusse
% o
f h
ou
seh
old
s th
at w
ou
ld b
e ab
le t
o a
ffo
rd a
nu
triit
ou
s d
iet
Municipality
Nutritous Diet Food Basket (unfortified) Food Basket (fortified)

74
Final observations: combined impact of household packages The last step of the CotD modelling is to form the modelled interventions into household packages
to simulate the simultaneous provision of programmes by different sectors or partners. In each of
the figures presented, a series of scenarios are compared in which different, multisectoral
interventions are implemented to reach alternative individuals in the household or the entire
household. This modelling is included to estimate the possible impact on nutritious diet access if
multiple actions were put into place at the same time within areas, reaching the same households.
Two sets of household packages are modelled to show how results would differ if MMT was used as
the supplement for women and adolescent girls instead of IFA.
A key message from the results shown in figures 56 and 57 is that interventions from one sector only
would not be able to provide access to nutritious diets to all households in the population.
Conversely, it would only be with interventions from all relevant sectors that such improvements can
be made. This information can be used to show that nutrition is not only the responsibility of the
health sector but the combined responsibility of all sectors and that nutrition-specific and -sensitive
approaches are needed.
Table 9: Household intervention packages modelled to show potential combined intervention of multiple
nutrition-sensitive and nutrition-specific interventions across sectors (sector colours shown in key)
Package IYC School
Child
Adolescent
Girl
PLW Adult Man Entire
Household
Household packages shown in figure 56
1. Supplements MNP
IFA IFA
2. Supplements +
School Feeding
(SF)
MNP School
Feeding
IFA IFA
3. Cash transfers
(CT) + vouchers
Bolsa da
Mae $5
Bolsa da
Mae $5
Bolsa da
Mae $5
Food
Vouchers
4. Supplements +
SF + CT
MNP
BdM $5
SF
BdM $5
IFA
BdM $5
IFA
5. Supplements +
SF + CT +
Vouchers
MNP
BdM $5
SF
BdM $5
IFA
BdM $5
IFA Food
Vouchers
6. Supplements, SF
+ CT + Agriculture
MNP
BdM $5
SF
BdM $5
IFA
BdM $5
IFA Reduced
PH losses
Household packages shown in figure 57 (showing impact if MMT was used instead of IFA)
1. Supplements MNP
MMT MMT
2. Supplements +
School Feeding
(SF)
MNP School
Feeding
MMT MMT
3. Cash transfers
(CT) + vouchers
Bolsa da
Mae $5
Bolsa da
Mae $5
Bolsa da
Mae $5
Food
Vouchers
4. Supplements +
SF + CT
MNP
BdM $5
SF
BdM $5
MMT
BdM $5
MMT
5. Supplements +
SF + CT +
Vouchers
MNP
BdM $5
SF
BdM $5
MMT
BdM $5
MMT Food
Vouchers
6. Supplements, SF
+ CT + Agriculture
MNP
BdM $5
SF
BdM $5
MMT
BdM $5
MMT Reduced
PH losses

75
KEY
Health Sector Social Protection Agriculture Sector Education
Figure 56: Impact of different packages of household interventions on the percentage of households who would
be able to afford a nutritious diet (packages using IFA for women and girls)
37%
20%24%
20%
28%
15%
77%
50%
45%49%
67%
56%
82%
55%51%
54%
72%
59%
79%
51%
37%
50%
63%
40%
91%
67%
51%
66%
85%
74%
94%
75%
51%
80%
93%
82%
100%
85%
70%
92%
99%
93%
0%
10%
20%
30%
40%
50%
60%
70%
80%
90%
100%
Baucau Bobonaro Dili Ermera Manufahi Oecusse
% o
f h
ou
seh
old
s th
at w
ou
ld b
e u
nab
le t
o
affo
rd a
nu
trit
iou
s d
iet
Nutritious Diet
1.Supplementation Only (MNP and IFA)
2. School Feeding and Supplementation (MNP and IFA)
3. Cash Transfers and Fortified Food vouchers
4. Supplementation (MNP and IFA), School feeding, Cash Transfers
5. Supplementation (MNP and IFA), School feeding, Cash Transfers and Food Basket
6. Supplementation (MNP and IFA), School feeding, Cash Transfers and PH loss reduction

76
Figure 57: Impact of different packages of household interventions on the percentage of households who would
be able to afford a nutritious diet (packages using MMT for women and girls)
37%
20%24%
20%
28%
15%
94%
72%70%
72%
85%
72%
96%
86%
79% 78%
89%
78%79%
51%
37%
50%
63%
40%
100%95%
88%91%
95%
90%
100% 98%
73%
94%97%
93%
100% 100%
92%
100% 100% 99%
0%
10%
20%
30%
40%
50%
60%
70%
80%
90%
100%
Baucau Bobonaro Dili Ermera Manufahi Oecusse
% o
f h
ou
seh
old
s th
at w
ou
ld b
e u
nab
le t
o
affo
rd a
nu
trit
iou
s d
iet
Nutritious Diet
1. Supplementation Only (MNP and MMT)
2. School Feeding and Supplementation (MNP and MMT)
3. Cash Transfers and Fortified Food vouchers
4. Supplementation (MNP and MMT), School feeding, Cash Transfers
5. Supplementation (MNP and MMT), School feeding, Cash Transfers and Food Basket
6. Supplementation (MNP and MMT), School feeding, Cash Transfers and Post-Harvest LossReduction

77
Draft KONSSANTIL Recommendations
In October 2019 the preliminary FNG results were shared with Technical Working group members,
KONSSANTIL, UN partners, Donors and other intuitional partners via a series of workshops. During
this process, KONSSANTIL members developed a set of draft, initial recommendations from the FNG
results available to them. These recommendations are not in any way intended to be final or binding
but will be used to initiate discussion amongst KONSSANTIL and partners when the FNG analysis is
finalised and final results are available. For the purpose of discussion and review before this stage,
the draft, unvalidated and non-binding recommendations are summarised by sector in the table
below.
Table 10: DRAFT recommendations prioritised by KONSSANTIL members for follow-up as the FNG process
continues
Health Social Protection Education Agriculture Commerce KONSSANTIL
(overarching)
Strengthen
existing
supplement
programmes for
IYC, adolescent
girls and women
(MNP and IFA)
For future
procurement and
policy rounds,
provide MMT to
girls and women
instead of IFA
Extend targeted
supplementary
feeding
programme for
PLW,
incorporating
fortified food
such as Timor
Vita (Super Cereal
for PLW)
Provide food
vouchers to
vulnerable
households,
ensuring nutritious
foods are included
Increase the Bolsa
da Mae transfer
from per child per
month to cover a
greater proportion
of diet cost
Provide targeted
and informed
behaviour change
activities
communication to
encourage
purchase of
nutritious foods
with cash transfers
Increase budget for
school menu from
25c to 50c per day
per child
Strengthen home
grown school
feeding to ensure a
minimum
proportion of
school meal
ingredients are
sourced from local
farmers
Include fortified
rice in school
feeding meals
where possible
Revise menus in
guidance to specify
inclusion of the
most nutritious
food options
Provide budget for
school feeding
directly to schools
using mobile
payments (mosan)
to avoid delay
Diversify food
production by
supporting
homestead
production
(including small
animals) via
Gov/NGO
Agriculture
extension
programmes
Provision of well-
informed BCC and
education to
encourage
households to
consume rather
than sell nutritious
produce
Continue to
promote nutrition-
sensitive
agriculture
programming
across
Further explore and
model options for
supporting fish
production and
consumption
Support food
innovation to
promote new uses
of local foods and
create markets
Improve market
access for small
producers via
farmer
cooperatives and
distribution
networks
Monitoring and
evaluation of
multisectoral
activities prioritised
through FNG
process

78
Figure 58: KONSSANTIL Presentation of the FNG Preliminary Findings, October 9th, 2019

79

80
References 1. FIRST FAO-EU Partnership Programme Policy Assistance Facility. Food Security and Nutrition
Policy Effectiveness Analysis: Setting priorities through evidence based policy dialogue. Dili;
2019.
2. Fanzo J, Boavida J, Bonis-Profumo G, Mclaren R, Davis C, Fanzo J. Timor Leste Strategic
Review: Progress and Success in Achieving the Sustainable Development Goal 2. 2017.
3. National Directorate of Food Security and Cooperation. The First IPC Analysis Report on the
Chronic Food Insecurity Situation in Timor-Leste. Evidence and Standards for Better Food
Security and Nutrition Decisions [Internet]. Dili; 2019. Available from:
http://www.ipcinfo.org/fileadmin/user_upload/ipcinfo/docs/3_IPC_Timor
Leste_CFI_20182023_English.pdf
4. Provo A, Atwood S, Sullivan EB, Mbuya N. Malnutrition in Timor-Leste : A review of the
burden , drivers , and potential response [Internet]. Dili; 2017. Available from:
https://openknowledge.worldbank.org/bitstream/handle/10986/26394/114087-WP-PUBLIC-
EAPEC-176-p-MalnutritioninTimorLeste.pdf?sequence=1&isAllowed=y
5. Bonis-Profumo G, Meyanathan S. Adolescent Nutrition in Timor-Leste: A Formative Research
Study. Dili; 2018.
6. General Directorate of Statistics/Timor-Leste. Timor-Leste Survey of Living Standards 2014-
2015. Dili; 2015.
7. General Directorate of Statistics. Time series Consumer Price Index Data 2012-2019. Dili;
2019.
8. Ministry of Health Timor-Leste. Timor-Leste National Nutrition Strategy 2014-2019 [Internet].
Dili; 2014. Available from: https://extranet.who.int/nutrition/gina/sites/default/files/TLS 2014
National Nutrition Strategy.pdf
9. KONSSANTIL. Zero Hunger Challenge National Action Plan for a Hunger and Malnutrition
Free Timor-Leste [Internet]. Dili; 2014. Available from:
http://www.fao.org/fileadmin/templates/rap/files/ESP/Action_plan_for_a_hunger___malnutriti
on_free_Timor-Leste__update_.pdf
10. Parliament P of the N. Resolution of the National Parliament n. 2016 on supporting the
Government in identifying the Sustainable Development Goal No. 2 (Eradication of Hunger)
as a priority for 2017 and strengthening measures to ensure a healthy and well-nourished
diet. Dili: Parliament of Timor-Leste; 2016.
11. Government of Timor-Leste. National Food and Nutrition Security Policy. Dili; 2011.
12. Ruel MT, Alderman H. Nutrition-sensitive interventions and programmes: How can they help
to accelerate progress in improving maternal and child nutrition? Lancet. 2013;382(9891).
13. Ministry of Health Timor-Le. National Health Sector Strategic Plan 2011-2030, Towards a
Healthy East Timorese People in a Healthy Timor-Leste. [Internet]. Dili; 2011. Available from:
http://www.searo.who.int/timorleste/publications/national_health_sector_plan.pdf?ua=1
14. Secretary of State for Youth and Sport. National Youth Policy 2016 [Internet]. Dili; 2016.
Available from: https://timor-leste.unfpa.org/sites/default/files/pub-pdf/NYP English.pdf
81
15. Ministry of Education Timor-Leste. National Education Strategic Plan 2011-2030 [Internet].
http://www.moe.gov.tl/pdf/NESP2011-2030.pdf. Dili; 2011. Available from:
http://www.moe.gov.tl/pdf/NESP2011-2030.pdf
16. National Directorate of Fisheries and Aquaculture (NFDA). National Aquaculture Strategy
[Internet]. Dili; 2017. Available from: http://pubs.iclarm.net/resource_centre/WF_3602.pdf
17. Government of Timor-Leste. DRAFT Agriculture Policy and Strategic Framework: Towards
Nutrition-Sensitive, Climate Smart Agriculture and Food Systems. Dili; 2017.
18. Ministry of Social Solidarity (MSS). DRAFT National Social Protection Strategy Timor-Leste
2018 to 2030. Dili; 2018.
19. Government of Timor-Leste. Timor-Leste strategic development plan, 2011-2030 [Internet].
Dili; 2010. Available from: http://timor-leste.gov.tl/wp-content/uploads/2011/07/Timor-
Leste-Strategic-Plan-2011-20301.pdf
20. Ba Futuru, Rain Barrel Communications. Baseline Study of Knowledge , Attitudes and
Practices towards Ten Key Focus Areas of Parenting in Timor-Leste [Internet]. Dili; 2016.
Available from: https://www.unicef.org/timorleste/media/416/file/UNICEF-TL2018.pdf
21. Government of Timor-Leste. Timor-Leste Food and Nutrition Survey 2013. Dili; 2015.
22. Wong J. Factors influencing consumption of animal-source foods in Timor-Leste. In:
IMMANA, editor. ANH Academy Conference [Internet]. Kathmandu; 2017. Available from:
https://www.youtube.com/watch?v=ydQLq2ssC9M
23. Wong JT, Bagnol B, Grieve H, da Costa Jong JB, Li M, Alders RG. Factors influencing animal-
source food consumption in Timor-Leste. Food Secur. 2018;10(3):741–62.
24. Bonis-Profumo G, Stacey N, Brimblecombe J. A mixed methods approach enables a nuanced
understanding of the gender pathway from agriculture to nutrition outcomes: a case study
in Timor-Leste. In: IMMANA, editor. ANH Academy Conference [Internet]. Hyderabad, India;
2019. Available from: https://www.youtube.com/watch?v=4--kXRa6rDg
25. TOMAK. TOMAK Baseline Study. Component 1: Food Security and Nutrition. Summary
Findings | May 2018 [Internet]. Dili; 2018. Available from: http://tomak.org/wp-
content/uploads/2018/05/20180517-NSA-Baseline-Summary-English-web.pdf
26. Williams R, Goncalves M. What Are the Main Drivers of Childhood Stunting in Timor-Leste?
[Internet]. Dili; Available from: https://ai-com.tl/wp/wp-
content/uploads/2019/04/TLSA2017_VOl1_Ch39Nutrition.pdf
27. Belo E, Snowball K, Grieve H. Roundtable Dialogue on Nutrition and Food Security Mapping
the Underlying Drivers of Malnutrition in Timor-Leste. 2015.
28. URC. Addressing Stunting in Timor-Leste : An Assessment Report [EXTERNAL] [Internet]. Dili;
2019. Available from: https://www.urc-chs.com/sites/default/files/urc-Addressing-Stunting-
Timor-Leste-Assessment-Report-1809.pdf
29. Cornwell K, Inder B, Benevides C, Grey E. Measuring Undernutrition Among Young Children
in Timor-Leste [Internet]. Dili, Timor-Leste; 2016. Available from:
https://drive.google.com/file/d/0BxiFT7ChCZQqMGJibHlWdE5TckU/view
30. General Directorate of Statistics/Timor-Leste, Ministry of Finance/Timor-Leste, ICF. Timor-
82
Leste Demographic and Health Survey 2016. [Internet]. Dili, Timor-Leste and Rockville,
Maryland, USA; 2018. Available from:
https://www.dhsprogram.com/pubs/pdf/FR329/FR329.pdf
31. National Statistics Directorate/Timor-Leste, Ministry of Finance/Timor-Leste, ICF Macro.
Timor-Leste Demographic and Health Survey 2009-10 [Internet]. Dili, Timor-Leste; 2010.
Available from:
http://ovidsp.ovid.com/ovidweb.cgi?T=JS&CSC=Y&NEWS=N&PAGE=fulltext&D=cagh&AN
=20113091711
32. Moriarty H, Darnton-Hill P. Timor-Leste Nutrition Strategic Review [Internet]. Dili, Timor-
Leste; 2017. Available from: https://dfat.gov.au/about-us/publications/Documents/timor-
leste-nutrition-strategic-review-summary.pdf
33. Save the Children UK. The cost of the diet: A novel tool for understanding the barriers to
improving child nutrition [Internet]. London; 2009. Available from:
http://www.savethechildren.org.uk/resources/online-library/the-cost-of-the-diet
34. Lutter CK, Rivera JA. Nutrient Composition for Fortified Complementary Foods Nutritional
Status of Infants and Young Children and Characteristics of Their Diets 1. 2003;(1):2941–9.
35. Dewey KG, Brown KH. Update on technical issues concerning complementary feeding of
young children in developing countries and implications for intervention programs. Food
Nutr Bull [Internet]. 2003 Mar;24(1):5–28. Available from:
http://www.ncbi.nlm.nih.gov/pubmed/12664525
36. FAO, WHO, UNU. Human energy requirements: report of a joint FAO/ WHO/UNU Expert
Consultation. [Internet]. Vol. 26, Food and nutrition bulletin. Rome; 2005. Available from:
http://www.fao.org/3/a-y5686e.pdf
37. WHO, FAO. Human Vitamin and Mineral Requirements. Second Edition. Rome; 2004.
38. Hilton B, Cornwell K, Dowling M, Grieve H, Evangelita O, Alves da Costa N, et al. Alarming
Anaemia Rates Amongst Women Represents a Critical Gender Gap in Timor-Leste. TLSA Res
Conf [Internet]. 2019; Available from: http://tlstudies.org/pdfs/TLSA
ABSTRACTS_2019_FINAL.pdf
39. Spencer PR, Sanders KA, Judge DS. Rural Livelihood Variation and its Effects on Child Growth
in Timor-Leste. Hum Ecol. 2018;46(6):787–99.
40. UNICEF. Technical Standards - Pharmaceutical Products [Internet]. Supplies and Logistics.
2019. Available from: https://www.unicef.org/supply/index_52844.html
41. World Food Programme (WFP). Technical Specifications for the manufacture of: SUPER
CEREAL plus [Internet]. WFP Technical Specicfications. 2014. Available from:
https://documents.wfp.org/stellent/groups/public/documents/manual_guide_proced/wfp26
2697.pdf
42. FAO. FAO Pre-Common Country Analysis (DRAFT). Dili, Timor-Leste; 2019.
43. Niner S. Barlake: An exploration of marriage practices and issues of women’s status in Timor-
Leste. Local-Global: Identity, Secuity, Community. 2012;11(138).
44. Alkatiri NR. Gender Inequality in Timor-Leste: The Need for Investment Towards Change of
Mindset. TLSA Res Conf. 2019;
83
45. Waters WF, Gallegos CA, Karp C, Lutter C, Stewart C, Iannotti L. Cracking the Egg Potential:
Traditional Knowledge, Attitudes, and Practices in a Food-Based Nutrition Intervention in
Highland Ecuador. Food Nutr Bull. 2018;39(2):206–18.
46. National Statistics Directorate/Timor-Leste. Timor-Leste Census 2015. Dili; 2015.
47. MoH. National Strategy on Reproductive, Maternal, Newborn, Child and Adolescent Health,
2015-2019. Dili;
48. UNDP. Timor-Leste Human Development Report [Internet]. Dili; 2018. Available from:
https://www.undp.org/content/dam/timorleste/docs/reports/HDR/2018NHDR/TL-NHDR-
2018.web.pdf
49. World Bank. Timor-Leste Economic Report – Moving Beyond Uncertainty [Internet]. Dili,
Timor-Leste; 2019. Available from:
http://documents.worldbank.org/curated/en/207941557509771185/Timor-Leste-Economic-
Report-Moving-Beyond-Uncertainty
50. Molyneux N, Da Cruz GR, Williams RL, Andersen R, Turner NC. Climate change and
population growth in timor leste: Implications for food security. Ambio. 2012;41(8):823–40.
51. IRRI, CIAT, AfricaRice. Global Average Rice Yields [Internet]. Rice Almanac. 2019. Available
from: http://ricepedia.org/
52. FAO. Training Implementation and Adaptive Research Programme Development. Dili; 2017.
53. FAO. Post-Harvest Management Practices of Maize and Cowpea in Timor-Leste: Present
Situation and Future Strategies. Dili; 2015.
54. TOMAK. VILLAGE CHICKEN DEVELOPMENT Technical Report 15 [Internet]. Dili; 2017.
Available from: http://tomak.org/wp-content/uploads/2018/04/TOMAK-Village-Poultry-
Production-Report.pdf
55. Australian Centre for International Agricultural Research (ACIAR). Sub-sector Analysis of the
Timor-Leste Beef Industry. Canberra; 2015.
56. Gillespie S, Harris J, Kadiyala S. The Agriculture-Nutrition Disconnect in India What Do We
Know? IFPRI Discuss Pap 01187. 2012;(June).
57. TOMAK. Chicken and Egg: The Hard Choices [Internet]. Dili; 2019. Available from:
http://tomak.org/chicken-egg-the-hard-choices/
58. Young P. Complementarity Between Maize Seed Production and Good Storage [Internet].
Dili, Timor-Leste; 2013. Available from: http://seedsoflifetimor.org/wp-
content/uploads/2013/10/Complementarity-between-maize-seed-pdn-and-good-storage-
P-Young1.pdf
59. Amaral A. Experiences and perspective on food losses and food waste in Timor-Leste. In:
High-Level Multi-Stakeholder Consultation on Food Losses and Food Waste in Asia and the
Pacific Region. Bangkok; 2013.
60. Lopes M, Nesbitt H. Improving food security in Timor-Leste with higher yield crop Varieties
Improving food security in Timor-Leste with higher yielding crop varieties. 56th AARES Annu
Conf. 2012;
61. FAO. Food loss analysis: causes and solutions: Maize supply chain in Timor-Leste [Internet].

84
Dili; Available from: http://www.fao.org/3/BU691EN/bu691en.pdf
62. Pozzi S. Conservation Agriculture Impact Evaluation survey. Results & main findings. Dili,
Timor-Leste; 2019.
63. Pozzi S. Impact evaluation survey on Conservation Agriculture in Timor-Leste. Dili, Timor-
Leste; 2019.
64. WFP. Technical Specifications for RICE – Fortified – 25% Broken [Internet]. 2016. Available
from:
https://documents.wfp.org/stellent/groups/public/documents/manual_guide_proced/wfp28
3518.pdf
65. ILO, Ministry of Social Solidarity (MSS). Challenges and ways forward to extend social
protection to all in Timor-Leste: assessment-based national dialogue report. Dili;
66. Save the Children UK. Cost of the Diet (CotD) Practitioners Guide [Internet]. London, UK;
2014. Available from: https://www.securenutrition.org/resource/cost-diet-tool-v2
67. Roberfroid D, Huybregts L, Habicht J-P, Lanou H, Henry M-C, D’Alessandro U, et al.
Randomized controlled trial of 2 prenatal iron supplements: Is there a dose-response
relation with maternal hemoglobin? Am J Clin Nutr. 2011;93:1012–8.
68. UNICEF. Vitamin A Supplementation [Internet]. 2019. Available from:
https://data.unicef.org/resources/vitamin-supplementation-statistical-snapshot/
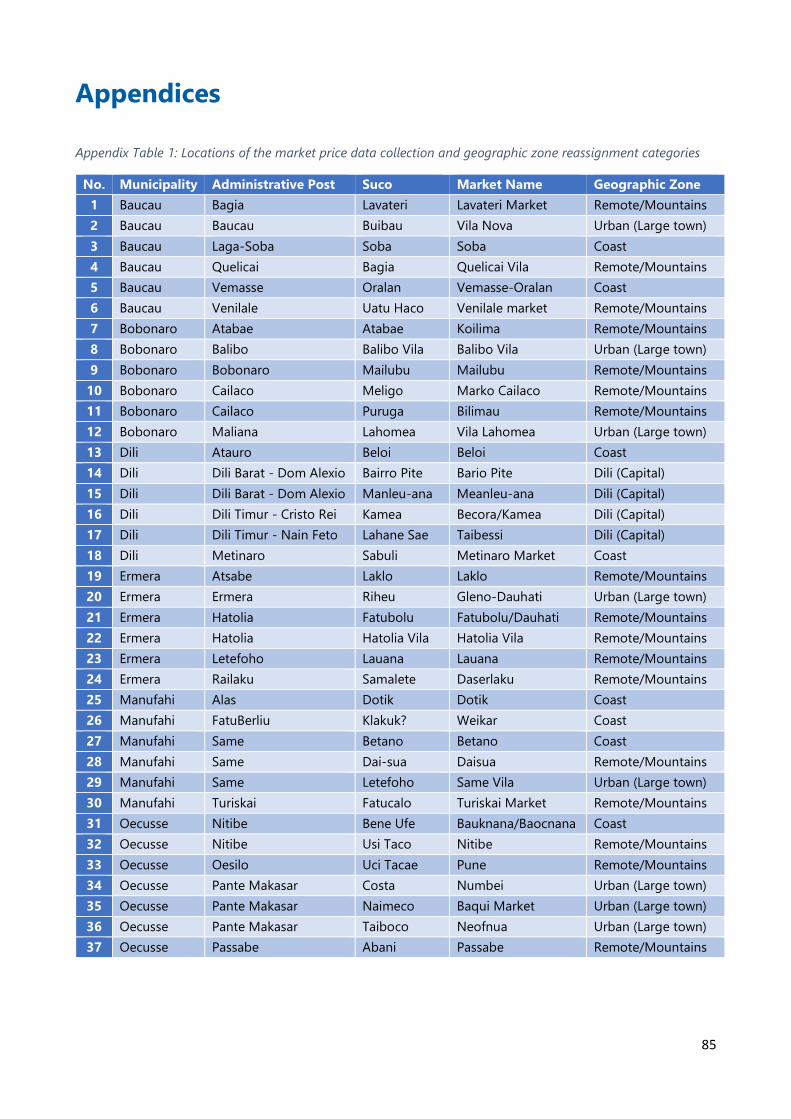
85
Appendices
Appendix Table 1: Locations of the market price data collection and geographic zone reassignment categories
No. Municipality Administrative Post Suco Market Name Geographic Zone
1 Baucau Bagia Lavateri Lavateri Market Remote/Mountains
2 Baucau Baucau Buibau Vila Nova Urban (Large town)
3 Baucau Laga-Soba Soba Soba Coast
4 Baucau Quelicai Bagia Quelicai Vila Remote/Mountains
5 Baucau Vemasse Oralan Vemasse-Oralan Coast
6 Baucau Venilale Uatu Haco Venilale market Remote/Mountains
7 Bobonaro Atabae Atabae Koilima Remote/Mountains
8 Bobonaro Balibo Balibo Vila Balibo Vila Urban (Large town)
9 Bobonaro Bobonaro Mailubu Mailubu Remote/Mountains
10 Bobonaro Cailaco Meligo Marko Cailaco Remote/Mountains
11 Bobonaro Cailaco Puruga Bilimau Remote/Mountains
12 Bobonaro Maliana Lahomea Vila Lahomea Urban (Large town)
13 Dili Atauro Beloi Beloi Coast
14 Dili Dili Barat - Dom Alexio Bairro Pite Bario Pite Dili (Capital)
15 Dili Dili Barat - Dom Alexio Manleu-ana Meanleu-ana Dili (Capital)
16 Dili Dili Timur - Cristo Rei Kamea Becora/Kamea Dili (Capital)
17 Dili Dili Timur - Nain Feto Lahane Sae Taibessi Dili (Capital)
18 Dili Metinaro Sabuli Metinaro Market Coast
19 Ermera Atsabe Laklo Laklo Remote/Mountains
20 Ermera Ermera Riheu Gleno-Dauhati Urban (Large town)
21 Ermera Hatolia Fatubolu Fatubolu/Dauhati Remote/Mountains
22 Ermera Hatolia Hatolia Vila Hatolia Vila Remote/Mountains
23 Ermera Letefoho Lauana Lauana Remote/Mountains
24 Ermera Railaku Samalete Daserlaku Remote/Mountains
25 Manufahi Alas Dotik Dotik Coast
26 Manufahi FatuBerliu Klakuk? Weikar Coast
27 Manufahi Same Betano Betano Coast
28 Manufahi Same Dai-sua Daisua Remote/Mountains
29 Manufahi Same Letefoho Same Vila Urban (Large town)
30 Manufahi Turiskai Fatucalo Turiskai Market Remote/Mountains
31 Oecusse Nitibe Bene Ufe Bauknana/Baocnana Coast
32 Oecusse Nitibe Usi Taco Nitibe Remote/Mountains
33 Oecusse Oesilo Uci Tacae Pune Remote/Mountains
34 Oecusse Pante Makasar Costa Numbei Urban (Large town)
35 Oecusse Pante Makasar Naimeco Baqui Market Urban (Large town)
36 Oecusse Pante Makasar Taiboco Neofnua Urban (Large town)
37 Oecusse Passabe Abani Passabe Remote/Mountains

86
Appendix Table 2: Availability and cost (average across all markets) of foods
Food Group
Name
Food Name Tetun Food Name
English
Baucau
Bobonaro
Dili
Ermera.
.
Manufahi.
.
Oecusse.
.
PRICE
per
100g
Cost/10
0kcal
PRICE
per
100g
Cost/10
0kcal
PRICE
per
100g
Cost/10
0kcal
PRICE
per
100g
Cost/10
0kcal
PRICE
per
100g
Cost/10
0kcal
PRICE
per
100g
Cost/10
0kcal
Grains and
grain-based
products
Batar Fai () Pounded Maize 0.20 0.06 0.10 0.03 0.21 0.06 0.13 0.04 0.12 0.03 0.12 0.03
Batar Ikis Maize Powder 0.18 0.05 0.16 0.04 0.22 0.06 0.16 0.04 . . . .
Batar Maran- musan () Corn(maize) 0.10 0.03 0.07 0.02 0.12 0.03 0.09 0.03 0.07 0.02 0.07 0.02
Batar Maran-fulin () Dry corn 0.07 0.02 . . 0.12 0.03 0.06 0.02 0.02 0.01 . .
Batar mutin () White Maize . . . . . . 0.07 . . . . .
Batar Nurak () Young/baby maize 0.08 0.05 0.05 0.03 0.07 0.05 . . 0.07 0.05 . .
Batar Uut () Yellow Maize flour 0.07 0.02 . . . . . . . . . .
Foos Mutin -importa () White rice -
imported
0.05 0.01 0.06 0.02 0.07 0.02 0.07 0.02 0.08 0.02 0.07 0.02
Foos Rai Mean () Red local rice 1.20 0.33 0.12 0.03 0.21 0.06 0.14 0.04 0.14 0.04 0.29 0.08
Foos Rai Metan () Black local rice 0.22 0.06 0.14 0.04 0.26 0.07 0.18 0.05 . . . .
Foos Rai mutin () White local rice 0.13 0.04 0.09 0.02 0.18 0.05 0.12 0.03 0.14 0.04 0.10 0.03
Makaraun () Macaroni 0.30 0.08 0.45 0.13 0.28 0.08 0.30 0.08 0.30 0.08 0.73 0.21
Mie () Chinese noodles 0.27 0.08 0.26 0.08 0.27 0.08 0.22 0.07 0.33 0.10 0.27 0.08
Paun () Bread 0.12 0.04 0.12 0.04 0.42 0.16 0.12 0.04 0.07 0.03 0.11 0.04
Terigu/farina () Wheat flour 0.09 0.02 0.11 0.03 0.10 0.03 0.09 0.02 0.09 0.02 0.08 0.02
Tora () Millet . . . . . . . . 0.10 0.03 . .
Roots and
tubers
Ai farina isin () Fresh Cassava 0.04 0.03 0.03 0.02 0.09 0.07 0.05 0.04 0.03 0.02 0.05 0.04
Akar ut () Sago . . 0.11 0.03 0.12 0.04 0.16 0.05 0.13 0.04 . .
Fehuk Midar () White Sweet
Potato
0.06 0.05 0.04 0.04 0.09 0.08 0.05 0.04 0.09 0.08 0.05 0.04
Fehuk midar mean () Red Sweet Potato 0.05 0.04 . . . . . . . . . .
Fehuk ropa () Potatoes 0.16 0.17 0.19 0.20 0.14 0.15 0.15 0.16 0.14 0.15 0.18 0.19
Sinkumas () Jicama/ yambean 0.05 0.13 0.05 0.13 0.07 0.18 . . . . 0.07 0.18
Talas Bee () Water taro 0.08 0.07 0.07 0.06 . . 0.06 0.05 . . . .
Talas Rai maran () Taro 0.05 0.01 0.10 0.03 0.10 0.03 0.05 0.01 0.04 0.01 0.06 0.02
Uhi () Mountain Yam 0.07 0.10 . . . . . . . . . .

87
Food Group
Name
Food Name Tetun Food Name
English
Baucau
Bobonaro
Dili
Ermera.
.
Manufahi.
.
Oecusse.
.
PRICE
per 100g
Cost/100
kcal
PRICE
per 100g
Cost/100
kcal
PRICE
per 100g
Cost/100
kcal
PRICE
per 100g
Cost/100
kcal
PRICE
per 100g
Cost/100
kcal
PRICE
per 100g
Cost/100
kcal
Legumes,
nuts and
seeds
Ervilla nurak () Green peas in pod . . 0.18 0.51 0.39 1.11 0.08 0.23 . . . .
Fore Keli musan () Soy beans 0.23 0.16 0.29 0.20 0.28 0.19 0.28 0.19 0.32 0.22 . .
Fore masin/ Fore lotuk () Rice bean 0.17 0.05 0.12 0.04 0.25 0.08 0.19 0.06 0.30 0.09 . .
Fore mungu () Mung bean(green
gram)
0.22 0.19 0.14 0.12 0.28 0.24 0.23 0.20 0.28 0.24 0.28 0.24
Fore mungu mean () Red Mung bean . . . . . . . . 0.19 . . .
Fore Mungu moris () Mung bean sprouts 0.22 0.36 0.14 0.23 0.25 0.41 . . 0.28 0.46 0.40 0.66
Fore rai () Pea nut 0.24 0.04 0.24 0.04 0.39 0.07 0.29 0.05 0.33 0.06 0.25 0.04
Fore rai ho kulit () Peanuts with skin 0.20 0.05 . . . . . . . . 0.19 0.05
Fore rai sona () Roasted Peanut 0.22 0.04 0.35 0.06 . . . . . . . .
Fore tali musan/ Fore
metan ()
Black Beans 0.21 0.06 0.18 0.05 0.34 0.10 0.20 0.06 0.27 0.08 0.13 0.04
Kami () Candlenut 0.14 0.02 0.30 0.05 0.35 0.06 0.17 0.03 0.05 0.01 0.56 0.10
Kiar(Nut) () Nuts . . 0.39 0.07 0.49 0.08 0.37 0.06 . . . .
Koto mean () Kidney beans 0.26 0.08 0.18 0.05 0.30 0.09 0.23 0.07 0.22 0.07 0.34 0.10
Koto moruk () Lima bean 0.14 0.11 0.08 0.06 0.17 0.13 0.09 0.07 . . 0.10 0.08
Koto mutin () Common bean 0.28 0.08 0.14 0.04 0.29 0.09 0.23 0.07 0.23 0.07 . .
Kulu jaka musan bot () Jack fruit seed . . . . 0.04 0.03 . . . . . .
Lehe musan () Wild beans 0.11 0.03 . . . . . . . . 0.05 0.01
Tahu () Soy bean tofu 0.10 0.13 0.13 0.17 0.13 0.17 0.16 0.21 0.09 0.12 0.11 0.14
Tempe () Fermented soybean 0.14 0.07 0.17 0.09 0.18 0.09 0.18 0.09 0.15 0.08 0.23 0.12
Tunis () Pigeon Pea . . 0.09 0.03 0.20 0.06 0.18 0.06 0.10 0.03 0.15 0.05
Meat and
offal
Ayam potong - Frozen chicken
(imported)
. . 0.37 0.26 0.28 0.20 0.41 0.29 . . . .
Fahi Moris () Live Pig 0.99 0.52 . . . . . . . . 0.90 0.47
Manu kelen () Chicken Drumstick . . . . 0.13 . . . . . . .
Manu lokal (moris) () Chicken (local) 1.19 0.40 0.96 0.33 1.33 0.45 0.88 0.30 0.99 0.34 1.05 0.36
Naan aten () Liver . . 0.48 0.40 0.65 0.55 0.78 0.66 0.60 0.50 0.60 0.50
Naan bibi (Bibi Timor) () Goat . . . . 0.80 0.30 . . . . . .
Naan fahi () Pork 0.77 0.40 . . 0.80 0.42 0.81 0.42 . . . .
Na'an Karau () Beef 0.55 0.20 0.70 0.26 0.80 0.30 0.81 0.30 0.80 0.30 0.67 0.25

88
Food Group
Name
Food Name Tetun Food Name English Baucau
Bobonaro
Dili
Ermera.
.
Manufahi.
.
Oecusse.
.
PRICE
per
100g
Cost/100
kcal
PRICE
per 100g
Cost/100
kcal
PRICE
per 100g
Cost/100
kcal
PRICE
per 100g
Cost/100
kcal
PRICE
per 100g
Cost/100
kcal
PRICE
per 100g
Cost/100
kcal
Meat and
offal
Naan kuda () Horse . . . . 0.80 0.71 . . . . . .
Naan manu lokal () Chicken (dead) 1.14 0.40 . . . . . . . . . .
Naan manu rasa (buras) Dark Chicken Meat . . . . 1.28 0.55 0.95 0.41 . . . .
Naan maran (karau) () Dried meat (beef) 0.90 0.34 0.70 0.27 3.18 1.21 1.00 0.38 0.73 0.28 1.43 0.55
Naan ten () Beef or Pork intestine 0.40 0.43 0.45 0.48 . . . . 0.60 0.64 . .
Naan toalha (Karau) () Tripe or other pale
organ meats
0.50 0.60 0.47 0.57 0.50 0.60 0.50 0.60 0.60 0.72 0.40 0.48
Fish,
seafood,
amphibians
and
invertebrate
s
Deho () Canned tuna 0.60 0.12 1.25 0.53 0.77 0.33 1.25 0.53 0.68 0.29 0.75 0.32
Gurita maran () Octopus Dry 3.05 3.72 . . 2.02 2.46 . . . . . .
Ikan maran () Dried Fish 0.73 0.62 0.66 0.56 0.72 0.62 0.65 0.56 0.51 0.44 0.48 0.41
Ikan maran kiik () Dried small fish 1.30 0.39 . . . . . . . . . .
Ikan Saboko () Baked Fish . . . . . . 0.41 0.39 . . . .
Ikan Tasi Fresku () Fresh fish (large) 0.43 0.51 0.23 0.27 0.34 0.40 . . . . . .
Ikan tri () Small dried fish 0.58 0.17 0.53 0.16 0.78 0.23 0.49 0.15 0.56 0.17 0.78 0.23
Langostra () Lobster . . . . 2.33 2.35 . . . . . .
Ramis () Mussels/Clams . . . . 0.11 0.18 . . . . . .
Sardines can () Sardines 0.59 0.17 . . . . . . . . 0.32 0.09
Eggs and
egg
products
Manu tolun rasa () Chicken eggs
(Imported)
0.35 0.25 0.40 0.29 0.39 0.28 0.41 0.30 . . 0.44 0.32
Manu tolun timor () Chicken eggs 0.73 0.46 0.50 0.32 1.05 0.66 0.47 0.30 0.56 0.35 0.57 0.36
Milk and
milk
products
Dancow (Nestle) () Dancow (Nestle) () 0.99 0.20 . . . . . . . . . .
Susu been karau fresku () Fresh cow milk 0.25 0.49 . . . . . . . . . .
Susu kental () Condensed milk 0.54 0.17 0.29 0.09 0.21 0.07 0.34 0.11 0.23 0.07 0.34 0.11
Susuben Uut (sachet) () Powdered Milk 0.88 0.18 0.72 0.14 0.93 0.19 0.89 0.18 1.00 0.20 0.93 0.19
Vegetables
and
vegetable
products
Budu Tasi () Fresh Seaweed 0.17 0.65 . . 0.12 0.46 0.09 0.35 0.15 0.58 . .
Agriaun () Water cress 0.10 0.20 0.10 0.20 0.13 0.27 0.06 0.12 0.11 0.22 0.15 0.31
Aidila fuan okir () Baby young papaya
fruit
0.05 0.23 0.05 0.23 0.06 0.27 0.05 0.23 0.03 0.14 0.04 0.18

89
Aidila funan () Papaya flower 0.20 0.91 0.18 0.82 0.35 1.59 0.22 1.00 0.14 0.64 0.15 0.68
Aidila nu () Unripe Papaya 0.04 0.18 . . . . . . . . . .
Aidila tahan () Papaya leaves 0.07 0.12 0.11 0.18 0.30 0.50 0.31 0.52 0.07 0.12 0.18 0.30
Food Group
Name
Food Name Tetun Food Name English Baucau
Bobonaro
Dili
Ermera.
.
Manufahi.
.
Oecusse.
.
PRICE
per
100g
Cost/10
0kcal
PRICE
per
100g
Cost/10
0kcal
PRICE
per
100g
Cost/10
0kcal
PRICE
per
100g
Cost/10
0kcal
PRICE
per
100g
Cost/10
0kcal
PRICE
per
100g
Cost/10
0kcal
Vegetables
and
Vegetable
Products
Aifarina tahan () Cassava leaves 0.06 0.16 0.07 0.19 0.10 0.27 0.07 0.19 0.05 0.14 0.06 0.16
Alfase (romaine) () Lettuce(bib, romaine) 0.20 1.25 0.17 1.06 0.27 1.69 0.10 0.63 0.22 1.38 0.29 1.81
Alfase2 (light green) () Lettuce(light green) 0.24 1.85 0.15 1.15 0.27 2.08 0.19 1.46 0.17 1.31 0.22 1.69
Audubun () Bamboo shoot . . . . 0.25 1.92 . . . . . .
Baria () Bitter melon 0.12 0.39 0.11 0.35 0.19 0.61 0.14 0.45 0.11 0.35 0.13 0.42
Baria tahan () Bitter Gourd Leaf 0.08 0.27 . . 0.11 0.37 0.27 0.90 0.10 0.33 . .
Bayam mean () Red Spinach 0.11 0.30 . . . . . . . . . .
Bayang () Spinach 0.09 0.24 0.10 0.27 0.11 0.30 0.12 0.32 0.09 0.24 0.17 0.46
Brinjela () Eggplant
(aubergine, brinjal)
0.11 0.39 0.07 0.25 0.11 0.39 0.09 0.32 0.09 0.32 0.09 0.32
Ervilla () Peas, green, when
eaten as fresh pod
0.33 0.94 0.20 0.57 0.43 1.23 0.17 0.49 0.32 0.91 . .
Ervilla mussan () Dry green pea (sweet
pea)
. . . . . . 0.16 . . . . .
Fahi matak () Eggplant 0.13 0.43 . . . . 0.10 0.33 0.08 0.27 0.10 0.33
Fehuk dikin () Sweet potato leaves 0.07 0.47 0.11 0.73 0.12 0.80 0.10 0.67 0.07 0.47 0.08 0.53
Fore sikoti () Long strangle
green bean
0.15 0.43 0.25 0.71 0.25 0.71 0.14 0.40 0.14 0.40 0.20 0.57
Fore tali ho kulit
matak ()
Cowpeas in pods 0.12 0.31 . . . . . . . . 0.07 0.18
Hudi dubun fresku () Banana heart 0.06 0.29 0.10 0.48 0.10 0.48 0.07 0.33 0.04 0.19 0.07 0.33
Kabura () Flowering Fern
(warabi)
0.10 0.29 . . 0.11 0.32 0.14 0.41 0.09 0.26 0.04 0.12
Kanko () Water spinach(kang
kung)
0.08 0.31 0.10 0.38 0.12 0.46 0.08 0.31 0.08 0.31 0.08 0.31
Kobi funan () Cauliflower 0.37 1.48 . . . . . . . . 0.40 1.60
Kobi tahan () Broccoli rabe (rappi,
turnip greens)
. . 0.07 0.25 0.06 0.21 0.06 0.21 0.11 0.39 . .

90
Kobi tahan
(nurak/matak) ()
Chinese Kale (Chinese
broccoli, kai-lan)
. . . . 0.13 0.46 0.04 0.14 0.11 0.39 . .
Koto nurak () Bush and pole beans 0.16 0.46 0.10 0.29 0.32 0.91 0.11 0.31 0.14 0.40 0.28 0.80
Lakeru dikin () Pumpkin greens 0.08 0.28 0.10 0.34 0.09 0.31 0.10 0.34 0.08 0.28 . .
Lakeru fuan tasak () Pumpkin 0.04 0.22 0.06 0.33 0.06 0.33 0.04 0.22 . . 0.04 0.22
Lakeru Japanes dikin Chayote leaves 0.11 0.73 . . . . . . . . . .
Lakeru japanes verdi
ka mutin ()
Chayote (sayote,
tayota, choko)
0.04 0.20 0.05 0.25 0.06 0.30 0.04 0.20 0.03 0.15 0.05 0.25
Food Group
Name
Food Name Tetun Food Name English Baucau
Bobonaro
Dili
Ermera.
.
Manufahi.
.
Oecusse.
.
PRICE
per 100g
Cost/100
kcal
PRICE
per 100g
Cost/100
kcal
PRICE
per 100g
Cost/100
kcal
PRICE
per 100g
Cost/100
kcal
PRICE
per 100g
Cost/100
kcal
PRICE
per 100g
Cost/100
kcal
Vegetables
and
Vegetable
Products
Lakeru nurak (Naruk)
()
Zucchini 0.07 0.41 0.04 0.24 0.05 0.29 0.05 0.29 0.04 0.24 . .
Lakeru ukir () Squash(Summer and
other light squash)
0.07 0.44 0.04 0.25 0.10 0.63 0.05 0.31 0.05 0.31 0.07 0.44
Maraquijas Tahan () Roselle Leaf . . . . . . 0.21 0.43 0.16 0.33 . .
Marungi () Drumstick greens 0.07 0.10 . . . . . . . . . .
Mostarda () Chinese cabage(bok
choy, pak choy)
0.09 0.41 . . 0.13 0.59 0.07 0.32 0.18 0.82 0.10 0.45
Mostarda Metan () Green mustard leaf 0.09 0.60 0.07 0.47 0.10 0.67 0.08 0.53 0.09 0.60 0.13 0.87
Mostarda mutin naruk
()
White Mustard Leaf 0.09 0.33 0.06 0.22 0.08 0.30 0.07 0.26 0.08 0.30 0.12 0.44
Mustarda mutin () Mustard greens 0.10 0.45 0.07 0.32 0.08 0.36 0.07 0.32 0.09 0.41 0.11 0.50
Nabu/seinora mutin () Radish . . . . 0.17 1.31 0.03 0.23 . . . .
Patola () Patola/Sponge Gourd 0.03 0.13 . . . . . . 0.06 0.25 . .
Picai () Chinese Cabbage 0.10 0.63 0.09 0.56 0.10 0.63 0.05 0.31 0.13 0.81 0.15 0.94
Pipinu () Cucumbers 0.04 0.31 0.05 0.38 0.10 0.77 0.05 0.38 0.07 0.54 0.03 0.23
Repolhu (mutin,
mean) ()
Cabbage(common and
red varieties)
0.10 0.77 0.10 0.77 0.10 0.77 0.07 0.54 0.10 0.77 0.13 1.00
Salsa () Celery 0.50 3.85 0.99 7.62 1.22 9.38 0.41 3.15 0.33 2.54 0.75 5.77
Senoura () Carrot 0.15 0.33 0.11 0.24 0.13 0.29 0.08 0.18 0.15 0.33 0.26 0.58
Talas tahan () Taro greens . . . . . . 0.03 0.08 . . . .
Fruit and
fruit
products
Aidila () Papaya(ripe, fresh and
dried)
0.04 0.10 0.03 0.08 0.07 0.18 0.06 0.15 0.03 0.08 0.04 0.10
Ainanas () Pineapple 0.08 0.16 0.14 0.29 0.16 0.33 0.09 0.18 . . 0.17 0.35

91
Aiyata boot () Soursop (guanabana,
graviola)
. . 0.08 0.11 0.16 0.23 0.02 0.03 . . 0.06 0.09
Amare () Ambarella 0.04 0.13 . . 0.08 0.25 0.05 0.16 . . . .
Avocati () Avocado 0.13 0.08 0.10 0.06 0.17 0.11 0.06 0.04 . . 0.15 0.09
Bilimbi () Star fruit(kamrakh) . . 0.02 0.06 0.28 0.88 0.27 0.84 . . 0.03 0.09
Goiavas () Guavas 0.06 0.12 0.05 0.10 0.08 0.16 0.04 0.08 0.09 0.18 0.03 0.06
Haas () Mango (ripe fresh and
dried)
. . . . 0.23 0.35 . . . . . .
Hudi Fatuk () White Banana 0.04 0.04 0.05 0.05 0.05 0.05 0.05 0.05 0.03 0.03 0.04 0.04
Hudi fatuk tasak () Ripe Banana . . . . . . . . . . 0.04 0.04
Hudi karau () Ripe Banana . . 0.06 . . . . . . . . .
Food Group
Name
Food Name Tetun Food Name English Baucau
Bobonaro
Dili
Ermera.
.
Manufahi.
.
Oecusse.
.
PRICE
per 100g
Cost/100
kcal
PRICE
per 100g
Cost/100
kcal
PRICE
per 100g
Cost/100
kcal
PRICE
per 100g
Cost/100
kcal
PRICE
per 100g
Cost/100
kcal
PRICE
per 100g
Cost/100
kcal
Fruit and
fruit
products
Hudi Tambaga () Yellow Banana 0.05 0.05 0.06 0.06 0.07 0.07 0.09 0.08 0.05 0.05 . .
Hudi Tasak () Banana 0.05 0.05 0.07 0.08 0.10 0.11 0.09 0.10 0.08 0.09 0.05 0.05
Jambu air () Rose apple 0.04 0.16 . . . . . . . . . .
Jambua () Citrus Bali 0.03 0.09 . . 0.10 0.31 . . 0.03 0.09 0.04 0.13
Karambola () Sour Carambola . . . . . . 0.04 0.13 . . 0.06 0.19
Kulu Jaka Tasak () Jackfruit(kathal) . . . . 0.08 0.07 0.03 0.03 0.02 0.02 0.05 0.04
Kulu modo () Breadfruit 0.08 0.08 . . . . 0.03 0.03 0.03 0.03 . .
Manggis () Mangosteen . . . . . . 0.66 1.12 . . . .
Markuzas () Passion fruit(ripe) 0.11 0.26 . . 0.38 0.88 0.05 0.12 . . 0.09 0.21
Masan () Apple 0.35 0.59 0.17 0.29 0.23 0.39 . . 0.36 0.61 . .
Nuu Laloir () Coconut flesh 0.04 0.01 0.07 0.02 0.02 0.01 0.07 0.02 . . . .
Nuu Maran () Dried Coconut 0.03 0.00 0.04 0.01 0.07 0.01 0.04 0.01 0.03 0.00 0.03 0.00
Pateka () Watermelon . . 0.10 0.45 . . . . . . 0.03 0.14
Rambutan () Rambutan . . . . . . 0.56 1.14 . . . .
Sabraka () Orange 0.09 0.19 0.06 0.13 0.12 0.26 0.09 0.19 0.08 0.17 0.10 0.21
Sukaer () Tamarind 0.34 0.15 0.42 0.19 0.42 0.19 0.11 0.05 0.23 0.10 0.36 0.16
Tanjerinya () Mandarin 0.19 0.40 0.16 0.34 0.29 0.62 0.13 0.28 0.21 0.45 0.17 0.36

92
Tomate (red, yellow,
green)
Tomato(red, yellow 0.18 0.86 0.13 0.62 0.20 0.95 0.21 1.00 0.22 1.05 0.09 0.43
Herbs,
spices and
condiments
Derok kinur boot () Lemon 0.06 0.21 0.05 0.17 0.14 0.48 0.10 0.34 . . 0.10 0.34
Derok masin () Lime 0.12 0.41 0.19 0.66 0.30 1.03 0.18 0.62 0.10 0.34 0.17 0.59
Pimentaun matak () Chili greens 0.39 0.87 . . 0.55 1.22 . . . . . .
Oils and fats
Manteiga () Butter . . 0.19 0.03 0.18 0.03 0.22 0.03 0.16 0.02 0.17 0.02
Margarina () Margarine, shortening 0.16 0.03 0.20 0.03 . . . . . . 0.17 0.03
Mina azeite () Olive Oil . . . . 1.90 0.21 . . . . . .
Mina importa
(hanesan bimoli)
Imported Vegetable Oil 0.17 0.02 0.22 0.03 0.27 0.03 0.19 0.02 0.19 0.02 0.22 0.03
Mina Kami () Candlenut Oil . . . . 0.34 0.04 . . . . . .
Mina nu () Coconut oil 0.18 0.02 0.32 0.04 0.36 0.04 0.26 0.03 0.21 0.02 0.60 0.07
Food Group
Name
Food Name Tetun Food Name English Baucau
Bobonaro
Dili
Ermera.
.
Manufahi.
.
Oecusse.
.
PRICE
per 100g
Cost/100
kcal
PRICE
per 100g
Cost/100
kcal
PRICE
per 100g
Cost/100
kcal
PRICE
per 100g
Cost/100
kcal
PRICE
per 100g
Cost/100
kcal
PRICE
per 100g
Cost/100
kcal
Supplement
s and infant
foods
Energen Vanila () Energen Vanila () 0.34 0.09 . . . . . . . . . .
Serelak () Cerelac Complementary
Feeding Product
. . . . . . . . 0.63 0.16 . .
SUN (ba labarik) () SUN Complementary
Feeding Product
0.63 0.16 0.63 0.16 0.63 0.16 0.56 0.14 0.63 0.16 0.57 0.15

93
Appendix Table 3: Weekly content and cost of the modelled nutritious diet in BAUCAU Municipality by Household Member
Food Name White
Rice
Cowpea
s
Velvet
Beans
Tofu Dried
Meat
Dried
squid
Small
dried
fish
Papaya
Leaves
Cassava
leaves
Spinach Drumst
ick/
Moring
a leaves
Dried
coconu
t
Vegeta
ble Oil
Breast
milk
Food Name (Tetun) (Foos
Mutin)
(Fore
tali
musan/
Fore
metan)
(Lehe
musan)
(Tahu) (Naan
maran
(karau))
(Gurita
maran)
(Ikan tri) (Aidila
tahan)
(Aifarina
tahan)
(Bayang
)
(Marun
gi)
(Nuu
Maran)
(Mina
importa
(bimoli)
Breast
milk
TOTAL
The WEEKLY quantities of foods in grams (g) selected by the software
12-23-month-old Child 477 17 325 477 0 0 22 0 671 0 0 43 0 3724 5756
6-7-year-old Child 1578 40 344 0 0 0 70 0 731 0 190 455 0 0 3408
Adolescent Girl 2520 0 0 1287 685 129 0 0 5524 0 0 0 362 0 10508
Lactating Woman 2418 0 920 1210 19 0 158 0 5744 1191 0 517 0 0 12176
Adult Man 2891 0 1039 0 0 0 140 439 1307 0 0 621 0 0 6438
Total edible weight 9883 57 2629 2974 705 129 390 439 13976 1191 190 1636 362 3724 38286
Total weight 9883 57 2629 2974 705 129 390 578 16443 1489 254 1636 362 3724 41252
The WEEKLY number of servings of foods selected by the software
12-23-month-old Child 7 1 14 21 0 0 1 0 7 0 0 2 0 7 N/A
6-7-year-old Child 14 2 10 0 0 0 2 0 5 0 2 9 0 0 N/A
Adolescent Girl 14 0 0 22 15 2 0 0 19 0 0 0 12 0 N/A
Lactating Woman 14 0 16 21 1 0 3 0 21 5 0 7 0 0 N/A
Adult Man 15 0 16 0 0 0 2 2 5 0 0 7 0 0 N/A
Total Servings 64 3 56 64 16 2 8 2 57 5 2 25 12 7 N/A
WEEKLY Cost of the Diet (USD):
12-23-month-old Child 0.24 0.04 0.36 0.48 0 0 0.13 0 0.47 0 0 0.01 0 0 1.73
6-7-year-old Child 0.79 0.08 0.38 0 0 0 0.41 0 0.52 0 0.18 0.14 0 0 2.49
Adolescent Girl 1.26 0 0 1.29 6.17 3.94 0 0 3.9 0 0 0 0.62 0 17.17
Lactating Woman 1.21 0 1.01 1.21 0.17 0 0.91 0 4.05 1.34 0 0.16 0 0 10.07
Adult Man 1.45 0 1.14 0 0 0 0.81 0.4 0.92 0 0 0.19 0 0 4.91
Total Cost of the Diet 4.94 0.12 2.89 2.97 6.34 3.94 2.26 0.4 9.87 1.34 0.18 0.49 0.62 0 36.36

94
Appendix Table 4: Weekly quantity of each nutrient provided by the edible portions of foods included in the Weekly Nutritious Household Diet in BAUCAU
Municipality
Food Name Energy
(kcal)
Protein
(g)
Fat (g) Vitamin
A (µg RE)
Vitamin
C (mg)
Vitamin
B1 (mg)
Vitamin
B2 (mg)
Niacin
(mg NE)
Pantothe
nic acid
(mg)
Vitamin
B6 (mg)
Folic acid
(µg DFE)
Vitamin
B12 (µg)
Calcium
(mg)
Iron
(mg)
Magnesi
um (mg)
Zinc
(mg)
Grains and grain-based products
White Rice 35679 662.2 59.3 0 0 5.9 5.9 237.2 112.7 13.8 593 0 790.7 3 3558 108.7
Legumes, nuts and seeds
Cowpeas 193.9 12.3 0.8 0 0 0.5 0.1 1.1 0.5 0.2 252.5 0 70 0.1 97.2 2.1
Velvet Beans 9701.5 620.5 102.5 65.7 105.2 10 4.5 153.8 32.1 11 12252 0 2366.2 10.8 2918.3 97.3
Tofu 2259.9 240.9 142.7 0 0 2.4 1.5 68.4 2.1 1.5 446 0 3122.3 8 3062.8 23.8
Meat and offal
Dried Meat 1846.2 377.7 25.4 0 0 0.4 3.5 165.6 2.4 6.5 126.8 24.7 211.4 7.4 465.1 35.2
Fish, seafood, amphibians and invertebrates
Dried squid 105.9 19.3 1.3 58.1 6.5 0 0.1 2.7 0.6 0.5 20.7 25.8 68.4 1.7 38.7 2.2
Small dried fish 1306.8 228.6 36.7 0 0 0.4 1.1 74.6 6 1.6 109.2 46.8 6631.4 2.4 546.1 20.3
Vegetables and vegetable products
Papaya Leaves 263.6 23.3 4 1539.6 136.2 1 2.2 14.7 0.4 4.1 101 0 663.3 0.5 663.3 2.2
Cassava leaves 5171.2 517.1 28 36269 4612.2 12.6 26.6 181.7 34.9 75.5 14535 0 29490 21.7 8665.3 55.9
Spinach 440.6 44.1 2.4 3090.1 393 1.1 2.3 15.5 3 6.4 1238.4 0 2512.6 1.8 738.3 4.8
Drumstick/Moring
a leaves
137 12.7 3.4 2093.2 418.6 0.5 1.3 4.9 0.3 2.3 390.1 0 837.3 0.1 79.9 0.3
Fruit and fruit products
Dried Coconut 9913.7 97 922.7 0 4.9 1.3 1.3 14.7 2.8 1.3 427 0 523.5 2.8 1210.6 24.5
Oils and fats
Vegetable Oil 3122.4 0 362.2 0 0 0 0 0 0 0 0 0 0 0 0 0
Breast Milk
Breast milk 2420.6 39.1 145.2 1862 149 0.8 1.3 16.1 6.7 0.3 316.5 3.6 1042.7 0 130.3 4.5
Totals
Total 72562 2894.7 1836.6 44977 5825.4 36.9 51.5 951.1 204.5 125 30809 100.9 48330 60.3 22174 381.7
Target nutrient
amount for the
household
72562 1213.9 1836.6 20300 1505 34.3 35 441 154 39.2 11550 67.9 30800 60.3 6202 212.1

95
Appendix Table 5: The percentage (%) of each nutrient target provided by the edible portion of foods selected by the software for the Weekly Nutritious Household
Diet in BAUCAU Municipality
Food Name
English
Food Name
Tetun
Energy Protein Fat Vitamin
A
Vitamin
C
Vitamin
B1
Vitamin
B2
Niacin Pantoth
enic
acid
Vitamin
B6
Folic
acid
Vitamin
B12
Calcium Iron Magnes
ium
Zinc
Grains and grain-based products
White Rice (Foos Mutin -
importa)
49.2 54.5 3.2 0 0 17.3 16.9 53.8 73.2 35.3 5.1 0 2.6 4.9 57.4 51.3
Legumes, nuts and seeds
Cowpeas (Fore tali
musan/ Fore
metan)
0.3 1 0 0 0 1.5 0.3 0.3 0.3 0.4 2.2 0 0.2 0.2 1.6 1
Velvet Beans (Lehe musan) 13.4 51.1 5.6 0.3 7 29.1 12.8 34.9 20.8 28.2 106.1 0 7.7 17.9 47.1 45.9
Tofu (Tahu) 3.1 19.8 7.8 0 0 6.9 4.2 15.5 1.4 3.8 3.9 0 10.1 13.3 49.4 11.2
Meat and offal
Dried Meat (Naan maran
(karau))
2.5 31.1 1.4 0 0 1.2 10.1 37.5 1.6 16.5 1.1 36.3 0.7 12.3 7.5 16.6
Fish, seafood, amphibians and invertebrates
Dried squid (Gurita maran) 0.1 1.6 0.1 0.3 0.4 0.1 0.1 0.6 0.4 1.2 0.2 38 0.2 2.8 0.6 1
Small dried fish (Ikan tri) 1.8 18.8 2 0 0 1.1 3 16.9 3.9 4.1 0.9 68.9 21.5 4 8.8 9.6
Vegetables and vegetable products
Papaya Leaves (Aidila tahan) 0.4 1.9 0.2 7.6 9 2.8 6.4 3.3 0.3 10.4 0.9 0 2.2 0.8 10.7 1
Cassava leaves (Aifarina tahan) 7.1 42.6 1.5 178.7 306.5 36.7 75.9 41.2 22.7 192.5 125.8 0 95.7 35.9 139.7 26.4
Spinach (Bayang) 0.6 3.6 0.1 15.2 26.1 3.1 6.5 3.5 1.9 16.4 10.7 0 8.2 3.1 11.9 2.2
Drumstick/Moring
a leaves
(Marungi) 0.2 1.1 0.2 10.3 27.8 1.4 3.6 1.1 0.2 5.8 3.4 0 2.7 0.1 1.3 0.1
Fruit and fruit products
Dried coconut (Nuu Maran) 13.7 8 50.2 0 0.3 3.8 3.7 3.3 1.8 3.3 3.7 0 1.7 4.6 19.5 11.6
Oils and fats
Vegetable Oil (Mina importa) 4.3 0 19.7 0 0 0 0 0 0 0 0 0 0 0 0 0
Breast Milk
Breast milk Breast milk 3.3 3.2 7.9 9.2 9.9 2.3 3.7 3.7 4.4 0.9 2.7 5.3 3.4 0 2.1 2.1
Total 1 100 238.5 100 221.6 387.1 107.5 147.3 215.7 132.8 318.9 266.7 148.6 156.9 100 357.5 180

96
Appendix Table 6: Weekly content and cost of the modelled nutritious diet in BOBONARO Municipality by Household Member
White
Rice
Kidney
Bean
White
Bean
Tofu Pigeon
Pea
Liver Dried
meat
Small
dried
fish
Egg
(local)
Cassava
leaves
Dried
Coconut
Vegetabl
e Oil
Breast
milk
Total
(Foos
Mutin -
importa)
(Koto
mean)
(Koto
mutin)
(Tahu) (Tunis) (Naan
aten)
(Naan
maran
(karau))
(Ikan tri) (Manu
tolun
timor)
(Aifarina
tahan)
(Nuu
Maran)
(Mina
importa
Breast
milk
The WEEKLY quantities of foods in grams (g) selected by the software for the household nutritious diet
12-23-month-old Child 477 196 1 477 162 20 0 0 0 751 60 0 3724 5867
6-7-year-old Child 1578 0 170 0 0 2 0 54 0 1344 587 0 0 3736
Adolescent Girl 2520 0 0 1287 0 21 811 0 682 3796 0 283 0 9400
Lactating Woman 2418 1051 0 1210 0 56 187 0 0 5744 572 0 0 11238
Adult Man 2891 0 75 0 1047 85 0 0 0 2559 689 0 0 7346
Total edible weight 9883 1247 246 2974 1209 184 998 54 682 14194 1908 283 3724 37587
Total weight 9883 1247 246 2974 1209 184 998 54 784 16699 1908 283 3724 40194
The WEEKLY number of servings of the foods selected by the software for the household nutritious diet
12-23-month-old Child 7 9 0 21 7 1 0 0 0 7 2 0 7
6-7-year-old Child 14 0 5 0 0 0 0 2 0 8 11 0 0
Adolescent Girl 14 0 0 22 0 1 18 0 6 14 0 10 0
Lactating Woman 14 19 0 21 0 1 5 0 0 21 7 0 0
Adult Man 15 0 2 0 16 1 0 0 0 8 7 0 0
Total Servings 64 28 7 64 23 4 23 2 6 58 27 10 7
WEEKLY Cost of the Household Nutritious Diet (USD):
12-23-month-old Child 0.29 0.35 0 0.62 0.15 0.1 0 0 0 0.62 0.02 0 0 2.14
6-7-year-old Child 0.95 0 0.24 0 0 0.01 0 0.29 0 1.11 0.23 0 0 2.83
Adolescent Girl 1.51 0 0 1.67 0 0.1 5.68 0 3.92 3.13 0 0.62 0 16.63
Lactating Woman 1.45 1.89 0 1.57 0 0.27 1.31 0 0 4.73 0.23 0 0 11.45
Adult Man 1.73 0 0.1 0 0.94 0.41 0 0 0 2.11 0.28 0 0 5.57
Total Cost of the Diet 5.93 2.24 0.34 3.87 1.09 0.88 6.99 0.29 3.92 11.69 0.76 0.62 0 38.63

97
Appendix Table 7: Weekly quantity of each nutrient provided by the edible portions of foods included in the Weekly Nutritious Household Diet in BOBONARO
Municipality
Food Name Food
Name
(tetun)
Energy
(kcal)
Protein
(g)
Fat (g) Vitami
n A (µg
RE)
Vitami
n C
(mg)
Vitami
n B1
(mg)
Vitami
n B2
(mg)
Niacin
(mg
NE)
Pantot
henic
acid
(mg)
Vitami
n B6
(mg)
Folic
acid
(µg
DFE)
Vitami
n B12
(µg)
Calciu
m (mg)
Iron
(mg)
Magne
sium
(mg)
Zinc
(mg)
Grains and grain-based products
White Rice (Foos
Mutin)
35679 662.2 59.3 0 0 5.9 5.9 237.2 112.7 13.8 593 0 790.7 3 3558 108.7
Legumes, nuts and seeds
Kidney Bean (Koto
mean)
4176.6 286.8 16.2 0 37.4 5.2 2 76.4 7.2 4 4276.4 0 922.6 4.8 1483.6 36.2
White Bean (Koto
mutin)
823.5 54.4 3.6 36.7 0 2.2 0.3 4 1.2 1.3 971 0 181.9 0.7 456.9 9.3
Tofu (Tahu) 2259.9 240.9 142.7 0 0 2.4 1.5 68.4 2.1 1.5 446 0 3122.3 8 3062.8 23.8
Pigeon Pea (Tunis) 3858.3 266.1 14.5 36.3 0 3.5 3.1 66.3 5.6 2.4 3652.7 0 1257.9 2.7 1511.9 35.1
Meat and offal
Liver (Naan
aten)
219.3 33.4 6.6 27760 20.3 0.2 4.9 22 7.8 0.7 396.2 150 9.2 2.3 27.6 8.3
Dried meat (Naan
maran
(karau))
2615.1 535 35.9 0 0 0.6 5 234.6 3.4 9.2 179.7 34.9 299.4 10.5 658.8 49.9
Fish, seafood, amphibians and invertebrates
Small dried
fish
(Ikan tri) 182 31.8 5.1 0 0 0.1 0.1 10.4 0.8 0.2 15.2 6.5 923.4 0.3 76 2.8
Eggs and egg products
Egg (local) (Manu
tolun
timor)
1078.1 90.8 79.2 1450.1 0 1.2 2.7 23.2 9.6 1 341.2 17.7 409.4 2.8 72.1 13.9
Vegetables and vegetable products
Cassava leaves (Aifarina
tahan)
5251.8 525.2 28.4 36834 4684.1 12.8 27 184.5 35.5 76.6 14762 0 29950 22 8800.4 56.8
Fruit and fruit products
Dried Coconut (Nuu
Maran)
11562 113.1 1076.1 0 5.7 1.5 1.5 17.2 3.2 1.5 498 0 610.5 3.2 1411.8 28.6
Oils and fats
Vegetable Oil (Mina
importa)
2436.1 0 282.6 0 0 0 0 0 0 0 0 0 0 0 0 0
Breast Milk
Breast milk Breast milk 2420.6 39.1 145.2 1862 149 0.8 1.3 16.1 6.7 0.3 316.5 3.6 1042.7 0 130.3 4.5
Total 72562 2878.6 1895.5 67979 4896.4 36.4 55.4 960.3 195.8 112.6 26448 212.7 39520 60.3 21250 377.7
Target amount for the
household
72562 1213.9 1836.6 20300 1505 34.3 35 441 154 39.2 11550 67.9 30800 60.3 6202 212.1

98
Appendix Table 8: The percentage (%) of each nutrient target provided by the edible portion of foods selected by the software for the Weekly Nutritious Household
Diet in BOBONARO Municipality
Food Name Food Name
(Tetun)
Energy Protein Fat Vitamin
A
Vitamin
C
Vitamin
B1
Vitamin
B2
Niacin Pantot
henic
acid
Vitamin
B6
Folic
acid
Vitamin
B12
Calciu
m
Iron Magnes
ium
Zinc
Grains and grain-based products
White Rice (Foos Mutin) 49.2 54.5 3.2 0 0 17.3 16.9 53.8 73.2 35.3 5.1 0 2.6 4.9 57.4 51.3
Legumes, nuts and seeds
Kidney Bean (Koto mean) 5.8 23.6 0.9 0 2.5 15.3 5.7 17.3 4.7 10.2 37 0 3 8 23.9 17
White Bean (Koto mutin) 1.1 4.5 0.2 0.2 0 6.4 0.8 0.9 0.8 3.2 8.4 0 0.6 1.2 7.4 4.4
Tofu (Tahu) 3.1 19.8 7.8 0 0 6.9 4.2 15.5 1.4 3.8 3.9 0 10.1 13.3 49.4 11.2
Pigeon Pea (Tunis) 5.3 21.9 0.8 0.2 0 10.2 9 15 3.6 6.2 31.6 0 4.1 4.4 24.4 16.5
Meat and offal
Liver (Naan aten) 0.3 2.7 0.4 136.7 1.3 0.7 14 5 5 1.8 3.4 220.9 0 3.8 0.4 3.9
Dried meat (Naan maran
(karau))
3.6 44.1 2 0 0 1.7 14.3 53.2 2.2 23.4 1.6 51.4 1 17.4 10.6 23.5
Fish, seafood, amphibians and invertebrates
Small dried
fish
(Ikan tri) 0.3 2.6 0.3 0 0 0.2 0.4 2.4 0.5 0.6 0.1 9.6 3 0.6 1.2 1.3
Eggs and egg products
Egg (local) (Manu tolun
timor)
1.5 7.5 4.3 7.1 0 3.6 7.8 5.3 6.2 2.6 3 26 1.3 4.7 1.2 6.5
Vegetables and vegetable products
Cassava
leaves
(Aifarina tahan) 7.2 43.3 1.5 181.4 311.2 37.2 77.1 41.8 23 195.5 127.8 0 97.2 36.5 141.9 26.8
Fruit and fruit products
Dried
Coconut
(Nuu Maran) 15.9 9.3 58.6 0 0.4 4.4 4.4 3.9 2.1 3.9 4.3 0 2 5.4 22.8 13.5
Oils and fats
Vegetable
Oil
(Mina importa) 3.4 0 15.4 0 0 0 0 0 0 0 0 0 0 0 0 0
Breast Milk
Breast milk Breast milk 3.3 3.2 7.9 9.2 9.9 2.3 3.7 3.7 4.4 0.9 2.7 5.3 3.4 0 2.1 2.1
Total 100 237.1 103.2 334.9 325.3 106.3 158.3 217.8 127.1 287.3 229 313.3 128.3 100 342.6 178.1

99
Appendix Table 9: Weekly content and cost of the modelled nutritious diet in DILI Municipality by Household Member
White
Rice
Adzuki/R
ice Bean
Red
Kidney
Bean
White
Beans
Tofu Liver Beef Small
dried
fish
Mussles/
Clams
Cassava
Leaves
Spinach Mustard
Greens
Coconut
flesh
Breast
milk
Total
(Foos
Mutin)
(Fore
masin/
Fore
lotuk)
(Koto
mean)
(Koto
mutin)
(Tahu) (Naan
aten)
(Naan
karau)
(Ikan tri) (Ramis) (Aifarina
tahan)
(Bayang) (Mustard
a mutin)
(Nuu
Laloir)
Breast
milk
The WEEKLY quantities of foods in grams (g) selected by the software for the household nutritious diet
12-23-month-old Child 477 64 193 8 477 19 0 0 0 806 0 0 180 3724 5948
6-7-year-old Child 1578 0 0 119 0 8 0 14 0 1111 0 598 1077 0 4505
Adolescent Girl 2520 0 60 0 1287 0 297 0 1932 4468 0 0 1033 0 11598
Lactating Woman 2418 0 1066 0 1210 34 0 0 0 5744 1281 0 978 0 12730
Adult Man 2891 0 0 285 275 43 0 0 0 2848 0 0 1849 0 8190
Total edible weight 9883 64 1319 411 3249 104 297 14 1932 14976 1281 598 5117 3724 42970
Total weight 9883 64 1319 411 3249 104 431 14 6038 17619 1601 787 6561 3724 51805
The WEEKLY number of servings of the foods selected by the software for the household nutritious diet
12-23-month-old Child 7 3 9 1 21 1 0 0 0 8 0 0 6 7
6-7-year-old Child 14 0 0 4 0 1 0 1 0 7 0 4 20 0
Adolescent Girl 14 0 2 0 22 0 7 0 21 16 0 0 12 0
Lactating Woman 14 0 19 0 21 1 0 0 0 21 5 0 12 0
Adult Man 15 0 0 5 4 1 0 0 0 9 0 0 18 0
Total Servings 64 3 30 10 68 4 7 1 21 61 5 4 68 7
WEEKLY Cost of the Household Nutritious Diet (USD):
12-23-month-old Child 0.67 0.16 0.58 0.02 0.62 0.12 0 0 0 0.95 0 0 0.05 0 3.17
6-7-year-old Child 2.21 0 0 0.34 0 0.05 0 0.11 0 1.31 0 0.63 0.28 0 4.93
Adolescent Girl 3.53 0 0.18 0 1.67 0 3.45 0 6.64 5.26 0 0 0.26 0 20.99
Lactating Woman 3.38 0 3.2 0 1.57 0.22 0 0 0 6.76 1.76 0 0.25 0 17.14
Adult Man 4.05 0 0 0.83 0.36 0.28 0 0 0 3.35 0 0 0.47 0 9.33
Total Cost of the Diet 13.84 0.16 3.96 1.19 4.22 0.68 3.45 0.11 6.64 17.62 1.76 0.63 1.31 0 55.56

100
Appendix Table 10: Weekly quantity of each nutrient provided by the edible portions of foods included in the Weekly Nutritious Household Diet in DILI
Municipality
Food Name Food
Name
(Tetun)
Energy
(kcal)
Protei
n (g)
Fat (g) Vitami
n A
(µg
RE)
Vitami
n C
(mg)
Vitami
n B1
(mg)
Vitami
n B2
(mg)
Niacin
(mg
NE)
Pantot
henic
acid
(mg)
Vitami
n B6
(mg)
Folic
acid
(µg
DFE)
Vitami
n B12
(µg)
Calciu
m
(mg)
Iron
(mg)
Magne
sium
(mg)
Zinc (mg)
Grains and grain-based products
White Rice (Foos
Mutin)
35679 662.2 59.3 0 0 5.9 5.9 237.2 112.7 13.8 593 0 790.7 3 3558 108.7
Legumes, nuts and seeds
Adzuki/
Rice Bean
(Fore
masin/
lotuk)
209.5 12.7 0.3 0.6 0 0.3 0.1 1.7 0.9 0.2 396 0 42 0.2 80.9 3.2
Red Kidney
Bean
(Koto
mean)
4419.8 303.4 17.2 0 39.6 5.5 2.1 80.9 7.7 4.2 4525.3 0 976.3 5.1 1570 38.3
White
Beans
(Koto
mutin)
1377.1 91 6.1 61.3 0 3.7 0.5 6.7 2.1 2.1 1623.7 0 304.1 1.2 763.9 15.5
Tofu (Tahu) 2469 263.1 155.9 0 0 2.6 1.6 74.7 2.3 1.6 487.3 0 3411.1 8.8 3346.1 26
Meat and offal
Liver (Naan aten) 123.7 18.8 3.7 15660 11.4 0.1 2.8 12.4 4.4 0.4 223.5 84.6 5.2 1.3 15.6 4.7
Beef (Naan
kuda)
395.6 63.6 13.7 0 3 0.4 0.3 13.7 0 1.1 0 8.9 17.8 2.8 71.4 8.6
Fish, seafood, amphibians and invertebrates
Small dried
fish
(Ikan tri) 46.1 8.1 1.3 0 0 0 0 2.6 0.2 0.1 3.9 1.7 233.8 0.1 19.3 0.7
Mussles/
Clams
(Ramis) 1159.2 224.9 29.8 2798.3 0 0.2 0.6 86.7 11.6 0.2 76.7 66.1 598.1 6.2 291.3 7.7
Vegetables and vegetable products
Cassava
Leaves
(Aifarina
tahan)
5541.3 554.1 30 38864 4942.2 13.5 28.5 194.7 37.4 80.9 15576 0 31600 23.2 9285.4 59.9
Spinach (Bayang) 473.9 47.4 2.6 3324 422.7 1.2 2.4 16.7 3.2 6.9 1332.2 0 2702.8 2 794.2 5.1
Mustard
Greens
(Mustarda
mutin)
131.6 13.2 1.8 2961.6 777.8 0.4 0.5 4.1 1.1 0.9 951.3 0 1256.4 0.4 65.8 1
Fruit and fruit products
Coconut
Flesh
(Nuu Laloir) 18116 168.9 1714.4 0 153.5 3.6 1 58.9 15.4 2.6 1330.5 0 716.4 6.1 1637.6 56.3
Breast Milk
Breast milk Breast milk 2420.6 39.1 145.2 1862 149 0.8 1.3 16.1 6.7 0.3 316.5 3.6 1042.7 0 130.3 4.5
Total 72562 2470.4 2181.2 65532 6499.2 38.2 47.7 807.1 205.6 115.4 27436 164.9 43698 60.4 21630 340.2
Target amount for the
household
72562 1213.9 1836.6 20300 1505 34.3 35 441 154 39.2 11550 67.9 30800 60.3 6202 212.1

101
Appendix Table 11: The percentage (%) of each nutrient target provided by the edible portion of foods selected by the software for the Weekly Nutritious
Household Diet in DILI Municipality
Food Name Food Name
(Tetun)
Energ
y
Protei
n
Fat Vitam
in A
Vitam
in C
Vitam
in B1
Vitam
in B2
Niaci
n
Panto
thenic
acid
Vitam
in B6
Folic
acid
Vitam
in
B12
Calciu
m
Iron Magn
esium
Zinc
Grains and grain-based products
White Rice (Foos Mutin) 49.2 54.5 3.2 0 0 17.3 16.9 53.8 73.2 35.3 5.1 0 2.6 4.9 57.4 51.3
Legumes, nuts and seeds
Adzuki/Rice
Bean
(Fore masin/
Fore lotuk)
0.3 1 0 0 0 0.9 0.4 0.4 0.6 0.6 3.4 0 0.1 0.3 1.3 1.5
Red Kidney
Bean
(Koto mean) 6.1 25 0.9 0 2.6 16.2 6 18.3 5 10.8 39.2 0 3.2 8.4 25.3 18
White Beans (Koto mutin) 1.9 7.5 0.3 0.3 0 10.7 1.3 1.5 1.3 5.3 14.1 0 1 1.9 12.3 7.3
Tofu (Tahu) 3.4 21.7 8.5 0 0 7.6 4.6 16.9 1.5 4.1 4.2 0 11.1 14.5 54 12.3
Meat and offal
Liver (Naan aten) 0.2 1.5 0.2 77.1 0.8 0.4 7.9 2.8 2.8 1 1.9 124.6 0 2.2 0.3 2.2
Beef (Naan kuda) 0.5 5.2 0.7 0 0.2 1.1 0.8 3.1 0 2.9 0 13.1 0.1 4.7 1.2 4.1
Fish, seafood, amphibians and invertebrates
Small dried
fish
(Ikan tri) 0.1 0.7 0.1 0 0 0 0.1 0.6 0.1 0.1 0 2.4 0.8 0.1 0.3 0.3
Mussles/Cla
ms
(Ramis) 1.6 18.5 1.6 13.8 0 0.6 1.7 19.7 7.5 0.5 0.7 97.3 1.9 10.3 4.7 3.6
Vegetables and vegetable products
Cassava
Leaves
(Aifarina tahan) 7.6 45.6 1.6 191.4 328.4 39.3 81.3 44.1 24.3 206.3 134.9 0 102.6 38.5 149.7 28.2
Spinach (Bayang) 0.7 3.9 0.1 16.4 28.1 3.4 7 3.8 2.1 17.6 11.5 0 8.8 3.3 12.8 2.4
Mustard
Greens
(Mustarda
mutin)
0.2 1.1 0.1 14.6 51.7 1.2 1.5 0.9 0.7 2.3 8.2 0 4.1 0.7 1.1 0.5
Fruit and fruit products
Coconut
Flesh
(Nuu Laloir) 25 13.9 93.3 0 10.2 10.4 2.9 13.3 10 6.5 11.5 0 2.3 10.2 26.4 26.5
Breast Milk
Breast milk Breast milk 3.3 3.2 7.9 9.2 9.9 2.3 3.7 3.7 4.4 0.9 2.7 5.3 3.4 0 2.1 2.1
Total 100 203.5 118.8 322.8 431.8 111.3 136.3 183 133.5 294.3 237.5 242.8 141.9 100.1 348.8 160.4

102
Appendix Table 12: Weekly content and cost of the modelled nutritious diet in ERMERA Municipality by Household Member
White
Rice
Adzuki
/Rice
Bean
Black
Bean
Kidney
Bean
Tofu Liver Dried
meat
Small
dried
fish
Egg
(local)
Cassav
a
leaves
Taro
leaves
Dried
Coconu
t
Vegeta
ble Oil
Breast
Milk
Total
(Foos
Mutin)
(Fore
masin/
Fore
lotuk)
(Fore
tali
musan/
metan)
(Koto
mean)
(Tahu) (Naan
aten)
(Naan
maran
(karau))
(Ikan
tri)
(Manu
tolun
timor)
(Aifarin
a tahan)
(Talas
tahan)
(Nuu
Maran)
(Mina
importa
Breast
milk
The WEEKLY quantities of foods in grams (g) selected by the software for the household nutritious diet
12-23-month-old Child 477 147 0 0 71 0 0 22 0 0 1917 146 0 3724 6504
6-7-year-old Child 1578 0 129 0 0 10 0 0 0 0 1762 611 0 0 4091
Adolescent Girl 2520 0 0 0 1287 0 617 0 838 0 4860 0 270 0 10392
Lactating Woman 2418 0 0 648 1210 17 0 45 0 2235 5744 722 0 0 13039
Adult Man 2891 0 255 0 0 21 0 0 0 0 3874 1070 0 0 8111
Total edible weight 9883 147 385 648 2568 48 617 67 838 2235 18157 2549 270 3724 42137
Total weight 9883 147 385 648 2568 48 617 67 963 2629 30262 2549 270 3724 54761
The WEEKLY number of servings of the foods selected by the software for the household nutritious diet
12-23-month-old Child 7 7 0 0 4 0 0 1 0 0 18 5 0 7
6-7-year-old Child 14 0 4 0 0 1 0 0 0 0 10 11 0 0
Adolescent Girl 14 0 0 0 22 0 14 0 7 0 17 0 9 0
Lactating Woman 14 0 0 12 21 1 0 1 0 9 21 9 0 0
Adult Man 15 0 4 0 0 1 0 0 0 0 12 11 0 0
Total Servings 64 7 8 12 47 3 14 2 7 9 78 36 9 7
WEEKLY Cost of the Household Nutritious Diet (USD):
12-23-month-old Child 0.33 0.28 0 0 0.11 0 0 0.11 0 0 0.96 0.06 0 0 1.85
6-7-year-old Child 1.1 0 0.26 0 0 0.08 0 0 0 0 0.88 0.24 0 0 2.57
Adolescent Girl 1.76 0 0 0 2.06 0 6.17 0 4.53 0 2.43 0 0.51 0 17.46
Lactating Woman 1.69 0 0 1.49 1.94 0.14 0 0.22 0 1.84 2.87 0.29 0 0 10.48
Adult Man 2.02 0 0.51 0 0 0.16 0 0 0 0 1.94 0.43 0 0 5.06
Total Cost of the Diet 6.92 0.28 0.77 1.49 4.11 0.38 6.17 0.33 4.53 1.84 9.08 1.02 0.51 0 37.42

103
Appendix Table 13: Weekly quantity of each nutrient provided by the edible portions of foods included in the Weekly Nutritious Household Diet in ERMERA
Municipality
Food Name Food Name
Tetun
Energy
(kcal)
Protein
(g)
Fat (g) Vitamin
A (µg
RE)
Vitamin
C (mg)
Vitamin
B1 (mg)
Vitamin
B2 (mg)
Niacin
(mg NE)
Pantoth
enic
acid
(mg)
Vitamin
B6 (mg)
Folic
acid (µg
DFE)
Vitamin
B12 (µg)
Calcium
(mg)
Iron
(mg)
Magnesi
um (mg)
Zinc
(mg)
Grains and grain-based products
White Rice (Foos Mutin) 35679 662.2 59.3 0 0 5.9 5.9 237.2 112.7 13.8 593 0 790.7 3 3558 108.7
Legumes, nuts and seeds
Adzuki/Rice
Bean
(Fore masin/
Fore lotuk)
483.1 29.2 0.8 1.5 0 0.7 0.3 3.9 2.2 0.5 913.3 0 96.9 0.4 186.5 7.4
Black Bean (Fore tali musan/
Fore metan)
1311.2 83.1 5.5 0 0 3.5 0.7 7.5 3.5 1.1 1707.3 0 473 1 657.5 14
Kidney Bean (Koto mean) 2170.6 149 8.4 0 19.4 2.7 1 39.7 3.8 2.1 2222.5 0 479.5 2.5 771.1 18.8
Tofu (Tahu) 1951.7 208 123.3 0 0 2.1 1.3 59.1 1.8 1.3 385.2 0 2696.4 6.9 2645 20.5
Meat and offal
Liver (Naan aten) 57.6 8.8 1.7 7290.7 5.3 0.1 1.3 5.8 2 0.2 104.1 39.4 2.4 0.6 7.3 2.2
Dried meat (Naan maran
(karau))
1616.7 330.7 22.2 0 0 0.4 3.1 145 2.1 5.7 111.1 21.6 185.1 6.5 407.3 30.9
Fish, seafood, amphibians and invertebrates
Small dried
fish
(Ikan tri) 225.9 39.5 6.3 0 0 0.1 0.2 12.9 1 0.3 18.9 8.1 1146.3 0.4 94.4 3.5
Eggs and egg products
Egg (local) (Manu tolun
timor)
1323.9 111.4 97.2 1780.7 0 1.5 3.4 28.5 11.7 1.3 419 21.7 502.8 3.5 88.6 17
Vegetables and vegetable products
Cassava
leaves
(Aifarina tahan) 826.9 82.7 4.5 5799.5 737.5 2 4.2 29.1 5.6 12.1 2324.3 0 4715.6 3.5 1385.6 8.9
Taro leaves (Talas tahan) 6718.2 671.8 36.3 47118 5991.9 16.3 34.5 236 45.4 98 18884 0 38312 28.1 11258 72.6
Fruit and fruit products
Dried
Coconut
(Nuu Maran) 15448 151.2 1437.8 0 7.6 2 2 22.9 4.3 2 665.3 0 815.7 4.3 1886.4 38.2
Oils and fats
Vegetable Oil (Mina importa) 2328.7 0 270.1 0 0 0 0 0 0 0 0 0 0 0 0 0
Breast Milk
Breast milk Breast milk 2420.6 39.1 145.2 1862 149 0.8 1.3 16.1 6.7 0.3 316.5 3.6 1042.7 0 130.3 4.5
Total 72562 2566.7 2218.6 63853 6910.8 38 59.3 843.7 202.8 138.7 28664 94.4 51259 60.6 23076 347.3
Target amount for the
household
72562 1213.9 1836.6 20300 1505 34.3 35 441 154 39.2 11550 67.9 30800 60.3 6202 212.1

104
Appendix Table 14: The percentage (%) of each nutrient target provided by the edible portion of foods selected by the software for the Weekly Nutritious
Household Diet in ERMERA Municipality
Food Name Food Name Tetun Energy Protein Fat Vitamin
A
Vitamin
C
Vitamin
B1
Vitamin
B2
Niacin Pantoth
enic
acid
Vitamin
B6
Folic
acid
Vitamin
B12
Calcium Iron Magnesi
um
Zinc
Grains and grain-based products
White Rice (Foos Mutin) 49.2 54.5 3.2 0 0 17.3 16.9 53.8 73.2 35.3 5.1 0 2.6 4.9 57.4 51.3
Legumes, nuts and seeds
Adzuki/Ric
e Bean
(Fore masin/ Fore
lotuk)
0.7 2.4 0 0 0 2 0.9 0.9 1.4 1.3 7.9 0 0.3 0.6 3 3.5
Black Bean (Fore tali musan/
Fore metan)
1.8 6.8 0.3 0 0 10.1 2.1 1.7 2.2 2.8 14.8 0 1.5 1.6 10.6 6.6
Kidney
Bean
(Koto mean) 3 12.3 0.5 0 1.3 7.9 3 9 2.4 5.3 19.2 0 1.6 4.1 12.4 8.9
Tofu (Tahu) 2.7 17.1 6.7 0 0 6 3.7 13.4 1.2 3.3 3.3 0 8.8 11.5 42.6 9.7
Meat and offal
Liver (Naan aten) 0.1 0.7 0.1 35.9 0.4 0.2 3.7 1.3 1.3 0.5 0.9 58 0 1 0.1 1
Dried meat (Naan maran
(karau))
2.2 27.2 1.2 0 0 1.1 8.8 32.9 1.4 14.5 1 31.8 0.6 10.7 6.6 14.5
Fish, seafood, amphibians and invertebrates
Small dried
fish
(Ikan tri) 0.3 3.3 0.3 0 0 0.2 0.5 2.9 0.7 0.7 0.2 11.9 3.7 0.7 1.5 1.7
Eggs and egg products
Egg (local) (Manu tolun timor) 1.8 9.2 5.3 8.8 0 4.4 9.6 6.5 7.6 3.2 3.6 32 1.6 5.7 1.4 8
Vegetables and vegetable products
Cassava
leaves
(Aifarina tahan) 1.1 6.8 0.2 28.6 49 5.9 12.1 6.6 3.6 30.8 20.1 0 15.3 5.7 22.3 4.2
Taro leaves (Talas tahan) 9.3 55.3 2 232.1 398.1 47.6 98.6 53.5 29.5 250.1 163.5 0 124.4 46.6 181.5 34.2
Fruit and fruit products
Dried
Coconut
(Nuu Maran) 21.3 12.5 78.3 0 0.5 5.9 5.8 5.2 2.8 5.2 5.8 0 2.6 7.2 30.4 18
Oils and fats
Vegetable
Oil
(Mina importa) 3.2 0 14.7 0 0 0 0 0 0 0 0 0 0 0 0 0
Breast Milk
Breast milk Breast milk 3.3 3.2 7.9 9.2 9.9 2.3 3.7 3.7 4.4 0.9 2.7 5.3 3.4 0 2.1 2.1
Total 100 211.4 120.8 314.5 459.2 110.9 169.4 191.3 131.7 353.9 248.2 139 166.4 100.5 372.1 163.7

105
Appendix Table 15: Weekly content and cost of the modelled nutritious diet in MANUFAHI Municipality by Household Member
Maize White
Rice
Candle
nut
Tofu Pigeon
Pea
Liver Dried
Meat
Egg
(local)
Cassava
leaves
Dried
Coconut
Vegetabl
e Oil
Breast
milk
Total
(Batar
Maran-
fulin)
(Foos
Mutin) (Kami) (Tahu) (Tunis)
(Naan
aten)
(Naan
maran
(karau))
(Manu
tolun
timor)
(Aifarina
tahan)
(Nuu
Maran)
(Mina
importa)
Breast
milk
The WEEKLY quantities of foods in grams (g) selected by the software for the household nutritious diet
12-23-month-old
Child 55 477 63 477 266 3 0 0 1164 0 0 3724 6228
6-7-year-old Child 322 1578 197 0 0 10 0 0 1605 316 0 0 4029
Adolescent Girl 0 2520 0 1287 0 21 811 682 3796 0 283 0 9400
Lactating Woman 915 2418 0 1210 0 56 449 0 5744 513 0 0 11304
Adult Man 898 2891 0 641 0 21 0 0 2705 688 0 0 7842
Total edible weight 2190 9883 260 3614 266 111 1260 682 15014 1517 283 3724 38803
Total weight 4659 9883 277 3614 266 111 1260 784 17663 1517 283 3724 44041
The WEEKLY number of servings of the foods selected by the software for the household nutritious diet
12-23-month-old
Child 1 7 11 21 12 0 0 0 11 0 0 7
6-7-year-old Child 3 14 22 0 0 1 0 0 10 6 0 0
Adolescent Girl 0 14 0 22 0 1 18 6 14 0 10 0
Lactating Woman 6 14 0 21 0 1 11 0 21 6 0 0
Adult Man 5 15 0 10 0 1 0 0 9 7 0 0
Total Servings 15 64 33 74 12 4 29 6 65 19 10 7
WEEKLY Cost of the Household Nutritious Diet (USD):
12-23-month-old
Child 0.02 0.38 0.03 0.43 0.27 0.02 0 0 0.68 0 0 0 1.84
6-7-year-old Child 0.14 1.26 0.11 0 0 0.06 0 0 0.94 0.09 0 0 2.61
Adolescent Girl 0 2.02 0 1.16 0 0.12 5.92 4.39 2.23 0 0.54 0 16.38
Lactating Woman 0.39 1.93 0 1.09 0 0.34 3.28 0 3.38 0.15 0 0 10.56
Adult Man 0.38 2.31 0 0.58 0 0.12 0 0 1.59 0.21 0 0 5.19
Total Cost of the Diet 0.93 7.91 0.14 3.25 0.27 0.66 9.2 4.39 8.83 0.46 0.54 0 36.57

106
Appendix Table 16: Weekly quantity of each nutrient provided by the edible portions of foods included in the Weekly Nutritious Household Diet in MANUFAHI
Municipality
Food Name Food Name Energ
y
(kcal)
Protei
n (g)
Fat (g) Vitami
n A
(µg
RE)
Vitam
in C
(mg)
Vitami
n B1
(mg)
Vitami
n B2
(mg)
Niacin
(mg
NE)
Panto
thenic
acid
(mg)
Vitami
n B6
(mg)
Folic
acid
(µg
DFE)
Vitami
n B12
(µg)
Calciu
m
(mg)
Iron
(mg)
Magn
esium
(mg)
Zinc
(mg)
Grains and grain-based products
Maize (Batar Maran-
fulin)
7642.3 200.4 90 0 0 7.7 2.2 44.9 12.3 4.4 569.3 0 410.1 3.4 1792.1 33.9
White Rice (Foos Mutin -
importa)
35679 662.2 59.3 0 0 5.9 5.9 237.2 112.7 13.8 593 0 790.7 3 3558 108.7
Legumes, nuts and seeds
Candlenut (Kami) 1531.2 52 135.7 0 2.6 0.5 2 24.4 1.2 0.3 153.4 0 691.5 0.5 769.5 7.5
Tofu (Tahu) 2746.8 292.8 173.5 0 0 2.9 1.8 83.1 2.5 1.8 542.1 0 3795 9.8 3722.7 28.9
Pigeon Pea (Tunis) 847.7 58.5 3.2 8 0 0.8 0.7 14.6 1.2 0.5 802.6 0 276.4 0.6 332.2 7.7
Meat and offal
Liver (Naan aten) 131.7 20 4 16678 12.2 0.1 2.9 13.2 4.7 0.4 238 90.1 5.5 1.4 16.6 5
Dried Meat (Naan maran
(karau)
3300.4 675.2 45.3 0 0 0.8 6.3 296 4.3 11.6 226.7 44.1 377.9 13.2 831.4 63
Eggs and egg products
Egg (local) (Manu tolun
timor)
1078.1 90.8 79.2 1450.1 0 1.2 2.7 23.2 9.6 1 341.2 17.7 409.4 2.8 72.1 13.9
Vegetables and vegetable products
Cassava
leaves
(Aifarina
tahan)
5555.1 555.5 30 38961 4954.6 13.5 28.5 195.2 37.5 81.1 15615 0 31679 23.3 9308.6 60.1
Fruit and fruit products
Dried
Coconut
(Nuu Maran) 9193.1 90 855.6 0 4.6 1.2 1.2 13.7 2.6 1.2 395.9 0 485.4 2.6 1122.6 22.8
Oils and fats
Vegetable
Oil
(Mina
importa)
2436.1 0 282.6 0 0 0 0 0 0 0 0 0 0 0 0 0
Breast Milk
Breast milk Breast milk 2420.6 39.1 145.2 1862 149 0.8 1.3 16.1 6.7 0.3 316.5 3.6 1042.7 0 130.3 4.5
Total 72562 2736.
3
1903.
6
58959 5122.
9
35.4 55.7 961.5 195.2 116.5 19793 155.5 39964 60.4 21656 355.9
Target amount for the
household
72562 1213.
9
1836.
6
20300 1505 34.3 35 441 154 39.2 11550 67.9 30800 60.3 6202 212.1

107
Appendix Table 17: The percentage (%) of each nutrient target provided by the edible portion of foods selected by the software for the Weekly Nutritious
Household Diet in MANUFAHI Municipality
Food
Name
Food Name Energ
y
Prote
in
Fat Vita
min
A
Vita
min C
Vita
min
B1
Vita
min
B2
Niaci
n
Panto
theni
c acid
Vita
min
B6
Folic
acid
Vita
min
B12
Calci
um
Iron Magn
esiu
m
Zinc
Grains and grain-based products
Maize (Batar
Maran-fulin)
10.5 16.5 4.9 0 0 22.3 6.3 10.2 8 11.2 4.9 0 1.3 5.6 28.9 16
White Rice (Foos Mutin -
importa)
49.2 54.5 3.2 0 0 17.3 16.9 53.8 73.2 35.3 5.1 0 2.6 4.9 57.4 51.3
Legumes, nuts and seeds
Candlenut (Kami) 2.1 4.3 7.4 0 0.2 1.6 5.8 5.5 0.8 0.7 1.3 0 2.2 0.8 12.4 3.6
Tofu (Tahu) 3.8 24.1 9.4 0 0 8.4 5.2 18.8 1.6 4.6 4.7 0 12.3 16.2 60 13.6
Pigeon
Pea
(Tunis) 1.2 4.8 0.2 0 0 2.2 2 3.3 0.8 1.4 6.9 0 0.9 1 5.4 3.6
Meat and offal
Liver (Naan aten) 0.2 1.7 0.2 82.2 0.8 0.4 8.4 3 3 1.1 2.1 132.7 0 2.3 0.3 2.3
Dried
Meat
(Naan maran
(karau))
4.5 55.6 2.5 0 0 2.2 18 67.1 2.8 29.6 2 64.9 1.2 21.9 13.4 29.7
Eggs and egg products
Egg (local) (Manu tolun
timor)
1.5 7.5 4.3 7.1 0 3.6 7.8 5.3 6.2 2.6 3 26 1.3 4.7 1.2 6.5
Vegetables and vegetable products
Cassava
leaves
(Aifarina
tahan)
7.7 45.8 1.6 191.9 329.2 39.4 81.5 44.3 24.4 206.8 135.2 0 102.9 38.6 150.1 28.3
Fruit and fruit products
Dried
Coconut
(Nuu Maran) 12.7 7.4 46.6 0 0.3 3.5 3.5 3.1 1.7 3.1 3.4 0 1.6 4.3 18.1 10.7
Oils and fats
Vegetable
Oil
(Mina
importa)
3.4 0 15.4 0 0 0 0 0 0 0 0 0 0 0 0 0
Breast Milk
Breast
milk
Breast milk 3.3 3.2 7.9 9.2 9.9 2.3 3.7 3.7 4.4 0.9 2.7 5.3 3.4 0 2.1 2.1
Total Total 100 225.4 103.7 290.4 340.4 103.3 159 218 126.8 297.2 171.4 229 129.8 100.1 349.2 167.8

108
Appendix Table 18: Weekly content and cost of the modelled nutritious diet in OECUSSE Municipality by Household Member
White
Rice
Black
Bean
Velvet
Beans
Tofu Liver Dried
Meat
Egg
(local)
Cassava
Leaves
Kangkon
g/Water
Spinach
Dried
Coconut
Vegetabl
e Oil
Breast
milk
Total
(Foos
Mutin)
(Fore tali
musan/
metan)
(Lehe
musan)
(Tahu) (Naan
aten)
(Naan
maran
(karau))
(Manu
tolun
timor)
(Aifarina
tahan)
(Kanko) (Nuu
Maran)
(Mina
importa)
Breast
milk
The WEEKLY quantities of foods in grams (g) selected by the software for the household nutritious diet
12-23-month-old
Child
477 3 347 430 3 0 0 775 0 49 0 3724 5808
6-7-year-old Child 1578 0 348 0 10 0 0 1710 0 475 0 0 4121
Adolescent Girl 2520 0 0 1287 0 617 838 4860 0 0 270 0 10392
Lactating Woman 2418 0 1030 1210 21 82 0 5744 1297 523 0 0 12323
Adult Man 2891 0 962 0 21 0 0 2691 0 700 0 0 7265
Total edible weight 9883 3 2687 2927 55 699 838 15779 1297 1747 270 3724 39910
Total weight 9883 3 2687 2927 55 699 963 18564 1491 1747 270 3724 43013
The WEEKLY number of servings of the foods selected by the software for the household nutritious diet
12-23-month-old
Child
7 0 16 19 0 0 0 8 0 2 0 7
6-7-year-old Child 14 0 10 0 1 0 0 10 0 9 0 0
Adolescent Girl 14 0 0 22 0 14 7 17 0 0 9 0
Lactating Woman 14 0 18 21 1 2 0 21 5 7 0 0
Adult Man 15 0 14 0 1 0 0 9 0 7 0 0
Total Servings 64 0 58 62 3 16 7 65 5 25 9 7
WEEKLY Cost of the Household Nutritious Diet (USD):
12-23-month-old
Child
0.33 0 0.17 0.47 0.02 0 0 0.55 0 0.01 0 0 1.57
6-7-year-old Child 1.1 0 0.17 0 0.06 0 0 1.21 0 0.14 0 0 2.69
Adolescent Girl 1.76 0 0 1.42 0 8.82 5.49 3.43 0 0 0.59 0 21.52
Lactating Woman 1.69 0 0.52 1.33 0.12 1.17 0 4.05 1.19 0.16 0 0 10.23
Adult Man 2.02 0 0.48 0 0.12 0 0 1.9 0 0.21 0 0 4.74
Total Cost of the Diet 6.92 0 1.34 3.22 0.33 9.99 5.49 11.14 1.19 0.52 0.59 0 40.75

109
Appendix Table 19: Weekly quantity of each nutrient provided by the edible portions of foods included in the Weekly Nutritious Household Diet in OECUSSE
Municipality
Food Name Food Name
(Tetun)
Energ
y
(kcal)
Protei
n (g)
Fat (g) Vitami
n A (µg
RE)
Vita
min C
(mg)
Vita
min
B1
(mg
)
Vitam
in B2
(mg)
Niacin
(mg
NE)
Panto
thenic
acid
(mg)
Vitam
in B6
(mg)
Folic
acid
(µg
DFE)
Vitam
in B12
(µg)
Calciu
m
(mg)
Iron
(mg)
Magn
esium
(mg)
Zinc
(mg)
Grains and grain-based products
White Rice (Foos Mutin) 35679 662.2 59.3 0 0 5.9 5.9 237.2 112.7 13.8 593 0 790.7 3 3558 108.7
Legumes, nuts and seeds
Black Bean (Fore tali musan/
metan)
11.1 0.7 0 0 0 0 0 0.1 0 0 14.4 0 4 0 5.6 0.1
Velvet Beans (Lehe musan) 9914.1 634.1 104.8 67.2 107.5 10.2 4.6 157.2 32.8 11.3 12520 0 2418.1 11 2982.3 99.4
Tofu (Tahu) 2224.6 237.1 140.5 0 0 2.3 1.5 67.3 2 1.5 439.1 0 3073.4 7.9 3014.9 23.4
Meat and offal
Liver (Naan aten) 65.2 9.9 2 8259.4 6 0.1 1.5 6.5 2.3 0.2 117.9 44.6 2.7 0.7 8.2 2.5
Dried Meat (Naan maran
(karau))
1830.6 374.5 25.2 0 0 0.4 3.5 164.2 2.4 6.4 125.8 24.5 209.6 7.3 461.1 34.9
Eggs and egg products
Egg (local) (Manu tolun
timor)
1323.9 111.4 97.2 1780.7 0 1.5 3.4 28.5 11.7 1.3 419 21.7 502.8 3.5 88.6 17
Vegetables and vegetable products
Cassava
Leaves
(Aifarina tahan) 5838.4 583.8 31.6 40948 5207.2 14.2 30 205.1 39.4 85.2 16411 0 33295 24.5 9783.3 63.1
Kangkong/W
ater Spinach
(Kanko) 337.2 38.5 6.4 5302.4 274.7 0.4 1.2 18.2 2.1 2.6 2515.8 0 1163.1 1.5 671.9 11.7
Fruit and fruit products
Dried
Coconut
(Nuu Maran) 10589 103.6 985.5 0 5.2 1.4 1.4 15.7 3 1.4 456.1 0 559.2 3 1293 26.2
Oils and fats
Vegetable Oil (Mina importa) 2328.7 0 270.1 0 0 0 0 0 0 0 0 0 0 0 0 0
Breast Milk
Breast milk Breast milk 2420.6 39.1 145.2 1862 149 0.8 1.3 16.1 6.7 0.3 316.5 3.6 1042.7 0 130.3 4.5
Total 72562 2795 1867.8 58219 5749.
6
37.3 54.1 916.1 215.1 124 33928 94.4 43061 62.3 21997 391.5
Target amount for the
household
72562 1213.9 1836.6 20300 1505 34.3 35 441 154 39.2 11550 67.9 30800 60.3 6202 212.1

110
Appendix Table 20: The percentage (%) of each nutrient target provided by the edible portion of foods selected by the software for the Weekly Nutritious
Household Diet in OECUSSE Municipality
Food
Name
Food Name
(Tetun)
Energ
y
Protei
n
Fat Vitam
in A
Vitam
in C
Vitam
in B1
Vitam
in B2
Niacin Panto
thenic
acid
Vitam
in B6
Folic
acid
Vitam
in B12
Calciu
m
Iron Magn
esium
Zinc
Grains and grain-based products
White Rice (Foos Mutin) 49.2 54.5 3.2 0 0 17.3 16.9 53.8 73.2 35.3 5.1 0 2.6 4.9 57.4 51.3
Legumes, nuts and seeds
Black Bean (Fore tali
musan/metan)
0 0.1 0 0 0 0.1 0 0 0 0 0.1 0 0 0 0.1 0.1
Velvet
Beans
(Lehe musan) 13.7 52.2 5.7 0.3 7.1 29.8 13 35.6 21.3 28.8 108.4 0 7.9 18.3 48.1 46.9
Tofu (Tahu) 3.1 19.5 7.7 0 0 6.8 4.2 15.3 1.3 3.7 3.8 0 10 13.1 48.6 11
Meat and offal
Liver (Naan aten) 0.1 0.8 0.1 40.7 0.4 0.2 4.2 1.5 1.5 0.5 1 65.7 0 1.1 0.1 1.2
Dried
Meat
(Naan maran
(karau))
2.5 30.8 1.4 0 0 1.2 10 37.2 1.5 16.4 1.1 36 0.7 12.2 7.4 16.5
Eggs and egg products
Egg (local) (Manu tolun
timor)
1.8 9.2 5.3 8.8 0 4.4 9.6 6.5 7.6 3.2 3.6 32 1.6 5.7 1.4 8
Vegetables and vegetable products
Cassava
Leaves
(Aifarina tahan) 8 48.1 1.7 201.7 346 41.4 85.7 46.5 25.6 217.4 142.1 0 108.1 40.5 157.7 29.8
Kangkong
/Water
Spinach
(Kanko) 0.5 3.2 0.3 26.1 18.2 1.1 3.3 4.1 1.3 6.6 21.8 0 3.8 2.4 10.8 5.5
Fruit and fruit products
Dried
Coconut
(Nuu Maran) 14.6 8.5 53.7 0 0.3 4.1 4 3.6 1.9 3.6 3.9 0 1.8 4.9 20.8 12.4
Oils and fats
Vegetable
Oil
(Mina importa) 3.2 0 14.7 0 0 0 0 0 0 0 0 0 0 0 0 0
Breast Milk
Breast
milk
Breast milk 3.3 3.2 7.9 9.2 9.9 2.3 3.7 3.7 4.4 0.9 2.7 5.3 3.4 0 2.1 2.1
Total 100 230.2 101.7 286.8 382 108.7 154.6 207.7 139.7 316.4 293.8 139 139.8 103.2 354.7 184.6

111
Appendix Table 21: Limiting nutrients by household member and municipality in the CotD modelled
Nutritious diet.
Limiting nutrients in the CotD analysis are defined as nutrients for which requirements would
be difficult to meet for all or some household members using locally available foods without
exceeding the energy threshold.
Municipalit
y
Target Group Vit
A
B1 B2 B5 B12 Cal Iro
n
Zin
c
Baucau Breastfeeding Child (12-23 months)
1
1 1 1 1
Primary School Child (6-7 years)
1 1
1 1
Adolescent girl (14-15 years)
1
1
Lactating adult woman
1
1
1
Adult man
1 1
1 1 1
Bobonaro
Breastfeeding Child (12-23 months) 1 1
1
Primary School Child (6-7 years) 1 1
1
Adolescent girl (14-15 years)
1
1 1
Lactating adult woman
1
1
1 1
Adult man 1 1
1
Dili
Breastfeeding Child (12-23 months)
1 1
1 1 1
Primary School Child (6-7 years)
1
Adolescent girl (14-15 years)
Lactating adult woman
Adult man
1 1
1 1
Ermera Breastfeeding Child (12-23 months)
1
1 1
Primary School Child (6-7 years)
1
1 1
Adolescent girl (14-15 years)
1
Lactating adult woman
1
1
1
Adult man
Manufahi Breastfeeding Child (12-23 months)
1
1
1 1
Primary School Child (6-7 years)
1
1 1
Adolescent girl (14-15 years)
1 1
Lactating adult woman
1
1
1
Adult man
1
1 1 1
Oecusse
Breastfeeding Child (12-23 months)
1
1 1 1
Primary School Child (6-7 years)
1
1 1
Adolescent girl (14-15 years)
1
1
Lactating adult woman
1
1
Adult man
1
1 1

112
Appendix Table 22: Results of CotD re-analysis to estimate cost by geographic zone instead of
municipality using non-representative data.
The results in appendix tables 5 and 6 have been provided for comparison only at the request
of members of the technical working group in Timor-Leste. Here results are presented from a
re-analysis of the market price data according to geographic zones (approved by the technical
working group) rather than municipalities. For this re-analysis, each market location from the
dataset (see appendix table 4) was allocated to one of four geographic zones; Coastal-rural,
Mountains-rural, Dili City or Urban (outside Dili). Next, market food availability and food prices
were averaged across each new geographic zone and new CotD analyses were run to estimate
the cost of meeting a) Estimated energy needs only and b) Estimated energy needs and
requirements for protein and 13 micronutrients for the model 5-person household. These
results are presented in Appendix Table 5. The cost of the energy-only diet ranged from $32-
$64 per month, similar to the original analysis (figure 12). Instead the redistributed nutritious
diets cost $172-$241 per month. The costs of diets in Dili were similar to those presented in
table 12 in section 3 as the sample of markets did not differ greatly. Likewise, the cost of diets
in rural mountain areas were similar to the costs of diets in Bobonaro and Ermera municipalities
which are quite mountainous. Differences were seen in the costs of meeting nutrient
requirements in urban areas (outside of Dili), which was more expensive than some of the
municipal averages, and in the cost of meeting nutrient requirements in coastal areas.
Next, these diet costs were compared to re-distributed household food-expenditure data
(adjusted for inflation) from the 2014-2015 TL-SLS to estimate the percentage of households
in each geographic zone that would be able to afford the two diets. The results show that 93-
100% of households would be able to afford a diet that met energy needs only and 15-19%
would be able to afford a nutritious diet. Compared with figure 18, less households would be
able to afford nutritious diets according to the analysis considering geographic zones.
$54
$32
$64 $62
$212
$172
$241
$205
$0
$50
$100
$150
$200
$250
Coast - Rural Mountains -Rural Dili City Urban (Outside Dili)
Co
st (
$U
SD/M
on
th)
of
mee
tin
g n
utr
ien
t re
qu
irem
ents
fo
r a
mo
del
fiv
e-p
erso
n
ho
use
ho
ld
Geographic Area (re-distribution for comparison only)
Energy Only Nutritious Diet

113
It is important to note that these figures should be interpreted with caution and used for
comparison with the results in this report only and not to inform decision-making. This is
because neither the sampling of market survey locations or the sampling of households within
the TL-SLS were carried out to provide representation at the level of geographic-zones.
Appendix Table 23: Results of CotD re-analysis to estimate diet affordability by geographic zone instead
of municipality using non-representative data.
Appendix Table 24: Comparison of CotD estimated diet costs with the estimated 2019 household food
expenditure to estimate the percentage of households that would be able to afford the energy-only and
nutritious diets in BAUCAU
97% 100% 97%93%
16%19% 18%
15%
0%
10%
20%
30%
40%
50%
60%
70%
80%
90%
100%
Coast - Rural Mountains -Rural Dili City Urban (Outside Dili)
Esti
mat
ed p
erce
nta
ge o
f h
ou
seh
old
s w
ho
wo
uld
be
able
to
aff
ord
a n
utr
itio
us
die
t
Geographic Area (re-distribution for comparison only)Energy Only Nutritious Diet

114
Appendix Table 27: Comparison of CotD estimated diet costs with the estimated 2019 household food expenditure to estimate the percentage of households that would be able to afford the energy-only and nutritious diets in DILI
Appendix Table 26: Comparison of CotD estimated diet costs with the estimated 2019 household food expenditure to estimate the percentage of households that would be able to afford the energy-only and nutritious diets in ERMERA

115
Appendix Table 28: Comparison of CotD estimated diet costs with the estimated 2019 household food expenditure to estimate the percentage of households that would be able to afford the energy-only and nutritious diets in MANUFAHI
Appendix Table 29: Comparison of CotD estimated diet costs with the estimated 2019 household food expenditure to estimate the percentage of households that would be able to afford the energy-only and nutritious diets in OECUSSE

116
Appendix Table 30: Nutrient composition of Orange-Flesh Sweet Potato used for modelling in section 8
Food Name SWEETPOTATO,ORAN
GE,W/SKIN,FRESH,RA
W
Sweet potato, orange,
raw
ORIGIN
HarvestPlus 4103 USDA
ENERGY kcal/100g 123 86
PROTEIN g/100g 2.3 1.57
WATER mg/100g 67.4 67.4
FAT mg/100g 0.1 0.05
CARBOHYDR
ATE
mg/100g 28.9 20.12
Ca mg/100g 43 30
Fe mg/100g 0.9 0.61
Zn mg/100g 0.448 0.3
Vit C ug/dietary folate
equivalents/
100g
3.4 2.4
B-1 ug/100g 0.112 0.08
B-2 ug/Retinol Equivalents/100g 0.088 0.06
B-3 ug/Retinol Activity
Equivalents/100g
0.8 0.56
B-6 mg/100g 0.3 0.21
Fol mg/day 16 11
B-12 mg/100g 0 0
VA RE mg/100g 899.5 709
VA RAE mg/100g 503.43 709

117

118
The United Nations World Food Program (WFP) would like to acknowledge the financial
and technical support from The Food and Agriculture Organisation of the United
Nations (FAO), The United Nations Children's Fund (UNICEF), The World Health
Organisation (WHO), The European Union, Korea International Cooperation Agency
(KOICA) and the USAID Avansa Agriculture Project for this study.
Further Information:
WFP Timor Leste, UN House, Caicoli Street, Dili, Timor-Leste. Box No. 133
[email protected], Tel: +670 3310503
https://www1.wfp.org/countries/timor-leste