4.2 HOUSEHOLD DATA COLLECTION - WFP Document ...
44
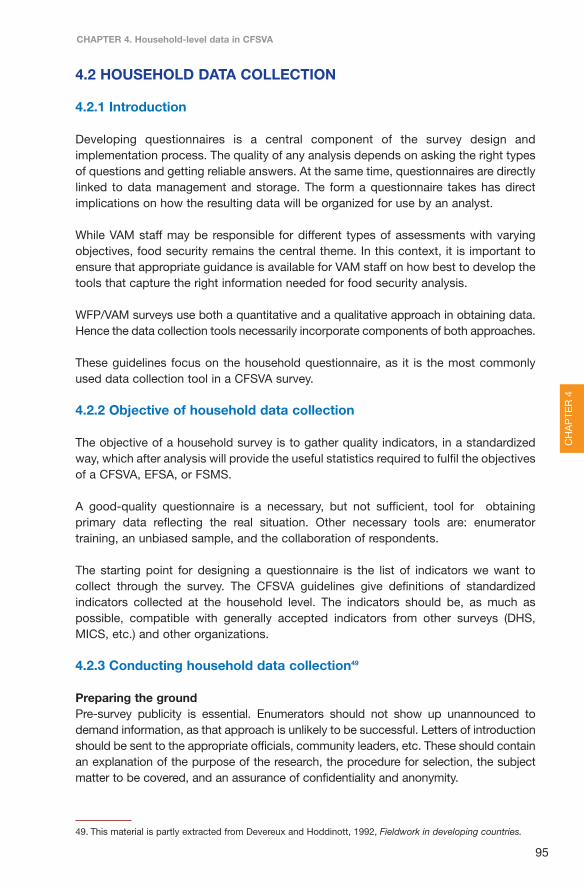
CHAPTER 4. Household-level data in CFSVA 95 4.2 HOUSEHOLD DATA COLLECTION 4.2.1 Introduction Developing questionnaires is a central component of the survey design and implementation process. The quality of any analysis depends on asking the right types of questions and getting reliable answers. At the same time, questionnaires are directly linked to data management and storage. The form a questionnaire takes has direct implications on how the resulting data will be organized for use by an analyst. While VAM staff may be responsible for different types of assessments with varying objectives, food security remains the central theme. In this context, it is important to ensure that appropriate guidance is available for VAM staff on how best to develop the tools that capture the right information needed for food security analysis. WFP/VAM surveys use both a quantitative and a qualitative approach in obtaining data. Hence the data collection tools necessarily incorporate components of both approaches. These guidelines focus on the household questionnaire, as it is the most commonly used data collection tool in a CFSVA survey. 4.2.2 Objective of household data collection The objective of a household survey is to gather quality indicators, in a standardized way, which after analysis will provide the useful statistics required to fulfil the objectives of a CFSVA, EFSA, or FSMS. A good-quality questionnaire is a necessary, but not sufficient, tool for obtaining primary data reflecting the real situation. Other necessary tools are: enumerator training, an unbiased sample, and the collaboration of respondents. The starting point for designing a questionnaire is the list of indicators we want to collect through the survey. The CFSVA guidelines give definitions of standardized indicators collected at the household level. The indicators should be, as much as possible, compatible with generally accepted indicators from other surveys (DHS, MICS, etc.) and other organizations. 4.2.3 Conducting household data collection 49 Preparing the ground Pre-survey publicity is essential. Enumerators should not show up unannounced to demand information, as that approach is unlikely to be successful. Letters of introduction should be sent to the appropriate officials, community leaders, etc. These should contain an explanation of the purpose of the research, the procedure for selection, the subject matter to be covered, and an assurance of confidentiality and anonymity. CHAPTER 4 49. This material is partly extracted from Devereux and Hoddinott, 1992, Fieldwork in developing countries.
-
Upload
khangminh22 -
Category
Documents
-
view
0 -
download
0
Transcript of 4.2 HOUSEHOLD DATA COLLECTION - WFP Document ...
CHAPTER 4. Household-level data in CFSVA
95
4.2 HOUSEHOLD DATA COLLECTION
4.2.1 Introduction
Developing questionnaires is a central component of the survey design andimplementation process. The quality of any analysis depends on asking the right typesof questions and getting reliable answers. At the same time, questionnaires are directlylinked to data management and storage. The form a questionnaire takes has directimplications on how the resulting data will be organized for use by an analyst.
While VAM staff may be responsible for different types of assessments with varyingobjectives, food security remains the central theme. In this context, it is important toensure that appropriate guidance is available for VAM staff on how best to develop thetools that capture the right information needed for food security analysis.
WFP/VAM surveys use both a quantitative and a qualitative approach in obtaining data.Hence the data collection tools necessarily incorporate components of both approaches.
These guidelines focus on the household questionnaire, as it is the most commonlyused data collection tool in a CFSVA survey.
4.2.2 Objective of household data collection
The objective of a household survey is to gather quality indicators, in a standardizedway, which after analysis will provide the useful statistics required to fulfil the objectivesof a CFSVA, EFSA, or FSMS.
A good-quality questionnaire is a necessary, but not sufficient, tool for obtainingprimary data reflecting the real situation. Other necessary tools are: enumeratortraining, an unbiased sample, and the collaboration of respondents.
The starting point for designing a questionnaire is the list of indicators we want tocollect through the survey. The CFSVA guidelines give definitions of standardizedindicators collected at the household level. The indicators should be, as much aspossible, compatible with generally accepted indicators from other surveys (DHS,MICS, etc.) and other organizations.
4.2.3 Conducting household data collection49
Preparing the groundPre-survey publicity is essential. Enumerators should not show up unannounced todemand information, as that approach is unlikely to be successful. Letters of introductionshould be sent to the appropriate officials, community leaders, etc. These should containan explanation of the purpose of the research, the procedure for selection, the subjectmatter to be covered, and an assurance of confidentiality and anonymity.
CH
AP
TER
4
49. This material is partly extracted from Devereux and Hoddinott, 1992, Fieldwork in developing countries.
Chapt 4 p 63_178 esec 18-05-2009 1:38 Pagina 95
96
Comprehensive Food Security & Vulnerability Analysis Guidelines
The first step to a successful interview is properly introducing oneself to therespondent and obtaining informed consent.50 Enumerators must briefly explain tothose being interviewed the purpose of their study, who has funded and supported it,how the data will be collected, the expected duration of the interview, and how theresults may be used. If a respondent does not understand the purpose of the interviewor does not wish to participate, the survey may end up with inaccurate or misleadinganswers. The respondents should be aware that they will not receive payment or anyother form of compensation, but that their participation is voluntary and that they mayrefuse to participate in the interview or stop it at any time. Consent must be derivedfrom the actual people involved, not just officials or leaders.
Equally important is talking with an appropriate respondent. The respondent should bean adult member of the household – not a guest – and preferably the household heador her/his spouse. If nobody suitable is available, skip this household and move to thenext on the list, returning later to interview the household, if possible.51
Interacting with respondentsAn essential qualification for successful fieldworkers is a demonstrable and genuineinterest in other people. The ideal interview is a friendly conversation betweenenumerator and respondent. The posing of questions and the noting of replies shouldhave the flow and pattern of a dialogue.52 This is not accomplished if enumerators areimpolite or brusque; nor is it possible if poorly trained enumerators fumble their waythrough the questionnaire.
A common pitfall is the mechanical recitation of questions without thinking about theresponses being given; often this leads to extensive work for those cleaning dataduring analysis. Time must be taken during the interview. Questions must be askedcarefully, making sure that respondents have understood them correctly. It may benecessary to repeat questions and probe to be sure the answer recorded is the oneintended.
The interview settingInterviews are usually one-on-one encounters. When the research deals withpersonally sensitive matters, the presence of outsiders, or even other family members,may inhibit respondents, embarrassing them into evasion or silence. Onlookers mayencourage respondents to answer untruthfully. For example, working during foodcrises is problematic because respondents have an incentive to understate their stocksof grain and their general wealth, with the expectation that food aid will be brought intothe community. This tendency will be exacerbated during a public interview, since arespondent who admits to being wealthy may face demands for help from poorerneighbours or relatives. In general, the more sensitive the topic, the stronger the casefor conducting the interview in private.
50. Wilson, 1992. 51. WFP. EFSA Handbook 2009. 52. Casley and Lury (1987:111)
Chapt 4 p 63_178 esec 18-05-2009 1:38 Pagina 96

CHAPTER 4. Household-level data in CFSVA
97
It is critical to be mindful of when the interview is conducted, as the process can be animposition on respondents’ time. Day of the week and time of day are important in bothrural and urban settings. Attempt to meet on days and at times convenient torespondents. For example, in urban settings, interviews outside of regular work weekhours may be necessary. In rural settings, women may be busy on market days andwhen preparing meals; men may be busy working in the field at a particular time of day.One way of ensuring that interviews are not an imposition is to make appointments tosee people. An interview should never last more than 90 minutes and should be heldin a place convenient for the respondent. Urban teams and respondents should beprotected from violence and crime by interviewing only at “safe times.”
4.2.4 Modules of questions
The questions used to construct single indicators, or different indicators related to similartopics, are usually organized in modules, which should be ordered logically in aquestionnaire. Within a module, questions follow a logical flow, and should not be redundant.
Types of modules in a food security household questionnaireBased on an extensive review of household questionnaires, commonly used moduleshave been divided into four broad categories:
1. Core modules with standard, non-changeable, questions. These modules havebeen tested and used in several CFSVAs, EFSAs, and FSMS and must be used inall food security assessment questionnaires. They contain standard questions(formulated in a standardized way but with country-specific adaptations, e.g. fooditems, expenditure items) that have proven to be useful for data analysis andanswering the five VAM questions. The modules were identified as:
• Food consumption patterns (including sources of foods consumed)• Expenditures• Household assets• Sources of water• Access to sanitation
2. Core modules with questions that are flexible (i.e. changeable) depending onspecific contexts and survey objectives. Some standards have been developedfor these modules – but there are slight variations from country to country. Thesemodules are central to WFP food security assessments and essential to answeringthe five VAM questions. Specifically, the modules containing flexible questions are:
• Household composition/demography and education• Housing materials (walls, floors)• Access to credit, indebtedness• Livelihoods/sources of income• Agriculture• Livestock• External assistance (food and non-food)• Shocks, coping, and/or coping strategies index
CH
AP
TER
4
Chapt 4 p 63_178 esec 18-05-2009 1:38 Pagina 97
98
Comprehensive Food Security & Vulnerability Analysis Guidelines
3. Non-core modules with non-changeable questions. These modules aresometimes, but not always included in CFSVAs, EFSAs and FSMS. Globalstandards have been established for these modules, and therefore thequestions should not be adapted or changed. The data are very relevant interms of answering the five VAM questions. Specifically, this type of moduleincludes:• Maternal health and nutrition• Child health and nutrition
4. Non-core modules with changeable/flexible questions. This type of module issometimes, but not always included in WFP food security assessments. Thesemodules are quite flexible in terms of structure and the types of questions posed.The main modules that fall within this category are:• Migration/movement, displacement status• Remittances
5. For each one of the four categories and modules contained therein, a series ofguidance notes have been written that include the following information:• Main purpose of the module• Current limitations of the module• Creation of the module (i.e., how-to)• Modifications that can be made to the module• Links to other modules
Each category and associated modules are detailed in section 4.2.4.1.
4.2.4.1 Core modules with standard, non-changeable questions
Module Title: Food Consumption Patterns (including sources of food)
Main purpose of the module: This module allows the analyst to calculate the foodconsumption score (FCS) for each household and to investigate current foodconsumption patterns.
Limitations of the module• The module cannot provide the caloric value or nutritional adequacy of the
household diet.• The module cannot measure the quantity of the food consumed.• The module does not look at the intra-household differences in consumption.
Creation of the Food Consumption Patterns moduleBefore recording the dietary diversity and frequency of the household diet, ask thefollowing questions as to the number of meals consumed:i) Yesterday, how many times did adults eat?ii) Yesterday, how many times did children 6 to 12 years of age eat (should link with
demographic section)?
Chapt 4 p 63_178 esec 18-05-2009 1:38 Pagina 98

CHAPTER 4. Household-level data in CFSVA
99
List the food items belonging to food groups typically eaten in a specific context. Thelist (which is country specific) should contain: (a) staples and food eaten commonlythroughout the study area; and (b) preferred items (e.g. maize versus millet, cassavaversus Irish potatoes). The list of food items is country specific and should reflectwhat is typically consumed in the country. However, food items should be listed insuch a way that allows their aggregation into the food groups used for computationof the FCS.
• The list should include between 15 and 20 food items. The list is not meant to becomprehensive of all food items found in the country. Instead, it should reflect thebasic items found in a general diet (e.g. oil, salt, meat, dairy products). Use of theword “other” can make the list comprehensive enough.
• Corn-soya blend (CSB) should be considered a separate food item.
• If particular condiments are consumed with staples, it is important to identify themas such and not group them with that food item (e.g. fish powder with fresh fish, milkin tea and glass of milk). Training should be given on whether to include condimentsin the analysis.53
• It is important to ask about combination food items. For example, when a householdindicates that maize and sauce were eaten, and the sauce is prepared with oil,vegetables, salt, and chicken, these items should be indicated as consumed, withthe amounts of oil, salt, vegetables, and chicken regarded as more than merecondiments.
• If one member of a household consumes food away from the household, the itemseaten should not be recorded. If the entire household ate outside of the household,then the items consumed should be recorded.54
• For all food items, the recall period is set at the previous seven days. The purpose isto capture the number of days out of seven that a particular food item wasconsumed.
• Aside from the food items it is important to identify the primary sources from whichthe food was acquired (this can be either the primary source or the two primarysources). Generally these sources are: own production; hunting, fishing andgathering;55 exchange; borrowed; purchased; gift; food aid; and credit.
• All items should have a numeric value. There should be no empty cells. If noconsumption is reported, then the source and number of days is recorded as zero.
CH
AP
TER
4
53. This issue needs further discussion and consensus. 54. This is particularly acute in urban and peri-urban areas.55. If any of these food sources is a specific and important activity, then hunting, fishing, and gathering can be
split up.
Chapt 4 p 63_178 esec 18-05-2009 1:38 Pagina 99

100
Comprehensive Food Security & Vulnerability Analysis Guidelines
• The main indicators emanating from the analysis of these data are: (a) number ofdays out of seven that items and food groups are consumed; (b) household FCS; and(c) percentage contribution of the sources to the household food basket over theprevious seven days.
• This module has to be adapted to the context. The food items can be changed, butthe exact same eight food groups (staple food, pulses, vegetables, fruits, meat andfish, milk, sugar, oil, condiments) should always be used.56
Modifications to the module• A separate column can be added to the table if an item was consumed in the
previous 24 hours. This would be a way to incorporate the Household DietaryDiversity Score (HDDS) indicator in the module. However, the HDDS uses a differentdata collection methodology and a different questionnaire.57
• The number of meals people consumed in the previous 24 hours by age cohortgroups in the household (e.g. children under 6, children 6 to 12, and children 13 to 18)can be modified when specific information on child food consumption (or other agecohorts) is needed (e.g. in order to programme a school-age child or MCH food aidintervention).
• Contribution of sources in the previous year and quarters, which can provideinformation about seasonality for food security analysis, can be modified.Information for a few key staple food groups or for general food consumption maysuffice. The source categories should be the same as those used for the foodsources. See the following table for an example:
Table 4.4: Example of a Food Consumption Patterns moduleYesterday, how many meals did the ______ in this house eat?
Adults Children (< 6 yrs)
Food Item No. of days eatenover last 7 days
Food source (mainand secondary)
Food Source Codes
Maize |__| |__|,|__|Rice/paddy |__| |__|,|__|Millets |__| |__|,|__|Wheat/Barley andother cereal products |__| |__|,|__|Roots and tubers(potatoes, yam) |__| |__|,|__|Pulses/lentils |__| |__|,|__|Fish |__| |__|,|__|White meat (poultry) |__| |__|,|__|Pork |__| |__|,|__|Red meat (goat, sheep) |__| |__|,|__|Red meat (buffalo) |__| |__|,|__|Eggs |__| |__|,|__|Milk/curd/otherdairy products |__| |__|,|__|Vegetables |__| |__|,|__|Fresh fruits |__| |__|,|__|Oil/fats/ghee/butter |__| |__|,|__|Sugar/sweets |__| |__|,|__|Salt/spices/condiments |__| |__|,|__|
1 = Own production(crops, animals)
2 = Hunting, fishing
3 = Gathering
4 = Borrowed
5 = Purchased with wages
6 = Exchanged labour for food
7 = Exchanged items for food
8 = Gift (food) from relatives
9 = Food aid (NGOs, etc.)
10 = Other (Specify: ________________)
56. See WFP guidelines: Food Consumption Analysis, at http://vam.wfp.org/MATERIAL/FCS_Guidance.57. See FAO, 2007, Guidelines for measuring household and individual dietary diversity, June.
Chapt 4 p 63_178 esec 18-05-2009 1:38 Pagina 100

CHAPTER 4. Household-level data in CFSVA
101
Link with other modules• For internal consistency, it is important that the food items listed in the consumption
module be reflected in the expenditures module.
CH
AP
TER
4
Food Consumption Score (FCS) and Household Dietary Diversity Score (HDDS)
WFP and FAO both use measurements of dietary diversity in their assessments and monitoringsystems. WFP has adopted a methodology and tailored it to its own information needs in termsof data collection and analysis of food consumption. FAO uses a methodology based on theDemographic and Health Survey (DHS) procedures developed by FANTA. For both approaches,standard methodologies have been developed to calculate indicators of dietary diversity andconsumption frequency.
The Food Consumption Score (FCS). Information is collected from a country-specific list of fooditems and food groups. The household is asked about the number of times (in days) a givenfood item was consumed over a recall period of the past seven days. Items are grouped intoeight standard food groups (each group has a maximum value of seven days/week). Theconsumption frequency of each food group is multiplied by an assigned weight based on thenutrient content of a portion. Those values are then summed to obtain the FCS. The FCS hasa theoretical range from 0 to 112; WFP has defined thresholds (WFP 2007) to convert thecontinuous FCS into categories creating three food consumption groups (FCGs): poor,borderline, and acceptable.
The Household Dietary Diversity Score (HDDS). A standard list of 16 food groups, the same forany country/context, is used to gather information on food consumed in the past 24 hours.Information for each group is of a bivariate type (yes/no). To calculate the HDDS, the 16 foodgroups are aggregated into 12 main groups. All food groups have the same importance (relativeweights equal to 1), with each group consumed providing 1 point. The HDDS is the simple sumof the number of consumed food groups (it goes theoretically from 0 to 12). For analyticalpurposes, the HDDS is often ranked into thirds or quartiles.
Both the FCS and HDDS are used as proxy indicators of household access to food. Data collectedfor both indicators can also be used to consider dietary patterns and the consumption of specificfoods. The FCS and HDDS are used for monitoring economic access to food and surveillance atdecentralized levels; moreover, the FCS is used for classifying households who are food insecure,while the HDDS is used for monitoring dietary quality.
In the last calendar year (2006) what was the contribution of (source) to your annual food consumption? How does this differ throughout the year?(Use proportional piling, or divide the pie method, to estimate the relative contribution of each sourceto total food consumption)
Food source Annual Jan.–March April–June July–Sept. Oct.–Dec.(%) (%) (%) (%) (%)
Own production
Hunting, fishing, gathering
Purchases
Gifts/borrowing
Food aid
Total contribution 100 100 100 100 100
Chapt 4 p 63_178 esec 18-05-2009 1:38 Pagina 101

102
Comprehensive Food Security & Vulnerability Analysis Guidelines
Sources of inspiration• The standard food consumption module currently adopted for the CFSVAs is unique
in its format and methodology. FAO’s food consumption module is based on a24-hour recall. The list of food items in the FAO module is different from WFP’s inthat it focuses more on diversity and specific food groups (e.g., vitamin A–rich foods).
Module title: Expenditures
Main purpose of the module: This module allows the calculation of householdexpenditure (in cash)–related indicators. Expenditures are useful as a proxy for widerpurchasing power, which is an important component of food access. Moreover,understanding expenditures on specific items allows the analyst to determine howhouseholds allocate scarce resources and give priority to competing needs.
Limitations of the module• Cannot estimate the value of own production (section revolves around only cash
expenditures). Collecting consumption and expenditure data is tricky because of thevarying extent to which households consume out of their own production, which isnot collected in this questionnaire and hence reduces its usefulness.
• Cannot estimate the quantity of food items purchased.• Food expenditure is linked to the season (e.g. is lower after harvest).• Non-food expenditures (especially education) are also seasonal.
Creation of the Expenditure module• List of food and non-food items that are mutually exclusive and yet will encompass
all essential expenditures (e.g. education and clothing – do not include schooluniforms in both categories).
• List of food items should match those found in the Food Consumption Patternsmodule, with a few possible exceptions (e.g. collapse meat into one category;include expenditures on condiments).
• In addition to main food items, include “condiments” (e.g. salt, spices, beef-teacubes, fish powder).
• For all food items, the recall period is set at one month.• Some non-food items also have a one-month recall period. These are: soap,
transport, firewood/charcoal, rent, paraffin, and alcohol/tobacco. (Tip: Collectinformation on likely daily expenditure for households, not infrequent bulkexpenditures.)
• For the remaining non-food items, the recall period is set at six months (prior to theday of survey).
• If other CFSVA and/or EFSAs have been conducted, use the same lists.• All items should have a numeric value. There should be no empty cells, as that would
mean “missing data.” If there are no expenditures, use a zero.• Include debt expenditures (i.e. repayment of loans).
Chapt 4 p 63_178 esec 18-05-2009 1:38 Pagina 102

CHAPTER 4. Household-level data in CFSVA
103
The typical indicators emanating from this module include: (a) total household expenditures (food and non-food); (b) total per capita expenditures; (c) percentage food expenditures; (d) percentage non-food expenditures; and (e) percentage individual food and non-food items.
CH
AP
TER
4
Table 4.5: Example of Expenditure module
In the past MONTH, how much money have you spent on each of thefollowing items or services? (Write 0 if no expenditure.)
In the past 6 MONTHS (semester), how much money (in cash) have you spent on each of the followingitems or services? Write 0 if no expenditure.
b. Estimatedexpenditurein credit (ifapplicable)
1234567891011121314151617181920212223
24
25
26
27
28
29
MaizeWheat/barleyMilletRice/paddyRoots and tubers (potatoes, yams)Pulses/lentilsVegetablesMilk/yogurt/milk productsFresh fruits/nuts FishWhite meat (poultry)PorkRed meat (goat, sheep)Red meat (buffalo)EggsOil/butter/ghee (fats)Sugar/saltCondimentsAlcohol and tobaccoSoapTransportFirewood/charcoalKerosene
Equipment, tools, seeds
Hiring labour
Medical expenses, health care
Education, school fees
Clothing, shoes
Veterinary expenses
30
31
32
33
34
a. Estimatedexpenditure
in cash
Celebrations, social events, funerals,weddings
Fines/taxes
Debts
Construction, house repair
Otherlong-term expenditure
(Specify: ____________)
Chapt 4 p 63_178 esec 18-05-2009 1:38 Pagina 103
104
Comprehensive Food Security & Vulnerability Analysis Guidelines
Modifications to the module• Recall period for non-food expenditures can be modified to one year.• Recall period for education can be realigned with the calendar of payments;
however, a conversion of the expenditures to “yearly expenditures” must be allowed.• Recall period for food expenditures can be reduced (1 week) during an EFSA.• FSMS may modify the non-food recall period to correspond to the last data
collection round, as long as a pro-rated amount can be calculated.• A credit or exchange/barter column could be added when appropriate, but this will
require additional time for survey administering. Based on the experience withprevious CFSVAs, such data add little value for food security analysis.
• Pastoralists: include information on veterinary fees, water costs for animals,livestock purchases (this could be placed in the Water/sanitation module, as long asboth modules have the same recall period).
• Seasonality of expenditures — information on celebrations, school fees, agriculturalinputs, seasonal disease outbreaks (e.g., malaria) and health —could be collected ina community/key informant questionnaire.
• Rent expenditures should be included in the monthly expenditures, unless specificquestions on house ownership and rental are posed under the “Housing” section.
Links with other modules• Questions on expenditures can be asked in other modules, as long as they are not
duplicated.• Link to income sources, food consumption modules (triangulation at field level as
well as analysis stages). • When deciding on a recall period, make sure that all relevant secondary data are reviewed
to ensure that the proper period is chosen. Harmonize all recall periods in other parts ofthe questionnaire, otherwise enumerators will likely make mistakes with the period used.
Module Title: Household Assets
Main purpose of the module: This module allows the analyst to calculate proxyindicators of wealth and qualify the type of assets the household possesses.
Limitations of the module• It does not allow for an exact measure of wealth.• The list is a finite number of wealth and production assets. The selected assets must
be typical for the context but allow for inter-household differences to be captured.• It is advisable that the list contain between 10 and 15 non-perishable assets.
Creation of the Assets module• Prepare a list of productive and non-productive assets. Guidance on the applicability
for the specific country or region can be sought from previous WFP surveys or HEA,MICS, and DHS studies. In the development of this module, questionnaire designersshould look at other household surveys done in the same country, especially large-scale government surveys or DHS, and make the asset module of the CFSVA surveycompatible with these. A big advantage to this is the ability to compare levels anddistributions of assets to determine, for example, if households in your survey arericher or poorer than households found in other data sets.
Chapt 4 p 63_178 esec 18-05-2009 1:38 Pagina 104

CHAPTER 4. Household-level data in CFSVA
105
• Based on the context, assets should include agricultural and journeyman’s tools(e.g., pesticide sprayer, plough, mason’s tools, carpenter’s tools), as these areexamples of productive assets.
• “Luxury” assets are a reflection of the wealth and/or social status of a household.They can be used to generate income, though this is not their primary use. Examplesare context specific, but can include a radio, television, satellite receiver, mobilephone, car, and microwave.
• Typical household assets should also be included and, though context-specific, caninclude: a mattress, a lantern, a mosquito net, or a manufactured cooking stove.
• Once the list has been created and verified by local experts as being applicable tothe context, list the items by category (basic, productive, and wealth).
• To the right of the “Assets” column, place either 1 (yes) or 0 (no); the asset thehousehold owns can also be circled.
• The main indicators emanating from this module are: (a) percentage of householdsowning an asset (e.g. radio), and (b) wealth index.
• Enumerators can be given guidance on excluding assets beyond repair.
Modification to the module• The number of each asset can be recorded (e.g. 4 chairs, 2 beds, 6 radios), but this
adds little value for food security analysis.
Link with other modules• There should be an internal consistency between productive assets and household
economic activities.
Source of inspiration• Household questionnaires from the DHS always include comparable questions
regarding the ownership of productive and non-productive assets. Similar to DHSsurveys, CFSVAs look at assets ownership and adopt the same methodology tocompute the wealth index (i.e. Principal Component Analysis).
CH
AP
TER
4
Table 4.6: Example of Household Assets module
Indicator Productive/transport assets
Household assets
Does your householdown any of the followingassets?
Circle all that apply
1 Shovel/spade 2 Plough3 Sickle 4 Weaving tool5 Fish net 6 Pounding mill (wood),7 Rice mill (fuel) foot or hand9 Motorcycle 8 Rice mill (electricity)
11 Bicycle 10 Hand tractor12 Boat/canoe
13 Sleeping mats 14 Bed15 Table 16 Radio17 Stove (gas/fuel) 18 Generator (run by water)19 Generator (run by fuel) 20 Mosquito net
Chapt 4 p 63_178 esec 18-05-2009 1:38 Pagina 105

106
Comprehensive Food Security & Vulnerability Analysis Guidelines
Module Title: Sources of Water and Sanitation
Main purpose of the module: This module allows the analyst to estimate the percentageof the population using improved drinking water sources and improved sanitation, whichis a commonly used indicator to assess hygiene at the household level.
Limitations of the module• The module cannot tell us about the quality of the drinking water for each type of
source, the quantity of water the household is drinking, or the household waterstorage practices.
• The module alone cannot tell us the impact of poor hygiene on food security andnutrition. The link between poor water access and hygienic conditions, malnutritionand food security has to be statistically explored and proven. Appropriate expertiseis required for this.
Creation of the Water and Sanitation module• Based on the accepted United Nations guidance, the primary household water
sources must be grouped accordingly: water tap in household; water tap incompound; public stem pipe; borehole; protected dug well; protected spring;rainwater collection; unprotected well; unprotected spring, river, or pond; vendorprovided; tanker truck; bottled water. The list is context-specific. An example ofthe question follows:
• Based on the accepted United Nations guidance, household sanitation sources mustbe grouped as follows: flush toilet, pail flush, simple pit latrine, ventilated improvedpit latrine, public/shared latrine, open pit latrine, bucket latrine, bush. An example ofthe question follows here:
• The main indicators from these modules are: (a) percentage of households usingimproved drinking water sources; and (b) percentage using improved sanitation.
What is the mainsource of drinkingwater for yourhousehold?
Circle one
1 Piped water in-/outside 5 Mountain source (incl. gravity water feeder system)
2 Well/borehole protected6 Rainwater from tank
3 Well/borehole unprotected
4 River, stream, or dam 7 Other
Where do members ofyour householdnormally go to thetoilet? (Do not read answersaloud.) Circle one
1 Flush latrine/toilet with water 4 Communal latrine2 Traditional pit latrine (no water) 5 None/bush (go into forest)3 (Partly) open pit
(no roof or no wall)
Chapt 4 p 63_178 esec 18-05-2009 1:38 Pagina 106
CHAPTER 4. Household-level data in CFSVA
107
Modifications to the moduleThe following questions can be added to further the understanding of householdaccess to water:• How much time is required to collect water (round trip)? This can either be a specific
time (e.g. 35 minutes) or a categorical response (e.g. 1 to 3 hours).• What is the distance from the water source (one way; usually collected as continuous
variable in kilometres)? This information can be used for spatial analysis ofaccessibility of resources. Appropriate skills and other relevant data must beavailable for this type of analysis.
• Who collects the water (e.g. girls, boys, women, men)? This information can becollected in the Key Informant or Community questionnaire.
• Do you pay for water? How much do you pay for the water per day/week/month(depending on the context)?
• What is the seasonal variation of your water source? Is there is a second source?
Links with other modules• If questions are asked regarding expenditure on water, they should not be repeated in
the Expenditure module, and the reference period should be the same (e.g. 1 month).• The link between water source and sanitation and the nutritional status of the
households can be explored.• Components of a wealth index.
Sources of inspiration• Questions on water sources are always included also in the MICS and DHS
questionnaires. The main differences between CFSVA and DHS/MICS modules are: i) CFSVAs focus on the source of drinking water, whereas DHS and MICS consider
sources of water used for cooking and hand-washing.ii) A more detailed list of options is typically included in the DHS/MICS
questionnaires than in the CFSVA questionnaires.• Questions on sanitation are always included in the MICS and DHS questionnaires. In
DHS and MICS, the options for type of toilet are usually more detailed. CFSVA HHquestionnaires do not include questions on the number of people sharing toilet facilities.
4.2.4.2 Core modules with flexible questions
Module Title: Demography and Education/Household Composition Roster
Main purpose of the module: This module records demographic characteristics ofhouseholds.
Limitations of the module• A household is usually defined as people living in the same compound and eating
“from the same pot,” forming a clear socio-economic entity. The head of thehousehold makes the major decisions. However, these definitions have to beadjusted to be in line with country-specific definitions. The definition of a householdcan bias results (e.g. polygamy can be incompatible with the standard definition of ahousehold). Often the definition of the “head of household” is culturally defined andmay not reflect “who is making the key decisions” or who is the bread winner.
CH
AP
TER
4
Chapt 4 p 63_178 esec 18-05-2009 1:38 Pagina 107
108
Comprehensive Food Security & Vulnerability Analysis Guidelines
• With a comprehensive roster (at the individual level), the module can become quiteweighty and time-consuming.
• It will not provide rates of fertility or fecundity.• Mortality and morbidity rates can be calculated provided that the module is
organized in a suitable way (using roster type) and that appropriate questions areasked. However, the usual sampling design, while suitable for food securityindicators, can give rather imprecise estimates of mortality and morbidity.
• This module is not meant to capture members of the household who have migrated.
Creation of the Demographics module• There are two standardized methods for collecting household information. However,
depending on the information desired, one approach will be recommended (e.g. mortality;non-age-bound population estimates will require a more detailed enumeration of thehousehold, and a roster approach is the recommended tool). The type of tool will affect theamount of time required to administer and the level of skills required by the enumerators.
As with other modules, the simplest approach is presented as standard base forCFSVA surveys. It can provide a limited but sufficient amount of information. As moreinformation is required, more questions can be added, but the module’s structure thenbecomes more complex, as with the individual roster.
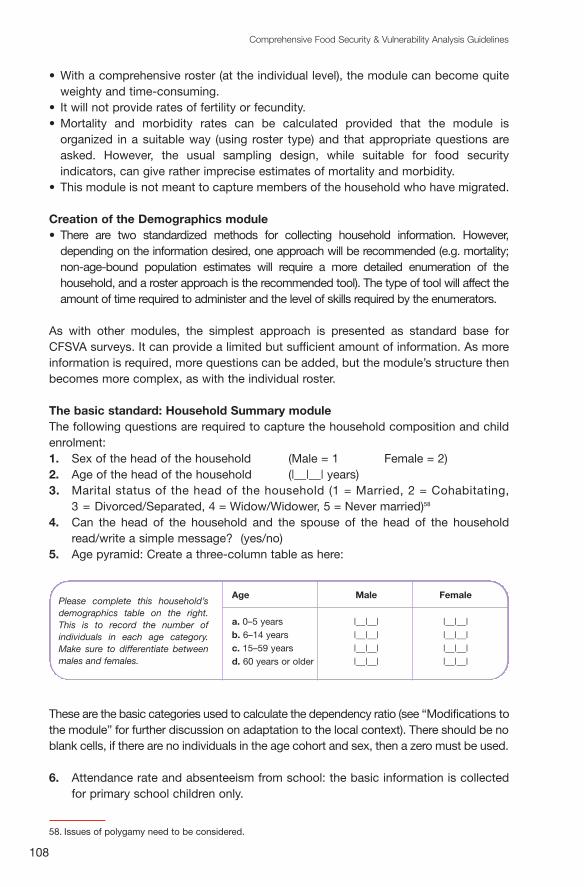
The basic standard: Household Summary moduleThe following questions are required to capture the household composition and childenrolment:1. Sex of the head of the household (Male = 1 Female = 2)2. Age of the head of the household (|__|__| years)3. Marital status of the head of the household (1 = Married, 2 = Cohabitating,
3 = Divorced/Separated, 4 = Widow/Widower, 5 = Never married)58
4. Can the head of the household and the spouse of the head of the householdread/write a simple message? (yes/no)
5. Age pyramid: Create a three-column table as here:
These are the basic categories used to calculate the dependency ratio (see “Modifications tothe module” for further discussion on adaptation to the local context). There should be noblank cells, if there are no individuals in the age cohort and sex, then a zero must be used.
6. Attendance rate and absenteeism from school: the basic information is collectedfor primary school children only.
58. Issues of polygamy need to be considered.
Age Male Female
a. 0–5 years |__|__| |__|__|b. 6–14 years |__|__| |__|__|c. 15–59 years |__|__| |__|__|d. 60 years or older |__|__| |__|__|
Please complete this household’sdemographics table on the right.This is to record the number ofindividuals in each age category.Make sure to differentiate betweenmales and females.
Chapt 4 p 63_178 esec 18-05-2009 1:38 Pagina 108

CHAPTER 4. Household-level data in CFSVA
109
The main indicators created through the household roster/summary are:• Average household size;• Percentage of male- and female-headed households;• Average age of head of household (aggregated by sex);• Marital status;• Age pyramid;• Literacy rates of household heads and spouses;• Attendance rates (check definition) and causes for not attending school;• Absenteeism and causes; and• Percentage of dependents/dependency ratio.
Modifications to the moduleHousehold Summary • Total years or completed level of education of household head and spouse.• The generic child age cohort can vary depending on the primary school age category
in the country. For example, in the 2006 Lao PDR CFSVA, the generic school agecohort was split in two (6 to 11 and 12 to 14 years) in order to reflect the schoolsystem of the country and the types of information WFP needed for its schoolfeeding programmes.
CH
AP
TER
4
Table 4.7: Example of household questionnaire for primary school attendance
Male Children Female ChildrenIf yes, why?
CIRCLE THEMOSTIMPORTANTREASON
Number of children attending primary school(6–11 years)?
1.10
Did anyone miss school for at least 1 month in thelast year?
1 Yes 2 No Õ go to 1.131.11
1.12
1 Sickness 1 Sickness2 Work for money or food 2 Work for money or food3 Domestic work (gardening, 3 Domestic work (gardening,
fetching water) fetching water)4 Taking care of siblings 4 Taking care of siblings5 School is far away/located 5 School is far away/located in
in insecure area insecure area6 No money for school fees/ 6 No money for school fees/
school costs school costs7 Refused to go 7 Refused to go8 Other 8 Other
(Specify:__________________) (Specify:_____________)
Male Children Female ChildrenIf there areboys, girls, orboth who donot attendschool, what isthe mainreason?
CIRCLE THEMOSTIMPORTANTREASON
1.13
1 Sickness 1 Sickness2 Work for money or food 2 Work for money or food3 Domestic work (gardening, 3 Domestic work (gardening,
fetching water) fetching water)4 Taking care of siblings 4 Taking care of siblings5 School is far away/located in 5 School is far away/located in
insecure area insecure area6 No money for school fees/ 6 No money for school fees/
school costs school costs7 Refused to go 7 Refused to go8 Other 8 Other
(Specify:__________________) (Specify:_____________)
Male Female
|__|__| |__|__|
Chapt 4 p 63_178 esec 18-05-2009 1:38 Pagina 109
110
Comprehensive Food Security & Vulnerability Analysis Guidelines
• Number of days of absenteeism from school in a certain reference time (the twoparameters can vary according to local agreement).
• Child labour and adult labour to household economic unit.• Chronic illness.• Disabilities.
The decision to move from household summary questions on demography andeducation to a household roster type of table, where each question is asked for eachindividual in the household, is usually driven by the need to obtain more articulatedinformation about education, labour, chronic illness, and disabilities for both adults andchildren. The household roster provides information and statistics at the individuallevel. This adds valuable information but also difficulties: the administration of thequestionnaire is time-consuming, and this method adds data management andanalytical difficulties. Again, the choice of having household- or individual-levelindicators must be driven by programme need, analytical capacity, and the intendeduse of this more detailed information.
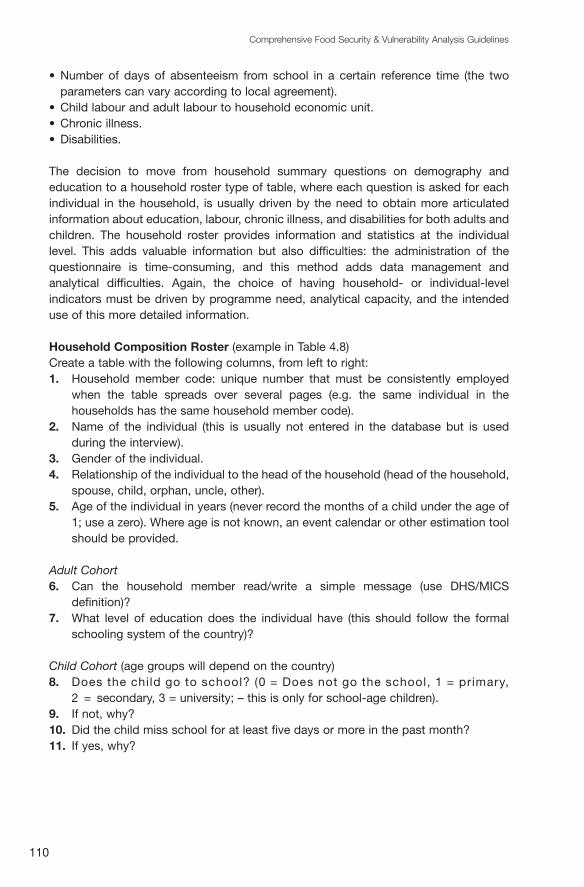
Household Composition Roster (example in Table 4.8)Create a table with the following columns, from left to right: 1. Household member code: unique number that must be consistently employed
when the table spreads over several pages (e.g. the same individual in thehouseholds has the same household member code).
2. Name of the individual (this is usually not entered in the database but is usedduring the interview).
3. Gender of the individual.4. Relationship of the individual to the head of the household (head of the household,
spouse, child, orphan, uncle, other).5. Age of the individual in years (never record the months of a child under the age of
1; use a zero). Where age is not known, an event calendar or other estimation toolshould be provided.
Adult Cohort6. Can the household member read/write a simple message (use DHS/MICS
definition)?7. What level of education does the individual have (this should follow the formal
schooling system of the country)?
Child Cohort (age groups will depend on the country)8. Does the child go to school? (0 = Does not go the school, 1 = primary,
2 = secondary, 3 = university; – this is only for school-age children).9. If not, why?10. Did the child miss school for at least five days or more in the past month?11. If yes, why?
Chapt 4 p 63_178 esec 18-05-2009 1:38 Pagina 110

CHAPTER 4. Household-level data in CFSVA
111
CH
AP
TER
4
1.3
Gen
der
1.4
Rel
atio
nshi
pto
hea
d
1.5
Ag
e in
year
s
Do
not
reco
rd f
ull
nam
e, o
nly
a fir
st n
ame
to r
efer
to
the
hous
ehol
dm
emb
er
01 02 03 ... ... 14 15
1 =
Mal
e2
= F
emal
e1
= H
ead
2 =
Spo
use
3 =
Chi
ld4
= P
aren
t5
= S
iblin
g6
= G
rand
child
7 =
Gra
ndpa
rent
8 =
Orp
han
bein
g ta
ken
care
of
9 =
Oth
er re
lativ
e10
= N
o re
latio
n
For
child
ren
< 12
mon
ths,
writ
e 0
1 =
Mar
ried
2 =
Coh
abita
ting
(not
mar
ried)
3 =
Div
orce
d4
= Li
ving
apa
rt, n
otdi
vorc
ed5
= W
idow
or
wid
ower
6 =
Not
mar
ried
1 =
No
scho
olin
g2
= S
ome
prim
ary
3 =
Com
plet
ed p
rimar
y4
= S
ome
seco
ndar
y5
= C
ompl
eted
sec
onda
ry6
= Vo
catio
nal
7 =
Som
e un
iver
sity
8 =
Com
plet
ed u
nive
rsity
9 =
N/A
1 =
Atte
nds
prim
ary
2 =
Atte
nds
seco
ndar
y3
= N
otat
tend
ing
scho
ol
Did
[nam
e]m
iss
scho
olfo
r at l
east
1 m
onth
inth
e la
stye
ar?
1 =
Yes
2 =
No
Wha
t was
the
reas
onfo
r mis
sing
?
1 =
Sic
knes
s2
= W
ork
3 =
Hou
seho
ld W
ork
4 =
Taki
ng c
are
ofsi
blin
gs5
= Lo
ng d
ista
nce
tosc
hool
6 =
Sch
ool f
ees
not
paid
7 =
Inse
curit
y8
= R
efus
ed to
go
1.6
Mar
ital
Sta
tus
1.7
Cur
rent
leve
lo
f ed
ucat
ion
1.8
Sch
oo
ling
stat
us o
fch
ildre
n 6-
14
1.9
1.10
1.2
Firs
t N
ame
Household Member codeTab
le 4
.8:
Exa
mp
le o
f ho
useh
old
co
mp
osi
tio
n ro
ster
If at
tend
ing
scho
ol
Chapt 4 p 63_178 esec 18-05-2009 1:38 Pagina 111
112
Comprehensive Food Security & Vulnerability Analysis Guidelines
Additional modifications to the Household Composition Roster• For mortality/morbidity refer to WFP nutrition guidelines. This addition should be
made only if required and strongly supported and properly undertaken.• Child labour and adult labour to household economic unit.• Chronic illness.• OVC issues (see HIV/AIDS guidelines).• Disabilities.
Links with other modules• Links with the maternal and child modules (same number of under-5s and women
listed as in the modules; carry over the codes.• The age cohorts need to be identical to those used for schooling of children.
Sources of inspiration• Information on household demographics is typically collected by DHS, MICS, and
LSMS questionnaires through a household roster (individual-level information).CFSVAs use either individual level rosters or household-level questions.
• When a roster is included in the CFSVAs, it usually covers the same areas addressed by MICS,DHS and LSMS, including sex, age, position of the HH members, health conditions,educational level, school enrolment/attendance (for children), questions related to OVC. Ingeneral, questions on health status and schooling are more detailed in MICS, DHS, and LSMS;in particular, MICS (used by UNICEF to assist countries in filling data gaps for monitoringthe situation of children) systematically collects information on OVC and child labour.
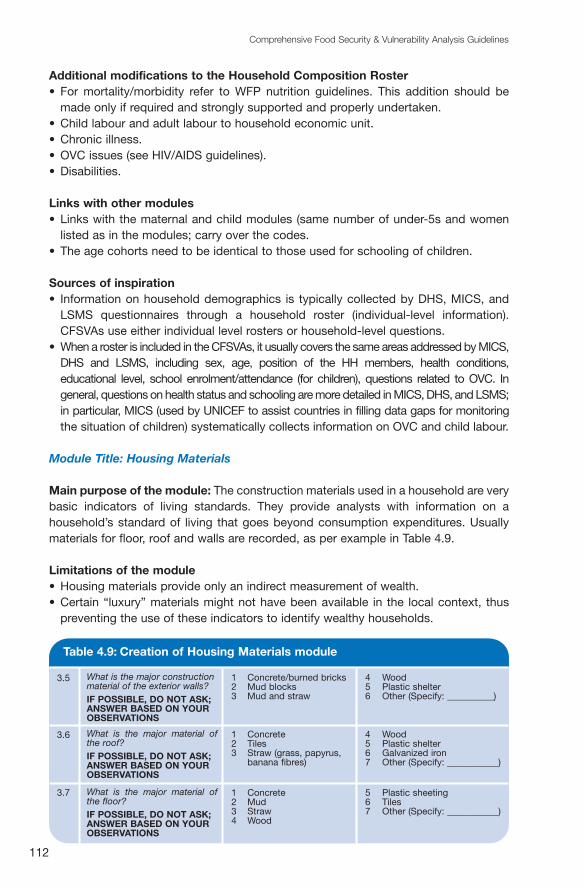
Module Title: Housing Materials
Main purpose of the module: The construction materials used in a household are verybasic indicators of living standards. They provide analysts with information on ahousehold’s standard of living that goes beyond consumption expenditures. Usuallymaterials for floor, roof and walls are recorded, as per example in Table 4.9.
Limitations of the module• Housing materials provide only an indirect measurement of wealth.• Certain “luxury” materials might not have been available in the local context, thus
preventing the use of these indicators to identify wealthy households.
Table 4.9: Creation of Housing Materials module
What is the major constructionmaterial of the exterior walls?IF POSSIBLE, DO NOT ASK;ANSWER BASED ON YOUROBSERVATIONS
3.5 1 Concrete/burned bricks 4 Wood2 Mud blocks 5 Plastic shelter3 Mud and straw 6 Other (Specify: __________)
What is the major material ofthe roof?IF POSSIBLE, DO NOT ASK;ANSWER BASED ON YOUROBSERVATIONS
3.6 1 Concrete 4 Wood2 Tiles 5 Plastic shelter3 Straw (grass, papyrus, 6 Galvanized iron
banana fibres) 7 Other (Specify: ___________)
What is the major material ofthe floor?IF POSSIBLE, DO NOT ASK;ANSWER BASED ON YOUROBSERVATIONS
3.7 1 Concrete 5 Plastic sheeting2 Mud 6 Tiles3 Straw 7 Other (Specify: ___________)4 Wood
Chapt 4 p 63_178 esec 18-05-2009 1:38 Pagina 112

CHAPTER 4. Household-level data in CFSVA
113
Modifications to the moduleAdditional elements can be included in the Housing Materials module other thanconstruction materials:• The type of dwelling (single family house, separate apartment, mud house, shelter, other).• The number of rooms.• Availability of electricity.
Links with other modules• Water and sanitation facilities and assets to construct the wealth index.• Expenditure to cross-check wealth status.
Sources of inspiration• Information about the main material of the dwelling, floor, roof, and walls is collected
in the MICS, DHS, and LSMS questionnaires. As with the DHS, the CFSVA takes intoconsideration this information while selecting the variables for the wealth index.
Module Title: Access to Credit
Type of questionnaire: The following presents the Access to Credit module ascollected in a quantitative/household survey. However, access to credit can be deeplyexplored in focus group discussions or in community interviews. This would save timeand would make the household-level module optional. More information on qualitativetools can be found in Section 5, “Qualitative and Community-level Data in CFSVA.”
Main purpose of the module: The module provides for an estimation of household’saccess to sources of credit and their actual use of credit.
Limitations of the module• The module does not aim to estimate the amount actually borrowed.• There is no information collected with regard to the “interest rates” charged to
borrowers or other credit conditions.
Modifications to the module• The first question can be broken into two: Do you have access to credit? If yes, where?• Additional questions can be added to explore the average amount of debt in addition
to the issue of access to credit sources. Experience from past surveys indicates thatpiece of information might not be fully reliable, perhaps because of people’sreluctance to declare their financial status.
CH
AP
TER
4
Table 4.10: Creation of Access to Credit module
Do you have access to a placeto borrow money?
Circle all that apply
3.5 1 Yes – relatives/friends 5 Yes – cooperatives2 Yes – charities/NGOs 6 Yes – village head3 Yes – local lender 7 Yes – company/middle men4 Yes – bank 8 No access to credit
In the last 3 months, how oftendid you use credit or borrowmoney to purchase food?
Circle one
3.6 1 = Never 4 = On three occasions 2 = On one occasion 5 = On more than three 3 = On two occasions occasions
Chapt 4 p 63_178 esec 18-05-2009 1:38 Pagina 113

114
Comprehensive Food Security & Vulnerability Analysis Guidelines
Links with other modules• Expenditure module: if the household manages to pay back their debt. • Information about access to credit facilities can be gathered in focus groups or
community interviews.
Source of inspiration• Questions on credit usually are not included in DHS and MICS questionnaires, but
they are frequently inserted in the LSMS questionnaires, which collect thisinformation at the individual level. Source, frequency, and time needed forreimbursement are also addressed by the LSMS module.
Module Title: Livelihoods and Economic Activities
Main purpose of the module: This module attempts to identify the activities andcombinations of activities that sustain households, and their relative importance to ahousehold’s income strategy.
Limitations of the module• This is not a comprehensive livelihood analysis, which includes but is not limited
to economic activities. Its main goal is to identify and group households basedon a common set of economic activities and their relative importance for riskanalysis.
• If absolute values are collected from the economic activities, the sum of those valuesshould not be considered as an income level for the household. This derived incomeis not intended for poverty analysis.
Creation of the Livelihoods and Economic Activities module• Prepare a list of economic activities that households would undertake or the main
income sources a household would exploit to earn cash or acquire food or services.The list of activities should be based on secondary data and local expert knowledge.It is important to include atypical sources that vulnerable households would exploitto sustain themselves.
• If another CFSVA and/or other EFSAs have been conducted previously, review theactivities listed and include (1) those reported in the previous study, and (2) throughreview, those that might have been excluded. The aim is to differentiate householdsand minimize the reporting of undefined “other” activities, which are difficult tointerpret and could confound results.
• Include a column where households are asked, using proportional piling, to estimatethe relative importance of the activities to contributing to the household’s income,food, and access to services.
• The module is not meant to be exhaustive in identifying all the activities undertakenby each household. Instead, it is critical to identify the three or four essential activities.
• It is likely that the three or four activities cover almost all income sources of thehousehold. The sum of the three to four contributions should equal 100 percent.59
59. When there are more than three to four activities, it must be made clear to the enumerator that the proportionsreported are valid only for the identified activities.
Chapt 4 p 63_178 esec 18-05-2009 1:38 Pagina 114

CHAPTER 4. Household-level data in CFSVA
115
• The categories should not be duplicated. For example, if men undertake one type ofagricultural activity and women undertake another type, the two activities should begrouped, as the level of analysis is the household.
• The main indicators emanating from this module are: (a) main economic livelihoodactivities; and (b) percentage contribution of main economic/livelihood activities tohousehold income.
The minimum information required can be obtained through one of the following tables:
CH
AP
TER
4
Table 4.11a: Recommended layout of economic livelihoods table
Activity(ies) undertaken to earncash or acquire food or services (√)
Using proportional piling or “divide the pie”methods, estimate the relative contributionto total income of each activity (%)
1 = Agriculture and sales of crops |__| |__||__||__| 2 = Livestock and sales of animals |__| |__||__||__| 3 = Brewing |__| |__||__||__| 4 = Fishing |__| |__||__||__| 5 = Unskilled wage labour |__| |__||__||__| 6 = Skilled labour |__| |__||__||__| 7 = Handicrafts/artisanal work |__| |__||__||__|
8 = Use of natural resources |__| |__||__||__| (firewood, charcoal, bricks,grass, wild foods, honey, etc.)
9 = Petty trading |__| |__||__||__| 10 = Seller, commercial activity |__| |__||__||__| 11 = Remittances |__| |__||__||__| 12 = Salaries, wages (employees) |__| |__||__||__| 13 = Begging, assistance |__| |__||__||__| 14 = Government allowance |__| |__||__||__|
(pension, disability benefit)15 = Others (Specify:_____________) |__| |__||__||__|
TOTAL 1 0 0
Table 4.11b: Alternative layout of economic livelihoods table
Activity a. List, in order of importance,household income activities?(Use activity code from a list like the onein Table 4.11a)
b. Using proportional piling or “dividethe pie” methods, estimate the relativecontribution to total income of eachactivity (%)
Main |__| |__||__||__| Second |__| |__||__||__| Third |__| |__||__||__| Fourth |__| |__||__||__|
Chapt 4 p 63_178 esec 18-05-2009 1:38 Pagina 115
116
Comprehensive Food Security & Vulnerability Analysis Guidelines
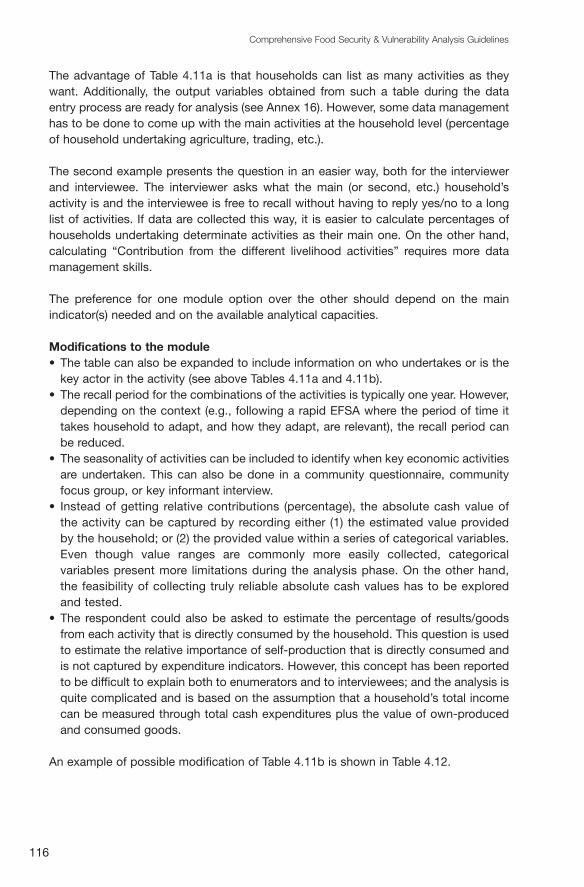
The advantage of Table 4.11a is that households can list as many activities as theywant. Additionally, the output variables obtained from such a table during the dataentry process are ready for analysis (see Annex 16). However, some data managementhas to be done to come up with the main activities at the household level (percentageof household undertaking agriculture, trading, etc.).
The second example presents the question in an easier way, both for the interviewerand interviewee. The interviewer asks what the main (or second, etc.) household’sactivity is and the interviewee is free to recall without having to reply yes/no to a longlist of activities. If data are collected this way, it is easier to calculate percentages ofhouseholds undertaking determinate activities as their main one. On the other hand,calculating “Contribution from the different livelihood activities” requires more datamanagement skills.
The preference for one module option over the other should depend on the mainindicator(s) needed and on the available analytical capacities.
Modifications to the module• The table can also be expanded to include information on who undertakes or is the
key actor in the activity (see above Tables 4.11a and 4.11b).• The recall period for the combinations of the activities is typically one year. However,
depending on the context (e.g., following a rapid EFSA where the period of time ittakes household to adapt, and how they adapt, are relevant), the recall period canbe reduced.
• The seasonality of activities can be included to identify when key economic activitiesare undertaken. This can also be done in a community questionnaire, communityfocus group, or key informant interview.
• Instead of getting relative contributions (percentage), the absolute cash value ofthe activity can be captured by recording either (1) the estimated value providedby the household; or (2) the provided value within a series of categorical variables.Even though value ranges are commonly more easily collected, categoricalvariables present more limitations during the analysis phase. On the other hand,the feasibility of collecting truly reliable absolute cash values has to be exploredand tested.
• The respondent could also be asked to estimate the percentage of results/goodsfrom each activity that is directly consumed by the household. This question is usedto estimate the relative importance of self-production that is directly consumed andis not captured by expenditure indicators. However, this concept has been reportedto be difficult to explain both to enumerators and to interviewees; and the analysis isquite complicated and is based on the assumption that a household’s total incomecan be measured through total cash expenditures plus the value of own-producedand consumed goods.
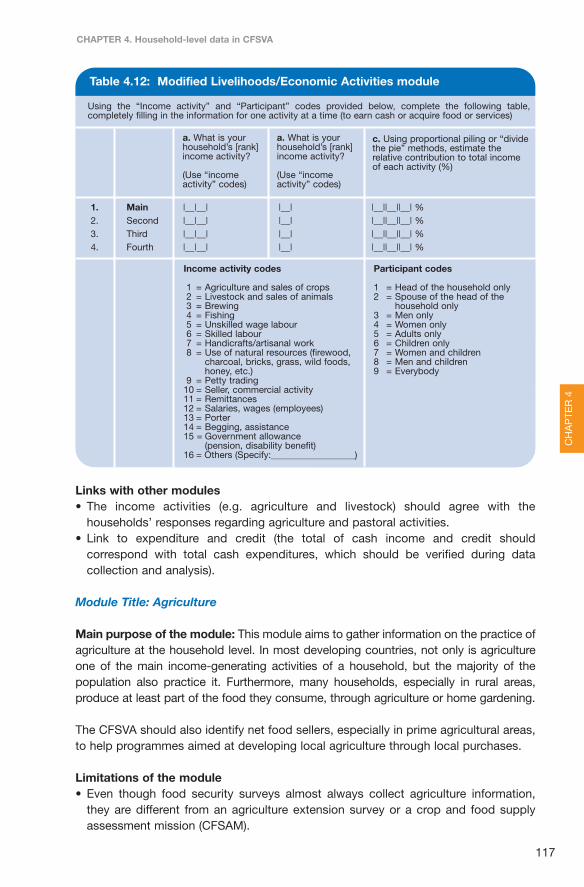
An example of possible modification of Table 4.11b is shown in Table 4.12.
Chapt 4 p 63_178 esec 18-05-2009 1:38 Pagina 116
CHAPTER 4. Household-level data in CFSVA
117
Links with other modules• The income activities (e.g. agriculture and livestock) should agree with the
households’ responses regarding agriculture and pastoral activities. • Link to expenditure and credit (the total of cash income and credit should
correspond with total cash expenditures, which should be verified during datacollection and analysis).
Module Title: Agriculture
Main purpose of the module: This module aims to gather information on the practice ofagriculture at the household level. In most developing countries, not only is agricultureone of the main income-generating activities of a household, but the majority of thepopulation also practice it. Furthermore, many households, especially in rural areas,produce at least part of the food they consume, through agriculture or home gardening.
The CFSVA should also identify net food sellers, especially in prime agricultural areas,to help programmes aimed at developing local agriculture through local purchases.
Limitations of the module• Even though food security surveys almost always collect agriculture information,
they are different from an agriculture extension survey or a crop and food supplyassessment mission (CFSAM).
CH
AP
TER
4
Table 4.12: Modified Livelihoods/Economic Activities module
Using the “Income activity” and “Participant” codes provided below, complete the following table,completely filling in the information for one activity at a time (to earn cash or acquire food or services)
1. Main |__|__| |__| |__||__||__| %2. Second |__|__| |__| |__||__||__| %3. Third |__|__| |__| |__||__||__| %4. Fourth |__|__| |__| |__||__||__| %
a. What is yourhousehold’s [rank]income activity?
(Use “incomeactivity” codes)
a. What is yourhousehold’s [rank]income activity?
(Use “incomeactivity” codes)
Income activity codes
1 = Agriculture and sales of crops2 = Livestock and sales of animals3 = Brewing4 = Fishing5 = Unskilled wage labour6 = Skilled labour7 = Handicrafts/artisanal work8 = Use of natural resources (firewood,
charcoal, bricks, grass, wild foods, honey, etc.)
9 = Petty trading10 = Seller, commercial activity11 = Remittances12 = Salaries, wages (employees)13 = Porter14 = Begging, assistance15 = Government allowance
(pension, disability benefit)16 = Others (Specify:__________________)
c. Using proportional piling or “dividethe pie” methods, estimate therelative contribution to total incomeof each activity (%)
Participant codes
1 = Head of the household only2 = Spouse of the head of the
household only3 = Men only4 = Women only5 = Adults only6 = Children only7 = Women and children8 = Men and children9 = Everybody
Chapt 4 p 63_178 esec 18-05-2009 1:38 Pagina 117

118
Comprehensive Food Security & Vulnerability Analysis Guidelines
• In a food security survey, the aim is not to precisely measure the size of cultivatedland and yields, but rather to cross-tabulate agriculture-related data with othersocio-economic characteristics such as family size, data on income, expenditure,and consumption, for the purpose of presenting a better picture of the livelihood ofrural households and to identify possible factors of food insecurity and informresponse options later on.
Creation of the Agriculture moduleInformation obtained from a basic module on agriculture includes:• Percentage of households having access to land• Most common types/methods of land access• Percentage of households cultivating land• Common crops cultivated• Prevalence of kitchen gardens
Modifications to the module• The nature and scope of the study will determine the level of information sought from
the module. Hence, the above list is not meant to be comprehensive.• Additional questions for the key staples: duration of production for own
consumption, share of the production sold, share of the production consumed.• Additional questions for consideration: size of land, major crops grown, source of seeds,
use of agrochemicals, source and extent of irrigation and average yields per harvest. Ofcourse, the more information collected the more complex the module becomes for boththe enumerator and for the interviewee. Carefully evaluate the needs of the survey inorder to avoid overloading the questionnaire with questions that will not be analysed.
• Questions regarding agriculture can be very specific and detailed, or more generalcovering the agriculture sector as a whole.
Links with other modules• Livelihood and economic activities• Productive assets• Livestock• Sources of consumed food• Expenditure
Module Title: Livestock
Main purpose of the module: to gather information on livestock ownership. Livestockcan be seen as assets or as main livelihood activities for pastoralists and nomads, butalso involves specific vulnerabilities.
Limitation of the module• Although food security surveys collect livestock ownership information, they are
different from livestock surveys.
Creation of the Livestock moduleUsually a filter question opens the module. The list of commonly owned animals andwealth status livestock follows.
Chapt 4 p 63_178 esec 18-05-2009 1:38 Pagina 118

CHAPTER 4. Household-level data in CFSVA
119
Modifications to the module• The filter question can be removed. When the household does not own any livestock,
it is important to enter a zero (0).• The data collection can be simplified by recording single-species ownership only as
a categorical bivariate (yes/no).• However, in appropriate countries, collecting the number of animals allows for
computing the synthetic indicator “Livestock Index” through the use of LivestockTropical Unit values.
• Extra information on amount of fodder needed, average fodder price, and monthlyexpenditure on fodder can be useful.
Links with other modules• Livelihood and economic activities• Agriculture• Sources of consumed food• Expenditure
Module Title: External Assistance (food and non-food)
Main purpose of the module: Any external assistance going on in the surveyed areaor in the country should be recorded and taken into account when evaluatinghouseholds’ self-reliance and food security.
Limitation of the module• The module is not designed to record tonnage or quantities of aid delivered/received
by each household.
Creation of the External Assistance moduleUsually the module is introduced with a filter question. After that, there is the list of foodaid programmes, the organizations that provide non-food assistance in the area, andthe types of assistance received by the household. The two lists must be customizedaccording to the local context.
CH
AP
TER
4
4.20 - Does your household own any farm animal(s)? 1 Yes 2 No Õ next Section
4.21 - If yes, how many of each of the following animals do you own? (write 00 if none)
a Chicken |__|__| g Pigs |__|__|b Ducks |__|__| h Bulls |__|__|c Other birds |__|__| k Cows |__|__|d Rabbits |__|__| l Oxen |__|__|e Goats |__|__| m Donkey |__|__|f Sheep |__|__| n Camels |__|__|
Chapt 4 p 63_178 esec 18-05-2009 1:38 Pagina 119

120
Comprehensive Food Security & Vulnerability Analysis Guidelines
Modification to the module• The list of assistance programmes and organizations has to be context-specific.
Link with other modules• Livelihood activities – since assistance programmes sometimes focus on certain
livelihood activities, there should be a correspondence; for instance, if the householdbenefits from agricultural assistance, we could expect crop production to bementioned as a livelihood activity.
Source of inspiration• Questions on external assistance are usually not included in DHS and MICS
questionnaires, but can be found in LSMS questionnaires.
Module Title: Shocks and Coping
Main purpose of the module: This module aims to identify shocks that, in the recentpast, have affected the household’s ability to acquire food or cash perceived as importantby each household, and the types of coping mechanisms used. This will determine whichhouseholds are prone to be affected by shocks and which have poor coping capacity.
Limitations of the module• Problem with the definition of shock: A shock is an abnormal event affecting a
household’s economic status and capacity to feed themselves. Sometimes eventsare reported as shocks that do not have real consequences on a household’s statusbecause they are (or should be considered) normal events (e.g. lack of rain in adesert area). Information on shocks can be more appropriately collected through
Table 4.13: Example of External Assistance module
Has any member of your household received food aid in thelast 6 months?
If yes, please specify the type of programme and thenumber of beneficiaries in your household?
Circle all that apply and specify number of beneficiaries inthe last column.
Has any member of your household received any other typeof external assistance besides food aid in the last 6 months?
If yes, from whom?
Circle all that apply
If yes, what type of assistance?
Circle all that apply
1 Yes 2 No
1 School feeding |__|__|2 Food for work/food for assets |__|__|3 Supplementary feeding |__|__|4 Other (Specify: __________) |__|__|
1 Yes 2 No
1 World Food Programme2 SAPPROSC/DEPROSC3 Save the Children4 UNICEF5 GT2/SNV/DFID6 French Cooperation7 The Government8 Other (Specify: _____________)
1 Food products2 Money allowances/loans3 For education (fees, books, uniforms)4 For medical services5 Construction material, building6 Agricultural assistance (tools/seeds)7 Other (Specify:________________)
Chapt 4 p 63_178 esec 18-05-2009 1:38 Pagina 120

CHAPTER 4. Household-level data in CFSVA
121
secondary data. The problem of shock definition should be carefully consideredduring questionnaire design and enumerator training.
• Shocks and coping strategies depend on household perception.• Households may not be able to attribute their coping mechanisms or the
consequences of a shock to a particular event.• Neither intensity of shock nor coping mechanism is measured.• This is not equivalent to the Coping Strategy Index. If this is a desired output, it
should be included as a separate section.• If an initial filter question is used (e.g. Have you experienced a shock in the last
12 months?) as a skip question, this may lead to unwarranted non-response byhouseholds, as some may not understand what is meant by the term shock (i.e. theymight not consider specific shocks, such as fire, drought, or war).
• If no initial filter question is used, and each shock is enumerated (i.e. Have youexperienced drought? Have you experienced floods?), this may increase the numberof responses, as each may be a leading question.
Creation of the Shocks and Coping Strategies module• The focus of this module is on shocks that affect the economy of the household
or the ability to acquire (produce/purchase) food.• The minimum structure of this module should be a list of shocks experienced and
coping mechanisms used.• The recommended standard recall period is one year. There are exceptions to this;
see “Modifications to the module.”• The module should reflect:
- Covariate shocks experienced during the period of recall (e.g. one year), includingeconomic and environmental shocks;
- Idiosyncratic shocks that likely affected the household;- Coping mechanisms commonly employed by households within the context,
especially those used by known vulnerable households.m Coping mechanisms should reflect food and non-food responses (i.e. the list
should come from the secondary data review or previous surveys/studies).
Modifications to the module• Once the shock and coping strategy lists are made, the following options can be
added (there is no current agreed-upon standard):- A filter question at the beginning of the section (Have you experienced a shock?)
that will determine the enumeration of the rest of the section (if no shock, go to thenext module);
- When enumerating the shocks experienced, a question about each individualshock, or a general question, allowing the household to list all shocks;
- Based on the suggested focus for this module, a filter question to ensure the HHunderstands they are responding with a list of shocks that have affected theireconomic status or their ability to acquire food;
- Once the section on shock identification is complete, coping mechanisms usedduring the same period, ideally from a pre-coded list (i.e. the enumerator lists allthe coping mechanisms used during the recall period).
• Rank the importance of a given shock for that household. • Record the seasonality of the shock or coping mechanisms. When during the
CH
AP
TER
4
Chapt 4 p 63_178 esec 18-05-2009 1:38 Pagina 121

122
Comprehensive Food Security & Vulnerability Analysis Guidelines
previous recall period did the household experience this shock or use the copingmechanisms? (Note that this question has limited field experience but can haveinteresting results.)
• Link each specific shock (two to four main shocks) to a coping mechanism. However,feedback suggests that unless the problem is major – for example, an earthquake –households often struggle to link one unique coping strategy to one unique shock.
• Instead of 12 months, the recall period, if in an FSMS, may be back to the previousround of data collection. In an EFSA, it may be back to the period of the last maincovariate shock.
• Relate specific shocks to their impact on assets (loss of, recovery of), usually inconjunction with linking specific shocks to coping strategies.
• Relate specific shocks to their impact on income (reduction of, return to the same level of).• Relate specific shocks to the ability to feed the household.• Relate specific shocks to current recovery status (not recovered, partially recovered,
totally recovered).
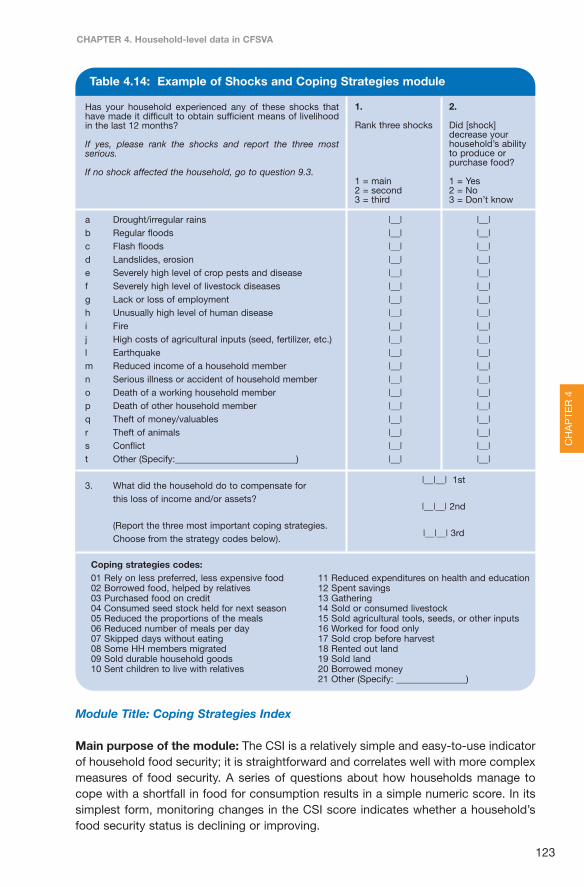
Sources of inspirationQuestions on shocks and coping strategies can be found in the LSMS questionnaires.Such questions are quite similar to those included in the CFSVA module, even thoughthey draw attention to the impact on household welfare, whereas the CFSVA modulelooks more specifically at the impact on food consumption.
Table 4.14 presents a typical set of questions and options for the Shocks and CopingStrategies module. However, note that analysing the number of indicators presented isdifficult, as most of the data obtained from such a table are not significant due to themultiple combinations of answers that result in a small number of cases. Hence, it issuggested to group the indicators based on type. For example, “Reduced number ofmeals,” “Reduced proportions of the meals,” “Rely on less preferred, less expensivefood,” “Reduced expenditures on health and education” can be grouped as“adjustment strategies,” while all borrowing can be combined as “borrowingstrategies.” Similarly, all selling of assets could be combined as “divestment strategy,”and all instances of migration could be combined as “migration strategy.” The analystcan create other categories based on the importance of a particular coping strategy ina particular country, and on the number of households that adopted the strategy.
Links with other modules• This section should not be combined with the Coping Strategies Index (CSI), nor is
it a substitute for a CSI (a CSI is done in addition to this and has its own specificmethodology).
• To the qualitative data, if collected.
Tips• If using the initial skipping rule, be sure the enumerators do not lead respondents on
this question in order to skip the entire section. • It is imperative that a relevant list of shocks and food and non-food coping strategies
is created. • When linking shocks and coping strategies, enumerator training and clarification of
questions is important.
Chapt 4 p 63_178 esec 18-05-2009 1:38 Pagina 122
CHAPTER 4. Household-level data in CFSVA
123
Module Title: Coping Strategies Index
Main purpose of the module: The CSI is a relatively simple and easy-to-use indicatorof household food security; it is straightforward and correlates well with more complexmeasures of food security. A series of questions about how households manage tocope with a shortfall in food for consumption results in a simple numeric score. In itssimplest form, monitoring changes in the CSI score indicates whether a household’sfood security status is declining or improving.
CH
AP
TER
4
Table 4.14: Example of Shocks and Coping Strategies module
Has your household experienced any of these shocks thathave made it difficult to obtain sufficient means of livelihoodin the last 12 months?
If yes, please rank the shocks and report the three mostserious.
If no shock affected the household, go to question 9.3.
a Drought/irregular rains |__| |__|b Regular floods |__| |__|c Flash floods |__| |__|d Landslides, erosion |__| |__|e Severely high level of crop pests and disease |__| |__|f Severely high level of livestock diseases |__| |__|g Lack or loss of employment |__| |__|h Unusually high level of human disease |__| |__|i Fire |__| |__|j High costs of agricultural inputs (seed, fertilizer, etc.) |__| |__|l Earthquake |__| |__|m Reduced income of a household member |__| |__|n Serious illness or accident of household member |__| |__|o Death of a working household member |__| |__|p Death of other household member |__| |__|q Theft of money/valuables |__| |__|r Theft of animals |__| |__|s Conflict |__| |__|t Other (Specify:__________________________) |__| |__|
3. What did the household do to compensate forthis loss of income and/or assets?
(Report the three most important coping strategies.Choose from the strategy codes below).
|__|__| 1st
|__|__| 2nd
|__|__| 3rd
Coping strategies codes:01 Rely on less preferred, less expensive food02 Borrowed food, helped by relatives03 Purchased food on credit04 Consumed seed stock held for next season05 Reduced the proportions of the meals06 Reduced number of meals per day07 Skipped days without eating08 Some HH members migrated 09 Sold durable household goods10 Sent children to live with relatives
11 Reduced expenditures on health and education12 Spent savings13 Gathering14 Sold or consumed livestock 15 Sold agricultural tools, seeds, or other inputs16 Worked for food only17 Sold crop before harvest18 Rented out land19 Sold land20 Borrowed money21 Other (Specify: _______________)
1.
Rank three shocks
1 = main2 = second3 = third
2.
Did [shock]decrease yourhousehold’s abilityto produce orpurchase food?
1 = Yes2 = No3 = Don’t know
Chapt 4 p 63_178 esec 18-05-2009 1:38 Pagina 123
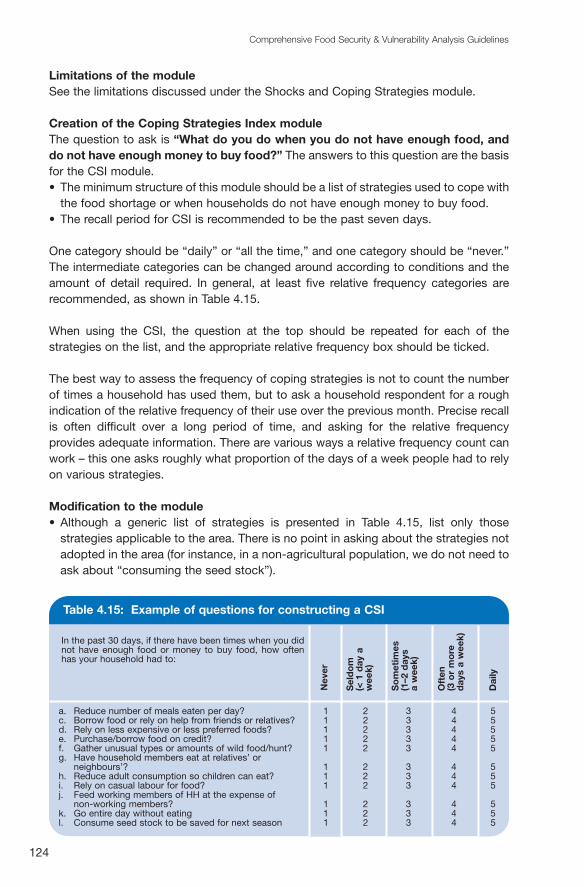
124
Comprehensive Food Security & Vulnerability Analysis Guidelines
Limitations of the moduleSee the limitations discussed under the Shocks and Coping Strategies module.
Creation of the Coping Strategies Index moduleThe question to ask is “What do you do when you do not have enough food, anddo not have enough money to buy food?” The answers to this question are the basisfor the CSI module.• The minimum structure of this module should be a list of strategies used to cope with
the food shortage or when households do not have enough money to buy food.• The recall period for CSI is recommended to be the past seven days.
One category should be “daily” or “all the time,” and one category should be “never.”The intermediate categories can be changed around according to conditions and theamount of detail required. In general, at least five relative frequency categories arerecommended, as shown in Table 4.15.
When using the CSI, the question at the top should be repeated for each of thestrategies on the list, and the appropriate relative frequency box should be ticked.
The best way to assess the frequency of coping strategies is not to count the numberof times a household has used them, but to ask a household respondent for a roughindication of the relative frequency of their use over the previous month. Precise recallis often difficult over a long period of time, and asking for the relative frequencyprovides adequate information. There are various ways a relative frequency count canwork – this one asks roughly what proportion of the days of a week people had to relyon various strategies.
Modification to the module• Although a generic list of strategies is presented in Table 4.15, list only those
strategies applicable to the area. There is no point in asking about the strategies notadopted in the area (for instance, in a non-agricultural population, we do not need toask about “consuming the seed stock”).
Table 4.15: Example of questions for constructing a CSI
In the past 30 days, if there have been times when you didnot have enough food or money to buy food, how oftenhas your household had to:
Nev
er
Sel
do
m(<
1 d
ay a
wee
k)
So
met
imes
(1
–2 d
ays
a w
eek)
Oft
en
(3 o
r m
ore
day
s a
wee
k)
Dai
ly
a. Reduce number of meals eaten per day? 1 2 3 4 5c. Borrow food or rely on help from friends or relatives? 1 2 3 4 5d. Rely on less expensive or less preferred foods? 1 2 3 4 5e. Purchase/borrow food on credit? 1 2 3 4 5f. Gather unusual types or amounts of wild food/hunt? 1 2 3 4 5g. Have household members eat at relatives’ or
neighbours’? 1 2 3 4 5h. Reduce adult consumption so children can eat? 1 2 3 4 5i. Rely on casual labour for food? 1 2 3 4 5j. Feed working members of HH at the expense of
non-working members? 1 2 3 4 5k. Go entire day without eating 1 2 3 4 5l. Consume seed stock to be saved for next season 1 2 3 4 5
Chapt 4 p 63_178 esec 18-05-2009 1:38 Pagina 124

CHAPTER 4. Household-level data in CFSVA
125
The context-specific CSI “has been criticized for being relatively unhelpful incomparative analysis. However, fieldworkers have noted that several of the individualbehaviours that the CSI measured recur across different contexts”60. Recognizing this,a reduced CSI was developed to compare food security across different contexts. It isbased on the same short list of (5) coping strategies (see figure below) and the sameseverity weights.
The reduced CSI is less valuable in identifying the most vulnerable HHs in a givenlocation, but it is very useful for comparison across countries as it focuses on the sameset of behaviours. Furthermore, “extensive research demonstrated that the ‘reduced’CSI reflects food insecurity nearly as well as the ‘full’ or context-specific CSI”.61
The figure below describes how to calculate a reduced household CSI score:
In order to conduct the analysis of the CSI, however, you need a few more pieces ofinformation. The first is a way to “weight” the individual strategies or behaviours.
The CSI tool relies on counting coping strategies that are not equal in severity. Differentstrategies are therefore “weighted” – multiplied by a weight that reflects their severitybefore being added together. The simplest procedure for doing this is to group thestrategies according to similar levels of severity and assign a weight to each group.The severity of coping strategies is, to some extent, a matter of perception.
Focus group discussions with different community groups are needed to determine theseverity of the coping mechanisms. The first step is to try to group the strategies intocategories of roughly the same level of severity. Since this task is carried out with differentgroups, it is useful to impose some structure from the outset. For example, one coulddivide them into four different categories: very severe, severe, moderate, and not severe.
• It is always easiest to determine the most severe coping strategies, so ask the groupto select the most severe and least severe individual strategies first.
• Then ask if there are other individual strategies that are more or less the equivalentof these two, in terms of how severe they are perceived to be. Once the twoextremes are established, it is easier to group the remaining behaviours intointermediate categories.
CH
AP
TER
4
60. Source: “Coping Strategy Index: Field Methods Manual” II edition (2008)61. ibid
Weighted Score =Frequency X weight
UniversalSeverity Weight
Raw ScoreIn the past 7 days, if there have been times when you didnot have enough food or money to buy food, how oftenhas your household had to:
Sum down the totals foreach individual strategy
Relative Frequency Score
a. Rely on less preferred and less expensive foods? 5 1 5b. Borrow food, or rely on help from a friend or relative? 2 2 4c. Limit portion size at mealtimes? 7 1 7d. Restrict consumption by adults in order for small
children to eat? 2 3 6e. Reduce number of meals eaten in a day? 5 1 5
TOTAL HOUSEHOLD SCORE – Reduced CSI 27
Chapt 4 p 63_178 esec 18-05-2009 1:38 Pagina 125
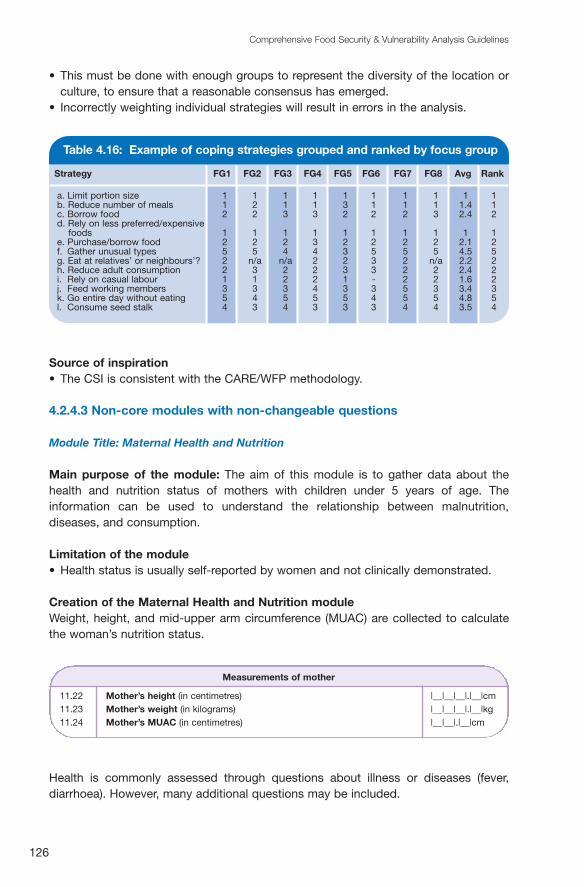
126
Comprehensive Food Security & Vulnerability Analysis Guidelines
• This must be done with enough groups to represent the diversity of the location orculture, to ensure that a reasonable consensus has emerged.
• Incorrectly weighting individual strategies will result in errors in the analysis.
Source of inspiration• The CSI is consistent with the CARE/WFP methodology.
4.2.4.3 Non-core modules with non-changeable questions
Module Title: Maternal Health and Nutrition
Main purpose of the module: The aim of this module is to gather data about thehealth and nutrition status of mothers with children under 5 years of age. Theinformation can be used to understand the relationship between malnutrition,diseases, and consumption.
Limitation of the module• Health status is usually self-reported by women and not clinically demonstrated.
Creation of the Maternal Health and Nutrition moduleWeight, height, and mid-upper arm circumference (MUAC) are collected to calculatethe woman’s nutrition status.
Health is commonly assessed through questions about illness or diseases (fever,diarrhoea). However, many additional questions may be included.
Table 4.16: Example of coping strategies grouped and ranked by focus group
Strategy FG1 FG2 FG3 FG4 FG5 FG6 FG7 FG8 Avg Rank
a. Limit portion size 1 1 1 1 1 1 1 1 1 1b. Reduce number of meals 1 2 1 1 3 1 1 1 1.4 1c. Borrow food 2 2 3 3 2 2 2 3 2.4 2d. Rely on less preferred/expensive
foods 1 1 1 1 1 1 1 1 1 1e. Purchase/borrow food 2 2 2 3 2 2 2 2 2.1 2f. Gather unusual types 5 5 4 4 3 5 5 5 4.5 5g. Eat at relatives’ or neighbours’? 2 n/a n/a 2 2 3 2 n/a 2.2 2h. Reduce adult consumption 2 3 2 2 3 3 2 2 2.4 2i. Rely on casual labour 1 1 2 2 1 - 2 2 1.6 2j. Feed working members 3 3 3 4 3 3 5 3 3.4 3k. Go entire day without eating 5 4 5 5 5 4 5 5 4.8 5l. Consume seed stalk 4 3 4 3 3 3 4 4 3.5 4
Measurements of mother
11.22 Mother’s height (in centimetres) |__|__|__|.|__|cm11.23 Mother’s weight (in kilograms) |__|__|__|.|__|kg11.24 Mother’s MUAC (in centimetres) |__|__|.|__|cm
Chapt 4 p 63_178 esec 18-05-2009 1:38 Pagina 126

CHAPTER 4. Household-level data in CFSVA
127
Modification to the module• Additional questions about a mother’s health can be added: Is she currently pregnant
or breastfeeding? The number of pregnancies, miscarriages, stillbirths? The numberof living children? The age of the first delivery? Has she received iron-folate tablets,antenatal care, vitamin A capsules? What are her health and hygiene practices(sleeping under a mosquito net, boiling or treating drinking water, washing handsbefore preparing meals or after going to the toilet)? Her level of education,occupation, and control over food and income could be included as potentiallyrelevant for the analysis of the results.
Links with other modules• Child health and nutrition• Water and sanitation• Food consumption• Community-level infrastructure (specifically, health facilities)
Source of inspiration• MICS and DHS surveys have more extensive questionnaires for women,
including information on child mortality, maternal and newborn health, andmarriage. Likewise, the CFSVAs, MICS, and DHS collect anthropometric data onwomen.
Module Title: Child Health and Nutrition
Main purpose of the module: The aim of the module is to gather data about the nutritionstatus and health conditions of children under 5 years old (usually 6 to 59 months).
Limitations of the module• Appropriate sampling approaches and sample sizes are required to calculate
prevalence rates with a sufficient degree of precision.• If that is not feasible, data can be collected and used to investigate relationships
between nutritional outcome and other food security indicators, but not to provideprevalence rates.
• Collecting height and weight data requires some effort. Data are collected usingspecial equipment that is bulky and troublesome to carry around to each household.Frequently, an individual appropriately trained in anthropometry must be added toeach survey field team.
Creation of the Child Health and Nutrition moduleThe key data to assess child nutrition status are: sex, age, weight and height/length.Additionally, MUAC is often collected. Basic health information is related toillness, particularly to diarrhoea and fever. Table 4.17 offers an example of a simpleChild Health and Nutrition module.
CH
AP
TER
4
Chapt 4 p 63_178 esec 18-05-2009 1:38 Pagina 127

128
Comprehensive Food Security & Vulnerability Analysis Guidelines
Modification to the module• Additional questions about the child’s health can be added: size at birth,
breastfeeding and weaning history, vaccination, de-worming or other treatment. Alsouseful would be questions on other diseases (e.g. malaria, measles, acute respiratoryinfections) and on the child’s feeding patterns.
Links with other modules• Mother health and nutrition• Water and sanitation• Food consumption• Community-level infrastructure (specifically, health facilities)• Sources of inspiration• MICS and DHS surveys have more extensive questionnaires for children. Similar to
the CFSVAs, MICS and DHS collect anthropometric data on children and informationon health status. LSMS questionnaires sometimes include a children’s module foranthropometric data.
4.2.4.4 Non-core modules with changeable/flexible questions
Gender-sensitive survey design and implementation
Study preparationAn in-depth literature review can be used to identify factors that shape genderrelations, such as cultural beliefs, values and practices, religion, education, politics,
Table 4.17: Example of Child Health and Nutrition module
1.a
F i r s tname
1.b
Mother’s/caretaker’sID no.
(link withmother’ssection, ifcollected)
8 = missingat interview9 = dead
2.
If available,date of birthfrom themedical card
If no Õ 10.3
If yes Õ enter,then Õ 10.4
Use formatdd/mm/yy
3.
Child’sage inmonths
4.
Child’s sex?
1= Male
2 = Female
5.
Are you themother/care-taker of[Name]
1 = yes
2 = no
If no Õ 10.8
6.
Has [Name]been ill inthe last 2weeks?
1 = yes2 = noÕ 10.8
3 = do not knowÕ 10.8
7.
Has [NAME]been ill withdiarrhoeaand/or fever atany time in thepast 2 weeks?(Diarrhoea:perceived bymother as 3 ormore loosestools per dayfor 3 days orone largewatery stool orblood in stool)1 = yes2 = no3 = do notknow
Diarrhoea Fever
8.
Child’sheight/length
(incentimetres,with 1decimalplace)
9.
Child’sweight
Enterweight inkilograms,with onedecimalplace
10.
Child’sMUAC
(incentimetres,with 1decimalplace)
|__| |__|__|/|__|__|/|__|__|
|__|__| |__| |__| |__| |__| |__| |__|__|__|.|__|
|__|__|.|__| |__|__|.|__|
ASK SELECTED RESPONDENT IF THERE ARE CHILDREN OF 6–59 MONTHS OF AGE IN THEHOUSEHOLD. IF NOT, TERMINATE INTERVIEW.Read aloud: Now I would like to ask you some questions about the children in this household (Continue theinterview with the same woman)We would like you to come with all the children aged 6 to 59 months from your household. We would like tomeasure and weigh them as part of our assessment.It is very important that children are measured, so be persuasive. Assist women in transportation, if need be.
Starting with the youngest child, and focusing on one child at a time, enter each child’s first name and askfor the following information:
Chapt 4 p 63_178 esec 18-05-2009 1:38 Pagina 128

CHAPTER 4. Household-level data in CFSVA
129
legislation, economic situation and demographic factors. Generating this type of overviewprior to primary data collection provides a context for tailoring generic data collection toolsto ensure that they are gender-sensitive and appropriate for a particular setting.
Selection, composition, and training of survey teamsAlthough members of field teams do not need to have a technical background ingender analysis per se, it is crucial that enumerators are sensitized to the importanceand rationale behind collecting sex-disaggregated data and phrasing questions in away that allows for an analysis of the relationship between gender, food security, andvulnerability. This is even more important for facilitators applying qualitative tools suchas focus group discussions and participatory rural appraisal techniques. A balancedmixture of male and female enumerators will minimize the extent to which bias isintroduced due to enumerator gender. Where group discussions are to be heldseparately for men and women, same-sex discussion facilitators are likely to contributeto a more relaxed and open discussion.
Study design (household surveys)In each questionnaire, sex, age, and relationship to the household head of the mainrespondent should be indicated to determine possible biases introduced during thedata collection process. This will also assist with the identification of differentperceptions of men, women, and age groups during analysis.
To the extent possible, all questions concerning food security and vulnerability includedin household surveys should be designed in such a way as to differentiate between theexperiences of women and men (girls and boys). Please refer to Box 4.6 for examplesof key questions that should be disaggregated by gender. Gender-disaggregated dataprovides valuable information about those intra-household differences that can bemasked by surveys that treat households as a single, homogenous unit. Quantitativeindicators produced by household survey data can be used to measure the degree ofgender inequalities related to food security and vulnerability.
Community discussions or interviews The qualitative data generated through discussions or interviews with communitymembers provides key insights for understanding the underlying causes and reasonsfor inequalities identified during household surveys, and allows for further elaborationof the causal mechanisms suggested by quantitative data.
Interviews with key informants (i.e. local authorities)It is important to include knowledgeable women in the list of persons to be used as keyinformants. Women’s organizations or women’s affairs offices often provide suitablecandidates. Discrepancies between authorities’ perceptions and household- andcommunity-level realities enable an assessment of whether key decision-makers areaware of gender-related differences and inequalities.
Timing of data collectionAppropriate timing is crucial for ensuring that women and men are able to participatein all data collection exercises. Although communities are busy throughout the year,there may be periods when their workload is slightly less burdensome. Similarly, the
CH
AP
TER
4
Chapt 4 p 63_178 esec 18-05-2009 1:38 Pagina 129

130
Comprehensive Food Security & Vulnerability Analysis Guidelines
Household Roles/Social and Cultural Constraints• What are the different needs, roles, and interests of women and men?• What are the power dynamics between women and men?• Which decisions are made by men and which by women?• What are the social and cultural constraints and opportunities of women and men?• What are the relations between women and men in society, the community, and the
household?• What different coping mechanisms are available to women and men to lessen the risk of
food insecurity for their families?• How do access to and control of resources, information, and services affect participation by
women and men in the programme/project?• How do gender roles (e.g. workload, time, mobility) influence the ability of women and men
to participate in the programme/project?
Food and Livelihoods
Who manages food within the household?• How is food distributed within the household?• Who cultivates land and grows food?• Who is the family’s main income earner?• What are the income-generating opportunities and needs of men and women?• Where is it convenient for women and/or men to collect food assistance?• Who collects food assistance?
Health Risks and Accessibility to Health Services• What are the health risks for women and men? How and why are they different?• What barriers (e.g., self-confidence, mobility, financial resources, role in decision-making) do
women and men face in accessing health services and health information?• Where do women and men go for health services and information?• Which communication channels are most appropriate for women and men?• Can women and men discuss their health problems/issues among themselves?• Is this culturally accepted?• Where can women and men learn more about how to address their health concerns?• What social networks exist in the community for men and for women?• Can these networks help address health concerns?
HIV-Affected Households• For HIV-affected households, what are the different coping mechanisms of women and
men? Of girls and boys?• For HIV-affected households, what is the impact on girls’ and boys’ school attendance? Are
girls withdrawn from school more often than boys?• What are women’s and men’s responsibilities related to caring for PLHIV?
Box 4.6: Key questions for use in conducting gender analysis (WFP 2006)
availability of community and household members is influenced by the daily pattern ofagricultural work, and the income-generating and household activities of men andwomen. For example, women may not be able to attend meetings during eveninghours due to domestic responsibilities.
Chapt 4 p 63_178 esec 18-05-2009 1:38 Pagina 130

CHAPTER 4. Household-level data in CFSVA
131
Collecting data on gender issuesAs a general rule, gender-sensitive data is to be collected in each module of ahousehold survey. In the context of a CFSVA, the gender-sensitive data usuallyincorporated (or that can be easily incorporated) into a household surveyincludes:• Demography: sex and age of the head of the household; household
composition;• Migration: circumstances of migration (reasons, remittances, gender of the migrated
members) in order to assess impact of migration on gender prevalence (at thehousehold and community levels) and on food security;
• Education: primary and secondary school attendance of girls and boys, andliteracy skills of the head and his/her spouse, informal training of men and women;
• Income sources: differentiated participation of household members in income-generatingactivities;
• Food consumption: intra-household distributions and sequence of family memberseating food; and
• Health and nutrition: prevalence of malnutrition among women, prevalence of childmalnutrition by gender, data on breastfeeding and reproductive health, andawareness of HIV/AIDS prevention and transmission.
Key questions in the household questionnaire for HIV/AIDS Literature on HIV/AIDS identifies some key attributes of chronically ill or deceasedadults that are crucial to studying the impact of and responses to HIV/AIDS. Theseattributes include age, gender, relationship to the household head, educational level,active role of the individual in the household, and decreased capability to work. Ideally,a survey on the impact of HIV/AIDS should collect information on all these attributes.Within the context of food security assessments, the minimum set of attributes toconsider includes:• age; • relationship to the head of the household; and• decreased capability to work.
The way we capture the presence and key attributes of chronically ill or deceasedhousehold members depends on how demographic data are collected during thehousehold survey.
Option 1: Data are collected through a rosterIf data are collected through a roster, ID, name, age, gender, and relationship to thehousehold head are typically collected. Table 4.18 shows how a roster can be adaptedto capture information related to chronically ill members. Yellow highlighted sectionshelp identify chronically ill adult members and some key attributes.
CH
AP
TER
4
Chapt 4 p 63_178 esec 18-05-2009 1:38 Pagina 131

132
Comprehensive Food Security & Vulnerability Analysis Guidelines
Table 4.18: Demographic data collected through a roster
Name
________________________________________
Age
(in years, if<1yr. old,write 0)
|__||__||__||__||__||__||__||__||__||__||__||__||__||__||__||__|
If 98 or more,write 98
99 = NK
ID
0102030405……N
Gender
|__||__||__||__||__||__||__||__|
0 = M1 = F
Relationship tothe HH head
|__||__||__||__||__||__||__||__|
1 = head 2 = spouse3 = son/daughter4 = father/mother5 = brother/sister6 = grandparent7 = uncle/aunt/
cousin8 = niece/nephew/
grandchild9 = adopted/foster
child10 = stepchild11 = no relation
Is s/heengaged inpaid work(cash/in-kind)? If ill, considerthe periodbefore illness.
|__||__||__||__||__||__||__||__|
0=no1=yes
If chronicallyill, over thepast 12 months,has s/hebeen able towork asbefore?
|__||__||__||__||__||__||__||__|
1=yes, able towork thesame numberof hours/days
2= no,working forfewerhours/days
3=completelyunable towork
Q1 Q2 Q3 Q4 Q5 Q6 Q7 Q8 Q9
NK = not known
Table 4.19: Collecting data on deceased household members
Q3Gender
|__||__||__||__|
0=M1=F
12…N
Q4Relationship to the HH head
|__||__||__||__|
1=head 2=spouse 3=other member
Q5Was s/heengaged in paid work(cash/in kind)?consider periodbefore illness
|__||__||__||__|
0=no1=yes
Q6In the period s/he wassick, was s/he able towork as before?
|__||__||__||__|
1=yes, able to work thesame number ofhours/days
2=no, working for fewerhours/days
3=completely unable towork
Q1 Did any adult (ages 18–59) household member die during the 12 monthsbefore the survey after being sick for at least 3 months over the past 12?
For each of the adult (ages 18–59) household members who died after being sick for at least 3 months overthe past 12, report:
If yes, withwhich kind ofillness?
|__||__||__||__||__||__||__||__|
0=mentally/physicallydisabled
1= chronicillness
Data on deceased members require nesting a separate table within the questionnaire.Table 4.19 suggests how questions on recent deaths can be formulated. They are verysimilar to the questions on chronically ill members.
|__|
0=no (skip the wholesection)1=yes
Q2Cause of death
|__||__||__||__|
1=after chronicillness2=after a period ofphysical disability 3=old age4=problemscaused bypregnancy
9=other(Spec. :_________)
Has s/hebeen notfullyfunctional forat least 3months overthe past 12months?
|__||__||__||__||__||__||__||__|
0=no1=yes
Chapt 4 p 63_178 esec 18-05-2009 1:38 Pagina 132

CHAPTER 4. Household-level data in CFSVA
133
Option 2: Data are not collected through a rosterIf the household questionnaire does not include a roster, questions on deceasedmembers are the same as in Option 1; questions on chronically ill members need to beasked in a different format.
CH
AP
TER
4
4.2.5 Ensuring data quality
The manager of the CFSVA should ensure that the highest quality data are collected.Data quality is influenced by many factors, such as whether or not PDAs or paperquestionnaires are used, the selection of previously experienced enumerators(knowledge of local languages and the language of the supervisors, country, foodsecurity, data collection), the quality of the training, how motivated staff are to collectaccurate data (this can be seen during the test), and how well the data collectionprocess is supervised. If PDAs are used, enumerators should possess basiccomputer knowledge.
4.2.5.1 Training of the enumeratorsQuality training is essential to ensure that enumerators are able to ask questions in anon-leading way, probe during the interviews, and triangulate the information collected.
Although there are several ways to go about enumerator training, there are some rulesof thumb for CFSVAs. A typical training schedule could include sections on:• Administrative issues;• Overview of survey purpose and objectives;• The role of interviewers and interviewer comportment, standard operating procedure (SOP);• Overview of questionnaire and discussion of individual items;• Mock interview demonstrations;
Table 4.20: Demographic data not collected through a roster
Q3Gender
|__||__||__||__|
0=M1=F
12…N
Q4Relationshipto the HH head
|__||__||__||__|
1=head 2=spouse 3=other
Q5Was engagedin paid work(cash/in kind)?Consider periodbefore illness
|__||__||__||__|
0=no1=yes
Q6Over the past 12 monthshas s/he been able towork as before?
|__||__||__||__|
1=yes, able to work thesame amount ofhours/days2= no, working for fewerhours/days3=completely unable towork
Q1 Has any adult (ages 18–59) household member been not fully functionalfor at least 3 months over the past 12 months?
For each of the adult (ages 18–59) household members who have not been fully functional, reportthe following:
Q2Kind of illness
|__||__||__||__|
0=mentally/physically disabled
1=chronic illness
|__|
0=no (skip the wholesection)1=yes
Chapt 4 p 63_178 esec 18-05-2009 1:38 Pagina 133
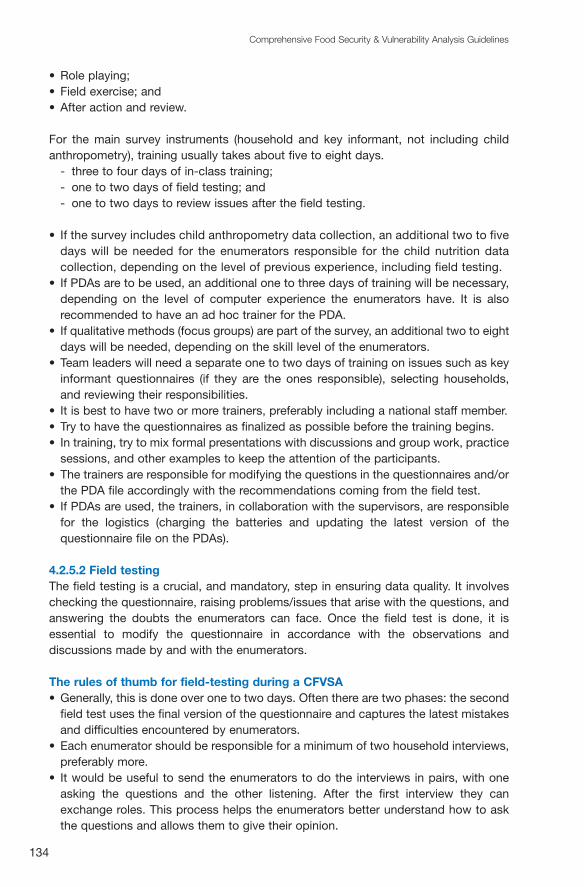
134
Comprehensive Food Security & Vulnerability Analysis Guidelines
• Role playing;• Field exercise; and• After action and review.
For the main survey instruments (household and key informant, not including childanthropometry), training usually takes about five to eight days.
- three to four days of in-class training;- one to two days of field testing; and - one to two days to review issues after the field testing.
• If the survey includes child anthropometry data collection, an additional two to fivedays will be needed for the enumerators responsible for the child nutrition datacollection, depending on the level of previous experience, including field testing.
• If PDAs are to be used, an additional one to three days of training will be necessary,depending on the level of computer experience the enumerators have. It is alsorecommended to have an ad hoc trainer for the PDA.
• If qualitative methods (focus groups) are part of the survey, an additional two to eightdays will be needed, depending on the skill level of the enumerators.
• Team leaders will need a separate one to two days of training on issues such as keyinformant questionnaires (if they are the ones responsible), selecting households,and reviewing their responsibilities.
• It is best to have two or more trainers, preferably including a national staff member. • Try to have the questionnaires as finalized as possible before the training begins. • In training, try to mix formal presentations with discussions and group work, practice
sessions, and other examples to keep the attention of the participants. • The trainers are responsible for modifying the questions in the questionnaires and/or
the PDA file accordingly with the recommendations coming from the field test.• If PDAs are used, the trainers, in collaboration with the supervisors, are responsible
for the logistics (charging the batteries and updating the latest version of thequestionnaire file on the PDAs).
4.2.5.2 Field testingThe field testing is a crucial, and mandatory, step in ensuring data quality. It involveschecking the questionnaire, raising problems/issues that arise with the questions, andanswering the doubts the enumerators can face. Once the field test is done, it isessential to modify the questionnaire in accordance with the observations anddiscussions made by and with the enumerators.
The rules of thumb for field-testing during a CFVSA• Generally, this is done over one to two days. Often there are two phases: the second
field test uses the final version of the questionnaire and captures the latest mistakesand difficulties encountered by enumerators.
• Each enumerator should be responsible for a minimum of two household interviews,preferably more.
• It would be useful to send the enumerators to do the interviews in pairs, with oneasking the questions and the other listening. After the first interview they canexchange roles. This process helps the enumerators better understand how to askthe questions and allows them to give their opinion.
Chapt 4 p 63_178 esec 18-05-2009 1:38 Pagina 134
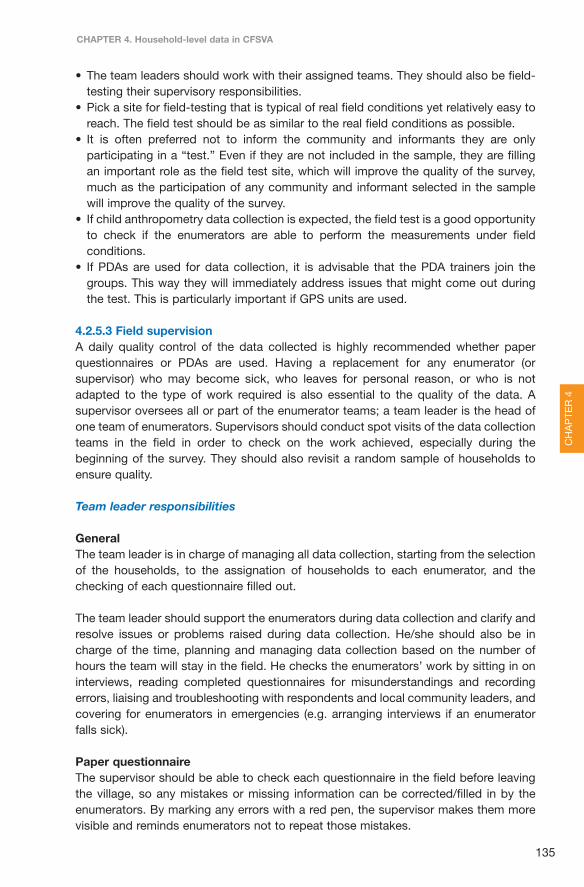
CHAPTER 4. Household-level data in CFSVA
135
• The team leaders should work with their assigned teams. They should also be field-testing their supervisory responsibilities.
• Pick a site for field-testing that is typical of real field conditions yet relatively easy toreach. The field test should be as similar to the real field conditions as possible.
• It is often preferred not to inform the community and informants they are onlyparticipating in a “test.” Even if they are not included in the sample, they are fillingan important role as the field test site, which will improve the quality of the survey,much as the participation of any community and informant selected in the samplewill improve the quality of the survey.
• If child anthropometry data collection is expected, the field test is a good opportunityto check if the enumerators are able to perform the measurements under fieldconditions.
• If PDAs are used for data collection, it is advisable that the PDA trainers join thegroups. This way they will immediately address issues that might come out duringthe test. This is particularly important if GPS units are used.
4.2.5.3 Field supervision A daily quality control of the data collected is highly recommended whether paperquestionnaires or PDAs are used. Having a replacement for any enumerator (orsupervisor) who may become sick, who leaves for personal reason, or who is notadapted to the type of work required is also essential to the quality of the data. Asupervisor oversees all or part of the enumerator teams; a team leader is the head ofone team of enumerators. Supervisors should conduct spot visits of the data collectionteams in the field in order to check on the work achieved, especially during thebeginning of the survey. They should also revisit a random sample of households toensure quality.
Team leader responsibilities
GeneralThe team leader is in charge of managing all data collection, starting from the selectionof the households, to the assignation of households to each enumerator, and thechecking of each questionnaire filled out.
The team leader should support the enumerators during data collection and clarify andresolve issues or problems raised during data collection. He/she should also be incharge of the time, planning and managing data collection based on the number ofhours the team will stay in the field. He checks the enumerators’ work by sitting in oninterviews, reading completed questionnaires for misunderstandings and recordingerrors, liaising and troubleshooting with respondents and local community leaders, andcovering for enumerators in emergencies (e.g. arranging interviews if an enumeratorfalls sick).
Paper questionnaireThe supervisor should be able to check each questionnaire in the field before leavingthe village, so any mistakes or missing information can be corrected/filled in by theenumerators. By marking any errors with a red pen, the supervisor makes them morevisible and reminds enumerators not to repeat those mistakes.
CH
AP
TER
4
Chapt 4 p 63_178 esec 18-05-2009 1:38 Pagina 135
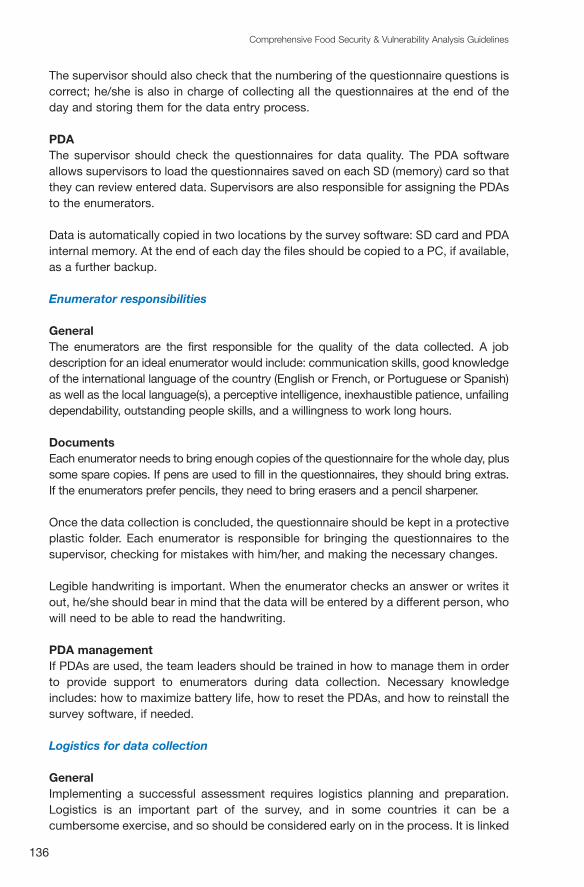
136
Comprehensive Food Security & Vulnerability Analysis Guidelines
The supervisor should also check that the numbering of the questionnaire questions iscorrect; he/she is also in charge of collecting all the questionnaires at the end of theday and storing them for the data entry process.
PDAThe supervisor should check the questionnaires for data quality. The PDA softwareallows supervisors to load the questionnaires saved on each SD (memory) card so thatthey can review entered data. Supervisors are also responsible for assigning the PDAsto the enumerators.
Data is automatically copied in two locations by the survey software: SD card and PDAinternal memory. At the end of each day the files should be copied to a PC, if available,as a further backup.
Enumerator responsibilities
General The enumerators are the first responsible for the quality of the data collected. A jobdescription for an ideal enumerator would include: communication skills, good knowledgeof the international language of the country (English or French, or Portuguese or Spanish)as well as the local language(s), a perceptive intelligence, inexhaustible patience, unfailingdependability, outstanding people skills, and a willingness to work long hours.
DocumentsEach enumerator needs to bring enough copies of the questionnaire for the whole day, plussome spare copies. If pens are used to fill in the questionnaires, they should bring extras.If the enumerators prefer pencils, they need to bring erasers and a pencil sharpener.
Once the data collection is concluded, the questionnaire should be kept in a protectiveplastic folder. Each enumerator is responsible for bringing the questionnaires to thesupervisor, checking for mistakes with him/her, and making the necessary changes.
Legible handwriting is important. When the enumerator checks an answer or writes itout, he/she should bear in mind that the data will be entered by a different person, whowill need to be able to read the handwriting.
PDA managementIf PDAs are used, the team leaders should be trained in how to manage them in orderto provide support to enumerators during data collection. Necessary knowledgeincludes: how to maximize battery life, how to reset the PDAs, and how to reinstall thesurvey software, if needed.
Logistics for data collection
GeneralImplementing a successful assessment requires logistics planning and preparation.Logistics is an important part of the survey, and in some countries it can be acumbersome exercise, and so should be considered early on in the process. It is linked
Chapt 4 p 63_178 esec 18-05-2009 1:38 Pagina 136
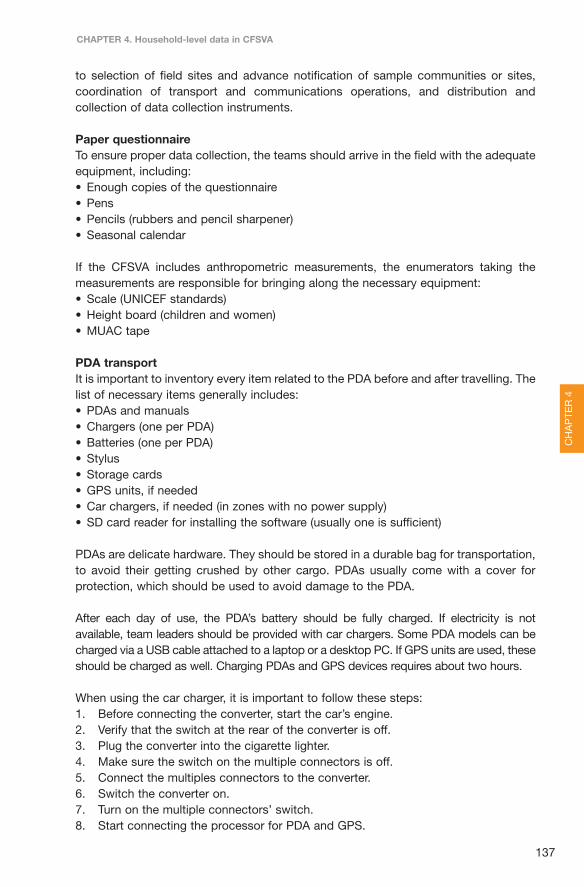
CHAPTER 4. Household-level data in CFSVA
137
to selection of field sites and advance notification of sample communities or sites,coordination of transport and communications operations, and distribution andcollection of data collection instruments.
Paper questionnaireTo ensure proper data collection, the teams should arrive in the field with the adequateequipment, including:• Enough copies of the questionnaire• Pens• Pencils (rubbers and pencil sharpener)• Seasonal calendar
If the CFSVA includes anthropometric measurements, the enumerators taking themeasurements are responsible for bringing along the necessary equipment:• Scale (UNICEF standards)• Height board (children and women)• MUAC tape
PDA transportIt is important to inventory every item related to the PDA before and after travelling. Thelist of necessary items generally includes:• PDAs and manuals• Chargers (one per PDA)• Batteries (one per PDA)• Stylus• Storage cards• GPS units, if needed• Car chargers, if needed (in zones with no power supply)• SD card reader for installing the software (usually one is sufficient)
PDAs are delicate hardware. They should be stored in a durable bag for transportation,to avoid their getting crushed by other cargo. PDAs usually come with a cover forprotection, which should be used to avoid damage to the PDA.
After each day of use, the PDA’s battery should be fully charged. If electricity is notavailable, team leaders should be provided with car chargers. Some PDA models can becharged via a USB cable attached to a laptop or a desktop PC. If GPS units are used, theseshould be charged as well. Charging PDAs and GPS devices requires about two hours.
When using the car charger, it is important to follow these steps:1. Before connecting the converter, start the car’s engine.2. Verify that the switch at the rear of the converter is off.3. Plug the converter into the cigarette lighter. 4. Make sure the switch on the multiple connectors is off. 5. Connect the multiples connectors to the converter. 6. Switch the converter on.7. Turn on the multiple connectors’ switch. 8. Start connecting the processor for PDA and GPS.
CH
AP
TER
4
Chapt 4 p 63_178 esec 18-05-2009 1:38 Pagina 137

138
Comprehensive Food Security & Vulnerability Analysis Guidelines
9. The unit is charged when the light is green. 10. Extinguish the multiple connectors and then plug in the converters. 11. Unplug the converter from the cigarette lighter. 12. Run the engine for another 20 to 30 minutes before shutting it down.
Managing problems with PDAs
Battery problemsWith normal continuous usage, the battery lasts about 5 hours. In order to maximizethe battery life:• Charge the PDA as often as possible.• Keep the screen brightness low.• Turn off the volume.• Switch off the PDA when not used.• Enable the automatic “power off” function in the PDA’s battery settings.
ResettingIf the PDA freezes, it is possible to do a “soft reset” to restart it (Note: you will lose thedata that is currently being entered.) In most models, there is a button on the back ofthe PDA that you can push using the stylus. If this button cannot be found, consult themanual that comes with the PDA.
Speed/memoryTo increase performance of the application, quit unused applications using the PDAsmemory manager tool.
4.2.6 Key references: Survey- Devereux and Hoddinott. 1992. Fieldwork in developing countries.- CARE, Second Edition. 2008. The Coping Strategies Index: Field Methods Manual.- WFP Nutrition Service. 2005. Measuring and Interpreting Malnutrition and Mortality.
4.3 HOUSEHOLD DATA ENTRY
The analysis of household survey data is undertaken in Microsoft Excel, SPSS, orSTATA. A key step in the process is to convert responses collected during the interviewinto a format that can be easily manipulated by the analyst. The two most popularchoices currently used by WFP are direct data entry through PDAs and manual entryof responses into a data entry programme. This chapter focuses solely on manual dataentry by data entry operators using desktop or laptop computers. Regardless of themethod employed to digitize the responses, a series of standardized steps must befollowed to ensure the quality of data. The process may vary depending on the context,availability of resources, and the circumstances.
Ideally the management of quantitative survey data, or closed question/semi-openquestion qualitative data survey, will take the following steps:1. Prior to the study, review the questionnaire and ensure that the format is adapted
for ease of data entry.
Chapt 4 p 63_178 esec 18-05-2009 1:38 Pagina 138