FIFTEENTH FINANCE COMMISSION
138
EVALUATION OF STATE FINANCE MIZORAM SUBMITTED TO FIFTEENTH FINANCE COMMISSION DR. JAMES L.T. THANGA DEPARTMENT OF ECONOMICS MIZORAM UNIVERSITY, AIZAWL, MIZORAM 2018
-
Upload
khangminh22 -
Category
Documents
-
view
3 -
download
0
Transcript of FIFTEENTH FINANCE COMMISSION
EVALUATION OF STATE FINANCE
MIZORAM
SUBMITTED TO
FIFTEENTH FINANCE COMMISSION
DR. JAMES L.T. THANGA
DEPARTMENT OF ECONOMICS
MIZORAM UNIVERSITY, AIZAWL, MIZORAM
2018


EVALUATION OF STATE FINANCE
MIZORAM
SUBMITTED TO
FIFTEENTH FINANCE COMMISSION
DR. JAMES L.T. THANGA
DEPARTMENT OF ECONOMICS MIZORAM UNIVERSITY, AIZAWL, MIZORAM
2018

(i)
EXECUTIVE SUMMARY
1. Introduction
Mizoram, situated in the North Eastern corner of the country, has a geographical area of
21,087 sq. kms and shares a 722 km long international border with Myanmar (404 kms in
East and South) and Bangladesh (318 kms in the West). It was one of the districts of Assam
till 1972 when it was elevated to UT, and became the 23rd State of India in 1987. There are
719 census villages spread in 8 administrative districts with a total population of 10.97 lakh
in 2011. The state is the third most literate state of India with 91.58% literacy, and is
dominated by tribal population (more than 95% are ST) and Christianity is the main religion.
With unfavourable natural endowments, the state does not have sufficient resource base and
is one of the Special Category States (SCS) of India. Agriculture and allied sector remains the
mainstay of the population while the service sector accounted for more than half of the state’s
income. Being resource deficient, the state heavily depends on revenue transfer from the
central government.
2. Revenue Capacities
The revenue transfer from the central government which accounted for around 90% of the
revenue receipts of the state government increased consistently from `1768 crores in 2006-07
to `6020 crores in 2015-16. The implementation of FC XIV recommendation, which raised
vertical devolution from 32% to 42% of divisible central taxes (shared tax), is implicated in
the changing composition of central transfer to the state in which shared taxes gained more
significance, from 16.5% in 2014-15 to 35.2% in 2015-16 with substantial decline in the
share of grants from 74.2% to 55% of total state revenue receipt during this period. There was
quantum increase in the revenue from shared taxes in the FY 2015-16 by 157.8%, while
grants from the centre decreased by 10.3%. Further, there was substantial reduction in plan
grants and its share in the total fund transfer sharply decreased from 59.9% in 2014-15 to
24.6% in 2015-16 due to the discontinuation of several CSS as recommended by FC XIV.
The total revenue receipt as percentage of GSDP declined continuously with apparent reason
of the robust economic growth relative to revenue receipt.
The own tax revenue (OTR) which accounted for around 10% of the total revenue receipt of
the state government increased by more than 3 times in a span of 10 years, from `201 crores

(ii)
in 2006-07 to `656 crores in 2015-16 with annual growth rate of 14%, and its share in the
total own revenue receipt increased from 33.6% to 54.6% during this period. At the same
time, the own non-tax revenue (ONTR) had lower growth, from `133 crores to `298 crores at
annual growth rate of 9%.
VAT/Sales tax constituted 68.9% of the OTR in 2015-16 followed by state excise (16.9%).
Among the sources of OTR, land revenue, stamp & registration, and state excise showed
growth of more than 20% during the last 10 years, and these taxes have significant
buoyancies. Taxes on vehicles, taxes on goods & passengers, and profession taxes were not
found to be buoyant with respect to the levels of economic growth, while the state had low
tax effort index in these taxes. At the same time, ONTR on various services rendered by the
government did not show significant buoyancy in most of the cases, implicating lesser effort
of the state government for their rationalisation in view of the economic development and
changing consumption pattern of the people.
3. Public Expenditure
The aggregate expenditure of the government increased at an annual rate of 14.7% from
`2294 crores in 2006-07 to `7770 crores in 2014-15 but decreased to `6840 crores in 2015-
16. Revenue expenditure expanded tremendously from `1717 crores in 2006-07 to `5571
crores in 2015-16 at annual growth rate of 15.4%, and its share in the total expenditure
increased from 74.8% to 81.5%. At the same time, capital outlay grew by 5.2% per year from
`466 crores to `711 crores. The ever increasing revenue expenditure surpassing the growth
rate of capital outlay invite serious attention, while the increasing resource allocation for
government administration at the cost of expenditure for creation of additional assets do not
bear sound economic rationality. However, taken as percentage of GSDP, the revenue
expenditure decreased gradually from 57.5% in 2006-07 to 56% in 2012-13 and further to
41.7% in 2015-16, and thus, there had been an improvement over time.
Plan expenditure showed continuous increase from `1055 crores in 2006-07, reaching a peak
of `2945 crores in 2014-15, but decreased sharply to `2589 crores in 2015-16. Non-plan
expenditure also showed the same pattern as it increased from `1240 crores to `4827 crores
to `4251 crores during the same years. The non-plan expenditure gained more significance

(iii)
year after year and its share in the total expenditure increased substantially to 62.1% by 2015-
16.
The committed expenditure which comprise of salary, pension, and interest increased from
`776 crores in 2006-07 to `2769 crores in 2015-16, driven by a fast increase in expenditure
on salary and pension which constituted more than 80% of the committed expenditure
especially after 2010-11. This was mostly due to the implementation of New Pay Rules to the
employees in line with the recommendation of the 6th Central Pay Commission. Salary and
Pension together constituted 31.35% of the total revenue expenditure in 2006-07 and
increased further to 43.08% in 2015-16. Thus, any expenditure reform measure to contain
expanding revenue expenditure has to be directed towards control of expenditure liabilities on
salary and pension.
The functional composition of expenditure showed higher allocation of resources for
development expenditure under social and economic services which constituted more than
60% of the total expenditure throughout the years. While the share of social services
increased from 31.2% in 2006-07 to 35.6% in 2015-16, economic services decreased from
36% to 27.8%. The declining share of economic services was found to be accounted for by
the abolition of Planning Commission and discontinuation of several CSS for agriculture and
rural development. The state being agrarian where majority of the population depends on
agriculture and allied sector as their main livelihood source, it is necessary that the
government allocate more resources to agriculture and rural development to achieve inclusive
growth.
The state government embarked on public expenditure reform through Mizoram Public
Resource Management Programme (MPRMP) by availing structural adjustment loan from
ADB. Of the several initiatives undertaken under MPRMP, computerisation of treasuries,
introduction of contributory based New Pension Scheme (NPS), introduction of voluntary
retirement scheme (VRS) to the employees, restructuring of Public Sector Undertakings
(PSUs) were eminent and these initiatives are expected to have far reaching impacts in
containing revenue expenditure in the long run. Further, end-to-end computerisation of TPDS
side by side with reform in procurement system had saved huge public expenditure on food
subsidy.

(iv)
4. Deficits, Liabilities, and FRBM Act
Mizoram is a revenue surplus state as there was revenue surplus in most of the years. It
increased from `252 crores in 2006-07 to `339 crores in 2008-09, but there was deficit in two
years to the tune of `152 crores in 2013-14 and `141 crores in 2014-15. After the slippage in
the two successive years, it bounced back to a historic amount of `1106 crores of revenue
surplus in 2015-16 and continued to be in surplus till date. The state is struggling to contain
fiscal deficit within the roadmap laid down by the FRBM Act, 2006 and it Amendments from
time to time. It was hard for the state government to contain fiscal deficit below 3% of GSDP
during the study period except in two years, 2008-09 and 2011-12. However, the state could
successfully contain its fiscal deficit below 3% of the GSDP from the year 2015-16 till date.
The outstanding debt liabilities increased continuously from `2811 crores in 2006-07 to
`6550 crores in 2014-15, and decreased by 2.18% to `6407 crores in 2015-16 when the state
achieved substantial revenue surplus. The Debt-GSDP ratio gradually declined from 94.1% in
2006-07 to 61% in 2010-11, 63.5% in 2012-13 and 47.9% in 2015-16, and the state was able
to achieve the targets set by the FC XIII at 87.3% in 2010-11, 85.7% in 2011-12, and 82.9%
in 2012-13.
There was changes in the composition of public debt in which borrowing from the central
government showed a declining trend from `566 crores in 2006-07 to `305 crores in 2015-16
while there was significant increase in the borrowing from public provident fund, etc. (public
account) at annual rate of 13.5%, from `863 crores in 2006-07 to `2859 crores in 2015-16.
Borrowing from financial institutions decreased by 3.1% per annum, and the state had
eliminated liability on ways and means advances, and other borrowings from RBI. In
addition, there was substantial increase in other liabilities mainly from public account
(deposit and advances, etc.), from `994 crores in 2012-13 to `1617 crores in 2014-15 and
`1078 crores in 2015-16. Provident funds alone constituted 44.62% of the total outstanding
liabilities while other liabilities contributed 16.83%, and thus, more than 60% of the debt
outstanding was derived from public account.
Given the successive reduction of revenue and fiscal deficits as percentage of GSDP in
meeting the roadmap recommended by FC XIII and FRBM Act, especially in the recent
years, it may be said that Mizoram has continuously improved the condition of its financial
position. It may be noted that as the GST has been implemented only for one year, it is rather

(v)
difficult to forecast the conditions of OTR and central devolution under this new tax regime.
In spite of this data insufficiency for accurate forecasting, the study emphasised on the
necessity of containing fiscal deficit below 3% of GSDP with zero revenue deficit, and
interest payment below 10% of revenue receipt as sustainability benchmark of the fiscal
management during the period 2020-25.
5. Subsidy, Power Sector, and PSUs
The government spend huge amount of expenditure in the provision of material and services
for which the recovery are well below the economic cost. This study divided the subsidies
availed by the people into ‘explicit’ and ‘implicit.’ If the government clarifies the actual
amount that would go to the beneficiaries, it is called explicit; but when the government
spends high amount of expenditure in the provision of public services but receive lesser
amount in return, it may be called implicit subsidies. Relatively lower amounts of subsidies
(explicit) were given by the government to the agriculture and allied sector and cooperation
(in cash or kind) over the years mostly through CSS and other plan schemes. The total
amount of subsidies was highest in 2007-08 when it was `7.53 crores, and it was less than `6
crores in all the other years.
Food subsidy through TPDS, considered as explicit subsidy in this report, was found to be the
most important subsidy given by the government to the people in Mizoram and had great
significance on public expenditure. Public expenditure on food subsidy, although showing
high fluctuation, showed increasing trend from `14.26 crores in 2006-07 to a peak of `45.25
crores in 2009-10 followed by sharp decline to `20.65 crores the next year and increased to
`33.87 crores in 2015-16. The state’s purchase of rice for TPDS is booked under capital
disbursement, and receipt from the sale proceeds is well below the procurement price. It was
rather difficult to estimate it from such a complicated accounting system. Given this situation,
the capital disbursement on food storage & warehousing may be considered a good proxy for
public expenditure on food subsidy. It increased from `55 crores in 2007-08 to `246 crores in
2012-13 and decreased to `107 crores in 2015-16. As per the official record, more than 2.5
lakhs families are given food subsidy under different schemes (AAY, FSA, NFSA, etc.)
indicating the coverage of most of the bona fide resident of the state. Consequently, it is
necessary to take reform measures to bring about efficiency in its coverage, distribution
channels, and accounting system.

(vi)
The total budgetary expenditure on power & electricity for generation, purchase, etc.
increased consistently from `128.8 crores in 2007-08 to `292.2 crores in 2015-16, while
revenue generation increased from `82.9 crores to `166 crores during this period. As the
revenue collection was 56.8% of the total expenditure in 2015-16, it is clear that the
government spent huge amount of money on power subsidy over the years. The most
significant power sector reform initiative of the state government is the signing of MOA in
2002 which stipulated the need to constitute State Electricity Regulatory Commission
(SERC), corporatisation of P&ED; and 100% metering, coverage of all villages and
households. The constitution of Joint Electricity Regulatory Commission (JERC) for Manipur
and Mizoram in 2008, under Electricity Act 2003, was considered the most important reform
measure taken so far. Since several outcome indicators of power sector reform like T&D
losses, AT&C losses, etc. showed unsatisfactory level and the P&ED is yet to be
corporatised, the state has a long way to go with regards to power sector reforms.
In recognition of their poor performance and the need to minimise expenditure incurred by
the loss making PSUs, the state government announced the closure of three PSUs, namely
ZENICS, ZOHANDCO, and MAMCO in 2015. It also approved the proposal for downsizing
ZIDCO and the privatisation of MIFCO in 2016. The reform measures were found to be
successful, and are expected to have far reaching impact on improving the state finance in the
long run. It is also expected that the state government would pursue further reforms for
ZIDCO and MIFCO until they are brought on the right track in terms of finance and
management.
6. Transfers to Local Bodies
The exemption of the state from the operation of 73rd and 74th Constitutional Amendment and
the subsequent non-existence of PRIs resulted in limited fund transfer to the rural local
bodies, especially after the implementation of the recommendation of FC XIV. Despite the
commendable initiatives of the state government for transfer to rural local bodies by adopting
proper mechanism of fund transfer through SFCs, there cannot be transfer of substantial
amount given the limited amount of state’s OTR.
The total transfer to the three Autonomous District Councils (ADCs) in the form of non-plan
and plan grants increased from `140.03 crores in 2009-10 to `225.91 crores in 2014-15,
while the own revenue receipts (ORR) of these ADCs increased from `1.33 crores to `3.46

(vii)
crores during this period. The total revenue transfer to the Village Councils (VCs) increased
from `21.31 crores in 2010-11 to `33.06 crores in 2013-14, and decreased to `16.10 crores in
2014-15. While the VCs collected limited amount of own revenue as the total own revenue of
all VCs taken together was less than `10 lakhs, there had been consistent increase in grant-in-
aid from the state government, from `1.52 crores in 2010-11 to `2.50 crores in 2014-15 to
meet their revenue expenditure, mostly salary and allowances. Notably, there was substantial
revenue transfer from the central government to the VCs through FC XIII recommendations
amounting to `87.98 crores in a 5 year period which was used for capital expenditure, mostly
for construction of internal roads, water & sanitation, etc. However, the central transfer was
discontinued from 2015-16 as the FC XIV discontinued transfer to non-PRI rural local
bodies.
The Aizawl Municipal Corporation (AMC), the only municipality in the state, has been
receiving transfer from the central government through the recommendations of FC XIII and
FC XIV as well as grants from the state government. The total transfer increased from `10.94
crores in 2010 to `41.58 crores in 2014-15, and decreased to `17.24 crores due to the lower
transfer with the onset of FC XIV award period, but increased further to `35.68 crores in
2017-18. Meanwhile, the own revenue of AMC also increased substantially from `0.20 crore
in 2010-11 to `4.31 crores in 2017-18.
The study recognised the significance of central fund transfer to various local bodies on their
capacities to undertake several development works. At the same time, the discontinuation of
central transfer to VCs by FC XIV, for being non-PRIs, had practically taken away the
capacity of the rural local bodies to undertake developmental effort on their own which they
are supposed to perform according to the local needs and requirements. Moreover, the VCs
are continuously deprived of financial and administrative powers it used to have during the
period prior to UT, and consequently, the very principle of local self-government has
practically lost its ground in rural areas of Mizoram. Therefore, it is necessary to delegate
more functions to the democratically elected Village Councils to sustain grassroot democracy
in rural areas. Given their roles and functional composition, which have affinity to the PRIs
in other parts of the country in many respects, they should not be deprived of fund transfer
from the Central Government through the Finance Commission.

(viii)
Acknowledgement
It is a genuine pleasure to have experience with the Fifteenth Finance Commission,
Government of India in the Evaluation of Mizoram State Finance, and it is a matter of great
joy for me to see its completion after a great deal of effort and energy were put into it. At the
outset, I would like to express my gratitude to the staff of the Finance Department,
Government of Mizoram for their constant support during the process of data collection.
I am grateful to the Head and faculty members of the Department of Economics, Mizoram
University for their understanding and for giving me their valuable support. I owe a deep
sense of gratitude to Prof. Vanlalchhawna, Finance Officer, Mizoram University for his
advice and necessary arrangements. My sincere thanks also goes to my Research Associate
Dr. Lianhmingthanga who was there at every stage of the study.
Despite our best effort, we do recognise that this report may not be without errors and
discrepancies. We are ready to rectify and make necessary correction for any error in the
report.
Dr. James L.T. Thanga

(ix)
C O N T E N T S
Executive Summary .................................................................................................................... i-vii Acknowledgement ........................................................................................................................ viii Contents ix-x List of Tables ......................................................................................................................... xi-xii List of Figures ..............................................................................................................................xii Abbreviations ....................................................................................................................... xiii-xv CHAPTER 1 INTRODUCTION ............................................................................................ 1-8 1.1 Introductory Profile of the State ............................................................................. 1 1.2 Overview of the Economy...................................................................................... 2 1.3 Fiscal Position of the State ..................................................................................... 3 1.4 Methodology .......................................................................................................... 5
CHAPTER 2 REVENUE CAPACITIES ............................................................................ 9-38 2.1 Introduction ............................................................................................................ 9 2.2 Trends and Composition of Revenue Receipts ...................................................... 9 2.3 Trends and Composition of Own Tax Revenue ................................................... 13 2.4 Trends and Composition of Own Non-Tax Revenue ........................................... 20 2.5 Devolution and Revenue Transfer........................................................................ 23 2.6 Funds Directly Transferred to State Implementing Agencies .............................. 27 2.7 Revenue Buoyancies ............................................................................................ 29 2.8 Tax Capacity and Effort to raise Tax Revenue .................................................... 31 2.9 Measures Taken by the Government to Improve Tax-GSDP Ratio ..................... 34 2.10 Concluding Notes & Suggestions to improve Tax-GSDP Ratio.......................... 36
CHAPTER 3 STATE’S EXPENDITURE ......................................................................... 39-57 3.1 Introduction .......................................................................................................... 39 3.2 Economic Classification of Expenditure .............................................................. 39 3.3 Functional Composition of Expenditure .............................................................. 44 3.4 Committed Expenditure ....................................................................................... 47 3.5 Efficiency of Public Expenditure ......................................................................... 49 3.6 Measures to Enhance Allocative and Technical Efficiency of
Public Expenditure ............................................................................................... 53 3.7 Concluding Observations and Suggestions .......................................................... 55
CHAPTER 4 DEFICITS AND LIABILITIES ................................................................. 58-70 4.1 Introduction .......................................................................................................... 58 4.2 Trends in Deficits/Surpluses ................................................................................ 58 4.3 Trends in Outstanding Debts ................................................................................ 61 4.4 Composition of Public Debt ................................................................................. 63 4.5 Loans from Multilateral Lending Agencies ......................................................... 67 4.6 Contingent Liabilities of the State ........................................................................ 68 4.7 Forecasting of Deficits and Liabilities ................................................................. 69

(x)
CHAPTER 5 IMPLEMENTATION OF FRBM ACT ..................................................... 71-76 5.1 Introduction .......................................................................................................... 71 5.2 Implementation of FRBM Act in Mizoram ......................................................... 71 5.3 Roadmap for Fiscal Consolidation ....................................................................... 72 5.4 Outcome Evaluation of Fiscal Correction ............................................................ 73 5.5 Suggested Fiscal Consolidation Roadmap for the period 2020-25 ...................... 76
CHAPTER 6 ANALYSIS OF SUBSIDIES ....................................................................... 77-83 6.1 Introduction .......................................................................................................... 77 6.2 Explicit Subsidies ................................................................................................. 77 6.3 Implicit Subsidies ................................................................................................. 81
CHAPTER 7 POWER SECTOR AND PUBLIC SECTOR UNDERTAKINGS .......... 84-91 7.1 Introduction .......................................................................................................... 84 7.2 Power Sector Reforms .......................................................................................... 84 7.3 Analysis on the Outcome Indicators of Power Sector.......................................... 85 7.4 Public Sector Undertakings .................................................................................. 88 7.5 Reform Initiatives of the Government on PSUs................................................... 90 7.6 Concluding Note .................................................................................................. 91
CHAPTER 8 STATE’S TRANSFER TO LOCAL BODIES ........................................ 92-103 8.1 Introduction .......................................................................................................... 92 8.2 Mizoram Finance Commission ............................................................................ 93 8.3 Transfer to Autonomous District Councils .......................................................... 94 8.4 Transfer to Village Councils ................................................................................ 98 8.5 Transfer to Aizawl Municipal Corporation ........................................................ 101 8.6 Concluding Notes ............................................................................................... 102
CHAPTER 9 CONCLUSIONS AND SUGGESTIONS ............................................... 104-112 References ................................................................................................................... 112-11 Annexure-I: Estimated Double Log Regression For Buoyancy of Own Tax Revenues in North
Eastern States of India ........................................................................................ 108-109 Annexure-II: Mizoram at a Glance .................................................................................... 109-114

(xi)
List of Tables Table No. Title
Page No.
1.1 Sectoral Share of GSDP at Factor Cost........................................................................ 3 1.2 Financial Position of Mizoram State Government ..................................................... 4 2.1 Trends of Revenue Receipts of the State Government ............................................ 10 2.2 Composition of Revenue Receipts of the State Government .................................. 11 2.3 Trend & Composition of Own Tax and Non-Tax Revenue of the State
Government ................................................................................................................... 12 2.4 Revenue Receipt from Major Own Tax Revenue ..................................................... 13 2.5 Own Tax Revenue of the State Government ............................................................. 16 2.6 Composition of Own Tax Revenue of the State Government................................. 16 2.7 Annual Growth of Own Tax Revenue of the State Government ............................ 17 2.8 Analysis of Revenue from Goods & Service Tax (GST) ........................................ 18 2.9 Trends & Patterns of Own Non-Tax Revenue of the State Government .............. 20 2.10 Composition of Non-Tax Revenue -- Social Services ............................................. 21 2.11 Composition of Non-Tax Revenue -- Economic Services ...................................... 22 2.12 Devolution and Revenue Transfer from the Centre to the State Government ...... 25 2.13 Detailed Breakup of Devolution and Revenue Transfer .......................................... 25 2.14 FC-XIV Recommendations & Achievements in Fund Devolution from Centre . 26 2.15 Fund directly transferred to the State Implementing Agencies............................... 28 2.16 Major Schemes/Programme to which Funds are directly transferred to State
Implementing Agencies ............................................................................................... 28 2.17 Buoyancy of State’s Own Tax and Non-Tax Revenues .......................................... 30 2.18 Own Tax Revenue as Percentage of GSDP among the North Eastern States ....... 32 2.19 Estimated Tax Potential and Efforts of North Eastern States ................................. 33 2.20 Measures to Improve the Revenue Capacities of the States .................................... 35 3.1 Economic Classification of Total Expenditure in Mizoram .................................... 40 3.2 Expenditures as Percentage of GSDP ........................................................................ 41 3.3 Trends in Plan and Non-Plan Expenditure and Changes in Composition ............. 42 3.4 Further Economic Classification of Revenue and Capital Expenditure ................ 43 3.5 Functional Composition of Total Expenditure .......................................................... 45 3.6 Percentage Breakup of Total Expenditure on Various Functional Classifications45 3.7 Functional Composition of Expenditure as Percentage of GSDP .......................... 46 3.8 Functional Composition of Revenue and Capital Expenditures ............................. 47 3.9 Components of Committed Expenditure of the State Government ........................ 48 3.10 Functional Composition of Major Head of Revenue Expenditures ....................... 50 3.11 Cost Recovery (NTR/NPRE) for Selected Social and Economic Services ........... 51 3.12 Financing of Expenditure by Own Revenue ............................................................. 52 4.1 Major Deficit Indicators of Mizoram State Finance................................................. 59 4.2 Financing of Plan Expenditure by Revenue Surplus ................................................ 61 4.3 Trends in Total Public Debt of the State Government ............................................. 62 4.4 Trends of Mizoram State Government Liabilities .................................................... 63 4.5 Composition of State Government Debt Liabilities ................................................. 63 4.6 State Government Debt Liabilities as Percentage of GSDP .................................... 64 4.7 Detailed Break up of Outstanding Liabilities of the State by Various Sources .... 66 4.8 External Assistances Received by the Government ................................................. 67 4.9 Composition of Outstanding Guarantees of the State Government ....................... 68 4.10 Projections of Revenue Deficit and Fiscal Deficit during 2020-25 ....................... 69 4.11 Forecasted Debt Outstanding Liability of the State Government ........................... 70

(xii)
5.1 Medium Term Fiscal Policy (MTFP) Roadmap Drawn by FC-XIII ..................... 73 5.2 Outcome Indicators of State Finance in the light of FC-XIII Recommendation .. 74 5.3 Outcome Evaluation of the State Finance in the Context of FC-XIV
Recommendations ......................................................................................................... 75 5.4 Suggested Roadmap for Fiscal Consolidation in Mizoram during 2020-25 ......... 76 6.1 Public Expenditure on Subsidies for Agriculture and Allied Activities in
Mizoram ......................................................................................................................... 78 6.2 Trends of Government Expenditure on Food Subsidy ............................................. 80 6.3 Cost Recovery from Selected Activities under Social and Economic Services ... 82 6.4 Impact of the Losses of State Transport in State Finance ....................................... 83 7.1 Expenditure and Revenue of Power & Electricity Department .............................. 85 7.2 Purchase of Power by the State Government ............................................................ 86 7.3 Performance Indicators of Power Sector of Mizoram .............................................. 87 7.4 Organisational Details of Public Sector Undertakings in Mizoram ....................... 88 7.5 Performance Indicators of Public Sector Undertakings in Mizoram ..................... 89 7.6 General Status of the 5 Public Sector Undertakings in Mizoram ........................... 90 8.1 Allocation of Weightages to Different Criteria for Fund Devolution to
Local Bodies .................................................................................................................. 94 8.2 Distribution of the 15% of State's OTR among Local Bodies ................................ 94 8.3 Budgetary Positions of the three Autonomous District Councils ........................... 96 8.4 Evaluation of the Impact of First SFC Recommendation to ADCs ...................... 96 8.5 Detailed Statement of Fund Transfer to the three Autonomous District Councils97 8.6 Fund Devolution to the Village Council and Expenditure ...................................... 99 8.7 Impact Evaluation of State Finance Commission on Fund Transfer to Village
Council ......................................................................................................................... 100 8.8 Revenue and Expenditure of Aizawl Municipal Council ...................................... 102
List of Figures
Figure No. Title
Page No.
1.1 Growth of GSDP at Current Prices ................................................................................... 2 2.1 Trends in Revenue Receipts of Mizoram ........................................................................ 10 2.2 Growth of Own Tax Revnue and Own Non-Tax Revenue .............................................. 12 2.3 Impact of Goods & Service Tax (GST) on the State’s OTR ........................................... 19 2.4 Trends in Tax Devolution and Revenue Transfer from the Central Government ........... 23 2.5 Trends of Tax Devolution and Revenue Transfer as Percentage of GSDP ..................... 24 3.1 Trends in Economic Composition of Expenditure .......................................................... 40 3.2 Committed Expenditure as Percentage of GSDP ............................................................ 49 4.1 Trends in Deficit Indicators relative to GSDP ................................................................. 59 4.2 Ratio of Revenue Deficit to Fiscal Deficit....................................................................... 60 4.3 Total Outstanding Debt as Percentage of GSDP ............................................................. 62 4.4 Average Interest of Public Debt from Different Sources ................................................ 65 6.1 Expenditures on Food Subsidy by the Government of Mizoram .................................... 80 8.1 Fund Transfer to Aizawl Municipal Corporation .......................................................... 101

(xiii)
Abbreviations
AAY - Antyodaya Anna Yojana ABT - Availability Based Tariff ACS - Average Cost of Supply ADB - Asian Development Bank ADCs - Autonomous District Councils AE - Aggregate Expenditure AMC - Aizawl Municipal Council /Corporation APDRP - Accelerated Power Development and Reform Programme APL - Above Poverty Line ARR - Average Realisation Rate BE - Budget Estimate CADC - Chakma Autonomous District Council CAG - Comptroller and Auditor General CAGR - Compound Annual Growth Rate CSO - Central Statistics Office CSS - Centrally Sponsored Scheme DBT - Direct Benefit Transfer DLRS - Department of Land Revenue and Settlement ERR - Early Retirement Rules FC - Finance Commission FCI - Food Corporation of India FMU - Fiscal Management Unit FRBM Act - Fiscal Responsibility and Budget Management Act FY - Financial Year GPF - General Provident Fund GSDP - Gross State Domestic Product GST - Goods and Service Tax GVA - Gross Value Added IAY - Indira Awas Yojana IFMIS - Integrated Financial Management Information System ILP - Inner Line Permit IMFL - Indian-Made Foreign Liquor ISOPOM - Integrated Scheme on Oilseeds, Pulses, Oil palm & Maize LAD - Local Administration Department LADC - Lai Autonomous District Council LC - Local Council LIC - Life Insurance Corporation JERC - Joint Electricity Regulatory Commission MADC - Mara Autonomous District Council MAMCO - Mizoram Agricultural Marketing Corporation Limited MFC - Mizoram Finance Commission MHIP - Mizo Hmeichhe Insuihkhawm Pawl MIFCO - Mizoram Food & Allied Industries Corporation MLPC Act - Mizoram Liquor (Prohibition & Control) Act MLTP Act - Mizoram Liquor Total Prohibition Act MOA - Memorandum of Agreement MPRMP - Mizoram Public Resource Management and Development
Programme

(xiv)
MTFP - Medium Term Fiscal Policy MUP - Mizoram Upa Pawl MW - Megawatt MZP - Mizo Zirlai Pawl NABARD - National Bank For Agriculture & Rural Development NCDC - National Cooperative Development Corporation NEDP - New Economic Development Policy NEEPCO - North Eastern Electric Power Corporation Limited NFSA - National Food Security Act NFSH - Non-Food Security Household NHPC - National Hydroelectric Power Corporation NLRMP - National Land Record Modernisation Programme NPRE - Non-Plan Revenue Expenditure NPS - New Pension Scheme NREGS - National Rural Employment Guarantee Scheme NSS - National Sample Survey NSSF - National Small Saving Fund NTR - Non-Tax Revenue ONTR - Own Non-Tax Revenue OR - Own Revenue ORR - Own Revenue Receipt OTR - Own Tax Revenue PDMS - Pensioner’s Database Management System PDRDG - Post Devolution Revenue Deficit Grant PDS - Public Distribution Scheme PHH - Priority Households POL - Petroleum, Oils, and Lubricants PRI - Panchayati Raj Institutions PSE - Public Sector Enterprises PSU - Public Sector Undertaking P&ED - Power & Electricity Department RE - Revised Estimate RBI - Reserve Bank of India RKVY - Rashtriya Krishi Vikas Yojana RMSA - Rashtriya Madhyamik Shiksha Abhiyan RTS - Representative Tax System SC - Scheduled Caste SDCRF - State’s Debt Consolidation and Relief Facility SERC - State Electricity Regulatory Commission SFC - State Finance Commission SSA - Sarva Shiksha Abhiyan ST - Scheduled Tribe ToR - Terms of Reference TPDS - Targeted Public Distribution System TRR - Total Revenue Receipt TSECL - Tripura State Electricity Corporation Limited T&D Loss - Transmission and Distribution Loss VAT - Value Added Tax VC - Village Council WMA/OD - Ways & Means Advances or Other Deposit

(xv)
YMA - Young Mizo Association ZENICS - Zoram Electronics Development Corporation Limited ZIDCO - Zoram Industrial Development Corporation Limited ZOHANDCO - Zoram Handloom and Handicrafts Development Corporation Limited

Chapter 1
INTRODUCTION
1.1. Introductory Profile of the State
Mizoram, situated in the North Eastern corner of the country, shares a 722 km long
international border with Myanmar in the East and South (404 km) and Bangladesh in the
West (318 km). This small hilly state, having a geographical area of only 21,087 sq. km (less
than 1% of the total area of the country), has recorded substantial population increase over
the years, from 1.96 lakh in 1951 to 3.32 lakh in 1971 and 10.97 lakh in 2011 with a
compound annual growth rate of 3.45%. Mizoram was one of the districts of Assam till it was
elevated to UT status in 1972, and it became the 23rd State of India in 1987 following the
Peace Accord signed between the Government of India and the underground Mizo National
Front (MNF) on the 30th of June, 1986. There is an unicameral state legislature and the total
strength of the State Legislative Assembly stands at 40 members. The state is divided into
eight administrative districts, and there are three Autonomous District Councils, namely Lai,
Mara, and Chakma autonomous district councils in the southern part of the state. There are
719 census villages in the state as per the Population Census 2011.
The state is the third most literate state of India with literacy rate of 91.58%, after Kerala and
Lakshadweep (2011 Census). Scheduled Tribe (ST) constitutes more than 94% of the total
population and the absolute majority of the population are Mizo who belong to Mongoloid
stock. Mizo, classified under Tibeto-Burman language group, is the main language spoken in
the state. Christianity is the largest religion (around 87% of the total population) which
deeply influence the social and cultural practices, and value system of the people. The state is
blessed with a plethora of state- and village-level community organisations and NGOs
working in harmony for the development of the state and the people. The major state level
NGOs are Young Mizo Association (YMA), elders association - Mizoram Upa Pawl (MUP),
women association – Mizo Hmeichhe Insuihkhawm Pawl (MHIP), and students organisation
– Mizo Zirlai Pawl (MZP). These organisations have played commendable roles in the
implementation and monitoring of several government schemes and programmes.
Page 1

1.2. Overview of the Economy
The state of Mizoram has unfavourable topography and location. It does not have sufficient
resource base and is one of the 11 Special Category States of India. In spite of these
unfavourable natural endowments, the state experienced tremendous growth in recent years
and is among the fastest growing states of India. As presented in Figure 1.1, the GSDP at
current prices grew by more than more than 4 times during the last ten years (i.e. 2006-07 to
2015-16) showing a compound annual growth rate (CAGR) of more than 17%. Further,
although the per capita income is below the national average, it has grown substantially over
the years. The per capita income at current price increased from `28764 in 2006-07 to
`106519 in 2015-16, showing more than 15% annual growth rate during this period.
The fast increase in per capita income has been accompanied by substantial improvement in
various indicators of human development. The state is one of the most literate states of India;
the gross enrolment ratio of the state is well above the national average; female labour force
participation rate is 54%; malnutrition rate at 11.9%; and a commendable achievement in
IMR at 12.66 in 2016. In addition to this, the state was declared open defecation free by the
Government of India in 2018.
Despite commendable achievement in human resource development, the problem of poverty
persists in the state even today. The estimated poverty head-count ratio for the year 2011-12
was still very high at 20.40% and 27.4% according to the Tendulkar Methodology and
Rangarajan Committee Methodology respectively. In the face of slow industrial development
that generate employment opportunities, the problem of unemployment becomes the main
challenge faced by the state. According to the NSS, there is an increasing trend in the rate of
unemployment in Mizoram, from 1.1% in 2004-05 to 2% in 2009-10 and 3.4% in 2011-12.
2006-07 2007-08 2008-09 2009-10 2010-11 2011-12 2012-13 2013-14 2014-15 2015-16
2985 3412 3809 5498 6058
6991 8053
10297
12499 13374
Figure 1.1: Growth of GSDP at Current Prices (Rs. Crore)
Page 2

Table 1.1: Sectoral Share of GSDP at Factor Cost (Current Prices)
Percent
Sector 2006-07 2007-08 2008-09 2009-10 2010-11 2011-12 2012-13 2013-14 Agriculture & Allied 20.8 21.0 20.6 20.5 20.1 20.0 19.1 22.0 Industry 19.5 20.0 20.8 19.5 17.3 18.7 17.2 20.4 Services 59.6 59.0 58.6 60.0 62.6 61.3 63.8 57.6 Source: Central Statistics Office, Ministry of Statistics & Programme Implementation
As shown in Table 1.1, services sector driven by the government spending is the main driver
of the state economy, contributing more than half of the GSDP. Although Table 1.1 does not
include later years (after 2014-15) due to comparability issues between New Series and Old
Series of GSDP, it can clearly be seen that the contribution of agriculture & allied sector
revolved around 20% without a clear trend, so also is the industry sector. It should be noted
that more than half of the population derive their income from agriculture and allied sector
(Economic Survey 2017-18). The stagnant agriculture sector can be assumed to have
implication on poverty incidence and unemployment in the state. So, laggard agriculture
sector vis-à-vis slow industrial progress contributes to increasing unemployment, and hence
is the future challenge of development.
1.3. Fiscal Position of the State
In the face of lower contribution of agriculture and slow growth of industrial sector, public
expenditure is the main driver of economic growth of the state. So, fiscal management of the
state government has clear significance to the health of the state economy. The overall
financial position of Mizoram from 2006-07 to 2015-16 is summarised in Table 1.2. The
fiscal imbalances have been corrected through revenue surpluses over the years. Except for
two years, 2013-14 and 2014-15, the state government recorded revenue surplus throughout
the years under study. There were fiscal surplus in two years, 2008-09 and 2015-16, and
notably the state could achieve fiscal surplus of 3.09% of GSDP in Financial Year (FY)
2015-16.
Page 3

Table 1.2: Financial Position of Mizoram State Government (Rs. Crore) SN Item of Receipt/ Expenditure 2006-07 2007-08 2008-09 2009-10 2010-11 2011-12 2012-13 2013-14 2014-15 2015-16 1 Revenue receipts 1969 2040 2653 2964 3375 4012 4537 4765 5511 6676
(a) Tax-revenue 68 78 95 108 130 179 223 230 267 358
(b) Non-tax-revenue 133 130 159 127 147 168 213 194 242 298
(c) State’s share of Central Taxes 288 363 383 395 591 828 786 858 911 2348
(d) Grants from Central Government 1480 1469 2016 2335 2507 2837 3315 3483 4092 3672
(i) Non-Plan Grants 643 679 735 725 819 857 1057 1142 1095 2190
(ii) Plan Grants 837 790 1282 1610 1688 1981 2258 2341 2996 1482 2 Capital receipts – 469 424 319 295 831 609 646 1466 2171 865
(a) Borrowings o/a of Internal Debt of the State Govt. 231 214 100 194 510 443 420 1123 1378 559
(Of which W& MA) 20 24 - - 163 71 167 735 1067 263
(b) Loans and advances from the Centre 5 10 6 32 3 22 0 0 5 4
(c) Recovery of loans and advances 24 28 25 25 26 28 29 33 32 26
(d) Borrowings from Public Account (Net) 208 172 188 44 291 116 196 310 756 276 3 Total expenditure 2295 2603 2700 3666 4157 4538 5433 6504 7772 6839
(a) Revenue account 1717 1908 2144 2703 3255 3724 4509 4917 5652 5571
(i) Interest payments 240 208 226 254 106 274 288 285 306 369
(ii) Salaries 463 588 739 882 1396 1150 1728 1942 2082 2202
(iii) Pensions 77 97 126 164 250 298 371 525 545 616
(iv) Others 938 1015 1055 1402 1504 2002 2122 2166 2719 2383
(b) Capital Account 578 694 555 963 902 815 924 1587 2119 1268
(i) Public Debt- Repayment of borrowings 111 144 96 365 257 286 286 957 1189 550
(Of which W&MA) 20 44 - 137 163 52 97 868 1067 263
(ii) Loans and advances 0 6 17 25 30 34 30 31 2 7
(iii) Capital Outlay 466 544 441 573 615 495 608 599 928 711 4. GSDP 2985 3412 3809 5498 6058 6991 8053 10297 12499 13374 5. Revenue Deficit/Surpluses 252 131 509 261 120 288 28 -152 -141 1106 6 Fiscal Deficit -191 -391 75 -312 -500 -213 -580 -749 -1040 413 7 Revenue Deficit (% of GSDP) 8.43 3.85 13.36 4.74 1.98 4.12 0.35 -1.48 -1.13 8.27 8 Fiscal Deficit (% of GSDP) -6.40 -11.47 1.98 -5.67 -8.25 -3.04 -7.21 -7.28 -8.32 3.09 Source: Budget Documents, Government of Mizoram & Central Statistics Office
Page 4

As the state do not have adequate revenue sources, around 90% of the revenue is
accounted for by fund transfer from the Central Government. The state’s Own Tax
Revenue (OTR) increased consistently from `68 crores in 2006-07 to `358 crores in 2015-
16, by more than 5 times over the years, while the Own Non-Tax Revenue (ONTR) also
recorded gradual increase from `133 crores to `298 crores during the same period.
Meanwhile, fund devolution from the centre for plan and non-plan expenditure increased
by more than 3 times, from `1768 crores in 2006-07 to `6020 crores in 2015-16.
Accordingly, the contribution of state’s own revenue (OR), comprising of OTR and
ONTR, hovered around 10% of the total revenue receipt of the state government.
A notable trend in the state finance is the increase in committed expenditure of the state
government in the form of salaries, interest payments, and pensions. The total expenditure
on these items increased by more than 4 times - from `780 crores in 2006-07 to `3188
crores in 2015-16. Taken as a percentage of total revenue receipt, it increased from 39.6%
to 47.7% during this period. There was a quantum jump of expenditure in salaries by `514
crores in the FY 2010-11 following the implementation of new pay to the employees
according to the recommendation of 6th Pay Commission in that year. However, the
committed expenditure as a percentage of GSDP slightly declined to 24% in 2015-16 as
the state experienced robust economic growth over the years. At the same time, the
increase in capital outlay for creation of additional assets was quite minimal in these years,
i.e. `466 crores in 2006-07 to `711 crores in 2015-16. The highly increasing revenue
expenditure in the form of salaries and pension limited the capacity of the state
government to expand budgetary allocation for capital expenditures.
1.4. Methodology
1.4.1. Data Sources
The study used secondary data from different sources, such as Finance Accounts, Budget
Documents, various issues of Economic Survey, CAG Reports, RBI Reports on State
Finances, Central Statistics Office (CSO), Report of the State Finance Commission,
various publications of Directorate of Economics and Statistics, and unpublished official
records of Mizoram Government. Budget documents of the state government for various
years were the main data sources of this study. It consists of six booklets:
Page 5

(a) Annual Financial Statement,
(b) Budget Speech,
(c) Macroeconomic Framework Statement,
(d) Demand for Grant,
(e) Medium Term Fiscal Policy Statement, and
(f) Fiscal Policy Strategy Statement.
To supplement the information collected from these sources, the views of experts who
possess experience in public finance were taken by conducting interviews. The exercise
was found to have enriched the findings and observations of this study.
1.4.2. Coverage and Data Limitations
As given in the Terms of Reference (ToR), this study covers a period of 10 years starting
from 1st April 2006 (i.e. 2006-07) to 2015-16. It may be noted that there were years when
regular budgets could not be passed on time due to factors like general election, late
allocation of plan budget, etc. The government had to seek vote-on-account budget to meet
essential expenditure till a regular budget could be passed for those years. There can be
multiple budgetary figures (budget estimates, revised estimate, pre-actual, actual) in such
situations. Consequently, data collected from different sources did not tally in some cases,
while there were also deviations due to rounding off of the decimal figures. The movement
of Base Year for GSDP estimation from 2004-05 to 2011-12 created problems in the
comparability between the two series as GVA method was introduced in the latter for the
estimation of state income. Given this problem, it was decided that the study would use
the published GSDP at current prices of Central Statistics Office, Ministry of Statistics and
Programme Implementation, for various estimations as presented in the budget documents
for various years. Despite all these limitations, utmost care was given to obtain the most
accurate budgetary and other estimated figures during the study period.
1.4.3. Analytical Tools
Simple statistical tools like ratios, percentages, graphs, etc. were used to show changes in
the fiscal parameters of the state over the period. Compound Annual Growth Rate
(CAGR) was estimated using semi-log growth model. Double log regression model (log-
Page 6

log regression) was also adopted to estimate buoyancy, elasticity, and revenue capacity of
the state government. In addition, the Box-Jenkins (BJ) methodology (i.e. ARIMA)
models are also used for making projections. Normally, the GSDP and its disaggregated
values on different sectors of the economy were adopted as the explanatory variables in
these regression models.
1.4.4. Terms of Reference (ToR)
The study is basically anchored in the following ToR given by the Fifteenth Finance
Commission:
i. Estimation of revenue capacities of state and measures to improve the tax-GDP
ratio during the last five years. Suggestions for enhancing the revenue
productivity of the tax system of the state.
ii. Analysis of the state’s own non-tax revenue and suggestions to enhance
revenue from user charges and profit from departmental enterprises and
dividends from non-departmental commercial enterprises.
iii. Examine expenditure pattern and trends separately for revenue and capital, and
major components of expenditure thereunder. Measures to enhance allocative
and technical efficiency in expenditure during the last 5 years. Suggestions for
improving efficiency in public spending.
iv. Analysis of Deficits – Fiscal and Revenue.
v. The level of debt: GSDP ratio and the use of debt (i.e. whether it has been used
for capital expenditure or otherwise). Composition of the state’s debt in terms
of market borrowing, central government debt (including those from
bilateral/multilateral lending agencies routed through the Central Government),
liabilities in public account (small savings, provident funds, etc.) and
borrowing from agencies such as NABARD, LIC, etc.
vi. Implementation of FRBM Act and commitment towards targets. Analysis of
MTFP of various departments and aggregate.
vii. Analysis of the state’s transfers to urban and rural local bodies in the state.
Major decentralisation initiatives.
Page 7

viii. Impact of State Public Enterprises finances on the state’s financial health and
measures taken to improve their performance and/or alternatives of closure,
disinvestment, etc.
ix. Impact of Power Sector Reforms on State’s fiscal health. In case reforms have
not been implemented, the likely outcome on the state’s fiscal health.
x. Analysis of contingent liabilities of the state.
xi. Subsidies given by the state (other than the central subsidies), its targeting and
evaluation.
xii. Outcome evaluation of State Finance in the context of recommendation of the
14th Finance Commission.
xiii. Determination of a sustainable debt roadmap for 2020-25, taking into account
impact of introduction of GST and other tax/non-tax trend forecasts.
Page 8

Chapter 2
REVENUE CAPACITIES
2.1. Introduction
Revenue receipts of the State Government comprise of revenue raised through various tax
and non-tax sources, and transfers from the Central Government in the form of shared taxes
and grants-in-aid as per the recommendation of the Finance Commission. The first two
sources are called Own Tax Revenue (OTR) and Own Non-Tax Revenue (ONTR) and the
state has the constitutional mandate to mobilise revenue through these sources to finance its
expenditure obligations for administration, and social and economic development. Due to
geographical factors and lack of natural resources, Mizoram do not have enough resource
base to generate large OTR. As such, the state heavily depends on fund transfers from the
Centre to finance its ever increasing revenue expenditure. So, it is of utmost importance to
raise more revenue from its own sources so as to raise the fiscal capacity of the state. This
chapter attempts to examine the trends and composition of revenue receipts, revenue
capacities of the state, and suggest measures for improvement.
2.2. Trends and Composition of Revenue Receipts
Figure 2.1 and Table 2.1 present the composition and trends of revenue receipts of
Government of Mizoram. The total revenue receipt increased from `1969 crores in 2006-07
to `6676 crores in 2015-16, with compound annual growth rate (CAGR) of 14.5% during this
period. Annual growth was found to be highest in 2008-09 (30%) due to significant increase
in grant-in-aid from the centre (37.3%). Although showing consistent growth, state own
revenue showed the lowest growth with CAGR of 14% - from `201 crores in 2006-07 to
`656 crores in 2015-16. Meanwhile, the state’s share in central taxes experienced the highest
growth (21.2%) over the years. It increased by more than 157% in 2015-16 with the apparent
reason of the implementation of the recommendations of FC XIV which increased divisible
pool of central taxes from 32% to 42%. As against this, grants-in-aid received from the
Centre declined by more than 10% in this FY.
Page 9

Table 2.1: Trends of Revenue Receipts of the State Government
Year
Amount (` in Crore) Annual Growth (%) Total
Revenue Receipts
Own Revenue
Shared Tax
Grants from
Centre
Total Revenue Receipts
Own Revenue
Shared Tax
Grants from
Centre 2006-07 1969 201 288 1480 -- -- -- -- 2007-08 2040 208 363 1469 3.6 3.4 26.1 -0.8 2008-09 2653 253 383 2016 30.1 21.9 5.5 37.3 2009-10 2964 234 395 2335 11.7 -7.6 2.9 15.8 2010-11 3375 277 591 2507 13.9 18.2 49.7 7.4 2011-12 4012 347 828 2837 18.9 25.3 40.1 13.2 2012-13 4537 436 786 3315 13.1 25.7 -5.1 16.8 2013-14 4765 424 858 3483 5.0 -2.7 9.2 5.1 2014-15 5511 508 911 4092 15.7 19.9 6.1 17.5 2015-16 6676 656 2348 3672 21.1 29.0 157.8 -10.3 CAGR for the whole period 2006-07 to 2015-06 (%) 14.5 14.0 21.2 12.4 Source: Budget Documents
It can be observed from Table 2.2 that around 90% of the revenue receipts of the state were
from the Central Government in the form of state’s share of taxes and grants, while the
contribution of own revenue hovered around 10%. In the face of limited capacity of the state
government to generate more revenue from its own sources, the state’s finance has been
sustained by the fund devolution from the Centre according to the recommendations of
different Finance Commissions. Table 2.2 also shows the percentage of revenue receipts
relative to GSDP at current prices as a rough measure of revenue capacities of the state
government. The total revenue receipt relative to GSDP gradually declined from 66% in
2006-07 to 49.9% in 2015-16, while the state’s share in central taxes increased substantially
from 9.6% to 17.6% during this period. The failure of own revenue to cope with an
201 208 253 234 277 347 436 424 508 656 288 363 383 395 591 828 786 858 911
2348
1480 1469 2016 2335 2507
2837 3315 3483
4092 3672
2006-07 2007-08 2008-09 2009-10 2010-11 2011-12 2012-13 2013-14 2014-15 2015-16
Figure 2.1: Trends in Revenue Receipts of Mizoram (Rs. Crore)
Own Revenue Share Taxes Grants from Centre
Page 10

increasing tax base as indicated by economic growth was depicted by the decline of own
revenue from 6.7% in 2006-07 to 4.9% of GSDP in 2015-16.
Table 2.2: Composition of Revenue Receipts of the State Government (Percent)
Year
Share in the Total Revenue Receipt (%) Revenue Receipt as Percentage of GSDP Total
Revenue Receipts
Own Revenue
Shared Tax
Grants from
Centre
Total Revenue Receipts
Own Revenue
Shared Tax
Grants from
Centre 2006-07 100 10.2 14.6 75.2 66.0 6.7 9.6 49.6 2007-08 100 10.2 17.8 72.0 59.8 6.1 10.6 43.0 2008-09 100 9.5 14.5 76.0 69.7 6.6 10.1 52.9 2009-10 100 7.9 13.3 78.8 53.9 4.3 7.2 42.5 2010-11 100 8.2 17.5 74.3 55.7 4.6 9.8 41.4 2011-12 100 8.6 20.6 70.7 57.4 5.0 11.8 40.6 2012-13 100 9.6 17.3 73.1 56.3 5.4 9.8 41.2 2013-14 100 8.9 18.0 73.1 46.3 4.1 8.3 33.8 2014-15 100 9.2 16.5 74.2 44.1 4.1 7.3 32.7 2015-16 100 9.8 35.2 55.0 49.9 4.9 17.6 27.5 Source: Budget Documents
Figure 2.2 and Table 2.3 present the trends of the state’s own tax and non-tax revenue (OTR
& ONTR) during the study period. OTR recorded an annual compound growth of 20.3%
during this period, increasing from `68 crores in 2006-07 to `358 crores i.e., more than 5
times. The significant jump in OTR in the later years is accounted for by the increase in
revenue from state excise following the implementation of Mizoram Liquor (Prohibition &
Control) Act 2014, in short MLPC Act, in 2015 which allows the sale of liquor in the state.
Collection of revenue from state excise, which used to be less than `5 crores, was more than
` 60 crores in 2015-16.
Meanwhile, the ONTR did not show commendable growth during the 10 years under study.
Its average CAGR for the whole period was only 9%, and revenue collection from this source
increased by a little more than 2 times, from `133 crores in 2006-07 to `298 crores in 2015-
16. The total contribution of OTR on the total own revenue of the state was only 33.4% in
2006-07, showing consistent increase year by year to more than 54% in 2015-16, while that
of ONTR showed continuous decline from 66.4% to 45.4% during this period.
Page 11

Table 2.3: Trend & Composition of Own Tax and Non-Tax Revenue of the State Government
Year
Amount (` Crore) % of Total Own Revenue as % of GSDP Tax
Revenue Non Tax Revenue
Total Own Revenue
Tax Revenue
Non Tax Revenue
Tax Revenue
Non Tax Revenue
2006-07 68 133 201 33.6 66.4 2.27 4.47 2007-08 78 130 208 37.3 62.7 2.27 3.82 2008-09 95 159 253 37.4 62.6 2.48 4.17 2009-10 108 127 234 46.0 54.0 1.96 2.30 2010-11 130 147 277 47.0 53.0 2.15 2.42 2011-12 179 168 347 51.5 48.5 2.56 2.40 2012-13 223 213 436 51.2 48.8 2.77 2.64 2013-14 230 194 424 54.2 45.8 2.23 1.89 2014-15 267 242 508 52.4 47.6 2.13 1.94 2015-16 358 298 656 54.6 45.4 2.68 2.23 CAGR (%) 20.3 9.0 14.0 CAGR = Compound Annual Growth Rate Source: Budget Documents
Table 2.3 also presents the composition of state’s own revenue relative to GSDP. The OTR as
a percentage of GSDP hovered around 2-3% over the years with a slight increase, while
ONTR showed continuous decline over time from 4.47% in 2006-07 to 2.23% in 2015-16.
Taking into consideration the growth rate of GSDP of more than 17% during this period, it is
clear that tax revenue is more buoyant than non-tax revenue during this period. It is
understood that tax revenue is supposed to be an increasing function of economic growth,
while non-tax revenue is a function of continued effort of the state government through
revision of users’ charges, fees, etc., meaning that there exist more space for increasing non-
tax revenues in the state.
68 78 95 108 130 179
223 230 267
358
133 130 159 127 147 168
213 194 242
298
2006-07 2007-08 2008-09 2009-10 2010-11 2011-12 2012-13 2013-14 2014-15 2015-16
Figure 2.2: Growth of Own Tax Revnue and Own Non-Tax Revenue (` Crore)
OTR ONTR
Annual Growth Rate OTR: 20.3% ONTR: 9%
Page 12

2.3. Trends and Composition of Own Tax Revenue
The sources of Own Tax Revenue (OTR) of the state government are classified into three
broad categories as follows:
i) Taxes on Income & Expenditure – Profession tax,
ii) Taxes on Property & Capital Transaction – Land revenue, and Stamp &
Registration, and
iii) Taxes on Commodities & Services – State Excise, Sales Tax, Taxes on Vehicles,
Other taxes on Goods & Passengers, other taxes & duties (taxes on petroleum
products, etc.)
Table 2.4 presents the trends of revenue receipts of Mizoram Government from these major
sources. The main chunk (more than 90%) of the OTR was generated from taxes on
commodities & services and showed an annual compound growth of around 20% during the
ten years under study. Meanwhile, taxes on property & capital transaction, although
contributing less than 5% throughout the years, showed a significant jump in recent years
with CAGR of 30.7%. At the same time, taxes on income & expenditure, though having
slightly higher contribution in the total tax revenue, had the lowest growth rate (15.2%)
during this period.
Table 2.4: Revenue Receipt from Major Own Tax Revenue
Year
Amount (` Crore) Percentage Breakup (%)
Taxes on Income &
Expenditure
Taxes on Property &
Capital Transaction
Taxes on Commodities & Services
Total Own Tax Revenue
Taxes on Income &
Expenditure
Taxes on Property &
Capital Transaction
Taxes on Commodities & Services
2006-07 5.0 0.9 61.7 67.6 7.4 1.4 91.2 2007-08 5.3 1.7 70.5 77.5 6.9 2.2 90.9 2008-09 5.9 2.1 86.6 94.6 6.2 2.2 91.5 2009-10 7.9 3.1 96.5 107.5 7.3 2.9 89.7 2010-11 8.4 4.7 117.0 130.1 6.5 3.6 90.0 2011-12 11.9 3.2 163.6 178.7 6.6 1.8 91.6 2012-13 13.0 3.7 205.8 222.5 5.9 1.7 92.5 2013-14 14.7 6.1 208.9 229.7 6.4 2.6 90.9 2014-15 14.0 14.8 237.7 266.5 5.3 5.5 89.2 2015-16 15.4 12.4 330.6 358.4 4.3 3.5 92.2 CAGR (%) 15.2 30.7 20.4 20.4 Source: Budget Documents
Page 13

Brief details of the nature and institutional provisions for the collection of different
components of the own taxes revenue may be presented as follow:
1) Professional Tax
This tax is levied under The Mizoram Professions, Trades, Callings and Employment
Taxation Act 1995. The Act clearly defined the rates of profession tax for various
categories of professions and income slab, and the rate cannot be above `2500 per
annum. In 2011, the government by Notification revised the rates for various
categories of professions without changing the ceiling rate.
2) Land Revenue
Under The Mizoram (Taxes on Land, Building and Assessment of Revenue) Act 2005,
the following taxes and fees are collected by Department of Land Revenue and
Settlement (DLRS): land tax, building and house taxes; taxes on farms, shops, stalls,
mutation fees, fees on transfer of ownership of property.
3) Stamp and Registration
The Mizoram Government collects stamp duties and registration fees on various
instruments under the rates stipulated under The Indian Stamp (Mizoram Amendment)
Act, 2005. The Act was last amended in 2016.
4) Value Added Tax (VAT) and Sales Taxes
The State Government introduced VAT in the state from 1st April 2005 under The
Mizoram Value Added Taxes (VAT) Act, 2005. The rate structure was determined by
the government as per the recommendation of Empowered Committee of State
Finances. As per the amendment of the Act in December 2012, the standard rates
were 13.5%, 5%, and 1% for various categories of goods as notified by the
government. The state’s Taxation Department is the enforcing agency of this tax. In
addition, the government also levy taxes on sale of petroleum and petroleum products
under The Mizoram (Sale of Petroleum and Petroleum Products, including Motor and
Lubricants) Act, 1973.
5) State Excise
It should be noted that produce, sale, import, and consumption of liquor was banned
in the state under the Mizoram Liquor Total Prohibition Act, 1995. Import and
consumption was permitted to army and paramilitary forces working in Mizoram.
Excise duties were levied on the import of Indian-made foreign liquor (IMFL) for
these personnel under this Act by the Excise and Narcotics Department. The
Page 14

prohibition was lifted in 2015 and the Act was replaced by The Mizoram Liquor
(Prohibition & Control) Act, 2014, in short MLPC Act. The MLPC Act allows the
sale of IMFL in the state, and collection of state excise became a major revenue
source for the state afterwards.
6) Taxes on Motor Vehicles
There is a dual taxation system in force in Mizoram, namely The Mizoram Vehicle
(Taxation) Act, 1996, and The Mizoram Passengers and Goods Taxation Act, 1988.
While road tax is levied and collected under the former, passenger and goods tax are
collected under the latter. The state Transport Department is the nodal agency for
collection of these taxes as per the Rules under the two Acts, which are amended from
time to time.
7) Entertainment Tax
The State Government adopted The Assam Amusement and Betting Act, 1939 for levy
and collection of taxes and duties on entertainment and other amusement including
exhibitions, dramatic/music performance, cable TV, cinematographic or video shows,
etc. This Act was replaced by The Mizoram Entertainment Tax Act, 2013. However,
revenue collection from this tax is quite minimal till date.
Table 2.5 and Table 2.6 present the trends and breakup of own tax revenues during the 10
years under study. It shows that the main contributor of the state’s OTR was VAT, which on
average accounted for 70-80% of the total revenue, i.e. 79.5% in 2006-07, 81.9% in 2008-09
and 68.9% in 2015-16. The revenue from this source grew by CAGR of 19.3%, from `53.7
crores in 2006-07 to `247 crores in 2015-16. It is notable that all the taxes had substantial
growth rate during this period. The annual growth rate of stamp & registration was highest at
38.7% as the revenue increased consistently from `0.2 crore in 2006-07 to `3.6 crores in
2015-16, followed by state excise which increased from `1.7 to `60.6 crores in 2015-16 with
CAGR of 29.6%. Other items such as profession tax, goods & passengers, and other taxes &
duties had comparatively lower growth during this period. While the quantum of revenue
from goods & passenger and other taxes & duties were quite minimal and sticky within a
small range, profession tax has gained importance as it showed an increase from a mere `5
crores to `15.4 crores during this period.
Page 15
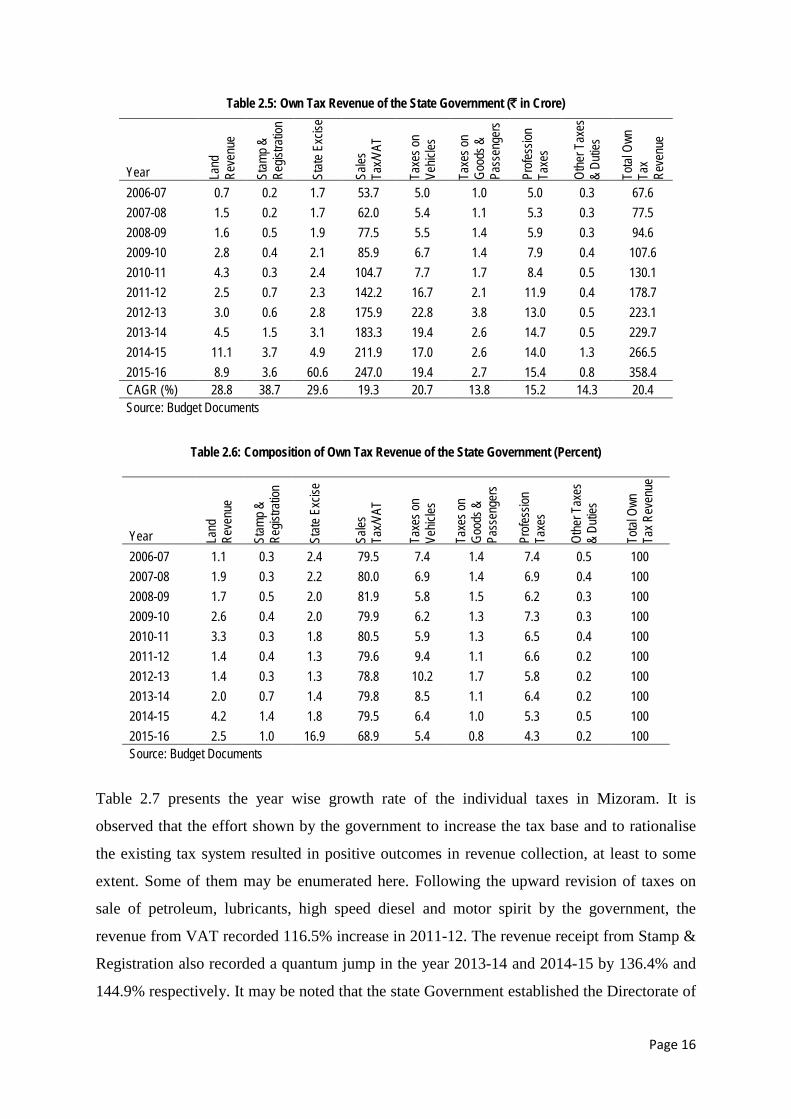
Table 2.5: Own Tax Revenue of the State Government (` in Crore)
Year Land
Re
venu
e
Stam
p &
Regis
tratio
n
State
Exc
ise
Sales
Ta
x/VAT
Taxe
s on
Vehic
les
Taxe
s on
Good
s &
Pass
enge
rs
Profe
ssion
Ta
xes
Othe
r Tax
es
& Du
ties
Total
Own
Ta
x Re
venu
e
2006-07 0.7 0.2 1.7 53.7 5.0 1.0 5.0 0.3 67.6 2007-08 1.5 0.2 1.7 62.0 5.4 1.1 5.3 0.3 77.5 2008-09 1.6 0.5 1.9 77.5 5.5 1.4 5.9 0.3 94.6 2009-10 2.8 0.4 2.1 85.9 6.7 1.4 7.9 0.4 107.6 2010-11 4.3 0.3 2.4 104.7 7.7 1.7 8.4 0.5 130.1 2011-12 2.5 0.7 2.3 142.2 16.7 2.1 11.9 0.4 178.7 2012-13 3.0 0.6 2.8 175.9 22.8 3.8 13.0 0.5 223.1 2013-14 4.5 1.5 3.1 183.3 19.4 2.6 14.7 0.5 229.7 2014-15 11.1 3.7 4.9 211.9 17.0 2.6 14.0 1.3 266.5 2015-16 8.9 3.6 60.6 247.0 19.4 2.7 15.4 0.8 358.4 CAGR (%) 28.8 38.7 29.6 19.3 20.7 13.8 15.2 14.3 20.4 Source: Budget Documents
Table 2.6: Composition of Own Tax Revenue of the State Government (Percent)
Year Land
Re
venu
e
Stam
p &
Regis
tratio
n
State
Exc
ise
Sales
Ta
x/VAT
Taxe
s on
Vehic
les
Taxe
s on
Good
s &
Pass
enge
rs
Profe
ssion
Ta
xes
Othe
r Tax
es
& Du
ties
Total
Own
Ta
x Rev
enue
2006-07 1.1 0.3 2.4 79.5 7.4 1.4 7.4 0.5 100 2007-08 1.9 0.3 2.2 80.0 6.9 1.4 6.9 0.4 100 2008-09 1.7 0.5 2.0 81.9 5.8 1.5 6.2 0.3 100 2009-10 2.6 0.4 2.0 79.9 6.2 1.3 7.3 0.3 100 2010-11 3.3 0.3 1.8 80.5 5.9 1.3 6.5 0.4 100 2011-12 1.4 0.4 1.3 79.6 9.4 1.1 6.6 0.2 100 2012-13 1.4 0.3 1.3 78.8 10.2 1.7 5.8 0.2 100 2013-14 2.0 0.7 1.4 79.8 8.5 1.1 6.4 0.2 100 2014-15 4.2 1.4 1.8 79.5 6.4 1.0 5.3 0.5 100 2015-16 2.5 1.0 16.9 68.9 5.4 0.8 4.3 0.2 100 Source: Budget Documents
Table 2.7 presents the year wise growth rate of the individual taxes in Mizoram. It is
observed that the effort shown by the government to increase the tax base and to rationalise
the existing tax system resulted in positive outcomes in revenue collection, at least to some
extent. Some of them may be enumerated here. Following the upward revision of taxes on
sale of petroleum, lubricants, high speed diesel and motor spirit by the government, the
revenue from VAT recorded 116.5% increase in 2011-12. The revenue receipt from Stamp &
Registration also recorded a quantum jump in the year 2013-14 and 2014-15 by 136.4% and
144.9% respectively. It may be noted that the state Government established the Directorate of
Page 16
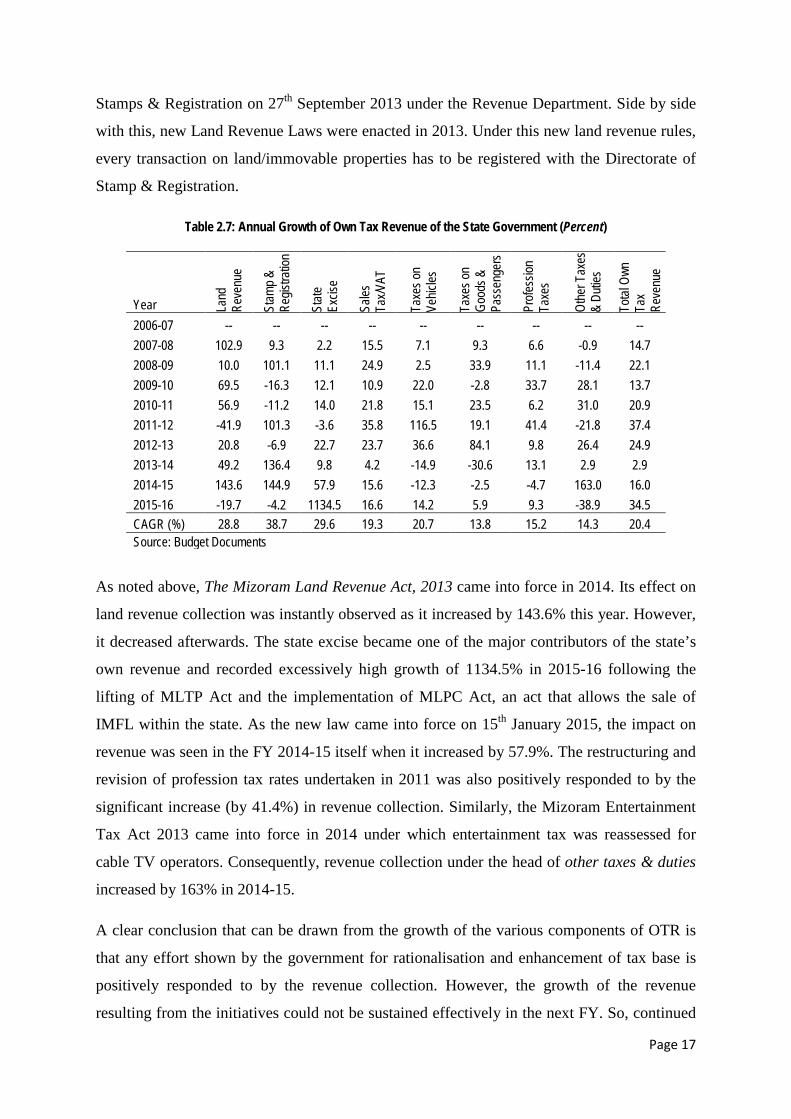
Stamps & Registration on 27th September 2013 under the Revenue Department. Side by side
with this, new Land Revenue Laws were enacted in 2013. Under this new land revenue rules,
every transaction on land/immovable properties has to be registered with the Directorate of
Stamp & Registration.
Table 2.7: Annual Growth of Own Tax Revenue of the State Government (Percent)
Year Land
Re
venu
e
Stam
p &
Regis
tratio
n
State
Ex
cise
Sales
Ta
x/VAT
Taxe
s on
Vehic
les
Taxe
s on
Good
s &
Pass
enge
rs
Profe
ssion
Ta
xes
Othe
r Tax
es
& Du
ties
Total
Own
Ta
x Re
venu
e
2006-07 -- -- -- -- -- -- -- -- -- 2007-08 102.9 9.3 2.2 15.5 7.1 9.3 6.6 -0.9 14.7 2008-09 10.0 101.1 11.1 24.9 2.5 33.9 11.1 -11.4 22.1 2009-10 69.5 -16.3 12.1 10.9 22.0 -2.8 33.7 28.1 13.7 2010-11 56.9 -11.2 14.0 21.8 15.1 23.5 6.2 31.0 20.9 2011-12 -41.9 101.3 -3.6 35.8 116.5 19.1 41.4 -21.8 37.4 2012-13 20.8 -6.9 22.7 23.7 36.6 84.1 9.8 26.4 24.9 2013-14 49.2 136.4 9.8 4.2 -14.9 -30.6 13.1 2.9 2.9 2014-15 143.6 144.9 57.9 15.6 -12.3 -2.5 -4.7 163.0 16.0 2015-16 -19.7 -4.2 1134.5 16.6 14.2 5.9 9.3 -38.9 34.5 CAGR (%) 28.8 38.7 29.6 19.3 20.7 13.8 15.2 14.3 20.4 Source: Budget Documents
As noted above, The Mizoram Land Revenue Act, 2013 came into force in 2014. Its effect on
land revenue collection was instantly observed as it increased by 143.6% this year. However,
it decreased afterwards. The state excise became one of the major contributors of the state’s
own revenue and recorded excessively high growth of 1134.5% in 2015-16 following the
lifting of MLTP Act and the implementation of MLPC Act, an act that allows the sale of
IMFL within the state. As the new law came into force on 15th January 2015, the impact on
revenue was seen in the FY 2014-15 itself when it increased by 57.9%. The restructuring and
revision of profession tax rates undertaken in 2011 was also positively responded to by the
significant increase (by 41.4%) in revenue collection. Similarly, the Mizoram Entertainment
Tax Act 2013 came into force in 2014 under which entertainment tax was reassessed for
cable TV operators. Consequently, revenue collection under the head of other taxes & duties
increased by 163% in 2014-15.
A clear conclusion that can be drawn from the growth of the various components of OTR is
that any effort shown by the government for rationalisation and enhancement of tax base is
positively responded to by the revenue collection. However, the growth of the revenue
resulting from the initiatives could not be sustained effectively in the next FY. So, continued
Page 17

effort of the government on tax reforms is necessary to achieve robust growth of OTR in the
state.
It is to be noted that Goods & Service Taxes (GST) was implemented throughout the country
from 1st July 2017. As the VAT which used to contribute around 70% of the OTR was
subsumed under GST, substantial change in the revenue collection was anticipated. Due to
limited time period post GST, actual budgetary figures on it could not be obtained from the
Finance Department. Only the budget estimates for the year 2017-18 and 2018-19 could be
obtained from the official documents. Given its importance to our study, the record of the
Taxation Department was examined. However, GST data were available only for 8 months
(August-March) in the FY 2017-18 and 11 months (April-March) for FY 2018-19.
Consequently, projection on GST revenue for the year 2018-19 was made using the average
monthly GST revenue. Finally, the projected OTR for FY 2018-19 was made by combining
projected GST revenue and budget estimates from other sources. Table 2.8 presents the
analysis of revenue from GST and Figure 2.8 shows the impact of GST on the state’s OTR.
Table 2.8: Analysis of Revenue from GST Period SGST IGST Total GST Actual Collection (`. Crore) August 17 - March 18 107.75 23.75 131.51 April 18-Feb 19 250.77 59.13 309.90 Composition (%) August 17 - March 18 81.94 18.06 100 April 18-Feb 19 80.92 19.08 100 Average GST Revenue per Month (` Crore) August 17 - March 18 13.47 2.97 16.44 April 18-Feb 19 22.80 5.38 28.17 Growth % 69.25 81.04 71.38 Projected GST Revenue (` Crore) 2018-19 273.56 64.51 338.07 Note: GST Data are collected from Taxation Department, Govt. of Mizoram
The revenue collection from GST during the first 8 months of its implementation was
`131.51 crores showing an average of `16.44 crores per month. It has increased to `309.9
crores in the next 11 years during the FY 2018-19 showing an average of `28.17 crores per
month. The average monthly revenue of the state government from GST has increased by
71.38% in the second years of its implementation. A closer look at the composition of GST
may be helpful to examine if the GST increase or reduce the OTR of the state. It is observed
that SGST accounted for more than 80%, while IGST contributes around 20% of the total
Page 18

revenue. Considering its nature and collection procedure, revenue from SGST is a good
proxy to VAT collection as all items under it were subsumed to it, while IGST may be
considered as additional benefit accrued to the state because it is basically a revenue transfer
for consumption outside the state. A clear conclusion that can be drawn from this observation
is that Mizoram is likely to gain more revenue from GST in the long run. Thus, one can say
that there is no revenue loss after GST, and thereby, no compensation was received from the
centre.
It is observed from Figure 2.3 that there was significant decrease in total revenue from VAT (
till the end of first quarter) and GST (since August) in the FY 2017-18, while OTR also
decreased by as much as `53.5 crores. There were two major factors that contribute to the
reduction in tax collection, viz. demonetisation which heavily reduced consumption in the
last quarter of 2016-17 and the first quarter of 2017-18; and problems that are arising on the
implementation of GST, especially in the process of registration, transfer, filing of returns,
etc. However, tax collection has significantly increased to `338.07 crores in the FY 2018-19
and OTR also increased by around 20%. Despite substantial bounce back in tax revenue, the
estimated buoyancy for OTR had declined from 1.12 in pre-GST to 1.01 in the post-GST
period (inclusion of GST era), mainly on account of inadequate data for the latter period.
Meanwhile, it was reported that at least 40% of business entities in rural areas are yet to file
GST Returns due to poor internet services. Thus, the new tax regime is likely to bring more
revenue to the state government than the earlier VAT regime.
0.050.0
100.0150.0200.0250.0300.0350.0400.0450.0500.0
2016-17 2017-18 2018-19VAT/GST 307.8 275.7 338.07Total OTR 441.92 388.4 463.57
Figure 2.3: Impact of GST on the State's OTR (Rs. Crore)
Page 19

2.4. Trends and Composition of Own Non-Tax Revenue
Own Non-Tax Revenue (ONTR) of the state covers revenue receipt from fiscal services,
interest receipts on the loans given by the state government, dividend and profits, revenue
from general services such as state lotteries, user charges, fees and penalties, and economic
services. Table 2.9 presents the trends of the major sources of ONTR and its percentage
distribution during the 10 years under study.
Table 2.9: Trends & Patterns of Own Non-Tax Revenue of the State Government
Year
Amount (` Crore) Share in the Total ONTR (%) Interest Receipt
General Services
Social Services
Economic Services Total
Interest Receipt
General Services
Social Services
Economic Services
2006-07 8.8 52.5 7.8 64.4 133.5 6.56 39.34 5.84 48.25 2007-08 15.6 6.5 8.8 99.4 130.3 11.97 4.98 6.75 76.30 2008-09 32.9 12.1 8.3 105.4 158.7 20.74 7.64 5.20 66.41 2009-10 17.8 18.0 9.6 81.0 126.5 14.11 14.27 7.59 64.03 2010-11 12.7 23.2 10.7 100.1 146.7 8.66 15.81 7.27 68.26 2011-12 15.6 9.1 12.4 130.9 168.0 9.28 5.44 7.39 77.89 2012-13 16.9 11.5 19.5 165.0 212.8 7.93 5.39 9.15 77.53 2013-14 15.6 9.1 12.4 130.9 168.1 9.28 5.44 7.39 77.89 2014-15 19.9 22.1 27.6 172.3 242.0 8.22 9.15 11.41 71.23 2015-16 30.7 26.0 42.5 198.4 297.6 10.33 8.74 14.29 66.64 CAGR (%) 5.8 -0.9 18.2 11.2 8.5 CAGR: Compound Annual Growth Rate Source: Budget Documents
It can be seen in Table 2.9 that economic services dominated the state’s ONTR followed by
general services. Revenue receipt from economic services, which contributed 48.25% in
2006-07, 77.89% in 2013-14, and 66.64% in 2015-16, increased from `64.4 crores in 2006-
07 to `190 crores in 2015-16, showing a CAGR of 11.2%. At the same time, the receipt from
social services had the highest growth (18.2%), and its share in the total ONTR also
experienced an increasing trend from 5.84% in 2006-07 to 14.29% in 2015-16. The receipt
from interest, dividend, and profit also recorded a 5.8% increase over the years, from `8.8
crores to `30.7 crores during this period, although its share in the total did not improve.
Meanwhile, revenue receipt from general services showed a declining trend in amount as well
as percentage contribution. It declined from `52.5 crores in 2006-07 to `26 crores in 2015-16
with a negative growth of -0.9%, and its share in the total also decreased drastically from
39.34% to 8.74% during the same period. This trend may be construed as the declining
quality of expenditure recovery in administration of general services.
Page 20

Table 2.10 presents the detailed contribution of various activities in the total ONTR under
Social Services. The receipt from these services include fees from educational institutions,
user charges of medical services, water tariff, rental receipts from government buildings and
quarters, etc. It can be seen from this table that the main contributor of the ONTR under
social services is Water Supply & Sanitation which showed an increasing share from 67.9%
in 2006-07 to 80.3% in 2015-16. Other significant contributors are Social Security & Welfare
(7.7% in 2015-16) and Education, Sports & Culture (4.7% in 2015-16).
Table 2.10: Composition of Non-Tax Revenue -- Social Services
Percent
SN Head 2006-07
2007-08
2008-09
2009-10
2010-11
2011-12
2012-13
2013-14
2014-15
2015- 16
1 Education, Sports, Art & Culture 6.6 5.7 6.3 9.6 13.1 13.0 7.7 5.3 6.0 4.7
2 Medical & Public Health 7.1 7.5 6.6 2.9 1.7 2.5 2.0 0.9 1.1 2.5
4 Water Supply & Sanitation 67.9 72.6 79.6 76.9 71.6 71.0 74.5 76.8 85.0 80.3
5 Housing 6.5 9.3 5.4 4.9 4.9 5.8 4.2 3.7 3.6 3.9 6 Urban Development 0.0 0.8 0.4 0.5 1.2 1.8 0.4 0.3 0.4 0.2
7 Information & Publicity 0.8 0.0 1.6 0.0 2.0 1.3 0.9 7.7 0.5 0.5
8 Labour & Employment 0.8 0.0 0.0 0.0 0.0 1.8 0.3 0.2 0.0 0.2
9 Social Security & Welfare 10.2 4.1 0.0 5.3 5.3 2.9 10.1 5.0 3.4 7.7
Total 100 100 100 100 100 100 100 100 100 100 Source: Budget Documents
The Economic Services which contributed major part of the ONTR of the state government
includes services ranging from agriculture, infrastructure, power tariff, user charge, etc. The
amount and trends of revenue from these services are presented in Table 2.8, and the detailed
breakup of the revenue from various activities under Economic Services (in percentage) is
presented in Table 2.11.
Page 21

Table 2.11: Composition of Non-Tax Revenue -- Economic Services
Percent
SN Head 2006-07
2007-08
2008-09
2009-10
2010-11
2011-12
2012-13
2013-14
2014-15
2015-16
1 Crop Husbandry 0.3 0.2 0.2 0.4 0.9 0.6 0.4 0.6 0.5 0.6 2 Animal Husbandry 0.9 0.6 0.5 0.9 0.5 0.5 0.3 0.3 0.4 0.3 3 Dairy Development 0.1 0.1 0.1 0.2 0.2 0.1 0.1 0.2 0.2 0.1 4 Fisheries 0.7 0.1 0.1 0.2 0.3 0.3 0.1 0.2 0.2 0.2 5 Forestry & Wildlife 6.3 3.0 2.1 3.1 2.4 2.4 1.4 2.2 3.0 1.6
6 Food Storage & Warehousing 0.0 0.1 0.0 0.1 0.1 0.1 0.0 0.4 0.0 0.0
7 Co-operation 0.0 0.0 0.0 0.0 0.0 0.0 0.0 0.2 2.2 1.4 8 Other Agri. Prog. 0.9 0.6 0.9 1.0 1.0 0.8 1.0 1.2 1.1 0.9 9 Land Reforms 1.3 0.9 0.8 1.3 1.0 0.9 0.8 1.0 0.8 0.8 10 Other RD Prog. 0.0 3.5 0.0 0.1 0.2 0.0 0.0 0.0 0.0 0.0 11 Minor Irrigation 0.1 0.0 0.0 0.0 0.0 0.1 0.0 1.3 0.0 0.0 12 Power 79.8 84.1 88.6 83.8 72.5 83.7 67.4 80.2 83.8 83.9
13 Village & Small Industries 0.3 0.1 0.1 0.2 0.3 0.2 0.2 0.2 0.2 0.2
14 Non-Ferrous Mining 0.7 1.0 1.5 1.7 5.0 5.3 3.2 3.3 2.2 2.4
15 Civil Aviation 3.8 3.0 1.9 2.3 1.3 0.6 1.4 1.5 1.2 1.6 16 Road & Bridges 0.4 0.2 0.1 0.5 9.9 1.4 21.1 3.8 1.7 3.7 17 Road Transport 2.7 1.7 2.0 2.5 2.7 1.7 1.2 1.4 1.4 0.9 18 Tourism 1.3 0.9 1.1 1.5 1.5 1.2 1.0 1.8 1.3 1.1 19 Others 0.2 0.1 0.1 0.1 0.1 0.1 0.1 0.1 0.1 0.2 Total 100 100 100 100 100 100 100 100 100 100 Source: Budget Documents
Revenue collected from power tariff was the main contributor of revenue under economic
services throughout the years under study. Revenue from power tariff increased from `51.79
crores in 2006-07 to more than `166 crores in 2015-16, and its contribution decreased from
79.8% in 2006-07 to 67.4% in 2012-13, but increased significantly to 83.9% in 2015-16. At
the same time, the contribution of other activities (or sub-sectors) were mostly quite minimal
(below 5%) throughout the 10 years. It is thus clear that the main sources of NTR in the
Social and Economic sectors are both user charges (water tariff and power tariff). The overall
trend of the total ONTR was in pace with the receipts from these two sources, and thus,
efficiency in tariff collection would be one of the key requisites for efficient fiscal system in
the state.
Page 22

2.5. Devolution and Revenue Transfer
It was already stated in Section 2.2 that more than 90% of the revenue receipts of the
Government of Mizoram came from the Central Government in the form of devolution of
central taxes and grants-in-aid. It is also understood that Mizoram is one of the Special
Category States which lack resource to raise revenue sufficient to meet its expenditure
obligation in the delivery of public services and developmental efforts. The fund transfers
from the central government remain to be the lifeline of the state finance. Accordingly, the
quantum increase or decrease in revenue receipt from the centre is of crucial importance as it
is the key factor of economic development for the state. Figure 2.4 presents the trends of tax
devolutions and revenue transfer from the central government to Mizoram government during
the period of 2006-07 to 2015-16.
It is clear from Figure 2.4 that there was a consistent increase in the total transfer from the
centre, from `1623 crores to `6020 crores, during the period. The annual compound growth
rate is estimated at 15.1%. At the same time, there was structural changes in the revenue
receipts from the three main sources, namely shared taxes, non-plan grants, plan grants post
2014-15 due to the discontinuation of Planning Commission in 2014 and implementation of
the recommendations of the XIV Finance Commission since 2015. The receipts under plan
grants which showed consistent increase of 12% CAGR over the years suddenly came down
from `2996 crores in 2014-15 to `1482 crores in 2015-16. Meanwhile, the shared taxes and
non-plan grants which were growing in a range bound areas accelerated and showed a
breakout in the upward direction post 2014-15. So, these two sources became the main
components of central transfer to the state government.
143 363 383 395 591 828 786 858 911
2348
643 679 735 725 819 856 1057 1142 1095
2190
837 790 1282 1610 1688 1981 2258 2341
2996
1482 1623 1832 2400 2729
3098 3665
4101 4341 5003
6020
2006-07 2007-08 2008-09 2009-10 2010-11 2011-12 2012-13 2013-14 2014-15 2015-16
Figure 2.4: Trends in Tax Devolution and Revenue Transfer from the Central Government (` Crore)
Shared Taxes Non-Plan Grants Plan Grants Total Transfer
Annual Compound Growth Rates Shared Taxes : 25.9% Non-Plan Grants : 11.4% Plan Grant : 12% Total Transfer : 15.1%
Page 23

To have better understanding of the significance of the fund transfers from the central
government to the state, Figure 2.5 presents the trends relative to the growth of GSDP over
the years. This may also be interpreted as the concordance of fund transfers to the economic
growth of the state. It can be seen that the transfers showed declining trends when considered
relative to GSDP, and a more intense situation was observed in case of plan grants.
Meanwhile, the total transfer reverted to its declining trend after 2014-15 due to substantial
growth in the shared taxes and non-plan grants.
Table 2.12 presents the major head wise fund devolution from the Central Government to the
State Government, while Table 2.13 presents its percentage breakup. As noted earlier, the
revenue transfer in the form of state’s share in the central taxes gained importance over the
years. The revenue receipt from this source as a percentage of total transfers from the central
government increased from only 8.8% in 2006-07 to 18.2% in 2014-5 and jumped to 39% in
2015-16. It is likely that shared taxes will be the main sources of fund transfer for the state in
the post FC XIV era. Under the head of non-plan grants, statutory grants had gained
importance year after year and its contribution increased substantially from `3.4 crores in
2006-07 to `35.5 crores in 2015-16, while its share in the total revenue transfer increased
from 3.4% to 35.5% during this period.
Table 2.12 & 2.13 show the structural changes in the revenue transfer post FC XIV with non-
plan grants and shared taxes gaining importance, while the share of non-plan grants decreased
drastically. Under the plan grants, the receipt for state plan schemes increased from `626
crores in 2006-07 and gained momentum up to `2264 crores in 2014-15 but decreased
drastically to `1003 crores in 2015-16. Its share in the total transfer increased from 38.6% to
45.3% and reduced to only 16.7% during the same period. The income receipt for CSS also
4.8 10.6 10.1 7.2 9.8 11.8 9.8 8.3 7.3
17.6 21.5 19.9 19.3 13.2 13.5 12.3 13.1 11.1 8.8
16.4
28.0 23.2
33.7 29.3 27.9 28.3 28.0 22.7 24.0
11.1
54.4 53.7 63.0
49.6 51.1 52.4 50.9 42.2 40.0
45.0
2006-07 2007-08 2008-09 2009-10 2010-11 2011-12 2012-13 2013-14 2014-15 2015-16
Figure 2.5: Trends of Tax Devolution and Revenue Transfer as Percentage of GSDP (%)
Shared Taxes Non-Plan Grants Plan Grants Total Transfer
Page 24

increased significantly from `169 crores in 2006-07 to `663 crores in 2014-15, but decreased
by almost 50% in 2015-16, following the discontinuation of several CSS. Only 66 schemes
were to be continued as per the recommendations of FC XIV. At the same time, receipt under
special plan schemes showed continuous increase from `38 crores in 2006-07 to `97 crores in
2015-16, while its contribution to the total transfer decreased from 2.3% to only 1.6% during
this period.
Table 2.12: Devolution and Revenue Transfer from the Centre to the State Government (` in Crore) Head
2006-07
2007-08
2008-09
2009-10
2010-11
2011-12
2012-13
2013-14
2014-15
2015-16
A. Shared Taxes 143 363 383 395 591 828 786 858 911 2348 B. Non-Plan Grant 643 679 735 725 819 856 1057 1142 1095 2190 i. Statutory Grants 56 605 634 686 736 779 988 1016 990 2139 ii. Contribution to CRF 5 14 50 11 9 9 9 14 10 15 iii. Other Grants 79 59 51 28 73 69 60 111 95 36 C. Plan Grants 837 790 1282 1610 1688 1981 2258 2341 2996 1482 i. State Plan Schemes 626 660 920 1339 1166 1572 1866 1905 2264 1003 ii. Central Plan Schemes 5 9 20 11 13 15 12 25 40 iii. Centrally Sponsored Schemes
169 85 285 223 475 327 294 369 663 342
iv. Special Plan Schemes 38 36 58 37 47 68 83 55 45 97 D. Total Grants (B+C) 1480 1469 2016 2335 2507 2837 3315 3483 4092 3672 E. Total Transfer (A+D) 1623 1832 2400 2729 3098 3665 4101 4341 5003 6020 Source: Budget Documents, Government of Mizoram
Table 2.13: Detailed Breakup of Devolution and Revenue Transfer
Percent
Head 2006-07
2007-08
2008-09
2009-10
2010-11
2011-12
2012-13
2013-14
2014-15
2015-16
A. Shared Taxes 8.8 19.8 16.0 14.5 19.1 22.6 19.2 19.8 18.2 39.0 B. Non-Plan Grant 39.6 37.0 30.6 26.6 26.4 23.4 25.8 26.3 21.9 36.4 i. Statutory Grants 3.4 33.0 26.4 25.1 23.8 21.3 24.1 23.4 19.8 35.5 ii. Contribution to CRF 0.3 0.8 2.1 0.4 0.3 0.2 0.2 0.3 0.2 0.3 iii. Other Grants 4.9 3.2 2.1 1.0 2.4 1.9 1.5 2.6 1.9 0.6 C. Plan Grants 51.6 43.1 53.4 59.0 54.5 54.0 55.1 53.9 59.9 24.6 i. State Plan Schemes 38.6 36.0 38.3 49.0 37.6 42.9 45.5 43.9 45.3 16.7 ii. Central Plan Schemes 0.3 0.5 0.8 0.4 0.0 0.4 0.4 0.3 0.5 0.7 iii. Centrally Sponsored Schemes
10.4 4.6 11.9 8.2 15.3 8.9 7.2 8.5 13.2 5.7
iv. Special Plan Schemes 2.3 2.0 2.4 1.4 1.5 1.9 2.0 1.3 0.9 1.6 E. Total Transfer (A+B+C) 100 100 100 100 100 100 100 100 100 100 Source: Budget Documents, Government of Mizoram
The above analysis of the trends in the devolution and revenue transfer from the central
government to the state government clearly revealed that plan grants had gained lesser
importance after 2015-16. To sustain the gaps caused by the decrease in plan grants, there
was significant increase in non-plan grants and shared taxes. Thus, the post FC XIV is likely
Page 25

to see increasing receipt under shared taxes and non-plan grants with declining receipt under
plan grants. At the same time, it may be worthwhile to analyse the FC-IV recommended fund
transfer vis-a-vis actual transfer to have better understanding. Table 2.14 presents the
recommended amount and actual transfer till FY 2018-19.
Table 2.14: FC-IV Recommendation & Achievement in Fund Devolution from the Centre ` Crore Revenue Head 2015-16 2016-17 2017-18 (RE) 2018-19 (BE) I. FC-XIV Recommendation A. Shared Taxes 2670 3081 3559 4118 B. Non-Plan Grant 2166 2331 2487 2633 i. Statutory Grants 2139 2294 2446 2588 ii. Contribution to CRF 15 16 17 18 iii. Other Grants 12 21 24 27
Total 4836 5412 6046 6751 II. Actual Devolution A. Shared Taxes 2348.11 2801 3107.3 3625.3 B. Non-Plan Grant 2190.37 2356.4 2496.4 2643.5 i. Statutory Grants 2139 2294 2446 2588 ii. Contribution to CRF 15 16 17 18 iii. Other Grants 36 46 34 38
Total 4538 5157 5604 6269 III. Achievement Ratio (%) A. Shared Taxes 87.9 90.9 87.3 88.0 B. Non-Plan Grant 101.1 101.1 100.4 100.4 i. Statutory Grants 100 100 100 100 ii. Contribution to CRF 102.0 101.3 100 100 iii. Other Grants 300.6 220.0 140.8 138.9
Total 93.8 95.3 92.7 92.9 Source: Budget Documents, Government of Mizoram & Economic Survey of Mizoram, Department of Planning & Programme Implementation BE: Budget Estimates & RE: Revised Estimates
Table 2.14 shows that there were 100% achievements on non-plan grants (statutory grants,
contribution to CRF & others) throughout the years under consideration. At the same time,
the revenue transfers from shared taxes were well below the FC-IV recommended (projected)
transfer in all the years. This may be due to the slowing down of economic growth thanks to
the short term disruptions caused to the economy by demonetisation and GST. As a result, the
projected revenue transfer to the state by the FC-IV may not be achieved during the award
period. However, looking at the existing trend, the actual fund transfer is likely to be more
than 90% of the recommended amount.
Page 26

2.6. Funds Directly Transferred to State Implementing Agencies
There are central plan grants given to the state through CSS that are transferred directly to the
societies and implementing agencies normally bypassing the state’s budgetary routes. These
funds play a significant role for the social and economic development of the state. As they are
not routed through the state budgets, the Annual Financial Accounts do not capture the
volume and nature of these transfers. As a result, the total plan fund availability and its
impacts on the fiscal parameters are normally underestimated. Although the FRBM Act
requires that there should be transparency in respect of estimates of receipts and expenditure,
they are not properly monitored by any single agency at the state level. Consequently, it is
difficult to estimate the actual quantum of all the fund flows at any point of time.
Table 2.15 presents the total amount of fund released by the end of FY since 2008-09,
obtained from the CAG Reports of State Finance. As can be observed from this table, these
funds alone constituted around 20% of GSDP and 45.75% of total transfer from the centre.
However, the actual transfer, although audited reports are not yet available, is assumed to be
drastically reduced after 2014 due to the discontinuation of Planning Commission in 2014
and the discontinuation of several CSS after FC XIV. Table 2.16 presents some of the major
schemes and programmes which are implemented through state level agencies by direct fund
transfer. The most important scheme in terms of fund transfer is National Rural Employment
Guarantee Scheme (NREGS). The amount received increased from `152.3 crores in 2008-09
to `244 crores in 2013-14.
There are also substantial amount of funds transferred for Sarva Shiksha Abhiyan (SSA)
during the same period, and the fund received increased from `85.1 crores in 2009-10 to
`106.6 crores in 2013-14. In addition to SSA, the state has also received substantial amount
of fund under Rashtriya Madhyamik Shiksha Abhiyan (RMSA) since 2012-13.
Page 27

Table 2.15: Fund directly transferred to the State Implementing Agencies Year No. of Schemes Amount (` Crore) as % of GSDP as % of Total Transfer 2008-09 13 704.8 20.66 29.37 2009-10 13 683.2 17.94 25.03 2010-11 53 984.1 17.90 31.77 2011-12 18 668.4 11.03 18.24 2012-13 37 934.3 13.36 22.78 2013-14 65 1985.9 24.66 45.75 Source: Report of the Comptroller and Auditor General of India on State Finances, Government of Mizoram, end March 2009, 2010, 2011, 2012, 2013 & 2014
Table 2.16: Major Schemes/Programme to which Funds are directly transferred to State Implementing
Agencies (` Crore) Schemes Implementing
Agencies 2008-09
2009-10
2010-11
2011-12
2012-13
2013-14
1. Mahatma Gandhi National Rural Employment Guarantee Act (MGNREGA)
Rural Development Department 152.3 277.0 216.2 312.0 251.6 244.7
2. Pradhan Mantri Gram Sadak Yojana (PMGSY)
Public Work Department 315.2 44.6 95.6 71.8
3. Sarva Shiksha Abhiyan (SSA) Education Department 85.1 112.9 108.1 153.2 106.6
4. National Rural Healh Mission (NRHM)
Health & Family Welfare 79.9 32.1 54.2 34.0 91.6 51.1
5. National Rural Drinking Water Programme
Public Health Engineering Department
54.5 53.4 80.5 37.1 47.9 44.9
7. Jawaharlal Nehru National Urban Renewal Mission (JNNURM)
Urban Development & Poverty Alleviation 47.2 58.2 50.3
8. Indira Awas Yojana (IAY) Rural Development 12.5 18.5 13.4 3.1 10.8 25.7 9. Rajiv Gandhi Grameen Viyutikaran Yojana (RGGVY)
Power & Electricity Department 81.0 78.3
10. Rashtriya Madhyamik Shiksha Abhiyan (RMSA)
Education Department 63.9 39.5
11. Integrated Watershed Management Programme (IWMP)
Rural Development Department 5.8 25.2 70.0
12. Others 90.5 44.3 274.9 168.4 168.0 1403.4 Total 704.8 683.2 984.1 668.4 934.3 1985.9 Source: Report of the Comptroller and Auditor General of India on State Finances, Government of Mizoram, end March 2009, 2010, 2011, 2012, 2013 & 2014
Table 2.16 also shows that there were continuous flow of funds for National Drinking Water
Programme and Indira Awas Yojana (IAY) throughout the years under study.
Page 28

2.7. Revenue Buoyancies
A good tax system is one which has strong linkage with the growth of the economy. Tax
buoyancy is one of the most effective indicators of the responsiveness of tax revenue to the
changes in the tax base. In the absence of a single comprehensive data representing changes
in the economic conditions, the Gross State Domestic Product (GSDP) would be the most
acceptable macroeconomic variable which best represent the tax base of the state. Attempt is
made in this section to estimate the buoyancy of the various sources of own revenue receipts,
including the fund transfer from the central government and non-tax revenue. To measure the
buoyancy of the revenue receipts during the entire period under study (2006-07 to 2015-16),
this study adopted the following log-linear regression model (double log model)
log(𝑅𝑡) = 𝑎 + 𝑏 𝑙𝑜𝑔 (𝐺𝑆𝐷𝑃𝑡) + 𝑢𝑡 Equation (1)
where Rt is the revenue receipt in year t, GSDPt is the Gross State Domestic Product in year
t, a is the intercept, b is the buoyancy estimate or constant elasticity, and ut is the error term.
The main advantage of this model is that b is constant elasticity and is independent of
measurement unit.
It is understood that a state’s domestic product on agriculture sector would be one of the most
appropriate determinant for the estimation of the buoyancy of land revenue. Similarly, the
base of profession tax is basically non-agriculture and as such the determinant for its
buoyancy may be the state’s income from this sector. However, due to the issues of
comparability of income series following the change of methodology for estimating income
from agriculture sector in the later years (i.e. 2011-12 series), the study decided to use GSDP
as a base for all taxes under consideration. The buoyancy estimated here would signify the
responsiveness of the tax revenue to the economic growth as indicated by GSDP. A buoyant
tax indicates increasing tax revenue with increase in GSDP. Thus, an individual tax is said to
be buoyant with respect to growth if its estimated coefficient is greater than unity, and not
buoyant or less buoyant if it less than one.
Table 2.17 presents the result of estimated double-log regression in which the slope
coefficients are tax buoyancy estimates. This table also presents the estimates not only for
own tax revenues, but also for major sources of own non-tax revenue. The estimates for tax
revenues are highly significant (i.e. significant at 1% level) with acceptable value of R-square
which ranged from 0.58 in case of state excise to 0.96 for VAT. This may be construed as the
Page 29

volatility of own tax revenue to the level of economic development. At the same time, there
are different results for ONTR as the estimate is not significant in case of revenue from
interest receipt and general services.
Table 2.17: Buoyancy of State’s Own Tax and Non-Tax Revenues (2006-07 to 2015-16)
Revenue Heads Buoyancy t-value R2 F-statistic A. Total Own Tax Revenue 1.12*** 14.86 0.96 220.7*** 1. Land Revenue 1.57*** 7.97 0.89 63.56*** 2. Stamp & Registration 2.03*** 7.9 0.89 63*** 3. State Excise 1.63*** 3.31 0.58 10.9*** 4. VAT/Sales Tax 1.06*** 13.8 0.96 191.8*** 5. Taxes on Vehicles 1.1*** 5.04 0.76 25.4*** 6. Taxes on Goods & Passenger 0.75*** 4.7 0.73 22.13*** 7. Profession Tax 0.84*** 8.37 0.90 70.1*** 8. Other Taxes & Duties 0.84*** 5.68 0.80 32.3*** B. Total Own Non-Tax Revenue 0.51*** 4.2 0.76 27.71*** 1. Interest, dividend, etc. 0.36 1.45 0.21 2.12 2. General Services 0.01 -0.02 0.000 0.00 3. Social Services 1.03*** 6.11 0.82 37.4***
of which, Water supply & sanitation 1.24*** 10.18 0.93 103.7*** 4. Economic Services 0.64*** 5.7 0.80 32.5***
of which, Power 0.63*** 5.28 0.78 27.9*** Note : ***, ** & * indicates significant at 1%, 5% & 10% level of significance respectively
The estimate of buoyancy of total OTR is marginally above 1 (i.e. 1.12) showing that the
existing own tax revenue of the state is not progressive enough with respect to economic
development. It is also notable that the estimated coefficient for VAT, which contributed
around 70% of the total tax revenue, is just buoyant (i.e. it is around unity). As noted earlier,
the revenue collected from stamp & registration had significant increase in the recent years
following the establishment of Directorate of Stamp & Registration in 2013. Similarly, there
was a quantum jump in the receipt from excise after 2014 due to the implementation of
MLPC Act. Consequently, these two taxes showed high buoyancies.
It is interesting to see a high buoyancy of 1.57 in case of land revenue and thus, this tax is one
of the most progressive relative to economic growth. Thus, there is a good scope for
enhancing revenue receipt from land revenue in the state. At the same time, the buoyancies
were less than unity for goods & passenger tax, profession tax, and other taxes & duties. The
revenue from these taxes grew less than proportionately with GSDP. So, these taxes have low
productivity, and hence, there is a need to increase productivity of these taxes.
The insignificant buoyancies for two items of ONTR, i.e. interest and general services may
be taken to indicate that these two are not significantly depending on economic growth. The
receipts from social services, water tariff, fees, etc., were just buoyant as its estimate is
Page 30

around unity. The main contributor of this sector was water tariff (water supply & sanitation)
and had significant buoyancy with respect to GSDP. Thus, the non-tax revenue from these
sources increased proportionately with the increase in GSDP. At the same time, the buoyancy
of receipt from economic sector was significant and only 0.64. The main driver of the
revenue receipt from this service was power tariff which is not buoyant (only 0.63).
Consequently, the revenue was growing less than proportionately with GSDP necessitating
effective mechanism to review tariff rate in consonant with the economic condition to make it
a progressive one.
2.8. Tax Capacity and Effort to raise Tax Revenue
The tax performance of the state government is often assessed in terms of tax effort, which
can be expressed as a relationship or ratio between the actual amount of collection and
taxable capacity. The level of tax effort of the state is normally judged by comparing it with
the levels of other states. The simplest and commonly used measure of relative tax effort is
the ratio of tax revenue collection to the total income of the state (GSDP). However, this
method assumes that the total income of a state is an appropriate indicator of taxable
capacity. This assumption ignores various capacities factors such as size of population,
administrative capability, degree of monetisation, etc. (Purohit, 2006).
Two different approaches are normally used for estimating tax efforts: representative tax
system (RTS) and regression approach. The former involves computing average effective
rates of tax of the entire sample after defining an appropriate proxy tax base for each of the
taxes being considered, and using these average rates to estimate tax potential on the basis of
each state’s tax base. In the latter case, tax revenue collections are explained by a set of
variables which are considered to be representing the taxable capacity. This study adopted
regression approach of estimating the taxable capacities of various sources of OTR.
Meanwhile, the relative tax effort of the state was also examined by presenting the individual
tax revenues as percentage of GSDP.
Eight sister states of North Eastern India, namely Arunachal Pradesh, Assam, Manipur,
Meghalaya, Mizoram, Nagaland, Sikkim, and Tripura, were selected for the analysis and
basis of comparison for evaluation of tax effort. All these states were given Special Category
status by different Finance Commissions in the determination of the basis of revenue transfer
and fund devolution. Further, most of them are tribal dominated and hilly states without
Page 31

sufficient revenue sources. These states have similarities in many respects. So, selection of
these 8 states for the analysis was considered appropriate.
For the sake of simplicity in the analysis and interpretation, the double-log regression given
in Equation (1) was adopted for estimation of taxable capacities for taxes in all states. The
respective GSDP is simply the adopted determinant of the individual tax revenue in each
state. Interestingly, as given in Annexure, the coefficients of these estimates are significant
with good R-square in majority of the cases. The data used in the estimation were taken from
RBI ‘Handbook of Statistics on Indian States’. The projected (or estimated) tax
potential/capacity was estimated by using the estimated double-log regression equation of
individual tax on respective GSDP, and the ratio of the actual tax revenue and the revenue
potential (projected) was calculated. To avoid the effect of annual fluctuation in the
estimation, the data used for making projection of tax revenue and actual revenues are the
averages of a respective three year period, 2013-14 to 2015-16. After this, the average for all
states was taken as the base by equating to 100 in order to assess the yield in the relative tax
effort index.
Table 2.18 presents the various sources of own tax revenues as percentage of GSDP among
the North Eastern States of India. The tax-GSDP ratio is known to be the simplest measure of
tax effort. Assam had the highest OTR-GSDP ratio (5%) and Mizoram had the second lowest
ratio (2.3%) above Nagaland (1.88%).
Table 2.18: Own Tax Revenue as Percentage of GSDP among the North Eastern States (calculated from the average of the last 3 years)
States Land
Re
venu
e
Stam
p &
Regis
tratio
n
State
Exc
ise
VAT/
Sales
Ta
x
Tax o
n Ve
hicles
Taxe
s on
Good
s &
Pass
enge
r
Profe
ssion
Ta
x
Othe
r Tax
es
& Du
ties
Total
Own
Ta
x Re
venu
e
Arunachal Pradesh 0.06 0.03 0.45 1.36 0.12 1.18 0.00 0.00 3.19 Assam 0.10 0.13 0.40 3.73 0.22 0.27 0.11 0.06 5.00 Manipur 0.01 0.06 0.06 2.91 0.14 0.01 0.16 0.11 3.47 Meghalaya 0.01 0.05 0.80 2.42 0.20 0.03 0.02 0.03 3.56 Mizoram 0.07 0.02 0.19 1.78 0.15 0.02 0.12 0.01 2.36 Nagaland 0.00 0.01 0.02 1.43 0.22 0.04 0.14 0.01 1.88 Sikkim 0.03 0.06 1.08 1.79 0.16 0.00 0.07 0.58 3.77 Tripura 0.03 0.14 0.48 3.37 0.13 0.00 0.14 0.01 4.30 All State Ave. 0.04 0.06 0.43 2.34 0.17 0.19 0.09 0.10 3.43 Source: (i) RBI Handbook of Statistics on Indian States, & (2) Computed
Table 2.19 presents the estimated taxable capacity calculated from double-log regression
function, and relative tax effort index of the NE states. While the actual OTR of Mizoram
Page 32

was only `284.9 crores, the estimated tax capacity is `306.5 crores. VAT, the main
contributor of OTR had actual revenue of `214.1 crores against the projected capacity of
`225.9 crores. These gaps reveal the existence of tax opportunities that can be leveraged by
the government to increase its own tax revenue.
Table 2.19: Estimated Tax Potential and Efforts of North Eastern States
States Land
Re
venu
e
Stam
p &
Regis
tratio
n
State
Exc
ise
VAT/
Sales
Ta
x
Tax o
n Ve
hicles
Taxe
s on
Good
s &
Pass
enge
r
Profe
ssion
Ta
x
Othe
r Tax
es
& Du
ties
Total
Own
Ta
x Re
venu
e
A. Actual Revenue (average for 3 years 2013-14 to 2015-16) (` Crore) Arunachal Pradesh 8.8 4.5 67.2 203.0 18.1 175.6 NA NA 477.2 Assam 175.8 221.6 694.4 6541.4 386.1 464.7 186.9 98.9 8769.8 Manipur 1.7 8.9 9.1 431.9 20.9 1.2 23.8 16.6 514.0 Meghalaya 2.2 10.8 161.3 486.7 39.4 5.0 3.8 5.4 714.6 Mizoram 8.2 2.9 22.9 214.1 18.6 2.6 14.7 0.8 284.9 Nagaland 0.7 1.9 4.9 291.0 45.2 8.8 28.6 1.8 383.0 Sikkim 3.8 7.2 131.4 217.8 20.1 NA 8.2 71.0 459.5 Tripura 8.3 39.8 132.6 934.0 36.8 NA 37.9 2.6 1191.9 B. Estimated Taxable Capacity (` Crore)
Arunachal Pradesh 7.8 4.5 68.6 215.8 18.5 155.7 NA NA 475.8 Assam 183.8 233.5 725.8 6852.9 377.5 618.9 176.8 113.1 8957.2 Manipur 1.5 8.9 10.6 444.1 21.4 1.3 24.9 21.9 504.1 Meghalaya 1.7 10.9 161.5 488.1 39.9 5.1 3.5 4.6 755.9 Mizoram 8.1 2.3 8.7 225.9 20.7 2.9 15.6 0.8 306.5 Nagaland 0.7 2.0 4.9 309.4 46.9 9.1 30.6 1.8 416.8 Sikkim 4.3 7.1 137.1 228.5 21.4 NA 6.3 70.3 459.9 Tripura 11.7 41.0 139.3 957.7 35.0 NA 37.8 2.0 1247.2 C. Relative Tax Effort Index
Arunachal Pradesh 111 98 84 98 100 120 NA NA 104 Assam 94 93 82 99 105 80 102 84 101 Manipur 112 97 73 101 100 97 92 73 105 Meghalaya 127 97 86 104 101 105 104 113 98 Mizoram 99 124 226 99 92 97 91 107 96 Nagaland 101 96 86 98 99 103 90 98 95 Sikkim 86 100 82 99 96 NA 125 97 103 Tripura 70 95 82 102 108 NA 96 126 99 All NE States 100 100 100 100 100 100 100 100 100 Source: (i) RBI Handbook of Statistics on Indian States, & (2) Computed. NA = Not Available
In clear support of the earlier observations, Mizoram is among the states which have lowest
tax effort, and the only state which has lower effort than Mizoram is Nagaland. The effort for
OTR of the state was estimated at 96% which is the second lowest in the North East. There
are three taxes for which the state has efforts above the average of the 7 states, namely stamp
& registration, state excise, and other taxes & duties. The first two have high buoyancy
coefficient and the last (other taxes & duties) is not buoyant to the level of economic
Page 33

development. The government has low effort for collection of VAT, which is the main
contributor of the state’s OTR. Similarly, relatively lower efforts were also observed in case
of land revenue, vehicles tax, and profession tax.
Recalling the initiatives of the government for increasing taxes in the recent years given
earlier, any crucial tax related policy reform undertaken by the government is strongly
correlated by an increase in the level of tax efforts. The establishment of Directorate of Stamp
& Registration in 2013 and amendment of rules for stamp and registration fees were positive
initiatives of the government to increase collection from stamp & registration. The abolition
of MLTP Act 1995 and introduction of MLPC Act 2014 had strong ramifications on the
increase of revenue collection from the state excise. Similarly, The Assam Amusement and
Betting Act, 1939 for levy of entertainment tax was replaced by The Mizoram Entertainment
Tax Act, 2013. This resulted in significant increase in revenue collection from other taxes &
duties, of which entertainment tax is the main contributor. Thus, any reform action is
expected to have positive impact on the tax revenue collection and level of tax efforts. A
responsible government that tries to increase tax-GSDP ratio has to take this fact into
consideration and take necessary reforms on the existing tax structure and the rationalisation
of tax parameters.
2.9. Measures Taken by the Government to Improve Tax-GSDP Ratio
Table 2.20 presents an outline of the various efforts taken up by the government to improve
revenue collection during the study period. Table 2.20 shows that the state government had
undertaken several initiatives to increase tax collection over the years. The tax items which is
most touched upon by this policy action is VAT. This was undertaken through improvement
in efficiency and revision of rates. The government initiated public sector reform programme
using the loan received from Asian Development Bank (ADB) in 2007. The programme was
named ‘Mizoram Public Resource Management and Development Programme’ (MPRMP)
and was completed in 2017. The focus areas of the programme were tax and non-tax reforms,
debt management, public expenditure management, sectoral improvement, pension reforms,
and PSE reforms. The state had taken initiatives for the improvement in the efficiency of tax
collection by restructuring and strengthening of the Taxation Department under MPRMP. It
was observed that the initiative was ratified by the collection of VAT during the study period.
Page 34

However, VAT was subsumed under GST which was implemented across the country on July
1st 2017.
Table 2.20: Measures to Improve the Revenue Capacities of the States
Tax Major Initiatives VAT/Sales Tax
• Taxation Department was structured and strengthened under MPRMP in 2011-12. • Rates were revised upward to a new structure of 0%, 1%, 4% and 12.5% in 2011-12. • Again, rates on goods taxable at 4% was raised to 5%, and 12.5% was to 13.5% in January 2012. In
addition, The 50 items originally listed in the Schedule was raised to 55 items. • Rates on tobacco products including Cigarettes, Cigars, Cigarillos and Vaihlo was revised upward
from 20% to 30% in 2015-16. • Sales tax on LPG increased from 2% to 4%, from 18% to 20% for Motor Spirit (Petrol), from 10% to
10% in High Speed Diesel during the FY 2011-12. Land Revenue and Stamp & Registration
• Amendment to the Mizoram (Land Revenue) Act, 2013 and the Mizoram (Land Revenue) Rules, 2013 was implemented in 2015 to streamline and improve procedures, record management, assessment and collection of revenue.
• National Land Record Modernisation Programme (NLRMP) was launched in 2011 to strengthen revenue administration, updating of land record, and computerisation of land records.
• The Indian Stamp (Mizoram Amendment) Act, 1996 was amended in 2007. By notification in February 2011, the levy of stamp duty is required on monthly payment of salaries to regular government officials including council of Ministers, on all bills in respect of payment made by various department and offices of private parties.
• Directorate of Registration and Stamp established in 2013 to deal with administration, levy and collection of fee and stamp duty.
State Excise
• The Mizoram Liquor (Prohibition and Control) Act, 2014 was passed and came into force from 15th January 2015.
Vehicles Tax
• The government rationalised road tax collection by introducing one-time lump sum payment in the FY 2011-12
Profession Tax
• The tax rate under The Mizoram Professions, Trades, Callings and Employment Taxation Act 1995 was revised upward for all categories within the stipulated ceilings.
Other taxes and user charges
• The Mizoram Entertainment Tax Act 2013 was passed. Reassessment was undertaken for Cable TV Operators.
• User charges, water tariff and power tariff were hiked in 2012-13. • Mizoram Entry Tax Bill 2015 was passed by the State Legislative Assembly.
Source: Budget Documents, Government of Mizoram
Another crucial event in the efforts of the government to raise revenue capacities is the
implementation of MLPC Act in 2015, which repealed the earlier prohibition law. There was
substantial increase in the receipt of state excise after the implementation of MLPC Act.
Several initiatives of the government to improve tax revenue collection can be seen in the
Table. However, the non-tax revenue, which is less buoyant with respect to GSDP, was
hardly touched by policy actions of the government during the 10 years under study. There
was a revision of tariff only once in 2012. To make it more buoyant and more responsive to
the changing dynamic of economic development vis-à-vis change in consumption patterns,
there should be continued efforts of the government to rationalise structures and revision of
rates.
Page 35

2.10. Concluding Notes & Suggestions to improve Tax-GSDP Ratio
The foregoing analysis revealed that the state performed moderately well in raising own tax
revenue (which grew at CAGR of 20.3%), while the revenue receipt from shared tax and
grants-in-aid recorded an increase of 21.2% and 12.4% respectively, and there was quantum
jump in shared tax in 2015-16 following the implementation of FC XIV. Likewise, the OTR
of the state also recorded significant increase during this year due to the surge in income from
state excise following the implementation of MLPC Act that allowed sale of liquor. However,
poor mobilisation of revenue from user charges resulted in sticky growth of ONTR which
grew by around 9% per annum during this period, and this limited the fiscal capacities of the
state.
VAT was the main source of the state’s OTR. Revenue mobilisation from it increased
consistently at around 19%. Continued effort was also undertaken by the government to
rationalise this tax and to bring about efficiency in its collection and administration. Despite
all these, the buoyancy was estimated at around unity, meaning that it grew more or less
proportionately with GSDP. Moreover, the estimated tax effort was very low compared to
other NE states. So, this study finds the existence of wide room for its improvement to
leverage opportunities arising out of the changes in the living standard and consumption
patterns of the population. In fact, this tax was subsumed under the GST regime, and the
transfer of registration is underway. It is expected that the new tax regime will transform the
system, thus enhancing the tax revenue of the state government.
Although land revenue is buoyant with respect to the GSDP, there is wide a gap between its
tax effort and tax capacity. It may be noted that the chieftainship was abolished in the state in
1954, and all the lands of chiefs were acquired by the government. As shifting cultivation is
still in practice in the state, land allotment is exercised by the elected village councils (VCs)
following the traditional system of the chiefs. At the same time, the existing land laws do not
authorise the VCs to allot land for permanent cultivation. However, due to limitations of the
state Revenue Department to cover all the households seeking land pass in different villages,
the VCs became the de facto authority for land allotment, even for permanent cultivation.
Consequently, large number of landholdings in the rural areas is not yet assessed by the
government. Although computerisation of holdings is in process under the National Land
Record Modernisation Programme (NLRMP), there is a long way to go for the complete
assessment of all the lands in different villages. Once this is done, it is expected that receipt
Page 36

from land revenue would increase significantly. The inability of the state to leverage the land
revenue capacity seems to be more on capacity, rather than institutional, constraints. It is thus
suggested that necessary efforts be made by the government to assess all the landholdings
and institute a more efficient mechanism for its revenue collection.
The most buoyant tax observed in this study is Stamp & Registration which recorded an
annual growth of more than 38%, mostly fuelled by the amendment of related rules and the
establishment of a separate directorate to look after it. The observed trend revealed the
existence of wide areas for its further increase. Its scope is normally restricted to transfer of
land pass and its securitisation, while the depth of coverage on other assets is low. Interview
of some officials and middlemen of land transfer business revealed that there is rampart
under-quoting of land price during sale deeds, undertaken in mutual agreement between the
participating parties to avoid high registration fee. The same also prevails in registrations
including those under Societies Registration Act 2005. To increase revenue collection from
stamp and registration, the state government needs to clearly define the tax parameters and
make the people aware of its significance, while also taking steps to make dealings on
transfer of assets more transparent, thus enhancing efficient assessment of taxes/fees.
Quantum jump in the buoyant revenue receipt from state excise post MLPC Act deserves
recognition. State excise has become the second most important source of OTR in the state,
and it is necessary to make it more progressive relative to the growth of the economy.
Alcohol is by nature a demerit good and its consumption is not desirable for the society and
unhealthy for the consumer themselves. As such, there is strong objection from the Church
bodies against its free sale in the state. At the same time, the prices of different IMFL sold in
the state are low compared to the neighbouring states. Given all these, there is a scope to
mobilise more revenue by introducing an additional levy which may be in the form of cess or
sin tax. In fact, there was an upward revision of VAT on tobacco products on these grounds
in the recent years.
Tax revenue from vehicles showed buoyancy of around unity relative to GSDP, while tax on
goods & passengers was not buoyant as it grew less than proportionately with GSDP. Further,
Mizoram had the lowest tax efforts in these two taxes among the NE states during the study
period. As per the record of Directorate of Economics & Statistics, the number of vehicles
registered by the government grew at a CAGR of more than 14%, from around 46 thousands
to 1.5 lakhs, during 10 years. It was also found that different types of luxury vehicles are
Page 37

increasingly plying on roads every year in the state. So, it is necessary to rationalise the
structure of vehicles tax and goods & passenger taxes in a progressive manner keeping in
view the (i) growing number of luxury vehicles, (ii) changes in the travel mode choices
among the people, and (iii) emergence and growth of logistic sector and changes in the
means of commodity transportation.
The tribal population living and working in Mizoram are exempted from paying income tax,
but they are liable if income is earned in any other part of India. Given the need for
augmenting resources for the state, it is a sound economic sense if professional tax is used as
some kind of proxy for taxing earnings in Mizoram and keeping it under the state subject. In
fact, there is no strong logic for fixing the ceiling of profession tax at `2500. Instead, it has to
be made progressive, according to the level of earnings of the income earners. However, any
action on this matter would invite the amendment of Article 276 (2) of the Indian
Constitution.
Although the foregoing analysis showed that there was significant growth in non-tax
revenues in Mizoram, it is not buoyant to the growth of GSDP. Both the estimates for
revenues from interest, dividends, etc., and general services were insignificant, which led to
the low buoyancy of the total ONTR. In the absence of dividends & profits received from the
investments of the government in public sector enterprises (PSE) and cooperatives
institutions, there is no possibility of earning income that is positively related to GSDP.
Instead of contributing revenue to the state’s coffers in the form of dividend and profits, the
PSEs are basically the liability of the state which drains the financial resources. The recent
initiative of the state government to close down some loss making PSEs is commendable, and
it is necessary to extend the initiatives in other loss making units as well.
A major contributor of ONTR under social services is water supply & sanitation which is
buoyant with respect to GSDP. At the same time, non-tax revenue from power supply is not
buoyant, which indicates inefficiency in its collection and administration. Looking at the poor
performance in cost recovery, collection of user charges from these two services is well
below satisfactory level. So, appropriate action is needed for the emergence of continuous
review mechanism to keep the collection of user charges in pace with economic growth. User
charges may be determined on the basis of economic status of different groups, rather than
that of a flat rate. There may also be an increment of the charges, in regular intervals, at
least at a marginal rate.
Page 38

Chapter 3
STATE’S EXPENDITURE
3.1. Introduction
Public expenditure is a significant driver of economic growth for states like Mizoram which
lack sufficient resource. In fact, the relationship between public expenditure and national
income is an enduring issue in economics and public finance literatures both at the theoretical
and empirical levels (Srinivasan, 2013). Keynes (1936) stated that public expenditure is a
fundamental determinant of economic growth. At the same time, Wagner (1883) suggested
that growth in public expenditure was inevitable for progressive economy, because it is
directly linked to the economic growth. Public expenditure plays an important role in
achieving the goals of growth, development, equity, and stability. In the context of
developing economies like India, public expenditure assumes importance in order to ensure
an equitable distribution of resources (RBI, 2009-10).
However, increasing public expenditure driven by the growth of revenue expenditure set
alarm to the fiscal health of the state and central government. The doctrine of curtailing
government expenditure to bring down deficit financing has become the core objective of the
fiscal management of the governments so as to bring deficit financing under control,
especially in the post economic reform era. At the same time, it is the responsibility of the
state government to make the provision of social and economic services for sustained and
inclusive development through public expenditure. Thus, a study on the trend, patterns, and
composition of government expenditures is of special significance for the health of the state
finance. Attempt is made in this chapter to study the trends and dimensions of the expenditure
of Government of Mizoram.
3.2. Economic Classification of Expenditure
The total expenditure of the state in terms of economic classification includes revenue
expenditure and capital expenditure. The expenditure on capital account (or capital
expenditure) includes outlays for creation of assets, and loans and advances made to various
parties and the repayment of loans obtained from them. The two accounts of disbursement are
further classified into plan and non-plan expenditures. Table 3.1 and Figure 3.1 present the
Page 39

trends and composition of government expenditure from 2006-07 to 2015-16. Table 3.1
presents capital expenditures under the following two heads: (i) capital outlay which
indicates expenditure for creation of assets, and (ii) loans & advances which includes
repayment of government debt, and loans and advances issued by the government.
Table 3.1: Economic Classification of Total Expenditure in Mizoram
Year
Amount (` Crores) Composition (%) Revenue
Expenditure Capital Outlay
Loans & Advances
Total Exp.
Revenue Expenditure
Capital Outlay
Loans & Advances
Total Exp.
2006-07 1717 466 111 2294 74.8 20.3 4.8 100 2007-08 1908 544 150 2602 73.3 20.9 5.8 100 2008-09 2314 579 114 3007 77.0 19.3 3.8 100 2009-10 2703 573 390 3666 73.7 15.6 10.6 100 2010-11 3255 753 287 4295 75.8 17.5 6.7 100 2011-12 3724 636 320 4680 79.6 13.6 6.8 100 2012-13 4509 748 316 5573 80.9 13.4 5.7 100 2013-14 4917 600 987 6504 75.6 9.2 15.2 100 2014-15 5652 927 1191 7770 72.7 11.9 15.3 100 2015-16 5571 711 557 6840 81.5 10.4 8.1 100 CARG (%) 15.4 5.2 26.9 14.7 CAGR: Compound Annual Growth Rate Source: Budget Documents, Government of Mizoram
The increasing expenditure of the state government was basically due to the continued and
consistent increase in revenue expenditure, while capital expenditure recorded relatively
lower increase. The total expenditure increased from `2295 crores in 2006-07 to `6839 crores
in 2015-16 with an annual growth of 14.7%, and revenue expenditure also recorded annual
increase of 15.4%, from `1717 crores to `5571 crores during the same period. The capital
expenditure on asset creation (capital outlay) increased from `466 crores in 2006-07 to `711
crores with annual growth of 5.2%, while expenditure on loans and advances also increased,
1717 1908 2314
2703 3255
3724 4509
4917 5652 5571
466 544 579 573 753 636 748 600 927 711
111 150 114 390 287 320 316 987 1191
557
2006-07 2007-08 2008-09 2009-10 2010-11 2011-12 2012-13 2013-14 2014-15 2015-16
Figure 3.1: Trends in Economic Composition of Expenditure (` Crore) Revenue Expenditure Capital Outlay Loans & Advances
Page 40

of which repayment of loans which accounted a major share increased tremendously from
`111 crores to `557 crores with annual growth of 26.9% during this period.
Study of the change in the composition of expenditure as given in Table 3.1 is in clear
support of the above observations. While the percentage share of revenue expenditure
increased by around 10% from 74.8% in 2006-07 to 83% in 2012-13 and 81.5% in 2015-16,
the share of capital outlay declined from 20.3% to 10.4% during this period. At the same
time, the share of loans and advances in the total expenditure increased from 4.8% to 8.1%
during the study period. Thus, the fiscal space of the state was reduced gradually with the
expansion of revenue expenditure side by side with the increasing expenditure obligation for
repayment of loans and advances. This resulted in lesser fraction of the revenue available for
asset creation. In other words, the expanding revenue expenditure gradually limited the
capacity of the government to exercise more fiscal effort to create necessary infrastructure for
socio-economic development.
Table 3.2: Expenditures as Percentage of GSDP
Percent
Year Revenue
Expenditure Capital Exp.
(Outlay) Loans &
Advances Capital
Expenditure Total Total
Expenditure 2006-07 57.5 15.6 3.7 19.3 76.9 2007-08 55.9 15.9 4.4 20.3 76.3 2008-09 60.8 15.2 3.0 18.2 78.9 2009-10 49.2 10.4 7.1 17.5 66.7 2010-11 53.7 12.4 4.7 17.2 70.9 2011-12 53.3 9.1 4.6 13.7 66.9 2012-13 56.0 9.3 3.9 13.2 69.2 2013-14 47.8 5.8 9.6 15.4 63.2 2014-15 45.2 7.4 9.5 16.9 62.2 2015-16 41.7 5.3 4.2 9.5 51.1 Source: Budget Documents, Government of Mizoram
The total expenditure as a percentage of GSDP consistently decreased from 76.9% in 2006-
07 to 51.1% in 2015-16 (Table 3.2). Although the revenue expenditure, which is the main
driver of increasing public expenditure, grew at a fast pace of more than 15% at compound
rate, it showed a declining trend relative to the GSDP over the years. The revenue
expenditure as a percentage of GSDP decreased from 57.2% in 2006-07 to 41.7% in 2015-16.
At the same time, there was an improvement in the revenue expenditure in the state if it is
taken relative to the resource base, or economic growth.
Page 41

The capital expenditure as a percentage of GSDP moved around 13-20% till 2014-15,
revealing that it had a more or less proportional increase with the GSDP. However, the
capital expenditure sharply decreased to 9.5% in 2015-16 from 16.6% in the previous FY,
mainly due to the substantial decline in the expenditure for repayment of public debt during
this FY. It is surprising that capital outlay as percentage of GSDP declined continuously from
15.6% in 2006-07 to 12.4% in 2010-11 and 5.3% in 2015-16, while continued expenditure on
capital formation is required to sustain the robust growth of GSDP.
Table 3.3: Trends in Plan and Non-Plan Expenditure and Changes in Composition
Year
Non-Plan Expenditure
(` Crore)
Plan Expenditure
(` Crore)
Total Expenditure
(` Crore)
Non-Plan as % of Total
Expenditure
Non- Plan Expenditure %
of GSDP
Plan Expenditure % of GSDP
2006-07 1240 1055 2295 54.0 41.5 35.3 2007-08 1460 1143 2603 56.1 42.8 33.5 2008-09 1749 1119 2868 61.0 45.9 29.4 2009-10 2212 1453 3665 60.4 40.2 26.4 2010-11 3454 1703 5157 67.0 57.0 28.1 2011-12 2600 1938 4538 57.3 37.2 27.7 2012-13 3161 2272 5433 58.2 39.3 28.2 2013-14 4218 2286 6504 64.9 41.0 22.2 2014-15 4827 2945 7772 62.1 38.6 23.6 2015-16 4251 2589 6840 62.1 31.8 19.4 CAGR(%) 16.1 12.7 14.7 CAGR: Compound Annual Growth Rate Source: Budget Documents, Government of Mizoram
Table 3.3 presents the breakup of total expenditure on plan and non-plan expenditures. It is
clear that the small state of Mizoram which is without sufficient revenue sources cannot
afford to have a larger portion of revenue devoted to plan expenditure due to the increasing
requirement of non-plan expenditure. The latter accounted for more than half (62% in 2015-
16) of the total expenditure and showed annual compound growth of 16% during the 10 years
under study. At the same time, plan expenditure recorded an annual increase of 12.7%. The
convention of adding committed and maintenance expenditure of plan schemes to non-plan
expenditure at the end of every plan expanded non-plan expenditure in bulk every five years
(Sarma, 2000). The expanding non-plan expenditure limited the capacity of the government
to put more fiscal effort on plan schemes that are essential for economic development.
Except for the FY 2015-16, non-plan expenditure revolved around 37-50% of the GSDP,
while it decreased to 31.8% in 2015-16. Thus, the growth of non-plan expenditure is more or
less in pace with the GSDP. At the same time, the plan expenditure showed declining trends,
Page 42

from 35.3% in 2006-07 to 23.6% in 2014-15 and 19.4% in 2015-16. The declining plan
expenditure relative to GSDP may be construed as the reduced ability of the government to
carry on with developmental activities.
Table 3.4: Further Economic Classification of Revenue and Capital Expenditure Expenditure Heads
2006-07
2007-08
2008-09
2009-10
2010-11
2011-12
2012-13
2013-14
2014-15
2015-16
Amount (` In Crores) Revenue Expenditure 1717 1908 2314 2703 3255 3724 4509 4917 5652 5571 (out of which)
Interest Payment 228 208 226 254 106 274 288 284 306 369 Debt Servicing 7 14 15 17 17 23 19 23 19 30
Capital Expenditure 578 694 692 963 1040 956 1064 1588 2118 1269 (out of which)
out of which 466 544 579 573 753 636 748 600 927 711 Internal Debt 79 127 78 346 234 268 267 938 1170 530
Loan Repayment to Centre 32 17 18 19 23 18 19 19 19 21 Loans & Advances 0.25 6 17 25 30 34 30 31 2 7
Total Expenditure 2295 2602 3006 3666 4295 4680 5573 6505 7770 6840 Percentage to Respective Totals (%)
Revenue Expenditure 100 100 100 100 100 100 100 100 100 100 (out of which)
Interest Payment 13.3 10.9 9.8 9.4 3.3 7.4 6.4 5.8 5.4 6.6 Debt Servicing 0.4 0.7 0.6 0.6 0.5 0.6 0.4 0.5 0.3 0.5
Capital Expenditure 100 100 100 100 100 100 100 100 100 100 (out of which)
Capital Outlay 80.7 78.4 83.7 59.5 72.4 66.5 70.3 37.8 43.8 56.0 Internal Debt 13.7 18.3 11.3 35.9 22.5 28.0 25.1 59.1 55.2 41.8
Loan Repayment to Centre 5.5 2.5 2.6 2.0 2.2 1.9 1.8 1.2 0.9 1.7 Loans & Advances 0.0 0.9 2.5 2.6 2.9 3.6 2.8 2.0 0.1 0.6
Source: Budget Documents, Government of Mizoram
To have better understanding of the trends of revenue and capital expenditure, Table 3.4
presents their further classifications. The increase in interest payment under revenue
expenditure was a result of accumulated public debt and it posed challenge to the financial
stability of the state government. It can be deduced that the interest payments showed
increasing trend with temporary fluctuation during the 10 years. It increased from `228 crores
in 2006-07 to `369 crores in 2015-16. However, it showed a declining trend when taken as a
percentage of total revenue expenditure, as it decreased from 13.3% to 6.6% during this
period. Thus, interest payments grew less than proportionately with an increase in revenue
expenditure on other items. It is also clear from Table 3.4 that more than half of the
disbursement under capital account (56% in 2015-16) went to capital outlay, which is
basically the expenditure incurred for creation of assets in the economy. Although capital
outlay formed major expenditure of the capital account, it declined from 80.7% in 2006-07 to
Page 43

56% in 2015-16. Side by side with the declining share of capital outlay, repayment of internal
debt showed substantial increase from a mere 13.7% to a high of 41.8%. The expanding
volume of repayment of internal debt from `19 crores to `530 crores may also be interpreted
as the declining quality of capital expenditure as the outgo for capital outlay was declining
relative to repayment of internal debt.
3.3. Functional Composition of Expenditure
Functional composition of total expenditure consists of expenditure on general services
including interest payment, social services (education, health, housing, urban development,
welfare of SC/ST, etc.), economic services (agriculture, animal husbandry, forestry, rural
development, energy, etc.), repayment of public debt, loans and advances. Table 3.5 presents
the trends of these expenditures, while Table 3.6 and Table 3.7 present their relative share in
the total expenditure and values as percentage of GSDP respectively. The compound annual
growth rate was also calculated for the entire study period to show the trend of expenditure in
each component.
Expenditure on the general services (non-developmental expenditure) which accounted for
around 28% of the total expenditure recorded 14.5% annual increase, from `641 crores in
2006-07 to `1951 crores in 2015-16. The development expenditure consisting of social
services and economic services recorded 13.3% annual growth. The social services, which
individually showed a rate of growth of 15.5%, were the main driver of development
expenditure. Meanwhile, the growth rates of repayment of public debt and loans and
advances also showed higher growth compared to other functional composition of
expenditure.
Page 44

Table 3.5: Functional Composition of Total Expenditure (` Crore)
Year General Services
Social Services
Economic Services
Developmental Expenditure (Soc+Eco)
Public Debt Repayment
Loans & Advances
Total Expenditure
2006-07 641 715 827 1542 111 0.25 2295 2007-08 659 803 991 1794 144 6 2603 2008-09 824 991 1078 2069 96 17 3007 2009-10 974 1256 1046 2302 365 25 3666 2010-11 1034 1363 1612 2975 257 30 4296 2011-12 1237 1460 1663 3123 286 34 4680 2012-13 1474 1874 1919 3793 286 30 5583 2013-14 1745 2032 1741 3773 957 31 6506 2014-15 1824 2475 2281 4756 1189 2 7771 2015-16 1951 2432 1899 4331 550 7 6839 CAGR (%) 14.5 15.5 11.2 13.3 27.5 17.1 14.7 Source: Budget Documents, Government of Mizoram Note: Figures in some years may not tally with other tables due to rounding off
Table 3.6: Percentage Breakup of Total Expenditure on Various Functional Classifications (%)
Year General Services
Social Services
Economic Services
Developmental Expenditure (Soc+Eco)
Public Debt Repayment
Loans & Advance
s Total
Expenditure 2006-07 28.0 31.2 36.0 67.2 4.8 0.0 100 2007-08 25.3 30.8 38.1 68.9 5.5 0.2 100 2008-09 27.4 33.0 35.9 68.8 3.2 0.6 100 2009-10 26.6 34.3 28.5 62.8 10.0 0.7 100 2010-11 24.1 31.7 37.5 69.3 6.0 0.7 100 2011-12 26.4 31.2 35.5 66.7 6.1 0.7 100 2012-13 26.4 33.6 34.4 67.9 5.1 0.5 100 2013-14 26.8 31.2 26.8 58.0 14.7 0.5 100 2014-15 23.5 31.8 29.4 61.2 15.3 0.0 100 2015-16 28.5 35.6 27.8 63.3 8.0 0.1 100 Source: Budget Documents, Government of Mizoram
Total development expenditure accounted for the larger portion of the total expenditure
throughout the 10 years, but its share in the total expenditure gradually decreased from 67.2%
in 2006-07 to 58% in 2013-14 and to 63.3% in 2015-16. Of the developmental expenditure,
the share of economic services decreased substantially from 36% to 27.8%, and as against
this, that of social services was around 31% throughout the period except in the year 2015-16
when its share increased to 35.6%. As observed in Table 3.7, the expenditure on different
functional heads showed declining trend while taken as a percentage of GSDP due to the fast
expanding magnitude of GSDP over the years. The development expenditure relative to
GSDP decreased from 51.7% in 2006-07 to 32.4% in 2015-16, while the non-developmental
expenditure also decreased from 21.5% to 14.6% during this period. Less than proportionate
Page 45

increase in public expenditure on various heads to the growth of GSDP may be construed as
an improvement of the state fiscal capacity relative to the growth of the economy.
Table 3.7: Functional Composition of Expenditure as Percentage of GSDP (%)
Year General Services
Social Services
Economic Services
Developmental Expenditure (Soc+Eco)
Public Debt Repayment
Loans & Advances
Total Expenditure
2006-07 21.5 24.0 27.7 51.7 3.7 0.0 76.9 2007-08 19.3 23.5 29.0 52.6 4.2 0.2 76.3 2008-09 21.6 26.0 28.3 54.3 2.5 0.5 78.9 2009-10 17.7 22.8 19.0 41.9 6.6 0.5 66.7 2010-11 17.1 22.5 26.6 49.1 4.2 0.5 70.9 2011-12 17.7 20.9 23.8 44.7 4.1 0.5 66.9 2012-13 18.3 23.3 23.8 47.1 3.6 0.4 69.3 2013-14 16.9 19.7 16.9 36.6 9.3 0.3 63.2 2014-15 14.6 19.8 18.2 38.1 9.5 0.0 62.2 2015-16 14.6 18.2 14.2 32.4 4.1 0.1 51.1 Source: Budget Documents, Government of Mizoram
To further examine the functional classification of expenditure, Table 3.8 presents the
classification within each of the revenue and capital expenditure. The expenditure on general
services accounted for around more than one-third of the total revenue expenditures and
showed an annual growth of 14.5%. At the same time, social services which showed the
highest growth rate at 16.1% p.a. contributed the largest share in the total revenue
expenditure, while the share of economic services, showing annual growth of 15.6%, slightly
decreased from 29.5% in 2006-07 to 25.7% in 2015-16. Thus, while the percentage share of
general services under revenue account revolved around 34% throughout the years, the share
of social services in the total revenue expenditure expanded substantially, mostly at the cost
of the declining share of economic services.
At the same time, expenditure on capital account was dominated by economic services in
most of the years. It accounted for 55.4% in 2006-07 and increased to 67.3% in 2008-09, but
sharply declined in the later years till 36.6% in 2015-16. Thus, expenditure outgo for
economic services under capital account recorded minimal annual growth of 2.3% during this
period. The sharp decline in share of economic services is accounted for by a surge in public
debt whose share rose from 19.2% in 2006-07 to 60.3% in 2012-13 and 43.4% in 2015-16.
As noted earlier, public debt expanded significantly with a high annual growth of 27.5%
during this period. This structural change in the capital expenditure was also negatively
Page 46

responded to by the outlay for social services which recorded declining share in the total
capital expenditure.
Table 3.8: Functional Composition of Revenue and Capital Expenditures
Expenditure Head
2006-07
2007-08
2008-09
2009-10
2010-11
2011-12
2012-13
2013-14
2014-15
2015-16
GACR (%)
A. Revenue Expenditure
1717 (100)
1909 (100)
2314 (100)
2703 (100)
3256 (100)
3724 (100)
4519 (100)
4918 (100)
5653 (100)
5571 (100)
15.0
General Services 617 (35.9)
646 (33.8)
804 (34.7)
948 (35.1)
1011 (31.1)
1220 32.8)
1431 (31.7)
1687 (34.3)
1750 (31)
1917 (34.4)
14.5
Social Services 593 (34.5)
697 (36.5)
898 (38.8)
1106 (40.9)
1237 (38)
1346 (36.1)
1652 (36.6)
1824 (37.1)
2161 (38.2)
2220 (39.8)
16.1
Economic Services
507 (29.5)
566 (29.6)
612 (26.4)
649 (24)
1008 (31)
1158 (31.1)
1436 (31.8)
1407 (28.6)
1742 (30.8)
1434 (25.7)
15.6
B. Capital Expenditure
578 (100)
694 (100)
693 (100)
963 (100)
1040 (100)
956 (100)
1064 (100)
1588 (100)
2118 (100)
1268 (100)
12.4
General 24 (4.2)
13 (1.9)
20 (2.9)
26 (2.7)
23 (2.2)
17 (1.8)
43 (4)
58 (3.7)
74 (3.5)
34 (2.7)
14.1
Social 122 (21.1)
106 (15.3)
93 (13.4)
150 (15.6)
126 (12.1)
114 (11.9)
222 (20.9)
208 (13.1)
314 (14.8)
212 (16.7)
11.3
Economic Services
320 (55.4)
425 (61.2)
466 (67.3)
397 (41.2)
604 (58.1)
505 (52.8)
483 (45.4)
334 (21)
539 (25.4)
465 (36.6)
2.3
Public Debt 111 (19.2)
144 (20.7)
96 (13.9)
365 (37.9)
257 (24.7)
286 (29.9)
286 (26.9)
957 (60.3)
1189 (56.1)
550 (43.4)
27.5
Loans & Adv. 0.25 (0.0)
6 (0.9)
17 (2.5)
25 (2.6)
30 (2.9)
34 (3.6)
30 (2.8)
31 (2)
2 (0.1)
7 (0.6)
17.0
Source: Budget Documents, Government of Mizoram Figures in parentheses are percentage to the respective total expenditure head
3.4. Committed Expenditure
Committed expenditure of the state government on revenue account mainly consists of salary,
pension, subsidies, and interest payment. The trend of committed expenditures is presented in
Table 3.9, and Figure 3.2 presents these expenditures relative to GSDP. In fact, the state
government incurs substantial expenditure on food, power, and water subsidies. However,
with the exception of few subsidies given under different CSS and central and state plan
schemes (like RKVY, ISOPOM, etc.), most of the subsidies given through revenue account
are implicit in nature and are difficult to estimate the actual values. To maintain uniformity in
trend analysis and comparison with respect to total expenditure, and due to unavailability of
sufficient data, the expenditures on subsidies are not presented in this table.
On an average, the committed expenditure increased at an annual compound rate of 15.6% -
from `779 crores in 2006-07 to `2769 crores in 2015-16. The increasing burden of
committed expenditure on total revenue expenditure could be seen from its increasing share
in the total revenue expenditure. The share of committed expenditure increased from 45.5%
to around half (49.7%) of the total revenue expenditure in 2015-16. The increasing
Page 47

committed expenditure should be considered a cause for alarm for the sustainability of the
fiscal position as it severely suppressed the capacity of the state government to meet its
expenditure obligations in its delivery of various services for socio-economic development of
the people.
Table 3.9: Components of Committed Expenditure of the State Government
Year
Amount (` Crores) as % of Total Revenue Expenditure Salary Pension Interest Total Salary Pension Interest Total
2006-07 462 77 240 779 26.9 4.5 14.0 45.4 2007-08 588 97 208 893 30.8 5.1 10.9 46.8 2008-09 739 126 226 1091 31.9 5.4 9.8 47.1 2009-10 882 164 254 1300 32.6 6.1 9.4 48.1 2010-11 1172 249 106 1527 36.0 7.6 3.3 46.9 2011-12 1150 298 274 1722 30.9 8.0 7.4 46.2 2012-13 1377 371 288 2036 30.5 8.2 6.4 45.2 2013-14 1507 490 284 2281 30.6 10.0 5.8 46.4 2014-15 1725 545 305 2575 30.5 9.6 5.4 45.6 2015-16 1784 616 369 2769 32.0 11.1 6.6 49.7 CAGR (%) 16.1 27.6 5.6 15.6 Source: Budget Documents (Fiscal Policy Strategy Statements), Government of Mizoram
It is notable that expenditure on salaries of the government employees, which accounted for
around one-third of the total revenue expenditure, increased at a fast rate of more than 16.1%
compounded annually. Salary expenditure increased from `462 crores in 2006-07 to more
than double at `1172 crores in 2010-11 and further to `1784 cores in 2015-16. The increase
in expenditure on salaries after 2010 is due to the implementation of ‘The Mizoram (Revision
of Pay) Rules, 2010’ which was made in line with the recommendation of Sixth Central Pay
Commission. The year to year increase in salary from 2009-10 to 2010-11 was 32.88% which
showed the clear impact of the Pay Revision in increasing the burden of the revenue account
of the state government. Also, the pension payment liability of the state government
increased manifold during the last 10 years, especially after the Pay Revision in 2010-11. It
increased from `77 crores in 2006-07 to a high of `616 crores in 2015-16 at annual
compound growth of 27.6%, while its share in the total revenue expenditure also expanded
significantly from 4.5% to 11.1%. This expanding committed expenditure on salary and
pension should be a great concern for the state government in its effort to enhance the fiscal
space.
At the same time, the expenditure on interest payment showed lower annual growth (5.6%)
compared to other committed expenditures. Given the lower rate of growth relative to the
Page 48

ever increasing revenue expenditure, its share in the total revenue expenditure declined from
14% in 2006-07 to 6.6% in 2015-16. This may be considered as a commendable trend in view
of the necessity of bringing down the revenue expenditure.
As observed in Figure 3.2, the committed expenditures showed declining trends when taken
as a percentage of GSDP, except for pension payment. The percentages were more or less
stable till 2012-13, but declined consistently afterwards, probably due to the pickup of GSDP
rather than reduction in the absolute values of these expenditures. At the same time, the
pension expenditure liability of the state increased at a faster rate than the growth of GSDP. It
increased from 2.6% in 2006-07 to 4.6% in 2015-16. The increasing burden of pension
expenditure on the revenue account is a serious concern, and it is necessary that the state
government take appropriate initiatives to chalk out better policies. It may be noted that the
state government introduced to its employees the New Pension Scheme (NPS), a
contribution-based pension scheme, in 2010. All the newly recruited employees who joined
after 1st September 2010 will be registered under the NPS. It is expected that the new system
will be a catalyst in containing the mounting pension liability of the state government.
3.5. Efficiency of Public Expenditure
Analysis on the distribution of government expenditure on various activities may be
considered an indicator or measure of efficiency of resource allocation. Table 3.10 presents
the expenditure of various activities under social, economic, and general services as
percentages of total revenue expenditure during the study period. The major activities under
15.5 17.2 19.4
16.0 19.3
16.4 17.1 14.6 13.8 13.3
2.6 2.8 3.3 3.0 4.1 4.3 4.6 4.8 4.4 4.6 8.0 6.1 5.9 4.6
1.7 3.9 3.6 2.8 2.4 2.8
26.1 26.2 28.6
23.6 25.2 24.6 25.3 22.2 20.6 20.7
2006-07 2007-08 2008-09 2009-10 2010-11 2011-12 2012-13 2013-14 2014-15 2015-16
Figure 3.2: Committed Expenditure as Percentage of GSDP (%)
Salary Pension Interest Total Committed Exp
Page 49

social services in terms of their share in the total revenue expenditure are education
(education, sports and art & culture), health (medical and public health, and family welfare),
welfare of SC/ST, etc. and water supply (water supply and sanitation). Education services
occupied major share of revenue expenditure under social services throughout these years.
Agriculture and allied activities occupied the largest share under economic services, although
it sharply declined in 2015-16. Energy (power) was the second largest expenditure
component in this service. Thus, education, health, water supply, welfare of the SC/ST etc.
were the main expenditure components under social services, while agriculture and allied,
power, and transport were the main components of expenditure under economic services.
Table 3.10: Functional Composition of Major Head of Revenue Expenditures (% of Total Rev. Expenditure) Major Heads
2006-07
2007-08
2008-09
2009-10
2010-11
2011-12
2012-13
2013-14
2014-15
2015-16
A. Social Services 34.5 36.5 38.8 40.9 38.0 36.2 36.6 37.1 38.2 39.8 Education, etc. 17.5 17.5 17.2 18.1 18.1 18.7 18.4 19.0 20.2 20.2 Health 4.8 5.2 7.4 9.3 5.3 5.0 4.9 5.0 5.8 6.6 Water Supply 2.7 4.0 3.7 3.9 3.3 2.8 4.2 4.4 2.8 2.8 Urban Development 1.0 1.3 1.0 1.0 1.2 1.0 1.0 0.0 1.6 1.5 Welfare of SC/ST etc. 4.1 4.5 3.9 5.2 5.4 5.4 5.9 5.0 5.0 5.2 Social Security 1.3 1.4 1.3 1.5 2.6 1.7 1.7 3.2 1.8 2.6 Others 3.0 2.8 4.3 2.0 2.1 1.6 0.5 0.4 1.0 1.0 B. Economic Services 29.5 29.7 26.4 24.0 31.0 31.1 31.8 28.6 30.8 25.7 Agri. & Allied 10.2 10.8 9.7 9.1 15.4 14.2 16.0 13.5 12.8 6.9 Rural Dev. 2.8 2.7 1.8 1.3 2.0 1.2 1.4 1.2 4.0 5.3 Special Area Dev. 1.5 1.5 1.5 1.2 1.2 1.0 0.7 0.8 0.6 0.4 Energy 8.0 7.6 7.2 6.3 6.1 7.8 6.7 6.4 6.0 6.5 Industry & Minerals 1.8 1.6 1.3 1.3 1.9 1.4 2.8 2.5 2.6 1.6 Transport 3.4 3.6 3.0 2.8 2.4 2.7 2.6 2.8 3.4 3.5 Others 1.8 1.9 1.9 2.0 2.0 2.9 1.6 1.4 1.4 1.6 C. General Services 35.9 33.9 34.7 35.1 31.1 32.8 31.7 34.3 31.0 34.4 Organs of the State 1.1 1.6 2.0 1.7 1.3 1.2 1.2 1.9 1.1 1.2 Interest Payment 13.7 11.6 10.4 10.0 3.7 8.0 6.8 6.2 5.8 7.2 Administrative Services 15.0 14.3 15.6 16.0 17.0 14.4 14.3 14.2 13.2 13.7 Pension 4.5 5.1 5.4 6.1 7.7 8.0 8.2 10.7 9.6 11.1 Other 1.6 1.3 1.3 1.3 1.4 1.3 1.2 1.3 1.3 1.3 Source: Budget Documents, Government of Mizoram
Administrative service was the main component of expenditure under general services.
However, the total expenditure for this service showed declining trend from 15% in 2006-07
to 13.7% in 2015-16. Another major expenditure component under general services was
interest payments, which showed declining trend when taken as a percentage of total revenue
expenditure, although the absolute amount increased over time. At the same time, it is notable
that there was a sharp increase in the expenditure on pensions. Its share in the total revenue
Page 50

expenditure increased from only 4.5% in 2006-07 to 11.1% in 2015-16. Thus, pension
payment became a major expenditure component under the general services.
It may be noted that politico-economic considerations are at play with respect to every
decision on collection of non-tax revenue through the changes in user charges, fees. The
government provides a variety of services, and all of them are not amenable to cost recovery
(NCDS, 2013). It is difficult to apply a purely economic rational policy for taking decision on
user charges. It is more appropriate for the government to focus on cost recovery, particularly
operational costs, for its services. Thus, user charges will be such that the cost is met and the
price of the commodity does not lead to over-consumption of such services and hence, to
wasteful use of scarce resources (Purohit and Purohit, 2009). Consequently, non-tax revenue
(NTR) for various services as a percentage of non-plan revenue expenditure (NPRE) may be
considered a good indicator of efficiency in public expenditure, and this is presented in Table
3.10.
Table 3.11: Cost Recovery (NTR/NPRE) for Selected Social and Economic Services (Percent)
Services 2006-07
2007-08
2008-09
2009-10
2010-11
2011-12
2012-13
2013-14
2014-15
2015-16
A. Social Services 0.77 0.70 0.52 0.53 0.52 0.53 0.71 0.82 0.79 1.17 Education, Sports, etc. 0.05 0.04 0.03 0.05 0.07 0.07 0.05 0.04 0.05 0.06 Water Supply & Sanitation
0.53 0.51 0.42 0.41 0.37 0.38 0.53 0.63 0.67 0.94
B. Economic Services
6.42 7.89 6.70 4.49 4.87 5.56 6.00 4.36 4.92 5.47
Power 5.12 6.64 5.94 3.76 3.53 4.66 4.05 3.50 4.12 4.59 Civil Aviation 0.25 0.24 0.13 0.10 0.07 0.03 0.08 0.07 0.06 0.09 Road & Bridges 0.02 0.02 0.01 0.02 0.48 0.08 1.27 0.17 0.08 0.20 Road Transport 0.17 0.13 0.13 0.11 0.13 0.09 0.07 0.06 0.07 0.05 Tourism 0.08 0.07 0.07 0.07 0.07 0.07 0.06 0.08 0.06 0.06 Source: Computed NTR: Non-Tax Revenue, & NPRE: Non-Plan Revenue Expenditure
Using the data collected from state budget documents, the extent of cost recoveries in social
and economic sector was examined. The ratio of Non-Tax Revenue (NTR) to Non-Plan
Revenue Expenditure (NPRE) was used as an indicator of cost recovery for the selected
services. The result is presented in Table 3.10. There was a substantial increase in the
NTR/NPRE ratio under social services in recent years due to improvement in the revenue
from water supply & sanitation. At the same time, the cost recovery deteriorated over the
years, from 6.42% in 2006-07 to 4.92% in 2014-15 and increased to 5.47% in 2015-16, on
account of the poor performance of collection from power tariff. It may be said that there has
Page 51

been a slight improvement in the efficiency of expenditure for social services in recent years,
mostly driven by an increase in collection of user charges from water supply & sanitation. At
the same time, deterioration of efficiency in economic services is a matter of concern as
power tariff collection, which is the main contributor of expenditure under this sector, did not
show improvement over the years.
The ratio of own revenue to the aggregate expenditure is considered to be another indicator of
the efficiency of public expenditure. This ratio indicates the capacity of the state government
to finance its expenditure obligations by its own revenue over a period of time. In other
words, the improvement in the fiscal capacity is indicated by the increasing trends of these
ratios. Given this fact, it is considered necessary to study the trends of these ratios. They are
presented in Table 3.11. The total own revenue (OR), as a percentage of aggregate
expenditure (AE), deteriorated from 8.76% in 2006-07 to 6.52% in 2013-14 which indicates
the failure of the revenue to catch up with the ever growing public expenditure during this
period. But there was significant improvement in the later years as it was almost 10%
(9.59%) in 2015-16. This was mostly driven by the expansion of OTR.
Table 3.12: Financing of Expenditure by Own Revenue (Percent)
Year OTR/AE ONTR/AE OTR/RE OR/AE 2006-07 2.95 5.82 3.94 8.76 2007-08 2.98 5.01 4.06 7.99 2008-09 3.30 5.53 4.09 8.83 2009-10 2.93 3.45 3.98 6.39 2010-11 3.13 3.53 4.00 6.66 2011-12 3.94 3.70 4.80 7.64 2012-13 4.11 3.92 4.95 8.02 2013-14 3.53 2.58 4.67 6.52 2014-15 3.43 3.11 4.72 6.54 2015-16 5.24 4.35 6.43 9.59 OTR: Own Tax Revenue; ONTR: Own Non-Tax Revenue; OR: Own Revenue; & AE: Aggregate Expenditure Source: Budget Documents, Government of Mizoram
The ratio of OTR-AE showed an upward trend from 2.95% in 2006-07 to 5.24% in 2015-16.
There was substantial upward movement in the year 2015-16, and the increasing tax revenue
in this year was fuelled by the increased collection from state excise. A more or less similar
trend was observed in case of the ratio of OTR and Revenue Expenditure (RE). So, the
capacity of the state to finance its expenditure by own revenue slightly increased during the
period under study. This is a commendable experience of the state to improve its tax-GSDP
Page 52

ratio over a period of time, although there is long way to go to attain an acceptable level. At
the same time, the situation of own non-tax revenue (ONTR) did not show improvement. It
decreased from 5.82% in 2006-07 to a low of 3.11% in 2014-15 and 4.35% in 2015-16. So,
the sticky revenue collection from ONTR in consonant with the ever growing expenditure has
been draining the fiscal capacity of the state.
3.6. Measures to Enhance Allocative and Technical Efficiency of Public Expenditure
The capacity of the state to control expenditure is an important factor for the fiscal
sustainability of the state government. As a consequence of Pay Revision of the Government
Employees in the FY 2010-11, there has been an upward pressure on public expenditures due
to the increasing committed salary and pension expenditures. At this juncture, it is critical to
take appropriate measures to enhance efficiency in public expenditure. The major initiatives
of the state government during the last 5 years may be summarised as follows:
3.6.1. Public Expenditure Reforms under MPRMP
The Government embarked on Mizoram Public Resource Management Programme
(MPRMP) to bring about fiscal reforms in a balanced and sustainable way. The programme
was implemented through the Programme Loan, also called Structural Adjustment Loan,
from Asian Development Bank (ADB) with a total corpus of $100 million (`470 crores
approx.). The Government of India converted the loan into 90% grant and 10% loan. The
loan was to be released in three tranches (instalments) based on their performance. The
programme started in September 2009 and ended in February 2015. The uncompleted works
under the MPRMP is still pursued by the Fiscal Management Unit (FMU) of the State
Finance Department. The major reform initiatives targeted towards improvement of public
expenditure efficiency under the programme are:
(a) Computerisation of Treasuries: Computerisation of treasury offices in Mizoram was
started on a pilot basis in September 2011. The computerisation of all treasuries was
completed in 2015. The programme is now known as Integrated Financial
Management Information System (IFMIS).
(b) Voluntary Retirement Scheme: To embark on improved quality framework in the
primary and middle education, Mizoram Special Voluntary Retirement Rules, 2009 –
Page 53

a voluntary retirement scheme (VRS) was adopted. As per Official record, 193
teachers opted for VRS. In addition, 300 government drivers also availed the scheme.
3.6.2. Pension Reform
The State Government introduced the Mizoram New Defined Contributory Pension Scheme
in June 2010, and all the State Government employees recruited after September 2010 are
covered by the new pension scheme (NPS). The government developed a computerised
system, called Pensioner’s Database Management System (PDMS), for processing of all
types of pension cases. Introduction of PDMS was found to have positive impact in speeding
up the settlement of all retirement benefits and the quantum of pension cases settled per year.
3.6.3. Restructuring of Public Sector Enterprise (PSE)
There are five PSEs under the Government Mizoram, namely ZENICS, MAMCO,
ZOHANDCO, ZIDCO, and MIFCO. Heeding on the report submitted by PSE Restructuring
Specialist, the Council of Ministers in its meeting dated 18th February 2015 decided to close
down three loss making PSEs, namely ZENICS, MAMCO, and ZOHANDCO with
immediate effect. In continuation to the efforts in restructuring PSEs, the Council of
Ministers meeting dated 7th April 2016 decided on the privatisation of MIFCO. As part of the
PSE restructuring, the Mizoram State Public Sector Enterprises (Early Retirement) Rules
2015 was framed and offered to all employees of the 5 PSEs. It was estimated that more than
` 42 crores was saved as a result of the implementation of early retirement schemes for PSE
employees. Restructuring PSEs may be considered as one of the biggest achievement of the
government in controlling an increasing pressure of public expenditure during the study
period.
3.6.4. Economy Measures
In an attempt to promote fiscal discipline without restricting the operational efficiency, the
Government of Mizoram issued an Office Memorandum on 8th July 2014 under the subject of
Expenditure Management – Economy Measures and Rationalisation of Expenditure. The
order covered a wide range of items for rationalisation of expenditures like expenditures on
meeting, seminar and conference, purchase of vehicles, engagement of muster roll/contract
employees, traveling expenses, POL, creation of posts, measures to avoid rush of expenditure
towards the end of the financial year, etc. All the administrative heads of government
departments were required to submit actions taken by them within a specified period.
Page 54

Successful compliance of these measures by the departments will have significant impact on
controlling public expenditure in the long run.
3.6.5. Rationalisation of PDS
Under the Targeted Public Distribution System (TPDS), the state government is allocated
foodgrains by the FCI which is insufficient to meet the actual requirements. Hence the
government has to purchase huge amount of foodgrains from the market at a higher rate and
sell it to the beneficiaries at highly subsidised rates. Since a separate budgetary allocation had
not been drawn up to meet this subsidisation, it puts a great pressure on the state exchequer as
the unrecovered expenditure on food trading amounted to more than `156 crores every year.
As the state has to continue with PDS, it has taken several steps to minimise losses in food
trading.
Firstly, the ex-godown rate of PDS rice retail selling was revised upward from `9.50 per kg,
which was used since 2002, to `15 per kg in 2015. Second, to avoid irregularities and bring
about efficiency, the government initiated end-to-end computerisation of TPDS in 2013.
Further, complete digitisation of ration cards in 2015 alone filtered out 31500 double or
bogus ration cards and about 4 lakh death/double/non-existent persons. This initiative alone
saved annual expenditure of around `100 crores for the purchase of foodgrains. Thirdly, the
government introduced a system of procurement of rice from the open market rather than
from the FCI at economic cost to meet additional requirement of about 8000MT per month
since 2014. Costs being lower in the open market, this measure alone reduced annual
expenditure by around `53.66 crores.
3.7. Concluding Observations and Suggestions
Although total public expenditure has increased manifold with double digit annual growth
rate, its magnitude as a percentage of GSDP has shown a declining trend. This may be
considered as an improvement in the resource utilisation by the state government in the recent
years. However, the expanding volume of revenue expenditure which surpassed the growth of
total expenditure invites serious concern. Moreover, the share of committed expenditures on
salaries, pensions, and interest payments increased tremendously which resulted in significant
decline of the allocation for capital outlay (for creation of assets). In fact, the increasing
budgetary allocation for capital outlay should be the basic fiscal effort to sustain economic
Page 55

growth, and its declining allocation would pose serious challenge to the sustainability of
economic growth in the long run. In addition, the composition of expenditure on plan and
non-plan expenditure also showed significantly higher growth rate of non-plan expenditure
over plan expenditure during the period under study. Consequently, the main thrust area for
efficiency in resource allocation boils down to the rationalisation and control of revenue
expenditure. Thus, any expenditure policy of the state government must be directed towards
containing the ever expanding revenue expenditure.
A look at the functional classification of expenditure showed higher allocation of resource for
developmental expenditure (social and economic services), while less than one-third was
allocated for general services. While the allocation for economic services showed a declining
share, that of social services expanded tremendously. The expanding social service
expenditure is justified by substantial increase in the allocation for education, health, and
water supply, which are key to social development. This is commendable on the grounds that
social development is the sine quo non for any developmental initiative. At the same time, the
share of economic services declined, driven by a sharp decline in the share of agriculture and
allied activities, after 2014 side by side with insufficient expenditure for rural development.
The state being an agrarian rural economy, it is surprising to see the decline in the relative
share of agriculture and rural development. Given the discontinuation of several CSS for
agriculture and allied, and rural development schemes post FC IV, it is necessary that the
state government allocate more resources to agriculture and rural development to achieve
more inclusive growth.
A good indicator of efficiency of public spending would be cost recovery as represented by
the ratio of Non-Tax Revenue (NTR) to Non Plan Revenue Expenditure (NPRE). There has
been slight improvement in cost recovery under social services, of which water tariff
recorded substantial increase while others like education did not show improvement over the
years. Meanwhile, the scenario of cost recovery under economic services deteriorated due to
the sticky and declining power tariff collection. It is thus clear that the efficiency of the
public expenditure is significantly dependent on the cost recovery, which in turn is dependent
on collection of user charges. Therefore, continuous effort should be undertaken for
rationalisation and revision of user charges and fees, keeping in view the changing
consumption patterns and living standard of the people, to improve efficiency of public
expenditure.
Page 56

A commendable measure taken up by the state government during the study period is the
closing down and restructuring of loss making PSEs. This initiative saved substantial amount
of fund for the exchequer and freed up fiscal space. It is suggested that such kind of drastic
reform action be extended further to other public undertakings to contain the growing
revenue expenditure. In the same way, the efforts of the state government to rationalise TPDS
through digitisation and other arrangement in rice procurements have significantly reduced
public expenditure. The success of the initiative should be taken as the beginning, and further
reforms may be introduced to improve efficiency in the supply chain and delivery of PDS. The
reforms may either be in the form of Aadhaar linked direct benefit transfer (DBT) or any
other technology aided system.
Page 57

Chapter 4
DEFICITS AND LIABILITIES
4.1. Introduction
Deficit in the government account simply indicates the gap between receipt and expenditure.
If the expenditure is greater than receipt it is called deficit and it is called surplus if the
former is greater than the latter. The nature of the deficit and the way it is financed are the
indicators of the financial health of a state government. The three measures of deficits namely
revenue, fiscal, and primary deficits are considered to be the extent of overall fiscal position
in the finance of state government. Revenue deficit is the difference between revenue receipt
and expenditure; fiscal deficit is the difference between total expenditure and total receipt net
of borrowing; and primary deficit is the difference between fiscal deficit and interest payment
on previous borrowings. This chapter examines the trends and magnitude the deficits, and the
outstanding debt of the Government of Mizoram during the period of 2006-07 to 2015-16.
4.2. Trends in Deficits/Surpluses
Table 4.1 and Figure 4.1 present the trends in deficits/surpluses in Mizoram during the period
of 2006-07 to 2015-16. As the revenue surplus represents the difference between revenue
receipts and revenue expenditure, revenue surplus helps to reduce the borrowing requirement
of the state government, while revenue deficit pressurise the government to borrow. It was
observed that there were revenue surpluses in most of the years, except for two years 2013-14
and 2014-15. This may be considered as a commendable achievement of the state
government in financial management. The magnitude of revenue surplus showed high
fluctuation and did not show a clear pattern as it decreased from `252 crores in 2006-07 to
`131 crores in 2007-08 and suddenly increased to `339 crores the next year and to a deficit of
`152 crores in 2013-14, and reversed back to a high amount of surplus of `1106 crores in
2015-16. It is notable that there was revenue surplus in the year when the government
adopted Pay Revision (2010-11). It may be said that the revenue deficit/surplus showed
sporadic trend which was basically on account of the change in fund devolution from the
centre. Revenue surplus relative to GSDP showed trend of deterioration till 2014-15, and
improved significantly afterwards. It decreased from 8.44% in 2006-07 to -1.48% in 2013-14
and reversed back to a surplus to the tune of 8.27% of GSDP.
Page 58

Table 4.1: Major Deficit Indicators of Mizoram State Finance
Year
Revenue Deficit
(` Crores)
Fiscal Deficit
(` Crores)
Primary Deficit
(` Crores)
Revenue Deficit as %
of GSDP
Fiscal Deficit as % of GSDP
Primary Deficit as %
of GSDP 2006-07 252 -191 49 8.44 -6.40 1.64 2007-08 131 -391 -183 3.84 -11.46 -5.36 2008-09 339 -94 131 8.90 -2.47 3.44 2009-10 261 -312 -57 4.75 -5.67 -1.04 2010-11 120 -500 -349 1.98 -8.25 -5.76 2011-12 128 -212 62 1.83 -3.03 0.89 2012-13 28 -580 -292 0.35 -7.20 -3.63 2013-14 -152 -749 -467 -1.48 -7.27 -4.54 2014-15 -141 -1039 -734 -1.13 -8.31 -5.87 2015-16 1106 413 44 8.27 3.09 0.33 Source: Budget Documents, Government of Mizoram Note: (+) Surplus and (-) deficit.
At the same time, the fiscal deficit showed an increasing trend from `191 crores in 2006-07
to `749 crores in 2013-14 and a substantial jump to `1039 crores in 2014-15. However, the
trend quickly reverted to fiscal surplus to the tune of `413 crores in 2015-16 with the
apparent reason being the significant increase in revenue surplus vis-à-vis the increased
revenue transfer from the centre with the start of FC-XIV era. It may also be noted that the
Finance Minister in its Budget speech avowed the commitment to bring down revenue deficit
and declared 2015-16 as the “Year of Consolidation”. Although several ups and downs in the
fiscal correction path was experienced, the state government could contain its fiscal deficit
around the benchmark of 3% of GSDP as suggested by FC-XIII in 2008-09 and 2011-12, and
could achieve surplus to the tune of 3.09% of GSDP in 2015-16.
8.44
3.84
8.90
4.75
1.98 1.83 0.35
-1.48 -1.13
8.27
-6.40
-11.46
-2.47
-5.67
-8.25
-3.03
-7.20 -7.27 -8.31
3.09 1.64
-5.36
3.44
-1.04
-5.76
0.89
-3.63 -4.54 -5.87
0.33 2006-07 2007-08 2008-09 2009-10 2010-11 2011-12 2012-13 2013-14 2014-15 2015-16
Figure 4.1: Trends in Deficit Indicators relative to GSDP (percent)
Revenue Deficit Fiscal Deficit Primary Deficit
Page 59

Primary deficit as the difference between fiscal deficit and interest payment is the extent to
which the borrowing is used for interest payment of the previous years’ outstanding debt.
With the exception of three years viz. 2006-07, 2011-12, and 2015-16 when there were
surpluses, the primary deficit showed fluctuation in the range of 1% to 6% of GSDP in all the
years.
Figure 4.2 presents the ratio of revenue deficit to fiscal deficit for a measure as to what extent
the borrowed fund was used for current consumption. Persistently high ratio implicates a
continuously deteriorating financial position as it indicates that major part of the borrowing
was used for expenditure which does not add to the asset base of the economy. Figure 4.2
shows significant deterioration in the quality of deficit financing in 2008-09, but showed an
improvement afterwards to a relatively better position in 2015-16 as the ratio moved up in the
positive zone, indicating an enhancement of capital account through revenue surplus. So, it
may be said that the fiscal position of the state significantly improved after 2014-15.
The state government had revenue surplus in most of the years since 2006-07, except for two
years (2013-14 and 2014-15) when there were revenue deficits. It is understood that surplus
in revenue account had been utilised to finance plan expenditure. Thus, the ratio of revenue
surplus to the total plan expenditure could be interpreted as the capacity of the state
government to finance its plan expenditure from the surplus of its revenue generation. Table
4.2 presents the ratio of revenue surplus to the plan expenditure, which may be interpreted as
adequacy of revenue for plan financing, during the study period.
-1.32 -0.34
-3.61
-0.84 -0.24 -0.60
-0.05 0.20 0.14
2.68
2006-07 2007-08 2008-09 2009-10 2010-11 2011-12 2012-13 2013-14 2014-15 2015-16
Figure 4.2: Ratio of Revenue Deficit to Fiscal Deficit
Page 60

Table 4.2: Financing of Plan Expenditure by Revenue Surplus
Parameters
2006-07
2007-08
2008-09
2009-10
2010-11
2011-12
2012-13
2013-14
2014-15
2015-16
Revenue Deficit (` Crores) 252 131 339 261 120 128 28 -152 -141 1106 Plan Expenditure (` Crore) 1055 1143 1119 1453 1703 1938 2272 2286 2945 2589 Ratio of Revenue Surplus to Plan Expenditure (%) 23.9 11.5 30.3 18.0 7.0 6.6 1.2 -- -- 42.7 Source: Budget Documents, Government of Mizoram
It can be deduced from Table 4.2 that the adequacy of revenue to finance plan expenditure
showed fluctuation as it decreased from 23.9% in 2006-07 to 11.5% in 2007-08, and reverted
back to 30.3% in 2008-09, and decreased continuously till 2012-13 when the revenue surplus
was only 1.2% of the plan expenditure and further went on deficit in the next two years. After
a 2-year revenue fallout, we saw substantial amount of revenue surplus in 2015-16 which
amounted to 42.7% of the plan expenditure. So, the surplus in the revenue account had helped
the state government to support the increasing percentage of plan expenditure.
4.3. Trends in Outstanding Debts
The trend of public debt of the state government is presented in Table 4.3. It can be observed
from this table that the accumulated public debt continuously increased with the average
annual compound growth rate of 10.83% during the 10 years under study. The total debt
outstanding also increased from `2810 crores in 2006-07 to `3260 crores in 2008-09, and
after a 2.95% decrease in the next year, there was an increase to `6550 crores in 2014-15.
However, the trend reversed in 2015-16 when the total outstanding debt decreased by 2.18%.
The year-on-year growth of debt was highest at 2012-13 when it recorded 27.85% increase,
followed by 2010-11 and 2014-15 when the rate of increase were 16.85% and 16.80%
respectively. It may be noted that the state government entered the 12th Plan era from the
fiscal year 2012-13, and it introduced New Pay Rules in 2010-11, while there was a drastic
change in the plan funding from the centre from the year 2014-15 following the abolition of
the Planning Commission. Meanwhile, the adoption of the recommendation of FC-IV since
FY 2015-16 resulted in substantial amount of surplus in the revenue account. So, major
events in the centre-state financial relation are believed to have impacted the debt position of
the state government. At the same time, the total public debt, when considered relative to
Page 61

GSDP (Figure 4.3), showed a declining trend from a high of 94.1% in 2006-07 to 47.9% in
2015-16.
Table 4.3: Trends in Total Public Debt of the State Government
Year Outstanding Liabilities (` Crore) Annual Growth (%) Debt-GSDP Ratio (%) 2006-07 2811 -- 94.1 2007-08 3062 8.97 89.7 2008-09 3260 6.47 85.6 2009-10 3164 -2.94 57.5 2010-11 3697 16.85 61.0 2011-12 4000 8.20 57.2 2012-13 5114 27.85 63.5 2013-14 5608 9.66 54.5 2014-15 6550 16.80 52.4 2015-16 6407 -2.18 47.9
Source: Budget Documents, Government of Mizoram Note: Debt outstanding at the end of the 31st March of the Year
It may be noted that the Thirteenth Finance Commission (FC-XIII) recommended that the
debt stock as a percentage of GSDP of Mizoram be reduced as per the target as follows:
87.3% in 2010-11, 85.7% in 2011-12, and 82.9% in 2012-13. Comparing the achievements
(Figure 4.3) with these targets, the actual position of the state in respect of outstanding debt is
quite amenable. The actual achievements were much lower than the targets laid down by the
FC-XIII.
2006-07 2007-08 2008-09 2009-10 2010-11 2011-12 2012-13 2013-14 2014-15 2015-16
94.1 89.7 85.6
57.5 61.0 57.2 63.5 54.5 52.4 47.9
Figure 4.3: Total Outstanding Debt as Percentage of GSDP (%)
Page 62

4.4. Composition of Public Debt
Table 4.4 and Table 4.5 present the trends and changing composition respectively of public
debt from various sources. To enhance better understanding of the trends of debt from these
sources, compound annual growth rate (CAGR) was calculated for each. However,
calculation of CAGR was avoided for Ways & Means Advances or Other Deposit
(WMA/OD) and other liabilities due the heavy impact of seasonal fluctuations on their
trends.
Table 4.4: Trends of Mizoram State Government Liabilities
Year Market
Borrowing
Loans from
Centre
Spl. Sec. Issued
to NSSF
Borrowing from Fin.
Inst. WMA/OD from RBI
Provident Funds,
etc. Other
Liabilities Total 2006-07 750 566 142 429 47 863 14 2811 2007-08 838 558 141 463 27 1035 -- 3062 2008-09 867 547 138 458 27 1223 -- 3260 2009-10 838 560 146 325 27 1267 -- 3163 2010-11 1084 540 168 336 27 1542 -- 3697 2011-12 1218 542 173 338 46 1658 25 4000 2012-13 1154 548 191 257 116 1854 994 5114 2013-14 1379 336 198 367 -18 2164 1180 5606 2014-15* 1550 322 222 381 -17 2475 1617 6550 2015-16 1606 305 233 344 -18 2859 1078 6407 CAGR (%) 9.2 -7.0 6.4 -3.1 -- 13.5 -- 10.8 Source: Budget Documents, Government of Mizoram Note: Debt outstanding at the end of the 31st March of the Year & * Pre Actual
Table 4.5: Composition of State Government Debt Liabilities (Percent)
Year Market
Borrowing
Loans from
Centre
Spl. Sec. Issued to
NSSF
Borrowing from Fin.
Inst. WMA/OD from RBI
Provident Funds,
etc. Other
Liabilities Total 2006-07 26.68 20.14 5.05 15.26 1.67 30.70 0.50 100 2007-08 27.37 18.22 4.60 15.12 0.88 33.80 -- 100 2008-09 26.60 16.78 4.23 14.05 0.83 37.52 -- 100 2009-10 26.49 17.70 4.62 10.28 0.85 40.06 -- 100 2010-11 29.32 14.61 4.54 9.09 0.73 41.71 -- 100 2011-12 30.45 13.55 4.33 8.45 1.15 41.45 0.63 100 2012-13 22.57 10.72 3.73 5.03 2.27 36.25 19.44 100 2013-14 24.60 5.99 3.53 6.55 -0.32 38.60 21.05 100 2014-15 23.66 4.92 3.39 5.82 -0.26 37.79 24.69 100 2015-16 25.07 4.76 3.64 5.37 -0.28 44.62 16.83 100 Source: Budget Documents, Government of Mizoram
Page 63

Table 4.6: State Government Debt Liabilities as Percentage of GSDP (%)
Year Market
Borrowing
Loans from
Centre
Spl. Sec. Issued to
NSSF
Borrowing from Fin.
Inst. WMA/OD from RBI
Provident Funds,
etc. Other
Liabilities Total 2006-07 25.13 18.96 4.76 14.37 1.57 28.91 0.47 94.17 2007-08 24.56 16.35 4.13 13.57 0.79 30.33 -- 89.74 2008-09 22.76 14.36 3.62 12.02 0.71 32.11 -- 85.59 2009-10 15.24 10.19 2.66 5.91 0.49 23.04 -- 57.53 2010-11 17.89 8.91 2.77 5.55 0.45 25.45 -- 61.03 2011-12 17.42 7.75 2.47 4.83 0.66 23.72 0.36 57.22 2012-13 14.33 6.80 2.37 3.19 1.44 23.02 12.34 63.50 2013-14 13.39 3.26 1.92 3.56 -0.17 21.02 11.46 54.44 2014-15 12.40 2.58 1.78 3.05 -0.14 19.80 12.94 52.40 2015-16 12.01 2.28 1.74 2.57 -0.13 21.38 8.06 47.91 Source: Budget Documents, Government of Mizoram
It can be seen in Table 4.4 that borrowing from provident funds, etc. gained importance over
the years as the quantum of outstanding liability increased from `863 crores in 2006-07 to
`2859 crores in 2015-16. The estimated annual compound growth turned out to be 13.5%.
The second most important source of borrowing is market borrowing as the outstanding
liability of the government on this source increased by 9.2% per annum from `750 crores to
in 2006-07 to `1606 crores in 2015-16. Debt outstanding from special securities issued to
National Small Saving Fund (NSSF) was more or less the same till 2013-14 (in the range of
`138-200 crores) but gained substantial increase afterwards to `233 crores in 2015-16 and
showed a CAGR of 6.4%. The loans from the centre (plan and non-plan loans, loans for
central plan schemes and CSS) showed a declining trend from `566 crores to `305 crores
with an annual decline rate of -7.0% during the study period. The rate of decline was sharper
after 2012-13. In the same way, borrowing from financial institutions also showed a decline
of -3.1% per annum, from `429 crores to `381 crores.
At the same time, Ways and Means Advances, and Other Deposit from RBI (WMA/OD)
declined from `47 crores in 2006-07 and remained constant at `27 crores from the next FY
till 2010-11, and there was a sharp increase afterwards. It reached a high of `116 crores in
2012-13, and again reverted back suddenly to a negative zone to `-18 crores the next year
and remained at this level till 2015-16. It is notable that the category of other liabilities came
up with substantial volume since 2012-13 at `994 crores to `1617 crores and `1078 crores in
2014-15 and 2015-16 respectively. The main contributor of liabilities under this is the reserve
fund parked under Deposit and Advances head of Public Account, which is a non-interest
bearing head. As the fund lying in this account is considered as debt outstanding, it may be
prudential for the government to take necessary action to avoid its further accumulation.
Page 64

Table 4.5 present the percentage composition of various sources of public debt during the
study period. It can be clearly seen from this table that provident fund had been the main
contributor of government liabilities in Mizoram and its share in the total outstanding showed
a rising trend from 30.7% in 2006-07 to 44.62% in 2015-16. Next to provident fund is market
borrowing which accounted for around more than a quarter of the total debt outstanding in
most of the years under study. At the same time, the share of outstanding from special
securities issued to NSSF slightly decreased from 5% in 2006-07 to 3.6% in 2015-16, and in
the same way, the contribution of the loans from the centre experienced a sharp fall from
20.14% to only 4.76% during the same period. Similarly, the share of financial institutions
declined from 15.26% in 2006-07 to 5.37% in 2015-16. Meanwhile, the share of other
liabilities shot up from a mere 0.63% in 2011-12 to 24.69% in 2014-15, but decreased to
16.83% the next year. Consequently, it is clear that there was structural change in the
composition of public debt during the study period as provident fund and market borrowing
gained increasing importance.
Table 4.6 presents the state government debt as percentage of GSDP. As noted above, the two
main sources of public debt are provident fund and market borrowing, of which the latter
showed increasing importance. When the outstanding from these sources were taken relative
to the growth of GSDP, they showed a declining trend: provident fund as a percentage of
GSDP decreased from 28.91% in 2006-07 to 21.33% in 2015-16, while that of market
borrowing declined from 25.13% to 12% during this period. This may be considered an
improvement in the debt position of the state government in relation to its economic growth.
It may also be an interest to know the borrowing cost (in terms of interest rate) of the existing
debt outstanding of the state government. Figure 4.4 presents the average interest of
borrowing from various sources. The average interest was highest for the borrowing from
NSSF followed by the loans obtained from the Central Government (i.e. Centre).
8.30% 8.70%
9.40% 8.30% 8.30%
market borrowingloans for cenre
special securitis to NSSFborrowing from Financial Institutions
provident funds, etc.
Figure 4.4: Average Interest of Public Debt from Different Sources (% per annum)
Page 65

Table 4.7 presents further detail of the borrowing of the state government. Upto the FY 2010-
11, the loans from the Government of India (centre) had two components, block loans and
other loans, with more or less equal significance. However, with the onset of 12th Five Year
Plan, block loan virtually became the main channel of loans obtained from the central
government. As discussed above, provident fund was the main source of state borrowing and
it gained importance year after year both in absolute and relative terms. There are two main
components under provident fund, namely general provident fund (GPF) and Insurance &
Pension Fund. Of these, GPF gained increasing shares, from 93.5% in 2006-07 to 97.2% in
2015-16. At the same time, borrowing from insurance & pension fund showed increasing
trend in absolute term, but its share in the total borrowing from provident funds, etc.
decreased due to the increase in borrowing from GPF.
Table 4.7: Detailed Break up of Outstanding Liabilities of the State by Various Sources (` Crores) Sources
2006-07
2007-08
2008-09
2009-10
2010-11
2011-12
2012-13
2013-14
2014-15
2015-16
1. Market Borrowing 709 838 867 838 1084 1218 1154 1379 1550 1606 (a) Market Loans 709 838 867 809 1059 1197 1138 1368 1543 1604 (b) Power Bonds -- -- -- 29 25 21 16 11 7 2 2. Loans from Centre 626 558 546 560 540 542 548 336 322 305 (a) Block Loans
310 300 318 298 533 523 336 322 305
(b) Other Loans -- 348 246 242 242 -- 25 -- -- -- 3. Special Securities Issued to NSSF -- 141 138 146 168 173 191 198 222 233
4. Borrowing from Financial Institutions 626 463 457 325 336 338 257 367 381 344 (a) LIC -- 286 282 235 221 186 72 68 65 -5 (b) NABARD -- 56 60 61 89 141 167 195 193 221 (c) NCDC -- 2 0.24 3 4 4 4 5 13 19 (d) Other Institutions -- 115 26 21 8 14 99 28 26 5. WMA/OD from RBI 47 27 27 27 27 46 116 -18 -18 -18 6. Provident Funds, etc. 863 1035 1223 1267 1542 1658 1854 2164 2475 2858 (a) General Provident Fund 807 976 1243 1204 1481 1593 1787 2095 2399 2778 (b) Insurance & Pension Fund 56 60 64 63 61 65 67 69 77 81 7. Other Liabilities -- -- -- -- -- 24 994 1180 1617 1078 TOTAL 2810 3062 3260 3164 3697 4000 5114 5606 6550 6407 Source: Budget Documents, Government of Mizoram Note: (i) Debt outstanding at the end of the 31st March of the Year & (ii) Figures may not tally due to rounding off
Borrowing from financial institutions has four major sources - LIC, NABARD, NCDC, and
other institutions. Among these sources, NABARD was the main source and its share
increased from 12.1% in 2006-07 to 65% in 2012-13 and 64.2% in 2015-16. Borrowing from
LIC, which used to be the main source till 2011-12, experienced declining importance in the
Page 66

later years. It constituted 61.8% of the total borrowing from financial institutions in 2006-07
and increased to 65.8% 2010-11 and 55% in 2011-12, but sharply decreased to 28% in 2012-
13 and further to -1.5% in 2015-16.
4.5. Loans from Multilateral Lending Agencies
Central Government, acting on behalf of the states, borrows from multilateral lending
agencies such as World Bank, Asian Development Bank (ADB), etc. and the loan amounts
are given to states as plan grants and the Grants–Loans components are decided in line with
the Gadgil formula. Normally, Special Category States receive these loans at 90% as grants
and 10% as loans. The general profile of the loans received by Mizoram Government is
presented in Table 4.8.
Table 4.8: External Assistances Received by the Government
Sl. No Name of the Project
Multilateral Agencies
Approved Amount Nature of Assistances
1 NERCCDIP, Tranche-1/Project-1 ADB ` 27.27 Crore
90% Grants & 10% Soft Loan @ 9% interest for a period of 25 years + 5 grace period
2 NERCCDIP, Tranche-2/Project-2 ADB ` 206 Crores - do - 3 NERCCDIP, Trance-3/Proect-3 ADB ` 385 Crores -do-
4 Mizoram State Roads II - Regional Connectivity Project World Bank ` 661 Crores -do-
5 North Eastern Roads Investment Program - Project 2 ADB ` 168 Crores 100% Grant-in-Aid
6 Mizoram Public Resource Management Project (MPRMP) ADB ` 245 Crores 100% Grant-in-Aid
Source: Finance Department, Government of Mizoram Note: NERCCDIP : North Eastern Capital Cities Development Investment Program; & ADB: Asian Development Bank
It was presented in the previous chapter that Mizoram Public Resource Management Project
(MPRMP) was an important measure taken by the government to reduce public expenditure
and improve efficiency in spending. This project encompassed a wide range of administrative
reforms like tax and non-tax reforms, debt management, public expenditure management,
sectoral improvement, pension reforms, and PSE reforms.
Page 67

4.6. Contingent Liabilities of the State
Contingent liabilities of the state government represent guarantees issued on behalf of the
PSEs and other institutions including urban local bodies to enable them to raise resources to
meet the requirement of public investment. The Mizoram State Legislative Assembly enacted
“The Mizoram Ceiling on Government Guarantees Act, 2011”, and under this Act, The
Mizoram Ceiling on Government Guarantee Rules 2013 was notified. As per the Rules, (i)
the total outstanding guarantees shall not exceed 25% of GSDP on the first day of April any
year, (ii) total fresh guarantees in a given year shall not exceed 3% of the estimated GSDP for
the year, (iii) guarantees shall be ordinarily extended by the government on behalf of
departmental undertakings, PSUs, local authority, statutory boards, cooperative institutions
and other authorities and agencies under the government, and (iv) the government shall
charge a minimum of 0.75% of the amount guaranteed loan as guarantee commission and this
will be remitted to public account of the state. The composition of current outstanding
guarantees of the state government is presented in Table 4.9.
Table 4.9: Composition of Outstanding Guarantees of the State Government
Categories
Outstanding Liability (` Crore) Share in Total Debt Outstanding (%) 2012-13 2013-14 2015-16 2012-13 2013-14 2015-16
Cooperative 36 26 29 0.70 0.46 0.45 Govt. Companies 60 19 16 1.17 0.34 0.25 Other Statutory Corporation 26 20 18 0.51 0.36 0.28 Other Institutions 5 15 5 0.10 0.27 0.08 Total 127 80 68 2.48 1.43 1.06 Source: Budget Documents, Government of Mizoram
The total outstanding liability of government guarantee sharply decreased in the later years. It
decreased by almost 50% in a span of 3 years: it decreased from `127 crores in 2012-13 to
`68 crores in 2015-16. If it goes on following this trend, the total outstanding liability will be
quite minimal in the future. Its relative value to total debt outstanding also showed consistent
decline from 2.48% to 1.06% during this period, and the sharpest decline was observed in the
case of government companies (undertakings) which recorded a fall from `60 crores to `16
crores. The guarantees given to cooperative sector, although it decreased in absolute terms,
gained increasing share in the total government guarantee, from 28.3% in 2012-13 to 42.6%
in 2015-16.
Page 68

4.7. Forecasting of Deficits and Liabilities
Having analysed the trends and patterns of deficits and liabilities of the state government over
the 10 years period under consideration, it may be worthwhile to make projections of these
fiscal parameters for the coming years, especially for 2020-25. However, as the actual budget
data were available only up to 2016-17, we have to use revised estimate and budget estimate
for the year 2017-18 and 2018-19 respectively. Given the limited time series data, it is a big
challenge to make accurate forecasting for future years. Despite this fact, attempt is made in
this section to forecast the various fiscal indicators for the year starting from 2019-20 till
2024-25 to give at least rough idea about the financial performance of the state in the near
future.
The Box-Jenkins (BJ) Methodology, also called ARIMA model, is adopted for making
forecasting of OTR, ONTR, Own Revenue Receipt (ORR), Revenue Expenditure, revenue
deficit and fiscal deficit. It is a combination of Auto-Regressive (AR) and Moving Average
(MA) of errors (residual) terms, with data being converted into stationary process before
forecasting. The results are presented in Table 4.10.
Table 4.10: Projections of Revenue Deficit and Fiscal Deficit during 2020-25
Year Own T
ax
Reve
nue
Own N
on-T
ax
Reve
nue
Own R
even
ue
Rece
ipt
Reve
nue
Expe
nditu
re
Reve
nue
Defic
it /
Surp
lus
Fisca
l Defi
cit
GSDP
Reve
nue
Defic
it /
Surp
lus (%
of
GSDP
)
Fisca
l Defi
cit
(% of
GSD
P)
2015-16 358 298 656 5571 1105.6 413.3 13374 8.3 3.1 2016-17 442 365 807 6230 1169 253 14549 8.0 1.7 2017-18 (RE) 388 318 706 7599 1256 -834 23067 5.4 -3.6 2018-19(BE) 483 464 947 7180 1869 -124 23067 8.1 -0.5 2019-20 (P) 443.7 481.3 925 7347.5 1107.5 -120.6 20099 5.5 -0.6 2020-21 (P) 607.7 544.3 1152 7577.7 1153.5 -105.0 22103 5.2 -0.5 2021-22 (P) 507.3 551.7 1059 7865.9 1211.2 -85.4 24239 5.0 -0.4 2022-23 (P) 705.8 608.2 1314 8063.9 1250.8 -72.0 26516 4.7 -0.3 2023-24 (P) 566.3 621.4 1188 8311.9 1300.4 -55.2 28944 4.5 -0.2 2024-25 (P) 809.0 672.9 1482 8482.3 1334.4 -43.6 31533 4.2 -0.1 CAGR (%) 7.9 9.5 8.7 4.0
RE: Revised Estimate, BE: Budget Estimate, and P: Projected
It is observed from Table 4.10 that the forecasted growth rate for OTR, ONTR and ORR for
the 10 years starting from 2015-16 till 2024-25 are 7.9%, 9.5% and 8.7% respectively, while
the revenue expenditure is forecasted to grow at an annual rate of 4% during this period. The
Page 69

state is forecasted to have revenue surplus over these years; however the surplus as
percentage of GSDP will decrease continuously from 8.3% in 2015-16 to 4.2% in 2025-25.
At the same time, the state is not likely to achieve zero fiscal deficits in the near future,
though fiscal deficit in absolute and relative to GSDP are forecasted to decline continuously.
However, the state is likely to achieve the FRBM fiscal deficit target of 3% throughout the
FC-XV award period (2020-25). In addition, Table 4.11 presents the forecasted debt
outstanding liabilities of the state government.
Table 4.11: Forecasted Debt Outstanding Liabilities of the State Government
Year Debt Outstanding (`Crore) GSDP (`Crore) Debt-GSDP Ratio (%) 2015-16 6407 13374 47.9 2016-17 6725 14549 46.2 2017-18 (RE) 7195 23067 31.2 2018-19(BE) 7887 23067 34.2 2019-20 (P) 8120 20099 40.4 2020-21 (P) 9328.8 22103 42.2 2021-22 (P) 9744.3 24239 40.2 2022-23 (P) 10161.6 26516 38.3 2023-24 (P) 10577.1 28944 36.5 2024-25 (P) 10992.9 31533 34.9 RE: Revised Estimate, BE: Budget Estimate, and P: Projected Note: Estimated Compound Annual Rate for Outstanding Liabilities of the Government during this period is 6.59%
Table 4.11 shows that debt outstanding liability will be increasing by 6.59% during the period
starting from 2015-16 till 2024-25, while GSDP is expected to increase by around 8% per
annum. Thus, the Debt-GSDP ratio would be continuously brought down from 42.21% in
2020-21 to 34.9% in 2024-25.
Page 70

Chapter 5
IMPLEMENTATION OF FRBM ACT
5.1. Introduction
Fiscal policy rule is defined as a permanent constraint on fiscal policy through numerical
limits on budgetary aggregates (Kopits and Symansky, 1998). The rule based fiscal policy
was introduced with the passing of the Fiscal Responsibility and Budget Management Act
(FRBMA) 2003. The FRBM Act 2003 that came into force on 5th July 2004 anchored at the
principle of intergenerational equity in fiscal management and fiscal sustainability for long
term macroeconomic stability. It aimed at the elimination of revenue deficit by 2008-09 and
the reduction of Fiscal Deficit to 3% of GSDP in the same year. The Twelfth Finance
Commission (FC-XII) insisted that the central government shall not provide loans to the
states and that the states may take recourse to market loans. The latter should adopt fiscal
responsibility legislation to avail State’s Debt Consolidation and Relief Facility (SDCRF) for
general debt relief comprising of consolidation, reschedule of, and lowering of interest rate.
5.2. Implementation of FRBM Act in Mizoram
Pursuant to the recommendation of Twelfth Finance Commission (FC-XII), government of
Mizoram also enacted fiscal responsibility legislation, “Mizoram Fiscal Responsibility and
Budget Management Act, 2006 (hereinafter, referred to as FRBM Act 2006). According to
Section 3 of FRBM Act 2006, the Government shall
1) take appropriate measures to eliminate the revenue deficit and contain the fiscal
deficit at sustainable levels,
2) pursue policies to raise non-tax revenue with due regard to cost recovery and equity,
and
3) lay down norms for prioritisation of capital expenditure, and pursue expenditure
policies that would provide impetus for economic growth, poverty reduction, and
improvement in human welfare.
The FRBM Act required that the government shall progressively reduce revenue deficit to
zero by 2008-09 and reduce fiscal deficit to 3% of the GSDP by 2008-09. Further, this Act
required the state government to take measures to ensure greater transparency in its fiscal
Page 71

operation. The Act also stipulated that Medium Term Fiscal Policy Statement and Fiscal
Policy Strategy Statement should be laid before the State Legislature along with the Annual
Budget in each financial year.
The Medium Term Fiscal Policy (MTFP) is concerned with the fiscal objectives and strategic
priorities of the state government. It also deals with (i) an assessment of the sustainability of
the balance between revenue receipts and revenue expenditure; (ii) the use of capital receipts
including borrowing for productive assets; and (iii) the estimated yearly pension liabilities
worked out on actuarial basis for the next 10 years. At the same time, The Fiscal Policy
Strategy Statement presents (i) the fiscal policy of the state government for the ensuing
financial year relating to revenue receipts, expenditure, borrowing and other liabilities, user
charges on public goods/utilities; (ii) the strategic priorities of the state government in the
fiscal area for the ensuing year; (iii) key financial measures and the rationale for any major
deviation in fiscal measures pertaining to revenue receipts, subsidy, expenditure,
administered pricing, borrowings, and other liabilities including guarantees; and (iv)
evaluation of current policies of the state government vis-à-vis fiscal management principles
set out.
5.3. Roadmap for Fiscal Consolidation
The Thirteenth Finance Commission (FC-XIII) required the Government of Mizoram to
reduce its fiscal deficit to 3% of GSDP by 2014-15. The FC-XIII recommended that the
government should maintain fiscal deficit target as a percentage of GSDP in the following
pattern: 7.5% in 2010-11, 6.4% in 2011-12, 5.2% in 2012-13, 4.1% in 2013-14 and 3% in
2014-15. The Fourteenth Finance Commission (FC-IV) further stipulated revised roadmap
for fiscal consolidation for the government of Mizoram in terms of specific target for fiscal
deficit and annual borrowing limits. The revised fiscal targets recommended by the FC-IV are
as follows:
1) Fiscal deficit of all states will be anchored at the annual limit of 3% of GSDP. The
state will be eligible for flexibility of 0.25% over and above this for any given year,
for which the borrowing limits are to be fixed if their debt-GSDP ratio is less than or
equal to 25% in the preceding year.
Page 72

2) States will further be eligible for an additional borrowing limit of 0.25% of GSDP in a
given year for which the borrowing limits are to be fixed if the interest payments are
less than or equal to 10% of the revenue receipts in the preceding year.
3) The two options under these flexibility provisions can be availed by a state either
separately, if any of the above criteria is fulfilled, or simultaneously if both the above
stated criteria are fulfilled. Thus, a state can have a maximum fiscal deficit-GSDP
limit of 3.5% in any given year.
4) The flexibility in availing the additional limit under either of the two options or both
will be available to a state only if there is no revenue deficit in the year in which
borrowing limits are to be fixed and the immediate preceding year.
The Fiscal Responsibility and Budget Management Act, 2006 and its subsequent amendments
in 2009, 2010, and 2011 envisage the reduction of fiscal deficit as a percentage of GSDP and
contain it at 7.50% in the base year 2010-11, 6.40% in 2011-12, 5.20% in 2012-13, 4.10% in
2013-14 and 3% in 2014-15. The Medium Term Fiscal Policy (MTFP) roadmap drawn by the
FC-XIII is presented in Table 5.1.
Table 5.1: Medium Term Fiscal Policy (MTFP) Roadmap Drawn by FC-XIII
Percentage of GSDP
Indicators 2010-11 2011-12 2012-13 2013-14 2014-15 Revenue Deficit 0 0 0 0 0 Grass Fiscal Deficit (-) -7.5 -6.4 -5.2 -4.1 3 Outstanding Debt 87.3 85.7 82.9 79.2 74.8 Source: Budget Documents, Government of Mizoram
5.4. Outcome Evaluation of Fiscal Correction
Table 5.2 presents the selected outcome indicators of fiscal correction path during the period
from 2010-11 to 2015-16. Although there were fallouts in the Gross Fiscal Deficit (referred
to as Fiscal Deficit) during 2013-14 and 2014-15, the state could achieve the target and also
had surplus in the year 2015-16. In the same way, there was revenue surplus in the FY 2015-
16 conforming to the correction path required by FC-XIII. Further, the debt-GSDP ratio is
also in line with the stipulation of the FC-XIII.
Page 73

Table 5.2: Outcome Indicators of State Finance in the light of FC-XIII Recommendation
Items 2010-11 2011-12 2012-13 2013-14 2014-15 2015-16 1 Gross Fiscal Deficit as % of GSDP 8.3 3.0 7.2 -7.3 -8.3 3.1 2 Revenue Deficit (-)/ Surplus (+) as % of GSDP 2.0 4.1 0.4 -1.5 -1.1 8.3 3 Revenue Deficit (-)/ Surplus (+) as % of TRR 5.9 7.2 0.6 -3.2 -2.6 16.6 4 Total Liabilities-GSDP Ratio (%) 61.0 57.2 63.5 54.5 52.4 47.9 5 Total Liabilities-Total Revenue Receipt (%) 109.6 99.7 112.7 117.7 118.9 96.0 6 Total Liabilities-State's Own Rev. Receipt (%) 1335.8 1153.7 1173.1 1322.7 1288.2 976.7 7 State's Own Revenue Receipts-Rev. Exp. (%) 8.5 9.3 9.7 8.6 9.0 11.8 8 Capital Outlay as % of Gross Fiscal Deficit 123.2 232.8 104.7 -80.0 -89.2 172.0 9 Interest Payment as % of TRR 3.1 6.8 6.4 6.0 5.6 5.5 10 Salary Expenditure as % of TRR 34.7 28.7 30.4 40.8 31.3 33.0 11 Pension Expenditure as % of TRR 7.4 7.4 8.2 11.0 9.9 9.2 12 Non-Development Expenditure as % of AD 24.1 26.9 26.3 25.9 22.5 28.0 13 Gross Transfer from the Centre as % of AD 72.1 80.8 61.0 53.6 52.7 53.7 14 Non-Tax Revenue as % of TRR 4.4 4.2 4.7 4.1 4.4 4.5 Source: Budget Documents, Government of Mizoram Note: (1) Pre Actual Figures are presented for the year 2014-15 and 2015-16 (ii) TRR: Total Revenue Receipt; AD: Aggregate Disbursement
The total liabilities as a percentage of total revenue receipt increased from 109.7% in 2010-11
to a high of 118.9% in 2013-14 and sharply decreased to 96% in 2015-16. A rather poor
performance of the state government in fiscal correction could be seen in the ratio of debt and
own revenue receipt. The outstanding liability was as high as 1335.8% of the own revenue in
2010-11 which showed a gradual decline to 1173.1% in 2012-13, but increased to 1322.7% in
2013-14. However, it sharply decreased to 976.7% in 2015-16. Although it is showed an
improvement over the years, the state government needs to raise its own revenue or reduce
debt outstanding to be in the right path of the fiscal correction. Side by side with this, only
around 10% of the total revenue expenditure could be met from own revenue of the state
government as the ratio of own revenue to total revenue expenditure hovered around 8-10%.
At the same time, considerably high capital outlay as percentage of fiscal deficit indicates
that the borrowings of the government were used for creating new assets.
Table 5.2 also shows that there was slight improvement in the fiscal correction through
reduction of interest payment because the percentage of total revenue receipt (TRR) slightly
decreased from a high of 6.8% in 2011-12 to 5.5% in 2015-16. However, there was no
substantial improvement in terms of salary expenditure and pension payments, and no
considerable improvement in non-tax revenue relative to TRR. With the bulging public
expenditure of the state, the gross transfer from the centre as percentage of aggregate
disbursement significantly decreased from 72.1% in 2010-11 to 53.7% in 2015-16.
Page 74

Meanwhile, the non-developmental expenditure as a percentage of aggregate disbursement
increased from 24.1% to 28%, indicating declining quality of public spending towards socio-
economic development. Similarly, the declining ratio of central fund transfer to aggregate
disbursement and the sticky trend of own revenue implicated the increasing expenditure
obligation of the state government irrespective of the revenue sources. Thus, it is necessary
that the state government take up initiatives to collect more revenue through rationalisation of
tax and non-tax sources.
Table 5.3 presents the various outcome indicators of the state finance during 2015-16 and
2019-20 and the roadmap stipulated by the FC-XIV. As the award period of FC-XIV is
underway, actual figures could be obtained for 2015-16 and 2016-17 only. The revised
estimate (RE), budget estimate (BE), and projected figures are used for the subsequent years.
Table 5.3: Outcome Evaluation of the State Finance in the Context of FC-XIV Recommendations
Year
2015-16 (Actual)
2016-17 (Actual)
2017-18 (RE)
2018-19 (BE)
2019-20 (Proj.)
Revenue Receipt (` Crore) 6676 7398 8950 8909 10466 Revenue Expenditure (` Crore) 5571 6230 7603 7182 8833 Revenue Deficit (` Crore) 1106 1168 1351 1730 2722 Gross Fiscal Deficit (` Crores) 413 252 -739 -264 569 Outstanding Debt (` Crore) 6407 6725 7195 7887.0 8124 Interest Payment (` Crore0 369 341 383 390.0 480 GSDP (` Crore) 13374 14549 18958 22471.0 26635.0 Revenue Surplus as % of GSDP 8.27 8.03 7.13 7.70 10.22 Fiscal Deficit (-)/Surplus (+) as % of GSDP 3.09 1.73 -3.90 -1.17 2.14 Outstanding Debt % of GSDP 47.91 46.22 37.95 35.10 30.50 Interest payment % of Revenue Receipt 5.53 4.61 4.28 4.38 4.59 Requirement Stipulated by FC-XIV
Revenue Deficit (%) 0 0 0 0 0 Fiscal Deficit (-) (%) -3 -3 -3 -3 -3 Debt-GSDP Ratio (%) 25 25 25 25 25 Interest Payment % of Revenue Receipt 10 10 10 10 10 Source: Budget Documents, Government of Mizoram & Own Calculation Note: (i) The GSDP figures after 2016-17 are projected using semi-log regression estimated from previous years (ii) Projected Figures for the Year 2019-20 are obtained from MTFP presented in the Budget 2018-19 BE: Budget Estimates, RE: Revised Estimates, and Proj.: Projected (made by Finance Department)
It can be seen that the state had revenue surplus which increased from 8.27% in 2015-16 to
10.22% by 2019-20 and the fiscal deficit contained below 3% of GSDP throughout the years.
Although the state could not achieve the standard stipulation of FC-XIV to avail the facility
of additional 0.25% borrowing, the projections made by the State Finance Department has
Page 75

shown that the outstanding debt-GSDP ratio could be brought down continuously from
47.91% in 2015-16 to 30.50% in 2019-20. Similarly, interest payment as percentage of
revenue receipt was contained within the required limit of 10% for availing additional
borrowing as stipulated by FC-XIV, and is showing decline from 5.53% in 2015-16 to 4.59%
in 2019-20. Given all these, it is clear that there has been substantial improvement in the
fiscal position of the government of Mizoram during the FC-XIV award period, and the state
is on track towards further fiscal consolidation.
5.5. Suggested Fiscal Consolidation Path for the period 2020-25
As shown in Table 4.11 in Chapter 4, the earlier projections made by the State Finance
Department on Debt-GSDP ratio as given in Table 5.3 could not be realised due short term
disruption in revenue receipt caused by GST implementation and demonetisation. Despite
this fall out, the projections made by this study, after giving due consideration to this short
term disruptions in government revenue, clearly suggests the possibility of fiscal
consolidation during the FC-XV award period (i.e. 2020-25). In view of the forecasted trends
of revenue expenditure, ORR and GSDP, given in Chapter 4, we have worked out suggested
roadmap for fiscal consolidation in Mizoram for a period of 2020-21 to 2024-25. This is
presented in Table 5.4.
Table 5.4: Suggested Roadmap for Fiscal Consolidation in Mizoram during 2020-25
Sl. No Fiscal Parameters 2020-21 2021-22 2022-23 2023-24 2024-25
1 Outstanding Debt (% of GSDP) 42.0 39.5 35.5 32.0 30.0
2 Revenue Deficit (% of GSDP) 0.0 0.0 0.0 0.0 0.0
3 Fiscal Deficit (% of GSDP) -0.45 -0.30 -0.25 -0.14 0.0 Source: Computed
The state has achieved revenue surplus for most of the years starting from 2006-07.
Consequently, zero revenue deficits may be continued throughout the FC-XV award period,
while fiscal deficit may be completely eliminated by 2024-25. Assuming normal business
environment in the economy, the GSDP is also forecasted to increase continuously. Side by
side with the fiscal deficit being projected to zero, the outstanding debt relative to GSDP may
also be brought down to 30% or below by 2024-25.
Page 76

Chapter 6
ANALYSIS OF SUBSIDIES
6.1. Introduction
Subsidies to the disadvantaged sections of the society is a common measure adopted by any
welfare state. Subsidy can be given in two forms - explicit (direct) and implicit (indirect)
subsidies. If the government clarifies the actual amount that would go to the beneficiaries
through budgetary outlays, it is called explicit subsidy. At the same time, poor recovery of
user charges from social and economic services provided by the government may be
considered as implicit subsidy. The government spends high amounts of expenditure in the
provision of public services but receive less amount in return, and as such, the users are
benefited by the public expenditure through lower user charges, fees, etc.
As substantial amount of public fund are expended for the provision of subsidies (direct or
indirect), it is always crucial for a responsible government to ensure that the target groups
benefit from it while non-target groups are excluded. While direct subsidy can be made to be
better target-oriented through effective mechanism in the identification of beneficiaries, the
chance of the inclusion of non-target groups is relatively high in case of implicit subsidy as it
is done by provision of public expenditure of the government department or bodies that
provide the services. The main items of explicit subsidies in Mizoram are rice through
Targeted Public Distribution System (TPDS), or simply PDS, direct subsidies (cash or
material) to agriculture and allied sector; and subsidies given to the cooperative societies. At
the same time, implicit subsidies arise through public expenditures in the delivery of social
and economic services like power, education, water supply, etc. in which the collection of
user charges are well below the expenditure on it.
6.2. Explicit Subsidies
This section considers the different types of direct subsidies given by the state government to
the people through budgetary support. It is broadly divided into two – subsidies to agriculture
and allied sector, and food subsidies through PDS. The former is generally provided through
price support and material support directly given to the beneficiaries, while the latter is that of
selling rice at highly subsidised rates through a network of ‘retailers’ across the state.
Page 77

6.2.1. Agriculture and Allied Activities
Table 6.1 presents the trend of subsidies given by the state government on various agriculture
and allied activities from 2006-07 to 2015-16. It can be seen that the quantum of subsidies is
quite minimal throughout the years under study, and these expenditures are normally given
through various CSS and other plan schemes.
Table 6.1: Public Expenditure on Subsidies for Agriculture and Allied Activities in Mizoram
Year Crops
Husbandry Manures & Fertilizers
Agriculture Engineering Fisheries Cooperation Total
% of Rev. Exp. Agri & Allied
2006-07 0.10 -- -- -- -- 0.10 0.06 2007-08 4.67 2.50 0.32 -- 0.04 7.53 3.66 2008-09 2.69 0.50 0.69 2.00 -- 5.88 2.61 2009-10 4.08 -- -- 1.50 -- 5.58 2.28 2010-11 1.89 -- -- -- 2.55 4.44 0.88 2011-12 4.07 -- -- -- 1.09 5.16 0.98 2012-13 2.11 -- -- -- 0.37 2.48 0.34 2013-14 0.49 -- -- -- 0.24 0.73 0.11 2014-15 0.08 -- -- -- 2.00 2.08 0.29 2015-16 -- -- -- -- 4.91 4.91 1.27 Source: CAG, Finance Accounts, Government of Mizoram
Till the FY 2009-10, subsidies on crop husbandry was the main expenditure component, and
subsidies for cooperative societies constituted another major component of subsidies since
2010-11. Expenditure on subsidies of crop husbandry showed fluctuating trend ranging from
`0.08 crores in 2014-15 to `4.67 crores in 2007-08, and decreased consistently from `4.07
crores in 2011-12 to zero in 2015-16. Meanwhile, considerable amount of subsidies was
observed for manures & fertilizers, agriculture engineering, and fisheries for two years each.
Subsidies for cooperative societies showed a more or less increasing trend, from `2.55 crores
in 2010-11 to `4.91 crores in 2015-16.
Taking the total agriculture & allied sector subsidies as a percentage of total revenue
expenditure on agriculture and allied services, agriculture subsidy showed declining
importance in the total revenue expenditure. Its share decreased from 3.66% in 2007-08 to
0.11% in 2013-14, and a slight increase to 1.27% in 2015-16. Given these trends, it can be
concluded that agriculture sector subsidy had gradually lost its significance in the total
expenditure, most likely because of the withdrawal of several CSS after the implementation
of FC-XIV. Side by side with the declining subsidies on other heads, cooperation gained
Page 78

importance, and thus became the main item of explicit subsidy given to the agriculture and
allied sector after 2014-15.
6.2.2. Food Subsidies
The state government spends huge amount of expenditure under Targeted Public Distribution
System (TPDS). It has to purchase food grains from the market at a high rate and sell it to the
beneficiaries at subsidised rates. The state government incurs heavy losses due to non-
recovery of the huge amount of expenditure on account of purchase of food under stock
suspense of Food, Civil Supplies & Consumer Affairs Department. Moreover, the
government adopted the National Food Security Act 2013 (NFSA, 2013) on 22nd June, 2015.
Under this Act, the public distribution system (PDS) was implemented by categorising all the
households into three categories, namely Antyodaya Anna Yojana (AAY), Priority
Households (PHH), and others or Above Poverty Line (APL). The AAY households are
entitled to 35 kg of rice per household per month at Rs.3 per kg. PHH are entitled to receive 5
kg of food grains per person per month at a rate of Rs.3 per kg, and they are permitted to
purchase additional 3 kg per person over and above their entitlement for being PHH but at
higher rate as specified for the others (APL households). Other households not covered by the
Food Security Act may be called Non-Food Security Household (NFSH) or APL households.
The APL households enjoy monthly ration quota of 8 kg per person at a rate of Rs.15 per kg
at present, which would be revised by the government as and when necessary.
As of October 2016, there were 25745 AAY Card holders, 115622 PHH holders and 121056
NFSA families. The quantity of rice lifted for distribution under TPDS was 1.42 lakh MT
during 2007-08, and decreased to 1.09 lakh MT in 2016-17. Given the interrelated nature of
TDPS delivery system and since no separate budget head for the subsidy component is
present, it is difficult to clearly evaluate the amount of subsidy expenditure for price and sale
of food grains under the TPDS. It may be more appropriate to put this expenditure under
unrecovered public expenditure for economic services. However, as the trend of yearly
expenditure on food subsidy during the study period could be obtained from the CAG Report,
it is presented here as part of direct (explicit) subsidy.
Figure 6.1 and Table 6.2 present the trends of government expenditure on food subsidy
during the period under study. The total amount of subsidy showed more or less increasing
Page 79

trends with seasonal fluctuations as it increased from `14.26 crores in 2006-07 to `33.7
crores in 2015-16, and recorded the highest amount of `45.24 crores in 2009-10.
Table 6.2: Trends of Government Expenditure on Food Subsidy
Year
Food Subsidy (Rs. Crore)
Expenditure on Food Storage, etc
Food Subsidy % of Exp. on Food Storage, etc
% of total Rev. Expenditure
2006-07 14.26 9 158.44 0.83 2007-08 15.99 55 29.07 0.84 2008-09 16.24 214 7.59 0.70 2009-10 45.24 107 42.28 1.67 2010-11 20.65 244 8.46 0.63 2011-12 20.47 207 9.89 0.55 2012-13 23.30 246 9.47 0.52 2013-14 42.90 114 37.63 0.87 2014-15 34.21 141 24.26 0.61 2015-16 33.87 107 31.65 0.61 Source: (i) Finance Account of States, CAG; and (ii) Budget Documents, Govt. of Mizoram
Since there is no separate budget head for food subsidy, expenditure on the procurement of
rice for PDS is booked on disbursement under capital account for economic services under
the head of food storage & warehousing along with other capital expenditure. However, the
main portion of expenditure under this head of account is constituted by expenditure on
procurement of rice, and thus, it is considered to be another proxy of government expenditure
on food subsidy. The total expenditure under this head increased from `9 crores in 2006-07
and reached the highest amount of `246 crores in 2012-13 but decreased to `107 crores in
2015-16. The amount of food subsidy as a percentage of total expenditure on procurement
showed the worst situation in 2006-07 when it recorded 158.44%, but it declined sharply
afterward to only 7.59% in 2008-09. It further increased to 31.65% in 2015-16. It is clear that
2006-07 2007-08 2008-09 2009-10 2010-11 2011-12 2012-13 2013-14 2014-15 2015-16
14.26 15.99 16.24
45.24
20.65 20.47 23.30
42.90 34.21 33.87
Figure 6.1: Expenditures on Food Subsidy by the Government of Mizoram (Rs. Crores)
Page 80

there was no substantial improvement in the cost recovery of food expenditure in the face of
increasing subsidy amount over the years.
The government has taken several measures to ensure better targeting of food subsidies as
part of its measure to rationalise public expenditure. The government started the project of
end-to-end computerisation of TPDS from the year 2013 with an aim to stop irregularities
and bring about efficiency in the delivery system. As part of this project, complete
digitisation of Ration Cards was undertaken. Further, to ensure better targeting of subsidies,
the government encourage rich families to surrender their Ration Card, and the government
would in turn issue Certificate of Appreciation which can be used for official documents in
lieu of family Ration Card. As a result of the above mentioned initiatives, around 31500
double or bogus Ration Cards and about 4 lakh death/double/non-existent persons were
filtered out in the year 2015. It is also reported that a number of families have surrendered
their Ration Card.
6.3. Implicit Subsidies
It is understood that the state government is responsible for the provision of several social
and economic services and for which it would collect user charges, fees, etc. from the public
in return of the expenditure. Since the collection of user charges from these services are well
below the expenditure incurred, the users are considered to be subsidised indirectly. Although
the extent to which the users are given subsidy cannot be worked out, a good indicator of the
implicit subsidy is cost-recovery as represented by the ratio of total non-tax revenue (NTR) to
the total Revenue Expenditure (RE) on the respective services.
Table 6.3 presents the cost-recovery on few selected activities (or sectors) under social
services and economic services from 2006-07 to 2015-16. The ratio was calculated by
dividing the NTR of a specific sector (like education, etc., water supply) by the RE
expenditure of the same sector, while the aggregate cost-recovery was also worked out
separately for social and economic services by dividing their NTR by respective RE
expenditures.
Page 81

Table 6.3: Cost Recovery from Selected Activities under Social and Economic Services (Ratio of Non-Tax Revenue to Total Revenue Expenditure)
Percent
Services 2006-
07 2007-
08 2008-
09 2009-
10 2010-
11 2011-
12 2012-
13 2013-
14 2014-
15 2015-
16 A Social Services 1.3 1.2 0.9 0.9 0.9 0.9 1.2 1.3 0.1 1.9
i. Education, Sports, Arts and Culture 0.2 1.5 0.1 0.2 0.2 0.2 0.2 0.3 0.1 0.2
ii. Medical and Public Health 0.7 0.8 0.3 0.1 0.1 0.2 0.1 0.0 0.1 0.3
iii. Water Supply and Sanitation 11.3 8.4 7.7 7.0 7.2 8.5 10.8 8.3 14.9 21.9
B Economic Services 12.6 17.6 17.2 12.5 9.9 11.3 11.5 13.2 9.9 13.8
i. Power 38.0 57.7 56.3 39.7 36.7 37.9 36.8 45.4 42.6 45.9
ii. Transport 3.4 2.4 3.0 2.6 3.4 2.2 1.7 1.5 1.3 0.9 Source: Budget Documents, Government of Mizoram
The cost-recovery of the government expenditures on social services (aggregate) was very
low. It was less than 2% of the total expenditure throughout the years under study. The
recovery was even lower in case of education, sports, arts and culture; and medical and public
health as it was less than 1% of the total expenditure on these activities all through the years.
Water supply and sanitation showed a slightly better cost recovery position of more than 10%
in most of the years. However, taking into consideration the existing market cost of drinking
water, there is wide room for enhancing the recovery through rationalisation of water tariff
structures.
At the same time, the cost recovery is slightly better for economic services and ranged from
9.9% in 2014-15 to 17.6% in 2007-08. But there was no clear improvement during the 10
years. Cost-recovery for power sector which is considered as the best proxy for power
subsidy did not show clear trends of improvement and ranged from 36.8% in 2012-13 to
57.7% in 2007-08. The situation of transport was no better as it showed gradual worsening of
cost-recovery and implicated increased loss of the government in its operations. Given the
above analysis, it is clear that the government had spent huge amount of expenditure on
social and economic services and the revenue generated from the collection of user charges
was quite low, showing substantial percentage of subsidies given to the people indirectly. In
view of their shares in the total revenue expenditure, the two critical sectors, namely power
and water & sanitation attracted attention the most. The low cost-recovery for these services
should be a critical point of any policy decision on government subsidies in the state.
Page 82

Table 6.4: Impact of the Losses of State Transport on State's Finances ` Crore
Particulars 2007-08
2008-09
2009-10
2010-11
2011-12
2012-13
2013-14
2014-15
2015-16
Persons employed 726 650 650 650 650 501 501 395 395 No. of Buses 28 54 52 49 31 33 29 33 44 Revenue receipt 1.66 2.07 1.91 2.31 2.14 1.95 2 2.31 1.85 Cost of operation 9.56 10.46 10.85 12.53 16.89 17.64 27.41 24.85 26.74 Profit/Loss -7.9 -8.4 -8.9 -10.2 -14.8 -15.7 -25.4 -22.5 -24.9 Profit/Loss (%) 82.6 80.2 82.4 81.6 87.3 88.9 92.7 90.7 93.1 Loss per Bus -0.28 -0.16 -0.17 -0.21 -0.48 -0.48 -0.88 -0.68 -0.57 Loss % of ONTR 6.06 5.29 7.07 6.97 8.78 7.37 15.12 9.32 8.36 Loss % of Rev. Exp. 0.41 0.36 0.33 0.31 0.40 0.35 0.52 0.40 0.45 Source: Statistical Abstract of Mizoram, 2017 & Finance Department, Mizoram
In addition, the state government is incurring substantial losses incur by the State Transport
Department which operate bus services in different locations. Unlike in other states, the state
transport is not corporatised and it is still full-fledge department till date. Normally, the fares
on these bus services are lower than their counterpart private services. As such, the loss
incurred on the bus services may be interpreted as implicit subsidy given to the passengers.
Table 6.4 presents the details of revenue and operation cost of buses operated by the state
transport department. It is clear that revenue receipt is well below the cost of operation
throughout the years and shows continued loss from `7.9 crores in 2007-08 to `24.9 crores in
2015-16. While taken relative to ONTR, the loss has ranged from 5.29% in 2008-09 to
15.12% in 2013-14. Similarly, the loss constituted 0.45% of the total revenue expenditure in
2015-16. This table clearly points to the fact that the loss of the state transport department is
substantial enough and has been a drain of public resources. So, it is necessary to reform the
state transport which may come in the form of corporatisation or privatisation or other
measures to increase operational efficiency.
Page 83
Chapter 7
POWER SECTOR AND PUBLIC SECTOR UNDERTAKINGS
7.1. Introduction
Although Mizoram is a hilly state having rich potential of hydropower generation, the
utilisation of this potential is very low till date despite several efforts of the state government.
As per the record of Economic Survey 2017-18, Mizoram is endowed with many rivers with
estimated hydro-power generation potential of 3663 MW. The present peak demand is 102
MW, but the state can generate only about 15 MW from the installed capacity of 29.35 MW.
Thus, the state government has spent huge amount of expenditure on purchase of power, and
the cost-recovery in the form of collection from power tariff is extremely low. Therefore,
electricity is heavily subsidised implicitly by the government through budgetary expenditure.
Further, due to the persistently high Transmission and Distribution Loss (T&D Loss), the
power sector reform to bring about efficiency in the distribution and tariff collection have
become a critical point of the policy decision for sustainable fiscal management. Likewise,
the state’s Public Sector Undertakings (PSUs) had been incurring huge losses year after year,
and became a drain of the state budget rather than contributing to it.
7.2. Power Sector Reforms
The State Government and Ministry of Power, Government of India signed Memorandum of
Agreement (MOA) in 2002 for power sector reform under which the latter would provide
funds to the former in the ratio of 90% grants and 10% loans under Accelerated Power
Development and Reform Programme (APDRP). Under the MOA, the state government
would take initiatives (i) to corporatise the Power & Electricity Department (P&ED), (ii) to
set up State Electricity Regulatory Commission (SERC), (iii) to ensure timely payment of
subsidies required in pursuance of orders on the tariff determined by Electricity Regulatory
Commission; and (iv) to achieve 100% metering of all consumers, and 100% electrification
of villages.
Till date, the P&E Department is yet to be corporatised and the proposal is underway for
consideration. Also, computerised billing was implemented and online payment of the bill
was started under the funding through the New Economic Development Policy (NEDP) since
Page 84

2017. As the state government could not have a separate SERC of its own, a Joint Electricity
Regulatory Commission (JERC) for the states of Manipur and Mizoram was constituted by
the Central Government under the provision of Electricity Act, 2003 and the Commission
started functioning from 2008. The tariff rates are revised annually by the state P&ED and
Tariff Petition are filed to JERC for approval. The award is then given by the latter based on
the petition for implementation. Further, the state is yet to ensure 100% electrification of
villages.
7.3. Analysis on the Outcome Indicators of Power Sector
Since the P&ED is not yet corporatised and remains a Government Department, power
subsidy is not booked separately and is deemed to be included in the annual budget of the
department. To study the performance of P&ED, the total expenditure on various heads and
revenue is presented in Table 7.1. It was found that the main component of expenditure was
purchase of power from central sector projects like TSECL of Tripura, NEEPCO, NHPC, etc.
While the total expenditure increased from `128.8 crores in 2007-08 to `292.2 crores in
2015-16, the share of power purchase revolved around 50-60% all through the years. A
notable trend observed here is the fast increase in expenditure on administration & general
administrative expenses from `27.4 crores in 2007-08 to `89.8 crores in 2015-16, while its
share increased from 21.3% to 30.7% during this period.
Table 7.1: Expenditure and Revenue of Power & Electricity Department
` Crore
Expenditure/Revenue Heads 2007-08
2008-09
2009-10
2010-11
2011-12
2012-13
2013-14
2014-15
2015-16
A Total Expenditure 128.8 161.1 209.7 176.6 216.1 228.2 242.6 297.2 292.2 1 Generation Cost 2.1 2.6 3.7 7.8 11.4 9.6 14 11.5 16.3 2 Purchase of Power 76.7 86.3 78.8 91 126.4 123.3 126.3 171.4 167 3 Repair & Maintenance 12.4 15.7 15.7 13 13 15.1 15.4 21 10 4 Adm. & Gen. Expenditure 27.4 36.8 60.4 59.2 58.3 71.9 78.8 84.2 89.8 5 Depreciation -- -- -- 3.9 4 4.1 4.1 5.6 6 6 Interest Payment 10.2 19.7 51.1 1.8 3 4.2 4 3.6 3.2
B Revenue 82.9 87.1 67.6 72.4 135.8 129.8 111.8 142.6 166 1 Sale of Power (within) 49.4 43.3 48.5 55.5 115.2 111.9 107.3 126.7 132.4 2 Sale of Power (outside state) 32.1 42.1 17.6 15.2 18.3 15.4 2.3 13.6 19 3 Other Income 1.4 1.6 1.6 -- -- -- -- -- --
C Revenue - Cost Ratio (%) 64.4 54.1 32.2 41.0 62.8 56.9 46.1 48.0 56.8 D Exp. % of Rev. Exp. Eco. Services 6.8 7.0 7.8 5.4 5.8 5.1 4.9 5.3 5.2 E Rev. % of ONTR on Eco. Services 83.4 82.7 83.5 72.3 83.7 78.7 82.2 82.7 83.7 Source: Finance Department, Government of Mizoram
Page 85

Table 7.2: Purchase of Power by the State Government
Particulars 2010-11 2011-12 2012-13 2013-14 2014-15 2015-16 Total Generation (MKWH) 38.87 22.8 58.61 55.34 36 28.88 Purchased (MKWH) 329.51 364.2 384.52 424.97 502.5 565.55 Purchased (% total) 89.45 94.11 86.77 88.48 93.31 95.14
Ave. Cost of Power Hydro (paise/kWH) 147.67 183.5 233.33 270.33 217 252.35
Thermal (Paise/kWH) 297.5 291.33 318.67 324.33 343 270.19 Gas (Paise/kWH) 273 282 344 344 317.5 353.45 Source: Finance Department, Government of Mizoram
On the revenue side, the total revenue increased by more than two-fold, from `82.9 crores in
2007-08 to `166 crores in 2015-16, of which receipt from sale of power within the state
accounted for around 80%, which increased from 59.6%. Under the Availability Based Tariff
(ABT) system, Mizoram also sell its unused power through power trading (bilateral, etc.).
The state generates substantial income from the sale of power outside the state under the
system. However, the share in the total revenue decreased from a high of 48.3% in 2008-09
to 11.4% in 2015-16.
The ratio of revenue and total expenditure (revenue-cost ratio) which implicitly revealed the
status of revenue loss incurred by P&ED did not have substantial improvement during the
years under study. It ranged from 32.2% in 2009-10 to 64.4% in 2007-08, while it was 56.8%
in 2015-16. The sticky revenue-cost ratio within a small range may be interpreted as the
situation where there is no substantial improvement in mitigating loss of revenue under
power sector. The trend of revenue-cost ratio being observed is also substantiated by the total
revenue as a percentage of ONTR under economic services which did not show a clear trend,
upward or downward. With the exception of 2010-11 when the ratio was 72.3%, the ratio
revolved around 80% all through the years. It may also be noted that P&ED being a
government department, the subsidy component is not booked separately. It is basically
subsidised to the user in implicit form and thus, it is rather difficult to study the subsidy
component, so also the presence of cross-subsidisation of power in the state.
To substantiate the information presented in Table 7.1, the general details of power purchase
by P&ED since 2010-11 is presented in Table 7.2. This table clearly reveals the fact that the
existing power generation is well below the requirement and thus, the state is heavily
Page 86

depending on purchase of power from sources from outside at a rate of `2.52, `2.70 and
`3.53 per kWH in 2015-16 for Hydro, Thermal and Gas respectively.
Table 7.3 presents the scenario of the power sector in Mizoram during the period from 2007-
08 to 2015-16. The installed capacity increased from 37 MW to 52.8 MW, while energy
generation was well below the installed capacity throughout the years. There was significant
progress in rural electrification as the number of villages electrified increased from 81% in
2007-08 to 96% in 2015-16. The number of electrified rural household also increased
significantly from 69% in 2010-11 to 89% in 2015-16, while more than 10% of the rural
households are still un-electrified. The total number of consumers also increased by around
72,000 during this period.
One of the crucial outcome indicators of the efficiency of power sector is the magnitude of
Transmission & Distribution (T&D) loss. Although the P&ED had shown several efforts to
bring down the T&D loss, Table 7.2 shows that there was no significant achievement on this.
Starting with 34%, it reached a high of 43.4% in 2008-09, and after temporary ups and downs
in the range of 29-34%, it came down to 28.4% in 2015-16. However, as it did not exhibit a
strong trend, a reduction to 28.4% might be due to a temporary phenomenon. At the same
time, there is no substantial improvement in the aggregated transmission and commercial
(AT&C) losses. Thus, it is necessary that the government set out a clear policy to bring down
T&D loss with workable time bound targets.
Table 7.3: Performance Indicators of Power Sector of Mizoram
Parameters
2007-08
2008-09
2009-10
2010-11
2011-12
2012-13
2013-14
2014-15
2015-16
1 Installed Capacity (MW) 37.27 37.8 40.8 52.8 52.8 52.8 52.8 52.8 52.8 2 Energy Generation (MKWH) 18.9 10.9 17.5 33.7 22.8 58.6 55.3 36 28.9 3 Village Electrified (%) 81 81 81 86 94 94 95 95 96 4 Rural Household Electrified (%) -- -- -- 69 75 78 83 86 89 5 Consumer Metering (%) 98 100 99 98.6 96 100 100 100 100 6 No. of Consumer (in lakh) 1.44 1.59 1.58 1.79 1.78 1.86 1.96 2.03 2.16 7 T&D Losses (%) 34 43.4 41.4 33.4 36.8 29.3 34.1 31.3 28.4 8 AT&C Losses (%) 28 34 38 32.1 41.3 29 35.3 27.8 31.2 9 ARR (`/KWH) 2.75 2.62 6.58 2.34 4.56 3.88 3.54 3.87 3.91 10 ACS (`/KWH) 3.81 3.33 3.58 4.03 7.01 3.34 3.77 6.5 7.68 11 ACS-ARR (`/KWH) 1.06 0.71 -3.00 1.69 2.45 -0.54 0.23 2.63 3.77 Source: Finance Department, Govt. of Mizoram & Statistical Abstract of Mizoram, Directorate of Eco. & Stats., Mizoram Note: Average Realisation Rated (ARR) and Average Cost of Supply (ACS) are computed from available data
Page 87

To further examine the performance of the state government in achieving efficiency in
revenue collection in power sector, average realisation rate (ARR) and average cost of supply
(ACS) rate were worked out by using the data obtained from the Finance Department. It is
desirable that the state government bring down ACS-ARR gap to zero to attain efficiency in
tariff collection and cost management. While the ARR showed slight improvement over the
years, the ACS increased much higher than the increase in the ARR, which reveals an
increase in the public expenditure (or implicit power subsidy) per unit of electricity supply.
Therefore, in addition to the inability of the state government to bring down the T&D losses,
it is not capable of raising efficiency in tariff collection and supply cost management.
7.4. Public Sector Undertakings
There are five units of public sector undertakings (PSUs) in Mizoram established mostly in
the pre-reform era, and the activities covered by these PSUs are agriculture marketing, food
processing, industrial finances, and electronic developments. The organisational details of
these PSUs are presented in Table 7.4.
Table 7.4: Organisational Details of Public Sector Undertakings in Mizoram
Name of PSUs Year of Estd.
Employees (excl. MR) Areas of Activities
1. Zoram Electronics Industries Development Corporation Ltd (ZENICS)
1991 89 Electronic development and imparting training in electronics and related trades
2. Mizoram Agricultural Marketing Development Corporation Ltd (MAMCO)
1993 26 Agriculture marketing
3. Zoram Industrial Development Corporation Ltd. (ZIDCO)
1978 62 Financing institution on industrial loans
4. Zoram Handloom & Handicraft Development Corporation Ltd (ZOHANCO)
1988 51 Handloom and handicraft development
5. Mizoram Food & Allied Development Corporation Ltd (MIFCO)
1989 89 Agriculture & food processing
Source: (1) Finance Department, Govt. of Mizoram, Memorandum to 13th Finance Commission (2) Ahmed, J. U. (2007). Industrialisation in North Eastern Region. New Delhi: Mittal Publications.
Although these PSUs were established with an aim to transform the economy and to protect
the interest of the people, and contribute to the state’s exchequer, all of them were suffering
losses and were always in need of support from the government. In other words, all the units
were sick units and in need of revitalisation or reforms urgently. The performance indicators
of these PSUs as observed from the CAG Report 2015 are presented in Table 7.5. The debt
Page 88

outstanding of the PSUs was around `30 crores which did not show a declining trend. The
accumulated loss increased from `40.23 crores in 2008-09 to 58.03 crores in 2013-14, while
taken as a percentage of GSDP showed slight decrease due to the robust growth of GSDP
rather than a decrease in the absolute amount of loss. Table 7.5 clearly reveals that the PSUs
that were supposed to have substantial contribution to the state government and improve the
fiscal health of the state were all incurring losses and practically become a drain of the state
finance. This table alone clearly justifies the need for their closure or restructuring.
Table 7.6 presents further financial details of the PSUs from 2007-08 to 2011-12. One thing
that is very clear from this table is that all of them were incurring huge loss every year
relative to their respective capital base. They were apparently depending on the budgetary
support from the government. The MIFCO had the highest amount of loss all through the
years. The aggregate annual loss of these PSUs increased consistently from `19.36 crores in
2007-08 to `22.46 crores in 2011-12. So, reforms of the PSUs became one of the key areas of
concern for fiscal consolidation by the state government.
Table 7.5: Performance Indicators of Public Sector Undertakings in Mizoram
Particulars 2008-09 2009-10 2010-11 2011-12 2012-13 2013-14 Turnover (` Crore) 2.41 1.45 1.72 1.57 5 15.26 Debt (` Crore) 33.65 30.3 30.93 30.93 30.93 30.93 Debt/Turnover Ratio (` Crore) 13.96 20.90 17.98 19.70 6.19 2.03 Interest Payment (` Crore) 2.18 2.18 0.3 0.3 0.3 0.06 Accumulated losses (` Crore) 40.23 43.45 49.2 50.58 51.34 58.03 Debt as % of GSDP 0.88 0.55 0.51 0.44 0.38 0.30 Accumulated Loss as % of GSDP 1.06 0.79 0.81 0.72 0.64 0.56 Source: CAG Report on State Finance, 2015
Page 89

Table 7.6: General Status of the 5 Public Sector Undertakings in Mizoram
` in Crore
Public Sector Undertakings 2007-08 2008-09 2009-10 2010-11 2011-12 1. ZENICS
a) Authorised Capital 5 5 5 5 5 b) Paid up Capital 6.32 6.974 7.22 8.6 9.76 c) Profit/Loss -0.69 -0.662 -0.243 -1.105 -0.463
2. MAMCO a) Authorised Capital 10 10 10 10 10
b) Paid up Capital 4.41 4.93 5.45 5.72 5.99 c) Profit/Loss -0.82 -0.78 -0.76 -1.02 -1.02
3. MIFCO a) Authorised Capital 20 20 20 20 20
b) Paid up Capital 17.06 18.46 19.78 20 20 c) Profit/Loss -15.72 -16.08 -16.69 -18.33 -18.95
4. ZOHANDCO a) Authorised Capital 10 10 10 10 10
b) Paid up Capital 8.37 8.96 9.51 10 c) Profit/Loss -0.07 -0.54 -0.94 -0.05 -1.2
5. ZIDCO a) Authorised Capital 20 20 20 20 20
b) Paid up Capital 15.78 15.78 15.78 15.78 15.78 c) Profit/Loss -2.06 -1.38 -1.41 -0.47 -0.83
6. Aggregate of all PSUs a) Authorised Capital 65 65 65 65 65
b) Paid up Capital 51.94 55.104 57.74 60.1 51.53 c) Profit/Loss -19.36 -19.44 -20.04 -20.98 -22.46
Source: Finance Department, Government of Mizoram
7.5. Reform Initiatives of the Government on PSUs
The state government contemplated the need and modus operandi for reforms of the loss
making PSUs from time to time. Given their poor performance and the need to minimise
expenditure incurred by the loss making PSUs, the Cabinet Meeting dated 18th February 2015
approved the closure of three PSUs, namely ZENICS, ZOHANDCO and MAMCO with
immediate effect. It also approved the downsizing and restructuring of ZIDCO, while the
proposal for privatisation of MIFCO was subsequently approved by the Cabinet Meeting on
7th April 2016. The cost of this reform was to be met from Structural Adjustment Loan from
ADB under MPRMP Programme. To reinforce the process of this reform, the state
government offered early retirement to all the employees of the PSUs under The Mizoram
State Public Enterprises Early Retirement Rules (ERR) 2015, notified in the Official Gazette
in July 2015. Those who decline the offer may opt for appointment into government service
under the category of Group B, C, and D as the case may be.
Page 90
As many as 135 employees opted for the ERR scheme and the total expenditure towards
settlement of these cases has been `33.60 crores as of now. At the same time, 51 employees
were absorbed into various posts under the government. The implementation of ERR
schemes made substantial savings to the state exchequer. The estimated salary of employees
who retired under the scheme was `76.12 crores, which would bring a saving of `42.52
crores approximately.
7.6. Concluding Note
Despite some initiatives undertaken by the government, there was no drastic measure
undertaken by the government towards power sector reforms in the state. The state
government embarked on MOA with the Ministry of Power in 2002 for undertaking reforms
in the power sector. Formation of the JERC for Manipur and Mizoram under the provision of
Electricity Act 2003, in compliance to the terms of this MOA, should be considered the most
important reform measure undertaken by the state government to bring about power sector
efficiency. However, as the P&ED is not yet corporatised, the state has a long way to go in
power sector reforms and enjoy its positive impact on the state fiscal position.
The initiatives of reforms on Public Sector Enterprises (PSEs) undertaken by the state
government was found to be successful and commendable. The success of closures,
restructuring and privatisation of the sick PSEs will have far reaching impact on improving
the state finance in the long run. It is also expected that the state government would pursue
the reform process for the remaining PSEs until they are brought on the right track in terms of
finance and corporate management. In-depth study on the financial and operational viability
of the existing PSUs, viz. ZIDCO and MIFCO is necessary to take further measures to
improve their performance.
Page 91

Chapter 8
STATE’S TRANSFER TO LOCAL BODIES
8.1. Introduction
Along with other hilly North Eastern states, Mizoram is exempted from the provision of 73rd
Constitutional Amendment, and thus, there is no Pachayati Raj system implemented in the
state. The village administration is governed by the Lushai Hills District (Village Council)
Act, 1953, and the amendment of this Act in 2014 reserved one-third of the seats for women
while also lengthening the tenure of the Village Council (VC) to a period of 5 years (from 3
years). The VCs are given limited administrative functions like maintenance of law and
order, allotment of houses (except in notified towns), jhumland allotment, maintenance of
village internal roads, etc. Under the Mizo District (Forest) Act, 1955, the VCs are
responsible for the demarcation of safety reserve, supply reserve, and community land.
However, the VCs have neither created significant impact at the village level nor have they
provided leadership to the local community due to lack of financial and political powers
(Prasad, 2003).
There are 22 notified urban towns in Mizoram and the urban population (including Aizawl
city) constitute around 50% of the total population of the state. Of these urban areas, only
Aizawl has a municipality till date. The Aizawl Municipal Council (AMC) was established
on 1st July 2007 under The Mizoram Municipalities Act, 2007. It was upgraded to
Corporation on 15th October 2015 by the Fourth Amendment of the Mizoram Municipalities
Act 2007.
Mizoram also has three Autonomous District Councils established under Sixth Schedule of
the Constitution of India. They are Lai Autonomous District Council (LADC), Mara
Autonomous District Council (MADC), and Chakma Autonomous District Council (CADC).
This chapter deals with the existing scenario of transfer from the state to the local bodies,
AMC, ADCs, and VCs. However, unavailability of time series data for a longer period
seriously limited the analysis and interpretation of the results.
Page 92

8.2. Mizoram Finance Commission
In spite of the fact that Mizoram is exempted from the operation of 73rd and 74th
Amendments to the Constitution, steps were actively taken by the state government to make
all the local bodies perform functions analogous to those of the local bodies existing in other
parts of the country, while enjoying the degree of autonomy to protect tribal culture, customs,
and traditions. In view of this, the Government of Mizoram passed the Mizoram Finance
Commission Act, 2010 (MFC Act, 2010) which stated, in its introduction, ‘it is expedient to
constitute a single State Finance Commission for all the local bodies which will also be
suitable to local bodies exempted from the aforementioned provision of the Constitution on
the basis of the existing administrative arrangements to enable all the local bodies to have
financial autonomy to perform functions analogous to the functions of other local bodies
constituted under Constitution Part IX and Part IX-A while retaining the distinctive tribal
identity protected by the Sixth Schedule to the Constitution of India which is foundational to
the local bodies of the State’.
Under MFC Act, 2010, the first State Finance Commission (SFC) with nomenclature of
“Mizoram Finance Commission” was constituted on 30th September 2011 and the award
period of the Commission is 2015 to 2020. The first SFC is considered to be the most
significant initiative undertaken by the state government towards decentralisation of powers
and revenue to various local bodies of the state.
The Commission submitted its report on 19th February 2015 which recommended devolution
of 15% of the state’s Own Tax Revenue (OTR) to local bodies of the state and non-plan
revenue deficit grants. The Report was laid in the Mizoram Legislative Assembly in March
2016 and subsequently, devolution to local bodies was implemented from May 2016. The
Commission set out clear criteria with appropriate weights in determining the mechanism for
the devolution of 15% of the OTR to the three Autonomous District Councils (ADCs) and
Village Councils (VCs). Table 8.1 presents the criteria and allocation of weightage to
different criteria of fund devolution. Further, the distribution of the devolution to local bodies
is being done in stages as given in Table 8.2.
Page 93

Table 8.1: Allocation of Weightages to Different Criteria for Fund Devolution to Local Bodies Autonomous District Councils Village Council Criteria Weight
Criteria Weight
1 Population (2011) 40%
1 Non-Municipal Population 40% 2 Area 30%
2 Non-Municipal Area (Sq. Km) 20%
3 Distance of ADC Headquarters from State Capital 10%
3
Per Capita Income Distance (from highest income district (in Rs) 10%
4 Literacy 10%
4 Road length (Km) 5% 5 Villages Electrified 10%
5 No. of Electrified Villages 5%
6 No. of Streetlight Connections 10% 7 No. of Water Connection 10% Source: Report of the First State Finance Commission, Mizoram 2015
Table 8.2: Distribution of the 15% of State's OTR among Local Bodies Stage I: 15% of state's OTR is shared by
Stage 3: 24.17% of the 15% OTR is shared by
1 Autonomous District Council 58.33%
1 Aizawl District 12.32% 2 Village Councils of the 8 Districts 24.17%
2 Lunglei District 22.27%
3 Aizawl Municipal Corporation 17.50%
3 Champhai District 16.42%
4 Serchhip District 7.66%
Stage 2: 58.33% of 15% of OTR is shared by
5 Mamit District 9.80% 1 Lai Autonomous District Council 41.97%
6 Kolasib District 10.73%
2 Mara Autonomous District Council 34.07%
7 Saiha District 7.81% 3 Chakma Autonomous District Council 23.96% 8 Lawngtlai District 12.99% Source: Report of the First State Finance Commission, Mizoram 2015
Besides the devolution and sharing of state’s resources, the first SFC recommended
delegation of powers and functions to different local bodies to enable them to function as
democratic institutions of local self-government. While the state government has adopted and
implemented the recommendation of the devolution to the local bodies in most of the cases,
recommendation of transfer of subjects and functional activities is achieved only in few cases
while the rest are under consideration.
8.3. Transfer to Autonomous District Councils
Under the Sixth Schedule of the Constitution of India, the Autonomous District Councils
(ADCs) are vested with certain powers and functions as organs of self-government and have
the power to make laws with respect to:
(1) Allotment, occupation and use, or setting apart of land other than reserved forest, for
the purpose of agriculture or grazing or residential or any other;
Page 94

(2) Management of forests that are not reserved forests;
(3) Use of canals or any water-course for agriculture purpose;
(4) Regulation of the practices of Jhum or any other forms of shifting cultivation;
(5) Establishment of village or town committees or councils and their powers;
(6) Any other matters relating to village or town administration, including village or town
police and public health and sanitation;
(7) Appointment of succession of chiefs or headmen;
(8) Inheritance of property, marriage and divorce;
(9) Social customs and regulation and control of money lending and trading by non-tribal.
The aggregates of own revenues and transfer of fund to the three ADCs, namely Chakma
Autonomous District Council (CADC), Lai Autonomous District Council (LADC), and Mara
Autonomous District Council (MADC) from 2009-2010 to 2014-15 is presented in Table 8.3.
As it is rather difficult obtain detailed data on readily comparable format, Tables related to
the finance of ADCs are simply reproduced from the Report the First SFC which also made
projections till 2014-15. It is seen from Table 8.3 that generation of own revenue through tax
and non-tax revenues of the ADCs increased by more than 3 times within a span of 5 years.
The non-plan devolution (non-plan grant) from the state government also increased
significantly from `8363.2 lakhs in 2009-10 to `16540 lakhs in 2014-15, while the total
transfer (plan and non-plan) also increased from `14002.8 lakh to `22591 lakhs during the
same period.
It can also be argued from Table 8.3 that these ADCs suffered high revenue deficits as
indicated by high revenue expenditure which was well above the total non-plan revenue. It
was as high as 100% of the plan and non-plan revenue taken together. Given the position of
the state government in the collection of OTR and the recommended percentage of
devolution to the ADCs, it is clear that the state government had to incur transfer of huge
amount of funds to them as post devolution revenue deficit grant (PDRDG). As presented in
Table 8.4, the projected amount of tax devolution accounted for only around 10% of the total
revenue expenditure of these ADCs.
In addition, as per the record of the Finance Department, the latest data on the revenues of the
ADCs (though no separation were made between OTR and ONTR) the aggregate own
revenue (OTR & ONTR) of the three ADCs did not show substantial increase in recent years.
The total own revenue receipt (ORR) of these ADCs are, respectively, `231.32 lakh, `213.1
Page 95

lakh, and `322.51 lakh for the year 2015-16, 2016-17 and 2017-18. The C&AG has been
entrusted with the Technical Guidance & Support (TG&S) over the audit of all the local
bodies. Meanwhile, the State Government made separate office for the Director of Local
Fund Audit under the Department of Account & Treasuries to take responsibility for audit of
the accounts of the local bodies. The local fund audit has to be laid in the State Legislative
Assembly. The latest report of Local Fund Audit was laid in the Assembly on 14th November
2017.
Table 8.3: Budgetary Positions of the three Autonomous District Councils
` lakh
Items 2009-10 (Actual)
2010-11 (Actual)
2011-12 (PA)
2012-13 (RE)
2013-14 (Proj)
2014-15 (Proj)
1 Own Tax Revenue 101.5 113.0 134.4 173.1 192.9 220.8 2 Own Non-Tax Revenue 31.9 35.5 109.3 88.3 93.3 125.5 3 Own Revenue Receipts (ORR) 133.4 148.6 243.7 261.4 286.2 346.3 4 Non-Plan Grants from State 8363.2 11466.0 12768.0 14500.0 15052.0 16540.0 5 Central FC Grants (Non plan) -- 80.0 187.5 -- 160.0 160.0 6 Total Non-Plan Grant 8363.2 11546.0 12955.5 14500.0 15212.0 16700.0 7 Plan Grants 5639.6 6174.2 7275.1 11613.9 11587.4 5891.0 8 Total Transfer 14002.8 17720.2 20230.6 26113.9 26799.4 22591.0 9 Total Revenue Receipt (TRR) 14136.1 17868.8 20474.3 26375.4 27085.6 22937.3
10 Total Revenue Expenditure (TRE) 14073.4 17720.2 19070.7 26603.0 27242.1 22591.0 11 TRE as % of TRR (percent) 99.6 99.2 93.1 100.9 100.6 98.5 Source: Budget Documents of ADCs (reproduce from the Report of the First SFC, Mizoram 2015) Note: PA: Pre Actual; & RE: Rough Estimate, & Proj.: Projected
Table 8.4: Evaluation of the Impact of First SFC Recommendation to ADCs
` Lakh
Items 2009-10 (Actual)
2010-11 (Actual)
2011-12 (PA)
2012-13 (RE)
2013-14 (Proj)
2014-15 (Proj)
1 Total Own Tax Revenue of the State 10758 13008 17867 22315 22978 26653
2 Non-Plan Grants to ADCs 8363 11466 12768 14500 15052 16540
5 Total Revenue Expenditure (TRE) 14073.4 17720.2 19070.7 26603.0 27242.1 22591.0
3 Projected Devolution as Recommended by SFC 941.3 1138.1 1563.3 1952.5 2010.5 2332.0
4 Projected Devolution as % of TRE (%) 6.69 6.42 8.20 7.34 7.38 10.32
Source: Computed
Table 8.5 presents the budgetary status of the 3 ADCs from 2009-10 to 2014-14 in a more
detailed manner. It can be seen from this table that the total revenue receipt (TRR) of MADC
was the highest throughout the years under consideration, while LADC generated the largest
Page 96

amount of own revenue (tax and non-tax) during this period. It should also be noted that there
was no significant improvement in revenue receipts relative to the increasing revenue
expenditure in all the 3 ADCs over the years.
Table 8.5: Detailed Statement of Fund Transfer to the three Autonomous District Councils
Rs. Lakh
Items 2009-10 (Actual)
2010-11 (Actual)
2011-12 (PA)
2012-13 (RE)
2013-14 (Proj)
2014-15 (Proj)
1. Chakma Autonomous District Council (CADC) 1 Own Tax Revenue 22.75 23.16 34.08 37.51 37 50
2 Own Non-Tax Revenue 3.91 4.84 55.54 23.42 29.49 55.65 3 Own Revenue Receipt (ORR) 26.66 28 89.62 60.93 66.49 105.65 4 Non-Plan Grants from State 1490.57 2186 2657 3136 3195 3510 5 Central FC Grants (Non plan) -- 22.5 45 -- 45 45 6 Total Non-Plan Grant 1490.57 2208.5 2702 3136 3240 3555 7 Plan Grants 2458.09 1861.98 2224.53 3920 2138.74 1550 8 Total Transfer 3948.66 4070.48 4926.53 7056 5378.74 5105 9 Total Revenue Receipt (TRR) 3975.32 4098.48 5016.15 7116.93 5445.23 5210.65
10 Total Revenue Expenditure (TRE) 3948.57 4070.48 4926.53 7101.01 5378.74 5105 11 TRE % of TRR (percent) 99.3 99.3 98.2 99.8 98.8 98.0 2. Lai Autonomous District Council (LADC)
1 Own Tax Revenue 48.7 55.2 65 71 72.5 73.3 2 Own Non-Tax Revenue 24.2 26.2 48.4 54.8 47.5 48.7 3 Own Revenue Receipt (ORR) 72.9 81.4 113.4 125.8 120 122 4 Non-Plan Grants from State 3491.6 4890 5183 5996 6237 6854 5 Central FC Grants (Non plan) -- 30 60 -- 60 60 6 Total Non-Plan Grant 3491.6 4920 5243 5996 6297 6914 7 Plan Grants 1627.8 2327 2679.4 3955.6 5611.4 2391 8 Total Transfer 5119.4 7247 7922.4 9951.6 11908.4 9305 9 Total Revenue Receipt (TRR) 5192.3 7328.4 8035.8 10077.4 12028.4 9427
10 Total Revenue Expenditure (TRE) 5190.12 7247 6762.5 10395.64 12351.17 9305 11 TRE % of TRR (percent) 100.0 98.9 84.2 103.2 102.7 98.7 3. Mara Autonomous District Council (MADC)
1 Own Tax Revenue 30 34.65 35.32 64.6 83.4 97.48 2 Own Non-Tax Revenue 3.8 4.5 5.37 10.11 16.3 21.18 3 Own Revenue Receipt (ORR) 33.8 39.15 40.69 74.71 99.7 118.66 4 Non-Plan Grants from State 3381 4390 4928 5368 5620 6176 5 Central FC Grants (Non plan) -- 27.5 82.5 -- 55 55 6 Total Non-Plan Grant 3381 4417.5 5010.5 5368 5675 6231 7 Plan Grants 1553.71 1985.24 2371.17 3738.33 3837.22 1950 8 Total Transfer 4934.71 6402.74 7381.67 9106.33 9512.22 8181 9 Total Revenue Receipt (TRR) 4968.51 6441.89 7422.36 9181.04 9611.92 8299.66
10 Total Revenue Expenditure (TRE) 4934.71 6402.74 7381.67 9106.33 9512.22 8181 11 TRE % of TRR (percent) 99.3 99.4 99.5 99.2 99.0 98.6 Source: Budget Documents of ADCs (reproduced from the Report of the First SFC, Mizoram 2015) Note: PA: Pre Actual; & RE: Rough Estimate, & Proj.: Projected
Page 97

8.4. Transfer to Village Councils
The Village Councils (VCs) in Mizoram enjoyed a high level of autonomy in village
administration including judicial matters prior to the abolition of Mizo District Council and
emergence of Union Territory in 1972, and statehood in 1987. The matters of village
governance have now been left to the Local Administration Department (LAD) of the
Government, while the VCs are given limited financial and administrative authorities. A total
of 757 villages have separate VCs, viz. 87 in LADC areas, 93 in MADC, 87 in CADC; and
91 in Aizawl District, 138 in Lunglei District, 105 in Champhai District, 44 in Serchhip
District, 45 in Kolasib District, and 85 in Mamit District. With the exception of the localities
in Aizawl City, which are under Aizawl Municipal Corporation (AMC), all localities in other
urban towns possess VCs.
The powers conferred to the VCs in Mizoram are as follows:
(1) Allotment of land for house sites (except in urban town);
(2) Control of stray animals, with fines imposed on owners;
(3) Power to enforce social works for common benefit of the community in which every
household has to participate by obligation, with fines imposed on those who do not
comply the social work order;
(4) It also functions as a Village Court and is capable of trying cases of civil and
miscellaneous nature falling within their purview of village or tribal laws and
customs;
(5) The Village Court can also try criminal cases falling within the purview of tribal laws
and customs, and offences of petty nature, and can impose fines which may extent to
`500 according to the nature of offence; and
(6) It looks after and manages burial grounds.
The regular core functions that have been assigned to the VC are: (i) street lights are fixed at
the points selected by the VC; (ii) public water points are fixed at the places selected by the
VC; (iii) public water points of natural sources are under the control of VC; and (iv) it looks
after village cleanliness and sanitation. In addition to these, they are also assigned
developmental functions: (i) activities related to the grants received from the Central Finance
Commissions for the schemes i.e. water supply & sanitation are implemented through VC;
and (ii) schemes under Rural Development Programmes are mostly implemented through
VC.
Page 98

At present, there are three main sources of revenue for the VCs, namely own revenue,
transfer from the centre through recommendation of Finance Commissions, and grand-in-aid
from the state government. In addition to these sources, there is also fund transfer from the
central government for some specific central schemes which are implemented by the
District/Block/Village Council. The main sources of own revenue for the VCs are animal tax,
collection of fees for the village crier, contribution against absence from social work and
fines for absence from social work, fees for issuing documents (ILP, etc.), and other sources.
Table 8.6 presents the revenue of the VCs from different sources and its expenditure from
2010-11 to 2014-15. Due to unavailability of data, data for earlier years could not be
presented in this table.
Table 8.6: Fund Devolution to the Village Council and Expenditure
` in Lakh
Year Own
Revenue
Grant-in-Aid from State
Government
Transfer from 13th
FC Total
Revenue Revenue
Expenditure Capital
Expenditure Total
Expenditure 2010-11 6.20 151.67 1971.96 2129.83 151.67 1978.16 2129.83 2011-12 3.28 124.41 1188.00 1315.69 124.41 1191.28 1315.69 2012-13 4.14 145.42 1188.00 1337.56 145.42 1192.14 1337.56 2013-14 4.92 198.14 3102.71 3305.77 198.14 3107.63 3305.77 2014-15 11.8 249.89 1348.32 1610.01 249.89 1348.32 1598.21 Source: Finance Department, Government of Mizoram
The VCs generated a meagre amount of revenue from own sources, which ranged from `3.28
lakh in 2011-12 to `11.8 lakh in 2014-15, while the grant-in-aid from the state government
increased over the years, from `151.6 lakh in 2010-11 to `249.89 lakh in 2014-15. The grant-
in-aid given to the VC are basically used for revenue expenditure under the head of salary
and expenditures. At the same time, there was substantial amount of fund transfer from the
13th Finance Commission. The total transfer was `1971.96 lakh in 2010-11, `1188 lakh in
2011-12. It reached a peak of `3102.71 lakh in 2013-14 but decreased to `1348.32 in 2014-
15. However, the receipt of fund transfer from the central Finance Commission was
discontinued from the FC-XIV award period (2015-16). The pattern of expenditure of the
VCs shows that the fund receipt from Central FC were fully utilised by the VC for capital
expenditures and were used mainly for creation of village assets like internal roads,
sanitation, etc. Unfortunately, with the onset of the FC-XIV award period, fund transfer to the
VCs for creation of assets (capital expenditure) have completely stopped, and they are
practically deprived of undertaking developmental activities.
Page 99

Table 8.7: Impact Evaluation of State Finance Commission on Fund Transfer to Village Council
` in lakh
Sources 2016-17 2017-18 2018-19 2019-20
1. Devolution Recommended by SFC 1200.72 1441.89 1752.34 2046.27
2. Actual Devolution 437.14 1441.89 ---- ----
3. Grant-in-Aid Recommended by SFC 930.71 852.78 753.25 628.37
4. Grant-in-Aid Actual 763.18 689.55 ---- ----
5. Total Transfer as Recommended by SFC 2131.43 2294.67 2505.59 2674.64
6. Actual Transfer 1200.32 2131.44 ---- ----
7. Achievement Percent (%) 56.32 92.89 ---- ---- Source: Finance Department, Government of Mizoram
As per the recommendation of the First SFC, devolution of funds to the Village Councils
(VCs) started from the FY 2016-17. To examine the impact of the SFC on the position of
fund transfer from the state government to the VCs, Table 8.7 presents the recommended
amount and achievement for the first two years of SFC award period. The recommended
amount of devolution to the VCs during the award period increased from `1200.72 lakh in
2016-17 to `2046.27 lakh in 2019-20, while the achievement rate in the first year was only
36.4%, but there was 100% achievement in the second year (2017-18). Similarly, the
recommended grant-in-aid decreased from `930.71 lakh in 2016-17 to `628.37 lakh in 2019-
20, and the achievements in the first and second year were 82% and 80.85% respectively. The
total fund transfer from the state government to VC as recommended by SFC increased
consistently from `2131.43 lakh in 2016-17 to `2674.64 lakh in 2019-20 with the
achievement rate (ratio of actual transfer to recommended transfer) in the first two years at
56.32% and 92.89%.
Given the discontinuation of fund transfer to the VC from Central Finance Commission with
effect from FC-XIV, the fund transfer from the state government through SFC
recommendation has occupied a significant place in the funding of local government in rural
areas. However, with the limited own tax revenue generation by the state government side by
side with the meagre own revenue collection by VCs, the capacity of the latter in undertaking
own development activities has been seriously limited.
Page 100

8.5. Transfer to Aizawl Municipal Corporation
The Aizawl Municipal Council was established on 1st July 2007 under The Mizoram
Municipalities Act, 2007. It was upgraded to Corporation on 15th October 2015 by Fourth
Amendment of the Mizoram Municipalities Act 2007. Under the AMC, there are 19 wards
comprising of 82 localities with a total population 2.93 lakhs, according to 2011 Census.
Each locality is governed by a separate elected council called Local Council (LC). Although
the AMC collects revenue from own sources like property tax, parking fees, advertisement
fee, trade license, etc., the fund transfer from the Central Government through
recommendations of Finance Commission and Grant-in-Aid received from the State
Government are the main sources of revenue.
Figure 8.1 presents the trends of fund transfer to AMCs from the two main sources of central
Finance Commission and Grant-in-Aid from the State Government during the period from
2010-11 to 2017-18. There was continuous increase in central transfer during the FC-XIII
award period, reaching a maximum of `3600.46 lakh in 2014-15. But there was a sharp
decline with the onset of FC-XIV award period to `1154 lakh in 2015-16, but it slightly
increased to `1846 lakh in 2017-18. Meanwhile, state transfer in the form of grant-in-aid
increased slowly and continuously till 2015-16 from `161.5 lakh in 2010-11 to `570.28 lakh
in 2015-16, but decreased to `388.04 lakh in 2016-17. However, the state transfer picked up
significantly to `1721.71 in the second year of the SFC award period (2017-18). It can be
assumed that the implementation of the recommendation of the 1st SFC had resulted in the
significant increase in fund transfer from the state government to AMC. Thus, the fund
transfer from the state government has started assuming significant importance in the funding
of the Corporation.
932.05 1107
1982.09 1863.1
3600.46
1154
2068 1846
161.5 378.09 339.37 604.19 558.09 570.28 388.04
1721.71
2010-11 2011-12 2012-13 2013-14 2014-15 2015-16 2016-17 2017-18
Figure 8.1: Fund Transfer to Aizawl Municipal Corporation (` lakh)
13th/14th FC Grant-in-Aid from State Govt.
Page 101

Table 8.8: Revenue and Expenditure of Aizawl Municipal Council
Rs. Lakh
Particulars 2010-11 2011-12 2012-13 2013-14 2014-15 2015-16 2016-17 2017-18 1. Total Own Revenue 20.41 29.7 304.81 102.97 131.02 311.35 498.84 430.66 Property Tax --- --- 223.47 --- 1.94 116.68 220.03 250 Non-Tax Revenue 20.41 29.7 81.34 102.97 129.08 194.67 278.81 180.66 2. Total Fund Transfer 1093.55 1485.09 2321.46 2467.29 4158.55 1724.28 2456.04 3567.71 Transfer from 13th/14th FC 932.05 1107 1982.09 1863.1 3600.46 1154 2068 1846 Grant-in-Aid from State Govt. 161.5 378.09 339.37 604.19 558.09 570.28 388.04 1721.71 3. Total Expenditure 393.76 1686.25 1878.82 2830.45 3027 2591.64 2802.57 6202.37 Revenue 181.91 407.79 931.97 1375.16 1374.87 1120.49 1741.97 2563.37 Capital 211.85 1278.46 946.85 1455.29 1652.13 1471.15 1060.6 3639 Source: Finance Department, Government of Mizoram
The substantial increase in revenue collection from own sources by more than 20 times
within a span of 8 years is a commendable development of the AMC. Of the own revenue,
collection from non-tax revenue increased consistently from `20.41 lakh in 2010-11 to
`180.66 lakh in 2017-18. Although there was high fluctuation in revenue collection from
property tax, this tax has become the major source of own revenue and is expected to
continue to be so in the future. It is also notable that the capital expenditure accounted for
more than half of the total expenditure all through the years. One can assume that AMC is
contributing substantial activities towards the development of Aizawl city.
8.6. Concluding Notes
The foregoing analysis showed that the exemption of the state from the operation of 73rd and
74th Constitutional Amendment and the resulting non-existence of PRIs resulted in limited
fund transfer to the rural local bodies, especially after the implementation of the
recommendation of FC-XIV which discontinued central transfer to non-PRI local bodies in
rural areas. This seriously affected the scope of developmental works undertaken by the local
government. Although the state government had taken up commendable initiatives for
transfer to rural local bodies by adopting proper mechanism of fund transfer through the
implementation of the recommendation of SFCs, there was no substantial improvement in the
amount of fund transfer, given the limited amount of state’s OTR. Moreover, the VCs are
deprived of financial and administrative powers it used to possess during the period prior to
UT. Thus, the very principle of local self-government practically lost its ground in rural areas
of Mizoram. Therefore, it is necessary to delegate more functions to the democratically
elected Village Councils to sustain grassroot democracy in rural areas. Further, as the tenure,
Page 102

composition, and forms of functioning of Village Council is similar to PRIs in other parts of
the country in many respects, they should not be deprived of transfer from the Central
Government through the Finance Commission.
The Autonomous District Councils (ADCs) are functioning as per Constitutional mandate
and are basically depending on the resource transfer from the state government. With the
slow growth of revenue collection from own sources relative to the fast growing revenue
expenditure vis-à-vis availability of limited amount of state’s OTR for devolution through
SFC formula, the three ADCs in the state are sustaining on the grant-in-aid received from the
state government. Steps have to be taken by these ADCs to augment their own revenue and
they should take measures to control their revenue expenditure. At the same time, given the
fiscal position of the state government, it is also necessary that the Central Government make
arrangements for transfer of substantial amount of fund to them through Finance
Commission.
The only municipality, Aizawl Municipal Corporation (AMC), which utilise both sources of
major transfer of fund from the Central Finance Commission as well as from the state
government, has made commendable progress in terms of own revenue generation and
expenditure towards the development of the city. However, the fund received from the central
government decreased sharply during the award period of FC-XIV necessitating more
transfer from state government in the form of grant-in-aid. Given the increasing expenditure
obligations in the delivery of public services in urban areas side by side with the declining
fiscal space of the state government, it is necessary that transfers via Finance Commission be
directed consistently in an upward trend.
Page 103

Chapter 9
CONCLUSIONS AND SUGGESTIONS
Evaluation of the state finance of Mizoram is undertaken in this study using various fiscal
parameters and other factors affecting the financial health of the state. The key indicators that
were analysed are revenue, expenditure, deficit, debt, and other liabilities. In addition to
these, this study also examined the implementation of the FRBM Act, nature, and magnitude
of subsidies, power sector, and public sector undertakings, and transfers to local bodies. The
conclusions and suggestions presented in the foregoing chapters of this study are summarised
as follows:
There has been a consistent increase in the revenue transfer from the centre, which constitutes
around 90% of the total revenue receipt of the state government, in the form grants and
shared taxes which recorded annual growth rates of 12.4% and 21.2% respectively. The onset
of FC XIV award period brought about significant changes in the component of central
revenue transfer where the contribution of shared taxes increased significantly from 16.5% to
35.2% side by side with a substantial decrease of grant-in-aid (post devolution revenue deficit
grant) from 74.2% to 55% of the total revenue receipt of the state government. So,
enhancement of vertical devolution by FC XIV had significant impact on fund transfer to the
state in which the state’s share in the central taxes has started to gain more importance.
The state performed moderately well in raising own tax revenue (OTR) and there was a
quantum jump in the later years due to increased collection of state excise following the
implementation of MLPC Act, 2014 that allowed sale of liquor. The state was able to achieve
commendable annual growth of OTR at 20.3% during this period. It is to be noted that more
than 85% of the OTR came from VAT (68.9%) and state excise (16.9%) in 2015-16. At the
same time, poor mobilisation of revenue from user charges resulted in a sticky growth of own
non-tax revenue (ONTR) which grew by around 9% per annum during this period.
The state government showed continued effort to rationalise VAT and to bring about
efficiency in its collection and administration. Despite all these, the buoyancy was estimated
at around unity, meaning that it grew more or less proportionately with GSDP. Moreover, the
estimated tax effort was very low compared to other NE states. So, this study found the
existence of a wide room for its improvement to leverage opportunities arising out of the
Page 104

changes in the living standard and consumption patterns of the population. In fact, this tax
was subsumed under the GST regime. It is expected that the new tax regime will transform
the system, thus enhancing the tax revenue of the state government.
Although land revenue had shown significant buoyancy with respect to GSDP, there is a wide
gap between its tax effort and tax capacity. This study observed large revenue potential to
leverage since large number of landholdings in rural areas are yet to be assessed due to the
capacity limitation of the state’s revenue department. So, the problem seems to lie on
capacity limitation, rather than institutional constraints. It is thus suggested that necessary
efforts be made by the government to assess all the landholdings with immediate effect and
institute a more efficient mechanism for its revenue collection.
The most buoyant tax observed in this study was Stamp & Registration which recorded an
annual growth of more than 38%, mostly fuelled by the amendment of related rules and the
establishment of a separate Directorate to look after it since the later part of the study period.
It was observed that the scope of Stamp & Registration in Mizoram is normally restricted to
transfer of land pass and its securitisation, while the depth of coverage on other assets is
rather low. Further, interview of some officials and middlemen of land transfer business
revealed that there is rampart under-quoting of land price during sale deeds, undertaken in
mutual agreement between the participating parties to avoid high registration fee. The same is
also practised in registrations including those under Societies Registration Act 2005. Thus,
there is high revenue potential from Stamp & Registration through rationalisation of its
structure and efficiency in the collection. The state government need to clearly define the tax
parameters and make the people aware of its significance, while also taking steps to make
dealings on transfer of assets more transparent, thus enhancing efficient assessment of
taxes/fees.
The significant increase in revenue receipt from state excise after the implementation of
MLPC Act, 2014 deserves recognition, because it has become the second most important
source of OTR in the state. Given the high degree of buoyancy, its collection can be increased
significantly by making its structure more progressive relative to the growth of the economy.
Alcohol is by nature a demerit good and its consumption is not desirable for the society nor is
it healthy for the consumer themselves. In fact, there is strong objection from the Church
bodies against its free sale in the state. At the same time, the prices of different IMFL sold in
the state are low compared to the neighbouring states. Given all these, there is a scope to
Page 105

mobilise more revenue by introducing an additional levy which may be in the form of cess or
sin tax. In fact, there was an upward revision of VAT on tobacco products on these grounds
in the recent years.
It is surprising to observe that tax collection from vehicles and passengers & goods tax were
non-buoyant with low tax effort in the age of fast growing transport sector, and ever
increasing motor vehicles causing traffic jams in all the urban areas. Moreover, different
types of luxury vehicles are increasingly plying on roads every year in the state. As per the
record of Directorate of Economics & Statistics, the number of vehicles registered by the
government grew at a CAGR of more than 14%, from around 46 thousands to 1.5 lakhs
during the 10 years. So, it is necessary to rationalise the structure of vehicles tax, and taxes
on goods & passenger in a progressive manner keeping in view the (i) growing number of
luxury vehicles, (ii) changes in the travel mode choices among the people, and (iii)
emergence and growth of logistic sector and changes in the means of commodity
transportation.
The tribal population living and working in Mizoram are exempted from paying income tax,
but they are liable if income is earned in any other part of India. Given the need for
augmenting resources for the state, there is a sound economic sense if professional tax is used
as some kind of proxy for taxing earnings in Mizoram and keeping it under the state subject.
In fact, there is no strong logic for fixing the ceiling of profession tax at `2500. Instead, it has
to be made progressive according to the level of earnings of the income earners. However,
any action on this matter would invite the amendment of Article 276 (2) of the Indian
Constitution which is beyond the legislative purview of the state government.
It was observed that there was substantial increase in the receipt from own non-tax revenue
(ONTR) from `133.5 crores to `297.6 crores during the study period, but the rate of increase
failed to keep in pace with the economic development, represented by GSDP. Thus, ONTR is
not buoyant to the level of economic development. This is basically due to the poor
performance of the state in the collection of user charges from different services. The
insignificant buoyancy of interest, dividend, etc. is the manifestation of the poor
performances of the PSUs and cooperative institutions in which the government had invested.
Instead of contributing revenue to the state’s coffers in the form of dividend and profits, the
PSUs are basically the liability of the state that drain the financial resources. Thus, the state
government need to take up initiatives to rationalise the user charges for different services
Page 106

rendered to the people and institute continuous review mechanism in view of the price
escalation as well as the level of economic development. The recent initiative of the state
government for the closure of some loss making PSUs is commendable, and it is necessary to
extend such initiatives in other loss making units as well.
It is notable that water tariff (receipt from water supply & sanitation) which contributed more
than 80% of the receipt under social services was found to be significant and buoyant with
respect to GSDP. This indicates the existence of great revenue potential through efficiency in
collection and review of the rate structure. At the same time, power tariff (power supply)
which is the major contributor of ONTR under economic services was not buoyant, indicating
stagnancy of revenue collection relative to GSDP. In this digital age where people are using
different kinds of household equipment with high electricity consumption, one would expect
revenue collection from power tariff be at least in pace with the level of economic
development. This observation clearly necessitates power sector reform in the state to bring
about efficiency in revenue collection while also improving technical efficiency by bringing
down operational losses. Further, this study also came up with the suggestion that user
charges for any service rendered by the government be determined on the basis of economic
status of different groups, rather than that of imposing a flat rate. There may also be an
increment of the charges, in regular intervals, at least at a marginal rate.
The government had taken several initiatives to raise the receipt from OTR and ONTR during
the study period. However, only few initiatives were undertaken by the government to raise
ONTR. Any effort shown by the government to rationalise and enhance the tax base was
found to be positively responded to by revenue collection, and similarly, the revision of tariff
also had a positive impact on ONTR receipt. Thus, continued effort of the government is
necessary to enhance the tax base and to raise ONTR. At the same time, it is understood that
politico-economic consideration are at play with respect to every decision on the collection of
non-tax revenue through changes in the user charges, fees, etc. and it is practically impossible
to apply pure economic rationality. In spite of this fact, it was found that there is indeed a
possibility of determining user charges (power tariff, etc.) at a level which would maximise
cost recovery, while also preventing over consumption by people in the higher income
bracket. It is necessary to understand the socio-economic status of the targeted users to
determine effective rate of user charges for any services provided by the government.
Page 107

The total public expenditure of the state government had increased manifold with double
digit annual growth rate. One can see an improvement in the magnitude of public expenditure
over the years when taken as a percentage of GSDP, which shows a declining trend.
However, the expanding volume of revenue expenditure surpassing the growth rate of total
expenditure has to be a serious concern.
The share of committed expenditures on salaries, pensions, and interest payments increased
tremendously which resulted in significant decline of the allocation for capital outlay (for
creation of assets). In fact, the increasing budgetary allocation for capital outlay should be the
basic fiscal effort to sustain economic growth, and its declining allocation would pose serious
challenge to the sustainability of economic growth in the long run. Moreover, the
composition of expenditure on plan and non-plan expenditure also showed significantly
higher growth rate of non-plan expenditure over plan expenditure during the period under
study. Consequently, the main thrust area for efficiency in resource allocation boils down to
the rationalisation and control of revenue expenditure. Thus, any expenditure policy of the
state government must be directed towards containing the ever expanding revenue
expenditure.
Functional composition of expenditure showed higher allocation of resources for
developmental expenditure (social and economic services), while less than one-third was
allocated for general services. The declining allocation for economic services was accounted
for by a surge in social services. This is justified on grounds that increased allocation for
education, health, and water supply are considered key to social development.
The share of economic services declined over the years, driven by a sharp decline in the share
of agriculture and allied activities after 2014 and insufficient expenditure for rural
development. The state being an agrarian rural economy, it is surprising to see the decline in
the relative share of agriculture and rural development. Given the discontinuation of several
CSS for agriculture and allied and rural development schemes post FC XIV, it is necessary
that the state government allocate more resources for agriculture and rural development to
achieve more inclusive growth.
There has been slight improvement in cost recovery under social services, under which water
tariff recorded substantial increase while others like education did not show improvement
over the years. Meanwhile, the scenario of cost recovery under economic services
deteriorated due to the stagnant and declining power tariff collection. It is thus clear that the
Page 108

efficiency of public expenditure is significantly dependent on the cost recovery, which in turn
is dependent on collection of user charges. Therefore, effort needs to be undertaken for
rationalisation and revision of user charges and fees, keeping in view the changing
consumption patterns and living standard of the people, to improve the efficiency of public
expenditure.
To improve efficiency in public expenditure, the state government embarked on expenditure
reform under Mizoram Public Resource Management Programme (MPRMP) through the
Structural Adjustment Loan availed from ADB since 2009. The significant achievement that
can be perceived as of now toward efficiency in public expenditure are the computerisation of
treasuries, introduction of Voluntary Retirement Scheme (VRS), and pension reform by
introducing contributory based New Pension Scheme (NPS). The reform is expected to have
far reaching effects in containing revenue expenditure in the long run. Further expenditure
reform is necessary to bring about efficiency of public expenditure on administrative
expenses. A good candidate for the next round of expenditure reform may be (i) streamlining
of existing posts in various departments and abolition of redundant posts, and (ii)
rationalisation of the liability of the state government on medical reimbursement of the
employees.
The efforts of the state government to rationalise TPDS through digitisation and other
arrangement in rice procurements have significantly reduced public expenditure. The success
of the initiative should be taken as the beginning, and further reforms may be introduced to
improve efficiency in the supply chain and delivery of PDS. The reforms may either be in the
form of Aadhaar linked direct benefit transfer (DBT) or any other technology aided system.
With the exception of two financial years, namely 2013-14 and 2014-15, the state could
achieve revenue surpluses. It was also able to attain fiscal surplus in 2015-16 with the onset
of FC XIV award period. Moreover, the roadmap laid down by the FC XIII on outstanding
debt as percentage of GSDP could also be achieved and the interest payment as percentage
ratio of revenue receipt was contained below 10% and is projected to decline further. It is
commendable that the state government expressed its commitment to bring down revenue
deficit to zero, and declared the year 2015-16 as “Year of Consolidation”. It is necessary that
the government extend its commitment in the coming years and adopt a clear benchmark in
the determination of fiscal roadmap. This study emphasised the necessity of keeping (i)
revenue deficit to zero, (ii) zero fiscal deficit below by 2020-24, and (iii) interest payment
Page 109

below 10% of revenue receipt, for a sustainable fiscal roadmap in the FC-XV period of 2020-
2025.
The huge expenditure incurred by the government in the delivery of various services at a rate
below the economic price is well known, and they are practically subsidies in implicit forms.
Food subsidy through TDPS has been the most significant subsidy given to the people, and it
has great impact on total public expenditure. The existing enrolment under different schemes
(Food Security, AAY, etc.) revealed that all the bona fide residents are the beneficiaries of
TPDS in Mizoram. The government has been spending huge amount of money for purchase
of rice for distribution under the scheme every year and it has gone a long way in bringing
about efficiency in its delivery. However, various budgetary documents do not clearly present
the actual amount of expenditure for its procurement and disaggregation of subsidy
component. In fact, the expenditure on the procurement of rice for TPDS is booked in the
capital disbursement account along with other capital expenditure under this head. The same
is also the case for the receipt which is booked under revenue account. Such a complicated
accounting system has prevented the people from clearly understanding the extent of food
subsidies and thus, they usually fail to honour its very purpose. It is suggested that (i) there
must be simplified accounting system for TPDS which clearly presents subsidy components
and make the people aware of the extent of subsidy they availed in a factual manner, thereby,
creating awareness and accountability of the beneficiaries; (ii) the simplified accounting
system may be extended to other social and economic services from which people receive
subsidies in implicit form; and (iii) universalisation of food subsidy to the people may lead to
waste of resources as it can easily be misused for other purposes (e.g. use for animal feed,
etc.) by certain strata of the population. Thus, the system has to be streamlined and made
more target oriented. Further, the use of Family Ration Card as documentary proof for
availing various services may be stopped or alternative documents may be issued in lieu of it.
The state government embarked on Memorandum of Agreement (MOA) with the Ministry of
Power in 2002 for undertaking reforms in the power sector, under which the JERC for
Manipur and Mizoram was established under the provision of Electricity Act 2003. The
establishment of JERC, which instituted mechanism for continuous revision of power tariffs,
is to date the only significant initiative of the state government in power sector reform.
However, corporatisation of power & electricity department (P&ED) is yet to be undertaken,
and there is no substantial improvement in efficiency in terms of T&D and AT&C losses till
date. Thus, the state has a long way to go in power sector reforms. It is necessary that power
Page 110

sector reform, to improve the overall operational efficiency, be one of the next agenda for
fiscal policy reforms. The next line of action to this effect may be (i) corporatisation of
P&ED, and (ii) management reforms through separation of the core business units of
generation, transmission, and distribution into legally and operationally distinct and
independent entities.
The exemption of the state from the operation of 73rd and 74th Constitutional Amendment and
the resulting non-existence of PRIs resulted in limited fund transfer to the rural local bodies,
especially after the implementation of the recommendation of FC-XIV. Despite the
commendable initiatives of the state government for transfer to rural local bodies by adopting
proper mechanism of fund transfer through SFCs, there cannot be transfer of substantial
amount given the limited amount of state’s OTR. Moreover, the VCs are continuously
deprived of financial and administrative powers it used to possess during the period prior to
UT, and consequently, the very principle of local self-government practically lost its ground
in rural areas of Mizoram. Therefore, it is necessary to delegate more functions to the
democratically elected Village Councils to sustain grassroot democracy in rural areas. Given
that their roles and functional composition have affinity to PRIs in other parts of the country
in many respects, they should not be deprived of fund transfer from the Central Government
through the Finance Commission.
Page 111

REFERENCES
Ahmed, J. U. (2007). Industrialisation in North Eastern Region. New Delhi: Mittal Publication.
Bank, W. (2004). India: State Fiscal Reforms in India (Progress and Prospects) Report No.28849-IN.
Bhaumik, S. K. (2015). Principles of Econometrics - Modern Approach using Eviews. New Delhi: Oxford University Press.
CAG. Report of the Comptroller and Auditor General of India on State Finances (2006-07 to 2014-15). Aizawl: Government of Mizoram.
Government of India (2009). Report of the Thirteeth Finance Commission (2010-15). New Delhi: Ministry of Finance.
_________________ (2014). Report of the Fourteenth Finance Commission. New Delhi: Ministry of Finance.
Government of Mizoram (2006-07 to 2017-18). Budget - Annual Financial Statement. Finance Department.
_________________ (2006-07 to 2017-18). Budget - Budget Speeches. Finance Department.
_________________ (2006-07 to 2017-18). Budget - Explanatory Memorandum. Finance Department.
_________________ (2006-07 to 2017-18). Budget - Fiscal Policy Strategy Statement. Finance Department.
_________________ (2006-07 to 2017-18). Budget - Medium Term Fiscal Policy Statement. Finance Department.
_________________ (2017). Statistical Abstract of Mizoram. Aizawl: Directorate of Economics & Statistics.
_________________ (Various Issues). Economic Survey. Aizawl: Planning & Programme Implementation Department.
Kopits, G and Symansky, Steven A. (1998, July 22). Fiscal Policy Rules. IMF Ocassional Paper No. 162.
NCDS. (2013). Evaluation of State Finances With Reference to State of Odisha. Bhubaneswar.
Purohit, M. C. (2006, February 25). Tax Efforts and Taxable Capacity of Central and State Governments. Economic and Polical Weekly, 747-754.
Page 112

Purohit, Mahesh C and Purohit, Vishnu Kanta. (2009, January 31). Mobilising Non-Tax Revenue: An Empirical Analysis of Trends in States. Economic and Political Weekly, 44(5).
RBI. (2006-07 to 2016-17). State Finances: A Study of Budgets (various issues). Reserve Bank of India.
Sarma, A. (2000, August 26). Gujarat Finances: Reforms of Budgetary Management. Economic and Polictical Weekly, 3125-3136.
Srinivasan, P. (2013). Causality between Public Expenditure and Economic Growth: The Indian Case. International Journal of Economics and Management, 7(2), 335-347.
Vanlalchhawna. (2013). Evaluation of State Finances with Respect to the State of Mizoram. Aizawl: Department of Economics, Mizoram University.
Page 113

Annexure - I
Estimated Double Log Regression For Buoyancy of Own Tax Revenues in North Eastern States of India
Dependent Variable Intercept Slope R-square Coefficient t-value Coefficient t-value
Mizoram Total Own Tax Revenue -4.8*** -7.3 1.12*** 14.8 0.96 Land Revenue -12.78*** -7.32 1.58*** 7.97 0.89 Stamp & Registration -18.3*** -8.1 2.03*** 7.9 0.89 State Excise -13.2** -3.02 1.6*** 3.31 0.58 VAT/Sales Tax -4.6*** -6.8 1.1*** 13.8 0.96 Taxes on Vehicles -7.29*** -3.8 1.1*** 5.04 0.76 Taxes on Goods & Passengers -6.01*** 1.41 0.75*** 4.7 0.73 Profession Tax -5.17*** -5.84 0.84*** 8.37 0.90 Other Taxes & Duties -8.5*** -5.11 0.91*** 4.67 0.73 Assam Total Own Tax Revenue -2.37 -1.64 0.95*** 7.58 0.88 Land Revenue -1.9 -1.4 0.59*** 4.97 0.76 Stamp & Registration -3.2** -2.7 0.72*** 6.87 0.85 State Excise -7.67*** -6.88 1.18*** 12.18 0.95 VAT/Sales Tax -3.0* -2.0 0.98*** 7.5 0.88 Taxes on Vehicles -4.45*** -4.89 0.86*** 10.94 0.94 Taxes on Goods & Passengers -11.22 8.42 1.46* 1.99 0.33 Profession Tax 1.07 1.66 0.34*** 6.13 0.82 Other Taxes & Duties -12.9*** -4.79 1.46*** 6.23 0.83 Arunachal Pradesh Total Own Tax Revenue -2.87** -3.31 0.94*** 9.62 0.92 Land Revenue -4.2** -2.89 0.65*** 3.95 0.66 Stamp & Registration -8.2*** -7.46 1.01*** 8.13 0.89 State Excise -5.48*** -6.87 1.01*** 11.21 0.94 VAT/Sales Tax 0.28 0.24 0.53*** 3.96 0.66 Taxes on Vehicles -3.77** -2.56 0.71*** 4.18 0.69 Taxes on Goods & Passengers -11.07*** -7.75 1.68*** 11.06 0.98 Manipur Total Own Tax Revenue -5.11*** -4.33 1.18*** 9.10 0.91 Land Revenue -5.65** -3.28 0.63** 3.34 0.58 Stamp & Registration -7.84*** -10.16 1.04*** 12.23 0.94 State Excise -5.82*** -3.66 0.84*** 4.84 0.74 VAT/Sales Tax -5.42*** -4.27 1.21*** 8.56 0.90 Taxes on Vehicles -14.13*** -8.27 1.79*** 9.53 0.92 Taxes on Goods & Passengers -4.47** -3.2 0.49** 3.19 0.56 Profession Tax -1.3* -2.09 0.47*** 6.86 0.85 Other Taxes & Duties -37.54*** -4.86 4.23*** 4.97 0.76 Meghalaya Total Own Tax Revenue -4.37* -2.13 1.11*** 5.08 0.76 Land Revenue 2.14 0.18 -0.17 -0.13 0.002 Stamp & Registration -2.27 -1.68 0.47** 3.3 0.58 State Excise -4.13*** -6.45 0.93*** 13.75 0.96 VAT/Sales Tax -5.6 -1.77 1.19*** 3.53 0.61 Taxes on Vehicles -8.61*** -9.38 1.24*** 12.76 0.95 Taxes on Goods & Passengers -2.63*** -5.01 0.43*** 7.71 0.88 Profession Tax 0.86 0.22 0.04 0.09 0.001 Other Taxes & Duties -10.57*** -6.89 1.23*** 7.53*** 0.87 Note ***, ** & * indicates significant at 1%, 5% & 10% level of significance respectively
Page 114

Continue…
Dependent Variable Intercept Slope R-square Coefficient t-value Value t-value
Nagaland Total Own Tax Revenue -2.51** -3.06 0.86 9.74 0.92 Land Revenue -2.92*** -7.53 0.26*** 6.37 0.84 Stamp & Registration -4.19*** -5.85 0.49*** 6.36 0.84 State Excise -3.28*** -5.32 0.49*** 7.36 0.87 VAT/Sales Tax -3.20*** -3.63 0.9*** 9.51 0.92 Taxes on Vehicles -6.48*** -6.08 1.04*** 9.12 0.91 Taxes on Goods & Passengers -8.3*** -4.19 1.06*** 4.97 0.76 Profession Tax -0.24 -0.44 0.37*** 6.15 0.82 Other Taxes & Duties -32.28*** -7.87 3.31*** 7.51 0.88 Sikkim Total Own Tax Revenue 0.11 0.15 0.64*** 7.34*** 0.87 Land Revenue -2.11 2.19 0.38 1.48 0.22 Stamp & Registration -1.32 -1.67 0.35*** 3.81 0.64 State Excise -1.08 -2.66 0.64*** 13.32 0.96 VAT/Sales Tax -3.6* -2 0.96*** 4.55 0.72 Taxes on Vehicles -2.76*** -7.64 0.62*** 14.49 0.96 Profession Tax 3.68 0.90 -0.19 -0.41 0.02 Other Taxes & Duties -3.17** -3.24 0.79*** 6.9 0.86 Tripura Total Own Tax Revenue -3.51*** -4.29 1.04*** 12.31 0.95 Land Revenue -5.52 -1.31 0.78 1.79 0.29 Stamp & Registration -4.87*** -6.05 0.84*** 10.11 0.93 State Excise -5.62*** -4.91 1.03*** 8.74 0.91 VAT/Sales Tax -4.81*** -5.24 1.14*** 12.08 0.95 Taxes on Vehicles 0.19 0.16 0.33** 2.74 0.48 Profession Tax -0.46 -1.19 0.4*** 10.07 0.93 Other Taxes & Duties -1.45 -0.33 0.21 0.46 0.02 Note ***, ** & * indicates significant at 1%, 5% & 10% level of significance respectively
Page 115

Annexure-II
Mizoram At a Glance
Sl. No. Particulars Unit
1. Geographical Area Sq. Km 21,081
2. Geographical Location Longitude Degree 92o.15‟E to 93o29‟E Latitude Degree 21o.58‟ N to 24o.35‟ N
3.
Length North to South Kms 277 East to West Kms 121
4.
International Borders With Myanmar Kms 404 With Bangladesh Kms 318
5.
Inter State Borders With Assam Kms 123 With Tripura Kms 66 With Manipur Kms 95
6.
Administrative Set Up 1. No. of District No. 8 2. No. of Autonomous
District Council No. 3
3. No. of Sub-Division No. 23 4. No. of R.D. Block No. 26 5. No. of villages (2011
census) No. 830
7.
Total Population (2011 Census) Persons No. 10,97,206 Males No. 5,55,339 Females No. 5,41,867
8.
Decadal Population Growth (2001 – 2011)
Absolute No. 2,08,633 Percentage % 23.48%
9. Population Density
Per Sq. Km
52
10. No. of females per 1000 males
No. 976
11.
0 – 6 Population (2011 Census) Persons No. 1,68,531 Males No. 85,561 Females No. 82,970
Literacy (2011 Census) 12 Persons No 8,48,175 Males No 4,38,529 Females No 4,09,646 Rate % 91.33 Population (2011 Census) 13 Rural No 5,25,435 Urban No 5,71,771 Total Workers (2011 Census) 14 Main No 4,15,030 Marginal No 71,675 Source: Economic Survey of Mizoram, 2017-18, Planning & Programme Implementation Department, Government of Mizoram
Page 116

15
Ave rage Monthly Per Capita Expenditure
(2009-10) (2011-12)
(Consumer Expenditure) NSS 66th
Round NSS 68th
Round a) Rural Rs. 1,127.90 1,346.35 b) Urban Rs. 1,778.94 2,218.67
16 Agriculture 2015-16 2016-17 a) Gross Cropped Area ‘’000 ha 221.43 - b) Net Area Sown ‘’000 ha 218.608 - c) Gross Irrigated Area ‘’000 ha 19.775 - d) Area under Principal Crops 2015-16 2016-17 i) Rice ha 37,153 36,858 ii) Maize ha 5,877 5,779 iii) Pulses ha 3,706 3,529 iv) Oilseeds ha 2,659 - e) Production of Principal Crops 2014-15 2015-16 i) Rice M. Tonnes 62,089 61,516 ii) Maize M. Tonnes 10,295 8,911 iii) Pulses M. Tonnes 5,041 4,774 iv) Oilseeds M. Tonnes 2,957 - f) Agricultural Census 2005-06 2010-11 i) No. of operational holdings Nos. 97,223 91,880 ii) Total operated area ha 1,16,645 1,04,789.34 iii) Average size of holdings ha 1.2 1.14
17 Livestock Census 2007 2012 a) Total Livestock ‘000 364 384.604 b) Total poultry ‘000 1241.814 1260.298
18 Forest (FSI Report) 2015 2017 a) Area under dense forest Sq. Km 5,996 5,992 b) Area under open forest Sq. Km 12,752 12,194
19 Electricity 2015-16 2016-17 a) Installed Capacity MW 52.27 29.35 b) Gross Generation MW 594.43 697.95 c) Power Purchased * MU 565.55 645.73 d) Total Consumption MW 338.35 353.54
Source: Economic Survey of Mizoram, 2017-18, Planning & Programme Implementation Department, Government of Mizoram
Page 117

20 Industries 2015-16 2016-17 a) Registered SSI Units during No. 122 71 b) No. of farmers registered in Sericulture Family 5,054 3,880 c) No. of enterprises (as per 2005 economic
census) No. 47,730
d) No. of enterprises (as per 2005 economic census)
No. 57,486
e) Average annual growth rate of enterprise (1998 to 2005)
20.44%
21 Cooperation 2014-15 2015-16 a) No. of Coop. Societies No. 1277 1325 b) Membership No. 47238 47750 c) Working Capital Rs. crore 528.14 528.97
22 Banking As on
31.03.2016 As on
31.03.2017 a) No. of Banks/Branches No. 185 201 b) Total Deposits Rs. crores 6423.18 7902.44 c) Total Advances Rs. crores 2838.6 3151.11 d) Credit Deposit Ratio % 44.19 39.88
23 Education 2015-16 2016-17 a) No. of Primary Schools No. 1,950 1,968 b) Enrolment in Primary Schools No. 1,59,334 1,49,612 c) No. of Middle Schools No. 1,511 1,542 d) Enrolment in Middle Schools No. 93,277 88,655 e) No. of High Schools No. 614 640 f) Enrolment in High Schools No. 41,534 36,529 g) No. of Higher Secondary Schools No. 138 163 h) Enrolment in Higher Secondary Schools No. 22,986 22,540 i) No. of Colleges No. 22 22 a) Enrolment in Colleges No. 12,934 13,152 b) No. of Universities No. 2 2 c) Enrolment in Universities No. 4,799 5,301
24 Health 2015-16 2016-17 a) No. of Hospitals (incl. Non-Government) No. 31 32 b) Community Health Centres No. 12 12 c) Primary Health Centres No. 57 57 d) Sub-Centres No. 372 372 2015 2016 e) Birth Rate Per '000 22.59 20.05 f) Death Rate Per '000 5.86 5.85 g) Infant Mortality Rate (CRS) Per '000 18.76 12.66
Source: Economic Survey of Mizoram, 2017-18, Planning & Programme Implementation Department, Government of Mizoram
Page 118

25 Roads 2015-16 2016-17 a) Total Road Length under State PWD Kms 2434.21 2426.56 b) National Highway Kms 1465.12 1414.32 c) State Highway Kms 170.00 170.00 d) District Road Kms 1579.70 1579.70 e) Village Road Kms 1863.15 1863.15 f) Town Road Kms 704.91 704.91 g) Misc roads (unclassified) Kms 1952.53 1789.22
26 Transport 2015-16 2016-17 Total Motor Vehicles No. 1,65,694 1,83,255
27 Communication 2015-16 2016-17 a) No. of Post Offices No. 388 383 b) No. of Mobile Connections (excluding
Vodafone) No. 9,54,633 9,56,833
28 Water Supply 2015-16 2016-17 1) Rural Water Scheme a) No. of villages fully covered (above 40
lpcd) No. 395 440
b) No. of villages partially covered (10 lpcd to 40 lpcd)
No. 339 298
c) No. of villages not covered No. 0 0 734 738 2) Urban Water Scheme a) No. of city/towns fully covered (70 lpcd) No. 12 10 b) No. of towns partially covered (above 10
lpcd but below to 70 lpcd) No. 8 13
c) No. of towns non-covered (less than 10 lpcd)
No. 3 0
Source: Economic Survey of Mizoram, 2017-18, Planning & Programme Implementation Department, Government of Mizoram
Page 119

POPULATION OF MIZORAM THROUGH DECADAL CENSUS
Sl. No.
Year Population (in nos.) Percentage
decadal variation Male Female Total
1 2 3 4 5 6 1 1901 39,004 43,430 82,434 - 2 1911 43,028 48,176 91,204 (+) 10.64 3 1921 46,652 51,754 98,406 (+) 7.90 4 1931 59,186 65,218 1,24,404 (+) 26.42 5 1941 73,855 78,931 1,52,786 (+) 22.81 6 1951 96,136 1,00,066 1,96,202 (+) 28.42 7 1961 1,32,465 1,33,598 2,66,063 (+) 35.61 8 1971 1,70,824 1,61,566 3,32,390 (+) 24.93 9 1981 2,57,239 2,36,518 4,93,757 (+) 48.55
10 1991 3,58,978 3,30,778 6,89,756 (+) 39.70 11 2001 4,59,109 4,29,464 8,88,573 (+) 28.82 12 2011 5,55,339 5,41,867 10,97,206 (+) 23.48
Source: Economic Survey of Mizoram, 2017-18, Planning & Programme Implementation Department, Government of Mizoram
Page 120