E-Textile Microinteractions: Augmenting Twist with Flick, Slide ...
STRENGTHENING DECENTRALIZATION - AUGMENTING THE CONSOLIDATED FUND OF THE STATES BY THE THIRTEENTH FINANCE
COMMISSION: A NORMATIVE APPROACH
Abhay Pethe, B.M. Misra and Rakhe.P.B.*
*Abhay Pethe is Professor at the Department of Economics, University of Mumbai. B. M. Misra is Adviser and Rakhe.P.B. is Research Officer, Department of Economic Analysis and Policy, Reserve Bank of India. The views expressed in this study are the authors’ own and do not necessarily reflect views of the organizations to which they belong.

2
Strengthening Decentralization - Augmenting the Consolidated Fund of the States by the Thirteenth Finance Commission: A Normative Approach
Content Page No.
Executive Summary 4
I. Introduction 5
II. Preamble 6
III. The Journey Thus Far 8
III.1 State Finances 8
III.2 Finance Commissions 13
III.2.1 State Finance Commissions 14
III.2.2 Earlier Central Finance Commissions 16
III.3 Finances of Local Bodies 19
III.3.1 Urban Local Bodies 19
III.3.2 Panchayat Raj Institutions (PRIs) 21
IV. Core: What can the 13FC do? 24
IV.1 Strengthening Decentralization – Some Qualitative Suggestions 25
IV.2 Grants to the Local Bodies – the Estimation and the Devolution Formula 31
V. Recommendations and Conclusion 45
References 47
List of Tables Page No.
1. Trends in Deficit Indicators 9
2. Trends in Revenue Receipts 10
3. Trend in Expenditure 12
4. Central Finance Commissions and Local Bodies 16
5. Revenue Significance of Municipal Sector 20
6. Revenues and Expenditures of ULBs in India (Rs. Crore) 21
7. Revenue Significance of Panchayat Raj Institutions 22
8. Key Indicators (15 states) (in Per Capita Terms) 23
9. The Good and Not Good Matrix 24

3
10. The Outline of a Model SFC Template 28
11. Time line for the Release of Share in Central Taxes 30
12. O&M Expenditure norms for Assets 34
13. Shares of different tiers of Government in the total O & M Requirement of the local bodies
36
14. State-wise Shares in Local Body Grants (Formula I) 38
15. State’s shares in the total O & M Requirements 40
16. Devolution formula for distributing Local Body Grants 42
17. State-wise Shares in Local Body Grants (Formulae II) 43
18. Comparison of Formula I and II 44
List of Charts Page No.
Trends in deficit indicators 9
List of Appendices Page No.
First SFC Reports: Dates of Constitution, Report Submission & Action Taken 51
Second SFC Reports: Details of Constitution, Report Submission & Action Taken 53
Functions of Urban local bodies 55
Functions of Panchayat Raj Institutions 56
Limitations of the data 57
Estimation of O&M requirements of the local bodies 59
Estimation of population pressure on assets 60
Estimation of inverse of asset density 61
Calculation of shares of States in the local body grants 62

4
Executive Summary
One of the terms of reference of the Thirteenth Finance Commission (ThFC) calls upon the
Finance Commission to look at ‘Measures needed to augment the consolidated fund of a State to
supplement the resources of the Panchayats and Municipalities in the State on the basis of the
recommendations made by the Finance Commission of the State’. In view of this, the present study
examines issues related to fiscal federalism at the third tier in general and grants to local bodies in
particular. It is well documented in the literature that the state of finances of local bodies, both
urban and rural, displays a dismal picture in India. In contrast, the finances of the Central and State
Governments are on a healthier track with the implementation of the rule based fiscal framework.
The study opines that there is a need to fine tune the micro design of grants for local bodies (both
urban and local) and their devolution across the States.
The process of devolving funds to the local bodies based on the recommendations of the
State Finance Commissions (SFCs) is not working efficiently in India. The issues in this area range
from timing of setting up of SFCs to attitude of the State Governments to the recommendations of
the SFCs. In this context, the study urges the ThFC to provide a uniform template for the SFCs
along with a time line to make progress in the area. This would help the successive Finance
Commissions to use the SFC reports as inputs for their recommendations.
The study presents a normative framework to estimate the requirements of operation and
maintenance (O&M) expenditure at the local body level based on three important public services i.e.
water, education and roads. The study estimates a quantum jump in the local body grants from
Rs.25,000 crore given by the Twelfth Finance Commission to Rs.94,451 crore during the award period
of the ThFC. This would mean roughly 0.3 per cent of GDP per year. The study provides devolution
formulae for distributing this amount among the State Governments. The aspects considered while
designing the formula are share in O&M expenditure, fiscal capacity of the State Governments,
population pressure on assets and inverse of asset density.
The study makes suggestions with regard to supplementing the resource base of the local
bodies (urban and local) such as making the local bodies grants unconditional, evenly distributing the
grants to local bodies over the fiscal year in a predictable manner, providing an uniform template for
SFCs, incentivizing State Governments for setting up of data warehouses for local bodies,
constitution of a pool of fiscal experts for selection of SFC members, setting up an incentive fund
for assisting the local bodies to access capital market and talking to local bodies directly until
decentralization truly takes place and SFCs are well established.

5
Strengthening Decentralization – Augmenting the Consolidated Fund of the States by the Thirteenth Finance Commission: A Normative Approach
If a man does not keep pace with his fellow companions;
It is perhaps because he hears a different drummer.
---- Henri Thoreau
Abhay Pethe, B.M. Misra and Rakhe.P.B.∗ I. Introduction
The Thirteenth Finance Commission (ThFC) has been set up by the Presidential order
and has begun its work in the right earnest. One of the terms of reference – of interest in the
context of this study – calls upon the Finance Commission to look at ‘Measures needed to
augment the consolidated fund of a State to supplement the resources of the Panchayats
and Municipalities in the State on the basis of the recommendations made by the
Finance Commission of the State’. In this context, the present study attempts to outline a
framework which can strengthen decentralization at the third tier of the Government in India
which has a constitutional status after the 73rd and 74th constitutional amendments in 1992.
The study also attempts to estimate the grants to local bodies for the operation and
maintenance expenditure and details how to distribute the grants among the State
Governments, while leaving the responsibility to distribute the same among the local bodies
with the respective State Governments. It may be noted that as per the term of reference of
the Finance Commission, this has to be done on the basis of the inputs received from the
State Finance Commission (SFC) reports. Thus, the study reviews the third SFC reports of
few States which are publicly available to assess their usability as inputs for the
recommendations of the ThFC related to the local body grants. The study also reviews the
approaches of the previous Finance Commissions in regard to the local body grants to
∗Abhay Pethe is Professor at the Department of Economics, University of Mumbai. B.M. Misra is Adviser and Rakhe, P. B. is Research Officer, Department of Economic Analysis and Policy, Reserve Bank of India. The authors would like to thank RBI for the opportunity to undertake this study. The authors would also like to thank R. K. Pattnaik, Adviser, RBI and Mala Lalvani Reader, Department of Economics, University of Mumbai for their unstinting support and help. Thanks are due to an anonymous referee for useful comments. The views expressed in this study are the authors’ own and do not necessarily reflect the organizations to which they belong. The usual disclaimer applies.

6
understand how the question was handled in the past. As a relevant aside, the study also
provides a backdrop of the state of finances at the State level and at the local body level.
The study has five sections. Section II followed by introduction – by way of a
preamble – sets out the parametric environment, in particular, the overall macroeconomic
situation and the political scenario, which constitute the ‘relevant givens’ of the system and
may be of interest to the ThFC in carrying out its task. Section III briefly traces the journey
thus far in terms of the state of finances of the State Governments and local bodies and also
reviews the SFC reports as well as the approaches followed by earlier Finance Commissions.
Section IV presents a framework for strengthening decentralization at the third tier of
Government in India, provides estimates of local body grants based on maintenance and
operations requirements of three important services, i.e. water, education and roads and also
attempts some devolution formulae for distributing the local body grants among the States.
Section V summarizes the recommendations and concludes.
II. Preamble
The great Indian growth story and the nature of polity that currently exists in India are
the two major defining factors of the parametric environment relevant to the ThFC while
making its recommendations to strengthen decentralization. The recent upswing in the
economic growth, with which the economy managed to significantly break away from the
‘Hindu rate’, has had positive impact on the macro-level fiscal and income variables at the
Centre and State levels. As a result, the affordability of the Indian economy to bring in more
inclusion in all the social spheres has gone up significantly. This presumes significance in the
context of the existence of an exclusionary sub-plot to the growth story. At the macro level,
this sub-plot is displayed in terms of the stagnant economies of the poorer States and at the
micro level by the depressing standard of living of some of the sections of population and the
sluggish development of some sectors. Thus, with the new opportunities opened up by the
growth momentum, this is an opportune time for the policy makers to ensure that all the
policy efforts have inclusion at its soul. To make inclusion plausible, greater attention needs
to be paid to the rural sector of the economy (farm and non-farm) with more focus on core
services such as water, education, roads, health and power. Further, it is crucial that the
economic growth, even though it is exclusionary in character, has to be sustained. This is
important for increasing the distributable resources in the economy. Thus, along with
7
including the excluded, attention needs to be paid to the better performing States and sectors
to make the policy strategy compatible with incentives.
Although India has a federal structure albeit not in the classical sense (see Roy, 2007),
it is essentially an Union with a strong centripetal bias with the constitution ensuring an
overwhelming and overriding power to the Central Government. However, over the decades
the nature of polity has undergone a dramatic change from single party domination to
coalitional politics. The regional parties with their local agendas have gained substantial
bargaining power at the national level in this new era of coalitional politics. Or in other
words, the bargaining power of the States ruled by these regional parties have gone up under
the coalitional political set up. This is important in the context of decentralization because
most of the important public goods - such as education, health, water, roads – are largely
provided by States and below. Thus, under the present political set up, the States are in a
better position to demand more funds from the Central Government.
These political developments can bring in more progress on the front of
empowerment of local bodies. This belief is supported by a couple of hazy propositions about
the link between political structure and decentralization. First, Central Government is far
more pro-decentralization (including financial devolution) than the State level Government.
As far as the Central Government is concerned, the disutility arising out of sharing resources
(economic and political) with others is invariant to whether the sharing takes place with one
or more sub-national governments. Instead, for the State Governments it matters how much it
actually devolves to lower level. Second, regional parties would – ceterus paribus – be more
inclined to decentralization. More specifically, political parties which derive their strength
from regional agenda (which are necessarily people-touching and participatory) and generally
parties that are cadre based are more positive about decentralization. This is because the party
structure continues to be prominent whether the party is in office or out of it, thus official/
elected positions do not grant sufficient powers to provide a threat to higher level
functionaries (in office as well as the party). Finally, coalitional government at the central
level – especially with one national and others essentially with regional identification – will
augur well for an effective big push towards effective decentralization. These then, are the
reasons for our seemingly sanguine hope and assertion for higher level of devolution to the
third tier of Government.
8
III. The Journey Thus Far
This section traces the journey thus far in terms of three important requisites for
decentralization such as the state finances, the Finance Commissions (State and Union) and
the financial condition of local bodies. The implication of each of these to the status of and
the demand on, the consolidated fund of the State is too obvious to require elaboration.
III.1 State Finances
The context here is provided by enactment of Fiscal Responsibility Legislations
(FRLs) by the Centre and States (26 so far) and how to improve the state finances further
keeping in view that one needs to fine tune the performance of the States. We take off from
the mid-eighties when the fiscal stress on the States was rather pronounced.
There has been a severe fiscal stress in respect of finances of State Governments since
the mid-eighties. The fiscal stress emanated from inadequacy of receipts in meeting the
expenditure requirements. The low and declining buoyancies in tax and non-tax receipts,
constraints on internal resources mobilization due to losses incurred by State Public Sector
Undertakings and decelerating resource transfer from Centre contributed to worsening of
State finances. Following the reform measures introduced in 1991, the State Governments
adopted fiscal adjustment resulting in improvement of consolidated fiscal position of the
States as reflected in the major deficit indicators for the period 1990-95 (award period of 9th
Finance Commission). But the trend reversed shortly thereafter largely on account of fall in
tax buoyancy, decline in transfer from the Centre, slowdown in PSU restructuring and
continuation of uneconomical user charges. The implementation of award of the Central Fifth
Pay Commission by the State Governments for their employees added to the fiscal
deterioration. The fiscal deterioration continued up to 2003-04 (Chart 1).

9
In recent years, State finances have witnessed a noticeable improvement with all but
two States (Sikkim and West Bengal) operating under a rule based framework in terms of
FRLs enacted by them (Misra and Khundrakpam, 2008). The consolidated revenue balance of
the State Government is approaching surplus mode while the gross fiscal deficit is contained
below 3 per cent of GDP (Table 1).
Table 1: Trends in Deficit Indicators (Rs. crore)
Item 1990-95 1995-00 2000-05 2005-06 2006-07 2007-08 2005-08 (Avg.) (Avg.) (Avg.) (Accounts) (RE) (BE) (Avg.)RD 5,330 28,400 55,091 7,013 5,566 -11,973 202 (0.7) (1.7) (2.2) (0.2) (0.1) -(0.3) (0.0)GFD 21,250 54,860 102,063 90,084 113,913 108,323 104,107 (2.8) (3.4) (4.0) (2.5) (2.7) (2.3) (2.5)PD 7,646 23,439 32,378 6,060 18,209 5,648 9,972 (1.1) (1.4) (1.3) (0.2) (0.4) (0.1) (0.2)RD: Revenue Deficit GFD: Gross Fiscal Deficit PD: Primary Deficit BE: Budget Estimates RE: Revised Estimates Avg.: Average Note: Figures in brackets are percentage to GDP. Source: Budget Documents of State Governments.
A crucial issue is that whether the fiscal correction during recent years has been
revenue led or on account of expenditure compression/rationalization. On the revenue side,
the States have two sources, i.e., own revenue (tax and non-tax) and devolution and transfers
from the Centre (share in Central taxes and grants-in-aid). The revenue receipts of the States

10
as a ratio to GDP have moved up to about 12.8 per cent of GDP in the recent years from
below 12.0 per cent of GDP in the earlier periods (Table 2). The revenue enhancement of the
States has been largely facilitated by devolution and transfers from the Centre through
shareable taxes and grants-in-aid based on recommendations of the Twelfth Finance
Commission (TFC). Improved macroeconomic fundamentals also aided the process. The own
tax revenue as a ratio to GDP also moved up, albeit slowly, to reach more than 6.0 per cent of
GDP in recent years compared to about 5.5 per cent of GDP in earlier years largely on
account of implementation of value added tax (VAT) by the States. There has been, however,
decline in own non-tax revenue of the States relative to GDP.
Table 2: Trends in Revenue Receipts (Rs. crore)Item 1990- 95 1995-00 2000-05 2005-06 2006-07 2007-08 2005-08 (Avg.) (Avg.) (Avg.) (Accounts) (RE) (BE) (Avg.)RR (1 + 2) 92,679 165,416 285,661 431,021 531,429 606,733 523,061 (12.0) (10.7) (11.2) (12.0) (12.8) (12.9) (12.6)1. OR (a +b) 55,546 103,542 178,171 260,247 312,738 353,229 308,738 (7.2) (6.7) (7.0) (7.3) (7.5) (7.5) (7.4) a. OTR 41,158 78,733 141,933 212,307 257,080 294,038 254,475 (5.3) (5.1) (5.6) (5.9) (6.2) (6.3) (6.1) Of which: Sales tax/VAT 24,238 47,317 86,008 128,769 158,113 182,973 156,618 (3.1) (3.0) (3.4) (3.6) (3.8) (3.9) (3.8) b. ONTR 14,388 24,809 36,238 47,939 55,657 59,191 54,263 (1.8) (1.6) (1.4) (1.3) (1.3) (1.3) (1.3)2. CT (a + b) 37,133 61,874 107,491 170,774 218,691 253,504 214,323 (4.8) (4.0) (4.2) (4.8) (5.3) (5.4) (5.1) a. SCT 19,790 37,608 61,047 94,024 115,737 136,184 115,315 (2.6) (2.4) (2.4) (2.6) (2.8) (2.9) (2.8) b. Grants 17,343 24,267 46,444 76,750 102,955 117,320 99,008 (2.3) (1.6) (1.8) (2.1) (2.5) (2.5) (2.4)RR: Revenue Receipts OR: Own Revenue VAT: Value Added Tax OTR: Own Tax Revenue CT: Current Transfers SCT: Share in Central Taxes ONTR: Own Non-Tax Revenue BE: Budget Estimates Note: Figures in brackets are percentage to GDP. RE: Revised Estimates Source: Budget Documents of State Governments. Avg.: Average.
Total expenditure of State Governments had moved up from the average level of 15.9
per cent of GDP in first half of 1990s to 17.1 per cent of GDP in first half of 2000s. The ratio
has started declining in recent years primarily on account of reduction in revenue

11
expenditure. Expenditure rationalization of the States has not been easy with several non-
discretionary components such as interest payments, pension and administrative services.
With increase in the fiscal deficits and rise in interest cost, interest payments as a ratio to
GDP went up gradually from 1.7 per cent during 1990-95 to 2.7 per cent in 2000-05. It has
come down to around 2.2 per cent of GDP in recent years, primarily due to the Debt Swap
Scheme (2002-05) and Debt Consolidation and Relief Facility recommended by the TFC.
Pension payments have moved up sharply during 2000s compared to 1990s; it, however,
stabilized around 1 per cent of GDP in recent years. There was decline in level of
development expenditure of States to about 9.4 per cent of GDP during 1995-2005 from 10.7
per cent of GDP during 1990-95. Presently the ratio is hovering around 10.0 per cent. One
distinguishing development is the rise in capital outlay to about 2.5 per cent of GDP in recent
years from about 1.5 per cent of GDP during 1995-2005 (Table 3).

12
Table 3: Trend in Expenditure (Rs. crore)Item 1990-95 1995-00 2000-05 2005-06 2006-07 2007-08 2005-08 (Avg.) (Avg.) (Avg.) (Accounts) (RE) (BE) (Avg.)
Total Expenditure
122,270
233,441
437,299 561,682
687,946
766,620
672,082 (15.9) (14.9) (17.1) (15.7) (16.6) (16.3) (16.2)of which:
Revenue Expenditure
98,009
193,794
340,752 438,034
536,995
594,760
523,263 (12.7) (12.4) (13.4) (12.2) (13.0) (12.7) (12.6) of which: Interest Payments 13,605 31,421 69,685 84,024 95,704 102,675 94,134 (1.7) (2.0) (2.7) (2.3) (2.3) (2.2) (2.3) Pension 4,588 13,617 30,816 40,648 47,739 54,263 47,550 (0.6) (0.8) (1.2) (1.1) (1.2) (1.2) (1.1)Administrative Services 9,172 17,525 27,718 34,298 42,511 49,066 41,958 (1.2) (1.1) (1.1) (1.0) (1.0) (1.0) (1.0)
Capital Outlay
11,893
21,044
41,656 77,559
104,942
118,796
100,432 (1.5) (1.4) (1.6) (2.2) (2.5) (2.5) (2.4)Memo item: Development Expenditure 81,989 145,852 239,576 330,044 419,050 467,696 405,597 (10.7) (9.4) (9.4) (9.2) (10.1) (10.0) (9.8)Social Sector Expenditure 44,690 85,823 139,612 189,430 244,241 275,590 236,420 (5.8) (5.5) (5.5) (5.3) (5.9) (5.9) (5.7)Avg.: Average BE: Budget Estimates Note: Figures in brackets are percentage to GDP. RE: Revised Estimates Source: Budget Documents of State Governments.
Thus, it can be seen that the fiscal situation of the States presents a healthier picture as
compared to the one that presented itself at the onset of the TFC. As Karnik (2005) in one of
the commentaries noted, ‘We are afraid that the report of Twelfth FC, while it is critical of
current situation of State finances is rather sanguine about future prospects’. Kelkar (2004)
clearly believes that it is much better to concentrate on revenue raising effort with its
powerful side effect of strengthening State finances which is not the consequence of
expenditure cuts.
The growth dividend in the form of tax revenue buoyancy has clearly had good effect
on the fiscal situation of the States. The expenditure as a ratio to GDP has, however, been

13
stabilizing. The outstanding liabilities have increased, though as a per cent to GDP, it has
witnessed a declining trend during the recent years. The revenue buoyancy, reduction of
compulsory borrowings from the NSSF to 80 per cent along with the Central schemes such as
debt swap scheme and the debt consolidation and relief facility helped the State Governments
to keep the interest payments at about 16 per cent of revenue receipts on an average.
However, the increasing trend in the rate of interest on market loans during the recent years
may dim the picture in future. It may be mentioned that the introduction of VAT provided a
new momentum to the revenue collection at the State level, with the help of which the State
Governments are on track with the targets set out in the respective FRLs.
In this context, the implications of holding the cap of revenue deficit for expenditure
on the crucial sectors such as health and education will require to be watched closely. Much
ingenuity – by way of micro-design – in neutralizing the negative impact on the ‘good’
revenue expenditure in this area will have to be exercised by the ThFC. Thus, further
refinements are called for in the on-going fiscal correction and consolidation process so as to
‘sensibly’ impose micro-caps so that the State finances are buoyant and healthier. This will
lead to augmentation of the consolidated fund of the States which will endow them with a
greater capability for onward transfers to the local bodies.
III.2 Finance Commissions
The theoretical efficiency and welfare gains to be made from decentralization are well
established for some time now (see e.g. Tiebout, 1961 and Oates, 1972). However, one needs
to be mindful of the institutional and administrative capacity constraints among other things
that undermine the actual operational aspects of decentralization (see e.g. Tanzi, 1996 and
Prud’homme, 1995). It then follows that in countries like India that do not face serious
macroeconomic crisis, decentralization of revenues and expenditure will require the active
engagement of the Central Government, both for management reasons as well as for directing
concerted and coordinated efforts towards attaining national goals. The Finance Commissions
derive their importance in this context. Apart from the State Governments, the spirit of 73rd
and 74th Constitutional amendments required simultaneous transfer of functions as well as
empowerment of the local governments. The finance, functions and functionaries have to be
completely on board for the Constitutional Amendment Act to be meaningfully implemented.
Finance Commissions are a progeny of the constitution and have performed their
functions so far in a manner that has earned them a reputation (especially the Central Finance

14
Commissions) for conducting their duty with utmost integrity and not being easily swayed by
the partisan political considerations. The State Finance Commissions are relatively of recent
origin. They have been constitutionally mandated only about fifteen years ago and continue
to be beset with problems. Their awards do not seem to attract the same respect when it
comes to either acceptance or indeed implementation. In the following sub-sections we look
at the issues related to the SFCs and the relevant treatment reported in the last three Central
FCs since we wish to naturally consider only those constituted after the 73rd and 74th
Constitutional Amendments.
III.2.1 State Finance Commissions
We reviewed the SFC Reports, their awards, acceptance and implementation with a
view to judge their utility to serve as inputs to Central Finance Commission award. This is a
huge area which has been widely researched (see e.g., World Bank/ Geeta Sethi, 2004, India
Infrastructure Report, 2003 and Shubham Chaudhary, 2007). However, the public domain
knowledge about these reports continues to be woefully sparse. The SFCs have been required
by the constitutional mandate as a part of the 73rd and 74th Constitutional Amendment Acts.
There are only few States that have rigorously kept to a time table of setting up SFCs. The
timing of setting SFCs up have also not been synchronized with the CFCs, thus, depriving
CFCs of the crucial inputs as envisaged. The newly formed States are only initiating the
process of setting up their first SFC (Chhattisgarh, Uttarakhand and Jharkhand). The status of
the SFCs of the different State Governments is given in Appendices I(a) and I(b). Though the
SFCs have mostly been set up rather mechanically, not much thought seems to have gone into
the exercise in the composition of the SFCs, especially from the view point of inherent
expertise.
The quality of the SFC reports in different States shows heterogeneity. Some of the
SFCs have recommended revenue (tax and non-tax) (Andhra Pradesh) and sometimes only
the tax measures (Assam), shares to be devolved as well as the sharing between the urban and
rural local bodies. The inter se distribution between the different tiers is also recommended
based on criteria that vary from simple and straight forward to complicated and detailed/
formula based formats that reflect social concerns. Some of the SFC reports have gone to the
extent of working out first level demarcation in terms of advanced, ordinary and backward
local bodies along with weights. Recommendations about assignments of taxes such as taxes
on advertisement, profession and property have routinely been made. In addition, some SFCs
15
have suggested newer revenue handles to the local bodies and improvement in the efficiency
of the existing ones. Some have recommended (and implemented) special grants for weak
PRIs as well as incentive grants for well performing ones (e.g., Haryana, Punjab,
Maharashtra). However, it is difficult to justify the efforts taken by the SFCs resulting in ad-
hoc, non-formulaic and paltry grants being handed down to the local bodies.
It can be seen that some of the SFCs have taken their job seriously and come up with
useful recommendations. However, by and large, most of these recommendations have been
rejected and when they have been accepted in principle, the States have dragged their feet in
the matter of actual implementation of the awards. Fewer still have actually gone through the
process of acceptance and Action Taken Report (ATR) by the respective governments and
legislatures. It is surprising to note that even several years have passed after the submission of
reports, States in their response to the query use phrases like ‘accepted in principle’, or ‘under
active consideration’, or ‘yet to be ascertained’ (Assam, Tripura and Goa) or indeed the more
drastic, ‘details are not available’ (Maharashtra). In most cases the conditional acceptance
means non-acceptance of recommendations that have financial implications.
Obviously, there are exceptions wherein not only the recommendations have been
accepted but actual implementation and quick releases of funds have happened (Gujarat,
Haryana, Sikkim and Punjab). In a rare case, Haryana has released advanced grants rather than
awaiting for the report of the next FC. Several new schemes have been initiated with strides in
implementation backed by financial releases is another best practice that is reported. This
shows the proactive stance of the State which should be considered a good practice especially
in contrast to the generally prevalent attitude of finding excuses or shifting blame.
In some States such as Jammu and Kashmir and Orissa, parallel bodies such as the
Halqua Panchayats and Pani-panchayats, respectively are responsible for devolving funds.
While they may be doing good work whether such parallel bodies are to be allowed is a moot
point. Quantum of aggregate and specific schematic funds that reaches each Panchayat is as
high as 20 to 30 per cent in some cases (Himachal Pradesh and Kerala). The enabling practice
in some States of allowing outsourcing especially in technical matters and mandate to raise
resources through borrowings is a good practice that deserves emulation. The transfer of
rights for extraction of minerals whilst keeping the revenues is another good practice worth
mentioning (Madhya Pradesh). The study of a few third SFC reports that are available show a
natural progression. Although they continue to lament the lack of reliable data, they have

16
come up with detailed (formulaic) recommendations (Rajasthan). Some good practices with
regards to process and quantum of flow of funds are undoubtedly in evidence, but these are
largely in States that have already been converted to the dharma of decentralization.
However, the role of SFCs in converting the significant majority of other States is non-
existent. Thus, it is clear from the above review that the SFCs as an instrument of devolution
of funds seem to have been a singular failure and there is no way that the CFC will be in a
position to take the inputs from SFC recommendations as inputs.
This cannot continue and the ThFC must create a template that could be
recommended to all the states. This should detail the data requirement and provide formulaic
boxes that all the SFCs must use (with perhaps differing weights duly justified). As in the
case of the manner of transfer of funds to the lower governments, the ‘best practices’ needs to
be documented and other States should be encouraged to emulate. Perhaps the centripetal bias
of our federation needs to be invoked to take concrete steps (including constitutional
amendment) to force the issue of empowering properly constituted SFCs, who would in their
turn become agents of real change.
III.2.2 Earlier Central Finance Commissions
In this section we provide a bird’s eye-view of the approach followed by earlier
Central Finance Commissions. We look at the Tenth, Eleventh and Twelfth Finance
Commission Reports – recommendations and methodologies particularly related to
strengthening of the local bodies. By and large, the treatment by the different Finance
Commissions has been ad-hoc, however each successive FC has brought something new to
the table. The constraints are fairly obvious and how to circumvent these is a major problem
facing the Central Finance Commissions. The tabular form presentation that follows is self
explanatory (Table 4).
Table 4: Central Finance Commissions and Local Bodies Item Tenth Finance
Commission Eleventh Finance Commission
Twelfth Finance Commission
Terms of reference relating to local bodies
- To make recommendations on the measures needed to augment the Consolidated Funds of the States to supplement the resources of the
To make recommendations on the measures needed to augment the Consolidated Funds of the States to supplement the resources of the

17
panchayats and the municipalities on the basis of the recommendations of the State Finance Commissions (SFCs).
panchayats and the municipalities on the basis of the recommendations of the State Finance Commissions (SFCs).
Recommendations Recommended Rs.100 per capita for rural population as per the 1971 census for the panchayats and Rs.1,000 crore for the municipalities for the five year period covered by the finance commission.
Recommended a total grant of Rs.1,600 crore for the panchayats and Rs.400 crore for the municipalities for each of the five years starting from the financial year 2000-01.
Recommended a sum of Rs.25,000 crore for the period 2005-10 as grants-in-aid to augment the consolidated fund of the States to supplement the resources of the municipalities and the panchayats. This amount may be divided between the panchayats and the municipalities in the ratio of 80:20, i.e., Rs.20,000 crore for the PRIs and Rs.5,000 crore for the municipalities.
Criteria for distribution of grant among States
The amount recommended for the urban local bodies has to be distributed amongst the States on the basis of the inter-state ratio of slum population derived from urban population figures as per 1971 census.
• Population – 40 per cent
• Index of decentralization – 20 per cent
• Distance from highest per capita income – 20 per cent
• Revenue effort – 10 per cent
• Geographical area – 10 per cent
• Population – 40 per cent
• Geographical area – 10 per cent
• Distance from highest per capita income – 20 per cent
• Index of Deprivation – 10 per cent
• Revenue effort – 20 per cent
of which • with respect to own
revenue of states – 10 per cent
• with respect to GSDP – 10 per cent
Conditions • These amounts should be additionality over and above the amounts flowing to the local bodies from State Governments.
• The State Governments were
• These amounts should be over and above the normal flow of funds to the local bodies from the States and the amounts that would flow from the implementation of SFC
• Of the grants allocated for panchayats, priority should be given to expenditure on the O&M costs of water supply and sanitation.
• At least 50 per cent of the grants-in-aid

18
required to prepare suitable schemes with detailed guidelines for the utilization of the grants.
• The local bodies should be required to provide suitable matching contributions by raising resources.
• The grant is not intended for expenditure on salaries and wages.
recommendations • The amounts indicated
for maintenance of accounts and audit and for development of database, would be the first charge on the grant recommended by EFC and would be released by the concerned Ministries of the Government of India, after the arrangements suggested by EFC have become operational. The remaining amount should be utilized for maintenance of core civic services by the local bodies, on the principles indicated in the EFC report.
provided to each State for the urban local bodies should be earmarked for the scheme of solid waste management through public-private partnership.
• States may assess the requirement of each local body in building data base and maintenance of accounts and earmark funds accordingly out of the total allocation recommended by TFC.
• It is for the State concerned to distribute the grants recommended for the State among the local bodies including those in the excluded areas in a fair and just manner.
• No conditionality over and above those recommended by TFC need be imposed by the Central Government for releasing the grants-in-aid.
Source: Central Finance Commission Reports.
Thus, whilst the successive CFCs have been trying to do their bit to put the finances
of the local bodies on firmer foundation, they need help from three fronts. The States must
devolve more funds, the local bodies must be enabled to raise more revenue and the SFCs
must be accorded their rightful esteem so that their awards can, inter alia, provide useful
inputs for action by the CFCs.

19
III.3 Finances of Local Bodies
It may be mentioned that during early 2000s, the local bodies revenue accounted for
around 1.75 per cent of GDP with Urban Local Bodies (ULBs) accounting for about 0.75 per
cent of GDP and PRIs accounting for 1.0 per cent of GDP.
III.3.1 Urban Local Bodies
The state of ULBs in India is slightly better as a whole compared to the Panchayati
Raj Institutions (PRIs). Here too there is a great deal of heterogeneity with some doing rather
well (especially the Municipal Corporations) whilst others smaller municipal councils
increasing their dependency on the higher governments even to deliver the core local public
goods and services. This is explained by the fact that the Indian economic growth in recent
times has been driven by urban areas and with reforms some of the ULBs have been able to
help themselves improve their situation. There have been comprehensive studies in this
sphere (see Pethe and Lalvani 2005, 2006 as well as Mohanty et al, 2007 to mention a few)
and so we shall be rather brief in our treatment here.
As per the TFC Report, India has as many as 3,723 Urban Local Bodies (ULBs), of
which 109 are Municipal Corporations, 1432 are Municipalities and 2182 are Nagar
Panchayats. The major sources of revenues of the urban local bodies include taxes on
property, profession, vehicles, advertisement, lighting, pilgrim, entertainment, etc. Presently,
property tax at the municipal level is not tapped to the full extent. However, it may be noted
that property tax is a promising revenue source for the urban local bodies considering the
expansion of cities with accelerating house construction and increasing project value. It can
be made a more buoyant revenue source in future by switching over to the capital-value
based system from the existing ratable-value system (Pethe, et.al., 2004). The total revenue of
the ULBs rose from Rs.11,515 crore in 1998-99 to Rs.15,149 crore in 2001-02 accounting for
about 0.75 per cent of GDP of the country. Municipal revenue forms a small proportion of
the State, Central and Combined State and Central Government revenues. It has marginally
declined during 1999-2000 and 2001-2002 (Table 5).
20
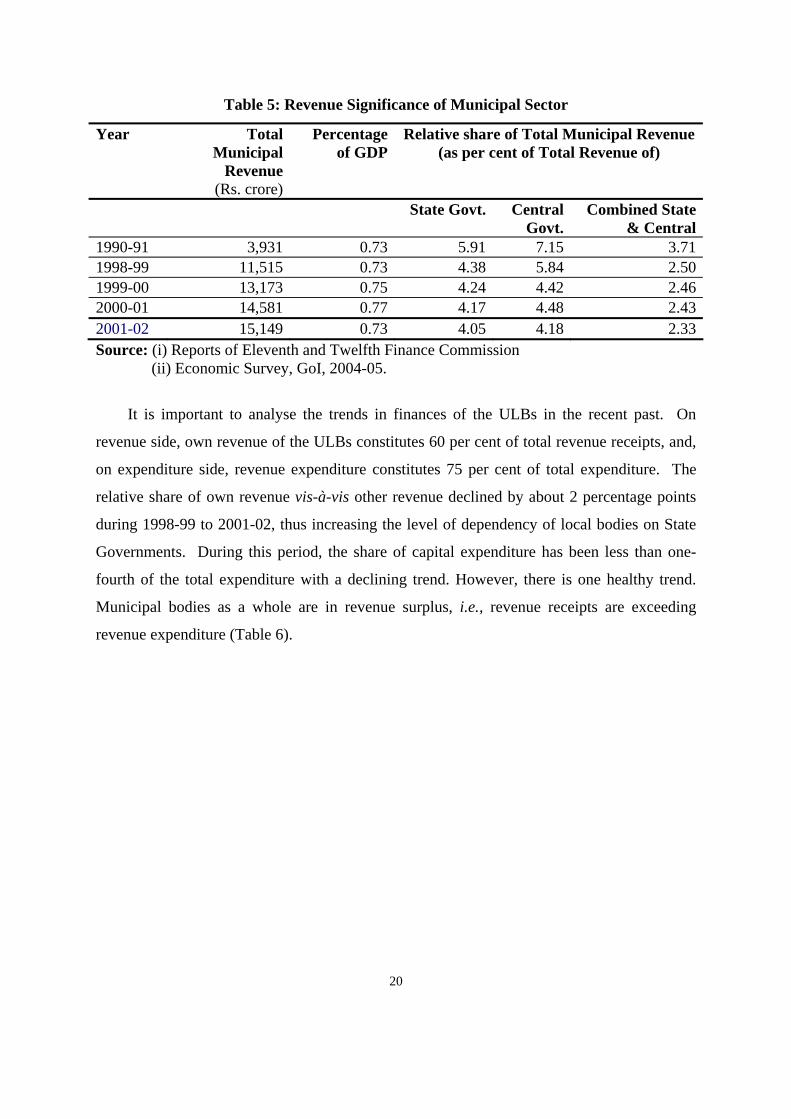
Table 5: Revenue Significance of Municipal Sector
Year Total Municipal
Revenue (Rs. crore)
Percentageof GDP
Relative share of Total Municipal Revenue (as per cent of Total Revenue of)
State Govt. Central Govt.
Combined State & Central
1990-91 3,931 0.73 5.91 7.15 3.711998-99 11,515 0.73 4.38 5.84 2.501999-00 13,173 0.75 4.24 4.42 2.462000-01 14,581 0.77 4.17 4.48 2.432001-02 15,149 0.73 4.05 4.18 2.33Source: (i) Reports of Eleventh and Twelfth Finance Commission (ii) Economic Survey, GoI, 2004-05.
It is important to analyse the trends in finances of the ULBs in the recent past. On
revenue side, own revenue of the ULBs constitutes 60 per cent of total revenue receipts, and,
on expenditure side, revenue expenditure constitutes 75 per cent of total expenditure. The
relative share of own revenue vis-à-vis other revenue declined by about 2 percentage points
during 1998-99 to 2001-02, thus increasing the level of dependency of local bodies on State
Governments. During this period, the share of capital expenditure has been less than one-
fourth of the total expenditure with a declining trend. However, there is one healthy trend.
Municipal bodies as a whole are in revenue surplus, i.e., revenue receipts are exceeding
revenue expenditure (Table 6).

21
Table 6: Revenue and Expenditure of ULBs in India (Rs. crore)
Item 1998-99 1999-00 2000-01 2001-02 Revenue Total Revenue (i+ii) 11514.63 13172.96 14581.05 15149.20(i) Own Revenue (a+b) 6873.42 7379.85 8260.52 8760.16
Share of Own Revenue in Total Revenue (per cent)
59.69 56.02 56.65 57.83
(a) Tax Revenue 4755.52 5151.01 5617.57 5885.81
(b) Non-Tax Revenue 2117.90 2228.84 2642.95 2874.35
(ii) Other Revenue (a+b+c) 4641.21 5793.11 6320.53 6389.04
Share Other Revenue in Total Revenue (per cent)
40.31 43.98 43.35 42.17
(a) Assignment & Devolution 2208.32 2646.60 2981.84 2744.63
(b)Grants-in-Aid 1807.86 2251.21 2239.24 2671.65
(c) Others 625.03 895.30 1099.45 972.76Expenditure Total Expenditure (i+ii) 12034.94 14451.66 15743.05 15914.29(i) Revenue Expenditure 9059.47 10690.30 11665.88 12204.78Share of Revenue Expenditure in Total Expenditure (per cent) 75.28 73.97 74.10 76.69(ii) Capital Expenditure 2975.47 3761.36 4077.17 3709.51Share of Capital Expenditure in Total Expenditure (per cent) 24.72 26.03 25.90 23.31Source: Report of the Twelfth Finance Commission.
It may be noted that whereas the state of fiscal health of large Municipal Corporations
is reasonable, the smaller urban local bodies are generally in a bad shape. They are not too
differently placed as compared to some of the PRIs and need the same kind of succor if they
have to be strengthened and allowed to stand on their own feet so that they may provide local
public goods and services efficiently and effectively given the number of services they are
mandated to deliver (Appendix II).
In sum, we may say that the financial-position of many of the urban local bodies is far
from good. However recognizing this does not take us far, except to say that ‘more ought to
be devolved’. The point is that in relative terms, some of the local bodies (urban and rural)
are reasonable enough so that we could exploit this fact to enable them, to singly or

22
collectively access financial markets. This alone will help them garner the tremendous
amount of resources they require for financing their infrastructure requirements. We now turn
to Panchayat Raj Institutions.
III.3.2 Panchayat Raj Institutions (PRIs)
Panchayat Raj Institutions are large in number distributed across the country. There
are 2,43,685 PRIs in India of which 2,36,350 are Gram/Village Panchayats (including
Village Councils & Boards), 6,795 are Panchayat Samities, 531 are Zilla Panchayats and 9
are Autonomous District Councils (Report of TFC, 2004).
As per the Eleventh Schedule of the Constitution of India, agriculture including
agriculture extension, animal husbandry, minor irrigation, land reforms, fisheries, rural
housing, drinking water, rural roads, rural electrification and primary and secondary school
education are some of the important functions of the PRIs (Appendix III). The major sources
of the revenue of the PRIs constitute profession tax, entertainment tax, taxes on residential
buildings and property, tolls on roads, advertisement tax, etc. It is well documented in the
literature that the state of finances of the PRIs portrays a dismal picture in India1 (Oommen,
2005, Agarwal (2005), Goel and Rajneesh (2003), Rao and Rao (2008).
It may be noted that most of the tax revenue sources assigned to the panchayat raj
institutions have very low tax bases coupled with low buoyancies. A recent study by Pethe
and Lalvani (2008) documents that a decade after the path breaking Constitutional
Amendment Acts, own revenues (per capita) still form a mere 9 per cent of the total
expenditure (per capita) of the PRIs. The revenue receipts of panchayat raj institutions are
given in Table 7 and the per capita revenue and expenditure of the PRIs (15 major States) are
given in Table 8.
1 Data on rural local bodies in the various States are available from the CFCs both 11th and 12th FCs. However, this data set needs to be used cautiously. A few studies (Govinda Rao, 2007 and Oommen, 2005) have drawn attention to several examples to explain why they find the data set to be suspect.

23
Table 7: Revenue Significance of Panchayat Raj Institutions (Rs.crore)
Total PercentageRelative share of Total Panchayat
Revenue Year Panchayat of GDP (as per cent of Total Revenue of):
Revenue State Govt. Central Govt. Combined
State and Central 1998-99 17,296 0.99 10.0 11.6 6.0 1999-00 22,264 1.14 11.0 12.3 6.5 2000-01 23,244 1.11 10.0 12.1 6.1 2001-02 22,470 0.99 9.0 11.2 5.6 2002-03 24,011 0.98 8.8 10.4 5.3 Source: Report of the Twelfth Finance Commission.
Table 8: Key Indicators of Panchayat Raj Institutions (15 Major States) (in Per Capita Terms)
(Amount in Rupees)
Own Tax
Revenue Own
Revenue Total
RevenueTotal
ExpGSDPP
(current)
GSDPPR (93/94 prices)
Grants
1993-94 3.13 9.21 160.91 158.51 4466.66 4573.31 N.A.1994-95 3.75 10.87 178.42 167.69 5190.48 4797.91 N.A.1995-96 4.18 11.80 203.46 202.32 5550.55 4681.05 N.A.1996-97 4.79 12.62 247.66 238.88 6390.17 4986.09 N.A.1997-98 5.25 13.87 302.75 295.42 6724.35 4846.38 N.A.Average
(1993-94 to 1997-98)
4.22 11.67 218.64 212.56 5664.44 4776.94
1998-99 15.28 28.11 306.70 318.79 7459.26 4975.00 166.03 1999-00 15.86 31.62 382.41 373.07 7674.06 4881.51 212.70 2000-01 17.66 33.06 403.51 404.27 8438.17 4830.20 220.82 2001-02 18.87 32.90 380.37 394.55 8627.50 5035.47 211.23 2002-03 20.60 37.07 405.27 399.70 8617.37 4665.48 223.07Average
(1998-99 to 2002-03)
17.65 32.55 375.65 378.08 8163.27 4877.53 206.77
N.A.: Not Available. Note: GSDPP: GSDP from Primary Sector; GSDPPR: GSDP from Primary Sector at constant 93/94 prices States= Andhra Pradesh, Assam, Bihar, Gujarat, Haryana, Karnataka, Kerala, Madhya Pradesh, Maharashtra, Orissa, Punjab, Rajasthan, Tamil Nadu, Uttar Pradesh, West Bengal Source: Pethe and Lalvani, 2008.

24
The study by Pethe and Lalvani (2008) also opined that the average PRI own revenues
are below 1 per cent of the States’ own revenue for fifteen major states and PRIs depend on
upper tiers to the extent of 77.0 per cent. Thus the broad story that emerges is clear – despite
the much spoken about decentralization de facto fiscal empowerment of rural local bodies has
moved at snails’ pace. Further, it may be noted that the shares allocated to various States by
the TFC from the funds set aside for PRIs does not seem to be in consonance with the
incremental performance of these States in the arena of fiscal decentralization (Pethe and
Lalvani, 2008). The classification of States as per fiscal decentralization and buoyancy is
given in Table 9. Only five States appear in the ‘good’ category both in terms of their ranks
in fiscal decentralization and buoyancy.
Table 9: The Good and Not Good Matrix
FISCAL DECENTRALISATION GRAND RANK
GOOD NOT GOOD GOOD
(I) Kerala M.P. Karnataka Goa Maharashtra
(II) Assam Tamil Nadu Punjab
BUOYANCY RANK
NOT GOOD
(III) Andhra P. Gujarat
(IV) Haryana Orissa West Bengal Rajasthan UP
Source: Pethe and Lalvani, 2008.
Thus, the key indicators suggest that while there has been some progress in terms of
increase in own sources of revenue, it has been very slow and the PRIs continue to depend
heavily on the upper tiers of government for their expenditure. It is also seen that the good
behavior on the part of the States yield benefits in terms of improved buoyancy and hence a
reduction in the fiscal stress on the States. This further implies that decentralization is an
advantageous virtue.

25
IV. Core: What can the Thirteenth Finance Commission do?
We recommend a bouquet approach for the empowerment of local bodies through
enablement, transfers encompassing incentive structure and loan/bond exposure (pooled
finance enablement). We are of the view that as far as the local body grant is concerned, the
ThFC may concentrate on the operations and maintenance (O&M) requirements of the local
bodies which is a major fiscal lacuna at the local body level. In the present study, we have
concentrated on the O&M requirements of the local bodies on water, education and roads,
mainly due to data and other constraints. The ThFC may consider expanding the coverage by
including other relevant sectors. The ThFC may suggest a uniform template for the SFCs so
that their reports can be used by the successive Finance Commissions, may incentivise the
States to develop data warehouses for the local bodies and may also incentivise the local
bodies to access the capital market as a group.
IV.1 Strengthening Decentralization – Some Qualitative Suggestions
In principle, decentralization was seen to be unanimously acceptable, yet at the real
ground level the States have not decentralized in the true sense. Local bodies have been
treated as ‘creatures’ of the States rather than as those of the constitution. Hence the States
having devolved the functions, have shied away from devolving either the requisite resources
in a predictable and certain manner or indeed enabled the local governments (especially in
case of urban bodies) by vesting them with sufficient legislative powers to raise resources.
The 73rd and 74th amendment do not go far enough to bring in the decentralization in its full
sense owing to the discretion with the State Governments that they ‘may’ rather than ‘shall’
transfer the resources to the local Government level. In this context, the work of Ministries
such as Ministry of Panchayat Raj (MoPR) in trying to transfer the resources directly through
treasury and banks is note-worthy. Further, it may also be noted that the local bodies have
also by and large not fully exploited the potential possibilities to help their cause.
The CFC can strengthen decentralization in two ways. First, incentivize the States to
decentralize more through its recommendations. This can be done by including a ‘measure of
decentralization’ in the inter se devolution formula for statutory tax transfers so that States
that are decentralizing would receive a reward and nudge others to follow suit. The States
may decentralize more on two accounts (i) by transferring more resources to the local
governments and (ii) by handing over more revenue handles to the local Government. In this

26
context, we wish to suggest a two pronged approach. First, the obligatory tax handles have to
be seriously implemented along with the floor rates prescribed in a mandatory manner. For
example the issue of property tax for ULBs and the issues of agricultural levies for PRIs, as
suggested by Rajaraman (2007) amongst others, will have to be faced. There are two things
to be mentioned here. One, that some of the ‘local taxes’ that collected by the State need to be
fully transmitted to the local bodies and two, exploitation of such taxes as land revenues, and
Property Taxes must be made mandatory with specified ‘floors’. Proper design of incentives
for such effort is necessary (with implication for design of statutory transfers) and will help
expand the fiscal base of the local bodies so that the trade-off between efficiency and equity
is carefully worked out. It is well worth emphasizing that we are not advocating use of
incentive grant for effort by the local bodies or indeed for decentralization just yet when it
comes to devolution to local bodies. Apart from granting greater taxation powers to the local
bodies, in any case, newer revenue handles will have to be innovatively unearthed; this is
especially important because the GST regime might take away some of the existing ones (see
Rao and Rao, 2008). Many times the argument is advanced that the requirements are so huge
that clearly such efforts will not help solve the problem. This is true, however what is not
recognized is that such efforts help create a far healthier balance sheet for the local bodies.
In their turn the local bodies can present a decent rating and a viable borrowing-risk that is
acceptable to the Financial Institutions. The financial institutions can hence be approached
for underwriting or taking exposure, and this is the second prong of our suggestion”.
The idea can be extended to creation of virtual entities formed by considering
different local bodies. The entire set of local bodies will have to be classified into different
classes according to economic criteria and strengths and then schemes can be worked out for
‘cross-overs’ that will allow even the weaker local bodies to access credit. Such a scheme
has been proposed by Pethe and Lalvani (2006) in the case of Urban Local Bodies. Indeed,
we would suggest the coming together of some PRIs with their urban counter parts too.
There is something to be said for a ‘regional’ approach in these matters (see Pethe and
Lalvani, 2007), for example consider the case of Mumbai Metropolitan Region (MMR)
which is being looked at for Mumbai Transformation Project. It has been noted that the
thoughtless legitimization of the artificial dichotomy between urban and rural bodies has
done more harm than good (see Jha and Mathur, 1999). This implies that we should be
looking at the entire space as one integrated continuum dotted with local bodies.

27
In this context, we suggest the setting up of an incentive fund by the ThFC, which can
be used for data compilation and accounting reforms but most importantly as seed money for
projects which will access financial markets. The minimum amount per project could be 5
per cent of the project cost thus creating a leveraging effect which is almost 20 times over.
The total amount of the incentive fund could be about 6 per cent of total devolution to local
bodies and should be devolved across States on the basis of properly weighted variables such
as population, area, number of local bodies (rural/ urban with types i.e., Corporations, A, B,
C types appropriately weighted) etc. Thus, anticipating what comes later in the study, the
total amount of the incentive fund will be about 5.5 to 6 thousand crore2. This fund should be
used for project feasibility or consultancy as well as underwriting and such other costs but
overwhelming proportion should be used as seed capital for the project. The most important
condition that we would recommend is that this must be a project that is undertaken by
more than one local body and must have at least one ‘weak’ local body, including a PRI.
Thus, our suggestion should incentivize inclusive regional approach and break down of the
artificial ‘urban rural’ dichotomy3. The stronger local bodies will have an incentive to work
at spatial fringes (where typically the service delivery is below average) and come together
with weaker local bodies (urban or rural) thereby unwittingly serving the tenet of inclusive
development mandate. The incentive fund(not to be confused as incentive for
doing things write – although that may well be the case with the local bodies
who can benefit from this – is to be explicitly used as a leveraging fund (since
FC cannot involve in ‘capital’ expenditure). It is amply clear from the
econometric evidence reported in this paper, that those states that have
decentralized more have shown significantly greater revenue buoyancies for
their local bodies. This is a clear incentive for the states to decentralize
(whether through increasing revenue handles or assignments). As far as the
access to financial markets by group is concerned, the incentives for all the
parties are reasonably clear. All that remains is for some side(s) to take the
first step. I do not think that one should stop at saying that this is not done! If
there is something in the rules we could change them to enable.
2 The total money kept aside for local bodies will be to the tune of 1 lakh crore implying a fourfold increase in devolution. 3 The Government of India launched a Pooled Finance Development Scheme in November 2006 to assist ULBs to access market borrowings. Similar scheme may be extended to all local bodies including PRIs as well.

28
The second way to strengthen decentralization is to effectively transfer funds to the
local bodies that represent a quantum jump from the past and hence increase the local
government size. There have always been doubts regarding the absorptive capacity as well as
the governance at the local level while transferring large scale resources to the local level.
However, there is good argument in favour of just devolving funds with faith, that the
capacity will be created. Thus, while recognizing the need and the efforts that are required to
be taken for capacity building, it is not necessary to treat it as an essential prerequisite for
transferring resources to the local level. This would require well funded institution building
and it will be worth looking into the financing of it.
In the context of resource transfers from the CFC to the local bodies, the CFC should
ensure that the amount of transfers to the local bodies is not decided on an ad hoc basis rather
it is estimated based on the needs and capacities of the local governments in a normative
sense. It is important that the CFC should make the local body grants unconditional, i.e., it
should not demand matching contributions from the State Governments or local bodies. It is
observed that the Central Government releases a substantial part of the share in Central taxes
in the last month of the fiscal year, i.e., March. This makes it difficult for the State
Governments to plan their expenditure. In the case of grants to local bodies, the CFC should
ensure that the release of the grant is evenly distributed over the fiscal year. Further, after
releasing resources to the State Governments, the CFC has to ensure that the State
Governments are transferring these grants promptly and efficiently to the third tier of the
Government. This is a matter of efficient processes and institutional practices and requires
clear and well formulated recommendations by the SFCs, that are formed with good sense
and responsibility and whose awards are – as a rule – accepted and implemented. In this
context, the creation of a uniform template for SFCs assumes significance.
Though the setting up of the SFCs is constitutionally mandated, most of the State
Governments are setting up SFCs in a casual manner not necessarily keeping in mind the skill
sets required to do a competent job. Similarly, the State Governments are not taking the SFC
awards seriously and sometimes treat them with hostility. Thus, to repeat, the non-synchronic
setting up of SFCs (even when they are set up) and non-uniform treatment by different State
Governments has meant that they are not useful as providers of inputs to the Central Finance
Commissions. It is in this context, the present study opines that the CFC may attempt to
suggest a uniform template for the SFCs.

29
The CFC may include the following aspects in SFC template (Table 10).
Table 10: The Outline of a Model SFC Template
Item Template Time of setting up of SFC At least two years before the setting up of
the Fourteenth FC – 2011 Number of SFC members Same as in CFC Qualifications of the members As applicable to CFC Award period of the SFC 2015-16 to 2019-20 Duration of SFC One and a half years, extendable up to 2
years Transfers Share in State’s Taxes and Grants-in-aid Requirement of local bodies Based on normative assessment Distribution of transfers Based on devolution formula Components of devolution formula 1. Economic backwardness
2. Social backwardness 3. Rural urban divide 4. Needs on a normative basis 5. Efforts of the local bodies 6. Quality of service delivery
Method of distribution of funds First to the district and then to the local bodies within the district
Central Finance Commission Detailed discussion on how much the CFC should augment the consolidated fund of the State for transferring the required amount to the local government level
The specification of the year of setting up the SFC and its uniform award period are
very important in the context of CFC. The report of the SFCs should contain a chapter on
what percentage of the requirement of the local bodies CFC should bear and augment the
consolidated fund of the State Governments accordingly. While projecting the requirements
of the local bodies on a normative basis, the major hurdle faced by the SFCs is the lack of
adequate and reliable data on various parameters at the local body level. Thus, the State
Governments may set up data warehouses on local finances by using the resources and
expertise of Universities/Research Institutes/State Governments. Since O&M expenditure is
the primary concern of the SFCs, it would be ideal if the data warehouse attempts to prepare
an asset map, public and private separately, for each local body.

30
The lack of authentic data base also poses challenges for distributing the vertically
decided amount among the local Governments4. In this context, it may be noted that most of
the detailed information, such as distance from highest income, index of backwardness, etc. is
available at the district level, which is the largest geographical entity inside a State. As far as
the local bodies are concerned, with some effort, financial data and information on their
population and area should be available. Given the difficulty involved in reconciling the
characteristics at the district level and those at the local government level we suggest a two-
stage strategy for the devolution of funds:
Stage 1: Use some specially selected criteria in combination with estimated shares for
each district to arrive at the disbursement to each district.
Stage 2: Having obtained the disbursement for each district, develop a method for
distribution of funds to each local body.
Regarding the devolution formula for distributing the transfers to the local bodies5,
the CFC may outline some major components such as economic backwardness, social
backwardness, effort of the local bodies, needs of the local bodies, etc. while leaving the
freedom to select the specific indicators in each category with the respective SFCs. To
illustrate, economic backwardness can be quantified in a number of ways such as distance
from the highest per capita income, per cent of agricultural income to the total income, per
cent of population below poverty line, etc. The SFCs can select appropriate indicator in each
category depending upon the regional specificities and data availability. Similarly, the CFC
should leave the freedom to attach weight to each criterion with the SFCs, which the SFC
would be in a better position to do owing to its closeness to the State-specific issues.
4 There are several methods in existence for formulating an approach towards devolution of funds to Local Bodies. Some of these have, at least, a partially theoretical basis, while some others are purely ad-hoc (informed by political and such other exigencies). Pethe, Karnik and Karmarkar, 2006 developed a methodology, which comprises of five cardinal principles or ‘Panchtatva’, abbreviated as PEACE. PEACE stands for (a) Political Feasibility (b) Equity (c) Adequacy (d) Computational Transparency and (e) Efficiency. In a study for the UNDP/UNCHS (2002) the authors have worked out the devolution of funds for all the ULBs in Maharashtra. 5 The formulae must be credible and compatible to incentives. The weights in the formulae used for devolution must be seen to be fair. Pethe and Lalvani (2005) suggested a scheme called ‘FAIR PLAN’ approach. The conceptual framework of this approach comprises eight cardinal principles. Each of the alphabets in the acronym ‘FAIR PLAN’ stands for: Fairness, Adequacy, Incentive Compatibility, Responsiveness, Political Feasibility, Level Playing Field, Accountability and Need Based.

31
Further, with regard to the normative assessment, the CFC may provide some broad
guidelines in the template. To illustrate, the CFC may suggest a general approach on how to
assess the needs on a normative basis in the following lines: Proportion of norms achieved by
the local body with regard to the assets identified. For each of the spheres there are
underlying norms in terms of area/population etc. The extent of achievement gap clearly
indicates how much more needs to be done. Based on this, the SFCs will be able to estimate
the required expenditure for the development of the region in various sectors. The SFCs may
calculate the expenditure gap by comparing the estimated required expenditure with the
actual expenditure. Further, by calculating the ratio of actual expenditure to the required
expenditure, the SFCs may calculate the effort of the local bodies in each of the spheres.
It is reported that lack of competent people to accomplish the SFC job efficiently is a
problem faced by the State Governments. In view of this, the Central Government may set
up a pool of fiscal experts with adequate regional representation. The State
Governments, while setting up the SFC may select at least one member of the SFC from
this central pool. Further, the Central Government may consider extending some technical
guidance to the SFC members of all States. The Central Government may request the help of
previous CFC members for this.
We feel that just providing the uniform template may not help much in the matter.
Thus, it would be better if the CFC can put forward a time line of events linked to the release
of FC transfers from the Central Government. A model timeline is provided in Table 11.
Table 11: Time line for the Release of Share in Central Taxes
Release of Share in Central Taxes Time line For the year 2010-11 After setting up the SFC For the year 2012-13 After getting the report of SFC For the year 2013-14 After getting the accepted
recommendations For the year 2014-15 After getting the action taken report
The FC grants should not be linked to the progress made in the area of SFCs, because
these grants are mostly directed towards specific sectors and States who are backward in
respect of those sectors. We feel that the development of these sectors or States should not be
adversely affected by the condition of SFC. On the other hand, share in Central taxes is a
right of the State Governments. Under normal circumstances fiscal federalism does not prefer
conditions for the release of these amounts to the State Governments. However, it should also

32
be remembered that under fiscal federalism the local governments should also enjoy the same
right to receive funds from the higher levels of Government. If the State Governments are
denying this right of the local Governments by not transferring enough resources to them, the
Central Government can step in with some conditions on the release of transfers to the State
Governments in the interest of fiscal federalism at the third tier. If the State Governments are
following the time line indicated in Table 10, in 2013 the Fourteenth Finance Commission
will be in a position to use the SFC reports as inputs for their recommendations. This can give
a great fillip to the fiscal decentralization at the third tier of the Government in India.
Till such time as the decentralization truly takes root and SFCs are established and
recognized, the CFC may think of talking directly to the local bodies (at the district level)
and may try to directly transfer funds to them.
IV.2 Grants to the Local Bodies – the Estimation and the Devolution Formula
Why Operation and Maintenance
Operations and maintenance (O&M) expenditure are recognized as crucial recurrent
outlays necessary to optimally sustain a project or program. In addition to macro-economic
consequences there are beneficial social welfare effects attached to them. These are in terms
of better delivery of services and indirectly through labour intensive maintenance leading to
greater employment. However, the political preference is not for O&M which is the first
casualty in face of scarcity of resources. This is myopic and reflects an inadequate
understanding of costly down stream effects of neglecting the efficient maintenance. Failure
to provide adequate O&M has consequences for the returns on public investments and the
ramifications are confined not only locally but also at the level of macro-economy, in terms
of growth and employment. Thus, it is essential that routine, periodic and renewal or
rehabilitation components of maintenance are treated in an integral fashion so as to maximize
benefits. As an aside, and by way of an illustrative example, we may mention that even in a
leading and progressive state like Maharashtra, there are 50,000 assets related to ‘water
project’ in a state of disrepair and disuse. It is claimed that this is so for want of funds. There
is a talk about ‘handing over the ownership’ of local assets created through various schemes
to the local bodies to ensure better O&M as well as accountable delivery (Mujumdar, 2007).
It is in this context that we are proposing that the single external locus of O&M be
vested importantly with the Central Finance Commission. This is not to exempt the
responsibility of the other authorities (State Government for example) of properly budgeting

33
O&M costs in its project and program formulation but given the strain on their resources for
some time at least it is unrealistic to expect them to shoulder the entire responsibility. Our
position is further refined – in the current context – to cover not only the projects that are
small and strictly local public goods, but also within that to those related to water, education
and roads in a well defined and delimited fashion.
When one is talking about the O&M expenditure, it is important to recognize that
inequality of stocks should not be a consideration. For rectification of such inequalities there
are other avenues. Thus, O&M expenditures are not equalizing in this sense (as they ought
not to be). Indeed misallocation of resources (i.e. funds flowing without commensurate stocks
that are to be maintained) will lead to either diversion of resources or inefficient utilization of
the same. It would be a simple matter to gauge the relative valuation of the relevant assets
and use it for determining the fund flow using this criterion with the condition that these be
used for precisely the purpose of O&M of water, education and road assets.
Why Water, Education and Roads
As far as water is concerned it is the life line of civilizations, it is said that the next
world war will be fought about water. It is important to combine all the assets created via
schemes that look at the consumption (drinking/conservation/wells) as well as the investment
(minor irrigation schemes/harvesting) aspects and play them through the instrumentality of
local bodies. The water programmes are not functioning properly especially the ones with
respect to minor irrigation. Indeed the technical committee on water shed development has
opined that given the estimate of about Rs.1,50,000 crore and the actual devolution is
woefully short, there is a good case for combining all related centrally sponsored schemes. It
has been noted that such programs alone will be the saviors of agriculture in rain fed regions.
Of course, in case of drought prone areas there would have to be a different approach. There
is evidence to show that the political empowerment of women have also thrown up such
schemes as perceived priorities so that acceptability will not be an issue (for all assertions
made above see, India Infrastructure Reports especially 2007 dealing with Rural
Infrastructure, also see Annual Report of RDD, GoI 2007, Shubham Chaudhary, 2007 and
N.A. Mujumdar, 2007).
Education as a constituent of development – rather than an instrument – needs no
argument, especially post Amartya Sen’s Development as Freedom (Sen, 1999). But its
delivery through various schemes (notably Sarva Shiksha Abhiyan) as now designed is
34
unsatisfactory. Whilst we have – because of constraints of data – considered only Primary
and Secondary level education, the vocational component needs to be considered too. The
externality of such reorganization will be that the utilization/service delivery – via
accountability – will improve and through impetus to the rural hubs initiative, livelihoods will
be created, which alone is the surest way of empowerment.
The road connectivity leads to remarkable impact on the lives of the rural folk, as has
been amply documented. As Narayan et al have pointed out (See, India Infrastructure Report
2007), the prevailing conditions make it difficult for people to get their goods to the market
or for people to get to their place of work or indeed to access health in emergency and
generally to access public services.
Here one ought to emphasize that there are two elements viz., health and power that
we have left out that are generally recognized as important. The reason is that whilst some
elements (extension) can be incorporated, prioritization requires that things be kept at
manageable levels and also that there are indications (from experience elsewhere) that given
the skill demands of both these sectors and the prevailing situation these are not sectors that
lend themselves to easy and successful decentralization. Before we get on with the job of
estimation of O&M and hence devolution to local bodies, we may enter a caveat. The data
and the norms are not completely satisfactory. It is clear that once the SFCs perform their
task properly will this problem be settled meaningfully. The question is that in the absence
of such an event and in the interim what is to be done. Making use of some of the well
known studies/sources we have given thumb-rule norms (that could well be refined).
Estimation of Grants to Local Bodies
In the present study, we have confined our analysis to the computation of local body
grants and State-wise shares in the total local body grants, without segregating urban and
rural local bodies, owing to the data and time constraints. As already mentioned, we have
concentrated on the operation and maintenance expenditure on water, education and roads.
We have considered wells and minor irrigation projects in the area of water, primary and
secondary schools in education and municipal and surfaced and un-surfaced village/ZP roads

35
in the case of roads6. The O&M expenditure norms in rupees terms used in the present study
for the different types of assets are given in Table 12.
Table 12: O&M Expenditure norms for Assets
Asset O&M Expenditure Norm
Source
Wells Rs.2,000/year/well 10 % of the amount needed for the minor irrigation
Minor irrigation Rs.20,000/year/minor irrigation
5 % of the total cost of minor irrigation*
Primary schools Rs.5,000/teacher/month Education Budget Allocation and National Education Goals: Implications for Teacher Salary Level by Pankaj. S. Jain, 2006
Secondary schools Rs.6,000/teacher/month 10 % more than the primary school
Surfaced road Rs.20,000/km/year India Infrastructure Report, 2007
Un-surfaced road Rs.2,000/km/year 10 % of the expenses for surfaced road
*The maximum limit for setting up a minor irrigation project is Rs.400000.
We have used the following simple equation to arrive at the O&M requirements of the
local bodies.
O&M requirement = n*P + n*S + n*W + n*M + n*SR + n*USR
Where,
n = respective norms as given in text table 11.
P = number of primary schools
S = number of secondary schools
W = number of wells
M = number of minor irrigation projects
SR = length of surfaced road
USR = length of un-surfaced road
Based on these information, we have estimated the O&M expenditure requirement of
the local bodies at Rs.1,88,902 crore for the period 2010-11 to 2014-20157. It may be recalled 6 We have collated the state-wise data on these assets from the website indiastat.com. The limitations of the data are detailed in Appendix IV. The raw data on all the assets used in the present study are also provided in Appendix IV.

36
that the TFC had recommended Rs.25,000 crore (0.7 per cent of GDP for the year 2005-06)
as grants to local bodies. If the ThFC wants to retain the ratio of local body grants to GDP at
0.7 per cent, it would have to increase the local body grants to Rs.47,880 crore. However,
given the pathetic fiscal position of local bodies, the urgent need for maintaining the public
assets and the problems associated with the SFCs and their recommendations, an increase in
the ratio of local body grants to GDP from 0.7 per cent to at least 1.4 per cent seems
legitimate. Further, as already mentioned, the size of local government in India (1.75 per cent
of GDP) is far below the international standards. Thus, apart from enabling the local bodies
to raise more revenues on their own, there is an urgent need to increase the revenue transfers
from the higher levels of Government to the local bodies in India. In this context, it is
important to ensure a gradual increase in the local body grants to GDP ratio by the successive
Finance Commissions.
Further, the share of grants in the total FC transfers stands at 13 per cent in India. The
TFC has already opined that there is a need to increase the amount of grants in the total FC
transfers with a view to bringing in more predictability to the FC transfers. As per the
recommendations of the Twelfth FC, grants for local bodies is the most important grant after
the post devolution non-plan revenue deficit grant, constituting 17.5 per cent of the total FC
grants. However, with the revenue account of the State Governments turning into a surplus in
the recent years, the post devolution non-plan revenue deficit grant will become insignificant
during the award period of the Thirteenth FC. Thus, the Thirteenth FC may afford to raise the
ratio of local body grants to the total FC grants as well as ratio of FC grants to the total FC
transfers during its award period. This will be a welcome development from the point of view
of the predictability of the FC transfers.
It may be mentioned that a FC grant of 1.4 per cent of GDP would be able to finance
at least 50 per cent of the O&M requirements of the local bodies. Out of the remaining
requirement, a part may be financed by the respective State Governments and a part may be
financed by the local bodies themselves. Accordingly, the respective State Governments may
finance 30 per cent of the total requirement and 20 per cent may be financed by the local
bodies themselves. Thus, the respective shares of each tier of the government in the total
O&M requirement are given in Table 13.
7 Detailed tables are given in Appendix V.

37
Table 13: Shares of different tiers of Government in the total O&M Requirement of the local bodies
(Amount in Rs.crore) Tier of Government Share of O&M requirement As per cent of GDP 2010-11
Central Government 94,451 1.4
State Governments 56,671 0.8
Local Governments 37,780 0.6
Total Requirement 1,88,902 2.8
Note: GDP for year 2010-11 has been projected using three year moving average growth rate.
Distribution of Local Body Grants among the State Governments
In this section we present a formula for distributing the local body grants among the
State Governments. It may be recalled that the Eleventh Finance Commission (EFC) and the
TFC had distributed the grants based on formulae. The various components of the formula
included population, area, revenue effort and distance from the highest per capita income.
The EFC had used index of decentralization and the TFC had used the index of deprivation
apart from the above-mentioned criteria. In the present study, we present two different
devolution methodologies: (i) one simple formula based on population, area and share in
O&M requirements and (ii) a refined formula by incorporating fiscal capacity and taking
population and area in relation to the assets along with the respective shares in O&M
requirements.
We admit the relevance of population and area for distributing the local body grants.
Thus, in our simple devolution formula, we have used these two criteria to calculate the
shares of States. However, we have decided to use them in relation to the assets in the refined
version of the formula.
We are not fully convinced with the logic of using revenue effort of the State
Government as a criterion for distributing the local body grants. We are of the view that the

38
local bodies should not be penalized for the fiscal laggardness of the State to which they
belong. We can take revenue effort of the State Governments as a criterion if the end use of
the grant rests with the State Government. In the case of local body grants the State
Government is only a mediator between the Central Government and the local bodies. The
revenue effort of the local body too is circumscribed by the over bearing State Acts that are
biting and non-uniform across States. We do not therefore believe that the time is yet ripe for
this to be a part of the devolution formula at the local body level.
As a proxy for the fiscal capacity of the State Governments, distance from the highest
per capita income is a good indicator for distributing the local body grants. However, in the
present Study we have calculated the fiscal capacity of the State Governments in relation to
the O&M requirements of the local bodies. We feel that this is more appropriate because the
whole purpose is to distribute grants for the O&M requirements of the local bodies.
It is true that decentralization in its all forms, fiscal, political and administrative, have
to be encouraged in the country. The comprehensive one available through the NCAER
report is – we fear – not very practical given the data constraints. Perhaps the present FC
could evolve a simple and transparent (and verifiable) formula that follows the 3Fs and uses
it. However, we do not agree with the idea of using index of decentralization in the
devolution formula for achieving this end. Decentralization in a particular State depends on
the political ideology of the ruling party of the State. The local bodies should not be punished
for the anti-decentralization stand of the State Governments. Instead, some measure of
decentralization can be a good criterion for the statutory tax devolution to the States so that
the pro-decentralization States may receive an add-on while others lose out.
We are of the view that the index of deprivation which is calculated on the basis of
lack of safe drinking water, lack of latrines within the house and lack of access to good
sanitation facilities is not a good indicator for distributing the local body grants. It may be
mentioned that creation of assets for reducing deprivation is not under the purview of FC.
Instead Planning Commission through the plan grants can take care of this aspect. Under the
present federal set up in India, FC is concerned only about the O&M expenditure of the assets
which are already created through the plans.
Thus, we feel that for distributing the local body grants which is primarily meant for
meeting the O&M expenditure of the local bodies on water, education and roads, the FC
should give utmost priority to the share of each State in the total O&M requirements. Thus, in

39
the simple devolution formula we have given 60 per cent weight to this criterion, the other
two criteria being population and area with a weight of 20 per cent each. The share of each
State in the total grants to local bodies based on this devolution formula is given in Table 14.
Table 14: State-wise Shares in Local Body Grants (Formula 1)
State Share in Local body Grant
Andhra Pradesh 7.3Arunachal Pradesh 0.7Assam 3.1Bihar 4.3Chhattisgarh 3.0Goa 0.1Gujarat 4.3Haryana 1.6Himachal Pradesh 1.1Jammu and Kashmir 2.6Jharkhand 1.4Karnataka 5.8Kerala 3.0Madhya Pradesh 10.3Maharashtra 10.3Manipur 0.5Meghalaya 0.5Mizoram 0.3Nagaland 0.4Orissa 5.2Punjab 1.9Rajasthan 8.8Sikkim 0.1Tamil Nadu 4.6Tripura 0.6Uttar Pradesh 13.3Uttarakhand 0.9West Bengal 4.1Total 100.0

40
The merit of formula 1 is its computational simplicity. However, the lack of
consideration of fiscal capacity of the States while distributing the grants to the States is the
major drawback of this formula. Thus, in the next section we present a refined formula by
incorporating fiscal capacity.
A Refined Variant of the Devolution Formula
In the refined devolution formula, we have given a weight of 50 per cent to the share
of O&M requirement of each state in the total requirement.
The fiscal capacity of the State Governments is the second factor which should
receive priority after the O&M requirement while distributing the local body grants among
the State Governments. This is because of the fact that different State Governments are
differently placed in their capacity to finance expenditure. As already mentioned, the
respective State Governments have to bear 30 per cent of the respective O&M requirement of
the local bodies. We have calculated the 30 per cent of the O&M requirement of each State as
a per cent of respective GSDPs (Table 15).

41
Table 15: State’s shares in the total O & M Requirements (Amount in Rs. crore)
State State’s Share in O&M Per cent Requirements to GSDP Andhra Pradesh 3915 0.9 Arunachal Pradesh 168 3.1 Assam 1995 2.9 Bihar 1929 1.9 Chhattisgarh 1620 2.2 Goa 68 0.2 Gujarat 1948 0.5 Haryana 851 0.4 Himachal Pradesh 584 1.0 Jammu and Kashmir 985 2.6 Jharkhand 345 0.4 Karnataka 3397 1.0 Kerala 1994 0.9 Madhya Pradesh 6866 3.5 Maharashtra 6131 0.7 Manipur 262 3.3 Meghalaya 295 3.3 Mizoram 145 2.5 Nagaland 224 1.8 Orissa 3325 3.1 Punjab 1020 0.6 Rajasthan 5277 2.5 Sikkim 88 2.9 Tamil Nadu 2452 0.6 Tripura 423 2.7 Uttar Pradesh 8083 1.6 Uttarakhand 419 0.1 West Bengal 1864 0.4 Total 56671 0.8
Note: GSDP for the year 2010-11 estimated based on three year moving average growth rate has been used in this table.
It is evident from table 14 that some of the States, especially the north eastern States
and poor States such as MP, Orissa, etc. have to transfer a larger share of their GSDP to the
local bodies to finance 30 per cent of O&M requirements. We feel that while distributing the

42
local body grants the FC may consider this factor. In the present Study, we attach 25 per cent
weight to this criterion, viz., ‘fiscal capacity of the States’.
We have included a new criteria ‘population pressure on the assets’ with a weight of
12.5 per cent in the devolution formula instead of using population shares directly. We feel
that this is a meaningful criterion as far as the O&M expenditure are concerned since wear
and tear of the assets will be more if there is more population pressure on the assets.
We have used the following equation to arrive at the population pressure on assets8.
PPA = {w*(P/S) + w*(P/W) + w*(P/R)}/10000
Where,
PPA = Population Pressure on Assets
w = equal weight given to all the assets. We have fixed the value of w at 0.3333.
P = Population
S = schools (both primary and secondary)
W = assets in the area of water (wells and minor irrigation projects)
R = roads (both surfaced and un-surfaced)
In this context, it may be mentioned that population pressure on the public assets will
be less in a particular sector if the role of the private sector is more in that sector. This may be
a relevant argument in the case of developed regions as well as sectors like education and
health. However, we have decided to include this criterion in our devolution formula because
in the case of poorer rural areas and sectors like roads and water, we feel that the role of
private sector is insignificant.
The next criterion we have included in the devolution formula is the ‘inverse of asset
density’ with a weight of 12.5 per cent. It is well documented in the literature that there exists
cost differentials in providing public services first due to low density of population and
secondly due to mountainous terrain. We feel the same applies to O&M cost too. Thus, if
asset density is less, then maintaining those assets situated in isolated far off places will also
be high. Conversely, if inverse of asset density is more the state should receive more grants
for the operation and maintenance of assets. This is relevant in the hilly areas of the country,
the north eastern states, etc.
We have used the following equation to calculate the inverse of asset density9.
8 Detailed tables are given in Appendix VI. 9 Detailed tables are given in Appendix VII.

43
IAD = {w*(A/S) + w*(A/W) + w*(A/R)}/10000
Where,
IAD = Inverse of Asset Density
w = equal weight given to all the assets. We have fixed the value of w at 0.3333.
A = Area of the State
S = schools (both primary and secondary)
W = assets in the area of water (wells and minor irrigation projects)
R = roads (both surfaced and un-surfaced)
Based on the above discussion, the devolution formula for distributing the local body
grants is presented in Table 16.
Table 16: Devolution formula for distributing Local Body Grants
Criterion Weight
Share in total O & M requirements 50 %
Fiscal Capacity of States 25 %
Population Pressure on Assets 12.5 %
Inverse of Asset Density 12.5 %
Based on the formula presented in Table 16, we have worked out each state’s share in
the total local body grant of Rs.94,451 crore, which is given in Table 1710.
10 Detailed tables are given in Appendix VIII.

44
Table 17: State-wise Shares in Local Body Grants (Formula II)
State Share in Local body Grant
Andhra Pradesh 5.7Arunachal Pradesh 1.5Assam 3.9Bihar 3.4Chhattisgarh 3.5Goa 0.2Gujarat 3.4Haryana 1.3Himachal Pradesh 1.2Jammu and Kashmir 2.4Jharkhand 0.6Karnataka 5.5Kerala 3.1Madhya Pradesh 10.8Maharashtra 9.6Manipur 1.7Meghalaya 1.7Mizoram 1.3Nagaland 1.0Orissa 5.8Punjab 1.6Rajasthan 8.2Sikkim 1.3Tamil Nadu 4.3Tripura 1.7Uttar Pradesh 11.7Uttarakhand 0.6West Bengal 2.8Total 100.0

45
The shares calculated using the refined formula provided higher shares to the poorer
States, particularly Special Category States11. Table 18 provides a comparative picture of
devolution based on both the formulae.
Table 18: Comparison of Formula I and II
State Formula I Formula IIImprovement (+)/
Deterioration (-) Andhra Pradesh 7.3 5.7 -1.6 Arunachal Pradesh 0.7 1.5 0.7 Assam 3.1 3.9 0.8 Bihar 4.3 3.4 -0.8 Chhattisgarh 2.9 3.5 0.5 Goa 0.1 0.2 0.1 Gujarat 4.3 3.4 -0.8 Haryana 1.6 1.3 -0.2 Himachal Pradesh 1.1 1.2 0.1 Jammu and Kashmir 2.6 2.4 -0.2 Jharkhand 1.4 0.6 -0.7 Karnataka 5.8 5.5 -0.3 Kerala 3.0 3.1 0.2 Madhya Pradesh 10.4 10.9 0.5 Maharashtra 10.3 9.6 -0.7 Manipur 0.5 1.7 1.2 Meghalaya 0.5 1.7 1.2 Mizoram 0.3 1.3 1.0 Nagaland 0.4 1.0 0.7 Orissa 5.2 5.8 0.6 Punjab 1.9 1.6 -0.2 Rajasthan 8.8 8.2 -0.6 Sikkim 0.1 1.3 1.1 Tamil Nadu 4.6 4.3 -0.3 Tripura 0.6 1.7 1.1 Uttar Pradesh 13.3 11.7 -1.6 Uttarakhand 0.9 0.6 -0.3 West Bengal 4.1 2.8 -1.3
11 However, there are exceptions to this general trend. Among the special category States Jammu and Kashmir and Uttarakhand and among the poorer States Bihar, Jharkhand, Rajasthan and Uttar Pradesh experienced deterioration in their shares with the refined formula. Relatively low values for the population pressure on assets and inverse of asset density for these States are the reasons for these.

46
However, it may be mentioned that our analysis is tentative due to the inherent
limitations of the data we have used. The basic objective of this study is to illustrate a norm-
based methodology for estimating the local body grants as well as designing devolution
formula for distributing the same among the State Governments. The Thirteenth Finance
Commission with richer data and other resources may take a view based on further analysis.
V. Recommendations and Conclusion
To sum up, the fiscal position of local bodies both urban and rural does not seem to be
promising in India. These local level institutions have to be strengthened by giving more
revenue handles on the one hand and by transferring more resources on the other. The State
Governments have an active role to play in strengthening the local bodies. The finances of the
State Governments display a healthier picture in the post FRL period. However, the fiscal
correction process needs to be fine tuned by providing a micro design to the targets. This may
enable the State Governments to devolve more funds to the lower level without jeopardizing
the normal expenditure both revenue and capital of the State Governments.
The functioning of SFCs in different States documents a dismal picture in India even
after the 73rd and 74th constitutional amendments. In view of this, the CFC may bring in
tightened policy suggestions to enforce fiscal federalism at the third tier. The CFC may
suggest a uniform template for the SFCs and may treat the progress made in the arena of SFC
as a condition for the release of share in central taxes.
The FC grants to the local bodies may be determined on the basis of a normative
approach. The CFC may concentrate on the O&M expenditure requirement of the local
bodies since that is the major fiscal lacuna at the local level. Based on a normative
assessment with the available data the present study proposes a quantum jump in the grants to
local bodies from Rs.25,000 crore to Rs.94,451 crore (1.4 per cent of GDP for the year 2010-
11) for the five year period 2010-11 to 2014-15. This would amounts to roughly 0.3 per cent
of GDP every year. This could be split up into 20:80 shares for the urban and rural local
bodies respectively. In addition, the study also urges the CFC to set up an incentive fund flow
of around Rs. 6,000 crore for helping the local bodies to access the capital market.
In nutshell, the following are the important suggestions put forward in the present
study.
• Include a measure of decentralization in the devolution formula for the share
in central taxes.

47
• Keep the grants to local bodies unconditional.
• Ensure that the release of local body grants is evenly distributed over the fiscal
year.
• Ensure that the State Governments are transferring the local body grants
promptly and efficiently to the local Government level.
• Provide a uniform template to the SFCs.
• Incentivize the State Governments to set up a data warehouse for the local
bodies.
• Set up a central pool of fiscal experts from which the State Governments may
select at least one member of SFC.
• Provide a time line to the State Governments in link to the release of share in
central taxes for making progress in the arena of SFC.
• Estimate the grants to local bodies on a normative basis.
• Provide Rs.94,451 crore as the local body grant.
• Set up an incentive fund of Rs.6,000 crore for assisting the local bodies to
access capital market.
• Devolve the local body grant on a formula basis among the State
Governments.
• Till such time as the decentralization truly takes root and SFCs are well
established and recognized, talk directly to the local bodies (at the district
level), and think of transferring resources directly to them.
The study is an exercise to estimate local body grants based on a normative approach.
Based on operations and maintenance expenditure required for three major assets i.e. water,
education and roads, the amount of grants is estimated at Rs.94,451 crore for the local bodies
(both urban and rural). The study has also devised formulae (one simple and the other
refined) for distribution of the grants across the States. The Thirteenth Finance Commission
may take a view on the matter, based on further analysis with richer data.
48
References Agarwal, Amba (2005) Fiscal Decentralization: Financing of Panchayati Raj Institutions
in India, Serials Publications, New Delhi. Alagh, Y. K. et al., (2008) The State of Panchayats: 2007-08, An Independent
Assessment, Vol. I Thematic Report, IRMA for Ministry of Panchayati Raj Alagh, Y.K. (2005) Panchayati Raj and Planning in India: Participatory Institutions and
Rural Roads, Mimeo. Bardhan, P. and D. Mookherjee (eds) (2007) Decentralization and Local Governance in
Developing Countries: A Comparative Perspective, OUP, New Delhi. Bird Richard and Christine Wallich (1993) Fiscal Dentralization and Intergovernmental
Relations in Transition Economies, Policy Research Working Papers (Public Economics) No 1122, The World Bank.
Chattopahyay, R. and E. Duflo (2004) Impact of Reservation in Panchayati Raj: Evidence from a Nationwide Randomized Experiment, Economic and Political Weekly, February 28.
Chaudhary, Shubham (2007) What Difference Does A Constitutional Amendment Make? The 1994 Panchayati Raj Act and the Attempt to Revitalize Rural Local Governments in India, in Bardhan, P. and D. Mookherjee (eds) (2007) Decentralization and Local Governance in Developing Countries: A Comparative Perspective, OUP, New Delhi.
Dillinger, William and Steven Webb (1999) Fiscal Management in Federal Democracies: Argetina and Brazil, Policy Research Working Paper 2121 The World Bank.
Goel, S.L. and Shalini Rajneesh (2003) Panchayat Raj in India: Theory and Practice, Deep and Deep Publications Private Limited, New Delhi.
GoI (1987) Mid-Term Appraisal of Seventh Five Year Plan, Planning Commission, New Delhi.
GoM (2005) Consolidated Annual Report of the PRIs for the Year 2003-04, CAG, GoM, Mumbai.
GoM (2006) Third State Level Review: Yeshwant Panchayat Abhiyan 2006, RDD, GoM, Mumbai.
GoM (2007) State of Panchayati Raj: Status Report, Internal Mimeo, Department of Panchayati Raj, GoM, Mumbai
Govinda Rao and U.A. Vasanth Rao (2008) Expanding the Resource Base of Panchayats: Augmenting Own Revenues, Economic and Political Weekly, January.
Jain, L.C. (2005) Decentralization and Local Governance, Orient Longman Private Limited, Hyderabad.
Jha, S.N. and P.C. Mathur (eds) (1999) Decentralization and Local Politics, Sage, New Delhi.
John, M.S. and J. Chathukualm (2003) Measuring Decentralization: The Case of Kerala (India), Public Administration and Development, 33.
Karnik, Ajit (2005) State Finances: Continuous Deterioration, Bleak Prospects. Journal of Indian School of Political Economy. Vol. XVII No (3), July-September.
Kelkar, Vijay (2002) Consultation Paper of the Task Force on Indirect Taxes, Committee constituted by the Ministry of Finance and Company Affairs, GoI.
Kelkar, Vijay (2004) Report of the Task Force on Implementation of the Fiscal Responsibility and Budgetary Management Act, 2003, Ministry of Finance, GoI.

49
Konrad, Adenauer Foundation (1998) Local Government Finances in India, Manohar, New Delhi.
Mathew, George (2000) Status of Panchayati Raj in India, Institute of Social Sciences, New Delhi.
Mathur, Mukesh (2003) Panchayati Raj Institutions and the State Finance Commissions – A Report, 3i Network (ed) Indian Infrastructure Report: Public Expenditure Allocation and Accountability, OUP, New Delhi.
Ministry of Panchayati Raj (2006) The State of Panchayati Raj: A Mid-Term Review and Appraisal, November, New Delhi.
Misra, B.M. and J.K.Khundarkpam (2008) “Fiscal Consolidation by Central and State Governments: The Medium-Term Outlook”, Paper presented at Seminar on “Issues Before the Thirteenth Finance Commission” organized by the National Institute of Public Finance and Policy at New Delhi on May 24.
Mohanty, P. K. et al, (2007) Municipal Finance in India: An Assessment, DRG Study No. 26, RBI.
Mujumdar, N.A. (2007) Inclusive Growth: Development Perspectives in Indian Economy, Academic Foundation, New Delhi.
NCAER (2007) Working Index of Devolution for Assessing Environment for Panchayati Raj Institutions in the States: Empirical Assessment, Final Report submitted to UNDP and MoPR, mimeo.
Oates, Wallace (1972) Fiscal Federalism, New York, Harcourt Brace and Javanovich. Oommen, M.A. (2005) Rural Fiscal Decentralization in India: A Brief Survey of
Literature, in Jain, L.C. (ed) Decentralization and Local Governance, Orient Longman Private Limited, Hyderabad.
Oommen, M.A. (2005) Twelfth Finance Commission and Local Bodies, Economic and Political Weekly, May 14.
Pethe, Abhay (2008a) Issues for the 13th Finance Commission: Welcome to the Grey World of Trade Offs! Mimeo, Department of Economics, University of Mumbai.
Pethe, Abhay (2008b) Financing the Panchayat Raj Institutions: Flagging Some Issues for 13th Finance Commission, Invited Paper presented at the NIPFP conference, May 23-24, to be published in a book.
Pethe, Abhay and Mala Lalvani (2004) A Fair Plan Approach For Devolution Under The Twelfth Central Finance Commission: Some Suggestions, in Alagh, Y.K et al. Strategic Policy and Economic Reform, ORF New Delhi.
Pethe, Abhay and Mala Lalvani (2005) Comparative Study of Municipal Finances in Maharashtra: Patterns, Problems and Prospects, Urban India, Vol. XXV, No. 1.
Pethe, Abhay and Mala Lalvani (2006) Towards Economic Empowerment of ULBs in Maharashtra, Economic and Political Weekly of India (EPW), Vol. XLI no. 7 Feb. 18-24.
Pethe, Abhay and Mala Lalvani (2007) Report on Finances of the MMR Region, Study conducted for MTSU on advice of the World Bank. Unpublished Report.
Pethe, Abhay and Mala Lalvani (2008) Finances of Panchayati Raj Institutions: A simple Story but a Messy Plot, Study commissioned by IRMA for MoPR, Vibhooti Shukla Working Paper Series No. 28.
Pethe, Abhay, Ajit Karnik and Dilip Karmarkar (2002), “An Approach to Designing Inter-Governmental Transfers” a study dealing with “Evolving Criteria For Allocation Of Funds As Per The State Finance Commission Recommendations From The State To

50
Urban Local Bodies To Strengthen Decentralization Efforts By Urban Local Bodies”, unpublished report submitted to United Nations Development Programme (UNDP) and United Nations Centre For Human Settlements (UNCHS/UN-Habitat, May. Pethe, Abhay, Ajit Karnik and Dilip Karmarkar (2006) Developing A Quantitative
Framework for Determining Devolution of Funds from the State Government to Local Bodies in Local Governments in India: Decentralization and Beyond (eds) Niraja Jayal et. al., OUP.
Pethe, Abhay, Anita Rath and J.C. Sharma (2004) Reforming Property Tax System: Simulated Results for Mumbai City, Economic and Political Weekly, August 21.
Prud’homme, Remy (1995) The Dangers of Decentralization, World Bank Research Observer, Vol.10 No(2) August.
R.B.I. (2007) State Finances: A Study of Budgets 2007-08, Reserve Bank of India, November.
Raghuram, G., et al (1999) Infrastructure Development Financing: Towards a Public-Private Partnership, Macmillan India Limited.
Rajaraman, Indira (2003) A Fiscal Domain for Panchayats, OUP. Rajaraman, Indira (2006) Fiscal Features of Local Governments in India in J.J. Dethier
(ed) Governance, Decentralization and Reform in India, China and Russia, Kluwer. Rajaraman, Indira (2007) The Political Economy of Indian Fiscal Federation, Brookings-
NCAER Policy Forum. Rao, Govinda and Tapas Sen (1996) Fiscal Federalism in India: Theory and Practice,
Macmillan India Limited. Rao, PSN (ed) (2006) Urban Governance and Management: India Initiatives, Kanishka
Publishers, Distributors, New Delhi. Rodden, T, G. Eskeland and J. Litvak (eds) (2003) Fiscal Decentralization and the
Challenge of Hard Budget Constraints, Cambridge Mass: MIT Press. Roy, Ash Narain (2007) Cajoling and Compromise Drive India’s Multi-Party System,
Federations, Forum of Federations, Canada October-November. Roy, Bahl (1999) The Rules of Fiscal Decentralization, Georgia State University, Georgia. Rural Development Department (2007) Annual Report 2007, RDD, GoI. Sen, Amartya Kumar (1999), “Development as freedom”, OUP, New Delhi. Sethi, Geeta (2004) Fiscal Decentralization to Rural Governments in India, The World
Bank, OUP, New Delhi. Tanzi, Vito (1995) Fiscal Federalism and Decentralization: A Review of Some Efficiency
and Macroeconomic Aspects, Annual Bank Conference in Development Economics, Washington: World Bank.
Teresa, Ter-Minassian (ed) (1997) Fiscal Federalism in Theory and Practice, International Monetary Fund, Washington.
Three-i Network (2007) India Infrastructure Report: Rural Infrastructure, OUP. Tiebout, C. (1961) An Economic Theory of Fiscal Decentralization in Public Finance:
Need, Sources and Utilization, Princeton, New Jersey, Princeton University Press. Tony, Travers (2007) International Comparisons of Local Government Finance:
Propositions and Analysis, Downloaded from the internet on 16/02/08. Vaidyanathan, A. (2003) Rural Infrastructure in 3i Network (ed) India Infrastructure
Report 2003: Public Expenditure Allocation and Accountability, OUP, New Delhi.

51
Appendix I(a): First SFC Reports: Dates of Constitution, Report Submission & Action Taken
State Date of
Constitution of SFC
Date of Submission of SFC report
Date of Submission of ATR
Period covered By SFC
Andhra Pradesh
22.6.1994 31.5.1997 29.11.1997 1997-98 to 1999-2000
Arunachal Pradesh
21.5.2003 6.6.2003 3.7.2003 2003-04 to 2005-06
Assam 23.6.1995 29.2.1996 18.3.1996 1996-97 to 2000-01
Bihar 23.4.1994/ 2.6.1999 *
Not submitted Not submitted
-
Chattisgarh 22.8.2003 Not submitted - - Goa 1.4.1999 5.6.1999 12.11.2001 2000-01 to
2004-05 RLBs-13.7.1998,
Gujarat 15.9.1994
ULBs Oct., 1998
Submitted 1996-97 to 2000-01
Haryana 31.5.1994 31.3.1997 1.9.2000 1997-98 to 2000-01
Himachal Pradesh
23.4.1994 30.11.96 5.2.1997 1996-97 to 2000-01
Jammu & Kashmir
24.4.2001 May,2003 Not submitted
2004-2005 ( Interim)
Jharkhand 28.01.2004 Not submitted Not specified RLBs-5.8.1996, Karnataka 10.6.1994 ULBs 30.1.1996
31.3.1997 1997 -98 to 2001-02
Kerala 23.4.1994 29.2.1996 13.3.1997 1996-97 to 2000-01
Madhya Pradesh
17.8.1994 20.7.1996 20 7. 1996 1996-97 to 2000-01
Maharashtra 23.4.1994 31.1.1997 5.3.1999 1996-97 to 2000-01 #
Manipur 22.4.1994/ 31.5.1996
December, 1996
28.7.1997 1996-97 to 2000-01
73rd Amendment not applicable as traditional Local Meghalaya SFC not yet constituted Institution of Self Government exists in these States
Mizoram SFC not yet constituted

52
Nagaland SFC not yet constituted
Orissa 21.11.1996/ 24.8.1998 *
30.12.1998 9.7.1999 1998-99 to 2004-05 $
Punjab July, 1994 31.12.1995 13.9.1996 1996-97 to 2000-01
Rajasthan 23.4.1994 31.12.1995 16.3.1996 1995-96 to 1999-2000
Sikkim 23.4.1997/ 22.7.1998 *
16.08.1999 June, 2000 2000-01 to 2004-05
Tamil Nadu 23.4.1994 29.11.1996 28.4.1997 1997-98 to 2001-02
RLBs-23.4.1994, RLBs-12.1.1996,
RLBs-O 1.04.1997
RLBs-Jan.1996. Jan.2001
Tripura
ULBs-19.8.1996 ULBs 17.9.1999
ULBs-27.11.2000
ULBs-1999-00 to 2003-04
Uttar Pradesh 22.10.1994 26.12.1996 20.1.1998 1996-97 to 2000-01
Uttaranchal 31.1.2001 2002 3.7.2004 2001-02 to 2005-06
West Bengal 30.5.1994 27.11.1995 22.7.1996 1996-97 to 2000-01
*: Date of reconstitution. In case of Gujarat, the SFC report on RLBs was submitted prior to the reconstitution of the SFC. #: As per the ATR, the SFC recommendations shall be effective from 1.4.1999. $: Though SFC was asked to submit the report covering a period of five years w.e.f. 1.4.1998, its report covers the period from 1998-99 to 2004-05. Source: Report of the Twelfth Finance Commission, Government of India, 2004.

53
Appendix I(b) : Second SFC Reports: Details of Constitution, Report Submission & Action Taken
Sl. No
State Date of Constitution of SFC
Date of submission of SFC report
Date of submission of ATR
Period covered by SFC
1. Andhra Pradesh 8.12.1998 19.08.2002 31.3.2003 2000-01 to 2004-05
2. Arunachal Pradesh
Not constituted
3. Assam 18.4.2001 18.08.2003 Not submitted 2001-02 to 2005-06
RLB-September, 2001
Not submitted 4. Bihar June,1999
ULB- January, 2003
Not submitted
5. Chattisgarh Not constituted 6. Goa Not constituted 7. Gujarat 19.11.2003 Not submitted 2005-06
to 2009-10
8. Haryana 6.9.2000 Not submitted 2001-02 to 2005-06
9. Himachal Pradesh
25.5.1998 24.10.2002 24.06.2003 2002-03 to 2006-07
10. Jammu & Kashmir
Not constituted
II. Jharkhand Not constituted 12. Karnataka October, 2000 December, 2002 Not submitted 2003-04
to 2007-08
13. Kerala 23.06.1999 January, 2001 Not submitted 2000-01 to 2005-06
14. Madhya Pradesh
17.06.1999 July, 2003 Not submitted 2001-02 to 2005-06
15. Maharashtra 22.06.1999 30.3.2002 Not submitted 2001-02 to

54
2005-06 16. Manipur 03.01.2003 Submitted Not submitted 2001-02
to 2005-06
17. Meghalaya 18. Mizoram 19. Nagaland 20. Orissa 5.6.2003 25.10.2003 Not submitted 2005-06
to 2009-10
21. Punjab Sep., 2000 15.2.2002 08.06.2002 2001-02 to 2005-06
22. Rajasthan 07.05.1999 30.08.200 I 26.03.2002 2000-01 to 2004-05
23. Sikkim July, 2003 Not submitted * 24. Tamil Nadu 2.12.1999 21.5.2001 8.5.2002 2002-03
to 2006-07
25. Tripura 29.10.1999 10.4.2003 Not submitted 2003-04 to 2007-08
26. Uttar Pradesh February, 2000 June, 2002 30.04.2004 2001-02 to 2005-06
27. Uttaranchal Not constituted 28. West Bengal 14.7.2000 6.2.2002 Not submitted 2001-02
to 2005-06
Constitution of Third SFCs 3. Rajasthan 15-09-2005 February, 2008 2005-06
to 2009-10
4. Tamil Nadu 14-12-2004 September, 2006
May, 2007 2007-08 to 2011-12
* No specific period of coverage has been prescribed.
Source: (1) Report of the Twelfth Finance Commission, Government of India, 2004.
(2) Report of the Third Finance Commissions of Rajasthan and Tamil Nadu.

55
Appendix II: Functions of Urban Local Bodies – Twelfth Schedule of Constitution of India 1. Urban Planning including town planning. 2. Regulation of land use and construction of buildings. 3. Planning for economic and social development. 4. Roads and bridges. 5. Water supply for domestic, industrial and commercial purposes. 6. Public health, sanitation conservancy and solid waste management. 7. Fire services. 8. Urban forestry, protection of the environment and promotion of ecological aspects. 9. Safe-guarding the interest of weaker sections of society, including the handicapped
and mentally retarded. 10. Slums improvement and upgrading. 11. Urban poverty alleviation. 12. Provision of urban amenities and facilities such as parks, gardens and
playgrounds. 13. Promotion of cultural, educational and aesthetic aspects. 14. Burials and burial grounds; cremations, cremation grounds and electric crematoriums 15. Cattle pounds; prevention of cruelty to animals. 16. Vital statistics, including registration of births and deaths. 17. Public amenities, including street lighting, parking lots, bus stops and public
conveniences. 18. Regulation of slaughter houses and tanneries.

56
Appendix III: Functions of Panchayat Raj Institutions – Eleventh Schedule of the Constitution of India
No. Description Category 1 Agriculture including agricultural extension Agriculture and allied 2 Land improvement, land reforms, land
consolidation, soil conservation Agriculture and allied
3 Minor irrigation, water management, watershed development
Agriculture and allied
4 Animal husbandry, dairy, poultry Agriculture and allied 5 Fisheries Agriculture and allied 6 Social forestry, farm forestry Agriculture and allied 7 Minor forest produce Agriculture and allied 8 Small scale industries Industries 9 Khadi, village, cottage industries Industries 10 Rural housing Welfare 11 Drinking water Core 12 Fuel and fodder Agriculture and allied 13 Roads, culverts, bridges, ferries, waterways Core 14 Rural electrification, electricity distribution Core 15 Non-conventional energy sources Welfare 16 Poverty alleviation programs Welfare 17 Education, including primary and secondary
schools Welfare
18 Technical training and vocational education Welfare 19 Adult and non-formal education Welfare 20 Libraries Welfare 21 Cultural activities Welfare 22 Markets and fairs Agriculture and
allied 23 Health and sanitation, hospitals, primary health
centres, dispensaries Core
24 Family welfare Welfare 25 Women and child development Welfare 26 Social welfare, welfare of handicapped and
mentally retarded Welfare
27 Welfare of weaker sections, Scheduled Castes and Tribes
Welfare
28 Public distribution system Welfare 29 Maintenance of community assets Core

57
Appendix IV – Limitations of the Data
We have collated the State-wise data on number of primary schools, secondary
schools, municipal roads (surfaced and unsurfaced), major district roads, village roads,
number of minor irrigation projects and wells from the website indiastat.com. Data on
primary and secondary schools are as per the year 2004-05. We have taken the number of
schools categorized as ‘middle senior basic schools’ in the website indiastat.com as the
secondary schools in our study. Similarly, we have taken the number of schools categorized
as ‘primary junior basic school’ as the primary schools in our study. Data for all the States
including the three newly created States were available on the web site.
The data on major district roads as well as on village roads are as on February 2002. It
is mentioned that data on major district roads and village roads for the three newly created
States such as Chhattisgarh, Jharkhand and Uttarakhand are included under the respective
parent States such as Madhya Pradesh, Bihar and Uttar Pradesh, respectively. We have used
the population ratios of 73.3797 and 26.6203 for Madhya Pradesh and Chhattisgarh, 74.71
and 25.29 for Bihar and Jharkhand, and 94.9676 and 5.0324 for Uttar Pradesh and
Uttarakhand, respectively to arrive at the length of major district roads in each of the States.
The data on village roads were included under the major district roads for some States such as
Andhra Pradesh, Bihar and Mizoram. Data on village roads were not available for a number
of States such as Gujarat, Haryana, Maharashtra, Punjab, Sikkim and West Bengal. The data
on municipal roads were not available for a number of States such as Arunachal Pradesh,
Chhattisgarh, Jharkhand, Mizoram, Nagaland, Sikkim and Uttarakhand.
The data on wells were as on November 2000. The data on wells were not available
for Jharkhand and Uttarakhand. Data on minor irrigation were not available for Chhattisgarh,
Gujarat, Karnataka, Maharashtra, Jharkhand, Uttarakhand and Tamil Nadu.
All possible efforts have been made to trace the required data for the Study. Non-
availability of data in respect of a few States in certain sectors, however, would have
implications for the findings of the Study. The raw data on all the above-mentioned assets are
given in the table.
Continued..

58
State-wise Data on Assets
State Primary schools
Secondary schools
Wells Minor irrigation
District roads
Village roads
Municipal roads
Andhra Pradesh 61680 16667 837 4641 141079 N.A. 9024.7Arunachal Pradesh 1371 495 22 50 12169 4657 N.A.Assam 30068 8143 214 419 26416 44135 1017Bihar 39347 10963 354 4147 45541 N.A. 2011.1Chhattisgarh 33595 10799 303 N.A. 225152 12556 N.A.Goa 1003 73 58 18 4462 3974 426Gujarat 16385 22623 579 N.A. 51555 N.A. 10723.6Haryana 11800 2269 352 2274 19651 N.A. 2926.9Himachal Pradesh 11178 2210 84 193 20772 560 903.5Jammu and Kashmir 12049 4239 201 356 7671 3372 441Jharkhand 16572 4933 N.A. N.A. 15416 N.A. N.A.Karnataka 26645 26816 857 N.A. 108506 4665 6854.9Kerala 6827 3049 210 424 18504 107988 10217.6Madhya Pradesh 96737 34641 549 5129 620640 34610 9368.2Maharashtra 41669 26295 693 N.A. 299608 N.A. 13304.1Manipur 2552 831 25 31 6638 2172 73.4Meghalaya 5851 1759 52 77 5416 604 26.4Mizoram 1481 939 3 8 3518 N.A. N.A.Nagaland 1520 480 11 66 13754 5137 N.A.Orissa 45700 15893 626 1401 38542 189445 9763.2Punjab 13352 2503 117 6777 42757 N.A. 3974.4Rajasthan 55942 26201 761 4133 72078 44287 3190.6Sikkim 684 185 31 20 1502 N.A. N.A.Tamil Nadu 33470 7111 579 N.A. 51010 72470 10451.3Tripura 1776 1001 48 41 5569 7912 160.7Uttar Pradesh 129976 36874 526 12357 114841 30383 39554Uttarakhand 14663 3861 N.A. N.A. 6086 1610 N.A.West Bengal 50397 1929 212 2797 44864 N.A. 15756.1
Concluded.

59
Appendix V – Estimation of O & M requirements of the Local Bodies for one year
(Rs. crore)
State Education Water RoadsO&M
requirements Andhra Pradesh 2300 9.4 300 2610 Arunachal Pradesh 78 0.1 34 112 Assam 1186 0.9 143 1330 Bihar 1183 8.4 95 1286 Chhattisgarh 605 0.1 475 1080 Goa 28 0.0 18 45 Gujarat 1174 0.1 125 1299 Haryana 517 4.6 45 567 Himachal Pradesh 344 0.4 44 389 Jammu and Kashmir 633 0.8 23 657 Jharkhand 199 0.0 31 230 Karnataka 2024 0.2 240 2264 Kerala 1055 0.9 273 1329 Madhya Pradesh 3238 10.4 1329 4577 Maharashtra 3461 0.1 626 4087 Manipur 157 0.1 18 175 Meghalaya 184 0.2 12 196 Mizoram 90 0.0 7 97 Nagaland 111 0.1 38 149 Orissa 1738 2.9 476 2216 Punjab 573 13.6 93 680 Rajasthan 3271 8.4 239 3518 Sikkim 55 0.0 3 58 Tamil Nadu 1366 0.1 268 1634 Tripura 255 0.1 27 282 Uttar Pradesh 4994 24.8 370 5389 Uttaranchal 264 0.0 15 279 West Bengal 1115 5.6 121 1242 Total 32,199 92.4 5,489 37,780

60
Appendix VI– Estimation of Population Pressure on Assets
Population Pressure on Assets State Population Education Water Roads Index Andhra Pradesh 75727541 927 1603 505 0.1011 Arunachal Pradesh 1091117 555 2085 65 0.0902 Assam 26638407 669 6054 372 0.2365 Bihar 82878796 1579 1981 1743 0.1767 Chhattisgarh 20795956 447 68634 87 2.3054 Goa 1343998 1232 5659 152 0.2347 Gujarat 50596992 1162 87387 812 2.9784 Haryana 21082989 1452 913 934 0.1099 Himachal Pradesh 6077248 439 3011 273 0.1241 Jammu and Kashmir 10069917 588 2679 877 0.1381 Jharkhand 26909428 1196 0 1746 0.0981 Karnataka 52733958 896 61533 439 2.0954 Kerala 31838619 3036 7155 233 0.3474 Madhya Pradesh 60385118 437 1165 91 0.0564 Maharashtra 96752247 1321 139614 309 4.7077 Manipur 2388634 673 7214 269 0.2718 Meghalaya 2306069 290 2822 381 0.1164 Mizoram 891058 342 11237 253 0.3943 Nagaland 1988636 949 2976 105 0.1343 Orissa 36706920 567 2508 154 0.1076 Punjab 24289296 1485 358 520 0.0787 Rajasthan 56473122 646 1342 472 0.0820 Sikkim 540493 597 2338 360 0.1098 Tamil Nadu 62110839 1479 107273 464 3.6401 Tripura 3191168 1072 6980 234 0.2762 Uttar Pradesh 166052859 953 1338 899 0.1063 Uttarakhand 8479562 439 0 1102 0.0514 West Bengal 80221171 1522 2846 1323 0.1897

61
Appendix VII – Inverse of Asset Density
Inverse of asset density State Area education water roads Index Andhra Pradesh 275,068 3.4 5.8 1.8 0.0004 Arunachal Pradesh 83,743 42.6 160.1 5.0 0.0069 Assam 78,483 2.0 17.8 1.1 0.0007 Bihar 94,164 1.8 2.3 2.0 0.0002 Chhattisgarh 135,194 2.9 446.2 0.6 0.0150 Goa 3,702 3.4 15.6 0.4 0.0006 Gujarat 196,024 4.5 338.6 3.1 0.0115 Haryana 44,212 3.0 1.9 2.0 0.0002 Himachal Pradesh 55,673 4.0 27.6 2.5 0.0011 Jammu and Kashmir 222,236 13.0 59.1 19.4 0.0030 Jharkhand 79,700 3.5 0.0 5.2 0.0003 Karnataka 191791 3.3 223.8 1.6 0.0076 Kerala 38,863 3.7 8.7 0.3 0.0004 Madhya Pradesh 308,144 2.2 5.9 0.5 0.0003 Maharashtra 307,713 4.2 444.0 1.0 0.0150 Manipur 22,327 6.3 67.4 2.5 0.0025 Meghalaya 22,429 2.8 27.4 3.7 0.0011 Mizoram 21,081 8.1 265.8 6.0 0.0093 Nagaland 16,579 7.9 24.8 0.9 0.0011 Orissa 155,707 2.4 10.6 0.7 0.0005 Punjab 50,362 3.1 0.7 1.1 0.0002 Rajasthan 342,236 3.9 8.1 2.9 0.0005 Sikkim 7,096 7.8 30.7 4.7 0.0014 Tamil Nadu 130,058 3.1 224.6 1.0 0.0076 Tripura 10,492 3.5 22.9 0.8 0.0009 Uttar Pradesh 238,566 1.4 1.9 1.3 0.0002 Uttaranchal 53,566 2.8 0.0 7.0 0.0003 West Bengal 88,752 1.7 3.1 1.5 0.0002

62
Appendix VIII – Calculation of Shares of each State in the local body grants
Calculation of Shares of each State in Local Body Grants
State
Fiscal
Capacity
Inverse of
AssetDensity
PopulationPressure
onAssets
Share of
O & M
Needs
Total
Shares of
Each State
Andhra Pradesh 0.2249 0.0000 0.0126 3.4540 3.6915 5.7Arunachal Pradesh 0.7778 0.0009 0.0113 0.1481 0.9380 1.5Assam 0.7139 0.0001 0.0296 1.7604 2.5039 3.9Bihar 0.4757 0.0000 0.0221 1.7020 2.1998 3.4Chhattisgarh 0.5545 0.0019 0.2882 1.4296 2.2741 3.5Goa 0.0519 0.0001 0.0293 0.0599 0.1413 0.2Gujarat 0.1160 0.0014 0.3723 1.7186 2.2083 3.4Haryana 0.1034 0.0000 0.0137 0.7506 0.8677 1.3Himachal Pradesh 0.2560 0.0001 0.0155 0.5152 0.7869 1.2Jammu and Kashmir 0.6464 0.0004 0.0173 0.8690 1.5331 2.4Jharkhand 0.0992 0.0000 0.0123 0.3040 0.4155 0.6Karnataka 0.2620 0.0010 0.2619 2.9968 3.5217 5.5Kerala 0.2157 0.0001 0.0434 1.7594 2.0186 3.1Madhya Pradesh 0.8846 0.0000 0.0071 6.0579 6.9495 10.8Maharashtra 0.1799 0.0019 0.5885 5.4092 6.1794 9.6Manipur 0.8140 0.0003 0.0340 0.2314 1.0796 1.7Meghalaya 0.8307 0.0001 0.0146 0.2600 1.1054 1.7Mizoram 0.6342 0.0012 0.0493 0.1280 0.8126 1.3Nagaland 0.4535 0.0001 0.0168 0.1974 0.6679 1.0Orissa 0.7838 0.0001 0.0135 2.9334 3.7306 5.8Punjab 0.1394 0.0000 0.0098 0.8997 1.0489 1.6Rajasthan 0.6344 0.0001 0.0103 4.6562 5.3009 8.2Sikkim 0.7372 0.0002 0.0137 0.0773 0.8284 1.3Tamil Nadu 0.1520 0.0010 0.4550 2.1631 2.7711 4.3Tripura 0.6629 0.0001 0.0345 0.3734 1.0710 1.7Uttar Pradesh 0.3897 0.0000 0.0133 7.1318 7.5348 11.7Uttaranchal 0.0202 0.0000 0.0064 0.3697 0.3963 0.6West Bengal 0.1098 0.0000 0.0237 1.6442 1.7777 2.8
Copyright © 2022 FDOKUMEN