Augmenting Transformers with Expert Knowledge for Indoor ...
18
ATEK: Augmenting Transformers with Expert Knowledge for Indoor Layout Synthesis KURT LEIMER, TU Wien, Austria and NJIT, USA PAUL GUERRERO, Adobe Research, UK TOMER WEISS, NJIT, USA PRZEMYSLAW MUSIALSKI, NJIT, USA Data Expert Knowledge Loss Transformer Synthesis u v v l v g S = (F , ...) 0 F 1 , S = (F , , ,...) 0 F 1 F 2 S = (F , , , ,...) 0 F 1 F 2 F 3 S = (F , , , , ,..., s) 0 F 1 F 2 F 3 F 4 S = (F , ...) 0 V0: V2: + V3: ( - ) + V1: ( - ) Fig. 1. Our layout generation method combines data-driven learning with other manually added sources, e.g., expert knowledge. Leſt, input from data and from expert knowledge in ergonomics. Middle, transformer training: We propose four different loss-functions (V0,V1,V2,V3), where we incorporate expert knowledge in different ways. Right: a set of generated room layouts using the trained Transformer. We address the problem of indoor layout synthesis, which is a topic of con- tinuing research interest in computer graphics. The newest works made significant progress using data-driven generative methods; however, these approaches rely on suitable datasets. In practice, desirable layout properties may not exist in a dataset, for instance, specific expert knowledge can be missing in the data. We propose a method that combines expert knowledge, for example, knowledge about ergonomics, with a data-driven generator based on the popular Transformer architecture. The knowledge is given as differentiable scalar functions, which can be used both as weights or as additional terms in the loss function. Using this knowledge, the synthesized layouts can be biased to exhibit desirable properties, even if these properties are not present in the dataset. Our approach can also alleviate problems of lack of data and imperfections in the data. Our work aims to improve gener- ative machine learning for modeling and provide novel tools for designers and amateurs for the problem of interior layout creation. CCS Concepts: • Computing methodologies → Neural networks; Com- puter graphics. Additional Key Words and Phrases: neural networks, layout synthesis, inte- rior design, Transformers, ergonomic layouts 1 INTRODUCTION Indoor spaces play a crucial role in our everyday lives and serve a number of essential purposes. The problem of indoor layout design (apartment layout, workplace layout) has been tackled for a long time across several disciplines, including architectural design [Pile and Gura 2013] and ergonomics [Kroemer 2017]. That is because Authors’ addresses: Kurt Leimer, [email protected], TU Wien, Austria , NJIT, USA; Paul Guerrero, Adobe Research, UK, [email protected]; Tomer Weiss, NJIT, USA, [email protected]; Przemyslaw Musialski, NJIT, USA, [email protected]. the furniture arrangement in a room is inherently connected with the geometry and functionality of the space, but also with other aspects, like usability, aesthetics, cost-effectiveness, or quality. In this paper, we address the problem of data-driven layout synthe- sis, which recently has again become a research focus in computer graphics due to the advent of the next generation of generative machine learning [Para et al. 2021; Paschalidou et al. 2021]. Despite recent progress, interior layout synthesis is still challeng- ing for machine learning methods since indoor scenarios are char- acterized by high variability, making them very high-dimensional. Consequently, generative algorithms require large amounts of reli- able data to learn the probability distributions adequately to syn- thesize realistic results. Additionally, indoor design requires expert knowledge, like architectural or ergonomic design principles, to ensure the created layouts allow high living quality. At the same time, indoor layout training data is difficult and expensive to obtain. Especially high-quality designs need to be crafted manually by professionals, making the process labor and time-intensive. Readily available datasets are often not well suited for the demanding training task and often lacks the aspects of expert knowledge, like ergonomic design principles. The data may have been created by non-experts and necessary design principles can be missing (cf. Figure 2). It may further contain errors and geometric flaws, like incorrect overlaps, intersections, or misplaced objects, making it unsuitable or unreliable for further digital processing. We address these problems by using an autoregressive Trans- former architecture with an additional information “injected” into the data-driven training process that is not contained in the data. 2022-02-02 01:42. Page 1 of 1–18. arXiv:2202.00185v1 [cs.GR] 1 Feb 2022
-
Upload
khangminh22 -
Category
Documents
-
view
2 -
download
0
Transcript of Augmenting Transformers with Expert Knowledge for Indoor ...

ATEK: Augmenting Transformers with Expert Knowledge for IndoorLayout Synthesis
KURT LEIMER, TU Wien, Austria and NJIT, USAPAUL GUERRERO, Adobe Research, UKTOMER WEISS, NJIT, USAPRZEMYSLAW MUSIALSKI, NJIT, USA
Data
Expert Knowledge
Loss
TransformerSynthesis
uv vl vg
S = (F , ...)0 F1,S = (F , , ,...)0 F1 F2S = (F , , , ,...)0 F1 F2 F3S = (F , , , , ,..., s)0 F1 F2 F3 F4
S = (F , ...)0
V0:
V2: +
V3: ( - ) +
V1: ( - )
Fig. 1. Our layout generation method combines data-driven learning with other manually added sources, e.g., expert knowledge. Left, input from data andfrom expert knowledge in ergonomics. Middle, transformer training: We propose four different loss-functions (V0,V1,V2,V3), where we incorporate expertknowledge in different ways. Right: a set of generated room layouts using the trained Transformer.
We address the problem of indoor layout synthesis, which is a topic of con-tinuing research interest in computer graphics. The newest works madesignificant progress using data-driven generative methods; however, theseapproaches rely on suitable datasets. In practice, desirable layout propertiesmay not exist in a dataset, for instance, specific expert knowledge can bemissing in the data. We propose a method that combines expert knowledge,for example, knowledge about ergonomics, with a data-driven generatorbased on the popular Transformer architecture. The knowledge is givenas differentiable scalar functions, which can be used both as weights or asadditional terms in the loss function. Using this knowledge, the synthesizedlayouts can be biased to exhibit desirable properties, even if these propertiesare not present in the dataset. Our approach can also alleviate problems oflack of data and imperfections in the data. Our work aims to improve gener-ative machine learning for modeling and provide novel tools for designersand amateurs for the problem of interior layout creation.
CCS Concepts: • Computing methodologies → Neural networks; Com-puter graphics.
Additional Key Words and Phrases: neural networks, layout synthesis, inte-rior design, Transformers, ergonomic layouts
1 INTRODUCTIONIndoor spaces play a crucial role in our everyday lives and serve anumber of essential purposes. The problem of indoor layout design(apartment layout, workplace layout) has been tackled for a longtime across several disciplines, including architectural design [Pileand Gura 2013] and ergonomics [Kroemer 2017]. That is because
Authors’ addresses: Kurt Leimer, [email protected], TU Wien, Austria , NJIT,USA; Paul Guerrero, Adobe Research, UK, [email protected]; Tomer Weiss, NJIT,USA, [email protected]; Przemyslaw Musialski, NJIT, USA, [email protected].
the furniture arrangement in a room is inherently connected withthe geometry and functionality of the space, but also with otheraspects, like usability, aesthetics, cost-effectiveness, or quality.
In this paper, we address the problem of data-driven layout synthe-sis, which recently has again become a research focus in computergraphics due to the advent of the next generation of generativemachine learning [Para et al. 2021; Paschalidou et al. 2021].
Despite recent progress, interior layout synthesis is still challeng-ing for machine learning methods since indoor scenarios are char-acterized by high variability, making them very high-dimensional.Consequently, generative algorithms require large amounts of reli-able data to learn the probability distributions adequately to syn-thesize realistic results. Additionally, indoor design requires expertknowledge, like architectural or ergonomic design principles, toensure the created layouts allow high living quality.At the same time, indoor layout training data is difficult and
expensive to obtain. Especially high-quality designs need to becrafted manually by professionals, making the process labor andtime-intensive. Readily available datasets are often not well suitedfor the demanding training task and often lacks the aspects of expertknowledge, like ergonomic design principles. The data may havebeen created by non-experts and necessary design principles can bemissing (cf. Figure 2). It may further contain errors and geometricflaws, like incorrect overlaps, intersections, or misplaced objects,making it unsuitable or unreliable for further digital processing.We address these problems by using an autoregressive Trans-
former architecture with an additional information “injected” intothe data-driven training process that is not contained in the data.
2022-02-02 01:42. Page 1 of 1–18.
arX
iv:2
202.
0018
5v1
[cs
.GR
] 1
Feb
202
2

0:2 • Kurt Leimer, Paul Guerrero, Tomer Weiss, Przemyslaw Musialski
Fig. 2. Examples of potential errors in ground truth data (from the 3DFRONTdataset [Fu et al. 2021a,b]). Ergonomic issues (left room): (1) A windowdirectly behind the TV causes glare on sunny days, making it difficult towatch due to a big contrast in brightness. (2) Insufficient illumination forreading a book without a light source behind or beside the bed. Geometricissues (right room): (1) Desk is intersecting with the bed and the closet; (2)closet is covering the door.
Transformers are generative models originally proposed for naturallanguage processing that have proven very successful in a widerange of domains [Vaswani et al. 2017]. Recently, several methodshave successfully used transformers for layout generation [Paraet al. 2021; Paschalidou et al. 2021; Wang et al. 2020].We use data-driven learning, since a dataset distribution often
captures properties of layouts that would be hard to describe withmanually designed rules, but at the same time it may contain anundesirable bias or other undesirable properties for a given task.In our approach, a layout 𝐿 is defined as a set of discrete elements𝐿 B {𝐹0, . . . , 𝐹𝑁 }, each represented with a fixed-length parametervector. A generative model learns to generate new layouts accordingto a probability distribution 𝑝 (𝐿) that approximates the probabilitydistribution of the dataset 𝑝 (𝐿) ≈ 𝑝data (𝐿). We propose to encodeadditional prior knowledge about a layout problem to obtain alearned distribution 𝑝 ′(𝐿) that reflects both the dataset distributionand the prior knowledge.
This knowledge can be based on expert knowledge and allow tobias the learned probability distributions, such that specific proper-ties of layouts are emphasized or diminished. In Section 3 we derivea set ergonomic rules from expert literature [Kroemer 2017], whichwe convert into differentiable cost functions that can be integratedinto the Transformer training.We integrate prior information into the loss function to train a
transformer network in two ways: (1) we utilize them as weightingfactors of the input training samples. In other words, if a layout doesnot match well with the given goal, its contribution to the learningprocess is diminished. Further (2), we use them to assess the qualityof samples proposed during the training process. In the second case,expert knowledge is defined to be differentiable w.r.t. the predictedprobabilities. In such manner, it serves as a form of a prior in theloss function. We discus the details in Section 4.
In Section 5 we evaluate the proposed method and compare it toa recent data-driven method that does not utilize additional knowl-edge [Paschalidou et al. 2021]. We show that with our approach wecan improve the realism of generated room layouts. Finally, we gen-eralize the manual loss to other examples, like overlap minimizationto compensate potential geometric errors contained in the trainingdata.In summary, the contributions of this paper are:
• We introduce an ergonomic loss for indoor layout design thatimproves the ergonomic quality of the layouts. We derive thisloss from the expert knowledge in ergonomics (Section 3).
• We integrate the manually designed differentiable loss intothe training of a Transformer network that augments thedata-driven information and allows the control of the learnedprobability distribution (Section 4). We also show that thiscan be generalized to various other (differentiable) functions,like minimizing geometric overlaps.
• We empirically show that we can train a generative modelwhich creates samples that have the similar realism-level tothe ground truth data but increases the ergonomic quality, andwe generalize the introduced manual loss to other functions(Section 5).
2 RELATED WORKInterior spaces and their layouts are part of everyday life. Henceit is not surprising that such layouts are also an important part ofmultiple virtual domains, ranging from entertainment, architecture,to retail. For example, organizations such as Ikea andWayfair are ac-tively working toward understanding their customers needs [Ataer-Cansizoglu et al. 2019]. Typically, each domain has different require-ments and needs, which require manual design [Wayfair 2022]. Inpractice, designing layouts is a laborious task due to high dimen-sional design space, ranging from selecting relevant furniture pieces,to arranging the target space to fit the design goals. To alleviatesuch manual workflow, researchers have proposed multiple com-putational methods to assist in layout design. Below we classifyprevious work based on their approach.
2.1 Deep Learning MethodsWith the rise of deep neural networks, numerous work increasinglyrely on data to synthesize layouts. Typically, such methods employneural networks, in which the network learns layout patterns fromimages, graphs, or other data. Such 3d scene data and the data modal-ity is an important factor in deep learning [Fu et al. 2021a]. Earlydeep learning work utilizes top-down images of layouts to under-stand object-object layout relationships [Wang et al. 2018]. However,images do not naturally contain sufficient detail for the network tosynthesize complex human-centered layouts. Graphs have also beenproposed as a means to encode spatial layout information. Hence, ascene synthesis problem is transformed to predicting appropriategraph nodes and edges [Wang et al. 2019; Zhou et al. 2019]. Whilegraphs provide more fine grain control for synthesis than images,they do not readily encode ergonomic qualities.
In addition to images and graphs, researchers explored how to useother 3d scene data representations for synthesis. [Li et al. 2019] syn-thesize scenes by sampling from a vector that represents the spatialstructure of a scene. Such structure encodes a hierarchy of geometri-cal and co-occurrence relations of layout objects. [Zhang et al. 2020]proposed a hybrid approach that combines such vector representa-tion with an image-based approach. The authors claim that imagesare needed to better capture local spatial relations. [Yang et al. 2021]combine such vector representation with Bayesian optimization toimprove furniture placement predictions of the generative network.
2022-02-02 01:42. Page 2 of 1–18.
ATEK: Augmenting Transformers with Expert Knowledge for Indoor Layout Synthesis • 0:3
Most recently, researchers have proposed to use neural networksbased on transformers [Paschalidou et al. 2021; Wang et al. 2020].The authors mention that an advantage of transformers is a fastersynthesis compared to other other deep-learning approaches. How-ever, their work does not account for ergonomic qualities whichresults in misplaced furniture items. We demonstrate this pointfurther in Section 5.
2.2 Other ApproachesBefore the era of deep learning, early work considered layout asa mathematical optimization problem, where a set of constraintsdescribe the layout quality in terms of energy [Merrell et al. 2011;Weiss et al. 2018; Yu et al. 2011]. The layout is then optimized viastochastic or deterministic optimization process. Other researchersproposed data-driven methods. In such methods, abstract layoutstructure and object-object relations are extracted from scene datasets. Qi et al. [2018] use interaction affordance maps for each layoutobject for stochastic layout synthesis. However, they only take intoaccount static poses and spatial relationships between furniturepieces. Similarly, Fisher et al. [2015] used annotated 3d scans ofrooms to identify which activities does an environment support.Based on such activity maps they synthesize small objects arrange-ments. Other researchers also learn layout structure from 3d scansfor scene synthesis [Kermani et al. 2016]. They extract manuallydefined geometric relationships between objects from such scans,which are then placed using a stochastic optimization. Regrettably,previously mentioned synthesis work does not readily account forhumans-centered ergonomic qualities, except for accessibility andspacing around furniture.
Recently, researchers did attempt to incorporate human-centeredconsiderations for 3d scene synthesis. Fu et al. [2017] use a graphof objects to guide a layout synthesis process. The authors signalthat object related activities play a role in human-object relations.However, they only consider static human poses in relation to suchactivities. Zhang et al. [2021] and Liang et al. [2019] focus on optimalwork-space design. While the authors demonstrate novel use ofsimulation and dynamic capture of agent in action metrics, theyonly focus on mobility and accessibility based factors. In [Puig et al.2018], the authors demonstrate how to evaluate the functionality oflayouts. However, this work does not include 3d scene synthesis.
While 3d scene synthesis work has made impressive progress inunderstanding how to create new virtual layouts, it is still a chal-lenging problem, since it is difficult to objectively measure qualityof resulting scene. Our work proposes to directly combine suchqualities with recent novel deep learning architectures.
3 ERGONOMIC RULESErgonomics is the scientific discipline concerned with understand-ing interactions among humans and other elements of a system.Instead of expecting humans to adapt to a design that might turnout to be uncomfortable, ergonomics aims to improve the designsuch that it suits its function and the needs of its users.In our approach, we study the literature of ergonomic guide-
lines [Kroemer 2017] and derive a set of rules used to quantify anergonomic quality of a design.
To evaluate how a given layout suits the ergonomic rules, wedefine a set of activities a typical user would perform in the givenroom. An activity is a set or sequence of actions that need to beperformed to accomplish a specific goal [Puig et al. 2018]. An activitycould be, for instance, reading a book or watching TV. Please referto Table 1 for an association of activities we consider to the set ofergonomic rules we introduce.
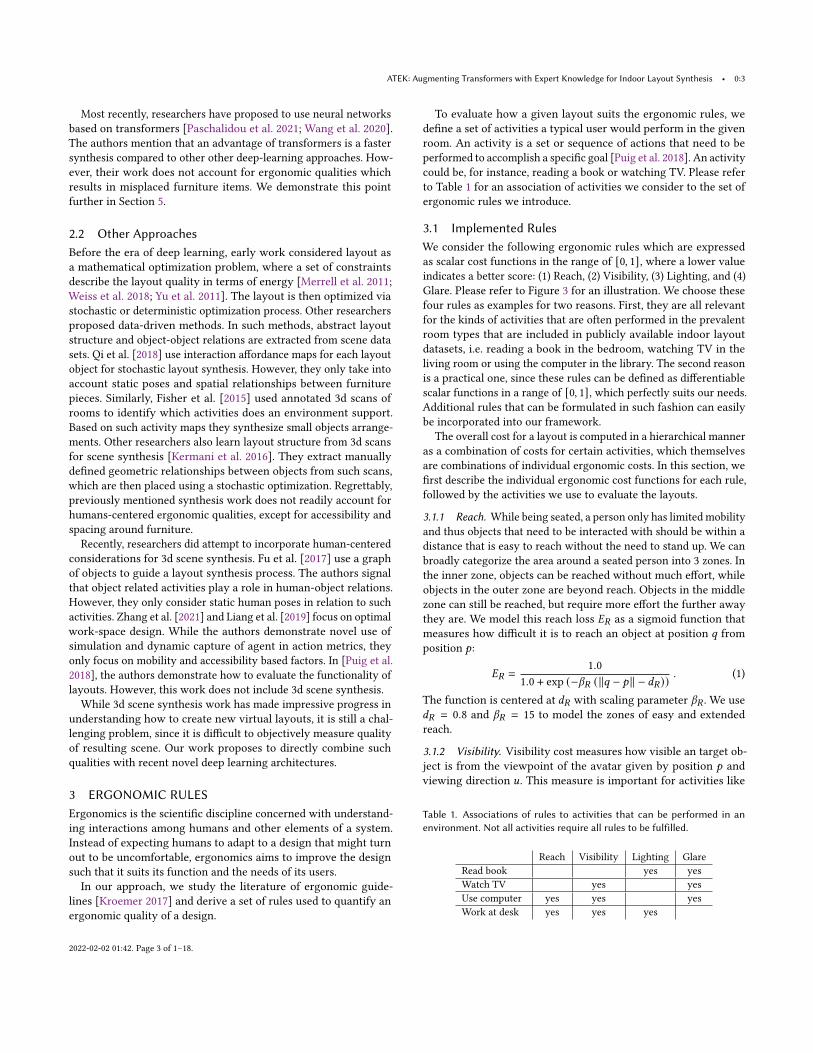
3.1 Implemented RulesWe consider the following ergonomic rules which are expressedas scalar cost functions in the range of [0, 1], where a lower valueindicates a better score: (1) Reach, (2) Visibility, (3) Lighting, and (4)Glare. Please refer to Figure 3 for an illustration. We choose thesefour rules as examples for two reasons. First, they are all relevantfor the kinds of activities that are often performed in the prevalentroom types that are included in publicly available indoor layoutdatasets, i.e. reading a book in the bedroom, watching TV in theliving room or using the computer in the library. The second reasonis a practical one, since these rules can be defined as differentiablescalar functions in a range of [0, 1], which perfectly suits our needs.Additional rules that can be formulated in such fashion can easilybe incorporated into our framework.
The overall cost for a layout is computed in a hierarchical manneras a combination of costs for certain activities, which themselvesare combinations of individual ergonomic costs. In this section, wefirst describe the individual ergonomic cost functions for each rule,followed by the activities we use to evaluate the layouts.
3.1.1 Reach. While being seated, a person only has limited mobilityand thus objects that need to be interacted with should be within adistance that is easy to reach without the need to stand up. We canbroadly categorize the area around a seated person into 3 zones. Inthe inner zone, objects can be reached without much effort, whileobjects in the outer zone are beyond reach. Objects in the middlezone can still be reached, but require more effort the further awaythey are. We model this reach loss 𝐸𝑅 as a sigmoid function thatmeasures how difficult it is to reach an object at position 𝑞 fromposition 𝑝:
𝐸𝑅 =1.0
1.0 + exp (−𝛽𝑅 (∥𝑞 − 𝑝 ∥ − 𝑑𝑅)). (1)
The function is centered at 𝑑𝑅 with scaling parameter 𝛽𝑅 . We use𝑑𝑅 = 0.8 and 𝛽𝑅 = 15 to model the zones of easy and extendedreach.
3.1.2 Visibility. Visibility cost measures how visible an target ob-ject is from the viewpoint of the avatar given by position 𝑝 andviewing direction 𝑢. This measure is important for activities like
Table 1. Associations of rules to activities that can be performed in anenvironment. Not all activities require all rules to be fulfilled.
Reach Visibility Lighting GlareRead book yes yesWatch TV yes yesUse computer yes yes yesWork at desk yes yes yes
2022-02-02 01:42. Page 3 of 1–18.

0:4 • Kurt Leimer, Paul Guerrero, Tomer Weiss, Przemyslaw Musialski
sequences
ci oi di xi yi
i=1
i=2
i=0 0 1 3 4 5
wi
2
6 7 9 10 118
12 13 15 16 1714(x , y )2 2
d2
w2c0
c2
c1
o2
c2
c0 o0 w0 d0 x0 y0 c1 o1 w1 d1 y2S = [ ... ]
0 1 2 3 4 5 6 7 8 9 17P = [ ... ]
0 1 2 3 4 5 0 1 2 3 5I = [ ... ]
x1
10
4
y1
11
5
c2
12
0
...
...
...
c2
c1
y
x
c0
c3
c4c5
c6
P=(0, 1, 2, 3, 4, 5, , , , )6, 7, 8, 9, 10, 11, 12, ... 24, ...18, ... 30, ...
I=(0, 1, 2, 3, 4, 5, , , , )0, 1, 2, 3, 4, 5, 0, ... 0, ... 0, ... 0, ...
(x , y )3 3
d3
w3
o3
S=(c , o , w , d , x , y , , , , , )0 0 0 0 0 0 c , o , w , d , x , y1 1 1 1 1 1 c , ... c , ...2 4c , ...3 c , ...5
c3
c1
y
x
c3
c0
c2
c4 c5
room door bed closet
old mateial
colors
ergo_rules
P=(0, 1, 2, 3, 4, 5, , , )6, 7, 8, 9, 10, 11 12, ..., 17 18, ..., 23
I=(0, 1, 2, 3, 4, 5, , , )0, 1, 2, 3, 4, 5 0, ..., 5 0, ..., 5
(x , y )3 3
d3
w3
o3
S=(c , o , w , d , x , y , , , )0 0 0 0 0 0 c , o , w , d , x , y1 1 1 1 1 1 c , ..., y2 2 c , ..., y3 3
c3
c1
y
x
c3
c0
c2
room door bedwindow
interpolation
P=(0, 1, 2, 3, 4, 5, , , , , , , , , , , , )6 7 8 9 10 11 12 ... 17 18 ... 23
I=(0, 1, 2, 3, 4, 5, , , , , , , , , , , , )0 1 2 3 4 5 0 ... 5 0 ... 5
S=(c , o , w , d , x , y , , , , , , , , , , , , )0 0 0 0 0 0 c o w d x y1 1 1 1 1 1 c ... y2 2 c ... y3 3
room door bedwindow
c , o , w , d , ? , y , c , o , ...0 0 0 0 0 1 1
p0
p_vhat
pr
g(j,σ)
(0)g(j,σ)
(j)g(j,σ)
(r)g(j,σ)
sitting_locations
u1
a) reach b) visibility c) lighting d) glare
uv vl vg
u1
u2 u3
v1
v2v3
u1 u2u3
v1
v2v3
c , o , w , d , x , y , c , ? , w , d , x , y , c , o , ...0 0 0 0 0 0 1 1 1 1 1 2 2
p0 pj pr
g(j,σ)
(0)g(j,σ)
(j)g(j,σ)
(r)g(j,σ)
p1
p2p3
q
grid
j=0 j=v hat
0 I v_hat,sigma) v_hat I v_hat,sigma)
r I v_hat,sigma)
v_hat,sigma)
c , o , w , d , ? , y , c , o , ...0 0 0 0 0 1 1
p0
p_vhat
pr
g(j,σ)
(0)g(j,σ)
(j)g(j,σ)
(r)g(j,σ)
j=0 j=v hat
0 I v_hat,sigma) v_hat I v_hat,sigma)
r I v_hat,sigma)
v_hat,sigma)
Fig. 3. Ergonomic rules implemented in our system. We chose these guide-lines as they are essential in most indoor scenarios, like reading a book,watching TV, or working at the desk or the computer. We convert the rulesto scalar cost functions (cf. Section 3) and evaluate them using activities (cf.Table 1).
watching TV or using the computer (cf. Table 1), since seating fur-niture with sub-optimal positions or orientations may require theuser to take on unhealthy postures. To introduce this cost as smoothscalar function 𝐸𝑣 which can be minimized, we define the cost toincrease with the angle between the two vectors 𝑢 and 𝑣 =
𝑞−𝑝∥𝑞−𝑝 ∥ :
𝐸𝑉 = 1 −(
1 + ⟨𝑢, 𝑣⟩2
)2. (2)
3.1.3 Lighting. Lighting cost measures how well an object is illumi-nated by light sources in the room. Ideally, when looking at an object,the viewer and the light source should be positioned in the samehalf-space of the viewed object, as otherwise the object itself wouldpartially obstruct the direct illumination and cause self-shadowing.A light source 𝑏𝑖 is thus well suited for illuminating the object atposition 𝑞 when viewed from position 𝑝 as long as the position-to-object vector 𝑣 =
𝑞−𝑝∥𝑞−𝑝 ∥ and the vector 𝑙𝑖 =
𝑞−𝑏𝑖∥𝑞−𝑏𝑖 ∥ pointing from a
light source at position 𝑏𝑖 to 𝑞 do not point in opposite directions:
𝑒𝐿𝑖 =
(1 − 1 + ⟨𝑣, 𝑙𝑖 ⟩
2
)4.
Since multiple light sources can contribute to this cost, we computetheir contribution by applying the softmin function to the vector𝑒𝑙 = [𝑒𝑙
𝑖]𝑖∈𝐵 and using them as weights for computing the weighted
sum:𝐸𝐿 = ⟨𝑒𝑙 , softmin(𝛽 · 𝑒𝑙 )⟩, (3)
with 𝛽 being a temperature parameter that determines the hardnessof the softmin function. We use 𝛽 = 10. Since the computation ofindirect illumination is prohibitively expensive, we only considerdirect lighting.
3.1.4 Glare. Glare cost 𝐸𝑔 measures the decrease in visual perfor-mance from strong brightness contrast caused by having brightlight sources in the field of view. Given position-to-object vector𝑣 =
𝑞−𝑝∥𝑞−𝑝 ∥ and glare vector 𝑔𝑖 =
𝑏𝑖−𝑝∥𝑏𝑖−𝑝 ∥ pointing from 𝑝 to the light
source at 𝑏𝑖 , the cost increases as the angle between the vectorsdecreases:
𝑒𝐺𝑖 =
(1 + ⟨𝑣, 𝑔𝑖 ⟩
2
)4.
sequences
ci oi di xi yi
i=1
i=2
i=0 0 1 3 4 5
wi
2
6 7 9 10 118
12 13 15 16 1714(x , y )2 2
d2
w2c0
c2
c1
o2
c2
c0 o0 w0 d0 x0 y0 c1 o1 w1 d1 y2S = [ ... ]
0 1 2 3 4 5 6 7 8 9 17P = [ ... ]
0 1 2 3 4 5 0 1 2 3 5I = [ ... ]
x1
10
4
y1
11
5
c2
12
0
...
...
...
c2
c1
y
x
c0
c3
c4c5
c6
P=(0, 1, 2, 3, 4, 5, , , , )6, 7, 8, 9, 10, 11, 12, ... 24, ...18, ... 30, ...
I=(0, 1, 2, 3, 4, 5, , , , )0, 1, 2, 3, 4, 5, 0, ... 0, ... 0, ... 0, ...
(x , y )3 3
d3
w3
o3
S=(c , o , w , d , x , y , , , , , )0 0 0 0 0 0 c , o , w , d , x , y1 1 1 1 1 1 c , ... c , ...2 4c , ...3 c , ...5
c3
c1
y
x
c3
c0
c2
c4 c5
room door bed closet
old mateial
colors
ergo_rules
P=(0, 1, 2, 3, 4, 5, , , , , , , , , , , , )6 7 8 9 10 11 12 ... 17 18 ... 23
I=(0, 1, 2, 3, 4, 5, , , , , , , , , , , , )0 1 2 3 4 5 0 ... 5 0 ... 5
(x , y )3 3
d3
w3
o3
S=(c , o , w , d , x , y , , , , , , , , , , , , )0 0 0 0 0 0 c o w d x y1 1 1 1 1 1 c ... y2 2 c ... y3 3
c3
c1
y
x
c3c0 c2
room door bedwindow
interpolation
c , o , w , d , ? , y , c , o , ...0 0 0 0 0 1 1
p0 pj pr
g(j,σ)
(0)g(j,σ)
(j)g(j,σ)
(r)g(j,σ)
sitting_locations
u1
a) reach b) visibility c) lighting d) glare
u
ToDo: check vector naming
v uv uv
u1
u2 u3
v1
v2v3
u1 u2u3
v1
v2v3
c , o , w , d , x , y , c , ? , w , d , x , y , c , o , ...0 0 0 0 0 0 1 1 1 1 1 2 2
p0 pj pr
g(j,σ)
(0)g(j,σ)
(j)g(j,σ)
(r)g(j,σ)
p1
p2p3
q
Fig. 4. Human activity in the room based on the example of Watch TV. Forall possible sitting locations 𝑝 𝑗 an avatar is sampled and the ergonomic rulesfor visibility and glare are evaluated. The final contribution is the weightedsum of costs over every combination of a sitting possibility 𝑝 𝑗 and all TVs𝑞𝑘 . Please refer to Section 3 for more details.
Similar to the lighting cost we compute the weighted sum ofmultiplelight sources using the softmax function for computing the weights:
𝐸𝐺 = ⟨𝑒𝑔, softmax(𝛽 · 𝑒𝑔)⟩ . (4)
For simplicity, we do not consider indirect glare, such as light sourcesthat are reflected by a computer screen. Ceiling lights such as chan-deliers are also excluded from this rule since light sources positionedabove the field of view have a smaller impact on visual performance[Kroemer 2017].
3.2 Activity EvaluationWe evaluate the ergonomic score of a layout in the context of activi-ties that are typically performed in rooms of a given category. Basedon research on this topic [Puig et al. 2018], we select 4 such activitieswhich we label as Read book, Watch TV, Use computer and Workat desk. To evaluate an activity, it is necessary to compute the er-gonomic costs relevant to that activity (cf. Table 1). We furthermoreuse a logarithmic function to re-scale the ergonomic cost functionsto more strongly punish scenes with high costs, for example
𝐸𝑅 = − ln(1.0 + 𝜖 − 𝐸𝑅), (5)
with the scaling functions for the other rules defined analogously.We use 𝜖 = exp(5), so that when 𝐸𝑅 = 1, then 𝐸𝑅 = 5.
For the activity Read book, proper illumination conditions are themost important factor, so we need to apply the rules for lighting andglare. Given the position 𝑝 𝑗 of seating furniture (like beds, chairs,or sofas), an associated object position 𝑞 𝑗 (a book close to 𝑝 𝑗 ) andlight sources 𝐵 we define
𝑒𝑏𝑜𝑜𝑘𝑗 =𝐸𝐿
(𝑝 𝑗 , 𝐵, 𝑞 𝑗
)+ 𝐸𝐺
(𝑝 𝑗 , 𝐵, 𝑞 𝑗
)2
.
Since we do not require all possible positions to have a good score forevery activity, we once again use the softmin function to compute aweighted sum of costs for the layout. That way, if there is only oneposition that is suitable for an activity, it will be the only one with alarge contribution to the layout cost, while having multiple suitablepositions will have them contribute equally. For a set of positions𝑝 𝑗 ∈ 𝑃 we therefore have
𝐸𝑏𝑜𝑜𝑘 = ⟨𝑒𝑏𝑜𝑜𝑘 , softmin(𝛽 · 𝑒𝑏𝑜𝑜𝑘 )⟩, (6)
2022-02-02 01:42. Page 4 of 1–18.

ATEK: Augmenting Transformers with Expert Knowledge for Indoor Layout Synthesis • 0:5
with 𝑒𝑏𝑜𝑜𝑘 = [𝑒𝑏𝑜𝑜𝑘𝑗
] 𝑗 ∈𝑃 and using 𝛽 = 10.The other activities are defined similarly. For Watch TV, we re-
quire the TV to be visible from a piece of seating furniture and thereshould not be a light source in the field of view. We therefore com-pute the visibility and glare costs for positions 𝑝 𝑗 with orientation𝑢 𝑗 (for chairs, beds, sofas) and TVs with position 𝑞𝑘 :
𝑒𝑡𝑣𝑗,𝑘
=𝐸𝑉
(𝑝 𝑗 , 𝑢 𝑗 , 𝑞𝑘
)+ 𝐸𝐺
(𝑝 𝑗 , 𝐵, 𝑞𝑘
)2
.
Since there can be multiple TVs in a room in addition to multi-ple pieces of seating furniture, we need to compute the weightedsum of costs over every combination of 𝑝 𝑗 and 𝑞𝑘 , using 𝑒𝑡𝑣 =
[𝑒𝑡𝑣𝑗,𝑘] 𝑗 ∈𝑃,𝑘∈𝑄 :
𝐸𝑡𝑣 = ⟨𝑒𝑡𝑣, softmin(𝛽 · 𝑒𝑡𝑣)⟩ . (7)
The same rules are required for the activity Use computer, inaddition to the reach rule since the seating furniture and computershould be in close proximity. We do not evaluate the lighting rulebecause the direction from which the light illuminates the computeris not as important, since the computer screen is already illuminated.Using 𝑞𝑘 to denote the positions of computers we define
𝑒𝑐𝑜𝑚𝑝
𝑗,𝑘=𝐸𝑉
(𝑝 𝑗 , 𝑢 𝑗 , 𝑞𝑘
)+ 𝐸𝐺
(𝑝 𝑗 , 𝐵, 𝑞𝑘
)+ 𝐸𝑅
(𝑝 𝑗 , 𝑞𝑘
)3
.
Finally, for the activity Work at desk we apply the rules visibil-ity, lighting and reach. Since the viewing angle is mostly directeddownward toward the desk during this activity, it is not necessaryto consider direct glare caused by light sources in the room. Giventable positions 𝑞𝑘 and light sources 𝐵 we compute
𝑒𝑤𝑜𝑟𝑘𝑗,𝑘
=𝐸𝑉
(𝑝 𝑗 , 𝑢 𝑗 , 𝑞𝑘
)+ 𝐸𝐿
(𝑝 𝑗 , 𝐵, 𝑞 𝑗
)+ 𝐸𝑉
(𝑝 𝑗 , 𝑞𝑘
)3
.
In order to compute the overall score 𝐸 for a layout we take theaverage of all activity costs that are possible in the layout (e.g. ifthere is no computer in the scene, we do not evaluate the cost forUse computer):
𝐸 =
∑𝑎 𝛿𝑎𝐸𝑎∑𝑎 𝛿𝑎
,
with 𝑎 ∈ {𝑏𝑜𝑜𝑘, 𝑡𝑣, 𝑐𝑜𝑚𝑝, 𝑤𝑜𝑟𝑘} and 𝛿𝑎 = 1 if the correspondingactivity can be performed in the layout and 𝛿𝑎 = 0 otherwise.
4 LAYOUT GENERATION WITH EXPERT KNOWLEDGEA loss designed by an expert, such as the ergonomic cost, definesdesirable properties of layouts that may not be fully realized in adataset. However, while minimizing the expert loss may be neces-sary to obtain a desirable layout, it is usually not sufficient, since amanually defined loss can usually not describe all desirable prop-erties of a layout exhaustively. Thus, our goal is to combine theexpert loss with a data-driven generative model for layouts. Weuse Transformers [Vaswani et al. 2017] as generative model, whichare currently the state-of-the-art for layout generation [Para et al.2021; Paschalidou et al. 2021; Wang et al. 2020]. We first presentour Transformer-based generative model and then describe how weintegrate our ergonomic cost into our training setup.
sequences
ci oi di xi yi
i=1
i=2
i=0 0 1 3 4 5
wi
2
6 7 9 10 118
12 13 15 16 1714(x , y )2 2
d2
w2c0
c2
c1
o2
c2
c0 o0 w0 d0 x0 y0 c1 o1 w1 d1 y2S = [ ... ]
0 1 2 3 4 5 6 7 8 9 17P = [ ... ]
0 1 2 3 4 5 0 1 2 3 5I = [ ... ]
x1
10
4
y1
11
5
c2
12
0
...
...
...
c2
c1
y
x
c0
c3
c4c5
c6
P=(0, 1, 2, 3, 4, 5, , , , )6, 7, 8, 9, 10, 11, 12, ... 24, ...18, ... 30, ...
I=(0, 1, 2, 3, 4, 5, , , , )0, 1, 2, 3, 4, 5, 0, ... 0, ... 0, ... 0, ...
(x , y )3 3
d3
w3
o3
S=(c , o , w , d , x , y , , , , , )0 0 0 0 0 0 c , o , w , d , x , y1 1 1 1 1 1 c , ... c , ...2 4c , ...3 c , ...5
c3
c1
y
x
c3
c0
c2
c4 c5
room door bed closet
old mateial
colors
ergo_rules
P=(0, 1, 2, 3, 4, 5, , , )6, 7, 8, 9, 10, 11 12, ..., 17 18, ..., 23
I=(0, 1, 2, 3, 4, 5, , , )0, 1, 2, 3, 4, 5 0, ..., 5 0, ..., 5
(x , y )3 3
d3
w3
o3
S=(c , o , w , d , x , y , , , )0 0 0 0 0 0 c , o , w , d , x , y1 1 1 1 1 1 c , ..., y2 2 c , ..., y3 3
c3
c1
y
x
c3
c0
c2
room door bedwindow
interpolation
P=(0, 1, 2, 3, 4, 5, , , , , , , , , , , , )6 7 8 9 10 11 12 ... 17 18 ... 23
I=(0, 1, 2, 3, 4, 5, , , , , , , , , , , , )0 1 2 3 4 5 0 ... 5 0 ... 5
S=(c , o , w , d , x , y , , , , , , , , , , , , )0 0 0 0 0 0 c o w d x y1 1 1 1 1 1 c ... y2 2 c ... y3 3
room door bedwindow
c , o , w , d , ? , y , c , o , ...0 0 0 0 0 1 1
p0 pj pr
g(j,σ)
(0)g(j,σ)
(j)g(j,σ)
(r)g(j,σ)
sitting_locations
u1
a) reach b) visibility c) lighting d) glare
u
ToDo: check vector naming
v uv uv
u1
u2 u3
v1
v2v3
u1 u2u3
v1
v2v3
c , o , w , d , x , y , c , ? , w , d , x , y , c , o , ...0 0 0 0 0 0 1 1 1 1 1 2 2
p0 pj pr
g(j,σ)
(0)g(j,σ)
(j)g(j,σ)
(r)g(j,σ)
p1
p2p3
q
Fig. 5. A layout is represented as a sequence 𝑆 = (𝑠1, . . . , 𝑠𝑛) . Each individ-ual token 𝑠𝑖 in the sequence represents an attribute of a furniture object,such as its category, orientation, dimensions or position.
4.1 Layout RepresentationTransformers are sequence generators that originate from naturallanguage processing. A layout is generated step-wise as a sequenceof discrete tokens 𝑆 = (𝑠1, . . . , 𝑠𝑛), one token 𝑠𝑖 at a time. Thus, wefirst need to define a sequence representation of our layouts.
4.1.1 Sequence representation. Each furniture object is representedas a 6-tuple 𝐹
𝑖= (𝑐
𝑖, 𝑜
𝑖,𝑤
𝑖, 𝑑
𝑖, 𝑥
𝑖, 𝑦
𝑖), with 𝑐
𝑖indicating the object
category, such as chair or table, 𝑜𝑖the orientation, 𝑤
𝑖the width,
𝑑𝑖the depth, and 𝑥
𝑖and 𝑦
𝑖being the x- and y-coordinates of the
bottom left corner of the furniture object (cf. Figure 5). The furni-ture objects in each scene are ordered based on the object category,with categories that tend to have larger objects before categories ofsmaller objects. If two objects have the same category, their order isarbitrary. Previous work [Paschalidou et al. 2021] has shown thatrandomizing the order of objects that do not admit a consistentordering can be beneficial. The shape of the room itself is repre-sented as the furniture object 𝐹0 and is always at the beginning ofthe sequence. We concatenate the 6-tuples of the ordered furnitureobjects and add a special stop token to the end of the sequence toobtain the sequence 𝑆 .
Similar to previous work [Wang et al. 2020], we use two additionalparallel sequences to provide context for each token in 𝑆 : a positionsequence 𝑆𝑃 = (1, 2, . . . , 𝑛) that provides the global position in thesequence, and an index sequence 𝑆𝐼 = (1, 2, . . . , 6, 1, 2 . . . , 6) thatdescribes the index of a token inside the 6-tuple of a furniture object.An example of these sequences can be seen in Figure 5.
4.1.2 Quantization. Transformers typically operate with discretetoken values. By learning to predict a probability for each possiblevalue of a token, a transformer can model arbitrary distributionsover token values. To obtain discrete values, we quantize all objectparameters except orientations 𝑜𝑖 and categories 𝑐𝑖 uniformly be-tween the minimum and maximum extent of the room along thelongest axis, plus a margin of one quantization level on either side(i.e. below the minimum and above the maximum extent) to allowfor windows and doors to extend slightly beyond the bounds of theroom. Orientations 𝑜𝑖 are uniformly quantized in [0, 2𝜋), adjustingthe resolution to preserve axis-aligned orientations as integer val-ues. We use a resolution of 𝑟 = 256. Categories 𝑐𝑖 do not require
2022-02-02 01:42. Page 5 of 1–18.

0:6 • Kurt Leimer, Paul Guerrero, Tomer Weiss, Przemyslaw Musialski
sequences
ci oi di xi yi
i=1
i=2
i=0 0 1 3 4 5
wi
2
6 7 9 10 118
12 13 15 16 1714(x , y )2 2
d2
w2c0
c2
c1
o2
c2
c0 o0 w0 d0 x0 y0 c1 o1 w1 d1 y2S = [ ... ]
0 1 2 3 4 5 6 7 8 9 17P = [ ... ]
0 1 2 3 4 5 0 1 2 3 5I = [ ... ]
x1
10
4
y1
11
5
c2
12
0
...
...
...
c2
c1
y
x
c0
c3
c4c5
c6
P=(0, 1, 2, 3, 4, 5, , , , )6, 7, 8, 9, 10, 11, 12, ... 24, ...18, ... 30, ...
I=(0, 1, 2, 3, 4, 5, , , , )0, 1, 2, 3, 4, 5, 0, ... 0, ... 0, ... 0, ...
(x , y )3 3
d3
w3
o3
S=(c , o , w , d , x , y , , , , , )0 0 0 0 0 0 c , o , w , d , x , y1 1 1 1 1 1 c , ... c , ...2 4c , ...3 c , ...5
c3
c1
y
x
c3
c0
c2
c4 c5
room door bed closet
old mateial
colors
ergo_rules
P=(0, 1, 2, 3, 4, 5, , , )6, 7, 8, 9, 10, 11 12, ..., 17 18, ..., 23
I=(0, 1, 2, 3, 4, 5, , , )0, 1, 2, 3, 4, 5 0, ..., 5 0, ..., 5
(x , y )3 3
d3
w3
o3
S=(c , o , w , d , x , y , , , )0 0 0 0 0 0 c , o , w , d , x , y1 1 1 1 1 1 c , ..., y2 2 c , ..., y3 3
c3
c1
y
x
c3
c0
c2
room door bedwindow
interpolation
P=(0, 1, 2, 3, 4, 5, , , , , , , , , , , , )6 7 8 9 10 11 12 ... 17 18 ... 23
I=(0, 1, 2, 3, 4, 5, , , , , , , , , , , , )0 1 2 3 4 5 0 ... 5 0 ... 5
S=(c , o , w , d , x , y , , , , , , , , , , , , )0 0 0 0 0 0 c o w d x y1 1 1 1 1 1 c ... y2 2 c ... y3 3
room door bedwindow
c , o , w , d , ? , y , c , o , ...0 0 0 0 0 1 1
p0
p_vhat
pr
g(j,σ)
(0)g(j,σ)
(j)g(j,σ)
(r)g(j,σ)
sitting_locations
u1
a) reach b) visibility c) lighting d) glare
uv vl vg
u1
u2 u3
v1
v2v3
u1 u2u3
v1
v2v3
c , o , w , d , x , y , c , ? , w , d , x , y , c , o , ...0 0 0 0 0 0 1 1 1 1 1 2 2
p0 pj pr
g(j,σ)
(0)g(j,σ)
(j)g(j,σ)
(r)g(j,σ)
p1
p2p3
q
grid
j=0 j=v hat
0 I v_hat,sigma) v_hat I v_hat,sigma)
r I v_hat,sigma)
v_hat,sigma)
c , o , w , d , ? , y , c , o , ...0 0 0 0 0 1 1
p0
p_vhat
pr
g(j,σ)
(0)g(j,σ)
(j)g(j,σ)
(r)g(j,σ)
j=0 j=v hat
0 I v_hat,sigma) v_hat I v_hat,sigma)
r I v_hat,sigma)
v_hat,sigma)
c , o , w , d , ? , y , c , o , ...0 0 0 0 0 1 1
j=0
pr
g(j,σ)
(0)g(j,σ)
(j)g(j,σ)
(r)g(j,σ)
j= j=r
(0 | ,σ)
( ,σ)( | ,σ)
(r | ,σ)
c , o , w , d , ? , y , c , o , ...0 0 0 0 0 1 1
j=0
pr
j= j=r
pj
p(0 | ,σ)
( ,σ)( | ,σ)
(r | ,σ)
pj
p
Fig. 6. To propagate the ergonomic loss back to the token probabilities,we choose the maximum of the discrete values of the predicted token andconvolve the neighborhood with a Gaussian kernel. The kernel is centeredat the discrete maximum.
quantization as they are already integers. For more details, pleaserefer to Appendix A.
4.1.3 Sequence generation. Our Transformer-based sequence gen-erator 𝑓\ factors the probability distribution over sequences 𝑆 intoa product of conditional probabilities over individual tokens:
𝑝 (𝑆 |\ ) =∏𝑖
𝑝 (𝑠𝑖 |𝑠<𝑖 , \ ),
where 𝑠<𝑖 B 𝑠1, . . . , 𝑠𝑖−1 is the partial sequence up to (excluding)𝑖 . Given a partial sequence 𝑠<𝑖 , our model predicts the probabilitydistribution over all possible discrete values for the next token:𝑝 (𝑠𝑖 |𝑠<𝑖 , \ ) = 𝑓\ (𝑠<𝑖 , 𝑠𝑃<𝑖 , 𝑠
𝐼<𝑖) that can be sampled to obtain the next
token 𝑠𝑖 . Here 𝑠𝑃<𝑖 and 𝑠𝐼<𝑖
are the corresponding partial position andindex sequences that are fully defined by the index 𝑖 . We implement𝑓\ as a GPT-2 model [Radford et al. 2019] using the implementationincluded in the Huggingface library [Wolf et al. 2020].
4.2 Ergonomic LossWe face two main challenges when trying to use the ergonomiccost as a loss for a Transformer-based generative model. First, theergonomic cost is defined on an entire layout, while the genera-tive model receives a loss for each generated token. Second, theergonomic cost is defined over continuous furniture object parame-ters, while the generative model outputs a distribution over discretevalues, making gradient propagation from the ergonomic cost tothe generative model difficult.To tackle the first challenge, we observe that transformers are
typically trained with a strategy called teacher forcing, where thepartial sequence 𝑠<𝑖 preceding the current token 𝑠𝑖 is taken froma ground truth layout. Thus, when generating a token 𝑠𝑖 , we canevaluate the ergonomic cost on the layout defined by 𝑠<𝑖 , 𝑠𝑖 , 𝑠>𝑖 ,where only 𝑠𝑖 is generated and both the preceding tokens 𝑠<𝑖 andthe following tokens 𝑠>𝑖 are taken from the ground truth, effectivelyevaluating 𝑠𝑖 in the context of the ground truth layout.To solve the second challenge, we need an ergonomic loss that
is differentiable w.r.t. the probabilities 𝑝 (𝑠𝑖 |𝑠<𝑖 , \ ) predicted by ourgenerative model. A straight-forward solution computes the ex-pected value of the ergonomic cost 𝐸 over all possible values 𝑣 𝑗 ofa token
∑𝑗 𝐸 (𝑠<𝑖 , 𝑣 𝑗 , 𝑠>𝑖 )𝑃 (𝑠𝑖 = 𝑣 𝑗 |𝑠<𝑖 , \ ). This solution is differ-
entiable w.r.t. the probabilities, but requires an evaluation of the
ergonomic cost for each possible value of a token, which is prohib-itively expensive. Instead, we opt for a less exact but much moreefficient approach, where only a single evaluation of the ergonomiccost per token is needed. We compute the ergonomic loss L𝐸 as theergonomic cost for the expected value of a token in a small windowaround the most likely value of the token:
L𝐸 = 𝐸 (𝑠<𝑖 , 𝑣, 𝑠>𝑖 ), with (8)
𝑣 =
∑𝑗
(N(𝑣 𝑗 |𝑣, 𝜎) 𝑃 (𝑠𝑖 = 𝑣 𝑗 |𝑠<𝑖 , \ ) 𝑣 𝑗
)∑𝑗
(N(𝑣 𝑗 |𝑣, 𝜎) 𝑃 (𝑠𝑖 = 𝑣 𝑗 |𝑠<𝑖 , \ )
) ,
where N(𝑥 |𝑣, 𝜎) is the normal distribution centered at 𝑣 with stan-dard deviation 𝜎 . 𝑣 is the token value with highest probability, and𝜎 is set to 1/32 of the full value range in our experiments. Figure 6illustrates the approach. This loss provides gradients to all valuesin smooth window. Note that increasing the size of the windowby increasing 𝜎 would propagate the gradient to a larger range oftoken values, but could also result in expected token values 𝑣 thatare in low-probability regions of the distribution 𝑝 (𝑠𝑖 |𝑠<𝑖 , \ ), sincethe distribution may be multi-modal.
The total loss function L is then given by
L(𝑆𝑘
)= 𝛽𝑇L𝑇
(𝑆𝑘
)+ 𝛽𝐸L𝐸
(𝑆𝑘
), (9)
with L𝑇 being the cross-entropy loss, L𝐸 being our proposed er-gonomic loss and 𝛽𝑇 , 𝛽𝐸 being weights that determine the influenceof the two loss terms to the overall loss. We use 𝛽𝑇 = 1 − 𝐸
(𝑆𝑘
)and 𝛽𝐸 = 𝐸
(𝑆𝑘
), such that the cross-entropy loss has higher influ-
ence for training samples with better ergonomic score while theergonomic loss is more important for samples with lower ergonomicscore. Essentially, we want the network to learn about the generaltarget distribution from examples that are already considered good,while learning how to improve the ergonomic score from bad exam-ples. Please note that we do not apply the scaling function definedin Eq. 5 when computing the ergonomic score for the weights sothat they remain in the range of [0, 1]. In Section 5.2, we discuss theinfluence of the weights 𝛽𝑇 and 𝛽𝐸 in more detail.
4.3 Training and Inference4.3.1 Training. We train our models using the 3DFRONT dataset[Fu et al. 2021a,b] as training data. Since some room types in thedataset only contain few samples, we make use of a transfer learningstrategy. We first train a base model containing training samples ofall room types using a learning rate of 0.00005. This base model isthen fine-tuned for each room type using a learning rate of 0.00002for the Bedrooms dataset and 0.00001 for the other room types toprevent overfitting to the smaller datasets. The effect of this strategyis discussed in Section 5.6.As hyperparameters for our networks we use 12 hidden layers,
8 attention heads, embedding dimensionality of 256, dropout prob-ability of 0.1 and a batch size of 32. Each network is trained for10 epochs, with the number of training samples per epoch being 8times the number of samples in the training set, so that each aug-mented variation of a layout is seen once per epoch (cf. Section 5.1for details). For the learning rate, we use a linear rate of decay anda warm-up period of 1 epoch. These parameters were determined
2022-02-02 01:42. Page 6 of 1–18.

ATEK: Augmenting Transformers with Expert Knowledge for Indoor Layout Synthesis • 0:7
empirically in preliminary experiments. For layout synthesis, wealways choose the learned network parameters of the epoch withthe smallest validation loss during training.
Our networks are trained on Google Colab, using a machine witha NVIDIA Tesla P100 GPU. When only using the cross-entropy loss,training for one epoch takes 115 seconds on average. Adding ourergonomic loss increases training times to 578 seconds per epochon average, since we cannot make use of parallelization for layoutevaluation as easily. There is room for further optimizations in thisaspect.
4.3.2 Inference. During inference, we follow a similar approach tothe strategy proposed by Sceneformer [Wang et al. 2020], using top-p nucleus sampling with 𝑝 = 0.9 for the object categories, as well asthe attributes of the room, doors and windows. For the attributes ofother object categories, we always pick the token with the highestprobability.
The layouts synthesized by the transformer network often includeintersecting objects which greatly disturb the perceived realism ofa layout. We therefore follow the approach of similar methods likeSceneformer and check for object intersections during inference.After the attributes of a furniture object have been generated, wecheck if the object can be inserted into the scene without causinglarge intersections. If this is not the case, we resample the cate-gory and other attributes of the current object. If this resamplingapproach fails too often (we choose a limit of 20 attempts experi-mentally), we discard the entire layout and start anew. Certain pairsof object categories are excluded from this check, e.g. chairs can beput underneath a table and thus do not cause collisions.
In terms of computation time, the intersection-detection processis the bottleneck of the inference process. If we do check for inter-section during inference, it takes 1653 seconds for our models tosynthesize 1000 layoutsequences, for 1.653 seconds per layout onaverage. If we do not perform intersection-checks between objects,we can make use of parallelization to greatly reduce inference time.In such a setup, our networks can synthesize 1000 layout sequencesin 27 seconds for 0.027 seconds per scene on average.
4.3.3 Scene reconstruction. Since our networks only generate the2d bounding boxes of furniture objects, we use an additional post-processing step to reconstruct a 3d scene from the generated layout.For each furniture object, we select the 3d model of the same cate-gory with the smallest difference in bounding box dimensions fromthe models in the 3DFRONT dataset [Fu et al. 2021a,b]. For cate-gories not included in the dataset, such as doors and windows, wehandpick a few suitable models from online sources [Turbosquid2022].As a final step, the vertical position of each object is adjusted
based on its category. The position of some categories like windowsand chandeliers are set to a fixed height. We label some categories assupporting objects (like tables and stands) and others as supportedobjects (like indoor lamps and TVs). If there is an intersection be-tween a supporting and supported object, the vertical position of thesupported object is adjusted to be placed on top of the supportingobject.
5 RESULTS AND EVALUATION
5.1 DatasetWe use the 3DFRONT dataset [Fu et al. 2021a,b] to evaluate ourproposed approach. In a pre-processing step, we parse the data toextract rooms belonging to the categories Bedroom, Dining Room,Living Room and Library. For this purpose we use the filter criteriaprovided by ATISS [Paschalidou et al. 2021], consisting of a list ofrooms for each category, as well as a split into training, testing andvalidation data. We use the rooms marked as train for our trainingsets and combine those marked as test and val for our validationsets. Since we opt to only use rectangular rooms, we filter out roomswith more complex shapes. For the Bedrooms dataset, this results in4040 rooms for the training set and 324 rooms for the validation set.
For most furniture objects, their attributes such as the categoryand the transformation of the corresponding 3d model data can bedirectly extracted from the room data. Since separate 3d models fordoors and windows are not provided with the dataset, we extracttheir positions and bounding box dimensions from the mesh datawith corresponding labels. Since doors are only provided with eachhouse and not attached to individual rooms, we include a door withthe furniture objects of a room if its distance to the closest wall ofthe room is lower than a chosen threshold and its orientation isaligned with that of the wall.
Additionally, we group some of the object categories in the datasetthat are very similar to each other, while filtering out some othersthat occur only in very few rooms, for a total of 31 categories thatwe use across all room types.
Since the dataset is typically lacking object categories that arenecessary to properly evaluate the ergonomic score of a layout, weaugment the dataset with additional objects in the following way.For each layout, there is a 50% chance to place a furniture object ofthe indoor lamp category in the center of every stand and side-tableobject. In the same manner, a computer object is placed at the centerof each desk object in a layout with a probability of 50%. Finally,every TV stand object is augmented with a TV object.
5.2 AblationTo evaluate the influence of our proposed ergonomic loss, we define4 versions of our network that are trained with different loss func-tions. Recall that the total loss function given in Eq. 9 is defined asthe weighted sum of the cross-entropy loss L𝑇 and the ergonomicloss L𝐸 with weights 𝛽𝑇 , 𝛽𝐸 . Using these weight parameters, wedefine the following 4 versions of our network:
• V0, with 𝛽𝑇 = 1 and 𝛽𝐸 = 0,• V1, with 𝛽𝑇 = 1 − 𝐸
(𝑆𝑘
)and 𝛽𝐸 = 0,
• V2, with 𝛽𝑇 = 1 and 𝛽𝐸 = 1,• V3, with 𝛽𝑇 = 1 − 𝐸
(𝑆𝑘
)and 𝛽𝐸 = 𝐸
(𝑆𝑘
).
In other words, V0 only uses the cross-entropy loss with each inputsample having equal weight, V1 uses the cross-entropy loss witheach sample being weighted by its ergonomic score, V2 uses the sumof cross-entropy loss and ergonomic loss and V3 uses a weightedsum of cross-entropy loss and ergonomic loss, weighted by theergonomic score of each sample.
2022-02-02 01:42. Page 7 of 1–18.

0:8 • Kurt Leimer, Paul Guerrero, Tomer Weiss, Przemyslaw Musialski
0 1 2 3 4 5 6 7 8 9Epoch
0.85
0.90
0.95
Loss
Training loss
0 1 2 3 4 5 6 7 8 9Epoch
0.90
0.92
0.94
Loss
Validation loss
0 1 2 3 4 5 6 7 8 9Epoch
4.8
4.9
5.0
5.1
5.2
Loss
Ergonomic loss (training set)
0 1 2 3 4 5 6 7 8 9Epoch
5.2
5.4
5.6
Loss
Ergonomic loss (validation set)
V0V1V2V3
Fig. 7. Training loss, validation loss and ergonomic loss for each version of our network used in the ablation study, evaluated on the Bedrooms dataset.Networks V2 and V3 which include our proposed ergonomic loss term significantly decrease the ergonomic score of layouts during training.
GT ATISS V0 V1 V2 V30.0
0.2
0.4
0.6
Loss
Mean ergonomic loss of room-conditioned Bedrooms
GT ATISS V0 V1 V2 V30.4
0.2
0.0
0.2
0.4
Real
ism
Perceived realism of other methods relative to the GT
Fig. 8. Room-conditioned layout synthesis. We synthesize 20 layout varia-tions for each floor plan in the Bedrooms validation set and evaluate theergonomic score. The left chart shows the mean ergonomic loss of the syn-thesized layouts, with the 80% confidence interval of the mean shown inblack. The realism of the synthesized layouts is evaluated in a user study.The right chart shows how the layouts synthesized using each method areperceived compared to the ground truth, with a negative value meaningthat the ground truth is seen as more realistic. Our proposed approach (V3)improves the ergonomic score of the scenes, while still being perceived assimilarly realistic as the ground truth.
Figure 7 depicts the cross-entropy loss and ergonomic loss evalu-ated on both the training and validation sets for each version, usingthe Bedroom dataset for training. The results show a significantdecrease in ergonomic loss for both V2 and V3 which make useof our ergonomic loss term during training. While both versionsperform similarly in terms of ergonomic loss, the validation lossof V2 is much higher than that of other versions, suggesting thatV2 performs worse at learning the target distribution which candecrease the perceived realism of synthesized scenes. V1 only yieldsa small decrease of ergonomic loss during training, since weightingthe training samples by their ergonomic score only reduces the in-fluence of bad training samples without teaching the network howto improve the sample. However, this still has a noticeable effect onthe synthesized scenes as we will discuss in Section 5.3.
5.3 Room-conditioned Layout SynthesisWe use the 4 versions of our network introduced in the previoussection for layout synthesis and evaluate the results in terms of bothrealism and ergonomic loss. In order to evaluate the realism of ourgenerated results, we perform a perceptual study in which we askparticipants to compare pairs of Bedroom layouts with the questionof which layout is more realistic. We compare layouts from 6 sourcesin this study: the ground truth layouts from the 3DFRONT dataset[Fu et al. 2021a,b], layouts generated with ATISS [Paschalidou et al.
2021] which we train using the code provided on their website, aswell as the 4 versions of our proposed method which we label V0,V1, V2 and V3.
To allow for a direct comparison, we use the attributes of theroom, doors and windows from the ground truth data for eachlayout and only generate the rest of the furniture objects using theselected methods. For each layout in the validation set we generate20 variations each using ATISS and our trained networks and createsets of size 6 that contain one layout of each method generated fromthe same floor plan. Since ATISS does not handle any collisionsbetween furniture objects and even some of the ground truth layoutsmay contain such collisions, we discard the entire set if one of itslayouts contains an intersection between furniture objects largerthan a threshold, which we set as 20% of the smaller boundingbox area. For our networks, we perform intersection-checks duringinference, only discarding a set if an intersection-free layout cannotbe generated after 20 attempts. Since our networks may also tryto generate additional windows or doors, we simple resample thecategory in such a case. Finally, the ATISS layouts are augmentedwith additional objects such as indoor lamps and computers in thesame manner as explained in Section 5.1.For the user study, we randomly select 50 sets from all sets of
synthesized layouts and ask users to compare the layouts in termsof realism. In each comparison, the user is shown a pair of layoutsfrom the same set, each represented by a top-view image and ananimated 3d rendering with the camera rotating around the scene.Users are asked which layout is more realistic on a 7-point scale. Weuse Amazon Mechanical Turk to conduct the user study. A total of327 users participated in the study. Each pair of layouts was showntwice to 5 users each for a total of 10 comparisons per scene pair.
The left side of the Figure 8 shows the mean ergonomic score ofall layouts created for the user study. As can be seen, our networksV1, V2 and V3 perform better at generating layouts with lowerergonomic score, reducing the mean ergonomic score by 26.6%,39.8% and 48.9% respectively compared to the ground truth data.The right side of Figure 8 shows how the users perceive the
realism of synthesized layouts compared to those of the groundtruth, with a negative value meaning that the ground truth is seenas more realistic. The responses show that ATISS is consideredsignificantly less realistic than the ground truth. On the other hand,layouts generated by our networks V0, V1 and V3 are seen similarlyrealistic, while V2, though still considered to be more realistic thanATISS, is seen as less realistic than the ground truth. Though bothV2 and V3 synthesize layouts with better ergonomic scores than
2022-02-02 01:42. Page 8 of 1–18.

ATEK: Augmenting Transformers with Expert Knowledge for Indoor Layout Synthesis • 0:9
GT ATISS V0 V1 V2 V30.0
0.2
0.4
0.6
0.8
1.0
Loss
Mean intersection loss of room-conditioned scenes
GT ATISS V0 V1 V2 V30.4
0.2
0.0
0.2
0.4
Real
ism
Perceived realism of other methods relative to the GT
Fig. 9. Evaluation of layouts synthesized by networks using our geometricintersection loss. The left chart shows that our networks V1, V2, and V3,which all make use of this loss, generate layouts with less intersectionsbetween furniture objects. The right chart shows how the realism of thelayouts is perceived by users compared to the ground truth, with a negativevalue meaning that the ground truth is seen as more realistic. Layoutsgenerated by V2 and V3 are seen as similarly realistic as the ground truth.
other methods, only V3 also manages to preserve the perceivedrealism of the generated layouts. We therefore conclude that ourproposed approach V3 is the most suitable for fulfilling the objectiveof synthesizing realistic layouts with a good ergonomic score.
5.4 Generalization to Other LossTo show that our proposed approach can also be used with otherloss terms, we perform another experiment in which we replacethe ergonomic loss term with a geometric term that aims to reduceintersections between furniture objects in the generated layouts.This is especially useful since both our and existing approachesthat use transformers for indoor scene synthesis [Wang et al. 2018,2020] have shown difficulties in generating intersection-free layoutswithout additional post-processing.
To compute the intersection loss L𝑋 between 2 furniture objects𝐹𝑖and 𝐹
𝑗, we take 9 sample points 𝑞𝑖,ℎ of 𝐹
𝑖consisting of the bound-
ing box center, edge midpoints and corners. Then the weighted sumof the signed distance of each sample point to 𝐹
𝑗is computed using
L𝑋
(𝐹𝑖 , 𝐹 𝑗
)=
8∑ℎ=0
𝛽ℎ ·min(𝑑
(𝑞𝑖,ℎ,𝐹 𝑗
),0)
8∑ℎ=0
𝛽ℎ
for 𝑖 > 0, 𝑗 = 0
8∑ℎ=0
𝛽ℎ ·max(−𝑑
(𝑞𝑖,ℎ,𝐹 𝑗
),0)
8∑ℎ=0
𝛽ℎ
for 𝑖 > 0, 𝑖 ≠ 𝑗 > 0
0 otherwise,
(10)
with 𝑑
(𝑞𝑖,ℎ, 𝐹 𝑗
)as the signed distance from sample point 𝑞𝑖,ℎ to
furniture object 𝐹𝑗, and 𝛽ℎ denoting the weight for each sample
point. We use 𝛽ℎ = 16 for the center, 𝛽ℎ = 4 for the edge midpointsand 𝛽ℎ = 1 for the corners. The first case of Equation 10 penalizesfurniture objects outside the room boundaries, while the secondcase penalizes intersections between objects. Since this function hasno upper limit, we clamp the intersection loss at 1.0 when we use itto weight the training samples.We conduct another perceptual study in the same manner as
described in Section 5.3, using the intersection loss instead of the
Train Val V0 V1 V2 V30.0
0.2
0.4
0.6
Loss
Mean ergonomic loss of freely synthesized Bedrooms
Train Val V0 V1 V2 V30.0
0.2
0.4
0.6
Mean intersection loss of freely synthesized Bedrooms
Fig. 10. Layout synthesis without room-conditioning, meaning that theroom dimensions, windows and doors are synthesized as well. We generateand evaluate 10000 layouts for each method and compare their score tothat of scenes in the training and validation sets. On the left, we use theergonomic loss as an additional term for our models, while on the rightwe use the intersection loss as an additional term. The y-axis shows thecorresponding mean score of synthesized layouts for each method, with the80% confidence interval of the mean shown in black.
ergonomic loss during training of the network and for the evalua-tion of the layouts. For the generation of the results, we also skipthe intersection-detection step this time. Figure 9 shows that theadditional loss term allows the transformer networks to generatelayouts with significantly fewer intersections between furnitureobjects (V1, V2, V3) compared to those without the additional loss(ATISS, V0). The results of our user study show that layouts gener-ated by V2 or V3 are generally seen as more realistic and similar tothe ground truth compared to those generated by ATISS, V0 or V1.
5.5 Unconditional Layout SynthesisIn Sections 5.3 and 5.4 we have demonstrated our networks capabil-ity to synthesize layouts when given a partial sequence includingthe room, doors and windows as a starting condition. However, ourmodels are also capable of generating entire layouts including thesetypes of elements from scratch. Examples of such layouts can beseen in Figure 13, where we show synthesized bedrooms in the toprow in addition to examples for other room types. For each of ourtrained models, we generate 10000 layouts and evaluate the resultsusing our ergonomic loss. The mean ergonomic score of the result-ing layouts can be seen on the left of Figure 10. Compared to thetraining data that the networks learned from, the mean ergonomicscore of the layouts synthesized by our networks V1, V2 and V3 is39.1%, 66.7% and 61.8% smaller respectively.
Additionally, we evaluate layouts generated using our alternativegeometric loss term which aims to reduce intersections betweenobjects in the same manner. The right of Figure 10 shows the meanintersection loss of the 10000 scenes synthesized by each versionof our network. As can be seen, the intersection loss of layoutsgenerated with V0 is 62.2% higher than that of the training datalayouts. The other versions of our network all yield an improvementcompared to V0, with V2 layouts having 19.0% higher intersectionloss than the training layouts, and V1 and V3 having 21.2% and18.7% lower intersection loss. While V3 produces better resultsthan V1 for room-constrained layout synthesis (Figure 9), the twoversions perform similarly for unconditioned synthesis. We reasonthat V1 can already provide a significant improvement for simple
2022-02-02 01:42. Page 9 of 1–18.

0:10 • Kurt Leimer, Paul Guerrero, Tomer Weiss, Przemyslaw Musialski
loss functions, like the geometric intersection loss, while V2 is betterat improving scenes when the loss function is more complex, suchas our proposed ergonomic loss. Since V3 combines the advantagesof both V1 and V2, and has proven to be effective in both of ourstudies, we conclude that it is the model best suited for the generalcase.
5.6 Evaluation of Transfer LearningTo evaluate the effectiveness of our proposed transfer learning strat-egy, we train networks from scratch using only the training datafrom each individual room category and compare the cross-entropyloss to that of our networks which are first trained on a generalset of training data before being fine-tuned for a room category.Figure 11 shows that the transfer learning strategy already yieldsa lower training and validation loss after the first epoch of fine-tuning. While the training loss for networks that are trained fromscratch eventually approaches that of the pre-trained network, thevalidation loss remains higher throughout. This effect is less pro-nounced when the size number of training samples is sufficientlylarge, as is the case with the Bedrooms dataset. For small trainingdatasets however, transfer learning proves to be a good strategy forimproving the training process.
6 LIMITATIONS AND CONCLUSIONSLimitations. Our proposed approach has a number of limitations.
Designing layouts is a complex high dimensional problem that in-cludes modalities including selecting 3D furniture model that fitwell together stylistically [Lun et al. 2015; Weiss et al. 2020]; archi-tectural elements such as room shapes walls and floor plans [Wuet al. 2019]; and various other aspects of lighting and illuminationconditions [Vitsas et al. 2020]. While important, such methods areorthogonal to our layout synthesis focused scope.The implementation of our model also has a few technical lim-
itations. We only demonstrate support for rectangular rooms, 2-dimensional layouts and sorted sequences of furniture objects. So-lutions to these problems have already been discussed in recentwork ([Paschalidou et al. 2021; Wang et al. 2018, 2020]) and arenot inherently incompatible with our approach, though the effectof extending the problem domain in these directions needs to befurther examined.Furthermore, while our ergonomic loss functions are derived
from ergonomics literature, they are only theoretical models andand have not been evaluated in a real-life setting. We think thatthe problem of translating the vast number of ergonomic rules andinterior design guidelines into differentiable functions to quantifythe ergonomic quality of indoor layouts can be a promising topic offurther research.
While we have demonstrated that our approach of incorporatingexpert knowledge into the Transformer training process producespromising results, we think that this is only the first step in com-bining data-driven and rule-based learning using state-of-the-artdeep-learning models such as Transformers. We believe that futureresearch in this direction can assist with making data-driven learn-ing approaches more applicable to domains where large amounts ofhigh-quality data with desired properties are not readily available.
Conclusions. We presented a novel method for the synthesis ofindoor layouts, which combines data-driven learning and manu-ally designed expert knowledge. To our knowledge, we are the firstto propose such a solution to the problem. The main benefit ofour approach is that it allows emphasizing features that might beunderrepresented in the data or might not be contained at all. Atthe same time, we maintain the benefits of a data-driven approachwhich is important for layout generation which is high-dimensionaland ill-defined. Manually crafting all design rules needed to syn-thesize comparable results would give a high-dimensional problem,but more importantly, it would be very difficult to define all nec-essary rules manually. Hence, combining both expert knowledgeand distribution learned from data gives us the benefits from bothworlds.
As a technical contribution, we proposed a modern Transformernetwork that can be trained using a loss function composed of cross-entropy and additional knowledge. In particular, we demonstratedthat simply adding the additional loss term can decrease the net-works capability of synthesizing realistic results since the two lossterms may serve conflicting objectives. We have shown that weight-ing the two loss terms on a per-sample basis leads to results thatfulfill the additional objective well and still maintain a high degreeof realism.Further, we introduced expert knowledge in the form of cost
functions derived from ergonomics, whose goal is to improve layoutsto be more usable and comfortable for humans. We also introducedanother loss that minimizes the overlap of objects in the room.This shows the generality of our approach and, at the same time, italso serves as another application to improve datasets containingpotential geometric errors.We described the details of our implementation (we will release
our code on GitHub), and we evaluated the method thoroughly. Weintroduced four variants for our novel loss and provided a rigor-ous ablation study. We showed numerical quantitative results andperformed two user studies (each with 327 participants on AmazonMechanical Turk) where the variants of our method out-performrecent related work. We also used our system to synthesize a largeset of realistic results. Our method is meant to help professionalsand amateurs in the future to address the problem of interior layoutdesign.
REFERENCESEsra Ataer-Cansizoglu, Hantian Liu, Tomer Weiss, Archi Mitra, Dhaval Dholakia,
Jae-Woo Choi, and Dan Wulin. 2019. Room style estimation for style-aware rec-ommendation. In 2019 IEEE International Conference on Artificial Intelligence andVirtual Reality (AIVR). IEEE, 267–2673.
Matthew Fisher, Manolis Savva, Yangyan Li, Pat Hanrahan, and Matthias Nießner.2015. Activity-centric scene synthesis for functional 3D scene modeling. ACMTransactions on Graphics (TOG) 34, 6 (2015), 1–13.
Huan Fu, Bowen Cai, Lin Gao, Ling-Xiao Zhang, Jiaming Wang, Cao Li, Qixun Zeng,Chengyue Sun, Rongfei Jia, Binqiang Zhao, et al. 2021a. 3d-front: 3d furnished roomswith layouts and semantics. In Proceedings of the IEEE/CVF International Conferenceon Computer Vision. 10933–10942.
Huan Fu, Rongfei Jia, Lin Gao, Mingming Gong, Binqiang Zhao, Steve Maybank, andDacheng Tao. 2021b. 3d-future: 3d furniture shape with texture. InternationalJournal of Computer Vision (2021), 1–25.
Qiang Fu, Xiaowu Chen, Xiaotian Wang, Sijia Wen, Bin Zhou, and Hongbo Fu. 2017.Adaptive synthesis of indoor scenes via activity-associated object relation graphs.ACM Transactions on Graphics (TOG) 36, 6 (2017), 1–13.
Z Sadeghipour Kermani, Zicheng Liao, Ping Tan, and H Zhang. 2016. Learning 3D SceneSynthesis from Annotated RGB-D Images. In Computer Graphics Forum, Vol. 35.
2022-02-02 01:42. Page 10 of 1–18.

ATEK: Augmenting Transformers with Expert Knowledge for Indoor Layout Synthesis • 0:11
0 1 2 3 4 5 6 7 8 9Epoch
0.75
1.00
1.25
1.50
1.75
Loss
Bedrooms - Training loss
0 1 2 3 4 5 6 7 8 9Epoch
0.9
1.0
1.1
Loss
Bedrooms - Validation loss
0 1 2 3 4 5 6 7 8 9Epoch
2.0
2.5
3.0
3.5
Loss
Living Rooms - Training loss
0 1 2 3 4 5 6 7 8 9Epoch
1.8
2.0
2.2
2.4
2.6
Loss
Living Rooms - Validation loss
V0 (with TL)V3 (with TL)V0 (no TL)V3 (no TL)
Fig. 11. By pre-training the network on a general dataset containing samples from all room types and then fine-tuning the network for a specific room type,the validation loss can be decreased significantly, especially for small datasets.
Wiley Online Library, 197–206.Karl H.E. Kroemer. 2017. Fitting the Human: Introduction to Ergonomics / Human Factors
Engineering, Seventh Edition. CRC Press.Manyi Li, Akshay Gadi Patil, Kai Xu, Siddhartha Chaudhuri, Owais Khan, Ariel Shamir,
Changhe Tu, Baoquan Chen, Daniel Cohen-Or, and Hao Zhang. 2019. Grains:Generative recursive autoencoders for indoor scenes. ACM Transactions on Graphics(TOG) 38, 2 (2019), 1–16.
Wei Liang, Jingjing Liu, Yining Lang, Bing Ning, and Lap-Fai Yu. 2019. FunctionalWorkspace Optimization via Learning Personal Preferences from Virtual Experi-ences. IEEE transactions on visualization and computer graphics 25, 5 (2019), 1836–1845.
Zhaoliang Lun, Evangelos Kalogerakis, and Alla Sheffer. 2015. Elements of style:learning perceptual shape style similarity. ACM Transactions on graphics (TOG) 34,4 (2015), 1–14.
Paul Merrell, Eric Schkufza, Zeyang Li, Maneesh Agrawala, and Vladlen Koltun. 2011.Interactive furniture layout using interior design guidelines. ACM transactions ongraphics (TOG) 30, 4 (2011), 1–10.
Wamiq Para, Paul Guerrero, Tom Kelly, Leonidas J Guibas, and Peter Wonka. 2021.Generative layout modeling using constraint graphs. In Proceedings of the IEEE/CVFInternational Conference on Computer Vision. 6690–6700.
Despoina Paschalidou, Amlan Kar, Maria Shugrina, Karsten Kreis, Andreas Geiger, andSanja Fidler. 2021. ATISS: Autoregressive Transformers for Indoor Scene Synthesis.In Advances in Neural Information Processing Systems (NeurIPS).
John F. Pile and Judith Gura. 2013. A History of Interior Design. Laurence King Publish-ing.
X. Puig, K. Ra, M. Boben, J. Li, T. Wang, S. Fidler, and A. Torralba. 2018. VirtualHome:Simulating Household Activities Via Programs. In 2018 IEEE/CVF Conference on Com-puter Vision and Pattern Recognition (CVPR). IEEE Computer Society, Los Alamitos,CA, USA, 8494–8502. https://doi.org/10.1109/CVPR.2018.00886
Siyuan Qi, Yixin Zhu, Siyuan Huang, Chenfanfu Jiang, and Song-Chun Zhu. 2018.Human-centric indoor scene synthesis using stochastic grammar. In Proceedings ofthe IEEE Conference on Computer Vision and Pattern Recognition. 5899–5908.
Alec Radford, Jeffrey Wu, Rewon Child, David Luan, Dario Amodei, Ilya Sutskever,et al. 2019. Language models are unsupervised multitask learners. OpenAI blog 1, 8(2019), 9.
Turbosquid. 2022. 3D Model Collection. https://www.turbosquid.com/. [Online;accessed Jan-2022].
Ashish Vaswani, Noam Shazeer, Niki Parmar, Jakob Uszkoreit, Llion Jones, Aidan NGomez, Łukasz Kaiser, and Illia Polosukhin. 2017. Attention is all you need. InAdvances in neural information processing systems. 5998–6008.
Nick Vitsas, Georgios Papaioannou, Anastasios Gkaravelis, and Andreas-AlexandrosVasilakis. 2020. Illumination-Guided Furniture Layout Optimization. In ComputerGraphics Forum, Vol. 39. Wiley Online Library, 291–301.
Kai Wang, Yu-An Lin, Ben Weissmann, Manolis Savva, Angel X Chang, and DanielRitchie. 2019. Planit: Planning and instantiating indoor scenes with relation graphand spatial prior networks. ACM Transactions on Graphics (TOG) 38, 4 (2019), 1–15.
Kai Wang, Manolis Savva, Angel X Chang, and Daniel Ritchie. 2018. Deep convolutionalpriors for indoor scene synthesis. ACM Transactions on Graphics (TOG) 37, 4 (2018),1–14.
XinpengWang, Chandan Yeshwanth, and Matthias Nießner. 2020. SceneFormer: IndoorScene Generation with Transformers. arXiv preprint arXiv:2012.09793 (2020).
Wayfair. 2022. Room Planner. https://www.wayfair.com/RoomPlanner3D. [Online;accessed Jan-2022].
Tomer Weiss, Alan Litteneker, Noah Duncan, Masaki Nakada, Chenfanfu Jiang, Lap-Fai Yu, and Demetri Terzopoulos. 2018. Fast and scalable position-based layoutsynthesis. IEEE Transactions on Visualization and Computer Graphics 25, 12 (2018),3231–3243.
Tomer Weiss, Ilkay Yildiz, Nitin Agarwal, Esra Ataer-Cansizoglu, and Jae-Woo Choi.2020. Image-Driven Furniture Style for Interactive 3D Scene Modeling. In ComputerGraphics Forum, Vol. 39. Wiley Online Library, 57–68.
Thomas Wolf, Lysandre Debut, Victor Sanh, Julien Chaumond, Clement Delangue,Anthony Moi, Pierric Cistac, Tim Rault, Rémi Louf, Morgan Funtowicz, Joe Davison,Sam Shleifer, Patrick von Platen, Clara Ma, Yacine Jernite, Julien Plu, Canwen Xu,Teven Le Scao, Sylvain Gugger, Mariama Drame, Quentin Lhoest, and Alexander M.Rush. 2020. Transformers: State-of-the-Art Natural Language Processing. In Pro-ceedings of the 2020 Conference on Empirical Methods in Natural Language Processing:System Demonstrations. Association for Computational Linguistics, Online, 38–45.https://www.aclweb.org/anthology/2020.emnlp-demos.6
Wenming Wu, Xiao-Ming Fu, Rui Tang, Yuhan Wang, Yu-Hao Qi, and Ligang Liu. 2019.Data-driven interior plan generation for residential buildings. ACM Transactions onGraphics (TOG) 38, 6 (2019), 1–12.
Haitao Yang, Zaiwei Zhang, Siming Yan, Haibin Huang, Chongyang Ma, Yi Zheng,Chandrajit Bajaj, and Qixing Huang. 2021. Scene Synthesis via Uncertainty-DrivenAttribute Synchronization. In Proceedings of the IEEE/CVF International Conferenceon Computer Vision. 5630–5640.
Lap Fai Yu, Sai Kit Yeung, Chi Keung Tang, Demetri Terzopoulos, Tony F Chan, andStanley J Osher. 2011. Make it home: automatic optimization of furniture arrange-ment. ACM Transactions on Graphics (TOG)-Proceedings of ACM SIGGRAPH 2011, v.30,(4), July 2011, article no. 86 30, 4 (2011).
Yongqi Zhang, Haikun Huang, Erion Plaku, and Lap-Fai Yu. 2021. Joint computationaldesign of workspaces and workplans. ACM Transactions on Graphics (TOG) 40, 6(2021), 1–16.
Zaiwei Zhang, Zhenpei Yang, Chongyang Ma, Linjie Luo, Alexander Huth, EtienneVouga, and Qixing Huang. 2020. Deep generative modeling for scene synthesis viahybrid representations. ACM Transactions on Graphics (TOG) 39, 2 (2020), 1–21.
Yang Zhou, Zachary While, and Evangelos Kalogerakis. 2019. SceneGraphNet: NeuralMessage Passing for 3D Indoor Scene Augmentation. In Proceedings of the IEEEInternational Conference on Computer Vision. 7384–7392.
ACKNOWLEDGMENTSThis research was funded by NJIT’s faculty startup funds, giftsfrom Adobe, and by Austrian Science Fund FWF P 29981 (https://www.fwf.at). In addition, the authors would like to thank StefanPillwein for his help with the paper production.
A SEQUENCE REPRESENTATION DETAILSThe category 𝑐
𝑖of a furniture object is obtained by simply assigning
each category a unique integer value. To obtain the integer-valuedfurniture object attributes from the real-valued attributes of theobjects in the layout, we employ the following quantization scheme.Since the real-valued orientation 𝑜
𝑖is within the range (−𝜋, 𝜋], we
use
𝑜𝑘𝑖 =
𝑜𝑘𝑖−(
2𝜋𝑟 − 𝜋
)2𝜋 − 2𝜋
𝑟
(𝑟 − 1) ,
to obtain the integer-valued orientation 𝑜𝑖, with 𝑟 being the resolu-
tion of the quantization, such that 𝑜𝑘𝑖∈ {0, . . . , 𝑟 − 1}. This formu-
lation guarantees that the 4 cardinal directions, which are the mostcommon orientations for furniture objects, are each represented byan integer value if 𝑟 mod 4 = 0. For the other attributes, insteadof setting a predetermined range of possible values, we determine
2022-02-02 01:42. Page 11 of 1–18.

0:12 • Kurt Leimer, Paul Guerrero, Tomer Weiss, Przemyslaw Musialski
Results Ours V3: Bedrooms
Results Ours V0: Bedrooms
Results ATISS: Bedrooms
Ground Truth: Bedrooms
Fig. 12. Selected synthesis results used in the conditional user study as described in Section 5. The input to all algorithms were the same: floorplan, includinggiven positions of windows and doors. From to top to bottom, we show the results of our Transformer variant V3, variant V0, following ATISS [Paschalidouet al. 2021], and the ground truth. Please refer to supplemental material for all results, including our V0, V1 and V2 variants.
2022-02-02 01:42. Page 12 of 1–18.

ATEK: Augmenting Transformers with Expert Knowledge for Indoor Layout Synthesis • 0:13
Results Ours V3: Bedrooms
Results Ours V3: Living Rooms
Results Ours V3: Dining Rooms
Results Ours V3: Libraries
Fig. 13. Selected samples of different room categories freely synthesized using our variant V3 and transfer learning. As datasets for other room categories wepre-train the network on all categories and next specialize it on specific categories (refer to Sec.5 for the detailed description.)
2022-02-02 01:42. Page 13 of 1–18.

0:14 • Kurt Leimer, Paul Guerrero, Tomer Weiss, Przemyslaw Musialski
sequences
ci oi di xi yi
i=1
i=2
i=0 0 1 3 4 5
wi
2
6 7 9 10 118
12 13 15 16 1714(x , y )2 2
d2
w2c0
c2
c1
o2
c2
c0 o0 w0 d0 x0 y0 c1 o1 w1 d1 y2S = [ ... ]
0 1 2 3 4 5 6 7 8 9 17P = [ ... ]
0 1 2 3 4 5 0 1 2 3 5I = [ ... ]
x1
10
4
y1
11
5
c2
12
0
...
...
...
c2
c1
y
x
c0
c3
c4c5
c6
P=(0, 1, 2, 3, 4, 5, , , , )6, 7, 8, 9, 10, 11, 12, ... 24, ...18, ... 30, ...
I=(0, 1, 2, 3, 4, 5, , , , )0, 1, 2, 3, 4, 5, 0, ... 0, ... 0, ... 0, ...
(x , y )3 3
d3
w3
o3
S=(c , o , w , d , x , y , , , , , )0 0 0 0 0 0 c , o , w , d , x , y1 1 1 1 1 1 c , ... c , ...2 4c , ...3 c , ...5
c3
c1
y
x
c3
c0
c2
c4 c5
room door bed closet
old mateial
colors
ergo_rules
P=(0, 1, 2, 3, 4, 5, , , )6, 7, 8, 9, 10, 11 12, ..., 17 18, ..., 23
I=(0, 1, 2, 3, 4, 5, , , )0, 1, 2, 3, 4, 5 0, ..., 5 0, ..., 5
(x , y )3 3
d3
w3
o3
S=(c , o , w , d , x , y , , , )0 0 0 0 0 0 c , o , w , d , x , y1 1 1 1 1 1 c , ..., y2 2 c , ..., y3 3
c3
c1
y
x
c3
c0
c2
room door bedwindow
interpolation
P=(0, 1, 2, 3, 4, 5, , , , , , , , , , , , )6 7 8 9 10 11 12 ... 17 18 ... 23
I=(0, 1, 2, 3, 4, 5, , , , , , , , , , , , )0 1 2 3 4 5 0 ... 5 0 ... 5
S=(c , o , w , d , x , y , , , , , , , , , , , , )0 0 0 0 0 0 c o w d x y1 1 1 1 1 1 c ... y2 2 c ... y3 3
room door bedwindow
c , o , w , d , ? , y , c , o , ...0 0 0 0 0 1 1
p0 pj pr
g(j,σ)
(0)g(j,σ)
(j)g(j,σ)
(r)g(j,σ)
sitting_locations
u1
a) reach b) visibility c) lighting d) glare
u
ToDo: check vector naming
v uv uv
u1
u2 u3
v1
v2v3
u1 u2u3
v1
v2v3
c , o , w , d , x , y , c , ? , w , d , x , y , c , o , ...0 0 0 0 0 0 1 1 1 1 1 2 2
p0 pj pr
g(j,σ)
(0)g(j,σ)
(j)g(j,σ)
(r)g(j,σ)
p1
p2p3
q
grid
Fig. 14. The quantization of the positions and dimensions of furniture ob-jects is dependent on the room dimensions. It can be understood as fittinga grid of fixed size into the room and expressing the object attributes asmultiples of the cell size of the grid.
the range in relation to the size of the room. Intuitively, it can beunderstood as dividing the room using a uniform grid, and placingall other objects in alignment with this grid (Figure 14). To achievethis, we need to treat the quantization of the room separately fromthe other furniture objects.We assume that the bounding box of each input room is axis-
aligned, with the bottom left corner of the room positioned at (0, 0)and the orientation of the room aligned with the positive y-axis,which corresponds to real-valued attributes 𝑜𝑘0 = 0, 𝑥𝑘0 = 0 and𝑦𝑘0 = 0. Parsing the ground truth data, we extract the minimumand maximum room dimensions �̂�
𝑚𝑖𝑛= min𝑘 �̂�𝑘
0 , 𝑑𝑚𝑖𝑛= min𝑘 , 𝑑𝑘0 ,
�̂�𝑚𝑎𝑥 = max𝑘 �̂�𝑘0 and 𝑑𝑚𝑎𝑥 = max𝑘 𝑑𝑘0 . The grid cell size Δ𝑘 used
for the quantization of the furniture objects 𝐹𝑘𝑖is then determined
using the greater dimension of each room. For �̂�𝑘0 ≥ 𝑑𝑘0 we obtain
Δ𝑘 =�̂�𝑘
0𝑟 − 2
,
𝑤𝑘0 =
�̂�𝑘0 − �̂�
𝑚𝑖𝑛
�̂�𝑚𝑎𝑥 − �̂�𝑚𝑖𝑛
(𝑟 − 2) ,(11)
with the opposite case defined analogously, using the depth insteadof the width to compute the grid cell size Δ𝑘 . In practice, since itis necessary to differentiate between the two possible cases �̂�𝑘
0 ≥𝑑𝑘0 and �̂�𝑘
0 < 𝑑𝑘0 when reconstructing the layout, we store thisinformation by setting the real-valued room orientation 𝑜𝑘0 = −𝜋
2and swapping the width𝑤𝑘
0 and depth 𝑑𝑘0 values in the latter case,such that𝑤𝑘
0 always indicates the greater dimension of the room.Please note that, since �̂�𝑘
0 = (𝑟 − 2) Δ𝑘 , the room does not occupythe entire range of the grid, even along its greater dimension. Thereason for this is that windows and doors may be positioned outsidethe room boundaries, so we ensure that there is at least one row orcolumn of the grid available beyond each wall of the room.
After computing the grid cell size Δ𝑘 from the dimensions of theroom, the integer-valued attributes of all other furniture objects are
then given by
𝑤𝑘𝑖 =
�̂�𝑘𝑖− Δ𝑘
Δ𝑘for 𝑖 > 0,
𝑑𝑘𝑖 =𝑑𝑘𝑖− Δ𝑘
Δ𝑘for 𝑖 ≥ 0,
𝑥𝑘𝑖 =𝑥𝑘𝑖+ Δ𝑘
Δ𝑘for 𝑖 ≥ 0,
𝑦𝑘𝑖 =𝑦𝑘𝑖+ Δ𝑘
Δ𝑘for 𝑖 ≥ 0 .
(12)
Windows and doors are treated slightly differently, as we set theirdepth 𝑑𝑘0 = Δ𝑘 and adjust their position such that they are alwaystouching the room boundary, since their actual position in the layoutcan vary depending on the thickness of the walls.Since all sequences need to be of the same length in order to be
used as input to the transformer network, we append the paddingtoken with value 𝑟 to each sequence until they reach the desiredmaximum length. In our case, we want to represent a maximum of𝑁 = 21 furniture objects including the room, resulting in a lengthof 𝑛 = 126.In order to reconstruct a layout from a given integer-valued se-
quence, the quantization process is reversed. The orientation of afurniture object is given by
𝑜𝑘𝑖 =
(2𝜋𝑟
− 𝜋
)+
𝑜𝑘𝑖
𝑟 − 1
(2𝜋 − 2𝜋
𝑟
). (13)
To reconstruct the room, we first need to consider if 𝑜𝑘0 = −𝜋2 . If this
is not the case, the real-valued attributes of the room are obtainedusing
�̂�𝑘0 = �̂�𝑚𝑖𝑛 +
𝑤𝑘0
𝑟 − 2(�̂�𝑚𝑎𝑥 − �̂�𝑚𝑖𝑛
),
Δ𝑘 =�̂�𝑘
0𝑟 − 2
.
(14)
Otherwise, we swap the width𝑤𝑘0 and depth 𝑑𝑘0 values, set 𝑜𝑘0 = 0
and compute the grid cell size Δ𝑘 using the depth instead of thewidth of the room. Finally, the attributes of the other furnitureobjects are recovered using
�̂�𝑘𝑖 = 𝑤𝑘
𝑖 Δ𝑘 + Δ𝑘 for 𝑖 > 0,
𝑑𝑘𝑖 = 𝑑𝑘𝑖 Δ𝑘 + Δ𝑘 for 𝑖 ≥ 0,
𝑥𝑘𝑖 = 𝑥𝑘𝑖 Δ𝑘 − Δ𝑘 for 𝑖 ≥ 0,
𝑦𝑘𝑖 = 𝑦𝑘𝑖 Δ𝑘 − Δ𝑘 for 𝑖 ≥ 0 .
(15)
2022-02-02 01:42. Page 14 of 1–18.

ATEK: Augmenting Transformers with Expert Knowledge for Indoor Layout Synthesis • 0:15
Realism Study: Ours V3
Realism Study: Ours V0
Realism Study: ATISS [Paschalidou et al. 2021]
Realism Study: Ground Truth
Fig. 15. Selected synthesis results used in the conditional user study. The input to all algorithms were the same: floorplan, including given positions ofwindows and doors. From to top to bottom, we show the results of our Transformer variant V3, variant V0, following ATISS [Paschalidou et al. 2021], and theground truth. Please refer to supplemental material for all results, including our V0, V1 and V2 variants.
2022-02-02 01:42. Page 15 of 1–18.

0:16 • Kurt Leimer, Paul Guerrero, Tomer Weiss, Przemyslaw Musialski
Realism Study: Ours V3
Realism Study: Ours V2
Realism Study: Ours V1
Realism Study: Ours V0
Fig. 16. Selected synthesis results used in the conditional user study. The input to all algorithms were the same: floorplan, including given positions ofwindows and doors. From to top to bottom, we show the results of our Transformer variants V3, V2, V1 and V0.
2022-02-02 01:42. Page 16 of 1–18.
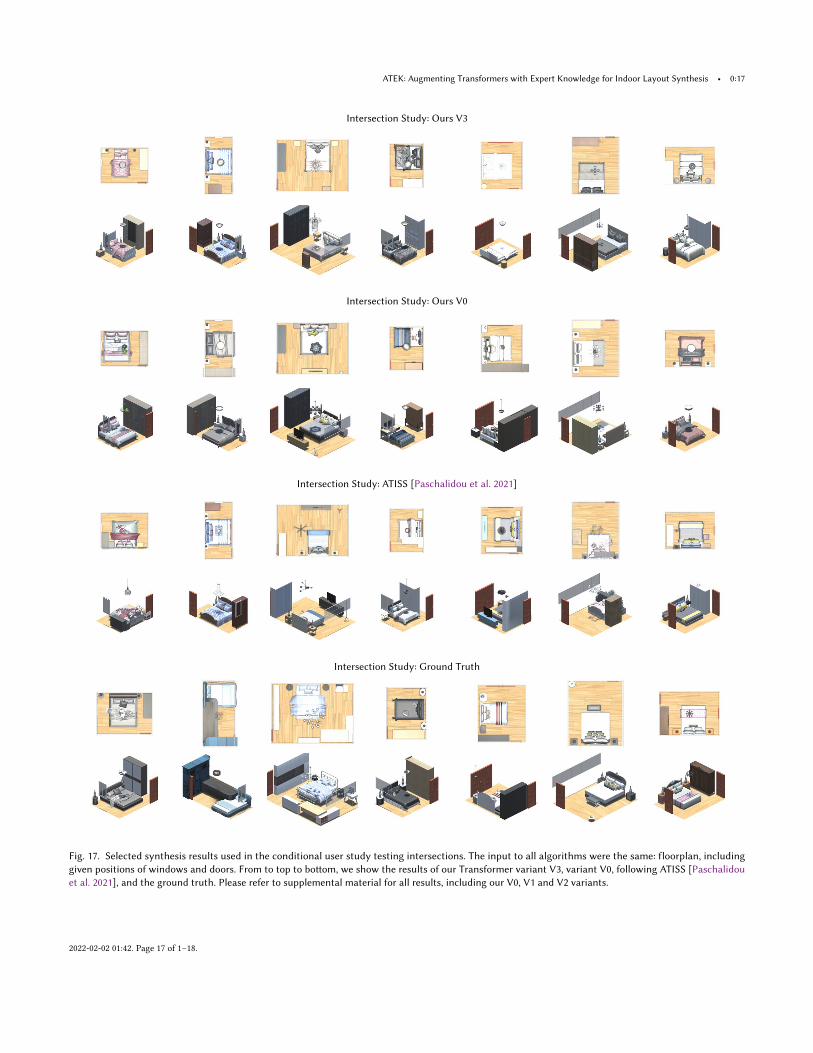
ATEK: Augmenting Transformers with Expert Knowledge for Indoor Layout Synthesis • 0:17
Intersection Study: Ours V3
Intersection Study: Ours V0
Intersection Study: ATISS [Paschalidou et al. 2021]
Intersection Study: Ground Truth
Fig. 17. Selected synthesis results used in the conditional user study testing intersections. The input to all algorithms were the same: floorplan, includinggiven positions of windows and doors. From to top to bottom, we show the results of our Transformer variant V3, variant V0, following ATISS [Paschalidouet al. 2021], and the ground truth. Please refer to supplemental material for all results, including our V0, V1 and V2 variants.
2022-02-02 01:42. Page 17 of 1–18.

0:18 • Kurt Leimer, Paul Guerrero, Tomer Weiss, Przemyslaw Musialski
Intersection Study: Ours V3
Intersection Study: Ours V2
Intersection Study: Ours V1
Intersection Study: Ours V0
Fig. 18. Selected synthesis results used in the conditional user study testing intersections. The input to all algorithms were the same: floorplan, includinggiven positions of windows and doors. From to top to bottom, we show the results of our Transformer variants V3, V2, V1 and V0.
2022-02-02 01:42. Page 18 of 1–18.