
Field Operations Manual - Environmental Protection Agency
485
United States Environmental Protection Agency Office of Water Office of Environmental Information Washington, DC EPA 843-R-10-001 National Wetland Condition Assessment Field Operations Manual
-
Upload
khangminh22 -
Category
Documents
-
view
0 -
download
0
Transcript of Field Operations Manual - Environmental Protection Agency

United States Environmental Protection Agency Office of Water Office of Environmental Information Washington, DC EPA 843-R-10-001
National Wetland Condition Assessment
Field Operations Manual


EPA-843-R-10-001
2011 National Wetland Condition Assessment
Field Operations Manual
U.S. Environmental Protection Agency Office of Water
Office of Environmental Information Washington, DC

ii

2011 NWCA Field Operations Manual
iii
NOTICE
Methods described in the National Wetland Condition Assessment: Field Operations Manual are to be used specifically in work relating to the National Wetland Condition Assessment (NWCA). Mention of trade names or commercial products in the document does not constitute endorsement or recommendation for use. The suggested citation for this document is:
U.S. Environmental Protection Agency. 2011. National Wetland Condition Assessment: Field Operations Manual. EPA-843-R-10-001. U.S. Environmental Protection Agency, Washington, DC.
Companion documents for the NWCA are:
National Wetland Condition Assessment: Quality Assurance Project Plan (EPA-843-R-10-003) National Wetland Condition Assessment: Site Evaluation Guidelines (EPA-843-R-10-004) National Wetland Condition Assessment: Laboratory Methods Manual (EPA-843-R-10-002)

2011 NWCA Field Operations Manual
iv

2011 NWCA Field Operations Manual
v
TABLE OF CONTENTS
Notice. . . . . . . . . . . . . . . . . . . . . . . . . . . . . . . . . . . . . . . . . . . . . . . . . . . . . . . . . . . . .
Table of Contents. . . . . . . . . . . . . . . . . . . . . . . . . . . . . . . . . . . . . . . . . . . . . . . . . . . .
Acknowledgements . . . . . . . . . . . . . . . . . . . . . . . . . . . . . . . . . . . . . . . . . . . . . . . . . .
Chapter 1. Overview of NWCA . . . . . . . . . . . . . . . . . . . . . . . . . . . . . . . . . . . . . . . . .
Chapter 2. Base Site Activities and Summary of Field Operations. . . . . . . . . . . . . .
Chapter 3. Establishing the Assessment Area. . . . . . . . . . . . . . . . . . . . . . . . . . . . .
Chapter 4. Characterizing the Buffer. . . . . . . . . . . . . . . . . . . . . . . . . . . . . . . . . . . . .
Chapter 5. Vegetation. . . . . . . . . . . . . . . . . . . . . . . . . . . . . . . . . . . . . . . . . . . . . . . .
Chapter 6: Soils. . . . . . . . . . . . . . . . . . . . . . . . . . . . . . . . . . . . . . . . . . . . . . . . . . . . .
Chapter 7. Hydrology . . . . . . . . . . . . . . . . . . . . . . . . . . . . . . . . . . . . . . . . . . . . . . . .
Chapter 8. Water Quality. . . . . . . . . . . . . . . . . . . . . . . . . . . . . . . . . . . . . . . . . . . . . .
Chapter 9. Algae. . . . . . . . . . . . . . . . . . . . . . . . . . . . . . . . . . . . . . . . . . . . . . . . . . . .
Appendix A. Shipping and Tracking
Appendix B. Target Invasive and Alien Plant Species
Appendix C. Vegetation Supplementary Material – Lists of Floristic Resources
Appendix D. Photography
Appendix E. Example Oil Decontamination Procedures
iii
v
vii
1-1
2-1
3-1
4-1
5-1
6-1
7-1
8-1
9-1

2011 NWCA Field Operations Manual
vi

2011 NWCA Field Operations Manual
vii
ACKNOWLEDGEMENTS
Many collaborators contributed to the development of the U.S. Environmental Protection Agency’s (USEPA) National Wetland Condition Assessment Field Operations Manual (NWCA FOM). These committed partners improved the technical quality of the field sampling approach described in this document. In particular, state, tribal, and federal members of the National Wetlands Monitoring and Assessment Work Group provided tireless effort in reviewing protocols, attending and planning workshops, challenging our thinking, and committing to the goal of improved national data describing wetland quality. In addition, participants in the NWCA Indicators Workshop (2008) contributed to the scientific foundation for the manual and participants in the NWCA FOM Technical Review Panel (2010) provided the final scientific review of the field sampling approach. While it is not possible to list every person who provided input along the way, some of the key contributors are acknowledged below. Mary E. Kentula and Teresa Magee from the USEPA Office of Research and Development are the lead authors of this document and worked with the other members of the NWCA FOM writing team which included Gregg Lomnicky, Sandy Bryce and Howard Bruner from Dynamac Corporation, Inc. The writing team was responsible for writing, revising, and finalizing the document. This involved technical research on indicators, field protocol development and testing, and resolution of partner comments. They also organized the 2010 Technical Review at the USEPA National Health and Environmental Effects Laboratory’s Western Ecology Division in Corvallis, OR. Elizabeth Riley, an Oak Ridge Institute for Science and Education (ORISE) Fellow with USEPA Office of Water, provided invaluable technical support to almost every component of the NWCA FOM. In particular, Elizabeth wrote text for the appendices and competently led demonstrations of the protocols for the 2010 Technical Review and other NWCA meetings. Lenore Vasilas*, Phil King*, and other soil scientists with the US Department of Agriculture, Natural Resource Conservation Service provided input that was key to development of the soils chapter. Joanna Lemly* from the Colorado Natural Heritage Program and Michael Bourdaghs* from the Minnesota Pollution Control Agency provided detailed reviews of all the chapters of the FOM and served as co-chairs of the NWCA FOM Technical Review Panel. The NWCA builds on the work of the other National Aquatic Resource Surveys conducted by the USEPA and the states and tribes (see http://water.epa.gov/type/watersheds/monitoring/nationalsurveys.cfm). Other key contributors are noted below. While space limitations prevent listing of all the people who contributed to the Field Operations Manual, we gratefully acknowledge their input and extend our most sincere thanks to them as well. - Michael Scozzafava, USEPA Office of Water
State and Tribal Programs
Beth Connors, Maine Department of Environmental Protection
Jeanne DiFranco, Maine Department. of Environmental Protection Jan Smith, Massachusetts Bays National Estuary Program Marc Carullo, Massachusetts Coastal Zone Management
Lisa Rhodes, Massachusetts Department Environmental Protection Alan Quackenbush, Vermont Agency of Natural Resources
Kathleen Walz, New Jersey Natural Heritage Program Kerry Strout, New England Interstate Water Pollution Control Commission
Amy Jacobs, Delaware Department of Natural Resources and Environmental Control

2011 NWCA Field Operations Manual
viii
Alison Rogerson, Delaware Department of Natural Resources and Environmental Control Danielle Kreeger, Delaware Estuary National Estuary Program
David Davis, Virginia Department of Environmental Quality Michelle Henicheck, Virginia Department of Environmental Quality
Walt Kordek, West Virginia Department of Natural Resources Virginia Baker, North Carolina Department of the Environment and Natural Resources *Rick Savage, North Carolina Department of the Environment and Natural Resources
*Barbara Scott, Kentucky Department of Water Brian Gara, Ohio Environmental Protection Agency
*Mick Miccachion, Ohio Environmental Protection Agency John Mack, Cleveland Metroparks
Peg Bostwick, Michigan Department of Natural Resources and Environment Tracy Collin, Michigan Department of Natural Resources and Environment Todd Lossee, Michigan Department of Natural Resources and Environment
Tom Bernthal, Wisconsin Department of Natural Resources Gina LaLiberte, Wisconsin Department of Natural Resources
John Genet, Minnesota Pollution Control Agency Ted LaGrange, Nebraska Game and Parks
Debra Baker, Kansas Water Office Vince Evelsizer, Iowa Department of Natural Resources
Cat McIntyre, Montana Natural Heritage Program Karen Newlon, Montana Natural Heritage Program Linda Vance, Montana Natural Heritage Program
Jason Jones, Arizona Department of Environmental Quality *Betty Fetcher, Southern California Coastal Water Research Project
Chris Solek, Southern California Coastal Water Research Project Eric Stein, Southern California Coastal Water Research Project
Martha Sutula, Southern California Coastal Water Research Project Josh Collins, San Francisco Estuary Institute
Aaron Borisenko, Oregon Department of Environmental Quality Janet Morlan, Oregon Division of State Lands Kathy Verble, Oregon Division of State Lands
Renee Davis-Borne, Oregon Watershed Enhancement Board Tom Hruby, Washington Department of Ecology
Joe Rocchio, Washington Department of Natural Resources *Jason Pappani, Idaho Department of Environmental Quality Terri Lomax, Alaska Department of Environmental Control
Academia, Non-Profit and Private Organizations
Rick Rheinhardt, East Carolina University Dennis McCauley, Great Lakes Environmental Center
Jamie Saxton, Great Lakes Environmental Center Chris Turner, Great Lakes Environmental Center
Siobhan Fennessy, Kenyon College Jan Stevenson, Michigan State University
Cara Clark, Moss Landing Marine Laboratories Kevin O’Connor, Moss Landing Marine Laboratories
Don Faber-Langendoen, NatureServe Robert Peet, North Carolina State University
*Shawn DeKeyser, North Dakota State University Christine Hargiss, North Dakota State University
Paul Adamus, Oregon State University Rob Brooks, Penn State University
Sarah (Miller) Chamberlain, Penn State University Hannah Ingram, Penn State University Denice Wardrop, Penn State University
*Kelly Reiss, University of Florida John Galbraith, Virginia Tech University
Kirk Havens, Virginia Institute of Marine Science

2011 NWCA Field Operations Manual
ix
Federal Agencies
Tom Dahl, US Fish and Wildlife Service Keith Loftin, US Geologic Survey
Tom Heitmuller, US Geologic Survey Martin Stapanian, US Geologic Survey Keith Langdon, National Park Service
Kate Miller, National Park Service *Brian Mitchell, National Park Service Billy Schweiger, National Park Service
Larry West, US Department of Agriculture, Natural Resource Conservation Service Chris Smith, US Department of Agriculture, Natural Resource Conservation Service
Rich Ferguson, US Department of Agriculture, Natural Resource Conservation Service Dan Shurtliff, US Department of Agriculture, Natural Resource Conservation Service
Cameron Loerch, US Deparment of Agriculture, Natural Resource Conservation Service Chris Carlson, US Department of Agriculture, Forest Service
Gregg Serenbetz USEPA Chris Faulkner, USEPA HQ
Sarah Lehmann, USEPA HQ Ellen Tarquinio, USEPA HQ Timothy Taylor, USEPA HQ
Jeanne Voorhees, USEPA Region 1 Tom Faber, USEPA Region 1
Kathleen Drake, USEPA Region 2 *Regina Poeske, USEPA Region 3
Peter Kalla, USEPA Region 4 David Melgaard, USEPA Region 4
Bill Ainslie, US EPA Region 4 Diana Woods, US EPA Region 4 *Peter Jackson, USEPA Region 5
Sue Elston, USEPA Region 5 Mark Stead, USEPA Region 6
Richard Prather, USEPA Region 6 Laura Hunt, USEPA Region 6
Eliodora Chamberlain, USEPA Region 7 Leah Medley, USEPA Region 7
Jill Minter, USEPA Region 8 Karl Hermann, USEPA Region 8
Paul Jones, USEPA Region 9 *Mary Anne Theising, USEPA Region 10
Virginia Engle, USEPA Office of Research and Development Michael Osland, USEPA Office of Research and Development
*Janet Nestlerode, USEPA Office of Research and Development *Anett Trebitz, USEPA Office of Research and Development Mary Moffet, USEPA Office of Research and Development
Amanda Nahlik, USEPA Office of Research and Development Walt Nelson, USEPA Office of Research and Development
Christine Weilhoefer, USEPA Office of Research and Development David Peck, USEPA Office of Research and Development
Debra Taylor, USEPA Office of Research and Development Alex Amario, USEPA Office of Research and Development
Cathleen Wigand, USEPA Office of Research and Development Charles Lane, USEPA Office of Research and Development
* Member of the 2010 Technical Review Panel

2011 NWCA Field Operations Manual
x

2011 NWCA FOM Errata
2011 NWCA Field Operations Manual Errata A. Minor Errors or Changes in Forms or Labels and Modifications to Accompanying Protocols Errors on forms or labels that will be corrected on the final data forms to be provided in the Form Packets for sampling in summer 2011 are: 1) Form AA‐1: NWCA Assessment Area Establishment (Front) The spaces for entering the LAT in the Location of the AA section have been changed to accommodate entering decimal degrees, which is the format used in NARS. 2) Form B‐1: NWCA Buffer Sample Plots (Front)
a) The right half of the Location field under the header has been changed to document situations when data could not be collected for Buffer Plot(s) due to inability to access. See below.
b) In the Buffer Natural Cover Strata legend, under Canopy Type, note that more than one bubble can be filled out to indicate that a mixed canopy is present. See image below.
c) Under Buffer Cover Strata “bare dirt” has been changed to “bare ground”.
3) Form B‐1: NWCA Buffer Sample Plots –Targeted Alien Species (Back) a) Canada thistle and leafy spurge have been added to the target alien list. b) Four spaces for “Other” alien species are included, should states want to record this information for their use. c) The location and plot coordinates section of this form has been changed and clarified. Now the section is titled Plot
Coordinates. The new form provides instruction on what to record about Buffer Plot location and what to record if a Buffer Plot is not accessible. See image below.
4) Form V‐1: NWCA Vegetation Plot Establishment (Front)
a) Plot Location section: i) A parenthetical phrase has been added so the plot location section heading now reads: “Plot locations in
relation to AA (in non‐standard Vegetation plot layout)”. This means that distance and bearing need only be recorded for Alternate Veg Plot Layouts.
ii) The Veg Plot location column titled “Based on Magnetic or True North” has been deleted. iii) The column titled “Bearing” has been changed to “Magnetic N Bearing”. This means that bearing to plots
from the AA CENTER should be recorded based on magnetic north.

2011 NWCA FOM Errata
b) Plant Species Nomenclature section: i) The phrase “Plant species names must be based on USDA‐PLANTS (http://plants.usda.gov/)” has been
changed to read “Plant species names should be based on USDA‐PLANTS (http://plants.usda.gov/)”. If possible, reconcile the species names to USDA‐PLANTS. If this is not feasible, then be certain that you list the floras used for plant identification and naming conventions for each NWCA (see iii below).
ii) Only fill in the following bubble if the species names have been reconciled to USDA PLANTS: “ USDA‐PLANTS – Fill to indicate names for plant species observed at this site have been reconciled to USDA‐PLANTS”. Leave this bubble unfilled if this reconciliation has not been completed.
iii) Under the “Record citations for Floras/Field Guides/Databases used for plant identification” section do the following: (1) Record the citation for the primary flora you are using for plant identification first under 1. (2) Record secondary floras or field guides under 2 through 4. (3) For any species names recorded on Form V‐2 or V‐4 that are not included in your primary flora, flag them
and indicate the citation (2 through 4, or other nomenclatural source) that applies. You do not need to flag species that use the nomenclature from your primary flora.
(4) IT IS CRITICALLY IMPORTANT that the floristic citations used at the site are included on Form V‐1 to allow reconciliation of the species names to one standard nomenclature nationwide.
5) Form V‐3: NWCA Ground Surface Attributes (Back) – In the Vegetative Litter section in the Plot 1 cell of the Predominant or Primary Litter Types field, the “E” and “F” bubbles were inverted. This has been corrected so that the order of choices is the same for all Plot cells in this field.
6) Form V‐4b: NWCA Snag and Tree Counts and Tree Cover (Continued) – The form title has been corrected. Previously the title was incorrect and listed as Form V‐4a.
7) Plant Specimen Label – The last row of the label has been corrected from “Plant Habitat” to “Plant Habit”.
8) Form S‐1: NWCA Soil Profile Data (Front) – In the horizon cells for the Composition field of the Redoximorphic, Organic, or Mottle Feature Types Section, a small error has been corrected: “M” has been changed “Mn” to reflect the abbreviation for Manganese.
B. Errors to Figure 5‐3 – Several “species presence” bubbles were inadvertently left unfilled on this example of a filled‐out
set of Form V‐2a and V‐2b: NWCA Vascular Presence and Cover that are illustrated in Figure 5‐3a‐c in the FOM. In addition, incorrect cover values were recorded for two species. The corrections needed across Figure 5‐3a and 5‐3c are: 1) Mimulus primuloides: Plot 1 – Fill the S (1m2‐quadrat) bubble for NE corner. 2) Polygonum bistortoides: Plot 2 – Fill the S bubble for the NE corner. 3) Carex 2 – Rugose sheath: Plot 2 – % Cover should read “50”. 4) Salix 1 – Yellow twig: Plot 1 – Cross out L bubble and fill in S bubble for NE corner. 5) Salix 1 – Yellow twig: Plot 4 ‐ % Cover should read “5”. 6) Carex utriculata: Plot 2 – Fill the S bubble for the NE corner. 7) Carex utriculata: Plot 4 – Fill the L (100m2‐plot) bubble for the SW corner. 8) Aconitum columbianum: Plot 2 – Fill the L bubble for the NE corner. 9) Pinnate‐Lf Umbel: Plot 3 – Fill the L bubble for the NE corner. 10) Deschampsia caespitosa: Plot 3 – Fill in the S bubble for NE corner 11) Deschampsia caespitosa: Plot 4 – Fill the M (10m2‐quadrat) for the SW corner and the S bubble for the NE corner. 12) Carex limosa: Plot 3 – Fill the L bubble for the SW corner and the S bubble for the NE corner. We recommend that you fill in the appropriate bubbles in Figure 5‐3 in your copy of the FOM so that it is accurate.
C. Chapter 9. Algae – In several places in Chapter 9 of the NWCA FOM, the term “epiphytes” is erroneously used to mean “epiphytic algae”, i.e., algae growing on plants.
2011 NWCA FOM Protocol Clarifications
NWCA 2011 Protocol Clarifications Chapter 5. Vegetation 1) Plant specimen collection – Follow the protocols in the FOM carefully (Sections 5.1.3.1 and 5.2), with the
following change for unknown plant specimens: a) Collect all unknown species that are mature and have the key elements needed for keying‐out and
identifying specimens (e.g., leaves, stems, flowers and/or fruits). b) For immature or senescent specimens with key parts missing (e.g., grasses or sedges with only leaf blades
and no flowers or fruits; forbs that are seedlings, have unremarkable leaf shapes, or missing flowers), do the following: i) If the species has >10% cover, collect it anyway. It is possible that a regional expert may be able to
identify the species even it is incomplete. ii) If the species has < 10% cover do not collect a specimen, but still record a pseudonym and estimate
its cover.
2) Estimating DBH (diameter breast height) for live trees and snags – Follow the protocols in the FOM carefully (Section 5.1.3.9, Form V‐4), with the following clarification for trees or snags with multiple trunks: a) If the tree or snag has one trunk up to breast height (1.37m, estimate this height – do not measure) then
splits into multiple trunks above this height, estimate its DBH below the split. b) If the tree or snag has multiple trunks originating below breast height (1.37m), then estimate the DBH of
each trunk.
3) Cover of Arboreal Lichens and Bryophytes – Follow this clarified procedure for estimating the cover of arboreal lichens and bryophytes. If arboreal (living on shrubs and trees) bryophytes and lichens are present, view the amount of branch, twig, or trunk surface area of woody vegetation in the Veg Plot that this group occupies. Imagine that all arboreal lichens and bryophytes were dropped like a blanket on the horizontal surface of the Veg Plot and estimate its cover. Make this estimate rapidly as you scan the available arboreal surface area. It is intended to give a gross indication of the amount of arboreal bryophytes and lichens present.
Chapter 9. Algae
1) Chlorophyll‐a Sample – Follow the protocols in the FOM carefully (Section 9.1.4), except with the following addition. When the last volume of algal sample is being filtered into the flask, rinse the graduated cylinder with a small amount (e.g., 10 ml) of DI water to capture all remaining algal cells. Add this rinsate to the remaining volume in the filter funnel on the flask and extract most of the liquid. Rinse the sides of the filter funnel with a very small amount of DI water. Add MgCO3 and complete the extraction of liquid from the sample on the filter paper.


2011 NWCA Field Operations Manual Chapter 1. Overview of NWCA
1-1
CHAPTER 1. OVERVIEW OF NWCA
1.1 GOALS AND OBJECTIVES OF NWCA This manual describes field protocols and daily operations for the National Wetland Condition Assessment (NWCA). The NWCA is one in a series of statistically-valid National Aquatic Resource Surveys (NARS) conducted by the Environmental Protection Agency (USEPA) to provide the public with a comprehensive assessment of the condition of the Nation’s waters. In addition to wetlands, the NARS surveys coastal waters, lakes, and flowing waters in a revolving sequence. USEPA will collaborate with state, tribal, federal, and other partners to implement the NWCA to meet three goals:
1. Produce a report that describes the ecological condition of the Nation’s wetlands. 2. Assist states and tribes in the implementation of wetland monitoring and assessment
programs that will guide policy development and aid project decision-making. 3. Advance the science of wetlands monitoring and assessment to support management
needs. The NWCA responds to the long-term goals outlined in USEPA’s current strategic plan (USEPA 2006a) to improve the Nation’s water quality (Goal 2.3) and to protect, sustain, and restore the health of critical natural habitats and ecosystems, including wetlands (Goal 4.3). Development of the NWCA builds on the accomplishments of the U.S. Fish and Wildlife Service (USFWS) and their production of national reports on status and trends in wetland acreage. When taken together, the results from the NWCA and the USFWS Wetland Status and Trends (S&T) will over time be used to measure progress toward attainment of the national goal to increase the quantity and quality of the Nation’s wetlands. These complementary studies can influence how wetlands are managed at local, state, and national scales (Scozzafava et al. 2007). 1.2 KEY DEFINITIONS Condition – The current state of a resource compared to reference relative to physical, chemical and biological characteristics. Survey Design – 900 wetland assessment locations were randomly selected from the USFWS S&T plots using a survey design that ensures the sample is representative of wetland resources at national and regional scales (Stevens and Olsen 2004). The S&T plots were used as the base data layer because they are the most consistent and current source of mapped wetlands on a national scale. NWCA sites are distributed across seven of the wetland classes characterized by S&T to facilitate comparison of the findings from both efforts. In addition, some states invested resources to supplement the NWCA survey design to provide state-scale reporting of wetland quality. For example, additional NWCA sites were added in North Dakota to allow reporting of wetland quality for the Prairie Pothole region.

2011 NWCA Field Operations Manual Chapter 1. Overview of NWCA
1-2
Target Population – Tidal and nontidal wetlands of the conterminous U.S., including certain farmed wetlands not currently in crop production. The wetlands have rooted vegetation and, when present, open water less than 1 meter deep. A wetland’s jurisdictional status1 under state or federal regulatory programs will not affect a site’s status as target. Sample Frame – The 2005 National Wetland Status and Trends assessment sample frame, obtained through collaboration with the USFWS. The S&T sample frame consists of all polygons mapped based on primarily 2005 remote sensing information for over 5,048 four square-mile plots across the 48 states. Additional attributes added to the sample frame were the boundaries for states, EPA Regions, Omernik Level III Ecoregions, and Wadeable Stream Assessment ecoregions. S&T Classification – A modified version of the Cowardin classification system (Cowardin et al. 1979) used by USFWS S&T. The NWCA will include wetlands from the following S&T categories because these wetlands are very likely to be consistent with the target population for the NWCA:
Estuarine Intertidal Emergent Estuarine Shrub/Forested Palustrine Emergent Palustrine Scrub/Shrub Palustrine Forested Palustrine Unconsolidated Bottom and Aquatic Bed Palustrine Farmed.
The NWCA will not include wetlands from the following S&T categories because wetlands in these categories are not consistent with the NWCA target population:
Estuarine and Marine Intertidal Aquatic Bed Estuarine Intertidal Unconsolidated Shore Palustrine Unconsolidated Shore.
Reporting Units – The survey design will allow USEPA to report nationally on all wetlands in the target population, all wetlands in the target population by S&T and Hydrogeomorphic (HGM) wetland class, and on all wetlands in the target population occurring in coastal watersheds. In addition, USEPA expects to report results by the Wadeable Streams Assessment Ecoregions (USEPA 2006b) and other geographically-derived assessment units that have yet to be determined. These may be a “political” unit (i.e., state or territory) or a unit at a higher resolution, for example, a watershed within the political unit. In addition, states and tribes that are able to invest additional resources will have the opportunity to leverage USEPA design and logistical support to produce a state or tribal-scale assessment. POINT – The location defined by the coordinates generated by the NWCA sample draw. Not all POINTS generated by the sample draw will be sampleable or part of the target population. Assessment Area – The area sampled that represents the POINT. Assessment Area (AA) will encompass the POINT and is typically 0.5ha in area. Most of the data for the NWCA will be collected within the AA.
1 Impacts to wetlands and other aquatic resources are regulated under the Clean Water Act when an aquatic resource is determined to be a “Water of the United States.” Jurisdictional Determinations are made on a case-by-case basis according to the definition found in 40 CFR 230.3(s). For more information please visit the website: http://www.epa.gov/owow/wetlands/guidance/CWAwaters.html.

2011 NWCA Field Operations Manual Chapter 1. Overview of NWCA
1-3
Index Period -- the peak growing season when most vegetation is in flower or fruit. Sampling during this period minimizes seasonal phenological variability and enhances plant species identification accuracy, particularly of difficult species such as grasses and sedges. Although some early ephemeral flowering forbs may be missed by not sampling early in the season, most plant species will be in mature reproductive stages and more readily detected and identified. Vegetation (Veg) Team – a Botanist/Ecologist and a Botanist Assistant. Primary responsibilities for the Veg Team are:
Laying out the Assessment Area (AA) and vegetative plots; Collecting high quality plant ecological data (including species identities, presence
and cover of individual species, presence and cover of vertical vegetation strata, and counts of trees);
Collecting other information related to vegetation condition; Collecting and processing plant specimens.
Assessment Area-Buffer (AB) Team – two crew members, whose primary responsibilities are:
Collecting high-quality biological (e.g., algal samples), water quality, hydrology, soils and stressor data,
Collecting and processing associated samples. Indicator – a major component of an ecosystem or a stressor type that can be used to assess ecological integrity or condition. 1.3 OVERVIEW OF INDICATORS Multiple indicators will be assessed in the NWCA to maximize the potential of detecting anthropogenic stress and describing its potential effect on wetland condition across multiple spatial scales. The choice of NWCA field methods and indicators was influenced by considerations of timing and resources, such as the need to complete travel and sampling for each site in one day. A summary of the indicators, and their relation to wetland condition, is provided below. Vegetation will be characterized by collecting plant data in five 100-m2 Vegetation Plots systematically placed across the AA. Vegetation is a major component of biodiversity found in wetlands and is habitat for a myriad of organisms. The composition and abundance of plant species is both reflective of, and may influence, the hydrology, water quality, and soil characteristics of a wetland. Plants respond to, and reflect, physical, chemical, or biological disturbances and stressors (Selinger-Looten et al. 1999, Rayamajhi et al. 2006). The presence and abundance of alien plant species often reflect degraded or declining quality. In addition, plant data can be used to derive a numerous metrics or indicators that are useful descriptors of ecological integrity or stress (e.g., USEPA 2002a, Bourdaghs et al. 2006, Magee et al. 2008, Mack and Kentula 2010). Examples of the types of data to be collected are:
Species composition and abundance Native species Alien species Floristic quality Guild composition Community composition Vegetation structure

2011 NWCA Field Operations Manual Chapter 1. Overview of NWCA
1-4
Soils data will be collected in four soil pits and will include an on-site description of the soil profile and collection of four types of soil samples (chemistry, bulk density, soil enzymes and stable isotopes) for laboratory analysis. Soils cycle nutrients, store pollutants, mediate groundwater, and provide habitat for microorganisms, invertebrates, and other more complex organisms (Richardson and Vepraskas 2001). Biogeochemical processes characteristic of hydric soils directly influence wetland condition and the delivery of associated ecosystem services. Soil structure and chemistry can indicate water quality and hydrology (Hargreaves et al. 2003, Mitsch and Gosselink 2007). Examples of the types of data to be collected are:
Soil profile description Hydric soil field indicators Soil chemistry.
Hydrology data will include an assessment of hydrologic sources and connectivity, indirect evidence of hydroperiod, estimates of hydrologic fluctuations, and documentation of hydrology alterations or stressors. Wetland hydrology is the primary driver of wetland formation and persistence. Hydrology impacts soil geochemical dynamics, plant productivity, nutrient cycling, and accretion and erosion of organic and inorganic materials in wetlands (Mitch and Gosselink 2007, Tiner 1999). Examples of the types of data to be collected are:
Degree of saturation Degree of inundation Types of hydrologic alteration.
When standing water is present at a wetland assessment area, water chemistry samples will be taken and analyzed for general surface water conditions, various chemical analytes, and evidence of disturbance. Total nitrogen and phosphorus reflect the trophic state of the wetland, providing crucial information on possible eutrophication (Keddy 1983). Anthropogenic disturbances such as hydrologic modifications and land use changes are known to alter water quality variables (Lane and Brown, 2007; Reiss and Brown, 2005). Algae samples will be collected from substrates (substrate samples) and from the surface of vegetation stems and leaves (epiphytic samples), and, if water is present, from water (planktonic samples). Algae respond rapidly to ecological change in wetlands and have been widely used as indicators of wetland condition because of their rapid reproduction rates, short life cycles, and broad distribution (McCormick and Cairns 1994). More notably, because nutrients such as nitrogen and phosphorus are limiting factors to most types of algae, they respond quickly to excess nutrients. In addition, diatom species can provide insights into past hydrology such as recent flooding, standing water, or droughts (Lane and Brown 2007, USEPA 2002, McCormick and Cairns 1994). Data on species composition and abundance, including guilds, and the presence of algal toxins will be collected. As part of the NWCA we will also evaluate the utility across regions and wetland classes of the newly-developed USA Rapid Assessment Method (USA-RAM). Rapid assessment methods are becoming increasingly useful tools for evaluating the ecological integrity of wetlands and the risk posed by stressors affecting the broader environment. (Fennessy et al. 2004, Fennessy et al. 2007). The primary purpose of USA-RAM is to effectively assess wetland condition in a significantly shorter timeframe than required for more detailed sampling. It unites information gained from field observations of wetland ecology, buffers and stessors. Once verified, USA-RAM will provide states and tribes with a wetland assessment tool that can be adapted to meet their own monitoring needs.

2011 NWCA Field Operations Manual Chapter 1. Overview of NWCA
1-5
1.4 NWCA REFERENCE DOCUMENTS
The complete documentation of overall project management, design, methods, rationale and
standards for the NWCA is contained in eight companion documents and two fact sheets.
Ecological Indicators for the 2011 National Wetland Condition Assessment (In
Preparation) presents the rationale for the indicators and metrics selected for inclusion in the
NWCA.
National Wetland Condition Assessment: Quality Assurance Project Plan (EPA-843-R10-
003) contains the elements of the overall project management, data quality objectives,
measurement and data acquisition, and information management for NWCA.
National Wetland Condition Assessment: Site Evaluation Guidelines (EPA-843-R10-004)
provide the process involved in locating a sampling site, evaluating the site to determine if it
should be sampled, and selecting appropriate alternate sites when necessary.
National Wetland Condition Assessment: Field Operations Manual (EPA-843-R10-001)
documents field protocols and daily operations for use by Field Crews during the NWCA.
National Wetland Condition Assessment: Laboratory Operations Manual (EPA-843-R10-
002) documents laboratory protocols for use by laboratory personnel for sample processing
associated with the NWCA.
National Wetland Condition Assessment: USA RAM Field Operations Manual (In Review)
documents the procedures for completing the rapid assessment component of the NWCA field
protocols.
National Wetland Condition Assessment: Data Analysis Plan (Draft) outlines the questions
we intended to pursue while analyzing data from the NWCA.
State Safety Plans are created by the participating states and tribes for use during the National
Wetland Condition Assessment (NWCA). They are based on state or tribal safety procedures
and not provided by EPA.

2011 NWCA Field Operations Manual Chapter 1. Overview of NWCA
1-6
2011 NWCA Field Operations Manual Chapter 1. Overview of NWCA
1-7
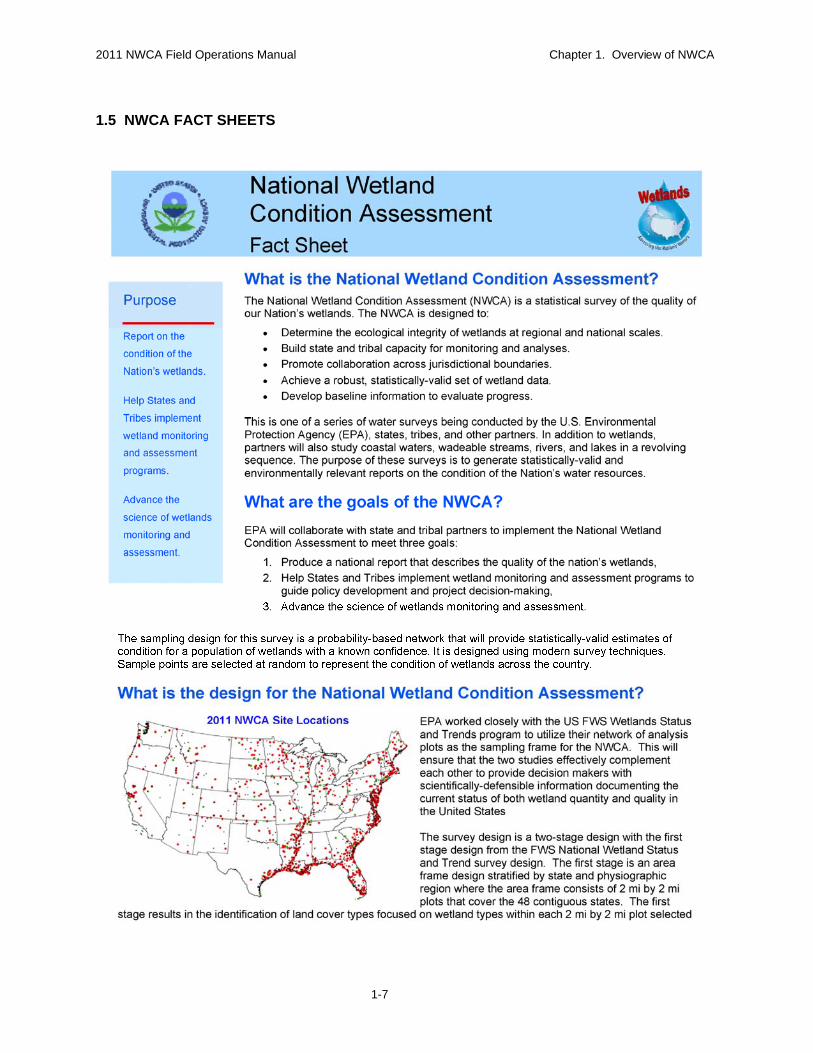
1.5 NWCA FACT SHEETS

2011 NWCA Field Operations Manual Chapter 1. Overview of NWCA
1-8

2011 NWCA Field Operations Manual Chapter 1. Overview of NWCA
1-9

2011 NWCA Field Operations Manual Chapter 1. Overview of NWCA
1-10
2011 NWCA Field Operations Manual Chapter 1. Overview of NWCA
1-11
1.6 LITERATURE CITED Bourdaghs, M., C.A. Johnston, and R.R. Regal. 2006. Properties and Performance of the Floristic Quality Index in Great Lakes Coastal Wetlands. Wetlands 26:718-735. Cowardin, L.M., V. Carter, F.C. Golet, and E.T. LaRoe. 1979. Classification of Wetlands and Deepwater Habitats of the United States. FWS/OBS-79/31. U.S. Fish and Wildlife Service, Washington, DC. Fennessy, M.S., A.D. Jacobs, and M.E. Kentula. 2004. Review of rapid methods for assessing wetland condition. EPA-620-R-04-009. U.S. Environmental Protection Agency, Washington, D.C. Fennessy, M.S., A.D. Jacobs, and M.E. Kentula. 2007. An evaluation of rapid methods for assessing the ecological condition of wetlands. Wetlands 27(3):543-560. Hargreaves, P.R., P.C. Brookes, G.J.S. Ross, and P.R. Poulton. 2003. Evaluating soil microbial biomass carbon as an indicator of long-term environmental change. Soil Biology and Biochemistry 35:401-407. Keddy, P.A. 1983. Freshwater wetlands human-induced changes: indirect effects must also be considered. Environmental Management 7(4): 299-302. Lane, C.R. and M.T. Brown. 2007. Diatoms as indicators of isolated herbaceous wetland condition in Florida, USA. Ecological Indicators 7(3):521-540. Mack, J.J. and M.E. Kentula. 2010. Metric Similarity in Vegetation-Based Wetland Assessment Methods. EPA/600/R-10/140. U.S. Environmental Protection Agency, Office of Research and Development, Washington, DC. Magee, T.K, P.L. Ringold, and M. Bollman. 2008. Alien species importance in native vegetation along wadeable streams, John Day River Basin, Oregon, USA. Plant Ecology 195(2): 287-307. McCormick, P. and J. Cairns. 1994. Algae as indicators of environmental change. Journal of Applied Phycology 6:509-526. Mitsch, W.J. and J.G. Gosselink. 2007. Wetlands. 4th edition. John Wiley & Sons, Hoboken, NJ. Rayamajhi, M., T. Van, P. Pratt, and T. Center. 2006. Temporal and structural effects of stands on litter production in the Melalueca quinquenervia dominated wetlands of south Florida. Wetlands Ecology and Management 14:303-316. Reiss, K. and M. Brown. 2005. Evaluation of Florida palustrine wetlands: Application of USEPA levels 1, 2, and 3 assessment methods. EcoHealth 4(2):206-218. Richardson, J.L. and M.J. Vepraskas. 2001. Wetland Soils: Genesis, Hydrology, Landscape, and Classification. Lewis Publishers, Boca Raton, Florida, USA.

2011 NWCA Field Operations Manual Chapter 1. Overview of NWCA
1-12
Scozzafava, M.E., T.E. Dahl, C. Faulkner, and M. Price. 2007. Assessing status, trends, and condition of wetlands in the United States. National Wetlands Newsletter 29:24-28. Selinger-Looten, R., F. Grevilliot, and S. Muller. 1999. Structure of plant communities and landscape patterns in allubial meadows of two flooded plains in the north-east of France. Landscape Ecology 14:213-229. Stevens, D.L., Jr. and A.R. Olsen. 2004. Spatially-balanced sampling of natural resources. Journal of American Statistical Association 99:262-278. Tiner, R. W. 1999. Wetland Indicators: A guide to wetland identification, delineation, classification, and mapping. Lewis Publishers, Boca Raton, Florida, USA. USEPA (U.S. Environmental Protection Agency). 2002a. Methods for Evaluating Wetland Condition: #10 Using Vegetation to Assess Environmental Conditions in Wetlands. EPA-822-R-02-020. Office of Water, U.S. Environmental Protection Agency, Washington, DC. USEPA (U.S. Environmental Protection Agency). 2002b. Methods for Evaluating Wetland Condition: Using Algae to Assess Environmental Conditions in Wetlands. EPA-822-R-02-021. Office of Water, U.S. Environmental Protection Agency, Washington, DC. USEPA (U.S. Environmental Protection Agency). 2006a. 2006-2011 EPA Strategic Plan: Charting Our Course. EPA-190-R-06-001. U.S. Environmental Protection Agency, Washington, DC. USEPA (U.S. Environmental Protection Agency). 2006b. Wadeable Streams Assessment: A Collaborative Survey of the Nation’s Streams. EPA 841-B-06-002. U.S. Environmental Protection Agency, Washington, DC.
2011 NWCA Field Operations Manual Chapter 2. Base Location Activities and Summary of Field Operations
2 - 1
CHAPTER 2. BASE LOCATION ACTIVITIES AND SUMMARY OF FIELD OPERATIONS
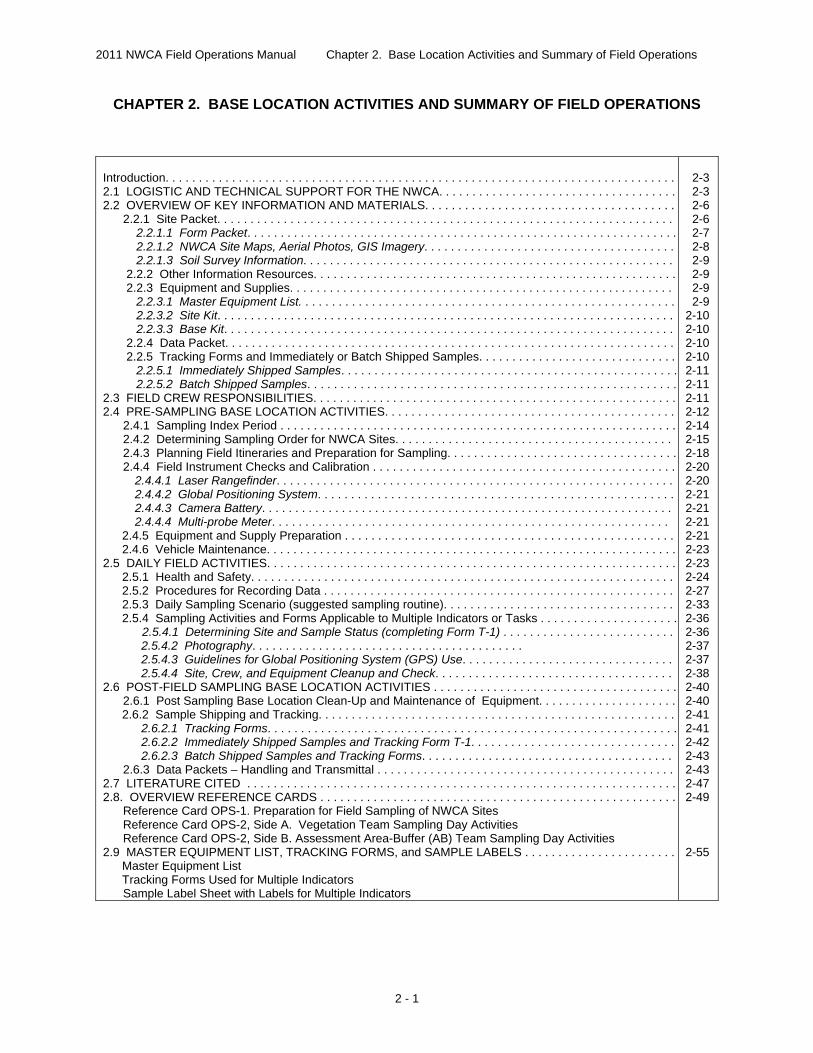
Introduction. . . . . . . . . . . . . . . . . . . . . . . . . . . . . . . . . . . . . . . . . . . . . . . . . . . . . . . . . . . . . . . . . . . . . . . . . . . . . 2.1 LOGISTIC AND TECHNICAL SUPPORT FOR THE NWCA. . . . . . . . . . . . . . . . . . . . . . . . . . . . . . . . . . . .2.2 OVERVIEW OF KEY INFORMATION AND MATERIALS. . . . . . . . . . . . . . . . . . . . . . . . . . . . . . . . . . . . . . 2.2.1 Site Packet. . . . . . . . . . . . . . . . . . . . . . . . . . . . . . . . . . . . . . . . . . . . . . . . . . . . . . . . . . . . . . . . . . . . . 2.2.1.1 Form Packet. . . . . . . . . . . . . . . . . . . . . . . . . . . . . . . . . . . . . . . . . . . . . . . . . . . . . . . . . . . . . . . . . 2.2.1.2 NWCA Site Maps, Aerial Photos, GIS Imagery. . . . . . . . . . . . . . . . . . . . . . . . . . . . . . . . . . . . . . 2.2.1.3 Soil Survey Information. . . . . . . . . . . . . . . . . . . . . . . . . . . . . . . . . . . . . . . . . . . . . . . . . . . . . . . . 2.2.2 Other Information Resources. . . . . . . . . . . . . . . . . . . . . . . . . . . . . . . . . . . . . . . . . . . . . . . . . . . . . . . 2.2.3 Equipment and Supplies. . . . . . . . . . . . . . . . . . . . . . . . . . . . . . . . . . . . . . . . . . . . . . . . . . . . . . . . . . 2.2.3.1 Master Equipment List. . . . . . . . . . . . . . . . . . . . . . . . . . . . . . . . . . . . . . . . . . . . . . . . . . . . . . . . . 2.2.3.2 Site Kit. . . . . . . . . . . . . . . . . . . . . . . . . . . . . . . . . . . . . . . . . . . . . . . . . . . . . . . . . . . . . . . . . . . . . 2.2.3.3 Base Kit. . . . . . . . . . . . . . . . . . . . . . . . . . . . . . . . . . . . . . . . . . . . . . . . . . . . . . . . . . . . . . . . . . . . 2.2.4 Data Packet. . . . . . . . . . . . . . . . . . . . . . . . . . . . . . . . . . . . . . . . . . . . . . . . . . . . . . . . . . . . . . . . . . . . 2.2.5 Tracking Forms and Immediately or Batch Shipped Samples. . . . . . . . . . . . . . . . . . . . . . . . . . . . . . 2.2.5.1 Immediately Shipped Samples. . . . . . . . . . . . . . . . . . . . . . . . . . . . . . . . . . . . . . . . . . . . . . . . . . . 2.2.5.2 Batch Shipped Samples. . . . . . . . . . . . . . . . . . . . . . . . . . . . . . . . . . . . . . . . . . . . . . . . . . . . . . . . 2.3 FIELD CREW RESPONSIBILITIES. . . . . . . . . . . . . . . . . . . . . . . . . . . . . . . . . . . . . . . . . . . . . . . . . . . . . . . 2.4 PRE-SAMPLING BASE LOCATION ACTIVITIES. . . . . . . . . . . . . . . . . . . . . . . . . . . . . . . . . . . . . . . . . . . . 2.4.1 Sampling Index Period . . . . . . . . . . . . . . . . . . . . . . . . . . . . . . . . . . . . . . . . . . . . . . . . . . . . . . . . . . . . 2.4.2 Determining Sampling Order for NWCA Sites. . . . . . . . . . . . . . . . . . . . . . . . . . . . . . . . . . . . . . . . . . 2.4.3 Planning Field Itineraries and Preparation for Sampling. . . . . . . . . . . . . . . . . . . . . . . . . . . . . . . . . . . 2.4.4 Field Instrument Checks and Calibration . . . . . . . . . . . . . . . . . . . . . . . . . . . . . . . . . . . . . . . . . . . . . .
2.4.4.1 Laser Rangefinder. . . . . . . . . . . . . . . . . . . . . . . . . . . . . . . . . . . . . . . . . . . . . . . . . . . . . . . . . . . .2.4.4.2 Global Positioning System. . . . . . . . . . . . . . . . . . . . . . . . . . . . . . . . . . . . . . . . . . . . . . . . . . . . . .2.4.4.3 Camera Battery. . . . . . . . . . . . . . . . . . . . . . . . . . . . . . . . . . . . . . . . . . . . . . . . . . . . . . . . . . . . . . 2.4.4.4 Multi-probe Meter. . . . . . . . . . . . . . . . . . . . . . . . . . . . . . . . . . . . . . . . . . . . . . . . . . . . . . . . . . . .
2.4.5 Equipment and Supply Preparation . . . . . . . . . . . . . . . . . . . . . . . . . . . . . . . . . . . . . . . . . . . . . . . . . . 2.4.6 Vehicle Maintenance. . . . . . . . . . . . . . . . . . . . . . . . . . . . . . . . . . . . . . . . . . . . . . . . . . . . . . . . . . . . . .
2.5 DAILY FIELD ACTIVITIES. . . . . . . . . . . . . . . . . . . . . . . . . . . . . . . . . . . . . . . . . . . . . . . . . . . . . . . . . . . . . .2.5.1 Health and Safety. . . . . . . . . . . . . . . . . . . . . . . . . . . . . . . . . . . . . . . . . . . . . . . . . . . . . . . . . . . . . . . . 2.5.2 Procedures for Recording Data . . . . . . . . . . . . . . . . . . . . . . . . . . . . . . . . . . . . . . . . . . . . . . . . . . . . . 2.5.3 Daily Sampling Scenario (suggested sampling routine). . . . . . . . . . . . . . . . . . . . . . . . . . . . . . . . . . . 2.5.4 Sampling Activities and Forms Applicable to Multiple Indicators or Tasks . . . . . . . . . . . . . . . . . . . . . 2.5.4.1 Determining Site and Sample Status (completing Form T-1) . . . . . . . . . . . . . . . . . . . . . . . . . .
2.5.4.2 Photography. . . . . . . . . . . . . . . . . . . . . . . . . . . . . . . . . . . . . . . . . 2.5.4.3 Guidelines for Global Positioning System (GPS) Use. . . . . . . . . . . . . . . . . . . . . . . . . . . . . . . . 2.5.4.4 Site, Crew, and Equipment Cleanup and Check. . . . . . . . . . . . . . . . . . . . . . . . . . . . . . . . . . . .
2.6 POST-FIELD SAMPLING BASE LOCATION ACTIVITIES . . . . . . . . . . . . . . . . . . . . . . . . . . . . . . . . . . . . . 2.6.1 Post Sampling Base Location Clean-Up and Maintenance of Equipment. . . . . . . . . . . . . . . . . . . . .
2.6.2 Sample Shipping and Tracking. . . . . . . . . . . . . . . . . . . . . . . . . . . . . . . . . . . . . . . . . . . . . . . . . . . . . . 2.6.2.1 Tracking Forms. . . . . . . . . . . . . . . . . . . . . . . . . . . . . . . . . . . . . . . . . . . . . . . . . . . . . . . . . . . . . . 2.6.2.2 Immediately Shipped Samples and Tracking Form T-1. . . . . . . . . . . . . . . . . . . . . . . . . . . . . . . 2.6.2.3 Batch Shipped Samples and Tracking Forms. . . . . . . . . . . . . . . . . . . . . . . . . . . . . . . . . . . . . .
2.6.3 Data Packets – Handling and Transmittal . . . . . . . . . . . . . . . . . . . . . . . . . . . . . . . . . . . . . . . . . . . . . 2.7 LITERATURE CITED . . . . . . . . . . . . . . . . . . . . . . . . . . . . . . . . . . . . . . . . . . . . . . . . . . . . . . . . . . . . . . . . . 2.8. OVERVIEW REFERENCE CARDS . . . . . . . . . . . . . . . . . . . . . . . . . . . . . . . . . . . . . . . . . . . . . . . . . . . . . . Reference Card OPS-1. Preparation for Field Sampling of NWCA Sites Reference Card OPS-2, Side A. Vegetation Team Sampling Day Activities Reference Card OPS-2, Side B. Assessment Area-Buffer (AB) Team Sampling Day Activities 2.9 MASTER EQUIPMENT LIST, TRACKING FORMS, and SAMPLE LABELS . . . . . . . . . . . . . . . . . . . . . . .
Master Equipment List Tracking Forms Used for Multiple Indicators
Sample Label Sheet with Labels for Multiple Indicators
2-3 2-3 2-6 2-6 2-7 2-8 2-9 2-9 2-9 2-9 2-10 2-10 2-10 2-10 2-11 2-11 2-11 2-12 2-14 2-15 2-18 2-20 2-20 2-21 2-21 2-21 2-21 2-23 2-23 2-24 2-27 2-33 2-36 2-36 2-37 2-37 2-38 2-40 2-40 2-41 2-41 2-42 2-43 2-43 2-47 2-49 2-55

2011 NWCA Field Operations Manual Chapter 2. Base Location Activities and Summary of Field Operations
2 - 2

2011 NWCA Field Operations Manual Chapter 2. Base Location Activities and Summary of Field Operations
2 - 3
CHAPTER 2. BASE LOCATION ACTIVITIES AND SUMMARY OF FIELD OPERATIONS This chapter aids in structuring the field season and each sampling day by providing the following information: 1) Contacts for logistic and technical support (Section 2.1). 2) Description of site information, data forms, equipment, and sample tracking needed for
NWCA (Section 2.2). 3) Field Crew responsibilities (Section 2.3). 4) Pre-sampling Base Location activities – Preparation for field sampling (activities essential for
staging field work and for accurate data and sample collection) (Section 2.4): a) Determining the sampling index period and the sampling order for sites. b) Developing weekly itineraries for sampling and compiling needed site information. c) Instrument checks and calibration, equipment and supply preparation, and vehicle
maintenance. 5) Field Day activities (Section 2.5):
a) Health and Safety b) Protocols for recording data. c) Overview of sampling tasks (AA establishment; data collection in the buffer area; data
and sample collection for vegetation, soils, hydrology, water quality, and algae). d) Field protocols used in multiple NWCA indicators
6) Post-sampling Base Location activities (Section 2.6): a) Equipment maintenance and clean-up. b) Sample shipping and tracking. c) Handling and transmittal of completed data.
2.1 LOGISTIC AND TECHNICAL SUPPORT FOR THE NWCA Effective communication between Field Crews, U.S. Environmental Protection Agency (USEPA) coordinators, and NWCA contractor support staff is essential for the survey to proceed with maximum efficiency and to ensure collection of high quality data. This section provides 1) a general description of the roles of key NWCA personnel in providing logistical and technical support to the Field Crews, 2) the flow of communication between Field Crews and these individuals (i.e., who to call for specific types of questions or support needs) (Table 2-1), and 2) their contact information (Table 2-2). The EPA Headquarters Project Management Team consists of the Project Leader, Alternate Project Leaders, and Project QA Lead. The Team is responsible for overseeing all aspects of the project and ensuring technical and quality assurance requirements are properly carried out. The Team is the final authority on all decisions regarding field sampling, site evaluation, site replacement, and laboratory analysis. The EPA Regional Coordinators are the primary USEPA point of contact for Field Crews operating in their Region. Field Crews should direct all technical and logistical questions to their EPA Coordinator, who will work with the EPA HQ Team to resolve the issue. Field Crews should also work with their EPA Coordinator to schedule an Assistance Visit to occur within the first two weeks of field sampling. An Assistance Visit is part of the Quality Assurance component of the NWCA (see NWCA Quality Assurance Project Plan (QAPP), USEPA 2011a). To meet the requirements of the QAPP, each Field Crew will allow an EPA employee or contractor to observe that crew sampling for one day. The Assistance Visit is used to confirm

2011 NWCA Field Operations Manual Chapter 2. Base Location Activities and Summary of Field Operations
2 - 4
the protocols are implemented as intended and to suggest corrective actions, if needed, to the Field Crew’s sampling approach. The Information Management Coordinator tracks the Field Crew’s sampling schedules to provide packets of forms for each site scheduled to be sampled, and to track the location of each NWCA sample that involves post-processing. Field crews are responsible for providing the Information Management Coordinator with their sampling schedule before sampling occurs and filing a status report after each site visit. The Field Logistics Coordinator is responsible for tracking the Field Crew’s sampling schedules and whereabouts, providing site kits and base kits with supplies and equipment, and assisting Field Crews with questions concerning field logistics, equipment, and supplies as they arise during field season. Table 2-1. Personnel to call for specific types of questions and support needs.
Personnel Call
EPA Regional Coordinators - First, to ask any questions about the NWCA, including questions on the field protocols
- To ask questions about your CWA Section106 grant
- To schedule a field assistance visit EPA HQ Project Management Team (Comprised of the Project Leader, Alternate Project Leaders, and Project QA Lead)
- To ask questions about Site Access, Site Evaluation, and Site Replacement
- To ask questions about Shipping Locations and Sample Handling Procedures
- To ask questions about the Field Methods - To ask questions about the Survey Design - To ask questions about the Quality Assurance
Procedures - To ask questions about the Laboratory Methods - If you can’t reach the EPA Regional Coordinator,
IM Coordinator, or Field Logistics Coordinator - If you are unsure of who to call
Personnel ONLY Call
Information Management Coordinator - To order more field forms - To submit a status report - To notify EPA about a change in sampling
schedule - To ask questions about submitting the data packet - If an EPA Regional Coordinator directs you to
contact them Field Logistics Coordinator - To order more site kits, base kits, or miscellaneous
consumable supplies - To ask questions about the shipping contract, or to
order more shipping forms - If an EPA Coordinator directs you to contact them - If you can’t reach an EPA HQ or Regional
Coordinator, and you have an urgent question
2011 NWCA Field Operations Manual Chapter 2. Base Location Activities and Summary of Field Operations
2 - 5
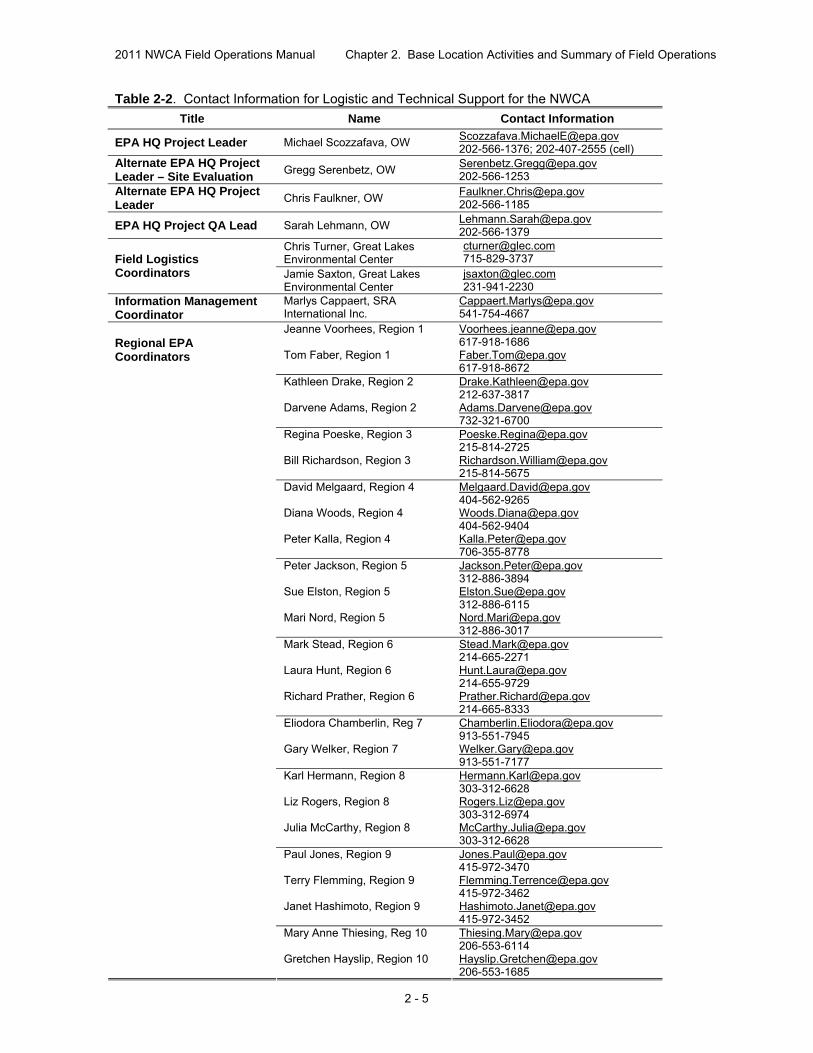
Table 2-2. Contact Information for Logistic and Technical Support for the NWCA
Title Name Contact Information
EPA HQ Project Leader Michael Scozzafava, OW [email protected] 202-566-1376; 202-407-2555 (cell)
Alternate EPA HQ Project Leader – Site Evaluation
Gregg Serenbetz, OW [email protected] 202-566-1253
Alternate EPA HQ Project Leader
Chris Faulkner, OW [email protected] 202-566-1185
EPA HQ Project QA Lead Sarah Lehmann, OW [email protected] 202-566-1379
Chris Turner, Great Lakes Environmental Center
[email protected] 715-829-3737 Field Logistics
Coordinators Jamie Saxton, Great Lakes Environmental Center
[email protected] 231-941-2230
Information Management Coordinator
Marlys Cappaert, SRA International Inc.
[email protected] 541-754-4667
Jeanne Voorhees, Region 1 Tom Faber, Region 1
[email protected] 617-918-1686 [email protected] 617-918-8672
Kathleen Drake, Region 2 Darvene Adams, Region 2
[email protected] 212-637-3817 [email protected] 732-321-6700
Regina Poeske, Region 3 Bill Richardson, Region 3
[email protected] 215-814-2725 [email protected] 215-814-5675
David Melgaard, Region 4 Diana Woods, Region 4 Peter Kalla, Region 4
[email protected] 404-562-9265 [email protected] 404-562-9404 [email protected] 706-355-8778
Peter Jackson, Region 5 Sue Elston, Region 5 Mari Nord, Region 5
[email protected] 312-886-3894 [email protected] 312-886-6115 [email protected] 312-886-3017
Mark Stead, Region 6 Laura Hunt, Region 6 Richard Prather, Region 6
[email protected] 214-665-2271 [email protected] 214-655-9729 [email protected] 214-665-8333
Eliodora Chamberlin, Reg 7 Gary Welker, Region 7
[email protected] 913-551-7945 [email protected] 913-551-7177
Karl Hermann, Region 8 Liz Rogers, Region 8 Julia McCarthy, Region 8
[email protected] 303-312-6628 [email protected] 303-312-6974 [email protected] 303-312-6628
Paul Jones, Region 9 Terry Flemming, Region 9 Janet Hashimoto, Region 9
[email protected] 415-972-3470 [email protected] 415-972-3462 [email protected] 415-972-3452
Regional EPA Coordinators
Mary Anne Thiesing, Reg 10 Gretchen Hayslip, Region 10
[email protected] 206-553-6114 [email protected] 206-553-1685
2011 NWCA Field Operations Manual Chapter 2. Base Location Activities and Summary of Field Operations
2 - 6
2.2 OVERVIEW OF KEY INFORMATION AND MATERIALS Prior to going to an NWCA site to conduct sampling, the site’s suitability for sampling will have been evaluated using a desk evaluation and in many cases an on-site evaluation (see the NWCA Site Evaluation Guidelines (USEPA 2011b) and Chapter 3). Site evaluation includes locating the NWCA POINT and confirming that the wetland at the POINT is a NWCA target wetland type. In addition, a variety of other kinds of information important for planning and conducting sampling must be gathered and reviewed before going into the field. These activities are often conducted from a base location. The base location is the location from which NWCA activities are organized and staged; e.g., a state or tribal office, field lodgings, or a camp-site. It is critical to efficient sampling to keep site information, data forms, sampling equipment, and gear needed for data and sample collection at each NWCA site organized and readily available. Likewise, managing completed data forms and the water quality, algae, soils, and plant samples after collection is critical to data quality and sample tracking. For the NWCA, there are standard ways to organize and handle the equipment needed to conduct sampling and the data and samples gathered at each site. Key terms and steps for this organization process are defined or introduced in this section. 2.2.1 Site Packet A Site Packet contains information key to the planning and preparation for visiting and sampling a particular NWCA site. Development of Site Packets should have been initiated during site evaluation and reconnaissance (USEPA 2011b). However, the Field Crew (or other state, tribe, or organization personnel) may need to gather additional information for the Site Packet during preparation for the sampling visit to a site. Also, it is the responsibility of the Field Crew (or other state, tribe, or organization personnel) to obtain access permissions and any needed permits as part of developing the Site Packet. Prior to the Field Crew traveling to a NWCA site for sampling, the information for the Site Packet must be gathered and reviewed. Site Packet Components Form Packet (see Section 2.2.1.1)
Applicable Site Maps, Aerial Photos, and Other Imagery:
NWCA State Site Maps, Imagery, and GIS Data (see Section 2.2.1.2) – Maps and aerial photos for the NWCA sites in each state are included in the National Wetland Condition Assessment 2011 Site Maps, with separate versions available for each state. Maps or images from Google Earth and ArcInfo files depicting locations and information for each NWCA Site are also provided by the NWCA EPA Headquarters Project Management Team.
Other Maps, Imagery, or GIS Data – Any other maps, aerial photos, GIS data, or sources of information compiled by Field Crews and/or their partners that could be helpful to sampling the NWCA sites.

2011 NWCA Field Operations Manual Chapter 2. Base Location Activities and Summary of Field Operations
2 - 7
Soil Survey Information (see Section 2.2.1.3): Soil maps and soil survey information pertinent to site.
Land Ownership Status, Requirements and Permissions for Access:
Landowner identity and contact information. Results of communication with landowners. Documentation of permission to access private land. Permissions for crossing private lands to reach sites located on public lands. For public land, response of relevant agency to notification that you will be accessing
a site, and, if needed, permissions to do so. Permits: Any permits or documentation required for site access, or for data collection
activities or sample/specimen collection. Information for Accessing the Site:
Contact information for landowners. Notes about whether landowner(s) want to be informed when Field Crew is on site. Contact information for individuals who must be available to open gates or allow entry
to a site, and the time and location for meeting them. Notes on locked gates, pets, livestock, or other things that could impede access. Notes about active hunting, farming, mining, or other activities on or near the site. Current conditions that could prevent access (e.g., high water, forest fires).
Site Evaluation Notes (should already be in the Site Packet):
Site Evaluation notes, annotated aerial photos, sketch map, and completed Form PV-1 (if a field evaluation was conducted) that can aid with planning for accessing or sampling a site.
Driving and Hiking Routes to the Site:
Detailed driving directions may be obtained from the NWCA Google Earth files. Results from the Site Evaluation may include driving directions and notations about
site access or logistically challenging conditions on the site, which can be useful in relocating the site or helpful in anticipating special circumstances.
Preliminary plan for Assessment Area (AA) Establishment: As part of the base
location activities to prepare for field work, review aerial photos and maps of the site and make a plan for laying out the AA based on rules in Chapter 3. This plan should be included in the Site Packet.
Any other site specific information useful to the Field Crew. 2.2.1.1 Form Packet The Form Packet for each site is composed of: Complete set of NWCA data forms. Complete set of NWCA sample tracking forms. Complete set of NWCA sample/specimen labels and tags. Complete set of USA-RAM (Rapid Assessment Method, USEPA in review) data forms.

2011 NWCA Field Operations Manual Chapter 2. Base Location Activities and Summary of Field Operations
2 - 8
A Form Packet for each site will be provided by the Information Management Coordinator and you will need to add it to the Site Packet prior to going in the field. Note that forms, sample tags, and labels will have pre-printed Site ID and sample numbers, so it is critical to be sure to include the correct site specific Form Packet in the matching NWCA Site Packet. 2.2.1.2 NWCA Site Maps, Aerial Photos, and GIS Data Maps for the NWCA sites in each state are included in the National Wetland Condition Assessment 2011 Site Maps). Site maps have been produced for each NWCA to provide nationally consistent base data and imagery to assist in conducting sampling. A separate, state specific version of this document is available for each state and includes: A list of all NWCA sites within a state with basic information about each site. An aerial image of each site at a scale appropriate to view wetland and land features
present in the assessment and buffer area surrounding the POINT for the randomly-selected NWCA site.
A USGS topographic map illustrating the location of the site at a scale appropriate to view
road and topographic features in the vicinity of the site that will provide helpful information on site access.
For those who have access to ArcGIS software, a special ArcMap Template containing a layer with NWCA shapefiles was provided to the state, tribal, and contract NWCA Field Crew Leaders. The template and shape files link to publicly-available online data that may be useful in planning sampling activities at each site. This includes the U.S. Fish and Wildlife Service’s (USFWS) wetlands map service, the National Hydrography Dataset feature service, and imagery, topographic maps, and a new soil data layer from ESRI's online GIS server. The NWCA shapefiles also include a layer that contains all of the NWCA sites, with additional attribute information pulled from national databases of protected areas, counties, and 12-digit watersheds (field descriptions). For those with access to Google Earth Pro, there is a Google Earth KMZ file containing all of the sites in the NWCA. Clicking on this file should automatically load the sites into Google Earth Pro. Clicking on a POINT with your mouse should cause a pop-up box to appear with basic attributes about the site. National Wetland Inventory (NWI) data can be added to the map by downloading a KMZ file available at http://www.fws.gov/wetlands/Data/GoogleEarth.html. The NWCA Site Maps, the NWCA ArcMap template and NWCA shapefiles, and the NWCA Google Earth KMZ file should all have been made available to you. If, for any reason, you have not received these files, they can be obtained from the National Wetland Monitoring and Assessment Work Group FTP site (ftp:\\ftp.glec.com) and QuickR web-site. For more information on how to access this web-site, contact your Regional EPA Coordinator.
2011 NWCA Field Operations Manual Chapter 2. Base Location Activities and Summary of Field Operations
2 - 9
2.2.1.3 Soil Survey Information Site specific information about soils on each NWCA site will be useful in planning for sampling, as well as providing background information that may aid in generating soil profile descriptions during data collection. Soil Survey information can provide insight into the soil types that might be expected at a particular NWCA site and help anticipate likely site conditions and the tools that may be needed for soil sampling. Soil Survey information for NWCA sites can easily be downloaded from the U.S. Department of Agriculture, Natural Resources Council (http://websoilsurvey.nrcs.usda.gov/app/HomePage.htm). In addition, your local soil scientist may be able to offer useful insights into what tools may be particularly useful for sampling soils in your area. 2.2.2 Other Information Resources For each field sampling trip, you will carry a variety of resources (listed below) in addition to the Site Packets for the sites to be sampled. These resources should be organized for easy access and kept in the field vehicle or carried in the field, as appropriate, by the Crew Leader (see Section 2.3) or relevant Crew Member. The State, Tribe, or organization approved health and safety plan (see Section 2.5.1),
which should include: Detailed health and safety protocols for field work. Contact information and locations for emergency and medical services nearest to each
site being sampled. Emergency contact information for supervisors and personnel health care
representatives of the Field Crew. NWCA logistics and research support contact information (see Section 2.1). Floras and field guides appropriate to the region of study (see also Appendix C). Soil reference books that are not part of the field equipment. Any available, regional or site specific plant species lists or wetland plant species lists that
can be helpful in plant identification (see discussion in Chapter 5, Appendix C). 2.2.3 Equipment and Supplies Organizing and maintaining NWCA equipment is discussed in Section 2.4 and a master checklist for field equipment and supplies is provided in Section 2.9. 2.2.3.1 Master Equipment List The state, tribe, or other organization will provide some of this equipment. However, some consumable supplies and some durable equipment will be provided by the USEPA Office of Water. Items that are provided by USEPA are included in the Site Kit or in the Base Kit (see below), which will be delivered to the Field Crews by the Logistics Coordinator. See the Master Equipment List (Section 2.9) for specific items that will be provided in the Site Kits or the Base Kit. It is also important that each Field Crew review the Master Equipment List to determine what additional pieces of equipment that may need to be gathered or purchased by the Field Crew’s organization prior to the field season.

2011 NWCA Field Operations Manual Chapter 2. Base Location Activities and Summary of Field Operations
2 - 10
2.2.3.2 Site Kit A Site Kit contains the subset of consumable supplies (i.e., used up during sampling or requiring replacement after use) provided by USEPA through the Logistics Coordinator. A new Site Kit is provided for each site sampled. See the Master Equipment List for the consumable items that will be provided by USEPA (e.g., cubitainers, sample bags, plastic bottles, nitrile gloves, toothbrush, etc.). For a subsample of 50 sites, field crews will also receive a Soils Pesticide Site Kit that will include everything needed to complete the Soils Pesticides Sampling protocol. Soils Pesticides should only be sampled at the specific sites where this kit is provided. 2.2.3.3 Base Kit The Base Kit is comprised of the subset of durable equipment and supplies needed for NWCA sampling that is provided by USEPA through the Logistics Coordinator. One Base Kit is provided to each Field Crew and contains some of the equipment that is used throughout the field season. See the Master Equipment List for a list of the items provided by USEPA in the Base Kit (e.g., laser rangefinder, plant presses, Munsell Soil Color book, etc.). 2.2.4 Data Packet After a site is sampled, the completed NWCA data forms and USA RAM data forms are organized sequentially into a Data Packet. The Data Packets from several sites are batched together and sent every 1-2 weeks to the Information Management Team and accompanied by a data tracking form (Form T-5) to track which Data Packets have been shipped. Form T-5 is to be transmitted electronically to the Information Management Team and a copy of the form is to be included with the Data Packets that are being shipped (see Section 2.6.3). 2.2.5 Tracking Forms and Immediately or Batch Shipped Samples Tracking forms that describe the status and location of all samples and specimens collected during the NWCA are typically transmitted electronically to the Information Management Team at specified times with hard copies packed in the shipping containers with the samples.
Form T-1: Site and Sample Status/WRSTracking (See Sections 2.6.2.2 and 2.9) is transmitted within 24 hours of sampling a site to report on the status of the site (e.g., sampleable or not), to indicate all samples collected at the site, and to record the Sample ID numbers for the immediately shipped samples (within 24 hours of sampling, see below). A copy of Form T-1 is also enclosed in the shipping ice-chest with the samples.
Forms T-2 to T-5 (See Sections 2.6.2.3 and 2.9) accompany samples that are batched
together from multiple sites and shipped every 1 or 2 weeks. Whenever batched samples are shipped to their designated lab for analysis, the appropriate tracking form, which lists the Sample ID numbers for all samples packed in a shipping container, is included in the shipping package and is also transmitted electronically to the Information Management Team.

2011 NWCA Field Operations Manual Chapter 2. Base Location Activities and Summary of Field Operations
2 - 11
2.2.5.1 Immediately Shipped Samples Immediately Shipped Samples are any NWCA samples that are shipped within 24 hours of collection. Samples that are immediately shipped are water chemistry, chlorophyll-a, algal toxins, soil isotopes, and sediment enzymes. These samples are kept cool on blue or wet ice or refrigerated until they are shipped, and then are shipped on wet ice (See Section 2.6.2.2, Appendix A). 2.2.5.2 Batch Shipped Samples Batch Shipped Samples are NWCA samples that are collected, held, and then samples from several sites are shipped together in a “batch” to a designated lab for analysis (See Section 2.6.2.3, Appendix A). Unknown and QA voucher plant specimens, soil chemistry and soil bulk density samples, and algae taxonomic ID samples are all shipped in batches. 2.3 FIELD CREW RESPONSIBILITIES The NWCA Field Crews are responsible for collecting all field data and samples. Field Crews will also need to conduct a number of activities at their base location (e.g., a state office, a laboratory, camping site, or motel) that must be completed both before departure to the wetland site and after return from the field. Field Crew tasks will include:
1) Gathering information for the Site Packet and obtaining permits and permissions for site access or sample collection, if not previously completed (Section 2.2.1).
2) Reviewing the Site Packet (Section 2.2.1.1) prior to going to a NWCA site and making a preliminary plan for establishing the AA (Chapter 3).
3) For each NWCA site, completing those USA-RAM Metrics (Metrics 1 and 2, possibly part of Metric 5) that require evaluation of aerial photographs or other imagery in the office (Chapter 3 and the USA-RAM Field Operations Manual (USEPA in review).
4) Organizing equipment, supplies, and field vehicle prior to traveling to the field sites and post sampling (Sections 2.4 and 2.6).
5) Conducting NWCA data and sample collection at field sites (Section 2.5; Chapters 3, 4, 5, 6, 7, 8, and 9).
6) Collecting USA-RAM field data for Metrics 3-12 and verifying office evaluations for Metrics 1 and 2 at NWCA sites (USEPA in review).
7) Post-sampling handling and shipping of samples and data (Section 2.6.2 and 2.6.3, Chapters 5, 6, 8, and 9).
8) Cleaning and maintaining equipment (Section 2.6.3). The Field Crew is comprised of the Vegetation (Veg) Team and the Assessment Area-Buffer (AB) Team, each with two members. The Veg Team is made up of a Botanist/Ecologist and a Botanist Assistant. The AB Team members will have general field sampling experience. One of the Field Crew Members will serve as the Crew Leader and will have responsibilities for planning field logistics and sampling, and confirming that all data and samples have been collected.

2011 NWCA Field Operations Manual Chapter 2. Base Location Activities and Summary of Field Operations
2 - 12
Veg Team – Primary field sampling responsibilities are: Locating the NWCA POINT and establishing the AA (Chapter 3). Collecting Vegetation data and plant specimens (Chapter 5). Collecting data for the USA-RAM Assessment Area Metrics 4 -12 (See USEPA in review).
AB Team – Primary field sampling responsibilities are: Collecting natural cover and stressors data in the Buffer (Chapter 4). Collecting field data or verifying office data for the USA-RAM Buffer Area Metrics 1-3 (See
USEPA in review). Collecting Soils data and samples (Chapter 6). Collecting Hydrology data (Chapter 7). Collecting Water Quality data and samples (Chapter 8). Collecting Algae data and samples (Chapter 9).
Crew Leader – Primary responsibilities are: Developing or participating in the development of sampling schedules (See Section 2.4.2);
then ensuring the Information Management Coordinator and the Field Crew’s local supervisor(s) have the sampling schedules.
Keeping the Information Management Coordinator and local supervisors updated about any sampling schedule changes that may occur.
Developing field itineraries and preparing for sampling, identifying field accommodations, and making lodging reservations, and checking that needed supplies, equipment, and data forms are available to conduct the planned work.
Organizing the Field Crew’s daily field activities and pre- and post-sampling base location activities.
Overseeing the Field Crew sampling and the review of data and tracking forms. Double checking that all data and samples have been collected before leaving a sample
site. Ensuring all samples are shipped to designated locations. Ensuring Data Packets are copied and the originals sent to the Information Management
Team. The number of NWCA sites a Field Crew will be able to sample per week is likely to vary depending upon ease of access, relative proximity of sites to one another and to the Field Crew’s base location, and on sampling challenges posed by various site conditions. An effective approach to sampling might be for a Field Crew to sample two or three sites per week on average, using additional days as needed for travel, copying forms, managing plant specimens, identifying unknown plant species, sample packaging and shipment, confirming site access permission, equipment cleanup equipment repair, lodging logistics, restocking field supplies, forms, and crew essentials (e.g., food). 2.4 PRE-SAMPLING BASE LOCATION ACTIVITIES This section focuses on base location activities that must be completed prior to going into the field to sample a NWCA site. Procedures for these activities are described in detail in the subsections below and summarized in Reference Card OPS-1. Section 2.6 describes base location activities that must be conducted post field sampling.
2011 NWCA Field Operations Manual Chapter 2. Base Location Activities and Summary of Field Operations
2 - 13
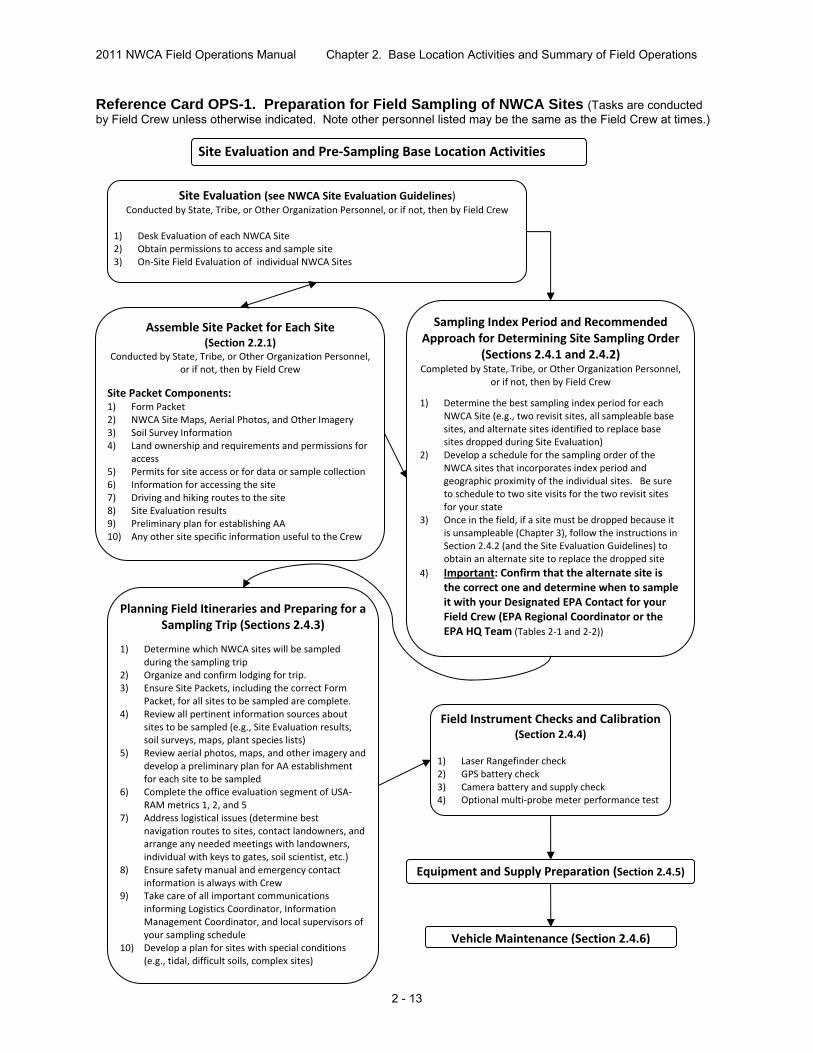
Site Evaluation (see NWCA Site Evaluation Guidelines) Conducted by State, Tribe, or Other Organization Personnel, or if not, then by Field Crew
1) Desk Evaluation of each NWCA Site 2) Obtain permissions to access and sample site 3) On‐Site Field Evaluation of individual NWCA Sites
Assemble Site Packet for Each Site(Section 2.2.1)
Conducted by State, Tribe, or Other Organization Personnel, or if not, then by Field Crew
Site Packet Components: 1) Form Packet 2) NWCA Site Maps, Aerial Photos, and Other Imagery 3) Soil Survey Information 4) Land ownership and requirements and permissions for
access 5) Permits for site access or for data or sample collection 6) Information for accessing the site 7) Driving and hiking routes to the site 8) Site Evaluation results 9) Preliminary plan for establishing AA 10) Any other site specific information useful to the Crew
Site Evaluation and Pre‐Sampling Base Location Activities
Sampling Index Period and Recommended Approach for Determining Site Sampling Order
(Sections 2.4.1 and 2.4.2) Completed by State, Tribe, or Other Organization Personnel,
or if not, then by Field Crew
1) Determine the best sampling index period for each NWCA Site (e.g., two revisit sites, all sampleable base sites, and alternate sites identified to replace base sites dropped during Site Evaluation)
2) Develop a schedule for the sampling order of the NWCA sites that incorporates index period and geographic proximity of the individual sites. Be sure to schedule to two site visits for the two revisit sites for your state
3) Once in the field, if a site must be dropped because it is unsampleable (Chapter 3), follow the instructions in Section 2.4.2 (and the Site Evaluation Guidelines) to obtain an alternate site to replace the dropped site
4) Important: Confirm that the alternate site is the correct one and determine when to sample it with your Designated EPA Contact for your Field Crew (EPA Regional Coordinator or the EPA HQ Team (Tables 2‐1 and 2‐2))
Planning Field Itineraries and Preparing for a Sampling Trip (Sections 2.4.3)
1) Determine which NWCA sites will be sampled during the sampling trip
2) Organize and confirm lodging for trip. 3) Ensure Site Packets, including the correct Form
Packet, for all sites to be sampled are complete. 4) Review all pertinent information sources about
sites to be sampled (e.g., Site Evaluation results, soil surveys, maps, plant species lists)
5) Review aerial photos, maps, and other imagery and develop a preliminary plan for AA establishment for each site to be sampled
6) Complete the office evaluation segment of USA‐RAM metrics 1, 2, and 5
7) Address logistical issues (determine best navigation routes to sites, contact landowners, and arrange any needed meetings with landowners, individual with keys to gates, soil scientist, etc.)
8) Ensure safety manual and emergency contact information is always with Crew
9) Take care of all important communications informing Logistics Coordinator, Information Management Coordinator, and local supervisors of your sampling schedule
10) Develop a plan for sites with special conditions (e.g., tidal, difficult soils, complex sites)
Field Instrument Checks and Calibration(Section 2.4.4)
1) Laser Rangefinder check 2) GPS battery check 3) Camera battery and supply check 4) Optional multi‐probe meter performance test
Equipment and Supply Preparation (Section 2.4.5)
Vehicle Maintenance (Section 2.4.6)
Reference Card OPS-1. Preparation for Field Sampling of NWCA Sites (Tasks are conducted by Field Crew unless otherwise indicated. Note other personnel listed may be the same as the Field Crew at times.)

2011 NWCA Field Operations Manual Chapter 2. Base Location Activities and Summary of Field Operations
2 - 14
NWCA Index Period
-April - September-May - September-June –September- May - August
2 4.1. Sampling Index Period Field sampling for the NWCA takes place during peak growing season when most vegetation is in flower or fruit. Sampling near the peak of the growing season minimizes phenological variability and enhances plant species identification accuracy, particularly of difficult species such as grasses and sedges. This sampling index period optimizes characterization of the vegetation and is also a good time for sampling the other NWCA indicators. The timing and duration of peak growing season will vary depending on geographic location and elevation. The typical ranges for the sampling index period for each U.S. state are indicated in Figure 2-1. Note that within a state NWCA sites (POINTS) occurring at lower elevations or in drier, warmer locations are likely to be ready to sample early in the index period and sites at higher elevations or in wetter, cooler locations are likely to be at peak growing season later in the index period.
Figure 2-1. NWCA Sampling Index Period by state.

2011 NWCA Field Operations Manual Chapter 2. Base Location Activities and Summary of Field Operations
2 - 15
2.4.2 Determining Sampling Order for NWCA Sites For many states the Field Crew, Site Evaluation Team, and the group who schedules the timing and order for sampling sites may be comprised of the same individuals. In other cases, a different set of personnel from the relevant state, tribe, or organization associated with the Field Crew may handle this task and communicate the schedule for sampling to the Field Crew. This will likely be the case where multiple crews are operating in one state. It is vitally important that all people involved in scheduling or coordinating field sampling communicate with one another to ensure the most efficient sampling approach and to eliminate any chance of either double sampling of the same sites or skipping sites. The sampling order for NWCA sites should allow the most efficient data collection and most favorable travel logistics while incorporating the appropriate index period for each site. A recommended procedure for developing a plan for sampling order for the NWCA sites in the state(s) where you are working is outlined below.
1) Begin by examining the NWCA Site Information Table in the National Wetland Condition Assessment 2011 Site Maps for your state (e.g., see Figure 2-2). The Site Information Table is the list of sites randomly selected for the NWCA for your state, and contains a list of “revisit,” “base” and “oversample” POINTS (defined below). The POINTS are listed in the table in the order in which they were randomly selected in the survey design. All revisit and base POINTS must be evaluated and should be sampled unless they are determined to be non-sampleable (See Site Evaluation Guidelines, USEPA 2011b).
Base Site – A base site is a POINT that was randomly selected using a statistically valid
survey design that allows estimation of wetland condition in the target wetland types across the conterminous 48 states of the U.S.
Revisit Site – A revisit site is a base site that is sampled twice in the during the same
field season to gather information on the quality and noisiness of data collected in the NWCA (USEPA 2011a).
The revisit sites are the first two sites on the NWCA Site Information table (e.g.,
Figure 2-2). The second sampling visit (Visit #2) to a revisit site should occur at least 2 weeks
after the original sampling visit (Vist#1), but within the index period for the revisit site.
Exactly the same data and samples are collected for both Visit#1 and Visit#2, and a separate Form Packet (See Section 2.2.1.1) will be provided for Visit#2 for each revisit site by the Information Management Coordinator.
Oversample Site – An oversample site is a randomly selected POINT that can be used
as a replacement for an unsampleable base site.
Oversample POINTS are used as alternate base sites in the order they are listed on the Site Information Table for a state.
If an oversample site on the list is skipped (not sampled), it creates a data gap
that invalidates all data from sampled sites that occur below the skipped site and affects the validity of the survey design.

2011 NWCA Field Operations Manual Chapter 2. Base Location Activities and Summary of Field Operations
2 - 16
Using Figure 2-2 as a hypothetical example, if the oversample sites from NWCA11-2349 through NWCA-2354 (highlighted yellow) and sites NWCA11-2359 and NWCA11-2360 (highlighted red) were sampled, the data from the last two sites would be discarded because the original order of random selection for the sites was not maintained. In this example, sites NWCA11-2355 and NWCA11-2356 (highlighted green) should have been selected and sampled instead of sites NWCA11-2359 and 2360.
siteID longitude (NAD83) Latitude (NAD83) panel nwca class NWCA11-2337 -123.0963128570 45.2430105404 Revisit PUBPAB NWCA11-2338 -124.2813068130 43.3291727249 Revisit E2EM NWCA11-2339 -124.0085989120 44.9187449403 Base E2EM NWCA11-2340 -117.1504354640 43.7740909380 Base PFO NWCA11-2341 -123.0943877920 45.2405347796 Base PEM NWCA11-2342 -124.2665601820 43.3481750503 Base PEM NWCA11-2343 -124.0051738840 44.9190095524 Base E2EM NWCA11-2344 -117.1500273650 43.7734788335 Base PUBPAB NWCA11-2345 -123.0938598280 45.2447298407 Base Pf NWCA11-2346 -122.9878636240 43.5662106679 Base PSS NWCA11-2347 -121.0643413520 42.0979519566 Base PSS NWCA11-2348 -118.7542369630 43.0501830242 Base PEM NWCA11-2349 -123.1803277080 45.4609312255 OverSamp PFO NWCA11-2350 -123.8384612230 45.0670693096 OverSamp PFO NWCA11-2351 -121.0583084510 42.1010322458 OverSamp PSS NWCA11-2352 -118.7810387370 43.0503934583 OverSamp PEM NWCA11-2353 -123.0938713400 45.2446996198 OverSamp Pf NWCA11-2354 -120.9304025330 45.2009619291 OverSamp PFO NWCA11-2355 -124.0089001970 44.9321001106 OverSamp PUBPAB NWCA11-2356 -118.7635813370 43.0478968239 OverSamp PEM NWCA11-2357 -123.1837027550 45.4637433585 OverSamp PUBPAB NWCA11-2358 -124.0077760860 44.9177766355 OverSamp E2EM NWCA11-2359 -120.7465554360 42.5299049781 OverSamp PSS NWCA11-2360 -118.7721600290 43.0552185555 OverSamp PEM
Figure 2-2. Example of part of a NWCA Site Information Table to illustrate hypothetical example described above.
2) During Site Evaluation it is likely that some POINTS in your state were found to be unsampleable. The Site Evaluation Team, working with the EPA HQ Project Management Team, will have used the following rules to select alternate sites from the NWCA Site Information List for your state (See also Site Evaluation Guidelines (USEPA 2011b)). a) If a revisit POINT was rejected, it was replaced by the next base POINT, and then the
first oversample site on the NWCA Site Information list for the state became a base POINT.
b) If a base POINT was rejected, then it was replaced by the next unused oversample
POINT on the list. As describe in #1 above, oversample POINTS must be selected to become alternate sites in the order they are listed.
3) After Site Evaluation has been completed, you will have a final list of sites to sample, which
includes two revisit sites, all base sites not dropped during Site Evaluation, and the alternate
2011 NWCA Field Operations Manual Chapter 2. Base Location Activities and Summary of Field Operations
2 - 17
sites (oversample sites from the NWCA Site List for your state) that replaced any base sites dropped because they were unsampleable (see Site Evaluation Guidelines, USEPA2011b).
4) After reviewing the final list of NWCA sites to be sampled, determine the best index period
for each of these sites (See Section 2.4.1).
5) Develop a schedule for the order and timing for sampling the sites that incorporates specific index periods and geographic proximity of NWCA Sites. Prioritize sampling date order by: a) Index period that is most appropriate to each site. b) Geographic proximity of sites to one another. c) Proximity of field lodging locations to sites. This will minimize travel time, maximize in-field time and allow sampling of individual NWCA sites as closely as possible to peak growing season.
6) Occasionally upon arrival at a site, you may discover that it is no longer sampleable (see
Chapter 3) because: a) Only a Desk Site Evaluation was completed and conditions on the ground do not match
the information used in the evaluation. b) It became a non-target wetland in the interval since Site Evaluation (e.g., was developed
or planted in crops). c) Access permission or sampling permits have been revoked or could not be obtained. d) Conditions on the site are hazardous or the site is completely inaccessible. e) An AA could not be established on the site.
If this occurs follow the instructions below for selecting a new site in the Site Evaluation Guidelines (USEPA 2011b).
7) If a site must be dropped in the field and there is only one Field Crew working in a state,
determine the correct alternate site to use to replace it. This will be the next unused oversample site on the NWCA Site List for your state.
If there are multiple Field Crews or contractor Field Crews working in a state, then the individual (varies by state) who is coordinating the sampling schedule for the Crews will select any needed alternates sites and communicate their location and when to sample them to the appropriate Field Crew.
a) When either a revisit or base POINT is rejected, it must be reported it to the Designated
EPA Contact, which depending on the particular Field Crew will be the EPA Regional NWCA Coordinator or EPA HQ Project Management Team (See Table 2-2; Alternate EPA Headquarters Project Leader or EPA Headquarters Project Leader). In making this report, indicate which site was rejected, the reason why, and the POINT selected from the oversample list to replace it. The EPA Contact will then confirm that the correct process was used to select the alternate POINT and inform the Logistics Coordinator and the Information Management Coordinator about the replacement.
b) Once the alternate sample site is confirmed, the person coordinating the sampling
schedule for the Crew(s) will designate which Field Crew is responsible for sampling the alternate POINT (if multiple organizations are sampling within state boundaries)

2011 NWCA Field Operations Manual Chapter 2. Base Location Activities and Summary of Field Operations
2 - 18
c) Finally, the sampling order plan is modified to include the new alternate base site into the schedule based on its appropriate index period and geographic proximity to other NWCA sites. If the index period for the alternate site has already passed, it should be sampled as soon as practicable based on logistic considerations.
d) Repeat this process whenever a site must be dropped in the field.
2.4.3 Planning Field Itineraries and Preparation for Sampling The Field Crew Leader, with assistance from the other Field Crew Members, will develop an itinerary for each sampling trip (e.g., the length of one sampling excursion may vary from a 1 or 2 days, a week, or longer time period depending on distances to sites and number of sites sampled). The itinerary includes the sampling schedule and locations of NWCA sites to be completed during the trip, lodging locations and contact information, and other important information. Some important steps in developing the itinerary and preparing for the sampling trip are listed below. Determine which NWCA sites will be sampled based on the sampling plan that orders
sites for sampling based on the index period, geographic proximity of sites to one another, and access logistics (See Section 2.4.2).
Address logistical issues:
Review routes for navigating to and accessing each site. Call the landowners or local contacts to confirm access permission and notify
regarding timing of sample visit. If necessary, arrange rendezvous locations and times with individuals who must
provide access to a site, e.g., open gates, provide any keys to gates, or accompany the Field Crew, etc.
If needed, arrange consultation or field meetings with local soil scientist. Determine the best locations for field lodging during the sampling trip, make needed
reservations, and confirm lodging plans. Identify your nearest FedEx drop off location, or arrange a roadside pickup for
immediately shipping samples Ensure the Site Packets for each scheduled site are complete before leaving to travel to
the sites (See Section 2.2.1). Confirm that the correct and complete Form Packet is included in the Site Packet for
each site. Forms and labels for each site will have preprinted Site ID and sample ID numbers, so be careful to include the correct Form Packet in each Site Packet.
When multiple sites are to be sampled, keep some extra blank Form Packets (e.g.,
several complete sets of NWCA and USA-RAM forms and labels without Site ID or sample ID numbers) in the vehicle. Then, if it happens that a scheduled site is unsampleable and must be dropped, you will have blank forms available to sample another NWCA site if one is in the vicinity. Site and Sample IDs can be written in at the appropriate places on the blank forms.
Locate and review any special information resources (e.g., soil surveys, plant species
lists) that would be helpful to conducting sampling (See Section 2.2.2).
2011 NWCA Field Operations Manual Chapter 2. Base Location Activities and Summary of Field Operations
2 - 19
Work with other Crew members to review the aerial photos provided in the site packet for each site to gain an overview of the area in the vicinity of the POINT and to develop a preliminary plan for the location, layout and establishment of the AA (See Chapter 3). Preplanning is critical to maximize the actual onsite time available to collect data and samples at the site. Once the AA establishment plan is developed place it in the site packet and return the annotated aerial photos and any other materials you used to the Site Packet.
Work with other Crew members to review aerial photos in the office to complete USA-
RAM Metrics 1 (Percent of AA having buffer) and 2 (Buffer Width) and to complete the portion of Metric 5 (Patch Mosaic Complexity) that reviews NAIP or other imagery. See USA-RAM Manual (USEPA in review). Return the completed USA-RAM forms to the Form Packet in the Site Packet so they can be finalized during sampling.
Ensure the safety manual and emergency contact information is always with the Crew so
it is available if needed. Important communications:
1) Inform the your local supervisors and personal emergency contacts of the field
schedule, the Site IDs for the sites to be sampled, and of where the Field Crew is going each day and the expected time of return to the field lodging or camp. This is critical for safety reasons so that the whereabouts of the Crew is known by some one able to respond quickly should any problems arise.
2) Inform the Information Management Coordinator of the field schedule and the Site
IDs for the sites to be sampled. This allows the Information Management Team to know what samples and data to expect to receive. The Information Management Coordinator will to communicate the Field Crew’s sampling schedule to the Field Logistics Coordinator.
Contact the Information Management Coordinator about any issues related to NWCA data or tracking forms, sample labels or tags, or USA-RAM data forms, e.g., the need for additional site specific or blank Form Packets, questions about transmittal of tracking forms. Requests for supplies can also be made through the Information Management Coordinator, who will communicate them to the Logistics Coordinator.
3) If needed, interact directly with the Field Logistics Coordinator who is available to
provide assistance to the Field Crews regarding needs for additional supplies or shipping containers, etc.
4) Contact your Regional EPA Coordinator if you have technical questions regarding the
field protocols, design, or site replacement procedures. The Regional EPA Coordinator will work with the EPA HQ Project Management Team to provide a response directly to the Field Crew in a timely manner.
5) Contact any member of the EPA HQ Project Management team if you have a time
sensitive question and cannot get in contact with the Information Management Team, Field Logistics Coordinator, or Regional EPA Coordinator.

2011 NWCA Field Operations Manual Chapter 2. Base Location Activities and Summary of Field Operations
2 - 20
6) Any changes in the itinerary during the week, such as canceling a sampling day or collecting data at a site not on the original sampling schedule, must be relayed by the Field Crew Leader to the Information Management Coordinator and to the appropriate emergency contacts and local supervisors for the Field Crew as soon as possible.
Planning for special circumstances:
Tidal wetlands – Check tide tables for all tidal wetlands and schedule arrival and departure from the site to maximize the time available for sampling. For example, arrive on-site as the tide is going out so that you can begin work on the landward side of the site and work toward the seaward side as the tide recedes. This allows work to be continued until the tide begins coming in again and flooding lower areas. Note that timing of flooding and exposure of areas within the AA may require some modification of the normal sampling order to get everything done.
Difficult soils – Review of information in the Site Packet may indicate that collection
of soil samples at particular site could be problematic. If difficult to sample soils are anticipated, the local NRCS soil scientist may have useful advice or may be able to lend you tools to aid in collection of soil samples.
Difficult or complex sites – Sites that require long travel or hike-in distances,
particularly those with complex topography or high plant species diversity may take more than one day to sample. Although, this may not happen often, when it does, the Field Crew will need to plan for camping on site and to determine how to handle the extra gear and food required. For sites that take more than one day to sample, but which are located near to lodging or a developed campground, the Field Crew will want to plan for what can be left in place (e.g., AA, Veg Plot, and Soil Pit markers) for the next sampling day to expedite data and sample collection.
2.4.4 Field Instrument Checks and Calibration Each Field Crew must test and calibrate field instruments prior to sampling. Field instruments include a laser rangefinder, a Global Positioning System (GPS) receiver, a camera, and an optional multi-probe unit for measuring temperature, dissolved oxygen, conductivity and pH, in water. Ideally, Field Crews will have access to backup instruments in case any instruments fail the manufacturer performance tests or calibrations prior to a field trip. 2.4.4.1 Laser Rangefinder Follow the instructions in the user’s manual for operating and maintaining your laser rangefinder. Before traveling to the first field site, run through the procedures for operating the rangefinder until you are comfortable with its operation. Throughout the field season, make any recommended periodic maintenance checks suggested in the user’s manual.

2011 NWCA Field Operations Manual Chapter 2. Base Location Activities and Summary of Field Operations
2 - 21
2.4.4.2 Global Positioning System
Turn on the GPS receiver and check the batteries prior to departure. Replace batteries immediately if a battery warning is displayed. Ensure that extra batteries are carried in the field. Complete any calibration requirements described in the GPS manual. GPS uses many alternative mathematical models to describe the spherical shape of the earth and each is a separate Datum. The NWCA standard Datum will be NAD83. GPS units should be switched to this standard as part of their pre-field set up. 2.4.4.3 Camera Battery Turn on digital camera and check the batteries prior to departure from the base location. Replace batteries immediately if a battery warning is displayed. Carry extra batteries in the field. For rechargeable batteries, make certain to keep a charged battery in the camera and another battery in the charger. Ensure the camera memory card has sufficient space for the photos to be captured during the week. If needed, carry an additional flash card or a camera specific cable for downloading images. Keep a supply of lens paper or cloths and lens cleaning solution in the camera case for easy access in the field. Refer to Appendix D for photography guidelines and for a list of photos to take at the for each NWCA site. 2.4.4.4 Multi-probe Meter Field collection of water quality data with multi-probe meters is optional. However, the following text describes what must be done if Field Crews are asked to collect water quality data with a multi-probe meter for their state or other employer. Test and pre-calibrate the multi-probe meter prior to departure from the base on the day of each site visit. A copy of the manufacturer's calibration and maintenance procedures should always be kept with the instrument, and the multi-probe meter should be carefully calibrated according to manufacturer specifications. If pH data is collected, perform a quality control (QC) check of the pH meter calibration (and conductivity meter calibration). Table 2-3 contains a stock solution for preparing a QC sample for pH and conductivity. Calibration can be conducted prior to departure for the wetland site or at the wetland, with the exception of dissolved oxygen calibration, which because of the potential influence of altitude must to be performed only at the wetland site (Chapter 8). 2.4.5 Equipment and Supply Preparation Field Crews must inventory supplies and equipment prior to departure for each trip using the Master Equipment List provided in Section 2.9 to avoid forgetting anything that could preclude collecting data at a field site. This task can be divided between the Veg and AB Teams, with each focusing on the gear and supplies that their team requires. Pack equipment, supplies, and any samples carried in the vehicle so that physical shock and vibration are minimized during transport. Keep personal field gear, equipment, and samples in the same locations in the vehicle for each trip, so that packing becomes routine and omissions are easier to spot. The Crew Leader should confirm everything needed is present before departing for the field.

2011 NWCA Field Operations Manual Chapter 2. Base Location Activities and Summary of Field Operations
2 - 22
The Logistics Coordinator will provide some durable sampling equipment in the Base Kit at the beginning of the field season, and will provide a Site Kit that contains some of consumable supplies for each NWCA site. Other equipment and supplies are provided by your state, tribe, or other organization. See the Master Equipment List and Section 2.2.3 for details. You will use several solutions as part of the sampling or clean-up protocols for the NWCA, including Lugol’s solution (Chapter 9), magnesium chloride solution (Chapter 8), bleach solution (Section 2.5.4.4), and if you are collecting optional water quality data with a multi-probe, a solution for use as a calibration sample. Lugol’s solution and magnesium chloride solution will normally be part of the Base Kit provided by the Logistic Coordinator. You will need to prepare bleach solution for cleaning gear and equipment. A QC calibration sample for the optional multi-probe meter may be needed if you are collecting this optional data (Chapter 8). If necessary, before going into the field, prepare stock preservation solutions as described in Table 2-3. When preparing solutions, follow appropriate safety protocols, (e.g., see your state, tribe, or other organization approved safety plan and procedures).
Table 2-3. Stock solutions, uses, and methods for preparation
Solution Use Preparation Bleach (10%) Clean waders, shovels, dipper, and
other gear. Add 400mL laundry bleach to 3,600mL distilled water.
Lugol’s Preservative for taxonomic algae samples (See Chaper 9).
Dissolve 100g KI in 1L of distilled water. Dissolve 50g iodine (crystalline) in 100ml glacial acetic acid. Mix these two solutions. Remove any precipitates. Store in the dark in a dark container.
MgCO3 (Magnesium Carbonate)
Buffer for Chlorophyll-a Dissolve 1g MgCO3 per 100ml distilled water
Calibration QC Sample
For Optional Water Quality Data
QC sample for pH and conductivity calibration check (See Chapter 8).
Dissolve 3.4022g KH2PO4 and 3.5490g Na2HPO4 (analytical grade; dried at 120°C for 3h and stored desiccated) in 1000.0g (1.0018 L at 20 °C, 1.0029L at 25 °C) reagent water.
Prepare a 1:100 dilution of standard stock solution with reagent water for a QC sample that has a theoretical pH of 6.98 and a theoretical conductivity = 75.3 μS/cm at 25 ̊C

2011 NWCA Field Operations Manual Chapter 2. Base Location Activities and Summary of Field Operations
2 - 23
2.4.6 Vehicle Maintenance Each day prior to traveling into the field to sample ensure the vehicles are filled with gas or have sufficient fuel for the day’s activities. Further safety checks should include checking the tires for sufficient air pressure. Occasional maintenance checks should include oil, washer fluid, and radiator fluid. Follow your state, tribe, or other organization approved guidelines for maintaining and operating your field vehicle. In addition, it is important to clean the vehicle when traveling to different geographic areas (e.g., at the end of a sampling trip or at intervals during the sampling trip if traveling long distances between sites) to remove propagules of invasive plant species or other non-native biotic hitchhikers. For example, the vehicle might be routinely taken through a car wash at specified intervals. 2.5 DAILY FIELD ACTIVITIES Major sample and data collection tasks for the Veg and AB Teams are listed below in Table 2-4, along with estimated times required for their completion at sites of varying complexity.
Table 2-4. Estimated time ranges for field activities depending on site complexity. It is anticipated that most sites will fall in the middle of these ranges. Estimates do not include travel to and from the site.
Veg Team – Hours to Complete AB Team – Hours to Complete
Range Range
Task
Number of People Easy
Site
Highly Complex
Site
Number of people Easy
Site
Highly Complex
Site AA - Site verification/POINT & CENTER Location/ AA establishment
2 people 0.5 1.5
Vegetation – Plot layout, Data and specimen collection
2 people 2.5 8
Buffer – Transect location and data collection
1-2 people 1 2.5
Soil – Pit location, data and sample collection
2 people 2 6
Hydrology – Data collection 1 person 0.25 1 Algae – Sample collection and processing
1 person 0.5 1
Water Quality – Sample collection
1 person 0.25 0.5
USA-RAM1 1-2 people 0.75 1.5 1-2 people 0.25 0.5 Sample/Specimen Handling and Tracking
1-2 people 1 2 1-2 people 1 1.5
Sample Day Length = Total Hours/Site
4.75 13 5.25 13
Estimated Mean Sample Day Length2 = ~ 8 to 9 hrs 1USA-Rapid Assessment Method. 2Estimated mean sample day length based on combined estimated minimum times for easy sites and maximum times highly complex for tasks for each team.

2011 NWCA Field Operations Manual Chapter 2. Base Location Activities and Summary of Field Operations
2 - 24
This section presents an overview of the sampling activities that a four-person field crew conducts during a typical 1-day visit to a site and details or protocols that pertain to the entire sampling day or to multiple individual indicator protocols. To begin, safety and health considerations and guidelines related to field operations are
described in Section 2.5.1. Guidelines for recording data are presented in Section 2.5.2. An overview and flowchart (Reference Card OPS-2) describing how to structure the field day
to accomplish all sampling tasks is provided in Section 2.5.3. NWCA protocol tasks that apply to data collection for multiple wetland indicators are found in
Section 2.5.4, including gathering information on site and sample status, guidelines for GPS use, post-sampling review of forms and samples, cleanup and final checks.
2.5.1 Health and Safety Collection and analysis of samples can involve risks to personal safety and health, and the safety of the Field Crew must always be the primary consideration during sampling. This section describes general safety considerations, some safety equipment, and general safety guidelines for field operations. Text in this section is adapted from USEPA (2007). This section does not substitute for an official Health and Safety Plan. The Crew MUST ALWAYS carefully follow the protocols in their Health and Safety Plan for the NWCA field work that was approved by state, tribe, or other organization with which the Field Crew is affiliated. A copy of this approved safety plan must be carried in the field. Some important considerations related to field safety are presented in Table 2-5, however, it is the responsibility of the group safety officer (state, tribe, or other organization) to ensure that the necessary safety courses are taken by all field personnel and that all safety policies and procedures are followed. Each state, tribe, or other organization must develop and have a specific safety plan for the NWCA sites they are assigned to sample. In addition, a communications plan to address safety and emergency situations is essential. Field personnel should have a daily check-in procedure. An emergency communications plan includes contacts for police, ambulance, fire departments, hospitals, and search and rescue personnel. All personnel need to be fully aware of all lines of communication. In wetlands, a potential hazard is water overlying soft sediments. Care should be taken in situations where shallow water overlies deep soft sediments to avoid falling or becoming mired. In these situations it is important for people to work in pairs so that one person can assist someone who is stuck in the mud. For example, a long-handled shovel can be used to help pull a person from the mud while a second person stays on firmer ground. This is also a case where the plastic snow sled recommended in the soils protocol can be used as a platform to distribute a person’s weight and enable them to crawl out of a dangerous area. This is particularly important in tidal situations. The NWCA recognizes these safety issues; a sampleable wetland AA can have no more than 10% of its area with water greater than 1m deep or a combination of water and soft sediment that may be hazardous.

2011 NWCA Field Operations Manual Chapter 2. Base Location Activities and Summary of Field Operations
2 - 25
Table 2-5. Some basic health and safety considerations for field work. Recommended Training: First aid Cardiopulmonary resuscitation (CPR) Vehicle safety (e.g., operation of 4-wheel drive vehicles) Boating and water safety (if boats are required to access sites) Field safety (weather, personal safety, orienteering, site reconnaissance prior to sampling) Equipment design, operation, and maintenance Handling of chemicals and other hazardous materials that might be encountered Communications: Check-in schedule Sampling itinerary (vehicle used, description and license plate number, time of departure & return,
travel route) Contacts for police, ambulance, hospitals, fire departments, search and rescue personnel Emergency services available near each sampling site and base location Cell phone, if possible satellite phone Personal Safety: Field clothing and other protective gear (including lifejackets for boat accessed sites) for all Crew
Members Medical and personal information (allergies, personal health conditions) Personal contacts (family, telephone numbers, etc.) Physical exams and immunizations Any person allergic to bee stings, other insect bites, or plants (i.e., poison ivy, oak, sumac, etc.) must take proper precautions and have any needed medications handy. General Safety Guidelines for Field Operations: Two persons must be present during all sample collection activities; no one should be left alone
while in the field. Exposure to wetland water and sediments should be minimized. Use gloves if necessary, and clean
exposed body parts as soon as possible after contact. All electrical equipment must bear the approval seal of Underwriters Laboratories and must be
properly grounded to protect against electric shock. Use appropriate protective equipment (e.g., gloves, safety glasses) when handling and using any
chemicals. Handle and dispose of chemical wastes properly. Do not dispose any chemicals in the field. Persons working in areas where poisonous snakes or spiders may be encountered must check with
the local Drug and Poison Control Center for recommendations on what should be done in case of a bite.
Persons working in areas where large predatory animals such as bears, cougars, wolves, or alligators are known to reside should be familiar with and take appropriate precautions to avoid encounters that could lead to aggressive behavior or attacks from such wildlife.
Field personnel should protect themselves against the bites of deer or wood ticks because of the potential risk of acquiring pathogens that cause Rocky Mountain spotted fever and Lyme disease.
Also, where mosquitoes or other biting insects are prevalent (particularly where they are known to potentially transmit disease, e.g., West Nile virus), minimize exposure to bites by wearing long sleeve shirts and long pants and, as appropriate, by wearing mosquito nets or using insect repellent.
All field personnel should be familiar with the symptoms of hypothermia and know what to do in case symptoms occur. Hypothermia can kill a person at temperatures much above freezing (up to 10oC or 50oF) if he or she is exposed to wind or becomes wet.
Field personnel should be familiar with the symptoms of heat/sun stroke and be prepared to move a suffering individual into cooler surroundings and hydrate immediately.

2011 NWCA Field Operations Manual Chapter 2. Base Location Activities and Summary of Field Operations
2 - 26
Some hazards lie out of sight beneath the surface of wetland waters or their associated ponds, rivers and streams. Broken glass or sharp pieces of metal embedded in the substrate can cause serious injury if care is not exercised when walking or working with the hands in such environments. Infectious agents and toxic substances that can be absorbed through the skin or inhaled may also be present in the water or sediment. Personnel who may be exposed to water known or suspected to contain human or animal wastes that may carry pathogens must be immunized against tetanus, hepatitis, typhoid fever, and polio. Biological wastes can also be a threat in the form of viruses, bacteria, rickettsia, fungi, or parasites. If boats are used to access sampling sites (e.g., for tidally influenced sites or wetlands fringing bodies of water), personnel must be trained in operating the type of boat in use, and must consider and prepare for hazards associated with the operation of motor vehicles, boats, winches, tools, and other incidental equipment. Boat operators should be familiar with U.S. Coast Guard rules and regulations for safe boating contained in a pamphlet, Federal Requirements for Recreational Boats, available from a local U.S. Coast Guard Director or Auxiliary or State Boating Official and online (U.S. Coast Guard, http://www.uscgboating.org/fedreqs/default.html). All boats with motors must have fire extinguishers, boat horns, life jackets or flotation cushions, and flares or communication devices. Field Crew members using sampling equipment should be familiar with the hazards involved and establish appropriate safety practices prior to using them. Make sure all equipment is in safe working condition. Proper field clothing should be worn to prevent hypothermia, heat exhaustion, sunstroke, or other dangers. For boat accessed sites, field personnel should be able to swim, and personal flotation devices must be used. Chest waders made of rubberized or neoprene material and suitable footwear must always be worn with a belt to prevent them from filling with water in case of a fall. Wetlands, and the surrounding landscape, can be home to various dangerous organisms. Field Crews should take care to minimize contact with biting insects, bees, poisonous snakes and dangerous animals. Insect repellent and protective clothing will help reduce the possibility that Field Crew members will come in contact with biting insects. At the end of each field day workers should inspect their bodies for ticks. Any person allergic to bee stings, other insect bites, or plants (i.e., poison ivy, oak, sumac, etc.) should take proper precautions and have any needed medications on hand. In addition, Field Crew members should always be aware of their surrounding to protect themselves from dangerous animals, such as alligators, mountain lions, bears, and wolves. For some wetlands in Gulf Coast areas of the U.S. that have NWCA sites, it is possible that there could be some oil contamination resulting from the 2010 BP oil spill. If this is likely in the region where you are working, the approved health and safety plan of your state, tribe, or other organization should have protocols for handling Field Crew safety and for equipment clean-up after working in such locations. Appendix E, Example Oil Decontamination Procedures, provides an example of one such protocol. Appropriate safety apparel such as waders, gloves, safety glasses, etc. must be available and used when necessary. First aid kits, fire extinguishers, and blankets must be readily available. Cellular or satellite telephones and/or portable radios should be carried by Field Crews working in remote areas for use in case of an emergency. Supplies must be available for cleaning of exposed body parts that may have been contaminated by pollutants in the water such as anti-bacterial soap and an adequate supply of clean water or ethyl alcohol.

2011 NWCA Field Operations Manual Chapter 2. Base Location Activities and Summary of Field Operations
2 - 27
Personnel participating in field activities on a regular or infrequent basis should be in sound physical condition and have a physical examination annually or in accordance with regional, state, tribe, or organizational requirements. All surface waters and sediments should be considered potential health hazards due to potential toxic substances or pathogens. During the course of field research activities, it is possible that field crews may observe violations of environmental regulations, may discover improperly disposed hazardous materials, or may observe an accidental spill or release of hazardous materials. If this occurs, it is important that the proper actions be taken and that field personnel do not expose themselves to something harmful. The following guidelines should be applied:
1) First and foremost, protect the health and safety of all personnel. Take any necessary steps to avoid injury or exposure to hazardous materials. If you have been trained to take action such as cleaning up a minor fuel spill during fueling of a boat, do it. However, you should always error on the side of personal safety.
2) Field personnel should never disturb or retrieve improperly disposed hazardous materials
from the field to bring back to a facility for "disposal”. To do so may worsen the impact, may incur personal liability or liability for the Crew Members and their respective organizations, may cause personal injury, or may cause unbudgeted expenditure of time and money for proper treatment and disposal of the material.
3) It is important not to ignore environmental incidents. Notify the proper authorities of any
incident involving hazardous materials so they can take the necessary actions to properly respond. For most environmental incidents, the following emergency telephone numbers should be provided to all Field Crews: state or tribal department of environmental quality or protection, U.S. Coast Guard, and the USEPA regional office. If a Field Crew is unsure about who to contact, they should call their Designated EPA Coordinator. In the event of a major environmental incident, the National Response Center may need to be notified at 1-800-424-8802.
2.5.2 Procedures for Recording Data The NWCA data and tracking forms are formatted so that the data you record can be scanned into a data entry system. Each completed NWCA Form Packet will result in a minimum of 3000 data points (ranging from a single character to a long species name or comment field). For the NWCA, there will be over 4 million data fields entered, reviewed, assured, and stored in perpetuity. The legacy of this study starts with the Information Management Team’s ability to capture what you are communicating on the scannable NWCA data forms. Thus, it is important that field data and sample information are recorded accurately, consistently, and legibly. Detailed instructions for filling out specific forms are provided in each protocol chapter of this manual. Some important overall points for filling out all forms are discussed below and standard guidelines that must be followed for recording field data are presented in Table 2-6. Figures 2-3 (below) and 5-3a-c, and 5-4 (in Chapter 5) illustrate examples of correctly filled out forms. Figure 2-4 illustrates an incorrectly filled out form.
2011 NWCA Field Operations Manual Chapter 2. Base Location Activities and Summary of Field Operations
2 - 28
Official Data Forms – The Information Management Team will provide all forms for use in the NWCA. These forms will be provided in the Form Packet for each site. It is important to use only these forms because they are formatted for to be read by the digital data scanners. Data not recorded on the Official NWCA Data Forms are unusable. Site Number, Date, and Page Numbers
1) The Site ID is preprinted on the forms, and, for many sample types, the sample id numbers are preprinted on sample labels and tags. Thus, it is vital to ensure that you use the correct set of forms, tags, and labels for the site being sampled. If using forms or labels without preprinted site numbers, be sure to fill in the correct site and sample id information.
If the Site ID, Sample ID, sampling date, or page number is incorrect or omitted, it may be impossible to connect data or samples to a particular site, resulting in lost data.
2) Be sure to record the date sampling is initiated wherever it is requested.
3) For forms that have multiple pages, be sure to fill in the page number for each page and the total number of pages.
Form Instructions – Carefully follow all instructions on each data form. Consult the appropriate protocol chapter, if you have questions not answered by the form instructions, about how to record data for a particular form. Confirmation Bubbles – Most NWCA forms have confirmation bubbles to indicate the meaning of blank data fields or unfilled data bubbles. Read these statements carefully and fill in the bubbles as requested to confirm exactly what empty data fields or unfilled data bubbles on a particular form mean. Completing the confirmation bubbles is critical to note that a data element was not observed at the site, rather than overlooked by the Field Crew.
Data Flags and Comments – There is space on all forms to flag data for which additional information or explanation may be needed. See Table 2-6 and Figures 2-3, and 5-3a-c for examples of how to correctly use flags for qualifying data.

2011 NWCA Field Operations Manual Chapter 2. Base Location Activities and Summary of Field Operations
2 - 29
Table 2-6. Guidelines for recording field data and tracking information.
ACTIVITY GUIDELINES
Recording Information on Data Forms and Tracking Forms
Record observations and measurement values only on official NWCA data and
tracking forms (provided by the Information Management Team) that are preprinted on water-resistant paper.
Use a writing instrument that leaves clear, dark text (e.g., a No. 2 pencil or a water and smear proof fine-point indelible marker) to record information on all forms.
If you make an error when recording data and changes are required, it is best to
cross out the error and rewrite the correct information. Use a flag if there isn’t enough room in the data field and write the correct information in the comments section.
Complete all header information and record all data and sample id information requested on each form.
Use the formats specified on individual data forms for recording data. Print legibly (and as large as possible). Clearly distinguish letters from numbers
(e.g., 0 versus O, 2 versus Z, 7 versus T, etc.), but do not use slashes, i.e., lines drawn through the character. Printing in capital letters enhances legibility.
When recording plant species names on Forms V-2 and V-4, print clearly using CAPITAL LETTERS.
For data that is recorded by filling a data bubble, be certain to keep markings inside the circle while completely filling the bubble.
When using workspace areas provided for estimating cover or tallying counts of trees on Vegetation Forms, keep all marks inside workspace area.
When recording comments, print legibly. Make notations in comments field only; avoid marginal notes. Be concise, but avoid using abbreviations or "shorthand" notations. If you run out of space, attach a sheet of paper with the additional information, rather than trying to squeeze everything into the space.
Do not doodle on the forms, including the margins.
Data Qualifiers (Flags)
Use only defined flag codes and record flag on data form in appropriate field.
K = No measurement or observation made. U = Suspect measurement; re-measurement not possible. E = End of plant species list (used only on some vegetation forms) Fn = Miscellaneous flags (n = 1, 2, etc.) assigned by a Field Crew during a
particular sampling visit.
Explain reason for using K or U flags and define each Fn flag in the comments section of the data form. Ensure the Fn numbers are unique on the data form and matched to the flag definition.
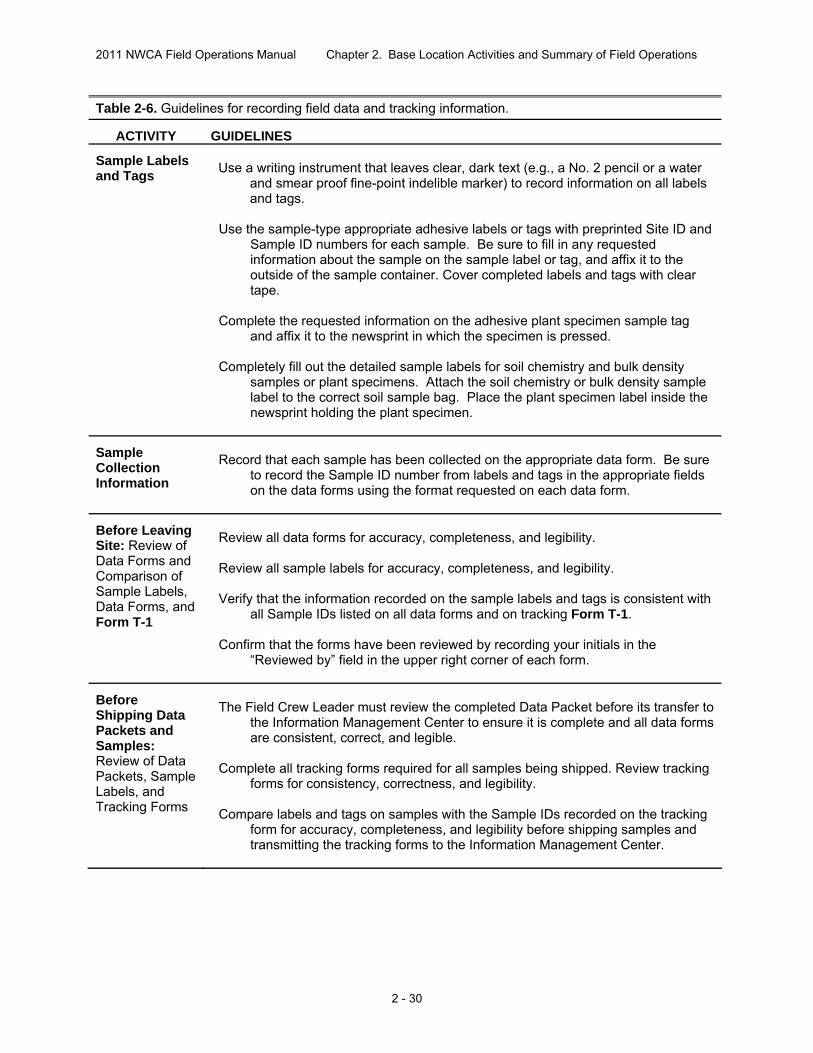
2011 NWCA Field Operations Manual Chapter 2. Base Location Activities and Summary of Field Operations
2 - 30
Table 2-6. Guidelines for recording field data and tracking information.
ACTIVITY GUIDELINES
Sample Labels and Tags
Use a writing instrument that leaves clear, dark text (e.g., a No. 2 pencil or a water
and smear proof fine-point indelible marker) to record information on all labels and tags.
Use the sample-type appropriate adhesive labels or tags with preprinted Site ID and
Sample ID numbers for each sample. Be sure to fill in any requested information about the sample on the sample label or tag, and affix it to the outside of the sample container. Cover completed labels and tags with clear tape.
Complete the requested information on the adhesive plant specimen sample tag
and affix it to the newsprint in which the specimen is pressed. Completely fill out the detailed sample labels for soil chemistry and bulk density
samples or plant specimens. Attach the soil chemistry or bulk density sample label to the correct soil sample bag. Place the plant specimen label inside the newsprint holding the plant specimen.
Sample Collection Information
Record that each sample has been collected on the appropriate data form. Be sure
to record the Sample ID number from labels and tags in the appropriate fields on the data forms using the format requested on each data form.
Before Leaving Site: Review of Data Forms and Comparison of Sample Labels, Data Forms, and Form T-1
Review all data forms for accuracy, completeness, and legibility. Review all sample labels for accuracy, completeness, and legibility. Verify that the information recorded on the sample labels and tags is consistent with
all Sample IDs listed on all data forms and on tracking Form T-1. Confirm that the forms have been reviewed by recording your initials in the
“Reviewed by” field in the upper right corner of each form.
Before Shipping Data Packets and Samples: Review of Data Packets, Sample Labels, and Tracking Forms
The Field Crew Leader must review the completed Data Packet before its transfer to
the Information Management Center to ensure it is complete and all data forms are consistent, correct, and legible.
Complete all tracking forms required for all samples being shipped. Review tracking
forms for consistency, correctness, and legibility. Compare labels and tags on samples with the Sample IDs recorded on the tracking
form for accuracy, completeness, and legibility before shipping samples and transmitting the tracking forms to the Information Management Center.
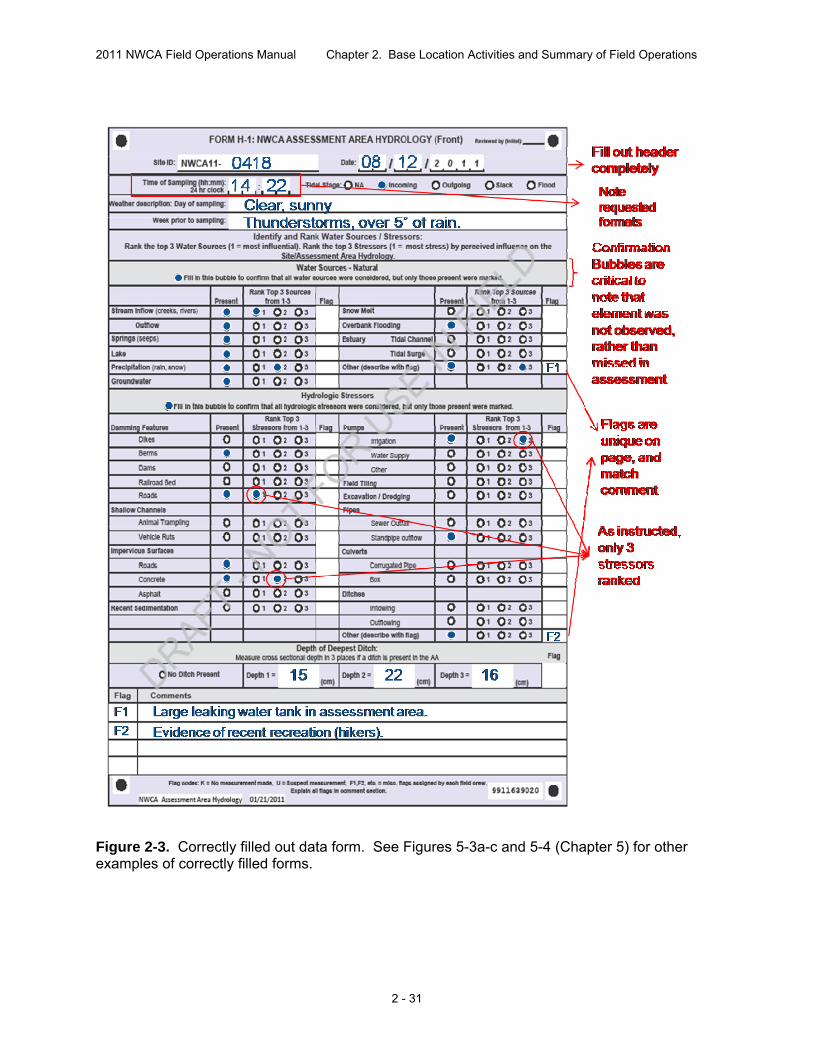
2011 NWCA Field Operations Manual Chapter 2. Base Location Activities and Summary of Field Operations
2 - 31
Figure 2-3. Correctly filled out data form. See Figures 5-3a-c and 5-4 (Chapter 5) for other examples of correctly filled forms.
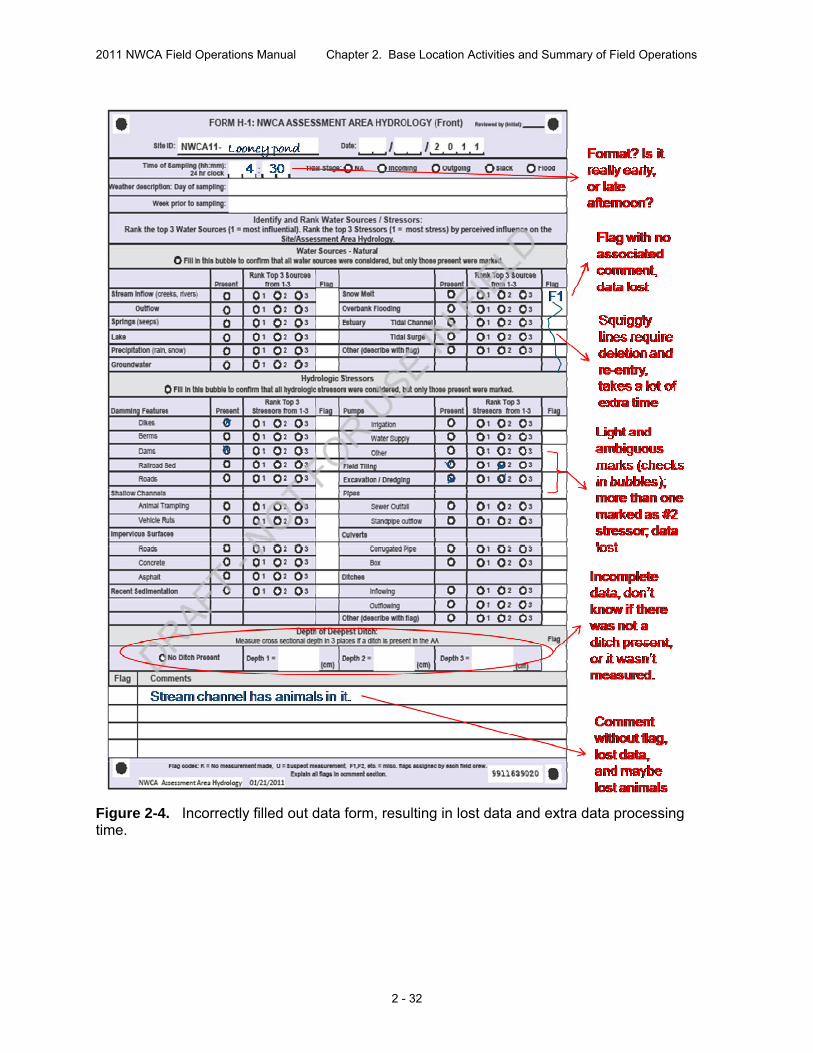
2011 NWCA Field Operations Manual Chapter 2. Base Location Activities and Summary of Field Operations
2 - 32
Figure 2-4. Incorrectly filled out data form, resulting in lost data and extra data processing time.

2011 NWCA Field Operations Manual Chapter 2. Base Location Activities and Summary of Field Operations
2 - 33
2.5.3 Daily Sampling Scenario (suggested sampling routine) Field methods for the NWCA are designed to be completed in one field day at a site. Depending on the time needed for both the sampling and traveling for that day, an additional day may be needed for pre-departure and post-sampling activities (e.g., cleaning equipment, repairing gear, shipping samples, and traveling to the next site). Remote wetlands with lengthy or difficult approaches may require extended time to gain access to the wetland, and Field Crews will need to plan accordingly. Details of all sampling protocols are described in Chapters 3 through 9 of this manual. Several other sampling tasks that cross multiple chapters are detailed in Section 2.5.4. Most chapters include reference cards that summarize key protocols required for sampling specific NWCA indicators. These reference cards are also compiled together in the in the Quick Reference Version of the Field Operations Manual (USEPA 2011c). The quick reference is intended as a field tool to rapidly access key information; however, the full manual should always be available so that it can be consulted whenever questions about specific sampling activities emerge. A suggested daily field sampling scenario showing how the work load may be split between the Field Crew members over the day is presented in Reference Card OPS-2. Side A of the Reference Card outlines tasks for the Veg Team and Side B outlines tasks for the AB Team. The entire Field Crew should be familiar with all the tasks that need to be completed in the sampling day so that they can assist one another if one Team finishes earlier than the other. To organize field activities efficiently, each Field Crew should define roles and responsibilities for each Crew Member. Minor modifications to the sampling scenario may be made by crews; however the general sequence of sampling events presented in Reference Card OPS-2, Side A and Side B should not be changed because it is based on the need to protect some types of samples from potential contamination and to minimize holding times once samples are collected. In the flowcharts on Reference Card OPS-2, the direction of the arrows indicates the order in which work should be conducted. Note that in some instances the arrows are double headed to indicate that work between the associated tasks may take place in either order, iteratively, or simultaneously. Sometimes this depends on whether both members of a Team are working together on one protocol or are working separately on different protocols. For example (See Reference Card OPS-2, Side B), consider the following two scenarios:
At times it may be most efficient for the AB Team to work together collecting Buffer data, and while they are doing this they might begin observations on hydrology at outer edges of the AA. In this case, once the Buffer data is collected, one AB Team Member could collect the Water Quality data and sample, while the other completes collection of the Hydrology data. Which ever member completes their task first would then collect the Algae samples. Then both AB Team members would proceed to collecting Soil data and samples. In contrast, sometimes it may be more convenient for one AB Team Member to collect the Buffer data, while the other AB Team Member begins work in the AA. The member working in the AA would first collect the Water Quality data and sample, then the Hydrology data, followed by the Algae data. Once each member has completed their separate tasks both AB Team Members work together to collect Soil data and samples.

2011 NWCA Field Operations Manual Chapter 2. Base Location Activities and Summary of Field Operations
2 - 34
USA RAM – ASSESSMENT AREA (USA RAM Manual)
Condition Metrics
Metric 4: Topographic Complexity
Metric 5: Patch Mosaic Complexity
Metric 6: Vertical Complexity
Metric 7: Plant Community Complexity Stressor Metrics
Metric 8: Stressors to Water Quality
Metric 9: Alterations to Hydroperiod
Metric 10: Stress to Substrate
Metric 11: Cover of Invasive Plant Species
Metric 12: Stress to Vegetation
VEGETATION (VEG) Team (2 persons)BE‐ Botanist/Ecologist BA‐Botanist Assistant
SITE VERIFICATION AND ASSESSMENT AREA (AA) ESTABLISHMENT1) On site, verify office plan for AA establishment 2) Verify POINT and CENTER 3) Verify wetland sampleable and define AA (Form PV‐1, RC AA‐1, RC AA‐2) 4) Set‐up AA (RC AA‐1) 5) Complete Form AA‐1 and annotate aerial photo or make a sketch map of
AA and its components. 6) Characterize AA:
a) Determine FWS Status & Trends (S&T) classes (Form AA‐2, RC AA‐3A) b) Determine HGM Type (Form AA‐2, RC AA‐3B)
PHOTOS (Appendix D) 1) Take photos of AA (overview, photos from AA CENTER
toward boundary along Veg Plot placement lines) 2) Other photos as needed (e.g., TES species, or unusual
conditions in the AA)
VEGETATION CHARACTERIZATION ‐‐ EACH VEG PLOT(NWCA‐FOM, RC V‐1)
1) Collect Plant Species Presence data (RC V‐3B, Forms V‐2a, b)
2) Estimate % Cover for all Individual Vascular Plant Species and identify the Primary Height Class in which each species occurs (RC V‐3B and V‐4, Forms V‐2a, b)
3) Collect unknown and QA Voucher plant specimens as encountered
4) Determine predominant Status & Trends Wetland Class ( Form V‐3, Front)
5) Estimate % Cover of Vertical Vegetation Strata (Form V‐3, Front)
6) Estimate % Cover for Non‐Vascular Groups (bryophytes, lichens, and macroalgae) (Form V‐3, Front)
7) Collect data describing Ground Surface Attributes (Form V‐3, Back)
8) Collect Snag (counts) and Live Tree Species (cover and counts) data (Forms V‐4a, b)
VEGETATION PLOT LAYOUT1) Select Veg Plot Layout configuration (RC V‐2) 2) Establish five 100‐m2
Veg Plots (RC V‐2 and V‐3A, Form V‐1)
PLANT SPECIMEN COLLECTION AND HANDLINGAt Site: 1) Ensure that all unknowns and QA Vouchers have
been collected At Site, Vehicle, or Field Lodging on Sample Day: 2) Complete a Plant Sample Tag and Plant Specimen
Label for each plant specimen 3) Press plant specimens 4) Record number of plant specimens collected at the
site on Form T‐1: Site and Sample Status/WRS Tracking
On Subsequent Days (see Post‐sampling tasks): 1) Dry specimens, change blotters in press as needed 2) Package, ship or deliver to designated herbarium or
laboratory, completing and enclosing the appropriate plant specimen tracking information (Form T‐2 or T‐3) in the shipping box
FINAL ON‐SITE ACTIVITIES1) Review field data forms 2) Clean up wetland site and organize gear,
equipment, and samples for transport to vehicle3) Clean equipment & crew of plant or other
biological propagules 4) Crew Leader Final Check‐off
Begin Sample Day at Site
Complete Sample Day
Reference Card OPS-2, Side A. Vegetation Team Sampling Day Activities
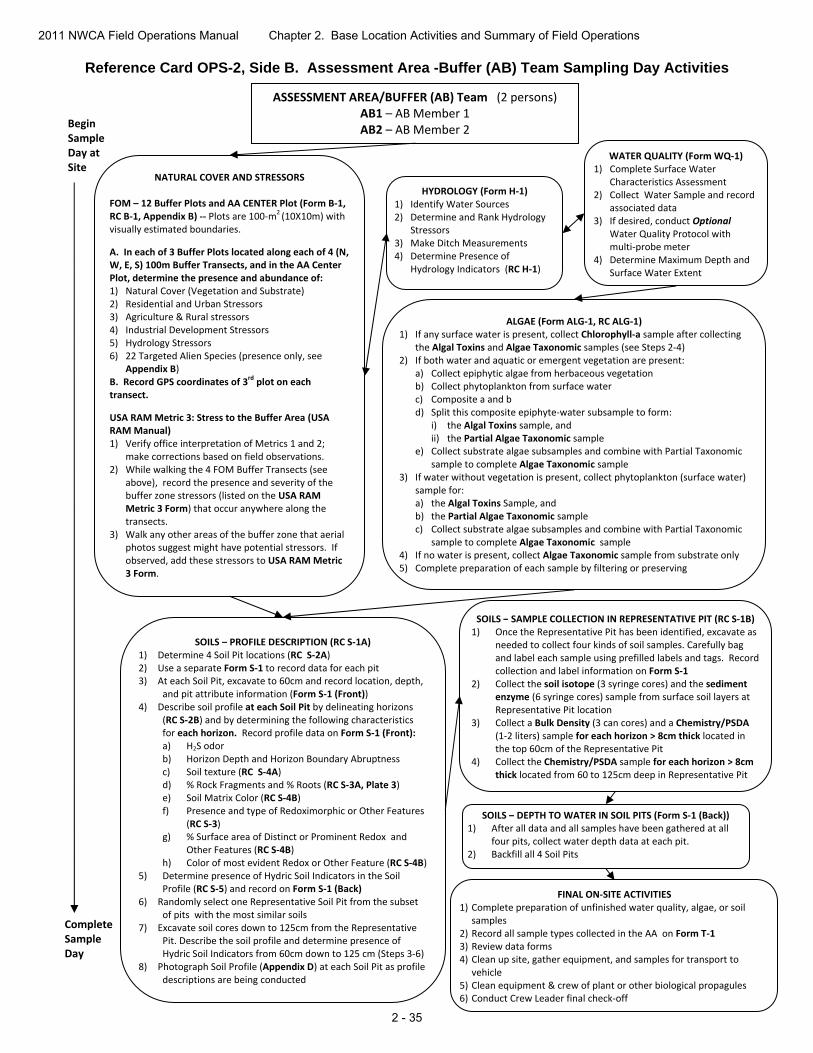
2011 NWCA Field Operations Manual Chapter 2. Base Location Activities and Summary of Field Operations
2 - 35
ASSESSMENT AREA/BUFFER (AB) Team (2 persons)AB1 – AB Member 1 AB2 – AB Member 2
NATURAL COVER AND STRESSORS FOM – 12 Buffer Plots and AA CENTER Plot (Form B‐1, RC B‐1, Appendix B) ‐‐ Plots are 100‐m
2 (10X10m) with
visually estimated boundaries.
A. In each of 3 Buffer Plots located along each of 4 (N, W, E, S) 100m Buffer Transects, and in the AA Center Plot, determine the presence and abundance of: 1) Natural Cover (Vegetation and Substrate) 2) Residential and Urban Stressors 3) Agriculture & Rural stressors 4) Industrial Development Stressors 5) Hydrology Stressors 6) 22 Targeted Alien Species (presence only, see
Appendix B) B. Record GPS coordinates of 3
rd plot on each
transect.
USA RAM Metric 3: Stress to the Buffer Area (USA RAM Manual) 1) Verify office interpretation of Metrics 1 and 2;
make corrections based on field observations. 2) While walking the 4 FOM Buffer Transects (see
above), record the presence and severity of the buffer zone stressors (listed on the USA RAM Metric 3 Form) that occur anywhere along the transects.
3) Walk any other areas of the buffer zone that aerial photos suggest might have potential stressors. If observed, add these stressors to USA RAM Metric 3 Form.
HYDROLOGY (Form H‐1)1) Identify Water Sources 2) Determine and Rank Hydrology
Stressors 3) Make Ditch Measurements 4) Determine Presence of
Hydrology Indicators (RC H‐1)
WATER QUALITY (Form WQ‐1)1) Complete Surface Water
Characteristics Assessment 2) Collect Water Sample and record
associated data 3) If desired, conduct Optional
Water Quality Protocol with multi‐probe meter
4) Determine Maximum Depth and Surface Water Extent
SOILS – PROFILE DESCRIPTION (RC S‐1A)1) Determine 4 Soil Pit locations (RC S‐2A) 2) Use a separate Form S‐1 to record data for each pit 3) At each Soil Pit, excavate to 60cm and record location, depth,
and pit attribute information (Form S‐1 (Front)) 4) Describe soil profile at each Soil Pit by delineating horizons
(RC S‐2B) and by determining the following characteristics for each horizon. Record profile data on Form S‐1 (Front): a) H2S odor b) Horizon Depth and Horizon Boundary Abruptness c) Soil texture (RC S‐4A) d) % Rock Fragments and % Roots (RC S‐3A, Plate 3) e) Soil Matrix Color (RC S‐4B) f) Presence and type of Redoximorphic or Other Features
(RC S‐3) g) % Surface area of Distinct or Prominent Redox and
Other Features (RC S‐4B) h) Color of most evident Redox or Other Feature (RC S‐4B)
5) Determine presence of Hydric Soil Indicators in the Soil Profile (RC S‐5) and record on Form S‐1 (Back)
6) Randomly select one Representative Soil Pit from the subset of pits with the most similar soils
7) Excavate soil cores down to 125cm from the Representative Pit. Describe the soil profile and determine presence of Hydric Soil Indicators from 60cm down to 125 cm (Steps 3‐6)
8) Photograph Soil Profile (Appendix D) at each Soil Pit as profile descriptions are being conducted
ALGAE (Form ALG‐1, RC ALG‐1) 1) If any surface water is present, collect Chlorophyll‐a sample after collecting
the Algal Toxins and Algae Taxonomic samples (see Steps 2‐4) 2) If both water and aquatic or emergent vegetation are present:
a) Collect epiphytic algae from herbaceous vegetation b) Collect phytoplankton from surface water c) Composite a and b d) Split this composite epiphyte‐water subsample to form:
i) the Algal Toxins sample, and ii) the Partial Algae Taxonomic sample
e) Collect substrate algae subsamples and combine with Partial Taxonomic sample to complete Algae Taxonomic sample
3) If water without vegetation is present, collect phytoplankton (surface water) sample for: a) the Algal Toxins Sample, and b) the Partial Algae Taxonomic sample c) Collect substrate algae subsamples and combine with Partial Taxonomic
sample to complete Algae Taxonomic sample 4) If no water is present, collect Algae Taxonomic sample from substrate only 5) Complete preparation of each sample by filtering or preserving
Begin Sample Day at Site
FINAL ON‐SITE ACTIVITIES1) Complete preparation of unfinished water quality, algae, or soil
samples 2) Record all sample types collected in the AA on Form T‐1 3) Review data forms 4) Clean up site, gather equipment, and samples for transport to
vehicle 5) Clean equipment & crew of plant or other biological propagules 6) Conduct Crew Leader final check‐off
SOILS – SAMPLE COLLECTION IN REPRESENTATIVE PIT (RC S‐1B)1) Once the Representative Pit has been identified, excavate as
needed to collect four kinds of soil samples. Carefully bag and label each sample using prefilled labels and tags. Record collection and label information on Form S‐1
2) Collect the soil isotope (3 syringe cores) and the sediment enzyme (6 syringe cores) sample from surface soil layers at Representative Pit location
3) Collect a Bulk Density (3 can cores) and a Chemistry/PSDA (1‐2 liters) sample for each horizon > 8cm thick located in the top 60cm of the Representative Pit
4) Collect the Chemistry/PSDA sample for each horizon > 8cm thick located from 60 to 125cm deep in Representative Pit
SOILS – DEPTH TO WATER IN SOIL PITS (Form S‐1 (Back))1) After all data and all samples have been gathered at all
four pits, collect water depth data at each pit. 2) Backfill all 4 Soil Pits
Complete Sample Day
Reference Card OPS-2, Side B. Assessment Area -Buffer (AB) Team Sampling Day Activities

2011 NWCA Field Operations Manual Chapter 2. Base Location Activities and Summary of Field Operations
2 - 36
2.5.4 Sampling Activities and Forms Applicable to Multiple Indicators or Tasks
Sampling activities that span multiple protocols are: Determining site and sample status (Section 2.5.4.1). Photography (Section 2.5.4.2, Appendix D). Use of GPS (Section 2.5.4.3). Post-sampling review of the Data Packet, samples, and Form T-1: Site and Sample
Status/WRS Tracking (See Reference Card OPS-2, Sides A and B, Table 2-6).
Aspects of Form T-1 are discussed in Sections 2.5.4.1 and 2.6.2 of this chapter and other aspects are discussed in Chapters 5, 6, 8, and 9. Form T-5: NWCA Tracking-Batched Samples is used to track both taxonomic algae samples (Chapter 9) and completed Data Packets (Section 2.6.3).
Adhesive sample labels for several sample types are printed together on one label sheet for each site (Section 2.9). Each sample label is preprinted with sample type, the Site ID, a Sample ID. Specifics of these labels are discussed with their relevant sample types in other chapters. 2.5.4.1 Determining Site and Sample Status (completing Form T-1) Form T-1: Site and Sample Status/WRS Tracking must be filled out for every NWCA site that is visited for sampling. It provides three key types of information:
1) Site status 2) Sample status 3) Tracking information for immediately shipped samples One copy of this form is completed for each site, but to gather all of the required information it is accessed multiple times during sampling by both the Veg and AB Teams. Particular elements of the form that pertain to specific NWCA indicators are discussed in the relevant chapter and elements related to shipping are discussed in Section 2.6.2. Note that the hardcopy of Form T-1 with the preprinted Site ID from your Form Packet has several elements that are completed in the field, while the shipping information is completed when the immediately shipped (within 24hours of collection) samples are prepared for shipping. This hardcopy is included with the samples when they are shipped. Form T-1 must also simultaneously be submitted to the Information Management Team either as a fillable electronic file submitted by email, or the completed hardcopy version can be faxed, or the information on the form can be telephoned in (see Section 2.6.2.2, Appendix A and the bottom of Form T-1 for how to transmit Form T-1 to the Information Management Team). An overview of how to fill out the all the information for Form T-1 is presented here. Header Section – Completely fill out the requested information. Shipping Information Section – Complete this section when you are packing the immediately shipped samples for shipping. Fill in the Sender and Sender Phone fields. Select and fill the appropriate bubble to indicate the shipping carrier in the Shipped by field. Enter the Airbill/Tracking Number and the Date Sent for the package.

2011 NWCA Field Operations Manual Chapter 2. Base Location Activities and Summary of Field Operations
2 - 37
Site Status – Complete the Site Status section during the field verification of the AA establishment plan (Chapter 3, Section 3.1.2). Answer the question “Is the Site Sampleable?” If yes, fill in the Yes bubble and proceed to the Sample Status section of the form. If no, fill in the No bubble and select and fill one reason from the Non-Sampled Status list. If the site is not sampleable and further explanation is needed, provide notes in the Site Status Comments section. Although this site status information is similar to information collected on Form PV-1, it is also critical on Form T-1 because it reaches the Information Management Team quickly and is used to track field crew progress and sample locations. Sample Status – Answer the question “Were Samples Collected?” If yes, fill in the Yes bubble. If no, fill the No bubble. If no samples were collected, or if only some samples were collected, explain the reasons why in the Site Status Comments section. Indicate each sample type collected (see relevant chapters). For plant QA vouchers and unknown specimens also indicate the number of plants sampled (i.e., number of specimens collected). WRS Sample Tracking – WRS refers to lab where the set of immediately shipped samples are sent. Carefully fill in the Sample ID for each of the immediately shipped samples: water chemistry (CHEM), water chemistry duplicate (if taken), chlorophyll-a (CHLA), soil isotope (SISO), algal toxins (ALGT), and sediment enzymes (SEDE). See the relevant chapter for specific details on how to handle and pack these samples. Note that the bottom of Form T-1 provides the email address or phone numbers for transmitting the form to the Information Management Team. The contact information for the WRS lab and for tracking related inquiries will typically be used by the lab and Information Management Team, and will not often be needed by the Field Crew. 2.5.4.2 Photography For the NWCA field work, a series of digital photographs will be taken to characterize the AA (see Chapter 3), document the presence of any threatened, endangered, or sensitive (TES) plant species (see Chapter 5), and illustrate soils profiles. In addition, if the Field Crew finds something of interest that they believe should be documented, photos may be taken of these situations. See Appendix D - Photography for details on how to take and frame the photographs, how to label and track the photos, and how to upload and save the photos and their location and identification information. 2.5.4.3 Guidelines for Global Positioning System (GPS) Use A GPS unit is used to locate the POINT and to establish the AA at NWCA Sites (Chapter 3). It is also used to determine the coordinates of a subset of the Buffer Plots (Chapter 4). Therefore, it is imperative that the Field Crew understands how to operate their GPS unit. The Global Positioning System (GPS) uses signals sent from multiple orbiting satellites to a ground-based sensor in order to fix a position on the earth. Position accuracy depends on the Position Dilution of Precision (PDOP) which is a measure of the geometry of the satellite spread over the location of the observer. Low PDOP values represent more advantageous satellite geometry and give better positional accuracy (= wider spread of satellites for more definitive triangulation). For NWCA a target PDOP < 10 is preferred.

2011 NWCA Field Operations Manual Chapter 2. Base Location Activities and Summary of Field Operations
2 - 38
GPS uses many alternative mathematical models to describe the spherical shape of the earth and each is a separate Datum. Commonly used datums include NAD27 CONUS, NAD83, and WGS84. Each represents a different interpretation of the shape of the earth. The NWCA standard is NAD83. Thus, all GPS units should be switched to this standard as part of their pre field-use set up. Crews should confirm that the NAD83 datum is being used when the GPS is turned on prior to data collection. If the GPS is not set for NAD83 and the unit cannot be changed readily, note the datum used on the data forms for later conversion. GPS devices use a variety of units for position designation based on an imaginary latitude and longitude coordinate grid system laid across the earth (degrees, minutes, seconds, or degrees and decimal minutes, and UTMs (a metric system). The NWCA standard is decimal degrees for reporting all GPS positions. When using a hand held GPS, a position is captured by receiving signals from orbiting satellites. A hit is a complete record of a position based input from ≥ 3 satellites. A GPS position capture generally takes about 1 second per hit. The PDOP is generally displayed on the unit while it is averaging hits. For NWCA we will average ≥ 50 hits for a position. Refer to the GPS user’s manual to provide specific instructions on setting the Datum, coordinate system, and units to NWCA standards. 2.5.4.4 Site, Crew, and Equipment Check and Cleanup Once all sampling is completed at a site, gather all equipment, remove all flagging, and return the site to as close to its original condition as possible. If the site is a revisit site leave the flagging marking the POINT and the AA CENTER if it is different from the POINT. Before leaving the site, check that all equipment, gear, samples, and data are accounted for and ready to carry back to the vehicle. Make a final sweep of the site to ensure nothing has been left behind. Zero Taxa Transport Before leaving the site, implement the Zero Taxa Transport protocol. Increases in invasive and noxious alien species are occurring throughout all regions of the U.S., with many deleterious effects on ecosystem services. Thus, it is imperative that all NWCA Field Crews employ a decontamination protocol with the goal of Zero Taxa Transport to new sites. The Site Packet or other resources that you reviewed before traveling to the site may have information about areas of the sample region known or suspected to be infested with aggressive non-indigenous species. If any specific invasive species are known to occur in the sample area, take species specific precautions against transporting them. However all sites should be treated with equal caution to minimize the spread of invasive taxa. Stringent decontamination procedures will help to prevent the spread organisms via NWCA field work. The protocol for the Zero Taxa Transport Goal has two elements: Procedures conducted on site or at the field location of the vehicle (this section). Procedures to be conducted from the field lodgings or base location (See sections 2.4.6 and
2.6.1). Every effort must be made to limit the potential for transport of mature and immature life stages of invasive plant and animal species, and of pathogens that may affect native plants or animals.

2011 NWCA Field Operations Manual Chapter 2. Base Location Activities and Summary of Field Operations
2 - 39
Take precautions to avoid transporting seeds or vegetative propagules, pollen, pathogens, fungi, eggs, any small organisms, invertebrates, fish, or other animals. While still onsite, before leaving to hike to the vehicle, conduct the following decontamination measures to clean off personal clothing, gear, and field equipment: Remove visible plants, seeds, mud and animals from equipment, gear, clothing, raingear,
boots, and waders through brushing and shaking. Use a small scrub brush to clean the lace area and soles of boots. Rinse personal protective equipment including raingear, waders and wading boots if water is
available on the site to remove all visible dirt, mud, and plant seeds and fragments. In instances where mud is clinging to gear and equipment, but no standing water is present
in the AA; remove as much mud as possible. If a spray bottle with a 10% bleach solution (see Table 2-3) is available at the site, spray
down boots, waders, and soil sampling equipment before leaving the site. If a boat was used to access the site, prior to leaving, drain all bilge water in the boat. At the staging area for the AA (where the vehicle is parked): Repeat the on-site protocol prior to departure for base location. The initial cleaning and
wipe-down at the field site by Crew Members before returning to the vehicle should minimize the potential for the road edge becoming an invasives species loci or vector.
Ideally, a hand pressurized sprayer filled with clean water or 10% bleach solution should be
kept in the vehicle and used to rinse all gear of water from the site and to finish rinsing mud from gear.
When site access has necessitated travel on an unimproved road, remove any vegetation
debris that may have accumulated on accessible areas of the vehicle with a whisk broom before leaving the area.
If the vehicle has collected packed mud and detritus in the wheel wells and undercarriage,
run the vehicle through a car wash at the earliest opportunity ,and if at all possible, before visiting another site.
Special Equipment Clean-up Circumstances In some situations along the U.S. Gulf Coast, an NWCA site may occur in a wetland that was contaminated with oil during the 2010 BP oil spill. If so, special precautions and techniques for decontaminating gear and equipment may need to be implemented. If you encounter this situation, refer to your state, tribe, or other organization approved health and safety plan for protocols on how to handle sampling and clean-up. Appendix E. Example Oil Decontamination Procedures provides an example of one such protocol. .
2011 NWCA Field Operations Manual Chapter 2. Base Location Activities and Summary of Field Operations
2 - 40
2.6 POST-FIELD SAMPLING BASE LOCATION ACTIVITIES This section describes activities that are completed after field sampling and back the base location. These are the critical final elements to complete the NWCA sampling and data collection and include: Post-Sampling Equipment Clean-up and Maintenance (Section 2.6.1) Sample Shipping and Tracking (Section 2.6.2) Data Packet Handling and Transmittal (Section 2.6.3) No reference card summarizes these tasks as many of them are noted in other protocols, reference cards, or checklists. However, information on sample shipping and tracking is summarized on Reference Card ST-1, Side A. (NWCA Sample Packaging and Shipping Flowchart for Different Sample Types) and Reference Card ST-1, Side B. (NWCA Summary of Sample Handling, Shipping Procedures, and Shipping Permits) from Appendix A. 2.6.1 Post Sampling Base Location Equipment Clean-Up and Maintenance Once back at the base location (or at the field lodgings, if needed), complete the following clean-up and maintenance tasks. 1) Inspect all equipment, vehicle and boat (if used) and clean off any plant propagules or
fragments and animal material that were missed in the on-site clean-up procedures (Section 2.5.4.5).
2) Disinfect all equipment, personal gear, and boat (if used) with 10% bleach solution or other
approved chemical agent to prevent spread of nonnative and invasive taxa. 3) If any equipment was exposed to oil, completely decontaminate using your state, tribe, or
other organization approved protocols. See Appendix E. for an example of an Oil Decontamination protocol.
4) Rinse and dry equipment and gear prior to storage or repacking for the next sampling trip:
a) Rinse waders, boots, and other personal protective gear with tap water. b) Rinse chlorophyll-a filtration chambers three times with distilled water after each use. c) Rinse long handled dipper three times with distilled water after each use. d) Rinse vegetation quadrat frames with tap water. e) Rinse soil pit sampling gear (e.g., shovels, corers, augers) with tap water. f) Rinse coolers with water to clean off any dirt or debris on the outside and inside.
5) Inventory equipment and supply needs and relay orders to the Field Logistics Coordinator or
to the Information Management Team. 6) Before moving to the next site, if a commercial car wash facility is available, wash vehicle
(and boat, and trailer if used for tidal wetland sites) and thoroughly clean with a hot water pressurized rinse–no soap.

2011 NWCA Field Operations Manual Chapter 2. Base Location Activities and Summary of Field Operations
2 - 41
2.6.2 Sample Shipping and Tracking All samples are processed following specific protocols described in each indicator chapter (see Chapters 5, 6, 8, and 9). The Field Crew ships time-sensitive samples, known as immediately shipped samples (water chemistry, chlorophyll-a, soil isotope, sediment enzymes, and algal toxins), to the designated analytical laboratory within 24 hours of collection to ensure sample quality and data integrity. Other samples, called batch samples (e.g., algae taxonomic id, plant specimens, soil bulk density and chemistry) are held by the Field Crew for 1 or 2 weeks, then shipped or delivered in batches to the appropriate laboratory (See Figure 2-5 and Appendix A). All samples must be shipped with sample-type specific tracking forms, which include the site where samples were collected and list for each sample: the sample ID, the sample type, and the date of collection. In addition to the completed tracking form included in the shipping container, a copy of each tracking form is transmitted to the Information Management Team at the same time the sample package is shipped to its designated lab. More detail on shipping and tracking is provided in Appendix A. 2.6.2.1 Tracking Forms Tracking forms ensure that samples are always accounted for, and that their status and location is always known by the Information Management Team. This is an important protection for the valuable data that the NWCA samples represent. 1) All Tracking forms (Forms T-1 through T-5) have electronic versions as well as
the hardcopy versions with preprinted site numbers that will be included in the Form Packet for each site.
2) Among the tracking forms, Form T-1 is the only one that is typically filled out in
the field (See Section 2.5.4.1). Forms T-2 through T-5 are usually completed at the base location or field lodging when the samples are batched for shipment to the specific lab for each sample type.
3) Typically three copies of each completed tracking form are needed, though one
of these may be an electronic file. One copy is enclosed in the shipping box with the samples it tracks, one is transmitted to the Information Management Team, and one is retained in the Field Crew’s records.
4) Teams have the option to either handwrite the tracking data on the hardcopy
versions of Forms T-2 through T-5 from the Form Packet or record the tracking data on the electronic version of the form. Specifically, the options are as follows:
a) The completed electronic version of the tracking forms maybe emailed to the
Information Management Team at the email address listed on the bottom of the each form. OR

2011 NWCA Field Operations Manual Chapter 2. Base Location Activities and Summary of Field Operations
2 - 42
b) The completed hardcopy version of tracking forms may be faxed to the Information Management Team at the Fax Number on the bottom of each form.
OR for Form T-1 only
c) If it is difficult to access a computer or fax machine to return a completed
electronic Form T-1 for a particular NWCA site to the Information Management Team within 24 hours of sample collection, the status and tracking data from Form T-1 may be communicated by voice to the phone number for the Voice Message Center (provided at the bottom of the form).
2.6.2.2 Immediately Shipped Samples The soil isotopes, sediment enzymes, water chemistry, water chemistry duplicate (when taken), algal toxins, and chlorophyll-a samples for each AA will be sent in an ice chest to the USEPA Lab in Corvallis, Oregon, within 24 hours of collection. The protocol below pertains to all of these immediately shipped samples. See the Sample and Data Handling Section in the appropriate chapter for protocols on shipping that pertain to a specific type of immediately shipped sample. See Appendix A for detailed protocols on packing, tracking, and shipping samples and for shipping addresses. 1) Arrange for the NWCA shipping carrier to pickup the samples (See Appendix A for carrier
options). 2) Organize the samples for the site that are to be immediately shipped. 3) Review the information for the immediately shipped samples on Form T-1: NWCA Status
and Tracking to ensure that All the samples are present. The information on the form is correct. The site and sample numbers on the sample labels match those recorded on the form.
4) Place the completed Form T-1 (or a copy of it) in a zippered plastic bag. 5) Prepare the ice-chest for shipping (see Appendix A for specifics). Ice should be double
wrapped in plastic bags to avoid any leakage from the ice chest and to avoid any potential contamination of samples.
6) Place samples into the ice chest with ice under and surrounding samples. Place the
zippered plastic bag containing Form T-1 on top of the samples and ice. 7) Seal the ice-chest package (See Appendix A). 8) Affix an APHIS Regulated Soils permit for the USEPA Corvallis Lab to the outside of the ice
chest (See Appendix A). 9) Fill out the shipping label (See Appendix A or Form T-1 for the shipping address).

2011 NWCA Field Operations Manual Chapter 2. Base Location Activities and Summary of Field Operations
2 - 43
10) Deliver the ice chest to the shipping company and retain all receipts and records of shipping.
2.6.2.3 Batch Shipped Samples and Tracking Forms (Form T-2 through T-5) Several kinds of samples (soil chemistry, soil bulk density, algae taxonomic id, unknown plant specimens, and plant QA vouchers) are collected and held for 1 or 2 weeks. These samples, from one to several sites, are then shipped in batches by sample type to designated labs. See Figure 2-5 and Appendix A for shipping destinations, addresses, and packing specifications. Follow the procedures outlined in Section 2.6.2.1 for submitting tracking forms to the Information Management Team and for including them in the shipping boxes with the pertinent samples. Use one tracking form for each set of samples in each shipping container shipped to a laboratory. Details on how to fill out the tracking forms for individual sample types and additional guidelines for packing samples are covered in the relevant indicator chapters: Form T-2: NWCA Unknown Plant Sample Tracking (Chapter 5, Section 5.2.5) Form T-3: NWCA QA Plant Sample Tracking (Chapter 5, Section 5.2.5) Form T-4: NWCA Soil Chemistry and Bulk Density Sample Tracking (Chapter 6, Section
6.2.2) Form T-5: NWCA Tracking - Batched Sample
o Used with Algae taxonomic ID samples (See Chapter 9, Section 9.2.2.2) o Used for Data Packets (See Section 2.6.3)
2.6.3 Data Packets (Completed Data Forms) – Handling and Transmittal Data Packets consist of the entire set of completed data forms for each NWCA site sampled. Data Packets are batched and shipped to the Information Management Team within 2 weeks of sampling, and are tracked like laboratory samples using Form T-5. When completed the data forms are submitted within 2 weeks of sampling, the data entry team has the ability to clear up any ambiguities with Field Crews, saving time, and increasing confidence in the data. In addition, the timely return of the completed Data Packets can allow initial data entry to be completed within weeks following the conclusion of the field effort because of the scannable forms used in the NWCA. The Field Crew leader is responsible for ensuring that all forms are correctly handled at all times. Proper handling, tracking, and shipping of Data Packets include the following steps: 1) Review each form to ensure that all fields are correctly filled out and the Site IDs and
Sample IDs are correct. 2) Assemble the completed forms from a site into the Data Packet. Forms should be
sequentially ordered by protocol within the Data Packet to aid in determining that all forms are present and to facilitate data entry once the Data Packet reaches the Information Management Team.

2011 NWCA Field Operations Manual Chapter 2. Base Location Activities and Summary of Field Operations
2 - 44
Order forms in the Data Packet as follows: Form PV-1: NWCA Point Verification Form Form AA-1: NWCA Assessment Area Establishment Form AA-2: NWCA Assessment Area Characterization Form B-1: Buffer Sample Plots & Targeted Alien Species (5/site) Form V-1: NWCA Vegetation Plot Establishment Form V2a & b: NWCA Vascular Species Presence and Cover (multiple V-2b,
continuation pages likely) Form V-3: NWCA Vegetation Types Form V-4a & b: NWCA Snag and Tree Counts and Tree Cover (multiple V-4b,
continuation pages likely) Form S-1: NWCA Soil Profile Data (4/site) Form H-1: NWCA Assessment Area Hydrology Form WQ-1: NWCA Assessment Area Water Quality Form ALG-1: NWCA Algae Form USA-RAM 1: Buffer Perimeter and Buffer Mean Form USA-RAM 2: Stressors in Buffer Area Form USA-RAM 3: Topographic Complexity Form USA-RAM 4: Patch Mosaic Complexity Form USA-RAM 5: Vertical Complexity Form USA-RAM 6: Plant Community Complexity Form USA-RAM 7: Stressors to Water Quality in the AA Form USA-RAM 8: Alterations to Hydroperiod in the AA Form USA-RAM 9: Stressors to Substrate in the AA Form USA-RAM 10: Cover of Invasive Plant Species in the AA Form USA-RAM 11: Stress to Vegetation in the AA
3) While held until batch shipped, Data Packets must be neatly and securely stored in a
protected area. It is vital that no forms from the Data Packet are misplaced or damaged to assure the quality of the NWCA data.
4) Prior to shipping, make a hard copy (or if you prefer a scanned copy) of all forms in each
Data Packet, and retain the copied Data Packets for your records. This is critical as it a) prevents the possibility of data loss because of a lost package during shipment, and b) allows you to view the completed forms in a Data Packet should you be contacted by the Information Management Team to discuss a particular data item.
5) For the Data Packets that you are shipping to the Information Management Team,
complete Form T-5: NWCA 2011 TRACKING - BATCHED SAMPLES by filling out the electronic or the hardcopy version of the form. Enter the information for each of the Data Packets on Form T-5 by completing the following fields:
a) Site ID b) Date Sample Collected (in this case, date data was collected) c) Visit Number (1 = the visit when the sampling was done; 2 = scheduled revisit) d) Sample ID from the label the sample (leave blank, does not apply) e) Sample Type (in this case PACK) f) # of containers (leave blank) g) Comments, if needed h) Ensure that the Site ID, Sample Date, Visit # recorded on Form T-5 matches that on the
forms in the Data Packet i) Fill in the bubble for WED-Corvallis, OR in the Lab section of Form T-5.

2011 NWCA Field Operations Manual Chapter 2. Base Location Activities and Summary of Field Operations
2 - 45
6) Make two copies of Form T-5. Immediately, transmit the original to the Information
Management Team. See Section 2.6.2.1 and Appendix A for details on transmitting forms to Information Management.
7) Pack the Data Packets in a sturdy box as indicated in Appendix A. 8) Place one copy of Form T-5 on top of the Data Packets in the shipping box. 9) Retain the second copy for your records. 10) See Appendix A for detailed information on shipping company, shipping labels, and
shipping addresses. 11) Deliver the package of samples to the shipping company and retain all receipts and
records of shipping.

2011 NWCA Field Operations Manual Chapter 2. Base Location Activities and Summary of Field Operations
2 - 46
PRESS AND DRY
SPECIMENS
ALGAETAXONOMY
OVERNIGHT COURIER
Saturday Delivery OK
EcoAnalyst Lab(Or State Lab as Applicable)
CHLOR-aWATER CHEM
PRESERVE ON WET ICE
SHIP IMMEDIATELY ON WET ICE (WITHIN 24 HOURS)
OVERNIGHT COURIER REQUIRED
Saturday Delivery OK
SOIL CHEMISTRY
&BULK DENSITY
EPA LabFt. Meade,
MD
EPA LabCorvallis, OR
(Or State Lab As Applicable)
GROUND COURIER
No SaturdayDelivery
SEDIMENTENZYMES
PRESERVE WITH
LUGOL’S SOLUTION
PLANTQA VOUCHERS
& UKNOWNSPECIES
SOIL ISOTOPE
SOIL PESTICIDES(If Collected)
ALGALTOXINS
NRCS LabLincoln, NE
KEEP SAMPLE
COOL (No Ice)
SHIP IN BATCHES(1-2 weeks)
DATA PACKET
EPA IM Team
Corvallis, OR
Figure 2-5. NWCA sample packaging and shipping flowchart by sample type. See Appendix A for more details.

2011 NWCA Field Operations Manual Chapter 2. Base Location Activities and Summary of Field Operations
2 - 47
2.7 LITERATURE CITED: USEPA (U.S. Environmental Protection Agency). 2007. National Rivers and Streams Assessment: Field Operations Manual. EPA-841-B-07-009, Revision #1 – May 2008. U.S. Environmental Protection Agency, Washington, DC. USEPA (U.S. Environmental Protection Agency). 2011a. National Wetland Condition Assessment: Quality Assurance Project Plan. EPA/843/R10/003. U.S. Environmental Protection Agency, Washington DC. USEPA (U.S. Environmental Protection Agency). 2011b. National Wetland Condition Assessment: Site Evaluation Guidelines. EPA/843/R10/004. U.S. Environmental Protection Agency, Washington, DC. USEPA (U.S. Environmental Protection Agency). 2011. National Wetland Condition Assessment: Field Operations Manual (Quick Reference Version). EPA-843-R-10-001. U.S. Environmental Protection Agency, Washington, DC. USEPA (U.S. Environmental Protection Agency). In Review. National Wetland Condition Assessment: USA-RAM Field Operations Manual. EPA/XXX/R-XX/XXX. U.S. Environmental Protection Agency, Washington, DC.

2011 NWCA Field Operations Manual Chapter 2. Base Location Activities and Summary of Field Operations
2 - 48

2011 NWCA Field Operations Manual Chapter 2. Base Location Activities and Summary of Field Operations
2 - 49
2.8 OVERVIEW REFERENCE CARDS Reference Card OPS-1. Preparation for Field Sampling of NWCA Sites Reference Card OPS-2, Side A. Vegetation Team Sampling Day Activities Reference Card OPS-2, Side B. Assessment Area-Buffer (AB) Team Sampling Day
Activities

2011 NWCA Field Operations Manual Chapter 2. Base Location Activities and Summary of Field Operations
2 - 50

Site Evaluation (see NWCA Site Evaluation Guidelines) Conducted by State, Tribe, or Other Organization Personnel, or if not, then by Field Crew
1) Desk Evaluation of each NWCA Site 2) Obtain permissions to access and sample site 3) On‐Site Field Evaluation of individual NWCA Sites
Assemble Site Packet for Each Site(Section 2.2.1)
Conducted by State, Tribe, or Other Organization Personnel, or if not, then by Field Crew
Site Packet Components: 1) Form Packet 2) NWCA Site Maps, Aerial Photos, and Other Imagery 3) Soil Survey Information 4) Land ownership and requirements and permissions for
access 5) Permits for site access or for data or sample collection 6) Information for accessing the site 7) Driving and hiking routes to the site 8) Site Evaluation results 9) Preliminary plan for establishing AA 10) Any other site specific information useful to the Crew
Site Evaluation and Pre‐Sampling Base Location Activities
Sampling Index Period and Recommended Approach for Determining Site Sampling Order
(Sections 2.4.1 and 2.4.2) Completed by State, Tribe, or Other Organization Personnel,
or if not, then by Field Crew
1) Determine the best sampling index period for each NWCA Site (e.g., two revisit sites, all sampleable base sites, and alternate sites identified to replace base sites dropped during Site Evaluation)
2) Develop a schedule for the sampling order of the NWCA sites that incorporates index period and geographic proximity of the individual sites. Be sure to schedule to two site visits for the two revisit sites for your state
3) Once in the field, if a site must be dropped because it is unsampleable (Chapter 3), follow the instructions in Section 2.4.2 (and the Site Evaluation Guidelines) to obtain an alternate site to replace the dropped site
4) Important: Confirm that the alternate site is the correct one and determine when to sample it with your Designated EPA Contact for your Field Crew (EPA Regional Coordinator or the EPA HQ Team (Tables 2‐1 and 2‐2))
Planning Field Itineraries and Preparing for a Sampling Trip (Sections 2.4.3)
1) Determine which NWCA sites will be sampled during the sampling trip
2) Organize and confirm lodging for trip 3) Ensure Site Packets, including the correct Form
Packet, for all sites to be sampled are complete 4) Review all pertinent information sources about
sites to be sampled (e.g., Site Evaluation results soil surveys, maps, plant species lists)
5) Review aerial photos, maps, and other imagery and develop a preliminary plan for AA establishment for each site to be sampled
6) Complete the office evaluation segment of USA‐RAM metrics 1, 2, and 5
7) Address logistical issues (determine best navigation routes to sites, contact landowners, and arrange any needed meetings with landowners, individual with keys to gates, soil scientist, etc.)
8) Ensure safety manual and emergency contact information is always with Crew
9) Take care of all important communications informing Logistics Coordinator, Information Management Coordinator, and local supervisors of your sampling schedule
10) Develop a plan for sites with special conditions (e.g., tidal, difficult soils, complex sites)
Field Instrument Checks and Calibration(Section 2.4.4)
1) Laser Rangefinder check 2) GPS battery check 3) Camera battery and supply check 4) Multi‐probe meter performance test
Equipment and Supply Preparation (Section 2.4.5)
Vehicle Maintenance (Section 2.4.6)
Reference Card OPS-1. Preparation for Field Sampling of NWCA Sites (Tasks are conducted by Field Crew unless otherwise indicated. Note other personnel listed may be the same individuals as the field crew in some instances.)
Refer to the indicated Sections of the 2011 NWCA‐Field Operations Manual and to the 2011 NWCA Site Evaluation Guidelines for more detail on the protocols summarized on this card.


USA RAM – ASSESSMENT AREA(USA RAM Manual)
Condition Metrics
Metric 4: Topographic Complexity
Metric 5: Patch Mosaic Complexity
Metric 6: Vertical Complexity
Metric 7: Plant Community Complexity Stressor Metrics
Metric 8: Stressors to Water Quality
Metric 9: Alterations to Hydroperiod
Metric 10: Stress to Substrate
Metric 11: Cover of Invasive Plant Species
Metric 12: Stress to Vegetation
VEGETATION (VEG) Team (2 persons)BE‐ Botanist/Ecologist BA‐Botanist Assistant
SITE VERIFICATION AND ASSESSMENT AREA (AA) ESTABLISHMENT 1) On site, verify office plan for AA establishment 2) Verify POINT and CENTER 3) Verify wetland sampleable and define AA (Form PV‐1, RC AA‐1, RC AA‐2) 4) Set‐up AA (RC AA‐1) 5) Complete Form AA‐1 and annotate aerial photo or make a sketch map of
AA and its components. 6) Characterize AA:
a) Determine FWS Status & Trends (S&T) classes (Form AA‐2, RC AA‐3A) b) Determine HGM Type (Form AA‐2, RC AA‐3B)
PHOTOS (Appendix D)1) Take photos of AA (overview, photos from AA CENTER
toward boundary along Veg Plot placement lines) 2) Other photos as needed (e.g., TES species, or unusual
conditions in the AA)
VEGETATION CHARACTERIZATION ‐‐ EACH VEG PLOT(NWCA‐FOM, RC V‐1)
1) Collect Plant Species Presence data (RC V‐3B, Forms V‐2a, b)
2) Estimate % Cover for all Individual Vascular Plant Species and identify the Primary Height Class in which each species occurs (RC V‐3B and V‐4, Forms V‐2a, b)
3) Collect unknown and QA Voucher plant specimens as encountered
4) Determine predominant Status & Trends Wetland Class ( Form V‐3, Front)
5) Estimate % Cover of Vertical Vegetation Strata (Form V‐3, Front)
6) Estimate % Cover for Non‐Vascular Groups (bryophytes, lichens, and macroalgae) (Form V‐3, Front)
7) Collect data describing Ground Surface Attributes (Form V‐3, Back)
8) Collect Snag (counts) and Live Tree Species (cover and counts) data (Forms V‐4a, b)
VEGETATION PLOT LAYOUT1) Select Veg Plot Layout configuration (RC V‐2) 2) Establish five 100‐m2
Veg Plots (RC V‐2 and V‐3A, Form V‐1)
PLANT SPECIMEN COLLECTION AND HANDLINGAt Site: 1) Ensure that all unknowns and QA Vouchers have
been collected At Site, Vehicle, or Field Lodging on Sample Day: 2) Complete a Plant Sample Tag and Plant Specimen
Label for each plant specimen 3) Press plant specimens 4) Record number of plant specimens collected at the
site on Form T‐1: Site and Sample Status/WRS Tracking
On Subsequent Days (see Post‐sampling tasks): 1) Dry specimens, change blotters in press as needed 2) Package, ship or deliver to designated herbarium or
laboratory, completing and enclosing the appropriate plant specimen tracking information (Form T‐2 or T‐3) in the shipping box
FINAL ON‐SITE ACTIVITIES1) Review field data forms 2) Clean up wetland site and organize gear,
equipment, and samples for transport to vehicle3) Clean equipment & crew of plant or other
biological propagules 4) Crew Leader Final Check‐off
Begin Sample Day at Site Complete Sample Day
Reference Card OPS‐2, Side A. Vegetation Team Sampling Day Activities
Refer to the 2011 NWCA‐Field Operations Manual for more detail on the protocols summarized on this card.

ASSESSMENT AREA/BUFFER (AB) Team (2 persons)AB1 – AB Member 1 AB2 – AB Member 2
NATURAL COVER AND STRESSORS FOM – 12 Buffer Plots and AA CENTER Plot (Form B‐1, RC B‐1, Appendix B) ‐‐ Plots are 100‐m
2 (10X10m) with
visually estimated boundaries.
A. In each of 3 Buffer Plots located along each of 4 (N, W, E, S) 100m Buffer Transects, and in the AA Center Plot, determine the presence and abundance of: 1) Natural Cover (Vegetation and Substrate) 2) Residential and Urban Stressors 3) Agriculture & Rural stressors 4) Industrial Development Stressors 5) Hydrology Stressors 6) 22 Targeted Alien Species (presence only, see
Appendix B) B. Record GPS coordinates of 3
rd plot on each
transect.
USA RAM Metrics 1, 2, and 3: Stress to the Buffer Area (USA RAM Manual) 1) Verify office interpretation of Metrics 1 and 2;
make corrections based on field observations. 2) While walking the 4 FOM Buffer Transects (see
above), record the presence and severity of the buffer zone stressors (listed on the USA RAM Metric 3 Form) that occur anywhere along the transects.
3) Walk any other areas of the buffer zone that aerial photos suggest might have potential stressors. If observed, add these stressors to USA RAM Metric 3 Form.
HYDROLOGY (Form H‐1)1) Identify Water Sources 2) Determine and Rank Hydrology
Stressors 3) Make Ditch Measurements 4) Determine Presence of
Hydrology Indicators (RC H‐1)
WATER QUALITY (Form WQ‐1)1) Complete Surface Water
Characteristics Assessment 2) Collect Water Sample and record
associated data 3) If desired, conduct Optional
Water Quality Protocol with multi‐probe meter
4) Determine Maximum Depth and Surface Water Extent
SOILS – PROFILE DESCRIPTION (RC S‐1A)1) Determine 4 Soil Pit locations (RC S‐2A) 2) Use a separate Form S‐1 to record data for each pit 3) At each Soil Pit, excavate to 60cm and record location,
depth, and pit attribute information (Form S‐1 (Front)) 4) Describe soil profile at each Soil Pit by delineating horizons
(RC S‐2B) and by determining the following characteristics for each horizon. Record profile data on Form S‐1 (Front): a) H2S odor b) Horizon Depth and Horizon Boundary Abruptness c) Soil texture (RC S‐4A) d) % Rock Fragments and % Roots (RC S‐3A, Plate 3) e) Soil Matrix Color (RC S‐4B) f) Presence and type of Redoximorphic or Other Features
(RC S‐3) g) % Surface area of Distinct or Prominent Redox and
Other Features (RC S‐4B) h) Color of most evident Redox or Other Feature (RC S‐4B)
5) Determine presence of Hydric Soil Indicators in the Soil Profile (RC S‐5) and record on Form S‐1 (Back)
6) Randomly select one Representative Soil Pit from the subset of pits with the most similar soils
7) Excavate soil cores down to 125cm from the Representative Pit. Describe the soil profile and determine presence of Hydric Soil Indicators from 60cm down to 125 cm (Steps 3‐6)
8) Photograph Soil Profile (Appendix D) at each Soil Pit as profile descriptions are being conducted
ALGAE (Form ALG‐1, RC ALG‐1) 1) If any surface water is present, collect Chlorophyll‐a sample after collecting
the Algal Toxins and Algae Taxonomic samples (see Steps 2‐4) 2) If both water and aquatic or emergent vegetation are present:
a) Collect epiphytic algae from herbaceous vegetation b) Collect phytoplankton from surface water c) Composite a and b d) Split this composite epiphyte‐water subsample to form:
i) the Algal Toxins sample, and ii) the Partial Algae Taxonomic sample
e) Collect substrate algae subsamples and combine with Partial Taxonomic sample to complete Algae Taxonomic sample
3) If water without vegetation is present, collect phytoplankton (surface water) sample for: a) the Algal Toxins Sample, and b) the Partial Algae Taxonomic sample c) Collect substrate algae subsamples and combine with Partial Taxonomic
sample to complete Algae Taxonomic sample 4) If no water is present, collect Algae Taxonomic sample from substrate only 5) Complete preparation of each sample by filtering or preserving
Begin Sample Day at Site
FINAL ON‐SITE ACTIVITIES1) Complete preparation of unfinished water quality, algae, or soil
samples 2) Record all sample types collected in the AA on Form T‐1 3) Review data forms 4) Clean up site, gather equipment, and samples for transport to
vehicle 5) Clean equipment & crew of plant or other biological propagules 6) Conduct Crew Leader final check‐off
SOILS – SAMPLE COLLECTION IN REPRESENTATIVE PIT (RC S‐1B)1) Once the Representative Pit has been identified, excavate as
needed to collect four kinds of soil samples. Carefully bag and label each sample using prefilled labels and tags. Record collection and label information on Form S‐1
2) Collect the soil isotope (3 syringe cores) and the sediment enzyme (6 syringe cores) sample from surface soil layers at Representative Pit location
3) Collect a Bulk Density (3 can cores) and a Chemistry/PSDA (1‐2 liters) sample for each horizon > 8cm thick located in the top 60cm of the Representative Pit
4) Collect the Chemistry/PSDA sample for each horizon > 8cm thick located from 60 to 125cm deep in Representative Pit
SOILS – DEPTH TO WATER IN SOIL PITS (Form S‐1 (Back))1) After all data and all samples have been gathered at all
four pits, collect water depth data at each pit. 2) Backfill all 4 Soil Pits
Complete Sample Day
Reference Card OPS‐2, Side B. Assessment Area ‐Buffer (AB) Team Sampling Day Activities Refer to the 2011 NWCA‐Field Operations Manual for more detail on the protocols summarized on this card.

2011 NWCA Field Operations Manual Chapter 2. Base Location Activities and Summary of Field Operations
2 – 55
2.9 MASTER EQUIPMENT LIST, TRACKING FORMS, SAMPLE LABELS Master Equipment Checklist Tracking Forms Used for Multiple Indicators
Form T-1: NWCA 2011 Site and Sample Status/WRS Tracking Form T-5: NWCA Tracking – Batched Samples
Sample Label Sheet with Labels for Multiple Indicators

2011 NWCA Field Operations Manual Chapter 2. Base Location Activities and Summary of Field Operations
2 – 56

2011 NWCA – MASTER EQUIPMENT AND SUPPLY LIST Page 1
BASE KIT – Durable Supplies and Equipment (Supplied by USEPA) Protocols, References and Reference Cards
____64 MB USB drive with: Field Operations Manual Quick Reference Guide Schoeneberger, P.J., D.A. Wysocki, E.C. Benham, and
W D. Broderson. 2002. Field Book for Describing and Sampling Soils, Version 2.0. Natural Resources Conservation Service, National Soil Survey Center, Lincoln, Nebraska, USA.
Regional Hydric Soils Indicators Table Site Information Table (excel spreadsheet) Electronic versions of Tracking Forms ___Munsell Color X-Rite. 2009. Munsell Soil Color
Charts. Grand Rapids, MI.
___United States Department of Agriculture, Natural Resources Conservation Service. 2010. Field Indicators of Hydric Soils in the United States, Version 7.0. L.M. Vasilas, G.W. Hurt, and C.V. Noble (eds.). USDA, NRCS, in cooperation with the National Technical Committee for Hydric Soils.
___Laminated Quick Reference Guide that includes: Equipment Checklists – protocol specific Reference Card OPS-1—Preparation for Sampling Reference Card OPS-2a and OPS-2b—Vegetation Team and
Assessment Area- Buffer (AB) Team Sampling Day Activities Reference Card SH-1—Sample Packaging and Shipping
Flowchart and Handling, Shipping and Permit Table Reference Card AA-1—Assessment Area Establishment Reference Card AA-2a and AA-2b—Criteria for sampleable
area and examples of hydrogeomorphic boundaries and human altered types
Reference Card AA-3a and AA-3b—FWS Status and Trends Classes included in the NWCA and key to hydrogeomorphic classes
Reference Card B-1a and 1b—Buffer Sample Plot Layouts and Completing Form B-1
Reference Card V-1—Flowchart of Vegetation Protocol Tasks Reference Card V-2a and V-2b—Key for veg plot placement
and examples of plot layout configurations Reference Card V-3a and V-3b—Vegetation Plot Establishment
and Configuration, Data Collection Summary Reference Card V-4a and V-4b—Cover Estimation Procedures
and Assigning Pseudonyms for Unknown Plant Species Reference Card S-1a and S-1b—NWCA Soil Protocol
Flowchart Reference Card S-2a and S-2b—Soil Pit Placement and
Characteristics of Soil Horizon Types and Distinguishing Soil Horizons
Reference Card S-3a and S-3b—Soil Structure, Coats and Films, Guidelines for Cover Estimation and Examples of Some Redox and Other Soil Features
Reference Card S-4a and S-4b—Determining Soil Texture and Soil Color
Reference Cards S-5a and S-5b—USDA Land Resource Regions (LRRs) and Hydric Soil Indicators by LRR, Evaluating Hydric Soil Indicators
Reference Card H-1—NWCA Assessment Area Hydrology Reference Card ALG-1—Flowchart of Algae Sampling
Activities
Sampling Equipment and Supplies ___Cargo Box (containing base kit supplies) ___Frame backpack ___2, 100-m tapes ___2, Compasses ___Laser rangefinder ___Sharpie® or similar fine-point, permanent, silver marker ___Surveyor’s flagging tape (2 rolls red, 2 rolls blue) ___100 Pin flags (50 red, 50 blue) ___2, 10X hand lenses ___6-inch ruler for measuring plant parts during field keying ___Diameter measuring tape (cm) ___20 U-shaped pins/stakes ___6.32-m rope for inside edges of 10-m2 quadrat ___2, 1-m PVC poles with 90o coupler for 1-m2 quadrat ___Trowel for obtaining plant specimens with intact roots ___Pruners ___2 large plant presses with blotters, cardboard ventilators,
newsprint, compression straps, and small envelopes for loose plant parts
___Twist-ties and tyvec tags for marking unknown plant specimens
___White garbage bag for consolidating collection bags ___Metal flashing 10” tall for supporting/sealing earthen
coffer dam built from Soil Pit spoils for inundated soils ___Hand water pump ___Small scoop for bailing water from pit ___Four, 6 mil thick, ~1.5m2 black plastic sheets for laying
out soil slabs/cores at each Soil Pit ___20 Golf tees for marking soil horizons ___Spray bottle for water ___Heavy-duty sample bag stapler ___Soil bulk density corer ___4 meter Telescoping surveyor’s rod (aka: stadia rod) ___1 meter stick ___Small, soft-sided cooler ___Collapsible 1-liter cubitainer for duplicate water sample ___6’ Long-handled plastic dipper ___1½ inch stiff putty knife (to shear off excess soil from
bulk density core when sampling) ___Squirt bottle for surface water ___Squirt bottle for DI water ___2.5 gal carboy ___Electrician’s tape for sealing sample caps ___Small funnel (243mL) ___Lugol’s solution with 2mL pipette and bulb ___500mL Sidearm filter flask ___Tygon tubing (for connecting vacuum pump to filter flask) ___Silicone stopper with hole to attach filter funnel to flask ___Adapter for filter funnel to stopper ___Whatman GF/F 0.7 μm glass fiber filter (47-mm diam.) ___Graduated cylinder (250-mL) ___500-mL plastic amber bottle (for Chlorophyll-a) ___Hand-operated vacuum pump ___Magnesium Carbonate (MgCO3) saturated solution -
dropper bottle ___Aluminum foil squares (wrap Chlorophyll-a sample vial) ___Clear tape strip packs for covering labels ___1 package of 100 nitrile gloves

2011 NWCA – MASTER EQUIPMENT AND SUPPLY LIST Page 2 SITE KITS (one per site) Consumable Sampling Supplies (Supplied by USEPA) ___Gallon size zipper plastic bags ___Quart-size zipper plastic bags ___Cooler Liner Bags (one per cooler) ___2 Ice chests ___8 mil plastic soil sample bags for bulk density and chemistry soil samples ___Collapsible 1-liter cubitainer for surface water sample ___1, 250-mL plastic bottle (for Algae Taxonomic ID sample) ___1, 125-mL plastic bottle with screw lid (Algal Toxins bottle) ___2, 60-mL syringe core samplers with beveled edge (for taking substrate subsample for algal taxonomy) ___2 x 60-mL syringe core sampler (soil isotope and enzyme samples) ___30-mL syringe (for sucking up algae off hard substrate) ___Soft bristled toothbrush (to be used at one site only) ___1, 50-mL Centrifuge tube with screw cap type (for Chlorophyll-a filter) ___2, Disposable flat forceps ___Nitrile gloves, disposable ___250mL Filter funnel for chlorophyll-a ___Whirl-Pak and Ziploc bag for chlorophyll-a sample ___1, Plant specimen folder ___Shipping supplies (fed ex shipping airbills, plastic pouches, zip ties, fedex envelope) FORM PACKET (one per site) – Supplied by Information Management Team
NWCA Forms on Waterproof Paper: ___Form PV-1: NWCA Point Verification Form ___Form AA-1: NWCA Assessment Area Establishment ___Form AA-2: NWCA Assessment Area Characterization ___Form B-1: NWCA Buffer Sample Plots and Targeted Alien Species ___Form V-1: Vegetation Plot Establishment ___Form V-2a and V-2b: Vascular Species Presence and Cover ___Form V-3: Vegetation Types and Ground Surface Attributes ___Form V-4a and V-4b: Snag and Tree Counts and Tree Cover ___Form S-1: NWCA Soil Profile Data ___Form H-1: NWCA Assessment Area Hydrology ___Form WQ-1: NWCA Assessment Area Water Quality ___Form ALG-1: NWCA Algae ___Form T-1: NWCA 2011 Site and Sample Status/WRS Tracking ___Form T-2 (Unknown) and T-3 (QA): Plant Sample Tracking ___Form T-4: NWCA Bulk Density & Chemistry Soil Sample Tracking ___Form T-5: NWCA 2011 Tracking - Batched Samples
NWCA Sample Tags and Labels: ___Plant Specimen Label ___Plant Sample Tags ___Bulk Density or Chemistry Soil Sample
Label ___Bulk Density or Chemistry Soil Sample
Tag ___Sediment Enzymes Tag ___Soil Isotope Tag ___Soil Pesticides Sample Tag ___Soil Pesticides Rinsate Blank Tag ___Soil Pesticides Field Blank Tag ___Algae Taxonomic ID Tag ___Chlorophyll-a Tag ___Cholorphyll-a Outer Bag Tag ___Algal Toxins Tag ___Water Chemistry Tag ___Duplicate Water Chemistry Tag
USA-RAM Forms ___Data Forms on waterproof paper:
___Form USA-RAM 1: Buffer Perimeter and Buffer Mean Width ___Form USA-RAM 2: Stressors in Buffer Area ___Form USA-RAM 3: Topographic Complexity ___Form USA-RAM 4: Patch Mosaic Complexity ___Form USA-RAM 5: Vertical Complexity ___Form USA-RAM 6: Plant Community Complexity ___Form USA-RAM 7: Stressors to Water Quality in the AA ___Form USA-RAM 8: Alterations to Hydroperiod in the AA ___Form USA-RAM 9: Stressors to Substrate in the AA ___Form USA-RAM 10: Cover of Invasive Plant Species in the AA ___Form USA-RAM 11: Stress to Vegetation in the AA

2011 NWCA – MASTER EQUIPMENT AND SUPPLY LIST Page 3 OTHER EQUIPMENT AND SUPPLIES NEEDED BY FIELD CREWS (NOT SUPPLIED BY USEPA) ___Waterproof boots (waders, hip boots, or knee boots as site conditions dictate) ___2-way hand-held radios (with extra batteries or charger) ___Digital camera with batteries and memory card ___Extra batteries for range finder ___Field clip boards ___GPS loaded with coordinates for the POINT, manual, extra battery pack ___ Blue ice to fit soft sided cooler ___De-ionized Water ___Indelible markers to write on flagging ___Pencils ___Site packet with maps with POINT marked, directions to the POINT, access information ___Binoculars ___Available plant species lists pertinent to the site and/or region (wetland species, alien species, threatened
and endangered species) ___Waterproof field notebook ___Regional floras ___Paper towels ___Reflector for sighting rangefinder ___Dissecting tools (e.g., single edge razor blades, forceps, and dissecting needles) ___Tiling or Sharpshooter style shovel ___Bucket auger with interchangeable extension handles and appropriate head(s) for anticipated soil
conditions (regular, mud, sand, dutch, etc). A ratchet handle crossbar may often be useful. ___King tube soil extractor for saturated/inundated conditions, particularly in sandy soils – if needed ___Sharp knife shaving soil slices to expose fresh surface, for cutting out bulk density samples in difficult soils
(e.g., peat, or saturated soils extracted with the King tub extractor method). ___ Small flashlight for viewing in situ soil profile in Representative Soil Pit ___Metal shears for cutting coffer dam flashing material ___OPTIONAL - Mudders Boots (for walking in mud) ___OPTIONAL - Metric tape measure (e.g., a fiberglass seamstress’s measuring tape with lead weight (e.g.,
fishing weight) attached to the bottom) ___OPTIONAL - Two 20-m or four 10-m lengths of strong, durable cord/rope1 ___OPTIONAL- Field vest to carry tools and small equipment ___OPTIONAL- Field meter calibration kit (contained in a good quality, plastic box, e.g. tackle box) with:
___Calibration cup with removable cove, DO membranes, backup probes and spare parts (o-rings, etc). ___pH buffers ___Thermometer ___Squeeze bottle ___Appropriate size leak-proof, screw-cap containers (e.g., nalgene) for additional calibration solutions ___Basic tools (assorted screwdrivers, Allen wrenches)
___OPTIONAL - Multi-Probe Field Meter (Dissolved Oxygen, pH, Conductivity, Temperature)
1 Durable cord (e.g., nylon)/rope in 10 or 20m lengths – with 5m points with blue tape, 10m points with red tape (for marking the edges of vegetation plots).

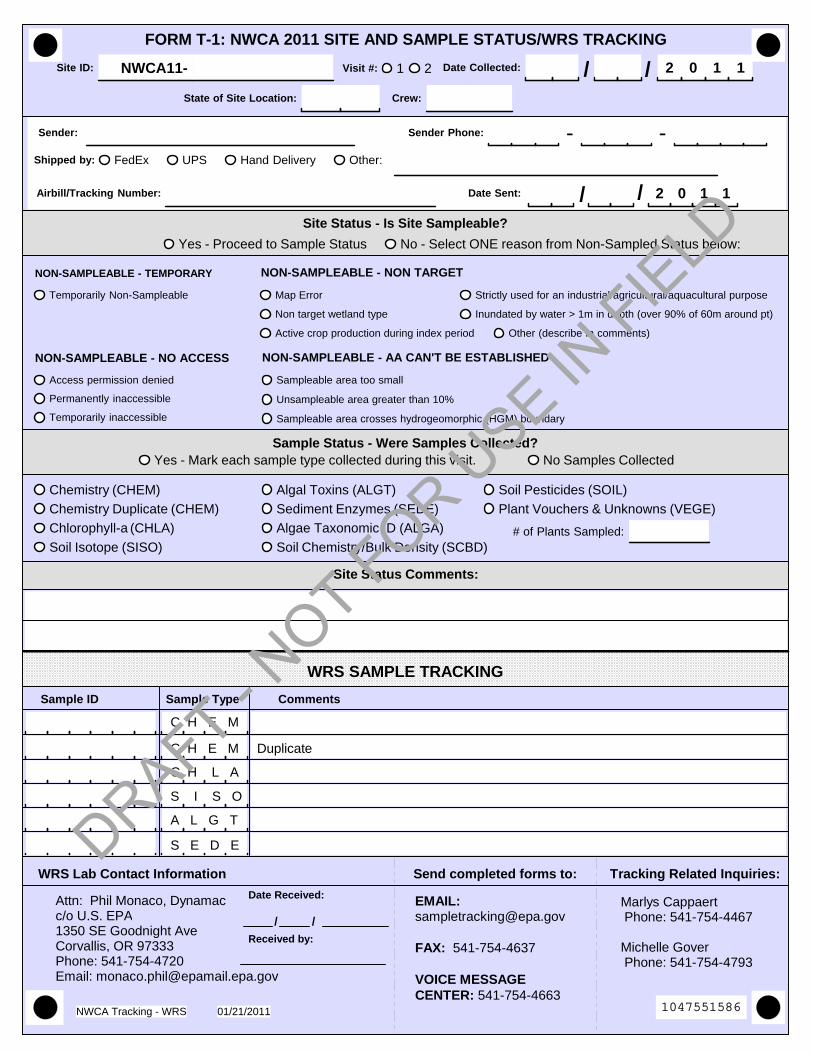
Site Status Comments:
FORM T-1: NWCA 2011 SITE AND SAMPLE STATUS/WRS TRACKING
Shipped by: FedEx UPS Hand Delivery Other:
Sample ID Sample Type Comments
Visit #: 1 2
C H E M
C H L A
01/21/2011NWCA Tracking - WRS
Site ID: NWCA11-
NON-SAMPLEABLE - TEMPORARY
Temporarily Non-Sampleable
NON-SAMPLEABLE - NO ACCESS
Access permission denied
Permanently inaccessible
Temporarily inaccessible
NON-SAMPLEABLE - NON TARGET
Map Error
Non target wetland type
Active crop production during index period
Strictly used for an industrial/agricultural/aquacultural purpose
Inundated by water > 1m in depth (over 90% of 60m around pt)
Other (describe in comments)
NON-SAMPLEABLE - AA CAN'T BE ESTABLISHED
Sampleable area too small
Unsampleable area greater than 10%
Sampleable area crosses hydrogeomorphic (HGM) boundary
Yes - Proceed to Sample Status No - Select ONE reason from Non-Sampled Status below:
Site Status - Is Site Sampleable?
Chemistry (CHEM)
Chlorophyll-a (CHLA)
Soil Isotope (SISO)
Algal Toxins (ALGT)
Sediment Enzymes (SEDE) Plant Vouchers & Unknowns (VEGE)
Algae Taxonomic ID (ALGA)
Soil Pesticides (SOIL)
Soil Chemistry/Bulk Density (SCBD)
Sample Status - Were Samples Collected?Yes - Mark each sample type collected during this visit. No Samples Collected
//Date Collected: 2 0 1 1
WRS SAMPLE TRACKING
Attn: Phil Monaco, Dynamacc/o U.S. EPA1350 SE Goodnight AveCorvallis, OR 97333Phone: 541-754-4720Email: [email protected]
Date Received:
/ /
Received by:
Marlys Cappaert Phone: 541-754-4467
Michelle Gover Phone: 541-754-4793
WRS Lab Contact Information Send completed forms to: Tracking Related Inquiries:
EMAIL:[email protected]
FAX: 541-754-4637
VOICE MESSAGECENTER: 541-754-4663
# of Plants Sampled:
Chemistry Duplicate (CHEM)
Crew:State of Site Location:
Date Sent: 2 0 1 1/ /Airbill/Tracking Number:
C H E M Duplicate
S I S O
A L G T
S E D E
Sender Phone: - -Sender:
1047551586
DRAFT - NOT FOR U
SE IN FIE
LD


Sent by:
FedEx UPS Hand Delivery
Held at address:
EcoAnalysts
WED - CORVALLIS, OR
OTHER:
FORM T-5: NWCA TRACKING - BATCHED SAMPLES
ALGA - AlgaePACK - Data Packet
Airbill/Tracking Number:
Site ID Date Sample CollectedMM/DD/YYYY Visit Sample ID Sample Type
# ofContainers Comments
State ofSite Location:
SenderPhone:
Crew:
01/21/2011NWCA Tracking - Batch
ShippedBy:
12
NWCA11-
12
NWCA11-
12
NWCA11-
12
NWCA11-
12
NWCA11-
12
NWCA11-
12
NWCA11-
12
NWCA11-
12
NWCA11-
12
NWCA11-
12
NWCA11-
12
NWCA11-
12
NWCA11-
12
NWCA11-
12
NWCA11-
12
NWCA11-
12
NWCA11-
EMAIL:[email protected]
FAX: 541-754-4637
VOICE MESSAGECENTER: 541-754-4663
Lab Completed by lab: Sample Types Send completed forms to: Tracking Inquiries:
Marlys Cappaert Phone: 541-754-4467
Michelle Gover Phone: 541-754-4793
Date Received:
/ /
Received
2 0 1 1Date Shipped / /
7630487465
DRAFT - NOT FOR U
SE IN FIE
LD


WATER CHEMISTRY - NOT FILTERED
NWCA11‐7771 Visit#: 1
_____ /_____ /2011
999981
CHLOROPHYLL-a
NWCA11‐7771 Visit#: 1
_____ /_____ /2011
Volume Filtered: ______mL
999982 CHLOROPHYLL-a - OUTER BAG
NWCA11‐7771 Visit#: 1
_____ /_____ /2011
Volume Filtered: ______mL
999982
SOIL ISOTOPE
NWCA11‐7771 Visit#: 1
_____ /_____ /2011
999983
ALGAL TOXINS
NWCA11‐7771 Visit#: 1
_____ /_____ /2011
999984
SEDIMENT ENZYMES
NWCA11‐7771 Visit#: 1
_____ /_____ /2011
999985
ALGAE TAXONOMIC ID
NWCA11‐7771 Visit#: 1
_____ /_____ /2011
999986
DUPLICATE WATER CHEMISTRY - NOT FILTERED
NWCA11‐7771 Visit#: 1
_____ /_____ /2011
999987
DRAFT - NOT FOR U
SE IN FIE
LD
tmagee
Rectangle
tmagee
Rectangle
tmagee
Rectangle
tmagee
Rectangle
tmagee
Rectangle
tmagee
Rectangle
tmagee
Rectangle
tmagee
Rectangle
tmagee
Text Box
Example Adhesive Labels for NWCA Water Chemistry, Chlorophyll-a, Algal Toxins, Algae Taxonomic ID, Soil Isotope and Sediment Enzymes


2011 NWCA Field Operations Manual Chapter 3. Establishing the Assessment Area
3 – 1
CHAPTER 3. ESTABLISHING THE ASSESSMENT AREA
Introduction. . . . . . . . . . . . . . . . . . . . . . . . . . . . . . . . . . . . . . . . . . . . . . . . . . . . . . . . . 3.1 DEVELOP A PLAN FOR AA ESTABLISHMENT. . . . . . . . . . . . . . . . . . . . . . . . .
3.1.1 Develop a Plan in the Office. . . . . . . . . . . . . . . . . . . . . . . . . . . . . . . . . . . 3.1.2 Verify Plan in the Field. . . . . . . . . . . . . . . . . . . . . . . . . . . . . . . . . . . . . . .
3.2 ESTABLISH THE AA. . . . . . . . . . . . . . . . . . . . . . . . . . . . . . . . . . . . . . . . . . . . . . 3.2.1 Standard AA Layouts. . . . . . . . . . . . . . . . . . . . . . . . . . . . . . . . . . . . . . . .
3.2.1.1 Standard Circular AA. . . . . . . . . . . . . . . . . . . . . . . . . . . . . . . . . 3.2.1.2 Standard Circular AA-Shifted . . . . . . . . . . . . . . . . . . . . . . . . . .
3.2.2 Alternate AA Layouts. . . . . . . . . . . . . . . . . . . . . . . . . . . . . . . . . . . . . . . . 3.2.2.1 Polygon AA . . . . . . . . . . . . . . . . . . . . . . . . . . . . . . . . . . . . . . . . 3.2.2.2 Wetland Boundary AA. . . . . . . . . . . . . . . . . . . . . . . . . . . . . . . .
3.3 CHARACTERIZE THE AA. . . . . . . . . . . . . . . . . . . . . . . . . . . . . . . . . . . . . . . . . . 3.4 DATA HANDLING . . . . . . . . . . . . . . . . . . . . . . . . . . . . . . . . . . . . . . . . . . . . . . . . 3.5 LITERATURE CITED. . . . . . . . . . . . . . . . . . . . . . . . . . . . . . . . . . . . . . . . . . . . . . 3.6 REFERENCE CARDS. . . . . . . . . . . . . . . . . . . . . . . . . . . . . . . . . . . . . . . . . . . . .
Reference Card AA-1, Sides A and B. Assessment Area Establishment Reference Card AA-2, Side A. Criteria for Sampleable Area Reference Card AA-2, Side B. Hydrogeomorphic Boundaries and Human
Altered Types Reference Card AA-3, Side A. FWS Status and Trends Classes Reference Card AA-3, Side B. Key to Hydrogeomorphic Classes
3.7 EQUIPMENT LIST AND DATA FORMS . . . . . . . . . . . . . . . . . . . . . . . . . . . . . . . Equipment and Supplies Data Forms . . . . . . . . . . . . . . . . . . . . . . . . . . . . . . . . . . . . . . . . . . . . . . . . . . . .
Form PV-1: NWCA POINT Verification Form Form AA-1: NWCA Assessment Area Establishment Form AA-2: NWCA Assessment Area Characterization
3-33-33-43-5
3-103-103-113-113-123-123-133-143-143-153-17
3-25
3-29

2011 NWCA Field Operations Manual Chapter 3. Establishing the Assessment Area
3 – 2
2011 NWCA Field Operations Manual Chapter 3. Establishing the Assessment Area
3 – 3
CHAPTER 3. ESTABLISHING THE ASSESSMENT AREA
The Assessment Area (AA) represents the POINT. The POINT is the location defined by the coordinates generated by the NWCA sample draw. Proper placement of the AA is crucial because it defines the area where most of the data collection for the NWCA occurs. The principles guiding AA establishment are:
1) The NWCA sampling protocols are designed to produce an assessment of the ecological condition of wetland area at the POINT. This approach assumes that condition can change spatially, especially in a large wetland.
2) The area sampled is large enough to accurately characterize the wetland area at the
POINT using rapid (Level 2) or comprehensive (Level 3) assessment methods (e.g., see Wardrop et al. 2007a, b) but is small enough to be sampled in one day (Kentula and Cline 2004, Fennessy et al. 2008).
3) The POINT has been evaluated according to the procedures in the NWCA Site
Evaluation Guidelines (USEPA 2011) and was determined sampleable. 4) The boundaries of the AA encompass the POINT.
3.1 DEVELOP A PLAN FOR AA ESTABLISHMENT A Desktop Evaluation as described in the NWCA Site Evaluation Guidelines (USEPA 2011) will be conducted for all POINTS to begin the process of determining if they are sampleable. The process of determining if the AA is sampleable starts with the analysis in the office and is completed in the field. For each sampleable POINT, a plan for AA establishment (Section 3.1.1) is developed in the office. At the same time, metrics for the USA-RAM (USEPA in review) that require use of site imagery are completed. The protocol for verifying the plan for AA establishment (Section 3.1.2) is completed as part of Field Evaluation described in the Site Evaluation Guidelines (USEPA 2011) or, if that is not possible, as part of the AA establishment as described in this protocol. The details of the plan for AA establishment, including any information on the site obtained during Field Evaluation (e.g., the copy of Form PV-1 completed during reconnaissance), are added to the materials in the Site Packet.
The Vegetation Team (Veg Team) establishes the AA and, therefore, plays a major part in all aspects of the following protocol.

2011 NWCA Field Operations Manual Chapter 3. Establishing the Assessment Area
3 – 4
3.1.1 Develop Plan in the Office Develop a plan for AA establishment using the aerial photos in the Site Packet, other supporting information, and the general procedures below. See the detailed protocol in Section 3.2 for specific information to gather for the AA layout being considered. 1) Search the materials in the Site Packet to determine whether a field reconnaissance was
conducted and directions to the POINT developed and recorded on a copy of Form PV-1. If a field reconnaissance was not conducted, use the materials in the Site Packet to develop directions and record them in the Directions to POINT field on the front of Form PV-1.
If the site is tidally influenced, consider stage of tide in scheduling sampling of the POINT. The best way to maximize time in the field is to plan to arrive at the site at or slightly before the time that it is exposed at low tide.
2) Select the aerial photo that best depicts the setting at the POINT to annotate with the details
of the plan for AA establishment. Other photos and supporting material (e.g., wetland maps) may be needed to confirm details depicted on the aerial photo chosen.
3) Use the key on Reference Card AA-1 to determine which AA layout is appropriate. Use the
text in Section 3.2 that describes the AA layout chosen to determine how it will likely fit at the POINT and for information that will be helpful to laying out the AA in the field. See examples of the possible AA types on Reference Card AA-1 and in Figures 3-1 to 3-4.
4) Determine if the AA is sampleable. See Reference Card AA-2, Side A for the criteria for
what is sampleable and Reference Card AA-2, Side B for examples of hydrogeomorphic boundaries and mixes of types to avoid. The process of determining if the AA is sampleable starts with the analysis in the office then is completed or verified in the field.
5) Annotate the aerial photo to clearly indicate the following:
POINT AA CENTER AA boundaries Bearings and estimates of important distances, e.g., from the POINT or AA CENTER to
locations on the AA boundary North Likely Status and Trends (S&T) class(es) and hydrogeomorphic (HGM) class as
interpreted from the photo (see Reference Card AA-3,for information on the classes). Other information useful for establishing the AA, e.g., features that can be used to guide
AA set up.
See examples of the possible AA types and annotations of the photos in Figures 3-1 to 3-4. In our experience, a Sharpie® fine-point, permanent, silver marker that can be purchased at many retail stores works well to annotate the photo. If it is difficult to clearly mark the photo, use the back of Form AA-1 to sketch the AA and note the information listed above.
6) Complete the analysis for metrics 1, 2, and 5 for the USA-RAM (USEPA in review). 7) Indicate if a photo was annotated by filling in the bubble on the back of Form AA-1 and
place all materials in the Site Packet.

2011 NWCA Field Operations Manual Chapter 3. Establishing the Assessment Area
3 – 5
3.1.2 Verify Plan in the Field The plan for AA establishment developed prior to the date of sampling (Section 3.1) is checked in the field to assure that it fits the situation on-the-ground. Ideally, plan verification is done as part of the Field Evaluation as described in the NWCA Site Evaluation Guidelines (USEPA 2011). Although this protocol is written for the Field Crew verifying the AA layout plan on the day of sampling, the same approach is used during Field Evaluation. 1) Prior to sampling, the Veg Team reviews the plan for AA establishment (Section 3.1.1). 2) After travelling to the vicinity of the POINT, the Field Crew should wait outside the likely
boundaries of the AA while one member of the Veg Team obtains Forms PV-1 and AA-1 and uses a GPS to navigate to the POINT and marks it with flagging labeled “POINT.”
If there are obstacles to getting to the POINT (e.g., deep water), place flagging labeled with its location, e.g., 5m, 120°, as close to the POINT as possible.
3) The member of the Veg Team at the POINT:
Completes the header on Forms PV-1 and AA-1. The date on both forms is the first day of sampling no matter how many days sampling takes.
Fills in the bubble on both forms to indicate the Visit. Visit #1 is when initial sampling is
done; Visit #2 is a scheduled revisit. Completes the Field Crew Personnel field on the front of Form AA-1. Completes the POINT Location and Accessibility field on the front of Form PV-1.
4) The Field Crew should use their respective vantage points (the vicinity of the POINT and outside the likely AA boundary) and work together to complete the Predominant Wetland Type at the POINT field on the front of Form PV-1. Note that this includes the Special Conditions field if either PUBPAB of Pf is marked.
If the predominant wetland type is excluded from the NWCA target population, do not
sample the site. Instead, follow the procedures in the NWCA Site Evaluation Guidelines (USEPA 2011) for selecting an alternate POINT (i.e., an alternate NWCA site).
If the predominant wetland type at the POINT is part of the target population, the Field
Crew should use their respective vantage points (the vicinity of the POINT and outside the likely AA boundary) to decide whether the AA can be established as planned or if adjustments to the plan are needed.
○ Refer to the protocol in Section 3.1.1 for details of the planning process and to
Reference Card AA-2, Side A for the criteria for a sampleable AA. ○ Confirm the AA Layout in the plan is appropriate for the site using the key on
Reference Card AA-1, Side A.

2011 NWCA Field Operations Manual Chapter 3. Establishing the Assessment Area
3 – 6
N
40m
Figure 3-1. The Standard Circular AA layout with the standard boundary for buffer evaluation is depicted on an example aerial photo as would be found in the site packet (see Section 3.2.1.1). The POINT and the AA CENTER are at the same location.
KEY: POINT Wetland boundary
Standard Buffer Evaluation boundary
Standard CircularAA boundaryAA CENTER
NNN
S&T Class: Palustrine Emergent Marsh (PEM)HGM Class: Riverine Lower Perennial

2011 NWCA Field Operations Manual Chapter 3. Establishing the Assessment Area
3 – 7
POINT Wetland boundary
Standard Buffer boundary
Standard Circular AA boundary
Standard Circular AA Shifted boundary
AA CENTER
Figure 3-2. Example of a Standard Circular AA-Shifted layout (see Section 3.2.1.2) depicted on an example aerial photo as would be found in the site packet. Distance and bearing from the POINT to the AA CENTER are indicated. The Standard Circular AA layout and the Standard Buffer evaluation boundary are shown for comparison.
KEY:
15m, 120°
N S&T Class: Estuarine Intertidal Emergent (E2EM)HGM Type: Tidal Fringe
Shifted Buffer boundary

2011 NWCA Field Operations Manual Chapter 3. Establishing the Assessment Area
3 – 8
Note stream different from one in AA--Do not cross this hydrogeomorhphicboundary
Average width is about 30m. 0.5ha = 5000m2
5000m2/30m = 167m for the AA length 167m/2 = 89m on either side of the CENTERArea west of CENTER = 30m X 89m = 2670m2
Area east of CENTER = 30m X 60m = 1800m2
Area far east CENTER = 9m X 60m = 540m2
TOTAL = 5010m2
10m, 180°
89m
Ditch with culvert that drains site to pond--stressor; not a hydrogeomorphic boundary
60m
9m
Figure 3-3. Example of a Polygon AA layout (see Section 3.2.2.1) depicted on an aerial photo as would be found in the site packet. Distance and bearing from the POINT to the AA CENTER and notes on likely dimensions of the AA are shown. A hydrogeomorphic boundary (a tributary stream), a stressor (ditch with culvert), and a stream in the vicinity of the POINT are illustrated to show features that should be considered in determining AA layout and in conducting the assessment. A Standard Circular AA is shown for comparison.
Note that this AA contains three of the S&T categories that are part of the NWCA target population. The AA is predominantly palustrine forested and has elements of palustrinescrub-shrub and palustrine emergent.
KEY: POINTWetland boundary
Approximate Polygon AA boundary
Standard Circular AA boundaryAA CENTER
30m
30m
60m
NS&T Classes: Palustrine Forested (PFO), Scrub-Shrub (PSS), Emergent (PEM)HGM Class: Riverine Upper Perennial
2nd order stream runs through site

2011 NWCA Field Operations Manual Chapter 3. Establishing the Assessment Area
3 – 9
KEY: POINT Wetland boundary
Standard Buffer Evaluation boundary
Standard CircularAA boundaryAA CENTER
7m, 340°
N
Figure 3-4. Example of a Wetland Boundary AA layout (see Section 3.2.2.2) depicted on an example aerial photo as would be found in the site packet. Distance and bearing from the POINT to the AA CENTER are indicated. The Standard Circular AA layout and the Standard Buffer Evaluation boundary are shown for comparison.
S&T Class: Palustrine Emergent (PEM)HGM Class: Depression Closed
2011 NWCA Field Operations Manual Chapter 3. Establishing the Assessment Area
3 – 10
5) Record whether an AA that contains the original POINT could be established at the site by filling in the appropriate data bubble in the Can an AA that Contains the Original POINT be Established field on the front of Form AA-1 and by completing the Is POINT Sampleable field on the back of Form PV-1.
If an AA containing the original POINT cannot be established, document the reasons in
the Comments field on the front of Form AA-1. Then, follow the procedures in the NWCA Site Evaluation Guidelines (USEPA 2011) for either relocating the POINT at the current site, or for selecting an alternate POINT (i.e., an alternate NWCA site).
If the POINT can be relocated at the current site, follow the procedures in the NWCA
Site Evaluation Guidelines (USEPA 2011) and complete the Documentation for Relocated POINT field on the back of Form PV-1. Proceed with Step 6 below.
6) Record the decisions on AA establishment by annotating the aerial photo of the site and/or
the sketch of the AA plan on the back of Form AA-1. There may be cases where a combination of the photo and sketch are needed to adequately document the AA layout. In our experience, a Sharpie® fine-point, permanent, silver marker that can be purchased at many retail stores works well for annotating photos.
7) Proceed with establishing the AA (Section 3.2) and completing the AA Layout Used and
Location of AA CENTER fields on the front of Form AA-1. 3.2 ESTABLISH THE AA The Veg Team follows the appropriate protocol below to direct the layout of the AA and notifies the AB Team when the first cardinal direction is marked so that they can begin sampling the first buffer transect. In many cases, using a GPS while walking the AA boundary will be the most efficient way to establish the AA and calculate its area. Alternative strategies may be required depending on site conditions and satellite availability. A laser rangefinder, meter tapes, and ropes of appropriate lengths may be useful. For example, it may easier to use a rangefinder or meter tape than a GPS for an open wetland with low vegetation, especially for a Standard Circular AA. Two-way radios would facilitate communication between the people setting up the AA. The Field Crew should minimize trampling of the AA, especially prior to sampling vegetation. This can be accomplished by avoiding the area in which the AA is likely to be located until the Vegetation Plots are marked and by maneuvering around patches of vegetation (as feasible) and walking in single file on the same path. 3.2.1 Standard AA Layouts There are two standard AA layouts—a circular AA and a circular AA that is shifted to fit the site.
2011 NWCA Field Operations Manual Chapter 3. Establishing the Assessment Area
3 – 11
3.2.1.1 Standard Circular AA The Standard Circular AA is a circular plot with a 40-m radius (80-m diameter) centered on the POINT (Figure 3.1 and Reference Card AA-1, Plate 1). No specific preparations are needed for this layout prior to going to the site. In the field, for sites that are fairly open, it may be easiest to use a laser rangefinder or tape to set up the AA. For example, the Veg Team member at the POINT locates the AA boundary by using the rangefinder to determine a distance of 40m by sighting on a metal clipboard or reflector carried by the Veg Team member walking the AA boundary. This Veg Team member flags the boundary as often as site conditions warrant and works with the person at the POINT to place labeled flags where the cardinal compass directions from the POINT cross the AA boundary. Complete the AA Layout Used field on the front of Form AA-1 by filling in the Standard Circular AA bubble for layout type and by entering the area of the AA to the nearest 0.1ha. Complete the Location of AA CENTER field on the front of Form AA-1 by filling in the bubble indicating that the POINT is the CENTER and record the GPS accuracy information. A Veg Team member notifies the AB Team when the first cardinal direction is marked so that they can begin sampling the first buffer transect. 3.2.1.2 Standard Circular AA-Shifted The Standard Circular AA-Shifted is used when a ½-ha circular plot with a 40-m radius (80-m diameter) can be established but the POINT is not the AA CENTER (Figure 3.2 and Reference Card AA-1, Plate 1). Use this layout at sites with a ½-ha or more of sampleable area in the vicinity of a POINT located close to the wetland boundary or other unsampleable area, e.g., deep water or upland. Prior to going to the site: Select the aerial photo from the Site Packet that best depicts the setting at the POINT and
determine the distance and bearing from the POINT to the location of the AA CENTER. Note this information on the photo (see Figure 3-2) or make a sketch of the AA on the back of Form AA-1.
The distance from the POINT to the AA CENTER should not exceed 40m. If the distance
exceeds 40m, do not continue planning the AA layout. Use the NWCA Site Evaluation Guidelines (USEPA 2010) to determine whether the POINT can be relocated or an alternate POINT is needed.
In the field on the sampling day: Verify and modify the AA establishment plan as ground conditions dictate. The Veg Team member at the POINT uses bearing and distance information from the AA
layout plan to navigate to the location of the CENTER of the AA, places a labeled flag at the CENTER. If there are obstacles to getting to the CENTER (e.g., deep water), place flagging labeled with its location, e.g., 5m, 120°, as close as possible to the CENTER.

2011 NWCA Field Operations Manual Chapter 3. Establishing the Assessment Area
3 – 12
Record the GPS coordinates and accuracy information in the Location of the AA CENTER field of Form AA-1 and fill in the bubble indicating that the POINT is not the CENTER.
The Veg Team proceeds with the AA establishment. For sites that are fairly open, it may be
easiest to use a laser rangefinder or tape to set up the AA. For example, the Veg Team member at the CENTER uses a laser rangefinder to locate the AA boundary (a distance of 40m) by sighting on a metal clipboard or reflector carried by the second member of the Veg Team walking the AA boundary. This Veg Team member flags the AA boundary as often as site conditions warrant and works with the person at the CENTER to place labeled flags where the cardinal compass directions cross the AA boundary.
Complete the AA Layout Used field on the front of Form AA-1 by filling in the appropriate
bubble for layout type and entering the area of the AA to the nearest 0.1ha. A Veg Team member notifies the AB Team when the first cardinal direction is marked so
that they can begin sampling the first buffer transect. 3.2.2 Alternate AA Layouts An Alternate Layout is used in situations where a ½-ha circular AA encompassing the POINT will not fit the sampleable area. The Polygon AA layout is used when a non-circular, ½-ha AA is possible at the POINT; the Wetland Boundary layout applies when the AA would be <0.5ha but at least 0.1ha in size. 3.2.2.1 Polygon AA The Polygon AA is used to establish a 0.5-ha AA at sites where the wetland is >0.5ha, but has dimensions <80m in at least one direction. The AA CENTER is as close to the POINT as possible (Reference Card AA-1, Side B, Plate 2). Prior to going to the site: Select the aerial photo from the Site Packet that best depicts the setting at the POINT and
determine the distance and bearing from the POINT to the location of the AA CENTER. Note this information on the photo (see Figure 3-3) or on a sketch of the AA on the back of Form AA-1.
Use a planimeter, if one is available, to approximate the boundary of the AA. Alternatively,
use the scale of the photo to estimate the average width of the area and use it to estimate the length needed to get 0.5ha (see calculations in Figure 3-3).
In cases where the site has bends or is oddly shaped, break the AA into sections and
estimate the area for each (see Figure 3-3). In the field on the sampling day: Verify and modify the AA establishment plan as ground conditions dictate.

2011 NWCA Field Operations Manual Chapter 3. Establishing the Assessment Area
3 – 13
Locate the AA CENTER using the information on the annotated photo or the sketch of the AA on the back of Form AA-1. Fill in the bubble indicating whether the CENTER is the POINT and the GPS accuracy information in the Location of the AA CENTER field of Form AA-1. If the AA CENTER is not the POINT, record its GPS coordinates.
In most situations in the field, using a GPS will be the most efficient way to establish the AA
boundary and calculate the AA area. Turn on the “Area Calculation” function on the GPS and walk the perimeter of the AA, using the vegetation and other indicators to identify the wetland boundary (see Reference Card AA-2, Side A).
At open sites with mostly low vegetation one could effectively use a rangefinder or meter tape to lay out a rectangular AA. For example, if the wetland in Figure 3-3 had been dominated by emergent vegetation, one could set up a rectangular AA (30m X 167m) centered on the AA CENTER by sighting on the Veg Team member walking the AA boundary (see second example on Reference Card AA-1, Plate 2).
Complete the AA Layout Used field on the front of Form AA-1 by filling in the Polygon AA
bubble and entering the area of the AA to the nearest 0.1ha. If the area of the AA as initially bounded is too small or too large, area can be added or subtracted from either end of the AA to equal 0.5ha.
3.2.2.2 Wetland Boundary AA The Wetland Boundary AA is used when the sampleable area at the POINT is smaller than 0.5ha, but is at least 0.1ha, and is at least 20m wide so that vegetation plots can be established (see Chapter 5). In this case the AA boundary coincides with the wetland boundary, i.e., the entire area of the wetland will be sampled (Figure 3.4, Reference Card AA-1, Plate 3). Prior to going to the site: Use an aerial photo from the Site Packet to identify the likely AA boundary. Sketch the AA
boundary on the aerial photo and/or on the back of Form AA-1. Determine the bearing and distance from the POINT to the CENTER and add this information to the sketch (Figure 3.4). Place the form and photo in the Site Packet.
In the field on the sampling day: Verify and modify the AA establishment plan as ground conditions dictate.
Locate the AA CENTER using the information on the annotated photo or the sketch of the
AA on the back of Form AA-1. Fill in the bubble indicating whether the CENTER is the POINT and the GPS accuracy information in the Location of the AA CENTER field of Form AA-1. If the AA CENTER is not the POINT, record its GPS coordinates.
The preferred method for establishing the AA is to use a GPS to determine the boundary
and calculate the area. Turn on the “Area Calculation” function on the GPS and walk the perimeter of the AA, using the vegetation and other indicators to identify the wetland boundary (see Reference Card AA-2, Side A).

2011 NWCA Field Operations Manual Chapter 3. Establishing the Assessment Area
3 – 14
Complete the AA Layout Used field on the front of Form AA-1 by filling in the Wetland Boundary AA bubble and entering the area of the AA to the nearest 0.1ha.
3.3 CHARACTERIZE THE AA The Veg Team identifies the S&T and HGM types found in the AA by completing Form AA-2, referring to Reference Card AA-3 as needed. The Veg Team also completes metrics 4-13 of the USA-RAM (USEPA in review). The AB Team completes Form B-1 to characterize stressors and targeted alien species at the AA CENTER in the same manner as is in the buffer (see Chapter 4, Section 4.1.2). To complete the AA characterization, the Veg Team takes the following digital photos after establishing the Veg Plots (Chapter 5): Overview of the setting around the POINT, Overview of the setting around the CENTER, if in a different location than the POINT, View from the CENTER along each of the plot placement lines for vegetation sampling (if
possible, capture flagging for Veg Plots in the photo), and Important features the Crew feels must be recorded, e.g., threatened and endangered
species. The protocol for photography is found in Appendix D. Be sure to include location information in the photo descriptions, e.g., the direction of the plot placement lines.
3.4 DATA HANDLING See Chapter 2 for protocols on copying and shipping completed data forms to the Information Management Team. See Appendix D for information on transmitting the image files of the photos taken.

2011 NWCA Field Operations Manual Chapter 3. Establishing the Assessment Area
3 – 15
3.5 LITERATURE CITED Brooks, R.P., M.M. Brinson, K.J. Havens, C.S. Hershner, R.D. Rheinhardt, D.H. Wardrop, D.F. Whigham, A.D. Jacobs, and J.M. Rubbo. In Press. Proposed hydrogeomorphic classification for wetlands of the Mid-Atlantic Region, USA. Wetlands. Cowardin, L.M., V. Carter, F.C. Golet, and E.T. LaRoe. 1979. Classification of Wetlands and Deepwater Habitats of the United States. FWS/OBS-79/31. U.S. Fish and Wildlife Service, Washington, DC. Dahl, T.E. 2006. Status and Trends of Wetlands in the Conterminous United States 1998 to 2004. U.S. Department of the Interior; Fish and Wildlife Service, Washington, DC. Dahl, T.E. and M.T. Bergeson. 2009. Technical Procedures for Conducting Status and Trends of the Nation’s Wetlands. U.S. Fish and Wildlife Service, Division of Habitat and Resource Conservation, Washington, DC. Fennessy, M.S., A. Jacobs, M.E. Kentula, J. Sifneos, and A. Rokosch. 2008. Field Testing Rapid Assessment Methods for Use in Wetland Monitoring Programs. Report to U.S. EPA for Grant X7-83158301-0. Kenyon College, Gambier, OH. Kentula, M.E., and S.P. Cline. 2004. Riparian Investigations in the John Day and Lower Deschutes Basins of Eastern Oregon: Amendment to Quality Assurance Project Plan. Internal Report, U.S. Environmental Protection Agency, National Health and Environmental Effects Research Laboratory, Western Ecology Division, Corvallis, OR. Smith, R., A. Ammann, C. Bartoldus, and M.M. Brinson. (1995). An Approach for Assessing Wetland Functions Using Hydrogeomorphic Classification, Reference Wetlands, and Functional Indices. Technical Report WRP-DE-9. U.S. Army Corps of Engineers, Waterways Experiment Station, Vicksburg, MS. USEPA (U. S. Environmental Protection Agency). 2011. National Wetland Condition Assessment: Site Evaluation Guidelines. EPA/843/R10/004. U.S. Environmental Protection Agency, Washington DC. USEPA (U.S. Environmental Protection Agency). In Review. National Wetland Condition Assessment: USA-RAM Field Operations Manual. EPA/XXX/R-XX/XXX. U.S. Environmental Protection Agency, Washington, DC. Wardrop, D. H., M.E. Kentula, S.F. Jensen, D.L. Stevens, Jr., and R.P. Brooks. 2007a. Assessment of wetlands in the Upper Juniata watershed in Pennsylvania, USA, using the hydrogeomorphic approach. Wetlands 27:432-445. Wardrop, D.H., M.E. Kentula, D.L. Stevens, Jr., S.F. Jensen, and R.P. Brooks. 2007b. Assessment of wetland condition: an example from the Upper Juniata Watershed in Pennsylvania, USA. Wetlands 27:416-430.

2011 NWCA Field Operations Manual Chapter 3. Establishing the Assessment Area
3 – 16

2011 NWCA Field Operations Manual Chapter 3. Establishing the Assessment Area
3 – 17
3.6 REFERENCE CARDS
Reference Card AA-1. Sides A and B: Assessment Area Establishment Reference Card AA-2, Side A: Criteria for Sampleable Area Reference Card AA-2, Side B: Hydrogeomorphic Boundaries and Human Altered Types Reference Card AA-3, Side A: FWS Status and Trends Classes Reference Card AA-3, Side B: Key to Hydrogeomorphic Classes

2011 NWCA Field Operations Manual Chapter 3. Establishing the Assessment Area
3 – 18

AA CENTER
AA boundaryWetland boundary
Cardinal Compass Directions
Shallow water
Deep water (not sampleable)
Reference Card AA-1. Assessment Area Establishment – Side A
POINT
40m
N Plate 1. Standard Layouts½ hectacre area
Upland (not sampleable)
Key to Assessment Area (AA) Layouts
1a Sampleable area1 contains POINT and is ≥ ½ha………………………………………..………...…..….2
2a Sampleable area1 can contain a circular plot with a diameter of 80m …………………...……….3
3a POINT is at the center of sampleable area1…………………....……….Standard Circular AA3b POINT is not at the center of sampleable area1…..…………..Standard Circular AA-Shifted
2b Sampleable area1 contains POINT but ranges from minimum width 20m (length 250m) and maximum width of 79.5m (length 63m)…………………….……………….…...……..Polygon AA
1b Sampleable area1 contains POINT and is < ½ha but > 0.1ha……………..…….Wetland Boundary AA
40m
Standard Circular AA Standard Circular AA-Shifted
Un
sam
ple
ab
le a
rea
Labeled flags are placed at the POINT, AA CENTER, and where the cardinal directions cross the AA boundary.
Refer to NWCA Field Operations Manual Section 3.2 – Selecting the Appropriate AA Layout for the details of the protocol summarized on this card.
1 Sampleable Area: ≤10% of the area of the AA contains water ≥1m deep; has standing water or soft substrate that is unsafe or impossible to sample effectively; and/or is upland. If the criteria for sampleable area can not be met, see the NWCA Site Evaluation Guidelines and determine whether POINT relocation or selection of an alternate POINT is appropriate.

Reference Card AA-1 Assessment Area Establishment – Side B – More Examples of Layout Configurations
Plate 3. Wetland Boundary AA Layouts – AA (0.5ha to ≤0.1ha) = wetland boundary
Example AA ≈ 0.14ha
30m
N
40m
Example AA ≈ 0.20ha
Example AA ≈ 0.22ha
20m
20m
250m
N
N30
m
167m
N
In this example, the wetland has mostly low vegetation and sampleable area to accommodate a rectangular AA.
Plate 2. Polygon AA Layouts AA = ½ hectacreAA CENTER is as close to the POINT as possible give site conditions.
In this example, the wetland is narrow and curved. AA follows wetland edge. The POINT is the AA CENTER.
Refer to NWCA Field Operations Manual Section 3.2 – Selecting the Appropriate AA Layout for the details of the protocol summarized on this card.

Reference Card AA-2, Side A. Criteria for Sampleable Area
The AA is sampleable if ALL of the following criteria are met: The AA contains the POINT and ranges in size from 0.1haa to 0.5ha.
a 0.1ha is the lower limit of detection of the U.S. Fish and Wildlife Service’s Wetland Status and Trends project (Dahl and Bergeson 2009). It is also the smallest AA that will accommodate the vegetation plots.
The AA will be at least 20-m wide to accommodate the vegetation plots (see Chapter 5). Less than 10%b of the area of the AA is unsampleable due to:
(a) water ≥1m deepc (b) standing water or soft substrate that is unsafe or impossible to sample effectively; and/or (c) upland, i.e., area not wetland (see definition of wetland below).
b The 10% limit is based on the criteria used by the U.S. Fish and Wildlife Service’s Wetland Status and Trends project (Dahl and Bergeson 2009).
c One meter is the minimum water depth sampled in the National Lakes Assessment and, thus sets the boundary between open water and fringing wetlands used in the National Aquatic Resource Surveys.
The sampleable area contains one or more of the Status and Trends (S&T) categories
representing the NWCA target population. See the Predominant Wetland Type at the POINT field on Form PV-1 for a list of target S&T categories. See Figure 3-3 for an example of an AA with multiple S&T types.
The NWCA Target Population is defined as: Tidal and nontidal wetlands of the conterminous U.S., including certain farmed wetlands not currently in crop production. The wetlands have rooted vegetation and, when present, open water less than 1 meter deep.
An ecologic (not jurisdictional) definition of wetland is used in establishing the AA. However, experience in wetland delineation for regulatory purposes and the related indicators will be helpful in determining wetland boundaries. The definition of wetlands used by the S&T and NWCA is as follows:
Wetlands are lands transitional between terrestrial and aquatic systems where the water table is usually at or near the surface or the land is covered by shallow water. Wetlands must have one or more of the following three attributes:
1) at least periodically, the land supports predominantly hydrophytes; 2) the substrate is predominantly undrained hydric soil, and 3) the substrate is non-soil and is saturated with water or covered by
shallow water at some time during the growing season of each year (Dahl 2006).
Examples of characteristics that could be used in the field to identify whether the AA is wetland include:
○ predominance of hydrophytic vegetation; ○ presence of plants with morphological or structural adaptations for growing in wetland
soils, e.g., buttressed tree trunks, multiple trunks, pneumataphores, adventitious roots, hypertrophied lenticels, polymorphic leaves;
○ visual observation of soil saturation and/or inundation; ○ presence of undrained hydric soil; ○ presence of indicators of wetland hydrology. e.g., drift lines, watermarks, sediment
deposits; and ○ geomorphic boundaries such as the active floodplain or flood-prone width.
The AA does not cross any hydrogeomorphic boundaries (see Side B).

Reference Card AA-2, Side B. Hydrogeomorphic Boundaries and Human Altered Types
Examples of Human Altered Hydrogeomorphic Types
It is often difficult to determine the hydrogeomorphic (HGM) class of a site that has been altered because the alteration has changed the class or created a hybrid. To avoid these problems and for consistency, the site should be placed in the “human” class associated with the original HGM type (see Reference Card AA-3, Side B).
Examples of Hydrogeomorphic Boundaries or Mixes of Types to Avoid in Establishing the AA The AA should not include: A mix of tidal and nontidal wetlands, A tributary to the river or stream associated with the POINT, or A combination of lacustrine fringe or riverine wetlands and the seeps or springs (i.e., slope wetlands)
upslope from them, in other words, the hydrogeomorphic (HGM) types are distinct (excluding any transition zone).
Alternatively, an AA can include a mosaic of HGM types (see Riverine Complex on Reference Card 3, Side B) or drainage channels typical in tidal and lacustrine fringing wetlands.
Slope – Human Altered
Riverine – Human Altered
Riverine – Human Altered
Excavated pond

Reference Card AA-3, Side A. FWS Status and Trends Classes1
CATEGORIES INCLUDED IN NWCA
Code Subcode Full Name Common Description Technical Description1 E2EM Estuarine Intertidal Emergent Salt marsh Emergent wetlands in estuarine systems
characterized by erect, rooted, herbaceous hydrophytes, excluding mosses and lichens. This vegetation is present for most of the growing season in most years. These wetlands are usually dominated by perennial plants.
E2SS Estuarine Intertidal Scrub Shrub / Forested
Mangroves Other estuarine shrubs
Shrub wetlands in estuarine systems that are dominated by woody vegetation less than 20 feet (6 meters) tall. The species include true shrubs, young trees, and trees or shrubs that are small or stunted because of environmental conditions. Forested wetlands are characterized by woody vegetation that is 6 meters tall or taller.
PEM Palustrine Emergent Inland marshes Wet meadows
Emergent wetlands in palustrine systems characterized by erect, rooted, herbaceous hydrophytes, excluding mosses and lichens. This vegetation is present for most of the growing season in most years. These wetlands are usually dominated by perennial plants.
PSS Palustrine Scrub Shrub Shrub wetlands Shrub wetlands in palustrine systems that are dominated by woody vegetation less than 6 meters (20 feet) tall. The species include true shrubs, young trees, and trees or shrubs that are small or stunted because of environmental conditions.
PFO Palustrine Forested Forested swamps Forested wetlands in palustrine systems that are characterized by woody vegetation that is 6 meters (20 feet) tall or taller.
Pf Palustrine Farmed Farmed wetland Farmed wetlands are wetlands that meet the Cowardin et al. definition where the soil surface has been mechanically or physically altered for production of crops, but where hydrophytes will become reestablished if farming is discontinued.
PUBPAB Palustrine Unconsolidated Bottom / Aquatic Bed
Ponds, aquatic beds
PAB Palustrine Aquatic Bed Intertidal freshwater seagrass beds
Pondweeds PUBf Pond – Agriculture Farm ponds
Drainage water ponds PUBn Pond - Natural Bog lakes
Vernal pools Kettles Beaver ponds Alligator holes
PUBu Pond - Urban Aesthetic ponds Recreation ponds Golf course ponds Residential lakes Water retention ponds
Aquatic beds are dominated by plants that grow principally on or below the surface of the water for most of the growing season in most years. Examples include seagrass beds, pondweeds (Potamogeton spp.), wild celery (Vallisneria americana), waterweed (Elodea spp.), and duckweed (Lemna spp.). Unconsolidated bottom includes all wetlands with at least 25 percent cover of particles smaller than stones, and a vegetative cover less than 30 percent. Examples of unconsolidated substrates are: sand, mud, organic material, cobble gravel. The wetlands must also have the following four characteristics: (1) area less than 20 acres (8 ha); (2) active wave formed or bedrock shoreline features are lacking; (3) water depth in the deepest part of a basin less than 6.6 feet (2 meters) at low water; and (4) salinity due to ocean derived salts less than 0.5 parts per thousand.
1 Descriptions are from Dahl, T.E. 2006. Status and Trends of Wetlands in the Conterminous United States 1998 to 2004. U.S. Department of the Interior; Fish and Wildlife Service, Washington, DC.

Reference Card AA-3, Side B. Key to Hydrogeomorphic Classesa
1. Wetland is naturally under the influence of tides……………………………………………..............................…..………2 1. Wetland is not naturally under the influence of tides………….………………..................................………..………...…4 1. Wetland would be under the influence of tides if not for human actions, e.g., diked...............Tidal – Human Altered b
2. Salinity greater than 0.5 parts per thousand (ppt)……..…….…………..………...…...…....……..…Tidal Fringe 2. Salinity less than 0.5 parts per thousand (ppt)...………….........………………...….........…….….Riverine Tidal 4. Wetland is topographically flat and precipitation is a dominant source of water…………..................................……….5 4. Wetland is not topographically flat and precipitation is not a dominant source of water……...........................………...6 5. Wetland has a mineral soil……………………………..……………................................…….Flats Mineral Soil 5. Wetland has an organic soil…………...............……………………….….......................…….Flats Organic Soil 5. Either of the above with hydrology altered by human actions, e.g., ditching..............Flats – Human Altered b
6. Wetland is associated with a nontidal stream channel, floodplain, or terrace……….......………...................…………..7 6. Wetland is not associated with a nontidal stream channel, floodplain, or terrace..…....…...........................……………9 7. Stream is 1st or 2nd order……………………………………............................…...…..Riverine Upper Perennial 7. Stream is 3rd order or higher…………………………….…...……..…...................…..Riverine Lower Perennial
7. Wetland is part of a mosaic of small streams, floodplain features (former channels, depressions) and/or slope wetlands (supported by groundwater).................................................................Riverine Complex
7. Wadable stream channel has been impounded by beaver activity............Riverine – Beaver Impounded 7. Wadable stream channel has been excavated and deepened, the active floodplain has been excavated
and/or isolated from overbank flows from the channel..................................Riverine – Human Altered b
7. Stream is constrained by a graminoid-dominated wetland supported primarily by groundwater….....….12
9. Wetland is fringing a lake or reservoir……..………………………......………......….……......………........……………..10 9. Wetland is not fringing a lake or reservoir……………………….................….….......……………….......…………….…11 10. Wetland inundation controlled by relatively natural hydroperiod….….............….......…..…Lacustrine Fringe 10. Wetland inundation controlled by dam releases……………....................…..Lacustrine Artificially Flooded 11. Wetland is primarily supported by ground water………………………........................…………....….......…………….12 11. Wetland is associated with a topographic depression……………………........................………........................…….13
12. Water source is ground water discharged to the surface on the side of a hill due to a geologic feature, e.g., a confining layer………………………….……….........................…............….Slope Stratographic
12. Water source is ground water discharged at the toe-of-slope………….........……..Slope Topographic 12. Slope wetland has been excavated to increase depth and amount of surface water....Slope – Human
Altered b
13. Topographic depression without surface water inlets, outlets or other connections...…….....................……..14 13. Topographic depression with surface water inlets, outlets, or other connections………....….................….….15 14. Wetland is a naturally occurring feature of the landscape….......…..........….……….....…Depression Closed 14. Closed Depression is impounded by beaver activities.................Depression – Closed Beaver Impounded 14. Closed Depression is impounded by human activities….….........Depression – Closed Human Impounded 14. Closed Depression is excavated by human activities….............…Depression – Closed Human Excavated
14. Closed Depression is excavated and impounded by human activities…......…Depression – Closed Human Excavated and Impounded
15. Wetland is a naturally occurring feature of the landscape…......…................……..……..…Depression Open 15. Open Depression is impounded by beaver activities......................Depression – Open Beaver Impounded 15. Open Depression is impounded by human activities…...…............Depression – Open Human Impounded 15. Open Depression is excavated by human activities………….......…Depression – Open Human Excavated
15. Open Depression is excavated and impounded by human activities............….Depression – Open Human Excavated and Impounded
________________________________ a Adapted from Smith et al. (1995), Brooks et al. (in press), and the personal experience of M.E. Kentula, USEPA. b For examples of human altered hydrogeomorphic types see Reference Card AA-2, Side B.

2011 NWCA Field Operations Manual Chapter 3. Establishing the Assessment Area
3-25
3.7 EQUIPMENT LIST AND DATA FORMS

2011 NWCA Field Operations Manual Chapter 3. Establishing the Assessment Area
3-26

EQUIPMENT AND SUPPLIES
___50-m or 100-m measuring tape with reel and/or other measuring devices for situations where GPS or rangefinder does not work
___2-way hand-held radios ___Compass ___Data forms and reference cards ___Digital camera with batteries and memory card ___Field clip board ___GPS loaded with coordinates for the POINT, manual, extra battery pack ___Indelible markers to write on flagging ___Laser rangefinder with extra batteries (optional) ___Sharpie® or comparable fine-point, permanent, silver marker ___Site packet with maps with POINT marked, directions to the POINT, access information ___Surveyor’s flagging tape to mark the AA boundary


2011 NWCA Field Operations Manual Chapter 3. Establishing the Assessment Area
3 - 29
DATA FORMS FORM PV-1, Front and Back: NWCA Point Verification Form FORM AA-1, Front and Back: NWCA Assessment Area Establishment FORM AA-2: NWCA Assessment Area Characterization

2011 NWCA Field Operations Manual Chapter 3. Establishing the Assessment Area
3 - 30

Predominant wetland type if it were not in crop production
E2EM E2SS PEM PSS PFO PUBPAB
Directions to POINT:
DATE: 2 0 1 1//EVALUATOR:
POINT LOCATION AND ACCESSIBILITY
01/21/2011NWCA Point Verification Form
SITE ID: NWCA11-
FORM PV-1: NWCA POINT VERIFICATION FORM (Front)
AFFILIATION:
Provide GPS coordinates at the locationevaluation took place (use NAD83); identifywhere below:
POINT Nearest practicable
POINT verified by (fill in all that apply): Aerial Photo Topo Map
VISIT: RECON 1 2
Note any difficulties accessing site
Dense Vegetation
Special Access Requirements
Locked Gates
Is the POINT accessible? YES NO
If it is not accessible, note the reason, whether this is permanent ortemporary, and provide any relevant comments below.
Permission to access site denied
Physically inaccessible (crew saftey, barriers, high water)
Temporary
Permanent
PREDOMINANT WETLAND TYPE AT THE POINT (MARK ONE)
Status & Trend Categories INCLUDED in target population
E2EM - Estuarine Intertidal Emergent
E2SS - Estuarine Shrub/Forested
PEM - Palustrine Emergent
PSS - Palustrine Scrub/Shrub
PFO - Palustrine Forested
PUBPAB - Palustrine Unconsolidated Bottom/Aquatic Bed (see conditions)
Pf - Palustrine Farmed (see conditions)
Other (upland, developed, etc)
Lacustrine/Riverine (deep water)
Palustrine Unconsolidated Shore (non-tidal mudflats)
Estuarine Intertidal Unconsolidated Shore (mudflats)
Status & Trend Categories EXCLUDED from target population
Estuarine/Marine Intertidal Aquatic Bed (SAV)
Estuarine/Marine Subtidal (deep water)
Deep Water
Other (describe):
Steep/Unstable terrain
Livestock
Special Permits
Palustrine Farmed (Mark all that apply)
Presence of row or close grown crops (list type in comments)
Terraced Land
Recent evidence land has been mechanically tilled
Confirmation from land owner
Other evidence (describe)
Palustrine Unconsolidated Bottom (Mark all that apply)
Strictly used to treat waste
Strictly used for industrial, agricultural, or aquacultural purposes
Lined wholly with concrete or other manufactured non-vegetative barrier
Provide any additional information in the comments section onthe back of this form
Other (describe):
Latitude
.Decimal Degrees
Additional Access Comments:
Longitude
.
Inundated by water greater than 1m depth covering most of the area
within a 60m radius of POINT
(Mark One)
SPECIAL CONDITIONSIf either PUBPAB or Pf are marked above then indicate the presence of any feature(s) that exclude the POINT from sampling in the
appropriate section below.
Reviewed by (initial):
2733231641
DRAFT - NOT FOR U
SE IN FIE
LD

FORM PV-1: NWCA POINT VERIFICATION FORM (Back)
NWCA Point Verification Form 01/21/2011
Site ID: NWCA11- DATE: 2 0 1 1/ /IS POINT SAMPLEABLE
YES NO (fill in category below)original POINT is sampleable (fill in category below)
POINT can be relocated (fill in category below
AND enter documentation for relocated point)
SAMPLEABLE CATEGORIES
E2EM - Estuarine Intertidal Emergent
E2SS - Estuarine Scrub Shrub/Forest
PEM - Palustrine Emergent
PSS - Palustrine Scrub Shrub
PFO - Palustrine Forested
PUBPAB - Palustrine Unconsolidated Bottom/Aquatic Bed. Ponds
Pf - Palustrine Farmed. Farmed wetlands that are not currentlybeing intensively managed for crop (row and close ground crops,rice, horticulture) production.
that are not used solely for waste treatment or for other strictlyindustrial, aquacultural, or agricultural purposes.
NON-SAMPLEABLE - TEMPORARY CATEGORIES
Temporarily Non-Sampleable
NON-SAMPLEABLE - NO ACCESS CATEGORIES
Access permission denied
Permanently inaccessible
Temporarily inaccessible
NON-SAMPLEABLE - NON TARGET CATEGORIES
Map Error
Non target wetland type
Active crop production during index period
Strictly used for an industrial/agricultural/aquacultural purpose
Inundated by water > 1m in depth (over 90% of 60m around pt)
Other (describe)
NON-SAMPLEABLE - AA CAN'T BE ESTABLISHED
Sampleable area too small
Unsampleable area greater than 10%
Sampleable area crosses hydrogeomorphic (HGM) boundary
DOCUMENTATION FOR RELOCATED POINT
Latitude
.
Provide GPS coordinates for therelocated point (use NAD83) Decimal Degrees
Basis for Wetland Determination
Hydrophytic vegetation predominant
(fill in all that apply):
Hydric soil predominant
Wetland hydrology is presentHydric Soil Indicators:
High organic content
Hydrophytic Vegetation Indicators (describe):
If at least one of the above is filled inthe POINT is a wetland for the purposesof this survey. Reducing conditions
Sulfidic odor
Histosol
Aquic moisture regime
Gleyed
Concretions Histic epipedon
Organic streaking
Soil Map Unit: Listed as hydric? Yes No
Wetland Hydrology Indicators:
Buttressed trunks
Saturated Soils
Other
Oxidized rhizospheres
Water stained leaves
Shallow roots
Water carried debris
Floating Mat
Bare areas
Standing water Water marks
COMMENTS
Longitude
.
Reviewed by (initial):
7893231643
DRAFT - NOT FOR U
SE IN FIE
LD

ASSESSMENT AREA ESTABLISHMENT
01/26/2011NWCA Assessment Area Establishment
AA Layout Used (Mark one) :
Standard Circular AA Standard Circular AA-Shifted Polygon AA Wetland Boundary AA
Location of AA CENTER (Mark one) :
The POINT is the AA CENTER
The POINT is not the AA CENTER; the coordinates of the CENTER are:
Site ID: NWCA11-
LAT LONG . NAD 83
Document the reasons in the Comment section. Follow the procedures in the NWCA Site Evaluation Guidelines for relocating the POINT at this siteor for selecting an alternate POINT (i.e., alternate NWCA site). If the POINT can be relocated at this site, complete the documentation required inthe Site Evaluation Guidelines and proceed to "AA Layout Used".
Can an AA that contains the original POINT be established?
Yes
No
FORM AA-1: NWCA ASSESSMENT AREA ESTABLISHMENT (Front)
Proceed to "AA Layout Used".
Date: 2 0 1 1
Instructions: Fill in the Date above. The date is always the first day of sampling no matter how many days taken forsampling. Visit # 1 is when the sampling was done. Visit # 2 is a scheduled revisit. Complete the table below by providing theperson's name for each position on the crew and filling in the bubble indicating the protocol(s) completed by the person.Refer to Reference Card AA-1 for information on establishing the Assessment Area.
Field Crew Personnel: Tasks: AA VEG BUFFER SOIL HYD WQ ALG USARAM
Crew Leader:
COMMENTS AND NOTES
Vegetation TeamBotanist/Ecologist:
Botanist Assistant:
AB TeamAB 1:
AB 2:
Area of the AA: 0. ha (1 ha is 10,000 m²)
Record GPS accuracy below by noting the number of satellites traced for the LAT/LONG reading above and the variance (in meters) associated with thecoordinate measurement.
Number of satellites: Distance variance:m
VISIT: 1 2/ /
Reviewed by (initial):
4567552925
DRAFT - NOT FOR U
SE IN FIE
LD

FORM AA-1: NWCA ASSESSMENT AREA ESTABLISHMENT (Back)
SKETCH MAPAnnotate an aerial photo and/or make a sketch below to document the plan for establishing the AA and any changes madeduring actual AA establishment. A fine-point, silver Sharpie® or similar pen works well for marking photos. At minimum,include the information below in the documentation.
Draw the AA boundary and indicate the position of the POINT and AA CENTER, the AA boundaries, bearings and estimatesof important distances (e.g., segments of the AA boundary), a north-arrow, and other information that might be useful for AAestablishment. On the day of sampling, update the plan to reflect what was actually done.
* Add the approximate locations and boundaries of the vegetation plots with a square with the plot number inside.* Add the approximate locations of the soil pits with their letter designation, e.g., A, B, C, D.* Note the nature and direction of environmental gradients, water bodies, major vegetation patches, and other prominent features of the site and the surrounding area.
If a photo was annotated, place it in the Site Packet with the completed FORM AA-1 and fill in the bubble:Annotated photo included in the Site Packet
01/26/2011NWCA Assessment Area Establishment
Site ID: NWCA11- Date: 2 0 1 1/ /
Reviewed by (initial):
2324552924
DRAFT - NOT FOR U
SE IN FIE
LD

Other Wetland Classification SystemsIf other wetland classification system(s), e.g., a state system, is/are used in the area, list the system and the predominant class below.
Site ID: NWCA11-
FORM AA-2: NWCA ASSESSMENT AREA CHARACTERIZATION
Date: 2 0 1 1/ /
Estuarine Intertidal Emergent (E2EM) Estuarine Intertidal Shrub/Forested (E2SS)
Palustrine Emergent (PEM) Palustrine Scrub Shrub (PSS)
Palustrine Forested (PFO)
Palustrine Farmed (not currently in crop production) (Pf)*
Palustrine Unconsolidated Bottom/Aquatic Bed (PUBPAB)*
Wetland Class:System:
Wetland Class:System:
Wetland Class:System:
NWCA Assessment Area Characterization 01/21/2011
Hydrogeomorphic TypeMark the class (one) and, if possible, the subclass (one). Refer to Reference Card AA-3, Side B for a key to the classes.
Mineral Soil
Organic SoilHuman Altered**
FWS Status and Trends ClassMark predominant class. If classes are equally abundant in a complex, mark the target class from the survey design or, if the target class isnot present, mark the class nearest the POINT. Refer to Reference Card AA-3, Side A for descriptions of the classes.
* See NWCA Site Evaluation Guidelines for criteria for inclusion.
Depression
Flats
Lacustrine Fringe
Riverine
Slope
Tidal Fringe
Class Subclass
Naturally occurring Artificially Flooded
Stratographic
TopographicHuman Altered**
Naturally occurring Human Altered**
COMMENTS
** Refer to Reference Card AA-2, Side B for examples of human altered hydrogeomorphic types.
Closed
Closed Beaver Impounded
Closed Human Impounded**
Closed Human Excavated**
Closed Human Excavated and Impounded**
Open
Open Beaver Impounded
Open Human Impounded**
Open Human Excavated**
Open Human Excavated and Impounded**
Tidal
Upper Perennial (1st and 2nd order)
Lower Perennial (3rd and higher)
Complex
Beaver Impounded
Human Altered**
Reviewed by (initial):
4933080782
DRAFT - NOT FOR U
SE IN FIE
LD

2011 NWCA Field Operations Manual Chapter 4. Characterizing the Buffer
4 -1
CHAPTER 4. CHARACTERIZING THE BUFFER
Introduction . . . . . . . . . . . . . . . . . . . . . . . . . . . . . . . . . . . . . . . . . . . . . . . . . . . . 4.1 SAMPLING PROCEDURE . . . . . . . . . . . . . . . . . . . . . . . . . . . . . . . . . . . . .
4.1.1 Buffer Sample Plot Layout - Standard AAs . . . . . . . . . . . . . . . . . . . 4.1.2 Buffer Sample Plot Layout - Alternate AAs . . . . . . . . . . . . . . . . . . . 4.1.3 Recording Data on the Buffer Field Form . . . . . . . . . . . . . . . . . . . .
4.1.3.1 Buffer Natural Cover Strata. . . . . . . . . . . . . . . . . . . . . . . . . . . 4.1.3.2 Buffer Stressors . . . . . . . . . . . . . . . . . . . . . . . . . . . . . . . . . . . 4.1.3.3 Targeted Alien Species. . . . . . . . . . . . . . . . . . . . . . . . . . . . . .
4.1.4 Data Handling . . . . . . . . . . . . . . . . . . . . . . . . . . . . . . . . . . . . . . . . . 4.2 LITERATURE CITED. . . . . . . . . . . . . . . . . . . . . . . . . . . . . . . . . . . . . . . . . 4.3 PROTOCOL CHECKLIST AND REFERENCE CARD. . . . . . . . . . . . . . . .
Buffer Protocol Checklist Reference Card B-1: Buffer Sample Plot Layouts (Side A) Reference Card B-1: Completing Form B-1 (Side B)
4.4 EQUIPMENT LIST AND DATA FORMS . . . . . . . . . . . . . . . . . . . . . . . . . . Buffer Protocol Equipment Checklist Form B-1: NWCA Buffer Sample Plots (Front) Form B-1: NWCA Buffer Sample Plots - Targeted Alien Species (Back)
4-34-34-34-64-84-8
4-104-114-114-124-13
4-19
See also APPENDIX B. TARGET INVASIVE ALIEN SPECIES

2011 NWCA Field Operations Manual Chapter 4. Characterizing the Buffer
4 -2

2011 NWCA Field Operations Manual Chapter 4. Characterizing the Buffer
4 -3
CHAPTER 4. CHARACTERIZING THE BUFFER
Buffer is often defined as an area of natural vegetation surrounding the perimeter of a wetland that is not directly affected by human activities and that can provide some protection to the wetland from stressors and neighboring land uses. An alternative use of the term buffer is simply as a prescribed measurement area or discrete zone (e.g., riparian buffer or GIS buffer). For the Level 3 Assessment in NWCA, the buffer surrounding the Assessment Area (AA) serves both functions. Because we are characterizing the POINT and associated AA rather than the whole wetland, Buffer Sample Plots may encompass wetland or upland, natural vegetation cover or human land uses. The natural cover attributes recorded within the Buffer Sample Plots quantify the buffer’s protective or mitigating role, if any, and record the number and extent of stressors influencing the AA. Both types of information are necessary for an assessment of wetland condition to place the AA on a gradient of disturbance relative to a reference standard. Another objective of this portion of the field effort is to maximize the information to be gleaned from the buffer area that is consistent with the comprehensive nature of the study (Level 3 Assessment). In other words, the data collected in the buffer at Level 3 are expected to be more detailed and more quantitative than data recorded in either the Rapid Assessment (Level 2, USA RAM USEPA in review) or Landscape Assessment (Level 1). For detailed information on the rationale for the buffer indicator, see “Ecological Indicators for the 2011 National Wetland Condition Assessment” (USEPA in preparation). The stressor lists compiled for the buffer field form (Form B-1) contain elements from multiple sources, including (in alphabetical order by senior author) the California Rapid Assessment Method (CRAM) for Wetlands and Riparian Areas (Collins et al. 2006), Gulf of Mexico Coastal Wetlands Condition Assessment (Heitmuller 2008), Delaware Comprehensive Assessment Procedure (Jacobs et al. 2008), Delaware Rapid Assessment Procedure (Jacobs 2007), USEPA Environmental Monitoring and Assessment Program Stream Survey (Kaufmann et al. 1999, Peck et al. 2006), and Ohio Rapid Assessment Method for Wetlands (Mack 2001). The Assessment Area and Buffer Team (AB Team) is responsible for recording natural cover, stressor information, and targeted alien species information at the center of the AA (AA CENTER) and in the buffer area surrounding the AA. The AB Team also completes Buffer Metric 3 (Stress to the Buffer) from the USA RAM protocol (USEPA in review) in the buffer area. 4.1 SAMPLING PROCEDURE 4.1.1 Buffer Sample Plot Layout - Standard AAs The AB Team records buffer natural cover and stressors at twelve 100-m2 Buffer Sample Plots laid out along four cardinal transects (marked N, S, E, and W in figures) and at a plot at the AA CENTER. The Buffer Sample Plots are arranged so that they may be

2011 NWCA Field Operations Manual Chapter 4. Characterizing the Buffer
4 -4
given weights for proximity analysis. Follow the instructions for locating Buffer Sample Plots given below and, as needed, refer to the description of the Standard AA layouts, circular and shifted, in Chapter 3. The buffer protocol is also summarized on Reference Card B-1, Side A. Figure 4-1 shows a Standard Circular AA layout where the CENTER and the POINT coincide and three Buffer Sample Plots are evenly spaced along each 140-m cardinal transect. The transects do not have to be sampled in any particular order as long as the sample plots are identified correctly. Buffer Sample Plots N1, E1, S1, and W1 are placed at the outer boundary of the AA to sample natural cover and stressors that are in closest proximity to the AA. 1) Assist the Vegetation Team (Veg Team) in locating the POINT and/or the AA
CENTER. It is the Veg Team’s responsibility to establish and flag the AA (as described in Chapter 3). Once the intersection of the AA boundary and the first cardinal transect has been located, the AB Team may begin locating Buffer Sample Plots along that transect.
2) Use a GPS or a rangefinder and compass to measure the distance to the center of
the first Buffer Sample Plot on the transect at 45m from the CENTER. Number the plot as shown in Figure 4-1.
3) Stand in the center of the Buffer Sample Plot and estimate 5m in each direction (i.e.,
identify a 100-m2 area). 4) Record data on the front of Form B-1 for the buffer natural cover strata and stressor
information visible within the surrounding 100-m2 plot (as explained in Section 4.1.3 Recording Data on the Buffer Field Form).
5) Record targeted alien species presence (back of Form B-1)(see Appendix B for
identification characteristics). It may be helpful to place a temporary flag in the center of the plot while roaming the plot to search for target species.
6) Complete Metric 3 for the USA-RAM (USEPA in review). 7) Repeat steps 2–6 traveling another 45m along the cardinal transect to the second
Buffer Sample Plot at 90m from the CENTER. Fill out Form B-1 at the second Sample Plot; proceed another 45m from the second sample plot to reach the third plot at 135m from the AA CENTER and record the data on Form B-1. At the third Buffer Sample Plot (farthest from the CENTER, i.e., plot N3, E3, S3, or W3), record the geographic coordinates in the appropriate space on the back of Form B-1.
8) Proceed to the remaining three transects and repeat steps 2–7 Use a separate
Form B-1 for each Buffer Transect and the plot at the AA CENTER. 9) After completing the cardinal transects, return to the AA CENTER and repeat steps
3–5 to record natural cover, stressor, and alien species information there. Record the geographic coordinates of the CENTER in the appropriate space on the back of Form B-1.
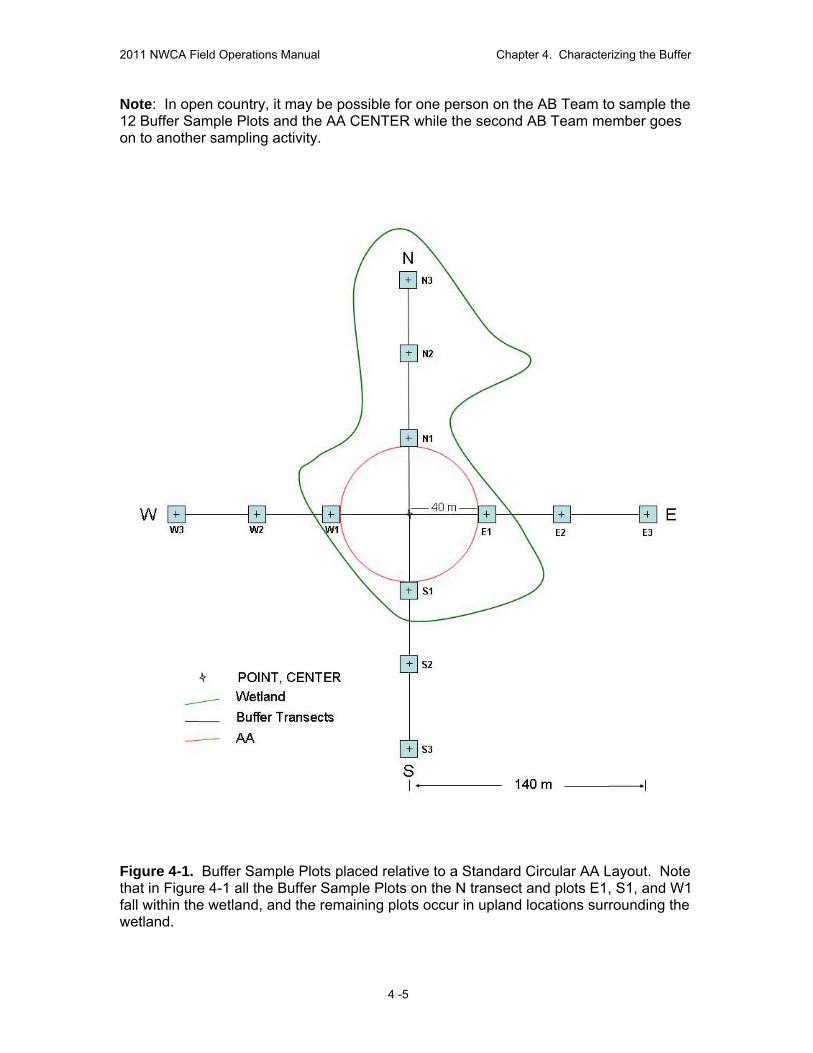
2011 NWCA Field Operations Manual Chapter 4. Characterizing the Buffer
4 -5
Note: In open country, it may be possible for one person on the AB Team to sample the 12 Buffer Sample Plots and the AA CENTER while the second AB Team member goes on to another sampling activity.
Figure 4-1. Buffer Sample Plots placed relative to a Standard Circular AA Layout. Note that in Figure 4-1 all the Buffer Sample Plots on the N transect and plots E1, S1, and W1 fall within the wetland, and the remaining plots occur in upland locations surrounding the wetland.

2011 NWCA Field Operations Manual Chapter 4. Characterizing the Buffer
4 -6
4.1.2 Buffer Sample Plot Layout - Alternate AAs If a wetland is not large enough to accommodate a 40m-radius circle, an alternate AA layout is used. Chapter 3 presents instructions for laying out alternate AAs and marking the locations at which the cardinal transects cross the sides of the polygon. Once the first of these locations has been identified, the field crew can begin to establish and sample the Buffer Sample Plots. The distances between Buffer Sample Plots along the cardinal transects may vary depending on the location of the CENTER and the shape and orientation of the AA (Figure 4-2). The procedure for locating Buffer Sample Plots on transects of varying lengths appears below and are summarized on Reference Card B-1, Side A.. This Buffer Sample Plot layout may also be used for small wetlands (< ½ ha) where the AA covers the entire wetland, e.g., the Wetland Boundary Layout described in Chapter 3. For wetlands smaller than ½ ha, the centers of Buffer Sample Plots N1, E1, S1, and W1 are located 5m from the edge of the wetland on the cardinal transects. 1) Work with the Veg Team to locate the POINT and CENTER of the AA. 2) If the wetland will not accommodate a standard 40-m radius circle, work with the Veg
Team to determine the size and orientation of an Alternate AA relative to the CENTER. Once any of the cardinal transects has been located and where it crosses the edge of the AA marked, the AB Team may begin sampling the three Buffer Sample Plots on that transect.
3) To locate the center of the first Buffer Sample Plot on the cardinal transect, add 5m
to the distance from the CENTER to the edge of the AA (or to the edge of the wetland for a Wetland Boundary Layout).
4) The center of the farthest Buffer Sample Plot on a transect is 135m from the
CENTER. [(135m) minus (distance from the CENTER to plot #1)] ÷ 2 = the distance from plot #1 to plot #2 (and plot #2 to plot #3).
5) Stand in the center of the Buffer Sample Plot and estimate 5m in each direction from
the center of the plot (i.e., identify a 100-m2 area). 6) Record data on the front of Form B-1 for the buffer natural cover strata and stressor
information visible within the surrounding 100-m2 plot (as explained in Section 4.1.3 Recording Data on the Buffer Field Form). Record targeted alien species presence (back of Form B-1)(see Appendix B for identification characteristics). It may be helpful to place a temporary flag in the center of the plot while roaming the plot to search for target species.
7) Follow the procedure above for locating and sampling the rest of the sample plots on
the other three transects. Use a separate Form B-1 for each Buffer Transect and the plot at the AA CENTER.

2011 NWCA Field Operations Manual Chapter 4. Characterizing the Buffer
4 -7
NOTE: If a narrow AA (like in a riparian area) is aligned directly along the E-W or N-S transects, it may be necessary to extend the length of the transects to accommodate three Buffer Sample Plots. That is, if a transect length is too short, such that the distance measured between sample plots is <10m, the transect may be extended to allow the plots to be at least 10m apart.
Figure 4-2. Polygon AA with an area of ½ ha. The shape and orientation of the AA determines the distance of plots N1, E1, S1, and W1 from the CENTER as well as the distance between Buffer Sample Plots on each transect.

2011 NWCA Field Operations Manual Chapter 4. Characterizing the Buffer
4 -8
4.1.3 Recording Data on the Buffer Field Form Form B-1: Buffer Sample Plots, is used to record natural cover, stressor, and targeted alien species data for each Buffer Transect and the plot at the AA CENTER. A separate Form B-1 is used for each transect. In the Location field at the top of Form B-1, record whether the data collected applies to the AA CENTER or the N, S, E, or W Transect by filling in the appropriate bubble. Record data by filling in the appropriate bubble in the Buffer Natural Cover Strata field and the fields for the five categories of buffer stressors on Form B-1: Buffer Sample Plots (Front). Report on the presence or absence of 22 targeted alien invasive species (see Appendix B for identification characteristics) by filling in the appropriate bubbles on Form B-1: Buffer Sample Plots -Targeted Alien Species (Back). 4.1.3.1 Buffer Natural Cover Strata The Buffer Natural Cover Strata field at the top of Form B-1 (Front) documents the canopy type and the natural vegetative cover in each of the 12 Buffer Sample Plots and the AA CENTER plot, to recognize the layers of vegetation and other natural cover that are important to a diverse habitat structure within the buffer area. The information recorded here gives an indication of the mitigating influence of natural cover surrounding the AA that may reduce the impact of stressors. The list of vegetation types listed under Natural Cover Strata is loosely organized into three sections:
Canopy (> 5m high) including Big Trees (>0.3m DBH) and Small Trees (< 0.3m DBH)
Understory (0.5 to 5m high) including Woody Shrubs, Saplings (0.5-5m high) Ground cover (<0.5m high) including Woody Shrubs, Saplings and Herbs, Forbs,
and Grasses (<0.5m high). The presence and abundance of a vegetation type within each 100-m2 sample plot is recorded by cover class:
0=Absent 1=Sparse (<10%) 2=Moderate (10-40%) 3=Heavy (40-75%) 4 =Very Heavy (>75%).
Other natural cover types include:
Bare dirt Litter, duff Rock Water Submerged vegetation

2011 NWCA Field Operations Manual Chapter 4. Characterizing the Buffer
4 -9
For each Buffer Plot and the AA CENTER, record data for Buffer Natural Cover Strata using the following steps: 1) Find the section for Natural Cover Strata on the front of Form B-1. Fill in the bubble
at the top of the page identifying the location as either a transect or the AA CENTER. 2) On Form B-1, the various buffer sample plots are listed as Buffer Plot 1, 2, and 3.
These columns correspond to plots located along the transect progressively farther from the CENTER (with Buffer Plot 1 placed just outside the AA boundary nearest the CENTER). When completing the form for AA CENTER, the column labeled Plot 1 is the only one completed and the columns for Plots 2 and 3 are left blank.
3) Fill in the appropriate bubbles for Canopy Type:
Absent bubble if no tree canopy is present. If tree canopy is present, fill in a bubble for both canopy type and leaf type:
○ D or E for deciduous or evergreen ○ B or N for leaf type—broadleaf or needle leaf
4) Under the next section of Form B-1, indicate the strata for the vegetation and natural
cover types present:
Fill in the bubble corresponding to the appropriate number (0–4) representing the percent cover of big trees (> 0.3m [or 1 foot] Diameter Breast Height [DBH]) and small trees (< 0.3m DBH) for each of the three Buffer Plots on each transect and the AA CENTER. Estimate the area covered by each tree category as the amount of shade cast (imagined as noon or midday shade) by a particular tree (or shrub) type.
Fill in the bubble corresponding to the appropriate percent cover of woody shrubs
0.5m-5m high and <0.5m high for each of the sample plots. Do the same for non-woody vegetation (i.e., herbs, grasses, and forbs), bare dirt,
litter or duff, rock, water, and submerged vegetation. NOTE: Because of the use of cover classes and because the vegetation strata overlap each other, the total vegetative cover in a plot may exceed 100%.
5) Repeat steps 2–4 for the other three transects and the AA CENTER. Use a separate Form B-1 for each Buffer Transect and the plot at the AA CENTER.
NOTE: If AB Team members are not able to stand at the center of a Buffer Sample Plot due to open water, thick brush, fencing, or some other impediment, approach as close to the center of the plot as possible and visually estimate or use binoculars to view and record what is within the sample plot. If this occurs and a Buffer Sample Plot is estimated from afar, mark F1, F2, etc. in the Flag box and describe the situation in the Flag Comments field on the back of the form. If the plot is inaccessible and its visibility is impaired, fill in U (suspect measurement) or K (no measurement made) in the Flag box and explain in the Flag comment section. The aerial photograph can also be used to corroborate natural cover and stressor estimates if a Buffer Sample Plot is inaccessible.

2011 NWCA Field Operations Manual Chapter 4. Characterizing the Buffer
4 -10
4.1.3.2 Buffer Stressors In the Buffer Stressors portion of Form B-1, the stressors are listed in five classes: Hydrology, Habitat/Vegetation, Agricultural and Rural, Residential and Urban, and Industrial Development. Hydrology Stressors are attributes that may affect the water flow or water quality of a wetland and buffer area. For the Dike/Dam/Road/RR Bed field, mark the bubble if you consider a road to be a hydrology stressor because it is impeding water flow and causing an impoundment. Note that road appears three more times (Road - gravel, Road - two lane, Road - four lane) as a direct stressor in the Residential and Urban Stressors section of Form B-1. Habitat/Vegetation Stressors are changes made to the natural vegetation cover. Most of the attributes record human disturbances; however, there are natural stressors listed, such as tree canopy insect herbivory or recent fire (forest canopy or grassland). Tree Canopy Herbivory refers to tree canopy insect damage, such as that from pine bark beetle or gypsy moth. Highly Grazed Grasses refers to animal grazing (cattle, horse, goat, deer, elk, or bison) within the various Buffer Sample Plots. Highly-grazed is defined as grasses within the sample plot uniformly grazed to <7.6cm (<3in) high (Cortland County Soil and Water Conservation District 2010, Rayburn 2000, Washington State University Extension Service 2010). Shrub browsing is recognized by nipped-off branches and a dominance of new twigs. Land Use Activities that may have a negative influence on AA condition are listed under Agricultural and Rural Stressors, Residential and Urban Stressors, and Industrial Development stressors. To document the stressors in each Buffer Plot on the cardinal transects and at the AA CENTER: 1) Find the section for stressors on the front of Form B-1. On Form B-1, the various
Buffer Sample Plots are listed as Buffer Plot 1, 2, and 3. These columns correspond to plots located along a transect progressively farther from the CENTER (e.g., N1, N2, or N3, see Figures 4-1 and 4-2).
NOTE: When completing the form for the plot at the AA CENTER, the column labeled Plot 1 is the only one completed and the columns for Plots 2 and 3 are left blank. 2) From the center of each plot, systematically search for each attribute in the five
stressor sections of Form B-1. Darken the bubble if a stressor is present.
There likely will be many unfilled bubbles on the page. Note the box at the top of the stressor section marked Stressor Presence/Absence. It reads, “Confirm that a filled data bubble indicates presence and an unfilled bubble indicates absence by filling this bubble.” Fill in this “super bubble” so that the Information Management Team knows that unmarked bubbles were consciously left that way.
NOTE: The stressors portion of the form has several boxes labeled Other where stressors of any type not listed may be entered.

2011 NWCA Field Operations Manual Chapter 4. Characterizing the Buffer
4 -11
3) If any entry presents a problem or merits a comment, mark F1, F2, etc. in the Flag
box and write out the comment in the Flag Comments field on the back of the form. 4) As a last step before finishing each cardinal transect, use the GPS to mark the plot
coordinates (latitude and longitude in decimal degrees) for the center of the Buffer Sample Plot at the far end of each transect (N3, E3, S3, or W3) and for the AA CENTER. Record the location coordinates in the appropriate boxes in the Plot Coordinates field on the back of Form B-1. If delayed by lack of satellite coverage, record other data while the GPS seeks coordinates.
4.1.3.3 Targeted Alien Species Invasive alien plant species may irreversibly alter native plant communities. Both natural and human disturbances create opportunities for the establishment of alien plant species. The Veg Team documents the occurrence and cover of all alien species as they are detected in the Veg Plots. In the buffer and at the AA CENTER, the AB Team records the presence or absence of targeted alien plant species listed on the back of Form B-1. The twenty-two alien species were selected for their widespread distribution, their importance and ecological impact, and their ease of identification for non-botanists (see Appendix B). To document the presence of the targeted alien species: 1) Find the Targeted Alien Species section on the back of Form B-1. The various
Buffer Sample Plots are listed as Plot 1, 2, and 3. These columns correspond to plots located along each transect progressively farther from the CENTER.
NOTE: When completing the form for AA CENTER, the column labeled Plot 1 is the only one completed and the columns for Plots 2 and 3 are left blank. 2) Search the Plot for the targeted alien species while standing at the center of the Plot
or place a temporary flag at the center and roam the Plot. 3) If a target alien species appears in a Plot, fill in the bubble to indicate presence for
the Plot. Bubbles will remain unfilled for species that were not encountered. Note that the heading for each transect has a statement saying, “Confirm that a filled data bubble indicates presence and an unfilled bubble indicates absence by filling in this bubble.” Filling in this “super bubble” indicates to the Information Management Team that unmarked bubbles were consciously left that way.
4) Review both sides of Form B-1 to check that all sections have been completed and
super bubbles marked as appropriate. Review the form for Metric 3 of USA-RAM (USEPA in review) for completeness.
4.1.4 Data Handling See Chapter 2 for protocols on copying and shipping completed data forms to the Information Management Team.

2011 NWCA Field Operations Manual Chapter 4. Characterizing the Buffer
4 -12
4.2 LITERATURE CITED Collins, J.N., E.D. Stein, M. Sutula, R. Clark, A.E. Fetscher, L. Grenier, C. Grosso, and A. Wiskind. 2006. California Rapid Assessment Method (CRAM) for Wetlands and Riparian Areas. Version 5.0.2, 151 pp. Cortland County Soil and Water Conservation District. 2010. Prescribed grazing management. www.cortlandswcd.org . Accessed 4/2010. Heitmuller, T. 2008. Gulf of Mexico Coastal Wetlands Condition Assessment-Pilot Survey. Quality Assurance Project Plan, U. S. Geological Survey, Gulf Breeze Project Office, Gulf Breeze, FL. 317 pp. Jacobs, A.D. 2007. Delaware Rapid Assessment Procedure, Version 4.1. Delaware Department of Natural Resources and Environmental Control, Dover, DE. 34pp. Jacobs, A.D., D.F. Whigham, D.Fillis, E. Rehm, and A. Howard. 2008. Delaware Comprehensive Assessment Procedure Version 5.1. Delaware Department of Natural Resources and Environmental Control, Dover, DE. 74pp. Kaufmann, P.R., P. Levine, E.G. Robison, C. Seeliger, and D.V. Peck. 1999. Quantifying Physical Habitat in Wadable Streams. EPA/620/R_99/003. U.S. Environmental Protection Agency, Washington, DC. Mack, J.J. 2001. Ohio Rapid Assessment Method for Wetlands, Manual for Using Version 5.0. Ohio EPA Technical Bulletin Wetland/2001-1-1. Ohio Environmental Protection Agency, Division of Surface Water, 401 Wetland Ecology Unit, Columbus, OH. Peck, D.V., A.T. Herlihy, B.H. Hill, R.M. Hughes, P.R. Kaufmann, D.J. Klemm, J.M. Lazorchak, F.H. McCormick, S.A. Peterson, P.L. Ringold, T. Magee, and M. Cappaert. 2006. Environmental Monitoring and Assessment Program – Surface Waters Western Pilot Study: Field Operations Manual for Wadable Streams. EPA/620/R-06/003. Office of Research and Development, U.S. Environmental Protection Agency, Washington, DC. Rayburn, E. 2000. Overgrazing can hurt environment, your pocketbook. West Virginia Extension Service, West Virginia Farm Bureau News. www.wvu.edu/~agexten/forglvst/overgraz.htm . Accessed 4/2010. USEPA (U.S. Environmental Protection Agency). In Review. National Wetland Condition Assessment: USA-RAM Field Operations Manual. EPA/XXX/R-XX/XXX. U.S. Environmental Protection Agency, Washington, DC. USEPA (U.S. Environmental Protection Agency). In Preparation. Ecological Indicators for the 2011 National Wetland Condition Assessment. EPA-XXX-YY-0000. U.S. Environmental Protection Agency, Washington, DC. Washington State University Extension Service. 2010. How green is your grass? Five steps to better pasture and grazing management. Extension service bulletin, Clark County, Brush Prairie, Washington. http://clark.wsu.edu. Accessed 4/2010.

2011 NWCA Field Operations Manual Chapter 4. Characterizing the Buffer
4 -13
4.3 PROTOCOL CHECKLIST AND REFERENCE CARD Buffer Protocol Checklist Reference Card B-1,. Buffer Sample Plot Layouts (Side A) Reference Card B-1, Completing Form B-1 (Side B)

2011 NWCA Field Operations Manual Chapter 4. Characterizing the Buffer
4 -14

Buffer Protocol Checklist ___Check equipment and supplies. ___Use GPS, or range finder and 50-m tape if necessary to measure the location of
each Buffer Sample Plot as described in Sections 4.1.1 and 4.1.2. ___Record natural cover strata information, stressor data, and targeted alien species
presence on Form B-1 at each sample plot and at the AA CENTER. ___Complete Metric 3 for the USA-RAM (USEPA in review). ___When all Buffer Sample Plots are completed, review field forms for accuracy.


E
S
W
N
140 m
N1
N2
N3
E1 E2 E3
S1
S2
S3
W1W2W3
C
Standard Layout ‐ Circular and Shifted (A): Overview: Once one of the cardinal directions has been located and the place where it crosses the AA boundary is marked, use a GPS or rangefinder and compass to locate three Buffer Sample Plots equidistant along the transect extending beyond the boundary of the AA. Do the same for the other cardinal directions to establish a total of four transects oriented in the four cardinal directions from the AA CENTER.
Number each Buffer Sample Plot as shown in Figure A. The transects do not have to be sampled in any particular order as long as the sample plots are identified correctly.
1. On each transect, measure the distance to the center of the first Buffer Sample Plot at 45m from the AA CENTER. 2. Stand in the center of the Buffer Sample Plot and estimate 5m in each direction from the Plot center to locate stressors and fill out Form B‐1.3. Travel another 45m along the transect to the second Buffer Sample Plot at 90m.4. Travel another 45m from that plot to reach the third plot at 135m from the AA CENTER.5. At the farthest Sample Plot on each transect (e.g., N3), record the geographic coordinates of the center of the plot on the back of Form B‐1. Proceed to the other transects and repeat layout and data entry.
E
S
W
N
140 m
40 m
Wetland
Buffer Transects
AA
POINT, CENTER
N1
N2
N3
E1 E2
S1
E3
S2
S3
W1W2W3
Reference Card B-1, Side A. Buffer Sample Plot Layouts
A
B
Alternate Layout Overview (B): In the cases where a Standard AA can not be established, work with the VegTeam to determine the size and orientation of an Alternate AA. Once one of the cardinal directions has been located and the place where it crosses the AA boundary is marked, use a GPS or rangefinder and compass to locate three Buffer Sample Plots equidistant along the transect extending beyond the boundary of the AA. Do the same for the other cardinal directions to establish a total of four transects oriented in the four cardinal directions from the AA CENTER.
Number each Buffer Sample Plot as shown in Figure B. The transects do not have to be sampled in any particular order as long as the sample plots are identified correctly.
1. To locate the center of the first Buffer Sample Plot on the transect, add 5m to the distance from the CENTER to the AA edge.2. The center of the farthest Plot on a transect is typically 135m from the CENTER: [(135m) minus (distance from the CENTER to plot #1)] ÷ 2 = the distance from plot #1 to plot #2 (and plot #2 to plot #3). 3. Proceed as described in Step 2 above for a Standard Layout to fill out forms from center of each Plot.4. Follow the same procedure for locating Buffer Sample Plots on the other transects.NOTE: If a narrow riparian rectangle is aligned directly along the E‐W or N‐S transects, it may be necessary to extend the length of the transects beyond 135m to accommodate three Buffer Sample Plots in each cardinal direction. Distance between sample plots should be ≥ 10m.

Buffer Natural Cover Strata Section of Form B-1
1. Complete a separate form for each transect and the AA CENTER. Fill in the bubble at the top of the page identifying the location as either a cardinal transect or the AA CENTER. On Form B-1, the various Buffer Sample Plots are listed as Buffer Plot 1, 2, and 3 (e.g., N1, N2, or N3). When completing the form for AA CENTER, the column labeled Plot 1 is the only one completed and the sections for Plots 2 and 3 are left blank.2. For each sample plot, fill in the appropriate bubbles for Canopy Type: D or E for deciduous or evergreen; B or N for leaf type—broadleaf or needle leaf; or Absent if no tree canopy is present. If tree canopy is present, make sure to fill in a bubble for both canopy type and leaf type.3. Under Strata, fill in the bubble corresponding to the appropriate number (0–4) representing the percent cover of big trees (> 0.3m [or 1 foot] Diameter Breast Height [DBH]) and small trees (< 0.3m DBH). Estimate the area covered by each tree category as the amount of shade cast (imagined as noon or midday shade) by a particular tree (or shrub) type. 4. Fill in the bubble corresponding to the appropriate number representing the percent cover of woody shrubs 0.5m-5m high and <0.5m high for each of the Buffer Sample Plots.5. Do the same for the remaining entries in the Natural Cover Strata section: non-woody plants (i.e., herbs, grasses, and forbs), bare dirt, litter or duff, rock, water, and submerged vegetation.6. Repeat steps 2-5 for the other 3 cardinal transects and the AA CENTER.NOTE: Because of the use of cover classes and because the vegetation strata overlap each other, the total vegetative cover in a plot may exceed 100%.NOTE: If AB Team members are not able to stand at the center of a Buffer Sample Plot due to open water, thick brush, fencing, or some other impediment, approach as close to the center of the plot as possible and visually estimate or use binoculars to view and record what is within the sample plot. If this occurs and a Buffer Sample Plot is estimated from afar, mark F1, F2, etc. in the Flag box and write out a comment in the Flag Commentsection on the back of the form. The aerial photograph can also be used to corroborate natural cover and stressor estimates in the buffer if a Buffer Sample Plot is inaccessible.
Reference Card B-1, Side B. Completing Form B-1
Buffer Stressors Section of Form B-1
1. From the center of each Buffer Sample Plot, systematically search for each attribute in the five stressor sections of Form B-1. Darken the bubble if a stressor is present. There will be many unfilled bubbles on the page. Fill in the “super bubble” at the top of the stressor section, so that Information Management knows that unmarked bubbles were consciously left that way.NOTE: The stressors portion of the form has several fields labeled Other where stressors of any type not listed may be entered.3. If any entry presents a problem or merits a comment, mark F1, F2, etc. in the Flag box and write out the comment in the Flag Comments section on the back of the form.4. As a last step before finishing each cardinal transect, use the GPS to mark the plot coordinates (latitude and longitude in decimal degrees) for the center of the Buffer Sample Plot at the far end of each transect (N3, E3, S3, or W3) and the AA CENTER. Record the coordinates in the appropriate fields in the middle of the back side of Form B-1, and fill in the bubble identifying the location as a cardinal transect or AA CENTER.
Targeted Alien Species Section of Form B-1
1. Standing in the center of each of the Buffer Sample Plots (or at the AA CENTER), scan the plot for any of the targeted alien species that may be found in your region. You may also place a temporary flag at the center of the Buffer Sample Plot and roam the plot searching for any targeted alien species.2. If a listed species appears in a Buffer Sample Plot, fill in the bubble to indicate presence of that species for the appropriate number plot (Plot 1, Plot 2 etc.). Bubbles will remain unfilled for species that were not encountered. Fill in the “super bubble” at the top of the section that indicates to Information Management that unmarked bubbles were consciously left that way.3. Review both sides of Form B-1 to check that all sections have been completed.

2011 NWCA Field Operations Manual Chapter 4. Characterizing the Buffer
4- 19
4.4 EQUIPMENT LIST AND DATA FORM Buffer Equipment List Form B-1: NWCA Buffer Sample Plots (Front) Form B-1: NWCA Buffer Sample Plots – Targeted Alien Species (Back)

2011 NWCA Field Operations Manual Chapter 4. Characterizing the Buffer
4- 20
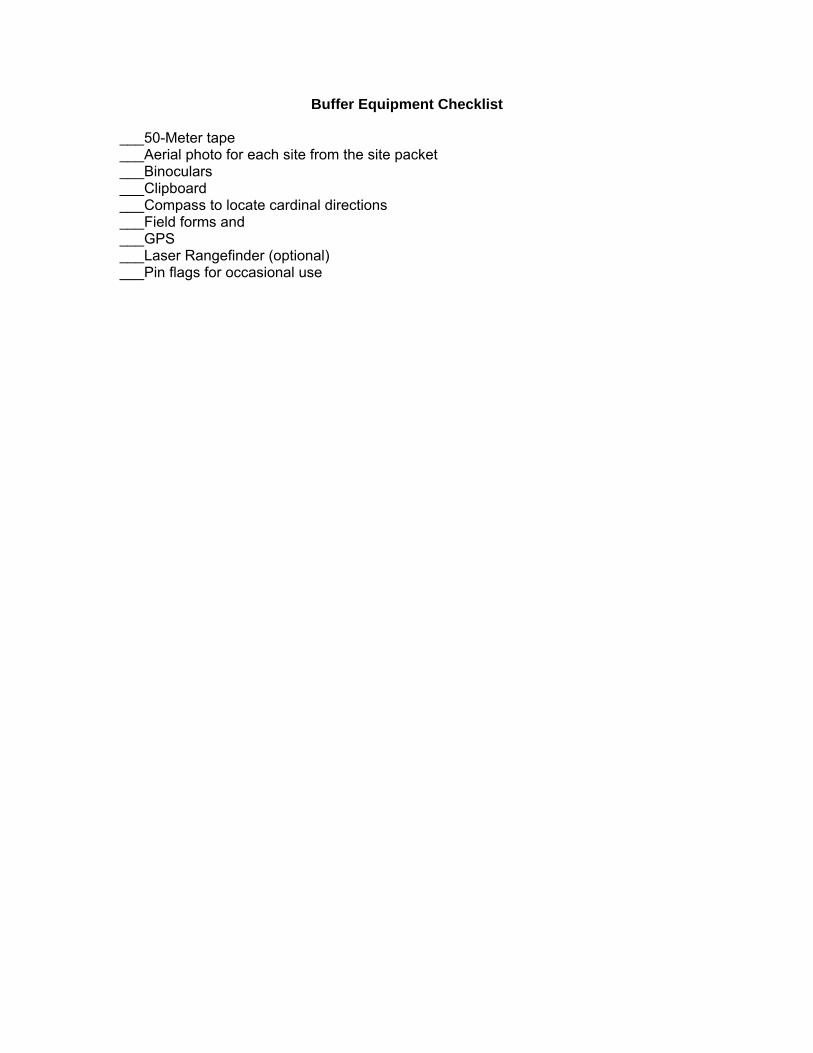
Buffer Equipment Checklist ___50-Meter tape ___Aerial photo for each site from the site packet ___Binoculars ___Clipboard ___Compass to locate cardinal directions ___Field forms and ___GPS ___Laser Rangefinder (optional) ___Pin flags for occasional use


Flag codes: K = No measurement made, U = Suspect measurement., F1,F2, etc. = misc. flags assigned by each field crew.Explain all flags in comment section on the back of this form
Stressor Presence/Absence - Confirm that a filled data bubble indicates presence and an unfilled bubble indicates absence by filling this bubble.
Industrial Development Stressors Habitat/Vegetation Stressors
Fill bubble if present - Plot 1 2 3 Flag
Fill bubble if present - Plot 1 2 3 Flag
Residential and Urban Stressors Hydrology Stressors Agricultural & Rural Stressors
Forest Clear Cut
FORM B-1: NWCA BUFFER SAMPLE PLOTS (Front)
Site ID: NWCA11- DATE: 2 0 1 1/ /
Buffer Natural Cover Strata Fill one bubble for each type:Canopy Type: D = Deciduous; E = Evergreen. Leaf Type: B = Broadleaf; N = Needle Leaf. If no tree canopy, fill in Absent
Strata: Fill in bubble for each plot. 0 = Absent; 1 = Sparse(<10%); 2=Moderate(10-40%); 3 = Heavy (40-75%); 4 = Very Heavy (>75%)
Ditches, Channelization
Dike/Dam/Road/RR Bed(IMPEDE FLOW)
Water Level Control Structure
Excavation, Dredging
Fill/Spoil Banks
Freshly Deposited Sediment(UNVEGETATED)
Soil Loss/Root Exposure
Wall/Riprap
Inlets, Outlets
Point Source/Pipe(EFFLUENT OR STORMWATER)Impervious surface input(SHEETFLOW)
Road - gravel
Road - two lane
Road - four lane
Other:
Forest Selective Cut
Tree Plantation
Tree Canopy Herbivory(INSECT)
Shrub Layer Browsed(WILD OR DOMESTIC)
Highly Grazed Grasses(OVERALL <3" HIGH)
Recently Burned Forest CanopyRecently Burned Grassland(BLACKENED)
Herbicide Use
Mowing/Shrub Cutting
Trails
Soil Compaction(ANIMAL OR HUMAN)
Offroad vehicle damage
Other:
Soil erosion (FROM WIND, WATER,
OR OVERUSE)
Flag
Location: AA Center N S E W
Flag Flag
Fill bubble if present - Plot 1 2 3 Flag
Fill bubble if present - Plot 1 2 3 Flag Fill bubble if present - Plot 1 2 3 Flag
Dumping
Landfill
Oil Drilling
Urban/Multifamily
Parking Lot/Pavement
Suburban Residential
Lawn/Park
Golf Course
Trash
Other:
Gas Wells
Mine (surface)
Mine (underground)
Military
Other:
Other:
Pasture/Hay
Range
Row Crops
Fallow Field (RECENT-RESTINGROW CROP FIELD)
Fallow Field (OLD - GRASS,SHRUBS, TREES)
Nursery
Dairy
Orchard
Confined Animal Feeding
Rural Residential
Irrigation
Gravel Pit
Other:
SubmergedVegetation
Other:
01/27/2011NWCA Buffer Sample Plots
Fill bubble if present - Plot 1 2 3 Flag
0 1 2 3 4
0 1 2 3 4
0 1 2 3 4
0 1 2 3 4
0 1 2 3 4
Bare dirt 0 1 2 3 4
Litter, duff 0 1 2 3 4
Rock 0 1 2 3 4
Water 0 1 2 3 4
Leaf Type: B N
Canopy Type: D E Absent:BufferPlot 2
0 1 2 3 4
Herbs, Forbs andGrasses
Woody Shrubs, Saplings(<0.5m HIGH)
Woody Shrubs, Saplings(0.5m-5m HIGH)
0 1 2 3 4
0 1 2 3 4
0 1 2 3 4
0 1 2 3 4
0 1 2 3 4
Bare dirt 0 1 2 3 4
Litter, duff 0 1 2 3 4
Rock 0 1 2 3 4
Water 0 1 2 3 4
Leaf Type: B N
Canopy Type: D E Absent:BufferPlot 3
0 1 2 3 4
Herbs, Forbs andGrasses
Woody Shrubs, Saplings(<0.5m HIGH)
Woody Shrubs, Saplings(0.5m-5m HIGH)
SubmergedVegetation
SubmergedVegetation
Woody Shrubs, Saplings(<0.5m HIGH)
Woody Shrubs, Saplings(0.5m-5m HIGH)
Small Trees (<0.3m DBH)
Big Trees (>0.3m DBH)
Other: Other:
Small Trees (<0.3m DBH)
Big Trees (>0.3m DBH)
Small Trees (<0.3m DBH)
Big Trees (>0.3m DBH)0 1 2 3 4
0 1 2 3 4
0 1 2 3 4
0 1 2 3 4
0 1 2 3 4
Bare dirt 0 1 2 3 4
Litter, duff 0 1 2 3 4
Rock 0 1 2 3 4
Water 0 1 2 3 4
Leaf Type: B N
Canopy Type: D E Absent:BufferPlot 1
0 1 2 3 4
Herbs, Forbs andGrasses
Reviewed by (initial):
8621005046
DRAFT - NOT FOR U
SE IN FIE
LD

Confirm a filled data bubble indicates presence and an unfilled bubble indicates absence by filling in this bubble
Fill bubble if present - Plot 1 2 3 Flag
Flag Comments
Purple Loosestrife
Knotweed
Japanese Knotweed
Johnson Grass
Kudzu
Multiflora Rose
Himalayan Blackberry
Fill bubble if present - Plot 1 2 3 Flag Fill bubble if present - Plot 1 2 3 Flag
Eurasian Watermilfoil
Water hyacinth
Yellow Floating Heart
Giant Salvinia
Garlic Mustard
Other:
Location: AA CENTER N3 S3 E3 W3
DATE: 2 0 1 1Site ID: NWCA11-
Poison Hemlock
Mile-A-Minute Weed
Birdsfoot Trefoil
Perennial Pepperweed
Giant Reed
Cheatgrass
Reed Canary Grass
Common Reed
Common Buckthorn
Tamarisk
Other:
01/21/2011NWCA Buffer Sample Points ‐ Targeted Alien Species
FORM B-1: NWCA BUFFER SAMPLE PLOTS - TARGETED ALIEN SPECIES (Back)
Latitude North . Longitude West .
Center of Plot 3 orAA CENTER
(Decimal Degrees)
PLOT COORDINATES
/ /
Reviewed by (initial):
7568341903
DRAFT - NOT FOR U
SE IN FIE
LD
2011 NWCA Field Operations Manual Chapter 5. Vegetation
5 - 1
Chapter 5. Vegetation
See also APPENDIX C. VEGETATION SUPPLEMENTARY MATERIAL – LISTS OF FLORISTIC RESOURCES
Introduction. . . . . . . . . . . . . . . . . . . . . . . . . . . . . . . . . . . . . . . . . . . . . . . . . . . . . . . . . . . . . . . . . . . . . . . . 5.1 SAMPLING PROCEDURES. . . . . . . . . . . . . . . . . . . . . . . . . . . . . . . . . . . . . . . . . . . . . . . . . . . . . . . 5.1.1 Placement of the Vegetation Plots. . . . . . . . . . . . . . . . . . . . . . . . . . . . . . . . . . . . . . . . . . . . . . . 5.1.1.1 Key Concepts For All Veg Plot Layout Configurations . . . . . . . . . . . . . . . . . . . . . . . . . . . . 5.1.1.2 Standard Veg Plot Layout. . . . . . . . . . . . . . . . . . . . . . . . . . . . . . . . . . . . . . . . . . . . . . . . . . 5.1.1.3 Wide Polygon AA Veg Plot Layout . . . . . . . . . . . . . . . . . . . . . . . . . . . . . . . . . . . . . . . . . . . . 5.1.1.4 Narrow Polygon AA Veg Plot Layout. . . . . . . . . . . . . . . . . . . . . . . . . . . . . . . . . . . . . . . . . . 5.1.1.5 Wetland Boundary AA Veg Plot Layout . . . . . . . . . . . . . . . . . . . . . . . . . . . . . . . . . . . . . . . . 5.1.1.6 Obstacle Veg Plot Layout. . . . . . . . . . . . . . . . . . . . . . . . . . . . . . . . . . . . . . . . . . . . . . . . . . . 5.1.2 Establishing the Vegetation Plots. . . . . . . . . . . . . . . . . . . . . . . . . . . . . . . . . . . . . . . . . . . . . . . . 5.1.3 Vegetation Data Collection. . . . . . . . . . . . . . . . . . . . . . . . . . . . . . . . . . . . . . . . . . . . . . . . . . . . . 5.1.3.1 Activities Key to Veg Data Collection . . . . . . . . . . . . . . . . . . . . . . . . . . . . . . . . . . . . . . . . . . 5.1.3.2 Collecting Vascular Plant Species Presence Data and Creating Species List . . . . . . . . . . . 5.1.3.3 General Cover Estimation Procedures . . . . . . . . . . . . . . . . . . . . . . . . . . . . . . . . . . . . . . . . . 5.1.3.4 Vascular Plant Species Height and Cover Data . . . . . . . . . . . . . . . . . . . . . . . . . . . . . . . . . . 5.1.3.5 Predominant Status and Trends Wetland Class . . . . . . . . . . . . . . . . . . . . . . . . . . . . . . . . . 5.1.3.6 Vertical Strata Data for Vascular Vegetation . . . . . . . . . . . . . . . . . . . . . . . . . . . . . . . . . . . . . 5.1.3.7 Non-Vascular Taxonomic Group Data . . . . . . . . . . . . . . . . . . . . . . . . . . . . . . . . . . . . . . . . .. 5.1.3.8 Ground Surface Attribute Data . . . . . . . . . . . . . . . . . . . . . . . . . . . . . . . . . . . . . . . . . . . . . . . 5.1.3.9 Snag Count and Tree Species Count and Cover Data . . . . . . . . . . . . . . . . . . . . . . . . 5.1.4 Field Day Wrap-Up Activities . . . . . . . . . . . . . . . . . . . . . . . . . . . . . . . . . . . . . . . . . . . . . . . . . . . 5.2 SAMPLE COLLECTION AND PROCESSING AND DATA HANDLING . . . . . . . . . . . . . . . . . . . . . 5.2.1 Collecting Plant Specimens . . . . . . . . . . . . . . . . . . . . . . . . . . . . . . . . . . . . . . . . . . . . . . . . . . . . 5.2.2 Pressing Plant Specimens. . . . . . . . . . . . . . . . . . . . . . . . . . . . . . . . . . . . . . . . . . . . . . . . . . . . . 5.2.3 Plant Sample Tag and Plant Specimen Label . . . . . . . . . . . . . . . . . . . . . . . . . . . . . . . . . . . . . . 5.2.4 Drying Plant Specimens . . . . . . . . . . . . . . . . . . . . . . . . . . . . . . . . . . . . . . . . . . . . . . . . . . . . . . 5.2.5 Shipping or Transporting Plant Specimens . . . . . . . . . . . . . . . . . . . . . . . . . . . . . . . . . . . . . . . . 5.2.6 Data Handling. . . . . . . . . . . . . . . . . . . . . . . . . . . . . . . . . . . . . . . . . . . . . . . . . . . . . .. . . . . . . . . 5.3 LITERATURE CITED . . . . . . . . . . . . . . . . . . . . . . . . . . . . . . . . . . . . . . . . . . . . . . . . . . . . . . . . . . . . 5.4 VEGETATION PROTOCOL CHECKLISTS AND REFERENCE CARDS . . . . . . . . . . . . . . . . . . . . Vegetation Protocol Task Checklist Reference Card V-1. Flow Chart of Vegetation Protocol Tasks Reference Card V-2, Side A. Key for Veg Plot Placement and Example Plot Layout Configurations Reference Card V-2, Side B. Veg Plot Layout Configuration Continued Reference Card V-3, Side A. Vegetation Plot Establishment Reference Card V-3, Side B. Veg Plot Configuration and Data Collection Summary Reference Card V-4, Side A. Cover Estimation Procedures. Reference Card V-4, Side B. Assigning Pseudonyms for Unknown Plant Species 5.5 EQUIPMENT LIST, DATA FORMS, SPECIMEN LABELS. . . . . . . . . . . . . . . . . . . . . . . . . . . . . . . . Vegetation Equipment and Supply Checklist Form V-1 (front and back): NWCA Vegetation Plot Establishment Form V-2a (front and back), Form V-2b (continued): NWCA Vascular Species Presence and Cover Form V-3 (front): NWCA Vegetation Types Form V-3 (back): NWCA Ground Surface Form V-4a (front and back), Form V-4b (continued): NWCA Snag and Tree Counts and Tree Cover Plant Sample Tags Plant Specimen Label Form T-2: NWCA Unknown Plant Sample Tracking Form T-3: NWCA QA Plant Sample Tracking
5-3 5-5 5-5 5-6 5-6 5-7
5-10 5-10 5-11 5-11 5-15 5-16 5-19 5-25 5-27 5-29 5-29 5-29 5-30 5-31 5-34 5-35 5-36 5-38 5-40 5-42 5-43
5-45 5-45 5-49
5-61

2011 NWCA Field Operations Manual Chapter 5. Vegetation
5 - 2

2011 NWCA Field Operations Manual Chapter 5. Vegetation
5 - 3
CHAPTER 5. VEGETATION
Wetland plant species 1) represent diverse adaptations, ecological tolerances, and life history strategies, and 2) effectively integrate environmental conditions, species interactions, and human-caused disturbance. Data describing plant species composition and abundance and vegetation structure are powerful, robust, and relatively easy to gather. In addition, they can be used to derive myriad metrics or indicators that are useful descriptors of ecological integrity or stress (e.g., Lopez and Fennessy 2002, USEPA 2002, Pino et al. 2005, Bourdaghs et al. 2006, Quétier et al. 2007, Magee et al. 2008, Magee et al. 2010, Mack and Kentula 2010). For more detailed information about the rationale for indicator selection see "Ecological Indicators for the 2011 National Wetland Condition Assessment" (USEPA in prep.). Examples of the types of data to be collected are:
• Species composition and abundance - Native species - Alien species - Floristic quality - Guild composition - Community composition
• Vegetation structure The NWCA vegetation sampling methods were designed to address NWCA objectives, while meeting logistics constraints of the study. Vegetation protocols were informed by evaluating numerous existing sampling approaches and through discussions with many wetland scientists. Several existing applications of flexible-plot methods in wetland and upland vegetation types, as well as other wetland sampling approaches, were particularly useful in developing the NWCA vegetation methods, and we gratefully acknowledge these efforts (Magee et al. 1993, Peet et al. 1998, Mack 2007, Rocchio 2007, FGDC 2008, Jennings et al. 2008, Lee et al. 2008). Protocols in this chapter document the methods for vegetation sampling (Section 5.1 Sampling Procedures) for the National Wetland Condition Assessment (NWCA). A Vegetation Team (Veg Team) comprised of a Botanist/Ecologist and a Botanist Assistant collects the vegetation data. Field sampling for the NWCA takes place during peak growing season when most vegetation is in flower or fruit to optimize plant species identification and characterization of species abundance (see Chapter 2 for regional sampling index periods). Vegetation data collection in each Assessment Area (AA) is typically completed in one day. Collection and pressing of plant specimens is also usually conducted during the sampling day for each AA. Other activities such as plant specimen tracking, keying and identification of unknown species, drying plant specimens, and shipping specimens to appropriate herbaria may be initiated during the field sampling day, but will often be continued and completed as non-field day (Section 5.2 Sample Handling and Processing) or laboratory activities (USEPA 2011a). The Vegetation Protocols are outlined in the flowchart in Reference Card V-1 (next page) and summarized in other Reference Cards and the Vegetation Protocol Checklist. Reference Cards illustrate major protocol steps for Vegetation sampling. They are gathered together in Section 5.4 for easy access, but are also presented near the text for the applicable protocol. The Vegetation Equipment List, example Data Forms, and Plant Sample Tags and Labels are in Section 5.5. It will be useful to consult these materials when reading the protocols.

2011 NWCA Field Operations Manual Chapter 5. Vegetation
5 - 4
Reference Card V-1. Flowchart of Vegetation Protocol Tasks
Plant Specimen Collection, Processing, and Shipping
Collect specimens for all unknown plant species.
Randomly select and collect five known plant species for each AA for Quality Assurance check.
Complete Plant Sample Tag and Plant Specimen Label for each plant sample; then press specimen. Record number of plant samples collected at the site on Form T-1: Site and Sample Status/WRS Tracking. Dry specimens; then ship or deliver to designated herbarium or laboratory, enclosing the appropriate plant specimen tracking information (Form T-2 or T-3) in the shipping box.
Collecting Vegetation Data in the AA
3. Predominant Status &Trends Wetland Class for the 100-m2 Veg Plot (Form V-3 (Front)).
Select Veg Plot Layout configuration appropriate for the AA (Reference Card V-2).
Establish five 100-m2 (10X10m) Veg Plots at the locations designated for the selected Veg Plot Layout (Reference Cards V-2 and V-3, Side A; Form V-1). Once all five Veg Plots are established, collect the following data for each Veg Plot.
1. Plant species presence in nested 1-m2 and 10-m2 quadrats in the SW and NE corners of the 100-m2 Veg Plot, and across the 100-m2 Veg Plot (Reference Card V-3, Side B; Forms V-2a, b). 2. Percent cover estimates for all individual
vascular plant species across the entire 100-m2 Veg Plot and identification of the primary height class in which each species occurs (Reference Cards V-3, Side B and V-4; Forms V-2a, b).
4. Percent cover estimates across the 100-m2 Veg Plot for Vascular Vegetation Strata: a) submerged aquatic vegetation, b) floating aquatic vegetation, c), lianas, vines and epiphytes, d) all other vascular vegetation by height class (Form V-3 (Front)).
5. Percent cover estimates across the 100-m2 Veg Plot for non-vascular groups (ground bryophytes, ground lichens, arboreal bryophytes and lichens, filamentous or mat forming algae, and macroalgae) (Form V-3 (Front)).
6. Data describing ground surface attributes across the 100-m2 Veg Plot (Form V-3 (Back)).
7. Across the 100-m2 Veg Plot (Forms V-4a, b): • Percent cover estimates of live tree species by height class. • Counts of live trees by species and diameter class. • Counts of standing dead trees and snags by diameter class.

2011 NWCA Field Operations Manual Chapter 5. Vegetation
5 - 5
Key for Selecting Veg Plot Layout Configuration within the Assessment Area (AA)
1a AA type, any; no obstacles to Veg Plot placement……………………...……….…....……………….…...2
2a AA is a ½-ha circle………….....Standard Veg Plot Layout – Circular AA (Veg Plots on Two Axes) Section 5.1.1.2; Reference Card V-2, Plate 1 2b AA is not a circle or is < ½ha…………….……….……….Alternate Veg Plot Layouts go to……....3
3a AA is a ½-ha polygon……………...……………………………..…………………..……..…………....4
4a AA width and length > 30m…….Wide Polygon AA Veg Plot Layout (Veg Plots on Two Axes) Section 5.1.1.3; Reference Card V-2, Plate 2 4b AA is ≤ 30m wide ………..…...Narrow Polygon AA Veg Plot Layout (Veg Plots on One Axis) Section 5.1.1.4; Reference Card V-2, Plate 3
3b AA < ½ ha, but > 0.1ha; a polygon equaling wetland boundary…………………..………………… ..…………….……………....... Wetland Boundary AA Veg Plot Layout (Veg Plots Distributed) Section 5.1.1.5; Reference Card V-2, Plate 4
1b AA type, any; obstacles (deep water; wide, deep channels; cliffs; other physical barriers; etc.) to Veg Plot placement……………………………………..……Obstacle Veg Plot Layout (Veg Plots Distributed) Section 5.1.1.6; Reference Card V-2, Plate 5
5.1 SAMPLING PROCEDURES Vegetation is characterized by collecting data describing vegetation structure, and individual plant species presence and percent cover in five 100-m2 Vegetation (Veg) Plots that are placed systematically in the AA. In addition, cover of various biotic and abiotic surface materials are collected in each Veg Plot. Detailed protocols for collecting each kind of data and instructions for filling out data forms are found in this section (5.1). Protocols for plant specimen collection and processing are in Section 5.2. Prior to beginning field work for the day, compile data forms and organize the equipment needed for vegetation data collection activities (See Chapter 2). The vegetation equipment checklist, examples of data forms, plant specimen labels, plant sample tags, and tracking forms are provided in Section 5.5. Forms and labels with preprinted NWCA site numbers will be provided for each site prior to sampling. 5.1.1 Placement of the Vegetation Plots The Veg Team identifies locations for the five 100-m2 Veg Plots within the AA using guidelines for plot placement provided in this Section and summarized on Reference Card V-2, Sides A and B. Begin by identifying the appropriate Veg Plot Layout configuration for the AA being sampled using the key below.
Note that all Veg Plot Layout configurations are designed to provide an unbiased characterization of the vegetation of the AA surrounding the POINT in a manner that can consistently be applied by numerous field crews across the country.
2011 NWCA Field Operations Manual Chapter 5. Vegetation
5 - 6
• Locations of the Vegetation (Veg) Plots within circular 0.5-ha Standard AAs are
systematically determined using the Standard Veg Plot Layout. • Veg Plot locations for Alternate AA Layouts are identified using the Veg Plot Layout
key above to select the appropriate Alternate Veg Plot Layout configurations. Alternate Veg Plot Layouts are used only when the Standard Veg Layout will not fit into the AA.
• The Obstacle Veg Plot Layout is applied only when there are obstacles preventing the
placement of a Veg Plot in its designated location within any particular Veg Plot Layout type.
5.1.1.1 Key Concepts for All Veg Plot Layout Configurations Wetlands can be fragile ecosystems. Minimize foot traffic to limit crushing vegetation and compacting soils and to avoid trampling the AA prior to sampling. • Before beginning Veg Plot establishment, make a plan for limiting the number of
traverses across the AA as work is conducted. • The AA CENTER is a focal location for Veg Plot Layout so some trampling at the
CENTER is unavoidable; however, limit the disturbance radius as much as possible. • In most AAs, Veg Plots are placed at specified distances along plot placement lines
extending outward from the CENTER of the AA (see illustrations on Reference Card V-2). These plot placement lines are represented by imaginary lines extending from the CENTER of the AA outward.
• The plot placement lines will receive considerable foot traffic during Veg Plot set-up
and sampling. Veg Plots are typically placed immediately to the left side of plot placement lines (when facing the AA boundary from the CENTER) to avoid walking in the Veg Plots prior to sampling.
5.1.1.2 Standard Veg Plot Layout – Veg Plots on Two Axes in a ½-ha Circular AA In the Standard AA five 100-m2
Veg Plots are distributed as depicted in the Standard Veg Plot Layout (see Reference Card V-2, Plate 1). Position Veg Plots along the four cardinal (north, east, south, west) directions from the CENTER of the AA. Number the Veg Plots in clockwise order from Veg Plot 1 near the AA CENTER to Veg Plot 5 along the eastern plot placement line.
• To avoid the trampled area at the AA CENTER, place Veg Plot 1 approximately 2m from the AA CENTER as indicated in Reference Card V-2, Plate 1.
• Place Veg Plot 2 to the east side (e.g., to the left when facing outward from the AA
CENTER) of the south plot placement line with its northern edge 10m from the southern edge of Veg Plot 1.

2011 NWCA Field Operations Manual Chapter 5. Vegetation
5 - 7
• Place Veg Plot 3 to the south side of the west plot placement line 15m from the AA
CENTER. • Place Veg Plot 4 to the west side of the north plot placement line 15m from the AA
CENTER. • Place Veg Plot 5 to the north side of the east plot placement line 20m from the AA
CENTER. 5.1.1.3 Wide Polygon AA Veg Plot Layout – Veg Plots on Two Axes in ½-ha Polygon AA with Width and Length > 30m If the wetland in which the POINT occurs is greater than or equal to 0.5ha, but has dimensions < 80m in at least one direction, the AA will be configured as a polygon. Recall that the Polygon AA may be a rectangle, may have more than four sides, or may have sinuous edges paralleling the wetland boundary depending on conditions at the study site (see Chapter 3). If the Polygon AA is greater than 30m in width and length, use the Wide Polygon AA Veg Plot Layout to determine Veg Plot locations (see Reference Card V-2, Plate 2) along plot placement lines that are oriented on the compass bearings of the long and short axes of the AA and intersecting the AA CENTER. Polygon AA > 40m wide (see Reference Card V-2, Plate 2 - Example A) – • Place the Veg Plots in a configuration matching as closely as possible the Standard
Veg Plot Layout, while distributing plots evenly along plot placement lines. Note distances from the AA CENTER to each Veg Plot may have to be lengthened or contracted compared to the Standard Veg Plot Layout based on the distance from the AA CENTER to its edge.
• Locate each Veg Plot to the left side of the plot placement line when looking from the
AA center to the AA edge. Number Veg Plots in clockwise order with Veg Plot 1 nearest the AA center.
Polygon AA < 40m, but > 30m wide (see Reference Card V-2, Plate 2 - Example B) – • Place one Veg Plot along one of the plot placement lines making up the short axis of
the AA so that the plot is mid-way between the CENTER and the AA boundary. Locate the Veg Plot on the left side of the plot placement line, when looking from the AA CENTER to its edge.
• Evenly distribute the other four Veg Plots along the long axis of the AA, placing plots to
left side of the plot placement lines when looking from the AA CENTER to its edge. • Number Veg Plots consecutively from one end of the long axis of the AA to the other.

2011 NWCA Field Operations Manual Chapter 5. Vegetation
5 - 8
Reference Card V-2, Side A. Key for Veg Plot Placement and Examples of Plot Layout Configurations.Examples of Additional Layout Configurations on Side B. Note scales vary among example diagrams.
Plate 1. Standard Veg Plot Layout –Circular AA (½ hectare)
4
40m
N
3
2
1
515m
15m
20m
10m
Place Veg Plots at specified locations on plot placement lines oriented through the AA CENTER on cardinal directions. Veg Plot 1 is placed 2m from the CENTER.
Key for Selecting Veg Plot Layout Configuration within the Assessment Area (AA)
1a AA type, any; no obstacles to Veg Plot placement………………………………………………………..……………………....……………………...2
2a AA is ½-ha circle…………………..……………………………………………………………Standard Veg Plot Layout – Circular AA (Plate 1)2b AA is not a circle or is < ½ ha………..…………….……………………………………………….Alternate Veg Plot Layouts go to ..……....3
3a AA is a ½ ha polygon ……………...…….………………………………………..…………………..………………………………………..……….……....44a AA has width and length > 30m………………….………………………….…..…Wide Polygon AA Veg Plot Layout (Plate 2)4b AA is ≤ 30m wide ……………………………………..…………..……...........…..Narrow Polygon AA Veg Plot Layout (Plate 3)
3b AA < ½ ha, but > 0.1ha; a polygon equaling wetland boundary........Wetland Boundary AA Veg Plot Layout (Plate 4)
1b AA type, any; obstacles (deep water; wide, deep channels; cliffs, other physical barriers, etc.) to Veg Plot placement……………………………………………………………………….……………………………..….…………...………Obstacle Veg Plot Layout (Plate 5)
Plate 2. Wide Polygon AA Veg Plot Layout – AA = ½ hectare polygon, width and length > 30m.
Place Veg Plots along plot placement lines originating from CENTER and defined by long and short axes of AA.
Example A – Wide Polygon AAs with width > 40 m: Place Veg Plots in a configuration matching the Standard Veg Plot Layout as closely as possible, while distributing Veg Plots relatively evenly along plot placement lines.
Example B – Wide Polygon AAs with width 30 to 40 m: Place 1 Veg Plot mid-way between the CENTER and AA boundary along only one placement line of the short axis, and 4 Veg Plots at uniform distances along long axis.
61m
82m
2
4
3
1
5
40m
125m
1
3
2
4
5
Example A
Example B
Veg Plot
AA Center
AA boundaries
Plot placement line
Shallow water
Deep water (not sampleable)
Patterns = Community types

2011 NWCA Field Operations Manual Chapter 5. Vegetation
5 - 9
Reference Card V-2, Side B. Plot Layout Configuration continued
Plate 3. Narrow Polygon AA Veg Plot Layout – AA is a ½-ha polygon ≤ 30 wide
Plate 4. Wetland Boundary AA Veg Plot Layout – AA (0.1ha to < 0.5ha) = wetland boundary
Example A: AA ≈ 0.14ha
30m
N
1
4
23
5
Example C: AA ≈ 0.22ha
20m
N1
2 34
5
Example B: Wetland Boundary AA ≈ 0.4ha
N
60m
3
2
5
4
1
LargeBoulder
Plate 5. Obstacle Veg Plot Layout – AA any type
Obstacles prohibit placement of Veg Plots at designated locations for the appropriate Veg Layout configuration.
Distribute Veg Plots as closely as possible to locations designated in the Veg Layout Configuration appropriate to AA type, while avoiding obstacles and aiming for at least 10m between Veg Plots.
4
40m
3
2
Example A: Standard Circular AA = 0.5ha
N
Tide Channel 1
5
Example B: AA ≈ 0.20ha
40m
N
1
5
4
3
2
Distribute the 5 Veg Plots using the most efficient arrangement to fit them in and cover the AA. Where possible arrange Veg Plots to conform with Standard or Polygon Layout configurations.
Orient Veg Plots on cardinal directions when possible, but if space is limiting orient individual Veg Plots to bearings allowing them to fit in the AA.
165m
30
m 1
2 4
3 5
Example A:
200m
25
m
2
5
43
1
Example B:
For Polygon AAs 25 to 30m wide, alternate Veg plots along one plot placement line oriented on the long axis of the AA.
For Polygon AAs 20 to 25m wide, center Veg plots along one plot placement line oriented on the long axis of the AA.
2011 NWCA Field Operations Manual Chapter 5. Vegetation
5 - 10
5.1.1.4 Narrow Polygon AA Veg Plot Layout – Veg Plots on One Axis in ½-ha Polygon AA ≤ 30m wide The Narrow Polygon AA Veg Plot Layout (Reference Card V-2, Plate 3) is used for ½-ha Polygon AAs that are ≤ 30m wide. AAs of this type might occur in long narrow riparian areas bordering small streams or along lake or pond shorelines. AAs < 20m wide are not sampleable (Chapter 3). All Polygon AAs ≤ 30m wide – • The plot placement line is oriented on the long axis of the AA and passes through the
AA CENTER. The plot placement line may be: o A straight line, as in the case of a narrow rectangle (see Reference Card V-2,
Plate 3 - Example A). o A sinuous line that parallels the shape of an AA with its width defined by a
wetland edge (see Reference Card V-2, Plate 3 - Example B).
• Evenly distribute Veg Plots along the plot placement line and number them in sequence along the long axis of the AA.
Polygon AA width 25 to 30m – • Place Veg Plots alternately on opposite sides of the plot placement line (see
Reference Card V-2, Plate 3 - Example A). Polygon AA width > 20 up to 25m – • Center Veg Plots on the plot placement line (see Reference Card V-2, Plate 3 -
Example B). Take care to avoid trampling in the middle of the plots while moving around the AA.
5.1.1.5 Wetland Boundary AA Veg Plot Layout –Veg Plots Distributed Across a Wetland Boundary AA (< 0.5ha but > 0.1ha)
When the wetland in which the POINT occurs is smaller than 0.5ha but greater than or equal to 0.1ha, the AA equals the wetland boundary. Wetlands that are smaller than 0.1ha or less than 20m wide are not sampleable (Chapter 3). Use the Wetland Boundary AA Veg Plot Layout (Reference Card V-2, Plate 4) to distribute Veg Plots over small (< ½ha) Wetland Boundary AAs. • Distribute the 5 Veg Plots using the most efficient arrangement to fit them within the
AA and evenly cover the AA area. • Wherever feasible, arrange Veg Plots so they mirror as closely as possible the plot
placement patterns used in the Standard or Polygon Veg Plot Layout configurations. • When possible, orient individual Veg Plots on cardinal directions or along the
bearings for long and short axis of the AA. However, if the configuration of the AA prevents this, orient individual Veg Plots along bearings that allow them to fit in the AA.

2011 NWCA Field Operations Manual Chapter 5. Vegetation
5 - 11
5.1.1.6 Obstacle Veg Plot Layout – Veg Plots distributed around obstacles in any AA type Occasionally a Veg Plot cannot be placed at its designated location for a particular Veg Plot Layout configuration because of the presence of an obstacle creating unsafe or unsampleable conditions. In such situations, use the Obstacle Veg Plot Layout (see Reference Card V-2, Plate 5) to select a new location for the plot. The Obstacle Veg Plot Layout can be applied to any AA type; however, Veg Plots should be relocated only when absolutely
necessary, and should be done in a way that aims for at least 10m between plots.
If a Veg Plot cannot be sampled because more than 10% of the space in which it would fall is obstructed by unsafe or unsampleable conditions, then the plot may be moved. If a Veg Plot is relocated, position it as closely to the original location designated by the AA appropriate Veg Plot Layout as possible. An individual Veg Plot may be moved to an alternate location to: • Avoid areas of deep (> 1m) water, water < 1m deep but underlain by soft sediments
posing safety hazards, water < 1m deep but moving rapidly enough to pose safety hazards, or water likely to have widely varying depths during the sample period such as wide, deep tide channels.
• Avoid large patches of upland in the AA. However, the plot should not be moved
when there are microtopographic upland inclusions (e.g., hummocks or mounds). • Avoid other obstacles such as very large boulders (e.g., glacial erratics), cliffs, or
other physical barriers that would occupy a large portion of the Veg Plot.
5.1.2 Establishing the Vegetation Plots Establish the Veg Plots in the AA as closely as possible to their designated locations in the selected Veg Plot Layout configuration (Section 5.1.1, Reference Card V-2). Lay out all five 100-m2
Veg Plots before vegetation sampling begins so the Assessment Area-Buffer (AB) Team can find soil pit locations and avoid trampling the Veg Plots as they work. To set up the Veg Plots for an AA:
1) Double check header information on the front and back of Form V-1: Vegetation Plot Establishment to ensure the preprinted site number matches the site being sampled and fill in the sampling date.
2) Document which Veg Plot Layout configuration is used for sampling the AA by filling
in the appropriate bubble in the Vegetation Plot Layout section of Form V-1. 3) Establish Veg plots in whatever order is most convenient and causes the least
disturbance to the AA. Take care to avoid walking in the interior of a plot. 4) Number Veg Plots, 1 through 5, using conventions on Reference Card V-2. Place a
flag with the Veg Plot number in the SE corner of the four plots furthest from the CENTER to facilitate Soil Pit placement by the AB Team.

2011 NWCA Field Operations Manual Chapter 5. Vegetation
5 - 12
5) Complete the Plot Locations in Relation to the AA CENTER section of Form V-1.
Measure (e.g., using a meter tape or rangefinder) or if necessary (due to dense vegetation) estimate (e.g., by pacing) the distance of each Veg Plot from the AA CENTER along the pertinent plot placement line. Record this distance in the Estimated Distance field, and record the bearing from the AA Center along the plot placement line to the closest corner of the Veg Plot in the Bearing field of the form.
6) Set-up each Veg Plot as illustrated and described on Reference Card V-3, Side A.
Note, a variety of approaches may be used to demarcate the edges of the Veg Plot:
• Often the easiest method is to use four 10-m lengths of durable (e.g., nylon) rope or cord on which the 5-m point is marked with brightly colored, waterproof tape. This method offers high flexibility for use in open to dense vegetation types and the rope is compact and lightweight for carrying into the field.
• Only one set of four 10-m ropes or cords need be carried in the field. Use the four
ropes to measure the boundaries of each plot and then clearly mark boundaries with flagging. If desired, for sites near a road and with open vegetation, five sets of the four 10-m cord lengths can be carried in the field so the rope can be left in place at Veg Plot to clearly demarcate its edges during sampling.
• Other alternatives that some field crews prefer are using two 20-m lengths of rope
or one 40-m length with the 5 and 10-m points marked, or a 50-m tape. Note that ropes are more durable and easier to handle than a meter tape.
7) If an obstacle to Veg Plot placement occurs and one or more Veg Plots must be
moved from their normally designated locations in the selected Veg Plot Layout configuration, also
fill in the Obstacle Veg Plot Layout bubble on Form V-1.
• For example, in the situation where a Standard Veg Plot Layout is used and an obstacle necessitates moving a Veg Plot, fill the bubbles for both Standard Veg Plot Layout and the Obstacle Veg Plot Layout.
• Provide an explanation in the Notes section on the back of Form V-1 and
highlight the obstacle on the sketch map on the back of Form AA-1 or on the aerial photo used to document AA establishment.
8) Once all Veg Plots are established:
• Draw the plot placement lines and Veg Plot locations on the aerial photo (examples: Figures 5-1 and 5-2) annotated during AA establishment (Chapter 3). A Sharpie® (or similar) fine-point, permanent, silver marker works well for annotating the photo. If an aerial photo is unavailable or if too little space is available on the photo, draw Veg Plot locations on a sketch map on Form AA-1.
• Note any environmental gradients (e.g., slope, water depth) in the Notes section
(Form V-1, Back) and the gradient direction on the sketch map or aerial photo.
9) Once the AB Team has designated the Soil Pit names (A, B, C, D) and flagged their locations, record and label the pit positions on the aerial photo or sketch map.
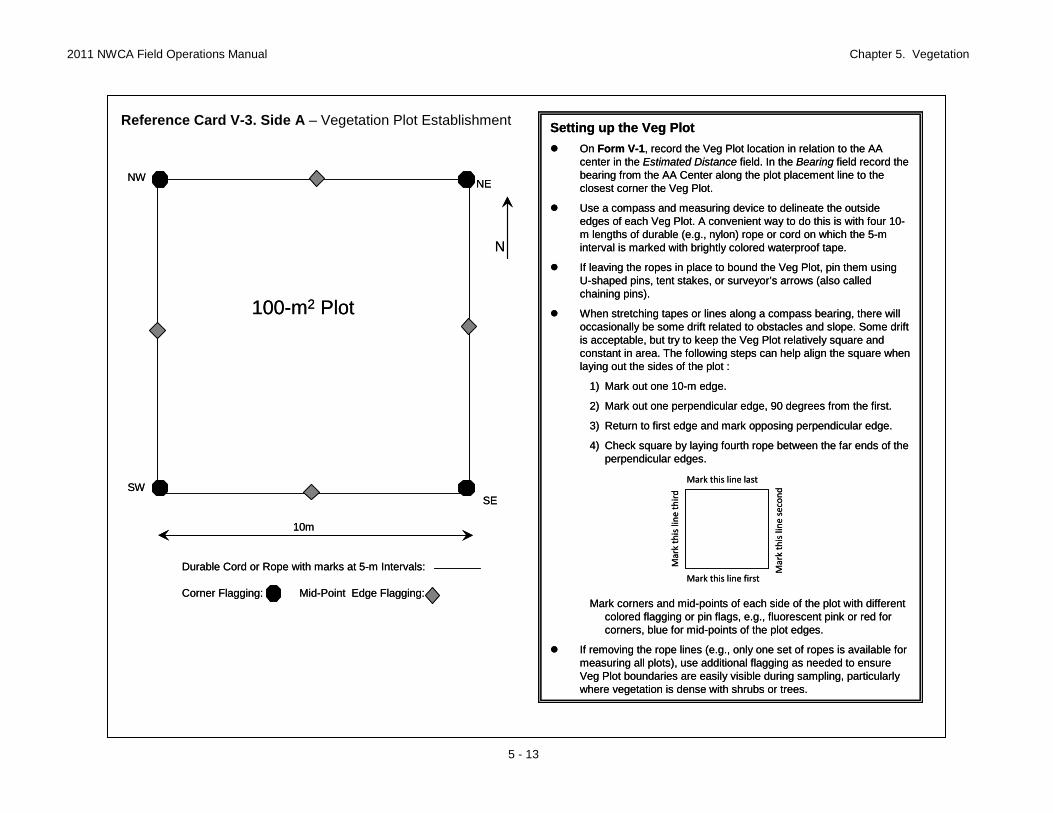
2011 NWCA Field Operations Manual Chapter 5. Vegetation
5 - 13
Reference Card V-3. Side A – Vegetation Plot Establishment
Durable Cord or Rope with marks at 5-m Intervals:
Corner Flagging: Mid-Point Edge Flagging:
N
SW
NWNE
SE
10m
100-m2 Plot
Setting up the Veg Plot On Form V-1, record the Veg Plot location in relation to the AA
center in the Estimated Distance field. In the Bearing field record the bearing from the AA Center along the plot placement line to the closest corner the Veg Plot.
Use a compass and measuring device to delineate the outside edges of each Veg Plot. A convenient way to do this is with four 10-m lengths of durable (e.g., nylon) rope or cord on which the 5-m interval is marked with brightly colored waterproof tape.
If leaving the ropes in place to bound the Veg Plot, pin them using U-shaped pins, tent stakes, or surveyor’s arrows (also called chaining pins).
When stretching tapes or lines along a compass bearing, there will occasionally be some drift related to obstacles and slope. Some drift is acceptable, but try to keep the Veg Plot relatively square and constant in area. The following steps can help align the square when laying out the sides of the plot :
1) Mark out one 10-m edge.
2) Mark out one perpendicular edge, 90 degrees from the first.
3) Return to first edge and mark opposing perpendicular edge.
4) Check square by laying fourth rope between the far ends of the perpendicular edges.
Mark corners and mid-points of each side of the plot with different colored flagging or pin flags, e.g., fluorescent pink or red forcorners, blue for mid-points of the plot edges.
If removing the rope lines (e.g., only one set of ropes is available for measuring all plots), use additional flagging as needed to ensure Veg Plot boundaries are easily visible during sampling, particularly where vegetation is dense with shrubs or trees.
Mark this line last
Mark this line first
Mar
k th
is li
ne th
ird
Mar
k th
is li
ne s
econ
d

2011 NWCA Field Operations Manual Chapter 5. Vegetation
5 - 14
Figure 5-1. Aerial photo from the site packet illustrating a Standard AA Layout annotated to show Veg Plot (white squares) locations and plot placement lines (dashed white arrows) for a Standard Veg Plot Layout.
N
40
KEY
POINT Wetland boundary
Standard Buffer Evaluation boundary
Standard Circular AA boundary AA CENTER
1
4 5
3
2

2011 NWCA Field Operations Manual Chapter 5. Vegetation
5 - 15
5.1.3 Vegetation Data Collection Several kinds of data (e.g., presence, percent cover, or counts) describing vegetation (for individual vascular species, vascular vegetation strata, non-vascular groups, and predominant Status &Trends wetland class) and data describing ground surface attributes are collected over the 100-m2 area of each Veg Plot (Forms V-2 through V-4). Additional presence data by plant species are collected in nested quadrats located at the SW and NE most corners of each Veg Plot and established in each Veg Plot as it is sampled. Reference Cards V-3, Side B and V-4 illustrate the configuration of the 100-m2 Veg Plot and its nested quadrats and summarize vegetation data collection activities.
KEY: POINT Wetland boundary
Approximate Polygon AA boundary
Standard Circular AA boundary
AA CENTER
N
30
1
2
3 4
5
Figure 5-2. Aerial photo from the site packet annotated to show Veg Plots (white squares) locations and plot placement lines (dashed white arrows) for a Wide Polygon AA Veg Plot Layout. Note the boundary of the Standard AA Layout (red) and the actual Polygon AA (blue).
2011 NWCA Field Operations Manual Chapter 5. Vegetation
5 - 16
Often an efficient approach to collecting vegetation data is for the Botanist Assistant to record data as the Botanist/Ecologist makes observations. At other times, it will be more efficient for the Botanist/Ecologist and Botanist Assistant to collect different kinds of data. For example:
Botanist/Ecologist collects all data that require identification or cover estimation of individual plant species.
Botanist Assistant collects data on cover of vegetation strata, ground surface attributes, groups of non-vascular taxa, and count data for trees and snags.
5.1.3.1 Activities Key to Vegetation Data Collection Several kinds of data are recorded, sampling activities conducted, and resources are consulted throughout the sampling day, which are essential to data quality. Site Number, Date, and Page Numbers – Note that in most cases the Site Number is preprinted on the forms (e.g., see Figure 5-3a-c), plant sample tags and plant specimen labels, so ensure that you use the correct set of forms, tags, and labels for the site being sampled. Be sure to record the date sampling is initiated wherever it is requested. If using forms or labels without preprinted site numbers, be sure to fill in the correct site number. If this information is incorrect or omitted, it may be impossible to connect data or plant specimens to a particular site, resulting in data loss. For forms that have multiple pages (Forms V-2 and V-4) be sure to fill in the page number for each page and the total number of pages (Figure 5-3a-c). Note the back of Form V-2a is unnumbered. Form Instructions and Using Capital Letters – Carefully follow all instructions on each data form. Use capital letters to neatly record species names on forms (see Figure 5-3a). Confirmation Bubbles (appear near top of some data forms) – Several forms have bubbles to fill to confirm aspects of how data are recorded. Read these statements carefully and fill in the bubbles as requested to confirm what empty data fields or unfilled data bubbles on a particular form mean. For example: On forms where cover data or counts (Forms V-2, V-3, and V-4) are recorded, one
kind of confirmation bubble indicates that empty data cells equal zero. On forms where presence/absence data or categorical data (Forms V-2 and V-3) are
recorded, one kind of confirmation bubble indicates that filled bubbles denote presence and unfilled bubbles denote absence.
Data Flags and Comments – There is space on all Forms V-2, V-3, and V-4 to flag data for which additional information or explanation may be needed. Standard flag types are predefined at the bottom of each form (e.g., E = end of
species list, K = no measurement, U = suspect measurement). For predefined flags, write the code for the flag in the Flag column in the appropriate data row. If necessary provide more information about the reason for the flag in the Flag and Comments section at the bottom or on the back side of each data form.
Additional flag codes may need to be created to describe other situations. For each
unique situation, create a flag code (e.g., F1, F2, F3...) and define the code in the Flag

2011 NWCA Field Operations Manual Chapter 5. Vegetation
5 - 17
and Comments section on the form. Flag codes are numbered consecutively, beginning with F1, on each set of V-2, V-3, or V-4 forms for the site.
Examples of how to use vegetation data flags are illustrated in Figure 5-3a-c, which
depicts imaginary data for pages of a set of Form V-2 for one AA. V-2 Forms are used for illustration because they are the most complex of the vegetation forms. One set of Form V-2: Vascular Species Presence and Cover pages is used to record data for vascular species presence, height, and cover for each AA. Form V-2a includes data collection instructions and several rows for recording plant
species data on the front, and provides space on the back for defining flags that might be associated with data on front of the form, as well as overflow space, if needed, for defining flags from the continuing Form V-2b pages. Form V2-b provides space for both species data and defining flags associated with the data.
In Figure 5-3a, two species, Corydalis aquae-gelidae and Kalmiopsis fragrans,
recorded on Form V-2a (front) are flagged (F1 and F2, respectively) to indicate there is additional information regarding these taxa. These flags are defined on the back of Form V-2a (Figure 5-3b). The explanation for the F2 flag for Kalmiopsis fragrans occupies two lines, so the flag code (F2) is repeated on both lines.
Note that flags defined on the Form V-2a (back) may refer to species data on Form
V-2a (front), page 1 of the V-2 set, or to flags from various pages of Form V-2b (continued). Consequently, flags on Form V-2a (back) should include, in the comment field, the page number (e.g., P1, P4 as illustrated in Figure 5-3b) to which the flag code refers. However, typically there should be enough room for most needed data flags at the bottom of each Form V-2b page (Figure 5-3c).
Nomenclatural Sources – Use the nomenclature in the USDA PLANTS database (USDA, NRCS 2010, http://plants.usda.gov/), hereafter PLANTS, when recording plant species names on Forms V-2: Vascular Species Presence and Cover and V-4: Snag and Tree Counts and Tree Cover. It is important to use the PLANTS nomenclature at each site so species names are based on a common taxonomic standard across all NWCA sites. In the Plant Species Nomenclature section of Form V-1: 1) Confirm that you have reconciled the names for the plant species observed at the site
to PLANTS nomenclature by filling in the USDA-PLANTS bubble.
2) Record the citations for the flora(s), field guides, or databases you used in identifying plant species at the site. Include author(s), publication date, title, and publisher. If the reference you are using is listed in the Regional Floras and Botanical Field Guides section of Appendix C (Supplementary Vegetation Material), you need only record the author(s) and publication date for the floristic source.
3) Occasionally a species might occur for which there is no name or synonym in
PLANTS; e.g., a recently described species or an occurrence of a newly introduced species. For a species with no synonym in PLANTS do one of the following:
a) Flag the data recorded for this species on Form V-2 or V-4 and record the
botanical authority for the species (e.g., Figure 5-3a, b, Kalmia fragrans Meinke & Kaye, sp. nov., (Meinke and Kaye 2007)).
2011 NWCA Field Operations Manual Chapter 5. Vegetation
5 - 18
b) Make a note next to the citation on Form V-1 for the flora, field guide, or database used to identify the species. Include a flag next to where the species is listed on Form V-2 or V-4, (e.g., F1 – species name is from source #1 listed on Form V-1).
Regional or Site Specific Species Lists – When identifying plant species, it can be helpful to consult existing plant species lists for similar habitats in the region of the AA you are sampling. If such lists are available, include them in the Site Packet for the AA (see Chapter 2) or carry them in the vehicle with your other floristic resources. Other Floristic Resources –A range of useful floristic resources are listed in Appendix C. Tree and Shrub Species Identification – The Botanist Assistant may often collect tree cover and count data in each Veg Plot (Section 5.1.3.9), so it will be useful to keep a list of the scientific names or pseudonyms for tree species observed in the Veg Plots on his or her clipboard. If needed, the Botanist/Ecologist can convey key distinguishing characteristics for tree species to the Botanist Assistant. Plant Specimen Collection –Specimens of all unknown plant species and a voucher specimen for one randomly selected species of known identity occurring in each Veg Plot is collected for later identification or taxonomic verification. Unknown plant specimens are typically collected over the entire sampling day as they are encountered. One randomly selected species of known identity is collected from each Veg Plot (i.e., 5 specimens/AA) for quality assurance checks. Section 5.2 details plant specimen collection and handling procedures. An overview is outlined here:
1) For each species that needs to be collected, fill in the appropriate bubble to designate
the sample as an unknown species or as a QA sample (see Section 5.2) under the Complete if Collecting section of Form V-2: Vascular Species Presence and Cover (Figure 5-3a, c). Once the plant sample is collected, assign it a collection number and record in the Collect # field of Form V-2. Collection numbers are assigned beginning with 1 and continued consecutively in order of observation or collection.
2) For each species collected, place enough fresh plant material for a complete specimen
(see Section 5.2) into a plastic bag (e.g., 1 gallon zipper-lock or larger bag, if necessary). Write the Site Number and the Collection Number for the specimen on the outside of the bag with a water proof marker or on a slip of water proof paper placed inside the bag. Bagging plants individually can help keep plant parts together and prevent mixing different species.
However, if it is easier, multiple species can be placed into larger bags. If more than one specimen is included in a single bag, be sure they can be easily distinguished from one another and related to their collection numbers from Form V-2. For example, tag individual species by bundling plant material by the stems with masking tape or a strip of flagging and labeling with the collection number.
3) Keep specimen collection bags out of the sun and cool during the sampling day.
4) Press plant specimens as soon as possible. When specimens are pressed (usually at the end of the sampling day, Sections 5.1.4 and 5.2.2) a completed Plant Specimen Label is included with each specimen inside its newsprint folder, and an adhesive Plant Sample ID Tag affixed to the outside of the newsprint (Section 5.2.3).

2011 NWCA Field Operations Manual Chapter 5. Vegetation
5 - 19
Sensitive Plant Species – Avoid collecting plant species that are listed as THREATENED, ENDANGERED, or SENSTIVE (TES), or are easily destroyed if collected (e.g., many orchid species). Become familiar with national and state TES species lists relevant to the state in which you are working and with wetland TES species in particular. Photograph TES species using the guidance in Appendix D: Photography. Add a flag to the data recorded for this species on Form V-2 or V-4 (e.g., F1 – Threatened in Oregon, photo taken; see example on Figure 5-3a,b). 5.1.3.2 Collecting Vascular Plant Species Presence Data and Creating Species List One set of Forms V-2: Vascular Species Presence and Cover (V-2a (Front) V-2a (Back), and V-2b (Continued)) is used to record data for vascular species presence (this section), height, and cover for each AA (Sections 5.1.3.3 – 5.1.3.4). On these forms, a row represents data for an individual plant species; columns represent data elements for each Veg Plot. Several V2-b pages may be required for each AA depending on how many species are present. Species presence data are collected from nested quadrats located in the SW and NE most corners of each 100-m2
Veg Plot (Reference Card V-3, Side B). Presence data are collected first to begin building the species list for the Veg Plot and to prevent trampling of the quadrats before the presence data is obtained.
Collect species presence data in both the 1-m2 and 10-m2
quadrats of one nest, then move to the other corner nest and repeat the procedure using the steps below.
1) Establish Quadrat Nests – Each nest is comprised of a 1-m2 and a 10-m2
quadrat and can be set-up in a variety of ways. For example:
• Outside edges of the 1-m2 and 10-m2 quadrats are formed by the edges of the 100-m2
Veg Plot demarcated by during plot establishment.
• Interior sides of the 1-m2
quadrat may be defined using (a) two 1m PVC poles, (b) two 1m long wooden slats, or (c) a 2m length of rope with the mid-point marked.
• The interiors of the 10-m2
quadrat can be set-up using (a) two 3.16m segmented PVC poles, or (b) a 6.32m length of rope with the mid-point marked.
• Any of the items used for the inside quadrat edges can be placed on the ground in open or herbaceous vegetation, or threaded through or over the top of shrubby vegetation. If obstacles prevent leaving these materials in place, measure the distance to the quadrat corners and mark quadrat edges with flagging.
2) Create the Plant Species List – As each species is observed during sampling (See 4,
below), enter its name in the Species Name or Pseudonym column on Form V-2 (Figure 5-3). • Initiate a species list for Form V-2 by recording the names of all species
encountered in the first nested corner sampled. • If the species identity is known, record the full binary genus and species name. • If the species identity is unknown, give it a descriptive pseudonym (See 3, next).

2011 NWCA Field Operations Manual Chapter 5. Vegetation
5 - 20
• Continue adding species to Form V-2 as they are encountered during collection of species presence in the second nested corner.
• Once both corner nests have been searched, examine the entire 100-m2
Veg Plot for additional species. Add these species to Form V-2.
3) Assign Pseudonyms for Unknown Plant Species (Reference Card V-4, Side B) – The Botanist/Ecologist makes pseudonym assignments for unknown plant species using the following rules:
• If the genus name is known, but the species name is not, then a number and short
description of identifying characteristics is substituted for the species epithet (e.g., Carex 1 – winged stem, Carex 2 – tussock, Carex 3 – bidentate perigynia, Carex 4 – striped scale, Salix 1 – acuminate leaf, Salix 2 – hairy under-leaf). Numbers indicate how many unknowns occur in a single genus and should be included even if there is only one unknown species in the genus.
• Where neither genus nor species names are known, devise a descriptive name
reflecting growth habit, microhabitat, or some distinctive morphological feature (e.g., bunchgrass 1, pinnate-lf. aquatic herb, low shrub linear lf.).
• It is often useful to carry examples of unknown plants, in small individual ‘tagged
bouquets’, to keep pseudonyms straight; particularly when there are several unknown species in a single genus.
4) Collect Species Presence Data – For the NWCA, a plant is present if it is rooted in or
overhangs the sample unit (quadrat or Veg Plot). Make sure to look up when working in nested corners, as species overhanging the plot may be above your head
.
• Presence for a given species in smaller sample units implicitly includes its presence in larger sample units (e.g., if a species is present in the 1-m2 quadrat it is also present in the10-m2quadrat and the100-m2
Veg Plot).
• For each species encountered in either the SW or NE quadrat nest of a plot, record the smallest quadrat size (S = 1-m2 or M = 10-m2
) in which a plant species is observed by filling in the appropriate data bubble (S or M) in the field for the SW or NE nest on Form V-2 (Figure 5-3a, c).
• If a species does not occur in a particular nest, but occurs in the 100-m2 Veg Plot, fill the L (large plot = 100-m2
) bubble for that nest (Figure 5-3a, c).
5) Correcting Plant Species Names on Forms During Data Collection – It is likely that (a) some taxa not initially recognized will later be identified, or (b) a species initially misidentified, will be later corrected. To make updates or corrections to names recorded on Form V-2 (or Form V-4) use a single line to strike out the pseudonym or erroneous name, then write the correct name above the lined-out name (Figure 5-3a). If there is not enough room to fit the correction in the species name field, add a flag to the species row and record the corrected name in the Flag and Comments section of the form (e.g., see Figure 5-3b, c).

2011 NWCA Field Operations Manual Chapter 5. Vegetation
5 - 21
Figure 5-3a. Example of Completed Form V-2a (Front). All data depicted on Figures 5-3a -5-3b are fictitious and for illustration only.
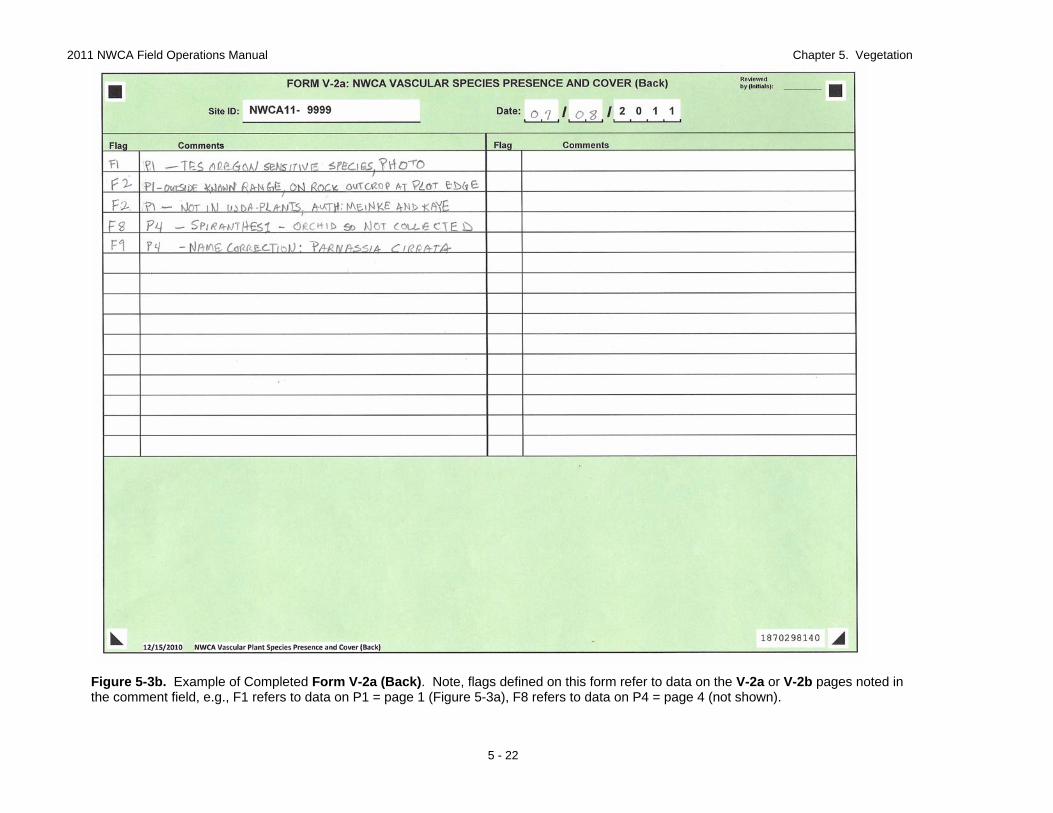
2011 NWCA Field Operations Manual Chapter 5. Vegetation
5 - 22
Figure 5-3b. Example of Completed Form V-2a (Back). Note, flags defined on this form refer to data on the V-2a or V-2b pages noted in the comment field, e.g., F1 refers to data on P1 = page 1 (Figure 5-3a), F8 refers to data on P4 = page 4 (not shown).

2011 NWCA Field Operations Manual Chapter 5. Vegetation
5 - 23
Figure 5-3c. Example of Completed Form V-2b (Continued). Note, the space for flags available at bottom of this form.
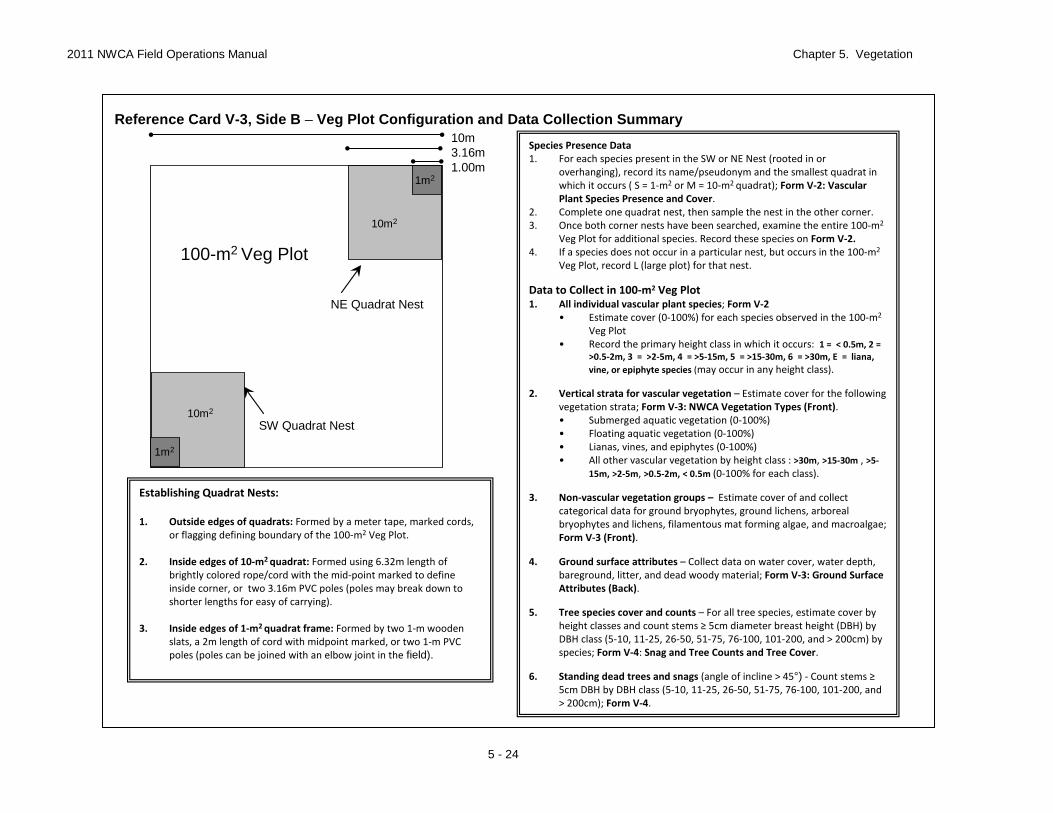
2011 NWCA Field Operations Manual Chapter 5. Vegetation
5 - 24
Species Presence Data1. For each species present in the SW or NE Nest (rooted in or
overhanging), record its name/pseudonym and the smallest quadrat in which it occurs ( S = 1-m2 or M = 10-m2 quadrat); Form V-2: Vascular Plant Species Presence and Cover.
2. Complete one quadrat nest, then sample the nest in the other corner.3. Once both corner nests have been searched, examine the entire 100-m2
Veg Plot for additional species. Record these species on Form V-2.4. If a species does not occur in a particular nest, but occurs in the 100-m2
Veg Plot, record L (large plot) for that nest.
Data to Collect in 100-m2 Veg Plot1. All individual vascular plant species; Form V-2
• Estimate cover (0-100%) for each species observed in the 100-m2
Veg Plot• Record the primary height class in which it occurs: 1 = < 0.5m, 2 =
>0.5-2m, 3 = >2-5m, 4 = >5-15m, 5 = >15-30m, 6 = >30m, E = liana, vine, or epiphyte species (may occur in any height class).
2. Vertical strata for vascular vegetation – Estimate cover for the following vegetation strata; Form V-3: NWCA Vegetation Types (Front).• Submerged aquatic vegetation (0-100%)• Floating aquatic vegetation (0-100%)• Lianas, vines, and epiphytes (0-100%)• All other vascular vegetation by height class : >30m, >15-30m , >5-
15m, >2-5m, >0.5-2m, < 0.5m (0-100% for each class).
3. Non-vascular vegetation groups – Estimate cover of and collect categorical data for ground bryophytes, ground lichens, arborealbryophytes and lichens, filamentous mat forming algae, and macroalgae; Form V-3 (Front).
4. Ground surface attributes – Collect data on water cover, water depth, bareground, litter, and dead woody material; Form V-3: Ground Surface Attributes (Back).
5. Tree species cover and counts – For all tree species, estimate cover by height classes and count stems ≥ 5cm diameter breast height (DBH) by DBH class (5-10, 11-25, 26-50, 51-75, 76-100, 101-200, and > 200cm) by species; Form V-4: Snag and Tree Counts and Tree Cover.
6. Standing dead trees and snags (angle of incline > 45°) - Count stems ≥5cm DBH by DBH class (5-10, 11-25, 26-50, 51-75, 76-100, 101-200, and > 200cm); Form V-4.
Establishing Quadrat Nests:
1. Outside edges of quadrats: Formed by a meter tape, marked cords, or flagging defining boundary of the 100-m2 Veg Plot.
2. Inside edges of 10-m2 quadrat: Formed using 6.32m length of brightly colored rope/cord with the mid-point marked to define inside corner, or two 3.16m PVC poles (poles may break down to shorter lengths for easy of carrying).
3. Inside edges of 1-m2 quadrat frame: Formed by two 1-m wooden slats, a 2m length of cord with midpoint marked, or two 1-m PVC poles (poles can be joined with an elbow joint in the field).
Reference Card V-3, Side B – Veg Plot Configuration and Data Collection Summary10m3.16m1.00m
100-m2 Veg Plot
NE Quadrat Nest
SW Quadrat Nest
10m2
1m2
10m2
10m2
1m2
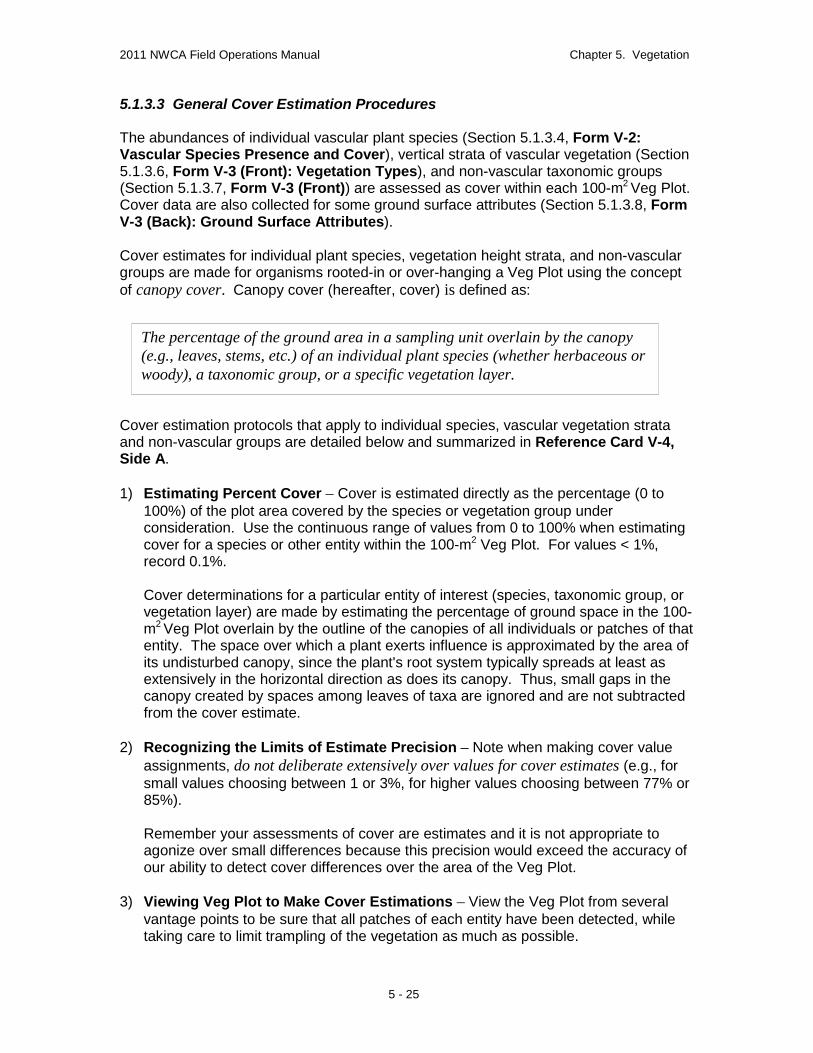
2011 NWCA Field Operations Manual Chapter 5. Vegetation
5 - 25
5.1.3.3 General Cover Estimation Procedures The abundances of individual vascular plant species (Section 5.1.3.4, Form V-2: Vascular Species Presence and Cover), vertical strata of vascular vegetation (Section 5.1.3.6, Form V-3 (Front): Vegetation Types), and non-vascular taxonomic groups (Section 5.1.3.7, Form V-3 (Front)) are assessed as cover within each 100-m2
Veg Plot. Cover data are also collected for some ground surface attributes (Section 5.1.3.8, Form V-3 (Back): Ground Surface Attributes).
Cover estimates for individual plant species, vegetation height strata, and non-vascular groups are made for organisms rooted-in or over-hanging a Veg Plot using the concept of canopy cover. Canopy cover (hereafter, cover) is defined as: Cover estimation protocols that apply to individual species, vascular vegetation strata and non-vascular groups are detailed below and summarized in Reference Card V-4, Side A. 1) Estimating Percent Cover – Cover is estimated directly as the percentage (0 to
100%) of the plot area covered by the species or vegetation group under consideration. Use the continuous range of values from 0 to 100% when estimating cover for a species or other entity within the 100-m2
Veg Plot. For values < 1%, record 0.1%.
Cover determinations for a particular entity of interest (species, taxonomic group, or vegetation layer) are made by estimating the percentage of ground space in the 100-m2
Veg Plot overlain by the outline of the canopies of all individuals or patches of that entity. The space over which a plant exerts influence is approximated by the area of its undisturbed canopy, since the plant's root system typically spreads at least as extensively in the horizontal direction as does its canopy. Thus, small gaps in the canopy created by spaces among leaves of taxa are ignored and are not subtracted from the cover estimate.
2) Recognizing the Limits of Estimate Precision – Note when making cover value assignments, do not deliberate extensively over values for cover estimates (e.g., for small values choosing between 1 or 3%, for higher values choosing between 77% or 85%).
Remember your assessments of cover are estimates and it is not appropriate to agonize over small differences because this precision would exceed the accuracy of our ability to detect cover differences over the area of the Veg Plot.
3) Viewing Veg Plot to Make Cover Estimations – View the Veg Plot from several
vantage points to be sure that all patches of each entity have been detected, while taking care to limit trampling of the vegetation as much as possible.
The percentage of the ground area in a sampling unit overlain by the canopy (e.g., leaves, stems, etc.) of an individual plant species (whether herbaceous or woody), a taxonomic group, or a specific vegetation layer.

2011 NWCA Field Operations Manual Chapter 5. Vegetation
5 - 26
Estimating Cover in 100-m2 Veg Plots
1. Cover estimates for various entities (individual plant species, vegetation height strata, non-vascular taxonomic groups, and ground surface attributes) are made in all five 100-m2 Veg Plots in an AA. Cover data are recorded on Forms V-2a,b, Forms V-3a,b, and Forms V-4a,b.
2. Cover estimates for individual plant species, vegetation height strata, and non-vascular groups are made for organisms rooted-in or over-hanging a Veg Plot.
3. Cover determinations for a particular entity of interest are made by estimating the percentage of ground space in a 100-m2 Veg Plot overlain by the canopies of all individuals or patches of that entity.
4. Cover values may range from 0 to 100% for a particular individual species or entity. Because species or other entities often overlie one another vertically, the combined cover for all species or entities may often exceed 100%.
5. Estimate cover directly as the percentage (0 to 100%) of the plot area covered by the species or entity under consideration. Cover may be estimated in 1% increments, however, do not deliberate excessively over values for cover estimates. For values < 1%, record 0.1%.
6. The figure to the right illustrates some examples of different levels of percent cover across 100-m2 Veg Plots.
55%
95%
1%
25%15%
< 1%, Record as 0.1%
4%
35%
6% 10%
45%
2%
75% 100%
65%
85%
Examples of Percent Cover Estimates. Each large square = a 100-m2 Veg Plot, grid squares = 1m2 = 1% cover in a Veg Plot, shaded areas represent cover of an individual species, a vegetation stratum, or of a non-vascular species group.
Reference Card V-4, Side A. Cover Estimation Procedures

2011 NWCA Field Operations Manual Chapter 5. Vegetation
5 - 27
4) Noting Horizontal and Vertical Distribution of Cover Across Veg Plot – When estimating cover, remember the pattern of distribution of particular species or entity might be aggregated or dispersed across a 100-m2
Veg plot (Reference Card V-4, Side A). Take care to detect low cover, widely dispersed taxa. Similarly, plant species or vegetation strata vary in height, and it is common for the canopies of species or vegetation layers to be distributed vertically, but overlie the same horizontal space.
5) Assigning cover values – It is helpful to visualize percent cover in terms of spatial areas within the 100-m2 Veg Plot, and to use this information to guide cover estimations for a particular species or entity. In a 10×10m Veg Plot, 1m2 is equivalent to 1% cover, a 3x3m block equals 9% cover, and a 5x5m block represents 25% of the area of the Veg Plot. Reference Card V-4, Side A provides examples of cover estimates reflecting different distributions and abundances for an individual entity (e.g., a species, a vegetation layer, or a taxonomic group) within a 100-m2
Veg Plot.
5.1.3.4 Vascular Plant Species Height and Cover Data Data collected for each vascular plant species occurring in a 100-m2
Veg Plot include its identity, the primary height class in which it occurs, and an estimate of its cover (See Reference Cards V-3, Side B and V-4, Side A). For each species, height and cover data can be collected concurrently.
1) Species Identity – Recall that during collection of species presence data (Section 5.1.3.2), you recorded, on the set of V-2: Species Presence and Cover forms for the AA, the names/pseudonyms of all species observed in the 100-m2
Veg Plot (Figure 5-3a-c). As you collect data on height class and estimate cover for each species in the Veg Plot, add any newly detected taxa you encounter to the Species Name or Pseudonym field of Form V-2.
2) Species Height Class – Estimate the predominant height class in which each species occurs across the Veg Plot. Record the height class number in the Height Class (Ht. Class) field on Form V-2 for the Veg Plot under consideration (Figure 5-3a, c). Height classes are defined below. Note that E class is a life form class that encompasses all vascular liana, vine, or epiphyte species, and which may occur in any height class.
Height Classes (except E, which may occur in any vertical stratum)
1 < 0.5m
2 >0.5 to 2m
3 >2 to 5m
4 >5 to 15m
5 >15 to 30m
6 >30m
E Liana, vine, or epiphyte species

2011 NWCA Field Operations Manual Chapter 5. Vegetation
5 - 28
3) Species Cover – Estimate percent cover for each species observed in the Veg Plot and record this data in the % Cover field of the appropriate plot on Form V-2 (Figure 5-3a,c). Use the following general guidelines, based on the complexity of the vegetation, to estimate cover for the plant species occurring in the 100-m2
Veg Plot.
• Cover for any individual plant species observed in a Veg Plot can range from 0 to 100%. However, because of vertical stratification of plant species within communities, the sum of the covers of all observed species often substantially exceeds 100%.
• View and search the Veg Plot from several vantage points (e.g., from several points
outside the plot and from the plot center) to detect and make cover estimates for all species that are present.
• When estimating cover of tall species (i.e., tall shrubs and trees) care should be taken to
try to visually project the Veg Plot boundaries upwards to frame the vertical sample area and identify the edges of the Veg Plot.
• Where species diversity is high, vegetation is patchy, or species are widely distributed
across the Veg Plot, it will likely be helpful, to make preliminary estimates of cover for different patches of a particular species in different parts of the Veg Plot (e.g., Species 1 may occur in patches of the following sizes: 1m2 = 1%, 7m2 = 7%, 25m2
= 25%). To keep track of these preliminary estimates while moving around the Veg Plot, record them in the Work Space field associated with the species of interest on Form V-2 (Figure 5-3a,c). Once all patches of the species in the Veg Plot are observed, the preliminary estimates can be combined to obtain the total percent cover for the species (e.g., continuing with the example above, Species 1 = 33%), which is then recorded in the % Cover field.
• If a Veg Plot is particularly complex or diverse, necessitating preliminary cover estimates for many species in a plot, it may be useful to employ a systematic procedure to do this. A recommended approach follows:
o Visually divide the 100-m2 Veg Plot into four 25m2
quarters. In each quarter of the Veg Plot, search for all species occurring in that quarter.
o Estimate the approximate percent area of the Veg Plot (remember 1m2 = 1%) occupied by each plant species present in the quarter (25% if the entire quarter is covered by a particular species since 25m2 = 25% of the entire 100-m2
Veg Plot). Record the percent area of the Veg Plot covered by each species in each quarter in the Work Space field for that species (see examples in Figure 5-3a,c).
o Once preliminary cover estimates for all four quarters of the Veg Plot are completed, sum the preliminary estimates for each species to obtain the total percent cover of that species in the Veg Plot. This final percent cover value is then recorded in the % Cover field for the species.
2011 NWCA Field Operations Manual Chapter 5. Vegetation
5 - 29
5.1.3.5 Predominant Status and Trends Wetland Class On Form V-3: NWCA Vegetation Types (Front), record the predominant Status and Trends (S&T) Wetland Class comprising each Veg Plot. See Reference Card AA-3, Side A and Chapter 3 for S&T class definitions. 1) If the Veg Plot S&T class is Pf - Palustrine Farmed (not currently in production), fill in the Pf
bubble in the Predominant S&T Class section of Form V-3 (front). Then select and fill the bubble indicating the predominant S&T class of the Veg Plot if it were never cropped. Recall, currently cropped Pf wetlands are not sampleable (Chapter 3 and USEPA 2011c).
2) If the S&T class of the Veg Plot is not Pf (not currently farmed), leave the Pf bubble unfilled.
Indicate the predominant S&T class by filling the appropriate S&T class bubble for the plot. 5.1.3.6 Vertical Strata Data for Vascular Vegetation One of the ways the NWCA assesses the vertical structure of wetland vegetation is to estimate the cover of nine vertical vegetation strata, defined in part by life form type and in part by height classes (Form V-3: NWCA Vegetation Types (Front), Reference Card V-3, Side B). Cover of all the species making up a particular vegetation stratum are estimated collectively and the total cover for an individual stratum can range between 0 and 100 percent. Because vegetation strata may overlie one another the combined cover for all vegetation strata may substantially exceed 100 percent. Estimate cover for each of the following strata across each Veg Plot: 1) Submerged aquatic vegetation (cover 0-100%) – rooted in sediment, most plant cover
submerged or floating on water.
2) Floating aquatic vegetation (cover 0-100%) – not rooted in sediment, floating on water. 3) Cover of all lianas, vines, and epiphytes (cover 0-100%). 4) Cover of all other
a) > 30m tall (0-100%): e.g., very tall trees vascular vegetation by height class:
b) >15 to 30m tall (0-100%): e.g., tall trees c) > 5 to 15m tall (0-100%): e.g., very tall shrubs, short to mid-sized trees d) > 2 to 5m tall (0-100%): e.g., tall shrubs; tree saplings e) 0.5m to 2m (0-100%): e.g., medium height shrubs; tree seedlings and samplings; tall
emergent/terrestrial herbaceous species f) < 0.5 m tall (0-100%): e.g., low emergent/terrestrial herbaceous species; low shrubs,
tree seedlings Record cover estimates for each vegetation stratum in the appropriate Veg Plot column in the % Cover Vascular Vegetation Strata section of Form V-3: NWCA Vegetation Types (Front). 5.1.3.7 Non-Vascular Taxonomic Group Data Bryophytes (mosses and liverworts) growing on ground-level surfaces, ground lichens, arboreal epiphytic bryophytes and lichens, filamentous or mat forming algae, and macroalgae can be

2011 NWCA Field Operations Manual Chapter 5. Vegetation
5 - 30
important components of many wetlands. Data for non-vascular taxonomic groups are collected in each 100-m2
Veg Plot and recorded in the % Cover and Categorical Data for Non-Vascular Taxa section on Form V-3 (Front): Vegetation Types (see also Reference Card V-3, Side B). Cover for each of these groups can range from 0-100%.
Bryophytes – Estimate the collective cover of mosses, and leafy and thalloid liverworts that are growing on ground surfaces, logs, rocks, etc. If the bryophyte layer is dominated by Sphagnum or other peat forming mosses, fill in the peat mosses bubble under the Bryophyte data row. Ground Lichens – Estimate the collective cover of all lichens growing on the ground or other ground layer substrate (e.g., boulders, fallen logs). Do not include arboreal lichens that have fallen from trees in this estimate. Arboreal Epiphytic Bryophytes and Lichens – If arboreal (living on shrubs and trees) bryophytes and lichens are present, estimate the amount of branch, twig, stem, or trunk surface area of woody vegetation in the Veg Plot that this group occupies. Make this estimate rapidly as you scan the available arboreal surface area. It is intended to give a gross indication of the amount of arboreal bryophytes and lichens present. Filamentous Or Mat Forming Algae – Estimate the collective cover of all unicellular or small algae that form visible and often extensive filaments or mats. Macroalgae – Estimate the collective cover of macroalgae. Macroalgae are found in freshwater (e.g., Chara) or tidal settings (seaweeds), and may occur in a wetland both as living, attached material or as wrack (algae that is broken free and/or washed into the wetland). Where macroalgae is present, indicate whether it is wrack, living material, or is of unknown status by filling-in the appropriate data bubbles for each Veg Plot. 5.1.3.8 Ground Surface Attribute Data Data describing surface attributes (water, bare ground, vegetative litter, and woody debris) of each 100-m2
Veg Plot are collected by the Veg Team (see also Reference Card V-3, Side B). Metrics describing these indicators include percent of the plot area covered by an attribute, and where appropriate, the type and depth of the attribute.
Collect and record the following data on Form V-3 (Back): Ground Surface Attributes in the appropriate fields:
Water – Estimate the area of the Veg Plot covered by water and measure water depth. 1) Water Cover – Estimate total percent of the Veg Plot area covered by water, then estimate
cover for three categories of water. The sum of the covers for water categories (a-c) should equal total water cover (e.g., total water cover across Veg Plot = 50% = 30% of Veg Plot with water and floating/submerged aquatic vegetation + 20% of Veg Plot with water and emergent vegetation). Total Water Cover – percent of Veg Plot area with water. a) % Veg Plot area with water and no vegetation. b) % Veg Plot area with water and floating/submerged aquatic vegetation. c) % Veg Plot area with water and emergent vegetation.

2011 NWCA Field Operations Manual Chapter 5. Vegetation
5 - 31
Where floating/submerged and emergent vegetation occur together, classify water type based on vegetation type with greatest cover. If cover of vegetation types is equal, then classify as water and emergent vegetation.
2) Water Depth – Measure water depth from 3 locations that represent the range of water
levels observed (minimum, predominant, maximum). Make depth measurements within 10 minutes of one another. Record the time, using a 24 hour scale, in the Time of Day field in the Water Depth section of the Form V-3 (Back). Depths may be measured using a ruler, meter stick, or a 1-m PVC pole with decimeter marks.
Bare Ground – Estimate the percent of the Veg Plot area occupied by each of the following: 1) Exposed Soil/Sediment. 2) Exposed Gravel/Cobble (~ 2mm to 25cm in diameter). 3) Exposed Rock (>25cm in diameter). The sum of these three elements of bare ground should not exceed 100%. Vegetative Litter – Litter may be overlain by other vegetation layers, but does not typically overlap with water or bare ground. Collect the following data: 1) Total Cover of Vegetative Litter, which may range from 0 to 100%. 2) Identify Predominant Litter Type(s) (all types having ≥ 25% cover), or if total litter cover is <
25% indicate Primary Litter Type): T = thatch (dead graminoid (e.g., grass, sedge, rush) leaves, rhizomes, or other material) F = forb C = coniferous tree E = broadleaf evergreen tree D = deciduous tree N = none
3) Measure litter depth in the center of the 1-m2
quadrat at the NE and the SW Veg Plot corners and record measurements in the appropriate Litter Depth (cm) field.
Woody Debris – Downed woody debris occurs at an angle of incline ≤ 45°. Estimate the percent of the of Veg Plot area covered by: 1) Downed Coarse Woody Debris (> 5cm diameter) 2) Downed Fine Woody Debris (< 5 cm diameter) Woody debris may overlay other vegetation or ground surface layers, so dead woody material in either category may range from 0 to 100%. 5.1.3.9 Snag Count and Tree Species Count and Cover Data Several structural attributes of woody vegetation are evaluated in the NWCA (see also Reference Card V-3, Side B), including: Counts of standing dead trees or snags (angle of incline ≥ 45°) that are > 5cm diameter
breast height (DBH) by DBH classes. Counts of trees (> 5cm DBH) by species in estimated DBH classes. Cover for trees species by estimated height classes. Early in the field season or during training the Veg Team will be calibrated to estimate DBH classes by using a diameter tape to measure a series of trees of different sizes to develop a

2011 NWCA Field Operations Manual Chapter 5. Vegetation
5 - 32
1 2 3 4 10765 98
search image for each DBH class. Height class estimation will also be practiced during training. Once calibrated, the Veg Team will be able to rapidly visually estimate whether a tree belongs in a particular DBH or height class. This snag and tree data for all five Veg Plots is recorded on Form V-4: Snag and Tree Counts and Tree Cover pages. Form V-4a (Front) (see Figure 5-4 for filled out example) is the first page of the set of V-4 forms. If the number of tree species exceeds the space provided on Form V-4a (Front and Back), use as many Form 4-Vb (Continued) pages as needed. 1) Presence of Trees or Snags – If live trees or snags are absent from a Veg Plot, indicate by
filling in the appropriate box in the Trees or Snags Absence section of Form V-4a (Front). If live trees or
snags are present collect the required count and cover data for the Veg Plot.
2) Standing Dead Tree and Snags Counts – Count the number of dead trees/snags that have angle of incline ≥ 45° (≤ 45° = downed woody debris, see Section 5.1.3.8) by DBH class (5-10, 11-25, 26-50, 51-75, 76-100,101-200 and > 200 cm), and record the values in the appropriate DBH columns of the Standing Dead Tree/Snag section on Form V-4a. If needed, while counting dead trees and snags, a running tally* can be kept in the gray workspace for each diameter class. Record the total number for each DBH class in the white data field.
*Tallying method – If needed, use the compact tallying method shown below to aid in counting snags or live trees. Each dot or line equals one snag or tree.
3) Live Tree Species Names/Pseudonyms and Plot Numbers – Record species names or
pseudonyms for live trees occurring in each Veg Plot in the designated rows on Form V-4.
a) If a pseudonym (Section 5.1.3.2, Reference Card V-4, Side B) is needed, use the same pseudonym for a particular unknown as recorded on Form V-2
.
b) When recording data for tree cover and counts in height classes, indicate the number of the Veg Plot
under consideration by filling in the appropriate bubble in the Plot # field next to the species name. If the same tree species occurs in multiple Veg Plots, you must write its name on a separate row on the form for each plot in which it occurs (i.e., each row represents one tree species in one plot).
c) If a new tree species is detected, i.e., one not observed when data for individual species (Form V-2) were collected, estimate its total cover and record this value and its species name or pseudonym on Form V-2.
If the newly observed tree species is an unknown, collect a specimen and record its collection number on Form V-2.
4) Cover of Live Trees in Height Classes – Record the percent cover (0-100%) for each tree species in each height classes (< 0.5m, >0.5-2m, >2-5m, >5-15m, >15-30m, and >30m).
5) Live Tree Counts – For each tree species in the Veg Plot, count individual trees by DBH
classes (5-10, 11-25, 26-50, 51-75, 76-100, 101-200 and > 200 cm). If needed, keep a running tally of trees for each species in the gray shaded workspace area for each DBH class. Record the total number for each species in each DBH class in the white data field.

2011 NWCA Field Operations Manual Chapter 5. Vegetation
5 - 33
Figure 5-4. Example of completed Form V-4a (Front). All data depicted on this figure are fictitious and for illustration only.

2011 NWCA Field Operations Manual Chapter 5. Vegetation
5 - 34
5.1.4 Field Day Wrap-Up Activities After completing the sampling of the five Veg Plots (this chapter) and the AA portion (Metrics 4-12) of from the USA-RAM (USEPA in review), the Veg Team conducts field day wrap-up activities. At the AA: 1) Complete collection of unknown and QA voucher specimens (Section 5.2.1): 2) Review all Vegetation Data Forms:
Botanist/Ecologist – Review Forms V-2 and V-4 for errors in species names and missing data. Make any needed corrections.
Botanist Assistant – Review Forms V-1 and V-3 for missing data. Veg Team – If needed, return to Veg Plots and collect any missing information.
3) Time permitting, begin plant identification and specimen pressing:
Botanist/Ecologist use any time available after vegetation sampling and plant specimen collection are completed to key out unknown plant species. For unknowns confidently keyed to species, update pseudonyms to scientific names on Forms V-2 and V-4.
If a plant press is available at the AA, Veg Team presses plant specimens.
However, the AA will often be far enough from the vehicle to make carrying a press to the AA infeasible, so pressing plants will most often be conducted back at the vehicle (see the At the Vehicle heading below).
4) Collect and organize Veg equipment and samples for transport back to the vehicle. 5) Remove all flagging and markers, unless the site will receive a repeat sampling visit (for
quality assurance sampling, other researchers collecting data, etc). For repeat visit sites, labeled flagging should be left at the AA CENTER and POINT.
6) Once all Veg tasks at the AA are complete, assist the AB Team if they are still working.
Alternatively, if there are numerous plant specimens to process, return to the vehicle and begin pressing plants.
Before leaving the AA to return the vehicle make a final check to ensure no equipment,
data, or samples are left behind. If leaving for the vehicle prior to the AB Team, carry selected AB Team equipment and samples to the vehicle.
To prevent spread of potentially harmful organisms and invasive species between
research sites, employ ZERO TAXA TRANSPORT protocols (Chapter 2). Decontaminate equipment, shoes, clothing and person as thoroughly as possible before leaving the site.
At the Vehicle: 1) Press plant specimens (see Section 5.2.2):
Plant specimens are pressed at the vehicle whenever possible. If this is not feasible due to safety issues of parking location or weather, then plants may be pressed upon arrival at the field lodging location at the end of the day.

2011 NWCA Field Operations Manual Chapter 5. Vegetation
5 - 35
• Pressing specimens might be facilitated by forming an assembly line of all four Crew
members (Veg + AB Team). Be sure to affix a completed Plant Sample Tag to the newsprint for each specimen and include a completed Plant Specimen Label inside the newsprint folder with each specimen (see Sections 5.2.2 and 5.2.3). Normally one specimen is pressed for each unknown or QA species. If more than one specimen is collected for a particular species use the same collection number (from Form V-2) on the Plant Sample Tag and Plant Specimen Label for that species.
Note the field day is not finished until all the plants from an AA are pressed. If necessary, the entire Field Crew works together to complete this task.
• On Form T-1: Site and Sample Status/WRS Tracking (Chapter 2), fill the bubble in the
Sample Status section indicating Plant Vouchers & Unknowns were collected and record the total number of plant species collected for the AA (e.g., the highest collection number from the Collect # field on the set of Forms V-2) in the # of Plants Sampled field.
2) Arrange the completed vegetation data forms in order and place into the Data Packet for the
AA (see Chapter 2). 3) Repeat decontamination of equipment, shoes, clothing and person, if the vehicle is located a
long distance from the AA, to prevent spread of potentially harmful organisms and invasive species that may have been picked up between the AA and the vehicle. Employ ZERO TAXA TRANSPORT protocols (Chapter 2).
4) Return all vegetation equipment and supplies to their standard locations in the vehicle. 5.2 SAMPLE COLLECTION AND PROCESSING AND DATA HANDLING Several existing protocols for plant specimen collection, pressing, and handling (Magee et al. 1993, Mack 2007, WIPP 2008, University of Florida Herbarium 2009) and helpful reviews from several wetland ecologists were useful in developing the NWCA protocols for plant sample collection and processing presented in this section. Specimens of all unknown plant species and voucher specimens for five known taxa are collected across the five Veg Plots. Specimen collection, labeling, and plant pressing are completed during the field day (Sections 5.2.1 through 5.2.3). Activities for specimen preservation (drying) and shipping or delivering dried specimens to a designated office or herbarium carry over to subsequent field or travel days, or may sometimes be completed at the base location or lodging (Section 5.2.4 and 5.2.5). Other specimen management and identification tasks are conducted from the office or designated herbarium. Protocols for these tasks are outside the purview of this document and are detailed in the NWCA – Laboratory Operations Manual (NWCA-LOM) (USEPA 2011a), and include: identification of unknown pressed specimens, updating data forms or spreadsheets with scientific species names, and shipping QA specimens and a percentage of the unknowns after initial identification to regional botanical experts for verification.

2011 NWCA Field Operations Manual Chapter 5. Vegetation
5 - 36
5.2.1 Collecting Plant Specimens Plant specimen collection is typically conducted throughout the sampling day as unknown species are encountered. This is particularly important for less common unknown species as they may be difficult to find again if collection is delayed. A plant specimen is a pressed and dried plant sample. An integral part of each plant specimen is written data describing the location and date of collection and other information, which is recorded on the Plant Sample Tag and the Plant Specimen Label that accompany each specimen from pressing through identification (Section 5.2.3). The plant specimens collected in the NWCA are critical data, which are used: 1) to identify unknown plant species encountered in the Veg Plots and 2) for quality assurance (QA) assessment of the overall taxonomic accuracy of the vegetation data (see NWCA-QAPP; USEPA 2011b). Unknown Plant Specimens – Whenever the Botanist/Ecologist does not recognize or is uncertain of the identity of a plant species occurring in a Veg Plot, collect a specimen for later identification in the office or lab. QA Plant Specimens – Randomly select five known species that the Botanist/Ecologist has identified, one from each Veg Plot, to collect for QA verification. • Use a random numbers table or random numbers generator on a calculator to select one
species identified by the botanist from each plot. • Count the first known species listed on Form V-2: Vascular Species Presence and Cover
for a particular Veg Plot as number 1. • Do not count unknown species in the random selection process. • If a species has been selected as a QA specimen, it cannot be selected as a QA specimen
from another Veg Plot in the same AA. Do Not Collect Threatened, Endangered and Sensitive Species (TES) – If TES species are encountered document their presence by photographing them and recording data photo data as described in Appendix D. Collecting Material for Plant Specimens – 1) For each species to be collected, select one or more healthy plants typical of its population
within the Vegetation Plot. Collect enough plant material for species identification and to fill a standard herbarium sheet (29x42cm) when pressed.
2) Whenever possible, material for each specimen should consist of a stem with attached
leaves, flowers, fruits, and, if possible, roots. Flowers and fruit are particularly important as they are generally needed to determine species identity. • If the plant is small enough, collect the entire plant including the roots.

2011 NWCA Field Operations Manual Chapter 5. Vegetation
5 - 37
• If the plant is too large to fit in the plant press, collect 1) sufficient leaves and stems to illustrate leaf shape and size, opposite or alternate branching, and buds, 2) some of the root or rhizome, and 3) the inflorescence (flowering stem). In the case of trees, shrubs, or vines, material should be selected to illustrate the overall characteristics of the plant and the range of variation in flowers, leaves, and other structures.
• For grasses and grass-like plants, try to include roots or rhizomes. If possible, include
mature fruit for Carex (sedge) species, which are important for their identification.
• If the species has separate male plants and female plants (e.g., Salix sp. (willows)) or male and female flowers on the same plant, collect specimens from both sexes whenever possible.
• If the species is immature or senescent, collect a sample that illustrates as many key
diagnostic parts of the plant as possible.
3) Place the fresh plant material collected for each individual species into its own plastic bag (e.g., 1 species/ bag) to contain the specimen until it can be pressed. Using a permanent marker write the Plant Sample ID Number (NWCA site number-collection number) on the outside of the bag. • Gallon zipper-lock bags are appropriately sized for many species. • For species too large to fit into a gallon sized bag, e.g., shrubs, tall grasses or sedges, a
kitchen trash bag may be used to store the specimen.
• Use clear or white plastic bags as collection bags. Dark colored plastic bags will absorb too much heat during the day.
Alternatively, if it is more convenient multiple species can be placed into larger bags. If more than one specimen is included in the same bag, make sure they can be easily distinguished from one another and related to their collection numbers from Form V-2. For example, tag individual species by bundling plant material by the stems with masking tape or a strip of flagging labeled with the collection number from Form V-2.
Storing Plant Specimens During the Sampling Day – 1) Place the smaller plastic bags with one or more plant species into a large heavy-duty, light
colored plastic bag. Double bagging keeps specimens fresher in warm weather and keeps fragile plant parts together by species.
2) Plants will normally and ideally be pressed upon arriving back at the vehicle at the end of
the sample day. If weather or road conditions where the vehicle is parked make pressing at this location infeasible or unsafe, place the bags of collected plant material into an ice chest until the Crew has returned to field lodging, then press the plants immediately.
Ensuring All Unknown and QA Specimens Have Been Gathered – 1) Before leaving the site at the end of the day, double check the Complete if Collecting field of
Form V-2 (See Section 5.1.3.1) to make certain every species indicated for collection (i.e., the U = unknown species or the QA= quality assurance specimen bubble is filled) has been obtained.
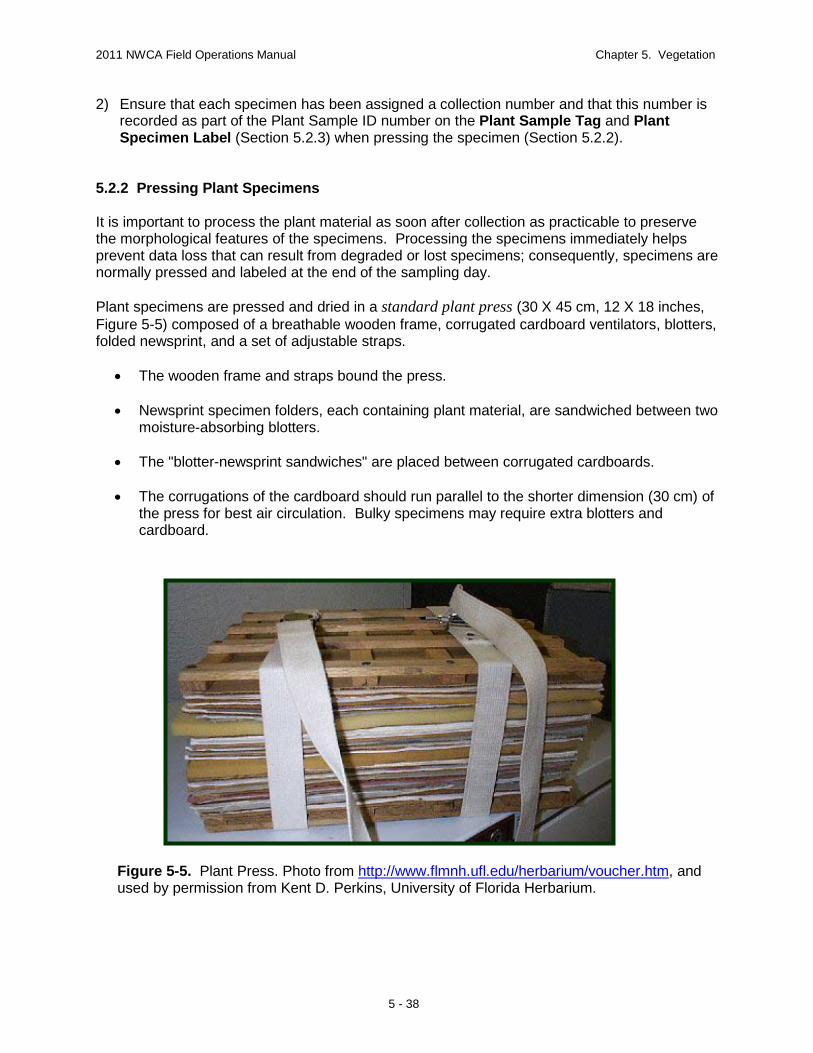
2011 NWCA Field Operations Manual Chapter 5. Vegetation
5 - 38
Figure 5-5. Plant Press. Photo from http://www.flmnh.ufl.edu/herbarium/voucher.htm, and used by permission from Kent D. Perkins, University of Florida Herbarium.
2) Ensure that each specimen has been assigned a collection number and that this number is recorded as part of the Plant Sample ID number on the Plant Sample Tag and Plant Specimen Label (Section 5.2.3) when pressing the specimen (Section 5.2.2).
5.2.2 Pressing Plant Specimens It is important to process the plant material as soon after collection as practicable to preserve the morphological features of the specimens. Processing the specimens immediately helps prevent data loss that can result from degraded or lost specimens; consequently, specimens are normally pressed and labeled at the end of the sampling day. Plant specimens are pressed and dried in a standard plant press (30 X 45 cm, 12 X 18 inches, Figure 5-5) composed of a breathable wooden frame, corrugated cardboard ventilators, blotters, folded newsprint, and a set of adjustable straps.
• The wooden frame and straps bound the press. • Newsprint specimen folders, each containing plant material, are sandwiched between two
moisture-absorbing blotters.
• The "blotter-newsprint sandwiches" are placed between corrugated cardboards.
• The corrugations of the cardboard should run parallel to the shorter dimension (30 cm) of the press for best air circulation. Bulky specimens may require extra blotters and cardboard.

2011 NWCA Field Operations Manual Chapter 5. Vegetation
5 - 39
Figure 5-6. Assembling the plant press. Photo from http://www.flmnh.ufl.edu/herbarium/voucher.htm, and used by permission from Kent D. Perkins, University of Florida Herbarium.
Protocol for Pressing Plant Specimens: 1) To begin pressing a specimen, place a cardboard on the bottom wooden frame of the press,
then add a blotter. 2) Lay a newsprint folder on top of the blotter. To the outside of the newsprint folder, affix a
completed Plant Sample Tag with the Plant Sample ID Number (see Section 5.2.3) for the specimen you are pressing.
3) Open the newsprint folder and place a filled-out Plant Specimen Label (see Section 5.2.3)
inside the folded newsprint. 4) Clean as much dirt as possible off the plant material before placing it in the newsprint folder.
Place the plant material inside the sheet of folded newsprint so that it lies entirely within the dimensions of the plant press and is positioned inside the folded newsprint and on top of the Plant Specimen Label.
5) Carefully arrange the plant material (Figure 5-6), to display diagnostic features.
a) Lay the specimen flat and avoid overlapping plant parts.
b) Spread leaves, flowers, and fruits so they can be easily observed from different perspectives.
c) Show upper and lower surfaces of leaves and flowers.
d) If possible arrange material so some flowers have the blossom open, and some flowers
and fruits appear in longitudinal and transverse views.

2011 NWCA Field Operations Manual Chapter 5. Vegetation
5 - 40
e) Multiples of smaller plants of the same species should be pressed together on one sheet.
f) For large specimens, bend stems sharply into a V or N shape so they fit within the press
frame. Avoid curving or twisting stems. g) Thick stems, large fruits, or bulbs may be trimmed to reduce bulk by cutting them in half
lengthwise.
6) Examples of small, loose plant parts (i.e., seeds, Carex perigynia) should be placed in a small paper packet or envelope inside of the newspaper.
7) Once the plant material is arranged, fold the newsprint closed. 8) Add another blotter, then a cardboard on top of the newsprint folder. 9) To begin pressing the next specimen, place a blotter over the top cardboard in the stack.
Repeat steps 2 - 8 until the press is full or all specimens are included. 10) Use two adjustable straps to tighten and firmly compress the plant press and its contents
(Figure 5-5).
5.2.3 Plant Sample Tag and Plant Specimen Label
Plant Sample Tags and Specimen Labels are important field data and their absence can result in loss of data represented by the plant specimen, so it is critical that tag and label information is complete and accurate. Note that the Site Number will often be preprinted on the tags and labels in your site packet, so ensure that you have the correct set of tags and labels for the site you are sampling. For each plant specimen: 1) Complete a Plant Sample Tag –
The Plant Sample Tag is an adhesive tag used to track a plant specimen. A sample tag is completed and affixed to the outside of the newsprint in which each specimen is pressed (Section 5.2.2). An example of a completed tag is illustrated here. a) Plant Sample ID Number is the Site Number (in the case above: Site NWCA11-9999)
and the collection number (on the plant sample tag above: the specimen with collection number 7 as recorded on Form V-2, see Figure 5-3c).
b) The specimen in this example is a QA sample, so the bubble for QA specimen is filled. c) Date refers to the date the site was sampled.

2011 NWCA Field Operations Manual Chapter 5. Vegetation
5 - 41
d) Visit Number indicates whether the visit is the primary sampling event (1) or the QA revisit (2) to the site. For more information about the QA revisit see the NWCA QAPP (USEPA 2011b).
2) Complete a Plant Specimen Label (Figure 5-7) –
The Plant Specimen Label provides key descriptive information that can aid identifying an unknown plant sample when it is reviewed at the lab or herbarium. a) Complete the label header information
• Complete the Plant Sample ID Number ensuring it matches the Plant Sample Tag and the Collection Number from Form V-2.
• Record the Sampling Date. • Indicate the Visit Number.
b) For a QA Specimen: Fill the QA specimen bubble, but do not include the genus and species name of the specimen on the label, as a blind verification will be used to confirm the identity of QA species at the lab/herbarium.
c) For an Unknown Species: Provide the Pseudonym that was used to describe it on Form
V-2 (see Section 5.1.3.2). d) Record the Collector(s) Name(s). e) Abundance of Plant – Indicate whether the species is dominant, common, sparse, or
uncommon, i.e., occurs only as a few individuals in the Veg Plot in which it occurs. f) Habitat Description – Describe the plant community or immediate setting where the plant
is growing.
g) Plant Habit – Describe key features of the plant such as growth form (tree, shrub, vine, herb), approximate height, longevity (annual, biennial, perennial), clonal, rhizomatous, tussock-forming, etc. List any characteristics of the plant which may be lost upon drying, such as flower/fruit color and fragrance, leaf orientation and aroma.
Figure 5-7. Example of completed Plant Specimen Label.

2011 NWCA Field Operations Manual Chapter 5. Vegetation
5 - 42
Figure 5-8. Plant Dryer. Photo from Mack (2007). Reproduced with permission from the Wetland Ecology Group, Division of Surface Water, Ohio Environmental Protection Agency.
5.2.4 Drying Plant Specimens Pressed plant specimens should be thoroughly dried before removing them from the presses. Once dry, remove specimens from the presses and ship or transport them to designated lab or herbarium for identification. • To encourage drying, keep full presses in a warm, dry, well-ventilated location in the vehicle
during the day and in a well-ventilated warm location in the lodging at night. • As the specimens dry they will loose volume, so periodically tighten the straps on the press
to maintain pressure on the specimens and minimize shrinkage and wrinkling. • Rapid and thorough drying is enhanced by low humidity and ample airflow around and
through the presses. The best preservation of color and morphology is obtained with rapid drying over low heat. Also, dry air circulating through the press may kill many insects and insect eggs, potentially protecting the specimens from damage.
• The easiest way to achieve these conditions is by using an electric plant dryer that provides
steady bottom heat (95°F to 113°F), where plants usually dry in 12 to 48 hours. Plant dryers (e.g., Figure 5-8) are typically constructed as a simple box with a heat source (often incandescent light bulbs) and a fan for air circulation, on which plant presses can be placed to accelerate drying.
Protocol for drying specimens – 1) Ideally, full plant presses will be returned to the base location after a few field days and
placed on a plant dryer to dry. 2) If plant dryer is not available keep the full presses in a warm, dry, well-ventilated location.
Check the press every couple of days and replace wet blotters to speed drying.

2011 NWCA Field Operations Manual Chapter 5. Vegetation
5 - 43
3) Periodically, tighten the straps on the press as the specimens dry and shrink to maintain pressure on the press.
4) Once plant specimens are dry, remove them from the presses with individual specimens
kept in their newsprint folders with their Plant Specimen Labels. 5) Organize the plant specimens for transport or shipping to the designated location for
identification or verification (Section 5.2.5, Chapter 2, Appendix A) 5.2.5 Shipping or Transporting Plant Specimens Careful management of the dried plant specimens and specimen tracking information, and prompt shipment or transport of specimens to the herbarium, lab, or office where they will be identified, is critical to data quality and timeliness of data acquisition. Develop a regular weekly schedule for completing these activities (See Chapter 2 and Appendix A). 1) Specimens from several sites may be batched together to ship or transport to the office, lab,
or herbarium for identification. Unknown specimens and QA plant samples may need to be packed in separate boxes as they may be shipped to different destinations (see Figure 5-9).
2) For each batch of unknown specimens shipped or transported, group the specimens by
NWCA Site, ordered by collection number, into herbarium folders labeled with the Site ID(s) written on the outside of the folders. Put only as many specimens into each herbarium folder as will comfortably fit. If needed, use separate folders for each site. If multiple folders are needed for one site, clearly mark this on the outside of the folder by recording: Site ID-folder 1, Site ID-folder 2, etc.
3) For each batch of QA specimens shipped or transported, group the QA specimens by NWCA Site, ordered by collection number, in herbarium folders labeled with the Site ID(s). Use photocopies of the site appropriate Form V-1 to separate the specimens from different sites, placing the V-1 form on top of the set of specimens for a particular site. Form V-1 lists the flora and field guides used in plant identification at the site and this information may be useful to the QA botanists. Make 2 copies of the completed Form V-1 for each site represented for which specimens are present. Include one copy with the QA specimens for the site, send the original to the Information Management Team with the completed site Data Packet, and retain one for your records (see Chapter 2).
4) Fill out a Form T-2: Unknown Plant Sample Tracking and/or a Form T-3: Form QA Plant
Sample Tracking for the specimens being shipped, transported, or stored for later identification. a) Fill out all contact, shipping, and custody information at the top of the form. b) For each row in the body of the form fill in the Site ID, Visit Number, and Collection Date
(Sample Date) for each site from which specimens originate, and then list the collection numbers for the specimens associated with each site.
c) Ensure that all information recorded on these forms corresponds to the information on
the Plant Specimen Tags and Plant Specimen Labels accompanying the specimens.

2011 NWCA Field Operations Manual Chapter 5. Vegetation
5 - 44
Figure 5-9. Plant specimen destinations for identification and verification (see Chapter 2, Appendix A, and NWCA-LOM (USEPA 2011a) for details).
Plant Specimens
1) – Unknown Species 2a) – Quality Assurance Species (5 randomly selected species of known identity for QA verification, 1 species/Veg Plot)
1a) – Field Crew Botanist/Ecologist, or Other State Botanist or Herbarium selected by State to identify unknowns
1b) – EcoAnalysts Plant Lab
3) – Independent Botanist
•For specimens from 2a – not the person who collected the QA specimens in the field
•For specimens from 2b: – not the person who identified these species
2b) –10% of species identified in steps 1a or 1b, randomly selected for QA verification
5) Carefully pack the assembled specimen folders into shipping boxes. Place cardboard dividers between groups of specimen folders to provide extra protection. Make sure the box is full or padded so no space is available for specimens to shift around and get damaged.
6) Make 2 copies of each of the completed tracking forms. Place a copy of the completed
Form T-2 on top of the specimens in the box in which the unknown specimens are shipped or stored, and ensure that the form will be easily visible to the person unpacking the box upon its arrival at the designated office, lab, or herbarium. Similarly, place a copy of the completed Form T-3 on top of the specimens in the box in which the QA voucher specimens are shipped or stored. When the batched specimens are shipped, immediately transmit the original T-2 and T-3 Forms to the Information Management Team. Retain a copy for your records. See Chapter 2 for details of copying and handling tracking forms.
7) Ship or transport the boxes to the designated office or herbarium for identification (Figure 5-
9). Note that in some cases the Botanist/Ecologist or a State Botanist may be conducting some of the identification of unknowns. In other cases, the specimens will be shipped directly to a designated plant lab or herbarium.
8) The NWCA-LOM (USEPA 2011a) provides procedures for 1) identification of unknown
specimens, 2) verification of species identities for a subset of the unknowns identified by the lab or herbarium, 3) specimen tracking during the identification/verification process, and 4) data entry for linking pseudonyms for unknown species with their scientific names once they have been identified, 5) identification of QA voucher specimens, and 6) reconciliation of nomenclature to the USDA PLANTS database.
2011 NWCA Field Operations Manual Chapter 5. Vegetation
5 - 45
5.2.6 Data Handling At the end of the sampling day, after you have reviewed the vegetation data forms arrange the completed forms in order and place them in the Data Packet for the AA. See Chapter 2 for protocols on copying and shipping the completed data forms to the Information Management Team and Appendix D for transmitting any photos of plants or vegetation that may have been taken. 5.3 LITERATURE CITED Bourdaghs, M., C.A. Johnston, and R.R. Regal. 2006. Properties and performance of the floristic quality index in Great Lakes coastal wetlands. Wetlands 26:718–735. FGDC (Federal Geographic Data Committee). 2008. National Vegetation Classification Standard, Version 2. FGDC-STD-005-2008. http://www.fgdc.gov/standards/projects/FGDC-standards-projects/vegetation/fgdc-endorse-NVCS-V2. Vegetation Subcommittee, Federal Geographic Data Committee. Jennings, M.D., D. Faber-Langendoen, R.K. Peet, O.L. Loucks, D.C. Glenn-Lewin, A. Damman, M.G. Barbour, R. Pfister, D. Grossman, D.H. Roberts, D. Tart, M. Walker, S.S. Talbot, J. Walker, G.S. Hartshorn, G. Waggoner, M.D. Abrams, A. Hill, and M. Rejmanek. 2008. Description, Documentation, and Evaluation of Associations and Alliances of The U.S. National Vegetation Classification. Version 5.2. (http://esa.org/vegweb/docFiles/ESA_Guidelines_Version_5.2.pdf, http://esa.org/vegweb/docFiles/ESA_Guidelines_Version_5.2_Appendices.pdf). Ecological Society of America Panel on Vegetation Classification. Lee, M.T., R.K. Peet, S.D. Roberts, and T.R. Wentworth. 2008. CVS-EEP Protocol for Recording Vegetation: All Levels of Plot Sampling. Version 2008. The Carolina Vegetation Survey (CVS, http://cvs.bio.unc.edu) and the North Carolina Ecosystem Enhancement Program (EEP, http://www.nceep.net). Lopez, R.D., and M.S. Fennessy. 2002. Testing the floristic quality assessment index as an indicator of wetland condition. Ecological Applications 12:487–497. Mack, J.J. 2007. Integrated Wetland Assessment Program. Part 9: Field Manual for the Vegetation Index of Biotic Integrity for Wetlands ver. 1.4. Ohio EPA Technical Report WET/2004-9. Ohio Environmental Protection Agency, Wetland Ecology Group, Division of Surface Water, Columbus, OH. Mack, J.J. and M.E. Kentula. 2010. Metric similarity in vegetation-based wetland assessment methods. EPA/600/R-10/140. U.S. Environmental Protection Agency, Office of Research and Development, Washington, DC. Magee, T.K., S.E. Gwin, R.G. Gibson, C.C. Holland, J.E. Honea, P.W. Shaffer, J.C. Sifneos, and M.E. Kentula. 1993. Research Plan and Methods Manual for the Oregon Wetlands Study. EPA/600/R-93/072. U.S. Environmental Protection Agency, Environmental Research Laboratory, Corvallis, OR.

2011 NWCA Field Operations Manual Chapter 5. Vegetation
5 - 46
Magee, T.K., P.L. Ringold, and M.A. Bollman. 2008. Alien species importance in native vegetation along wadeable streams, John Day River basin, Oregon, USA. Plant Ecology 195:287–307. Magee, T.K., P.L. Ringold, M.A. Bollman, and T.L. Ernst. 2010. Index of Alien Impact: A method for evaluating ecological impact of alien plant species. Environmental Management 45:75–778. Meinke, R.J. and T.N. Kaye. 2007. Kalmiopsis fragrans (Ericaceae), a new distylous species from the southern Cascade Mountains of Oregon. Journal of Botanical Research Institute of Texas 1:9-19. Peet, R.K., T.R. Wentworth, and P.S. White. 1998. A flexible, multipurpose method for recording vegetation composition and structure. Castena 63:262–274. Pino, J., X. Font, J. Carbó, M. Jové, and L. Pallarès. 2005. Large-scale correlates of alien plant invasion in Catalonia (NE of Spain). Biological Conservation 122:339–350. Quétier, F., S. Lavorel, W. Thuiller, and I. Davies. 2007. Plant-trait-based modeling assessment of ecosystem-service sensitivity to land-use change. Ecological Applications 17:2377–2386. Rocchio, J. 2007. Assessing ecological condition of headwater wetlands in the Southern Rocky Mountains using a vegetation index of biotic integrity (Version 1.0). Colorado State University, Colorado Natural Heritage Program, Fort Collins, Colorado. University of Florida Herbarium. 2009. Preparation of Plant Specimens for Deposit as Herbarium Vouchers. http://www.flmnh.ufl.edu/herbarium/voucher.htm, (http://www.flmnh.ufl.edu/herbarium/gifs/plantpress1.jpg, http://www.flmnh.ufl.edu/herbarium/gifs/PressedPlant1.jpg, Accessed June 12, 2009. USDA, NRCS (U.S. Department of Agriculture, Natural Resources Conservation Service). 2010. The PLANTS Database (http://plants.usda.gov, 27 December 2010). National Plant Data Center, Baton Rouge, LA 70874-4490 USA. USEPA (U.S. Environmental Protection Agency). 2002. Methods for Evaluating Wetland Condition: #10 Using Vegetation to Assess Environmental Conditions in Wetlands. EPA-822-R-02-020, Office of Water, U.S. Environmental Protection Agency, Washington, DC. USEPA (U.S. Environmental Protection Agency). 2011a. National Wetland Condition Assessment: Laboratory Operations Manual. EPA/843/R10/002. U.S. Environmental Protection Agency, Washington, DC. USEPA (U.S. Environmental Protection Agency). 2011b. National Wetland Condition Assessment: Quality Assurance Project Plan. EPA/843/R10/003. U.S. Environmental Protection Agency, Washington, DC. USEPA (U.S. Environmental Protection Agency). 2011c. National Wetland Condition Assesssment: Site Evaluation Guidelines EPA/843/R10/004. U.S. Environmental Protection Agency, Washington, D.C.

2011 NWCA Field Operations Manual Chapter 5. Vegetation
5 - 47
USEPA (U.S. Environmental Protection Agency). In Preparation. Ecological Indicators for the 2011 National Wetland Condition Assessment. EPA-XXX-YY-0000. U.S. Environmental Protection Agency, Washington, DC. USEPA (U.S. Environmental Protection Agency). In Review. National Wetland Condition Assessment: USA-RAM Field Operations Manual. EPA/XXX/R-XX/XXX. U.S. Environmental Protection Agency, Washington, DC.
WIPP (Wisconsin Invasive Plants Project). 2008. http://www.ipaw.org/mapping/voucherhandout.pdf. Accessed December 2008.

2011 NWCA Field Operations Manual Chapter 5. Vegetation
5 - 48

2011 NWCA Field Operations Manual Chapter 5. Vegetation
5 - 49
5.4 VEGETATION PROTOCOL CHECKLISTS AND REFERENCE CARDS Brief summaries of the major tasks to be completed for the Vegetation Sampling Protocols are provided in this section. Vegetation Protocol Checklist The Vegetation Protocol Task Checklist is for use during field sampling to aid in directing the order of work, to ensure all data and specimens have been collected, and all tasks are completed. Reference Cards Summarizing Vegetation Protocols These paired figures are intended to be printed, and laminated if desired, on the front (side A) and back (side B) of durable card stock, so that they can be carried for easy reference when conducting field work. Reference Card V-1: Flowchart of Vegetation Protocol Tasks Reference Card V-2, Side A and Side B: Key for Veg Plot Placement and Examples of Plot Layout Configurations Reference Card V-3, Side A: Vegetation Plot Establishment Reference Card V-3, Side B: Veg Plot Configuration and Data Collection Summary Reference Card V-4, Side A: Cover Estimation Procedures Reference Card V-4, Side B: Assigning Pseudonyms for Unknown Plant Species

2011 NWCA Field Operations Manual Chapter 5. Vegetation
5 - 50

NWCA 2011 Vegetation Protocol Task Checklist Page 1 Pre-sampling and Plot Establishment Activities 1) ___Organize data forms and assemble vegetation sampling equipment. 2) ___Determine the Vegetation Plot Layout configuration and plot locations within the AA
(Section 5.1.1, Reference Card V-2). 3) ___Establish the five Vegetation Plots (Section 5.1.2, Reference Card V-3, Side A). Activities Key to all Veg Data Collection (Section 5.1.3.1) 1) ___Botanist/Ecologist and Botanist Assistant determine approach to sampling
Often it will be efficient for the Botanist/Ecologist and Botanist Assistant to work together with the Botanist Assistant recording data as the Botanist/Ecologist makes observations.
At other times, it may be more convenient for the Botanist/Ecologist to make all observations that require identification or cover estimation of individual plant species, while the Botanist Assistant collects data on cover of vegetation strata, ground surface types, groups of non-vascular taxa, and count data for trees and snags.
2) ___If needed the Botanist Assistant compiles a list of the scientific names or pseudonyms for shrub and tree species on his/her clipboard for use in collecting tree count data (Form V-4).
3) ___Fill out all header information on all data forms and plant specimen labels during sampling.
4) ___List floras used field identification (Form V-1) at the Site being sampled. 5) ___Follow procedures on Reference Card V-4, Side B for assigning pseudonyms for
unknown plant species. 6) ___Collect specimens for unknown plant species and five QA vouchers for known species,
making certain to assign Plant Sample ID Numbers and ensuring all tracking information always remains with the specimens (Section 5.1.3.1 and Section 5.2).
Major Data Collection Activities for each Veg Plot (Sections 5.1.3.2–5.1.3.9, Reference Cards V-3, Side B and V-4) 1) ___Collect the USA-RAM (Metrics 4-12) data in the AA. 2) ___Make presence observations for all vascular species occurring within the two corner
quadrat nests (Section 5.1.3.2, Form V-2). 3) ___Complete species list for the 100-m2 Veg Plot. 4) ___Make cover estimates, and note the vertical height class for all individual vascular plant
species in each 100-m2 Veg Plot (Section 5.1.3.4, Form V-2). 5) ___Determine predominant S&T class (Section 5.1.3.5, Form V-3 (Front)). 6) ___Make cover estimates for vascular vegetation strata (Section 5.1.3.6, Form V-3 (Front)). 7) ___Make cover estimates and collect associated occurrence data for non-vascular
taxonomic groups (Sections 5.1.3.7, Form V-3 (Front)). 8) ___Collect data on ground surface attributes (Section 5.1.3.8, Form V-3 (Back)). 9) ___Count snags (> 5cm DBH) by estimated diameter class; count trees (> 5cm DBH) by
species and estimated diameter class; estimate cover of trees by species by height class (Section 5.1.3.9, Form V-4).
10) ___If needed take photos of threatened, endangered, or sensitive plant species.

NWCA 2011 Vegetation Protocol Task Checklist Page 2 Field Day Wrap-Up Activities – At the Site 1) ___Double check that all unknown and QA voucher specimens have been collected
(Section 5.2.1). 2) ___Review all Vegetation Data Forms:
___Botanist/Ecologist – Review Forms V-2 and V-4 for errors in species names and missing data. Make any needed corrections.
___Botanist Assistant – Review Forms V-1 and V-3 for missing data. ___Veg Team – If needed, return to Veg Plots of AA and collect any missing information.
3) ___Collect and organize Veg equipment and samples for transport back to the vehicle. 4) ___Time permitting, Botanist/Ecologist key out unknown plant species. For unknowns
confidently keyed to species, update pseudonyms to scientific names on Forms V-2, V-4.
5) ___Botanist Assistant remove all flagging and markers, unless the site will receive a repeat sampling visit.
6) ___Veg Team assist the AB (if they are still working), or, if numerous plant specimens have been collected return to the vehicle to begin pressing plants.
a) ___Before leaving the AA make a final check to ensure no equipment, data, or samples are left behind. If leaving for the vehicle prior to the AB Team, carry selected AB Team equipment and samples to the vehicle.
b) ___To prevent spread of potentially harmful organisms and invasive species between research sites; employ ZERO TAXA TRANSPORT protocols (Chapter 2). Decontaminate equipment, shoes, clothing and person as thoroughly as possible before leaving the site.
Field Day Wrap-Up Activities – At the Vehicle 1) ___Press plant specimens (see Section 5.2.2):
a) ___Plant specimens are pressed at the vehicle whenever possible. If this is not feasible due to safety issues of parking location or weather, then plants may be pressed upon arrival at the field lodging location at the end of the day.
b) ___Pressing specimens might be facilitated by forming an assembly line of all four crew members (Veg + AB Team). Be sure to affix a completed Plant Sample Tag on the newsprint for each specimen and place the Plant Specimen Label inside the newsprint with each specimen (see Sections 5.2.2 and 5.2.3).
c) ___Record the number of plant specimens collected at the site on Form T-1. 2) ___Organize the completed forms into the Data Packet for the AA. 3) ___If the vehicle is some distance from the AA, again decontaminate equipment, shoes,
clothing and person at the vehicle to prevent spread of potentially harmful organisms and invasive species between research sites. Employ ZERO TAXA TRANSPORT protocols (Chapter 2).
4) ___Return all vegetation equipment and supplies to their standard locations in the vehicle. Plant Specimen Drying and Shipping (Sections 5.2.4 and 5.2.5) 1) ___Deliver the full presses to the home base where they can be completely dried. Pick up
empty presses for next field trip. 2) ___Once plant specimens are dry, carefully pack them, being certain to include the
appropriate tracking forms, then ship or deliver to the designated office/lab/herbarium. 3) ___If Botanist/Ecologist is involved during non-field days or post-field season in plant
specimen identification and data form or spreadsheet update with correcting pseudonyms to scientific names, follow the procedures outlined in the NWCA-LOM (USEPA 2011a).

Reference Card V-1. Flowchart of Vegetation Protocol Tasks
Refer to 2011 NWCA‐Field Operations Manual – Chapter 5 for detail on protocols summarized on this card.
Plant Specimen Collection, Processing, and Shipping
Collect specimens for all unknown plant species.
Randomly select and collect five known plant species for each AA for Quality Assurance check.
Complete Plant Sample Tag and Plant Specimen Label for each plant sample; then press specimen. Record number of plant samples collected at the site on Form T‐1: Site and Sample Status/WRS Tracking. Dry specimens; then ship or deliver to designated herbarium or laboratory, enclosing the appropriate plant specimen tracking information (Form T‐2 or T‐3) in the shipping box.
Collecting Vegetation Data in the AA
Establish five 100‐m2 (10X10m) Veg Plots at the locations designated for the selected Veg Plot Layout (Reference Cards V‐2 and V‐3, Side A; Form V‐1). Once all five Veg Plots are established, collect the following data for each
Select Veg Plot Layout configuration appropriate for the AA (Reference Card V‐2).
Veg Plot.
1. Plant species presence in nested 1‐m2 and 10‐m2 quadrats in the SW and NE corners of the 100‐m2 Veg Plot, and across the 100‐m2 Veg Plot (Reference Card V‐3
3. Predominant Status &Trends Wetland Class for the 100‐m2 Veg Plot (Form V‐3 (Front)).
, Side B; Forms V‐2a, b). 2. Percent cover estimates for all individual vascular plant species across the entire 100‐m2 Veg Plot and identification of the primary height class in which each species occurs (Reference Cards V‐3, Side B and V‐4; Forms V‐2a, b).
5. Percent cover estimates across the 100‐m2 Veg Plot for non‐vascular groups (ground bryophytes, ground lichens, arboreal bryophytes and lichens, filamentous or mat forming algae, and macroalgae) (Form V‐3 (Front)).
4. Percent cover estimates across the 100‐m2 Veg Plot for Vascular Vegetation Strata: a) submerged aquatic vegetation, b) floating aquatic vegetation, c), lianas, vines and epiphytes, d) all other vascular vegetation by height class (Form V‐3 (Front)).
6. Data describing ground surface attributes across the 100‐m2 Veg Plot (Form V‐3 (Back)).
7. Across the 100‐m2 Veg Plot (Forms V‐4a, b):
Percent cover estimates of live tree species by height class.
Counts of live trees by species and diameter class.
Counts of standing dead trees and snags by diameter class.


Reference Card V-2, Side A. Key for Veg Plot Placement and Examples of Plot Layout Configurations.Examples of Additional Layout Configurations on Side B. Note scales vary among example diagrams.
Plate 1. Standard Veg Plot Layout – Circular AA (½ hectare)
4
40m
N
3
2
1
515m
15 m
20m
10m
Place Veg Plots at specified locations on plot placement lines oriented through the AA CENTER on cardinal directions. Veg Plot 1 is placed 2m from the CENTER.
Key for Selecting Veg Plot Layout Configuration within the Assessment Area (AA)
1a AA type, any; no obstacles to Veg Plot placement………………………………………………………..……………………....……………………...2
2a AA is ½‐ha circle…………………..……………………………………………………………Standard Veg Plot Layout – Circular AA (Plate 1)2b AA is not a circle or is < ½ ha………..…………….……………………………………………….Alternate Veg Plot Layouts go to ..……....33a AA is a ½ ha polygon ……………...…….………………………………………..…………………..………………………………………..……….……....4
4a AA has width and length > 30m………………….………………………….…..…Wide Polygon AA Veg Plot Layout (Plate 2)4b AA is ≤ 30m wide ……………………………………..…………..……...........…..Narrow Polygon AA Veg Plot Layout (Plate 3)
3b AA < ½ ha, but > 0.1ha; a polygon equaling wetland boundary........Wetland Boundary AA Veg Plot Layout (Plate 4)
1b AA type, any; obstacles (deep water; wide, deep channels; cliffs, other physical barriers, etc.) to Veg Plot placement……………………………………………………………………….……………………………..….…………...………Obstacle Veg Plot Layout (Plate 5)
Refer to 2011 NWCA‐Field Operations Manual (Chapter 5. Vegetation, Section 5.1.1 – Placement of the Vegetation Plots) for more detail on protocols summarized on this card.
Plate 2. Wide Polygon AA Veg Plot Layout – AA = ½ hectare polygon, width and length > 30m.
Place Veg Plots along plot placement lines originating from CENTER and defined by long and short axes of AA.
Example A – Wide Polygon AAs with width > 40 m: Place Veg Plots in a configuration matching the Standard Veg Plot Layout as closely as possible, while distributing Veg Plots relatively evenly along plot placement lines.
Example B – Wide Polygon AAs with width 30 to 40 m: Place 1 Veg Plot mid-way between the CENTER and AA boundary along only one placement line of the short axis, and 4 Veg Plots at uniform distances along long axis.
61m
82m
2
4
3
1
5
40m
125m
1
3
2
4
5
Example A
Example B
Veg Plot
AA Center
AA boundaries
Plot placement line
Shallow water
Deep water (not sampleable)
Patterns = Community types

Reference Card V-2, Side B. Plot Layout Configuration continued
Plate 3. Narrow Polygon AA Veg Plot Layout – AA is a ½-ha polygon ≤ 30 wide
Plate 4. Wetland Boundary AA Veg Plot Layout – AA (0.1ha to < 0.5ha) = wetland boundary
Example A: AA ≈ 0.14ha
30m
N
1
4
23
5
Example C: AA ≈ 0.22ha
20m
N1
2 34
5
Example B: Wetland Boundary AA ≈ 0.4ha
N
60m
3
2
5
4
1
LargeBoulder
Plate 5. Obstacle Veg Plot Layout – AA any type
Obstacles prohibit placement of Veg Plots at designated locations for the appropriate Veg Layout configuration.
Distribute Veg Plots as closely as possible to locations designated in the Veg Layout Configuration appropriate to AA type, while avoiding obstacles and aiming for at least 10m between Veg Plots.
4
40m
3
2
Example A: Standard Circular AA = 0.5ha
N
Tide Channel 1
5
Example B: AA ≈ 0.20ha
40m
N
1
5
4
3
2
Distribute the 5 Veg Plots using the most efficient arrangement to fit them in and cover the AA. Where possible arrange Veg Plots to conform with Standard or Polygon Layout configurations.
Orient Veg Plots on cardinal directions when possible, but if space is limiting orient individual Veg Plots to bearings allowing them to fit in the AA.
165m
30m 1
2 4
3 5
Example A:
200m
25m
2
5
43
1
Example B:
For Polygon AAs 25 to 30m wide, alternate Veg plots along one plot placement line oriented on the long axis of the AA.
For Polygon AAs 20 to 25m wide, center Veg plots along one plot placement line oriented on the long axis of the AA.
Refer to 2011 NWCA‐Field Operations Manual (Chapter 5. Vegetation, Section 5.1.1 – Placement of the Vegetation Plots) for more detail on protocols summarized on this card.

Reference Card V-3. Side A – Vegetation Plot Establishment
Durable Cord or Rope with marks at 5-m Intervals:
Corner Flagging: Mid-Point Edge Flagging:
N
SW
NWNE
SE
10m
100-m2 Plot
Refer to NWCA‐Field Operations Manual (Chapter 5. Vegetation, Section 5.1.2 Establishing the Vegetation Plots) for more detail on protocols summarized on this card.
Setting up the Veg Plot
On Form V-1, record the Veg Plot location in relation to the AA center in the Estimated Distance field. In the Bearing field record the bearing from the AA Center along the plot placement line to the closest corner the Veg Plot.
Use a compass and measuring device to delineate the outside edges of each Veg Plot. A convenient way to do this is with four 10- m lengths of durable (e.g., nylon) rope or cord on which the 5-m interval is marked with brightly colored waterproof tape.
If leaving the ropes in place to bound the Veg Plot, pin them using U-shaped pins, tent stakes, or surveyor’s arrows (also called chaining pins).
When stretching tapes or lines along a compass bearing, there will occasionally be some drift related to obstacles and slope. Some drift is acceptable, but try to keep the Veg Plot relatively square and constant in area. The following steps can help align the square when laying out the sides of the plot :
1 ) Mark out one 10-m edge.
2 ) Mark out one perpendicular edge, 90 degrees from the first.
3 ) Return to first edge and mark opposing perpendicular edge.
4 ) Check square by laying fourth rope between the far ends of the perpendicular edges.
Mark corners and mid-points of each side of the plot with different colored flagging or pin flags, e.g., fluorescent pink or red for corners, blue for mid-points of the plot edges.
If removing the rope lines (e.g., only one set of ropes is available for measuring all plots), use additional flagging as needed to ensure Veg Plot boundaries are easily visible during sampling, particularly where vegetation is dense with shrubs or trees.
Mark this line last
Mark this line first
Mark this line third
Mark this line second

Reference Card V-3, Side B – Veg Plot Configuration and Data Collection Summary
Establishing Quadrat Nests:
1. Outside edges of quadrats: Formed by a meter tape, marked cords, or flagging defining boundary of the 100‐m2 Veg Plot.
2. Inside edges of 10‐m2 quadrat: Formed using 6.32m length of brightly colored rope/cord with the mid‐point marked to define inside corner, or two 3.16m PVC poles (poles may break down to shorter lengths for easy of carrying).
3. Inside edges of 1‐m2 quadrat frame: Formed by two 1‐m wooden slats, a 2m length of cord with midpoint marked, or two 1‐m PVC poles (poles can be joined with an elbow joint in the field).
10m3.16m1.00m
100-m2 Veg Plot
NE Quadrat Nest
SW Quadrat Nest
10m2
1m2
10m2
10m2
1m2
Refer to NWCA‐Field Operations Manual (Chapter 5. Vegetation ‐ Section 5.1.3 Vegetation Data Collection ) for more detail on protocols summarized on this card.
Species Presence Data1. For each species present in the SW or NE Nest (rooted in or
overhanging), record its name/pseudonym and the smallest quadrat in which it occurs ( S = 1‐m2 or M = 10‐m2 quadrat); Form V‐2: Vascular Plant Species Presence and Cover.
2. Complete one quadrat nest, then sample the nest in the other corner.3. Once both corner nests have been searched, examine the entire 100‐m2
Veg Plot for additional species. Record these species on Form V‐2.4. If a species does not occur in a particular nest, but occurs in the 100‐m2
Veg Plot, record L (large plot) for that nest.
Data to Collect in 100‐m2 Veg Plot1. All individual vascular plant species; Form V‐2
• Estimate cover (0‐100%) for each species observed in the 100‐m2
Veg Plot• Record the primary height class in which it occurs: 1 = < 0.5m, 2 =
>0.5‐2m, 3 = >2‐5m, 4 = >5‐15m, 5 = >15‐30m, 6 = >30m, E = liana, vine, or epiphyte species (may occur in any height class).
2. Vertical strata for vascular vegetation – Estimate cover for the following vegetation strata; Form V‐3: NWCA Vegetation Types (Front).• Submerged aquatic vegetation (0‐100%)• Floating aquatic vegetation (0‐100%)• Lianas, vines, and epiphytes (0‐100%)• All other vascular vegetation by height class : >30m, >15‐30m , >5‐
15m, >2‐5m, >0.5‐2m, < 0.5m (0‐100% for each class).
3. Non‐vascular vegetation groups – Estimate cover of and collect categorical data for ground bryophytes, ground lichens, arboreal bryophytes and lichens, filamentous mat forming algae, and macroalgae; Form V‐3 (Front).
4. Ground surface attributes – Collect data on water cover, water depth, bareground, litter, and dead woody material; Form V‐3: Ground Surface Attributes (Back).
5. Tree species cover and counts – For all tree species, estimate cover by height classes and count stems ≥ 5cm diameter breast height (DBH) by DBH class (5‐10, 11‐25, 26‐50, 51‐75, 76‐100, 101‐200, and > 200cm) by species; Form V‐4: Snag and Tree Counts and Tree Cover.
6. Standing dead trees and snags (angle of incline > 45°) ‐ Count stems ≥ 5cm DBH by DBH class (5‐10, 11‐25, 26‐50, 51‐75, 76‐100, 101‐200, and > 200cm); Form V‐4.
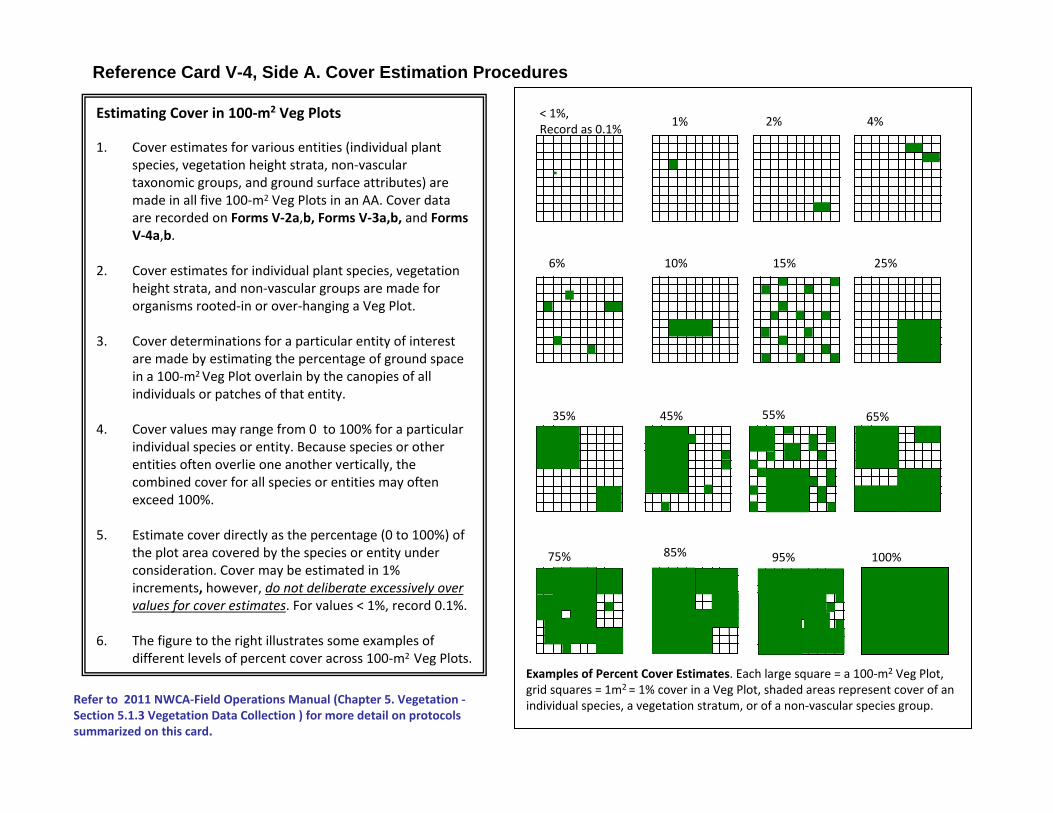
Estimating Cover in 100‐m2 Veg Plots
1. Cover estimates for various entities (individual plant species, vegetation height strata, non‐vascular taxonomic groups, and ground surface attributes) are made in all five 100‐m2 Veg Plots in an AA. Cover data are recorded on Forms V‐2a,b, Forms V‐3a,b, and Forms V‐4a,b.
2. Cover estimates for individual plant species, vegetation height strata, and non‐vascular groups are made for organisms rooted‐in or over‐hanging a Veg Plot.
3. Cover determinations for a particular entity of interest are made by estimating the percentage of ground space in a 100‐m2 Veg Plot overlain by the canopies of all individuals or patches of that entity.
4. Cover values may range from 0 to 100% for a particular individual species or entity. Because species or other entities often overlie one another vertically, the combined cover for all species or entities may often exceed 100%.
5. Estimate cover directly as the percentage (0 to 100%) of the plot area covered by the species or entity under consideration. Cover may be estimated in 1% increments, however, do not deliberate excessively over values for cover estimates. For values < 1%, record 0.1%.
6. The figure to the right illustrates some examples of different levels of percent cover across 100‐m2 Veg Plots.
55%
95%
1%
25%15%
< 1%, Record as 0.1%
4%
35%
6% 10%
45%
2%
75% 100%
65%
85%
Examples of Percent Cover Estimates. Each large square = a 100‐m2 Veg Plot, grid squares = 1m2 = 1% cover in a Veg Plot, shaded areas represent cover of an individual species, a vegetation stratum, or of a non‐vascular species group.
Reference Card V-4, Side A. Cover Estimation Procedures
Refer to 2011 NWCA‐Field Operations Manual (Chapter 5. Vegetation ‐ Section 5.1.3 Vegetation Data Collection ) for more detail on protocols summarized on this card.

Reference Card V-4, Side B. Assigning Pseudonyms for Unknown Plant Species
Assigning Pseudonyms for Unknown Plant Species –
The Botanist/Ecologist makes pseudonym assignments for unknown plant species using the following rules:
If the genus name is known, but the species name is not, then a number and short description of identifying characteristics is substituted for the species epithet. For example:
• Carex 1 – winged stem• Carex 2 – tussock• Carex 3 – bidentate perigynia• Carex 4 – striped scale• Salix 1 – acuminate leaf• Salix 2 – hairy under‐leaf.
• Numbers indicate how many unknowns occur in a single genus at a site and should be included even if there is only one unknown in the genus.
Where neither the genus nor species names are known, devise a descriptive name that reflects growth habit, microhabitat, or some distinctive morphological feature. For example:• bunchgrass 1• pinnate‐lf. aquatic herb• decid. low shrub simple lin. lf.
Where numerous unknown taxa occur, it may be useful to carry examples of the plants, in small individual ‘tagged bouquets’, to keep pseudonyms straight. This is especially relevant if a single genus has several unknown representatives on the site.
Refer to 2011 NWCA‐Field Operations Manual (Chapter 5. Vegetation ‐ Section 5.1.3 Vegetation Data Collection) for more detail on protocols summarized on this card.
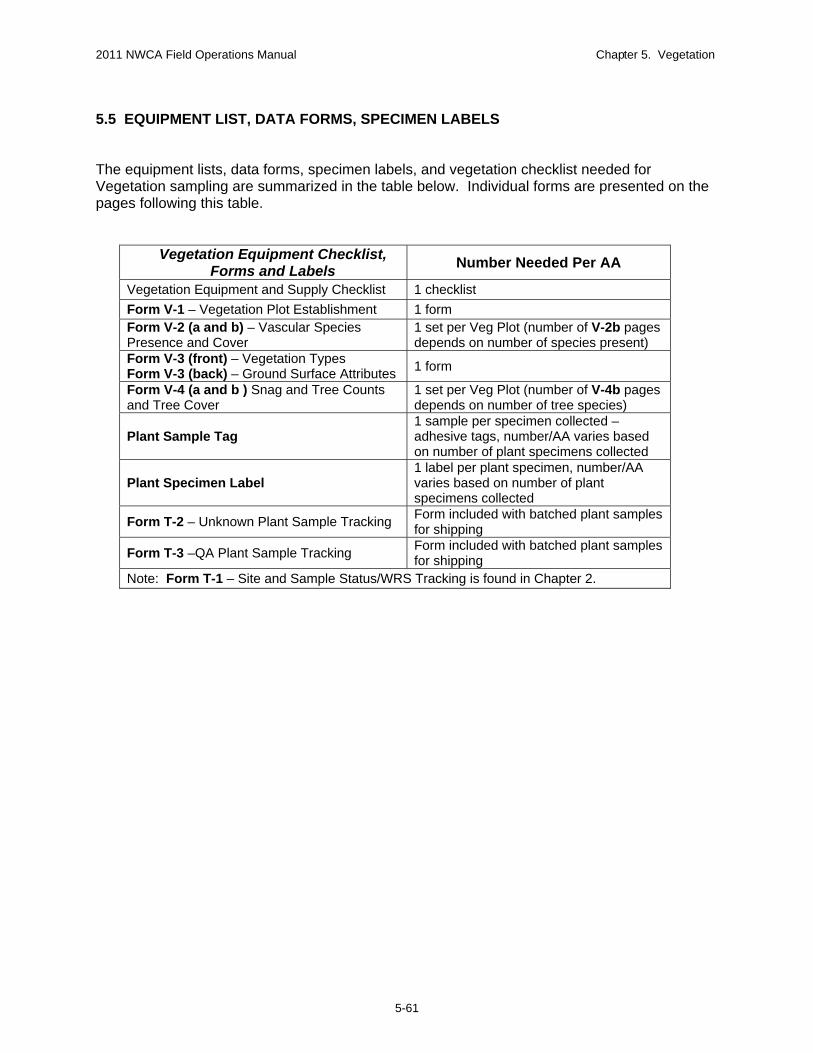
2011 NWCA Field Operations Manual Chapter 5. Vegetation
5.5 EQUIPMENT LIST, DATA FORMS, SPECIMEN LABELS The equipment lists, data forms, specimen labels, and vegetation checklist needed for Vegetation sampling are summarized in the table below. Individual forms are presented on the pages following this table.
Vegetation Equipment Checklist, Forms and Labels
Number Needed Per AA
Vegetation Equipment and Supply Checklist 1 checklist
Form V-1 – Vegetation Plot Establishment 1 form Form V-2 (a and b) – Vascular Species Presence and Cover
1 set per Veg Plot (number of V-2b pages depends on number of species present)
Form V-3 (front) – Vegetation Types Form V-3 (back) – Ground Surface Attributes
1 form
Form V-4 (a and b ) Snag and Tree Counts and Tree Cover
1 set per Veg Plot (number of V-4b pages depends on number of tree species)
Plant Sample Tag 1 sample per specimen collected – adhesive tags, number/AA varies based on number of plant specimens collected
Plant Specimen Label 1 label per plant specimen, number/AA varies based on number of plant specimens collected
Form T-2 – Unknown Plant Sample Tracking Form included with batched plant samples for shipping
Form T-3 –QA Plant Sample Tracking Form included with batched plant samples for shipping
Note: Form T-1 – Site and Sample Status/WRS Tracking is found in Chapter 2.
5-61

2011 NWCA Field Operations Manual Chapter 5. Vegetation
5 - 62

NWCA 2011 VEGETATION EQUIPMENT AND SUPPLY CHECKLIST Protocols, forms, checklists, supplies ___This equipment checklist ___Vegetation protocol checklist ___Reference Cards V-1, V-2, V3, and V-4 ___Available plant species lists pertinent to the
site and/or region (wetland species, alien species, threatened and endangered species)
___Data Forms on waterproof paper: ___Form V-1 – Vegetation Plot Establishment ___Form V-2a and V-2b – Vascular Species
Presence and Cover ___Form V-3 – Vegetation Types and Ground
Surface Attributes ___Form V-4a and V-4b – Snag and Tree Counts
and Tree Cover ___Form T2 (Unknown) and T-3 (QA) – Plant
Specimen Tracking ___Waterproof field notebook ___ 2 covered clip boards, with storage for
completed forms ___ Sharpies or similar marker (one silver for
annotating aerial photos, regular pencils, mechanical pencils, extra leads)
Plant identification in the field or vehicle ___Regional floras ___2 10X hand lenses ___Dissecting tools (e.g., single edge razor
blades, forceps, and dissecting needles) ___6-cm ruler for measuring plant parts during
field keying
Plot establishment and data collection (Note a variety of different supplies can be used for plot set-up, select appropriate gear) ___1 set of 2-way radios ___Compass ___GPS unit ___Laser rangefinder ___Reflector for sighting rangefinder ___Diameter measuring tape (cm) to calibrate
investigators to make tree DBH estimates (carry until calibrated, then leave in vehicle)
___ 50-m tape ___ Two 20-m or four 10-m lengths of strong,
durable cord/rope1; carry 1 to 4 sets of one or the other lengths of cord depending on site distance from road.
1 Durable cord (e.g., nylon)/rope in 10 or 20m lengths – with 5m points with blue tape, 10m points with red tape.
Plot establishment and data collection continued ___ As needed: tent stakes, U-shaped pins, or
surveyors’ arrows for securing meter tapes and/or ropes to demarcate plots
___40 to 50 pin flags (recommend two bright colors with1/2 of pins in each color) and pouch for carrying
___Bright colored flagging in 2 colors ___Inside edges of 10-m2 quadrat: two 3.16-m
PVC poles with decimeter points marked in red2 (poles may break down to two shorter lengths for easy of carrying, one segment/pole = 1m), or one 6.32-m rope
___Inside edges of 1-m2 quadrat frame: two 1-m PVC poles (1m lengths from 3.16m segmented pole) that can be connected with an elbow joint in the field, or two 1-m wooden slats
Plant specimen collection, processing, and shipping ___Trowel for obtaining plant specimens with
intact roots ___Clippers/pruners ___Twist-tie tags or flagging for marking unknown
species that may be carried in small ‘bouquets’ for reference during sampling
___Gallon size zipper plastic bags and kitchen size white trash bags for collecting plant specimens
___White garbage bag for consolidating collection bags
___Ice chest (kept in vehicle) ___At least 2 large plant presses (kept in vehicle)
loaded with blotters, cardboard ventilators, and newsprint, compression straps, small envelopes for loose plant parts
___At least 2 extra complete plant presses (kept at base location to exchange for full presses)
___Plant Specimen Tracking Tags ___Plant Specimen Labels ___At base location, plant specimen folders and
shipping boxes for shipping plant specimens to herbaria for identification
2 PVC poles with decimeter marks can also be used as measuring sticks


M T
M T
M T
M T
M T
FORM V-1: NWCA VEGETATION PLOT ESTABLISHMENT (Front)
Plot 1
Plot 2
Plot 3
Plot 4
Plot 5
Site ID: NWCA11- Date: 2 0 1 1//
Standard Veg Plot Layout - 1/2 ha Circular AA (Veg Plots on 2 Axes, cardinal directions from AA Center)
Wide Polygon AA Veg Plot Layout - 1/2 ha Polygon AA with width and length >30m (Veg Plots on 2 axes)
Narrow Polygon AA Veg Plot Layout - 1/2-ha Polygon AA < 30m wide (Veg Plots on 1 axis)
Wetland Boundary AA Veg Plot Layout - AA <1/2-ha polygon equal to wetland boundary (Veg Plots distributed)
Vegetation Plot Layout - Fill in the bubble for the Vegetation Plot Layout configuration used in this AA (see ReferenceCard V-1 for descriptions of plot layout configurations).
Record citations for Floras/Field Guides/Databases used for plant identification
01/21/2011NWCA Vegetation Plot Establishment
Alternate Veg Plot Layouts
Obstacle Veg Plot Layout (Describe obstacles in Notes section on the back of this form)
If obstacles prevent placement of plot(s) in the locations designated by the Veg Plot Layout selected above, also fill inthe bubble for Obstacle Veg Plot Layout below
Plot locations in Relation to AA Center
Plot Estimated Distance (m)¹ Bearing²
Based onMagnetic orTrue North
¹ Estimated distance fromAA Center to the closestplot corner (e.g., determinewith meter tape, rangefinder,or by pacing)
²Bearing from the AA Centeralong plot placement line tothe closest plot corner.
USDA-PLANTS - Fill to indicate names for plant species observed at this site have been reconciled to USDA-PLANTS.
Plant Species Nomenclature: Plant species names must be based on USDA-PLANTS (http://plants.usda.gov/)
1.
2.
3.
4.
5.
Reviewed by (initial):
Add the locations of the Veg Plots and Soil Pits to the aerial photo annotated during AA establishment, or if no photo is available to AA sketch map on Form AA‐1. Number Veg Plots 1 through 5 using guidelines on Reference Card V‐1. Label Soil Pits, A‐D, as determined by the AB Team. If appropriate, record the nature and direction of environmental gradients (e.g., slope, water depth, etc.), water bodies, and major vegetation patches in the notes section on the back of this form.
5049429474
DRAFT - NOT FOR U
SE IN FIE
LD

FORM V-1: NWCA VEGETATION PLOT ESTABLISHMENT (Back)
Date: 2 0 1 1/ /NOTES:
If needed elaborate on reasons for plot layout selection and make notes about unique features of vegetation or environment.
01/21/2011NWCA Vegetation Plot Establishment
Site ID: NWCA11-
Reviewed by (initial):
5400429475
DRAFT - NOT FOR U
SE IN FIE
LD
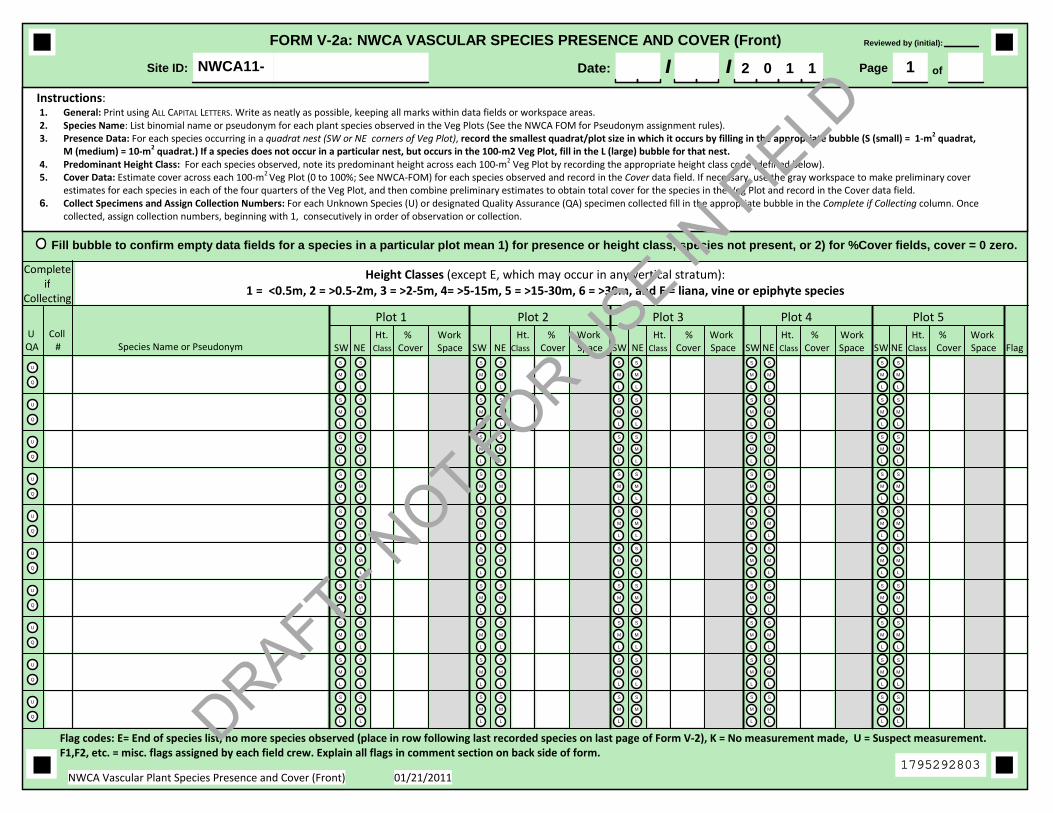
Ht. % Work Ht. % Work Ht. % Work Ht. % Work Ht. % WorkSW NE Class Cover Space SW NE Class Cover Space SW NE Class Cover Space SW NE Class Cover Space SW NE Class Cover Space Flag
Plot 1 Plot 2 Plot 3 Plot 4 Plot 5
U
Q
S
M
L
S
M
L
S
M
L
S
M
L
S
M
L
S
M
L
S
M
L
S
M
L
S
M
L
S
M
L
U
Q
S
M
L
S
M
L
S
M
L
S
M
L
S
M
L
S
M
L
S
M
L
S
M
L
S
M
L
S
M
L
U
Q
S
M
L
S
M
L
S
M
L
S
M
L
S
M
L
S
M
L
S
M
L
S
M
L
S
M
L
S
M
L
U
Q
S
M
L
S
M
L
S
M
L
S
M
L
S
M
L
S
M
L
S
M
L
S
M
L
S
M
L
S
M
L
U
Q
S
M
L
S
M
L
S
M
L
S
M
L
S
M
L
S
M
L
S
M
L
S
M
L
S
M
L
S
M
L
U
Q
S
M
L
S
M
L
S
M
L
S
M
L
S
M
L
S
M
L
S
M
L
S
M
L
S
M
L
S
M
L
U
Q
S
M
L
S
M
L
S
M
L
S
M
L
S
M
L
S
M
L
S
M
L
S
M
L
S
M
L
S
M
L
U
Q
S
M
L
S
M
L
S
M
L
S
M
L
S
M
L
S
M
L
S
M
L
S
M
L
S
M
L
S
M
L
U
Q
S
M
L
S
M
L
S
M
L
S
M
L
S
M
L
S
M
L
S
M
L
S
M
L
S
M
L
S
M
L
U
Q
S
M
L
S
M
L
S
M
L
S
M
L
S
M
L
S
M
L
S
M
L
S
M
L
S
M
L
S
M
L
Site ID: NWCA11- Date: 2 0 1 1
FORM V-2a: NWCA VASCULAR SPECIES PRESENCE AND COVER (Front)
/ /
Fill bubble to confirm empty data fields for a species in a particular plot mean 1) for presence or height class, species not present, or 2) for %Cover fields, cover = 0 zero.
Completeif
Collecting
NWCA Vascular Plant Species Presence and Cover (Front) 01/21/2011
Height Classes (except E, which may occur in any vertical stratum):1 = <0.5m, 2 = >0.5‐2m, 3 = >2‐5m, 4= >5‐15m, 5 = >15‐30m, 6 = >30m, and E = liana, vine or epiphyte species
Flag codes: E= End of species list, no more species observed (place in row following last recorded species on last page of Form V‐2), K = No measurement made, U = Suspect measurement.F1,F2, etc. = misc. flags assigned by each field crew. Explain all flags in comment section on back side of form.
Page 1 of
U CollQA # Species Name or Pseudonym
Instructions: 1. General: Print using ALL CAPITAL LETTERS. Write as neatly as possible, keeping all marks within data fields or workspace areas. 2. Species Name: List binomial name or pseudonym for each plant species observed in the Veg Plots (See the NWCA FOM for Pseudonym assignment rules). 3. Presence Data: For each species occurring in a quadrat nest (SW or NE corners of Veg Plot), record the smallest quadrat/plot size in which it occurs by filling in the appropriate bubble (S (small) = 1‐m2 quadrat,
M (medium) = 10‐m2 quadrat.) If a species does not occur in a particular nest, but occurs in the 100‐m2 Veg Plot, fill in the L (large) bubble for that nest. 4. Predominant Height Class: For each species observed, note its predominant height across each 100‐m2 Veg Plot by recording the appropriate height class code (defined below). 5. Cover Data: Estimate cover across each 100‐m2 Veg Plot (0 to 100%; See NWCA‐FOM) for each species observed and record in the Cover data field. If necessary, use the gray workspace to make preliminary cover
estimates for each species in each of the four quarters of the Veg Plot, and then combine preliminary estimates to obtain total cover for the species in the Veg Plot and record in the Cover data field. 6. Collect Specimens and Assign Collection Numbers: For each Unknown Species (U) or designated Quality Assurance (QA) specimen collected fill in the appropriate bubble in the Complete if Collecting column. Once
collected, assign collection numbers, beginning with 1, consecutively in order of observation or collection.
Reviewed by (initial):
1795292803
DRAFT - NOT FOR U
SE IN FIE
LD

Flag Comments
Site ID: NWCA11- Date: 2 0 1 1
FORM V-2a: NWCA VASCULAR SPECIES PRESENCE AND COVER (Back)
/ /
Flag Comments
01/21/2011NWCA Vascular Plant Species Presence and Cover (Back)
Reviewed by (initial):
1870298140
DRAFT - NOT FOR U
SE IN FIE
LD

U
Q
S
M
L
S
M
L
S
M
L
S
M
L
S
M
L
S
M
L
S
M
L
S
M
L
S
M
L
S
M
L
U
Q
S
M
L
S
M
L
S
M
L
S
M
L
S
M
L
S
M
L
S
M
L
S
M
L
S
M
L
S
M
L
U
Q
S
M
L
S
M
L
S
M
L
S
M
L
S
M
L
S
M
L
S
M
L
S
M
L
S
M
L
S
M
L
U
Q
S
M
L
S
M
L
S
M
L
S
M
L
S
M
L
S
M
L
S
M
L
S
M
L
S
M
L
S
M
L
U
Q
S
M
L
S
M
L
S
M
L
S
M
L
S
M
L
S
M
L
S
M
L
S
M
L
S
M
L
S
M
L
U
Q
S
M
L
S
M
L
S
M
L
S
M
L
S
M
L
S
M
L
S
M
L
S
M
L
S
M
L
S
M
L
U
Q
S
M
L
S
M
L
S
M
L
S
M
L
S
M
L
S
M
L
S
M
L
S
M
L
S
M
L
S
M
L
U
Q
S
M
L
S
M
L
S
M
L
S
M
L
S
M
L
S
M
L
S
M
L
S
M
L
S
M
L
S
M
L
U
Q
S
M
L
S
M
L
S
M
L
S
M
L
S
M
L
S
M
L
S
M
L
S
M
L
S
M
L
S
M
L
U
Q
S
M
L
S
M
L
S
M
L
S
M
L
S
M
L
S
M
L
S
M
L
S
M
L
S
M
L
S
M
L
U
Q
S
M
L
S
M
L
S
M
L
S
M
L
S
M
L
S
M
L
S
M
L
S
M
L
S
M
L
S
M
L
U
Q
S
M
L
S
M
L
S
M
L
S
M
L
S
M
L
S
M
L
S
M
L
S
M
L
S
M
L
S
M
L
U
Q
S
M
L
S
M
L
S
M
L
S
M
L
S
M
L
S
M
L
S
M
L
S
M
L
S
M
L
S
M
L
Flag Comments
Site ID: NWCA11- Date: 2 0 1 1
FORM V-2b: NWCA VASCULAR SPECIES PRESENCE AND COVER (Continued)
/ /Fill bubble to confirm empty data fields for a species in a particular plot mean 1) for presence or height class, species not present, or 2) for %Cover fields, cover = 0 zero.
Flag Comments
Flag codes: E= End of species list, no more species observed (place in row following last recorded species on last page of Form V‐2), K = No measurement made,U = Suspect measurement, F1,F2, etc. = misc. flags assigned by each field crew. Explain all flags in comment section, continuing as needed on Form V‐2a (Back).
Page 2 of
01/21/2011NWCA Vascular Plant Species Presence and Cover (Continued)
Ht. % Work Ht. % Work Ht. % Work Ht. % Work Ht. % WorkSW NE Class Cover Space SW NE Class Cover Space SW NE Class Cover Space SW NE Class Cover Space SW NE Class Cover Space Flag
Plot 1 Plot 2 Plot 3 Plot 4 Plot 5
Completeif
Collecting
Height Classes (except E, which may occur in any vertical stratum):1 = <0.5m, 2 = >0.5‐2m, 3 = >2‐5m, 4= >5‐15m, 5 = >15‐30m, 6 = >30m, and E = liana, vine or epiphyte species
U CollQA # Species Name or Pseudonym
Reviewed by (initial):
2909441751
DRAFT - NOT FOR U
SE IN FIE
LD


% Cover Vascular Vegetation Strata Plot 1 Plot 2 Plot 3 Plot 4 Plot 5 Flag
COVER OF FLOATING AQUATIC VEGETATION (not rooted in sediment) (0 - 100%)
Fill bubble if Bryophytes are dominated by Sphagnum or other peat-forming mosses
COVER FOR ALL OTHER VASCULAR VEGETATION FOR EACH OF THEFOLLOWING HEIGHT CLASSES:
>30m tall: e.g., very tall trees (0 - 100%)
FORM V-3: NWCA VEGETATION TYPES (Front)
Flag Comments
Flag codes: K = No measurement made, U = Suspect measurement., F1,F2, etc. = misc. flags assigned by each field crew.Explain all flags in comment section.
>15 to 30m tall: e.g., tall trees (0 - 100%)
>5 to 15m tall: e.g., very tall shrubs; short to mid-sized trees (0 - 100%)
>2 to 5m tall: e.g., tall shrubs; tree saplings (0 - 100%)
< 0.5m tall: e.g., low emergent/terrestrial; herbaceous species; low shrubs;tree seedlings (0 - 100%)
COVER OF LIANAS, VINES AND EPIPHYTES IN ANY HEIGHT CLASS (0 - 100%)
COVER OF FILAMENTOUS OR MAT FORMING ALGAE (0 - 100%)
COVER OF MACROALGAE (freshwater species/seaweeds) (0 - 100%):
Algae occurs as wrack (detached, debris, stranded)
When Macroalgae is present, fill in all bubbles that apply for each Veg Plot:
Algae is attached/living
Algae Status Unknown (Can't determine whether algaeis wrack or attached/living)
Date: 2 0 1 1//Instructions:1. Estimate the cover for each Vascular Vegetation Stratum.2. Estimate cover and collect categorical data for Non-Vascular Taxonomic Groups.3. Cover can range from 0 - 100% for each of the following groups: submerged aquatic vegetation, floating aquatic vegetation, lianas, vines, andepiphytes, each height class of other vascular vegetation and each Non-Vascular Group.
01/21/2011NWCA Vegetation Types
Site ID: NWCA11-
0.5 to 2m tall: e.g., medium height shrubs; tree seedlings and saplings; tall emergent/terrestrial herbaceous species (0 - 100%)
COVER OF ARBOREAL EPIPHYTIC BRYOPHYTES AND LICHENS (see NWCA-FOM for cover estimation procedures for this group) (0 - 100%)
COVER OF LICHENS growing on ground surfaces, logs, rocks, etc. (0 - 100%)
COVER OF BRYOPHYTES (mosses and liverworts) growing on groundsurfaces, logs, rocks, etc.) (0 - 100%)
COVER DATA CELLS:
Confirm that empty cells equal zero by filling in this bubble
CATEGORICAL DATA:
Confirm a filled data bubble indicates Yes and an unfilledbubble indicates No by filling in this bubble
% Cover and Categorical Data for Non-Vascular Taxa Plot 1 Plot 2 Plot 3 Plot 4 Plot 5 Flag
COVER OF SUBMERGED AQUATIC VEGETATION (rooted in sediment, mostplant cover submerged or floating on water) (0 - 100%)
Plot 1 Plot 2 Plot 3 Plot 4 Plot 5 Flag
E2EME2SSPEMPSSPFOPUBPAB
E2EM - Estuarine Intertidal Emergent PSS - Palustrine Scrub ShrubE2SS - Estuarine Intertidal Scrub/Shrub/Forested PFO - Palustrine ForestedPEM - Palustrine Emergent PUBPAB - Palustrine
UnconsolidatedBottom/Aquatic Bed
Predominant S & T Class
(see Reference Card AA-3, Side A for definitions)
Flag Comments
Pf
E2EME2SSPEMPSSPFOPUBPAB
E2EME2SSPEMPSSPFOPUBPAB
E2EME2SSPEMPSSPFOPUBPAB
E2EME2SSPEMPSSPFOPUBPAB
If plot is Pf - Palustrine Farmed (not currently in production) fill Pf bubble AND indicatepredominant S & T class each plot would be if never cropped.
Pf Pf Pf Pf
If not Pf - Palustrine Farmed select the predominant S & T class for each plot.
Reviewed by (initial):
4741595533
DRAFT - NOT FOR U
SE IN FIE
LD
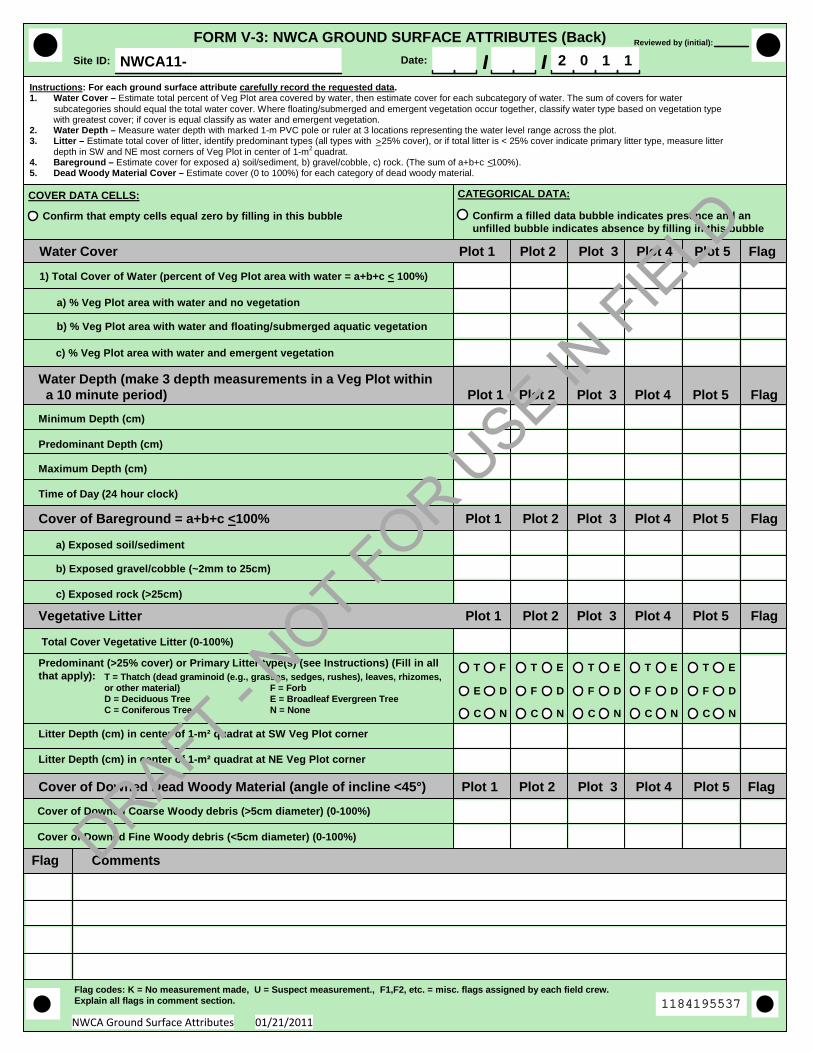
Predominant (>25% cover) or Primary Litter type(s) (see Instructions) (Fill in allthat apply):
Cover of Bareground = a+b+c <100% Plot 1 Plot 2 Plot 3 Plot 4 Plot 5 Flag
a) % Veg Plot area with water and no vegetation
FORM V-3: NWCA GROUND SURFACE ATTRIBUTES (Back)
Flag Comments
Flag codes: K = No measurement made, U = Suspect measurement., F1,F2, etc. = misc. flags assigned by each field crew.Explain all flags in comment section.
b) % Veg Plot area with water and floating/submerged aquatic vegetation
c) % Veg Plot area with water and emergent vegetation
Site ID: NWCA11- Date: 2 0 1 1//
Time of Day (24 hour clock)
Maximum Depth (cm)
Predominant Depth (cm)
c) Exposed rock (>25cm)
b) Exposed gravel/cobble (~2mm to 25cm)
a) Exposed soil/sediment
Litter Depth (cm) in center of 1-m² quadrat at NE Veg Plot corner
Total Cover Vegetative Litter (0-100%)
Litter Depth (cm) in center of 1-m² quadrat at SW Veg Plot corner
Cover of Downed Fine Woody debris (<5cm diameter) (0-100%)
01/21/2011NWCA Ground Surface Attributes
1) Total Cover of Water (percent of Veg Plot area with water = a+b+c < 100%)
Water Depth (make 3 depth measurements in a Veg Plot within a 10 minute period) Plot 1 Plot 2 Plot 3 Plot 4 Plot 5 Flag
Minimum Depth (cm)
Cover of Downed Dead Woody Material (angle of incline <45°) Plot 1 Plot 2 Plot 3 Plot 4 Plot 5 Flag
Cover of Downed Coarse Woody debris (>5cm diameter) (0-100%)
COVER DATA CELLS:
Confirm that empty cells equal zero by filling in this bubble Confirm a filled data bubble indicates presence and anunfilled bubble indicates absence by filling in this bubble
CATEGORICAL DATA:
C
F D
ET
NC
F D
ET
NC
F D
ET
NC
F D
ET
NC
F
DE
T
N
Water Cover Plot 1 Plot 2 Plot 3 Plot 4 Plot 5 Flag
Vegetative Litter Plot 1 Plot 2 Plot 3 Plot 4 Plot 5 Flag
>
T = Thatch (dead graminoid (e.g., grasses, sedges, rushes), leaves, rhizomes,or other material) F = Forb D = Deciduous Tree E = Broadleaf Evergreen TreeC = Coniferous Tree N = None
<
Reviewed by (initial):
Instructions: For each ground surface attribute carefully record the requested data. 1. Water Cover – Estimate total percent of Veg Plot area covered by water, then estimate cover for each subcategory of water. The sum of covers for water
subcategories should equal the total water cover. Where floating/submerged and emergent vegetation occur together, classify water type based on vegetation type with greatest cover; if cover is equal classify as water and emergent vegetation.
2. Water Depth – Measure water depth with marked 1-m PVC pole or ruler at 3 locations representing the water level range across the plot. 3. Litter – Estimate total cover of litter, identify predominant types (all types with 25% cover), or if total litter is < 25% cover indicate primary litter type, measure litter
depth in SW and NE most corners of Veg Plot in center of 1-m2 quadrat. 4. Bareground – Estimate cover for exposed a) soil/sediment, b) gravel/cobble, c) rock. (The sum of a+b+c 100%). 5. Dead Woody Material Cover – Estimate cover (0 to 100%) for each category of dead woody material.
1184195537
DRAFT - NOT FOR U
SE IN FIE
LD

Instructions for Recording Data: 1. Fill out Header Information. 2. If Live Trees or Snags are Absent from a Veg Plot, fill in the appropriate bubble in the Tree or Snag
Absence field. 3. If either Live Trees or Snags are Present in a Veg Plot, collect data across the entire 100-m2 area of
each Veg Plot. 4. Standing Dead Trees and Snags (angle of incline > 45°): Count snags > 5cm DBH by diameter class
and record the total number of snags for each DBH class in the white data column for the appropriate Veg Plot.
5. For Each Live Tree Species: Use one row for each plot in which each tree species is found. Be sure to indicate the Veg Plot number in the Plot # column next to each species name.
6. Cover of trees in height classes: Record species names or pseudonyms for each tree species. Ensure pseudonyms match those used on Form V-2. Record the percent cover (0-100%) for each tree species for each of the following height classes: < 0.5m, 0.5 to 2m, > 2 to 5m, > 5 to 15m, >15 to 30m, >30m.
7. Live Trees: Count trees > 5cm DBH in each Veg Plot by species in DBH classes and record the total number of trees for each diameter class in the white data column.
8. Counting Trees or Snags: If needed, for smaller DBH classes when many trees or snags are present, a running tally* of the numbers of all snags, or for each tree species, in each DBH class can be recorded in the gray shaded workspace in the DBH columns. Once all the snags or tree species are tallied for a plot, record the total number for each species in each DBH class in the white data field for each DBH column.
FORM V-4a: NWCA SNAG AND TREE COUNTS AND TREE COVER (Front)
123
45
123
45
123
45
123
45
123
45
123
45
Page 1 of
TREES OR SNAGS ABSENCE: Fill in all that apply: LTA=Live Trees Absent, DTA=Dead Trees/Snags Absent
Plot 1 Plot 4Plot 3 Plot 5Plot 2
Plot # Live Tree Species Name/Pseudonym
Tree Cover by Height Class Tree Counts by DBH Class (White box = data field, Gray box = tally workspace) (DBH = diameter breast height)
Standing Dead Tree/Snag Counts by DBH Class (White box = data field, Gray box = tally workspace)
Plot
1
2
3
4
5
Flag5 to 10cm 11 to 25cm 26 to 50cm 51 to 75cm76 to100cm
101 to200cm
Flag codes:K = No measurement made, U = Suspect measurement, F1, F2, etc = misc.flags assigned by each field crew. Explain all flags in comment section on back side of form.
5 to 10cm Flag11 to 25cm 26 to 50cm 51 to 75cm76 to100cm
101 to200cm
>200cm
<0.5m >0.5-2m
>2-5m >5-15m
>15-30m
>30m
LTADTA
LTADTA
LTADTA
LTADTA
LTADTA
1 2 3 4 10765 98Tallyformat*
Site ID: NWCA11- Date: 2 0 1 1/ /
01/21/2011NWCA Snag & Tree Counts (Front)
Fill in bubble to confirm that empty data cells equal zero.
Reviewed by (initial):
2318393335
DRAFT - NOT FOR U
SE IN FIE
LD

123
45
123
45
123
45
123
45
123
45
123
45
123
45
123
45
123
45
123
45
123
45
123
45
123
45
123
45
123
45
FORM V-4a: NWCA SNAG AND TREE COUNTS AND TREE COVER (Back)
Date: 2 0 1 1/ / Tree Counts by DBH Class
(White box = data field, Gray box = tally workspace)
5 to 10cm 11 to 25cm 26 to 50cm 51 to 75cm76 to100cm
101 to200cm
>200cm Flag
Tree Cover by Height Class
>30m
Plot # Live Tree Species Name/Pseudonym
Flag Comment
<0.5m>0.5-2m >2-5m
>5-15m
>15-30m
Flag codes:K = No measurement made, U = Suspect measurement, F1, F2, etc = misc.flags assigned by each field crew. Explain all flags in comment section.01/21/2011NWCA Snag & Tree Counts (Back)
Site ID: NWCA11- Page of
Flag Comment
Reviewed by (initial):
6613382414
DRAFT - NOT FOR U
SE IN FIE
LD
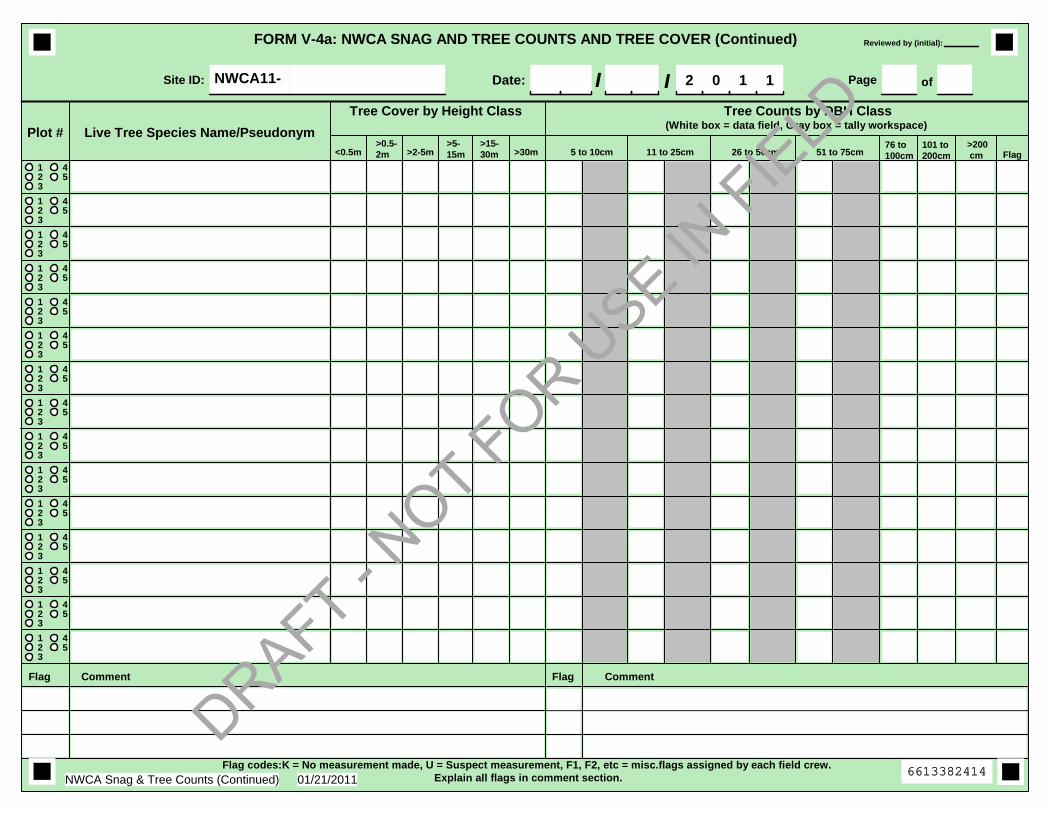
123
45
123
45
123
45
123
45
123
45
123
45
123
45
123
45
123
45
123
45
123
45
123
45
123
45
123
45
123
45
FORM V-4a: NWCA SNAG AND TREE COUNTS AND TREE COVER (Continued)
Date: 2 0 1 1/ / Tree Counts by DBH Class
(White box = data field, Gray box = tally workspace)
5 to 10cm 11 to 25cm 26 to 50cm 51 to 75cm76 to100cm
101 to200cm
>200cm Flag
Tree Cover by Height Class
>30m
Plot # Live Tree Species Name/Pseudonym
Flag Comment
<0.5m>0.5-2m >2-5m
>5-15m
>15-30m
Flag codes:K = No measurement made, U = Suspect measurement, F1, F2, etc = misc.flags assigned by each field crew. Explain all flags in comment section.01/21/2011NWCA Snag & Tree Counts (Continued)
Site ID: NWCA11- Page of
Flag Comment
Reviewed by (initial):
6613382414
DRAFT - NOT FOR U
SE IN FIE
LD


Plant Sample ID Number: NWCA11‐_____‐_______ (Site#) (Collection#)
Date: ___/___/2011 Visit #: 1 2 ‐ fill in circle if QA specimen
Plant Sample ID Number: NWCA11‐_____‐_______ (Site#) (Collection#)
Date: ___/___/2011 Visit #: 1 2 ‐ fill in circle if QA specimen
Plant Sample ID Number: NWCA11‐_____‐_______ (Site#) (Collection#)
Date: ___/___/2011 Visit #: 1 2 ‐ fill in circle if QA specimen
Plant Sample ID Number: NWCA11‐_____‐_______ (Site#) (Collection#)
Date: ___/___/2011 Visit #: 1 2 ‐ fill in circle if QA specimen
Plant Sample ID Number: NWCA11‐_____‐_______ (Site#) (Collection#)
Date: ___/___/2011 Visit #: 1 2 ‐ fill in circle if QA specimen
Plant Sample ID Number: NWCA11‐_____‐_______ (Site#) (Collection#)
Date: ___/___/2011 Visit #: 1 2 ‐ fill in circle if QA specimen
Plant Sample ID Number: NWCA11‐_____‐_______ (Site#) (Collection#)
Date: ___/___/2011 Visit #: 1 2 ‐ fill in circle if QA specimen
Plant Sample ID Number: NWCA11‐_____‐_______ (Site#) (Collection#)
Date: ___/___/2011 Visit #: 1 2 ‐ fill in circle if QA specimen
Plant Sample ID Number: NWCA11‐_____‐_______ (Site#) (Collection#)
Date: ___/___/2011 Visit #: 1 2 ‐ fill in circle if QA specimen
Plant Sample ID Number: NWCA11‐_____‐_______ (Site#) (Collection#)
Date: ___/___/2011 Visit #: 1 2 ‐ fill in circle if QA specimen
Plant Sample ID Number: NWCA11‐_____‐_______ (Site#) (Collection#)
Date: ___/___/2011 Visit #: 1 2 ‐ fill in circle if QA specimen
Plant Sample ID Number: NWCA11‐_____‐_______ (Site#) (Collection#)
Date: ___/___/2011 Visit #: 1 2 ‐ fill in circle if QA specimen
Plant Sample ID Number: NWCA11‐_____‐_______ (Site#) (Collection#)
Date: ___/___/2011 Visit #: 1 2 ‐ fill in circle if QA specimen
Plant Sample ID Number: NWCA11‐_____‐_______ (Site#) (Collection#)
Date: ___/___/2011 Visit #: 1 2 ‐ fill in circle if QA specimen
Plant Sample ID Number: NWCA11‐_____‐_______ (Site#) (Collection#)
Date: ___/___/2011 Visit #: 1 2 ‐ fill in circle if QA specimen
Plant Sample ID Number: NWCA11‐_____‐_______ (Site#) (Collection#)
Date: ___/___/2011 Visit #: 1 2 ‐ fill in circle if QA specimen
Plant Sample ID Number: NWCA11‐_____‐_______ (Site#) (Collection#)
Date: ___/___/2011 Visit #: 1 2 ‐ fill in circle if QA specimen
Plant Sample ID Number: NWCA11‐_____‐_______ (Site#) (Collection#)
Date: ___/___/2011 Visit #: 1 2 ‐ fill in circle if QA specimen
Plant Sample ID Number: NWCA11‐_____‐_______ (Site#) (Collection#)
Date: ___/___/2011 Visit #: 1 2 ‐ fill in circle if QA specimen
Plant Sample ID Number: NWCA11‐_____‐_______ (Site#) (Collection#)
Date: ___/___/2011 Visit #: 1 2 ‐ fill in circle if QA specimen
Plant Sample ID Number: NWCA11‐_____‐_______ (Site#) (Collection#)
Date: ___/___/2011 Visit #: 1 2 ‐ fill in circle if QA specimen
Plant Sample ID Number: NWCA11‐_____‐_______ (Site#) (Collection#)
Date: ___/___/2011 Visit #: 1 2 ‐ fill in circle if QA specimen
Plant Sample ID Number: NWCA11‐_____‐_______ (Site#) (Collection#)
Date: ___/___/2011 Visit #: 1 2 ‐ fill in circle if QA specimen
Plant Sample ID Number: NWCA11‐_____‐_______ (Site#) (Collection#)
Date: ___/___/2011 Visit #: 1 2 ‐ fill in circle if QA specimen
Plant Sample ID Number: NWCA11‐_____‐_______ (Site#) (Collection#)
Date: ___/___/2011 Visit #: 1 2 ‐ fill in circle if QA specimen
Plant Sample ID Number: NWCA11‐_____‐_______ (Site#) (Collection#)
Date: ___/___/2011 Visit #: 1 2 ‐ fill in circle if QA specimen
Plant Sample ID Number: NWCA11‐_____‐_______ (Site#) (Collection#)
Date: ___/___/2011 Visit #: 1 2 ‐ fill in circle if QA specimen
Plant Sample ID Number: NWCA11‐_____‐_______ (Site#) (Collection#)
Date: ___/___/2011 Visit #: 1 2 ‐ fill in circle if QA specimen
Plant Sample ID Number: NWCA11‐_____‐_______ (Site#) (Collection#)
Date: ___/___/2011 Visit #: 1 2 ‐ fill in circle if QA specimen
Plant Sample ID Number: NWCA11‐_____‐_______ (Site#) (Collection#)
Date: ___/___/2011 Visit #: 1 2 ‐ fill in circle if QA specimen
DRAFT - NOT FOR U
SE IN FIE
LD
tmagee
Text Box
Example of Plant Sample Adhesive Tags


PLANT SPECIMEN LABEL (enclose in newsprint with sample)
For Unknown species, record pseudonym from Form V‐2
Plant Sample ID Number:
NWCA11‐______‐_______ (Site#) (Collection#) Date: ___/___/2011 Visit #: 1 2 ‐ fill in circle if QA specimen
Collector(s) Name(s): Abundance of Plant (fill appropriate circle): Dominant Common Sparse Uncommon
Habitat:
Plant Habitat:
DRAFT - NOT FOR U
SE IN FIE
LD

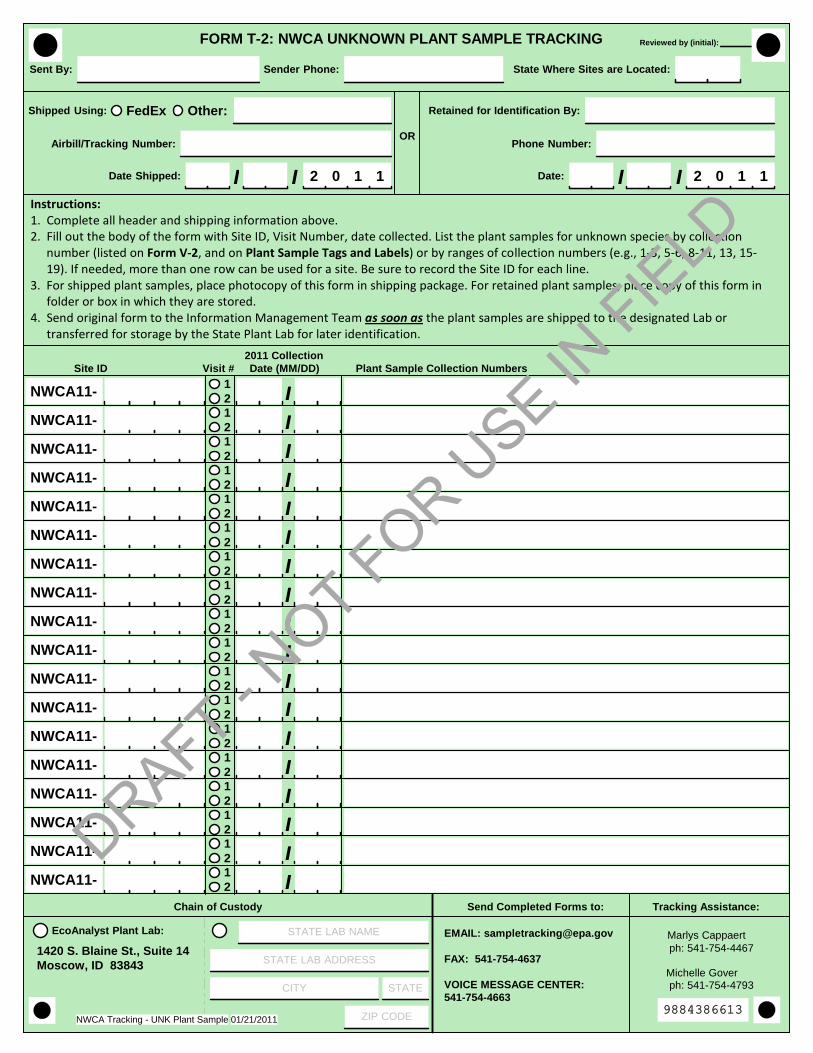
Chain of Custody Send Completed Forms to: Tracking Assistance:
2011 Collection Site ID Visit # Date (MM/DD) Plant Sample Collection Numbers
NWCA11-12 /
NWCA11-12 /
NWCA11-12 /
NWCA11-12 /
NWCA11-12 /
NWCA11-12 /
NWCA11-12 /
NWCA11-12 /
NWCA11-12 /
NWCA11-12 /
NWCA11-12 /
NWCA11-12 /
NWCA11-12 /
NWCA11-12 /
NWCA11-12 /
NWCA11-12 /
NWCA11-12 /
NWCA11-12 /
01/21/2011NWCA Tracking - UNK Plant Sample
FORM T-2: NWCA UNKNOWN PLANT SAMPLE TRACKING
Marlys Cappaert ph: 541-754-4467
Michelle Gover ph: 541-754-4793
Shipped Using: FedEx Other:
Sender Phone:Sent By:
Airbill/Tracking Number:
State Where Sites are Located:
Date Shipped: 2 0 1 1/ /
OR
Date: 2 0 1 1/ /
Phone Number:
Retained for Identification By:
EcoAnalyst Plant Lab:
Reviewed by (initial):
EMAIL: [email protected]
FAX: 541-754-4637
VOICE MESSAGE CENTER:541-754-4663
STATE LAB NAME
STATE LAB ADDRESS
CITY STATE
ZIP CODE
1420 S. Blaine St., Suite 14Moscow, ID 83843
Instructions: 1. Complete all header and shipping information above. 2. Fill out the body of the form with Site ID, Visit Number, date collected. List the plant samples for unknown species by collection
number (listed on Form V‐2, and on Plant Sample Tags and Labels) or by ranges of collection numbers (e.g., 1‐3, 5‐6, 8‐11, 13, 15‐19). If needed, more than one row can be used for a site. Be sure to record the Site ID for each line.
3. For shipped plant samples, place photocopy of this form in shipping package. For retained plant samples, place copy of this form in folder or box in which they are stored.
4. Send original form to the Information Management Team as soon as the plant samples are shipped to the designated Lab or transferred for storage by the State Plant Lab for later identification.
9884386613
DRAFT - NOT FOR U
SE IN FIE
LD

NWCA11-12 /
NWCA11-12 /
NWCA11-12 /
NWCA11-12 /
NWCA11-12 /
NWCA11-12 /
NWCA11-12 /
NWCA11-12 /
NWCA11-12 /
NWCA11-12 /
NWCA11-12 /
NWCA11-12 /
NWCA11-12 /
NWCA11-12 /
NWCA11-12 /
NWCA11-12 /
NWCA11-12 /
NWCA11-12 /
NWCA11-12 /
NWCA11-12 /
NWCA11-12 /
NWCA11-12 /
NWCA11-12 /
NWCA11-12 /
NWCA11-12 /
NWCA11-12 /
NWCA11-12 /
NWCA11-12 /
NWCA11-12 /
NWCA11-12 /
NWCA11-12 /
NWCA11-12 /
2011 Collection Site ID Visit # Date (MM/DD) Plant Sample Collection Numbers
01/21/2011NWCA Tracking - UNK Plant Sample
FORM T-2: NWCA UNKNOWN PLANT SAMPLE TRACKING Reviewed by (initial):
5702386618
DRAFT - NOT FOR U
SE IN FIE
LD
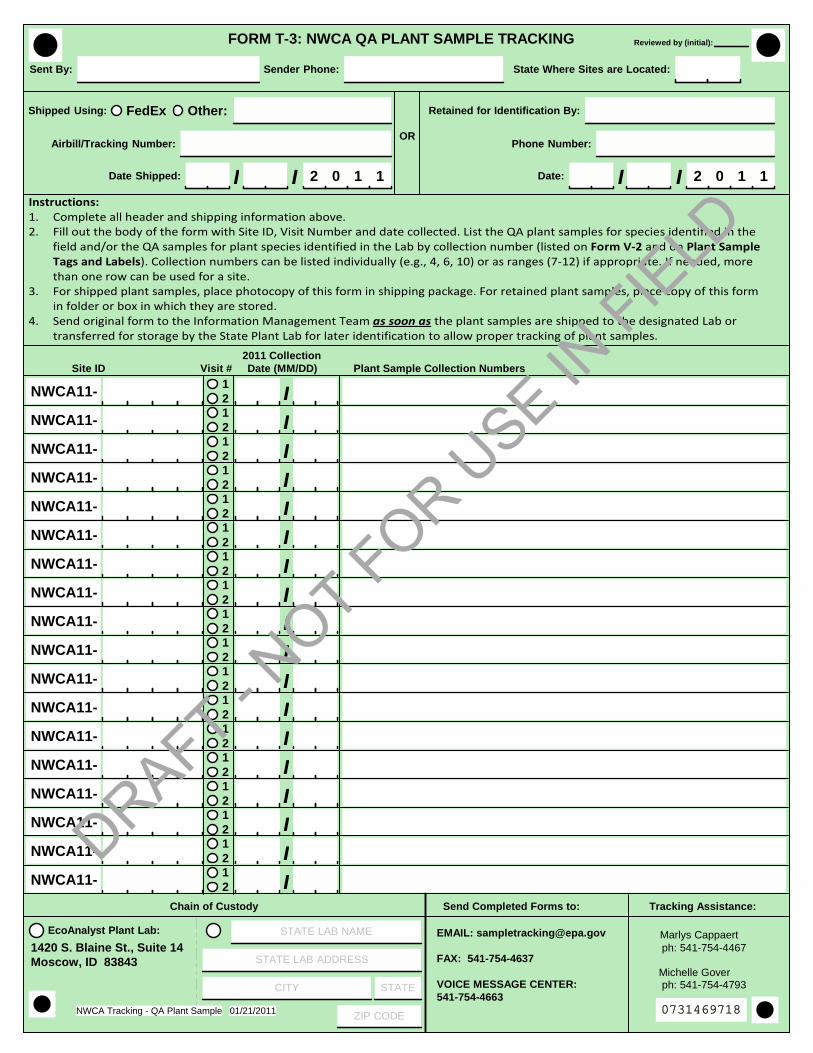
NWCA11-12 /
NWCA11-12 /
NWCA11-12 /
NWCA11-12 /
NWCA11-12 /
NWCA11-12 /
NWCA11-12 /
NWCA11-12 /
NWCA11-12 /
NWCA11-12 /
NWCA11-12 /
NWCA11-12 /
NWCA11-12 /
NWCA11-12 /
NWCA11-12 /
NWCA11-12 /
NWCA11-12 /
NWCA11-12 /
2011 Collection Site ID Visit # Date (MM/DD) Plant Sample Collection Numbers
01/21/2011NWCA Tracking - QA Plant Sample
FORM T-3: NWCA QA PLANT SAMPLE TRACKING
Shipped Using: FedEx Other:
Sender Phone:Sent By:
Airbill/Tracking Number:
State Where Sites are Located:
Date Shipped: 2 0 1 1/ /
OR
Date: 2 0 1 1/ /
Phone Number:
Retained for Identification By:
Reviewed by (initial):
Marlys Cappaert ph: 541-754-4467
Michelle Gover ph: 541-754-4793
Chain of Custody Send Completed Forms to: Tracking Assistance:
EMAIL: [email protected]
FAX: 541-754-4637
VOICE MESSAGE CENTER:541-754-4663
STATE LAB NAME
STATE LAB ADDRESS
CITY STATE
ZIP CODE
EcoAnalyst Plant Lab:
1420 S. Blaine St., Suite 14Moscow, ID 83843
Instructions: 1. Complete all header and shipping information above. 2. Fill out the body of the form with Site ID, Visit Number and date collected. List the QA plant samples for species identified in the
field and/or the QA samples for plant species identified in the Lab by collection number (listed on Form V‐2 and on Plant Sample Tags and Labels). Collection numbers can be listed individually (e.g., 4, 6, 10) or as ranges (7‐12) if appropriate. If needed, more than one row can be used for a site.
3. For shipped plant samples, place photocopy of this form in shipping package. For retained plant samples, place copy of this form in folder or box in which they are stored.
4. Send original form to the Information Management Team as soon as the plant samples are shipped to the designated Lab or transferred for storage by the State Plant Lab for later identification to allow proper tracking of plant samples.
0731469718
DRAFT - NOT FOR U
SE IN FIE
LD

2011 Collection Site ID Visit # Date (MM/DD) Plant Sample Collection Numbers
01/21/2011NWCA Tracking - QA Plant Sample
FORM T-3: NWCA QA PLANT SAMPLE TRACKING
NWCA11-12 /
NWCA11-12 /
NWCA11-12 /
NWCA11-12 /
NWCA11-12 /
NWCA11-12 /
NWCA11-12 /
NWCA11-12 /
NWCA11-12 /
NWCA11-12 /
NWCA11-12 /
NWCA11-12 /
NWCA11-12 /
NWCA11-12 /
NWCA11-12 /
NWCA11-12 /
NWCA11-12 /
NWCA11-12 /
NWCA11-12 /
NWCA11-12 /
NWCA11-12 /
NWCA11-12 /
NWCA11-12 /
NWCA11-12 /
NWCA11-12 /
NWCA11-12 /
NWCA11-12 /
NWCA11-12 /
NWCA11-12 /
NWCA11-12 /
NWCA11-12 /
NWCA11-12 /
Reviewed by (initial):
8517469718
DRAFT - NOT FOR U
SE IN FIE
LD

2011 NWCA Field Operations Manual Chapter 6. Soils
CHAPTER 6. SOILS
Introduction. . . . . . . . . . . . . . . . . . . . . . . . . . . . . . . . . . . . . . . . . . . . . . . . . . . . . . . . . . . . . . . . . . . . . . . 6.1 SAMPLING PROCEDURES. . . . . . . . . . . . . . . . . . . . . . . . . . . . . . . . . . . . . . . . . . . . . . . . . . . . . . .
6.1.1 Identifying Soil Pit Locations. . . . . . . . . . . . . . . . . . . . . . . . . . . . . . . . . . . . . . . . . . . . . . . . . . . 6.1.1.1 Standard Locations for Soil Pits. . . . . . . . . . . . . . . . . . . . . . . . . . . . . . . . . . . . . . . . . . . .6.1.1.2 Alternate Locations – Moving Soil Pits to Avoid Obstacles . . . . . . . . . . . . . . . . . . . . . .
6.1.2 Description of Soil Profiles. . . . . . . . . . . . . . . . . . . . . . . . . . . . . . . . . . . . . . . . . . . . . . . . . . . . Overview of Soil Profile Description Activities . . . . . . . . . . . . . . . . . . . . . . . . . . . . . . . . . . . . . .
6.1.2.1 Excavating Soil Pits for Profile Description. . . . . . . . . . . . . . . . . . . . . . . . . . . . . . . . . . . Easy to Sample Soils . . . . . . . . . . . . . . . . . . . . . . . . . . . . . . . . . . . . . . . . . . . . . . . . . . . . . . .Difficult to Sample Soils . . . . . . . . . . . . . . . . . . . . . . . . . . . . . . . . . . . . . . . . . . . . . . . . . . . . .
6.1.2.2 Initial Color for Saturated Soils and Detection of Hydrogen Sulfide (H2S) Odor. . . . . . . 6.1.2.3 Delineating Soil Horizons. . . . . . . . . . . . . . . . . . . . . . . . . . . . . . . . . . . . . . . . . . . . . . . . . 6.1.2.4 Describing Soil Texture. . . . . . . . . . . . . . . . . . . . . . . . . . . . . . . . . . . . . . . . . . . . . . . . . . 6.1.2.5 Estimating Percent Rock and Roots. . . . . . . . . . . . . . . . . . . . . . . . . . . . . . . . . . . . . . . . 6.1.2.6 Describing Soil Color and Identifying Redoximorphic and Other Soil Features. . . . . . ..6.1.2.7 Identifying Hydric Soil Indicators. . . . . . . . . . . . . . . . . . . . . . . . . . . . . . . . . . . . . . . . . . .
6.1.3 Soil Sample Collection. . . . . . . . . . . . . . . . . . . . . . . . . . . . . . . . . . . . . . . . . . . . . . . . . . . . . . 6.1.3.1 Collecting Soil Samples for Isotope and Enzyme Analysis. . . . . . . . . . . . . . . . . . . . . . . 6.1.3.2 Collecting Bulk Density and Chemistry Samples. . . . . . . . . . . . . . . . . . . . . . . . . . . . . .
Preparing Labels and Sample Collection Bags. . . . . . . . . . . . . . . . . . . . . . . . . . . . . . . . . . . . . Expanding the Representative Pit and Collecting Soil Samples. . . . . . . . . . . . . . . . . . . . . . . .
6.1.4 Water Depth In Pit After Equilibration. . . . . . . . . . . . . . . . . . . . . . . . . . . . . . . . . . . . . . . . . . . 6.1.5 Backfilling the Soil Pit . . . . . . . . . . . . . . . . . . . . . . . . . . . . . . . . . . . . . . . . . . . . . . . . . . . . . . . 6.1.6 Soil Tool Decontamination and Maintenance. . . . . . . . . . . . . . . . . . . . . . . . . . . . . . . . . . . . .
6.2 SAMPLE AND DATA HANDLING . . . . . . . . . . . . . . . . . . . . . . . . . . . . . . . . . . . . . . . . . . . . . . . . . . 6.2.1 At the Site. . . . . . . . . . . . . . . . . . . . . . . . . . . . . . . . . . . . . . . . . . . . . . . . . . . . . . . . . . . . . . . . 6.2.2 At Field Lodging or Office. . . . . . . . . . . . . . . . . . . . . . . . . . . . . . . . . . . . . . . . . . . . . . . . . . . . 6.2.4 Data Forms, Tracking Forms, and Shipping Records . . . . . . . . . . . . . . . . . . . . . . . . . . . . . .
6.3 LITERATURE CITED. . . . . . . . . . . . . . . . . . . . . . . . . . . . . . . . . . . . . . . . . . . . . . . . . . . . . . . . . . . . 6.4 SUPPLEMENTARY MATERIAL. . . . . . . . . . . . . . . . . . . . . . . . . . . . . . . . . . . . . . . . . . . . . . . . . . . . 6.4.1 List of Soil Resources to be Carried in Field or Vehicle . . . . . . . . . . . . . . . . . . . . . . . . . . . . . 6.4.2 Other Useful Soil Resources . . . . . . . . . . . . . . . . . . . . . . . . . . . . . . . . . . . . . . . . . . . . . . . . . 6.4.3 Glossary of Soil Terminology. . . . . . . . . . . . . . . . . . . . . . . . . . . . . . . . . . . . . . . . . . . . . . . . . 6.5 REFERENCE CARDS. . . . . . . . . . . . . . . . . . . . . . . . . . . . . . . . . . . . . . . . . . . . . . . . . . . . . . . . . . .
Reference Card S-1, Sides A and B. Soil Protocol Flowchart Reference Card S-2, Side A. Soil Pit Placement and Characteristics of Soil Horizon Types Reference Card S-2, Side B. Distinguishing Soil Horizons Reference Card S-3, Side A. Soil Structure, Coats, and Films; Guidelines for Cover Estimation . . Reference Card S-3, Side B. Examples of Some Redox and Other Soil Features Reference Card S-4, Side A. Determining Soil Texture Reference Card S-4, Side B. Soil Color Determinations Reference Card S-5, Side A. USDA Land Resource Regions (LRRs) Reference Card S-5, Side B. Hydric Soil Indicators by Land Resource Region, Evaluating Hydric Soil Indicators.
6.6 EQUIPMENT LIST, DATA FORMS, AND SAMPLE LABELS. . . . . . . . . . . . . . . . . . . . . . . . . . . . . . Equipment and Supply Checklist Form S-1: NWCA Soil Profile Data Example Labels for Soil Isotope and Sediment Enzyme Samples Soil Bulk Density or Chemistry Sample Tag Soil Bulk Density or Chemistry Sample Label Form T-4: NWCA Soil Chemistry and Bulk Density Sample Tracking
6-36-66-66-76-86-86-9
6-106-106-126-146-156-176-196-196-226-246-246-286-286-326-386-396-396-406-406-406-426-426-436-436-436-436-47
6-59
6-1

2011 NWCA Field Operations Manual Chapter 6. Soils
6-2

2011 NWCA Field Operations Manual Chapter 6. Soils
6-3
CHAPTER 6. SOILS The presence of hydric soil is a defining characteristic of wetland ecosystems. Soils influence surface and ground water movement in wetlands and provide a matrix for biogeochemical processes that affect wetland vegetation and other wetland ecosystem components, which reflect ecological condition (Tiner 1999, Mitsch and Gosselink 2007). The types of data to be collected as part of the NWCA are:
Soil profile and physical characteristics Hydric soil field indicators Soil chemistry and bulk density Soil isotopes and enzymes.
For more detailed information on the rationale for the soil indicator, see "Ecological Indicators for the 2011 National Wetland Condition Assessment" (USEPA in prep.). This chapter provides detailed protocols and methods for sampling the NWCA Soil Indicator. The Assessment Area and Buffer (AB) Team collects all soils data at each NWCA site. Soil sampling is conducted at four Soil Pits within each Assessment Area (AA), and includes 1) on-site description of the soil profile at 4 soil pits and 2) collection of four types of soil samples (chemistry, bulk density, isotope, and enzyme) for laboratory analysis (one pit only). A brief overview of sampling tasks is provided in the flowcharts on Reference Card S-1 (on the following two pages and in Section 6.5). While reading the protocols in this chapter it will be useful to refer to the flowcharts on Reference Card S-1, to several other Reference Cards that summarize key protocols or provide key information (Section 6.5), and to the soils data forms and equipment checklist (Section 6.6). Reference Cards may be laminated for easy access and use in the field. In addition to this chapter, two other field references are required to complete the soil protocols. They are:
Munsell Color X-Rite. 2009. Munsell Soil Color Charts. Grand Rapids, MI. USDA, NRCS (United States Department of Agriculture, Natural Resources Conservation Service). 2010. Field Indicators of Hydric Soils in the United States, Version 7.0. L.M. Vasilas, G.W. Hurt, and C.V. Noble (eds.). USDA, NRCS, in cooperation with the National Technical Committee for Hydric Soils. http://soils.usda.gov/use/hydric/ or ftp://ftp-fc.sc.egov.usda.gov/NSSC/Hydric_Soils/FieldIndicators_v7.pdf
Another useful reference, which should be carried in the vehicle or as needed into the field is:
Schoeneberger, P.J., D.A. Wysocki, E.C. Benham, and W.D. Broderson. 2002. Field Book for Describing and Sampling Soils, Version 2.0. Natural Resources Conservation Service, National Soil Survey Center, Lincoln, Nebraska, USA. ftp://ftp-fc.sc.egov.usda.gov/NSSC/Field_Book/FieldBookVer2.pdf
A list of additional reference material and a glossary of important soil terminology are provided in Section 6.4.

2011 NWCA Field Operations Manual Chapter 6. Soils
6-4
Reference Card S-1, Side A. NWCA Soil Protocol Flowchart
NO
Photograph the Soil Profile (Appendix D) either after horizon delineation or after the profile description is completed, as convenient.
1) Place a lettered flag (A, B, C, or D) at the Soil Pit location to identify it. 2) Excavate one Soil Pit to 60cm deep and extract a slab for soil profile using appropriate tools and methods for soil
conditions. Record pit depth, time of excavation, and lighting conditions on Form S-1. If an impenetrable layer prevents excavation and pit cannot be moved, record pit depth and type of impenetrable layer
on Form S-1. 3) Collect all soil profile data (see below) in this pit, then dig the next Soil Pit to 60cm and describe its soil profile. 4) Repeat until all four pits have been excavated and described to 60cm. Choose the Representative Pit. 5) Do not refill any pit until all pits have been examined, all samples have been collected from the Representative Pit, and water
depth data have been collected in all four pits.
Are standing water or obstacles present at the standard Soil Pit Location?
If water or mud ≥ 0.25m deep or other obstacle (e.g., TES species, large rock, tree, woody debris) is present, move pit to an alternate location as close to SE corner of Veg Plot as possible. Record pit location on Form S-1.
NO
If water and soft sediment < 0.25m deep, locate soil pit just outside SE corner of Veg Plot. Record pit location on Form S-1.
Place Soil Pit just outside SE corner of designated Veg Plot. Record pit location on Form S-1.
YES
Identify standard locations for Soil Pits (i.e., outside the SE corner of designated Veg Plot).
A. Soil Pit Location and Excavation to 60cm (See Section 6.1.1)
B. Soil Profile Description at Each Soil Pit (See Section 6.1.2)
YES Does soil have an inundated or saturated layer?
Immediately upon excavation, record initial soil matrix color and determine whether H2S odor (rotten egg) is detected (Form S-1).
Randomly select one Representative Soil Pit from the subset of pits that most represent the soils conditions of the AA.
Delineate soil horizons and for each horizon observed at each Soil Pit, determine and record on Form S-1 (Front):
Determine presence of Hydric Soil Indicators in the Soil Profile: 1) Use Reference Card S-5 to determine the Land Resource
Region (LRR) in which the AA occurs.
1) Horizon depth 2) Horizon boundary abruptness 3) Soil texture 4) % Rock fragments 5) % Roots 6) Soil matrix color 7) Presence and type of
redoximorphic or other features 8) % Horizon composed of distinct
or prominent redox and other features
9) Color of most evident redox or other feature
2) Evaluate the soil for the presence of Hydric Soil Indicators for the selected LRR and record on Form S-1 (Back).
Excavate soil, using an auger, to 125cm from the Representative Pit, or if easier dig pit to125 cm, and describe the soil profile from 60cm down to 125 cm. Complete photography of the soil profile for this pit.
Continue to Soil Sample Collection flowchart (Reference Card S-1, Side B).

2011 NWCA Field Operations Manual Chapter 6. Soils
6-5
Reference Card S-1, Side B. Soil Protocol Flowchart
C. Soil Sample Collection (See Section 6.1.3)
Soil Isotope and Sediment Enzyme Samples Collect soil isotope sample and sediment enzyme sample before expanding the Representative Pit for bulk density and chemistry sample collection. Collect 3 cores for the isotope sample and 6 for the enzyme sample. The same procedure is used for collecting both kinds of samples. 1) Fill out the appropriate sample tag and
sample label. Affix tag to outside of bag. 2) Use the syringe-corer to extract the
required number of 10-cm long soil cores from evenly spaced undisturbed locations within 1-m area surrounding the 60-cm pit.
3) Place all cores for the sample into the prepared sample bag. Properly fold the sample label into the top edge of the bag with the soil cores and carefully seal and staple the bag.
4) Place sealed bag of soil into a plastic food storage box, and place box in a small ice chest to keep it cool during the sampling day.
Bulk Density Samples1) For each horizon > 8cm thick
located in the top 60cm of the soil profile, prepare one bulk density sample bag, with completed sample tag and sample label.
2) Collect 3 soil cores using a small can, or if this is not feasible, a known volume of soil using another method, e.g., cut out a block of soil.
3) Place all 3 cores, or the soil blocks, into the sample bag.
4) Record the volume or dimensions of each of the cores or soil blocks making up the sample on the Sample Label.
Once the Representative Pit has been identified, collect four kinds of soil samples
Select tools appropriate to site conditions and expand the Representative Soil Pit and collect Bulk Density and Chemistry Soil Samples.
Chemistry/PSDASamples 1) For each horizon > 8cm
thick located down to 125cm, prepare one chemistry sample bag, with completed Sample Tag and Sample Label.
2) Collect 1 to 2.5 liters of soil (depending on rock and root content) for each sample.
1) Carefully remove air from sample bag.
2) Properly fold sample label into the top edge of the bag and staple bag shut.
3) Keep samples in a cool location during the day.
F. Soil Sample Handling and Processing (See Section 6.2, Chapter 2, Appendix A)
1) After all data and all samples have been gathered at all four pits, collect water depth data at each pit.
2) For each pit, record water depth values in the appropriate fields of the Soil Pit Water Depth section of its Form S-1: NWCA Soil Profile Data (Back).
1) Ensure all data and samples have been collected from all soil pits.
2) Backfill each pit and replace vegetation cap.
D. Soil Pit Water Depth (Section 6.1.4), Back-filling Soil Pits (Section 6.1.5), and Soil Tool Decontamination and Maintenance (Section 6.1.6)
1) Clean and decontaminate soils equipment.
2) Maintain soils equipment weekly by routinely lubricating all threads for connecting joints.
Wh 1) Keep bulk density and chemistry samples as cool as possible
by placing them in a shaded location whenever possible, and place isotope and sediment enzyme samples on ice.
ile at the Site:
2) At the end of the sample day, double check that all samples have been collected.
3) Complete Form T-1: NWCA 2011 Site and Sample Status and Tracking. a) In the Sample Status section of Form T-1, indicate the soil
isotope, the sediment enzyme, and the soil chemistry and bulk density samples have been collected.
b) Record sample id numbers on the labels for the soil isotope and sediment enzyme samples on Form T-1 in the WRS Sample Tracking section.
At Field Lodging or Office 1) Submit Form T-1 to Information Management Team; pack isotope
and enzyme samples in the ice-chest for immediately (within 24 hours) shipped samples to be sent to the EPA Lab, Corvallis, OR.
2) Ship batched bulk density and chemistry samples every two weeks
to the NRCS Lab with completed Form T-4: Bulk Density and Chemistry Soil Sample Tracking.
3) When packing soil samples for shipping, include a copy of the
pertinent tracking forms in the package and send any required copies to the Information Management Team.
4) Carefully seal the package, fill out shipping labels and affix to
package, affix required labels for regulated soils, and deliver package to shipping company.
2011 NWCA Field Operations Manual Chapter 6. Soils
6.1 SAMPLING PROCEDURES Protocols for NWCA soil sampling include several major elements (see Reference Card S-1), which are described in detail in this section: 1) Identifying Soil Pit location (Section 6.1.1) 2) Excavating pit (Sections 6.1.2 and 6.1.3) 3) Soil profile description (Section 6.1.2) 4) Soil sample collection (Section 6.1.3) 5) Water depth measurements (6.1.4) Prior to the sampling season, it will be helpful if you can consult with your local National Resource Conservation Service (NRCS) soil scientist for advice about likely soil conditions and the best methods for sampling soils at particular NWCA sites. Assistance with soils from the local NRCS office can be arranged through your Regional Monitoring Coordinator for the NWCA. This assistance could include: 1) obtaining preliminary site-specific information on soils for the site packet and 2) office or field meetings with the soil scientist for advice on specific issues concerning sampling soils on-site. Before going to each NWCA site, review the soil survey, maps, and photo information in the Site Packet (See Chapter 2). Use the Site Packet review and any discussions with the soil scientist to select the tools best suited to the anticipated soil conditions for the site to carry into the Assessment Area (AA) (see also Equipment List (Section 6.6) and Sections 6.1.2 and 6.1.3). Note that the NRCS soil scientist may also have specialized equipment to lend you for specific conditions in your area. Every effort should be made to obtain soils data and samples at each Soil Pit to the depth specified in the protocols (e.g., 60cm or 125cm). However, occasionally, due to inundation, cemented soils, or other major obstacles, it may not be possible to excavate the soil to the specified depth (even using excavation and sampling techniques appropriate to the site conditions (see Sections 6.1.2 and 6.1.3)). In such instances, describe soils and collect samples to the greatest depth feasible, and, if at all possible, to at least 30cm deep. 6.1.1 Identifying Soil Pit Locations The AB Team identifies the locations for soil sampling in the AA once the Vegetation (Veg) Team has established the Veg Plots to avoid disturbing plant communities prior to vegetation sampling. Prior to digging, clear proposed Soil Pit locations with the Botanist/Ecologist to ensure no threatened, endangered, or sensitive (TES) plant species are present. If any TES species are observed, move the proposed Soil Pit to an alternate location without TES species. Soil observations are made at four Soil Pits labeled with the letters, A, B, C, or D.
Designation of the pits as A, B, C, or D is at the convenience of the AB Team. A flag with the letter name for each Soil Pit is placed near its excavation site, so the Veg Team can easily note the locations of the Soil Pits on the sketch map or on an annotated aerial photo.
Soil Pits are typically placed at Standard Locations, but may be placed in Alternate
Locations to avoid certain obstacles (see below for details).
6-6
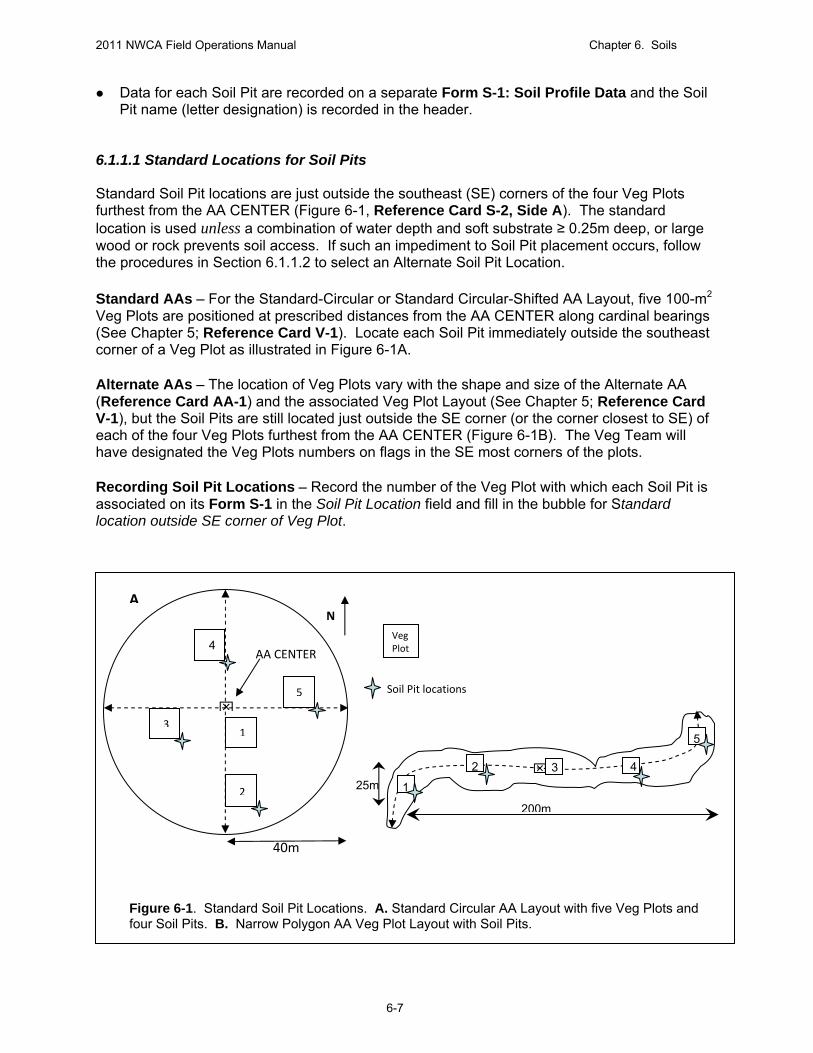
2011 NWCA Field Operations Manual Chapter 6. Soils
6-7
Data for each Soil Pit are recorded on a separate Form S-1: Soil Profile Data and the Soil Pit name (letter designation) is recorded in the header.
6.1.1.1 Standard Locations for Soil Pits Standard Soil Pit locations are just outside the southeast (SE) corners of the four Veg Plots furthest from the AA CENTER (Figure 6-1, Reference Card S-2, Side A). The standard location is used unless a combination of water depth and soft substrate ≥ 0.25m deep, or large wood or rock prevents soil access. If such an impediment to Soil Pit placement occurs, follow the procedures in Section 6.1.1.2 to select an Alternate Soil Pit Location. Standard AAs – For the Standard-Circular or Standard Circular-Shifted AA Layout, five 100-m2
Veg Plots are positioned at prescribed distances from the AA CENTER along cardinal bearings (See Chapter 5; Reference Card V-1). Locate each Soil Pit immediately outside the southeast corner of a Veg Plot as illustrated in Figure 6-1A. Alternate AAs – The location of Veg Plots vary with the shape and size of the Alternate AA (Reference Card AA-1) and the associated Veg Plot Layout (See Chapter 5; Reference Card V-1), but the Soil Pits are still located just outside the SE corner (or the corner closest to SE) of each of the four Veg Plots furthest from the AA CENTER (Figure 6-1B). The Veg Team will have designated the Veg Plots numbers on flags in the SE most corners of the plots. Recording Soil Pit Locations – Record the number of the Veg Plot with which each Soil Pit is associated on its Form S-1 in the Soil Pit Location field and fill in the bubble for Standard location outside SE corner of Veg Plot.
Figure 6-1. Standard Soil Pit Locations. A. Standard Circular AA Layout with five Veg Plots and four Soil Pits. B. Narrow Polygon AA Veg Plot Layout with Soil Pits.
4 AA CENTER
NA
3
2
1
Veg Plot
Soil Pit locations 5
5
2 4 325m 1
200m
40m

2011 NWCA Field Operations Manual Chapter 6. Soils
6.1.1.2 Alternate Locations – Moving Soil Pits to Avoid Obstacles If a combination of water depth and soft substrate ≥ 0.25m deep, the presence of TES plant species, large wood, or rock prevent soil access at the standard Soil Pit location, move the pit so it is outside of and as close as possible to the SE corner of the Veg Plot. Moving the Soil Pit – Place the Soil Pit so it is at least 2m away from an upland edge or other non-wetland landcover type that might influence soil condition. If more than one Soil Pit must be relocated, try to maintain 10m between soil pits. Recording Soil Pit Locations – Record the new Soil Pit location on its corresponding Form S-1. Fill in the Alternate Location bubble in the Soil Pit Location field and record distance and bearing of the pit from the SE corner of the nearest Veg Plot. 6.1.2 Description of Soil Profiles At each of the four Soil Pit locations (see Section 6.1.1), the AB Team collects data describing the properties of the soil profile (Form S-1: Soil Profile Data, Reference Cards S-1 through S-5). Soils are characterized by multiple horizons, each of which has unique properties. Soil horizons develop from the action of water, plants, and soil biota on the soil parent material. All horizons present at a given location (e.g., an NWCA soil pit) constitute the soil profile. Understanding general differences in major types of soil horizons (Text Box 6-1) can aid in distinguishing horizon boundaries; however, the AB Team will not determine horizon types when evaluating soils. During sampling, the AB Team consecutively numbers (beginning with 1 at the soil surface) each distinct soil horizon observed at each Soil Pit. Horizon names will be added post-sampling by a soil scientist based on the soil profile data collected by the AB Team.
Text Box 6-1. Major Soil Horizon Types O – Organic horizon consisting of high accumulations of organic carbon (if you feel more than a couple of
mineral grains (grit from sand, stickiness from clay, silt deposits on hands) it is most likely a mineral horizon high in organic matter (OM), not an organic soil)
A – Mineral horizon formed at the surface from significant organic carbon accumulation (will be darker in color
than the horizons below due to OM accumulation) E – Mineral horizon that exhibits significant loss of organic carbon, Fe (Iron), Mn (Manganese), Al (Aluminum),
and/or clays (usually paler in color and lighter in texture (less clayey) than horizons below) B –Mineral horizon with accumulations of Fe, Mn, secondary minerals, Al-organic compounds, and/or clay, or
development of soil structure (can be higher in clay, may be brighter in color, or may contain more redoximorphic (redox) concentrations than the horizons above it)
C – Mineral soil little affected by soil genesis, or soft bedrock or former bedrock. Lacking properties of O, A, E,
and B horizons (lacks structure, may appear to look like parent material (hard bedrock) but breaks into mineral grains and gravel upon excavation)
L – Inorganic and organic limnic materials deposited in water by precipitation or derived from underwater and
floating aquatic plants and aquatic animals (lacks structure, may appear to look like parent material (hard bedrock) but breaks into mineral grains and gravel upon excavation)
R – Strongly cemented bedrock horizon W – A layer of water found under floating but fixed vegetation Note: O, A, E, B horizons, and mucky mineral layers must be at least 1-cm thick to be considered a horizon.
6-8

2011 NWCA Field Operations Manual Chapter 6. Soils
Overview of Soil Profile Description Activities To describe the soil profiles for each of the four Soil Pits in the AA, the AB Team will: Excavate the Soil Pit (Section 6.1.2.1) Make initial observations of changeable properties, if soil is saturated or inundated (6.1.2.2) Delineate soil horizons (Section 6.1.2.3) Describe soil texture for each horizon (Section 6.1.2.4), Estimate percent rocks and roots for each horizon (Section 6.1.2.5) Describe soil color, redoximorphic, and other features for each horizon (Section 6.1.2.6) Identify hydric soil indicators (Section 6.1.2.7) Photograph the soil profile (Section 6.1.2.3 and Appendix D) Important: Note that although the soil profile description generally proceeds in the order listed above, soil profile description is an iterative process and information from all steps inform horizon delineation and hydric soil indicator identification. The AB Team will use Soil Pits of two depths to describe soil profiles in the AA; three 60cm deep Soil Pits and one 125cm deep Representative Pit. An overview of the two Soil Pit types is provided here. Detailed protocols for profile description activities are presented in Sections 6.1.2.1 – 6.1.2.7. All Soil Pits Initially Excavated to 60cm – Each of the four Soil Pits is excavated to a depth of 60cm and its profile described. 1) As each Soil Pit is excavated to 60cm, immediately begin soil profile description; giving your
initial attention to characteristics that may fade or change rapidly upon exposure to air (i.e., hydrogen sulfide odor and color, Section 6.1.2.2).
2) Record on Form S-1, all components of the profile data for each horizon using the protocols described in Sections 6.1.2.3 - 6.1.2.7.
3) Once the profile description is completed for one Soil Pit, move to the next Soil Pit location
and excavate and describe its soil profile.
One Representative Pit Excavated to 125cm – After the profile descriptions are completed for the four 60cm Soil Pits, use this information to select one pit for expanded soil profile description and collection of soil samples down to, or as near as possible to,125cm. The pit selected for excavation to 125cm should be randomly selected from the subset of the four 60-cm pits that are most representative of the soils in the AA.
Guidelines for selecting the Representative Soil Pit: 1) Random selection – If all four Soil Pits have similar or dissimilar soils, randomly select
the Representative Pit. If two pits are similar, and two are different from the first set, but similar to one another, randomly select the Representative Pit from the two pits that represent the dominant condition for the AA. For example, if two pits are inundated and two are saturated and the dominant condition is saturation, randomly choose the representative pit from the two that are saturated.
2) Common physical setting, texture, or hydric soil field indicators – If three of the four
pits are similar and one is different, randomly select the representative pit from the three similar pits. For example: common physical settings (e.g., three pits lacking water and
6-9

2011 NWCA Field Operations Manual Chapter 6. Soils
one submerged, three pits in swales one on a low hummock), similar texture (e.g., three pits with clayey soils and one with coarser, sandier texture), or presence of hydric soil field indicators (e.g., three pits with hydric indicators, one without).
3) Ease of excavation – If any of the Soil Pits most representative of the AA soils coincide
with an obstacle (e.g., large roots, rocks, etc.); select the pit that is most easily sampled.
Expanding the Representative Pit to collect additional soil profile data: 1) Extract or view the soil profile from 60 to 125cm using one of the following approaches:
a) In most soils, an auger (Figure 6-2b) can be used to extend the depth of the Representative Pit to 125 cm and extract successive segments of the soil profile.
b) For difficult soils, use the excavation technique appropriate for the soil conditions (See the Difficult to Sample Soils subheading in Section 6.1.2.1).
2) Carefully lay out the soil core or slab segments end to end, on plastic sheeting placed on
the ground surface, in spatial order to mirror the in situ position of the soil.
3) View the reconstructed soil profile and describe all horizons between 60 and 125cm (Sections 6.1.2.2 – 6.1.2.8).
4) Later, when the Representative Pit is expanded to collect soil samples (Section 6.1.3);
reexamine the pit wall to refine the soil profile description. Techniques for expanding the pit for soil sample collection and protocols for collecting and preparing soil samples for shipping to the laboratory are described in Sections 6.1.3 and 6.2, respectively.
6.1.2.1 Excavating Soil Pits for Profile Description
As each Soil Pit is excavated, complete the Soil Pit Attributes section, and, if applicable, the Representative Pit section of Form S-1 (Front). 1) Record depth (cm) of the hole dug for each Soil Pit in the Total Pit Depth field. In the case of
the Representative Pit, this is the depth for the initial profile description (usually 60cm). 2) Note the time of pit excavation. 3) Indicate the prevailing Lighting Conditions during soil profile description activities. 4) Important – For the Representative Pit:
a) Fill in the Representative Pit bubble on the appropriate Form S-1 b) Record the Final Pit depth after excavation and sample completed (Section 6.1.2.3) c) Ensure the site specific Sample ID for the Representative Pit on Form S-1 (typically
preprinted) matches the Sample ID on the Bulk Density or Chemistry Soil Sample Tag and the Bulk Density or Chemistry Soil Sample Label (Section 6.1.2.3). Note that the last digit on the tags and labels is absent from Form S-1 because it reflects the horizon number from which each sample is collected.
See procedures below for excavating Easy to Sample Soils and Difficult to Sample Soils.
Easy to Sample Soils (e.g., not submerged, not cemented)
1) Begin by removing the vegetation surface layer using a shovel with a long narrow blade (e.g., ~30cm in length, Figure 6-2a).
6-10

2011 NWCA Field Operations Manual Chapter 6. Soils
a) Use shallow shovel cuts (~15cm deep or just through the vegetation layer) to outline a rectangular area wider than the shovel blade and about 45cm long to define the “vegetation cap”.
b) Use the cutting edge of the shovel to slice through as many roots as possible. If
needed, use pruners to cut large roots that could tear the vegetation cap apart when it is lifted. Scoop up this upper block of soil just under the root mass with the shovel.
c) Set the cap of rooted vegetation, shoot side up, in the shade. The vegetation cap will be
replaced after soil sampling is complete and the Soil Pit is backfilled, to allow the vegetation to reestablish.
2) Each of the four Soil Pits should be excavated to 60cm. Initially, dig a pit to a depth of at
least 30 to 40cm. Use the shovel or an auger (Figure 6-2a,b, Text Box 6-2) to excavate the remainder of the soil pit to a depth of 60cm.
3) If water or slumping soil in a pit prevents soil extraction to the 60cm depth, excavate the soil slab to the greatest depth possible and describe the soil profile to that depth. Then, if possible, use techniques for Difficult to Samples Soils (subheading below, Text Box 6-2) to excavate down to 60cm and complete the profile description.
4) If a large rock, log, very large root, or disturbed area (animal burrow, tree-fall pit) is encountered before reaching 60cm, move or expand the pit.
5) If a cemented horizon or similar impenetrable material is encountered and is large enough in extent to make moving the pit impractical, excavate the pit to the maximum possible depth. Record the occurrence and type of the impenetrable layer or object and its depth from the surface in the Impenetrable Layer section on Form S-1.
6) Use a knife (e.g., inexpensive hunting or kitchen knife) or root pruners to clean the soil on
one narrow face of the pit by removing plant tissue or soil transferred from other depths. 7) Remove the soil slab and, if taken, auger cores:
a) On the cleaned face end of the pit, carefully make cuts perpendicular to the face of approximately a shovel width to demarcate the sides of the soil slab to be extracted.
b) Slice through the soil about 10cm behind the cleaned pit face to connect the side cuts. c) Push the shovel 30cm deep and pull back on the shovel as the other AB Team member
gently holds the soil against the blade.
d) Carefully slide the slab section from the shovel blade onto a clean plastic sheet or tarp.
e) Clean loose soil out of the pit and extract a second slab section to the 60-cm depth using the shovel (or extract this lower section with an auger).
f) Match up the slab sections or the upper slab section and lower augered sections end-to-
end mirroring the soil’s in situ position.
8) Once the soil slab, or slab and core, is extracted, immediately conduct the protocols for detection of hydrogen sulfide odor, and if the soil is inundated or saturated, for initial matrix color (Section 6.1.2.2). Then continue with all other soil profile description activities (Sections 6.1.2.3 to 6.1.2.7).
6-11

2011 NWCA Field Operations Manual Chapter 6. Soils
Difficult to Sample Soils
Subaqueous (submerged) soils, saturated sands, organic soils, and clayey soils can be challenging when attempting to obtain an intact soil slab or soil core. See Text Box 6-2 and Figure 6-2 and 6-2 continued for special tools and alternate extraction methods.
Shallowly Submerged Soils (e.g., water ≤ 0.25m deep) – If soil strength allows, soil pits 60cm deep may be excavated from under shallow water using a hand pump to evacuate water and digging techniques similar to those used for soils that are not submerged. If water is swift or soil too unconsolidated, special tools may be required.
Saturated Soils – Slumping of soil may be minimized by lifting the soil slab away from the pit face very slowly or using extraction tools other than a shovel.
Submerged Sandy Soils – A tube extractor may be useful for unconsolidated sandy soils.
Low-Strength Organic Soils – A peat auger may be required for high organic content soils.
Heavy Clay Soils – To avoid breaking the shovel handle when excavating heavy clay soil (particularly if dry), extract a thin slab.
Once the soil pit is dug and the slab and core extracted, immediately conduct soil profile description activities (Sections 6.1.2.2 to 6.1.2.7).
Text Box 6-2. Special Tools and Soil Extraction Methods 1) Augers: Augers are available in many styles of bucket and cutting tips (Figure 6-2b) for
different soil conditions. Use an auger for extending the Representative Pit to 125cm and in conditions where the soil cannot be retrieved with a shovel. Note, augers mix the soil sample so they are not used to obtain bulk density samples. For profile description and chemistry sample collection, take care to mark the depth from which the soil is removed using an auger because of the potential for compression or expansion of the soil as it is extracted.
2) Tube extractor (King soil extractor, Figure 6-2 continued): The King soil extractor is used for
submerged sandy soils and low-strength organic soils. It is typically constructed from a plastic or metal tube (15-cm diameter and 60cm long) with a metal tube-clamp at its base for adjusting tube diameter. Hammer the King extractor into the unconsolidated substrate. Dig a slot alongside the tube and insert a spade to cover the deep end of the tube. Tip the tube and spade over into the slot and lift tube onto a floating sled. Expand the tube slightly and extrude the soil in the tube, forcing it out with a plunger.
3) Coffer dam and hand pump (Figures 6-2 continued and 6-8c): For submerged soils with
shallow standing water, build a coffer dam using the spoils from the pit. If needed, use plastic or metal sheeting to reinforce the dam walls around the soil pit area. With the dam in place, remove the standing water with a hand pump and proceed to excavate a slab and describe the soil profile. Remove vegetation around the base of the coffer dam if necessary to achieve a seal for the dam walls against the ground. It may be necessary to operate the hand pump continuously during extraction of the soil slab and collection of soil samples.
4) Plastic snow sled: At sites with standing water or soft sediments (Figure 6-2 continued), a
plastic snow sled is a useful platform to lay out slabs and cores for viewing for profile description, for facilitating sample collection, and to store equipment.
5) Consult with local soil scientist: In some cases, the local soil scientist may suggest
alternative sampling methods appropriate to particular site conditions. The soil scientist may be able to loan you the tools (e.g., peat sampler, gas-powered water pump, or specialized equipment that is used locally) and provide training on their use so samples can be more readily and quickly extracted.
6) Soil Probe (Figure 6-2d): May be useful for collecting isotope soil samples in drier clay soils.
6-12

2011 NWCA Field Operations Manual Chapter 6. Soils
A
B
C
D
Figure 6-2. Examples of Tools for Soil Pit Excavation or Soil Extraction. Photos by Gregg Lomnicky. A. (Left to right) Tiling, Sharpshooter, Regular Shovels. B. (Left to Right) Auger handle extensions, ratchet handle, mud auger buckets (solid), bucket auger with handle, auger buckets. C. Bulk density corer (steel tubing with beveled edge). D. (Left to Right) Soil Probe, Hammer Corer. The tools most commonly used in the NWCA are a tiling or sharpshooter shovel (A) and an auger (B) for pit excavation and chemistry sampling, and a can (see Figures 6-8 and 6-9) for bulk density sample collection. Other tools pictured (C and D) may be useful for specific conditions and may be available from a local soil scientist (e.g., see Text Boxes 6-2 and 6-6).
6-13
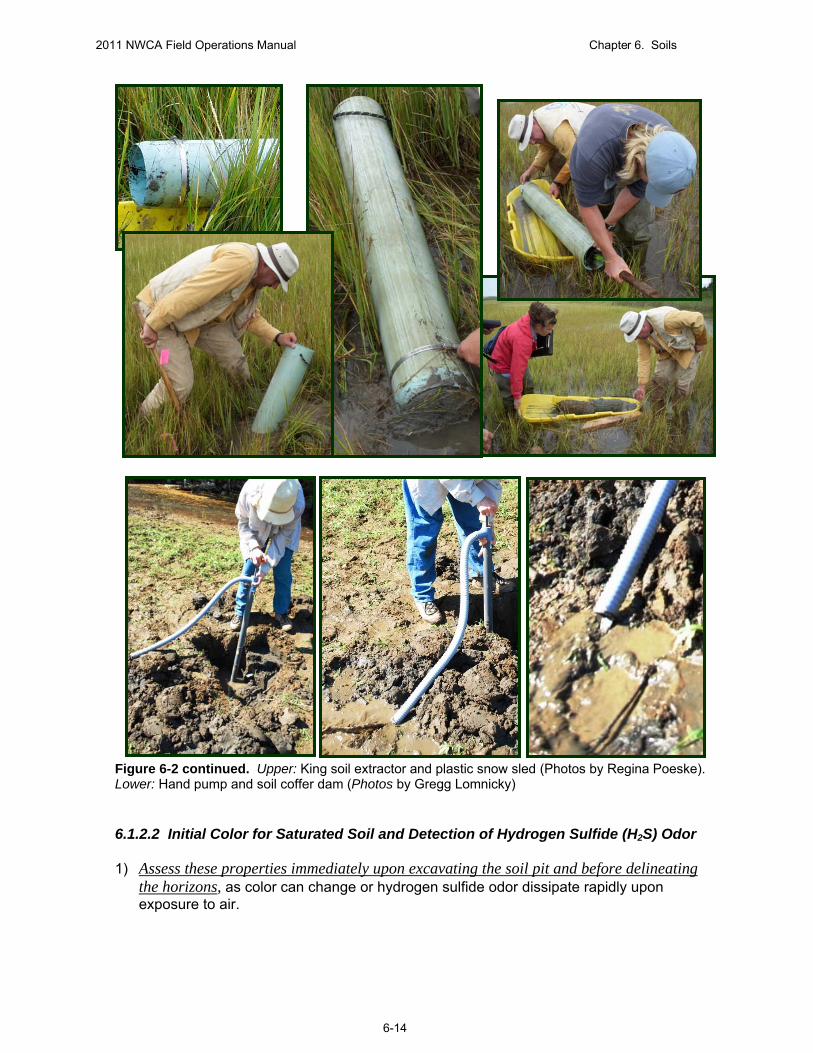
2011 NWCA Field Operations Manual Chapter 6. Soils
Figure 6-2 continued. Upper: King soil extractor and plastic snow sled (Photos by Regina Poeske). Lower: Hand pump and soil coffer dam (Photos by Gregg Lomnicky) 6.1.2.2 Initial Color for Saturated Soil and Detection of Hydrogen Sulfide (H2S) Odor 1) Assess these properties immediately upon excavating the soil pit and before delineating
the horizons, as color can change or hydrogen sulfide odor dissipate rapidly upon exposure to air.
6-14

2011 NWCA Field Operations Manual Chapter 6. Soils
2) Record the results in the Initial Readings field of Form S-1 (Front): INITIAL READINGS
Hydrogen Sulfide odor (rotten egg) Inundated/saturated soil in pit:, If present: Initial color: ______ ______ ______ Hue Value Chroma Color reading depth from surface: _____ cm Color change after exposure to air
3) If part of the soil profile is inundated or saturated, determine the initial color of the soil
matrix (Section 6.1.2.6 describes how to determine color) for the saturated area. Record hue, value, and chroma, and depth from the surface to where the color reading is made.
4) Determine if an odor of H2S gas (hydrogen sulfide = rotten egg scent) occurs in the first
30cm of the profile. Be careful not to confuse rotten egg odor with rotting organic matter. The odor should be evident upon excavation and not something that is only detected when the soil is held close to the nose.
5) Continue with horizon delineation (see Section 6.1.2.3) and complete soil profile
description (Sections 6.1.2.4 through 6.1.2.7). Once the profile description is completed:
a) Compare the initial soil matrix color you recorded for the saturated or underwater portion of the soil profile with the final color you recorded in the Soil Matrix Color section of Form S-1 (Section 6.1.2.6) for the horizon at the depth of initial reading.
b) If there is a change in color between the initial and final color reading, fill in the bubble
for Color change after exposure to air. A rapid change in color (difference of one or more color chips in the Munsell Color Book (2009)) following exposure to air indicates a reduced matrix, which is a hydric soil indicator (USDA, NRCS 2010).
6.1.2.3 Delineating Soil Horizons 1) For each Soil Pit, identify all distinct horizons visible on the spatially aligned soil slabs
and cores previously placed on the plastic ground sheet (Section 6.1.2.1). For the Representative Soil Pit, it may be easier to view horizons above 60cm on the in situ soil profile on the pit wall.
Horizons are delineated (Reference Card S-2, Side B) based on differences in: Soil structure – the arrangement of soil peds and pore space in varying forms (e.g.,
prismatic, platy, granular, blocky, etc.; see Reference Card S-3 Side A, Plate 1). Texture (Reference Card S-4 Side A and Section 6.1.2.4). Soil color based on Munsell Soil Color Charts (2009) (Section 6.1.2.6). Presence and type of redoximorphic features (Section 6.1.2.6, Reference Card S-3,
Side B).
2) Place a marker (e.g., golf tee, plastic or metal strip, large headed nail) at the bottom of each horizon. Number the horizons in order from the top of the profile, for example, the bottom of Horizon 1 is nearest the upper surface of the soil (Figure 6-3).
6-15

2011 NWCA Field Operations Manual Chapter 6. Soils
6-16
3) Clear loose organic debris from the top of the profile at the ground surface, then measure the depth from the top of the soil profile to the bottom of each horizon in centimeters (a metric fiberglass seamstress tape with a fishing weight on the bottom end works well).
4) For the Soil Pit under consideration, record the depth to the lower boundary of each
horizon in the Depth to Lower Boundary of Horizon column of Form S-1 (Front). For example, in Figure 6-3 (diagram), the lower horizon boundaries are at 2cm for Horizon 1, 4cm for Horizon 2, 7cm for Horizon 3, 20cm for Horizon 4, and 45cm for Horizon 5.
5) If either boundary of a horizon is less than 2cm wide, fill in the abrupt boundary bubble in the Horizons section of Form S-1 (Front).
6) Space is provided for nine horizons on Form S-1; although, it is unlikely you will routinely
encounter that many horizons in a particular profile. If more than nine horizons at a single pit are ever encountered, flag the last horizon and make a note in the Comments section that data for additional horizons are continued on another page of Form S-1 (Front).
7) Once the horizons are delineated and marked, photograph the soil profile as directed in
Appendix D.
4
5
Ground Surface
60 cm
Soil Pit Bottom
23 1
Figure 6-3. Left top: Soil slab diagram with horizons marked. Left bottom: Soil slab photo by Eric Vance, EPA. Right: Example soil profiles illustrating horizons distinguished by different colors, structure, or texture. Profile photos from USDA-NRCS (2010).

2011 NWCA Field Operations Manual Chapter 6. Soils
6.1.2.4 Describing Soil Texture Understanding whether soil is organic or mineral and noting major differences in texture across the soil profile can help distinguish between horizons, and is important in determining the presence of Field Indicators of Hydric Soils (Section 6.1.2.7, Form S-1 (Back)). Different hydric soil indicators apply to specific soil textures. Sands and loamy sands are evaluated using the Sandy (S) hydric soil indicators, while finer mineral textures are evaluated using the Loamy and Clayey (F) indicators (USDA, NRCS 2010). The All-Soil (A) indicators are used for both organic and mineral soils. Procedures for Hand Texturing Soils Use the following steps (which are repeated on Reference Card S-4, Side A) to describe the soil texture for each horizon of a soil profile. 1) Determine whether the soil has organic or mineral content – Take a dime-sized
chunk of moist soil in your hand and gently rub the wet soil between forefingers and thumb several times.
If the soil feels greasy, the soil is either mucky mineral or organic soil; go to Step 2.
If the soil does not feel greasy, the texture is a mineral soil; go to Step 3.
2) Texturing soils with high organic matter content – Use Text Box 6-3 to distinguish
between mucky mineral and organic soil and to distinguish among types of organic textures.
Text Box 6-3. Texturing Soils with High Organic Matter Content a. Determine whether the soil is mucky mineral or organic. (Both have a greasy feel.)
Squeeze a chunk of wet soil. Mucky Mineral texture –The soil is a mucky mineral if it is gritty or sticks to your
hand when squeezed and rubbed. Identifiable plant fibers are rare to none. Organic texture – The soil has an organic texture, if when squeezed, it either
extrudes liquid or much of the soil material and whatever material remains does not stick to your hand. Identifiable plant fibers are common. Go to Step b, below.
b. Distinguish among organic textures – Organic textures include: peat, mucky-peat,
or muck. The three textures are defined based on differences in percent volume of plant fibers visible with a hand lens after rubbing. To distinguish between them, grab a fresh sample of moist soil, visually estimate
the percent volume plant fibers and dead roots after rubbing, and use the chart below to determine the organic soil texture.
Organic Soil Texture % Fibers Visible with 10X Hand Lens After Rubbing
Peat > 40 Mucky Peat 20 - 40 Muck < 20
6-17
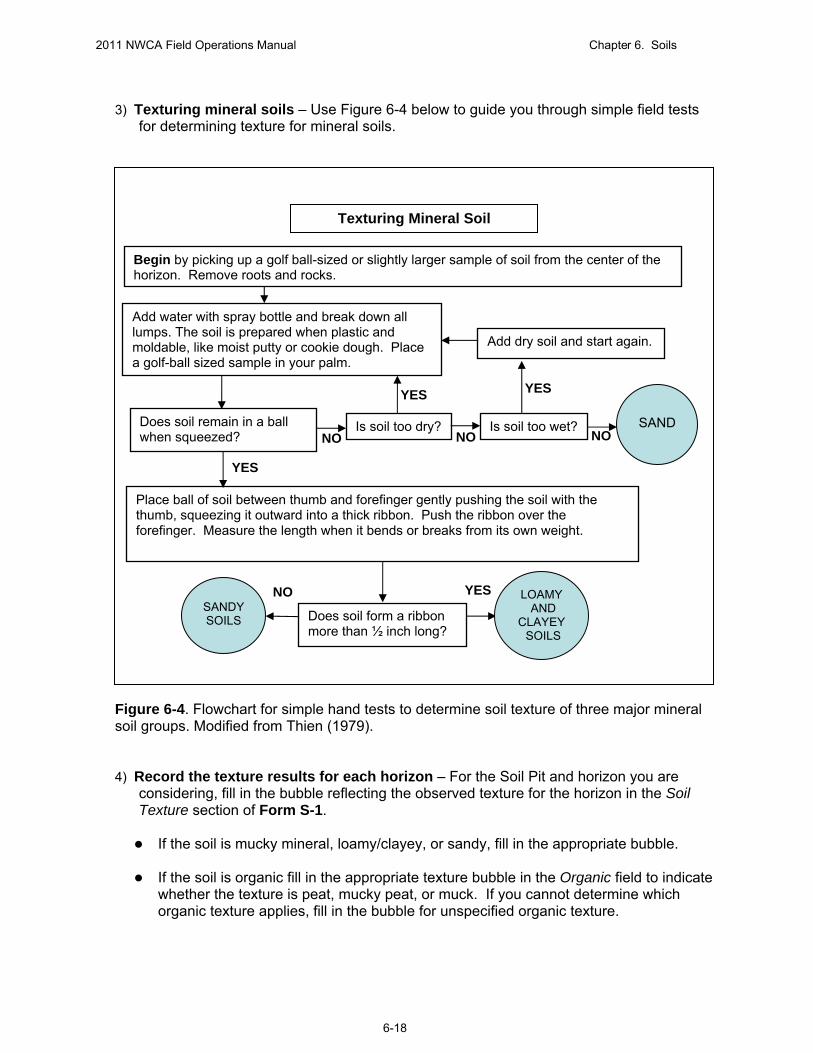
2011 NWCA Field Operations Manual Chapter 6. Soils
3) Texturing mineral soils – Use Figure 6-4 below to guide you through simple field tests
for determining texture for mineral soils.
Texturing Mineral Soil
Begin by picking up a golf ball-sized or slightly larger sample of soil from the center of the horizon. Remove roots and rocks.
Add water with spray bottle and break down all lumps. The soil is prepared when plastic and moldable, like moist putty or cookie dough. Place a golf-ball sized sample in your palm.
Add dry soil and start again.
Figure 6-4. Flowchart for simple hand tests to determine soil texture of three major mineral soil groups. Modified from Thien (1979).
4) Record the texture results for each horizon – For the Soil Pit and horizon you are
considering, fill in the bubble reflecting the observed texture for the horizon in the Soil Texture section of Form S-1.
If the soil is mucky mineral, loamy/clayey, or sandy, fill in the appropriate bubble. If the soil is organic fill in the appropriate texture bubble in the Organic field to indicate
whether the texture is peat, mucky peat, or muck. If you cannot determine which organic texture applies, fill in the bubble for unspecified organic texture.
Does soil remain in a ball when squeezed?
Place ball of soil between thumb and forefinger gently pushing the soil with the thumb, squeezing it outward into a thick ribbon. Push the ribbon over the forefinger. Measure the length when it bends or breaks from its own weight.
Is soil too dry? Is soil too wet?
SAND
Does soil form a ribbon more than ½ inch long?
YES YES
NO NO NO
YES
NO YES LOAMY
SANDY AND SOILS CLAYEY
SOILS
6-18

2011 NWCA Field Operations Manual Chapter 6. Soils
6.1.2.5 Estimating Percent Rocks and Roots 1) Examine an area of each horizon (e.g., ~10cm2) and estimate the percent of the surface
area of the soil matrix occupied by rocks > 2mm diameter and by roots.
Percent surface area is estimated directly from 0-100%. Review Plate 3. Surface Area Estimation of Soil Features on Reference Card S-3, Side A to familiarize yourself with the appearance of different percentages for a particular feature. Note that the same percentage can look different depending on whether the feature is aggregated or dispersed. Do not deliberate extensively over surface area estimates (e.g., for small values choosing between 1 or 3%, or 5 or 10%; for higher values choosing between 25 and 35%, or 75% or 85%). It is not appropriate to agonize over small differences because this precision exceeds the accuracy of our ability to detect surface area differences.
2) Record the percentage for each feature in the appropriate column on Form S-1 (Front):
Percent rock fragments > 2mm in diameter Percent roots
6.1.2.6 Describing Soil Color and Identifying Redoximorphic and Other Soil Features For each horizon evaluate the following properties and record the data on Form S-1: 1) Determine the color of the soil matrix (dominant part of soil) using a Munsell Soil Color
Book (Munsell Color X-Rite 2009) (Figure 6-5) and the procedures in Text Box 6-4 (repeated on Reference Card S-4, Side B). Record the color codes for the hue, value, and chroma matching the soil matrix in the Soil Matrix Color section on Form S-1: NWCA Soil Profile Data (Front). Color reflects physical and chemical properties of the soil and provides information on hydric conditions. Soil color has three components; hue, value, and chroma. Chroma is particularly important as a hydric soil indicator.
2) Determine whether redoximorphic, organic, or mottle features are present in the horizon.
See Reference Card S-3, Side B for examples illustrating some of these features. Redoximorphic and other soil features provide information about inundation and other soil properties.
Redoximorphic (Redox) features are color patterns (deviations from the soil matrix
color) caused by recent redistribution of carbon (C), Iron (Fe), or Manganese (Mn) as a result of reduction and oxidation processes associated with wetting and drying cycles (Vepraskas 1995, USDA, NRCS 2010). Redox features include uncemented concentrations and depletions (losses) of these elements, and are observed in pore linings, ped faces, or the soil matrix as soft masses and colors that contrast with soil matrix color (USDA, NRCS 2010). A soft mass is a splotch in the soil and a pore lining would have iron or other elements coating the larger voids (i.e., root channels, cracks between peds). Depletions are gray zones that occur in the matrix or on pore linings and ped faces.
Mottles are any other kind of splotch of color.
6-19

2011 NWCA Field Operations Manual Chapter 6. Soils
Nodules and Concretion – Nodules are cemented bodies (commonly spherical or tubular) that can be removed as discrete units from the soil, but which do not have discernible crystalline structure when viewed with a 10X hand lens. Concretions are similar to nodules, but have concentric layers of material around a point (Schoeneberger et al. 2002).
Organic bodies typically occur at the tips of roots and are commonly 1 to 3 cm in
diameter with muck or mucky modified textures. Other organic features include stripped zones and organic infilling. Stripped zones
are areas where iron-manganese oxides and/or organic matter have been stripped from the matrix and the primary base color of the soil material is exposed. The stripped areas and translocated oxides and organic matter form a contrasting pattern of two or more colors with diffuse boundaries (USDA, NRCS 2010).
For more detailed discussion of these features, see Field Indicators of Hydric Soils in the United States (USDA, NRCS 2010) and Schoeneberger et al. (2002).
3) If redox, organic, or mottle features are absent from a horizon, fill in the bubble in the Absent field of the Redoximorphic, Organic, or Mottle Features section of Form S-1 and proceed to describing the next horizon.
4) If present in a horizon, note which kind of redox or other features occur by filling in all
pertinent bubbles in the Feature Types fields of the Redoximorphic, Organic, or Mottle Features section of Form S-1: Composition: Fe = iron, Mn = manganese, C = carbon, U = unable to specify. Redox Features: S = Soft masses, N = nodules, concretions, P= pore linings, D =
depletions. Mottles and Organic Features: M = mottles, MS = masked sand grains, OB = organic
bodies, OF = other organic features.
5) If masked sand grains are present (see Reference Card S-3, Side A, Plate 2), estimate the percentage of the horizon that they occupy and record this value in the % Masked Sand Grains field. This is important for determining if a sandy soil is hydric. Also a sandy soil with a thick black surface and 30 percent or more unmasked grains is an indication that the site is becoming drier. To determine if more than 70 percent of the grains are masked it should look like almost 100 percent black to the naked eye when soil is moist. Under a 10x hand lens you should see 30 percent or less of the individual grains uncoated.
6) Estimate the percent surface area (0 to 100%) of a horizon occupied by a combination of
distinct and prominent redox features (see Reference Card S-3, Side B). Record these estimates in the % Horizon with Distinct or Prominent Features column of the Redoximorphic Features section of Form S-1.
Note, the terms “faint”, “distinct”, and “prominent” refer to level of color contrast
between soil matrix and redox features, not to discreteness of redox features. Use the tables on Reference Card S-4, Side B (see Schoeneberger et al. (2002) for
more detail) to quickly distinguish faint from distinct and prominent contrast levels between redox features and the soil matrix.
6-20

2011 NWCA Field Operations Manual Chapter 6. Soils
Exclude faint contrast redoximorphic features from the percent estimates.
7) Determine the colors (see Text Box 6-4) of the most evident (in terms of contrast and abundance) redoximorphic or other features observed in the matrix of each horizon. Record this color information in the Hue, Value, and Chroma color fields in the Redoximorphic, Organic, or Mottle Features section of Form S-1.
Text Box 6-4. Evaluating Color for the Soil Matrix and for Redoximorphic Features Determining Color of the Soil Matrix: 1) To determine soil matrix color, choose a representative, freshly broken surface of a soil ped
that is not coated with clay, Fe (Iron), or Mn (Manganese). 2) Use a spray bottle to wet the soil if it is dry. Spray until moist, but not saturated. As soon as
the water is absorbed into the soil, read the color from the Munsell Soil Color Book (Munsell Soil Color, X-Rite 2009) (See Step 3).
3) Match the soil matrix color (hue, value, and chroma) to the soil color chips from the Munsell
Soil Color Book (See Figure 6-5). Hue is found on the Munsell page tab and labeled using numbers and letters (e.g., 2.5YR or 10R). Value is found on the left side of the page along the y-axis of the color chip array and is represented by numbers (e.g., 2.5, 8). Chroma is found at the bottom of the page along the x-axis of the color chip array and is represented by numbers or by numbers and letters for gleyed soils (e.g., 1, 8, 5G, 10GY).
4) Observe the soil color in direct sunlight with the sun at your back and shining over your right
shoulder whenever possible (Figure 6-5). Match the color of the soil with the closest color chip from the Munsell Soil Color Book. Start at the 10YR page and go left for redder and right for yellower or grayer colors. The color chips in the Munsell Book have central holes so that the soil can be directly
compared through the hole to the chip of interest. Take care to keep the color chips clean and dry.
5) Record color codes for the hue, value, and chroma matching the soil matrix color on Form S-1:
NWCA Soil Profile Data (Front). Determining Color of Redoximorphic, Organic, or Mottle Features: 1) When redoximorphic or other features (See Reference Card S-3 for examples) are present in
the horizon, determine the color for the most evident feature observed. 2) Select a representative, freshly broken surface of a soil ped that clearly illustrates the redox or
other feature of interest. 3) Focus on this feature and use Steps 2 through 4 (as described above for determining Soil
Matrix color) to match the feature color with the closest color chip from the Munsell Color Book. Record the color codes for the hue, value, and chroma matching in the appropriate fields on Form S-1: NWCA Soil Profile Data (Front).
6-21

2011 NWCA Field Operations Manual Chapter 6. Soils
Hue
Value
Chroma
Match soil color by viewing soil clod through center holes to compare to color chips
Viewing color book with sun shining over right shoulder
Hue
Figure 6-5. Using a Munsell Soil Color Book. Photos by Thanh Nguyen and Amanda Nahlik, USEPA.
6.1.2.7 Identifying Hydric Soil Indicators The next component of soil profile description is to evaluate the soil profile for the presence of Hydric Soil Indicators using the:
Field Indicators of Hydric Soils in the United States (USDA-NRCS 2010); hereafter the Hydric Soil Indicators manual. This manual is the standard for the NWCA for determining the presence of the hydric soil indicators.
Procedures for evaluating hydric soil indicators for the NWCA are described in Text Box 6-5 (repeated on Reference Card 5). Hydric soil indicators form as a result of the soil being
6-22

2011 NWCA Field Operations Manual Chapter 6. Soils
saturated, and anaerobic, long enough to meet the definition of a hydric soil. Note, hydric soil indicators were designed for determining wetland boundaries, and hydric soils in the interior of wetlands may not always display these indicators (USDA, NRCS 2010). Hydric Soil Indicators are texture specific – Different indicators apply to different texture
groups (USDA, NRCS 2010). The All Soil (A) indicators are applicable to all soils. Textures from sands to loamy fine sands are evaluated using the Sandy Soils (S)
indicators. Finer textured mineral soils (loamy very fine sand and finer) are evaluated using the
Loamy/Clayey Soil (F) indicators. Hydric Soil Indicators are regionally specific – Specific subsets of the hydric soil
indicators are used for different USDA Land Resource Regions (LLRs). A map illustrating LRRs applicable to your state, and a list of hydric indicators for each LLR, are provided on Reference Card S-5 and in the NRCS Hydric Soil Indicators Manual (USDA, NRCS 2010).
Hydric Soil Indicator Codes – Hydric Soil Indicator names have two parts, a descriptive
label (e.g., Histic epipedon, Dark surface, Iron Manganese mass) and an alpha-numeric code (e.g., A2, S7, F12, etc.), where A, F, or S each represent a texture group and the number refers to a specific indicator in that group (See USDA, NRCS 2010, Reference Card S-5, and Form S-1).
Text Box 6-5. Procedures for Evaluating Hydric Soil Indicators 1. Data describing Hydric Soil Indicators are recorded in the Hydric Soil Indicators section
of Form S-1 NWCA Soil Profile Data (Back). 2. Determine the USDA-NRCS Land Resource Region (LRR) in which the AA being
sampled is located by consulting the LRR map on Reference Card S-5 (or in the Hydric Soils Indicators Manual). The hydric soil indicators that apply to each LRR are listed on the back of Reference Card S-5 and included in parentheses next to the indicator names in the Hydric Soil Indicators section of Form S-1 NWCA Soil Profile Data (Back).
3. While examining the soil profile, use the Field Indicators of Hydric Soils in the United
States (USDA, NRCS 2010) manual and the information on texture, color, redoximorphic features (which you previously recorded for each horizon on the front side of Form S-1) to determine whether the hydric indicators specific to the LRR where the AA is located are present.
4. Evaluate the profile for all regionally appropriate Hydric Soil Indicators that fall into the
soil texture groups A (All Soils), or F (Loamy/Clayey Soils), or S (Sandy Soils) pertinent to the soil profile under examination.
5. Record the presence of any of these hydric soils indicators in the Hydric Soil Indicators
section of Form S-1 NWCA Soil Profile Data (Back) by filling in the appropriate bubbles.
6. All hydric soil indicators that are observed are assumed to occur in the soil profile
location specified in the description of that indicator in Field Indicators of Hydric Soils in the United States (USDA, NRCS 2010). If something unusual is observed, note the soil horizon number and describe the anomaly in the Hydric Indicator Comments section of Form S-1 NWCA Soil Profile Data (Back).
6-23

2011 NWCA Field Operations Manual Chapter 6. Soils
6.1.3 Soil Sample Collection
Soil samples are collected from the Representative Soil Pit after profile description down to 60cm has been completed for all four soil pits. The description of the lower soil profile may have been completed for the Representative Pit earlier (See Section 6.1.2) if the soil was easily augured to 125cm. Alternatively, if it is easier, complete the 60 to 125cm section of the soil description of the Representative Pit as the pit expanded for sample collection. Soil Sample Types Four types of soil samples are collected at the Representative Pit in the following order: 1) Isotope Samples – collected for isotope analysis of 15N from the surface layer of three
locations near the Representative Pit (Section 6.1.3.1). 2) Sediment Enzyme Samples – collected for enzyme analysis from the surface layer of three
locations near the Representative Pit (Section 6.1.3.1). 3) Bulk Density (BD) Samples – collected for determination of bulk density from each horizon
greater than 8cm thick down to 60cm (Section 6.1.3.2). 4) Chemistry /Particle Size Density Analysis (PSDA) Samples (hereafter Chemistry) –
collected for chemical, physical, and nutrient analysis from each horizon greater than 8cm thick down to 125cm (Section 6.1.3.2).
Carefully follow the protocols in Sections 6.1.3.1 and 6.1.3.2 for collection of each specific soil sample type. 6.1.3.1 Collecting Soil Samples for Isotope and Enzyme Analysis Soil isotope and soil enzyme (called sediment enzyme) samples are collected in near proximity to the Representative Soil Pit before it is expanded for collection of bulk density and chemistry samples. Collection of these two sample types is very similar, but note that three cores will be collected and placed into a quart-size plastic bag for the isotope sample while 6 cores will be collected in a gallon-size plastic bag for the soil enzyme sample. Preparing the Sample Bags 1) Fill out the Soil Isotope Sample Label (example below). It is printed as an adhesive label
with a pre-assigned Sample ID# and Site ID. Fill in all requested information and affix the label to the front of a quart-size zipper plastic bag. Place clear tape over top of the label to protect it from dirt and debris, and to ensure that it stays affixed to the sample bag.
Sample ID
Number Site ID
6-24

2011 NWCA Field Operations Manual Chapter 6. Soils
2) Fill out the Sediment Enzyme Sample Label (example below). It is printed as an adhesive
label with a pre-assigned Sample ID# and Site ID. Fill in all requested information and affix the label to the front of a gallon-size zipper plastic bag. Place clear tape over top of the label to protect it from dirt and debris, and to ensure that it stays affixed to the sample bag.
Sample ID
Number Site ID
Collecting the Isotope and Sediment Enzyme Samples 1) Collect three isotope soil cores and six sediment enzyme cores, before expanding the
Representative Soil Pit for bulk density and chemistry samples. The core sampling locations should be spaced evenly around the soil pit and positioned in undisturbed areas within a 1-m radius of where the pit will be expanded (see diagram below). The spacing of the sampling locations for the cores may be shifted so they are positioned in undisturbed areas.
2) Clear vegetation and any loose litter (e.g., fallen leaves, branches, etc.) from the surface of
the soil in the sampling area.
6-25

2011 NWCA Field Operations Manual Chapter 6. Soils
3) From each of the three locations, extract three 10-cm deep soil cores (measured from the soil surface and including the O horizon – uppermost organic soil layer, if present) using the soil syringe-corer device. Avoid sampling through thick root mats and rhizomes as this will contaminate the analysis. Minimal amounts of small roots are acceptable in the core.
Remove the plunger while taking the soil core (Figure 6-6a). Push the syringe tube into to the soil to the 10cm (60 mL) mark on the wall of the syringe
tube. The air hole should be above the soil (Figure 6-6b). While the syringe tube is still in the soil, replace the plunger in the syringe, pushing it
down just enough to cover the air hole. This will create a vacuum to aid in removing the core (Figure 6-6c).
Carefully remove the syringe tube containing the soil from the ground by gently twisting
and lifting it upwards. If necessary, use your fingers or a hand trowel to break the soil from under the core and support the core as it is lifted from the surrounding matrix (Figure 6-6d).
If this syringe device is unavailable (or if the soil is too dry for the device), a standard
stainless steel soil probe (7/8” or similar diameter, see Figure 6-2d) can be used to collect a 10 cm deep soil core.
4) Remove each core from the coring device as described below.
Extract the core after it is collected into the labeled sample bag using the plunger (Figure 6-6e) or your fingers if a soil probe is used.
If using the plunger, avoid pushing it beyond the end of the syringe-corer (Figure 6-6f).
5) Place one of the three cores collected from each location in the prepared quart-size sample bag for isotope analysis. Place two cores from each location in the prepared gallon-size sample bag for sediment enzyme analysis. When all three locations are sampled there will be three cores in the quart-size bag and six in the gallon-size bag.
6) Roll down the top of each sample bag to remove excess air. Once the air is evacuated from
the bag, seal the top by zippering it. Double check that the zipper is secure. 7) Record the Sample ID number from the Sample Label for the isotope and for the sediment
enzyme sample in the Sample ID field in the Soil Isotope/Sediment Enzymes section on the back of Form S-1. Note anything usual about the sample in the Comments field. If no sample is collected for either soil isotopes or sediment enzymes, fill in the appropriate No Sample Collected bubble, and explain the reason in the Comments field.
8) Place each sample bag in a second bag of the same size (i.e., double-bag the sample).
Press out the excess air and seal the top by zippering it. Double check that the zipper is secure.
9) Keep the samples on ice or cool while in the field or traveling (e.g., in a small ice chest). 10) Follow the protocols in Section 6.2 on sample tracking, shipping, and handling of samples.
6-26

2011 NWCA Field Operations Manual Chapter 6. Soils
a
Remove the plunger.
b
Push the syringe 10 cm into the soil. The air hole should be above the soil.
c
Replace the plunger, pushing it down just enough to cover the air hole.
d
Carefully remove the syringe, supporting the soil core as it is lifted.
e
Slowly extract the core using the plunger.
f
Avoid pushing the plunger beyond the end of the coring device.
Figure 6-6. Extracting a soil core for an isotope soil sample or sediment enzyme sample. Photos by Casey Pollock and Amanda Nahlik, USEPA.
6-27
2011 NWCA Field Operations Manual Chapter 6. Soils
6.1.3.2 Collecting Bulk Density and Chemistry Samples Soil samples for bulk density analysis and for chemistry analysis (includes chemical, physical, and nutrient analyses) are collected from the Representative Pit. To collect samples: Select techniques for excavating soils and sample collection that are suitable for the
conditions encountered at each Representative Pit (See Expanding the Representative Pit and Collecting Soil Samples and Text Box 6-6, below). Your local NRCS soil scientist may be able suggest equipment appropriate to particular locations or conditions.
Collect both the bulk density and the chemistry sample from a given horizon before moving
on to the next horizon.
Collect bulk density samples for every horizon greater than 8cm thick down to 60-cm depth. A bulk density sample is typically comprised of three individual cores of known volume for each horizon that are placed together in one sample bag.
Collect chemistry samples for every horizon greater than 8cm thick down to the125-cm depth. Chemistry samples for each horizon are comprised of 1 to 2.5 liters or quarts of soil.
Samples are generally collected for all described horizons (Form S-1 (Front)), except when horizons are less than 8cm thick as these shallow horizons are not practical to sample. The only exception to this shallow horizon rule is for Organic (O) and A horizons (at the top of the profile, Text Box 6-1). In this situation, the O and A should be combined and sampled as one layer.
As each soil sample is collected, indicate that it has been collected by filling in its type (bulk
density or chemistry) in the appropriate horizon row of the Sample Collected column under the Horizons section of the Form S-1 for the Representative Pit.
Protocols for collecting bulk density and chemistry samples are detailed in the next two subheadings: 1) Preparing Labels and Sample Collection Bags, and 2) Expanding the Representative Pit and Collecting Bulk Density and Chemistry Samples. Preparing sample tags, labels, and collection bags is initiated prior to collecting samples, but some label information is completed during sample collection. Properly sealing the sample bags continues throughout sample collection. Thus, for convenience these activities are described before the protocols for expanding the Representative Pit and collecting soil samples are presented. Preparing Labels and Sample Collection Bags Precise preparation of sample tags, labels, and bags for the Chemistry and Bulk Density samples is critical to ensuring each soil sample is connected to the horizon, the NWCA site from which it originated, and to its associated data on Form S-1 for the Representative Pit. Before beginning preparation of sample bags, make certain that you have the correct set of preprinted sample tags and labels for the NWCA Site at which you are working. As you collect samples, be sure to associate the correct preprinted tag and label with each sample. 1) The Soil Sample Tag – For each horizon and sample type, begin by completing the
preprinted adhesive sample tag (see example below) with the Sample ID Number and Horizon Number pertinent to the sample you will collect.
6-28

2011 NWCA Field Operations Manual Chapter 6. Soils
a) The preprinted Sample ID Number at the top of the sample tag has several elements:
Site ID number: In the example above = NWCA11-9999. Make sure the Site ID
matches the site you are sampling.
Visit Identifier (1 = primary sampling visit, 2 = second visit (QA revisit)): In the example, the visit number = 1. Be sure this number corresponds with the visit you are making to the site.
Information specific to each site that is automatically generated when the label is printed to aid in sample tracking, but which is not immediately relevant to sample collection: o Last two digits of calendar year when samples are collected: In example = 11. o Code for state in which site occurs: In the example = OR (Oregon). o Federal Information Processing Code (FIPS) for the county: In example = 002. o County pedon number (generated by Information Management Team based on
number of sites in a particular county): In the example = 001. o nth horizon (the horizon sampled): In the example = 1.
b) The Horizon Number is also pre-printed in the bottom row of the sample tag. Since the
sample tags are preprinted it is critical to double check that you are using the correct tag for the horizon being sampled. If a horizon that was described on Form S-1 is too thin to sample (< 8cm thick), avoid inadvertently using its preprinted tag on another sample.
c) Fill out the other sample and horizon specific information requested on the tag:
Record the Date of sampling. Indicate whether this is Visit 1 (primary sample visit) or 2 (QA revisit). Indicate the Sample Type (Chemistry/PDSA or Bulk Density) Record the Horizon Location (the depth range in which the horizon occurs (e.g., 0 -
16cm, 27 – 54cm) from Form S-1. d) Affix the completed sample tag to the outside front of an 8mil thick plastic soil sample
bag. Cover the entire label with clear tape to protect it from moisture and mud. e) Note that the adhesive sheet of sample tags for a site is printed in two columns
(Section 6.6); one for bulk density and one for chemistry samples. Horizon numbers are the same across rows (e.g., one tag for bulk density and one for the chemistry sample for the same horizon), and increment between rows from Horizon 1 to Horizon 7. If more than seven horizons are observed, use blank tags for the remaining horizons being careful to record the Sample ID# from the preprinted tags and modifying the last digit to reflect the horizon number of the sample you are labeling. For example, if you were sampling Horizon 8 for the site in the example above, the Sample ID# would be NWCA-9999-1-11-OR-002-001-8.
6-29

2011 NWCA Field Operations Manual Chapter 6. Soils
2) The Soil Sample Label (see example below) – Completely fill out the sample label (preprinted on waterproof paper) for the same sample:
a) Make sure the Sample ID# and the Horizon # on the Soil Sample Label matches those
on the Soil Sample Tag. b) Indicate whether the sample is a Chemistry/PSDA or a Bulk Density sample. c) Fill in the Date and indicate the Visit #. d) Provide the Horizon Location from Form S-1, making sure it matches the sample tag. e) For bulk density samples only: Fill in the information for calculating volume after the
soil cores or blocks have been collected (See Collecting Bulk Density and Chemistry Samples, below).
f) For chemistry samples only: If any rocks are removed from the chemistry sample
record the percent of sample volume comprised by the removed rocks. Unless very large and heavy, rocks should not be removed from the chemistry sample, and rocks should never be removed from the bulk density sample.
g) After the sample is collected, note anything unusual about the sample in the comments
section of the label. 3) Remember to ensure the Sample ID on the Bulk Density or Chemistry Soil Sample Tag
and the Bulk Density or Chemistry Soil Sample Label matches the preprinted Sample ID for the Representative Pit on Form S-1. Note that the last digit on the tags and labels is absent from Form S-1 because it reflects the horizon number from which each sample is collected.
6-30
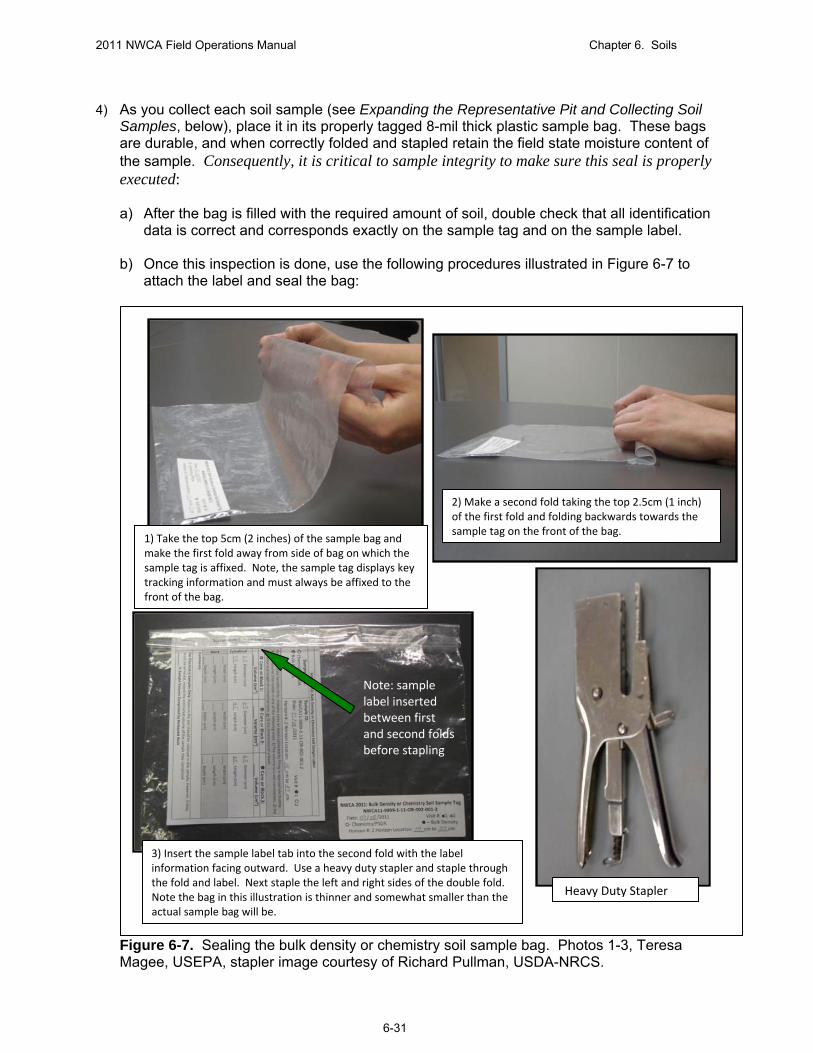
2011 NWCA Field Operations Manual Chapter 6. Soils
4) As you collect each soil sample (see Expanding the Representative Pit and Collecting Soil
Samples, below), place it in its properly tagged 8-mil thick plastic sample bag. These bags are durable, and when correctly folded and stapled retain the field state moisture content of the sample. Consequently, it is critical to sample integrity to make sure this seal is properly executed:
a) After the bag is filled with the required amount of soil, double check that all identification
data is correct and corresponds exactly on the sample tag and on the sample label. b) Once this inspection is done, use the following procedures illustrated in Figure 6-7 to
attach the label and seal the bag:
Figure 6-7. Sealing the bulk density or chemistry soil sample bag. Photos 1-3, Teresa Magee, USEPA, stapler image courtesy of Richard Pullman, USDA-NRCS.
Heavy Duty Stapler
2) Make a second fold taking the top 2.5cm (1 inch) of the first fold and folding backwards towards the sample tag on the front of the bag.
1) Take the top 5cm (2 inches) of the sample bag and make the first fold away from side of bag on which the sample tag is affixed. Note, the sample tag displays key tracking information and must always be affixed to the front of the bag.
Note: sample label inserted between first and second folds before stapling
3) Insert the sample label tab into the second fold with the label information facing outward. Use a heavy duty stapler and staple through the fold and label. Next staple the left and right sides of the double fold. Note the bag in this illustration is thinner and somewhat smaller than the actual sample bag will be.
6-31
2011 NWCA Field Operations Manual Chapter 6. Soils
6-32
Expanding the Representative Pit and Collecting Soil Samples To collect bulk density and chemistry samples and confirm the profile description conducted earlier (Section 6.1.2), expand the Representative Pit using a shovel and/or tiling spade and an auger. The basic procedure for expanding the Representative Pit and collecting samples is described below under a) Overview, b) Collecting Bulk Density Samples, and c)Collecting Chemistry Samples. Alternative sampling techniques for difficult to sample soils are provided in Text Box 6-6.
Figure 6-2 illustrates a variety of soil excavating and sampling tools. Figure 6-8 illustrates Representative Pit excavation and summarizes sample collection. Figure 6-9 illustrates details of bulk density sample collection.
Overview of Pit Expansion and Sample Collection 1) For the top 60cm of the soil profile in which both bulk density and chemistry samples are
collected, excavate the hole to the dimensions needed (usually not more than 1m X 1m and 60cm deep) to access (Figure 6-8a, b) and view the soil (Figure 6-8c).
2) Mark horizons with golf tees, nails, or plastic/metal tabs so that you have a guide for the
depths at which to collect the samples for each horizon (Figure 6-8c). 3) To collect soil samples, begin by clearing off vegetation and loose litter from the top horizon.
Collect both the bulk density sample (typically three cores of known volume) and the chemistry sample (1 to 2.5 liters or quarts) for the top horizon before digging down to the next horizon (Figure 6-8d, e).
4) Once a horizon is sampled, excavate off the remaining material from that horizon to form a
shelf with the horizontal surface being the top of the next horizon (Figure 6-8f). 5) When the next horizon is exposed, cut out three bulk density cores for that horizon and then
collect the chemistry sample (Figure 6-8g). 6) Continue excavation until all horizons (>8cm thick) to a depth of 60cm have been exposed
and all bulk density samples collected (bulk density samples are not collected below 60cm). 7) Collect chemistry samples from horizons that occupy the 60 to 125cm depth range with an
auger, or if it is easier, by using a shovel. When using an auger: a) Take care to note the horizon boundary depths for the horizon for which you are
collecting the sample so that the soil is pulled from the correct depth. You can also confirm that the correct soil horizon has been sampled by comparing the extracted soil with the soil profile data collected earlier for this horizon.
b) For shallow horizons, it may be necessary to bore more than one auger hole to obtain enough material (1.5 to 2.5 liters) for a chemistry sample.
c) When using an auger to grab chemistry samples be careful to extract a clean sample for the horizon of interest (e.g., not contaminated by debris from other soil layers).
8) In some instances, water may seep in from the sides and fill the pit. If this happens it will be
necessary to pump water out of the pit to continue soil excavation and sample collection (See Figure 6-8f-i). In some cases, (e.g., very wet, high organic, low-strength, cemented soils, or other difficult soils) alternate excavation techniques will be needed (Text Box 6-6).
9) Keep all samples cool and out of the sun during the sampling day.

2011 NWCA Field Operations Manual Chapter 6. Soils
6-33
a b c
Figure 6‐8. Expanding the Representative Soil Pit and Collecting Soil Samples Photos by Gregg Lomnicky. 1) Expand the Representative Pit using straight vertical cuts (a) at existing pit edge and lifting out slab of soil (b). 2) Use the excavated soil to create a berm or coffer dam outside the Representative Pit (c). 3) Excavate the pit to 60cm or as deep as possible before encountering ground water (c). 4) Mark horizon boundaries on the pit wall (c) to facilitate soil sample collection, and to confirm the initial soil profile description you made for this pit. In this example, ground water was encountered at about 35cm deep so the pit was initially excavated to about 35cm (c). Three horizons are visible; Horizon 1 (0 to 10cm), Horizon 2 (10 to 20cm), Horizon 3 (20 to 29cm), and part of Horizon 4, which begins around 29cm and extends to 60cm+, can also be seen (c). 5) Collect bulk density and chemistry soil samples (see d‐h) from the exposed horizons above 60cm depth or above water level. If water is present, collect all accessible samples, then evacuate water from pit (i), excavate the next lower horizons down to 60cm, and collect soil samples (this may require alternate excavation techniques; see Text Boxes 6‐2 and 6‐6). 6) In soils that are above the water table and not completely saturated, use an auger to extract material to complete profile description and collect chemistry soil samples for each horizon from 60 to 125cm deep. If the soil is saturated in this depth range, alternate sample approaches (see Text Boxes 6‐2 and 6‐6) may allow collection of samples.
Collecting soil for bulk density and chemistry samples – Horizon 1 d e
Remove vegetation and debris from top horizon and smooth the surface of the soil at the top of the pit to expose Horizon 1 (d).
Collect the cores for the bulk density sample (d) (See Figure 6‐9 for details of bulk density sample collection).
Collect the soil for the chemistry sample (e).

At the end of the day, once all samples are collected, refill the pit.
If possible, return the soil to the pit in horizon order.
Replace and tap vegetation to top of the refilled pit (j).
Collect the cores for the bulk density sample. In (g), bulk density cores were collected on the right side of the Horizon 2 shelf (note missing soil).
Excavate any remaining Horizon 2 soil on the bench to expose Horizon 3 and collect the bulk density and chemistry samples (h).
Collect soil chemistry samples for each horizon occurring between 60 and 125cm
In some cases, (e.g., as in the very wet soils as illustrated here or other difficult soils) alternate excavation techniques will be needed (Text Box 6‐6).
After collecting the Horizon 1 samples, remove any remaining Horizon 1 soil in the sample area to form a bench exposing Horizon 2 (f).
Collecting soil for bulk density and chemistry samples – Horizon 2 to the Horizon at 60cm depth
Collect the soil for the chemistry sample for Horizon 2 (g).
Continue this process until bulk density and chemistry samples have been collected for all horizons down to 60cm.
This is typically done using an auger (not pictured).
If needed pump out water to access horizons (i).
Figure 6‐8 Continued.
2011 NWCA Field Operations Manual Chapter 6. Soils
6-34
i
f g
h
j

2011 NWCA Field Operations Manual Chapter 6. Soils
Collecting Bulk Density Samples Knowing bulk density (ratio of the mass of solids to the total or bulk volume) is critical to converting sample data from a weight to a volume basis to allow correct interpretation of chemical and nutrient levels in the soil (USDA, NRCS 2009). A known volume of uncompacted soil is necessary for determining bulk density. General protocol for bulk density sample collection at each horizon above 60cm 1) Collect three soil cores, or alternatively (if required by soil characteristics) three soil blocks
(e.g., 5cm on a side) or one larger block or cylinder of soil. 2) Place all soil cores or blocks from one horizon together in the appropriate pre-tagged
sample bag. Do not remove or discard roots or rocks from the sample. 3) As each soil core or block is collected and deposited into the sample bag, record its volume
information (volume in cm3, if known; diameter and length for cores, dimensions for blocks) on the bulk density sample label.
4) Carefully seal the sample bag and attach the sample label (see Preparing Labels and
Sample Collection Bags). 5) Once the sample is collected, fill in the bulk density bubble in the Sample Collected column
of Form S-1. 6) Make every effort to obtain the bulk density sample for each horizon. However, if soil
conditions prohibit sample collection, leave the bulk density bubble in the Samples Collected column of Form S-1 unfilled, flag the horizon, and note the reason in the Comments section.
For many wetland soils, a small can with known diameter and depth (or with a known volume) is an excellent, inexpensive tool for extracting bulk density cores (Figure 6-9). Consequently, the NWCA will employ a small can as the primary tool for bulk density sample collection. Some soils or site conditions (e.g., high organic matter soils, inundation, or severe compaction when using can corer) will require other techniques for collecting bulk density samples and several alternate methods are described in Text Box 6-6. Your local soil scientist may also be able to alert you to problem soils in your sample area, before you go in the field, and advise you on the bulk density sampling methods that will be most effective. Can core method Wherever possible (most moist to dry soils), use a small can to collect three cores for each bulk density sample at a particular horizon). A small can, such as a sliced olive can (2.25 ounces dry weight, 6 ounce liquid volume), with a 6.5-cm diameter and a 4.5-cm depth (~150 cm3 volume), makes an excellent bulk density corer for most wetland soils. Cut two or three holes with a bottle/can opener equidistantly around the rim of the can’s bottom (Figure 6-9a-c) to allow air to escape as the can is inserted into the soil and to allow you to see how full the can is during bulk density sample collection. To collect bulk density cores at each horizon: 1) Begin with the top horizon (at the ground surface). Smooth a planar horizontal area at the
top of the horizon where bulk density will be sampled (see Figure 6-8d). Choose an area that appears representative of the horizon from which to extract the sample.
2) Be careful to avoid compacting the core when inserting the can into the soil:
6-35

2011 NWCA Field Operations Manual Chapter 6. Soils
a) If the horizon is thicker than the height of the can, use the palm of your hand to gently push the can into the smoothed area until the bottom of the can is flush with the soil surface (Figure 6-9a, b).
b) If the horizon is not as thick as the can, carefully push the can into soil until the open end
of the can reaches, but does not cross, the lower boundary of the horizon. c) If you hit some resistance in pushing the can into the soil, lay a board across the bottom
of the can and tap lightly with a hammer or geology pick until the bottom of the can is flush with the ground surface or is at the lower boundary of the horizon.
3) Dig out the sampling can plus a little of the surrounding soil (Figure 6-9c, d) and, with a knife
blade, cut off the excess soil so the sample material is flush with the top of the can (Figure 6-9e). If the can is not full (e.g., because the horizon is thin), be careful not to push additional soil into the can during excavation.
4) Empty the contents of the can into the previously labeled sample bag. Collect two more cores to complete the sample for this horizon. Record volume information for each core on the sample label.
5) Repeat steps 2 through 4 for each sampleable horizon down to 60cm.
b a
Figure 6-9. Collecting a bulk density core using a small can. Photos by Gregg Lomnicky.
e d
c
6-36

2011 NWCA Field Operations Manual Chapter 6. Soils
Collecting Chemistry Samples Once you have collected the bulk density sample for a horizon, collect a chemistry sample from the same horizon. 1) Slice or otherwise extract (Figure 6-8e, g) a representative sample from boundary to
boundary of the horizon and for a lateral extent large enough to include the observed short-range variability.
2) If there are no rock fragments (larger than 2mm), then 1.0 to 1.5 liters or quarts of sample
are needed for the chemistry sample to accommodate the required lab tests. 3) If course rock fragments are present, collect a larger volume of soil. You do not need to
remove rock fragments; the lab will do that for you. However, once the rock fragments are removed, 1.0 to 1.5 liters or quarts of soil must remain. Therefore, if your soil is 50% rock you need 2 to 3 quarts of sample. If there are large rock fragments too big to be placed in the sample bag, estimate their total volume and remove them from the sample. Record the % volume of the sample comprised by the rock removed in the For Chemistry Samples Only section of the Soil Sample Label. This is critical information for calculating percent rock fragments during lab analysis.
4) Once the chemistry soil sample is obtained place it into the designated sample bag.
Carefully attach its completed label and properly seal the bag using the procedures described above under the Preparing Labels and Sample Collection Bags subheading. Fill in the chemistry bubble in the Sample Collected column of Form S-1.
5) Make every effort to obtain the chemistry sample for each horizon. However, if soil
conditions prohibit sample collection, leave the chemistry bubble in the Sample Collected column of Form S-1 unfilled, flag the horizon and note the reason in the Comment section.
Text Box 6-6. Techniques for Collecting Bulk Density and Chemistry Samples in Difficult Soils For All Alternate Techniques for Collecting Soil Samples: Carefully follow the procedures for bagging and labeling the samples described in Preparing and Labeling Sample Bags above. Ensure that both the sample tag and the sample label have been filled out completely for each sample. For bulk density samples, be sure to record the diameter and length for each core or the dimensions of subsamples with non-cylindrical shapes (e.g., cubes, rectangular blocks) on the Sample Label. If the Soil has a Water Table Present: Excavate only to just above the depth of the water table. Sample all horizons above the water table. Once the bulk density and chemistry samples are collected for horizons above the water table, begin excavation below the water table using the hand pump to pump the water out of the hole. Try to get to at least 60cm deep by excavation. Excavate to the bottom of each lower horizon and sample it before trying to get deeper. If possible, for the bulk density sample at each horizon above 60cm, carve out cubes of known dimension (e.g., 5cm on a side) and place the block(s) in the sample bag. Remember to collect a chemistry sample for each horizon above 60cm as you are collecting the bulk density samples. Once you get to 60cm, collect chemistry samples for the area from 60 to 125cm deep with a bucket auger, taking care to get a clean chemistry sample of each horizon. Drier Soils (Hammered Corer): Hammered soil core samplers consist of a slide and a drop hammer that is attached to a solid coring device about 5cm in diameter and of varying lengths (Figure 6-2). Hammered corers are efficient for extracting bulk density samples in many soil conditions (excluding gravelly, loose organic, soupy, or sandy soils); but this tool is heavy, so not ideal for routinely carrying into the field over long distances. However, when soils are too dry for retrieving bulk density cores with a can, a hammered corer (if available) may work well. You will need to ensure that the soil cores extracted using
6-37
2011 NWCA Field Operations Manual Chapter 6. Soils
Text Box 6-6. Techniques for Collecting Bulk Density and Chemistry Samples in Difficult Soils the hammered corer are not severely compacted. Check for compaction by comparing the length of the soil core in the hammered corer with the depth of the void left by its removal. If the core length is more than 10% less than the void length, another sampling approach should be selected. When using a hammered corer, be sure to carefully follow the instructions for its operation. Organic Soils: If the water table is below the surface, obtain the soil samples for the non-inundated upper layers from the side of the pit. If the hydraulic conductivity is slow enough, dig and remove samples below the water table as far as practical and place on a plastic sheet or sled in an orderly fashion (i.e., in the in situ order from the surface) for describing and processing. If samples can be removed for bulk density in the normal manner, do so. You can also carve out cubes of known dimension (e.g., 5cm on a side) and place them in the bulk density sample bag. Note the sample dimensions on the Sample Label. Collect samples from below the water table with a Macaulay peat sampler or using the King soil extractor technique (see below). Place the sample for each horizon in its designated sample bag, knead the bag to remove air, fold top, insert label in fold and staple. Place this sealed bag into another sample bag, getting all the air out to limit oxidation, and staple this bag as well. Sulfidic Soil Materials (Tidal Marsh): Follow this protocol whenever sampling tidal marsh soils and any other soils known to contain sulfides (rotten egg odor usually present). Excavate using the normal technique or one of the modified techniques for sampling saturated soils. Bulk density can be done in the typical manner for the technique used. For chemistry samples, place samples in sample bags and knead the bag so that all air is eliminated when the bag is secured. Fold top, staple, and label. Place in another bag, getting all the air out, minimizing head space, and stapling this bag as well. It is important to avoid exposure to air keep the soil from oxidizing or the pH of the soil will change drastically. Adding some ambient soil water to the sample can limit oxidation. Keep containers in a dark and cool place. Indicate in the comments section of the Soil Sample Label that the sample may contain sulfides so that once it reaches the lab it can be stored correctly and processed as quickly as possible. Tube Extractor Method (King soil extractor, see Figure 6-2): When using the King soil extractor to obtain bulk density samples, use a sharp knife to slice through the bottom of the horizon being sampled and then cut bulk density samples out of the middle of the horizon. You may need to use two or three extractor tubes of sample to obtain enough soil for each horizon to get enough material for bulk density and chemistry samples. Once the bulk density samples are obtained put the rest of the soil material for that horizon into the chemistry sample bag. 6.1.4 Water Depth in Pit after Equilibration After all AB Team sampling tasks are completed and prior to filling in the soil pit holes, collect water depth data at each soil pit and record the data in the appropriate field of the Soil Pit Water Depth section of Form S-1: NWCA Soil Profile Data (Back). 1) If the area in the vicinity of the soil pit is inundated and surface water is present, record
water depth in centimeters in the Surface Water field as a positive number. If no surface water is present, fill in the bubble in the Absent column.
2) If there is water in the soil pit, measure the depth in centimeters from the ground surface
down to the top of the water level and record this depth as a negative number in the Water Level in Pit field. If no water is present in the pit, fill in the bubble in the Absent column.
3) Note whether the soil is saturated at a depth above any standing water in the pit or
anywhere in the pit if there is no standing water. Record the depth from the ground to the point at which saturation occurs as negative number in the Saturation field. Saturated soil is indicated by:
6-38

2011 NWCA Field Operations Manual Chapter 6. Soils
a) Water seeping from the pit walls above the water level (e.g., general seepage, or along ped faces or from macropores).
b) Pit surfaces with a sheen of moisture or which appear to be glistening.
If no evidence of saturation is present, fill in the bubble in the Absent column of this field.
4) Record the time (24 hour clock) that the water level observation was made in the Time field of the Soil Pit Water Depth section of the form.
6.1.5 Backfilling the Soil Pits Soils pits can be backfilled once the water depth data has been collected. Before backfilling a soil pit, check to be certain all samples and profile data have been collected and all information has been recorded on the data forms. 1) If the soil pit is the Representative Pit, for each horizon greater than 8cm thick, double check
that the bulk density samples (in horizons ≤ 60cm deep) and chemistry samples (in horizons to 125cm deep) that have been collected are recorded in the Sample Collected column under the Horizons section of the Form S-1 for the Representative Pit.
2) Remember to record the Final Pit Depth for the Representative Pit in the Representative Pit
section of Form S-1. 3) Return the excavated soil into the pit. 4) Once the pit is filled, replace the vegetation cap that was removed and set aside at the
beginning of Soil Pit excavation. 5) Tamp the vegetation cap down into the soil to give it a chance to re-root and enhance its
likelihood of surviva (Figure 6-8j). 6.1.6 Soil Tool Decontamination and Maintenance 1) Clean soil sampling tools as thoroughly as possible at the end of every sample day while still
on-site to remove excess soil and any alien species propagules. See Chapter 2 for details of procedures for preventing inadvertent transport of taxa from the site.
2) Once back at lodgings or other convenient location, carefully and thoroughly clean all soils
equipment and keep all threads for connecting joints well-oiled or lubricated. This is imperative to keep tools in good working order.
3) Note: If tools are exposed to contaminants such as oil, use the appropriate state approved
safety protocols for cleaning them (See Appendix E for an example protocol).
6-39
2011 NWCA Field Operations Manual Chapter 6. Soils
6.2 SAMPLE AND DATA HANDLING There are two components to soil sample handling. One is completed before leaving the site; the other, at the field lodging or office. 6.2.1 At the Site 1) During the sampling day, keep all soil samples as cool as possible
a) Keep bulk density and chemistry samples out of direct sun and, if possible, in the shade. b) Keep the soil isotope and sediment enzyme samples on ice and out of the direct sun and
in the shade whenever possible. 2) At the end of the sample day, double check that all samples (isotope, sediment enzyme,
bulk density, and chemistry) have been collected and that label and tag information is accurate and legible.
3) Ensure all identification information for each isotope, sediment enzyme, bulk density, and
chemistry sample corresponds exactly on all Sample Tags, Sample Labels, and Form S-1 for the Representative Pit.
4) Complete Form T-1: NWCA 2011 Site and Sample Status and Tracking.
a) In the Sample Status section of Form T-1, indicate the soil isotope (SISO), the sediment enzyme (SEDE), and the soil chemistry and bulk density samples (SCBD) have been collected for the site.
b) Record the sample id numbers for the soil isotope and sediment enzyme samples on
Form T-1 in the WRS Sample Tracking section. Make sure that the information on the Isotope Soil Sample Label and the Sediment Enzyme Sample Label on the sample bags and Form T-1 correspond exactly.
6.2.2 At Field Lodging or Office See Chapter 2 for an overview of sample shipping and Appendix A for detailed protocols on packing, tracking, and shipping soil samples and for shipping addresses. Isotope and Sediment Enzyme Soil Samples The isotope and sediment enzyme samples for each AA will be sent to the USEPA Lab in Corvallis, Oregon, within 24 hours of collection in an ice chest with the other immediately shipped samples. These samples are water chemistry, water chemistry duplicate (when taken), algal toxins, and chlorophyll-a. The protocol below covers the details of shipping that pertain to the isotope and sediment samples. See Chapter 2 for information that pertains to all of the immediately shipped samples. See Appendix A for detailed protocols on packing, tracking, and shipping samples and for shipping addresses. 1) Confirm that the label affixed to each sample has the correct Site ID, is complete, and is
covered with clear tape. 2) Ensure that any air has been removed from the sample bag and that it is completely sealed.
6-40

2011 NWCA Field Operations Manual Chapter 6. Soils
3) Place each individual isotope and sediment sample bag in another, separate, gallon-sized self-sealing plastic bag, making sure the gallon bag is sealed to protect the sample from moisture in the ice-chest.
4) Affix the APHIS Regulated Soils permit on the outside of the ice-chest for immediately
shipped samples. Be certain you use the Regulated Soils Permit for isotope and sediment enzyme soil samples, i.e., the permit for samples sent to the USEPA Lab in Corvallis, Oregon.
5) Go to Chapter 2 and complete the protocols on packing and shipping the samples to be
immediately shipped. Soil Bulk Density and Chemistry Samples The bulk density and chemistry samples will be sent to the UDSA-NRCS Lab in Lincoln, Nebraska. These soil samples may be stored and shipped in batches every two weeks. 1) For each sample, confirm the Sample Tag with the Sample ID is completed, legible, and
affixed to the front of the sample bag and covered with clear plastic tape. 2) For each sample, confirm the Sample Label is complete and legible, the sample bag has
been sealed and the Sample Label is stapled in the fold sealing the bag (see Figure 6-7) 3) Record tracking information (sample id and collection date) for the Bulk Density and
Chemistry Samples on Form T-4: NWCA Chemistry and Bulk Density Soil Sample Tracking.
4) Ensure all identification information and tracking data for each sample corresponds exactly
on the Sample Tag affixed to the bag, on the Sample Label stapled to the bag, and on Form T-4.
5) Pack soil samples, organizing them by site, neatly in a shipping carton. 6) Make two copies of the completed Form T-4. Retain one for your records, transmit the
original to the Information Management Team, and place one inside a self-sealing plastic bag and place in on top of the soil samples in the shipping box. See Chapter 2 for details of copying forms and transmitting them to the Information Management Team.
7) An APHIS Regulated Soils permit must be displayed on the shipping package containing the
bulk density and chemistry soil samples. Ensure that you have the Regulated Soils Permit for soil samples sent to the USDA-NRCS Lab in Lincoln, Nebraska and that it is affixed to the outside of the package.
8) Fill out the shipping label (See Appendix A and Form T-4 for the shipping address). 9) Once you are certain that all samples and completed tracking forms are included in the
shipping box, carefully seal the package, affix shipping label. 10) Deliver the package of soil samples to the shipping company and retain all receipts and
records of shipping.
6-41

2011 NWCA Field Operations Manual Chapter 6. Soils
6.2.4 Soil Data Forms, Tracking Forms, and Shipping Records After reviewing the soil data forms for completeness order them sequentially and place them in the Data Packet for the AA. See Chapter 2 for protocols on copying and shipping completed soils data and tracking forms to the Information Management Team. See Appendix D for information on transmitting the image files of the soil profile photos. 6.3 LITERATURE CITED Mitsch, W.J. and J.G. Gosselink. 2007. Wetlands. John Wiley & Sons, Hoboken, NJ. Munsell Color X-Rite. 2009 . Munsell Soil Color Charts. Munsell Color Corporation. Grand Rapids, MI. Schoeneberger, P.J., D.A. Wysocki, E.C. Benham, and W.D. Broderson. 2002. Field Book for Describing and Sampling Soils, Version 2.0. Natural Resources Conservation Service, National Soil Survey Center, Lincoln, Nebraska, USA. ftp://ftp-fc.sc.egov.usda.gov/NSSC/Field_Book/FieldBookVer2.pdf Thien, S.J. 1979. A flow diagram for teaching texture by feel analysis. Journal of Agronomic Education. 8:54-55. Tiner, R.W. 1999. Wetland Indicators: A Guide to Wetland Identification, Delineation, Classification, and Mapping. Lewis Publishers, Boca Raton, FL. USDA, NRCS (U.S. Department of Agriculture, Natural Resources Conservation Service). 2009. Soil Survey Manual. Chapter 3. Soil Survey Division Staff. U.S. Department of Agriculture Handbook 18. Updated electronically and available at: http://soils.usda.gov/technical/manual/, verified 26 Feb. 2010. USDA, NRCS (U.S. Department of Agriculture, Natural Resources Conservation Service). 2010. Field Indicators of Hydric Soils in the United States, Version 7.0. L.M. Vasilas, G.W. Hurt, and C.V. Noble (eds.). United States Department of Agriculture, Natural Resources Conservation Service, in cooperation with the National Technical Committee for Hydric Soils. (http://soils.usda.gov/use/hydric/ or ftp://ftp-fc.sc.egov.usda.gov/NSSC/Hydric_Soils/FieldIndicators_v7.pdf) USEPA (U.S. Environmental Protection Agency). In Preparation. Ecological Indicators for the 2011 National Wetland Condition Assessment. EPA-XXX-YY-0000. U.S. Environmental Protection Agency, Washington, DC. Vepraskas, M.J. 1995 (revised). Redoximorphic Features for Identifying Aquic Conditions. Techical Bulletin 301, North Carolina State University, Raleigh, NC.
6-42

2011 NWCA Field Operations Manual Chapter 6. Soils
6.4 SUPPLEMENTARY MATERIAL 6.4.1 List of Soil Resources to be Carried in Vehicle
Munsell Color X-Rite. 2009. Munsell Soil Color Charts. Grand Rapids, MI. United States Department of Agriculture, Natural Resources Conservation Service. 2010. Field Indicators of Hydric Soils in the United States, Version 7.0. L.M. Vasilas, G.W. Hurt, and C.V. Noble (eds.). USDA, NRCS, in cooperation with the National Technical Committee for Hydric Soils. Schoeneberger, P.J., D.A. Wysocki, E.C. Benham, and W.D. Broderson. 2002. Field Book for Describing and Sampling Soils, Version 2.0. Natural Resources Conservation Service, National Soil Survey Center, Lincoln, Nebraska, USA. 6.4.2 Other Useful Soil Resources United States Department of Agriculture, Natural Resources Conservation Service Website: http://soils.usda.gov/ USACE (United States Army Corps of Engineers). 2009. Regional Supplements to Corps Delineation Manual. Website: http://www.usace.army.mil/cecw/pages/reg_supp.aspx Any additional references recommended by your regional soil scientist. 6.4.3 Glossary of Soil Terminology Color Components:
Hue - The quality that distinguishes one color from another. Five principle colors: red, yellow, green, blue, and purple and 5 intermediate colors. Hue is generally found in the upper right hand corner of the Munsell Soil Color Book pages. Value - The quality that distinguishes a light color from a dark one. This refers to the grey level of the color and ranges from white to black. Value decreases as you go down a column on the Munsell Soil Color Book pages. Chroma -The quality that distinguishes the difference from a pure hue to a gray shade. Chroma generally runs from left to right on the Munsell Color Book pages with grayer colors as you go to the left.
Hydric Soils - Soils formed under conditions of saturation, flooding, or ponding long enough during the growing season to develop anaerobic conditions in the upper part. Matrix- The dominant soil volume that is continuous in appearance and may envelope other features. When three colors occur, such as when a matrix, depletions, and concentrations are present, the matrix may represent less than 50 percent of the total. Mottle – Splotch of color in the soil matrix. Muck - Sapric organic soil material in which virtually all of the organic material is so decomposed that identification of plant forms is not possible.
6-43

2011 NWCA Field Operations Manual Chapter 6. Soils
Nodules and Concretion – Nodules are cemented bodies (commonly spherical or tubular) that can be removed as discrete units from the soil, but which do not have discernible crystalline structure when viewed with a 10X hand lens. Concretions are similar to nodules, but have concentric layers of material around a point. Organic Bodies – Typically occur at the tips of roots and are commonly 1 to 3cm in diameter with muck or mucky modified textures. Other Organic Features – Include stripped zones and organic infilling. Ped - A single unit of soil structure. Soil Horizon - A layer, approximately parallel to the surface of the soil, distinguishable from adjacent layers by distinctive properties produced by soil-forming processes.
O Horizon – Organic horizon consisting of high accumulations of organic carbon (if you feel more than a couple of mineral grains (grit from sand, stickiness from clay, silt deposits on hands) it is most likely a mineral horizon high in organic matter (OM) not an organic soil).
A Horizon – Mineral horizon formed at the surface from significant organic carbon accumulation (will be darker in color than the horizons below due to OM accumulation).
E Horizon – Mineral horizon that exhibits significant loss of organic carbon, Fe (Iron), Mn (Manganese), Al (Aluminum), and/or clays (usually paler in color and lighter in texture (less clayey) than horizons below).
B Horizon –Mineral horizon with accumulations of Fe, Mn, secondary minerals, Al-organic
compounds, and/or clay, or development of soil structure (can be higher in clay, may be brighter in color, or may contain more redoximorphic (redox) concentrations than the horizons above it).
C Horizon – Mineral soil little affected by soil genesis, or soft bedrock or former bedrock. Lacking properties of O, A, E, and B horizons (lacks structure, may appear to look like parent material (hard bedrock) but breaks into mineral grains and gravel upon excavation).
L Horizon – Organic and inorganic limnic materials deposited in water by precipitation or derived from underwater and floating aquatic plants and aquatic animals (lacks structure, may appear to look like parent material (hard bedrock) but breaks into mineral grains and gravel upon excavation).
R Horizon – Strongly cemented bedrock horizon.
W Horizon – A layer of water found under floating but fixed vegetation.
Soil Profile – Vertical arrangement of layers of soil down to the bedrock or zone absent of weathering. Soil Texture - The relative proportions, by weight, of sand, silt, and clay particles in the soil material less than 2mm in size. Stripped Zones – Areas where iron-manganese oxides and/or organic matter have been stripped from the matrix and the primary base color of the soil material is exposed. The stripped
6-44
2011 NWCA Field Operations Manual Chapter 6. Soils
areas and translocated oxides and organic matter form a contrasting pattern of two or more colors with diffuse boundaries. Redoximoprhic (Redox) Features - Features formed by the processes of reduction, translocation, and/or oxidation of Fe and Mn oxides; formerly called mottles and low-chroma colors. Redox features include uncemented concentrations and depletions (losses) of these elements, and are observed in pore linings, ped faces, or the soil matrix as soft masses and colors that contrast with soil matrix color (USDA, NRCS 2010). A soft mass is a splotch in the soil and a pore lining would have iron or other elements coating the larger voids (i.e., root channels, cracks between peds). Redox Concentrations - Bodies of apparent accumulation of Fe-Mn oxides. Redox concentrations include soft masses, pore linings, nodules, and concretions. They appear as reddish, yellowish, or black splotches in the soil. For the purposes of hydric indicators, nodules and concretions (hard, brittle concentrations) are excluded from the concept of redox concentrations unless otherwise specified by specific indicators. Most hydric indicators require distinct or prominent concentrations, therefore faint concentrations do not reflect a hydric indicator. Redox Depletions - Bodies of low chroma (2 or less) having value of 4 or more where Fe-Mn oxides have been stripped or where both Fe-Mn oxides and clay have been stripped. Redox depletions are gray splotches or zones that, for most hydric indicators, must contrast distinctly or prominently with the matrix to count. Depletions can occur in the matrix or on pore linings and ped faces.
6-45

2011 NWCA Field Operations Manual Chapter 6. Soils
6-46

2011 NWCA Field Operations Manual Chapter 6. Soils
6.5 REFERENCE CARDS
Reference Card S-1, Sides A and B. Soil Protocol Flowchart Reference Card S-2, Side A. Soil Pit Placement, Characteristics of Soil Horizon Types Reference Card S-2, Side B. Distinguishing Soil Horizons Reference Card S-3, Side A. Soil Structure, Coats and Films, and Guidelines for Cover Estimation Reference Card S-3, Side B. Examples of Some Redox and Other Soil Features Reference Card S-4, Side A. Determining Soil Texture Reference Card S-4, Side B. Soil Color Determinations Reference Card S-5, Side A. USDA Land Resource Regions (LLRs) Reference Card S-5, Side B. Hydric Soil Indicators by Land Resource Region, Evaluating Hydric Soil Indicators
6-47

2011 NWCA Field Operations Manual Chapter 6. Soils
6-48

Reference Card S-1, Side A. NWCA Soil Protocol Flowchart
NO
Photograph the Soil Profile (Appendix D) either after horizon delineation or after the profile description is completed, as convenient.
1) Place a lettered flag (A, B, C, or D) at the Soil Pit location to identify it. 2) Excavate one Soil Pit to 60cm deep and extract a slab for soil profile using appropriate tools and methods for soil
conditions. Record pit depth, time of excavation, and lighting conditions on Form S-1. If an impenetrable layer prevents excavation and pit cannot be moved, record pit depth and type of impenetrable layer
on Form S-1. 3) Collect all soil profile data (see below) in this pit, then dig the next Soil Pit to 60cm and describe its soil profile. 4) Repeat until all four pits have been excavated and described to 60cm. Choose the Representative Pit. 5) Do not refill any pit until all pits have been examined, all samples have been collected from the Representative Pit, and water
depth data have been collected in all four pits.
Are standing water or obstacles present at the standard Soil Pit Location?
If water or mud ≥ 0.25m deep or other obstacle (e.g., TES species, large rock, tree, woody debris) is present, move pit to an alternate location as close to SE corner of Veg Plot as possible. Record pit location on Form S-1.
NO
If water and soft sediment < 0.25m deep, locate soil pit just outside SE corner of Veg Plot. Record pit location on Form S-1.
Place Soil Pit just outside SE corner of designated Veg Plot. Record pit location on Form S-1.
YES
Identify standard locations for Soil Pits (i.e., outside the SE corner of designated Veg Plot).
A. Soil Pit Location and Excavation to 60cm (See Section 6.1.1)
B. Soil Profile Description at Each Soil Pit (See Section 6.1.2) YES Does soil have an inundated or saturated layer?
Randomly select one Representative Soil Pit from the subset of pits that most represent the soils conditions of the AA.
Delineate soil horizons and for each horizon observed at each Soil Pit, determine and record on Form S-1 (Front): 1) Horizon depth 2) Horizon boundary abruptness 3) Soil texture 4) % Rock fragments 5) % Roots 6) Soil matrix color 7) Presence and type of
redoximorphic or other features 8) % Horizon composed of distinct
or prominent redox and other features
9) Color of most evident redox or other feature
Immediately upon excavation, record initial soil matrix color and determine whether H2S odor (rotten egg) is detected (Form S-1).
Determine presence of Hydric Soil Indicators in the Soil Profile: 1) Use Reference Card S-5 to determine the Land Resource
Region (LRR) in which the AA occurs. 2) Evaluate the soil for the presence of Hydric Soil Indicators for the
selected LRR and record on Form S-1 (Back).
Excavate soil, using an auger, to 125cm from the Representative Pit, or if easier dig
pit to125 cm, and describe the soil profile from 60cm down to 125 cm. Complete photography of the soil profile for this pit.
Continue to Soil Sample Collection flowchart (Reference Card S-1, Side B). Refer to NWCA-Field Operations Manual (Chapter 6. Soils) for more detail on the information summarized on this card.

Reference Card S-1, Side B. Soil Protocol Flowchart
Refer to NWCA-Field Operations Manual (Chapter 6. Soils) for more detail on the information summarized here.
Soil Isotope and Sediment Enzyme Samples Collect soil isotope sample and sediment enzyme sample before expanding the Representative Pit for bulk density and chemistry sample collection. Collect 3 cores for the isotope sample and 6 for the enzyme sample. The same procedure is used for collecting both kinds of samples. 1) Fill out the appropriate sample tag and
sample label. Affix tag to outside of bag. 2) Use the syringe-corer to extract the required
number of 10-cm long soil cores from evenly spaced undisturbed locations within 1-m area surrounding the 60-cm pit.
3) Place all cores for the sample into the prepared sample bag. Properly fold the Sample Label into the top edge of the bag with the soil cores and carefully seal and staple the bag.
4) Place sealed bag of soil into a plastic food storage box, and place box in a small ice chest to keep it cool during the sampling day.
C. Soil Sample Collection (See Section 6.1.3)
Once the Representative Pit has been identified, collect four kinds of soil samples.
Select tools appropriate to site conditions and expand the Representative Soil Pit and collect Bulk Density and Chemistry Soil Samples.
Chemistry/PSDASamples
Bulk Density Samples1) For each horizon > 8cm thick
located in the top 60cm of the soil profile, prepare one bulk density sample bag, with completed sample tag and sample label.
1) For each horizon > 8cm thick located down to 125cm, prepare one chemistry sample bag, with completed Sample Tag and Sample Label. 2) Collect 3 soil cores using a
small can, or if this is not feasible, a known volume of soil using another method, e.g., cut out a block of soil.
2) Collect 1 to 2.5 liters of soil (depending on rock and root content) for each sample.
3) Place all 3 cores, or the soil blocks, into the sample bag.
4) Record the volume or dimensions of each of the cores or soil blocks making up the sample on the Sample Label. 1) Carefully remove air from
sample bag. 2) Properly fold sample label
into the top edge of the bag and staple bag shut.
F. Soil Sample Handling and Processing (See Section 6.2, Chapter 2, Appendix A)
1) After all data and all samples have been gathered at all four pits, collect water depth data at each pit.
2) For each pit, record water depth values in the appropriate fields of the Soil Pit Water Depth section of its Form S-1: NWCA Soil Profile Data (Back).
1) Ensure all data and samples have been collected from all soil pits.
2) Backfill each pit and replace vegetation cap.
D. Soil Pit Water Depth (Section 6.1.4), Back-filling Soil Pits (Section 6.1.5), and Soil Tool Decontamination and Maintenance (Section 6.1.6)
3) Keep samples in a cool location during the day.
1) Clean and decontaminate soils equipment.
2) Maintain soils equipment weekly by routinely lubricating all threads for connecting joints.
While at the Site: At Field Lodging or Office 5) Submit Form T-1 to Information Management Team; pack isotope
and enzyme samples in the ice-chest for immediately (within 24 hours) shipped samples to be sent to the EPA Lab, Corvallis, OR.
4) Keep bulk density and chemistry samples as cool as possible by placing them in a shaded location whenever possible, and place isotope and sediment enzyme samples on ice.
5) At the end of the sample day, double check that all samples have been collected.
6) Ship batched bulk density and chemistry samples every two weeks to the NRCS Lab with completed Form T-4: Bulk Density and Chemistry Soil Sample Tracking.
6) Complete Form T-1: NWCA 2011 Site and Sample Status and Tracking.
7) When packing soil samples for shipping, include a copy of the pertinent tracking forms in the package and send any required copies to the Information Management Team.
a) In the Sample Status section of Form T-1, indicate the soil isotope, the sediment enzyme, and the soil chemistry and bulk density samples have been collected.
b) Record sample id numbers on the labels for the soil isotope and sediment enzyme samples on Form T-1 in the WRS Sample Tracking section.
8) Carefully seal the package, fill out shipping labels and affix to package, affix required labels for regulated soils, and deliver package to shipping company.

Reference Card S-2, Side A. Soil Pit Placement and Characteristics of Soil Horizon Types
Characteristics of Major Soil Horizon Types
You do not need to name horizons on Form S‐1, but horizon characteristics may help distinguish horizon boundaries.
O – Organic horizon consisting of high accumulations of organic carbon (if you feel more than a couple of mineral grains (grit from sand, stickiness from clay, silt deposits on hands) it is most likely not organic, but mineral soil high in organic matter (OM))
A – Mineral horizon at the surface with significant organic carbon accumulation (darker in color than the horizons below due to OM accumulation)
E – Mineral horizon that exhibits significant loss of organic carbon, Fe (Iron), Mn (Manganese), Al (Aluminum), and/or clays (usually paler in color and lighter in texture (less clayey) than horizons below)
B –Mineral horizon with accumulations of Fe, Mn, secondary
minerals, Al‐organic compounds, and/or clay, or development of soil structure (can be higher in clay, may be brighter in color, or may contain more redoximorphic (redox) concentrations than the horizons above it)
C – Mineral soil little affected by soil genesis, or soft bedrock or
former bedrock. Lacking properties of O, A, E, and B horizons (lacks structure, may appear to look like parent material (hard bedrock) but breaks into mineral grains and gravel upon excavation)
L – Organic and inorganic limnic materials deposited in water
by precipitation or derived from underwater and floating aquatic plants and aquatic animals (lacks structure, may appear to look like parent material (hard bedrock) but breaks into mineral grains and gravel upon excavation)
R – Strongly cemented bedrock horizon W – A layer of water found under floating but fixed vegetation Note: O, A, E, B horizons, and mucky mineral layers have a 1‐cm minimum thickness.
Soil Pits Locations
Standard AAs – For the Standard‐Circular or Standard Circular‐Shifted AA Layout, five 100‐m2 Veg Plots are positioned at prescribed distances from the AA CENTER along cardinal bearings (See Chapter 5; Reference Card V‐1). Locate a Soil Pit immediately outside the southeast corner of each of the four Veg Plots furthest from the AA CENTER (Figure 6‐1A).
Alternate AAs –Veg Plot locations vary with the shape and size of the Alternate AA (See Chapter 5; Reference Card V‐1), but Soil Pits are still located just outside the SE corners of the four Veg Plots furthest from the AA CENTER (Figure 6‐1B).
Recording Soil Pit Locations – The Veg Team will have designated the Veg Plots numbers on flags in the SE corners of the plots. Record the number of the Veg Plot with which each Soil Pit is associated on its Form S‐1 in the Soil Pit Location field and fill in the bubble for Standard location outside SE corner of Veg Plot.
Alternate Locations – Moving Soil Pits to Avoid Obstacles If a combination of water depth and soft substrate ≥ 0.25m deep, TES (threatened, endangered, or sensitive plant species) large wood, or rock prevent soil access at the Standard Soil Pit Location, move the pit so it is outside of and as close as possible to the SE corner of the Veg Plot.
Moving the Soil Pit – Place the Soil Pit so it is at least 2m away from an upland edge or other non‐wetland landcover type that might influence soil condition. If more than one Soil Pit must be relocated, try to maintain 10m between soil pits.
Recording Soil Pit Locations – Record the new Soil Pit location on its corresponding Form S‐1. Fill in the Alternate Location bubble in the Soil Pit Location field and record distance and bearing of the pit from the SE corner of the nearest Veg Plot.
Figure 6-1. Standard Soil Pit Locations. A. Standard Circular AA Layout with five Veg Plots and four Soil Pits. B. Narrow Polygon AA Veg Plot Layout with Soil Pits.
4 AA CENTER
N A
3
2
1
Veg Plot
Soil Pit locations 5
5
2 4325m 1
200m
40m

Reference Card S-2, Side B. Distinguishing Soil Horizons.
4
5
Ground Surface
60 cm
Soil Pit Bottom
23 1
Distinguishing Soil Horizons. Left top: Soil slab diagram with horizons marked. Left bottom: Soil slab photo (Eric Vance, EPA). Right : Example soil profiles illustrating horizons distinguished by different colors, structure, or texture. Profile photos from USDA, NRCS (2010).
Soil Horizons are delineated based on differences in:
Soil structure (e.g., Reference Card S‐3 Side A, Plate 1, see also Schoeneberger et al. 2002).
Texture (see Reference Card S‐4 Side A).
Soil color based on Munsell Soil Color Charts (2009) (see Reference Card S‐4 Side B).
Presence and type of redoximorphic other features (See Reference Card S‐3 Side A and B).
Place marker (e.g., golf tee) at bottom of
each horizon. Number horizons in order from the top of the profile (e.g., see figure at left).
Measure depth from the top of the soil
profile to the bottom of each horizon in centimeters (a metric fiberglass seamstress tape works well).
For the Soil Pit under consideration,
record the depth to the lower boundary of each horizon in the Depth to Lower Boundary of Horizon column of Form S‐1 (Front).
If the lower boundary of a horizon is less
than 2cm thick, fill in the abrupt boundary bubble in the Horizons section of Form S‐1 (Front).
Refer to NWCA-Field Operations Manual (Chapter 6. Soils) for more detail on the reference information summarized on this card.

Reference Card S-3, Side A. Soil Structure, Coats and Films, Guidelines for Cover Estimation.
Plate 1. Examples of Soil Structure Types. Plate 2. Coats and Films on Peds. Formed by translocation and deposition (e.g., clay films (argillans), clay bridging, manganese (black), iron (orange or red) dark organic stains, masked sand grains, etc.).
35% 75%
Plate 3. Examples of Surface Area Estimation for Soil Features. Percent surface area of soil matrix occupied by other components, (e.g., rocks, roots, redox and other features with contrasting colors).
Refer to NWCA-Field Operations Manual (Chapter 6. Soils) for more detail on the reference information summarized on this card. Graphics from (or adapted from) Schoeneberger, P.J., D.A. Wysocki, E.C. Benham, and W. D. Broderson. 2002. Field Book for Describing and Sampling Soils, Version 2.0. Natural Resources Conservation Service, National Soil Survey Center, Lincoln, Nebraska, USA.

Reference Card S-3, Side B. Examples of Some Redox and Other Soil Features
Legend A – Iron redox concentrations as pore linings B – Iron redox concentrations as pore linings C – Depletions as pore linings D – Redox concentrations in sandy soil E – Pore linings and soft masses F – Redox concentration as soft masses G – Stripped zones in sandy soil H – Organic bodies Photos by Lenore Vasilas, NRCS and Gregg Lomnicky, Dynamac
A
G H
B C
D E
F

Reference Card S-4, Side A. Determining Soil Texture. Use the following steps to describe the soil texture for each horizon.
Step 1. Determine whether the soil has organic or mineral content Take a dime-sized chunk of moist soil in your hand and gently rub the wet soil between forefingers and thumb several times.
If the soil feels greasy, the soil is either mucky mineral or organic soil; go to Step 2.
If the soil does not feel greasy, the texture is a mineral soil; go to Step 3.
Step 2. Texturing Soils with High Organic Matter Content – Distinguishing between mucky mineral and organic soil a. Determine whether the soil is mucky mineral or organic. (Both
have a greasy feel). Squeeze a chunk of wet soil. Mucky Mineral texture –The soil is a mucky mineral if it is
gritty or sticks to your hand when squeezed and rubbed. Identifiable plant fibers are rare to none.
Organic texture – The soil has an organic texture, if when squeezed, it either extrudes liquid or much of the soil material and whatever material remains does not stick to your hand. Identifiable plant fibers are common. Go to Step b, below.
b. Distinguish among organic textures – Organic textures include:
peat, mucky-peat, or muck. The three textures are defined based on differences in percent volume of plant fibers visible with a hand lens after rubbing. To distinguish between them, grab a fresh sample of moist soil,
visually estimate the percent volume plant fibers and dead roots after rubbing, and use the chart below to determine the organic soil texture.
Organic Soil Texture % Fibers Visible with Hand Lens After Rubbing
Peat > 40 Muck Peat 20 - 40 Muck < 20
Add water with spray bottle and break down all lumps. The soil is prepared when plastic and moldable, like moist putty or cookie dough. Place a golf‐ball sized sample in your palm.
Does soil remain in a ball when squeezed?
Place ball of soil between thumb and forefinger gently pushing the soil with the thumb, squeezing it outward into a thick ribbon. Push the ribbon over the forefinger. Measure the length when it bends or breaks from its own weight.
Begin by picking up a golf ball‐sized or slightly larger sample of soil from the center of the horizon. Remove roots and rocks.
Is soil too dry? Is soil too wet?
Add dry soil and start again.
SAND
Does soil form a ribbon more than ½ inch long?
YES
NO
YES
NO NO
YES
NO YES LOAMY AND CLAYEY SO S
SANDY SOILS
Step 3. Texturing Mineral Soil*
*Flowchart for simple hand tests to determine soil texture of three major mineral texture groups. Modified from S.J. Thien. 1979 (USDA, NRCS 2009)
Refer to NWCA-Field Operations Manual (Chapter 6. Soils) for more detail on protocols summarized on this card.

Reference Card S-4, Side B. Soil Color Determinations
Tables for Distinguishing Faint from Distinct or Prominent Color Contrast for Redoximorphic or Other Features Compared to the Soil Matrix (from Schoeneberger et al. 2002). Use these tables to determine the redox or other color features (distinct + prominent) for which to estimate surface area (Form S‐1, NWCA‐FOM Section 6.1.2.6, Step 6).
Evaluating Color for the Soil Matrix and for Redoximorphic Features
Determining Color of the Soil Matrix: 1) To determine soil matrix color, choose a representative, freshly broken surface of a soil ped
that is not coated with clay, Fe (Iron), or Mn (Manganese). 2) Use a spray bottle to wet the soil if it is dry. Spray until moist, but not saturated. As soon as
the water is absorbed into the soil, read the color from the Munsell Soil Color Book (Munsell Soil Color, X‐Rite 2009) (See Step 3). For horizons with high organic content (e.g., A and O horizons), rub the soil between your fingers, then read the color of rubbed material.
3) Match the soil matrix color (hue, value, and chroma) to the soil color chips from the Munsell
Soil Color Book. Hue is found on the Munsell page tab and labeled using numbers and letters (e.g., 2.5YR or 10R). Value is found on the left side of the page along the y‐axis of the color chip array and is represented by numbers (e.g., 2.5, 8). Chroma is found at the bottom of page along the x‐axis of the color chip array and is represent by numbers or by numbers and letters for gley sois (e.g., 1, 8, 5G, 10GY).
4) Observe the soil color in direct sunlight with the sun at your back and shining over your right
shoulder whenever possible. Match the color of the soil with the closest color chip from the Munsell Soil Color Book.
Start at the 10YR page and go left for redder and right for yellower or grayer colors.
The color chips in the Munsell Book have central holes so that the soil can be directly compared through the hole to the chip of interest.
Take care to keep the color chips clean and dry. 5) Record color codes for the hue, value, and chroma matching the soil matrix color on Form S‐1:
NWCA Soil Profile Data (Front). Determining Color of Redoximorphic, Organic, or Mottle Features: 1) When redoximorphic or other features (See Reference Card S‐3 for examples) are present in
the horizon, determine the color for the most evident feature observed. 2) Select a representative, freshly broken surface of a soil ped that clearly illustrates the redox or
other feature of interest. 3) Focus on this feature and use Steps 2 through 4 (as described above for determining Soil
Matrix color) to match the feature color with the closest color chip from the Munsell Color Book. Record the color codes for the hue, value, and chroma matching in the appropriate fields on Form S‐1: NWCA Soil Profile Data (Front).
Refer to NWCA-Field Operations Manual (Chapter 6. Soils) for more detail on protocols summarized on this card.

Reference Card S-5, Side A. USDA Land Resource Regions (LRRs). Use this map to identify the LRR appropriate to the location of the AA being sampled. Use the list of Hydric Soil Indicators by Land Resource Regions on Side B of this Reference Card to identify the Hydric Soil Indicators pertinent to the AA. Refer to NWCA-Field Operations Manual (Chapter 6. Soils) and Field Indicators of Hydric Soils in the United States (USDA, NRCS 2010) for more detail.

Reference Card S-5, Side B. Hydric Soil Indicators by Land Resource Regions, Evaluating Hydric Soil Indicators
Refer to NWCA-Field Operations Manual (Chapter 6. Soils) and Field Indicators of Hydric Soils in the United States (USDA, NRCS 2010) for more detail.
Procedures for Evaluating Hydric Soil Indicators 1. Data describing Hydric Soil Indicators are recorded in the
Hydric Soil Indicators section of Form S-1 NWCA Soil Profile Data (Back).
2. Determine the USDA-NRCS Land Resource Region (LRR) in
which the AA being sampled is located by consulting the LRR map on the front of this card or in the Hydric Soils Indicators Manual. The hydric soil indicators that apply to each LRR are listed in the table to the left and included in parentheses next to the indicator names in the Hydric Soil Indicators section of Form S-1 NWCA Soil Profile Data (Back).
3. While examining the soil profile, use the Field Indicators of Hydric Soils in the United States (USDA, NRCS 2010) manual and the information on texture, color, redoximorphic features (which you previously recorded for each horizon on the front side of Form S-1) to determine whether the hydric indicators specific to the LRR where the AA is located are present.
4. Evaluate the profile for all regionally appropriate Hydric Soil
Indicators that fall into the soil texture groups A (All Soils), or F (Loamy/Clayey Soils), or S (Sandy Soils) pertinent to the soil profile under examination.
5. Record the presence of any of these hydric soils indicators in
the Hydric Soil Indicators section of Form S-1 NWCA Soil Profile Data (Back) by filling in the appropriate bubbles.
6. All hydric soil indicators that are observed are assumed to
occur in the soil profile location specified in the description of that indicator in Field Indicators of Hydric Soils in the United States (USDA, NRCS 2010). If something unusual is observed, note the soil horizon number and describe the anomaly in the Hydric Indicator Comments section of Form S-1 NWCA Soil Profile Data (Back).
Hydric Soil Indicators LRR
All Soils Sandy Soils Loamy/Clayey Soils
A A1,A2,A3,A4,A11, A12 S1, S4, S5, S6 F1, F2, F3, F6, F7, F8
B A1, A2, A3, A4, A11, A12 S1, S4, S5, S6 F1, F2, F3, F6, F7, F8, F9
C A1, A2, A3, A4, A5, A11, A12 S1, S4, S5, S6 F1, F2, F3, F6, F7, F8, F9
D A1, A2, A3, A4, A9, A11, A12 S1, S4, S5, S6 F1, F2, F3, F6, F7, F8, F9
E A1, A2, A3, A4, A11 , A12 S1, S4, S5, S6 F1, F2, F3, F6, F7, F8
F A1, A2, A3, A4, A5, A9, A11, A12
S1, S3, S4, S5, S6 F1, F2, F3, F6, F7, F8
G A1, A2, A3, A4, A9, A11, A12 S1, S2, S4, S5, S6 F1, F2, F3, F6, F7, F8
H A1, A2, A3, A4, A9, A11, A12 S1, S2, S4, S5, S6 F1, F2, F3, F6, F7, F8
I A1, A2, A3, A4, A11, A12 S1, S4, S5, S6 F1, F2, F3, F6, F7, F8
J A1, A2, A3, A4, A11, A12 S1, S4, S5, S6 F1, F2, F3, F6, F7, F8
K A1, A2, A3, A4, A5, A11, A12 S1, S4, S5, S6 F1, F2, F3, F6, F7, F8
L A1, A2, A3, A4, A5, A11, A12 S1, S4, S5, S6 F1, F2, F3, F6, F7, F8
M A1, A2, A3, A4, A5, A10, A11, A12
S1, S3, S4, S5, S6 F1, F2, F3, F6, F7, F8
N A1, A2, A3, A4, A5, A10, A11, A12
S1, S4, S5, S6, S7 F2, F3, F6, F7, F8, F12, F13
O A1, A2, A3, A4, A5, A11, A12 S1, S4, S5, S6 F1, F2, F3, F6, F7, F8, F12
P A1, A2, A3, A4, A5, A6, A7, A9, A11, A12
S4, S5, S6, S7 F2, F3, F6, F7, F8, F12, F13
R A1, A2, A3, A4, A5, A11, A12
S1, S3, S4, S5, S6, S7, S8, S9
F2, F3, F6, F7, F8
S A1, A2, A3, A4, A5, A11, A12
S1, S4, S5, S6, S7, S8, S9
F2, F3, F6, F7, F8, F19, F20
T A1, A2, A3, A4, A5, A6, A7, A9, A11, A12, A16
S4, S5, S6, S7, S8, S9 F2, F3, F6, F7, F8, F11, F12, F13, F17, F18, F20
U A1, A2, A3, A4, A5, A6, A7, A8, A11, A12
S4, S5, S6, S7, S8, S9 F2, F3, F6, F7, F8, F10, F13
*For descriptions of the Hydric Soil Indicators please see: Field Indicators of Hydric Soils in the United States. **LLRs for areas outside the conterminous United States have been omitted.

2011 NWCA Field Operations Manual Chapter 6. Soils
6.6 SOIL EQUIPMENT LIST, DATA FORMS, AND LABELS Equipment Checklist Forms Form S-1: NWCA Soil Profile Data (Front) Form S-1: NWCA Soil Profile Date (Back) Form T-4: NWCA Soil Sample Tracking Sample Tags and Labels Soil Isotope and Sediment Enzyme Sample Labels Soil Bulk Density or Chemistry Sample Tag Soil Bulk Density or Chemistry Sample Label
6-59

2011 NWCA Field Operations Manual Chapter 6. Soils
6-60

SOIL EQUIPMENT AND SUPPLY CHECKLIST Protocols, forms, checklists, supplies ___This equipment checklist ___References Cards S-1 through S-4 ___Data Forms on waterproof paper:
___Form S-1: NWCA Soil Profile Data (Four/site, but carry extras in case soil has many horizons) ___Form T-4: NWCA Bulk Density and Chemistry Soil Sample Tracking ___Form T-1: NWCA Site and Sample Status/WRS Tracking Form
___Site packet including a copy of the NRCS soils map and soil survey information for the site ___2 covered clipboards, with storage for completed forms for the AB Team ___Waterproof field notebook, pencils, mechanical pencils and lead, waterproof pens or marker ___Clear packing tape to place over labels (labels listed by sample type below) Field guides that must be carried in the field __ For color determinations: Munsell Color X-Rite. 2009. Munsell Soil Color Charts. Grand Rapids, MI. ___For Hydric Soil Indicator determinations: United States Department of Agriculture, Natural Resources
Conservation Service. 2010. Field Indicators of Hydric Soils in the United States, Version 7.0. L.M. Vasilas, G.W. Hurt, and C.V. Noble (eds.). USDA, NRCS, in cooperation with the National Technical Committee for Hydric Soils.
Supporting reference to keep in vehicle or carry in field ___Schoeneberger, P.J., D.A. Wysocki, E.C. Benham, and W.D. Broderson. 2002. Field Book for Describing and
Sampling Soils, Version 2.0. Natural Resources Conservation Service, National Soil Survey Center, Lincoln, Nebraska, USA.
Sampling supplies and tools (Note: other soil tools may be available to borrow from local soil scientist) ___Tote, pack, or field vest to carry tools and small equipment ___Excavating and profile description supplies (Note: Carry excavating tools pertinent to likely soil conditions)
___4 Pin flags labeled A, B, C, or D for marking soil pit locations ___Tiling or Sharpshooter style shovel ___Bucket auger with interchangeable extension handles and appropriate head(s) for anticipated soil conditions
(regular, mud, sand, dutch, etc). A ratchet handle crossbar may often be useful. ___King tube soil extractor for saturated/inundated conditions, particularly in sandy soils ___Root-pruners (or other cutting tools for roots) ___Metal flashing 12” tall for supporting/sealing earthen coffer dam built from Soil Pit spoils for inundated soils ___Small scoop for bailing water from pit ___Hand water pump ___Four, 6 mil thick, ~1.5m2 black plastic sheets for laying out soil slabs/cores at each Soil Pit ___Plastic or metal strips or golf tees for marking soil horizons ___Metric tape measure (e.g., a fiberglass seamstress’s measuring tape with lead weight (e.g., fishing weight)
attached to the bottom) ___Spray bottle with water for moistening soil as needed ___10X Hand lens ___Sharp knife shaving soil slices to expose fresh surface, for cutting out bulk density samples in difficult soils
(e.g., peat, or saturated soils extracted with the King tub extractor method). ___ Small flashlight for viewing in situ soil profile in Representative Soil Pit
___Isotope soil sample and sediment enzyme samples supplies ___Quart-size zipper plastic bag and gallon-sized zipper plastic bag ___Isotope Soil Sample Label ___Sediment Enzyme Sample Label ___Syringe corer (2 – one for use and one for back-up) ___Sealable plastic food storage container to store filled isotope soil and sediment enzyme sample bags ___Moderate sized ice chest to keep isotope and sediment enzyme samples cool (chlorophyll-a samples will
also be kept in ice chest) ___ Bulk density and chemistry soil sample supplies
___8ml thick plastic soil sample bags for bulk density and chemistry soil samples ___Bulk density and chemistry soil sample tags and labels to affix to sample bags ___Heavy-duty sample bag stapler ___Small can to serve as soil bulk density core extractor (recommend a can ~6.5cm diameter, 4.5cm deep,
e.g., small, sliced olive can) ___Tote, pack, and/or ice chest for storing and carrying soil samples


PM
MPU
Fe S MC U
MP D
NOB OF
MSB
C
PM
MPU
Fe S MC U
MP D
NOB OF
MSB
C
PM
MPU
Fe S MC U
MP D
NOB OF
MSB
C
PM
MPU
Fe S MC U
MP D
NOB OF
MSB
C
PM
MPU
Fe S MC U
MP D
NOB OF
MSB
C
PM
MPU
Fe S MC U
MP D
NOB OF
MSB
C
PM
MPU
Fe S MC U
MP D
NOB OF
MSB
C
PM
MPU
Fe S MC U
MP D
NOB OF
MSB
C
PM
MPU
Fe S MC U
MP D
NOB OF
MSB
C
Refer to Reference Cards S-1 through S-4 for summary of protocols for collecting data on this page.
Redoximorphic, Organic, or Mottle Features
% o
f H
oriz
on w
ith D
istin
ct
or P
rom
inen
t F
eatu
res
Flag codes: K = No measurement made, U = Suspect measurement, F1, F2, etc = misc. flags assigned by each field crew. Explain all flags in comment section on the back of this form.
CompositionFe = IronMn =ManganeseC = CarbonU = Unableto specify
Color of Most EvidentFeature
FORM S-1 : NWCA SOIL PROFILE DATA (Front)
01/21/2011NWCA Soil Profile Data (Front)
HorizonName-
(soilscientist
willcomplete)
Depth(cm) tolower
boundaryof
Horizon
Fill in if lower
boundaryis abrupt(< 2 cm)
Site ID: NWCA11- Date: 2 0 1 1/ /Soil Map Unit Symbol from Site Packet:
Soil Pit: A B C D
Near Veg Plot #:
SOIL PIT LOCATION
Standard location near SE corner of Veg Plot
Alternate Location
(from SE corner of Veg Plot)
SOIL PIT ATTRIBUTES
CATEGORICAL DATA CELLS:
Fill in this bubble to confirm that a filled bubble indicates presence (except for Absent in theRedox, Organic, or Mottle Features Section) and an empty bubble indicates absence.
COVER DATA CELLS:Fill in this bubble to confirm that empty Data Cells for % Surface Area Rock or Roots and %Horizon with Distinct or Prominent Features equal zero.
Fill in if this Soil Pit is the Representative Pit (up to125cm deep) and indicate in the
Sample ID, if Representative Pit:
- - - - - -N W C A 1 1
Lighting Conditions:
Bright
Overcast
Dappled
Shaded
cmTotal Pit Depth:
°Bearingm,Distance
IMPENETRABLE LAYER PRESENT
If present, indicate Type:
Clay Pan
cmDepth below Surface:
Cemented layer
Bedrock
Large boulder
Other
INITIAL READINGS
Hydrogen Sulfide odor (rotten eggs)
Inundated/saturated soil in pit:, If Present:
Color change after exposure to air
Initial Color:
Time of Pit Excavation
:
cmColor reading depth from surface:
San
dy
Loam
y/C
laye
y
Muc
ky M
iner
al
% R
ock
Fra
gmen
ts
>2m
m
% R
oots
Abs
ent
Hue Value Chroma
RedoxFeaturesS = Softmasses,N = nodules,concretions,P = porelinings, D =depletions
Mottles &Org. FeaturesM = mottlesMS = maskedsand grains,OB = organicbodies, OF =other organicfeatures
Flag
Feature Types(fill in all observed in horizon)
#
Horizons Soil Texture (fill one per horizon) Soil Matrix Color
(hh:mm)24 hr clock
OrganicP = Peat,M = Muck,MP = Mucky PeatU = Unspecified
Hue Value Chroma
1
2
3
4
5
6
7
8
9
cmFinal Pit Depth:
%Masked
SandGrains
Samples Collected column the bulk density (B) and Chemistry (C) samplescollected.
Sam
ples
Col
lect
edReviewed by (initial):
1968209140
DRAFT - NOT FOR U
SE IN FIE
LD

Hydric Soil Indicator Comments
NWCA Soil Profile Data (Back) 01/21/2011
FORM S-1 : NWCA SOIL PROFILE DATA (Back)Soil Pit: A B C D
Site ID: NWCA11- Date: 2 0 1 1/ /Hydric Soil Indicators (USDA Land Resource Region in the 48 conterminous US States (A to U) in which each indicator applies) - Refer to 1) Reference CardS-5 in the NWCA Field Operations Manual and 2) United States Department of Agriculture, National Resources Conservation Service. 2010 Field indicators of Hydric Soils in the UnitedStates, Version 7.0. L.M. Vasilas, G.W. Hurt, and C.V. Noble (eds.), USDA, NRCS, in cooperation with the National Technical Committee for Hydric Soils.
Soil Pit Water Depth (cm)
A1 - Histosol (A-U)
A2 - Histic Epipedon (A-U)
A3 - Black Histic (A-U)
A4 - Hydrogen Sulfide (A-U)
A5 - Stratified Layers (C, F, K-U)
A6 - Organic Bodies (P, T, U)
A7 - 5 cm Mucky Mineral (P, T, U)
A8 - Muck presence (U)
A9 - 1 cm Muck (D, F, G, H, P, T)
A11 - Depleted Below Dark Surface (A-U)
A12 - Thick Dark Surface (A-U)
A16 - Coast Prairie Redox (T)
A10 - 2 cm Muck (M, N)
Fill in all that apply:
- No Hydric Soil Indicator Observed
All Soils
F1 - Loamy Mucky Mineral (A-M, O)
F2 - Loamy Gleyed Matrix (A-U)
F3 - Depleted Matrix (A-U)
F6 - Redox Dark Surface (A-U)
F7 - Depleted Dark Surface (A-U)
F8 - Redox Depressions (A-U)
F9 - Vernal Pools (B-D)
F10 - Marl (U)
F11 - Depleted Ochric (T)
F12 - Iron-Manganese Mass (N-P, T)
F13 - Umbric Surface (N, P, T)
F16 - High Plains Depressions (H)
F17 - Delta Ochric (T)
F18 - Reduced Vertic (T)
F19- Piedmount Flood Plain Soils (S)
F20 - Anomalus Bright Loamy Soils (S, T)
Loamy/Clayey Soils
S1 - Sandy Mucky Mineral (A-O, R, S)
S2 - 2.5 cm Mucky Peat or Peat (G, H)
S4 - Sandy Gleyed Matrix (A-U)
S5 - Sandy Redox (A-U)
S6 - Stripped Matrix (A-U)
S7 - Dark Surface (N, P, R-U)
S8 - Polyvalue Below Surface (R-U)
S9 - Thin Dark Surface (R-U)
S3 - 5 cm Mucky Peat or Peat (F, M, R)
Sandy Soils
Flag Comment Flag Comment
Flag codes:K = No measurement made, U = Suspect measurement, F1, F2, etc = misc.flags assigned by each field crew. Explain all flags in comment section.
Saturation (depth from ground surface down tolevel of saturated soil, e.g. glistening, oozing pit wall)
Water level in pit (depth from ground surfacedown to water level)
Surface Water (depth of water above groundsurface)
Water Type cm Absent Flag
:(hh:mm) 24 hr clockTime of water level observation:
No Sample Collected
No Sample CollectedSediment Enzymes
Soil Isotope/Sediment Enzymes
Sample ID Comments Soil Isotope
Reviewed by (initial):
Sample ID Comments
6604003054
DRAFT - NOT FOR U
SE IN FIE
LD

SOIL ISOTOPE
NWCA11-7771 Visit#: 1
_____ /_____ /2011
999983
SEDIMENT ENZYMES
NWCA11-7771 Visit#: 1
_____ /_____ /2011
999985
Example Labels for Soil Isotope and Sediment Enzyme Samples


▼Use for Bulk Density Samples Horizons 1-7 ▼Use for Chemistry Soil Samples Horizons 1-7
NWCA 2011: Bulk Density or Chemistry Soil Sample TagNWCA11‐9999‐1‐11‐OR‐002‐001‐1
Date: ___/___/2011 Visit #: o1 o2 ‐ Chemistry/PSDA – Bulk Density Horizon #: 1 Horizon Location: ____cm to ____cm
NWCA 2011: Bulk Density or Chemistry Soil Sample TagNWCA11‐9999‐1‐11‐OR‐002‐001‐1
Date: ___/___/2011 Visit #: o1 o2 ‐ Chemistry/PSDA – Bulk Density Horizon #: 1 Horizon Location: ____cm to ____cm
NWCA 2011: Bulk Density or Chemistry Soil Sample TagNWCA11‐9999‐1‐11‐OR‐002‐001‐2
Date: ___/___/2011 Visit #: o1 o2 ‐ Chemistry/PSDA – Bulk Density Horizon #: 2 Horizon Location: ____cm to ____cm
NWCA 2011: Bulk Density or Chemistry Soil Sample TagNWCA11‐9999‐1‐11‐OR‐002‐001‐2
Date: ___/___/2011 Visit #: o1 o2 ‐ Chemistry/PSDA – Bulk Density Horizon #: 2 Horizon Location: ____cm to ____cm
NWCA 2011: Bulk Density or Chemistry Soil Sample TagNWCA11‐9999‐1‐11‐OR‐002‐001‐3
Date: ___/___/2011 Visit #: o1 o2 ‐ Chemistry/PSDA – Bulk Density Horizon #: 3 Horizon Location: ____cm to ____cm
NWCA 2011: Bulk Density or Chemistry Soil Sample TagNWCA11‐9999‐1‐11‐OR‐002‐001‐3
Date: ___/___/2011 Visit #: o1 o2 ‐ Chemistry/PSDA – Bulk Density Horizon #: 3 Horizon Location: ____cm to ____cm
NWCA 2011: Bulk Density or Chemistry Soil Sample TagNWCA11‐9999‐1‐11‐OR‐002‐001‐4
Date: ___/___/2011 Visit #: o1 o2 ‐ Chemistry/PSDA – Bulk Density Horizon #: 4 Horizon Location: ____cm to ____cm
NWCA 2011: Bulk Density or Chemistry Soil Sample TagNWCA11‐9999‐1‐11‐OR‐002‐001‐4
Date: ___/___/2011 Visit #: o1 o2 ‐ Chemistry/PSDA – Bulk Density Horizon #: 4 Horizon Location: ____cm to ____cm
NWCA 2011: Bulk Density or Chemistry Soil Sample TagNWCA11‐9999‐1‐11‐OR‐002‐001‐5
Date: ___/___/2011 Visit #: o1 o2 ‐ Chemistry/PSDA – Bulk Density Horizon #: 5 Horizon Location: ____cm to ____cm
NWCA 2011: Bulk Density or Chemistry Soil Sample TagNWCA11‐9999‐1‐11‐OR‐002‐001‐5
Date: ___/___/2011 Visit #: o1 o2 ‐ Chemistry/PSDA – Bulk Density Horizon #: 5 Horizon Location: ____cm to ____cm
NWCA 2011: Bulk Density or Chemistry Soil Sample TagNWCA11‐9999‐1‐11‐OR‐002‐001‐6
Date: ___/___/2011 Visit #: o1 o2 ‐ Chemistry/PSDA – Bulk Density Horizon #: 6 Horizon Location: ____cm to ____cm
NWCA 2011: Bulk Density or Chemistry Soil Sample TagNWCA11‐9999‐1‐11‐OR‐002‐001‐6
Date: ___/___/2011 Visit #: o1 o2 ‐ Chemistry/PSDA – Bulk Density Horizon #: 6 Horizon Location: ____cm to ____cm
NWCA 2011: Bulk Density or Chemistry Soil Sample TagNWCA11‐9999‐1‐11‐OR‐002‐001‐7
Date: ___/___/2011 Visit #: o1 o2 ‐ Chemistry/PSDA – Bulk Density Horizon #: 7 Horizon Location: ____cm to ____cm
NWCA 2011: Bulk Density or Chemistry Soil Sample TagNWCA11‐9999‐1‐11‐OR‐002‐001‐7
Date: ___/___/2011 Visit #: o1 o2 ‐ Chemistry/PSDA – Bulk Density Horizon #: 7 Horizon Location: ____cm to ____cm
tmagee
Text Box
Example of Bulk Density or Chemistry Sample Adhesive Tags


NWCA 2011: Bulk Density or Chemistry Soil Sample Label
Stap
le under sample bag fold
Sample Type: Chemistry/PSDA Bulk Density
Sample ID: NWCA11‐9999‐1‐11‐OR‐002‐001‐1 Date: ___/___/2011 Visit #: 1 2
Horizon #: 1 Horizon Location: ____cm to ____cm
For Bulk Density Samples Only: Indicate cores or blocks collected by filling in appropriate bubble. Record volume information in one of the following ways: 1) The volume as cubic centimeters, 2) the diameter and length of cylindrical core, or 3) the dimensions of a block.
Core or Block 1: Core or Block 2: Core or Block 3:
_____ Volume (cm³) _____ Volume (cm³) _____ Volume (cm³)
Cylindrical
____ Diameter (cm) ____ Length (cm)
____ Diameter (cm) ____ Length (cm)
____ Diameter (cm) ____ Length (cm)
Block
____ Width (cm)
____ Length (cm)
____ Depth (cm)
____ Width (cm)
____ Length (cm)
____ Depth (cm)
____ Width (cm)
____ Length (cm)
____ Depth (cm)
Comments:
For Chemistry Samples Only: Rocks in the soil should be retained in the sample; however, if they must be removed, record the estimated volume of the sample they comprised. _______ % Sample Volume Comprised by Removed Rock
NWCA 2011: Bulk Density or Chemistry Soil Sample Label
Stap
le under sample bag fold
Sample Type: Chemistry/PSDA Bulk Density
Sample ID: NWCA11‐9999‐1‐11‐OR‐002‐001‐1 Date: ___/___/2011 Visit #: 1 2
Horizon #: 1 Horizon Location: ____cm to ____cm
For Bulk Density Samples Only: Indicate cores or blocks collected by filling in appropriate bubble. Record volume information in one of the following ways: 1) The volume as cubic centimeters, 2) the diameter and length of cylindrical core, or 3) the dimensions of a block.
Core or Block 1: Core or Block 2: Core or Block 3:
_____ Volume (cm³) _____ Volume (cm³) _____ Volume (cm³)
Cylindrical
____ Diameter (cm) ____ Length (cm)
____ Diameter (cm) ____ Length (cm)
____ Diameter (cm) ____ Length (cm)
Block
____ Width (cm) ____ Length (cm) ____ Depth (cm)
____ Width (cm) ____ Length (cm) ____ Depth (cm)
____ Width (cm) ____ Length (cm) ____ Depth (cm)
Comments:
For Chemistry Samples Only: Rocks in the soil should be retained in the sample; however, if they must be removed, record the estimated volume of the sample they comprised. _______ % Sample Volume Comprised by Removed Rock


2011 Collection Sample ID Date (MM/DD) Comments
- - - - - - -N W C A 1 1 /- - - - - - -N W C A 1 1 /- - - - - - -N W C A 1 1 /- - - - - - -N W C A 1 1 /- - - - - - -N W C A 1 1 /- - - - - - -N W C A 1 1 /- - - - - - -N W C A 1 1 /- - - - - - -N W C A 1 1 /- - - - - - -N W C A 1 1 /- - - - - - -N W C A 1 1 /- - - - - - -N W C A 1 1 /- - - - - - -N W C A 1 1 /- - - - - - -N W C A 1 1 /- - - - - - -N W C A 1 1 /- - - - - - -N W C A 1 1 /- - - - - - -N W C A 1 1 /- - - - - - -N W C A 1 1 /- - - - - - -N W C A 1 1 /- - - - - - -N W C A 1 1 /- - - - - - -N W C A 1 1 /- - - - - - -N W C A 1 1 /- - - - - - -N W C A 1 1 /- - - - - - -N W C A 1 1 /
FORM T-4: NWCA Soil Chemistry and Bulk Density Sample Tracking
01/21/2011NWCA Tracking - Soil Chemistry and Bulk Density Sample
Sent By: Sender Phone: State Where Sites are Located:
Shipped Using: FedEx Other:
Airbill/Tracking Number: Date Shipped: 2 0 1 1/ /
Sample Tracking Contact Info:FAX: 541-754-4637 VOICE MESSAGE CENTER: 541-754-4663 EMAIL: [email protected]
Marlys Cappaert ph: 541-754-4467
NRCS LAB INFO Tracking Assistance:Natural Resources Conservation ServiceRm 152, Federal Building100 Centennial Mall NorthLincoln, NE 68508-3866
Michelle Gover ph: 541-754-4793
Reviewed by (initial):
2936162256
DRAFT - NOT FOR U
SE IN FIE
LD


2011 NWCA Field Operations Manual Chapter 7. Hydrology
7-1
CHAPTER 7. HYDROLOGY Introduction. . . . . . . . . . . . . . . . . . . . . . . . . . . . . . . . . . . . . . . . . . . . . . . . . . . . . . . . . 7.1 SAMPLING PROCEDURES . . . . . . . . . . . . . . . . . . . . . . . . . . . . . . . . . . . . . . . . 7.1.1 Water Sources. . . . . . . . . . . . . . . . . . . . . . . . . . . . . . . . . . . . . . . . . . . . . 7.1.2 Hydrology Stressors Within the AA. . . . . . . . . . . . . . . . . . . . . . . . . . . . . . 7.1.3 Ditch Depth Within the AA . . . . . . . . . . . . . . . . . . . . . . . . . . . . . . . . . . . . 7.1.4 U.S. Army Corps of Engineers Indicators of Hydrology. . . . . . . . . . . . . 7.2 SAMPLE AND DATA HANDLING. . . . . . . . . . . . . . . . . . . . . . . . . . . . . . . . . . . . 7.3 LITERATURE CITED . . . . . . . . . . . . . . . . . . . . . . . . . . . . . . . . . . . . . . . . . . . . . 7.4 REFERENCE CARD. . . . . . . . . . . . . . . . . . . . . . . . . . . . . . . . . . . . . . . . . . . . . Reference Card H-1: NWCA Assessment Area Hydrology (Side A) Reference Card H-1: NWCA Assessment Area Hydrology (Side B) 7.5 EQUIPMENT LIST AND DATA FORMS. . . . . . . . . . . . . . . . . . . . . . . . . . . . . . . Hydrology Equipment Checklist Form H-1: NWCA Assessment Area Hydrology (Front) Form H-1: NWCA Assessment Area Hydrology (Back)
7-37-37-47-47-57-67-67-77-9
7-13

2011 NWCA Field Operations Manual Chapter 7. Hydrology
7-2

2011 NWCA Field Operations Manual Chapter 7. Hydrology
7-3
CHAPTER 7. HYDROLOGY Hydrology is the major defining characteristic of wetland ecosystems; affecting both soil development and vegetation composition, which in turn reflect ecological condition (Mitsch and Gosselink 2007). The following protocol is designed to characterize the hydrologic characteristics of the site being assessed. The types of data to be collected are:
Identification of Water Sources Hydrology Indicators Hydrology Stressors, including measurements of ditches.
For detailed information on the rationale for the hydrology indicator, see "Ecological Indicators for the 2011 National Wetland Condition Assessment" (in prep.). This chapter provides the details necessary to collect hydrology data by the Assessment Area and Buffer (AB) Team within the Assessment Area (AA). Prior to departure for the site the AB Team will review pertinent hydrology information concerning the site and ready the forms and equipment (See Section 7.5) needed for hydrology sampling. In locations under the influence of tides, stage of tide may affect access to the site and may make portions of the AA unsampleable or unsafe, particularly if the area is inundated by surface water 1m or more in depth. Refer to local tide tables and plan the visit so that maximum time is available to sample the site. Collecting hydrologic data for the NWCA involves a number of tasks. These include: recording the weather on the day of sampling and for the previous week; documentation and ranking of hydrologic characteristics including surface water connectivity to the buffer; estimates of hydrologic fluctuations based on evidence of seasonal water levels, and documentation and ranking of hydrologic alterations or stressors. Additionally, indicators of hydrology including observation of current or recently saturated soils, and evidence of recent inundation will also be assessed and recorded. To avoid impairing data collection for the Vegetation Indicator (Chapter 5), AB Team members will avoid stepping into areas that might be delineated as Vegetation Plots, by waiting until the Plots are marked before entering the AA. Assessment of hydrologic features occurring in Vegetation Plots must be done from plot peripheries to avoid trampling vegetation in the plots. The AB Team will survey the entire AA, as it fits into the overall survey schedule of the day’s activities to identify, rank, and record Hydrology Indicator data. Hydrologic indicators and stressors in the buffer zone surrounding the AA will be evaluated using the buffer protocol (Chapter 4). Additional hydrologic information will be collected as part of the soil (Chapter 6) and water quality (Chapter 8) protocols. 7.1 SAMPLING PROCEDURES Protocols for the NWCA hydrology sampling are: 1) Identification and Ranking of Water Sources 2) Identification and Ranking of Hydrology Stressors 3) Ditch Measurements 4) Identification of Indicators of Hydrology.

2011 NWCA Field Operations Manual Chapter 7. Hydrology
7-4
Fill out the header information for Form H-1. Note the start time for collecting hydrology data in the Time of Sampling field using a 24-h clock. In the appropriate field, describe the weather for the day of sampling and the previous week, and indicate stage of tide, if applicable. Fill in the bubble at the beginning of each section to confirm that items not completed were absent rather than overlooked. 7.1.1 Water Sources Water sources and outflows provide an indication of the seasonality and hydrograph of the wetland. Sources of water input may include surface water (e.g., direct rainfall, stream inlets, sheet flow, flooding) and groundwater. In estuarine environments, tidal surge or tidal channels may be a significant source of water inundation within the AA. Particularly in urban settings, surface water may originate from anthropogenic sources including pipes and ditches. 1) Walk the entire AA as necessary to identify the presence or suspected presence of various
water sources influencing site hydrology including inlets and outlets.
Use the aerial photos and topographic maps in the Site Packet to help identify potential inlets to investigate at ground level, especially for heavily vegetated sites.
2) Record each type of water source found within the AA as Present in the Water Sources - Natural section of Form H-1. If the water source is not listed, record the related data in the Other field and describe the source using a flagged comment.
Sources may include natural inlet streams/springs, tidal channels, ocean, lake,
groundwater, precipitation and surface water runoff. Some source indicators may require interpretation. Provide a best informed
decision for your determination. Flag any decisions that require clarification to inform data interpretation.
3) Consider all natural types of water sources found, and rank the three most important.
Give each a score from 1 to 3 with a value of 1 to the most important, ecosystem driving or influential type.
7.1.2 Hydrology Stressors Within the AA Wetland hydrologic alterations include a number of human influenced changes in hydrologic complexity, duration and magnitude that will be recorded on Form H-1. The Buffer Protocol (Chapter 4) will document stressors found in the buffer zone adjacent to the AA that are influencing the hydrology of the AA. 1) Identify the presence of anthropogenic hydrology stressors within the AA in the Hydrologic
Stressors section of Form H-1. The following list identifies a number of possible hydrologic disrupters that may be observed:
a) Damming Features – Dikes/Berms/ Dams/ RR Beds/Roads- Record the presence of
these flow impeding structures within the AA. Such structures may elevate or lower the natural water table of the AA.

2011 NWCA Field Operations Manual Chapter 7. Hydrology
7-5
b) Shallow channels – Record the presence of shallow channels (e.g., animal trampling,
vehicle ruts) within the AA.
c) Impervious surfaces – Record the presence of any impervious surfaces found present within the AA. These surfaces (e.g., compacted soil roads, asphalt, concrete) hinder or block infiltration of water, thus changing the local water table level.
d) Recent sedimentation – Note and record if the AA is receiving freshly deposited
sediment. Recently deposited sediment may be different in color (often lighter) than sediment deposited in the past, be a different particle size than the wetland substrate, and lack algae or vegetation growing on the deposit.
e) Pumps – Record the presence of any pumps within the AA used to divert water away
from or into the wetland. Many types of pumps may be used for purposes including crop irrigation or household water supply.
f) Field tiling – If agricultural field tiling is apparent within the AA, mark present.
g) Excavation/Dredging – Record the presence of any dredging or other excavation activity
noted in the AA. h) Pipes – Record the presence of pipes that act to direct water into or out of the AA. i) Culverts – Record the presence of culverts that act to direct water into or out of the AA.
j) Other – Record presence of other hydrology stressors identified. Describe the stressor
in a flagged comment.
2) Review the stressors identified in the AA and rank the top three most influential hydrologic stressors (1-3, with 1 being most stress) to complete the Hydrology Stressors section of Form H-1.
7.1.3 Ditch Depth Within the AA Ditches facilitate the movement of water from one location to another and generally lower the local groundwater table. However, depending upon topography, ditches may expedite the draining of a wetland or its flooding (by bringing in water that raises the water table). 1) Search for ditches within the AA.
a) If one ditch is present, proceed to Step 2. b) If more than one ditch is present, identify the deepest ditch and proceed with
Step 2. c) If there are no ditches in the AA, fill in the No Ditch Present bubble on Form H-1.

2011 NWCA Field Operations Manual Chapter 7. Hydrology
7-6
2) Measure the depth of the deepest ditch in three locations within the AA using a surveyor’s rod (also known as a stadia rod) and a ski pole or other graduated rod marked in centimeters following the steps below.
a) One AB team member places the surveyor’s rod across the ditch. For wider
ditches, the rod may need to be held to keep it horizontal without bowing from its own weight.
b) The second AB team member holds a ski pole or other rod with graduations
marked in centimeters vertically from the bottom of the ditch up to the surveyor’s rod.
The intersection of the bottom of the horizontal surveyor’s rod on the vertical rod is the depth of ditch.
c) Record Depth 1 in centimeters on Form H-1. d) Take two more measurements of ditch depth spaced fairly evenly within the AA.
e) Record Depth 2 and 3 on Form H-1.
f) Mark the depth measurement locations on the aerial photo from the Site Packet
and/or the sketch map on the back of Form AA-1 that is being used to document the layout of the AA (Chapter 3).
7.1.4 U.S. Army Corps of Engineers Indicators of Hydrology Indicators of hydrology may take many forms. The AB team should carefully look around the entire AA to note the presence of indicators and record their presence on the back of Form H-1. Reference card H-1 has pictures and/or descriptions of some U.S. Army Corps indicators (USACOE 2009) to help with identification. 1) Record the presence of surface water, saturated soils and other site condition evidence
that suggests the presence of various wetland characteristics by filling in all applicable bubbles.
2) Record any evidence of recent inundation. Mark the bubbles for various residual marks
from water (stains, drift lines or deposits, mineral deposits, etc,) and sediment (deposits, drainage patterns, crusts, etc.) and plant and animal presence or indicators.
3) Note any evidence of current or recent soil saturation. Mark bubbles for evidence
including olfactory as well as visual indicators. 4) For all indicators, if further explanation is required, use a flagged comment to elaborate. 7.2 SAMPLE AND DATA HANDLING
There are no physical samples to process and track for the Hydrology Indicator. All data is recorded on Form H-1. See Chapter 2 for data form and records management protocols.

2011 NWCA Field Operations Manual Chapter 7. Hydrology
7-7
7.3 LITERATURE CITED Mitsch, W.J. and J.G. Gosselink. 2007. Wetlands, 4th ed., John Wiley & Sons, Inc., New York, NY. 582 pp. USACOE (U.S. Army Corps of Engineers). 2009. Regional Supplements to Corps Delineation Manual. Website: http://www.usace.army.mil/cecw/pages/reg_supp.aspx. USEPA (U.S. Environmental Protection Agency). In Preparation. Ecological Indicators for the 2011 National Wetland Condition Assessment. EPA-XXX-YY-0000. U.S. Environmental Protection Agency, Washington, DC.

2011 NWCA Field Operations Manual Chapter 7. Hydrology
7-8

2011 NWCA Field Operations Manual Chapter 7. Hydrology
7-9
REFERENCE CARD Reference Card H-1: NWCA Assessment Area Hydrology

2011 NWCA Field Operations Manual Chapter 7. Hydrology
7-10

Reference Card H‐1: NWCA ASSESSMENT AREA HYDROLOGY (Side A)U.S. ARMY CORPS OF ENGINEERS HYDROLOGY INDICATORS***
Sediment deposits
Evidence of Recent Inundation
Water marks ‐ Discolorations or stains on the bark of woody vegetation, rocks, bridge supports, buildings, fences, or other fixed objects as a result of inundationSediment deposits (A) ‐ Thin layers or coatings of fine‐grained mineral material (e.g., silt or clay) or organic matter (e.g., pollen), sometimes mixed with other detritus, remaining on tree bark, plant stems or leaves, rocks, and other objects after surface water recedes
A BAlgal mat
plant stems or leaves, rocks, and other objects after surface water recedesDrift deposits ‐ Rafted debris that has been deposited on the ground surface or entangled in vegetation or other fixed objects. Debris consists of remnants of vegetation (e.g., branches, stems, and leaves), manmade litter, or other waterborne materials Algal mat or crust (A) ‐ A mat or dried crust of algae, perhaps mixed with other detritus, left on or near the soil surface after dewateringIron deposits (B) ‐ Thin orange or yellow crust or gel of oxidized iron on the soil surface or on objects near the surfacejSurface soil cracks (C) ‐ Shallow cracks that form when fine‐grained mineral or organic sediments dry and shrink, often creating a network of cracks or small polygonsWater‐stained leaves (D) ‐ Water‐stained leaves are fallen or recumbent dead leaves that have turned grayish or blackish in color due to inundation for long periodsDrainage Patterns ‐ Consists of flow patterns visible on the soil surface or eroded into the soil, low vegetation bent over in the direction of flow, absence of leaf litter or small woody debris due to flowing water, and similar evidence that water flowed across the ground surface
C D
Salt crust (E) ‐ Hard or brittle deposits of salts formed on the ground surface due to theevaporation of saline surface waterAquatic invertebrate ‐ Presence of live individuals, diapausing insect eggs or crustacean cysts, or dead remains of aquatic fauna, such as, but not limited to, sponges, bivalves, aquatic snails, aquatic insects, ostracods, shrimp, other crustaceans, tadpoles, or fish, either on the soil surface or clinging to plants or other emergent objectsBiotic crust (F) ‐ Ponding‐remnant biological crusts, benthic micro‐flora, and the dried remains of
FE
free‐floating algae left on or near the soil surface after dewateringSparsely vegetated concave surface ‐ Concave surfaces should contrast with vegetated slopes and convex surfaces in the same areaMarl deposits (G) ‐ Crumbly mixture of clays, calcium and magnesium carbonates, on the soil surfaceMoss trim lines (H)‐ Presence of lines of moss on trees (note arrow) or other upright objects in seasonally inundated areas G
HG
***U. S. Army Corps of Engineers. 2009. Regional Supplements to Corps Delineation Manual. Website: http://www.usace.army.mil/cecw/pages/reg_supp.aspx
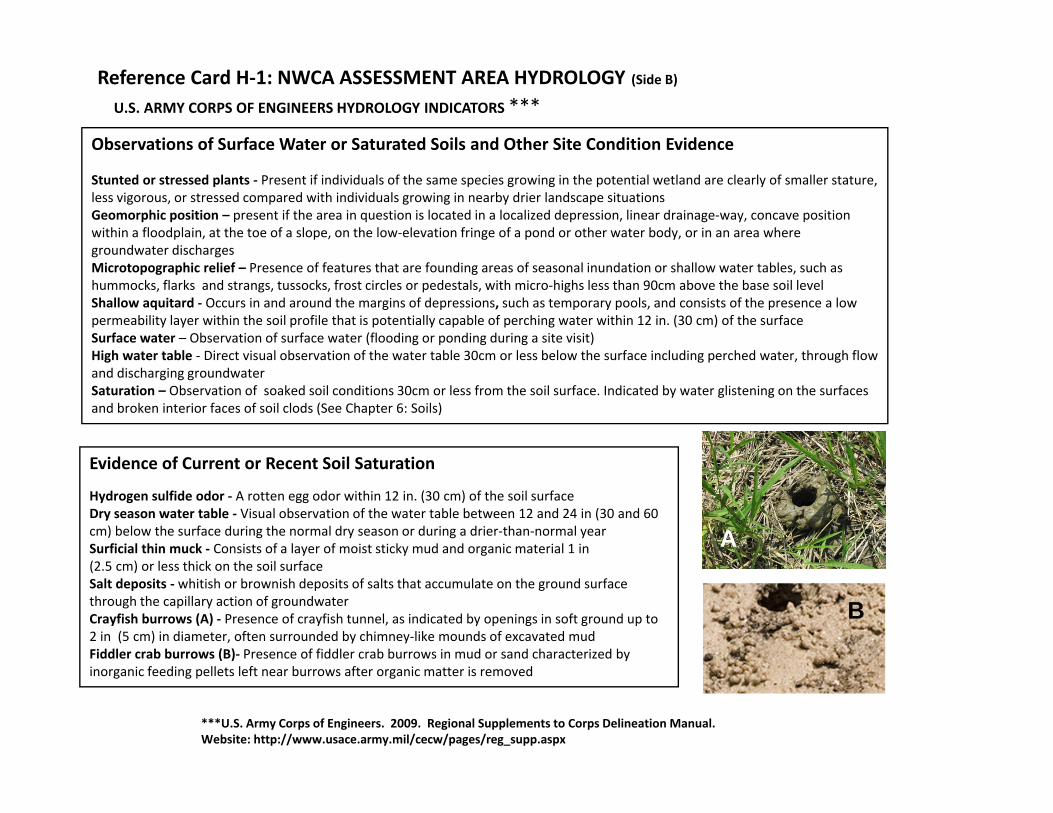
Reference Card H‐1: NWCA ASSESSMENT AREA HYDROLOGY (Side B)
U.S. ARMY CORPS OF ENGINEERS HYDROLOGY INDICATORS ***
Observations of Surface Water or Saturated Soils and Other Site Condition Evidence
Stunted or stressed plants ‐ Present if individuals of the same species growing in the potential wetland are clearly of smaller stature, less vigorous, or stressed compared with individuals growing in nearby drier landscape situationsGeomorphic position – present if the area in question is located in a localized depression, linear drainage‐way, concave position within a floodplain, at the toe of a slope, on the low‐elevation fringe of a pond or other water body, or in an area where groundwater dischargesgroundwater dischargesMicrotopographic relief – Presence of features that are founding areas of seasonal inundation or shallow water tables, such as hummocks, flarks and strangs, tussocks, frost circles or pedestals, with micro‐highs less than 90cm above the base soil levelShallow aquitard ‐ Occurs in and around the margins of depressions, such as temporary pools, and consists of the presence a low permeability layer within the soil profile that is potentially capable of perching water within 12 in. (30 cm) of the surfaceSurface water – Observation of surface water (flooding or ponding during a site visit)High water table Direct visual observation of the water table 30cm or less below the surface including perched water through flow
E id f C R S il S i
High water table ‐ Direct visual observation of the water table 30cm or less below the surface including perched water, through flow and discharging groundwaterSaturation – Observation of soaked soil conditions 30cm or less from the soil surface. Indicated by water glistening on the surfaces and broken interior faces of soil clods (See Chapter 6: Soils)
Evidence of Current or Recent Soil Saturation
Hydrogen sulfide odor ‐ A rotten egg odor within 12 in. (30 cm) of the soil surfaceDry season water table ‐ Visual observation of the water table between 12 and 24 in (30 and 60 cm) below the surface during the normal dry season or during a drier‐than‐normal yearSurficial thin muck ‐ Consists of a layer of moist sticky mud and organic material 1 in A(2.5 cm) or less thick on the soil surfaceSalt deposits ‐ whitish or brownish deposits of salts that accumulate on the ground surface through the capillary action of groundwaterCrayfish burrows (A) ‐ Presence of crayfish tunnel, as indicated by openings in soft ground up to 2 in (5 cm) in diameter, often surrounded by chimney‐like mounds of excavated mud Fiddler crab burrows (B)‐ Presence of fiddler crab burrows in mud or sand characterized by
B
***U.S. Army Corps of Engineers. 2009. Regional Supplements to Corps Delineation Manual. Website: http://www.usace.army.mil/cecw/pages/reg_supp.aspx
inorganic feeding pellets left near burrows after organic matter is removed

2011 NWCA Field Operations Manual Chapter 7. Hydrology
7-13
7.5 EQUIPMENT LIST AND DATA FORM

2011 NWCA Field Operations Manual Chapter 7. Hydrology
7-14

HYDROLOGY EQUIPMENT CHECKLIST
___ Data Form and Reference Card ___ Pencils ___Telescoping surveyor’s rod (also known as a stadia rod) (need one to measure ditch depth) ___Ski pole or rod marked in 1cm and 10cm gradations


Water Sources - Natural
1 2 3
1 2 3
1 2 3
1 2 3
1 2 3
1 2 3
Identify and Rank Water Sources / Stressors:Rank the top 3 Water Sources (1 = most influential). Rank the top 3 Stressors (1 = most stress) by perceived influence on the
Site/Assessment Area Hydrology.
NWCA Assessment Area Hydrology 01/21/2011
Date: 2 0 1 1
FORM H-1: NWCA ASSESSMENT AREA HYDROLOGY (Front)
Site ID: NWCA11-
Weather description: Day of sampling:
Tidal Stage: NA Incoming Outgoing Slack Flood
/ /
Week prior to sampling:
Time of Sampling (hh:mm): :
Rank Top 3 Sources Present from 1-3 Flag
1 2 3
1 2 3
1 2 3
1 2 3
1 2 3
Rank Top 3 Sources Present from 1-3 Flag
1 2 3
1 2 3
1 2 3
1 2 3
1 2 3
Stream Inflow (creeks, rivers)
Outflow
Lake
Springs (seeps)
Groundwater
Precipitation (rain, snow)
Snow Melt
Overbank Flooding
Estuary Tidal Channel
Tidal Surge
Other (describe with flag)
Rank Top 3 Present Stressors from 1-3 Flag
Rank Top 3 Present Stressors from 1-3 Flag
Hydrologic Stressors
Damming Features
Dikes
Berms
Dams
Railroad Bed
Roads
1 2 3
1 2 3
1 2 3
1 2 3
1 2 3
1 2 3
Shallow Channels
Animal Trampling
Vehicle Ruts
Impervious Surfaces
Roads
Concrete
Asphalt
1 2 3
1 2 3
1 2 3
1 2 3
1 2 3
Pumps
Irrigation
Water Supply
Other
Excavation / Dredging
Pipes
1 2 3
1 2 3
Sewer Outfall
Standpipe outflow
Culverts
Corrugated Pipe
Box
1 2 3
1 2 3
Ditches
Inflowing
Outflowing
Other (describe with flag)
No Ditch Present Depth 1 = Depth 2 = Depth 3 =
Flag Comments
Flag codes: K = No measurement made, U = Suspect measurement, F1,F2, etc. = misc. flags assigned by each field crew.Explain all flags in comment section.
Depth of Deepest Ditch:Measure cross sectional depth in 3 places if a ditch is present in the AA
(cm) (cm) (cm)
Flag
Recent Sedimentation
Fill in this bubble to confirm that all water sources were considered, but only those present were marked.
Fill in this bubble to confirm that all hydrologic stressors were considered, but only those present were marked.
Field Tiling
1 2 3
1 2 3
1 2 3
Reviewed by (initial):
24 hr clock
9911639020
DRAFT - NOT FOR U
SE IN FIE
LD

FORM H-1: NWCA ASSESSMENT AREA HYDROLOGY (Back)
Site ID: NWCA11- /Date: 2 0 1 1/
Observation of Surface Water or Saturated Soils and other Site Condition Evidence
Stunted or Stressed Plants
Surface Water High Water Table
Geomorphic Position
USACOE - Hydrology Indicators Fill in bubbles for all applicable indicators.(Reference Card H-1 provides details about each indicator. Not all indicators will be found in every wetland).
Soil Saturation
Microtopographic Relief
Iron Deposits
Sediment Deposits
Drainage Patterns
Aquatic Invertebrate
Water-stained Leaves
Algal Mat or Crust
Evidence of Recent Inundation
Water Marks
01/21/2011NWCA Assessment Area Hydrology
Evidence of Current or Recent Soil Saturation
Hydrogen Sulfide Odor
Marl Deposits
Surface Soil Cracks
Drift DepositsSparsely VegetatedConcave Surfaces
Moss Trim Lines
Biotic Crust
Salt Crust
Dry Season Water Table
Crayfish Burrows Surficial Thin Muck
Salt Deposits
Fiddler Crab Burrows
Flag Comments
FLAG
FLAG
FLAG
Flag codes: K = No measurement made, U = Suspect measurement, F1,F2, etc. = misc. flags assigned by each field crew. Explain all flags in comment section.
Shallow Aquitard
Reviewed by (initial):
6783639024
DRAFT - NOT FOR U
SE IN FIE
LD
2011 NWCA Field Operations Manual Chapter 8: Water Quality
8 - 1
CHAPTER 8. WATER QUALITY
Introduction. . . . . . . . . . . . . . . . . . . . . . . . . . . . . . . . . . . . . . . . . . . . . . . . . . . . . . . . . 8.1 SAMPLING PROCEDURES. . . . . . . . . . . . . . . . . . . . . . . . . . . . . . . . . . . . . . . . 8.1.1 Determination of Sampleable Water and Location of Sample. . . . . . . . . 8.1.2 Characterization of the AA Surface Water Body. .. . . . . . . . . . . . . . . . . . 8.1.3 Collection of Water Chemistry Sample . . . . . . . . . . . . . . . . . .. . . . . . . . . 8.1.4 Optional Protocol – Data Collection with a Hydrolab or YSI Handheld Multi-probe Meter . . . . . . . . . . . . . . . . . . . . . . . . . . . . . . 8.1.5 After Sampling Clean-up. . . . . . . . . . . . . . . . . . . . . . . . . . . . . . . . . . . . . . 8.1.6 Determination of Maximum Surface Water Depth . . . . . . . . . . . . . . . . . . 8.1.7 Determination of Percent of AA Covered by Surface Water. . . . . . . . . . . 8.2 SAMPLE AND DATA HANDLING. . . . . . . . . . . . . . . . . . . . . . . . . . . . . . . . . . . . 8.2.1 At the Site . . . . . . . . . . . . . . .. . . . . . . . . . . . . . . . . . . . . . . . . . . . . . . . . . 8.2.2 At Field Lodging or Office. . . . . . . . . . . . . . . . . . . . . . . . . . . . . . . . . . . . . 8.2.3 Data Handling . . . . . . . . . . . . . . . . . . . . . . . . . . . . . . . . . . . . . . . . . . . . . 8.3 LITERATURE CITED . . . . . . . . . . . . . . . . . . . . . . . . . . . . . . . . . . . . . . . . . . . . . 8.4 EQUIPMENT LIST, DATA FORM, AND LABELS. . . . . . . . . . . . . . . . . . . . . . . Water Quality Equipment Checklist Form WQ-1: NWCA Assessment Area Water Quality Sample Labels
8-38-38-38-48-4
8-88-88-88-98-98-98-9
8-108-108-11

2011 NWCA Field Operations Manual Chapter 8: Water Quality
8 - 2

2011 NWCA Field Operations Manual Chapter 8: Water Quality
8 - 3
CHAPTER 8. WATER QUALITY This chapter describes the procedures and methods for the field collection and analysis of the NWCA water quality indicators. The types of data to be collected as part of the water quality protocol are:
Characteristics of the Surface Water Body Water Sample for Chemical Analysis Maximum Depth Surface Water Extent Field Probe Readings (Optional)
For detailed information on the rationale for the use of the water quality indicator, see "Ecological Indicators for the 2011 National Wetland Condition Assessment" (in prep.). Prior to arrival on the site, the Assessment Area and Buffer (AB) Team should review the summary of activities from this chapter and have the forms and equipment needed for water quality sampling. The Team should also review information about the site that might influence implementation of the protocol. This is particularly important for planning the timing of access and to maximize time for sampling in tidally-influenced areas. Tides may make portions of the AA unsampleable or unsafe if the area is inundated by surface water 1m or more in depth at some time during the tidal cycle on the day of sampling. 8.1 SAMPLING PROCEDURES After delineation of the Assessment Area (AA) by the Vegetation (Veg) Team, the AB Team will determine if surface water meeting the collection criteria (see Section 8.1.1) is present within the AA. If necessary, the AB team should coordinate with the Veg Team to confirm that the water sampling location is not in a Veg Plot. If sampleable water is found only within a Veg Plot, then consult with the Botanist/Ecologist to determine the best strategy for sampling to avoid compromising data for either indicator. If the site is tidal be sure to take stage of tide into consideration in the timing of the sampling. The AB team should complete the water quality sampling prior to collecting data for other indicators to avoid degrading the water while completing other sampling tasks. Use flagging if necessary to keep Crew members clear of the water sampling location until the water can be sampled. 8.1.1 Determination of Sampleable Water and Location of Sample Water in wetlands may be ponded or flowing. In either case, the sample must be collected from an area that meets all of the following criteria:
sufficient depth (i.e., 2x height of collecting dipper or ~15cm); within the AA and as close to the POINT as possible;
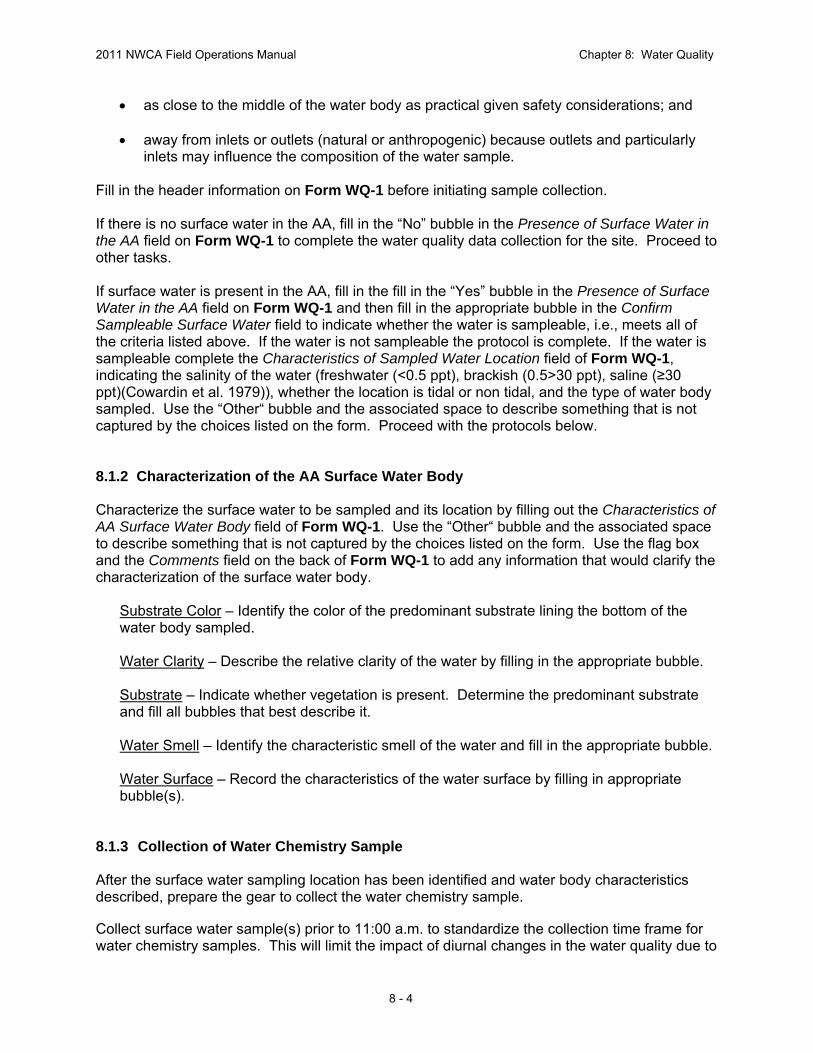
2011 NWCA Field Operations Manual Chapter 8: Water Quality
8 - 4
as close to the middle of the water body as practical given safety considerations; and away from inlets or outlets (natural or anthropogenic) because outlets and particularly
inlets may influence the composition of the water sample. Fill in the header information on Form WQ-1 before initiating sample collection. If there is no surface water in the AA, fill in the “No” bubble in the Presence of Surface Water in the AA field on Form WQ-1 to complete the water quality data collection for the site. Proceed to other tasks. If surface water is present in the AA, fill in the fill in the “Yes” bubble in the Presence of Surface Water in the AA field on Form WQ-1 and then fill in the appropriate bubble in the Confirm Sampleable Surface Water field to indicate whether the water is sampleable, i.e., meets all of the criteria listed above. If the water is not sampleable the protocol is complete. If the water is sampleable complete the Characteristics of Sampled Water Location field of Form WQ-1, indicating the salinity of the water (freshwater (<0.5 ppt), brackish (0.5>30 ppt), saline (≥30 ppt)(Cowardin et al. 1979)), whether the location is tidal or non tidal, and the type of water body sampled. Use the “Other“ bubble and the associated space to describe something that is not captured by the choices listed on the form. Proceed with the protocols below. 8.1.2 Characterization of the AA Surface Water Body Characterize the surface water to be sampled and its location by filling out the Characteristics of AA Surface Water Body field of Form WQ-1. Use the “Other“ bubble and the associated space to describe something that is not captured by the choices listed on the form. Use the flag box and the Comments field on the back of Form WQ-1 to add any information that would clarify the characterization of the surface water body.
Substrate Color – Identify the color of the predominant substrate lining the bottom of the water body sampled.
Water Clarity – Describe the relative clarity of the water by filling in the appropriate bubble.
Substrate – Indicate whether vegetation is present. Determine the predominant substrate and fill all bubbles that best describe it. Water Smell – Identify the characteristic smell of the water and fill in the appropriate bubble.
Water Surface – Record the characteristics of the water surface by filling in appropriate bubble(s).
8.1.3 Collection of Water Chemistry Sample After the surface water sampling location has been identified and water body characteristics described, prepare the gear to collect the water chemistry sample. Collect surface water sample(s) prior to 11:00 a.m. to standardize the collection time frame for water chemistry samples. This will limit the impact of diurnal changes in the water quality due to

2011 NWCA Field Operations Manual Chapter 8: Water Quality
8 - 5
metabolic activity of the organisms in the water. If the sample cannot be collected prior to 11:00 a.m., collect it close to 11:00 am as possible. Duplicate samples will be collected for performing Quality Assurance checks (USEPA 2011a, USEPA 2011b). The AB Team should collect the duplicate sample at the first site visited containing sampleable surface water in the AA, and then every 10th collection thereafter. This will ensure that at least one duplicate sample will have been collected by each Crew. Note that there is a field on Form WQ-1 for tracking the cumulative number of sites with sampleable surface water since the last water chemistry sample was taken. 1) Label sample containers prior to filling. Use the preprinted, adhesive-backed label
provided by NWCA Information Management (IM) Team similar to the one shown below (Figure 8-1). The preprinted labels will be provided together with the data forms as part of the Site Packet materials (see Chapter 2). Actual labels will have the site identification (ID) number pre-printed for all labels. Make sure the site ID number is correct for the site being visited, the date is clearly written on the label with an indelible marker, and the label is affixed to the correct container.
Use the duplicate water chemistry sample label when a duplicate sample is collected.
2) Cover the label with a strip of clear tape to protect the writing from getting smudged or
rubbed off. Keep the container upright with the lid closed until the water chemistry sample is collected and ready to pour into the container. Keeping the lid closed until the AB team is ready to sample helps keep contaminants out of the container.
Figure 8-1. Water chemistry labels to be affixed to surface water sample cubitainers.
3) Approach the surface water sample location (Figure 8-2) carefully. Do not step into the
water to avoid disturbing sediments, falling in, or fouling the water and potentially contaminating or otherwise compromising the quality of the sample.
SITE ID
SAMPLE ID

2011 NWCA Field Operations Manual Chapter 8: Water Quality
8 - 6
Figure 8-2. Example of long-handled dipper in use for sampling surface water. (Photo credit – U.S. Environmental Protection Agency, Eric Vance)
4) Put on nitrile gloves to avoid contaminating the sample with creams, ointments, sunscreen
or other materials that might be on the hands of the person taking the sample. 5) Rinse the dipper cup three times by immersing the cup in the water while being careful not
to stir or otherwise disturb bottom sediments as the dipper cup is rinsed. Pour the water away from the area to be sampled so that the discarded water does not drain back into the sample area and potentially affect the collected sample.
6) Take sample towards the center of the water body, away from inlets and/or outlets, and
from water deep enough (2X the height of the dipper or ~15cm) to avoid fouling the water as the dipper is used to collect the sample.
Collect sample(s) in areas which are completely free of surface debris. If vegetation or debris is present and cannot be avoided, slowly and carefully push aside the floating vegetation or other debris with the long handle of the dipper to create a clear section of water for sample collection. Use care not to disturb bottom sediments when pushing aside debris or vegetation or when collecting water with the dipper. If bottom sediments become disturbed, move to an adjacent area where the water has not been contaminated.
7) Remove the lid from the 1-liter cubitainer and expand it by gently pulling out the sides.
NOTE: DO NOT BLOW into the cubitainer to expand it since this will contaminate the sample.
8) Rinse the inside of the cubitainer with sample water. Pour water from the dipper into the
container and then rinse the container by gently swishing the water around and then pouring it away from where the sample will be taken. Repeat the process three times. Hold the container while filling to keep the container from tipping over and spilling the sample and/or allowing the opening to touch the ground which would contaminate the sample.

2011 NWCA Field Operations Manual Chapter 8: Water Quality
8 - 7
To avoid sample contamination by substances potentially present on the gloved fingers, do not touch the threads of the container opening or the inside of the cap to the container. Collapsible containers usually have a molded collar just below the screw threads that should be used to hold the container and keep fingers away from the screw threads while filling (Figure 8-3).
Figure 8-3. Example of filling the cubitainer. (Photo credit – U.S. Environmental Protection Agency, Eric Vance)
9) Use the dipper to fill the container to just overflowing. When the container has been filled,
carefully cap and tighten to seal the container without capturing any air bubbles. Removal of all air bubbles eliminates the opportunity for chemicals in the water to interact with air and change chemical characteristics of the sample.
10) Should a bubble a cubic centimeter or greater occur in the sample, remove the lid, tap the
cubitainer slightly to cause any bubbles to rise to the surface and escape. Squeeze the cubitainer slightly to expunge air and form a bulging meniscus so that air is not trapped in the container when it is capped. Replace and tighten the cap, again taking care to avoid touching the threads. If a sample is compromised by potential contamination, discard the sample, and re-rinse the cubitainer and threads before starting over.
11) Record the time that the sample was collected and the Sample ID number from the label in
the Water Chemistry Sampling field of Form WQ-1.
12) Place the water chemistry sample on ice in a cooler as soon as possible after collection. If a cooler is not immediately available on-site, place the cubitainer in a small white plastic trash bag out of direct sunlight and in a cool location. Record on Form WQ-1 that the sample was placed on ice by filling in the “Yes” bubble indicating that the sample was chilled before and during transport back to base the base site.
13) If the Optional Field Probe Data are being collected, go to Section 8.1.4. If not, go to
Section 8.1.5 and complete clean up activities.

2011 NWCA Field Operations Manual Chapter 8: Water Quality
8 - 8
8.1.4 Optional Protocol – Data Collection with a Hydrolab or YSI Handheld Multi-probe Meter Collecting in situ data with a multi-probe meter is not required for the NWCA, but individual states may choose to collect water quality data with multi-probe instruments using their state specific protocols. Make sure the meter has been calibrated according to the multi-probe manual specific to the instrument being used by the Crew. Form WQ-1 contains a field, Optional - Surface Water Field Probe Readings, to record field probe data. 1) Put on nitrile gloves, if not already wearing them, to avoid contaminating the water sample
with hand oils, lotions or other substances. 2) Collect the data for dissolved oxygen, pH, conductivity and temperature. 3) Record the results and the information on the instrument used on Form WQ-1. 4) Clean meter probes and proceed to Section 8.1.5.
8.1.5 After Sampling Clean-up
1) Empty any remaining water sample from the dipper cup and rinse the cup with deionized
water. Remove the cup from the handle and place it in a zippered plastic bag to keep it clean.
2) Place the gloves in a trash container with the rest of the unrecyclable materials from the
day’s sampling effort.
8.1.6 Determination of Maximum Surface Water Depth
Determine the maximum depth (up to 100cm or 1m) of the water body sampled after the water sample has been collected. 1) Measure the depth of the water body (surface down to top of substrate) from which the
chemistry sample was collected. Use the handle of the long handled dipper if it has centimeter graduations. Otherwise use a stadia rod or other graduated rod.
2) Record the value in the Surface Water Measurements field on Form WQ-1.
Due to safety considerations, record the depth as >100cm if water is over 1
meter deep rather than trying to measure the actual depth. In tidally influenced locations, make sure to fill in the bubble on the top of the AA
Hydrology form (Form H-1) identifying tidal stage because depth will vary with tidal stage.

2011 NWCA Field Operations Manual Chapter 8: Water Quality
8 - 9
8.1.7 Determination of Percent of AA Covered by Surface Water Estimate the percent of the AA covered by surface water (to the nearest 10%). There is no minimum depth required for this measurement. Record the value in the Surface Water Measurement field on Form WQ-1.
8.2 SAMPLE AND DATA HANDLING There are two components to water chemistry sample handling. One is completed before leaving the site; the other, at the field lodging or office. 8.2.1 At the Site 1) Complete Form T-1, NWCA 2011 Site and Sample Status/WRS Tracking for the water
chemistry sample and duplicate, whenever a duplicate sample is collected. Carefully, fill out the tracking data that pertains to the water chemistry sample(s). For more information on Form T-1 see Chapter 2.
In the Sample Status – Were Samples Collected? field of Form T-1,
indicate that the water chemistry sample (CHEM) and the duplicate, of appropriate, were collected.
Record the water chemistry Sample ID numbers in the appropriate area of the WRS Sample Tracking field.
2) Ensure all identification information and tracking data for the sample corresponds exactly
to the data on the label. 3) Transport samples to field lodging or the office in an ice chest on blue ice or wet ice. 8.2.2 At Field Lodging or Office The water chemistry sample and, when collected, the duplicate sample for each AA will be sent to the USEPA Lab in Corvallis, Oregon, within 24 hours of collection in an ice chest with the other immediately shipped samples. These samples are soil isotope, sediment enzymes, algal toxins, and chlorophyll-a. The protocol below covers the details of shipping that pertain to the water chemistry sample. See Chapter 2 for information that pertains to all of the immediately shipped samples. See Appendix A for detailed protocols on packing, tracking, and shipping samples and for shipping addresses. 1) Maintain the water chemistry sample(s) on blue ice, wet ice, or under refrigeration (4˚C)
until the samples are shipped. 2) Confirm that the label affixed to each sample cubitainer has the correct site identification
number, is complete and legible, and is covered with clear tape.

2011 NWCA Field Operations Manual Chapter 8: Water Quality
8 - 10
3) Ensure that any air has been removed from each cubitainer (see #10 in Section 8.1.3) and that the cubitainer is tightly sealed.
4) Go to Chapter 2 for the protocols on packing and shipping the samples to be immediately
shipped. 8.2.3 Data Handling See Chapter 2 for protocols on copying and shipping the completed data forms to the Information Management Team. See Appendix D for information on transmitting the image files of any photos taken of any important features related to water quality that the AB team feels should be documented. 8.3 LITERATURE CITED
Cowardin, L.M., V. Carter, F.C. Golet, and E.T. LaRoe. 1979. Classification of Wetlands and Deepwater Habitats of the United States. FWS/OBS-79/31. U.S. Fish and Wildlife Service, Washington, DC. Heitmuller, T. 2008. Gulf of Mexico Coastal Wetlands Condition Assessment– Pilot Survey: Quality Assurance Project Plan. U.S. Geological Survey National Wetlands Research Center, Gulf Breeze Project Office, Gulf Breeze, FL. USEPA (U.S. Environmental Protection Agency). 2011a. National Wetland Condition Assessment: Quality Assurance Project Plan. EPA/843/R10/003. U.S. Environmental Protection Agency, Office of Water and Office of Research and Development, Washington, DC. USEPA (U.S. Environmental Protection Agency). 2011b. National Wetland Condition Assessment: Laboratory Operations Manual. EPA/843/R10/002. U.S. Environmental Protection Agency, Office of Water and Office of Research and Development, Washington, DC.

2011 NWCA Field Operations Manual Chapter 8: Water Quality
8 - 11
8.4 EQUIPMENT LIST, DATA FORM, AND LABELS

2011 NWCA Field Operations Manual Chapter 8: Water Quality
8 - 12

WATER QUALITY EQUIPMENT CHECKLIST
___Clear tape strip packs for covering labels ___Collapsible 1-liter cubitainers for surface water sample ___De-ionized (DI) water in a five gallon carbouy ___Form WQ‐1: NWCA Assessment Area WATER QUALITY ___Large cooler with ice at vehicle ___Long-handled plastic dipper with cm graduations on handle (See schematic below for making long handled dipper) ___Nitrile gloves, disposable (always carry half dozen per site) ___No. 2 Pencils ___Paper towels (for any clean up) ___Permanent marker (Fine-tip for labels) ___Plastic bags, 1-quart, zippered ___Squirt/squeeze bottle of DI water ___Small white plastic trash bags (7-10 gallon) ___Small, soft-sided cooler w/ blue ice to fit (for sites not close to vehicle) Optional items ___Field meter calibration kit (can be contained in a good quality, plastic box, e.g. tackle
box) and should contain: o Calibration cup with removable cove, DO membranes, backup probes and spare
parts (o-rings, etc). o pH buffers o Thermometer o Squeeze bottle o Appropriate size leak-proof, screw-cap containers (e.g., nalgene) for additional
calibration solutions o Basic tools (assorted screwdrivers, Allen wrenches)
___Multi-Probe Field Meter (Dissolved Oxygen, pH, Conductivity, Temperature)
Exploded Schematic for Building Long-handled Water Dipper


SAMPLE ID: COMMENTSChilled:
Yes
No
Time Collected
:
FORM WQ-1: NWCA ASSESSMENT AREA WATER QUALITY (Front)
DUPLICATE SAMPLE ID: COMMENTSChilled:
Yes
No
Time Collected
:
.
.
.
.
01/07/2011 NWCA Water Quality
No Sample Collected
WATER SURFACE:
Film
WATER SMELL:
None
SUBSTRATE COLOR:
Black
(hhmm) 24 hour clock
Site ID: NWCA11- Date: 2 0 1 1
Reviewedby (Initials):
/ /
Choose one:
Freshwater
Brackish
Saline
Characteristics of AA Surface Water Body (where sampled) - Mark all that apply
WATER CLARITY:
Clear
Brown
Gray
Other
Turbid
Stained
Milky
Other
Chemical
Sulphur
Other
Algae Odor
Fishy
Floc
Sheen
Algae Bloom
Other
Vegetation
Water Chemistry Sampling
Temp. (°C) XX.X
Conductivity (µS/cm) XXX.XX
pH XX.XX
DO(mg/L) XX.X
Optional - Surface Water Field Probe Readings
Duplicate Water Chemistry SamplingCollect duplicate sample at team's 1st, 10th, 20th site with sampleable water
(hhmm) 24 hour clock
Flag:
Instrument manufacturer and model:
Confirm Sampleable Surface Water (>15cm): Yes NoPresence of Surface Water in the AA: Yes No
Characteristics of Sampled Water Location
Choose one:
Tidal
Non-Tidal
Choose One:
Pond
Lake
Channel
Backwater
Other:
Mineral Soil
Organic
Shellhash
Sand
Muck
Gravel
Cobble
Other
SUBSTRATE:
Yes No
Vegetation Present?:
RottenVegetation
Flag
Cumulative number of sites with sampleable water.
Surface Water Measurements
Surface Water > 100cm Yes No
Maximum Depth of Surface Water(cm):
% AA covered with surface water:
Flag codes: K = No measurement made, U = Suspect measurement, F1,F2, etc. = misc. flags assigned by each field crew.Explain all flags in comment section on the back of this form. 8980109746
DRAFT - NOT FOR U
SE IN FIE
LD

Flag Comments
FORM WQ-1: NWCA ASSESSMENT AREA WATER QUALITY (Back)
Site ID: NWCA11- Date: 2 0 1 1/ /
Reviewedby (Initials):
NWCA Water Quality01/07/2011
0601109748
DRAFT - NOT FOR U
SE IN FIE
LD
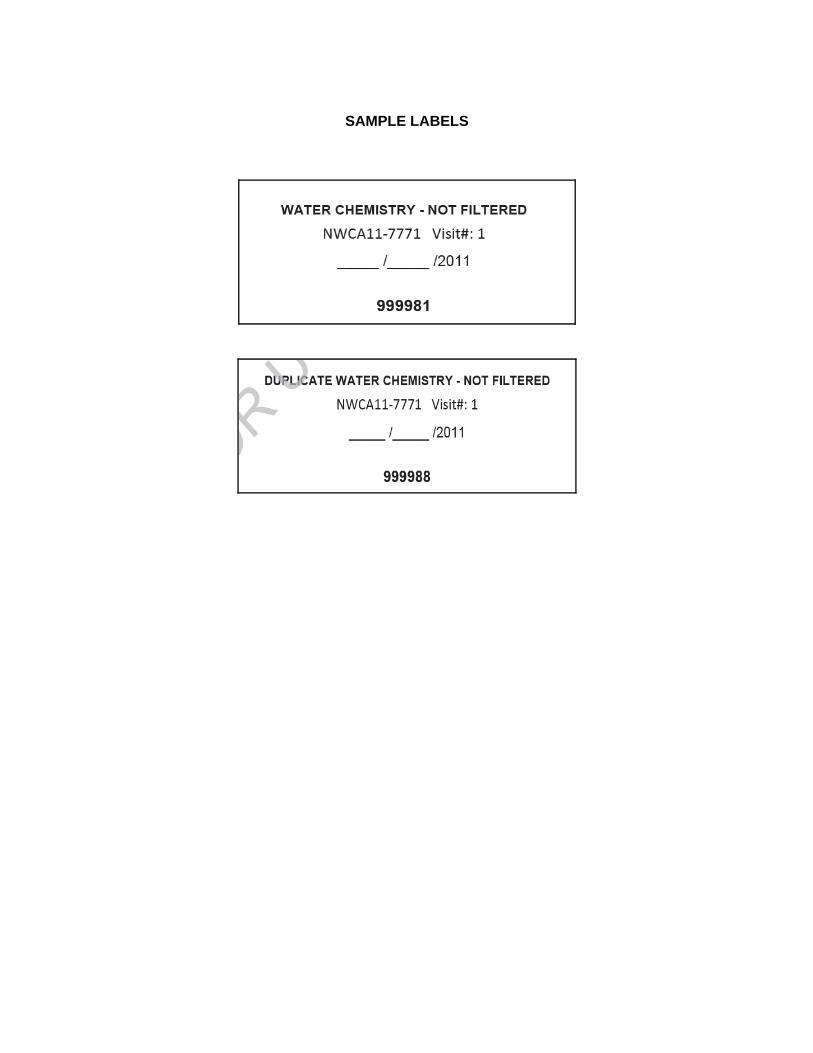
SAMPLE LABELS


2011 NWCA Field Operations Manual Chapter 9. Algae
9 - 1
CHAPTER 9. ALGAE Introduction . . . . . . . . . . . . . . . . . . . . . . . . . . . . . . . . . . . . . . . . . . . . . . . . . . . . . . . . 9.1 SAMPLING PROCEDURES. . . . . . . . . . . . . . . . . . . . . . . . . . . . . . . . . . . . . . . . 9.1.1 Protocols for Collection of Samples. . . . . . . . . . . . . . . . . . . . . . . . . . . . . 9.1.2 Procedure for Algal Toxins Sampling. . . . . . . . . . . . . . . . . . . . . . . . . . . . 9.1.3 Procedure for Algae Taxonomic ID Sampling. . . . . . . . . . . . . . . . . . . . . 9.1.4 Procedure for Collecting a Chlorophyll-a (Biomass) Sample. . . . . . . . . . 9.2 SAMPLE AND DATA HANDLING. . . . . . . . . . . . . . . . . . . . . . . . . . . . . . . . . . . . 9.2.1 At the Site. . . . . . . . . . . . . . . . . . . . . . . . . . . . . . . . . . . . . . . . . . . . . . . . 9.2.2 At Field Lodging or Office . . . . . . . . . . . . . . . . . . . . . . . . . . . . . . . . . . . . 9.2.2.1 Immediately Shipped Samples. . . .. . . . . . . . . . . . . . . . . . . . . . 9.2.2.2 Batch Samples. . . . .. . . . . . . . . . . . . . . . . . . . . . . . . . . . . . . . . . 9.2.3 Data Handling. . . . . . . . . . . . . . . . . . . . . . . . . . . . . . . . . . . . . . . . . . . . . 9.3 LITERATURE CITED. . . . . . . . . . . . . . . . . . . . . . . . . . . . . . . . . . . . . . . . . . . . . 9.4 REFERENCE CARD. . . . . . . . . . . . . . . . . . . . . . . . . . . . . . . . . . . . . . . . . . . . . . Reference Card ALG-1 Flowchart of NWCA, Algae Sample Collection Activities 9.5 EQUIPMENT LIST, DATA FORM, AND LABELS . . . . . . . . . . . . . . . . . . . . . . Algae Equipment Checklist Form: ALG-1: NWCA Algae Sample Labels
9-39-39-39-59-8
9-129-159-159-159-159-169-169-179-19
9-23

2011 NWCA Field Operations Manual Chapter 9. Algae
9 - 2

2011 NWCA Field Operations Manual Chapter 9. Algae
9 - 3
CHAPTER 9. ALGAE Disbursed by spores and moving water, algae are wide-spread across the landscape. They are found on many substrates including mineral, organic, wood, and vegetation, as well as in the water column. Some algae persist in soils that are saturated and never inundated. Although some classes of wetlands dry out during a portion of the year, the silica frustules (skeletons) left behind by diatoms (one group of algae taxa) can still be collected for analysis. Thus, researchers are able to identify specific algal taxa inhabiting locations like seasonally wet wetlands because frustules are unique (like fingerprints) for each species. For detailed information on the rationale for the algae indicator, see "Ecological Indicators for the 2011 National Wetland Condition Assessment" (in prep.). This chapter provides the protocols necessary to collect pertinent data for the algae indicator by the Assessment Area and Buffer (AB) Team within the Assessment Area (AA). The algae data collected will include a composite sample for identification and enumeration of taxa. Substrate samples will be collected at all sites with suitable substrate regardless of whether surface water is present because saturated soils produce conditions for algae to persist at the soil/air interface. Collecting algae data for the NWCA involves three main tasks: collecting substrate and epiphyte (if available) subsamples for the Algae Taxonomic Identification (ID) composite sample, collecting the Algal Toxins sample, and filtering surface water (if present) for a Chlorophyll–a sample that will be analyzed to obtain an algal biomass estimate. 9.1 SAMPLING PROCEDURES The AB Team will identify locations for algal sample collection in the AA during AA establishment. The Chlorophyll-a sample can be collected only if sampleable (approximately 15cm deep) surface water exists. If surface water is located only in a Vegetation (Veg) Plot, the AB team works with the botanist to minimize vegetation impacts while collecting the algal samples. 9.1.1 Protocols for Collection of Samples The vast majority of algae are found in the top few millimeters of the substrate or on submerged or emergent vegetation, therefore, the protocols in this chapter focus on collection of the algae from those areas within the AA. Collection of the Taxonomic ID composite sample may be a multistep process in combination with the Algal Toxins protocol depending upon the presence of submerged aquatic and/or emergent vegetation from which epiphytic algae can be obtained. If no vegetation is present or the vegetation cannot be sampled for epiphytes, then only substrate cores will be collected for the Taxonomic ID sample for analysis. A flow-chart summary of sampling activities for collecting the various algae samples is presented in Figure 9-1. This summary has been developed as a Reference Card (RC ALG-1, Section 9.4) for use in the field.

2011 NWCA Field Operations Manual Chapter 9. Algae
9 - 4
Identify Algae Sampling Locations in the AA after the Vegetation Plots are Established.
Is there surface water in the AA ≥ 15cm?
Yes No
Chlorophyll‐a:
• Collect 500ml of surface water in a500‐ml bottle using the long‐handleddipper
• Filter water using vacuum flask
• Add 2 drops MgCO3 solution to buffersample
• Immediately place filtered sample in alabeled, 50‐ml screw‐top vial
• Cover with aluminum foil, and placein a labeled, zippered plastic bag
• Set in second zippered bag,
and place on ice
Algae Taxonomic ID:
• Add substrate subsamples to the Algae Taxonomic ID 250‐mL bottle which may:
o Contain a 50‐mL partial Taxonomic ID sample collected during the Algal Toxin procedure OR
o Be empty if no epiphytes were collected.
• Dilute to shoulder of labeled 250‐ml bottle withsurface water, if present, or DI water
• Add Lugol’s solution, amount appropriate for sample
• Cap bottle and tape shut• Double bag and place on ice
Aquatic or emergent vegetation is present
Algal Toxins (Epiphytes &/or Surface Water):
A. If no epiphytes,• Fill Algal toxins bottle (125‐mL) to shoulder with surface water, label and place in plastic zippered bag
• Place on ice in cooler
B. If epiphytes collected, • Fill bottle to shoulder with surface water from squirt bottle
• Mix to homogenize epiphyte subsamples in 125‐ml bottle
• Form a partial Algal Taxonomic ID sample by using a graduated cylinder to transfer 50mL of homogenized epiphyte subsample into 250‐mL Algae Taxonomic ID bottle
• Add surface water to refill 125‐ml bottle to shoulder
• Label bottle and place in zippered bag• Place on ice in cooler
Collect 5epiphyte algae
subsamples
YesNo
Collect surface water for Algal Toxins sample
Collect 10substrate
subsamples for the Taxonomic ID sample in the 250‐ml bottle
If 5 epiphyte subsamples are taken,
Collect 5 substrate subsamples
If no sampleable substrate, mark “No sample collected” for all algae samples
Collect 10substrate
subsamples to composite for
Algae Taxonomic ID sample
Yes or No
Figure 9-1. Flowchart of NWCA, Algae Sample Collection Activities. A maximum of three samples will be collected from each site for laboratory analysis: an Algae Taxonomic ID sample, an Algal Toxins sample, and a Chlorophyll-a sample.
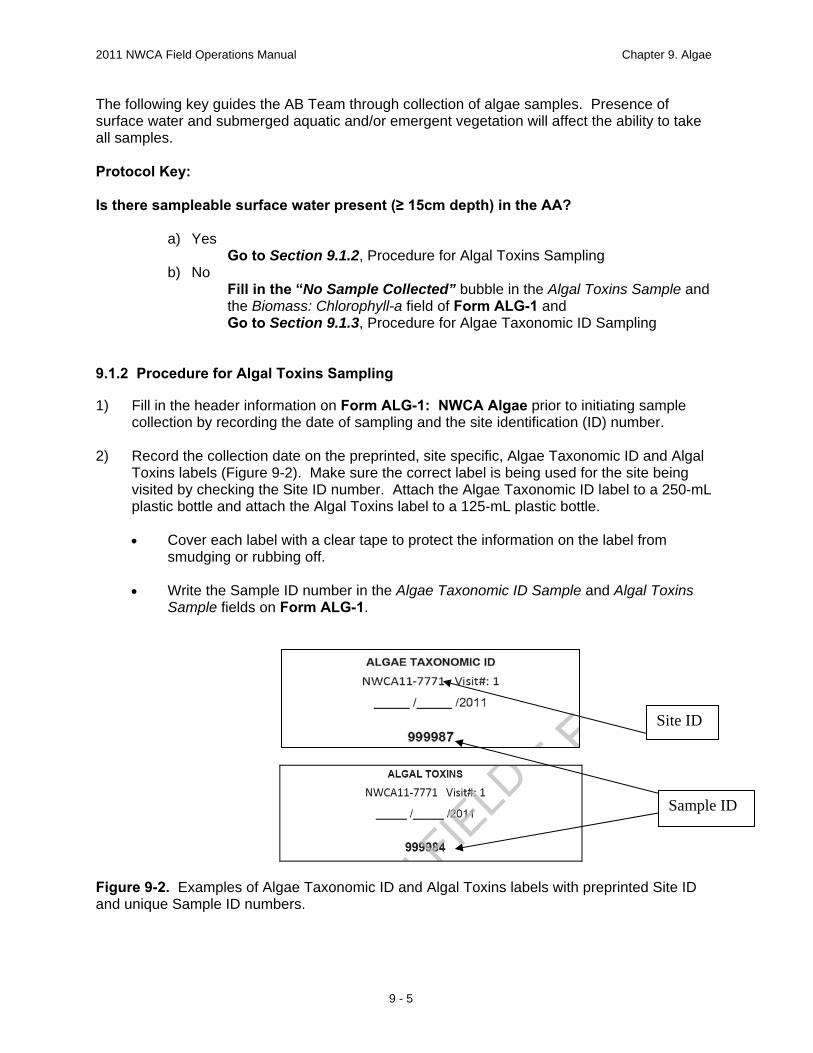
2011 NWCA Field Operations Manual Chapter 9. Algae
9 - 5
The following key guides the AB Team through collection of algae samples. Presence of surface water and submerged aquatic and/or emergent vegetation will affect the ability to take all samples. Protocol Key: Is there sampleable surface water present (≥ 15cm depth) in the AA?
a) Yes
Go to Section 9.1.2, Procedure for Algal Toxins Sampling b) No
Fill in the “No Sample Collected” bubble in the Algal Toxins Sample and the Biomass: Chlorophyll-a field of Form ALG-1 and Go to Section 9.1.3, Procedure for Algae Taxonomic ID Sampling
9.1.2 Procedure for Algal Toxins Sampling 1) Fill in the header information on Form ALG-1: NWCA Algae prior to initiating sample
collection by recording the date of sampling and the site identification (ID) number. 2) Record the collection date on the preprinted, site specific, Algae Taxonomic ID and Algal
Toxins labels (Figure 9-2). Make sure the correct label is being used for the site being visited by checking the Site ID number. Attach the Algae Taxonomic ID label to a 250-mL plastic bottle and attach the Algal Toxins label to a 125-mL plastic bottle.
Cover each label with a clear tape to protect the information on the label from
smudging or rubbing off. Write the Sample ID number in the Algae Taxonomic ID Sample and Algal Toxins
Sample fields on Form ALG-1.
Figure 9-2. Examples of Algae Taxonomic ID and Algal Toxins labels with preprinted Site ID and unique Sample ID numbers.
Site ID
Sample ID

2011 NWCA Field Operations Manual Chapter 9. Algae
9 - 6
3) If submerged aquatic and/or emergent herbaceous vegetation is present, go to Step 4.
If submerged aquatic and/or emergent herbaceous vegetation is not present, Use the long-handled dipper (Chapter 8, Figure 8-2) to add some surface water to
the 125-mL Algal Toxins bottle. Rinse the bottle and dump the water out on the ground away from the surface water source.
Use the dipper to obtain more surface water and fill the 125-mL Algal Toxins bottle to
the shoulder.
Replace the cap and tighten securely.
Immediately place the Algal Toxins sample in a zippered plastic bag, deflate the bag and close it. Put this sample on ice. If a cooler with ice is not immediately available, place the sample out of the light in the coolest location possible, either in a white plastic bag or in a small cooler filled with a frozen gel-pack until the sample can be placed on ice in a cooler.
Proceed to the Procedure For Algae Taxonomic ID (Section 9.1.3).
4) Use the long-handled dipper to add some surface water to a squirt bottle. Rinse the squirt
bottle and dump the water on the ground away from the surface water source. Fill the bottle with the surface water from the dipper. Replace the top of the bottle.
5) Identify submerged aquatic and/or emergent herbaceous vegetation from which to collect
algal epiphytes. 6) Collect five pieces of plant stems and/or leaf surfaces of submerged aquatic or emergent
herbaceous vegetation sufficient for sampling a total of 5in2 of surface area. Try to take the material from different plants and locations.
The pieces of vegetation will be scraped to create a composite Algal Toxins sample
and a partial Algae Taxonomic ID sample. Use scissors or shears to cut sections of the stems if it makes collection of the algal
epiphytes easier. NOTE: There may be situations where there is very little herbaceous submerged aquatic and/or emergent vegetation in the AA. Sampling it might destroy what little vegetation of that type exists at the site and the sample will not accomplish the goal of creating a composite sample from different plants and locations. In such cases, fewer than five subsamples can be collected and documented on Form ALG-1. Section 9.1.3 explains how to adjust the number of substrate subsamples to account for this situation in the Algae Taxonomic ID protocol.
7) Use a clean, soft-bristled toothbrush to gently brush a 1-in2 surface in a circular motion for
20 seconds to loosen algae on one of the pieces of plant material.
2011 NWCA Field Operations Manual Chapter 9. Algae
9 - 7
Use the 60-mL corer as a convenient guide for an approximate 1-in2 removal area from vegetation stems and leaves. The inside area of the opening of the syringe is 1in2.
Always use a new toothbrush at each site so that algae remaining in the bristles do
not contaminate the sample at the next site where a toothbrush is used.
8) Rinse the loose algal material into the Algal Toxins bottle using a funnel and the squirt bottle filled with surface water.
9) Repeat with each of the remaining pieces of vegetation to collect a total of 5in2 of
vegetation surface area. 10) Rinse the algal material caught in the toothbrush bristles into the bottle and give the funnel
a final rinse into the bottle. 11) Fill the 125-mL Algal Toxins bottle to the shoulder with surface water from the squirt bottle.
Cap the bottle and moderately shake it to homogenize the sample as much as possible. 12) Pour 50-mL from the Algal Toxins bottle into a 100-mL graduated cylinder before the
sample has a chance to start settling. Immediately, pour the water from the graduated cylinder into the previously labeled 250-mL Algae Taxonomic ID bottle. Cap the Algae Taxonomic ID bottle, and place it out of direct sun while completing the Algal Toxins sample.
13) Fill the Algal Toxins bottle to the shoulder with surface water from the squirt bottle and
replace the cap and tighten securely. The Algal Toxins bottle now contains a composite of epiphytic and surface water algae.
14) Immediately place the Algal Toxins sample in a zippered plastic bag, deflate the bag and
close it. Put the sample on ice. If a cooler with ice is not immediately available, place the sample out of the light in the coolest location possible, either in a white plastic bag or in a small cooler filled with a frozen gel-pack until the sample can be placed on ice in a cooler.
15) Complete the Epiphytic Algae field of the Algal Toxins Sample and the Algae Taxonomic
Sample sections of Form ALG-1 by:
Filling in the Y (Yes) bubble in the Collected? field to indicate that a sample was collected.
Recording the total number of vegetation pieces scraped (i.e., a number up to five)
in the # of Subsamples field. 16) Proceed to the Procedure For Algae Taxonomic ID below.

2011 NWCA Field Operations Manual Chapter 9. Algae
9 - 8
9.1.3 Procedure for Algae Taxonomic ID Sampling A total of ten subsamples are collected within the AA to create a composite sample for algal taxonomy. If epiphyte subsamples were collected during Algal Toxin Sample collection (Section 9.1.2), they will account for up to five of the ten taxonomic subsamples, depending on how many pieces of vegetation (subsamples) were scraped. If an epiphyte subsample was not taken, ten subsamples are taken from substrate(s) within the AA. The subsamples should be taken using a 60-mL syringe coring device (Figure 9-3) from several locations within the AA rather than in close proximity. In addition, select and sample a mix of soft soil or sediment, and hard (i.e., submerged rock or wood) substrates if both are present. Note that the syringe corer is the same type as is used for the soil isotope and sediment enzyme sampling. A separate corer should be dedicated to collecting algal substrate samples. In cases where the AA has seasonally saturated soils and no surface water, samples can be collected only if suitable substrate can be located. Look for low lying areas with bare ground that might have dried algae crusted on the surface or areas that give some other visual indication of previous inundation and probable algal growth (dried & cracked crust, sheen, etc.).
If no sampleable surface water, submerged and/or emergent herbaceous vegetation, and substrate are present in the AA, fill in the bubbles on Form ALG-1 for “No Sample Collected” for all three kinds of algae samples (Algal Toxins, Algae Taxonomic ID, and Chlorophyll-a). The Algae protocol is complete. Go on to other AB Team tasks.
If sampleable substrate is present in the AA, proceed with the protocol below.
1) If an epiphyte subsample was not taken (Section 9.1.2), go to Step 2.
If an epiphyte subsample was taken (Section 9.1.2), go to Step 6. 2) Fill in Form ALG-1: NWCA Algae header information by recording the date of sampling
and the Site ID number on the form. 3) Put on nitrile gloves, if desired, for protection from potentially harmful microorganisms that
might be present in the wetland. 4) Fill out the preprinted, site specific, Algae Taxonomic ID label (Figure 9-2) with the
collection date and make sure the correct label is being used for the site being visited. Attach the Algae Taxonomic ID label to a 250-mL plastic bottle.
Cover each label with clear tape to protect the information on the label from
smudging or rubbing off. Write the Sample ID number in the Algal Taxonomic ID Sample field on Form ALG-
1. 5) Use the long-handled dipper (Chapter 8, Figure 8-2) to add some surface water to a squirt
bottle. Rinse the squirt bottle and dump the water on the ground away from the surface water source. Fill the bottle with the surface water from the dipper. Replace the top of the bottle.
2011 NWCA Field Operations Manual Chapter 9. Algae
9 - 9
6) Determine the number of substrate subsamples needed from each type of sample location in the AA by estimating the relative area occupied by each.
7) Identify suitable sampling locations free of vegetation, leaves, roots and other material that would prohibit the syringe (Figure 9-3) from effectively collecting a core of the substrate. For soft substrates at the edge of the water, or, just above the water line if the area
shows signs of recent inundation, go to Step 8 and repeat until the number of subsamples needed is collected.
For submerged hard substrates such as rock or wood, go to Step 9 and repeat
until the number of samples needed is collected.
8) Take the 60-mL corer and align the edge of the plunger to the end of the syringe body (Figure 9-3A).
Collect the core by gently pressing the cut off end of the syringe into the substrate to
about the 20-mL mark on the syringe. Use a gentle back and forth twisting motion while pressing the syringe into the
substrate to help “cut” the core while using your other hand to gently pull back on the plunger to create a vacuum that will help capture the core (Figure 9-3B).
Use a finger, knife, plastic card, or a similar support, if necessary, to confine the core
inside the syringe while carefully extracting the syringe and core from the substrate. Carefully extrude the core from the syringe by pushing the plunger to the 5mL (5cc)
mark and cut off the exposed core flush with the tip of the syringe and discard (Fig 9-3C-E). Angle the syringe tip upright so that the core remaining in the syringe does not fall out while the excess is cut off.
Extrude the portion of the core remaining in the syringe into the 250-mL Algae
Taxonomic ID bottle (Fig. 9-3F). Repeat until the number of subsamples needed is collected. Go to Step 9.
For example, if five epiphyte subsamples were taken, five substrate samples are needed. The example AA has approximately 20% submerged wood (in this example, Cypress knees), 40% soft substrate at the edge or near the water line, and 40% soft, seasonally flooded substrate. Therefore, the substrate portion of the sample should be made up of one subsample (1/5) from wood (submerged hard substrate), two subsamples (cores) (2/5) from the soft substrate at the edge or near the water line, and two subsamples (cores) (2/5) from the soft, seasonally flooded substrate.

2011 NWCA Field Operations Manual Chapter 9. Algae
9 - 10
Figure 9-3. Use of the 60-mL coring device (syringe with tip cut off and beveled edge) to take an algae substrate core for the Algae Taxonomic ID sample. 9) Use the 60-mL corer to mark the area to sample on the hard surface by pulling back the
plunger to expose the beveled edge and pressing it against the wood or rock. Remember that the inside area of the syringe is 1in2.
Take the 30-mL syringe with uncut tip and carefully slurp up the material inside the
marked area that is deposited/growing on the rock or wood. The tip can be used to rub the surface to further dislodge and collect algae from the wood or rock.
Expel the 10-20mL of water and algae collected from the syringe into the Algae
Taxonomic ID bottle and replace the cap. Repeat until the number of subsamples needed is collected.
10) Record the combined number of substrate subsamples (soft and hard) in the Substrate field of the Algae Taxonomic ID section of Form ALG-1. Confirm that the total number of subsamples (epiphyte and substrate) collected for the composite sample is ten by adding the number of epiphyte and substrate subsamples listed for Algae Taxonomic ID on Form ALG-1 and recording the sum in the Total # of subsamples field.
11) Fill the 250-mL Algae Taxonomic ID bottle to the shoulder with surface water from the
squirt bottle. If no surface water is found in the AA, use deionized (DI) water to fill the bottle.
12) Carefully add 2-3mL of Lugol’s solution to the 250-mL bottle with the aliquot dispenser or a
small syringe.

2011 NWCA Field Operations Manual Chapter 9. Algae
9 - 11
When using Lugol’s solution (see Chapter 2 for details for making Lugol’s solution), the final color of the preserved sample should look like weak tea (see the middle bottle in Figure 9-4).
Due to differences in substrate composition, the quantity of Lugol’s solution
necessary to preserve the algae cells will vary slightly.
Visually determine the correct quantity of Lugol’s solution to use each time by following the procedure below. o Add 2mL of solution initially to the sample bottle (See Figure 9-4). o Cap the bottle and gently shake to distribute. o Open the bottle and check the color of the sample. o Add more Lugol’s solution if necessary.
Note: It is better to add slightly more Lugol’s solution than less since the preservative will be soaked up by both the algae and other organic material in the sample. However, adding too much Lugol’s solution (right bottle in Figure 9-4) stains the algae cells so dark that taxa identification is difficult or impossible.
Figure 9-4. Examples of Lugol’s solution concentrations in algae samples (left to right): too little solution, correct concentration (looking like weak tea), too much Lugol’s solution.
13) Tightly cap the sample bottle and tape the bottle cap securely with electrician’s tape to
seal it. 14) Place the 250-mL bottle with the Algae Taxonomic ID sample in a zippered plastic bag,
seal and store upright in a cooler with ice.
Because Lugol’s solution is not a fixative, the sample must be kept chilled for maintaining the best quality samples.
15) Thoroughly rinse all equipment with DI water before leaving the site. Discard the
toothbrush, if used, by placing it in the container for items for disposal.
Remember to replace the toothbrush with a new one before sampling the next site.

2011 NWCA Field Operations Manual Chapter 9. Algae
9 - 12
9.1.4 Procedure for Collecting a Chlorophyll-a (Biomass) Sample If surface water is present in the AA, and the water meets the sampling criteria for water chemistry (at least 15cm deep), then a Chlorophyll-a sample will be collected. 1) Put on nitrile gloves. 2) Set up an area for processing the sample. Sample processing should be done out of
direct sunlight whenever possible, because the sunlight readily breaks down the Chlorophyll-a.
3) Rinse the long-handled dipper (Chapter 8, Figure 8-2) three times with surface water and
then rinse a 500-mL collection bottle three times with surface water. Pour the used water on ground away from the surface water area to be sampled so that the sample is not compromised.
4) Fill the 500-mL bottle with surface water by collecting water with the long-handled dipper.
Collect water from the same location that the water chemistry sample was taken. 5) Use clean, flat-bladed forceps (clean with tissue paper) to place a Whatman GF/F 0.7-μm
glass fiber filter in the graduated filter holder with the gridded side of the filter facing down (See Figure 9-5).
6) Filter as much of the 500mL of surface water from the sample bottle that will readily pass through the filter following the procedure below.
Begin by measuring 100mL of surface water from the 500-mL bottle into the
graduated cylinder. o If the water is very green or turbid, use a smaller, measured volume. o In subsequent iterations, use less water if filtering is slow. o Use the space at the bottom of Form ALG-1 to make notes on the amount of
water filtered so that the total can be calculated and recorded.
Pour all the water from the graduated cylinder into the filter holder. Replace the lid on the filter holder and the cap on the 500-mL bottle. Use the vacuum pump to pull the sample through the filter, not exceeding 7in of Hg
pressure (3.44psi). Check to assure that water is not leaking out of the apparatus and is moving through
the filter.
If 100mL of water from the AA will not pass through the filter, change the filter, rinse the apparatus with DI water, discard the water, and repeat the procedure using 50mL of the water from the 500-mL bottle.
Check the filter for visible color.
o If there is visible color, go to Step 7. o If there is little or no visible color, repeat Step 6 until color is visible on the filter.

2011 NWCA Field Operations Manual Chapter 9. Algae
9 - 13
Figure 9-5. Set-up for filtering the Chlorophyll-a sample. (a) Filter flask with filter holder and vacuum pump for sample filtration, (b) flat-bladed forceps, (c) Whatman glass fiber filter, (d) screw top centrifuge tube with folded filter with the Chlorophyll-a sample inside, (e) 100-mL graduated cylinder, (f) 500-mL bottle with graduations, (g) squeeze bottle for DI water.
7) Rinse the filter holder portion of the filter flask apparatus thoroughly using a squeeze bottle filled with DI water to dislodge any cells adhering to the filter flask. Pump the water through the filter, not exceeding 7in of Hg pressure (3.44psi). Monitor the level of water in the lower chamber to ensure that it does not contact the
filter or flow into the vacuum pump. If the filter starts to plug and the filtering starts to go more slowly, stop adding water
and allow the remaining water to finish being filtered. Add two drops of a saturated MgCO3 solution to the sample just prior to the end of
filtration when only a few milliliters of water are left to be filtered. If added prematurely, it may greatly increase the sample filtration time. The MgCO3 acts to buffer the sample.
8) Record the total surface water sample volume filtered in the Biomass: Chlorophyll-a
Sample field on FORM ALG-1. 9) Carefully remove the bottom chamber of the filter apparatus and discard the filtered water.
Replace the bottom chamber on the apparatus. 10) Remove the filter from the holder with clean, flat forceps. Avoid touching the colored
portion of the filter which contains the chlorophyll sample. Fold the filter in half using the forceps, keeping the sample to the inside of the fold.
11) Place the folded filter into a 50-mL screw-top centrifuge tube and cap the tube. 12) Record the sample volume filtered and date on the CHLOROPHYLL-a label (Figure 9-5)
and attach it to the centrifuge tube (do not cover the volume markings on the tube). Ensure
a b
c d
e
f
g

2011 NWCA Field Operations Manual Chapter 9. Algae
9 - 14
that all written information is complete and legible. Cover the label with a strip of clear tape to protect the information on the label.
Figure 9-5. Chlorophyll-a label to be filled out and placed on the centrifuge tube
13) Record the sample ID number on the Chlorophyll-a label in the Biomass: Chlorophyll-a
Sample field of Form ALG-1. 14) Wrap the centrifuge tube in foil immediately to keep sunlight from degrading the sample.
Place the tube in a small Whirl-Pak or zippered plastic bag. Record the volume filtered and date on the CHLOROPHYLL-a OUTER BAG label (Figure 9-6), and attach this label to the outside of the plastic bag. Cover with a strip of clear tape to protect the information on the label.
Figure 9-6. Chlorophyll-a, outer bag label to be filled out and placed on the plastic bag containing the Chlorophyll-a sample.
15) Immediately place the Chlorophyll-a sample in a cooler with ice to keep it as cold as
possible.
Site ID
Sample ID
Site ID
Sample ID

2011 NWCA Field Operations Manual Chapter 9. Algae
9 - 15
9.2 SAMPLE AND DATA HANDLING There are two components to algae sample handling and processing. One is done before leaving the site; the other, at the base location. 9.2.1 At the Site 1) Check Form ALG-1 to ensure that all samples collected are present and that
the sample label information is accurate. 2) Complete the Sample Status – Were Samples Collected? field on Form T-1,
NWCA 2011 SITE AND SAMPLE STATUS/WRS TRACKING by filling in the appropriate bubbles to record whether samples were collected and, if so, which types. In the case of algae, the types of samples that should normally have been collected are Algal Toxins, Chlorophyll-a, and Algae Taxonomic ID.
3) Complete the WRS Sample Tracking field on Form T-1 for the Chlorophyll-a
(CHLA) and Algal Toxins (ALGT) samples. Ensure all identification information and tracking data for each sample corresponds exactly to the data on the sample label.
4) Transport samples to field lodging or the office in an ice chest on blue or wet
ice. 9.2.2 At Field Lodging or Office Maintain all samples on blue or wet ice, or under refrigeration (4˚C) until they are shipped (USEPA 2011a,b). 9.2.2.1 Immediately Shipped Samples Prepare the Algal Toxins and Chlorophyll-a samples for shipment with the other immediately shipped samples (water chemistry, soil isotopes, and sediment enzymes). These samples will be sent in an ice chest within 24 hours of collection to the USEPA Lab in Corvallis, Oregon.
Confirm that the label affixed to each sample has the correct site identification
number, is complete and legible, and is covered with clear tape. Go to Chapter 2 for the protocols on packing and shipping all samples to be
immediately shipped.

2011 NWCA Field Operations Manual Chapter 9. Algae
9 - 16
9.2.2.2 Batch Samples
The Algae Taxonomic ID samples may be stored in the cold, then shipped in batches every two weeks on the same schedule as the soil bulk density and chemistry samples. 1) Retrieve the samples from cold storage and confirm that the label affixed to
each sample has the correct site identification number (as listed on Form ALG-1 from the date of sampling), is complete and legible, and is covered with clear tape.
2) Enter the information for each of the Algae Taxonomic ID samples on Form T-
5: NWCA 2011 TRACKING - BATCHED SAMPLES by completing the following fields: Site ID Date Sample Collected Visit Number (1 = the visit when the sampling was done; 2 = scheduled
revisit) Sample ID from the sample label Sample Type (in this case ALGA) # of containers (in this case 1) comments, if needed.
3) Ensure that the information recorded on Form T-5 matches that on the label for
each sample. 4) Fill in the bubble for EcoAnalysts in the Lab section of Form T-5. 5) Pack the samples in an ice chest with ice according to the protocol in Appendix
A. 6) Make two copies of Form T-5.
Transmit the original to the Information Management Team. See Chapter 2 for details on transmitting forms to Information Management.
Place one copy in a self-sealing plastic bag and place on top of the samples in the ice chest.
Retain the second copy for your records. 7) Seal the ice chest according to the protocol in Appendix A and affix the
shipping label. See Appendix A for detailed information on shipping company, shipping labels, and shipping addresses.
8) Deliver the package of samples to the shipping company and retain all receipts
and records of shipping. 9.2.3 Data Handling See Chapter 2 for protocols on copying and shipping the completed data forms to the Information Management Team. See Appendix D for information on transmitting the image files of any photos taken of any important algal features the AB team feels should be documented.

2011 NWCA Field Operations Manual Chapter 9. Algae
9 - 17
9.3 LITERATURE CITED USEPAa (U.S. Environmental Protection Agency). 2011. National Wetland Condition Assessment: Integrated Quality Assurance Project Plan. EPA/843/R10/003. U.S. Environmental Protection Agency, Office of Water and Office of Research and Development, Washington, DC. USEPAb. (U.S. Environmental Protection Agency). 2011. National Wetland Condition Assessment: Laboratory Operations Manual. EPA/843/R10/002. U.S. Environmental Protection Agency, Office of Water and Office of Research and Development, Washington, DC. USEPA (U.S. Environmental Protection Agency). In Preparation. Ecological Indicators for the 2011 National Wetland Condition Assessment. EPA-XXX-YY-0000. U.S. Environmental Protection Agency, Washington, DC.

2011 NWCA Field Operations Manual Chapter 9. Algae
9 - 18

2011 NWCA Field Operations Manual Chapter 9. Algae
9 - 19
9.4 REFERENCE CARD Reference Card ALG-1 Flowchart of NWCA, Algae Sample Collection Activities

2011 NWCA Field Operations Manual Chapter 9. Algae
9 - 20
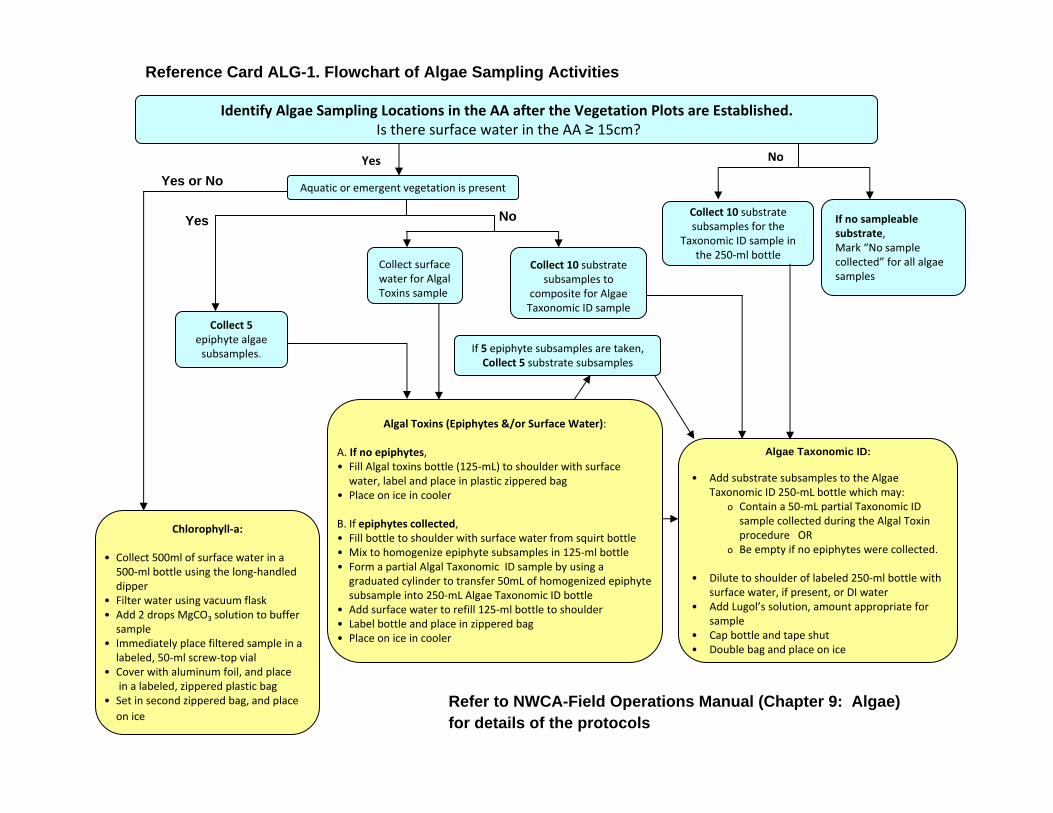
Identify Algae Sampling Locations in the AA after the Vegetation Plots are Established.Is there surface water in the AA ≥ 15cm?
Yes No
Chlorophyll‐a:
• Collect 500ml of surface water in a500‐ml bottle using the long‐handleddipper
• Filter water using vacuum flask • Add 2 drops MgCO3 solution to buffersample
• Immediately place filtered sample in alabeled, 50‐ml screw‐top vial
• Cover with aluminum foil, and placein a labeled, zippered plastic bag
• Set in second zippered bag, and place
on ice
Algae Taxonomic ID:
• Add substrate subsamples to the Algae Taxonomic ID 250‐mL bottle which may:
o Contain a 50‐mL partial Taxonomic ID sample collected during the Algal Toxin procedure OR
o Be empty if no epiphytes were collected.
• Dilute to shoulder of labeled 250‐ml bottle withsurface water, if present, or DI water
• Add Lugol’s solution, amount appropriate for sample
• Cap bottle and tape shut• Double bag and place on ice
Aquatic or emergent vegetation is present
Algal Toxins (Epiphytes &/or Surface Water):
A. If no epiphytes,• Fill Algal toxins bottle (125‐mL) to shoulder with surface water, label and place in plastic zippered bag
• Place on ice in cooler
B. If epiphytes collected, • Fill bottle to shoulder with surface water from squirt bottle• Mix to homogenize epiphyte subsamples in 125‐ml bottle• Form a partial Algal Taxonomic ID sample by using a graduated cylinder to transfer 50mL of homogenized epiphyte subsample into 250‐mL Algae Taxonomic ID bottle
• Add surface water to refill 125‐ml bottle to shoulder• Label bottle and place in zippered bag• Place on ice in cooler
Collect 5epiphyte algae subsamples.
Yes No
Collect surface water for Algal Toxins sample
Collect 10 substrate subsamples for the
Taxonomic ID sample in the 250‐ml bottle
If 5 epiphyte subsamples are taken, Collect 5 substrate subsamples
If no sampleable substrate,Mark “No samplecollected” for all algae samples
Collect 10 substrate subsamples to
composite for Algae Taxonomic ID sample
Reference Card ALG-1. Flowchart of Algae Sampling Activities
Refer to NWCA-Field Operations Manual (Chapter 9: Algae) for details of the protocols
Yes or No


2011 NWCA Field Operations Manual Chapter 9. Algae
9 - 23
9.5 EQUIPMENT LIST, DATA FORM, AND LABELS

2011 NWCA Field Operations Manual Chapter 9. Algae
9 - 24

ALGAE EQUIPMENT CHECKLIST
Algal Toxin and Taxonomic ID samples ____Long-handled dipper (Schematic in Chapter 8, Sect. 8.4) ____1, 250-mL plastic bottle (for Algae Taxonomic ID sample) ____1, 125-mL plastic bottle with screw lid (Algal Toxins bottle) ____60-mL syringe core sampler with beveled edge (for taking substrate subsample
for algal taxonomy) ____30-mL syringe (for sucking up algae off hard substrate) ____Small funnel ____Soft bristled toothbrush (need a new one for each site) ____Small knife or plastic card (to shear off excess core) ____Plant shears (for cutting vegetation stems for easier epiphytic algae collection) ____Lugol’s solution with aliquot dispenser ____Electrician’s tape for sealing taxonomic sample ____Squirt bottle for surface water Chlorophyll-a Sample ____Aluminum foil or foil squares (to wrap Chlorophyll-a sample vial) ____Centrifuge tube, 1, 50-mL screw cap type (for Chlorophyll-a filter) ____De-ionized (DI) water carbouy (2.5 gallon) filled with DI water ____DI squirt bottle ____Disposable flat forceps ____Graduated cylinder (100-mL) ____Hand-operated vacuum pump ____Magnesium Carbonate (MgCO3) saturated solution in dropper bottle ____500-mL plastic bottle ____Portable acrylic vacuum filter flask (e.g., Nalgene, Millipore) ____Tygon tubing (for connection vacuum pump to filter flask) ____Whatman GF/F 0.7 μm glass fiber filter (47-mm diam. filters to fit filter flask) ____Whirl-Pak & zippered plastic bags in which to place the Chlorophyll-a vial prior
to shipping General ____Ice chest with ice ____Soft pack cooler with frozen gel-packs (for longer distance hikes away from
vehicle) ____Data Form (Form ALG-1), Reference Card (RC ALG-1) & Labels ____No. 2 pencils & fine tipped permanent marker ____Nitrile gloves


FORM ALG-1: NWCA ALGAE
NWCA Algae 01/21/2011
Date: 2 0 1 1Site ID: NWCA11-
Algae Taxonomic ID Sample
Comments *Collected?
# ofSubsamples
# ofSubsamples
*Use comment field to explain: No measurement, suspect measurement or observation made.
Algal Toxins Sample
No Sample Collected
Total # of subsamples =
/ /
SAMPLE ID:
Y
# ofSubsamples
Biomass: Chlorophyll-a Sample No Sample Collected
Vol filtered(500 ml max)
Comments *
SAMPLE ID:
Collected? Comments *
Epiphytic Algae Y
No Sample Collected
Substrate
# ofSubsamples
Epiphytic Algae
SAMPLE ID:
Reviewed by (initial):
6285024681
DRAFT - NOT FOR U
SE IN FIE
LD


EXAMPLE SAMPLE LABELS
These labels will be included on an adhesive sheet with a set of labels for each site (see Chapter 2).


APPENDIX A
SHIPPING AND TRACKING GUIDELINES


NWCA Field Operations Manual Appendix A. Shipping and Tracking Guidelines
A - 1
I. Tracking Forms If you have access to a computer, fill out the electronic tracking forms available on the USEPA provided USB-drive in your base kit and at ftp://ftp.glec.com (user id: NWCA; password: swamp).
� Be careful to fill out all information on the electronic form(s) accurately and completely, including the Site ID.
� Email the tracking form to [email protected]. Be sure to save and print a copy of
all forms for your records.
If you cannot use a computer before shipping:
� Fill out the paper version of the appropriate tracking form. � Notify the Information Management Center (contact info on bottom of tracking form) by
faxing the form or leaving voice message with ALL the information on the form. � Include the original form in the shipping cooler or box and make a copy for your records.
1 - Tracking and Sample Status – Form T1
� Form T-1 is filled out for the samples that are shipped immediately after each sampling event, i.e., water chemistry, chlorophyll-a, soil isotopes, algal toxins, and sediment enzyme samples
� All of these samples will go together in one cooler to the USEPA lab in Corvallis, Oregon.
� Save the file of the completed electronic form according to the file naming convention on the bottom of the form.
� Email the file to [email protected] (address on bottom of the form) and print a copy of the form to include in the shipping cooler.
*Emailing the electronic Form T-1 serves as the “status report” for that sampling event 2 - Tracking (Batched and Retained Samples) (Forms T-2, T-3, T-4, T-5)
� BATCHED samples are held and shipped within 2 weeks. BATCHED SAMPLES ARE soil chemistry, bulk density, unknown plant specime ns, QA plant specimens, algae taxonomic ID and the Data Packet.
� Submit the appropriate electronic form via email when samples are shipped.
o Form T-2 : NWCA Unknown Plant Sample Tracking o Form T-3 : NWCA QA Plant Sample Tracking o Form T-4 : NWCA Soil Chemistry and Bulk Density Sample Tracking o Form T-5 : NWCA Tracking - Batched Sample (for use with algae taxonomic ID
samples and for the Data Packet).
� Save the file of the completed electronic form according to the file naming convention on the bottom of the form.

NWCA Field Operations Manual Appendix A. Shipping and Tracking Guidelines
A - 2
� Email the file to [email protected] (address on bottom of the form) and print a copy of the form to include in the shipping cooler.
� Use one tracking form for each set of samples in each shipping container shipped to a laboratory.
Status Report
� After sampling each site, the Field Crew Leader must file a status report with the Information Management Center and the Field Logistics Coordinator to track visits/samples and to report on Crew activities, problems, and requests.
� Emailing the electronic Form T-1 serves as the status report! � If Form T-1 cannot be emailed, faxing or phoning the information serves as the status
report. II. Overview of Shipping Guidelines
Before shipping, it is very important to handle each sample as directed in the Sample and Data Handling section of the appropriate chapter in the NWCA Field Operations Manual. General directions for sample processing, shipping and tracking are found in Chapter 2, Section 2.6.
� Store the samples as specified before shipping (Reference Card ST-1, Side A ). � Be aware of the holding times for each type of sample (Reference Card ST-1, Side B ):
o Water chemistry samples must be shipped within 24 hours of collection. o Chlorophyll-a, soil isotopes, algal toxins, and sediment enzymes samples will be sent
with the water chemistry samples because they are going to the same laboratory. o Soil Chemistry and Bulk Density Samples can be batched and shipped every 2 weeks. o Soil Pesticides will not be taken at every site; the site packet will have a collection
protocol and forms (the soil pesticide kit) indicating that this sample should be collected at the site.
o Plant specimens (unknowns and QA samples) must be pressed immediately upon collection and completely dried. After drying; they are sent in batches to the appropriate laboratory (see Chapter 5, Section 5.25 for more information on shipping and packing the plant specimens).
When ice is used for shipment (water chemistry, chlorophyll-a, sediment enzymes, soil isotopes, algal toxins)
� Ensure that the ice is fresh. � Double-bag the ice within 1-gallon self-sealing plastic bags. � Use white or clear bags and label with a dark indelible marker. Label all bags of ice as “ICE”
to prevent misidentification by couriers of any water leakage as a possible hazardous material spill.
� Line the cooler with a large, 30-gallon plastic bag. � Pack the entire cooler full of ice. � Place bagged samples and bags of ice inside the cooler liner and seal the liner. � Secure the cooler with strapping tape.

NWCA Field Operations Manual Appendix A. Shipping and Tracking Guidelines
A - 3
When soils are being shipped an APHIS Regulated Soils Permit must be displayed on the shipping package. In the site kit, there is a copy of the Soils Permit for samples sent to the USEPA lab in Corvallis, Oregon (soil isotopes and sediment enzymes). There is also a copy of the Soils Permit for samples (soil chemistry and bulk density) sent to the NRCS in Lincoln, NE.

NWCA Field Operations Manual Appendix A. Shipping and Tracking Guidelines
A - 4
III. Shipping Locations USEPA Lab, Corvallis, Oregon ( Water Chemistry, Chlorophyll-a, Soil Isotopes, Algal Toxins, Sediment Enzymes) Attn: Phil Monaco, Dynamac c/o U.S. EPA, NHEERL-WED 1350 SE Goodnight Ave Corvallis, OR 97333 USEPA Data Management Cetner, Corvallis Oregon (Data Packet) Attn: Marlys Cappaert, SRA c/o U.S. EPA, NHEERL-WED 200 S.W. 35th Street Corvallis, OR 97333 NRCS Soil Survey Research and Laboratory (Soil Chemistry and Bulk Density) NRCS Soil Survey Research and Laboratory National Soil Survey Center Natural Resources Conservation Service Federal Bldg., MS-41 100 Centennial Mall North Lincoln, NE 68508 EcoAnalyst (Algae and Vegetation Taxonomy) EcoAnalyst 1420 S. Blaine St., Suite 14, Moscow, ID 83843 USEPA Lab, Ft. Meade, MD (Soil Pesticide) Attn: Thuy L. Nguyen c/o EPA OPP Analytical Chemistry Laboratory Environmental Science Center 701 Mapes Road Ft. Meade, Maryland 20755-5350

Reference Card ST-1, Side A. NWCA Sample Packaging and Shipping Flowchart for Different Sample Types.
PRESS AND DRY
SPECIMENS
ALGAETAXONOMY
OVERNIGHT COURIER
Saturday Delivery OK
EcoAnalyst Lab(Or State Lab as Applicable)
CHLOR-aWATER CHEM
STORE ON BLUE OR WET ICE
SHIP IMMEDIATELY ON WET ICE (WITHIN 24 HOURS)
OVERNIGHT COURIER REQUIRED
Saturday Delivery OK
SOIL CHEMISTRY
&BULK DENSITY
EPA LabFt. Meade,
MD
EPA LabCorvallis, OR
(Or State Lab As Applicable)
GROUND COURIER
No SaturdayDelivery
SEDIMENTENZYMES
PRESERVE WITH
LUGOL’S SOLUTION
PLANTQA VOUCHERS
& UKNOWNSPECIES
SOIL ISOTOPE
SOIL PESTICIDES(If Collected)
ALGALTOXINS
NRCS LabLincoln, NE
KEEP SAMPLE
COOL (No Ice)
SHIP IN BATCHES(1-2 weeks)
DATA PACKET
EPA IM Team
Corvallis, OR
Refer to Section 2.6 and Appendix A of the 2011 NWC A Field Operations Manual for more detail on packag ing and shipping.

Reference Card ST-1, Side B. NWCA Summary of Sampl e Handling, Shipping Procedures, and Shipping Permits
SAMPLE STORAGE CONDITIONS
PACKAGING FOR SHIPMENT
HOLDING TIME SHIPPING PERMITS
Water Chemistry Blue or wet ice in field
Ship in cooler with wet ice
24 hours; ship these samples together to USEPA Lab, Corvallis, OR
None
Chlorophyll-a Blue or wet ice in field
Soil Isotopes Blue or wet ice in field
APHIS Regulated Soils
Sediment enzymes
Blue or wet ice in field; refrigerate to hold
24 hours; ship these samples together to USEPA Lab, Corvallis, OR Corvallis Lab holds and batch ships every 4 weeks to USEPA Lab Duluth, MN
APHIS Regulated Soils
Algal Toxins
Blue or wet ice in field; freeze to hold
24 hours; ship these samples together to USEPA Lab, Corvallis, OR Corvallis Lab holds and batch ships every 4 weeks to USGS Lab
None
Soil Pesticides
Blue or wet ice in field
Ship in cooler with wet ice
24 hours, ship immediately to Ft. Meade Lab
APHIS Regulated Soils
Soil Chemistry and Bulk Density
Keep samples in shade in field
Ship in cooler or sturdy container
Batch; ship every 2 weeks to NRCS, Lincoln, NE Lab
APHIS Regulated Soils
Algae Taxonomy Sample
Preserve with Lugol’s solution
Ship in sturdy container
Batch; ship every 2 weeks to EcoAnalyst Lab
None
Plant specimens
Dry in plant press, then store in dry conditions in newsprint folders
Ship dry samples in a sturdy container (see Chapter 5, Section 5.2.5)
Batch; ship every 2 weeks to EcoAnalyst Lab or to state lab, as appropriate
None
Data Packet NA Ship in a sturdy container
Batch; ship every 2 weeks to the Information Management Team in Corvallis, OR
None
Refer to Section 2.6 and Appendix A of the 2011 NWC A Field Operations Manual for more detail on packaging and shipping.

Appendix B
Target Invasive Alien Plant Species

Introduction..................................................................................................................................... 3
Eurasian Watermilfoil ................................................................................................................. 5 Waterhyacinth ............................................................................................................................. 6 Yellow Floating heart ................................................................................................................. 7 Giant Salvinia.............................................................................................................................. 8 Garlic Mustard ............................................................................................................................ 9 Poison Hemlock ........................................................................................................................ 11 Mile-a-Minute Weed................................................................................................................. 13 Birdsfoot Trefoil ....................................................................................................................... 14 Purple Loosestrife ..................................................................................................................... 15 Knotweed .................................................................................................................................. 16 Japanese Knotweed................................................................................................................... 17 Perennial Pepperweed............................................................................................................... 18 Giant Reed ................................................................................................................................ 19 Cheatgrass ................................................................................................................................. 20 Reed Canary Grass.................................................................................................................... 21 Common Reed .......................................................................................................................... 22 Johnsongrass ............................................................................................................................. 23 Kudzu........................................................................................................................................ 24 Multiflora Rose ......................................................................................................................... 25 Common Buckthorn.................................................................................................................. 26 Himalayan Blackberry .............................................................................................................. 27 Tamarisk ................................................................................................................................... 28
References..................................................................................................................................... 29

Introduction The NWCA is one in a series of statistically-valid National Aquatic Resource Surveys (NARS)
conducted by the Environmental Protection Agency (USEPA) in partnership with states, tribes,
and other federal agencies to provide the public with a comprehensive assessment of the
condition of the Nation’s waters. The NWCA objectives are to:
1. Produce a national report that describes the ecological condition of the nation’s
wetlands,
2. Assist states and tribes in the implementation of wetland monitoring and assessment
programs that will guide policy development and aid project decision-making, and
3. Advance the science of wetlands monitoring and assessment to support management
needs.
NWCA is an ecological assessment of wetlands based on chemical, physical, and biological
data. It employs a statistically-valid probability design stratified to allow estimates of the
condition of wetlands on national and regional scales. The NWCA responds to the long-term
goals outlined in USEPA’s current strategic plan (USEPA 2006a) to improve the Nation’s water
quality (Goal 2.3) and to protect, sustain, and restore the health of critical natural habitats and
ecosystems, including wetlands (Goal 4.3). Development of the NWCA builds on the
accomplishments of the U.S. Fish and Wildlife Service (USFWS) and their production of national
reports on status and trends in wetland acreage. When taken together, NWCA and the USFWS
Wetland Status and Trends (S&T) results will over time be used to measure progress toward
attainment of the national goal to increase the quantity and quality of the Nation’s wetlands.
These complementary assessments can influence how wetlands are managed at local, state,
and national scales.
Special consideration will be given to the analysis of alien invasive plants during data analysis.
The hypothesis is that reported wetland degradation will likely be explained, in part, by the
occurrence of alien invasive plants. Another hypothesis is that alien plant invasion is correlated
to buffer occurrence. The third hypothesis is that alien plant invasion is correlated to abiotic
(including structural) condition and other stressors in a wetland (e.g., water level fluctuation
beyond reference condition). A possible outcome of data analysis is policy consideration of the
role of wetland buffers in sustaining or improving wetland condition.
Richardson et al (2000) developed the following terminology, which the NWCA will use:
Alien Plants: any species outside of its native range.
Casual Alien Plants: escaped alien plant that is not self-sustaining in the new
environment.
Naturalized Plants: self perpetuating alien species.
Invasive Plants: alien species that invade aggressively.
Weeds: any plant that grows where it is not wanted, usually with negative ecologic or
economic impacts.
Transformers: invasive plants that change the ecosystem they have invaded.
Species selected for inclusion in the NWCA buffer protocol: 1) are defined as Invasive Plants
and Transformers (hereafter called Invasive Species) because of the impacts they have on
various ecosystems, 2) are readily identifiable in the field since the AB team will be responsible
for identifying them, and 3) have national distributions. The list of Invasive Species for use in the
NWCA buffer protocol is not meant to be comprehensive for any geographic location.
Invasive Species selected for inclusion in the buffer protocol will be used to inform the
prevalence of stressors on the landscape and their potential impacts on wetland condition.
Invasive Species are a major cause of global change; often promoting declines in biodiversity
and changes in ecosystem processes that lead to impairment of ecosystem services and to
economic losses (Dukes and Mooney 2004, Pimentel et al. 2005, Meyerson and Mooney 2007).
Numerous direct and indirect effects of Invasive Species on native vegetation and other
ecosystem components demonstrate their role as stressors and as indicators of reduced
ecosystem integrity. The Invasive Species list is not intended to be representative of all Invasive
Species present at a site. The vegetation data collected within the assessment area will
characterize the presence of all other Invasive Species present.

Eurasian Watermilfoil Myriophyllum spicatum L. Haloragaceae Synonyms: Spiked Watermilfoil Description
• Submersed aquatic plant • Rooted emergent stems reach 3 to 10 ft. (0.9-3m) in
length; can be up to 30 ft. (9.1 m) long. • Grows in dense mats • Bright green, finely dissected, whorled leaves • Delicate leaflets have feathery appearance • Native to Europe, Asia, and northern Africa
Impacts
• Dense mats restrict light availability • Causes decline in diversity and abundance of native plants • Displaces the native species of watermilfoil • Reduces habitat for fish spawning and feeding
Distribution
• Lakes, ponds, and other aquatic environments • Stagnant to slowly moving water • Can tolerate brackish conditions
States Where Invasive CA, CT, DE, ID, NH, NJ, NV, NY, OH, OR, PA, TN, VA, WA, WI
USDA PLANTS Database Bugwood.org

Wilfredo Robles, MSU
Bugwood.org
Waterhyacinth Eichhornia crassipes (Mart.) Solms Pontederiaceae Synonyms: Floating Water Hyacinth Description
• Free floating aquatic plant • Grows to 3 ft. (1 m) in height • Leaves are oval to elliptical, thick, up to 6 in.
(15 cm) wide and waxy with spongy petioles • Leaves curve inward at the edge • Showy blue-purple flowers are born on
upright spikes • Flowers have six petals with the uppermost having a
yellow patch • Native to South America
Impacts
• Reproduces mainly by vegetative means; quickly forms dense floating mats of vegetation
• Dense mats restrict light to the underwater environment and deplete the oxygen levels. Distribution
• Invades aquatic areas throughout the eastern and southern portions of the US • Invades lakes, ponds, rivers, marshes, and other types of wetland habitats
States Where Invasive AL, AR, AZ, CA, CO, CT, DE, FL, GA, HI, IL, KY, LA, MO, MS, NC, NH, NY, OR, SC, TN, TX, VA, WA

Yellow Floating heart Nymphoides peltata Menyanthaceae Synonyms: none Description
• Perennial, water-lily like plant • Carpets the water surface with long-
stalked, heart-shaped leaves • Showy five-petaled yellow flower
occur on long stalks and rise a few inches above the water surface
• Leaves average 3 to 10 cm in diameter Fruit capsule is 2.5 cm long and contains numerous seed
• Seeds are oval and flat (about 3.5 mm long) and hairy along their outer edges Impacts
• Grows in dense patches, excluding native species • Creates stagnant areas with low oxygen levels underneath the floating mats • Mats reduce fish habitat • Hinder recreation on the water
Distribution
States where invasive CT, ME, MA, OR, VT, WA
A. Mrkvicka, 2007
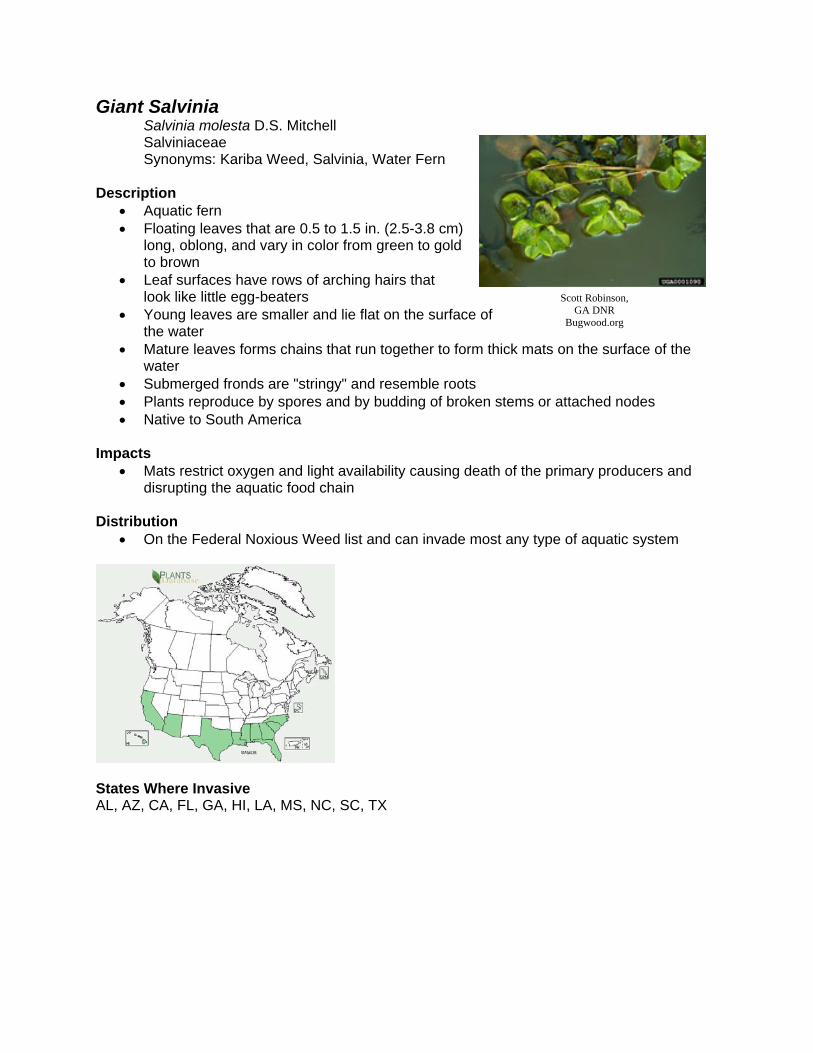
Scott Robinson, GA DNR
Bugwood.org
Giant Salvinia Salvinia molesta D.S. Mitchell Salviniaceae Synonyms: Kariba Weed, Salvinia, Water Fern Description
• Aquatic fern • Floating leaves that are 0.5 to 1.5 in. (2.5-3.8 cm)
long, oblong, and vary in color from green to gold to brown
• Leaf surfaces have rows of arching hairs that look like little egg-beaters
• Young leaves are smaller and lie flat on the surface of the water
• Mature leaves forms chains that run together to form thick mats on the surface of the water
• Submerged fronds are "stringy" and resemble roots • Plants reproduce by spores and by budding of broken stems or attached nodes • Native to South America
Impacts
• Mats restrict oxygen and light availability causing death of the primary producers and disrupting the aquatic food chain
Distribution
• On the Federal Noxious Weed list and can invade most any type of aquatic system
States Where Invasive AL, AZ, CA, FL, GA, HI, LA, MS, NC, SC, TX
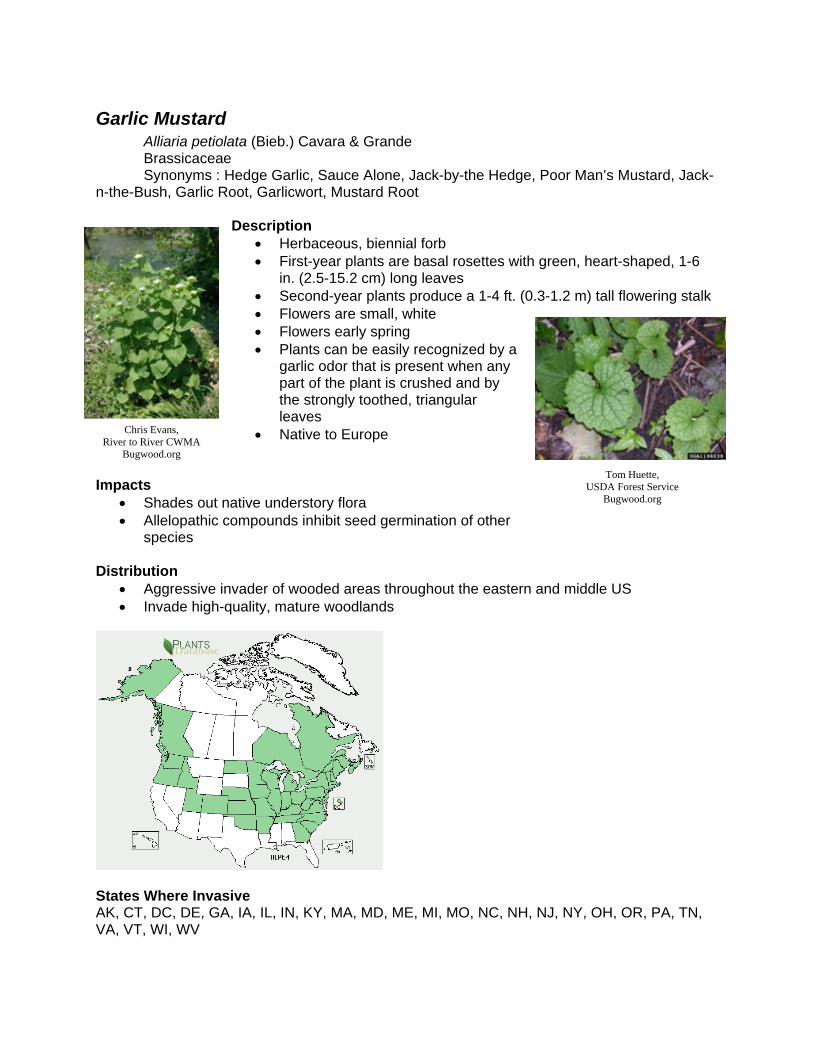
Tom Huette, USDA Forest Service
Bugwood.org
Chris Evans, River to River CWMA
Bugwood.org
Garlic Mustard Alliaria petiolata (Bieb.) Cavara & Grande Brassicaceae Synonyms : Hedge Garlic, Sauce Alone, Jack-by-the Hedge, Poor Man’s Mustard, Jack-n-the-Bush, Garlic Root, Garlicwort, Mustard Root
Description • Herbaceous, biennial forb • First-year plants are basal rosettes with green, heart-shaped, 1-6
in. (2.5-15.2 cm) long leaves • Second-year plants produce a 1-4 ft. (0.3-1.2 m) tall flowering stalk • Flowers are small, white • Flowers early spring • Plants can be easily recognized by a
garlic odor that is present when any part of the plant is crushed and by the strongly toothed, triangular leaves
• Native to Europe
Impacts • Shades out native understory flora • Allelopathic compounds inhibit seed germination of other
species Distribution
• Aggressive invader of wooded areas throughout the eastern and middle US • Invade high-quality, mature woodlands
States Where Invasive AK, CT, DC, DE, GA, IA, IL, IN, KY, MA, MD, ME, MI, MO, NC, NH, NJ, NY, OH, OR, PA, TN, VA, VT, WI, WV

Canada Thistle Cirsium arvense (L.) Scop. Asteraceae Synonyms: Californian Thistle, Creeping Thistle, Field Thistle Description
• Tall, erect, spiny, perennial • Grows to 4 ft. (1.2 m) tall • Extensive creeping rootstock • Leaves are lance-shaped, irregularly lobed, 2-6 in. (5-
15 cm) long with prickly margins • Stems are ridged and hairy • Flowers are purple to white and can be up to 0.5 in.
(1.8 cm) in diameter • June to August • Achene fruit 1 to 1.5 in. (2.5-3.8 cm) long with feathery
pappus • Native to Europe and Asia
Impacts
• It forms dense stands which can shade out and displace native vegetation • Once established it spreads rapidly and is difficult to remove
Distribution
• Canada thistle can invade a variety of open habitats including prairies, savannas, fields, pastures, wet meadows and open forests
States Where Invasive AK, AZ, CO, CT, DE, IA, ID, IN, MD, MI, MN, MO, MT, ND, NJ, OH, OR, PA, RI, SD, TN, VA, WA, WI, WV, WY
Leslie J. Mehrhoff, University of Connecticut
Bugwood.org
Steve Dewey, Utah State University
Bugwood.org
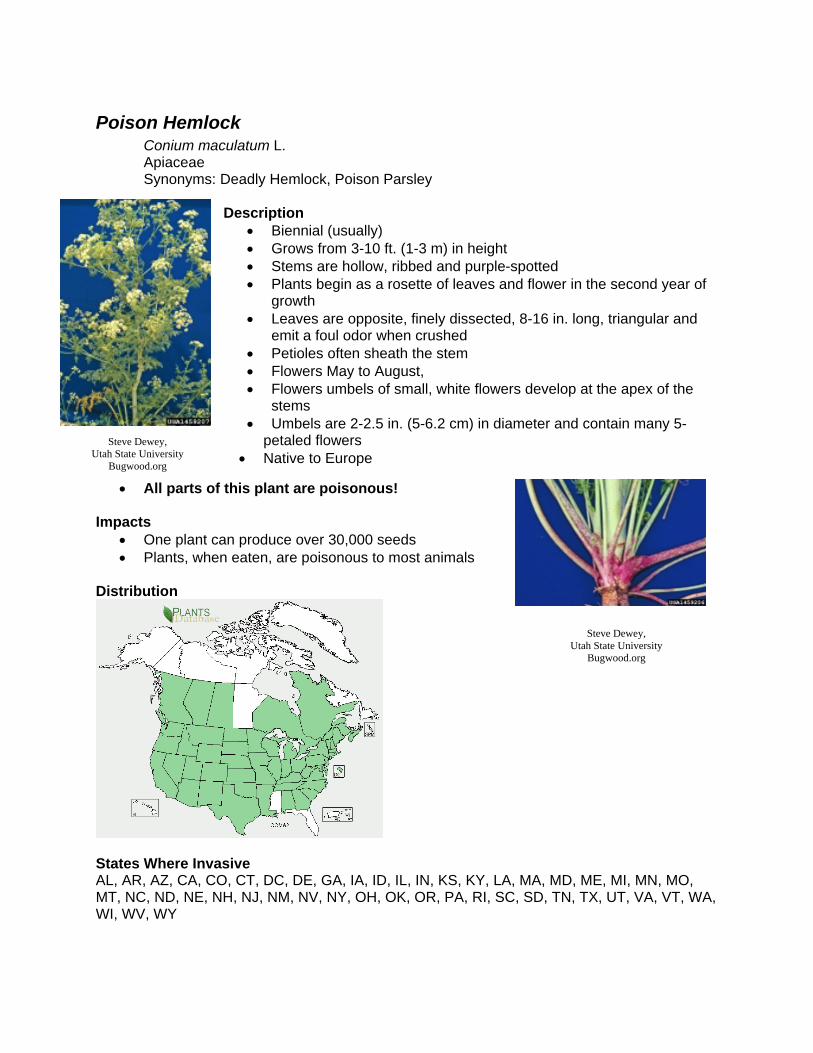
Steve Dewey, Utah State University
Bugwood.org
Poison Hemlock Conium maculatum L. Apiaceae Synonyms: Deadly Hemlock, Poison Parsley
Description
• Biennial (usually) • Grows from 3-10 ft. (1-3 m) in height • Stems are hollow, ribbed and purple-spotted • Plants begin as a rosette of leaves and flower in the second year of
growth • Leaves are opposite, finely dissected, 8-16 in. long, triangular and
emit a foul odor when crushed • Petioles often sheath the stem • Flowers May to August, • Flowers umbels of small, white flowers develop at the apex of the
stems • Umbels are 2-2.5 in. (5-6.2 cm) in diameter and contain many 5-
petaled flowers • Native to Europe
• All parts of this plant are poisonous! Impacts
• One plant can produce over 30,000 seeds • Plants, when eaten, are poisonous to most animals
Distribution
States Where Invasive AL, AR, AZ, CA, CO, CT, DC, DE, GA, IA, ID, IL, IN, KS, KY, LA, MA, MD, ME, MI, MN, MO, MT, NC, ND, NE, NH, NJ, NM, NV, NY, OH, OK, OR, PA, RI, SC, SD, TN, TX, UT, VA, VT, WA, WI, WV, WY
Steve Dewey, Utah State University
Bugwood.org

Richard Old, XID Services Inc.
Bugwood.org
Leafy Spurge Euphorbia esula L. Euphorbiaceae Synonyms: None
Description
• Erect, perennial, herbaceous plant
• Grows from 2 to 3.5 ft. (0.6-1.1 m) tall • Leaves are oval-shaped, smooth and 1-4 in. (2.5-
10.2 cm) long • Produces a milky sap if stem is broken or a leaf is removed • Stem is smooth and bluish-green • Flowers late spring (and sometimes the late summer) • Flowers are yellow, form clusters at the apex of the plant • Fruits are 3 lobed capsules that explode when mature, spreading seeds up to 15 ft. (4.6
m) • Native to Europe
Impacts
• Large infestations give the landscape a yellowish tinge due to the yellow bracts
• Overtakes large areas of land and displace native vegetation Distribution
• Invades prairies, pastures and other open areas • Major pest of national parks and nature preserves in the western US
States Where Invasive AZ, CA, CO, CT, DE, IA, ID, IL, IN, KS, MA, MD, ME, MI, MN, MO, MT, ND, NE, NH, NJ, NM, NV, NY, OH, OR, PA, SD, UT, VA, VT, WA, WI, WV, WY
Norman E. Rees, USDA Forest Service
Bugwood.org

Leslie J. Mehrhoff, University of Connecticut
Bugwood.org
Mile-a-Minute Weed Polygonum perfoliatum L. Polygonaceae Synonyms : Devil’s Tearthumb
Description
• Herbaceous, annual vine • Delicate stems are reddish, highly branched and covered with
small, curved spines • Circular, leafy structures (ocreae) surround the stem at the
base of the petioles • Leaves alternate, triangular, light green, 1-3 in. (2.5-7.6 cm)
wide and barbed on the undersurface • Flowers are small, white, inconspicuous, and arise from the
ocreae • Fruits, present in mid-July through the first frost, are metallic
blue and segmented with each segment containing a single black or reddish black seed • Native to Eastern Asia and the Philippines
Impacts
• Covers existing vegetation and restrict light availability, potentially killing plants below • Dense mats restrict establishment of new vegetation.
Distribution
• Invades disturbed areas in Oregon and portions of the northeastern US • Invades open disturbed areas such as fields, forest edges, roadsides, ditches and stream
banks
States Where Invasive CT, DC, DE, MA, MD, NJ, NY, PA, VA, WV

Birdsfoot Trefoil Lotus corniculatus L. Fabaceae Synonyms: Birdfoot, Deervetch, bloomfell, cat’s clover, crowtoes, ground honeysuckle Description
• Low-growing, perennial forb • Stems 2 ft. (0.6 m) long • Leaves are compound (with 5 oval to linear leaflets),
stipulate and alternate • Leaflets (upper 3) are 0.5 in. (1.3 cm) long and less than
1/8 in. (0.3 cm) wide; the lower two resemble leaf-like stipules
• Flowers May to August, • Flowers yellow, sweet pea-like in clusters of 2-8 on a
long peduncle (stalk) • Fruits are brown to black (1.5-3.5 cm) pods that occur in
head-like clusters • Native to Eurasia and North Africa
Distribution
• Occurs in pastures, roadsides, wetlands, disturbed grasslands and riparian areas
States Where Invasive AL, AR, AZ, CA, CO, CT, DC, DE, GA, IA, ID, IL, IN, KS, KY, MA, MD, ME, MI, MN, MO, MT, NC, ND, NE, NH, NJ, NM, NY, OH, OK, OR, PA, RI, SD, TN, TX, UT, VA, VT, WA, WI, WV, WY
David Cappaert, Michigan State University
Bugwood.org
Ohio States Weed Lab Archive, Ohio State University
Bugwood.org
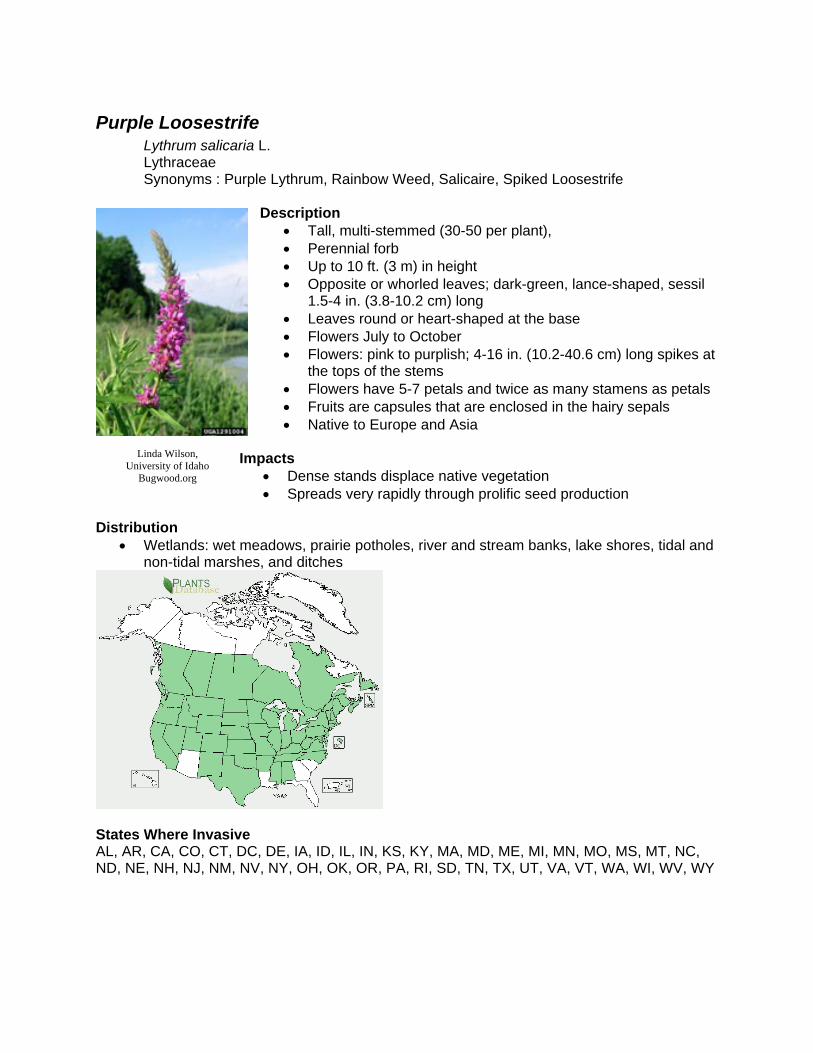
Linda Wilson, University of Idaho
Bugwood.org
Purple Loosestrife Lythrum salicaria L. Lythraceae Synonyms : Purple Lythrum, Rainbow Weed, Salicaire, Spiked Loosestrife
Description • Tall, multi-stemmed (30-50 per plant), • Perennial forb • Up to 10 ft. (3 m) in height • Opposite or whorled leaves; dark-green, lance-shaped, sessil
1.5-4 in. (3.8-10.2 cm) long • Leaves round or heart-shaped at the base • Flowers July to October • Flowers: pink to purplish; 4-16 in. (10.2-40.6 cm) long spikes at
the tops of the stems • Flowers have 5-7 petals and twice as many stamens as petals • Fruits are capsules that are enclosed in the hairy sepals • Native to Europe and Asia
Impacts
• Dense stands displace native vegetation • Spreads very rapidly through prolific seed production
Distribution
• Wetlands: wet meadows, prairie potholes, river and stream banks, lake shores, tidal and non-tidal marshes, and ditches
States Where Invasive AL, AR, CA, CO, CT, DC, DE, IA, ID, IL, IN, KS, KY, MA, MD, ME, MI, MN, MO, MS, MT, NC, ND, NE, NH, NJ, NM, NV, NY, OH, OK, OR, PA, RI, SD, TN, TX, UT, VA, VT, WA, WI, WV, WY

Knotweed Polygonum aviculare L. Polygonaceae Synonyms: Prostrate knotweed Description
• Germinating plant is grass-like with long, dark green leaves
• Forms a mat up to 2 feet wide on slender wiry stems
• Papery sheath at each node gives stems a knotted or swollen appearance
• Leaves alternate; small; narrowly oval; dull, bluish green; up to 1 ¼ inches long and 1/3 inch wide
• Flowers are small, borne in clusters in leaf axils • Flower buds are purplish opening to white to yellow flowers during • Flowers June through October
Impacts
• Dense mats outcompetes native vegetation Distribution
• Found in compacted, infertile soils or thin turn in the sun
States Where Invasive AK, AL, AR, AZ, CO, CT, DC, DE, FL, GA, HI, IA, ID, IL, IN, KS, KY, LA, MA, MD, ME, MI, MN, MO, MS, MT, NC, ND, NE, NH, NJ, NM, NV, NY, OH, OK, OR, PA, RI, SC, SD, TN, TX, UT, VA, VT, WA, WI, WV, WY
WSA Invasive Species Document

Jan Samanek, State Phytosanitary Administration
Bugwood.org
Jack Ranney, University of Tennessee
Bugwood.org
Japanese Knotweed Polygonum cuspidatum Siebold & Zucc. Polygonaceae Synonyms: Fleeceflower, Japanese Bamboo Description
• Dense shrub • Grows to 10 ft. (3 m) • Semi-woody stem is hollow with enlarged nodes • Leaves are alternate, 6 in. (15.2 cm) long, 3-4 in. (7.6-10 cm) wide and broadly-ovate • Flowers late summer • Flowers small, greenish-white in long panicles in
the axils of the leaves • Plants are dioecious (male and female flowers
occur on separate plants) • Native to eastern Asia
Impacts
• Reproduction occurs both vegetatively (rhizomes) and seeds,
• Extremely hard to eradicate • Dense patches shade and displace other plant life and reduce wildlife habitat
Distribution
• Invades disturbed areas with high light, such as roadsides and stream banks
States Where Invasive AK, CT, DC, DE, GA, IN, MA, MD, ME, MI, MO, NC, NH, NJ, NY, OH, OR, PA, RI, TN, VA, VT, WA, WI, WV

Leslie J. Mehrhoff, University of Connecticut
Bugwood.org
Steve Dewey, Utah State University
Bugwood.org
Perennial Pepperweed Lepidium latifolium L. Brassicaceae Synonyms: Virginia Pepperweed, Broadleaved Pepperweed, Tall Whitetop, Broadleaved Peppergrass
Description • Perennial forb • Grow from 1-5 ft. (0.3-1.5 m) in height • Rosette leaves are long petiolate 4-12 in. (10-30cm) long and 1-2 in. (2.5-5 cm) wide and
toothed • Cauline (stem) leaves are alternate, 1-3 in. (2.5-7.6 cm) long and oblong • Flowers late spring to summer • Inflorescences are flat, dense clusters that develop at the
apex of the flowering stem • Individual flowers are 4-petaled and white • Fruit are round to oval, hairy pod that is 1/16 in. (1.5 mm)
in diameter • Native to Eurasia
Impacts
• Adapts readily to natural and disturbed wetlands. • Creates large monospecific stands that displace native
plants and animals. Distribution
• Occurs in coastal wetlands, riverbanks, marshes, rangelands and roadsides
States Where Invasive CA, CO, CT, OR UT, WA

Chris Evans, River to River CWMA
Bugwood.org
David J. Moorhead, University of Georgia
Bugwood.org
James H. Miller USDA Forest Service
Bugwood.org
Giant Reed Arundo donax L. Poaceae Synonyms : Elephant Grass
Description
• Perennial grass • Grows up to 20 ft. (6.1 m) in
height • Stem resembles a corn stalk and has long, flat leaves up to 1.5
ft. (0.5 m) long • Flowers late summer to early fall • Large, dense flower plumes develop at the tops of the culms • Plums can grow up to 3 ft. (0.9 m) in length • Native to India
Impacts • Suppresses and removes native vegetation very easily • Reduces wildlife habitat, increases fire risks and interferes with
flood control Distribution
• Invades wetlands such as ditches, stream banks and lake shores
States Where Invasive AZ, CA, GA, MD, NM, NV, TX, VA
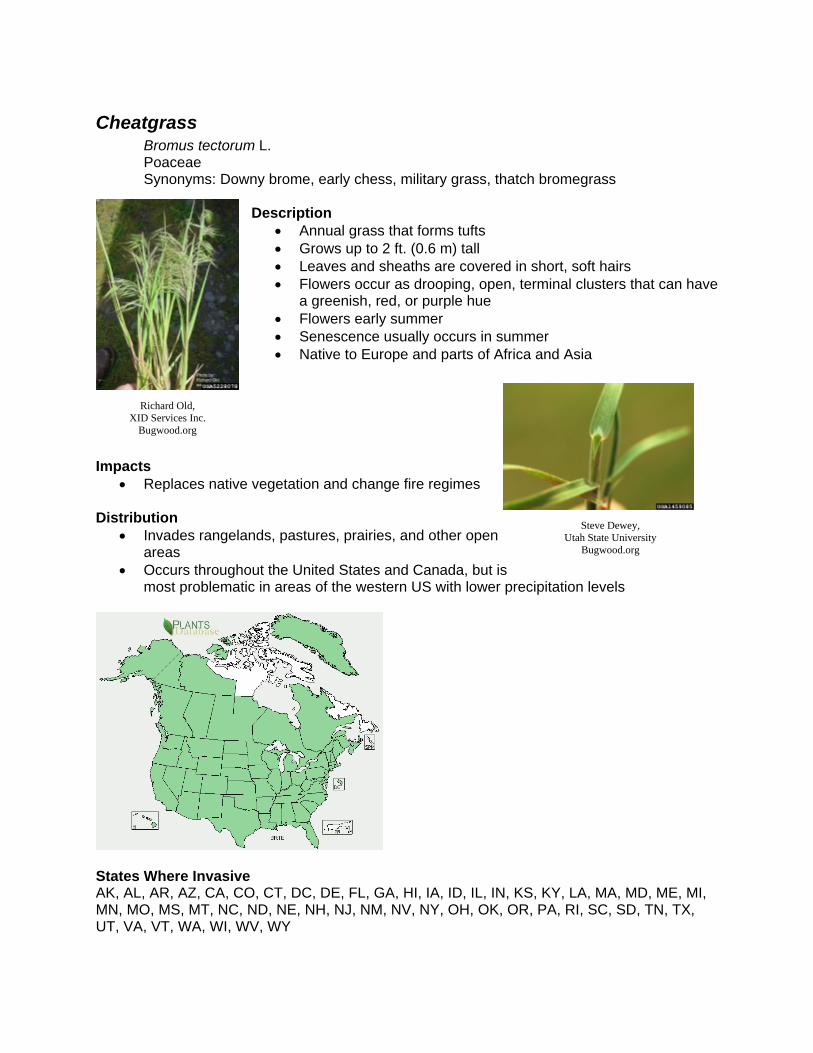
Steve Dewey, Utah State University
Bugwood.org
Richard Old, XID Services Inc.
Bugwood.org
Cheatgrass Bromus tectorum L. Poaceae Synonyms: Downy brome, early chess, military grass, thatch bromegrass
Description
• Annual grass that forms tufts • Grows up to 2 ft. (0.6 m) tall • Leaves and sheaths are covered in short, soft hairs • Flowers occur as drooping, open, terminal clusters that can have
a greenish, red, or purple hue • Flowers early summer • Senescence usually occurs in summer • Native to Europe and parts of Africa and Asia
Impacts • Replaces native vegetation and change fire regimes
Distribution
• Invades rangelands, pastures, prairies, and other open areas
• Occurs throughout the United States and Canada, but is most problematic in areas of the western US with lower precipitation levels
States Where Invasive AK, AL, AR, AZ, CA, CO, CT, DC, DE, FL, GA, HI, IA, ID, IL, IN, KS, KY, LA, MA, MD, ME, MI, MN, MO, MS, MT, NC, ND, NE, NH, NJ, NM, NV, NY, OH, OK, OR, PA, RI, SC, SD, TN, TX, UT, VA, VT, WA, WI, WV, WY

Richard Old, XID Services Inc.
Bugwood.org
Richard Old, XID Services Inc.
Bugwood.org
Reed Canary Grass Phalaris Arundinacea L. Poaceae Synonyms: Reed Canarygrass Description
• Cool-season perennial grass • Grows to 6 ft. (1.7 m) tall • Leaf blades are flat, 1-4 ft.
(0.3-1.2 m) long, up to 3/4 in. (1.9 cm) wide, glabrous and taper gradually
• Ligule is membranous (transparent) and long • Flower/seed heads can be green, purple, or brown in color
and usually 3-6 in. (7.6-15.2 cm) in length. • Flowers May to July • Variable in morphology, so characteristics may depend upon
the habitat • Native to Europe and possibly parts of Asia
Impacts • Spreads by seeds and rhizomes and can exclude all other vegetation • Extremely difficult to eradicate once established
Distribution
• Quickly dominates wetlands, ditches, prairie potholes and other sites with moist soil
States Where Invasive AK, AL, AR, AZ, CA, CO, CT, DC, DE, IA, ID, IL, IN, KS, KY, MA, MD, ME, MI, MN, MO, MT, NC, ND, NE, NH, NJ, NM, NV, NY, OH, OK, OR, PA, RI, SD, TN, UT, VA, VT, WA, WI, WV, WY
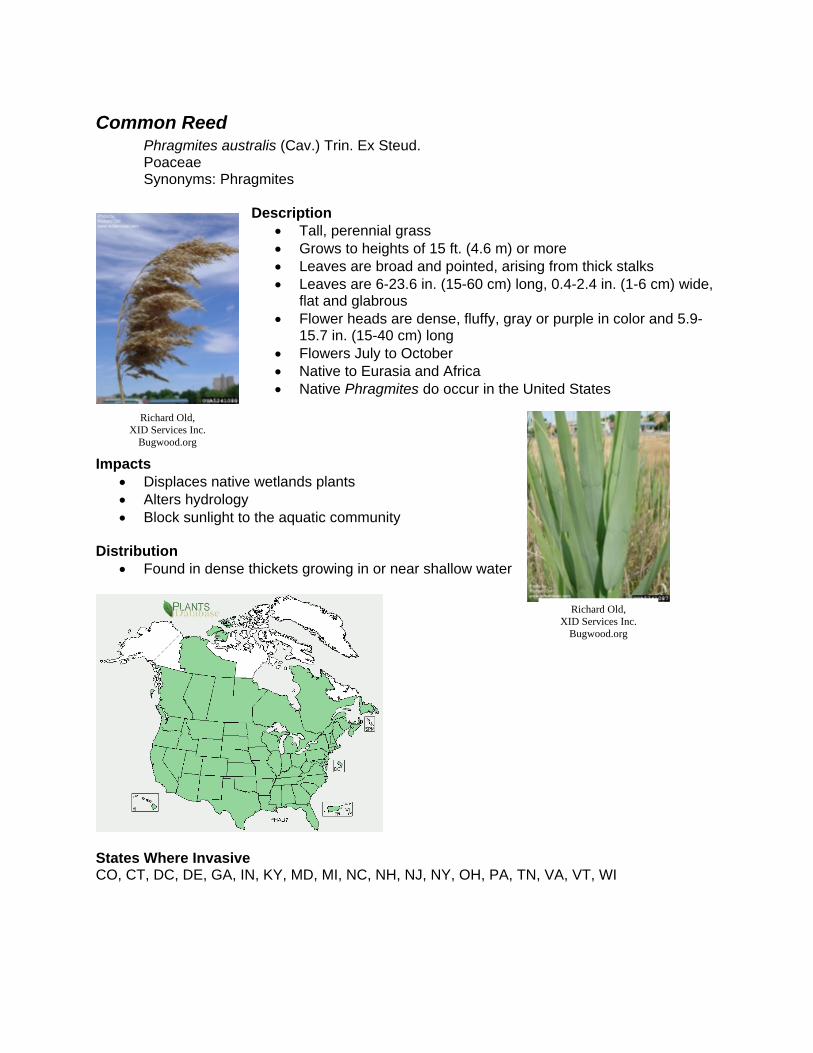
Richard Old, XID Services Inc.
Bugwood.org
Richard Old, XID Services Inc.
Bugwood.org
Common Reed Phragmites australis (Cav.) Trin. Ex Steud. Poaceae Synonyms: Phragmites
Description • Tall, perennial grass • Grows to heights of 15 ft. (4.6 m) or more • Leaves are broad and pointed, arising from thick stalks • Leaves are 6-23.6 in. (15-60 cm) long, 0.4-2.4 in. (1-6 cm) wide,
flat and glabrous • Flower heads are dense, fluffy, gray or purple in color and 5.9-
15.7 in. (15-40 cm) long • Flowers July to October • Native to Eurasia and Africa • Native Phragmites do occur in the United States
Impacts • Displaces native wetlands plants • Alters hydrology • Block sunlight to the aquatic community
Distribution
• Found in dense thickets growing in or near shallow water
States Where Invasive CO, CT, DC, DE, GA, IN, KY, MD, MI, NC, NH, NJ, NY, OH, PA, TN, VA, VT, WI

James H. Miller, USDA Forest Service
Bugwood.org
Steve Dewey, Utah State University
Bugwood.org
Johnsongrass Sorghum halepense (L.) Pers. Poaceae Synonyms: None
Description
• Tall (up to 8 ft. [2.4 m]), rhizomatous, perennial grass
• Leaves 2 ft. (0.6 m) long, lanceolate and arranged alternately along a stout, hairless, somewhat upward branching stem
• Leaves have distinct, white midribs • Flowers occur in a loose, spreading, purplish panicle • Native to the Mediterranean region
Impacts
• Forms dense colonies which displace native vegetation and restrict tree seedling establishment
Distribution
• Invades open areas throughout the United States. • Adapted to a wide variety of habitats including open forests, old fields, ditches and
wetlands
States Where Invasive AL, AR, AZ, CA, CO, CT, DC, DE, FL, GA, HI, IA, ID, IL, IN, KS, KY, LA, MA, MD, MI, MO, MS, MT, NC, ND, NE, NH, NJ, NM, NV, NY, OH, OK, OR, PA, RI, SC, SD, TN, TX, UT, VA, VT, WA, WI, WV, WY

Chuck Bargeron, University of Georgia
Bugwood.org
Kerry Britton, USDA Forest Service
Bugwood.org
Kudzu Pueraria montana (Lour.) Merr. Fabacaea Synonyms: None
Description • Climbing, deciduous vine • Grows over 100 ft. (30.5 m) • Leaves are alternate, compound (with three, usually lobed,
leaflets), hairy and up to 5.4 in. (15 cm) long • Flowers midsummer • Flowers 0.5 in. (1.3 cm) long, purple, fragrant • Flowers hang, in clusters, in the axils of the leaves • Fruit are brown, hairy, flat, 3 in. (7.6 cm) long, 0.3 in. (0.8 cm)
wide seed pods • Native to Asia
Impacts • Grows over, smothers and kills all other
vegetation, including trees Distribution
• Invades open, disturbed areas such as roadsides, right-of-ways, forest edges and old fields
States Where Invasive AL, AR, CT, DC, DE, FL, GA, HI, IL, IN, KS, KY, LA, MA, MD, ME, MO, MS, NC, NE, NJ, NY, OH, OK, OR, PA, SC, TN, TX, VA, WA, WV

Chris Evans, River to River CWMA
Bugwood.org
WSA Invasive Species Document
Multiflora Rose Rosa multiflora Thunb. Ex Murr. Rosaceae Synonyms: None Description
• Multi-stemmed, thorny, perennial shrub • Grows up to 15 ft. (4.6 m) tall • Stems are arching canes which are round in cross section and
have stiff, curved thorns • Leaves are pinnately compound with 7-9 leaflets • Leaflets are oblong, 1-1.5 in. (2.5-3.8 cm) long and have serrated edges • The fringed petioles • Small, white to pinkish, 5-
petaled flowers occur abundantly in clusters
• Fruit are small, red, rose hips that remain on the plant throughout the winter.
• Native to Asia Impacts
• Restricts human, livestock, and wildlife movement and displaces native vegetation
Distribution
• Forms impenetrable thickets in pastures, fields and forest edges
States Where Invasive AR, CA, CO, CT, DC, DE, GA, IL, IN, KY, LA, MA, MD, ME, MI, MO, MS, NC, NH, NJ, NY, OH, OR, PA, RI, SC, TN, VA, VT, WI, WV
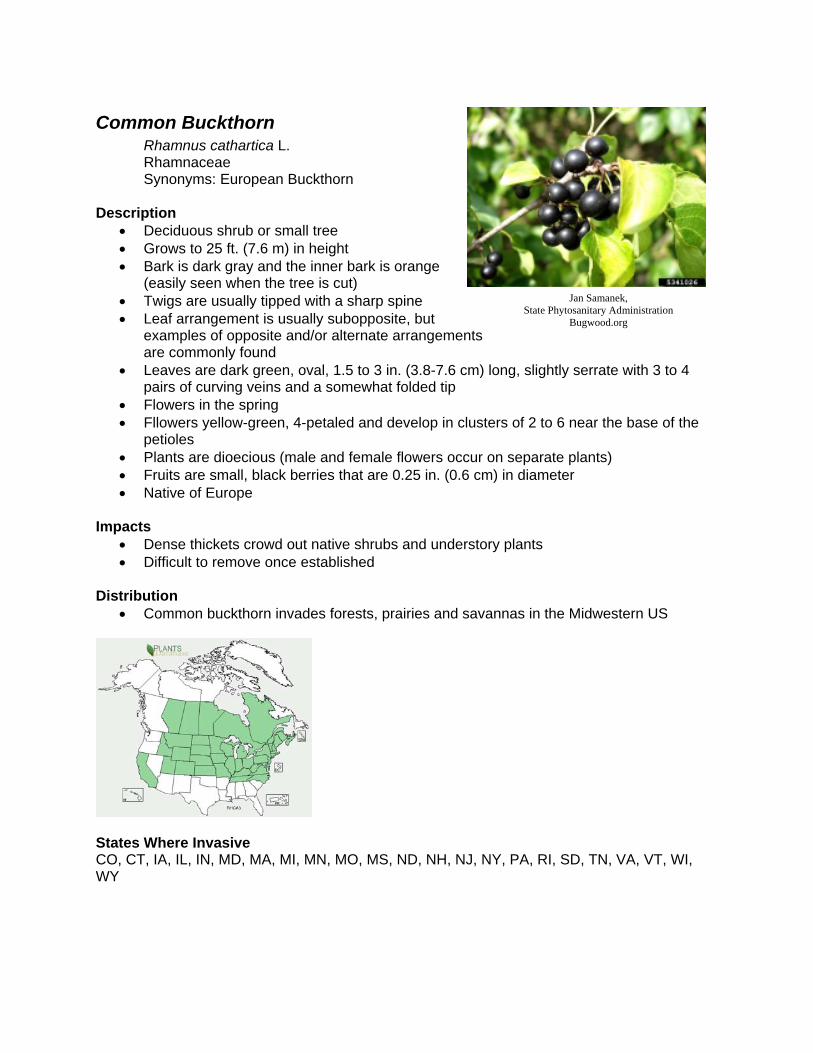
Jan Samanek, State Phytosanitary Administration
Bugwood.org
Common Buckthorn Rhamnus cathartica L. Rhamnaceae Synonyms: European Buckthorn Description
• Deciduous shrub or small tree • Grows to 25 ft. (7.6 m) in height • Bark is dark gray and the inner bark is orange
(easily seen when the tree is cut) • Twigs are usually tipped with a sharp spine • Leaf arrangement is usually subopposite, but
examples of opposite and/or alternate arrangements are commonly found
• Leaves are dark green, oval, 1.5 to 3 in. (3.8-7.6 cm) long, slightly serrate with 3 to 4 pairs of curving veins and a somewhat folded tip
• Flowers in the spring • Fllowers yellow-green, 4-petaled and develop in clusters of 2 to 6 near the base of the
petioles • Plants are dioecious (male and female flowers occur on separate plants) • Fruits are small, black berries that are 0.25 in. (0.6 cm) in diameter • Native of Europe
Impacts
• Dense thickets crowd out native shrubs and understory plants • Difficult to remove once established
Distribution
• Common buckthorn invades forests, prairies and savannas in the Midwestern US
States Where Invasive CO, CT, IA, IL, IN, MD, MA, MI, MN, MO, MS, ND, NH, NJ, NY, PA, RI, SD, TN, VA, VT, WI, WY

Richard Old, XID Services Inc.
Bugwood.org
Richard Old, XID Services Inc.
Bugwood.org
Himalayan Blackberry Rubus armeniacus Focke Rosaceae Synonyms: None Description
• Perennial shrub • Stems grow to 15 ft. (4.6 m) before arching and
then trailing over the ground for up to 40 ft. (12.2 m)
• As stems touch the ground they root at the nodes, producing a dense thicket • Leaves of the prima cane (first year shoots) are 2.8-7.9 in. (7-20 cm) long and palmately
compound with 5 leaflets • No flowers are produced on the first year's growth • The second year several side shoots are
produced (flora canes) having smaller leaves with 3 leaflet
• Leaflets are oval and toothed with thorns along the underside of the mid-rib
• Flowers late spring to early summer • Flowers white to pale pink flowers develop on
the flora canes • Flowers have 5 petals, numerous stamens
and are 0.8-1 in. (2-2.5 cm) in diameter • Fruits are an aggregate of drupelets that are
black, when mature, and 0.5-0.8 in. (1.2-2 cm) in diameter
• Native to Eurasia Distribution
• Occurs in pastures, riparian areas, wastelands, fence lines and right-of-ways
States Where Invasive AL, AR, AZ, CA, CO, DC, DE, HI, ID, IL, KY, MA, MO, MT, NJ, NM, NV, OH, OR, PA, TN, UT, VA, WA
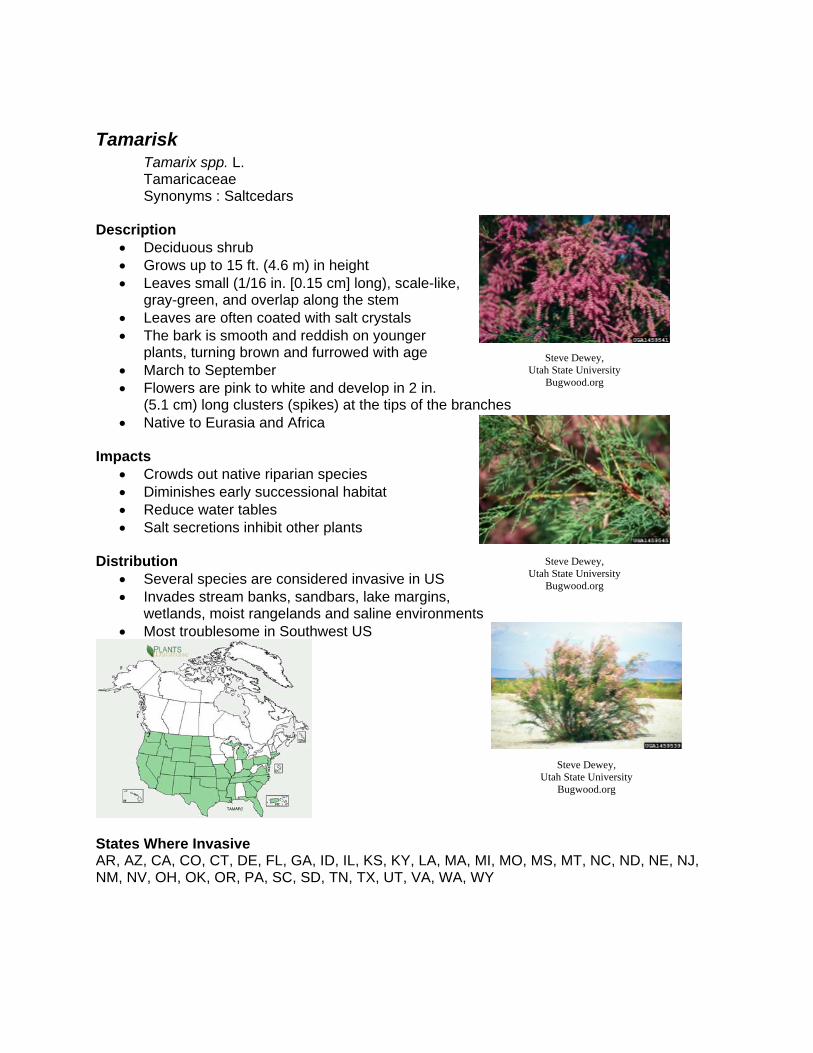
Steve Dewey, Utah State University
Bugwood.org
Steve Dewey, Utah State University
Bugwood.org
Steve Dewey, Utah State University
Bugwood.org
Tamarisk Tamarix spp. L. Tamaricaceae Synonyms : Saltcedars Description
• Deciduous shrub • Grows up to 15 ft. (4.6 m) in height • Leaves small (1/16 in. [0.15 cm] long), scale-like,
gray-green, and overlap along the stem • Leaves are often coated with salt crystals • The bark is smooth and reddish on younger
plants, turning brown and furrowed with age • March to September • Flowers are pink to white and develop in 2 in.
(5.1 cm) long clusters (spikes) at the tips of the branches • Native to Eurasia and Africa
Impacts
• Crowds out native riparian species • Diminishes early successional habitat • Reduce water tables • Salt secretions inhibit other plants
Distribution
• Several species are considered invasive in US • Invades stream banks, sandbars, lake margins,
wetlands, moist rangelands and saline environments • Most troublesome in Southwest US
States Where Invasive AR, AZ, CA, CO, CT, DE, FL, GA, ID, IL, KS, KY, LA, MA, MI, MO, MS, MT, NC, ND, NE, NJ, NM, NV, OH, OK, OR, PA, SC, SD, TN, TX, UT, VA, WA, WY
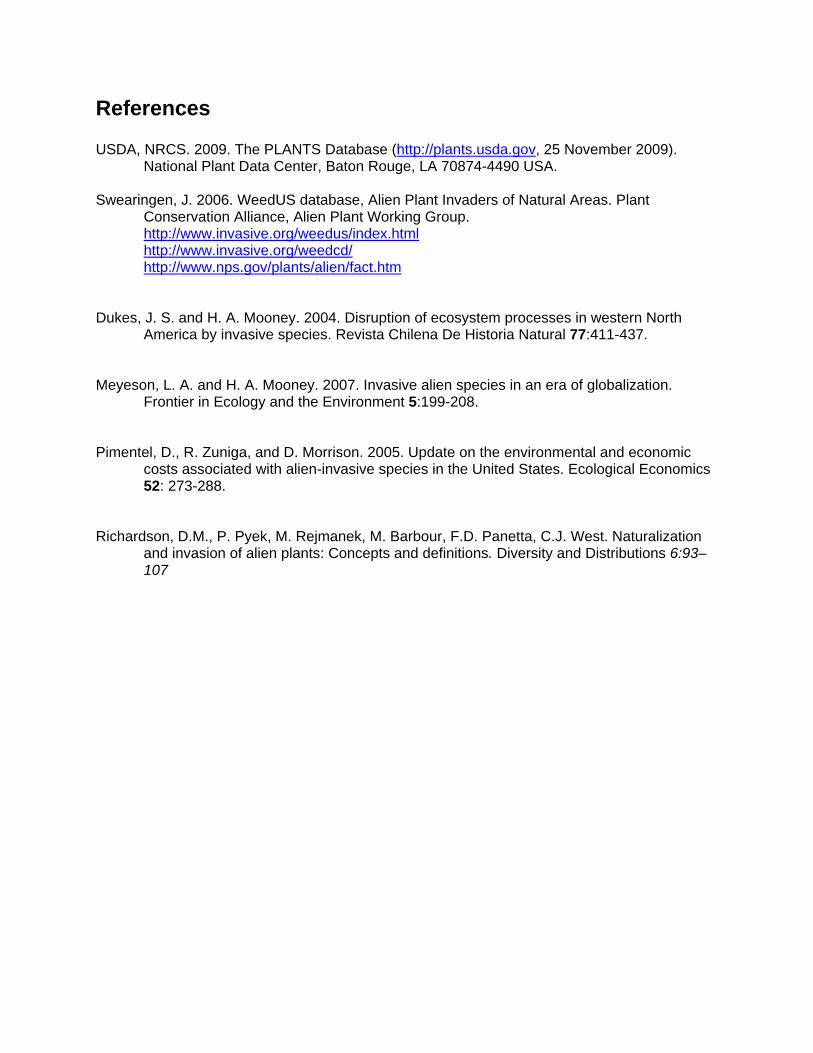
References USDA, NRCS. 2009. The PLANTS Database (http://plants.usda.gov, 25 November 2009).
National Plant Data Center, Baton Rouge, LA 70874-4490 USA. Swearingen, J. 2006. WeedUS database, Alien Plant Invaders of Natural Areas. Plant
Conservation Alliance, Alien Plant Working Group. http://www.invasive.org/weedus/index.html http://www.invasive.org/weedcd/ http://www.nps.gov/plants/alien/fact.htm
Dukes, J. S. and H. A. Mooney. 2004. Disruption of ecosystem processes in western North
America by invasive species. Revista Chilena De Historia Natural 77:411-437. Meyeson, L. A. and H. A. Mooney. 2007. Invasive alien species in an era of globalization.
Frontier in Ecology and the Environment 5:199-208. Pimentel, D., R. Zuniga, and D. Morrison. 2005. Update on the environmental and economic
costs associated with alien-invasive species in the United States. Ecological Economics 52: 273-288.
Richardson, D.M., P. Pyek, M. Rejmanek, M. Barbour, F.D. Panetta, C.J. West. Naturalization
and invasion of alien plants: Concepts and definitions. Diversity and Distributions 6:93–107

Appendix C
Vegetation Resources
List of Potentially useful resources, not intended to be exhaustive

I. Nomenclatural Source
USDA Plants: http://plants.usda.gov/java/
II. Regional Floras and Field Guides Note that some of the floras and field guides listed below are not regional in scope and
only apply to the areas listed (i.e., for a particular state).
Region I Peterson, R.T. 1968. A Field Guide to Wildflowers of Northeastern and North-Central North
America. Houghton Mifflin, Boston. 420 pp. Gleason and Cronquist. 1963. Manual of the Vascular Plants of Northeastern United States and
Adjacent Canada. Van Nostrand, Princeton NJ. 910 pp. Gleason, H.A., N.H. and P.K. Holmgren. 1998. Illustrated Companion to Gleason and Cronquit’s
Manual: Illustrations of the Vascular Plants of Northeastern United States and Adjacent Canada. New York Botanical Garden, New York. 937 pp.
Common Wetland Delineation Sedges of the Northeast - Robert Lichvar Knobel, E. 1977. Field Guide to the Grasses, Sedges, and Rushes of the United States. Dover
Publications. 96 pp. Brown, L. 1992.Grasses: An Identification Guide. Houghton Mifflin Harcourt. 256 pp. Petrides, G.A and R.T. Peterson. 1973. A Field Guide to Trees and Shrubs: Northeastern and
North-Central United States and Southeastern and South-Central Canada. 464 pp. Farnsworth, A., B. Cobb, and C. Lowe. 2005. Peterson Field Guide to Ferns, Second Edition:
Northeastern and Central North America. Houghton Mifflin Harcourt. 440 pp. Newcomb, L. 1989. Newcomb's Wildflower Guide. Little, Brown and Company. 490 pp. Ballard, B.D, H.L. Whittier, C.A. Nowark. 2004. Northeastern Shrub and Short Tree
Identification. SUNY. 120 pp. Hallowell, A.C, and B.G. Hallowell. 2001. Fern Finder: A Guide to Native Ferns of Central and
Northeastern United States and Eastern Canada. Wilderness Press. 64 pp. Semple, J. 1999. The Goldenrods of Ontario: Solidago L. and Euthamia Nutt. 3rd Edition.
University of Waterloo Biology Department. 90 pp.

McQueen, C.B. 1990. Field Guide to the Peat Mosses of Boreal North America. University Press of New England. 163 pp.
Gleason, H.A. 1968. The new Britton and Brown illustrated flora of the Northeastern United
States and adjacent Canada. Macmillan Pub Co. New York Botanical Garden. 1098 pp. Campbell, C.S. 1978. Winter Keys to Woody Plants of Maine. University of Maine Press. 52 pp. Region II Peterson, R.T. 1968. A Field Guide to Wildflowers of Northeastern and North-Central North
America. Houghton Mifflin, Boston. 420 pp. Gleason and Cronquist. 1963. Manual of the Vascular Plants of Northeastern United States and
Adjacent Canada. Van Nostrand, Princeton NJ. 910 pp. Gleason, H.A., N.H. and P.K. Holmgren. 1998. Illustrated Companion to Gleason and Cronquit’s
Manual: Illustrations of the Vascular Plants of Northeastern United States and Adjacent Canada. New York Botanical Garden, New York. 937pp.
Region III Peterson, R.T. 1968. A Field Guide to Wildflowers of Northeaster and North-Central North
America. Houghton Mifflin, Boston. 420 pp. Gleason and Cronquist. 1963. Manual of the Vascular Plants of Northeastern United States and
Adjacent Canada. Van Nostrand, Princeton NJ. 910 pp. Gleason, H.A., N.H. and P.K. Holmgren. 1998. Illustrated Companion to Gleason and Cronquit’s
Manual: Illustrations of the Vascular Plants of Northeastern United States and Adjacent Canada. New York Botanical Garden, New York. 937pp.
Region IV Eastman, J. 1995. The book of swamp and bog. Stackpole Books, Mechanicsburg, PA. Foote, L.E., S. B. Jones, Jr. 2005. Native shrubs and woody vines of the Southeast. Timber
Press, OR. Godfrey, R.K. 1989. Trees, Shrubs, and Woody Vines of Northern Florida and Adjacent Georgia
and Alabama. The University of Georgia Press (http://www.ugapress.uga.edu/index.php/ugapressbook/trees_shrubs/)
Godfrey, R.K., J.W. Wooten. 1979. Aquatic and Wetland Plants of Southeastern United States, Monocotyledons. The University of Georgia Press (http://www.ugapress.uga.edu/index.php/ugapressbook/aquatic_and_wetland_plants/)
Godfrey, R.K., J.W. Wooten. 1981. Aquatic and Wetland Plants of Southeastern United States,
Dicotyledons. The University of Georgia Press (http://www.ugapress.uga.edu/index.php/ugapressbook/aquatic_and_wetland_plants1/)
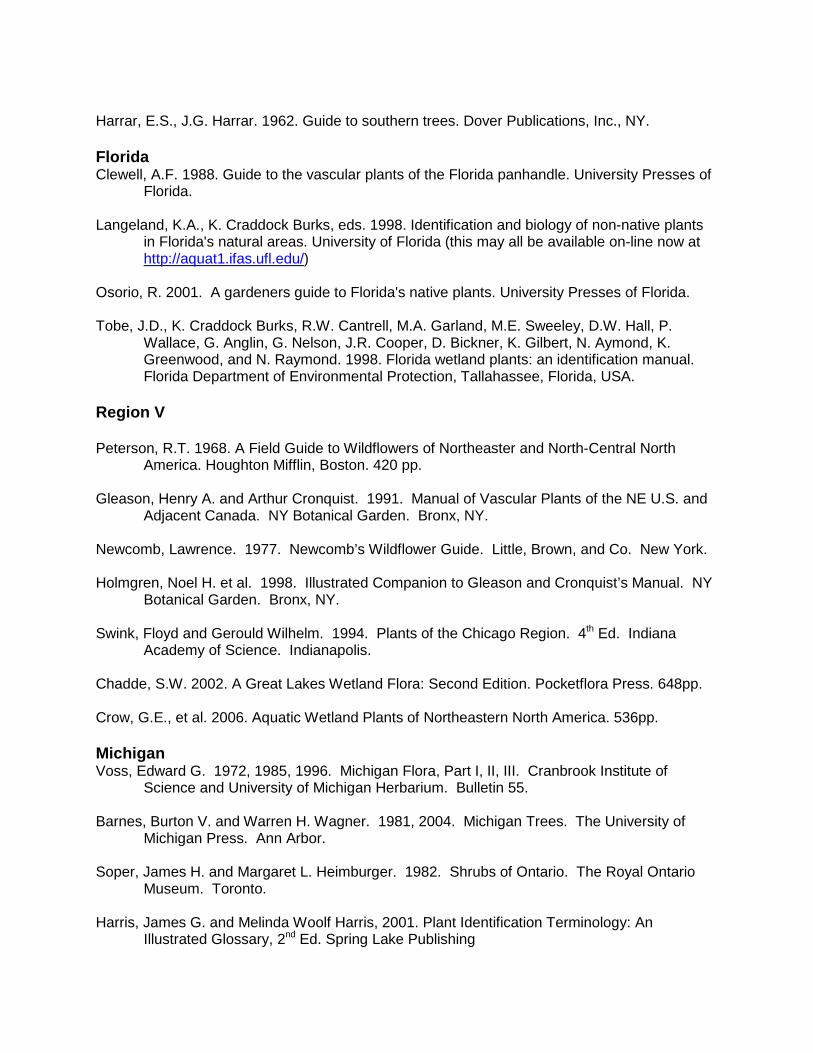
Harrar, E.S., J.G. Harrar. 1962. Guide to southern trees. Dover Publications, Inc., NY. Florida Clewell, A.F. 1988. Guide to the vascular plants of the Florida panhandle. University Presses of
Florida. Langeland, K.A., K. Craddock Burks, eds. 1998. Identification and biology of non-native plants
in Florida's natural areas. University of Florida (this may all be available on-line now at http://aquat1.ifas.ufl.edu/)
Osorio, R. 2001. A gardeners guide to Florida's native plants. University Presses of Florida. Tobe, J.D., K. Craddock Burks, R.W. Cantrell, M.A. Garland, M.E. Sweeley, D.W. Hall, P.
Wallace, G. Anglin, G. Nelson, J.R. Cooper, D. Bickner, K. Gilbert, N. Aymond, K. Greenwood, and N. Raymond. 1998. Florida wetland plants: an identification manual. Florida Department of Environmental Protection, Tallahassee, Florida, USA.
Region V Peterson, R.T. 1968. A Field Guide to Wildflowers of Northeaster and North-Central North
America. Houghton Mifflin, Boston. 420 pp. Gleason, Henry A. and Arthur Cronquist. 1991. Manual of Vascular Plants of the NE U.S. and
Adjacent Canada. NY Botanical Garden. Bronx, NY. Newcomb, Lawrence. 1977. Newcomb’s Wildflower Guide. Little, Brown, and Co. New York. Holmgren, Noel H. et al. 1998. Illustrated Companion to Gleason and Cronquist’s Manual. NY
Botanical Garden. Bronx, NY. Swink, Floyd and Gerould Wilhelm. 1994. Plants of the Chicago Region. 4th Ed. Indiana
Academy of Science. Indianapolis. Chadde, S.W. 2002. A Great Lakes Wetland Flora: Second Edition. Pocketflora Press. 648pp. Crow, G.E., et al. 2006. Aquatic Wetland Plants of Northeastern North America. 536pp. Michigan Voss, Edward G. 1972, 1985, 1996. Michigan Flora, Part I, II, III. Cranbrook Institute of
Science and University of Michigan Herbarium. Bulletin 55. Barnes, Burton V. and Warren H. Wagner. 1981, 2004. Michigan Trees. The University of
Michigan Press. Ann Arbor. Soper, James H. and Margaret L. Heimburger. 1982. Shrubs of Ontario. The Royal Ontario
Museum. Toronto. Harris, James G. and Melinda Woolf Harris, 2001. Plant Identification Terminology: An
Illustrated Glossary, 2nd Ed. Spring Lake Publishing

Core, Earl L. and Nelle P. Ammons. 1958. Woody Plants in Winter. The Boxwood Press.
Pacific Grove, California. Steven G. Newmaster, Allan G. Harris, and Linda J. Kershaw 1997. Wetland Plants of Ontario,
Lone Pine Publishing; Edmonton, Alberta, Canada. Semple, John C. and Gordon S. Ringius. 1992. Goldenrods of Ontario. University of Waterloo.
Waterloo, Ontario, Canada. Symonds, George W.D. 1963. The Shrub Identification Book. William Morrow & Co. New
York. Mohlenbrock, Robert H. 1999. The Illustrated Flora of Illinois – Sedges: Carex. Southern
Illinois University Press. Carbondale, Illinois. Mohlenbrock, Robert H. 2001. The Illustrated Flora of Illinois – Sedges: Cyperus to Scleria.
2nd Ed. Southern Illinois University Press. Carbondale, Illinois. Mohlenbrock, Robert H. 1970. The Illustrated Flora of Illinois – Flowering Rush to Rushes.
Southern Illinois University Press. Carbondale, Illinois. Semple, John C., Stephen B. Heard, and Chun Sheng Xiang. 1996. The Asters of Ontario.
University of Waterloo. Waterloo, Ontario, Canada. Region VI Stutzenbaker, Charles D. 1999. Aquatic and Wetland Plants of the Western Gulf Coast. Texas
Parks and Wildlife Press (distributed by the University of Texas Press). 465pp. Correll, D.S, and M.C Johnston. 1970. Manual of vascular plants of Texas. Texas Research
Foundation, renner. 1881 pp. Diggs, G.M Jr., B.L. Lipscomb, and R.J. O’Kennon. 1999. Botanical Research Institute of Texas,
Fort Worth, Texas. 1626 pp. Arkansas Smith. E.B. 1994. Keys to the Flora of Arkansas. University of Arkansas Press. 376 pp. New Mexico Martin, W.C. 1981. Flora of New Mexico. Lubrecht & Cramer, Limited. 3000 pp. Region VII Missouri

Yatskeivych, George. 1999. Steyermark’s Flora of Missouri, Volume 1. Missouri Botanical Garden Press. 991 pp.
Steyemark’s Flora of Missouri, Volume 2. 2006. Missouri Botanical Garden Press. 1200 pp. Region VIII Hitchcock, C.L and A. Cronquist. 1973. Flora of the Pacific Northwest: An Illustrated Manual.
University of Washington Press. 730 pp. Great Plains Flora Association. 1986. Atlas of the flora of the Great Plains. Coordinator, R.L.
McGregor Editor T. M. Barkley. University Press of Kansas 1408 pp. Wilson et al. 2008. Field Guide to the Sedges of the Pacific Northwest. Oregon State University
Press. Colorado Weber, W.A. and R.C. Wittmann. 2001. Colorado Flora Eastern Slope, Third Edition. University
Press of Colorado. 521 pp. Weber, W.A. and R.C. Wittmann. 2001. Colorado Flora Western Slope, Third Edition. University
Press of Colorado. 488 pp. Kershaw L.J., A. MacKinnon, and J. Pojar. 1998. Plants of the Rocky Moutains. Lone Pine
Press. 384 pp. Beidleman, L.H., R.G. Beidleman, and B.E. Willard. 2000. Plants of Rocky Mountain National
Park. Falcon Press. 266 pp. Carter, J. L. 2006. Trees and Shrubs of Colorado, Revised and Expanded. Mimbres Publishing.
165 pp. Hurd, E.G., N.L. Shaw, J. Mastroguiseppe, L.C. Smithman, and S. Goodrich. 1998. Field Guide
to Intermountain Sedges. RMRS-GTR-10. USDA Rocky Mountain Research Station. 282 pp. (http://www.fs.fed.us/rm/pubs/rmrs_gtr010.html.)
Montana Dorn, R.D. and J.L Dorn. 1984. Vascular Plants of Montana. Mountain West Pub. 276 pp. Region IX California Hickman, James C., Editor. 1993. The Jepson Manual of Higher Plants of California. University
of California Press, Berkeley, California. Third printing with corrections 1996. Region X
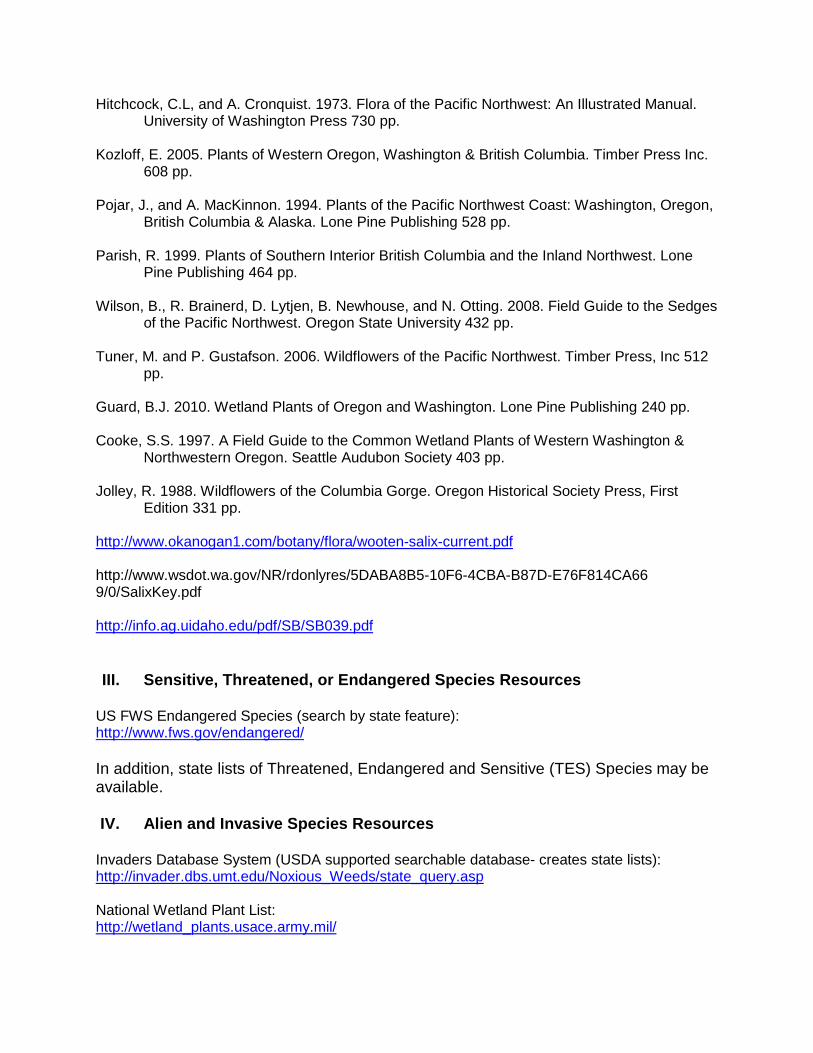
Hitchcock, C.L, and A. Cronquist. 1973. Flora of the Pacific Northwest: An Illustrated Manual. University of Washington Press 730 pp.
Kozloff, E. 2005. Plants of Western Oregon, Washington & British Columbia. Timber Press Inc.
608 pp. Pojar, J., and A. MacKinnon. 1994. Plants of the Pacific Northwest Coast: Washington, Oregon,
British Columbia & Alaska. Lone Pine Publishing 528 pp. Parish, R. 1999. Plants of Southern Interior British Columbia and the Inland Northwest. Lone
Pine Publishing 464 pp. Wilson, B., R. Brainerd, D. Lytjen, B. Newhouse, and N. Otting. 2008. Field Guide to the Sedges
of the Pacific Northwest. Oregon State University 432 pp. Tuner, M. and P. Gustafson. 2006. Wildflowers of the Pacific Northwest. Timber Press, Inc 512
pp. Guard, B.J. 2010. Wetland Plants of Oregon and Washington. Lone Pine Publishing 240 pp. Cooke, S.S. 1997. A Field Guide to the Common Wetland Plants of Western Washington &
Northwestern Oregon. Seattle Audubon Society 403 pp. Jolley, R. 1988. Wildflowers of the Columbia Gorge. Oregon Historical Society Press, First
Edition 331 pp. http://www.okanogan1.com/botany/flora/wooten-salix-current.pdf http://www.wsdot.wa.gov/NR/rdonlyres/5DABA8B5-10F6-4CBA-B87D-E76F814CA66 9/0/SalixKey.pdf http://info.ag.uidaho.edu/pdf/SB/SB039.pdf III. Sensitive, Threatened, or Endangered Species Resources
US FWS Endangered Species (search by state feature): http://www.fws.gov/endangered/ In addition, state lists of Threatened, Endangered and Sensitive (TES) Species may be available. IV. Alien and Invasive Species Resources
Invaders Database System (USDA supported searchable database- creates state lists): http://invader.dbs.umt.edu/Noxious_Weeds/state_query.asp National Wetland Plant List: http://wetland_plants.usace.army.mil/

Invasive Plants of the United States: http://www.invasive.org/weedcd/ Plant Conservation Alliance’s Alien Plant Working Group: http://www.nps.gov/plants/alien/fact.htm
V. Regional Lists of Wetland Plants Reed, P.B. Jr. 1988. National list of plant species that occur in wetlands: national summary.
U.S. Fish and Wildlife Service Biological Report 88(24). 244 pp. Reed, P.B. Jr. 1988. National list of plant species that occur in wetlands: Northeast (Region 1).
U.S. Fish and Wildlife Service Biological Report 88(26.1). 111 pp. National Wetland Plant List: http://wetland_plants.usace.army.mil/ VI. Plant Identification or Plant Image Web Databases
National National Wetland Plant List: http://wetland_plants.usace.army.mil/ USDA Plants: http://plants.usda.gov/java/ Regional Midwest Illinois Natural History Survey Gallery of Illinois Plants: http://www.inhs.illinois.edu/animals_plants/plants/ilgallery/ Kansas Wildflowers and Grasses: http://www.kswildflower.org/ Michigan Wildflowers Index: http://www.carsoncity.k12.mi.us/~hsstudent/wildflowers00/ Missouriplants.com: http://www.missouriplants.com/index.html Missouri Wildflower Guide: http://www.missouriwildflowerguide.com/ Tennessee Wildflowers:
http://www.blueshoenashville.com/wildflowers.html South Alabamaplants.com: http://www.alabamaplants.com/ Wildflowers of Alabama: http://www.auburn.edu/~deancar/ Institute for Systematic Botany Atlas of Florida Vascular Plants: http://florida.plantatlas.usf.edu/Default.aspx Fairchild Tropical Botanic Garden Virtual Herbarium: http://www.virtualherbarium.org/ Stinger’s Large Image Collection: http://www.stingersplace.com/photolistsp.html East Delaware Wildflowers: http://www.delawarewildflowers.org/ Wildflowers of Eastern North America: http://www.nearctica.com/flowers/index.htm New England Wild Flower Society: http://www.newfs.org/ Old Dominion University Plant Site: http://www.odu.edu/~lmusselm/plant/index.php Georgian Court University Plants of New Jersey Pinelands: http://www.georgian.edu/pinebarrens/index.htm Southern Appalachian Wildflowers: http://www.pbase.com/waterfallrich/southern_appalachian_wildflowers&page=all West Califlora: http://www.calflora.org/ Idaho Mountain Wildflowers: http://www.larkspurbooks.com/ Image Archive of Central Texas Plants: http://www.sbs.utexas.edu/bio406d/PlantPics_archive.htm Lady Bird Johnson Wildflower Center:

http://www.wildflower.org/ Nevada Natural Heritage Program: http://heritage.nv.gov/images.htm North Arizona Flora: http://www.nazflora.org/index.html San Diego County Wildflowers: http://www.kenbowles.net/SDwildflowers/ReadMe.htm Southwest Colorado Wildflowers, Ferns, and Trees: http://www.swcoloradowildflowers.com/index.htm Utah Weeds and Wildflowers: http://www.rootcellar.us/wildflowers/contenta.htm Wildflowers and Other Wild Plants of Southern California: http://www.calflora.net/bloomingplants/index.html

1
Appendix D
Photography

2
I. Taking Photographs
Taking photographs is a required NWCA field activity that provides an important visual record of sampling activities at each site. Photographs are taken with a digital camera.
Ensure that the date and time stamp features are enabled on the digital camera before taking photos when taking photographs at an NWCA site. Alternatively, an initial photograph of an 8.5 × 11 inch piece of paper with the site ID, date, and name of the individual(s) taking the picture printed in large, thick letters can be taken first, to begin the series of photos (this piece of paper could be printed out in advance).
After the photo of the site ID information, take the following photographs at each site:
• Assessment Area (AA) characterization photographs
• Soil profile photographs and
• Threatened, Endangered and Sensitive (TES) species photographs.
Be sure to include photos that provide a frame of reference, including photos of crew members collecting the sample. It is strongly suggested that the permission to take photos be obtained from each of the individuals photographed.
1 - AA Characterization Photos
During the Assessment Area (AA) characterization, the VegTeam takes the following digital photos after establishing the Veg Plots (Chapter 5):
� Overview of the setting around the POINT: This photograph should contain the flag marking the POINT.
� Overview of the setting around the CENTER: This photograph is only taken if the CENTER is in a different location than the POINT. The flag marking the center of the AA should also be visible in this photograph.
� View from the CENTER along each of the plot placement lines for vegetation sampling: This photograph is taken for each Vegetation Plot placement line. Note the compass bearing for the plot placement line and, if possible, capture any relevant flagging. The optimal time to take this photograph is when the sun lights the scene from the side. This will ensure the photograph has depth. Keep the camera level with the horizon and ensure the image contains no more than one-third sky.
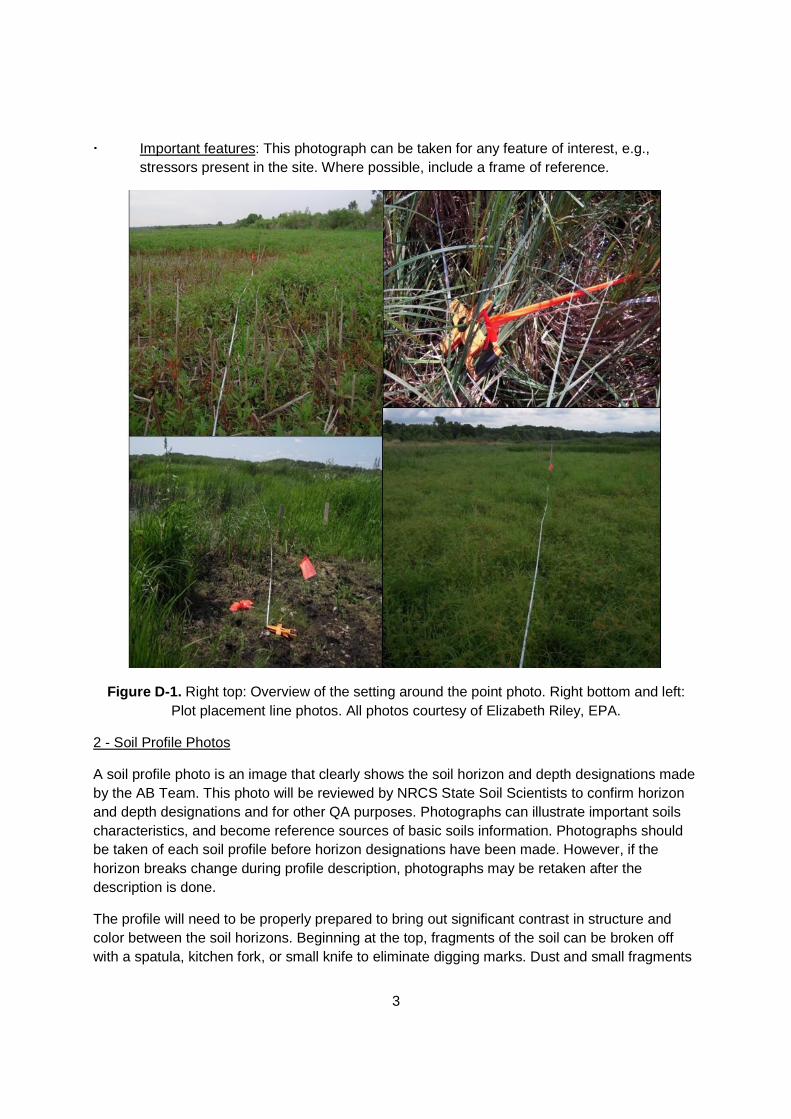
3
� Important features: This photograph can be taken for any feature of interest, e.g., stressors present in the site. Where possible, include a frame of reference.
Figure D-1. Right top: Overview of the setting around the point photo. Right bottom and left: Plot placement line photos. All photos courtesy of Elizabeth Riley, EPA.
2 - Soil Profile Photos
A soil profile photo is an image that clearly shows the soil horizon and depth designations made by the AB Team. This photo will be reviewed by NRCS State Soil Scientists to confirm horizon and depth designations and for other QA purposes. Photographs can illustrate important soils characteristics, and become reference sources of basic soils information. Photographs should be taken of each soil profile before horizon designations have been made. However, if the horizon breaks change during profile description, photographs may be retaken after the description is done.
The profile will need to be properly prepared to bring out significant contrast in structure and color between the soil horizons. Beginning at the top, fragments of the soil can be broken off with a spatula, kitchen fork, or small knife to eliminate digging marks. Dust and small fragments

4
can be brushed or blown away. Moistening the whole profile or part of it with a hand sprayer is helpful in obtaining uniform moisture content and contrast.
Place a tape measure or meter stick starting from the top of the soil profile next to where the horizons have been marked. When taking photos of soils, the profile should be oriented so that the maximum amount of light will strike the prepared face at the proper angle (i.e., the sun comes over your right shoulder). The camera should be held 1.5 to 2.5m from the profile.
Figure D-2. Top: Soil profile photo courtesy of Dave Rider, EPA. Bottom: Soil slab photo courtesy of Eric Vance, EPA.

5
3 - Threatened, Endangered and Sensitive Species Photos
A plant photo voucher is an image that shows enough plant characteristics to allow identification by plant experts. As with all vouchers, all relevant data must be kept for each plant photographed. If the site contains a species that is considered, or is suspected of being, a Threatened, Endangered or Sensitive (TES) plant species, the Veg Team takes a photograph to document the occurrence. The photograph must include as many diagnostic features as possible to aid in identification. Try to get close-ups of flowers (from two or more angles), inflorescences, fruits, seed heads, leaves (upper and lower surfaces), branching patterns, buds, roots, and other diagnostic features. Take photos of the whole plant. Include a scale in the photo, using objects of known size, such as a pencil, coin, shoe, finger, or a person.
Figure D-3. Series of plant voucher photos showing diagnostic features for Butomus umbellatus. Photos courtesy of Elizabeth Riley, EPA.

6
Figure D-4. Series of plant voucher photos showing different objects that can be used as a scale. Clockwise from top left, field crew member with Typha latifolia, bees with Alisma triviale, index finger with Dichorisandra thursifolia (photos courtesy of Elizabeth Riley, EPA), and a ruler with Woodwardia areolata (photo courtesy of Janet Nestlerode, EPA).

7
II. Tracking Photographs
Back at the office, save each photograph using the appropriate naming convention provided in more detail below. The naming convention for each type of photograph includes the site ID, a special modifier indicating the type of photograph taken, and the date. Images must be saved in a medium- to high-quality jpeg format, with the resulting file name of each picture noted in an excel spreadsheet photo log. Maintain a separate excel spreadsheet for each type of photo. Include a brief description of each photograph, the name of the photographer, and the compass bearing (for plot placement line photographs only) in the log.
Photo Name Description Photographer Compass Bearing
Photographs are BATCHED and uploaded to the NWCA FTP site (see below) every 2 weeks. Place photos in the appropriate state and photograph type folder. Make sure to include the excel photo log in the folder.
To access the NWCA FTP Site, navigate to the address below via Windows Explorer (i.e. a ‘My Documents’ window) or your FTP client:
ftp://ftp.glec.com
You will be prompted to login. Enter the username and password below:
username: NWCA
password: swamp
There you will find a folder labeled “Site Photographs” into which teams can upload their photos.
It is suggested that teams use Windows Explorer (i.e. a ‘My Documents’ window) to navigate to the FTP site if they don't have an FTP client program. Just type the address into the address bar of Windows Explorer, and drag-and-drop the files/folders from another window or your desktop just as you would to move files on your own computer.

8
Use the following naming conventions when saving photos:
� AA Characterization Photos
o Site ID number (i.e., in the format NWCA11-0000 or other assigned number)
o Photos taken to characterize the AA are signified by the letters AA
o Modifier indicating the AA characterization photo taken:
� POINT: photo taken of the setting around the POINT
� CENTER: photo taken of the setting around the CENTER, if different from POINT
� Photos taken from the CENTER along each of the plot placement lines for vegetation sampling are designated by the letter P and the bearing of the plot placement line.
� Photos taken of important features are designated by the letter F and a sequential number for each feature documented at the site (i.e., F-1, F-2, etc).
o Date in the format MM.DD (note: you do not need to include the year in the date because it is included in the site ID number)
o Example photo tracking code:
� NWCA11-1516_AA_POINT_08.15.jpg
� NWCA11-1516_AA_CENTER_08.15.jpg
� NWCA11-1516_AA_P-290_08.15.jpg
� NWCA11-1516_AA_P-310_08.15.jpg
� NWCA11-1516_AA_F-1_08.15.jpg

9
� Soil Profile Photos
o Site ID number (i.e., in the format NWCA11-0000 or other assigned number)
o Photos taken of the soil profile are designated by the letter S and the letter used to designate the soil pit (A, B, C, or D) assigned by the AB Team during data collection (see Soils Chapter and Reference card S-1 side A).
o Date in the format MM.DD (note: you do not need to include the year in the date because it is included in the site ID number)
o Example photo tracking code:
� NWCA11-1516_S-A_08.15.jpg
� TES Species Photos
o Site ID number (i.e., in the format NWCA11-0000 or other assigned number)
o Photos taken of a Threatened, Endangered or Sensitive plant species are designated by the letters TES
o Species name or pseudonym if the species is unknown but suspected of being a TES species.
o Date in the format MM.DD (note: you do not need to include the year in the date because it is included in the site ID number)
o Example photo tracking codes:
� NWCA11-1516_TES_Ledum groenlandicum_08.15.jpg
� NWCA11-1516_TES_Carex1-3 stigmas_08.15.jpg

Appendix E
Example Oil Decontamination Procedures

COPY

______________________________________________________________________________________ SESD Operating Procedure Page 2 of 14 SESDPROC-205-R1 Field Equipment Cleaning and Decontamination Field Equipment Cleaning and Decontamination_AF.R1 Effective Date: November 1, 2007
Revision History This table shows changes to this controlled document over time. The most recent version is presented in the top row of the table. Previous versions of the document are maintained by the SESD Field Quality Manager.
History Effective Date
SESDPROC-205-R1, Field Equipment Cleaning and Decontamination, replaces SESDPROC-205-R0. General Corrected any typographical, grammatical and/or editorial errors. Title Page Changed title for Antonio Quinones from Environmental Investigations Branch to Enforcement and Investigations Branch. Changed Bill Cosgrove’s title from Acting Chief to Chief. Section 1.3 Updated information to reflect that the procedure is located on the H: drive of the LAN. Clarified Field Quality Manager (FQM) responsibilities. Section 1.5 Alphabetized and revised the referencing style for consistency. Section 1.6.1 Corrected the title of the Safety, Health, and Environmental Management Program Procedures and Policy Manual.
November 1, 2007
SESDPROC-205-R0, Field Equipment Cleaning and Decontamination, Original Issue
February 05, 2007
COPY
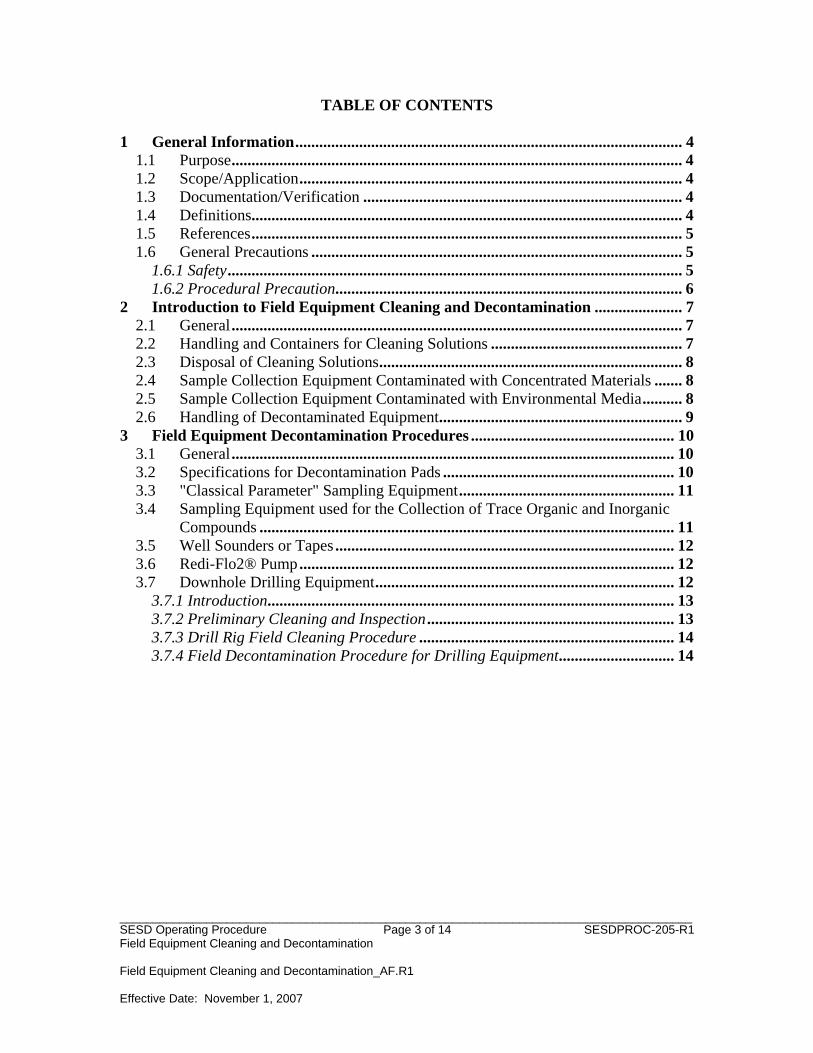
______________________________________________________________________________________ SESD Operating Procedure Page 3 of 14 SESDPROC-205-R1 Field Equipment Cleaning and Decontamination Field Equipment Cleaning and Decontamination_AF.R1 Effective Date: November 1, 2007
TABLE OF CONTENTS
1 General Information................................................................................................. 4 1.1 Purpose................................................................................................................. 4 1.2 Scope/Application................................................................................................ 4 1.3 Documentation/Verification ................................................................................ 4 1.4 Definitions............................................................................................................ 4 1.5 References............................................................................................................ 5 1.6 General Precautions ............................................................................................. 5
1.6.1 Safety.................................................................................................................. 5 1.6.2 Procedural Precaution....................................................................................... 6
2 Introduction to Field Equipment Cleaning and Decontamination ...................... 7 2.1 General ................................................................................................................. 7 2.2 Handling and Containers for Cleaning Solutions ................................................ 7 2.3 Disposal of Cleaning Solutions............................................................................ 8 2.4 Sample Collection Equipment Contaminated with Concentrated Materials ....... 8 2.5 Sample Collection Equipment Contaminated with Environmental Media.......... 8 2.6 Handling of Decontaminated Equipment............................................................. 9
3 Field Equipment Decontamination Procedures ................................................... 10 3.1 General ............................................................................................................... 10 3.2 Specifications for Decontamination Pads .......................................................... 10 3.3 "Classical Parameter" Sampling Equipment...................................................... 11 3.4 Sampling Equipment used for the Collection of Trace Organic and Inorganic
Compounds ........................................................................................................ 11 3.5 Well Sounders or Tapes ..................................................................................... 12 3.6 Redi-Flo2® Pump .............................................................................................. 12 3.7 Downhole Drilling Equipment........................................................................... 12
3.7.1 Introduction...................................................................................................... 13 3.7.2 Preliminary Cleaning and Inspection .............................................................. 13 3.7.3 Drill Rig Field Cleaning Procedure ................................................................ 14 3.7.4 Field Decontamination Procedure for Drilling Equipment............................. 14
COPY

______________________________________________________________________________________ SESD Operating Procedure Page 4 of 14 SESDPROC-205-R1 Field Equipment Cleaning and Decontamination Field Equipment Cleaning and Decontamination_AF.R1 Effective Date: November 1, 2007
Contents
1 General Information 1.1 Purpose This document describes general and specific procedures, methods and considerations to be used and observed when cleaning and decontaminating sampling equipment during the course of field investigations. 1.2 Scope/Application The procedures contained in this document are to be followed when field cleaning sampling equipment, for both re-use in the field, as well as used equipment being returned to the Field Equipment Center (FEC). On the occasion that SESD field investigators determine that any of the procedures described in this section are either inappropriate, inadequate or impractical and that other procedures must be used to clean or decontaminate sampling equipment at a particular site, the variant procedure will be documented in the field log book, along with a description of the circumstances requiring its use. 1.3 Documentation/Verification This procedure was prepared by persons deemed technically competent by SESD management, based on their knowledge, skills and abilities and have been tested in practice and reviewed in print by a subject matter expert. The official copy of this procedure resides on the H: drive of the SESD local area network. The Field Quality Manager (FQM) is responsible for ensuring the most recent version of the procedure is placed on the H: drive and for maintaining records of review conducted prior to its issuance. 1.4 Definitions Decontamination: The process of cleaning dirty sampling equipment to the degree to which it can be re-used, with appropriate QA/QC, in the field. Field Cleaning: The process of cleaning dirty sampling equipment such that it can be returned to the FEC in a condition that will minimize the risk of transfer of contaminants from a site.
De-ionized water: Tap water that has been treated by passing through a standard de-ionizing resin column. At a minimum, the finished water should contain no detectable heavy metals or other inorganic compounds (i.e., at or above analytical detection limits)
COPY

______________________________________________________________________________________ SESD Operating Procedure Page 5 of 14 SESDPROC-205-R1 Field Equipment Cleaning and Decontamination Field Equipment Cleaning and Decontamination_AF.R1 Effective Date: November 1, 2007
as defined by a standard inductively coupled Argon Plasma Spectrophotometer (ICP) (or equivalent) scan. De-ionized water obtained by other methods is acceptable, as long as it meets the above analytical criteria. Organic-free water may be substituted for de-ionized water. Organic-free water: Tap water that has been treated with activated carbon and de-ionizing units. At a minimum, the finished water must meet the analytical criteria of de-ionized water and it should contain no detectable pesticides, herbicides, or extractable organic compounds, and no volatile organic compounds above minimum detectable levels as determined by the Region 4 laboratory for a given set of analyses. Organic-free water obtained by other methods is acceptable, as long as it meets the above analytical criteria.
Soap: A standard brand of phosphate-free laboratory detergent, such as Luminox®. Tap water: Water from any potable water supply. De-ionized water or organic-free water may be substituted for tap water. Drilling Equipment: All power equipment used to collect surface and sub-surface soil samples or install wells. For purposes of this procedure, direct push is also included in this definition.
1.5 References SESD Operating Procedure for Management of Investigation Derived Waste, SESDPROC-202, Most Recent Version SESD Operating Procedure for Equipment Cleaning and Decontamination at the FEC, SESDPROC-206, Most Recent Version United States Environmental Protection Agency (US EPA). 2001. Environmental Investigations Standard Operating Procedures and Quality Assurance Manual. Region 4 Science and Ecosystem Support Division (SESD), Athens, GA US EPA. Safety, Health and Environmental Management Program Procedures and Policy Manual. Region 4 SESD, Athens, GA, Most Recent Version 1.6 General Precautions
1.6.1 Safety Proper safety precautions must be observed when field cleaning or decontaminating dirty sampling equipment. Refer to the SESD Safety, Health and Environmental Management Program (SHEMP) Procedures and Policy Manual and any pertinent site-specific Health and Safety Plans (HASPs) for guidelines on safety precautions. These guidelines, however, should only be used
COPY

______________________________________________________________________________________ SESD Operating Procedure Page 6 of 14 SESDPROC-205-R1 Field Equipment Cleaning and Decontamination Field Equipment Cleaning and Decontamination_AF.R1 Effective Date: November 1, 2007
to complement the judgment of an experienced professional. Address chemicals that pose specific toxicity or safety concerns and follow any other relevant requirements, as appropriate. At a minimum, the following precautions should be taken in the field during these cleaning operations:
• When conducting field cleaning or decontamination using laboratory detergent,
safety glasses with splash shields or goggles, and latex gloves will be worn. • No eating, smoking, drinking, chewing, or any hand to mouth contact should be
permitted during cleaning operations. 1.6.2 Procedural Precaution
Prior to mobilization to a site, the expected types of contamination should be evaluated to determine if the field cleaning and decontamination activities will generate rinsates and other waste waters that might be considered RCRA hazardous waste or may require special handling.
COPY
______________________________________________________________________________________ SESD Operating Procedure Page 7 of 14 SESDPROC-205-R1 Field Equipment Cleaning and Decontamination Field Equipment Cleaning and Decontamination_AF.R1 Effective Date: November 1, 2007
2 Introduction to Field Equipment Cleaning and Decontamination 2.1 General The procedures outlined in this document are intended for use by field investigators for cleaning and decontaminating sampling and other equipment in the field. These procedures should be followed in order that equipment is returned to the FEC in a condition that will minimize the risk of transfer of contaminants from a site. Sampling and field equipment cleaned in accordance with these procedures must meet the minimum requirements for the Data Quality Objectives (DQOs) of the study or investigation. Site-specific alterations to these procedures should be documented in the study plan. Deviations from these procedures should be documented in the field records. Cleaning procedures for use at the Field Equipment Center (FEC) are found in SESD Operating Procedure for Equipment Cleaning and Decontamination at the FEC (SESDPROC-206). 2.2 Handling and Containers for Cleaning Solutions Improperly handled cleaning solutions may easily become contaminated. Storage and application containers must be constructed of the proper materials to ensure their integrity. Following are acceptable materials used for containing the specified cleaning solutions:
• Soap must be kept in clean plastic, metal, or glass containers until used. It should be poured directly from the container during use.
• Tap water may be kept in tanks, hand pressure sprayers, squeeze bottles, or
applied directly from a hose. • De-ionized water must be stored in clean, glass or plastic containers that can be
closed prior to use. It can be applied from plastic squeeze bottles. • Organic-free water must be stored in clean glass or Teflon® containers prior to
use. It may be applied using Teflon® squeeze bottles, or with the portable system.
COPY

______________________________________________________________________________________ SESD Operating Procedure Page 8 of 14 SESDPROC-205-R1 Field Equipment Cleaning and Decontamination Field Equipment Cleaning and Decontamination_AF.R1 Effective Date: November 1, 2007
2.3 Disposal of Cleaning Solutions Procedures for the safe handling and disposition of investigation derived waste (IDW); including used wash water and rinse water are in SESD Operating Procedure for Management of Investigation Derived Waste (SESDPROC-202). 2.4 Sample Collection Equipment Contaminated with Concentrated Materials Equipment used to collect samples of concentrated materials from investigation sites must be field cleaned before returning from the study. At a minimum, this should consist of washing with soap and rinsing with tap water. When the above procedure cannot be followed, the following options are acceptable: 1. Leave with facility for proper disposal; 2. If possible, containerize, seal and secure the equipment and leave on-site for later
disposal; 3. Containerize, bag or seal the equipment so that no odor is detected and return to
the SESD. It is the project leader’s responsibility to evaluate the nature of the sampled material and determine the most appropriate cleaning procedures for the equipment used to sample that material. 2.5 Sample Collection Equipment Contaminated with Environmental Media Equipment used to collect samples of environmental media from investigation sites should be field cleaned before returning from the study. Based on the condition of the sampling equipment, one or more of the following options must be used for field cleaning: 1. Wipe the equipment clean; 2. Water-rinse the equipment; 3. Wash the equipment in detergent and water followed by a tap water rinse. 4. For grossly contaminated equipment, the procedures set forth in Section 2.4 must
be followed. Under extenuating circumstances such as facility limitations, regulatory limitations, or during residential sampling investigations where field cleaning operations are not feasible, equipment can be containerized, bagged or sealed so that no odor is detected and returned to the FEC without being field cleaned. If possible, FEC personnel should be
COPY
______________________________________________________________________________________ SESD Operating Procedure Page 9 of 14 SESDPROC-205-R1 Field Equipment Cleaning and Decontamination Field Equipment Cleaning and Decontamination_AF.R1 Effective Date: November 1, 2007
notified that equipment will be returned without being field cleaned. It is the project leader’s responsibility to evaluate the nature of the sampled material and determine the most appropriate cleaning procedures for the equipment used to sample that material. 2.6 Handling of Decontaminated Equipment After decontamination, equipment should be handled only by personnel wearing clean gloves to prevent re-contamination. In addition, the equipment should be moved away (preferably upwind) from the decontamination area to prevent re-contamination. If the equipment is not to be immediately re-used it should be covered with plastic sheeting or wrapped in aluminum foil to prevent re-contamination. The area where the equipment is kept prior to re-use must be free of contaminants.
COPY

______________________________________________________________________________________ SESD Operating Procedure Page 10 of 14 SESDPROC-205-R1 Field Equipment Cleaning and Decontamination Field Equipment Cleaning and Decontamination_AF.R1 Effective Date: November 1, 2007
3 Field Equipment Decontamination Procedures 3.1 General Sufficient equipment should be transported to the field so that an entire study can be conducted without the need for decontamination. When equipment must be decontaminated in the field, the following procedures are to be utilized. 3.2 Specifications for Decontamination Pads Decontamination pads constructed for field cleaning of sampling and drilling equipment should meet the following minimum specifications:
• The pad should be constructed in an area known or believed to be free of surface contamination.
• The pad should not leak. • If possible, the pad should be constructed on a level, paved surface and should
facilitate the removal of wastewater. This may be accomplished by either constructing the pad with one corner lower than the rest, or by creating a sump or pit in one corner or along one side. Any sump or pit should also be lined.
• Sawhorses or racks constructed to hold equipment while being cleaned should be
high enough above ground to prevent equipment from being splashed. • Water should be removed from the decontamination pad frequently. • A temporary pad should be lined with a water impermeable material with no
seams within the pad. This material should be either easily replaced (disposable) or repairable.
At the completion of site activities, the decontamination pad should be deactivated. The pit or sump should be backfilled with the appropriate material designated by the site project leader, but only after all waste/rinse water has been pumped into containers for disposal. See SESD Operating Procedure for Management of Investigation Derived Waste (SESDPROC-202) for proper handling and disposal of these materials. If the decontamination pad has leaked excessively, soil sampling may be required.
COPY
______________________________________________________________________________________ SESD Operating Procedure Page 11 of 14 SESDPROC-205-R1 Field Equipment Cleaning and Decontamination Field Equipment Cleaning and Decontamination_AF.R1 Effective Date: November 1, 2007
3.3 "Classical Parameter" Sampling Equipment "Classical Parameters" are analyses such as oxygen demand, nutrients, certain inorganics, sulfide, flow measurements, etc. For routine operations involving classical parameter analyses, water quality sampling equipment such as Kemmerers, buckets, dissolved oxygen dunkers, dredges, etc., may be cleaned with the sample water or tap water between sampling locations as appropriate. Flow measuring equipment such as weirs, staff gages, velocity meters, and other stream gauging equipment may be cleaned with tap water between measuring locations, if necessary. Note: The procedures described in Section 3.3 are not to be used for cleaning field equipment to be used for the collection of samples undergoing trace organic or inorganic constituent analyses. 3.4 Sampling Equipment used for the Collection of Trace Organic and Inorganic
Compounds For samples undergoing trace organic or inorganic constituent analyses, the following procedures are to be used for all sampling equipment or components of equipment that come in contact with the sample:
1. Clean with tap water and Luminox® soap using a brush, if necessary, to remove particulate matter and surface films. Equipment may be steam cleaned (Luminox® soap and high pressure hot water) as an alternative to brushing. Sampling equipment that is steam cleaned should be placed on racks or saw horses at least two feet above the floor of the decontamination pad. PVC or plastic items should not be steam cleaned.
2. Rinse thoroughly with tap water.
3. Rinse thoroughly with organic-free water and place on a clean foil-wrapped
surface to air-dry.
4. All equipment must be wrapped with foil. If the equipment is to be stored overnight before it is wrapped in foil, it should be covered and secured with clean, unused plastic sheeting.
COPY

______________________________________________________________________________________ SESD Operating Procedure Page 12 of 14 SESDPROC-205-R1 Field Equipment Cleaning and Decontamination Field Equipment Cleaning and Decontamination_AF.R1 Effective Date: November 1, 2007
3.5 Well Sounders or Tapes The following procedures are recommended for decontaminating well sounders (water level indicators) and tapes:
1. Wash with soap and tap water.
2. Rinse with tap water.
3. Rinse with de-ionized water. 3.6 Redi-Flo2® Pump The Redi-Flo2® pump should be decontaminated prior to use and between each monitoring well. The following procedure is required: CAUTION - Make sure the pump is not plugged in.
1. Using a brush, scrub the exterior of the pump, electrical cord and garden hose with soap and tap water. Do not wet the electrical plug.
2. Rinse with tap water. 3. Rinse with de-ionized water.
4. Place the equipment in a clean plastic bag.
To clean the Redi-Flo2® ball check valve:
1. Remove the ball check valve from the pump head. Check for wear and/or corrosion, and replace as needed.
2. Using a brush, scrub all components with soap and tap water.
3. Rinse with de-ionized water.
4. Replace the ball check valve to the Redi-Flo27 pump head.
3.7 Downhole Drilling Equipment These procedures are to be used for drilling activities involving the collection of soil samples for trace organic and inorganic constituent analyses and for the construction of monitoring wells to be used for the collection of groundwater samples for trace organic and inorganic constituent analyses.
COPY

______________________________________________________________________________________ SESD Operating Procedure Page 13 of 14 SESDPROC-205-R1 Field Equipment Cleaning and Decontamination Field Equipment Cleaning and Decontamination_AF.R1 Effective Date: November 1, 2007
3.7.1 Introduction
Cleaning and decontamination of all equipment should occur at a designated area (decontamination pad) on the site. The decontamination pad should meet the specifications of Section 3.2 of this procedure. Tap water brought on the site for drilling and cleaning purposes should be contained in a pre-cleaned tank. A steam cleaner and/or high pressure hot water washer capable of generating a pressure of at least 2500 PSI and producing hot water and/or steam (200o F plus), with a soap compartment, should be obtained.
3.7.2 Preliminary Cleaning and Inspection
Drilling equipment should be clean of any contaminants that may have been transported from off-site to minimize the potential for cross-contamination. The drilling equipment should not serve as a source of contaminants. Associated drilling and decontamination equipment, well construction materials, and equipment handling procedures should meet these minimum specified criteria:
• All downhole augering, drilling, and sampling equipment should be
sandblasted before use if painted, and/or there is a buildup of rust, hard or caked matter, etc., that cannot be removed by steam cleaning (soap and high pressure hot water), or wire brushing. Sandblasting should be performed prior to arrival on site, or well away from the decontamination pad and areas to be sampled.
• Any portion of the drilling equipment that is over the borehole (kelly bar
or mast, backhoe buckets, drilling platform, hoist or chain pulldowns, spindles, cathead, etc.) should be steam cleaned (soap and high pressure hot water) and wire brushed (as needed) to remove all rust, soil, and other material which may have come from other sites before being brought on site.
• Printing and/or writing on well casing, tremie tubing, etc., should be
removed before use. Emery cloth or sand paper can be used to remove the printing and/or writing. Most well material suppliers can provide materials without the printing and/or writing if specified when ordered. Items that cannot be cleaned are not acceptable and should be discarded.
COPY

______________________________________________________________________________________ SESD Operating Procedure Page 14 of 14 SESDPROC-205-R1 Field Equipment Cleaning and Decontamination Field Equipment Cleaning and Decontamination_AF.R1 Effective Date: November 1, 2007
• Equipment associated with the drilling and sampling activities should be inspected to insure that all oils, greases, hydraulic fluids, etc., have been removed, and all seals and gaskets are intact with no fluid leaks.
3.7.3 Drill Rig Field Cleaning Procedure
Any portion of the drill rig, backhoe, etc., that is over the borehole (kelly bar or mast, backhoe buckets, drilling platform, hoist or chain pulldowns, spindles, cathead, etc.) should be steam cleaned (soap and high pressure hot water) between boreholes.
3.7.4 Field Decontamination Procedure for Drilling Equipment
The following is the standard procedure for field cleaning augers, drill stems, rods, tools, and associated equipment. This procedure does not apply to well casings, well screens, or split-spoon samplers used to obtain samples for chemical analyses, which should be decontaminated as outlined in Section 3.4 of this procedure.
1. Wash with tap water and soap, using a brush if necessary, to remove
particulate matter and surface films. Steam cleaning (high pressure hot water with soap) may be necessary to remove matter that is difficult to remove with the brush. Drilling equipment that is steam cleaned should be placed on racks or saw horses at least two feet above the floor of the decontamination pad. Hollow-stem augers, drill rods, etc., that are hollow or have holes that transmit water or drilling fluids, should be cleaned on the inside with vigorous brushing.
2. Rinse thoroughly with tap water.
3. Remove from the decontamination pad and cover with clean, unused
plastic. If stored overnight, the plastic should be secured to ensure that it stays in place.
COPY


USA RAM MANUAL
Version 11 January 2011

This document is formatted for 2-sided copies. This page is intentionally blank.

i
Table of Contents Basic Guidance ……………………………………………………….. 1
Purposes of USA-RAM …………………………………………… 1
Basic Assumptions of USA-RAM ………………………………… 1
Structure of USA-RAM …………………………………………… 1
Joint Sampling for USA-RAM and NWCA FOM………………… 2
How to Use USA-RAM Version 10 …………………….................. 2
Scoring Plan …………………………………………….................. 3
Establishing the Assessment Area and Buffer Area………………... 3
Integration of USA-RAM and NWCA Site Evaluation Guidelines... 4
Section A: Assessment of the Buffer ………………………………… 5
Integrated Sampling of the Buffer ……………………………... 5
Metric 1: Percent of AA having Buffer ………………................6
Metric 2: Buffer Width ………………………………………... 8
Metric 3: Stress to the Buffer Zone …………………………... 11
Section B: Assessment of Wetland Form and Structure …………. 14
Physical Structure Attribute………………………………………. 14
Metric 4: Topographic Complexity …………………………. 14
Metric 5: Patch Mosaic Complexity …………………………. 15
Biological Structure Attribute ……………………………………. 18
Metric 6: Vertical Complexity ……………………………….. 18
Metric7: Plant Community Complexity ……………………... 19
Section C: Assessment of Stressors to the AA …………………….. 22
Hydrology Attribute ……………………………………………… 23
Metric 8: Stressors to Water Quality ……………………….. 23
Metric 9: Alterations to Hydroperiod ……………………….. 24
Physical Structure Attribute ……………………………………… 25
Metric 10: Habitat /Substrate Alterations …………………… 25
Biological Structure Attribute …………………………………… 26
Metric 11: Percent Cover of Invasive Plant Species …………. 26
Metric 12: Vegetation Disturbance …………………………... 28
Glossary ……………………………………………………………… 29

ii
This document is formatted for 2-sided copies. This page is intentionally blank.

USA‐RAM Errata The following minor errors and clarifications pertain to the USA‐RAM Manual and Forms which are used in association with the NWCA. 1) Unlike many of the other NWCA Forms, the USA‐RAM forms do not include a “super‐bubble”
that teams will fill in to confirm that a filled bubble on the rest of the form indicates presence/rank and an empty bubble indicates absence. For the USA‐RAM forms listed below, it is assumed that empty bubbles indicate absence of the given indicator.
• FORM USA‐RAM 2: Metric 3
• FORM USA‐RAM 3: Metric 4
• FORM USA‐RAM 6: Metric 7
• FORM USA‐RAM 7: Metric 8
• FORM USA‐RAM 8: Metric 9
• FORM USA‐RAM 9: Metric 10
• FORM USA‐RAM 11: Metric 12 2) Table 2 ‐ Buffer Land Cover Criteria – Line 4 in this table incorrectly indicates that if a buffer is
separated from the AA by a non‐buffer cover or open water ≥ 5 meters, it should not be counted as buffer for the purposes of RAM Metric 1. Since open water itself is considered a buffer, this line should read:
Is not separated from the AA by a non‐buffer cover that is ≥ 5m wide.
3) Figure 3 ‐ Example calculations of Metric 2: buffer width – This figure contains two aerial photos and two worksheets that contain example calculations of Metric 2 (labeled A and B). The figures and worksheets are mis‐matched such that the calculations displayed in Worksheet 3A actually pertain to Figure 3B and vice versa.
4) Throughout the USA‐RAM Manual, example worksheets are provided and instructions are given
for the calculation of the final Metric score. These are provided so that teams may better understand how the individual rankings contribute to the overall score for each Metric. This would also be helpful for states/tribes that choose to use this method to develop their own RAM protocols. For NWCA, however, the individual rankings will be placed directly on the RAM data sheets and all calculations will be done by the Information Management Team.
5) Metric 11, Percent Cover of Invasive Plant Species, has been revised. Previously the metric
instructed that the percent cover of invasive species in each plant strata in the AA be assessed separately. The metric has been updated so that it now calls for an assessment of the absolute percent cover of invasive species in the AA for all strata combined. Information gathered in Metric 7 can be used to inform this metric, however this metric is based on the invasive species cover for all strata combined over the entire AA. Invasive species include those indentified in the NWCA Invasive Species List as well as those in any approved state or regional lists. (see field data form below). Table 17 of the USA RAM manual should not be consulted as a list of invasive species for the purposes of the NWCA (Russian olive is not on the list of target invasive alien plant species provided in Appendix B)
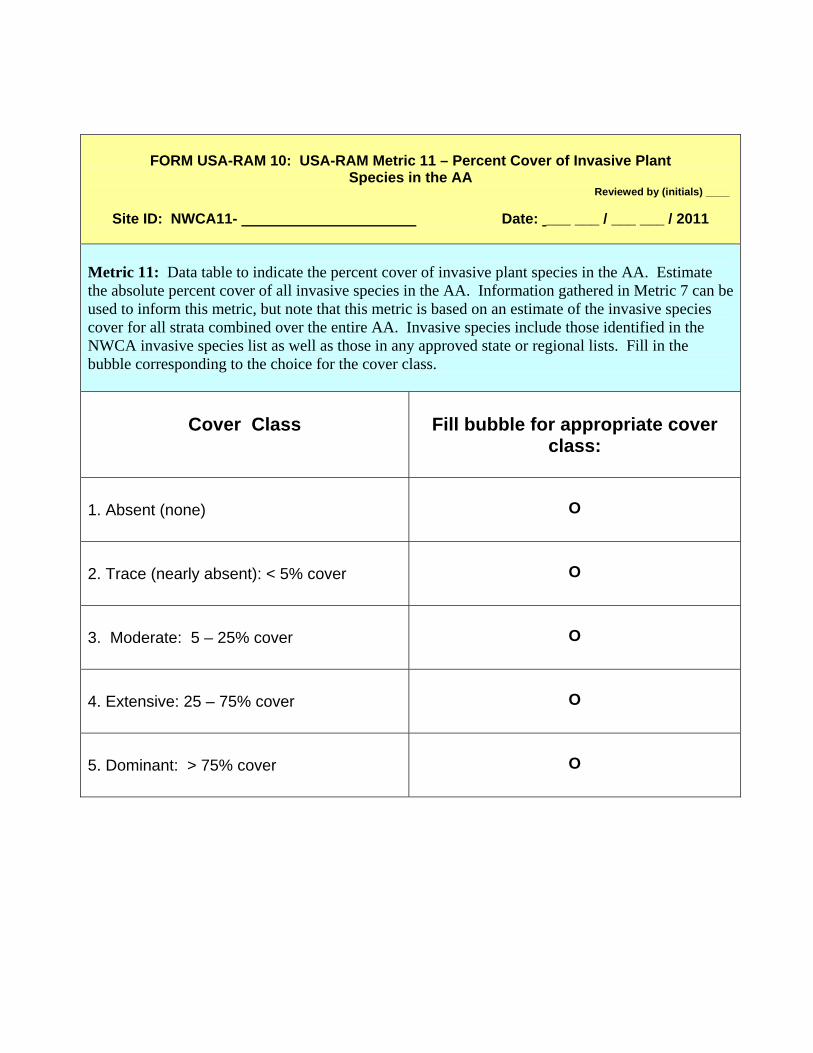
FORM USA-RAM 10: USA-RAM Metric 11 – Percent Cover of Invasive Plant
Species in the AA Reviewed by (initials) ____
Site ID: NWCA11- Date: ___ ___ / ___ ___ / 2011
Metric 11: Data table to indicate the percent cover of invasive plant species in the AA. Estimate the absolute percent cover of all invasive species in the AA. Information gathered in Metric 7 can be used to inform this metric, but note that this metric is based on an estimate of the invasive species cover for all strata combined over the entire AA. Invasive species include those identified in the NWCA invasive species list as well as those in any approved state or regional lists. Fill in the bubble corresponding to the choice for the cover class.
Cover Class
Fill bubble for appropriate cover
class:
1. Absent (none) O
2. Trace (nearly absent): < 5% cover O
3. Moderate: 5 – 25% cover O
4. Extensive: 25 – 75% cover O
5. Dominant: > 75% cover O

1
Basic Guidance
Purposes of USA-RAM
The primary purpose of USA-RAM is to assess the overall condition and stress for the nation’s wetlands as part of the USEPA 2011 National Wetland Condition Assessment (NWCA). Secondary purposes include exploring relationships between stress and condition as mediated by buffers, and providing a RAM to US States and Tribes that they can further develop for their own purposes. Assumptions of USA-RAM
• The overall condition of a wetland is its capacity or potential to provide its full suite of functions and services, relative to reference sites.
• The overall condition of a wetland can be assessed in terms of the complexity of its visible form and structure, relative to reference sites.
• The overall stress on a wetland is the sum total and extent of human-caused processes and events that are likely to degrade wetland form and structure.
• The overall stress on a wetland can be assessed as the number of evident stressors and their cumulative extent. As the number and extent of stressors accumulates, wetland overall condition declines, regardless of wetland type or vegetation community composition.
• Indicators are visible representations of wetland form, structure, or stress. Suitable indicators can be identified using conceptual models that relate wetland form and structure to wetland processes, functions, and stress.
• For any wetland type or class, larger wetlands with more intact structure and less stress tend to have greater levels of characteristic functions and services. This can be represented by Condition Profiles and Stress Profiles.
Structure of USA-RAM
USA-RAM is designed to assess overall condition and stress for a 0.5-ha Assessment Area (AA) and its buffer (defined here as the area within 100m distance from the perimeter of the AA). Each AA is assessed in terms of Attributes of condition and stress, based on Metrics of the Attributes and Field Indicators of the Metrics (Table 1). USA-RAM recognizes four Attributes of condition and stress: Buffer, Hydrology, Physical Structure, and Biological Structure. However, for the following reasons, the Hydrology Attribute is only assessed in terms of its stressors.
• All aspects of wetland condition are affected by hydrology. Physical structure, biological structure, and buffer condition tend to be correlated to hydrology. The importance of the Hydrology Attribute is therefore adequately reflected by the assessment of these other Attributes of condition, without having to assess

2
hydrological conditions per se. An assessment of hydrological stressors is necessary, however, to understand the results for of the condition assessment.
• The hydrological conditions that account for the conditions of the other Attributes is not always evident during the assessment. The observed conditions might be affected by the hydrology of a previous season or year. In general, efforts to reconstruct previous hydrological conditions tend to incur substantial uncertainty.
• Hydrology varies more that the other Attributes of condition, both within and among wetland classes. Different metrics of hydrological condition are needed to assess different types of wetlands. Wetland hydrology is therefore not well assessed by a single set of hydrological metrics, as required for USA RAM.
Table 1: USA RAM Attributes and Metrics of wetland condition and stress.
Attributes Condition Metrics Stress Metrics
Buffer Percent of AA Having Buffer Stress to the Buffer Zone
Buffer Width
Hydrology None Alterations to Hydroperiod Stress to Water Quality
Physical Structure Topographic Complexity Habitat/Substrate Alterations
Patch Mosaic Complexity
Biological Structure Vertical Complexity Percent Cover of Invasive Plants Plant Community Complexity Vegetation Disturbance
Joint Sampling for USA-RAM and the Field Operations Manual
During data collection for the NWCAA, field crews will be organized to simultaneously collect all data necessary to complete both the USA-RAM and the Field Operations Manual (FOM; USEPA 2010). The Vegetation Team and the AB Team will be tasked with completing different sections of USA-RAM. The AB Team will verify and collect data for the USA-RAM Buffer Metrics (Metrics 1 - 3), while the Vegetation Team will collect data for the Stressor and Condition Metrics (Metrics 4 - 12). This will streamline data collection efforts, making time spent in the field more efficient, while matching the Metrics to the different expertise of the Teams. Each Team will receive the appropriate Field Data Forms for its particular set of USA-RAM Metrics.
How to Use USA-RAM Version 11
• Learn USA-RAM in it entirety before applying it in the field. Many of the Metrics can be addressed more-or-less concurrently when all the Metrics are understood in detail. The time required to apply USA-RAM decreases as experience in its use is gained.
• Begin each application by inspecting the entire AA and its buffer zone. Many of the Metrics can be provisionally assessed during this initial inspection.

3
• Record all data on the appropriate Field Data Forms using the protocols described in the FOM.
• Use USA-RAM faithfully. Finalize all the Metrics while in the field at the AA. Do not alter any Metric. However, recommendations to improve the method should be recorded and provided to the USEPA NWCA team.
Scoring Plan
USA-RAM will provide separate scores for stress and condition for each AA and its associated buffer zone. Each AA score and each buffer zone score will be the sum of their respective Attribute scores. The Attribute scores will be sums of their respective Metric scores. The Metric scores will be derived from standardized “scoring tables.” The scoring tables will be used to assign each Metric result to one of four categories of condition or stress. The categories will have unique numerical values that are scaled to help distinguish between similar AAs. Separate scoring tables will be developed for each wetland class and NWCA region. This will help assure that the USA-RAM results reflect the natural variation in form and structure between wetland classes and regions, and that similar scores for like wetlands in different regions indicate similar condition or stress (i.e., scores for like wetlands will be comparable across the country). A regional cumulative frequency distribution (regional CFD) will be calculated for the AA scores of each wetland class. It is likely that each AA score will be assigned to one of four categories of overall condition that correspond to the quartiles of the affiliated regional CFD. This will support regional and national reports on the distribution of wetlands among different categories of condition and stress. A final stage in the analysis of USA-RAM results will be quantification of the effect of buffer condition on the correlation between AA condition and AA stress. The intent of this analysis is to explore how buffers might be used to mitigate stress. Establishing the Assessment Area (AA) and Buffer Area
The rules for establishing an AA and its buffer zone are the same for USA-RAM and the NWCA Field Operations Manual (FOM; USEPA 2010). Highlights of the rules are described below. For a full description of the rules see Chapters 3 and 4 of the FOM The FOM provides strict guidelines for establishing an AA. Once the sampling POINT has been identified, the AA can be been planned. After the plan has been verified in the field (see FOM Section 3.1.2), the AA can be established (see FOM Section 3.2). The guidelines for establishing an AA are summarized below.
• The “Standard Circular AA” is a 40m-radius circle centered on the POINT.
• The “Standard Circular AA–Shifted” is used when the center of the AA has to be shifted away from the POINT to fit within the wetland area that can be assessed.

4
• The “Polygon AA” is used for sites that are large enough for a full-sized (0.5 ha) AA, if the AA is not a circle. In this situation a 0.5 ha polygon is established with the center of the AA situated as close to the POINT as possible.
• The “Wetland Boundary AA” is used when the total area of the site is less than 0.5 ha but at least 0.1 ha. In this case, the AA boundary coincides with the wetland boundary.
The buffer zone for an AA will be established as follows (see Chapter 4 of the FOM for full details).
• For a Circular AA, the buffer zone is the area that lies within a 100m distance of the AA perimeter or 140m from the AA center. To mark the edge of the buffer zone, four (4) 140m transects are established in the four cardinal directions from the AA center, whether or not the center is the POINT (Figure 1A on page 7 below). The buffer zone is defined by the distance greater than 40m from the AA center.
• For a Polygon AA, the buffer zone is the area that lies within a 100m distance from the polygon boundary (Figure 1B on page 7 below).
• For a Wetland Boundary AA, the buffer extends 100m from the wetland boundary.
Integration of USA-RAM with the NWCA Site Evaluation Guidelines
Before fieldwork begins, a desktop evaluation of each sampling POINT will be done as described in the NWCA Site Evaluation Guidelines (USEPA 2010). The primary purpose of this evaluation is to determine if the selected POINT is, or likely will be, in the target population. Sources of information that will be used in the desktop evaluation include, but are not limited to, aerial photos, topographic maps, NWI data, NAIP imagery, and state, county or tribal wetland resource data. As part of the data collection for the NWCA, several of the USA-RAM Metrics will be assessed using the NWCA imagery of the POINTS as described in the NWCA Site Evaluation Guidelines (USEPA 2010). The Metrics for which data will be derived in this way are:
Metric 1: Percent of the AA Having Buffer
Metric 2: Buffer Width
Metric 6: Patch Mosaic Complexity The measurements needed for these Metrics will be determined by the Field Crews before the AA is assessed (i.e., during the desktop evaluation) using the site packet that contains information about site location and site access (e.g., maps and aerial images).

5
Section A: Assessment of the Buffer The following three Metrics are designed to evaluate the form and condition of the buffer zone and the kind of stressors and amount of stress to which it is subject. Here we define the buffer as land adjacent to the AA that is comprised of natural vegetation and lacks evidence of intrusive human activity. As described above, the buffer has a maximum width of 100m. It is assumed that the buffer helps protect the AA by mitigating stress, including the deleterious effects of human land uses that adjoin the buffer zone. Metrics 1 and 2 will be completed in two steps. Metric 1 consists of a desktop evaluation at the time of AA planning (USEPA 2010, Chapter 3, FOM) to determine the land use surrounding each sample POINT. Once the AA is established, the land area within 100m of the AA boundary will comprise the buffer zone (i.e., the area that has the potential to serve as buffer, depending on its land use). Examples of the buffer configuration to be used for the Standard Circular AA and the Polygon AA are shown in Figure 1. The second step for metric 1 is a field verification of the data derived from the aerial imagery. Integrated Sampling of the Buffer
In order to streamline data collection for the NWCA, the AB Team will collect data for the Buffer Metrics that are included in USA-RAM, as well as complete the field protocol for sampling the buffer zone as described in the FOM. This will allow for efficient sampling of the buffer and enable field crews to use the information provided on aerial imagery to gather data and then perform a rigorous field verification of these data.
Figure 1. Establishment of the 100m buffer zone, defined as the 100m distance from the AA perimeter for a Circular AA (A) or the Polygon AA (B). Note the four transects laid out in the cardinal directions (North, South, East, West), along which are located the plots for assessing the buffer according to the FOM (original figure modified from the FOM; USEPA 2010). USA-RAM Buffer Metrics 1 and 2 will be verified when walking the four cardinal-direction transects.
A B

6
Metric 1: Percent of AA having Buffer. Land only counts as buffer if it consists of a land cover type that is capable of “buffering” the AA by protecting it from multiple kinds of stressors originating in the surrounding landscape outside. This Metric is based on the percent of the AA perimeter that adjoins a general type of “buffer land cover” as defined in Table 2. For the NWCA, land covers that might provide limited buffering under special circumstances, such as pasture land managed for ecological functions are not considered to be buffers because adequate knowledge of such localized circumstances cannot be assured throughout the survey. General approach – The NWCA sample point imagery will be used to score this Metric, followed by ground verification of the imagery during the fieldwork. Site imagery plus field reconnaissance will be used to examine the entire perimeter of the AA and to estimate the percent of the perimeter that adjoins any type of Buffer Land Cover, based on Tables 2 and 3 below. Make estimates in increments of 5% of the distance of the perimeter of the AA. The AB Team) will implement USA-RAM protocol described here as well as the buffer sampling protocol described in the Field Operations Manual.
Table 2: Buffer Land Cover Criteria. To qualify as buffer, a land cover must meet all four of the listed criteria.
Buffer Land Cover Criteria 1. Is on the list of “buffer land covers” in Table 2 2. Is at least 5m wide 3. Extends at least 10m along the AA boundary as a contiguous cover patch 4. Is not separated from the AA by a non-buffer cover or open water that is ≥ 5m wide
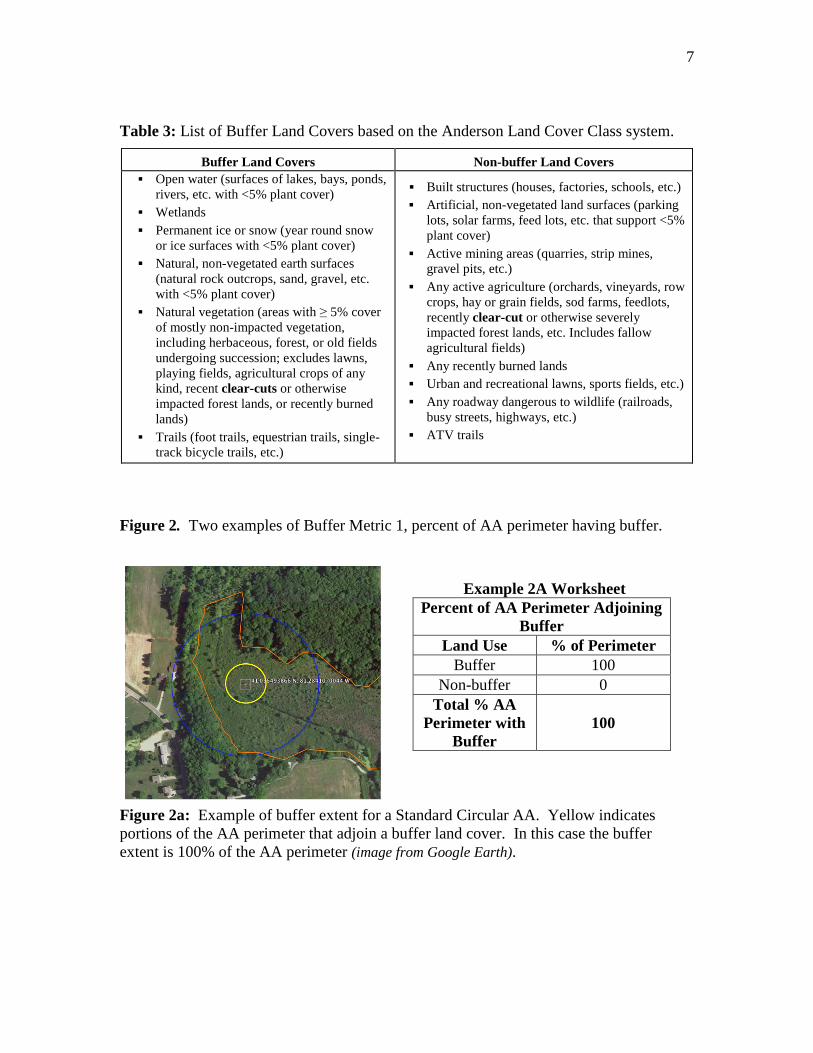
7
Table 3: List of Buffer Land Covers based on the Anderson Land Cover Class system.
Buffer Land Covers Non-buffer Land Covers � Open water (surfaces of lakes, bays, ponds,
rivers, etc. with <5% plant cover) � Wetlands � Permanent ice or snow (year round snow
or ice surfaces with <5% plant cover) � Natural, non-vegetated earth surfaces
(natural rock outcrops, sand, gravel, etc. with <5% plant cover)
� Natural vegetation (areas with ≥ 5% cover of mostly non-impacted vegetation, including herbaceous, forest, or old fields undergoing succession; excludes lawns, playing fields, agricultural crops of any kind, recent clear-cuts or otherwise impacted forest lands, or recently burned lands)
� Trails (foot trails, equestrian trails, single-track bicycle trails, etc.)
� Built structures (houses, factories, schools, etc.) � Artificial, non-vegetated land surfaces (parking
lots, solar farms, feed lots, etc. that support <5% plant cover)
� Active mining areas (quarries, strip mines, gravel pits, etc.)
� Any active agriculture (orchards, vineyards, row crops, hay or grain fields, sod farms, feedlots, recently clear-cut or otherwise severely impacted forest lands, etc. Includes fallow agricultural fields)
� Any recently burned lands � Urban and recreational lawns, sports fields, etc.) � Any roadway dangerous to wildlife (railroads,
busy streets, highways, etc.) � ATV trails
Figure 2. Two examples of Buffer Metric 1, percent of AA perimeter having buffer.
Example 2A Worksheet Percent of AA Perimeter Adjoining
Buffer Land Use % of Perimeter
Buffer 100 Non-buffer 0
Total % AA Perimeter with
Buffer 100
Figure 2a: Example of buffer extent for a Standard Circular AA. Yellow indicates portions of the AA perimeter that adjoin a buffer land cover. In this case the buffer extent is 100% of the AA perimeter (image from Google Earth).

8
Example 2B Worksheet Percent of AA Perimeter
Adjoining Buffer Land Use % of Perimeter
Buffer 75 Non-buffer 25
Total % AA Perimeter with
Buffer 75
Figure 2b. Example of buffer extent for a Standard Circular AA. Yellow indicates portions of the AA perimeter that adjoin a buffer land cover. In this case, about 75% of the AA perimeter is buffered (image from Google Earth). Table 4: Metric 1 data table.
Choose 1 Percent of AA Perimeter adjoining buffer O < 25 %
O 26 – 50%
O 51 – 75%
O > 75%
Metric 2: Buffer Width. The ability of an area to buffer a wetland from external stressors depends on the width of the buffer area. Minimum effective buffer widths can vary among stressors. However, it is assumed that buffers do not usually need to be wider than 100m. A width of 100m has become a commonly used definition of what constitutes a buffer for the sake of assessment in many programs, and land use in the 100m buffer has been found to be correlated with wetland condition. For the NWCA, the AB Team will implement the USA-RAM protocol described here as well as the buffer sampling protocol described in the Field Operations Manual. General approach - Four lines, each 100m long, are drawn from the AA perimeter on the site imagery in the cardinal directions (N, S, E, W); these are the transect lines along which the sampling plots for the FOM buffer protocol will be located. Another four lines are drawn in the ordinal directions (NE, SE, SW, NW), outward from the AA perimeter
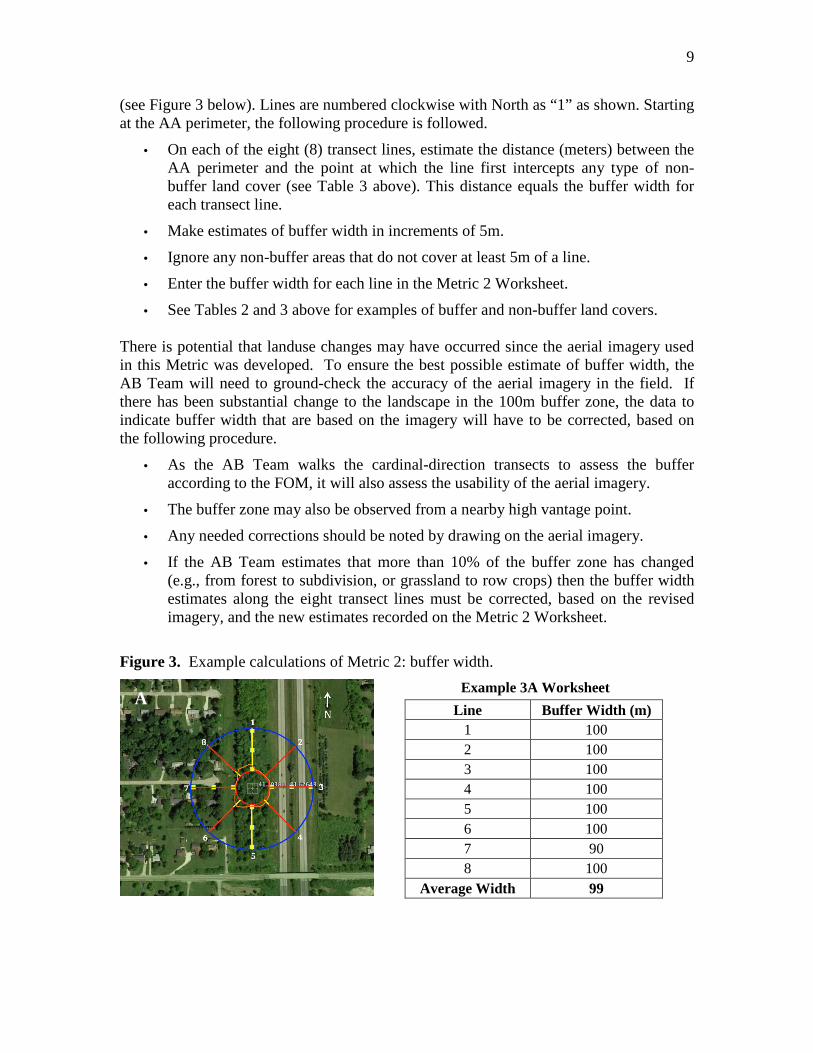
9
(see Figure 3 below). Lines are numbered clockwise with North as “1” as shown. Starting at the AA perimeter, the following procedure is followed.
• On each of the eight (8) transect lines, estimate the distance (meters) between the AA perimeter and the point at which the line first intercepts any type of non-buffer land cover (see Table 3 above). This distance equals the buffer width for each transect line.
• Make estimates of buffer width in increments of 5m.
• Ignore any non-buffer areas that do not cover at least 5m of a line.
• Enter the buffer width for each line in the Metric 2 Worksheet.
• See Tables 2 and 3 above for examples of buffer and non-buffer land covers. There is potential that landuse changes may have occurred since the aerial imagery used in this Metric was developed. To ensure the best possible estimate of buffer width, the AB Team will need to ground-check the accuracy of the aerial imagery in the field. If there has been substantial change to the landscape in the 100m buffer zone, the data to indicate buffer width that are based on the imagery will have to be corrected, based on the following procedure.
• As the AB Team walks the cardinal-direction transects to assess the buffer according to the FOM, it will also assess the usability of the aerial imagery.
• The buffer zone may also be observed from a nearby high vantage point.
• Any needed corrections should be noted by drawing on the aerial imagery.
• If the AB Team estimates that more than 10% of the buffer zone has changed (e.g., from forest to subdivision, or grassland to row crops) then the buffer width estimates along the eight transect lines must be corrected, based on the revised imagery, and the new estimates recorded on the Metric 2 Worksheet.
Figure 3. Example calculations of Metric 2: buffer width.
Example 3A Worksheet
Line Buffer Width (m) 1 100 2 100 3 100 4 100 5 100 6 100 7 90 8 100
Average Width 99
A
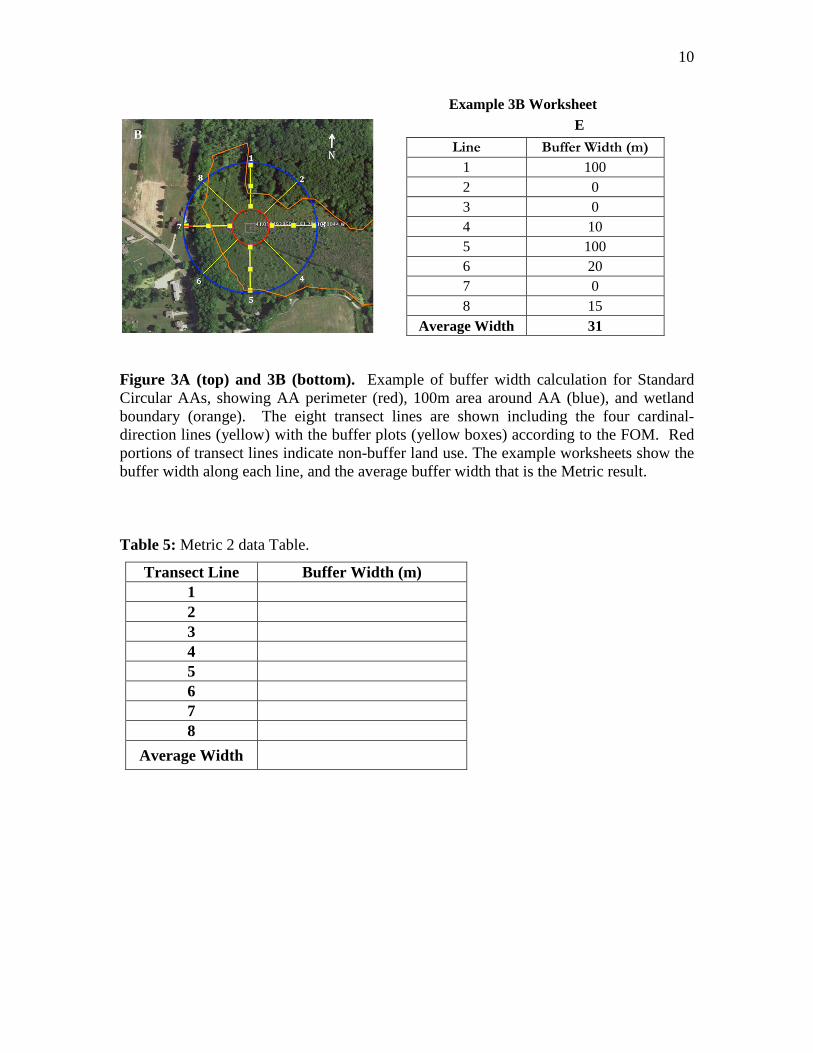
10
Example 3B Worksheet E
Line Buffer Width (m)
1 100 2 0 3 0 4 10 5 100 6 20 7 0 8 15
Average Width 31
Figure 3A (top) and 3B (bottom). Example of buffer width calculation for Standard Circular AAs, showing AA perimeter (red), 100m area around AA (blue), and wetland boundary (orange). The eight transect lines are shown including the four cardinal-direction lines (yellow) with the buffer plots (yellow boxes) according to the FOM. Red portions of transect lines indicate non-buffer land use. The example worksheets show the buffer width along each line, and the average buffer width that is the Metric result. Table 5: Metric 2 data Table.
Transect Line Buffer Width (m) 1 2 3 4 5 6 7 8
Average Width
B

11
Metric 3: Stress to the Buffer Zone. Buffer areas can provide some protection to wetlands from human activities and the stressors they can generate. This metric is designed to tabulate and characterize the types and severity of stressors that can act to reduce the effectiveness of the buffer in protecting the AA from activity in the surrounding landscape. For the sake of this Metric, the buffer zone is considered to be the entire 100m area around the AA, regardless of land use. Stressors that occur in land use covers, whether or not they count as buffers (see Table 3), have the potential to directly impact the AA. Therefore, stressors that occur in any land use within 100m of the AA will be tallied using the provided checklist. General approach - Buffer stress will be assessed by the AB Team as it walks the four cardinal-direction transects (N, S, E, W) established in the buffer zone to assess the buffer according to the FOM. The AB Team will thoroughly examine the buffer zone along these transects and the visible adjoining buffer zone for evidence of stressors. It is particularly important to investigate any evidence of stressors noted in the buffer zone on the aerial imagery or maps, even if such evidence occurs away from the four cardinal-direct transect lines. Observations will be made using site imagery, direct field observations, maps, and any other useful sources of information. Only stressors that are observed at the time of the field assessment should be counted. Indicators of past disturbance tend be less reliable and should not be considered. This Metric is assessed based on the number of stressors that are evident (i.e., their presence – absence), as well as their severity. The severity of a stressor is characterized based on the portion of the entire buffer zone that the stressor apparently influences, using the guidelines shown in Table 6. The field indicators of stress are provided in Table 5, and are organized by Stressor Category (i.e., Hydrology, Habitat/Vegetation, Residential/Urban/Commercial Land Use, and Agriculture). All stressor indicators that are observed in the buffer zone should be checked, and the severity of that stressor must be indicated. After the checklist has been completed for a Stressor category, the overall severity of stress for the Categories is estimated on the field form.
Table 6: Guidelines for assessing stressor severity.
Portion of Buffer Zone Influenced by Stressor
Severity Code
less than one-third 1
between one-third and two-thirds 2
at least two-thirds 3

12
Table 7: Indicators of stress in the buffer zone. Rank each observed indicator based on Table 6 above. Rank the overall severity of stress for any Stressor Category with observed stress indicators. Do not include these overall rankings for Stressor Categories in the final tally of stressors.
If stressor is present, mark
its severity Field Indicators by Stressor Category
1 2 3 Hydrological Stressors 1 2 3 Ditches/ drains/ channelization 1 2 3 Dikes/dams/levees/ railroad or road beds 1 2 3 Culverts, pipes (point source discharge except stormwater) in buffer zone 1 2 3 Water level control structure 1 2 3 Obvious spills, discharges or odors; unusual water color or foam 1 2 3 Moderate to heavy formation of filamentous algae 1 2 3 Excavation, dredging 1 2 3 Fill / spoil banks 1 2 3 Wall/riprap 1 2 3 Inlets and outlets 1 2 3 Input from impervious surfaces (stormwater culvert) 1 2 3 Habitat/Vegetation Stressors 1 2 3 Soil subsidence, scour or surface erosion (root exposure) 1 2 3 Substrate disturbance (ATVs off-road vehicles, mountain biking) 1 2 3 Sediment input (construction, erosion, agricultural runoff) 1 2 3 Forest - selective cut 1 2 3 Forest - clear cut 1 2 3 Removal of large woody debris 1 2 3 Tree plantation present 1 2 3 Heavily grazed grasses, excessive grazing 1 2 3 Tree canopy herbivory 1 2 3 Shrub layer browsed 1 2 3 Fire lines (fire breaks) 1 2 3 Recently burned forest canopy 1 2 3 Recently burned grassland 1 2 3 Mowing/shrub cutting (brush hogging) 1 2 3 Other mechanical plant removal 1 2 3 Chemical vegetation control (herbicide application) 1 2 3 Cover of non-native or invasive species 1 2 3 Presence of power lines or utility corridors (continual maintenance) 1 2 3 Oil/gas wells 1 2 3 Logging roads 1 2 3 Trails 1 2 3 Residential/Urban/Commercial Stressors 1 2 3 Suburban residential land use 1 2 3 Urban multifamily land use 1 2 3 Urban/commercial buildings
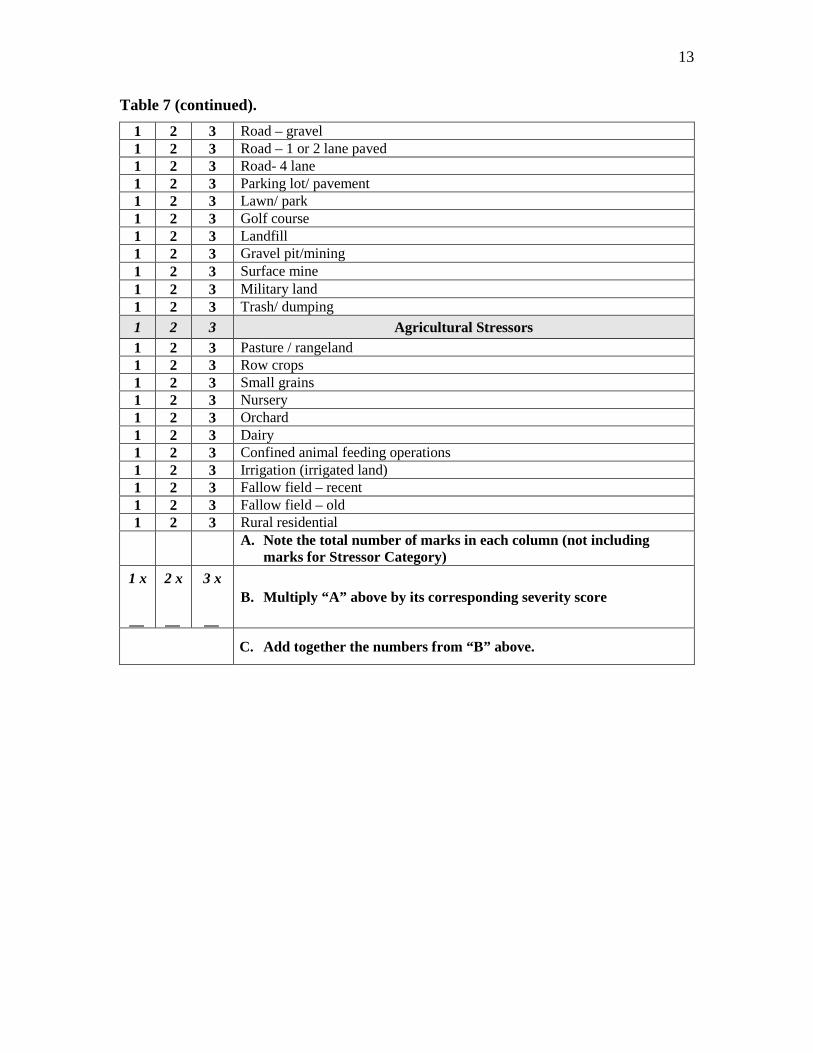
13
Table 7 (continued).
1 2 3 Road – gravel 1 2 3 Road – 1 or 2 lane paved 1 2 3 Road- 4 lane 1 2 3 Parking lot/ pavement 1 2 3 Lawn/ park 1 2 3 Golf course 1 2 3 Landfill 1 2 3 Gravel pit/mining 1 2 3 Surface mine 1 2 3 Military land 1 2 3 Trash/ dumping 1 2 3 Agricultural Stressors 1 2 3 Pasture / rangeland 1 2 3 Row crops 1 2 3 Small grains 1 2 3 Nursery 1 2 3 Orchard 1 2 3 Dairy 1 2 3 Confined animal feeding operations 1 2 3 Irrigation (irrigated land) 1 2 3 Fallow field – recent 1 2 3 Fallow field – old 1 2 3 Rural residential
A. Note the total number of marks in each column (not including marks for Stressor Category)
1 x
__
2 x
__
3 x
__ B. Multiply “A” above by its corresponding severity score
C. Add together the numbers from “B” above.

14
Section B: Assessment of Wetland Form and Structure Physical Structure Attribute Metric 4: Topographic Complexity. Natural wetlands develop topographic relief due to variations in sediment production or deposition, erosion or oxidation of sediments, variations in hydroperiod, wildlife activities, etc. The resulting relief can be evident at multiple spatial scales. Increases in micro-relief represent increases in the surface area of a wetland and therefore can lead to increased bio- and geo-chemical processes at the sediment-water or sediment-air interface. It can also represent an increase in habitat quantity and diversity for diminutive forms of plants and animals, including plant propagules, insects, and amphibian larvae. Increases in macro-relief can lead to increases in the diversity of larger species or larger colonies of diminutive species, and plant community zonation. General approach – the number of standard indicators of macro- and micro-topographic relief evident in the AA is used to assess its overall topographic complexity. To aid in the assessment, the likely influence of the indicators on the topographic cross-section of AA should be considered (Figure 4). Macro-relief refers to the overall shape of the profile, including major changes in its steepness and the locations and sizes of persistent topographic features such as benches, plains, berms, furrows, channels, etc. Micro-relief refers to less persistent relief that occurs as details or elements of the macro-relief, such as animal burrows, soil cracks, surface objects (e.g., woody debris, cobbles or boulders), etc.
Figure 4: Example topographic cross-section of an AA showing the effect of macro- and micro-relief on overall topographic complexity. In this example, there are two benches and intervening slopes that account for the macro-relief of each half of the AA. Some of the benches and slopes have micro-relief , which might result from woody debris, tussocks, cobbles, animal burrows, etc. The vertical scale, which spans the total range of macro-relief, is exaggerated relative to the horizontal scale, which spans the AA.
sloping bench without micro-relief
bench with micro-relief
bench with micro-relief
bench without
micro-relief
steep slope
Diameter of AA
Ra
ng
e o
f Mac
ro-r
elie
f

15
Table 8: Checklist of field indicators of topographic complexity observed in the AA. Bold terms are in the glossary. An indicator should not be checked unless it covers at least 2m2 of the AA. For example, animal burrows should not be checked unless, in aggregate, they cover at least 2m2 of the AA.
Indicators Check if observed
Multiple horizontal plains, benches, terraces, or flats at different elevations Multiple slopes of varying steepness Natural or artificial levee or berm Bank slumps or undercut banks Undercut banks Multiple high water marks etched in substrate Potholes, sink holes or similar depressions not caused by animals Natural or artificial channels Natural or artificial swales Animal burrows or spoil piles from burrows (including ant or termite mounds) Animal tracks deep enough to hold water (e.g., cattle or elk tracks) Wallows, pig damage, or similar scale excavations by animals Inorganic sediment mounds not made by animals Natural or artificial debris or wrack along high water lines Natural or artificial debris in topographic low areas Natural or artificial debris dispersed across AA (tree limbs, lumber, etc) Plant hummocks or tussocks Soil cracks or fissures Cobbles or boulders Bare ground
Total Number of Indicators Observed Metric 5: Patch Mosaic Complexity. This metric addresses the structural complexity of the AA in plan-view (i.e., as viewed from above), based on the number of structural patches and their zonation or interspersion. When viewed from above, most wetlands are mosaics of different patches of substrate or plant cover. The complexity of the mosaic has two basic aspects: the diversity of the component patches and the degree to which they are interspersed (i.e., the amount of interface between multiple patches). Within a given wetland class, the diversity and levels of ecological function of a wetland mosaic are expected to increase

16
with its overall complexity. The basic assumption is that more patches and more interface between them translates into more kinds of habitat and broader ranges in habitat condition, as well as more kinds and higher levels of material and energy transformation per unit area of the mosaic. General approach – This metric is assessed based on visual comparisons between the AA, as viewed in NAIP imagery or imagined in plan-view, and schematic diagrams of the full range of possible patch mosaic complexity. The scale at which the AA is viewed must be standardized. The AA should be viewed or envisioned in its entirety. The 1m-pixel NAIP imagery supports this view. However, expert field personnel can also imagine a detailed orthogonal view of the entire AA based on their on-the-ground reconnaissance. Table 9: Suggested patch types. The following surfaces or land covers should be
considered possible patches, if they are obviously visibly distinct when the entire AA is viewed or envisioned from above. Each patch must cover a contiguous area of at least 10m2 to be considered for this metric. Inert constructed covers, such as pavement, roofs, etc., are ignored.
Mono-specific patches, including patches of one tree or shrub species, etc.
Visibly distinct assemblages of plant species; patches may have species in common.
Surface water visible in lakes, lagoons, channels, wetlands, etc.
Bare substrate (i.e., < 5% plant cover), such as bedrock outcrops, river bars, etc.
Natural organic debris, including tree fall, flood deposits, etc.
Figure 5: Example sketch of a patch mosaic (right-side image) based on NAIP imagery (left-side image). The white area in the mosaic is the matrix or background patch type. The other colors represent patches of different plant species, distinct assemblages of plant species, or bare ground. This mosaic has eight patch types, including the matrix.
1
1
1
2 2
3
4
5
6 7
8
8

17
Figure 6: Schematic diagrams of alternative patch mosaics. Each column of sketches represents a different patch pattern or template, ranging from separate circular patches (far left column) to parallel linear patches (far right column). For each column, mosaic complexity increases from Row 1 to Row 4. The large circle in each case represents the AA. The non-colored (white) area represents the matrix of the AA, or its background patch type. It could be upland. Blue represents standing water. Other colors represent patch types based on Table 9 above.
Select the diagram that most closely resembles the actual AA. The mosaic within the AA might appear to consist of replications of one of these diagrams. Any AA with a simpler mosaic than indicated in Row 1 should be assumed to belong to Row 1. Any AA with a more complex mosaic than indicated in Row 4 should be assumed to belong to Row 4.
Row 1
Row 2
Row 3
Row 4

18
Table 10: Metric 5 data table.
Selected the Row Number of the Mosaic That Most Resembles the AA
1 2
3
4
Biological Structure Attribute
Metric 6: Vertical Complexity.
This metric addresses the vertical structure of the plant community in terms of its component number of plant strata. Different strata provide different physical and ecological services. Tall vegetation tends to be more efficient at intercepting and holding rainwater, providing shade, serving as sources of allochthonous inputs, and moderating air temperature. Low-growing vegetation can shield soils from intense rainfall while serving as forage for herbivorous game. Transpiration by wetland plants can cause diel fluctuations in groundwater height or surface water depth. Perennial wetland plants tend to produce abundant below-ground biomass that influences substrate elevation and chemistry. Animal species tend to partition themselves vertically among wetland and riparian plant strata. The basic assumption is that more strata translates into more kinds of habitat and broader ranges in habitat condition, as well as more kinds and higher levels of material and energy transformation for the wetland as a whole. General approach –The following worksheet is used to identify the dominant plant strata of the AA. USA-RAM recognizes seven (7) strata: Submerged Plants, Floating or Floating-Leaved Plants, Tall Emergent Plants, Short Emergent Plants, Short Woody Plants, Tall Woody Plants, and Vines. The absolute percent cover of each plant stratum is estimated in increments of 10%, based on a reconnaissance of the AA and site imagery. Each stratum is then assigned to one of five cover classes based on Table11 below. Dominant strata cover at least 10% of the AA. Cover estimates should include vegetation covering the AA but rooted outside the AA. Data can include standing stock from previous seasons, but all data must represent observed conditions rather that hindcasts or forecasts.
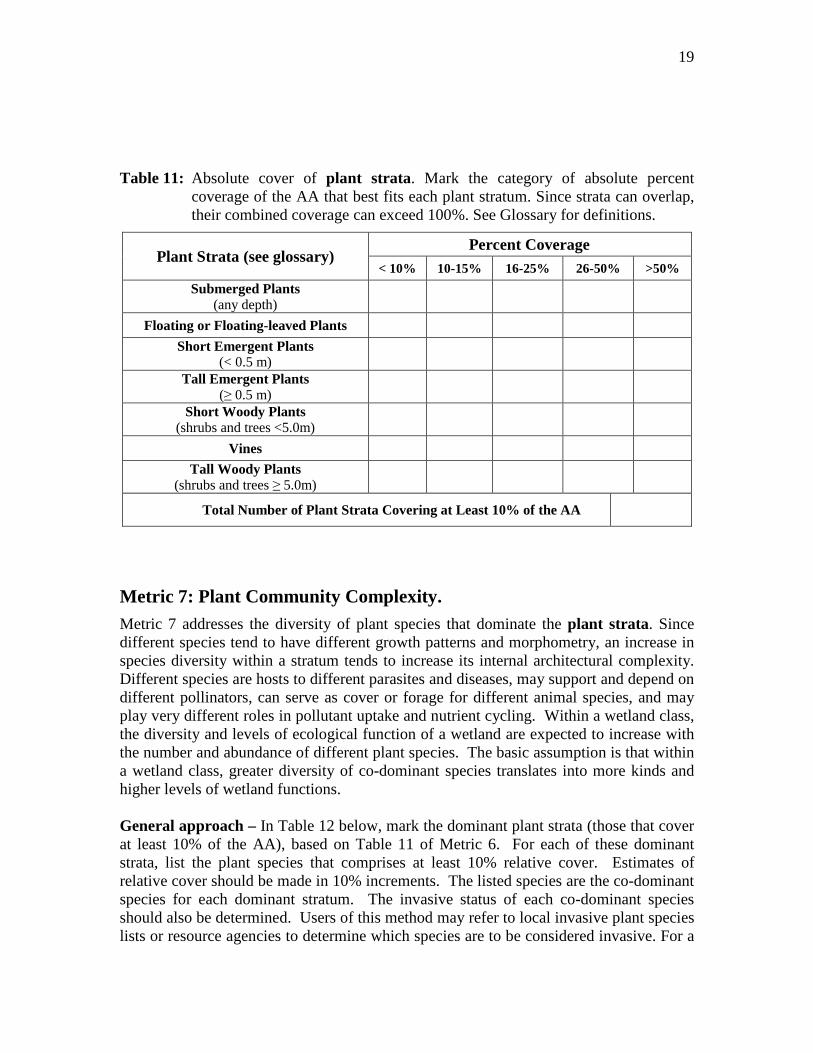
19
Table 11: Absolute cover of plant strata. Mark the category of absolute percent
coverage of the AA that best fits each plant stratum. Since strata can overlap, their combined coverage can exceed 100%. See Glossary for definitions.
Plant Strata (see glossary) Percent Coverage
< 10% 10-15% 16-25% 26-50% >50%
Submerged Plants (any depth)
Floating or Floating-leaved Plants
Short Emergent Plants (< 0.5 m)
Tall Emergent Plants (≥ 0.5 m)
Short Woody Plants (shrubs and trees <5.0m)
Vines
Tall Woody Plants (shrubs and trees ≥ 5.0m)
Total Number of Plant Strata Covering at Least 10% of the AA
Metric 7: Plant Community Complexity. Metric 7 addresses the diversity of plant species that dominate the plant strata. Since different species tend to have different growth patterns and morphometry, an increase in species diversity within a stratum tends to increase its internal architectural complexity. Different species are hosts to different parasites and diseases, may support and depend on different pollinators, can serve as cover or forage for different animal species, and may play very different roles in pollutant uptake and nutrient cycling. Within a wetland class, the diversity and levels of ecological function of a wetland are expected to increase with the number and abundance of different plant species. The basic assumption is that within a wetland class, greater diversity of co-dominant species translates into more kinds and higher levels of wetland functions. General approach – In Table 12 below, mark the dominant plant strata (those that cover at least 10% of the AA), based on Table 11 of Metric 6. For each of these dominant strata, list the plant species that comprises at least 10% relative cover. Estimates of relative cover should be made in 10% increments. The listed species are the co-dominant species for each dominant stratum. The invasive status of each co-dominant species should also be determined. Users of this method may refer to local invasive plant species lists or resource agencies to determine which species are to be considered invasive. For a
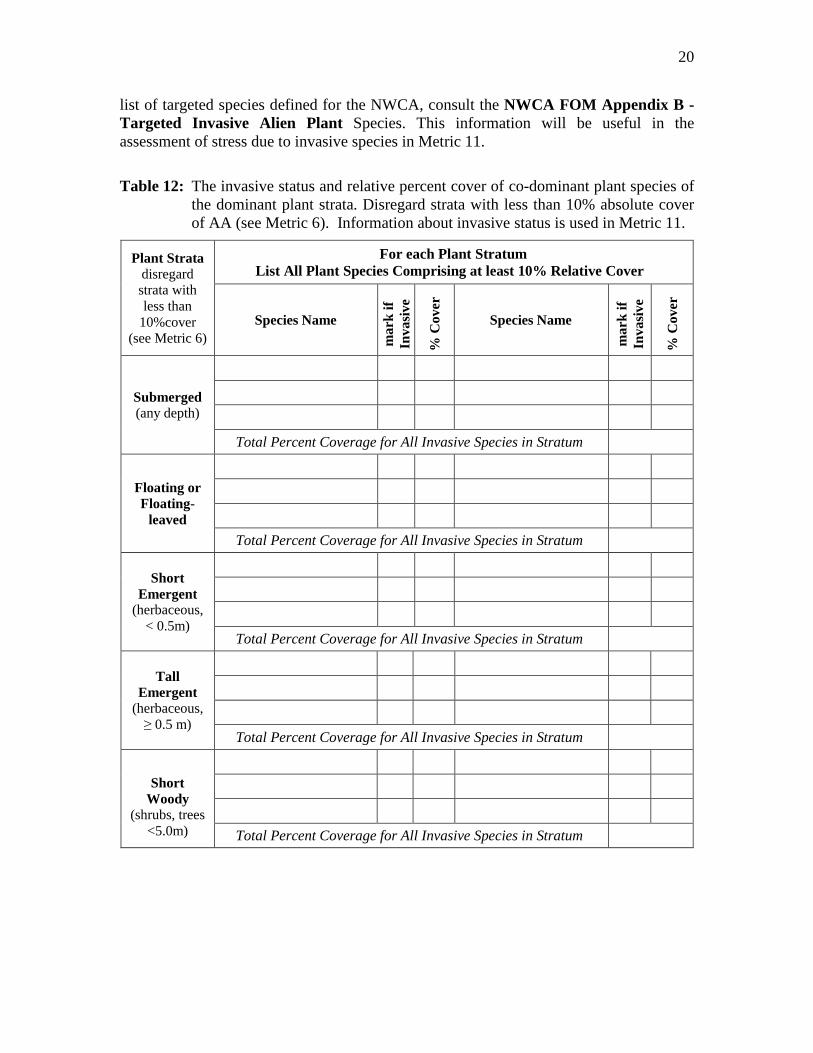
20
list of targeted species defined for the NWCA, consult the NWCA FOM Appendix B - Targeted Invasive Alien Plant Species. This information will be useful in the assessment of stress due to invasive species in Metric 11.
Table 12: The invasive status and relative percent cover of co-dominant plant species of the dominant plant strata. Disregard strata with less than 10% absolute cover of AA (see Metric 6). Information about invasive status is used in Metric 11.
Plant Strata disregard strata with less than
10%cover (see Metric 6)
For each Plant Stratum List All Plant Species Comprising at least 10% Relative Cover
Species Name
mar
k if
Inva
sive
% C
over
Species Name
mar
k if
Inva
sive
% C
over
Submerged (any depth)
Total Percent Coverage for All Invasive Species in Stratum
Floating or Floating-
leaved
Total Percent Coverage for All Invasive Species in Stratum
Short Emergent
(herbaceous, < 0.5m)
Total Percent Coverage for All Invasive Species in Stratum
Tall Emergent
(herbaceous, ≥ 0.5 m)
Total Percent Coverage for All Invasive Species in Stratum
Short
Woody (shrubs, trees
<5.0m)
Total Percent Coverage for All Invasive Species in Stratum

21
Table 12 (continued).
Vines (any present)
Total Percent Coverage for All Invasive Species in Stratum
Tall Woody (shrubs, trees ≥ 5.0m)
Total Percent Coverage for All Invasive Species in Stratum
Total number of listed species for all plant strata combined (Do not count any species more than once).

22
Section C: Assessment of Stressors in the AA The following Metrics are used to assess stressors within the AA. Stress to the buffer is considered in the preceding Section A. The primary purpose of the Stressor Metrics is to assess the distribution and severity of stressors within and among regions of the US. Information on stressors is valuable for diagnosing the causes of impairment and for determining what remediation or rehabilitation measures are warranted. A secondary purpose is to gain insight into possible causes for low condition scores. To meet this purpose, each Stressor Metric is designed to provide information relevant to one or both Metrics of an Attribute of condition. As explained in Section B, the Hydrology Attribute is assessed only in terms of its stressors. The effects of stressors on wetland condition tend to increase with the number of different kinds of stressors and their severity, regardless of wetland type or vegetation community. The severity of a stressor depends on its duration, intensity, frequency, and proximity. The field indicators of stress tend to integrate across these parameters, such that they are not assessed independently. However, by observing whether the stressor indicators are obvious and pervasive, subtle and highly restricted, or characterized as more moderate, the users should be able to judge whether each stressor has a high, medium, or low degree of severity. Additional evidence of stressors that is provided by maps, aerial imagery, and local reports can also be used. Each observed indicator will be ranked according to Table 13 below.
Table 13: Descriptions of stressor severity ranks.
Severity Rank
Not severe - the stressor is present, but does not appear to negatively impact any Attribute of condition in the AA. 1
Moderately severe - the stressor is present and appears to have moderately negative impacts on one or more Attributes of condition in the AA.
2
Severe - the stressor is present and appears to have major negative impacts on one or more Attributes of condition in the AA. 3
The stressors in the following Metrics will be assessed based on these integrated rankings of stressor duration, intensity and frequency, and not based on aerial extent as was done for Metric 3. Walking the AA to make observations will be necessary, but care must be taken not to damage or trample the vegetation or other habitat features within the AA.

23
Hydrology Attribute Metric 8: Stress to Water Quality. Hydrology has been called the “master variable” that determines the structure, function and ecosystem services provided by wetlands. It includes measures of both water quality (Metric 8) and quantity (Metric 9). Human activities that degrade water quality include discharge from point sources, watershed activities that result in high sediment loads, nutrient runoff, mine drainage, or excess salts. As stressors accumulate at a site, services such as biodiversity support and biogeochemical cycling are compromised and downstream aquatic systems become altered. Water quality impacts can reduce vegetation diversity and lead to the establishment of invasive species. The water quality purification function of a wetland is typically reduced as water contaminants accumulate. General approach – This Metric accounts for activities that affect or degrade water quality in the AA. It is assessed based on a checklist of field indicators of water quality stressors (Table 14 below). The indicators are listed in Stressor Categories. All indicators of water quality stressors that are observed in the AA should be noted, and the severity of the indicated stressors should be ranked based on Table 13 above. After completing the checklist for a Stressor Category, the overall severity of stress for the Stressor Category as a whole should be estimated, unless none of the indicators in the category were observed. To complete the assessment for this Metric, the noted severity ranks should be tallied (added together) and recorded on the field form. Ranks for the Stressor Categories are not included in the tally of the indicator ranks. Table 14: Indicators of water quality stress observed in the AA. Each observed indicator
is ranked as (1) not severe; (2) moderately severe; or (3) severe, based on Table 13. Each indicator can have only one severity rank. Tally all the marked ranks to complete the metric, excluding the ranks for the Stressor Categories. Bold terms are in the glossary.
If stressor is present, mark
its severity Field Indicators by Stressor Category
1 2 3 Point Sources
1 2 3 Point source inputs (discharge from wastewater plants, factories, etc)
1 2 3 Stormwater inputs (discharge pipes, culverts, sewer outfalls)
1 2 3 Sedimentation/Pollutants
1 2 3 Debris lines on plants, trees or silt-laden vegetation
1 2 3 Sedimentation (e.g., the presence of sediment fans, deposits or plumes)
1 2 3 Industrial or domestic spills or discharges (odors; foam, oil sheen*)
1 2 3 Turbidity in the water column

24
Table 14 (continued).
1 2 3 Eutrophication
1 2 3 Direct discharges from feedlot manure pits, etc.
1 2 3 Direct discharges from septic or sewage systems
1 2 3 Direct application of fertilizer
1 2 3 Agricultural runoff (drain tiles, etc. discharging to site)
1 2 3 Formation of heavy algal or Lemna sp. surface mats or heavy benthic algal growth
1 2 3 Mining Impacts
1 2 3 Acid mine drainage discharge (excessively clear water (low pH) or presence/accumulation of “yellow-boy” orange precipitate)
1 2 3 Salinity
1 2 3 Obvious increases in the concentration of dissolved salts (dead or stressed plants; salt encrustations, etc)
Tally of all Ranks (excluding ranks for Stressor Categories)
* Oil sheen should not be confused with surface iron films (normal in many wetlands); iron films can be broken while oil films cannot.
Metric 9: Alterations to Hydroperiod. The hydroperiod (pattern of water level change over time) affects wetland vegetation community composition and productivity, the provision of spawning and nursery grounds for fish and amphibians, migratory waterfowl habitat, and biogeochemical processes. Functions such as floodwater storage and flood peak reduction are reflected in the hydroperiods of wetlands. General approach - This Metric is assessed using a checklist of field indicators of hydroperiod alterations in the AA (Table 15 below). While many hydroperiod alterations will occur outside of the AA, only those that occur within the AA are considered in the Metric. Hydrologic alterations that are outside of the AA are assessed in Metric 3 or using other assessment methods. The occurrence of any stressor indicator in the AA should be noted in the checklist, and its severity should be estimated, based on Table 13 above. To assess this Metric, the severity ranks (1, 2, and 3) noted for each observed indicator should be tallied (added together) and the sum should be recorded on the field form.

25
Table 15: Indicators of altered hydroperiod observed in AA. Each observed indicator is ranked as (1) not severe; (2) moderately severe; or (3) severe based on Table 13. Each indicator can have only one severity rank. Tally all the marked ranks to complete the Metric. Bold terms are in the glossary.
If stressor is present, mark
its severity Field Indicators
1 2 3 Ditches/channelization within AA
1 2 3 Dikes/dams/levees/berms at AA margin or within AA or roadbed or railroad (acting as block to water flows into or through AA)
1 2 3 Channels have deeply undercut banks and/or bank slumps or slides
1 2 3 Culverts, pipes (point sources) into AA (change in water quantity)
1 2 3 Water level control structure that impound water in all or part of the AA
1 2 3 Upland plant species encroaching into AA (due to drying of wetland)
1 2 3 Die-off of trees within AA due to increased ponding (exempting beaver impounded sites)
1 2 3 Tidal restriction in tidal wetlands (restricts flows to and from AA )
1 2 3 Presence of agricultural tiles or culverts at AA margin or within AA
1 2 3 Siphons, pumps moving water in or out of AA
1 2 3 Stormwater inputs from impervious surfaces/flashy flows into AA
Tally of all Ranks
Physical Structure Attribute
Metric 10: Habitat /Substrate Alterations. There is a range of anthropogenic events and activities that alter wetland habitats by disturbing their substrates. Off-site events and activities are usually hydrological. For example, floods caused by excessive runoff or major releases of water from dams can cause scouring of substrates or large deposits of sediment and debris. Onsite events and activities that alter substrates include grading, mining, off-road vehicle use, and vegetation control. Some urban wetlands are severely impacted by dumping of yard debris and other trash. Substrate alterations can cause changes in drainage and soil productivity that subsequently alter wetland plant communities. Severe alterations of wetland substrates often lead to plant invasions. General approach - This Metric is assessed using a checklist of field indicators of stressors that affect or degrade the substrate observed in the AA (Table 16).

26
Table 16. Indicators of altered substrate observed in AA. Each observed indicator is ranked as (1) not severe, (2) moderately severe, or (3) severe based on Table 13. Each indicator can have only one severity rank. Tally all the marked ranks to complete the metric. Bold terms are in the glossary.
If stressor is present, mark
its severity Field Indicators
1 2 3 Soil subsidence, scour or surface erosion (root exposure, etc)
1 2 3 Off-road vehicles, mountain biking, trails cut, etc.
1 2 3 Inorganic sedimentation inflow (sediment accumulation around vegetation, deep sediment splays, recent vegetation burial, etc)
1 2 3 Dredging or other prominent excavation at AA margin or in AA
1 2 3 Grazing by domesticated or feral animals in AA (includes trampling, digging, wallowing, etc)
1 2 3 Grazing by native ungulates.
1 2 3 Recent farming activity (plowing, disking, etc.)
1 2 3 Soil compaction by human activity (parking by cars, heavy machinery, etc)
1 2 3 Filling, grading, or other prominent deposition of sediment
1 2 3 Dumping of garbage or other debris
1 2 3 Mechanical plant removal that disturbs substrate (rutting, grubbing by heavy machinery, etc.)
1 2 3 Fire lines (fire breaks) dug in AA or at AA margin
Tally of all Ranks
Biological Structure Attribute Metric 11: Percent Cover of Invasive Plant Species. Wetland plants are particularly useful as indicators because they are an easily observed, universal component of wetland ecosystems. Plant community composition, including the occurrence of invasive species, provides clear and robust signals of human disturbance. This Metric is assessed based on field observations of the percent cover of invasive species in each of the plant strata within the AA. The observations made to assess Metric 7 will be useful, although in this metric the presence of any invasive species (i.e., any cover) is tallied using four broad cover classes (<5%, 5–25%, 26-75%, >75%). Users of this method may refer to local invasive plant species lists or resource agencies to determine which species are to be considered invasive. For a list of targeted species defined for the NWCA, consult the NWCA FOM Appendix B – Targeted Invasive Alien Plant Species. Some common invasive species are listed below (Table 17). This is not an exhaustive list.
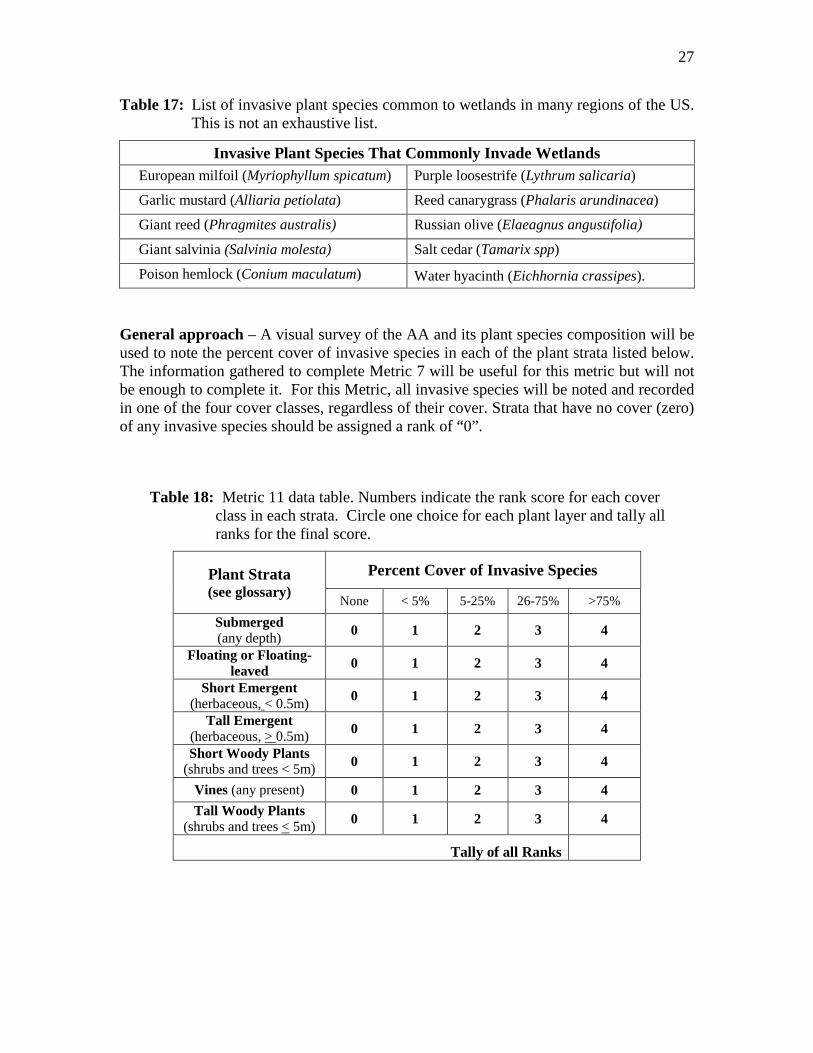
27
Table 17: List of invasive plant species common to wetlands in many regions of the US. This is not an exhaustive list.
Invasive Plant Species That Commonly Invade Wetlands European milfoil (Myriophyllum spicatum) Purple loosestrife (Lythrum salicaria)
Garlic mustard (Alliaria petiolata) Reed canarygrass (Phalaris arundinacea)
Giant reed (Phragmites australis) Russian olive (Elaeagnus angustifolia)
Giant salvinia (Salvinia molesta) Salt cedar (Tamarix spp)
Poison hemlock (Conium maculatum) Water hyacinth (Eichhornia crassipes). General approach – A visual survey of the AA and its plant species composition will be used to note the percent cover of invasive species in each of the plant strata listed below. The information gathered to complete Metric 7 will be useful for this metric but will not be enough to complete it. For this Metric, all invasive species will be noted and recorded in one of the four cover classes, regardless of their cover. Strata that have no cover (zero) of any invasive species should be assigned a rank of “0”.
Table 18: Metric 11 data table. Numbers indicate the rank score for each cover class in each strata. Circle one choice for each plant layer and tally all ranks for the final score.
Plant Strata (see glossary)
Percent Cover of Invasive Species
None < 5% 5-25% 26-75% >75%
Submerged (any depth) 0 1 2 3 4
Floating or Floating-leaved 0 1 2 3 4
Short Emergent (herbaceous, < 0.5m) 0 1 2 3 4
Tall Emergent (herbaceous, > 0.5m) 0 1 2 3 4
Short Woody Plants (shrubs and trees < 5m) 0 1 2 3 4
Vines (any present) 0 1 2 3 4
Tall Woody Plants (shrubs and trees < 5m) 0 1 2 3 4
Tally of all Ranks

28
Metric 12: Vegetation Disturbance. This metric accounts for human activities that directly alter the plant community in the AA. Vegetation is an easily observed component of wetlands that responds predictably to disturbance. As vegetation communities shift in response to stress, important wetland services, such as biodiversity support and water quality improvement, may be affected. General approach - This Metric is assessed based on a checklist of field indicators of anthropogenic disturbance to the plant community (Table 19 below). The indicators are listed in Stressor Categories. All stressors observed in the AA are noted, and the severity of the indicated stressors is ranked based on Table 13. Only on-going or recent disturbances that are clearly impacting the vegetation are considered. After completing the checklist for a Stressor Category, the overall severity of stress for the category as a whole should be estimated, unless none of the indicators in the category were observed. To complete this Metric, the noted severity ranks should be tallied (added together) and recorded on the field form. Exclude the ranks for the Stressor Categories from the tally. Table 19. Indicators of vegetation disturbance observed in AA. Each observed indicator
is ranked as (1) not severe, (2) moderately severe, or (3) severe based on Table 13. Each indicator can have only one severity rank. Bold terms are in the glossary.
If stressor is present, rank
its severity Field Indicators by Stressor Category
1 2 3 Human Use and/or Management
1 2 3 Mowing within AA ( or at AA margin)
1 2 3 Forest - selective cut
1 2 3 Forest - clear cut
1 2 3 Prominent removal of large woody debris
1 2 3 Mechanical plant removal besides tree cutting or woody debris removal
1 2 3 Evidence of planting of non-native vegetation
1 2 3 Chemical vegetation control (herbicide application, defoliant use)
1 2 3 Farming (recent plowing, disking, etc)
1 2 3 Excessive Grazing or Herbivory
1 2 3 Grazing by domestic or feral animals (cows, sheep, pigs, etc)
1 2 3 Excessive wildlife herbivory (deer, muskrat, geese, carp, beaver, etc.)
1 2 3 Excessive insect herbivory of tree canopy, shrub stratum
1 2 3 Fire
1 2 3 Evidence of intentional burning at AA margin or in AA
1 2 3 Fire lines (fire breaks)
Tally of all Ranks (excluding ranks for Stressor Categories)

29
USA RAM Glossary
Acid mine drainage – acidic water typically with high metal concentrations that results
from water flowing over sulfur bearing materials. Acid mine drainage often results from the process of mining, particularly coal mining.
Bank slumps – sediment or soil collapse from the face of a riverbank.
Bench - A flat, horizontal area of land that is longer than wide, with the long axis general parallel to a nearby shoreline or bank, one long side bounded by land sloping steeply upward, and the other side bounded by land sloping steeply downward.
Berm - A narrow bench of land typically along the top or bottom of a slope that separates two areas, also termed “ledge” and “shelf” (see “bench”).
Channel - A landscape feature with well-defined bed and banks that has been formed by water and which under normal circumstances is maintained by the flow of water, or that is purposefully constructed and maintained to convey water.
Clear cut – a logging practice in which most or all of the trees in an area of forest are cut and removed.
Die-off - The relatively sudden, severe, and cotemporaneous deaths of most of the plants and/or animals of a kind in one area or habitat type, such as a lake or wetland.
Dike – An embankment or wall, typically of earth and stone, built to prevent flooding.
Disking – in farming, turning and loosening the soil with a series of discs (as in plowing)
Ditch – A small channel dug for the purposes of moving water, often used to speed drainage of an area.
Emergent (herbaceous) – Plants rooted in the soil with basal portions often in the water and whose leaves, stems, and reproductive structures are aerial. Examples include cattails (Typha spp.) and reed canary grass (Phalaris arundinacea).
Fire line – A gap in vegetation cut by fire crews in advance of a wildfire to stop its spread buy depriving the fire of fuel. Also known as fire breaks.
Flashy flows – Stream flows characterized by rapid rises and falls in water levels in response to rainfall. This includes higher peak flows (discharge) and lower base flows and is the result of impervious surfaces in the watershed. High water flows can lead to bank erosion and associated water quality issues.
Flat - A non-vegetated, horizontal area of land of any shape with at least one side bounded by water.

30
Invasive species - Plant species that are 1) non-native (alien) to the AA, and 2) whose introduction is likely to cause economic or environmental harm.
Large woody debris – Trees or portions of trees (limbs, rootwads, etc) typically with a diameter of 10 cm or more that have fallen into aquatic sites. These provide substantial habitat benefits.
Levee – An embankment that runs along the bank of a river or channel. It can be natural (due to flooding and sediment deposition) or human-made.
Macro-relief – Variations in ground surface elevation due to such factors as ground subsidence, erosion by waves, differential weathering rates of geologic strata, land slides, etc.
Micro-relief – Small scale variations in ground surface elevation due to such factors as animal burrowing, spatial differences in sediment accumulation, buried debris, etc.
Mosaic - An arrangement or array of patches of a landscape (see “patch”).
Patch - An area assigned to a single land cover type or class that differs from its surroundings.
Pig damage - A wallow caused by wild or feral pigs digging into the ground (see “wallows”).
Plant hummock or tussock – a compact tuft especially of grass or sedge, or an area of raised solid ground that is bound by roots of low-growing vegetation.
Plant Stratum (strata) – A class of plant height. Plants are classified based on their maximum height above the substrate, including aquatic plants rooted in benthic substrates and floating plants.
Point Source - any discernible confined and discrete conveyance including a pipe, ditch, channel, or conduit from which pollutants may be discharged.
Pothole - Any depression or hole in the land surface that is caused by physical processes other than subterranean erosion by groundwater, and that has a maximum width less than 3m.
Sediment mound - Any mound of sediment of any shape having a maximum height less that 2m and a maximum width or diameter less than 5m.
Sediment splay - A small fan of sediment deposited at the margin of a sudden and temporary inundation of the land surface by flood waters. Sediment splays are common on active riverine floodplains and interfluves.
Selective cut – Forestry practice in which certain desirable trees are cut and the remainder is left standing.
Shrub – Shrubs are woody species that have a relatively low height (typically 1.5 m or

31
less). This group includes true shrubs (woody species that lack a single trunk), and young or stunted trees. Common examples include blackberries (Rubus spp.).
Soil cracks - Cracks less than 1m deep in the permeable ground surface caused by its shrinking and swelling, or by freezing and thawing.
Soil subsidence – The downward movement of a soil surface. In wetlands this is often due to dewatering and peat oxidation or to sediment starvation when floodplains are cut off from the river and sediment deposition is reduced.
Submerged – Plants that spend their entire life cycle below the surface of the water except for flowers, which are typically borne about the water. Most are rooted although there are rootless species that float free in the water column.
Floating-leaved, and floating plants – Plants having leaves that float on the water surface. Floating-leaved species are rooted and included members of the water lily family, and some pondweeds (Potamogeton sp.). Floating plants are not rooted and so float on the water surface. They include some of the most troublesome invasive species such as water hyacinth (Eichhornia crassipes).
Swale - A channel with gently sloping banks that is as wide or wider than the channel bed (see “channel”).
Terrace - A terrace is a former floodplain that is no longer inundated frequently enough to be termed active (ser “riverine floodplain” and “lacustrine floodplain”).
Tidal restriction – Restrictions of tidal flows caused by water control structures such as floodgates that prevent the free movement of tidal inflows and outflows.
Tree - Woody plants that dominate the canopy of forested wetlands with a height greater than 6m. Young and small stature individuals can also be seen in the sub canopy, typically ranging from 1.5 to 5m in height. Common species include Melaleuca sp.
Turbidity – A measure of substances in the water column that interfere with the passage of light, such as suspended sediments, algae.
Vine – Weak-stemmed, climbing plants that gain support by growing on other, more robust plant species or substrates. Common species include grapevines (Vitis spp.)
Wallow - Any depression in the land surface that is wider than deep and is caused by animals sitting, lying, or rolling on the ground surface or digging into it.
Woody debris – tree limbs, branches, lumber, and other large pieces of wood.
Wrack - Debris, including plant material and trash that is transported and deposited on the land surface by water.