Report to Congress - US Environmental Protection Agency
525
United States Environmental Protection Agency Office of Water (4203) Washington, D.C. 20460 www.epa.gov/npdes EPA 833-R-01-003 December 2001 Report to Congress Implementation and Enforcement of the Combined Sewer Overflow Control Policy
-
Upload
khangminh22 -
Category
Documents
-
view
0 -
download
0
Transcript of Report to Congress - US Environmental Protection Agency
United StatesEnvironmental ProtectionAgency
Office of Water (4203)Washington, D.C. 20460www.epa.gov/npdes
EPA 833-R-01-003December 2001
Report to CongressImplementation and Enforcement of the Combined Sewer Overflow Control Policy
i
Table of ContentsExecutive Summary— . . . . . . . . . . . . . . . . . . . . . . . . . . . . . . . . . . . . . . . . . . . . . . . . . . . . . . . . . . . . . . . . . . . . . . . . . . . . . .ES-1
Chapter 1—Introduction . . . . . . . . . . . . . . . . . . . . . . . . . . . . . . . . . . . . . . . . . . . . . . . . . . . . . . . . . . . . . . . . . . . . . . . . . . . .1-1
1.1 Brief History of Combined Sewers and CSOs . . . . . . . . . . . . . . . . . . . . . . . . . . . . . . . . . . . . . . . . . . . . . . . . . . . . . . . . . . . . . . . . .1-1
1.2 Organization of the Report . . . . . . . . . . . . . . . . . . . . . . . . . . . . . . . . . . . . . . . . . . . . . . . . . . . . . . . . . . . . . . . . . . . . . . . . . . . . . . . . .1-4
Chapter 2—Regulatory and Environmental Background for the CSO Control Policy . . . . . . . . . . . . . . . . . . . . . . .2-1
2.1 Description of Combined Sewer Systems and CSOs . . . . . . . . . . . . . . . . . . . . . . . . . . . . . . . . . . . . . . . . . . . . . . . . . . . . . . . . . . . . .2-1
2.2 Environmental and Public Health Impacts of CSOs . . . . . . . . . . . . . . . . . . . . . . . . . . . . . . . . . . . . . . . . . . . . . . . . . . . . . . . . . . . . .2-3
2.3 Initial Efforts to Control CSOs . . . . . . . . . . . . . . . . . . . . . . . . . . . . . . . . . . . . . . . . . . . . . . . . . . . . . . . . . . . . . . . . . . . . . . . . . . . . . .2-6
2.3.1 1965 to 1989 . . . . . . . . . . . . . . . . . . . . . . . . . . . . . . . . . . . . . . . . . . . . . . . . . . . . . . . . . . . . . . . . . . . . . . . . . . . . . . . . . . . . . . . 2-62.3.2 National Municipal Policy . . . . . . . . . . . . . . . . . . . . . . . . . . . . . . . . . . . . . . . . . . . . . . . . . . . . . . . . . . . . . . . . . . . . . . . . . . . . 2-62.3.3 1989 National CSO Control Strategy . . . . . . . . . . . . . . . . . . . . . . . . . . . . . . . . . . . . . . . . . . . . . . . . . . . . . . . . . . . . . . . . . . . . 2-92.3.4 Office of Water Management Advisory Group (MAG) . . . . . . . . . . . . . . . . . . . . . . . . . . . . . . . . . . . . . . . . . . . . . . . . . . . . . 2-9
2.4 The CSO Control Policy . . . . . . . . . . . . . . . . . . . . . . . . . . . . . . . . . . . . . . . . . . . . . . . . . . . . . . . . . . . . . . . . . . . . . . . . . . . . . . . . . .2-11
2.4.1 Purpose, Objectives and Key Principles of the CSO Control Policy . . . . . . . . . . . . . . . . . . . . . . . . . . . . . . . . . . . . . . . . . . . 2-112.4.2 Objectives for CSO Communities . . . . . . . . . . . . . . . . . . . . . . . . . . . . . . . . . . . . . . . . . . . . . . . . . . . . . . . . . . . . . . . . . . . . . 2-122.4.3 Expectations for Permitting Authorities . . . . . . . . . . . . . . . . . . . . . . . . . . . . . . . . . . . . . . . . . . . . . . . . . . . . . . . . . . . . . . . . 2-142.4.4 Coordination with Water Quality Standards: Development, Review, and Approval . . . . . . . . . . . . . . . . . . . . . . . . . . . . . . 2-142.4.5 Enforcement and Compliance . . . . . . . . . . . . . . . . . . . . . . . . . . . . . . . . . . . . . . . . . . . . . . . . . . . . . . . . . . . . . . . . . . . . . . . . 2-14
2.5 Summary . . . . . . . . . . . . . . . . . . . . . . . . . . . . . . . . . . . . . . . . . . . . . . . . . . . . . . . . . . . . . . . . . . . . . . . . . . . . . . . . . . . . . . . . . . . . . .2-15
Chapter 3—Methodology for Development of the CSO Report to Congress . . . . . . . . . . . . . . . . . . . . . . . . . . . . . .3-1
3.1 Overview of Study Objectives and Approaches . . . . . . . . . . . . . . . . . . . . . . . . . . . . . . . . . . . . . . . . . . . . . . . . . . . . . . . . . . . . . . . . .3-1
3.2 Data Sources . . . . . . . . . . . . . . . . . . . . . . . . . . . . . . . . . . . . . . . . . . . . . . . . . . . . . . . . . . . . . . . . . . . . . . . . . . . . . . . . . . . . . . . . . . . .3-3
3.2.1 National Data Sources . . . . . . . . . . . . . . . . . . . . . . . . . . . . . . . . . . . . . . . . . . . . . . . . . . . . . . . . . . . . . . . . . . . . . . . . . . . . . . . 3-33.2.2 NPDES Authorities and Other State Program Files . . . . . . . . . . . . . . . . . . . . . . . . . . . . . . . . . . . . . . . . . . . . . . . . . . . . . . . . 3-33.2.3 Community-level Data Sources . . . . . . . . . . . . . . . . . . . . . . . . . . . . . . . . . . . . . . . . . . . . . . . . . . . . . . . . . . . . . . . . . . . . . . . . 3-43.2.4 External Sources . . . . . . . . . . . . . . . . . . . . . . . . . . . . . . . . . . . . . . . . . . . . . . . . . . . . . . . . . . . . . . . . . . . . . . . . . . . . . . . . . . . . 3-4
3.3 Data Collection . . . . . . . . . . . . . . . . . . . . . . . . . . . . . . . . . . . . . . . . . . . . . . . . . . . . . . . . . . . . . . . . . . . . . . . . . . . . . . . . . . . . . . . . . .3-4
3.3.1 Assessment of EPA Efforts . . . . . . . . . . . . . . . . . . . . . . . . . . . . . . . . . . . . . . . . . . . . . . . . . . . . . . . . . . . . . . . . . . . . . . . . . . . . 3-53.3.2 Assessment of Efforts by NPDES Authorities and Other State Programs . . . . . . . . . . . . . . . . . . . . . . . . . . . . . . . . . . . . . . . 3-53.3.3 Assessment of Community Efforts . . . . . . . . . . . . . . . . . . . . . . . . . . . . . . . . . . . . . . . . . . . . . . . . . . . . . . . . . . . . . . . . . . . . . 3-63.3.4 CSO Surveys from AMSA and the CSO Partnership . . . . . . . . . . . . . . . . . . . . . . . . . . . . . . . . . . . . . . . . . . . . . . . . . . . . . . . . 3-7
3.4 Stakeholder Involvement . . . . . . . . . . . . . . . . . . . . . . . . . . . . . . . . . . . . . . . . . . . . . . . . . . . . . . . . . . . . . . . . . . . . . . . . . . . . . . . . . .3-7
3.5 Data Considerations . . . . . . . . . . . . . . . . . . . . . . . . . . . . . . . . . . . . . . . . . . . . . . . . . . . . . . . . . . . . . . . . . . . . . . . . . . . . . . . . . . . . . .3-8
3.6 Quality Control and Quality Assurance . . . . . . . . . . . . . . . . . . . . . . . . . . . . . . . . . . . . . . . . . . . . . . . . . . . . . . . . . . . . . . . . . . . . . . .3-9
3.7 Summary . . . . . . . . . . . . . . . . . . . . . . . . . . . . . . . . . . . . . . . . . . . . . . . . . . . . . . . . . . . . . . . . . . . . . . . . . . . . . . . . . . . . . . . . . . . . . . .3-9

ii
Chapter 4—CSO Control Policy Status: EPA . . . . . . . . . . . . . . . . . . . . . . . . . . . . . . . . . . . . . . . . . . . . . . . . . . . . . . . . . . . .4-1
4.1 General Activities to Support CSO Control Policy Implementation . . . . . . . . . . . . . . . . . . . . . . . . . . . . . . . . . . . . . . . . . . . . . . . . .4-1
4.2 NPDES Permitting . . . . . . . . . . . . . . . . . . . . . . . . . . . . . . . . . . . . . . . . . . . . . . . . . . . . . . . . . . . . . . . . . . . . . . . . . . . . . . . . . . . . . . .4-3
4.2.1 EPA Headquarters Responsibilities and Activities . . . . . . . . . . . . . . . . . . . . . . . . . . . . . . . . . . . . . . . . . . . . . . . . . . . . . . . . . . 4-34.2.2 EPA Regional Office Responsibilities and Activities . . . . . . . . . . . . . . . . . . . . . . . . . . . . . . . . . . . . . . . . . . . . . . . . . . . . . . . . 4-4
4.3 Water Quality Standards . . . . . . . . . . . . . . . . . . . . . . . . . . . . . . . . . . . . . . . . . . . . . . . . . . . . . . . . . . . . . . . . . . . . . . . . . . . . . . . . . . .4-4
4.3.1 Section 303(d) and the Total Maximum Daily Load Program . . . . . . . . . . . . . . . . . . . . . . . . . . . . . . . . . . . . . . . . . . . . . . . . 4-54.3.2 Section 305(b) and the National Water Quality Inventory Report to Congress . . . . . . . . . . . . . . . . . . . . . . . . . . . . . . . . . . . 4-6
4.4 Compliance and Enforcement . . . . . . . . . . . . . . . . . . . . . . . . . . . . . . . . . . . . . . . . . . . . . . . . . . . . . . . . . . . . . . . . . . . . . . . . . . . . . .4-6
4.4.1 General NPDES Compliance and Enforcement Process . . . . . . . . . . . . . . . . . . . . . . . . . . . . . . . . . . . . . . . . . . . . . . . . . . . . . 4-74.4.2 National Compliance and Enforcement Priorities . . . . . . . . . . . . . . . . . . . . . . . . . . . . . . . . . . . . . . . . . . . . . . . . . . . . . . . . . 4-74.4.3 NPDES Compliance and Enforcement Activities . . . . . . . . . . . . . . . . . . . . . . . . . . . . . . . . . . . . . . . . . . . . . . . . . . . . . . . . . . 4-7
4.5 Guidance, Training, and Compliance and Technical Assistance . . . . . . . . . . . . . . . . . . . . . . . . . . . . . . . . . . . . . . . . . . . . . . . . . . .4-12
4.5.1 Guidance . . . . . . . . . . . . . . . . . . . . . . . . . . . . . . . . . . . . . . . . . . . . . . . . . . . . . . . . . . . . . . . . . . . . . . . . . . . . . . . . . . . . . . . . . 4-134.5.2 Training . . . . . . . . . . . . . . . . . . . . . . . . . . . . . . . . . . . . . . . . . . . . . . . . . . . . . . . . . . . . . . . . . . . . . . . . . . . . . . . . . . . . . . . . . . 4-154.5.3 Compliance and Technical Assistance . . . . . . . . . . . . . . . . . . . . . . . . . . . . . . . . . . . . . . . . . . . . . . . . . . . . . . . . . . . . . . . . . . 4-164.5.4 Wet Weather Flow Research Plan . . . . . . . . . . . . . . . . . . . . . . . . . . . . . . . . . . . . . . . . . . . . . . . . . . . . . . . . . . . . . . . . . . . . . . 4-17
4.6 Communication and Coordination . . . . . . . . . . . . . . . . . . . . . . . . . . . . . . . . . . . . . . . . . . . . . . . . . . . . . . . . . . . . . . . . . . . . . . . . .4-17
4.6.1 Outreach to State and Regional CSO Coordinators . . . . . . . . . . . . . . . . . . . . . . . . . . . . . . . . . . . . . . . . . . . . . . . . . . . . . . . 4-174.6.2 CSO Awards Program . . . . . . . . . . . . . . . . . . . . . . . . . . . . . . . . . . . . . . . . . . . . . . . . . . . . . . . . . . . . . . . . . . . . . . . . . . . . . . . 4-184.6.3 Listening Sessions on Implementing the Water Quality-Based Provisions of the CSO Control Policy . . . . . . . . . . . . . . . . 4-18
4.7 Information Management . . . . . . . . . . . . . . . . . . . . . . . . . . . . . . . . . . . . . . . . . . . . . . . . . . . . . . . . . . . . . . . . . . . . . . . . . . . . . . . .4-19
4.7.1 Clean Water Needs Survey (CWNS) . . . . . . . . . . . . . . . . . . . . . . . . . . . . . . . . . . . . . . . . . . . . . . . . . . . . . . . . . . . . . . . . . . . 4-194.7.2 Government Performance and Results Act (GPRA) . . . . . . . . . . . . . . . . . . . . . . . . . . . . . . . . . . . . . . . . . . . . . . . . . . . . . . . 4-204.7.3 Permit Compliance System (PCS) . . . . . . . . . . . . . . . . . . . . . . . . . . . . . . . . . . . . . . . . . . . . . . . . . . . . . . . . . . . . . . . . . . . . . 4-214.7.4 Statistically Valid Non-Compliance Rate Project . . . . . . . . . . . . . . . . . . . . . . . . . . . . . . . . . . . . . . . . . . . . . . . . . . . . . . . . . 4-214.7.5 Other Information Management Activities . . . . . . . . . . . . . . . . . . . . . . . . . . . . . . . . . . . . . . . . . . . . . . . . . . . . . . . . . . . . . . 4-22
4.8 Financial Assistance . . . . . . . . . . . . . . . . . . . . . . . . . . . . . . . . . . . . . . . . . . . . . . . . . . . . . . . . . . . . . . . . . . . . . . . . . . . . . . . . . . . . .4-22
4.8.1 The Clean Water SRF Program . . . . . . . . . . . . . . . . . . . . . . . . . . . . . . . . . . . . . . . . . . . . . . . . . . . . . . . . . . . . . . . . . . . . . . . 4-224.8.2 Section 104(b)(3) Water Quality Cooperative Agreements . . . . . . . . . . . . . . . . . . . . . . . . . . . . . . . . . . . . . . . . . . . . . . . . . . 4-244.8.3 Section 106 Water Pollution Control Program Support Grants . . . . . . . . . . . . . . . . . . . . . . . . . . . . . . . . . . . . . . . . . . . . . . 4-244.8.4 Specific Line Items in EPA's Budget . . . . . . . . . . . . . . . . . . . . . . . . . . . . . . . . . . . . . . . . . . . . . . . . . . . . . . . . . . . . . . . . . . . . 4-25
4.9 Performance Measures . . . . . . . . . . . . . . . . . . . . . . . . . . . . . . . . . . . . . . . . . . . . . . . . . . . . . . . . . . . . . . . . . . . . . . . . . . . . . . . . . . .4-26
4.9.1 Specific Efforts to Track Benefits Resulting from CSO Control Policy Implementation . . . . . . . . . . . . . . . . . . . . . . . . . . . 4-264.9.2 Other Agency Initiatives to Document Environmental Results Related to CSO Control . . . . . . . . . . . . . . . . . . . . . . . . . . 4-284.9.3 Promoting the Use of Watershed Approach . . . . . . . . . . . . . . . . . . . . . . . . . . . . . . . . . . . . . . . . . . . . . . . . . . . . . . . . . . . . . 4-30
4.10 Findings . . . . . . . . . . . . . . . . . . . . . . . . . . . . . . . . . . . . . . . . . . . . . . . . . . . . . . . . . . . . . . . . . . . . . . . . . . . . . . . . . . . . . . . . . . . . . .4-30
Chapter 5—CSO Control Policy Status: NPDES Authorities and Other State Programs . . . . . . . . . . . . . . . . . . . . . .5-1
5.1 Policy Development and Support . . . . . . . . . . . . . . . . . . . . . . . . . . . . . . . . . . . . . . . . . . . . . . . . . . . . . . . . . . . . . . . . . . . . . . . . . . . .5-4
5.1.1 Efforts to Adhere to the 1989 National CSO Control Strategy . . . . . . . . . . . . . . . . . . . . . . . . . . . . . . . . . . . . . . . . . . . . . . . . 5-45.1.2 Efforts to Adhere to the 1994 CSO Control Policy . . . . . . . . . . . . . . . . . . . . . . . . . . . . . . . . . . . . . . . . . . . . . . . . . . . . . . . . . 5-7
5.2 NPDES Permitting . . . . . . . . . . . . . . . . . . . . . . . . . . . . . . . . . . . . . . . . . . . . . . . . . . . . . . . . . . . . . . . . . . . . . . . . . . . . . . . . . . . . . .5-12
5.2.1 Permit Requirements for NMC . . . . . . . . . . . . . . . . . . . . . . . . . . . . . . . . . . . . . . . . . . . . . . . . . . . . . . . . . . . . . . . . . . . . . . . 5-135.2.2 Permit Requirements for LTCP . . . . . . . . . . . . . . . . . . . . . . . . . . . . . . . . . . . . . . . . . . . . . . . . . . . . . . . . . . . . . . . . . . . . . . . 5-16

iii
5.3 Water Quality Standards . . . . . . . . . . . . . . . . . . . . . . . . . . . . . . . . . . . . . . . . . . . . . . . . . . . . . . . . . . . . . . . . . . . . . . . . . . . . . . . . . .5-20
5.3.1 Integrating Water Quality Standards Review with LTCP Development and Implementation . . . . . . . . . . . . . . . . . . . . . . . 5-215.3.2 State Approaches for Reviewing Water Quality Standards for CSO Receiving Waters . . . . . . . . . . . . . . . . . . . . . . . . . . . . . 5-215.3.3 State Water Quality Assessment Reports . . . . . . . . . . . . . . . . . . . . . . . . . . . . . . . . . . . . . . . . . . . . . . . . . . . . . . . . . . . . . . . . 5-24
5.4 Compliance and Enforcement . . . . . . . . . . . . . . . . . . . . . . . . . . . . . . . . . . . . . . . . . . . . . . . . . . . . . . . . . . . . . . . . . . . . . . . . . . . . .5-24
5.4.1 Policy . . . . . . . . . . . . . . . . . . . . . . . . . . . . . . . . . . . . . . . . . . . . . . . . . . . . . . . . . . . . . . . . . . . . . . . . . . . . . . . . . . . . . . . . . . . . 5-245.4.2 State Inspections . . . . . . . . . . . . . . . . . . . . . . . . . . . . . . . . . . . . . . . . . . . . . . . . . . . . . . . . . . . . . . . . . . . . . . . . . . . . . . . . . . . 5-26
5.5 Guidance, Training and Compliance and Technical Assistance . . . . . . . . . . . . . . . . . . . . . . . . . . . . . . . . . . . . . . . . . . . . . . . . . . . .5-29
5.5.1 Guidance . . . . . . . . . . . . . . . . . . . . . . . . . . . . . . . . . . . . . . . . . . . . . . . . . . . . . . . . . . . . . . . . . . . . . . . . . . . . . . . . . . . . . . . . . 5-295.5.2 Training . . . . . . . . . . . . . . . . . . . . . . . . . . . . . . . . . . . . . . . . . . . . . . . . . . . . . . . . . . . . . . . . . . . . . . . . . . . . . . . . . . . . . . . . . . 5-305.5.3 Compliance and Technical Assistance . . . . . . . . . . . . . . . . . . . . . . . . . . . . . . . . . . . . . . . . . . . . . . . . . . . . . . . . . . . . . . . . . . 5-30
5.6 Communication and Coordination . . . . . . . . . . . . . . . . . . . . . . . . . . . . . . . . . . . . . . . . . . . . . . . . . . . . . . . . . . . . . . . . . . . . . . . . .5-32
5.6.1 Communication . . . . . . . . . . . . . . . . . . . . . . . . . . . . . . . . . . . . . . . . . . . . . . . . . . . . . . . . . . . . . . . . . . . . . . . . . . . . . . . . . . . 5-325.6.2 Coordination . . . . . . . . . . . . . . . . . . . . . . . . . . . . . . . . . . . . . . . . . . . . . . . . . . . . . . . . . . . . . . . . . . . . . . . . . . . . . . . . . . . . . 5-32
5.7 Financial Assistance . . . . . . . . . . . . . . . . . . . . . . . . . . . . . . . . . . . . . . . . . . . . . . . . . . . . . . . . . . . . . . . . . . . . . . . . . . . . . . . . . . . . .5-33
5.8 Performance Measures . . . . . . . . . . . . . . . . . . . . . . . . . . . . . . . . . . . . . . . . . . . . . . . . . . . . . . . . . . . . . . . . . . . . . . . . . . . . . . . . . . .5-36
5.9 Findings . . . . . . . . . . . . . . . . . . . . . . . . . . . . . . . . . . . . . . . . . . . . . . . . . . . . . . . . . . . . . . . . . . . . . . . . . . . . . . . . . . . . . . . . . . . . . . .5-37
Chapter 6—CSO Control Policy Status: Communities . . . . . . . . . . . . . . . . . . . . . . . . . . . . . . . . . . . . . . . . . . . . . . . . . . .6-1
6.1 National CSO Demographics . . . . . . . . . . . . . . . . . . . . . . . . . . . . . . . . . . . . . . . . . . . . . . . . . . . . . . . . . . . . . . . . . . . . . . . . . . . . . . .6-2
6.1.1 CSO Permits and Types of Systems . . . . . . . . . . . . . . . . . . . . . . . . . . . . . . . . . . . . . . . . . . . . . . . . . . . . . . . . . . . . . . . . . . . . . 6-26.1.2 CSO Size . . . . . . . . . . . . . . . . . . . . . . . . . . . . . . . . . . . . . . . . . . . . . . . . . . . . . . . . . . . . . . . . . . . . . . . . . . . . . . . . . . . . . . . . . . 6-36.1.3 Small System Considerations . . . . . . . . . . . . . . . . . . . . . . . . . . . . . . . . . . . . . . . . . . . . . . . . . . . . . . . . . . . . . . . . . . . . . . . . . . 6-46.1.4 CSO Receiving Waters . . . . . . . . . . . . . . . . . . . . . . . . . . . . . . . . . . . . . . . . . . . . . . . . . . . . . . . . . . . . . . . . . . . . . . . . . . . . . . . 6-5
6.2 Implementation of CSO Controls . . . . . . . . . . . . . . . . . . . . . . . . . . . . . . . . . . . . . . . . . . . . . . . . . . . . . . . . . . . . . . . . . . . . . . . . . . .6-6
6.2.1 Assessment of Control Implementation . . . . . . . . . . . . . . . . . . . . . . . . . . . . . . . . . . . . . . . . . . . . . . . . . . . . . . . . . . . . . . . . . 6-66.2.2 Documented Implementation of CSO Controls . . . . . . . . . . . . . . . . . . . . . . . . . . . . . . . . . . . . . . . . . . . . . . . . . . . . . . . . . . . 6-7
6.3 Implementation of the NMC . . . . . . . . . . . . . . . . . . . . . . . . . . . . . . . . . . . . . . . . . . . . . . . . . . . . . . . . . . . . . . . . . . . . . . . . . . . . . . .6-7
6.3.1 NMC Implementation Status . . . . . . . . . . . . . . . . . . . . . . . . . . . . . . . . . . . . . . . . . . . . . . . . . . . . . . . . . . . . . . . . . . . . . . . . . . 6-86.3.2 Specific CSO Control Measures Implemented for the NMC . . . . . . . . . . . . . . . . . . . . . . . . . . . . . . . . . . . . . . . . . . . . . . . . . 6-8
6.4 Implementation of the LTCP . . . . . . . . . . . . . . . . . . . . . . . . . . . . . . . . . . . . . . . . . . . . . . . . . . . . . . . . . . . . . . . . . . . . . . . . . . . . . .6-17
6.4.1 Status of Documented Implementation of the LTCP . . . . . . . . . . . . . . . . . . . . . . . . . . . . . . . . . . . . . . . . . . . . . . . . . . . . . . 6-186.4.2 Selected LTCP Approach . . . . . . . . . . . . . . . . . . . . . . . . . . . . . . . . . . . . . . . . . . . . . . . . . . . . . . . . . . . . . . . . . . . . . . . . . . . . 6-186.4.3 Specific CSO Control Measures for LTCPs . . . . . . . . . . . . . . . . . . . . . . . . . . . . . . . . . . . . . . . . . . . . . . . . . . . . . . . . . . . . . . 6-186.4.4 Minimum Elements of an LTCP . . . . . . . . . . . . . . . . . . . . . . . . . . . . . . . . . . . . . . . . . . . . . . . . . . . . . . . . . . . . . . . . . . . . . . 6-20
6.5 Financial Considerations . . . . . . . . . . . . . . . . . . . . . . . . . . . . . . . . . . . . . . . . . . . . . . . . . . . . . . . . . . . . . . . . . . . . . . . . . . . . . . . . .6-28
6.5.1 Funding Options . . . . . . . . . . . . . . . . . . . . . . . . . . . . . . . . . . . . . . . . . . . . . . . . . . . . . . . . . . . . . . . . . . . . . . . . . . . . . . . . . . 6-28
6.6 Obstacles and Challenges . . . . . . . . . . . . . . . . . . . . . . . . . . . . . . . . . . . . . . . . . . . . . . . . . . . . . . . . . . . . . . . . . . . . . . . . . . . . . . . . .6-29
6.6.1 Resources . . . . . . . . . . . . . . . . . . . . . . . . . . . . . . . . . . . . . . . . . . . . . . . . . . . . . . . . . . . . . . . . . . . . . . . . . . . . . . . . . . . . . . . . 6-306.6.2 Water Quality Standards . . . . . . . . . . . . . . . . . . . . . . . . . . . . . . . . . . . . . . . . . . . . . . . . . . . . . . . . . . . . . . . . . . . . . . . . . . . . 6-316.6.3 Uncertainty . . . . . . . . . . . . . . . . . . . . . . . . . . . . . . . . . . . . . . . . . . . . . . . . . . . . . . . . . . . . . . . . . . . . . . . . . . . . . . . . . . . . . . . 6-326.6.4 The Watershed Approach . . . . . . . . . . . . . . . . . . . . . . . . . . . . . . . . . . . . . . . . . . . . . . . . . . . . . . . . . . . . . . . . . . . . . . . . . . . . 6-34
6.7 Performance Measures and Environmental Benefits . . . . . . . . . . . . . . . . . . . . . . . . . . . . . . . . . . . . . . . . . . . . . . . . . . . . . . . . . . . .6-35
6.7.1 CSO Performance Measures for CSO Communities . . . . . . . . . . . . . . . . . . . . . . . . . . . . . . . . . . . . . . . . . . . . . . . . . . . . . . 6-356.7.2 Loading Reduction and Environmental Benefits . . . . . . . . . . . . . . . . . . . . . . . . . . . . . . . . . . . . . . . . . . . . . . . . . . . . . . . . . . 6-356.7.3 Data, Findings and Examples . . . . . . . . . . . . . . . . . . . . . . . . . . . . . . . . . . . . . . . . . . . . . . . . . . . . . . . . . . . . . . . . . . . . . . . . 6-36
6.8 Findings . . . . . . . . . . . . . . . . . . . . . . . . . . . . . . . . . . . . . . . . . . . . . . . . . . . . . . . . . . . . . . . . . . . . . . . . . . . . . . . . . . . . . . . . . . . . . . .6-42
iv
Chapter 7—Evaluation of the CSO Control Policy . . . . . . . . . . . . . . . . . . . . . . . . . . . . . . . . . . . . . . . . . . . . . . . . . . . . . .7-1
7.1 Implementation and Enforcement of the CSO Control Policy . . . . . . . . . . . . . . . . . . . . . . . . . . . . . . . . . . . . . . . . . . . . . . . . . . . . .7-1
7.1.1 Implementation of the CSO Control Policy . . . . . . . . . . . . . . . . . . . . . . . . . . . . . . . . . . . . . . . . . . . . . . . . . . . . . . . . . . . . . . 7-27.1.2 Compliance and Enforcement . . . . . . . . . . . . . . . . . . . . . . . . . . . . . . . . . . . . . . . . . . . . . . . . . . . . . . . . . . . . . . . . . . . . . . . . . 7-3
7.2 Observations Related to the Four Key Guiding Principles of the CSO Control Policy . . . . . . . . . . . . . . . . . . . . . . . . . . . . . . . . . . .7-4
7.2.1 Provide Clear Levels of Control to Meet Appropriate Health and Environmental Objectives . . . . . . . . . . . . . . . . . . . . . . . 7-57.2.2 Provide Sufficient Flexibility to Municipalities to Consider the Site-Specific Nature of CSOs . . . . . . . . . . . . . . . . . . . . . . . 7-77.2.3 Allowing a Phased Approach to Implementation of CSO Controls . . . . . . . . . . . . . . . . . . . . . . . . . . . . . . . . . . . . . . . . . . 7-107.2.4 Review and Revise, as Appropriate, Water Quality Standards When Developing CSO Control Plans . . . . . . . . . . . . . . . . 7-12
7.3 Accomplishments Attributable to Implementation and Enforcement of the CSO Control Policy . . . . . . . . . . . . . . . . . . . . . . . .7-14
7.3.1 National Estimates of CSO Volume and Pollutant Loading Reductions . . . . . . . . . . . . . . . . . . . . . . . . . . . . . . . . . . . . . . . 7-147.3.2 Accomplishments Attributable to Implementation and Enforcement of the CSO Control Policy . . . . . . . . . . . . . . . . . . . 7-16
7.4 Next Steps . . . . . . . . . . . . . . . . . . . . . . . . . . . . . . . . . . . . . . . . . . . . . . . . . . . . . . . . . . . . . . . . . . . . . . . . . . . . . . . . . . . . . . . . . . . . .7-17
List of FiguresFigure 1.1—Typical Combined Sewer Overflow Structure . . . . . . . . . . . . . . . . . . . . . . . . . . . . . . . . . . . . . . . . . . . . . . . . . . . . . . . . . . .1-2
Figure 2.1—National Distribution of CSO Communities . . . . . . . . . . . . . . . . . . . . . . . . . . . . . . . . . . . . . . . . . . . . . . . . . . . . . . . . . . . .2-3
Figure 5.1—Distribution of CSO Permits by Region and State . . . . . . . . . . . . . . . . . . . . . . . . . . . . . . . . . . . . . . . . . . . . . . . . . . . . . . . .5-5
Figure 5.2—Distribution of CSO Outfalls by Region and State . . . . . . . . . . . . . . . . . . . . . . . . . . . . . . . . . . . . . . . . . . . . . . . . . . . . . . . .5-6
Figure 5.3—Status of NMC Requirements in CSO Permits . . . . . . . . . . . . . . . . . . . . . . . . . . . . . . . . . . . . . . . . . . . . . . . . . . . . . . . . . .5-13
Figure 5.4—CSO Permits With Requirements to Implement the NMC . . . . . . . . . . . . . . . . . . . . . . . . . . . . . . . . . . . . . . . . . . . . . . . .5-14
Figure 5.5—Mechanism Used to Require NMC Implementation . . . . . . . . . . . . . . . . . . . . . . . . . . . . . . . . . . . . . . . . . . . . . . . . . . . . .5-15
Figure 5.6—Status of Facility Plan Requirements in CSO Permits . . . . . . . . . . . . . . . . . . . . . . . . . . . . . . . . . . . . . . . . . . . . . . . . . . . .5-17
Figure 5.7—Mechanism Used to Require LTCPs . . . . . . . . . . . . . . . . . . . . . . . . . . . . . . . . . . . . . . . . . . . . . . . . . . . . . . . . . . . . . . . . . .5-17
Figure 5.8—CSO Permits With Requirements to Develop and Implement an LTCP . . . . . . . . . . . . . . . . . . . . . . . . . . . . . . . . . . . . . .5-18
Figure 5.9—SRF Loans for CSO Projects,1988—2000 . . . . . . . . . . . . . . . . . . . . . . . . . . . . . . . . . . . . . . . . . . . . . . . . . . . . . . . . . . . . . .5-34
Figure 5.10—Distribution of SRF Loans for CSO Projects by State, 1988—2000 . . . . . . . . . . . . . . . . . . . . . . . . . . . . . . . . . . . . . . . . .5-35
Figure 6.1—Geographic Distribution of CSO Permits . . . . . . . . . . . . . . . . . . . . . . . . . . . . . . . . . . . . . . . . . . . . . . . . . . . . . . . . . . . . . .6-3
Figure 6.2—Types of CSO Facilities . . . . . . . . . . . . . . . . . . . . . . . . . . . . . . . . . . . . . . . . . . . . . . . . . . . . . . . . . . . . . . . . . . . . . . . . . . . . .6-4
Figure 6.3—POTW Facility Size Classification . . . . . . . . . . . . . . . . . . . . . . . . . . . . . . . . . . . . . . . . . . . . . . . . . . . . . . . . . . . . . . . . . . . . .6-5
Figure 6.4—Distribution of POTW Facility Sizes . . . . . . . . . . . . . . . . . . . . . . . . . . . . . . . . . . . . . . . . . . . . . . . . . . . . . . . . . . . . . . . . . . .6-5
Figure 6.5—Types of Waters Receiving CSO Discharges . . . . . . . . . . . . . . . . . . . . . . . . . . . . . . . . . . . . . . . . . . . . . . . . . . . . . . . . . . . . .6-6
Figure 6.6—Distribution of CSO Control Measures Implemented as Part of an LTCP . . . . . . . . . . . . . . . . . . . . . . . . . . . . . . . . . . . .6-19
Figure 6.7—Cost-Benefit Analysis Using Knee-of-the-Curve . . . . . . . . . . . . . . . . . . . . . . . . . . . . . . . . . . . . . . . . . . . . . . . . . . . . . . . .6-26
Figure 6.8—New York Inner Harbor Water Quality Improvements Due to Pollution Controls . . . . . . . . . . . . . . . . . . . . . . . . . . . . .6-39
Figure 6.9–Genesee River Water Quality Improvements Due to CSO Controls . . . . . . . . . . . . . . . . . . . . . . . . . . . . . . . . . . . . . . . . . .6-41

v
List of TablesTable 2.1—CSO Pollutants of Concern and Principle Consequences . . . . . . . . . . . . . . . . . . . . . . . . . . . . . . . . . . . . . . . . . . . . . . . . . . . .2-5
Table 2.2—Typical Pollutant Concentrations Found in CSOs . . . . . . . . . . . . . . . . . . . . . . . . . . . . . . . . . . . . . . . . . . . . . . . . . . . . . . . . .2-5
Table 2.3—CSOs as a Source of Water Quality Impairment . . . . . . . . . . . . . . . . . . . . . . . . . . . . . . . . . . . . . . . . . . . . . . . . . . . . . . . . . . .2-5
Table 4.1—Summary of 303(d) List Impaired Waters in States With CSOs . . . . . . . . . . . . . . . . . . . . . . . . . . . . . . . . . . . . . . . . . . . . . .4-5
Table 4.2—Extent of CSOs as a Source of Impairment . . . . . . . . . . . . . . . . . . . . . . . . . . . . . . . . . . . . . . . . . . . . . . . . . . . . . . . . . . . . . . .4-6
Table 4.3—EPA CSO Guidance Documents . . . . . . . . . . . . . . . . . . . . . . . . . . . . . . . . . . . . . . . . . . . . . . . . . . . . . . . . . . . . . . . . . . . . . .4-13
Table 4.4—Comparison of CSO and Total Needs . . . . . . . . . . . . . . . . . . . . . . . . . . . . . . . . . . . . . . . . . . . . . . . . . . . . . . . . . . . . . . . . .4-20
Table 4.5—SRF Loans for CSO Projects . . . . . . . . . . . . . . . . . . . . . . . . . . . . . . . . . . . . . . . . . . . . . . . . . . . . . . . . . . . . . . . . . . . . . . . . .4-23
Table 4.6—EPA 104(b)(3) Grant Cooperative Agreements for CSO Projects . . . . . . . . . . . . . . . . . . . . . . . . . . . . . . . . . . . . . . . . . . . .4-24
Table 4.7—Annual Section 106 Grant Totals . . . . . . . . . . . . . . . . . . . . . . . . . . . . . . . . . . . . . . . . . . . . . . . . . . . . . . . . . . . . . . . . . . . . .4-25
Table 4.8—Annual EPA Budget Line Items for CSO Control Projects . . . . . . . . . . . . . . . . . . . . . . . . . . . . . . . . . . . . . . . . . . . . . . . . .4-25
Table 4.9—Environmental Measurements from 1997 Pilot GPRA Performance Plan . . . . . . . . . . . . . . . . . . . . . . . . . . . . . . . . . . . . .4-27
Table 5.1—Roles and Responsibilities . . . . . . . . . . . . . . . . . . . . . . . . . . . . . . . . . . . . . . . . . . . . . . . . . . . . . . . . . . . . . . . . . . . . . . . . . . . .5-2
Table 5.2—States With CSO Permits . . . . . . . . . . . . . . . . . . . . . . . . . . . . . . . . . . . . . . . . . . . . . . . . . . . . . . . . . . . . . . . . . . . . . . . . . . . . .5-3
Table 5.3—States With No CSO Permits . . . . . . . . . . . . . . . . . . . . . . . . . . . . . . . . . . . . . . . . . . . . . . . . . . . . . . . . . . . . . . . . . . . . . . . . .5-4
Table 5.4—Online Information Resources . . . . . . . . . . . . . . . . . . . . . . . . . . . . . . . . . . . . . . . . . . . . . . . . . . . . . . . . . . . . . . . . . . . . . . .5-31
Table 6.1—Status of NMC Implementation Documentation . . . . . . . . . . . . . . . . . . . . . . . . . . . . . . . . . . . . . . . . . . . . . . . . . . . . . . . . .6-9
Table 6.2—10 Most Frequently Implemented NMC Activities . . . . . . . . . . . . . . . . . . . . . . . . . . . . . . . . . . . . . . . . . . . . . . . . . . . . . . . .6-9
Table 6.3—10 Most Frequently Implemented LTCP Controls . . . . . . . . . . . . . . . . . . . . . . . . . . . . . . . . . . . . . . . . . . . . . . . . . . . . . . . .6-20
Table 6.4—Sensitive Areas Affected by CSO Discharges . . . . . . . . . . . . . . . . . . . . . . . . . . . . . . . . . . . . . . . . . . . . . . . . . . . . . . . . . . . .6-24
Table 6.5—MWRA Critical-Use Prioritization Program Results . . . . . . . . . . . . . . . . . . . . . . . . . . . . . . . . . . . . . . . . . . . . . . . . . . . . . .6-25
Table 6.6—Bacteriological Indicators Used By States . . . . . . . . . . . . . . . . . . . . . . . . . . . . . . . . . . . . . . . . . . . . . . . . . . . . . . . . . . . . . . .6-32
Table 6.7—CSO Control Performance Measures . . . . . . . . . . . . . . . . . . . . . . . . . . . . . . . . . . . . . . . . . . . . . . . . . . . . . . . . . . . . . . . . . .6-36
Table 6.8—Pollutant Removal Capability of Retention Treatment Basins on the Saginaw River . . . . . . . . . . . . . . . . . . . . . . . . . . . . .6-37
Table 6.9—Pollutant Removal Capability of Two CSO Treatment Facilities in Columbus, GA . . . . . . . . . . . . . . . . . . . . . . . . . . . . . .6-40
Table 6.10—Benefits of CSO Controls in San Francisco Harbor . . . . . . . . . . . . . . . . . . . . . . . . . . . . . . . . . . . . . . . . . . . . . . . . . . . . . .6-42
Table 7.1—Implementation Schedule Based on Financial Capability . . . . . . . . . . . . . . . . . . . . . . . . . . . . . . . . . . . . . . . . . . . . . . . . . .7-12
Table 7.2—Pollutant Reduction Estimates Based on Implementation of CSO Control Policy . . . . . . . . . . . . . . . . . . . . . . . . . . . . . . .7-15
vi
List of AppendicesAppendix A . . . . . . . . . . . . . . . . . . . . . . . . . . . . . . . . . . . . . . . . . . . . . . . . . . . . . . . . . . . .Statutes, Policies, and Interpretative Memoranda
Appendix B . . . . . . . . . . . . . . . . . . . . . . . . . . . . . . . . . . . . . . . . . . . . . . . . . . . . . . . . . . . . . . . . . . . . . . . . . .Profiles of State CSO Programs
Appendix C . . . . . . . . . . . . . . . . . . . . . . . . . . . . . . . . . . . . . . . . . . . . . . . . . . . . . . . . . . . . . . . . . . . . . . . . . .CSO Community Case Studies
Appendix D . . . . . . . . . . . . . . . . . . . . . . . . . . . . . . . . . . . . . . . . . . . . . . . . . . . . . . . . . . . . . . . . . . . . . . . . . . . .List of Current CSO Permits
Appendix E . . . . . . . . . . . .Summary of CSO-Related Civil Judicial Actions Taken By EPA Prior to Issuance of the CSO Control Policy
Appendix F . . . . . . . . . . . . . . . . . . . . . . . . . . . . . . . . . . . . . . . . . . . . . . . . . . . . . . . . . . . . . . . . . . . . . . . . . . . . . .Data Base Documentation
Appendix G . . . . . . . . . . . . . . . . . . . . . . . . . . . . . . . . . . . . . . . . . . . . . . . . . . . . . . . . .AMSA and CSO Partnership CSO Survey Summary
Appendix H . . . . . . . . . . . . . . . . . . . . . . . . . . . . . . . . . . . . . . . . . . . . . . . . . . . . . . . . . . . . . . .Forms Used to Guide Data Collection Effort
Appendix I . . . . . . . . . . . . . . . . . . . . . . . . . . . . . . . . . . . . . . . . . . . . . . .Stakeholder Meeting Summary, July 12-13, 2001, Chicago, Illinois
Appendix J . . . . . . . . . . . . . .Summary of CSO-Related Enforcement Actions Initiated by EPA After Issuance of the CSO Control Policy
Appendix K . . . . . . . . . . . . . . . . . . . . . . . . . . . . . . . . . . . . .Summary of Planned Research by EPA’s Office of Research and Development
Appendix L . . . . . . . . . . . . . . . . . . . . . . . . . .List of Recipients of National Combined Sewer Overflow Control Policy Excellence Awards
Appendix M . . . . . . . . . . . . . . . . . . . . . . . . . . . . . . . . . . . . . . . . . . . . . . . . . . . . . . . . . . . . . . .Summary of Outcomes of 104(b)(3) Grants
Appendix N . . . . . . . . . . . . . . . . . . . . . . . . . . . . . . . . . . . .Summary, by State, of CSO Impacted Water Body Segments from 303(d) Lists
Appendix O . . . . . . . . . . . . . . . . . . . . . . . . . . . . . . . . . . . . . . . . . . . . . . . . . . . . . . . . . . . . . . . . . . .Summary of State Inspection Programs
Appendix P . . . . . . . . . . . .Summary of CSO-Related Enforcement Actions Initiated By States After Issuance of the CSO Control Policy
Appendix Q . . . . . . . . . . . . . . . . . . . . . . .Sample State Information Management Systems Used to Track Requirements for CSO Control
Appendix R . . . . . . . . . . . . . . . . . . . . . . . . . . . . . . . . . . . . . . . . . . . . . . . . . . .Summary of Controls Implemented by CSO Communities
Appendix S . . . . . . . . . . . . . . . . . . . . . . . . . . . . . . . . . . . . . . . . . . . . . . . . . . . . . . . . . . . . . . . . . . . . . . . .GPRACSO Model Documentation
ACR-1
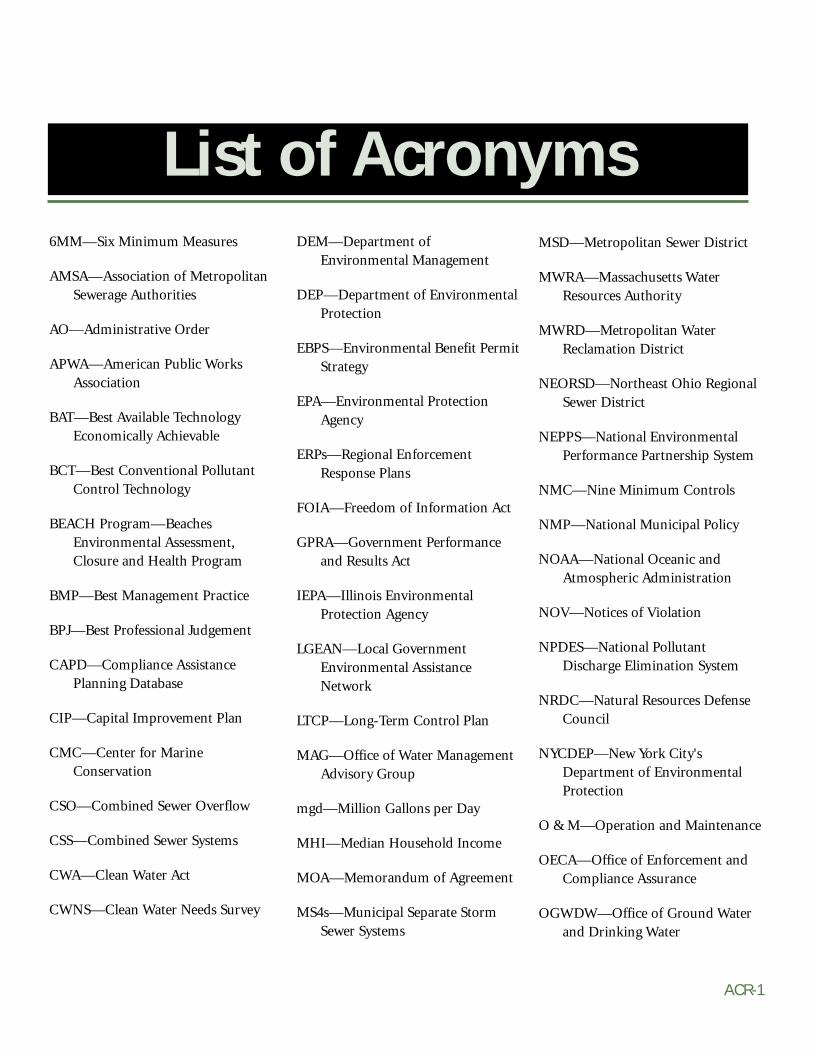
6MM—Six Minimum Measures
AMSA—Association of MetropolitanSewerage Authorities
AO—Administrative Order
APWA—American Public WorksAssociation
BAT—Best Available TechnologyEconomically Achievable
BCT—Best Conventional PollutantControl Technology
BEACH Program—BeachesEnvironmental Assessment,Closure and Health Program
BMP—Best Management Practice
BPJ—Best Professional Judgement
CAPD—Compliance AssistancePlanning Database
CIP—Capital Improvement Plan
CMC—Center for MarineConservation
CSO—Combined Sewer Overflow
CSS—Combined Sewer Systems
CWA—Clean Water Act
CWNS—Clean Water Needs Survey
DEM—Department ofEnvironmental Management
DEP—Department of EnvironmentalProtection
EBPS—Environmental Benefit PermitStrategy
EPA—Environmental ProtectionAgency
ERPs—Regional EnforcementResponse Plans
FOIA—Freedom of Information Act
GPRA—Government Performanceand Results Act
IEPA—Illinois EnvironmentalProtection Agency
LGEAN—Local GovernmentEnvironmental AssistanceNetwork
LTCP—Long-Term Control Plan
MAG—Office of Water ManagementAdvisory Group
mgd—Million Gallons per Day
MHI—Median Household Income
MOA—Memorandum of Agreement
MS4s—Municipal Separate StormSewer Systems
MSD—Metropolitan Sewer District
MWRA—Massachusetts WaterResources Authority
MWRD—Metropolitan WaterReclamation District
NEORSD—Northeast Ohio RegionalSewer District
NEPPS—National EnvironmentalPerformance Partnership System
NMC—Nine Minimum Controls
NMP—National Municipal Policy
NOAA—National Oceanic andAtmospheric Administration
NOV—Notices of Violation
NPDES—National PollutantDischarge Elimination System
NRDC—Natural Resources DefenseCouncil
NYCDEP—New York City'sDepartment of EnvironmentalProtection
O & M—Operation and Maintenance
OECA—Office of Enforcement andCompliance Assurance
OGWDW—Office of Ground Waterand Drinking Water
List of Acronyms

ACR-2
Report to Congress on Implementation and Enforcement of the CSO Control Policy
ORD—Office of Research andDevelopment
OW—Office of Water
OWM—Office of WastewaterManagement
OWOW—Office of Wetlands, Oceansand Watersheds
PCS—Permit Compliance System
POTW—Publicly Owned TreatmentWorks
PPA—Performance PartnershipAgreement
RCATS—Reporting ComplianceAssistance System
SCSs—Satellite Collection Systems
SEA—Senate Enrolled Act
SRF—State Revolving Fund
SSES—Sewer System EvaluationStudy
SSO—Sanitary Sewer Overflow
SWAP—Source Water AssessmentProgram
TARP—Tunnel and Reservoir Plan
TMDL—Total Maximum Daily Loads
TOGS—Technical and OperationalGuidance Series
UAA—Use Attainability Analysis
USDA—United States Department ofAgriculture
WEF—Water EnvironmentFederation
WPD—Water Permits Division
WWTP—Wastewater TreatmentPlants

GL-1
AAnti-backsliding—A provision in the
Federal Regulations [CWA§303(d)(4); CWA §402(c); CFR§122.44(l)] that requires areissued permit to be as stringentas the previous permit with someexceptions.
Antidegradation—Policies whichensure protection of water qualityfor a particular water body wherethe water quality exceeds levelsnecessary to protect fish andwildlife propagation andrecreation on and in the water.This also includes specialprotection of waters designated asoutstanding natural resourcewaters. Antidegradation plans areadopted by each state to minimizeadverse effects on water.
Authorized Program or AuthorizedState—A state, territorial, tribal,or interstate NPDES programwhich has been approved orauthorized by EPA under 40 CFRPart 123.
Average Number of Overflow EventsPer Year—The total number ofcombined sewer overflow eventsthat occurred during the term ofthe permit divided by the permitterm in years.
BBest Available Technology
Economically Achievable(BAT)—Technology-basedstandard established by the CleanWater Act (CWA) as the mostappropriate means available on anational basis for controlling thedirect discharge of toxic andnonconventional pollutants tonavigable waters. BAT effluentlimitations guidelines, in general,represent the best existingperformance of treatmenttechnologies that areeconomically achievable withinan industrial point sourcecategory or subcategory.
Best Conventional Pollutant ControlTechnology (BCT)—Technology-
based standard for the dischargefrom existing industrial pointsources of conventional pollutantsincluding BOD, TSS, fecalcoliform, pH, oil and grease. TheBCT is established in light of atwo-part “cost reasonableness”test which compares the cost foran industry to reduce its pollutantdischarge with the cost to aPOTW for similar levels ofreduction of a pollutant loading.The second test examines thecost-effectiveness of additionalindustrial treatment beyond BPT.EPA must find limits which arereasonable under both tests beforeestablishing them as BCT.
Best Management Practice (BMP)—Permit condition used in place ofor in conjunction with effluentlimitations to prevent or controlthe discharge of pollutants. Mayinclude schedule of activities,prohibition of practices,maintenance procedure, or othermanagement practice. BMPs mayinclude, but are not limited to,treatment requirements, operatingprocedures, or practices to controlplant site runoff, spillage, leaks,sludge or waste disposal, ordrainage from raw materialstorage.
Best Professional Judgment (BPJ)—The method used by permitwriters to develop
Glossary
This glossary includes a collection of the terms used in this manual and an
explanation of each term. To the extent that definitions and explanations
provided in this glossary differ from those in EPA regulations or other official
documents, they are intended for use in understanding this manual only.
GL-2
Report to Congress on Implementation and Enforcement of the CSO Control Policy
technology-based NPDES permitconditions on a case-by-case basisusing all reasonably available andrelevant data.
BOD5—Five-day biochemical oxygendemand; a standard measure ofthe organic content of wastewater,expressed in mg/l.
Biochemical Oxygen Demand(BOD)—A measurement of theamount of oxygen utilized by thedecomposition of organicmaterial, over a specified timeperiod (usually 5 days) in awastewater sample; it is used as ameasurement of the readilydecomposable organic content ofa wastewater.
Bypass—The intentional diversion ofwastestreams from any portion ofa treatment (or pretreatment)facility.
CCatch Basin—A chamber usually built
at the curbline of a street, whichadmits surface water for dischargeinto a storm drain.
Clean Water Act (CWA)—The CleanWater Act is an act passed by theU.S. Congress to control waterpollution. It was formerly referredto as the Federal Water PollutionControl Act of 1972 or FederalWater Pollution Control ActAmendments of 1972 (Public Law92-500), 33 U.S.C. 1251 et. seq., asamended by: Public Law 96-483;Public Law 97-117; Public Laws
permit or an enforcement order,including a sequence of interimrequirements (for example,actions, operations, or milestoneevents) that lead to compliancewith the CWA and regulations.
Criteria—The numeric values and thenarrative standards that representcontaminant concentrations thatare not to be exceeded in thereceiving environmental media(surface water, ground water,sediment) to protect beneficialuses.
DDesignated use—Use specified in
WQS for each water body orsegment whether or not it is beingattained.
Director—The RegionalAdministrator or State Director,as the context requires, or anauthorized representative. Whenthere is no approved stateprogram, and there is an EPAadministered program, Directormeans the RegionalAdministrator. When there is anapproved state program,“Director” normally means theState Director.
Discharge Monitoring Report(DMR)—The form used(including any subsequentadditions, revisions, ormodifications) to reportself-monitoring results by NPDESpermittees. DMRs must be usedby approved states as well as byEPA.
95-217, 97-117, 97-440, and100-04.
Code of Federal Regulations (CFR)—A codification of the final rulespublished daily in the FederalRegister. Title 40 of the CFRcontains the environmentalregulations.
Collector Sewer—The first element ofa wastewater collection systemused to collect and carrywastewater from one or morebuilding sewers to a main sewer.Also called a lateral sewer.
Combined Sewage—Wastewater andstorm drainage carried in thesame pipe.
Combined Sewer Overflow (CSO)—Adischarge of untreated wastewaterfrom a combined sewer system ata point prior to the headworks ofa publicly owned treatmentworks. CSOs generally occurduring wet weather (rainfall orsnowmelt). During periods of wetweather, these systems becomeoverloaded, bypass treatmentworks, and discharge directly toreceiving waters.
Combined Sewer System (CSS)—Awastewater collection systemwhich conveys sanitarywastewaters (domestic,commercial and industrialwastewaters) and storm waterthrough a single pipe to a publiclyowned treatment works fortreatment prior to discharge tosurface waters.
Compliance Schedule—A schedule ofremedial measures included in a
Glossary
GL-3
Draft Permit—A document preparedunder 40 CFR §124.6 indicatingthe Director’s tentative decision toissue, deny, modify, revoke andreissue, terminate, or reissue apermit. A notice of intent toterminate a permit, and a noticeof intent to deny a permitapplication, as discussed in 40CFR §124.5, are considered draftpermits. A denial of a request formodification, revocation andreissuance, or termination, asdiscussed in 40 CFR §124.5, is nota draft permit.
Dry Weather Flow Conditions—Hydraulic flow conditions withinthe combined sewer systemresulting from one or more of thefollowing: flows of domesticsewage, ground water infiltration,commercial and industrialwastewaters, and any other non-precipitation event related flows(e.g., tidal infiltration undercertain circumstances). Othernon-precipitation event relatedflows that are included in dryweather flow conditions will bedecided by the permit writerbased on site-specific conditions.
Dry Weather Flow Overflow—Acombined sewer overflow thatoccurs during dry weather flowconditions.
EEffluent Limitation—Any restriction
imposed by the Director onquantities, discharge rates, andconcentrations of pollutantswhich are discharged from point
sources into waters of the Unitedstates, the waters of thecontiguous zone, or the ocean.
GGeneral Permit—An NPDES permit
issued under 40 CFR §122.28 thatauthorizes a category ofdischarges under the CWA withina geographical area. A generalpermit is not specifically tailoredfor an individual discharger.
IIndirect Discharge—The
introduction of pollutants into amunicipal sewage treatmentsystem from any nondomesticsource (i.e., any industrial orcommercial facility) regulatedunder Section 307(b), (c), or (d)of the CWA.
Infiltration—Water other thatwastewater that enters awastewater system and buildingsewers from the ground throughsuch means as defective pipes,pipe joints, connections, ormanholes. (Infiltration does notinclude inflow).
Infiltration/Inflow (I/I) —The totalquantity of water from bothinfiltration and inflow.
Inflow—Water other than wastewaterthat enters a wastewater systemand building sewer from sourcessuch as roof leaders, cellar drains,yard drains, area drains,

GL-4
Report to Congress on Implementation and Enforcement of the CSO Control Policy
foundation drains, drains fromsprings and swampy areas,manhole covers, crossconnections between storm drainsand sanitary sewers, catch basins,cooling towers, stormwaters,surface runoff, street wash waters,or drainage. (Inflow does notinclude infiltration).
Interceptor Sewer—A sewer withoutbuilding sewer connections whichis used to collect and carry flowsfrom main and trunk sewers to acentral point for treatment anddischarge.
LLoad Allocation (LA) —The portion
of a receiving water’s loadingcapacity that is attributed to oneof its existing or future nonpointsources of pollution, or to naturalbackground sources.
MMajor Facility—Any NPDES facility
or activity classified as such by theRegional Administrator, or in thecase of approved state programs,the Regional Administrator inconjunction with the StateDirector. Major municipaldischargers include all facilitieswith design flows of greater thanone million gallons per day andfacilities with EPA/state approvedindustrial pretreatment programs.Major industrial facilities aredetermined based on specific
ratings criteria developed byEPA/state.
Million Gallons per Day (mgd)—Aunit of flow commonly used forwastewater discharges. One mgdis equivalent to 1.547 cubic feetper second.
Mixing Zone—An area where aneffluent discharge undergoesinitial dilution and is extended tocover the secondary mixing in theambient water body. A mixingzone is an allocated impact zonewhere water quality criteria canbe exceeded as long as acutelytoxic conditions are prevented.
NNational Pollutant Discharge
Elimination System (NPDES)—The national program for issuing,modifying, revoking andreissuing, terminating,monitoring and enforcingpermits, and imposing andenforcing pretreatmentrequirements, under Sections 307,318, 402, and 405 of CWA.
National Pretreatment Standard orPretreatment Standard—Anyregulation promulgated by theEPA in accordance with Sections307(b) and (c) of the CWA thatapplies to a specific category ofindustrial users and provideslimitations on the introduction ofpollutants into publicly ownedtreatment works. This termincludes the prohibited dischargestandards under 40 CFR §403.5,

Glossary
GL-5
including local limits [40 CFR§403.3(j)].
OOverflow Rate—Detention basin
release rate divided by the surfacearea of the basin. It can bethought of as an average flow ratethrough the basin. Generallyexpressed as gallons per day persq. ft. (gpd/sq.ft.).
PPeak Flow—The maximum flow that
occurs over a specific length oftime (e.g., daily, hourly,instantaneous).
Point Source—Any discernible,confined, and discreteconveyance, including but notlimited to any pipe, ditch,channel, tunnel, conduit, well,discrete fixture, container, rollingstock, concentrated animalfeeding operation, landfillleachate collection system, vessel,or other floating craft from whichpollutants are or may bedischarged.
Pollutant—Dredged spoil, solid waste,incinerator residue, filterbackwash, sewage, garbage,sewage sludge, munitions,chemical wastes, biologicalmaterials, radioactive materials(except those regulated under theAtomic Energy Act of 1954, asamended (42 U.S.C. 2011 etseq.)), heat, wrecked or discarded
equipment, rock, sand, cellar dirtand industrial, municipal, andagricultural waste discharged intowater.
Precipitation Event—An occurrenceof rain, snow, sleet, hail, or otherform of precipitation.Precipitation events are generallycharacterized by parameters ofduration and intensity (inches ormillimeters per unit of time).This definition will be highly site-specific. For example, aprecipitation event could bedefined as 0.25 inches or more ofprecipitation in the form of rainor 3 inches or more ofprecipitation in the form of sleetor snow, reported during thepreceding 24-hour period at aspecific gaging station. Aprecipitation event could also bedefined by a minimum timeinterval between measurableamounts of precipitation (e.g., 6hours between the end of rainfalland the beginning of the nextrainfall).
Pretreatment—The reduction of theamount of pollutants, theelimination of pollutants, or thealteration of the nature ofpollutant properties inwastewater prior to or in lieu ofdischarging or otherwiseintroducing such pollutants intoa publicly owned treatmentworks [40 CFR §403.3(q)].
Primary Clarification or Equivalent—The level of treatment that wouldtypically be provided by one ormore treatment technologiesunder peak wet weather flow

GL-6
Report to Congress on Implementation and Enforcement of the CSO Control Policy
conditions. Options for definingprimary clarification include adesign standard (e.g., side walldepth and maximum overflowrate), a performance standard(e.g., percent removal), or aneffluent standard (e.g.,concentration of pollutants).“Equivalent to primaryclarification” is site-specific andincludes any single technology orcombination of technologiesshown by the permittee to achieveprimary clarification under thepresumption approach. Thepermittee is responsible forshowing equivalency to primarytreatment as part of theevaluation of CSO controlalternatives during LTCPdevelopment. Primaryclarification is discussed in moredetail in the Combined SewerOverflows-Guidance for Long-Term Control Plan (EPA, 1995a).
Primary Treatment—The practice ofremoving some portion of thesuspended solids and organicmatter in a wastewater throughsedimentation. Common usage ofthis term also includespreliminary treatment to removewastewater constituents that maycause maintenance or operationalproblems in the system (i.e., gritremoval, screening for rags anddebris, oil and grease removal,etc.).
Publicly Owned Treatment Works(POTW)—A treatment works, asdefined by Section 212 of theCWA, that is owned by the stateor municipality. This definitionincludes any devices and systems
used in the storage, treatment,recycling, and reclamation ofmunicipal sewage or industrialwastes of a liquid nature. It alsoincludes sewers, pipes, and otherconveyances only if they conveywastewater to a POTW treatmentplant [40 CFR §403.3].
RRainfall Duration—The length of
time of a rainfall event.
Rainfall Intensity—The amount ofrainfall occurring in a unit oftime, usually expressed in inchesper hour.
Regulator—A device in combinedsewer systems for diverting wetweather flows which exceeddownstream capacity to anoverflow.
SSanitary Sewer—A pipe or conduit
(sewer) intended to carrywastewater or water-borne wastesfrom homes, businesses, andindustries to the POTW.
Sanitary Sewer Overflows (SSO)—Untreated or partially treatedsewage overflows from a sanitarysewer collection system.
Secondary Treatment—Technology-based requirementsfor direct discharging municipalsewage treatment facilities.Standard is based on acombination of physical and

Glossary
GL-7
biological processes typical for thetreatment of pollutants inmunicipal sewage. Standards areexpressed as a minimum level ofeffluent quality in terms of:BOD5,suspended solids (SS), and pH(except as provided for specialconsiderations and treatmentequivalent to secondarytreatment).
Sensitive Areas—Areas of particularenvironmental significance orsensitivity that could be adverselyaffected by a combined seweroverflow, including OutstandingNational Resource Waters,National Marine Sanctuaries,water with threatened orendangered species, waters withprimary contact recreation, publicdrinking water intakes, shellfishbeds, and other areas identified bythe permittee or NationalPollutant Discharge EliminationSystem permitting authority, incoordination with the appropriatestate or federal agencies.
Solid and Floatable Materials—Solidor semi-solid materials should bedefined on a case-by-case basisdetermined by the controltechnologies proposed by thepermittee to control thesematerials. The term generallyincludes materials that mightimpair the aesthetics of thereceiving water body.
State Revolving Fund Program—Afederal program created by theClean Water Act Amendments in1987 that offers low interest loansfor wastewater treatment projects.
STORET—EPA’s computerizedSTOrage and RETrieval waterquality database that includesphysical, chemical, and biologicaldata measured in waterbodiesthroughout the United States.
Storm Water—Storm water runoff,snow melt runoff, and surfacerunoff and drainage [40 CFR§122.26(b)(13)].
TTotal Maximum Daily Load
(TMDL)—The amount ofpollutant, or property of apollutant, from point, nonpoint,and natural background sources,that may be discharged to a waterquality-limited receiving water.Any pollutant loading above theTMDL results in violation ofapplicable water qualitystandards.
Total Suspended Solids (TSS)—Ameasure of the filterable solidspresent in a sample, asdetermined by the methodspecified in 40 CFR Part 136.
VVariance—Any mechanism or
provision under Sections 301 or316 of the CWA or under 40CWR Part 125, or in theapplicable “effluent limitationsguidelines” which allowsmodification to or waiver of thegenerally applicable effluentlimitations requirements or time
GL-8
Report to Congress on Implementation and Enforcement of the CSO Control Policy
deadlines of the CWA. Thisincludes provisions, which allowthe establishment of alternativelimitations based onfundamentally different factors.
WWasteload Allocation (WLA)—The
proportion of a receiving water’stotal maximum daily load that isallocated to one of its existing orfuture point sources of pollution.
Water Quality Criteria—Comprisedof numeric and narrative criteria.Numeric criteria are scientificallyderived ambient concentrationsdeveloped by EPA or states forvarious pollutants of concern toprotect human health and aquaticlife. Narrative criteria arestatements that describe thedesired water quality goal.
Water Quality Standard (WQS)—Alaw or regulation that consists ofthe beneficial use or uses of awaterbody, the numeric andnarrative water quality criteriathat are necessary to protect theuse or uses of that particularwaterbody, and anantidegradation statement.
Waters of the United States-All watersthat are currently used, were usedin the past, or may be susceptibleto use in interstate or foreigncommerce, including all waterssubject to the ebb and flow of thetide. Waters of the United Statesinclude but are not limited to allinterstate waters and intrastatelakes, rivers, streams (including
intermittent streams), mudflats,sand flats, wetlands, sloughs,prairie potholes, wet meadows,play lakes, or natural ponds. [See40 CFR §122.2 for the completedefinition.]
Wet Weather Flow—Dry weather flowcombined with stormwaterintroduced into a combinedsewer, and dry weather flowcombined with inflow in aseparate sewer.
Wet Weather Flow Conditions—Hydraulic flow conditions withinthe combined sewer systemresulting from a precipitationevent. Since the definition ofprecipitation event is site-specific,the permit writer should evaluateand define certain site-specificweather conditions that typicallycontribute to wet weather flow.EPA encourages permit writers toinclude snowmelt as a conditionthat typically contributes to wetweather flow.

ES-1
made by EPA, states and
municipalities in implementing
and enforcing the CSO Control
Policy.
This Executive Summary provides anoverview of this report and highlightsreport findings, key programchallenges, and EPA actions and nextsteps to ensure effectiveimplementation and enforcement ofthe CSO Control Policy.
What are CSOs, and why are they aproblem?
As defined in the CSO Control Policy,a combined sewer system (CSS) is:
A wastewater collection system
owned by a state or municipality
(as defined by Section 502(4) of
the CWA) which conveys sanitary
wastewaters (domestic, commercial
and industrial wastewaters) and
storm water through a single-pipe
system to a publicly owned
treatment works (POTW)...
Further, a CSO is defined as:
Executive Summary
The U.S. EnvironmentalProtection Agency (EPA or “theAgency”) is transmitting this
Report to Congress on the progressmade by EPA, states, andmunicipalities in implementing andenforcing the Combined SewerOverflow (CSO) Control Policy signedby the Administrator on April 11,1994. This report is required bySection 402(q)(3) of the Clean WaterAct (CWA).
Overview and Background
Why is EPA preparing this report?
In the Consolidated AppropriationsAct for Fiscal Year 2001, P.L. 106-554 (or “2000 amendments to the
CWA”) Congress made several changesto the CWA regarding CSOs,including:
Section 402(q) Combined Sewer
Overflows
(3) Report.–Not later than
September 1, 2001, the
Administrator shall transmit to
Congress a report on the progress
Overview and Background
Report Findings
Key Program Challenges
EPA Actions and Next Steps
Report to Congress onImplementation and Enforcement of the Combined
Sewer Overflow Control Policy
In this chapter:
ES-2
Report to Congress on Implementation and Enforcement of the CSO Control Policy
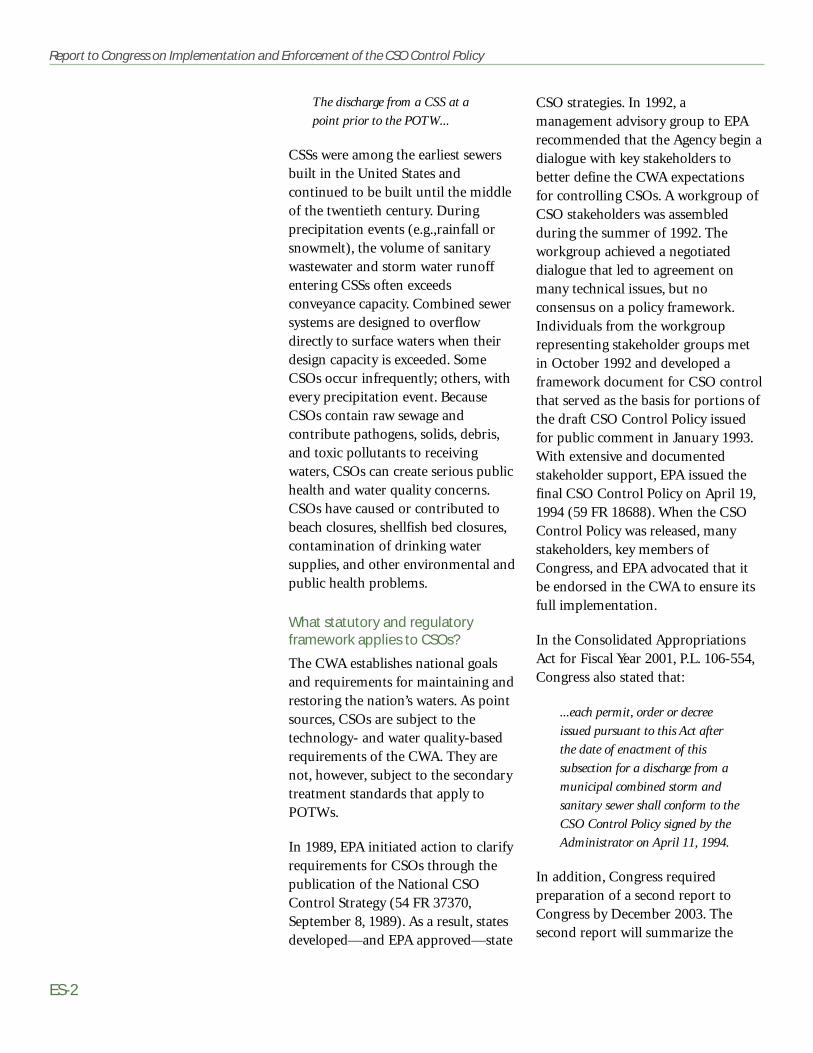
The discharge from a CSS at a
point prior to the POTW...
CSSs were among the earliest sewersbuilt in the United States andcontinued to be built until the middleof the twentieth century. Duringprecipitation events (e.g.,rainfall orsnowmelt), the volume of sanitarywastewater and storm water runoffentering CSSs often exceedsconveyance capacity. Combined sewersystems are designed to overflowdirectly to surface waters when theirdesign capacity is exceeded. SomeCSOs occur infrequently; others, withevery precipitation event. BecauseCSOs contain raw sewage andcontribute pathogens, solids, debris,and toxic pollutants to receivingwaters, CSOs can create serious publichealth and water quality concerns.CSOs have caused or contributed tobeach closures, shellfish bed closures,contamination of drinking watersupplies, and other environmental andpublic health problems.
What statutory and regulatoryframework applies to CSOs?
The CWA establishes national goalsand requirements for maintaining andrestoring the nation’s waters. As pointsources, CSOs are subject to thetechnology- and water quality-basedrequirements of the CWA. They arenot, however, subject to the secondarytreatment standards that apply toPOTWs.
In 1989, EPA initiated action to clarifyrequirements for CSOs through thepublication of the National CSOControl Strategy (54 FR 37370,September 8, 1989). As a result, statesdeveloped—and EPA approved—state
CSO strategies. In 1992, amanagement advisory group to EPArecommended that the Agency begin adialogue with key stakeholders tobetter define the CWA expectationsfor controlling CSOs. A workgroup ofCSO stakeholders was assembledduring the summer of 1992. Theworkgroup achieved a negotiateddialogue that led to agreement onmany technical issues, but noconsensus on a policy framework.Individuals from the workgrouprepresenting stakeholder groups metin October 1992 and developed aframework document for CSO controlthat served as the basis for portions ofthe draft CSO Control Policy issuedfor public comment in January 1993.With extensive and documentedstakeholder support, EPA issued thefinal CSO Control Policy on April 19,1994 (59 FR 18688). When the CSOControl Policy was released, manystakeholders, key members ofCongress, and EPA advocated that itbe endorsed in the CWA to ensure itsfull implementation.
In the Consolidated AppropriationsAct for Fiscal Year 2001, P.L. 106-554,Congress also stated that:
...each permit, order or decree
issued pursuant to this Act after
the date of enactment of this
subsection for a discharge from a
municipal combined storm and
sanitary sewer shall conform to the
CSO Control Policy signed by the
Administrator on April 11, 1994.
In addition, Congress requiredpreparation of a second report toCongress by December 2003. Thesecond report will summarize the
Executive Summary
ES-3
extent of human health andenvironmental impacts from CSOsand sanitary sewer overflows (SSOs),quantify and characterize resourcesspent by municipalities to addressthese impacts, and evaluate thetechnologies used by municipalities tocontrol overflows. EPA collected dataduring the preparation of this firstreport in anticipation of preparing thesecond report.
What is the CSO Control Policy?
The CSO Control Policy “represents acomprehensive national strategy toensure that municipalities, permittingauthorities, water quality standardsauthorities and the public engage in acomprehensive and coordinated effortto achieve cost effective CSO controlsthat ultimately meet appropriatehealth and environmental objectives.”In 1994, EPA estimated that the cost ofCSO control, consistent with the CSOControl Policy, would be $40 billion.In the 1996 Clean Water Needs SurveyReport to Congress (EPA, 1997b), EPAestimated the cost to be $44.7 billion(1996 dollars).
The CSO Control Policy establishedfour key principles to guide CSOplanning decisions by municipalities,NPDES authorities, and water qualitystandards authorities:
1. Providing clear levels of controlthat would be presumed to meetappropriate health andenvironmental objectives.
2. Providing sufficient flexibility tomunicipalities, especiallyfinancially disadvantagedcommunities, to consider the site-specific nature of CSOs and to
determine the most cost-effectivemeans of reducing pollutants andmeeting CWA objectives andrequirements.
3. Allowing a phased approach toimplementation of CSO controlsconsidering a community’sfinancial capability.
4. Reviewing and revising, asappropriate, water qualitystandards and theirimplementation procedures whendeveloping CSO control plans toreflect the site-specific wet weatherimpacts of CSOs.
The CSO Control Policy expected thatNPDES permits or other enforceablemechanisms would require CSOcommunities to implement nineminimum technology-based controls(the “nine minimum controls” orNMC) by January 1, 1997, and todevelop CSO long-term control plans(LTCPs). The LTCP must assess arange of control options, includingcosts and benefits, and lead toselection of an alternative that wouldachieve appropriate water qualityobjectives and compliance with theCWA. Once the NPDES authority andCSO community reached agreementon an LTCP, the CSO communitywould design and construct the CSOcontrols as soon as practicable.
What methodology did EPA use forthis Report to Congress?
The basic study approach for thisreport was to collect data and reporton implementation and enforcementactivities across EPA headquarters andthe nine EPA regions and 32 states

ES-4
Report to Congress on Implementation and Enforcement of the CSO Control Policy
known to have CSO communitieswithin their jurisdictions. Thisentailed:
● Reviewing existing information instate and EPA permit andenforcement files, and federal databases.
● Performing a literature search onpolicy, technology, andenvironmental data.
● Using modeling projections incertain cases.
● Conducting site visits to five EPARegions and 16 states in whichmore than 90 percent of thenation’s CSSs are located.
● Developing 15 CSO communitycase studies.
● Reviewing data from surveysconducted by the Association ofMetropolitan Sewerage Agencies(AMSA) and the CSO Partnership.
● Organizing a stakeholderdiscussion of the preliminaryissues and findings from thereport at a meeting in Chicago,Illinois on July 12 and 13, 2001.
These efforts have allowed the Agencyto compile a data base of all CSOpermits, prepare profiles of all stateCSO programs, and identify anddocument data gaps. Themethodology for this Report toCongress recognizes that the Report toCongress required in 2003 will focuson the extent of environmental andhuman health impacts, resourcesspent, and an evaluation oftechnologies for CSO control.
Report Findings
What are the overall findings of thisReport to Congress?
Progress has been made inimplementing and enforcingCSO controls prior to, and as a
result of, the 1994 CSO Control Policy.Cities that have made substantialprogress and investments in CSOcontrol are realizing public health andwater quality benefits. The CSOControl Policy provides a soundapproach to assess and implement costeffective CSO controls that meetappropriate environmental goals andobjectives and achieve CWAcompliance. It fosters and expectssignificant involvement of the publicand the NPDES and water qualitystandards authorities.
Although federal, state, and municipalofficials are involved in a broad rangeof activities to regulate and controlCSOs, CSOs continue to pose aserious environmental and publichealth threat. Much remains to bedone to fully realize the objectives ofthe CSO Control Policy and the CWA.The CSO Control Policy provides anappropriate framework forcommunities to control CSOs. EPAbelieves the codification of the CSOControl Policy through the 2000amendments to the CWA will focusgreater attention on implementationof the CSO Control Policy.
EPA believes a number of factors haveaffected the degree of implementationof the CSO Control Policy, includingthe lack of any statutory or regulatoryendorsement of the CSO Control
Executive Summary
ES-5
Policy from 1994 until December2000, and competing priorities at thefederal, state and local level.
Below, EPA presents a summary of thekey findings of this report, organizedalong four central themes. Thesethemes are:
● A description of the status ofCSOs in the United States.
● An overview of progress inimplementing and enforcing theCSO Control Policy, examiningkey programmaticaccomplishments at the federaland state levels, as well asmunicipal actions to implementthe technology- and water quality-based controls.
● Early feedback on the nature andextent of environmental resultsstemming from CSO control.
● A review of remaining challengesin implementing and enforcingthe CSO Control Policy.
What is the status of CSOs in theUnited States?
Today, there are 772 CSOcommunities with a total of 9,471CSOs that are identified and regulatedby 859 NPDES permits. Key attributesof the CSO universe include:
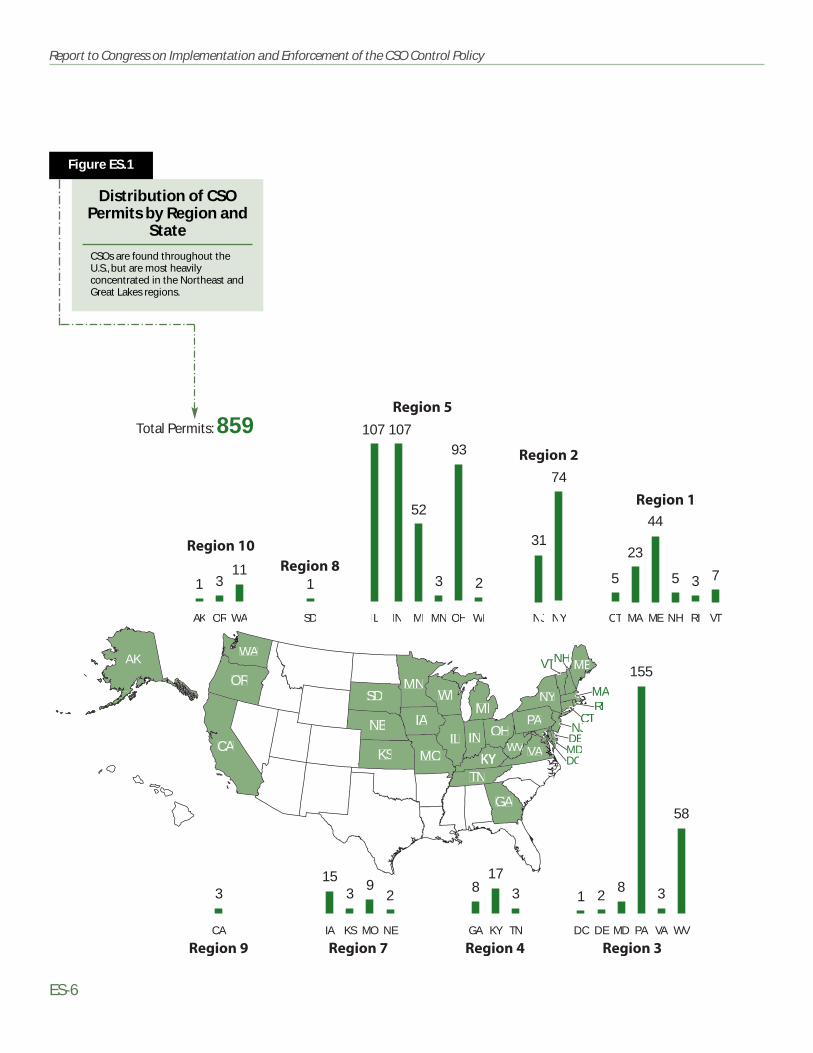
● CSSs are found in 32 states(including the District ofColumbia) and nine EPA Regions.They are regionally concentratedin older communities in theNortheast and Great Lakes regionsas shown in Figure ES.1.
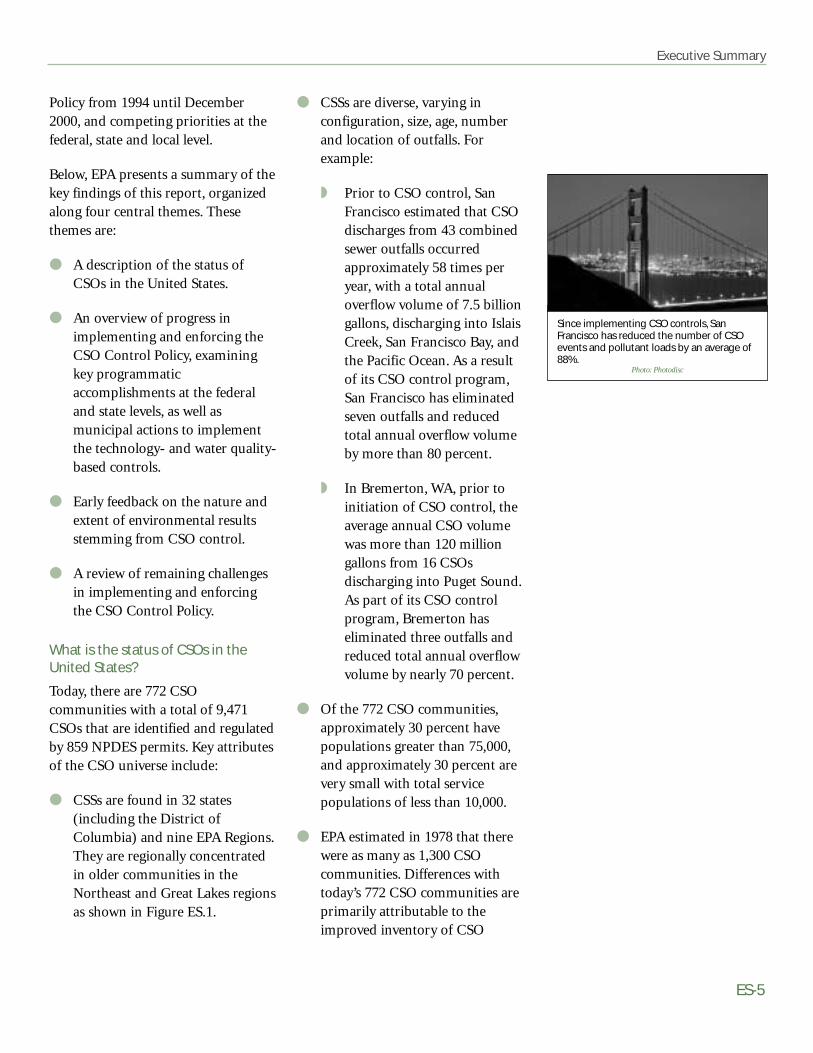
● CSSs are diverse, varying inconfiguration, size, age, numberand location of outfalls. Forexample:
◗ Prior to CSO control, SanFrancisco estimated that CSOdischarges from 43 combinedsewer outfalls occurredapproximately 58 times peryear, with a total annualoverflow volume of 7.5 billiongallons, discharging into IslaisCreek, San Francisco Bay, andthe Pacific Ocean. As a resultof its CSO control program,San Francisco has eliminatedseven outfalls and reducedtotal annual overflow volumeby more than 80 percent.
◗ In Bremerton, WA, prior toinitiation of CSO control, theaverage annual CSO volumewas more than 120 milliongallons from 16 CSOsdischarging into Puget Sound.As part of its CSO controlprogram, Bremerton haseliminated three outfalls andreduced total annual overflowvolume by nearly 70 percent.
● Of the 772 CSO communities,approximately 30 percent havepopulations greater than 75,000,and approximately 30 percent arevery small with total servicepopulations of less than 10,000.
● EPA estimated in 1978 that therewere as many as 1,300 CSOcommunities. Differences withtoday’s 772 CSO communities areprimarily attributable to theimproved inventory of CSO
Since implementing CSO controls, SanFrancisco has reduced the number of CSOevents and pollutant loads by an average of88%.
Photo: Photodisc
ES-6
Report to Congress on Implementation and Enforcement of the CSO Control Policy
AKWA
OR
CA
NE
KS
SDMN
WI
IA
MOIL IN OH
MI
TN
GA
WVVWVVV VA
PA
NY
ME
CTRI
NJDE
NHVT
MDDC
MA
C
T H
M
3
CA
31
NJ
74
NY
1
SD
5
CT
23
MA
44
ME
5
NH
7
VT
3
RI
AK
3
OR
1
AK
11
WA
3
KS
2
NE
9
MO
15
IA
3
MN
2
WI
93
OH
52
MI
107
IN
107
IL
3
TN
17
KY
8
GA
3
VA
1
DC
2
DE
8
MD
155
PA
58
WV
Total Permits: 859
Distribution of CSOPermits by Region and
State
CSOs are found throughout theU.S., but are most heavilyconcentrated in the Northeast andGreat Lakes regions.
Figure ES.1
Executive Summary
ES-7
permits developed for this report,completed sewer separationprojects, and better differentiationbetween CSSs and separate sewersystems.
● National projections of annualCSO discharges are estimated at1,260 billion gallons per year.
● Available data indicate thefollowing distribution in receivingwaters for CSOs: 43 percent torivers, 38 percent to streams, fivepercent to oceans, estuaries andbays, two percent to ponds/lakes,and 12 percent to other waters(ditches, canals, unclassifiedwaters).
● Uncontrolled CSOs continue toimpair water quality in areasserved by CSSs:
◗ According to EPA’s 1998National Water QualityInventory, CSOs are a sourceof impairment for 12 percentof assessed estuaries (in squaremiles) and two percent ofassessed lakes (in shore miles)(EPA, 2000a).
◗ According to a state-by-statereport of impaired waterslisted under CWA Section303(d), less than one percentof the nearly 15,600 impairedwater bodies in states withCSOs are impaired by CSOs.Further, approximately eightpercent of the assessed waterbodies are impaired by urbanrunoff (which may includeCSOs). Appendix N provides asummary of the 303(d) listedwaters.
◗ The Natural ResourcesDefense Council (NRDC)reported in its 2000 Testing theWaters report that sewagespills and overflows accountedfor 2,230 beach closings andadvisories in 2000. Sewagespills in the NRDC reportinclude combined seweroverflows, sanitary seweroverflows, and breaks in sewerlines or septic systems(NRDC, 2001).
● Localized impacts of uncontrolledCSO discharges have been welldocumented by somecommunities. For example:
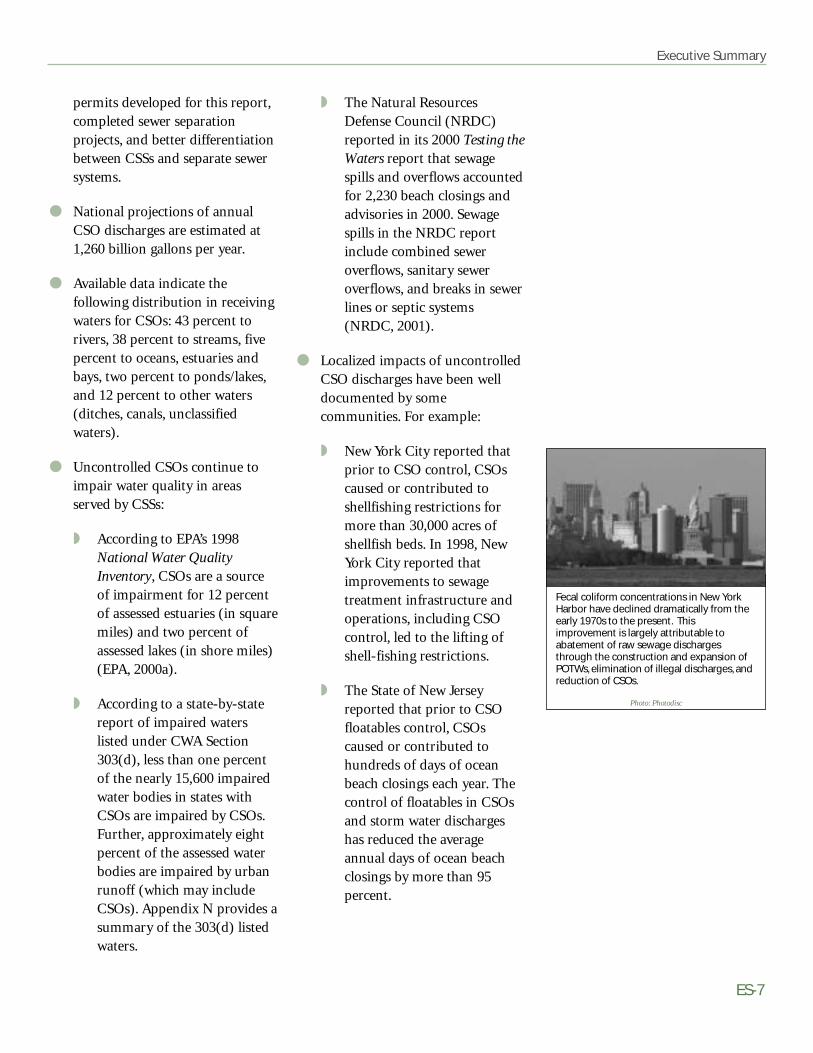
◗ New York City reported thatprior to CSO control, CSOscaused or contributed toshellfishing restrictions formore than 30,000 acres ofshellfish beds. In 1998, NewYork City reported thatimprovements to sewagetreatment infrastructure andoperations, including CSOcontrol, led to the lifting ofshell-fishing restrictions.
◗ The State of New Jerseyreported that prior to CSOfloatables control, CSOscaused or contributed tohundreds of days of oceanbeach closings each year. Thecontrol of floatables in CSOsand storm water dischargeshas reduced the averageannual days of ocean beachclosings by more than 95percent.
Fecal coliform concentrations in New YorkHarbor have declined dramatically from theearly 1970s to the present. Thisimprovement is largely attributable toabatement of raw sewage dischargesthrough the construction and expansion ofPOTWs, elimination of illegal discharges, andreduction of CSOs.
Photo: Photodisc

ES-8
Report to Congress on Implementation and Enforcement of the CSO Control Policy
What is the status of implementationand enforcement of the 1994 CSOControl Policy?
There has been definitive progressimplementing and enforcing CSOcontrols prior to, and as a result of, theCSO Control Policy, resulting indemonstrable environmental progressin some communities where CSOcontrols have been instituted. EPA,states, and municipalities all haveplayed important roles in advancingthe CSO Control Policy.
EPA Progress
● EPA issued guidance, supportedcommunication and outreach, andprovided compliance assistanceand some financial support forCSO control.
● EPA issued guidance oncoordinating CSO LTCPs withwater quality standards in 2001.
● EPA issued extensive technical and policy guidance documents tofoster implementation of CSOcontrols dealing with the NMC,monitoring and modeling,financial capability, LTCPs, andpermit writing and water qualitystandards reviews. EPA hassponsored and conducted morethan 15 workshops and seminarson various aspects ofimplementation of the CSOControl Policy as well as othercompliance assistance activities.
● Administrative and civil judicialactions have been usedsuccessfully together withpermitting and complianceassistance activities to fosterdevelopment and implementation
of CSO controls. Many of the CSOcommunities that have made themost progress to date, includingseveral of the largestmunicipalities in the UnitedStates, have done so as the resultof enforcement actions.
● EPA issued the Compliance andEnforcement Strategy for CombinedSewer Overflows and SanitarySewer Overflows in 2000.
State Progress
● Most states have made efforts toregulate and control CSOs.NPDES authorities have doneextensive work placing conditionsfor CSO control in permits. Intotal, 94 percent of CSOcommunities are required tocontrol CSOs, either through apermit or an enforceable order.
● All 32 states with CSSs developedCSO strategies in response to theNational CSO Control Strategy.Most states have adopted the keyprovisions of the CSO ControlPolicy:
◗ 27 require implementation ofthe NMC or a suite of bestmanagement practices (BMPs)that include or are analogousto the NMC.
◗ 25 require development andimplementation of LTCPs.
● Most CSO communities arerequired to implement BMPmeasures to mitigate CSO-relatedimpacts:
Executive Summary
ES-9
◗ 94 percent of CSO permitsrequire implementation ofone or more BMPs.
◗ 86 percent of CSO permitshave requirements toimplement the NMC or a setof BMPs that includes or isanalogous to the NMC.
◗ 6 percent of CSO permits donot require any BMPs.
● Imposition of permit or otherenforceable requirements for morecapital intensive CSO facilityplanning (e.g., sewer separation orunderground storage) is lessextensive:
◗ 82 percent of CSO permitsinclude enforceablerequirements to develop andimplement CSO facilities plan.
◗ 65 percent of CSO permitscontain requirements todevelop and implement anLTCP.
◗ 18 percent of CSO permits donot require CSO facilitiesplanning.
● Several states have addressed thefull range of programmaticcomponents (e.g.,guidance,compliance assistance,communications and informationmanagement, among others).Other states, principally thosewith fewer CSO communities,have dealt with CSOs on a site-specific basis.
● Many states have providedcompliance assistance and most
include compliance monitoring ofCSOs in their NPDES inspectionsprograms. Many state strategieshave been updated since issuanceof the CSO Control Policy in1994. Yet, state programs varywidely in the approaches used toimplement the CSO ControlPolicy.
● Most states have not developedseparate, specific procedures forcoordinating the review of waterquality standards with LTCPdevelopment. Some states haveapproaches for considering waterquality standards for CSOreceiving waters. For example:
◗ Indiana passed legislationproviding a mechanismwhereby CSO communitiesmay apply for a temporarysuspension of state waterquality standards when certaincriteria are met.
◗ Maine passed legislationcodifying standard proceduresfor providing variances forCSO receiving waters duringthe implementation of anapproved LTCP.
◗ Massachusetts added a seriesof refined uses to its statewater quality standards useclassification system toaddress CSO-impacted waters.
◗ Illinois’ water qualitystandards program frameworkpresumes compliance withwater quality standards uponthe completedimplementation of a CSOfacility plan that meets the

ES-10
Report to Congress on Implementation and Enforcement of the CSO Control Policy
criteria for the state-derivedpresumption approach.
◗ Michigan rules allow the useof alternate design flows (i.e.,alternate to 7Q10 low flows or95-percent exceedance flows)when determining waterquality based requirements forintermittent wet weatherdischarges such as treatedCSOs.
◗ New Hampshire hasdeveloped a surface waterpartial-use designation. Apartial-use designation ismade only if the communityplanning process andwatershed planning effortsdemonstrate that theallowance of minor CSOdischarges is the mostenvironmentally protectiveand cost-effective optionavailable.
● At least 16 states have broughtenforcement actions that haveincluded CSO violations. Theenforcement actions haveprimarily been administrativeactions, such as administrativecompliance orders.
Municipal Progress
● Most CSO communities havedocumented CSO control throughsome combination of the NMCand other best managementpractices.
◗ 77 percent of CSOcommunities have submitteddocumentation ofimplementation of one or
more of the NMC to theirNPDES authority.
◗ 32 percent have submitteddocumentation ofimplementation of all NMC.
● A smaller number of CSOcommunities have developedLTCPs.
◗ 34 percent of CSOcommunities have submitteddraft LTCPs to their NPDESauthority.
◗ 19 percent have had theirLTCPs approved.
◗ 17 percent have initiatedimplementation of LTCPs orother CSO facility plans.
◗ 87 CSO communities havesubstantially completedimplementation of theirLTCPs or other CSO controlprograms.
● CSO communities with LTCPsdeveloped or approved arepursuing attainment of waterquality standards in roughly equalmeasure under three approaches –demonstration, presumption, anda combination of thedemonstration and presumptionapproaches.
● LTCPs indicate that CSOcommunities are relying on a widerange of technologies to addressCSOs including storage(e.g.,tunnels), expanded treatmentcapacity, sewer separation, andimproved conveyance. EPA will beexamining the environmental
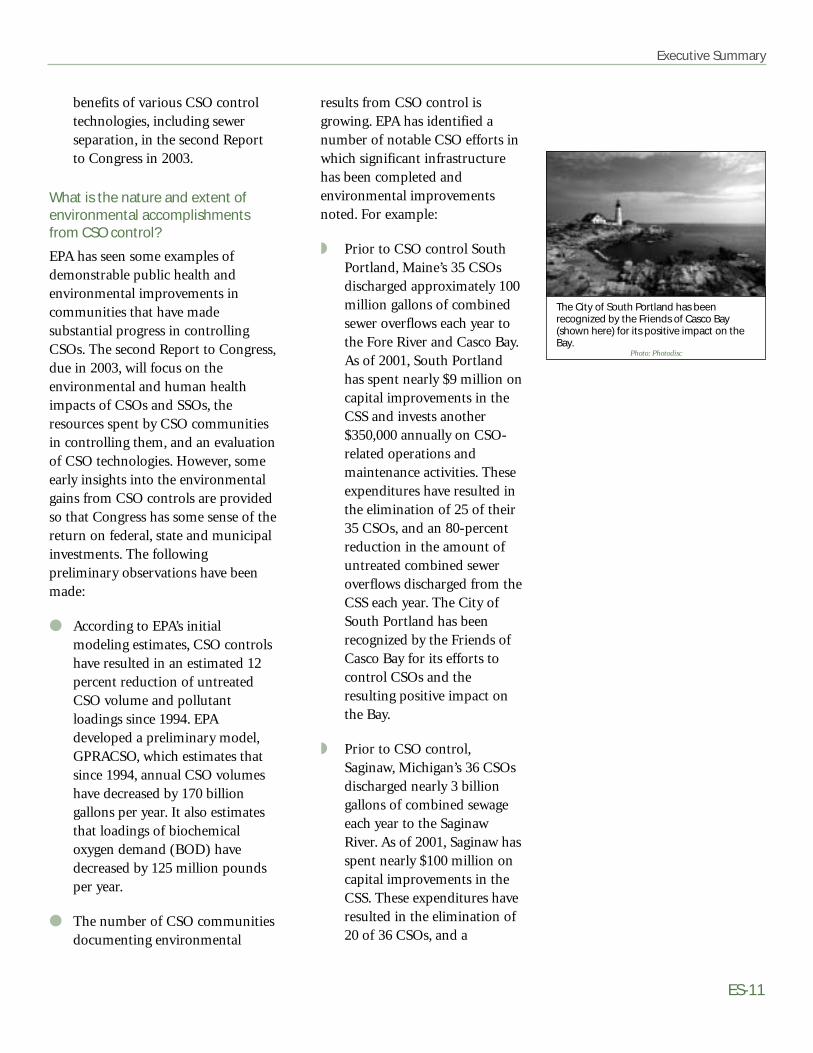
Executive Summary
ES-11
benefits of various CSO controltechnologies, including sewerseparation, in the second Reportto Congress in 2003.
What is the nature and extent ofenvironmental accomplishmentsfrom CSO control?
EPA has seen some examples ofdemonstrable public health andenvironmental improvements incommunities that have madesubstantial progress in controllingCSOs. The second Report to Congress,due in 2003, will focus on theenvironmental and human healthimpacts of CSOs and SSOs, theresources spent by CSO communitiesin controlling them, and an evaluationof CSO technologies. However, someearly insights into the environmentalgains from CSO controls are providedso that Congress has some sense of thereturn on federal, state and municipalinvestments. The followingpreliminary observations have beenmade:
● According to EPA’s initialmodeling estimates, CSO controlshave resulted in an estimated 12percent reduction of untreatedCSO volume and pollutantloadings since 1994. EPAdeveloped a preliminary model,GPRACSO, which estimates thatsince 1994, annual CSO volumeshave decreased by 170 billiongallons per year. It also estimatesthat loadings of biochemicaloxygen demand (BOD) havedecreased by 125 million poundsper year.
● The number of CSO communitiesdocumenting environmental
results from CSO control isgrowing. EPA has identified anumber of notable CSO efforts inwhich significant infrastructurehas been completed andenvironmental improvementsnoted. For example:
◗ Prior to CSO control SouthPortland, Maine’s 35 CSOsdischarged approximately 100million gallons of combinedsewer overflows each year tothe Fore River and Casco Bay.As of 2001, South Portlandhas spent nearly $9 million oncapital improvements in theCSS and invests another$350,000 annually on CSO-related operations andmaintenance activities. Theseexpenditures have resulted inthe elimination of 25 of their35 CSOs, and an 80-percentreduction in the amount ofuntreated combined seweroverflows discharged from theCSS each year. The City ofSouth Portland has beenrecognized by the Friends ofCasco Bay for its efforts tocontrol CSOs and theresulting positive impact onthe Bay.
◗ Prior to CSO control,Saginaw, Michigan’s 36 CSOsdischarged nearly 3 billiongallons of combined sewageeach year to the SaginawRiver. As of 2001, Saginaw hasspent nearly $100 million oncapital improvements in theCSS. These expenditures haveresulted in the elimination of20 of 36 CSOs, and a
The City of South Portland has beenrecognized by the Friends of Casco Bay(shown here) for its positive impact on theBay.
Photo: Photodisc

ES-12
Report to Congress on Implementation and Enforcement of the CSO Control Policy
75-percent reduction in theamount of combined sewagedischarged from the CSS eachyear. The Saginaw River isnow characterized by fishingperiodicals as one of the topwalleye fisheries in thecountry.
Key Program Challenges
In developing this Report toCongress, EPA identified severalnoteworthy challenges to CSO
control in the United States. Each ofthese challenges, based on an overallsynthesis of the report findings, isbriefly described below.
Financial Challenges
When the CSO Control Policy wasissued, EPA estimated the nationwidefinancial need to control CSOs,consistent with the CSO ControlPolicy, at $40 billion (in 1992 dollars).
More recently, data from EPA’s 1996Needs Survey sets national CSO needsat $44.7 billion (in 1996 dollars). CSOcontrol costs will continue to beconsiderable, and EPA has receivednumerous requests from CSOcommunities for financial assistance,given mounting water and wastewaterinfrastructure costs and the resource-intensive nature of CSO controls. CSOLTCPs typically involve majorinfrastructure investments that mustcompete with other infrastructureneeds. Respondents to the AMSA andCSO Partnership surveys reported thatfunding is the primary challenge inimplementing LTCPs.
CSO communities are using acombination of local funding sources,Clean Water State Revolving Fund(SRF) loans, state grants and loans,and, in special cases, line itemcongressional appropriations to fundCSO controls. EPA does not have dataon the total extent of CSO spending.
$0$14.6m
$121.5m
$180.1m
$245.4m
$190.4m
$168.1m$157.8m
$272.8m
$410.6m
$169.5m
$139.6m
1988 1989 1990 1991 1992 1993 1994 1995 1996 1997 1998 1999 2000
$4.7m
SRF Loans for CSOProjects,1988—2000
SRF loans for CSO projectsreached more than $245 million in1994 and began to rise again in1998, reaching more than $400million in 2000. This suggests thatfunding for the implementation ofCSO controls lagged several yearsbehind the issuances of the 1989Strategy and the 1994 Policy.
Figure ES.2

Executive Summary
ES-13
Use of SRF loans for CSOinfrastructure continues to climb.
● State use of the SRF to fund CSOcontrol projects has increasedsteadily since 1990. As shown inFigure ES.2, CSO loans in 2000were the highest ever, accountingfor $411 million, or about 12percent, of total SRF assistance.SRF loans for CSO control totaled$2.08 billion from 1989 to 2000(about 5 percent of the total CSOneed). States with the highest SRFspending levels for CSO control(typically driven by a few largeprojects) were Illinois, Michigan,New York, and California.
● Congress has appropriated specificCSO infrastructure grants totalingover $600 million for 32 CSOcommunities since FY 1992.
Congress has shown some support foradditional funding for CSO control.The 2000 amendments to the CWAauthorize EPA to provide grants toCSO communities, either directly orthrough states, for planning, design,and construction of CSO and sanitarysewer overflow (SSO) treatment. Theamendments also require EPA toprovide technical assistance and grantsto POTWs for watershed-basedmanagement of CSOs, SSOs, andstorm water discharges. The EPAAdministration requested $450 millionfor this program in its FY 2002budget. To date, however, Congresshas not appropriated funds for thesegrant programs.
Water Quality Standards Review
The CSO Control Policy anticipatedthat development of LTCPs would becoordinated with the review andrevision, as appropriate, of waterquality standards. Many reasons,including institutional barriers, existfor the lack of coordination in theLTCP development and water qualitystandards review processes. States citepublic pressure to maintain theirwater quality standards, EPArequirements for development of a“use attainability analysis” (UAA)prior to revising a state water qualitystandard, and the lack of water qualitymonitoring data that could be used tojustify water quality standardsrevisions. During EPA-sponsoredlistening sessions held in the spring of1999, designed to supportdevelopment of guidance forcoordinating CSO LTCPs and waterquality standards reviews, manyparticipants expressed concern aboutthe complexity of the process forrevising water quality standards.
Among the changes in the 2000amendments to the CWA, Congressadded Section 402(q) to requireissuance of guidance to facilitate theconduct of water quality anddesignated use reviews for CSOreceiving waters by July 31, 2001. EPAprepared a draft guidance for publicreview and comment (66 FR 364,January 3, 2001) and issued the finalguidance on August 2, 2001.
Information Management andPerformance Measurement
This Report to Congress reliedextensively on an assessment of CSOinformation that resides in EPA and
ES-14
Report to Congress on Implementation and Enforcement of the CSO Control Policy
state files. EPA believes that thisadditional information on progress inimplementing CSO controls andderived water quality benefits exists atthe community level. EPA washindered by the lack of a national datasystem for comprehensively evaluatingthe implementation and effectivenessof the CSO program, and by the lackof clear, national performancemeasures in place to assess theeffectiveness of CSO control efforts ona national basis.
EPA Actions and Next Steps
What actions will EPA take toimprove implementation andenforcement of the CSO ControlPolicy?
Despite significant efforts andprogress by EPA, states, andCSO communities to
implement CSO controls, more workremains to ensure that human healthand the environment are adequatelyprotected from CSOs. The 1994 CSOControl Policy provides a sound andappropriate framework for developingand implementing cost-effective CSOcontrols. With the codification of theCSO Control Policy in the 2000amendments to the CWA, EPA willcontinue to work in partnership withthe states to address remaining CSOissues. EPA will work aggressively withNPDES authorities, water qualitystandards authorities, and CSOcommunities to implement andenforce the CSO Control Policy. Basedon the findings of this Report toCongress, EPA will pursue a numberof activities to ensure the continued
effective implementation andenforcement of the CSO ControlPolicy.
Ensure That all CSOs areAppropriately Controlled.
● Implement the “shall conform”statutory mandate.
◗ Begin efforts to implementnew CWA Section 402(q)(1),which requires that futurepermits or other enforceablemechanisms for CSOsconform to the CSO ControlPolicy.
● Ensure all CSOs are covered by anNPDES permit or otherenforceable mechanism.
◗ Follow up with NPDESauthorities to ensure thatNPDES permits or otherenforceable mechanisms areissued as soon as possible forthose CSO communities thathave not yet been required tocontrol CSOs. EPA will alsowork with the states to ensurethat permits and enforcementactions (e.g.,orders, decrees)conform with the CSOControl Policy, as required bythe 2000 amendments to theCWA.
Improve Implementation of the CSOControl Policy.
● Advocate CSO control on awatershed basis.
◗ Continue efforts to focusprotection of water quality ona watershed scale, and supportdevelopment of LTCPs on a

Executive Summary
ES-15
watershed basis. EPA willcontinue efforts to encourageintegration of wet weatherprograms, including supportto facilitate wet weather pilotprojects as designated in the2000 CWA amendments.
● Work with states to speed thewater quality standards review andrevision process.
◗ Continue to work with states,communities, andconstituency groups oncoordinating the review andrevision of water qualitystandards with developmentof LTCPs. EPA will establish atracking system for waterquality standards reviews onCSO receiving waters. EPAwill also assess the need foradditional guidance and toolsto facilitate the water qualitystandards review process forall sources, including CSOs.
● Strengthen CSO informationmanagement.
◗ Ensure that the Office ofWater and the Office ofEnforcement and ComplianceAssurance coordinateinformation management andperformance measurementactivities to demonstrate theenvironmental outcomes andbenefits of CSO control.
● Improve compliance assistanceand enforcement.
◗ CSOs will continue to be anational compliance andenforcement priority in fiscal
years 2002 and 2003. EPA willwork closely with NPDESauthorities to targetenforcement actions, whereappropriate, to ensurecompliance with the CSOrequirements in NPDESpermits or other enforceablemechanisms. In addition, EPAwill develop and promotecompliance assistance tools.
Initiate Efforts for 2003 Report toCongress.
● Initiate efforts to define the scopeand methodology for the secondReport to Congress on effortsrelated to CSO controls. ByDecember 2003, EPA is requiredto summarize the extent of humanhealth and environmental impactscaused by CSOs and SSOs, reporton the resources spent bymunicipalities to address theseimpacts, and evaluate thetechnologies used, includingwhether sewer separation isenvironmentally preferred for allsituations. EPA will build on CSOdata collected for this report anddevelop a methodology foraddressing the challenges ofcollecting and analyzing SSO data.
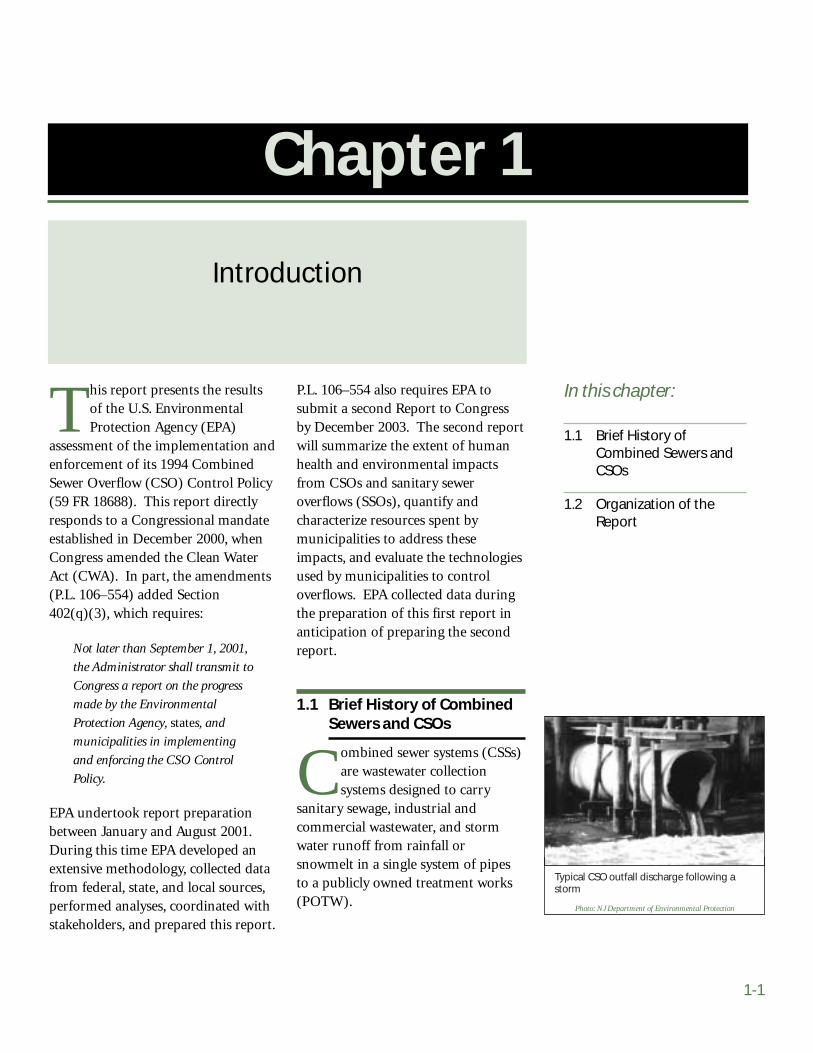
Typical CSO outfall discharge following astorm
Photo: NJ Department of Environmental Protection
P.L. 106–554 also requires EPA tosubmit a second Report to Congressby December 2003. The second reportwill summarize the extent of humanhealth and environmental impactsfrom CSOs and sanitary seweroverflows (SSOs), quantify andcharacterize resources spent bymunicipalities to address theseimpacts, and evaluate the technologiesused by municipalities to controloverflows. EPA collected data duringthe preparation of this first report inanticipation of preparing the secondreport.
1.1 Brief History of CombinedSewers and CSOs
Combined sewer systems (CSSs)are wastewater collectionsystems designed to carry
sanitary sewage, industrial andcommercial wastewater, and stormwater runoff from rainfall orsnowmelt in a single system of pipesto a publicly owned treatment works(POTW).
Chapter 1
This report presents the resultsof the U.S. EnvironmentalProtection Agency (EPA)
assessment of the implementation andenforcement of its 1994 CombinedSewer Overflow (CSO) Control Policy(59 FR 18688). This report directlyresponds to a Congressional mandateestablished in December 2000, whenCongress amended the Clean WaterAct (CWA). In part, the amendments(P.L. 106–554) added Section402(q)(3), which requires:
Not later than September 1, 2001,
the Administrator shall transmit to
Congress a report on the progress
made by the Environmental
Protection Agency, states, and
municipalities in implementing
and enforcing the CSO Control
Policy.
EPA undertook report preparationbetween January and August 2001.During this time EPA developed anextensive methodology, collected datafrom federal, state, and local sources,performed analyses, coordinated withstakeholders, and prepared this report.
1-1
1.1 Brief History ofCombined Sewers andCSOs
1.2 Organization of theReport
Introduction
In this chapter:
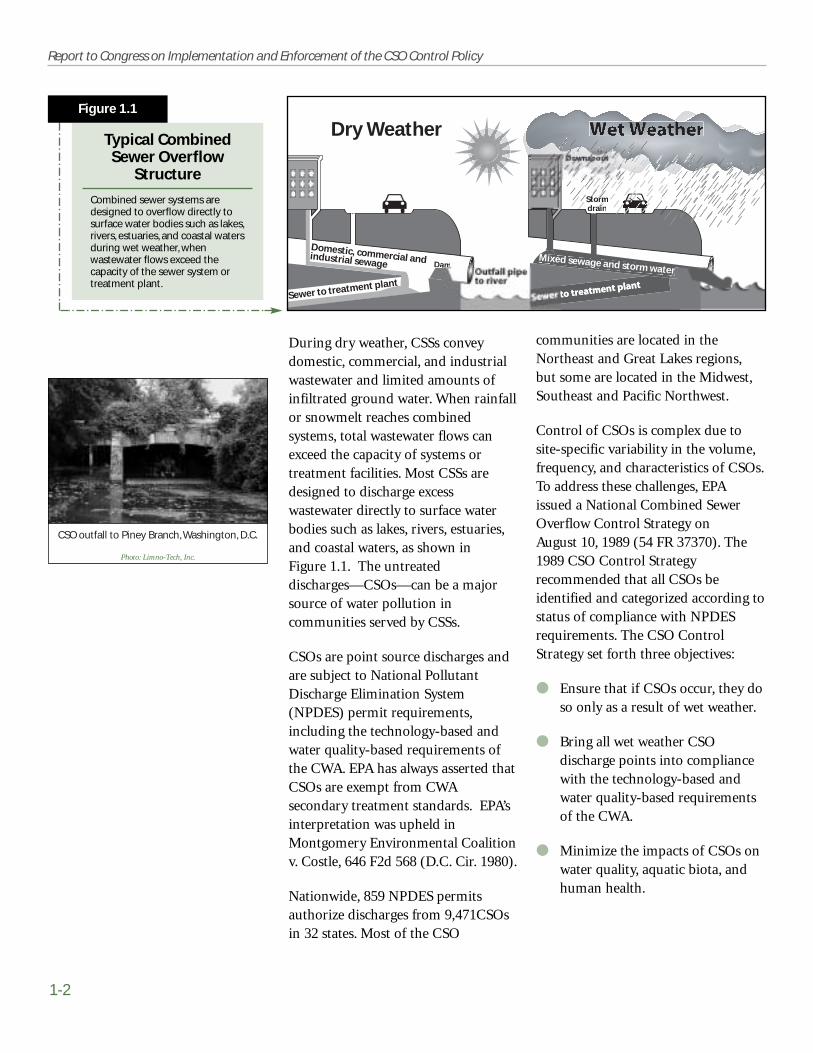
CSO outfall to Piney Branch, Washington, D.C.
Photo: Limno-Tech, Inc.
1-2
Report to Congress on Implementation and Enforcement of the CSO Control Policy
During dry weather, CSSs conveydomestic, commercial, and industrialwastewater and limited amounts ofinfiltrated ground water. When rainfallor snowmelt reaches combinedsystems, total wastewater flows canexceed the capacity of systems ortreatment facilities. Most CSSs aredesigned to discharge excesswastewater directly to surface waterbodies such as lakes, rivers, estuaries,and coastal waters, as shown in Figure 1.1. The untreateddischarges—CSOs—can be a majorsource of water pollution incommunities served by CSSs.
CSOs are point source discharges andare subject to National PollutantDischarge Elimination System(NPDES) permit requirements,including the technology-based andwater quality-based requirements ofthe CWA. EPA has always asserted thatCSOs are exempt from CWAsecondary treatment standards. EPA’sinterpretation was upheld inMontgomery Environmental Coalitionv. Costle, 646 F2d 568 (D.C. Cir. 1980).
Nationwide, 859 NPDES permitsauthorize discharges from 9,471CSOsin 32 states. Most of the CSO
communities are located in theNortheast and Great Lakes regions,but some are located in the Midwest,Southeast and Pacific Northwest.
Control of CSOs is complex due tosite-specific variability in the volume,frequency, and characteristics of CSOs.To address these challenges, EPAissued a National Combined SewerOverflow Control Strategy on August 10, 1989 (54 FR 37370). The1989 CSO Control Strategyrecommended that all CSOs beidentified and categorized according tostatus of compliance with NPDESrequirements. The CSO ControlStrategy set forth three objectives:
● Ensure that if CSOs occur, they doso only as a result of wet weather.
● Bring all wet weather CSOdischarge points into compliancewith the technology-based andwater quality-based requirementsof the CWA.
● Minimize the impacts of CSOs onwater quality, aquatic biota, andhuman health.
Domestic, commercial and industrial sewage
Dry Weather
Sewer to treatment plant
StormorSt mt rdrainaiain
M xed sewage and storm waterix
erMix
Dam
Typical CombinedSewer Overflow
Structure
Combined sewer systems aredesigned to overflow directly tosurface water bodies such as lakes,rivers, estuaries, and coastal watersduring wet weather, whenwastewater flows exceed thecapacity of the sewer system ortreatment plant.
Figure 1.1

Chicago’s Navy Pier is one of manyattractions on the Lake Michigan waterfront.
Photo: Photodisc
Chapter 1—Introduction
1-3
In addition, the CSO Control Strategycharged all states to developpermitting strategies designed toreduce, eliminate, or control CSOs.
In early 1992, EPA accelerated effortsto bring combined sewer systems withCSOs into compliance with the CWA.The efforts included negotiations withrepresentatives of the regulatedcommunity, state regulatory agencies,and environmental groups. Theinitiative resulted in the developmentof the CSO Control Policy, which waspublished in the Federal Register onApril 19, 1994 (59 FR 18688). Thecomplete text of the CSO ControlPolicy is provided in Appendix A.
The CSO Control Policy is acomprehensive national strategy toensure that municipalities, NPDESpermitting and water qualitystandards authorities, EPA, and thepublic engage in a comprehensive andcoordinated planning effort to achievecost-effective CSO controls thatultimately meet the requirements ofthe CWA. The key principles of theCSO Control Policy are:
● Provide clear levels of control thatwould be presumed to meetappropriate health andenvironmental objectives.
● Provide sufficient flexibility tomunicipalities, especiallyfinancially disadvantagedcommunities, to consider the site-specific nature of CSOs, and todetermine the most cost-effectivemeans of reducing pollutants andmeeting CWA objectives andrequirements.
● Allow a phased approach toimplementation of CSO controlsconsidering a community’sfinancial capability.
● Review and revise, as appropriate,water quality standards and theirimplementation procedures whendeveloping CSO control plans toreflect the site-specific wet weatherimpacts of CSOs.
The CSO Control Policy containsprovisions for developing appropriatesite-specific NPDES permitrequirements for all CSSs thatoverflow due to wet weather events.The CSO Control Policy also includesan enforcement initiative requiringimmediate elimination of overflowsthat occur during dry weather andpromoting timely compliance withremaining CWA requirements.
Since 1994, federal, state, and localauthorities have undertakensignificant efforts to control wetweather discharges such as CSOs.Watershed protection initiatives,including the development of totalmaximum daily loads (TMDLs) forimpaired water bodies nationwide,have further focused attention on theimpacts of wet weather discharges.
In December 2000, Congress amendedthe CWA in recognition of thecontinuing challenges posed by wetweather discharges, including CSOs.The amendments added Section402(q)(1) to require conformancewith the CSO Control Policy inpermitting and enforcement activities.The amendment text is provided inAppendix A.

1-4
Report to Congress on Implementation and Enforcement of the CSO Control Policy
Congress also acknowledged the needfor funding to address wet weatherdischarges by authorizing $1.5 billionover fiscal years 2002 and 2003 for useby EPA and states to provide grants forcontrolling CSOs and SSOs. To date,however, Congress has notappropriated funds for these grantprograms.
In addition, Congress recognized theimportance of the watershed approachby authorizing “wet weather watershedpilot projects.”
1.2 Organization of the Report
The purpose of this report is todetail progress made by EPA,states, and municipalities in
implementing and enforcing the CSOControl Policy. The report containsseven chapters, the contents andpurpose of which are summarizedbelow.
● Chapter 2 summarizes the historyof regulatory efforts to controlCSOs. It describes actions andactivities leading to thedevelopment and release of the1989 National CSO ControlStrategy and the 1994 CSOControl Policy, and includes asummary of both.
● Chapter 3 describes themethodology used to develop thisReport to Congress. Tounderstand the implementation,enforcement, and generalapplication of the CSO ControlPolicy, EPA designed andimplemented a comprehensiveapproach to gather the necessaryinformation and data. This effort
included an extensive literaturesearch, numerous site visits, andoutreach to stakeholdersresponsible for the developmentand implementation of the CSOControl Policy. The data EPAcollected from these efforts aresummarized in Chapters 4, 5,and 6.
● Chapter 4 presents EPA activitiesundertaken between 1994 and2001to implement and enforce theCSO Control Policy. This chaptersummarizes technical andfinancial assistance provided byEPA to the states andmunicipalities. The chapterdetails Agency efforts to documentenvironmental benefits of CSOcontrol.
● Chapter 5 summarizes states’activities to implement andenforce the CSO Control Policy.The chapter reports on theissuance of permits and otherenforceable orders requiring thedevelopment and implementationof the nine minimum controls(NMC) and of long-term controlplans (LTCPs) as outlined by theCSO Control Policy. The chapteralso describes important aspects ofstate-specific policies or strategies,technical and financial assistanceprovided by states to CSOpermittees, and documentedenvironmental benefits from CSOcontrol. The state profiles, whichsummarize each of the 32 states’approach to implementing theCSO Control Policy andcontrolling CSOs, are presented inAppendix B.
CSO separation project underway inLouisville, Kentucky.
Photo: Louisville-Jefferson County Metropolitan Sewer District
Chapter 1—Introduction
1-5
● Chapter 6 describes actions takenby communities to implementCSO controls. This chapter drawsheavily from CSO community casestudies, provided in their entiretyin Appendix C. The chapterprovides information on factorsperceived by municipalities asimpediments to fullimplementation of the CSOControl Policy. This chapter alsodiscusses the efficacy of CSOcontrols in reducing pollutantloads and improving water quality.It identifies the specific controlsmost often used by CSOcommunities and discusses thebenefits of CSO control inmeeting other locally definedobjectives.
● Chapter 7 evaluates the success ofthe CSO Control Policy as ameans for complying with therequirements of the CWA andprovides:
◗ An overall assessment of theeffectiveness of the CSOControl Policy in controllingCSOs.
◗ Assessment ofimplementation in terms ofthe four key principlesestablished by the CSOControl Policy.
◗ Environmental results relatedto CSO control.
◗ Next steps EPA will pursue toensure the continued effectiveimplementation andenforcement of the CSOControl Policy.

This chapter explains the developmentof the 1994 CSO Control Policy. Ituses data and information on CSOimpacts, as known at the time theCSO Control Policy was beingdeveloped. This chapter provides abrief history of the initial constructionand use of combined sewers in theUnited States; describes characteristicsof CSOs and resulting impacts tosurface waters; outlines measurestaken to regulate and control CSOsfrom the 1960s to 1994; and providesan overview of the key components ofthe CSO Control Policy.
2.1 Description of CombinedSewer Systems and CSOs
In the mid-1800s, municipalitiesbegan installing public sewersystems to address health and
aesthetic concerns. The wastetreatment technology of the pre-sewerera, backyard privies and cesspools,were progressively less effective ascities grew. During this period,human waste was dumped into privyvaults and cesspools, and storm waterran into the streets or into surface
Chapter 2
Establishing a national regulatoryapproach for CSO control hasproven difficult due to the site-
specific nature of CSOs and theirimpacts. CSOs discharge to a widerange of aquatic environments,including rivers, estuaries, lakes,coastal waters, ditches, and ephemeralstreams of all sizes. Generally, CSOsare related to wet weather, but thefrequency and duration of overflowsvary widely from one CSO to another.Moreover, the pollutant characteristicsof CSOs vary depending on thelocation of the collection system, typesof residential and industrialdevelopment in the area, and types ofrunoff in the collection system.
CSOs differ from POTWs andindustrial point source discharges inmany ways. Traditional point sourcecontrol needs are assessed based onlow flow design conditions. CSOs,however, often discharge during highflow conditions. Additionally, manyother point sources have continuousdischarges, but CSOs are intermittent.For these reasons, it became necessaryto develop a national programspecifically for controlling CSOs.
2-1
2.1 Description ofCombined SewerSystems and CSOs
2.2 Environmental andPublic Health Impacts ofCSOs
2.3 Initial Efforts to ControlCSOs
2.4 The CSO Control Policy
2.5 Summary
Regulatory and EnvironmentalBackground for the CSO Control Policy
In this chapter:
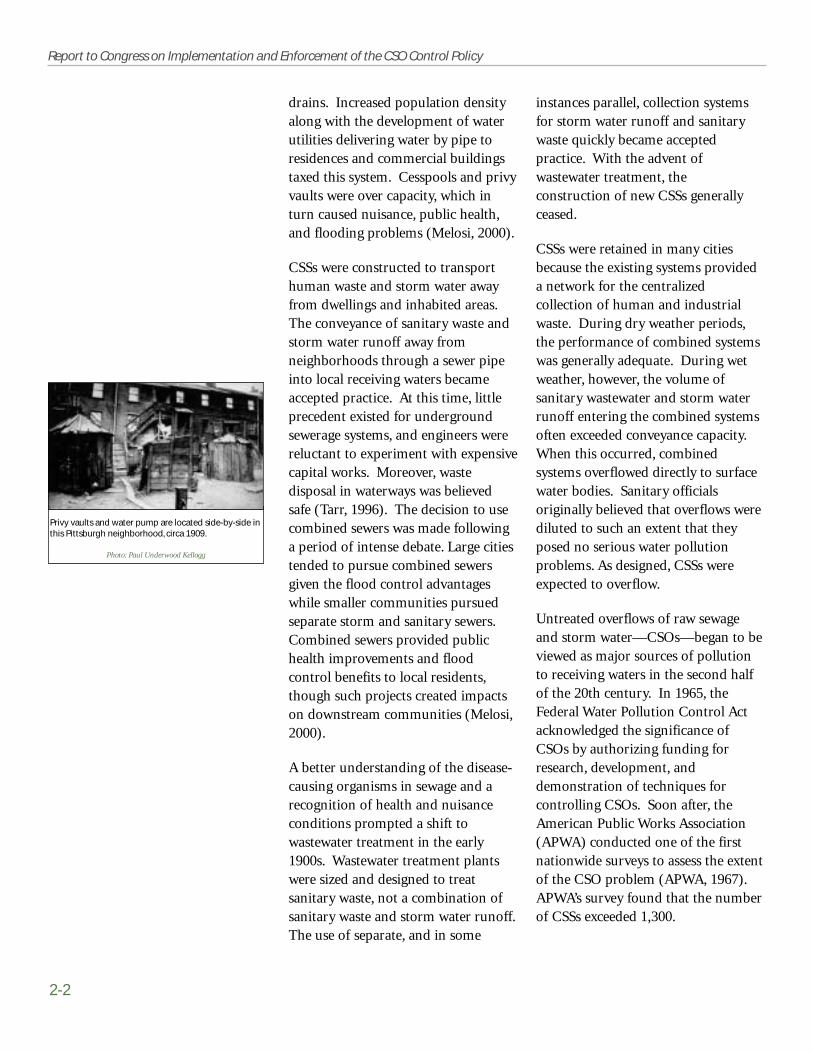
2-2
Report to Congress on Implementation and Enforcement of the CSO Control Policy
drains. Increased population densityalong with the development of waterutilities delivering water by pipe toresidences and commercial buildingstaxed this system. Cesspools and privyvaults were over capacity, which inturn caused nuisance, public health,and flooding problems (Melosi, 2000).
CSSs were constructed to transporthuman waste and storm water awayfrom dwellings and inhabited areas.The conveyance of sanitary waste andstorm water runoff away fromneighborhoods through a sewer pipeinto local receiving waters becameaccepted practice. At this time, littleprecedent existed for undergroundsewerage systems, and engineers werereluctant to experiment with expensivecapital works. Moreover, wastedisposal in waterways was believedsafe (Tarr, 1996). The decision to usecombined sewers was made followinga period of intense debate. Large citiestended to pursue combined sewersgiven the flood control advantageswhile smaller communities pursuedseparate storm and sanitary sewers.Combined sewers provided publichealth improvements and floodcontrol benefits to local residents,though such projects created impactson downstream communities (Melosi,2000).
A better understanding of the disease-causing organisms in sewage and arecognition of health and nuisanceconditions prompted a shift towastewater treatment in the early1900s. Wastewater treatment plantswere sized and designed to treatsanitary waste, not a combination ofsanitary waste and storm water runoff.The use of separate, and in some
instances parallel, collection systemsfor storm water runoff and sanitarywaste quickly became acceptedpractice. With the advent ofwastewater treatment, theconstruction of new CSSs generallyceased.
CSSs were retained in many citiesbecause the existing systems provideda network for the centralizedcollection of human and industrialwaste. During dry weather periods,the performance of combined systemswas generally adequate. During wetweather, however, the volume ofsanitary wastewater and storm waterrunoff entering the combined systemsoften exceeded conveyance capacity.When this occurred, combinedsystems overflowed directly to surfacewater bodies. Sanitary officialsoriginally believed that overflows werediluted to such an extent that theyposed no serious water pollutionproblems. As designed, CSSs wereexpected to overflow.
Untreated overflows of raw sewageand storm water—CSOs—began to beviewed as major sources of pollutionto receiving waters in the second halfof the 20th century. In 1965, theFederal Water Pollution Control Actacknowledged the significance ofCSOs by authorizing funding forresearch, development, anddemonstration of techniques forcontrolling CSOs. Soon after, theAmerican Public Works Association(APWA) conducted one of the firstnationwide surveys to assess the extentof the CSO problem (APWA, 1967).APWA’s survey found that the numberof CSSs exceeded 1,300.
Privy vaults and water pump are located side-by-side inthis Pittsburgh neighborhood, circa 1909.
Photo: Paul Underwood Kellogg
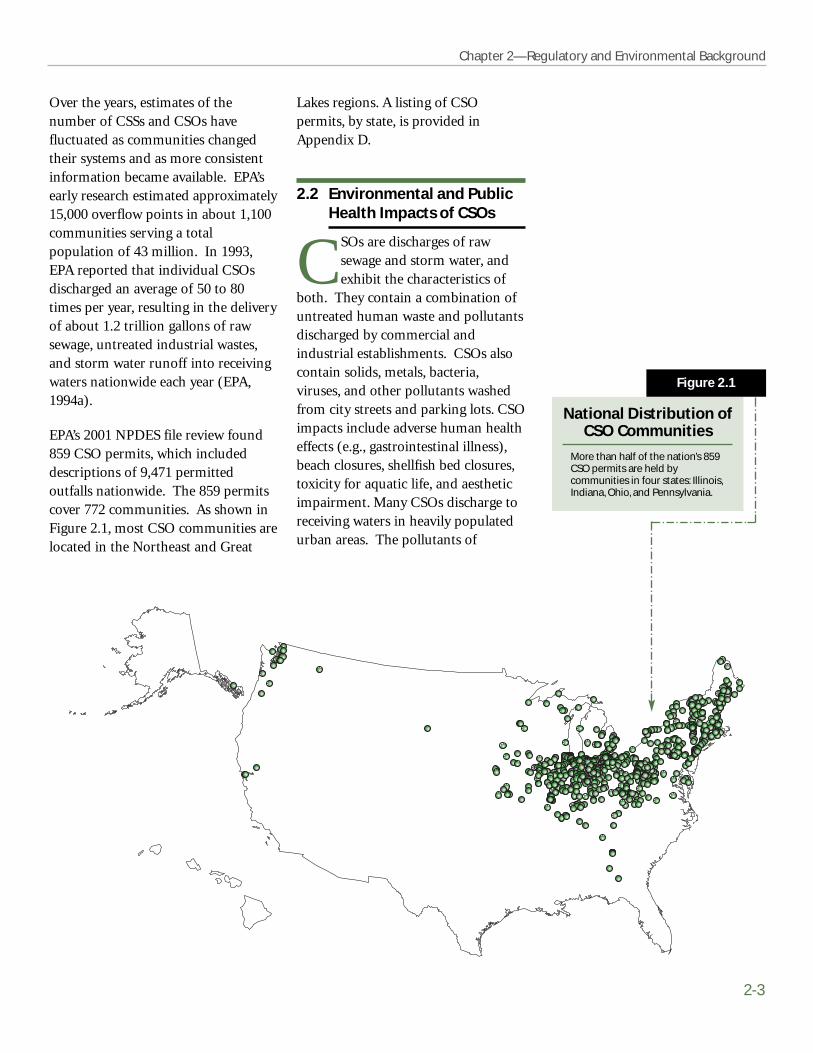
Chapter 2—Regulatory and Environmental Background
2-3
Over the years, estimates of thenumber of CSSs and CSOs havefluctuated as communities changedtheir systems and as more consistentinformation became available. EPA’searly research estimated approximately15,000 overflow points in about 1,100communities serving a totalpopulation of 43 million. In 1993,EPA reported that individual CSOsdischarged an average of 50 to 80times per year, resulting in the deliveryof about 1.2 trillion gallons of rawsewage, untreated industrial wastes,and storm water runoff into receivingwaters nationwide each year (EPA,1994a).
EPA’s 2001 NPDES file review found859 CSO permits, which includeddescriptions of 9,471 permittedoutfalls nationwide. The 859 permitscover 772 communities. As shown inFigure 2.1, most CSO communities arelocated in the Northeast and Great
Lakes regions. A listing of CSOpermits, by state, is provided inAppendix D.
2.2 Environmental and PublicHealth Impacts of CSOs
CSOs are discharges of rawsewage and storm water, andexhibit the characteristics of
both. They contain a combination ofuntreated human waste and pollutantsdischarged by commercial andindustrial establishments. CSOs alsocontain solids, metals, bacteria,viruses, and other pollutants washedfrom city streets and parking lots. CSOimpacts include adverse human healtheffects (e.g., gastrointestinal illness),beach closures, shellfish bed closures,toxicity for aquatic life, and aestheticimpairment. Many CSOs discharge toreceiving waters in heavily populatedurban areas. The pollutants of
National Distribution ofCSO Communities
More than half of the nation’s 859CSO permits are held bycommunities in four states: Illinois,Indiana, Ohio, and Pennsylvania.
Figure 2.1

2-4
Report to Congress on Implementation and Enforcement of the CSO Control Policy
concern and the principalconsequences of CSOs are presentedin Table 2.1.
A tabulation of typical pollutantconcentrations in CSOs comparedwith concentrations from othertreated and untreated sources ispresented in Table 2.2. As shown, thetypes of pollutants found in untreatedsewage and urban runoff are similar.
Under CWA Section 305(b), EPAprepares biennial national waterquality assessment reports toCongress. The National Water QualityInventory 1994 Report to Congress(EPA, 1995a), listed CSOs as a sourceof water quality impairment, assummarized in Table 2.3. AlthoughCSOs ranked lower on a national levelthan other major sources, the localimpacts of CSOs may be intense andhighly visible.
Several assessments of use impairmentattributed to CSO discharges werepublished in the late 1980s and early1990s. The Natural Resources DefenseCouncil (NRDC) reported in its 1992Testing the Waters report that:
High levels of bacteria–primarily
from raw sewage–are responsible
for the overwhelming majority of
[beach] closures and advisories.
There have been over 5,000
closings and advisories since 1988.
. . .The major causes of high
bacteria levels in beach water are:
inadequate and overloaded sewage
treatment systems, combined sewer
overflows, raw sewage overflows,
poison runoff, faulty septic
systems, and boating wastes
(NRDC, 1992).
The National Oceanic andAtmospheric Administration (NOAA)reported that CSOs are a major causeof contaminated shellfish beds andfish kills (NOAA, 1991). NOAAestimated that between 10 and 20percent of harvest-limited shellfishacreage, amounting to nearly 600,000acres, was attributable to CSOs.
The Center for Marine Conservation(CMC) summarized public healthrisks presented by CSOs as follows:
The primary health issue
associated with CSOs is the risk of
exposure to disease-causing
bacteria and viruses. Combined
sewers contain human waste that
can carry pathogenic organisms.
Activities involving water-exposure
to these contaminants through
swimming or other contact can
lead to infectious disease. Some of
the common diseases include
hepatitis, gastric disorders,
dysentery, and swimmer’s ear.
Other forms of bacteria found in
untreated waters can cause
typhoid, cholera, and dysentery.
Human health is also impacted
when fish or shellfish that have
been contaminated by combined
sewer discharges are consumed
(CMC, 1992).
Referencing EPA’s harbor studyprogram and its own Beach CleanupResults (CMC, 1991), CMC alsodocumented floatables and aestheticimpairment due to CSOs:
Although only one percent of
debris found by the U.S. EPA’s
Harbor Studies Program and 4.9
percent of the items found in the
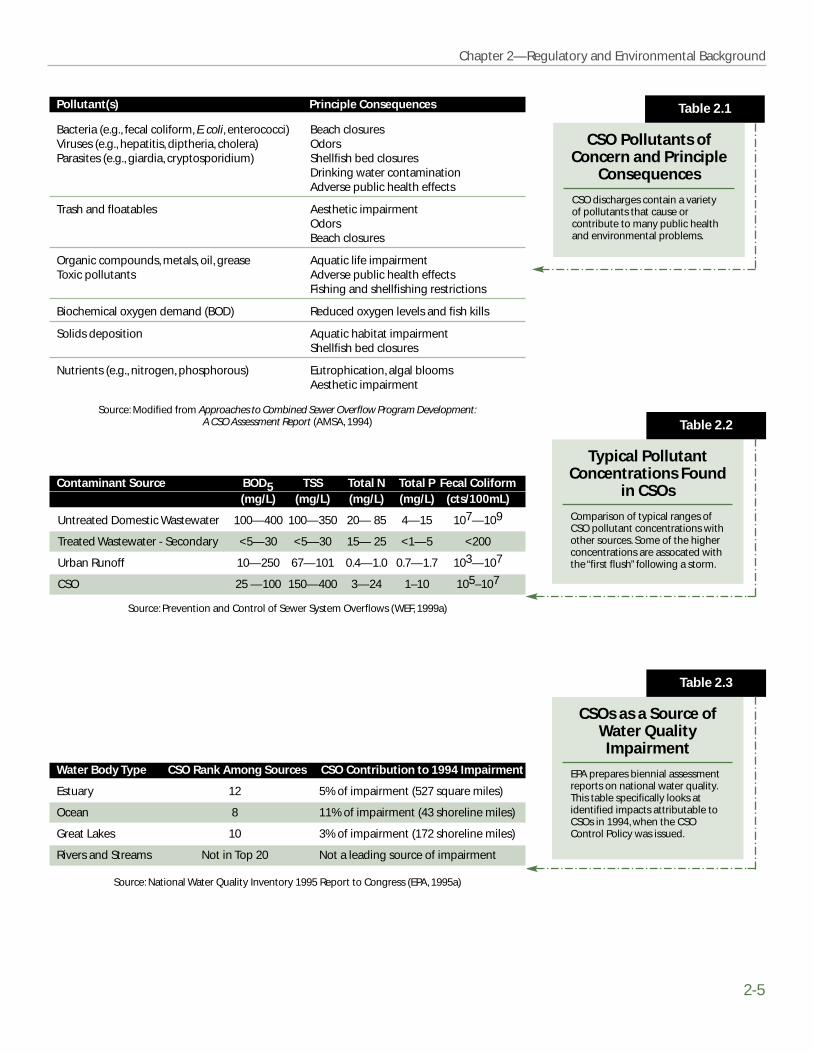
Chapter 2—Regulatory and Environmental Background
2-5
Pollutant(s) Principle Consequences
Bacteria (e.g., fecal coliform, E. coli, enterococci) Beach closuresViruses (e.g., hepatitis, diptheria, cholera) OdorsParasites (e.g., giardia, cryptosporidium) Shellfish bed closures
Drinking water contaminationAdverse public health effects
Trash and floatables Aesthetic impairmentOdorsBeach closures
Organic compounds, metals, oil, grease Aquatic life impairmentToxic pollutants Adverse public health effects
Fishing and shellfishing restrictions
Biochemical oxygen demand (BOD) Reduced oxygen levels and fish kills
Solids deposition Aquatic habitat impairmentShellfish bed closures
Nutrients (e.g., nitrogen, phosphorous) Eutrophication, algal bloomsAesthetic impairment
Contaminant Source BOD5 TSS Total N Total P Fecal Coliform (mg/L) (mg/L) (mg/L) (mg/L) (cts/100mL)
Untreated Domestic Wastewater 100—400 100—350 20— 85 4—15 107—109
Treated Wastewater - Secondary <5—30 <5—30 15— 25 <1—5 <200
Urban Runoff 10—250 67—101 0.4—1.0 0.7—1.7 103—107
CSO 25 —100 150—400 3—24 1–10 105–107
Typical PollutantConcentrations Found
in CSOs
Comparison of typical ranges ofCSO pollutant concentrations withother sources. Some of the higherconcentrations are assocated withthe “first flush” following a storm.
Table 2.2
CSOs as a Source ofWater Quality
Impairment
EPA prepares biennial assessmentreports on national water quality.This table specifically looks atidentified impacts attributable toCSOs in 1994, when the CSOControl Policy was issued.
Table 2.3
Water Body Type CSO Rank Among Sources CSO Contribution to 1994 Impairment
Estuary 12 5% of impairment (527 square miles)
Ocean 8 11% of impairment (43 shoreline miles)
Great Lakes 10 3% of impairment (172 shoreline miles)
Rivers and Streams Not in Top 20 Not a leading source of impairment
Source: Prevention and Control of Sewer System Overflows (WEF, 1999a)
Source: National Water Quality Inventory 1995 Report to Congress (EPA, 1995a)
CSO Pollutants ofConcern and Principle
Consequences
CSO discharges contain a varietyof pollutants that cause orcontribute to many public healthand environmental problems.
Table 2.1
Source: Modified from Approaches to Combined Sewer Overflow Program Development:A CSO Assessment Report (AMSA, 1994)

In the late 1980s and early 1990s, floatables from CSOand storm water discharges caused beach closures,adverse impacts on coastal species, and propertydamage in New Jersey’s harbor complex.
Photo: NJ Department of Environmental Protection
2-6
Report to Congress on Implementation and Enforcement of the CSO Control Policy
National Beach Cleanup Results
constituted medical, drug and
sewage-related debris, these wastes
were more common in eastern
cities that have [combined sewer
systems]. New Jersey and
Massachusetts had five times the
national average of sewage-
associated wastes, making up 2.8
and 2.6 percent respectively of total
trash found. New York and Rhode
Island had a significantly higher
percent as well (1.6 and 1.1
percent respectively) ..... The
Harbor Study found CSO- related
wastes like condoms, tampon
applicators, fecal matter, grease
and food in New York City waters.
In Philadelphia, the plume from
two CSO discharges was seen to
contain condoms, tampons, and
fecal matter (CMC, 1991).
Substantial documentation of theconsequences of CSOs was available inthe early 1990s. These consequenceswere specifically recognized in theCSO Control Policy (EPA, 1994b),which stated:
CSOs consist of mixtures of
domestic sewage, industrial and
commercial wastewaters, and
storm runoff. CSOs often contain
high levels of suspended solids,
pathogenic microorganisms, toxic
pollutants, floatables, nutrients,
oxygen-demanding compounds, oil
and grease, and other pollutants.
CSOs can cause exceedances of
water quality standards. Such
exceedances may pose risk to
human health, threaten aquatic
life and its habitat, and impair the
use and enjoyment of the Nation’s
waterways (Section I.A).
2.3 Initial Efforts to ControlCSOs
2.3.1 1965 to 1989
The Federal Water PollutionControl Act of 1965 authorizedfunding for research,
development, and demonstration oftechniques for controlling CSOs andstorm water. More than 100 grantsand contracts totaling $82 million,with a federal share of $39 million(47.5 percent), were devoted to thiseffort between 1965 and 1972 (EPA,1973). The absence of an explicitfederal mandate for CSO control,however, meant that the problemreceived little attention.
Passage of the Federal Water PollutionControl Act Amendments of 1972focused greater attention on CSOs.The legislation established theregulatory framework for controllingpoint source discharges, includingCSOs, through the NPDES program.The legislation also established theConstruction Grants Program forwastewater infrastructure (CWASection 201). Some communities usedthe Construction Grants Program tocontrol CSOs. Most investment inmunicipal facilities during the 1970sfocused on POTW upgrades tosecondary and advanced treatmentand expansion, not on wet weatherissues.
EPA’s 1978 Report to Congress onControl of Combined SewerOverflows in the United States (EPA,1978) focused on funding for CSOpollution abatement projects. Thereport documented the status of grantrequests and funding, identified the

Chapter 2—Regulatory and Environmental Background
2-7
time required to achieve CSO control,compared POTWs and CSOs, andpresented legislative alternatives tocontrol pollution from CSOs. Basedupon the 1978 Needs Survey, thereport estimated total national needsfor CSO control at $21.16 billion in1978 dollars ($57.28 billion in 2000dollars).
Case Law
In 1972 and 1981, CSOs were thesubject of two Supreme Court casesinvolving the City of Milwaukee. InIllinois vs. City of Milwaukee, 406 U.S.91 (1972), the Court recognized thefederal common law of nuisance toabate pollution from CSOs. In 1981,the court ruled that the federal CWAsupplants federal common law ofnuisance to abate pollution fromCSOs, City of Milwaukee v. Illinois,451 U.S. 304 (1981).
The 1980 ruling in MontgomeryEnvironmental Coalition vs. Costle, 46F2d 568 (D.C. Cir. 1980), is recognizedby many as a landmark case in CSOcontrol. The court accepted EPA’sinterpretation of the CWA that CSOsare not discharges from POTWs andthus are not subject to the secondarytreatment standards applicable toPOTWs. The CWA requires non-municipal discharges to comply withNPDES permits that includetechnology-based best conventionalpollutant control technology (BCT)for conventional pollutants and bestavailable technology economicallyachievable (BAT) for toxics and non-conventional pollutants. Followingthis decision, EPA and states began toregulate and permit CSOs under theNPDES program. This meant CSOsneeded to comply with the
technology-based requirements of theCWA and with water qualitystandards.
Some CSO communities advancedCSO controls during this period,establishing the groundwork for futurecontrol. For example:
● The Metropolitan WaterReclamation District of GreaterChicago initiated its CSO controlprogram and construction of theTunnel and Reservoir Plan(TARP) facilities to storecombined sewage in the 1970s.
● The District of Columbia initiateda CSO abatement program in1979 that led to construction of aswirl concentrator facility,installation of inflatable dams,regulator modifications, andexpanded wet weather pumpingcapacity during the 1980s.
● The City of San Francisco initiatedCSO control planning in 1970 andimplemented CSO controls duringthe 1980s, including a deep tunnelthat resulted in substantialreductions of CSO frequency andvolume.
● The cities of Minneapolis, St. Paul,and South St. Paul committed tolarge-scale sewer separation.

San Francisco’s Islais Creek Transport/Storage Facilitystores and conveys flow to the Southeast Plant. With a600-foot overflow weir and 45 mgd storage capacity,this facility reduced combined sewer overflows from 40to the allowable 10 per year.
Photo: San Francisco Public Utilities Commission
2-8
Report to Congress on Implementation and Enforcement of the CSO Control Policy
2.3.2 National Municipal Policy
The National Municipal Policy onPublicly-Owned Treatment Works(NMP), published by EPA on January30, 1984, was another early impetusfor CSO control. The NMPencouraged a collaborative effortbetween EPA and states in addressingcompliance with the CWA at POTWs.The NMP was designed to focus EPA’scompliance efforts on three types ofPOTWs: those that had receivedfederal funding and were out ofcompliance, all major POTWs, andminor POTWs that discharged toimpaired waters. The NMP wasintended to facilitate compliance at allPOTWs by July 1, 1988.
The NMP recommended that eachEPA region draft a strategy to bringPOTWs into compliance with theCWA. Each strategy was to inventoryall POTWs in the region that had notachieved compliance, an identificationof which noncompliant municipalitiesmet the criteria for the NMP, and aplan for each facility to achievecompliance. The 1984 NMP providedsome flexibility in the planningprocess, depending on whether thePOTW was proposed, underconstruction, or operational. All plansrequired a schedule for compliance.This schedule was meant to enableregions to initiate appropriateenforcement actions, shouldmunicipalities fail to meet thenegotiated deadlines.
As a result of the NMP, state andfederal agencies brought hundreds ofenforcement actions againstmunicipalities for noncompliance with
the CWA. Several major casesspecifically addressed CSO problemsat POTWs.
Civil Judicial Actions
A total of 16 CSO Civil Judicialactions resulted from the NMP. Sixcases occurred in Region 1, one inRegion 2, one in Region 3, and eightin Region 5. The types of CSOviolations which led to enforcementactions included:
● NPDES permit violations
● Violations of consent decrees
● Violations of water-qualityeffluent limits
● Failure to meet constructionschedules for CSO abatement
Outcomes of these cases includedsewer separation; financial penalties;and development of abatement,construction, and management plans.A summary of the cases is provided inAppendix E. Examples of NMP casesare as follows: an NMP case inHammond, Indiana, resulted in theissuance of a court ordered consentdecree for the development of animplementation plan to eliminate dryweather overflows and a penaltypayment of $1,272,604. An NMP caseaffecting Metropolis, Illinois, whichhas a population of 7,200, was settledthrough a consent decree that requiredcorrection of its CSO overflowstructure and a penalty payment of$17,500. The municipality hadviolated a construction schedulepreviously defined in anadministrative order.
Chapter 2—Regulatory and Environmental Background
2-9
Additional CSO Enforcement Actions(Before 1989)
EPA initiated 13 judicial enforcementactions during the 1980s. Theseactions were brought under the CWA,but not under the NMP (Wade MillerAssociates, 1989). Six cases occurred inRegion 1, three in Region 2, three inRegion 5, and one in Region 10. Mostof these actions involved CSOsdischarging above effluent limitsaccording to provisions in an NPDESpermit. The principal effluent limitviolations were for BOD, TSS, andfecal coliform. Seven municipalitieswere identified as having dry weatheroverflows. The majority ofcommunities were assessed civilpenalties for noncompliance withpermit limits and were required todevelop plans to control CSOs. Thesecases are also summarized inAppendix E.
2.3.3 1989 National CSO ControlStrategy
EPA issued a National CSO ControlStrategy in 1989 (54 FR 37370). TheNational CSO Control Strategyrequested that states develop statewideCSO permitting strategies by January15, 1990. The National CSO ControlStrategy also recommended thatNPDES permits for municipal systemswith CSO discharges, at a minimum,include BAT/BCT technology-basedcontrols established according to thebest professional judgement (BPJ) ofthe permitting authority. Sixminimum control measures wererecommended:
1. Proper operation and regularmaintenance.
2. Maximum use of the collectionsystem for storage.
3. Review and modification ofpretreatment programs.
4. Maximum flow delivery to thePOTW for treatment.
5. Prohibition of dry weatheroverflows.
6. Control of solid and floatablematerial in CSO discharges.
During the next several years, nearlyall states with CSSs submittedpermitting strategies. EPA approvedall submitted plans.
2.3.4 Office of Water ManagementAdvisory Group (MAG)
As EPA, states, and municipalitiesworked to implement the NationalCSO Control Strategy in the early1990s, the consequences of CSOs(described in Section 2.2) continuedto receive national attention, andenvironmental organizations pushedfor further action. Municipalorganizations were also dissatisfiedwith the National CSO ControlStrategy, as they sought a consistentnational approach or policy on CSOsand clarification on how to proceedwith CSO control. In addition, somestudies suggested that states wereimplementing strategies and technicalapproaches to CSO control that variedgreatly from the National CSOControl Strategy and from those ofother states.
A review of sample state CSOstrategies by HydroQual (1992)suggested the following:

2-10
Report to Congress on Implementation and Enforcement of the CSO Control Policy
● States were employing a variety ofwet weather design standards,including overflow frequency,factor of flow method (e.g., 10times dry weather flow),frequency/duration design storms,and depth/duration design storms.
● States’ wet weather designstandards were either incorporatedinto individual permits on a site-specific basis, or adopted asstatewide policy or regulation.
● Treatment requirements for wetweather flows varied from state tostate as either primary orsecondary treatment.
In response to these concerns, EPAformed a Management AdvisoryGroup (MAG) in 1992. The MAG wasto assist the Agency in theconceptualization and development ofa national CSO policy. The MAGincluded representatives from states,municipalities, sewerage-relatedassociations, and environmentalgroups. The MAG was charged withaddressing the following issues:
● What CSO controls areappropriate?
● When should CSO controls beimplemented?
● How should CSO controls befunded?
In addition to continuing with the sixminimum controls identified in theNational CSO Control Strategy, MAGrecommended three additionalcontrols (MAG, 1992):
● Inspection, monitoring, andreporting of CSOs.
● Pollution prevention, includingwater conservation, to reduce CSOimpacts.
● Public notification for any areasaffected by CSOs, especially beachand recreational areas.
The MAG also recommended that awork group be convened, in amodified regulation/negotiationprocess, to develop a consistentnational permitting policy for CSOcontrol.
A work group of CSO stakeholdersmet during the summer of 1992 toaddress these issues. The work groupincluded environmental groups,municipalities, municipal associations,and state and federal water authorities.The work group agreed to thefollowing objective:
To develop consensus on a
consistent set of criteria with an
adequate degree of specificity to be
used in determining long-term
CSO control programs
implemented through NPDES
permits (MAG, 1993).
The work group’s discussions led tothe resolution of many technical,economic, and policy issues raised bystakeholders. Although the workgroup failed to reach consensus on apolicy framework document for CSOcontrol, their work set the stage forwhat proved to be the foundation ofthe 1994 CSO Control Policy.
Chapter 2—Regulatory and Environmental Background
2-11
A subset of the MAG workgroup,including EPA, the Association ofMetropolitan Sewerage Authorities(AMSA), and NRDC, met in October1992. Participants of this meetingdeveloped a CSO FrameworkDocument based upon the MAGdiscussions and recommendations.The CSO Framework Document didnot include all enforcementcomponents.
EPA used the CSO FrameworkDocument to develop a policystatement that would provide aconsistent national approach forcontrolling CSOs. Stakeholdersupport for this initiative continuedthroughout its development. Anexample of this support is a letter sentJanuary 13, 1994, signed by fivedivergent stakeholder groups – AMSA,NRDC, the Environmental DefenseFund, the National League of Cities,and the Association of State andInterstate Water Pollution ControlAdministrators – to the Office ofManagement and Budget during thefinal phases of review. The letterrecognized that the CSO ControlPolicy was “the product of many hoursof thoughtful, deliberate negotiations”and “truly represents a faircompromise among many divergentpositions and an effective approach tonational CSO permit guidance.”Moreover, the signatories cautionedthat:
There is a strong national coalition
of support for the Policy as
negotiated. Any changes in the
structure and requirements set
forth in the Policy will, without a
doubt, disaffect members of this
coalition and undermine the
significant progress that would be
made by implementing the Policy
as it is currently written.
EPA held a press conference April 11,1994, to announce the release of thefinal CSO Control Policy. At the pressconference, key stakeholders spoke insupport of the CSO Control Policy,and letters were read expressingsupport from various members ofCongress. The CSO Control Policywas published on April 19, 1994 (59FR 18688). In October 1996, keyparticipants in the development of theCSO Control Policy were presentedwith the Vice President’s HammerAward for Reinvention in recognitionof the success of the CSO ControlPolicy negotiation.
2.4 The CSO Control Policy
2.4.1 Purpose, Objectives and KeyPrinciples of the CSO ControlPolicy
The purpose of the CSO ControlPolicy was twofold: 1)elaboration on EPA’s 1989
National CSO Control Strategy; and 2)expeditious compliance with CWArequirements. The CSO ControlPolicy provided guidance to CSOcommunities, NPDES authorities, andwater standards authorities forplanning, selecting, and implementingCSO controls. It also established asubstantial role for public involvementduring the decision-making process.
The CSO Control Policy reiterated theobjectives of the National CSOControl Strategy. In addition, the CSOControl Policy recognized the site-specific nature of CSOs and CSO
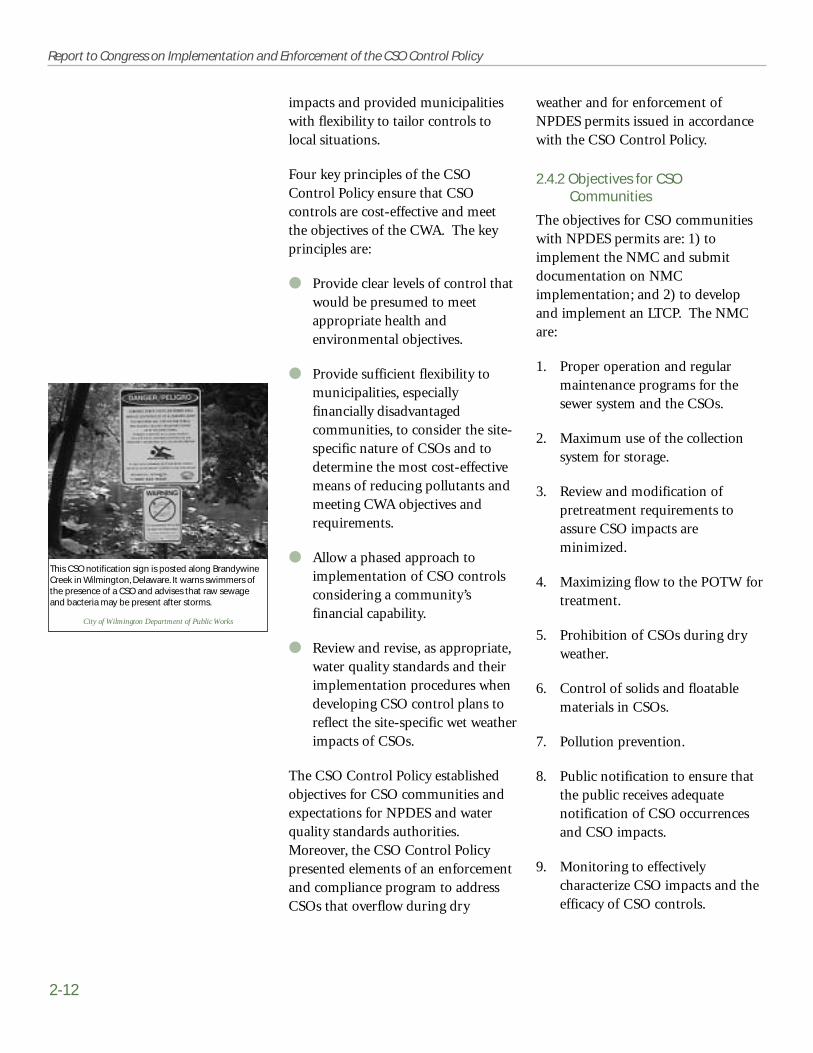
2-12
Report to Congress on Implementation and Enforcement of the CSO Control Policy
impacts and provided municipalitieswith flexibility to tailor controls tolocal situations.
Four key principles of the CSOControl Policy ensure that CSOcontrols are cost-effective and meetthe objectives of the CWA. The keyprinciples are:
● Provide clear levels of control thatwould be presumed to meetappropriate health andenvironmental objectives.
● Provide sufficient flexibility tomunicipalities, especiallyfinancially disadvantagedcommunities, to consider the site-specific nature of CSOs and todetermine the most cost-effectivemeans of reducing pollutants andmeeting CWA objectives andrequirements.
● Allow a phased approach toimplementation of CSO controlsconsidering a community’sfinancial capability.
● Review and revise, as appropriate,water quality standards and theirimplementation procedures whendeveloping CSO control plans toreflect the site-specific wet weatherimpacts of CSOs.
The CSO Control Policy establishedobjectives for CSO communities andexpectations for NPDES and waterquality standards authorities.Moreover, the CSO Control Policypresented elements of an enforcementand compliance program to addressCSOs that overflow during dry
weather and for enforcement ofNPDES permits issued in accordancewith the CSO Control Policy.
2.4.2 Objectives for CSOCommunities
The objectives for CSO communitieswith NPDES permits are: 1) toimplement the NMC and submitdocumentation on NMCimplementation; and 2) to developand implement an LTCP. The NMCare:
1. Proper operation and regularmaintenance programs for thesewer system and the CSOs.
2. Maximum use of the collectionsystem for storage.
3. Review and modification ofpretreatment requirements toassure CSO impacts areminimized.
4. Maximizing flow to the POTW fortreatment.
5. Prohibition of CSOs during dryweather.
6. Control of solids and floatablematerials in CSOs.
7. Pollution prevention.
8. Public notification to ensure thatthe public receives adequatenotification of CSO occurrencesand CSO impacts.
9. Monitoring to effectivelycharacterize CSO impacts and theefficacy of CSO controls.
This CSO notification sign is posted along BrandywineCreek in Wilmington, Delaware. It warns swimmers ofthe presence of a CSO and advises that raw sewageand bacteria may be present after storms.
City of Wilmington Department of Public Works
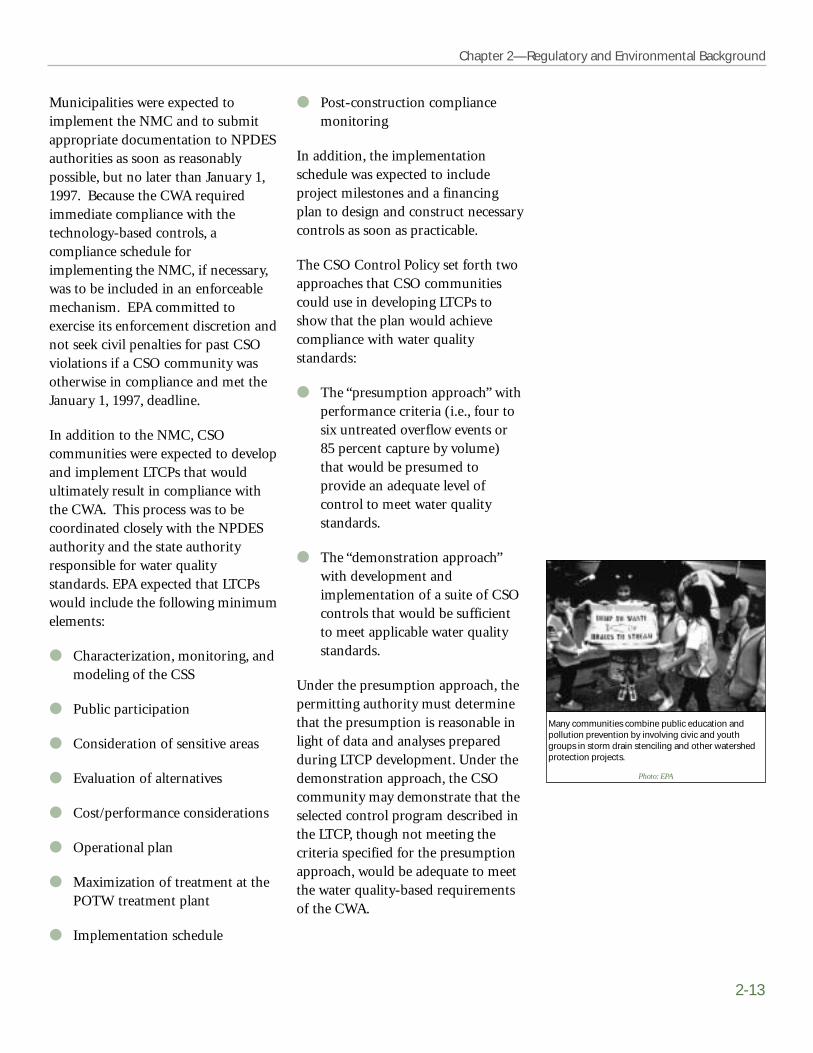
Chapter 2—Regulatory and Environmental Background
2-13
Municipalities were expected toimplement the NMC and to submitappropriate documentation to NPDESauthorities as soon as reasonablypossible, but no later than January 1,1997. Because the CWA requiredimmediate compliance with thetechnology-based controls, acompliance schedule forimplementing the NMC, if necessary,was to be included in an enforceablemechanism. EPA committed toexercise its enforcement discretion andnot seek civil penalties for past CSOviolations if a CSO community wasotherwise in compliance and met theJanuary 1, 1997, deadline.
In addition to the NMC, CSOcommunities were expected to developand implement LTCPs that wouldultimately result in compliance withthe CWA. This process was to becoordinated closely with the NPDESauthority and the state authorityresponsible for water qualitystandards. EPA expected that LTCPswould include the following minimumelements:
● Characterization, monitoring, andmodeling of the CSS
● Public participation
● Consideration of sensitive areas
● Evaluation of alternatives
● Cost/performance considerations
● Operational plan
● Maximization of treatment at thePOTW treatment plant
● Implementation schedule
● Post-construction compliancemonitoring
In addition, the implementationschedule was expected to includeproject milestones and a financingplan to design and construct necessarycontrols as soon as practicable.
The CSO Control Policy set forth twoapproaches that CSO communitiescould use in developing LTCPs toshow that the plan would achievecompliance with water qualitystandards:
● The “presumption approach” withperformance criteria (i.e., four tosix untreated overflow events or85 percent capture by volume)that would be presumed toprovide an adequate level ofcontrol to meet water qualitystandards.
● The “demonstration approach”with development andimplementation of a suite of CSOcontrols that would be sufficientto meet applicable water qualitystandards.
Under the presumption approach, thepermitting authority must determinethat the presumption is reasonable inlight of data and analyses preparedduring LTCP development. Under thedemonstration approach, the CSOcommunity may demonstrate that theselected control program described inthe LTCP, though not meeting thecriteria specified for the presumptionapproach, would be adequate to meetthe water quality-based requirementsof the CWA.
Many communities combine public education andpollution prevention by involving civic and youthgroups in storm drain stenciling and other watershedprotection projects.
Photo: EPA
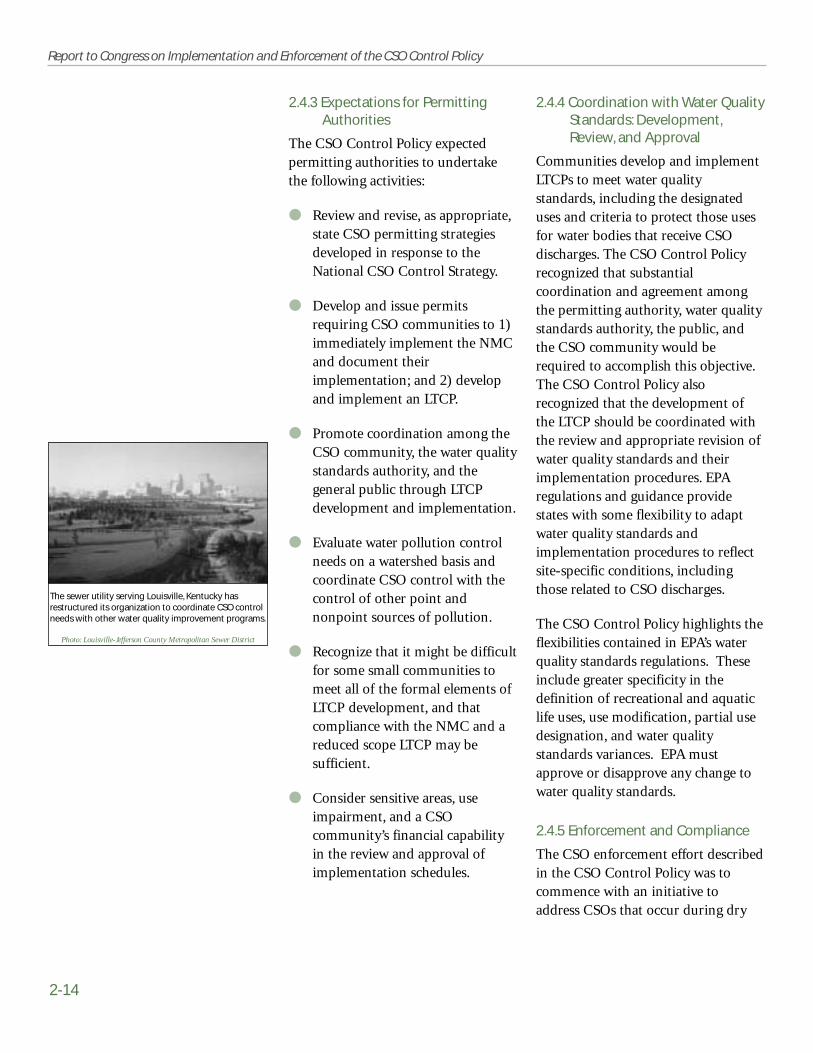
2-14
Report to Congress on Implementation and Enforcement of the CSO Control Policy
2.4.3 Expectations for PermittingAuthorities
The CSO Control Policy expectedpermitting authorities to undertakethe following activities:
● Review and revise, as appropriate,state CSO permitting strategiesdeveloped in response to theNational CSO Control Strategy.
● Develop and issue permitsrequiring CSO communities to 1)immediately implement the NMCand document theirimplementation; and 2) developand implement an LTCP.
● Promote coordination among theCSO community, the water qualitystandards authority, and thegeneral public through LTCPdevelopment and implementation.
● Evaluate water pollution controlneeds on a watershed basis andcoordinate CSO control with thecontrol of other point andnonpoint sources of pollution.
● Recognize that it might be difficultfor some small communities tomeet all of the formal elements ofLTCP development, and thatcompliance with the NMC and areduced scope LTCP may besufficient.
● Consider sensitive areas, useimpairment, and a CSOcommunity’s financial capabilityin the review and approval ofimplementation schedules.
2.4.4 Coordination with Water QualityStandards: Development,Review, and Approval
Communities develop and implementLTCPs to meet water qualitystandards, including the designateduses and criteria to protect those usesfor water bodies that receive CSOdischarges. The CSO Control Policyrecognized that substantialcoordination and agreement amongthe permitting authority, water qualitystandards authority, the public, andthe CSO community would berequired to accomplish this objective.The CSO Control Policy alsorecognized that the development ofthe LTCP should be coordinated withthe review and appropriate revision ofwater quality standards and theirimplementation procedures. EPAregulations and guidance providestates with some flexibility to adaptwater quality standards andimplementation procedures to reflectsite-specific conditions, includingthose related to CSO discharges.
The CSO Control Policy highlights theflexibilities contained in EPA’s waterquality standards regulations. Theseinclude greater specificity in thedefinition of recreational and aquaticlife uses, use modification, partial usedesignation, and water qualitystandards variances. EPA mustapprove or disapprove any change towater quality standards.
2.4.5 Enforcement and Compliance
The CSO enforcement effort describedin the CSO Control Policy was tocommence with an initiative toaddress CSOs that occur during dry
The sewer utility serving Louisville, Kentucky hasrestructured its organization to coordinate CSO controlneeds with other water quality improvement programs.
Photo: Louisville-Jefferson County Metropolitan Sewer District
Chapter 2—Regulatory and Environmental Background
2-15
weather. This was to be followed by anenforcement effort in conjunctionwith CSO permitting:
Under the CWA, EPA can use
several enforcement options to
address permittees with CSOs.
Those options directly applicable to
this Policy are Section 308
Information Requests, Section
309(a) Administrative Orders,
Section 309(g) Administrative
Penalty Orders, Section 309(b)
and (d) Civil Judicial Actions, and
Section 504 Emergency Powers.
NPDES states should use
comparable means.
EPA recognized that the success of theenforcement effort would depend onexpeditious action by NPDESauthorities in issuing enforceablepermits with NMC requirements andother CWA requirements.Enforcement priorities were to bebased upon human health impacts,environmental impacts, and impactson sensitive areas.
2.5 Summary
Uncontrolled CSOs are asignificant source ofpollution. They adversely
impact public health and theenvironment. Regulation of CSOs,however, has proven complex becauseof the intermittent character and site-specific nature of CSO discharges. Inaddition, unlike POTWs, CSOs are notsubject to the CWA secondarytreatment standards, but must complywith NPDES permits that include BCTand BAT requirements on a BPJ basis.
As a result of the 1984 NationalMunicipal Policy, state and federalagencies brought hundreds ofenforcement actions againstmunicipalities for violations of theCWA. Several cases specificallyaddressed CSO problems. EPA’s 1989National CSO Control Strategyresulted in state-wide CSO permittingstrategies and recommended sixminimum measures for CSO control.
The CSO Control Policy wasdeveloped between 1992 and 1994.During this time, all parties expresseddissatisfaction with the lack ofprogress toward CSO controlimplementation. Stakeholders werestrongly committed to developing aconsensus-based document that wouldmeet the challenge of guiding CSOfacility permitting and controlimplementation into the 21st century.
The CSO Control Policy wasdeveloped to provide clear levels ofcontrol that would be presumed tomeet appropriate health andenvironmental objectives. The CSOControl Policy, which dealt with manydifficult technical and permittingissues, was innovative in the followingways:
● Recognizing the site-specificnature of CSOs.
● Providing flexibility tomunicipalities, especiallyfinancially disadvantagedmunicipalities, to determine themost cost-effective means ofreducing pollutants and meetingCWA objectives and requirements.
● Recommending the use of theNMC in the form of best
2-16
Report to Congress on Implementation and Enforcement of the CSO Control Policy
management practices (BMPs) asthe minimum technology-basedrequirements for CSOs.
● Expecting municipalities todevelop and implement LTCPs tomeet water quality standards,using either a demonstration orpresumption approach as well asother CWA requirements.
● Expecting substantial publicparticipation in the decision-making process.
● Giving highest priority tocontrolling overflows to sensitiveareas.
● Expecting that the LTCPdevelopment process would becoordinated with the review andrevision of water qualitystandards, as appropriate.
● Encouraging permittingauthorities to evaluate waterpollution control needs on awatershed basis and to coordinateCSO control efforts with otherpoint and nonpoint source controlactivities.
● Prioritizing enforcement efforts toaddress CWA violations due to dryweather CSOs.
The CSO Control Policy was intendedto guide the planning, selection,design, implementation, andenforcement of CSO managementpractices and controls to meet therequirements of the CWA. This reportis designed to describe the progressmade by EPA, states, andmunicipalities in meeting theseobjectives.

3-1
Fishing contest in Oswego, New York, a CSOcommunity that has implemented the NMC andstructural controls, including a swirl concentratorand disinfection system.
Photo: P. MacNeill
headquarters and the nine EPAregions and 32 states known to haveCSO communities within theirjurisdictions. The breadth of EPA andstate activities (including policy andguidance development, permitting,implementation, complianceassistance, enforcement, training,research, development andinformation management activities,among others) made this an extensiveundertaking.
EPA emphasized the collection ofactual regulatory data from EPAregions and states rather than rely oninformation from centralized EPAdatabases and anecdotal data. EPAconducted file reviews and staffinterviews in five regions and 16states, reviewing permit and otherregulatory files for over 90 percent ofthe CSO communities in the UnitedStates. EPA's approach was challengingbecause of the diversity in state CSOprograms, but it greatly improvedEPA's confidence in its assessment ofimplementation and enforcementstatus.
Chapter 3
This chapter documents themethodology that EPA used toprepare this Report to
Congress. It summarizes the steps EPAhas taken to compile information onthe status of the implementation andenforcement of the CSO ControlPolicy. The chapter lays out EPA'sstudy objectives, analytical approaches,and data sources. It explains essentialinformation collection methods anddescribes steps EPA took to involvestakeholders in the development ofthis report. The chapter summarizesquality assurance measures used toenhance the accuracy and precision ofresults.
3.1 Overview of StudyObjectives and Approaches
The overall objective of thereport was to accuratelydescribe the nature and extent
of activities by EPA, states, andmunicipalities to implement andenforce the CSO Control Policy. Thebasic study approach was to collectdata and report on implementationand enforcement activities across EPA
3.1 Overview of StudyObjectives andApproaches
3.2 Data Sources
3.3 Data Collection
3.4 StakeholderInvolvement
3.5 Data Considerations
3.6 Quality Control andQuality Assurance
3.7 Summary
Methodology for Development of theCSO Report to Congress
In this chapter:

3-2
Report to Congress on Implementation and Enforcement of the CSO Control Policy
A new line is installed as part of a sewer systemseparation project in New Brunswick, New Jersey.
Photo: NJ Department of Environmental Protection
EPA had developed and maintained alist of potential CSO communitiessince the late 1980s, but had notvalidated the list in the field withregions and states. This reportafforded EPA the opportunity toevaluate this list, identify additionalCSO communities, eliminate others,and compile a relational data base.EPA now has a solid baseline to use totrack CSO activities of regions, statesand CSO communities. EPA will usethis data base for preparation of thesecond Report to Congress due in2003. Data base documentation isprovided in Appendix F.
EPA took an inclusive approach topreparing this report. The Agencybelieves that, since the CSO ControlPolicy had its genesis in intensivestakeholder consultations, it would beappropriate to solicit stakeholderinput in evaluating progress to date.The Agency met with stakeholdersearly to communicate the goals andmethods of the study, to offerstakeholders the opportunity tocontribute data, and to invite theircomments on preliminary findings.
With these objectives as a foundation,EPA undertook the following majorstudy approaches to describe the statusof implementation and enforcementof the CSO Control Policy:
● Compile information across EPAheadquarters and regions todocument major implementationand enforcement actions by EPAoffices.
● Gather information from availableNPDES authority files to confirmthe CSO regulatory universe and
to assess progress on afacility/permit-specific basis bycommunities in initiating CSOcontrols.
● Interview federal and state officialsinvolved in water qualitystandards review, permitting,compliance assistance, andenforcement activities to augmentthe NPDES file data.
● Develop fact sheets describingeach state's approach to CSOcontrol and implementation andenforcement of the CSO ControlPolicy.
● Develop case studies of CSOcommunities to describeapproaches used to address CSO-related problems, to identifysuccesses in CSO control, todevelop data on the effectivenessof CSO controls, and to documentremaining challenges.
● Meet with interested stakeholderson report preparation, soliciteddata input, and invited commentson preliminary findings fromstakeholders.
● Deliver the Report to Congresswithin nine months to meet theCongressional deadline.
In conducting this study, EPA found itimperative to focus on the specificCongressional objectives for thisreport, while at the same time layingthe groundwork for the second Reportto Congress on impacts, resources, andtechnologies due in 2003. Thus, thisreport retains its emphasis onassessing implementation andenforcement and provides only

Chapter 3—Methodology
3-3
preliminary insight into theenvironmental, technological, andresource implications of CSO control.
3.2 Data Sources
EPA developed a comprehensivelist of potential sources ofinformation that could be used
to assess the implementation andenforcement of the CSO ControlPolicy. This list included informationavailable from EPA; NPDESauthorities and other state programs;CSO communities; and stakeholderssuch as AMSA, the CSO Partnership,NRDC, and the Water EnvironmentFederation (WEF). The followingsections describe the sources ofinformation EPA used to develop thisreport.
3.2.1 National Data Sources
EPA researched its own files related todevelopment, implementation andenforcement of the CSO ControlPolicy. EPA maintains a library ofCSO-related documents and achronological record of relevantmemoranda and communications.EPA also maintains files withinformation submitted to the Agencyby CSO communities, documentinglocal efforts to implement the CSOControl Policy. In addition, EPA has acompendium of water enforcementpolicy and guidance documents thatcontains several CSO-relateddocuments.
EPA also looked to a number ofexisting data systems for CSOinformation. This included thePermits Compliance System (PCS),EPA's enforcement docket, and data
bases supporting the GovernmentPerformance and Results Act (GPRA),the Clean Water Needs Survey(CWNS), the National Water QualityInventory, and the State RevolvingFund (SRF). Lastly, EPA collected CSOdata and research results from a widerange of EPA programmatic officeswith activities affecting CSOs such asthe Office of Research andDevelopment, the Office ofGroundwater and Drinking Water, theOffice of Science and Technology, andthe Office of Wetlands, Oceans, andWatersheds.
3.2.2 NPDES Authorities and OtherState Program Files
Individual NPDES authorities andassociated state programs were theprimary sources of regulatoryinformation used in this report. Thisdata collection effort included anassessment of information containedin permit files and otherdocumentation related toimplementation and enforcementactivities. EPA and its contractorsconducted site visits to 16 states andfive EPA regional offices. To select themost appropriate targets for thesevisits EPA established the followingpriorities:
● Maximizing the number of CSOpermits reviewed.
● Ensuring geographic distributionacross states and EPA regionaloffices.
● Capturing a range of permitting,compliance assistance,enforcement and water qualitystandards review experiences.

EPA collected permit number, information on thenumber and location of outfalls, andrequirements for CSO controls for all CSOcommunities. This information was supplementedwith municipal case studies to capture thevarying degrees of progress in CSO controlimplementation.
Photo: Wilmington Department of Public Works
3-4
Report to Congress on Implementation and Enforcement of the CSO Control Policy
● Maximizing the number of majormetropolitan centers for whichdata were collected.
To complete the national assessmentof CSO Control Policyimplementation and enforcement,EPA needed a baseline of specific dataon the status of CSO permits in allstates. This core information included:
● NPDES permit number
● Number of outfalls
● Status of requirements to developand implement NMC and LTCPs
For states EPA was unable to visit, EPAsummarized the information availablein its own files and verified thisinformation with the appropriate CSOcoordinators in each region or state.
3.2.3 Community-level Data Sources
EPA supplemented information fromNPDES authorities with municipalcase studies to illustrate community-level implementation of the CSOControl Policy. CSO communitieswere selected for case study analysis to:
● Capture a range of programmaticexperiences.
● Capture the varying degrees ofimplementation and progress inconstruction of controls achievedby communities.
● Document results of CSO controlactivities within the community.
● Ensure geographic distributionacross states and EPA regionaloffices.
In addition, AMSA and a CSOcommunity offered to develop casestudies. EPA accepted these offers andprovided AMSA and the communitywith the draft outline the Agency haddeveloped for the case studies.
3.2.4 External Sources
In February and March of 2001, EPAmet with representatives from keystakeholder groups including AMSA,the CSO Partnership, NRDC, andWEF. During these meetings, EPApresented an overview of thecongressional directive to report onimplementation and enforcement ofthe CSO Control Policy and theAgency's planned response. EPA thensolicited feedback on the proposedapproach. The comments andsuggestions of the stakeholder groupswere incorporated into the finalmethodology presented in this report,as appropriate.
AMSA and the CSO Partnership alsoconducted independent surveys oftheir members during the spring of2001. The surveys focused onquantifying activities undertaken byCSO communities implementing theCSO Control Policy. Both AMSA andthe CSO Partnership furnished EPAwith the results of their surveys. Asummary of the results of thesesurveys is provided in Appendix G.
3.3 Data Collection
The primary sources of data forthis report were existing data inNPDES authority files and
federal data bases, and data obtaineddirectly from municipalities insupport of community case studies. In

Chapter 3—Methodology
3-5
addition, EPA performed acomprehensive literature search, andapplied national assessment models,where appropriate.
The following sections describe EPA'sdata collection efforts.
3.3.1 Assessment of EPA Efforts
EPA's first step in implementing theinformation collection strategy was toassess the information in its own fileson development, implementation, andenforcement of the CSO ControlPolicy, including an extensive set offiles on local communities' CSOissues.
EPA used the federal docket as itsprincipal source of information onadministrative and civil judicialactions taken to address CSOviolations. EPA initially created reportslisting all violations of CWA sections301 and 402 and then isolated casesspecifically addressing CSOs,overflows, bypasses, and dry-weatherdischarges. (The cases examinedincluded those resulting from theNMP, the CWA, and the CSO ControlPolicy.) EPA also evaluated CSO-specific information in the Lexis-Nexisdatabase and the Federal Register inorder to compile the CSOenforcement action statistics discussedin Chapter 4.
EPA also relied on existing Agencydata systems wherever possible. Theseinclude PCS, GPRA, the CWNS, theNational Water Quality Inventory, andSRF. Information obtained from thesedata systems is described in Chapter 4.
3.3.2 Assessment of Efforts by NPDESAuthorities and Other StatePrograms
EPA's next step in implementing theinformation collection strategy was aseries of visits to NPDES authorities in16 states and five EPA regional offices.These visits allowed EPA to accesspermit files for nearly 90 percent ofthe CSO communities nationwide.EPA visited the following states andregions:
● California
● Georgia
● Illinois
● Indiana
● Iowa
● Kentucky
● Maine
● Massachusetts
● Michigan
● New Jersey
● New York
● Ohio
● Pennsylvania (three of six stateregional offices)
● Vermont
● Washington
● West Virginia
● Region 1 (NPDES authority forMassachusetts, New Hampshire)

3-6
Report to Congress on Implementation and Enforcement of the CSO Control Policy
● Region 3 (NPDES authority forWashington, DC)
● Region 4
● Region 9 (NPDES co-permittingauthority for City of SanFrancisco's CSOs)
● Region 10 (NPDES authority forAlaska)
During visits to regional offices, EPAalso reviewed available CSO permitfiles for states not visited. Each visit toa state or EPA regional office beganwith a discussion with the CSOcoordinator and other staff (typicallywater quality standards andenforcement officials) involved in thepermitting of CSOs. In the interview,EPA collected general information onthe NPDES authority's approach toCSO control, such as:
● Efforts to incorporate the CSOControl Policy into the permittingauthority's existing programmaticframework.
● Established CSO-related policiesor strategies.
● Activities to integrate waterquality standards reviews withCSO control planning.
● Data management techniques.
After completing the discussion, EPAand its contractors reviewed CSOpermit files and documentation ofNMC and LTCP activities submittedto the NPDES authority. EPA usedfield data sheets to guide thediscussions and file review process,and to ensure consistency in the
information collected in each locale.The field data sheets are included inthis report as Appendix H.
EPA also spoke with state and EPAregional staff to obtain CSO andNPDES inspection information. Thesedata were supplemented with andchecked against state and regionalinspection information posted on theInternet, and reviews of inspectioninformation in PCS and the federaldocket.
3.3.3 Assessment of CommunityEfforts
Based on information collected duringsite visits and internal file review, EPAidentified eight CSO communities forcase study development. The casestudies were selected to highlight arange of programmatic experiencesand to reflect geographic diversity.EPA worked with the relevant NPDESauthority to identify an appropriatecontact in each CSO communityselected as a case study.
EPA and its contractors then contactedan appropriate official in eachcommunity to seek support for casestudy development. Seven officialsagreed to assist in development of casestudies, and EPA identified anadditional community to replace theone that declined.
EPA developed case studies of thefollowing CSO programs:
● Bremerton, Washington
● Burlington, Iowa
● Muncie, Indiana
● North Bergen, New Jersey
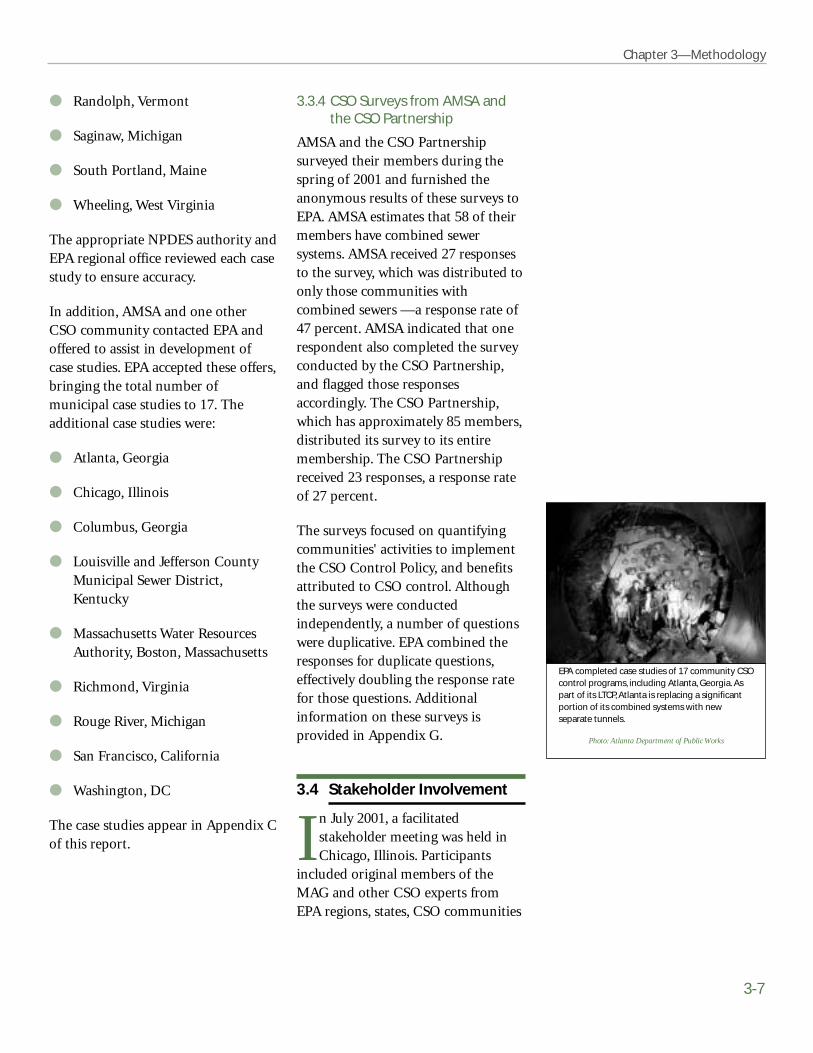
Chapter 3—Methodology
3-7
EPA completed case studies of 17 community CSOcontrol programs, including Atlanta, Georgia. Aspart of its LTCP, Atlanta is replacing a significantportion of its combined systems with newseparate tunnels.
Photo: Atlanta Department of Public Works
● Randolph, Vermont
● Saginaw, Michigan
● South Portland, Maine
● Wheeling, West Virginia
The appropriate NPDES authority andEPA regional office reviewed each casestudy to ensure accuracy.
In addition, AMSA and one otherCSO community contacted EPA andoffered to assist in development ofcase studies. EPA accepted these offers,bringing the total number ofmunicipal case studies to 17. Theadditional case studies were:
● Atlanta, Georgia
● Chicago, Illinois
● Columbus, Georgia
● Louisville and Jefferson CountyMunicipal Sewer District,Kentucky
● Massachusetts Water ResourcesAuthority, Boston, Massachusetts
● Richmond, Virginia
● Rouge River, Michigan
● San Francisco, California
● Washington, DC
The case studies appear in Appendix Cof this report.
3.3.4 CSO Surveys from AMSA andthe CSO Partnership
AMSA and the CSO Partnershipsurveyed their members during thespring of 2001 and furnished theanonymous results of these surveys toEPA. AMSA estimates that 58 of theirmembers have combined sewersystems. AMSA received 27 responsesto the survey, which was distributed toonly those communities withcombined sewers —a response rate of47 percent. AMSA indicated that onerespondent also completed the surveyconducted by the CSO Partnership,and flagged those responsesaccordingly. The CSO Partnership,which has approximately 85 members,distributed its survey to its entiremembership. The CSO Partnershipreceived 23 responses, a response rateof 27 percent.
The surveys focused on quantifyingcommunities' activities to implementthe CSO Control Policy, and benefitsattributed to CSO control. Althoughthe surveys were conductedindependently, a number of questionswere duplicative. EPA combined theresponses for duplicate questions,effectively doubling the response ratefor those questions. Additionalinformation on these surveys isprovided in Appendix G.
3.4 Stakeholder Involvement
In July 2001, a facilitatedstakeholder meeting was held inChicago, Illinois. Participants
included original members of theMAG and other CSO experts fromEPA regions, states, CSO communities
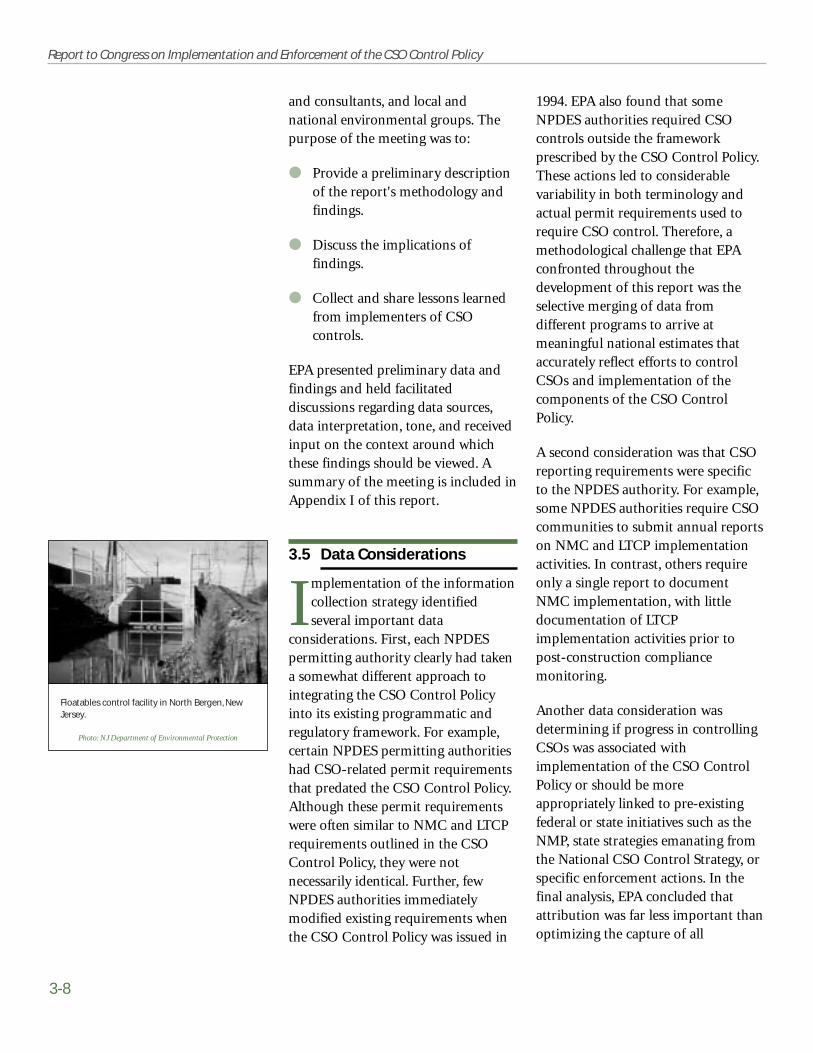
Floatables control facility in North Bergen, NewJersey.
Photo: NJ Department of Environmental Protection
3-8
Report to Congress on Implementation and Enforcement of the CSO Control Policy
and consultants, and local andnational environmental groups. Thepurpose of the meeting was to:
● Provide a preliminary descriptionof the report's methodology andfindings.
● Discuss the implications offindings.
● Collect and share lessons learnedfrom implementers of CSOcontrols.
EPA presented preliminary data andfindings and held facilitateddiscussions regarding data sources,data interpretation, tone, and receivedinput on the context around whichthese findings should be viewed. Asummary of the meeting is included inAppendix I of this report.
3.5 Data Considerations
Implementation of the informationcollection strategy identifiedseveral important data
considerations. First, each NPDESpermitting authority clearly had takena somewhat different approach tointegrating the CSO Control Policyinto its existing programmatic andregulatory framework. For example,certain NPDES permitting authoritieshad CSO-related permit requirementsthat predated the CSO Control Policy.Although these permit requirementswere often similar to NMC and LTCPrequirements outlined in the CSOControl Policy, they were notnecessarily identical. Further, fewNPDES authorities immediatelymodified existing requirements whenthe CSO Control Policy was issued in
1994. EPA also found that someNPDES authorities required CSOcontrols outside the frameworkprescribed by the CSO Control Policy.These actions led to considerablevariability in both terminology andactual permit requirements used torequire CSO control. Therefore, amethodological challenge that EPAconfronted throughout thedevelopment of this report was theselective merging of data fromdifferent programs to arrive atmeaningful national estimates thataccurately reflect efforts to controlCSOs and implementation of thecomponents of the CSO ControlPolicy.
A second consideration was that CSOreporting requirements were specificto the NPDES authority. For example,some NPDES authorities require CSOcommunities to submit annual reportson NMC and LTCP implementationactivities. In contrast, others requireonly a single report to documentNMC implementation, with littledocumentation of LTCPimplementation activities prior topost-construction compliancemonitoring.
Another data consideration wasdetermining if progress in controllingCSOs was associated withimplementation of the CSO ControlPolicy or should be moreappropriately linked to pre-existingfederal or state initiatives such as theNMP, state strategies emanating fromthe National CSO Control Strategy, orspecific enforcement actions. In thefinal analysis, EPA concluded thatattribution was far less important thanoptimizing the capture of all
Chapter 3—Methodology
3-9
meaningful results. Since the clearintent behind the CSO Control Policywas not to disrupt ongoing controlefforts, EPA concluded that it shouldinclude any documented results ofprogress in controlling CSOsindependent of the date of initiationof the control effort.
The final consideration was that mostNPDES authorities have no dataavailable on the annual volume,frequency, and duration of CSOdischarges. Moreover, data on waterquality improvements specificallyattributable to CSO control effortswere absent in the NPDES authorities'files. This complicated EPA'sassessment of the effectiveness of, andenvironmental benefits derived from,CSO control. EPA anticipates that thistype of detailed information will bethe focus of the December 2003Report to Congress required bySection 112(d)(1) of P.L. 106-554.
Although the above considerationsshaped the approach used to developthis report, the basic objective—todetermine the status ofimplementation and enforcement ofthe CSO Control Policy—nevervaried.
3.6 Quality Control and QualityAssurance
Adetailed data verification andinterpretation process followedthe data collection effort. Data
sets were evaluated for missing andinconsistent information inaccordance with a data collection andreporting quality assurance andcontrol protocol. Summary reportsfrom file reviews were prepared and
distributed to appropriate EPA regionand state CSO coordinators. Inaddition, each coordinator received acopy of the profile EPA developed forhis or her state or regional program.Follow-up phone calls to eachcoordinator verified the accuracy andcompleteness of EPA's records used todevelop the state profiles. Likewise,each municipal case study wasreviewed by community officials andthe appropriate state and EPA regionalauthorities.
Data from the AMSA and CSOPartnership surveys was not obtaineddirectly by EPA, and hence was notsubject to the same quality control asthe EPA data.
3.7 Summary
Chapters 4 through 6 provide adetailed assessment of the dataand materials collected in
support of this report. The assessmentincludes:
● A broad national evaluation offederal, state, and municipalactivities related to theimplementation and enforcementof the CSO Control Policy.
● State fact sheets to describeactivities of the 32 states with CSOcommunities.
● Detailed municipal case studies toillustrate community-levelactivities.
A bibliography of principle datasources appears at the end of thisreport.
● Developing new regulations ormodifying existing regulations.
● Interpreting regulatoryrequirements and initiativesthrough policy as needed.
● Developing guidance documentsand other forms of technicalassistance.
● Communicating and coordinatingwith stakeholders.
● Providing program complianceand enforcement assistance.
● Providing financial assistance.
● Monitoring compliance status andtargeting facilities for follow-up.
● Tracking environmental benefitsfrom program implementationand enforcement.
● Managing information pertainingto the status of implementationand enforcement activities.
Chapter 4
4.1 General Activities toSupport CSO Control PolicyImplementation
As described in Chapter 2 of thisreport, EPA's 1994 CSOControl Policy is designed to
ensure that CSO controls meet therequirements of the CWA and arecost-effective. Under the CWA, anyfacility that discharges pollutants froma point source into waters of theUnited States must obtain an NPDESpermit. NPDES permits must containrequirements based on treatmenttechnology performance, but morestringent requirements may beimposed when technology-basedrequirements are insufficient toprovide for attainment of waterquality standards in receiving waters.The CWA authorizes EPA toimplement the NPDES permitprogram or to authorize states,territories, or tribes to do so.
To ensure that the goals of the CWAare met, EPA is responsible for anumber of activities, including:
4-1
4.1 General Activities toSupport CSO ControlPolicy Implementation
4.2 NPDES Permitting
4.3 Water Quality Standards
4.4 Compliance andEnforcement
4.5 Guidance, Training, andCompliance andTechnical Assistance
4.6 Communication andCoordination
4.7 InformationManagement
4.8 Financial Assistance
4.9 Performance Measures
4.10 Findings
CSO Control Policy Status: EPA
In this chapter:

Addressing deteriorating infrastructure, suchas this crumbling CSO outfall, is one aspectof most CSO control programs.
Photo: NJ Department of Environmental Protection
4-2
Report to Congress on Implementation and Enforcement of the CSO Control Policy
● Providing general oversight forimplementation and enforcementof the NPDES program.
● Reviewing state-issued NPDESpermits and issuing NPDESpermits in states not authorized todo so.
● Approving water qualitystandards.
● Commencing enforcementactivities as appropriate.
● Promoting research anddevelopment.
● Promulgating water qualitystandards when states fail to do so.
EPA's Office of Water (OW) andOffice of Enforcement andCompliance Assurance (OECA) shareoversight responsibility forimplementation and enforcement ofthe CSO Control Policy. Since issuingthe CSO Control Policy in 1994, EPAhas worked to interpret the Policy andensure implementation by EPAregions and states. To this end, EPAhas issued three memoranda topromote more effectiveimplementation of the CSO ControlPolicy. The memoranda, summarizedbelow, are provided in Appendix A.
● CSO Deadline Memorandum. OnNovember 18, 1996, EPA issued amemorandum titled “January 1,1997 Deadline for Nine MinimumControls in Combined SewerOverflow Control Policy.” Thisdocument alerted EPA WaterManagement Division Directors,Regional Counsels, and RegionalState Directors to the January 1,
1997, deadline for implementationof the NMC. The memorandumalso specified that the first phase ofimplementation includeddevelopment of an LTCP for CSOsto provide for attainment of waterquality standards. EPA also statedthat its approach of not seekingcivil penalties for past CSOviolations (as described in the CSOControl Policy) would not applyunless permittees implemented theNMC by January 1, 1997. TheAgency further noted that OWintended to track implementation(during FY 1997) through aprogram performance plandeveloped under the GPRA (seerelated discussion in Section 4.7.2of this report).
● CSO ImplementationMemorandum. On May 19, 1998,EPA issued “Implementation ofthe CSO Control Policy.” Thismemorandum discussedimplementation of the CSOControl Policy and identified areaswhere increased efforts weredeemed necessary. Thememorandum observed that,although stakeholders continuedto affirm the CSO Control Policy'skey themes and EPA continued towork with stakeholders to fosterimplementation, numerousimplementation challengesremained. The memorandumdiscussed implementation of theNMC, development of LTCPs,achievement of water qualitystandards, and measurement ofprogram performance.

Chapter 4—CSO Control Policy Status: EPA
4-3
● Water Quality- and Technology-Based CSO RequirementsMemorandum. On July 7, 1999,EPA issued “Water Quality-Basedand Technology-Based CSORequirements.” Thismemorandum discussed waterquality-based requirements;technology-based requirements;and coordination of enforcement,permitting, and water qualityprograms in enforcement cases.
The remainder of this chapterdescribes activities EPA hasundertaken to ensure that CSOcommunities and NPDES authoritiesfully implement the CSO ControlPolicy. Information related to theactivities of EPA regions as thepermitting authority in non-authorized states is provided inChapter 5.
4.2 NPDES Permitting
Under the NPDES permitprogram, any discharge ofpollutants to waters of the
United States must be authorized byan NPDES permit. Permits are issuedto dischargers by EPA regional offices,or by states or territories or tribesauthorized by EPA to administer astate permitting program that meetsminimum federal requirements. Todate, EPA has authorized 44 states andone territory to administer the NPDESprogram. EPA remains the permittingauthority in the remaining six states(Alaska, Arizona, Idaho,Massachusetts, New Hampshire, andNew Mexico), the District of
Columbia, all U.S. territories (exceptthe U.S. Virgin Islands), and allFederal Indian Reservations.
4.2.1 EPA HeadquartersResponsibilities and Activities
EPA headquarters provides legal andtechnical support at the national leveland is responsible for ensuring thatthe NPDES permit program issuccessfully implemented. EPAprovides technical tools, training, andcontract support to promote theissuance of timely and high-qualityNPDES permits; tracks, manages, andreports permit issuance data; andevaluates and reports on the quality ofpermits across all EPA regions andauthorized NPDES states. Theactivities described in Chapter 4 arerelated to EPA's efforts to addressproper implementation of the CSOControl Policy.
Permit Quality Management
The Water Permits Division (WPD) ofEPA's Office of WastewaterManagement (OWM) recentlydeveloped several draft managementtools for use by EPA regions andauthorized states to ensure NPDESpermit quality. These draft toolsinclude central tenets of the NPDESpermit program and a municipalpermit review checklist, both of whichinclude provisions that evaluateagreement with the CSO ControlPolicy. These draft tools are availableat WPD's web site atwww.epa.gov/npdes/issuance. Inaddition, WPD periodically conductsevaluations of permit quality in EPAregions and states. The evaluationsassess implementation of the CSOControl Policy where applicable.
4-4
Report to Congress on Implementation and Enforcement of the CSO Control Policy
Revised NPDES Permit ApplicationForm for Municipal Discharges
In 1999, EPA developed and issued anew “Form 2A” permit application forthe discharge of municipal wastewaterfrom a POTW at 40 CFR 122.21(j)(and associated regulations). A sectionin the new Form 2A is devoted totreatment works with CSSs and isdesigned to provide NPDES permitwriters with information related toCSOs. In particular, the applicant isrequired to provide a description ofthe system; locate each CSO dischargepoint or outfall; document the outfallevents (frequency, duration, andvolume); describe the receiving watersthat might be impacted; and describeany known water quality impactscaused by CSOs.
4.2.2 EPA Regional OfficeResponsibilities and Activities
For those states authorized toadminister the NPDES program, EPAretains a program oversight role. Theextent and type of interaction betweenan authorized state and an EPA region,including the types of NPDES permitsto be reviewed, is typicallysummarized in a memorandum ofunderstanding. In this oversight role,EPA ensures that NPDES permitsissued by authorized states meetprogram requirements, including CSOrequirements, and that stateadministration of the NPDESprogram is consistent with federalrequirements. Two EPA regionaloffices have issued NPDES permitpolicies or strategies specific to CSOControl, as described below.
Region 1: NPDES Permit Policy
In July 1996, Region 1 issued modifiedfact sheet language, permit language,and guidance to implement the CSOControl Policy. The modifieddocuments closely follow the NMCand LTCP elements of the CSOControl Policy. Region 1 issues NPDESpermits in Massachusetts and NewHampshire. Until early 2001, Region 1was also the permitting authority forMaine.
Region 5: NPDES Permit Strategy forCombined Sewer Systems
Issued in 1985, Region 5's strategyoutlined a phased approach toimplementation of CSO controls.Region 5 encouraged states toprioritize dischargers with combinedsewer systems and to incorporate bestmanagement practices into permits.Under this strategy, dischargerscausing significant water qualityproblems are targeted for additionalcontrols. Many of the provisionsoutlined in Region 5's strategy servedas bases for the 1989 National CSOControl Strategy.
4.3 Water Quality Standards
The CWA establishes thestatutory framework governingthe development of water
quality standards and their use. TheCWA requirements for water qualitystandards are further elaborated byEPA regulations for the program,found at 40 CFR 131. CWA Section402(a) specifically requires NPDESpermits to provide for the attainmentof water quality standards.

San Francisco Bay and the Golden GateBridge are considered local and nationaltreasures. San Francisco initiated CSOcontrols in the 1970s and has madesignificant improvements to local waterquality.
Photo: Photodisc
Chapter 4—CSO Control Policy Status: EPA
4-5
State water quality standards mustprotect public health and theenvironment by enhancing andmaintaining the quality of the water.To protect the uses designated in theirwater quality standards, states adopt:(1) a suite of criteria to protect themost sensitive of the designated uses;and (2) an anti-degradation policyincluding implementation proceduresto protect water quality. However,states have considerable discretion totailor water quality standards toparticular climatic, hydrologic, andseasonal conditions. EPA regulationsand guidance provide states with theflexibility to adapt their water qualitystandards and implementationprocedures to reflect site-specificconditions, including those related toCSOs. EPA’s Office of Water issuedGuidance for Coordinating CSO Long-Term Control Planning with WaterQuality Standards Reviews. Thisguidance describes the specific ways inwhich states may exercise theirflexibility for water quality standardsreview in conjunction withdevelopment and implementation ofLTCPs by CSO communities.
4.3.1 Section 303(d) and the TotalMaximum Daily Load Program
Under CWA Section 303(d), statesidentify waters not attaining waterquality standards, submit a list to EPAof those impaired waters, and develop
TMDLs for them. EPA is responsiblefor approving or disapproving stateimpaired waters lists and TMDLs, andfor establishing lists and TMDLs in thecase of disapproval. Table 4.1summarizes waters identified asimpaired by CSOs or urban runoff in1996 and 1998 assessments by stateswith active CSO permits. Informationon segments impaired by urban runoffis included because not all statesseparate CSO impairments from thosecaused by urban runoff.
Based on information supplied bystates as part of their list of impairedwaters, CSOs have been found tocontribute to non-attainment of waterquality standards, particularly inurbanized areas. The contribution ofpathogens in quantities that exceedwater quality standards is of particularconcern for CSOs.
In January 2001, the EPA Office ofWetlands, Oceans and Watersheds(OWOW) published a Protocol forDeveloping Pathogen TMDLs (EPA,2001a) to reduce confusion arisingfrom the complexity of developingTMDLs for pathogens. This protocolidentifies CSOs as one of severalcategories of major point sourcesdischarging pathogens to surfacewaters. The protocol notes that CSOscontribute significant pathogen loadsduring storm events. In addition, theprotocol indicates that modeling CSO
Summary of 303(d) ListImpaired Waters in
States With CSOs
Information on segmentsimpaired by urban runoff isincluded because not all statesseparate CSO and urban runoffimpairments.
Table 4.1
Year Segments Assessed Impaired by CSOs Impaired by Urban Runoff
1996 10,552 140 652
1998 15,598 150 1,233

One of the goals of EPA’s water complianceand enforcement program is to ensurecompliance with the CWA for point sourcedischarges.
Photo: NJ Department of Environmental Protection
4-6
Report to Congress on Implementation and Enforcement of the CSO Control Policy
impacts can be difficult due to theintermittent nature of pathogenloadings from CSOs and associateddata limitations. The protocolacknowledges that the CSO ControlPolicy takes this into account throughuse of the presumption anddemonstration approaches.
4.3.2 Section 305(b) and the NationalWater Quality Inventory Reportto Congress
EPA established the CWA Section305(b) program to inventory thehealth of waters of the United States.This program relies on states to assessrepresentative subsets of their watersand to report on the causes ofimpairment, if any. The data generatedby the 305(b) program are tabulatedand made available to the publicthrough STORET. The data were usedto prepare the biennial National WaterQuality Inventory Report to Congressfrom 1976 to 1998.
The National Water Quality InventoryReport to Congress is EPA’s primaryvehicle for informing Congress andthe public about the quality of thenation's rivers, lakes, wetlands,estuaries, coastal waters, and ground
waters, along with information onpublic health and aquatic lifeconcerns. CSOs have beendocumented as a source of waterquality impairment in each report.The most recent (1998) assessment ofwater quality impairment attributableto CSOs is summarized in Table 4.2.
Notwithstanding the limitations ofstate resources to fully assess all water,the subset captured in the 305(b)inventory and its associated waterquality report will remain animportant tool in assessing theprogress in reducing impairmentassociated with CSOs.
4.4 Compliance andEnforcement
The goal of EPA's watercompliance and enforcementprogram is to ensure
compliance with the CWA. EPA uses asystematic approach to meet fivemajor objectives: provide complianceassistance tools and information to theregulated community, identifyinstances of noncompliance, returnthe violator to compliance, recover any
Water Body Category Impairment Attributed to CSOs
Rivers and Streams ● 842,426 of 3,662,255 total miles of rivers and streams assessed● CSOs were not a leading source of river and stream impairment
Estuary ● 28,687 of 90,465 total square miles of estuaries assessed● 12,622 square miles are impaired for one or more uses● 1,451 square miles of impaired estuaries are impaired by CSOs
Ocean Shoreline ● 3,130 of 66,645 of shoreline assessed● CSOs were not a leading source of ocean impairment
Great Lakes Shoreline ● 4,950 of 5,521 total miles of shoreline assessed● 4,752 miles of shoreline are impaired for one or more uses● 102 miles of impaired shoreline are impaired by CSOs
Extent of CSOs as aSource of Impairment
Impairment attributed to CSOs inNational Water Quality Inventory -1998 Report to Congress (EPA,2000a)
Table 4.2
Chapter 4—CSO Control Policy Status: EPA
4-7
economic advantage obtained by theviolator's noncompliance, and deterother regulated facilities fromnoncompliance.
4.4.1 General NPDES Compliance andEnforcement Process
EPA maintains an inventory ofNPDES point source dischargers in itsPermit Compliance System (PCS).NPDES authorities enter facilityinformation, permit requirements,self-monitoring data, inspectionresults, and enforcement actioninformation into PCS. Region or statepersonnel identify violations byreviewing facility self-monitoring data,inspecting facilities, and investigatingcitizen complaints. The samepersonnel determine appropriatefollow-up action to noncompliance.EPA's national enforcement guidance,Enforcement Management System,recommends using a scaled responseto noncompliance considering suchfactors as the nature, frequency, andseverity of the violation, potentialharm to public health and theenvironment, and the compliancehistory of the facility. EPA'senforcement response guidelines rangefrom an informal action such as atelephone call or warning letter to aformal administrative or civil judicialaction.
4.4.2 National Compliance andEnforcement Priorities
With input from stakeholders such asregions and states, EPA has identifiedCSOs as a national enforcementpriority since FY 1998. For FY 2002and 2003, based on feedback fromstakeholders, EPA issued a FederalRegister notice soliciting comments on
a draft list of 15 suggested priorities.The resulting list of priorities includedretaining "wet weather" (i.e., CSOs,sanitary sewer overflows, storm water,and concentrated animal operations)as a national enforcement priority forFY 2002 and 2003. EPA is developingbetter measures to determine theresults of compliance and enforcementactivities in the national priority areas.
EPA's Memorandum of Agreement(MOA) Guidance (EPA, 2001b) servesas the basis for developing individualagreements between EPA headquartersand regions to enforce nationalpriorities. Through the MOA process,EPA headquarters and regions outlinerelevant enforcement priorities,region-specific goals, and availableenforcement tools for the twoupcoming fiscal years. The FY 2000and 2001 MOA recommended thatregions assess CSO communities'implementation of the NMC andLTCPs, provide compliance assistance,and ensure that compliance schedulesare met. The FY 2002 and 2003 MOArecommends that EPA regionscontinue to implement theircompliance and enforcement responseplans, which were to have beensubmitted pursuant to the Complianceand Enforcement Strategy AddressingCombined Sewer Overflows andSanitary Overflows, described below.
4.4.3 NPDES Compliance andEnforcement Activities
Policies and Strategies
On April 27, 2000, EPA issued theCompliance and Enforcement StrategyAddressing Combined Sewer Overflowsand Sanitary Sewer Overflows,requiring regions to submit
4-8
Report to Congress on Implementation and Enforcement of the CSO Control Policy
compliance and enforcement responseplans (ERPs) within 60 days. The 2000Strategy is intended to facilitateregional implementation andenforcement of the CSO ControlPolicy. The 2000 Strategy recommendsthat individual plans include asystematic approach to assess thecurrent compliance status of eachCSO permittee, including determiningwhether:
● The existing NPDES permits andadministrative orders are properlywritten to require implementationof the NMC and development ofan LTCP.
● The permittee is implementing theNMC.
● The permittee is developing anLTCP to comply with all CWArequirements.
● The permittee is implementing anLTCP.
ERPs should include a process andtimetable for the region or state toinspect all CSO permittees by the endof FY 2001 and to take appropriatefollow-up action. The 2000 Strategysuggests priorities that regions shouldconsider in targeting enforcementefforts, such as: elimination of dryweather CSOs; beach and shellfish bedclosures resulting from CSOs; sourcewater protection; impaired watershedsand other sensitive areas; failure toimplement the NMC and develop anLTCP; and failure to correctnoncompliance with CSO provisionsin a permit or an enforcement action.
The 2000 Strategy describes prioritiesfor compliance assistance in smallcommunities and available complianceassistance tools, such as the LocalGovernment EnvironmentalAssistance Network (LGEAN), whichis described in more detail in Section4.5.3 of this report. The 2000 Strategyalso describes enforcement activitiesthat regions may undertake in order toencourage implementation of CSOcontrols. These actions, which can beimplemented in accordance with CWASections 308, 309, and 504, includenotices of violation, administrativeactions, and civil judicial actions.
To date, EPA headquarters has receivedERPs from a majority of the regionswith CSOs. The available regionalERPs vary in level of detail. Someoutline an inspection program forcompliance determination, whileothers depend on reporting from theregulated community. In otherinstances, the regional role for CSOenforcement consists of oversight andassistance in cases of significantnoncompliance. Priorities forenforcement actions range fromtargeting facilities with persistentviolations to protecting sensitivewatersheds. Not all plans explicitlydescribe regional priorities fordetermining cases in whichcompliance assistance might beappropriate. In addition, not all theERPs describe NPDES stateenforcement activities. EPAheadquarters is evaluating thesubstantive content of the ERPs.

Region 2 tracks and oversees state CSOprograms. The State of New Jersey conductsthe inspections of CSO facilities, includingthis new separated sewer tunnel in NewBrunswick.
Photo: NJ Department of Environmental Protection
Chapter 4—CSO Control Policy Status: EPA
4-9
Audit Policy
EPA's audit policy, formally known asIncentives for Self-Policing: Discovery,Disclosure, Correction and Preventionof Violations (65 FR 19618, April 11,2000), was developed as an incentivefor facilities to conduct self-audits todetermine compliance withenvironmental laws. When applicable,the policy eliminates "gravity-based"penalties (penalties assessed based onthe characteristics and consequencesof the effluent violation) for facilitiesthat voluntarily discover, promptlydisclose, and expeditiously correctviolations of federal environmentallaw. As of June 2001, no municipalitieshave used this policy, but it remains anoption.
Inspections and ComplianceMonitoring
CWA Section 308(a)(4)(B) authorizesEPA to conduct inspections at pointsources. Most inspections areperformed by authorized NPDESstates. EPA headquarters conductsinspections when a case is particularlycomplex and additional resources areneeded, when a case is of nationalsignificance, or when a case involvesseveral jurisdictions. CSOs can beaddressed as part of a broader NPDESinspection or as a targeted, CSO-specific inspection. The steps involvedin conducting each type of inspectionare nearly identical, although theCSO-specific inspection may include areview of all CSO data, verification ofimplementation of the NMC anddevelopment or implementation of anLTCP, a visit to the CSO outfalls, anduse of a detailed CSO checklist ofquestions. Regional approaches toCSO inspections vary.
● Region 1 participates in jointinspections with states, as well asconducting its own, independentCSO inspections. Regionalinvolvement is prompted if theregion is checking an aspect of anLTCP or if it is a complex case. Theregion has no CSO-specificinspector training program, butdoes have a CSO checklist. Region 1tracks all data in PCS and uses anindependent tracking system tomonitor CSO communities. Theregion also conducts quarterlymeetings and teleconferences withthe states to discuss instances ofsignificant noncompliance andCSO issues.
● Region 2 tracks and oversees stateCSO programs. Most inspectionsare conducted by the states. Theregion also conducts quarterlymeetings and teleconferences withstates to discuss instances ofsignificant noncompliance.
● Region 3 conducts inspectionsunder its CSO strategy forFY 2001, which addresses bothenforcement and complianceassistance efforts. Using severalcriteria, including streamimpairment, number of CSOoutfalls, history of flow-limitviolations, and citizen complaints,Region 3 targeted 35 CSOcommunities for inspection inFY 2001. As of October 2000, theregion had conducted 14 CSOinspections, in addition to basiccompliance-evaluation orpretreatment inspections at CSOfacilities. The region expects tocomplete the remaining 21inspections by the end of FY 2001.

4-10
Report to Congress on Implementation and Enforcement of the CSO Control Policy
The region also holds quarterlyconference calls with states todiscuss issues of significant non-compliance that states encounterin their inspections.
Region 3 developed guidance forconducting inspections ofcombined sewer systems. Thisguidance outlines the elements ofa CSO inspection and suggestsquestions inspectors mightaddress during an inspection, withspecific regard to NMCcompliance.
● Region 4 has conducted severalinspections in its states but, for themost part, defers to its states forinspections and relies on them toverify that all CSO facilities are incompliance. The region conductsannual reviews of state inspectionprocesses to ensure that theinspectors are addressing allrelevant aspects of CSO control.
● Region 5 assists states inconducting CSO inspections andbasic NPDES wet weathercompliance inspections. Theregion has an annual agreementwith the states to conduct acertain number of inspections,and the states conduct annualCSO inspections within budgetlimitations, so that Region 5 canmeet the desired goal of 100-percent coverage by the end ofFY 2002. The region selectsfacilities for CSO inspections for anumber of reasons, includingcompliance assistance (technicaltransfer), noncompliance, andenforcement support, consistent
with the region's Wet WeatherCSO/SSO Compliance EnforcementStrategy.
The region holds quarterlynoncompliance phone calls, fromwhich the region's QuarterlyNoncompliance Report is created.Region 5's CSO checklist, which itdeveloped in 1994, is shared withthe states. The region conducts aseries of state wet weatherinspector training programsleading to CSO inspectorcertification and conducts thistraining in the states. The regiontracks all inspection activities byentering final inspection reports inPCS.
● Region 7 oversees most CSOinspections and has alsoconducted seven regional CSOinspections in the past two yearsand has scheduled several forFY 2002. The region issues CWASection 308 information requestsasking communities to clarifytheir NMC and LTCPimplementation status as anothermethod of compliance assurance.The region holds quarterlymeetings with states to discussCSO implementation andenforcement as states continue tofinalize strategies and plans forCSO control.
● Region 8 oversees inspectionsconducted for CSO communitiesin the region.
● Region 9 oversees inspectionsconducted by California for thetwo CSO communities in theregion.

EPA and the State of Georgia consolidatedenforcement efforts to resolve CSO andother water quality violations in Atlanta. Thisnew sewer tunnel is part of the city’sremedial action plan.
Photo: City of Atlanta Department of Public Works
Chapter 4—CSO Control Policy Status: EPA
4-11
● Region 10 is the NPDES authorityin Alaska and recently completed aCSO inspection there. The regionplays an oversight role in Oregonand Washington. The regionusually defers to the states, but stillconducts inspections and recentlycompleted a CSO inspection inOregon. Region 10's CSOinspections are targeted based oncitizen complaints, the volume ofpotential CSO discharges, andinformation on potentialviolations. The region is workingon a more concise version of itsCSO inspection checklist.
Enforcement Actions
The CSO Control Policy recommendsenforcement options to address CSOpermit violations. The Federal Docket,Federal Register, and the Lexis-Nexislegal data base were used to compiledata concerning EPA-initiatedenforcement actions with CSOviolations commenced after the CSOControl Policy. This research revealedseveral cases initiated as the result ofthe CWA or the CSO Control Policy.
Five judicial enforcement actionsbrought against municipalities inRegions 1, 3, 4, and 5 as a result ofCSO violations are summarized inAppendix J. The enforcement actionswere outgrowths of violations of theCWA, NPDES permits, or inadequateCSO control plans. Each case resultedin the issuance of consent decrees;financial penalties up to $3.2 millionwere assessed.
Thirty-two administrative CSOactions filed against municipalities inresponse to CSO violations are alsolisted in Appendix J. Twenty-eight
cases occurred in Region 1, and fouroccurred in Region 5. The outcomesof these enforcement actions includedissuance of administrative complianceorders, administrative penalty orders,and a judicial referral.
This number of cases is an estimate,based on the best informationcurrently available, and may notinclude all actions taken to enforce theCSO Control Policy.
Examples of CSO EnforcementActivities
Atlanta, GeorgiaEPA and the State of Georgiaconsolidated enforcement effortswith citizen plaintiffs in the caseof Upper ChattahoocheeRiverkeeper Fund, Inc., et. al. v.the City of Atlanta. The City hadviolated NPDES permitrequirements due to CSOs. Atlantaalso had SSO, operation andmaintenance, effluent limit, andpretreatment violations.
To resolve the CSO portion of thecase, Atlanta agreed to implementa phased remedial action plan to:evaluate the character of CSOdischarges; develop remedialmeasures to bring CSO dischargesinto compliance; and implementremedial measures by July 1, 2007.
Atlanta's preferred approach ofstorage and treatment will becompared with other alternativessuch as sewer separation. EPA andGeorgia will authorize the City toimplement the final remedy. Otherterms of the overall settlementinclude a $3.2 million total cashpenalty, and implementation of a
4-12
Report to Congress on Implementation and Enforcement of the CSO Control Policy
$27.5 million supplementalenvironmental project to create agreenway corridor and conduct aone-time clean-up along selectedstreams by March 31, 2007. Thisaction followed 1992 and 1999state fines totaling $20.7 millionfor previous delays in CSOabatement.
Hammond, IndianaThe federal government originallyfiled suit in 1993 against theHammond Sanitary District. Theresultant consent decree resolvedclaims that the Sanitary District,including the City of Hammondand the Town of Munster, wereresponsible for more than 19,000violations of the CWA and theRivers and Harbors Act throughthe discharge of untreated andimproperly treated sewage into thewest branch of the Grand CalumetRiver.
The settlement was reached afterthree consent decrees—one for theTown of Munster, one for theHammond Sanitary District, andone for the City of Hammond—were lodged in April 1999. Thesettlement included a $2.1 millioncontribution to the GrandCalumet River Restoration Fundfor sediment cleanup and $34million in improvements to thesewer system, including storageand treatment systems for wetweather flows, pump stationupgrades, sewer interceptors,sewer separation, sludge lagoonclosures, and the implementationof a program to remove residentialdownspout connections to thesewer system.
In addition, the HammondSanitary District was required topay $225,000 in cash penalties,split equally between the UnitedStates and the State of Indiana.
Port Clinton, OhioThe City of Port Clintonexperienced CSOs thatcontributed to beach closuresassociated with high levels of fecalcoliform. A consent decree lodgedin 1999 required Port Clinton toimplement a program to inspectand sample its outfallsimmediately following CSOevents, establish a beach samplingprogram, develop a publicinformation system (e.g., postingof warning signs) to protecthuman health, and develop andimplement a plan to permanentlyimprove or close CSO structuresno later than June 1, 2000. Inaddition, Port Clinton wasrequired to pay a $60,000 civilpenalty. The settlement willprotect water quality andbeneficial uses, increase availabledata from CSOs, and raise localawareness regarding CSOs andwater quality.
4.5 Guidance, Training, andCompliance and TechnicalAssistance
Since issuing the CSO ControlPolicy in 1994, EPA hasdeveloped and distributed
information and technical resourcesneeded by communities, permitwriters, and other stakeholders toimplement effective CSO controls.These resources include guidance
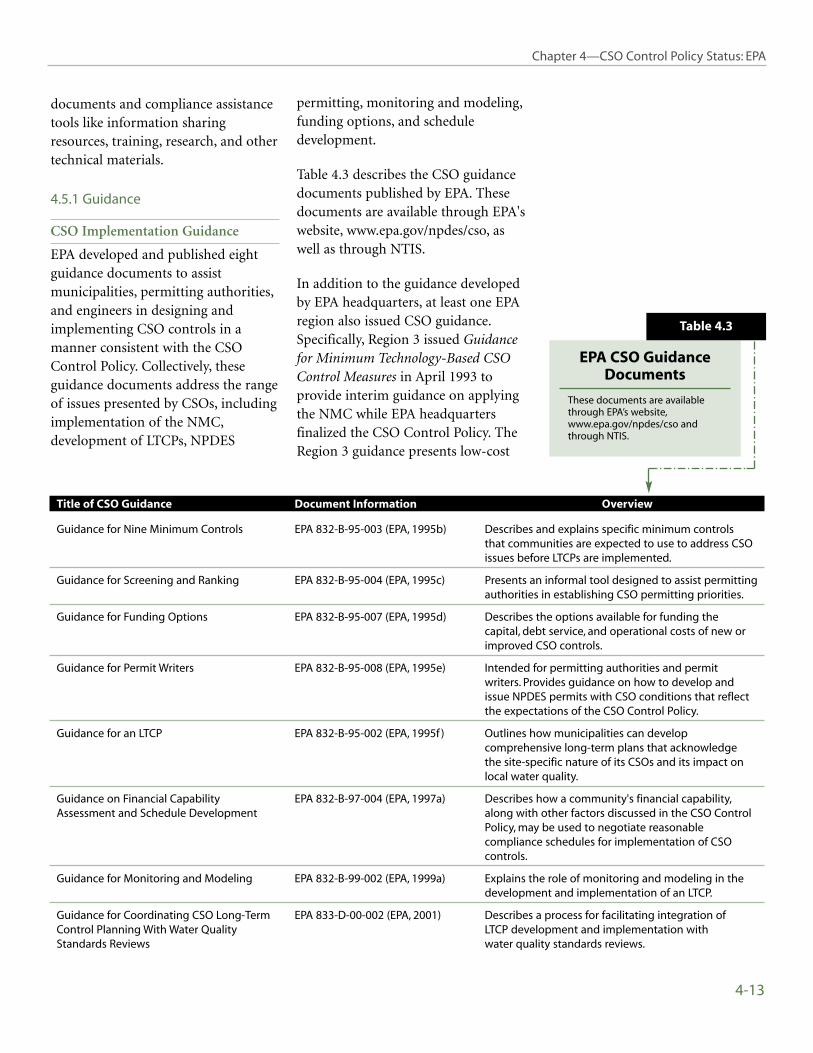
Chapter 4—CSO Control Policy Status: EPA
4-13
documents and compliance assistancetools like information sharingresources, training, research, and othertechnical materials.
4.5.1 Guidance
CSO Implementation Guidance
EPA developed and published eightguidance documents to assistmunicipalities, permitting authorities,and engineers in designing andimplementing CSO controls in amanner consistent with the CSOControl Policy. Collectively, theseguidance documents address the rangeof issues presented by CSOs, includingimplementation of the NMC,development of LTCPs, NPDES
permitting, monitoring and modeling,funding options, and scheduledevelopment.
Table 4.3 describes the CSO guidancedocuments published by EPA. Thesedocuments are available through EPA'swebsite, www.epa.gov/npdes/cso, aswell as through NTIS.
In addition to the guidance developedby EPA headquarters, at least one EPAregion also issued CSO guidance.Specifically, Region 3 issued Guidancefor Minimum Technology-Based CSOControl Measures in April 1993 toprovide interim guidance on applyingthe NMC while EPA headquartersfinalized the CSO Control Policy. TheRegion 3 guidance presents low-cost
Title of CSO Guidance Document Information Overview
Guidance for Nine Minimum Controls EPA 832-B-95-003 (EPA, 1995b) Describes and explains specific minimum controls that communities are expected to use to address CSO issues before LTCPs are implemented.
Guidance for Screening and Ranking EPA 832-B-95-004 (EPA, 1995c) Presents an informal tool designed to assist permittingauthorities in establishing CSO permitting priorities.
Guidance for Funding Options EPA 832-B-95-007 (EPA, 1995d) Describes the options available for funding the capital, debt service, and operational costs of new or improved CSO controls.
Guidance for Permit Writers EPA 832-B-95-008 (EPA, 1995e) Intended for permitting authorities and permit writers. Provides guidance on how to develop and issue NPDES permits with CSO conditions that reflect the expectations of the CSO Control Policy.
Guidance for an LTCP EPA 832-B-95-002 (EPA, 1995f ) Outlines how municipalities can develop comprehensive long-term plans that acknowledge the site-specific nature of its CSOs and its impact onlocal water quality.
Guidance on Financial Capability EPA 832-B-97-004 (EPA, 1997a) Describes how a community's financial capability,Assessment and Schedule Development along with other factors discussed in the CSO Control
Policy, may be used to negotiate reasonable compliance schedules for implementation of CSOcontrols.
Guidance for Monitoring and Modeling EPA 832-B-99-002 (EPA, 1999a) Explains the role of monitoring and modeling in the development and implementation of an LTCP.
Guidance for Coordinating CSO Long-Term EPA 833-D-00-002 (EPA, 2001) Describes a process for facilitating integration ofControl Planning With Water Quality LTCP development and implementation withStandards Reviews water quality standards reviews.
EPA CSO GuidanceDocuments
These documents are availablethrough EPA’s website,www.epa.gov/npdes/cso andthrough NTIS.
Table 4.3
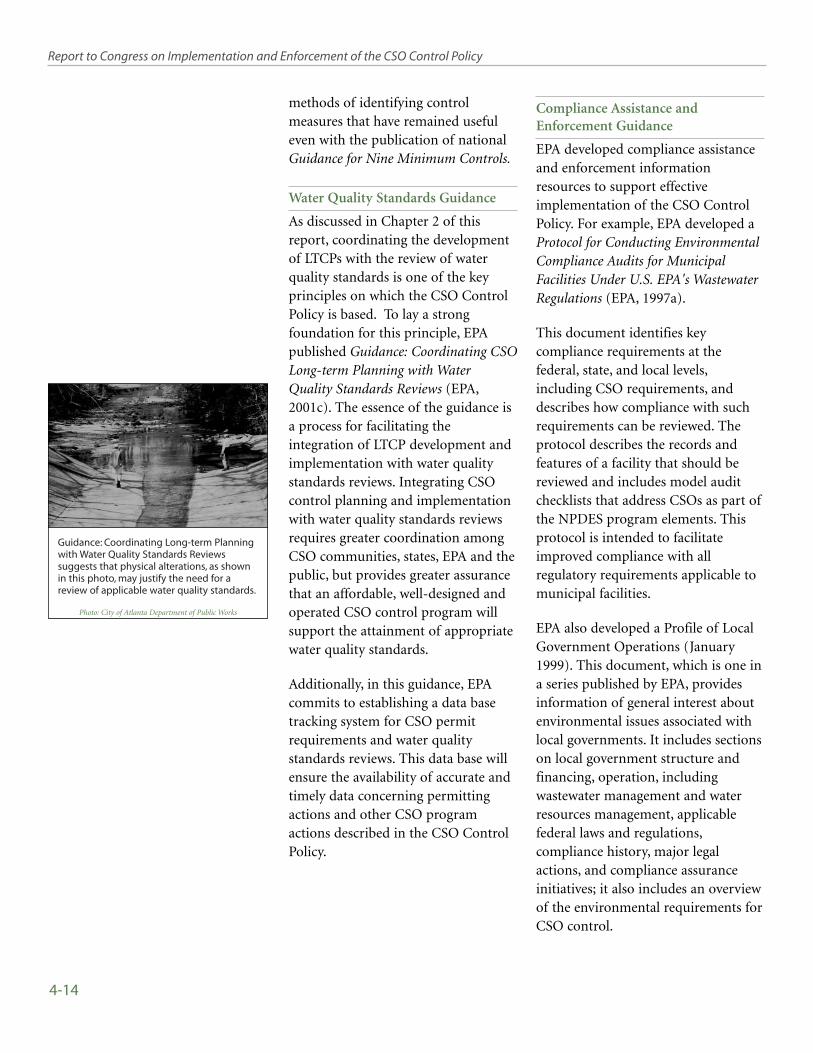
Guidance: Coordinating Long-term Planningwith Water Quality Standards Reviewssuggests that physical alterations, as shownin this photo, may justify the need for areview of applicable water quality standards.
Photo: City of Atlanta Department of Public Works
4-14
Report to Congress on Implementation and Enforcement of the CSO Control Policy
methods of identifying controlmeasures that have remained usefuleven with the publication of nationalGuidance for Nine Minimum Controls.
Water Quality Standards Guidance
As discussed in Chapter 2 of thisreport, coordinating the developmentof LTCPs with the review of waterquality standards is one of the keyprinciples on which the CSO ControlPolicy is based. To lay a strongfoundation for this principle, EPApublished Guidance: Coordinating CSOLong-term Planning with WaterQuality Standards Reviews (EPA,2001c). The essence of the guidance isa process for facilitating theintegration of LTCP development andimplementation with water qualitystandards reviews. Integrating CSOcontrol planning and implementationwith water quality standards reviewsrequires greater coordination amongCSO communities, states, EPA and thepublic, but provides greater assurancethat an affordable, well-designed andoperated CSO control program willsupport the attainment of appropriatewater quality standards.
Additionally, in this guidance, EPAcommits to establishing a data basetracking system for CSO permitrequirements and water qualitystandards reviews. This data base willensure the availability of accurate andtimely data concerning permittingactions and other CSO programactions described in the CSO ControlPolicy.
Compliance Assistance andEnforcement Guidance
EPA developed compliance assistanceand enforcement informationresources to support effectiveimplementation of the CSO ControlPolicy. For example, EPA developed aProtocol for Conducting EnvironmentalCompliance Audits for MunicipalFacilities Under U.S. EPA's WastewaterRegulations (EPA, 1997a).
This document identifies keycompliance requirements at thefederal, state, and local levels,including CSO requirements, anddescribes how compliance with suchrequirements can be reviewed. Theprotocol describes the records andfeatures of a facility that should bereviewed and includes model auditchecklists that address CSOs as part ofthe NPDES program elements. Thisprotocol is intended to facilitateimproved compliance with allregulatory requirements applicable tomunicipal facilities.
EPA also developed a Profile of LocalGovernment Operations (January1999). This document, which is one ina series published by EPA, providesinformation of general interest aboutenvironmental issues associated withlocal governments. It includes sectionson local government structure andfinancing, operation, includingwastewater management and waterresources management, applicablefederal laws and regulations,compliance history, major legalactions, and compliance assuranceinitiatives; it also includes an overviewof the environmental requirements forCSO control.
Chapter 4—CSO Control Policy Status: EPA
4-15
Additionally, EPA has issued tools toguide inspectors in conductingNPDES and CSO-specific inspections.Such tools help promote moreconsistent and more effectivecompliance monitoring andassessment activities.
● NPDES Compliance InspectionManual (EPA, 1994c) The manualexplains all aspects of conductingan inspection. The manual is usedby inspectors addressing NPDESpermitted facilities. It is intendedto provide information to regionaland state inspectors. Within themanual is a chapter devoted toCSO inspections and a CSOEvaluation Checklist. The checklistis intended to help inspectorsfocus on the identification andevaluation of CSOs, dry weatheroverflows, records, operation andmaintenance, and complianceschedules.
● NPDES Compliance InspectionTraining Program Student's Guide(EPA, 1995g) The guide is afollow-up to the manual. Itprovides practice exercises andexams that are designed to helpthe inspector review inspectionprotocol. Chapter 12 is devoted toCSO policies and inspectionprocedures.
4.5.2 Training
EPA has developed training programsfor NPDES permit writers, operatorsof wastewater treatment plants, andinspectors of CSO facilities. Thetraining courses are intended toprovide personnel working in andwith CSO communities with anunderstanding of the intent and
expectations of the CSO ControlPolicy and requirements of the CWA.In addition, the courses recommendways to identify non-compliance.
Training for Permit Writers
EPA's “NPDES Permit Writers'Training Course” provides permitwriters with an overview of theregulatory framework of the NPDESprogram. The course gives participantsknowledge of permit components,effluent limits, permitting conditions,and tools and techniques for ensuringcompliance with permit conditions.The course is designed to facilitatedevelopment of NPDES permits ingeneral. CSOs are addressed in twomodules of the course.
EPA's NPDES Permit Writers' Manual(EPA, 1996a) provides permit writersthe technical and legal guidance todevelop NPDES permits. The manualdescribes CSO policy provisions anddiscusses the phased permit processfor CSOs and the suggested permittingconditions that correspond to eachphase.
Training for Inspectors
With contract and technical assistancefrom EPA headquarters, Region 3 hastaken the lead in developing aguidance and training program onCSOs for regional and state inspectors.Training on the compliance assistancetools for municipalities will be part ofthis training.
Training for Permittees
EPA, in cooperation with the WEF,sponsors a two-day training coursetitled “Participating in the NPDESPermit Process: A Workshop.” This
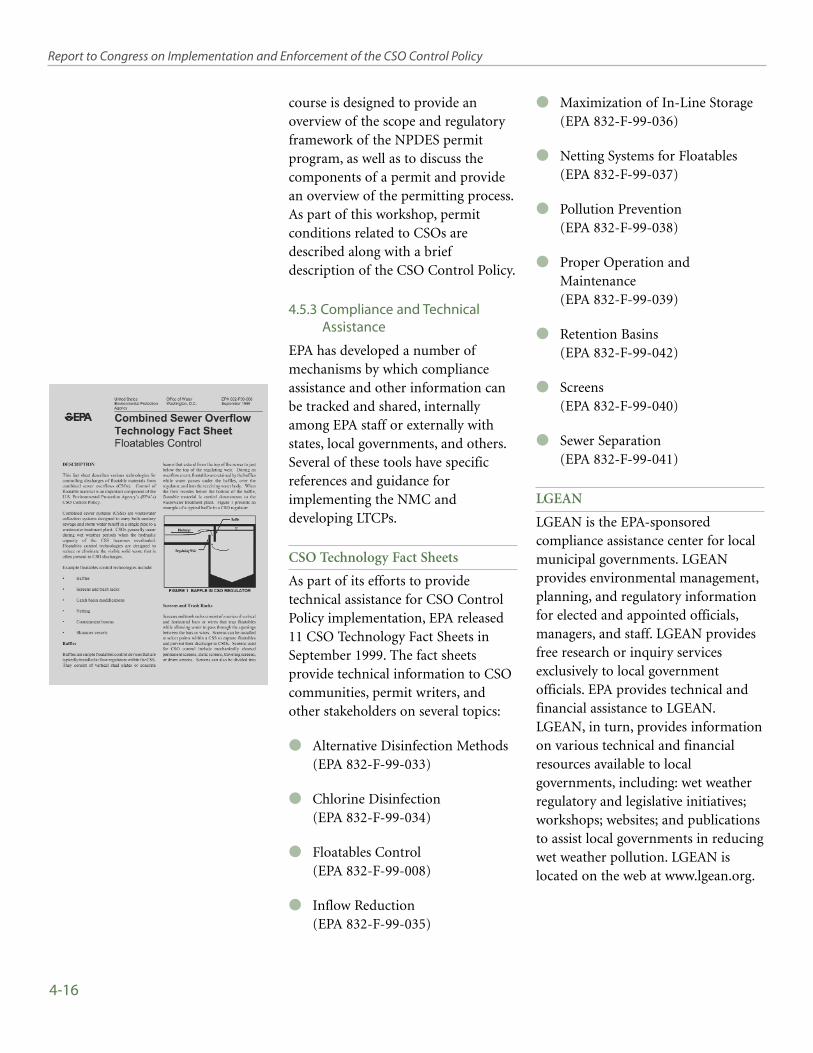
4-16
Report to Congress on Implementation and Enforcement of the CSO Control Policy
course is designed to provide anoverview of the scope and regulatoryframework of the NPDES permitprogram, as well as to discuss thecomponents of a permit and providean overview of the permitting process.As part of this workshop, permitconditions related to CSOs aredescribed along with a briefdescription of the CSO Control Policy.
4.5.3 Compliance and TechnicalAssistance
EPA has developed a number ofmechanisms by which complianceassistance and other information canbe tracked and shared, internallyamong EPA staff or externally withstates, local governments, and others.Several of these tools have specificreferences and guidance forimplementing the NMC anddeveloping LTCPs.
CSO Technology Fact Sheets
As part of its efforts to providetechnical assistance for CSO ControlPolicy implementation, EPA released11 CSO Technology Fact Sheets inSeptember 1999. The fact sheetsprovide technical information to CSOcommunities, permit writers, andother stakeholders on several topics:
● Alternative Disinfection Methods(EPA 832-F-99-033)
● Chlorine Disinfection (EPA 832-F-99-034)
● Floatables Control (EPA 832-F-99-008)
● Inflow Reduction (EPA 832-F-99-035)
● Maximization of In-Line Storage(EPA 832-F-99-036)
● Netting Systems for Floatables(EPA 832-F-99-037)
● Pollution Prevention(EPA 832-F-99-038)
● Proper Operation andMaintenance (EPA 832-F-99-039)
● Retention Basins (EPA 832-F-99-042)
● Screens (EPA 832-F-99-040)
● Sewer Separation (EPA 832-F-99-041)
LGEAN
LGEAN is the EPA-sponsoredcompliance assistance center for localmunicipal governments. LGEANprovides environmental management,planning, and regulatory informationfor elected and appointed officials,managers, and staff. LGEAN providesfree research or inquiry servicesexclusively to local governmentofficials. EPA provides technical andfinancial assistance to LGEAN.LGEAN, in turn, provides informationon various technical and financialresources available to localgovernments, including: wet weatherregulatory and legislative initiatives;workshops; websites; and publicationsto assist local governments in reducingwet weather pollution. LGEAN islocated on the web at www.lgean.org.

Chapter 4—CSO Control Policy Status: EPA
4-17
National Compliance AssistanceClearinghouse
The National Compliance AssistanceClearinghouse is a website thatprovides links to compliance assistancetools, contacts, and other resourcesavailable from EPA and other publicand private compliance assistanceproviders. Although currently, theClearinghouse has links to only abouteight CSO-specific resources, there area number of wet weather resourcesand related information. It is locatedat www.epa.gov/clearinghouse.
4.5.4 Wet Weather Flow ResearchPlan
EPA's Office of Research andDevelopment (ORD) conductsresearch to identify, understand, andsolve current and futureenvironmental problems. In an effortto direct wet weather flow research atEPA, ORD prepared the RiskManagement Research Plan for WetWeather Flows (EPA, 1996b) in 1996,which describes potential researchprojects EPA may pursue.
Wet weather research efforts by ORDcover CSOs, storm water, and SSOs.Wet weather research is organized intofive areas:
● Characterization and ProblemAssessment
● Watershed Management
● Toxic Substances Impacts andControl
● Control Technologies
● Infrastructure Improvement
Although several wet weather researchprojects evaluate wet weatherdischarges collectively, a number ofresearch projects address CSOs. Asummary of potential researchprojects is provided in Appendix K.
4.6 Communication andCoordination
Since 1994, EPA has maintainedopen lines of communicationand coordinated with those
involved in implementation andenforcement of the CSO ControlPolicy. This section describes specificactivities by EPA to inform and obtainfeedback from those most directlyresponsible for implementing andenforcing the CSO Control Policy.
4.6.1 Outreach to State and RegionalCSO Coordinators
Following the issuance of the 1989CSO Control Strategy, EPA asked eachNPDES authority with CSO permitsto appoint a CSO coordinator. TheCSO coordinators serve as points ofcontact for EPA headquarters indisseminating information related toCSO control.
EPA's National CSO ProgramManager hosts monthly conferencecalls with the CSO coordinators. Thecalls allow EPA headquarters to shareinformation on programs andinitiatives related to theimplementation and enforcement ofthe CSO Control Policy. The calls arealso a forum for information sharingacross state and regional programs.The calls have spurred national CSOcoordinator meetings in 1997 and1999. The national meetings of CSO

The City of Richmond, VA won a NationalCSO Control Program Excellence Award in1999 for its efforts to control CSO discharges,which include the construction of deeptunnels for storage, as shown.
Photo: City of Richmond Department of Public Works
4-18
Report to Congress on Implementation and Enforcement of the CSO Control Policy
coordinators allowed representativesfrom state and EPA regional programsto interact with EPA headquarters,share information on successfultechniques for implementing andenforcing the CSO Control Policy, andobtain feedback on challenges toimplementation of the CSO ControlPolicy.
4.6.2 CSO Awards Program
EPA has sponsored National CSOControl Program Excellence Awardssince 1991. The awards recognizemunicipalities that are implementinginnovative and cost-effective CSOcontrol programs and projects. Theawards are intended to heightenoverall public awareness of CSOcontrol measures and to encouragepublic support of CSO programs.
EPA regions and states nominatemunicipalities believed to beimplementing cost-effective andinnovative CSO control programs orprojects. Nominations are screened byappropriate regional enforcementoffices to ensure that nominatedmunicipalities are in compliance.Qualified nominees are notified byEPA headquarters of their nominationand asked to submit materials to beused in assessing the details of theircontrol programs. Winners receivepublic recognition through local pressreleases and coverage in variousnational publications. Appendix Lprovides a list of previous winners anddescribes their CSO control programs.
4.6.3 Listening Sessions to SupportDevelopment of Guidance onImplementing the WaterQuality-Based Provisions of theCSO Control Policy
House Report 105-769 on EPA'sFY 1999 appropriations urged theAgency to:
● Develop guidance, after publiccomment, to facilitate the conductof water quality and designateduse reviews for CSO-receivingwaters.
● Provide technical and financialassistance to states and EPAregions to conduct these reviews.
● Report progress to relevantauthorizing and appropriationscommittees by December 1, 1999.(This report was submitted toCongress on December 17, 1999.)
To address the objectives of HouseReport 105-769, EPA conducted aseries of stakeholder meetings andconference calls during Spring 1999.This outreach effort allowed EPA toobtain a broad range of perspectiveson perceived impediments toimplementing the water quality-basedprovisions of the CSO Control Policyand actions EPA should take.
A total of 156 individuals participatedin the stakeholder meetings andconference calls, including:
● 73 CSO community officialsand/or their consultants
● 53 state agency staff from 15different states

Chapter 4—CSO Control Policy Status: EPA
4-19
● 21 EPA regional and headquarterspersonnel
● Nine environmental interestgroups and watershed associations
Based on this extensive stakeholderinput, six general categories ofimpediments were identified aspreventing full implementation of thewater quality-based provisions of theCSO Control Policy:
● The CSO Control Policy. Thewater quality-based provisions ofthe CSO Control Policy areguidance, whereas the “fishable-swimmable” language of the CWAis law.
● Water quality standards. ManyCSO communities and otherstakeholders do not understandthe water quality standards reviewprocess, the analyses required torevise the standards, and the rolethe public plays in influencing anyrevision to a standard.
● The watershed approach. Statesand CSO communities arepresented with conflictingpriorities and resource constraintsas efforts are made to comply withseveral competing regulatoryprograms (e.g., CSOs, TMDLs,SSOs, storm water) applicable inany given watershed.
● Resources. States and CSOcommunities have insufficientresources and inadequate ormissing tools (regulations,policies, guidance) and data tosupport water quality standardsreviews.
● Uncertainty. The roles of EPA,state regulatory agencies, and CSOcommunities as they relate tocoordination of LTCP and waterquality standards review processesoccur are poorly defined.
● Small communities. The financialand technical requirements of theCSO Control Policy are beyondthe capabilities of many smallcommunities.
EPA used this information to supportthe development of Guidance:Coordinating CSO Long-Term Planningwith Water Quality Standards Reviews.
4.7 Information Management
EPA has established severalinformation management andtracking systems that contain
information related to CSOs. Thissection describes several of the keyinformation sources.
4.7.1 Clean Water Needs Survey(CWNS)
EPA's CWNS is required by CWASections 205(a) and 516(b)(1). TheCWNS summarizes estimated capitalcosts for water quality projects andserves as a basis for capitalizationgrants for the SRF program. Needsestimates are prepared for thefollowing categories of wastewatertreatment and water pollution controlprojects:
● Secondary wastewater treatment
● Advanced wastewater treatment
● Infiltration/inflow correction

Year CSO Needs Total Needs(1996 $Billions) (1996 $Billions)
1988 20.2 103.3
1990 19.5 94.9
1992 46.6 143.6
1996 44.7 120.6
4-20
Report to Congress on Implementation and Enforcement of the CSO Control Policy
● Replacement/rehabilitation ofsewers
● New interceptor and collectorsewers
● CSO control
● Storm water control
● Nonpoint source control
The 1996 CWNS was the twelfthsurvey completed since passage of theCWA in 1972 (EPA, 1997b). As part ofthe 1996 CWNS effort, EPA reviewedall facilities in the CWNS data basewith documented CSO needs oridentified as CSO facilities. EPAcompared this list of facilities with alist of CSO facilities with NPDESpermits. This enabled EPA to correctthe CWNS data base by eliminatingincorrectly identified CSOs andincorporating resolved CSO problems.
The CWNS cost-curve methodologywas based on the presumptionapproach criterion for “adequatecontrol,” which is:
... the elimination or capture for
treatment of no less than 85% of
the wet weather flow by volume of
the combined sewage collected in
the CSS during precipitation
events on a system-wide annual
average basis.
The cost curve uses rainfall patternsfor each CSO community and a runoffcoefficient to calculate flows resultingfrom storm events and to estimaterequired CSO control measures. Thecost of the facilities required toprovide additional treatmentconsisting of primary sedimentation,chlorine disinfection, anddechlorination was estimated with thecost curves. Estimated CSO needsfrom the the most recent surveys aresummarized in Table 4.4.
4.7.2 Government Performance andResults Act (GPRA)
The 1993 GPRA requires federalagencies to develop performance plansto track progress by focusing onmeasurable goals and programobjectives. GPRA requires federalagencies to develop annualperformance plans and reports tomeasure progress in meeting theirgoals and objectives.
EPA selected the CSO program as aGPRA pilot program starting ingovernment FY 1997. EPA OWMdeveloped a “CSO Performance Planfor FY 1997” that contained threeperformance goals: 1) increase thenumber of communitiesimplementing the CSO Control Policy;2) reduce point source loadings fromCSOs; and 3) reduce CSOcontributions to receiving waterimpairment. The plan also containedthree types of performance measuresto track progress toward the goals:
● Administrative Measures.Percentage of CSO communitiesdocumenting the NMC and thepercent of CSO cities required todevelop LTCPs to provide for
Comparison of CSO andTotal Needs
Source: 1996 Clean Water NeedsSurvey Report to Congress (EPA,1997b).
Table 4.4
Chapter 4—CSO Control Policy Status: EPA
4-21
water quality standardsattainment.
● End-of-Pipe Measures. Pollutantloadings measured through CSOfrequency and CSO volume.
● Receiving Water Measures.Impairments measured throughthe number of beach closures andshellfish bed closures per yearattributable to CSOs.
On April 9, 1997, EPA issued itsAssessment of the GPRA Pilot Program(EPA, 1997c). EPA found that:
● 96 of 918 (11 percent) CSOcommunities were "implementingthe CSO Control Policy" asdefined (i.e., documentedimplementation of the NMC andsubject to a requirement todevelop an LTCP). EPA foundfewer CSO communitiesimplementing the CSO ControlPolicy than expected andattributed this to several factors.First, some communities hadcompleted sewer separationprojects and were removed fromthe list of CSO communities.Second, several states emphasizedimplementation of the NMC ordevelopment of LTCPs, but notcompliance with both of thesecriteria. Finally, somecommunities implemented the sixminimum measures listed in the1989 National CSO ControlStrategy, but not the threeremaining controls included in theCSO Control Policy.
● Considerable variation inimplementation of the NMChindered EPA's ability to track
progress and report on programeffectiveness.
4.7.3 Permit Compliance System(PCS)
EPA's PCS provides information onpoint sources holding NPDES permitsto discharge wastewater. The data basecontains NPDES permit issuance andexpiration dates, discharge limits, anddischarge monitoring data. PCS wasdeveloped to track compliance withNPDES permit conditions, specificallyeffluent limits. This design limits theability of PCS to track non-numericpermit conditions such as those mostcommonly used for CSOs. Therefore,the CSO information available fromPCS varies from state to state, anddepends on specific reportingrequirements established by each state.More information on state dataavailable from PCS is provided inChapter 5.
EPA is now modernizing PCS. Themodernized system will allow entry ofall data element fields needed to trackevery discharger, including CSOs. Themodernized system will be capable oftracking additional relevantinformation, including permitrequirements, inspections, andcompliance and enforcement actiondata. EPA regions and states areinvolved in the PCS modernizationprocess. Implementation is scheduledfor completion by the end of 2003.
4.7.4 Statistically Valid Non-Compliance Rate Project
EPA has traditionally focused itsenforcement activities at facilities insignificant regulatory non-compliance.To determine a more accurate rate of
4-22
Report to Congress on Implementation and Enforcement of the CSO Control Policy
overall compliance, EPA initiated theStatistically Valid Noncompliance RateProject in 1999. One regulatory area isaddressed each year. CSOnoncompliance is the focus forFY 2002. As part of the project, EPAheadquarters is providing funding forRegion 3's CSO-inspection trainingprogram and offering the training inRegions 3, 4, and 5. Inspectors will betrained on determining CSO non-compliance and baselines and will alsobe made aware of complianceassistance materials available to assistcommunities. The main focus ofcompliance determination will be thelevel of NMC implementation.
4.7.5 Other InformationManagement Activities
Compliance Assistance PlanningDatabase (CAPD) and theCompliance Assistance Activity Plan
CAPD was created in 2000. It wasdesigned to help EPA documentcompliance assistance activities thatare being planned at the headquartersand regional levels. Once a year, thedata base contents are captured andpublished in the form of theCompliance Assistance Activity Plan.The most current plan includesactivities being undertaken duringFY 2001. CSO-related activities listedin the current activity plan include theGreat Lakes Wet Weather ControlProject (multi-regional) and TechnicalAssistance to Regulated Entities onCSO and SSO Requirements(Region 5).
Reporting Compliance AssistanceTracking System (RCATS)
RCATS, developed in 1999, is aninternal data base for trackingcompleted compliance assistanceactivities undertaken by EPA. It is afollow-up tool to CAPD, in that ittracks those planned activities that arenow being implemented. RCATSreports on activities such asworkshops and training, phone calls,on-site visits, mailed material, andcompliance assistance tools developedby EPA. As of July 2001, Regions 1, 3, 5and 10 had information entered inRCATS relating to CSO complianceassistance activities.
4.8 Financial Assistance
The CSO Control Policyrecognizes the need to considerthe relative importance of
environmental and financial issueswhen developing implementationschedules for CSO controls. Thissection describes funding mechanismsEPA and other federal agencies havemade available to CSO permittees tofund CSO abatement efforts.
4.8.1 The Clean Water SRF Program
With the passage of the 1987 CWAAmendments, each state wasinstructed to create a revolving loanfund to provide independent andpermanent sources of low-costfinancing for a range of water qualityinfrastructure projects. Funds toestablish or capitalize the SRFprograms were provided by federal (83percent) and state (17 percent)governments. SRF programs areoperating in all 50 states and PuertoRico. The District of Columbia

Chapter 4—CSO Control Policy Status: EPA
4-23
participates in the SRF program bycontributing annual funds to its SRFaccount and receiving federalmatching funds, but the program istreated as a grant fund rather than arevolving loan program.
Capitalization began in 1988. Today,total assets of the SRF program standat more than $34 billion. As paymentsare made on loans, funds are recycledto fund additional water protectionprojects.
Under the SRF, states have significantflexibility in selecting assistanceavailable for clean water projects.
Options include:
● Loans
● Refinancing, purchasing orguaranteeing local debt
● Purchasing bond insurance
States set loan terms, includinginterest rates (from zero percent tomarket rate), repayment periods (upto 20 years), and many other features.SRF loans are also available to fund awide variety of water quality projectsincluding CSO control and abatementprojects, as well as more traditionalmunicipal wastewater treatmentprojects. In addition, states maycustomize loan terms to meet theneeds of small and disadvantagedcommunities within certainparameters.
Year SRF Loans1 SRF Loans for CSOs1 % of SRF Spent on CSOs
1988 $6.2 $0 0%
1989 $255.9 $4.7 2%
1990 $788.9 $14.6 2%
1991 $1,976.1 $121.5 6%
1992 $1,688.7 $180.0 11%
1993 $1,311.2 $169.5 13%
1994 $2,455.3 $245.4 10%
1995 $2,157.2 $190.7 9%
1996 $1,959.8 $168.1 9%
1997 $1,772.5 $139.6 8%
1998 $2,283.0 $157.8 7%
1999 $2,159.2 $272.8 13%
2000 $3,367.4 $410.6 12%
Total $22,181.4 $2,075.3 9%
1In Millions
SRF Loans for CSOProjects
SRF funding for CSO controlprojects peaked in 1994 anddeclined until 1998. Funding ratesrebounded in 1999 and continuedto increase in 2000.
Table 4.5

4-24
Report to Congress on Implementation and Enforcement of the CSO Control Policy
Table 4.5 summarizes the total amountof SRF assistance provided by stateseach year since 1989 and SRF loans forCSO control projects.
4.8.2 Section 104(b)(3) Water QualityCooperative Agreements
Under authority of CWA Section104(b)(3), EPA makes grants to statewater pollution control agencies,interstate agencies, and othernonprofit institutions, organizations,and individuals to prevent, reduce,and eliminate water pollution. Amongthe efforts eligible for funding underthe Section 104(b)(3) program areresearch, investigations, experiments,training, environmental technologydemonstrations, surveys, and studiesrelated to the causes, effects, extent,and prevention of pollution. Fundedprojects include activities associatedwith CSO abatement and control.
Unlike the CWA Section 106 grantprogram described in Section 4.8.3 ofthis report, Section 104(b)(3) grantscannot fund ongoing programs oradministrative activity. Table 4.6highlights cooperative agreements for
CSO projects funded by EPA sinceissuance of the CSO Control Policy.Additional information on theoutcome of each grant is provided inAppendix M.
4.8.3 Section 106 Water PollutionControl Program SupportGrants
CWA Section 106 authorizes EPA toprovide assistance to states (includingterritories, the District of Columbia,and tribes) and interstate agencies toestablish and implement waterpollution control programs. TheSection 106 program provides grantsto these agencies to assist in theadministration of programs forpreventing, reducing, and eliminatingwater pollution.
Eligible activities include permitting,enforcement, water quality planning,monitoring, and assistance to localagencies developing pollution controlprograms.
Section 106 funds are used for a broadrange of water quality programs.Neither CSOs nor any other specific
EPA 104(b)(3) GrantCooperative
Agreements for CSOProjects
This funding is awarded forresearch, investigations,experiments, training,environmental technologydemonstrations, surveys, andstudies related to the causes,effects, extent, and prevention ofpollution.
Table 4.6Grantee Title Federal $ Years
AMSA Performance Measures for CSO Control $294,000 9/94—1/97
City of Indianapolis Wet Weather Public Education Program $112,000 7/97—7/99
Low Impact Feasibility of Applying LID Stormwater $110,000 4/99—4/00Development Micro-Scale Techniques to Highly Center Urbanized Areas to Control the Effects
of Urban Stormwater Runoff in CSOs
ORSANCO Wet Weather Study of Ohio River $1,383,000 7/97—12/01
CSO Partnership Information Outreach $176,500 10/94—2/99
California State Training Video $245,000 7/96—7/98University
CSO Partnership Development of CSO Handbook $181,000 4/97—4/99For Small Communities

Chapter 4—CSO Control Policy Status: EPA
4-25
water quality programs are targeted bySection 106. EPA does not requirestates to report on how funds are used,and states use a variety of methods forfunding programs (i.e., permit fees tofund NPDES program, or Section 106funds allocated to support NPDES).Therefore, reliable identification ofprograms receiving Section 106 fundsis impossible.
The national appropriation figures forSection 106 funds to state andinterstate agencies, tribes, andterritories from 1994 to 2001 arepresented in Table 4.7.
4.8.4 Specific Line Items in EPA'sBudget
From FY 1992 through FY 2000,Congress appropriated more than$600 million to 32 communities withCSSs (Table 4.8).
These funds were earmarked for awide variety of structural CSO controlprojects including:
● Sewer separation
● Deep tunnel storage
● Satellite treatment facilities
● Concrete retention basins
Six communities received more thantwo-thirds of the total fundsearmarked by Congress for CSOcontrol. These communities are:
● Rouge River, MI—$253,000,000
● Newark, NJ—$44,300,000
● Onondaga County,NY—$41,089,000
● King County, WA—$35,000,000
● New York City, NY—$34,910,000
● Lackawanna County,PA—$30,000,000
Fiscal Year Grant Amount (Millions)
1994 $81.7
1995 $80.2
1996 $80.2
1997 $80.7
1998 $95.5
1999 $115.5
2000 $115.5
2001 $169.8
Total $819.1
Fiscal Year Appropriation (Millions)
1992 $32.0
1993 $61.0
1994 $154.9
1995 $211.8
1996 $13.0
1997 $23.4
1998 $34.0
1999 $43.3
2000 $33.3
Total $606.7
Annual Section 106Grant Totals
Section 106 funds are used for abroad range of water qualityprograms. It is not possible toassess the amount of funds usedfor CSO control, since CSOs are notseparately tracked, and EPA doesnot require states to report onhow funds are used.
Table 4.7
Annual EPA BudgetLine Items for CSO
Control Projects
Each year, Congress earmarksfunds for a wide variety of CSOcontrol projects. In general,communities using these fundshave made substantial progress incontrolling CSOs.
Table 4.8

4-26
Report to Congress on Implementation and Enforcement of the CSO Control Policy
4.9 Performance Measures
Akey EPA objective included inthe National CSO ControlStrategy and reiterated in the
CSO Control Policy was to "minimizewater quality, aquatic biota, andhuman health impacts from CSOs." Asa result, the CSO Control Policycontains several provisions that, ifproperly implemented, would protectwater quality and other human healthand environmental benefits:
● Implementing the NMC.
● Developing LTCPs that consider arange of options to meet waterquality standards. The CSOControl Policy provides for use ofa presumption or demonstrationapproach for showing that selectedCSO controls will achieve waterquality standards.
● Encouraging communities to givethe highest priority in controllingCSOs to sensitive areas. Sensitiveareas include designatedOutstanding National ResourceWaters, National MarineSanctuaries, waters withthreatened or endangered speciesand associated habitat, waters withprimary contact recreation, publicdrinking water intakes, ordesignated protection areas, andshellfish beds.
Moreover, NPDES authorities wereencouraged to evaluate waterpollution control needs on awatershed management basis and tocoordinate CSO control efforts withother point and nonpoint sourcecontrol activities.
This section describes EPA efforts toidentify and report the benefitsassociated with implementation of theCSO Control Policy. It is important tonote that these benefits are not trackedthrough an all-inclusive CSOprogram. CSO-specific measures,however, are tracked through anumber of other programs.
4.9.1 Specific Efforts to Track BenefitsResulting from CSO ControlPolicy Implementation
EPA has initiated several efforts totrack the benefits resulting fromimplementation of the CSO ControlPolicy.
Government Performance Results Act:CSO Performance Goals
As described in Section 4.7.2, EPAdeveloped the GPRA Pilot Program toquantify benefits related toimplementation of the CSO ControlPolicy. As shown in Table 4.9, specificperformance goals related to benefitswere established in response to GPRA.On April 9, 1997, EPA completed itsassessment of the GPRA PilotProgram (EPA, 1997c). The results arealso summarized in Table 4.9.
Since the 1997 report, EPA hasinitiated efforts to better track andreport on GPRA performancemeasures. EPA has developed a modelto predict pollutant and flowreductions attributable toimplementation of CSO controls byCSO communities. This model,GPRACSO, estimates CSO flowvolume and pollutant loadings basedon hourly simulation of a typicalrainfall year. It also estimates flowvolume and pollutant reductions

Chapter 4—CSO Control Policy Status: EPA
4-27
under various CSO managementscenarios. A discussion of somepreliminary results from theGPRACSO model is provided inSection 7.3.1 of this report.
Assessment of CSO Characterizationand Monitoring Efforts
The CSO Control Policy expectspermittees to characterize, monitor,and model the CSS to predict theeffectiveness of controls to reduceCSO frequency, volume, pollutantloadings, and impacts to receivingwaters and designated uses. Inaddition, the CSO Control Policyanticipates post-constructionmonitoring to verify attainment ofwater quality standards and to verifythe effectiveness of CSO controls.
PCS is used to track compliance withNPDES permit limitations and otherpermit conditions (described inSection 4.7.3 of this report). PCScontains CSO monitoring data foronly a few permits. This is due in partto the fact that the system wasdesigned to track compliance witheffluent limitations, but notspecifically CSO controls. Becauseindividual states established CSOreporting requirements, theavailability of CSO-relatedinformation varies from state to state.
As a result, EPA has been unable to usePCS to track reductions in CSOfrequency, CSO volume, and pollutantloadings at a national or state scale.
EnvironmentalMeasurements from
1997 Pilot GPRAPerformance Plan
Findings from this pilot study ledEPA to initiate efforts to bettertrack and report on CSO controlprogram performance measures.
Table 4.9Performance Measure Summary of Results
Reduce point source loadings EPA found that insufficient data were available to estimate by 3 percent CSO loadings on a national basis or to provide a baseline.
In addition, the Agency found that reporting methods were inconsistent among communities, and from state to state. Reasons that made it difficult to obtain end-of-pipe measurements include the fact that many communities are not required to monitor or report CSO data and a general lack of resources needed to support state reporting to EPA.
Reduce by 10 percent the extent EPA found it difficult to report on the performanceto which CSOs restrict uses of measure related to beach closures and shellfishreceiving waters bed closures, given that there was no consistent national
approach to assessing and tracking beach closures. The Agency recommended retaining this measure for upcoming assessments and suggested that EPA develop guidance on beach assessment (see discussion related to the EPA BEACH Program in Section 4.9.2). With respect to counting shellfish bed closures attributable to CSOs, EPA found that the current five-year rotating cycle approach to assessing shellfish bed closures used by NOAA’s National Shellfish Sanitation Program is not conducive to annual tracking of CSO impacts.EPA has recommended discontinuing this measure in future performance evaluations.
4-28
Report to Congress on Implementation and Enforcement of the CSO Control Policy
Although EPA has been unable totrack environmental benefitinformation at a national or statescale, EPA has continually solicitedmonitoring data to gauge theeffectiveness of the CSO ControlPolicy. EPA has participated in anumber of internal and externaloutreach efforts to collect informationon the effectiveness of the CSOControl Policy in reducing CSOfrequency, volume, and pollutantloadings (described in Section 4.7 ofthis report). In addition, during thedata collection phase for this report,EPA identified a number ofdocumented instances in whichimplementation of the CSO ControlPolicy has resulted in environmentalbenefits. These results are describedfurther in Section 6.7 of this report.
4.9.2 Other Agency Initiatives toDocument EnvironmentalResults Related to CSO Control
Several other EPA programs directlyor indirectly track environmentalresults related to CSO control. Theseefforts, although not the direct resultof the CSO Control Policy, show howoffices, programs, and initiatives canbe coordinated to help identify, define,and remediate CSO-related discharges.This section describes several effortsaddressing CSOs.
Beaches Environmental And CoastalHealth (BEACH) Program
The goal of EPA's BEACH program,announced in 1997, is to reduce therisk of disease to users of recreationwaters by focusing on several keyobjectives: strengthening water qualitystandards for bathing beaches,improving state and local government
beach programs, better informing thepublic, and promoting scientificresearch to better protect the health ofpublic beach users.
Initial efforts focused on current waterquality standards, improvingunderstanding of current state andlocal programs through national andlocal conferences, and identifyingscientific needs. EPA also started itsannual survey of state and localagencies that monitor water quality atbeaches. The voluntary NationalHealth Protection Survey of Beachescollected information about localbeach monitoring, agenciesresponsible for beach programs, anddetailed information about advisoriesand closures at specific beaches. InMarch 1999, EPA published the ActionPlan for Beaches and RecreationalWaters (EPA, 1999b), a multi-yearstrategy describing the Agency'sprogrammatic and scientific researchefforts to improve beach programsand research.
The scope of these activities changedon October 10, 2000. The BEACH Actamended the CWA, in part, to includeSections 303(i) and 406. Theamendment addresses fecalcontamination in coastal recreationwaters. Three significant provisions ofthe BEACH Act amended the CWA to:
● Include Section 303(i), whichrequires states and authorizedtribes having coastal recreationwaters to adopt new or revisedwater quality standards by April2004 for pathogens and pathogenindicators for which EPA haspublished criteria under CWASection 304(a). The BEACH Act
Chapter 4—CSO Control Policy Status: EPA
4-29
further directs EPA to promulgatesuch standards for states that failto do so.
● Sections 104(v)and 303(i) alsorequire EPA to study issuesassociated with pathogens andhuman health and to publish newor revised CWA Section 304(a)criteria for pathogens andpathogen indicators for coastalrecreational waters based on thatstudy. Within three years afterEPA's publication of the new orrevised Section 304(a) criteria,states with coastal recreationwaters must adopt new or revisedwater quality standards for allpathogens and pathogenindicators, to which EPA's new orrevised Section 304(a) criteriaapply, that are as protective ofhuman health as those publishedby EPA. If they are not asprotective, EPA shall proposeregulations for the state for itscoastal recreation waters.
● Include a new Section 406, whichauthorizes EPA to award grants tostates and authorized tribes for thepurpose of developing andimplementing a program tomonitor for pathogens andpathogen indicators in coastalrecreation water adjacent tobeaches used by the public, and tonotify the public if water qualitystandards for pathogens andpathogen indicators are exceeded.To be eligible for theimplementation grants, states andauthorized tribes must developmonitoring and notificationprograms consistent withperformance criteria published by
EPA under the Act. The BEACHAct also requires EPA to performmonitoring and notificationactivities for waters in states thatlack a program consistent withEPA's performance criteria, usinggrants funds that would otherwisehave been available to those states.
Source Water Protection Program
EPA's Office of Ground Water andDrinking Water (OGWDW) seeks toprotect public health by ensuring safedrinking water and protecting groundwater. The Source Water ProtectionProgram aims to preventcontamination of drinking watersupplies. OGWDW's source waterprotection guidance identifies CSOs asa source of pollution in source water.
In addition, under OGWDW's SourceWater Assessment Program (SWAP),states should analyze existing andpotential threats to the quality of thepublic drinking water and submit aSWAP to EPA for review and approval.A state SWAP includes: a delineationof the source water protection area; acontaminant source inventory; adetermination of susceptibility of thepublic water supply to contaminationfrom the inventoried sources; andrelease of results of the assessments tothe public. EPA has approved 52SWAP programs. EPA expects states tocomplete all assessments no later thanthree years after EPA approval of theprogram. Sewer lines, including CSOs,are identified in EPA's State SourceWater Assessment and ProtectionGuidance (EPA, 1997d) as potentialsources of drinking watercontaminants.
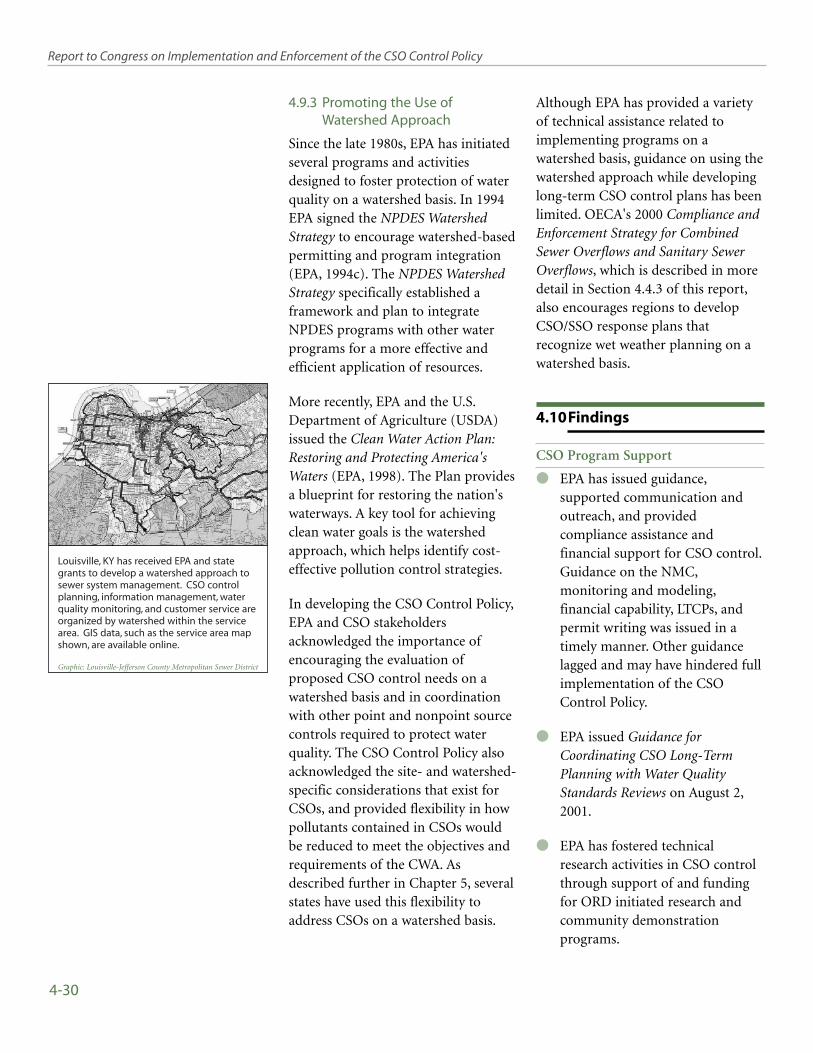
Louisville, KY has received EPA and stategrants to develop a watershed approach tosewer system management. CSO controlplanning, information management, waterquality monitoring, and customer service areorganized by watershed within the servicearea. GIS data, such as the service area mapshown, are available online.
Graphic: Louisville-Jefferson County Metropolitan Sewer District
4-30
Report to Congress on Implementation and Enforcement of the CSO Control Policy
4.9.3 Promoting the Use ofWatershed Approach
Since the late 1980s, EPA has initiatedseveral programs and activitiesdesigned to foster protection of waterquality on a watershed basis. In 1994EPA signed the NPDES WatershedStrategy to encourage watershed-basedpermitting and program integration(EPA, 1994c). The NPDES WatershedStrategy specifically established aframework and plan to integrateNPDES programs with other waterprograms for a more effective andefficient application of resources.
More recently, EPA and the U.S.Department of Agriculture (USDA)issued the Clean Water Action Plan:Restoring and Protecting America'sWaters (EPA, 1998). The Plan providesa blueprint for restoring the nation'swaterways. A key tool for achievingclean water goals is the watershedapproach, which helps identify cost-effective pollution control strategies.
In developing the CSO Control Policy,EPA and CSO stakeholdersacknowledged the importance ofencouraging the evaluation ofproposed CSO control needs on awatershed basis and in coordinationwith other point and nonpoint sourcecontrols required to protect waterquality. The CSO Control Policy alsoacknowledged the site- and watershed-specific considerations that exist forCSOs, and provided flexibility in howpollutants contained in CSOs wouldbe reduced to meet the objectives andrequirements of the CWA. Asdescribed further in Chapter 5, severalstates have used this flexibility toaddress CSOs on a watershed basis.
Although EPA has provided a varietyof technical assistance related toimplementing programs on awatershed basis, guidance on using thewatershed approach while developinglong-term CSO control plans has beenlimited. OECA's 2000 Compliance andEnforcement Strategy for CombinedSewer Overflows and Sanitary SewerOverflows, which is described in moredetail in Section 4.4.3 of this report,also encourages regions to developCSO/SSO response plans thatrecognize wet weather planning on awatershed basis.
4.10Findings
CSO Program Support
● EPA has issued guidance,supported communication andoutreach, and providedcompliance assistance andfinancial support for CSO control.Guidance on the NMC,monitoring and modeling,financial capability, LTCPs, andpermit writing was issued in atimely manner. Other guidancelagged and may have hindered fullimplementation of the CSOControl Policy.
● EPA issued Guidance forCoordinating CSO Long-TermPlanning with Water QualityStandards Reviews on August 2,2001.
● EPA has fostered technicalresearch activities in CSO controlthrough support of and fundingfor ORD initiated research andcommunity demonstrationprograms.

Chapter 4—CSO Control Policy Status: EPA
4-31
Compliance and Enforcement
● EPA issued the Compliance andEnforcement Strategy for AddressingCombined Sewer Overflows andSanitary Sewer Overflows in 2000.
● EPA has taken 32 administrativeactions and 35 civil judicialactions (five since issuance of theCSO Control Policy, 16 under theNational Municipal Policy, and 13other) related to CSO controls.Cases brought under the NationalMunicipal Policy were animportant force in bringing aboutearly CSO control initiatives atmajor municipalities.

distinct roles of which are outlined inthe CSO Control Policy and detailedin Table 5.1. NPDES authorities areusually state environmental agencies,but are EPA regional offices wherestates have not obtained the authorityto issue and enforce NPDES permits.
State water quality standardsauthorities are responsible foradopting, reviewing, and revisingwater quality standards. The specificrole of the state water qualitystandards authority, as defined by theCSO Control Policy, is described inTable 5.1.
As shown in Table 5.2, 32 states(including the District of Columbia)have CSO permittees in theirjurisdiction. State agencies are theNPDES authority in 28 of these states.Programs in Alaska, the District ofColumbia, Massachusetts, and NewHampshire are administered by EPAregional offices.
States and territories without CSOpermittees within their jurisdiction, ascertified by the state and confirmed by
Chapter 5
EPA's 1994 CSO Control Policyassigns primary responsibilityfor its implementation and
enforcement to NPDES authoritiesand water quality standardsauthorities. The major provisions ofthe CSO Control Policy are as follows:
NPDES authorities will
issue/reissue or modify permits, as
appropriate, to require compliance
with the technology-based and
water quality-based requirements
of the CWA... ...NPDES
authorities should ensure the
implementation of the minimum
technology-based controls and
incorporate a schedule into an
appropriate enforceable
mechanism ...
The water quality standards
authorities will help ensure that
development of the CSO
permittees' long-term control plans
are coordinated with that review
and possible revision of water
quality standards ...
NPDES authorities include bothpermitting and enforcement staff, the
5-1
CSO Control Policy ImplementationStatus: NPDES Authorities and Other
State Programs
In this chapter:
5.1 Policy Development andSupport
5.2 NPDES Permitting
5.3 Water Quality Standards
5.4 Compliance andEnforcement
5.5 Guidance, Training andCompliance andTechnical Assistance
5.6 Communication andCoordination
5.7 Financial Assistance
5.8 Performance Measures
5.9 Findings

5-2
Report to Congress on Implementation and Enforcement of the CSO Control Policy
the EPA regional office, are listed inTable 5.3.
As of June 2001, the 32 states withcombined sewer systems hold a totalof 859 CSO permits. The permitsauthorize discharges from 9,471 CSOoutfalls. The numbers of CSO permitsand permitted outfalls in each state areshown in Figure 5.1 and Figure 5.2,respectively. Historically, the reportednumber of CSO permits nationwidehas varied from fewer than 900 tomore than 1,500. Similarly, thereported number of CSO outfalls hasranged from fewer than 9,000 toapproximately 15,000. Comparisons ofhistoric CSO permits and outfallsestimates with those developed for thisreport are inappropriate due toimprovements in the quality ofinformation available on CSSs andchanges in the way they are permitted.For example, since the issuance of the1989 National CSO Control Strategy,
the number of CSO permits hasdeclined steadily as states haveundertaken efforts to better identifyCSSs. A number of permits werereclassified when systemcharacterizations revealed "leaky"sanitary systems, rather thancombined sewers. Conversely, recentdecisions by NPDES authorities haveincreased the number of CSO permitsin some states (e.g., Pennsylvania, NewJersey) through the issuance of generalpermits to communities with CSSsand CSO outfalls, but withouttreatment plants. Previously, thesecollection systems often receivedpermit coverage through the facilitytreating its wastewater. Collectionsystems with no associated POTW areoften referred to as "satellite collectionsystems."
This chapter documents how NPDESauthorities and state water qualitystandards authorities have
NPDES Permitting
● Reassess/revise CSOpermitting strategy
● Incorporate CSO-conditions(e.g., NMC and LTCP)
● Review documentation ofNMC implementation
● Coordinate review of LTCPcomponents throughoutLTCP development processand accept/approvepermittee's LTCP
● Coordinate review andrevision of water qualitystandards, as appropriate
● Incorporate implementationschedule into anappropriate enforceablemechanism
● Review implementationactivity report
NPDES Enforcement
● Monitor compliance withJanuary 1, 1997 deadline forNMC implementation anddocumentation
● Take appropriateenforcement actions againstdry weather overflows
● Monitor compliance withpermit requirements
● Ensure CSO requirementsand schedules forcompliance areincorporated intoappropriate enforceablemechanisms
● Incorporate implementationschedules longer than threeyears in a judicial courtorder
State WQS Authority
● Review water qualitystandards in CSO-impactedreceiving water bodies
● Coordinate review withLTCP development toensure long-term controlswill be sufficient to meetwater quality standards
● Revise water qualitystandards as appropriate,subject to EPA approval
Roles andResponsibilities
The CSO Control Policy describesspecific expectations for NPDESpermitting and enforcementauthorities, and state water qualitystandards authorities indeveloping and implementingCSO controls that meet CWAobjectives and requirements.
Table 5.1
Source: Combined Sewer Overflow Guidance for Long-Term Control Plan

Chapter 5—NPDES and Other State Authorities
5-3
implemented and enforced the CSOControl Policy. Areas addressedinclude:
● Pre-policy CSO strategiesdeveloped by NPDES authoritiesin response to the 1989 NationalCSO Control Strategy.
● Efforts of NPDES authorities tomeet the requirements of the CSOControl Policy.
● Enforcement and compliancestrategies being applied to ensure
compliance with the CWA as soonas practicable.
● Compliance assistance activities bystates to help local governmentscomply with CSO requirements.
● Information management systemsand techniques developed tofacilitate CSO Control Policyimplementation.
● Mechanisms for internal andexternal communication andparticipation in CSO ControlPolicy implementation.
Region State Permitting Authority
1 Connecticut Connecticut Department of Environmental ProtectionMaine Maine Department of Environmental ProtectionMassachusetts EPA Region 1New Hampshire EPA Region 1Rhode Island Rhode Island Department of Environmental ManagementVermont Vermont Department of Environmental Conservation
2 New Jersey New Jersey Department of Environmental ProtectionNew York New York State Department of Environmental Conservation
3 Delaware Delaware Department of Natural Resources and Env. ControlMaryland Maryland Department of the EnvironmentPennsylvania Pennsylvania Department of Environmental ProtectionVirginia Virginia Department of Environmental QualityWest Virginia West Virginia Department of Environmental ProtectionDist. of Columbia EPA Region 3
4 Georgia Georgia Department of Natural ResourcesKentucky Kentucky Department for Environmental ProtectionTennessee Tennessee Department of Environment and Conservation
5 Illinois Illinois Environmental Protection AgencyIndiana Indiana Department of Environmental ManagementMichigan Michigan Department of Environmental QualityMinnesota Minnesota Pollution Control AgencyOhio Ohio Environmental Protection AgencyWisconsin Wisconsin Department of Natural Resources
7 Iowa Iowa Department of Natural ResourcesKansas Kansas Department of Health and EnvironmentMissouri Missouri Department of Natural ResourcesNebraska Nebraska Department of Environmental Quality
8 South Dakota South Dakota Department of Environment and Natural Resources
9 California California State Water Resources Control Board
10 Alaska EPA Region 10Oregon Oregon Department of Environmental QualityWashington Washington Department of Ecology
States With CSOPermits
As of 2001, 32 states (including theDistrict of Columbia) have CSOpermits.
Table 5.2

5-4
Report to Congress on Implementation and Enforcement of the CSO Control Policy
● Measures of environmentalimpacts and benefits of the CSOControl Policy.
● Funding mechanisms for CSOprogram implementation.
5.1 Policy Development andSupport
Prior to the issuance of theNational CSO Control Strategy,some states (e.g., Illinois, Ohio,
and Washington) developed statestrategies or regulations requiringCSO planning and abatement invarying degrees. Other statesimplemented requirements for CSOcontrol through administrative orders(e.g., Tennessee) or throughenforcement mechanisms on a case-
by-case basis (e.g.,Wisconsin—Milwaukee, NewYork—New York City). As described inChapter 2, however, the National CSOControl Strategy prompted manyNPDES authorities to initiate CSOcontrol activities.
5.1.1 Efforts to Adhere to the 1989National CSO Control Strategy
The National CSO Control Strategycontained some elements thatoriginated in existing state programs,including the suggestion, drawn fromIllinois' six minimum measures, thatNPDES authorities consider requiringBMPs to be applied as BAT on a BPJbasis. Furthermore, the National CSOControl Strategy urged states todevelop a CSO permitting strategy orcertify that no combined sewer
Region State/Territory Notes
2 Puerto Rico No CSOs per Region’s verbal certification.US Virgin Islands No CSOs per Region’s verbal certification.
4 Alabama September 1988 letter certifying no known CSOs.Florida October 1992 letter noting elimination of Florida’s last CSO.Mississippi September 1988 letter certifying no known CSOs.North Carolina October 1988 letter certifying no known CSOs.South Carolina October 1990 letter certifying no known CSOs.
6 Arkansas September 1989 letter noting elimination of Arkansas’ last CSO.Louisiana October 1989 letter certifying no known CSOs.New Mexico August 1989 letter certifying no known CSOs.Oklahoma September 1989 letter certifying no known CSOs.Texas August 1988 letter certifying no known CSOs.
8 Colorado Region verbally certified elimination of Colorado’s last CSO.Montana November 1990 letter certifying no known CSOs.North Dakota November 1990 letter certifying no known CSOs.Utah November 1990 letter certifying no known CSOs.Wyoming November 1990 letter certifying no active CSOs.
9 Arizona October 1990 letter certifying no known CSOs.Hawaii October 1990 letter certifying no known CSOs.Nevada Verbally certified no known CSOs to Region on October 1990.Pacific Islands No CSOs per Region’s verbal certification.Tribal Nations No CSOs per Region’s verbal certification.
10 Idaho September 1990 letter certifying no active CSOs.
States With No CSOPermits
As of 2001, 19 states, theCommonwealth of Puerto Rico,Tribal Nations, and two territoriesreport having no active CSOoutfalls. Each state or tribalagency has certified thisassessment, either verbally or inwriting, to its EPA Region.
Table 5.3
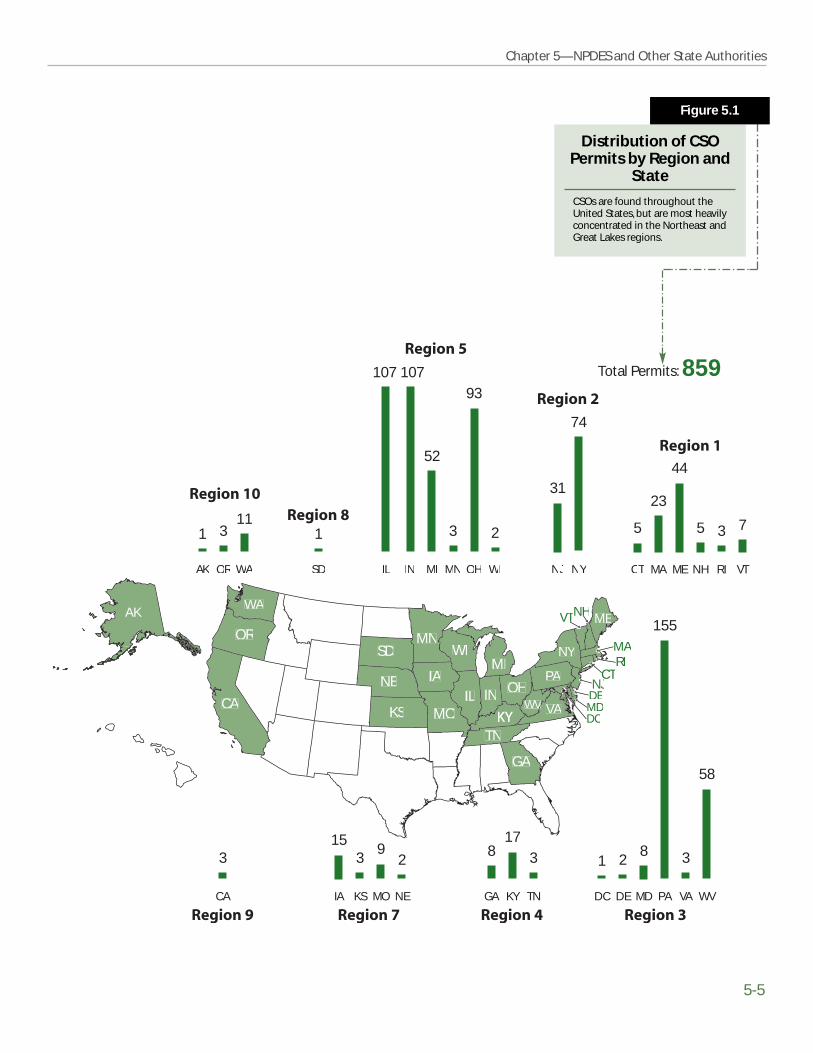
Chapter 5—NPDES and Other State Authorities
5-5
Distribution of CSOPermits by Region and
State
CSOs are found throughout theUnited States, but are most heavilyconcentrated in the Northeast andGreat Lakes regions.
Figure 5.1
AKWA
OR
CA
NE
KS
SDMN
WI
IA
MOIL IN OH
MI
TN
GA
WVVWVVV VA
PA
NY
ME
CTRI
NJDE
NHVT
MDDC
MA
C
T H
M
3
CA
31
NJ
74
NY
1
SD
5
CT
23
MA
44
ME
5
NH
7
VT
3
RI
AK
3
OR
1
AK
11
WA
3
KS
2
NE
9
MO
15
IA
3
MN
2
WI
93
OH
52
MI
107
IN
107
IL
3
TN
17
KY
8
GA
3
VA
1
DC
2
DE
8
MD
155
PA
58
WV
Total Permits: 859

5-6
Report to Congress on Implementation and Enforcement of the CSO Control Policy
Distribution of CSOOutfalls by Region and
State
Similar to the distribution of CSOpermits, CSO outfalls are alsoconcentrated in the Northeast andGreat Lakes regions.
Figure 5.2
AKWA
OR
CA
NE
KS
SDMN
WI
IA
MOIL IN OH
MI
TN
GA
WVVWVVV VA
PA
NY
ME
CTRI
NJDE
NHVT
MDDC
MA
C
T H
M
Total Outfalls: 9,471
122
CT
311
MA
229
ME
44
NH
87
RI
64
VT
274
NJ
1,098
NY
60
DC
1,662
PA
39
DE
58
MD
99
VA
784
WV
19
GA
299
KY
50
TN
813
IL
898
IN
297
MI
9
MN
1,421
OH
123
WI
102
IA
71
KS
49
MO
26
NE
41
CA
1
D
99
OR
3
AK
219
WA

Chapter 5—NPDES and Other State Authorities
5-7
systems operated within theirboundaries by 1990. The overall goalfor the CSO permitting strategies wascompliance with the CWA. Thestrategies included provisions toeliminate dry weather overflows andto minimize the impacts of CSOs.
A majority of states with CSO permits(20 of 32) developed CSO strategies bythe 1990 deadline. Those statessubmitting strategies after the deadlinetended to be states with large numbersof CSO communities (e.g., Indiana,New York, Pennsylvania, and WestVirginia). All permitting authorities,except New York, had strategies inplace by 1991. New York finalized itsstrategy in 1993.
CSO strategies ranged from detaileddocuments discussing statewideapproaches for implementation ofCSO controls within the NPDESprogram framework (e.g., Maine,Michigan, and Oregon), to lists ofcurrent CSO permits noting how eachwas or would be addressed (e.g.,Alaska, Minnesota, and Wisconsin).Typically, the latter approach wasreserved for NPDES authorities withfew CSO permits.
Just as CSO strategies varied fromstate to state, so did procedures forstrategy implementation.Implementation procedures typicallyadded CSO strategy elements toreissued permits or included CSOstrategies as part of a state regulationor code.
CSO strategy requirements were addedto NPDES permits as early as 1990(Illinois) and as recently as 1999(Connecticut). Notably, most NPDES
authorities did not complete a fullfive-year permit cycle between theissuance of its own CSO strategy and1994, when the CSO Control Policywas published. This means thatNPDES authorities would notnecessarily have added CSOrequirements from its strategy in allCSO permits before the CSO ControlPolicy was issued.
5.1.2 Efforts to Adhere to the 1994CSO Control Policy
As described in Chapter 2, the CSOControl Policy defined roles for andprovided guidance to NPDESauthorities, water quality standardsauthorities, and CSO communities onthe selection and implementation ofCSO controls. Specifically, the CSOControl Policy expected that NPDESauthorities would:
● Review and revise, as appropriate,state CSO permitting strategiesdeveloped in response to theNational CSO Control Strategy.
● Develop and issue permitsrequiring CSO communities toimmediately implement the NMCand document implementation,and to develop and comply withan LTCP.
● Promote coordination among theCSO community, the state waterquality standards authority, andthe general public during LTCPdevelopment and implementation.
● Consider evaluating waterpollution control needs on awatershed basis, and coordinateCSO control with the control of

5-8
Report to Congress on Implementation and Enforcement of the CSO Control Policy
other point and nonpoint sourcesof pollution.
● Recognize the difficulty for somesmall communities in meeting theformal elements of LTCPdevelopment, and that compliancewith the NMC and a reducedscope LTCP may be sufficient.
● Consider sensitive areas, useimpairment, and the permitholder's financial capability in thereview and approval ofimplementation schedules.
NPDES authorities generally took oneof four approaches in responding tothe CSO Control Policy:
● Revised existing CSO strategy tomatch CSO Control Policyrequirements. NPDES authoritiesrevised their existing CSOstrategies, adding elements to theirpermitting approach to matchcomponents of the CSO ControlPolicy.
● Continued implementation ofexisting CSO strategy. NPDESauthorities did not respondimmediately to the CSO ControlPolicy, but continued toimplement existing CSO strategieswhile determining if or how toincorporate components of theCSO Control Policy into theirpermitting programs.
● Adopted approach withrequirements beyond or outsideCSO Control Policy. NPDESauthorities continued to useexisting strategies or developednew strategies advocating
approaches beyond or outside thecontext of the CSO Control Policy.
● Developed CSO control programson a site-specific basis. Thisapproach was generally used byNPDES authorities with fewerthan five CSO permits within theirjurisdiction. These authoritiestypically worked with the CSOcommunities to develop site-specific CSO control programs,incorporating elements of theCSO Control Policy as applicable.
A profile of each state, including theNPDES authority's approach toregulating CSOs, is provided inAppendix B.
Revised Existing CSO Strategy toMatch CSO Control PolicyRequirements
The following NPDES authoritiesrevised existing strategies to beconsistent with the CSO ControlPolicy:
● Region 1 in Massachusetts
● Region 1 in New Hampshire
● Connecticut
● Georgia
● Indiana
● Kentucky
● Maine
● Maryland
● Missouri
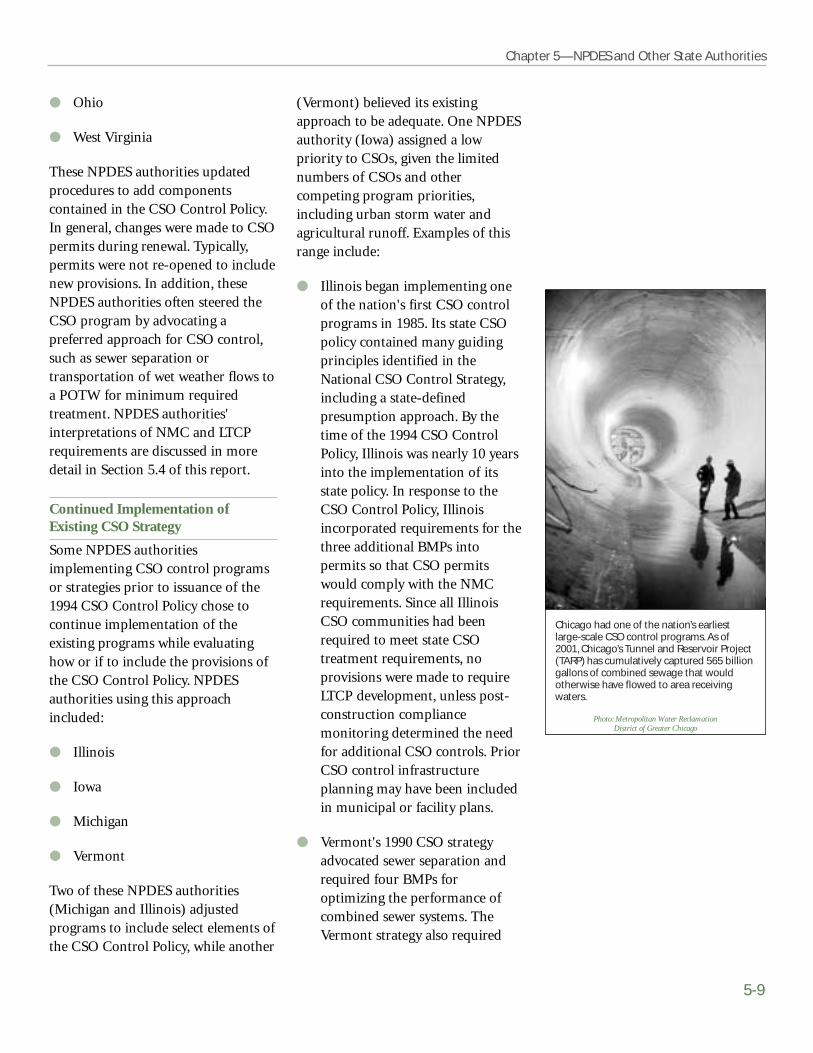
Chicago had one of the nation’s earliestlarge-scale CSO control programs. As of2001, Chicago’s Tunnel and Reservoir Project(TARP) has cumulatively captured 565 billiongallons of combined sewage that wouldotherwise have flowed to area receivingwaters.
Photo: Metropolitan Water Reclamation District of Greater Chicago
Chapter 5—NPDES and Other State Authorities
5-9
● Ohio
● West Virginia
These NPDES authorities updatedprocedures to add componentscontained in the CSO Control Policy.In general, changes were made to CSOpermits during renewal. Typically,permits were not re-opened to includenew provisions. In addition, theseNPDES authorities often steered theCSO program by advocating apreferred approach for CSO control,such as sewer separation ortransportation of wet weather flows toa POTW for minimum requiredtreatment. NPDES authorities'interpretations of NMC and LTCPrequirements are discussed in moredetail in Section 5.4 of this report.
Continued Implementation ofExisting CSO Strategy
Some NPDES authoritiesimplementing CSO control programsor strategies prior to issuance of the1994 CSO Control Policy chose tocontinue implementation of theexisting programs while evaluatinghow or if to include the provisions ofthe CSO Control Policy. NPDESauthorities using this approachincluded:
● Illinois
● Iowa
● Michigan
● Vermont
Two of these NPDES authorities(Michigan and Illinois) adjustedprograms to include select elements ofthe CSO Control Policy, while another
(Vermont) believed its existingapproach to be adequate. One NPDESauthority (Iowa) assigned a lowpriority to CSOs, given the limitednumbers of CSOs and othercompeting program priorities,including urban storm water andagricultural runoff. Examples of thisrange include:
● Illinois began implementing oneof the nation's first CSO controlprograms in 1985. Its state CSOpolicy contained many guidingprinciples identified in theNational CSO Control Strategy,including a state-definedpresumption approach. By thetime of the 1994 CSO ControlPolicy, Illinois was nearly 10 yearsinto the implementation of itsstate policy. In response to theCSO Control Policy, Illinoisincorporated requirements for thethree additional BMPs intopermits so that CSO permitswould comply with the NMCrequirements. Since all IllinoisCSO communities had beenrequired to meet state CSOtreatment requirements, noprovisions were made to requireLTCP development, unless post-construction compliancemonitoring determined the needfor additional CSO controls. PriorCSO control infrastructureplanning may have been includedin municipal or facility plans.
● Vermont's 1990 CSO strategyadvocated sewer separation andrequired four BMPs foroptimizing the performance ofcombined sewer systems. TheVermont strategy also required
5-10
Report to Congress on Implementation and Enforcement of the CSO Control Policy
that an administrative order (AO)be issued to CSO communitiesthat opted not to pursue sewerseparation. The AO required suchcommunities to identify controloptions and funding needs.Vermont provided state grants andinterest-free loans to facilitate andaccelerate CSO planning andprojects. Rather than changing itsapproach to align with the CSOControl Policy, Vermontcontinued implementation of its1990 CSO strategy. To date, 20 of27 original CSO communitieshave completed their sewerseparation projects and are nolonger considered by the state tobe CSSs.
● Iowa's 1990 CSO strategy met therequirements of the National CSOControl Strategy and identifiedseveral additional componentsrequiring:
◗ An inventory of all CSOdischarge points.
◗ An evaluation of currentwater quality standards andstream use designations andtechnology-based limitationsfor wet weather CSO waterquality impacts.
◗ A state rule-making processfor implementing andenforcing the strategy.
◗ A process for including theprovisions in the strategy inthe NPDES permittingprocess.
Given the limited number of CSOpermits and other priorities in its state
water program, Iowa took a wait-and-see approach to determine if the CSOControl Policy would be revised beforerevising its state strategy. In 2001, Iowabegan including NMC and LTCPrequirements in reissued CSO permits,for communities not proceeding withseparation.
Adopted Approach WithRequirements Beyond or OutsideCSO Control Policy
Some NPDES authorities developedand implemented programs withnotable variation on the measuresoutlined in the CSO Control Policy.NPDES authorities using thisapproach included:
● New Jersey
● New York
● Pennsylvania
● Washington
Permitting authorities often developedapproaches based on priorities forwastewater pollution control as relatedto CSOs (e.g., New York), the desire toemphasize abatement of specificpollutants associated with CSOdischarges (e.g., New Jersey), the needor desire to be more proscriptive at astate level (e.g., Pennsylvania,Washington), or the decision tointegrate CSO controls within awatershed management approach.Examples include:
● New York uses its EnvironmentalBenefit Permit Strategy (EBPS) toestablish priorities for reissuingpermits based on theenvironmental benefits to be

New Jersey provides CSO communities withplanning and design grants for solids andfloatables control measures, such as nets likethe system used in North Bergen.
Photo: NJ Department of Environmental Protection
Chapter 5—NPDES and Other State Authorities
5-11
gained by modifying the permit,rather than reviewing permits inchronological order. Under theEBPS, permits receive a numericalscore for each of 15 factorsapplicable to that particularpermit. Two factors are specific toCSO control: permit requirementsto implement the 15 BMPs, andpermit requirements to developand submit an LTCP. New York'sgoal is to revise the top 10 percentof state-issued NPDES permitsbased on the priority ranking listeach year.
● Under the New Jersey SewerageInfrastructure Improvement Act(enacted in 1988), the stateinitiated a program that, in part,provides planning and designgrants for the development andimplementation of solids andfloatables control measures, andfor the identification andelimination of dry weatheroverflows. Communities with CSOdischarges are required to capture,remove, and properly dispose ofall solid and floatable materialsfrom CSO discharges that wouldhave been captured with a 1/2-inch bar screen. All CSO pointsmust be controlled.
● Pennsylvania's strategy identifiestwo requirements for CSO permitsprior to the implementation of theNMC and development of anLTCP: a system inventorycharacterization report(identifying all outfalls, providingengineering drawings of theoutfall structures, anddetermining if outfalls dischargeto sensitive waters); and a system
hydraulic characterization report(containing a detailed analysis ofthe hydraulic capacity of thesystem and a statistical analysis ofarea precipitation data related tooverflow events). While thesecomponents are typical of theNMC and LTCPs, Pennsylvaniaconsiders the reports prerequisitesto the development andimplementation of CSO controls.
● In 1987, Washington State codified(State Code 173-245 WAC) itsapproach of reducing CSOdischarges to no more than oneuntreated event per average year,including implementation ofseveral BMPs and development ofa CSO facilities reduction plan.Washington asserted that thecomponents of its state programmet or exceeded the CSO ControlPolicy in all areas except publicparticipation. Washington nowrequires increased publicparticipation in CSO planning andincludes such provisions throughpermit conditions uponreissuance.
Developed CSO Control Programs ona Site-Specific Basis
In response to the National CSOControl Strategy, NPDES authoritieswith fewer than five CSO permitstypically submitted a list of the CSOpermits, noting how each was orwould be addressed. With the issuanceof the CSO Control Policy, theseNPDES authorities incorporatedelements of the Policy into site-specificprograms, as appropriate. NPDESauthorities using this approachincluded:

5-12
Report to Congress on Implementation and Enforcement of the CSO Control Policy
● Region 3 (District of Columbia)
● Region 10 in Alaska
● California
● Delaware
● Kansas
● Minnesota
● Nebraska
● Oregon
● Rhode Island
● South Dakota
● Tennessee
● Virginia
● Wisconsin
Some NPDES authorities (California,Delaware, District of Columbia,Kansas, Oregon, Rhode Island, SouthDakota, Tennessee, Virginia) adjustedpermits to include elements of theCSO Control Policy in one or more ofits CSO permits. Nebraska has notimplemented the CSO Control Policy.Some NPDES authorities (Alaska,Minnesota, Wisconsin) indicated thattheir CSO communities hadimplemented CSO control plans thatrendered changes to permits inresponse to the CSO Control Policyunnecessary.
A variable and evolving set of CSOcontrols resulted from these differentapproaches and schedules, which wereincorporated into permits as thepermits were reissued. This variabilityis discussed further in Section 5.2.
5.2 NPDES Permitting
As discussed in Chapter 2 of thisreport, CSOs are point sourcedischarges subject to NPDES
permit requirements, including bothtechnology-based and water quality-based requirements of the CWA. TheCSO Control Policy specificallyexpects NPDES authorities should, ata minimum, include requirements inCSO permits for the following:
...demonstration of
implementation of the nine
minimum controls and
development of the long-term
control plan ...
... implementation of a long-term
CSO control plan ...
As of June 2001, 859 CSO permits forCSSs regulated discharges from 9,471CSO outfalls. Each of the 859 permitscontained a site-specific list of CSOoutfalls. In addition, most NPDESauthorities have imposedrequirements for, or initiated actionresulting in, implementation of CSOcontrols:
● 94 percent of CSO permits includeenforceable requirements toimplement low-cost BMPmeasures to mitigate CSO-relatedimpacts.
● 82 percent of CSO permits includean enforceable requirement todevelop a CSO facilities planoutlining more capital intensiveplans for CSO control.
Further, the requirements for CSOcontrol employed by the majority ofNPDES authorities are similar to those
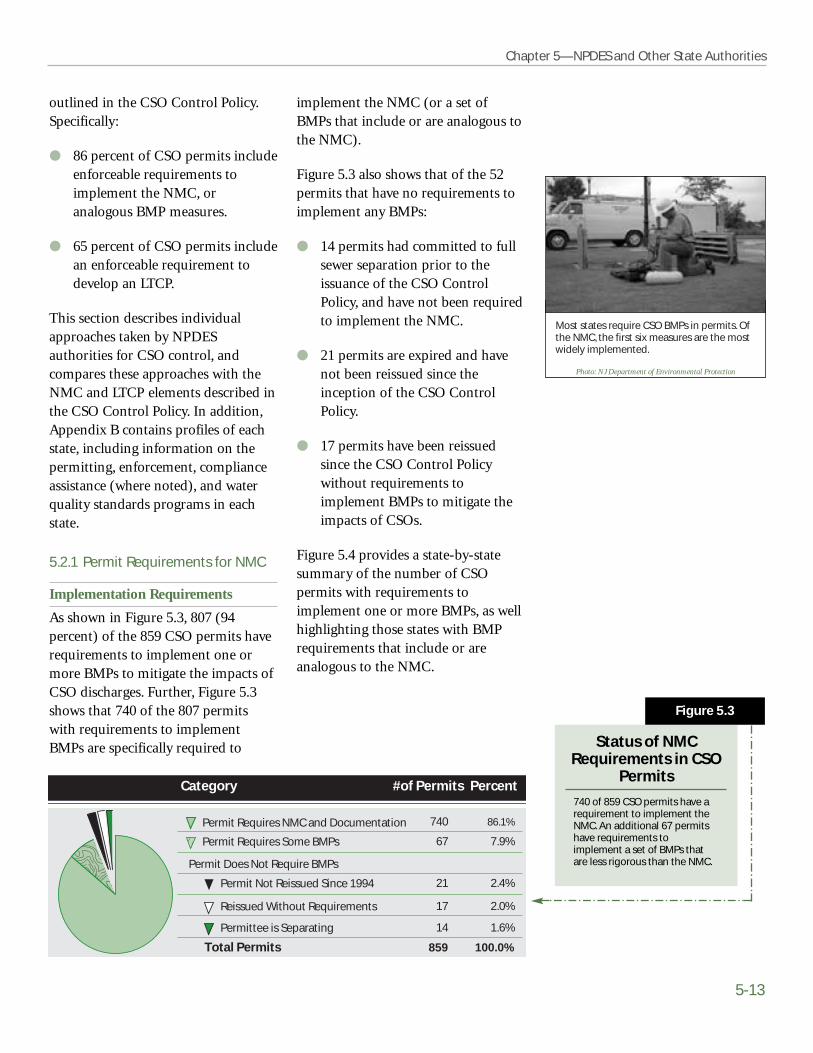
Most states require CSO BMPs in permits. Ofthe NMC, the first six measures are the mostwidely implemented.
Photo: NJ Department of Environmental Protection
Chapter 5—NPDES and Other State Authorities
5-13
outlined in the CSO Control Policy.Specifically:
● 86 percent of CSO permits includeenforceable requirements toimplement the NMC, oranalogous BMP measures.
● 65 percent of CSO permits includean enforceable requirement todevelop an LTCP.
This section describes individualapproaches taken by NPDESauthorities for CSO control, andcompares these approaches with theNMC and LTCP elements described inthe CSO Control Policy. In addition,Appendix B contains profiles of eachstate, including information on thepermitting, enforcement, complianceassistance (where noted), and waterquality standards programs in eachstate.
5.2.1 Permit Requirements for NMC
Implementation Requirements
As shown in Figure 5.3, 807 (94percent) of the 859 CSO permits haverequirements to implement one ormore BMPs to mitigate the impacts ofCSO discharges. Further, Figure 5.3shows that 740 of the 807 permitswith requirements to implementBMPs are specifically required to
implement the NMC (or a set ofBMPs that include or are analogous tothe NMC).
Figure 5.3 also shows that of the 52permits that have no requirements toimplement any BMPs:
● 14 permits had committed to fullsewer separation prior to theissuance of the CSO ControlPolicy, and have not been requiredto implement the NMC.
● 21 permits are expired and havenot been reissued since theinception of the CSO ControlPolicy.
● 17 permits have been reissuedsince the CSO Control Policywithout requirements toimplement BMPs to mitigate theimpacts of CSOs.
Figure 5.4 provides a state-by-statesummary of the number of CSOpermits with requirements toimplement one or more BMPs, as wellhighlighting those states with BMPrequirements that include or areanalogous to the NMC.
Status of NMCRequirements in CSO
Permits
740 of 859 CSO permits have arequirement to implement theNMC. An additional 67 permitshave requirements toimplement a set of BMPs thatare less rigorous than the NMC.
Figure 5.3
#of Permits Percent
Total Permits 859 100.0%
Permit Requires Some BMPs
Permit Not Reissued Since 1994
Category
Permit Requires NMC and Documentation 740
21
67
86.1%
2.4%
7.9%
Reissued Without Requirements
Permittee is Separating
17
14
2.0%
1.6%
Permit Does Not Require BMPs
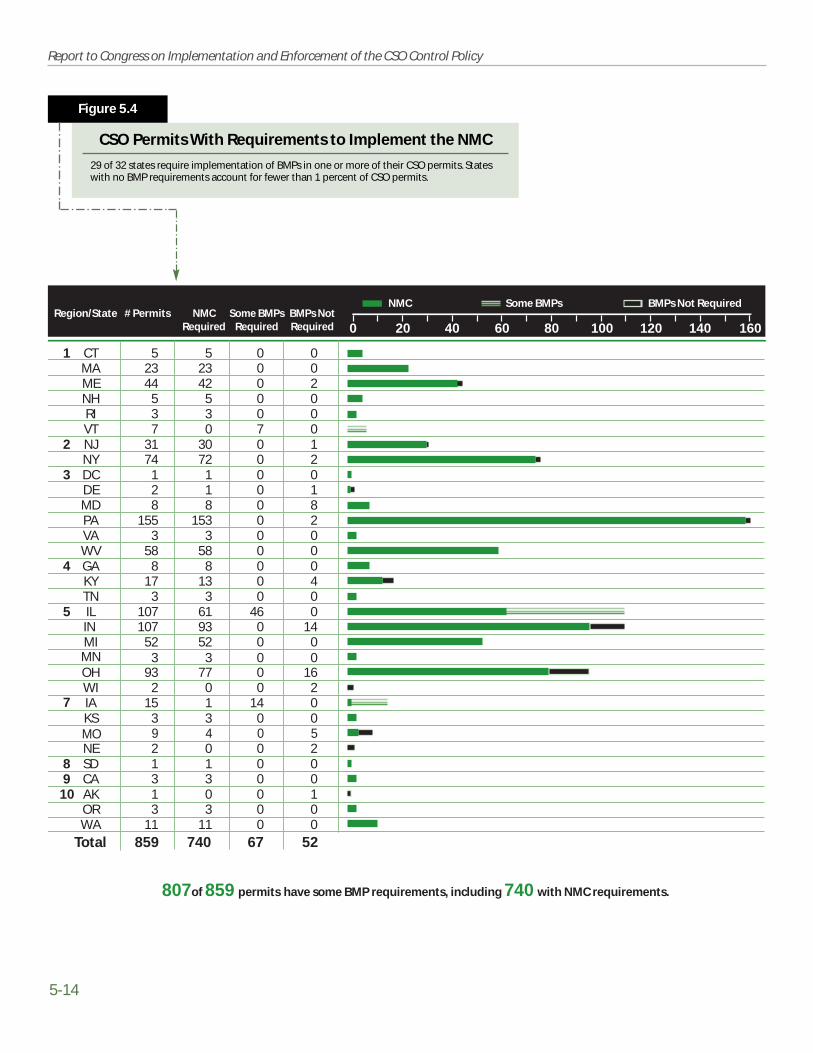
5-14
Report to Congress on Implementation and Enforcement of the CSO Control Policy
Region/State # Permits
0 16020 40 60 80 100 120 140
807of 859 permits have some BMP requirements, including 740 with NMC requirements.
Total 859
1 CT 5 5MA 23 23
NH 5 5RI 3 3
3 DC 1 1
MD 8 8
VA 3 3WV 58 58
4 GA 8 8
TN 3 3
MI 52 52MN 3 3
7KS 3 3
SD8 1 19 CA 3 3
OR 3 3WA 11 11
ME 44 42
VT 7 02 NJ 31 30
NY 74 72
DE 2 1
PA 155 153
KY 17 13
5 IL 107 61IN 107 93
OH 93 77WI 2 0IA 15 1
NE 2 0
AK10 1 0
MO 9 4
00
00
0
0
000
0
00
0
00
00
0
700
0
0
0
460
00
14
0
0
0
00
00
0
8
000
0
00
0
00
00
2
012
1
2
4
014
1620
2
1
5
67740 52
NMC Some BMPs BMPs Not RequiredSome BMPs
RequiredNMC
RequiredBMPs NotRequired
CSO Permits With Requirements to Implement the NMC
29 of 32 states require implementation of BMPs in one or more of their CSO permits. Stateswith no BMP requirements account for fewer than 1 percent of CSO permits.
Figure 5.4
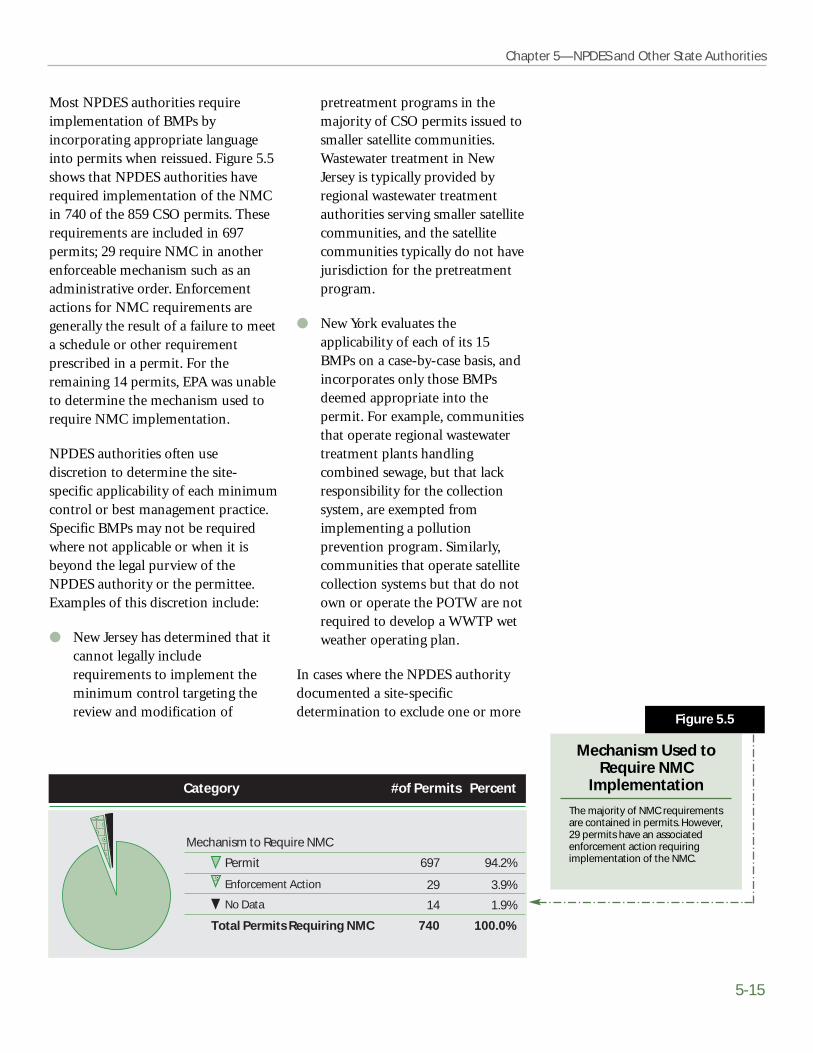
Chapter 5—NPDES and Other State Authorities
5-15
Most NPDES authorities requireimplementation of BMPs byincorporating appropriate languageinto permits when reissued. Figure 5.5shows that NPDES authorities haverequired implementation of the NMCin 740 of the 859 CSO permits. Theserequirements are included in 697permits; 29 require NMC in anotherenforceable mechanism such as anadministrative order. Enforcementactions for NMC requirements aregenerally the result of a failure to meeta schedule or other requirementprescribed in a permit. For theremaining 14 permits, EPA was unableto determine the mechanism used torequire NMC implementation.
NPDES authorities often usediscretion to determine the site-specific applicability of each minimumcontrol or best management practice.Specific BMPs may not be requiredwhere not applicable or when it isbeyond the legal purview of theNPDES authority or the permittee.Examples of this discretion include:
● New Jersey has determined that itcannot legally includerequirements to implement theminimum control targeting thereview and modification of
pretreatment programs in themajority of CSO permits issued tosmaller satellite communities.Wastewater treatment in NewJersey is typically provided byregional wastewater treatmentauthorities serving smaller satellitecommunities, and the satellitecommunities typically do not havejurisdiction for the pretreatmentprogram.
● New York evaluates theapplicability of each of its 15BMPs on a case-by-case basis, andincorporates only those BMPsdeemed appropriate into thepermit. For example, communitiesthat operate regional wastewatertreatment plants handlingcombined sewage, but that lackresponsibility for the collectionsystem, are exempted fromimplementing a pollutionprevention program. Similarly,communities that operate satellitecollection systems but that do notown or operate the POTW are notrequired to develop a WWTP wetweather operating plan.
In cases where the NPDES authoritydocumented a site-specificdetermination to exclude one or more
Mechanism Used toRequire NMC
Implementation
The majority of NMC requirementsare contained in permits. However,29 permits have an associatedenforcement action requiringimplementation of the NMC.
Mechanism to Require NMC
#of Permits Percent
Total Permits Requiring NMC 740 100.0%
Enforcement Action
No Data
Category
Permit 697
14
29
94.2%
1.9%
3.9%
Figure 5.5

5-16
Report to Congress on Implementation and Enforcement of the CSO Control Policy
of the NMC from a permit, the permitwas still included in the 740considered to include (or to beanalogous to) the NMC.
State CSO Program Status
Most states (29 of 32) have establisheda suite of BMPs for mitigating theimpacts associated with CSOdischarges. Specifically:
● 25 states require implementationof the NMC.
● Two states (New York andWashington) require a greaternumber of BMPs than the NMC.
● Two states (Vermont and Iowa)require a set of BMPs less rigorousthan the NMC; Iowa adopted theNMC in early 2001 but hasincorporated the requirements inonly one permit.
Seventeen states require implement-ation of the NMC (or an equivalentsuite of BMPs) in all CSO permits.The most common reasons given byNPDES authorities for not requiringthe NMC in every permit include:
● CSO permits are part of NPDESpermit backlog and have not beenreissued since the publication ofthe CSO Control Policy in 1994.
● The community committed tosewer separation prior to theissuance of the CSO ControlPolicy, and the NPDES authorityhas not required the communityto change its approach.
In three states (Alaska, Nebraska, andWisconsin), CSO permits lackrequirements to implement any of the
NMC. Together, these states accountfor less than 1 percent of the CSOpermits nationwide (5 of 859). In twoof these states (Alaska and Wisconsin),the NPDES authority requiredsignificant CSO control activities priorto issuance of the CSO Control Policy.The decision not to establish NMCrequirements in these states was madebecause the CSO communities werewell into implementation of CSOcontrols prior to the issuance of theCSO Control Policy. Both ofNebraska's CSO permits are up forrenewal in 2001, and the state hasindicated that the reissued permits willcontain requirements to implementthe NMC. Region 10 has alsoindicated that it will add requirementsto implement the NMC in Alaska'slone CSO permit upon reissuance.
5.2.2 Permit Requirements for LTCP
LTCP Development
As shown in Figure 5.5, 718 (82percent) of the 859 CSO permitsinclude requirements to develop andimplement CSO facilities plans tocontrol CSO discharges. Further,Figure 5.6 shows that 559 of the 718are required to develop andimplement CSO facilities plans thatare consistent with the LTCPframework outlined in the CSOControl Policy.
Figure 5.6 also shows that of the 141permits currently lackingrequirements to develop andimplement a CSO facilities plan:
● 39 permits are expired and havenot been reissued since theinception of the CSO ControlPolicy.
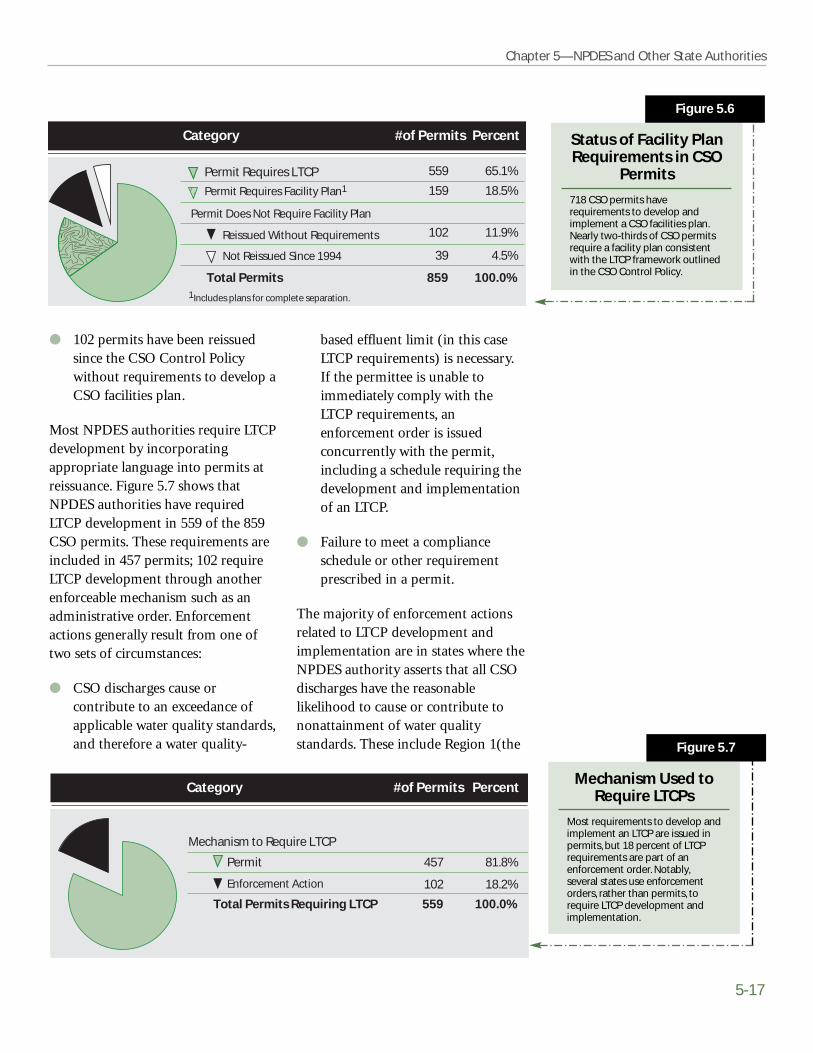
Chapter 5—NPDES and Other State Authorities
5-17
● 102 permits have been reissuedsince the CSO Control Policywithout requirements to develop aCSO facilities plan.
Most NPDES authorities require LTCPdevelopment by incorporatingappropriate language into permits atreissuance. Figure 5.7 shows thatNPDES authorities have requiredLTCP development in 559 of the 859CSO permits. These requirements areincluded in 457 permits; 102 requireLTCP development through anotherenforceable mechanism such as anadministrative order. Enforcementactions generally result from one oftwo sets of circumstances:
● CSO discharges cause orcontribute to an exceedance ofapplicable water quality standards,and therefore a water quality-
based effluent limit (in this caseLTCP requirements) is necessary.If the permittee is unable toimmediately comply with theLTCP requirements, anenforcement order is issuedconcurrently with the permit,including a schedule requiring thedevelopment and implementationof an LTCP.
● Failure to meet a complianceschedule or other requirementprescribed in a permit.
The majority of enforcement actionsrelated to LTCP development andimplementation are in states where theNPDES authority asserts that all CSOdischarges have the reasonablelikelihood to cause or contribute tononattainment of water qualitystandards. These include Region 1(the
Status of Facility PlanRequirements in CSO
Permits
718 CSO permits haverequirements to develop andimplement a CSO facilities plan.Nearly two-thirds of CSO permitsrequire a facility plan consistentwith the LTCP framework outlinedin the CSO Control Policy.
Figure 5.6
#of Permits Percent
Total Permits 859 100.0%
Permit Requires Facility Plan1
Reissued Without Requirements
Category
Permit Requires LTCP 559
102
159
65.1%
11.9%
18.5%
Not Reissued Since 1994 39 4.5%
Permit Does Not Require Facility Plan
1Includes plans for complete separation.
Mechanism Used toRequire LTCPs
Most requirements to develop andimplement an LTCP are issued inpermits, but 18 percent of LTCPrequirements are part of anenforcement order. Notably,several states use enforcementorders, rather than permits, torequire LTCP development andimplementation.
Figure 5.7
Mechanism to Require LTCP
#of Permits Percent
Total Permits Requiring LTCP 559 100.0%
Enforcement Action
Category
Permit 457
102
81.8%
18.2%
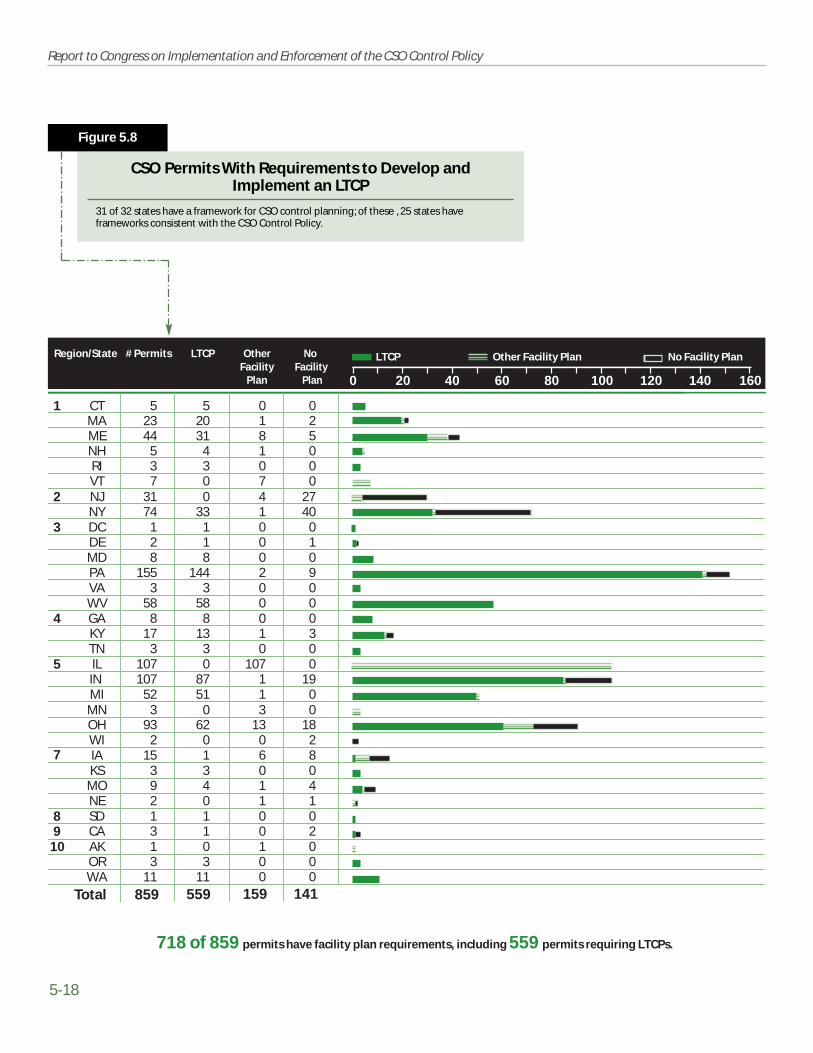
5-18
Report to Congress on Implementation and Enforcement of the CSO Control Policy
Region/State # Permits
0 16020 40 60 80 100 120 140
718 of 859 permits have facility plan requirements, including 559 permits requiring LTCPs.
Total 859
1 CT 5 5MA 23 20
NH 5 4RI 3 3
3 DC 1 1
MD 8 8
VA 3 3WV 58 58
4 GA 8 8
TN 3 3
MI 52 51MN 3 0
7KS 3 3
SD8 1 19 CA 3 1
OR 3 3WA 11 11
ME 44 31
VT 7 02 NJ 31 0
NY 74 33
DE 2 1
PA 155 144
KY 17 13
5 IL 107 0IN 107 87
OH 93 62WI 2 0IA 15 1
NE 2 0
AK10 1 0
MO 9 4
01
10
0
0
000
0
13
0
00
00
8
741
0
2
1
1071
1306
1
1
1
02
00
0
0
000
0
00
0
02
00
5
02740
1
9
3
019
1828
1
0
4
559 159 141
LTCP Other Facility Plan Other Facility
Plan
No Facility
Plan
LTCP No Facility Plan
CSO Permits With Requirements to Develop and Implement an LTCP
31 of 32 states have a framework for CSO control planning; of these , 25 states haveframeworks consistent with the CSO Control Policy.
Figure 5.8
Chapter 5—NPDES and Other State Authorities
5-19
Chapter 5—NPDES and Other State Authorities
NPDES authority for Massachusettsand New Hampshire), Vermont,Maine, and Maryland.
Figure 5.8 provides a state-by-statesummary of the number of CSOpermits with requirements to developand implement a CSO facilities plan. Ithighlights states in whichrequirements for facilities planning areconsistent with the LTCP frameworkoutlined in the CSO Control Policy.
State CSO Program Status
Most states (31 of 32) have establisheda framework for CSO facilitiesplanning to meet the water quality-based requirements of the CWA forCSOs. Of these 31:
● 25 have established a frameworkthat includes the LTCPcomponents outlined in the CSOControl Policy.
● Five (Alaska, Illinois, Minnesota,Vermont, and Wisconsin) requireengineering design studies forCSO facilities plans and, often,achieved implementation ofsignificant CSO control prior toissuance of the CSO ControlPolicy.
● One (New Jersey) is awaitingcompletion of its TMDL process(i.e., planning on a watershedbasis) before implementingadditional CSO controls,rendering separate LTCPsunnecessary.
● Only Nebraska has established noframework for CSO facilityplanning. Both of Nebraska's CSOpermits are up for renewal in
2001. The state has indicated thatthe reissued permits will containrequirements for LTCPdevelopment and implementation.
In most of the 25 states requiringLTCPs, formal LTCP requirementsmirror the CSO Control Policy andoffer two bases for LTCP development(the presumption approach and thedemonstration approach). Severalstates, however, have advocated apreferred approach for CSO control.These approaches include:
● 85 percent capture, by volume, asincluded in the definition of thepresumption approach.
● Transporting all wet weather flowsto the POTW for minimumtreatment prior to discharge.
● Capacity to provide treatment forflows generated by a specificdesign storm.
● Sewer separation.
Sixteen states require developmentand implementation of a CSOfacilities plan in all CSO permits. Themost common reasons given byNPDES authorities for not requiringLTCP development andimplementation in a CSO permitinclude:
● Long-term CSO control planningefforts are beyond the financial ortechnical capabilities of smallcommunities.
● CSOs are not a top permittingpriority, given a limited number ofCSOs and competing programs
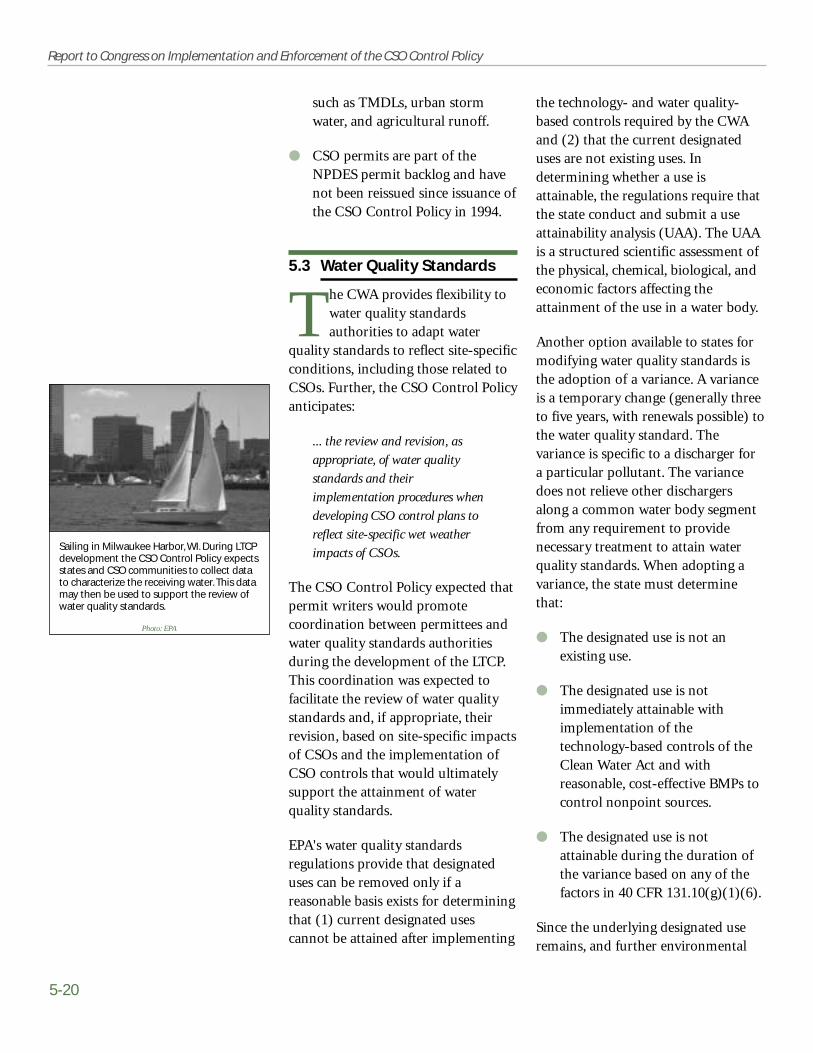
5-20
Report to Congress on Implementation and Enforcement of the CSO Control Policy
Sailing in Milwaukee Harbor, WI. During LTCPdevelopment the CSO Control Policy expectsstates and CSO communities to collect datato characterize the receiving water. This datamay then be used to support the review ofwater quality standards.
Photo: EPA
such as TMDLs, urban stormwater, and agricultural runoff.
● CSO permits are part of theNPDES permit backlog and havenot been reissued since issuance ofthe CSO Control Policy in 1994.
5.3 Water Quality Standards
The CWA provides flexibility towater quality standardsauthorities to adapt water
quality standards to reflect site-specificconditions, including those related toCSOs. Further, the CSO Control Policyanticipates:
... the review and revision, as
appropriate, of water quality
standards and their
implementation procedures when
developing CSO control plans to
reflect site-specific wet weather
impacts of CSOs.
The CSO Control Policy expected thatpermit writers would promotecoordination between permittees andwater quality standards authoritiesduring the development of the LTCP.This coordination was expected tofacilitate the review of water qualitystandards and, if appropriate, theirrevision, based on site-specific impactsof CSOs and the implementation ofCSO controls that would ultimatelysupport the attainment of waterquality standards.
EPA's water quality standardsregulations provide that designateduses can be removed only if areasonable basis exists for determiningthat (1) current designated usescannot be attained after implementing
the technology- and water quality-based controls required by the CWAand (2) that the current designateduses are not existing uses. Indetermining whether a use isattainable, the regulations require thatthe state conduct and submit a useattainability analysis (UAA). The UAAis a structured scientific assessment ofthe physical, chemical, biological, andeconomic factors affecting theattainment of the use in a water body.
Another option available to states formodifying water quality standards isthe adoption of a variance. A varianceis a temporary change (generally threeto five years, with renewals possible) tothe water quality standard. Thevariance is specific to a discharger fora particular pollutant. The variancedoes not relieve other dischargersalong a common water body segmentfrom any requirement to providenecessary treatment to attain waterquality standards. When adopting avariance, the state must determinethat:
● The designated use is not anexisting use.
● The designated use is notimmediately attainable withimplementation of thetechnology-based controls of theClean Water Act and withreasonable, cost-effective BMPs tocontrol nonpoint sources.
● The designated use is notattainable during the duration ofthe variance based on any of thefactors in 40 CFR 131.10(g)(1)(6).
Since the underlying designated useremains, and further environmental

Chapter 5—NPDES and Other State Authorities
5-21
Chapter 5—NPDES and Other State Authorities
progress can be attained with theimplementation of the LTCP, the rigorof the analyses and the level ofdemonstration used for a variance aregenerally less than those required for apermanent change in the use. Becausea variance is a change in the waterquality standards, however, the samerequirements apply for a variance asfor a new or revised standard (e.g., anopportunity for public review andcomment, and EPA approval ordisapproval of the variance).
5.3.1 Integrating Water QualityStandards Review with LTCPDevelopment andImplementation
The implementation of CSO controlsidentified in a well-designed andoperated LTCP may lead to thedetermination that a water body hasthe potential of supporting improvedaquatic life. Under this circumstance,states would upgrade their designatedaquatic life use for the water body.Alternatively, implementation of CSOcontrols may not necessarily ensurethe attainment of water qualitystandards within the CSO receivingwater. During LTCP development, theCSO Control Policy expects states andCSO communities to collect data toassess baseline conditions in thereceiving water and evaluate thepotential effectiveness of any proposedcontrols in improving water qualityand supporting the uses of the waterbody. If the data show that even withthe installed controls, CSOs willcontinue to contribute to theimpairment of water qualitystandards, the NPDES authority isexpected to work with the CSOcommunity to evaluate other CSOcontrol alternatives. If, however,
chemical, physical, or economicfactors appear to preclude attainmentof the use, the data collected duringthe LTCP development process may beused to support revisions to waterquality standards. Revisions couldinclude adoption of uses that betterreflect the water quality that can beachieved with a level of CSO controlthat does not cause substantial andwidespread economic and socialimpact.
In the seven years since EPA issued theCSO Control Policy, coordination ofLTCP development andimplementation with water qualitystandards reviews has not progressedas quickly as expected. Therefore, atthe urging of Congress, EPA recentlypublished Guidance: Coordinating CSOLong-term Planning with WaterQuality Standards Reviews (EPA,2001c), as discussed in Section 4.5 ofthis report.
5.3.2 State Approaches for ReviewingWater Quality Standards forCSO Receiving Waters
A few states have developedapproaches reconciling their waterquality standards with overflows thatwill remain after the implementationof a well-designed CSO LTCP.Summaries of the actions taken by thestates are provided below.
Indiana
All waters in Indiana are designatedfor full-body contact recreational useand for support of a well-balancedaquatic community. State SenateEnrolled Act (SEA) 431, enacted onMarch 17, 2000, provides amechanism whereby CSO
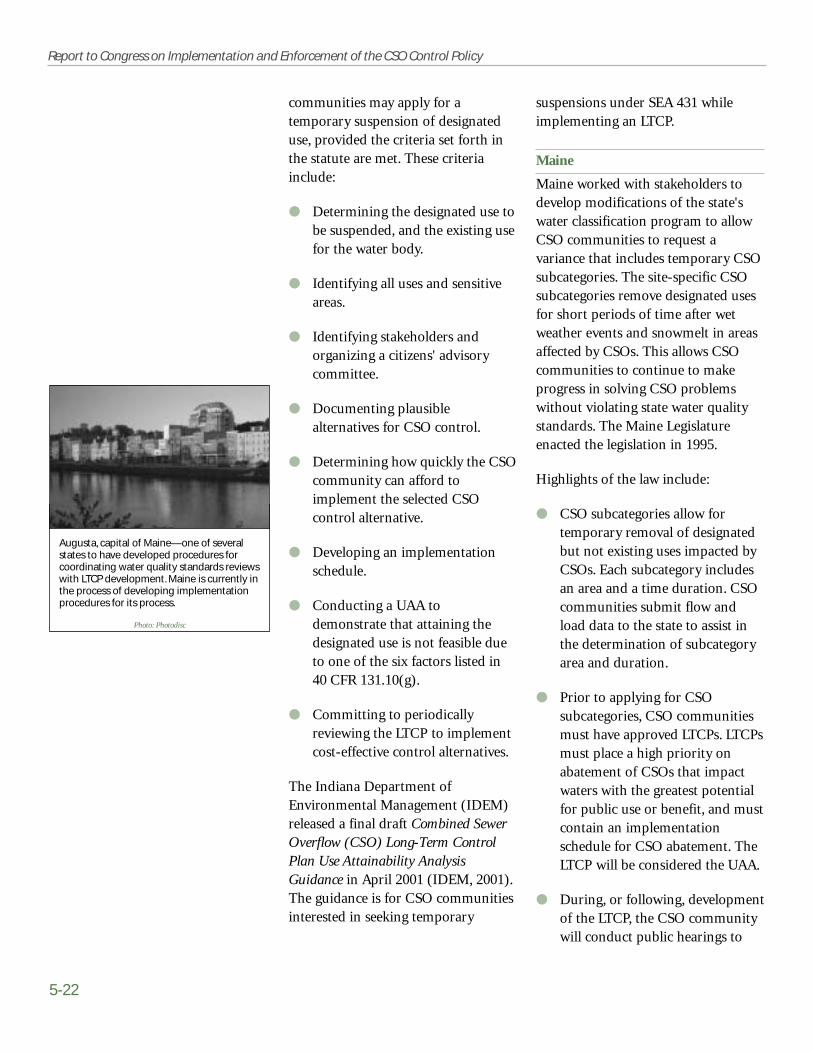
5-22
Report to Congress on Implementation and Enforcement of the CSO Control Policy
Augusta, capital of Maine—one of severalstates to have developed procedures forcoordinating water quality standards reviewswith LTCP development. Maine is currently inthe process of developing implementationprocedures for its process.
Photo: Photodisc
communities may apply for atemporary suspension of designateduse, provided the criteria set forth inthe statute are met. These criteriainclude:
● Determining the designated use tobe suspended, and the existing usefor the water body.
● Identifying all uses and sensitiveareas.
● Identifying stakeholders andorganizing a citizens' advisorycommittee.
● Documenting plausiblealternatives for CSO control.
● Determining how quickly the CSOcommunity can afford toimplement the selected CSOcontrol alternative.
● Developing an implementationschedule.
● Conducting a UAA todemonstrate that attaining thedesignated use is not feasible dueto one of the six factors listed in40 CFR 131.10(g).
● Committing to periodicallyreviewing the LTCP to implementcost-effective control alternatives.
The Indiana Department ofEnvironmental Management (IDEM)released a final draft Combined SewerOverflow (CSO) Long-Term ControlPlan Use Attainability AnalysisGuidance in April 2001 (IDEM, 2001).The guidance is for CSO communitiesinterested in seeking temporary
suspensions under SEA 431 whileimplementing an LTCP.
Maine
Maine worked with stakeholders todevelop modifications of the state'swater classification program to allowCSO communities to request avariance that includes temporary CSOsubcategories. The site-specific CSOsubcategories remove designated usesfor short periods of time after wetweather events and snowmelt in areasaffected by CSOs. This allows CSOcommunities to continue to makeprogress in solving CSO problemswithout violating state water qualitystandards. The Maine Legislatureenacted the legislation in 1995.
Highlights of the law include:
● CSO subcategories allow fortemporary removal of designatedbut not existing uses impacted byCSOs. Each subcategory includesan area and a time duration. CSOcommunities submit flow andload data to the state to assist inthe determination of subcategoryarea and duration.
● Prior to applying for CSOsubcategories, CSO communitiesmust have approved LTCPs. LTCPsmust place a high priority onabatement of CSOs that impactwaters with the greatest potentialfor public use or benefit, and mustcontain an implementationschedule for CSO abatement. TheLTCP will be considered the UAA.
● During, or following, developmentof the LTCP, the CSO communitywill conduct public hearings to

Chapter 5—NPDES and Other State Authorities
5-23
Massachusetts has developedsubclassifications for receiving waters withdifferent numbers of CSO outfalls.Communities must complete a UAA toqualify for a subclassification. To date, onlythe Metropolitan Water Resources Authority,which serves the Greater Boston area, hascompleted a UAA.
Photo: Photodisc
Chapter 5—NPDES and Other State Authorities
gain input from stakeholders onthe areas affected by the variance.If the variance is approved, theCSO community must providepublic notice describinglimitations on use of the waterbody.
● Approval of a CSO subcategorydoes not relieve other dischargersfrom any requirement to providenecessary treatment to complywith water quality standards.
Maine will periodically review all CSOsubcategories. If the CSO communityfails to comply with theimplementation schedule in itsapproved LTCP, the variance may berevoked and the state may takeenforcement action for permitviolations. Maine received a 104(b)(3)grant from EPA in FY 2001 to developimplementation procedures for the1995 legislation and to pilot test itsapplication.
Massachusetts
Massachusetts amended its waterquality standards in 1996 to include aCSO subclassification in its useclassification system for receivingwaters with substantial numbers ofCSO outfalls. The application of aCSO subclassification requires EPAapproval of a UAA. Massachusetts usesthe UAA to evaluate the attainabilityof the designated use, particularlywhether CSO controls would likelycause substantial and widespreadeconomic and social impact.
For example, the Class B (CSO)subclassification requires that CSOcontrols be sufficient to meet waterquality standards 95 percent of the
time, generally no more than fourCSOs per year. A UAA must bedeveloped that demonstrates achievinggreater than 95-percent control wouldcause substantial and widespreadeconomic and social impact. Thecommonwealth must make the UAAavailable for public review andcomment and receive EPA approvalprior to applying the Class B (CSO)subclassification to a particular waterbody. The standard suspends only thebacteriological criteria; toxicpollutants are not affected.
To date, only the Massachusetts WaterResources Authority (provider ofwater and sewer services to the greaterBoston metropolitan area) hascompleted a UAA and justified theneed for a CSO subclass.
Other State Approaches
● Illinois’ existing water qualitystandards program frameworkpresumes compliance with waterquality standards upon thecompleted implementation of aCSO facility plan that meets thecriteria for the state-derivedpresumption approach.
● Michigan rules allow the use ofalternate design flows (i.e.,alternate to 7Q10 low flows or95% exceedance flows) whendetermining water quality-basedrequirements for intermittent wetweather discharges such as treatedcombined sewer overflows.
● New Hampshire has alsodeveloped a surface-water partial-use designation called TemporaryPartial Use (TPU) or Class B(TPU). A designation of Class B

efforts with other point and
nonpoint source control activities.
Section 303(d) of the CWA establishesthe TMDL process. The TMDLprocess provides a mechanism forintegrating the management of boththe point and nonpoint pollutionsources that may contribute to a waterbody's impairment. In addition, theTMDL process can be used to expeditewater quality-based NPDESpermitting and can lead to technicallysound and legally defensible decisionsfor attaining and maintaining waterquality standards.
Under the authority of Section 303(d),states are expected to develop TMDLsfor water quality-limited waters wheretechnology-based effluent limitationsor other legally required pollutioncontrol mechanisms are not sufficientor stringent enough to implement theapplicable water quality standards. Aspart of this effort, every two yearsstates submit a report to EPAidentifying water quality-limitedwaters still needing TMDLs, includinga priority ranking of water bodies. Asummary, by state, of the number ofwater segments impacted by CSOs isincluded in Appendix N.
5.4 Compliance andEnforcement
5.4.1 Policy
Many states have issuedcompliance andenforcement policies to
coordinate regulatory activities and toinform municipalities of complianceexpectations and enforcementconsequences. Based on available
5-24
Report to Congress on Implementation and Enforcement of the CSO Control Policy
(TPU) is made only if thecommunity planning process,watershed planning efforts and aUAA demonstrate that theallowance of minor CSOdischarges is the mostenvironmentally protective andcost-effective option available.Furthermore, this designation isonly allowed in "non-criticalresource areas." Critical areaswould include beaches, shellfishhabitats, drinking water intakes,and endangered species habitats.
● Four communities in Ohio haverequested water quality standardsreviews and submitted biologicalmonitoring data as part of theirCSO control plans. The stateconducted the reviews but madeno changes in standards as a resultof these reviews.
● Pennsylvania has indicated that itdoes not currently intend toreview water quality standards inconjunction with LTCPdevelopment and implementation,but will explore water qualitystandards reviews in their nexttriennial review.
5.3.3 State Water Quality AssessmentReports
Urban water quality may be affectedby a combination of CSOs, stormwater discharges, other point sourcesand nonpoint source runoff. The CSOControl Policy encourages permittingauthorities to:
... evaluate water pollution control
needs on a watershed management
basis and coordinate CSO control

Chapter 5—NPDES and Other State Authorities
5-25
Ohio EPA initiated an enforcement actionagainst the City of Akron in 1995 forviolations of the CWA related to CSOdischarges to the Cuyahoga River. Akroncontinues its efforts to implement CSOcontrols, including storage/conveyancetunnels, sewer separation projects, anddetention basins.
Photo: City of Akron Bureau of Engineering Services
Chapter 5—NPDES and Other State Authorities
information, state CSO complianceand enforcement policies can begrouped into three categories:
● Enforcement policies promulgatedby the state.
● Enforcement policies resultingfrom state participation in theNational EnvironmentalPerformance Partnership System(NEPPS).
● Enforcement initiatives based onEPA policies.
State-promulgated and state NEPPS-based CSO policies are discussedbelow.
State-Promulgated CSO EnforcementPolicies
Georgia, Indiana, Iowa, NewHampshire, Ohio, Pennsylvania,Rhode Island, Vermont, and WestVirginia each promulgated CSOenforcement policies. The CSOpolicies of Indiana and Ohio illustratethe range of approaches taken by stateCSO enforcement authorities.
● Indiana's Final Combined SewerOverflow Strategy, issued in 1996,is intended to bring Indiana'sCSOs into compliance with therequirements of the CWA andIndiana's goal of all state surfacewaters meeting water qualitystandards by 2005. Indiana'sStrategy recommends that CSOenforcement activities focus on:enforcement of the dry weatheroverflow prohibition, CSO permitdocumentation requirements, andthe state's minimum water qualitycriteria.
● Ohio's 1995 CSO Strategy includesa dry weather overflowprohibition. The Strategyrecommends that Notices ofViolation (NOV) be issued foroccasional dry weather overflowsand the use of administrative orjudicial actions to eliminate dryweather overflows. Ohio's strategyalso suggests several enforcementmechanisms to enforce CSOpermits. These include NOV toaddress violations of interimschedule dates not affecting finaldeadlines, as well as administrativeor judicial actions to addressmajor delays in meeting interimschedule dates.
State CSO Enforcement Policies Basedon the NEPPS
The objectives of the NEPPS include:
● Facilitating joint EPA and stateplanning and priority setting.
● Providing states with greaterflexibility with regard to resourceallocation.
● Fostering the use of integrated andinnovative strategies foraddressing natural resourcequestions.
In order to implement NEPPS, statesand their respective EPA regionaloffices develop a PerformancePartnership Agreement (PPA). PPAsare designed to detail joint prioritiesand methodology for implementationof NEPPS at the state level.
In Alaska, Connecticut, Illinois,Massachusetts, and Wisconsin, stateCSO policies grew out of NEPPS
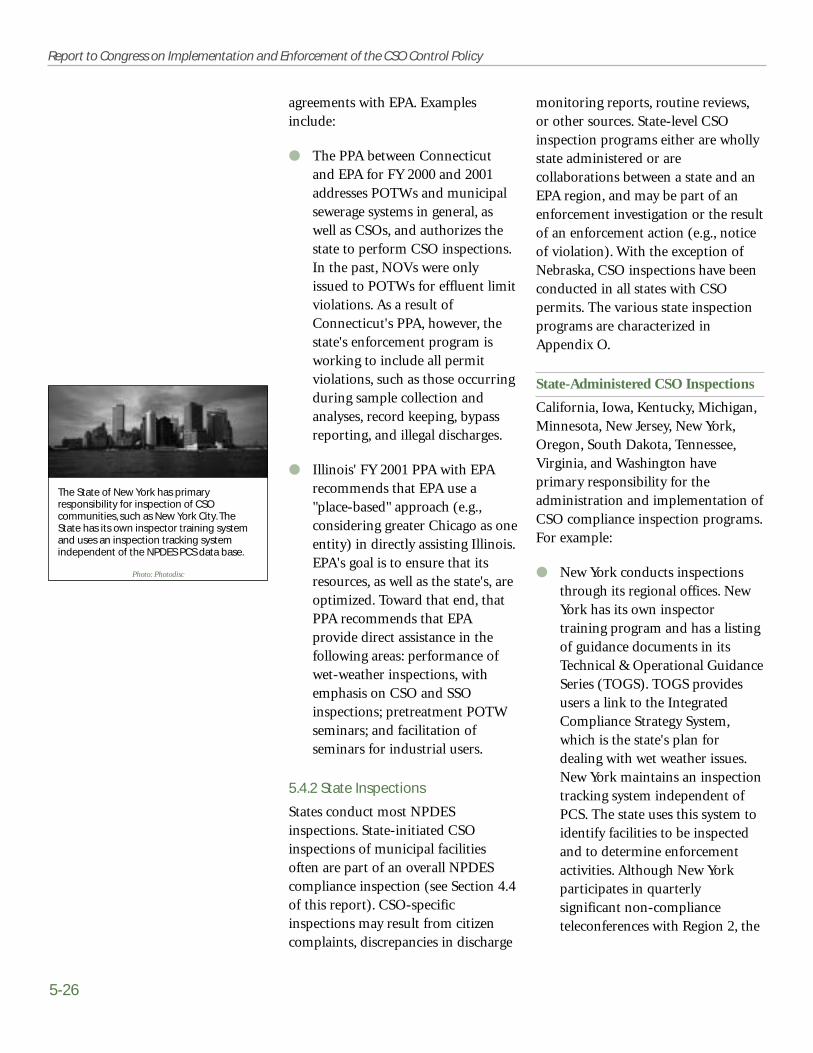
5-26
Report to Congress on Implementation and Enforcement of the CSO Control Policy
agreements with EPA. Examplesinclude:
● The PPA between Connecticutand EPA for FY 2000 and 2001addresses POTWs and municipalsewerage systems in general, aswell as CSOs, and authorizes thestate to perform CSO inspections.In the past, NOVs were onlyissued to POTWs for effluent limitviolations. As a result ofConnecticut's PPA, however, thestate's enforcement program isworking to include all permitviolations, such as those occurringduring sample collection andanalyses, record keeping, bypassreporting, and illegal discharges.
● Illinois' FY 2001 PPA with EPArecommends that EPA use a"place-based" approach (e.g.,considering greater Chicago as oneentity) in directly assisting Illinois.EPA's goal is to ensure that itsresources, as well as the state's, areoptimized. Toward that end, thatPPA recommends that EPAprovide direct assistance in thefollowing areas: performance ofwet-weather inspections, withemphasis on CSO and SSOinspections; pretreatment POTWseminars; and facilitation ofseminars for industrial users.
5.4.2 State Inspections
States conduct most NPDESinspections. State-initiated CSOinspections of municipal facilitiesoften are part of an overall NPDEScompliance inspection (see Section 4.4of this report). CSO-specificinspections may result from citizencomplaints, discrepancies in discharge
monitoring reports, routine reviews,or other sources. State-level CSOinspection programs either are whollystate administered or arecollaborations between a state and anEPA region, and may be part of anenforcement investigation or the resultof an enforcement action (e.g., noticeof violation). With the exception ofNebraska, CSO inspections have beenconducted in all states with CSOpermits. The various state inspectionprograms are characterized inAppendix O.
State-Administered CSO Inspections
California, Iowa, Kentucky, Michigan,Minnesota, New Jersey, New York,Oregon, South Dakota, Tennessee,Virginia, and Washington haveprimary responsibility for theadministration and implementation ofCSO compliance inspection programs.For example:
● New York conducts inspectionsthrough its regional offices. NewYork has its own inspectortraining program and has a listingof guidance documents in itsTechnical & Operational GuidanceSeries (TOGS). TOGS providesusers a link to the IntegratedCompliance Strategy System,which is the state's plan fordealing with wet weather issues.New York maintains an inspectiontracking system independent ofPCS. The state uses this system toidentify facilities to be inspectedand to determine enforcementactivities. Although New Yorkparticipates in quarterlysignificant non-complianceteleconferences with Region 2, the
The State of New York has primaryresponsibility for inspection of CSOcommunities, such as New York City. TheState has its own inspector training systemand uses an inspection tracking systemindependent of the NPDES PCS data base.
Photo: Photodisc

Chapter 5—NPDES and Other State Authorities
5-27
Chapter 5—NPDES and Other State Authorities
state has primary responsibilityfor CSO inspection and control.
● Iowa is responsible for CSOinspections. Iowa offers inspectortraining, schedules inspections,and tracks inspection activities ina state matrix. These inspectionshave not focused on CSOs andcompliance with the CSO ControlPolicy.
● Kentucky has NPDES enforcementauthority and conducts regularinspections of NPDES permittees.The inspections have not focusedon CSOs and compliance with theCSO Control Policy. Region 4 hasassisted Kentucky in some CSOinspections emphasizingcompliance with the NMC. Theregion also visits Kentucky on anannual basis in order tocoordinate CSO activities with thestate.
● Michigan conducts its NPDESinspections, which include a state-developed evaluation of CSOfacilities, through its eight regionaloffices. CSO data are tracked inregional databases overseen by thestate. Michigan is working withRegion 5 to expand its CSOinspection program efforts toinclude federal concerns andensure a uniform inspectionapproach throughout the region.
State- and EPA-Administered CSOInspections
Alaska, Delaware, Georgia, Illinois,Indiana, Kentucky, Maine,Massachusetts, Nebraska, NewHampshire, Ohio, Pennsylvania,Vermont, and West Virginia each have
cooperative agreements with EPAregarding CSO and NPDESinspections. Examples of these types ofagreements include:
● Ohio's NPDES inspections followthe procedure recommended inthe NPDES Compliance InspectionManual (see Section 4.5.1 of thisreport). These inspections addressCSOs and are conducted annuallywith Region 5. When resourcesallow, Ohio and Region 5undertake joint inspections ofNPDES facilities. When Ohio isunable to inspect all identifiedfacilities within the agreed time,Region 5 will administer someinspections. Following aninspection, any follow-upinformation is entered into a database Ohio uses to trackinspections and complianceactivities. Information from thesedata bases is fed into PCS. Ohio iscoordinating with Region 5 tohave its inspectors take part in theregional CSO inspector trainingprogram.
● Georgia has three CSOcommunities. One is the City ofAtlanta, which is under a consentdecree to bring its CSO facilitiesinto compliance with the CWAand the Georgia Water QualityControl Act. Georgia and Region 4performed joint inspections of theAtlanta CSO facilities and workedcooperatively in developing thefederal court-ordered consentdecree. Georgia and Region 4work together to monitor theprogress of the consent decree andconduct inspections. Georgia

5-28
Report to Congress on Implementation and Enforcement of the CSO Control Policy
conducts inspections in its othertwo CSO communities.
● Indiana, by agreement withRegion 5, conducts 75 percent ofthe state's NPDES inspections atCSO sites and the region conductsthe remaining 25 percent. Indianacooperates closely with Region 5regarding CSO inspections.Indiana, for example, sends itsinspectors to the region fortraining, uses regional guidancedocuments and checklists, andparticipates in teleconferenceswith the region to discuss cases ofsignificant non-compliance.Indiana also coordinates withRegion 5 to determine thecomponents of its CSO inspectionchecklist.
● Massachusetts meets withRegion 1 on a quarterly basis todiscuss CSO inspections and theresults of those inspections. Thestate has a PPA with the regionunder which funds are shared tohelp Massachusetts keep facilitiesin compliance with regulations,including the CSO Control Policy.
● Vermont follows EPA guidanceabout inspections and has arelationship with Region 1whereby the region conductsinspections when Vermont isunable to do so. Vermont and theregion communicate quarterlyabout major facilities that will beinspected and what the level ofinspection should be at each.
CSO Inspections Prompted byEnforcement Activities
State CSO inspections also may occurin response to enforcement activities.CSO inspections in Georgia,Pennsylvania, and Washington haveresulted from this process.
5.4.3 CSO Enforcement Activities
For this report, EPA reviewedindividual NPDES permit complianceinformation and performed a Lexis-Nexis search to document stateenforcement activities. This processidentified 136 state-initiatedenforcement actions (primarilyadministrative actions, such asadministrative compliance orders) thatinclude CSO violations. This numberis an estimate, as EPA was unable toverify each state action that includedCSO violations. Documentation ofstate CSO enforcement activities wasnot completed in a uniform manner,so dates for all settlements wereunavailable. A summary of availableinformation regarding state-initiatedCSO enforcement actions is presentedin Appendix P.
Although some states (e.g.,Massachusetts) have not initiatedadministrative or civil judicial actionsagainst CSO violations, they formallyjoin EPA in its actions and/or becomeinvolved in the review and approval ofLTCPs, water quality standards review,and oversight of implementation ofsubsequent CSS improvements.

Chapter 5—NPDES and Other State Authorities
5-29
Chapter 5—NPDES and Other State Authorities
Administrative and OtherEnforcement Actions
States enforce CSO compliance in avariety of ways. Water-quality effluentlimit violations and failures to meetcompliance schedules have been themost common reasons for state-initiated enforcement actions. Basedon available information, most stateshave initiated administrativeenforcement actions to address CSOviolations. A list of 92 administrativeactions is included in Appendix P.
Civil Judicial Actions
EPA's review of available state-initiated CSO enforcement casesrevealed one CSO civil judicial action.The case is listed in Appendix P.
Other State Enforcement Actions
Forty-three CSO facilities have beensubject to enforcement actionsresulting from state actions or jointstate-EPA actions. The majority ofcases are administrative actionsresulting in an administrative order.Summaries of these cases are includedin Appendix P.
5.5 Guidance, Training andCompliance and TechnicalAssistance
Most guidance andcompliance assistancedocuments being used by
NPDES authorities and CSOcommunities have been produced byEPA (see Section 4.2.1). However,some states have produced permitboiler-plate language for CSOsaddressing issues related toimplementation of their CSO
program. Some states have alsodeveloped training programs to assisttheir staff in administering CSOprograms. The following sectionsdiscuss some of these state specificmaterials.
5.5.1 Guidance
In many cases, NPDES authoritiesdeveloped standard language toinclude in NPDES permits to addressCSOs and incorporated this languageinto guidelines for CSO permitwriters. For example, Region 1developed a policy memorandum thatincluded draft fact sheet language forCSO permits, model permit language,and guidance on documenting andimplementing the NMC (Region 1,1996). This information is used inCSO permits in Massachusetts andNew Hampshire (and previously inMaine), where Region 1 is the NPDESauthority.
Other cases in which permittingauthorities have developed documentsto assist in implementation of theCSO Control Policy include thefollowing:
● Maine developed a guidancedocument, Program Guidance onCombined Sewer Overflow FacilityPlans, that provides informationon monitoring, selection of BMPs,and development of a CSO masterplan (the functional equivalent ofan LTCP).
● Michigan produced a 1994Combined Sewer Overflow ControlProgram Manual (MDNR, 1994)to assist staff in implementation ofthe state's CSO permittingstrategy. The manual provides

5-30
Report to Congress on Implementation and Enforcement of the CSO Control Policy
detailed information onMichigan's CSO program. It alsocontains a discussion of theelements needed to implement theprogram and guidance ondetermining compliance.
● Pennsylvania developed a strategydocument that defines the stateprogram and approach, discussespermitting options for small andlarge POTW and satellitecommunities, explains specialexemptions from LTCPrequirements, establishes animplementation strategy, andprovides an enforcement policyfor the program.
5.5.2 Training
Some permitting authorities havesponsored workshops and trainingcourses. For example:
● Pennsylvania has offered CSOworkshops for small communities.The workshops served as a forumfor better communicating CSOprogram requirements, answeringquestions from CSO communities,and providing an opportunity forCSO communities to voiceconcerns to the state.
● New York provides training foroperators of municipal facilities inconjunction with EPA. Thisprogram includes trainingspecifically for operators offacilities served by combinedsewer systems. New York alsoprovides a number of services toits inspectors and CSOcommunities, including: trainingmaterials and on-site assistancefor developing effective wet-
weather operating plans; theTechnical & Operational GuidanceSeries website; and an IntegratedCompliance Strategy System thatcollects information on NewYork's entire compliance assistanceprogram.
● Illinois offers a wastewateroperator certification programthat includes CSO operatorcertification. Illinois' website alsoprovides links to other providersof certification training.
5.5.3 Compliance and TechnicalAssistance
Compliance assistance includes on-siteassistance, website materials, anddistribution of outreach materials tosupport compliance with regulatoryrequirements. EPA's review found thata limited number of CSO statesprovide compliance assistance to helpcommunities meet CSO permitrequirements.
A review of websites for states withCSO discharges (Table 5.4) indicatedthat even states with relatively largenumbers of CSO communities did nothave CSO compliance informationreadily available. A few states, however,have programs to assist communitieswith CSO compliance.
The five states highlighted below offerCSO inspection guidance, andtechnical assistance.
● Maine trains its inspectors toperform all aspects of wet weathercontrol.
In addition to compliance and enforcementinspections, New Jersey provides CSOcommunities with onsite consultations andtechnical assistance services. The state isdeveloping a manual to provide state andlocal inspectors with standard operatingprocedures.
NJ Department of Environmental Protection
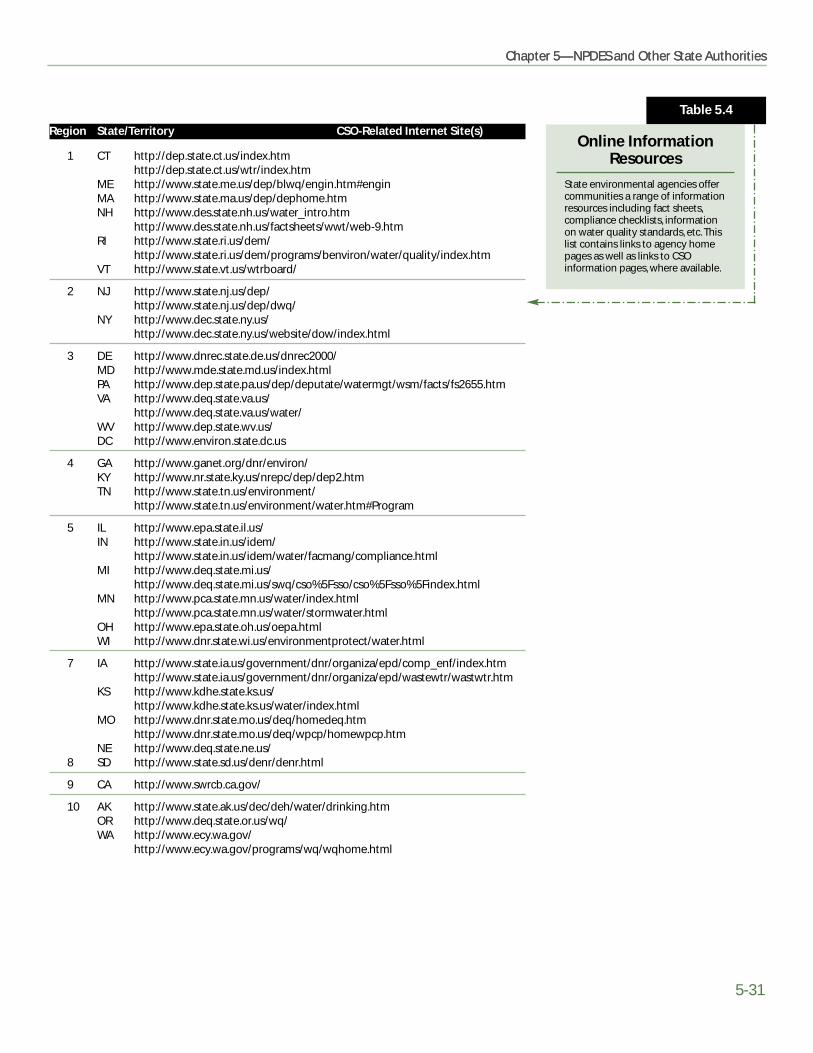
Chapter 5—NPDES and Other State Authorities
5-31
Chapter 5—NPDES and Other State Authorities
Region State/Territory CSO-Related Internet Site(s)
1 CT http://dep.state.ct.us/index.htmhttp://dep.state.ct.us/wtr/index.htm
ME http://www.state.me.us/dep/blwq/engin.htm#enginMA http://www.state.ma.us/dep/dephome.htmNH http://www.des.state.nh.us/water_intro.htm
http://www.des.state.nh.us/factsheets/wwt/web-9.htmRI http://www.state.ri.us/dem/
http://www.state.ri.us/dem/programs/benviron/water/quality/index.htmVT http://www.state.vt.us/wtrboard/
2 NJ http://www.state.nj.us/dep/http://www.state.nj.us/dep/dwq/
NY http://www.dec.state.ny.us/ http://www.dec.state.ny.us/website/dow/index.html
3 DE http://www.dnrec.state.de.us/dnrec2000/MD http://www.mde.state.md.us/index.htmlPA http://www.dep.state.pa.us/dep/deputate/watermgt/wsm/facts/fs2655.htm VA http://www.deq.state.va.us/
http://www.deq.state.va.us/water/WV http://www.dep.state.wv.us/DC http://www.environ.state.dc.us
4 GA http://www.ganet.org/dnr/environ/KY http://www.nr.state.ky.us/nrepc/dep/dep2.htmTN http://www.state.tn.us/environment/
http://www.state.tn.us/environment/water.htm#Program
5 IL http://www.epa.state.il.us/ IN http://www.state.in.us/idem/
http://www.state.in.us/idem/water/facmang/compliance.htmlMI http://www.deq.state.mi.us/
http://www.deq.state.mi.us/swq/cso%5Fsso/cso%5Fsso%5Findex.htmlMN http://www.pca.state.mn.us/water/index.html
http://www.pca.state.mn.us/water/stormwater.htmlOH http://www.epa.state.oh.us/oepa.htmlWI http://www.dnr.state.wi.us/environmentprotect/water.html
7 IA http://www.state.ia.us/government/dnr/organiza/epd/comp_enf/index.htmhttp://www.state.ia.us/government/dnr/organiza/epd/wastewtr/wastwtr.htm
KS http://www.kdhe.state.ks.us/ http://www.kdhe.state.ks.us/water/index.html
MO http://www.dnr.state.mo.us/deq/homedeq.htm http://www.dnr.state.mo.us/deq/wpcp/homewpcp.htm
NE http://www.deq.state.ne.us/ 8 SD http://www.state.sd.us/denr/denr.html
9 CA http://www.swrcb.ca.gov/
10 AK http://www.state.ak.us/dec/deh/water/drinking.htmOR http://www.deq.state.or.us/wq/WA http://www.ecy.wa.gov/
http://www.ecy.wa.gov/programs/wq/wqhome.html
Online InformationResources
State environmental agencies offercommunities a range of informationresources including fact sheets,compliance checklists, informationon water quality standards, etc. Thislist contains links to agency homepages as well as links to CSOinformation pages, where available.
Table 5.4

5-32
Report to Congress on Implementation and Enforcement of the CSO Control Policy
● Illinois provides a CSO inspectionchecklist in conjunction withRegion 5.
● Indiana provides a CSOinspection checklist inconjunction with Region 5.
● New Jersey is developing aninspection manual to provide stateand local inspectors with standardinspection operating procedures.
● Pennsylvania trains its inspectorstwice each year and provides acompliance manual for use asguidance.
5.6 Communication andCoordination
The CSO Control Policy expectsthat the permit writer shouldplay a critical role in the
development and implementation ofCSO controls. The permit writer isexpected to coordinate with the CSOcommunity, review interim LTCPdeliverables and other submissions,and participate in the consensus-building process with otherstakeholders. The permit writer is alsoexpected to serve as the point ofcontact for coordination with statewater quality standards andenforcement authorities, asappropriate.
5.6.1 Communication
Within an NPDES authority, theorganizational structure to supportfull implementation and enforcementof all aspects of the CSO ControlPolicy is often decentralized. SomeNPDES authorities (e.g., Michigan,
New York, Pennsylvania) have regionaloffices with varying degrees ofresponsibility for the development,implementation, and enforcement ofthe NPDES program. In some states(e.g., Illinois, Massachusetts, Vermont,West Virginia), responsibility for thewater quality standards program is inan agency distinct and separate fromthe NPDES authority. The permitwriter's responsibility is to ensureopen and informed lines ofcommunication among all interestedparties.
Many NPDES authorities useelectronic spreadsheets and databasesto track the status of efforts by CSOcommunities to develop andimplement NMC and LTCP. Theseelectronic files are easily shared acrossprograms and offices, therebyfacilitating communication. Examplesof CSO tracking systems developed byNPDES authorities are presented inAppendix Q.
5.6.2 Coordination
Several NPDES authorities haveundertaken coordination of theactivities of CSO communitiesdischarging to the same receivingwater. EPA's Combined SewerOverflows Guidance for Permit Writersoffers:
The permit writer may also be able
to assist communities in
coordinating aspects of its CSO
control programs with each other.
This might be particularly
beneficial for adjacent
communities discharging to the
same receiving water.

Chapter 5—NPDES and Other State Authorities
5-33
Chapter 5—NPDES and Other State Authorities
Examples of actions by NPDESauthorities to coordinate the activitiesof CSO communities discharging tothe same receiving water are presentedin the following summaries.
● New Jersey uses a watershedprocess to develop watershedrestoration plans that include CSOcontrols. During the watershedprocess, water quality standardsand uses are considered asmanagement responses aredeveloped. Possible managementresponses include TMDLs, LTCPdevelopment and implementation,and other appropriate activities.
● New York determined that thenine CSO permits with outfallsimpacting the Hudson River in thevicinity of Albany should bemodified simultaneously. Theconcurrent modification of thesepermits is intended to promotecomprehensive and coordinatedplanning.
● Region 3, working with the Waterand Sewer Authority for theDistrict of Columbia, organized aSpecial Panel on Combined SewerOverflows and Storm WaterManagement in the District ofColumbia. The Special Panelprovided an opportunity forfederal land holders and otherlocal and regional multi-jurisdictional government agenciesto provide input andrecommendations for CSO controlwithin the District of Columbia.The Special Panel highlighted theneed for implementation of awatershed approach andcooperation with Maryland to
improve water quality within theDistrict of Columbia.
5.7 Financial Assistance
NPDES authorities areconcerned with two primaryfinancial obligations with
regard to CSOs: funding the stateprogram's operation and assistingCSO communities in securing fundsnecessary to implement CSO control.
The primary mechanism for fundingstate CSO programs is the federalassistance EPA provides to NPDESauthorities and other agenciesresponsible for implementing waterpollution control programs throughSection 106 Water Pollution ControlProgram Grants. These grants arediscussed in Section 4.8.3 of thisreport. No state-level data exist ongrant totals or prioritization of grantsfor specific programs.
State-level data exist for theappropriation of categorized listingsfor the State Revolving Fund (SRF).The SRF is a low-interest loanprogram administered by the statesbut funded by the federal governmentand the states. CSO municipalities areeligible for SRF funding under aspecial combined sewer category(Category V). Between 1988 and 2000,over $2.0 billion was identified asbeing used for CSO projects.Figure 5.9 shows trends in SRF loansfor CSO projects over time. Thisgeneral pattern suggests that demandfor SRF loans for CSO controlassociated with the 1989 National CSOControl Strategy and the 1994 CSOControl Policy may have lagged theissuance of these documents by a few
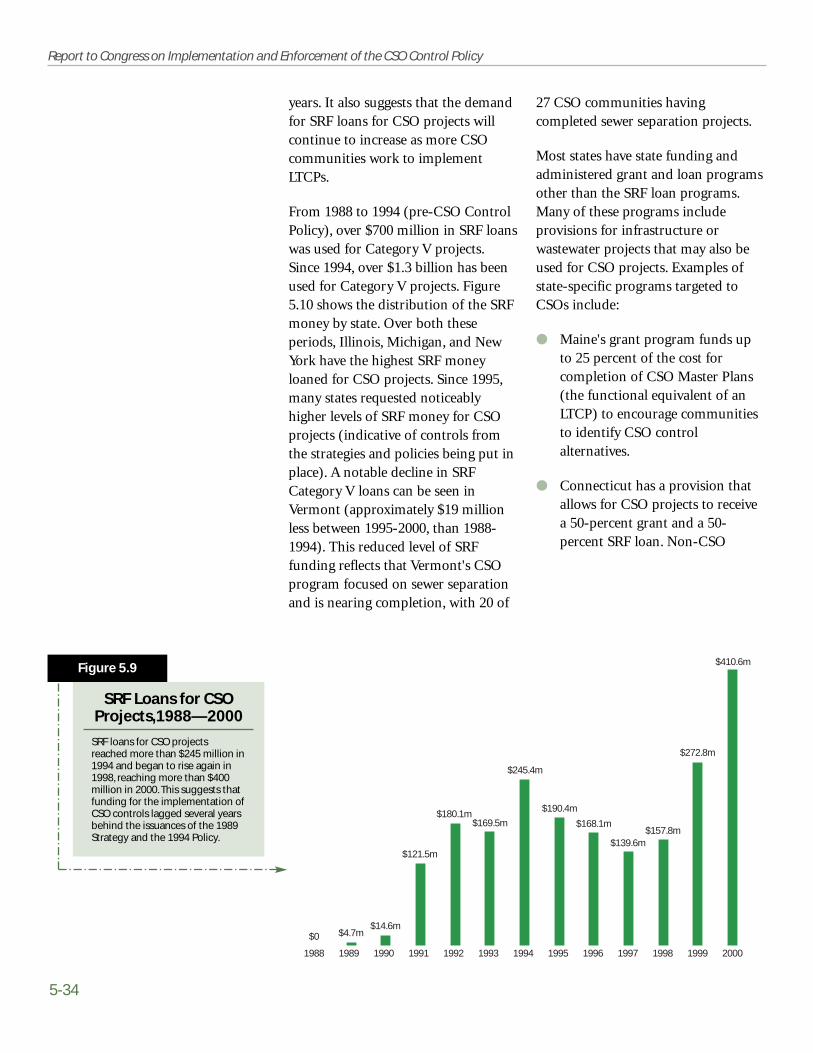
5-34
Report to Congress on Implementation and Enforcement of the CSO Control Policy
years. It also suggests that the demandfor SRF loans for CSO projects willcontinue to increase as more CSOcommunities work to implementLTCPs.
From 1988 to 1994 (pre-CSO ControlPolicy), over $700 million in SRF loanswas used for Category V projects.Since 1994, over $1.3 billion has beenused for Category V projects. Figure5.10 shows the distribution of the SRFmoney by state. Over both theseperiods, Illinois, Michigan, and NewYork have the highest SRF moneyloaned for CSO projects. Since 1995,many states requested noticeablyhigher levels of SRF money for CSOprojects (indicative of controls fromthe strategies and policies being put inplace). A notable decline in SRFCategory V loans can be seen inVermont (approximately $19 millionless between 1995-2000, than 1988-1994). This reduced level of SRFfunding reflects that Vermont's CSOprogram focused on sewer separationand is nearing completion, with 20 of
27 CSO communities havingcompleted sewer separation projects.
Most states have state funding andadministered grant and loan programsother than the SRF loan programs.Many of these programs includeprovisions for infrastructure orwastewater projects that may also beused for CSO projects. Examples ofstate-specific programs targeted toCSOs include:
● Maine's grant program funds upto 25 percent of the cost forcompletion of CSO Master Plans(the functional equivalent of anLTCP) to encourage communitiesto identify CSO controlalternatives.
● Connecticut has a provision thatallows for CSO projects to receivea 50-percent grant and a 50-percent SRF loan. Non-CSO
SRF Loans for CSOProjects,1988—2000
SRF loans for CSO projectsreached more than $245 million in1994 and began to rise again in1998, reaching more than $400million in 2000. This suggests thatfunding for the implementation ofCSO controls lagged several yearsbehind the issuances of the 1989Strategy and the 1994 Policy.
Figure 5.9
$0$14.6m
$121.5m
$180.1m
$245.4m
$190.4m
$168.1m$157.8m
$272.8m
$410.6m
$169.5m
$139.6m
1988 1989 1990 1991 1992 1993 1994 1995 1996 1997 1998 1999 2000
$4.7m
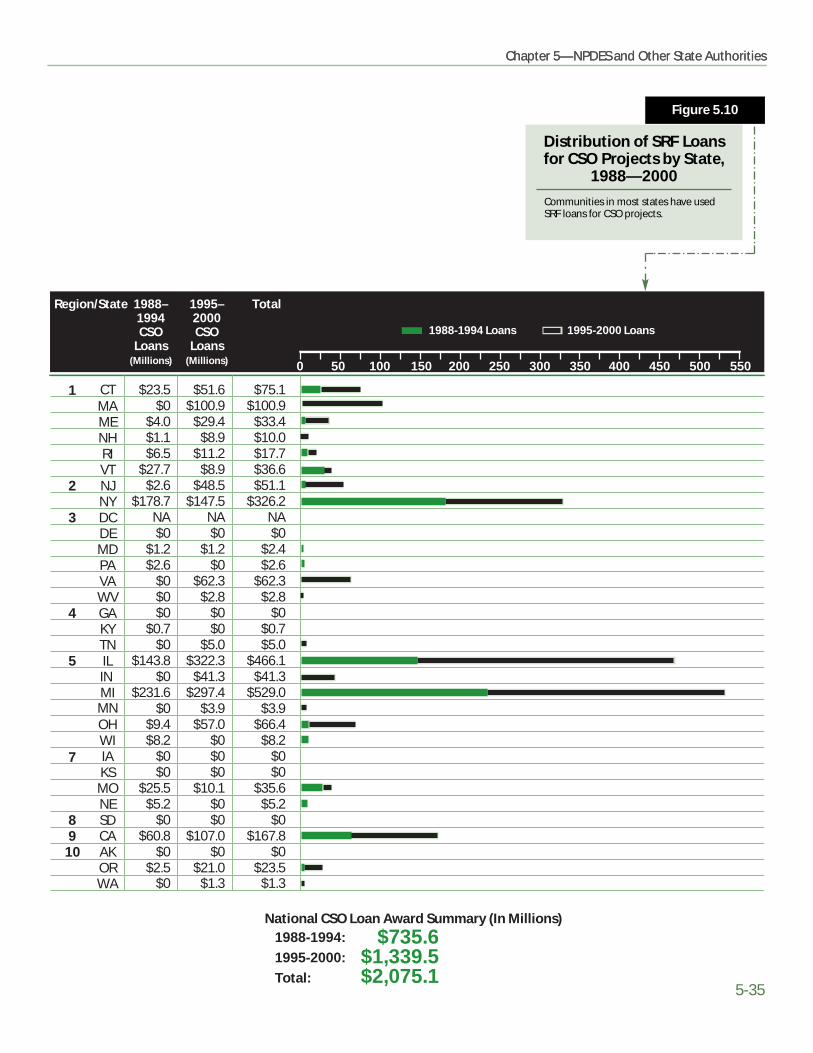
Chapter 5—NPDES and Other State AuthoritiesChapter 5—NPDES and Other State Authorities
Distribution of SRF Loansfor CSO Projects by State,
1988—2000
Communities in most states have usedSRF loans for CSO projects.
Figure 5.10
Region/State
0 550200 250 300 350 400 450 50015010050
1988–1994CSO
Loans(Millions)
1995–2000CSO
Loans(Millions)
Total
National CSO Loan Award Summary (In Millions)1988-1994:
1995-2000:
Total:
$1,339.5$2,075.1
$735.6
1 CTMA
NHRI
3 DC
MD
VAWV
4 GA
TN
MIMN
7KS
SD89 CA
ORWA
ME
VT2 NJ
NY
DE
PA
KY
5 ILIN
OHWIIA
NE
AK10
MO
1988-1994 Loans 1995-2000 Loans
$23.5 $51.6 $75.1$0 $100.9 $100.9
$4.0 $29.4 $33.4$1.1 $8.9 $10.0$6.5 $11.2 $17.7
$27.7 $8.9 $36.6$2.6 $48.5 $51.1
$178.7 $147.5 $326.2NA NA NA$0 $0 $0
$1.2 $1.2 $2.4$2.6 $0 $2.6
$0 $62.3 $62.3$0 $2.8 $2.8$0 $0 $0
$0.7 $0 $0.7$0 $5.0 $5.0
$143.8 $322.3 $466.1$0 $41.3 $41.3
$231.6 $297.4 $529.0$0 $3.9 $3.9
$9.4 $57.0 $66.4$8.2 $0 $8.2
$0 $0 $0$0 $0 $0
$25.5 $10.1 $35.6$5.2 $0 $5.2
$0 $0 $0$60.8 $107.0 $167.8
$0 $0 $0$2.5 $21.0 $23.5
$0 $1.3 $1.3
5-35

5-36
Report to Congress on Implementation and Enforcement of the CSO Control Policy
projects are eligible to receive amaximum 20-percent grant.
While nearly two-thirds of CSO stateshave a grant or loan program, most ofthese are targeted toward small and/orfinancially distressed communities,and often have fairly low fundinglevels. Such programs may helpinitiate the CSO planning process, butfew of these programs would helpsupplement financing large capitalexpenditures associated with CSOcontrols.
5.8 Performance Measures
Performance measures areobjective, quantifiable indicatorsto track trends and results over
time. In the case of CSOs and CSOimpacts, the Combined Sewer OverflowGuidance for Permit Writers suggeststhat performance measures generallyfall into one of four categories:
● Administrative measures thattrack programmatic activities suchas the number of permitsrequiring the NMC and LTCPs.
● End-of-pipe measures that showtrends in CSO activity, such asreductions in pollutant loadingand the frequency and duration ofCSO events.
● Receiving water measures thatshow trends in in-streamconcentrations of CSO pollutants,such as dissolved oxygen and totalsuspended solids.
● Ecological, human health, anddesignated use measures that showtrends in conditions relating to the
use of the water, such as beachclosures and restored habitat.
All NPDES authorities have amechanism for tracking administrativeperformance measures. Thisinformation, as collected from theNPDES authorities, was summarizedand presented in Section 5.2 of thisreport.
As part of the data gathering effort forthis report, EPA collected data readilyavailable from NPDES authorities thatcould be used to assess and documentother performance measuresattributable to CSO control. Morethan one-quarter of CSO permit files(266 of 859) contained data on end-of-pipe measures, such as frequency orvolume of CSOs, typically as part of apermit application or as part of thesystem characterization activities.Information presented in this format,however, is most often a "snapshot" ofcurrent conditions, based on datacollected six to 18 months prior to thesubmission of the report orapplication. It is not possible toestablish meaningful trends in CSOcontrol with this data.
Several NPDES authorities includerequirements in CSO permits forsubmission of end-of-pipe data on amonthly or annual basis, but oftenhave no system for tracking themeasures from year to year. Forexample:
● Some NPDES authorities includerequirements in CSO permits toestimate the volume andfrequency of overflows, by outfall,as part of a monthly dischargemonitoring report (DMR). DMRs
As part of Portland, Oregon’s sampling andmonitoring program, the city regularlymonitors the Columbia Slough at ninelocations for parameters of concern. Theseinclude: bacteria, toxics, and nutrients.
Photo: Photodisc

Chapter 5—NPDES and Other State Authorities
5-37
Chapter 5—NPDES and Other State Authorities
are submitted to the NPDESauthority as hard copies, and theNPDES authority has noelectronic system for tracking datareported by CSO communities.
● Some NPDES authorities includerequirements in CSO permits forannual reports documenting thecontinued implementation of theNMC. These reports containinformation on end-of-pipemeasures such as the number ofdry weather overflow eventsduring the previous year. NPDESauthorities requiring these reportshave not established a system forcompiling the data reported.
Both cases illustrate situations inwhich information that could be usedto assess benefits from programimplementation is filed with theNPDES authority but is not easilyaccessed and is therefore of limiteduse.
EPA's review of CSO permit filesfound that less than 10 percentcontained information on specificprograms geared toward trackingCSO-related benefits by usingreceiving water, ecological, humanhealth, or designated use measures ofsuccess in CSO planning activities.The activities included measuring in-stream water quality to establishbackground and pre-controlconditions, and monitoring in-streampollutant characteristics during wetweather events. Documentation ofmonitoring studies was most oftenpresented in an LTCP, annual reports,periodic reports, or correspondencefiles between communities andNPDES authorities. No state has
developed a system for statewide,CSO-specific assessment.
Data associated with receiving wateror ecological performance measuresare site-specific. This makes it difficultto track performance measures at thestate level. The CSO community casestudies developed to support thisreport indicate that informationavailable from CSO communities maysupport an assessment using theseperformance measures. Additionaldiscussion of these measures isprovided in Section 6.6 and includedin the case studies provided inAppendix C.
5.9 Findings
CSO Permits and PermittingAuthorities
● There are 859 CSO permitsregulating 9,471 outfalls.
● CSO permits regulate outfalls in32 states (including the District ofColumbia) within nine EPAregions.
● State agencies administer thepermitting programs in 28 states;EPA is the NPDES permittingauthority for Alaska, the Districtof Columbia, Massachusetts, andNew Hampshire.
CSO Program Development andPermit Requirements
● All of the 32 states with combinedsewer systems developed CSOstrategies in response to the 1989National CSO Control Strategyand most have mechanisms inplace to address CSOs through

5-38
Report to Congress on Implementation and Enforcement of the CSO Control Policy
● Three states (Massachusetts,Maine, and Indiana) havedeveloped statutory frameworks toaddress water quality standards inCSO-impacted receiving waters.
Enforcement and ComplianceAssistance
● Enforcement actions initiated byNPDES authorities are mainlyadministrative orders used toestablish or enforceimplementation milestones anddeadlines for CSO controls. Therehave been at least 173 actions todate.
● States have provided complianceassistance to CSO permittees byutilizing EPA-issued guidancedocuments, developing stateguidance and training materials,hosting workshops andconducting outreach. Most statesattempt to incorporate CSOcompliance activities within theoverall NPDES complianceprograms for the state.
● States perform compliancemonitoring of CSOs throughNPDES inspections programs.
● States coordinate enforcement andcompliance activities with theregion.
Funding
● The SRF loan program is theprincipal mechanism used by thestates to provide funding for CSOcontrol projects ($2.08 billionbetween 1989 and 2000).
● SRF loans for CSO projects in 2000were the highest ever, accounting
NPDES permits or CWAenforceable mechanisms.
● Upon issuance of the 1994 CSOControl Policy, many statestrategies were updated; however,state programs vary in the extentto which they specifically followthe provisions of the CSO ControlPolicy:
◗ 27 require the NMC or a suiteof BMPs that include or areanalogous to the NMC.
◗ 25 have a framework for CSOfacilities planning that isconsistent with the LTCPapproach outlined in the CSOControl Policy.
● 807 (94 percent) of CSOcommunities are under anenforceable requirement, either ina permit or an enforceable order,to implement some level of CSOcontrol.
● 740 (86 percent) are required toimplement a set of BMPs thatincludes or is analogous to theNMC.
● 559 (66 percent) requiredevelopment of an LTCP.
Coordination of LTCP Developmentwith Water Quality Standards Reviews
● Most NPDES authorities have notestablished a process forcoordinating the review of LTCPsand the development of CSOpermits with the water qualitystandards authority to determineif revisions to the water qualitystandards are appropriate.

Chapter 5—NPDES and Other State Authorities
5-39
for $411 million (12 percent oftotal SRF assistance).
● State-specific loan and grantprograms exist but offer limitedfunding (generally available foruse in covering planning andprogram development versusimplementation costs).
Performance Measures
● Data necessary for measuringadministrative performance ofNPDES authority efforts toimplement the Policy are readilyavailable and tracked.
● Data needed for understandingand reporting environmentalbenefits on a statewide basis arenot readily available.
● Comprehensive state datamanagement and analysis onenvironmental progress (includingload reductions associated withCSO control) is not beingconducted.

Comply with permit conditionsbased on narrative water qualitystandards.
Implement selected CSO controlsfrom the LTCP.
Perform post-constructioncompliance monitoring.
Reassess overflows to sensitiveareas.
Coordinate all activities withNPDES permitting authority, statewater quality standards authority,and state watershed personnel.
This chapter describes activities byCSO communities to meet theseresponsibilities. Specifically, thechapter provides a discussion of thefollowing:
National CSO demographics
Implementation of documentedCSO controls
Implementation of the NMC
Implementation of the LTCP
Chapter 6
The CSO Control Policyestablished implementationobjectives and responsibilities
for CSO communities in stating:
[Communities] with combined
sewer systems that have CSOs
should immediately undertake a
process to accurately characterize
their sewer systems, to demonstrate
implementation of the nine
minimum controls, and to develop
a long-term CSO control plan.
EPA's Guidance for Long-Term ControlPlan (EPA, 1995f) further outlines theexpectations of the permittees:
Evaluate and implement NMC.
Submit documentation on NMCimplementation by January 1,1997.
Develop an LTCP and submit forreview to the NPDES permittingauthority.
Support the review of waterquality standards in CSO-impacted receiving water bodies.
6-1
6.1 National CSODemographics
6.2 Implementation of CSOControls
6.3 Implementation of theNMC
6.4 Implementation of theLTCP
6.5 Financial Considerations
6.6 Obstacles andChallenges
6.7 Performance Measuresand EnvironmentalBenefits
6.8 Findings
CSO Control Policy ImplementationStatus: Communities
In this chapter:
Learn More About Them . . .
Additional information about a number ofthe community CSO programs describedin this chapter can be found in AppendixC. Case study communities have thissymbol ✦✦ next to their names.
Learn More About Them . . .
Additional information about a number ofthe community CSO programs describedin this chapter can be found inAppendix C. Case study communitieshave this symbol ✦✦ next to their names.
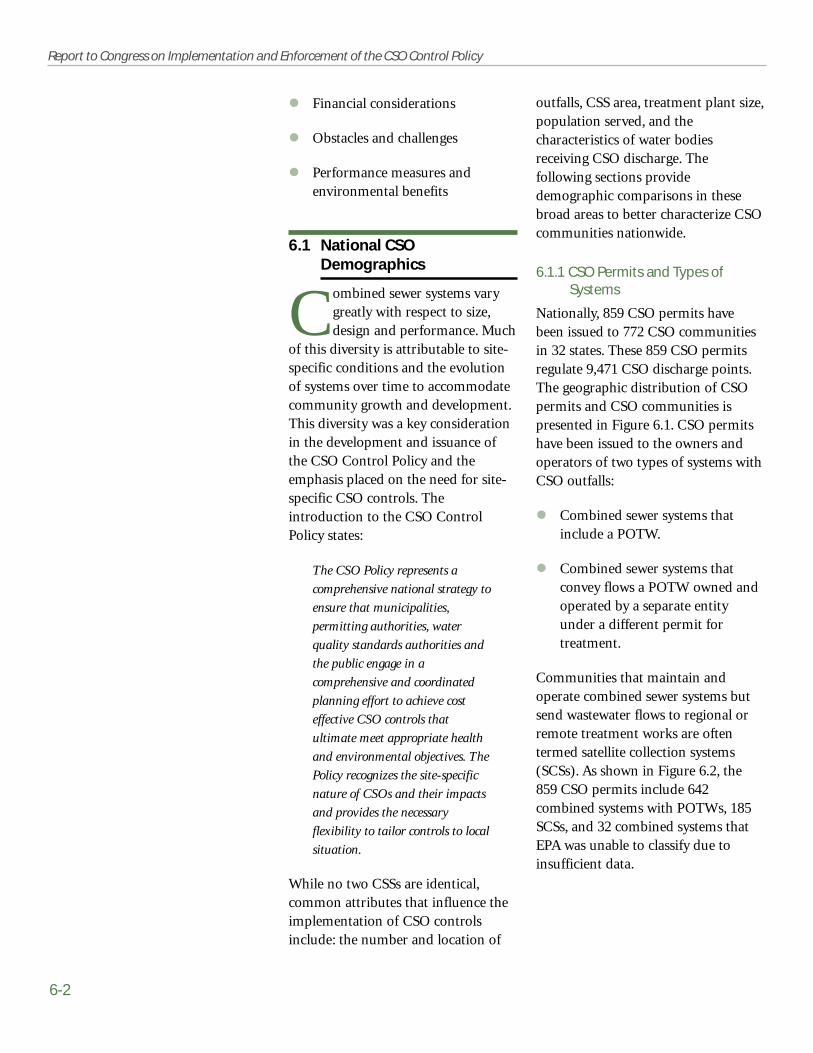
6-2
Report to Congress on Implementation and Enforcement of the CSO Control Policy
outfalls, CSS area, treatment plant size,population served, and thecharacteristics of water bodiesreceiving CSO discharge. Thefollowing sections providedemographic comparisons in thesebroad areas to better characterize CSOcommunities nationwide.
6.1.1 CSO Permits and Types ofSystems
Nationally, 859 CSO permits havebeen issued to 772 CSO communitiesin 32 states. These 859 CSO permitsregulate 9,471 CSO discharge points.The geographic distribution of CSOpermits and CSO communities ispresented in Figure 6.1. CSO permitshave been issued to the owners andoperators of two types of systems withCSO outfalls:
Combined sewer systems thatinclude a POTW.
Combined sewer systems thatconvey flows a POTW owned andoperated by a separate entityunder a different permit fortreatment.
Communities that maintain andoperate combined sewer systems butsend wastewater flows to regional orremote treatment works are oftentermed satellite collection systems(SCSs). As shown in Figure 6.2, the859 CSO permits include 642combined systems with POTWs, 185SCSs, and 32 combined systems thatEPA was unable to classify due toinsufficient data.
Financial considerations
Obstacles and challenges
Performance measures andenvironmental benefits
6.1 National CSODemographics
Combined sewer systems varygreatly with respect to size,design and performance. Much
of this diversity is attributable to site-specific conditions and the evolutionof systems over time to accommodatecommunity growth and development.This diversity was a key considerationin the development and issuance ofthe CSO Control Policy and theemphasis placed on the need for site-specific CSO controls. Theintroduction to the CSO ControlPolicy states:
The CSO Policy represents a
comprehensive national strategy to
ensure that municipalities,
permitting authorities, water
quality standards authorities and
the public engage in a
comprehensive and coordinated
planning effort to achieve cost
effective CSO controls that
ultimate meet appropriate health
and environmental objectives. The
Policy recognizes the site-specific
nature of CSOs and their impacts
and provides the necessary
flexibility to tailor controls to local
situation.
While no two CSSs are identical,common attributes that influence theimplementation of CSO controlsinclude: the number and location of
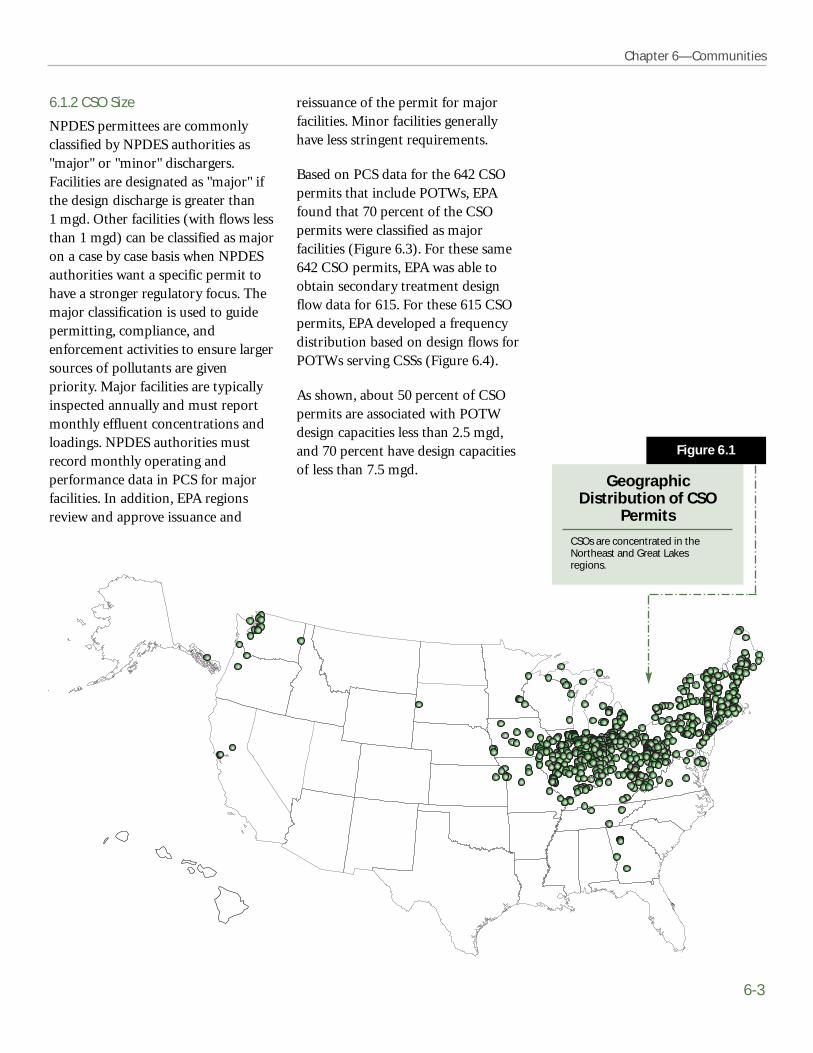
Chapter 6—Communities
6-3
reissuance of the permit for majorfacilities. Minor facilities generallyhave less stringent requirements.
Based on PCS data for the 642 CSOpermits that include POTWs, EPAfound that 70 percent of the CSOpermits were classified as majorfacilities (Figure 6.3). For these same642 CSO permits, EPA was able toobtain secondary treatment designflow data for 615. For these 615 CSOpermits, EPA developed a frequencydistribution based on design flows forPOTWs serving CSSs (Figure 6.4).
As shown, about 50 percent of CSOpermits are associated with POTWdesign capacities less than 2.5 mgd,and 70 percent have design capacitiesof less than 7.5 mgd.
6.1.2 CSO Size
NPDES permittees are commonlyclassified by NPDES authorities as"major" or "minor" dischargers.Facilities are designated as "major" ifthe design discharge is greater than1 mgd. Other facilities (with flows lessthan 1 mgd) can be classified as majoron a case by case basis when NPDESauthorities want a specific permit tohave a stronger regulatory focus. Themajor classification is used to guidepermitting, compliance, andenforcement activities to ensure largersources of pollutants are givenpriority. Major facilities are typicallyinspected annually and must reportmonthly effluent concentrations andloadings. NPDES authorities mustrecord monthly operating andperformance data in PCS for majorfacilities. In addition, EPA regionsreview and approve issuance and
GeographicDistribution of CSO
Permits
CSOs are concentrated in theNortheast and Great Lakesregions.
Figure 6.1
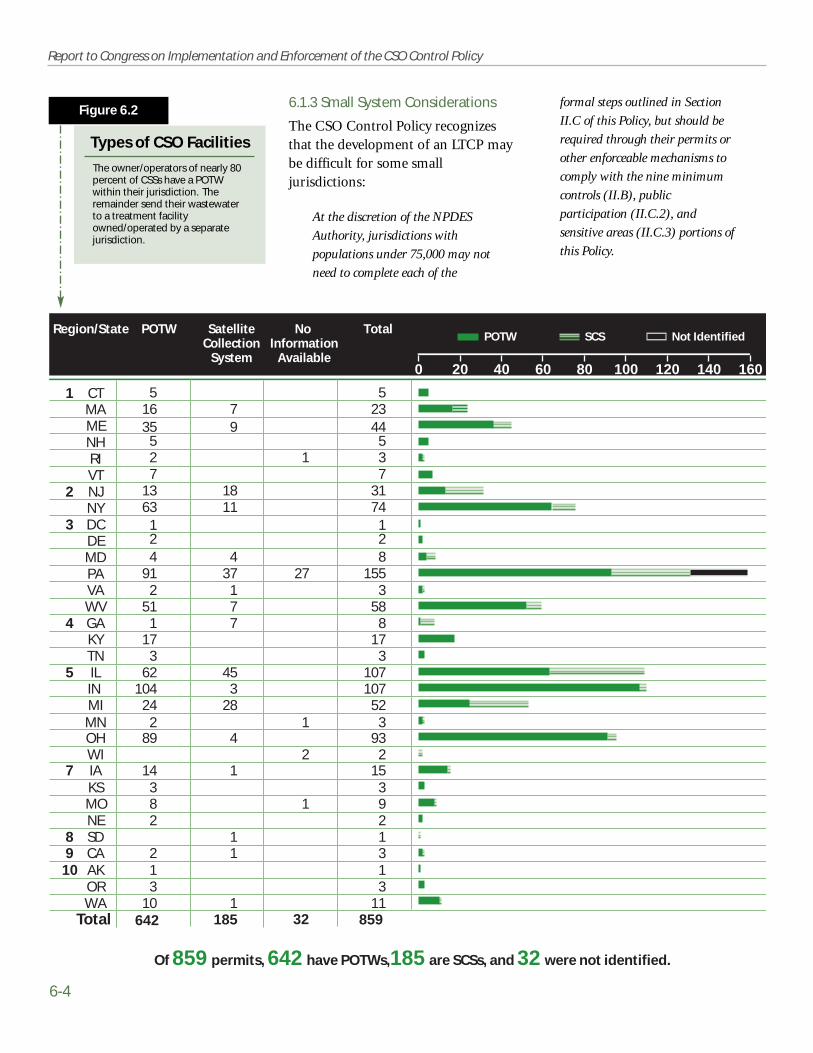
6-4
Report to Congress on Implementation and Enforcement of the CSO Control Policy
formal steps outlined in Section
II.C of this Policy, but should be
required through their permits or
other enforceable mechanisms to
comply with the nine minimum
controls (II.B), public
participation (II.C.2), and
sensitive areas (II.C.3) portions of
this Policy.
6.1.3 Small System Considerations
The CSO Control Policy recognizesthat the development of an LTCP maybe difficult for some smalljurisdictions:
At the discretion of the NPDES
Authority, jurisdictions with
populations under 75,000 may not
need to complete each of the
Types of CSO Facilities
The owner/operators of nearly 80percent of CSSs have a POTWwithin their jurisdiction. Theremainder send their wastewaterto a treatment facilityowned/operated by a separatejurisdiction.
Figure 6.2
Region/State
16060 80 100 120 14020 40
Total
0
Of 859 permits, 642 have POTWs,185 are SCSs, and 32 were not identified.
642 185 32 859Total
1 CTMA
NHRI
3 DC
MD
VAWV
4 GA
TN
MIMN
7KSMO
SD89 CA
ORWA
ME
VT2 NJ
NY
DE
PA
KY
5 ILIN
OHWIIA
NE
AK10
5 516 7 2335 9 44
5 52 1 37 7
13 18 3163 11 74
1 12 24 4 8
91 37 27 1552 1 3
51 7 581 7 8
17 173 3
62 45 107104 3 107
24 28 522 1 3
89 4 932 2
14 1 153 38 1 92 2
1 12 1 31 13 3
10 1 11
POTW SCSNo
InformationAvailable
POTW SatelliteCollection
System
Not Identified
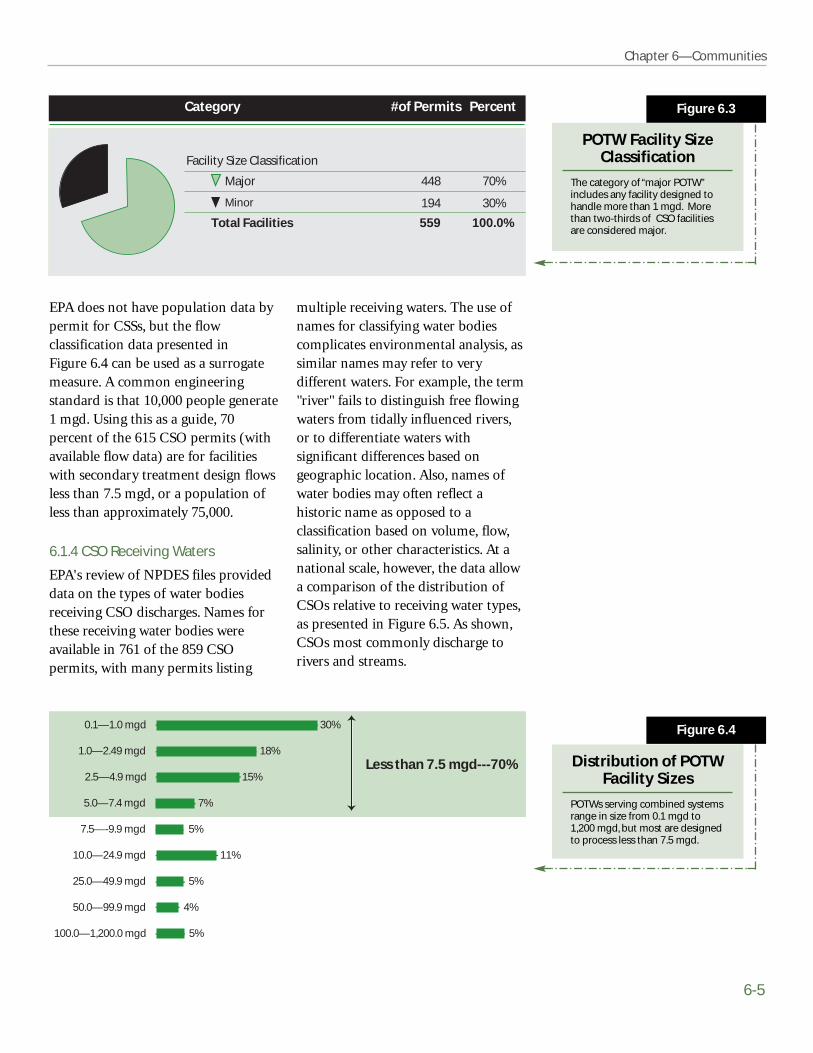
Chapter 6—Communities
6-5
multiple receiving waters. The use ofnames for classifying water bodiescomplicates environmental analysis, assimilar names may refer to verydifferent waters. For example, the term"river" fails to distinguish free flowingwaters from tidally influenced rivers,or to differentiate waters withsignificant differences based ongeographic location. Also, names ofwater bodies may often reflect ahistoric name as opposed to aclassification based on volume, flow,salinity, or other characteristics. At anational scale, however, the data allowa comparison of the distribution ofCSOs relative to receiving water types,as presented in Figure 6.5. As shown,CSOs most commonly discharge torivers and streams.
EPA does not have population data bypermit for CSSs, but the flowclassification data presented inFigure 6.4 can be used as a surrogatemeasure. A common engineeringstandard is that 10,000 people generate1 mgd. Using this as a guide, 70percent of the 615 CSO permits (withavailable flow data) are for facilitieswith secondary treatment design flowsless than 7.5 mgd, or a population ofless than approximately 75,000.
6.1.4 CSO Receiving Waters
EPA's review of NPDES files provideddata on the types of water bodiesreceiving CSO discharges. Names forthese receiving water bodies wereavailable in 761 of the 859 CSOpermits, with many permits listing
Facility Size Classification
#of Permits Percent
Total Facilities 559 100.0%
Minor
Category
Major 448
194
70%
30%
0.1—1.0 mgd 30%
1.0—2.49 mgd 18%
2.5—4.9 mgd 15%
5.0—7.4 mgd 7%
7.5—-9.9 mgd 5%
10.0—24.9 mgd 11%
25.0—49.9 mgd 5%
50.0—99.9 mgd 4%
100.0—1,200.0 mgd 5%
Less than 7.5 mgd---70%
POTW Facility SizeClassification
The category of “major POTW”includes any facility designed tohandle more than 1 mgd. Morethan two-thirds of CSO facilitiesare considered major.
Figure 6.3
Distribution of POTWFacility Sizes
POTWs serving combined systemsrange in size from 0.1 mgd to1,200 mgd, but most are designedto process less than 7.5 mgd.
Figure 6.4

6-6
Report to Congress on Implementation and Enforcement of the CSO Control Policy
were not available. Data gathered forthis report has established a baselineof CSO facilities (including those thathave recently separated). Completeseparation, full outfall elimination, orsubstantial completion of CSO controlefforts was found for 87 CSO permits.
6.2.1 Assessment of ControlImplementation
During visits to states and regions,NPDES files for 781 CSO permits werereviewed. Data on implementedcontrols for another 30 CSO permitswere on file with EPA or wereprovided by the NPDES authority orthe region. In discussingimplementation, any controlsdocumented for these 811 CSOpermits are considered.Documentation types included NMCimplementation reports, draft andfinal LTCPs, annual CSO reports,other engineering and planningdocuments, enforcement files, andcorrespondence and communicationrecords maintained in the NPDESfiles. In the case of annual reports,documented controls were typicallyfor specific reporting periods (i.e., theprevious year) rather than acomprehensive set of CSO controlsbeing considered and implemented.EPA believes that more comprehensive
6.2 Implementation of CSOControls
Many community-level CSOprograms predate the CSOControl Policy. The design
and operation of CSSs has requiredmunicipalities to consider wet weatherflows and system capacities inoperating, upgrading, and expandingservice. As more NPDES authoritiesinitiated formalized CSO programs inthe 1980s, greater attention was paidto the implementation of controls andto research, development, and testingof possible control alternatives.
Although this chapter of the reportfocuses on communityimplementation of controls in thecontext of the CSO Control Policy,other instances of documentedcontrols are discussed. Documentedcontrols include those resulting fromimplementation of the NMC, LTCPcontrol alternatives, or other CSOstudies or planning efforts.
Many communities have eitherseparated their CSS or eliminatedoverflows (through systemmanagement or outfall elimination).Prior to this report, national trackingand estimates of communities thathad separated or eliminated CSOs
Types of WatersReceiving CSO
Discharges
Discharges occur to a wide varietyof freshwater and marineenvironments, but most outfallsare located on rivers and streams.
Figure 6.5
Types of CSO Receiving Waters
#of Waterbodies Percent
Total CSO Receiving Waters 1,409 100.0%
Streams
Other
Category
Rivers 606
164
538
43%
12%
38%
Oceans/Bays/Estuaries
Ponds/Lakes
69
32
5%
2%
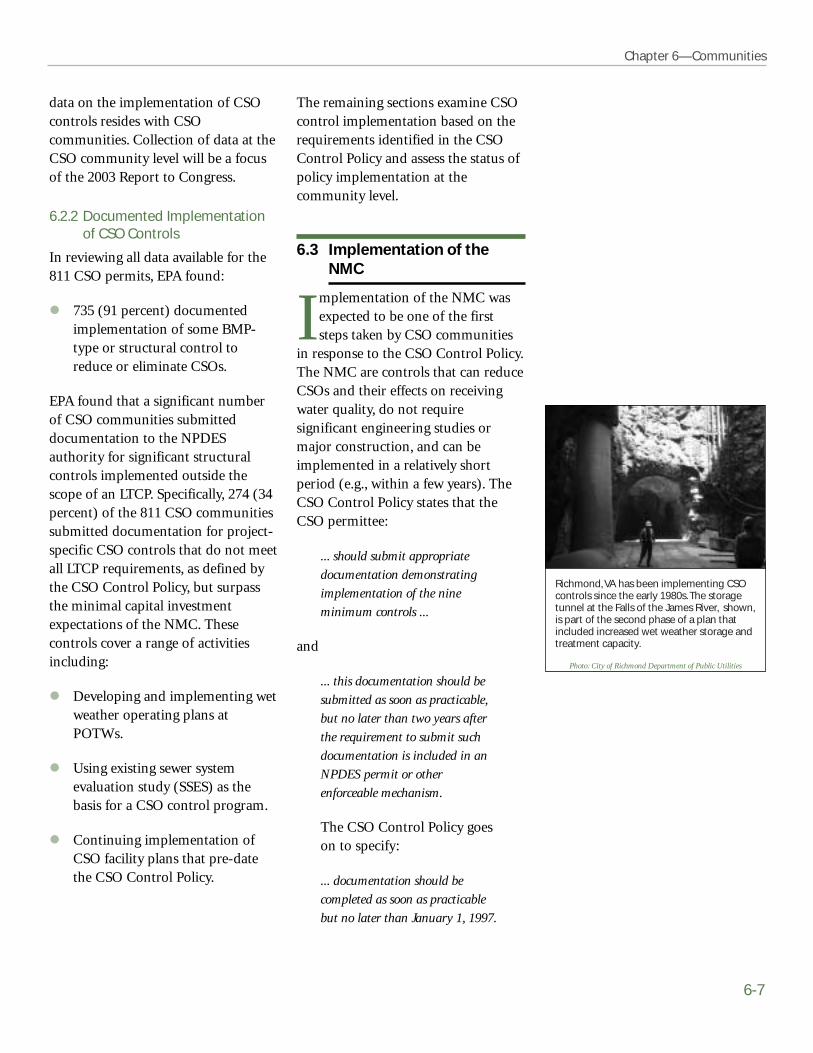
Richmond, VA has been implementing CSOcontrols since the early 1980s. The storagetunnel at the Falls of the James River, shown,is part of the second phase of a plan thatincluded increased wet weather storage andtreatment capacity.
Photo: City of Richmond Department of Public Utilities
Chapter 6—Communities
6-7
The remaining sections examine CSOcontrol implementation based on therequirements identified in the CSOControl Policy and assess the status ofpolicy implementation at thecommunity level.
6.3 Implementation of theNMC
Implementation of the NMC wasexpected to be one of the firststeps taken by CSO communities
in response to the CSO Control Policy.The NMC are controls that can reduceCSOs and their effects on receivingwater quality, do not requiresignificant engineering studies ormajor construction, and can beimplemented in a relatively shortperiod (e.g., within a few years). TheCSO Control Policy states that theCSO permittee:
... should submit appropriate
documentation demonstrating
implementation of the nine
minimum controls ...
and
... this documentation should be
submitted as soon as practicable,
but no later than two years after
the requirement to submit such
documentation is included in an
NPDES permit or other
enforceable mechanism.
The CSO Control Policy goeson to specify:
... documentation should be
completed as soon as practicable
but no later than January 1, 1997.
data on the implementation of CSOcontrols resides with CSOcommunities. Collection of data at theCSO community level will be a focusof the 2003 Report to Congress.
6.2.2 Documented Implementationof CSO Controls
In reviewing all data available for the811 CSO permits, EPA found:
735 (91 percent) documentedimplementation of some BMP-type or structural control toreduce or eliminate CSOs.
EPA found that a significant numberof CSO communities submitteddocumentation to the NPDESauthority for significant structuralcontrols implemented outside thescope of an LTCP. Specifically, 274 (34percent) of the 811 CSO communitiessubmitted documentation for project-specific CSO controls that do not meetall LTCP requirements, as defined bythe CSO Control Policy, but surpassthe minimal capital investmentexpectations of the NMC. Thesecontrols cover a range of activitiesincluding:
Developing and implementing wetweather operating plans atPOTWs.
Using existing sewer systemevaluation study (SSES) as thebasis for a CSO control program.
Continuing implementation ofCSO facility plans that pre-datethe CSO Control Policy.
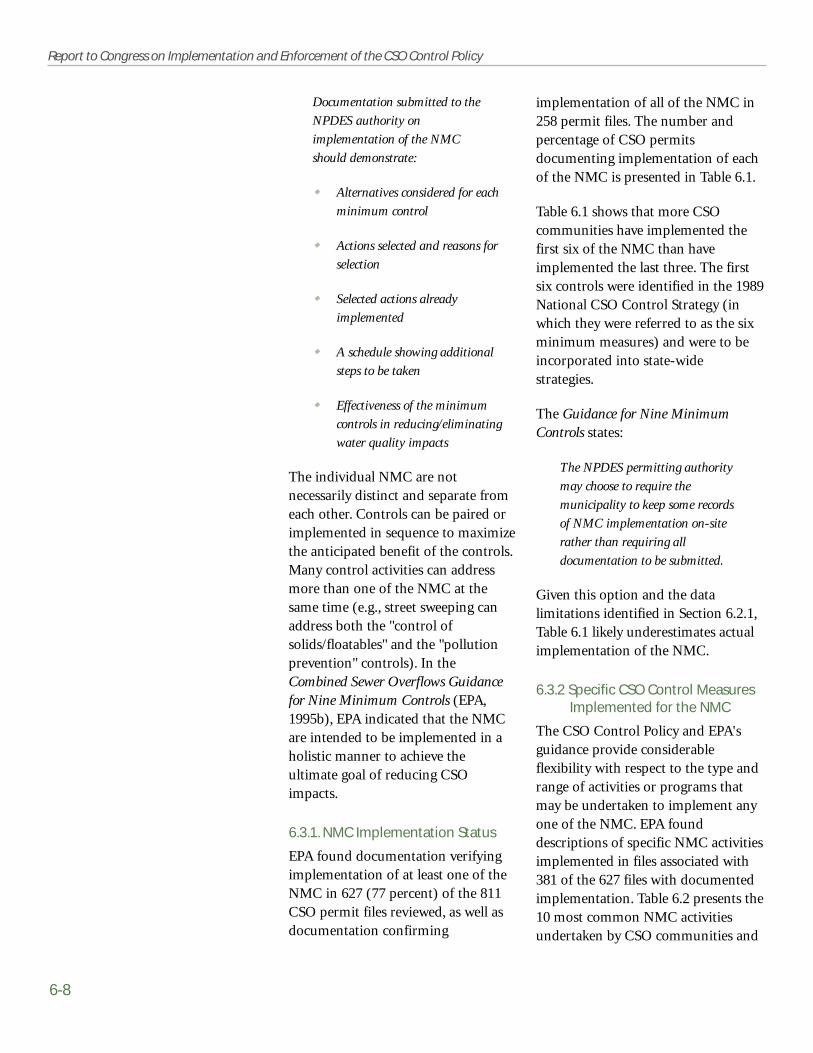
6-8
Report to Congress on Implementation and Enforcement of the CSO Control Policy
implementation of all of the NMC in258 permit files. The number andpercentage of CSO permitsdocumenting implementation of eachof the NMC is presented in Table 6.1.
Table 6.1 shows that more CSOcommunities have implemented thefirst six of the NMC than haveimplemented the last three. The firstsix controls were identified in the 1989National CSO Control Strategy (inwhich they were referred to as the sixminimum measures) and were to beincorporated into state-widestrategies.
The Guidance for Nine MinimumControls states:
The NPDES permitting authority
may choose to require the
municipality to keep some records
of NMC implementation on-site
rather than requiring all
documentation to be submitted.
Given this option and the datalimitations identified in Section 6.2.1,Table 6.1 likely underestimates actualimplementation of the NMC.
6.3.2 Specific CSO Control MeasuresImplemented for the NMC
The CSO Control Policy and EPA'sguidance provide considerableflexibility with respect to the type andrange of activities or programs thatmay be undertaken to implement anyone of the NMC. EPA founddescriptions of specific NMC activitiesimplemented in files associated with381 of the 627 files with documentedimplementation. Table 6.2 presents the10 most common NMC activitiesundertaken by CSO communities and
Documentation submitted to the
NPDES authority on
implementation of the NMC
should demonstrate:
Alternatives considered for each
minimum control
Actions selected and reasons for
selection
Selected actions already
implemented
A schedule showing additional
steps to be taken
Effectiveness of the minimum
controls in reducing/eliminating
water quality impacts
The individual NMC are notnecessarily distinct and separate fromeach other. Controls can be paired orimplemented in sequence to maximizethe anticipated benefit of the controls.Many control activities can addressmore than one of the NMC at thesame time (e.g., street sweeping canaddress both the "control ofsolids/floatables" and the "pollutionprevention" controls). In theCombined Sewer Overflows Guidancefor Nine Minimum Controls (EPA,1995b), EPA indicated that the NMCare intended to be implemented in aholistic manner to achieve theultimate goal of reducing CSOimpacts.
6.3.1. NMC Implementation Status
EPA found documentation verifyingimplementation of at least one of theNMC in 627 (77 percent) of the 811CSO permit files reviewed, as well asdocumentation confirming

Chapter 6—Communities
6-9
NMC 1—Proper operation andregular maintenance programs for thesewer system and the CSOs.
The effectiveness of this control relieson a well-developed operation andmaintenance (O&M) program. AnO&M program generally shouldinclude the following:
The organizations and peopleresponsible for various aspects ofthe O&M program.
the number and percentages of CSOpermit files documenting use of theactivity in information submitted tothe NPDES authority. A more detailedlist of CSO controls implemented byCSO communities to address theNMC is presented in Appendix R.
The following subsections describe theindividual NMC and provide selectexamples of implementation activitiesby CSO communities.
NMC Category Number of % of NMCDocumented 811 Permits
Implementations Reviewed
1—Proper O&M 567 70%
2— Maximize use of collection system for storage 571 70%
3—Pretreatment program review and modification 526 65%
4—Maximize flow to the POTW 561 70%
5—Eliminate dry-weather overflows 567 70%
6—Solids and floatables control 478 59%
7—Pollution prevention 455 56%
8—Public notification 450 56%
9—Monitoring of CSO impacts and efficacy of controls 430 53%
NMC Activity NMC Implementation % of 381Category Frequency Permits
Reviewed
Street sweeping and cleaning 6 181 48%
Catch basin cleaning 6 158 41%
Public education programs 8 101 27%
Sewer flushing 1 90 24%
Screens and trash racks 6 84 22%
In-sewer storage 2 77 20%
Solid waste reduction and recycling 7 68 18%
Infiltration and inflow control 2 66 17%
Industrial pretreatment 3 61 16%
Area/foundation drain, roof leader disconnection 2 57 15%
Status of NMCImplementationDocumentation
EPA reviewed 811 permit files fordocumentation of NMCimplementation. As the tableshows, the first six minimumcontrols are more widelyimplemented than the last three.
Table 6.1
10 Most FrequentlyImplemented NMC
Activities
EPA found 381 permit files withdescriptions of specific activitiesundertaken to implement one ormore of the NMC. Solids andfloatables control measuresdominated the top five activities.Six of the NMC are represented inthis list.
Table 6.2
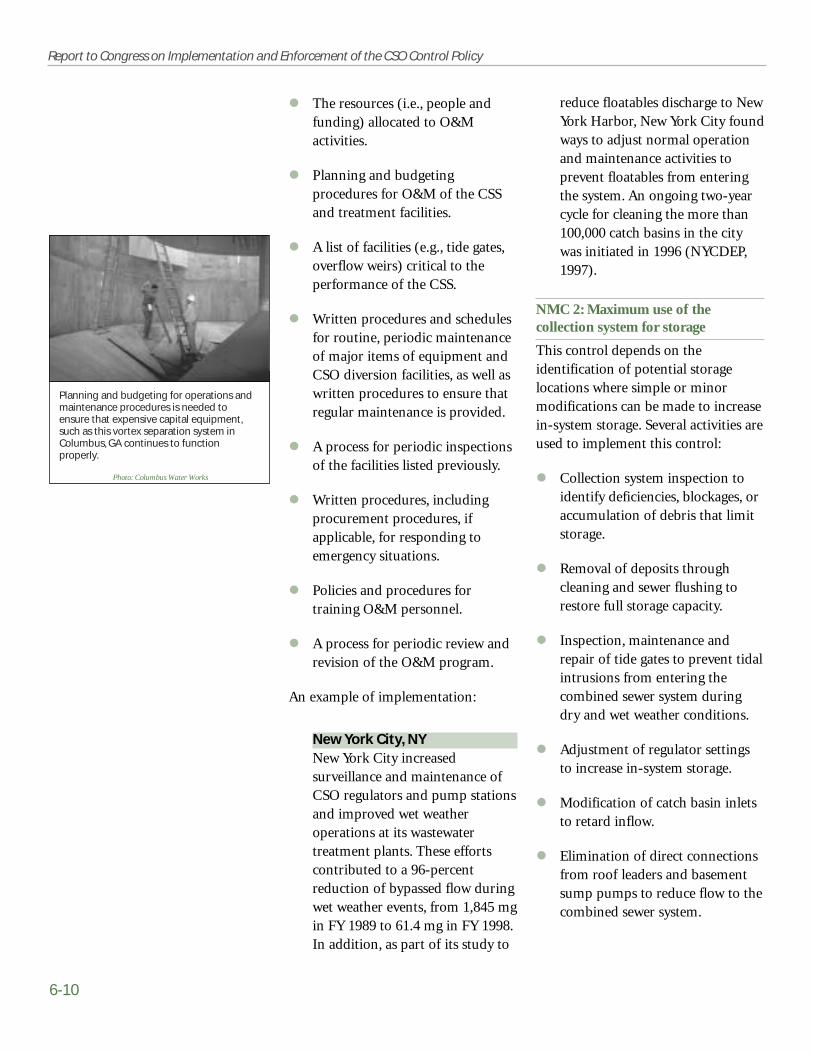
Planning and budgeting for operations andmaintenance procedures is needed toensure that expensive capital equipment,such as this vortex separation system inColumbus, GA continues to functionproperly.
Photo: Columbus Water Works
6-10
Report to Congress on Implementation and Enforcement of the CSO Control Policy
reduce floatables discharge to NewYork Harbor, New York City foundways to adjust normal operationand maintenance activities toprevent floatables from enteringthe system. An ongoing two-yearcycle for cleaning the more than100,000 catch basins in the citywas initiated in 1996 (NYCDEP,1997).
NMC 2: Maximum use of thecollection system for storage
This control depends on theidentification of potential storagelocations where simple or minormodifications can be made to increasein-system storage. Several activities areused to implement this control:
Collection system inspection toidentify deficiencies, blockages, oraccumulation of debris that limitstorage.
Removal of deposits throughcleaning and sewer flushing torestore full storage capacity.
Inspection, maintenance andrepair of tide gates to prevent tidalintrusions from entering thecombined sewer system duringdry and wet weather conditions.
Adjustment of regulator settingsto increase in-system storage.
Modification of catch basin inletsto retard inflow.
Elimination of direct connectionsfrom roof leaders and basementsump pumps to reduce flow to thecombined sewer system.
The resources (i.e., people andfunding) allocated to O&Mactivities.
Planning and budgetingprocedures for O&M of the CSSand treatment facilities.
A list of facilities (e.g., tide gates,overflow weirs) critical to theperformance of the CSS.
Written procedures and schedulesfor routine, periodic maintenanceof major items of equipment andCSO diversion facilities, as well aswritten procedures to ensure thatregular maintenance is provided.
A process for periodic inspectionsof the facilities listed previously.
Written procedures, includingprocurement procedures, ifapplicable, for responding toemergency situations.
Policies and procedures fortraining O&M personnel.
A process for periodic review andrevision of the O&M program.
An example of implementation:
New York City, NYNew York City increasedsurveillance and maintenance ofCSO regulators and pump stationsand improved wet weatheroperations at its wastewatertreatment plants. These effortscontributed to a 96-percentreduction of bypassed flow duringwet weather events, from 1,845 mgin FY 1989 to 61.4 mg in FY 1998.In addition, as part of its study to

Chapter 6—Communities
6-11
of flow entering the CSS. Skokieconstructed 871 berms on streetsand installed more than 2,900flow-restricting devices at catchbasins. In addition, most of theroof drains were disconnected,resulting in a substantial reductionin wet weather flow entering theCSS (EPA,1999c).
NMC 3: Review and modification ofpretreatment requirements to assureCSO impacts are minimized
For this control to be effective,municipalities must develop aninventory of non-domesticdischargers, assess potential volumeand pollutant impacts, evaluate thefeasibility of modifying pretreatmentprograms, and implement controlmeasures.
Examples of implementation:
✦ Richmond, VA The City of Richmond adapted itspretreatment program toimplement this NMC. One keyactivity is that several industriesretain storm water during wetweather events and release flow tothe CSS after the event, whensewer system capacity is available.Another related activity is that thedischarge of water treatment plantresiduals to the combined sewersystem is stopped during wetweather events (City of RichmondDPU, 2001).
Detention of runoff in upstreamareas (parking lots, streets, ponds)to increase storage in thecombined sewer system.
Coordination of pumpingoperations to maximize storage inthe combined sewer system.
Examples of implementation:
Wilmington, DELeaking tide gates and poorlyadjusted regulator settings allowsubstantial amounts of water toenter sewer collection systems.This unwanted inflow uses in-system storage and adds totreatment costs. The City ofWilmington observed that at hightide, river water was spilling over aregulating weir at one of its largestCSO outfall structures and intothe collection system. A simple,inexpensive solution wasemployed to increase the weirelevation by 16 inches. Pumpstation records indicated that thismodification reduced inflow by5 mgd and increased in-systemstorage by an equivalent amountduring periods of wet weatherflow. A more permanent solutionwas implemented when the sameweir was reconfigured duringconstruction of a floatablescontrol unit (City of WilmingtonDPW, 2000).
Skokie, ILSkokie implemented a city wideprogram to retard the delivery ofsurface runoff entering the CSS.Berms were used to increase on-street storage, and flow restrictorswere used to reduce the peak rate
To properly assess pretreatmentrequirements in busy industrial areas likeNew York Harbor, CSS operators mustmaintain an inventory of the volume andimpact of non-domestic discharges to thesystem.
Photo: Photodisc
Learn More About Them . . .
Additional information about a number ofthe community CSO programs describedin this chapter can be found inAppendix C. Case study communitieshave this symbol ✦✦ next to their names.
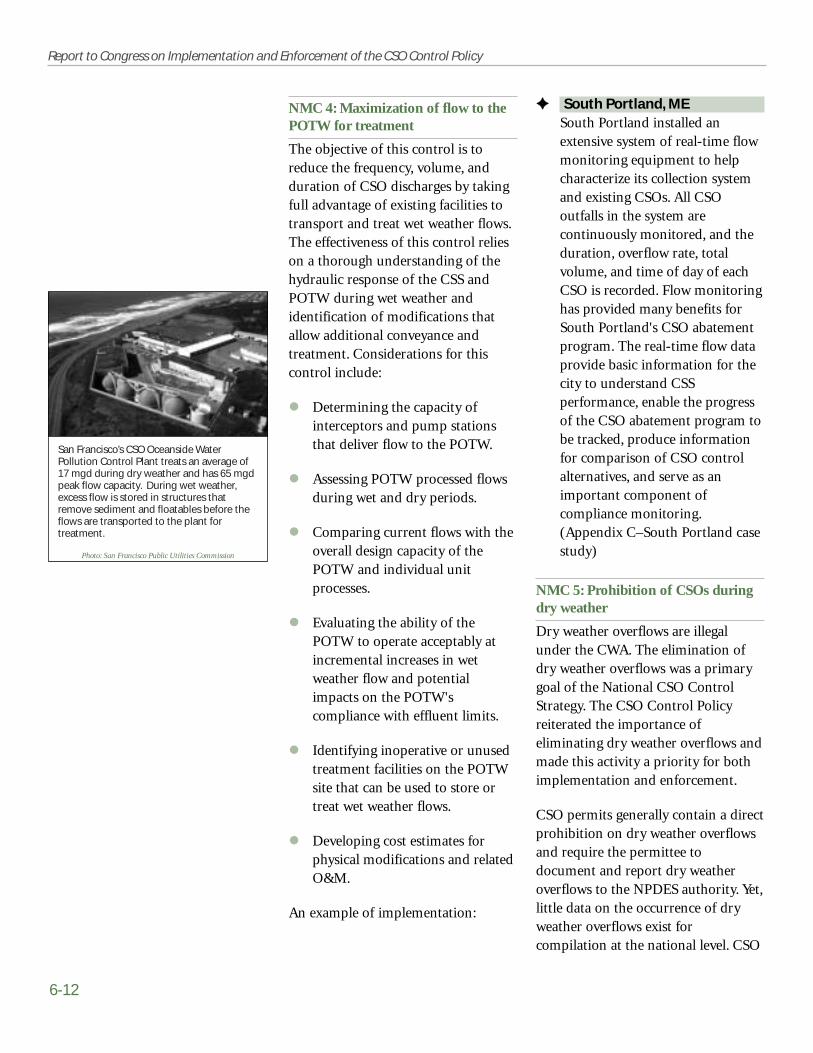
San Francisco’s CSO Oceanside WaterPollution Control Plant treats an average of17 mgd during dry weather and has 65 mgdpeak flow capacity. During wet weather,excess flow is stored in structures thatremove sediment and floatables before theflows are transported to the plant fortreatment.
Photo: San Francisco Public Utilities Commission
6-12
Report to Congress on Implementation and Enforcement of the CSO Control Policy
✦✦ South Portland, ME South Portland installed anextensive system of real-time flowmonitoring equipment to helpcharacterize its collection systemand existing CSOs. All CSOoutfalls in the system arecontinuously monitored, and theduration, overflow rate, totalvolume, and time of day of eachCSO is recorded. Flow monitoringhas provided many benefits forSouth Portland's CSO abatementprogram. The real-time flow dataprovide basic information for thecity to understand CSSperformance, enable the progressof the CSO abatement program tobe tracked, produce informationfor comparison of CSO controlalternatives, and serve as animportant component ofcompliance monitoring.(Appendix C–South Portland casestudy)
NMC 5: Prohibition of CSOs duringdry weather
Dry weather overflows are illegalunder the CWA. The elimination ofdry weather overflows was a primarygoal of the National CSO ControlStrategy. The CSO Control Policyreiterated the importance ofeliminating dry weather overflows andmade this activity a priority for bothimplementation and enforcement.
CSO permits generally contain a directprohibition on dry weather overflowsand require the permittee todocument and report dry weatheroverflows to the NPDES authority. Yet,little data on the occurrence of dryweather overflows exist forcompilation at the national level. CSO
NMC 4: Maximization of flow to thePOTW for treatment
The objective of this control is toreduce the frequency, volume, andduration of CSO discharges by takingfull advantage of existing facilities totransport and treat wet weather flows.The effectiveness of this control relieson a thorough understanding of thehydraulic response of the CSS andPOTW during wet weather andidentification of modifications thatallow additional conveyance andtreatment. Considerations for thiscontrol include:
Determining the capacity ofinterceptors and pump stationsthat deliver flow to the POTW.
Assessing POTW processed flowsduring wet and dry periods.
Comparing current flows with theoverall design capacity of thePOTW and individual unitprocesses.
Evaluating the ability of thePOTW to operate acceptably atincremental increases in wetweather flow and potentialimpacts on the POTW'scompliance with effluent limits.
Identifying inoperative or unusedtreatment facilities on the POTWsite that can be used to store ortreat wet weather flows.
Developing cost estimates forphysical modifications and relatedO&M.
An example of implementation:

Chapter 6—Communities
6-13
✦✦ Massachusetts WaterResources Authority (MWRA),Boston, MA Through a series of "fast-track"CSO projects, MWRA was able toeliminate dry weather overflowscaused by capacity problems orother structural conditions in themetropolitan Boston area. Controlof dry weather overflows iscurrently managed through fieldoperations, including frequentsystem inspections, routinemaintenance, and as-neededmaintenance to removeobstructions and make otherrepairs.(Appendix C–MWRA case study)
✦ South Portland, ME From 1996 to 1998, all of the dryweather overflows experienced bythe City of South Portlandresulted from power or equipmentfailures. The city installed backuppower sources at key systemlocations and is utilizing itsnetwork of continuous flowmonitors to quickly identify andeliminate dry weather overflows.South Portland reported no dryweather overflows during 1999.(Appendix C–South Portland casestudy)
NMC 6: Control of solids andfloatable materials in CSOs
Floatables controls can beimplemented in several ways;effectiveness is highly dependent ondesign, operation, maintenance, andsite-specific conditions. Principaloptions for the control of solids andfloatables include:
communities are often required toreport the annual average number ofdry weather overflows observedduring reissuance of their NPDESpermits. CSO communities usuallycalculate the annual average numberof dry weather overflows based upondata one to three years prior tosubmitting the NPDES application. Of301 CSO permit files with associateddry weather overflow information, 278permits (more than 90 percent)reported no dry weather overflows.
Several methods are used to alleviatedry weather overflows:
Adjusting regulator settings tokeep peak dry weather flowswithin the combined sewersystem.
Repairing and rehabilitatingregulators to correct problems.
Maintaining regulators to removedry weather overflow-producingblockages caused by trash andrefuse.
Maintaining tide gates andremoving debris to ensure that thegates close properly to preventtidal intrusions from entering thecombined sewer system.
Cleaning interceptors to removesediment, roots, and other objectsthat restrict flow.
Repairing sewers to reducegroundwater infiltration.
Examples of implementation:

Floatables control is accomplished throughpollution prevention activities such as streetcleaning and public education, and throughphysical controls, such as this netting systemserving the Cleveland, Ohio area.
Photo: Northeast Ohio Regional Sewer District
6-14
Report to Congress on Implementation and Enforcement of the CSO Control Policy
discharged into the Hudson Riverand various tributaries of theHackensack River.(Appendix C–North Bergen casestudy).
✦ South Portland, ME South Portland utilizes contractedsweeping services to sweep theentire 104 miles of city roadwayseach spring following theapplication of sand and salt overthe winter. This process yields over2,000 cubic yards of materialannually. City streets arecontinually maintained by citypersonnel during the summer andfall, and an additional 1,000 cubicyards of material is picked upduring this period. These activitiesprevent solids and floatables fromentering the CSS.(Appendix C–South Portland casestudy and EPA, 1999d).
NMC 7: Pollution prevention
The effectiveness of this minimumcontrol relies heavily on publiceducation and outreach. Pollutionprevention activities are far reachingand provide environmental benefitsthat go beyond CSO control. Specificpollution prevention activities include:
Solid waste collection andrecycling
Product ban or substitution toreduce problematic packagingwaste
Control of illegal dumping
Bulk refuse disposal
Hazardous waste collection
Prevention of extraneous solidsand floatables from entering theCSS, by reducing the amount ofstreet litter and encouraginghouseholds not to flushinappropriate items (such aspersonal hygiene products) downthe toilet.
Removal of solids and floatablesfrom CSOs, using physicalcontrols to keep floatables in theCSS or capture floatables beforebeing discharged to receivingwaters. Controls under this optioninclude baffles, trash racks,screens, catch basin modifications,and end-of-pipe netting systems.
Removal of floatables from surfacewaters after discharge to receivingwaters. The floatables controlsunder this option include boomsand skimmer boats.
Examples of implementation:
✦ North Bergen, NJ North Bergen's solids andfloatables controls consist of anetting system that captures solidand floatable material one-halfinch and larger in diameter. Thecity has installed three end-of-pipenetting units, four in-line units,and two floating units to complywith the solids and floatablescontrol requirements of theirNJDEP permit. Each unit haseither two or four disposable meshnets which are removed anddisposed when full. North Bergenestimates it captures and removesover 40 tons of solids andfloatables in these nets each yearthat otherwise would have been
Communities use a variety of pollutionprevention techniques to keep floatablesfrom entering the CSSs, including streetsweeping.
Photo: NJ Department of Environmental Protection
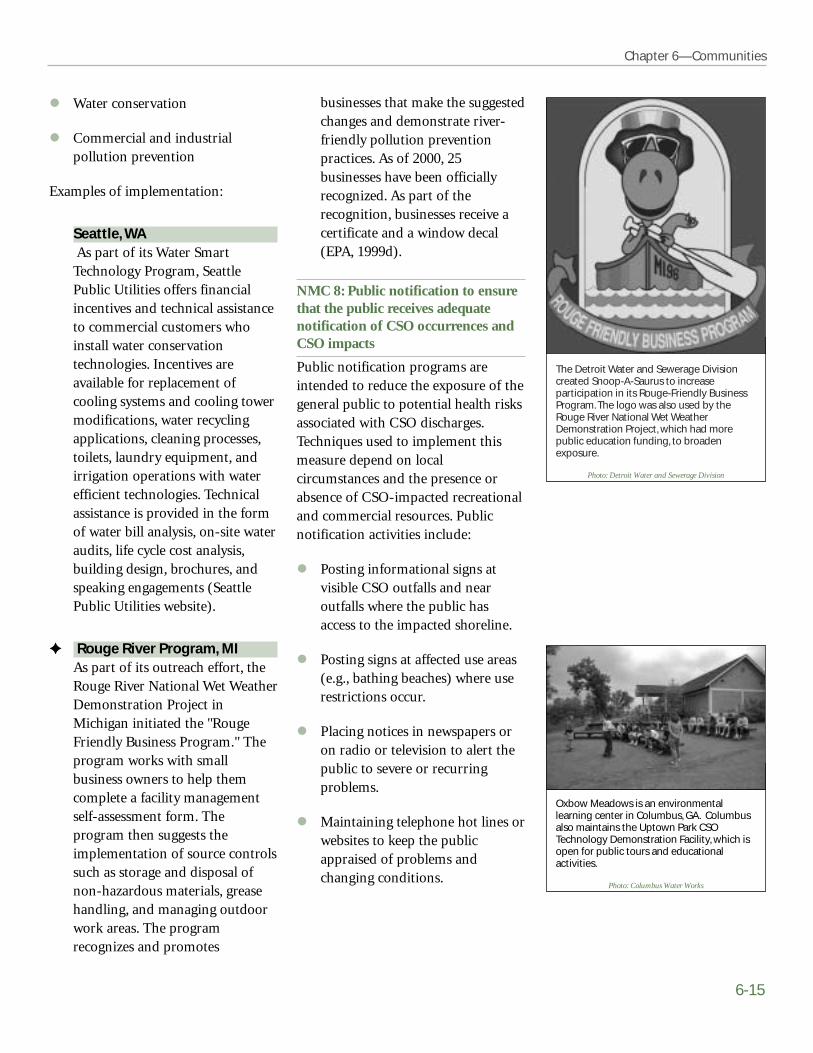
The Detroit Water and Sewerage Divisioncreated Snoop-A-Saurus to increaseparticipation in its Rouge-Friendly BusinessProgram. The logo was also used by theRouge River National Wet WeatherDemonstration Project, which had morepublic education funding, to broadenexposure.
Photo: Detroit Water and Sewerage Division
Chapter 6—Communities
6-15
businesses that make the suggestedchanges and demonstrate river-friendly pollution preventionpractices. As of 2000, 25businesses have been officiallyrecognized. As part of therecognition, businesses receive acertificate and a window decal(EPA, 1999d).
NMC 8: Public notification to ensurethat the public receives adequatenotification of CSO occurrences andCSO impacts
Public notification programs areintended to reduce the exposure of thegeneral public to potential health risksassociated with CSO discharges.Techniques used to implement thismeasure depend on localcircumstances and the presence orabsence of CSO-impacted recreationaland commercial resources. Publicnotification activities include:
Posting informational signs atvisible CSO outfalls and nearoutfalls where the public hasaccess to the impacted shoreline.
Posting signs at affected use areas(e.g., bathing beaches) where userestrictions occur.
Placing notices in newspapers oron radio or television to alert thepublic to severe or recurringproblems.
Maintaining telephone hot lines orwebsites to keep the publicappraised of problems andchanging conditions.
Water conservation
Commercial and industrialpollution prevention
Examples of implementation:
Seattle, WAAs part of its Water Smart
Technology Program, SeattlePublic Utilities offers financialincentives and technical assistanceto commercial customers whoinstall water conservationtechnologies. Incentives areavailable for replacement ofcooling systems and cooling towermodifications, water recyclingapplications, cleaning processes,toilets, laundry equipment, andirrigation operations with waterefficient technologies. Technicalassistance is provided in the formof water bill analysis, on-site wateraudits, life cycle cost analysis,building design, brochures, andspeaking engagements (SeattlePublic Utilities website).
✦ Rouge River Program, MI As part of its outreach effort, theRouge River National Wet WeatherDemonstration Project inMichigan initiated the "RougeFriendly Business Program." Theprogram works with smallbusiness owners to help themcomplete a facility managementself-assessment form. Theprogram then suggests theimplementation of source controlssuch as storage and disposal ofnon-hazardous materials, greasehandling, and managing outdoorwork areas. The programrecognizes and promotes
Oxbow Meadows is an environmentallearning center in Columbus, GA. Columbusalso maintains the Uptown Park CSOTechnology Demonstration Facility, which isopen for public tours and educationalactivities.
Photo: Columbus Water Works
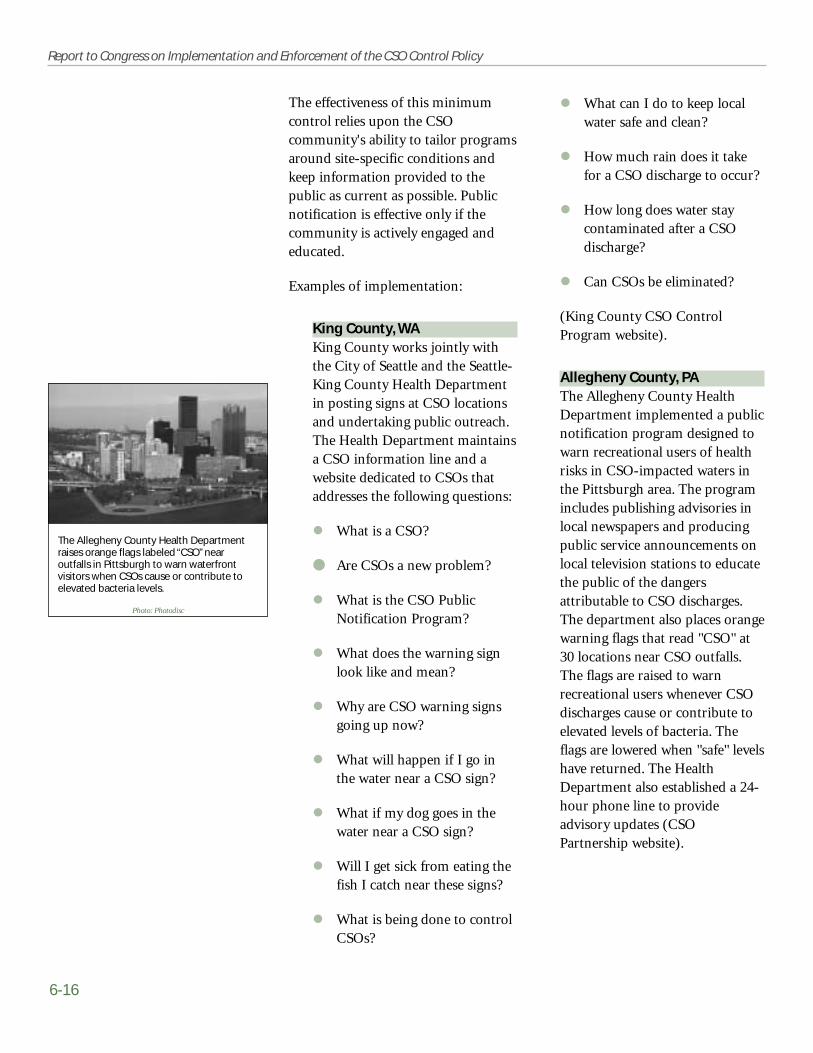
6-16
Report to Congress on Implementation and Enforcement of the CSO Control Policy
What can I do to keep localwater safe and clean?
How much rain does it takefor a CSO discharge to occur?
How long does water staycontaminated after a CSOdischarge?
Can CSOs be eliminated?
(King County CSO Control Program website).
Allegheny County, PAThe Allegheny County HealthDepartment implemented a publicnotification program designed towarn recreational users of healthrisks in CSO-impacted waters inthe Pittsburgh area. The programincludes publishing advisories inlocal newspapers and producingpublic service announcements onlocal television stations to educatethe public of the dangersattributable to CSO discharges.The department also places orangewarning flags that read "CSO" at30 locations near CSO outfalls.The flags are raised to warnrecreational users whenever CSOdischarges cause or contribute toelevated levels of bacteria. Theflags are lowered when "safe" levelshave returned. The HealthDepartment also established a 24-hour phone line to provideadvisory updates (CSOPartnership website).
The effectiveness of this minimumcontrol relies upon the CSOcommunity's ability to tailor programsaround site-specific conditions andkeep information provided to thepublic as current as possible. Publicnotification is effective only if thecommunity is actively engaged andeducated.
Examples of implementation:
King County, WAKing County works jointly withthe City of Seattle and the Seattle-King County Health Departmentin posting signs at CSO locationsand undertaking public outreach.The Health Department maintainsa CSO information line and awebsite dedicated to CSOs thataddresses the following questions:
What is a CSO?
● Are CSOs a new problem?
What is the CSO PublicNotification Program?
What does the warning signlook like and mean?
Why are CSO warning signsgoing up now?
What will happen if I go inthe water near a CSO sign?
What if my dog goes in thewater near a CSO sign?
Will I get sick from eating thefish I catch near these signs?
What is being done to controlCSOs?
The Allegheny County Health Departmentraises orange flags labeled “CSO” nearoutfalls in Pittsburgh to warn waterfrontvisitors when CSOs cause or contribute toelevated bacteria levels.
Photo: Photodisc

Chapter 6—Communities
6-17
✦✦ Randolph, VT Randolph is using block testing atits two CSO outfalls to determinewhether an overflow event hastaken place. Block testing is asimple and inexpensive way toevaluate the frequency of CSOdischarges. Block testing involvesresting a block of wood on thedam or diversion structure at theCSO outfall and checking on aregular basis to see if it has beendislodged by a CSO event. Blocktesting is being used to confirmthe success of local sewerseparation efforts and bestmanagement practices in reducingoverflows at Randolph's CSOlocations.(Appendix C–Randolph casestudy).
6.4 Implementation of theLTCP
Concurrent with theimplementation of the NMC,the CSO Control Policy
expects that:
Permittees with CSOs are
responsible for developing and
implementing long-term CSO
control plans that will ultimately
result in compliance with the
requirements of the CWA. The
long-term control plans should
consider the site-specific nature of
CSOs and evaluate the cost
effectiveness of a range of control
options/strategies.
NMC 9: Monitoring to effectivelycharacterize CSO impacts and theefficacy of CSO controls
Understanding the characteristics ofthe CSS, the hydraulic response torainfall, and impacts of CSOdischarges is critical to the success ofany control program. The expectationof this control is the use of visualreconnaissance and simple monitoringmethods to develop a basicunderstanding of the combined sewersystem. More advanced monitoringand modeling during LTCPdevelopment and implementationserve to supplement this control.Examples of characterization measuresinclude:
Assemble maps, reports, and otherexisting information to provide areference for CSO assessment.
Monitor and record theoccurrence and frequency ofoverflows through visualinspection, inspection aids such aschalk and wood blocks, andautomatic monitoring equipment.
Track citizen inquiries, waterquality data, and other readilyavailable information on impactsto recreational uses and otherimpairments.
The effectiveness of this controldepends on utilizing availablemonitoring data and the CSOcommunity's ability to develop andimplement simple monitoringmeasures to characterize the combinedsewer system and the magnitude ofCSO impacts.
An example of implementation:
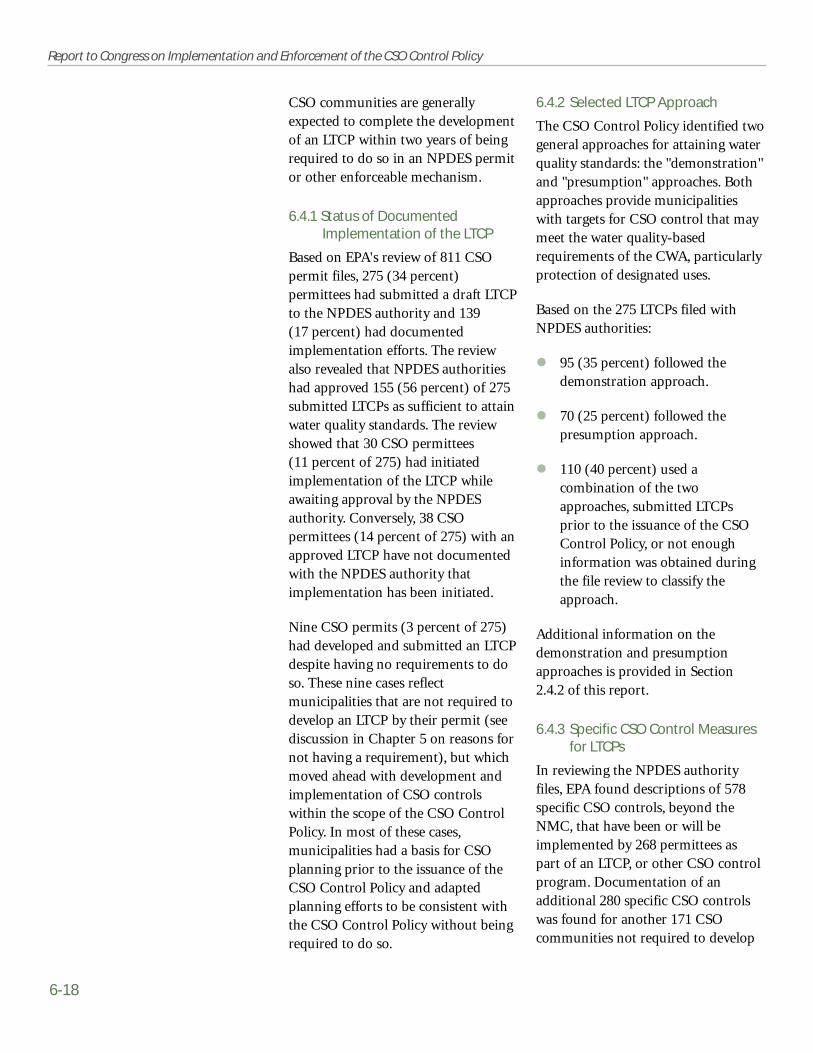
6-18
Report to Congress on Implementation and Enforcement of the CSO Control Policy
6.4.2 Selected LTCP Approach
The CSO Control Policy identified twogeneral approaches for attaining waterquality standards: the "demonstration"and "presumption" approaches. Bothapproaches provide municipalitieswith targets for CSO control that maymeet the water quality-basedrequirements of the CWA, particularlyprotection of designated uses.
Based on the 275 LTCPs filed withNPDES authorities:
95 (35 percent) followed thedemonstration approach.
70 (25 percent) followed thepresumption approach.
110 (40 percent) used acombination of the twoapproaches, submitted LTCPsprior to the issuance of the CSOControl Policy, or not enoughinformation was obtained duringthe file review to classify theapproach.
Additional information on thedemonstration and presumptionapproaches is provided in Section2.4.2 of this report.
6.4.3 Specific CSO Control Measuresfor LTCPs
In reviewing the NPDES authorityfiles, EPA found descriptions of 578specific CSO controls, beyond theNMC, that have been or will beimplemented by 268 permittees aspart of an LTCP, or other CSO controlprogram. Documentation of anadditional 280 specific CSO controlswas found for another 171 CSOcommunities not required to develop
CSO communities are generallyexpected to complete the developmentof an LTCP within two years of beingrequired to do so in an NPDES permitor other enforceable mechanism.
6.4.1 Status of DocumentedImplementation of the LTCP
Based on EPA's review of 811 CSOpermit files, 275 (34 percent)permittees had submitted a draft LTCPto the NPDES authority and 139(17 percent) had documentedimplementation efforts. The reviewalso revealed that NPDES authoritieshad approved 155 (56 percent) of 275submitted LTCPs as sufficient to attainwater quality standards. The reviewshowed that 30 CSO permittees(11 percent of 275) had initiatedimplementation of the LTCP whileawaiting approval by the NPDESauthority. Conversely, 38 CSOpermittees (14 percent of 275) with anapproved LTCP have not documentedwith the NPDES authority thatimplementation has been initiated.
Nine CSO permits (3 percent of 275)had developed and submitted an LTCPdespite having no requirements to doso. These nine cases reflectmunicipalities that are not required todevelop an LTCP by their permit (seediscussion in Chapter 5 on reasons fornot having a requirement), but whichmoved ahead with development andimplementation of CSO controlswithin the scope of the CSO ControlPolicy. In most of these cases,municipalities had a basis for CSOplanning prior to the issuance of theCSO Control Policy and adaptedplanning efforts to be consistent withthe CSO Control Policy without beingrequired to do so.

Chapter 6—Communities
6-19
swirl/vortex technologies, anddisinfection.
The number of CSO controlsdocumented in the permit files forthese three categories is presented inFigure 6.6. The 10 CSO controls thatmost frequently have been or will beimplemented as part of an LTCP arepresented in Table 6.3. A detailedsummary of all documented CSOcontrols implemented by the CSOcommunities as part of an LTCP ispresented in Appendix R. The CSOcontrols implemented or selected forimplementation suggest that CSOcommunities have considered a rangeof controls as expected by the CSOControl Policy.
As shown in Table 6.3, sewerseparation was the most widelyimplemented CSO control. Completeor limited sewer separation has beenimplemented or planned by themajority of CSO communities forwhich documentation of CSO controlswas found in the NPDES authorityfiles. Limited sewer separation is aprevalent solution for communitiesthat have small areas served bycombined sewers; these areas oftenlend themselves to separation.
an LTCP. Based upon this review, these858 controls documented by CSOcommunities are classified ascollection system controls, storagecontrols, or treatment controls. Ingeneral:
Collection system controls aremeasures that remove flow from,or divert flow within, the CSS tomaximize the conveyance of flowthrough the combined sewersystem to the POTW. Thiscategory includes inflow/infiltration control, pump stationcapacity upgrades, expandedinterceptor capacity, regulatingdevices and backwater gates,inflatable dams, flow diversion,real-time control, and sewerseparation.
Storage controls are measures thattemporarily store combinedsewage for subsequent treatmentat the POTW once capacitybecomes available. This categoryincludes in-line storage, retentionbasins, and tunnels.
Treatment controls are measuresthat reduce the pollutant load inCSO discharges. This categoryincludes coarse screening, primarysedimentation, increasedtreatment plant capacity,
Controls Implemented for LTCP
#of Permits Percent
Total Controls 636 100.0%
Treatment
Storage
Category
Collection System Optimization/Control 387
213
258
45.1%
24.8%
30.1%
Distribution of CSOControl Measures
Implemented as Part ofan LTCP
CSO controls used as part of anLTCP are relatively evenlydistributed between treatment,storage, and collection systemimprovements. Notably, collectionsystem controls are dominated bysewer separation activities.
Figure 6.6
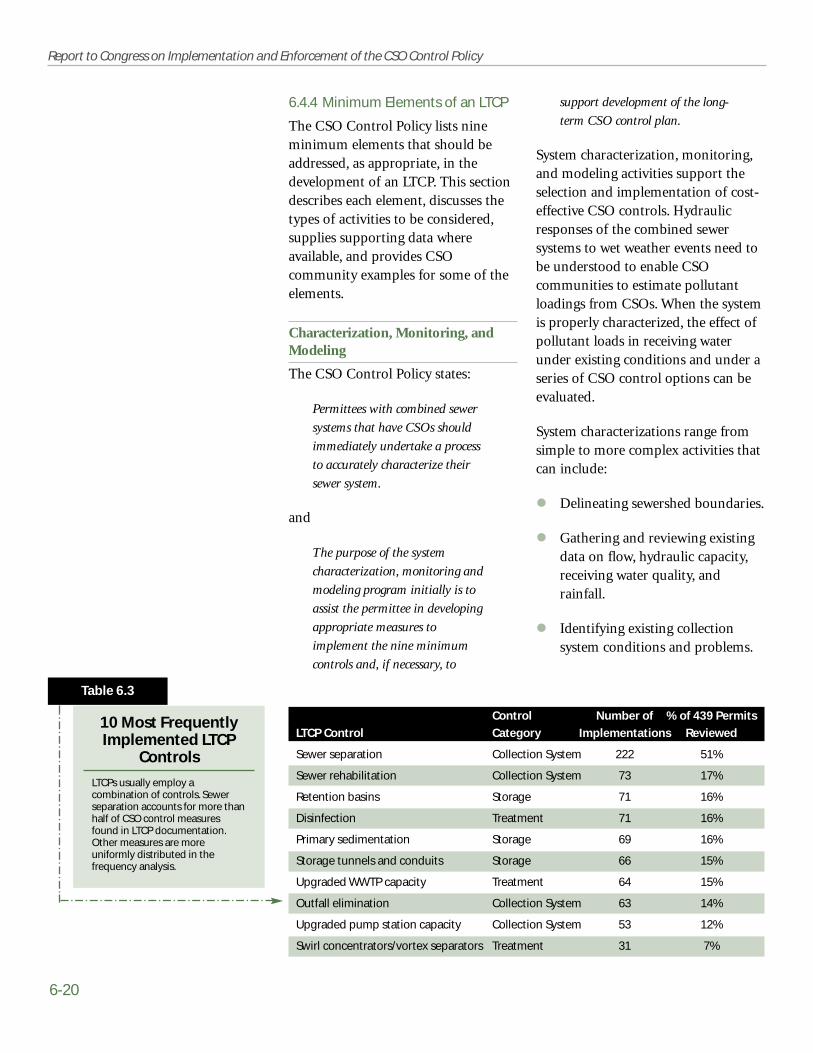
6-20
Report to Congress on Implementation and Enforcement of the CSO Control Policy
support development of the long-
term CSO control plan.
System characterization, monitoring,and modeling activities support theselection and implementation of cost-effective CSO controls. Hydraulicresponses of the combined sewersystems to wet weather events need tobe understood to enable CSOcommunities to estimate pollutantloadings from CSOs. When the systemis properly characterized, the effect ofpollutant loads in receiving waterunder existing conditions and under aseries of CSO control options can beevaluated.
System characterizations range fromsimple to more complex activities thatcan include:
Delineating sewershed boundaries.
Gathering and reviewing existingdata on flow, hydraulic capacity,receiving water quality, andrainfall.
Identifying existing collectionsystem conditions and problems.
6.4.4 Minimum Elements of an LTCP
The CSO Control Policy lists nineminimum elements that should beaddressed, as appropriate, in thedevelopment of an LTCP. This sectiondescribes each element, discusses thetypes of activities to be considered,supplies supporting data whereavailable, and provides CSOcommunity examples for some of theelements.
Characterization, Monitoring, andModeling
The CSO Control Policy states:
Permittees with combined sewer
systems that have CSOs should
immediately undertake a process
to accurately characterize their
sewer system.
and
The purpose of the system
characterization, monitoring and
modeling program initially is to
assist the permittee in developing
appropriate measures to
implement the nine minimum
controls and, if necessary, to
Control Number of % of 439 Permits
LTCP Control Category Implementations Reviewed
Sewer separation Collection System 222 51%
Sewer rehabilitation Collection System 73 17%
Retention basins Storage 71 16%
Disinfection Treatment 71 16%
Primary sedimentation Storage 69 16%
Storage tunnels and conduits Storage 66 15%
Upgraded WWTP capacity Treatment 64 15%
Outfall elimination Collection System 63 14%
Upgraded pump station capacity Collection System 53 12%
Swirl concentrators/vortex separators Treatment 31 7%
10 Most FrequentlyImplemented LTCP
Controls
LTCPs usually employ acombination of controls. Sewerseparation accounts for more thanhalf of CSO control measuresfound in LTCP documentation.Other measures are moreuniformly distributed in thefrequency analysis.
Table 6.3

Chapter 6—Communities
6-21
implemented by NEORSD withinthe Mill Creek Watershed Studyincluded:
● Identifying 175 CSO andstorm water outfallsdischarging to Mill Creek andits tributaries.
● Monitoring at 17 sites tocharacterize the volume andcharacteristics of dischargesduring storms.
● Monitoring at a network offour receiving water stationsto characterize flow andquality during dry and wetweather conditions.
● Assessing aquatic life andhabitat at 11 sites in MillCreek for biological healthindicators including theQualitative Habitat EvaluationIndex, InvertebrateCommunity Index, Index ofBiological Integrity, andsediment quality and in-stream toxicity.
(WEF, 1999b)
New York City, NYNew York City conducts extensivecombined sewer system andreceiving water monitoring. Themonitoring program data providethe basis for the estimation ofCSO flows and loads, and forreceiving water qualityassessments. The major pollutantsof concern are bacteria, BOD,solids, and toxics. By 1998 the cityhad sampled 124 CSO outfalls forup to five rainfall events, for a
Quantifying CSO flows andpollutant loads.
EPA's review of CSO files revealed that369 (45 percent) of the 811 CSOpermit files reviewed containedinformation on the miles of combinedsewer maintained by the CSOcommunity and/or the acres served bycombined sewers. This informationwas typically required as part of theNPDES permit application orincluded in NMC documentation. TheCSO file review also revealed:
259 CSO files (32 percent) withdocumentation of the frequencyof CSO events, by outfall, for oneor more years.
197 CSO files (24 percent) withdocumentation of annual CSOdischarge volumes, by outfall, forone or more years.
45 CSO files (6 percent) withreceiving water monitoring data.
In addition, EPA's review of CSO filesfound that 121 (15 percent) containedinformation indicating that the CSOcommunity intended to develop eithera collection system or receiving watermodel to support development of anLTCP.
Examples of implementation:
Northeast Ohio Regional Sewer District (NEORSD)NEORSD serves the greaterCleveland metropolitan area. Onefocus of NEORSD's CSO controlis Mill Creek Watershed, the17,000-acre service area of theMill Creek Interceptor. Systemcharacterization activities
6-22
Report to Congress on Implementation and Enforcement of the CSO Control Policy
success of a CSO control program.The importance of publicparticipation is stressed in the CSOControl Policy:
In developing its long-term CSO
control plan, the permittee will
employ a public participation
process that actively involves the
affected public in the decision-
making to select the long-term
CSO controls.
Examples include:
Birmingham, MIThe City of Birmingham designedits public participation process toeducate and involve as manycitizens as possible. The processincluded four primarycomponents:
● Public hearings andnotification on siting andfunding alternatives for CSOcontrol and abatementprojects.
● Creation of an Ad HocCitizens' Advisory Committeeto review alternative CSOabatement plans as well asdesign concepts, including siteplanning, architecturalconsiderations, and parkrestoration considerations.
● Development and distributionof press background materials(including identification ofappropriate contacts withinthe city to respond to mediainquiries) prior to andthroughout the constructionof a 5.5 mg retention basin.
total of 600 outfall samplingevents. The city has performedover 46,000 analyses to determinethe characteristics of CSOs. Inaddition, the city monitors 52stations in New York Harborbimonthly on a year-round basisto track trends.
New York City uses three modelsto assess the relationship betweenpollutant sources and waterquality response:
● A landside model of thecombined sewer system thatsimulates CSO loads inresponse to rainfall inputs;
● A hydrodynamic model ofcirculation in New YorkHarbor; and
● A water quality model of theHarbor that simulates the fateand transport of pollutants.
The monitoring and modelingprogram has helped the city toidentify priority areas and identifyappropriate control measures forthese locations (WEF, 1999b).
Public Participation
Coordination and communicationwith the public and regulatoryagencies is important in establishing abasis for communicating CSO issuesand in discussing proposed controlsduring the LTCP process. Given thepotential for significant expendituresof public funds to implement CSOcontrols, establishing earlycommunication with the public is animportant first step in the long-termplanning approach, and crucial to the
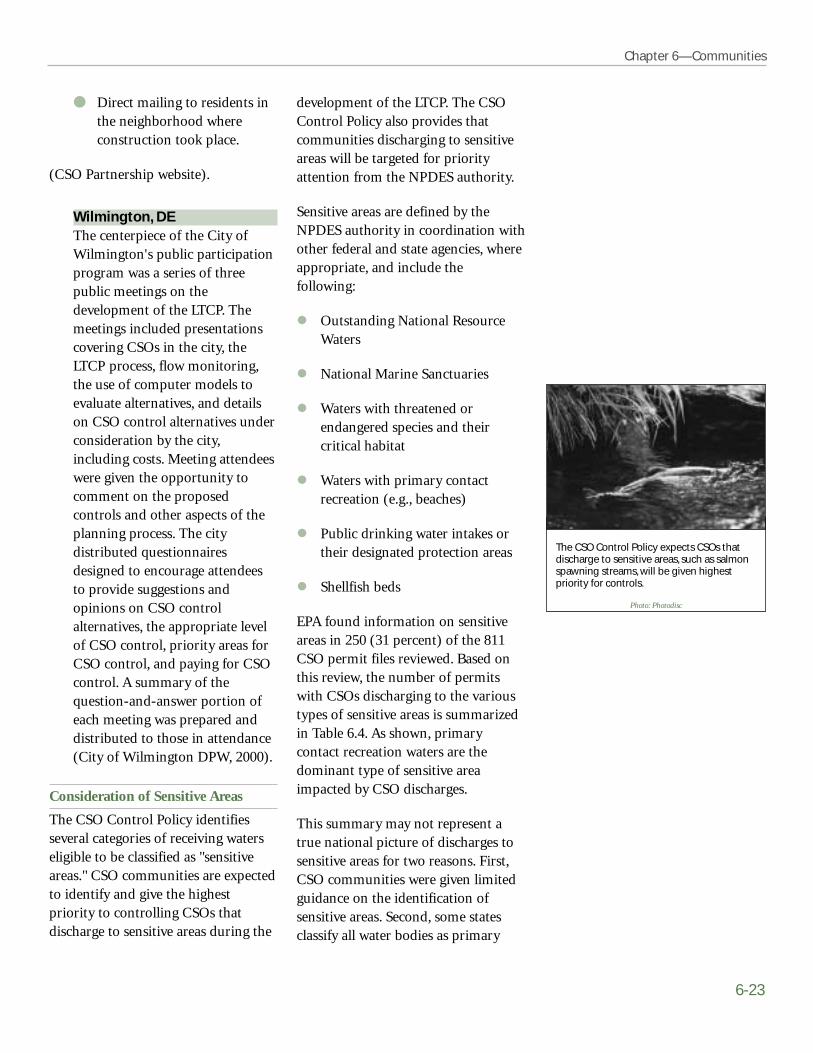
Chapter 6—Communities
6-23
development of the LTCP. The CSOControl Policy also provides thatcommunities discharging to sensitiveareas will be targeted for priorityattention from the NPDES authority.
Sensitive areas are defined by theNPDES authority in coordination withother federal and state agencies, whereappropriate, and include thefollowing:
Outstanding National ResourceWaters
National Marine Sanctuaries
Waters with threatened orendangered species and theircritical habitat
Waters with primary contactrecreation (e.g., beaches)
Public drinking water intakes ortheir designated protection areas
Shellfish beds
EPA found information on sensitiveareas in 250 (31 percent) of the 811CSO permit files reviewed. Based onthis review, the number of permitswith CSOs discharging to the varioustypes of sensitive areas is summarizedin Table 6.4. As shown, primarycontact recreation waters are thedominant type of sensitive areaimpacted by CSO discharges.
This summary may not represent atrue national picture of discharges tosensitive areas for two reasons. First,CSO communities were given limitedguidance on the identification ofsensitive areas. Second, some statesclassify all water bodies as primary
● Direct mailing to residents inthe neighborhood whereconstruction took place.
(CSO Partnership website).
Wilmington, DEThe centerpiece of the City ofWilmington's public participationprogram was a series of threepublic meetings on thedevelopment of the LTCP. Themeetings included presentationscovering CSOs in the city, theLTCP process, flow monitoring,the use of computer models toevaluate alternatives, and detailson CSO control alternatives underconsideration by the city,including costs. Meeting attendeeswere given the opportunity tocomment on the proposedcontrols and other aspects of theplanning process. The citydistributed questionnairesdesigned to encourage attendeesto provide suggestions andopinions on CSO controlalternatives, the appropriate levelof CSO control, priority areas forCSO control, and paying for CSOcontrol. A summary of thequestion-and-answer portion ofeach meeting was prepared anddistributed to those in attendance(City of Wilmington DPW, 2000).
Consideration of Sensitive Areas
The CSO Control Policy identifiesseveral categories of receiving waterseligible to be classified as "sensitiveareas." CSO communities are expectedto identify and give the highestpriority to controlling CSOs thatdischarge to sensitive areas during the
The CSO Control Policy expects CSOs thatdischarge to sensitive areas, such as salmonspawning streams, will be given highestpriority for controls.
Photo: Photodisc
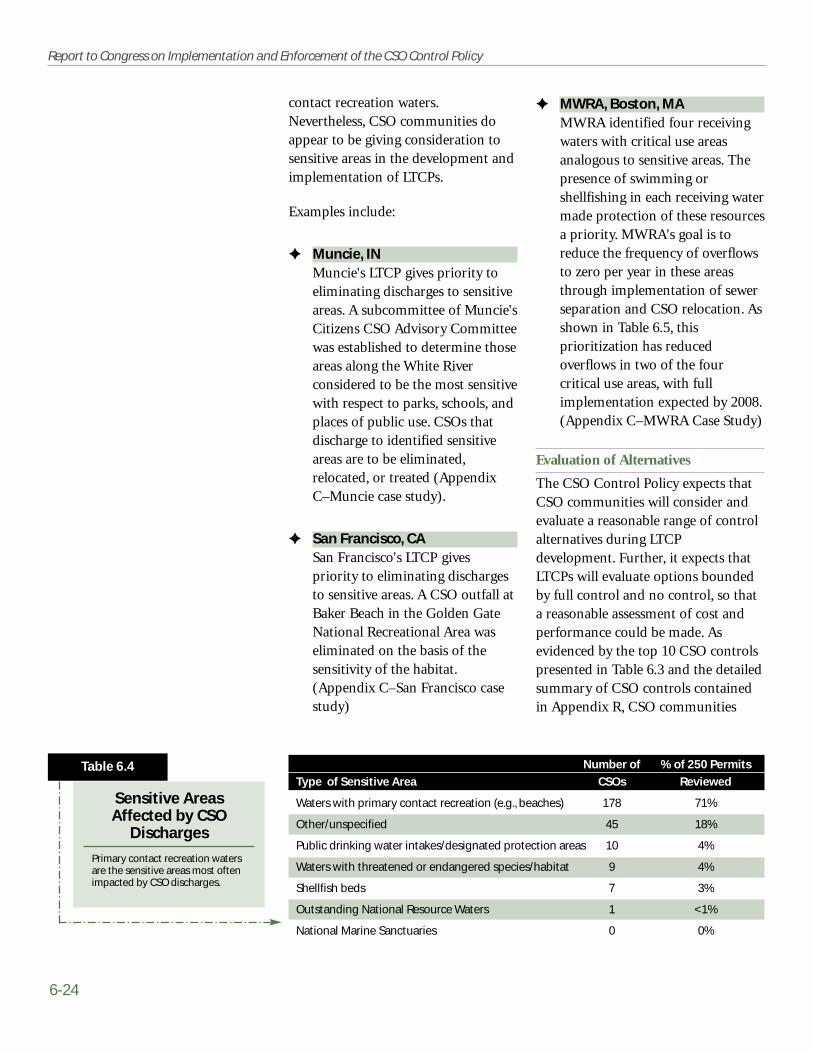
6-24
Report to Congress on Implementation and Enforcement of the CSO Control Policy
✦ MWRA, Boston, MA MWRA identified four receivingwaters with critical use areasanalogous to sensitive areas. Thepresence of swimming orshellfishing in each receiving watermade protection of these resourcesa priority. MWRA's goal is toreduce the frequency of overflowsto zero per year in these areasthrough implementation of sewerseparation and CSO relocation. Asshown in Table 6.5, thisprioritization has reducedoverflows in two of the fourcritical use areas, with fullimplementation expected by 2008.(Appendix C–MWRA Case Study)
Evaluation of Alternatives
The CSO Control Policy expects thatCSO communities will consider andevaluate a reasonable range of controlalternatives during LTCPdevelopment. Further, it expects thatLTCPs will evaluate options boundedby full control and no control, so thata reasonable assessment of cost andperformance could be made. Asevidenced by the top 10 CSO controlspresented in Table 6.3 and the detailedsummary of CSO controls containedin Appendix R, CSO communities
contact recreation waters.Nevertheless, CSO communities doappear to be giving consideration tosensitive areas in the development andimplementation of LTCPs.
Examples include:
✦ Muncie, IN Muncie's LTCP gives priority toeliminating discharges to sensitiveareas. A subcommittee of Muncie'sCitizens CSO Advisory Committeewas established to determine thoseareas along the White Riverconsidered to be the most sensitivewith respect to parks, schools, andplaces of public use. CSOs thatdischarge to identified sensitiveareas are to be eliminated,relocated, or treated (AppendixC–Muncie case study).
✦ San Francisco, CASan Francisco's LTCP givespriority to eliminating dischargesto sensitive areas. A CSO outfall atBaker Beach in the Golden GateNational Recreational Area waseliminated on the basis of thesensitivity of the habitat.(Appendix C–San Francisco casestudy)
Number of % of 250 Permits
Type of Sensitive Area CSOs Reviewed
Waters with primary contact recreation (e.g., beaches) 178 71%
Other/unspecified 45 18%
Public drinking water intakes/designated protection areas 10 4%
Waters with threatened or endangered species/habitat 9 4%
Shellfish beds 7 3%
Outstanding National Resource Waters 1 <1%
National Marine Sanctuaries 0 0%
Sensitive AreasAffected by CSO
Discharges
Primary contact recreation watersare the sensitive areas most oftenimpacted by CSO discharges.
Table 6.4

Chapter 6—Communities
6-25
CSO controls were evaluated based ona thorough analysis of CSO volumeand frequency, water quality, financialimpacts, and public input. (AppendixC–Richmond case study)
Cost/Performance Considerations
Cost/performance considerationsenable CSO communities to identifyand select the most cost-effective levelof CSO control, often referred to asthe knee-of-the-curve. This is thepoint at which incremental pollutionreduction or water qualityimprovement diminishes relative toincreased cost. As stated in the CSOControl Policy,
The permittee should develop
appropriate cost/performance
curves to demonstrate the
relationship among a
comprehensive set of reasonable
control alternatives that
correspond to the different ranges
specified...this should include an
analysis to determine where the
increment of pollution reduction
achieved in the receiving water
diminishes compared to increased
costs.
This type of analysis providescommunities with informationnecessary to compare LTCP controlalternatives in relation to
appear to have considered a range ofcontrol alternatives as expected by theCSO Control Policy.
Examples include:
✦ Richmond, VA Richmond considered a full rangeof CSO control alternatives as partof its Long Term CSO ControlPlan Re-Evaluation. The range ofalternatives included:
Sewer separation
In-system storage
Disinfection
High-rate filtration
Retention basins
Swirl concentrators
Sedimentation basins
Screening
Additional conveyancecapacity
BMPs and source control
Expansion of the POTW
Critical Use Area CSO Control 1997 Baseline 2001 Projected 2008
N. Dorchester Bay CSO Relocation 78 per year 21 per year (2) 0 per year
S. Dorchester Bay (1) Separation 22 per year 19 per year 0 per year
Neponset River Separation 17 per year 0 per year (3) 0 per year
Constitution Beach Separation 16 per year 0 per year (3) 0 per year
1. Treatment (screening and disinfection) provided in 19972. Modified baseline following additional characterization3. Sewer separation completed in 2000
MWRA Critical-UsePrioritization Program
Results
MWRA developed its LTCP basedon a water body use andsensitivity analysis. The programreduced CSO discharges tosensitive areas from 133 to 40 inthree years and is expected toeliminate CSOs by 2008.
Table 6.5
Before selecting CSO controls such as tunnelstorage for wet weather flows, Richmond, VAevaluated many alternatives in view of CSOfrequency and volume reductions, controleffectiveness, financial impacts, and publicinput.
Photo: Richmond Department of Public Utilities
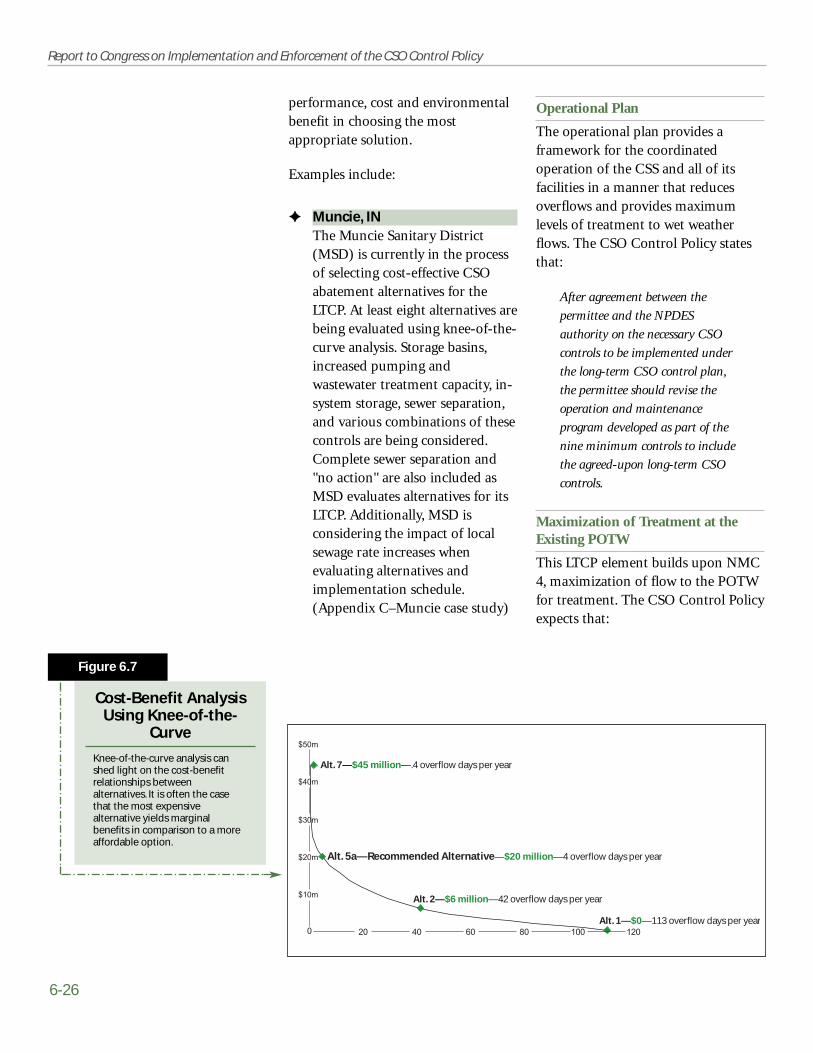
6-26
Report to Congress on Implementation and Enforcement of the CSO Control Policy
Operational Plan
The operational plan provides aframework for the coordinatedoperation of the CSS and all of itsfacilities in a manner that reducesoverflows and provides maximumlevels of treatment to wet weatherflows. The CSO Control Policy statesthat:
After agreement between the
permittee and the NPDES
authority on the necessary CSO
controls to be implemented under
the long-term CSO control plan,
the permittee should revise the
operation and maintenance
program developed as part of the
nine minimum controls to include
the agreed-upon long-term CSO
controls.
Maximization of Treatment at theExisting POTW
This LTCP element builds upon NMC4, maximization of flow to the POTWfor treatment. The CSO Control Policyexpects that:
performance, cost and environmentalbenefit in choosing the mostappropriate solution.
Examples include:
✦ Muncie, IN The Muncie Sanitary District(MSD) is currently in the processof selecting cost-effective CSOabatement alternatives for theLTCP. At least eight alternatives arebeing evaluated using knee-of-the-curve analysis. Storage basins,increased pumping andwastewater treatment capacity, in-system storage, sewer separation,and various combinations of thesecontrols are being considered.Complete sewer separation and"no action" are also included asMSD evaluates alternatives for itsLTCP. Additionally, MSD isconsidering the impact of localsewage rate increases whenevaluating alternatives andimplementation schedule.(Appendix C–Muncie case study)
$10m
$20m
$30m
$40m
$50m
20 40 60 80 100 120Alt. 1—$0—113 overflow days per year
Alt. 2—$6 million—42 overflow days per year
Alt. 5a—Recommended Alternative—$20 million—4 overflow days per year
Alt. 7—$45 million—.4 overflow days per year
0
Cost-Benefit AnalysisUsing Knee-of-the-
Curve
Knee-of-the-curve analysis canshed light on the cost-benefitrelationships betweenalternatives. It is often the casethat the most expensivealternative yields marginalbenefits in comparison to a moreaffordable option.
Figure 6.7

Chapter 6—Communities
6-27
In particular, the CSO Control Policy:
... recognizes that financial
considerations are a major factor
affecting the implementation of
CSO controls...[and]...allows
consideration of a permittee's
financial capability in connection
with a the long-term CSO control
planning effort, WQS review, and
negotiation of enforceable
schedules.
It should be noted that many of thecommunities nearing fullimplementation of controls orrealizing environmental benefits fromCSO controls have worked on CSOabatement since the 1970s.
Post-construction ComplianceMonitoring
The CSO Control Policy expects that:
The selected CSO controls should
include a post-construction water
quality monitoring program
adequate to verify compliance with
water quality standards and
protection of designated uses as
well as to ascertain the
effectiveness of controls.
CSO communities are responsible forconducting a monitoring programduring and after LTCPimplementation to aid in determiningthe effectiveness of the overall LTCPcontrols in meeting CWArequirements and in attaining waterquality standards. Pre- and post-construction monitoring data werenot typically found in the datamaintained in NPDES authority files.
In some communities, POTW
treatment plants may have
primary treatment capacity in
excess of their secondary treatment
capacity. One effective strategy to
abate pollution resulting from
CSOs is to maximize the delivery
of flows during wet weather to the
POTW treatment plant for
treatment.
See example provided in Section 6.3.2of this report.
Implementation Schedule
Development of an implementationschedule is typically based upon acombination of financial,environmental, and other site-specificfactors. The CSO Control Policyexpects that:
The permittee should include all
pertinent information in the long-
term control plan necessary to
develop the construction and
financing schedule for
implementation of CSO controls.
The scheduling and phasing ofconstruction activities can be basedupon the following:
Elimination of CSOs to sensitiveareas
Use impairment
Financial capability
Grant and loan availability
User fees and rate structures
Other variable fundingmechanisms and sources offinancing
Like most cities, Chicago maintains excessprimary treatment capacity to accommodatewet weather flows. Shown is a primaryclarifier at a Chicago-area POTW.
Photo: EPA
6-28
Report to Congress on Implementation and Enforcement of the CSO Control Policy
State Revolving Fund (SRF) loans.SRF programs can offer low orzero interest loans, guarantees ofrepayment, bond insurance, andrefinancing of existing debt undercertain conditions.
Federal grants. The federalgovernment has several programsthat provide assistance for CSOprojects. Most are offered only tosmall and economicallydisadvantaged communities.
State grants. Twenty-eight stateshave grant programs that varysignificantly in funding level andrestrictions.
Other capital funding options.Special assessment districts can beused to fund projects for a specificgeographic area (require legalarrangement to charge thosereceiving the service for capital oroperating costs of the project). Inaddition, proffers or exactions ofcontribution of land, services, orfacilities from private sectordevelopment companies for rightsto connect to a water/sewer systemin the future.
These funding options are notavailable to every CSO community.For example, some CSO communitiesmay have difficulty obtaining long-term bond financing due to limitedexperience in obtaining debtfinancing. In addition, separate grantor loan assistance programs for CSOcommunities are not available in allstates. CSO communities generallyidentify their best funding options
6.5 Financial Considerations
Successful implementation of anLTCP rests upon the ability ofthe CSO community to obtain
funding for the selected controls in asustained manner so that controls canbe implemented and paid for overtime. The financial capability of thecommunity is a major factor indetermining the implementationschedule for the LTCP. In fact, theCSO Control Policy expects:
NPDES permitting authorities
should consider the financial
capability of permittees when
reviewing CSO control plans.
The method of securing financing
is also important. The CSO
Control Policy states that each
municipality....is ultimately
responsible for aggressively
pursuing financial arrangements...
This section outlines the fundingoptions available to CSO communitiesand describes the specific approachestaken by several CSO communities tosecure funding to implement theLTCP.
6.5.1 Funding Options
A variety of capital funding optionsare available for CSO projects,including:
Self financing. CSO control self-financing typically occurs throughthe issuance of bonds,establishment of special reservefunds, or the funding of CSOcontrol projects with annual taxes,water and sewer fees, or otherrevenues.

Chapter 6—Communities
6-29
Environment. The SRF loancovered another third of theproject costs. A grant from theFederal Community DevelopmentBlock Grant program coveredone-fifth of the project costs, anda county grant covered 3 percentof the project. The net result wasfinancing from a number offunding sources that enabledWestern Port to keep user fees atan acceptable level of 1.2 percentof median household income(EPA, 1995d).
✦ Randolph, VT Preliminary engineering anddesign work for Randolph's CSOabatement program took placebetween 1991 and 1994. This workwas funded through the StatePlanning Advance Program, with atotal cost of approximately$250,000. Randolph spent anadditional $2.66 million on LTCPdevelopment and CSO abatementby 1997. Funding for thisadditional cost was obtainedthrough state grants (25 percent),SRF loans (50 percent), and fromthe town's annual operatingbudget (25 percent).(Appendix C–Randolph casestudy)
6.6 Obstacles and Challenges
The CSO Control Policyestablishes a consistent nationalapproach for controlling
discharges from combined sewersystems to the nation's waters throughthe NPDES permit program. Asdescribed in the CSO Control Policy:
after reviewing all the funding sources,considering benefits and limitations,and determining applicability.
Specific examples of funding optioncombinations used by CSOcommunities to cover the costs ofCSO control are presented below.
✦ Burlington, IA The City of Burlington used a mixof Federal CommunityDevelopment Block Grants,federal grants, and bonds tofinance CSO control. The city hasbeen working on a sewerseparation project in the Hawkeyedrainage basin since 1988. Thetotal cost of the project isprojected to be $13.3 million. In1998, the city was awarded aFederal Special Infrastructuregrant for $7 million. The city isproviding the local cost-share forthis project through bond issuanceand user fees.(Appendix C–Burlington casestudy)
Western Port, MDThe town of Western Port, withapproximately 2,750 residents,developed a CSO control programthat cost nearly $1.5 million toimplement. Because of itsproximity to and involvementwith a local paper company,Western Port was eligible for grantfunding from the Federal Bureauof Mines and the SoilConservation Service. This grantcovered one-third of project costs.The community also secured alow-interest SRF loan from theMaryland Department of
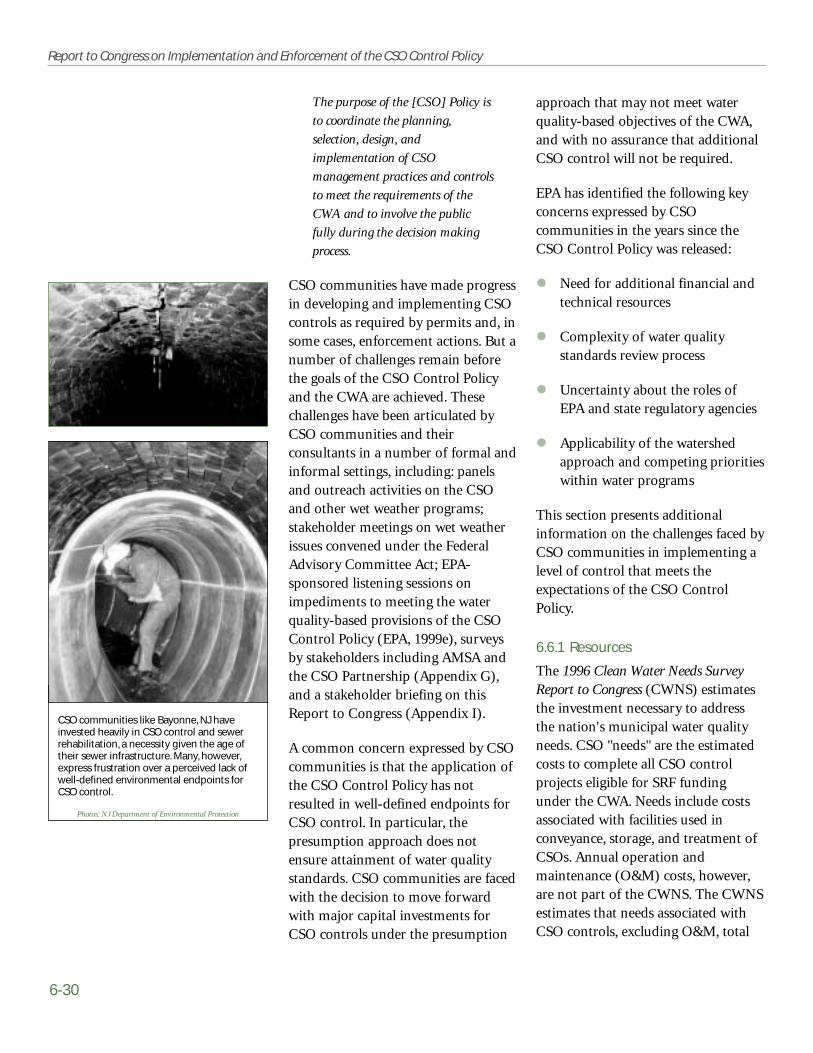
6-30
Report to Congress on Implementation and Enforcement of the CSO Control Policy
approach that may not meet waterquality-based objectives of the CWA,and with no assurance that additionalCSO control will not be required.
EPA has identified the following keyconcerns expressed by CSOcommunities in the years since theCSO Control Policy was released:
� Need for additional financial andtechnical resources
� Complexity of water qualitystandards review process
� Uncertainty about the roles ofEPA and state regulatory agencies
� Applicability of the watershedapproach and competing prioritieswithin water programs
This section presents additionalinformation on the challenges faced byCSO communities in implementing alevel of control that meets theexpectations of the CSO ControlPolicy.
6.6.1 Resources
The 1996 Clean Water Needs SurveyReport to Congress (CWNS) estimatesthe investment necessary to addressthe nation's municipal water qualityneeds. CSO "needs" are the estimatedcosts to complete all CSO controlprojects eligible for SRF fundingunder the CWA. Needs include costsassociated with facilities used inconveyance, storage, and treatment ofCSOs. Annual operation andmaintenance (O&M) costs, however,are not part of the CWNS. The CWNSestimates that needs associated withCSO controls, excluding O&M, total
The purpose of the [CSO] Policy is
to coordinate the planning,
selection, design, and
implementation of CSO
management practices and controls
to meet the requirements of the
CWA and to involve the public
fully during the decision making
process.
CSO communities have made progressin developing and implementing CSOcontrols as required by permits and, insome cases, enforcement actions. But anumber of challenges remain beforethe goals of the CSO Control Policyand the CWA are achieved. Thesechallenges have been articulated byCSO communities and theirconsultants in a number of formal andinformal settings, including: panelsand outreach activities on the CSOand other wet weather programs;stakeholder meetings on wet weatherissues convened under the FederalAdvisory Committee Act; EPA-sponsored listening sessions onimpediments to meeting the waterquality-based provisions of the CSOControl Policy (EPA, 1999e), surveysby stakeholders including AMSA andthe CSO Partnership (Appendix G),and a stakeholder briefing on thisReport to Congress (Appendix I).
A common concern expressed by CSOcommunities is that the application ofthe CSO Control Policy has notresulted in well-defined endpoints forCSO control. In particular, thepresumption approach does notensure attainment of water qualitystandards. CSO communities are facedwith the decision to move forwardwith major capital investments forCSO controls under the presumption
CSO communities like Bayonne, NJ haveinvested heavily in CSO control and sewerrehabilitation, a necessity given the age oftheir sewer infrastructure. Many, however,express frustration over a perceived lack ofwell-defined environmental endpoints forCSO control.
Photos: NJ Department of Environmental Protection

Chapter 6—Communities
6-31
required Great Lakes and coastal statesto adopt by April 2004, the 1986 waterquality criteria for bacteria (E.coliand/or enterococci).
EPA recommends that states andtribes adopt these criteria for they aremore protective of human health forgastrointestinal illness than fecal ortotal coliform. EPA recognizes thedifficulties some states and tribes havehad in adopting E.coli or enterococcias water quality criteria for bacteriaand drafted implementation guidanceto assist in the adoption process. EPAexpects to publish finalimplementation guidance by the endof 2001.
The CSO Control Policy encouragesCSO communities and states tocoordinate the development andimplementation of the LTCP with thereview and, if appropriate, revision ofwater quality standards to ensure thatthe CSO controls will be sufficient tomeet water quality standards. TheCWA and the CSO Control Policyexpect NPDES permits requirementsto ensure that CSOs will not interferewith the attainment of water qualitystandards.
CSO communities, states, andenvironmental and CSOconstituencies have voiced a numberof different opinions on the timing ofwater quality standards reviews inrelationship to the development andimplementation of the LTCP. EPArecently published Guidance:Coordinating Long-Term CSO Planningwith Water Quality Standards Reviewsto lay a strong foundation forintegrating CSO long-term controlplanning with water quality standards
$44.7 billion (in 1996 dollars). TheCWNS estimate is based on thepresumption approach to CSOcontrol, which provides primarytreatment for wet weather flows andassumes four to six untreated overflowevents per year.
CSO communities raised concernsthat the CWNS underestimates theactual level of control that will beneeded to meet the requirements ofthe CWA. In particular, they noted thepresumption approach may notprovide a sufficient level of control toprovide for the attainment of currentwater quality standards.
6.6.2Water Quality Standards
The CSO Control Policy identifiesattainment of water quality standardsas one of its fundamental objectives:
A primary objective of the long-
term CSO control plan is to meet
water quality standards, including
the designated uses, through
reducing risks to human health
and the environment by
eliminating, relocating or
controlling CSOs to the affected
waters.
Water quality standards consist ofdesignated uses, narrative or numericcriteria to support these uses and anantidegradation policy andimplementation procedures to protectthe water quality improvementsattained. There is considerablevariability in the criteria that states useto protect recreational uses becausenot all states have adopted EPA’sAmbient Water Quality Criteria ForBacteria—1986 (see Table 6.6). TheBEACH Act of 2000, discussed above,

6-32
Report to Congress on Implementation and Enforcement of the CSO Control Policy
implement affordable CSO controlprograms that meet appropriate waterquality standards.
6.6.3 Uncertainty
CSO communities identified anumber of areas in which they feel theCSO Control Policy is not explicit.Specific concerns related to:
The attainment of water qualitystandards with implementation ofLTCP.
review. Many CSO communities andother stakeholders do not understandthe water quality standards reviewprocess, the analyses required to revisethe standards and the role the publicplays in influencing any revision to astandard. The guidance outlines aprocess to facilitate agreement amongCSO communities, states, and EPA onthe data to be collected and theanalyses to be conducted to supportboth the LTCP development and waterquality standards reviews. Integratingthe processes should provide greaterassurance that CSO communities will
Region State Freshwater Indicator Bacteria Marine Indicator Bacteria
1 CT Enterococci/Fecal Coliform/Total Coliform EnterococciME E. coli EnterococciMA Fecal Coliform/Total Coliform Fecal ColiformNH E. coli EnterococciRI Fecal Coliform/Total Coliform Fecal ColiformVT E. coli
2 NJ Enterococci/Fecal Coliform Enterococci/Fecal ColiformNY Fecal Coliform/Total Coliform Fecal Coliform/Total Coliform
3 DE Enterococci EnterococciMD Fecal Coliform Fecal ColiformPA Fecal ColiformVA Fecal Coliform Fecal ColiformWV Fecal ColiformDC Fecal Coliform
4 GA Fecal Coliform Fecal ColiformKY Fecal ColiformTN Fecal Coliform
5 IL Fecal ColiformIN E. coliMI E. coli/Total ColiformMN Fecal ColiformOH E. coli/Fecal ColiformWI Fecal Coliform
7 IA Fecal ColiformKS Fecal Coliform
MO Fecal ColiformNE Fecal Coliform
8 SD Fecal Coliform
9 CA E. Coli/Enterococci/ Enterococci/Fecal Coliform/Total Coliform Fecal Coliform/Total Coliform
10 AK Fecal Coliform Fecal ColiformOR E. coli Fecal ColiformWA Fecal Coliform Fecal Coliform
BacteriologicalIndicators Used By
States
States vary in their use of indicatorbacteria to establish water qualitystandards. Several states use acombination of indicators, butmany rely solely on fecal coliform.
Table 6.6
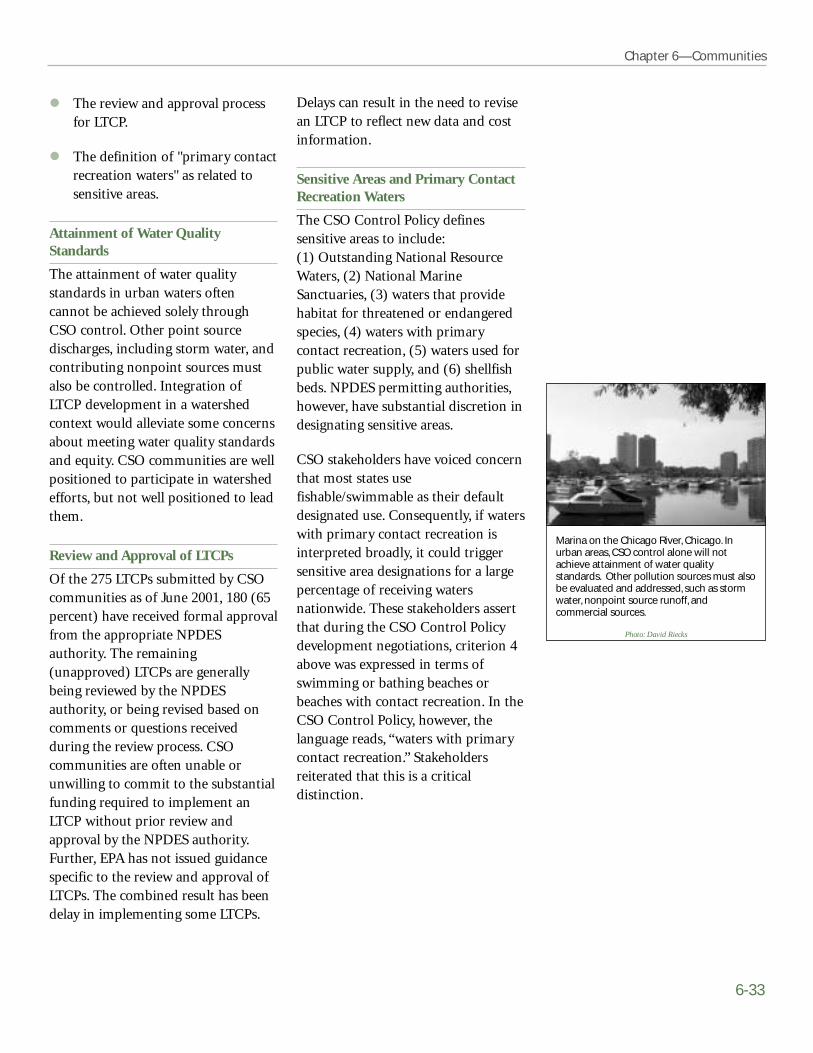
Chapter 6—Communities
6-33
Delays can result in the need to revisean LTCP to reflect new data and costinformation.
Sensitive Areas and Primary ContactRecreation Waters
The CSO Control Policy definessensitive areas to include:(1) Outstanding National ResourceWaters, (2) National MarineSanctuaries, (3) waters that providehabitat for threatened or endangeredspecies, (4) waters with primarycontact recreation, (5) waters used forpublic water supply, and (6) shellfishbeds. NPDES permitting authorities,however, have substantial discretion indesignating sensitive areas.
CSO stakeholders have voiced concernthat most states usefishable/swimmable as their defaultdesignated use. Consequently, if waterswith primary contact recreation isinterpreted broadly, it could triggersensitive area designations for a largepercentage of receiving watersnationwide. These stakeholders assertthat during the CSO Control Policydevelopment negotiations, criterion 4above was expressed in terms ofswimming or bathing beaches orbeaches with contact recreation. In theCSO Control Policy, however, thelanguage reads, “waters with primarycontact recreation.” Stakeholdersreiterated that this is a criticaldistinction.
The review and approval processfor LTCP.
The definition of "primary contactrecreation waters" as related tosensitive areas.
Attainment of Water QualityStandards
The attainment of water qualitystandards in urban waters oftencannot be achieved solely throughCSO control. Other point sourcedischarges, including storm water, andcontributing nonpoint sources mustalso be controlled. Integration ofLTCP development in a watershedcontext would alleviate some concernsabout meeting water quality standardsand equity. CSO communities are wellpositioned to participate in watershedefforts, but not well positioned to leadthem.
Review and Approval of LTCPs
Of the 275 LTCPs submitted by CSOcommunities as of June 2001, 180 (65percent) have received formal approvalfrom the appropriate NPDESauthority. The remaining(unapproved) LTCPs are generallybeing reviewed by the NPDESauthority, or being revised based oncomments or questions receivedduring the review process. CSOcommunities are often unable orunwilling to commit to the substantialfunding required to implement anLTCP without prior review andapproval by the NPDES authority.Further, EPA has not issued guidancespecific to the review and approval ofLTCPs. The combined result has beendelay in implementing some LTCPs.
Marina on the Chicago River, Chicago. Inurban areas, CSO control alone will notachieve attainment of water qualitystandards. Other pollution sources must alsobe evaluated and addressed, such as stormwater, nonpoint source runoff, andcommercial sources.
Photo: David Riecks
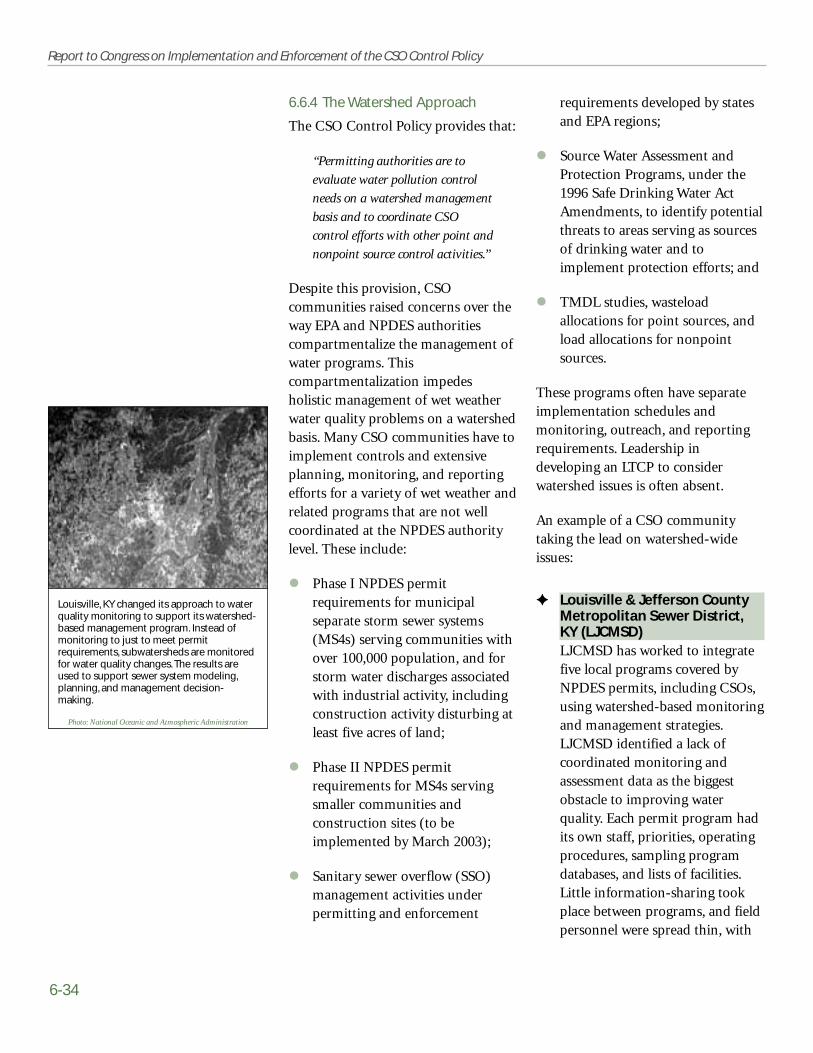
6-34
Report to Congress on Implementation and Enforcement of the CSO Control Policy
requirements developed by statesand EPA regions;
Source Water Assessment andProtection Programs, under the1996 Safe Drinking Water ActAmendments, to identify potentialthreats to areas serving as sourcesof drinking water and toimplement protection efforts; and
TMDL studies, wasteloadallocations for point sources, andload allocations for nonpointsources.
These programs often have separateimplementation schedules andmonitoring, outreach, and reportingrequirements. Leadership indeveloping an LTCP to considerwatershed issues is often absent.
An example of a CSO communitytaking the lead on watershed-wideissues:
✦ Louisville & Jefferson County Metropolitan Sewer District,KY (LJCMSD) LJCMSD has worked to integratefive local programs covered byNPDES permits, including CSOs,using watershed-based monitoringand management strategies.LJCMSD identified a lack ofcoordinated monitoring andassessment data as the biggestobstacle to improving waterquality. Each permit program hadits own staff, priorities, operatingprocedures, sampling programdatabases, and lists of facilities.Little information-sharing tookplace between programs, and fieldpersonnel were spread thin, with
6.6.4 The Watershed Approach
The CSO Control Policy provides that:
“Permitting authorities are to
evaluate water pollution control
needs on a watershed management
basis and to coordinate CSO
control efforts with other point and
nonpoint source control activities.”
Despite this provision, CSOcommunities raised concerns over theway EPA and NPDES authoritiescompartmentalize the management ofwater programs. Thiscompartmentalization impedesholistic management of wet weatherwater quality problems on a watershedbasis. Many CSO communities have toimplement controls and extensiveplanning, monitoring, and reportingefforts for a variety of wet weather andrelated programs that are not wellcoordinated at the NPDES authoritylevel. These include:
Phase I NPDES permitrequirements for municipalseparate storm sewer systems(MS4s) serving communities withover 100,000 population, and forstorm water discharges associatedwith industrial activity, includingconstruction activity disturbing atleast five acres of land;
Phase II NPDES permitrequirements for MS4s servingsmaller communities andconstruction sites (to beimplemented by March 2003);
Sanitary sewer overflow (SSO)management activities underpermitting and enforcement
Louisville, KY changed its approach to waterquality monitoring to support its watershed-based management program. Instead ofmonitoring to just to meet permitrequirements, subwatersheds are monitoredfor water quality changes. The results areused to support sewer system modeling,planning, and management decision-making.
Photo: National Oceanic and Atmospheric Administration
Chapter 6—Communities
6-35
standards. The CSO Control Policydid not establish or recommend anyother programmatic measures ofperformance for CSO communitiesthat could be used to quantify anddocument the results and effectivenessof CSO controls.
6.7.1 CSO Performance Measures forCSO Communities
In 1996, AMSA, in cooperation withEPA, published Performance Measuresfor the National CSO Control Program(AMSA,1996). The purpose of thereport was to establish arecommended series of performancemeasures for use by communities totrack improvements and resultsassociated with CSO control. Thereport identified and described 24performance measures grouped intofour broad categories (Table 6.7).
These categories of performancemeasures paralleled those identifiedfor permitting authorities'consideration in EPA's CombinedSewer Overflow Guidance for PermitWriters (see Section 5.8 for adiscussion of these categories).
6.7.2 Loading Reduction andEnvironmental Benefits
Establishing CSO performancemeasures provides the foundation forassessing loading reductions andenvironmental benefits. Theadministrative and end-of-pipecategories provide a direct measure ofCSO reduction and controls. Thereceiving water and ecological/humanhealth/resource use categories providea direct measure for assessment ofenvironmental benefits achieved fromCSO control.
two- and three-person teamstrying to cover enormous areasduring the same wet weatherevent, often gathering differentsamples at the same locations. Itwas nearly impossible to establishlong-term monitoring sitesthroughout LJCMSD for each ofthe five NPDES programs.LJCMSD developed a CombinedAnnual Report (a unified reportformat) that considers permitrequirements and watershed issuesas a whole. This effort hasimproved the effectiveness ofLJCMSD's management activitiesand the ability of LJCMSD totrack progress.(Appendix C–Louisville &Jefferson County MetropolitanSewer District case study)
6.7 Performance Measures andEnvironmental Benefits
As a matter of policy, EPAencourages communities tomonitor and track
environmental benefits associated withCSO control. The CSO Control Policyspecifies:
...selected CSO controls should
include a post-construction water
quality monitoring program
adequate to verify compliance with
water quality standards and
protection of designated uses as
well as to ascertain the
effectiveness of CSO controls.
The overall goal of the prescribedpost-construction monitoring is todetermine compliance with the CWAand the overall effectiveness of theLTCP in achieving water quality
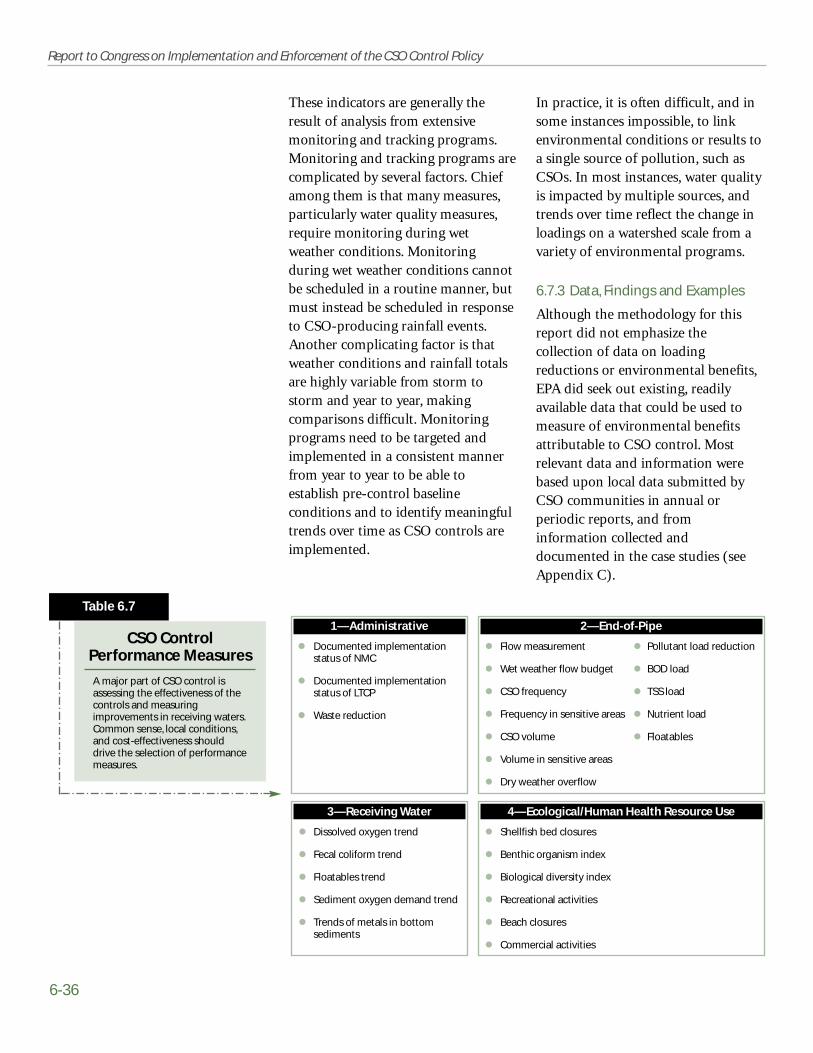
6-36
Report to Congress on Implementation and Enforcement of the CSO Control Policy
In practice, it is often difficult, and insome instances impossible, to linkenvironmental conditions or results toa single source of pollution, such asCSOs. In most instances, water qualityis impacted by multiple sources, andtrends over time reflect the change inloadings on a watershed scale from avariety of environmental programs.
6.7.3 Data, Findings and Examples
Although the methodology for thisreport did not emphasize thecollection of data on loadingreductions or environmental benefits,EPA did seek out existing, readilyavailable data that could be used tomeasure of environmental benefitsattributable to CSO control. Mostrelevant data and information werebased upon local data submitted byCSO communities in annual orperiodic reports, and frominformation collected anddocumented in the case studies (seeAppendix C).
These indicators are generally theresult of analysis from extensivemonitoring and tracking programs.Monitoring and tracking programs arecomplicated by several factors. Chiefamong them is that many measures,particularly water quality measures,require monitoring during wetweather conditions. Monitoringduring wet weather conditions cannotbe scheduled in a routine manner, butmust instead be scheduled in responseto CSO-producing rainfall events.Another complicating factor is thatweather conditions and rainfall totalsare highly variable from storm tostorm and year to year, makingcomparisons difficult. Monitoringprograms need to be targeted andimplemented in a consistent mannerfrom year to year to be able toestablish pre-control baselineconditions and to identify meaningfultrends over time as CSO controls areimplemented.
1—Administrative
Documented implementationstatus of NMC
Documented implementationstatus of LTCP
Waste reduction
2—End-of-Pipe
Flow measurement Pollutant load reduction
Wet weather flow budget BOD load
CSO frequency TSS load
Frequency in sensitive areas Nutrient load
CSO volume Floatables
Volume in sensitive areas
Dry weather overflow
3—Receiving Water
Dissolved oxygen trend
Fecal coliform trend
Floatables trend
Sediment oxygen demand trend
Trends of metals in bottomsediments
4—Ecological/Human Health Resource Use
Shellfish bed closures
Benthic organism index
Biological diversity index
Recreational activities
Beach closures
Commercial activities
CSO ControlPerformance Measures
A major part of CSO control isassessing the effectiveness of thecontrols and measuringimprovements in receiving waters.Common sense, local conditions,and cost-effectiveness shoulddrive the selection of performancemeasures.
Table 6.7

Chapter 6—Communities
6-37
communities follow this discussion.The information provided onenvironmental results drawssubstantially on material from CSOcommunities that initiated CSOcontrol programs before the CSOControl Policy. The benefits realized inthese CSO communities are likely tobe achieved by other communities asmore and more CSO control solutionsare implemented.
Examples of Loading Reductions
✦ Chicago, IL The frequency of CSO dischargesin Chicago has decreased from 80per year to 15 per year due toconstruction of the MetropolitanWater Reclamation District ofGreater Chicago's Tunnel andReservoir Plan (TARP) system. Inaddition, the volume of combinedsewage captured and treated inTARP reached a cumulative totalof 565 billion gallons in 2001.(Appendix C–MWRD Case Study)
✦ Saginaw, MI The majority of the City ofSaginaw is served by combinedsewers, which discharge duringwet weather into the SaginawRiver. In 1990, an estimated 2,928million gallons per year of CSOwas discharged. Development of aplan to construct seven retentiontreatment basins for CSO controlwas also initiated in 1990.Implementation of this planreduced overflows to 760 milliongallons of treated overflow peryear, and eliminated the directdischarge of untreated combinedsewage under virtually allcircumstances. The range of
EPA's observations on tracking CSOloading reductions and environmentalbenefits are as follows:
Most of the available datanecessary to assess environmentalbenefits originate from the CSOcommunities in databases orpublished reports.
Data submitted by CSOcommunities on CSO controlprogram effectiveness and loadingreductions are not compiled at thestate level in a way that can beeasily assessed or distilled.
The limited available informationon environmental benefits comesmainly from CSO communitiesthat initiated CSO controls priorto the CSO Control Policy andconstructed facilities intended toprotect water quality anddesignated uses. Thesecommunities are farther alongthan communities still in theLTCP development and earlyimplementation stages.
Environmental benefits associatedwith CSO control may also beattributable and non-distinguishable from other wetweather program controls thathave been put in place.
While a national assessment ofperformance measures could not beundertaken, EPA's review of selectCSO community materials clearlyshows that major improvements inflow and load reduction and waterquality have been documented in afew cases. Examples of performancemeasures and associatedenvironmental results for CSO
Pollutant RemovalCapability of Retention
Treatment Basins onthe Saginaw River
Wet weather retention treatmentbasins have helped reduce CSOdischarges by 75% and yieldedsimilar pollutant removal rates inSaginaw, MI.
Table 6.8
CSO Variable Percent Removal
Volume 22—59%
BOD 50—83%
TSS 50—82%
Phosphorus 35—78%
Ammonia 39—84%
6-38
Report to Congress on Implementation and Enforcement of the CSO Control Policy
innovative pollution control
programs, the New York City
Department of Environmental
Protection has:
◗ Virtually eliminated raw sewage
discharges.
◗ Reduced illegal discharges by
more than 90 percent.
◗ Increased wet weather floatables
capture to almost 70 percent.
◗ Reduced toxic metals loadings to
the waste stream from industrial
sources by over 90 percent.
As a result of these actions there isstrong evidence of improvementto New York Harbor's waterquality and surroundingenvironment. These range fromthe reestablishment of breedingpopulations of herons, egrets andother waterfowl in several areas ofthe Harbor, to improved benthiccommunities in the lower NewYork Bay and include:
The opening of all New YorkCity public beaches for thefirst time since 1922 and thelifting of wet-weatherswimming advisories for allbut three of the beaches.
The upgrading of 68,000 acresof shellfish beds since 1985and the removal of shellfishing restrictions for 30,000acres in Raritan Bay.
The reestablishment ofHudson River Shortnesssturgeon.
pollutant removal accomplished inthe retention treatment basins ispresented in Table 6.8.(Appendix C– Saginaw CaseStudy)
✦ LJCMSDLJCMSD operates a combinedsewer system in a heavilyurbanized area that covers 24,000acres. Within the system, 115CSOs discharge to the Ohio Riverand tributaries that cross throughLouisville and neighboringcommunities. LJCMSD hassubmitted a draft LTCP thatincludes sewer separation and avariety of other CSO controls.Partial implementation of thisplan has yielded the elimination of5 CSOs, a 27-percent reduction inCSO frequency, and a 13-percentreduction in CSO volume.Substantial additional benefits areexpected to accrue when the LTCPis fully implemented.(Appendix C–Louisville &Jefferson County MetropolitanSewer District case study)
Examples of Environmental Benefits
New York City, NYNew York City has operated amonitoring program to assesspollution in the New York Harborsince 1909. As stated in the 1998New York Harbor Water QualitySurvey:
Through developments and
upgrades to New York City's
sewage treatment system, as well
as operational improvements
implemented over the past 10
years, and a suite of aggressive and
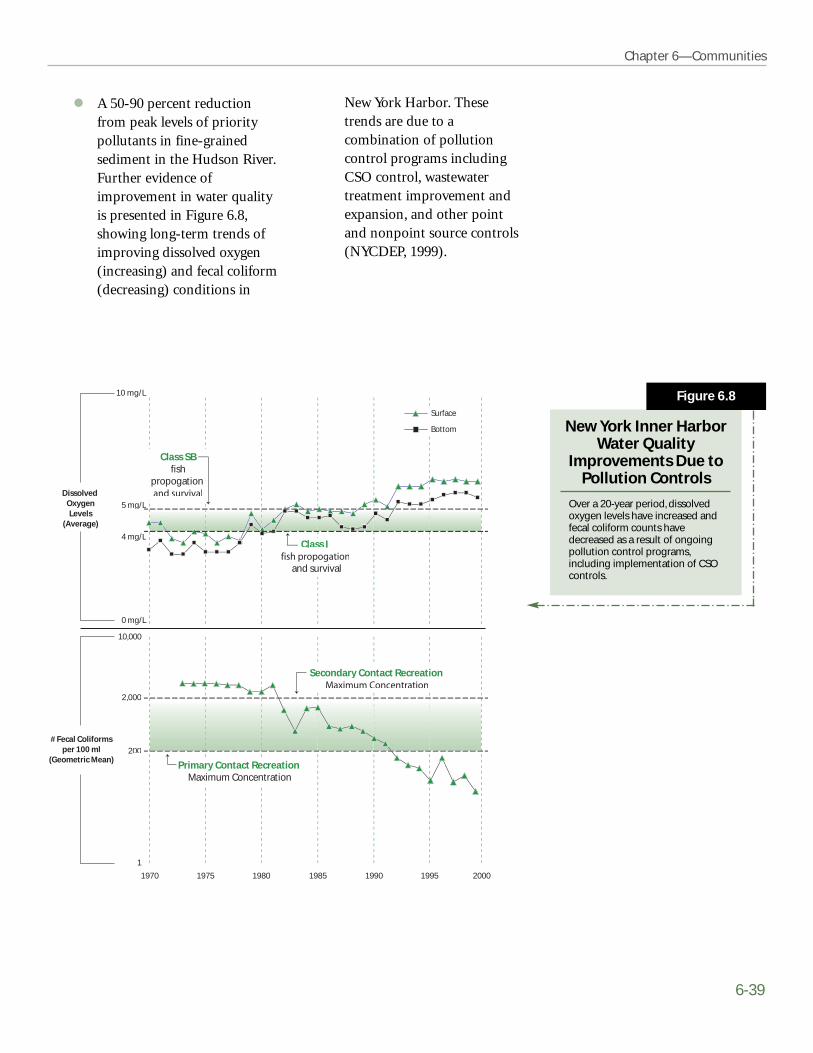
Chapter 6—Communities
6-39
New York Harbor. Thesetrends are due to acombination of pollutioncontrol programs includingCSO control, wastewatertreatment improvement andexpansion, and other pointand nonpoint source controls(NYCDEP, 1999).
A 50-90 percent reductionfrom peak levels of prioritypollutants in fine-grainedsediment in the Hudson River.Further evidence ofimprovement in water qualityis presented in Figure 6.8,showing long-term trends ofimproving dissolved oxygen(increasing) and fecal coliform(decreasing) conditions in
0 mg/L
4 mg/L
5 mg/L
10 mg/L
Class SB fish
propogation
Class I
and survival
Dissolved OxygenLevels
(Average)
Surface
Bottom
1
10,000
1970 1975 1980 1985 1990 1995 2000
Secondary Contact Recreation
# Fecal Coliformsper 100 ml
(Geometric Mean)Primary Contact Recreation
Maximum Concentration
200
2,000
New York Inner HarborWater Quality
Improvements Due toPollution Controls
Over a 20-year period, dissolvedoxygen levels have increased andfecal coliform counts havedecreased as a result of ongoingpollution control programs,including implementation of CSOcontrols.
Figure 6.8

6-40
Report to Congress on Implementation and Enforcement of the CSO Control Policy
✦ Rouge River Program, MI The Rouge River National WetWeather Demonstration Projectcovers 467 square miles of mostlyurbanized areas in the greaterDetroit area of southeasternMichigan. CSO controls have beenimplemented since the late 1990s,and the demonstration project'smonitoring program is beginningto show environmental benefitsassociated with CSO control.Some of the key results andaccomplishments are:
About 30 miles of the RougeRiver that was CSO-impactedin 1994 are now completelyfree of uncontrolled CSOdischarges.
The first two years of performancemonitoring data for the first sixCSO basins shows the following:
About 72 percent, or 933million gallons, of combinedsewage that previously went tothe river was captured andtreated at the Detroit POTW.
Previously untreated overflowsthat occurred in excess of 50times/year are now treatedand occur from one to seventimes per year.
Results from continuouslymonitored stations showimprovements in riverdissolved oxygen conditionsdue to upstream CSO controlprojects and other watershedmanagement measures/changes.(Appendix C–Rouge RiverCase Study)
✦ Columbus, GA Columbus fully implemented CSOcontrol program includes POTWupgrades, sewer separation, newwater resource treatment facilities,and a variety of pump station andcollection system improvements.Monitoring on the ChattahoocheeRiver shows that water quality andbeneficial use improvements havebeen the direct result of CSOcontrol. The Chattahoochee nowmeets water quality standards forfecal coliform and otherparameters. The river in thedowntown area is also free oftrash, oil and grease, and othersewage debris. In addition, theCity constructed a river walk andother riverside amenities thatbenefit residents and visitors inconjunction with CSO controls. Aspart of its LTCP, Columbusconstructed two remote facilitiesto provide treatment for excesswet weather flows. Thedocumented pollutant removalcapability of the two treatmentfacilities is presented in Table 6.9.(Appendix C–Columbus casestudy)
Pollutant Removal as % of Annual Load
BOD 55—61%
TSS 52—62%
Fecal coliform 95—99%
Copper 66—75%
Lead 62—83%
Zinc 62—82%
Pollutant RemovalCapability of Two CSOTreatment Facilities in
Columbus, GA
Remote wet weather treatmentfacilities, combined withimprovements to the CSS, havereduced annual discharges of CSOcontaminants by at least 52%.
Table 6.9
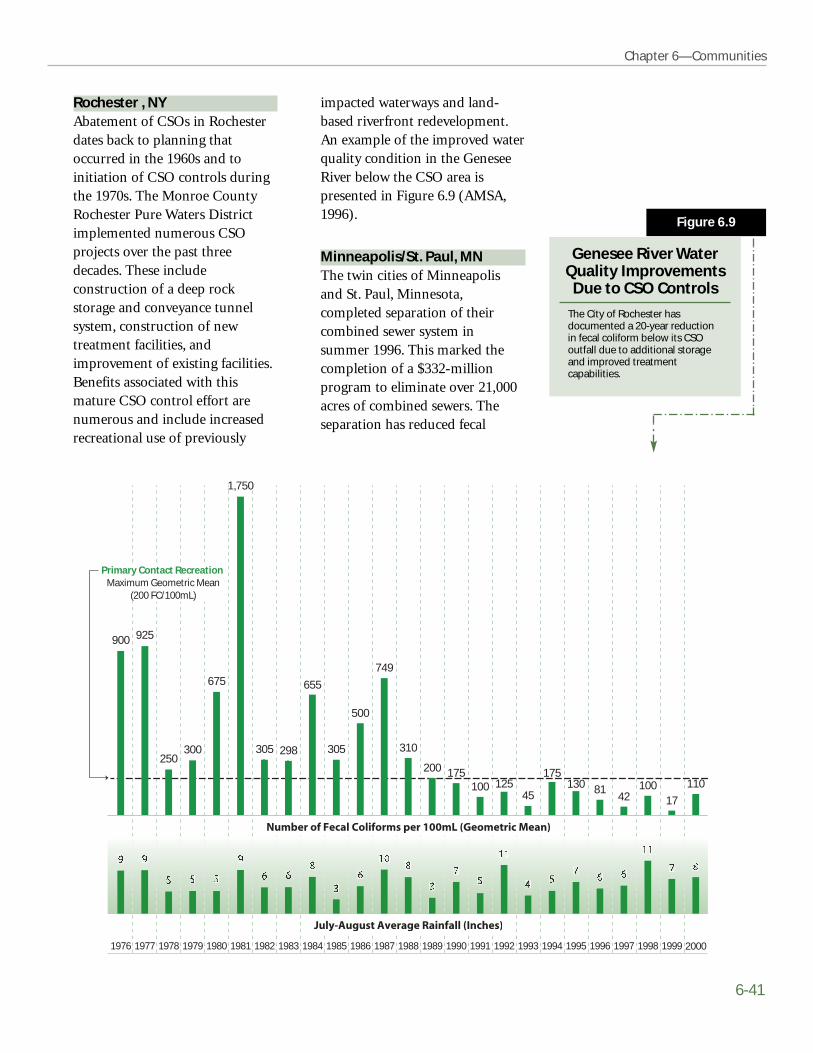
Chapter 6—Communities
6-41
impacted waterways and land-based riverfront redevelopment.An example of the improved waterquality condition in the GeneseeRiver below the CSO area ispresented in Figure 6.9 (AMSA,1996).
Minneapolis/St. Paul, MNThe twin cities of Minneapolisand St. Paul, Minnesota,completed separation of theircombined sewer system insummer 1996. This marked thecompletion of a $332-millionprogram to eliminate over 21,000acres of combined sewers. Theseparation has reduced fecal
Rochester , NYAbatement of CSOs in Rochesterdates back to planning thatoccurred in the 1960s and toinitiation of CSO controls duringthe 1970s. The Monroe CountyRochester Pure Waters Districtimplemented numerous CSOprojects over the past threedecades. These includeconstruction of a deep rockstorage and conveyance tunnelsystem, construction of newtreatment facilities, andimprovement of existing facilities.Benefits associated with thismature CSO control effort arenumerous and include increasedrecreational use of previously
Primary Contact Recreation Maximum Geometric Mean
(200 FC/100mL)
2000
110
900
1976
925
1977
250
1978
300
1979
675
1980
1,750
1981
305
1982
298
1983
655
1984
305
1985
500
1986
749
1987
310
1988
200
1989
175
1990
100
1991
125
1992
45
1993
175
1994
130
1995
81
1996
42
1997
100
1998
17
1999
Genesee River WaterQuality Improvements
Due to CSO Controls
The City of Rochester hasdocumented a 20-year reductionin fecal coliform below its CSOoutfall due to additional storageand improved treatmentcapabilities.
Figure 6.9
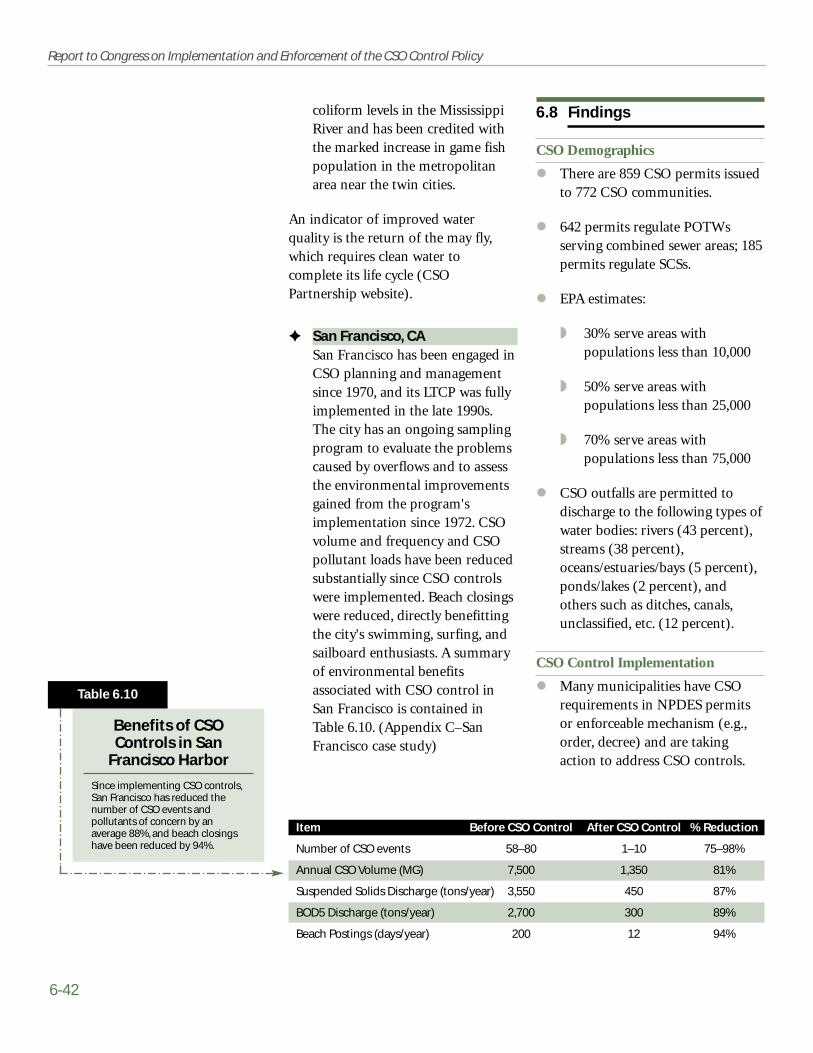
6-42
Report to Congress on Implementation and Enforcement of the CSO Control Policy
6.8 Findings
CSO Demographics
There are 859 CSO permits issuedto 772 CSO communities.
642 permits regulate POTWsserving combined sewer areas; 185permits regulate SCSs.
EPA estimates:
◗ 30% serve areas withpopulations less than 10,000
◗ 50% serve areas withpopulations less than 25,000
◗ 70% serve areas withpopulations less than 75,000
CSO outfalls are permitted todischarge to the following types ofwater bodies: rivers (43 percent),streams (38 percent),oceans/estuaries/bays (5 percent),ponds/lakes (2 percent), andothers such as ditches, canals,unclassified, etc. (12 percent).
CSO Control Implementation
Many municipalities have CSOrequirements in NPDES permitsor enforceable mechanism (e.g.,order, decree) and are takingaction to address CSO controls.
coliform levels in the MississippiRiver and has been credited withthe marked increase in game fishpopulation in the metropolitanarea near the twin cities.
An indicator of improved waterquality is the return of the may fly,which requires clean water tocomplete its life cycle (CSOPartnership website).
✦ San Francisco, CA San Francisco has been engaged inCSO planning and managementsince 1970, and its LTCP was fullyimplemented in the late 1990s.The city has an ongoing samplingprogram to evaluate the problemscaused by overflows and to assessthe environmental improvementsgained from the program'simplementation since 1972. CSOvolume and frequency and CSOpollutant loads have been reducedsubstantially since CSO controlswere implemented. Beach closingswere reduced, directly benefittingthe city's swimming, surfing, andsailboard enthusiasts. A summaryof environmental benefitsassociated with CSO control inSan Francisco is contained inTable 6.10. (Appendix C–SanFrancisco case study)
Item Before CSO Control After CSO Control % Reduction
Number of CSO events 58–80 1–10 75–98%
Annual CSO Volume (MG) 7,500 1,350 81%
Suspended Solids Discharge (tons/year) 3,550 450 87%
BOD5 Discharge (tons/year) 2,700 300 89%
Beach Postings (days/year) 200 12 94%
Benefits of CSOControls in San
Francisco Harbor
Since implementing CSO controls,San Francisco has reduced thenumber of CSO events andpollutants of concern by anaverage 88%, and beach closingshave been reduced by 94%.
Table 6.10
Chapter 6—Communities
6-43
—line item congressionalappropriations to fund CSOcontrols.
Obstacles and Challenges
CSO LTCP controls typicallyinvolve major infrastructureinvestments that often competewith other infrastructureactivities.
Many reasons, includinginstitutional barriers, exist for thelack of coordination between theLTCP development and waterquality standards review processes.States cite public pressure tomaintain their water qualitystandards, EPA requirements forUAAs, and the lack of waterquality monitoring data that couldbe used to justify standardsrevisions. Municipalities considerthe lack of a clear water quality-based endpoint to be a majorimpediment to development ofLTCPs that will provide for CWAcompliance, particularly whenurban waters are affected by morethan CSOs.
Municipal data on efficacy of theNMC and LTCPs are highlyvariable and not easily accessibleto EPA and the states. Municipaldata on the environmental andpublic health impacts andimprovements are very site-specific and not easily collected ordistilled.
CSO communities have toimplement controls and extensiveplanning, monitoring, andreporting efforts for a variety ofwet weather and related programs
91 percent of communities haveimplemented some CSO controlsas a result of permit orenforcement requirements, or on avoluntary basis.
77 percent documentedimplementation of at least one ofthe NMC as described in the CSOControl Policy; 32 percentdocumented implementation ofall NMC
The most commonly reportedmeasures to implement the NMCwere improving operation andmaintenance, maximizingcollection system storage,maximizing flow to the POTW,and elimination of dry weatheroverflows.
34 percent have submitted draftLTCPs; another 34 percent havedocumented implementation ofCSO controls that were notdeveloped as part of an LTCP.
Communities with LTCPs arepursuing attainment of waterquality standards in roughly equalmeasure under three approaches –demonstration, presumption, anda combination.
Communities are relying on awide range of technologicalapproaches to address CSOsincluding storage (e.g. tunnels),expanded treatment capacity,sewer separation, and improvedconveyance.
Communities are using acombination of local fundingsources, SRF loans, state grantsand loans and–—in special cases

6-44
Report to Congress on Implementation and Enforcement of the CSO Control Policy
that are not well coordinated atthe NPDES authority level. Theseprograms often have separateimplementation schedules andmonitoring, outreach, andreporting requirements.
Loading Reductions andEnvironmental Benefits
To the extent that environmentaldata necessary to assess theenvironmental impacts of CSOand the benefits achieved fromCSO controls is collected at all, itis done at the community level.Most environmental benefits citedin this report are site-specific andgenerated from community-levelreporting or through research forcase studies.
The limited data available indicatemarked improvements in waterquality for some communitiesimplementing controls; however, itis difficult to attributeimprovements to any one sourceof controls when other wetweather program controls are alsobeing implemented (e.g., stormwater, TMDLs, etc.).
7.1 Implementation andEnforcement of the CSOControl Policy
There has been definite progressin implementing and enforcingCSO controls prior to, and as a
result of, the CSO Control Policy. Thestrength of the CSO Control Policy isits recognition of the site-specificnature of CSOs and the flexibilitygiven to states and CSO communitiesto develop cost-effective approaches toachieving CSO control. The CSOControl Policy provides a federal andstate level of recognition of theimportance of controlling CSOs,stimulating dialogue at the local CSOcommunity level, and satisfying a needto get communities moving towardCSO control. Significant investmentshave been made by some CSOcommunities to reduce the frequency,volume, and duration of CSOs.Increased protection of human healthand water quality has beendocumented in a number of thesecases.
Chapter 7
Activities undertaken by EPA,states, and CSO communitiesto implement and enforce the
CSO Control Policy were discussed inChapters 4, 5, and 6, respectively. Thischapter synthesizes the findings fromearlier chapters to evaluate theprogress of the CSO Control Policy incontrolling CSOs and protectinghuman health and the environment.In particular, this evaluation assessesthe CSO Control Policy in thefollowing areas:
● General implementation andenforcement.
● Adherence to the four keyprinciples of the CSO ControlPolicy.
● Accomplishments attributable toimplementation and enforcementof the CSO Control Policy.
This chapter concludes with adiscussion of next steps to be taken byEPA based on report findings.
7-1
7.1 Implementation andEnforcement of the CSOControl Policy
7.2 Observations Related tothe Four Key GuidingPrinciples of the CSOControl Policy
7.3 AccomplishmentsAttributable toImplementation andEnforcement of the CSOControl Policy
7.4 Next Steps
Evaluation of the CSO Control Policy
In this chapter:
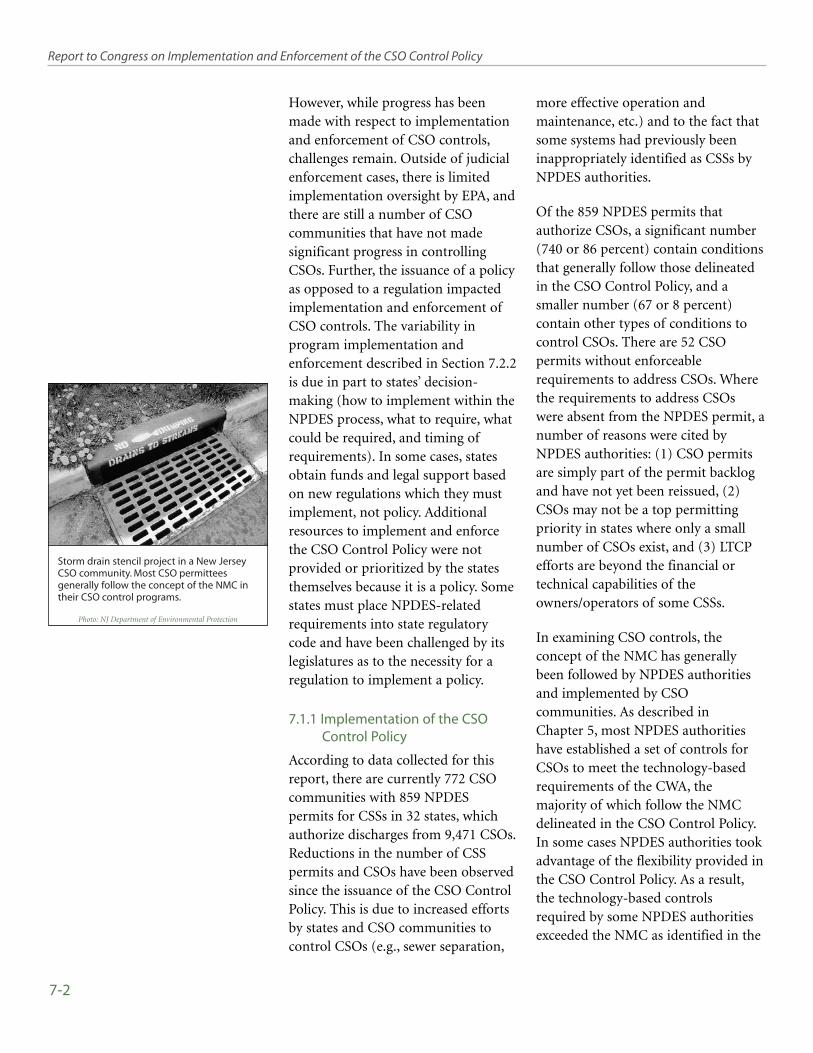
Storm drain stencil project in a New JerseyCSO community. Most CSO permitteesgenerally follow the concept of the NMC intheir CSO control programs.
Photo: NJ Department of Environmental Protection
7-2
Report to Congress on Implementation and Enforcement of the CSO Control Policy
However, while progress has beenmade with respect to implementationand enforcement of CSO controls,challenges remain. Outside of judicialenforcement cases, there is limitedimplementation oversight by EPA, andthere are still a number of CSOcommunities that have not madesignificant progress in controllingCSOs. Further, the issuance of a policyas opposed to a regulation impactedimplementation and enforcement ofCSO controls. The variability inprogram implementation andenforcement described in Section 7.2.2is due in part to states’ decision-making (how to implement within theNPDES process, what to require, whatcould be required, and timing ofrequirements). In some cases, statesobtain funds and legal support basedon new regulations which they mustimplement, not policy. Additionalresources to implement and enforcethe CSO Control Policy were notprovided or prioritized by the statesthemselves because it is a policy. Somestates must place NPDES-relatedrequirements into state regulatorycode and have been challenged by itslegislatures as to the necessity for aregulation to implement a policy.
7.1.1 Implementation of the CSOControl Policy
According to data collected for thisreport, there are currently 772 CSOcommunities with 859 NPDESpermits for CSSs in 32 states, whichauthorize discharges from 9,471 CSOs.Reductions in the number of CSSpermits and CSOs have been observedsince the issuance of the CSO ControlPolicy. This is due to increased effortsby states and CSO communities tocontrol CSOs (e.g., sewer separation,
more effective operation andmaintenance, etc.) and to the fact thatsome systems had previously beeninappropriately identified as CSSs byNPDES authorities.
Of the 859 NPDES permits thatauthorize CSOs, a significant number(740 or 86 percent) contain conditionsthat generally follow those delineatedin the CSO Control Policy, and asmaller number (67 or 8 percent)contain other types of conditions tocontrol CSOs. There are 52 CSOpermits without enforceablerequirements to address CSOs. Wherethe requirements to address CSOswere absent from the NPDES permit, anumber of reasons were cited byNPDES authorities: (1) CSO permitsare simply part of the permit backlogand have not yet been reissued, (2)CSOs may not be a top permittingpriority in states where only a smallnumber of CSOs exist, and (3) LTCPefforts are beyond the financial ortechnical capabilities of theowners/operators of some CSSs.
In examining CSO controls, theconcept of the NMC has generallybeen followed by NPDES authoritiesand implemented by CSOcommunities. As described inChapter 5, most NPDES authoritieshave established a set of controls forCSOs to meet the technology-basedrequirements of the CWA, themajority of which follow the NMCdelineated in the CSO Control Policy.In some cases NPDES authorities tookadvantage of the flexibility provided inthe CSO Control Policy. As a result,the technology-based controlsrequired by some NPDES authoritiesexceeded the NMC as identified in the

Chapter 7—Evaluation of the CSO Control Policy
7-3
CSO Control Policy. Only a limitednumber of NPDES authoritiesregulating a small number of CSOcommunities require less than theNMC.
Based upon EPA’s review of 811 CSOpermit files, 34 percent have submittedLTCPs, and 17 percent havedocumented some LTCPimplementation. NPDES authoritieshave approved slightly more than halfof the submitted LTCPs as sufficient toattain water quality standards. Severalreasons may explain the current statusof LTCP implementation:
● Delays in issuance of NPDESpermits and enforceablemechanisms to require LTCPdevelopment and implementation.
● Delays in issuance of guidancerelated to LTCP development.Although the basic guidance fordeveloping LTCPs was publishedby EPA in 1995, specific guidancerelated to financial capabilityassessment and monitoring andmodeling guidance was notpublished until 1997 and 1999,respectively. In addition, EPA didnot issue guidance on howdevelopment of LTCPs can bebetter integrated with reviews ofwater quality standards untilAugust 2001.
● Delays in review and approval ofsubmitted LTCPs, possibly due tothe absence of explicit guidance,criteria, training, and benchmarks.
● Uncertainty on the part of CSOcommunities on their ability toattain water quality standardswithout control of other sources.
● Lack of oversight at all levels, anda lack of information with whichto perform oversight (e.g., thereare no standard reportingrequirements).
● Inadequate resources and fundingat the EPA, state, and local levelsto facilitate development, review,approval, and implementation ofLTCPs.
7.1.2 Compliance and Enforcement
As described in Chapters 4 and 5,some focused CSO compliance (e.g.,inspections and monitoring) andenforcement activities have occurred.For example, several states havepromulgated specific CSOenforcement policies, while otherstates and EPA regional offices havedeveloped a Performance PartnershipAgreement (PPA) from which stateCSO enforcement policies developed.There also has been effectivecoordination within EPA inestablishing compliance requirements.EPA has issued three memoranda,each intended to facilitate theimplementation, compliance, andenforcement of the CSO ControlPolicy.
Based on compliance and enforcementdata collected for this report:
● Judicial cases brought by EPAunder the 1984 NationalMunicipal Policy were animportant factor in bringingabout early CSO control programsin major municipalities.
● Thirty-two administrative actionsand five judicial actions have beeninitiated by EPA in response to

CSO inspections are typically performed inconjunction with inspections of POTWoperations.
Photo: Photodisc
7-4
Report to Congress on Implementation and Enforcement of the CSO Control Policy
CSO-relateded violations ofNPDES permits or the CWA.
● State enforcement actionsaddressing CSO violations haveresulted in 92 administrativeactions, one civil judicial action,and 43 joint state-EPA or otherstate actions.
Even in light of these efforts, mostEPA regions and states continue toapproach compliance andenforcement as part of routineoversight of POTW operations (e.g.,inspections of CSOs and CSO controlsare performed in conjunction withinspections of POTW operations). Inresponse to the concern over thethreat to public health and theenvironment resulting from CSOs,EPA issued the Compliance andEnforcement Strategy AddressingCombined Sewer Overflows andSanitary Sewer Overflows in 2000(EPA, 2000b) to increase federal andstate enforcement and complianceassistance.
EPA has also initiated a variety ofcompliance assistance activities topromote compliance with the CSOControl Policy requirements. Thiscompliance assistance, initiated byEPA headquarters and regions, isprovided through training and on-linesystems, including the LocalGovernment EnvironmentalAssistance Network (LGEAN).Compliance assistance for CSOs is alsobeing provided in a few states. Moreneeds to be done in this area at boththe federal and state levels.
While EPA has identified CSOs as anational priority, oversight ofcompliance and enforcement activitieshas been difficult. Overall challengesassociated with compliance andenforcement of CSO controls include:
● Compliance and enforcement issomewhat limited by a lack ofenforceable conditions in somecases (e.g., see discussion inSection 7.2.1 related to clear levelsof control). NPDES authoritiescan evaluate compliance in termsof whether a CSO community isimplementing the NMC, but it isdifficult to determine theadequacy of implementation (e.g.,is enough being done to maximizeflow through the treatment plantor to control floatables?).
● The level of CSO complianceinspection and monitoring variesfrom region to region and state tostate. As CSO occurrences arerainfall driven it is difficult toschedule sampling and complianceinspections during wet weather.
7.2 Observations Related tothe Four Key GuidingPrinciples of the CSOControl Policy
This section discusses whetherimplementation andenforcement of the CSO
Control Policy generally followed thefour key principles to ensure that CSOcontrols are cost-effective and meetthe objectives of the CWA. The fourkey principles are discussed in thefollowing subsections.

Chapter 7—Evaluation of the CSO Control Policy
7-5
While the four key principles are usedas an analytical framework forassessment of the CSO Control Policy,it is acknowledged that some overlapoccurs among the principles.
7.2.1 Provide Clear Levels of Controlto Meet Appropriate Healthand Environmental Objectives
As described in Chapter 2, provisionscontained within the CSO ControlPolicy provide a number of optionsfor controlling CSOs under theframework of the NMC and LTCPs.The CSO Control Policy alsoacknowledges that significant effortshave already been undertaken by manyNPDES authorities and CSOcommunities to control CSOs. TheCSO Control Policy provides for theseexisting efforts:
...portions of this Policy may
already have been addressed by
permittees' previous efforts to
control CSOs. Therefore, portions
of this Policy may not apply, as
determined by the permitting
authority on a case-by-case basis.
The flexibility in the CSO ControlPolicy allowed for site-specific controlsolutions to be developed, previouslyimplemented controls to be creditedand considered, and for exceptionsfrom policy requirements if existingcontrols demonstrated attainment ofwater quality standards. However, inlight of this flexibility, data collectedfor this report indicates that clearlevels of control from the standpointof definitive compliance end-pointshave not yet been provided to anumber of CSO communities byNPDES authorities.
NMC
As described in Chapters 5 and 6, theNMC have provided a minimumtechnology-based level of control forCSOs. The examples of NMCimplementation provided in Chapter 6and in the case studies presented inAppendix C demonstrate that theNMC contribute to reductions in CSOvolume, frequency, and duration, aswell as providing additional benefits.The NMC have fostered better use ofexisting CSS facilities to store andconvey combined sewage, and theyhave given heightened priority to theelimination of dry weather overflows.They have also made CSOcommunities more attentive topollution prevention and floatablescontrol. In addition, they haveinformed the public about thepresence and dangers of CSOsthrough posting and other measures.There are, however, a number ofchallenges remaining related to theNMC centered on documentingimplementation and effectiveness.
The CSO Control Policyacknowledged the necessity todocument the actions to be taken byCSO permittees to implement theNMC and to report on theeffectiveness of the NMC in reducingor eliminating CSO impacts. Itexpected CSO communities toimplement the NMC with appropriatedocumentation by January 1, 1997.Based on data collected for this report,initial documentation of NMCimplementation was generally foundin NPDES permit files. However, therewas limited documentation related toon-going implementation of NMCactivities. Documentation is needed to
The NMC have made CSO communities moreattentive to pollution prevention andfloatables control through activities such asstreet sweeping and catch basin cleaning.
Photo: EPA
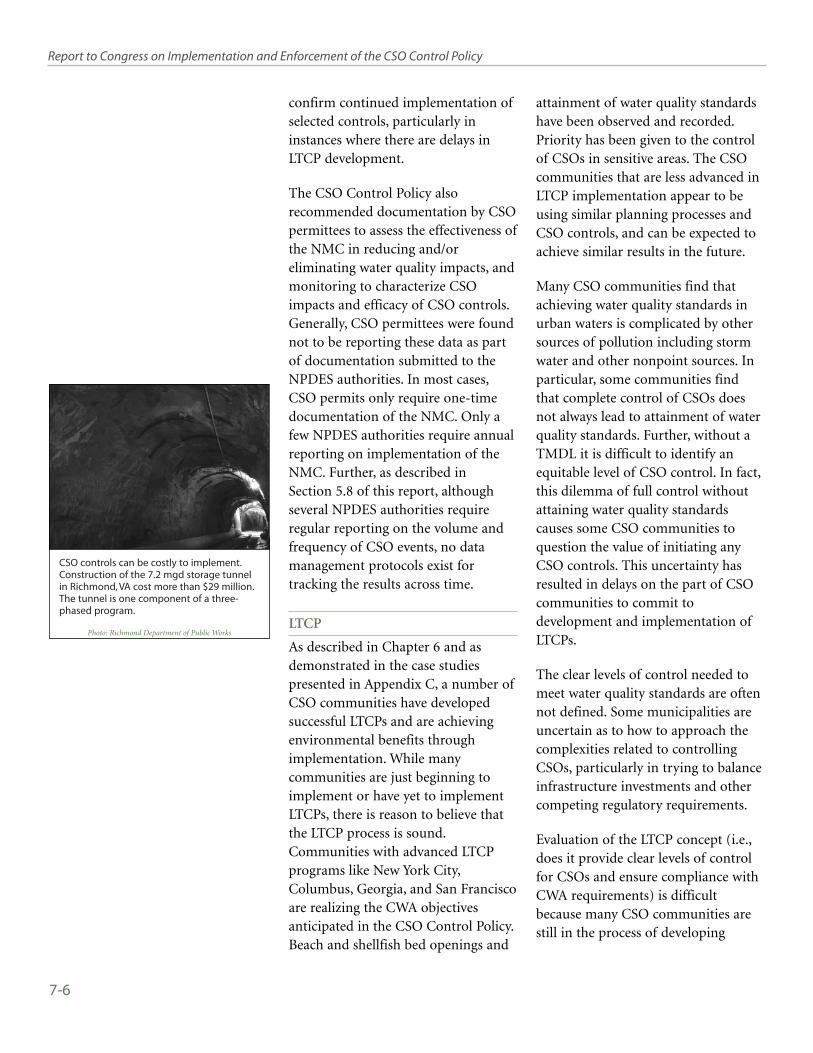
CSO controls can be costly to implement.Construction of the 7.2 mgd storage tunnelin Richmond, VA cost more than $29 million.The tunnel is one component of a three-phased program.
Photo: Richmond Department of Public Works
7-6
Report to Congress on Implementation and Enforcement of the CSO Control Policy
confirm continued implementation ofselected controls, particularly ininstances where there are delays inLTCP development.
The CSO Control Policy alsorecommended documentation by CSOpermittees to assess the effectiveness ofthe NMC in reducing and/oreliminating water quality impacts, andmonitoring to characterize CSOimpacts and efficacy of CSO controls.Generally, CSO permittees were foundnot to be reporting these data as partof documentation submitted to theNPDES authorities. In most cases,CSO permits only require one-timedocumentation of the NMC. Only afew NPDES authorities require annualreporting on implementation of theNMC. Further, as described inSection 5.8 of this report, althoughseveral NPDES authorities requireregular reporting on the volume andfrequency of CSO events, no datamanagement protocols exist fortracking the results across time.
LTCP
As described in Chapter 6 and asdemonstrated in the case studiespresented in Appendix C, a number ofCSO communities have developedsuccessful LTCPs and are achievingenvironmental benefits throughimplementation. While manycommunities are just beginning toimplement or have yet to implementLTCPs, there is reason to believe thatthe LTCP process is sound.Communities with advanced LTCPprograms like New York City,Columbus, Georgia, and San Franciscoare realizing the CWA objectivesanticipated in the CSO Control Policy.Beach and shellfish bed openings and
attainment of water quality standardshave been observed and recorded.Priority has been given to the controlof CSOs in sensitive areas. The CSOcommunities that are less advanced inLTCP implementation appear to beusing similar planning processes andCSO controls, and can be expected toachieve similar results in the future.
Many CSO communities find thatachieving water quality standards inurban waters is complicated by othersources of pollution including stormwater and other nonpoint sources. Inparticular, some communities findthat complete control of CSOs doesnot always lead to attainment of waterquality standards. Further, without aTMDL it is difficult to identify anequitable level of CSO control. In fact,this dilemma of full control withoutattaining water quality standardscauses some CSO communities toquestion the value of initiating anyCSO controls. This uncertainty hasresulted in delays on the part of CSOcommunities to commit todevelopment and implementation ofLTCPs.
The clear levels of control needed tomeet water quality standards are oftennot defined. Some municipalities areuncertain as to how to approach thecomplexities related to controllingCSOs, particularly in trying to balanceinfrastructure investments and othercompeting regulatory requirements.
Evaluation of the LTCP concept (i.e.,does it provide clear levels of controlfor CSOs and ensure compliance withCWA requirements) is difficultbecause many CSO communities arestill in the process of developing
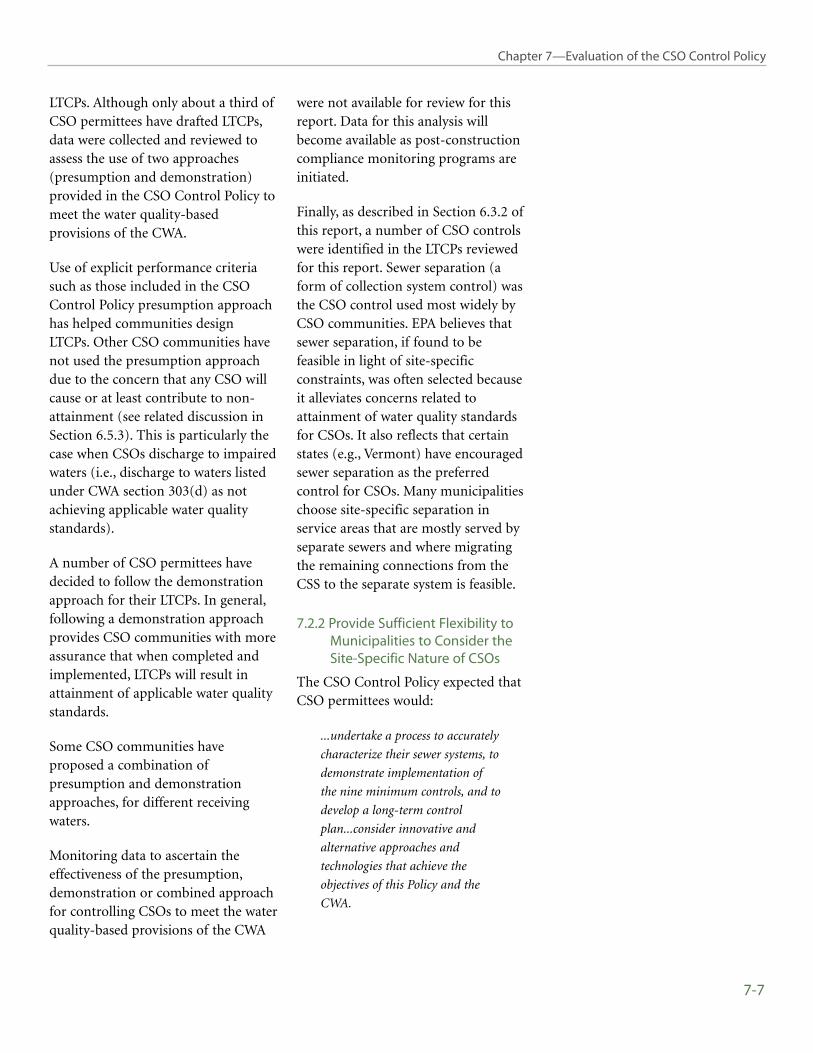
Chapter 7—Evaluation of the CSO Control Policy
7-7
LTCPs. Although only about a third ofCSO permittees have drafted LTCPs,data were collected and reviewed toassess the use of two approaches(presumption and demonstration)provided in the CSO Control Policy tomeet the water quality-basedprovisions of the CWA.
Use of explicit performance criteriasuch as those included in the CSOControl Policy presumption approachhas helped communities designLTCPs. Other CSO communities havenot used the presumption approachdue to the concern that any CSO willcause or at least contribute to non-attainment (see related discussion inSection 6.5.3). This is particularly thecase when CSOs discharge to impairedwaters (i.e., discharge to waters listedunder CWA section 303(d) as notachieving applicable water qualitystandards).
A number of CSO permittees havedecided to follow the demonstrationapproach for their LTCPs. In general,following a demonstration approachprovides CSO communities with moreassurance that when completed andimplemented, LTCPs will result inattainment of applicable water qualitystandards.
Some CSO communities haveproposed a combination ofpresumption and demonstrationapproaches, for different receivingwaters.
Monitoring data to ascertain theeffectiveness of the presumption,demonstration or combined approachfor controlling CSOs to meet the waterquality-based provisions of the CWA
were not available for review for thisreport. Data for this analysis willbecome available as post-constructioncompliance monitoring programs areinitiated.
Finally, as described in Section 6.3.2 ofthis report, a number of CSO controlswere identified in the LTCPs reviewedfor this report. Sewer separation (aform of collection system control) wasthe CSO control used most widely byCSO communities. EPA believes thatsewer separation, if found to befeasible in light of site-specificconstraints, was often selected becauseit alleviates concerns related toattainment of water quality standardsfor CSOs. It also reflects that certainstates (e.g., Vermont) have encouragedsewer separation as the preferredcontrol for CSOs. Many municipalitieschoose site-specific separation inservice areas that are mostly served byseparate sewers and where migratingthe remaining connections from theCSS to the separate system is feasible.
7.2.2 Provide Sufficient Flexibility toMunicipalities to Consider theSite-Specific Nature of CSOs
The CSO Control Policy expected thatCSO permittees would:
...undertake a process to accurately
characterize their sewer systems, to
demonstrate implementation of
the nine minimum controls, and to
develop a long-term control
plan...consider innovative and
alternative approaches and
technologies that achieve the
objectives of this Policy and the
CWA.

Sewer separation tunnel installed by NewBrunswick, NJ. Sewer separation is the mostcommon long-term control used by CSOpermittees.
Photo: NJ Department of Environmental Protection
7-8
Report to Congress on Implementation and Enforcement of the CSO Control Policy
The CSO Control Policy alsoadvocated that selected approachesand technologies be designed to:
...allow cost effective expansion or
cost effective retrofitting if
additional controls are
subsequently determined to be
necessary to meet WQS, including
existing and designated uses.
This section discusses the impact theflexibility has had on implementation.
Flexibility Provided by PermittingAuthorities in Implementing the CSOControl Policy
As described in Chapter 2, in responseto the National CSO Control Strategy,states were requested to develop CSOpermitting strategies to bring all wetweather CSOs into compliance withthe requirements of the CWA. Statessubmitted and received approval ofstate-wide permitting strategies. Asdescribed in Section 5.2, some stateshave adjusted the permitting strategiesto accommodate the provisionscontained in the CSO Control Policy.In other cases, states were found tocontinue to assert state prioritiesrelated to water quality protectionprograms, and some states were foundto operate on a project-specific basis.
Overall, EPA noted variability in howthe CSO Control Policy wasimplemented and enforced among thestates that regulate CSOs. Some of thevariability noted by EPA stems fromthe flexibility in the CSO ControlPolicy, which has led to differences inthe approaches used by states toimplement the NPDES permit andwater quality standards programs. Forexample, permit conditions for CSOs,
like any other point source dischargerin California, are based on basin plans.New York uses an EnvironmentalBenefits Priority System to identifythose permits whose reissuance wouldprovide the greatest environmentalbenefit. New Jersey issues permits,including those for CSOs, on awatershed basis. Some of thevariability noted is also based on therelative importance placed on CSOs ascompared to other discharges within astate. This was particularly noted byseveral states in light of the pressuresto reduce NPDES permit backlogs. Inthose states that contain a smallnumber of CSOs, EPA found that theCSO Control Policy provisions wereprimarily implemented on a CSOpermittee-specific basis.
EPA also found that although moststates require technology-basedrequirements similar to the NMC,certain states decided to requirecontrols different than the NMC, oremphasized the use of one or moreparticular control. For example, NewYork requires CSO permittees toimplement 15 specific BMPs tocontrol CSOs which are essentiallyequivalent to the NMC. New Jerseyinitially emphasized the control ofsolids and floatables to aestheticallyimprove waters, and is now focusingon use of disinfection to minimizehuman health impacts.
Variability was also noticed amongstate requirements to develop andimplement LTCPs. Some of thisvariability was based on the decisionin several states to develop a preferredstate-wide approach to specificallyaddress CSOs. For example, Vermonthas advocated the use of sewer
Chapter 7—Evaluation of the CSO Control Policy
7-9
separation as the means to controlCSOs. Michigan requires all CSOpermittees develop controls to meet adesign storm based presumptionapproach. Massachusetts uses awatershed-based approach toprioritize CSO controls along withother critical environmental needs.
Generally, the more prescriptive a statewas in terms of preferred approachesto CSO control, the more advancedprogram implementation was incontrolling CSOs. In part, this may bedue to the fact that state-wideapproaches provide definitive targetsfor CSO permittees (e.g., the non-negotiable approach used by Michiganthat requires either elimination of theCSO or adequate CSO treatment inaccordance with specified designrequirements). Alternatively, someCSO communities perceive theflexibility provided to NPDESauthorities in the CSO Control Policyhas not been extended to thecommunities, particularly in thosestates with very prescriptive state-wideapproaches. Similarly, the flexibility inthe process for reviewing and revisingstate water quality standards isperceived to be unevenly applied (seerelated discussion regarding waterquality standards in Section 7.2.4below).
Consideration of Cost-Effectiveness ofCSO Control Options
The CSO Control Policy encouragesmunicipalities, NPDES and waterquality standards authorities, and thepublic to work together to developcost-effective CSO controls that meetwater quality standards. The CSOControl Policy states thatcost/performance evaluations should:
...include an analysis to determine
where the increment of pollution
reduction achieved in the receiving
water diminishes compared to the
increased costs...(this analysis)
should be among the
considerations used to help guide
selection of controls.
As described in the EPA Guidance forLong Term Control Plan (EPA,1995f),these analyses typically involveestimating costs for a range of controllevels, then comparing performanceversus cost and identifying the pointof diminishing returns, referred to asthe "knee-of-the-curve.” The EPAguidance also recommends that CSOpermittees consider non-monetaryfactors (e.g., environmental issues andimpacts, technical issues, andimplementation issues) that caninfluence the selection of CSO controlalternatives.
According to the 1996 EPA CleanWater Needs Survey (EPA, 1997b),costs for all CSO control projects wereestimated to be $44.7 billion (in 1996dollars). As discussed in Section 6.4.4of this report, incremental increases inlevels of CSO controls considered mayresult in significant increases in totalproject costs. While it appears knee-of-the-curve analysis is beingconducted and considered indeveloping LTCP controlrecommendations, it is only oneelement considered in selectingCSOcontrol options.

7-10
Report to Congress on Implementation and Enforcement of the CSO Control Policy
Other Issues Related to Flexibility inImplementation of the CSO ControlPolicy
Although the CSO Control Policyprovides and promotes flexibility incontrolling CSOs, the flexibility islimited to CSO control. Many CSOpermittees are municipalities that arealso responsible for compliance withother NPDES permit programrequirements such as effluentlimitations for discharges from thePOTW (including secondarytreatment standards and applicablewater quality-based effluentlimitations), management of biosolids,implementation of a pretreatmentprogram, and control of dischargesfrom municipal separate storm sewersystems. In addition, there are anumber of other programs, such asthe TMDL program for impairedreceiving waters, that may impact thestringency of controls that must beimplemented for point sourcedischarges from municipal operations.EPA is also considering proposingrevisions to the NPDES permitregulations to improve the operationof municipal sanitary sewer collectionsystems and reduce the frequency andoccurrence of sanitary seweroverflows.
Other than encouraging the evaluationof proposed CSO control needs on awatershed basis, the CSO ControlPolicy does not discuss flexibility as itrelates to interaction and overlap inrelated NPDES regulatory programsand requirements (i.e., there is noflexibility afforded to CSOcommunities to balance other NPDESprogram requirements with thosebased on the CSO Control Policy).
However, there are some examples ofCSO communities that havesuccessfully worked with the NPDESauthority to balance NPDES programrequirements. For example, theLouisville & Jefferson CountyMetropolitan Sewer District has takenthe initiative to work with the State ofKentucky to combine NPDESprogram requirements so thatmonitoring can be coordinated andimplemented on a watershed basis.Coordination of programmaticrequirements has not only resulted inmore effective monitoring to assessreceiving water impacts (e.g.,monitoring CSO, storm water, andPOTW discharges to the samereceiving water body at the sametime), but has assisted in prioritizingand focusing future municipalexpenditures.
7.2.3 Allowing a Phased Approach toImplementation of CSOControls
The CSO Control Policy described aphased approach in permitting toimplement the CSO Control Policy.Phase I permits were to be designed toat least require immediateimplementation and subsequentdocumentation of the NMC, anddevelopment and submittal of anLTCP generally within two years afterthe effective date of the permit (unlessa longer schedule is determined to beneeded). Phase II permits were torequire continued implementation ofthe NMC, implementation of theLTCP including the selected controlsnecessary to meet CWA requirements,and implementation of the approvedpost-construction compliancemonitoring program.

Chapter 7—Evaluation of the CSO Control Policy
7-11
In general, the phasing concept of theCSO Control Policy has been followed.Most CSO communities were initiallyrequired through a NPDES permit orother type of enforceable mechanismto implement the NMC and thendevelop an LTCP.
Use of Enforceable Mechanisms toImplement CSO ControlRequirements
Development and implementation ofLTCPs by CSO communities wasrequired through an enforcementaction in some instances (e.g.,administrative order). Enforcementactions are used in some cases toaccommodate the fact that NPDESpermits are limited in the waycompliance schedules may beincorporated. If an LTCP for a CSOcommunity includes significantstructural controls (e.g., expandingPOTW capacity) that will take longerto complete than allowed by the statestandards (e.g., water quality standardsdo not allow for the issuance of acompliance schedule as part of anNPDES permit), then an enforcementorder is necessary to establish aschedule for implementation. If theschedule is for more than five years,then a judicial enforcement order isnecessary. In these cases, a judicialenforcement order is the only meansto establish a legally binding schedulefor implementation. Finally, anenforcement action may be taken as aresult of non-compliance on the partof a CSO permittee.
Role of Financial Capability andEffect of CSO Financing on PhasedImplementation
Financial capability is one of sixfactors listed in the CSO ControlPolicy for consideration whendeveloping a schedule forimplementation of CSO controls.Financial capability may justify alonger-term phased approach toimplementation of LTCPs andimplementation schedules.
According to the EPA Guidance onFinancial Capability Assessment andSchedule Development (EPA, 1997e),the financial capability determinationsand characterization of amunicipality’s financial capability toimplement CSO controls can be basedon a number of measures. Generalscheduling boundaries provided in thefinancial capability guidance arepresented in Table 7.1 below.
EPA found that CSO communities doperform a financial capabilityassessment and factor the results ofthe assessment into theimplementation schedule included aspart of the LTCP. In some cases, thelength of the proposed schedule forcompletion of selected CSO controlsmay be related to the effect of thelength of time provided foramortization of CSO-related capitalinvestments.
EPA also found that NPDESauthorities do follow the EPAguidance and negotiateimplementation schedules. However,there is little in the way ofdocumentation to describe how
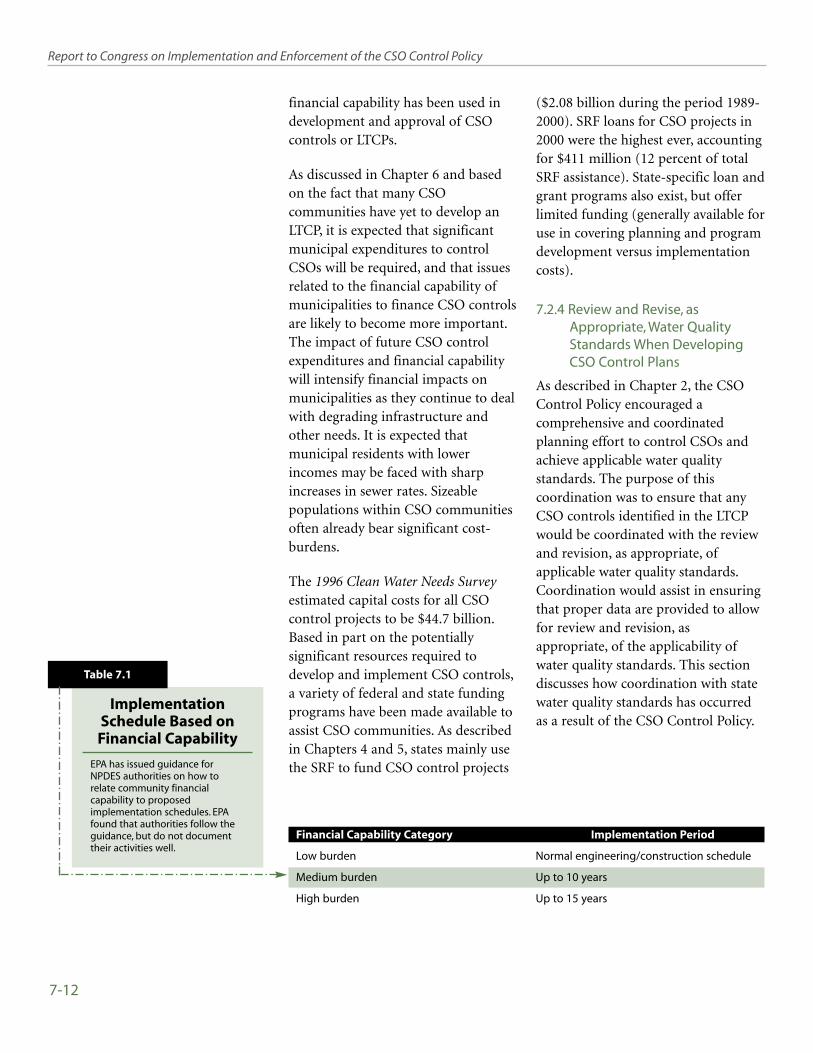
7-12
Report to Congress on Implementation and Enforcement of the CSO Control Policy
financial capability has been used indevelopment and approval of CSOcontrols or LTCPs.
As discussed in Chapter 6 and basedon the fact that many CSOcommunities have yet to develop anLTCP, it is expected that significantmunicipal expenditures to controlCSOs will be required, and that issuesrelated to the financial capability ofmunicipalities to finance CSO controlsare likely to become more important.The impact of future CSO controlexpenditures and financial capabilitywill intensify financial impacts onmunicipalities as they continue to dealwith degrading infrastructure andother needs. It is expected thatmunicipal residents with lowerincomes may be faced with sharpincreases in sewer rates. Sizeablepopulations within CSO communitiesoften already bear significant cost-burdens.
The 1996 Clean Water Needs Surveyestimated capital costs for all CSOcontrol projects to be $44.7 billion.Based in part on the potentiallysignificant resources required todevelop and implement CSO controls,a variety of federal and state fundingprograms have been made available toassist CSO communities. As describedin Chapters 4 and 5, states mainly usethe SRF to fund CSO control projects
($2.08 billion during the period 1989-2000). SRF loans for CSO projects in2000 were the highest ever, accountingfor $411 million (12 percent of totalSRF assistance). State-specific loan andgrant programs also exist, but offerlimited funding (generally available foruse in covering planning and programdevelopment versus implementationcosts).
7.2.4 Review and Revise, asAppropriate, Water QualityStandards When DevelopingCSO Control Plans
As described in Chapter 2, the CSOControl Policy encouraged acomprehensive and coordinatedplanning effort to control CSOs andachieve applicable water qualitystandards. The purpose of thiscoordination was to ensure that anyCSO controls identified in the LTCPwould be coordinated with the reviewand revision, as appropriate, ofapplicable water quality standards.Coordination would assist in ensuringthat proper data are provided to allowfor review and revision, asappropriate, of the applicability ofwater quality standards. This sectiondiscusses how coordination with statewater quality standards has occurredas a result of the CSO Control Policy.
Financial Capability Category Implementation Period
Low burden Normal engineering/construction schedule
Medium burden Up to 10 years
High burden Up to 15 years
ImplementationSchedule Based onFinancial Capability
EPA has issued guidance forNPDES authorities on how torelate community financialcapability to proposedimplementation schedules. EPAfound that authorities follow theguidance, but do not documenttheir activities well.
Table 7.1

Chapter 7—Evaluation of the CSO Control Policy
7-13
Review and revision as necessary ofwater quality standards within thecontext of the CSO Control Policywere rarely documented. There may bea number of reasons that impede thereview process:
● The water quality standardsregulations at 40 CFR Part 131acknowledge there may beinstances where modifications toor variances from applicable waterquality standards may be justifiedto acknowledge site-specificconditions of the discharge andreceiving water. However, revisionsto water quality standards aregenerally not encouraged. This isparticularly true as it relates todowngrading designated uses,which requires a UAA that can beresource intensive. Some types ofrevisions are completelyprohibited; for example, theremoval of an “existing” use,defined as a use that was beingattained in 1975. In addition, thereare a few states that, as a matter ofpractice, will not accept requestsfor modifications of water qualitystandards.
● The data and information tosupport changes to designateduses and associated water qualitystandards can be collected mostcost-effectively as part of thedevelopment of an LTCP, whichcan be an expensive process.
● There is uncertainty on the part ofcommunities about the process forthe review and revision, asappropriate, of state water qualitystandards. There has been a needfor guidance identifying explicit
data requirements to supportwater quality standards review forCSO receiving waters. EPApublished guidance concerningthe coordination of CSO controlsand water quality standards inAugust 2001.
As described in Section 5.6.1, a fewstates have developed specificprocedures for considering theapplicability of water quality standardsfor CSO receiving waters. However,most states have not specificallyaccommodated water qualitystandards reviews for CSOs (i.e., theydo not provide a specific method toaddress changes to designated uses,variances, or adjustment to waterquality criteria for CSO-impactedwater bodies as part of the LTCPprocess). Rather, most states addressthe review of water quality standardsfor CSOs during a state-wide orwatershed based triennial review.States have limited resources andcompeting priorities for water qualitystandards reviews, particularly forwaters with court-ordered TMDLs.Therefore, the state may be unable toaccommodate a specific reviewrequest.
EPA believes that greater levels ofcoordination are needed among allentities to support the development ofCSO control to meet appropriatewater quality standards and the reviewand revision of these standards asappropriate. This requires a moreintensive effort where permitting andwater quality standard activities are indifferent organizational units.
Although three states have procedures forconsidering the applicability of water qualitystandards for CSO receiving waters, onlyMWRA, the sanitary authority servingBoston, has received CSO-related standardsrevision.
Photo: Photodisc

7-14
Report to Congress on Implementation and Enforcement of the CSO Control Policy
Water quality standards reviews mustinclude sufficient data to supportdesignated use changes, site-specificcriteria development, and/or variancerequests. Often the data are notavailable to properly evaluatemodification requests. In these cases,the state, the CSO permittee, or both,would bear the responsibility togenerate an appropriate data set toallow for a determination. Ifcoordination is not occurring with allinterested stakeholders, thenadditional resources may be needed toaddress issues raised by these otherstakeholders.
EPA now recommends the use of E.colior enterococci for freshwaters andenterococci for marine waters becauseepidemiological studies show thatE.coli and enterococci are betterindicators of gastrointestinal illnessthan fecal coliform. EPA recommendsthe geometric mean of the samplestaken to not exceed the criterion andthe single sample maximum to be metfor a water body to fully support itsprimary contact recreation use. Futurestate decisions to adopt new indicatorbacteria will have implications forCSO LTCPs designed based on existingwater quality standards.
7.3 AccomplishmentsAttributable toImplementation andEnforcement of the CSOControl Policy
EPA believes that implementationof the CSO Control Policy byEPA regions, states, and CSO
communities since 1994 has reducedloadings and benefitted theenvironment.
7.3.1 National Estimates of CSOVolume and Pollutant LoadingReductions
As described in Chapter 4, EPA hasinitiated efforts to track and report onGPRA performance measures, and hasdeveloped a national model toestimate pollutant and flow reductionsattributable to implementation ofCSO controls by communities. Forpurposes of this report, the GPRACSOmodel was used to provide somepreliminary estimates of thenationwide CSO reductions based onvarious CSO management scenarios. Abrief summary of the GPRACSOmodel and how the model was used toderive estimates for this report ispresented in Appendix S. Overall, theGPRACSO model attempts to evaluatehow CSS management has evolvedover a 10-year period. EPA applied theGPRACSO model to obtain a basicunderstanding of CSS management,simplifying as necessary to obtainsystem-wide estimates of overflow foreach CSS.
For purposes of this report, theGPRACSO model was applied toevaluate CSO volume and BODpollutant loadings associated with fourscenarios:

Chapter 7—Evaluation of the CSO Control Policy
7-15
● Baseline scenario—representingCSO volumes and pollutantloadings prior to issuance of theCSO Control Policy.
● Low-end current implementationscenario—representing estimatesof CSO volumes and pollutantloadings after implementation ofthe CSO Control Policy. Thisscenario represents conservative,low-end estimates of managementmeasures that are currently in-place.
● High-end current implementationscenario—representing less-conservative, higher-end estimatesof implementation ofmanagement measures to reduceCSO volumes and pollutantloadings.
● Future expected implementationscenario—representing a best-casefuture scenario of CSO volumeand pollutant load reductionsassuming full implementation ofCSO controls.
As shown in Table 7.2, the GPRACSOmodel predicts that approximately1.46 trillion gallons per year of CSOsoccurred prior to issuance of the CSOControl Policy, and over 1 billionpounds per year of BOD weredischarged from CSOs. Currently, EPAestimates untreated CSO volumes
range from 1.26 to 1.29 trillion gallonsper year, and BOD loadings rangefrom 915 to 930 million pounds peryear. The GPRACSO model predictsthat there has been between a 12percent and 14 percent reductionnationwide of untreated CSO volumeand BOD loadings, respectively, sinceissuance of the CSO Control Policy in1994.
Assuming full implementation of theCSO Control Policy, approximately 1.3trillion gallons per year of CSOswould be treated nationally, andapproximately 600 million pounds peryear of BOD would be removed fromdischarges from CSOs. As shown inTable 7.2, this will requirecommunities with CSSs to provideadvanced primary treatment to anestimated additional one trilliongallons, or 35 percent more volume,than is currently receiving thisminimum level of treatment.
It should be noted that EPA hasattempted to be conservative whenestimating reductions in overflows andpollutant loadings. As described above,only structural CSO controls, such asimproved POTW operations, wereconsidered (i.e., non-structuralcontrols such as enhancedpretreatment requirements anddownspout disconnect programs arenot recognized). It should also benoted that GPRACSO model results
Scenario Annual Untreated Dry/Wet Weather Annual BOD
CSO Volume Volume Treated Discharged
(Trillion Gallons/Year) (Trillion Gallons/Year) (Million Pounds/Year)
Baseline 1.46 2.80 1,070
Low-End Current Implementation 1.29 2.97 930
High-End Current Implementation 1.26 3.00 915
Future Expected Implementation 0.20 4.06 480
Pollutant ReductionEstimates Based on
Implementation of CSOControl Policy
EPA’s GPRACSO model was used toevaluate the potential reductionto CSO volume based both oncurrent implementation andfuture expected implementation.
Table 7.2
7-16
Report to Congress on Implementation and Enforcement of the CSO Control Policy
sometimes indicated CSO volumesand loadings actually increased overthe baseline condition. This occurswherever the service population oracreage has increased, while POTWtreatment capacity has remainedconstant (i.e., the dry weather sanitaryflows have increased, leaving lesscapacity to treat wet weather flows).
7.3.2 Accomplishments Attributableto Implementation andEnforcement of the CSOControl Policy
The focus of the second Report toCongress in 2003 will be the extent ofhuman health and environmentalimpacts caused by CSOs and SSOs.Although not the focus of this report,this section describes some of theaccomplishments related to thecontrol of CSOs brought about by theCSO Control Policy.
As described in Chapter 4, EPA doesnot yet possess a data managementsystem that tracks reductions in CSOfrequency, duration or volume, orimprovements in water quality.However, based on data collected forthis report, EPA observed a number ofaccomplishments attributable toimplementation of the CSO ControlPolicy. Many of these achievementshave directly contributed to reductionsin CSOs and protection of receivingwater quality. Accomplishmentsinclude:
● Stimulating implementation ofeffective CSO controls—Asdescribed throughout Chapter 6,implementation and enforcementof the CSO Control Policy hasstimulated many CSOcommunities to take actions to
control CSOs. Some of theseactivities, such as floatablescontrols, have directly resulted inimproving the aesthetics andrecreation of receiving waters.Other activities, such as increasingcapacity at POTWs to treat greatervolumes wet weather flows, haveresulted in flow and loadreductions, and in a few cases,notable improvements to waterquality and protection of humanhealth have been documented.
● Reducing dry weatheroverflows—As described inSection 6.2.1, particularimportance (both from apermitting and compliance andenforcement basis) was placed onCSO permittees to eliminate dryweather overflows. This focus isimportant from a human healthand environmental protectionstandpoint, as dry weatheroverflows occur at times whenreceiving waters are less able toaccommodate pollutant loadings(as compared to when higher flowconditions occur as a result of wetweather). Data indicate that mostCSO communities have eliminatedchronic dry weather overflows,and have inspections programsdesigned to detect and eliminateother occasional dry weatheroverflows when they occur.
● Protecting sensitive areas - Asdescribed in Chapter 2, the CSOControl Policy expects that CSOpermittees give highest priority tocontrolling CSOs to sensitiveareas. Section 6.3.3 indicates thatmore than 30 percent of the CSOfiles reviewed noted CSO

Chapter 7—Evaluation of the CSO Control Policy
7-17
discharges to sensitive areas. As aresult, a number of CSOpermittees have prioritized andimplemented specific programsand initiatives to addressdischarges to sensitive areas.
● Raising public awareness - Amajor component of the CSOControl Policy was to ensure thatall stakeholders were aware of thepotential human health andenvironmental problemsassociated with CSOs, as well asthe types of controls available toreduce the volume, frequency andduration of CSOs. Raising theawareness of all stakeholdersassists in ensuring that CSOcontrol options will be protectiveof human health and theenvironment, as well as securingresource commitments fordeveloping and implementingCSO controls.
7.4 Next Steps
As described throughout thisreport, significant efforts havebeen made at all levels to
implement and enforce the CSOControl Policy. However, more workremains to ensure that human healthand the environment are adequatelyprotected from CSOs. Slower progressthan expected in the development andimplementation of LTCPs continuesfor several reasons. Chief among themare delays in the issuance of permitsrequiring CSO controls, delays in theissuance of guidance, and delays inLTCP approval. In addition, there is areluctance on the part of CSOcommunities to commit resources due
to actual or perceived uncertaintiesrelated to definitive complianceendpoints for CSO control.
EPA expects NPDES authorities, statewater quality standards authorities,and CSO communities to activelyparticipate in the implementation andenforcement of the CSO ControlPolicy. EPA realizes the importance ofits role to lead future activities thatwill ensure continued progress is madein controlling CSOs. Based on thefindings from this report, there are anumber of activities EPA will pursuein the future:
Ensure that All CSOs AreAppropriately Controlled
● Implement the “shall conform”statutory mandate.
◗ Begin efforts to implementnew CWA Section 402(q)(1),which requires that futurepermits or other enforceablemechanisms for CSOsconform to the CSO ControlPolicy. These efforts willinclude evaluating the needfor regulatory amendments,policy statements or otherappropriate actions to ensureimplementation of CSOprograms consistent with theCSO Control Policy.
Ensure All CSOs Are AppropriatelyRegulated
● Follow up with NPDES authoritiesto ensure that CSO permits orother enforceable mechanisms areissued as soon as possible forthose CSO communities that havenot yet been required to controlCSOs. EPA will also work with the

7-18
Report to Congress on Implementation and Enforcement of the CSO Control Policy
states to ensure that permits andenforcement actions (e.g. orders,decrees) are consistent with theCSO Control Policy, as required bynew CWA Section 402(q)(1). EPAwill issue guidance on this topic.
Improve Implementation of the CSOControl Policy
● Advocate CSO control on awatershed basis.
◗ Continue efforts to focusprotection of water quality ona watershed approach andsupport development of CSOLTCPs on a watershed basis.EPA will also continue effortsto encourage integration ofwet weather programs,including support infacilitating the wet weatherpilot projects grant programas described in an amendmentto Title I of the CWA.
● Work with states to speed thewater quality standards review andrevision process.
◗ Continue to work with states,communities, andconstituency groups oncoordinating the review andrevision of water qualitystandards with developmentof LTCPs. EPA will establish atracking system for waterquality standards reviews onCSO-receiving waters. EPAwill also assess the need foradditional guidance and toolsto facilitate the water qualitystandards review process forall sources, including CSO.
● Strengthen CSO informationmanagement.
◗ Work to coordinateinformation managementactivities and strengthenperformance measurementsuch that data generated byCSO communities can becollected and managed todemonstrate theenvironmental outcomes ofCSO control.
● Improve compliance assistanceand enforcement.
◗ CSOs will continue to be anational compliance andenforcement priority in fiscalyears 2002 and 2003. EPA willwork closely with NPDESauthorities and states to targetenforcement actions, whereappropriate, to ensurecompliance with the CSOrequirements in NPDESpermits or other enforceablemechanisms. In addition, EPAwill develop and promotecompliance assistance tools.
● Improve EPA and state oversight.
◗ Review and strengthenexisting practices andprocedures used by EPA andstates to ensure CSO controlsare being implemented. Thisreview will include evaluationof reporting requirements todemonstrate ongoingimplementation of the NMC,as well as examination ofprocedures used to ensureproper communication andcoordination during review

Chapter 7—Evaluation of the CSO Control Policy
7-19
and revision of water qualitystandards and implementationprocedures.
Initiate Efforts for the Second Reportto Congress in 2003.
● Initiate efforts to define the scopeand methodology for the secondReport to Congress due inDecember 2003. In the secondreport EPA is required tosummarize the extent of humanhealth and environmental impactscaused by CSOs and SSOs, reporton the resources spent by CSOcommunities to address theseimpacts, and evaluate thetechnologies used, includingwhether sewer separation isenvironmentally preferred for allsituations. EPA will build on CSOdata collected for this report anddevelop a methodology foraddressing the challenges ofcollecting and analyzing SSO data.
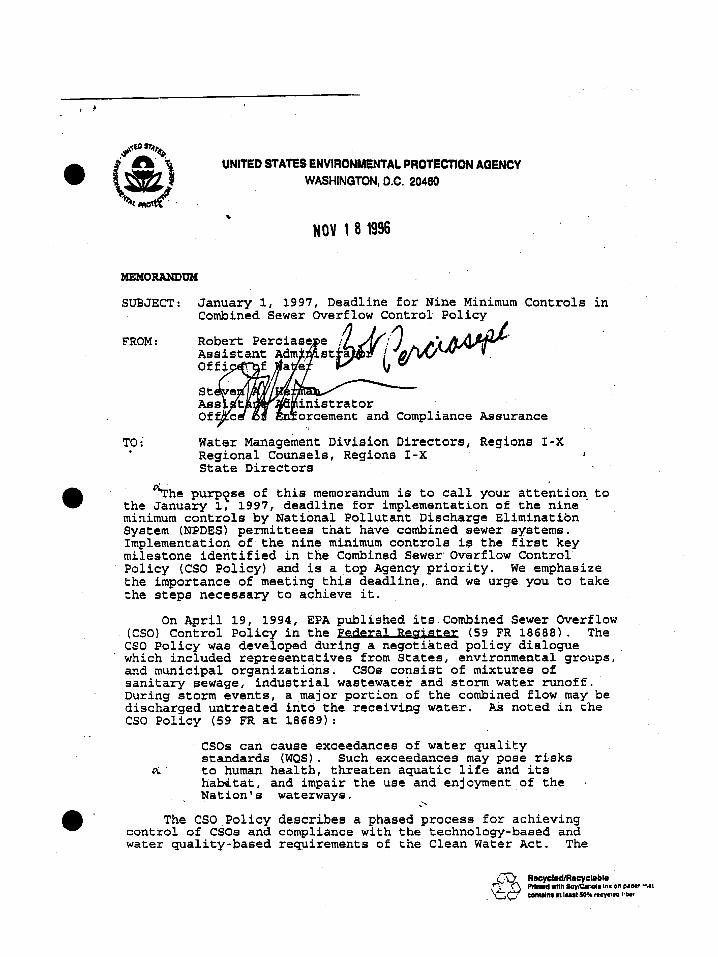
jslack
jslack
jslack
jslack
jslack
jslack
jslack
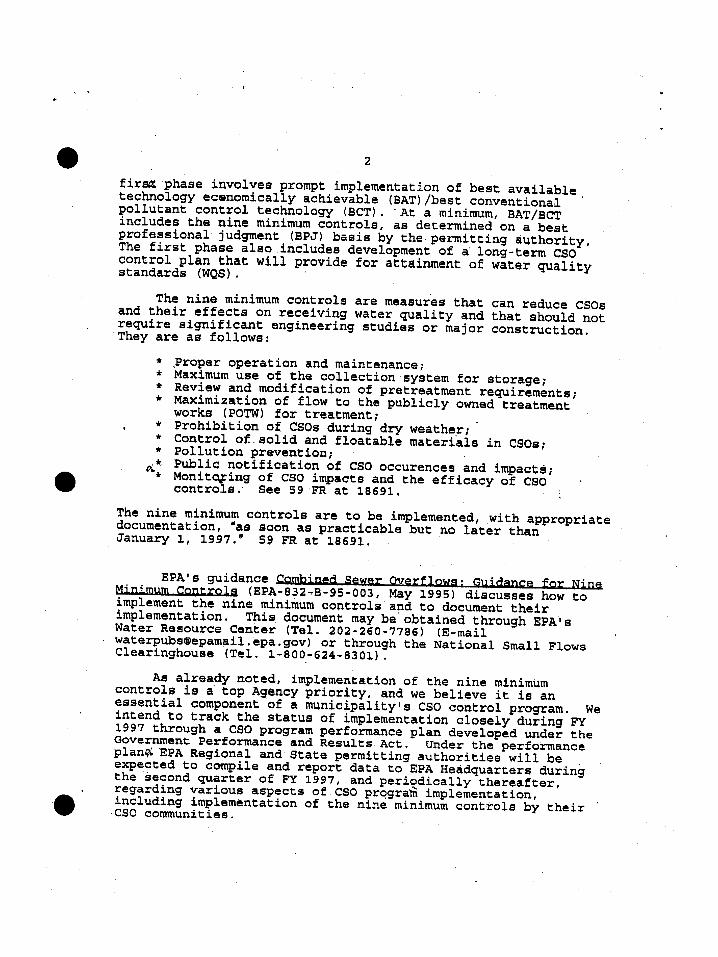
jslack
jslack
jslack
jslack
jslack
jslack
jslack
jslack
jslack
jslack
jslack
jslack
jslack
jslack
jslack
jslack
jslack
jslack
jslack

jslack
jslack
jslack
jslack
jslack
jslack
jslack
jslack
jslack
jslack
jslack
jslack
jslack
jslack
jslack
jslack
jslack
jslack
jslack
jslack
jslack
jslack
jslack
jslack
jslack
jslack
jslack
jslack
jslack
jslack

jslack
jslack
jslack
jslack
jslack
jslack
jslack

jslack
jslack
jslack
jslack
jslack
jslack
jslack

CONGRESSIONAL RECORD — HOUSE H12273December 15, 2000(2) $23,000,000 shall be deposited in the Res-
toration Fund, of which $4,000,000 shall be usedfor remediation in the Central Basin, California.
SEC. 111. PERCHLORATE. (a) IN GENERAL.—TheSecretary of the Army, in cooperation with Fed-eral, State, and local government agencies, mayparticipate in studies and other investigative ac-tivities and in the planning and design ofprojects determined by the Secretary to offer along-term solution to the problem of ground-water contamination caused by perchlorates.
(b) INVESTIGATIONS AND PROJECTS.—(1) BOSQUE AND LEON RIVERS.—The Secretary,
in coordination with other Federal agencies andthe Brazos River Authority, shall participateunder subsection (a) in investigations andprojects in the Bosque and Leon River water-sheds in Texas to assess the impact of the per-chlorate associated with the former Naval‘‘Weapons Industrial Reserve Plant’’ atMcGregor, Texas.
(2) CADDO LAKE.—The Secretary, in coordina-tion with other Federal agencies and the North-east Texas Municipal Water District, shall par-ticipate under subsection (a) in investigationsand projects relating to perchlorate contamina-tion in Caddo Lake, Texas.
(3) EASTERN SANTA CLARA BASIN.—The Sec-retary, in coordination with other Federal,State, and local government agencies, shall par-ticipate under subsection (a) in investigationsand projects related to sites that are sources ofperchlorates and that are located in the city ofSanta Clarita, California.
(c) AUTHORIZATION OF APPROPRIATIONS.—Forthe purposes of carrying out this section, thereis authorized to be appropriated to the Secretary$25,000,000, of which not to exceed $8,000,000shall be available to carry out subsection (b)(1),not to exceed $3,000,000 shall be available tocarry out subsection (b)(2), and not to exceed$7,000,000 shall be available to carry out sub-section (b)(3).
SEC. 112. WET WEATHER WATER QUALITY. (a)COMBINED SEWER OVERFLOWS.—Section 402 ofthe Federal Water Pollution Control Act (33U.S.C. 1342) is amended by adding at the endthe following:
‘‘(q) COMBINED SEWER OVERFLOWS.—‘‘(1) REQUIREMENT FOR PERMITS, ORDERS, AND
DECREES.—Each permit, order, or decree issuedpursuant to this Act after the date of enactmentof this subsection for a discharge from a munic-ipal combined storm and sanitary sewer shallconform to the Combined Sewer Overflow Con-trol Policy signed by the Administrator on April11, 1994 (in this subsection referred to as the‘CSO control policy’).
‘‘(2) WATER QUALITY AND DESIGNATED USE RE-VIEW GUIDANCE.—Not later than July 31, 2001,and after providing notice and opportunity forpublic comment, the Administrator shall issueguidance to facilitate the conduct of water qual-ity and designated use reviews for municipalcombined sewer overflow receiving waters.
‘‘(3) REPORT.—Not later than September 1,2001, the Administrator shall transmit to Con-gress a report on the progress made by the Envi-ronmental Protection Agency, States, and mu-nicipalities in implementing and enforcing theCSO control policy.’’.
(b) WET WEATHER PILOT PROGRAM.—Title I ofthe Federal Water Pollution Control Act (33U.S.C. 1251 et seq.) is amended by adding at theend the following:‘‘SEC. 121. WET WEATHER WATERSHED PILOT
PROJECTS.‘‘(a) IN GENERAL.—The Administrator, in co-
ordination with the States, may provide tech-nical assistance and grants for treatment worksto carry out pilot projects relating to the fol-lowing areas of wet weather discharge control:
‘‘(1) WATERSHED MANAGEMENT OF WET WEATH-ER DISCHARGES.—The management of municipalcombined sewer overflows, sanitary sewer over-flows, and stormwater discharges, on an inte-grated watershed or subwatershed basis for thepurpose of demonstrating the effectiveness of aunified wet weather approach.
‘‘(2) STORMWATER BEST MANAGEMENT PRAC-TICES.—The control of pollutants from munic-ipal separate storm sewer systems for the pur-pose of demonstrating and determining controlsthat are cost-effective and that use innovativetechnologies in reducing such pollutants fromstormwater discharges.
‘‘(b) ADMINISTRATION.—The Administrator, incoordination with the States, shall provide mu-nicipalities participating in a pilot project underthis section the ability to engage in innovativepractices, including the ability to unify separatewet weather control efforts under a single per-mit.
‘‘(c) FUNDING.—‘‘(1) IN GENERAL.—There is authorized to be
appropriated to carry out this section $10,000,000for fiscal year 2002, $15,000,000 for fiscal year2003, and $20,000,000 for fiscal year 2004. Suchfunds shall remain available until expended.
‘‘(2) STORMWATER.—The Administrator shallmake available not less than 20 percent ofamounts appropriated for a fiscal year pursuantto this subsection to carry out the purposes ofsubsection (a)(2).
‘‘(3) ADMINISTRATIVE EXPENSES.—The Admin-istrator may retain not to exceed 4 percent ofany amounts appropriated for a fiscal year pur-suant to this subsection for the reasonable andnecessary costs of administering this section.
‘‘(d) REPORT TO CONGRESS.—Not later than 5years after the date of enactment of this section,the Administrator shall transmit to Congress areport on the results of the pilot projects con-ducted under this section and their possible ap-plication nationwide.’’.
(c) SEWER OVERFLOW CONTROL GRANTS.—TitleII of the Federal Water Pollution Control Act(33 U.S.C. 1342 et seq.) is amended by adding atthe end the following:‘‘SEC. 221. SEWER OVERFLOW CONTROL GRANTS.
‘‘(a) IN GENERAL.—In any fiscal year in whichthe Administrator has available for obligation atleast $1,350,000,000 for the purposes of section601—
‘‘(1) the Administrator may make grants toStates for the purpose of providing grants to amunicipality or municipal entity for planning,design, and construction of treatment works tointercept, transport, control, or treat municipalcombined sewer overflows and sanitary seweroverflows; and
‘‘(2) subject to subsection (g), the Adminis-trator may make a direct grant to a munici-pality or municipal entity for the purposes de-scribed in paragraph (1).
‘‘(b) PRIORITIZATION.—In selecting fromamong municipalities applying for grants undersubsection (a), a State or the Administratorshall give priority to an applicant that—
‘‘(1) is a municipality that is a financially dis-tressed community under subsection (c);
‘‘(2) has implemented or is complying with animplementation schedule for the 9 minimum con-trols specified in the CSO control policy referredto in section 402(q)(1) and has begun imple-menting a long-term municipal combined seweroverflow control plan or a separate sanitarysewer overflow control plan; or
‘‘(3) is requesting a grant for a project that ison a State’s intended use plan pursuant to sec-tion 606(c); or
‘‘(4) is an Alaska Native Village.‘‘(c) FINANCIALLY DISTRESSED COMMUNITY.—‘‘(1) DEFINITION.—In subsection (b), the term
‘financially distressed community’ means a com-munity that meets affordability criteria estab-lished by the State in which the community islocated, if such criteria are developed after pub-lic review and comment.
‘‘(2) CONSIDERATION OF IMPACT ON WATER ANDSEWER RATES.—In determining if a community isa distressed community for the purposes of sub-section (b), the State shall consider, amongother factors, the extent to which the rate ofgrowth of a community’s tax base has been his-torically slow such that implementing a plan de-
scribed in subsection (b)(2) would result in a sig-nificant increase in any water or sewer ratecharged by the community’s publicly ownedwastewater treatment facility.
‘‘(3) INFORMATION TO ASSIST STATES.—The Ad-ministrator may publish information to assistStates in establishing affordability criteriaunder paragraph (1).
‘‘(d) COST SHARING.—The Federal share of thecost of activities carried out using amounts froma grant made under subsection (a) shall be notless than 55 percent of the cost. The non-Fed-eral share of the cost may include, in anyamount, public and private funds and in-kindservices, and may include, notwithstanding sec-tion 603(h), financial assistance, includingloans, from a State water pollution control re-volving fund.
‘‘(e) ADMINISTRATIVE REPORTING REQUIRE-MENTS.—If a project receives grant assistanceunder subsection (a) and loan assistance from aState water pollution control revolving fund andthe loan assistance is for 15 percent or more ofthe cost of the project, the project may be ad-ministered in accordance with State water pol-lution control revolving fund administrative re-porting requirements for the purposes of stream-lining such requirements.
‘‘(f) AUTHORIZATION OF APPROPRIATIONS.—There is authorized to be appropriated to carryout this section $750,000,000 for each of fiscalyears 2002 and 2003. Such sums shall remainavailable until expended.
‘‘(g) ALLOCATION OF FUNDS.—‘‘(1) FISCAL YEAR 2002.—Subject to subsection
(h), the Administrator shall use the amounts ap-propriated to carry out this section for fiscalyear 2002 for making grants to municipalitiesand municipal entities under subsection (a)(2),in accordance with the criteria set forth in sub-section (b).
‘‘(2) FISCAL YEAR 2003.—Subject to subsection(h), the Administrator shall use the amounts ap-propriated to carry out this section for fiscalyear 2003 as follows:
‘‘(A) Not to exceed $250,000,000 for makinggrants to municipalities and municipal entitiesunder subsection (a)(2), in accordance with thecriteria set forth in subsection (b).
‘‘(B) All remaining amounts for making grantsto States under subsection (a)(1), in accordancewith a formula to be established by the Adminis-trator, after providing notice and an oppor-tunity for public comment, that allocates toeach State a proportional share of such amountsbased on the total needs of the State for munic-ipal combined sewer overflow controls and sani-tary sewer overflow controls identified in themost recent survey conducted pursuant to sec-tion 516(b)(1).
‘‘(h) ADMINISTRATIVE EXPENSES.—Of theamounts appropriated to carry out this sectionfor each fiscal year—
‘‘(1) the Administrator may retain an amountnot to exceed 1 percent for the reasonable andnecessary costs of administering this section;and
‘‘(2) the Administrator, or a State, may retainan amount not to exceed 4 percent of any grantmade to a municipality or municipal entityunder subsection (a), for the reasonable andnecessary costs of administering the grant.
‘‘(i) REPORTS.—Not later than December 31,2003, and periodically thereafter, the Adminis-trator shall transmit to Congress a report con-taining recommended funding levels for grantsunder this section. The recommended fundinglevels shall be sufficient to ensure the continuedexpeditious implementation of municipal com-bined sewer overflow and sanitary sewer over-flow controls nationwide.’’.
(d) INFORMATION ON CSOS AND SSOS.—(1) REPORT TO CONGRESS.—Not later than 3
years after the date of enactment of this Act,the Administrator of the Environmental Protec-tion Agency shall transmit to Congress a reportsummarizing—
VerDate 11-MAY-2000 11:49 Dec 18, 2000 Jkt 079061 PO 00000 Frm 00177 Fmt 4634 Sfmt 6333 E:\CR\CRI\H15DE0.REC pfrm03 PsN: H15DE0
lutz
(2) $23,000,000 shall be deposited in the Restoration Fund, of which $4,000,000 shall be used for remediation in the Central Basin, California. SEC. 111. PERCHLORATE. (a) IN GENERAL.—The Secretary of the Army, in cooperation with Federal, State, and local government agencies, may participate in studies and other investigative activities and in the planning and design of projects determined by the Secretary to offer a long-term solution to the problem of groundwater contamination caused by perchlorates. (b) INVESTIGATIONS AND PROJECTS.— (1) BOSQUE AND LEON RIVERS.—The Secretary, in coordination with other Federal agencies and the Brazos River Authority, shall participate under subsection (a) in investigations and projects in the Bosque and Leon River watersheds in Texas to assess the impact of the perchlorate associated with the former Naval ‘‘Weapons Industrial Reserve Plant’’ at McGregor, Texas. (2) CADDO LAKE.—The Secretary, in coordination with other Federal agencies and the Northeast Texas Municipal Water District, shall participate under subsection (a) in investigations and projects relating to perchlorate contamination in Caddo Lake, Texas. (3) EASTERN SANTA CLARA BASIN.—The Secretary, in coordination with other Federal, State, and local government agencies, shall participate under subsection (a) in investigations and projects related to sites that are sources of perchlorates and that are located in the city of Santa Clarita, California. (c) AUTHORIZATION OF APPROPRIATIONS.—For the purposes of carrying out this section, there is authorized to be appropriated to the Secretary $25,000,000, of which not to exceed $8,000,000 shall be available to carry out subsection (b)(1), not to exceed $3,000,000 shall be available to carry out subsection (b)(2), and not to exceed $7,000,000 shall be available to carry out subsection (b)(3). SEC. 112. WET WEATHER WATER QUALITY. (a)

CONGRESSIONAL RECORD — HOUSEH12274 December 15, 2000(A) the extent of the human health and envi-
ronmental impacts caused by municipal com-bined sewer overflows and sanitary sewer over-flows, including the location of discharges caus-ing such impacts, the volume of pollutants dis-charged, and the constituents discharged;
(B) the resources spent by municipalities toaddress these impacts; and
(C) an evaluation of the technologies used bymunicipalities to address these impacts.
(2) TECHNOLOGY CLEARINGHOUSE.—Aftertransmitting a report under paragraph (1), theAdministrator shall maintain a clearinghouse ofcost-effective and efficient technologies for ad-dressing human health and environmental im-pacts due to municipal combined sewer over-flows and sanitary sewer overflows.
SEC. 113. FISH PASSAGE DEVICES AT NEW SA-VANNAH BLUFF LOCK AND DAM, SOUTH CARO-LINA. Section 348(l)(2) of the Water ResourcesDevelopment Act of 2000 is amended—
(1) in subparagraph (A), by striking ‘‘Dam, atFederal expense of an estimated $5,300,000’’ andinserting ‘‘Dam and construct appropriate fishpassage devices at the Dam, at Federal ex-pense’’; and
(2) in subparagraph (B), by striking ‘‘after re-pair and rehabilitation,’’ and inserting ‘‘aftercarrying out subparagraph (A),’’.
SEC. 114. (a) EXTINGUISHMENT OF REVER-SIONARY INTERESTS AND USE RESTRICTIONS.—With respect to the lands described in the deeddescribed in subsection (b)—
(1) the reversionary interests and the use re-strictions relating to port or industrial purposesare extinguished;
(2) the human habitation or other buildingstructure use restriction is extinguished in eacharea where the elevation is above the standardproject flood elevation; and
(3) the use of fill material to raise areas abovethe standard project flood elevation, without in-creasing the risk of flooding in or outside of thefloodplain, is authorized, except in any areaconstituting wetland for which a permit undersection 404 of the Federal Water Pollution Con-trol Act (33 U.S.C. 1344) would be required.
(b) AFFECTED DEED.—The deed referred to isthe deed recorded October 17, 1967, in book 291,page 148, Deed of Records of Umatilla County,Oregon, executed by the United States.
SEC. 115. MURRIETA CREEK, CALIFORNIA. Sec-tion 101(b)(6) of the Water Resources Develop-ment Act of 2000 is repealed.
SEC. 116. PENN MINE, CALAVERAS COUNTY,CALIFORNIA. (a) IN GENERAL.—The Secretary ofthe Army shall reimburse East Bay MunicipalWater District for the project for aquatic eco-system restoration, Penn Mine, Calaveras Coun-ty, California, carried out under section 206 ofthe Water Resources Development Act of 1996(33 U.S.C. 2330), $4,100,000 for the Federal shareof costs incurred by East Bay Municipal UtilityDistrict for work carried out by East Bay Mu-nicipal Utility District for the project. Suchamounts shall be made available within 90 daysof enactment of this provision.
(b) SOURCE OF FUNDING.—Reimbursementunder subsection (a) shall be from amounts ap-propriated before the date of enactment of thisAct for the project described in subsection (a).
SEC. 117. The project for flood control, GreersFerry Lake, Arkansas, authorized by the Riversand Harbors Act of June 28, 1938 (52 Stat. 1218),is modified to authorize the Secretary of theArmy to construct intake facilities for the ben-efit of Lonoke and White Counties, Arkansas.
SEC. 118. The project for flood control, Che-halis River and Tributaries, Washington, au-thorized by section 401(a) of the Water Re-sources Development Act of 1986 (100 Stat. 4126),is modified to authorize the Secretary of theArmy to provide the non-Federal interest credittoward the non-Federal share of the cost of theproject the cost of planning, design, and con-struction work carried out by the non-Federalinterest before the date of execution of a co-operation agreement for the project if the Sec-
retary determines that the work is integral tothe project.
SEC. 119. Within the funds appropriated to theNational Park Service under the heading ‘‘Op-eration of the National Park System’’ in PublicLaw 106–291, the Secretary of the Interior shallprovide a grant of $75,000 to the City of OceanBeach, New York, for repair of facilities at theOcean Beach Pavilion at Fire Island NationalSeashore.
SEC. 120. The National Park Service is directedto work with Fort Sumter Tours, Inc., the con-cessionaire currently providing services at FortSumter National Monument in South Carolina,on an amicable solution of the current legal dis-pute between the two parties. The Director ofthe Service is directed to extend immediately thecurrent contract through March 15, 2001, to fa-cilitate further negotiations and for 180 days iffinal settlement of all disputes is agreed to byboth parties.
SEC. 121. Title VIII—Land Conservation, Pres-ervation and Infrastructure Improvement ofPublic Law 106–291 is amended as follows: afterthe first dollar amount insert: ‘‘, to be derivedfrom the Land and Water Conservation Fund’’.
SEC. 122. GAS TO LIQUIDS. Section 301(2) of theEnergy Policy Act of 1992 (Public Law 102–486;42 U.S.C. 13211(2)) is amended by inserting ‘‘,including liquid fuels domestically producedfrom natural gas’’ after ‘‘natural gas’’.
SEC. 123. (a) The provisions of H.R. 4904 aspassed in the House of Representatives on Sep-tember 26, 2000 are hereby enacted into law.
SEC. 124. APPALACHIAN NATIONAL SCENICTRAIL. (a) ACQUISITIONS.—
(1) IN GENERAL.—The Secretary of the Interiorshall—
(A) negotiate agreements with landowners set-ting terms and conditions for the acquisition ofparcels of land and interests in land totallingapproximately 580 acres at Saddleback Moun-tain near Rangeley, Maine, for the benefit ofthe Appalachian National Scenic Trail;
(B) complete the pending environmental com-pliance process for the acquisitions; and
(C) acquire the parcels of land and interestsin land for consideration in the amount of$4,000,000 plus closing costs customarily paid bythe United States.
(2) ACCEPTANCE OF DONATIONS.—The Sec-retary may accept as donations parcels of landand interests in land at Saddleback Mountain,in addition to those acquired by purchase underparagraph (1), for the benefit of the Appa-lachian National Scenic Trail.
(b) CONVEYANCE TO THE STATE.—The Sec-retary shall convey to the State of Maine a por-tion of the land and interests in land acquiredunder subsection (a) without consideration, sub-ject to such terms and conditions as the Sec-retary and the State of Maine agree are nec-essary to ensure the protection of the Appa-lachian National Scenic Trail.
SEC. 125. The provisions of S. 2273, as passedin the United States Senate on October 5, 2000and engrossed, are hereby enacted into law.
SEC. 126. Section 116(a)(1)(A) of the Illinoisand Michigan Canal National Heritage CorridorAct of 1984 (98 Stat. 1467) is amended by striking‘‘$250,000’’ and inserting ‘‘$1,000,000’’.
SEC. 127. The provisions of S. 2885, as passedin the United States Senate on October 5, 2000and engrossed, are hereby enacted into law.
SEC. 128. None of the funds provided in this orany other Act may be used prior to July 31, 2001to promulgate or enforce a final rule to reduceduring the 2000–2001 or 2001–2002 winter seasonsthe use of snowmobiles below current use pat-terns at a unit in the National Park System:Provided, That nothing in this section shall beinterpreted as amending any requirement of theClean Air Act: Provided further, That nothingin this section shall preclude the Secretary fromtaking emergency actions related to snowmobileuse in any National Park based on authoritieswhich existed to permit such emergency actionsas of the date of enactment of this Act.
SEC. 129. The Secretary of the Interior shallextend until March 31, 2001 the ‘‘Extension ofStandstill Agreement,’’ entered into on Novem-ber 22, 1999 by the United States of America andthe holders of interests in seven campsite leasesin Biscayne Bay, Miami-Dade County, Floridacollectively known as ‘‘Stiltsville’’.
SEC. 130. The Secretary of the Interior is au-thorized to make a grant of $1,300,000 to theState of Minnesota or its political subdivisionfrom funds available to the National Park Serv-ice under the heading ‘‘Land Acquisition andState Assistance’’ in Public Law 106–291 to coverthe cost of acquisition of land in Lower PhalenCreek near St. Paul, Minnesota in the Mis-sissippi National River and Recreation Area.
SEC. 131. Notwithstanding any provision oflaw or regulation, funds appropriated in PublicLaw 106–291 for a cooperative agreement formanagement of George Washington’s BoyhoodHome, Ferry Farm, shall be transferred to theGeorge Washington’s Fredericksburg Founda-tion, Inc. (formerly known as Kenmore Associa-tion, Inc.) immediately upon signing of the co-operative agreement.
SEC. 132. During the period beginning on thedate of the enactment of this Act and ending onJune 1, 2001, funds made available to the Sec-retary of the Interior may not be used to paysalaries or expenses related to the issuance of arequest for proposal related to a light rail systemto service Grand Canyon National Park.
SEC. 133. None of the funds in this or anyother Act may be used by the Secretary of theInterior to remove the five foot tall white crosslocated within the boundary of the Mojave Na-tional Preserve in southern California firsterected in 1934 by the Veterans of Foreign Warsalong Cima Road approximately 11 miles southof Interstate 15.
SEC. 134. Section 6(g) of the Chesapeake andOhio Canal Development Act (16 U.S.C. 410y–4(g)) is amended by striking ‘‘thirty’’ and insert-ing ‘‘40’’.
SEC. 135. Funds provided in Public Law 106–291 for federal land acquisition by the NationalPark Service in Fiscal Year 2001 for BrandywineBattlefield, Ice Age National Scenic Trail, Mis-sissippi National River and Recreation Area,Shenandoah National Heritage Area, FallenTimbers Battlefield and Fort Miamis NationalHistoric Site may be used for a grant to a state,local government, or to a land management enti-ty for the acquisition of lands without regard toany restriction on the use of federal land acqui-sition funds provided through the Land andWater Conservation Act of 1965.
SEC. 136. Notwithstanding any other provisionof law, in accordance with Title IV—WildlandFire Emergency Appropriations, Public Law106–291, from the $35,000,000 provided for com-munity and private land fire assistance, the Sec-retary of Agriculture, may use up to $9,000,000for advance, direct lump sum payments for as-sistance to eligible individuals, businesses, orother entities, to accomplish the purposes of pro-viding assistance to non-federal entities most af-fected by fire. To expedite such financial assist-ance being provided to eligible recipients, thelump sum payments shall not be subject to CFRTitle 7 § 3015; Title 7 § 3019; Title 7 § 3052 relatedto the administration of Federal financial assist-ance.
SEC. 137. (a) IN GENERAL.—The first section ofPublic Law 91–660 (16 U.S.C. 459h) is amended—
(1) in the first sentence, by striking ‘‘That,in’’ and inserting the following:‘‘SECTION 1. GULF ISLANDS NATIONAL SEA-
SHORE.‘‘(a) ESTABLISHMENT.—In’’; and(2) in the second sentence—(A) by redesignating paragraphs (1) through
(6) as subparagraphs (A) through (F), respec-tively, and indenting appropriately;
(B) by striking ‘‘The seashore shall comprise’’and inserting the following:
‘‘(b) COMPOSITION.—‘‘(1) IN GENERAL.—The seashore shall comprise
the areas described in paragraphs (2) and (3).
VerDate 11-MAY-2000 11:49 Dec 18, 2000 Jkt 079061 PO 00000 Frm 00178 Fmt 4634 Sfmt 6333 E:\CR\CRI\H15DE0.REC pfrm03 PsN: H15DE0
lutz
SEC. 113. FISH PASSAGE DEVICES AT NEW SAVANNAH BLUFF LOCK AND DAM, SOUTH CAROLINA. Section 348(l)(2) of the Water Resources Development Act of 2000 is amended— (1) in subparagraph (A), by striking ‘‘Dam, at Federal expense of an estimated $5,300,000’’ and inserting ‘‘Dam and construct appropriate fish passage devices at the Dam, at Federal expense’’; and (2) in subparagraph (B), by striking ‘‘after repair and rehabilitation,’’ and inserting ‘‘after carrying out subparagraph (A),’’. SEC. 114. (a) EXTINGUISHMENT OF REVERSIONARY INTERESTS AND USE RESTRICTIONS.— With respect to the lands described in the deed described in subsection (b)— (1) the reversionary interests and the use restrictions relating to port or industrial purposes are extinguished; (2) the human habitation or other building structure use restriction is extinguished in each area where the elevation is above the standard project flood elevation; and (3) the use of fill material to raise areas above the standard project flood elevation, without increasing the risk of flooding in or outside of the floodplain, is authorized, except in any area constituting wetland for which a permit under section 404 of the Federal Water Pollution Control Act (33 U.S.C. 1344) would be required. (b) AFFECTED DEED.—The deed referred to is the deed recorded October 17, 1967, in book 291, page 148, Deed of Records of Umatilla County, Oregon, executed by the United States. SEC. 115. MURRIETA CREEK, CALIFORNIA. Section 101(b)(6) of the Water Resources Development Act of 2000 is repealed. SEC. 116. PENN MINE, CALAVERAS COUNTY, CALIFORNIA. (a) IN GENERAL.—The Secretary of the Army shall reimburse East Bay Municipal Water District for the project for aquatic ecosystem restoration, Penn Mine, Calaveras County, California, carried out under section 206 of the Water Resources Development Act of 1996 (33 U.S.C. 2330), $4,100,000 for the Federal share of costs incurred by East Bay Municipal Utility District for work carried out by East Bay Municipal Utility District for the project. Such amounts shall be made available within 90 days of enactment of this provision. (b) SOURCE OF FUNDING.—Reimbursement under subsection (a) shall be from amounts appropriated before the date of enactment of this Act for the project described in subsection (a). SEC. 117. The project for flood control, Greers Ferry Lake, Arkansas, authorized by the Rivers and Harbors Act of June 28, 1938 (52 Stat. 1218), is modified to authorize the Secretary of the Army to construct intake facilities for the benefit of Lonoke and White Counties, Arkansas. SEC. 118. The project for flood control, Chehalis River and Tributaries, Washington, authorized by section 401(a) of the Water Resources Development Act of 1986 (100 Stat. 4126), is modified to authorize the Secretary of the Army to provide the non-Federal interest credit toward the non-Federal share of the cost of the project the cost of planning, design, and construction work carried out by the non-Federal interest before the date of execution of a cooperation agreement for the project if the Secretary
lutz
Secretary determines that the work is integral to the project. SEC. 119. Within the funds appropriated to the National Park Service under the heading ‘‘Operation of the National Park System’’ in Public Law 106–291, the Secretary of the Interior shall provide a grant of $75,000 to the City of Ocean Beach, New York, for repair of facilities at the Ocean Beach Pavilion at Fire Island National Seashore. SEC. 120. The National Park Service is directed to work with Fort Sumter Tours, Inc., the concessionaire currently providing services at Fort Sumter National Monument in South Carolina, on an amicable solution of the current legal dispute between the two parties. The Director of the Service is directed to extend immediately the current contract through March 15, 2001, to facilitate further negotiations and for 180 days if final settlement of all disputes is agreed to by both parties. SEC. 121. Title VIII—Land Conservation, Preservation and Infrastructure Improvement of Public Law 106–291 is amended as follows: after the first dollar amount insert: ‘‘, to be derived from the Land and Water Conservation Fund’’. SEC. 122. GAS TO LIQUIDS. Section 301(2) of the Energy Policy Act of 1992 (Public Law 102–486; 42 U.S.C. 13211(2)) is amended by inserting ‘‘, including liquid fuels domestically produced from natural gas’’ after ‘‘natural gas’’. SEC. 123. (a) The provisions of H.R. 4904 as passed in the House of Representatives on September 26, 2000 are hereby enacted into law. SEC. 124. APPALACHIAN NATIONAL SCENIC TRAIL. (a) ACQUISITIONS.— (1) IN GENERAL.—The Secretary of the Interior shall— (A) negotiate agreements with landowners setting terms and conditions for the acquisition of parcels of land and interests in land totalling approximately 580 acres at Saddleback Mountain near Rangeley, Maine, for the benefit of the Appalachian National Scenic Trail; (B) complete the pending environmental compliance process for the acquisitions; and (C) acquire the parcels of land and interests in land for consideration in the amount of $4,000,000 plus closing costs customarily paid by the United States. (2) ACCEPTANCE OF DONATIONS.—The Secretary may accept as donations parcels of land and interests in land at Saddleback Mountain, in addition to those acquired by purchase under paragraph (1), for the benefit of the Appalachian National Scenic Trail. (b) CONVEYANCE TO THE STATE.—The Secretary shall convey to the State of Maine a portion of the land and interests in land acquired under subsection (a) without consideration, subject to such terms and conditions as the Secretary and the State of Maine agree are necessary to ensure the protection of the Appalachian National Scenic Trail. SEC. 125. The provisions of S. 2273, as passed in the United States Senate on October 5, 2000 and engrossed, are hereby enacted into law. SEC. 126. Section 116(a)(1)(A) of the Illinois and Michigan Canal National Heritage Corridor Act of 1984 (98 Stat. 1467) is amended by striking ‘‘$250,000’’ and inserting ‘‘$1,000,000’’. SEC. 127. The provisions of S. 2885, as passed in the United States Senate on October 5, 2000 and engrossed, are hereby enacted into law. SEC. 128. None of the funds provided in this or any other Act may be used prior to July 31, 2001 to promulgate or enforce a final rule to reduce during the 2000–2001 or 2001–2002 winter seasons the use of snowmobiles below current use patterns at a unit in the National Park System: Provided, That nothing in this section shall be interpreted as amending any requirement of the Clean Air Act: Provided further, That nothing in this section shall preclude the Secretary from taking emergency actions related to snowmobile use in any National Park based on authorities which existed to permit such emergency actions as of the date of enactment of this Act. SEC. 129. The Secretary of the Interior shall extend until March 31, 2001 the ‘‘Extension of Standstill Agreement,’’ entered into on November 22, 1999 by the United States of America and the holders of interests in seven campsite leases in Biscayne Bay, Miami-Dade County, Florida collectively known as ‘‘Stiltsville’’. SEC. 130. The Secretary of the Interior is authorized to make a grant of $1,300,000 to the State of Minnesota or its political subdivision from funds available to the National Park Service under the heading ‘‘Land Acquisition and State Assistance’’ in Public Law 106–291 to cover the cost of acquisition of land in Lower Phalen Creek near St. Paul, Minnesota in the Mississippi National River and Recreation Area. SEC. 131. Notwithstanding any provision of law or regulation, funds appropriated in Public Law 106–291 for a cooperative agreement for management of George Washington’s Boyhood Home, Ferry Farm, shall be transferred to the George Washington’s Fredericksburg Foundation, Inc. (formerly known as Kenmore Association, Inc.) immediately upon signing of the cooperative agreement. SEC. 132. During the period beginning on the date of the enactment of this Act and ending on June 1, 2001, funds made available to the Secretary of the Interior may not be used to pay salaries or expenses related to the issuance of a request for proposal related to a light rail system to service Grand Canyon National Park. SEC. 133. None of the funds in this or any other Act may be used by the Secretary of the Interior to remove the five foot tall white cross located within the boundary of the Mojave National Preserve in southern California first erected in 1934 by the Veterans of Foreign Wars along Cima Road approximately 11 miles south of Interstate 15. SEC. 134. Section 6(g) of the Chesapeake and Ohio Canal Development Act (16 U.S.C. 410y– 4(g)) is amended by striking ‘‘thirty’’ and inserting ‘‘40’’. SEC. 135. Funds provided in Public Law 106– 291 for federal land acquisition by the National Park Service in Fiscal Year 2001 for Brandywine Battlefield, Ice Age National Scenic Trail, Mississippi National River and Recreation Area, Shenandoah National Heritage Area, Fallen Timbers Battlefield and Fort Miamis National Historic Site may be used for a grant to a state, local government, or to a land management entity for the acquisition of lands without regard to any restriction on the use of federal land acquisition funds provided through the Land and Water Conservation Act of 1965. SEC. 136. Notwithstanding any other provision of law, in accordance with Title IV—Wildland Fire Emergency Appropriations, Public Law 106–291, from the $35,000,000 provided for community and private land fire assistance, the Secretary of Agriculture, may use up to $9,000,000 for advance, direct lump sum payments for assistance to eligible individuals, businesses, or other entities, to accomplish the purposes of providing assistance to non-federal entities most affected by fire. To expedite such financial assistance being provided to eligible recipients, the lump sum payments shall not be subject to CFR Title 7 § 3015; Title 7 § 3019; Title 7 § 3052 related to the administration of Federal financial assistance. SEC. 137. (a) IN GENERAL.—The first section of Public Law 91–660 (16 U.S.C. 459h) is amended— (1) in the first sentence, by striking ‘‘That, in’’ and inserting the following: ‘‘SECTION 1. GULF ISLANDS NATIONAL SEASHORE. ‘‘(a) ESTABLISHMENT.—In’’; and (2) in the second sentence— (A) by redesignating paragraphs (1) through (6) as subparagraphs (A) through (F), respectively, and indenting appropriately; (B) by striking ‘‘The seashore shall comprise’’ and inserting the following: ‘‘(b) COMPOSITION.— ‘‘(1) IN GENERAL.—The seashore shall comprise the areas described in paragraphs (2) and (3).
Appendix B
Profiles of State CSO Programs
B.18 Illinois
B.19 Indiana
B.20 Michigan
B.21 Minnesota
B.22 Ohio
B.23 Wisconsin
B.24 Iowa
B.25 Kansas
B.26 Missouri
B.27 Nebraska
B.28 South Dakota
B.29 California
B.30 Alaska
B.31 Oregon
B.32 Washington
B.1 Connecticut
B.2 Maine
B.3 Massachusetts
B.4 New Hampshire
B.5 Rhode Island
B.6 Vermont
B.7 New Jersey
B.8 New York
B.9 Delaware
B.10 District of Columbia
B.11 Maryland
B.12 Pennsylvania
B.13 Virginia
B.14 West Virginia
B.15 Georgia
B.16 Kentucky
B.17 Tennessee
Re
gio
n
1
8
7
5
4
3
2
9
10

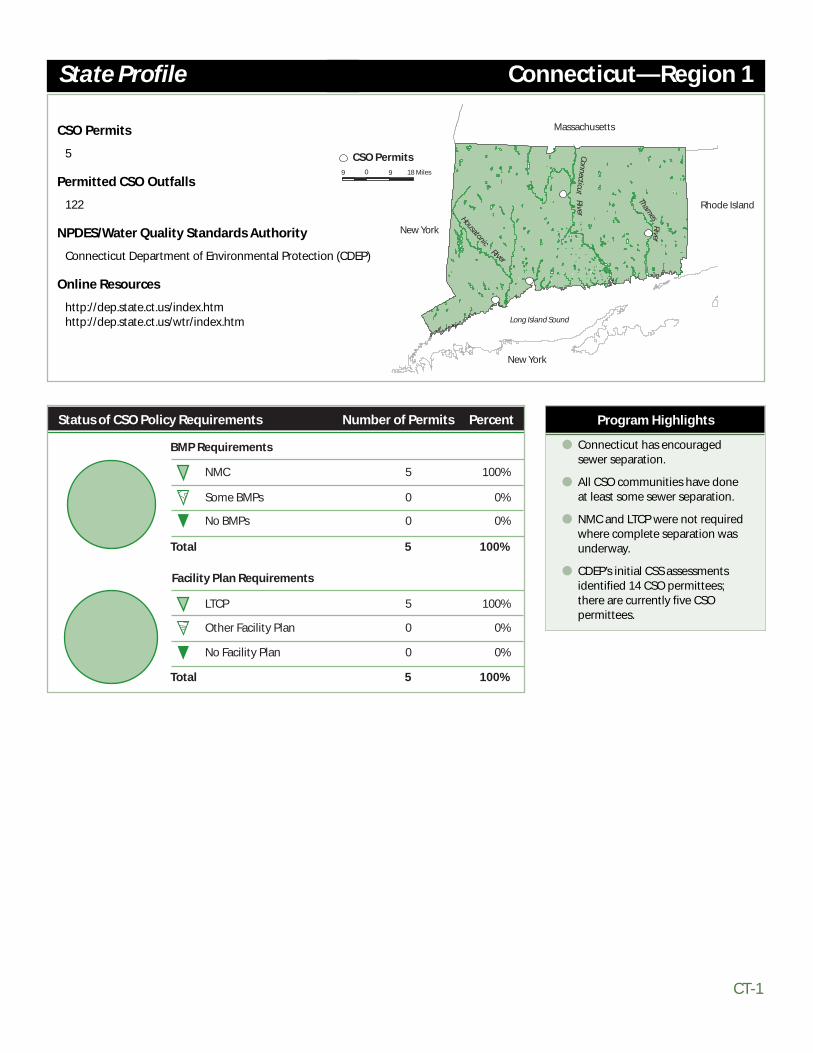
CT-1
CSO Permits
5
Permitted CSO Outfalls
122
NPDES/Water Quality Standards Authority
Connecticut Department of Environmental Protection (CDEP)
Online Resources
http://dep.state.ct.us/index.htmhttp://dep.state.ct.us/wtr/index.htm
Connecticut—Region 1
Program Highlights
● Connecticut has encouragedsewer separation.
● All CSO communities have doneat least some sewer separation.
● NMC and LTCP were not requiredwhere complete separation wasunderway.
● CDEP’s initial CSS assessmentsidentified 14 CSO permittees;there are currently five CSOpermittees.
State Profile
Connecticut
River
Housatonic
River
Thames
River
New York
Massachusetts
Rhode Island
New York
Long Island Sound
9 0 9 18 Miles
CSO Permits
NMC
Some BMPs
No BMPs
LTCP
Other Facility Plan
No Facility Plan
Total
5
0
0
5
0
0
100%
0%
0%
100%
0%
0%
5 100%
Total 5 100%
Number of Permits Percent
BMP Requirements
Facility Plan Requirements
Status of CSO Policy Requirements

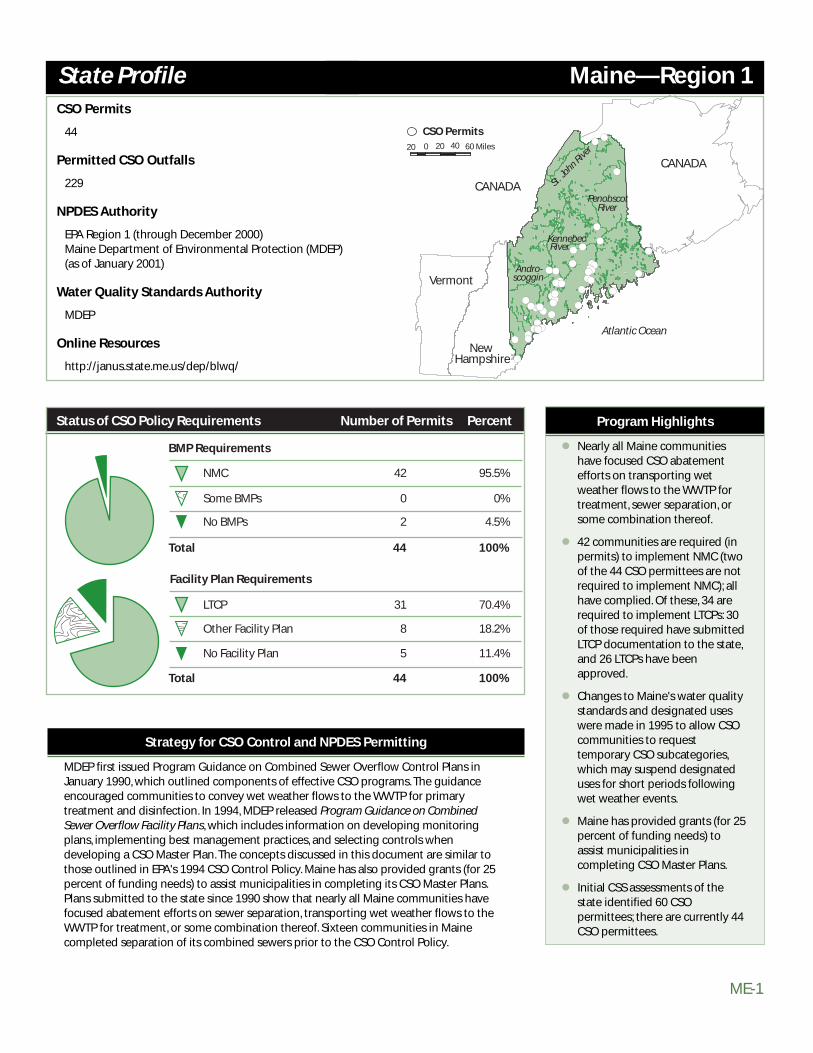
ME-1
Strategy for CSO Control and NPDES Permitting
MDEP first issued Program Guidance on Combined Sewer Overflow Control Plans inJanuary 1990, which outlined components of effective CSO programs. The guidanceencouraged communities to convey wet weather flows to the WWTP for primarytreatment and disinfection. In 1994, MDEP released Program Guidance on CombinedSewer Overflow Facility Plans, which includes information on developing monitoringplans, implementing best management practices, and selecting controls whendeveloping a CSO Master Plan. The concepts discussed in this document are similar tothose outlined in EPA's 1994 CSO Control Policy. Maine has also provided grants (for 25percent of funding needs) to assist municipalities in completing its CSO Master Plans.Plans submitted to the state since 1990 show that nearly all Maine communities havefocused abatement efforts on sewer separation, transporting wet weather flows to theWWTP for treatment, or some combination thereof. Sixteen communities in Mainecompleted separation of its combined sewers prior to the CSO Control Policy.
CSO Permits
44
Permitted CSO Outfalls
229
NPDES Authority
EPA Region 1 (through December 2000)Maine Department of Environmental Protection (MDEP) (as of January 2001)
Water Quality Standards Authority
MDEP
Online Resources
http://janus.state.me.us/dep/blwq/
Maine—Region 1
Program Highlights
Nearly all Maine communitieshave focused CSO abatementefforts on transporting wetweather flows to the WWTP fortreatment, sewer separation, orsome combination thereof.
42 communities are required (inpermits) to implement NMC (twoof the 44 CSO permittees are notrequired to implement NMC); allhave complied. Of these, 34 arerequired to implement LTCPs: 30of those required have submittedLTCP documentation to the state,and 26 LTCPs have beenapproved.
Changes to Maine's water qualitystandards and designated useswere made in 1995 to allow CSOcommunities to requesttemporary CSO subcategories,which may suspend designateduses for short periods followingwet weather events.
Maine has provided grants (for 25percent of funding needs) toassist municipalities incompleting CSO Master Plans.
Initial CSS assessments of thestate identified 60 CSOpermittees; there are currently 44CSO permittees.
State Profile
NMC
Some BMPs
No BMPs
LTCP
Other Facility Plan
No Facility Plan
Total
42
0
2
31
8
5
95.5%
0%
4.5%
70.4%
18.2%
11.4%
44 100%
Total 44 100%
Number of Permits Percent
BMP Requirements
Facility Plan Requirements
Status of CSO Policy Requirements
CANADA
CANADA
Vermont
New Hampshire
Atlantic Ocean
##
#
## #
###### #######
# ### ##
# #####
##
###
#
#
#
#
###
#
#
#
20 0 20 40 60 Miles
Kennebec
Penobscot
St. Jo
hn River
Andro-scoggin
River
River
CSO Permits

ME-2
Report to Congress on Implementation and Enforcement of the CSO Control Policy
Permitting Program
Prior to January 2001, EPA's Region 1 office served as the NPDES authority for the Stateof Maine. Maine issued state waste discharge licenses to any discharger receiving anNPDES permit from the EPA Region with similar terms.
Permits issued since 1994 have generally conformed with the CSO Control Policy. All ofthe 42 Maine communities with permit requirements to implement the NMC havecomplied. Of these, 34 communities also have enforceable requirements to developLTCPs. The eight, out of the 42, communities without LTCP requirements are typicallysmall communities and are actively implementing sewer separation. Currently, 30communities with requirements to develop LTCPs have submitted plans to the state, andthe state has approved 26 plans. To date, 21 of the 60 communities in Maine, identified inthe pre-1994 assessment of the state, have fully controlled its CSOs, and another 18 areworking to implement approved control plans.
Water Quality Standards Program
Following a two-year stakeholder process, changes to Maine's water quality standardsand designated uses were made in 1995 to allow CSO communities to requesttemporary CSO subcategories. The site-specific CSO subcategories will removedesignated uses for short periods of time (determined on a site-specific basis) after rainstorms and snow melt in areas affected by existing CSOs. The application of thesubcategories is determined based on modeling and monitoring data developed by thecommunity. This change allows communities to continue to make progress in controllingCSOs without undue financial hardship and to meet State water quality standards. Mainereceived a grant from EPA in 2001 to pilot test the application of the temporary CSOsubcategories in select communities.
Enforcement Program
Most ongoing enforcement actions within the State of Maine have been initiated by EPARegion 1's Water Enforcement Program. EPA Region 1 currently has nine CSO-relatedenforcement actions in Maine. The majority of these focus on CSO Master Planimplementation schedules that exceed five years. Maine also has its own enforcementauthority; it has initiated three CSO-related consent decrees to communities failing tocomply with the terms of their license.

MA-1
Strategy for CSO Control and NPDES Permitting
The primary approach in Massachusetts has been the use of the NPDES permittingprocess to initiate CSO planning and to follow up with combined enforcement andcompliance assistance efforts to help communities initiate projects and developprogram milestones and schedules. Communities are required to implement less-costlycontrols (i.e., NMC) as an initial means to abate CSOs. For those requiring more long-term solutions, the community must develop a phased approach for identifying andimplementing control solutions. The community is encouraged (through the LTCPprocess) to use technologies that maximize environmental benefits. Elimination of CSOsis preferred; where elimination of CSOs is determined to be infeasible, a protocol hasbeen developed for considering alternate class/designations, variances, and partial usedesignations. The long-term planning efforts are formalized in administrative orders,consent decrees, or other enforceable mechanisms. This approach was formalized inMDEP State CSO Control Policy.
CSO Permits
23
Permitted CSO Outfalls
311
NPDES Authority
EPA Region 1
Water Quality Standards Authority
Massachusetts Department of Environmental Protection (MDEP)
Online Resources
www.state.ma.us/dep/dephome.htm
Massachusetts—Region 1
Program Highlights
● Massachusetts’ CSO Program iscoordinated through EPA Region 1and MDEP.
● NMC are required in all CSOpermits.
● 21 communities have LTCPrequirements in theirenforcement orders, 15communities have submittedLTCPs, and 10 communities havehad LTCPs approved.
● Massachusetts developed awatershed-based approach forCSO control planning and aprotocol for UAA that reflectsCSOs.
● Massachusetts developed anapproach for water qualitystandards evaluation andredesignations.
● Initial CSS assessments of thestate identified 26 CSOpermittees; there are currently 23CSO permittees.
State Profile
NMC
Some BMPs
No BMPs
LTCP
Other Facility Plan
No Facility Plan
Total
23
0
0
20
1
2
100%
0%
0%
87.0%
4.3%
8.7%
23 100%
Total 23 100%
Number of Permits Percent
BMP Requirements
Facility Plan Requirements
Status of CSO Policy Requirements
Connecticut RhodeIsland
New HampshireVermont
AtlanticOceanNew York
Charles
ConnecticutMerrimack
River
Long Island, New York
River
River
#
###
####
### ##
#
# #
#
#
#
#
##
#
20 0 20 40 60 Miles
CSO Permits

MA-2
Report to Congress on Implementation and Enforcement of the CSO Control Policy
Massachusetts was the first State to initiate a watershed-based approach to prioritizeCSO controls along with other critical environmental needs. Massachusetts also is one ofthe three states that has established use category designations for CSO-impactedwaters. In addition, it has identified a UAA process for communities that believeachieving levels set in the State standards is not feasible or appropriate for a specificwater body.
Permitting Program
EPA Region 1's NPDES Permit Task Force issues wastewater discharge permits forMassachusetts. CSO communities are typically issued Phase I NPDES permits that requireimplementation and documentation of the NMC, containing a special CSO section thatthe CSO community meet water quality standards or equivalent. The CSO section alsoincludes a narrative requirement. Therefore, if the CSO community implements the NMCand cannot effectively eliminate the CSOs, the permittee is in violation of the permit.EPA Region 1 and MDEP are now in the process of developing Phase II CSO permitswhich will establish effluent limits for those communities that have completed their LTCPplanning process.
Water Quality Standards Program
MDEP establishes and reviews water quality standards. DEP developed the State CSOpolicy, which in turn led to the formal protocol for classifying and evaluating CSO-impacted waters. MDEP’s CSO policy and water quality standards approach serve as thebasis for CSO permitting and enforcement activities conducted by EPA Region 1.
MDEP developed a hierarchical list of surface water classifications to regulate CSOdischarges where CSO elimination was determined to be infeasible, based on thefrequency and impact of each overflow. The regulatory options for CSOs include:
● Class B—indicates that CSO discharges have been eliminated.
● Class B(CSO)— a partial use designation indicating that elimination of all CSOdischarges is not feasible and that the impacts from the remaining CSOs will beminor.
A designation of Class B(CSO) is made only if MDEP community planning process andwatershed planning efforts demonstrate that the allowance of minor CSO discharges isthe most environmentally protective and cost-effective option available. In general,MDEP does not consider the Class B(CSO) designation to be a significant downgrading ofwater quality, but believes that current water quality standards would be met most ofthe time, and that the CSO impacts from the minor discharges are at a level comparablewith the water quality goals. Furthermore, this designation is only allowed in "non-criticalresource areas." Critical areas would include beaches, shellfish habitats, drinking waterintakes, endangered species habitats, etc.
Specifically, MDEP's CSO control policy allows Class B(CSO) designations for dischargesthat can meet water quality standards more than 95 percent of the time (equivalent tocontrol of untreated CSO discharge up to a three-month frequency storm; each eventassumed to last a period of four days). The highest achievable/affordable control to meetthis level of standards must be identified and implemented through the LTCP process. AUAA must be developed for communities to document that achieving a higher level ofCSO control is not feasible or appropriate.
MDEP also allows for variances and partial use designation for CSO-impacted waters.Variances allow for short-term modifications of Massachusetts water quality standardswhen interim control measures or further analyses are warranted. Thus, variances allowcommunities to comply with temporary water quality standards in their NPDES permits
MA-3
State Profile: Massachusetts—Region 1
while progress is being made to comply with the existing standards. Variances are issuedby MDEP and can be both discharger- and pollutant-specific, and are time-limited; theydo not change the current water body class designation (e.g., Class B). MDEP grantspartial use designations (based on results from a UAA) in CSO-impacted waters, whereMDEP is certain that the designated uses or standards cannot and will not be attainedon a permanent basis. Partial use generally indicates a short-term impairment of usesand can be defined by seasons or a particular storm event when a use such as primarypublic recreation contact and bathing will be unattainable in CSO-impacted waters. Theuse must be fully protected downstream, in other seasons, or during smaller stormevents.
In areas where MDEP determines that designated uses cannot and will not be met on apermanent basis, MDEP will then consider a change in classification from Class B to Class C(a downgrading of water quality).This option is a last resort and must be based on UAAfindings that the designated use cannot be reasonably attained.
To date, MDEP has listed portions of Boston Harbor as Class B(CSO) and has approvedvariances for the CSO-impacted areas of the Charles and Mystic Rivers.
Enforcement Program
EPA Region 1's Water Enforcement Program is responsible for conducting compliancemonitoring and enforcement activities. Region 1's Office of Ecosystem Protection (OEP)issues NPDES permits. Most CSO communities are under a Consent Degree or anAdministrative Order in Massachusetts. EPA Region 1 requires (in permit) that the CSOcommunity must meet water quality standards. If this cannot be achieved through theNMC required in the permit, the community is in a noncompliance situation. Region 1then intervenes and works with the community to develop an approach and a schedulefor initiating and developing a LTCP. This is formalized in an enforceable schedule withinan Administrative Order and then reaffirmed during reissuance in the Permit Fact Sheetdeveloped by OEP.


NH-1
Strategy for CSO Control and NPDES Permitting
EPA Region 1's approach in New Hampshire has primarily relied upon the use of theNPDES permitting process to initiate CSO planning and follow-up. Combinedenforcement and assistance efforts have been used to help communities initiateprojects, develop program milestones, and establish schedules. Communities areencouraged to implement less costly, nonstructural controls (i.e., NMC) as a means toabate its CSOs. For those requiring more long-term solutions, the community mustdevelop a phased approach for identifying and implementing control solutions,encouraging the use of technologies that maximize environmental benefits (through theLTCP process). The long-term planning efforts are formalized in administrative orders,consent decrees, or other enforceable mechanisms. In 1987 EPA Region 1 developed anNPDES Policy for Control of CSOs that was used to address all of the CSOs in the state.
CSO Permits
5
Permitted CSO Outfalls
44
NPDES Authority
EPA Region 1
Water Quality Standards Authority
New Hampshire Department of Environmental Services (NHDES)
Online Resources
www.des.state.nh.us/water_intro.htm www.des.state.nh.us/factsheets/wwt/web-9.htm
New Hampshire—Region 1
Program Highlights
● EPA Region 1 and NHDEScoordinate New Hampshire's CSOprogram.
● NMC are required in all CSOpermits.
● Enforcement and complianceassistance lead the developmentand schedule for long-term CSOplanning efforts.
● New Hampshire developed anapproach for water qualitystandards evaluation andredesignations.
● Initial CSS assessments of thestate identified six CSOpermittees; there are currentlyfive CSO permittees (Berlin,Nashua, Portsmouth, Lebanon,and Manchester).
State Profile
NMC
Some BMPs
No BMPs
LTCP
Other Facility Plan
No Facility Plan
Total
5
0
0
4
1
0
100%
0%
0%
80%
20%
0%
5 100%
Total 5 100%
Number of Permits Percent
BMP Requirements
Facility Plan Requirements
Status of CSO Policy Requirements
ConnecticutRiver
MerrimackRiver
AndroscogginRiver
#
#
##
#
20 0 20 40 60 Miles
Vermont
Maine
Massachusetts
CANADA
Atlantic Ocean
CSO Permits

NH-2
Report to Congress on Implementation and Enforcement of the CSO Control Policy
Permitting Program
EPA Region 1's NPDES Permit Task Force issues wastewater discharge permits for NewHampshire. CSO communities are typically issued NPDES permits that requireimplementation and documentation of the NMC for control of CSOs outlined in a specialCSO section. In this section, the permit also requires in a narrative statement that theCSO community must meet water quality standards or equivalent. Therefore, if the CSOcommunity implements its NMC and cannot effectively eliminate its CSOs, the CSOcommunity is in violation of its permit.
Water Quality Standards Program
The NHDES establishes and reviews state water quality standards. The state's 1989 CSOcontrol strategy outlines the two step-process:
● Determine the volume and strength of CSO discharges and its impact on the waterquality of the receiving waters.
● Where it is determined that CSOs violate New Hampshire's Surface Water QualityRegulations (N.H. Administrative Rules, Env-Ws 1700), the community must thendevelop a comprehensive CSO Facility Plan (i.e., LTCP) to determine the most cost-effective solution to abate CSO pollution.
New Hampshire has also developed a surface water partial-use designation calledTemporary Partial Use (TPU) or Class B (TPU). A designation of Class B(TPU) is made onlyif the community planning process and watershed planning efforts demonstrate that theallowance of minor CSO discharges is the most environmentally protective and cost-effective option available. In general, NHDES does not consider the Class B(TPU)designation to be a significant downgrading of water quality, but believes that currentwater quality standards would be met most of the time and that the impacts from theCSO discharges would be at a level comparable with the water quality goals.Furthermore, this designation is only allowed in "non-critical resource areas." Criticalareas would include beaches, shellfish habitats, drinking water intakes, and endangeredspecies habitats.
Enforcement Program
EPA Region 1's Water Enforcement Program is responsible for conducting compliancemonitoring and enforcement activities in New Hampshire. Region 1's Office of EcosystemProtection (OEP) issues NPDES permits. Most CSO communities are under a ConsentDegree or an Executive or Administrative Order in New Hampshire. EPA Region 1 requires(in permit) that the CSO community must meet water quality standards. If this cannot beachieved through the NMC (required in the permit), the community is in anoncompliance situation. EPA Region 1 intervenes and works with the community todevelop an approach and schedule for initiating and developing an LTCP. This isformalized in a schedule within an Administrative Order. The schedule is then reaffirmedduring permit reissuance in the Permit Fact Sheet developed by OEP.

RI-1
CSO Permits
3
Permitted CSO Outfalls
87
NPDES/Water Quality Standards Authority
Rhode Island Department of Environmental Management (RIDEM)
Online Resources
www.state.ri.us/dem/www.state.ri.us/dem/programs/benviron/water/quality/index.html
Rhode Island—Region 1
Program Highlights
● Rhode Island's 1990 CSO policyrequires primary treatment orequivalent for all CSO discharges;higher levels of treatment arerequired when necessary to meetwater quality standards.
● A stakeholder-based LTCP wasdeveloped by the NarragansettBay Commission. A three-phaseabatement plan has beenapproved that limits CSO eventsto four per year. The primarycontrol is deep rock tunnelstorage and pump-back fortreatment. The final design ofPhase I has been approved(except for pump station andinstrumentation and controls).
● Newport has built two CSOabatement facilities, but the olderfacility does not comply withstate or federal CSO policy. RIDEMis requiring further planning toassess the need for additionalcontrols at both facilities.
State Profile
NMC
Some BMPs
No BMPs
LTCP
Other Facility Plan
No Facility Plan
Total
3
0
0
3
0
0
100%
0%
0%
100%
0%
0%
3 100%
Total 3 100%
Number of Permits Percent
BMP Requirements
Facility Plan Requirements
Status of CSO Policy Requirements
BlackstoneRiver
#
#
#
Connecticut
Massachusetts
Atlantic Ocean
NarragansettBay
0 20 40 Miles
CSO Permits


VT-1
Strategy for CSO Control and NPDES Permitting
VDEC published a state Combined Sewer Overflow Control Policy in1990. The state CSOpolicy included a listing of Vermont's CSO communities and outlined a strategy for CSOcompliance. The strategy required communities to identify all overflow structures withintheir collection systems as part of the permit application process. Once the overflowswere identified, VDEC determined which outfalls were subject to the guidelines of thestate CSO policy.
CSO outfalls that were not in compliance with Vermont water quality standards andfederal minimum technology-based limitations were issued an administrative orderoutlining a compliance schedule. Administrative orders were generally issuedimmediately following issuance of the community's NPDES permit. The state CSO policyencouraged complete elimination of CSOs (e.g., sewer separation) when other CSOcontrol alternatives were determined to be technically and economically equal.
CSO Permits
7
Permitted CSO Outfalls
64
NPDES Authority
Vermont Department of Environmental Conservation (VDEC)
Water Quality Standards Authority
Vermont Water Resources Board (VWRB)
State Online Resources
www.state.vt.us/wtrboard/
Vermont—Region 1
Program Highlights
● All CSO requirements have beenhandled through administrativeorders.
● Vermont provided up to 50percent of the total cost for CSOcorrection projects through stategrants and interest free loans.
● Initial CSS assessment by VDECidentified 27 CSO permittees. 20of these communities haveseparated their systems, leavingseven CSO permittees.
State Profile
NMC
Some BMPs
No BMPs
LTCP
Other Facility Plan
No Facility Plan
Total
0
7
0
0
7
0
0%
100%
0%
0%
100%
0%
7 100%
Total 7 100%
Number of Permits Percent
BMP Requirements
Facility Plan Requirements
Status of CSO Policy Requirements
New York New Hampshire
Maine
Atlantic Ocean
Connecticut
Lake Champlain
River
CANADA
##
#
#
#
##
20 0 20 40 60 Miles
CSO Permits

VT-2
Report to Congress on Implementation and Enforcement of the CSO Control Policy
Communities that opted for CSO separation were required to be able to capture andprovide full treatment for a minimum design flow generated by a 24 hour, 2.5-inchrainfall. Vermont provided funding up to 50 percent of the total cost for CSO correctionprojects through state grants and interest free loans. The majority of communities inVermont (20 out of 27) chose sewer separation as their primary method for CSO control.
Permitting Program
Vermont's NPDES permits do not require CSO communities to implement the NMC.However, communities that receive approval from VDEC to continue to operate CSOoutfalls are required by the state CSO policy to implement a series of BMPs as part oftheir CSO corrective plan. The BMPs required by VDEC are similar to a subset of the NMCand include:
● Solids and floatables control
● Proper operation and maintenance of the collection system
● Maximum use of collection system storage
● Maximization of flows to the wastewater treatment facility
Approximately 40 percent of the CSO communities in Vermont were required in eithertheir permits or administrative orders to implement a combination of the state BMPs aspart of their CSO control plan. Vermont did not require CSO communities to submit aformal document for their LTCP. Instead, communities were required underadministrative orders to submit a preliminary engineering report that outlined their CSOcorrection plans and funding needs. Following submission of each engineering report,VDEC adjusted statements in the community’s administrative order regarding thecompliance schedule, based on project needs and funding availability.
Water Quality Standards Program
VDEC is responsible for determining if approved CSO discharges are in compliance withwater quality standards. Disinfection is required for all CSO discharges under the stateCSO policy. VDEC may require additional in-stream monitoring, either through thecommunity's permit or administrative order, to ensure attainment of water qualitystandards. Over 30 percent of the communities were required to develop a monitoringprogram. Under the state CSO policy, communities are required to eliminate all CSOs thatdischarge to Class B waters. Vermont does not have a specific procedure for thereclassification of CSO receiving waters. Communities that determine complete CSOelimination to be unattainable can follow the standard state procedure and petitionVWRB to reclassify the receiving water. The majority of communities in the state achievedcompliance with state water quality standards by eliminating all CSO outfalls throughsewer separation.
Enforcement Program
Vermont required implementation of CSO controls through state-issued administrativeorders. Communities that did not meet the requirements set in the administrative orderwere issued a consent order. Only four communities in Vermont received a state-issuedconsent order for violation of administrative orders. Approximately 74 percent of thecommunities in the state have completed construction on their CSO control projects.During the next permit cycle, VDEC plans to review the effectiveness of eachcommunity's CSO control plan. If the community continues to be in violation of the stateCSO policy, VDEC will issue another administrative order outlining any additionalrequirements and compliance schedules the community must meet. To date, only onecommunity has been issued a second administrative order, because its sewer separationproject did not completely eliminate all CSO discharges for the required design flow.

#
#####
###
##
#
###
#
#
##
# ###
#
##
#
##
##
#
20 0 20 40 60 MilesCSO Permits
Delaware
New York
Pennsylvania
New York
DelawareBay
Connecticut
Long Island Sound
Atlantic Ocean
DelawareRiver
Maryland
CSO Permits
31
Permitted CSO Outfalls
274
NPDES Authority/Water Quality Standards Authority
New Jersey Department of Environmental Protection (NJDEP)
Online Resources
http:/www.state.nj.us/dep/http://www.state.nj.us/dep/dwq/
NJ-1
Strategy for CSO Control and NPDES Permitting
New Jersey has highly regionalized collection, conveyance, and treatment systems withportions of the sewer systems owned/operated by different local government entities.The wastewater treatment facilities generally serve multiple local governments.Collection systems and corresponding CSO points are generally owned/operated bymunicipalities, while conveyance and treatment facilities are owned/operated byindependent treatment authorities; however some utility authorities do own/operateCSOs.
The CSO program is administered using a combination of individual and general NPDESpermits. The program requires CSO communities that own or operate any portion of aCSS to develop and implement technology-based control measures, including the NMC.These enforceable commitments also initiate the first phase of LTCP planning activitiesby requiring development of calibrated and field-verified SWMM models of the CSS.
New Jersey—Region 2
Program Highlights
● New Jersey has highlyregionalized collection,conveyance, and treatmentsystems with portions of the CSSsowned/operated by differentlocal government entities.
● The CSO program is administeredusing a combination of individualand general NPDES permits.
● NJDEP provides substantialfunding for the planning, design,and construction of CSO controlfacilities and for infrastructurerehabilitation and improvement.
● LTCP development isincorporated into the ongoingstate-wide watershedmanagement and TMDL processin accordance with the TMDLdevelopment schedule containedin a Memorandum ofUnderstanding with EPA Region 2.
● NJDEP has adopted and isimplementing a comprehensivesolids and floatables controlrequirement, supported withstate financial assistance.
State Profile
NMC
Some BMPs
No BMPs
LTCP
Other Facility Plan
No Facility Plan
Total
30
0
1
0
4
27
96.8%
0%
3.2%
0%
12.9%
87.1%
31 100%
Total 31 100%
Number of Permits Percent
BMP Requirements
Facility Plan Requirements
Status of CSO Policy Requirements
NJ-2
Report to Congress on Implementation and Enforcement of the CSO Control Policy
NJDEP has adopted a far-reaching solids and floatables control requirement that hasresulted in reductions to the size of areas served by CSSs and the number of CSOoutfalls. CSO communities are required to capture, remove, and properly dispose of allsolids and floatables materials from all CSOs on an enforceable compliance schedule.
Under the New Jersey Sewerage Infrastructure Improvement Act (SIIA, enacted in 1988),NJDEP initiated a program that provides planning and design grants for thedevelopment and implementation of solids/floatables control measures and for theidentification and elimination of dry weather overflows. Grants are awarded forimplementation of control measures that capture and remove solids/floatables materialsfrom CSO discharges and that remediate or modify the CSS to eliminate dry weatheroverflows. Most often, "in-line" or "end-of-pipe" screen technologies have been selected.New Jersey estimates that $340 million will be spent for the planning, design, andconstruction of solids and floatables control measures. LTCP development isincorporated into the ongoing statewide watershed management and TMDL process, inaccordance with the TMDL development schedule contained in a Memorandum ofUnderstanding with EPA Region 2.
NJDEP uses the SRF Program to assist in the construction of CSO control facilities andinfrastructure rehabilitation and improvement.
Permitting Program
NJDEP serves as the NPDES authority. The CSO program is administered using acombination of individual and general permits. The general permit contains regulatoryrequirements applicable to collection and conveyance systems and CSOs. Approximately16 local government entities and approximately 231 CSOs are regulated under thegeneral permit. The general permit contains appropriate provisions of the NMCapplicable to owners/operators of collection and conveyance systems and CSOs,including:
● Prohibition of dry weather overflows
● Solids/floatables control
● Development and implementation of proper operation and regular maintenanceprograms
● Maximization of flow to the WWTP
● Public notification/reporting requirements
The general permit also initiates LTCP development, by requiring the development ofcalibrated and field-verified SWMM models of the CSS
Regulatory requirements applicable to wastewater treatment systems are generallycontained in individual NPDES permits. Each wastewater treatment facility and any CSOsowned by the treatment authority are regulated under an individual permit issued to thetreatment facility. Individual NPDES permits issued to wastewater treatment authoritiescontain appropriate provisions of the NMC applicable to owners/operators of WWTPs,including:
● Maximization of conveyance and treatment of wastewater at the WWTP
● Minimization of nondomestic discharges (during wet weather)
● Development and implementation of proper operation and regular maintenanceprograms
If the treatment authority also owns or operates CSOs, then the permit containsprovisions similar to those in the general permit.

NJ-3
State Profile: New Jersey—Region 2
Water Quality Standards Program
The water quality standards program is also administered by NJDEP. NJDEP is using awatershed process to develop watershed restoration plans. During the watershedprocess, water quality standards and uses will be considered as NJDEP developsmanagement responses that may include TMDLs, LTCPs and other appropriate activities.CSO communities have not yet formally approached NJDEP to request the initiation ofchanges to the surface water quality standards.
Enforcement Program
NJDEP uses a range of enforcement actions to implement CSO controls and has initiatednumerous enforcement actions against communities determined to be out ofcompliance with the CSO provisions of their NPDES permits. NJDEP has entered intojudicial consent orders in state superior court with five CSO communities, including onethat was the result of a citizen's suit, and has entered into administrative consent orderswith six CSO communities. In addition, NJDEP has filed complaints in state superior courtagainst two CSO communities that are in noncompliance with their NPDES permits, andis currently developing administrative consent orders with four additional localgovernment entities.

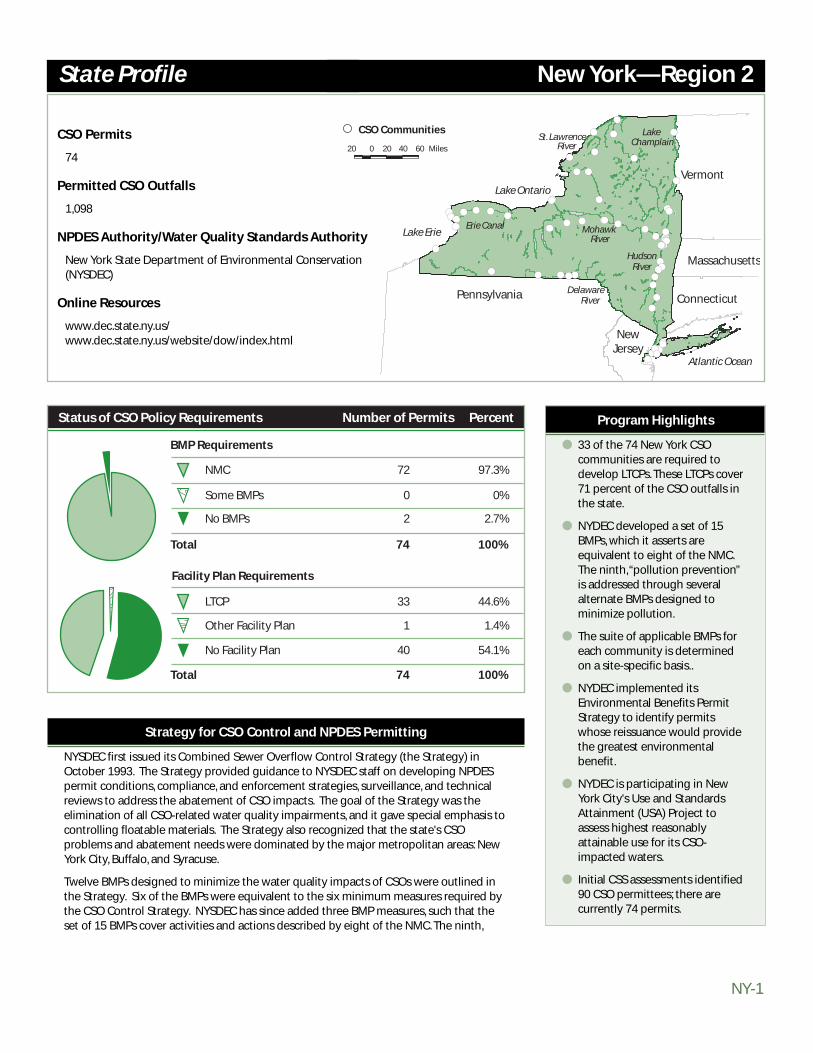
NY-1
Strategy for CSO Control and NPDES Permitting
NYSDEC first issued its Combined Sewer Overflow Control Strategy (the Strategy) inOctober 1993. The Strategy provided guidance to NYSDEC staff on developing NPDESpermit conditions, compliance, and enforcement strategies, surveillance, and technicalreviews to address the abatement of CSO impacts. The goal of the Strategy was theelimination of all CSO-related water quality impairments, and it gave special emphasis tocontrolling floatable materials. The Strategy also recognized that the state's CSOproblems and abatement needs were dominated by the major metropolitan areas: NewYork City, Buffalo, and Syracuse.
Twelve BMPs designed to minimize the water quality impacts of CSOs were outlined inthe Strategy. Six of the BMPs were equivalent to the six minimum measures required bythe CSO Control Strategy. NYSDEC has since added three BMP measures, such that theset of 15 BMPs cover activities and actions described by eight of the NMC. The ninth,
CSO Permits
74
Permitted CSO Outfalls
1,098
NPDES Authority/Water Quality Standards Authority
New York State Department of Environmental Conservation(NYSDEC)
Online Resources
www.dec.state.ny.us/ www.dec.state.ny.us/website/dow/index.html
New York—Region 2
Program Highlights
● 33 of the 74 New York CSOcommunities are required todevelop LTCPs. These LTCPs cover71 percent of the CSO outfalls inthe state.
● NYDEC developed a set of 15BMPs, which it asserts areequivalent to eight of the NMC.The ninth,“pollution prevention”is addressed through severalalternate BMPs designed tominimize pollution.
● The suite of applicable BMPs foreach community is determinedon a site-specific basis..
● NYDEC implemented itsEnvironmental Benefits PermitStrategy to identify permitswhose reissuance would providethe greatest environmentalbenefit.
● NYDEC is participating in NewYork City's Use and StandardsAttainment (USA) Project toassess highest reasonablyattainable use for its CSO-impacted waters.
● Initial CSS assessments identified90 CSO permittees; there arecurrently 74 permits.
State Profile
#
# ##
###
##
#########
## ### ### # ## #####
#
#### ### #
#
##
#
##
########
#
#
####
##
####
#
#
#
#
20 0 20 40 60 Miles
CSO Communities
Pennsylvania
NewJersey
Connecticut
Massachusetts
Vermont
Atlantic Ocean
Hudson
Delaware
Lake Ontario
Lake
Erie Canal
River
MohawkRiver
Lake Erie
St. Lawrence
River
River Champlain
NMC
Some BMPs
No BMPs
LTCP
Other Facility Plan
No Facility Plan
Total
72
0
2
33
1
40
97.3%
0%
2.7%
44.6%
1.4%
54.1%
74 100%
Total 74 100%
Number of Permits Percent
BMP Requirements
Facility Plan Requirements
Status of CSO Policy Requirements

NY-2
Report to Congress on Implementation and Enforcement of the CSO Control Policy
“pollution prevention”, is addressed through several alternate BMPs designed to minimizepollution. The 15 BMPs are:
● Development of a CSO maintenance and inspection program.
● Optimization of the collection system to maximize in-system storage.
● Consideration of CSOs in approved industrial pretreatment programs.
● Maximization of flow to WWTPs.
● Development and implementation of a wet weather operating plan.
● Prohibition of dry weather overflows.
● Elimination or minimization of floatable and settleable solids in discharges.
● Replacement of combined sewers with separate sewers to the greatest extentpossible.
● Prohibition on introduction of new sources of storm water.
● Prohibition of new connections in areas with recurring sewage back-ups.
● Prohibition of the discharge or release of septage or hauled waste upstream of a CSO.
● Implementation of practices and technologies to control runoff from newdevelopment.
● Installation and maintenance of signs at CSO outfalls.
● Characterization and monitoring of the CSS.
● Submission of annual reports summarizing BMP implementation.
Applicability of the 15 BMPs is determined on a site-specific basis, but 72 of 74 New YorkCSO communities currently have permit requirements to implement at least one of theBMPs.
Permitting Program
NYSDEC issued its Environmental Benefit Permit Strategy (EBPS) in September 1992. TheEBPS established a process for prioritizing reissuance of permits based on theenvironmental benefits that would be gained, rather than reviewing permits inchronological order. NYSDEC's goal is to revise the top 10 percent of the state-issuedNPDES permits on the priority ranking list each year. This equates to approximately 60NPDES POTW permits per year.
Under the EBPS, each permit receives a numerical score for each of 15 factors as theyapply to that particular permit. The two factors relevant to CSO control are permitrequirements to implement the 15 BMPs, and permit requirements to develop andsubmit an LTCP. Each factor is then multiplied by a "water quality enhancementmultiplier" (which ranges from 1–10) that describes the benefit of modifying the permitto address the factor.
In response to an EPA Office of the Inspector General audit survey, NYSDEC reviewed allof the NPDES permits with CSOs and elevated the priority of any permits that havedeficiencies with respect to CSO controls. As a result, most of the permits for CSOcommunities will be reviewed within the next three years. Currently 33 of New York's 74CSO communities have permit requirements to develop LTCPs; these 33 LTCPs cover 71percent, of the state's 1,098 CSO outfalls.
NY-3
State Profile: New York—Region 2
Water Quality Standards Program
Only New York City has approached the state to request a review of water qualitystandards for its CSO-impacted waters. New York City initiated a use and standardsattainment (USA) project to assess the highest reasonably attainable use for its CSO-impacted waters. NYSDEC also anticipates that Buffalo and Syracuse may have aninterest in standards reviews, but they have not yet initiated a formal process withNYSDEC.
The goals of the New York City USA Project are as follows:
● Define, through a public process, more specific and comprehensive long-termbeneficial use goals for each water body, including habitat, recreational, wetlands andriparian goals, in addition to water quality goals, thus maximizing the overallenvironmental benefit.
● Develop technical, economic, public, and regulatory support for prioritizing andexpediting implementation of projects and actions needed to attain the definedgoals.
● Provide the technical, scientific, and economic basis to support the regulatory processneeded to define water quality standards for the highest reasonably attainable use toallow water quality standards to be attained upon implementation of recommendedprojects.
Enforcement Program
NYDEC uses both NPDES permits and enforceable orders to require implementation ofminimum measures and LTCP requirements in CSO communities. This has resulted in ahigh rate of compliance with state submittal schedules and implementation progress.
NYDEC issued permits to New York City on September 27, 1988, requiring that CSOabatement be addressed by a series of Facility Planning Programs. Facility plans were tobe developed for nine area-specific segments: Flushing Bay, Paerdegat Basin, JamaicaBay, East River, Inner Harbor, Outer Harbor, Coney Island Creek, Newtown Creek, and theJamaica Drainage Area tributaries. New York City failed to start and/or complete facilityplans by the specified date for the Inner Harbor, Outer Harbor, East River, and the JamaicaBay Tributaries. As a result of these violations, DEC and New York City signed an Order ofConsent dated June 25, 1992. The order established a 14-year compliance schedule toplan, design, and construct CSO abatement (storage) facilities which will preventviolations of dissolved oxygen and coliform permit limits. Although significant progresshas been made, New York City is not in compliance with some of the requirements of thisorder.
The Amended Consent Judgement for Onondaga County (Syracuse) requires theimplementation of an LTCP designed to meet the presumption approach with acommitment to spend approximately $145-$150 million on CSO controls. Binghamton-Johnson City is under a consent order to implement an LTCP to meet the presumptionapproach.
In addition, a number of CSO communities in New York are under enforcement ordersrelated to violations at their WWTPs. These violations can often be traced to the wetweather impacts that the CSS is having on the operation of its treatment facility.

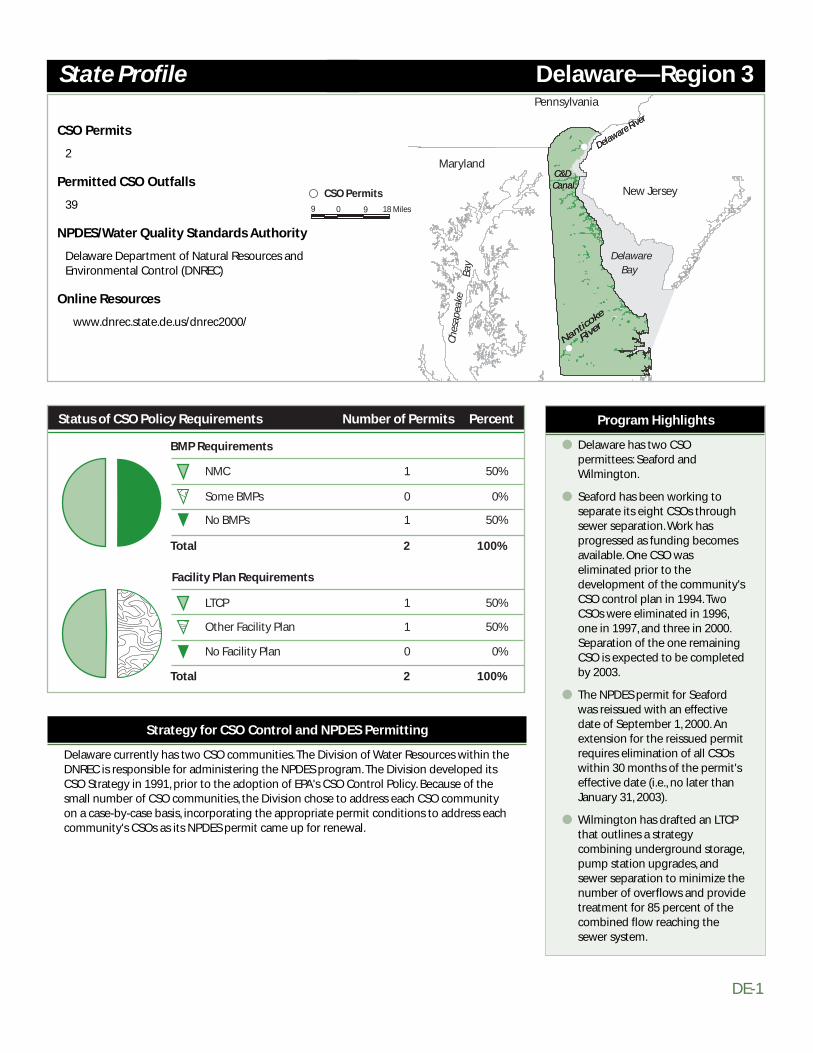
DE-1
Delaware River
C&D Canal
Nanticoke
River
Delaware River
C&D Canal
Nanticoke
River
#
#
9 90 18 Miles
Maryland
New Jersey
Pennsylvania
Che
sape
ake
Bay
DelawareBay
CSO Permits
Delaware—Region 3
Program Highlights
● Delaware has two CSOpermittees: Seaford andWilmington.
● Seaford has been working toseparate its eight CSOs throughsewer separation. Work hasprogressed as funding becomesavailable. One CSO waseliminated prior to thedevelopment of the community'sCSO control plan in 1994. TwoCSOs were eliminated in 1996,one in 1997, and three in 2000.Separation of the one remainingCSO is expected to be completedby 2003.
● The NPDES permit for Seafordwas reissued with an effectivedate of September 1, 2000. Anextension for the reissued permitrequires elimination of all CSOswithin 30 months of the permit'seffective date (i.e., no later thanJanuary 31, 2003).
● Wilmington has drafted an LTCPthat outlines a strategycombining underground storage,pump station upgrades, andsewer separation to minimize thenumber of overflows and providetreatment for 85 percent of thecombined flow reaching thesewer system.
State Profile
NMC
Some BMPs
No BMPs
LTCP
Other Facility Plan
No Facility Plan
Total
1
0
1
1
1
0
50%
0%
50%
50%
50%
0%
2 100%
Total 2 100%
Number of Permits Percent
BMP Requirements
Facility Plan Requirements
Status of CSO Policy Requirements
CSO Permits
2
Permitted CSO Outfalls
39
NPDES/Water Quality Standards Authority
Delaware Department of Natural Resources and Environmental Control (DNREC)
Online Resources
www.dnrec.state.de.us/dnrec2000/
Strategy for CSO Control and NPDES Permitting
Delaware currently has two CSO communities. The Division of Water Resources within theDNREC is responsible for administering the NPDES program. The Division developed itsCSO Strategy in 1991, prior to the adoption of EPA's CSO Control Policy. Because of thesmall number of CSO communities, the Division chose to address each CSO communityon a case-by-case basis, incorporating the appropriate permit conditions to address eachcommunity's CSOs as its NPDES permit came up for renewal.


DC-1
Strategy for CSO Control and NPDES Permitting
Approximately one-third of the District of Columbia is served by a CSS. The communityhas implemented the NMC and is in the process of developing its LTCP. The proposedCSO Control Program includes three storage tunnels, pump station rehabilitation,regulator improvements, and low impact development retrofits. There are a total of 60CSO outfalls listed in the District of Columbia's NPDES Permit that discharge to RockCreek, the Anacostia River, the Potomac River and tributary waters.
Permitting Program
EPA Region 3 is the NPDES authority for the District of Columbia. Documentation of theNMC was submitted to EPA Region 3 in 1996, with follow-up reports in 1999 and 2000.WASA began developing its LTCP in 1998, and submitted a draft LTCP to EPA Region 3and DCDOH in June 2001.
CSO Permits
1
Permitted CSO Outfalls
60
NPDES Authority
EPA Region 3
Water Quality Standards Authority
District of Columbia Department of Health (DCDOH)
Online Resources
www.environ.state.dc.uswww.epa.gov/reg3wapd/cso/index.htm
Program Highlights
● The District of Columbia Waterand Sewer Authority (WASA) isthe sole CSO permittee.
● EPA Region 3, as the NPDESauthority, requires NMCdocumentation and LTCPsubmission.
● DCDOH reviews and commentson the LTCP, determinescompliance with water qualitystandards, and serves on the CSOstakeholder committee.
State Profile
CSO Permit
District of Columbia
Rock Creek
Anacostia
Rive
r
Virginia
Maryland
Potomac River0 1 2 Miles1
NMC
Some BMPs
No BMPs
LTCP
Other Facility Plan
No Facility Plan
Total
1
0
0
1
0
0
100%
0%
0%
100%
0%
0%
1 100%
Total 1 100%
Number of Permits Percent
BMP Requirements
Facility Plan Requirements
Status of CSO Policy Requirements
Washington, District of Columbia—Region 3

DC-2
Report to Congress on Implementation and Enforcement of the CSO Control Policy
Through the review of the LTCP and water quality certification process, DCDOH exercisesregulatory authority. DCDOH has submitted to EPA a final TMDL for BOD in theAnacostia River that includes an allocation for CSOs.
Water Quality Standards Program
DCDOH is responsible for the development, issuance, and enforcement of the District ofColumbia's water quality standards program. The District of Columbia had wet weatherprovisions in its water quality standards in prior years, but these have since beenremoved at the request of EPA Region 3. As part of the LTCP, WASA is requesting that wetweather provisions be brought back into the water quality standards program. Thisrequest will be reviewed by DCDOH.
Enforcement Program
EPA Region 3 is responsible for ensuring enforcement and compliance with NPDESpermits within the District of Columbia. DCDOH is responsible for ensuring attainment ofwater quality standards within the District of Columbia through the District of ColumbiaWater Pollution Control Act of 1985.
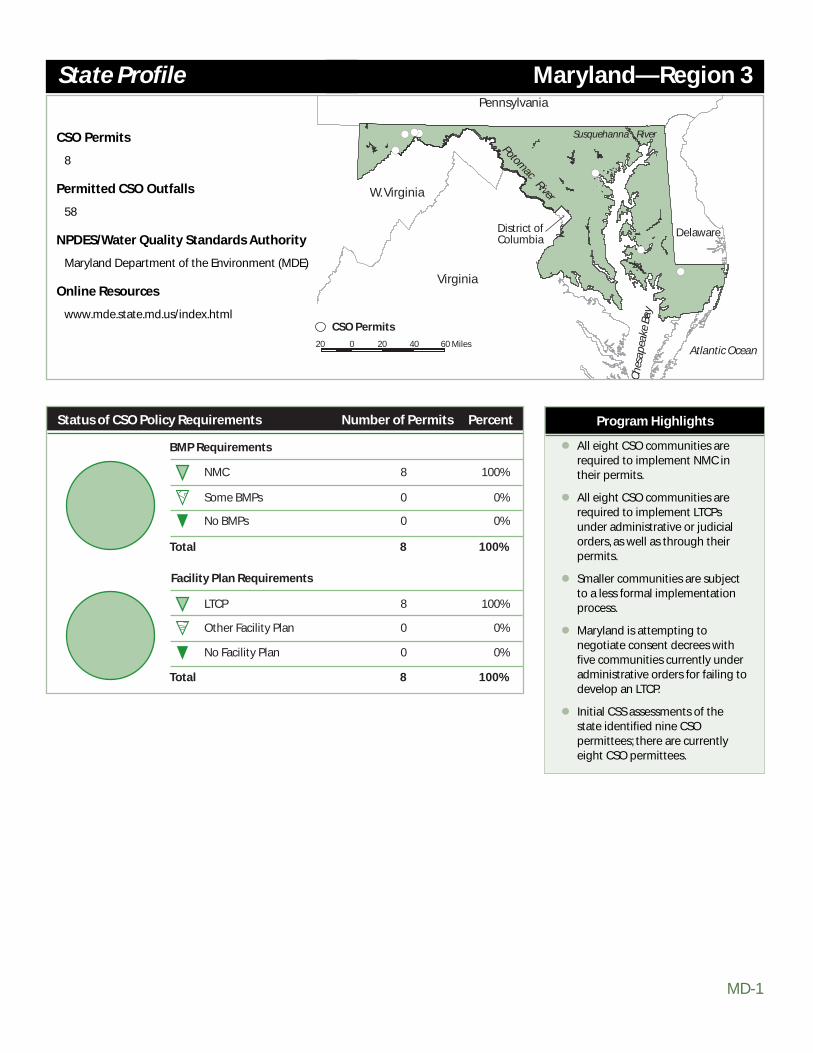
MD-1
CSO Permits
8
Permitted CSO Outfalls
58
NPDES/Water Quality Standards Authority
Maryland Department of the Environment (MDE)
Online Resources
www.mde.state.md.us/index.html
Maryland—Region 3
Program Highlights
All eight CSO communities arerequired to implement NMC intheir permits.
All eight CSO communities arerequired to implement LTCPsunder administrative or judicialorders, as well as through theirpermits.
Smaller communities are subjectto a less formal implementationprocess.
Maryland is attempting tonegotiate consent decrees withfive communities currently underadministrative orders for failing todevelop an LTCP.
Initial CSS assessments of thestate identified nine CSOpermittees; there are currentlyeight CSO permittees.
State Profile
NMC
Some BMPs
No BMPs
LTCP
Other Facility Plan
No Facility Plan
Total
8
0
0
8
0
0
100%
0%
0%
100%
0%
0%
8 100%
Total 8 100%
Number of Permits Percent
BMP Requirements
Facility Plan Requirements
Status of CSO Policy Requirements
Virginia
W. Virginia
District ofColumbia
Pennsylvania
Delaware
Che
sape
ake
Bay
Atlantic Ocean
Potomac
River
Susquehanna River##
#
#
#
#
##
20 200 40 60 Miles
CSO Permits


PA-1
Strategy for CSO Control and NPDES Permitting
PADEP developed its initial state CSO Strategy based on the 1989 National CSO ControlStrategy. In 1995, PADEP revised the Strategy to include the elements identified in theCSO Control Policy. The revised Strategy required municipal dischargers to identify CSOlocations and implement the NMC with additional long-term controls being required, asnecessary, to comply with water quality standards. CSO communities undergoingreissuance of an NPDES permit, or those eligible for and seeking coverage under ageneral CSO permit, were issued permits that reflected the Strategy's requirements and acompliance schedule.
Permitting, enforcement, and compliance activities related to the revised Strategy weredelegated to the regional PADEP offices. PADEP encouraged communities to use thenational guidance documents available for NMC and LTCPs in meeting their permitrequirements. PADEP also co-hosted an EPA-funded two-day workshop for officials fromcommunities with CSSs to better engage them in the program in 1997.
CSO Permits
155
Permitted CSO Outfalls
1,662
NPDES/Water Quality Standards Authority
Pennsylvania Department of Environmental Protection (PADEP)
Online Resources
www.dep.state.pa.us/dep/deputate/watermgt/wsm/facts/fs2655.htm
Pennsylvania—Region 3
Program Highlights
● Pennsylvania has the greatestnumber of CSO communities(155) and CSO discharge points(1,662) in the nation.
● PADEP developed a 1991 StateCSO Strategy, which was revisedin 1995 to reflect the 1994 EPACSO Control Policy; a State Policyis expected in 2001.
● PADEP is not currentlyconsidering revisions to Statewater quality standards for CSO-impacted areas, but will explorethem in the upcoming triennialreview.
● 55 CSO communities havesubmitted LTCPs (three in draftformat) and 24 have beenapproved by the state (twoconditionally). NMCdocumentation has beensubmitted by 112 communities.
● The number of CSSs identified inthe state rose from an initial 147to 155, primarily due to inclusionof combined satellite collectionsystems.
State Profile
NMC
Some BMPs
No BMPs
LTCP
Other Facility Plan
No Facility Plan
Total
153
0
2
144
2
9
98.7%
1.3%
0%
92.9%
1.3%
5.8%
155 100.0%
Total 155 100.0%
Number of Permits Percent
BMP Requirements
Facility Plan Requirements
Status of CSO Policy Requirements
SusquehannaRiver
DelawareRiver
River
Ohio
Monongahela
Allegheny
River
River
20 0 20 40 60 Miles
CSO Permits
New York
NewJersey
Dela-ware
MarylandW. Virginia
Ohio
Lake Erie
PA-2
Report to Congress on Implementation and Enforcement of the CSO Control Policy
Permitting Program
PADEP's six regional offices (Northeast, Southeast, Southcentral, Northcentral, Southwest,and Northwest) are responsible for NPDES permitting (including CSOs) within theirgeographic areas. In response to the initial state CSO Strategy, PADEP began requiringimplementation of the six minimum measures (or NMC) in permits of CSSs. When theRevised Strategy was issued in 1995, PADEP added the remaining three NMC and theLTCP requirements, which have been included in permits reissued since 1995.
PADEP also developed a CSO general permitting process. General permits were madeavailable only to small communities that met specific eligibility requirements and mainlyincluded satellite collection systems that operate and maintain a CSS, but sendwastewater to another town or regional facility for treatment. Notice-of-intent submittalrequirements for coverage under a CSO general permit were minimal; however, coverageincluded many of the same CSO requirements as the individual NPDES permit.
Most CSO communities in Pennsylvania have CSO requirements in their permits.Approximately 112 communities have submitted NMC documentation and 55 havesubmitted LTCPs (three in draft format).
Water Quality Standards Program
Development and implementation of water quality standards in Pennsylvania is also aprimary responsibility of PADEP. A change in water quality standards must be approvedthrough an independent regulatory review commission, submitted to the EnvironmentalQuality Board for review and approval, and then sent to the state legislature for finalapproval. Based on the involved state process for altering standards and negativeconnotations of lowering or downgrading water quality standards, PADEP does notbelieve UAAs or revisions to state standards for CSO-impacted waters are workable.These issues will be explored in the upcoming triennial review.
Enforcement Program
PADEP regional offices are responsible for enforcement and compliance activities,including review of all CSO documents and reports required to be submitted accordingto the NPDES permit compliance schedule. PADEP activities have focused on gettingrequirements into NPDES permits, ensuring that CSO programs are being initiated, andreviewing submitted documentation. The Southwest Regional PADEP office, having themost CSO communities, has a review system in place for NMC based on the suggestedevaluation checklist provided in the EPA publication, Guidance for Nine Minimum Controls.Informal enforcement notices of violations and noncompliance with the NMC are oftenissued, and consequently, updates to NMC documentation are required to demonstratefull implementation of the NMC. The other regional offices have incorporatedenforcement of the CSO requirements through normal permitting and enforcementactivities within the regional water quality management programs.
As permits that have CSO requirements expire and facilities apply for reissuance, PADEPdetermines their overall compliance status. EPA Region 3 has enforcement oversight, andhas indicated that permits that are not in compliance with the schedule listed in theexpiring NPDES permit should be brought into compliance through an enforcementaction (rather than reissuing the permit with a new/revised compliance schedule).
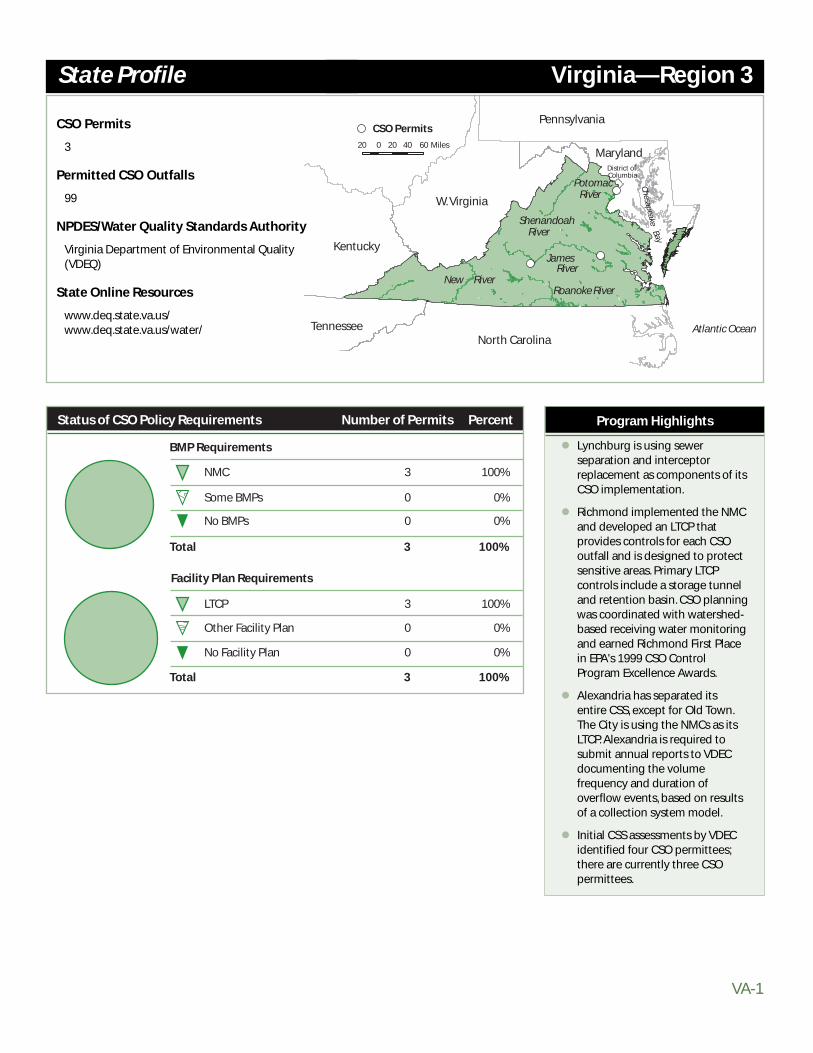
VA-1
CSO Permits
3
Permitted CSO Outfalls
99
NPDES/Water Quality Standards Authority
Virginia Department of Environmental Quality (VDEQ)
State Online Resources
www.deq.state.va.us/ www.deq.state.va.us/water/
Virginia—Region 3
Program Highlights
Lynchburg is using sewerseparation and interceptorreplacement as components of itsCSO implementation.
Richmond implemented the NMCand developed an LTCP thatprovides controls for each CSOoutfall and is designed to protectsensitive areas. Primary LTCPcontrols include a storage tunneland retention basin. CSO planningwas coordinated with watershed-based receiving water monitoringand earned Richmond First Placein EPA's 1999 CSO ControlProgram Excellence Awards.
Alexandria has separated itsentire CSS, except for Old Town.The City is using the NMCs as itsLTCP. Alexandria is required tosubmit annual reports to VDECdocumenting the volumefrequency and duration ofoverflow events, based on resultsof a collection system model.
Initial CSS assessments by VDECidentified four CSO permittees;there are currently three CSOpermittees.
State Profile
NMC
Some BMPs
No BMPs
LTCP
Other Facility Plan
No Facility Plan
Total
3
0
0
3
0
0
100%
0%
0%
100%
0%
0%
3 100%
Total 3 100%
Number of Permits Percent
BMP Requirements
Facility Plan Requirements
Status of CSO Policy Requirements
Potomac
Shenandoah
Roanoke RiverNew
James
RiverRiver
River
River
Pennsylvania
Atlantic Ocean
Chesapeake Bay
20 0 20 40 60 Miles
District of Columbia
W. Virginia
Maryland
North CarolinaTennessee
Kentucky
CSO Permits


WV-1
Strategy for CSO Control and NPDES Permitting
West Virginia has adopted EPA's CSO Control Policy, with some additional requirementsspecific to the state. All NPDES permits for communities with CSOs contain requirementsto comply with the NMC and to develop an LTCP. WVDEP has not issued any enforcementorders for violations of these permit requirements.
State-specific requirements include documentation of implementation of the NMC in areport titled "CSO Final Plan of Action,” and documentation of a required water qualitystudy that must be conducted by each permittee on its CSO receiving waters. To date, 54communities have submitted CSO Final Plans of Action, with 43 communitiesdocumenting implementation of all of the NMC.
The purpose of the water quality study is to evaluate the water quality impacts of CSOson receiving waters. Communities are required to collect dry weather receiving watersamples at least once a month, and wet weather receiving water data during at least
CSO Permits
58
Permitted CSO Outfalls
776
NPDES/Water Quality Standards Authority
West Virginia Division of Environmental Protection(WVDEP)
State Online Resources
www.dep.state.wv.us/www.dep.state.wv.us/wr/OWR_Website/index.htm
West Virginia—Region 3
Program Highlights
● The NMC are required in all WestVirginia CSO permits. 54 of 58communities have documentedsome implementation of theNMC, and 43 have implementedall of the NMC.
● LTCPs are required in all CSOpermits. To date, 16 LTCPs havebeen received by WVDEP and onehas been approved.
● WVDEP requires that all CSOcommunities conduct waterquality studies, which evaluatewater quality impacts of CSOs onreceiving waters. Approximately21 communities have submittedwater quality studies.
● Initial CSS assessments by WVDEPidentified 56 CSO permittees;there are currently 58 CSOpermittees.
State Profile
NMC
Some BMPs
No BMPs
LTCP
Other Facility Plan
No Facility Plan
Total
58
0
0
58
0
0
100%
0%
0%
100%
0%
0%
58 100%
Total 58 100%
Number of Permits Percent
BMP Requirements
Facility Plan Requirements
Status of CSO Policy Requirements
Virginia
Maryland
Pennsylvania
Ohio
Kentucky
Ohio River
Kanawha River
Potomac River
District of Columbia
20 0 20 40 60 Miles
CSO Permits
Appendix B
Profiles of State CSO Programs
B.18 Illinois
B.19 Indiana
B.20 Michigan
B.21 Minnesota
B.22 Ohio
B.23 Wisconsin
B.24 Iowa
B.25 Kansas
B.26 Missouri
B.27 Nebraska
B.28 South Dakota
B.29 California
B.30 Alaska
B.31 Oregon
B.32 Washington
B.1 Connecticut
B.2 Maine
B.3 Massachusetts
B.4 New Hampshire
B.5 Rhode Island
B.6 Vermont
B.7 New Jersey
B.8 New York
B.9 Delaware
B.10 District of Columbia
B.11 Maryland
B.12 Pennsylvania
B.13 Virginia
B.14 West Virginia
B.15 Georgia
B.16 Kentucky
B.17 Tennessee
Re
gio
n
1
8
7
5
4
3
2
9
10

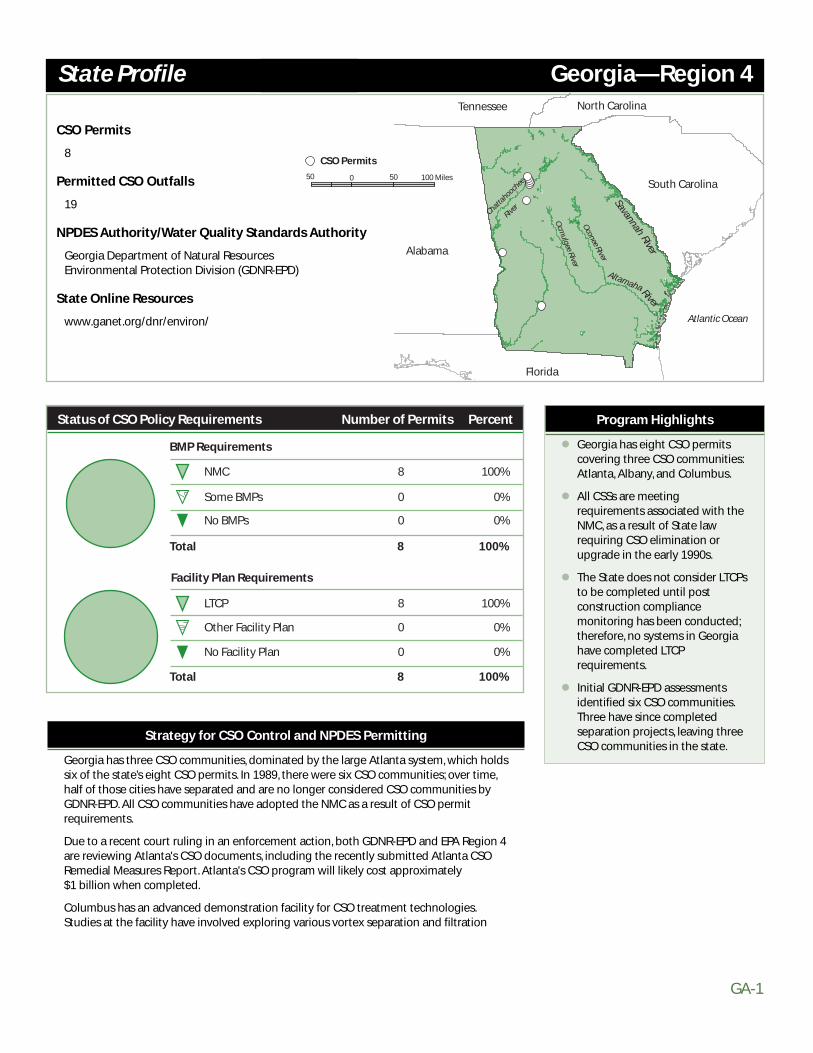
GA-1
Strategy for CSO Control and NPDES Permitting
Georgia has three CSO communities, dominated by the large Atlanta system, which holdssix of the state’s eight CSO permits. In 1989, there were six CSO communities; over time,half of those cities have separated and are no longer considered CSO communities byGDNR-EPD. All CSO communities have adopted the NMC as a result of CSO permitrequirements.
Due to a recent court ruling in an enforcement action, both GDNR-EPD and EPA Region 4are reviewing Atlanta's CSO documents, including the recently submitted Atlanta CSORemedial Measures Report. Atlanta's CSO program will likely cost approximately $1 billion when completed.
Columbus has an advanced demonstration facility for CSO treatment technologies.Studies at the facility have involved exploring various vortex separation and filtration
CSO Permits
8
Permitted CSO Outfalls
19
NPDES Authority/Water Quality Standards Authority
Georgia Department of Natural Resources Environmental Protection Division (GDNR-EPD)
State Online Resources
www.ganet.org/dnr/environ/
Program Highlights
Georgia has eight CSO permitscovering three CSO communities:Atlanta, Albany, and Columbus.
All CSSs are meetingrequirements associated with theNMC, as a result of State lawrequiring CSO elimination orupgrade in the early 1990s.
The State does not consider LTCPsto be completed until postconstruction compliancemonitoring has been conducted;therefore, no systems in Georgiahave completed LTCPrequirements.
Initial GDNR-EPD assessmentsidentified six CSO communities.Three have since completedseparation projects, leaving threeCSO communities in the state.
State Profile
Savannah
Chattahoochee
RiverRiver
Altamaha
Ocm
ulgee RiverO
conee RiverRiver
Atlantic Ocean
South Carolina
Florida
North CarolinaTennessee
Alabama
50 500 100 Miles
CSO Permits
NMC
Some BMPs
No BMPs
LTCP
Other Facility Plan
No Facility Plan
Total
8
0
0
8
0
0
100%
0%
0%
100%
0%
0%
8 100%
Total 8 100%
Number of Permits Percent
BMP Requirements
Facility Plan Requirements
Status of CSO Policy Requirements
Georgia—Region 4
GA-2
Report to Congress on Implementation and Enforcement of the CSO Control Policy
processes for pollutant removals, as well as various disinfection methods for pathogeninactivation. Columbus has spent approximately $95 million on CSO controls.
Permitting Program
The NPDES program is administered through GDNR-EPD. The NMC are required for allsystems; however, there is no regular reporting mechanism for communities to send thisinformation to the state. Draft LTCPs have been developed by the communities. Thestate, however, does not consider LTCPs to have been completed until all monitoring hasbeen conducted. Therefore, no systems in Georgia have completed the LTCPrequirements.
Water Quality Standards Program
In Georgia, the water quality standards officials do not have direct interaction with theCSO program as the LTCPs are being developed or reviewed. The City of Atlanta isrequesting a water quality standards review as part of its effort to develop andimplement an LTCP.
Enforcement Program
GDNR-EPD has enforcement authority for CSOs in Georgia. The City of Atlanta is under aFederal Consent Decree regarding its CSO program. Because of the complexity of theissues in Atlanta, and as a result of a lawsuit in district court, the State of Georgia, EPARegion 4, and a Federal district judge all have some degree of authority over Atlanta'sprogram. EPA Region 4 and GDNR-EPD have joint review authority over Atlanta's LTCP.Atlanta did not achieve compliance with the NMC on schedule and has other non-CSOrelated violations.

KY-1
Strategy for CSO Control and NPDES Permitting
KDEP began its CSO control program in the early 1990s. Kentucky implemented theprogram by developing standard CSO-related permit language for its NPDES permits.This standard language requires an approved Combined Sewer Operational Plan (CSOP).The CSOP has three principal objectives:
● Ensure that if CSOs occur, they occur only as a result of wet weather.
● Bring all wet weather CSO discharges into compliance with technology-based and/orwater quality-based requirements of the CWA.
● Minimize the impacts of CSOs on water quality, aquatic biota, and human health.
The specified contents of the CSOP follow the NMC and LTCP provisions of the CSOControl Policy, although the terms "NMC" and "LTCP" are not explicitly used in the permitlanguage. Nonetheless, the NMC requirements are outlined in the standard permit
CSO Permits
17
Permitted CSO Outfalls
299
NPDES/Water Quality Standards Authority
Kentucky Department for Environmental Protection (KDEP)
State Online Resources
www.nr.state.ky.us/nrepc/dep/dep2.htm
Kentucky—Region 4
Program Highlights
● Of the seven CSO communitiesthat have implemented anddocumented the NMC, six havealso submitted and initiatedLTCPs. For the remaining 10 CSOcommunities, NMC and LTCPdocumentation is in progress or isnot required. No community isoverdue with its submittals.
● Kentucky explicitly promotes acomprehensive watershedmanagement approach for allpoint and nonpoint sources in theCSO permit language. Coveredsources include storm, separatesanitary, and combined sewersystems.
● Kentucky encourages use of thepresumption approach over thedemonstration approach indeveloping LTCPs.
● Initial CSS assessments of theState identified 18 CSOpermittees; there are currently 17.
State Profile
NMC
Some BMPs
No BMPs
LTCP
Other Facility Plan
No Facility Plan
Total
13
0
4
13
1
3
76.5%
0%
23.5%
76.5%
5.9%
17.6%
17 100%
Total 17 100%
Number of Permits Percent
BMP Requirements
Facility Plan Requirements
Status of CSO Policy Requirements
# # #
#
# #
#
#
#
#
#
#
50 0 100 Miles
IndianaOhio
West Virginia
Illinois
Missouri
Tennessee
Virginia
OhioRiver
CSO Permits
KY-2
Report to Congress on Implementation and Enforcement of the CSO Control Policy
language. In addition, the CSO community is required to evaluate and select alternativesfor CSO controls, as well as develop a schedule of implementation, which is updatedannually in required CSOP annual reports. When selecting long-term CSO controls andperformance goals, the state encourages use of the "presumption approach" over the"demonstration approach.".
Other components of KDEP's approach involve watershed management and floodprotection. The state promotes, explicitly in the CSO permit language, a comprehensivewatershed management approach for all point and nonpoint sources, including storm,separate sanitary, and combined sewer systems. CSO-related permit language alsorequires coordination of the implementation of community flood protection programsand CSO abatement programs, such that implementation of one program does notadversely impact the other.
Permitting Program
Since the early 1990s, all NPDES permits covering CSO communities have contained aSpecial Conditions section for CSOs. This section lists the authorized overflow locationsand states that this authorization is premised on the conditions outlined within thepermit. The conditions generally include implementation of the NMC and developmentand implementation of an LTCP. The elements of the NMC and the LTCP are to bedocumented in the CSOP, which must be approved by the state. Annual updates to theCSOP must also be submitted to the state to maintain compliance with the permit.
Seven of the 17 CSO communities have implemented and acceptably documented theNMC. Six of these seven communities have also submitted and initiated implementationof LTCPs, but no community has completed implementation of an LTCP. (The single sewerseparation project that has been completed was not done as part of an LTCP.)
For the remaining communities, NMC and LTCP documentation is either in progress andnot yet due to the state, or not required. Four CSO communities do not havedocumentation requirements, although they do have NMC and LTCP language in theirpermits. Submittals are not considered necessary since: 1) two communities have aninactive system, i.e., rarely have overflows; 2) one community is in the process ofseparating its collection system; and 3) one community is deactivating its treatmentfacility and connecting its collection system to another CSS where documentation isrequired.
Water Quality Standards Program
A formal state process for review and evaluation of water quality standards exists;however, none of the CSO communities have requested a water quality standards reviewto date. Consequently, no review of water quality standards for a CSO receiving water hasbeen conducted.
In general, KDEP staff responsible for the water quality standards program are notinvolved in the CSO planning process, and generally do not give CSO-impacted watersany special consideration during the triennial review process for water quality standards.
Enforcement Program
No enforcement order within the State of Kentucky is CSO-related. One CSO communityis involved in an enforcement action, but it is not specifically related to a CSO issue.NPDES permits are the only enforceable mechanism used to date for the NMC and LTCPrequirements in CSO communities, and this has resulted in general compliance withstate submittal schedules and progress in implementation.
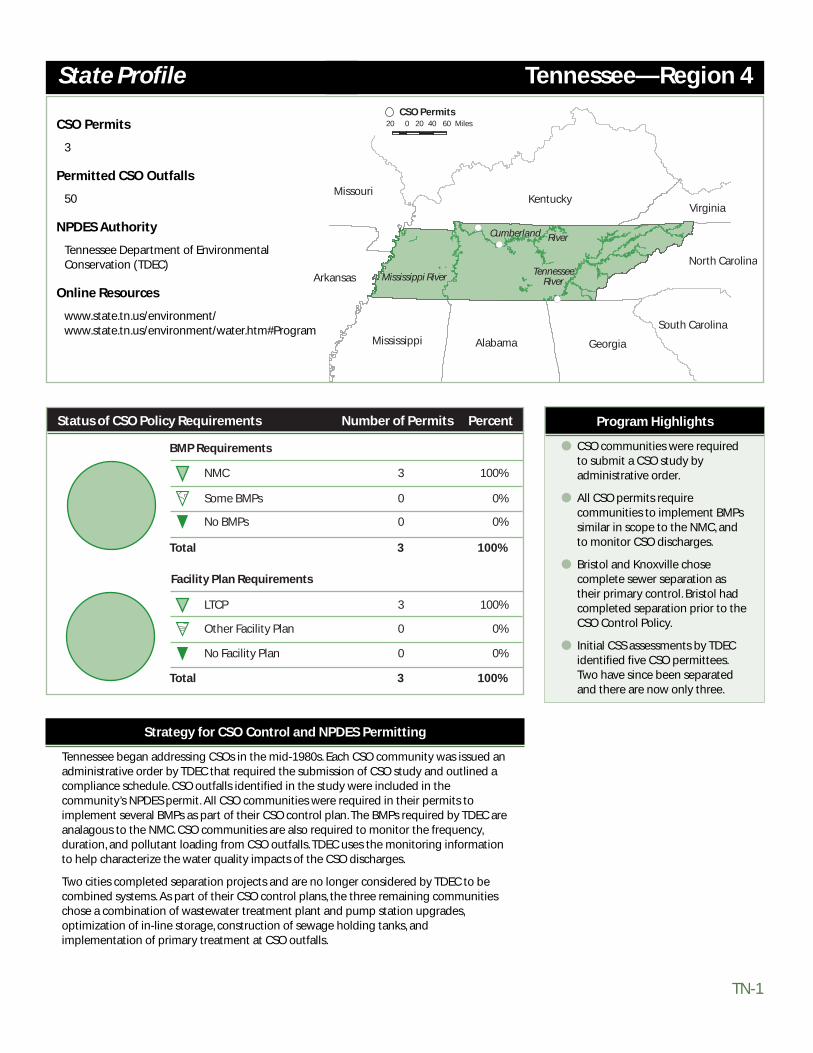
TN-1
CSO Permits
3
Permitted CSO Outfalls
50
NPDES Authority
Tennessee Department of Environmental Conservation (TDEC)
Online Resources
www.state.tn.us/environment/www.state.tn.us/environment/water.htm#Program
Tennessee—Region 4
Strategy for CSO Control and NPDES Permitting
Tennessee began addressing CSOs in the mid-1980s. Each CSO community was issued anadministrative order by TDEC that required the submission of CSO study and outlined acompliance schedule. CSO outfalls identified in the study were included in thecommunity’s NPDES permit. All CSO communities were required in their permits toimplement several BMPs as part of their CSO control plan. The BMPs required by TDEC areanalagous to the NMC. CSO communities are also required to monitor the frequency,duration, and pollutant loading from CSO outfalls. TDEC uses the monitoring informationto help characterize the water quality impacts of the CSO discharges.
Two cities completed separation projects and are no longer considered by TDEC to becombined systems. As part of their CSO control plans, the three remaining communitieschose a combination of wastewater treatment plant and pump station upgrades,optimization of in-line storage, construction of sewage holding tanks, andimplementation of primary treatment at CSO outfalls.
Program Highlights
● CSO communities were requiredto submit a CSO study byadministrative order.
● All CSO permits requirecommunities to implement BMPssimilar in scope to the NMC, andto monitor CSO discharges.
● Bristol and Knoxville chosecomplete sewer separation astheir primary control. Bristol hadcompleted separation prior to theCSO Control Policy.
● Initial CSS assessments by TDECidentified five CSO permittees.Two have since been separatedand there are now only three.
State Profile
NMC
Some BMPs
No BMPs
LTCP
Other Facility Plan
No Facility Plan
Total
3
0
0
3
0
0
100%
0%
0%
100%
0%
0%
3 100%
Total 3 100%
Number of Permits Percent
BMP Requirements
Facility Plan Requirements
Status of CSO Policy Requirements
Mississippi RiverTennessee
Cumberland
River
River#
#
#
20 0 20 40 60 Miles
Kentucky
Mississippi Alabama Georgia
South Carolina
North Carolina
Virginia
Arkansas
Missouri
CSO Permits


IL-1
Strategy for CSO Control and NPDES Permitting
IEPA has treatment standards in place for CSOs under Section 306.305 of the IllinoisCode. The treatment standards presume that CSO communities are meeting waterquality standards as long as they are meeting three conditions:
All dry weather flows and the first flush of storm flows, as determined by IEPA, shallmeet applicable effluent standards;
Additional flows, up to ten times the average dry weather flow for the design year,shall receive a minimum of one hour retention for primary treatment and 15 minutesretention for secondary disinfection; and
Flows in excess of ten times dry weather flow shall be treated to the extent necessaryto prevent depression of oxygen levels and accumulations of sludge deposits, floatingdebris, and solids.
CSO Permits
107
Permitted CSO Outfalls
813
NPDES Authority
Illinois Environmental Protection Agency (IEPA)
Water Quality Standards Authority
Illinois Pollution Control Board (IPCB)
Online Resources
http://www.epa.state.il.us/
Mississippi
River
Illin
ois
River
LakeMichigan
Indiana
Missouri
Kentucky
Iowa
Wisconsin
# #################### ## ###### ##
# ## ############# ### ####
### # #
# ### ###
# ##
# ## ## #
# ## ### ## #
### ##
##
#
#
#
#
#
#
##
#####
#
##
CSO Permits
OhioRiver
Wab
ash
Rive
r
Rock River50 0 50 100 Miles
Illinois—Region 5
Program Highlights
Illinois’ program includes anapproach pre-dating the 1994CSO Control Policy in establishingcontrol criteria presumed toprotect water quality andallowing a demonstration thatsome other criteria are protective.
61 of the CSO communities areimplementing the NMC. Theremaining 46 have implementedthe six minimum measuresidentified in EPA's 1989 CSOStrategy. Permits issued since1994 require the NMC; however,public notification is requiredonly for CSO discharges tosensitive areas.
CSO treatment is often providedin the form of primary treatmentat the headworks of the WWTP.
There is one federal enforcementaction involving a CSOcommunity in Illinois.
State Profile
NMC
Some BMPs
No BMPs
LTCP
Other Facility Plan
No Facility Plan
Total
61
46
0
0
107
0
57.0%
43.0%
0%
0%
100%
0%
107 100%
Total 107 100%
Number of Permits Percent
BMP Requirements
Facility Plan Requirements
Status of CSO Policy Requirements
IL-2
Report to Congress on Implementation and Enforcement of the CSO Control Policy State Profile: Illinois—Region 5
Communities can alternatively apply for an exception to the above requirements, andIPCB has approved exceptions for 21 CSO communities that did not need to meet therequirements of Section 306.305. These "exception" communities, which include Aurora,Cairo, and Alton, generally have reduced requirements written into their IPCB orders.
Illinois asserts its CSO program is similar to the federal CSO Control Policy because theSection 306.305 treatment standard is similar to the presumption approach in thefederal policy, while the exception procedure is similar to the demonstration approach.
CSO treatment is often provided in the form of primary treatment at the headworks ofthe WWTP.
Permitting Program
IEPA is the NPDES authority. Illinois has 107 CSO communities, of which 61 are requiredto implement the NMC. Compliance with the NMC is typically documented in Operationand Maintenance reports or Municipal Compliance Plans produced by the communities.All CSO communities have permit requirements for the six minimum measures identifiedin the EPA's 1989 National CSO Control Strategy; notices were issued in 1994 that theadditional three measures would be required. Most communities responded and havehad updated operational plans approved. Permits issued since 1994 includerequirements for all of the NMC. Illinois does not require public notification of CSOevents, except in designated sensitive waters.
Including Chicago, 56 permittees in Illinois are included in the Chicago Tunnel andReservoir Project (TARP). Nearly all of these communities have satellite collectionsystems that use the treatment plants of the Metropolitan Water Reclamation District ofGreater Chicago (MWRDGC), but have their own CSO outfalls. Many of thesecommunities, whose permits were issued in 1994 and have not yet been reissued, areawaiting reissuance of the MWRDGC permit. They will be covered under an associatedgeneral permit.
Plans for controlling CSOs were primarily developed prior to the CSO Control Policy andincluded in municipal or facilities plans. Recently issued permits are now requiring thatCSO communities develop monitoring plans to verify whether the controls put in placehave achieved the goals of protecting water quality. If monitoring indicates that waterquality objectives are not being met, new control plans will have to be developed.
Water Quality Standards Program
Water quality standards are the under jurisdiction of IPCB. Illinois bacterial standards arebased on a geometric mean fecal coliform level of 200 cfu/100ml, with no more than 10percent of samples exceeding 400 cfu/100ml. This standard is applicable May throughOctober.
The State asserts that most communities in Illinois are meeting the requirements ofSection 306.305, which is presumed to meet water quality standards in Illinois. Asmentioned previously, 21 CSO communities have an exception to Section 306.305.
Enforcement Program
Through a Performance Partnership Agreement, EPA is providing IEPA with directcompliance and enforcement assistance in the following areas: performing wet-weatherinspections, with emphasis on CSO and SSO inspections; offering pretreatment WWTPseminars; and facilitating seminars for industrial users of specific WWTPs. There is onefederal CSO enforcement action in Illinois. IEPA does not have administrative orderauthority.

IN-1
Strategy for CSO Control and NPDES Permitting
IDEM issued its Final Combined Sewer Overflow Strategy in May 1996. Amendmentswere in accordance with EPA's 1994 CSO Control Policy. The IDEM final strategy enhancesthe previous 1991 State CSO strategy's six minimum control requirements by includingthree additional controls and adding a requirement for the development of an LTCP.Operational plans that were previously submitted by communities to documentimplementation of the six minimum controls would have to be updated via the NPDESpermit process or through permit modification to account for the newly addedminimum controls.
CSO Permits
107
Permitted CSO Outfalls
898
NPDES Authority
Indiana Department of Environmental Management (IDEM)
Water Quality Standards Authority
IDEM; public comment and disputes handled by Indiana Water Pollution Control Board (WPCB)
Online Resources
www.dep.state.pa.us/dep/deputate/watermgt/wsm/facts/fs2655.htm Ohio River
Wabash
White
River
River
# # #### ## # ### # #### ### #### # ## #### #
# # ## ### ## ## # #
# #### #
# # ### ## ### ### ### #
## ## ### ## #
###
## ###
# ##
#
#
## ##
# #
#
#
#
#
#
#
#
#
#
#
50 0 50 100 Miles
CSO Permit
IllinoisOhio
Kentucky
MichiganMichigan
Lake
Indiana—Region 5
Program Highlights
● Indiana has 107 CSO permits,covering 105 CSO communities.
● Most permits issued since 1994require NMC (93 out of 107).Previously, permits required onlysix minimum controls.
● Indiana communities reportcompliance with the first eightNMC through submission andapproval of Operation andMaintenance Plans; the ninthNMC is satisfied through StreamReach Characterization andEvaluation Reports (SRCER).
● Most permittees are required todevelop LTCPs (87 of 107). Fivehave been submitted to date.
● A law passed in 2000 (SEA 431)will allow temporary suspensionof designated use following astorm event; guidance hasrecently been provided forcommunities on this provision.
● Initial CSS assessments of thestate identified approximately 130CSO permittees; there arecurrently 107 CSO permittees.
State Profile
NMC
Some BMPs
No BMPs
LTCP
Other Facility Plan
No Facility Plan
Total
93
0
14
87
1
19
86.9%
0%
13.1%
81.3%
1.0%
17.7%
107 100%
Total 107 100%
Number of Permits Percent
BMP Requirements
Facility Plan Requirements
Status of CSO Policy Requirements

IN-2
Report to Congress on Implementation and Enforcement of the CSO Control Policy
Permitting Program
IDEM is the NPDES authority. CSO communities are required to implement the NMC; 93of 107 permits have NMC requirements. CSO communities are also required to submit aCSO Operational Plan as part of the Operation and Maintenance Plan documents. TheOperational Plan (CSOOP) serves as the reporting mechanism for documentation of theNMC. A SRCER is required for most communities; it addresses the monitoringrequirement of the NMC. Several small communities and communities that are planningto separate its sewers do not have requirements to develop SRCERs.
LTCPs are required in 87 of 107 NPDES permits, however most of the LTCP due dates arein 2001 and beyond. Some communities that are separating their sewers or whosepermits have not been recently renewed do not have LTCP requirements. Fivecommunities have submitted LTCPs; none have been approved.
IDEM conducts inspections of CSO facilities on an annual or biannual basis. About 75percent of the inspections are conducted by IDEM, while EPA Region 5 conducts theremaining 25 percent.
Water Quality Standards Program
The Indiana WPCB is the rule-making arm of the IDEM water group and is responsible forreviewing and revising water quality standards. Use attainability analyses and waterquality standards reviews are conducted by IDEM. In 1990, Indiana required that allwaters at all times must support full-body contact uses. The state defines full-bodycontact as a daily maximum level for E. coli of 235 cfu/100ml, which has subsequentlybeen judicially interpreted as an end-of-pipe standard. Partly as a result of this decision,the legislature adopted SEA 431 in 2000 to allow targeted relief from this requirement,provided specific criteria are met.
Under SEA 431 CSO communities may request a suspension of designated use for nomore than four days after CSO discharge. IDEM guidance on SEA 431 provisions wasissued in May 2001. Between 50–75 percent of CSO communities are expected to takeadvantage of the SEA 431 suspension of use. Such suspensions of use are considered tobe changes to water quality standards and must be reviewed and approved by EPA.Suspensions of use are not likely to take place in areas that are genuine swimming areas,such as the beaches on Lake Michigan.
Enforcement Program
Several CSO communities have been issued warnings of noncompliance, generally forfailure to develop a CSOOP or a SRCER. In 2000, seven communities received a warningsof noncompliance. An additional two communities are expected to be referred toenforcement for failure to develop a SRCER in 2001. Five additional communities havealready been referred to enforcement for failure to develop a CSOOP, SRCER, or both.

MI-1
Strategy for CSO Control and NPDES Permitting
MDEQ requires that all CSO communities implement the NMC, and develop an LTCP.Although Michigan did not place emphasis on solids and floatables control during theinterim/initial phases of the CSO Control Plans, control of solids and floatables has beenrequired as part of the construction phase of the LTCP. Michigan requires thatcommunities either eliminate (via sewer separation) or provide "adequate treatment" ofCSOs. Adequate treatment is defined as follows:
Retention and full treatment of the one-year, one-hour design storm.
Primary treatment of the ten-year, one-hour design storm (primary treatment isdefined as 30-minute detention time).
Limited treatment of flows above the ten-year, one-hour design storm.
CSO Permits
52
Permitted CSO Outfalls
297
NPDES Authority/Water Quality Standards Authority
Michigan Department of Environmental Quality (MDEQ)
State Online Resources
www.deq.state.mi.us/
Michigan—Region 5
Program Highlights
Michigan requires design storm-based "adequate treatment" as abasis for the LTCP design. CSOcommunities may proposealternate treatment levels similarto EPA's "demonstrationapproach."
The Rouge River Valley (MetroDetroit) is the largest CSO project,encompassing 48 communities(20 permits).
48 of 52 CSO communities havesubmitted LTCPs and receivedState approval.
State Profile
#
#
####
#
##
###
#
## ## ## ##
### ##########
###########
#
# #
#
#
#
#
20 0 20 40 60 Miles
CSO Permits
Wisconsin
Illinois
IndianaOhio
Lake Erie
CANADA
CANADA
Lake Huron
Lake Superior
Lake
Michigan
Saginaw Bay
Kalamazoo River
Grand River
MuskegonRiver
NMC
Some BMPs
No BMPs
LTCP
Other Facility Plan
No Facility Plan
Total
52
0
0
51
0
1
100%
0%
0%
98%
0%
2%
52 100%
Total 52 100%
Number of Permits Percent
BMP Requirements
Facility Plan Requirements
Status of CSO Policy Requirements

MI-2
Report to Congress on Implementation and Enforcement of the CSO Control Policy
Communities that meet these requirements are presumed to meet water qualitystandards, corresponding to a more protective standard than the presumption approachoutlined in EPA's 1994 CSO Control Policy. Some communities are attempting todemonstrate that they can achieve water quality standards with lesser treatment thanthat required under Michigan's adequate treatment definition. This approach is explicitlyallowed in the permit.
In addition to the design standards above, approximately 25 communities haveseparated their sewers and are no longer considered CSSs. Several others haveeliminated CSO outfalls.
Permitting Program
MDEQ is the NPDES authority. Michigan's CSO program is implemented in two phases.Phase I requires operational improvement to minimize overflows, overflow monitoring,and construction of interim CSO control projects where feasible. Phase I also requiresdevelopment of a final program leading to elimination or adequate treatment of CSOs.Phase II is the implementation of the final program in subsequent NPDES permits. Allcommunities have submitted LTCPs, and all plans have had some degree of approval,with the exception of some projects and communities in the Rouge River watershed.
A special case in the State of Michigan is the Rouge River Watershed in and aroundMetro Detroit, which includes 48 communities and is spread over three counties insoutheast Michigan. The Rouge River is a National Demonstration Project for wetweather pollution control and watershed management. Approximately 20 CSO-relatedNPDES permits are associated with communities in the Rouge River area. In many cases,these permits include several co-permittees, including the county and neighboringcommunities. Total costs for CSO control in the Rouge River watershed are expected tototal $1-$3 billion when all controls are implemented by approximately 2005.
Water Quality Standards Program
MDEQ has jurisdiction over the water quality standards program. In general, Michiganwater quality standards staff are not involved in LTCP reviews, except when a communityis attempting to demonstrate that it can achieve water quality standards with lessertreatment than that required under Michigan's "adequate treatment" approach. Allcommunities meeting the design standards specified for CSO control are presumed tomeet water quality standards.
Michigan rules allow the use of alternate design flows (i.e., alternate to 7Q10 low flows or95 percent exceedance flows) when determining water quality-based requirements forintermittent wet weather discharges such as treated combined sewer overflows.
Enforcement Program
In cases where municipalities have been unwilling or unable to agree to correctiveprogram schedules acceptable to MDEQ, enforcement actions have been taken. Several"Director's Final Orders" have been issued to communities to develop and implement anLTCP. In addition, there is litigation and a consent order in the Rouge River Watershed.EPA Region 5 and the federal district court are also actively reviewing progress in theRouge River CSO program.

MN-1
Program Highlights
CSO Permits
3
Permitted CSO Outfalls
9
NPDES/Water Quality Standards Authority
Minnesota Pollution Control Agency (MPCA)
Online Resources
www.pca.state.mn.us/water/index.html
Minnesota—Region 5
● Sewer separation has beenrequired in permits since the late1970s, before issuance of the CSOControl Policy. Permit conditionsare essentially the NMC, andseparation is the LTCP.
● A 10-year, $331 million sewerseparation program inMinneapolis, St. Paul, and South St.Paul was more than 95 percentcomplete when the CSO Control
Policy was published in 1994.Separation was completed in 1996.
● Minneapolis and St. Paul still haveeight outfalls that are capable ofhaving a CSO; however, the twoCSOs belonging to St. Paul havenot overflowed within the past 5years. The cities monitor inflowand infiltration sources and willclose the regulators when theyhave verified that sufficient flowhas been removed. Five to six
regulators may remain open toprotect upstream facilities. SouthSt. Paul has no remaining outfallsand is no longer a CSOcommunity.
● In 1993, the City of Red Wingbegan a program to separate allremaining combined sewerswithin 10 years. The program is onschedule.
State Profile
NMC
Some BMPs
No BMPs
LTCP
Other Facility Plan
No Facility Plan
Total
3
0
0
0
3
0
100%
0%
0%
0%
100%
0%
3 100%
Total 3 100%
Number of Permits Percent
BMP Requirements
Facility Plan Requirements
Status of CSO Policy Requirements
Mississippi
RiverRiver St. Croix
RedRiver
Rainy River
#
#
#
North Dakota
South Dakota
Iowa
Michigan
CANADA
Lake Superior
Wisconsin
20 0 20 40 60 Miles
CSO Permits


OH-1
Strategy for CSO Control and NPDES Permitting
OEPA issued its revised CSO Strategy in 1995, which closely follows EPA's CSO ControlPolicy. Prior to 1995, OEPA required six minimum measures for CSO communities. Themajor provisions of Ohio's CSO Strategy require communities to:
● Develop an Operational Plan that includes documentation of the NMC.
● Conduct wet weather stress testing to maximize the ability of the wastewater plant totreat wet weather flows.
● Develop an LTCP.
There are some exceptions to the requirement to develop an LTCP. Small communitiesthat are separating their sewers are not required to develop an LTCP. Communities thatdo not discharge to State Resource Waters, bathing waters, or within 500 yards of apublic water supply intake, and for which there are no documented water quality
CSO Permits
93
Permitted CSO Outfalls
1,421
NPDES/Water Quality Standards Authority
Ohio Environmental Protection Agency (OEPA)
Online Resources
www.epa.state.oh.us/oepa.html
Ohio—Region 5
Program Highlights
● Operational Plans are required byOhio's CSO Strategy to documentimplementation of the NMC.
● 80 percent (62 out of 77 required)of CSO communities havesubmitted Operational Plans. 16communities are not required toimplement the NMC. Of these,three have not had permitsrenewed since 1995 and 13 arecompleting separation projects.
● LTCPs are required for 62 of the 93CSO communities. 25 LTCPs havebeen submitted to date and ninehave been approved.
● Small communities that areseparating sewers are notrequired to develop LTCPs.
● Initial CSS assessments of theState identified 101 CSOpermittees; there are currently 93CSO permittees.
State Profile
NMC
Some BMPs
No BMPs
LTCP
Other Facility Plan
No Facility Plan
Total
77
0
16
62
13
18
82.8%
0%
17.2%
66.7%
14.0%
19.4%
93 100%
Total 93 100%
Number of Permits Percent
BMP Requirements
Facility Plan Requirements
Status of CSO Policy Requirements
Ohio River
Scioto River
Muskingum
River
Maumee River
#
###
##
# ## # # # # # ###### # # #### # #### ### ## # #### ## ### ### ## ## ## # ##
#####
###
# ###
### ## ##
#
# ###
##
#
#
#
#
#
##
#
#
20 0 20 40 60 Miles
Indiana
Michigan
Pennsylvania
Kentucky
West Virginia
Lake Erie
CSO Permits
OH-2
Report to Congress on Implementation and Enforcement of the CSO Control Policy
impacts attributable to CSOs, initially must characterize and monitor the collectionsystem, but are not immediately required to develop a full LTCP. Development of an LTCPmay be required pending a review of the characterization and monitoring data or futurestream survey results. Approximately 35 percent of CSO communities fall in this lattercategory.
Most Ohio CSO communities are using the presumption approach in their LTCPs,choosing to capture and provide treatment for 85 percent of wet weather flows reachingthe collection system. Only a handful of communities are currently working with thedemonstration approach as the basis for their LTCPs.
Permitting Program
Prior to 1995, OEPA only required six of the minimum measures to be implemented. Forthree CSO communities which have not had permits renewed since that time, the NMCare not required. For all others (except for 13 communities that are completingseparation projects) the NMC are required by their NPDES permits. Operational Plans arethe mechanism by which Ohio communities report on the implementation of the NMC.Approximately 80 percent of communities have submitted these plans to the state.
LTCPs are required for approximately 62 of the 93 communities. Small communitiesplanning to separate its sewers are not required by the state to develop an LTCP. Thestate has received 25 of the required LTCPs to date, nine of which have been approved.
Water Quality Standards Program
Ohio has an active in-stream biological monitoring program to assess water quality andcompliance with standards. Bacterial standards in Ohio water bodies are set for fecalcoliform and E. coli; however, only fecal coliform standards are included in NPDESpermits. The fecal coliform standards are:
Designated Use Water Quality Standard
Secondary recreation No more than10 percent of samples can exceed 5000cfu/100mL
Primary recreation Geometric mean cannot exceed 1000 cfu/100mL No more than 10 percent of samples can exceed 2000 cfu/100mL
Bathing beaches Geometric mean cannot exceed 200 cfu/100mL No more than 10 percent of samples can exceed 400 cfu/100mL
The bacterial standards apply only during the May through October recreation season.Most water bodies in Ohio are classified for primary recreation, while bathing beachstandards apply only at actual bathing beaches. Four communities in Ohio haverequested water quality standards reviews and submitted biological monitoring data aspart of its CSO control plans; reviews have been conducted as a result. No changes instandards have resulted from these reviews.
Enforcement Program
When an enforcement action is brought in Ohio, the entire NPDES permit is examined,not only the CSO provisions. OEPA has used both Judicial Consent Orders andAdministrative Orders in its enforcement program, with the majority of enforcementactions taking the form of Judicial Consent Orders. OEPA has issued enforcement ordersfor: NMC implementation (three) LTCP development (two); and LTCP implementation(four). (There is overlap between the categories.) In addition, OEPA has joined in EPARegion 5 enforcement actions in Youngstown and Toledo.
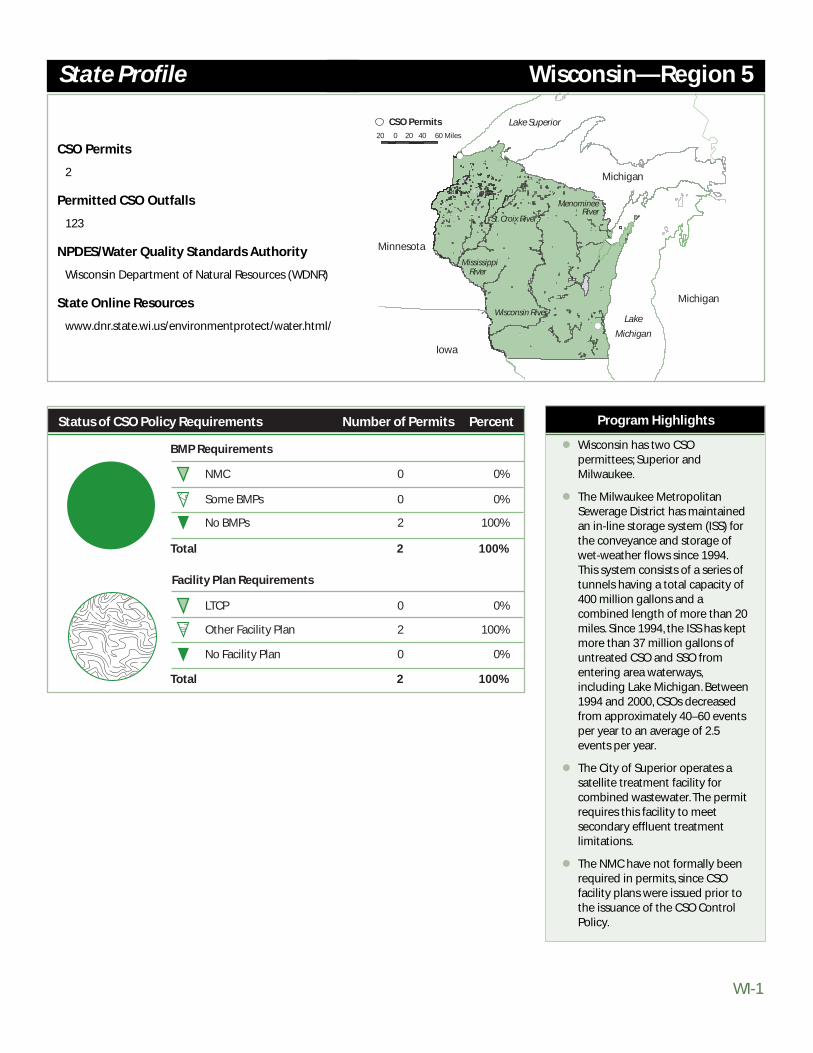
WI-1
CSO Permits
2
Permitted CSO Outfalls
123
NPDES/Water Quality Standards Authority
Wisconsin Department of Natural Resources (WDNR)
State Online Resources
www.dnr.state.wi.us/environmentprotect/water.html/
Wisconsin—Region 5
Program Highlights
Wisconsin has two CSOpermittees; Superior andMilwaukee.
The Milwaukee MetropolitanSewerage District has maintainedan in-line storage system (ISS) forthe conveyance and storage ofwet-weather flows since 1994.This system consists of a series oftunnels having a total capacity of400 million gallons and acombined length of more than 20miles. Since 1994, the ISS has keptmore than 37 million gallons ofuntreated CSO and SSO fromentering area waterways,including Lake Michigan. Between1994 and 2000, CSOs decreasedfrom approximately 40–60 eventsper year to an average of 2.5events per year.
The City of Superior operates asatellite treatment facility forcombined wastewater. The permitrequires this facility to meetsecondary effluent treatmentlimitations.
The NMC have not formally beenrequired in permits, since CSOfacility plans were issued prior tothe issuance of the CSO ControlPolicy.
State Profile
NMC
Some BMPs
No BMPs
LTCP
Other Facility Plan
No Facility Plan
Total
0
0
2
0
2
0
0%
0%
100%
0%
100%
0%
2 100%
Total 2 100%
Number of Permits Percent
BMP Requirements
Facility Plan Requirements
Status of CSO Policy Requirements
#
#
20 0 20 40 60 Miles
CSO Permits
Minnesota
Michigan
Michigan
Iowa
Lake
Michigan
Lake Superior
Mississippi River
St. Croix River
Wisconsin River
Menominee River


IA-1
Strategy for CSO Control and NPDES Permitting
IDNR based its CSO program on the 1989 National CSO Control Strategy and formalizedits state strategy in 1990 to:
● Eliminate dry-weather CSOs (ensure that CSOs occurred only during wet weatherevents).
● Encourage communities to separate sewers where possible.
● Bring all CSO discharge points into compliance with technology-based requirementsof the CWA and applicable state water quality standards.
● Minimize the impacts of wet-weather overflows on water quality, aquatic biota, andhuman health.
The strategy also outlines an approach and time frame for inventorying all CSOdischarge points; evaluating current water quality standards criteria and stream use
CSO Permits
15
Permitted CSO Outfalls
102
NPDES Authority/Water Quality Standards Authority
Iowa Department of Natural Resources (IDNR)
Online Resources
www.state.ia.us/government/dnr/organiza/epd/comp_enf/index.htmwww.state.ia.us/government/dnr/organiza/epd/wastewtr/wastwtr.htm/
Program Highlights
● The current state CSO strategywas developed in 1990 andrequires evaluating hydrauliccapacity and incorporating the sixminimum measures intooperations and maintenanceplans; the strategy wasincorporated into NPDES permitsissued/reissued through the mid-1990s.
● Some CSOs were addressedunder FEMA-funded hydrauliccapacity separation and upgradeprojects following MississippiRiver floods.
● IDNR is working to incorporatethe NMC and LTCPs into permits,with stakeholder involvement, asthey are reissued.
● 13 of 15 facilities havedocumented capacity upgrades,separation, hydraulicrehabilitation, and generalimprovements to treat more wet-weather flows; theseimprovements are generallyincluded in facility planningdocuments and capitalimprovement plans, or wereformalized through a complianceschedule in an enforceable orderfor hydraulic overloads.
State Profile
Illinois
Wisconsin
Minnesota
Nebraska
South Dakota
Missouri
River
Missouri
IowaRiver
Des Moines River
Mississippi
River
50 50 100 Miles0
CSO Permits
NMC
Some BMPs
No BMPs
LTCP
Other Facility Plan
No Facility Plan
Total
1
14
0
1
6
8
6.7%
93.3%
0%
6.7%
40.0%
53.3%
15 100%
Total 15 100%
Number of Permits Percent
BMP Requirements
Facility Plan Requirements
Status of CSO Policy Requirements
Iowa—Region 7
IA-2
Report to Congress on Implementation and Enforcement of the CSO Control Policy
designations, and technology-based limitations for wet-weather CSO water qualityimpacts; a rule-making process within the state for implementing the strategy; and aprocess for including this in the NPDES permitting process.
After the CSO Control Policy was developed, Iowa chose to continue withimplementation of its current state strategy, citing the following rationale: time andinvestment in formalizing the Iowa state strategy, uncertainty of whether or not the CSOControl Policy would be modified and/or made law, similarity of the six minimummeasures and the new NMC, lack of formal state program funding for the CSO program,and prioritization of permitting backlogs.
Permitting Program
Since inception of its CSO strategy through 1999, IDNR included a section called "SpecialConditions—Combined Sewer Overflows" in all NPDES permits covering CSOcommunities that had not been identified as moving forward with complete separation.Generally, this condition included the following provisions:
● Documentation specifying the collection system as having both combined storm andsanitary sewers with CSOs.
● The hydraulic capacity determined within 6 months of issuance date, for each sewerbetween the point of overflow and the treatment facility.
● An operational plan, developed and submitted within nine months of issuance date,with the objective of meeting the six minimum measures outlined in the NationalCSO Control Strategy and implement the approved plan within one year.
● A re-opener clause related to possible changes in state standards or effluent limitsrelated to CSOs.
During the last round of permit reissuance, EPA Region 7 objected to IDNR not includingthe CSO Control Policy program elements in NPDES permits for CSO communities. IDNRnow has an approach of contacting the CSO communities to develop aconsensus/stakeholder approach and time frame for implementing the NMC anddeveloping an LTCP. This approach is formalized in a special CSO section of the reissuedpermit. Beginning in 2000, reissued permits include a special condition with thefollowing stipulations:
● Development and submission of an operational plan for implementing the NMCwithin six months of permit issuance;
● Implementation of the operational plan within 24 months of issuance anddocumentation of implementation;
● Submission of an LTCP within 36 months of issuance;
● Provision not to discharge any pollutant at a level that causes or contributes to an in-stream excursion above the numeric or narrative criteria in Iowa's water qualitystandards; and
● A re-opener clause that addresses changes in water quality standards, informationindicating that the proposed level of CSO controls aren't meeting water qualitystandards, or new information generated from the LTCP.
To date, one CSO community permit has been reissued with identified milestones forimplementing the CSO Control Policy objectives in the NPDES permit, and three othersare pending reissuance. Of the original 20 CSO communities identified, five havecompletely separated their systems, and one community was found not to have acombined sewer system. Recently, Iowa issued a draft permit to the City of Des Moinesfor its CSOs, effectively increasing the number of Iowa permits by one. Des Moines hadbeen covered under a regional wastewater treatment provider’s permit.
IA-3
State Profile: Iowa—Region 7
Based on the 2000 Amendments to the CWA, IDNR plans on evaluating the codificationof the CSO Control Policy and determining how to formally incorporate the Policy into itsstate regulatory program.
Water Quality Standards Program
While a process for evaluation of water quality standards was identified in the IDNR CSOStrategy, the approach was not formalized or implemented state-wide. IDNR staffresponsible for the water quality standards program are not involved in the CSOplanning process, have not conducted any reviews for receiving waters impacted byCSOs, and generally do not give CSO-impacted waters any special consideration duringthe triennial review process for water quality standards.
Enforcement Program
Ongoing enforcement actions within Iowa's CSO communities are not specifically CSO-related. Administrative orders and other actions, at the state and regional level, havebeen issued to address effluent limits and loadings issues related to hydraulic capacityproblems during wet weather conditions. Those orders within CSO communities haveled to CSO planning, abatement, and elimination.

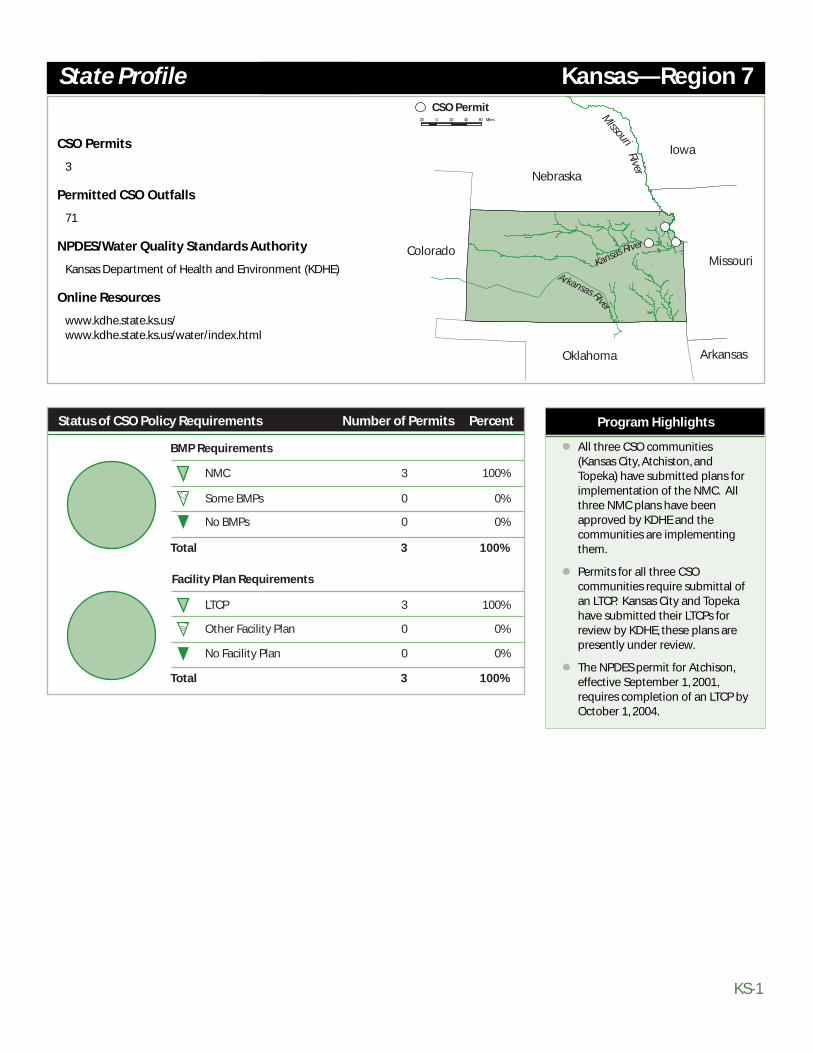
KS-1
Kansas—Region 7
CSO Permits
3
Permitted CSO Outfalls
71
NPDES/Water Quality Standards Authority
Kansas Department of Health and Environment (KDHE)
Online Resources
www.kdhe.state.ks.us/www.kdhe.state.ks.us/water/index.html
Program Highlights
All three CSO communities(Kansas City, Atchiston, andTopeka) have submitted plans forimplementation of the NMC. Allthree NMC plans have beenapproved by KDHE and thecommunities are implementingthem.
Permits for all three CSOcommunities require submittal ofan LTCP. Kansas City and Topekahave submitted their LTCPs forreview by KDHE, these plans arepresently under review.
The NPDES permit for Atchison,effective September 1, 2001,requires completion of an LTCP byOctober 1, 2004.
State Profile
Nebraska
Oklahoma
Missouri
Iowa
Colorado
Arkansas
Missouri
River
Kansas
Arkansas
River
River
CSO Permit20 0 20 40 60 Miles
NMC
Some BMPs
No BMPs
LTCP
Other Facility Plan
No Facility Plan
Total
3
0
0
3
0
0
100%
0%
0%
100%
0%
0%
3 100%
Total 3 100%
Number of Permits Percent
BMP Requirements
Facility Plan Requirements
Status of CSO Policy Requirements

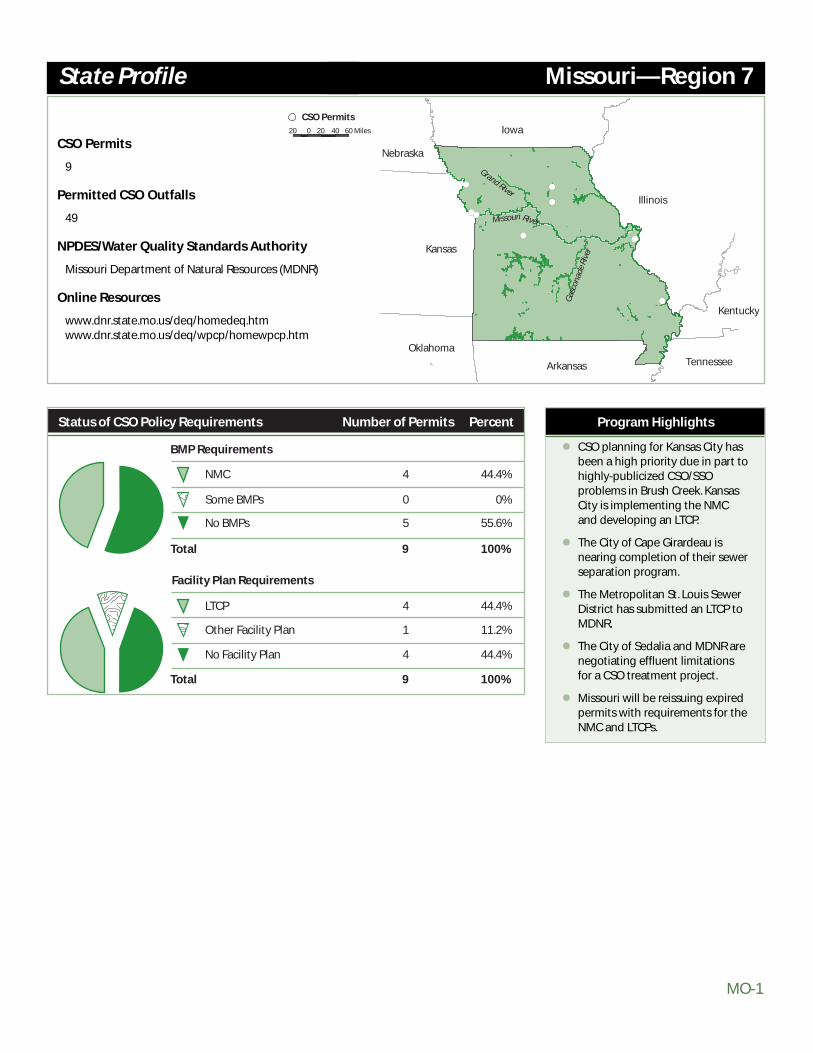
MO-1
CSO Permits
9
Permitted CSO Outfalls
49
NPDES/Water Quality Standards Authority
Missouri Department of Natural Resources (MDNR)
Online Resources
www.dnr.state.mo.us/deq/homedeq.htmwww.dnr.state.mo.us/deq/wpcp/homewpcp.htm
Missouri—Region 7
Program Highlights
CSO planning for Kansas City hasbeen a high priority due in part tohighly-publicized CSO/SSOproblems in Brush Creek. KansasCity is implementing the NMCand developing an LTCP.
The City of Cape Girardeau isnearing completion of their sewerseparation program.
The Metropolitan St. Louis SewerDistrict has submitted an LTCP toMDNR.
The City of Sedalia and MDNR arenegotiating effluent limitationsfor a CSO treatment project.
Missouri will be reissuing expiredpermits with requirements for theNMC and LTCPs.
State Profile
NMC
Some BMPs
No BMPs
LTCP
Other Facility Plan
No Facility Plan
Total
4
0
5
4
1
4
44.4%
0%
55.6%
44.4%
11.2%
44.4%
9 100%
Total 9 100%
Number of Permits Percent
BMP Requirements
Facility Plan Requirements
Status of CSO Policy Requirements
# #
#
##
#
##
#
Missouri River
Gas
cona
de R
iver
Grand River
Iowa
Illinois
Kentucky
Arkansas
Oklahoma
Kansas
Nebraska
Tennessee
CSO Permits20 0 20 40 60 Miles


NE-1
CSO Permits
2
Permitted CSO Outfalls
26
NPDES/Water Quality Standards Authority
Nebraska Department of Environmental Quality (NDEQ)
State Online Resources
www.deq.state.ne.us/ www.deq.state.ne.us/Programs.nsf/pages/WQD
Nebraska—Region 7
Strategy for CSO Control and NPDES Permitting
Plattsmouth discharges to the Missouri River. Permit requirements to address CSOdischarges will be included in the reissuance of its general NPDES permit, which iscurrently under review.
Omaha, which discharges to the Missouri River and tributaries, has voluntarilyimplemented the NMC. The management plan for implementing the NMC was submittedto NDEQ in 1997. This management plan continues to be revised as necessary to reflectoperation and maintenance changes.
Omaha is also in the process of collecting background information so that a watershedapproach can be used in developing an LTCP. Elements of the watershed-based LTCPinclude defining baseline conditions, developing the range of beneficial uses, definingCSO and non-CSO control levels, and the selection and implementation of a CSO controlprogram. NDEQ anticipates issuing a separate CSO permit to the City of Omaha beforethe end of 2001.
Program Highlights
● The Cities of Omaha andPlattsmouth are Nebraska’s onlyCSO dischargers. The City of Ord,which was previously identified ashaving some combined sewers,has eliminated CSO discharges.
● Omaha has voluntarilyimplementied the NMC and isdeveloping a watershed approachto LTCP development.
● Neither community has a CSOrequirement in its current permit.CSO requirements will be addedto the Plattsmouth generalNPDES permit when it is reissued,and Omaha will have a separateCSO permit by the end of 2001.
State Profile
NMC
Some BMPs
No BMPs
LTCP
Other Facility Plan
No Facility Plan
Total
0
0
2
0
1
1
0%
0%
100%
0%
50%
50%
2 100%
Total 2 100%
Number of Permits Percent
BMP Requirements
Facility Plan Requirements
Status of CSO Policy Requirements
Platte River
Republican River
Niobrara RiverMissouri
River
N. Platte River
Kansas
Missouri
Iowa
South Dakota
Wyoming
Colorado
#
#
20 0 20 40 60 Miles
CSO Permits


SD-1
CSO Permits
1
Permitted CSO Outfalls
1
NPDES/Water Quality Standards Authority
South Dakota Department of Environment andNatural Resources (SDENR)
State Online Resources
www.state.sd.us/denr/denr.html
South Dakota—Region 8
Strategy for CSO Control and NPDES Permitting
Lead, South Dakota’s only CSO community, has one outfall. It was originally listed in thepermit for the local sanitary district; however, following the release of EPA's CSO ControlPolicy, the sanitary district requested that the CSO outfall be removed from its permit andthe community be permitted directly. In December of 1996, the SDENR issued a CSOpermit to the community. The permit required implementation and documentation ofthe NMC and development of an LTCP. The LTCP was approved in January of 1999, and itrecommended sewer separation as the primary CSO control. The community hascompleted approximately 10 percent of the proposed sewer separation and plans toachieve full separation within the next few years.
Program Highlights
● South Dakota's one CSOcommunity, Lead, chose sewerseparation as its primary CSOcontrol.
● Sewer separation isapproximately10 percentcomplete.
State Profile
NMC
Some BMPs
No BMPs
LTCP
Other Facility Plan
No Facility Plan
Total
1
0
0
1
0
0
100%
0%
0%
100%
0%
0%
1 100%
Total 1 100%
Number of Permits Percent
BMP Requirements
Facility Plan Requirements
Status of CSO Policy Requirements
#
20 0 20 40 60 Miles
Missouri River
Minnesota River
Cheyenne River
Big Sioux River
North Dakota
Montana
Wyoming
Nebraska
Iowa
Minnesota
CSO Permit

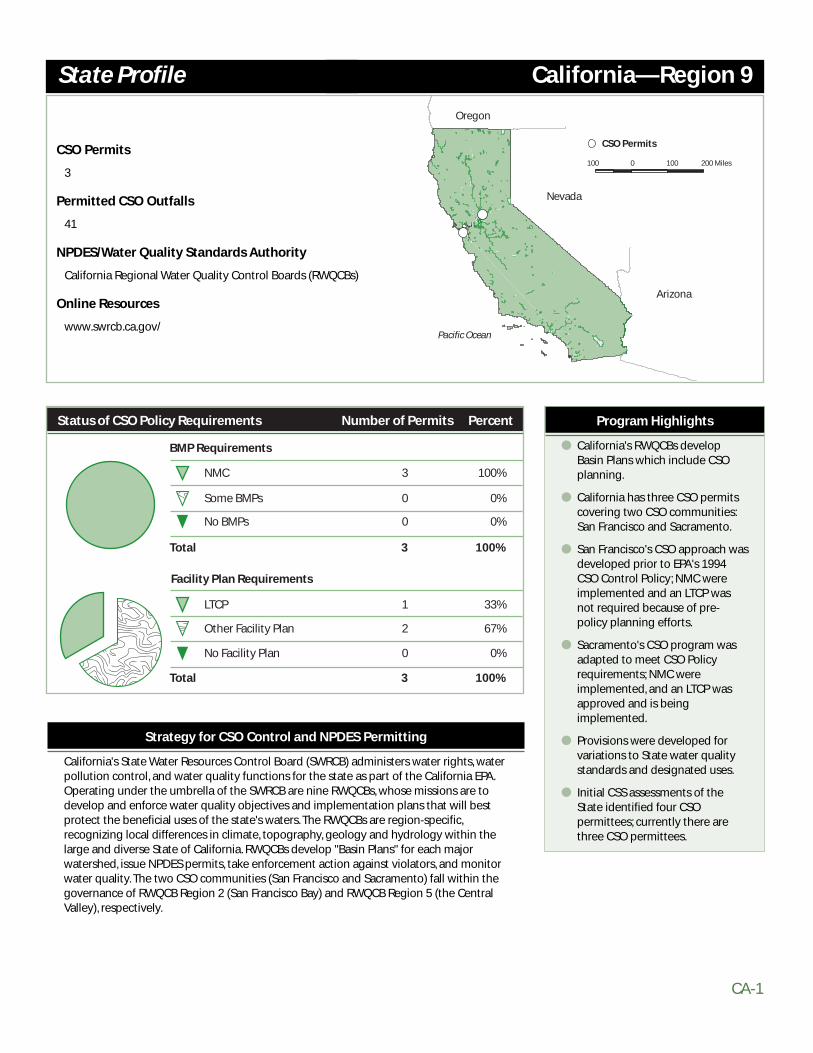
CA-1
Strategy for CSO Control and NPDES Permitting
California's State Water Resources Control Board (SWRCB) administers water rights, waterpollution control, and water quality functions for the state as part of the California EPA.Operating under the umbrella of the SWRCB are nine RWQCBs, whose missions are todevelop and enforce water quality objectives and implementation plans that will bestprotect the beneficial uses of the state's waters. The RWQCBs are region-specific,recognizing local differences in climate, topography, geology and hydrology within thelarge and diverse State of California. RWQCBs develop "Basin Plans" for each majorwatershed, issue NPDES permits, take enforcement action against violators, and monitorwater quality. The two CSO communities (San Francisco and Sacramento) fall within thegovernance of RWQCB Region 2 (San Francisco Bay) and RWQCB Region 5 (the CentralValley), respectively.
CSO Permits
3
Permitted CSO Outfalls
41
NPDES/Water Quality Standards Authority
California Regional Water Quality Control Boards (RWQCBs)
Online Resources
www.swrcb.ca.gov/
California—Region 9
Program Highlights
● California's RWQCBs developBasin Plans which include CSOplanning.
● California has three CSO permitscovering two CSO communities:San Francisco and Sacramento.
● San Francisco's CSO approach wasdeveloped prior to EPA's 1994CSO Control Policy; NMC wereimplemented and an LTCP wasnot required because of pre-policy planning efforts.
● Sacramento's CSO program wasadapted to meet CSO Policyrequirements; NMC wereimplemented, and an LTCP wasapproved and is beingimplemented.
● Provisions were developed forvariations to State water qualitystandards and designated uses.
● Initial CSS assessments of theState identified four CSOpermittees; currently there arethree CSO permittees.
State Profile
0100 100 200 Miles
Oregon
Nevada
Arizona
Pacific Ocean
CSO Permits
BMP Requirements
NMC
Some BMPs
No BMPs
Facility Plan Requirements
LTCP
Other Facility Plan
No Facility Plan
Total
3
0
0
1
2
0
100%
0%
0%
33%
67%
0%
3 100%
Total 3 100%
Number of Permits PercentStatus of CSO Policy Requirements

CA-2
Report to Congress on Implementation and Enforcement of the CSO Control Policy
San Francisco Bay RWQCB CSO Approach
In the mid-1970s, the San Francisco Bay RWQCB approved a Master Plan andEnvironmental Impacts Statement and Report developed to address San Francisco'sCSOs. These planning efforts led to the implementation of a series of structural and in-system controls prior to the development of the CSO Control Policy. Site-specificsolutions were developed and implemented based on San Francisco's sewer system (twodistinct systems; many steep slopes hindering storage in the system), with the overallobjective of addressing CSO impacts on public health in high-contact areas such aspublic parks, beaches, and recreation areas.
Central Valley RWQCB CSO Approach
In the early 1990s, the Central Valley RWQCB required Sacramento to initiate planning toaddress hydraulic capacity issues that were resulting in frequent CSOs, SSOs, and streetflooding. After the development of the CSO Control Policy, the Central Valley RWQCBrequired that the previously initiated planning effort include the provisions identified inthe Policy. This approach was formalized by requiring NMC and development of an LTCPin the NPDES permit. The LTCP focused on reducing flow into the system and increasingboth storage and treatment capacity.
Permitting Program
The RWQCBs issue NPDES permits within California, with input and oversight by EPARegion 9. All CSO facilities have special conditions within the permit that outline facilityrequirements, which are based on the community's status in planning and implementingCSO controls. All California NPDES permits for CSOs have narrative language requiringthe ongoing operation of the system through use of the NMC.
In the San Francisco area, two NPDES permits contain CSO provisions. The San FranciscoBay RWQCB has included special CSO language in both permits requiring the NMC andcertifies that all NMC have been implemented. LTCPs are not required in San Francisco aspre-policy planning efforts led to nonstructural and structural controls that meet itswater quality objectives (see discussion under Water Quality Standards Program below).
In Sacramento, the Central Valley RWQCB administers one NPDES permit to the City ofSacramento for the CSS and wet weather treatment facilities. The Central Valley RWQCBformalized the requirements for NMC and the development of an LTCP in the 1996reissuance of the NPDES permit. The RWQCB has certified that all NMC are in place andthat projects identified in the approved LTCP will be completed by 2001.
Water Quality Standards Program
By law, the RWQCBs are required to develop, adopt, and implement Water QualityControl Plans (Basin Plans) for major watersheds. Basin Plans provide the framework forprotection of water quality in California; they also include identification of beneficialuses, water quality objectives to protect beneficial uses, and an implementation programto ensure that beneficial uses are protected. All basin plans undergo triennial reviews.The SWRCB developed two state-wide water quality control documents: Water QualityControl Plan for Ocean Waters of California (Ocean Plan) and Water Quality Control Planfor Control of Temperature in the Coastal and Interstate Waters and Enclosed Bays andEstuaries of California (Thermal Plan). These plans describe objectives and effluentlimitations for ocean waters. None of the plans specifically address CSO-impacted waters;however, general provisions are cited which consider modifications to water qualityobjectives in cases where compliance would be prohibitively expensive or technicallyimpossible.
CA-3
State Profile: California—Region 9
The San Francisco RWQCB has issued two orders related to CSO-impacted water qualitystandards:
● The Board Order, issued in 1979, allowed for different long-term average overflowfrequencies (1, 4, or 10) per year for specific overflow points within San Francisco'sBayside combined sewer system. The order was based on CSO planning information(i.e., facility costs to achieve specific overflow frequencies and associated waterquality benefits), staff findings, and public input. The approach identified in the orderwas expected to provide adequate protection of beneficial uses.
● In 1979, the SWRCB also issued (and EPA Region 9 approved) an exception to all waterquality standards in the Ocean Plan for shoreline CSOs for San Francisco's Oceansidecombined sewer system (Order WQ79-16). The general findings, issued in 1979,indicated that this exception would not compromise the protection of ocean watersfor beneficial uses. This approach would therefore be presumed to provide anadequate level of control to meet the water quality-based provisions of the CWA (andthus numerical limits applicable to treated shoreline CSOs were not needed).
There are no known CSO-related water quality standards actions within the CentralValley RWQCB.
Enforcement Program
The RWQCBs have authority to implement and enforce the water quality laws,regulations, policies, and plans to protect the waters of the state. RWQCBs have a numberof formal and informal enforcement mechanisms that can be issued to CSOcommunities. For the two CSO communities in California, one enforcement action hasbeen issued for violations of state water quality provisions directly related to CSOs. ACease and Desist Order was issued to Sacramento requiring them to address chronicCSOs, SSOs, and sanitary sewage erupting from manholes during wet weather events.This order initiated Sacramento's pre-CSO Policy planning efforts and eventually led tothe development and implementation of its LTCP.

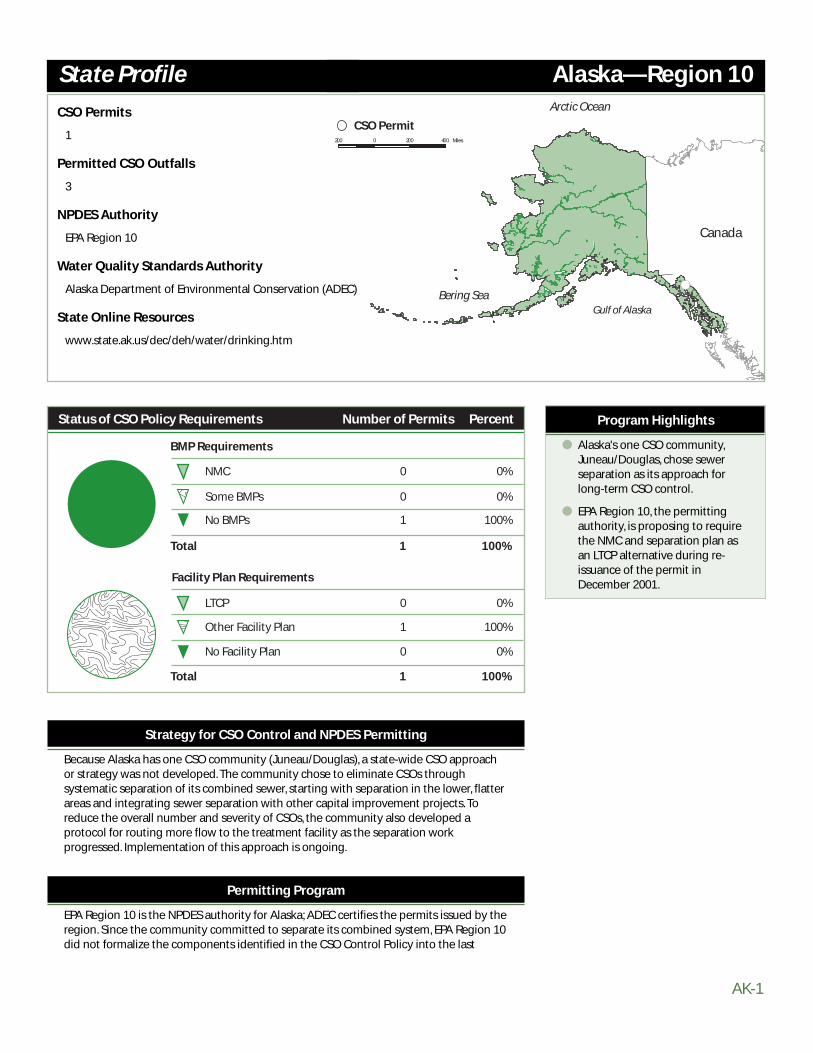
AK-1
Strategy for CSO Control and NPDES Permitting
Because Alaska has one CSO community (Juneau/Douglas), a state-wide CSO approachor strategy was not developed. The community chose to eliminate CSOs throughsystematic separation of its combined sewer, starting with separation in the lower, flatterareas and integrating sewer separation with other capital improvement projects. Toreduce the overall number and severity of CSOs, the community also developed aprotocol for routing more flow to the treatment facility as the separation workprogressed. Implementation of this approach is ongoing.
Permitting Program
EPA Region 10 is the NPDES authority for Alaska; ADEC certifies the permits issued by theregion. Since the community committed to separate its combined system, EPA Region 10did not formalize the components identified in the CSO Control Policy into the last
CSO Permits
1
Permitted CSO Outfalls
3
NPDES Authority
EPA Region 10
Water Quality Standards Authority
Alaska Department of Environmental Conservation (ADEC)
State Online Resources
www.state.ak.us/dec/deh/water/drinking.htm
Alaska—Region 10
Program Highlights
● Alaska's one CSO community,Juneau/Douglas, chose sewerseparation as its approach forlong-term CSO control.
● EPA Region 10, the permittingauthority, is proposing to requirethe NMC and separation plan asan LTCP alternative during re-issuance of the permit inDecember 2001.
State Profile
#
Arctic Ocean
Canada
Bering SeaGulf of Alaska
200 0 200 400 Miles
CSO Permit
BMP Requirements
NMC
Some BMPs
No BMPs
Facility Plan Requirements
LTCP
Other Facility Plan
No Facility Plan
Status of CSO Policy Requirements
Total
0
0
1
0
1
0
0%
0%
100%
0%
100%
0%
1 100%
Total 1 100%
Number of Permits Percent

AK-2
Report to Congress on Implementation and Enforcement of the CSO Control Policy
NPDES permit (1996). EPA Region 10 included a CSO section in the permit requiringmonitoring and reporting of CSOs. The current permit expires in 2001, and Region 10indicates that the new permit will include provisions for implementing and reporting theNMC and for formalizing the sewer separation schedule.
Water Quality Standards Program
ADEC is responsible for the development, issuance, and implementation of Alaska'swater quality standards. State standards do not allow for or address variances oramendments to current water quality standards for CSO-impacted waterways. Thecommunity's approach (i.e., separation) will eliminate the need for the state to considervariances or amendments to current water quality standards.
Enforcement Program
Both EPA Region 10 and ADEC are responsible for enforcement and compliance ofNPDES permitting within the State of Alaska. There are no documented enforcementefforts or activities related to CSOs.
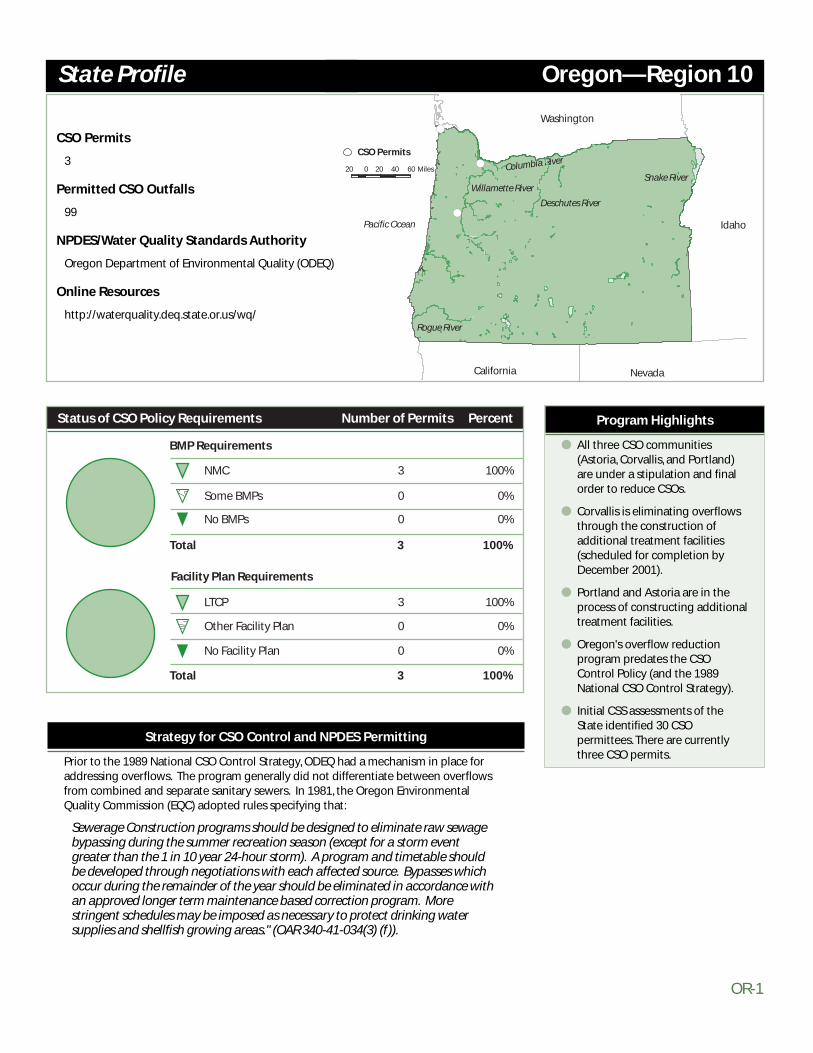
OR-1
Strategy for CSO Control and NPDES Permitting
Prior to the 1989 National CSO Control Strategy, ODEQ had a mechanism in place foraddressing overflows. The program generally did not differentiate between overflowsfrom combined and separate sanitary sewers. In 1981, the Oregon EnvironmentalQuality Commission (EQC) adopted rules specifying that:
Sewerage Construction programs should be designed to eliminate raw sewagebypassing during the summer recreation season (except for a storm eventgreater than the 1 in 10 year 24-hour storm). A program and timetable shouldbe developed through negotiations with each affected source. Bypasses whichoccur during the remainder of the year should be eliminated in accordance withan approved longer term maintenance based correction program. Morestringent schedules may be imposed as necessary to protect drinking watersupplies and shellfish growing areas." (OAR 340-41-034(3) (f)).
CSO Permits
3
Permitted CSO Outfalls
99
NPDES/Water Quality Standards Authority
Oregon Department of Environmental Quality (ODEQ)
Online Resources
http://waterquality.deq.state.or.us/wq/
Oregon—Region 10
Program Highlights
● All three CSO communities(Astoria, Corvallis, and Portland)are under a stipulation and finalorder to reduce CSOs.
● Corvallis is eliminating overflowsthrough the construction ofadditional treatment facilities(scheduled for completion byDecember 2001).
● Portland and Astoria are in theprocess of constructing additionaltreatment facilities.
● Oregon's overflow reductionprogram predates the CSOControl Policy (and the 1989National CSO Control Strategy).
● Initial CSS assessments of theState identified 30 CSOpermittees. There are currentlythree CSO permits.
State Profile
NMC
Some BMPs
No BMPs
LTCP
Other Facility Plan
No Facility Plan
Total
3
0
0
3
0
0
100%
0%
0%
100%
0%
0%
3 100%
Total 3 100%
Number of Permits Percent
BMP Requirements
Facility Plan Requirements
Status of CSO Policy Requirements
Pacific Ocean
Columbia River
Willamette River
Deschutes River
Snake River
Rogue River
#
#
#
20 0 20 40 60 Miles
Washington
Idaho
California Nevada
CSO Permits
OR-2
Report to Congress on Implementation and Enforcement of the CSO Control Policy
Oregon's policy provided a means to prioritize overflows for reduction or elimination.For example, overflows that contribute to shellfish contamination were among the firsttargeted for elimination. Many CSO communities within the Willamette Valley thatexperienced overflows during the summer recreation period were required to undertakecorrective action to eliminate summer overflows; other CSO communities that wereunder a longer term permit schedule elected to separate its systems.
As the program progressed and permits came up for renewal, all CSO communities withreported outfalls were placed under a compliance schedule to eliminate overflows inaccordance with the EQC policy, or were required to assess the frequency and durationof overflows to aid in determining further compliance actions that may be needed.Although these actions did not anticipate EPA's 1989 National CSO Control Strategy,Oregon's program did acknowledge the CWA objectives to address point sources ofpollution that can affect compliance with water quality standards and beneficial useprotection.

WA-1
Strategy for CSO Control and NPDES Permitting
In 1985, the Washington state legislature enacted law within the state code to begin CSOplanning through Ecology. The goal of the code was to achieve the greatest reduction inCSO discharges as soon as possible. In response to this code, Chapter 173-245 of theWashington Administrative Code (WAC), "Submission of Plans and Reports forConstruction and Operation of Combined Sewer Overflow Reduction Facilities," wasdeveloped and enacted in 1987 to enable Ecology to administer the program. Theprincipal features of the code required the development of a CSO reduction plan toreduce overflows to an average of no more than one per year. Required components ofthe reduction plans are as follows:
Documentation of CSO activity—Complete a field assessment and mathematicalmodeling study to determine CSO locations, overflow frequency, and overflowquantity, and to characterize the discharge and assess historical impacts.
CSO Permits
11
Permitted CSO Outfalls
219
NPDES/Water Quality Standards Authority
Washington Department of Ecology (Ecology)
Online Resources
www.ecy.wa.gov/ www.ecy.wa.gov/programs/wq/wqhome.html
Washington—Region 10
Program Highlights
The state program was initiated in1987 and allows one averageannual overflow.
The state program requires a CSOreduction plan, which Ecologyequates to an LTCP. Annualreporting and five-year updatesto CSO reduction plans are alsorequired.
All CSO communities havesubmitted NMC documentation,and all but one (a newlypermitted facility) have submittedand are implementing CSOreduction plans.
A CSO compliance schedule isincluded in the NPDES permits.
Initial CSS assessments of thestate identified 15 CSOpermittees; there are currently 11permittees.
State Profile
NMC
Some BMPs
No BMPs
LTCP
Other Facility Plan
No Facility Plan
Total
11
0
0
11
0
0
100%
0%
0%
100%
0%
0%
11 100%
Total 11 100%
Number of Permits Percent
BMP Requirements
Facility Plan Requirements
Status of CSO Policy Requirements
Columbia River
Snake River
Spokane
Columbia
Columbia
PugetSound
River River
River#
#
###
#
#
#
##
#
20 0 20 40 60 Miles
CSO Permits
CANADA
Idaho
Oregon
Pacific Ocean
WA-2
Report to Congress on Implementation and Enforcement of the CSO Control Policy
Analysis of control/treatment alternatives—Consider and assess use of BMPs (e.g.,sewer ordinances, pretreatment, sewer maintenance programs, I/I programs, etc.),storage and disinfection, routing more flow to the plant, site/outfall treatment, andseparation.
Analysis of selected treatment/control projects—Analyze water quality impacts of thecontrol projects.
Priority ranking—Rank the selected control alternatives to ensure impacts to sensitiveareas are the highest priority and other projects are ranked based on cost-effectiveness and overall environmental benefits.
Schedule—Propose a schedule for achieving the greatest reduction as soon aspossible (if more than five years; include the priority projects over the first five years).
Ecology evaluated its program and determined that it exceeded or met the goals ofEPA's CSO Control Policy, certifying that CSO reduction plans equated to LTCPs. The onlydeficiency noted was in meeting the public participation component, which was notlisted in the Ecology requirements. Ecology is working to ensure this requirement is metby CSO communities as they develop their controls and programs.
Permitting Program
NPDES permitting is handled through the four regional Ecology offices; three officeshave CSO-permitted facilities with more than 70 percent of the facilities under themanagement of the Northwest regional office. All regional offices have included CSOconditions within the NPDES permit for CSO communities requiring the following:
A list of CSO outfall locations.
Annual reports on CSO activities and overflows for the past year and planned projectsfor the next year.
A CSO reduction plan amendment, due upon renewal of the permit.
A compliance schedule.
All CSO facilities have submitted NMC, and all but one (a newly permitted collectionsystem) have submitted and are implementing controls identified in its CSO reductionplans. As permits are reissued, Ecology is attempting to include additional CSOconditions to ensure that public participation is addressed in CSO planning at allfacilities.
Water Quality Standards Program
Water quality standards revisions and triennial reviews are conducted by Ecology’sheadquarters office. No special considerations are given to CSO-impacted waters, as thestate's policy on CSOs (no more than one annual average overflow) is believed to enablecommunities to meet water quality standards. There are no provisions or plans forallowing revisions or variances to water quality standards within state waters.
Enforcement Program
Enforcement of the CSO program is handled through Ecology and inherently is includedin the review of the annual CSO reports, progress made in meeting water qualityobjectives, and progress made in completing projects as outlined in the CSO reductionplan. Ecology staff can issue compliance or other enforcement orders that areincorporated into a compliance schedule attached to the NPDES permit. EPA Region 10also has program oversight; however, there are no known EPA-enforcement actionsrelated to CSO compliance in Washington.

Appendix C
CSO Community Case Studies
C.10 Randolph, Vermont
C.11 Richmond, Virginia
C.12 Rouge River Wet WeatherDemonstration Project, Detroit,Michigan
C.12 Saginaw, Michigan
C.14 San Francisco, California
C.15 South Portland, Maine
C.16 Washington, DC
C.17 Wheeling, West Virginia
C.1 Atlanta, Georgia
C.2 Bremerton, Washington
C.3 Burlington, Iowa
C.4 Chicago, Illinois
C.5 Columbus, Georgia
C.6 Louisville-Jefferson County,Kentucky
C.7 Massachusetts Water ResourcesAuthority, Boston,Massachusetts
C.8 Muncie, Indiana
C.9 North Bergen, New Jersey

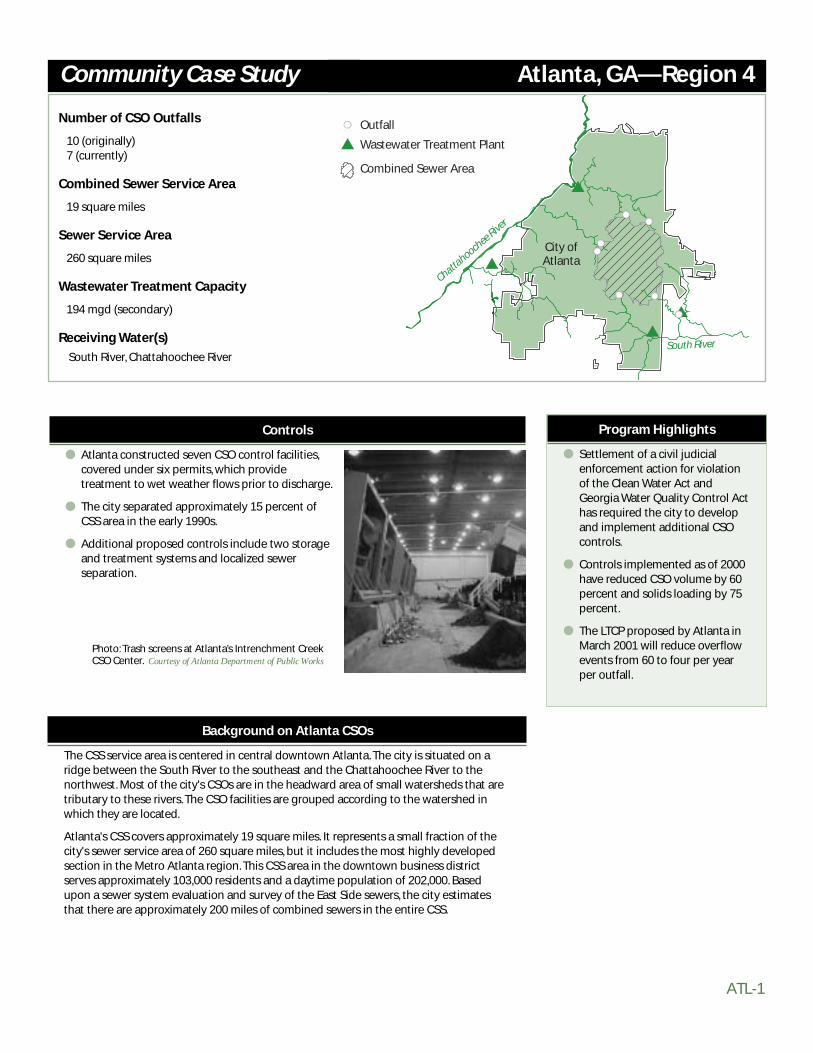
ATL-1
Number of CSO Outfalls
10 (originally)7 (currently)
Combined Sewer Service Area
19 square miles
Sewer Service Area
260 square miles
Wastewater Treatment Capacity
194 mgd (secondary)
Receiving Water(s)
South River, Chattahoochee River
Atlanta, GA—Region 4
Background on Atlanta CSOs
The CSS service area is centered in central downtown Atlanta. The city is situated on aridge between the South River to the southeast and the Chattahoochee River to thenorthwest. Most of the city's CSOs are in the headward area of small watersheds that aretributary to these rivers. The CSO facilities are grouped according to the watershed inwhich they are located.
Atlanta's CSS covers approximately 19 square miles. It represents a small fraction of thecity's sewer service area of 260 square miles, but it includes the most highly developedsection in the Metro Atlanta region. This CSS area in the downtown business districtserves approximately 103,000 residents and a daytime population of 202,000. Basedupon a sewer system evaluation and survey of the East Side sewers, the city estimatesthat there are approximately 200 miles of combined sewers in the entire CSS.
Program Highlights
● Settlement of a civil judicialenforcement action for violationof the Clean Water Act andGeorgia Water Quality Control Acthas required the city to developand implement additional CSOcontrols.
● Controls implemented as of 2000have reduced CSO volume by 60percent and solids loading by 75percent.
● The LTCP proposed by Atlanta inMarch 2001 will reduce overflowevents from 60 to four per yearper outfall.
Community Case Study
$
$
$$
#S#S
#S #S
#S#S
#S
Chattahoochee River
South River
$S Outfall
Combined Sewer Area
Wastewater Treatment Plant
City of Atlanta
Controls
● Atlanta constructed seven CSO control facilities,covered under six permits, which providetreatment to wet weather flows prior to discharge.
● The city separated approximately 15 percent ofCSS area in the early 1990s.
● Additional proposed controls include two storageand treatment systems and localized sewerseparation.
Photo: Trash screens at Atlanta’s Intrenchment CreekCSO Center. Courtesy of Atlanta Department of Public Works

ATL-2
Report to Congress on Implementation and Enforcement of the CSO Control Policy
Atlanta has four permitted POTWS: R.M. Clayton, Utoy Creek, Intrenchment Creek andSouth River. These facilities treated over 54 billion gallons of wastewater in 2000. Thereare also seven CSO treatment facilities covered under six permits.
A civil judicial enforcement action was taken jointly against Atlanta by the EPA, theGeorgia Department of Natural Resources–Environmental Protection Division (GDNR-EPD), Upper Chattahoochee Riverkeeper Fund, Inc., the Chattahoochee Riverkeeper, Inc.,and W. Robert Hancock, Jr. for violations of the CWA and Georgia Water Quality ControlAct. Extensive CSO activity by the city during the last three years was undertaken inconnection with the resulting CSO consent decree.
Status of Implementation
System Characterization
Atlanta constructed seven CSO control facilities in the mid-1980s and early 1990s toprovide a level of CSO treatment that met state and federal regulations. The city alsoseparated a 3.4-square-mile portion of the CSS area.
Three CSO treatment facilities, McDaniel, Custer, and Intrenchment Creek (the latter twocovered under one permit), are located in east Atlanta. These facilities were constructedin the mid-1980s. Each one treats wet weather combined wastewater flows in a differentmanner.
● McDaniel CSO Facility – Low flows, up to 5.5 mgd, are captured and diverted to theSouth River wastewater treatment plant. In the event of higher flows, flow exceedsthe interceptor sewer capacity and enters a 6 MG storage vault. While the vault isbeing filled, the stored storm water-sewage mixture is pumped to the sanitary sewerat a rate of 3 mgd. Any excess flow is coarse bar screened, disinfected, and routed overa weir into a tributary of the South River.
● Custer CSO Facility – Low flows are captured in a sanitary interceptor. When flowsexceed 20 mgd, a gate closes the entrance to the interceptor sewer and all flow isrouted over a weir through coarse bar screens into a concrete channel that leads tothe Custer CSO Facility. High flows to the Custer CSO Facility are routed into a storagetunnel that connects to the Intrenchment Creek CSO Treatment Facility—or over theweir into Intrenchment Creek when the tunnel capacity is exceeded.
● Intrenchment Creek CSO Facility – The storage tunnel between the Custer outfallsand this facility is designed to capture and treat the first 30 to 34 MG of wet-weatherflow to the tunnel. At the Intrenchment Creek CSO Treatment Facility, the capturedflow is subjected to a physical and chemical treatment process and the effluent isthen discharged into Intrenchment Creek. Treated effluent discharged from thisfacility contains lower concentrations of pollutants than discharges from the otherEast Area facilities, meeting the original 1985 reduction goal for biochemical oxygendemand and total suspended solids.
The four CSO facilities in the West Area of Atlanta are Greensferry, North Avenue, TanyardCreek, and Clear Creek. These CSO facilities provide rotating fine screens and disinfectiontreatment.
An extensive system characterization and sampling program was conducted under aconsent decree during 1999 and 2000 to characterize the CSS and discharges. EPA andGDNR-EPD approved the evaluation program on March 10, 1999 and approved theresulting evaluation report on September 21, 2000. To the best of the city's knowledge,this was the most extensive CSO characterization in the nation to date. In addition to theintensive system characterization, the city monitors overflows monthly as part of itspermit conditions.

ATL-3
Community Case Study: Atlanta, GA—Region 4
NMC
Creation of Maintenance, Operations, and Management Systems (MOMS) plans providedguidance to city personnel regarding the O&M requirements of each of the city's CSOfacilities, as well as management strategies to control CSOs. The completed MOMS planswere submitted in December 1998 and were approved by EPA and GDNR-EPD in June1999. The development of the MOMS plans addressed the NMC. There have been at leasttwo dry weather overflows covered under the Consent Decree for which EPA and GDNR-EPD imposed a stipulated penalty. The overflows were due to non-sewer relatedproblems (water line break and drinking water plant backwash).
The city has kept citizens informed of CSO developments with an informational website.Six Citizen Advisory Groups have been formed, and these groups have been given toursof CSO facilities and invited to attend public meetings to learn of developments inmanaging CSOs.
LTCP
The city submitted a proposed LTCP to EPA and GDNR-EPD in March 2001 under therequirements of the consent decree. The Administrative Order requires that EPA andGDNR-EPD authorize a plan, and that the city implement the plan by mid-2007, unless analternative schedule is approved. It is the city's goal to complete the CSO consent decreeagenda according to the schedule put forth in the Administrative Order.
The construction of two storage and treatment systems and the partial separation ofadditional areas are proposed in the LTCP. The storage and treatment systems will reducethe current number of overflows from approximately 60 or more per year to an averageof four per year. CSO volume and pollution reduction at the outfalls will be at least 80percent. Although there is already a significant improvement in the East Area with thestorage units installed there, it will require three times more storage volume to reducethe number of events to only four per year. Reducing the number of discharges belowthe average of four per year increases the required storage (and cost) exponentially foronly small improvements in pollutant reduction.
Costs and Financing
The city has invested about $244 million (1994 dollars) in the existing control facilities.This figure includes the total capital costs of planning, design, and construction of theCSO treatment facilities. The city has also spent $500 million for integrated wastewatertreatment system improvement program and sewer system repair and relief projects,some of which provide additional treatment capacity in the sewer system. This figuredoes not include the capital cost of implementing the CSO consent decree activities todate, which were approximately $15 million. All of these capital activities were funded bybonds paid by the general funding available from the wastewater utility. The proposedLTCP is expected to require an additional capital cost of about $950 million (2001dollars).
Financing for the preferred LTCP option is uncertain. While the city has good creditratings and bonding capacity, the total funding needs may outpace the bondingcapacity unless there are significant rate increases. The impact of the whole wastewaterprogram, funded solely by monthly sewer bills, could be at least 2.6 times the currentrate. This may constitute a high impact on households in Atlanta and could raise issuesabout the affordability of the program. The city is seeking assistance from EPA andGDNR-EPD to address this issue.

ATL-4
Report to Congress on Implementation and Enforcement of the CSO Control Policy
Water Quality Issues
CSO treatment is provided at each CSO outfall. The West Area CSO facilities have rotatingfine screens and disinfection treatment. The East Area CSO facilities have storage andmore advanced treatment. Even with these controls, the federal court ruled that Atlanta'sCSOs were violating water quality standards. Because there is little opportunity fordilution at the outfall points, enforcement of water quality standards is at the end-of-pipe.
The CSO sampling results confirmed several characteristics widely known about stormwater runoff and CSO. This evaluation also identified compliance issues for metals andtoxicity, such as:
● Each sewershed needs individual consideration for developing representativeconcentrations.
● The hardness of both the CSO effluent and rainfall is relatively low, resulting in morestringent water quality criteria.
● The Intrenchment CSO Facility met the average and the maximum bacteria criteria.Fecal coliform levels from the Westside facilities still occasionally exceed themaximum criteria.
● Highly variable first flush effects were observed early in runoff events. The range ofthese effects was different from event-to-event and was not always present for everypollutant.
● Residual chlorine from the CSO treatment facility occasionally caused acute toxicity,based on whole effluent toxicity tests, whereas heavy metals did not cause toxicity.Dechlorinated effluent did not cause toxicity.
● The city collected supplemental storm water data using clean methods to bettercharacterize metals and to determine contributions from parking lots and parks.Urban storm water discharges present challenges similar to CSO for complying withwater quality standards. However, the majority of pollutants discharged from the CSOoutfall were attributed to the deposition of sanitary sewage in the sewers during dryweather, rather than from storm water. The only storm water constituent that made asignificant contribution was zinc.
Enforcement Issues
The extensive CSO control activity during the last three years was undertaken inconnection with the settlement of a civil judicial enforcement action taken jointly by theEPA, GDNR-EPD, Upper Chattahoochee Riverkeeper Fund, Inc., the ChattahoocheeRiverkeeper, Inc., and W. Robert Hancock, Jr., for violations of the Federal Clean Water Actand Georgia Water Quality Control Act. The city is working diligently to meet all consentdecree deadlines and will continue to implement its CSO and SSO programs under thesettlement terms. The CSO consent decree calls for compliance by mid-2007, unlessotherwise amended, and the SSO consent decree calls for compliance by 2014. Inaddition to the implementation of corrective CSO and SSO measures, the settlementrequires Atlanta to create a greenway corridor and to clean up selected streams, as wellas to pay a cash penalty of $3.2 million.
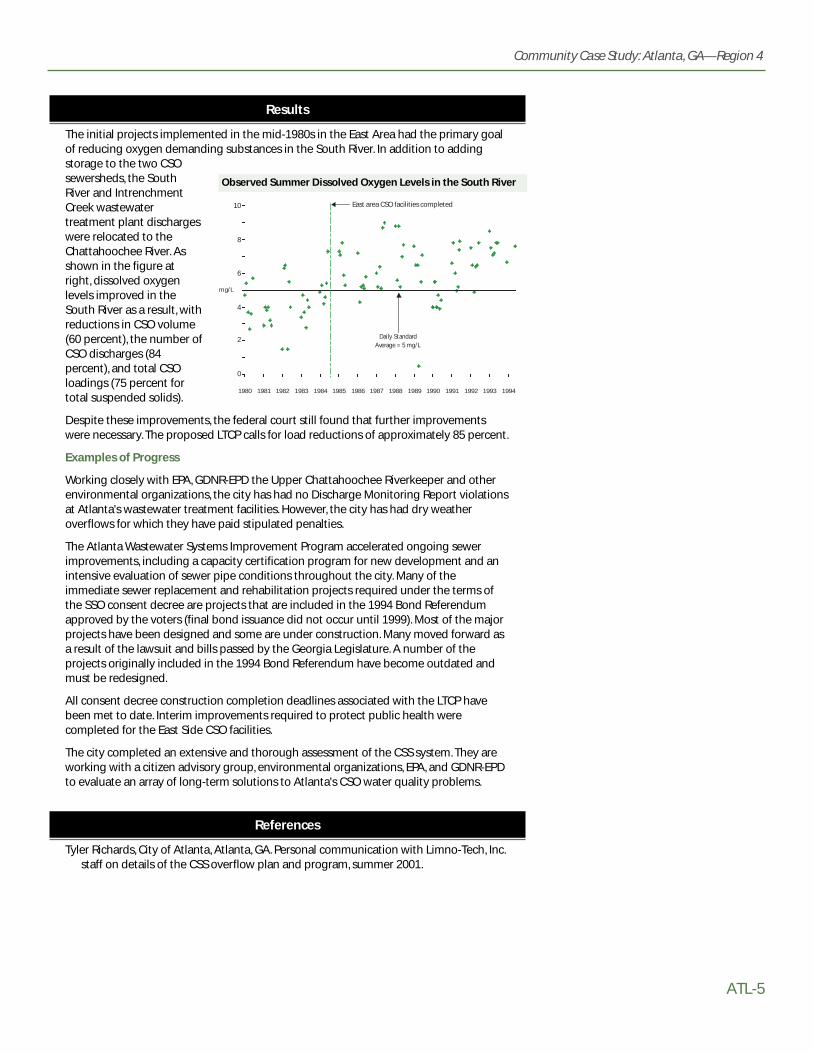
ATL-5
Community Case Study: Atlanta, GA—Region 4
Results
The initial projects implemented in the mid-1980s in the East Area had the primary goalof reducing oxygen demanding substances in the South River. In addition to addingstorage to the two CSOsewersheds, the SouthRiver and IntrenchmentCreek wastewatertreatment plant dischargeswere relocated to theChattahoochee River. Asshown in the figure atright, dissolved oxygenlevels improved in theSouth River as a result, withreductions in CSO volume(60 percent), the number ofCSO discharges (84percent), and total CSOloadings (75 percent fortotal suspended solids).
Despite these improvements, the federal court still found that further improvementswere necessary. The proposed LTCP calls for load reductions of approximately 85 percent.
Examples of Progress
Working closely with EPA, GDNR-EPD the Upper Chattahoochee Riverkeeper and otherenvironmental organizations, the city has had no Discharge Monitoring Report violationsat Atlanta's wastewater treatment facilities. However, the city has had dry weatheroverflows for which they have paid stipulated penalties.
The Atlanta Wastewater Systems Improvement Program accelerated ongoing sewerimprovements, including a capacity certification program for new development and anintensive evaluation of sewer pipe conditions throughout the city. Many of theimmediate sewer replacement and rehabilitation projects required under the terms ofthe SSO consent decree are projects that are included in the 1994 Bond Referendumapproved by the voters (final bond issuance did not occur until 1999). Most of the majorprojects have been designed and some are under construction. Many moved forward asa result of the lawsuit and bills passed by the Georgia Legislature. A number of theprojects originally included in the 1994 Bond Referendum have become outdated andmust be redesigned.
All consent decree construction completion deadlines associated with the LTCP havebeen met to date. Interim improvements required to protect public health werecompleted for the East Side CSO facilities.
The city completed an extensive and thorough assessment of the CSS system. They areworking with a citizen advisory group, environmental organizations, EPA, and GDNR-EPDto evaluate an array of long-term solutions to Atlanta's CSO water quality problems.
References
Tyler Richards, City of Atlanta, Atlanta, GA. Personal communication with Limno-Tech, Inc.staff on details of the CSS overflow plan and program, summer 2001.
1980 1981 1982 1983 1984 1985 1986 1987 1988 1989 1990 1991 1992 1993 1994
mg/L
Daily Standard Average = 5 mg/L
East area CSO facilities completed
0
2
4
6
8
10
Observed Summer Dissolved Oxygen Levels in the South River
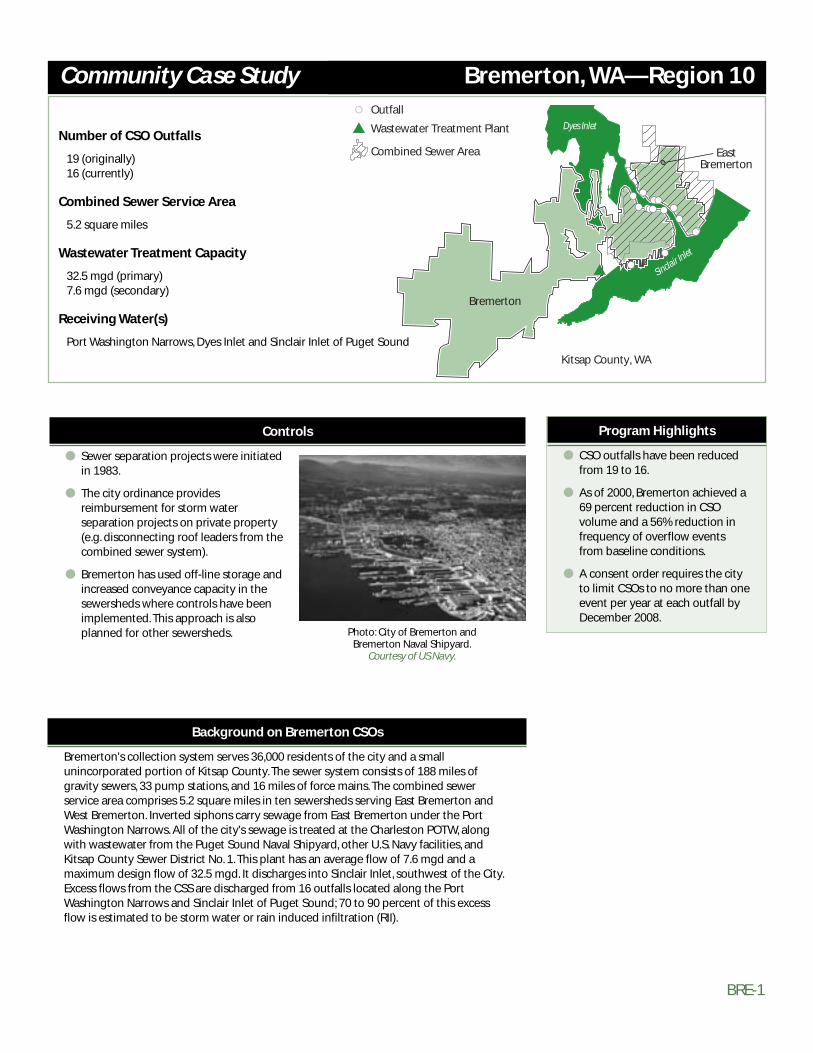
BRE-1
Number of CSO Outfalls
19 (originally)16 (currently)
Combined Sewer Service Area
5.2 square miles
Wastewater Treatment Capacity
32.5 mgd (primary)7.6 mgd (secondary)
Receiving Water(s)
Port Washington Narrows, Dyes Inlet and Sinclair Inlet of Puget Sound
Bremerton, WA—Region 10
Background on Bremerton CSOs
Bremerton's collection system serves 36,000 residents of the city and a smallunincorporated portion of Kitsap County. The sewer system consists of 188 miles ofgravity sewers, 33 pump stations, and 16 miles of force mains. The combined sewerservice area comprises 5.2 square miles in ten sewersheds serving East Bremerton andWest Bremerton. Inverted siphons carry sewage from East Bremerton under the PortWashington Narrows. All of the city's sewage is treated at the Charleston POTW, alongwith wastewater from the Puget Sound Naval Shipyard, other U.S. Navy facilities, andKitsap County Sewer District No. 1. This plant has an average flow of 7.6 mgd and amaximum design flow of 32.5 mgd. It discharges into Sinclair Inlet, southwest of the City.Excess flows from the CSS are discharged from 16 outfalls located along the PortWashington Narrows and Sinclair Inlet of Puget Sound; 70 to 90 percent of this excessflow is estimated to be storm water or rain induced infiltration (RII).
Program Highlights
● CSO outfalls have been reducedfrom 19 to 16.
● As of 2000, Bremerton achieved a69 percent reduction in CSOvolume and a 56% reduction infrequency of overflow eventsfrom baseline conditions.
● A consent order requires the cityto limit CSOs to no more than oneevent per year at each outfall byDecember 2008.
Community Case Study
#!#!#!#!#!
#!#!#!#! #!
#!
#!
#!
#!
#!
$
$S Outfall
Combined Sewer Area
Wastewater Treatment Plant
Bremerton
East Bremerton
Sinclair Inlet
Dyes Inlet
Kitsap County, WA
Controls
● Sewer separation projects were initiatedin 1983.
● The city ordinance providesreimbursement for storm waterseparation projects on private property(e.g. disconnecting roof leaders from thecombined sewer system).
● Bremerton has used off-line storage andincreased conveyance capacity in thesewersheds where controls have beenimplemented. This approach is alsoplanned for other sewersheds. Photo: City of Bremerton and
Bremerton Naval Shipyard.Courtesy of US Navy.

BRE-2
Report to Congress on Implementation and Enforcement of the CSO Control Policy
Status of Implementation
The City of Bremerton began addressing CSOs in the late 1970s and separating itssewers in 1983. State legislation requires the city to limit CSOs to no more than oneevent at each outfall annually by 2011. The city agreed to meet a 2008 schedule specifiedin a federal consent decree resulting from a third party Clean Water Act lawsuit. Stormwater discharge from new developments into the CSS is prohibited. The city mustupdate its CSO reduction plan with each 5-year NPDES permit cycle, and submit a statusreport each May on implementation activities. The report provides details on the pastyear's frequency and volume for each CSO, and whether overflow at a site has increasedover the baseline annual condition. Documentation of the previous year's CSO reductionaccomplishments and planned projects for the next year are also included.
In 1992, the city completed its first CSO reduction plan in accordance with WashingtonState Department of Ecology (Ecology) guidelines (CH2M Hill, 1992). This plan included:
● Documentation of the CSO system and improvements.
● Computation of baseline annual frequency and volume of CSO discharges.
● Sampling and analysis of CSO discharges effluent and sediment at CSO structures andoutfalls.
● Evaluation and selection of general control, reduction and treatment methods.
● Description (including costs) and evaluation of alternatives and recommendation ofCSO reduction projects.
● Analysis of the effects of the proposed projects on the WWTP operation.
● Recommendations for future studies.
● Preparation of an implementation schedule and financing plan.
The 1992 CSO reduction plan proposed sewer separation as the primary means to reachthe one event per year level in many of the city's sewersheds.
CSO volume and frequency data became available in 1994 when the CSO and rainfallmonitoring system went on-line. Monitoring helped to identify sewersheds that receivedirect storm water inflow and areas that had large amounts of RII. It was found that largeamounts of roof and parking lot drainage from private properties goes directly into theCSS. A city ordinance provides funding authority for a program to assist private propertyowners with development and implementation of storm water separation projects byJanuary 2002 and beyond, as funds are available. This program is called the CooperativeApproach to CSO Reduction.
Bremerton has published three educational brochures, hosted workshops, developed aninternet website, and produced a how-to video that covers the CSO reduction programgoals and requirements (Berthiaume, 2000). Private property owners willing todisconnect storm water inflow can obtain free technical assistance, site assessments anddetailed planning from a city representative. The City Council approved a reimbursementschedule that pays the property owner based on the type of connection and the effort itwill take to redirect the storm water to its yard, the street, or other conveyance.Separation work completed in the right-of-way is provided at no cost to the propertyowner. The city representative and property owner work together under this program tocomplete the site assessment. The method of separation is agreed to in a signedcontract. When the separation work has been completed, the property owner calls for apost-separation inspection. If completed per the agreement, payment is made to theproperty owner and the property status is updated in the city's wastewater accountdata base. Bremerton established a fee schedule for private properties that haveimproperly connected storm water to the sanitary sewer system. If a private property hasa storm water connection to the sanitary sewer system, the existing storm water fee,based on a per account or equivalent impervious surface unit, is increased 25 percentannually, beginning in 2002 to 100 percent of the fee by January 2005.

BRE-3
Community Case Study: Bremerton, WA—Region 10
In 1999, Bremerton developed a hydrologic and hydraulic conveyance model to supportfacility planning. The city also carried out additional work including an inflow andinfiltration study, installation of flow meters, and smoke and dye testing. The city initiateda source-tracing program to be implemented if contaminants in CSOs exceed marinechronic water quality criteria.
Bremerton updated its CSO Reduction Plan in 2000 (HDR, 2000). CSO reductionalternatives were evaluated based on an October 30, 1997 storm event. This storm has aone-year recurrence interval with a high intensity accumulation of rainfall at the end ofthe storm with two days of wet antecedent conditions. The storm produced a high flowswell suited for developing improvements primarily associated with increasingconveyance capacity. Reduction options that were considered included sewerseparation, removal of RII, increased conveyance capacity, storage, and treatment.Significant findings included:
● Separation should be continued, but only to provide a long-term benefit forcollection and treatment of sanitary sewage. Separation will not reduce the overflowsto one event per year since a major portion of the extraneous flow during majorevents is from RII.
● Removal of RII is feasible only when cost-effective and achievable within theschedule.
● Providing some storage offers valuable benefits, particularly when combined withonsite treatment or conveyance, but is not cost effective in all sewersheds because ofsite limitations and the volume of combined sewage.
● Increased conveyance capacity is needed to prevent overflows, but downstreamimpacts on the sewers and increased flow to the WWTP need to be considered.
● Treatment of CSOs at the old Manette WWTP site was the most cost effective methodof reducing untreated overflows from East Bremerton.
Many of the controls were completed in 2000. Flow slipping (intentional blocking ofstorm water from entering the CSS at catch basins for the purpose of routing, or slippingit, elsewhere) and installation of new storm water sewer mains also contributed toreduced CSO discharges during 2000.
Nine Minimum Controls
Bremerton addresses all of the NMC in its annual reports. Monitoring of CSOs andreceiving water bodies began in 1995, and there are no ongoing problems with dryweather overflows or floatables. The city has water conservation, rain barrels, recycling,and hazardous waste disposal programs in addition to the programs previouslydescribed. The city sweeps all major streets every six to ten weeks, and cleans each catchbasin annually. The city also initiated planning in individual storm water basins. Theseefforts all reduce contaminants in CSOs. Upgrades to wastewater collection systemcontrols and the installation of a Supervisory Control and Data Acquisition (SCADA)system have increased overall system reliability.
Costs and Financing
Bremerton completed CSO control projects in three sewersheds at a capital cost ofapproximately $17 million. It is estimated that an additional $27 million is needed tocomplete improvements for the seven remaining sewersheds. Annual operation andmaintenance costs are currently $4.5 million and are expected to increase to $6.0 millionby 2008. The city's wastewater utility has no bonding capacity until 2007. Therefore,outside financial resources are necessary to complete the program. Existing projectswere funded through Interfund Loans, Public Works Trust Fund (PWTF) loans, CentennialClean Water Funds (CCWF) loans/grants, State Revolving Funds (SRF) loans, and user fees.Future projects will be funded by these sources plus direct congressional grantappropriations ($3.48 million to date). Current debt service for funding CSO projects
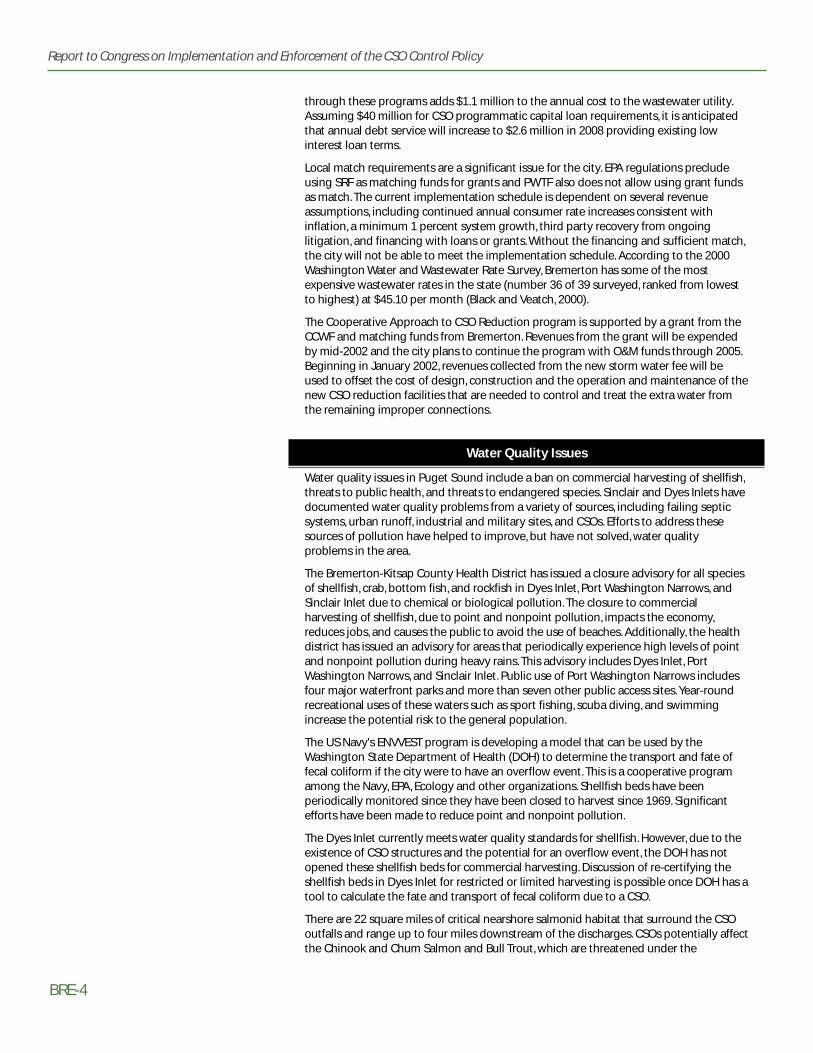
BRE-4
Report to Congress on Implementation and Enforcement of the CSO Control Policy
through these programs adds $1.1 million to the annual cost to the wastewater utility.Assuming $40 million for CSO programmatic capital loan requirements, it is anticipatedthat annual debt service will increase to $2.6 million in 2008 providing existing lowinterest loan terms.
Local match requirements are a significant issue for the city. EPA regulations precludeusing SRF as matching funds for grants and PWTF also does not allow using grant fundsas match. The current implementation schedule is dependent on several revenueassumptions, including continued annual consumer rate increases consistent withinflation, a minimum 1 percent system growth, third party recovery from ongoinglitigation, and financing with loans or grants. Without the financing and sufficient match,the city will not be able to meet the implementation schedule. According to the 2000Washington Water and Wastewater Rate Survey, Bremerton has some of the mostexpensive wastewater rates in the state (number 36 of 39 surveyed, ranked from lowestto highest) at $45.10 per month (Black and Veatch, 2000).
The Cooperative Approach to CSO Reduction program is supported by a grant from theCCWF and matching funds from Bremerton. Revenues from the grant will be expendedby mid-2002 and the city plans to continue the program with O&M funds through 2005.Beginning in January 2002, revenues collected from the new storm water fee will beused to offset the cost of design, construction and the operation and maintenance of thenew CSO reduction facilities that are needed to control and treat the extra water fromthe remaining improper connections.
Water Quality Issues
Water quality issues in Puget Sound include a ban on commercial harvesting of shellfish,threats to public health, and threats to endangered species. Sinclair and Dyes Inlets havedocumented water quality problems from a variety of sources, including failing septicsystems, urban runoff, industrial and military sites, and CSOs. Efforts to address thesesources of pollution have helped to improve, but have not solved, water qualityproblems in the area.
The Bremerton-Kitsap County Health District has issued a closure advisory for all speciesof shellfish, crab, bottom fish, and rockfish in Dyes Inlet, Port Washington Narrows, andSinclair Inlet due to chemical or biological pollution. The closure to commercialharvesting of shellfish, due to point and nonpoint pollution, impacts the economy,reduces jobs, and causes the public to avoid the use of beaches. Additionally, the healthdistrict has issued an advisory for areas that periodically experience high levels of pointand nonpoint pollution during heavy rains. This advisory includes Dyes Inlet, PortWashington Narrows, and Sinclair Inlet. Public use of Port Washington Narrows includesfour major waterfront parks and more than seven other public access sites. Year-roundrecreational uses of these waters such as sport fishing, scuba diving, and swimmingincrease the potential risk to the general population.
The US Navy's ENVVEST program is developing a model that can be used by theWashington State Department of Health (DOH) to determine the transport and fate offecal coliform if the city were to have an overflow event. This is a cooperative programamong the Navy, EPA, Ecology and other organizations. Shellfish beds have beenperiodically monitored since they have been closed to harvest since 1969. Significantefforts have been made to reduce point and nonpoint pollution.
The Dyes Inlet currently meets water quality standards for shellfish. However, due to theexistence of CSO structures and the potential for an overflow event, the DOH has notopened these shellfish beds for commercial harvesting. Discussion of re-certifying theshellfish beds in Dyes Inlet for restricted or limited harvesting is possible once DOH has atool to calculate the fate and transport of fecal coliform due to a CSO.
There are 22 square miles of critical nearshore salmonid habitat that surround the CSOoutfalls and range up to four miles downstream of the discharges. CSOs potentially affectthe Chinook and Chum Salmon and Bull Trout, which are threatened under the

Endangered Species Act. Studies are underway to determine the actual extent of thethreat and the effects of reducing pollutant sources.
Enforcement Issues
In 1993, Bremerton entered into a Consent Decree that further addressed its CSOs butdid not include sewer moratoriums. Amendments to this decree were adopted in 1999through mediation (Ballbach, 1999). The city agreed:
● To achieve a 95 percent reduction in CSO flows by 2003, subject to extraordinaryevents and extreme year anomalies.
● To accelerate the CSO reduction schedule to achieve the goal of one overflow peryear or less at each outfall by December 2008.
● To pay for a Financial Feasibility Study if schedule modifications become necessary.
In November 2000, a second citizens group issued a notice of intent to file suit againstthe city for failure to meet the requirements of the Consent Decree.
Results
Bremerton has eliminated three CSO outfalls. As shown, the city's efforts have reducedCSO volume by 69 percent from baseline conditions (City of Bremerton, 1999). The cityalso reduced the annual number of overflow events by 56 percent. In 2000, the Cityachieved a 96 percent reduction involume, and an 89 percentreduction in frequency of overflowevents. Nine of 16 CSO outfallsoverflowed only once or did notoverflow at all in 2000 (Bertiaume,2000). Some of the reduction canbe attributed to the unusually lowrainfall (20 inches less thannormal). However, Bremertonbelieves it is on the way toachieving a goal of one overflow orless per outfall on an annual basis.
1997
165 175
1998
173
120
1999
65
188
2000
2
78
Measured volume (MG)
Rainfall (inches)
BRE-5
Community Case Study: Bremerton, WA—Region 10
Annual CSO Volume and Rainfall

BRE-6
Report to Congress on Implementation and Enforcement of the CSO Control Policy
References
Ballbach, D. 1999. Mediation Resolution, Agreed Amendments to September 27, 1993Consent Decree. Signed by the Puget Soundkeeper Alliance and the City of Bremerton.
Berthiaume, Chance, and City of Bremerton. 2000. "City of Bremerton's CSO ReductionProgram and Drinking Water Quality & Conservation."http://www.cityofbremerton.com
Black and Veatch, 2000. 2000 Washington Water and Wastewater Rate Survey. Seattle, WA.
CH2M Hill, 1992. Combined Sewer Overflow Reduction Plan. Prepared for the City ofBremerton, Washington. 1992.
City of Bremerton, 1999. Combined Sewer Overflow Reduction Plan—Amendment No. 2.Bremerton, WA.
HDR, 2000. Bremerton CSO Reduction Plan Update. Prepared for the City of Bremerton,Washington. 2000.

BUR-1
Number of CSO Outfalls
20 (originally)11 (currently)
Combined Sewer Service Area
2.9 square miles
Wastewater Treatment Capacity
18 mgd
Receiving Water(s)
Mississippi River
Burlington, IA—Region 7
Background on Burlington CSOs
Burlington, Iowa is a hilly city located on the banks of the Mississippi River with apopulation of 27,500. The city's sewer system is a mix of sanitary, storm, and combinedsewers. Combined sewers were commonly constructed until the 1960s and primarilyserve the downtown area. Downtown Burlington is the largest retail center in SoutheastIowa containing more than 75 shops and restaurants.
The sewer system serves 5,250 acres through 135 miles of sewers, and has 10,451customer connections. Six sewersheds and 1,870 acres (36 percent of the sewer system)are served by combined sewers. The Hawkeye basin comprises two thirds of the city'ssewer system and 18.5 percent (664 acres) of the drainage area is combined. The Southand Market Street sewersheds, the next largest in size (493 and 273 acres respectively),are 100 percent combined. The Cascade sewershed is the next largest at 318 acres, and32 percent (102 acres) combined. The Angular and Locust sewersheds represent 273 and65 acres of combined sewers, respectively. Four other minor sewersheds, the Silver,Gnahn, Osborn, and Harrison, serve a combined area of 91 acres.
Program Highlights
● CSO outfalls have been reducedfrom 20 to 11.
● Burlington developed a plan toeliminate CSO discharges withsewer separation that will becompleted by 2017.
● Burlington has merged a widearray of television inspection andexisting sewer system informationin a common, detailed data baseto facilitate inspection andreporting.
Community Case Study
$
$S Outfall
Combined Sewer Area
Wastewater Treatment Plant
Burlington
Illinois
Mississippi River
#!#!
#!#!#!
#!#!#!
#!
#!
#!
Controls
● Burlington has been separatingportions of its CSS since the 1970sthrough major street reconstructionprojects.
● Work on eliminating individualCSOs started in 1982.
● As part of a 1996 CSO study, anumber of CSO control alternativeswere evaluated, but the citydecided to continue to pursuesewer separation.
Photo: Great River Bridge over the Mississippi Riverin Burlington.
Courtesy of Hawkeye Magazine

BUR-2
Report to Congress on Implementation and Enforcement of the CSO Control Policy
Burlington operates an activated sludge wastewater treatment plant with an averagedesign flow of 9.0 mgd and a peak flow capacity of 18.0 mgd. The city has worked oneliminating CSOs through separation and has reduced CSO outfalls from 20 to 11. Thewastewater treatment plant and the remaining CSOs discharge to the Mississippi River.The Iowa Department of Natural Resources (DNR) has designated this stretch of theMississippi for primary contact recreation (Class A) and as a significant resource warmwater (Class B- WW) .
Status of Implementation
The DNR's "Special Conditions for CSOs" requires that the city: (1) determine thehydraulic capacity of the sewers between the CSO and the wastewater treatment plant;and (2) develop an operational plan for the combined system. Burlington has adopted along-range goal of separating the combined sewer systems to comply with DNR and EPArequirements. The City has separated storm and sanitary sewers on major streetreconstruction projects since the 1970s. Implementing the long-range goal will extendthrough 2017 because of the significant cost to completely separate the sewer system.
Burlington eliminated five CSOs through sewer separation projects between 1982 and1993. In 1993, the City submitted the Report of Combined Sewer Overflows: Part 1 to theDNR (City of Burlington, 1993). The City concluded that the capacity of the sewers wasadequate for current average dry weather flows, except for the Hawkeye sewershed.Anticipated development in the Hawkeye sewershed, combined with significant inflowfrom Hawkeye Creek and an unnamed tributary, was predicted to exceed the capacity ofthat system, which was calculated to be 15.4 mgd. Burlington also identified dry weatheroverflows at three locations.
In 1995, the city submitted the Report of Combined Sewer Overflows: Part 2 to the DNR(City of Burlington, 1995). This report addressed NMC activities that are described in thefollowing summary. The city identified a number of repairs to the sewer system and CSOoutfalls, located a number of dry weather overflows and CSOs for elimination, and founda previously unknown CSO at a lift station.
NMC Activity
Proper O&M Clean, inspect, monitor flows. Conduct regular inspections by wastewater treatment plant personnel after every rainfall event.
Maximize collection system storage Raise dam heights. Disconnect all roof drains and smoke test entire collection system to locate unnecessary sources of inflow.
Review pretreatment requirements Develop storm water management plans tocontrol storm water from new development sites.
Maximize flow to POTW Raise dam heights to increase flow.
Prohibit CSO during dry weather Replace pipe at CSO 016. Separate 26 acres at Gnahn and Osborn.
Control solids and floatables Study alternatives once data are available.
Pollution prevention Institute a recycling program.
Public notification Publish results of CSO monitoring in thenewspaper.
Monitoring Install monitoring at seven active CSOs to measure number of activations, quantity of water discharged, water quality, and notify wastewater treatment plant personnel.

BUR-3
Community Case Study: Burlington, IA—Region 7
Burlington prepared a 20-year CSO Control Plan in 1996. This plan outlines a 20-yearcapital improvement program, describes the condition of the sewers, provides flowmonitoring information, and analyzes potential flow conditions during a standard storm(5-year, 1-hour event, 2 inches of rain). A number of CSO control alternatives wereevaluated. Inlet control storage, in-line storage, off-line storage, deep tunnel storage, andswirl concentrators/disinfection were eliminated due to ineffectiveness or cost. The Cityelected to use separation as the primary means of CSO control, and established sixphases to be implemented by 2017. The schedule and costs associated with each phaseis summarized below.
Phases and Outfalls Addressed Schedule Cost
1. Modify CSO and sewers, separate 1996 $ 1.5 millioncombined areas, and conduct inspections and eliminate improper private connections (eliminate eight CSOs; modify five others).
2. Separate the Hawkeye sewershed 1998 to 2002 $13.3 million(eliminate one CSO).
3. Separate the Cascade CSS 2003 $ 3.1 million (eliminate two CSOs).
4. Separate the Locust, Harrison, and South 2003 to 2007 $ 5.0 millionsewersheds (eliminate one CSO).
5. Separate the Angular sewershed 2008 to 2012 $ 4.9 million(eliminate one CSO).
6. Separate the Market sewershed (eliminate 012) 2013 to 2017 $ 7.3 million(eliminate one CSO).
Total Cost $35.1million
Many of the Phase 1 controls were completed in 1996. Work on Phase 2, the HawkeyeSewer Separation Project, began in early 1999. The Hawkeye Project has three parts andis expected to take five years to complete. Part 1 of the Hawkeye project includesstudying the system (flow monitoring, manhole inspection, smoke testing, dyed waterflooding, line cleaning and television inspection) to identify sewer capacities and propersizing of sanitary trunk lines, and to identify sources of unknown inflow such as roofdrain, back yard inlets, etc. Burlington used this opportunity to develop an innovativeapproach to sewer television inspection and reporting, where the information collectedon the sewer system was delivered on digital video discs (DVD). A wide array oftelevision inspection and existing information on the sewer system was merged into acommon, detailed data base management system. This approach saved time incollecting, annotating, analyzing and reviewing information as well as providingpermanent records with a design life of at least 100 years (Carhoff, 2000). These data arealso being entered into a county-wide GIS that should be available in 2002.
Part 2 of the Hawkeye Project consists of separating storm water inlets. The city intendsto implement a storm water management plan for each of the main trunks entering theHawkeye sewer. Part 3 consists of installing sanitary trunk sewers into the Hawkeyetrunk sewer to convey sanitary flow to the wastewater treatment plant. Storm water willbe conveyed in the existing trunk sewer to local receiving waters.
After the Hawkeye Project is completed, the city will reevaluate the 20-year plan.Separation will continue to the maximum extent possible, and the city will considerusing innovative end-of-pipe treatment technologies to address remaining overflows.

BUR-4
Report to Congress on Implementation and Enforcement of the CSO Control Policy
Costs, Financing and Results
Burlington used a mix of Community Development Block Grants, federal grants, andbonds to finance CSO control. Prior to the initiation of the Hawkeye project, the cityspent more than $2.9 million to separate sewers within 464 acres of the service area andto eliminate five CSOs.
The Hawkeye Sewer Separation Project is a $13.3 million project, where 82 percent of thebudget will fund sewer construction, 13 percent inspection and smoke testing, and theremaining 5 percent repairs to the trunk sewers. In 1998, the city was awarded a federalspecial infrastructure grant for $7 million. The city is providing the local cost-sharethrough bond issuance and user fees. When complete, the Hawkeye Sewer SeparationProject should eliminate 60 overflows per year and 1.5 mgd of CSO discharged to theMississippi River.
The city is facing an additional $20.3 million cost to implement the remainder of the 20-year CSO Control Plan and is seeking a grant to support this completion. The 20-yearimplementation schedule and financing for the plan are both critical issues forBurlington. Many of the residents are on fixed incomes or earning low wages, andcannot afford increased sewer rates. Federal grant funding is therefore a key componentof the city's LTCP.
References
Carhoff, Bob. 2000. "Computer Technology Improves Sewer TV Inspection and Reporting."Public Works, March, pp. 42-43.
City of Burlington, Iowa. 1993. Report of Combined Sewer Overflows: Part 1. City ofBurlington, Burlington, IA.
City of Burlington, Iowa. 1995. Report of Combined Sewer Overflows: Part 2. City ofBurlington, Burlington, IA.
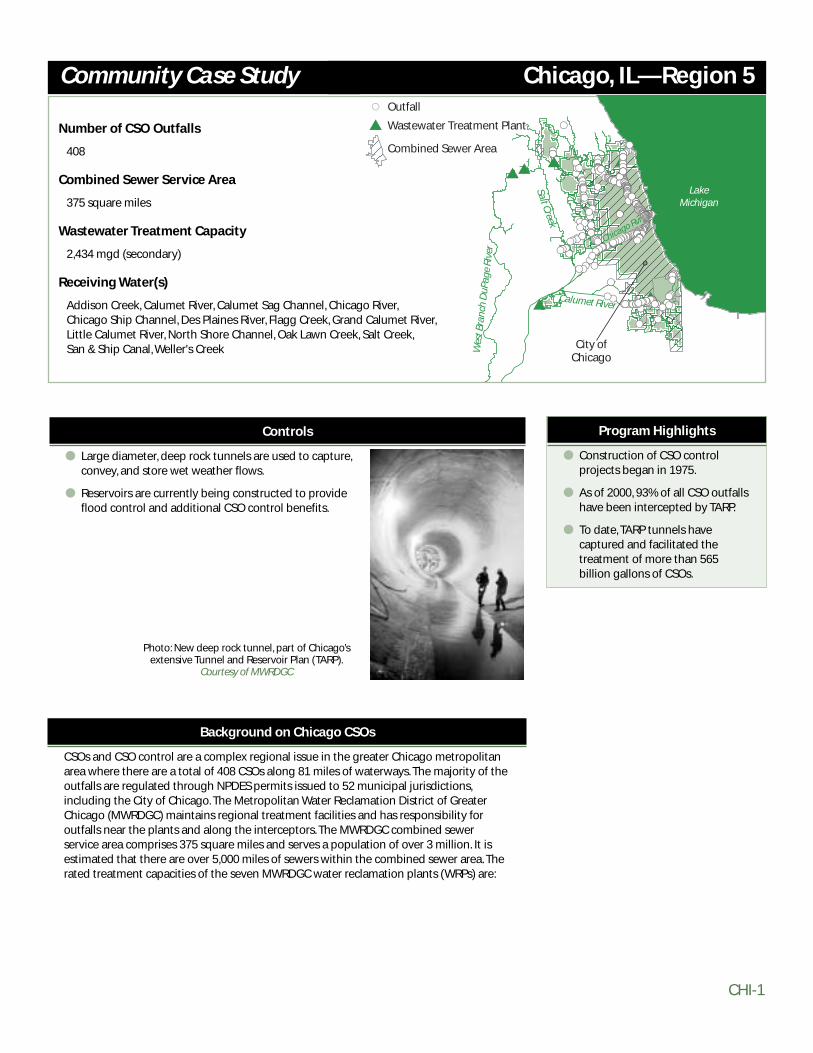
CHI-1
Number of CSO Outfalls
408
Combined Sewer Service Area
375 square miles
Wastewater Treatment Capacity
2,434 mgd (secondary)
Receiving Water(s)
Addison Creek, Calumet River, Calumet Sag Channel, Chicago River,Chicago Ship Channel, Des Plaines River, Flagg Creek, Grand Calumet River,Little Calumet River, North Shore Channel, Oak Lawn Creek, Salt Creek,San & Ship Canal, Weller's Creek
Chicago, IL—Region 5
Background on Chicago CSOs
CSOs and CSO control are a complex regional issue in the greater Chicago metropolitanarea where there are a total of 408 CSOs along 81 miles of waterways. The majority of theoutfalls are regulated through NPDES permits issued to 52 municipal jurisdictions,including the City of Chicago. The Metropolitan Water Reclamation District of GreaterChicago (MWRDGC) maintains regional treatment facilities and has responsibility foroutfalls near the plants and along the interceptors. The MWRDGC combined sewerservice area comprises 375 square miles and serves a population of over 3 million. It isestimated that there are over 5,000 miles of sewers within the combined sewer area. Therated treatment capacities of the seven MWRDGC water reclamation plants (WRPs) are:
Program Highlights
● Construction of CSO controlprojects began in 1975.
● As of 2000, 93% of all CSO outfallshave been intercepted by TARP.
● To date, TARP tunnels havecaptured and facilitated thetreatment of more than 565billion gallons of CSOs.
Community Case Study
$$$ $
$
$$
City of Chicago
Calumet River
Wes
t Bra
nch
DuP
age
Rive
r
Salt Creek
#!#!#!
#!#!#!
#!#!#!#!
#!
#!#!#!#!#!#!#!#!
#!#!#!
#!
#!#!#!#!#!#!
#!#!
#!
#!
#!
#!#!#!#!#!#!
#!
#!
#!
#!#!#!
#!#!#!#!#!#!#!#!#!#!#!#!
#!
#!#!
#!
#!
#!#! #! #!#!#!#!#!#!#!#!#!#!#!#!#!#!
#!#!#!#!#!#!#!#!#!#!#!#!#!#!#!#!#!#!#!#!#!
#!
#!#!#!#!#!#! #!#!#!#!#!#!#!#!#!#!#!#!#!#!#!#!#!#!#!#!#!#!#!#!#!#!#!#!#!#!#!#!#!#!#!#!#!#!#!#!#!#!#!#!#!#!#!#!#!#!#!#!#!#!#!#!#!#!#!#!#!#!#!#!#!#!#!#!#!#!#!#!#!#!#!#!#!#!#!#!#!#!#!#!#!#!#!#!#!#!#!#!#!#!#!#!#!#!#!#!#!#!#!#!#!#!#!#!#!#!#!#!#!#!#!#!#!#!#!#!#!#!#!#!#!#!#!#!#!#!#!#!#!#!#!#!#!#!#!#!#!#!
#!#!#!#!#!#!#!#!#!
#!#!#!#!
#!#!#!#!#!#!#!#!#!#!#!#!#!#!#!#!#!
#!#!#!#!#!#!#!#!
#!#!
#!#!#!#!#!
#!
#!#!
#!
#!#!
#!#!#!#!
#!
#!#!
#!#!#!
#!#!
#!
#!
#!#!#!#!
#!#!
#!
#!#!#!#!#!#!#!#!#!#!
#!#!#!
#!
LakeMichigan
Chicago Rvr
$S Outfall
Combined Sewer Area
Wastewater Treatment Plant
Controls
● Large diameter, deep rock tunnels are used to capture,convey, and store wet weather flows.
● Reservoirs are currently being constructed to provideflood control and additional CSO control benefits.
Photo: New deep rock tunnel, part of Chicago’sextensive Tunnel and Reservoir Plan (TARP).
Courtesy of MWRDGC

CHI-2
Report to Congress on Implementation and Enforcement of the CSO Control Policy
WRP Design Average Flow (mgd) Design Maximum Flow (mgd)
Stickney 1,200 1,440
North Side 333 450
Calumet 354 430
Kirie 52 110
Egan 30 50
Hanover Park 12 22
Lemont 2 4
Total 1,983 2,506
Status of Implementation
MWRDGC is implementing a two-phased approach to address CSO and flood controlknown as the Tunnel and Reservoir Plan, or TARP. The construction of large diameter,deep rock tunnels for the storage of combined sewage is the centerpiece of TARP Phase I. The construction of reservoirs to primarily address flooding issues is the maincomponent of TARP Phase II.
TARP Phase I is the MWRDGC's LTCP. TARP Phase I captures, conveys, and stores wetweather combined sewer flows in excess of interceptor capacity until they can bepumped out to existing WRPs for full advanced secondary treatment when plantcapacity becomes available following storms. TARP Phase I consists of 109.4 miles oftunnels 9 to 33 feet in diameter, three tunnel dewatering pumping stations, over 250drop shafts, and over 600 associated near-surface connecting and flow regulatingstructures. CSOs are intercepted at all outfalls. The system is designed to facilitatecapture and treatment of the CSO first flush from all storms, and all of the CSO from thesmaller, more frequent storms. This equates to a reduction of approximately 84 percentof the pollution load. Reservoirs being built under TARP Phase II are primarily intendedfor flood control and are not part of the LTCP, although they will provide additional CSOpollution control benefits.
TARP was developed through a joint effort of the State of Illinois, Cook County, the City ofChicago, and the MWRDGC. It represents a hybrid of the best eight of over 50 watermanagement plans proposed and studied beginning in the mid-1960s. TARP has beendesigned to protect Lake Michigan and Chicago-area waterways from CSO pollution, andto significantly reduce local basement flooding. Officially adopted by the MWRDGC in1972 with construction beginning in 1975, TARP was the first comprehensive Clean WaterAct CSO control plan developed for a major metropolitan area.
The design for TARP is based on the presumption approach. The storage tunnels builtunder Phase I are designed to pick up all 408 CSOs within the service area, but weredesigned to work with the reservoir system, which is not yet complete. The result hasbeen that when multiple storm events occur within a short period of time, the storagetunnels sometimes do not drain completely, producing short-term capacity reductions.Since the CSOs serve as CSS emergency relief points, TARP has cautioned all 52 membercities and villages not to disconnect their outfalls unless they feel confident their localsewer systems are adequate to handle wet weather flows without surcharging that maylead to street or basement flooding.
Approximately 75 TARP Phase I construction contracts have been completed, with onlytwo remaining. As of September 2001, 93.4 miles of tunnel system were complete and inoperation, 8.1 miles of tunnel were under construction, and 7.9 miles of tunnel wereexpected to be under construction by late 2001. Of the 2.3 billion gallons of CSO storagetunnel capacity, 2.1 billion gallons (92 percent) are online. Phase II, reservoir construction,is not as far advanced. A summary of TARP progress follows.
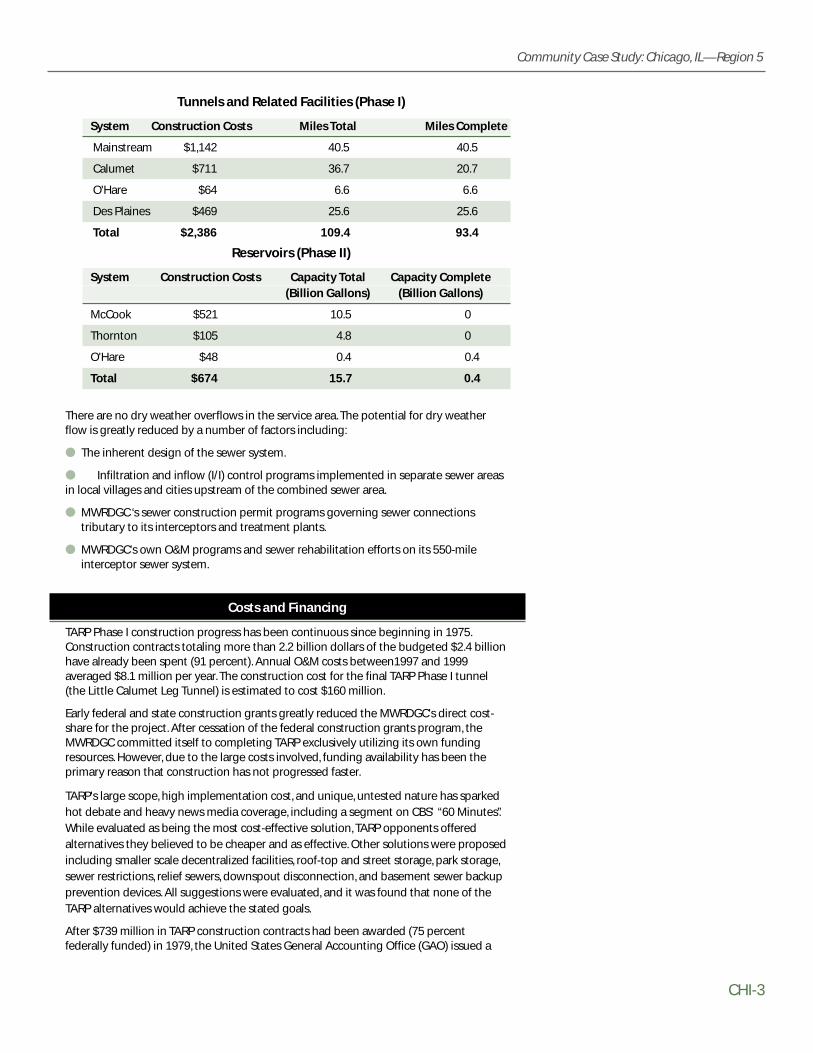
CHI-3
Community Case Study: Chicago, IL—Region 5
Tunnels and Related Facilities (Phase I)
System Construction Costs Miles Total Miles Complete
Mainstream $1,142 40.5 40.5
Calumet $711 36.7 20.7
O'Hare $64 6.6 6.6
Des Plaines $469 25.6 25.6
Total $2,386 109.4 93.4
Reservoirs (Phase II)
System Construction Costs Capacity Total Capacity Complete(Billion Gallons) (Billion Gallons)
McCook $521 10.5 0
Thornton $105 4.8 0
O'Hare $48 0.4 0.4
Total $674 15.7 0.4
There are no dry weather overflows in the service area. The potential for dry weatherflow is greatly reduced by a number of factors including:
● The inherent design of the sewer system.
● Infiltration and inflow (I/I) control programs implemented in separate sewer areasin local villages and cities upstream of the combined sewer area.
● MWRDGC ‘s sewer construction permit programs governing sewer connectionstributary to its interceptors and treatment plants.
● MWRDGC's own O&M programs and sewer rehabilitation efforts on its 550-mileinterceptor sewer system.
Costs and Financing
TARP Phase I construction progress has been continuous since beginning in 1975.Construction contracts totaling more than 2.2 billion dollars of the budgeted $2.4 billionhave already been spent (91 percent). Annual O&M costs between1997 and 1999averaged $8.1 million per year. The construction cost for the final TARP Phase I tunnel(the Little Calumet Leg Tunnel) is estimated to cost $160 million.
Early federal and state construction grants greatly reduced the MWRDGC's direct cost-share for the project. After cessation of the federal construction grants program, theMWRDGC committed itself to completing TARP exclusively utilizing its own fundingresources. However, due to the large costs involved, funding availability has been theprimary reason that construction has not progressed faster.
TARP's large scope, high implementation cost, and unique, untested nature has sparkedhot debate and heavy news media coverage, including a segment on CBS' “60 Minutes”.While evaluated as being the most cost-effective solution, TARP opponents offeredalternatives they believed to be cheaper and as effective. Other solutions were proposedincluding smaller scale decentralized facilities, roof-top and street storage, park storage,sewer restrictions, relief sewers, downspout disconnection, and basement sewer backupprevention devices. All suggestions were evaluated, and it was found that none of theTARP alternatives would achieve the stated goals.
After $739 million in TARP construction contracts had been awarded (75 percentfederally funded) in 1979, the United States General Accounting Office (GAO) issued a

CHI-4
Report to Congress on Implementation and Enforcement of the CSO Control Policy
report, Combined Sewer Flooding and Pollution—A National Problem: The Search forSolutions in Chicago (GAO, 1979). This report analyzed TARP's cost versus it's objectives. Aconclusion was in the form of a question: "Both phases of TARP and associated projectsoffer a promising solution to the (CSO) problem. But can the country afford it?" The GAOrecommended ceasing further federal funding of TARP until a reassessment was made tosee if less costly alternatives existed, and to consider adopting more flexible waterquality goals for the waterways affected by CSOs. The MWRDGC and local politicalleadership vigorously objected to both recommendations and to GAO's estimate ofTARP's cost, which was three to four times higher than the MWRDGC's estimated cost.More studies were conducted and TARP was reaffirmed as the most cost-effectivealternative.
Water Quality Issues
MWRDGC conducts several water quality monitoring programs in the Chicago andCalumet waterway systems. Water quality samples are taken on a weekly basis forgeneral chemistry and metals. In addition, dissolved oxygen monitoring is conducted ona continuous basis with in-place monitors. MWRDGC also conducts fish populationsurveys to track changes in the numbers of fish and fish species present in waterways.The results of these studies have documented dramatic improvement in water quality.MWRDGC believes that the completion of TARP Phase I (its LTCP) will result incompliance with the water quality standards.
By letter dated June 28, 1995, the State of Illinois Environmental Protection Agencyconcurred with the MWRDGC advising that "the Agency believes that the completion ofTARP will be adequate to meet water quality standards and protect the designated usedof the receiving waters pursuant to Section I.C of the CSO Control Policy.
Results
TARP tunnel fill levels and pumpout are measured to determine total CSO capture duringstorm events. Major portions of the TARP tunnel system were placed in operationbeginning in the mid 1980s, with new segments coming on-line afterwards. To date, the93.4 miles of completed TARP tunnels have captured and facilitated treatment of over565 billion gallons of first and second flush combined sewage that would haveotherwise spilled to local rivers and streams.
The frequency of CSO occurrences has decreased from nearly 100 times per year to lessthan 15 times per year.
Marked visible improvement in the condition of waterways has spurred recreational andother uses of the Chicago River including tourism and sightseeing, boating, canoeing,and fishing. Once perceived by many as a virtual open sewer, the river system has beencleaned up by TARP. This has brought about enhanced real estate values and boomingriverside development, including hotels, office/apartment buildings, restaurants,riverwalks, marinas, and canoe/kayak launches. Fish, including various species of gamefish, and other aquatic wildlife, have returned to the river system in dramatic numbers.The year 2000 Bassmaster Fishing Tournament was held in Chicago on its restoredwaterways.
TARP has received much recognition and numerous awards from government agenciesand technical/professional organizations for its innovative and effective design andperformance. The project has garnered favorable press from local media for itsperformance, and much local support from local villages and cities.

CHI-5
Community Case Study: Chicago, IL—Region 5
References
GAO, 1979. Combined Sewer Flooding and Pollution—A National Problem: The Search forSolutions in Chicago, CED 79-77. Washington, DC.
MWRDGC, 1998. Report No. 98-23: Water Quality Improvements in the Chicago and CalumetWaterways Between 1975 and 1993 Associated with the Operation of Water ReclamationPlants, the Tunnel and Reservoir System, and Instream and Sidestream Aeration Stations.Chicago, IL.

COL-1
Number of CSO Outfalls
16
Combined Sewer Service Area
4.1 square miles
Wastewater Treatment Capacity
42 mgd (secondary)
Receiving Water(s)
Chattahoochee River
Columbus, GA—Region 4
Background on Columbus, GA CSOs
The Columbus CSS extends over 2,600 acres of the old downtown area draining to theChattahoochee River. Until controls were implemented, there were 5,200 acres ofcombined sewer with 16 CSO outfalls to the river. The average annual river flow is 6,500cfs, with a flow of 3,500 cfs on average in summer and a regulated low flow of 1,160 cfs.Prior to CSO control, elevated levels of fecal coliform bacteria and visible sewage debrisoften plagued the Chattahoochee. Columbus began to implement CSO controls in 1995,including two water resources facilities (WRFs). One of the WRFs, in Uptown Park, alsoserves as a CSO technology testing facility.
Program Highlights
● Columbus' CSO program hasbeen fully implemented.Compliance monitoring andperformance testing continue.
● The Chattahoochee River nowmeets water quality standards forall criteria including bacteria.
● An extensive public educationprogram involving numerouspublic hearings, news articles,water bill flyers, watershedworkshops, and seminars was akey component of thedevelopment andimplementation of the LTCP.
Community Case Study
$
$
#S#S
#S#S#S#S#S#S#S#S#S#S#S
#S
#S
#S
#S
City of Columbus
Alabama
Chattahoochee River
Bull Creek
Wer
acho
ba C
reek
$S Outfall
Combined Sewer Area
Wastewater Treatment Plant
Controls
● Two water resources facilities (WRFs)provide direct treatment of CSOs. OneWRF is a national demonstration facilityused to evaluate alternative technologiesto remove CSO contaminants andprovide environmentally sensitivedisinfection. Technologies evaluatedinclude flow controls, screening, grithandling, vortex separation, compressedmedia filtration, UV disinfection,chlorination and dechlorination, andother disinfection methods. The otherWRF provides CSO pumping, screening,vortex separation with chlorine disinfection, grit handling, and residuals disposal.
● A strategically placed sanitary relief line is used to transport half of the sanitarysewage to the wastewater treatment plant, outside the bounds of the CSS.
● Remaining CSO discharges have been relocated downstream of public access areas.
Vortex separation facility under construction.Courtesy of Columbus Water Works.

COL-2
Report to Congress on Implementation and Enforcement of the CSO Control Policy
Status of Implementation
The Columbus Water Works (CWW) has fully implemented an LTCP based on thedemonstration approach of the CSO Control Policy. The LTCP was implemented byDecember 31, 1995, in compliance with Georgia State law. The Columbus programincluded characterization of the system and receiving water impacts, implementation ofthe NMC, pilot testing of alternative technologies, long-term planning, structuralcontrols, and post-construction monitoring to demonstrate compliance with waterquality standards.
Program development activities culminated in a $95 million capital program thatincluded:
● Municipal treatment plant upgrades
● Sewer separation
● Diversion structure
● Collector and transport conduits
● Pumping stations
● Two CSO treatment facilities (WRFs)
● Associated river walk, trail and parks
● Five-year technology demonstration testing
The technology demonstration part of the program evaluated technologies for pollutantremoval (including screening, vortex separation, filtration processes, flow controls) andseveral disinfection methods (including ultraviolet light, sodium hypochlorite, paraceticacid and chlorine dioxide). Sodium bisulfite dechlorination was also evaluated fordechlorination (Boner, 2001). Sewer separation was focused mainly in the upstreamcatchments where this type of solution made economic sense or had a high benefit-to-cost ratio. One strategically placed sanitary relief line eliminated half of the sanitarysewage that entered the CSS.
System Characterization
Columbus began its sampling program in 1990 and has continued the monitoring ofarea streams, rivers, and municipal infrastructure since then. From 1990 to 1993 the cityconducted wet weather sampling of CSOs, streams, rivers and pilot facilities constructedto evaluate alternative CSO treatment technologies. CWW subsequently conducted twonational demonstration programs to evaluate CSO controls. These programs included 38monitoring stations on streams, river, and CSO control facilities including individualprocess components.
A wet weather monitoring program has been the focal point of Columbus' effort tounderstand wet weather pollution, its impact on the environment, and cost-effectivemeans to control and reduce the problem. Watershed monitoring stations included flowmeasurement, automatic sampling and multi-parameter continuous-probemeasurements. Analytical tests included E. Coli and fecal coliform bacteria,cryptosporidium and giardia, suspended solids and particle distribution, oxygendemands, nutrients and metals. Probe measurements included dissolved oxygen,turbidity, pH, temperature, and conductivity. Aquatic biology and habitat measurementsin over 30 locations were monitored on a quarterly and/or biannual schedule to assessmacroinvertebrates and fish populations over a two-year period. Monitoring wasconducted to:
● Quantify CSO pollutant loadings
● Measure watershed health and impacts of wet weather pollution
● Determine performance of the various technologies tested

COL-3
Community Case Study: Columbus, GA—Region 4
● Calibrate the EPA BASINS model
● Develop a framework for area TMDLs
● Show compliance with the CSO Control Policy for the controls implemented
Characterization findings show that all of these objectives were achieved, and thatseveral protocols for monitoring and modeling have significant national benefit. TheCWW monitoring, modeling and technology performance testing was peer reviewed bythe Water Environment Research Foundation.
Nine Minimum Controls
In concert with the CSO Control Policy development, CWW evaluated the optimization ofits system and organization together with its long-term planning to address NMCrequirements. The NMC were identified for the Columbus system, implemented, anddocumented in a June 1995 report to the Georgia Department of Natural Resources -Environmental Protection Division, the NPDES permitting authority.
The system has been surveyed and hydraulically modeled, and there are no dry weathersewer overflows.
An extensive public education program involving public hearings, news articles, waterbill flyers, watershed workshops, and university seminars has been conducted during theplanning, implementation, and subsequent testing phases of the CWW CSO program. Acontinued program is being provided through CWW activities and support oforganizations such as Leadership Columbus, the Oxbow Environmental Learning Center,Adopt-A-Stream, and River Kids.
Long Term Control Plan
Columbus developed its LTCP based on the demonstration approach of the CSO ControlPolicy. Demonstration requires that remaining CSOs after implementation of controlsmust not preclude the attainment of water quality standards or contribute to waterquality impairment. In Columbus, this determination is made through a TMDL allocationprocess. Columbus was able to quantify pollutant contributions and link the source andthe ability to attain water quality standards to water quality targets. This analysis led to alevel of CSO control beyond which there is no "reasonable potential to cause orcontribute to exceedances of water quality standards." The result was a post-construction Phase II CSO NPDES Permit that had no numeric limits other than"performance standards based on average design conditions and consistent with thefacilities implemented and demonstrated." Columbus continues to monitor the receivingwater and CSO effluent. The data are aggregated with the calibrated BASINS modeloutput to demonstrate on a periodic basis (monthly if possible) that the sourcecontributions and comparison with ambient monitoring data add to the databasesupporting the TMDL allocation process.
Costs and Financing
Funds for the initial assessment studies, design and early construction were obtainedthrough revenue bonds. To obtain the necessary additional funds, the issue was taken tothe public through a series of hearings, workshops and through other outreach vehicles.Incorporating the river walk and park amenities into the project played a key role indrawing public interest to the river and the need for water quality and human healthprotection. An environmental learning center supported by CWW was created through apartnership with the Columbus State University. The center has since become the focalpoint for community discussions on environmental resources and municipalinfrastructure issues.
CWW furthered its public involvement by developing alternative financing methodsincluding a special options sales tax (SPLOST), Ad Valorem tax, water and sewer rateincreases, and a user fee approach. The SPLOST approach was put before public vote and
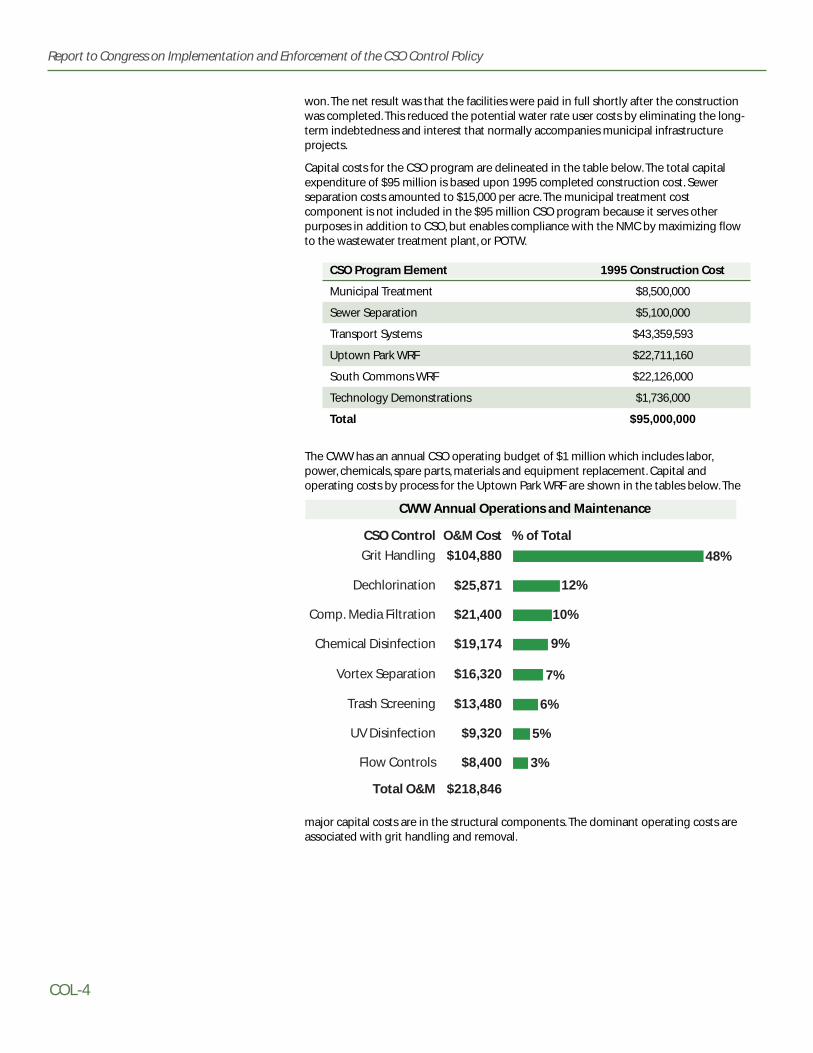
COL-4
Report to Congress on Implementation and Enforcement of the CSO Control Policy
won. The net result was that the facilities were paid in full shortly after the constructionwas completed. This reduced the potential water rate user costs by eliminating the long-term indebtedness and interest that normally accompanies municipal infrastructureprojects.
Capital costs for the CSO program are delineated in the table below. The total capitalexpenditure of $95 million is based upon 1995 completed construction cost. Sewerseparation costs amounted to $15,000 per acre. The municipal treatment costcomponent is not included in the $95 million CSO program because it serves otherpurposes in addition to CSO, but enables compliance with the NMC by maximizing flowto the wastewater treatment plant, or POTW.
CSO Program Element 1995 Construction Cost
Municipal Treatment $8,500,000
Sewer Separation $5,100,000
Transport Systems $43,359,593
Uptown Park WRF $22,711,160
South Commons WRF $22,126,000
Technology Demonstrations $1,736,000
Total $95,000,000
The CWW has an annual CSO operating budget of $1 million which includes labor,power, chemicals, spare parts, materials and equipment replacement. Capital andoperating costs by process for the Uptown Park WRF are shown in the tables below. The
major capital costs are in the structural components. The dominant operating costs areassociated with grit handling and removal.
Grit Handling $104,880
Dechlorination $25,871
Comp. Media Filtration $21,400
Chemical Disinfection $19,174
Vortex Separation $16,320
Trash Screening $13,480
UV Disinfection $9,320
Flow Controls $8,400
Total O&M $218,846
48%
12%
10%
9%
7%
6%
5%
3%
CSO Control O&M Cost % of Total
CWW Annual Operations and Maintenance
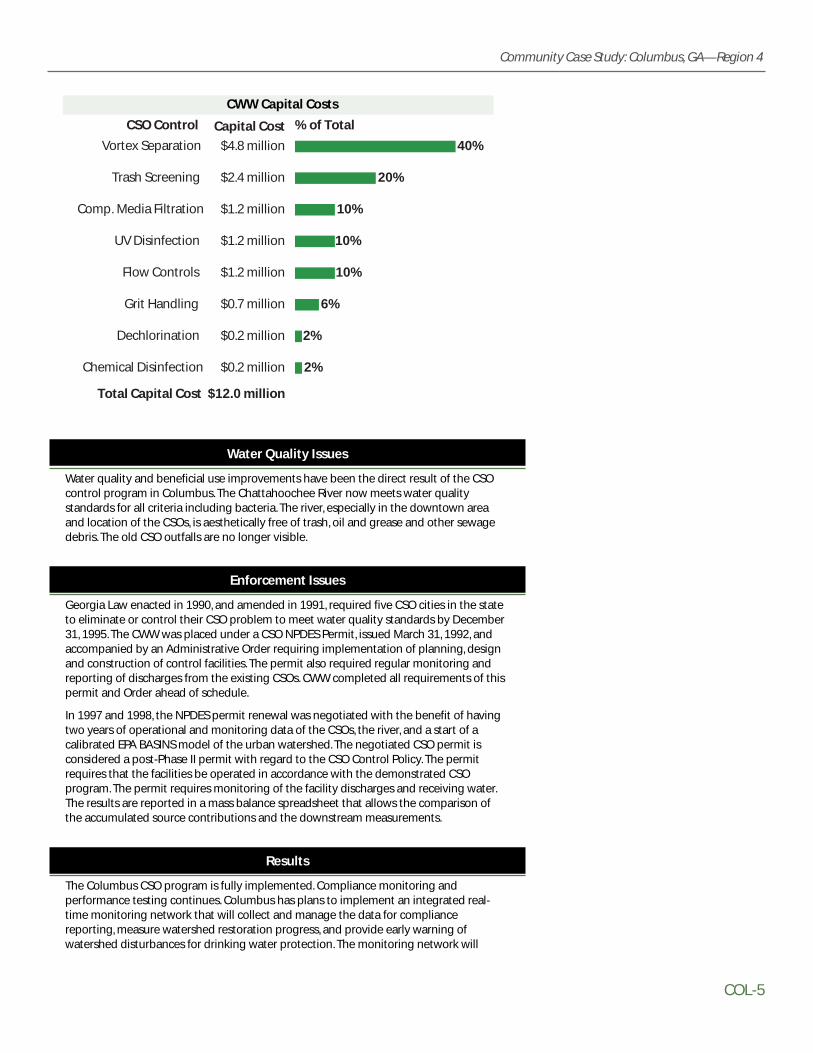
COL-5
Community Case Study: Columbus, GA—Region 4
Water Quality Issues
Water quality and beneficial use improvements have been the direct result of the CSOcontrol program in Columbus. The Chattahoochee River now meets water qualitystandards for all criteria including bacteria. The river, especially in the downtown areaand location of the CSOs, is aesthetically free of trash, oil and grease and other sewagedebris. The old CSO outfalls are no longer visible.
Enforcement Issues
Georgia Law enacted in 1990, and amended in 1991, required five CSO cities in the stateto eliminate or control their CSO problem to meet water quality standards by December31, 1995. The CWW was placed under a CSO NPDES Permit, issued March 31, 1992, andaccompanied by an Administrative Order requiring implementation of planning, designand construction of control facilities. The permit also required regular monitoring andreporting of discharges from the existing CSOs. CWW completed all requirements of thispermit and Order ahead of schedule.
In 1997 and 1998, the NPDES permit renewal was negotiated with the benefit of havingtwo years of operational and monitoring data of the CSOs, the river, and a start of acalibrated EPA BASINS model of the urban watershed. The negotiated CSO permit isconsidered a post-Phase II permit with regard to the CSO Control Policy. The permitrequires that the facilities be operated in accordance with the demonstrated CSOprogram. The permit requires monitoring of the facility discharges and receiving water.The results are reported in a mass balance spreadsheet that allows the comparison ofthe accumulated source contributions and the downstream measurements.
Results
The Columbus CSO program is fully implemented. Compliance monitoring andperformance testing continues. Columbus has plans to implement an integrated real-time monitoring network that will collect and manage the data for compliancereporting, measure watershed restoration progress, and provide early warning ofwatershed disturbances for drinking water protection. The monitoring network will
Vortex Separation $4.8 million 40%
Trash Screening $2.4 million 20%
Comp. Media Filtration $1.2 million 10%
UV Disinfection $1.2 million 10%
Grit Handling $0.7 million 6%
Chemical Disinfection $0.2 million 2%
Dechlorination $0.2 million 2%
Flow Controls $1.2 million 10%
Total Capital Cost $12.0 million
CSO Control Capital Cost % of Total
CWW Capital Costs

COL-6
Report to Congress on Implementation and Enforcement of the CSO Control Policy
include urban area creeks and river, CSOs and treatment plants. Watershedcharacterization data including near real-time displays will be available to the public viathe internet.
Performance testing at the Uptown Park WRF has generated the data necessary toevaluate combinations of the technologies tested. The alternative evaluation processconsidered the annual distribution of rainfall and runoff events such that annual yields(quantity per acre per year) and the reduction in yield can be assessed versus the cost forthe treatment scenario. The costs and benefits for different treatment levels provided bytechnologies demonstrated in Columbus were also evaluated. For example, the capitalcost per pound of total suspended solids removal increased from $27 per pound at the63 percent removal rate to $63 per pound at the 80 percent removal rate.
A new bromine-based chemical is being tested with potential for higher treatment ratecapabilities with minimal residuals. This technology evaluation is being undertakenthrough a collaboration of the Georgia Institute of Technology, the chemicalmanufacturer, and CWW. It is anticipated that other partnerships will be generated toevaluate various CSO technologies at the Uptown Park WRF.
The primary goal of the Columbus CSOcontrol program was to reduce fecal coliformbacteria to levels meeting water qualitystandards in the Chattahoochee River.Watershed measurements and a TMDLformulation were required to make thisdetermination. Area watersheds weremonitored over a three-year period and theBASINS model was calibrated from themeasured data. The results of this evaluationshow that the CSOs do not cause orcontribute to water quality standardsviolations. As shown in the table at right, thefecal coliform removal rate was extremelysuccessful, but other pollutants of concern were also significantly reduced.
The 30-day geometric mean fecal coliform represents all contributing sources and is wellwithin the summer and winter water quality criteria of 500 and 1,000 colonies per 100 ml. The maximum daily standard of 4,000 colonies per 100 ml was exceededperiodically (a few days within a two-year period), but was attributed to urban andsuburban streams that discharge to the river. Remaining bacteria attributable to CSOafter treatment is a small fraction of that contributed by the urban and rural watersheds.
The next challenge for the area is to implement management strategies that will focuson urban watershed protection including area drinking water supplies. In accomplishingthese goals, policies and ordinances will be developed and watershed technologies willbe demonstrated. Ultimately site-specific criteria defining water body use and protectivemeasures will be developed. The regional and local partnerships and the environmentaleducation network established by CWW will continue to be the focal point of theseefforts.
Most of the future needs for Columbus will be associated with storm water controls. Thecosts of urban watershed management could be very large and demand a sound-science approach to test alternative technology. Columbus has initiated several projectsto evaluate wet weather control strategies in which performance results will be appliedon a broader basis to quantify costs and benefits of watershed restoration.
Citations
Boner, Mark. Wet Weather Engineering and Technology (WWETCO), Columbus, GA.Personal communication with Limno-Tech, Inc. staff on details of the combined seweroverflow plan and program. Summer 2001.
Pollutant Removal as
% of Annual Load
BOD 55—61%
TSS 52—62%
Fecal coliform 95—99%
Copper 66—75%
Lead 62—83%
Zinc 62—82%

LOU-1
Number of CSO Outfalls
115
Combined Sewer Service Area
375 square miles
Wastewater Treatment Capacity
250 mgd (primary)140 mgd (secondary)
Receiving Water(s)
Ohio River
Louisville, KY—Region 4
Background on Louisville CSOs
The Louisville and Jefferson County Metropolitan Sewer District (LJCMSD) provides sewerservice as well as storm water utility management to the Louisville, Kentucky community.The sewer customer base is just over 198,000 and has grown at a rate of 12 percent overthe past five years. Sewer service is provided by a combination of separate sanitarysewers and combined sewers. The total length of sewers within the service area is over3,000 miles including 680 miles of combined sewers built before 1995. The combinedsewer service area is heavily urbanized and covers approximately 24,000 acres. There arecurrently a total of 115 CSO outfalls within the CSS.
Wastewater flow is treated at the Morris Forman Wastewater Treatment Plant (MFWTP).MFWTP is capable of providing full secondary treatment for up to 140 mgd and primarytreatment for an additional 110 mgd during wet weather periods. A project is currentlyunderway which will increase the wet weather primary treatment capacity from 250 mgdto 350 mgd.
Program Highlights
● Five CSO outfalls have beeneliminated.
● CSO frequency has been reducedby 27 percent and CSO volumehas been reduced by 13 percent.This keeps 681 million gallons peryear of combined sewage out oflocal receiving waters.
● LJCMSD's program to installbackflow prevention devices inhomes to eliminate sewerbackups has been used as anational model.
Community Case Study
$
Indiana
Louisville
Ohio River
Muddy Fork
Beargrass Creek
South ForkCreek
$S Outfall
Combined Sewer Area
Wastewater Treatment Plant
#!
#!
#!
#!#!#!
#!#!#!#!#!#!#!#!#!#!#!#!
#!#!#!#! #!#!#!#!#! #! #!
#!#!#!
#!#!#!
#!#!
#!
#!
#!#!
#!
#!#!#!
#!#!#!#!#! #!#!#!
#!#!#!
#!
#!#!
#!
#!
#!
#!#!
#!
#!
#!
#!#!
#!
#!#! #!#! #!#!
#!
#!#!
#!
#!
#!#!
#!
#!#!#!#!
#!#!#!
#!
#!
#!
#!#!#!#!#!#!#!#!#!
#!#!#!
#!
#!
#!
#!#!
Controls
● The Louisville and Jefferson CountyMetropolitan Sewer District(LJCMSD) has initiated in-linestorage projects, separation projects,storage basin projects, and pilot CSOtreatment projects.
● LJCMSD is currently working toexpand wet weather capacity at itstreatment plant by 40 percent, from250 to 350 mgd.
Photo: Inflatable dam at the Sneads Branch CSO.Courtesy of LJCMSD
LOU-2
Report to Congress on Implementation and Enforcement of the CSO Control Policy
Status of Implementation
Nine Minimum Controls
All of the NMC have been implemented, and LJCMSD provided NMC documentation tothe State of Kentucky. Many of the NMC activities were being implemented by LJCMSDbefore the CSO Control Policy was issued in 1994.
LJCMSD established a maintenance program in the 1980s to focus on inspection andmaintenance of CSO outfalls. Each CSO outfall is inspected on a set schedule. Thefrequency of the inspection ranges from daily to monthly depending on the particularoutfall size, history of the discharge, and past maintenance problems. Dry weatheroverflows have essentially been eliminated through regular maintenance activity.
Regularly scheduled cleaning of over 25,000 storm water catch basins in the CSS result inthe removal of over 600 tons/year of street debris and litter. This program reducespollutant discharge from CSOs and prevents plugging and dry weather blockages in thesewer system.
For notification of overflows, LJCMSD located signs at each CSO outfall to inform thepublic of the outfall and the reason for the outfall. The public is asked to call LJCMSDcustomer service if a dry weather overflow is occurring. During extreme wet weatherevents, LJCMSD purchases time on local radio stations to inform the public to stay out ofthe streams for safety reasons. LJCMSD's website (www.msdlouky.org) has additionalinformation about CSOs and water quality.
Long Term Control Plan
LJCMSD developed a flow-monitoring program in 1991 to characterize the CSS. Flowmonitors were installed at 50 locations throughout the CSS. This information was used todevelop and calibrate a SWMM model to simulate the combined system. Long-termquality samplers are located at 12 overflow locations. Permanent real-time flow monitorsare in place in three locations and additional locations are planned as part of real-timecontrol projects.
LJCMSD has developed an LTCP as required by their NPDES permit and has beenimplementing the plan within five-year increments for which the LJCMSD Board cancommit funding. The plan is dynamic. It will continue to evolve and improve based uponnew data (water quality impacts, land uses), new technology, and emerging regulations.The LTCP has been submitted to the State of Kentucky. LJCMSD is working to implementthe LTCP, although it has not yet been approved by the state.
The LTCP is based upon a mixture of the presumption and demonstration approachesdescribed in the CSO Control Policy. The combined sewer area in Louisville is divided intothree regions. CSO controls in Region 1 are based on the presumption approach, andCSO controls in Regions 2 and 3 are based on the demonstration approach. Region 1discharges to streams, which in turn discharge to the Ohio River; Regions 2 and 3discharge directly to the Ohio River.
LJCMSD has prioritized activities outlined in its LTCP so that controls for overflowsimpacting sensitive areas are implemented first. One key effort has been to addressoverflows in the most upstream areas of Region 1 that are located in a public park. Thelocation of these outfalls increases the risk of the public coming in contact with CSOdischarges and therefore the control of these CSOs has been given a high priority.
Costs
To date, LJCMSD has spent an estimated $25 million in implementing its LTCP. Fullimplementation will cost an estimated $210 million; this projection will be affected bythe availability of funding for CSO control and the complexity of completing projects infully urbanized areas.
LOU-3
Community Case Study: Louisville, KY—Region 4
LJCMSD is using its resources as efficiently as possible to implement the high prioritycontrol identified in its LTCP. The specific control measures outlined in the LTCP arecontinually reviewed in light of changing technology, improved understanding of thesystem, and the performance of controls that have been implemented. It should also benoted that LJCMSD has numerous programs that result in water quality improvements.LJCMSD attempts to allocate resources based on a combination of regulatoryrequirements, customer needs, and water quality benefits.
Water Quality Issues
Based on extensive and ongoing watershed monitoring, LJCMSD believes that, becauseof the impacts of heavy urbanization, meeting current water quality standards in manylocal CSO receiving waters will be difficult. In fact, LJCMSD believes that when the LTCPis fully implemented, water quality standards will not be attained. For example, fecalcoliform standards will still be exceeded about 30% of the time. Meeting current waterquality standards will require an integrated effort that addresses not only CSOdischarges, but also other point and non-point discharges (including storm water andsanitary sewer overflows). To help prioritize and address the many programs, LJCMSD isinitiating a "Water Quality Tool" computer program that will work to predict the benefitsof various projects in specific watersheds and compare them. This "Tool" is beingdeveloped by merging the computer models HSPF and SWMM.
Enforcement Issues
LJCMSD has been aggressively addressing CSOs to improve water quality through O&Mefforts as well as capital projects. Dry weather overflows have been virtually eliminated.Various capital projects to eliminate overflows have been completed along with twopilot projects to treat CSO discharges. The State of Kentucky has chosen, for now, toaddress CSO issues through the permitting program rather than through enforcement.Therefore, to date, no communities in Kentucky have been issued enforcement actionsrelated to the development and implementation of CSO controls, as described in theCSO Control Policy.
Results
A range of projects have been successfully implemented to date. LJCMSD has initiatedin-line storage projects, separation projects, storage basin projects, and pilot CSOtreatment projects. These pilot treatment projects are being reviewed by both WaterEnvironment Research Foundation and NSF International.
In an effort to address one of the key issues of CSOs – human contact - LJCMSD has beeninstalling backflow prevention devices in the basements of homes to eliminate sewerbackup from surcharged combined sewers. This program has become a national modelwith 5,100 homes protected to date.
LJCMSD has developed a county-wide geographic information system (GIS) to catalogueand track all aspects of the sewer system (i.e., pipe length, pipe type, etc). Upgrades willinclude condition ratings and other sewer operation and maintenance information. Workorder tracking for operation and maintenance activities has recently been implemented.These attributes are recorded and attached to the infrastructure assets within the GIS.
Visual representation of reductions in average CSO volume and frequency for LJCMSDRegions 1, 2, and 3 and a system-wide description of pollutant load reductions areprovided in the accompanying graphs. These numbers reflect the effect of the systemimprovements and form the basis for measuring the achieved reductions in overflowvolumes and frequencies for each region and the CSS as a whole.
LOU-4
Report to Congress on Implementation and Enforcement of the CSO Control Policy
Based on system improvements implemented between July 1993 and July 1999:
● Five CSOs have been eliminated through various projects, including separation.
● Average annual CSO volume has been reduced from 5,153 million gallons per year to 4,472 million gallons per year, a reduction of 681 million gallons per year, or 13 percent.
● The frequency of CSO discharges was reduced from 5,361 overflows per year to 3,898,representing an overall reduction of 27 percent.
● CSO loads of biological oxygen demand were decreased from 3.2 million pounds to2.9 million pounds per year, an overall decrease of eight percent.
● CSO loads of total suspended solids were decreased from 7.2 million pounds to 6.5 million pounds per year, an overall decrease of 10 percent.
LTCP storage projects now under construction will provide further reductions in CSOfrequency, volume, and pollutant loading. Based on a system assessment, LJCMSD hasalso begun implementation of a real-time control project that will result in additionalreductions in the next five years.
References
AMSA, 1994. Approaches to Combined Sewer Overflow Program Development: A CSOAssessment Report. AMSA, Washington D.C. November 1994.
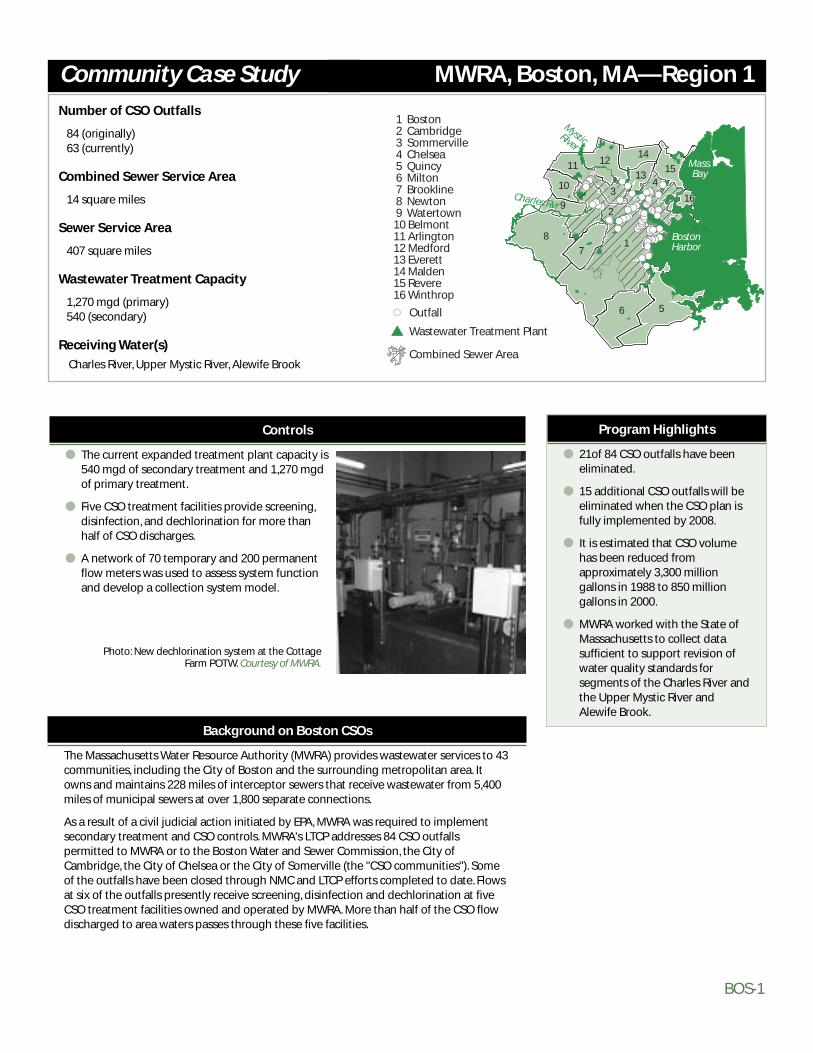
BOS-1
Number of CSO Outfalls
84 (originally)63 (currently)
Combined Sewer Service Area
14 square miles
Sewer Service Area
407 square miles
Wastewater Treatment Capacity
1,270 mgd (primary)540 (secondary)
Receiving Water(s)
Charles River, Upper Mystic River, Alewife Brook
MWRA, Boston, MA—Region 1
Background on Boston CSOs
The Massachusetts Water Resource Authority (MWRA) provides wastewater services to 43communities, including the City of Boston and the surrounding metropolitan area. Itowns and maintains 228 miles of interceptor sewers that receive wastewater from 5,400miles of municipal sewers at over 1,800 separate connections.
As a result of a civil judicial action initiated by EPA, MWRA was required to implementsecondary treatment and CSO controls. MWRA's LTCP addresses 84 CSO outfallspermitted to MWRA or to the Boston Water and Sewer Commission, the City ofCambridge, the City of Chelsea or the City of Somerville (the "CSO communities"). Someof the outfalls have been closed through NMC and LTCP efforts completed to date. Flowsat six of the outfalls presently receive screening, disinfection and dechlorination at fiveCSO treatment facilities owned and operated by MWRA. More than half of the CSO flowdischarged to area waters passes through these five facilities.
Program Highlights
● 21of 84 CSO outfalls have beeneliminated.
● 15 additional CSO outfalls will beeliminated when the CSO plan isfully implemented by 2008.
● It is estimated that CSO volumehas been reduced fromapproximately 3,300 milliongallons in 1988 to 850 milliongallons in 2000.
● MWRA worked with the State ofMassachusetts to collect datasufficient to support revision ofwater quality standards forsegments of the Charles River andthe Upper Mystic River andAlewife Brook.
Community Case Study
$
$S Outfall
Combined Sewer Area
Wastewater Treatment Plant
1 Boston 2 Cambridge 3 Sommerville 4 Chelsea 5 Quincy 6 Milton 7 Brookline 8 Newton 9 Watertown10 Belmont11 Arlington12 Medford13 Everett14 Malden15 Revere16 Winthrop
BostonHarbor
Mass.Bay
#! #!#!#!#!#!#!
#!#!#!#!#!#!#!#!#!#!#!
#!#!#!
#!#!#!#!#!#!#!
#!#!#!#!#!#!
#!#!#!#!
#!#!#!#!#!#!#!#!#!
#!#!#!#!#!
#!#!#!
#!#!#!#!#!#!#!#!#!#!
1
2
34
5
10
11 12
9
7
8
6
13
14
15
16
MysticRiver
Charles Rvr
Controls
● The current expanded treatment plant capacity is540 mgd of secondary treatment and 1,270 mgdof primary treatment.
● Five CSO treatment facilities provide screening,disinfection, and dechlorination for more thanhalf of CSO discharges.
● A network of 70 temporary and 200 permanentflow meters was used to assess system functionand develop a collection system model.
Photo: New dechlorination system at the CottageFarm POTW. Courtesy of MWRA.

BOS-2
Report to Congress on Implementation and Enforcement of the CSO Control Policy
MWRA's CSS area covers 14 square miles, with a service population of 550,000 people.The separate sewer service area is 393 square miles, with a service population of abouttwo million people. All wastewater flow is conveyed to the new Deer Island WastewaterTreatment Plant, which was upgraded in 1999 to expand capacity and provide secondarytreatment.
The Deer Island Wastewater Treatment Plant has an average dry weather design flow of480 mgd. It currently treats an average dry day flow of 330 mgd and an average dailyflow (dry and wet days) of 375 mgd. The plant has a primary treatment capacity of 1,270 mgd and a secondary treatment capacity of 540 mgd. Flows that exceed 540 mgdare bypassed around secondary treatment, blended with primary and secondaryeffluent, and discharged through MWRA's 9.5-mile ocean outfall.
Status of Implementation
In 1987, MWRA entered into a stipulation in the Federal Court Order in the BostonHarbor Case by which it assumed responsibility for development and implementation ofan LTCP for its CSO outfalls, as well as outfalls owned and operated by its CSOcommunities. In December 1994, MWRA completed the Final CSO Conceptual Plan andSystem Master Plan (the "Conceptual Plan"), in which MWRA recommended short-termand long-term CSO control plans (MWRA, 1994). The LTCP was developed in the contextof a system-wide master plan and in accordance with the new CSO Control Policy issuedby EPA in April 1994. In addition to CSO control, the master planning process consideredsystem improvement strategies that addressed transport capacity, treatment capacity,and infiltration/inflow removal.
The Conceptual Plan recommended more than 100 system optimization projects thatcould be implemented immediately at relatively low cost to maximize wet weatherconveyance and in-system storage in the short-term. For the long-term, it recommended28 wastewater system improvements covering a range of CSO control technologies thattargeted site-specific CSO impacts and site-specific water quality goals.
In August 1997, MWRA completed the Final CSO Facilities Plan and EnvironmentalImpact Report (the "Facilities Plan"), which carried the Conceptual Plan projects throughfacilities planning and state environmental review processes, resulting in some planchanges (MWRA, 1997). The Facilities Plan recommended 25 projects to control CSOdischarges to 14 receiving water segments.
For each of the projects in the plan, design, and construction milestones have beenincorporated into the Federal Court schedule. To date, seven of the 25 projects arecomplete, and an additional 11 projects are in construction. All projects are to becompleted by November 2008.
System Characterization
The key performance measures used by MWRA in developing the plan and monitoringachievement of plan goals are frequency and volume of CSO "in a typical rainfall year".The typical rainfall year was developed by MWRA using 40 years of rainfall records andapproved by EPA. MWRA conducted a metering and modeling program in 1992-1993 tosupport development of the LTCP. Meters were installed at more than 70 CSO outfalllocations for a period of at least several months. MWRA also utilized data from more than200 permanent flow meters it maintains throughout its collection system. MWRAconducts receiving water and sediment sampling to track water quality trends, includingfecal coliform, enterococci, anthropogenic viruses and bacteriophage, chlorophyll,nutrients, DO, clarity, toxic contaminants and other parameters.
To meet long-term NPDES monitoring requirements, MWRA is evaluating hydraulicmodels and will select and build an appropriate model for future applications to assesssystem and facility optimization. When it becomes available, the new model will be used
BOS-3
Community Case Study: MWRA, Boston, MA—Region 1
to estimate CSO discharges for NPDES reporting purposes and to assess systemperformance as MWRA continues to implement the LTCP. Along with this new hydraulicmodel, the MWRA will implement permanent meters located in the collection pipes andat each of the CSO facilities, headworks and pumping stations. Temporary meters will beinstalled at or just upstream of CSO outfalls. Installation and collection of data fromtemporary meters will be scheduled on a rotating subsystem basis, with preferencegiven to those outfalls for which the information is most critical (e.g., where a CSOcontrol project has been completed and performance verification is desired). At CSOtreatment facilities, the NPDES permit requires sampling and monitoring activities, andMWRA performs additional sampling and monitoring for routine operational controlpurposes. MWRA's NPDES permit includes limits on bacteria, residual chlorine, toxicityand pH at CSO treatment facilities.
NMC
MWRA submitted its NMC compliance documentation on December 31, 1996. Dryweather overflows caused by capacity problems or other structural conditions wereeliminated in the early 1990's through a series of fast-track CSO projects. Control of dryweather overflows is now managed through field operations efforts, including frequentsystem inspections and routine and as-needed maintenance, to remove obstructions.
Public notification is provided through the posting of signs at every CSO outfall, andthrough a flagging system at beaches and in other high-use recreational areas, such asthe Charles River.
LTCP
MWRA's LTCP was developed using the demonstration approach. This includedutilization of a watershed-based analysis to consider CSO and non-CSO sources and thepotential for attainment of water quality standards in each of 14 receiving watersegments in or as a tributary to Boston Harbor or Dorchester Bay. The contribution ofCSO discharges to water quality degradation was evaluated in detail, and a baselinewater quality assessment was performed in 1993-1994. The 1997 Facilities Plan becamethe primary source of information for a use attainability analysis (UAA) that was preparedby the Massachusetts Department of Environmental Protection (DEP) to support itsapproval of the CSO plan, including review and revision of water quality standards.
The CSO plan proposes elimination of CSO discharges to critical use areas (i.e. beachesand shellfish areas), significant reduction or treatment of discharges to less sensitivewaters, and means to control floatable materials where CSO discharges will remain. All 25projects in MWRA's LTCP were approved by EPA and DEP in 1997-1998, and are includedin the Federal Court Order in the Boston Harbor Case, with detailed design andconstruction milestones. However, MWRA is reevaluating several projects, which mayresult in significant project changes that will have to be approved. In addition, the levelof CSO control for the Charles River and for the Upper Mystic River/Alewife Brook isunder review, pursuant to water quality standards variances issued by DEP. Final waterquality standards determinations are expected to be made at the end of the varianceperiods (currently October 2001 and March 2002).
As of May 2001, CSO discharges have been eliminated at 21 of the 84 outfalls. Anadditional 15 outfalls are scheduled to be closed to CSO discharges by 2008, when theCSO plan is fully implemented.
Costs
The capital cost for design and construction to implement the LTCP is estimated to be$548 million (in 2001 dollars). Approximately $110 million has been spent. Annual O&Mcost for the CSS is estimated to be $2 million per year.

BOS-4
Report to Congress on Implementation and Enforcement of the CSO Control Policy
Water Quality Issues
Implementation of the NMC has resulted in the elimination of dry weather overflows anda significant reduction in CSO discharges. The CSO reductions to date are primarily dueto capital-intensive programs to increase conveyance capacity to the new Deer IslandTreatment Plant, and to CSO system optimization plans that maximized in-systemstorage through weir raising and tide gate repair/replacement. Receiving water samplingprograms show steady water quality improvement over the past decade.
Completion of MWRA's LTCP is intended to bring CSO discharges into compliance withwater quality standards. Final decisions on what those standards should be for theCharles River, Alewife Brook and Upper Mystic River will not be made until additionalwater quality information is collected and evaluated by MWRA and the DEP, pursuant toconditions in the water quality standards variances. In all receiving water segments,water quality standards may at times continue to be violated due to non-CSO sources(e.g., storm water) following full implementation of CSO controls in the LTCP.
Enforcement Issues
Development and implementation of the LTCP are subject to detailed schedulemilestones in the Federal Court Order in the Boston Harbor Case. MWRA's recentlyrenewed NPDES permit (Phase I CSO) also requires implementation of the plan. Phase IICSO requirements are expected to be added to the permit soon, and will require CSOdischarges to meet the Facilities Plan CSO activation frequency and volume predictions,as the CSO plan is implemented.
Results and Accomplishments
MWRA estimates that total annual volume of CSO discharge has been reduced fromabout 3.3 billion gallons in 1988 to about 850 million gallons today, primarily throughimprovements to its Deer Island Treatment Plant and transport system. Seven of the 25CSO construction projects that make up the LTCP are complete, and 11 more are inconstruction. Full implementation of the LTCP is predicted to further reduce dischargesto about 400 million gallons, with approximately 95% of the remaining CSO flowsreceiving screening, disinfection and dechlorination.
In addition to closing 21 of the 84 outfalls to date, MWRA has virtually eliminatedresidual chlorine in chlorinated effluent from its CSO treatment facilities, which processmore than half of the approximately 850 million gallons of CSO presently discharged tometropolitan Boston waters in a typical year.
References
Kubiak, David, Massachusetts Water Resource Authority, Boston,MA. Personalcommunication with Limno-Tech, Inc. staff on details of the combined sewer overflowplan and program. Summer 2001.
MWRA, 1994. Final CSO Conceptual Plan and System Master Plan. Boston, MA.
MWRA, 1997. Final CSO Facilities Plan and Environmental Impact Report. Boston, MA.

MUN-1
Number of CSO Outfalls
30 (originally)24 (currently)
Combined Sewer Service Area
10.2 square miles
Wastewater Treatment Capacity
27 mgd (tertiary)
Receiving Water(s)
White River, Buck Creek
Muncie, IN—Region 5
Background on Muncie CSOs
The Muncie Sanitary District (MSD) provides sewer service to the City of Muncie, Indianaand to a number of developments outside the city. The Muncie Water Pollution ControlFacility (WPCF) has a capacity of 27 mgd (Huyck, 2001). It is anticipated that the MSDservice area will continue to grow. Two newly developed sewer systems in surroundingareas are expected to eventually discharge to the WPCF.
Status of Implementation
MSD prepared a Stream Reach Characterization & Evaluation Report (SRCER) in 1999 tomeet a requirement of its NPDES permit (Amlin, 1999). The SRCER details the impacts ofCSOs on the White River. MSD used a SWMM model to facilitate SRCER development andto evaluate its combined sewer system. Total inflow to the collection system, averageannual pollutant loadings, and average annual discharge loadings were calculated from
Program Highlights
● CSO outfalls have been reducedfrom 30 to 24.
● Muncie has implemented theNMC.
● Muncie is working on a UseAttainability Analysis (UAA) torequest a temporary suspensionof designated uses during wetweather.
● Muncie recently completed a$5 million sewer separationprojects in response to a 1985enforcement action.
Community Case Study
$White River
Buck Creek
$S Outfall
Combined Sewer Area
Wastewater Treatment Plant
Muncie
((
(((
((((
(((
((((
(
(
((((
((
Controls
● Muncie's CSO abatement effortshave focused on sewer separationand treatment plant upgrades.
● Better O&M practices (e.g., sewerflushing and street sweeping) haveimproved system performanceduring wet weather.
● The presumption approach wasused as the basis for developmentof the LTCP scheduled to besubmitted to the state by November2001.
● A SWMM model was used in systemcharacterization and to evaluate the collection system/controls.
Photo: The White River, one of Muncie’s twoCSO receiving waters.
Courtesy of Nathan Bilger
MUN-2
Report to Congress on Implementation and Enforcement of the CSO Control Policy
the SWMM model simulations. The SRCER also includes proposed controls for CSOabatement. SRCER recommendations were considered in the development of Muncie'sLTCP, described below.
Nine Minimum Controls
MSD has implemented the NMC as described in EPA's 1994 CSO Control Policy. A CSOOperational Plan, required by the state, serves as a reporting mechanism for eight of thenine minimum controls. MSD Operational Plan was approved March 24, 2001. The SRCER,also required by the state, fulfils the monitoring requirement of the ninth minimumcontrol.
MSD has collected water quality and biotic data from affected areas of the White Riverthrough baseline studies for the past 26 years. Results of the baseline studies arepresented in the SRCER. While the data show dramatic improvement in the water qualityin the White River through Muncie, as measured by both chemical and biological indices,improvements are not only due to CSO abatement efforts. Improvements in waterquality likely reflect the composite of pollution abatement programs, including CSOcontrol efforts, sewer cleaning, street sweeping, and public education. Currently, MSD isenumerating E. coli populations, on a weekly basis, above and below the MSD CSOoutfalls known to potentially affect the water quality of the West Fork of the White River.
MSD has not experienced dry weather overflows. As part of its maintenance program,MSD has recently purchased two new jet-vactor trucks and one new street sweeper. Twosweepers are used five days per week, weather permitting. The jet-vactor trucks cleansewers and manholes on a continuous basis, five days per week.
MSD public notification activities include public meetings and sign placement near theCSO outfalls. Recently, MSD and the Citizen's CSO Advisory Committee held twomeetings regarding the LTCP. MSD has prepared warning signs to be placed at selectedCSO outfalls to warn citizens about possible health hazards as a result of CSO discharges.The signs direct observers to call MSD if they witness dry weather overflows. Brochuresdescribing the LTCP have been prepared, and MSD plans to distribute them when theLTCP has been finalized. In addition, MSD plans to use its web site to explain CSOs andintends to develop a video for public information and education.
To date, sewer separation and treatment plant upgrades have been importantcomponents of MSD's CSO abatement efforts. In addition, MSD has improved theoperation of the existing combined system with more extensive O&M practices (e.g.,street sweeping and sewer cleaning).
Long Term Control Plan
MSD is using the presumption approach in developing its LTCP. Under the terms andconditions of its NPDES permit, MSD must submit an LTCP by November 2001. As statedabove, information obtained from SRCER and SWMM model is being used to develop thecity's LTCP. MSD is currently in the process of selecting the CSO abatement alternativesfor its LTCP.
Muncie's draft LTCP gives priority to eliminating discharges to sensitive areas. Publicinput is also an important component of the LTCP and is required by EPA and IndianaDepartment of Environmental Management (IDEM). A subcommittee of the MuncieCitizens CSO Advisory Committee has been established to determine those areas alongthe White River considered to be the most sensitive (e.g., parks, schools, and places ofpublic use). CSOs that discharge to sensitive areas will be eliminated, relocated, ortreated.
Costs and Financing
MSD has spent over $5 million on sewer separation over the past 10 years. Currently,MSD is spending $15.5 million for improvement and renovations to its WPCF to providebetter treatment of sewage and combined sewage. Upon approval of the LTCP by IDEM,
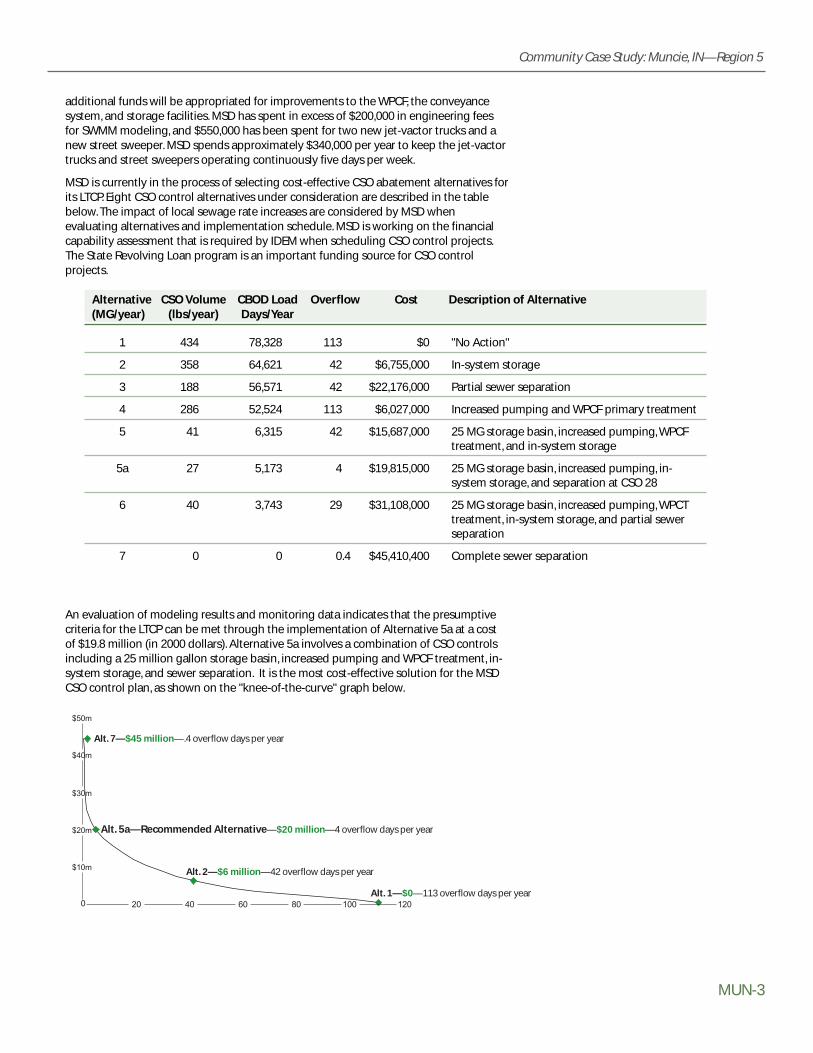
MUN-3
Community Case Study: Muncie, IN—Region 5
additional funds will be appropriated for improvements to the WPCF, the conveyancesystem, and storage facilities. MSD has spent in excess of $200,000 in engineering feesfor SWMM modeling, and $550,000 has been spent for two new jet-vactor trucks and anew street sweeper. MSD spends approximately $340,000 per year to keep the jet-vactortrucks and street sweepers operating continuously five days per week.
MSD is currently in the process of selecting cost-effective CSO abatement alternatives forits LTCP. Eight CSO control alternatives under consideration are described in the tablebelow. The impact of local sewage rate increases are considered by MSD whenevaluating alternatives and implementation schedule. MSD is working on the financialcapability assessment that is required by IDEM when scheduling CSO control projects.The State Revolving Loan program is an important funding source for CSO controlprojects.
An evaluation of modeling results and monitoring data indicates that the presumptivecriteria for the LTCP can be met through the implementation of Alternative 5a at a costof $19.8 million (in 2000 dollars). Alternative 5a involves a combination of CSO controlsincluding a 25 million gallon storage basin, increased pumping and WPCF treatment, in-system storage, and sewer separation. It is the most cost-effective solution for the MSDCSO control plan, as shown on the "knee-of-the-curve" graph below.
Alternative CSO Volume CBOD Load Overflow Cost Description of Alternative(MG/year) (lbs/year) Days/Year
1 434 78,328 113 $0 "No Action"
2 358 64,621 42 $6,755,000 In-system storage
3 188 56,571 42 $22,176,000 Partial sewer separation
4 286 52,524 113 $6,027,000 Increased pumping and WPCF primary treatment
5 41 6,315 42 $15,687,000 25 MG storage basin, increased pumping, WPCFtreatment, and in-system storage
5a 27 5,173 4 $19,815,000 25 MG storage basin, increased pumping, in-system storage, and separation at CSO 28
6 40 3,743 29 $31,108,000 25 MG storage basin, increased pumping, WPCT treatment, in-system storage, and partial sewer separation
7 0 0 0.4 $45,410,400 Complete sewer separation
$10m
$20m
$30m
$40m
$50m
20 40 60 80 100 120Alt. 1—$0—113 overflow days per year
Alt. 2—$6 million—42 overflow days per year
Alt. 5a—Recommended Alternative—$20 million—4 overflow days per year
Alt. 7—$45 million—.4 overflow days per year
0

MUN-4
Report to Congress on Implementation and Enforcement of the CSO Control Policy
Affordability constraints make the elimination of all CSOs (e.g., Alternative 7) unfeasible.Elimination of all CSOs is estimated to cost $45-65 million. IDEM has not approved any ofthe CSO abatement alternatives considered by MSD for its LTCP, including Alternative 5a.MSD is scheduled to submit its LTCP in November 2001 for state review.
One of the greatest needs for MSD is the replacement of some of the sewerinfrastructure. Many of the sewers are approaching 100 years in age and need to bereplaced or restored. For example, the main interceptor from the downtown area to theWPCF is 100 years old. It needs to be completely lined and structurally repaired. Thepreliminary estimate for this repair work is approximately $2 million, and is included inthe cost-effective alternative for CSO reduction.
Water Quality Issues
MSD believes that the implementation of the NMC has reduced the frequency andduration of overflows over the past several years, primarily through sewer cleaningactivities. However, data is not available to document the reductions.
The MSD stream monitoring program has found that non-CSO sources of pollutiongreatly affect the White River. Consequently, MSD believes that compliance with existingwater quality standards will not be achieved even if all CSOs are eliminated. MSD isworking on an IDEM required Use Attainability Analysis (UAA) to support a request for atemporary suspension of designated uses during wet weather.
Enforcement Issues
In 1985, IDEM issued an Agreed Order to MSD as a result of a fish kill in the White River,attributed to pollutant levels from a "first flush" of the CSOs. The $5 million sewerseparation project, mentioned above, was completed as a result of the Agreed Order.Since 1985, no fish kills attributable to MSD CSO discharges have occurred.
Results
MSD has spent $5 million on sewer separation projects. MSD has also improved O&Mpractices within the collection system (e.g., street sweeping five days per week). Inaddition, upgrades are being made to the WPCF to increase the treatment efficiency atthe plant. MSD has eliminated six CSOs to date.
MSD applied a SWMM model to evaluate its collection system and to investigate impactsof its CSOs on the White River. A SRCER was produced to document model findings,describe monitoring efforts in the White River, and present recommendations for futureCSO abatement efforts. MSD is currently in the process of developing its LTCP, and theSRCER has been instrumental in this process. The ultimate goals of the MSD LTCP are asfollows:
● Capture "first flush" of the CSOs.
● Remove solids and floatables.
● Decrease bacterial levels.
● Reduce discharges to the minimum level affordable.
● Eliminate CSOs to sensitive areas.

MUN-5
Community Case Study: Muncie, IN—Region 5
References
Amlin, Eugene P.E., 1999. Stream Reach and Characterization and Evaluation Report.Muncie, IN.
Huyck, Richard, Director, Bureau of Water Quality, Muncie Sanitary District. Personalcommunication with Limno-Tech,Inc. staff on details of CSO system and CSO controlplanning in Muncie, and review of case study. Spring/Summer 2001.

NBE-1
Number of CSO Outfalls
10
Combined Sewer Service Area
1.8 square miles
Wastewater Treatment Capacity
10 mgd
Receiving Water(s)
Bellmans Creek, Penhorn Creek, Cromakill Creek, Hudson River
North Bergen, NJ—Region 2
Background on North Bergen CSOs
The township of North Bergen, New Jersey has a population of approximately 48,000.North Bergen is served by a CSS that covers 1,130 acres. The North Bergen MunicipalUtilities Authority (NBMUA) is responsible for all CSOs and control systems within thetownship. Two wastewater treatment plants service the township. The Central TreatmentPlant services the West Side of North Bergen and lies within the Hackensack Riverdrainage basin. The Woodcliff Treatment Plant services the East Side of North Bergen andlies within the Hudson River drainage basin.
There are currently 10 CSO outfalls in the North Bergen CSS that are regulated by 36 flowcontrol chambers. Six of the flow control chambers have mechanical regulators whichlimit the flow to the interceptor by means of a sluice gate and a float mechanism. Theother 30 chambers use static control devices such as weirs, baffles, or orifices to controlflow to the interceptor and allow excess overflow to the CSO outfalls.
Program Highlights
● North Bergen has reduced thenumber of overflow points from13 to 10.
● The solid and floatables controlfacilities have captured more than68 tons of debris that would havebeen discharged to the HudsonRiver and various tributaries ofthe Hackensack River.
● Approximately 40 tons per year ofsolids are removed by in-line andend-of-pipe netting systems.
Community Case Study
$
$
$S Outfall
Combined Sewer Area
Wastewater Treatment Plant
Secaucus
JerseyCity
UnionCity
WestNew York
Hoboken
Weekawken
NorthBergen
Hud
son
Rive
r
Hackensack River
Bellmans Creek
Crom
akill
Creek
Penhorn Creek
#!
#!
#!
#!
#!
#!
#!#!#!
#!#!
Controls
● The minimum controls required bythe New Jersey Department ofEnvironmental Protection (NJDEP)permit have been implemented.
● Solids and floatables control hasbeen installed at all CSO outfalls.
● Netting technology is used at mostoutfalls to control floatables. Thereare two end-of pipe chambers,three in-line chambers, twofloating trash traps, and onemanually-cleaned bar rack. Photo: Solids and floatables controls, such as the
nets pictured here, are installed at all North BergenCSOs. Courtesy of NJDEP

NBE-2
Report to Congress on Implementation and Enforcement of the CSO Control Policy
Status of Implementation
NBMUA's control plan has focused on solids and floatables control (Fischer, 2001). Solidsand floatables controls have been installed at all CSO outfalls to capture half-inch indiameter and larger materials. Nine CSO outfall pipes have been retrofitted with nettingtechnology, and one CSO outfall uses a stationary bar rack for floatables control. Thestart-up date for the entire CSO control system was December 17, 1999.
Other infrastructure improvements made by NBMUA as part of their efforts to controlCSOs include installation of a new vortex valve regulator upstream of an existing pumpstation, and installation of a separate 48-inch combined sewer outfall pipe thateliminated the older systems which combined the plant outfall and the CSO.
System Characterization
NBMUA completed a Combined Sewer Overflow Characterization Study in 1997 (Killam,1997). NBMUA plans to conduct additional flow and water quality monitoring as part ofits CSO control plan. The monitoring information will be used to develop aSWMM/EXTRAN model of the CSS. The monitoring and modeling plan is currently underreview by NJDEP.
Nine Minimum Controls
NBMUA has implemented the minimum controls required by their NPDES permit,including :
● Prohibition of dry weather overflows
● Solids and floatables control
● Development and implementation of proper operation and maintenance (O&M)programs
● Maximization of flow to the publicly owner treatment works (POTW)
● Public notification/reporting requirements
Long Term Control Plan
The control plan adopted by NBMUA focuses on the control of solids and floatables.Cost estimates have been computed for disinfection at outfalls that may be added at afuture date. Full LTCP development is incorporated into the ongoing statewidewatershed management and TMDL processes.
Costs and Financing
The $3.9 million solids and floatables project was funded through a low interest loanprovided by the NJDEP and the New Jersey Environmental Infrastructure Trust (NJEIT).By using the NJDEP/NJEIT loan, the NBMUA saved the users of the system nearly $1.5million compared to conventional financing. Cost estimates to add disinfection withultraviolet lamps have been performed as part of the planning process. Disinfection atnine CSO outfalls is expected to cost approximately $24.2 million.
Budget tracking for CSO-related O&M has been set up, but sufficient data is not yetavailable to estimate annual O&M costs. O&M primarily consists of changing out thenetting bags and disposing of the collected solids. Nets are changed out approximatelyonce per month at each of the sites.
Enforcement Issues
In September 1993, NJDEP issued an Administrative Order citing NBMUA for failing tomeet the CSO permit discharge requirements. In January 1996, NBMUA entered into anAdministrative Consent Order to submit, among other things, an Interim/Final Solids and

NBE-3
Community Case Study: North Bergen, NJ—Region 2
Floatables Control Plan. The Interim/Final Solids and Floatables Control Plan wasapproved by NJDEP in July 1996 and involved reducing the number of CSO outlets from13 to 10 and installing solids and floatables netting devices at each of the CSOs(EPA, 2001).
Results
Since installing the netting systems in 1999, the solid and floatables control facilitieshave captured more than 68 tons of debris that would have been deposited in theHudson River and various tributaries of the Hackensack River. It is estimated that over 40tons of solids will be removed per year through implementation of the Solids andFloatables Control Plan. The tracking of the debris captured is a measure that is wellunderstood by the public.
Lack of historical operating information on the technology was a hurdle for this project.At the time of the planning study, netting technology in in-line chambers had not beeninstalled or operated as a solid and floatable collection technique anywhere in theUnited States. NBMUA now has extensive experience operating solids and floatablescontrol facilities and can provide other CSO communities with construction andoperational information needed to make decisions utilizing netting technology for CSOsolids and floatables control.
References
EPA, 2001. Combined Sewer Overflows in Region 2: Audit Report of the Inspector General.New York, NY.
Killam, 1977. Combined Sewer Overflow Characterization Study. Milburn, NJ.
Fischer, Robert, Executive Director, North Bergen Municipal Utilities Authority. Personalcommunication with Limno-Tech, Inc. staff on details of the combined sewer overflowplan and program. Summer 2001.
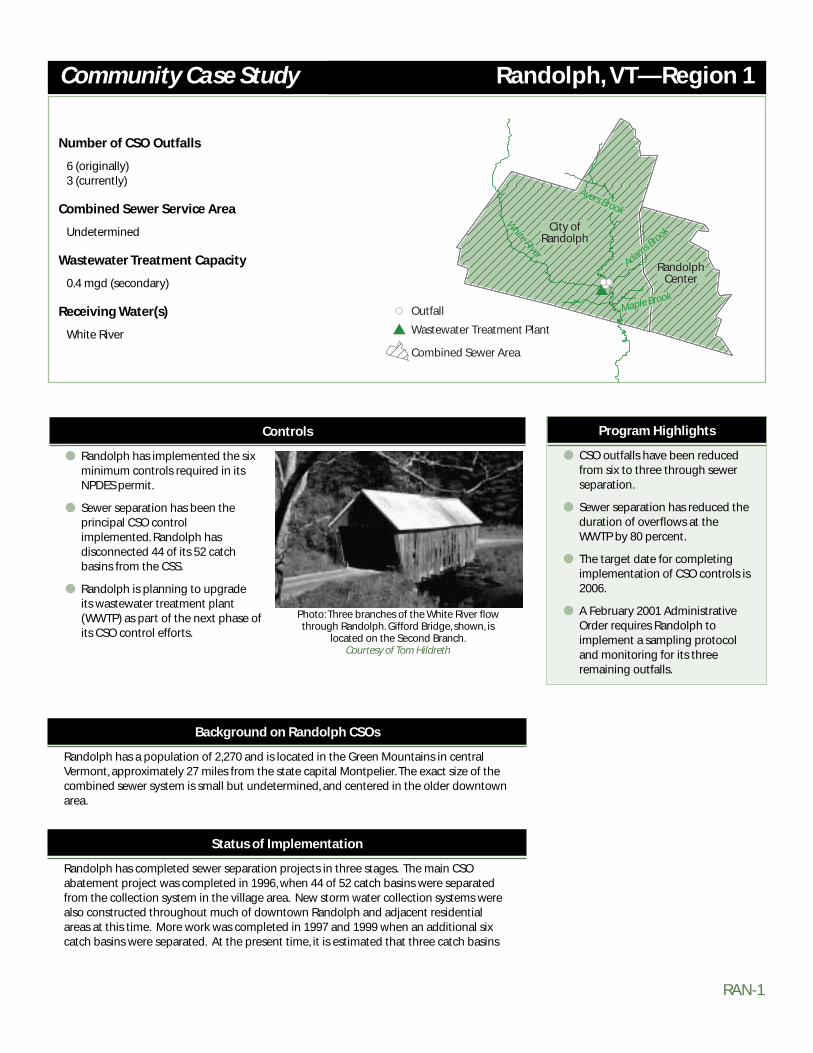
RAN-1
Number of CSO Outfalls
6 (originally)3 (currently)
Combined Sewer Service Area
Undetermined
Wastewater Treatment Capacity
0.4 mgd (secondary)
Receiving Water(s)
White River
Randolph, VT—Region 1
Background on Randolph CSOs
Randolph has a population of 2,270 and is located in the Green Mountains in centralVermont, approximately 27 miles from the state capital Montpelier. The exact size of thecombined sewer system is small but undetermined, and centered in the older downtownarea.
Status of Implementation
Randolph has completed sewer separation projects in three stages. The main CSOabatement project was completed in 1996, when 44 of 52 catch basins were separatedfrom the collection system in the village area. New storm water collection systems werealso constructed throughout much of downtown Randolph and adjacent residentialareas at this time. More work was completed in 1997 and 1999 when an additional sixcatch basins were separated. At the present time, it is estimated that three catch basins
Program Highlights
● CSO outfalls have been reducedfrom six to three through sewerseparation.
● Sewer separation has reduced theduration of overflows at theWWTP by 80 percent.
● The target date for completingimplementation of CSO controls is2006.
● A February 2001 AdministrativeOrder requires Randolph toimplement a sampling protocoland monitoring for its threeremaining outfalls.
Community Case Study
$S Outfall
Combined Sewer Area
Wastewater Treatment Plant
White River
Adams Brook
Ayers Brook
Maple Brook
City of Randolph
RandolphCenter
$#S#S#S
Controls
● Randolph has implemented the sixminimum controls required in itsNPDES permit.
● Sewer separation has been theprincipal CSO controlimplemented. Randolph hasdisconnected 44 of its 52 catchbasins from the CSS.
● Randolph is planning to upgradeits wastewater treatment plant(WWTP) as part of the next phase ofits CSO control efforts.
Photo: Three branches of the White River flowthrough Randolph. Gifford Bridge, shown, is
located on the Second Branch.Courtesy of Tom Hildreth
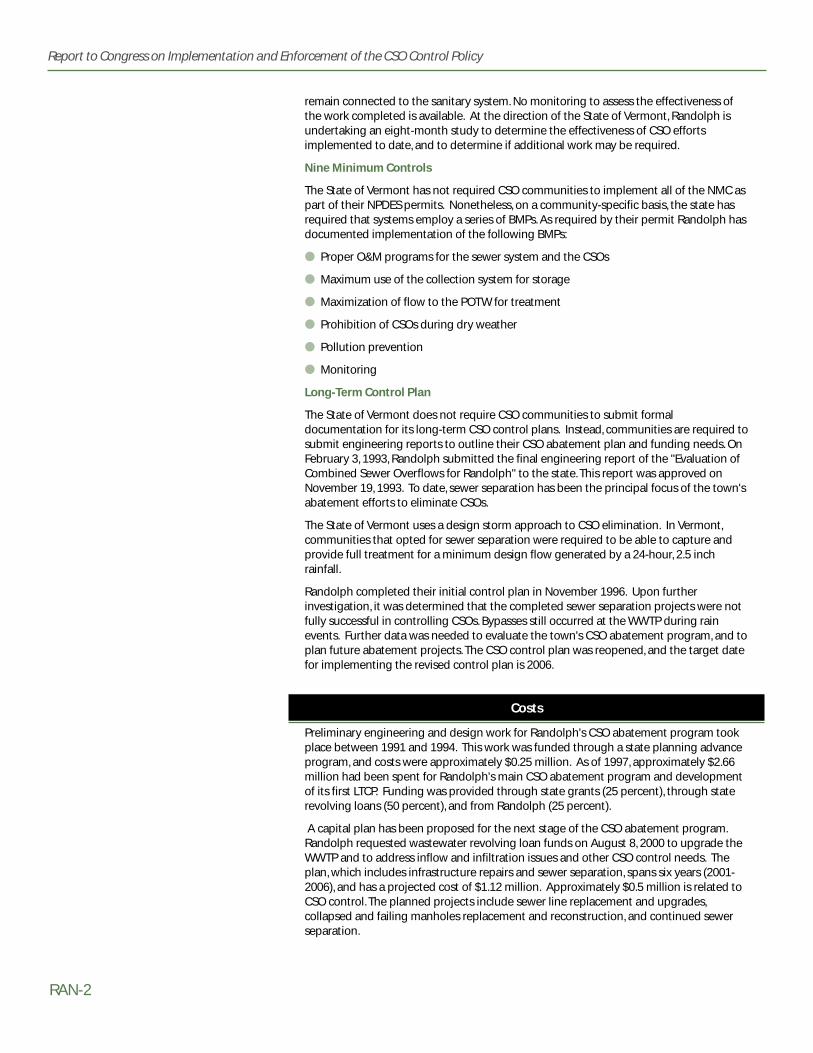
RAN-2
Report to Congress on Implementation and Enforcement of the CSO Control Policy
remain connected to the sanitary system. No monitoring to assess the effectiveness ofthe work completed is available. At the direction of the State of Vermont, Randolph isundertaking an eight-month study to determine the effectiveness of CSO effortsimplemented to date, and to determine if additional work may be required.
Nine Minimum Controls
The State of Vermont has not required CSO communities to implement all of the NMC aspart of their NPDES permits. Nonetheless, on a community-specific basis, the state hasrequired that systems employ a series of BMPs. As required by their permit Randolph hasdocumented implementation of the following BMPs:
● Proper O&M programs for the sewer system and the CSOs
● Maximum use of the collection system for storage
● Maximization of flow to the POTW for treatment
● Prohibition of CSOs during dry weather
● Pollution prevention
● Monitoring
Long-Term Control Plan
The State of Vermont does not require CSO communities to submit formaldocumentation for its long-term CSO control plans. Instead, communities are required tosubmit engineering reports to outline their CSO abatement plan and funding needs. OnFebruary 3, 1993, Randolph submitted the final engineering report of the "Evaluation ofCombined Sewer Overflows for Randolph" to the state. This report was approved onNovember 19, 1993. To date, sewer separation has been the principal focus of the town'sabatement efforts to eliminate CSOs.
The State of Vermont uses a design storm approach to CSO elimination. In Vermont,communities that opted for sewer separation were required to be able to capture andprovide full treatment for a minimum design flow generated by a 24-hour, 2.5 inchrainfall.
Randolph completed their initial control plan in November 1996. Upon furtherinvestigation, it was determined that the completed sewer separation projects were notfully successful in controlling CSOs. Bypasses still occurred at the WWTP during rainevents. Further data was needed to evaluate the town's CSO abatement program, and toplan future abatement projects. The CSO control plan was reopened, and the target datefor implementing the revised control plan is 2006.
Costs
Preliminary engineering and design work for Randolph's CSO abatement program tookplace between 1991 and 1994. This work was funded through a state planning advanceprogram, and costs were approximately $0.25 million. As of 1997, approximately $2.66million had been spent for Randolph's main CSO abatement program and developmentof its first LTCP. Funding was provided through state grants (25 percent), through staterevolving loans (50 percent), and from Randolph (25 percent).
A capital plan has been proposed for the next stage of the CSO abatement program.Randolph requested wastewater revolving loan funds on August 8, 2000 to upgrade theWWTP and to address inflow and infiltration issues and other CSO control needs. Theplan, which includes infrastructure repairs and sewer separation, spans six years (2001-2006), and has a projected cost of $1.12 million. Approximately $0.5 million is related toCSO control. The planned projects include sewer line replacement and upgrades,collapsed and failing manholes replacement and reconstruction, and continued sewerseparation.

RAN-3
Community Case Study: Randolph, VT—Region 1
Enforcement Issues
Although Randolph has reduced CSOs events through sewer separation projects,overflows still occur. Randolph experienced 17 overflows at the WWTP in the year 2000.For this reason, the state issued an Administrative Order (1272 Order #3-1198) toRandolph, dated February 8, 2001. This Administrative Order requires Randolph todevelop a CSO monitoring plan/sampling protocol for its three existing CSO outfalls(Kooiker, 2001).
The Administrative Order requires Randolph to obtain composite samples of thecombined discharge from the WWTP during eight CSO events between March 1 andSeptember 30, 2001. The composite samples will be analyzed for biochemical oxygendemand, total suspended solids, and E. coli. to determine compliance with the permitteddischarge effluent limits. The other two CSO outfalls are also being monitored foroverflow events using "tattle-tale" blocks, or block testing. Blocks of wood will be placedinside the overflow or pump station lines. Movement of disappearance of a blockfollowing a precipitation event indicates that an overflow has occurred. A rain gage isbeing used to document the cumulative rainfall amount, rainfall intensity, and rainfallduration so that local precipitation events can be quantified and related to sewer systemperformance.
The data collected from implementation of this monitoring plan will provide guidanceon remaining CSO control needs and help Randolph identify the best course of actionfor future CSO abatement efforts. A CSO abatement program effectiveness report will besubmitted to the state (due September 30, 2001) to fulfill the requirements set forth inthe Administrative Order.
Results
Three CSO outfalls have been eliminated since Randolph initiated its CSO abatementprogram. Only three known catch basins remain connected to the sanitary sewers as aresult of Randolph's sewer separation efforts. An 80 percent reduction in the duration ofCSOs has been observed at the WWTP. This reduction is based upon a comparison ofdata collected from a recent 20-month period (1/1999-8/2000) with data collected priorto the main CSO abatement project. Overflow (bypass) data at the Randolph WWTP areprovided in the accompanying graph. (Note: 1999 was a very dry year and 2000 was avery wet year.)
510
1994
435
1995
227
1996
112
1997
128
1998
40
1999
98
2000(Jan—Aug)
Bypass History at Randolph WWTP (hours per year)

RAN-4
Report to Congress on Implementation and Enforcement of the CSO Control Policy
References
Town of Randolph, 1993. Evaluation of Combined Sewer Overflows for the Town ofRandolph, submitted to the Vermont Agency of Natural Resources (ANR). Randolph,VT.
Kooiker, Brian, State of Vermont, Agency of Natural Resources, Department ofEnvironmental Conservation, Wastewater Management Division. Personalcommunication. Spring/Summer 2001.

RIC-1
Number of CSO Outfalls
31, plus 1 diffuser port in the James River
Combined Sewer Service Area
18.8 square miles
Wastewater Treatment Capacity
75 mgd (secondary)
Receiving Water(s)
James River, Gillies Creek
Richmond, VA—Region 3
Background on Richmond CSOs
Richmond is the capital of Virginia and it is centrally located in the state. The populationof Richmond is approximately 210,000, and the city spreads out over 38,000 acres. TheCSS is owned and operated by the Department of Public Utilities (DPU), and it occupies12,000 acres, or one-third of the city. The DPU also owns and operates a 75 mgdwastewater treatment plant (WWTP). The James River bisects the city and is the center oftransportation and recreation activities. The Falls of the James area is an importantrecreational resource and a component of the Virginia scenic river system. It consists ofsets of rapids and pools and adjacent parkland that provide substantial habitat andattract whitewater enthusiasts. There are 31 CSO outfalls within Richmond that dischargeto the James River or local urban creeks. The Shockoe Creek CSO is the largest, with adrainage area of over 6,000 acres. It discharges to the tidal James River, just below theFalls of the James.
Richmond has been actively implementing CSO controls for over 20 years in a three-phase program. Phase I was completed in 1990 and Phase II will be completed in 2002.
Program Highlights
● Richmond submitted a DraftLong-Term CSO Control Plan Re-Evaluation in May 2001 to theDEQ.
● LTCP Phase I and II controls havereduced overflow volumes by40 percent.
● LTCP Phase I and II controlsprovide an additional 131 daysper year in which water quality inthe James River meets waterquality standards, beyond the “noCSO control” condition.
● Restoration of the city's historiccanal system occurred as Phase IICSO interceptors were placed inan abandoned canal bed.Restoration of the canal was acenterpiece of a major downtownrevitalization project.
● Sampling to support Phase IIIcontrols indicates that upstreambacteria loads will preventattainment of water qualitystandards even if CSOs werecompletely eliminated.
Community Case Study
$
$
S Outfall
Combined Sewer Area
Wastewater Treatment Plant
James River
Gillies Creek
Almond CreekCity of Richmond
#!#!#!#!#!#!#!#!#!#! #!#!#!
#!
#!
#!#! #!
#!
#!#! #!#!
#!
#! #! #!#!#!
Controls
● Richmond has implemented the NMC anddocuments continued compliance in anannual report submitted to the VirginiaDepartment of Environmental Quality (DEQ)
● Richmond utilizes a 50 million gallonretention facility to capture and store forlater treatment wet weather flows from thecity's largest drainage basin.
● Conveyance and retention facilities havebeen employed to relocate CSO dischargesdownstream of the Falls of the James, a well-known recreation area frequented bykayakers.
Photo: Construction of a 6.7 million gallonstorage tunnel along the Falls of the James.
Courtesy of Richmond DPU
RIC-2
Report to Congress on Implementation and Enforcement of the CSO Control Policy
The plan for Phase III was submitted to the Virginia DEQ as a Draft Long Term CSOControl Plan Re-Evaluation in May of 2001 (City of Richmond, 2001).
Status of Implementation
Richmond began addressing CSO problems back in the 1970s. Early studies includingmonitoring and modeling led to the Phase I program. Completed in 1990, the majorcomponents of Phase I were construction of the 50 million gallon Shockoe RetentionFacility and expansion of WWTP capacity from 45 to 70 mgd.
Phase II controls were planned in the late 1980s and implemented in the 1990s. Phase IIwas focused on reducing CSO discharges to the Falls of the James. The majorcomponents of Phase II included expansion of conveyance facilities on the south side ofthe James River, expansion of conveyance facilities on the north side of the James River,and construction of a 6.7 million gallon storage tunnel on the north side (scheduled tocommence operation in late 2001). Another aspect of Phase II was a requirement to re-evaluate the CSO control plan following implementation and develop a Phase III plan.
System Characterization
Richmond has engaged in characterization monitoring and modeling activities for nearly20 years. Key activities include:
● Mapping the combined sewer are to characterize land use and surface features ineach drainage area.
● Review of construction documents for collection system to determine sewerdiameter, length, and slope.
● Implementation of collection system and receiving water monitoring programs.
● Development and application of collection system and receiving water models.
Nine Minimum Controls
Richmond has identified and implemented control measures under each of the NMC.Documentation was submitted to DEQ in December 1996 (City of Richmond, 1996) andhas been followed by annual reports on continued compliance. Highlights of the NMCprogram include:
● Adjustment of CSO regulator controls to optimize storage in interceptor system.
● Formation of a 24-hour on-call team to respond to reported dry weather overflows.
● On-going public education programs, including offering advice on proper disposal ofwaste (e.g., household wastes, leaves, use of fertilizers).
● Continued use of BMPs to control pollutants from runoff.
● Installation of continuous flow monitors and wet weather overflow samplers at theShockoe CSO to monitor frequency and volume, with annual reports provided toDEQ.
Long Term Control Plan
Richmond has been developing and refining its LTCP for over two decades. Thecontinuing objective is to abate or eliminate the adverse impacts to the James Riverfrom CSOs through the use of innovative and low maintenance solutions.
Richmond developed a thorough characterization of its CSS through extensiveinspections, monitoring and modeling. Monitoring programs have been implemented toquantify:
● Flow and pollutant concentrations at the Shockoe CSO outfall and other selectoutfalls within the CSS.
● Storage in the Shockoe Retention Facility.

RIC-3
Community Case Study: Richmond, VA—Region 3
● Water quality conditions in the James River above the CSO discharges, through theFalls of the James area, and along a 20-mile area below Richmond.
Richmond also developed computer models of the collection system and CSO-impactedwaters for use in the analysis of CSS performance, receiving water impacts, and theevaluation of control alternatives. Monitoring data was used to calibrate and verify themodels.
A full range of CSO control alternatives were evaluated as part of the LTCP development.This evaluation included:
● Sewer separation
● In-system storage
● Disinfection
● High-rate filtration
● Retention basins
● Swirl concentrators
● Sedimentation basins
● Screening
● Additional conveyance capacity
● BMPs and source control
● Expansion of the WWTP
The selection of a preferred plan for Phase III involved analysis of CSO volume andfrequency, water quality, financial impacts, and public input. The preferred plan builds onprojects completed under Phases I and II. The components of the plan for Phase IIIincluded:
● Expansion of the Shockoe Retention Facility
● Expansion of wet weather treatment capacity at the WWTP
● Disinfection at key outfalls
● Control of solids and floatables at remaining outfalls
Costs and Financing
Richmond has used a variety of funding sources including bonds, low-interest loans fromthe state, and federal grants to underwrite the cost of constructing, operating andmaintaining CSO control facilities. To date, the city has spent nearly $221 million oncapital improvements in the CSS and invests another $6.7 million annually on CSO-related operations and maintenance activities. The city estimates that implementation ofthe Phase III controls will cost an additional $242 million.
Water Quality Issues
The implementation of Phases I and II of the city's CSO control program havesignificantly improved aesthetics and water quality in the James River. Specifically, waterquality modeling indicates that these controls provide an additional 131 days per year inwhich water quality in the James River meets water quality standards, beyond the noCSO control condition. Receiving water modeling results from the Phase III re-evaluationindicates that the upstream bacteria loads will prevent full attainment of the currentwater quality standards even if the city completely eliminates CSO discharges.
RIC-4
Report to Congress on Implementation and Enforcement of the CSO Control Policy
Enforcement Issues
Richmond signed a Special Order with the Virginia DEQ in 1985 that required the city todevelop and implement a CSO control program. In 1992, the State Water Control Boardissued a consent Special Order requiring implementation of additional controlsidentified in Phase II of the city's CSO program. Then, in 1996, the DEQ amended theSpecial Order to accelerate the north side CSO control projects. DEQ issued a consentSpecial Order to the City in 1999, which advanced the schedule for the re-evaluation ofthe CSO program in the context of EPA's CSO Control Policy. A draft plan describing theproposed Phase III controls was submitted to the state in May 2001. The city also submitsannual detailed reports to the state to allow the state to monitor and verify compliancewith the Order.
Results
Richmond has realized many benefits from its CSO control program. The city has reducedoverflow volume to the James River by more than 40 percent, from 3 billion gallons peryear to 1.8 billion gallons per year. Further, overflows to the sensitive park areas alongthe James River have been reduced to an average of one event per year. All of theoverflows remaining in the park areas now receive local treatment to control solids andfloatables prior to discharge to the river. In addition to storage, the Shockoe RetentionFacility provides floatables control for more than two-thirds of all overflows.
Richmond's CSO projects have also provided tangential benefits including therestoration of the City's historic canal system as Phase II CSO interceptors were placed inthe abandoned canal bed. The restored canal has become a focus for commercial andrecreational activities.
Richmond's efforts to control CSOs were recognized in 1999 as the city received aNational Combined Sewer Overflows Control Program Excellence Award from EPA. Inaddition, the Richmond CSO Control Program has received awards and recognition fromlocal environmental and stakeholder groups and from users of the James River.
References
City of Richmond, Virginia. 1996. Combined Sewer System Documentation Report on NineMinimum Controls. Submitted to Virginia Department of Environmental Quality,Richmond, VA.
City of Richmond, Virginia. 2001. Draft Long-Term CSO Control Plan Re-evaluation.Submitted to Virginia Department of Environmental Quality, Richmond, VA.

ROU-1
Number of CSO Outfalls
168
Combined Sewer Service Area
93 square miles
Wastewater Treatment Capacity
1,700 mgd (primary)930 mgd (secondary)
Receiving Water(s)
Rouge River and tributaries
Rouge River Watershed, MI—Region 5
Background on Rouge River Watershed CSOs
The Rouge River Watershed occupies 438 square miles in southeastern Michigan. Thesouth and east portions of the watershed are highly urbanized and include parts ofDetroit and its suburbs. The Rouge River Watershed is home to approximately 1.5 millionpeople spread across 48 communities and 3 counties. The Rouge River itself extends formore than 100 miles, with 50 miles flowing through accessible public parklands. TheRouge River discharges to the Detroit River and affects water quality conditions in thatwater body as well as Lake Erie. Congress appropriated money through EPA and WayneCounty, Michigan in 1992 for the Rouge River National Wet Weather DemonstrationProject (Rouge Project). The Rouge Project is a comprehensive program to manage wetweather pollution to restore the water quality of the Rouge River. This cooperativewatershed management effort between federal, state and local agencies is supported bymulti-year grants from the federal government with additional funding from localcommunities.
Program Highlights
● The Rouge River National WetWeather Demonstration Projectcoordinates CSO implementationin 16 CSO communities inconjunction with other non-CSOrestoration efforts on a watershedbasis.
● About 30 miles of the Rouge Riverthat were CSO-impacted in 1994are now completely free ofuncontrolled CSO discharges.
● The amount of combined sewagecaptured for treatment hasincreased due to construction ofCSO retention treatment basins.
● Untreated overflows in excess of50 times per year have beenreduced to treated overflowsoccurring one to seven times peryear where retention treatmentbasins have been implemented.
● Monitoring indicates improveddissolved oxygen conditionsassociated with theimplementation of CSO controlsin the Rouge River.
Community Case Study
#!
#!#!#!
#! #!#!#!#!#!#!#!#!#!#!#!#!#!#!
#!#!#!#!#!#!#!#!
#!#!#!#!#!#!#!#!#!#!#!#!#!#!#!#!
#!#!#!#!
#!
#!#!#!
#!#!#!#!#!#!#!#!#!#!#!#!#!#!#!#!#!#!#!#!#!#!#!#!#!#!#!#!#!
#!#!#!
#!
#!#!#! #!#!#!#!#! #! #!#!#!#!#!#! #!#!
#!#!#!#!
#!#!#!
#!#!#!#!#!#!#!#!#!#!
#!#!#!#!#!
#!#!
#!
#!
#!
#!#!
#!
#!
#!#!#!#!#!#!#!
#!
#!
#!#!#!
#!#!
#!#!#!
#!
#!#!#!#!#!
#!#!
$
$S Outfall
Combined Sewer Area
Wastewater Treatment Plant WayneCounty
Canada
OaklandCounty
Detroit
Detroit River
Upper Rouge River
Middle Rouge River
Lower Rouge River
Controls
● CSO control activities in the Rouge RiverWatershed are focused on sewer separationand construction of local retention treatmentbasins.
● The NMC have been implemented for alluncontrolled CSOs for which the constructionof permanent control facilities is not imminent.
● Under its NMC program the City of Detroitinstalled outfall control gates at seven CSOs toeliminate CSO discharges during small events.
● A total of 10 retention treatment basins and onetunnel represent the major new CSO facilities that are planned, under construction, or in operation.
Photo: Retention basin underconstruction in Dearborn, MI.
Courtesy of EPA

ROU-2
Report to Congress on Implementation and Enforcement of the CSO Control Policy
As of 1994, there were a total of 168 permitted CSOs discharging into the Rouge Riverand its tributaries. These outfalls, owned and operated by Wayne County, the City ofDetroit, and 14 other CSO communities, are concentrated in the lower portions of thewatershed. Several of the permitted outfalls are reported to be overflow structureswhich discharge to interceptors, which then discharge into the Rouge River or one of itstributaries. There are 40 CSO outfalls that discharge to the Detroit River that are notincluded in the Rouge River case study. The combined sewer area comprised 20 percentof the watershed in 1994, or 60,000 acres. All dry weather flows and some wet weatherflows from these CSSs are delivered to the Detroit POTW along with other flows fromoutside the watershed. The Detroit POTW has a primary treatment capacity of 1,700mgd and a secondary treatment capacity of 930 mgd.
Status of Implementation
Michigan's equivalent to the NMC has been implemented for all uncontrolled CSOs forwhich the construction of permanent control facilities is not imminent. The mostsignificant NMC capital expenditure was the construction of outfall control gates atseven combined sewer outfalls in the Rouge River watershed owned by the City ofDetroit. During wet weather events, these gates have eliminated CSO discharges duringsmall rain events by maximizing the use of in-system storage. Other measures have notrequired significant capital expenditures.
Each CSO community with uncontrolled CSOs has taken measures to prevent theoccurrence of dry weather overflows. Each CSO community reports CSO discharges tothe Michigan Department of Environmental Quality (MDEQ), which provides publicnotification by posting the reported information on a website. State law also requiresCSO permittees to self-report to downstream communities and one major localnewspaper.
LTCPs are implemented in three phases as established through NPDES permits:
● Phase I— elimination of raw sewage and the protection of public health forapproximately 40 percent of the combined sewer area.
● Phase II— elimination of raw sewage and the protection of public health for theremaining combined sewer area.
● Phase III— meet water quality standards in the Rouge River.
Under Phase I, six communities separated their sewers and nine communitiesconstructed a total of 10 retention treatment basins. Each of these retention treatmentbasins is sized for different design storms, and several employ innovative technologies.These facilities also incorporate a variety of additional features or variations incompartment sizing and sequencing in order to improve their effectiveness. Theretention treatment basins capture most wet weather flows for later conveyance to theDetroit POTW for treatment. Flows from very large wet weather events that are notcaptured by the retention treatment basins receive screening, skimming, settling, anddisinfection prior to discharge. These projects have effectively eliminated or controlledthe discharge of untreated sewage from approximately half of the watershed's CSOs.
Working with the CSO communities, MDEQ established rigorous "Criteria for Success inCSO Treatment" to evaluate whether the CSO basins met the Phase I goals of eliminationof raw sewage discharges and protection of public health. MDEQ established a workgroup that included state personnel, CSO permittees and consultants to assess theevaluation process.
A detailed evaluation study of the CSO retention treatment basins constructed thus far isunderway to examine the performance of the facilities and the water quality impacts oftheir discharges. Basin influent and effluent flow and water quality are monitored for atleast two years at each facility. In addition, river monitoring is performed to identify
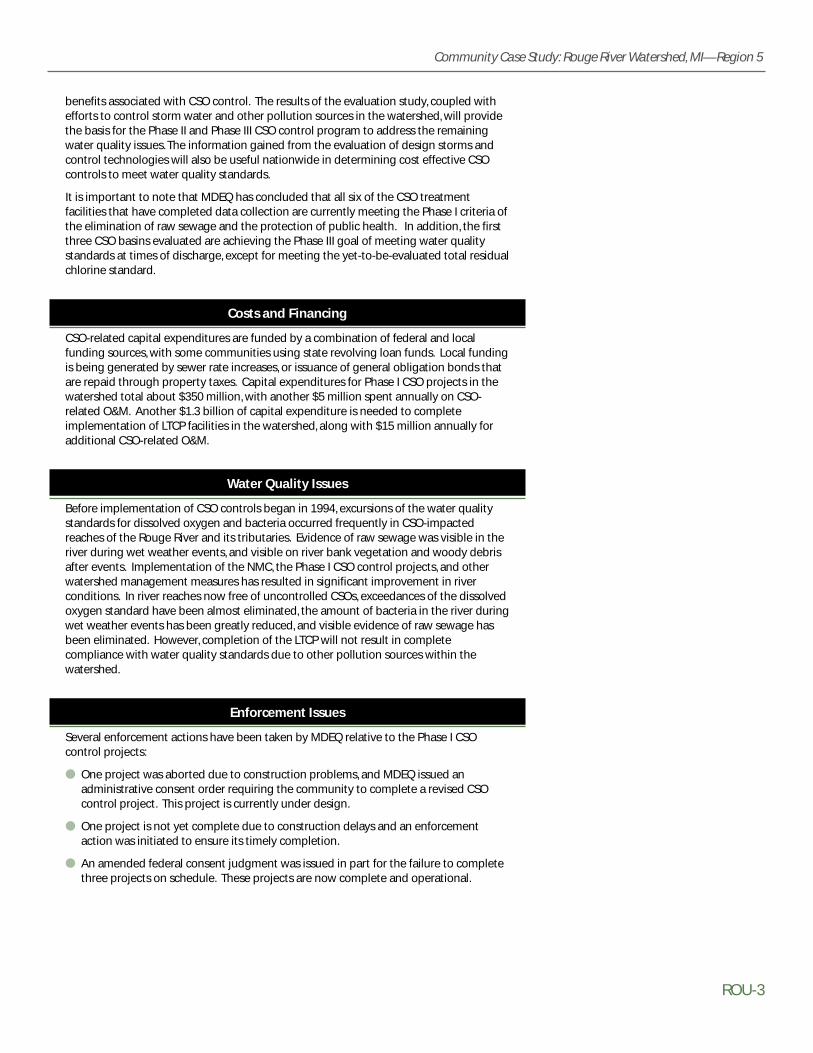
ROU-3
Community Case Study: Rouge River Watershed, MI—Region 5
benefits associated with CSO control. The results of the evaluation study, coupled withefforts to control storm water and other pollution sources in the watershed, will providethe basis for the Phase II and Phase III CSO control program to address the remainingwater quality issues. The information gained from the evaluation of design storms andcontrol technologies will also be useful nationwide in determining cost effective CSOcontrols to meet water quality standards.
It is important to note that MDEQ has concluded that all six of the CSO treatmentfacilities that have completed data collection are currently meeting the Phase I criteria ofthe elimination of raw sewage and the protection of public health. In addition, the firstthree CSO basins evaluated are achieving the Phase III goal of meeting water qualitystandards at times of discharge, except for meeting the yet-to-be-evaluated total residualchlorine standard.
Costs and Financing
CSO-related capital expenditures are funded by a combination of federal and localfunding sources, with some communities using state revolving loan funds. Local fundingis being generated by sewer rate increases, or issuance of general obligation bonds thatare repaid through property taxes. Capital expenditures for Phase I CSO projects in thewatershed total about $350 million, with another $5 million spent annually on CSO-related O&M. Another $1.3 billion of capital expenditure is needed to completeimplementation of LTCP facilities in the watershed, along with $15 million annually foradditional CSO-related O&M.
Water Quality Issues
Before implementation of CSO controls began in 1994, excursions of the water qualitystandards for dissolved oxygen and bacteria occurred frequently in CSO-impactedreaches of the Rouge River and its tributaries. Evidence of raw sewage was visible in theriver during wet weather events, and visible on river bank vegetation and woody debrisafter events. Implementation of the NMC, the Phase I CSO control projects, and otherwatershed management measures has resulted in significant improvement in riverconditions. In river reaches now free of uncontrolled CSOs, exceedances of the dissolvedoxygen standard have been almost eliminated, the amount of bacteria in the river duringwet weather events has been greatly reduced, and visible evidence of raw sewage hasbeen eliminated. However, completion of the LTCP will not result in completecompliance with water quality standards due to other pollution sources within thewatershed.
Enforcement Issues
Several enforcement actions have been taken by MDEQ relative to the Phase I CSOcontrol projects:
● One project was aborted due to construction problems, and MDEQ issued anadministrative consent order requiring the community to complete a revised CSOcontrol project. This project is currently under design.
● One project is not yet complete due to construction delays and an enforcementaction was initiated to ensure its timely completion.
● An amended federal consent judgment was issued in part for the failure to completethree projects on schedule. These projects are now complete and operational.
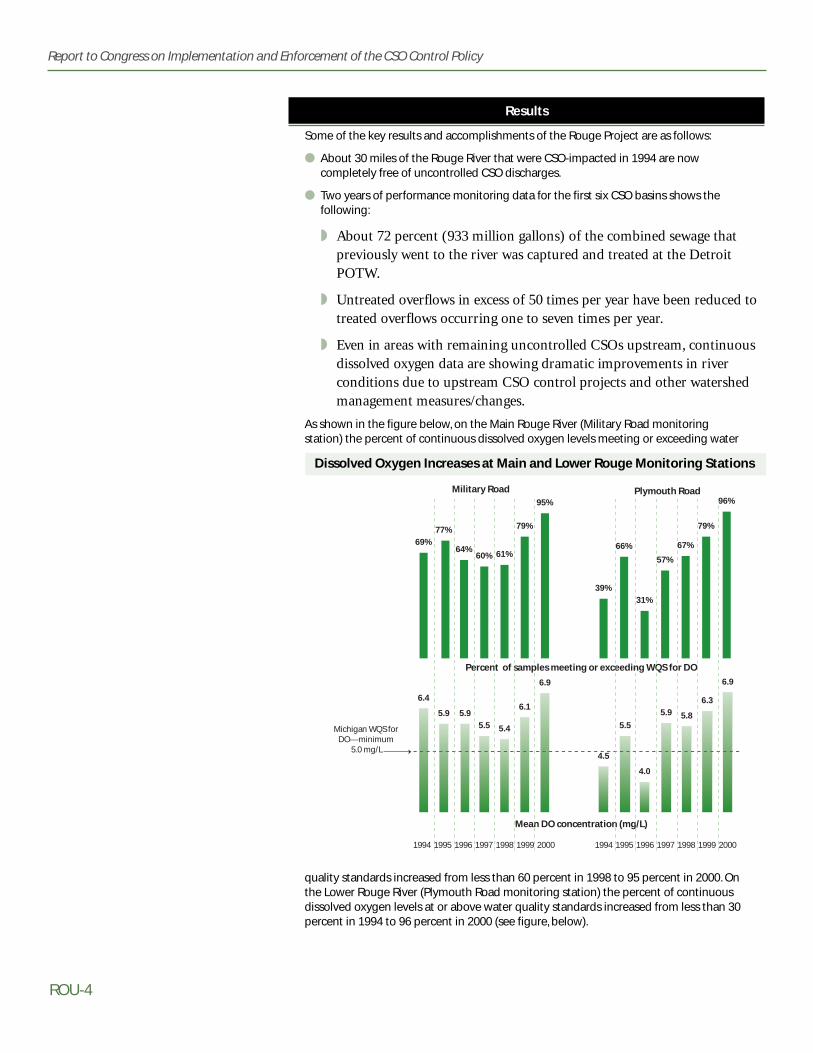
ROU-4
Report to Congress on Implementation and Enforcement of the CSO Control Policy
Results
Some of the key results and accomplishments of the Rouge Project are as follows:
● About 30 miles of the Rouge River that were CSO-impacted in 1994 are nowcompletely free of uncontrolled CSO discharges.
● Two years of performance monitoring data for the first six CSO basins shows thefollowing:
◗ About 72 percent (933 million gallons) of the combined sewage thatpreviously went to the river was captured and treated at the DetroitPOTW.
◗ Untreated overflows in excess of 50 times per year have been reduced totreated overflows occurring one to seven times per year.
◗ Even in areas with remaining uncontrolled CSOs upstream, continuousdissolved oxygen data are showing dramatic improvements in riverconditions due to upstream CSO control projects and other watershedmanagement measures/changes.
As shown in the figure below, on the Main Rouge River (Military Road monitoringstation) the percent of continuous dissolved oxygen levels meeting or exceeding water
quality standards increased from less than 60 percent in 1998 to 95 percent in 2000. Onthe Lower Rouge River (Plymouth Road monitoring station) the percent of continuousdissolved oxygen levels at or above water quality standards increased from less than 30percent in 1994 to 96 percent in 2000 (see figure, below).
6.4
69%
5.9
77%
5.9
64%
5.5
60%
5.4
61%
6.1
79%
6.9
95%
4.5
39%
5.5
66%
4.0
31%
5.9
57%
5.8
67%
6.3
79%
6.9
96%
Mean DO concentration (mg/L)
Michigan WQS for DO—minimum
5.0 mg/L
Percent of samples meeting or exceeding WQS for DO
Military Road Plymouth Road
1994 1995 1996 1997 1998 1999 2000 1994 1995 1996 1997 1998 1999 2000
Dissolved Oxygen Increases at Main and Lower Rouge Monitoring Stations

ROU-5
Community Case Study: Rouge River Watershed, MI—Region 5
Work groups have reached consensus with MDEQ that the first six CSO retentiontreatment basins evaluated are meeting MDEQ-defined criteria for protecting publichealth and eliminating raw sewage. Additionally, work groups have reached consensuswith MDEQ that the first three CSO basins evaluated are achieving MDEQ-defined criteriafor achieving water quality standards at times of discharge, except for meeting the yet-to-be-evaluated total residual chlorine standard.
In addition to the above, the aesthetics of the Rouge River and its tributaries are greatlyimproved, and there is evidence of aquatic habitat improvement. Recreational use of theRouge River is increasing.
References
Ed Kluitenberg, Applied Science, Inc. Personal communication with Limno-Tech, Inc. staffon details of the combined sewer overflow plan and program. Summer 2001.
Rouge River Project Web Site (http://www.wcdoe.org/rougeriver/).

SAG-1
Number of CSO Outfalls
16
Combined Sewer Service Area
16.1 square miles
Wastewater Treatment Capacity
32 mgd (secondary)
Receiving Water(s)
Saginaw River
Saginaw, MI—Region 5
Background on Saginaw CSOs
The City of Saginaw is located in the east central portion of Michigan's lower peninsula.The city lies within the Saginaw River Watershed, and the river runs through the city forapproximately five miles. The Saginaw River flows 15 miles northward from the City ofSaginaw into Saginaw Bay, in the southeastern section of Lake Huron. Saginaw Bay iswidely used for fishing, boating and recreation. Both the Saginaw River and Saginaw Bayhave been defined as two of 42 "areas of concern" by the International Joint Commissionon the Great Lakes.
Saginaw owns and operates a wastewater treatment plant (WWTP) and collection systemthat serve Saginaw as well as the neighboring communities of Zilwaukee, CarroltonTownship, Kochville Township, and portions of Saginaw Township. Much of the collectionsystem is combined with CSO outfalls that discharge during wet weather into theSaginaw River. Saginaw's WWTP began as a primary treatment facility in 1952. Secondarytreatment facilities and phosphorus removal equipment were added to the plant in 1975.The WWTP began treating wastewater of the neighboring communities in 1991.(Vasold, 2001).
Program Highlights
● 20 of 36 CSO outfalls have beeneliminated as part of Saginaw’sCSO Control Program.
● Seven of the remaining CSOoutfalls have facilities that provideprimary treatment anddisinfection.
● Saginaw continues to monitorupstream and downstreambacteria levels during CSOdischarge events and report theresults to both the state and localcounty health departments.
Community Case Study
$
#S
#S
#S
#S
#S#S#S#S
#S
#S#S#S#S#S#S
#S
Saginaw Township
South
Carrollton Township
$S Outfall
Combined Sewer Area
Wastewater Treatment Plant
Tittabawasee River
Sagi
naw
Riv
er
Kochville Township
Saginaw Township
North
City of Zilwaukee
City of Saginaw
Controls
● Retention treatment basins withdisinfection facilities have been thefocus of Saginaw's CSO controlefforts.
● Construction of relief sewers wasinitiated to provide capacity to bringwet weather flows to the retentionfacilities.
● Saginaw also considered sewerseparation but found the costs to beprohibitive.
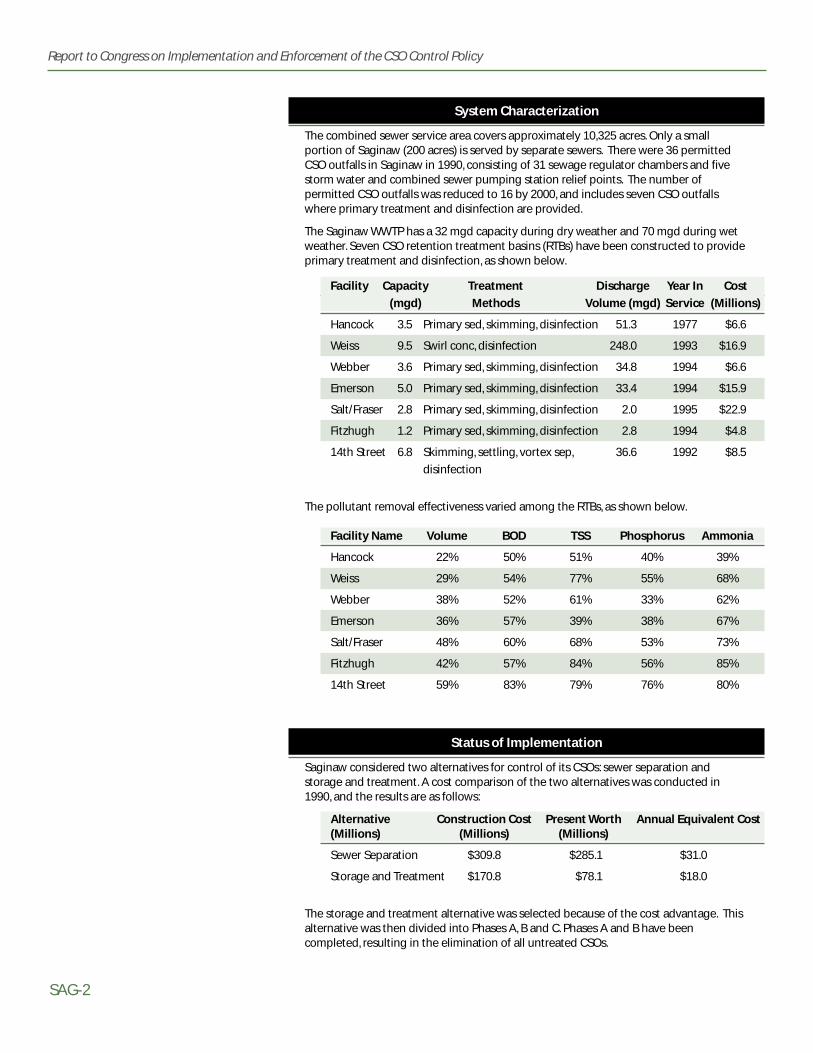
SAG-2
Report to Congress on Implementation and Enforcement of the CSO Control Policy
System Characterization
The combined sewer service area covers approximately 10,325 acres. Only a smallportion of Saginaw (200 acres) is served by separate sewers. There were 36 permittedCSO outfalls in Saginaw in 1990, consisting of 31 sewage regulator chambers and fivestorm water and combined sewer pumping station relief points. The number ofpermitted CSO outfalls was reduced to 16 by 2000, and includes seven CSO outfallswhere primary treatment and disinfection are provided.
The Saginaw WWTP has a 32 mgd capacity during dry weather and 70 mgd during wetweather. Seven CSO retention treatment basins (RTBs) have been constructed to provideprimary treatment and disinfection, as shown below.
Facility Capacity Treatment Discharge Year In Cost
(mgd) Methods Volume (mgd) Service (Millions)
Hancock 3.5 Primary sed, skimming, disinfection 51.3 1977 $6.6
Weiss 9.5 Swirl conc, disinfection 248.0 1993 $16.9
Webber 3.6 Primary sed, skimming, disinfection 34.8 1994 $6.6
Emerson 5.0 Primary sed, skimming, disinfection 33.4 1994 $15.9
Salt/Fraser 2.8 Primary sed, skimming, disinfection 2.0 1995 $22.9
Fitzhugh 1.2 Primary sed, skimming, disinfection 2.8 1994 $4.8
14th Street 6.8 Skimming, settling, vortex sep, 36.6 1992 $8.5
disinfection
The pollutant removal effectiveness varied among the RTBs, as shown below.
Facility Name Volume BOD TSS Phosphorus Ammonia
Hancock 22% 50% 51% 40% 39%
Weiss 29% 54% 77% 55% 68%
Webber 38% 52% 61% 33% 62%
Emerson 36% 57% 39% 38% 67%
Salt/Fraser 48% 60% 68% 53% 73%
Fitzhugh 42% 57% 84% 56% 85%
14th Street 59% 83% 79% 76% 80%
Status of Implementation
Saginaw considered two alternatives for control of its CSOs: sewer separation andstorage and treatment. A cost comparison of the two alternatives was conducted in1990, and the results are as follows:
Alternative Construction Cost Present Worth Annual Equivalent Cost(Millions) (Millions) (Millions)
Sewer Separation $309.8 $285.1 $31.0
Storage and Treatment $170.8 $78.1 $18.0
The storage and treatment alternative was selected because of the cost advantage. Thisalternative was then divided into Phases A, B and C. Phases A and B have beencompleted, resulting in the elimination of all untreated CSOs.
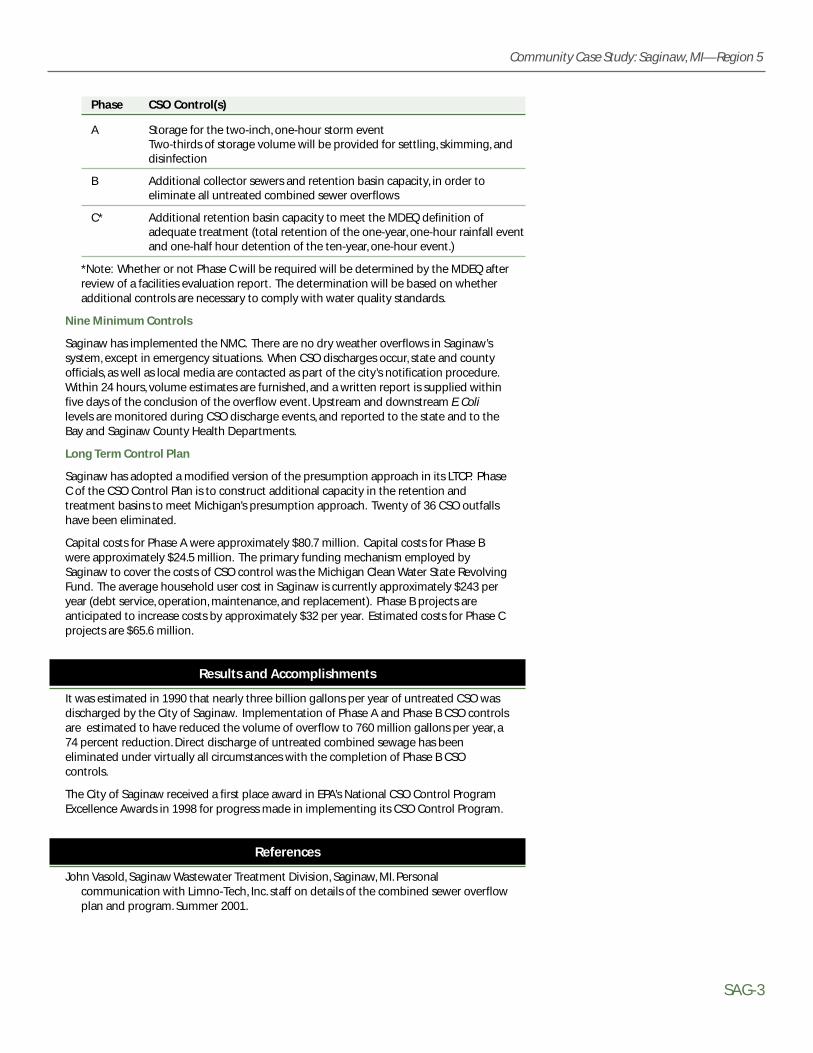
SAG-3
Community Case Study: Saginaw, MI—Region 5
Phase CSO Control(s)
A Storage for the two-inch, one-hour storm eventTwo-thirds of storage volume will be provided for settling, skimming, and disinfection
B Additional collector sewers and retention basin capacity, in order to eliminate all untreated combined sewer overflows
C* Additional retention basin capacity to meet the MDEQ definition of adequate treatment (total retention of the one-year, one-hour rainfall eventand one-half hour detention of the ten-year, one-hour event.)
*Note: Whether or not Phase C will be required will be determined by the MDEQ afterreview of a facilities evaluation report. The determination will be based on whetheradditional controls are necessary to comply with water quality standards.
Nine Minimum Controls
Saginaw has implemented the NMC. There are no dry weather overflows in Saginaw’ssystem, except in emergency situations. When CSO discharges occur, state and countyofficials, as well as local media are contacted as part of the city’s notification procedure.Within 24 hours, volume estimates are furnished, and a written report is supplied withinfive days of the conclusion of the overflow event. Upstream and downstream E. Colilevels are monitored during CSO discharge events, and reported to the state and to theBay and Saginaw County Health Departments.
Long Term Control Plan
Saginaw has adopted a modified version of the presumption approach in its LTCP. PhaseC of the CSO Control Plan is to construct additional capacity in the retention andtreatment basins to meet Michigan’s presumption approach. Twenty of 36 CSO outfallshave been eliminated.Costs and Financing
Capital costs for Phase A were approximately $80.7 million. Capital costs for Phase Bwere approximately $24.5 million. The primary funding mechanism employed bySaginaw to cover the costs of CSO control was the Michigan Clean Water State RevolvingFund. The average household user cost in Saginaw is currently approximately $243 peryear (debt service, operation, maintenance, and replacement). Phase B projects areanticipated to increase costs by approximately $32 per year. Estimated costs for Phase Cprojects are $65.6 million.
Results and Accomplishments
It was estimated in 1990 that nearly three billion gallons per year of untreated CSO wasdischarged by the City of Saginaw. Implementation of Phase A and Phase B CSO controlsare estimated to have reduced the volume of overflow to 760 million gallons per year, a74 percent reduction. Direct discharge of untreated combined sewage has beeneliminated under virtually all circumstances with the completion of Phase B CSOcontrols.
The City of Saginaw received a first place award in EPA’s National CSO Control ProgramExcellence Awards in 1998 for progress made in implementing its CSO Control Program.
References
John Vasold, Saginaw Wastewater Treatment Division, Saginaw, MI. Personalcommunication with Limno-Tech, Inc. staff on details of the combined sewer overflowplan and program. Summer 2001.

SF-1
Number of CSO Outfalls
43 (originally)36 (currently)
Combined Sewer Service Area
49 square miles
Wastewater Treatment Capacity
272 mgd (primary)194 mgd (secondary)
Receiving Water(s)
Islais Creek, San Francisco Bay, Pacific Ocean
San Francisco, CA—Region 9
Background on San Francisco CSOs
The combined sewer service area of the City and County of San Francisco isapproximately 31,360 acres and serves an estimated population of 800,000. There are nosignificant separated sewer service areas within the city. There are six main drainagebasins within the service area and approximately 898 miles of combined sewer.
Prior to the implementation of CSO controls, an average of 7.5 billion gallons of CSOdischarged during the wet weather season (October to April) each year. The overflowfrequency was approximately 58 times per year, and there were 43 CSO outfalls. All of theCSOs discharged into marine waters.
The city and County of San Francisco own and operate three wastewater treatmentplants in addition to the storage/transport facilities constructed for CSO control. TheSoutheast Water Pollution Control Plant (WPCP) is the city's largest wastewater treatmentplant and has a peak secondary treatment capacity of 150 mgd. The plant dischargesthrough an outfall to San Francisco Bay. The outfall has a capacity of 100 mgd, and flows
Program Highlights
● CSO outfalls have been reducedfrom 43 to 36.
● CSO events have been reduced byover 75 percent, and CSO volumeby 81 percent.
● An estimated 94 percentreduction in beach postings hasoccurred since implementation ofCSO controls.
● CSO control has improved Cityassets and enhanced waterquality of nearshore areas of theBay and Ocean.
Community Case Study
#!
#!#!#!
#!
#!
#!
#!#! #! #!#!
#!#!
#!
#!#!#!#!#!#!#!
#!#!#!
#!#!#!#!#!
#!#!
#!#!#!
#!
$
$
Marin CountyTreasure Island
San Mateo County
San Francisco
San FranciscoBay
PacificOcean
$S Outfall
Combined Sewer Area
Wastewater Treatment Plant
Controls
● San Francisco completedimplementation of its LTCP in 1997;initial CSO control began in the early1970s.
● Wet weather treatment facilitiesprovide 272 mgd of primarytreatment and disinfection for wetweather flows.
● Storage and transport structures holdflow until treatment plant capacitybecomes available. Photo: Islais Creek CSO Wet Weather Treatment
and Storage FacilityCourtesy San Francisco PUC

SF-2
Report to Congress on Implementation and Enforcement of the CSO Control Policy
in excess of 100 mgd are discharged to Islais Creek, a saltwater embayment. TheSoutheast WPCP was expanded in 1982 to provide a wet weather capacity of 250 mgdfor peak wet weather flows. This was achieved using the 150 mgd of available secondarytreatment capacity and 100 mgd of primary treatment capacity.
The North Point Wet Weather Facilities serves an area of approximately 6,500 acres in thenortheastern part of the city. The facilities provide primary treatment (i.e., screening andsettling), disinfection, and dechlorination of combined wet weather flows up to 150 mgd.
The Oceanside WPCP has a peak secondary treatment capacity of 43 mgd and a wetweather treatment capacity of 65 mgd. The capacities of the treatment facilities used bySan Francisco to treat dry weather and wet weather flows are summarized in the tablebelow.
Treatment Plant Secondary Primary Peak FlowCapacity Capacity Capacity
(mgd) (mgd) (mgd)
Southeast WPCP 150 100 250
North Point Wet Weather Facilities None 150 150
Oceanside WPCP 43 22 65
Total 193 272 465
Status of Implementation
CSO Planning History
Planning for CSO control began in the early-1970s. The city Department of Public Worksassessed various measures to upgrade treatment and control CSOs between 1970 and1974. The Wastewater Master Plan was approved in concept by the San Francisco Boardof Supervisors in January 1975. Based upon this planning effort, the San FranciscoRegional Water Quality Control Board issued the city its first NPDES permit for the CSOstructures. This permit was issued in the mid-1970s and set monitoring requirementsand tentative control levels at some of the structures, as well as requiring additionalstudies of CSO control measures. In late 1978 and 1979, the permits were revised andthe required CSO control levels were established based upon cost-benefit analyses.
System Characterization
The revised permits allowed a long-term average of 10 overflows per year where theshoreline usage is predominantly industrial and maritime, between eight and fouroverflows per year in areas where water contact recreation occurs, and only oneoverflow per year in an area where there are shellfish beds. The permits also requirethat:
● Wet weather treatment facilities are at maximum capacity before CSOs are allowed.
● Industrial source control and BMPs to control nonpoint source pollution must beimplemented.
● Floatables are contained in the storage/transport structures.
● Treatment plant effluent, CSOs, and receiving waters are monitored for pollutants.
● Beaches are posted following CSO events.
To intercept the flows, a series of large underground storage and transport structures(referred to as storage/transport boxes) were constructed along San Francisco'sshoreline. Gravity and pumping are used to transport the stored wet weather flows tothe treatment plants as treatment plant capacity becomes available. In addition to these

SF-3
Community Case Study: San Francisco, CA—Region 9
storage/transport boxes, the treatment plants were upgraded to expand the secondaryand wet weather treatment capacities.
The system is designed and operated so that all dry weather flows are kept in the sewersystem and routed to either the Southeast WPCP or the Oceanside WPCP for treatment.In wet weather the storage/transport boxes allow primary sedimentation to occur andare designed to remove floatables and reduce suspended solids concentration byapproximately 30 percent. The capacities of these structures are summarized in theaccompanying table. After a rain event, the settled solids are conveyed to thewastewater treatment plants. Therefore, all overflows from the storage/transport boxesreceive some treatment prior to discharge through the outfalls.
WPCP System Storage/Transport Structure Capacity (mgd)
Westside Core System Westside 50.0Richmond 10.0Lake Merced 10.0
Bayside Core System Northshore 17.5Mariposa 0.7Islais Creek 37.0Yosemite/Fitch 11.5Sunnydale 5.7Channel 28.0
Total 170.4
The Bayside Core System consists of seven miles of underground storage/transportboxes. These boxes drain to major pump stations where all dry weather flows arepumped to the Southeast WPCP for treatment before being discharged into SanFrancisco Bay. During wet weather, the North Point Wet Weather Facilities are broughtonline. Flows in the boxes exceeding the combined wet weather capacity of theSoutheast WPCP and the North Point Wet Weather Facilities receive partial treatment inthe boxes before discharge.
The Westside Core System consists of a 2.5 mile long storage/transport box, theOceanside WPCP, and the Southwest Ocean Outfall. The city has also constructedconsolidation conduits, tunnels, and new pump stations to intercept overflows anddivert them to the storage/transport boxes.
In addition to the massive capital improvements, the city embarked on a program oftoxics source control and pollution prevention. The Water Pollution Prevention Programwas developed in response to several state and federal permits, orders, and wasteminimization strategies. It consists of best management practices targeting educationaland technical outreach, increased inspection and sampling of non-traditional pollutantsources, mandated waste minimization, and storm water pollution prevention plans.
Nine Minimum Controls
San Francisco has implemented the NMC. Wet weather-related monitoring activitiesinclude characterization of CSO discharges for various chemical constituents. Followinga CSO event beaches are posted as not meeting state recreational water contactstandards. Local surf shops and swim clubs are contacted and a toll free recreationalwater quality hotline is available to the public. The city is also in the process ofdeveloping access to EPA's BEACH Watch website.
Long Term Control Plan
San Francisco completed implementation of its LTCP in 1997 and the planned capitalimprovements for controlling CSOs to the allowed number of annual overflows. The city'sLTCP gave priority to eliminating discharges to sensitive areas; a CSO outfall at Baker

SF-4
Report to Congress on Implementation and Enforcement of the CSO Control Policy
Beach in the Golden Gate National Recreational Area has been eliminated given thesensitivity of the habitat and potential human exposure.
Costs and Financing
The total capital costs associated with completing the LTCP were approximately $1.45billion. The annual CSO-related O&M costs are approximately $20 million. Nearly $700million in federal and state grants were received by San Francisco to assist in theplanning, design, and construction of the CSO control system. The remaining $750million, raised by revenue bonds and to be repaid by sewer rater, were city funds.
The North Point Wet Weather Facilities, which are more than 50 years old, are in need ofimprovement. Certain equipment is obsolete and some spare parts are no longeravailable on the market. Pollutant removal is less than optimal and in some instancesdischarges approach current effluent limits. With the consideration of future expansion,an upgrade is being planned for the facilities. The project involves: 1) upgrading primarysedimentation tanks and equipment with high rate clarification units, 2) replacingchlorine-based disinfection system with a more environmentally-friendly, mediumpressure, ultraviolet radiation disinfection system capable of achieving current NPDESfecal coliform standard, and 3) upgrading ancillary equipment (pre-treatment, pumps,piping, electrical/instrumentation) to meet needs of treatment processes. The upgrade isprojected to cost $38 million.
There are also plans to increase the capacity of the outfalls in conjunction with the NorthPoint upgrades described above. The outfalls were constructed in the 1950's and thediffusers were added in the 1970's. Both are necessary to meet the discharge permitrequirements of a minimum 10:1 dilution. Since the North Point Facilities are used forwet weather treatment only, and are not always in operation, barnacles and crustaceansinhabit the outfall system and have created blockages, thereby reducing its capacity andefficiency. The projected cost for increasing the capacity of the outfalls from 150 mgd to300 mgd is $22 million.
Depending on the outcome of current negotiations between the city and the Navy, thecity may be responsible for system upgrades and expansion at Hunters Point andTreasure Island. San Francisco’s remaining needs also depend on potential changes towater quality standards previously discussed.
Water Quality Issues
Since 1972 the city has conducted ongoing sampling to evaluate the impacts of CSOdischarges and to assess the environmental improvements gained from CSO control. Onthe Westside, where prior to the program as much as 83% of the storm flows weredischarged untreated at the Pacific Ocean shoreline, only 13% of the storm flows aredischarged at the shoreline and all of this overflow receives partial treatment.
Although San Francisco's LTCP has been completely implemented there are unresolvedissues regarding water quality standards compliance. The state anticipates that it will bereviewing the appropriateness of the water quality standards in the near future. The citymay have to implement additional programs depending on the outcome of that review.
Results
CSO volume and frequency have been reduced greatly since CSO controls have beenimplemented. Citywide pollutant reductions resulting from the city's LTCP aresummarized as follows:

SF-5
Community Case Study: San Francisco, CA—Region 9
Item Before Control After Control % Reduction
Number of CSO events 58 - 80 1-10 98-75
Annual CSO Volume (MG) 7,500 1,350 81
Suspended Solids Discharge (tons/yr) 3,550 450 87
BOD5 Discharge (tons/year) 2,700 300 89
Beach Postings (days/year) 200 12 94
San Francisco developed its LTCP in conjunction with the regulatory agencies andstarted to implement the plan in 1974. Within 20 years the following systems werecomplete: (1) the Westside system, which reduced overflows to eight times per year intothe Pacific Ocean along the central portion of Ocean Beach; (2) the Northshore system,which reduced overflows to four times per year along the northshore of the city theGolden Gate and Bay Bridges; (3) the Channel system, which reduced overflows to 10times per year from the Bay Bridge to Mission Creek; and (4) the Sunnydale/Yosemitesystem, which reduced overflows to one time per year south of Islais Creek to thesouthern city boundary.
In 1994, the Lake Merced Transport system was tied to the Westside system, whichfurther reduced overflows to the Pacific Ocean from the southwestern section of SanFrancisco. Shortly thereafter the Islais Creek system was completed, which reducedoverflows to 10 times per year from Mission Creek to Islais Creek along the easternboundary of the city. In 1997, the Richmond Transport connected flow from thenorthwestern edge of the city to the Westside system, diverting flow that previouslyspilled onto Baker and China Beaches.
Prior to CSO control implementation, San Francisco beaches were routinely posted fromOctober to April during the wet weather season for not complying with staterecreational water contact standards. Rainfall in excess of 0.02 inches per hour resultedin CSOs around the entire city. As CSO control structures were put in service, the numberof CSOs to San Francisco shoreline areas have been reduced as described above. Thenumber of CSOs that occur is dependent upon the amount of annual rainfall and theduration and intensity of each rainfall event.
From 1994 through 1996, a significant portion of control structures were in place and thenumber of days the beaches were posted ranged from 196 to 217, while rainfall rangedfrom 23.7 to 26.3 inches. In 1997, the first partial year of complete CSO controlimplementation, the number of days beaches were posted dropped to 54, but rainfallwas only 19.1 inches. In 1998, the first complete year of full implementation, the numberof days beaches were posted dropped to 48 and rainfall was significantly higher,measuring 33.5 inches. Since 1998, annual rainfall in San Francisco has ranged from 22to 27 inches and the days that beaches were posted decreased to between eight and 15days. In recent years, beaches remain posted only while sampling indicates that bacteriaconcentrations are above state bacteria standards. This is typically only a period of oneto three days. An estimated 94% reduction in beach postings has occurred due toimplementation of CSO controls. As shown in the following figure, these reductions havebeen achieved during both wet and dry years.

SF-6
Report to Congress on Implementation and Enforcement of the CSO Control Policy
This reduction in the numbers and volume of CSO events during the past 25 years hasfacilitated the transition of San Francisco's coastline from industrial uses to tourist,recreational, and residential uses by improving and enhancing the water quality ofnearshore areas of the bay and ocean. The continuing economic development of theFisherman's Wharf area south to Pac Bell Park and the water contact recreation enjoyedat Crissy Field, Fort Point, Baker, and Ocean Beaches (all within the Golden Gate NationalRecreational Area) have been supported in part by the control and treatment ofcombined sewer overflows (Lavelle, 2001).
San Francisco Bay has been listed for several pollutants under CWA Section 303(d). Thelisting has resulted in a need for developing TMDLs for certain pollutants, such as copperand nickel. The outcome of TMDLs may require further control measures for CSOs. Thesecontrol measures have not been determined at this time.
References
Jane Lavelle, San Francisco Planning Bureau, Public Utilities Commission, San Francisco,CA. Personal communication with Limno-Tech, Inc. staff on details of the combinedsewer overflow plan and program. Summer 2001.
54 54 54 54 54 54
6
50
44
4
45
2
41
2
40
4
58
6
59
74 4
8 812 12
8 8
14 14
6 6
Number of CSOs per year
Rainfall (inches)
1984 1985 1986 1987 1988 1989 1990 1991 1992 1993 1994 1995 1996 1997 1998 1999
Lake Merced Lincoln/Vicente
CSO Frequency and Rainfall at Lincoln/Vicente and Lake Merced Overflow Structures
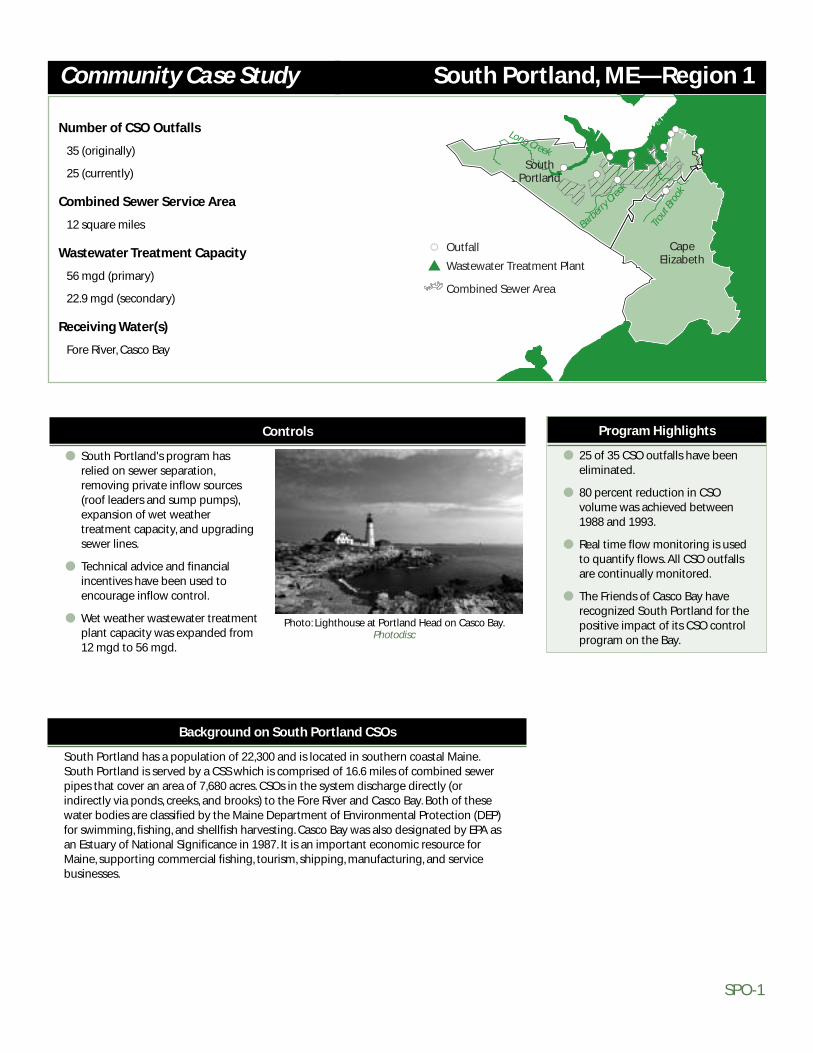
SPO-1
Number of CSO Outfalls
35 (originally)
25 (currently)
Combined Sewer Service Area
12 square miles
Wastewater Treatment Capacity
56 mgd (primary)
22.9 mgd (secondary)
Receiving Water(s)
Fore River, Casco Bay
South Portland, ME—Region 1
Background on South Portland CSOs
South Portland has a population of 22,300 and is located in southern coastal Maine.South Portland is served by a CSS which is comprised of 16.6 miles of combined sewerpipes that cover an area of 7,680 acres. CSOs in the system discharge directly (orindirectly via ponds, creeks, and brooks) to the Fore River and Casco Bay. Both of thesewater bodies are classified by the Maine Department of Environmental Protection (DEP)for swimming, fishing, and shellfish harvesting. Casco Bay was also designated by EPA asan Estuary of National Significance in 1987. It is an important economic resource forMaine, supporting commercial fishing, tourism, shipping, manufacturing, and servicebusinesses.
Program Highlights
● 25 of 35 CSO outfalls have beeneliminated.
● 80 percent reduction in CSOvolume was achieved between1988 and 1993.
● Real time flow monitoring is usedto quantify flows. All CSO outfallsare continually monitored.
● The Friends of Casco Bay haverecognized South Portland for thepositive impact of its CSO controlprogram on the Bay.
Community Case Study
$
CapeElizabeth
SouthPortland
Trout B
rook
Barberry
Creek
Long Creek
$S Outfall
Combined Sewer Area
Wastewater Treatment Plant
#!#!
#!
#!#!
#!
#!
#!
#!
#!
Controls
● South Portland's program hasrelied on sewer separation,removing private inflow sources(roof leaders and sump pumps),expansion of wet weathertreatment capacity, and upgradingsewer lines.
● Technical advice and financialincentives have been used toencourage inflow control.
● Wet weather wastewater treatmentplant capacity was expanded from12 mgd to 56 mgd.
Photo: Lighthouse at Portland Head on Casco Bay.Photodisc

SPO-2
Report to Congress on Implementation and Enforcement of the CSO Control Policy
Status of Implementation
Characterization
South Portland initiated their CSO Control program in 1988. City staff inventoried,numbered and mapped all of the sewer pipes, catch basins, and manholes. Thirty-fiveCSO outfalls were identified. Inflow and infiltration was high in the city's aging sewersystem. The average age of the system was approximately 50 years, and the oldest sewerpipes date to the 1880s (City of South Portland 1992 and 1993).
South Portland installed an extensive system of real-time flow monitoring equipment tocharacterize their CSS and existing CSOs. All CSO outfalls in the system are continuouslymonitored, and the duration, overflow rate, total volume, and time of day of each CSO isrecorded. South Portland also maintains rain gauges to be able to correlate overflow andprecipitation events. Flow monitoring has provided many benefits for South Portland'sCSO control program. The real-time flow data: (1) provide basic information for the city tounderstand CSS performance, (2) enable the progress of the CSO control program to betracked, (3) produce information for comparison of CSO control alternatives, and (4) serveas an important component of compliance monitoring. South Portland has maintainedrainfall records and flow records from the CSO outfalls and pump stations since 1992.Other monitoring efforts related to the CSO program include collection of bacteria data(enterococci) at swimming beaches. These efforts have enabled South Portland to collectsite-specific data on existing CSOs, and to calculate pollutant loadings and receivingwater impacts. This comprehensive monitoring program has also aided the developmentof South Portland's LTCP.
Nine Minimum Controls
The NMC were required for South Portland as part of the DEP CSO Discharge License,and an enforcement action (consent agreement with EPA Region 1, dated January 28,1992). South Portland has been recognized by the DEP for its implementation anddocumentation of the NMC, considered to be one of the best of 44 Maine CSOcommunities (City of South Portland, 1997).
Proper O&M was recognized to be an important component of CSO control. The city'ssewer maintenance division is responsible for cleaning and inspection of the collectionsystem. In addition, they maintain an emergency on-call system to quickly identify,eliminate, or mitigate any problems that might arise. No dry weather overflows occurredin 1999. In the previous three years, dry weather overflows occurred due to power orequipment failures that have since been corrected with backup power arrangements.Because South Portland continuously monitors flows at all CSO outfalls, dry weatheroverflows are quickly discovered and eliminated.
Signs are placed at all CSO locations to inform the public of possible wet-weatherhazards. The signs are regularly checked and replaced if damaged or missing. The WillardBeach outfall is recognized as a sensitive area for CSO activity because it is a publicswimming area. Bacteria testing has been performed at the outfall twice weekly duringthe summer since 1991. While beach closings have occurred, none corresponded directlywith CSO discharges.
South Portland has implemented an aggressive program to reduce inflow to the CSS.Homes and commercial establishments with roof leaders and basement sump pumpsdirectly connected to the CSS were identified. South Portland provided technical andfinancial support to owners to have roof leaders and sump pumps redirected from theCSS. A summary of CSO source control measures implemented by South Portlandfollows.

SPO-3
Community Case Study: South Portland, ME—Region 1
Source Control Activity and Progress as of 1999 Purpose
Roof Leader Disconnection—257 homes Stormwater Inflow Reduction
Sump Pump Removal—213 removed Stormwater Inflow Reduction
Catch Basin Cleaning—460 tons debris annually Pollution Prevention
Street Sweeping—2,000 cy debris removed annually Pollution Prevention
Annual community hazardous waste collection Pollution Prevention
Long Term Control Plan
South Portland has been implementing CSO controls since 1988. The LTCP is based uponthe demonstration approach. Priority has been given to eliminating the CSO dischargesnear the bathing beach, a sensitive area. Sewer separation, adjustment of weir heights,upgrading of pumps stations, upgrading of POTW capacity, and many other in-systemcontrols have contributed to substantial reductions in the number of CSO outfalls andthe volume of CSO discharge. The types of in-system control measures implementedsince 1988 by South Portland are listed below.
System Controls Implemented as of 1999 Type
Infiltration/inflow control Collection System Optimization and Control
Real-time flow control (50% overflow decrease Collection System Optimizationrealized by adjusting weirs) and Control
Sewer cleaning Collection System Optimizationand Control
Manhole/pump station maintenance Collection System Optimizationand Control
Sewer rehabilitation Collection System Optimizationand Control
Sewer separation (680 acres separated Collection System Optimizationbetween 1986-1998) and Control
Outfall elimination Collection System Optimizationand Control
In-line netting Floatables Control
Baffles (installed at 11 locations in CSS) Floatables Control
Screening improvements at discharge point Floatables Control
In-line storage (weirs adjusted to maximize Storage (In-Line and Off-Line)in-line storage)
Upgraded pump stations (6 pump stations Storage (In-Line and Off-Line)upgraded)
Upgraded POTW capacity (with additional Storage (In-Line and Off-Line)wet weather primaries)

SPO-4
Report to Congress on Implementation and Enforcement of the CSO Control Policy
Costs and Financing
South Portland has spent over $9 million to control CSOs. Most of this has been financedthrough voter-approved bonding. Costs for sewer separation of 680 acres of thecombined system were approximately $6 million and the separation projects scheduledover 10 years. Capital costs for the POTW upgrade were $9.2 million, but only a smallportion of this is associated with CSO control. The cost to upgrade six pump stations was$1.3 million. Capital costs for planned LTCP controls are $13.8 million, including $5million for partial sewer separation (to be complete by December 2005). Annual O&Mcosts are approximately $350,000 per year.
Enforcement Issues
South Portland was the first non-National Municipal Policy referral in EPA Region 1 inwhich the EPA sought relief for wet weather discharges only. As part of the consentagreement (entered into court on April 16, 1992), South Portland paid $30,000 inpenalties for violations of the CWA and its Maine CSO Discharge License. The consentagreement required, among other things, that yearly CSO progress reports be submittedto the DEP.
Results
South Portland initiated its CSO control program in 1988. The city's initial CSO masterplan focused on maximizing flow to the POTW. This involved increasing pump stationcapacity, maximizing flow (conveyance capacity) to the treatment plant, and upgradingtreatment and storage capacity at the plant. The current CSO control program primarilyrelies upon separating and upgrading (replacing) sewers and removing private inflowsources through roof leader and sump pump redirection. The removal of inflow andinfiltration sources has eliminated approximately 700 million gallons per year fromentering the CSS. Overall, South Portland had achieved an 80 percent reduction in totalCSO volumes in an average rainfall year by 1993. In addition, 25 of 35 CSO outfalls havebeen eliminated through sewer separation and other system improvements.
Prior to the POTW upgrade, 60 percent of the total CSO volume was discharged at theplant. Secondary treatment capacity at the POTW was upgraded from 12 to 22.9 mgd.Wet weather flows in excess of the upgraded secondary treatment capacity are divertedto empty storage/treatment tanks for primary treatment. CSO bypass of secondarytreatment is permitted under peak flow conditions. In total, maximum treatmentcapacity was expanded toapproximately 56 mgd (22.9mgd secondary, plus 33 mgd ofprimary treatment). The wetweather treatment capacity hasnot been exceeded since theupgrade.
South Portland has alsoobserved a reduction insummer CSOs. Monitoredvolumes for summer CSOs from1992 through 1997 are shownin the figure at right. SouthPortland has been recognizedby the Friends of Casco Bay forits positive impact on the Bay.
27
1992
17
1993
56
1994
1
1995
10
1996
4
1997
Annual summerCSO volume
(million gallons)
Summer CSO Volume Reductions, 1992—1997

SPO-5
Community Case Study: South Portland, ME—Region 1
References
City of South Portland, Maine. 1992. Combined Sewer Overflow Sewer System EvaluationReport. Report submitted to Maine Department of Environmental Protection and EPARegion 1. South Portland, ME.
City of South Portland, Maine. 1993. Combined Sewer Overflow Facilities Plan. SouthPortland, ME.
City of South Portland, Maine. 1997. Combined Sewer Overflows: Documentation for NineMinimum Controls. Report submitted to Maine Department of EnvironmentalProtection. South Portland, ME.
Pineo, David, Engineering Department, City of South Portland, ME. Personalcommunication with Limno-Tech, Inc. staff on details of the combined sewer overflowplan and program. Summer 2001.
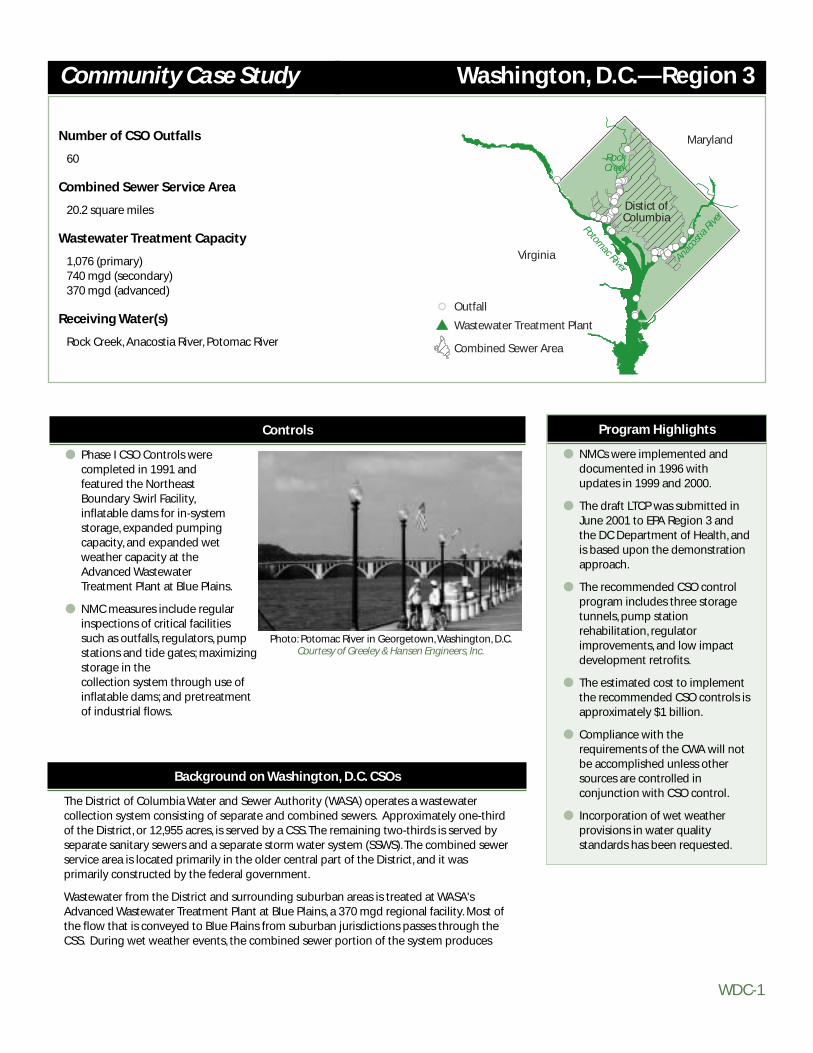
WDC-1
Number of CSO Outfalls
60
Combined Sewer Service Area
20.2 square miles
Wastewater Treatment Capacity
1,076 (primary)740 mgd (secondary)370 mgd (advanced)
Receiving Water(s)
Rock Creek, Anacostia River, Potomac River
Washington, D.C.—Region 3
Background on Washington, D.C. CSOs
The District of Columbia Water and Sewer Authority (WASA) operates a wastewatercollection system consisting of separate and combined sewers. Approximately one-thirdof the District, or 12,955 acres, is served by a CSS. The remaining two-thirds is served byseparate sanitary sewers and a separate storm water system (SSWS). The combined sewerservice area is located primarily in the older central part of the District, and it wasprimarily constructed by the federal government.
Wastewater from the District and surrounding suburban areas is treated at WASA'sAdvanced Wastewater Treatment Plant at Blue Plains, a 370 mgd regional facility. Most ofthe flow that is conveyed to Blue Plains from suburban jurisdictions passes through theCSS. During wet weather events, the combined sewer portion of the system produces
Program Highlights
● NMCs were implemented anddocumented in 1996 withupdates in 1999 and 2000.
● The draft LTCP was submitted inJune 2001 to EPA Region 3 andthe DC Department of Health, andis based upon the demonstrationapproach.
● The recommended CSO controlprogram includes three storagetunnels, pump stationrehabilitation, regulatorimprovements, and low impactdevelopment retrofits.
● The estimated cost to implementthe recommended CSO controls isapproximately $1 billion.
● Compliance with therequirements of the CWA will notbe accomplished unless othersources are controlled inconjunction with CSO control.
● Incorporation of wet weatherprovisions in water qualitystandards has been requested.
Community Case Study
$$S Outfall
Combined Sewer Area
Wastewater Treatment Plant
Potomac River
Anacostia River
Rock Creek
Distict ofColumbia
Virginia
Maryland#!
#!#!#!#!#!#!#!#!#!#!#!#!#!#!#!#!#!#!#!#!#!#!#!
#!
#! #!#!#!#!
#!
#!#!#!#!#!#!#!#!#!
#!
#!#!#!
#!
#!
#!#!
#!
#!
#!#!
#!
#!
#!
#!#!
#!
#!#!
Controls
● Phase I CSO Controls werecompleted in 1991 andfeatured the NortheastBoundary Swirl Facility,inflatable dams for in-systemstorage, expanded pumpingcapacity, and expanded wetweather capacity at theAdvanced WastewaterTreatment Plant at Blue Plains.
● NMC measures include regularinspections of critical facilitiessuch as outfalls, regulators, pumpstations and tide gates; maximizingstorage in the collection system through use ofinflatable dams; and pretreatment of industrial flows.
Photo: Potomac River in Georgetown, Washington, D.C.Courtesy of Greeley & Hansen Engineers, Inc.
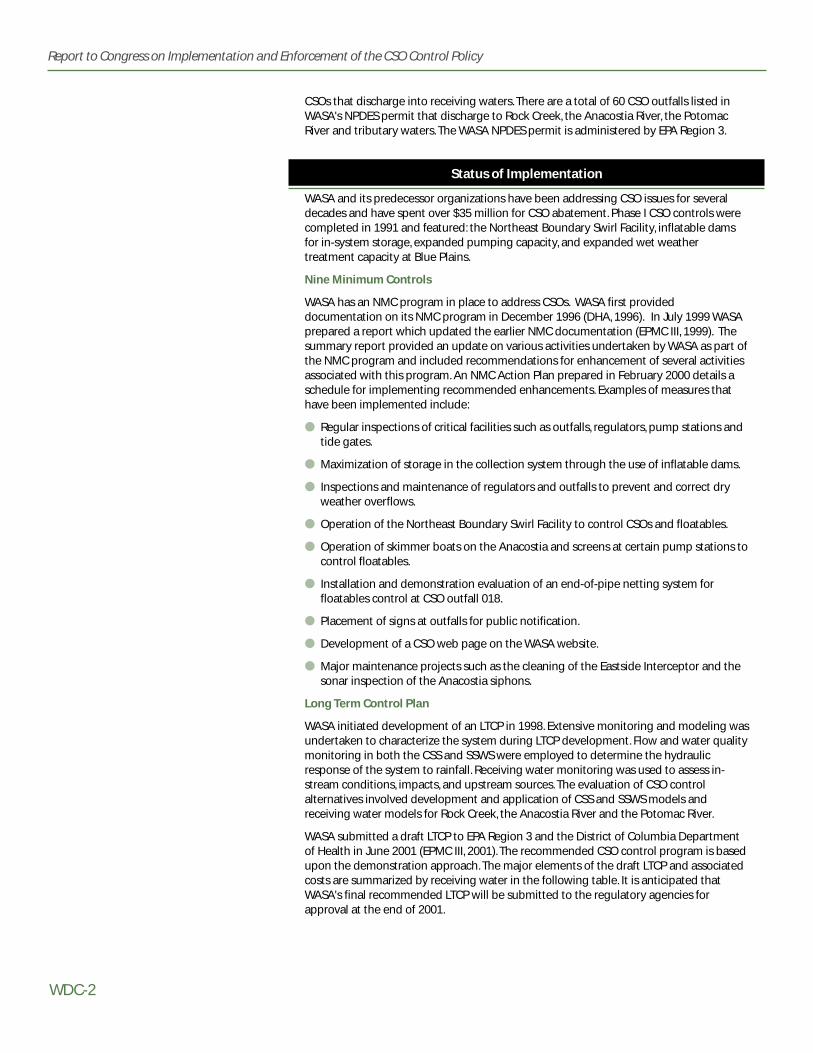
WDC-2
Report to Congress on Implementation and Enforcement of the CSO Control Policy
CSOs that discharge into receiving waters. There are a total of 60 CSO outfalls listed inWASA's NPDES permit that discharge to Rock Creek, the Anacostia River, the PotomacRiver and tributary waters. The WASA NPDES permit is administered by EPA Region 3.
Status of Implementation
WASA and its predecessor organizations have been addressing CSO issues for severaldecades and have spent over $35 million for CSO abatement. Phase I CSO controls werecompleted in 1991 and featured: the Northeast Boundary Swirl Facility, inflatable damsfor in-system storage, expanded pumping capacity, and expanded wet weathertreatment capacity at Blue Plains.
Nine Minimum Controls
WASA has an NMC program in place to address CSOs. WASA first provideddocumentation on its NMC program in December 1996 (DHA, 1996). In July 1999 WASAprepared a report which updated the earlier NMC documentation (EPMC III, 1999). Thesummary report provided an update on various activities undertaken by WASA as part ofthe NMC program and included recommendations for enhancement of several activitiesassociated with this program. An NMC Action Plan prepared in February 2000 details aschedule for implementing recommended enhancements. Examples of measures thathave been implemented include:
● Regular inspections of critical facilities such as outfalls, regulators, pump stations andtide gates.
● Maximization of storage in the collection system through the use of inflatable dams.
● Inspections and maintenance of regulators and outfalls to prevent and correct dryweather overflows.
● Operation of the Northeast Boundary Swirl Facility to control CSOs and floatables.
● Operation of skimmer boats on the Anacostia and screens at certain pump stations tocontrol floatables.
● Installation and demonstration evaluation of an end-of-pipe netting system forfloatables control at CSO outfall 018.
● Placement of signs at outfalls for public notification.
● Development of a CSO web page on the WASA website.
● Major maintenance projects such as the cleaning of the Eastside Interceptor and thesonar inspection of the Anacostia siphons.
Long Term Control Plan
WASA initiated development of an LTCP in 1998. Extensive monitoring and modeling wasundertaken to characterize the system during LTCP development. Flow and water qualitymonitoring in both the CSS and SSWS were employed to determine the hydraulicresponse of the system to rainfall. Receiving water monitoring was used to assess in-stream conditions, impacts, and upstream sources. The evaluation of CSO controlalternatives involved development and application of CSS and SSWS models andreceiving water models for Rock Creek, the Anacostia River and the Potomac River.
WASA submitted a draft LTCP to EPA Region 3 and the District of Columbia Departmentof Health in June 2001 (EPMC III, 2001). The recommended CSO control program is basedupon the demonstration approach. The major elements of the draft LTCP and associatedcosts are summarized by receiving water in the following table. It is anticipated thatWASA's final recommended LTCP will be submitted to the regulatory agencies forapproval at the end of 2001.

WDC-3
Community Case Study: Washington, District of Columbia—Region 3
Recommended LTCP Component Capital Cost Annual O&M Cost(in millions) (in millions)
System-wide low-impact development retrofit $3 $0.2
Anacostia River System Improvements— $816 $9.1pump station rehabilitation, additional tunnelstorage, and new interceptor
Rock Creek System Improvements— $39 $0.5partial separation, additional tunnel storage,and monitoring
Potomac River System Improvements— $170 $2.7additional tunnel storage, pump stationrehabilitation and dewatering
Blue Plains WWTP excess flow treatment $22 $0.4improvements
Total $1,050 $12.9
As shown below, the recommended LTCP is expected to reduce the volume andfrequency of CSOs.
LTCP Alternative Anacostia Potomac Rock SystemRiver River Creek Total
CSO Overflow Volume (MG/year)
No Controls 2,142 1,063 49 3,254
Phase I Controls (1991) 1,485 953 52 2,490
Recommended LTCP 96 157 11 264
Number of Overflows Per Year
No Controls 75 74 30 —
With Phase 1 Controls (1991) 75 74 30 —
Recommended LTCP 4 12 4 —
Cost and Financing
Implementation of the recommended CSO control program is estimated to cost morethan $1 billion (2001 dollars). WASA conducted a financial capability assessment andaffordability analysis to evaluate the impact of the recommended program onratepayers. The analysis considered existing rates, the rate increase associated withWASA’s current non-CSO capital improvements, and the rate increase associated with theaddition of the recommended CSO control program.
Using EPA guidance, wastewater treatment costs, including the recommended CSOcontrol program, are projected to impose a medium burden based on medianhousehold income. For lower income households, current wastewater treatment costsare projected to impose a medium burden without any additional CSO controls.Addition of the recommended CSO control program greatly increases the burden level.At this time, WASA cannot predict whether financial assistance in the form of grants orother mechanisms will be available. Without such assistance, the cost of implementingCSO controls will place a major burden on rate payers, particularly those least able toafford it.
A 20-year implementation schedule for the recommended control plan was developedbased on the financial capability assessment and practical aspects associated with longlinear construction operations. WASA identified several early action items where
WDC-4
Report to Congress on Implementation and Enforcement of the CSO Control Policy
implementation can proceed without waiting for approval of the complete LTCP. Earlyaction items include low impact development retrofits, rehabilitation and improvementsat pumping stations, completion of sewer separation in Luzon Valley, and monitoringand regulator improvements along Rock Creek.
Water Quality Issues
Water quality assessment concentrated on bacteria and dissolved oxygen. The CSOcontrol program is expected to significantly reduce bacteria concentrations in allreceiving waters, and improve dissolved oxygen levels in the Anacostia River. However,current water quality standards will not be attained in Rock Creek and in the AnacostiaRiver unless upstream point and nonpoint sources are controlled in conjunction withCSO control. The draft LTCP includes a suggestion to revise provisions in the currentDistrict of Columbia water quality standards to reflect the wet weather nature of CSOs.The LTCP meets the allocation requirements of the Anacostia TMDL for biochemicaloxygen demand as published by the DC Department of Health (DC Department ofHealth, 2001).
References
DC Department of Health, 2001. Biochemical Oxygen Demand Total Maximum Daily Loadfor the Anacostia River. Washington, DC.
Delon Hampton and Associates (DHA), 1996. CSO Abatement Program: Nine MinimumControl Compliance Report. Prepared for WASA. Washington, DC.
Engineering Program Management Consultant (EPMC) III, 1999. Combined Sewer SystemNine Minimum Controls Summary Report - Draft. Prepared for WASA. Washington,. DC.
Engineering Program Management Consultant (EPMC) III, 2001. Draft Report: CombinedSewer System Long Term Control Plan. Prepared for WASA. Washington, DC.
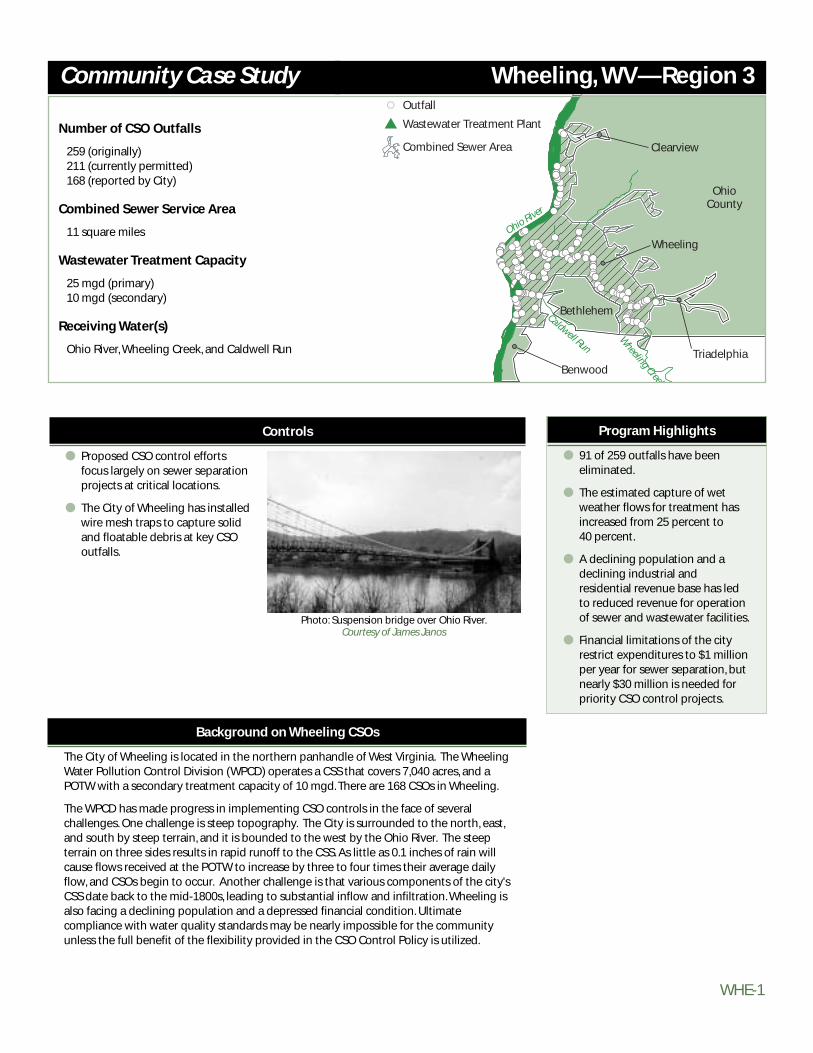
#!
#!#!#!#!#!#!#!#!#!
#!#!#!#!#!#!#!#!#!#!#!#!#! #!
#!#!#!#!#!#!#!#!#!#!#!#!
#!#!#!#!#!#!#!#!#!#!#!#! #!#!
#!#!
#!
#!#!#!#! #!#!#!#!#!#!#!#!#!#!
#!#!#!#!#!#!#!#!#!#!#!#!#!#!#!#!#!#!#!#!#!#!#!#!#!#!#!#!#!#!#!#! #!#!#!#!#!
#!#!#!#!#!#!#!#!#!#!#!#!#!#!#!
#!#!#!#! #!#!#!#!#!#!#!#!#!
#!
#! #!#!#!#!#!#!#!#!#!
#!#!#!#!
#!
#!
#!#!
#!
#!
#!
#!#!
#!#!
#!#!#!#!#!#!$
$S Outfall
Combined Sewer Area
Wastewater Treatment Plant
OhioCounty
Benwood
Wheeling
Clearview
Bethlehem
Triadelphia
Wheeling Creek
Caldwell Run
Ohio River
WHE-1
Number of CSO Outfalls
259 (originally)211 (currently permitted)168 (reported by City)
Combined Sewer Service Area
11 square miles
Wastewater Treatment Capacity
25 mgd (primary)10 mgd (secondary)
Receiving Water(s)
Ohio River, Wheeling Creek, and Caldwell Run
Wheeling, WV—Region 3
Background on Wheeling CSOs
The City of Wheeling is located in the northern panhandle of West Virginia. The WheelingWater Pollution Control Division (WPCD) operates a CSS that covers 7,040 acres, and aPOTW with a secondary treatment capacity of 10 mgd. There are 168 CSOs in Wheeling.
The WPCD has made progress in implementing CSO controls in the face of severalchallenges. One challenge is steep topography. The City is surrounded to the north, east,and south by steep terrain, and it is bounded to the west by the Ohio River. The steepterrain on three sides results in rapid runoff to the CSS. As little as 0.1 inches of rain willcause flows received at the POTW to increase by three to four times their average dailyflow, and CSOs begin to occur. Another challenge is that various components of the city'sCSS date back to the mid-1800s, leading to substantial inflow and infiltration. Wheeling isalso facing a declining population and a depressed financial condition. Ultimatecompliance with water quality standards may be nearly impossible for the communityunless the full benefit of the flexibility provided in the CSO Control Policy is utilized.
Program Highlights
● 91 of 259 outfalls have beeneliminated.
● The estimated capture of wetweather flows for treatment hasincreased from 25 percent to 40 percent.
● A declining population and adeclining industrial andresidential revenue base has ledto reduced revenue for operationof sewer and wastewater facilities.
● Financial limitations of the cityrestrict expenditures to $1 millionper year for sewer separation, butnearly $30 million is needed forpriority CSO control projects.
Community Case Study
Controls
● Proposed CSO control effortsfocus largely on sewer separationprojects at critical locations.
● The City of Wheeling has installedwire mesh traps to capture solidand floatable debris at key CSOoutfalls.
Photo: Suspension bridge over Ohio River.Courtesy of James Janos

WHE-2
Report to Congress on Implementation and Enforcement of the CSO Control Policy
Status of Implementation
The WPCD has completed several CSO discharge characterization studies, hasimplemented the NMC, and has submitted an LTCP to the West Virginia Department ofEnvironmental Protection (DEP) for approval.
System Characterization
Wheeling developed a Conceptual Plan for the Analysis and Minimization of CombinedSewer Overflow Discharges in1993. The plan outlined CSS deficiencies and prioritizedsubsequent CSO control activities. The plan was based on collection system analysisusing SWMM and STORM models. At the time of this report, the annual percent captureof total flow entering the CSS was estimated to be 25 percent, with virtually 100 percentcapture during dry weather flow conditions. In addition to the conceptual plan,Wheeling has also completed several studies in effort to characterize its CSO discharges,including:
● Analysis of water quality upstream and downstream of CSO discharges.
● Monitoring of rates and durations of representative discharges during rainfallconditions.
● Analysis of the quality of representative discharges.
Nine Minimum Controls
Wheeling developed its implementation plan for NMC in August 1996 (SmithEnvironmental Technologies Corporation, 1996). This plan was approved by the DEP andthe Ohio River Valley Water Sanitation Commission (ORSANCO) in December 1996. TheCity has successfully demonstrated implementation of each of the NMC. Examples ofactivities conducted to fulfill the NMC requirements include:
● Daily inspection and maintenance of the collection system.
● Modification of CSO structures and sewer cleaning to maximize in-system storage.
● Installation of wire mesh traps for solids and floatables control.
● Maximization of flow to the WWTP (assisted by use of a CSO-related bypass).
● Flow monitoring and sampling.
● Development and distribution of educational and public notice materials.
Dry weather overflows continue to occur. These overflows are attributed to temporaryblockages in the collection system, and to occasional surface water tie-ins that drain intooverflow pipes. During dry weather conditions, the drainage from these tie-ins does notcontact sanitary sewage flowing in the collection system. All observed dry weatheroverflows are immediately inspected when identified or reported, and blockages areremoved.
Long-Term Control Plan
Wheeling submitted its LTCP on April 28, 2000 in accordance with their complianceschedule. The LTCP is under review by the DEP.
The proposed LTCP follows the demonstration approach. This is considered thenecessary approach since the City cannot meet the 85 percent capture requirement ofthe presumption approach. Wheeling's draft March 2001 permit requires that, at aminimum, the LTCP must consist of continued maintenance and implementation of theNMC, provided there are no adverse water quality impacts. As part of its LTCP, Wheelingcommits to the continued maintenance and implementation of the NMC.
The city submitted data (collected as part of the NMC requirements) to demonstrate noadverse impacts to receiving water quality due to CSO discharges. This data is presented
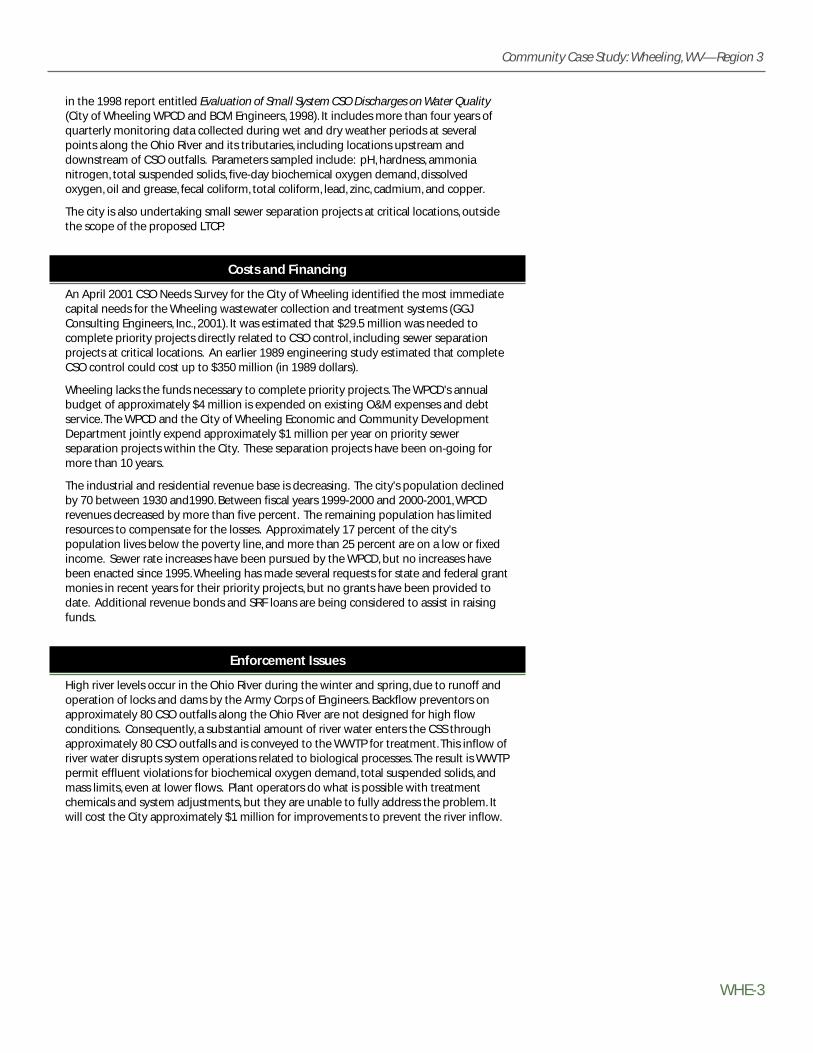
WHE-3
Community Case Study: Wheeling, WV—Region 3
in the 1998 report entitled Evaluation of Small System CSO Discharges on Water Quality(City of Wheeling WPCD and BCM Engineers, 1998). It includes more than four years ofquarterly monitoring data collected during wet and dry weather periods at severalpoints along the Ohio River and its tributaries, including locations upstream anddownstream of CSO outfalls. Parameters sampled include: pH, hardness, ammonianitrogen, total suspended solids, five-day biochemical oxygen demand, dissolvedoxygen, oil and grease, fecal coliform, total coliform, lead, zinc, cadmium, and copper.
The city is also undertaking small sewer separation projects at critical locations, outsidethe scope of the proposed LTCP.
Costs and Financing
An April 2001 CSO Needs Survey for the City of Wheeling identified the most immediatecapital needs for the Wheeling wastewater collection and treatment systems (GGJConsulting Engineers, Inc., 2001). It was estimated that $29.5 million was needed tocomplete priority projects directly related to CSO control, including sewer separationprojects at critical locations. An earlier 1989 engineering study estimated that completeCSO control could cost up to $350 million (in 1989 dollars).
Wheeling lacks the funds necessary to complete priority projects. The WPCD's annualbudget of approximately $4 million is expended on existing O&M expenses and debtservice. The WPCD and the City of Wheeling Economic and Community DevelopmentDepartment jointly expend approximately $1 million per year on priority sewerseparation projects within the City. These separation projects have been on-going formore than 10 years.
The industrial and residential revenue base is decreasing. The city's population declinedby 70 between 1930 and1990. Between fiscal years 1999-2000 and 2000-2001, WPCDrevenues decreased by more than five percent. The remaining population has limitedresources to compensate for the losses. Approximately 17 percent of the city'spopulation lives below the poverty line, and more than 25 percent are on a low or fixedincome. Sewer rate increases have been pursued by the WPCD, but no increases havebeen enacted since 1995. Wheeling has made several requests for state and federal grantmonies in recent years for their priority projects, but no grants have been provided todate. Additional revenue bonds and SRF loans are being considered to assist in raisingfunds.
Enforcement Issues
High river levels occur in the Ohio River during the winter and spring, due to runoff andoperation of locks and dams by the Army Corps of Engineers. Backflow preventors onapproximately 80 CSO outfalls along the Ohio River are not designed for high flowconditions. Consequently, a substantial amount of river water enters the CSS throughapproximately 80 CSO outfalls and is conveyed to the WWTP for treatment. This inflow ofriver water disrupts system operations related to biological processes. The result is WWTPpermit effluent violations for biochemical oxygen demand, total suspended solids, andmass limits, even at lower flows. Plant operators do what is possible with treatmentchemicals and system adjustments, but they are unable to fully address the problem. Itwill cost the City approximately $1 million for improvements to prevent the river inflow.

WHE-4
Report to Congress on Implementation and Enforcement of the CSO Control Policy
Results
Implementation of the NMC, sewer separation in priority areas, and other controls haveincreased the flow captured for treatment from 25 percent to 40 percent of the 7.2billion gallons entering the CSS annually, as shown in the figure below.
The City has reduced the number of CSO outfalls from 259 to 168. This reductionincludes 64 CSO outfalls that have been structurally modified to become inactive (i.e.,plugged), and 27 CSO outfalls that have been eliminated through localized sewerseparation.
References
City of Wheeling WPCD and BCM Engineers, 1998. Water Pollution Control DivisionEvaluation of Small System CSO Discharges on Water Quality. Report prepared forsubmittal to the West Virginia DEP. Wheeling, WV.
GGJ Consulting Engineers, Inc., 2001. Capital Needs Improvement Project Review. Reportprepared for the City of Wheeling. Wheeling, WV.
King Campbell, Superintendent, City of Wheeling Water Pollution Control Division.Personal communication with Limno-Tech, Inc. staff on details of the combined seweroverflow plan and program. Summer 2001.
Storm water—18%1.3 billion gallons
Sanitary flow—22%1.6 billion gallons
Overflow—60%4.3 billion
gallons
Total Flow Treated at WWTP—40%
2.9 billion gallons

Appendix D
List of Current CSO Permits


EPA Region
State NPDES Permit No.
Facility Name Number of Outfalls
1 Connecticut CT0100366 New Haven East Shore WPCF 191 Connecticut CT0100412 Norwich WPCF 151 Connecticut CT0100056 Bridgeport-West WPCF 321 Connecticut CT0100251 Hartford MDC WPCF 441 Connecticut CT0101010 Bridgeport-East WPCF 121 Maine ME0100561 Presque Isle Sewer District 11 Maine ME0102423 Randolph WWTF 11 Maine ME0102369 Fort Kent Utility District 41 Maine ME0102075 Portland Water District 351 Maine ME0101796 Lincoln Sanitary District 11 Maine ME0101702 City of Gardiner 21 Maine ME0101681 Madawaska PCF 21 Maine ME0101532 Belfast WWTF 21 Maine ME0101478 Lewiston-Auburn WPCA 11 Maine ME0101214 Bar Harbor WWTF 41 Maine ME0100072 City of Brewer 71 Maine ME0100439 Milo Water District 31 Maine ME0100391 Mechanic Falls Sanitary District 21 Maine ME0100323 Machias WWTP 21 Maine ME0100307 Lisbon WWTF 21 Maine ME0100285 Town of Kittery 31 Maine ME0100153 Corrina Sewer District 31 Maine ME0100111 Bucksport WWTF 21 Maine ME0100501 Town of Dover-Foxcroft Wastewater
Department4
1 Maine ME0100048 Biddeford Wastewater Department 131 Maine ME0100021 Bath WWTP 61 Maine ME0100013 Augusta Sanitary District 231 Maine ME0100129 Calais 11 Maine ME0100617 Sanford Sewerage District 21 Maine ME0100951 Paris WWTP 11 Maine ME0100854 Kennebec Sanitary District 31 Maine ME0100781 Bangor WWTP 121 Maine ME0100765 Yarmouth1 Maine ME0100749 Winterport Sewerage District 11 Maine ME0100471 Old Town PCF 31 Maine ME0100625 Skowhegan WPCP 91 Maine ME0100498 Orono Water Pollution Control Facility 11 Maine ME0100595 Rockland WWTF 31 Maine ME0100633 City of South Portland 101 Maine ME0101117 Saco WWTP 6
List of Current CSO Permits, Sorted by Region and State
D-1
Appendix D
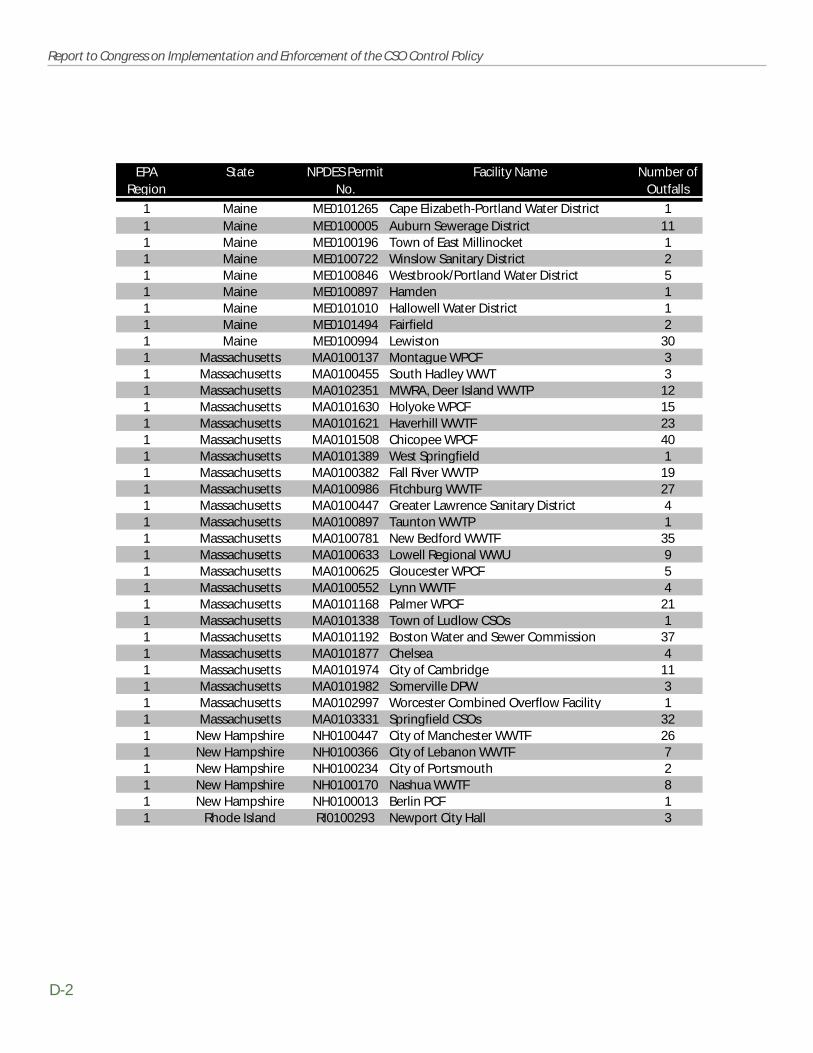
D-2
Report to Congress on Implementation and Enforcement of the CSO Control Policy
EPA Region
State NPDES Permit No.
Facility Name Number of Outfalls
1 Maine ME0101265 Cape Elizabeth-Portland Water District 11 Maine ME0100005 Auburn Sewerage District 111 Maine ME0100196 Town of East Millinocket 11 Maine ME0100722 Winslow Sanitary District 21 Maine ME0100846 Westbrook/Portland Water District 51 Maine ME0100897 Hamden 11 Maine ME0101010 Hallowell Water District 11 Maine ME0101494 Fairfield 21 Maine ME0100994 Lewiston 301 Massachusetts MA0100137 Montague WPCF 31 Massachusetts MA0100455 South Hadley WWT 31 Massachusetts MA0102351 MWRA, Deer Island WWTP 121 Massachusetts MA0101630 Holyoke WPCF 151 Massachusetts MA0101621 Haverhill WWTF 231 Massachusetts MA0101508 Chicopee WPCF 401 Massachusetts MA0101389 West Springfield 11 Massachusetts MA0100382 Fall River WWTP 191 Massachusetts MA0100986 Fitchburg WWTF 271 Massachusetts MA0100447 Greater Lawrence Sanitary District 41 Massachusetts MA0100897 Taunton WWTP 11 Massachusetts MA0100781 New Bedford WWTF 351 Massachusetts MA0100633 Lowell Regional WWU 91 Massachusetts MA0100625 Gloucester WPCF 51 Massachusetts MA0100552 Lynn WWTF 41 Massachusetts MA0101168 Palmer WPCF 211 Massachusetts MA0101338 Town of Ludlow CSOs 11 Massachusetts MA0101192 Boston Water and Sewer Commission 371 Massachusetts MA0101877 Chelsea 41 Massachusetts MA0101974 City of Cambridge 111 Massachusetts MA0101982 Somerville DPW 31 Massachusetts MA0102997 Worcester Combined Overflow Facility 11 Massachusetts MA0103331 Springfield CSOs 321 New Hampshire NH0100447 City of Manchester WWTF 261 New Hampshire NH0100366 City of Lebanon WWTF 71 New Hampshire NH0100234 City of Portsmouth 21 New Hampshire NH0100170 Nashua WWTF 81 New Hampshire NH0100013 Berlin PCF 11 Rhode Island RI0100293 Newport City Hall 3

Appendix D
D-3
EPA Region
State NPDES Permit No.
Facility Name Number of Outfalls
1 Rhode Island RI0100072 Narragansett Bay-Pawtucket 281 Rhode Island RI0100315 Narragansett Bay 561 Vermont VT0100196 Montpelier WWTF 161 Vermont VT0100871 Rutland WWTP 31 Vermont VT0100579 St. Johnsbury WWTF 201 Vermont VT0100404 Vergennes WWTF 01 Vermont VT0100285 Randolph WWTF 31 Vermont VT0100153 Burlington Main WWTF 11 Vermont VT0100374 Springfield WWTF 212 New Jersey NJ0020028 Bergen County WWTP 02 New Jersey NJ0020591 Edgewater MUA 72 New Jersey NJ0020141 Middlesex County Utility Authority 02 New Jersey NJ0108707 Passaic Valley 02 New Jersey NJ0034339 North Bergen MUA 02 New Jersey NJ0029084 Woodcliff 12 New Jersey NJ0026182 Camden County MUA 02 New Jersey NJ0026085 North Hudson-Adam Street 112 New Jersey NJ0025321 West New York MUA 22 New Jersey NJ0024741 Joint Meeting Sewage Treatment 02 New Jersey NJ0024643 Rahway Valley Sewerage Authority 02 New Jersey NJ0021016 Passaic Valley Sewerage Commission 02 New Jersey NJ0020923 Trenton Sewer Utility 12 New Jersey NJ0108898 North Bergen 92 New Jersey NJ0034517 Bluff Road 22 New Jersey NJ0109240 City of Bayonne CSOs 322 New Jersey NJ0111244 Town of Kearny 102 New Jersey NJ0117846 East Newark 12 New Jersey NJ0108880 City of Patterson 312 New Jersey NJ0109118 Ridgefield Park Village 62 New Jersey NJ0108758 Newark 302 New Jersey NJ0020141a Perth Amboy 182 New Jersey NJ0108715 Guttenberg Town 12 New Jersey NJ0108731 City of Rahway 32 New Jersey NJ0108766 City of Hackensack 22 New Jersey NJ0108782 City of Elizabeth 342 New Jersey NJ0108791 Camden County MUA 12 New Jersey NJ0108812 City of Camden 312 New Jersey NJ0108847 Gloucester City 72 New Jersey NJ0108871 Town of Harrison 72 New Jersey NJ0108723 Jersey City MUA 27

D-4
Report to Congress on Implementation and Enforcement of the CSO Control Policy
EPA Region
State NPDES Permit No.
Facility Name Number of Outfalls
2 New York NY0026131 Ward Island WPCP 772 New York NY0026221 NYCDEP Rockaway WWTP 272 New York NY0026212 NYCDEP 26th Ward 32 New York NY0026204 Newtown Creek WPCP 832 New York NY0026191 NYCDEP-Hunt's Point WPCP 282 New York NY0026182 NYCDEP Coney Island WPCP 42 New York NY0026174 NYCDEP Oakwood Beach WPCP 572 New York NY0026247 North River WPCF 502 New York NY0026158 NYCDEP Bowery Bay WPCP 522 New York NY0026255 Poughkeepsie WPCP 62 New York NY0026115 NYCDEP Jamaica WPCP 72 New York NY0026107 Port Richmond WPCF 362 New York NY0026018 Plattsburgh WPCP 142 New York NY0025984 Watertown WPCP 172 New York NY0025780 Oneida County WPCP 12 New York NY0025151 Carthage West WPCF 02 New York NY0026166 NYCDEP Owls Head WPCP 162 New York NY0027081 Syracuse Metro WWTP 622 New York NY0029173 Waterford WWTP 42 New York NY0029114 City of Oswego, East Side STP 62 New York NY0029050 Glens Falls WWTP 12 New York NY0028339 Frank E. VanLare STP 62 New York NY0028240 Saratoga County Sewer District 1 02 New York NY0027961 Dunkirk WWTP 12 New York NY0026239 Tallman Island WPCP 202 New York NY0027545 Clayton Village WTF 22 New York NY0027073 Red Hook WPCP 342 New York NY0027057 Lockport WWTP 292 New York NY0026875 Albany North WWTP 02 New York NY0026867 Albany South WWTP 02 New York NY0026689 Yonkers Joint WWTP 262 New York NY0026336 Niagara Falls WWTP 92 New York NY0026310 Newburgh WPCP 122 New York NY0026280 North Tonawanda WWTP 132 New York NY0027766 Lewiston Master S.D. 12 New York NY0020494 Boonville WWTP 12 New York NY0023256 Village of Holley STP 12 New York NY0022403 Little Falls WWTP 32 New York NY0022136 Erie County S.D. #6 12 New York NY0022039 Hudson STP 10

Appendix D
D-5
EPA Region
State NPDES Permit No.
Facility Name Number of Outfalls
2 New York NY0021903 Auburn STP 162 New York NY0021873 Medina WWTP 132 New York NY0020818 Potsdam WPCP 12 New York NY0020516 Schenectady WPCP 22 New York NY0020389 Catskill WWTP 52 New York NY0020290 Amsterdam WWTP 32 New York NY0020117 Gouverneur STP 12 New York NY0024414 Binghamton-Johnson City Joint WWTF 02 New York NY0020621 Wellsville WWTP 32 New York NY0029262 Owego STP 82 New York NY0029106 Oswego-West Side STP 12 New York NY0028410 Bird Island WWTF 652 New York NY0183695 Washington County S.D. 2 112 New York NY0087971 Rensselaer County 02 New York NY0036706 Ticonderoga S.D. #5 WPCP 22 New York NY0033545 Village of Coxsackie STP 32 New York NY0031208 Dock Street STP 02 New York NY0031194 Massena WWTP 102 New York NY0029939 Tupper Lake WPCP 32 New York NY0029831 Ogdensburg WWTP 172 New York NY0029807 Canastota WPCF 72 New York NY0029351 Kingston WWTF 72 New York NY0035742 Chemung County-Elmira S.D. STP 112 New York NY0029297 Owasco S.D. #1 Overflows 32 New York NY0024406 Binghamton CSO 72 New York NY0024481 Lewiston ORF 12 New York NY0026026 Rensselaer CSO 82 New York NY0030899 Watervliet CSO 52 New York NY0031046 Cohoes CSO 162 New York NY0031429 Utica CSO 822 New York NY0033031 Green Island CSO 32 New York NY0099309 Troy CSO 492 New York NY0248941 City of Mechanicville CSO 32 New York NY0025747 Albany CSO 123 Delaware DE0020320 Wilmington 383 Delaware DE0020265 Seaford WWTF 13 District of Columbia DC0021199 District of Columbia WWTP 603 Maryland MD0021601 Patapsco WWTP 23 Maryland MD0021636 Cambridge WWTP 143 Maryland MD0021598 Cumberland WWTP 16
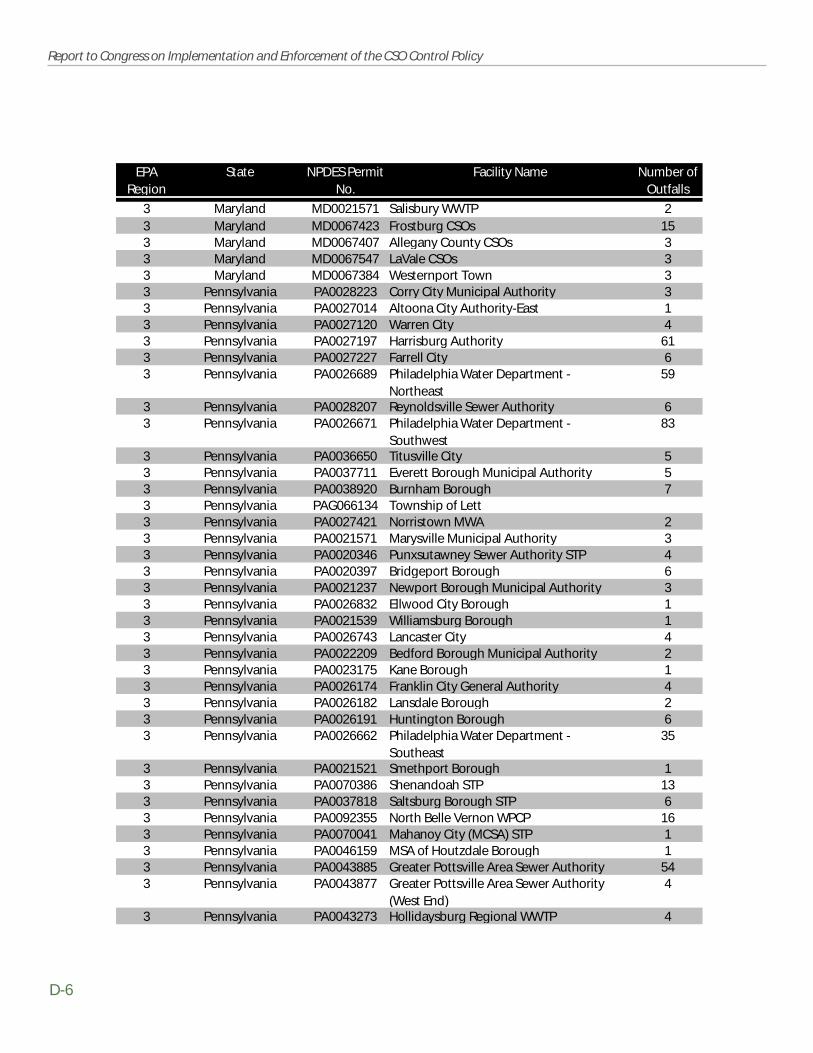
D-6
Report to Congress on Implementation and Enforcement of the CSO Control Policy
EPA Region
State NPDES Permit No.
Facility Name Number of Outfalls
3 Maryland MD0021571 Salisbury WWTP 23 Maryland MD0067423 Frostburg CSOs 153 Maryland MD0067407 Allegany County CSOs 33 Maryland MD0067547 LaVale CSOs 33 Maryland MD0067384 Westernport Town 33 Pennsylvania PA0028223 Corry City Municipal Authority 33 Pennsylvania PA0027014 Altoona City Authority-East 13 Pennsylvania PA0027120 Warren City 43 Pennsylvania PA0027197 Harrisburg Authority 613 Pennsylvania PA0027227 Farrell City 63 Pennsylvania PA0026689 Philadelphia Water Department -
Northeast59
3 Pennsylvania PA0028207 Reynoldsville Sewer Authority 63 Pennsylvania PA0026671 Philadelphia Water Department -
Southwest83
3 Pennsylvania PA0036650 Titusville City 53 Pennsylvania PA0037711 Everett Borough Municipal Authority 53 Pennsylvania PA0038920 Burnham Borough 73 Pennsylvania PAG066134 Township of Lett3 Pennsylvania PA0027421 Norristown MWA 23 Pennsylvania PA0021571 Marysville Municipal Authority 33 Pennsylvania PA0020346 Punxsutawney Sewer Authority STP 43 Pennsylvania PA0020397 Bridgeport Borough 63 Pennsylvania PA0021237 Newport Borough Municipal Authority 33 Pennsylvania PA0026832 Ellwood City Borough 13 Pennsylvania PA0021539 Williamsburg Borough 13 Pennsylvania PA0026743 Lancaster City 43 Pennsylvania PA0022209 Bedford Borough Municipal Authority 23 Pennsylvania PA0023175 Kane Borough 13 Pennsylvania PA0026174 Franklin City General Authority 43 Pennsylvania PA0026182 Lansdale Borough 23 Pennsylvania PA0026191 Huntington Borough 63 Pennsylvania PA0026662 Philadelphia Water Department -
Southeast35
3 Pennsylvania PA0021521 Smethport Borough 13 Pennsylvania PA0070386 Shenandoah STP 133 Pennsylvania PA0037818 Saltsburg Borough STP 63 Pennsylvania PA0092355 North Belle Vernon WPCP 163 Pennsylvania PA0070041 Mahanoy City (MCSA) STP 13 Pennsylvania PA0046159 MSA of Houtzdale Borough 13 Pennsylvania PA0043885 Greater Pottsville Area Sewer Authority 543 Pennsylvania PA0043877 Greater Pottsville Area Sewer Authority
(West End)4
3 Pennsylvania PA0043273 Hollidaysburg Regional WWTP 4

Appendix D
D-7
EPA Region
State NPDES Permit No.
Facility Name Number of Outfalls
3 Pennsylvania PA0042234 Kittanning Borough STP 93 Pennsylvania PA0039489 Garrett Boro SIP 23 Pennsylvania PA0026107 Wyoming Valley Sewer Authority 543 Pennsylvania PA0096229 Marianna-West Bethlehem STP 13 Pennsylvania PA0037044 Ford City WTP 33 Pennsylvania PA0026492 Scranton WWTF 693 Pennsylvania PA0027006 Tamaqua Borough Sewer Authority 163 Pennsylvania PA0026981 City of Duquesne STP 43 Pennsylvania PA0026921 Hazelton WTP 143 Pennsylvania PA0026913 McKeesart WPCP 283 Pennsylvania PA0026905 Connellsville STP 163 Pennsylvania PA0026891 Charleroi STP 123 Pennsylvania PA0038164 Borough of Confluence 23 Pennsylvania PA0027057 Williamsport Sanitary Authority Central 33 Pennsylvania PA0026476 Coaldale Landsford-Summitt Hill TP 63 Pennsylvania PA0026361 Lower Lackawanna Valley Sanitary
Authority24
3 Pennsylvania PA0026352 Coraopolis WPCF 63 Pennsylvania PA0026310 Clearfield Municipal Authority 93 Pennsylvania PA0026301 Erie City STP 203 Pennsylvania PA0026204 Oil City STP 163 Pennsylvania PA0026158 Monongahela Valley WWTP 213 Pennsylvania PA0026140 Rochester Area Joint Sewer Authority WTP 3
3 Pennsylvania PA0026581 Scottsdale STP 83 Pennsylvania PA0027430 Jeannette WWTP 53 Pennsylvania PA0036820 Galeton Borough Authority 43 Pennsylvania PA0028673 Borough of Gallitzin WWTP 63 Pennsylvania PA0028631 Mid-Cameron Authority 13 Pennsylvania PA0028436 Elizabeth Borough STP 63 Pennsylvania PA0028401 Dravosburg Borough STP 13 Pennsylvania PA0027693 Minersville Sewer Authority 103 Pennsylvania PA0027651 West Newton Borough STP 133 Pennsylvania PA0027626 Kiski Valley STP 323 Pennsylvania PA0027022 Altoona West STP 13 Pennsylvania PA0027456 Greater Greensboro STP 393 Pennsylvania PA0027049 Williamsport Sanitary Authority West Plant 1
3 Pennsylvania PA0027391 Upper Allegheny Joint Sanitary Authority STP
19
3 Pennsylvania PA0027324 Shamokin-Coal Township Joint Sewer Authority
5
3 Pennsylvania PA0027111 New Kensington STP 53 Pennsylvania PA0027103 DELCORA Chester STP 263 Pennsylvania PA0027090 Lackawanna River Basin Sewer Authority-
Throop25
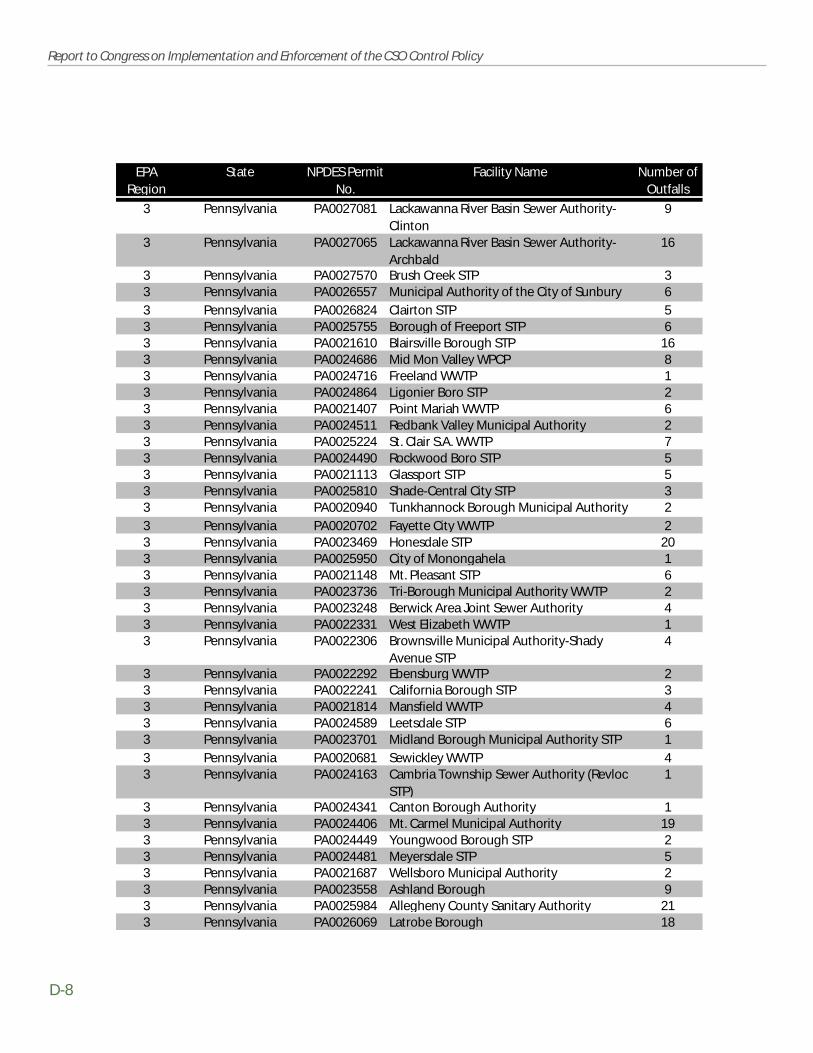
D-8
Report to Congress on Implementation and Enforcement of the CSO Control Policy
EPA Region
State NPDES Permit No.
Facility Name Number of Outfalls
3 Pennsylvania PA0027081 Lackawanna River Basin Sewer Authority-Clinton
9
3 Pennsylvania PA0027065 Lackawanna River Basin Sewer Authority-Archbald
16
3 Pennsylvania PA0027570 Brush Creek STP 33 Pennsylvania PA0026557 Municipal Authority of the City of Sunbury 6
3 Pennsylvania PA0026824 Clairton STP 53 Pennsylvania PA0025755 Borough of Freeport STP 63 Pennsylvania PA0021610 Blairsville Borough STP 163 Pennsylvania PA0024686 Mid Mon Valley WPCP 83 Pennsylvania PA0024716 Freeland WWTP 13 Pennsylvania PA0024864 Ligonier Boro STP 23 Pennsylvania PA0021407 Point Mariah WWTP 63 Pennsylvania PA0024511 Redbank Valley Municipal Authority 23 Pennsylvania PA0025224 St. Clair S.A. WWTP 73 Pennsylvania PA0024490 Rockwood Boro STP 53 Pennsylvania PA0021113 Glassport STP 53 Pennsylvania PA0025810 Shade-Central City STP 33 Pennsylvania PA0020940 Tunkhannock Borough Municipal Authority 2
3 Pennsylvania PA0020702 Fayette City WWTP 23 Pennsylvania PA0023469 Honesdale STP 203 Pennsylvania PA0025950 City of Monongahela 13 Pennsylvania PA0021148 Mt. Pleasant STP 63 Pennsylvania PA0023736 Tri-Borough Municipal Authority WWTP 23 Pennsylvania PA0023248 Berwick Area Joint Sewer Authority 43 Pennsylvania PA0022331 West Elizabeth WWTP 13 Pennsylvania PA0022306 Brownsville Municipal Authority-Shady
Avenue STP4
3 Pennsylvania PA0022292 Ebensburg WWTP 23 Pennsylvania PA0022241 California Borough STP 33 Pennsylvania PA0021814 Mansfield WWTP 43 Pennsylvania PA0024589 Leetsdale STP 63 Pennsylvania PA0023701 Midland Borough Municipal Authority STP 1
3 Pennsylvania PA0020681 Sewickley WWTP 43 Pennsylvania PA0024163 Cambria Township Sewer Authority (Revloc
STP)1
3 Pennsylvania PA0024341 Canton Borough Authority 13 Pennsylvania PA0024406 Mt. Carmel Municipal Authority 193 Pennsylvania PA0024449 Youngwood Borough STP 23 Pennsylvania PA0024481 Meyersdale STP 53 Pennsylvania PA0021687 Wellsboro Municipal Authority 23 Pennsylvania PA0023558 Ashland Borough 93 Pennsylvania PA0025984 Allegheny County Sanitary Authority 213 Pennsylvania PA0026069 Latrobe Borough 18

Appendix D
D-9
EPA Region
State NPDES Permit No.
Facility Name Number of Outfalls
3 Pennsylvania PA0026042 Bethlehem WWTP 33 Pennsylvania PA0020613 Waynesbug STP 23 Pennsylvania PA0020125 Boro of Monaca STP 63 Pennsylvania PAG066102 Braddock Borough 83 Pennsylvania PAG066109 McDonald Sewage Authority 203 Pennsylvania PA0217611 City of Pittsburgh 2173 Pennsylvania PAG062201 Easton City 23 Pennsylvania PAG062202 Lackawanna River Basin Authority-Moosic 4
3 Pennsylvania PAG064801 Shamokin City 333 Pennsylvania PAG066101 Pitcairn Borough 13 Pennsylvania PAG066103 Borough of Homestead 13 Pennsylvania PAG066104 Bureau of Wilmerding 93 Pennsylvania PAG066105 Borough of Rankin 23 Pennsylvania PAG066106 Girty's Run JSA, Millvale 93 Pennsylvania PAG066107 Township of Stowe 73 Pennsylvania PAG064802 Coal Township 333 Pennsylvania PAG066110 Borough of Crafton 43 Pennsylvania PAG066108 Larimer Avenue CSO 23 Pennsylvania PAG066129 Mayview State Hospital 23 Pennsylvania PAG066130 Export Borough 53 Pennsylvania PAG066131 Freedom Borough 33 Pennsylvania PAG066132 East Rochester Borough 13 Pennsylvania PAG066127 Munhall Boro 43 Pennsylvania PAG066126 Carnegie Borough 13 Pennsylvania PAG066119 Borough of Etna 83 Pennsylvania PAG066111 Emsworth Borough 13 Pennsylvania PAG066112 Borough of McKee Rocks 33 Pennsylvania PAG066113 Borough of Aspinwall 33 Pennsylvania PAG066114 Borough of North Braddock 13 Pennsylvania PAG066115 Ferndale Borough 53 Pennsylvania PAG066116 West View Borough 23 Pennsylvania PAG066128 Borough of Swissvale 13 Pennsylvania PAG066118 Borough of Turtle Creek 103 Pennsylvania PAG066120 Borough of East Pittsburgh 33 Pennsylvania PAG066121 City of Arnold 23 Pennsylvania PAG066122 East Conemaugh Borough 23 Pennsylvania PAG066123 Borough of West Homestead 23 Pennsylvania PAG066124 Dale Borough 73 Pennsylvania PAG066125 Sharpsburg Borough 63 Pennsylvania PAG066117 City of Uniontown 28

D-10
Report to Congress on Implementation and Enforcement of the CSO Control Policy
EPA Region
State NPDES Permit No.
Facility Name Number of Outfalls
3 Virginia VA0063177 Richmond WWTW 313 Virginia VA0024970 Lynchburg STP 643 Virginia VA0087068 Alexandria CSOs 43 West Virginia WV0105279 City of Piedmont3 West Virginia WV0023205 Charleston 583 West Virginia WV0024473 Marlington 13 West Virginia WV0024392 Keyser 13 West Virginia WV0023353 Fairmont 433 West Virginia WV0023302 City of Clarksburg 843 West Virginia WV0023299 Nitro 73 West Virginia WV0023264 City of Moundsville 53 West Virginia WV0024732 City of Hinton 63 West Virginia WV0023183 Beckley 23 West Virginia WV0023175 St. Albans 123 West Virginia WV0023167 Martinsburg 13 West Virginia WV0023159 Huntington 233 West Virginia WV0023124 City of Morgantown 333 West Virginia WV0023094 Princeton 13 West Virginia WV0022080 Town of Bethany 33 West Virginia WV0022063 City of Parsons 43 West Virginia WV0023230 Wheeling 2113 West Virginia WV0029289 City of Belington 73 West Virginia WV0084042 Flatwoods-Canoe Run PSD 63 West Virginia WV0054500 City of Shinnston 123 West Virginia WV0035939 Boone County PSD 13 West Virginia WV0033821 City of Logan 123 West Virginia WV0024562 City of Wayne 33 West Virginia WV0032336 Buckhannon 63 West Virginia WV0024589 Welch 283 West Virginia WV0028118 Dunbar 163 West Virginia WV0028088 Weston 53 West Virginia WV0027472 New Martinsville 43 West Virginia WV0027324 Monongah 63 West Virginia WV0026832 Wellsburg 103 West Virginia WV0025461 City of Bridgeport 113 West Virginia WV0024848 Town of Davis 33 West Virginia WV0021881 Kingwood 33 West Virginia WV0033804 Terra Alta3 West Virginia WV0022039 Point Pleasant 23 West Virginia WV0020273 City of Follansbee 5

Appendix D
D-11
EPA Region
State NPDES Permit No.
Facility Name Number of Outfalls
3 West Virginia WV0021865 Town of Farmington 33 West Virginia WV0021857 City of Philippi 133 West Virginia WV0021822 Grafton 353 West Virginia WV0021792 Petersburg 23 West Virginia WV0021750 Marmet 33 West Virginia WV0021741 Smithers 33 West Virginia WV0020681 Mullens 33 West Virginia WV0020621 Montgomery 53 West Virginia WV0022004 Richwood 23 West Virginia WV0020150 Moorefield 33 West Virginia WV0020141 McMechen 33 West Virginia WV0020109 Town of West Union 73 West Virginia WV0020028 City of Elkins 193 West Virginia WV0020648 City of Benwood 93 West Virginia WV0023221 Vienna 23 West Virginia WV0024449 City of Westover 53 West Virginia WV0035637 Cedar Grove 13 West Virginia WV0035912 City of Kenova 23 West Virginia WV0081434 City of Barrackville 93 West Virginia WV0084310 Greater Paw Paw Sanitary District 103 West Virginia WV0100901 Nutter Fort 24 Georgia GA0036854 City of Albany CSOs 104 Georgia GA0036838 Columbus CSO 24 Georgia GA0036871 Atlanta-Clear Creek 14 Georgia GA0037109 Atlanta-Tanyard Creek 14 Georgia GA0037117 Atlanta-Proctor Creek/North 14 Georgia GA0037125 Atlanta-Proctor Creek/Greenferry 14 Georgia GA0037133 Atlanta-McDaniel Street 14 Georgia GA0037168 Atlanta-Intrenchment and Custer Avenue 2
4 Kentucky KY0020095 Owensboro-West 74 Kentucky KY0022799 Paducah WWTP 104 Kentucky KY0035467 Catlettsburg WWTP 174 Kentucky KY0027413 Prestonsburg WWTP 14 Kentucky KY0026115 Loyall WWTP 64 Kentucky KY0026093 Harlan WWTP 14 Kentucky KY0025291 Pikeville WWTP 34 Kentucky KY0024058 Pinesville STP 64 Kentucky KY0022861 E.C. McManis WWTP 154 Kentucky KY0022411 Morris Forman WWTF 1154 Kentucky KY0022373 Ashland WWTP 8
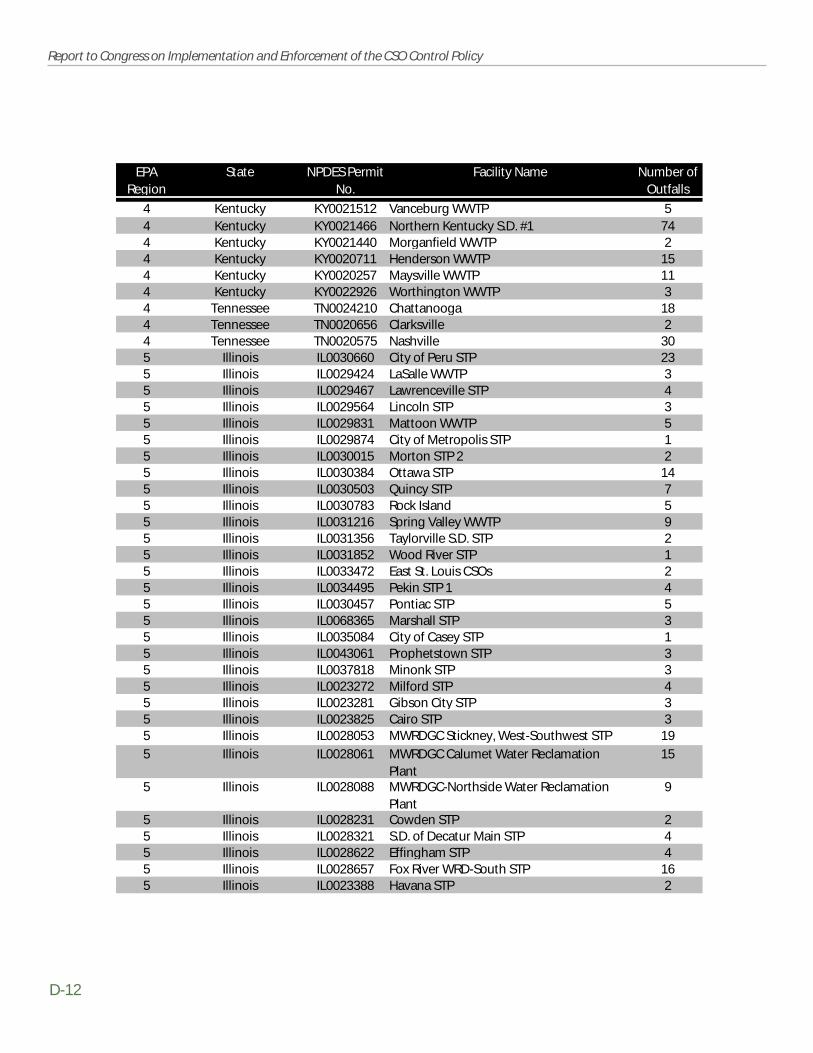
D-12
Report to Congress on Implementation and Enforcement of the CSO Control Policy
EPA Region
State NPDES Permit No.
Facility Name Number of Outfalls
4 Kentucky KY0021512 Vanceburg WWTP 54 Kentucky KY0021466 Northern Kentucky S.D. #1 744 Kentucky KY0021440 Morganfield WWTP 24 Kentucky KY0020711 Henderson WWTP 154 Kentucky KY0020257 Maysville WWTP 114 Kentucky KY0022926 Worthington WWTP 34 Tennessee TN0024210 Chattanooga 184 Tennessee TN0020656 Clarksville 24 Tennessee TN0020575 Nashville 305 Illinois IL0030660 City of Peru STP 235 Illinois IL0029424 LaSalle WWTP 35 Illinois IL0029467 Lawrenceville STP 45 Illinois IL0029564 Lincoln STP 35 Illinois IL0029831 Mattoon WWTP 55 Illinois IL0029874 City of Metropolis STP 15 Illinois IL0030015 Morton STP 2 25 Illinois IL0030384 Ottawa STP 145 Illinois IL0030503 Quincy STP 75 Illinois IL0030783 Rock Island 55 Illinois IL0031216 Spring Valley WWTP 95 Illinois IL0031356 Taylorville S.D. STP 25 Illinois IL0031852 Wood River STP 15 Illinois IL0033472 East St. Louis CSOs 25 Illinois IL0034495 Pekin STP 1 45 Illinois IL0030457 Pontiac STP 55 Illinois IL0068365 Marshall STP 35 Illinois IL0035084 City of Casey STP 15 Illinois IL0043061 Prophetstown STP 35 Illinois IL0037818 Minonk STP 35 Illinois IL0023272 Milford STP 45 Illinois IL0023281 Gibson City STP 35 Illinois IL0023825 Cairo STP 35 Illinois IL0028053 MWRDGC Stickney, West-Southwest STP 19
5 Illinois IL0028061 MWRDGC Calumet Water Reclamation Plant
15
5 Illinois IL0028088 MWRDGC-Northside Water Reclamation Plant
9
5 Illinois IL0028231 Cowden STP 25 Illinois IL0028321 S.D. of Decatur Main STP 45 Illinois IL0028622 Effingham STP 45 Illinois IL0028657 Fox River WRD-South STP 165 Illinois IL0023388 Havana STP 2
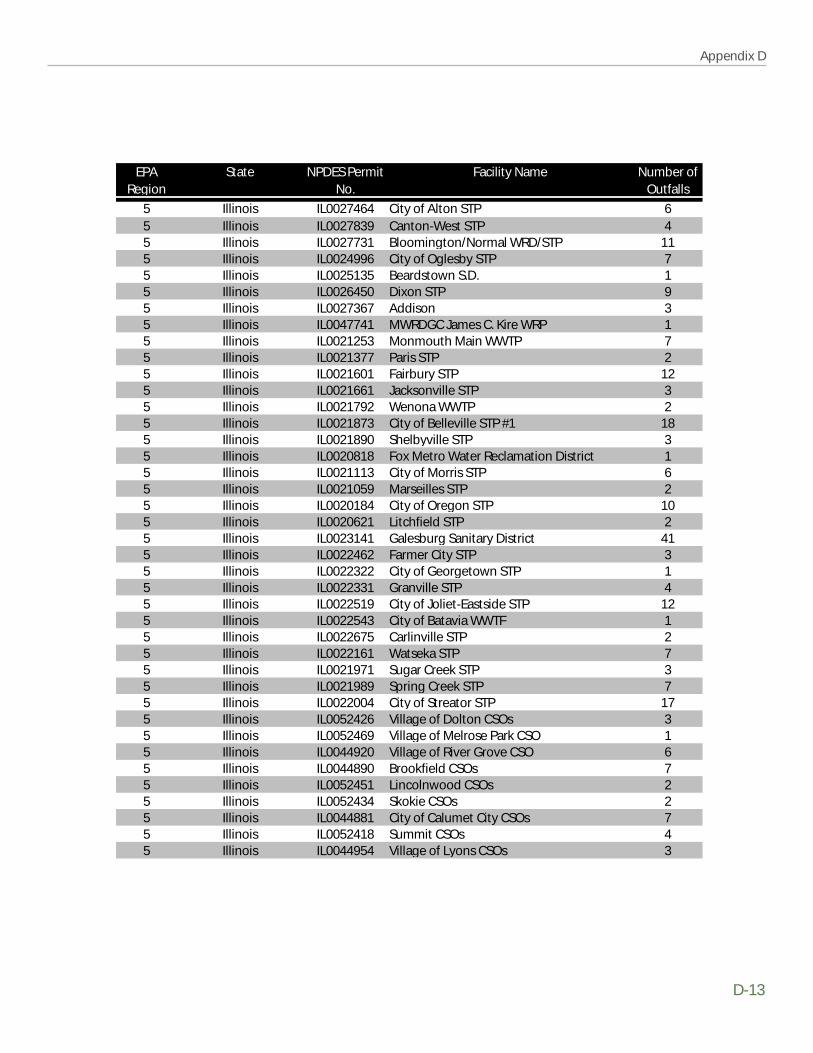
Appendix D
D-13
EPA Region
State NPDES Permit No.
Facility Name Number of Outfalls
5 Illinois IL0027464 City of Alton STP 65 Illinois IL0027839 Canton-West STP 45 Illinois IL0027731 Bloomington/Normal WRD/STP 115 Illinois IL0024996 City of Oglesby STP 75 Illinois IL0025135 Beardstown S.D. 15 Illinois IL0026450 Dixon STP 95 Illinois IL0027367 Addison 35 Illinois IL0047741 MWRDGC James C. Kire WRP 15 Illinois IL0021253 Monmouth Main WWTP 75 Illinois IL0021377 Paris STP 25 Illinois IL0021601 Fairbury STP 125 Illinois IL0021661 Jacksonville STP 35 Illinois IL0021792 Wenona WWTP 25 Illinois IL0021873 City of Belleville STP #1 185 Illinois IL0021890 Shelbyville STP 35 Illinois IL0020818 Fox Metro Water Reclamation District 15 Illinois IL0021113 City of Morris STP 65 Illinois IL0021059 Marseilles STP 25 Illinois IL0020184 City of Oregon STP 105 Illinois IL0020621 Litchfield STP 25 Illinois IL0023141 Galesburg Sanitary District 415 Illinois IL0022462 Farmer City STP 35 Illinois IL0022322 City of Georgetown STP 15 Illinois IL0022331 Granville STP 45 Illinois IL0022519 City of Joliet-Eastside STP 125 Illinois IL0022543 City of Batavia WWTF 15 Illinois IL0022675 Carlinville STP 25 Illinois IL0022161 Watseka STP 75 Illinois IL0021971 Sugar Creek STP 35 Illinois IL0021989 Spring Creek STP 75 Illinois IL0022004 City of Streator STP 175 Illinois IL0052426 Village of Dolton CSOs 35 Illinois IL0052469 Village of Melrose Park CSO 15 Illinois IL0044920 Village of River Grove CSO 65 Illinois IL0044890 Brookfield CSOs 75 Illinois IL0052451 Lincolnwood CSOs 25 Illinois IL0052434 Skokie CSOs 25 Illinois IL0044881 City of Calumet City CSOs 75 Illinois IL0052418 Summit CSOs 45 Illinois IL0044954 Village of Lyons CSOs 3

D-14
Report to Congress on Implementation and Enforcement of the CSO Control Policy
EPA Region
State NPDES Permit No.
Facility Name Number of Outfalls
5 Illinois IL0044911 Village of Schiller Park CSO 15 Illinois IL0045012 Chicago CSOs 2315 Illinois IL0052442 City of Blue Island CSOs 45 Illinois IL0045080 City of Harvey CSOs 75 Illinois IL0037800 City of Peoria CSOs 185 Illinois IL0036536 City of Evanston CSOs 145 Illinois IL0033618 Village of Villa Park CSOs 45 Illinois IL0033588 LaGrange Park CSOs 35 Illinois IL0028592 Metro East S.D. CSOs 45 Illinois IL0047147 Village of Maywood CSOs 85 Illinois IL0021423 Village of Hartford CSO 15 Illinois IL0046795 Village of River Forest CSOs 45 Illinois IL0044733 Park Ridge CSOs 45 Illinois IL0029416 Lansing CSO 15 Illinois IL0048518 Aurora CSOs 155 Illinois IL0045039 Village of Western Springs CSOs 35 Illinois IL0045047 Village of Arlington Heights CSO 15 Illinois IL0045055 Village of South Holland CSOs 45 Illinois IL0045063 Village of Calumet Park CSO 15 Illinois IL0045071 Village of North Riverside CSOs 25 Illinois IL0044725 Dixmoor CSO 15 Illinois IL0037885 City of Markham CSO 15 Illinois IL0043133 Posen CSO 15 Illinois IL0045021 Riverside CSOs 55 Illinois IL0045098 Village of Riverdale CSOs 45 Illinois IL0045101 Village of Forest Park CSOs 25 Illinois IL0046175 Village of Morton Grove CSOs 25 Illinois IL0046418 Franklin Park CSOs 45 Illinois IL0042901 Village of Burnham CSOs 35 Illinois IL0039551 Village of Lemont CSOs 25 Illinois IL0044717 Des Plaines CSO 15 Illinois IL0066818 Hinsdale CSOs 45 Illinois IL0069981 Wilmette CSO 15 Illinois IL0070505 City of Elgin CSOs 125 Illinois IL0072001 Bloomington CSOs 65 Illinois IL0052477 Village of Niles CSOs 105 Indiana IN0020044 City of Alexandria WPCP 45 Indiana IN0020095 Portland Municipal STP 165 Indiana IN0020001 Ridgeville WWTP 35 Indiana IN0020109 Greenfield 0

Appendix D
D-15
EPA Region
State NPDES Permit No.
Facility Name Number of Outfalls
5 Indiana IN0020117 Montpelier WWTP 45 Indiana IN0020125 Royal Center WWTP 25 Indiana IN0020133 Greensburg WWTP 35 Indiana IN0020168 City of Noblesville WWTP 75 Indiana IN0020176 Monticello Municipal STP 55 Indiana IN0020222 Attica 25 Indiana IN0025585 City of Marion WWTP 85 Indiana IN0025666 City of Madison WWTP 75 Indiana IN0025658 Washington Municipal STP 65 Indiana IN0021016 Tell City WWTP 55 Indiana IN0025640 City of Mishawaka WWTP 185 Indiana IN0021067 Rockport WWTP 15 Indiana IN0025631 Muncie Sanitary District 255 Indiana IN0025755 City of Goshen WWTP 65 Indiana IN0025607 City of Terre Haute POTW 105 Indiana IN0025763 City of Crownpoint WWTP 55 Indiana IN0025577 LaPorte Municipal STP 15 Indiana IN0025232 Town of Akron WWTP 35 Indiana IN0024821 West Lafayette WWTP 55 Indiana IN0024805 Warsaw WWTP 15 Indiana IN0024791 Warren 45 Indiana IN0024775 Wakarusa WWTP 65 Indiana IN0024741 City of Wabash WWTP 75 Indiana IN0024716 Veedersburg WWTP 45 Indiana IN0025615 William Edwin Ross WWTP 55 Indiana IN0032875 City of Kokomo Municipal Sanitation Utility 30
5 Indiana IN0039314 City of Decatur WWTP 45 Indiana IN0038318 Milford 15 Indiana IN0035696 Mt. Vernon WWTP 35 Indiana IN0033073 Evansville East WWTP 85 Indiana IN0032972 Civil Town of Speedway WWTP 35 Indiana IN0025674 City of Elkhart WWTP 395 Indiana IN0032956 Evansville Westside WWTP 155 Indiana IN0024554 City of Sullivan WWTP 55 Indiana IN0032719 Elwood 155 Indiana IN0032573 City of Columbus POTW 35 Indiana IN0032476 Anderson WWTP 195 Indiana IN0032468 Lafayette 135 Indiana IN0032336 Connersville 55 Indiana IN0032328 City of Peru WWTP 16
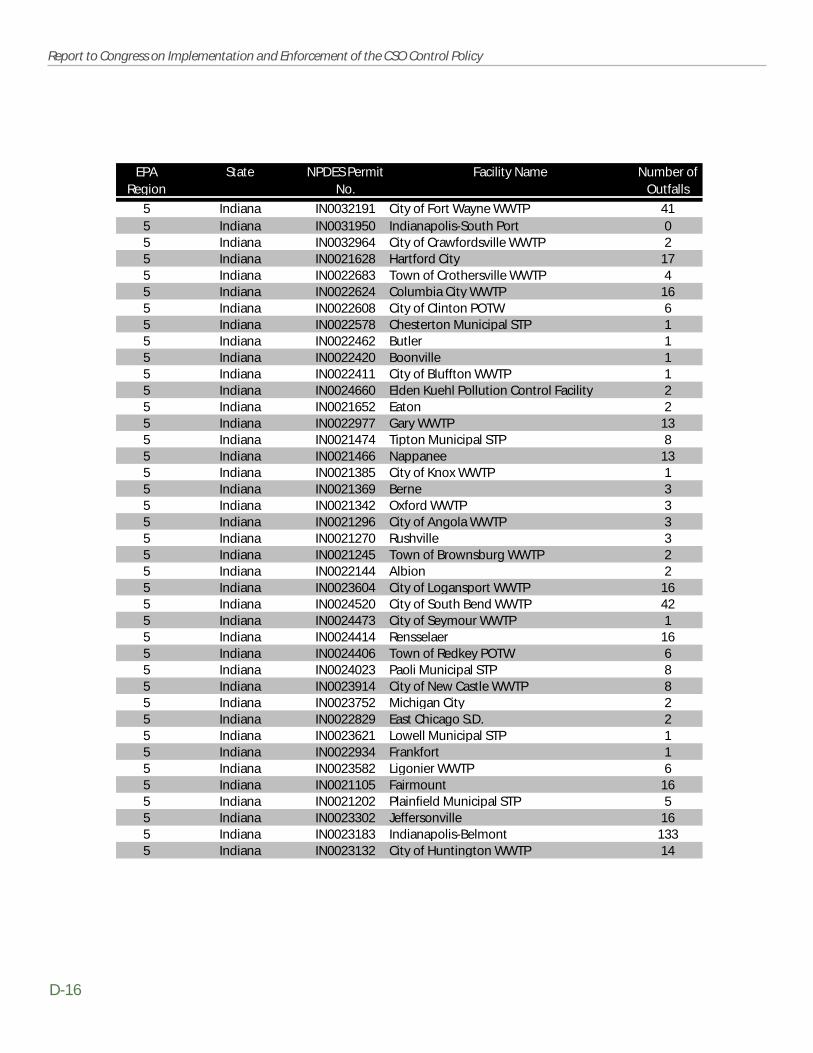
D-16
Report to Congress on Implementation and Enforcement of the CSO Control Policy
EPA Region
State NPDES Permit No.
Facility Name Number of Outfalls
5 Indiana IN0032191 City of Fort Wayne WWTP 415 Indiana IN0031950 Indianapolis-South Port 05 Indiana IN0032964 City of Crawfordsville WWTP 25 Indiana IN0021628 Hartford City 175 Indiana IN0022683 Town of Crothersville WWTP 45 Indiana IN0022624 Columbia City WWTP 165 Indiana IN0022608 City of Clinton POTW 65 Indiana IN0022578 Chesterton Municipal STP 15 Indiana IN0022462 Butler 15 Indiana IN0022420 Boonville 15 Indiana IN0022411 City of Bluffton WWTP 15 Indiana IN0024660 Elden Kuehl Pollution Control Facility 25 Indiana IN0021652 Eaton 25 Indiana IN0022977 Gary WWTP 135 Indiana IN0021474 Tipton Municipal STP 85 Indiana IN0021466 Nappanee 135 Indiana IN0021385 City of Knox WWTP 15 Indiana IN0021369 Berne 35 Indiana IN0021342 Oxford WWTP 35 Indiana IN0021296 City of Angola WWTP 35 Indiana IN0021270 Rushville 35 Indiana IN0021245 Town of Brownsburg WWTP 25 Indiana IN0022144 Albion 25 Indiana IN0023604 City of Logansport WWTP 165 Indiana IN0024520 City of South Bend WWTP 425 Indiana IN0024473 City of Seymour WWTP 15 Indiana IN0024414 Rensselaer 165 Indiana IN0024406 Town of Redkey POTW 65 Indiana IN0024023 Paoli Municipal STP 85 Indiana IN0023914 City of New Castle WWTP 85 Indiana IN0023752 Michigan City 25 Indiana IN0022829 East Chicago S.D. 25 Indiana IN0023621 Lowell Municipal STP 15 Indiana IN0022934 Frankfort 15 Indiana IN0023582 Ligonier WWTP 65 Indiana IN0021105 Fairmount 165 Indiana IN0021202 Plainfield Municipal STP 55 Indiana IN0023302 Jeffersonville 165 Indiana IN0023183 Indianapolis-Belmont 1335 Indiana IN0023132 City of Huntington WWTP 14

Appendix D
D-17
EPA Region
State NPDES Permit No.
Facility Name Number of Outfalls
5 Indiana IN0023060 Hammond WWTP 205 Indiana IN0024562 Summitville 35 Indiana IN0023736 Markle WWTP 25 Indiana IN0020664 Avilla WWTP 45 Indiana IN0020672 Auburn WWTP 45 Indiana IN0020711 Waterloo Municipal STP 35 Indiana IN0020745 Ossian WWTP 65 Indiana IN0021211 Brazil Municipal STP 45 Indiana IN0020362 North Manchester STP 85 Indiana IN0020427 Bremen WWTP 45 Indiana IN0020451 North Vernon WWTP 25 Indiana IN0020516 Winamac Municipal STP 55 Indiana IN0020567 South Whitley Municipal STP 25 Indiana IN0020656 City of Kendallville WWTP 15 Indiana IN0020770 Middletown 45 Indiana IN0020940 Remington Municipal STP 15 Indiana IN0020877 North Judson Municipal STP 25 Indiana IN0020907 Rossville 25 Indiana IN0020958 Fortville WWTP 125 Indiana IN0020991 Plymouth Municipal STP 105 Indiana IN0020346 New Haven STP 45 Indiana IN0022560 Chesterfield WWTP 35 Indiana IN0050903 City of Aurora WW Collection System 25 Michigan MI0026069 Grand Rapids WWTP 195 Michigan MI0020214 Norway WWTP 15 Michigan MI0022802 Detroit WWTP 865 Michigan MI0022284 Bay City WWTP 55 Michigan MI0022152 Adrian WWTP 25 Michigan MI0021695 Blissfield WWTP 25 Michigan MI0021440 Wakefield WWSL 15 Michigan MI0021083 Croswell WWTP 15 Michigan MI0020656 Marysville WWTP 15 Michigan MI0020362 Manistee WWTP 45 Michigan MI0023001 Gladwin WWTP 15 Michigan MI0020591 St. Clair WWTP 15 Michigan MI0023973 Saginaw Township WWTP 15 Michigan MI0025631 Menominee WWTP 15 Michigan MI0025577 Saginaw WWTP 155 Michigan MI0022853 East Lansing WWTP 25 Michigan MI0022918 Essexville WWTP 1
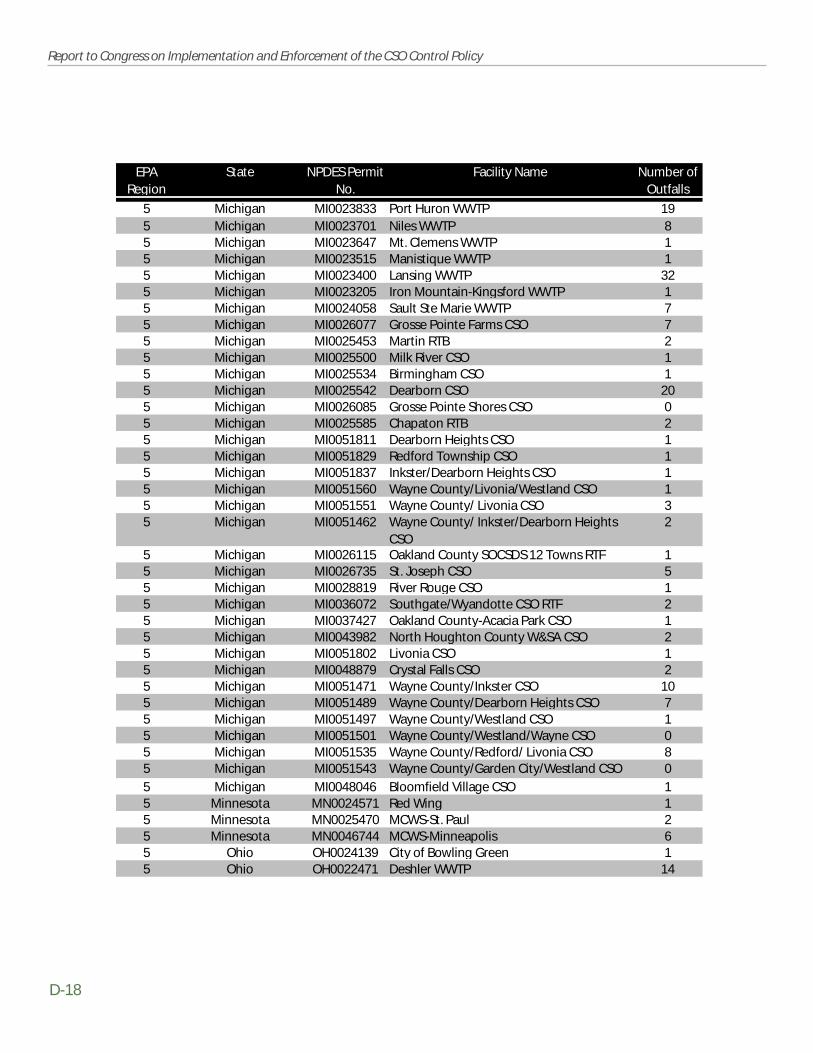
D-18
Report to Congress on Implementation and Enforcement of the CSO Control Policy
EPA Region
State NPDES Permit No.
Facility Name Number of Outfalls
5 Michigan MI0023833 Port Huron WWTP 195 Michigan MI0023701 Niles WWTP 85 Michigan MI0023647 Mt. Clemens WWTP 15 Michigan MI0023515 Manistique WWTP 15 Michigan MI0023400 Lansing WWTP 325 Michigan MI0023205 Iron Mountain-Kingsford WWTP 15 Michigan MI0024058 Sault Ste Marie WWTP 75 Michigan MI0026077 Grosse Pointe Farms CSO 75 Michigan MI0025453 Martin RTB 25 Michigan MI0025500 Milk River CSO 15 Michigan MI0025534 Birmingham CSO 15 Michigan MI0025542 Dearborn CSO 205 Michigan MI0026085 Grosse Pointe Shores CSO 05 Michigan MI0025585 Chapaton RTB 25 Michigan MI0051811 Dearborn Heights CSO 15 Michigan MI0051829 Redford Township CSO 15 Michigan MI0051837 Inkster/Dearborn Heights CSO 15 Michigan MI0051560 Wayne County/Livonia/Westland CSO 15 Michigan MI0051551 Wayne County/ Livonia CSO 35 Michigan MI0051462 Wayne County/ Inkster/Dearborn Heights
CSO2
5 Michigan MI0026115 Oakland County SOCSDS 12 Towns RTF 15 Michigan MI0026735 St. Joseph CSO 55 Michigan MI0028819 River Rouge CSO 15 Michigan MI0036072 Southgate/Wyandotte CSO RTF 25 Michigan MI0037427 Oakland County-Acacia Park CSO 15 Michigan MI0043982 North Houghton County W&SA CSO 25 Michigan MI0051802 Livonia CSO 15 Michigan MI0048879 Crystal Falls CSO 25 Michigan MI0051471 Wayne County/Inkster CSO 105 Michigan MI0051489 Wayne County/Dearborn Heights CSO 75 Michigan MI0051497 Wayne County/Westland CSO 15 Michigan MI0051501 Wayne County/Westland/Wayne CSO 05 Michigan MI0051535 Wayne County/Redford/ Livonia CSO 85 Michigan MI0051543 Wayne County/Garden City/Westland CSO 0
5 Michigan MI0048046 Bloomfield Village CSO 15 Minnesota MN0024571 Red Wing 15 Minnesota MN0025470 MCWS-St. Paul 25 Minnesota MN0046744 MCWS-Minneapolis 65 Ohio OH0024139 City of Bowling Green 15 Ohio OH0022471 Deshler WWTP 14
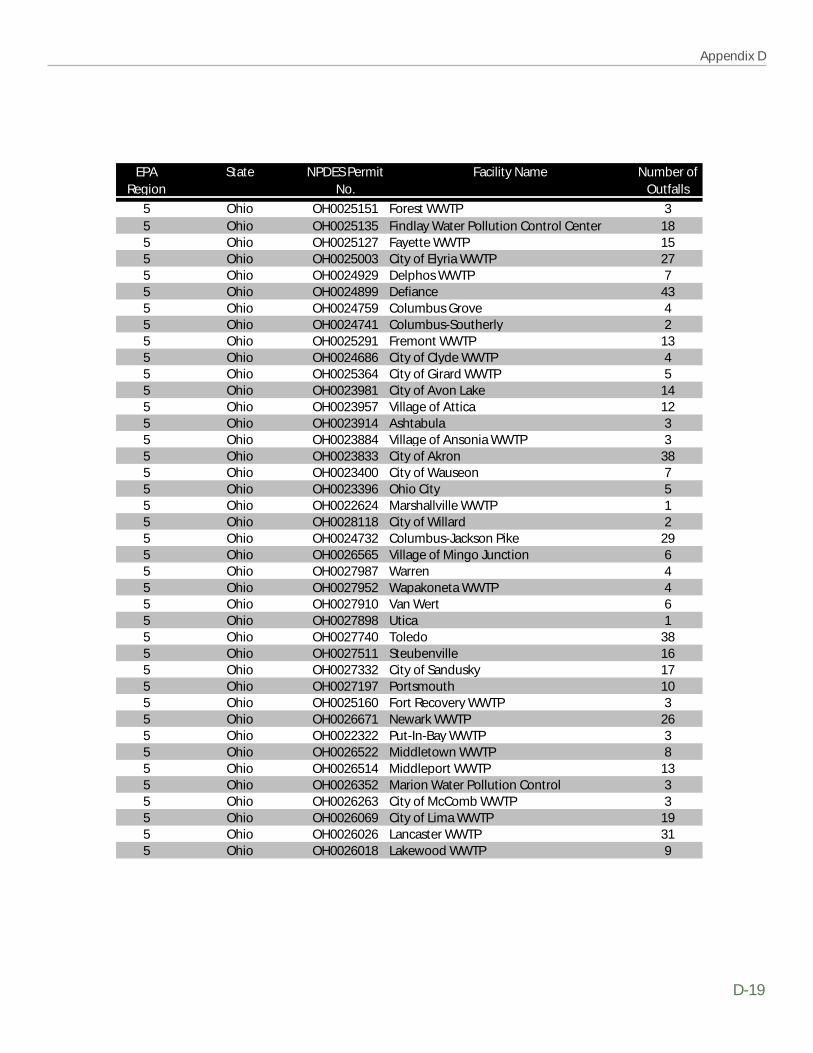
Appendix D
D-19
EPA Region
State NPDES Permit No.
Facility Name Number of Outfalls
5 Ohio OH0025151 Forest WWTP 35 Ohio OH0025135 Findlay Water Pollution Control Center 185 Ohio OH0025127 Fayette WWTP 155 Ohio OH0025003 City of Elyria WWTP 275 Ohio OH0024929 Delphos WWTP 75 Ohio OH0024899 Defiance 435 Ohio OH0024759 Columbus Grove 45 Ohio OH0024741 Columbus-Southerly 25 Ohio OH0025291 Fremont WWTP 135 Ohio OH0024686 City of Clyde WWTP 45 Ohio OH0025364 City of Girard WWTP 55 Ohio OH0023981 City of Avon Lake 145 Ohio OH0023957 Village of Attica 125 Ohio OH0023914 Ashtabula 35 Ohio OH0023884 Village of Ansonia WWTP 35 Ohio OH0023833 City of Akron 385 Ohio OH0023400 City of Wauseon 75 Ohio OH0023396 Ohio City 55 Ohio OH0022624 Marshallville WWTP 15 Ohio OH0028118 City of Willard 25 Ohio OH0024732 Columbus-Jackson Pike 295 Ohio OH0026565 Village of Mingo Junction 65 Ohio OH0027987 Warren 45 Ohio OH0027952 Wapakoneta WWTP 45 Ohio OH0027910 Van Wert 65 Ohio OH0027898 Utica 15 Ohio OH0027740 Toledo 385 Ohio OH0027511 Steubenville 165 Ohio OH0027332 City of Sandusky 175 Ohio OH0027197 Portsmouth 105 Ohio OH0025160 Fort Recovery WWTP 35 Ohio OH0026671 Newark WWTP 265 Ohio OH0022322 Put-In-Bay WWTP 35 Ohio OH0026522 Middletown WWTP 85 Ohio OH0026514 Middleport WWTP 135 Ohio OH0026352 Marion Water Pollution Control 35 Ohio OH0026263 City of McComb WWTP 35 Ohio OH0026069 City of Lima WWTP 195 Ohio OH0026026 Lancaster WWTP 315 Ohio OH0026018 Lakewood WWTP 9

D-20
Report to Congress on Implementation and Enforcement of the CSO Control Policy
EPA Region
State NPDES Permit No.
Facility Name Number of Outfalls
5 Ohio OH0025852 Ironton WWTP 95 Ohio OH0025771 Hicksville 35 Ohio OH0026841 Oak Harbor 95 Ohio OH0022578 Green Springs WWTP 15 Ohio OH0020192 Village of Bradford 95 Ohio OH0020117 North Baltimore 25 Ohio OH0020001 Upper Sandusky 75 Ohio OH0020338 Village of Paulding 25 Ohio OH0020451 City of Milford WWTP 25 Ohio OH0020974 Delta WWTP 115 Ohio OH0022110 Newton Falls WWTP 285 Ohio OH0021831 Montpelier WWTP 45 Ohio OH0021725 Pomeroy 135 Ohio OH0021491 Bremen 15 Ohio OH0021466 McConnelsville 95 Ohio OH0021326 Village of Payne WWTP 25 Ohio OH0021261 Elmore WWTP 55 Ohio OH0021148 Village of Pandora WWTP 105 Ohio OH0021105 Hamler WWTP 65 Ohio OH0020214 Toronto WWTP 75 Ohio OH0021008 Perrysburg Water Pollution Control 45 Ohio OH0027481 Springfield STP 585 Ohio OH0020940 Arcanum WWTP 145 Ohio OH0020893 Napoleon WWTP 35 Ohio OH0020851 Bluffton WWTP 205 Ohio OH0020664 Crestline WWTP 15 Ohio OH0020591 Woodville 185 Ohio OH0020559 Village of Caldwell WWTP 235 Ohio OH0020524 Village of Swanton 275 Ohio OH0020486 Village of Greenwich WWTP 145 Ohio OH0021016 Village of Genoa 65 Ohio OH0028177 Woodsfield WWTP 55 Ohio OH0028185 Wooster 35 Ohio OH0028223 City of Youngstown WTP 805 Ohio OH0028240 Zanesville WWTP 255 Ohio OH0029122 Village of Gibsonburg 35 Ohio OH0031062 Euclid 185 Ohio OH0043991 Northeast Ohio Regional Sewer District 1265 Ohio OH0048321 Dunkirk 65 Ohio OH0049999 Eastern Ohio Regional Wastewater
Authority47

Appendix D
D-21
EPA Region
State NPDES Permit No.
Facility Name Number of Outfalls
5 Ohio OH0052604 City of Norwalk 35 Ohio OH0052876 Port Clinton 25 Ohio OH0052922 City of Bucyrus 225 Ohio OH0052744 City of Fostoria 55 Ohio OH0052949 Tiffin 395 Ohio OH0058971 Luckey STP 45 Ohio OH0058408 Metamora 125 Ohio OH0126268 Lisbon WWTP 95 Ohio OH0094528 Village of Malta 105 Ohio OH0020613 Village of New Boston 25 Ohio OH0105457 Hamilton County Commissioners 1825 Wisconsin WIL024767 Milwaukee MSD-Jones Island 1205 Wisconsin WI0025593 Superior Sewage Disposal System 37 Iowa IA0042609 City of Keokuk STP 97 Iowa IA0020842 City of Lake City STP 17 Iowa IA0021059 City of Spencer STP 47 Iowa IA0023434 City of Muscatine STP 57 Iowa IA0025917 City of Mediapolis STP 17 Iowa IA0027219 City of Ft. Madison STP 97 Iowa IA0032433 City of Washington WWTP 87 Iowa IA0036641 City of Council Bluffs STP 57 Iowa IA0042650 City of Waterloo STP 77 Iowa IA0043079 City of Burlington STP 127 Iowa IA0047961 City of Wapello STP 27 Iowa IA0058483 City of Williams STP 17 Iowa IA0058611 Ottumwa STP 107 Iowa IA0035947 City of Clinton STP 107 Iowa IA0076601 Des Moines CSOs 187 Kansas KS0038563 Kansas City WWTP 587 Kansas KS0039128 Atchison City WWTP 77 Kansas KS0042722 Topeka City of Oakland STP 67 Missouri MO0024911 Kansas City, Blue River STP 57 Missouri MO0117960 Moberly East WWTP 87 Missouri MO0050580 Cape Girardeau WWTP 37 Missouri MO0025178 MSD, Bissell Point WWTP 37 Missouri MO0025151 MSD, Lemay WWTP 127 Missouri MO0024929 Kansas City, Westside STP 27 Missouri MO0023221 Macon WWTF 67 Missouri MO0023043 St. Joseph WWTP 27 Missouri MO0023027 Sedalia North WWTP 8
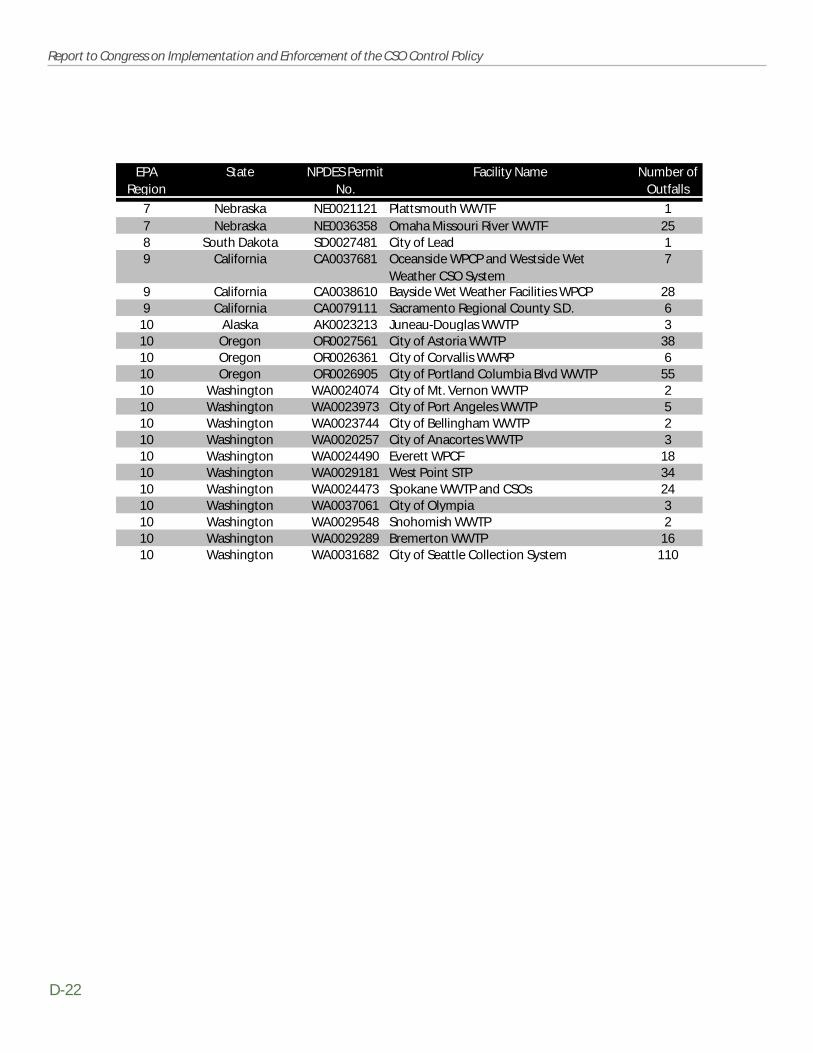
D-22
Report to Congress on Implementation and Enforcement of the CSO Control Policy
EPA Region
State NPDES Permit No.
Facility Name Number of Outfalls
7 Nebraska NE0021121 Plattsmouth WWTF 17 Nebraska NE0036358 Omaha Missouri River WWTF 258 South Dakota SD0027481 City of Lead 19 California CA0037681 Oceanside WPCP and Westside Wet
Weather CSO System7
9 California CA0038610 Bayside Wet Weather Facilities WPCP 289 California CA0079111 Sacramento Regional County S.D. 6
10 Alaska AK0023213 Juneau-Douglas WWTP 310 Oregon OR0027561 City of Astoria WWTP 3810 Oregon OR0026361 City of Corvallis WWRP 610 Oregon OR0026905 City of Portland Columbia Blvd WWTP 5510 Washington WA0024074 City of Mt. Vernon WWTP 210 Washington WA0023973 City of Port Angeles WWTP 510 Washington WA0023744 City of Bellingham WWTP 210 Washington WA0020257 City of Anacortes WWTP 310 Washington WA0024490 Everett WPCF 1810 Washington WA0029181 West Point STP 3410 Washington WA0024473 Spokane WWTP and CSOs 2410 Washington WA0037061 City of Olympia 310 Washington WA0029548 Snohomish WWTP 210 Washington WA0029289 Bremerton WWTP 1610 Washington WA0031682 City of Seattle Collection System 110

Appendix E
Summary of CSO-Related Civil JudicialActions Taken By EPA Prior to
Issuance of the CSO Control Policy

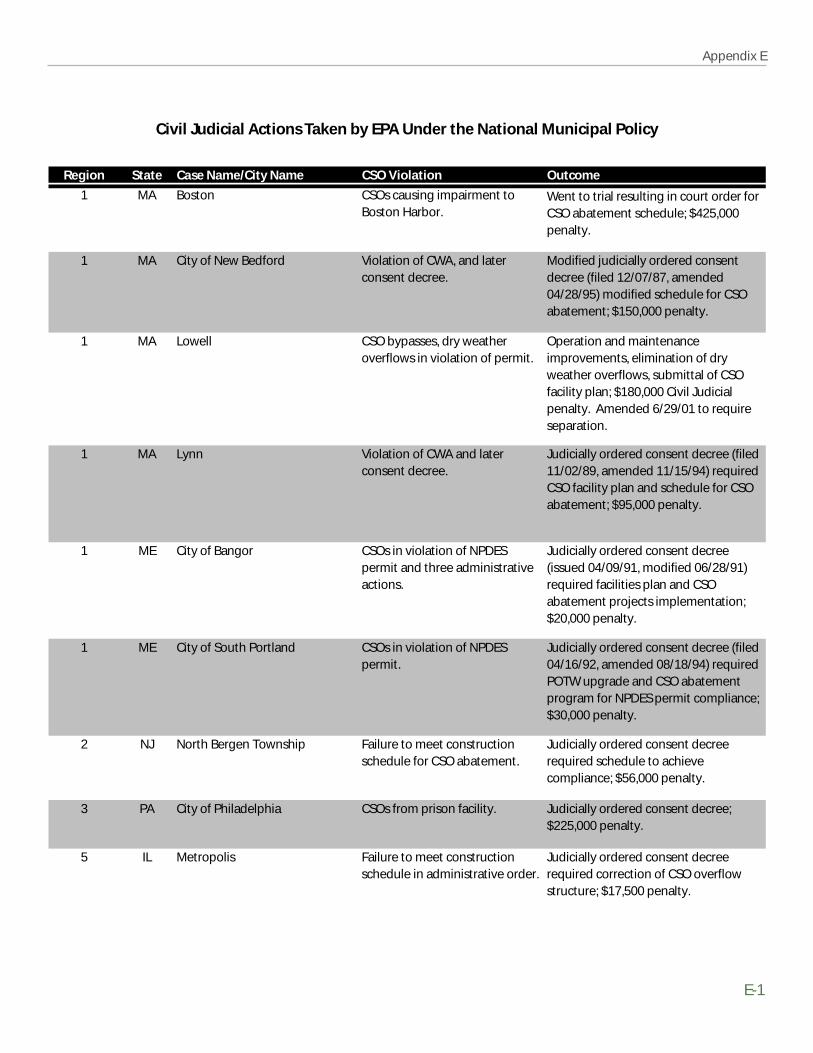
Region State Case Name/City Name CSO Violation Outcome
1 MA Boston CSOs causing impairment to Boston Harbor.
1 MA City of New Bedford Violation of CWA, and later consent decree.
1 MA Lowell CSO bypasses, dry weather overflows in violation of permit.
1 MA Lynn Violation of CWA and later consent decree.
1 ME City of Bangor CSOs in violation of NPDES permit and three administrative actions.
1 ME City of South Portland CSOs in violation of NPDES permit.
2 NJ North Bergen Township Failure to meet construction schedule for CSO abatement.
3 PA City of Philadelphia CSOs from prison facility.
5 IL Metropolis Failure to meet construction schedule in administrative order.
Judicially ordered consent decree required correction of CSO overflow structure; $17,500 penalty.
Judicially ordered consent decree (issued 04/09/91, modified 06/28/91) required facilities plan and CSO abatement projects implementation; $20,000 penalty.
Judicially ordered consent decree (filed 04/16/92, amended 08/18/94) required POTW upgrade and CSO abatement program for NPDES permit compliance; $30,000 penalty.
Judicially ordered consent decree required schedule to achieve compliance; $56,000 penalty.
Judicially ordered consent decree; $225,000 penalty.
Went to trial resulting in court order for CSO abatement schedule; $425,000 penalty.
Modified judicially ordered consent decree (filed 12/07/87, amended 04/28/95) modified schedule for CSO abatement; $150,000 penalty.
Operation and maintenance improvements, elimination of dry weather overflows, submittal of CSO facility plan; $180,000 Civil Judicial penalty. Amended 6/29/01 to require separation.
Judicially ordered consent decree (filed 11/02/89, amended 11/15/94) required CSO facility plan and schedule for CSO abatement; $95,000 penalty.
Civil Judicial Actions Taken by EPA Under the National Municipal Policy
E-1
Appendix E
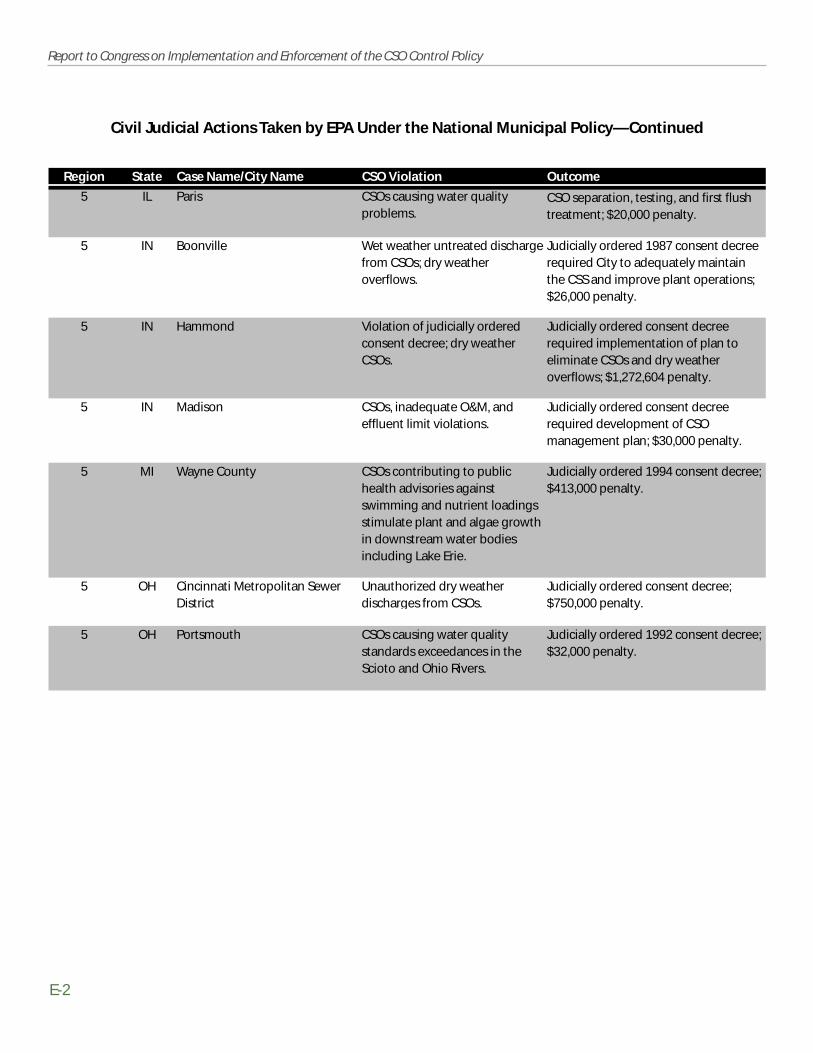
E-2
Report to Congress on Implementation and Enforcement of the CSO Control Policy
Region State Case Name/City Name CSO Violation Outcome
5 IL Paris CSOs causing water quality problems.
5 IN Boonville Wet weather untreated discharge from CSOs; dry weather overflows.
5 IN Hammond Violation of judicially ordered consent decree; dry weather CSOs.
5 IN Madison CSOs, inadequate O&M, and effluent limit violations.
5 MI Wayne County
5 OH Cincinnati Metropolitan Sewer District
Unauthorized dry weather discharges from CSOs.
5 OH Portsmouth CSOs causing water quality standards exceedances in the Scioto and Ohio Rivers.
CSOs contributing to public health advisories against swimming and nutrient loadings stimulate plant and algae growth in downstream water bodies including Lake Erie.
Judicially ordered consent decree required development of CSO management plan; $30,000 penalty.
Judicially ordered 1994 consent decree; $413,000 penalty.
Judicially ordered consent decree; $750,000 penalty.
Judicially ordered 1992 consent decree; $32,000 penalty.
CSO separation, testing, and first flush treatment; $20,000 penalty.
Judicially ordered 1987 consent decree required City to adequately maintain the CSS and improve plant operations; $26,000 penalty.
Judicially ordered consent decree required implementation of plan to eliminate CSOs and dry weather overflows; $1,272,604 penalty.
Civil Judicial Actions Taken by EPA Under the National Municipal Policy—Continued
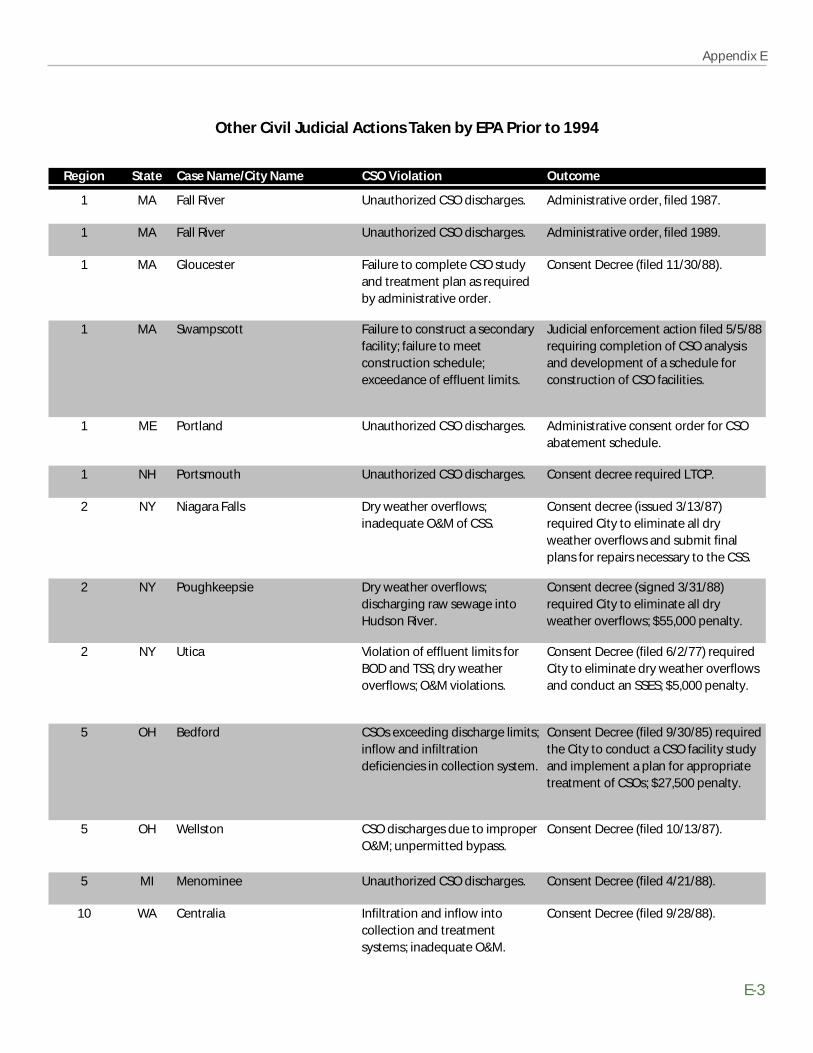
Appendix E
E-3
Region State Case Name/City Name CSO Violation Outcome
1 MA Fall River Unauthorized CSO discharges.
1 MA Fall River Unauthorized CSO discharges.
1 MA Gloucester Consent Decree (filed 11/30/88).
1 MA Swampscott Failure to construct a secondary facility; failure to meet construction schedule; exceedance of effluent limits.
1 ME Portland Unauthorized CSO discharges.
1 NH Portsmouth Unauthorized CSO discharges.
2 NY Niagara Falls Dry weather overflows; inadequate O&M of CSS.
2 NY Poughkeepsie Dry weather overflows; discharging raw sewage into Hudson River.
2 NY Utica Violation of effluent limits for BOD and TSS; dry weather overflows; O&M violations.
5 OH Bedford CSOs exceeding discharge limits; inflow and infiltration deficiencies in collection system.
5 OH Wellston Consent Decree (filed 10/13/87).
5 MI Menominee Unauthorized CSO discharges.
10 WA Centralia Consent Decree (filed 9/28/88).
Consent Decree (filed 9/30/85) required the City to conduct a CSO facility study and implement a plan for appropriate treatment of CSOs; $27,500 penalty.
CSO discharges due to improper O&M; unpermitted bypass.
Infiltration and inflow into collection and treatment systems; inadequate O&M.
Consent Decree (filed 4/21/88).
Administrative order, filed 1987.
Administrative order, filed 1989.
Failure to complete CSO study and treatment plan as required by administrative order.
Judicial enforcement action filed 5/5/88 requiring completion of CSO analysis and development of a schedule for construction of CSO facilities.
Administrative consent order for CSO abatement schedule.
Consent decree required LTCP.
Consent decree (issued 3/13/87) required City to eliminate all dry weather overflows and submit final plans for repairs necessary to the CSS.
Consent decree (signed 3/31/88) required City to eliminate all dry weather overflows; $55,000 penalty.
Consent Decree (filed 6/2/77) required City to eliminate dry weather overflows and conduct an SSES; $5,000 penalty.
Other Civil Judicial Actions Taken by EPA Prior to 1994

Appendix F
Data Base Documentation

1.0 Introduction
The purpose of this appendix is to document the onsite data collection effort for the CSO Report to Congress. The goal was to collectas much information on CSO communities as was available at the state and regional NPDES authorities(see Chapter 3 of this reportfor overall report methodology) . Teams were deployed to review NPDES authority files and to conduct introductory interviews withthe state CSO coordinator, a representative from enforcement, and a representative from water quality standards. The data collectionstrategy focused on obtaining information necessary to comply with the requirements in the 2001 CSO Report to Congress. Dataemphasized were the facility name, NPDES permit number, number of CSO outfalls, permit requirements for documentation of theNMC and development of an LTCP, and implementation of the NMC and LTCP. Other data, such as population and service areademographics, collection system characteristics, type of CSO controls being implemented, etc. were recorded as available during thefile reviews. After collection, all data were processed into a relational Data Collection System (DCS) that serves as the basis for acomprehensive national database for the CSO program (currently under development).
The following sections of this appendix further describe the data collection effort:
● Section 2.0 documents the data collection and data entry processes.
● Section 3.0 describes the relational data base structure and content (i.e., data elements).
● Section 4.0 explains the QA/QC process to ensure data quality and completeness.
2.0 Data Collection
The data collection effort consisted of onsite NPDES authority interviews and file reviews. EPA data collection teams visited permittingauthorities for nearly 90 percent of the CSO communities in the nation. During these visits, CSO coordinators and enforcement andwater quality standards representatives were interviewed to characterize each state’s approach and perspective towardsimplementing the CSO Control Policy. Following the interviews, collection teams reviewed permits and related files for each of theNPDES authority’s CSO permittees.
Teams used two types of data collection forms to guide staff interviews and record file data. The first form was developed to facilitatediscussions with the state CSO coordinator, a state water quality standards representative, and a state enforcement representative. Asecond form was developed to capture data collected during the file review for each CSO permit. The interview and data collectionorms are included as Appendix F-1. Upon leaving the site, forms were processed, information was entered into the DCS (furtherdiscussed in Section 3 of this appendix), and copies were then filed for future reference. Details about the data collection teams,onsite interviews, and file review processes are described in the sections following.
2.1 Collection Teams
Collection teams consisted of a team leader and one to three team members. The team leader’s responsibilities includedcoordinating site visits, serving as advisor to the data collection team, developing state fact sheets, and reporting on state programs,protocols, and findings. Team leaders were generally engineers who were well-versed in wastewater engineering; planning andtechnologies; CSO controls and the CSO Control Policy; and overall federal, state, and local roles in the NPDES permitting process.
A one-day training session for all data collection team members included an overview of the CSO Control Policy, explanation of CSOsystems and control technologies, and mock training exercises. The exercises consisted of reviewing information that would typicallybe found onsite and completing sample data collection forms. Team members were able to interact and pose questions to aid inunderstanding the collection materials as well as CSO concepts and terminology. Team member responses and rationale werereviewed/critiqued at the end of the class. Feedback and further direction was provided. Data collection forms were revised based onfeedback from the trainees.
F-1
Appendix F
Data Base Documentation
F-2
Report to Congress on Implementation and Enforcement of the CSO Control Policy
2.2 Site Visits
2.2.1 Interviews
Collection teams requested interviews with the CSO coordinator and representatives from enforcement and water quality standards.The interviews served to establish an understanding of how states implemented the CSO Control Policy within the context of existingprograms.
The state CSO coordinators served as the central point of contact, and acquainted the teams with state protocols and the types ofinformation that might be available during the file review. The CSO coordinators were asked to estimate the number of communitieswith NMC or LTCP permit requirements; the number of NMC documents or LTCPs that have been received; and the number of thesedocuments that had been approved to date. Other state CSO requirements, reporting and protocols were also discussed. Thisinterview was generally conducted prior to or upon arrival at the site, and provided insight in to subsequent interactions with theenforcement and water quality standards staff in the area of CSO control.
State enforcement staff were interviewed to determine the state’s approach for enforcing the CSO Control Policy, interaction with theregions on enforcement, primary types of enforcement actions taken for CSO-related permits, and any specific enforcement actionstaken to date primarily because of CSOs. Water quality standards representatives were interviewed to understand the state’s approachto considering CSO-impacted waters in relation to water quality standards reviews and revisions.
2.2.2 NPDES File Reviews
The file review process followed the introductory interview. Team members reviewed each CSO permit. The amount of time spent forreview and data compilation ranged from 15 to 60 minutes per permit file. Types of documents considered in the file review processincluded:
● NPDES files (individual and general permits and permit applications)
● Report files (NMC documentation, LTCPs, annual reports, etc.)
● Inspection reports (especially those discussing the collection system, CSO outfalls, or implementation of either the NMC or LTCP)
● Enforcement and compliance files
● Correspondence files
● State policy or regulation specifically targeting CSOs and/or wet-weather water quality standards
● Others (O&M reports discussing WWTP implementation of the NMC, engineering studies on the WWTP or collection system, andwatershed studies discussing CSO impacts on receiving water quality)
Team members recorded data and supplemental notes for the CSO permittee on the data collection form.
2.2.3 Data Collection Form
The data collection form was developed to simplify and standardize the data collection process. Form data elements were initiallybased on data needs identified for this report and on types of data typically maintained in NPDES permits, permit applications, NMCreports and LTCPs. The data collection form was first applied during a review of Maine’s files. Adjustments to the form were made.The revised form was re-evaluated during the onsite review of Illinois’ files. Final adjustments were made and this refined form wasused for all subsequent reviews. The form design used proven form techniques to promote consistency. Subjective data elementswere eliminated or avoided, and a limited number of carefully considered responses to each question were provided as check boxesor yes/no responses when possible. The form consists of 11 sections and is provided as Appendix F-1. Descriptions of each of the 11sections follow.
Facility Information. The facility information section documents identifying characteristics for each permittee including facility name,mailing and facility addresses, NPDES permit number, contact persons, type of permitted facility, and other permittee characterization.
Development and Evaluation of Alternatives. The development and evaluation of alternatives section captures informationregarding NMC and LTCP requirements and implementation. Team members were asked to determine whether each permittee wasrequired to implement the NMC, whether that requirement was established in a permit or some other type of enforceable action,which controls were being implemented, and whether documentation had been submitted to the NPDES permitting authority.Similar data were collected for LTCPs, along with the overall status of LTCP implementation and types of approaches taken.Documented CSO controls completed apart from a formal LTCP requirement were also noted. When possible, data collected weresupplemented with narrative notes.

Appendix F
F-3
Selection and Implementation of Controls. The selection and implementation of controls section collects data the characterizatingCSO controls implemented or being implemented. A look-up table of categorized, CSO controls technologies (further discussed insection 3.2 of this appendix) was provided. Controls were broadly categorized as being either a source or in-system control. Sourcecontrols keep storm water or pollutants out of the CSS; whereas in-system controls require modification of the CSS to treat combinedflow. Control implementation date and estimated capital costs were recorded where available. Control data was supplemented withnotes on control implementation issues (including types of controls considered, financial considerations, etc.).
Effectiveness of Structural Controls. The effectiveness of structural controls section contains monitoring data and/or pollutantremoval efficiencies for CSO control technologies. Data areas include pilot tests performed, pre-construction or post-constructionmonitoring data collected, and ambient receiving water data compiled.
Collection System Information. The collection system information section contains data that characterizes entities served by the CSOpermit. An entity could be a town, region, or municipal district. Data elements include the physical service area, system attributes,and demographic data on populations served.
Flow and Treatment Information. The flow and treatment information section contains data elements for average daily flow to theWWTP, design and peak flow capacity, and additional CSO treatment types that might be unique to the permittee.
Discharges and Other Disposal Methods. The discharges and other disposal methods section includes the number of CSO permittedoutfall points, yearly dry weather overflows, and discharge points with effluent receiving full or partial treatment. The details ofspecific outfalls, if available, are characterized in a later section.
System Characterization. The system characterization section contains data that describes the entire sewer system. Percentages ofthe sewer network consisting of each type (combined or separate), as well as sewer length and service area (acreage) are the key dataelements. Where available, data reflecting changes in the system throughout time are recorded. CSO discharges to sensitive areas arealso characterized in this section.
Receiving Water Description. The receiving water description section contains lists each water body that receives discharge fromeither the WWTP or CSO outfall. Data elements include the receiving water name, watershed, and data on whether or not a CSO-related water quality standards review had been conducted.
Water Quality Data. The water quality data section records any water quality data being collected as part of a CSO study. If available,documents reporting data for typical parameters were photocopied and attached to the data collection form.
Outfall Description. The outfall description section records information on each of the CSO outfalls, including location (both streetaddress and longitudinal/latitudinal coordinates, if available), number of annual CSO events, estimated annual CSO volume, andwhether the outfall is treated or untreated.
2.3 Data Entry
After data collection teams gathered the necessaryinformation during site visits, completed data collectionforms were transmitted to the data management team. Thedata management team was comprised of a data teamleader, a data manager, and the data entry team. The datamanager and data entry team reviewed the collection form,resolvedissues of missing or indecipherable information,and performed data entry and data QA/QC.
The data manager evaluated all incoming data forms forcompleteness and consistency. Prior to form review, thedata manager met with the data collection team leader togain a better understanding of the NPDES authority’sprotocols for implementing the CSO policy, and to ensurethat permittees in different states were characterizedsimilarly. All data collection forms were reviewed andannotated to facilitate data entry. Incomplete andquestionable field entries were flagged for follow up with the data team leader, the state, or the region. After this review and follow-up procedure was completed, the data collection forms were initialed by the data manager and distributed to a data entry team (seesection 3 of this appendix). The data entry team used an electronic data entry form designed in Microsoft Access to transferinformation from the collection forms into the DCS. Figure F-1 shows a screen capture of the Access data entry form. Data entry staffcompleted this process by initialing and placing a copy of the form in a filing system dedicated for this purpose. Additional QA/QCsteps taken with regard to the data are described in Section 4 of this appendix.
Figure F-1. DCS Data Entry Form
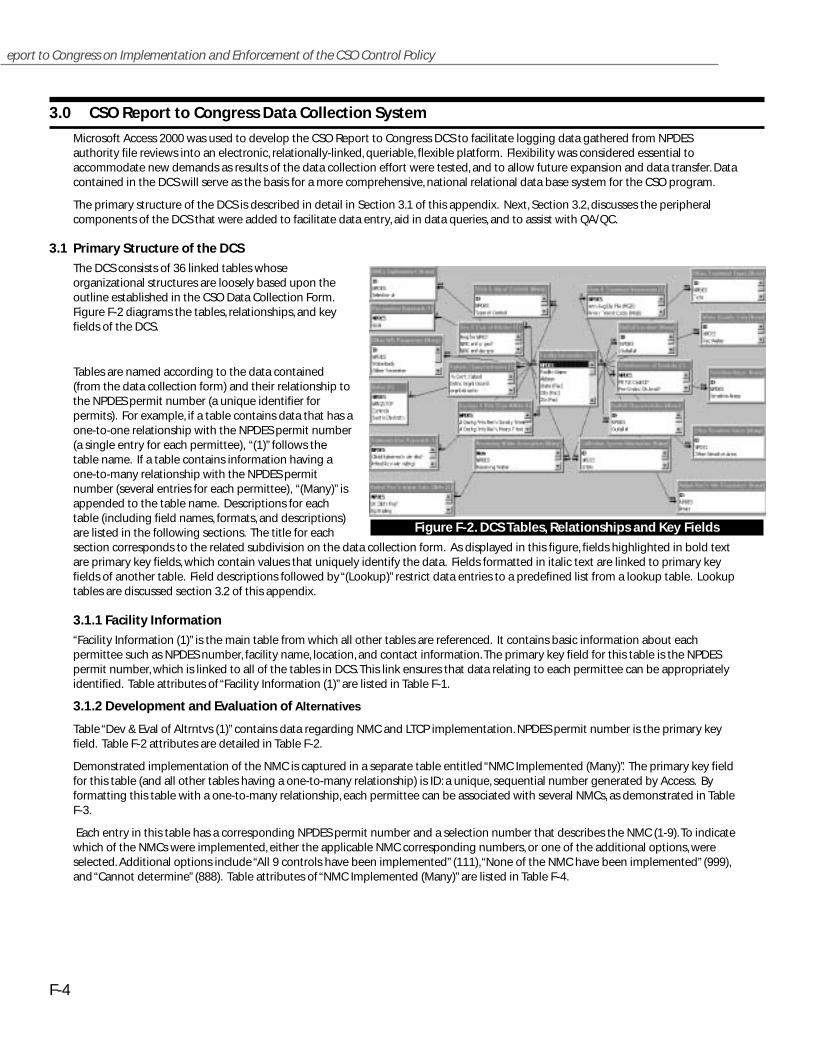
F-4
eport to Congress on Implementation and Enforcement of the CSO Control Policy
3.0 CSO Report to Congress Data Collection System
Microsoft Access 2000 was used to develop the CSO Report to Congress DCS to facilitate logging data gathered from NPDESauthority file reviews into an electronic, relationally-linked, queriable, flexible platform. Flexibility was considered essential toaccommodate new demands as results of the data collection effort were tested, and to allow future expansion and data transfer. Datacontained in the DCS will serve as the basis for a more comprehensive, national relational data base system for the CSO program.
The primary structure of the DCS is described in detail in Section 3.1 of this appendix. Next, Section 3.2, discusses the peripheralcomponents of the DCS that were added to facilitate data entry, aid in data queries, and to assist with QA/QC.
3.1 Primary Structure of the DCS
The DCS consists of 36 linked tables whoseorganizational structures are loosely based upon theoutline established in the CSO Data Collection Form.Figure F-2 diagrams the tables, relationships, and keyfields of the DCS.
Tables are named according to the data contained(from the data collection form) and their relationship tothe NPDES permit number (a unique identifier forpermits). For example, if a table contains data that has aone-to-one relationship with the NPDES permit number(a single entry for each permittee), “(1)” follows thetable name. If a table contains information having aone-to-many relationship with the NPDES permitnumber (several entries for each permittee), “(Many)” isappended to the table name. Descriptions for eachtable (including field names, formats, and descriptions)are listed in the following sections. The title for eachsection corresponds to the related subdivision on the data collection form. As displayed in this figure, fields highlighted in bold textare primary key fields, which contain values that uniquely identify the data. Fields formatted in italic text are linked to primary keyfields of another table. Field descriptions followed by “(Lookup)” restrict data entries to a predefined list from a lookup table. Lookuptables are discussed section 3.2 of this appendix.
3.1.1 Facility Information
“Facility Information (1)” is the main table from which all other tables are referenced. It contains basic information about eachpermittee such as NPDES number, facility name, location, and contact information. The primary key field for this table is the NPDESpermit number, which is linked to all of the tables in DCS. This link ensures that data relating to each permittee can be appropriatelyidentified. Table attributes of “Facility Information (1)” are listed in Table F-1.
3.1.2 Development and Evaluation of Alternatives
Table “Dev & Eval of Altrntvs (1)” contains data regarding NMC and LTCP implementation. NPDES permit number is the primary keyfield. Table F-2 attributes are detailed in Table F-2.
Demonstrated implementation of the NMC is captured in a separate table entitled “NMC Implemented (Many)”. The primary key fieldfor this table (and all other tables having a one-to-many relationship) is ID: a unique, sequential number generated by Access. Byformatting this table with a one-to-many relationship, each permittee can be associated with several NMCs, as demonstrated in TableF-3.
Each entry in this table has a corresponding NPDES permit number and a selection number that describes the NMC (1-9). To indicatewhich of the NMCs were implemented, either the applicable NMC corresponding numbers, or one of the additional options, wereselected. Additional options include “All 9 controls have been implemented” (111),“None of the NMC have been implemented” (999),and “Cannot determine” (888). Table attributes of “NMC Implemented (Many)” are listed in Table F-4.
Figure F-2. DCS Tables, Relationships and Key Fields

Appendix F
F-5
Field Name Format Description
NPDES Text The National Pollutant Discharge Elimination System permit number
Facility name Text Name of the facility, town, or sanitary authority holding the NPDES permit
Abbrev Text Common abbreviation of the permittee's name
State (Fac) Text State where the facility is located (Lookup)
City (Fac) Text City where the facility is located
Zip (Fac) Text Zip code for the facility
Street (Fac) Text Address for the facility
City (Mail) Text City in the facility's mailing address
State (Mail) Text State in the facility's mailing address (Lookup)
Zip (Mail) Text Zip code in the facility's mailing address
Street (Mail) Text Mailing address
County Text County in which the facility is located
Contact Person Text Cognizant official for the facility
Title Text Title of cognizant official
Phone number Text Contact number for cognizant official
Fax number Text Fax number for cognizant official
Permit Issue Date/Time NPDES permit issuance date
Permits Exp Date/Time NPDES permit expiration date
Permit Eff Date/Time NPDES permit effective date
Permittee Type Number The permittee may be classified as owning both a WWTP and collection system (WWTP), or a satellite collection system only (SCS). (Lookup)
Website Text Permittee's website
Total Pop Number Population served by the permittee
Trtmnt Fac Text Facility that treats sanitary flow if the permittee is a satellite collection system
Status Text A flag signaling that the permittee has completely separated (S) or eliminated (E) its discharge points
Category Text The permittee may be classified as a MAJOR or MINOR depending on WWTP flow (classification from EPA's PES data base)
Table F-1: Facility Attributes of Facility Information (1)
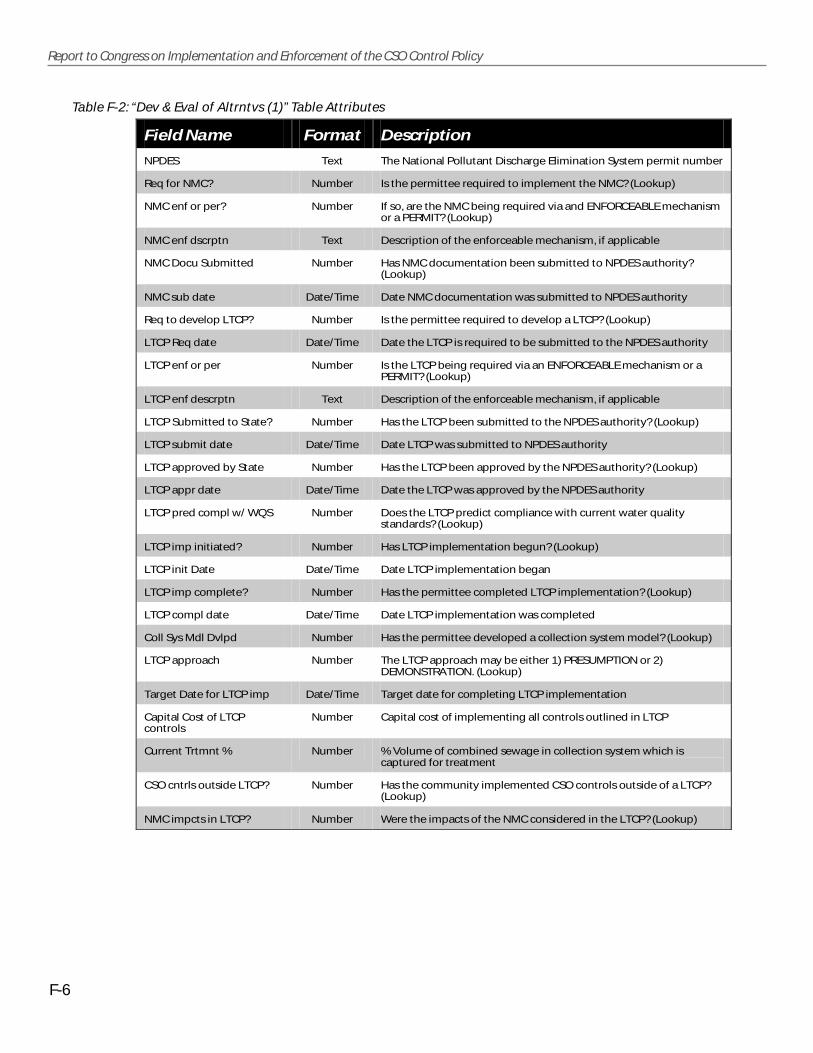
F-6
Report to Congress on Implementation and Enforcement of the CSO Control Policy
Field Name Format Description
NPDES Text The National Pollutant Discharge Elimination System permit number
Req for NMC? Number Is the permittee required to implement the NMC? (Lookup)
NMC enf or per? Number If so, are the NMC being required via and ENFORCEABLE mechanism or a PERMIT? (Lookup)
NMC enf dscrptn Text Description of the enforceable mechanism, if applicable
NMC Docu Submitted Number Has NMC documentation been submitted to NPDES authority? (Lookup)
NMC sub date Date/Time Date NMC documentation was submitted to NPDES authority
Req to develop LTCP? Number Is the permittee required to develop a LTCP? (Lookup)
LTCP Req date Date/Time Date the LTCP is required to be submitted to the NPDES authority
LTCP enf or per Number Is the LTCP being required via an ENFORCEABLE mechanism or a PERMIT? (Lookup)
LTCP enf descrptn Text Description of the enforceable mechanism, if applicable
LTCP Submitted to State? Number Has the LTCP been submitted to the NPDES authority? (Lookup)
LTCP submit date Date/Time Date LTCP was submitted to NPDES authority
LTCP approved by State Number Has the LTCP been approved by the NPDES authority? (Lookup)
LTCP appr date Date/Time Date the LTCP was approved by the NPDES authority
LTCP pred compl w/ WQS Number Does the LTCP predict compliance with current water quality standards? (Lookup)
LTCP imp initiated? Number Has LTCP implementation begun? (Lookup)
LTCP init Date Date/Time Date LTCP implementation began
LTCP imp complete? Number Has the permittee completed LTCP implementation? (Lookup)
LTCP compl date Date/Time Date LTCP implementation was completed
Coll Sys Mdl Dvlpd Number Has the permittee developed a collection system model? (Lookup)
LTCP approach Number The LTCP approach may be either 1) PRESUMPTION or 2) DEMONSTRATION. (Lookup)
Target Date for LTCP imp Date/Time Target date for completing LTCP implementation
Capital Cost of LTCP controls
Number Capital cost of implementing all controls outlined in LTCP
Current Trtmnt % Number % Volume of combined sewage in collection system which is captured for treatment
CSO cntrls outside LTCP? Number Has the community implemented CSO controls outside of a LTCP? (Lookup)
NMC impcts in LTCP? Number Were the impacts of the NMC considered in the LTCP? (Lookup)
Table F-2: “Dev & Eval of Altrntvs (1)” Table Attributes
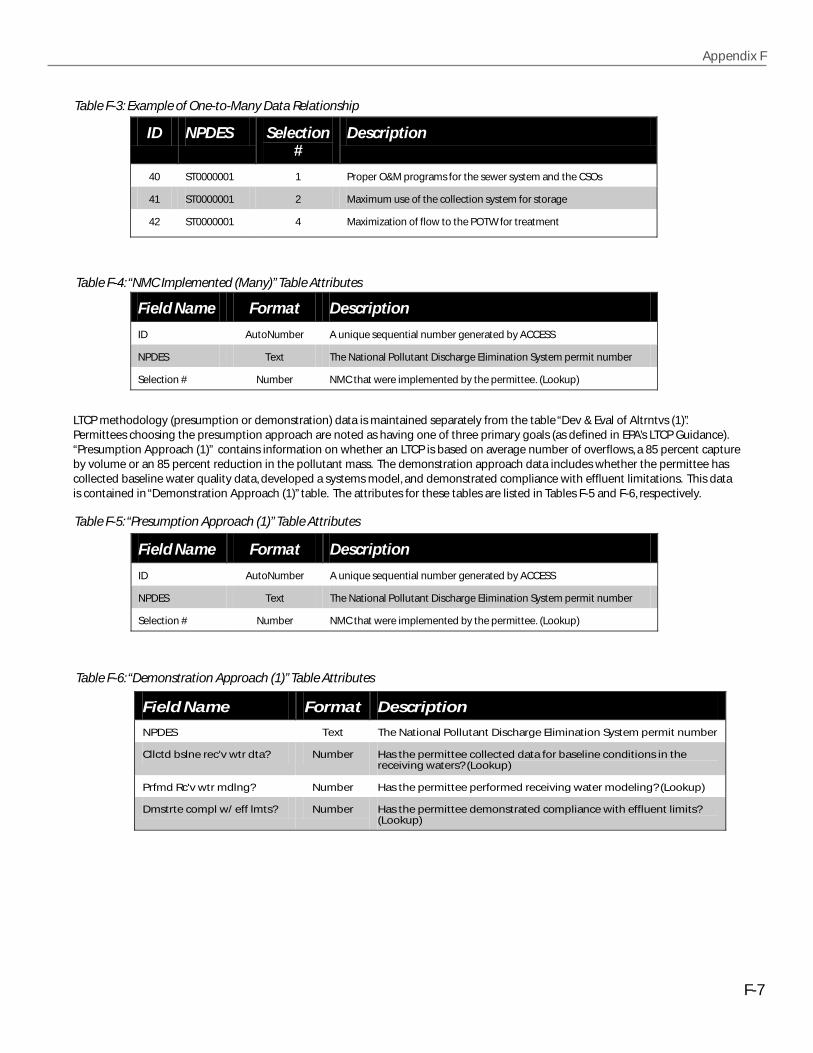
Appendix F
F-7
LTCP methodology (presumption or demonstration) data is maintained separately from the table “Dev & Eval of Altrntvs (1)”.Permittees choosing the presumption approach are noted as having one of three primary goals (as defined in EPA’s LTCP Guidance).“Presumption Approach (1)” contains information on whether an LTCP is based on average number of overflows, a 85 percent captureby volume or an 85 percent reduction in the pollutant mass. The demonstration approach data includes whether the permittee hascollected baseline water quality data, developed a systems model, and demonstrated compliance with effluent limitations. This datais contained in “Demonstration Approach (1)” table. The attributes for these tables are listed in Tables F-5 and F-6, respectively.
ID NPDES Selection #
Description
40 ST0000001 1 Proper O&M programs for the sewer system and the CSOs
41 ST0000001 2 Maximum use of the collection system for storage
42 ST0000001 4 Maximization of flow to the POTW for treatment
Table F-3: Example of One-to-Many Data Relationship
Field Name Format Description
ID AutoNumber A unique sequential number generated by ACCESS
NPDES Text The National Pollutant Discharge Elimination System permit number
Selection # Number NMC that were implemented by the permittee. (Lookup)
Table F-4: “NMC Implemented (Many)” Table Attributes
Field Name Format Description
ID AutoNumber A unique sequential number generated by ACCESS
NPDES Text The National Pollutant Discharge Elimination System permit number
Selection # Number NMC that were implemented by the permittee. (Lookup)
Table F-5: “Presumption Approach (1)” Table Attributes
Field Name Format Description
NPDES Text The National Pollutant Discharge Elimination System permit number
Cllctd bslne rec'v wtr dta? Number Has the permittee collected data for baseline conditions in the receiving waters? (Lookup)
Prfmd Rc'v wtr mdlng? Number Has the permittee performed receiving water modeling? (Lookup)
Dmstrte compl w/ eff lmts? Number Has the permittee demonstrated compliance with effluent limits? (Lookup)
Table F-6: “Demonstration Approach (1)” Table Attributes

F-8
Report to Congress on Implementation and Enforcement of the CSO Control Policy
3.1.3 Selection and Implementation of Controls
Table “Slctn & Imp of Controls (Many)” includes data on CSO control technologies that were or are being implemented. The Numberfield in this table relates to a “lookup table:” a predefined list of common control technologies that can be referenced by number(similar to the way that the NMC are referenced by a unique number). Lookup tables are described in more detail in Section 3.2 ofthis appendix. “Slctn & Imp of Controls (Many)” also lists estimated completion dates and capital costs for each control. Tableattributes are detailed in Table F-7.
3.1.4 Effectiveness of Structural Controls
Table “Effectiveness of Controls (1)” contains data regarding pilot tests and monitoring data for structural controls that have beenimplemented. The primary key field for this table is the NPDES permit number. Table attributes are listed in Table F-8.
Field Name Format Description
ID AutoNumber A unique sequential number generated by ACCESS
NPDES Text The National Pollutant Discharge Elimination System permit number
Type of Control Number CSO controls may be either source or in-system controls. (Lookup)
Number Text A LTI predefined list of common CSO control technologies. (Lookup)
Date Date/Time Date the selected controls were implemented
Cost Number Estimated capital cost of specified CSO controls
Table F-7: “Slctn & Imp of Controls (Many)” Table Attributes
Field Name Format Description
ID AutoNumber A unique sequential number generated by ACCESS
NPDES Text The National Pollutant Discharge Elimination System permit number
Type of Control Number CSO controls may be either source or in-system controls. (Lookup)
Number Text A LTI predefined list of common CSO control technologies. (Lookup)
Date Date/Time Date the selected controls were implemented
Cost Number Estimated capital cost of specified CSO controls
Table F-8: “Effectiveness of Controls (1)” Table Attributes

Appendix F
F-9
Data for ambient receiving water monitoring that was available at the NPDES authority is included in the “Ambnt Rec’v Water DataCllctn (1)” table. If a list of specific monitored parameters was available, the data was captured separately in “Ambnt Rec’v WtrParameters (Many)” table. Table attributes are shown in Tables F-9 and F-10, respectively.
3.1.5 Collection System Information
CSO permittees might treat wastewater, or own or maintain collection systems for several towns, regions, or municipal districts. Dataabout these “entities” such as population and collection system type (combined or separate) are stored in the “Collection SystemInformation (Many)”table. Table attributes are listed in Table F-11.
Field Name Format Description
ID AutoNumber A unique sequential number generated by ACCESS
NPDES Text The National Pollutant Discharge Elimination System permit number
Type of Control Number CSO controls may be either source or in-system controls. (Lookup)
Number Text A LTI predefined list of common CSO control technologies. (Lookup)
Date Date/Time Date the selected controls were implemented
Cost Number Estimated capital cost of specified CSO controls
Table F-9: “Ambnt Rec’v Wtr Data Cllctn (1)” Table Attributes
Field Name
Format Description
ID AutoNumber A unique sequential number generated by ACCESS
NPDES Text The National Pollutant Discharge Elimination System permit number
Prmtr Text The ambient receiving water parameter that was studied
Table F-10: “Abnt Rec’v Wtr Parameters (Many)” Table Attributes
Field Name
Format Description
ID AutoNumber A unique sequential number generated by ACCESS
NPDES Text The National Pollutant Discharge Elimination System permit number
Prmtr Text The ambient receiving water parameter that was studied
Table F-11: “Collection System Information (Many)” Table Attributes

F-10
Report to Congress on Implementation and Enforcement of the CSO Control Policy
3.1.6 Flow and Treatment Information
WWTP capacity and average daily flow are stored in the “Flow and Treatment Information (1)” table. When available, data includesdesign and peak flow capacities. Table attributes are listed in Table F-12.
When available, additional data for CSO treatment at (or before) the WWTP (other than secondary treatment) was collected. Commontreatment types include lagoons, storm water retention basins, and swirl concentrators. These data are stored in the “Other TreatmentTypes (Many)” table. This table was established with a one-to-many relationship because a particular permittee might utilize severaldifferent treatment technologies. Table attributes for “Other Treatment Types (Many)” are listed in Table F-13.
3.1.7 Discharges and Other Disposal Methods
Table “Dischrgs & Othr Displ Mthds (1)” contains data for permitted CSO outfalls, emergency overflow points, and dry weatheroverflows to waters of the U.S. The primary key field is NPDES number, which associates this information with other details abouteach permittee. See Table F-14 for the structure of “Dischrgs & Othr Displ Mthds (1)” table.
Field Name Format Description
NPDES Text The National Pollutant Discharge Elimination System permit number
Ann Avg Dly Flw (MGD) Number Annual average daily flow
Prmry Trtmnt Cpcty (MGD) Number Design primary treatment capacity
Scndry Trtmnt Cpcty (MGD) Number Design secondary treatment capacity
Pk Flw Prmry Trtmnt Cpcty (MGD) Number Peak flow primary treatment capacity
Pf Flw Scndry Trtmnt Cpcty (MGD) Number Peak flow secondary treatment capacity
CSO bypasses? Number Are CSO-related bypasses authorized? (Lookup)
Partly Trtd Eff & Trtd Flws Cmbnd? Number Are partially treated effluents combined with fully treated flows prior to discharge? (Lookup)
Table F-12: “Flow and Treatment Information (1)” Table Attributes
Field Name Format Description
ID AutoNumber A unique sequential number generated by ACCESS
NPDES Text The National Pollutant Discharge Elimination System permit number
Type Text Alternative or additional CSO treatment (other than primary or secondary)
Capacity (MGD) Number Capacity provided by the alternative treatment
Table F-13: “Other Treatment Types (Many)” Table Attributes
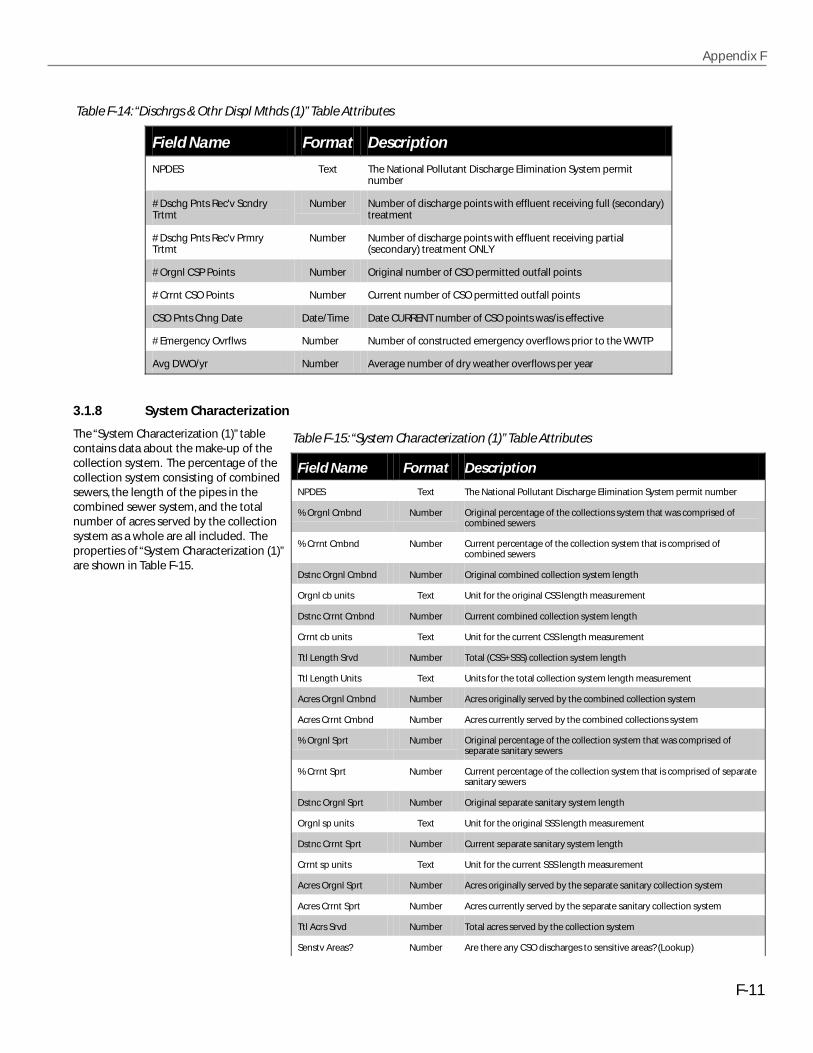
Appendix F
F-11
3.1.8 System Characterization
The “System Characterization (1)” tablecontains data about the make-up of thecollection system. The percentage of thecollection system consisting of combinedsewers, the length of the pipes in thecombined sewer system, and the totalnumber of acres served by the collectionsystem as a whole are all included. Theproperties of “System Characterization (1)”are shown in Table F-15.
Field Name Format Description
NPDES Text The National Pollutant Discharge Elimination System permit number
# Dschg Pnts Rec'v Scndry Trtmt
Number Number of discharge points with effluent receiving full (secondary) treatment
# Dschg Pnts Rec'v Prmry Trtmt
Number Number of discharge points with effluent receiving partial (secondary) treatment ONLY
# Orgnl CSP Points Number Original number of CSO permitted outfall points
# Crrnt CSO Points Number Current number of CSO permitted outfall points
CSO Pnts Chng Date Date/Time Date CURRENT number of CSO points was/is effective
# Emergency Ovrflws Number Number of constructed emergency overflows prior to the WWTP
Avg DWO/yr Number Average number of dry weather overflows per year
Table F-14: “Dischrgs & Othr Displ Mthds (1)” Table Attributes
Field Name Format Description
NPDES Text The National Pollutant Discharge Elimination System permit number
% Orgnl Cmbnd Number Original percentage of the collections system that was comprised of combined sewers
% Crrnt Cmbnd Number Current percentage of the collection system that is comprised of combined sewers
Dstnc Orgnl Cmbnd Number Original combined collection system length
Orgnl cb units Text Unit for the original CSS length measurement
Dstnc Crrnt Cmbnd Number Current combined collection system length
Crrnt cb units Text Unit for the current CSS length measurement
Ttl Length Srvd Number Total (CSS+SSS) collection system length
Ttl Length Units Text Units for the total collection system length measurement
Acres Orgnl Cmbnd Number Acres originally served by the combined collection system
Acres Crrnt Cmbnd Number Acres currently served by the combined collections system
% Orgnl Sprt Number Original percentage of the collection system that was comprised of separate sanitary sewers
% Crrnt Sprt Number Current percentage of the collection system that is comprised of separate sanitary sewers
Dstnc Orgnl Sprt Number Original separate sanitary system length
Orgnl sp units Text Unit for the original SSS length measurement
Dstnc Crrnt Sprt Number Current separate sanitary system length
Crrnt sp units Text Unit for the current SSS length measurement
Acres Orgnl Sprt Number Acres originally served by the separate sanitary collection system
Acres Crrnt Sprt Number Acres currently served by the separate sanitary collection system
Ttl Acrs Srvd Number Total acres served by the collection system
Senstv Areas? Number Are there any CSO discharges to sensitive areas? (Lookup)
Table F-15: “System Characterization (1)” Table Attributes

F-12
Report to Congress on Implementation and Enforcement of the CSO Control Policy
If a permittee has CSO discharges to sensitive areas, relevant data are located in the “Sensitive Areas (Many)”Table. The tablereferences a lookup table: a pre-defined list of common sensitive areas. Lookup tables are described in detail in Section 3.2 of thisappendix. Any receiving water sensitive area designations that are not on the pre-defined list must be recorded in the “OtherSensitive Areas (Many)” table. Table attributes are listed in Tables F-16 and F-17, respectively.
3.1.9 Receiving Water Description
Water bodies that receive discharge from either the WWTP or CSO outfalls are listed in the “Receiving Water Description (Many)”table. Data captured in this table include the watershed effected by the discharge and whether a CSO water quality standards reviewhas been completed. Table attributes are listed in Table F-18.
Field Name Format Description
ID AutoNumber A unique sequential number generated by ACCESS
NPDES Text The National Pollutant Discharge Elimination System permit number
Sensitive Areas Number A predefined list of sensitive area classifications for the waterbody. (Lookup)
Table F-16: “Sensitive Areas (Many)” Table Attributes
Field Name Format Description
ID AutoNumber A unique sequential number generated by ACCESS
NPDES Text The National Pollutant Discharge Elimination System permit number
Other Sensitive Area
Text Receiving water sensitive area categories that were not on LTCP predefined list
Table F-17: “Other Sensitive Areas (Many)” Table Attributes
Field Name Format Description
Num AutoNumber A unique sequential number generated by ACCESS
NPDES Text The National Pollutant Discharge Elimination System permit number
Receiving Water Text Receiving waters for the WWTP discharge and CSO discharge points
Watershed Text Watershed influenced by the permittee's discharges
CSO WQS Review Complete? Number Has a CSO-related water quality standards review been performed for the receiving water? (Lookup)
Table F-18: “Receiving Water Description (Many)” Table Attributes
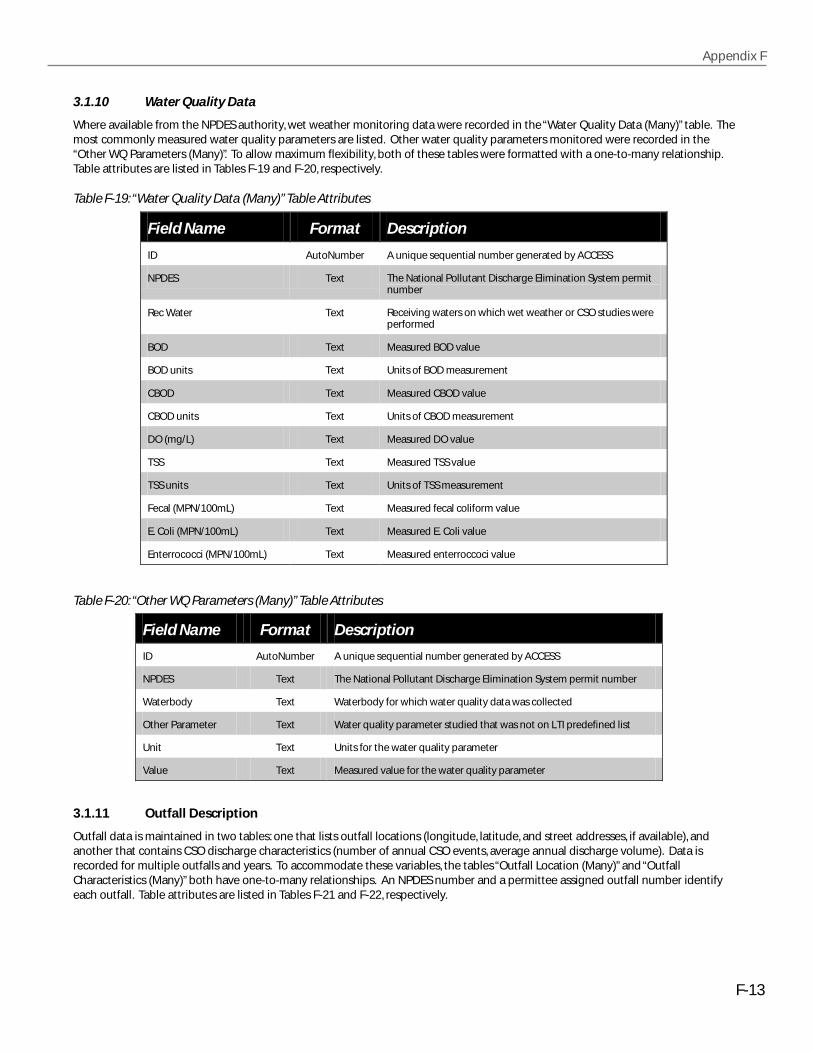
Appendix F
F-13
3.1.10 Water Quality Data
Where available from the NPDES authority, wet weather monitoring data were recorded in the “Water Quality Data (Many)” table. Themost commonly measured water quality parameters are listed. Other water quality parameters monitored were recorded in the“Other WQ Parameters (Many)”. To allow maximum flexibility, both of these tables were formatted with a one-to-many relationship.Table attributes are listed in Tables F-19 and F-20, respectively.
3.1.11 Outfall Description
Outfall data is maintained in two tables: one that lists outfall locations (longitude, latitude, and street addresses, if available), andanother that contains CSO discharge characteristics (number of annual CSO events, average annual discharge volume). Data isrecorded for multiple outfalls and years. To accommodate these variables, the tables “Outfall Location (Many)” and “OutfallCharacteristics (Many)” both have one-to-many relationships. An NPDES number and a permittee assigned outfall number identifyeach outfall. Table attributes are listed in Tables F-21 and F-22, respectively.
Field Name Format Description
ID AutoNumber A unique sequential number generated by ACCESS
NPDES Text The National Pollutant Discharge Elimination System permit number
Rec Water Text Receiving waters on which wet weather or CSO studies were performed
BOD Text Measured BOD value
BOD units Text Units of BOD measurement
CBOD Text Measured CBOD value
CBOD units Text Units of CBOD measurement
DO (mg/L) Text Measured DO value
TSS Text Measured TSS value
TSS units Text Units of TSS measurement
Fecal (MPN/100mL) Text Measured fecal coliform value
E. Coli (MPN/100mL) Text Measured E. Coli value
Enterrococci (MPN/100mL) Text Measured enterroccoci value
Table F-19: “Water Quality Data (Many)” Table Attributes
Field Name Format Description
ID AutoNumber A unique sequential number generated by ACCESS
NPDES Text The National Pollutant Discharge Elimination System permit number
Waterbody Text Waterbody for which water quality data was collected
Other Parameter Text Water quality parameter studied that was not on LTI predefined list
Unit Text Units for the water quality parameter
Value Text Measured value for the water quality parameter
Table F-20: “Other WQ Parameters (Many)” Table Attributes
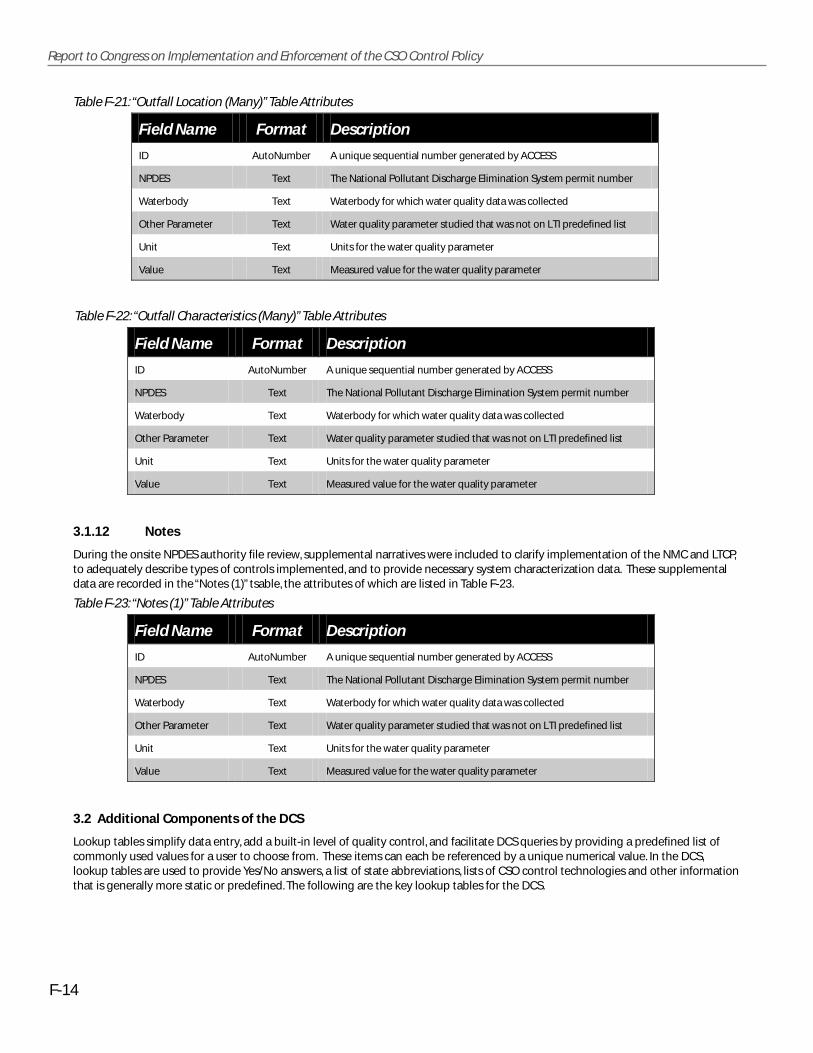
F-14
Report to Congress on Implementation and Enforcement of the CSO Control Policy
3.1.12 Notes
During the onsite NPDES authority file review, supplemental narratives were included to clarify implementation of the NMC and LTCP,to adequately describe types of controls implemented, and to provide necessary system characterization data. These supplementaldata are recorded in the “Notes (1)” tsable, the attributes of which are listed in Table F-23.
3.2 Additional Components of the DCS
Lookup tables simplify data entry, add a built-in level of quality control, and facilitate DCS queries by providing a predefined list ofcommonly used values for a user to choose from. These items can each be referenced by a unique numerical value. In the DCS,lookup tables are used to provide Yes/No answers, a list of state abbreviations, lists of CSO control technologies and other informationthat is generally more static or predefined. The following are the key lookup tables for the DCS.
Field Name Format Description
ID AutoNumber A unique sequential number generated by ACCESS
NPDES Text The National Pollutant Discharge Elimination System permit number
Waterbody Text Waterbody for which water quality data was collected
Other Parameter Text Water quality parameter studied that was not on LTI predefined list
Unit Text Units for the water quality parameter
Value Text Measured value for the water quality parameter
Table F-21: “Outfall Location (Many)” Table Attributes
Field Name Format Description
ID AutoNumber A unique sequential number generated by ACCESS
NPDES Text The National Pollutant Discharge Elimination System permit number
Waterbody Text Waterbody for which water quality data was collected
Other Parameter Text Water quality parameter studied that was not on LTI predefined list
Unit Text Units for the water quality parameter
Value Text Measured value for the water quality parameter
Table F-22: “Outfall Characteristics (Many)” Table Attributes
Field Name Format Description
ID AutoNumber A unique sequential number generated by ACCESS
NPDES Text The National Pollutant Discharge Elimination System permit number
Waterbody Text Waterbody for which water quality data was collected
Other Parameter Text Water quality parameter studied that was not on LTI predefined list
Unit Text Units for the water quality parameter
Value Text Measured value for the water quality parameter
Table F-23: “Notes (1)” Table Attributes

Appendix F
F-15
"Permittee Type (Lookup)" (Table F-24) was created for the Facility Information table. All CSO permittees fall into one of the followingtwo categories: Publicly Owned Treatment Works - POTW (WWTP) or satellite collection system (SCS). CSO permittees that operate aPOTW connected to a combined sewer area were categorized as WWTP, while permittees that only operate a combined sewercollection system and transfer flow to a POTW were categorized as an SCS.
"Enf or Per (Lookup)" (Table F-25) was developed to describe NMC and LTCP implementation in the "Dev and Eval of Altrntvs (1)"table. During data collection, team members were required to complete fields noting how the NMC and LTCP were being required (ornot being required). If this could not be determined, a question mark was chosen. This methodology was continued throughout thedata entry process; however most of these uncertainties were resolved during the QA/QC process.
"NMC Implemented (Lookup)" (Table F-26) was developed for the "Dev and Eval of Altrntvs (1)" table to allow only the selectionnumber to be recorded and stored in the DCS (the textual description could be relationally-linked and accessed via the lookup table).
ID Permittee Type Description
1 WWTP Permittee owns a WWTP and a collection system
2 SCS Permittee owns a satellite collection system ONLY
Table F-24: “Permitee Type (Lookup)” Table
ID Response Description
1 ENF The requirement is being implemented through an enforcement action
2 PER The requirement is being implemented through a permit
3 ? The requirement is being implemented through an unknown method
Table F-25: “Enf or Per (Lookup)” Table
Selection #
Controls Implemented
1 Proper O&M programs for the sewer system and the CSOs
2 Maximum use of the collection system for storage
3 Review of pretreatment requirements to minimize CSO impacts
4 Maximization of flow to the POTW for treatment
5 Prohibition of CSOs during dry weather
6 Control of solid and floatable materials in CSOs
7 Pollution Prevention
8 Public Notification
9 Monitoring
111 All 9 controls have been implemented
888 Cannot determine which controls have been implemented
999 No controls have been implemented
Table F-26: “NMC Implemented (Lookup)” Table

F-16
Report to Congress on Implementation and Enforcement of the CSO Control Policy
"LTCP Approach (Lookup)" (Table F-27) and "Presumption (Lookup)" (Table F-28) were developed to describe LTCP development.According to EPA's LTCP guidance document, permittees must use either a presumption or demonstration approach in developingtheir LTCP. If the presumption approach is chosen, implementation must satisfy one of three goals listed in the "Presumption(Lookup)" table.
"Selection and Implementation of Controls (Many)" stores the control ID from a list of commonly used CSO control technologies:"Source N In System Controls (Lookup)" (Table F-30). Controls fall under one of two categories: source or in-system ("Control Types(Lookup)" in Table F-29).
ID Approach Description
1 PRESUMPTION "Presumption approach" as defined by US EPA's LTCP guidance document
2 DEMONSTRATION "Demonstration approach" as defined by US EPA's LTCP guidance document
Table F-27: “LTCP Approach (Lookup)” Table
ID Goal
1 Limit # overflow events per year
2 Capture at least 85% wet weather combined sewage volume per year
3 Eliminate or reduce mass of pollutants to 85% capture requirement
Table F-28: “Presumption (Lookup)” Table
ID Control Type
Description
3 Source Source controls prevent storm water from entering the collection system
4 In System In System controls require some type of modification to the collection system
Table F-29: “Control Types (Lookup)” Table
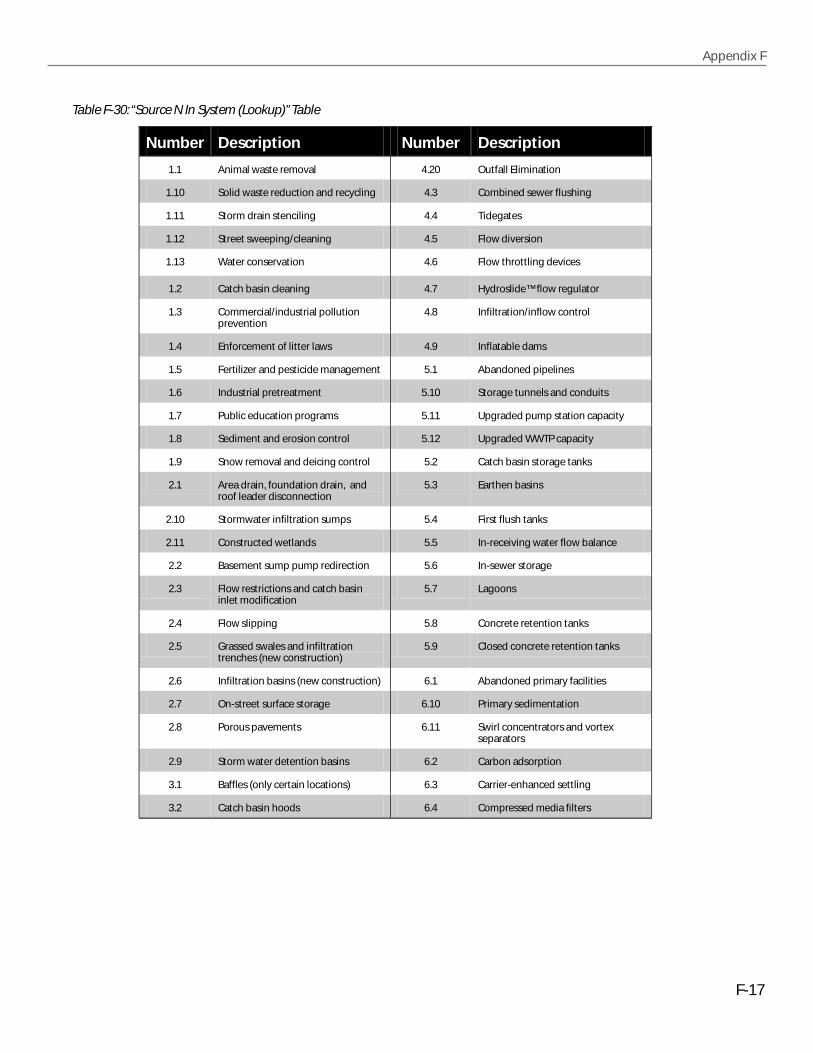
Appendix F
F-17
Number Description Number Description
1.1 Animal waste removal 4.20 Outfall Elimination
1.10 Solid waste reduction and recycling 4.3 Combined sewer flushing
1.11 Storm drain stenciling 4.4 Tidegates
1.12 Street sweeping/cleaning 4.5 Flow diversion
1.13 Water conservation 4.6 Flow throttling devices
1.2 Catch basin cleaning 4.7 Hydroslide™ flow regulator
1.3 Commercial/industrial pollution prevention
4.8 Infiltration/inflow control
1.4 Enforcement of litter laws 4.9 Inflatable dams
1.5 Fertilizer and pesticide management 5.1 Abandoned pipelines
1.6 Industrial pretreatment 5.10 Storage tunnels and conduits
1.7 Public education programs 5.11 Upgraded pump station capacity
1.8 Sediment and erosion control 5.12 Upgraded WWTP capacity
1.9 Snow removal and deicing control 5.2 Catch basin storage tanks
2.1 Area drain, foundation drain, and roof leader disconnection
5.3 Earthen basins
2.10 Stormwater infiltration sumps 5.4 First flush tanks
2.11 Constructed wetlands 5.5 In-receiving water flow balance
2.2 Basement sump pump redirection 5.6 In-sewer storage
2.3 Flow restrictions and catch basin inlet modification
5.7 Lagoons
2.4 Flow slipping 5.8 Concrete retention tanks
2.5 Grassed swales and infiltration trenches (new construction)
5.9 Closed concrete retention tanks
2.6 Infiltration basins (new construction) 6.1 Abandoned primary facilities
2.7 On-street surface storage 6.10 Primary sedimentation
2.8 Porous pavements 6.11 Swirl concentrators and vortex separators
2.9 Storm water detention basins 6.2 Carbon adsorption
3.1 Baffles (only certain locations) 6.3 Carrier-enhanced settling
3.2 Catch basin hoods 6.4 Compressed media filters
Table F-30: “Source N In System (Lookup)” Table
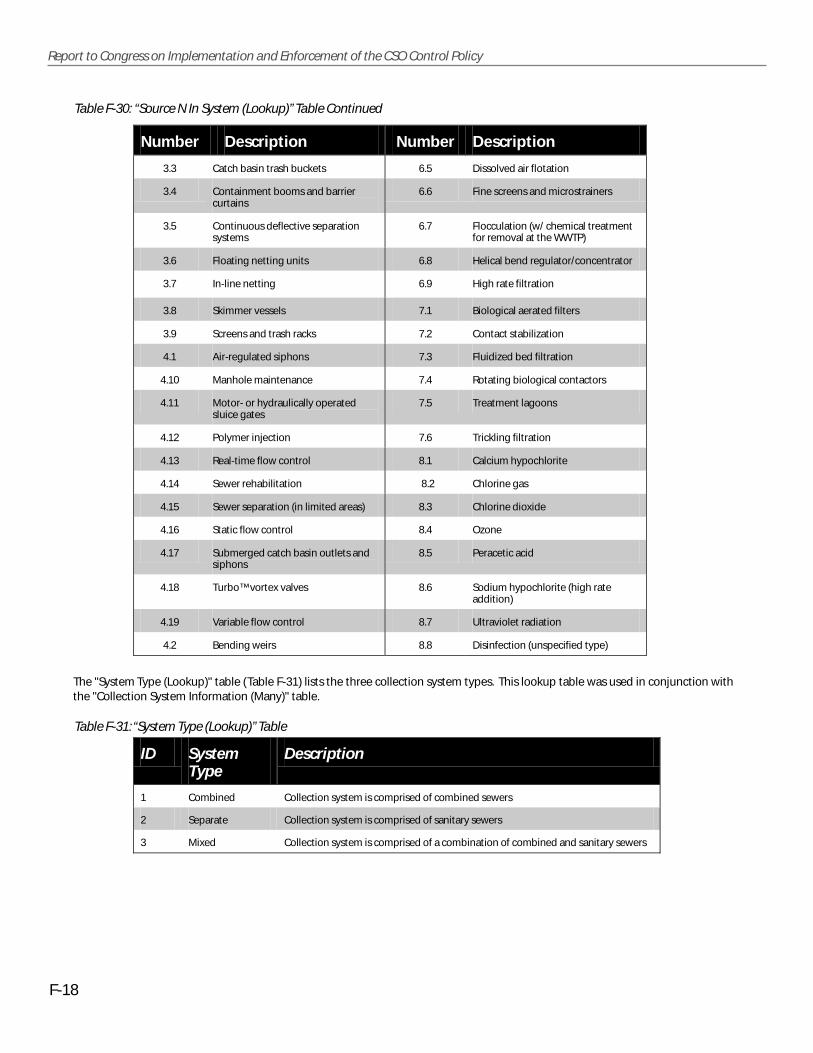
F-18
Report to Congress on Implementation and Enforcement of the CSO Control Policy
The "System Type (Lookup)" table (Table F-31) lists the three collection system types. This lookup table was used in conjunction withthe "Collection System Information (Many)" table.
Number Description Number Description
3.3 Catch basin trash buckets 6.5 Dissolved air flotation
3.4 Containment booms and barrier curtains
6.6 Fine screens and microstrainers
3.5 Continuous deflective separation systems
6.7 Flocculation (w/ chemical treatment for removal at the WWTP)
3.6 Floating netting units 6.8 Helical bend regulator/concentrator
3.7 In-line netting 6.9 High rate filtration
3.8 Skimmer vessels 7.1 Biological aerated filters
3.9 Screens and trash racks 7.2 Contact stabilization
4.1 Air-regulated siphons 7.3 Fluidized bed filtration
4.10 Manhole maintenance 7.4 Rotating biological contactors
4.11 Motor- or hydraulically operated sluice gates
7.5 Treatment lagoons
4.12 Polymer injection 7.6 Trickling filtration
4.13 Real-time flow control 8.1 Calcium hypochlorite
4.14 Sewer rehabilitation 8.2 Chlorine gas
4.15 Sewer separation (in limited areas) 8.3 Chlorine dioxide
4.16 Static flow control 8.4 Ozone
4.17 Submerged catch basin outlets and siphons
8.5 Peracetic acid
4.18 Turbo™ vortex valves 8.6 Sodium hypochlorite (high rate addition)
4.19 Variable flow control 8.7 Ultraviolet radiation
4.2 Bending weirs 8.8 Disinfection (unspecified type)
Table F-30: “Source N In System (Lookup)” Table Continued
ID System Type
Description
1 Combined Collection system is comprised of combined sewers
2 Separate Collection system is comprised of sanitary sewers
3 Mixed Collection system is comprised of a combination of combined and sanitary sewers
Table F-31: “System Type (Lookup)” Table
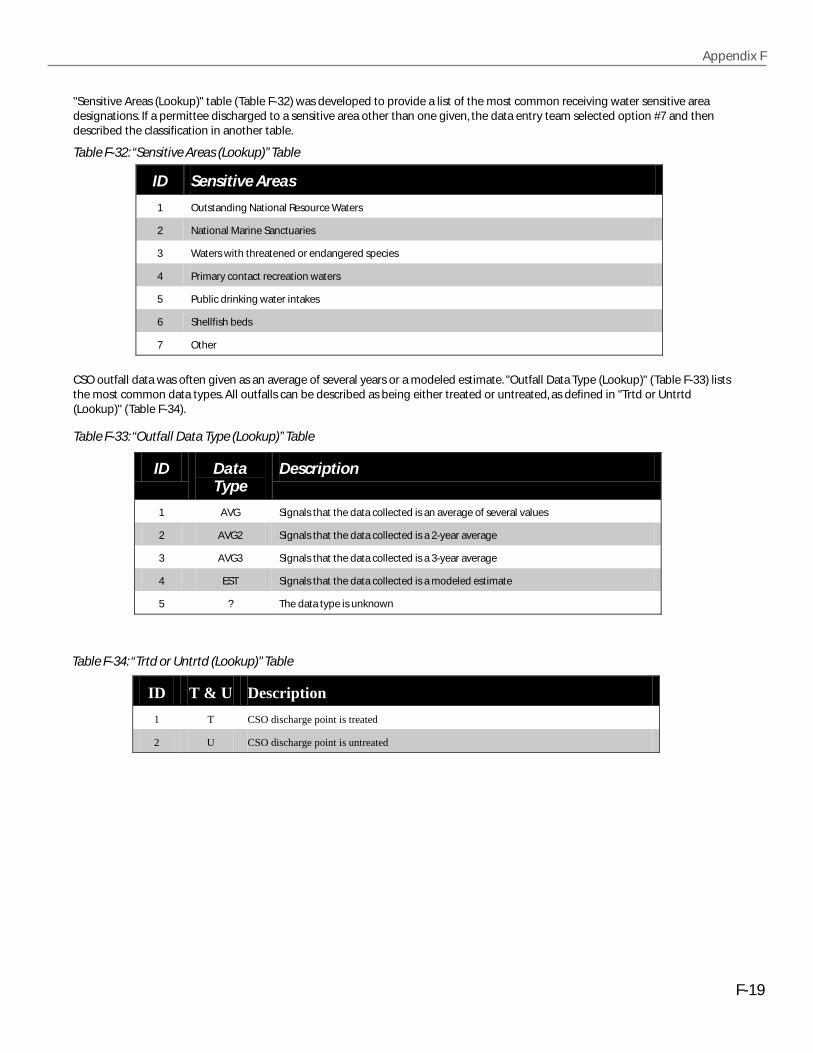
Appendix F
F-19
"Sensitive Areas (Lookup)" table (Table F-32) was developed to provide a list of the most common receiving water sensitive areadesignations. If a permittee discharged to a sensitive area other than one given, the data entry team selected option #7 and thendescribed the classification in another table.
CSO outfall data was often given as an average of several years or a modeled estimate. "Outfall Data Type (Lookup)" (Table F-33) liststhe most common data types. All outfalls can be described as being either treated or untreated, as defined in "Trtd or Untrtd(Lookup)" (Table F-34).
ID Sensitive Areas
1 Outstanding National Resource Waters
2 National Marine Sanctuaries
3 Waters with threatened or endangered species
4 Primary contact recreation waters
5 Public drinking water intakes
6 Shellfish beds
7 Other
Table F-32: “Sensitive Areas (Lookup)” Table
ID Data Type
Description
1 AVG Signals that the data collected is an average of several values
2 AVG2 Signals that the data collected is a 2-year average
3 AVG3 Signals that the data collected is a 3-year average
4 EST Signals that the data collected is a modeled estimate
5 ? The data type is unknown
Table F-33: “Outfall Data Type (Lookup)” Table
ID T & U Description
1 T CSO discharge point is treated
2 U CSO discharge point is untreated
Table F-34: “Trtd or Untrtd (Lookup)” Table
F-20
Report to Congress on Implementation and Enforcement of the CSO Control Policy
4.0 Quality Assurance And Control Protocol For The Data Collection System
The data collection effort for the CSO Report to Congress involved several stages of QA/QC. As previously mentioned, the first stagebegan onsite where team leaders reviewed completed data collection forms, clarified details as necessary, and initialed the formsindicating approval. Upon transmittal of the forms from the data collection team to the data management team, the data managerreviewed the forms for consistency and completeness. Data inconsistencies and anomalies were flagged by the data manager andresolved based on discussions with the data team leader or, if necessary, the permitting authority. The data manager and data teamleader performed random reviews of the CSO permit files, in comparing data on the completed forms with the data entered in theDCS. Data entry patterns causing errors were brought to the attention of data entry team members' in order to limit propagation oferroneous data into the DCS. Several data base queries were developed to detect illogical responses, data entry errors, and missingdata. These queries were applied continuously as new data was entered into the DCS. Summaries of the data stored in the DCS weresent to the state and regional CSO Coordinators for review and correction. Updates to the DCS were made based on state andregional responses, and revised summaries were resent for a final verification. These QA/QC levels helped not only to verify dataaccuracy, but also to ensure that different state CSO programs were characterized in a consistent manner.
This section focuses on the DCS QA/QC process, which consisted of both automated and manual components.
4.1 DCS Automated Queries
Automated queries for the DCS were developed to provide a level of efficiency in QA/QC that could not be accomplished throughmanual review. Manual file review could be biased because no two auditors are alike and identical reviews from one data collectionform to the next could not be guaranteed. Automated queries would allow global DCS reviews without human review bias or error,and could be performed very quickly, affording more time for the development and application of additional QA/QC queries.Automated queries also provided a means to compare expected responses with actual query results to further screen out impossibleor improbable data.
The most basic type of automated query sorted and compared actual data with expected values in order to reveal errors (e.g., "null"(i.e., missing) values - fields for which values were required but none recorded.) The following types of QA/QC steps applied used thismethodology:
● Typographic errors for data with specific numeric formats such as phone numbers and outfall latitudinal and longitudinal coordinates were detected and corrected.
● NPDES numbers and permit issuance and expiration dates were screened for formatting errors and then matched against a prior EPA data base of CSO permittees. Results were verified using PCS.
● Current and original outfall counts were compared-when the current number was greater than the original,results were verified using the data collection forms and through contacting the state or regional CSO Coordinator.
● Null values for NMC and LTCP requirements were detected and corrected.
● Any "?", blank, or N/A responses for LTCP and NMC implementation was verified with the data collection form and, if necessary, the permitting authority.
A second type of automated query was developed based on logical response progressions to groups of questions. For example, if"no" was recorded for the requirement to implement the NMC, then there should be no response recorded for a follow-up question.The reverse is also true-if there was a requirement to implement the NMC then there must also be data listed describingimplementation. This method was used to filter nonsense or unlikely responses for permittees meeting the following conditions:
● Permittees that were required to implement NMC and complete LTCPs, but data did not indicate how that requirement was executed (permit or enforcement action).
● Permittees that were required to implement the NMC, but did not have accompanying data describing which controls were implemented. This query also helped reveal permittees incorrectly marked as not having a NMC requirement.
● Communities that were not required to develop LTCPs, but were not recorded as having implemented CSO controls outside of an LTCP.
● Permittees that were required to develop an LTCP, but had null values for submittal status.
Appendix F
F-21
● Permittees that have submitted LTCPs, but had null values for approval status.
● Communities that were required to develop an LTCP but not implement the NMC.
● Permittees that were defined as being Satellite Collection Systems (SCSs), but listed no facilities where sanitary flow was being treated. This query also helped identify permittees that were incorrectly recorded as being SCS.
It is possible that permittees might meet any of the conditions listed above, however these situations were uncommon enough towarrant confirmation with the data collection form, and if necessary, the NPDES permitting authority.
4.2 DCS Manual Queries
While automated queries provide a reliable method of QA/QC, many tasks were still be performed manually. One example of a datatype best verified via a manual assessment is WWTP flow information. For example, there are facilities with 1.0 mgd flow capacitiesand facilities with 100 mgd capacities. It would be difficult to develop a query that could reliably conclude which of these entriesmight be a typographic error. It is much simpler to visually compare service population statistics or average daily flow to designtreatment capacity in order to uncover inconsistencies. The technique used for these manual queries often started with a computer-based query. Data was further analyzed by referring to the data collection forms and through conversations with state and regionalCSO Coordinators. The following types of data were best suited to manual verification:
● WWTP flow data
● CSO control technologies
● LTCP cost estimates
● Service populations
● Estimated annual CSO discharge volume
● Estimated number of annual CSO events
4.3 Data Validation/Verification
The DCS QA/QC process concluded with data validation and verification. Each state was provided with a narrative fact sheetdescribing the state's permitting, enforcement and water quality standards programs as relative to CSOs. As is evident from the datacollection form (see Appendix F-1), more data was collected and input into the DCS (where available) than was utilized. For reviewpurposes, a summary of specific DCS data used in this first CSO Report to Congress was distributed with the fact sheets (see examplein Appendix F-2). The data summary contained the facility name, location , NPDES permit number, permit issuance and expirationdates, NMC and LTCP requirements, LTCP submittal and approval details, and outfall counts for each CSO permittee.Comments/corrections received from both the EPA region and the permitting authority were then incorporated into the DCS.

F-22
Report to Congress on Implementation and Enforcement of the CSO Control Policy
PART I: INTERVIEW WITH STATE CSO COORDINATOR
Web Site:
Number of current permits requiring NMCs
Number of enforceable mechanisms requiring NMCs
Communities having implemented NMCs 0% 25% 50% 75% 100%
Communities submitting NMC documentation 0% 25% 50% 75% 100%
NMC documentation reviewed/approved by State 0% 25% 50% 75% 100%
Permits requiring LTCP development 0% 25% 50% 75% 100%
Are there any CSO control requirements for communities too small to develop LTCPs? YES NO
If yes, communities implementing CSO controls outside LTCP 0% 25% 50% 75% 100%
Number of LTCPs received, to date:
Number of LTCPs approved, to date:
For completed LTCPs, is permittee in compliance with WQS? YES NO ?
Have WQS staff been involved in LTCP reviews? YES NO ?
Has a coordination team of CSO stakeholders been formed? YES NO ?
Number of requests for CSO-related water quality standards reviews:
WQ data collected sufficient to perform a standards review? YES NO ?
CSO-related enforcement actions undertaken by the State for failure to implement NMCs:
CSO-related enforcement actions undertaken by the State for failure to implement LTCPs:
Where are these enforcement actions documented?
Estimated dollars spent state-wide on CSO controls
Estimated needs for additional CSO controls
NOTES:
Fax Number:
Telephone Number:
Contact Person:
Mailing Address:
Email Address:
Appendix F-1: Data Collection Forms
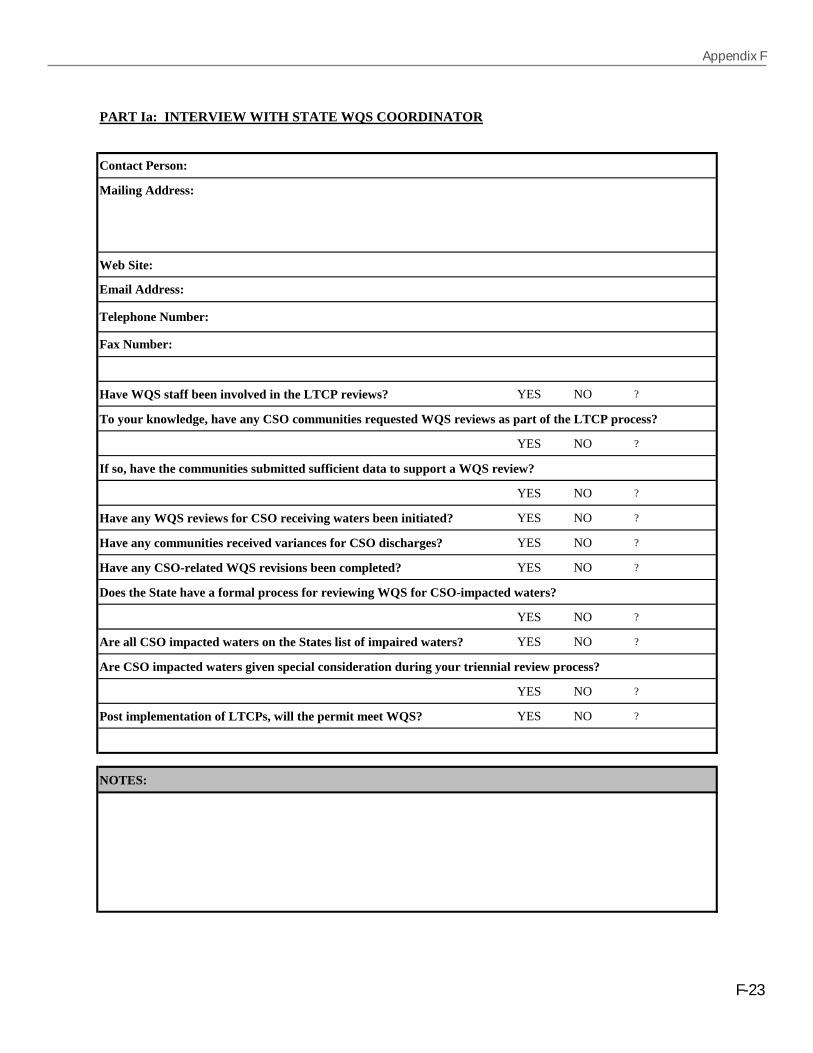
Appendix F
F-23
PART Ia: INTERVIEW WITH STATE WQS COORDINATOR
Web Site:
Have WQS staff been involved in the LTCP reviews? YES NO ?
To your knowledge, have any CSO communities requested WQS reviews as part of the LTCP process?
YES NO ?
If so, have the communities submitted sufficient data to support a WQS review?
YES NO ?
Have any WQS reviews for CSO receiving waters been initiated? YES NO ?
Have any communities received variances for CSO discharges? YES NO ?
Have any CSO-related WQS revisions been completed? YES NO ?
Does the State have a formal process for reviewing WQS for CSO-impacted waters?
YES NO ?
Are all CSO impacted waters on the States list of impaired waters? YES NO ?
Are CSO impacted waters given special consideration during your triennial review process?
YES NO ?
Post implementation of LTCPs, will the permit meet WQS? YES NO ?
NOTES:
Fax Number:
Telephone Number:
Contact Person:
Mailing Address:
Email Address:
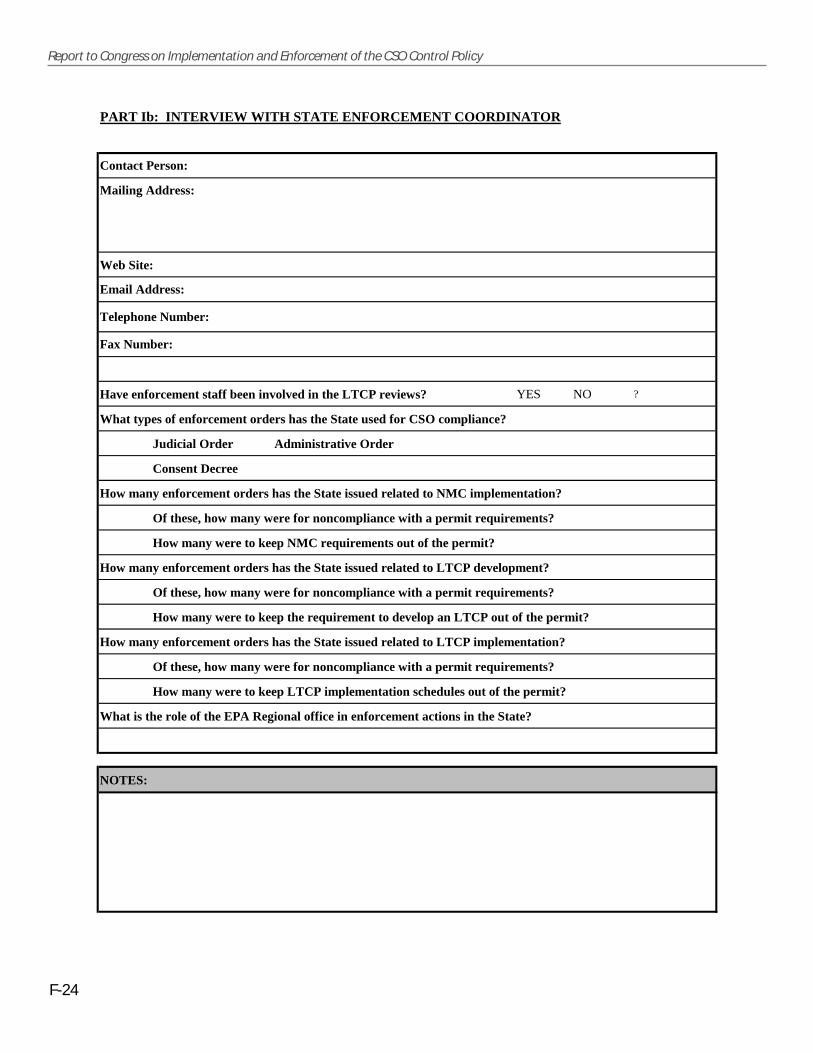
F-24
Report to Congress on Implementation and Enforcement of the CSO Control Policy
PART Ib: INTERVIEW WITH STATE ENFORCEMENT COORDINATOR
Web Site:
Have enforcement staff been involved in the LTCP reviews? YES NO ?
What types of enforcement orders has the State used for CSO compliance?
Judicial Order Administrative Order
Consent Decree
How many enforcement orders has the State issued related to NMC implementation?
Of these, how many were for noncompliance with a permit requirements?
How many were to keep NMC requirements out of the permit?
How many enforcement orders has the State issued related to LTCP development?
Of these, how many were for noncompliance with a permit requirements?
How many were to keep the requirement to develop an LTCP out of the permit?
How many enforcement orders has the State issued related to LTCP implementation?
Of these, how many were for noncompliance with a permit requirements?
How many were to keep LTCP implementation schedules out of the permit?
What is the role of the EPA Regional office in enforcement actions in the State?
NOTES:
Fax Number:
Telephone Number:
Contact Person:
Mailing Address:
Email Address:
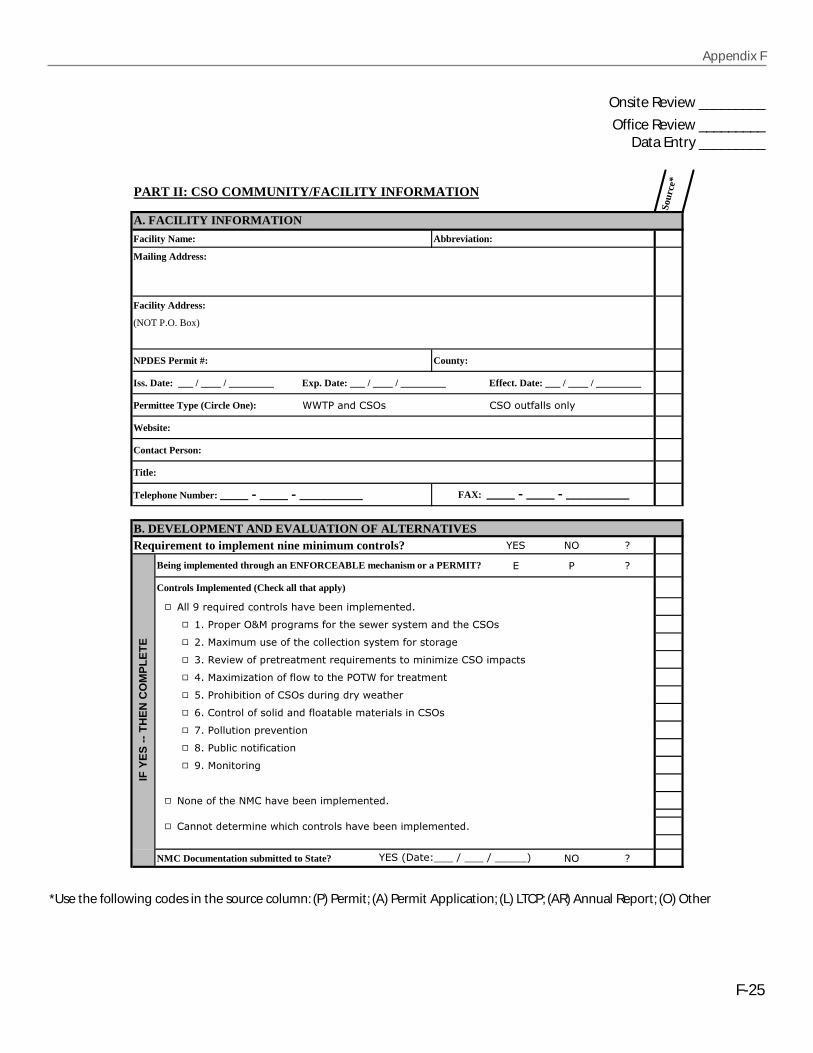
Appendix F
F-25
PART II: CSO COMMUNITY/FACILITY INFORMATION
Sour
ce*
A. FACILITY INFORMATION
Facility Name: Abbreviation:
Mailing Address:
Facility Address:
(NOT P.O. Box)
NPDES Permit #: County:
Iss. Date: ___ / ____ / _________ Exp. Date: ___ / ____ / _________ Effect. Date: ___ / ____ / _________
Permittee Type (Circle One): ����������� ��� �����������
Website:
Contact Person:
Title:
Telephone Number: �����������������������
B. DEVELOPMENT AND EVALUATION OF ALTERNATIVESRequirement to implement nine minimum controls? �� � �
� � �
Controls Implemented (Check all that apply)
� ��������� ������������������������� !�� �����"
� #"����!���$%�!��&�� ������������'�������� �����������
� ("�%�)� � �������������������������� ����������&�
� *"�+����'����!������� ������� ��� �������� ��� �,����� !����
� -"�%�)� �,������������'��������������������� ���
� ."�������������������� ���&�����'������
� /"�������������������������������� ��������������
� 0"����� �����!���������
� 1"�� �����������������
� �"�%��������&
� �������������%������������� !�� �����"
� ������������ ����'������������������������� !�� �����"
NMC Documentation submitted to State? � �
A. FACILITY INFORMATION
FAX: �����������������������
IF Y
ES
--
TH
EN
CO
MP
LE
TE
Being implemented through an ENFORCEABLE mechanism or a PERMIT?
���23���4555�6�555�6�555557
Onsite Review _________
Office Review _________Data Entry _________
*Use the following codes in the source column: (P) Permit; (A) Permit Application; (L) LTCP; (AR) Annual Report; (O) Other
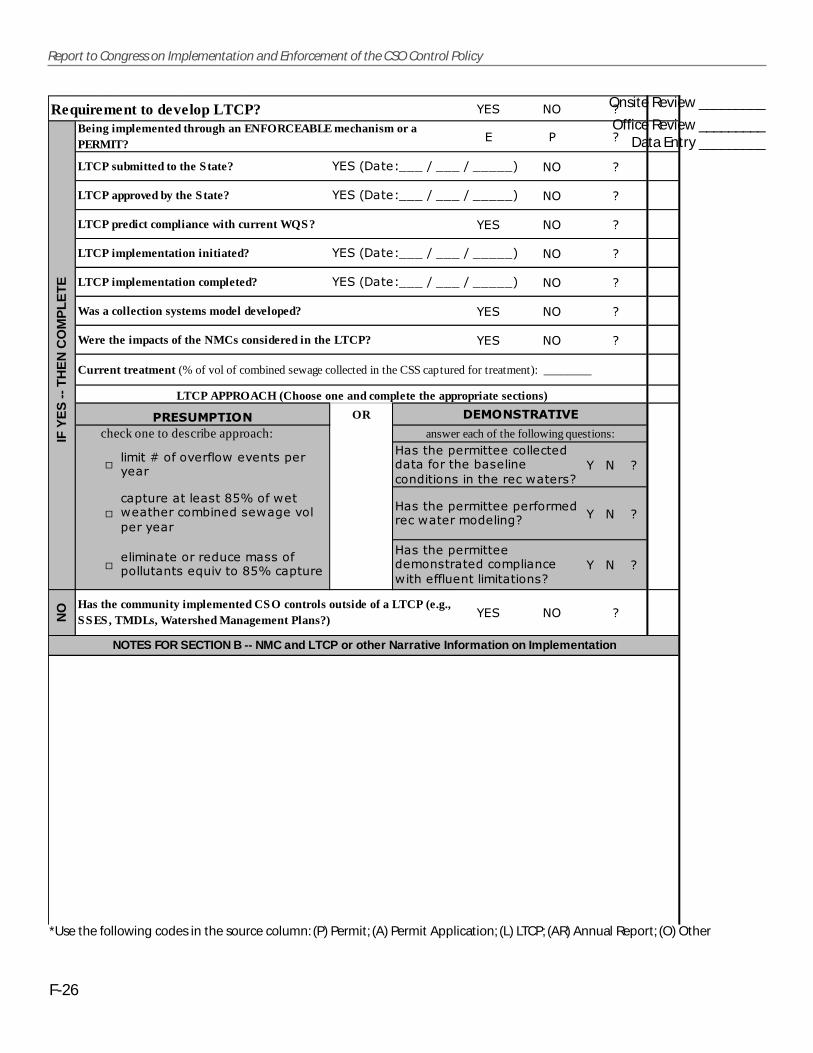
F-26
Report to Congress on Implementation and Enforcement of the CSO Control Policy
Requirement to develop LTCP? �� � �
� � �
LTCP submitted to the State? � �
LTCP approved by the State? � �
LTCP predict compliance with current WQS? �� � �
LTCP implementation initiated? � �
LTCP implementation completed? � �
Was a collection systems model developed? �� � �
Were the impacts of the NMCs considered in the LTCP? �� � �
Current treatment (% of vol of combined sewage collected in the CSS captured for treatment): ________
OR
� ����������
� ����������
� ����������
IF Y
ES
-- T
HE
N C
OM
PL
ET
E
Being implemented through an ENFORCEABLE mechanism or a PERMIT?
���23���4555�6�555�6�555557
���23���4555�6�555�6�555557
���23���4555�6�555�6�555557
���23���4555�6�555�6�555557
LTCP APPROACH (Choose one and complete the appropriate sections)
�������� ��� ������
check one to describe approach: answer each of the following questions:
�� ���8�����������'��������!�������
9�������!�� ������������������������������������������������������������'������
��!� ������������1.:����'���'��������� ��������'�&������!�������
9�������!�� ������!����� �������'����� ������&�
��� ������������ ��� �������!��� �������� ������1.:���!� ��
9�������!�� �������� ������������ !�������'�������� ������ ���������
�
NOTES FOR SECTION B -- NMC and LTCP or other Narrative Information on Implementation
NO Has the community implemented CSO controls outside of a LTCP (e.g.,
SSES, TMDLs, Watershed Management Plans?)�� �
Onsite Review _________
Office Review _________Data Entry _________
*Use the following codes in the source column: (P) Permit; (A) Permit Application; (L) LTCP; (AR) Annual Report; (O) Other
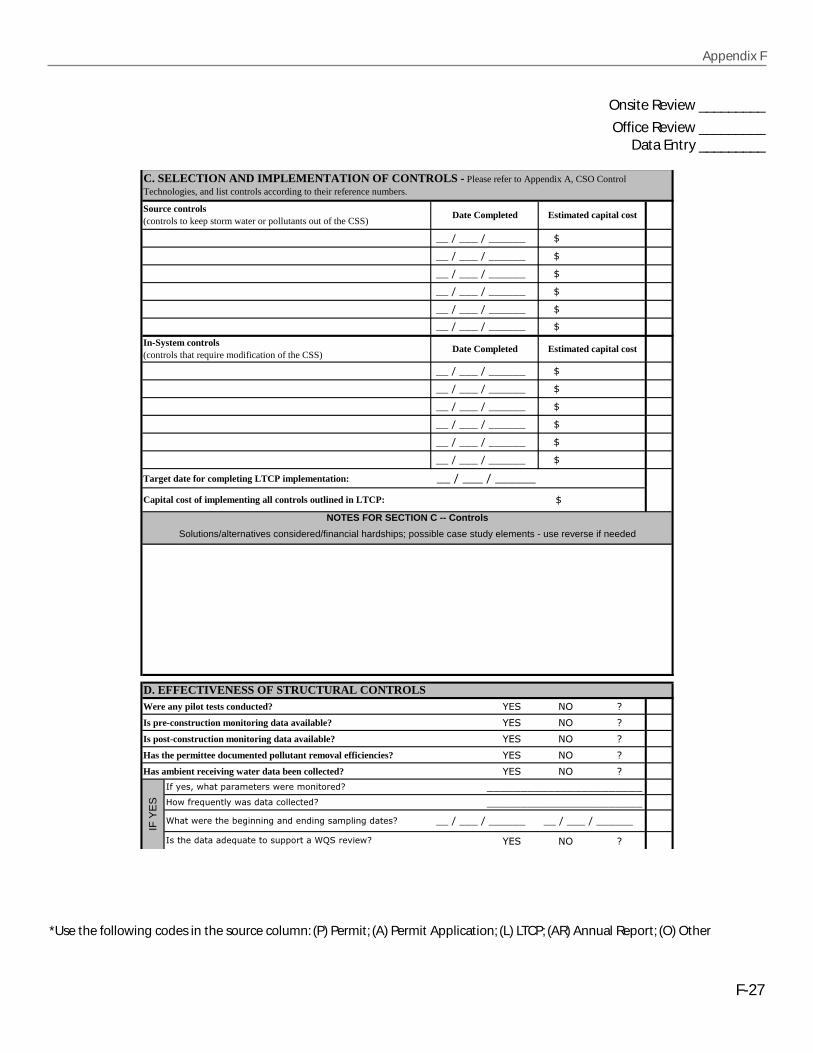
Appendix F
F-27
Target date for completing LTCP implementation:
Were any pilot tests conducted? �� � �
Is pre-construction monitoring data available? �� � �
Is post-construction monitoring data available? �� � �
Has the permittee documented pollutant removal efficiencies? �� � �
Has ambient receiving water data been collected? �� � �
�� � �
C. SELECTION AND IMPLEMENTATION OF CONTROLS - Please refer to Appendix A, CSO Control Technologies, and list controls according to their reference numbers.
Source controls (controls to keep storm water or pollutants out of the CSS)
Date Completed Estimated capital cost
�55�6�555�6�555555 ����;
�55�6�555�6�555555 ����;
�55�6�555�6�555555 ����;
�55�6�555�6�555555 ����;
�55�6�555�6�555555 ����;
�55�6�555�6�555555 ����;
In-System controls (controls that require modification of the CSS)
Date Completed Estimated capital cost
�55�6�555�6�555555 ����;
�55�6�555�6�555555 ����;
�55�6�555�6�555555 ����;
�55�6�555�6�555555 ����;
�55�6�555�6�555555 ����;
�55�6�555�6�555555 ����;
�55�6�555�6�555555
Capital cost of implementing all controls outlined in LTCP: ������������;
NOTES FOR SECTION C -- Controls
Solutions/alternatives considered/financial hardships; possible case study elements - use reverse if needed
D. EFFECTIVENESS OF STRUCTURAL CONTROLS
IF Y
ES
<�����=�'����!��� ������'���� ��������� 555555555555555555555559�'����� ������'������������������ 55555555555555555555555
�����'����������&�����&����������&��� !���&������� �55�6�555�6�555555 �55�6�555�6�555555
<��������������� �������� !!�������>������'�
Onsite Review _________
Office Review _________Data Entry _________
*Use the following codes in the source column: (P) Permit; (A) Permit Application; (L) LTCP; (AR) Annual Report; (O) Other

F-28
Report to Congress on Implementation and Enforcement of the CSO Control Policy
If permitted for OUTFALLS ONLY (no treatment fac.), list treatment facility and/or town receiving flow:
Annual average daily flow (MGD otherwise LIST UNITS):
Design primary treatment capacity (MGD):
Design secondary treatment capacity (MAD):
Peak flow primary treatment capacity (MGD):
Peak flow secondary treatment capacity (MGD):
Are CSO-related bypasses authorized? �� � �
�� � �
Original number of CSO PERMITTED outfall points: 5555555
Current number of CSO PERMITTED outfall points: 5555555 Date:
5555555
Average number of dry weather overflows per year: 5555555
5555555
5555555
E. COLLECTION SYSTEM INFORMATION - Provide information on entities served by the WWTP (name, estimated population, and whether the collection system is comprised of combined or separate sanitary sewers. If the entity is comprised of both system types, list each type separately)
ENTITY POPULATION TYPE OF SYSTEM
TOTAL POPULATION SERVED: 55555555555555555555555555555
55555555555555555555555555555
F. FLOW AND TREATMENT INFORMATION
5555555555555555555555
5555555555555555555555
5555555555555555555555
5555555555555555555555
5555555555555555555555
Other available treatment types (list treatment type and maximum daily flow allowed):
5555555555555555555555555555555555555555555555555555555555555
5555555555555555555555555555555555555555555555555555555555555
Are partially treated effluents combined with fully treated flows prior to discharge?
G. DISCHARGES & OTHER DISPOSAL METHODS - This section is ONLY concerned with discharges to waters of the U.S. List how many of each of the following types of discharge points are within the municipal collection system.
�55�6�555�6�555555
Number of constructed emergency overflows prior to the WWTP (e.g. relief at pump stations):
Number of discharge points with effluent receiving full (secondary) treatment:Number of discharge points with effluent receiving partial (primary) treatment ONLY:
Onsite Review _________
Office Review _________Data Entry _________
*Use the following codes in the source column: (P) Permit; (A) Permit Application; (L) LTCP; (AR) Annual Report; (O) Other
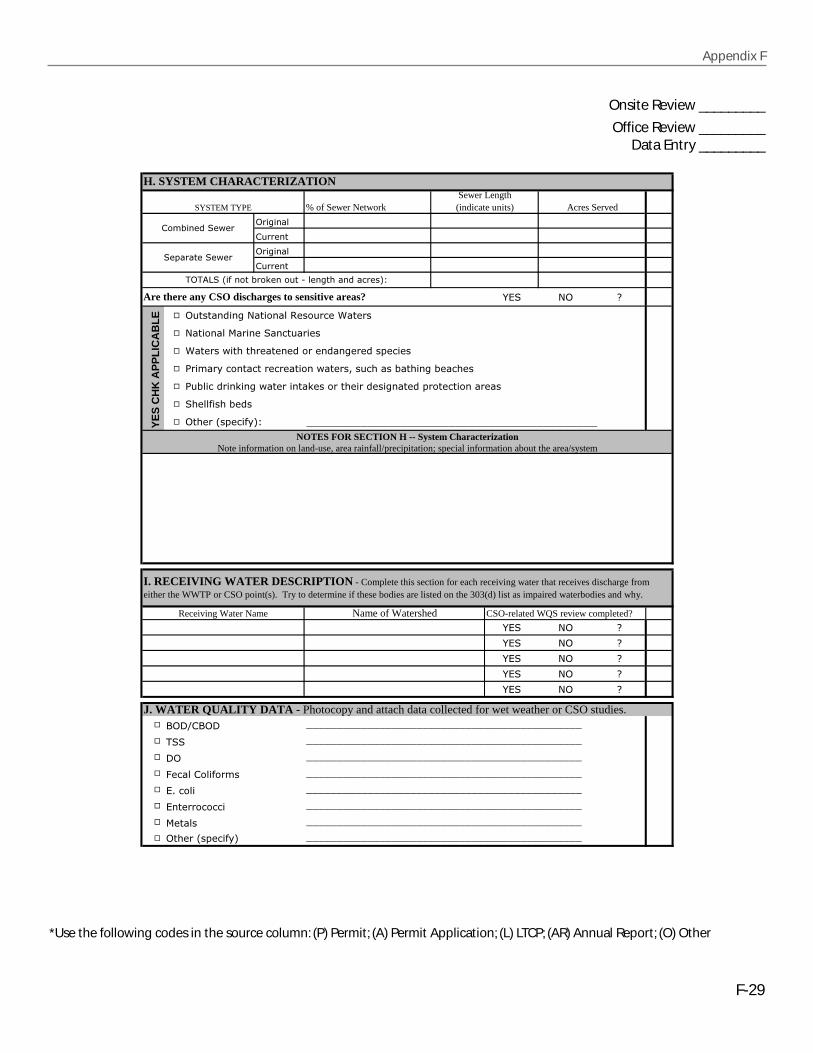
Appendix F
F-29
��&����
� �����
��&����
� �����
�� � �
� ��������&����������+��� ����������
� ���������%���������� �����
� �������'�����������������������&������!�����
� ��� �����������������������'�����=�� ������������&��������
� � ���������?��&�'���������?����������������&������!���������������
� �������������
� �����2�!�����74
�� � �
�� � �
�� � �
�� � �
�� � �
� @36�@3
� �
� 3
� A������������ �
� �"�����
� ������������
� %�����
� �����2�!�����7
H. SYSTEM CHARACTERIZATION
SYSTEM TYPE % of Sewer NetworkSewer Length
(indicate units) Acres Served
�� �������'��
�!�������'��
���B�2����������?���� ��C����&������������74
Are there any CSO discharges to sensitive areas?
YE
S C
HK
AP
PL
ICA
BL
E
5555555555555555555555555555555555555555555NOTES FOR SECTION H -- System Characterization
Note information on land-use, area rainfall/precipitation; special information about the area/system
I. RECEIVING WATER DESCRIPTION - Complete this section for each receiving water that receives discharge from either the WWTP or CSO point(s). Try to determine if these bodies are listed on the 303(d) list as impaired waterbodies and why.
Receiving Water Name Name of Watershed CSO-related WQS review completed?
J. WATER QUALITY DATA - Photocopy and attach data collected for wet weather or CSO studies.555555555555555555555555555555555555555555555
555555555555555555555555555555555555555555555
555555555555555555555555555555555555555555555
555555555555555555555555555555555555555555555
555555555555555555555555555555555555555555555
555555555555555555555555555555555555555555555
555555555555555555555555555555555555555555555
555555555555555555555555555555555555555555555
Onsite Review _________
Office Review _________Data Entry _________
*Use the following codes in the source column: (P) Permit; (A) Permit Application; (L) LTCP; (AR) Annual Report; (O) Other
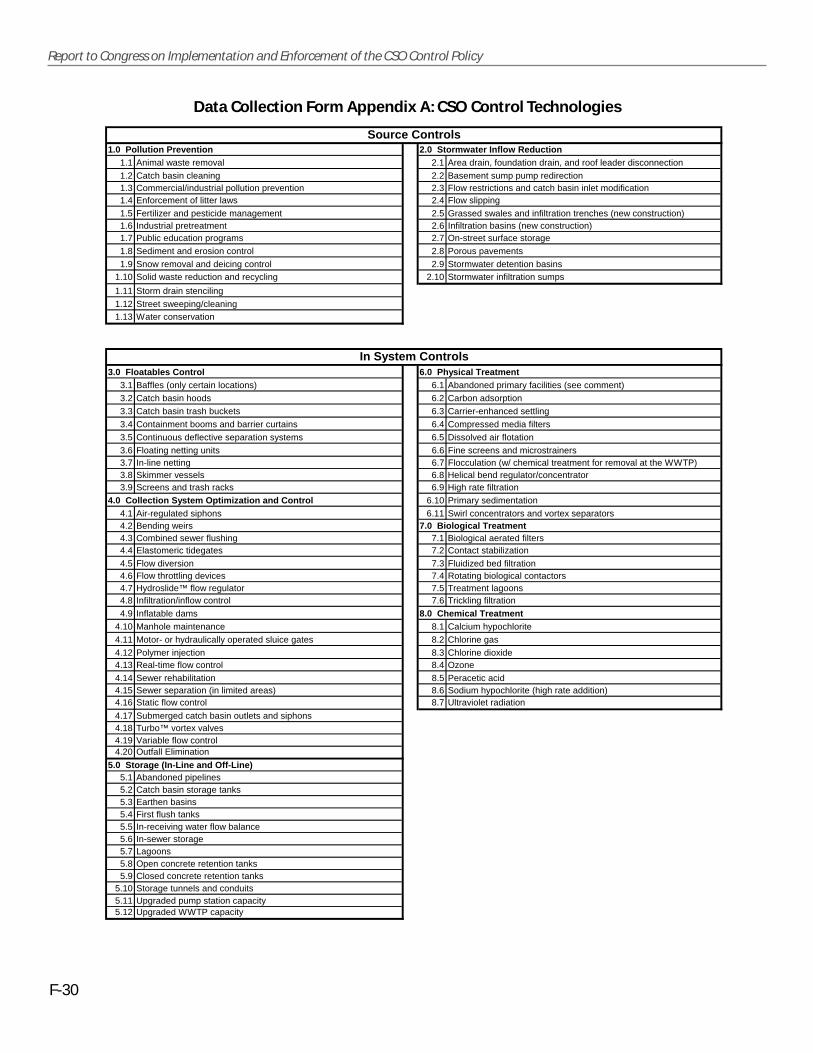
F-30
Report to Congress on Implementation and Enforcement of the CSO Control Policy
1.0 Pollution Prevention 2.0 Stormwater Inflow Reduction1.1 Animal waste removal 2.1 Area drain, foundation drain, and roof leader disconnection
1.2 Catch basin cleaning 2.2 Basement sump pump redirection1.3 Commercial/industrial pollution prevention 2.3 Flow restrictions and catch basin inlet modification1.4 Enforcement of litter laws 2.4 Flow slipping
1.5 Fertilizer and pesticide management 2.5 Grassed swales and infiltration trenches (new construction)1.6 Industrial pretreatment 2.6 Infiltration basins (new construction)1.7 Public education programs 2.7 On-street surface storage
1.8 Sediment and erosion control 2.8 Porous pavements
1.9 Snow removal and deicing control 2.9 Stormwater detention basins1.10 Solid waste reduction and recycling 2.10 Stormwater infiltration sumps
1.11 Storm drain stenciling
1.12 Street sweeping/cleaning1.13 Water conservation
3.0 Floatables Control 6.0 Physical Treatment3.1 Baffles (only certain locations) 6.1 Abandoned primary facilities (see comment)
3.2 Catch basin hoods 6.2 Carbon adsorption
3.3 Catch basin trash buckets 6.3 Carrier-enhanced settling
3.4 Containment booms and barrier curtains 6.4 Compressed media filters
3.5 Continuous deflective separation systems 6.5 Dissolved air flotation
3.6 Floating netting units 6.6 Fine screens and microstrainers3.7 In-line netting 6.7 Flocculation (w/ chemical treatment for removal at the WWTP)3.8 Skimmer vessels 6.8 Helical bend regulator/concentrator3.9 Screens and trash racks 6.9 High rate filtration
4.0 Collection System Optimization and Control 6.10 Primary sedimentation
4.1 Air-regulated siphons 6.11 Swirl concentrators and vortex separators4.2 Bending weirs 7.0 Biological Treatment4.3 Combined sewer flushing 7.1 Biological aerated filters4.4 Elastomeric tidegates 7.2 Contact stabilization
4.5 Flow diversion 7.3 Fluidized bed filtration4.6 Flow throttling devices 7.4 Rotating biological contactors4.7 Hydroslide™ flow regulator 7.5 Treatment lagoons4.8 Infiltration/inflow control 7.6 Trickling filtration
4.9 Inflatable dams 8.0 Chemical Treatment4.10 Manhole maintenance 8.1 Calcium hypochlorite
4.11 Motor- or hydraulically operated sluice gates 8.2 Chlorine gas
4.12 Polymer injection 8.3 Chlorine dioxide4.13 Real-time flow control 8.4 Ozone
4.14 Sewer rehabilitation 8.5 Peracetic acid4.15 Sewer separation (in limited areas) 8.6 Sodium hypochlorite (high rate addition)4.16 Static flow control 8.7 Ultraviolet radiation
4.17 Submerged catch basin outlets and siphons4.18 Turbo™ vortex valves4.19 Variable flow control4.20 Outfall Elimination
5.0 Storage (In-Line and Off-Line)5.1 Abandoned pipelines5.2 Catch basin storage tanks5.3 Earthen basins5.4 First flush tanks5.5 In-receiving water flow balance5.6 In-sewer storage5.7 Lagoons5.8 Open concrete retention tanks5.9 Closed concrete retention tanks
5.10 Storage tunnels and conduits5.11 Upgraded pump station capacity5.12 Upgraded WWTP capacity
Source Controls
In System Controls
Data Collection Form Appendix A: CSO Control Technologies
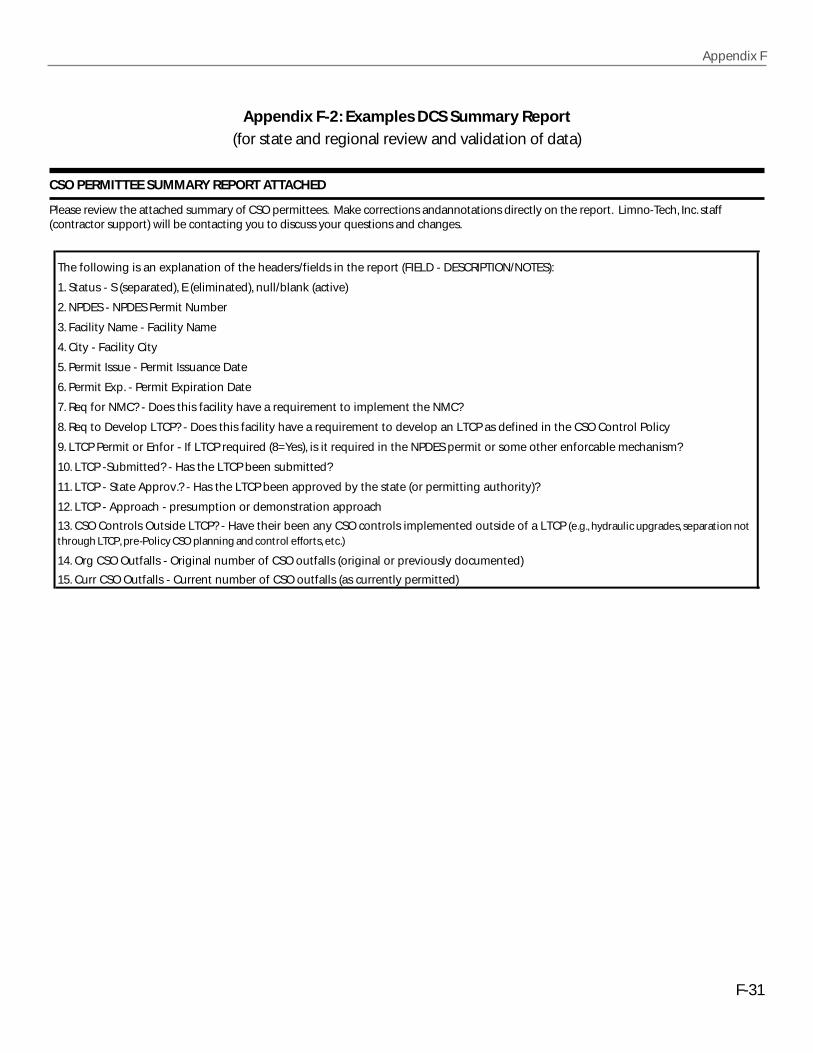
Appendix F
F-31
Appendix F-2: Examples DCS Summary Report
(for state and regional review and validation of data)
CSO PERMITTEE SUMMARY REPORT ATTACHED
Please review the attached summary of CSO permittees. Make corrections andannotations directly on the report. Limno-Tech, Inc. staff(contractor support) will be contacting you to discuss your questions and changes.
The following is an explanation of the headers/fields in the report (FIELD - DESCRIPTION/NOTES):
1. Status - S (separated), E (eliminated), null/blank (active)
2. NPDES - NPDES Permit Number
3. Facility Name - Facility Name
4. City - Facility City
5. Permit Issue - Permit Issuance Date
6. Permit Exp. - Permit Expiration Date
7. Req for NMC? - Does this facility have a requirement to implement the NMC?
8. Req to Develop LTCP? - Does this facility have a requirement to develop an LTCP as defined in the CSO Control Policy
9. LTCP Permit or Enfor - If LTCP required (8=Yes), is it required in the NPDES permit or some other enforcable mechanism?
10. LTCP -Submitted? - Has the LTCP been submitted?
11. LTCP - State Approv.? - Has the LTCP been approved by the state (or permitting authority)?
12. LTCP - Approach - presumption or demonstration approach
13. CSO Controls Outside LTCP? - Have their been any CSO controls implemented outside of a LTCP (e.g., hydraulic upgrades, separation not
through LTCP, pre-Policy CSO planning and control efforts, etc.)
14. Org CSO Outfalls - Original number of CSO outfalls (original or previously documented)
15. Curr CSO Outfalls - Current number of CSO outfalls (as currently permitted)
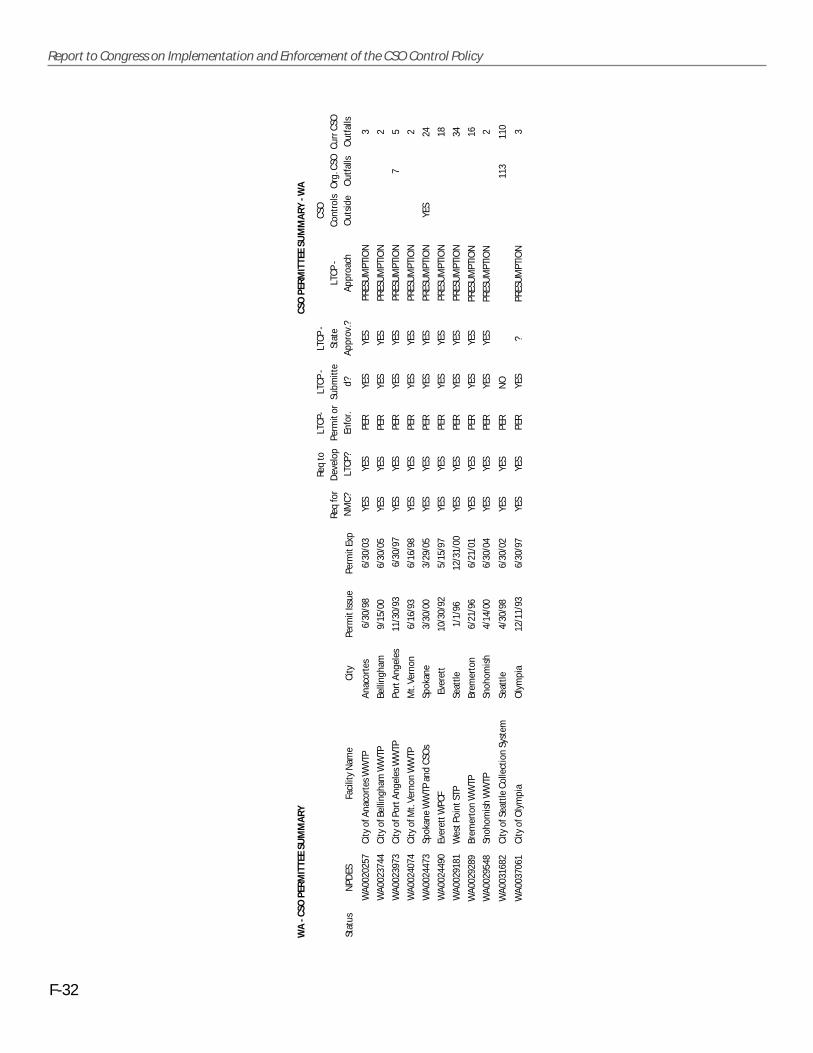
F-32
Report to Congress on Implementation and Enforcement of the CSO Control Policy
WA
- C
SO P
ERM
ITTE
E SU
MM
AR
YC
SO P
ERM
ITTE
E SU
MM
AR
Y -
WA
Stat
us
NPD
ES
Faci
lity
Nam
e C
ityPe
rmit
Issu
ePe
rmit
Exp
Req
for
NM
C?
Req
to
Dev
elop
LTC
P?
LTC
P-
Perm
it or
Enfo
r.
LTC
P -
Subm
itte
d?
LTC
P -
Stat
e
App
rov.
?
LTC
P -
App
roac
h
CSO
Con
trol
s
Out
side
Org
. CSO
Out
falls
Cur
r CSO
Out
falls
WA
0020
257
City
of A
naco
rtes
WW
TPA
naco
rtes
6/3
0/98
6/30
/03
YES
YES
PER
YES
YES
PRES
UM
PTIO
N3
WA
0023
744
City
of B
ellin
gham
WW
TPBe
lling
ham
9/15
/00
6/30
/05
YES
YES
PER
YES
YES
PRES
UM
PTIO
N2
WA
0023
973
City
of P
ort A
ngel
es W
WTP
Port
Ang
eles
11/3
0/93
6/3
0/97
YES
YES
PER
YES
YES
PRES
UM
PTIO
N7
5
WA
0024
074
City
of M
t. Ve
rnon
WW
TPM
t. Ve
rnon
6/16
/93
6/16
/98
YES
YES
PER
YES
YES
PRES
UM
PTIO
N2
WA
0024
473
Spok
ane
WW
TP a
nd C
SOs
Spok
ane
3/30
/00
3/29
/05
YES
YES
PER
YES
YES
PRES
UM
PTIO
NYE
S24
WA
0024
490
Ever
ett W
PCF
Eve
rett
10
/30/
92 5
/15/
97
YES
YES
PER
YES
YES
PRES
UM
PTIO
N18
WA
0029
181
Wes
t Poi
nt S
TPSe
attle
1/
1/96
12/3
1/00
YES
YES
PER
YES
YES
PRES
UM
PTIO
N34
WA
0029
289
Brem
erto
n W
WTP
Br
emer
ton
6/2
1/96
6/
21/0
1YE
SYE
SPE
RYE
SYE
SPR
ESU
MPT
ION
16
WA
0029
548
Snoh
omis
h W
WTP
Sn
ohom
ish
4/14
/00
6/30
/04
YES
YES
PER
YES
YES
PRES
UM
PTIO
N
2
WA
0031
682
City
of S
eatt
le C
olle
ctio
n Sy
stem
Se
attle
4/
30/9
86/
30/0
2YE
SYE
SPE
RN
O
113
110
WA
0037
061
City
of O
lym
pia
Oly
mpi
a 12
/11/
936/
30/9
7YE
SYE
SPE
RYE
S?
PRES
UM
PTIO
N
3
Appendix G
AMSA and CSO PartnershipCSO Survey Summary


G-1
Appendix G
1.0 Purpose of the AMSA and CSO Partnership Surveys
The Association of Metropolitan Sewerage Agencies (AMSA) and the CSO Partnership conducted independent, confidentialsurveys of their respective CSO community members during Spring 2001 to assess the status of CSO control programs. Thesurvey forms used by AMSA and the CSO Partnership are attached in Appendix G-1. The respondents to these surveysrepresent regulated entities that own and operate combined sewer systems. AMSA members tend to be large- to medium-sized communities. CSO Partnership members tend to be small- to medium-sized communities.
Twenty-three of the approximately 85 member communities responded to the CSO Partnership survey. Twenty-seven ofthe estimated 58 AMSA CSO communities participated. While there was some overlap in the questions posed in eachsurvey, the results are, for the most part, survey-specific. Where applicable, EPA combined responses from both surveys andsummarized in this appendix. The number of respondents (n) is noted with each survey result.
2.0 Program Implementation Status
The AMSA and CSO Partnership surveys included questions pertaining to implementation status of CSO control programs.Specifically, survey questions addressed the implementation of the CSO Control Policy with respect to the NMC,development and implementation of LTCPs, and reduction of CSOs since 1994.
Seventy percent of respondents to both surveys indicated full implementation of the NMC (n=47). The CSO Partnershipalso asked its members, "Of the NMC, which was the most effective in reducing CSO volume, frequency and/or duration?"Maximization of flow to the POTW for treatment and proper operation and regular maintenance programs were identifiedas the most effective NMC. The ranked results from the CSO Partnership survey are shown in Table G-1.
AMSA respondents were also surveyed about the status of LTCPs. Eighty percent of the AMSA respondents had developedan LTCP (n=25). Of those with LTCPs, 48 percent had been approved. An additional AMSA question focused on the choice ofLTCP approach. Of the 21 AMSA respondents, 50 percent of the LTCPs were based upon the demonstration approach, 43percent were based upon the presumption approach, and 19 percent were based on both approaches or were unspecified.The extent to which LTCPs have been implemented among AMSA survey respondents is given in Table G-2.
Table G-1: Effectiveness of NMC in reducing CSO volume, frequency, and duration (n=18) (CSO Partnership survey, 2001)
Rank NMC Description
1 Maximization of flow to the POTW for treatment
2 Proper operation and regular maintenance programs
3 Review and Modify Pretreatment Requirements
3 Elimination of CSOs during dry weather
5 Maximization of storage in the collection system
5 Control of solid and floatable material in CSOs
5 Pollution prevention programs to reduce contaminants in CSOs
8 Public notification
8 Monitoring to characterize CSO impacts and the efficacy of controls
Summary of AMSA and CSO Partnership Surveys
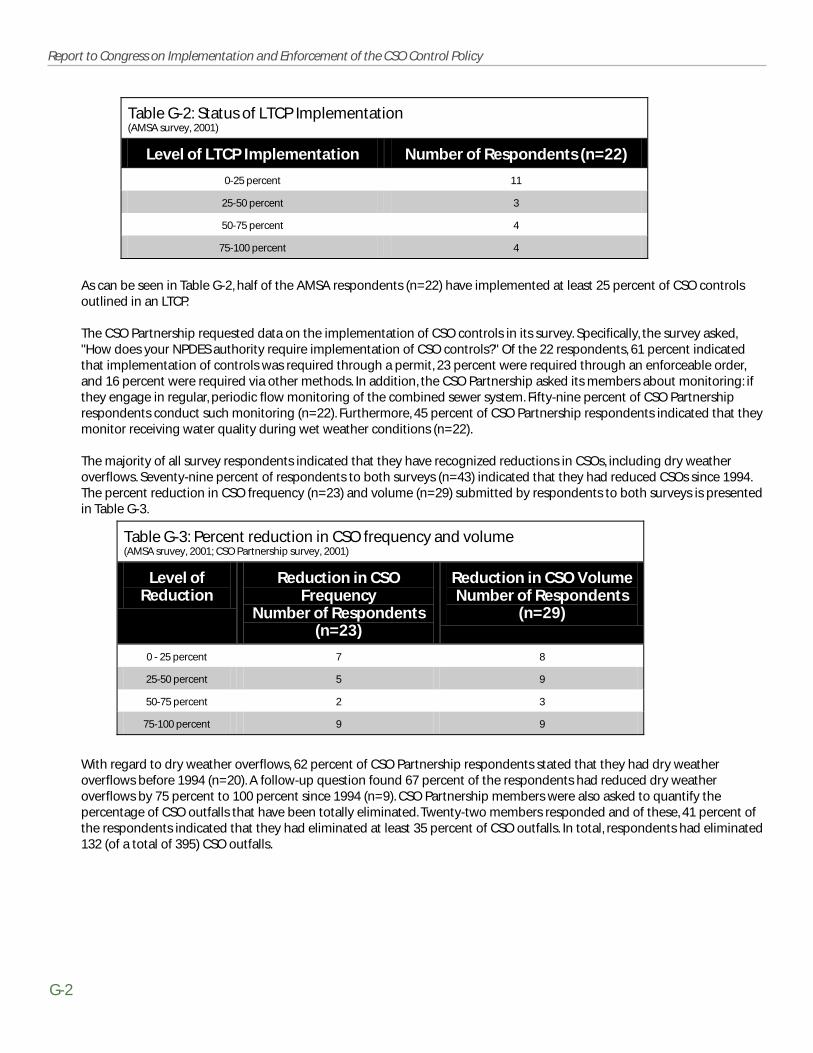
G-2
Report to Congress on Implementation and Enforcement of the CSO Control Policy
As can be seen in Table G-2, half of the AMSA respondents (n=22) have implemented at least 25 percent of CSO controlsoutlined in an LTCP.
The CSO Partnership requested data on the implementation of CSO controls in its survey. Specifically, the survey asked,"How does your NPDES authority require implementation of CSO controls?" Of the 22 respondents, 61 percent indicatedthat implementation of controls was required through a permit, 23 percent were required through an enforceable order,and 16 percent were required via other methods. In addition, the CSO Partnership asked its members about monitoring: ifthey engage in regular, periodic flow monitoring of the combined sewer system. Fifty-nine percent of CSO Partnershiprespondents conduct such monitoring (n=22). Furthermore, 45 percent of CSO Partnership respondents indicated that theymonitor receiving water quality during wet weather conditions (n=22).
The majority of all survey respondents indicated that they have recognized reductions in CSOs, including dry weatheroverflows. Seventy-nine percent of respondents to both surveys (n=43) indicated that they had reduced CSOs since 1994.The percent reduction in CSO frequency (n=23) and volume (n=29) submitted by respondents to both surveys is presentedin Table G-3.
With regard to dry weather overflows, 62 percent of CSO Partnership respondents stated that they had dry weatheroverflows before 1994 (n=20). A follow-up question found 67 percent of the respondents had reduced dry weatheroverflows by 75 percent to 100 percent since 1994 (n=9). CSO Partnership members were also asked to quantify thepercentage of CSO outfalls that have been totally eliminated. Twenty-two members responded and of these, 41 percent ofthe respondents indicated that they had eliminated at least 35 percent of CSO outfalls. In total, respondents had eliminated132 (of a total of 395) CSO outfalls.
Table G-2: Status of LTCP Implementation (AMSA survey, 2001)
Level of LTCP Implementation Number of Respondents (n=22)
0-25 percent 11
25-50 percent 3
50-75 percent 4
75-100 percent 4
Table G-3: Percent reduction in CSO frequency and volume (AMSA sruvey, 2001; CSO Partnership survey, 2001)
Level of Reduction
Reduction in CSO Frequency
Number of Respondents (n=23)
Reduction in CSO Volume Number of Respondents
(n=29)
0 - 25 percent 7 8
25-50 percent 5 9
50-75 percent 2 3
75-100 percent 9 9

Appendix G
3.0 Benefits
The CSO Partnership survey addressed benefits associated with CSO control and abatement measures by requesting itsmembers to identify environmental benefits specifically attributed to the implementation of CSO control measures. Themajority of respondents identified some benefits directly attributable to CSO controls (n= 22). Only six of 25 AMSArespondents indicated that full implementation of the LTCP will result in attainment of water quality standards. Benefitsidentified in the CSO Partnership survey are presented in Table G-4.
4.0 Costs and Financing of CSO Control
Costs and financing for CSO control were investigated in both the AMSA and CSO Partnership Surveys. AMSA surveyed itsmembers about how much of capital improvement plan (CIP) budgets are dedicated to LTCP implementation. Fifteenmembers responded: seven respondents dedicate between 0-25 percent, five respondents dedicate 25-50 percent, andthree respondents dedicate more than 50-70 percent of the CIP to the LTCP. None of the 15 respondents dedicate morethan 75 percent of the CIP to the LTCP.
The CSO Partnership survey also asked two questions related to capital costs of CSO control. The first was, "What is yourestimate of the investment in capital costs that your community has made to date?" The second question was, "What isyour estimate of the additional capital costs that is necessary to comply with the CSO Control Policy?" Capital investmentsmade to date and additional investments needs ranged from less that $100,000 to greater than $1 million. A breakdown ofthe survey results related to capital costs is shown in Table G-5.
Table G-4: Benefits identified as specifically attributable to CSO controls (CSO Partnership survey, 2001)
Benefit Percent of respondents (n=22)
Improved aesthetics 83 percent
Improvement in ambient water quality 78 percent
Drinking water source protection 6 percent
Prevention of beach closures 0 percent
Improvement in public health 39 percent
Shellfish bed re-openings 6 percent
Improved recreational use 50 percent
Protection of sensitive areas 56 percent
Table G-5: Capital costs related to CSO control (CSO Partnership survey, 2001)
Capital Costs Investment Made to Date (n=20)
Additional Investment to Comply with CSO Control
Policy (n=18)
< $100,000 4 1
$100,000 to $1 million 4 4
$1 million to $10 million 4 8
$10 million to $100 million 7 3
> $100 million 1 2

G-4
Report to Congress on Implementation and Enforcement of the CSO Control Policy
In addition, the CSO Partnership surveyed its members about operation and maintenance (O&M) costs. The CSO Partnership firstrequested an estimate by the CSO community of the investment in annual O&M costs that the community has made to date. Ten of the18 respondents indicated that annual O&M costs to date were less than $100,000. The second question was, "What is your estimate of theadditional annual O&M costs that is necessary to comply with the CSO Control Policy?" The O&M cost estimates are given in Table G-6.
Financing was also considered in the CSO Partnership survey. The survey asked how member communities have funded CSO controls todate. Among the 22 respondents, self-financing was the most prevalent form of funding; 82 percent of the respondents use this fundingsource. Other funding sources include SRF loans (55 percent), state grants (32 percent), federal grants (18 percent), and other fundingsources (5 percent).
5.0 Obstacles to Full Attainment of CSO Control
Lastly, the CSO Partnership survey asked respondents to rate factors as obstacles to full attainment of CSO control. Among the 19respondents, financial resources was recognized as the most important obstacle; data and guidance to support LTCP development werefound to be less significant obstacles. The ranked results are presented in Table G-7.
Table G-6: O&M costs related to CSO control (CSO Partnership survey, 2001)
O&M Costs Annual O&M Costs to Date (n=18)
Additional Annual O&M to Comply with CSO Control
Policy (n=15)
< $100,000 10 6
$100,000 to $1 million 7 5
$1 million to $10 million 1 4
Table G-7: Obstacles to full attainment of CSO control (n=19) (CSO Partnership survey, 2001)
Rank Obstacle
1 Financial resources
2 Complexity of water quality standards review process
3- Tie Other priorities within water programs
3- Tie Uncertainty about the roles of EPA and State regulatory authorities
5 Sufficient time
6 Data to support LTCP development and implementation
7 Guidance to support LTCP development and implementation
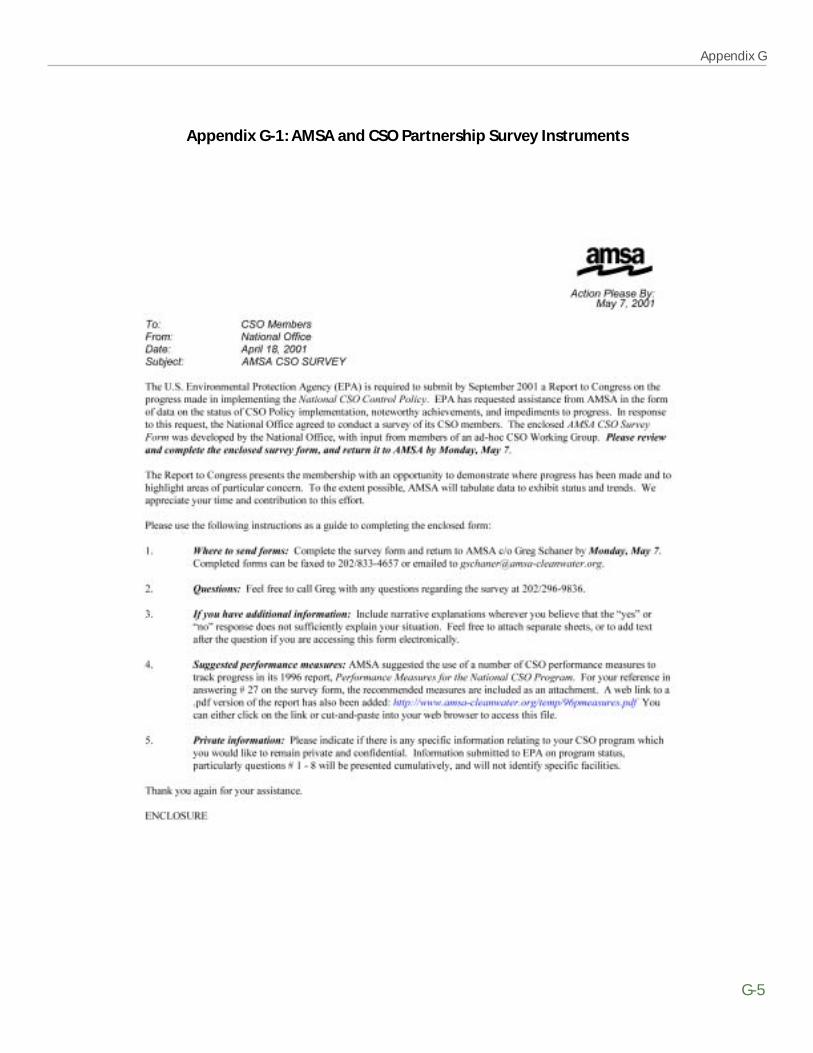
Appendix G
G-5
Appendix G-1: AMSA and CSO Partnership Survey Instruments

G-6
Report to Congress on Implementation and Enforcement of the CSO Control Policy

Appendix G
G-7
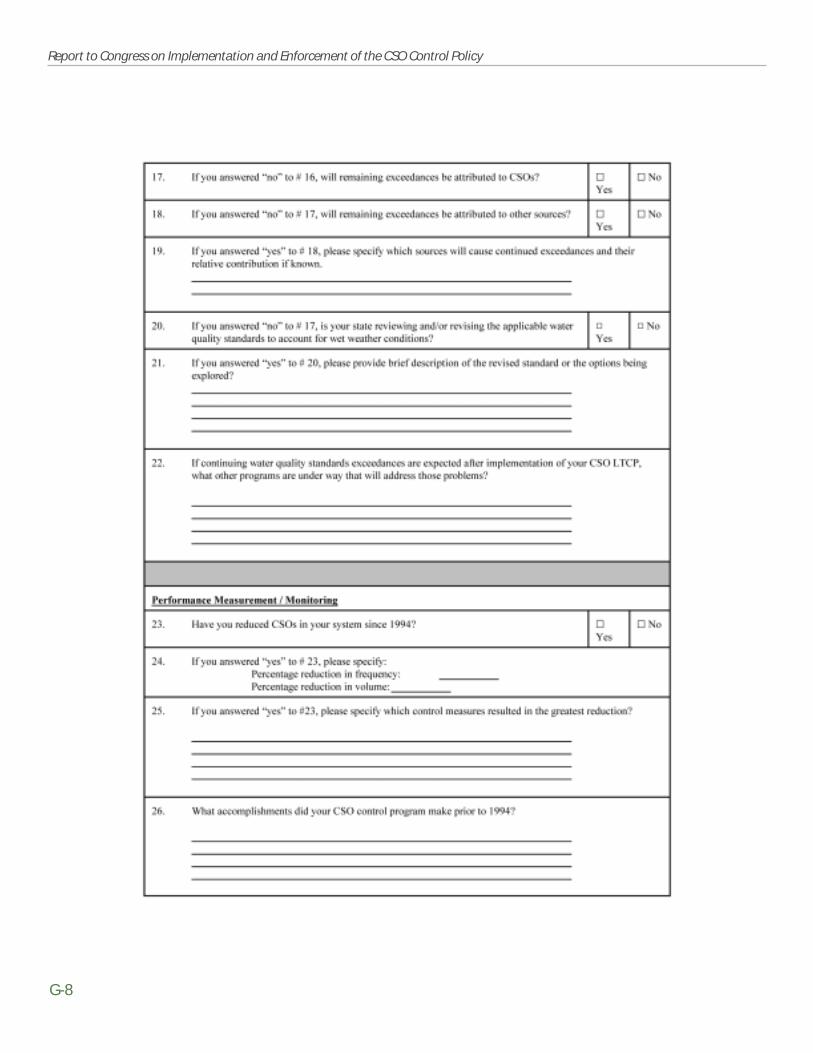
G-8
Report to Congress on Implementation and Enforcement of the CSO Control Policy

Appendix G
G-9
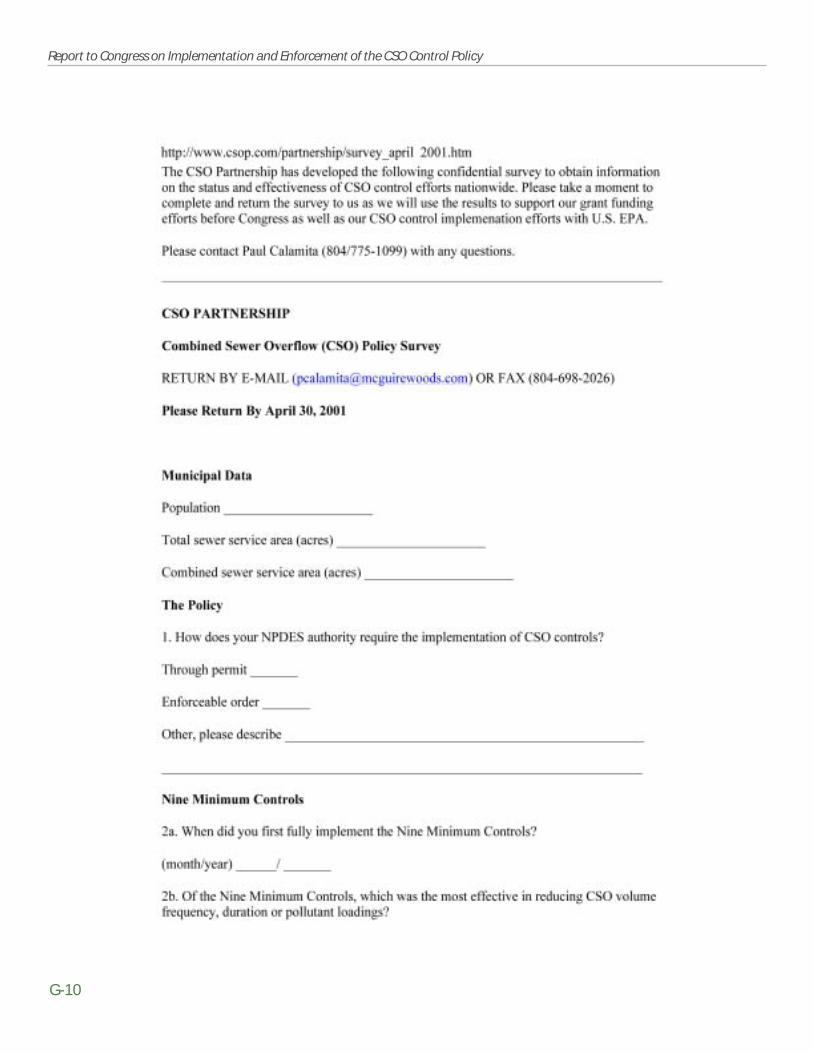
G-10
Report to Congress on Implementation and Enforcement of the CSO Control Policy

Appendix G
G-11
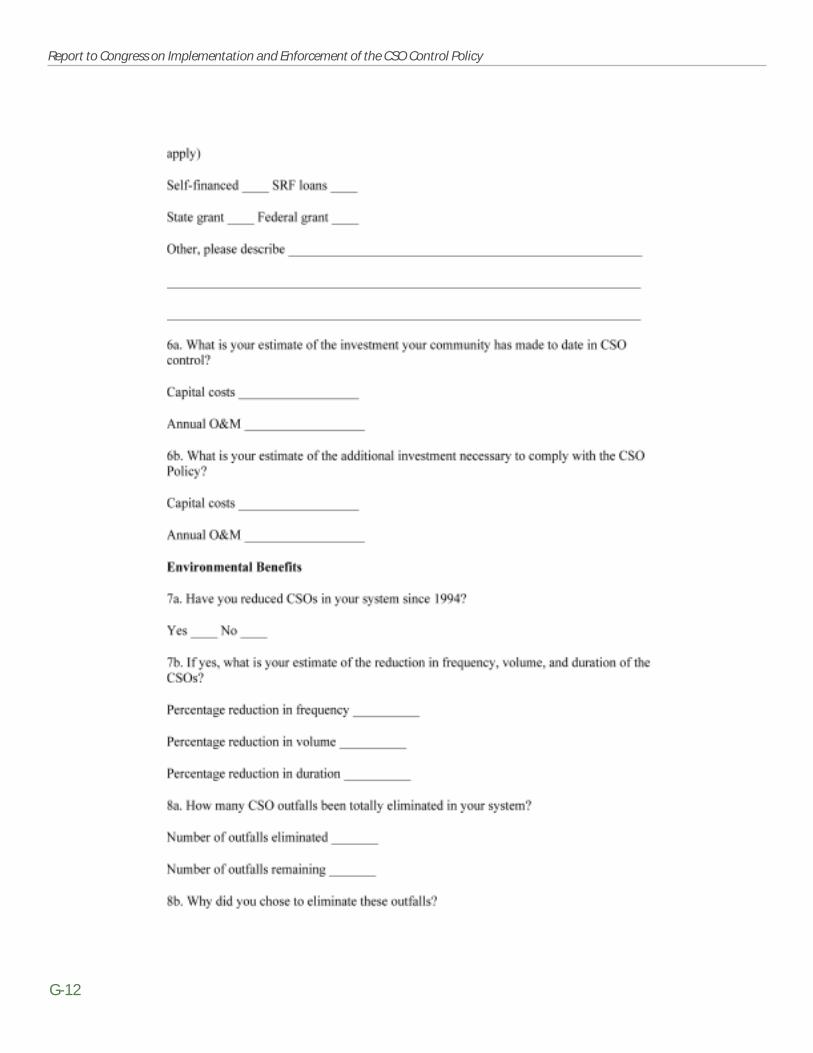
G-12
Report to Congress on Implementation and Enforcement of the CSO Control Policy

Appendix G
G-13

G-14
Report to Congress on Implementation and Enforcement of the CSO Control Policy

Appendix H
Forms Used to GuideData Collection Effort

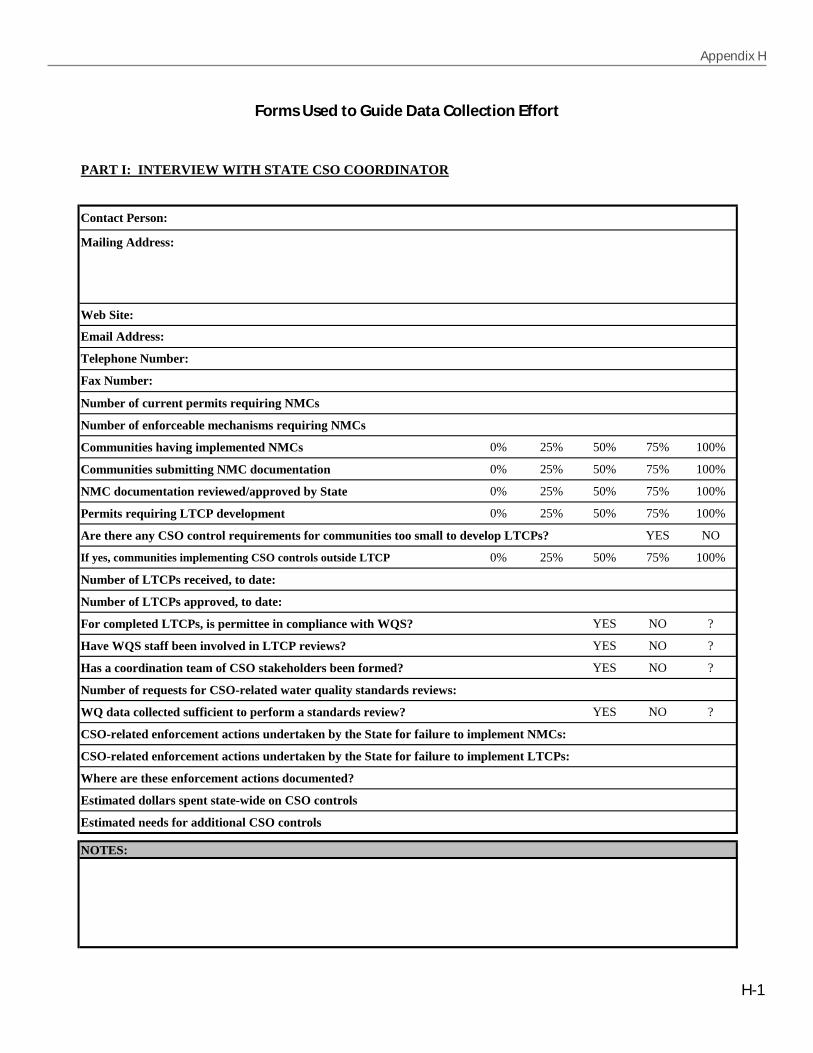
Appendix H
H-1
Forms Used to Guide Data Collection Effort
PART I: INTERVIEW WITH STATE CSO COORDINATOR
Web Site:
Number of current permits requiring NMCs
Number of enforceable mechanisms requiring NMCs
Communities having implemented NMCs 0% 25% 50% 75% 100%
Communities submitting NMC documentation 0% 25% 50% 75% 100%
NMC documentation reviewed/approved by State 0% 25% 50% 75% 100%
Permits requiring LTCP development 0% 25% 50% 75% 100%
Are there any CSO control requirements for communities too small to develop LTCPs? YES NO
If yes, communities implementing CSO controls outside LTCP 0% 25% 50% 75% 100%
Number of LTCPs received, to date:
Number of LTCPs approved, to date:
For completed LTCPs, is permittee in compliance with WQS? YES NO ?
Have WQS staff been involved in LTCP reviews? YES NO ?
Has a coordination team of CSO stakeholders been formed? YES NO ?
Number of requests for CSO-related water quality standards reviews:
WQ data collected sufficient to perform a standards review? YES NO ?
CSO-related enforcement actions undertaken by the State for failure to implement NMCs:
CSO-related enforcement actions undertaken by the State for failure to implement LTCPs:
Where are these enforcement actions documented?
Estimated dollars spent state-wide on CSO controls
Estimated needs for additional CSO controls
NOTES:
Fax Number:
Telephone Number:
Contact Person:
Mailing Address:
Email Address:
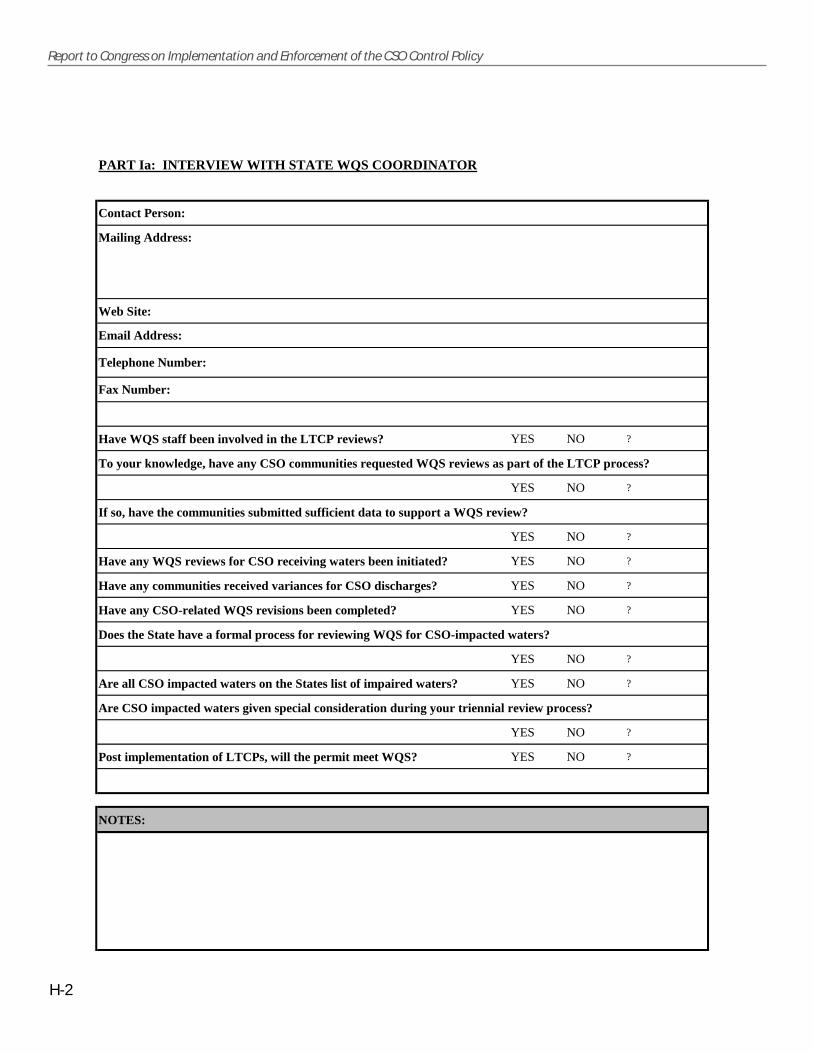
H-2
Report to Congress on Implementation and Enforcement of the CSO Control Policy
PART Ia: INTERVIEW WITH STATE WQS COORDINATOR
Web Site:
Have WQS staff been involved in the LTCP reviews? YES NO ?
To your knowledge, have any CSO communities requested WQS reviews as part of the LTCP process?
YES NO ?
If so, have the communities submitted sufficient data to support a WQS review?
YES NO ?
Have any WQS reviews for CSO receiving waters been initiated? YES NO ?
Have any communities received variances for CSO discharges? YES NO ?
Have any CSO-related WQS revisions been completed? YES NO ?
Does the State have a formal process for reviewing WQS for CSO-impacted waters?
YES NO ?
Are all CSO impacted waters on the States list of impaired waters? YES NO ?
Are CSO impacted waters given special consideration during your triennial review process?
YES NO ?
Post implementation of LTCPs, will the permit meet WQS? YES NO ?
NOTES:
Fax Number:
Telephone Number:
Contact Person:
Mailing Address:
Email Address:
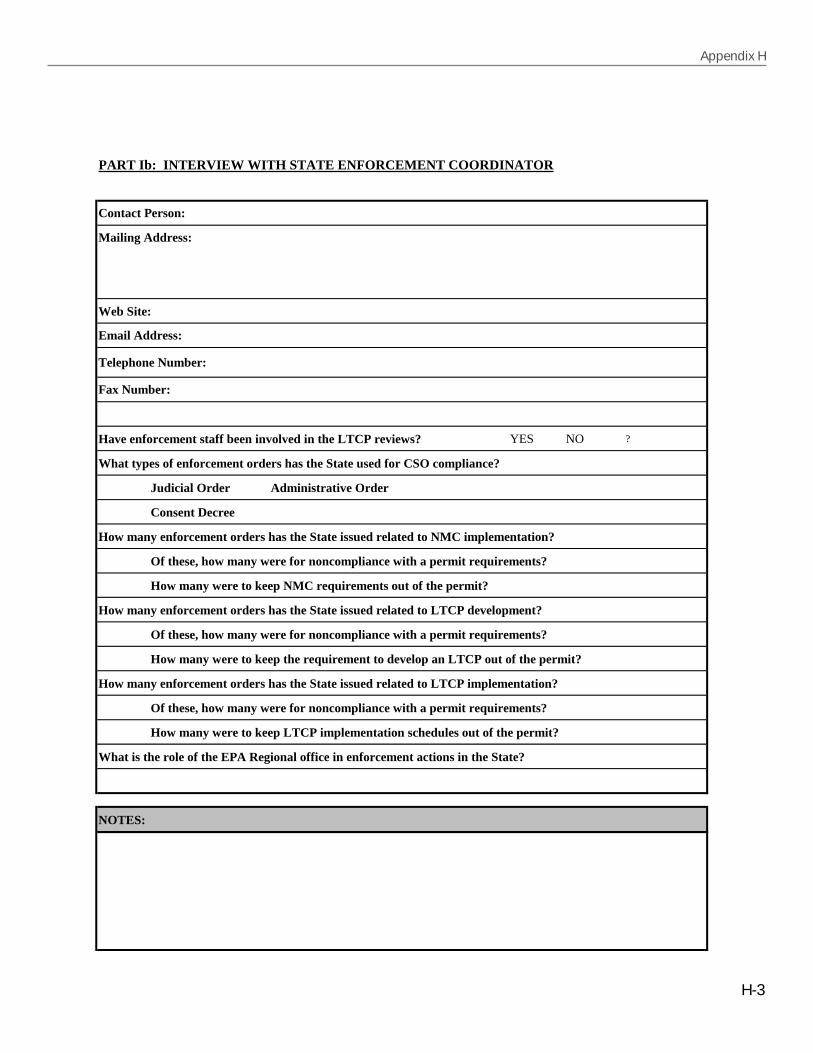
Appendix H
H-3
PART Ib: INTERVIEW WITH STATE ENFORCEMENT COORDINATOR
Web Site:
Have enforcement staff been involved in the LTCP reviews? YES NO ?
What types of enforcement orders has the State used for CSO compliance?
Judicial Order Administrative Order
Consent Decree
How many enforcement orders has the State issued related to NMC implementation?
Of these, how many were for noncompliance with a permit requirements?
How many were to keep NMC requirements out of the permit?
How many enforcement orders has the State issued related to LTCP development?
Of these, how many were for noncompliance with a permit requirements?
How many were to keep the requirement to develop an LTCP out of the permit?
How many enforcement orders has the State issued related to LTCP implementation?
Of these, how many were for noncompliance with a permit requirements?
How many were to keep LTCP implementation schedules out of the permit?
What is the role of the EPA Regional office in enforcement actions in the State?
NOTES:
Fax Number:
Telephone Number:
Contact Person:
Mailing Address:
Email Address:
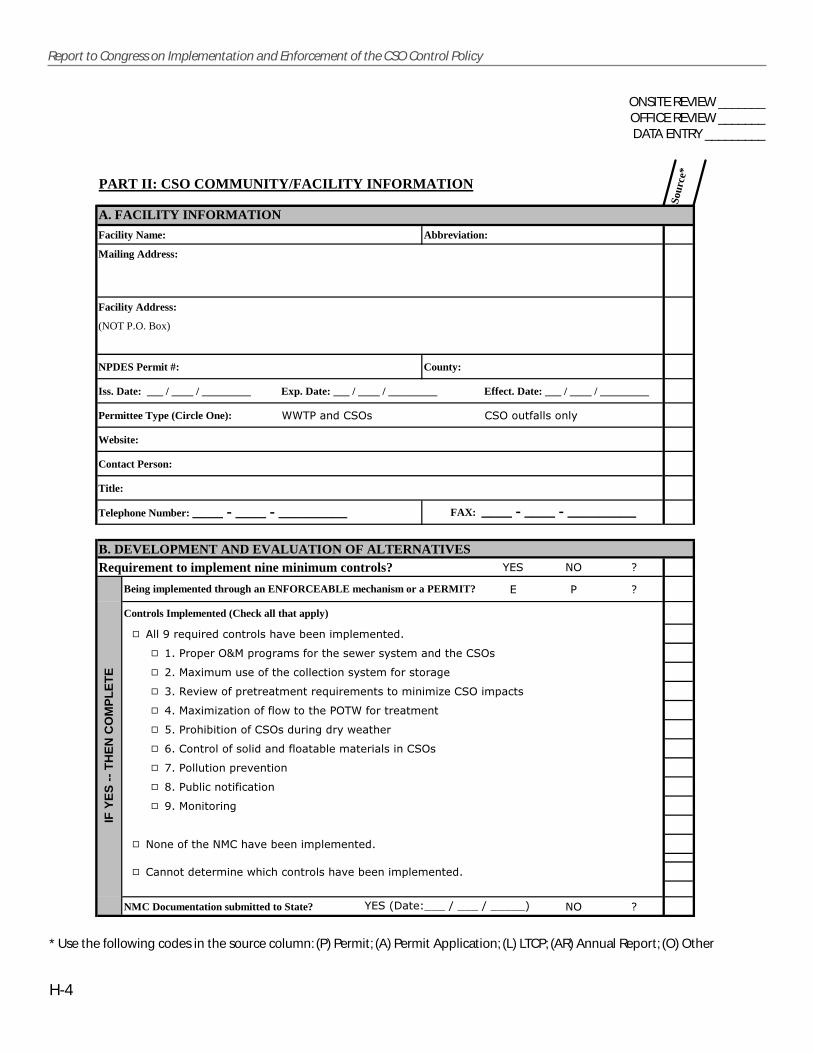
H-4
Report to Congress on Implementation and Enforcement of the CSO Control Policy
PART II: CSO COMMUNITY/FACILITY INFORMATION
Sour
ce*
A. FACILITY INFORMATION
Facility Name: Abbreviation:
Mailing Address:
Facility Address:
(NOT P.O. Box)
NPDES Permit #: County:
Iss. Date: ___ / ____ / _________ Exp. Date: ___ / ____ / _________ Effect. Date: ___ / ____ / _________
Permittee Type (Circle One): ����������� ��� �����������
Website:
Contact Person:
Title:
Telephone Number: �����������������������
B. DEVELOPMENT AND EVALUATION OF ALTERNATIVESRequirement to implement nine minimum controls? �� � �
� � �
Controls Implemented (Check all that apply)
� ��������� ������������������������� !�� �����"
� #"����!���$%�!��&�� ������������'�������� �����������
� ("�%�)� � �������������������������� ����������&�
� *"�+����'����!������� ������� ��� �������� ��� �,����� !����
� -"�%�)� �,������������'��������������������� ���
� ."�������������������� ���&�����'������
� /"�������������������������������� ��������������
� 0"����� �����!���������
� 1"�� �����������������
� �"�%��������&
� �������������%������������� !�� �����"
� ������������ ����'������������������������� !�� �����"
NMC Documentation submitted to State? � �
FAX: �����������������������
IF Y
ES
--
TH
EN
CO
MP
LE
TE
Being implemented through an ENFORCEABLE mechanism or a PERMIT?
���23���4555�6�555�6�555557
A. FACILITY INFORMATION
ONSITE REVIEW _______OFFICE REVIEW _______DATA ENTRY _________
* Use the following codes in the source column: (P) Permit; (A) Permit Application; (L) LTCP; (AR) Annual Report; (O) Other
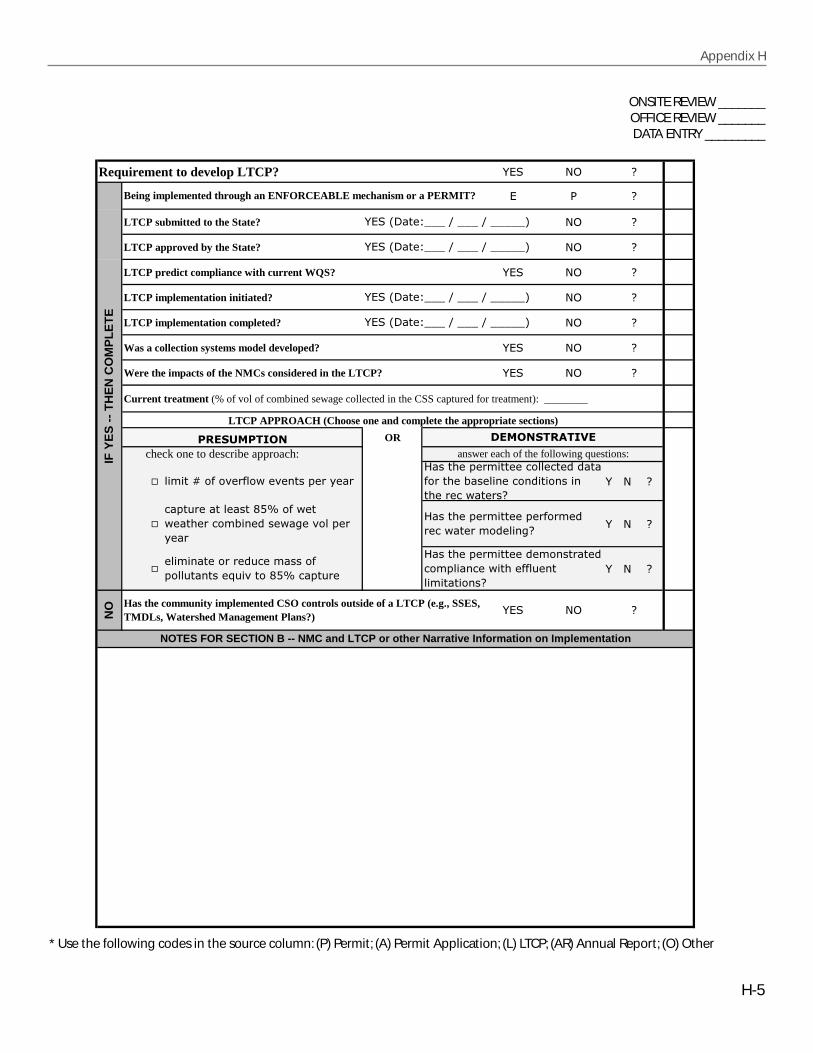
Appendix H
H-5
Requirement to develop LTCP? �� � �
� � �
LTCP submitted to the State? � �
LTCP approved by the State? � �
LTCP predict compliance with current WQS? �� � �
LTCP implementation initiated? � �
LTCP implementation completed? � �
Was a collection systems model developed? �� � �
Were the impacts of the NMCs considered in the LTCP? �� � �
Current treatment (% of vol of combined sewage collected in the CSS captured for treatment): ________
OR
� ����������
� ����������
� ����������
�
NOTES FOR SECTION B -- NMC and LTCP or other Narrative Information on Implementation
NO Has the community implemented CSO controls outside of a LTCP (e.g., SSES,
TMDLs, Watershed Management Plans?)�� �
check one to describe approach: answer each of the following questions:
�� ���8�����������'��������!�������9�������!�� ������������������������������������������������������������'������
��!� ������������1.:����'���'��������� ��������'�&������!�������
9�������!�� ������!����� �������'����� ������&�
��� ������������ ��� �������!��� �������� ������1.:���!� ��
9�������!�� �������� ������������ !�������'�������� ������ ���������
IF Y
ES
--
TH
EN
CO
MP
LE
TE
Being implemented through an ENFORCEABLE mechanism or a PERMIT?
���23���4555�6�555�6�555557
���23���4555�6�555�6�555557
���23���4555�6�555�6�555557
���23���4555�6�555�6�555557
LTCP APPROACH (Choose one and complete the appropriate sections)
�������� ��� ������
ONSITE REVIEW _______OFFICE REVIEW _______DATA ENTRY _________
* Use the following codes in the source column: (P) Permit; (A) Permit Application; (L) LTCP; (AR) Annual Report; (O) Other

H-6
Report to Congress on Implementation and Enforcement of the CSO Control Policy
Target date for completing LTCP implementation:
Were any pilot tests conducted? �� � �
Is pre-construction monitoring data available? �� � �
Is post-construction monitoring data available? �� � �
Has the permittee documented pollutant removal efficiencies? �� � �
Has ambient receiving water data been collected? �� � �
�� � �
IF Y
ES
;�����<�'����!��� ������'���� ��������� 555555555555555555555559�'����� ������'������������������ 55555555555555555555555
�����'����������&�����&����������&��� !���&������� �55�6�555�6�555555 �55�6�555�6�555555
;��������������� �������� !!�������=������'�
NOTES FOR SECTION C -- Controls
Solutions/alternatives considered/financial hardships; possible case study elements - use reverse if needed
D. EFFECTIVENESS OF STRUCTURAL CONTROLS
�55�6�555�6�555555 ����>
�55�6�555�6�555555
Capital cost of implementing all controls outlined in LTCP: ������������>
�55�6�555�6�555555 ����>
�55�6�555�6�555555 ����>
�55�6�555�6�555555 ����>
�55�6�555�6�555555 ����>
In-System controls (controls that require modification of the CSS)
Date Completed Estimated capital cost
�55�6�555�6�555555 ����>
�55�6�555�6�555555 ����>
�55�6�555�6�555555 ����>
�55�6�555�6�555555 ����>
�55�6�555�6�555555 ����>
�55�6�555�6�555555 ����>
�55�6�555�6�555555 ����>
C. SELECTION AND IMPLEMENTATION OF CONTROLS - Please refer to Appendix A, CSO Control Technologies, and list controls according to their reference numbers.
Source controls (controls to keep storm water or pollutants out of the CSS)
Date Completed Estimated capital cost
ONSITE REVIEW _______OFFICE REVIEW _______DATA ENTRY _________
* Use the following codes in the source column: (P) Permit; (A) Permit Application; (L) LTCP; (AR) Annual Report; (O) Other
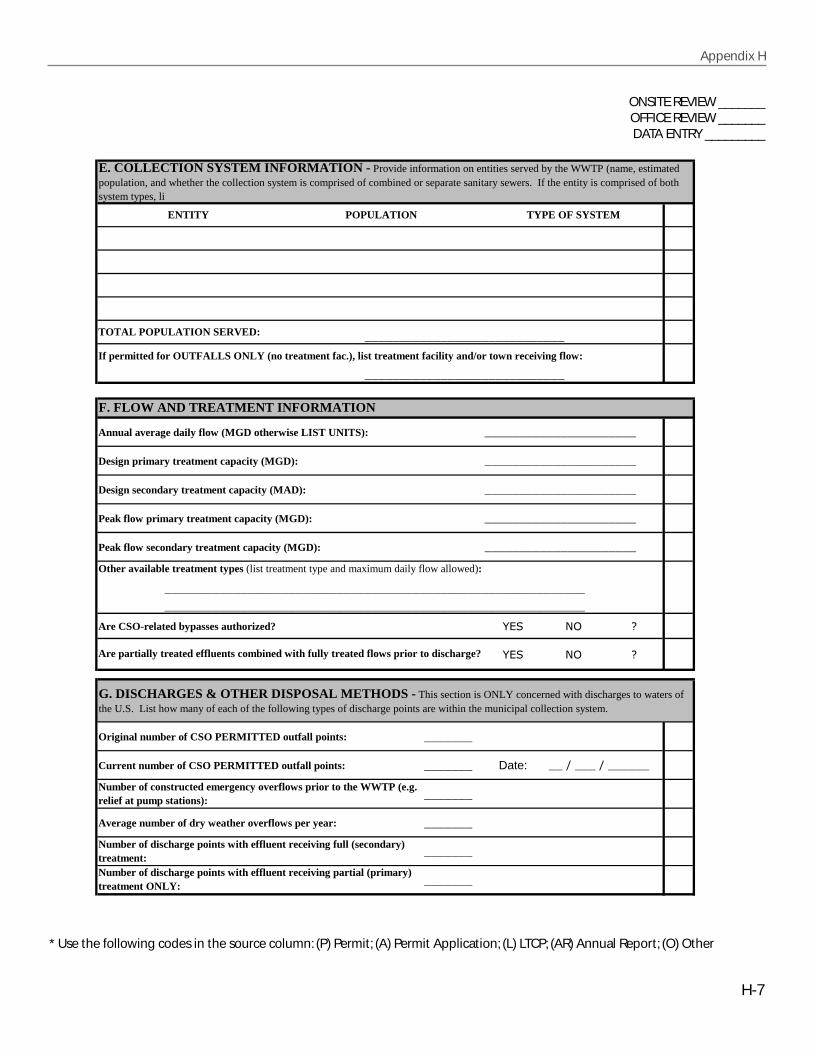
Appendix H
H-7
If permitted for OUTFALLS ONLY (no treatment fac.), list treatment facility and/or town receiving flow:
Annual average daily flow (MGD otherwise LIST UNITS):
Design primary treatment capacity (MGD):
Design secondary treatment capacity (MAD):
Peak flow primary treatment capacity (MGD):
Peak flow secondary treatment capacity (MGD):
Are CSO-related bypasses authorized? �� � �
�� � �
Original number of CSO PERMITTED outfall points: 5555555
Current number of CSO PERMITTED outfall points: 5555555 Date:
5555555
Average number of dry weather overflows per year: 5555555
5555555
5555555
E. COLLECTION SYSTEM INFORMATION - Provide information on entities served by the WWTP (name, estimated population, and whether the collection system is comprised of combined or separate sanitary sewers. If the entity is comprised of both system types, li
ENTITY POPULATION TYPE OF SYSTEM
TOTAL POPULATION SERVED: 55555555555555555555555555555
55555555555555555555555555555
F. FLOW AND TREATMENT INFORMATION
5555555555555555555555
5555555555555555555555
5555555555555555555555
5555555555555555555555
5555555555555555555555
Other available treatment types (list treatment type and maximum daily flow allowed):
5555555555555555555555555555555555555555555555555555555555555
5555555555555555555555555555555555555555555555555555555555555
Are partially treated effluents combined with fully treated flows prior to discharge?
G. DISCHARGES & OTHER DISPOSAL METHODS - This section is ONLY concerned with discharges to waters of the U.S. List how many of each of the following types of discharge points are within the municipal collection system.
�55�6�555�6�555555
Number of constructed emergency overflows prior to the WWTP (e.g. relief at pump stations):
Number of discharge points with effluent receiving full (secondary) treatment:Number of discharge points with effluent receiving partial (primary) treatment ONLY:
ONSITE REVIEW _______OFFICE REVIEW _______DATA ENTRY _________
* Use the following codes in the source column: (P) Permit; (A) Permit Application; (L) LTCP; (AR) Annual Report; (O) Other

H-8
Report to Congress on Implementation and Enforcement of the CSO Control Policy
��&����
� �����
��&����
� �����
�� � �
� ��������&����������+��� ����������
� ���������%���������� �����
� �������'�����������������������&������!�����
� ��� �����������������������'�����<�� ������������&��������
� � ���������?��&�'���������?����������������&������!���������������
� �������������
� �����2�!�����74
�� � �
�� � �
�� � �
�� � �
�� � �
� @36�@3
� �
� 3
� A������������ �
� �"�����
� ������������
� %�����
� �����2�!�����7
H. SYSTEM CHARACTERIZATION
SYSTEM TYPE % of Sewer NetworkSewer Length
(indicate units) Acres Served
�� �������'��
�!�������'��
���B�2����������?���� ��C����&������������74
Are there any CSO discharges to sensitive areas?
YE
S C
HK
AP
PL
ICA
BL
E
5555555555555555555555555555555555555555555NOTES FOR SECTION H -- System Characterization
Note information on land-use, area rainfall/precipitation; special information about the area/system
I. RECEIVING WATER DESCRIPTION - Complete this section for each receiving water that receives discharge from either the WWTP or CSO point(s). Try to determine if these bodies are listed on the 303(d) list as impaired waterbodies and why.
Receiving Water Name Name of Watershed CSO-related WQS review completed?
J. WATER QUALITY DATA - Photocopy and attach data collected for wet weather or CSO studies.555555555555555555555555555555555555555555555
555555555555555555555555555555555555555555555
555555555555555555555555555555555555555555555
555555555555555555555555555555555555555555555
555555555555555555555555555555555555555555555
555555555555555555555555555555555555555555555
555555555555555555555555555555555555555555555
555555555555555555555555555555555555555555555
ONSITE REVIEW _______OFFICE REVIEW _______DATA ENTRY _________
* Use the following codes in the source column: (P) Permit; (A) Permit Application; (L) LTCP; (AR) Annual Report; (O) Other
Appendix I
Stakeholder Meeting SummaryJuly 12-13, 2001Chicago, Illinois

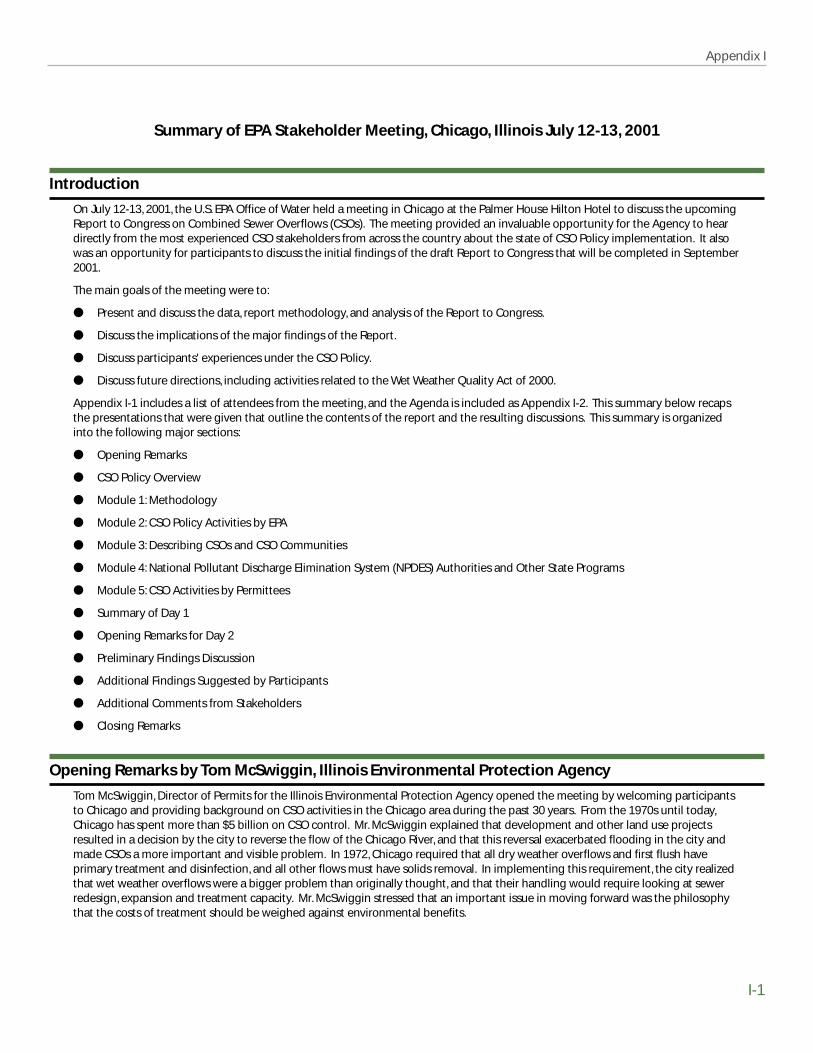
Introduction
On July 12-13, 2001, the U.S. EPA Office of Water held a meeting in Chicago at the Palmer House Hilton Hotel to discuss the upcomingReport to Congress on Combined Sewer Overflows (CSOs). The meeting provided an invaluable opportunity for the Agency to heardirectly from the most experienced CSO stakeholders from across the country about the state of CSO Policy implementation. It alsowas an opportunity for participants to discuss the initial findings of the draft Report to Congress that will be completed in September2001.
The main goals of the meeting were to:
● Present and discuss the data, report methodology, and analysis of the Report to Congress.
● Discuss the implications of the major findings of the Report.
● Discuss participants' experiences under the CSO Policy.
● Discuss future directions, including activities related to the Wet Weather Quality Act of 2000.
Appendix I-1 includes a list of attendees from the meeting, and the Agenda is included as Appendix I-2. This summary below recapsthe presentations that were given that outline the contents of the report and the resulting discussions. This summary is organizedinto the following major sections:
● Opening Remarks
● CSO Policy Overview
● Module 1: Methodology
● Module 2: CSO Policy Activities by EPA
● Module 3: Describing CSOs and CSO Communities
● Module 4: National Pollutant Discharge Elimination System (NPDES) Authorities and Other State Programs
● Module 5: CSO Activities by Permittees
● Summary of Day 1
● Opening Remarks for Day 2
● Preliminary Findings Discussion
● Additional Findings Suggested by Participants
● Additional Comments from Stakeholders
● Closing Remarks
Opening Remarks by Tom McSwiggin, Illinois Environmental Protection Agency
Tom McSwiggin, Director of Permits for the Illinois Environmental Protection Agency opened the meeting by welcoming participantsto Chicago and providing background on CSO activities in the Chicago area during the past 30 years. From the 1970s until today,Chicago has spent more than $5 billion on CSO control. Mr. McSwiggin explained that development and other land use projectsresulted in a decision by the city to reverse the flow of the Chicago River, and that this reversal exacerbated flooding in the city andmade CSOs a more important and visible problem. In 1972, Chicago required that all dry weather overflows and first flush haveprimary treatment and disinfection, and all other flows must have solids removal. In implementing this requirement, the city realizedthat wet weather overflows were a bigger problem than originally thought, and that their handling would require looking at sewerredesign, expansion and treatment capacity. Mr. McSwiggin stressed that an important issue in moving forward was the philosophythat the costs of treatment should be weighed against environmental benefits.
I-1
Appendix I
Summary of EPA Stakeholder Meeting, Chicago, Illinois July 12-13, 2001
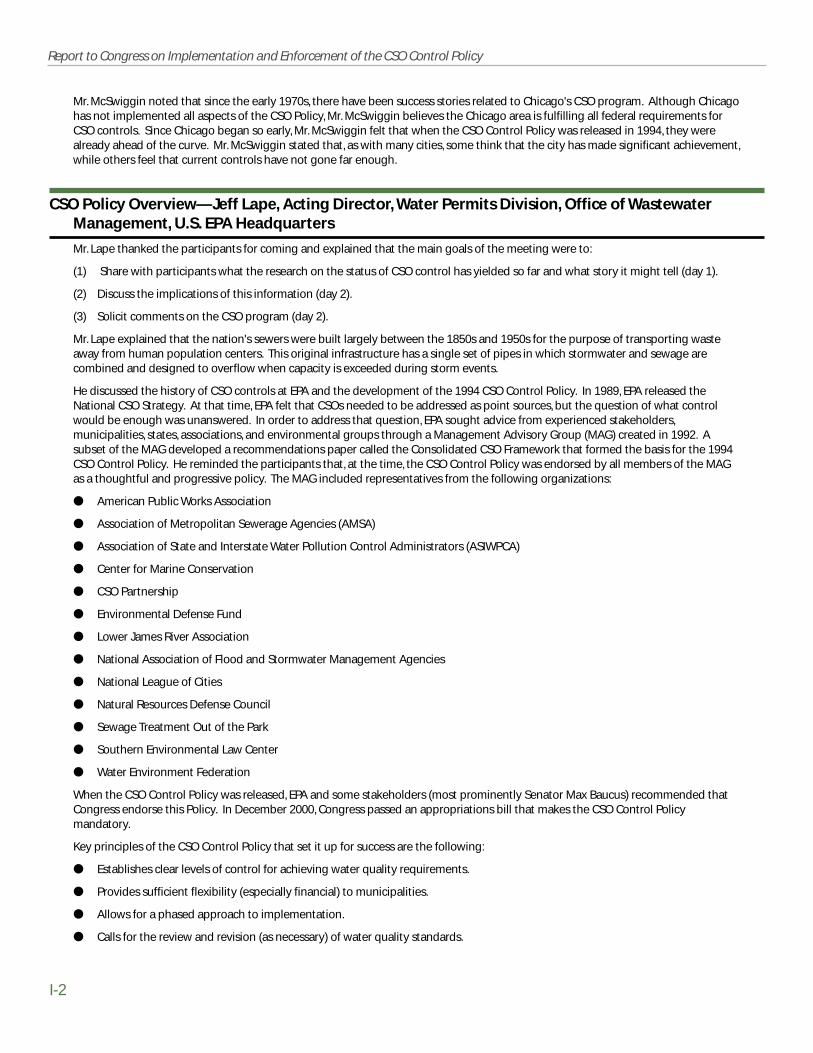
I-2
Report to Congress on Implementation and Enforcement of the CSO Control Policy
Mr. McSwiggin noted that since the early 1970s, there have been success stories related to Chicago's CSO program. Although Chicagohas not implemented all aspects of the CSO Policy, Mr. McSwiggin believes the Chicago area is fulfilling all federal requirements forCSO controls. Since Chicago began so early, Mr. McSwiggin felt that when the CSO Control Policy was released in 1994, they werealready ahead of the curve. Mr. McSwiggin stated that, as with many cities, some think that the city has made significant achievement,while others feel that current controls have not gone far enough.
CSO Policy Overview—Jeff Lape, Acting Director, Water Permits Division, Office of WastewaterManagement, U.S. EPA Headquarters
Mr. Lape thanked the participants for coming and explained that the main goals of the meeting were to:
(1) Share with participants what the research on the status of CSO control has yielded so far and what story it might tell (day 1).
(2) Discuss the implications of this information (day 2).
(3) Solicit comments on the CSO program (day 2).
Mr. Lape explained that the nation's sewers were built largely between the 1850s and 1950s for the purpose of transporting wasteaway from human population centers. This original infrastructure has a single set of pipes in which stormwater and sewage arecombined and designed to overflow when capacity is exceeded during storm events.
He discussed the history of CSO controls at EPA and the development of the 1994 CSO Control Policy. In 1989, EPA released theNational CSO Strategy. At that time, EPA felt that CSOs needed to be addressed as point sources, but the question of what controlwould be enough was unanswered. In order to address that question, EPA sought advice from experienced stakeholders,municipalities, states, associations, and environmental groups through a Management Advisory Group (MAG) created in 1992. Asubset of the MAG developed a recommendations paper called the Consolidated CSO Framework that formed the basis for the 1994CSO Control Policy. He reminded the participants that, at the time, the CSO Control Policy was endorsed by all members of the MAGas a thoughtful and progressive policy. The MAG included representatives from the following organizations:
● American Public Works Association
● Association of Metropolitan Sewerage Agencies (AMSA)
● Association of State and Interstate Water Pollution Control Administrators (ASIWPCA)
● Center for Marine Conservation
● CSO Partnership
● Environmental Defense Fund
● Lower James River Association
● National Association of Flood and Stormwater Management Agencies
● National League of Cities
● Natural Resources Defense Council
● Sewage Treatment Out of the Park
● Southern Environmental Law Center
● Water Environment Federation
When the CSO Control Policy was released, EPA and some stakeholders (most prominently Senator Max Baucus) recommended thatCongress endorse this Policy. In December 2000, Congress passed an appropriations bill that makes the CSO Control Policymandatory.
Key principles of the CSO Control Policy that set it up for success are the following:
● Establishes clear levels of control for achieving water quality requirements.
● Provides sufficient flexibility (especially financial) to municipalities.
● Allows for a phased approach to implementation.
● Calls for the review and revision (as necessary) of water quality standards.
Appendix I
I-3
Key elements of the Policy include:
● Nine Minimum Controls (NMC)
● Long-Term Control Plans (LTCPs)
● Coordination with review and revision of water quality standards
● Implementation
● Monitoring
Mr. Lape explained that in Phase I of CSO implementation, the NPDES permit should include implementation of the NMC anddevelopment and submittal of an LTCP. Municipalities should also prepare a report documenting implementation of the NMC withintwo years and comply with the water quality standards by the state's due date. Phase II NPDES permits should contain:
● Requirements to implement technology-based controls.
● Narrative requirements for CSO controls.
● Water quality-based effluent limits under Section 122.44(d)(1).
● Compliance with the state's Water Quality Standards numeric performance standards.
● A reopener clause for failures.
● Implementation assessment and monitoring to assess effectiveness.
● Assessment of overflows to sensitive areas.
● Requirements for maximizing treatment for wet weather.
Mr. Lape characterized the CSO Control Policy as a unique approach to a challenging problem. First, the Policy was designed to havestakeholder input from the beginning. Secondly, it describes a process rather than a level of control. This process was designed tomaximize environmental benefits while considering affordability. While the CSO Control Policy is process-based, it provides a clearframework for deciding on a level of control that will comply with the Clean Water Act.
The Wet Weather Water Quality Act (WWWQA) of December 2000 amended the Clean Water Act. The WWWQA called for this Reportto Congress, due September 1, 2001 (focused on implementation and enforcement), and a second Report to Congress (focused onenvironmental water quality impacts), due in 2003. The WWWQA also effectively made the CSO Control Policy mandatory. Finally, theWWWQA sets a completion date of July 31, 2001, for guidance on water quality standards as related to LTCP development. Thisguidance is one that EPA has been working on for several years but has only recently completed for Office of Management andBudget (OMB) review. It will reinforce the notion of coordination and ensure that the data will support the review of water qualitystandards.
The 2001 Report to Congress will be primarily descriptive and focus on answering following questions:
● What activities has EPA undertaken to implement provisions of the CSO Control Policy?
● What activities have states/NPDES authorities undertaken to control CSOs?
● What approaches have communities undertaken to control CSOs?
● What controls and CSO abatement measures have been successful?
● How successful has the CSO Control Policy been in controlling and abating CSOs?
Although the new Administration's appointees have yet to be confirmed, Mr. Lape gave participants some sense of what major areasof emphasis the current Office of Water leaders have identified:
(1) Watersheds—identify problems "on-the-ground" and tailor solutions (Mr. Lape called participants' attention to a new book calledRegulatory Craft by Malcolm Sparrow, which many managers in EPA were reading and using to think about a new paradigm forimproving the functioning of regulatory agencies)
(2) Infrastructure improvements
(3) Sound data and information
(4) Performance measures/outcomes
(5) Brownfields

I-4
Report to Congress on Implementation and Enforcement of the CSO Control Policy
(6) Invasive/nuisance species
Mr. Lape then pointed out that a copy of the strategic plan for NPDES permits was included in the meeting materials if participantswanted additional detail.
Mr. Lape introduced members of his staff and personnel from the Regions that were present: Beverly Bannister (EPA, Region 4 WaterManagement Division Director), Linda Murphy (EPA, Region 1 Water Management Division Director), Pat Bradley and Tim Dwyer(program managers in charge of the Report to Congress), and Kevin DeBell.
Mr. Lape said he hoped that participants at this meeting could assist EPA in validating its current findings, discuss the implications ofthese findings, provide insight regarding CSO implementation, discuss directions for the CSO Policy, and provide suggestions onmethodology for the next report. He told the group that a summary of the discussion at this meeting would be created, shared withthe group, and included as an appendix to the report. In addition, he explained that he was confident that this dialogue would behelpful to EPA in honing the report.
Module 1: Methodology—Kevin DeBell, U.S. EPA Headquarters, Office of Water
Mr. DeBell explained that EPA is preparing the report in response to the charge from Congress to review and report on theimplementation and enforcement of the CSO Control Policy. He explained that until last December the Policy was not mandatory,which meant that there was likely to be a variety of interpretations of what the Policy intended and various levels of adoption. As aresult of that variety, EPA decided to try to collect primary and secondary information from federal, state, and local data sources ratherthan rely on a projection of the whole based on partial data.
EPA also based this Report to Congress on information gathered from existing sources, rather than modeling results. These are alsorecognized as imperfect sources because recording of CSO activities varies widely among implementors. This Report to Congress isthe first comprehensive look at the implementation of the CSO Policy. The steps used to collect information for the report included:
● Culling information from existing national programmatic databases (SRF; 104(b)(3); PCS; etc.) and headquarters programmaticfiles.
● Conducting state visits and reviewed 790 permit, inspection, and enforcement files.
● Interviewing NPDES and water quality standards authorities.
● Developing a state profile for each CSO state describing CSO implementation activities.
● Supplementing programmatic data with 15 to 20 municipal case studies. These municipal case studies will serve to illustrate across section of implementation activities and help Congress understand important challenges and successes in CSO control.
● Identifying and documented data gaps.
● Supplementing programmatic data with modeling results.
● Performing a comprehensive literature search.
This report will not address the costs of implementation and the associated environmental benefits in a comprehensive manner. Thatinformation has been called for in the 2003 Report to Congress.
Independent information generated by CSO stakeholders will be used to verify or contrast data collected by EPA. It will not beincluded as independent data. Sources included in the Report to Congress are:
● Natural Resources Defense Council Testing the Waters Report
● Water Environment Federation Water Quality Standards Experts' Conference
● Association of Metropolitan Sewerage Agencies Case Studies and Survey of Members
● Association of Metropolitan Sewerage Agencies Performance Measures Report
● CSO Partnership Survey
● Center for Marine Conservation information
Question: Did EPA consider the Inspector General's (IG's) Report?
Response: EPA has looked at the report and meets regularly with the IG. EPA does not intend to fold data from the IG's report intothis report but will use some of the case study information. The IG's report was fairly restrictive in that it focused on only three of theNMC.

Appendix I
I-5
Suggestion: Include the information from the New York case study because several critical issues regarding CSO control arehighlighted, namely the difficulty of siting CSO outfalls on public land (need an act of the legislature).
Question: What type of data will be culled from the stakeholder sources?
Response: The stakeholder information will be used across the results from the analysis of primary EPA, state, and municipal sources.
Suggestion: Include information from the Natural Resources Defense Council Testing the Waters report, which includes reasons citedfor beach closings and documentation of environmental impacts. The next update of the annual report is due in August.
Question: Did EPA look at the 303(d) list?
Response: Yes. That list, along with the 305(b) list, was included in the EPA data.
Module 2: CSO Policy Activities by EPA—Ross Brennan, U.S. EPA Headquarters, Office of Water
Mr. Brennan began his presentation by explaining that after the release of the CSO Control Policy in 1994, everyone had high hopes.EPA poured a lot of resources into implementation of the Policy, which continues today. The challenge that EPA faces is movingforward with the most effective mix of activities. Because the CSO Policy was not a regulation, EPA spent considerable effort clarifyingand interpreting what the Policy meant, including the following memoranda:
● CSO Deadline Memorandum (1997)—reiterated the deadline for LTCPs
● CSO Implementation Memorandum (mid-1988)—explained who is out there and what they are doing
● Water Quality-based and Technology-based CSO Requirements Memorandum
In addition, EPA developed a Compliance and Enforcement Strategy for CSOs and SSOs that stated the Agency was following a strongenforcement stance for both of these issues. The Agency was also holding itself accountable by including performance measures forCSOs under the Government Performance and Results Act (GPRA) measures.
In addition to the clarification of the Policy, EPA developed seven separate permitting guidance documents that addressedimplementation of NMC, development of LTCPs, permitting, monitoring and modeling, funding, and schedule development. Aneighth guidance on the integration of LTCPs and water quality standards was never completed, but is now being finalized to meetCongress' July 31, 2001, deadline.
Mr. Brennan pointed out that the two components of successful CSO implementation involve permitting and enforcement. These twocomponents are interrelated. To help ensure that CSOs are incorporated into the NPDES program, EPA has conducted many permitwriting training courses. In addition, it has developed fact sheets on technologies to help inform permit writers and the regulatedcommunities about the latest technology. The Agency also has developed Memoranda of Agreements with Regions that outlineenforcement plans.
Mr. Brennan emphasized the importance of communication and coordination in carrying out the CSO program. He noted thatstakeholders have been involved heavily in the process. EPA holds frequent conference calls with the CSO coordinators in the 32states implementing programs, and they have held listening sessions that have involved a wider array of stakeholders.
Mr. Brennan noted that the Agency uses a number of tools to solicit and maintain the volume of information being tracked about theCSO program, including the Local Government Environmental Assistance Network (LGEAN), which helps with information distributionto local governments; the EPA Needs Survey, which helps to identify the cost of controls; the Permit Compliance System database,which helps to identify the universe of facilities; and the water quality inventory, which can help to identify impaired water bodies.
Finally, Mr. Brennan reviewed the status of financial assistance efforts to date for CSO projects. He highlighted that in 2000, over $400million was made available for CSO projects through the State Revolving Fund (SRF). Since 1994, six entities have been issuedcooperative agreements under CWA Section 104(b)(3) for innovative CSO projects. Although the Agency is aware that some moneyprovided to states under Section 106 Water Pollution Program Support Grants is used for CSO activities, grants are not programspecific and states are not required to report on how the grant was used, so no specific funding information is available.
At the end of his presentation, Mr. Brennan acknowledged that it is still a challenge to move forward in an environment of limitedfunding and a need to achieve water quality standards. He observed that EPA now better understands the challenges faced byregulated entities than in the early 1990s, when the Policy was developed.
Question: Has anyone revised their water quality standards?
Response: Some states have moved ahead in this arena, such as Massachusetts and Indiana, but lack of movement is an issue overall.
I-6
Report to Congress on Implementation and Enforcement of the CSO Control Policy
Comment: NPDES permitting process provides an inadequate vehicle for public participation. Since so many lawsuits are being filedagainst permits, the public participation activities have focused largely on preparing for litigation.
Comment: EPA has much guidance, but leadership is lacking. Leaving water quality standards revision to the states andmunicipalities is a political nightmare. The costs are high to implement controls, yet few politicians want to look "ungreen." This is anarena where federal leadership is needed.
Comment: EPA should intervene and take over the programs where necessary when permit backlogs are a big issue.
Comments: Some participants expressed that some stakeholders were making it difficult to revise water quality standards downwardand that was a problem. Others felt that there was a need to address water quality standards, but not necessarily revise themdownward.
Question: What is the nature of the enforcement actions?
Response: The Agency is still collecting these numbers, but initial estimates are that EPA has taken approximately 20 civil judicialactions and 23 administrative actions and the states have taken about 110 administrative actions. EPA also acknowledged thatcurrent systems, including PCS, are incomplete, inaccurate, and obsolete.
Module 3: Describing CSOs and CSO Communities—Ross Brennan, U.S. EPA Headquarters,Office of Water
Mr. Brennan explained that this section of the report attempts to summarize the current CSO universe. The summary data are asfollows:
● There are CSOs in nine of the 10 EPA Regions (none in Region 6).
● There are CSOs in 32 states, concentrated in the Northeast and Midwest. Many of these are along river valleys, which reinforcesthe need for a watershed approach.
● There are 860 permits that include CSOs (some municipalities have multiple permits and some permits cover multiplemunicipalities).
● There are 9,520 CSO outfalls.
● Four states (Illinois, Ohio, Indiana, Pennsylvania) have over 50 percent of the CSOs nationally.
● Ten states comprise 85 percent of the CSO universe.
● Fourteen states have fewer than 10 CSOs each.
● Nineteen states have no CSOs.
Further detail about the distribution of the permits is as follows:
● Of the 860 permits, 670 of these permits are with POTWs.
● 70-percent of the permits are with majors (more than 1.0 mgd or greater than 10,000 population).
● There are 193 with satellite collection systems.
● 40 of the 860 are unknown.
Question: What was the cause for the decrease in the numbers of CSSs from 1976, when there were thought to be 1,300 CSSs, to 860now?
Discussion from EPA and participants: There could be several causes for the change in the number. One explanation is that apercentage of these communities have separated their sewers. Another explanation is that the definition being used in 1976 is notthe same is it is now, meaning that many communities with separate sewer systems with storm drains are not called CSSs now, butmay have been counted previously. Another possible explanation is that the satellite systems may be counted differently. EPA alsoexplained that this is really the first time that they feel they have a good handle on the number of CSSs. The original number ofbetween 1,300 and 1,400 was based on the Needs Survey, which had a discrepancy when compared to the CSO coordinatorinformation. Participants suggested that EPA explain carefully the definition currently being used and possible explanations for thedramatic change in number. EPA should take credit for improvements where appropriate, including systems that have beenseparated, and then explain the remaining gaps where possible.
Question: Are you using the same definition of satellite systems as used in the SSO discussion?

Appendix I
I-7
Response: Yes.
Comment: Tell Congress that, while there are 860 permits, this represents many more political jurisdictions.
Comment: The definition of CSO should be clarified from an enforcement perspective and the new SSO rules; communities wouldrather fall under the more flexible CSO umbrella.
Question: Is the old estimate of cost for CSO controls $43 million?
Response: Yes.
Question: How was the 70/30 major versus minor split determined?
Response: Major or minor is not always population or flow based. Many of these communities are under 10,000, but we used themajor/minor field in PCS.
Module 4: NPDES Authorities and Other State Programs—Pat Bradley, U.S. EPA Headquarters,Office of Water
Mr. Bradley began his presentation by explaining that states and NPDES authorities have two major roles: (1) issuing permits and (2)taking enforcement actions and providing compliance assistance. State water quality authorities are responsible for assisting inconducting water quality standards reviews and revisions. These staff do not often closely coordinate their efforts. Indiana,Massachusetts, and Maine have formal processes for establishing water quality standards, and at least one state has announced thatthey will not do reviews or revisions.
Currently, 28 of the 32 states are NPDES authorized. Alaska, the District of Columbia, Massachusetts, and New Hampshire have theirrespective EPA Regional offices as their NPDES authority.
The 1989 CSO Control Strategy (precursor to the 1994 Policy) called for the elimination of dry weather overflows (DWOs), minimizingthe impacts of CSOs through the adoption of the six minimum measures and development of a CSO control strategy (or certificationof no CSOs) by 1990. A majority of the states met the 1990 deadline for development of a control strategy. All but one developed astrategy by 1991.
States took one of four major approaches to control CSOs. They are as follows:
(1) Revised existing state strategy to match federal CSO Control Policy (CT, GA, IN, KY, ME, MD, MA, NH, OH, WV).
(2) Continued using existing state strategy (IL, IA, MI, MO, VT).
(3) Adopted state requirements either beyond (more stringent than) or outside (aside from) the federal CSO Control Policy; such as:
◗ New Jersey—watershed approach
◗ New York—15 best management practices (BMPs)
◗ Pennsylvania—requires system characterization and water quality reports
◗ Washington—limits to one overflow per year.
(4) Developed CSO control programs on a site-specific or community-by-community basis (AK, CA, DE, DC, KS, MN, NB, OR, RI, SD, TN,VA, WI; this approach was generally taken by states with less than 4 or 5 CSSs).
Data on Implementation of the NMC:
● Requirements for the NMC were included in 87 percent of permits.
● NMC were adopted by 22 of the 32 states.
● Four states continue to require the Six Minimum Controls (1989 CSO Strategy).
● Two states developed BMPs that exceed requirements of the CSO Policy.
● Four states do not do not require implementation of the NMC.
Data on Implementation of LTCP:
● LTCP development is required with 64 percent of permits.
● Twenty-five states established framework for long-term control planning to meet water quality standards.

I-8
Report to Congress on Implementation and Enforcement of the CSO Control Policy
● Less than half of the 25 states have enforceable requirements for all CSO permittees to develop LTCPs, due to different priorities,permit backlog issues, and cost.
● Seven states do not require LTCPs.
Mr. Bradley explained that states have two primary financial obligations: (1) funding the state's CSO program and (2) assistingpermittees in securing funds necessary for CSO controls. The following statistics are from the State Revolving Fund (SRF):
● 1988 – 1994, $700 million spent on CSO controls.
● 1994 – 2000, $1.3 billion spent on CSO controls.
● Illinois, Michigan, and New York spend the most SRF monies on CSO projects.
● 17 states have additional state financial assistance of some kind (loans, bonds, grants).
Question: How much of this problem of permits not having NMC and LTCPs is due to a permit backlog issue?
Response: About 34 of the 112 permits that do not require the NMC are a result of backlog issues.
Comment: Some states have asked for NMC reports as part of the permit process, but they do not show up in the permit themselves.The compliance may be higher than is indicated by these numbers.
Question: What does enforcement mean given the "shall conform" language of the WWWQA?
Response: Now that the law has changed, and depending on how you interpret "shall conform," states that are issuing permits (afterDecember 2000) that do not include NMC and LTCPs could be inconsistent with the law and vulnerable to legal challenge.
Question: Since 1994, we have had a non-binding policy and states and communities have chosen a variety of approaches torespond to the Policy. How do we reconcile that with the fact that the Policy is now law?
Comment: EPA should require that all communities do the NMC. If some want to do more, that is OK, but at a minimum you must dothe NMC. The thrust of the report should be that we have a policy, not much has been done and we need to get moving on it.
Comment: The report should convey the other challenges that states face, such as competing water programs [i.e., storm water,concentrated animal feedlots (CAFOs)]. CSOs have suffered because the CSO Control Policy was not a regulation.
Comment: Before the Policy, many states were doing nothing. These results actually show tremendous progress. Communitiesdeserve a lot of credit for the progress that has been made in CSO controls, particularly since communities are challenged with oldinfrastructure. Flexibility has helped, but much more funding in the form of grants is needed. Please show financial burden on statesof CSO control in the Report to Congress. The communities have the financial data. Without federal assistance, rate payers are beingstressed.
Response: EPA said they would address financial burden and related environmental benefits in the 2003 report.
Comment: Several stakeholders stressed that the SRF monies are not a complete solution to CSO controls. Some states add points tothese loan dollars, in some cases making them less desirable than private loans. Others reminded EPA that these are loans, and somecommunities, especially small ones, really need grants to be able to do the work they need to do to comply with the Policy. Simplypouring more money into the SRF will not help everyone.
Module 5: CSO Activities by Permittees—Pat Bradley, U.S. EPA Headquarters, Office of Water
Mr. Bradley explained that EPA estimates that there are 860 CSO permits that cover 777 communities located in 32 different states. Of860 permits, 765 had data available on the type of receiving water body as summarized below:
● Streams (38 percent)
● Rivers (43 percent)
● Ponds/lakes (2 percent)
● Oceans/estuaries/bays (5 percent)
● Other (12 percent)
The following data were shared with the group on CSO control priorities:
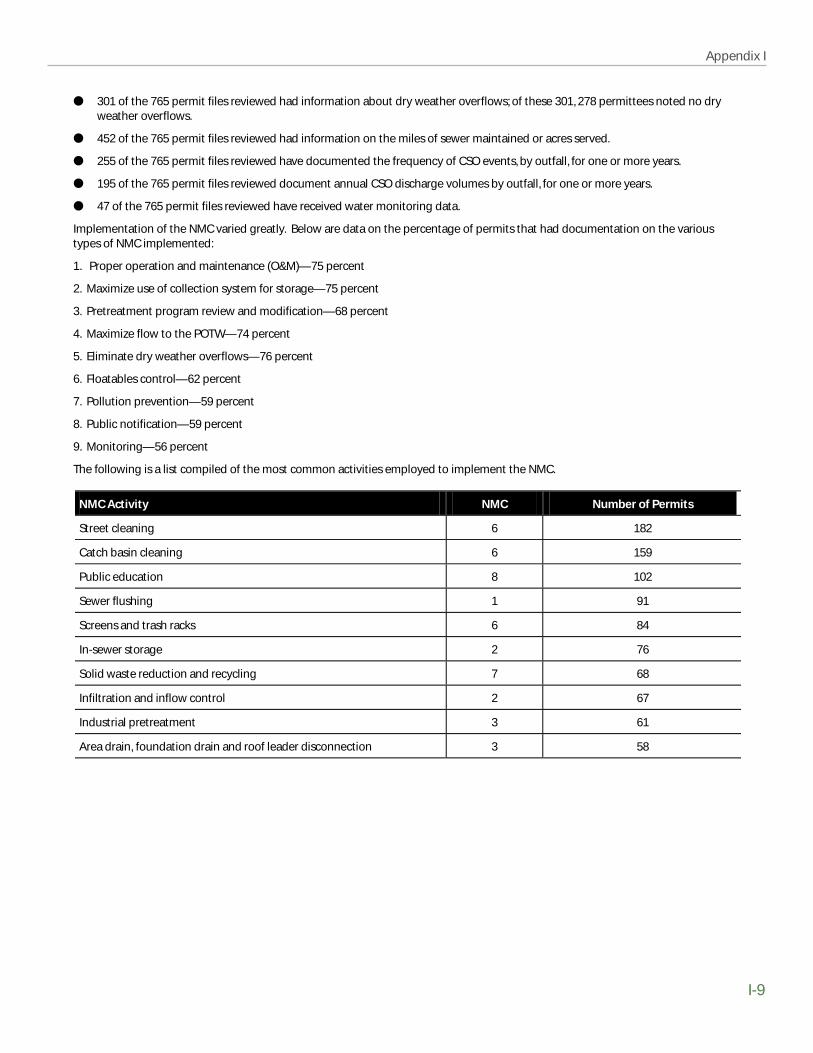
Appendix I
I-9
● 301 of the 765 permit files reviewed had information about dry weather overflows; of these 301, 278 permittees noted no dryweather overflows.
● 452 of the 765 permit files reviewed had information on the miles of sewer maintained or acres served.
● 255 of the 765 permit files reviewed have documented the frequency of CSO events, by outfall, for one or more years.
● 195 of the 765 permit files reviewed document annual CSO discharge volumes by outfall, for one or more years.
● 47 of the 765 permit files reviewed have received water monitoring data.
Implementation of the NMC varied greatly. Below are data on the percentage of permits that had documentation on the varioustypes of NMC implemented:
1. Proper operation and maintenance (O&M)—75 percent
2. Maximize use of collection system for storage—75 percent
3. Pretreatment program review and modification—68 percent
4. Maximize flow to the POTW—74 percent
5. Eliminate dry weather overflows—76 percent
6. Floatables control—62 percent
7. Pollution prevention—59 percent
8. Public notification—59 percent
9. Monitoring—56 percent
The following is a list compiled of the most common activities employed to implement the NMC.
NMC Activity NMC Number of Permits
Street cleaning 6 182
Catch basin cleaning 6 159
Public education 8 102
Sewer flushing 1 91
Screens and trash racks 6 84
In-sewer storage 2 76
Solid waste reduction and recycling 7 68
Infiltration and inflow control 2 67
Industrial pretreatment 3 61
Area drain, foundation drain and roof leader disconnection 3 58

I-10
Report to Congress on Implementation and Enforcement of the CSO Control Policy
Implementation of LTCPs:
● 282 of the 786 permits have submitted LTCPs.
◗ 28 percent followed the demonstration approach.
◗ 36 percent followed the presumption approach.
◗ 36 percent followed a combination of demonstration and presumption or different approach altogether.
● 180 of the 282 LTCPs submitted have been approved.
● 232 of the 786 have submitted documentation for project-specific CSO controls that do not meet all the requirements for anLTCP, but go beyond minimal capital investment expectations of the NMC.
The following is a list compiled of the most common activities employed to implement LTCPs.
Of the 786 permit files, 254 contained information on sensitive areas. Primary contact recreation waters was by far the most oftencited type of sensitive use cited by communities. Some states, such as Indiana, have categorized all of their waters as primary contactrecreation waters. The following is the breakdown of reported sensitive areas where CSOs are located or are impacting sensitiveareas.
● Waters with threatened or endangered species—9
● Shellfish beds— 8
● Public drinking water intake—10
● Primary contact recreation waters—179
● Outstanding National Resource Waters—1
● Other/unspecified—47
According to the CSO Partnership, the large majority of CSO program improvements are self funded (82 percent). Fifty-five of theprojects employ the SRF. Thirty-two percent utilize state grants, 18 percent federal grants, and five percent other sources.
LTCP Control CSO Control Category Number of Permits
Sewer separation Collection system 223
Sewer rehabilitation Collection system 72
Retention basins Storage 71
Primary sedimentation Storage 69
Disinfection Treatment 67
Storage tunnels and conduits Storage 66
Upgraded wastewater treatment plant capacity
Treatment 64
Outfall elimination Collection system 62
Upgraded pump station capacity Collection system 53
Swirl concentrators and vortex separator Treatment 31
Appendix I
I-11
Question: Does the definition of oceans/estuaries/bays match the definition in the Beaches Act? If so, five percent seems low since amajor impetus pushing CSO control in the early 1990s were the concern over coastal impacts. Perhaps focusing on this five percentwould give us the biggest bang for the buck.
Response: These categories were based on what the permit language said, not any standard definition. It is possible that more areoceans/estuaries/bays if the Beaches Act definition is used.
Question: Did you ask communities for receiving water data?
Response: We checked the permit files, but did not contact communities. We will go directly out to communities for the 2003 report.
Comment: Collecting data is a good start, but telling an accurate story is important as well. For example, while five percent ofreceiving waters may be coastal, if measured by population, the impact goes up dramatically.
Comment: It is important to note that before the CSO Policy, two-thirds of communities had dry weather overflow, now 278 of 301report no dry weather overflows.
Question: The dry weather overflow number seems low. What could account for that?
Response: People do not like to report dry weather overflows. Also, there is a different interpretation of what dry weather overflowmeans.
Question: How many permit files were reviewed?
Response: 786 files were reviewed in 16 states.
Comment: It seems as if the ninth minimum control (monitoring) is not being implemented. Is anyone monitoring to see if theyneed an LTCP?
Response: Generally, they are doing monitoring to characterize their system, they are not conducting stream monitoring.
Comment: The Report to Congress should convey that environmental impact monitoring is not being conducted as intended in theCSO Control Policy to determine if LTCPs are warranted.
Comment: Include the percentage of communities that have completed their LTCPs.
Comment: It would be nice to have information broken out by size of community, flow, and rainfall as well.
Question: Will enforcement data be in the report?
Response: Yes.
Comment: Participants emphasized that the report should be useful to Congress. For example, point out progress and ensure thatCongress understands that without additional funding it will be difficult to make more progress. We need to send the message toCongress that we need to spend the $40 billion necessary to repair this problem.
Summary of Day 1— Jeff Lape, Acting Director, Water Permits Division, Office of WastewaterManagement, U.S. EPA Headquarters
We received a mandate for this report seven months ago. We realized that we did not have data, information, or analyses on which tobase a progress report. Since that time, we have tried to define the universe, document progress, and list results but haveencountered a paucity of data from previous analysis. Many of the necessary data collection tools are not in place for CSOs, let alonethe entire NPDES program. Data system management (electronic, geo-referenced, and available systems) will be a priority for theNPDES program in the future.
I-12
Report to Congress on Implementation and Enforcement of the CSO Control Policy
Opening Remarks, Day 2—Mike Cook, Director, Office of Wastewater Management,U.S. EPA Headquarters
Mr. Cook discussed the political context, the state of water quality, and infrastructure issues as they affect CSOs. He told the groupthat EPA's Administrator is putting greater focus on wet weather issues, particularly as they feed into a larger context of having aholistic watershed approach for dealing with water quality problems. EPA's budget request for CSOs was $450 million.
Mr. Cook explained that there is a paucity of good water quality data. The state 305(b) lists are the primary source of data in this area.According to this source, 40 percent of the nation's water bodies have been characterized, but some have limited data. We do havegood data on a few sources, such as in Boston and Chicago. We do know that many waters are impaired and that many of theseimpaired waters are targeted by TMDLs. Also, many of these impaired waters are in urban areas. These urban areas should remain thefocus. EPA has court orders in 19 states to review TMDLs, some of which deal with point sources such as CSOs.
The new Administration has been influenced by a report from the National Academy of Sciences, which places an emphasis onbiomonitoring and suggests keeping the TMDL program moving using an adaptive management approach. The report states thatmany water quality standards were put in place 25 or more years ago and are no longer appropriate. Before initiating work onTMDLs, EPA should look at the water quality standards and determine if they are appropriate.
Mr. Cook reminded the group of the frequent discussions at the federal and state levels about the cost of new regulatoryrequirements and unfunded mandates (e.g., arsenic standards, effluent guidelines), but explained that these discussions paled incomparison to the cost of replacing an aging wastewater infrastructure, which is estimated at $1–2 trillion, not including the cost ofprivate connections. EPA estimates the cost of SSOs control to be $80–90 billion alone. These costs will only rise, so Mr. Cook believesthat the time to act is now, but reminded the group to realize that progress will be incremental. Long-term strategies will besuccessful only when measured in decades.
He also commented that the social costs associated with future infrastructure needs are significant. Affordability will take on moreimportance as costs for these improvements rise. Mr. Cook explained that because the income of 60 percent of the nation's poorestcitizens has remained steady, but sewerage rates have increased steadily, wastewater costs take a larger percentage of overallhousehold costs. This causes two main problems for communities faced with significant infrastructure improvement needs: (1) poorercommunities will not be able to afford improvements at all and (2) large communities may still be able to afford the user fees overall,but within the larger community there will be an increasing population that cannot afford the fees.
He reminded the group that this problem will be felt most severely at the local level, since local communities will bear most of thecost of infrastructure improvements. There will be political problems associated with this issue. For example, political difficulties havealready been felt by politicians in California due to beach closures.
Preliminary Findings Discussion
The group then reviewed six preliminary findings designed to stimulate discussion and refine thoughts on how to interpret the datapresented on Day 1.
Finding #1: The CSO universe is small (compared to the total POTW universe), regionally concentrated, diverse, and dynamic.EPA estimates that today the total number of permits covering CSSs is 860.
Reactions:
● The participants generally agreed that first finding has nothing to do with what was asked for by Congress (i.e., what EPA hasdone to enforce the Policy) and therefore does not warrant a finding. Findings should really be more punchy and tell the storybetter.
Recommendations:
● Should delete the word "small" because it diminishes the importance of the CSO problem. Instead, the report might want tostate that 43 million people are served by CSSs and which Congressional districts are affected.
● Focus the report on how EPA, the states, and municipalities have implemented and enforced the CSO Control Policy.
● Incorporate downstream miles of waters impacted, beach closings, and lost recreational opportunities.

Appendix I
I-13
Finding #2: Issuance of the CSO Control Policy focused attention on the CSO problem and gave momentum to EPAdevelopment and implementation activities.
Reactions:
● For the most part, participants agreed that the Policy was a catalyst for action by EPA and all stakeholders. One asked that thesub-topics present more information. Another asked that the report focus on impacts on people and the environment, not on"administrative bean counting" and paperwork.
● In disagreement with the finding, one stakeholder suggested that public attention gave momentum to create the Policy, not thatthe Policy created attention and momentum.
Recommendations:
● Change the bullet that says "EPA has inspected." States have also done inspections.
● Put it all in the context of need. How much money has been spent? Say what the needs are today. Do not assume that datafrom the 1996 Needs Survey is current.
● Convey that there was an immediate benefit from the Policy. The NMC were immediately implemented (in some places).
● EPA does not implement this program, states and municipalities do.
● Point out that the general population is benefitting from CSO controls that the Policy catalyzed. The cities are now focusing onother issues—they look at all aspects of wet weather control. There is an additional private sector economic benefit.
Finding #3: The vast majority of states have incorporated some CSO Control Policy provisions into state permitting and/orenforcement approaches. State CSO programs remain highly diverse, and some aspects of state implementation ofCSO Control Policy provisions have differed from the framer's expectations.
Reactions:
● Participants were concerned that there is a lack of consistency in implementation and enforcement.
● One stakeholder commented that these data are taken from enforceable documents only. Due to the permit backlog, voluntaryactivities would not be reflected in this analysis.
● Another pointed out that a state with 76 permittees can only negotiate one to two new permits each year. These constraintsaccount for the diversity in CSO Control implementation.
● Tim Dwyer, EPA Headquarters Office of Water, noted that EPA had not provided guidance on water quality standards review untilmandated in FY 1999. Also, no metrics exist to evaluate the success of NMC and LTCPs (e.g., reduction in volume, flow, andduration of CSO discharges). Please see the section on water quality standards review for more detail.
Recommendations:
● Mention that more water quality reviews have occurred, but they are not all documented. Please see the section on waterquality standards review.
Finding #4: Most municipalities have a clearer understanding of CSO control requirements as a result of CSO Control Policy.Adoption of BMPs to reduce CSO discharges is widespread. Progress in long-term, capital-intensive projects hasbeen slower. Nationwide there are success stories in communities where CSO discharges have been eliminated orsubstantially controlled.
Recommendations:
● One stakeholder asked for discussion of water quality standards reviews in this section.
● Explain what the federal government, states, and municipalities have done to enforce the NMC.
Finding #5: The CSO Control Policy is unique with respect to its genesis, content, coordination, and flexibility. These qualitiesmake its implementation different from other water pollution control efforts and make objective assessment ofprogress more difficult.

I-14
Report to Congress on Implementation and Enforcement of the CSO Control Policy
Reactions:
● Participants generally agreed that this finding was unimportant and could either be noted as a footnote or be cut completely.They did not want the findings to state that the Policy was unique, rather that the CSO problem is. They also wished to note thatthe flexibility built into the Policy cannot be utilized to its full degree if water quality standards revisions are not occurring.
● Another criticism was that the only flexibility in the Policy to date is in NMC implementation.
● Meeting water quality standards, as opposed to technology-based standards, is a primary difficulty in CSO Policyimplementation.
Recommendations:
● The Policy needs tinkering. There are many components to the water quality equation, and this needs to be made clear.
Finding #6: States and communities have accomplished important environmental objectives as part of their CSO control effortsto date. However, despite the CSO control efforts on the part of EPA, states, and municipalities, much more needs tobe done. More environmental data are needed to fully assess effectiveness of CSO controls and the attainment ofenvironmental outcomes, including water quality standards. Information reporting and management, as it currentlyexists in most cases, is inadequate to determine accomplishments.
Reactions:
● The general consensus of the group was that much more needs to be done on collecting and monitoring information.
Recommendations:
● Finding number two is misleading because only state permit files were addressed. Should either drop or make more explicit.
● One stakeholder requested that cost information be included in this finding.
● Point out that once CSO work has been done, a stream still may not be clean.
● Another stakeholder pointed out that wet weather monitoring is complicated and that many municipalities lack the technicalexpertise to design and implement a monitoring program. It was requested that the finding convey this difficulty.
Additional Findings Suggested by Participants
Water Quality Standards
EPA should put everything in the context of greater watershed management. Explain how CSOs are one of the things that impactwater quality and that CSO control is a step towards overall watershed improvement. Describe what water quality is, what revisionsentail, and the details of the one existing water quality standards review. Mention that other water quality reviews have occurred, butthey are not all documented. Say that revisions are not occurring. Explain use attainability analysis and explain that if revisions donot occur, the cost of control is going to rise (the cost of control is based on the assumptions of the presumptive approach, 4-6overflows/year). Explain that the Policy was intended to encourage permitting people to meet with water quality standards people,but these meetings are not occurring. Water quality standards people need to be engaged more.
EPA Leadership
EPA needs to exercise more leadership regarding water quality standards revisions. Start by talking about it more in the report.Perhaps the review can be incorporated more with the LTCP process. The public consultation process is not occurring and that is anarea where EPA can have some impact.
Enforcement
Since 1994, the CSO Control Policy has been non-binding, so the regulated community has developed varied levels of response. Therole of NPDES authorities in the CSO issue has been less forceful than in other EPA policies. Now, with the addition of the "shallconform" language, stakeholders want more guidance from EPA to enforce the Policy in a consistent manner. Some NPDESauthorities have actively enforced the CSO Policy and encouraged EPA to report details on enforcement actions.
Appendix I
I-15
Funding
There needs to be better public education about the costs and consequences of CSO control. Action has been spurred in some casesbecause of sewer crises, which dissolves opposition, but some communities have approved sewer improvements withoutunderstanding what that would actually entail. They are now having trouble making payments. The lack of grant money places muchof the financial burden on municipalities. Long-term schedules must be reasonable in light of funding capabilities. Involvement byCongressional and state representatives increases funding options and decreases local share.
Elaboration on funding options was requested by some participants. It was requested that EPA make some mention that some statesissue SRF loans with additional interest that may deter use of these funds. Many stressed that grants would be more helpful to smallcommunities than loans. Many participants were concerned about the funding burden to local communities and requested that thisreport illuminate the costs of CSO abatement. There was agreement that the flexibility inherent in the CSO Control Policy eased someof the burden, but that additional state and federal assistance was needed. The schedule of payments should be long-term, not short-term, and be tailored to the public's ability to pay. Extending schedules for implementation and payment would help defer costs. TheSRF infrastructure is in place, but may need to be adapted for CSO control. The possibility of providing grants through Clean WaterSRF programs was noted. A good model for this is the Drinking Water SRF.
Some stakeholders questioned the equity of CSO funding. Distribution of income in urban areas and regional economics make someless able to pay. One stakeholder claimed that in Saginaw, Michigan, a city which undertook expensive CSO controls, 25 percent ofthe ratepayers cannot pay their bills and that bond payments on detention basins will bankrupt the city within five years. Assistanceto economically disadvantaged communities will not necessarily help large, urban areas, which might require financial assistance butdo not meet the criteria. Some suggested making zero or negative interest loans through the SRF or providing an equivalent taxincentive for users. Perhaps SRF could be changed to make grants available to poor communities, though safeguards would benecessary to prevent abuse. There was some disagreement of the viability of loans versus grants. Some suggested that grants wouldencourage regulators to give to those who can show environmental benefits and for municipalities to better quantify those benefitsin order to get funding.
Additional Comments from Stakeholders
Definitions
● Many participants felt that the distinction between CSOs and SSOs was not clear. Another wondered if the number ofcommunities that reported CSOs would rise again, as SSO controls become more stringent. An EPA representative noted thatmany SSO communities would like to be treated like CSO communities when under enforcement actions.
● Clarify terminology: permittee versus CSO community; major/minor distinction; and definitions of SSO versus CSO. The definitionand inclusion of satellite communities should also be made explicit. Incentives for reporting CSOs versus SSOs should beinvestigated.
● Make clear the distinctions between EPA, NPDES permitting authority, and states.
● Should convey that LTCPs are only plans and that actual spending has not happened yet.
● Define and explain urban wet weather problems.
● Distinguish between small, urban tributaries and complex river systems.
● Do not use the term "Best Management Practice."
● One stakeholder requested that local governments be given credit for implementation and that EPA claim to create only policyand guidance.
Data
● Note that the only monitoring data reviewed was at state or EPA level, not each permittee's data.
● report should describe enforcement processes and enumerate enforcement actions for CSO violations.
● Include a more detailed discussion of information management related to CSOs ("incomplete, inaccurate, obsolete").
● Identify the number of political jurisdictions (communities) in the 860 permittees. Try to incorporate 2000 Census data.
● Look beyond the permit files for NMC data. Some states have asked for NMC reports as part of the permit process—these wouldnot be reflected in actual permit files. Also, should look at permits issued prior to 1994 that have not been reissued.

I-16
Report to Congress on Implementation and Enforcement of the CSO Control Policy
● Report should have more detail of which CSO controls are being implemented.
● Report should list and discuss the number of communities that have completed LTCPs.
● Report should mention initial estimates of the size of the CSO community (1300) and the reason for the apparent decline in thatnumber to 860. The report should include the number of communities that have separated their systems.
● Answer the question of how many CSO discharges were in violation of water quality standards at the time of the Policy and howmany discharges are in violation today (hopefully the former is greater than the latter).
● Mention that some water quality reviews have occurred, but they are not all documented.
● Need standard metrics for permittees to quantify compliance (frequency of CSOs, volume, duration). What about biologicalindicators? Many of the success stories are anecdotal, not based on documented and technical data.
● Explain what the federal government, states, and municipalities have done to enforce the NMC.
Report Format
● Some participants felt that this format does not answer the questions asked by Congress.
● There is a need to address the context and intended audience of this report. This report is not intended to makerecommendations; it is to present what has been done to implement and enforce the Policy. The report should state progress,needs, and how Congress can help.
● Tell Congress that 43 million people are served by CSOs (how many Congressional districts?). Also, bring in regional anddownstream miles impacted, lost recreational opportunities, and beach closings.
● The differences between the four approaches to the Policy taken by NPDES authorities should be made clear, as well as the legalimplications of the various approaches. Another participant wanted to simply state whether or not the NMC are required.
● Include mention of other activities being performed by states that may compete with CSOs as a priority (e.g., CAFOs, stormwater, etc.). CSO enforcement has not been a priority because it has been just a policy for so long. One participantrecommended looking at the Inspector General's Report, with particular attention to siting concerns for water pollution controlprojects in New York.
● Report should discuss the obstacles to NPDES programs (CAFOs, storm water, etc.) as reason for flexibility in the CSO Policy.
● Determine what goals and objectives EPA wants the report to accomplish. Then go back and write findings that focus on those.
● Report should be structured around the three "legs" of the Policy: (1) NMC; (2) LTCP to meet water quality standards; and (3)reviews and revisions of water quality standards. The third leg has not happened. NMC #9 ("monitoring to effectivelycharacterize CSO impacts and the efficacy of CSO controls") is not being faithfully implemented. Describe water qualitystandards review process for Congress. Participants wanted more discussion on water quality standards review and revision anda clear standard from EPA on how to conduct reviews of water quality standards.
● Enforcement of the Policy should have a separate finding that includes actual data on enforcement actions.
● Do not be shy in saying that the states have not done their jobs.
● State what EPA is planning to do in the future.
● EPA should tell Congress that there are long-term social issues associated with CSOs related to the distribution of income incities. This is a social problem that resulted from the development of the country.
Closing Comments—Mike Cook, Director, Office of Wastewater Management, U.S. EPA Headquarters
Mr. Cook thanked the participants for coming and reminded them that EPA does not have time to gather all the informationrequested, but they will do what is possible for the September 2001 Report and consider all of the comments for the 2003 Report. Hereminded participants that a summary of the meeting that reflects all of the group discussion will be sent out to the participants. EPAstill needs to do some thinking about what Congress will do with this report. There may be hearings based on the findings of thereport. They may respond legislatively. They may set aside some funding to address the problem, hopefully in a larger watershedcontext.
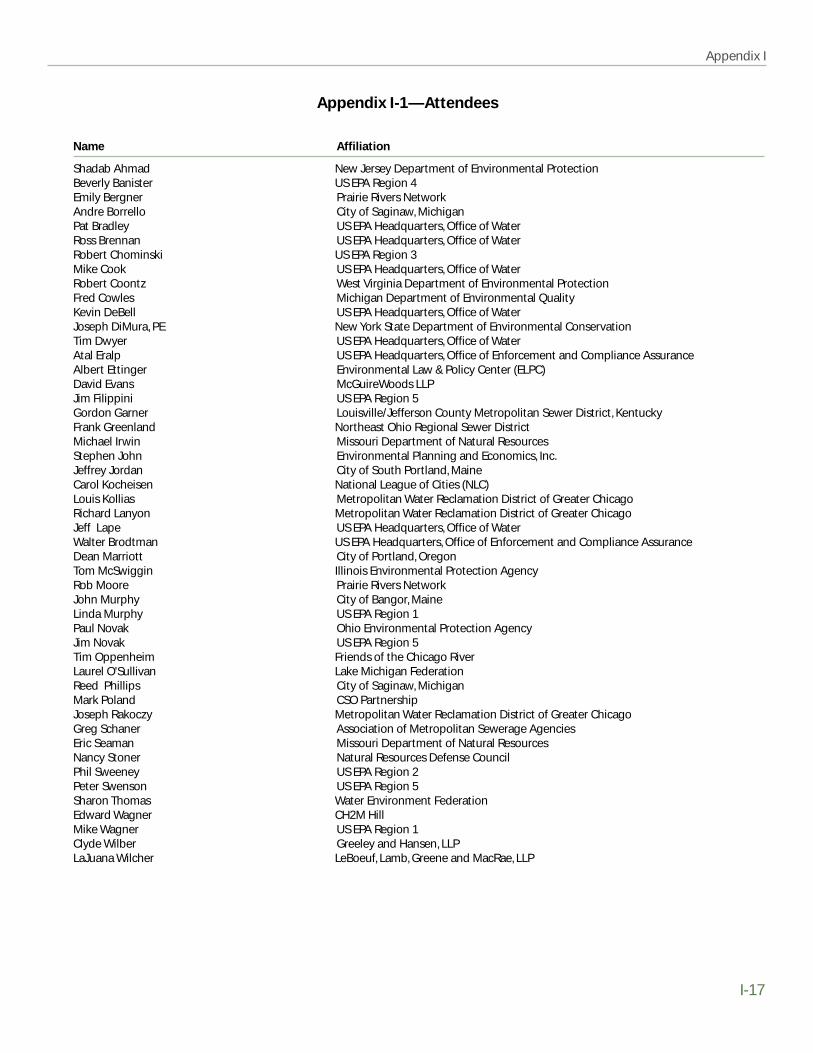
Appendix I
I-17
Appendix I-1—Attendees
Name Affiliation
Shadab Ahmad New Jersey Department of Environmental ProtectionBeverly Banister US EPA Region 4Emily Bergner Prairie Rivers NetworkAndre Borrello City of Saginaw, MichiganPat Bradley US EPA Headquarters, Office of WaterRoss Brennan US EPA Headquarters, Office of WaterRobert Chominski US EPA Region 3Mike Cook US EPA Headquarters, Office of WaterRobert Coontz West Virginia Department of Environmental ProtectionFred Cowles Michigan Department of Environmental QualityKevin DeBell US EPA Headquarters, Office of WaterJoseph DiMura, PE New York State Department of Environmental ConservationTim Dwyer US EPA Headquarters, Office of WaterAtal Eralp US EPA Headquarters, Office of Enforcement and Compliance AssuranceAlbert Ettinger Environmental Law & Policy Center (ELPC)David Evans McGuireWoods LLPJim Filippini US EPA Region 5Gordon Garner Louisville/Jefferson County Metropolitan Sewer District, KentuckyFrank Greenland Northeast Ohio Regional Sewer DistrictMichael Irwin Missouri Department of Natural ResourcesStephen John Environmental Planning and Economics, Inc.Jeffrey Jordan City of South Portland, MaineCarol Kocheisen National League of Cities (NLC)Louis Kollias Metropolitan Water Reclamation District of Greater ChicagoRichard Lanyon Metropolitan Water Reclamation District of Greater ChicagoJeff Lape US EPA Headquarters, Office of WaterWalter Brodtman US EPA Headquarters, Office of Enforcement and Compliance AssuranceDean Marriott City of Portland, OregonTom McSwiggin Illinois Environmental Protection AgencyRob Moore Prairie Rivers NetworkJohn Murphy City of Bangor, MaineLinda Murphy US EPA Region 1Paul Novak Ohio Environmental Protection AgencyJim Novak US EPA Region 5Tim Oppenheim Friends of the Chicago RiverLaurel O'Sullivan Lake Michigan FederationReed Phillips City of Saginaw, MichiganMark Poland CSO PartnershipJoseph Rakoczy Metropolitan Water Reclamation District of Greater ChicagoGreg Schaner Association of Metropolitan Sewerage AgenciesEric Seaman Missouri Department of Natural ResourcesNancy Stoner Natural Resources Defense CouncilPhil Sweeney US EPA Region 2Peter Swenson US EPA Region 5Sharon Thomas Water Environment FederationEdward Wagner CH2M HillMike Wagner US EPA Region 1Clyde Wilber Greeley and Hansen, LLPLaJuana Wilcher LeBoeuf, Lamb, Greene and MacRae, LLP

I-18
Report to Congress on Implementation and Enforcement of the CSO Control Policy
Appendix I-2—Agenda
Agenda for Stakeholders Meeting on the Report to Congress on Combined Sewer Overflows
July 12 – 13, 2001—Palmer House Hilton, Chicago, Illinois
Purpose
CSO experts from around the country will gather to:
● Discuss the data, report methodology, and analysis of the Report to Congress;
● Discuss the implications of the major findings of the report;
● Discuss participants' experiences under the CSO Policy; and
● Discuss future directions, including activities related to the Wet Weather Quality Act of 2000.
Thursday, July 12, 2001
12:00–1:30 Lunch and Opening Remarks: Progress in Controlling CSOs
Opening Remarks—Tom McSwiggin, Bureau of Water, Permits Office, State of Illinois
Mr. McSwiggin is a long-time expert in the CSO field and was one of the founders of the 1994 CSO Policy. Mr. McSwiggin willwelcome participants to Chicago and offer views on his State's experiences in CSO control.
Progress in Controlling CSOs—Jeff Lape, Acting Director, Water Permits Division, U.S. EPA
Mr. Lape played an active role in the formation of the 1994 CSO Policy. He will provide an overview of the 1994 CSO Policy andsubsequent milestones.
1:30–1:45 Break
1:45–5:00 Briefing and Discussion of Major Elements of the 2001 Report to Congress
Using a briefing-discussion format, the group will participate in focused discussions of the major elements of the Report to Congress,including methodology and scope, data gathered, and findings.
Evening Social event, to be determined
Friday, July 13, 2001
8:30– 8:45 CSO Policy and Future Directions
Michael B. Cook, Director, Office of Wastewater Management, U.S. EPA
Mr. Cook has been the Director of U.S. EPA's Office of Wastewater Management since 1991. Among his many duties, he is responsiblefor managing the national NPDES program and is a noted leader in the environmental field. Mr. Cook will offer his views of the CSOPolicy and its future.
8:45–10:00 Interpreting the Data and Findings of the 2001 Report to Congress
Participants will discuss the major findings of the report as a whole. Key questions may include:
(1) Are the wide variety of approaches that currently exist for CSO control a negative or positive outcome of the CSO Policy?
(2) How does this flexible approach impact regulators? Municipalities?
10:00–10:15 Break
10:15– 11:45 The Future Directions in CSO Control
In smaller discussion groups participants will discuss the CSO Policy in a broader context. Key topics will be determined based onconversation from Day 1.
11:45–12:00 Closing Remarks and Next Steps

Appendix J
Summary of CSO-RelatedEnforcement Actions Initiated by EPA
After Issuance of the CSO Control Policy

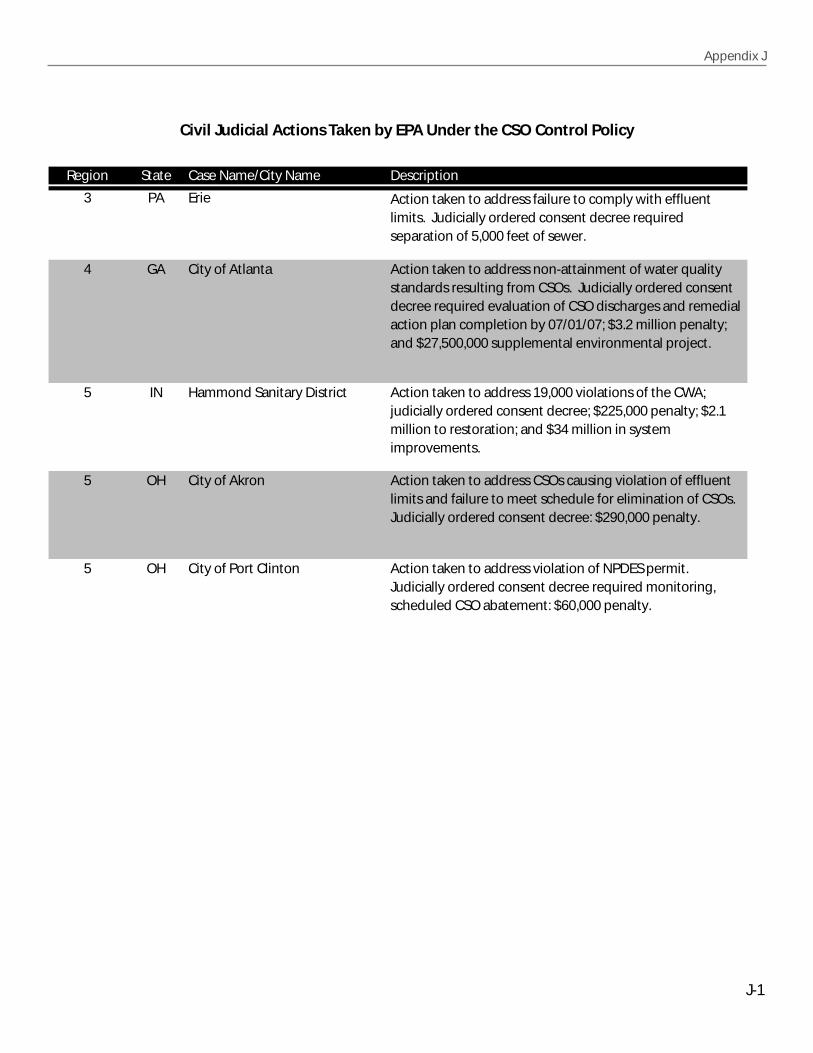
J-1
Appendix J
Region State Case Name/City Name Description
3 PA Erie
4 GA City of Atlanta
5 IN Hammond Sanitary District
5 OH City of Akron
5 OH City of Port Clinton
Action taken to address failure to comply with effluent limits. Judicially ordered consent decree required separation of 5,000 feet of sewer.
Action taken to address violation of NPDES permit. Judicially ordered consent decree required monitoring, scheduled CSO abatement: $60,000 penalty.
Action taken to address CSOs causing violation of effluent limits and failure to meet schedule for elimination of CSOs. Judicially ordered consent decree: $290,000 penalty.
Action taken to address 19,000 violations of the CWA; judicially ordered consent decree; $225,000 penalty; $2.1 million to restoration; and $34 million in system improvements.
Action taken to address non-attainment of water quality standards resulting from CSOs. Judicially ordered consent decree required evaluation of CSO discharges and remedial action plan completion by 07/01/07; $3.2 million penalty; and $27,500,000 supplemental environmental project.
Civil Judicial Actions Taken by EPA Under the CSO Control Policy
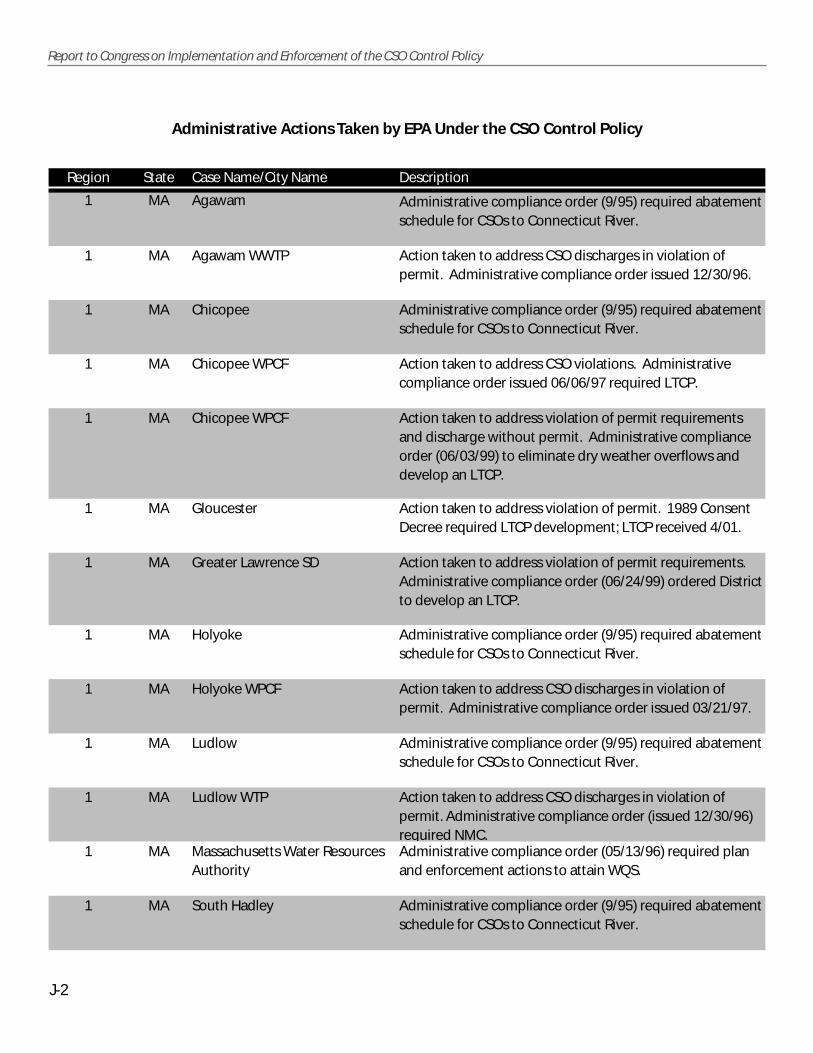
Region State Case Name/City Name Description
1 MA Agawam
1 MA Agawam WWTP
1 MA Chicopee
1 MA Chicopee WPCF
1 MA Chicopee WPCF
1 MA Gloucester
1 MA Greater Lawrence SD
1 MA Holyoke
1 MA Holyoke WPCF
1 MA Ludlow
1 MA Ludlow WTP Action taken to address CSO discharges in violation of permit. Administrative compliance order (issued 12/30/96) required NMC.
1 MA Massachusetts Water Resources Authority
1 MA South Hadley
Administrative compliance order (9/95) required abatement schedule for CSOs to Connecticut River.
Action taken to address CSO discharges in violation of permit. Administrative compliance order issued 12/30/96.
Administrative compliance order (9/95) required abatement schedule for CSOs to Connecticut River.
Action taken to address violation of permit requirements. Administrative compliance order (06/24/99) ordered District to develop an LTCP.
Action taken to address violation of permit. 1989 Consent Decree required LTCP development; LTCP received 4/01.
Action taken to address violation of permit requirements and discharge without permit. Administrative compliance order (06/03/99) to eliminate dry weather overflows and develop an LTCP.
Action taken to address CSO violations. Administrative compliance order issued 06/06/97 required LTCP.
Administrative compliance order (05/13/96) required plan and enforcement actions to attain WQS.
Administrative compliance order (9/95) required abatement schedule for CSOs to Connecticut River.
Action taken to address CSO discharges in violation of permit. Administrative compliance order issued 03/21/97.
Administrative compliance order (9/95) required abatement schedule for CSOs to Connecticut River.
Administrative compliance order (9/95) required abatement schedule for CSOs to Connecticut River.
J-2
Report to Congress on Implementation and Enforcement of the CSO Control Policy
Administrative Actions Taken by EPA Under the CSO Control Policy
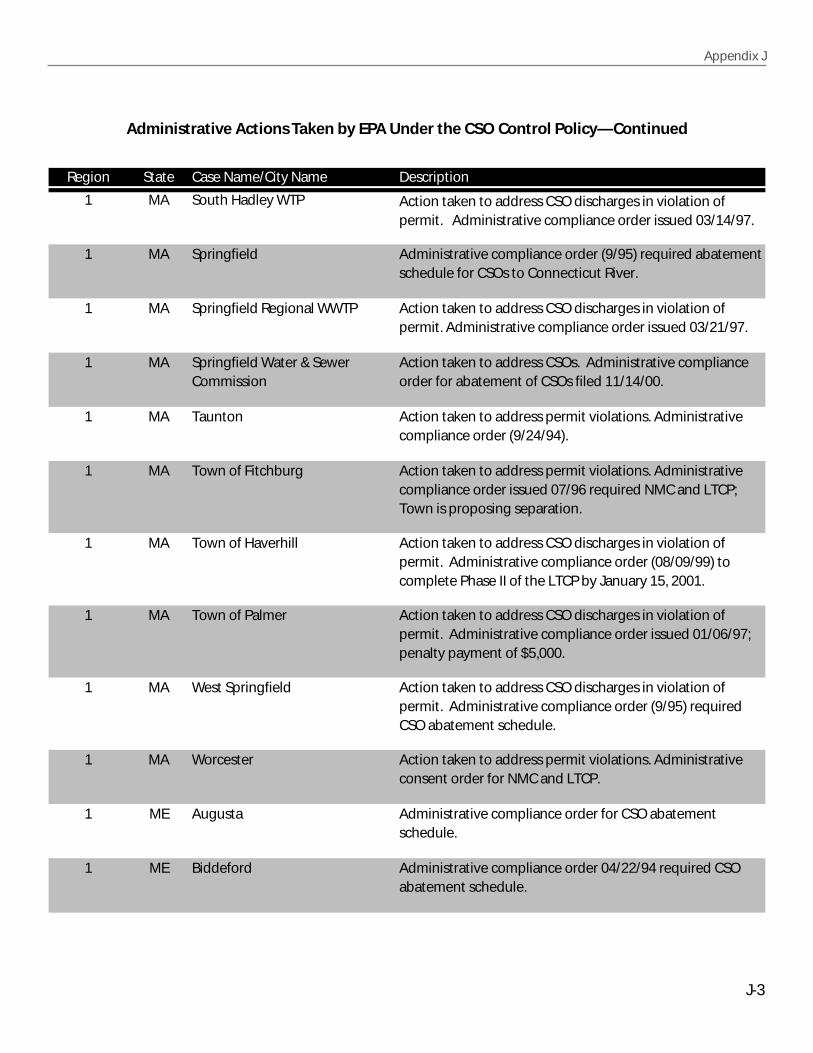
Appendix J
J-3
Region State Case Name/City Name Description
1 MA South Hadley WTP
1 MA Springfield
1 MA Springfield Regional WWTP
1 MA Springfield Water & Sewer Commission
1 MA Taunton
1 MA Town of Fitchburg
1 MA Town of Haverhill
1 MA Town of Palmer
1 MA West Springfield
1 MA Worcester
1 ME Augusta
1 ME Biddeford
Action taken to address CSO discharges in violation of permit. Administrative compliance order issued 03/21/97.
Administrative compliance order (9/95) required abatement schedule for CSOs to Connecticut River.
Action taken to address CSO discharges in violation of permit. Administrative compliance order issued 03/14/97.
Action taken to address CSO discharges in violation of permit. Administrative compliance order (08/09/99) to complete Phase II of the LTCP by January 15, 2001.
Action taken to address permit violations. Administrative compliance order issued 07/96 required NMC and LTCP; Town is proposing separation.
Action taken to address permit violations. Administrative compliance order (9/24/94).
Action taken to address CSOs. Administrative compliance order for abatement of CSOs filed 11/14/00.
Administrative compliance order for CSO abatement schedule.
Action taken to address permit violations. Administrative consent order for NMC and LTCP.
Action taken to address CSO discharges in violation of permit. Administrative compliance order (9/95) required CSO abatement schedule.
Action taken to address CSO discharges in violation of permit. Administrative compliance order issued 01/06/97; penalty payment of $5,000.
Administrative compliance order 04/22/94 required CSO abatement schedule.
Administrative Actions Taken by EPA Under the CSO Control Policy—Continued

J-4
Report to Congress on Implementation and Enforcement of the CSO Control Policy
Region State Case Name/City Name Description
1 NH Lebanon WWTP & City STP
1 NH Manchester STP
1 NH Nashua
5 IL City of Rock Island
5 IN Bluffton POTW
5 IN Fort Wayne
5 OH Port Clinton
Administrative compliance order required CSO abatement by 12/31/19.
Action taken to address non-attainment of water quality standards caused by CSOs. Administrative compliance order (03/08/99) requiring CSO abatement and $5.6 million supplemental environmental project (SEP).
Action taken to address CSO discharges in violation of permit. Administrative order (6/6/00) requires City to eliminate six CSOs by 12/31/08 and to submit a plan to EPA by 12/31/05 to eliminate the seventh CSO by 12/31/12.
CSOs in violation of permit resulted in a 1995 administrative order and subsequently a judicial referral.
CSOs in violation of permit and SSO violations resulted in the issuance of two administrative orders in 1995 and 1996.
Action taken to address violation of permit by failure to submit CSO plan. CSO plan received. Administrative penalty order filed 6/6/00 requiring SEP and $30,000 penalty.
Action taken to address CSOs to environmentally sensitive area and failure to implement the NMC. Administrative compliance order filed 02/13/98 requires plant and sewer improvements to reduce CSOs.
Administrative Actions Taken by EPA Under the CSO Control Policy—Continued

Appendix K
Summary of Planned Research byEPA’s Office of Research and
Development

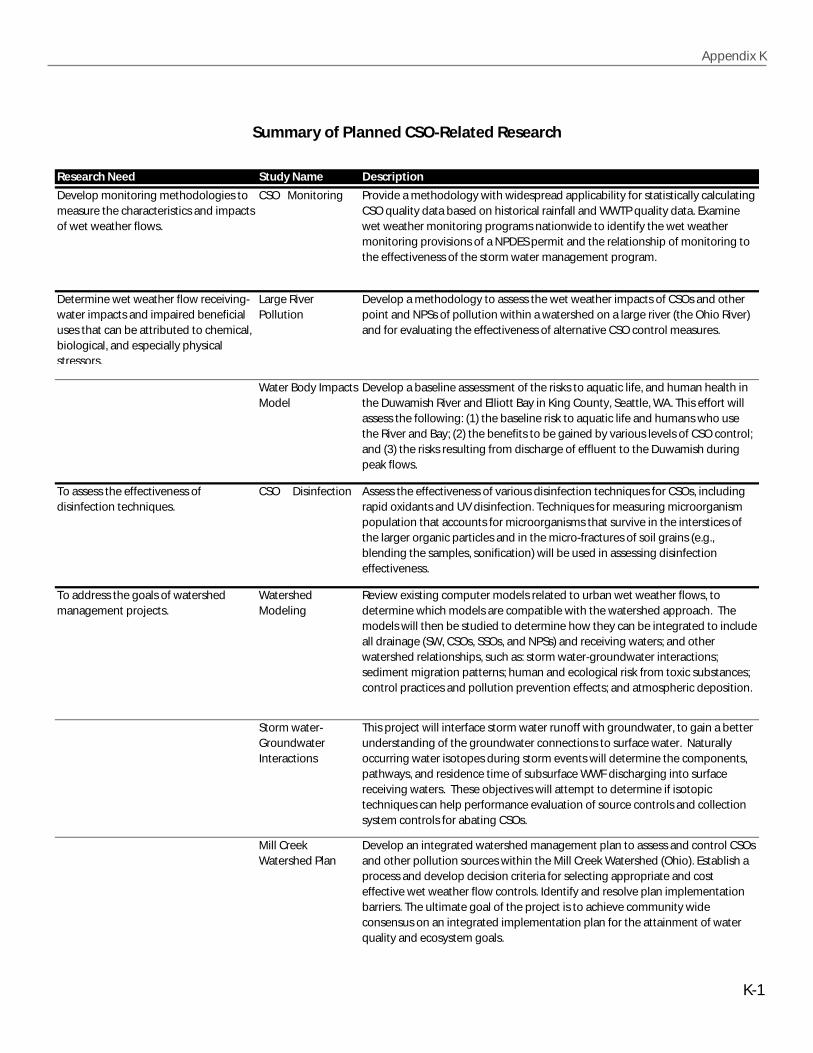
Research Need Study Name Description
Develop monitoring methodologies to measure the characteristics and impacts of wet weather flows.
CSO Monitoring
Determine wet weather flow receiving-water impacts and impaired beneficial uses that can be attributed to chemical, biological, and especially physical stressors.
Large River Pollution
Water Body Impacts Model
To assess the effectiveness of disinfection techniques.
CSO Disinfection
To address the goals of watershed management projects.
Watershed Modeling
Storm water-Groundwater Interactions
Mill Creek Watershed Plan
Review existing computer models related to urban wet weather flows, to determine which models are compatible with the watershed approach. The models will then be studied to determine how they can be integrated to include all drainage (SW, CSOs, SSOs, and NPSs) and receiving waters; and other watershed relationships, such as: storm water-groundwater interactions; sediment migration patterns; human and ecological risk from toxic substances; control practices and pollution prevention effects; and atmospheric deposition.
This project will interface storm water runoff with groundwater, to gain a better understanding of the groundwater connections to surface water. Naturally occurring water isotopes during storm events will determine the components, pathways, and residence time of subsurface WWF discharging into surface receiving waters. These objectives will attempt to determine if isotopic techniques can help performance evaluation of source controls and collection system controls for abating CSOs.
Develop an integrated watershed management plan to assess and control CSOs and other pollution sources within the Mill Creek Watershed (Ohio). Establish a process and develop decision criteria for selecting appropriate and cost effective wet weather flow controls. Identify and resolve plan implementation barriers. The ultimate goal of the project is to achieve community wide consensus on an integrated implementation plan for the attainment of water quality and ecosystem goals.
Provide a methodology with widespread applicability for statistically calculating CSO quality data based on historical rainfall and WWTP quality data. Examine wet weather monitoring programs nationwide to identify the wet weather monitoring provisions of a NPDES permit and the relationship of monitoring to the effectiveness of the storm water management program.
Develop a methodology to assess the wet weather impacts of CSOs and other point and NPSs of pollution within a watershed on a large river (the Ohio River) and for evaluating the effectiveness of alternative CSO control measures.
Develop a baseline assessment of the risks to aquatic life, and human health in the Duwamish River and Elliott Bay in King County, Seattle, WA. This effort will assess the following: (1) the baseline risk to aquatic life and humans who use the River and Bay; (2) the benefits to be gained by various levels of CSO control; and (3) the risks resulting from discharge of effluent to the Duwamish during peak flows.
Assess the effectiveness of various disinfection techniques for CSOs, including rapid oxidants and UV disinfection. Techniques for measuring microorganism population that accounts for microorganisms that survive in the interstices of the larger organic particles and in the micro-fractures of soil grains (e.g., blending the samples, sonification) will be used in assessing disinfection effectiveness.
K-1
Appendix K
Summary of Planned CSO-Related Research
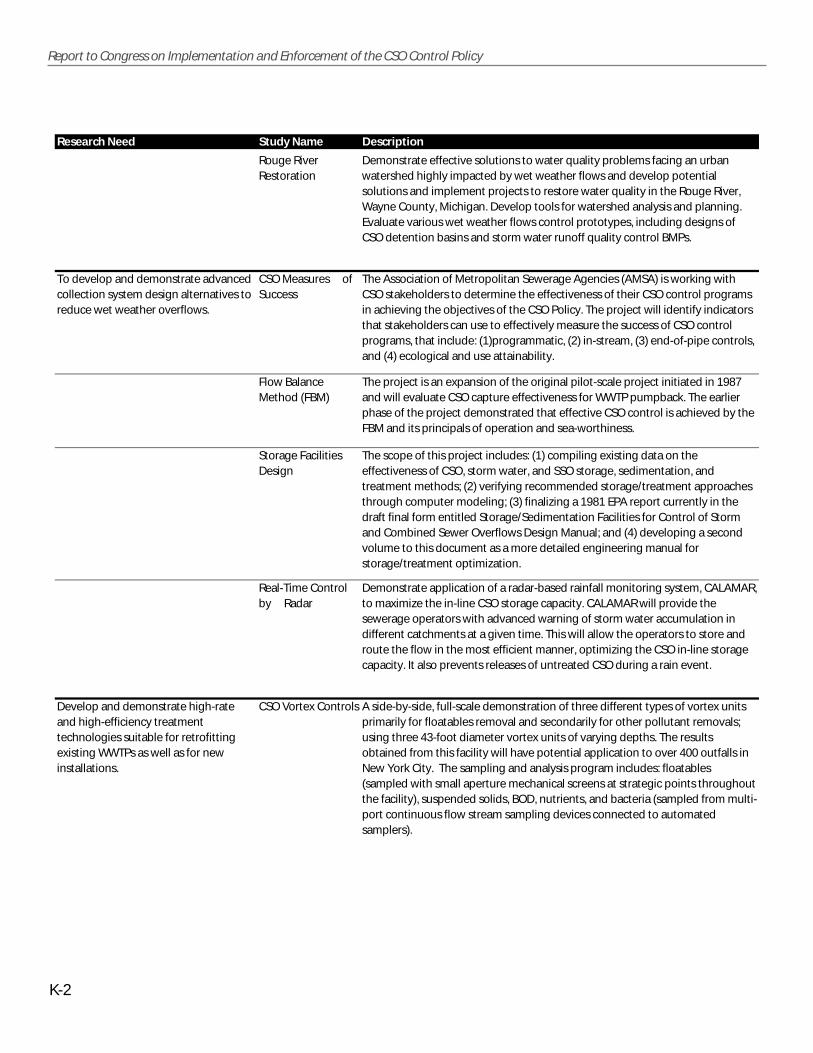
K-2
Report to Congress on Implementation and Enforcement of the CSO Control Policy
Research Need Study Name Description
Rouge River Restoration
To develop and demonstrate advanced collection system design alternatives to reduce wet weather overflows.
CSO Measures of Success
Flow Balance Method (FBM)
Storage Facilities Design
Real-Time Control by Radar
Develop and demonstrate high-rate and high-efficiency treatment technologies suitable for retrofitting existing WWTPs as well as for new installations.
CSO Vortex Controls A side-by-side, full-scale demonstration of three different types of vortex units primarily for floatables removal and secondarily for other pollutant removals; using three 43-foot diameter vortex units of varying depths. The results obtained from this facility will have potential application to over 400 outfalls in New York City. The sampling and analysis program includes: floatables (sampled with small aperture mechanical screens at strategic points throughout the facility), suspended solids, BOD, nutrients, and bacteria (sampled from multi-port continuous flow stream sampling devices connected to automated samplers).
The Association of Metropolitan Sewerage Agencies (AMSA) is working with CSO stakeholders to determine the effectiveness of their CSO control programs in achieving the objectives of the CSO Policy. The project will identify indicators that stakeholders can use to effectively measure the success of CSO control programs, that include: (1)programmatic, (2) in-stream, (3) end-of-pipe controls, and (4) ecological and use attainability.
The project is an expansion of the original pilot-scale project initiated in 1987 and will evaluate CSO capture effectiveness for WWTP pumpback. The earlier phase of the project demonstrated that effective CSO control is achieved by the FBM and its principals of operation and sea-worthiness.
The scope of this project includes: (1) compiling existing data on the effectiveness of CSO, storm water, and SSO storage, sedimentation, and treatment methods; (2) verifying recommended storage/treatment approaches through computer modeling; (3) finalizing a 1981 EPA report currently in the draft final form entitled Storage/Sedimentation Facilities for Control of Storm and Combined Sewer Overflows Design Manual; and (4) developing a second volume to this document as a more detailed engineering manual for storage/treatment optimization.
Demonstrate application of a radar-based rainfall monitoring system, CALAMAR, to maximize the in-line CSO storage capacity. CALAMAR will provide the sewerage operators with advanced warning of storm water accumulation in different catchments at a given time. This will allow the operators to store and route the flow in the most efficient manner, optimizing the CSO in-line storage capacity. It also prevents releases of untreated CSO during a rain event.
Demonstrate effective solutions to water quality problems facing an urban watershed highly impacted by wet weather flows and develop potential solutions and implement projects to restore water quality in the Rouge River, Wayne County, Michigan. Develop tools for watershed analysis and planning. Evaluate various wet weather flows control prototypes, including designs of CSO detention basins and storm water runoff quality control BMPs.
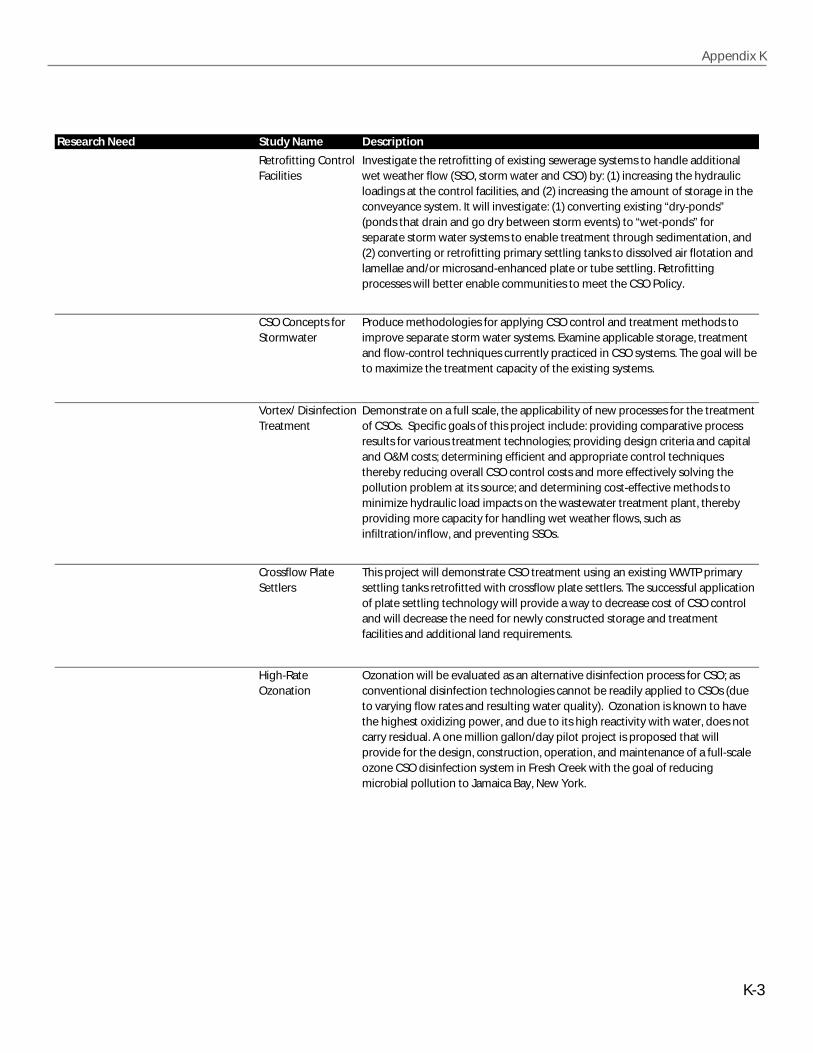
Appendix K
K-3
Research Need Study Name Description
Retrofitting Control Facilities
CSO Concepts for Stormwater
Vortex/ Disinfection Treatment
Crossflow Plate Settlers
High-Rate Ozonation
This project will demonstrate CSO treatment using an existing WWTP primary settling tanks retrofitted with crossflow plate settlers. The successful application of plate settling technology will provide a way to decrease cost of CSO control and will decrease the need for newly constructed storage and treatment facilities and additional land requirements.
Ozonation will be evaluated as an alternative disinfection process for CSO; as conventional disinfection technologies cannot be readily applied to CSOs (due to varying flow rates and resulting water quality). Ozonation is known to have the highest oxidizing power, and due to its high reactivity with water, does not carry residual. A one million gallon/day pilot project is proposed that will provide for the design, construction, operation, and maintenance of a full-scale ozone CSO disinfection system in Fresh Creek with the goal of reducing microbial pollution to Jamaica Bay, New York.
Investigate the retrofitting of existing sewerage systems to handle additional wet weather flow (SSO, storm water and CSO) by: (1) increasing the hydraulic loadings at the control facilities, and (2) increasing the amount of storage in the conveyance system. It will investigate: (1) converting existing “dry-ponds” (ponds that drain and go dry between storm events) to “wet-ponds” for separate storm water systems to enable treatment through sedimentation, and (2) converting or retrofitting primary settling tanks to dissolved air flotation and lamellae and/or microsand-enhanced plate or tube settling. Retrofitting processes will better enable communities to meet the CSO Policy.
Produce methodologies for applying CSO control and treatment methods to improve separate storm water systems. Examine applicable storage, treatment and flow-control techniques currently practiced in CSO systems. The goal will be to maximize the treatment capacity of the existing systems.
Demonstrate on a full scale, the applicability of new processes for the treatment of CSOs. Specific goals of this project include: providing comparative process results for various treatment technologies; providing design criteria and capital and O&M costs; determining efficient and appropriate control techniques thereby reducing overall CSO control costs and more effectively solving the pollution problem at its source; and determining cost-effective methods to minimize hydraulic load impacts on the wastewater treatment plant, thereby providing more capacity for handling wet weather flows, such as infiltration/inflow, and preventing SSOs.
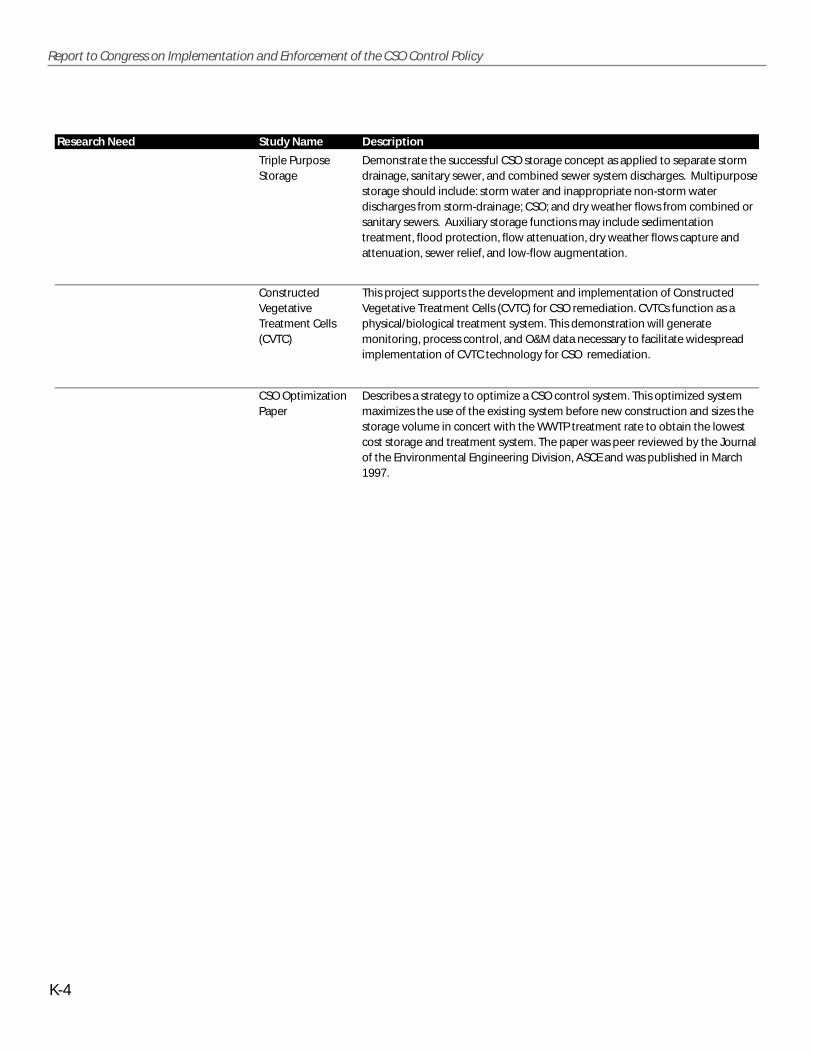
K-4
Report to Congress on Implementation and Enforcement of the CSO Control Policy
Research Need Study Name Description
Triple Purpose Storage
Constructed Vegetative Treatment Cells (CVTC)
CSO Optimization Paper
Describes a strategy to optimize a CSO control system. This optimized system maximizes the use of the existing system before new construction and sizes the storage volume in concert with the WWTP treatment rate to obtain the lowest cost storage and treatment system. The paper was peer reviewed by the Journal of the Environmental Engineering Division, ASCE and was published in March 1997.
Demonstrate the successful CSO storage concept as applied to separate storm drainage, sanitary sewer, and combined sewer system discharges. Multipurpose storage should include: storm water and inappropriate non-storm water discharges from storm-drainage; CSO; and dry weather flows from combined or sanitary sewers. Auxiliary storage functions may include sedimentation treatment, flood protection, flow attenuation, dry weather flows capture and attenuation, sewer relief, and low-flow augmentation.
This project supports the development and implementation of Constructed Vegetative Treatment Cells (CVTC) for CSO remediation. CVTCs function as a physical/biological treatment system. This demonstration will generate monitoring, process control, and O&M data necessary to facilitate widespread implementation of CVTC technology for CSO remediation.

Appendix L
List of Recipients ofNational Combined Sewer Overflow
Control Policy Excellence Awards

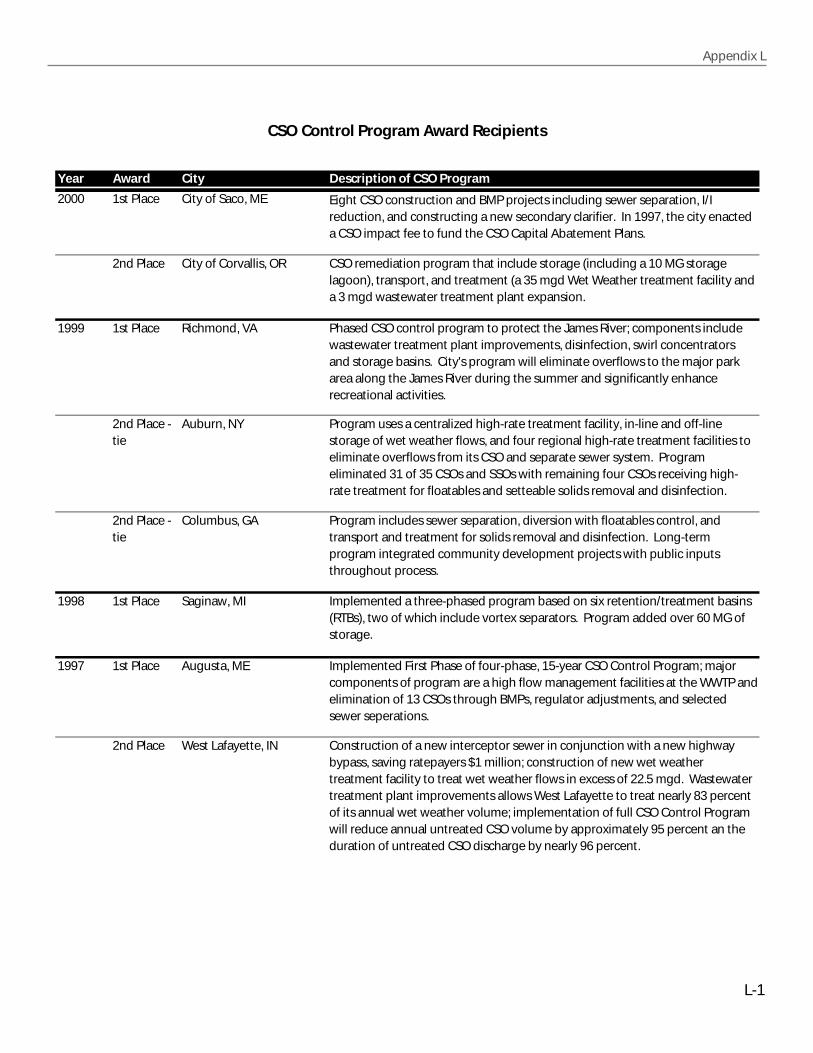
Year Award City Description of CSO Program
2000 1st Place City of Saco, ME
2nd Place City of Corvallis, OR
1999 1st Place Richmond, VA
2nd Place - tie
Auburn, NY
2nd Place - tie
Columbus, GA
1998 1st Place Saginaw, MI
1997 1st Place Augusta, ME
2nd Place West Lafayette, IN
Program includes sewer separation, diversion with floatables control, and transport and treatment for solids removal and disinfection. Long-term program integrated community development projects with public inputs throughout process.
Implemented a three-phased program based on six retention/treatment basins (RTBs), two of which include vortex separators. Program added over 60 MG of storage.
Implemented First Phase of four-phase, 15-year CSO Control Program; major components of program are a high flow management facilities at the WWTP and elimination of 13 CSOs through BMPs, regulator adjustments, and selected sewer seperations.
Construction of a new interceptor sewer in conjunction with a new highway bypass, saving ratepayers $1 million; construction of new wet weather treatment facility to treat wet weather flows in excess of 22.5 mgd. Wastewater treatment plant improvements allows West Lafayette to treat nearly 83 percent of its annual wet weather volume; implementation of full CSO Control Program will reduce annual untreated CSO volume by approximately 95 percent an the duration of untreated CSO discharge by nearly 96 percent.
Eight CSO construction and BMP projects including sewer separation, I/I reduction, and constructing a new secondary clarifier. In 1997, the city enacted a CSO impact fee to fund the CSO Capital Abatement Plans.
CSO remediation program that include storage (including a 10 MG storage lagoon), transport, and treatment (a 35 mgd Wet Weather treatment facility and a 3 mgd wastewater treatment plant expansion.
Phased CSO control program to protect the James River; components include wastewater treatment plant improvements, disinfection, swirl concentrators and storage basins. City's program will eliminate overflows to the major park area along the James River during the summer and significantly enhance recreational activities.
Program uses a centralized high-rate treatment facility, in-line and off-line storage of wet weather flows, and four regional high-rate treatment facilities to eliminate overflows from its CSO and separate sewer system. Program eliminated 31 of 35 CSOs and SSOs with remaining four CSOs receiving high-rate treatment for floatables and setteable solids removal and disinfection.
L-1
Appendix L
CSO Control Program Award Recipients

L-2
Report to Congress on Implementation and Enforcement of the CSO Control Policy
Year Award City Description of CSO Program
1996 1st Place Bangor, ME
2nd Place Bath, ME
1994 1st Place Metropolitan Water Reclamation District of Greater Chicago, Chicago, IL
2nd Place City of Lansing, MI
1993 1st place City of San Francisco, CA
2nd place Decatur, Illinois
1992 1st place New York, NY
2nd place Minneapolis-Saint Paul - South Saint Paul, MN
1991 1st place Monroe County/City of Rochester, NY
Program included BMP improvements to existing facilities, deep-rock storage and conveyance tunnels, and wet weather preliminary treatment facilities; cleaned and relined existing trunk sewers to handle increased flows; program increased recreational use of the area's waterways, increased public awareness of environmental issues and increased land-based recreation.
$1.4 million in construction cost program to eliminate discharge of CSO to the city's shoreline. The program constructed storage/treatment facilities to hold combined stormwater at the wastewater treatment plant, and to provide treatment for peak wastewater flows.
Constructed four satellite CSO treatment facilities and capture of first flush of each storm event in tanks for later treatment at the treatment facility. As a result, the odors and fish kills in the Sangamon River that were prevalent before the CSO program were eliminated. Results of a July 1991 biological and water quality survey indicated significant improvement in aquatic habitat over 40 miles of the river.
Innovative approach to CSO abatement and floatable capture; while proceeding on plans on a large scale facility, operations-based projects provided some CSO abatement at a major four-barrel outfall at a low-cost (approx $1/gallon).
Implemented 10-year program to eliminate CSO system. Achieved goal of 60 percent volume removal after the fifth year.
Program focused on elimination of CSOs in two sensitive areas. Eliminated eight of the city's 22 CSOs and reduced overflow occurrences for several others; LTCP contains 23 projects including several multi-year sewer separation projects, and upgrading of the treatment plant to handle 13 mgd of combined sewage.
Developed CSO abatement program to address its 10 CSO outfalls to the Kennebac River. Bath's LTCP consists of implementing creative and practical BMPs, optimizing existing facility capacities, and developing systematic and cost-effective capital improvement projects.
Developed two-phased $3.6 billion Tunnel and Reservoir Plan (TARP) project designed to eliminate CSOs and significantly reduce basement flooding. The completion of both phases was designed to reduce BOD loads to area's waterways from CSOs by 99 percent and will reduce flood damage by nearly 65 percent.
Received Federal Construction Grant Program to improve the wastewater collection and treatment system; improvement took the form of relocating regulators out of the influence of the Grand River up the ten-year flood elevation to prevent river back flow into the collection system. The City replaced mechanical regulators with leaping orifice regulators designed to discharge to the interceptor all dry weather flows.

Appendix M
Summary of Outcomes of 104(b)(3) Grants


Grantee DescriptionFederal Contribution Years Results
AMSA Performance Measures for CSO Control; Grant Number CX823736-01
$294,000 9/1/94 - 1/31/97
City of Indianapolis Wet Weather Public Education Program; Grant Number GX825886-01
$112,000 7/24/97 - 7/31/99
Low Impact Development (LID) Center
Feasibility of Applying LID Stormwater Micro-Scale Techniques to Highly Urbanized Areas in Order to Control the Effects of Urban Runoff in CSOs
$110,000 4/99 - 4/00
ORSANCO Wet Weather Study of Ohio River; Grant Numbers CX825699-01 and CX824105-01
$1,383,000 7/1/97 - 12/31/01
AMSA developed a series of performance measures for utilities and local government agencies to use to track benefits associated with CSO control. The study received input from a CSO stakeholder workgroup, focus group meetings, environmental groups, and state and federal permitting authorities. All 24 identified performance measures were considered to be appropriate for general use by CSO communities; four of these were also found to be appropriate for national tracking.
Indianapolis designed an educational program to inspire its residents to take action to improve water quality during wet weather events. A video and slide presentation was created to explain current wet weather issues facing Indianapolis and the actions being taken by the city to address those issues. The City of Indianapolis also established a Citizen Advisory Committee (CAC) to assist city officials in selecting media campaign messages and materials and to provide input regarding cost/benefit decisions for water quality improvement projects. Other components of the educational program include a campaign plan, five brochures, media kits and surveys to gauge needs/knowledge base of the public.
A literature review was conducted to determine the availability and reliability of data to assess the effectiveness of LID practices for controlling stormwater runoff and reducing pollutant loadings to receiving waters. Background information concerning the uses, ownership and associated costs for LID measures was also compiled.
ORSANCO developed a water quality model of the Ohio River capable of assessing CSO impacts and evaluating CSO controls on the river. The goal was to develop a model not only for the Ohio River but one that was suitable for evaluating other large rivers systems. In addition to CSO loads, stormwater and non-point source load estimates were included in the model to demonstrate the effect other wet weather pollutant sources have on large river systems. Watershed planning and wet weather monitoring protocols were also included in the model approach as a demonstration on how to incorporate these concepts in a large river system model.
M-1
Appendix M
Summary of Outcomes of 104(b)(3) Grants
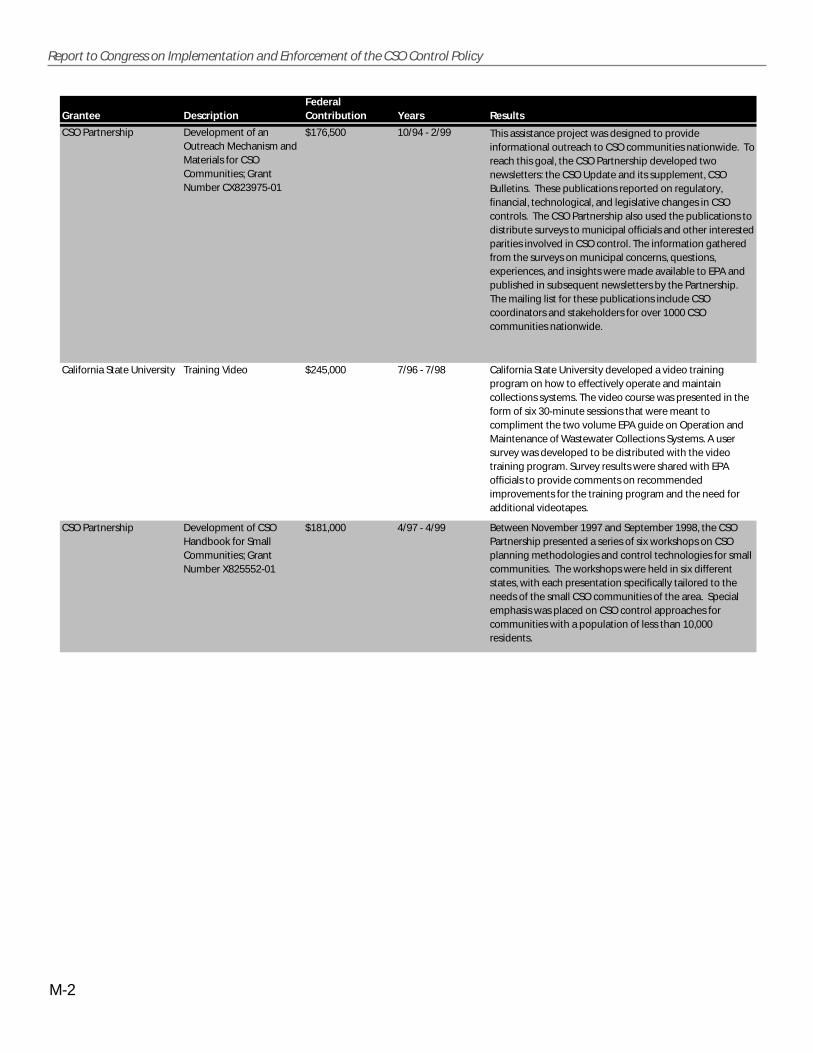
M-2
Report to Congress on Implementation and Enforcement of the CSO Control Policy
Grantee DescriptionFederal Contribution Years Results
CSO Partnership Development of an Outreach Mechanism and Materials for CSO Communities; Grant Number CX823975-01
$176,500 10/94 - 2/99
California State University Training Video $245,000 7/96 - 7/98
CSO Partnership Development of CSO Handbook for Small Communities; Grant Number X825552-01
$181,000 4/97 - 4/99 Between November 1997 and September 1998, the CSO Partnership presented a series of six workshops on CSO planning methodologies and control technologies for small communities. The workshops were held in six different states, with each presentation specifically tailored to the needs of the small CSO communities of the area. Special emphasis was placed on CSO control approaches for communities with a population of less than 10,000 residents.
California State University developed a video training program on how to effectively operate and maintain collections systems. The video course was presented in the form of six 30-minute sessions that were meant to compliment the two volume EPA guide on Operation and Maintenance of Wastewater Collections Systems. A user survey was developed to be distributed with the video training program. Survey results were shared with EPA officials to provide comments on recommended improvements for the training program and the need for additional videotapes.
This assistance project was designed to provide informational outreach to CSO communities nationwide. To reach this goal, the CSO Partnership developed two newsletters: the CSO Update and its supplement, CSO Bulletins. These publications reported on regulatory, financial, technological, and legislative changes in CSO controls. The CSO Partnership also used the publications to distribute surveys to municipal officials and other interested parities involved in CSO control. The information gathered from the surveys on municipal concerns, questions, experiences, and insights were made available to EPA and published in subsequent newsletters by the Partnership. The mailing list for these publications include CSO coordinators and stakeholders for over 1000 CSO communities nationwide.
Appendix N
Summary, by State, of CSO ImpactedWater Body Segments from 303(d)
Lists

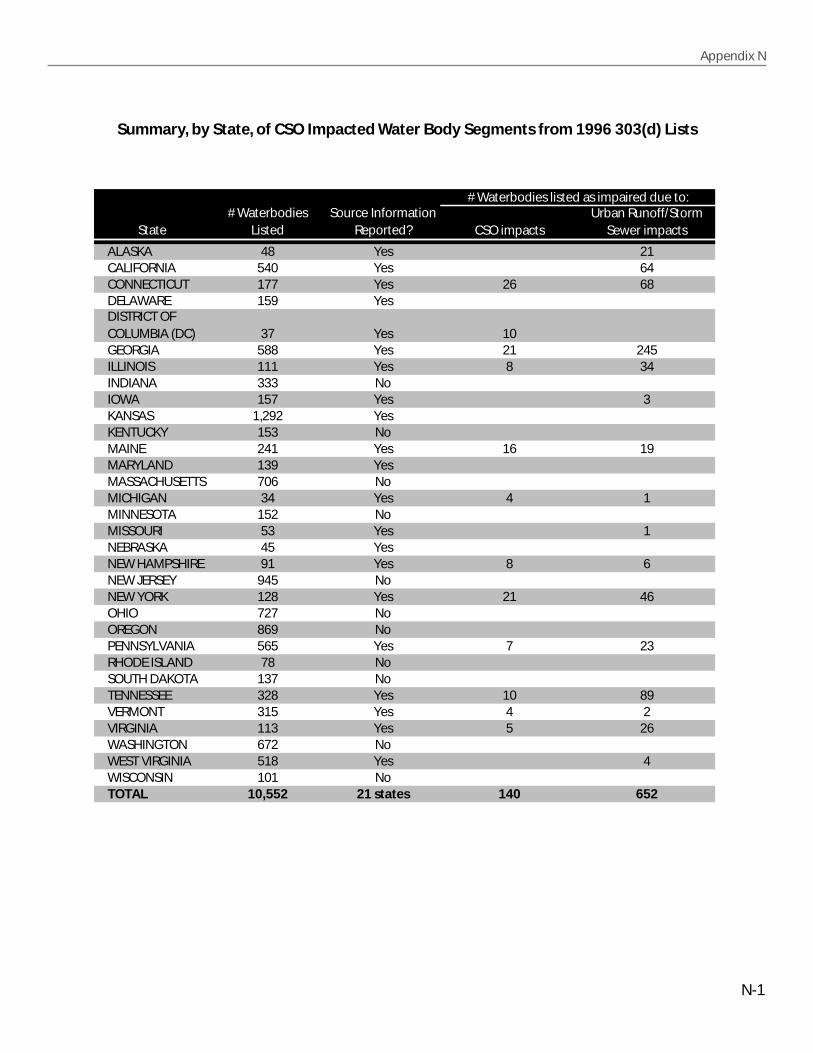
CSO impactsUrban Runoff/Storm
Sewer impacts
ALASKA 48 Yes 21CALIFORNIA 540 Yes 64CONNECTICUT 177 Yes 26 68DELAWARE 159 YesDISTRICT OF COLUMBIA (DC) 37 Yes 10GEORGIA 588 Yes 21 245ILLINOIS 111 Yes 8 34INDIANA 333 NoIOWA 157 Yes 3KANSAS 1,292 YesKENTUCKY 153 NoMAINE 241 Yes 16 19MARYLAND 139 YesMASSACHUSETTS 706 NoMICHIGAN 34 Yes 4 1MINNESOTA 152 NoMISSOURI 53 Yes 1NEBRASKA 45 YesNEW HAMPSHIRE 91 Yes 8 6NEW JERSEY 945 NoNEW YORK 128 Yes 21 46OHIO 727 NoOREGON 869 NoPENNSYLVANIA 565 Yes 7 23RHODE ISLAND 78 NoSOUTH DAKOTA 137 NoTENNESSEE 328 Yes 10 89VERMONT 315 Yes 4 2VIRGINIA 113 Yes 5 26WASHINGTON 672 NoWEST VIRGINIA 518 Yes 4WISCONSIN 101 NoTOTAL 10,552 21 states 140 652
# Waterbodies listed as impaired due to:# Waterbodies
ListedSource Information
Reported?State
N-1
Appendix N
Summary, by State, of CSO Impacted Water Body Segments from 1996 303(d) Lists
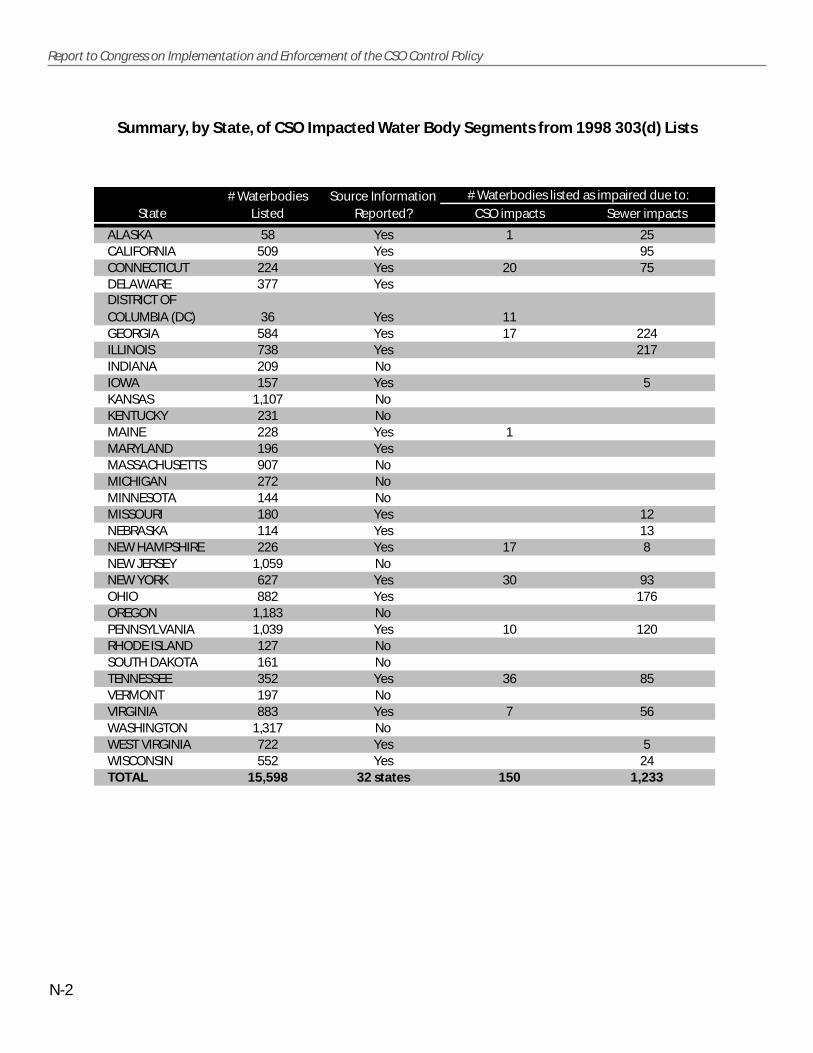
N-2
Report to Congress on Implementation and Enforcement of the CSO Control Policy
CSO impacts Sewer impacts
ALASKA 58 Yes 1 25CALIFORNIA 509 Yes 95CONNECTICUT 224 Yes 20 75DELAWARE 377 YesDISTRICT OF COLUMBIA (DC) 36 Yes 11GEORGIA 584 Yes 17 224ILLINOIS 738 Yes 217INDIANA 209 NoIOWA 157 Yes 5KANSAS 1,107 NoKENTUCKY 231 NoMAINE 228 Yes 1MARYLAND 196 YesMASSACHUSETTS 907 NoMICHIGAN 272 NoMINNESOTA 144 NoMISSOURI 180 Yes 12NEBRASKA 114 Yes 13NEW HAMPSHIRE 226 Yes 17 8NEW JERSEY 1,059 NoNEW YORK 627 Yes 30 93OHIO 882 Yes 176OREGON 1,183 NoPENNSYLVANIA 1,039 Yes 10 120RHODE ISLAND 127 NoSOUTH DAKOTA 161 NoTENNESSEE 352 Yes 36 85VERMONT 197 NoVIRGINIA 883 Yes 7 56WASHINGTON 1,317 NoWEST VIRGINIA 722 Yes 5WISCONSIN 552 Yes 24TOTAL 15,598 32 states 150 1,233
# Waterbodies listed as impaired due to:# Waterbodies Listed
Source Information Reported?State
Summary, by State, of CSO Impacted Water Body Segments from 1998 303(d) Lists

Appendix O
Summary of State InspectionPrograms


State Number of Facilities Inspected
Frequency of Inspections
Cause of Inspection
Contact with Region
Guidance Checklist Tracking Training
AK 1 CSO-Inspections are conducted by Region 10
CA Not Documented Annual Planned Not scheduled, but regular
Protocol No PCS State inspector and operator training
CT Not Documented
DE 1 CSO (Region 3) No information NPDES Monthly No No PCS Developing inspector training
GA Not Documented Annual CSO, scheduled plan, citizen complaint
Quarterly, some emergency meetings
Permit outline No PCS State inspector training
IA 3 CSOs (by Region 7)
Annual for majors NPDES scheduled plan, citizen complaint
Annual audit No No State matrix and PCS
EPA inspector training, State operator certification
IL 36 CSOs 3 to 4 years for majors
DWO, citizen complaints, monthly report discrepancy
Quarterly State plan Regional and State CSO checklists
PCS Coordinating with Region 5 for inspector training, State operator training
IN Must inspect 90 facilities per year
Annual Annual review, DWO, schedule
Quarterly Indiana uses the checklist as guidance
State CSO checklists
PCS No
KS Not Documented
KY 4 CSOs (by Region 4)
Annual NPDES, schedule, citizen complaint
Annually No No PCS Operator training
ME Not Documented No recent Maine inspections
Annual permittee report
Quarterly Forms for annual report, Guidance in development
No PCS and state matrix
State inspector training
MD Not Documented
MA 4 CSOs Annual NPDES, citizen complaint, DWO
Quarterly No No PCS and State matrix and tracking sheet
State operator certification
MI Not Documented Annual for majors NPDES, response to a problem
Quarterly State Guidance No PCS and State database
State operator training
MN Not documented Annual for majors, 5 years for minors
In the process of separating
Quarterly No Being redeveloped
PCS and State database
On-the-job inspector training, internal
MO 4 CSOs (by Region 7 )
Not Documented
NE Not documented Annual for majors, 5 years for minors
NPDES (CSOs are not yet permitted)
Quarterly Under development
Under development
PCS EPA training of inspectors
O-1
Appendix O
Summary of State Inspection Programs

O-2
Report to Congress on Implementation and Enforcement of the CSO Control Policy
State Number of Facilities Inspected
Frequency of Inspections
Cause of Inspection
Contact with Region
Guidance Checklist Tracking Training
NH Not documented Annual to biannual
NPDES Quarterly Under development
No PCS State operator training
NJ Not Documented Annual NPDES, citizen complaint, enforcement support, non-compliance
Quarterly National manual, developing State manual
Redeveloping CSO checklist
PCS On-the-job inspector training, State operator certification
NY 3 CSOs Annual NPDES, enforcement support, part of a wet weather plan
Quarterly State Technical and Operational Guidance Series (TOGS)
No PCS and state matrix
State training for operators and inspectors
OH 2 CSOs (by Region 5)
Annual for majors, 3 years for minors
NPDES, protocol for response to violation
Quarterly State protocol Regional CSO checklists
PCS Coordinating with Region 5 for inspector training
OR Not Documented Annual NPDES, monitors in outfalls
As needed Not Documented No PCS State inspector training and operator certification
PA Not Documented Annual for majors, 3 years for minors
Schedule, citizen complaint, DWO
Quarterly State Compliance & Enforcement Strategy, State manual
No PCS and State matrix: eFACTS
State training for inspectors, may join Region 3 inspector training
RI Not Documented
SD Not Documented Biannual NPDES, schedule, citizen complaint
Not scheduled, but regular contact
Not Documented Checklist for NPDES inspection
PCS EPA inspector training and on-the-job inspector training
TN Not documented Annual for majors, biannual for minors
CSO No No PCS State operator training
VT Not documented Annual NPDES, schedule Quarterly National Manual No PCS On-the-job inspector training
VA Not documented Annual for majors NPDES Quarterly Strategy No PCS Annual State inspector training, operator training
WA Not documented Biannual NPDES, enforcement action
Infrequent EPA manual No PCS and State matrix
State operator certification
WI 5 CSOs (by Region 5)
Not documented
WV 2 CSOs (joint Region and State)
Not documented CSO, knowledge of problem
Quarterly Region 3 Guidance on CSOs
No PCS and state matrix
State inspector training and operator certification

Appendix P
Summary of CSO-RelatedEnforcement Actions Initiated ByStates After Issuance of the CSO
Control Policy


P-1
Appendix P
State Number of CSO Enforcement Actions to Date
CSO Enforcement Action(s) Reasons for CSO Enforcement Actions
Remarks
AK Not Documented
CA 1 Cease and Desist Order (CDO) to Sacramento
Violations of state water quality provisions due directly to combined sewer overflows.
CT Not Documented
DE Not Documented
DC Not Documented
GA Not Documented City of Atlanta is under a CSO-related Federal Consent Decree
Lawsuit in district court.
IL 1
IN 14 Seven communities received warnings for noncompliance in 2000
Failure to develop their Operational Plan, Stream Reach Characterization and Evaluation Report, or both.
IA Not Documented
KS Not Documented
KY Not Documented
ME 3 initiated by DEP; 9 initiated by Region 1
Consent Decrees (DEP) Failure to comply with terms of state water-discharge licenses.
MD Not Documented
MA Not Documented Consent Degrees, Executive Orders, or Administrative Orders
Noncompliance with the water-quality standards in NPDES permit resulting from failure to implement NMC.
RWQCB has initiated Sacramento's pre CSO Policy planning efforts and eventually led to the development and implementation of its LTCP.
State of Georgia, Region 4, and Federal District Judge all have some degree of authority over the Atlanta CSO program. GAEPD and Region 4 have joint review authority for Atlanta's LTCP.
Two CSO communities in the state: one is using sewer separation; the other is scheduled to be completed during 2001.
Two communities expected to be referred in 2001; five others already have been referred to enforcement .
IEPA does not have authority to administer Administrative Orders .
The Region 1 Water Enforcement Program coordinates with CSO communities to develop a program for developing and implementing an LTCP; the program is formalized in a schedule within an Order.
MDE is attempting to negotiate consent decrees with five communities currently under administrative orders for failing to develop an LTCP.
Region 1 maintained CSO Control Policy Enforcement Authority through December 2000; Consent decrees are CSO related (DEP).
Only NPDES permits are used to enforce NMC and LTCP
Appendix P–1. Summary of State Enforcement Activities Through June 2001
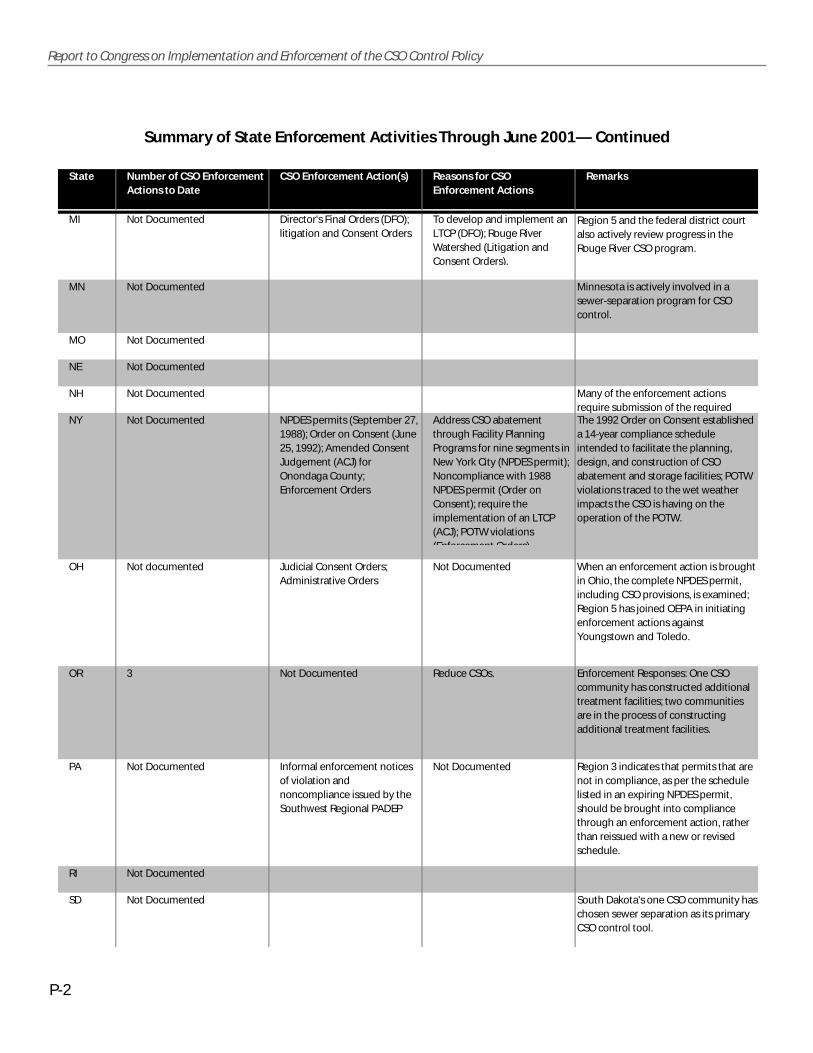
P-2
Report to Congress on Implementation and Enforcement of the CSO Control Policy
State Number of CSO Enforcement Actions to Date
CSO Enforcement Action(s) Reasons for CSO Enforcement Actions
Remarks
MI Not Documented Director's Final Orders (DFO); litigation and Consent Orders
To develop and implement an LTCP (DFO); Rouge River Watershed (Litigation and Consent Orders).
MN Not Documented
MO Not Documented
NE Not Documented
NH Not Documented
NY Not Documented NPDES permits (September 27, 1988); Order on Consent (June 25, 1992); Amended Consent Judgement (ACJ) for Onondaga County; Enforcement Orders
Address CSO abatement through Facility Planning Programs for nine segments in New York City (NPDES permit); Noncompliance with 1988 NPDES permit (Order on Consent); require the implementation of an LTCP (ACJ); POTW violations (Enforcement Orders)
OH Not documented Judicial Consent Orders; Administrative Orders
Not Documented
OR 3 Not Documented Reduce CSOs.
PA Not Documented Informal enforcement notices of violation and noncompliance issued by the Southwest Regional PADEP
Not Documented
RI Not Documented
SD Not Documented
Minnesota is actively involved in a sewer-separation program for CSO control.
Region 5 and the federal district court also actively review progress in the Rouge River CSO program.
Enforcement Responses: One CSO community has constructed additional treatment facilities; two communities are in the process of constructing additional treatment facilities.
When an enforcement action is brought in Ohio, the complete NPDES permit, including CSO provisions, is examined; Region 5 has joined OEPA in initiating enforcement actions against Youngstown and Toledo.
The 1992 Order on Consent established a 14-year compliance schedule intended to facilitate the planning, design, and construction of CSO abatement and storage facilities; POTW violations traced to the wet weather impacts the CSO is having on the operation of the POTW.
Many of the enforcement actions require submission of the required
South Dakota’s one CSO community has chosen sewer separation as its primary CSO control tool.
Region 3 indicates that permits that are not in compliance, as per the schedule listed in an expiring NPDES permit, should be brought into compliance through an enforcement action, rather than reissued with a new or revised schedule.
Summary of State Enforcement Activities Through June 2001— Continued

Appendix P
P-3
State Number of CSO Enforcement Actions to Date
CSO Enforcement Action(s) Reasons for CSO Enforcement Actions
Remarks
TN Not Documented
VT Not Documented Administrative orders; Consent orders
To facilitate implementation of CSO controls (Administrative Orders); violation of the Administrative Order (Consent Order).
VA Not Documented
WA Not Documented
WI Not Documented
WV Not Documented
Region 10 has administrative oversight.
The town of Randolph has been issued a second administrative order because sewer separation project did not completely eliminated all CSO discharges for the design flow.
Summary of State Enforcement Activities Through June 2001— Continued

P-4
Report to Congress on Implementation and Enforcement of the CSO Control Policy
Appendix P–2. Civil Judicial Actions Taken by States After the Issuance of the CSO Control Policy
Region State Case Name/City Name Outcome
2 NY Syracuse Metro WWTP Amended consent judgement requires LTCP; NYSDEC BMPs 8-12.
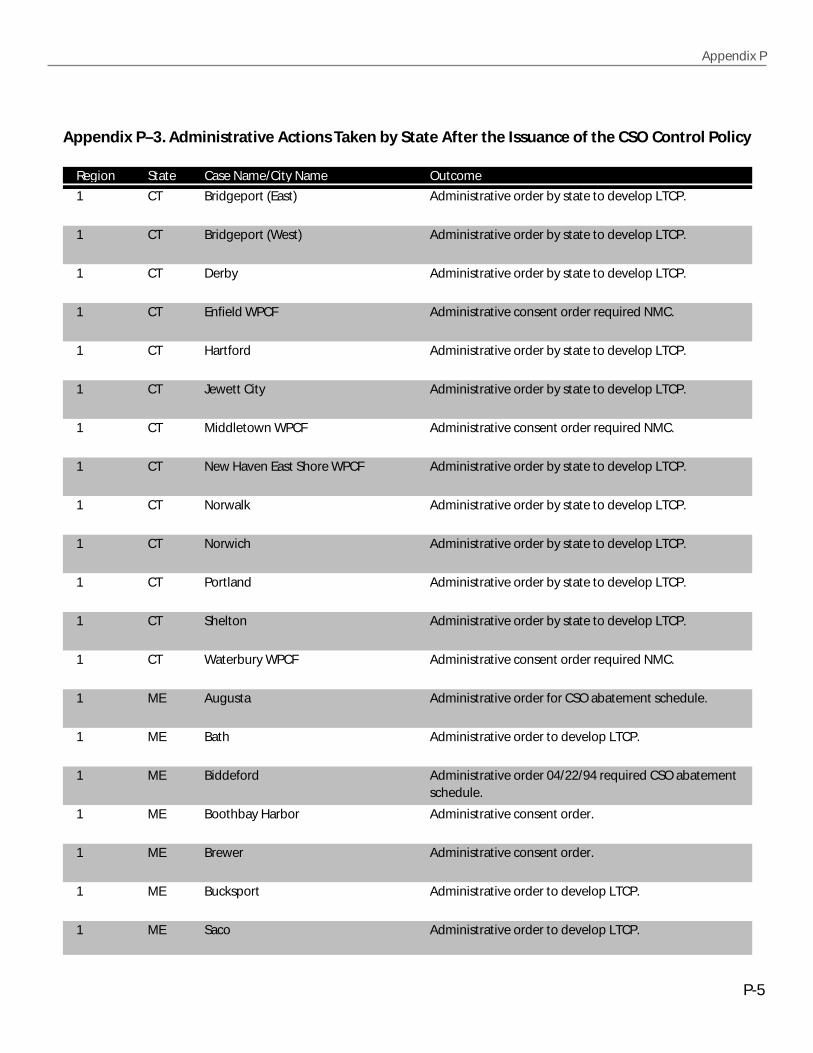
Appendix P
P-5
Appendix P–3. Administrative Actions Taken by State After the Issuance of the CSO Control Policy
Region State Case Name/City Name Outcome
1 CT Bridgeport (East) Administrative order by state to develop LTCP.
1 CT Bridgeport (West) Administrative order by state to develop LTCP.
1 CT Derby Administrative order by state to develop LTCP.
1 CT Enfield WPCF Administrative consent order required NMC.
1 CT Hartford Administrative order by state to develop LTCP.
1 CT Jewett City Administrative order by state to develop LTCP.
1 CT Middletown WPCF Administrative consent order required NMC.
1 CT New Haven East Shore WPCF Administrative order by state to develop LTCP.
1 CT Norwalk Administrative order by state to develop LTCP.
1 CT Norwich Administrative order by state to develop LTCP.
1 CT Portland Administrative order by state to develop LTCP.
1 CT Shelton Administrative order by state to develop LTCP.
1 CT Waterbury WPCF Administrative consent order required NMC.
1 ME Augusta Administrative order for CSO abatement schedule.
1 ME Bath Administrative order to develop LTCP.
1 ME Biddeford Administrative order 04/22/94 required CSO abatement schedule.
1 ME Boothbay Harbor Administrative consent order.
1 ME Brewer Administrative consent order.
1 ME Bucksport Administrative order to develop LTCP.
1 ME Saco Administrative order to develop LTCP.

P-6
Report to Congress on Implementation and Enforcement of the CSO Control Policy
Region State Case Name/City Name Outcome
1 ME Westbrook Administrative order to develop LTCP.
1 RI Narragansett Bay Commission Administrative consent order.
1 VT Burlington Main WWTF Administrative consent order required LTCP and compliance schedule.
1 VT Burlington North End WWTP Administrative consent order required LTCP and compliance schedule.
1 VT Enosburg Falls WWTF Administrative consent order required LTCP.
1 VT Ludlow Administrative order required LTCP and compliance schedule.
1 VT Lyndon State administrative order required NMC and LTCP.
1 VT Newport Administrative order required LTCP and compliance schedule.
1 VT Richford WWTF Administrative consent order for NMC and LTCP.
1 VT Rutland City Administrative compliance order (8/8/94) required NMC and LTCP.
1 VT St. Johnsbury Administrative order required NMC and LTCP.
1 VT Swanton Administrative order required NMC and LTCP.
1 VT Winooski Administrative consent order.
2 NY NYCDEP 1995 amendment to 06/24/92 consent order required mapping, inspection, & O&M of CSOs.
2 NJ Perth Amboy Administrative consent order for NMC.
2 NY Auburn STP Administrative order required NYSDEC BMPs 8-10.
2 NY Binghamton CSO Consent order.
2 NY Binghamton-Johnson City Joint WWTF
Consent order.
2 NY Newtown Creek WPCP Consent order.
2 NY North River WPCF Consent order for NYSDEC BMPs 8 and 9.
Administrative Actions Taken by State After the Issuance of the CSO Control Policy—Continued
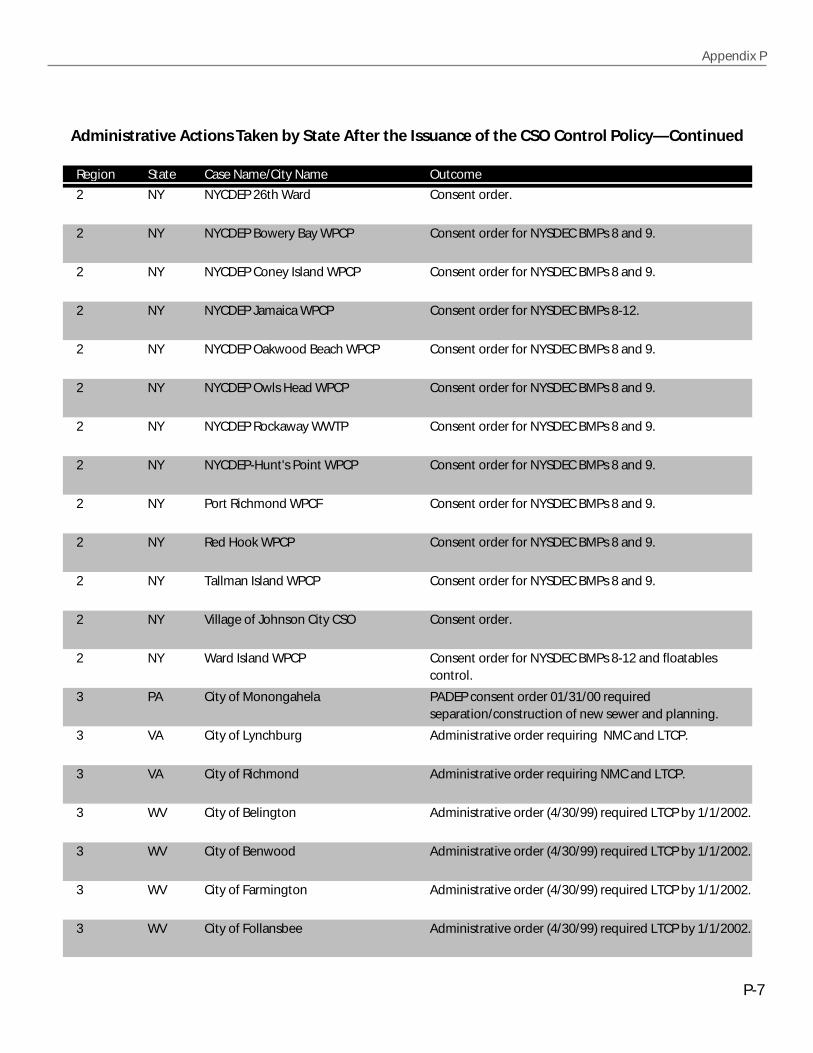
Appendix P
P-7
Region State Case Name/City Name Outcome
2 NY NYCDEP 26th Ward Consent order.
2 NY NYCDEP Bowery Bay WPCP Consent order for NYSDEC BMPs 8 and 9.
2 NY NYCDEP Coney Island WPCP Consent order for NYSDEC BMPs 8 and 9.
2 NY NYCDEP Jamaica WPCP Consent order for NYSDEC BMPs 8-12.
2 NY NYCDEP Oakwood Beach WPCP Consent order for NYSDEC BMPs 8 and 9.
2 NY NYCDEP Owls Head WPCP Consent order for NYSDEC BMPs 8 and 9.
2 NY NYCDEP Rockaway WWTP Consent order for NYSDEC BMPs 8 and 9.
2 NY NYCDEP-Hunt's Point WPCP Consent order for NYSDEC BMPs 8 and 9.
2 NY Port Richmond WPCF Consent order for NYSDEC BMPs 8 and 9.
2 NY Red Hook WPCP Consent order for NYSDEC BMPs 8 and 9.
2 NY Tallman Island WPCP Consent order for NYSDEC BMPs 8 and 9.
2 NY Village of Johnson City CSO Consent order.
2 NY Ward Island WPCP Consent order for NYSDEC BMPs 8-12 and floatables control.
3 PA City of Monongahela PADEP consent order 01/31/00 required separation/construction of new sewer and planning.
3 VA City of Lynchburg Administrative order requiring NMC and LTCP.
3 VA City of Richmond Administrative order requiring NMC and LTCP.
3 WV City of Belington Administrative order (4/30/99) required LTCP by 1/1/2002.
3 WV City of Benwood Administrative order (4/30/99) required LTCP by 1/1/2002.
3 WV City of Farmington Administrative order (4/30/99) required LTCP by 1/1/2002.
3 WV City of Follansbee Administrative order (4/30/99) required LTCP by 1/1/2002.
Administrative Actions Taken by State After the Issuance of the CSO Control Policy—Continued
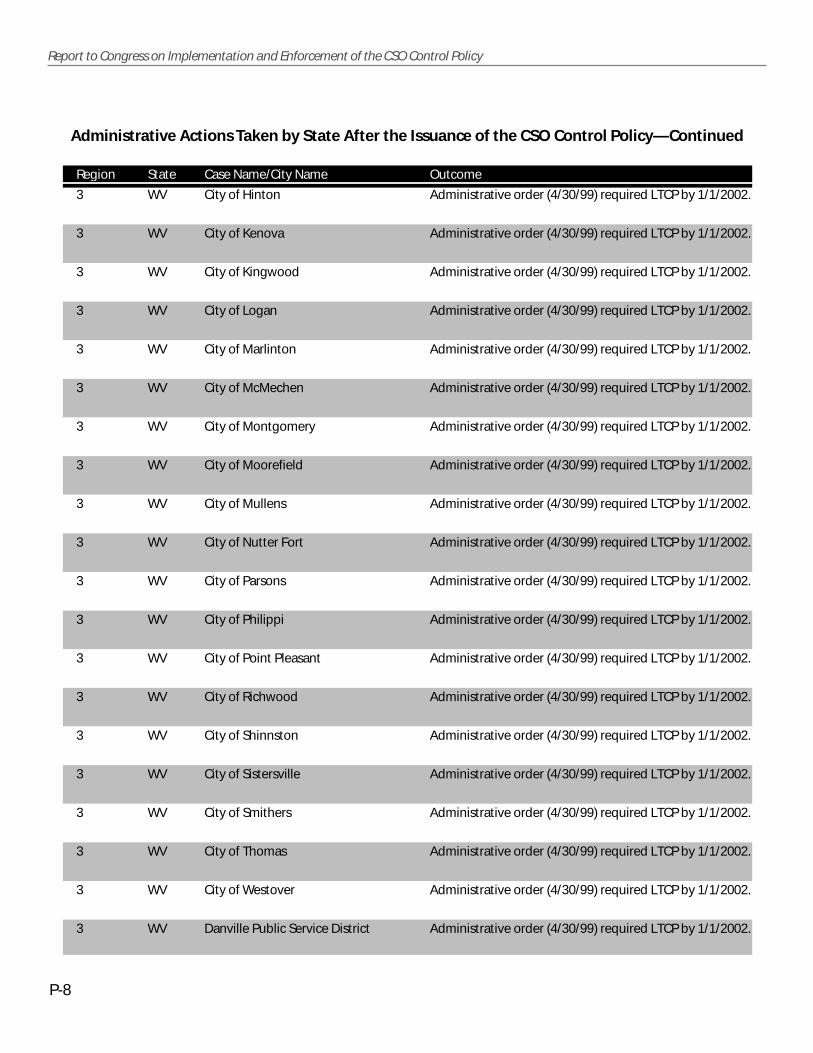
P-8
Report to Congress on Implementation and Enforcement of the CSO Control Policy
Region State Case Name/City Name Outcome
3 WV City of Hinton Administrative order (4/30/99) required LTCP by 1/1/2002.
3 WV City of Kenova Administrative order (4/30/99) required LTCP by 1/1/2002.
3 WV City of Kingwood Administrative order (4/30/99) required LTCP by 1/1/2002.
3 WV City of Logan Administrative order (4/30/99) required LTCP by 1/1/2002.
3 WV City of Marlinton Administrative order (4/30/99) required LTCP by 1/1/2002.
3 WV City of McMechen Administrative order (4/30/99) required LTCP by 1/1/2002.
3 WV City of Montgomery Administrative order (4/30/99) required LTCP by 1/1/2002.
3 WV City of Moorefield Administrative order (4/30/99) required LTCP by 1/1/2002.
3 WV City of Mullens Administrative order (4/30/99) required LTCP by 1/1/2002.
3 WV City of Nutter Fort Administrative order (4/30/99) required LTCP by 1/1/2002.
3 WV City of Parsons Administrative order (4/30/99) required LTCP by 1/1/2002.
3 WV City of Philippi Administrative order (4/30/99) required LTCP by 1/1/2002.
3 WV City of Point Pleasant Administrative order (4/30/99) required LTCP by 1/1/2002.
3 WV City of Richwood Administrative order (4/30/99) required LTCP by 1/1/2002.
3 WV City of Shinnston Administrative order (4/30/99) required LTCP by 1/1/2002.
3 WV City of Sistersville Administrative order (4/30/99) required LTCP by 1/1/2002.
3 WV City of Smithers Administrative order (4/30/99) required LTCP by 1/1/2002.
3 WV City of Thomas Administrative order (4/30/99) required LTCP by 1/1/2002.
3 WV City of Westover Administrative order (4/30/99) required LTCP by 1/1/2002.
3 WV Danville Public Service District Administrative order (4/30/99) required LTCP by 1/1/2002.
Administrative Actions Taken by State After the Issuance of the CSO Control Policy—Continued
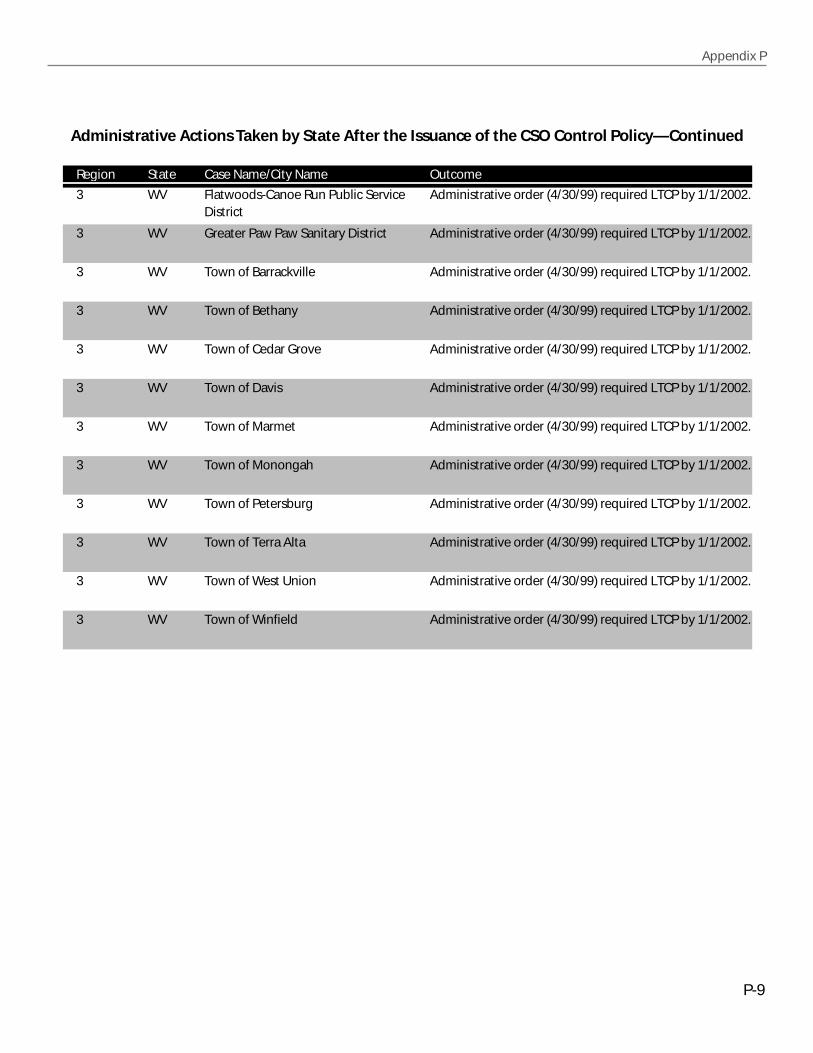
Appendix P
P-9
Region State Case Name/City Name Outcome
3 WV Flatwoods-Canoe Run Public Service District
Administrative order (4/30/99) required LTCP by 1/1/2002.
3 WV Greater Paw Paw Sanitary District Administrative order (4/30/99) required LTCP by 1/1/2002.
3 WV Town of Barrackville Administrative order (4/30/99) required LTCP by 1/1/2002.
3 WV Town of Bethany Administrative order (4/30/99) required LTCP by 1/1/2002.
3 WV Town of Cedar Grove Administrative order (4/30/99) required LTCP by 1/1/2002.
3 WV Town of Davis Administrative order (4/30/99) required LTCP by 1/1/2002.
3 WV Town of Marmet Administrative order (4/30/99) required LTCP by 1/1/2002.
3 WV Town of Monongah Administrative order (4/30/99) required LTCP by 1/1/2002.
3 WV Town of Petersburg Administrative order (4/30/99) required LTCP by 1/1/2002.
3 WV Town of Terra Alta Administrative order (4/30/99) required LTCP by 1/1/2002.
3 WV Town of West Union Administrative order (4/30/99) required LTCP by 1/1/2002.
3 WV Town of Winfield Administrative order (4/30/99) required LTCP by 1/1/2002.
Administrative Actions Taken by State After the Issuance of the CSO Control Policy—Continued

P-10
Report to Congress on Implementation and Enforcement of the CSO Control Policy
Region State Case Name/City Name Outcome
1 VT Barton WWTF Administrative consent order required LTCP and compliance schedule.
1 VT Brandon WWTP Administrative consent order required LTCP and compliance schedule.
1 VT Hardwick WWTP Administrative consent order required LTCP and compliance schedule.
1 VT Lundenburg Five District #2 WWTF Administrative consent order required LTCP and compliance schedule.
1 VT Montpelier WWTF Administrative consent order required LTCP, separation, and schedule.
1 VT Northfield WWTF Administrative consent order required LTCP and compliance schedule.
1 VT Randolph WWTF Administrative consent order for NMC and LTCP.
1 VT Springfield WWTF Administrative consent order required LTCP and compliance schedule.
1 VT St. Albans WWTF Administrative consent order required LTCP.
1 VT Vergennes WWTF Administrative consent order for elimination of CSOs.
1 VT Wilmington WWTF Administrative consent order required LTCP and compliance schedule.
1 VT Windsor Main WWTF Administrative consent order required LTCP and compliance schedule.
3 MD Allegany County CSOs Administrative consent order required LTCP; will separate.
3 MD Cambridge WWTP Administrative consent order required LTCP; will separate.
3 MD Cumberland WWTP Administrative consent order required LTCP.
3 MD Frostburg CSOs Administrative consent order required LTCP; will separate.
3 MD LaVale CSOs Administrative consent order required LTCP; will separate.
3 MD Patapsco WWTP Administrative consent order required LTCP; will separate.
3 MD Salisbury WWTP Compliance order (5/15/97) required NMC and LTCP.
3 MD Westernport Town Administrative consent order required LTCP.
Appendix P–4. Other Actions Taken by States

Appendix P
P-11
Region State Case Name/City Name Outcome
3 PA Berwick Area Joint Sewer Authority Compliance order required NMC and LTCP.
3 PA Coal Township Compliance order required NMC and LTCP.
3 PA Harrisburg Authority Action required NMC.
3 PA Shamokin City Compliance order required NMC and LTCP.
4 GA Columbus CSO Administrative consent order required LTCP.
4 TN Chattanooga Administrative consent order for elimination of CSOs.
4 TN Clarksville Administrative consent order (3/22/1990) required LTCP.
4 TN Nashville ACO (3/30/1990) required CSO abatement measures by 2001.
5 IN City of Fort Wayne WWTP Administrative order for NMC and LTCP.
5 IN City of Madison WWTP Consent decree for NMC and LTCP.
5 IN Hammond WWTP Consent decree for NMC and LTCP.
5 MI Grosse Pointe Farms CSO Required LTCP and sewer separation.
5 MI Grosse Pointe Park CSO Compliance order required LTCP and outfall removal.
5 MI River Rouge CSO 1994 CO required LTCP.
5 OH City of Fostoria Compliance order (8/24/93) required LTCP.
5 OH City of Girard WWTP Compliance order required NMC and LTCP.
5 OH City of Sandusky Compliance order required NMC and LTCP.
5 OH Eastern Ohio Regional Wastewater Authority
Compliance Order required NMC and LTCP.
5 OH Port Clinton Consent Decree for NMC and LTCP.
Other Actions Taken by States—Continued

P-12
Report to Congress on Implementation and Enforcement of the CSO Control Policy
Region State Case Name/City Name Outcome
5 OH Steubenville Compliance order required NMC and LTCP.
5 OH Toledo Administrative consent order (6/28/99) required LTCP.
5 OH Van Wert Consent Decree for NMC and LTCP.
5 OH Village of Continental Compliance order required LTCP.
7 MO Sedalia North WWTP Compliance order for NMC; will eliminate or treat CSOs.
10 OR City of Astoria WWTP S&FO (1/7/93) eliminated CSOs that violate WQS.
10 OR City of Corvallis WWRP S&FO required LTCP.
10 OR City of Portland Columbia Blvd WWTP S&FO (8/91) with penalties; Amended S&FO (8/94).
Other Actions Taken by States—Continued

Appendix Q
Sample State InformationManagement Systems
Used to Track Requirementsfor CSO Control


Q-1
Appendix Q
Sample Information Management System:Indiana Department of Environmental Management CSO Website

Q-2
Report to Congress on Implementation and Enforcement of the CSO Control Policy
Sample Information Management System: Massachusetts
Permit NMC Enforc. Long-Term Plan DEP CSO Permittee Number Date Outfalls Receiving Waters Submitted Type Date Submitted Approved Comments/Status Contact
Agawam MA0101320 9/29/1995 12 Westfield River 12/23/1997 AO 12/30/1996 Proceeding with separation. Inspections Kurt BoisjolieConnecticut River needed to confirm status (413) 755-2284
BWSC (MWRA) MA010119 9/29/1987 53 Boston Harbor Jan-97 CO (MWRA) MWRA Plan Proceeding with Separation, storage Kevin Brander & tributaries throughout CSO area pursuant to (978) 661-7770
MWRA CSO Facilities PlanCambridge MA010197 3/26/1993 13 Charles River 1/30/1997 CO (MWRA) MWRA Plan Proceeding with Separation pursuant Kevin Brander
Alewife Brook to MWRA CSO Facilities Plan (978) 661-7770re-evaluating CSO alternatives in Alewife area
Chelsea MA010187 3/23/1993 5 Mystic River Jan-97 CO (MWRA) MWRA Plan Proceeding with Separation and Kevin BranderChelsea Creek Hydraulic Relief pursuant to MWRA (978) 661-7770
CSO Facilities PlanChicopee MA0101508 9/29/1995 40 Chicopee River 12/17/1996 AO 6/3/1999 in planning phase -Scope approved Kurt Boisjolie
Connecticut River DLTCP now due June 30, 2001 (413) 755-2284Fall River MA010038 12/7/2000 19 Mount Hope Bay ? CO ? Jul-99 Deep Tunnel Storage moving forward Dave Burns
Taunton River (LTCP July 1999 report recommends (508) 946-2738Quequechan River Revision) revision to 1992 plan (under review)
Fitchburg MA010098 9/30/1992 27 Nashua River 11/20/1996 AO 7/9/1996 Jan-99 Draft Plan and Sewer Separation Study Bob KimballDLTCP submitted. More work needed (508) 792-7650
Gloucester MA010062 6/26/1985 4 Gloucester Harbor 2/1/2000 CD 10/8/1991 5/1/1992 9/28/1992 City re-evaluation sewer separation Kevin BranderCSO FP Report Due 4/2001 (978) 661-7770
GLSD MA010044 4 Merrimack River Nov-98 AO 6/25/1999 Planning underway Kevin BranderSpicket River Draft LTCP due 7/31/01 (978) 661-7770
Haverhill MA010162 23 Merrimack River Sep-96 AO 8/9/1999 Sep-00 Phase II Planning underway Kevin BranderLittle River DLTCP DLTCP due 1/15/01 (978) 661-7770
Holyoke MA0101630 9/29/1995 15 Connecticut River 1/10/1997 AO 12/12/2000 5/31/2000 Planning extension granted Kurt BoisjolieDLTCP City evaluating DBO procurement
DLTCP submitted 5/31/00 (413) 755-2284Lowell MA010063 8/14/1997 9 Merrimack River Apr-98 CD 11/10/1988 1990 Schedule modification requested to Kevin Brander
Concord River CSO FP establish date for DLTCP of 7/1/01 (978) 661-7770Ludlow MA0101338 8/26/1985 5 Chicopee River ? AO 12/30/1996 Separation moving forward. One outfall Kurt Boisjolie
remaining. City received SRF loan to complete planning. (413) 755-2284
Lynn MA010055 4 Lynn Harbor ? CD 2/1/2001 10/2/2000 City to implement complete sewer Kevin BranderStacy Brook, NPC/FP separation. Discharges to King's Beach (978) 661-7770Saugus River will be eliminated by 12/04, all CSOs
eliminated by 12/09Montague MA010013 9/29/1995 3 Connecticut River ? ? ? Sewer separation work done. Town has Kurt Boisjolie
received SRF loan for further LTCP work. (413) 755-2284MWRA MA010235 7/5/2000 7 Boston Harbor Jan-97 CO 8/31/1998 7/31/1997 10/31/1997 Plan being implemented. Variances Kevin Brander
Charles, Mystic Rivers issued in the Charles and Mystic (978) 661-7770(schedule Basins. Work will continue to 2010.
six)New Bedford MA0100781 11/2/2000 38 Buzzard's Bay Jan-97 CD ? 1991 much separation work done. City to Jeff Gould
Clark's Cove CSO FP submit scope for reassessment of (508) 946-2757Acushnet River 1991 plan.
Palmer MA0101168 11/29/2000 21 Quabog River Dec-98 AO 12/30/1996 7/6/1999 Plan for Sewer Separation approved Kurt BoisjolieSwift River FLTCP and being implemented. SRF funding (413) 755-2284Ware River obtained.
Somerville MA010198 9/29/1992 12 Mystic River 12/31/1996 CO (MWRA) MWRA Plan partial sewer separation being Kevin BranderAlewife Brook implemented pursuant to MWRA plan (978) 661-7770
South Hadley MA0100455 10/10/1995 11 Connecticut River 12/31/1996 AO ? implementing sewer separation. Kurt BoisjolieButtery Brook 4 outfalls remain. AO schedule needs (413) 755-2284Stony Brook modification.
Springfield MA0103331 4/14/1997 32 Connecticut River Apr-97 AO 11/15/2000 3/31/2000 DLTCP submitted 3/31/00 Kurt BoisjolieChicopee River DLTCP Phase I program moving forward.& Mill River FLTCP due March 2002 (413) 755-2284
Taunton MA0100897 1/9/2001 1 Taunton River 12/26/1996 AO ? Assessment Report needed. Jeff Gould(508) 946-2757
West Springfield MA0101389 9/28/1995 6 Connecticut River 12/23/1996 AO 9/8/1995 Separation being implemented. One Kurt BoisjolieWestfield River CSO remaining. (413) 755-2284
Worcester MA0102997 11/8/1990 1 Mill Brook 2/3/1997 AO 9/19/2000 ? Scope approved for final planning work. Ning Chen$54 million in CSO abatement work (508) 792-7650already completed
Appendix S
GPRACSO Model Documentation

How the GPRACSO Model and Data Base Work
The GPRACSO model estimates the volume of overflow and pollutant loadings for communities with combined sewer systems. Toaccomplish this, the model estimates the amount of wet weather flows that would be directed to a publically owned treatment works(POTWs), and based on existing dry weather flows, estimates the volumes that become combined sewer overflows (CSOs). Hour-by-hour estimates of biochemical oxygen demand (BOD) concentration within the combined sewer system are used to estimate thepollutant loadings in overflows and treated effluent from POTWs.
Wet-weather management algorithms within the model permit the user to estimate the management levels necessary to reach aspecified system-wide treatment level (e.g., 85 percent treatment of wet-weather flows). The management target may be reachedthrough a combination of POTW and end-of-pipe treatment, or through wet-weather storage. The GPRACSO model will also estimatethe effectiveness of secondary treatment bypass at POTWs with recombination of bypass flows, optimizing the system such that thetarget monthly discharge concentration in effluent does not exceed a permit level (e.g., 30 mg/L of BOD).
The key model outputs include wet-weather and dry weather BOD loadings (or other pollutants) and discharge for each hour in thetypical rainfall year. The model output can be summarized weekly, monthly, or annually for individual sewersheds or individualcommunities. The algorithms in the GPRACSO model can operate at multiple system scales. The only thing that establishes the scaleof the application is the data that is used to drive the GPRACSO model. Example system scales are the following:
● Simulating multiple separate sewersheds served by a single conveyance/treatment system
● Simulating multiple combined sewers communities within a single watershed that have separate conveyance/treatment systems
● Simulating all combined sewer communities in the nation
In estimating overflow volume, each individual combined sewer community is represented as a specified land acreage generating aknown quantity of dry weather flow and served by a known quantity of treatment (wet- and dry weather) and wet-weather storage.For the "typical" rainfall year (pulled from long-term meteorologic records for each combined sewer community in the nation) eachhour's rainfall and temperature is evaluated to determine if runoff occurs and then if overflow occurs.
The interaction between the GPRACSO model and data base is analogous to an automobile where the model is the engine and thedata base provides the fuel. The GPRACSO data base was constructed by EPA to facilitate national assessment of CSO issues, and assuch contains National data on combined sewer systems. The GPRACSO data base contains system data that represents:
● Individual combined sewer communities, where individual systems are stand alone elements and do not exist as a part of a larger regional sewer system
● Regional combined sewer communities, commonly encountered near large and well-established cities.
Wherever multiple combined sewer communities comprise a single regional system, the individual combined sewer communities arecondensed into a single data record within the GPRACSO data base representing the combination of related combined sewercommunities-totaling treatment capacity, wet-weather storage, and combined sewer service area. A "combined sewer community" isused to generically refer to the entity (or data record in the GPRACSO data base) analyzed, whether it is an individual sewer system ora totaled regional system. The GPRACSO model can evaluate all data records (approximately 700 combined sewer communities) inthe GPRACSO data base every time the model is "run," or analyze a single combined sewer community.
The GPRACSO data base consists of data from EPA Clean Water Needs Survey from 1992 and 1996, EPA's CSO data base, long-termcontrol plans (LTCPs), and Internet searches to identify most combined sewer community systems and identify interconnectedcombined sewer community networks served by regional POTWs. In addition, for approximately 15 percent of the combined sewercommunities recent data has been obtained through a review of state NPDES permit records performed in the summer of 2001. TheGPRACSO data base contains information on how the Clean Water Needs Facility numbers relate to combined sewer communitynames and NPDES numbers, and how complex combined sewer community systems connect to discharge into single regionalPOTWs. For highly detailed assessments of the impacts of a single combined sewer community, the GPRACSO data base may not haveaccurate information, but for EPA's efforts to summarize national conditions and assess policy options, the combination of theGPRACSO data base and the GPRACSO model is sufficiently accurate.
The following sections provide a brief overview of the GPRACSO model algorithms and the key assumptions it makes.
S-1
Appendix S
Documentation for the GPRACSO Model and Database
S-2
Report to Congress on Implementation and Enforcement of the CSO Control Policy
Simulating Dry weather Sanitary Flows
Average daily combined sewer community sanitary flows are based on discharge monitoring reports submitted to the PermitCompliance System (PCS). Flow peaking factors are used to represent the hourly variation of sanitary flows about the average flowrate, within the combined sewer system and then entering the POTW (Metcalf & Eddy, 1991). For example, the typical minimum andmaximum inflows are 32 percent and 141 percent of the average reported POTW inflow. Wherever data is available for a combinedsewer community on both average and maximum POTW capacity, peaking factors were modified to account for this data.
Regardless of the conditions encountered, simulated average dry weather inflow into a POTW always matches the average inflowobtained from the best available source for each combined sewer community. In addition, the maximum daily inflow never exceedsthe reported maximum POTW treatment capacity.
Hourly Dry weather Sanitary BOD Concentration Variation
In its current form, the GPRACSO model only analyses BOD pollutant loadings for dry weather and wet-weather conditions. While thealgorithm can be used to evaluate any pollutant, EPA established that BOD should be used as the indicator pollutant in assessingnational impacts of CSO management.
The GPRACSO model assumes that the average dry weather BOD concentration entering the POTW is 158 mg/L, with minimum andmaximum hourly values of 40 and 290 (mg/L) respectively. The diurnal variation in BOD concentration mimics typical system trendreported by Metcalf & Eddy (1991). There were no other influences on hourly dry weather sewage concentration of BOD unless thereare additions to sanitary inflows from snowmelt or from discharge from wet-weather storage facilities.
Flow source #1: GPRACSO identifies that there is a snow pack present in the combined sewer community and that hourly airtemperature is above 32 degrees.
Flow source #2: A combined sewer community has dedicated wet-weather storage available to capture any wet-weather flows inexcess of the POTW maximum treatment capacity.
Estimation of Overflow Volume
The GPRACSO model performs many hydrologic computations as it evaluates the potential and actual wet-weather inflow into thecombined sewer community system. The data sources used and the computations performed are as follows.
Typical meteorologic data was obtained for each combined sewer community based on a review of long-term data from theNational Weather Service (NWS). First, the combined sewer communities were geographically grouped based on hydrology into 84common zones. Next, a typical rainfall year was identified for each zone. As a rule, the typical year contained within +/-10 percent ofthe annual average precipitation and has no single rainfall event larger than the two-year return period rainfall. Depending on zoneevaluated, the typical rainfall year presents between 30 and 80 possible overflow events for combined sewer communities within thezone. The associated hourly temperature record was also retrieved from NWS records such that snow generation and melting couldbe assessed during the GPRACSO simulation.
Runoff Estimation was performed using the rational method, which multiplies hourly rainfall by a single coefficient to calculate therunoff depth. The coefficient was set to equal the overall impervious fraction of each combined sewer community. Land use/land
Model Response Assumptions
From the calculated melt rate, an estimate of the snowmelt is made, all of which is assumed to flow in to the combined sewer system. The relative volumes of dry weather sewage and snowmelt is used to calculate a reduction in t he BOD concentration entering the POTW.
It is assumed that snowmelt contains zero pollutant and as a result dilutes the inflow entering the POTW.
Model Response Assumptions
The GPRACSO model tracks on an hourly basis all of the storage volume along with the amount of pollutant (BOD) it contains.
GPRACSO assumes that the stored flow is discharged to the POTW as soon as there is available treatment capacity (i.e., the hourly POTW inflow is less than the reported maximum POTW treatment capacity).
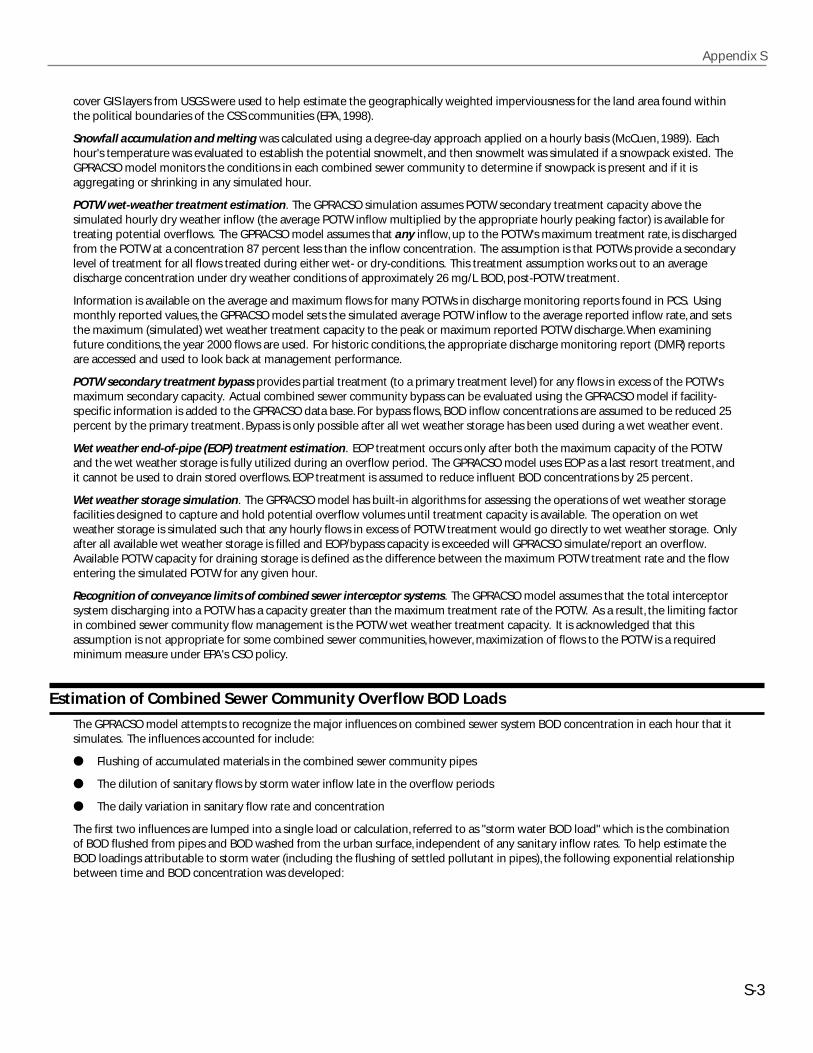
Appendix S
S-3
cover GIS layers from USGS were used to help estimate the geographically weighted imperviousness for the land area found withinthe political boundaries of the CSS communities (EPA, 1998).
Snowfall accumulation and melting was calculated using a degree-day approach applied on a hourly basis (McCuen, 1989). Eachhour's temperature was evaluated to establish the potential snowmelt, and then snowmelt was simulated if a snowpack existed. TheGPRACSO model monitors the conditions in each combined sewer community to determine if snowpack is present and if it isaggregating or shrinking in any simulated hour.
POTW wet-weather treatment estimation. The GPRACSO simulation assumes POTW secondary treatment capacity above thesimulated hourly dry weather inflow (the average POTW inflow multiplied by the appropriate hourly peaking factor) is available fortreating potential overflows. The GPRACSO model assumes that any inflow, up to the POTW's maximum treatment rate, is dischargedfrom the POTW at a concentration 87 percent less than the inflow concentration. The assumption is that POTWs provide a secondarylevel of treatment for all flows treated during either wet- or dry-conditions. This treatment assumption works out to an averagedischarge concentration under dry weather conditions of approximately 26 mg/L BOD, post-POTW treatment.
Information is available on the average and maximum flows for many POTWs in discharge monitoring reports found in PCS. Usingmonthly reported values, the GPRACSO model sets the simulated average POTW inflow to the average reported inflow rate, and setsthe maximum (simulated) wet weather treatment capacity to the peak or maximum reported POTW discharge. When examiningfuture conditions, the year 2000 flows are used. For historic conditions, the appropriate discharge monitoring report (DMR) reportsare accessed and used to look back at management performance.
POTW secondary treatment bypass provides partial treatment (to a primary treatment level) for any flows in excess of the POTW'smaximum secondary capacity. Actual combined sewer community bypass can be evaluated using the GPRACSO model if facility-specific information is added to the GPRACSO data base. For bypass flows, BOD inflow concentrations are assumed to be reduced 25percent by the primary treatment. Bypass is only possible after all wet weather storage has been used during a wet weather event.
Wet weather end-of-pipe (EOP) treatment estimation. EOP treatment occurs only after both the maximum capacity of the POTWand the wet weather storage is fully utilized during an overflow period. The GPRACSO model uses EOP as a last resort treatment, andit cannot be used to drain stored overflows. EOP treatment is assumed to reduce influent BOD concentrations by 25 percent.
Wet weather storage simulation. The GPRACSO model has built-in algorithms for assessing the operations of wet weather storagefacilities designed to capture and hold potential overflow volumes until treatment capacity is available. The operation on wetweather storage is simulated such that any hourly flows in excess of POTW treatment would go directly to wet weather storage. Onlyafter all available wet weather storage is filled and EOP/bypass capacity is exceeded will GPRACSO simulate/report an overflow.Available POTW capacity for draining storage is defined as the difference between the maximum POTW treatment rate and the flowentering the simulated POTW for any given hour.
Recognition of conveyance limits of combined sewer interceptor systems. The GPRACSO model assumes that the total interceptorsystem discharging into a POTW has a capacity greater than the maximum treatment rate of the POTW. As a result, the limiting factorin combined sewer community flow management is the POTW wet weather treatment capacity. It is acknowledged that thisassumption is not appropriate for some combined sewer communities, however, maximization of flows to the POTW is a requiredminimum measure under EPA's CSO policy.
Estimation of Combined Sewer Community Overflow BOD Loads
The GPRACSO model attempts to recognize the major influences on combined sewer system BOD concentration in each hour that itsimulates. The influences accounted for include:
● Flushing of accumulated materials in the combined sewer community pipes
● The dilution of sanitary flows by storm water inflow late in the overflow periods
● The daily variation in sanitary flow rate and concentration
The first two influences are lumped into a single load or calculation, referred to as "storm water BOD load" which is the combinationof BOD flushed from pipes and BOD washed from the urban surface, independent of any sanitary inflow rates. To help estimate theBOD loadings attributable to storm water (including the flushing of settled pollutant in pipes), the following exponential relationshipbetween time and BOD concentration was developed:

S-4
Report to Congress on Implementation and Enforcement of the CSO Control Policy
Equation 1. C = (200 * 10 -1.5*(t)) + 15
where
C = the BOD concentration in mg/L used to calculate the storm water load
t = time in hours since the overflow started
15 = the BOD concentration in mg/L assumed to be in urban storm water
Information from two data sources was used to develop the above relationship. The first data source is multi-event CSO monitoringresults of first-flush concentrations in combined sewers for a medium-sized east coast combined sewer community. The second datasource used to develop the relationship was from 90th percentile event mean concentration (EMC) BOD concentrations reported inthe EPA Nationwide Urban Runoff Program (NURP). The first data source suggests that BOD concentrations at the very start of runoffranges between 200 and 400 mg/L, but that BOD concentrations decrease rapidly within the first hour of runoff. As a result, theaverage first hour BOD concentration is set to be 215 mg/L, using the equation above. The second data source suggests a high-endlong-term urban runoff BOD concentration in the absence of CSOs is approximately 15mg/L, a feature also provided by the equationabove.
Calculation of hourly overflow concentration in storm water/sanitary mix. While the initial storm water inflows into the combinedsewer community cause a high concentration of flush load at the beginning of the overflow period, later in the overflow periodhighly dilute storm water thins the more concentrated sanitary flows. As a result, the GPRACSO hourly model continuously mixes thesanitary flow/BOD load with the storm water runoff/BOD load to calculate the average hourly concentration. It is assumed that themixing of sanitary and storm water is 100 percent complete for each hour simulated and that any overflows which occur will containthe same pollutant concentration as what enters the simulated POTW. The logic used to select the uniform concentration for anyparticular hour is:
The CSCConc(ttt,0) value is used to compute the overflow pollutant load, the inflow load entering the POTW, and the pollutant loadstored in any wet weather storage that may be present in the system. The assumed concentration for the first hour when overflowoccurs is 215 mg/L regardless of when it occurs in the day. For any subsequent hour in which overflow can occur, the BODconcentration is the greater of (1) the value taken from Equation 1 based on the time elapsed since the start of the overflow, or (2)the flow weighted combination of Equation 1 and the sanitary flow concentration based on daily variation. The first flush isrecognized as the strongest influence on concentration at the beginning of the event, the dominate role of storm water dilution isrecognized later in the event, and the daily variation in sanitary flow concentration is accounted for throughout the event.
If EventTime = 0 (the runoff has just started entering the CSS), then CSCConc(ttt,0) = (200 * 10 -1.5*(event time)) + 15
If EventTime > 0 (the overflow event is progressing), then CSCConc(ttt,0) = (200 * 10 -1.5*(event time)) + 15
If CSCConc(ttt,0) < DWBODconc * hours, then CSCConc(ttt,0) = (HRDischarge(ttt,0) - HRDWF(ttt,0)) * (CSCConc(ttt,0) +
HRDWF(ttt,0) * DWBODconc * hours) / HRDischarge(ttt,0)
EventTime = time since the start of the overflow event (hours) CSCConc = uniform concentration of the storm water/sanitary mixture (mg/L) from the combined sewer community DWBODconc * hours = the sanitary flow concentration in the absence of overflow (mg/L) for the “hour” under simulation HRDischarge(ttt,0) = the simulated total flow in the combined sewer (mg/d) HRDWF(ttt,0) = the hour’s sanitary flow rate in the absence of overflow (mg/d)
Appendix S
S-5
Removal efficiencies of POTW and EOP Treatments. All flows passing through POTWs are assumed to have a 87 percent reduction inthe inflow BOD load; the effluent concentration would be 13 percent of the influent concentration. All flows passing through EOPtreatment are assumed to have 25 percent reduction in the inflow BOD load; the effluent concentration would be 75 percent of theinfluent concentration. For the purpose of estimating pollutant loadings, bypassed flows are assumed to have a 25 percent reductionin inflow BOD concentration due to the primary treatment it receives.
Summary
Based on data within the GPRACSO data base, the GPRACSO model estimates combined sewer overflow volume, sanitary dischargevolume, and annual BOD load for approximately 700 combined sewer communities. Designers of the GPRACSO model haveattempted to estimate the annual performance expected under typical rainfall conditions based on historic POTW performance data.Recent POTW upgrades and/or new wet weather management facilities may not be incorporated within the current version of theGPRACSO data base. (Note, EPA is currently collecting data on CSS facilities which can be used to update the GPRACSO data base.) Forthis reason, the estimates produced by the GPRACSO simulation may not fully recognize current management. In addition, modelestimates will vary from the actual overflow measured at any given community for any given year because of natural hydrologicvariation.
Extensive efforts were made to account for the majority of physical and hydrologic factors encountered in the generation of sanitaryand storm water flows, and the operation of wet weather treatment and storage. As a result, it is expected that the bulk of the modelerror originates from errors in the basic system data (e.g, the combined sewer service acreage in each CSS). Where GPRACSO resultshave been compared against much more detailed/sophisticated models, the results have been found to agree within +/-20 percent.When compared against annual overflow estimates based on monitoring data (available for a limited number of cities), the GPRACSOmodel has been found to be with +/- 20 percent. These error ranges are well within that encountered in total annual rainfall; whenidentifying a typical rainfall year for each CSS the total annual rainfall was found to range +/- 30 percent throughout a 30 year period.Inaccuracies related to mathematical model errors generated as the model solves internal algorithms are very small; mathematicalerrors are less than 0.01 percent for the volume of water and less than 0.01 percent for the mass of pollutant.