10818.pdf - US Environmental Protection Agency
58
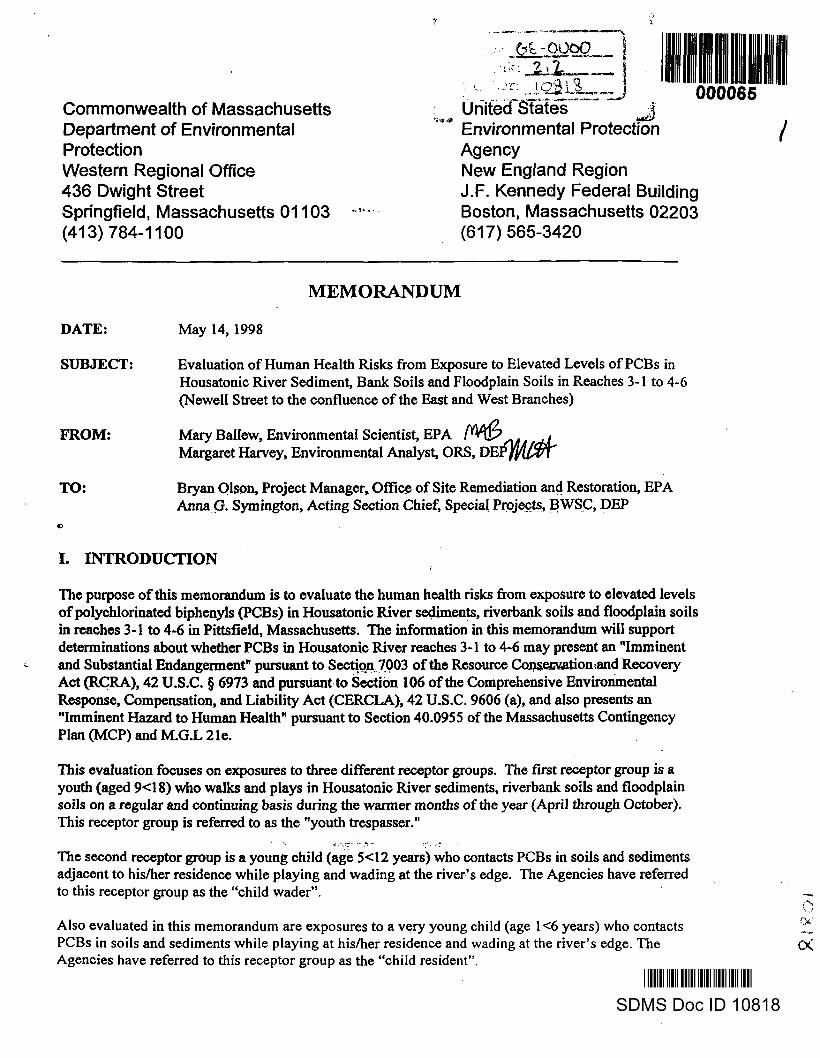
Commonwealth of Massachusetts Department of Environmental Protection Western Regional Office 436 Dwight Street Springfield, Massachusetts 01103 (413)784-1100 6i -0000 —. li>iiia-| *LMJ.I-^ '" , -, -tr ,. jgf ,£ ,,'SSm.^mfi mn UnitecTsTafeT~"~~ Environmental Protection Agency New England Region J.F. Kennedy Federal Building Boston, Massachusetts 02203 (617)565-3420 000065 MEMORANDUM DATE: May 14, 1998 SUBJECT: Evaluation of Human Health Risks from Exposure to Elevated Levels of PCBs in Housatonic River Sediment, Bank Soils and Floodplain Soils in Reaches 3-1 to 4-6 (Newell Street to the confluence of the East and West Branches) FROM: Mary Ballew, Environmental Scientist, EPA Margaret Harvey, Environmental Analyst, ORS, TO: Bryan Olson, Project Manager* Office of Site Remediation and Restoration, EPA Anna G. Symington, Acting Section Chief, Special Projects, BWSC, DEP I. INTRODUCTION The purpose of this memorandum is to evaluate the human health risks from exposure to elevated levels of polychlorinated biphenyls (PCBs) in Housatonic River sediments, riverbank soils and fioodplain soils in reaches 3-1 to 4-6 in Pittsfield, Massachusetts. The information in this memorandum will support determinations about whether PCBs in Housatonic River reaches 3-1 to 4-6 may present an "Imminent and Substantial Endangerment" pursuant to Section 7003 of the Resource Cons.ejcvation:and Recovery Act (RCRA), 42 U.S.C. § 6973 and pursuant to Section 106 of the Comprehensive Environmental Response, Compensation, and Liability Act (CERCLA), 42 U.S.C. 9606 (a), and also presents an "Imminent Hazard to Human Health" pursuant to Section 40.0955 of the Massachusetts Contingency Plan (MCP) and M.G.L 21e. This evaluation focuses on exposures to three different receptor groups. The first receptor group is a youth (aged 9<18) who walks and plays in Housatonic River sediments, riverbank soils and fioodplain soils on a regular and continuing basis during the warmer months of the year (April through October). This receptor group is referred to as the "youth trespasser." The second receptor group is a young child (age 5<12 years) who contacts PCBs in soils and sediments adjacent to his/her residence while playing and wading at the river's edge. The Agencies have referred to this receptor group as the "child wader". Also evaluated in this memorandum are exposures to a very young child (age 1<6 years) who contacts PCBs in soils and sediments while playing at his/her residence and wading at the river's edge. The Agencies have referred to this receptor group as the "child resident".
-
Upload
khangminh22 -
Category
Documents
-
view
0 -
download
0
Transcript of 10818.pdf - US Environmental Protection Agency
Commonwealth of MassachusettsDepartment of EnvironmentalProtectionWestern Regional Office436 Dwight StreetSpringfield Massachusetts 01103(413)784-1100
6i -0000mdash ligtiiia-| LMJI-
- -tr jgf pound SSm mfi mn
UnitecTsTafeT~~~Environmental ProtectionAgencyNew England RegionJF Kennedy Federal BuildingBoston Massachusetts 02203(617)565-3420
000065
MEMORANDUM
DATE May 14 1998
SUBJECT Evaluation of Human Health Risks from Exposure to Elevated Levels of PCBs inHousatonic River Sediment Bank Soils and Floodplain Soils in Reaches 3-1 to 4-6(Newell Street to the confluence of the East and West Branches)
FROM Mary Ballew Environmental Scientist EPAMargaret Harvey Environmental Analyst ORS
TO Bryan Olson Project Manager Office of Site Remediation and Restoration EPAAnna G Symington Acting Section Chief Special Projects BWSC DEP
I INTRODUCTION
The purpose of this memorandum is to evaluate the human health risks from exposure to elevated levelsof polychlorinated biphenyls (PCBs) in Housatonic River sediments riverbank soils and fioodplain soilsin reaches 3-1 to 4-6 in Pittsfield Massachusetts The information in this memorandum will supportdeterminations about whether PCBs in Housatonic River reaches 3-1 to 4-6 may present an Imminentand Substantial Endangerment pursuant to Section 7003 of the Resource Consejcvationand RecoveryAct (RCRA) 42 USC sect 6973 and pursuant to Section 106 of the Comprehensive EnvironmentalResponse Compensation and Liability Act (CERCLA) 42 USC 9606 (a) and also presents anImminent Hazard to Human Health pursuant to Section 400955 of the Massachusetts ContingencyPlan (MCP) and MGL 21e
This evaluation focuses on exposures to three different receptor groups The first receptor group is ayouth (aged 9lt18) who walks and plays in Housatonic River sediments riverbank soils and fioodplainsoils on a regular and continuing basis during the warmer months of the year (April through October)This receptor group is referred to as the youth trespasser
The second receptor group is a young child (age 5lt12 years) who contacts PCBs in soils and sedimentsadjacent to hisher residence while playing and wading at the rivers edge The Agencies have referredto this receptor group as the child wader
Also evaluated in this memorandum are exposures to a very young child (age 1lt6 years) who contactsPCBs in soils and sediments while playing at hisher residence and wading at the rivers edge TheAgencies have referred to this receptor group as the child resident
The Agencies have evaluated exposures to the youth trespasser child wader and child resident Exposure factors used in this evaluation reflect a combination of central tendency and upper end values Given the purpose of this evaluation a maximal exposure estimate was not generated
This evaluation presents separate risk estimates for soil and sediment exposures The reasons for this are to keep the risk assessment less complex and to allow risk managers to make separate risk management decisions for soil and sediment if they so choose
II CONCLUSIONS
Based on the evaluation presented in this Memorandum the Massachusetts Department of Environmental Protection and the Environmental Protection Agency conclude that short-term exposures to elevated levels of PCBs in Housatonic River floodplain soils riverbank soils and river sediments in reaches 3-1 to 4-6 in Pittsfield Massachusetts present significant risks to human health
in HAZARD IDENTIFICATION
The portion of the Housatonic River that is the subject of this memorandum begins at the Newell Street bridge (reach 3-1) and extends to the confluence of the East and West Branches (reach 4-6) within the City of Pittsfield This section of the river (reaches 3-1 to 4-6) is called the area of interest in this memorandum Reach designations are taken from the MCP Supplemental Phase n InvestigationRCRA Facility Investigation for the Housatonic River and Silver Lake (Blasland Bouck and Lee 1996)
Elevated levels of PCBs have been found in Housatonic River sediments and soils in reaches 3-1 to 4-6 In these reaches PCBs have been detected in surficial sediments at levels as high as 905 mgkg In surficial riverbank soils PCBs have been found at levels as high as 5800 mgkg PCBs have been detected in surficial floodplain soils at levels as high as 160 mgkg PCBs have also been found at high levels (over 1000 mgkg) in subsurface sediments and bank soils in reaches 3-1 to 4-6
Contaminated river sediments are typically covered by one to two feet of water However sediments near the banks are exposed during periods of low water There are a1sectbisandbars in the river which become exposed during periods of low water In the area of interestidfe-river is approximately 40 to 60 feet wide
The type and frequency of potential exposure to PCB-contaminated soils and sediments changes across the area of interest For this reason the Agencies have divided the area of interest into 3 exposure areas In identifying exposure areas the Agencies considered the current land use adjacent to the river steepness and height of the banks and the size of the sampling database A brief description of each exposure area is presented below
Each of the exposure areas described below is in the vicinity ofdj^rfsfcly settled residential areas andor recreational areas and is very accessible at many points The Hottsatonic-is the largest waterway in the area and is an attractive place for children to walk and play especially in the warmer months of the year
- 2 shy
Exposure Area A Reaches 3-1 to 3-10 (Newell Street bridge to Elm Street bridge) Land use along the river in this set of reaches is primarily commercial with several residences and one recreational property In the commercial areas the river is within easy walking distance of densely settled residential areas
GE owns the property on the north side of the river in reaches 3-1 to 3-7 (Newell Street to Lyman Street bridges) The top of the north riverbank between Newell and Lyman Streets is currently completely fenced Fences in this area are approximately eight feet in height Immediately adjacent to the Newell Street bridge are densely settled residential areas (Lombard Street and Parkside Avenue) Teenagers from these residential areas could easily access the river from just above the Newell Street bridge Teenager activity underneath the Newell and Lyman Street bridges is evidenced by the presence of graffiti
On the south side the top of the riverbank is currently almost completely fenced between Newell and Lyman Streets There is at least one hole in the fence east of the Newell Street Parking Lot On the south side of the river Hibbard Park comprises reaches 3-1 to 3-4 Access to the river from Hibbard Park currently is restricted by a fence Densely settled residential areas lie within a two minute walk of the south side of the river Just above and below the Lyman Street bridge there are two residences which directly abut the river There is a footbridge across the river at the Newell Street Parking Lot site (reach 3-7)
Oxbow Areas A and C comprise part of reach 3-8 and all of reach 3-9 on the south side of the river Oxbows A and C are undeveloped forested land PCB data from these oxbows was not included in this evaluation No fences currently exist between Lyman and Elm Streets (reaches 3-8 to 3-10)
Riverbanks in exposure area A are steeply sloped and thickly vegetated
Exposure Area B Reaches 4-1 to 4-3 (Elm Street bridge to Dawes Avenue bridge) Land use along the river in this set of reaches is entirely residential Distance between residences and the river and steepness of the riverbanks varies somewhat In reaches 4-1 and 4-2 the riverbank is mgdeitttely steeply sloped and some residences are setback as far as 100 feet from the river In reach4-3 the banks (especially on the northeast side) become much less steeply sloped and houses v~i are closer to the river During a site visit Agency personnel observed childrens toys in the sediment at the waters edge behind a residence in reach 4-3 Agency personnel also observed footpaths from the top of the bank down to the water
Exposure Area C Reaches 4-4 to 4-6 (Dawes Avenue to the Confluence of the East and West Branches) Land use along the river in this section of reaches is primarily residential In reach 4-4 houses are quite close to the river and riverbanks are moderately to slightly sloped and not very high Fred Garner Park is located on the northeast side of the river in part of reach 4-5 and all of reach 4-6
Many of the residences on the southwest side of the river across from Fred Garner Park are set back from the river Agency personnel have received anecdotal reports of children playing in the riverbed and of a 12-year old child digging in the riverbed in this area
- 3 shy
Land use described in each of the three exposure areas is current land use This evaluation focuses only on current uses and does not consider potential future land use
Separate Exposure Point Concentrations (EPCs) for PCBs were calculated for 1) sediment and 2) floodplainftank soils in each of the three exposure areas Data used to calculate EPCs is provided in Attachment 1 Attachment 1 also contains references for the data
In accordance with EPA risk assessment guidance (EPA 1994) EPA calculated the 95 percent upper confidence limit of the arithmetic mean (UCL^s) using the data in Attachment 1 The UCL95 was calculated using the procedure outlined in EPA guidance (EPA 1994 Gilbert 1987) In accordance with EPA Region I guidance when the UCLps exceeds the maximum concentration the maximum concentration should be used as the EPC Table 1 below presents the EPCs for each of the 3 exposure areas and indicates whether the EPC is the UCLgs or the maximum value
It is DEPs general practice to use the arithmetic average rather than the UCLgs in risk assessments Using the average concentration rather than the values in Table 1 jesults in a lower risk estimate but does not change the conclusions of the risk assessment DEP has adopted the practice of using the average rather than the UCL^s to streamline the MCP risk assessmentrisk management process However it should be recognized that using the average does not account for sampling error (ie error in the estimate of the true average) and may result in a substantial underestimate of the true average
In selecting data the Agencies included any sample result from a sample interval beginning at the surface The majority of sample results are from the 0 to 6-inch interval However at 15 out of 1 10 sediment sampling locations PCB surface sediment samples extended over an interval of greater than six inches but not more than two feet These samples were included hi the EPC The Agencies decided that it was reasonable to include these datapoints in this evaluation even though they are from greater than surficial depth If the EPC had been calculated using data only from the 0 to 6-inch depth interval it would not change the conclusions of the risk assessment
For sample results reported as non-detect one-half the detection limit was used in the EPC calculation For locations where duplicate samples were taken the average of the two duplicates was used in the EPC calculation Samples located within areas that have already been remediated (for example sediment removal at Building 68 and residential short-term measures) were not included in the EPC calculation
TABLE 1 EXPOSURE POINT CONCENTRATIONS USED TO EVALUATE RISKS IN REACHES 3-1 TO 4-6 OF THE HOUSATONIC RIVER
EXPOSURE AREA PCB EPC Basis (mgkg)
Sediment A Reaches 3-1 to 3-10 (Newell Street to Elm Streets) 46 UCLlt5 B Reaches 4-1 to 4-3 (Elm Street to Dawes Avenue) 905 Maximum C Reaches 4-4 to 4-6 (Dawes Avenue to confluence) 30
Floodplain amp Bank Soil A Reaches 3-1 to 3-10 (Newell Street to ElrnStreet) 2400 B Reaches 4-1 to 4-3 (Elm Street to Dawes Avenue) 377 Maximum C Reaches 4-4 to 4-6 (Dawes Avenue to confluence) 68 UCL5
have been rounded to 2 significant figures
- 4 shy
5
IV DOSE RESPONSE
To evaluate human health risks from exposure to PCBs in soil and sediments in the Housatonic River in reaches 3-1 to 4-6 the Agencies estimated the cancer and noncancer risks associated with PCB exposure To evaluate the cancer risk the Agencies used the 95 upper confidence limit of the linear-slope factor
(also known as the cancer slope factor) of 2 (mgkgday)1 for PCBs (IRIS 1998) In the cancer studies on which the slope factor is based a 12-month exposure (ie one-half a lifetime exposure) produced a high incidence of tumors This suggests that a less than lifetime exposure could have significant cancer risk implications (EPA 1996)
To evaluate chronic noncancer risks the Agencies used the EPA-published Reference Dose (RfD) of 2 x 10~5 mgkgday for Aroclor 1254 (IRIS 1998) To evaluate subchronic noncancer risks the Agencies used the EPA-published subchronic RfD of 5 x 10~5 mgkgday for Aroclor 1254 (HEAST 1997) The critical effects (ie those that occur at the lowest dose) for the chronic and subchronic RfDs are immunologic and reproductive effects Reference Doses for Aroclor 1254 were used because they are the closest to being applicable to the type of PCB mixture found in the Housatonic River (Aroclor 1260) The toxicity study on which the RfD is based was conducted over a timeframe comparable to exposure periods evaluated in this memorandum
A value of 14 was used for dermal absorption of PCBs from soil and sediment (Wester et al 1993 EPA 1998) This value was peer reviewed by a panel external to EPA (EPA 1996) A relative absorption factor (RAF) of 100 was used for oral absorption of PCBs from soil and sediment (DEP 1992) An RAF of 100 means that the assumed absorption of PCBs from ingestion of Housatonic soil and sediment is equal to the absorption of PCBs in the laboratory toxicity studies
PCB Toxicity PCBs can have a number of effects other than the critical effects mentioned above PCBs have been shown to produce a wide variety of effects in many animals including severe acne cancer liver damage and reproductive and developmental effects Monkeys which are physiologically more similar to humans than other animals have developed adverse immunological and neurological effects as well as skin and eye irritations after being fed PCBs Studies of PCB-exposed workers show that PCBs can cause skin problems such as acne and rashes andeye irritation There are also studies which have reported neurological behavioraJTand developmental abnormalities in children born to mothers who ate PCB-contaminated fish However in these studies the mothers exposures to PCBs were estimated and not measured directly Neurobehavioral effects reported in these studies are similar to effects seen in monkeys (IRIS 1998 ATSDR 1996 ATSDR 1997)
V EXPOSURE ASSESSMENT
In exposure area A (Newell to Elm Streets) the Agencies evaluated exposures to PCB-contaminated soil by focusing on a youth trespasser between the ages of 9 and 18 years who walks and plays two days per week in riverbank and floodplain soils and river sediments while exploring the area during the warmer months of the year (April through October) Walking or playing in contaminated soils or sediments could lead to exposure to PCBs by dermal absorption or by incidental ingestion so these two exposure routes are the focus of this evaluation As described in the Hazard Identification section of this memorandum
- 5 shy
exposure area A is primarily commercial property Thus it is the Agencies view that a trespasser exposure scenario (which assumes less frequent exposure) rather than a residential scenario (which assumes more frequent exposure) is more appropriate
In exposure area B (Elm Street to Dawes Avenue) the Agencies evaluated exposures to PCB-contaminated soil and sediment by focusing on a child wader between the ages of 5 and 12 years who wades in the water and plays in the soils and sediments five days per week during the^ warmest months of the year (June through August) in areas nearby hisher residence The Agencies also evaluated exposures to a child wader who plays in riverbank and floodplain soils five days per week nearby hisher residence during the warmer months of the year (April through October) As described in the Hazard Identification section of this memorandum exposure area B is dominated by residential property However riverbanks in Area B are more difficult to access because they are generally steeper and higher than riverbanks in Area C Thus it is the Agencies view that a child younger than age 5 is not likely to come into contact on a regular and continuing basis with PCBs in soils and sediments in Area B For this reason the Agencies focused on an older child (aged 5lt12 years) rather than a very young child as in Area C
gt In exposure area C (Dawes Avenue to the confluence) the Agencies evaluated exposures to a very young child aged 1lt6 years Riverbanks in area C are quite easily accessed because they are not as steeply sloped and not as high as in Areas A and B In portions of the river in Area C residences are located quite close to the river Thus the Agencies believe that is it reasonable that a very young child could come into contact with PCB-contaminated soils and sediments while playing and wading on the riverbank and at the waters edge in hisher backyard
AREA A - Youth Trespasser To estimate risks to the youth trespasser the Agencies used exposure assumptions described hi the following paragraphs The Agencies believe that such assumptions are appropriate considering the amount of site data available and the site conditions
This evaluation assumes that the youth (aged 9lt18 years) contacts soils and sediments two days per week while walking or playing during the warmer months of the year (April through October) This is equivalent to approximately 61 days per year (3057 weeks in the months April through October 2 days per week =611 days)
- C^r
The Agencies assumed that dermal contact for the youth trespasser occurs to tiiejjan4s arms feet and lower legs Values for surface area of exposed skin are taken from DEP Guidance (DEP 1995) Attachment 2 provides skin surface areas for each body part by age group The Agencies used DEPs default skin-soil adherence factor of 051 mgcm (DEP 1995)
For incidental soil ingestion for the trespasser the Agencies used 50 mgday This value was previously agreed upon by the Agencies in joint comments on General Electrics proposed Risk Assessment Scope of Work for the Housatonic River (DEPEPA 1997) A soil ingestion rate of 50 mgday is DEPs default rate for older children and adults (DEP 1995) This value is lower than the Reasonable Maximum Exposure (RME) value recommended by EPA guidance^PA 1997) EPA considers this value to be a central tendency value A high-end value for aduftsoil ingestion would be 100 mgday (EPA 1997)
- 6 shy
The body weight used in this evaluation is 46 kg which represents an average of the 50th percentile body weights for females aged 9 lt 18 years (DEP 1995 EPA 1989) For subchronic trespassing exposures a body weight of 30 kg for the nine-year old female was used
Exposures to the youth trespasser using the assumptions described above were evaluated using soil and sediment concentrations in Table 1 from exposure area A (Newell Street to Elm Street) Table 2A below summarizes some of the exposure factors used to evaluate the youth trespasser
TABLE 2A SUMMARY OF EXPOSURE FREQUENCY AND DURATION USED TO EVALUATE THE YOUTH TRESPASSER IN AREA A (REACH 3-1 TO 3-10) HOUSATONIC RIVER
Medium Risk Type Age Exposure Exposure Period Averaging Time (years) Frequency (days) (days)
(eventsdays) Soil Cancer 9lt18 01 67 3285^ 25550L
Soil Chronic Noncancer 9lt18 0167A 3285C 3285C
Soil Subchronic Noncancer 9 028B 214deg 214deg Sediment Cancer 9lt18 01 6T 3285shy 25550C
Sediment Chronic Noncancer 9lt18 01 67A 3285C 3285C
Sediment Subchronic Noncancer 9 028B 214deg 214deg
2 days per week April -October averaged over one year =61 events365 days = 0167 B 2 days per week April - October averaged over the period April - October = 61 events214 days = 028 c 9 years 365 days 0 214 days in the months April - October E 70 years 365 days
AREAS- Child Wader To estimate risks to the child wader the Agencies used exposure assumptions described in the following paragraphs The Agencies believe that such assumptions are appropriate considering the amount of site data available and the site conditions
This evaluation-assumes that the child (aged 5lt12 years) contacts floodplain and riverbank soil five days per week during the warmer months of the year (April through October) This is equivalent to approximately 153 days per year (3057 weeks in the months April through October 5 days per week= 15285 days)
For exposures to sediment this evaluation assumes that the child contacts sediment at the waters edge while wading and playing 5 times per week during the warmest months of the year (June through August) This is equivalent to approximately 65 days per year (13 weeks during the months June through August 5 days per week = 65 days)
For subchronic noncancer risks to the child wader this evaluation focused on a child (aged 5 years) who contacts sediments 5 days per week during the warmest months of the summer (June July and August) and soils 5 days per week during April through October
- 7 shy
The Agencies assumed that dermal contact to sediment occurs to the hands feet arms and legs and that dermal contact to soils occurs to the hands arms feet and lower legs Skin surface areas are from DEP guidance (DEP 1995) Attachment 2 provides skin surface areas for each body part by age group The Agencies used DEPs default skin-soil adherence factor of 051 mgcm2(DEP 1995)
For incidental soil ingestion for the child the Agencies used 50 mgday This value was previously agreed upon by the Agencies in joint comments on General Electrics proposed Risk Assessment Scope of Work for the Housatonic River (DEPEPA 1997) This value is DEPs default rate for children and adults over the age of 5 years (DEP 1995) As previously stated a soil ingestion rate of 50 mgday is lower than the RME value recommended by EPA guidance (EPA 1997) EPA considers 50 mgday to be a central tendency value A high-end value for adult soil ingestion would be 100 mgday (EPA 1997)
In an effort to simplify the risk calculations the Agencies used a soil ingestion rate of 50 mgday for the 5 year-old child rather than 100 mgday which is the value normally applied to that age Using 50 mgday for the-5 year-old does not change the conclusions of the risk assessment presented in this memorandum
The body weight used in this evaluation is 278 kg which represents the average body weight for a female aged 5lt12 years (DEP 1995 EPA 1989) For subchronic exposures a body weight of 188 kg for the five-year old female was used
Exposures to the child wader using the assumptions described above were evaluated using soil and sediment concentrations in Table 1 from exposure area B (Elm Street to Dawes Avenue) Table 2B below summarizes some of the exposure factors used to evaluate the child wader
TABLE 2B SUMMARY OF EXPOSURE FREQUENCY AND DURATION USED TO EVALUATE THE CHILD WADER IN AREA B (REACH 4-1 TO 4-3) HOUSATONIC RIVER
Medium Risk Type Age Exposure Exposure Period Averaging Time (years) Frequency (days) (days)
(eventsdays) Soil Cancer ~ 5lt12 0419 2555C 25550 Soil Chronic Noncancer 5lt12 0419A bulllaquo - 2555E 2555E
Soil Subchronic Noncancer 5 071B 214F 214F
Sediment Cancer 5lt12 0178shy 2555C 25550 Sediment Chronic Noncancer 5lt12 01 78C 2555E 2555E
Sediment Subchronic Noncancer 5 071deg 92deg 92deg
A 5 days per week April -October averaged over one year = 153 events365 days = 0419 B 5 days per week April - October averaged over the period April - October =153 events214 days = 071 C5 days per week June-August averaged over one year = 65 events365 days = 0178 D 5 days per week June - August averaged over the period June - August= 65 events92 days = 071 E 7 years 365 days F 214 days in months April - October 0 92 days in months June - August H 70 years 365 days
AREA C - Child Resident To estimate risks to the child resident the Agencies used exposure assumptions described in the following paragraphs The Agencies believe that such assumptions are appropriate and protective considering the amount of site data available and the site conditions
This evaluation assumes that a resident (aged 1lt6 years) contacts floodplain and riverbank soil five days per week during the warmer months of the year (April through October) This is equivalent to approximately 153 days per year (3057 weeks in the months April through October 5 days per week= 15285 days)
For exposures to sediment this evaluation assumes that a resident contacts sediment at the waters edge while wading and playing 5 times per week during the warmest months of the year (June through August) This is equivalent to approximately 65 days per year (13 weeks during the months June through August 5 days per week = 65 days)
For subchronic noncancer risks to the resident this evaluation focused on a child (aged 5 years) who contacts sediments and soils 5 days per week during the warmest months of the summer (June July and Afigust) and soils 5 days per week during April through October
The Agencies assumed that dermal contact to sediment occurs to the hands feet arms and legs Dermal contact to soils occurs to the hands arms feet and lower legs Skin surface areas are taken from DEP guidance (DEP 1995) Attachment 2 provides skin surface areas for each body part by age group The Agencies used DEPs default skin-soil adherence factor of 051 mgcm2(DEP 1995)
For incidental soil ingestion for the child resident the Agencies used 100 mgday This value was previously agreed upon by the Agencies in joint comments on General Electrics proposed Risk Assessment Scope of Work for the Housatonic River (DEPEPA 1997) It is lower than the RME value recommended by EPA guidance (EPA 1997) EPA considers 100 mgday to be a central tendency value A high-end value for a child could be as high as 200 or 400 mgday (studies by Calabrese reviewed in EPA 1997)
The body-weight used in this evaluation is 146 kg whiohtepresents the average body weight for a female aged 1lt6 years (DEP 1995 EPA 1989) ForTuocHromc exposures a body weight of 188 kg for the five-year old female was used
Exposures to the child resident using the assumptions described above were evaluated using soil and sediment concentrations in Table 1 from exposure area C (Dawes Avenue to the confluence) Table 2C below summarizes some of the exposure factors used to evaluate the child resident
- 9 shy
TABLE 2C SUMMARY OF EXPOSURE FREQUENCY AND DURATION USED TO EVALUATE THE CHILD RESIDENT IN AREA C (REACH 4-4 TO 4-6) HOUSATONIC RIVER
Medium Risk Type Age Exposure Exposure Period Averaging Time (years) Frequency (days) (days)
(eventsdays) ~amptpoundshy
Soil Cancer 1lt6 04 19A 1825C 25550H
Soil Chronic Noncancer 1lt6 04 19A 1825E 1825E
Soil Subchronic Noncancer 5 071B 214F 214F
Sediment Cancer 1lt6 01781- 1825C 25550
Sediment Chronic Noncancer 1lt6 0178C 1825E 1825E
Sediment Subchronic Noncancer 5 071deg 92deg 92deg
A 5 days per week April -October averaged over one year = 153 events365 days = 0419 B5 days per week April - October averaged over the period April - October = 153 events214 days = 071 c 5 days per week June-August averaged over one year = 65 events365 days = 0178 D 5 days per week June - August averaged over the period June - August = 65 events92 days = 071 E 5 years 365 days F 214 days in months April - October G 92 days in months June - August H 70 years 365 days
Table 3 below summarizes all of the exposure parameters used in this evaluation
TABLE 3 EXPOSURE FACTORS USED IN EVALUATING RISKS IN REACHES 3-1 TO 4-6 OF THE HOUSATONIC RIVER
EXPOSURE PARAMETER VALUE
Body Weight (kg) average for age 9lt18 years 46 Body Weight (kg) age 9 years 30 Body Weight (kg) average for age 5lt12 years 278 Body Weight (kg) age 5 years 188 BodyWejght (kg) average for age 1lt6 years 1 146-
Skin Surface Area (cmVd) average for age 9lt18 years handsarmsfeetiower legs 5437 Skin Surface Area (cm2d) age 9 years handsarmsfeetlower legs 3889 Skin Surface Area (cm2d) average for age 5lt12 years (soil) handsarmsfeetlowcr legs 3675 Skin Surface Area (cm2d) average for age 5lt12 years (sediment) handsarmsfeetlegs 5370 Skin Surface Area (cmzd) age 5 years (soil) handsarmsfeetlower legs 2970 Skin Surface Area (cm2d) age 5 years (sediment) handsarmsfeetlegs 4269 Skin Surface Area (cmVd) average for age 1lt6 years (soil) handsarmsfeetlowcr legs 2358 Skin Surface Area (cm2d) average for age 1lt6 years (sediment) handsarmsfeetlegs 3368
Skin-Soil Adherence Factor (mgcmz) bull 051
Soil ihgestion rate (mgday) 9lt18 year olds 5lt12 year olds 50 Soil ingestion rate (mgday) 1lt6 year olds 100
- 10shy
VI RISK CHARACTERIZATION
This evaluation estimates risks to three sensitive receptors youth trespassers child waders and child residents These receptor groups are appropriate given site data and current conditions in exposure areas A-C Land use described in this evaluation is current land use An evaluation considering current land use is appropriate for a removal action (or immediate response action) but does not restrict the Agencies to considering these land uses in decisions on final remedial actions Final remedial actions consider both current and future land uses Decisions on future land use are based on public participation development plans and detailed site-specific information (EPA 1995)
Calculations presented in this memorandum are protective for a person who has regular and continuing contact with soils or sediment Calculations are not necessarily protective for the worst case exposure scenario For example calculations in this memo could underestimate risks for a pica child who intentionally consumes soil or sediment (Calabrese 1997) or the risks from activities such as dirt biking Conversely potential risks for the average or typical child should be lower than those calculated here
This evaluation considers risks from exposure to PCBs in soils and sediment and does not evaluate potential risks from exposure to PCBs through other media such as river water
Equations for calculating doses and risks from ingestion and dermal contact with soil are presented below Detailed risk calculations are presented in Attachment 3 Tables 3A-3C below summarize the doses and risks that have been calculated for the three receptor groups in the three exposure areas Risk estimates have been rounded to three significant figures
A Risk Equations
CANCER RISKS
Using the assumptions noted above in Table 2 and the equations below a lifetime average daily dose of PCBs from ingestion and dermal contact with soil can be calculated
LADD^= BWAP
LADDoral = FPCB1 C IR ABS^ EF ED EP BWAP
Where LADDdennai mdash lifetime average daily dose from dermal contact with soil mgkgday LADDoraj = lifetime average daily dose from ingestion of soil mgkgday [PCB] = PCB concentration in soil ragkg
= conversion factor 106 kgmg AF = adherence factor of soil to skin mgcm2 per event ABSderma| = dermal absorption fraction from soil ABSora| = oral absorption fraction from soil SA = surface area of exposed skin cm2
IR = soil ingestion rate mgday
- 11 shy
C
BW = body weight kg EF = exposure frequency eventsdays ED = exposure duration daysevent EP = exposure period days AP = averaging period days
~The Excess Lifetime Cancer Risk from exposure to contaminated soil and sediment via dermal Contact and ingestion can be calculated using the following equation
ELCR = (LADDdemial + LADDoraI) CSF
Where ELCR = Excess Lifetime Cancer Risk CSF = Cancer Slope Factor 2 (mgkgday)1
LADDdermal = lifetime average daily dose from dermal contact with soil mgkgday LADDora = lifetime average daily dose from ingestion of soil mgkgday
NONCANCER RISKS
Using the exposure assumptions in Table 2 and the equations below an average daily dose of PCBs from ingestion and dermal contact with soil can be calculated
ADDdwmal =rPCB1CAF SA EF ED EP
BWAP
ADDoral = FPCB1 C IR EF ED EP BWAP
Where ADDdemuU = average daily dose from dermal contact with soil mgkgday ADDoraI = average daily dose from ingestion of soil mgkgday [PCB] = PCB concentration in soil mgkg C = conversion factor 106 kgmg
bullTT mdash tAF = adherence factor of soil to skin mgcm2 per event = dermal absorption fraction from soil
ABSoral = oral absorption fraction from soil SA = surface area of exposed skin cm2
IR = soil ingestion rate mgday BW = body weight kg EF = exposure frequency eventsdays ED = exposure duration daysevent EP = exposure period days AP = averaging period days
- 12shy
The Hazard Index can be calculated using the equation below
HI = RfD
Where HI = Hazard Index RfD = Reference Dose mgkgday ADDderma] = average daily dose from dermal contact with soil mgkgday ADDora| = average daily dose from ingestion of soil mgkgday
B Risk Results
Table 4A Summary of Doses and Risks To the Trespasser From Exposure to PCBs in Area A of the Housatonic River
Subchronic ADD^ 000113 00000217 mgkgday
000628 0000120 mdash mdash
mgkgday Hlnibehronic 200 3 Chronic
0000436 000000836 mgkgday
000338 00000649 mgkgday
200 4 Cancer LADD^ 00000560 000000107 mgKgaay
0000435 000000834 mgkgday ELCR 1E-3 2E-5 Risk results have been rounded to one significant figure
- 13shy
Table 4B Summary of Doses and Risks to the Child Wader (aged 5lt12 years) From Exposure to PCBs in Area B of the Housatonic River
5 year-old Child
mgkgday ADDdenMl
mgkgday HIubchronic
Chronic ADDoral
mgkgday
mgkgday
Cancer
mgkgday
mgkgday ELCR
Risk results have been rounded to one significant gifiire
0000284 0000290
000149 000222
90 100
00000284 00000290
0000149 0000222
4E-4 5E-4
Table 4C Summary of Doses and Risks to the Child Resident (aged 1lt6 years) From Exposure to PCBs in Area C of the Housatonic River
5 year old Child
Subchronic ADD^ 0000252 0000113 mgkgday ADD 0000543 0000344 mgkgday
20 9HIlaquoubchronic Chronic ADD^ mgkgday ADD^ mdash mdash mgkgday HIchHMUc
Cancer LADD^ mgkgday
bull S i -rLADDdennia
mgkgday ELCR
Risk results have been rounded to one significant figure
1lt6 Year old Child
mdash
0000192 00000366
0000323 00000879
30 6
00000137 000000261
0obOQ231 000000628
7E-5 2E-5
- 14shy
Federal RCRA CERCLA Risk Management Criteria This analysis focuses on whether children or teenagers could receive enough dose through short-term exposures to present an unacceptable risk Risk managers should note that exposure periods used in this analysis to evaluate residential cancer and noncancer risks (5 years) are shorter than those typically used for evaluating residential areas Risk managers should take this into account when considering the management actions connected with risks
As shown in Tables 4A-C above exposure to PCB-contaminated soils and sediments in each of the three Exposure Areas presents risks higher than levels at which EPA considers taking action EPA is justified in taking action when the excess lifetime cancer risk exceeds a range of 10 to 10 EPA is justified in taking action when a noncancer Hazard Index exceeds one
Moreover PCB concentrations found in Housatonic River sediments bank soils and floodplain soils exceed the EPA action level of 1 ragkg for residential soils and 10-25 mgkg for industrial soils (EPA 1990) Concentrations in soils also exceed DEPs default (Method 1) cleanup standard for residential and commercialindustrial soils of 2 mgkg (310 CMR 400985(6))
Exposure Area A Newell to Elm Streets PCB-contaminated sediments in Exposure Area A (Newell to Elm Streets) pose noncancer risks to the youth trespasser that are roughly 3 times higher than the level at which EPA is justified in taking action (ie Hazard Index greater than one) Cancer risks from sediment exposure are within the risk range at which EPA is justified in taking action (ie 106 to 104)
Chronic (9-year exposure) and subchronic (3-month exposure) noncancer Hazard Indices from soil exposure to the youth trespasser in Exposure Area A are approximately 200 times greater than the level at which EPA is justified in taking action (ie Hazard Index greater than one) PCB-contaminated soils in Exposure Area A pose cancer risks to the youth trespasser that are roughly 10 times higher than the EPA risk range (ie 106 to 104)
Exposure Area B Elm to Dawes Avenue PCB-contaminated sediments in Exposure Area B (Elm to Dawes Streets) pose chronic (7-year) and subchronic (3-month) risks to the child wader thatare over 100 times theJexeLat which EPA is justified in taking action (ie Hazard Index greater than one) Cancer risks from sediment exposure to the child wader are approximately 5 times higher than the EPA risk rangeie 10 to 10 )
Chronic (7-year) and subchronic (3-month) noncancer risks from soil exposure to the child wader in Exposure Area B are over 70 times higher than the level at which EPA is justified in taking action (ie Hazard Index greater than one) Cancer risks to the child wader from soil exposure are roughly 4 times higher than the EPA risk range (ie 106 to 104)
Exposure Area C Dawes to the Confluence PCB-contaminated sediments in Exposure Area C pose chronic (5-year) and subchronic (3-month) noncancer risks to the child resident that are over 6 times the level at which EPA is justified in taking action (ie Hazard Index greater than one) Cancer risks to the child resident from exposure to sediments are within the risk range at which EPA is justified in taking action (ie 106 to 104)
- 15shy
Chronic (5-year) and subchronic (3-month) noncancer risks to the child resident from exposure to PCB-contaminated soils in Exposure Area C are approximately 20 times higher than the level at which EPA is justified in taking action (ie Hazard Index greater than one) Cancer risks to the child resident from soil exposure is within the risk range at which EPA is justified in taking action (ie lO^tolO4)
MCP Risk Management Criteria
As stated previously in this memorandum it is DEPs practice to use the arithmetic average concentration for the EPC rather than the UCL95 or the maximum as was used to calculate risks presented in Tables 4A-C above DEP generated cancer risk estimates using the average as the EPC Results are contained in spreadsheets in Attachment 4 The following sections discuss the application of MCP risk management criteria to the risk estimates presented in Attachment 4
Under the Massachusetts Contingency Plan (MCP) hazardous waste sites must be remediated such that long-term risks do not pose significant risk of harm to human health Significant risk exists if the excess lifetime cancer risk exceeds the MCP risk limit of 1 x 10⁵ or if the noncancer hazard index (HI) exceeds the MCP risk limit of one (310 CMR 400993(6))
The MCP states that conditions at a disposal site pose an Imminent Hazard based upon the potential for cancer effects if the estimated excess lifetime cancer risk (ELCR) calculated for the short period of time under evaluation is greater than a cancer risk limit of 1 x 10⁵ (310 CMR 400955(2)(b)(l)) The MCP also provides that a HI limit of 10 is used to evaluate imminent hazards when the level of uncertainty inherent in a Reference Dose is high (greater than a factor of 10)- When the level of uncertainty inherent in a Reference Dose is low (less than or equal to a factor of 10) a HI limit of one is used (310 CMR 400955(2)(c)) In this evaluation it is appropriate to use a HI limit of 10 to evaluate imminent hazards from chronic and subchronic exposures to PCBs because the level of uncertainty inherent in each of the chronic and subchronic PCB RfDs is greater than 10 (IRIS 1998 HEAST 1997) Imminent hazards are levels of risk at which the MCP requires an Immediate Response Action to abate prevent or eliminate the imminent hazard
Cancer Risks As shown in Attachment 4 the ELCR calculated for exposure to soils in each of the three exposure areas exceeds the MCP risk limibfofSignificanfrisk to human health and exceeds the MCP Imminent Hazard risk limit For sediments the ELCR in Area B exceeds the MCP Imminent Hazard risk limit
Therefore it can be concluded that
bull PCB-contaminated soils in Exposure Areas A-C pose significant risk of harm to human health and an Imminent Hazard based upon the potential for cancer health effects
bull PCB-contaminated sediments in Exposure Area B pose significant risk of harm to human health and an Imminent Hazard based upon the potential for cancer health effects
NonConcer Risks As shown in Attachment 4 the His calculated for soils and sediment in each of the three exposure areas exceed the MCP risk limit for significant risk to human health In Area A the HI for soil exceeds the
e
- 16shy
MCP risk limit for an Imminent Hazard In Area B the HI for sediments also exceeds the MCP risk limit for an Imminent Hazard Therefore it can be concluded that
bull PCB-contaminated soils and sediments in exposure areas A-C pose significant risk of harm to human health based upon the potential for noncancer health effects
bull PCB-contaminated soils in exposure area A pose an Imminent Hazard to human health based upon the potential for noncancer health effects
bull PCB-contaminated sediments in exposure area B pose an Imminent Hazard to human health based upon the potential for noncancer health effects
If conditions at a site constitute an Imminent Hazard based on the potential for either cancer or noncancer health effects the MCP requires an Immediate Response Action to abate prevent or eliminate the Imminent Hazard
C Other Risk CharacterizationRisk Management Considerations
In order to make a judgment as to whether a specific dose level poses a health risk the level of uncertainty in the risk assessment along with qualitative information should be considered in addition to risk results This is discussed in more detail in the paragraphs which follow
1 Characterization of PCB Contamination
a)deg The number of soil and sediment samples available for the area of interest is one uncertainty about the risks associated with the exposure activities evaluated There are large numbers of sediment and soil samples available for each exposure area However each exposure area is also fairly large EPAs sampling effort in riverbank and floodplain soils was biased towards areas with high exposure potential but not necessarily to areas with high PCB concentration (EPA 1998a) Thus EPA samples may not represent the highest concentrations present Use of the UCLps or the maximum concentration provides a conservative estimate of the concentrations to which a receptor is exposed However it is possible that additional sampling could indicate that even higher PCB levels are present in the area
b) In this evaluation samples were included in the EPC only if they began at the surface In other words a sample result from the interval 6 to 12 inches would not have been included in the EPC In at least one stretch of the river (Newell to Elm Streets) there are samples from just below the 6-inch depth interval with PCB concentrations in the thousands of parts-per-million (Blasland Bouck amp Lee 1997) The EPCs used in this evaluation do not reflect these high PCB concentrations at depth Because of the dynamic nature of the river it is possible that these highly-contaminated sediments could become exposed at the surface where a receptor could come into contact with them If this is the case then this evaluation could underestimate actual risks
c) Another uncertainty about the risks evaluated in this memorandum is that some of the sediment data was collected from locations that are covered by shallow water for part of the year This may over or underestimate the PCB concentration in sediments at the waters edge that a receptor may come into contact with on a regular and continuing basis
- 17shy
d) It is possible that this evaluation could underestimate actual exposures and risks to the youth trespasser because PCB floodplain data from Oxbow Areas A and C were not included in the EPCs As stated previously Oxbows Area A and C are located in reaches 3-8 and 3-9
2 Exposure Assessment
a) The youth trespasser evaluated in this memorandum could receive additional exposures from PCBs present in his or her residential yard It is possible that a youth trespasser who receives PCB exposure to the sediments floodplain soils or bank soils may in fact have higher exposures and risks than estimated in this evaluation because of exposure to other sources of PCBs in other areas
b) This analysis does not consider risks from fish consumption Currently there is a fish consumption advisory in place for all fish species in the area of concern However there is no enforcement mechanism in the advisory and no monitoring of the advisorys effectiveness in preventing exposure Currently 37 of male and 31 of female Pittsfield residents surveyed by the Massachusetts Department of Public Health reported eating freshwater fish (not necessarily from the Housatonic) (MA DPH 1997) The fish consumption advisory is communicated by a brochure distributed when individuals receive fishing licenses In addition the advisory is posted on some locations on the river However young people under 16 years old can fish without a license and they may walk to and fish from locations that are not posted If individuals ignore the advisory or are not aware of it their cumulative risk may be much higher than the risks presented in this evaluation Risks from consuming Housatonic River fish were not considered in this memorandum However for purposes of providing supplemental information bullto EPA risk managers Appendix A to this memorandum contains risk calculations prepared by EPA for fish consumption assuming full use of the Housatonic River fishing resource
c) The exposure period evaluated for the child resident (7 years) may underestimate the actual exposure -that a resident may receive because it does not account for continuing exposure a resident may receive after age 12 Moreover PCBs have been present in the area of interest for many years already making it likely that exposure has already occurred for many years bull
d) In this evaluation it is assumed that a receptor is exposed to either soil or sediment and not both Because of the nature of the activity assumed to occur on the riverbanks and at the waters edge a receptor would actually be exposed to both soil and sediment as heshe climbs up and down the bank to the waters edge In areas A and C PCB concentrations in bank and floodplain soils are higher than in sediments If a receptor is contacting both soil and sediment then hisher risks would be different than the estimated risks presented in this evaluation
e) This analysis uses a dermal adherence value of 051 mgcm2 and an incidental soil ingestion rate for children 6 years and older of 100 mgday and 50 mgday for adults There are not good quantitative estimates for soil ingestion for children between the ages of 6 and 18 Limited data on children playing in wet soils suggest that dermal adherence could be 1 mgcm2 (EPA 1992) or higher (Kissel 1996) If the risk calculations in this evaluation had assumed a soil ingestion of 200 mgday for children up to age 12 100 mgday for youth trespassers and a dermal adherence of 1 mgcm2 then the risks would be about 2 times those presented here For example the noncancer hazard index would be roughly 300 for the 9-year old contacting soil in area A and roughly 500 for the 5-year old contacting sediment in area B
- 18shy
A choice of more conservative but still reasonable factors given the uncertainty in the application of the scientific information to site conditions could double the risks calculated in this memorandum
3 PCB Toxicity
a) Because of a lack of data this evaluation does not consider potential risks from exposure to dioxin-like PCBs Dioxin-like PCBs are PCB congeners which resemble dioxin (ie 2378- bdquo tetrachlorodibenzo-p-dioxin) in structure and toxicity If dioxin-like PCBs are present the risks could be much greater than those calculated The presence of highly chlorinated PCBs such as Aroclor 1260 in the area of interest makes the presence of dioxin-like PCBs a strong possibility
b) In many risk assessments doses received by laboratory animals in toxicity studies are substantially higher than estimated doses received by exposed receptors In this risk assessment some of the estimated dose rates received by exposed receptors are similar to dose rates received in the noncanccr PCB toxicity studies Therefore it can be concluded that there is less uncertainty about potential o noncancer effects of PCB exposure at this site than in risk assessments for many other sites
- 19shy
REFERENCES
ATSDR 1996 Public Health Implications ofPCB Exposures Agency for Toxic Substances and Disease Registry US Department of Health and Human Services Atlanta GA and US Environmental Protection Agency Washington DC December 1996
ATSDR 1997 Toxicological Profile for Polychlorinated Biphenyls Update prepared by Research Triangle Institute for the US Department of Health and Human Services Agency for Toxic Substances and Disease Registry September 1997
TechLaw Inc 1998 Draft Sediment Sampling Data for Samples collected during September through November 1998 Data collected by TechLaw Inc for EPA under EPA Contract No 68-W4-0013 and EPA Work Assignment No R01012 April 6 1998
Blasland Bouck and Lee 1996 Supplemental Phase IIRCRA Facility Investigation Report for Housatonic River and Silver Lake perpared by Blasland Bouck and Lee for General Electric January 1996
Blasland Bouck and Lee 1997 Building 68 Area Removal Action Work Plan prepared by Blasland Bouck and Lee on behalf of General Electric May 1997
Calabrese 1997 Soil Ingestion A Concern for Acute Toxicity in Children Calabrese EJ Stanek^EJ James RC et al Environmental Health Perspectives 1051354-58 December 1997
ChemRisk 1997 Work Plan for the Ecological Risk Assessment of the Housatonic River Site Volume II Appendix A Sampling Maps prepared by ChemRisk on behalf of General Electric May 24 1997
DEP 1992 Documentation For The Risk Assessment Shortform Residential Scenario Massachusetts Department of Environmental Protection Office of Research and Standards and the Bureau of Waste Site Cleanup Policy BWSCORS-142-92 October 1992
DEP 1995 Guidance For Disposal Site Risk Chatiacterization In Support of the Massachusetts Contingency Plan Interim Final Policy BWSCORS-95-141 Massachusetts Department of Environmental Protection Bureau of Waste Site Cleanup and Office of Research and Standards July 1995
DEPEPA 1997 Joint DEPEPA Technical and Review Comments on General Electric Proposal for Human Health Risk Assessment of the Housatonic River August 13 1997
EPA 1989 Risk Assessment Guidance for Superfund Volume I - Human Health Evaluation Manual (Part A) Interim Final US Environmental Protection Agency Office of Emergency and Remedial Response EPA5401-89002 December 1989
EPA 1990 A Guide on Remedial Actions at Superfund Sites with PCB Contamination EPA Office of Solid Waste and Emergency Response Directive 93554-01 August 1990
- 2 0 shy
EPA 1992 Dermal Exposure Assessment Principles and Applications Interim Report Exposure Assessment Group Office of Health and Environmental Assessment US Environmental Protection Agency EPA6008-9101 IB January 1992
EPA 1994 EPA Region One Waste Management Division Risk Updates Number 2 August 1994
EPA 1995 Land use in the CERCLA Remedy Selection Process Memorandum from Elliott P Laws to Directors of Waste Management Division OSWER Directive 93557-04 Office of Solid Waste and Emergency Response May 25 1995
EPA 1996 PCB Cancer Dose-Response Assessment and Application to Environmental Mixtures National Center for Environmental Assessment Office of Research and Development US EPA EPA600P-96001F September 1996
EPA 1997 Exposure Factors Handbook Volume General Factors US Environmental Protection Agency Office of Research and Development EPA600P-95002Fa August 1997
EPA 1998 Dermal Workgroup Response to GEs Challenge to the Soil Dermal Absorption Value for PCBs of 14 EPA Interoffice Memorandum from EPA Dermal Workgroup to Mary Ballew Region I RCRA Program January 27 1998
EPA 1998a General Electric - PCB Testing Results for Samples collected for EPA by Roy F Weston in March 1998 Memorandum from Peter Philbrook EPA Environmental Services Division to Susan Svirsky EPA March 23 1998
Gilbert 1987 Statistical Methods for Environmental Pollution Monitoring RO Gilbert Van Nostrand Reinhold NY 1987
HEAST 1997 Health Effects Assessment Summary Tables EPA Office of Solid Waste and Emergency Response 92006-303 (97-1) EPA-540-R-97-036 PB97-921199 July 1997
IRIS 1998 EPA Integrated Risk Information System 1998
Mass DPH 1997 Housatonic River Area PCB Exposure Assessment Study Final Report Massachusetts Department of Public Health Bureau of Environmental Health Assessment Environmental Toxicology Unit September 1997
Wester 1993 Percutaneous absorption of PCBs from soil In vivo rhesus monkey in vitro human skin and binding to powdered human stratum corneum RC Wester HI Maibach L Sedik et al Journal of Toxicology and Environmental Health 39375-82
-21 shy
this is uprchSM doc
ATTACHMENT 1
Data used to calculate Exposure Point Concentrations
)HOUSATONIC RIVER SEDIMENT Newell Street to Elm Street Area A sediments
STATION SO-9-G 3-1A-3A 3-2A-1 HCSE-5 3-5A-3 S09F
S09E1 S09E2 3-6A-1 3-6A S09D BBS09D S09C S09B 3-7B S09A HCSE-15 3-7D-CRD 3-6C-18 3-6C-66 3-6C-20 3-6C-55 3-6C-22 3-6C-49 3-6C-48 3-6C-27 3-6C-79 3-6C-35 3-6C-38 3-6C-62 3-6C-41 3-6C-65 3-6C-63 3-6C-43 3-6C-44 3-6C-45 3-6C-46 3-6C-47 3-1 A 3-2B 3-4A 3-5D 3-7E 3-8A HCSE-4
ID DEPTH0-0405-6 inches0-4 inches0-101
05-6 inches0-031
0-050-0505-6 inches0-050-030-050-050-0505-6 inches0-050-180-4 inches0-60-60-60-60-60-60-60-50-70-840-840-60-60-60-60-60-60-60-70-60-60-60-60-60-605-6 inches0-16
DATASOURC GEECO 597
GEECO 597 GEECO 597
GEECO 597 GEECO 597
GEECO 597 GEECO 597 GEECO 597
GEECO 597 GEECO 597 GEECO 597 GEECO 597 GEECO 597 GEECO 597
GEECO 597 GEECO 597 GEECO 597
GEECO 597 BLDG68 597 BLDG68 597 BLDG68 597 BLDG68 597 BLDG68 597 BLDG68 597 BLDG68 597 BLDG68 597 BLDG68 597
BLDG68 597 BLDG68 597
BLDG68 597 BLDG68 597 BLDG68 597 BLDG68 597 BLDG68 597 BLDG68 597 BLDG68 597 BLDG68 597 BLDG68 597 ATK ATK ATK ATK ATK
GEECO 597 GEECO 597
cone PCB (ppm) 3400 060 1000 010
6640 140
3000 052 490 030
6700 094 055 570 140 1600 10000 780 2700 120
14000 070 1640 024 1020 2010 120 450 135 036 135 016 102
6170 170 314 334 029 006 170 015 063 180 1580 1500
ND Ln RGBs 353 last modifie -051 051198 230 -230 420 034 340 -065 159 -120 420 -006 -060 174 034 277 461 205 330 018 494 -036 280 -143 232 300 018 150 030 -102 030 -183 002 412 053 114 121 -124 -281 053 -190 -046 059 276 271
S10B1 0-05 GEECO 597 730 199 S10B 0-05 GEECO 597 9000 450 BBS10B 0-05 GEECO 597 1400 264 3-3B-1 05-6 inches GEECO 597 954 226 3E-3 0-15 GEECO 597 860 215 3-8C 05-6 inches GEECO 597 590 177 3-9A 05-6 inches GEECO 597 140 034 HCSE-A6 02-08 T 3-7 SUP PH 14000 494 3-9B-1 05-6 inches GEECO 597 568 174 HCSE-2 0-16 GEECO 597 1000 230 3-9D 05-6 inches GEECO 597 075 -029 3-1 OB 05-6 inches GEECO 597 440 148 3-1 OC 0-05 GEECO 597 960 226 3-10C-1 05-6 inches GEECO 597 8540 445 S10A 0-05 GEECO 597 810 209 3-1 OD 05-6 inches GEECO 597 180 059 HCSE-1 o 0-15 GEECO 597 320 116 3-8C 0-6 ATK 2520 323 3-8E 0-6 ATK 140 034 3-9FF 0-6 ATK 220 079 3-9F 0-6 ATK 1270 254 3-1 OD 0-6 ATK 500 161 3-1 OE 0-6 ATK 190 064
mean 1666 1136 c~nipie variance 96431 3345 v iple stdev 3105 1186 maximum 14000 minimum 006 n 6800 68
Gilbert UCL 45489 Gilbert Mean 21939 Hstat 32125
Elm Street to Dawes Avenue Area B sediments PCB
STATION ID DEPTH DATA SOURC ic(ppm) ND Ln PCBs 4-1A-CRD 0-4 inches GEECO 597 123 481 HCSE-16 0-11 GEECO 597 025 -139 4-2A 05-6 inches GEECO 597 93 223 HCSE-17 0-18 GEECO 597 17 283 4-2B 0-05 GEECO 597 33 350 bull 4-2B-1 05-6 inches GEECO 597 17 283 BBS11 0-05 GEECO 597 22 309 4-3B S11
05-6 inches0-051
GEECO 597 GEECO 597
51 130
163 487
HCSE-18C 0-025 GEECO 597 31 113 HCSE-18B 0-025 GEECO 597 51 393 HCSE-18 0-05 GEECO 597 905 681 4-3A 05-6 inches GEECO 597 16 047 HCSE-18D 0-033 GEECO 597 16 047 HCSE-18A 0-025 GEECO 597 17 283
mean 8906 267 sample variance 265987 420 sample stdev 22948 205 maximum 90500 minimum 025 n 1500 1500
Gilbert UCL 1521077 Gilbert Mean 118141 Hstat 46633
Dawes to the confluence Area C sediments-- ^ PCB
STATION ID DEPTH DATA SOURC conc(ppm) ND Ln PCBs ^ i 05-6 inches GEECO 597 26 096 HCSE-19 0-20 GEECO 597 33 119 4-4C 05-6 inches GEECO 597 36 128 4-4B 0-05 GEECO 597 32 347 MD 05-6 inches GEECO 597 - 98 -=228 V4E 0-0 51 GEECO 597 093 -007 1-5A 05-6 inches GEECO 597 92 222 4-5A() 0-0 51 GEECO 597 16 047 HCSE-20 0-19 GEECO 597 53 167 4-5A-1 05-6 inches GEECO 597 101 231 BBS12 0-05 GEECO 597 24 318 S12 0-05 GEECO 597 28 333 4-5C-1 05-6 inches GEECO 597 1318 258 4-5E 0-05 GEECO 597 47 155 4-5B 05-6 inches GEECO 597 149 270 4-6B 0-05 GEECO 597 17 053 4-6A 05-6 inches GEECO 597 228 313 4-6C 05-6 inches GEECO 597 105 235 4-6D 05-6 inches GEECO 597 78 205 4-6F 05-6 inches GEECO 597 56 172 4-6G 0-05 GEECO 597 17 283 4^c 0-6 ATK 69 193 4 J 0-6 ATK 373 362 4-6H 0-6 ATK 18 059 4-5G 0-6 ATK 164 280 4-5F 0-6 ATK 142 265 4-6J 0-6 ATK 132 488
mean 1619 216 sample variance ----- v63145 ^ 128 sample stdev 2513 113 maximum 13200 minimum 093 n 2700 2700
Gilbert UCL 29580 Gilbert Mean 16361 Hstat 267088
ND - samples where ND was reported were listed as 12 the sample detection limit ATK = Data from AT Kearney GEECO 597 = Work Plan for the Ecological Risk Assessment of the Housatonic River Site Volume II by ChemRisk P ^G68 59 Building 68 Removal Action Work Plan May 1997 by BBL 1 _-7 Supplemental Phase II RCRA Facility Investigation Report for the Housatonic River and Silver Lake Table 3-7 196
GE Housatonic River Bank and Floodplain Data
Newell Street to Elm Street Area A soils last modified PCS 051198
Location Type Depth Cone Report Ln Cone ND
BE-0043-A Bank 0 to 6 250 Weston98 092 BW-0030-A Bank 0 to 6 2700 WestonQS 330 BE-0040-A Bank 0 to 6 580000 Weston9S 86Z BE-0041-A Bank 0 to 6 100000 Weston98 691shyBE-0042-A Bank 0 to 6 021 Weston98 -156 BE-0044-A Bank 0 to 6 488 Weston98 158 BE-0045-A Bank 0 to 6 028 Weston98 -127 BE-0046-A Bank 0 to 6 115 Weston98 014 BW-0031-A Bank 0 to 6 269 Weston98 099 HR-EB2 Bank 0 to 6 60000 ECO-RA 597 640 BW-0032-A Bank 0 to 6 215 Weston98 077 BW-0035-A Bank 0 to 6 11000 Weston98 470 BW-0038-A Bank 0 to 6 730 Weston98 199 BW-0037-A Bank 0 to 6 170 Weston98 053 BW-0036-A Bank 0 to 6 1100 Weston98 240 BW-0034-A Bank 0 to 6 5900 Weston98 408 HR-EB1 Bank 0 to 6 1240 ECO-RA 597 252 BW-0033-A Bank 0 to 6 447 Weston98 150 BE-0039-A Bank 0 to 6 14000 Weston98 494 19-4-1 4D Flood Plain 0 to 6 430 ECO-RA 597 146 19-4-1 4A Flood Plain 0 to 6 620 ECO-RA 597 182 19-4-1 4B Flood Plain 0 to 6 430 ECO-RA 597 146 19-4-1 4C Flood Plain 0 to 6 4700 ECO-RA 597 385 I8-24-5A Flood Plain 0 to 6 3800 ECO-RA 597 364 I8-24-5B Flood Plain 0 to 6 070 ECO-RA 597 -036 I8-24-5C Flood Plain 0 to 6 210 ECO-RA 597 074 BW-0029-A Bank 0 to 6 4300 Weston98 376 BW-0028-A Bank 0 to 6 015 Weston98 -190_ BW-0040-A Bank 0 to 6 3600 Weston98
mean 27477 233 sample variance 117334457 625 sample stdev 108321 250 maximum 580000 minimum 015 n 2900 2900
Gilbert UCL 2393253 Gilbert Mean 233360 Hstat 4928
Elm Street to Dawes Avenue Area B soils
Location
lb-laquo+-6-1 BE-0020-A BE-0014-A BE-0018-A BE-0017-A BE-0016-A BE-0015-A BE-0013-A BE-0034-A BE-0012-A BE-0021-A HR-EB4 HR-EB5 BE-0019-A HR-EB3 BE-0033-A BE-0022-A BE-0023-A BE-0025-A BE-0026-A BE-0027-A F X)24-A Bt-0028-A BE-0029-A BE-0031-A BE-0032-A BE-0030-A
mean variance sample stdev maximum minimum n
Gilbert UCL Gilbert Mean H statistic
Type
Flood plain Bank Bank Bank Bank Bank Bank Bank Bank Bank Bank Bank Bank Bank Bank Bank Bank Bank Bank Bank Bank Bank Bank Bank Bank Bank Bank
Depth
0 to 6 0 to 6 0 to 6 Otofi 0 to 6 0 to 6 0 to 6 0 to 6 0 to 6 0 to 6 0 to 6 0 to 6 0 to 6 0 to 6 0 to 6 0 to 6 0 to 6 0 to 6 0 to 6 0 to 6 0 to 6 0 to 6 0 to 6 0 to 6 0 to 6 0 to 6 0 to 6
PCB Cone
010100 010188 010100 17017000 020200 141499 18018000 010100 17017000 33033000 39039000
3770377000 2680268000 32032000 000077 28928966 242499 040455 010122 010100 46046000 14014000 343400 010100 030366 010100 65065000
3572 736324
8581 37700
007 2700
Report
ECO-RA 597 Weston98 Weston98 Weston98 Weston98 Weston98 Weston98 Weston98 Weston98 Weston98 Weston98 ECO-RA597 ECO-RA 597 Weston98 ECO-RA 597 Weston98 Weston98 Weston98 Weston98 Weston98 Weston98 Weston98 Weston98 Weston98 Weston98 Weston98 Weston98
bullbull
Ln Cone ND
-230 -171 -230 283 -163 040 289 -230 283 350 366 593 559 347 -266 337 091 -081 -208 -230 383 264 122 -230 -102 -230 417
087 813 285
2700
2857310 139253
5403
Dawes Avenue to the confluence of the Housatonic with the West Branch Area C soils PCB
Location Type Depth Cone Report Ln Cone ND I7-2-45A Flood Plain 0 to 6 12 ECO-RA 597 248 I7-2-45B Flood Plain 0 to 6 10 ECO-RA 597 230 I7-2-45C Flood Plain 0 to 6 30 ECO-RA 597 340 I7-2-33A Flood Plain 0 to 6 12 ECO-RA 597 248 I7-2-33B Flood Plain 0 to 6 49 ECO-RA 597 389 I7-2-33B-1 Flood Plain 0 to 6 62 ECO-RA 597 182 I7-2-33B-2 Flood Plain 0 to 6 16 ECO-RA 597 277 I7-2-33B-6 Flood Plain 0 to 6 34 ECO-RA 597 353 I7-2-33C Flood Plain 0 to 6 46 ECO-RA 597 153 I7-2-33D Flood Plain 0 to 6 36 ECO-RA 597 128 I7-2-32A Flood Plain 0 to 6 92 ECO-RA 597 452 I7-2-32A-5 Flood Plain 0 to 6 25 ECO-RA 597 ltQ92 I7-2-32B Flood Plain 0 to 6 24 ECO-RA 597 318 I7-3-7A-1 Flood Plain 0 to 6 12 ECO-RA 597 248 I7-3-7A Flood Plain 0 to 6 82 ECO-RA 597 441 I7-3-7A-2 Flood Plain 0 to 6 160 ECO-RA 597 508 I7-3-7B Flood Plain 0 to 6 24 ECO-RA 597 318 I7-3-7C Flood Plain 0 to 6 30 ECO-RA 597 340 I7-3-6C-12 Flood Plain 0 to 6 125 ECO-RA 597 253 I7-3-6C-10 Flood Plain 0 to 6 46 ECO-RA 597 383 I7-3-6C Flood Plain 0 to 6 62 ECO-RA 597 413 I7-3-6A Flood Plain 0 to 6 27 ECO-RA 597 330 I7-3-6B Flood Plain 0 to 6 40 ECO-RA 597 369 I7-2-25C Flood Plain 0 to 6 74 ECO-RA 597 200 I7-2-25B Flood Plain 0 to 6 56 ECO-RA 597 172 I7-2-25A Flood Plain 0 to 6 39 ECO-RA 597 366 I7-3-1A Flood Plain 0 to 6 12 ECO-RA 597 248 17-3-1 B Flood Plain 0 to 6 12 ECO-RA 597 248 17-3-1 C Flood Plain 0 to 6 33 ECO-RA 597 119 17-3-1 F Flood Plain 0 to 6 79 ^ECO-RA 597 207 17-1 -3A Flood Plain 0 to 6 07 ECO-RA 597 -036 16-1 -67B Flood Plain 0 to 6 64 ECO-RA 597 186 16-1 -67A Flood Plain 0 to 6 44 ECO-RA 597 378 16-1 -66A Flood Plain 0 to 6 15 ECO-RA 597 271 16-1 -66B Flood Plain 0 to 6 34 ECO-RA 597 353 17-1 -4A Flood Plain 0 to 6 8 ECO-RA 597 208 16-1 -64A Flood Plain 0 to 6 40 ECO-RA 597 369 16-1 -64B Flood Plain 0 to 6 1 ECO-RA 597 000 16-1 -62A Flood Plain 0 to 6 62 ECO-RA 597 182 16-1 -62B Flood Plain 0 to 6 12 ECO-RA 597 248
17-2-20-19 Flood Plain 0 to 6 349 SITE EXAC 695 355 17-2-20-1 Flood Plain 0 to 6 395 - SITE EXAC 695 368 I7-2-20-3 Flood Plain 0 to 6 57 SITE EXAC 695 174 P 9-20-2 Flood Plain 0 to 6 17 SITE EXAC 695 283
-20-12 Flood Plain 0 to 6 29 SITE EXAC 695 106 17-2-20-11 Flood Plain 0 to 6 26 SITE EXAC 695 096 I7-2-20-6 Flood Plain 0 to 6 4 SITE EXAC 695 139 17-2-20-16 Flood Plain 0 to 6 22 SITE EXAC 695 079 I7-2-3-2 Flood Plain 0 to 6 12 bull Sim-EXAC 695 018 BE-0011-A Bank 0 to 6 300 Weston98 340 BE-0010-A Bank 0 to 6 180 Weston98 289 BW-0023-A Bank 0 to 6 29 Weston98 107 BW-0025-A Bank 0 to 6 400 Weston98 369 BW-0027-A Bank 0 to 6 830 Weston98 442 BW-0026-A Bank 0 to 6 270 Weston98 330 BW-0024-A Bank 0 to 6 165 Weston98 280 BE-0009-A Bank 0 to 6 290 Weston98 337 BE-0004-A Bank 0 to 6 480 Weston98 387 BE-0008-A Bank 0 to 6 280 Weston98 333 HR-EB6 Bank 0 to 6 31 ECO-RA597 114 HR-EB7 Bank 0 to 6 07 ECO-RA 597 -037 BE-0002-A Bank 0 to 6 650 Weston98 417 BW-0021-A Bank 0 to 6 290 Weston98 337 BE-0003-A Bank 0 to 6 140 Weston98 264 BE-0007-A Bank 0 to 6 01 Weston98 -230 P--0001 -A Bank 0 to 6 41 Weston98 141 c -0005-A Bank 0 to 6 250 Weston98 322 BE-0006-A Bank 0 to 6 02 Weston98 -149 BW-0022-A Bank 0 to 6 590 Weston98 408 BW-0008-A Bank 0 to 6 130 Weston98 256 BW-0020-A Bank 0 to 6 370 Weston98 361 BW-0019-A Bank 0 to 6 340 Weston98 353 BW-0002-A Bank 0 to 6 690 Weston98 423 BW-0004-A Bank 0 to 6 480 L West$n98 387 BW-0003-A Bank 0 to 6 210 Weston98 304 BE-0037-A Bank 0 to 6 24 Weston98 089 BW-0001-A Bank 0 to 6 41 Weston98 142 BW-0006-A Bank 0 to 6 130 Weston98 256 BE-0036-A Bank 0 to 6 230 Weston98 314 BE-0035-A Bank 0 to 6 210 Weston98 304
BW-0005-A Bank 0 to 6 82 Weston98 210 BAMXX)9-A Bank 0 to 6 120 Weston98 248 BW-0007-A Bank 0 to 6 91 Weston98 221 BW-0018-A Bank 0 to 6 470 Weston98 385 BW-0015-A Bank 0 to 6 02 Weston98 -190 BW-0017-A Bank 0 to 6 360 Weston98 358 BW-0016-A Bank 0 to 6 100 Weston98 230 BW-0013-A Bank 0 to 6 01 Weston98 -230 BW-O014-A Bank 0 to 6 - 01 Weston98 -230 BW-0010-A Bank 0 to 6 180 Weston98 289 BW-0012-A Bank 0 to 6 01 Weston98 -230 BW-0011-A Bank 0 to 6 200 Weston98 300
mean 2310 236 sample variance 63598 268 sample stdev 2522 164 maximum 16000 minimum 010 n 9200 9200
Gilbert UCL 67810 Gilbert Mean 40448 Hstat 30098
ND - samples where ND was reported were listed as 12 the sample detection limit
ECO-RA 597 = Work Plan for the-Ecological Risk Assessments the Housatonic River Site Volume II May 24 1997 by Chem Risk SITE EXCAVATION PLAN 95-03-47-4 dated 695 Note Flood plain samples selected were those samples located within the 1 ppm isopleth that were not excavated or capped during short term measures or immediate response actions performed by GE Weston98 = Samples collected by Weston in March 1998
ATTACHMENT 2
Table of Skin Surface Areas by Age Group
Part of the Body Skin Surface Area (cm) Age9lt18
Hands 7462 Arms 18638 Feet 10710 Lower Legs 17563
Age 9 Hands 5618 Arms 13038 Feet 8056 Lower Legs 12169
Age 5lt12 Hands 51602 Arms 12926 Feet 7365 Lower Legs 11301 Legs 28252
Age5 Hands 4440 Arms 10906 Feet 5687 Lower Legs 8662 Legs 21656
Age 1lt6 Hands ~ 3650 Arms 8617 Feet 4578 Lower Legs 6735 Legs 16837
1 Skin Surface Areas are 50th percentile values for females (DEP 1995)
ATTACHMENT 3
Spreadsheets showing risk calculations
RISK CALCULATIONS PCB Exposure in Reaches 3-1 to 4-6 Housatonlc River
REACH A 3-1 TO 3-10 NEWELL TO ELM Trespasser Age 9lt18 - CANCER Trespasser Age 9lt18 - CHRONIC NONCANCER Trespasser Age 9 - SUBCHRONIC Trespasser Age 9lt18 - CANCER Trespasser Age 9lt18 - CHRONIC NONCANCER Trespasser Age 9 - SUBCHRONIC
REACH B 4-1 TO 4-3 ELM TOD AWES
Wader Age 5lt12 - CANCER Wader Age 5lt12 - CHRONIC NONCANCER Wader Age 5 - SUBCHRONIC Wader Age 5lt12 - CANCER Wader Age 5lt12 - CHRONIC NONCANCER Wader Age 5 - SUBCHRONIC
REACH C 4-4 TO 4-6 DAWES TO CONFLUENCE Young Resident Age 1lt 6 - CANCER Young Resident Age 1 lt 6 - CHR NONCANCER Young Resident Age 5 - SUBCHRONIC Young Resident Age 1 lt 6 - CANCER Young Resident Age 1lt 6 - CHR NONCANCER Young Resident Age 5 - SUBCHRONIC
Media
Soil Soil Soil Sediment Sediment Sediment
Media
Soil Soil Soil Sediment Sediment Sediment
Media
Soil Soil Soil Sediment Sediment Sediment
ELCR
983E-04
188E-05
ELCR
355E-04
503E-04
ELCR
737E-05
178E-05
HI
1910445 1481659
3661686 2839847
HI
8879105 7425684
1256323 2413448
HI
2580036 157254
6226499 9133987
(L)ADDoral mgkg-d
56054E-05 43597E-04 11304E-03 10744E-06 83562E-06 21667E-05
ADDoral mgkg-d
28423E-05 28423E-04 70840E-04
- 28986E-05 28986E-04 17005E-03
ADDoral mgkg-d
13734E-05 19228E-04 25196E-04 26125E-06 36575E-05 11282E-04
L)ADDdermal EPC RfD CSF mgkg-d mgkg mgkg-d (mgkg-d)-1
43520E-04 240000 2E-05 2 33S49E-03 240000 2E-05 2 62779E-03
tsect3414E-06 240000
4600 5E-05 2E-05
2 f2
sectlt4878E-05 12033E-04
4600 4600
2E-05 5E-05
2 f
ADDdermal EPC RfD CSF mgkg-d mgkg mgkg-d (mgkg-d)-1
14916E-04 37700 2E-05 pound
14916E-03 37700 2E-05 pound
30044E-03 37700 5E-05 4
422228E-04 90500 2E-05 422228E-03 90500 2E-05 f
4 10367E-02 90500 5E-05
ADDdermal EPC RfD CSF mgkg-d mgkg mgkg-d (mgkg-d)-1
23123E-05 6700 2E-05 2 32373E-04 6700 2E-05 gt 53431 E-04 6700 5E-05 t 62825E-06 3000 2E-05
- 8J955E-05 3000 2E-05 34388E-04 3000 5E-05
this Is UD rchsxls
RISK CALCULATIONS PCB Exposure in Reaches 3-1 to 4-6 Housatonic River
REACH A 3-1 TO 3-10 NEWELL TO ELM
Trespasser Age 9lt18 - CANCER Trespasser Age 9lt18 - CHRONIC NONCANCER Trespasser Age 9 - SUBCHRONIC Trespasser Age 9lt18 - CANCER Trespasser Age 9lt18 - CHRONIC NONCANCER Trespasser Age 9 - SUBCHRONIC
REACH B 4-1 TO 4-3 ELM TOD AWES
Wader Age 5lt12 - CANCER Wader Age 5lt12 - CHRONIC NONCANCER Wader Age 5 - SUBCHRONIC Wader Age 5lt12 - CANCER Wader Age 5lt12 - CHRONIC NONCANCER Wader Age 5 - SUBCHRONIC
REACH C 4-4 TO 4-6 DAWES TO CONFLUENCE
Youqg Resident Age 1lt 6gtT CANCER Youflg Resident Age 1lt 6 - CHR NONCANCER Young Resident Age 5 - SUBCHRONIC Young Resident Age 1 lt 6 - CANCER Young Resident Age 1 lt 6 - CHR NONCANCER Young Resident Age 5 - SUBCHRONIC
^
kgmg
100E-06 100E-06 100E-06 100E-06 100E-06 100E-06
C kgmg
100E-06 100E-06 100E-06 100E-06 100E-06 100E-06
C kgmg
100E-06 100E-06 100E-06 100E-06 100E-06 100E-06
IR mgd
IR mgd
IR mgd
50 50 50 50 50 50
50 50 50 50 50 50
100 100 100 100 100 100
EF evd
EF evd
EF evd
0167 0167 0283 0167 0167 0283
1
0419 0419 0707 0178 0178 0707
0419 0419 0707 0178 0178 0707
ED dev
ED dev
ED dev
EP days
1 1 1 1 1 1
EP days
1 1 1 1 1 1
EPdays
bull bull bull bull bull bull
3285 3285 214
3285 3285 214
2555 2555 214
2555 2555
92
1825 1825 214
1825 1825
92
RAF-o
RAF-o
RAF-o
RAF-d
1 014 1 014 1 014 1 014 1 014 1 014
RAF-d
bull 014 bull 014 bull 014 bull 014 bull 014 bull 014
RAF-d
014 014 014 014 014 014
BW AP
kg days
46 25550 46 3285 30 214 46 25550 46 3285 30 214
BW AP kg days
278 25550 278 2555 188 214 278 25550 278 2555 188 92
BW AP
kg days 146 25550 146 1825 188 214 146 25550
146 1825
188 92
this Is up_rchsxls
v
RISK CALCULATIONS PCB Exposure in Reaches 3-1 to 4-6 Housatonic River
REACH A 3-1 TO 3-10 SA AF NEWELL TO ELM cm2d mgcm2
Trespasser Age 9lt18 - CANCER 5437 051 Trespasser Age 9lt18 - CHRONIC NONCANCER 5437 051 Trespasser Age 9 shy SUBCHRONIC 3889 051 Trespasser Age 9lt18 shy CANCER 5437 051 Trespasser Age 9lt18 - CHRONIC NONCANCER 5437 051 Trespasser Age 9 - SUBCHRONIC 3889 051
REACH B 4-1 TO 4-3 SA AF ELM TO DAWES cm2d mgcm2 Wader Age 5lt12 - CANCER 3675 051 Wader Age 5lt12 - CHRONIC NONCANCER 3675 051 Wader Age 5 shy SUBCHRONIC 2970 051 Wader Age 5lt12 shy CANCER 5370 051 Wader Age 5lt12 - CHRONIC NONCANCER 5370 051 Wader Age 5 - SUBCHRONIC 4269 051
bull REACH C 4-4 TO 4-6 SA AF DAWES TO CONFLUENCE cm2d mgcm2
Young Resident Age 1lt 6 - CANCER 2358 051 Young Resident Age 1 lt 6 - CHR NONCANCER 2358 051 Young Resident Age 5 - SUBCHRONIC 2970 051 Young Resident Age 1 lt 6 - CANCER 3368 051 Young Resident Age 1lt 6 - CHR NONCANCER 3368 051 Young Resident Age 5 - SUBCHRONIC 4269 051
this is UD rchixls
g
ATTACHMENT 4
Spreadsheets showing risk calculations using Arithmetic Average PCB Concentrations for the EPCs
RISK CALCULATIONS Using AVERAGE PCB concentration as EPC REACH A 3-1 TO 3-10 NEWELL TO ELM
Trespasser Age 9lt18 - CANCER Trespasser Age 9lt18 - CHRONIC NONCANCER Trespasser Age 9 - SUBCHRONIC Trespasser Age 9lt18 - CANCER Trespasser Age 9lt18 - CHRONIC NONCANCER Trespasser Age 9 - SUBCHRONIC
REACH B 4-1 TO 4-3
Wader Age 5lt12 - CANCER Wader Age 5lt12 - CHRONIC NONCANCER Wader Age 5 - SUBCHRONIC Wader Age 5lt12 - CANCER Wader Age 5lt12 - CHRONIC NONCANCER Wader Age 5 - SUBCHRONIC
REACH C 4-4 TO 4-6
Young Resident Age 1lt 6 - CANCER Young Resident Age 1lt 6 - CHR NONCANCER Young Resident Age 5 - SUBCHRONIC Young Resident Age 1lt 6 - CANCER Young Resident Age 1lt 6 - CHR NONCANCER Young Resident Age 5- SUBCHRONIC
Media
Soil Soil Soil Sediment Sediment Sediment
Media
Soil Soil Soil Sediment Sediment Sediment
Media
Soil Soil Soil Sediment Sediment Sediment
ELCR
105E-04
638E-06
ELCR
315E-05
462E-05
ELCR
233E-05
887E-06
HI ADDoral ADDdermal EPC RfD CSF
mgkg-d mgkg-d mgkg mgkg-d mgkg-d)-1
59903E-06 46509E-05 27480 2E-05 2 218746 4991 9E-05 38757E-04 27480 2E-05 2
16965 12943E-04 71882E-04 27480 5E-05 2 36382E-07 28247E-06 1669 2E-05 2
1328555 30318E-06 23539E-05 1669 2E-05 2 103037 78612E-06 43657E-05 1669 5E-05 2
HI ADDoral ADDdermal EPC RfD CSF mgkg-d mgkg-d mgkg mgkg-d (mgkg-d)-1
25191E-06 13220E-05 3580 2E-05 A
48431617 26990E-05 14164E-04 3580 2E-05 47051445 67270E-05 28530E-04 3580 5E-05
26624E-06 20416E-05 8906 2E-05 2 1236333 28525E-05 21874E-04 8906 2E-05 2 2375046 - 16735E-04 10202E-03 8906 5E-05 2
HI ADDoral ADDdermal EPC RfD CSF
mgkg-d mgkg-d mgkg mgkg-d (mgkg-d)-1 43354E-06 72991 E-06 2266 2E-05 2
8725911 65031 E-05 10949E-04 2266 2E-05 2
5318471 85216E-05 18071 E-04 2266 5E-05 2
13021E-06 31312E-06 1602 2E-05 t 332495 19531 E-05 46968E-05 1602 2E-05
4877549 60245E-05 18363E-04 1602 5E-05
RISK CALCULATIONS Using AVERAGE PCB concentration as EPC REACH A 3-1 TO 3-10 NEWELL TO ELM
Trespasser Age 9lt18 - CANCER Trespasser Age 9lt18 - CHRONIC NONCANCER Trespasser Age 9 - SUBCHRONIC Trespasser Age 9lt18 - CANCER Trespasser Age 9lt18 - CHRONIC NONCANCER Trespasser Age 9 - SUpoundCHRONIC
REACH B 4-1 TO 4-3
Wader Age 5lt12 - CANCER Wada Age 5lt12 - CHRONIC NONCANCER Wader Age 5 - SUBCHRONIC Wader Age 5lt12 - CANCER Wader Age 5lt12 - CHRONIC NONCANCER Wader Age 5 - SUBCHRONIC
REACH C 4-4 TO 4-6
Young Resident Age 1lt 6 - CANCER Young Resident Agegt1 lt 6 - CHR NONCANCER Young Resident Age 5 - SUBCHRONIC Young Resident Age 1 lt 6 - CANCER Young Resident Age 1lt 6 - CHR NONCANCER Young Resident Age 5- SUBCHRONIC
C kgmg
100E-06 100E-06 100E-06 100E-06 100E-06 100E-06
C kgmg
100E-06 100E-06 100E-06 100E-06 100E-06 100E-06
C kgmg
100E-06 100E-06 100E-06 100E-06 100E-06 100E-06
R mgd
IR mgd
IR mgd
50 50 50 50 50 50
50 50 50 50 50 50
100 100 100 100 100 100
EF evd
EF evd
EF evd
0167 0167 0283 0167 0167 0283
0419 0419 0707 0178 0178 0707
0419 0419 0707 0178 0178 0707
ED dev
ED dev
ED dev
EP RAF-o days
1 3285 1 3285 1 214 1 3285 1 3285 1 214
EP RAF-o days
1 2565 1 25sect5 1 214 1 2555 1 2555 1 92
EP RAF-o days
bull 1825 bull 1825 bull 214 bull 1825 bull 1825 bull 92
RAF-d
1 014 1 014 1 014 1 014 1 014 1 014
RAF-d
1 014 1 014 014 014 bull 014 014
RAF-d
bull 014 bull 014 bull 014 bull 014 bull 014
014
BW AP
kg days
46 27375 46 3285 30 214 46 27375 46 3285 30 214
BW AP
kg days
278 27375 278 2555 188 214 278 27375 278 2555 188 92
BW AP
kg days
146 27375 146 1825 188 214 146 27375 146 1825 188 92
thU is up_rchsxls
RISK CALCULATIONS Using AVERAGE PCB concentration as EPC REACH A 3-1 TO 3-10 SA AF NEWELL TO ELM cm2d mgcm2 Trespasser Age 9lt18 - CANCER 5437 051 Trespasser Age 9lt18 - CHRONIC NONCANCER 5437 051 Trespasser Age 9 - SUBCHRONIC 3889 051 Trespasser Age 9lt18 - CANCER 5437 051 Trespasser Age 9lt18 - CHRONIC NONCANCER 5437 051 Trespasser Age 9 - SUBCHRONIC 3889 051
SA AF REACH B 4-1 TO 4-3 cm2d mgcm2 Wader Age 5lt12 - CANCER 3675 051 Wader Age 5lt12 - CHRONIC NONCANCER 3675 051 Wader Age 5 - SUBCHRONIC 2970 051 Wader Age 5lt12 - CANCER 5370 051 Wader Age 5lt12 - CHRONIC NONCANCER 5370 051 Wader Age 5 - SUBCHRONIC 4269 051
SA AF REACH C 4-4 TO 4-6 cm2d mgcm2
Young Resident Age 1lt 6 - CANCER 2358 051 Young Resident Age 1lt 6 - CHR NONCANCER 2358 051 Young Resident Age 5 - SUBCHRONIC 2970 051 Young Resident Age 1 lt 6 - CANCER 3368 051 Young Resident Age 1lt 6 - CHR NONCANCER 3368 051 Young Resident Age 5- SUBCHRONIC 4269 051
Appendix A Memo on Potential Human Health Risks from Consuming Fish from the Housatonic River in Massachusetts
United States Boston Massachusetts 02203 Environmental Protection Agency (617)565-3420 New England Region JF Kennedy Federal Building
MEMORANDUM
DATE May 141998
SUBJ Potential Human Health Risks from Consuming Fish from the Housatonic River in Massachusetts
FROM Mary BaUew Environmental Scientist EPA TO Bryan Olson Project Manager Office of Site Remediation and Restoration EPA
I INTRODUCTION
This memo provides calculations and a limited discussion of potential risks from consuming fish from the Housatonic River in Massachusetts Currently there is a fishing advisory on the Housatonic which may help to limit fish consumption
EL CONCLUSIONS
Consumption of fish in the Housatonic river even for periods as short as one summer presents a significant risk to human health
DL HAZARD IDENTIFICATION
For the Housatonic River in Massachusetts there is-afish consumption advisory in place for all fish species However there is no enforcement mechanism in the advisory and no monitoring of the advisorys effectiveness in preventing exposure Currently 37 of male and 31 of female Pittsfield residents surveyed by the Massachusetts Department of Public Health reported eating freshwater fish (not necessarily from the Housatonic) (MA DPH 1997) The fish consumption advisory is communicated by a brochure distributed when individuals receive fishing licenses In addition the advisory is posted on some locations on the river However young people under 16 years old can fish without a license and they may walk to and fish from locations that are not posted The river has numerous access points by foot or by boat Under the fishing advisory catching and releasing the fish is allowed which adds to the difficulty of monitoring its effectiveness If individuals ignore the advisory or are not aware of it their cumulative risk may be represented by the risks presented in this memo
GE collected young of year1 fish to monitor changes (trends) in PCB levels over time not to represent the type offish people were likely to eat Since these fish were about six months old (Finklestein 1998) they were too small to eat GE reported that composites of young of year fish (pumpkinseeds largemouth bass-and yellow perch) caught in 1994 near New Lenox Road (just downriver of Pittsfield) in the Housatonic ranged from 22 to 35 mg PCBs per kilogram (ppm) of whole fish composite Similarly fish composites at Woods Pond (12 miles downriver of GE) ranged from 3 to 58 ppm (GE 1994) So although Woods Pond contained high levels of PCBs the fish in sections of the river closer to Pittsfield contained comparable levels For example the 69 largemouth bass sampled at New Lenox Road averaged 31 ppm and the 70 largemouth bass sampled at Woods Pond averaged 23 ppm (young of year results GE 1994)
In 1994 the National Biological Survey of the US Geological Survey (USGS) collected 28 largemouth bass from Woods Pond which is a wide shallow section of the Housatonic River PCB levels in 24 whole fish ranged from a minimum of 27 ppm to a maximum of 206 ppm and averaged 100 ppm (not adjusted for lipid) Four additional muscle tissue samples ranged from 13 to 70 ppm PCBs (Attachment Al) Woods Pond is twelve miles downriver from the GE facility and the sediment levels of PCBs in Woods Pond average 27 ppm (personal communication Dean Tagliaferro April 1998) The dominant Aroclors2 found in the fish resemble Aroclors 1254 and 1260 which are the environmentally modified forms of the original Aroclor 1260 released from GE
In 1997 EPA-New England asked the EPA Office of Research and Development for technical assistance to perform congener-specific3 analysis of the USGS fish samples Since this was the only congener-specific data for fish available for the Housatonic River this data was selected for these risk calculations The USGS had a limited amount of data on other species however EPA chose the largemouth bass for congener analysis because they are a popular game species The largemouth bass caught by the USGS were all of a size that would provide good fillets In
1 Young of year fish are those less than one year old
2 PCB mixtures manufactured in the United States carried the trademark Aroclor followed by a four-digit number the first two digits are 12 and the last two digits indicate the percent chlorine by weight For example Aroclor 1260 was manufactured using 60 chlorine Aroclor 1016 is an exception because it contains 41 percent chlorine by weight (EPA 1996) Once released into the environment distribution and bioaccumulation of an Aroclor can change the character of the mixture so that it may no longer resemble the original mixture (EPA 1996)
3 Each PCB molecule consists oftwo 6-carbon rings with one chemical bond joining a carbon from each ring -imagine sunglasses with hexagonal frames) Chlorine can attach to any of the other 10 carbons There are 209 QSgible
arrangements called congeners The number and position of chlorines determine a PCB molecules physical and chemical properties Congeners are numbered 1 to 209 The coplanar congeners those with the two rings aligned on the same plane have dioxin-like properties (EPA 1996) Congener specific data improves our ability to identify the presence of bioaccumulated PCBs
contrast the GE young of year fish were too small to eat
IV DOSE RESPONSE
Toxicology To determine whether exposure to PCBs in fish from the Housatonic River in Massachusetts presents a potential risk to human health EPA evaluates the cancer and noncancer risks associated with PCB exposure To evaluate the cancer risk EPA uses the 95 upper confidence limit of the linear-slope factor (also known as the cancer slope factor) of 2 (mgkgday)1 for PCBs (IRIS 1998) The fish ingestion scenario involves ingestion of bioaccumulated PCBs Ingestion offish contaminated with these PCBs may result in a dose greater than that which occurred in the toxicity studies used to develop the potency estimates (EPA 1996) For that reason EPA estimates the risk of consuming bioaccumulated PCBs using the Toxic Equivalence Factor (TEF) approach (outlined in EPA 1996) The TEFs are ratios for certain PCB congeners that when multiplied by each congeners concentration in fish tissue and the cancer slope factor for dioxin yield an estimate of the carcinogenicity of the bioaccumulated PCBs in the fish Because of its toxicity the cancer slope factor for dioxin is very high 150000 (mgkgday)1 so even small concentrations of these dioxin-like PCBs in the fish can present a cancer risk
In the cancer study for Aroclor 1260 on which the slope factor is based a 12-month exposure produced approximately the same cancer potency as a full two-year exposure This suggests that a less than lifetime exposure could have significant risk implications (EPA 1996)
To evaluate chronic noncancer risks EPA used a Reference Dose (RfD) of 2 x 10⁵ mgkgday for Aroclor 1254 (IRIS 1998) To evaluate subchronic noncancer risks EPA used the subchronic RfD of 5 x 10⁵ mgkgday for Aroclor 1254 (HEAST 1997) Reference Doses for Aroclor 1254 were used because they are the closest ones applicable to the type of PCB mixture found in the
- Housatonic River (Aroclor 1260) The toxicity of Aroclor 1254 is much more similar to^Jtbajt of Aroclor 1260 than the toxicity of Aroclor 1016 (the other choice for an EPA accepted RfD) The toxicity study on which the RfDs are based was conducted over a shorter-term time frame (5 years) The subchronic exposure period evaluated in this memorandum (one summer) is consistent with that used in the toxicity study The critical effects for the chronic and subchronic RfDs are immunologic and reproductive effects In addition PCBs have been associated with deficits in learning and neurological effects (see ATSDR 1996 for a recent review)
A relative absorption factor (RAF) of 100 was used for oral absorption of PCBs from fish bull bull (DEP 1992) An RAF of 100 means that the assumed absorption of PCBs from ingestion of
Housatonic fish is equal to the absorption of PCBs in the laboratory toxicity studies
Data Analysis Of the available fish data only the 1994 USGS 24 whole fish and 4 tissue samples were tested for dioxin like PCBs (see data in attachment AL spreadsheets) The whole fish samples included skin organs and all other tissues For the muscle tissue samples USGS removed about 100 grams of muscle tissue and attached skin (about 2 inches wide 4 inches long and 1 inch deep) from the back of the fish directly above the gut (Steven Smith personal communication 1998)
To compare the fish on the same basis EPA adjusted the whole fish data to its equivalent in fish tissue thus
(ppm PCBs in whole fish divided by lipid in each fish) x 100 = micrograms of PCB per gram of fat
The concentration of PCBs in fish muscle tissue equivalents were determined using the lipid normalized concentration of PCBs and the average lipid found in the four fish tissue samples (approximately 1) While the use of lipid normalization data is not recommended in all cases4 the lipid approximation of 1 was considered to be reasonable given the very low levels of lipid in whole fish (087-58)
Following the procedure outlined in EPA 1996 EPA multiplied the concentrations of the shyindividual PCB dioxin-like congeners by the toxic equivalence factors (TEFs) appropriate to each This product called dioxin toxic equivalents (TEQs) is calculated for each tissue sample
Next EPA calculated the 95 upper confidence limit of the mean (Gilbert 1987) concentration for the non-dioxin PCBs and the dioxin-like PCBs These calculations resulted in a UCLs of 00013 for TEQs and 522 ppm for nondioxin PCBs These were the exposure point concentrations used with the exposure factorsrtocalculate the risks of consuming the fish Eleven of-the 13 dioxin-like PCBs were detected in fish samples used for this risk evaluation -gt --
V EXPOSURE ASSESSMENT
Currently the waters of the Housatonic are under a fishing advisory by the Commonwealth of Massachusetts The calculations for the adult fisher and subsistence fisher that follow assume that
4For human health risk assessment adjusting for lipid requires site-specific samples offish muscle tissue or fillet in addition to the data on whole fish A standardized (not site-specific) lipid adjustment is not appropriate because the lipid levels of the fish may have been affected by the site contamination Also the adjustment does not make biological sense unless the contaminant sequesters in the fat
lib
people do not adhere to the advisory
The calculations for the child fisher represent the short-term PCS doses and risks that a child could receive during one summer of consuming contaminated fish caught between GE and the Woods Pond Dam on the Housatonic River in Massachusetts
Adult Fisher To estimate risks to the adult fisher EPA used exposure assumptions that consider the amount of site data available and the site conditions The exposure assumptions described below are reflective of the Reasonable Maximum Exposure (RME) for adult residents who consume contaminated fish
These calculations assume that an adult fisher5 consumes a daily average of 26 grams offish over the course of 365 days per year (Ebert et al 1993) This could represent 3 or 4 (8shyounce) fish meals per month throughout a year or 7 (8-ounce) fish meals per month during the warmer months (April through October) A daily average of 26 grams represents the 95th percentile offish consumption for all water bodies in Maine (Ebert et al 1993) Because the Housatonic is the largest water body in the region and an attractive resource this value is appropriate This value was previously agreed upon by the Agencies in joint comments on General Electrics proposed Risk Assessment Scope of Work for the Housatonic River GE did not dispute this value (DEPEPA 1997)
The body weight used in this evaluation is 70 kg which represents the average body weight for an adult (EPA 1989)
Subsistence Fisher To estimate risks to the subsistsacefisher EPA used exposure assumptions that consider the amount of site data available and-the site conditions The exposure assumptions described below are appropriate for a sensitive subpopulation that is highly exposed
These calculations assume that a subsistence fisher5 consumes a daily average of 140 grams of fish over the course of 365 days per year This could represent 4 or 5 (8-ounce) fish meals per week during a year The daily average of 140 grams per day was estimated by EPA Office of Water staff based on a review of the literature on fish consumption by Native Americans and subsistence anglers (EPA 1995) Given site conditions this value is appropriate for subsistence fishers as a whole a particular ethnic group or tribe of Native
This is a person who has adult body weight and who would ingest adult-sized portions of fish For example for a thirty year exposure duration this could be a person who ate fish each year when they were between the ages of 18 and 48
Americans may consume more fish This value for subsistence fish consumption was previously agreed upon by the Agencies in joint comments on General Electrics proposed Risk Assessment Scope of Work for the Housatonic River GE did not dispute this value (DEPEPA 1997)
The body weight used in this evaluation is 70 kg which represents the average body weight for an adult (EPA 1989)
Childfisher To estimate the subchronic risks to the child fisher EPA used exposure assumptions that consider the amount of site data available and the site conditions The exposure assumptions described below are reflective of short term exposures and do not represent the RME
These calculations assume that the child fisher (age9 years) consumes one small (6- or 7shyounce) fish meal per week during the summer months (June July August) EPA assumes 13 weeks per summer (June July and August)
The one summer exposure period used in this evaluation is shorter than the 30-year exposure period (for cancer risks) typically evaluated by EPA as part of the RME The purpose of this calculation is to examine whether short term exposures could provide enough dose and present enough risk at some point later in life to be a concern
For fish ingestion for the child fisher EPA used 1825 gweek This is the same value for residential fish consumption mentioned above and adjusted to a weekly consumption rate (26 gday 365 daysyr divided by 52 weeksyr)
The body weight used in these calculations is 30 kg which represents an average of the 50th
percentile body weightierfemales age 9 years (DEP^ 1995 EPA 1989)
TABLE 1 Exposure factors used to calculate the potential risks from fishing on the Housatonic River
EXPOSURE PARAMETER VALUE
body weight (kg) adult or subsistence fisher 70 body weight (kg) age 9 years 30
exposure duration subchronic (weeks) 13 exposure duration (years) 30
fish ingcstion rate (gday) adults 26 fish ingestion rate (gday) subsistence fishers 140 fish ingestion rate (gwcck) children 1825
averaging time (days) cancer 25550 averaging time (days) chronic noncancer 10950 averaging time (days) subchronic noncancer 92
VL RISK CHARACTERIZATION
A Risk Calculations
CANCER RISKS e
Using the assumptions noted above in Table 1 and the equations below a lifetime average daily dose of PCBs from ingestion offish can be calculated
= fPGBl C IR ED BWAT
LADDlaquoi
Where
LADD^ = lifetime average daily dose from ingestion offish mgkgday [PCS] = PCB concentration in fish figkg C = conversion factor 106
IR = fish ingestion rate gday BW = body weight kg ED = exposure duration years AT F= averaging time period over which exposure is averaged - days or years
The Excess Lifetime Cancer Risk (ELCR) from ingestion of fish can be calculated using the following equations
ELCR = (LADD^J CSF (for cancer risks less than 1 in 100)
ELCR = 1- exp (-LADD^ CSF) (for cancer risks greater than 1 in 100)
Where ELCR = Excess Lifetime Cancer Risk CSF = Cancer Slope Factor 2 (mgkgday)-1 for nondioxin-like PCBs and 150000
(mgkgday)-1 fordioxinTEQs LADD^ = lifetime average daily dose from ingestion of fish exp = e raised to the power of x where x is the product of the dose and the cancer slope factor
NONCANCER RISKS
Using the exposure assumptions in Table 1 and the equations below an average daily dose of PCBs from ingestion offish can be calculated
= fPCBI C IR ED BWAT
Where
= average daily dose from ingestion of fish mgkgday [PCB] = PCB concentration in fish ngkg C = conversion factor 106
IR = fish ingestion rate gday or gweek BW = body weight kg ED = exposure duration weeks or years AT = averaging time period over which exposure is averaged - days or years
The Hazard Index can be calculated using the equation below
HI = [ADD ] RfD
Where HI = Hazard Index RfD = Reference Dose mgkgday
= average daily dose from ingestion of fish mgkgday
B Risk Results
RCRA CERCLA Risk Management Criteria
The cancer risks for the adult fisher and the subsistence fisher whom consume PCB contaminated fish are two orders of magnitude (100 times) or more above the EPA cancer risk range (discussed in EPA 1991) of 106 to 104 (see tables attached) and this justifies EPA in taking an (remedial or removal) action
Even a child who consumes one fish meal a week over the course of one summer has a cancer risk from that short term exposure which is nine times higher than the EPA cancer risk range of 106 to 10 and this justifies EPA in taking an action
The chronic noncancer risks for the adult fisher and the subsistence fisher whom consume PCB contaminated fish are over 900 times the risk (ie a chronic Hazard Index of 1) at which EPA is justified in taking an action
The noncancer risks (subchronic) for a child who consumes one fish meal a week over the course of one summer are over 800 times the risk (ie a subchronic Hazard Index of 1) at which EPA is justified in taking an action
If adults or children are consuming the fish on a regular basis they have a significant risk of cancer or noncancer health effects
C Discussion of Risk Characterization
Discussion Related to Exposure Scenarios The exposure period evaluated for the child fisher (one summer) may underestimate the actual exposure that a child may receive because it does not account for continuing exposure Moreover PCBs have been present in the residential areas in Pittsfield for many years already making it likely that exposure via some other environmental media has already occurred
The exposure period selected for evaluation of cancer effects is one summer for the child fisher However different assumptions about the exposure period have a significant impact on the risk results As the exposure period increases the cancer risk estimate increases For evaluating cancer risks one could easily justify using a longer exposure period than the ones selected Also typically the calculation of cancer risks attributable to fish consumption may involve some weighting of child and adult exposures which may make the risks higher than those calculated for
the adult alone
The risk calculations may not be conservative enough for ethnic groups whose members consume the whole fish Also particular Native American or ethnic groups may consume more fish than noted in the subsistence fishing calculations
Pre-natal exposure to PCBs as well as post-natal exposure to PCBs via breast milk may have higher risks than those noted Early stages of development may have an extra sensitivity to the effects of PCBs (reviewed in EPA 1993 IRIS 1998)
Toddlers consuming fish may have higher risks than those noted because of the large doses that these fish would provide given the small body size of a toddler Also the toddler may be more sensitive to the developmental effects of PCBs
Discussion Related to Toxicity and Exposure The cancer risks from the dioxin-like PCBs was about twice the risks from PCBs (without the properties of dioxin) This illustrates the importance of performing congener specific analysis of PCBs for estimates of cancer risk
The PCB doses from eating the fish even for as short a period as one summer are higher than the doses at which monkeys showed marked reproductive effects (Arnold et al 1995) and effects on cognitive behavior (Rice 1995 1997 Rice and Hayward 1997 Rice et al 1996) and activity (reviewed in EPA 1993) This suggests that there may be no safety margin between the exposure estimates for people who eat fish from the Housatonic river and the exposures in the monkey studies which show adverse health effects
The risks from consuming the fish are substantial If the fishing advisory is effective then there is no risk from the fish However a report in the literature suggests that fishing advisories are violated regularly (Tilden et al 1997)6 And-sbmepeople in the area may have consumed fish from the Housatonic before the fishing advisory was in place (about 10 years ago)
In sum doses estimated for children and adults who ingest contaminated fish from the Housatonic river are higher than those received by the monkeys in the PCB noncancer toxicity study that demonstrated adverse health effects This is true even in the case of children who ingest contaminated fish over the course of one summer These exposure estimates raise significant concerns regarding potential health effects in children and adults who ingest contaminated fish from the Housatonic river
6Tilden estimates that in one year as many as 47 million people ate Great Lakes sport fish despite long standing (since the mid-70s) state fishing advisories
10
REFERENCES
Arnold et al 1995 Toxicological Consequences ofAroclor 1254 Ingestion by Female Rhesus (Macaca mulatto) Monkeys Part 2 Reproduction andlnfant Findings Arnold DL Bryce F McGuire PF et al Fd Chem Toxic 33457-74
ATSDR1996 Public Health Implications ofPCBs December 1996
DEP 1992 Documentation For The Risk Assessment Shortform Residential Scenario Massachusetts Department of Environmental Protection Office of Research and Standards and the Bureau of Waste Site Cleanup Policy BWSCORS-142-92 October 1992
DEP 1995 Guidance For Disposal Site Risk Characterization In Support of the Massachusetts Contingency Plan Interim Final Policy BWSCORS-95-141 Massachusetts Department of Environmental Protection Bureau of Waste Site Cleanup and Office of Research and Standards July 1995
DEPEPA 1997 Joint DEPEPA Technical and Review Comments on General Electric Proposal for Human Health Risk Assessment of the Housatonic River August 13 1997
Ebertetal 1993 Estimating Consumption of Freshwater Fish among Maine Anglers EbertES Harrington NW Boyle KJ et al North American Journal of Fisheries Management 13737-45 1993
EPA 1989 Risk Assessment Guidancefor Superfund Volume I - Human Health Evaluation Manual (Part A) Interim Final US Environmental Protection Agency Office of Emergency and Remedial Response EPA5401-89002 December 1989
EPA 1991 Role of the Baseline Risk Assessment in Superjund Remedy Selection Decisions USEPA OSWER Directive 93550-30 April 22 1991
EPA 1993 Workshop Report on Developmental Neurotoxic Effects Associated with Exposure to PCBs VSEPA Risk Assessment Forum EPA63 OK-92004 May 1993
EPA 1995 Water Quality Guidance for the Great Lakes System Supplementary Information Document (SID) USEPA Office of Water EPA-820-B-95-001 March 1995 p 575
EPA 1996 PCBs Cancer Dose-Response Assessment and Application to Environmental Mixtures NCEA ORD EPA600P-96001F
Finklestein 1998 Personal communication Ken Finklestein NOAA May 111998
GE 1994 Preliminary draft MCP Supplemental Phase II InvestigationRCRA Facility Investigation of Housatonic River and Silver Lake Tables 8 through 10
Gilbert 1987 Statistical Methods for Environmental Pollution Monitoring RO Gilbert Van
11
Nostrand Reinhold NY 1987
HEAST 1997 Health Effects Assessment Summary Tables EPA Office of Solid Waste and Emergency Response 92006-303 (97-1) EPA-540-R-97-036 PB97-921199 July 1997
IRIS 1998 EPA Integrated Risk Information System a database 1998
Mass DPH 1997 Housatonic River Area PCB Exposure Assessment Study Final Report Massachusetts Department of Public Health Bureau of Environmental Health Assessment Environmental Toxicology Unit September 1997
Rice 1995 Neurotoxicity of Lead Methylmercury andPCBs in Relation to the Great Lakes DC Rice Environmental Health Perspectives 103(Supplement9)71-87 1995
Riceetal 1996 Lessons for Neurotoxioology from SelectedModel Compounds SGOMSEC Joint Report Rice DC de Duffard AME Duffard R et al Environmental Health Perspectives 104(Supplement 2)205-15
Rice 1997 Effect of Postnatal Exposure to a PCB Mixture in Monkeys on Multiple Fixed Interval-Fixed Ratio Performance DC Rice Neurotoxicology and Teratology 19429-34
Rice and Hayward 1997 Effects of Postnatal Exposure to a PCB Mixture in Monkeys on Nonspatial Discrimination Reversal and Delayed Alternation Performance Rice DC Hayward S Neurotoxicology 18479-94 1997
Smith 1998 Personal communication with Steven Smith USGS April 28 1998
Tagliaferro 1998 Personal communication Dean Tagliaferro EPA removals program April 1998
Tilden et al 1997 Health Advisories for Consumers of Great Lakes Sport Fish Is the Message Being Received Tilden J Hanrahan LP Anderson H et al Environmental Health Perspectives 1051360-65 1997
Tilson et al 1990 Polychlorinated Biphenyls and the Developing Nervous System Cross-species Comparisons Tilson HA Jacobson JL Rogan WJ Neurotoxicology and Teratology 12239-248 1990J
12
ATTACHMENT A1
Spreadsheets showing raw data and UCL calculations
13
Congener specific PCB concentrations and TEQs in largemouth bass collected from Woods Pond MA last modified 51098 PCBs
Fish refershyence
ppm PCBs
Lipid in Lipid AP raquosampx3 Dioxin-like ODngeners(ppm)
number total whole fish]
BO I B02 B03 B04 805
57 206 65 117 75
225 381 161 106 285
PCBsg
25333 54068 40373 110377 26316
I 1242
lt05 ltQ5 lt05
bullraquo
1248
-lt05 lt05 lt05
-
f
11035 60
Hshy
1260
96 30 57 -
77 1JT 1
ft 0001 0 a 0
105
042 052 017 033 026
1W 1 1 181061 iy^J 156
amp03S 0$43 0013 0037 002
26 33 12 2 2 17
^T^fPWJ bull shyamp0|7-MI
lt$amp$ OJWS$$ Q$$tff
046 06
021 042 034
032 041 015 03 024
lt 3
MpoundregL 0i0lt)33 00005 00014 0001$
31 42 016 3 3 26
pv09601$ 0045 011 0gt0amp7
y ootnoi2 0043 0087 0071
B06 63 579 10881 Hshy - 1 - a shy 027 002 16 001 034 025 001$ 2 7 00$ 007 B07 BOS B09
71 31 157
335 241 433
21194 12863 36259
lt05 w
lt05
lt05 -
lt05
sa Mshy
sa 33 -
69
0 0 0
021 023 039
0015 001amp 01032
13 16 25
ampG0ampJ 0gt00$)5 Oytj^fs
024 029 044
018 021 031
00012 00Q1 00022
2 2 4 34
00$7ao$6 011
005 0059 0089
BIO Bll B12
69 56 196
1 89 202 344
bull 3650 8 27723 56977
ltQ5 lt05 lt05
lt05 lt05 lt05
36 30 110
33 26 86
0 0 0
019 018 046
0016 00150037
14 12 2 9
lt 60^ c s
0101 j 0021
025 021 052
02 016 037
0001amp
bull 6^001 00027
18 15
4
amp04 0-gtQ4lf s
012
OJ554vamp$iirgti
oii B14 27 1 7 15882 - - 0 0 3 0026 2 0009S 04 03 00014 2 9 a097 007^ B15 77 329 23404 lt05 lt05 42 35 0 025 0022 1 7 010-14 003 023 00021 2 2 0072 0062 B19 110 399 27569 Hshy - bdquo 0 051 0044 3 0 17 056 039 00022 4 012 ou B20 121 2 13 56808 lt05 lt05 61 60 0 033 027 2 0$$ 045 032 00022 3 3 013 00$ B21 B22
198 89
369 246
53659 36179
lt05 lt05
lt05 lt05
110 4$
88 41
0001 0
053 026
0046 0022
33 17
0lt0i ipxOi
063 032
043 023
00024 00017
4 2 24
014 077
013 0067
B23 B24 B25
130 168 87
3 18 355 238
40881 47324 36555
lt05 ltQ5 lt05
lt05 lt05 lt05
7$ 95 48
51 73 39
- 0 0
036 043 025
0031 003amp
0ois
23 27 15
4gtk^5shyamp$ampbulllt bull000
038 05 03
028 035 022
00015 00021 00013
23 35 21
0073 011 007
0083 01
0064 B31
B33
47
50
139
139 33813
35971 lt05 lt05
lt05 lt05
24 26
23
24 p 0
015
014 0 0 1 rlaquo^ 00096
086
068 iiiSt6igt058i
019
019
014
014 0000 QJQOQ5
14
14
0046 00Si
004 ^ 0^39^ gt
B34 121 0872 13876 1 lt-05 lt05 62 59 0 031 0023 19 00amp1 042 03 0^0005 33 01 1 $poundamp muscle tissue
B13 138 0577 2391 7 lt05 lt05 79 59 o 0045 00031 023 ampQ04 005 0037 Q0005 039 001 00082 B16 70 1 86 37634 lt05 lt05 35 35 0 019 001S 13 028 023 amp0024 21 0075 0057 B17 41 1 19 34454 lt05 lt05 21 20 0 012 001 064 017 0 13 00012 12 0044 0034 B18 13 2 039 33846 lt05 lt05 72 6 0 0036 00025 019 000B 0047 0045 00005 034 0024 00075
1 i- isn refer- ppm TEFs and TEQ s for tested con jeners r umof TEQs 1 ence PCBs
number total Lipid 77 105 114 118106 126 156 167 169 170 189 157 (mg TEQkg meg TEQ meg TEQ Lnconc rruCTOgram whole fish () 00005 0000] 0 0005 J_0 0001 0 1 00005 000001 001 00001 00001 00005 whole fish) gfat g tissue TEQs PCBVg tissue Ln PCB
BO I 57 22 5 OE+00 4E-05 2E-05 3E-04 2amp02 2E-04 3E-06 2E-05 3Eraquo04 IE-OS SB-OS 00026 0 1174 00012 -675 2533 323 B02 206 3 81 6E-07 5E-05 2E-05 3E-04 2Elt03 3E-04 4E-06 3E-05 4ampQ4 2E-05 laquoamp05 00032 00850 00008 -707 5407 399 B03 65 1 61 OE+00 2E-05 7E-C6 IE-04 7E-04 IE-04 2E46 5E-06 2E-05 5E-06 bull2E^)5 00010 00638 00006 -736 4037 3 70 i B04805
117 75
1 06 28 5
OE+00 OE+00
3E-05 3E-05
2E-05 1E-05
2E-04 2E-04
1B-OJ IE-OS
2E-04 2E-04
3E-06 2E-06
IE-OS 2E-05
3amp04 3E-04
IE-OS 9E-0(
bull4amp054ms
00021 00017
0 1965 00582
00020 00006
-623 -7 45
11038 26 32
470 327
B06 63 5 79 OE+00 3E-05 1E-05 2E-04 1E-03 2E-04 3E-06 2E-04 3E-Q4 9E-0( 4E-OS 00019 00322 00003 -804 1088 239 B07 71 3 3 5 OE+00 2E-05 8E-06 1L-04 1E-03 IE-04 2E-Q6 IE 05 2ErC4 6E-0lt 3E-05 00015 00443 00004 -772 21 19 305 BOS 31 2 4 ] OE+00 2E-05 9E-06 2b-04 9E-04 IE-04 2E-0lt$ IE-OS 2E-Q4 7E-0( 3E-05 00015 00616 00006 -739 1286 2 55 B09 157 4 33 OE+00 4E-05 2E-05 3E-04 2E-03 2E-04 3E-06 2E-05 3E-lt4 1E-0 4Z45 00026 00611 0 0006 -7 40 36 26 359 BI O 69 1 89 OE+00 2E-05 8E-06 IE 04 1E-03 IE-04 2E-06 2E-05 2E-Q4 6E-Oi 3E-05 00015 00807 00008 -712 3651 3 60) BH 56 202 OE+00 2E-05 8E-06 1E-04 IE-OS IE-04 2E-06 IE-OS 2ErQ4 SE-Or 7amp05 00014 00712 00007 -725 2772 332 B12 196 3 44 OE+00 5E-05 2E-05 3E-04 2E-03shy 3E-04 4E-06 3E-05 4amp04 1E-0 ^E-05 0 0032 0 0934 00009 -6 98 56 98 404 B14 27 1 7 OE+00 3E-05 IE-OS 2E-04 1E-03 2E-04 SR-Q6 IE-OS 3ErQ4 1E-0 4U-Q5 00018 0 1046 00010 -686 1588 277 B15 77 329 OE+00 3E-05 IE-OS 2E-04 1E4raquo 2E-05 2E-06 2E-05 2E-04 7E-0( SE-05 00019 00578 0 0006 -7 46 23 40 3 15 B19 110 3 99 OE+00 5E-05 2E-05 3E-04 2E-03 3E-04 4E-06 2E-05 4E-Q4 1E-0-) ^amp05 00028 00713 00007 -725 2757 3 32 B20 121 2 13 OE+00 3E-05 IE-04 2E-04 2E-OS 2E-04 3E-06 2E-05 3ErQ4 1E-01) 5E-05 00025 0 1177 00012 -675 5681 404 B21 198 369 5E-07 5E-05 2E-05 3E-04 2E-03 3E-04 4E-06 2E-05 4ErltJ4 IE-OS 7amp05 00031 00853 00009 -707 5366 398 B22 89 246 OE+00 3E-05 IE-OS 2E-04 IE-03 2E-04 2E^5 2E-05 2ampG4 8E-05 3amp05 00019 00787 00008 -715 36 18 359 B23 130 3 18 OE+00 4E-05 2E-05 2E-04 2B4raquo 2E-04 3Elt06 2E-05 2E-Q4 7E-Oo 4amplaquoJ 00023 00713 00007 -7 25 40 88 371 B24 168 3 55 OE+00 4E-05 2E-05 3E-04 2E-03 3E-04 4E-06 2E-05 4E-Q4 IE-OS SE-05 00027 00765 00008 -717 4732 386 B25 87 2 38 QE+QO 3E-05 9E-06 2E-04 9E-04 2E-04 2E-06 IE-OS 2E-04 7E-Oo 3E-OS 00015 00642 00006 -735 3655 360
B31 47 1 39 OE+QO 2E-05 5E-06 9E-05 3amp04 IE-04 1amp06 5E-06 IE-04 SE-Oo 2ElaquoOS 00009 00656 00007 -733 33 81 3 52
B33 50 1 39 OE+CO 1E-05 5E-06 7E-05 6E-04 IE-04 1E-06 5E-06 IE-04 5E-06 2E-05 00009 00671 00007 -731 3597 358
B34 12 087 OE-00 3E-05 1E-05 2E-04 8E03 2E-04 3E^6 5E-06 3E^34 IE-OS 4E-OS 00089 10247 00102 -458 13876 493
muscle tissue mg TEQskg Us le i |
B13 138 0 58 OE+00 5E-06 2E06 2E-05 4amp-04 3E-05 4E-07 5E-06 4E-05 1E-06 4E-06 0 0005 00005 -7 59 138 262
B16 70 1 86 QE+00 2E-05 9E-06 IE-04 IE-Mr IE-04 2E-Q6 2E-05 2E-04 8E-06 3E-OS 00016 00016 -646 70 42 5
B17 41 1 19 OE+00 1E-05 5E-06 6E-05 6E-04 9E-05 1E^06 IE-OS IE-04 4E-06 7E^)5 00010 00010 -696 41 371 B18 132 0 39 OE+00 4E-06 1E-06 2E-05 IE-04 2E-05 5E-07 5E-06 3ampQ5 2E-06 4E-06 0 0002 0 0002 -841 132 2 5 8
GSD 0 66 GSD 061 ave lipid n 28 n 28 muscle tissue H statistic 2 0923 H statistic 20502
95 UCL of the TEQs 00013 95UCLPCBs 522 meg TEQg tissue meg PCBg tissue
max TEQs 00102 max PCBs 1388
ATTACHMENT A2
Spreadsheets showing risk calculations
14
Potential risks from ingesting largemouth bass from the Housatonic River (Woods Pond area) in Massachusetts on a regular basis last modified 51498 The concentrations are based upon the 95 UCL of the mean concentration in muscle tissue
adult who consumes PCB contaminated fish cone ingestion ED BW AT LADD slope risk
(megkg) (gday) (yrs) (yrs) (mgkg-d) (per mgkg-d) (kg)cancer risks dioxin TEQ 130 26 30 70 70 206E-07 150000 3E-02 cancer risk from TEQs
nondioxin-like PCBs 52E+04 26 30 70 70 00083 2 2E-02 cancer risk nondioxinlike PCBs bull 5E-02 excess cancer risk lifetime
ADD(mgkg-d) RfD oral(1254) HI noncancer risks nondioxin-like PCBs 52E-H)4 26 30 70 30 00194 000002 969 rounding to one significant figure
1000 noncancer risk (chronic)
subsistence fisher who consumes PCB contaminated fish cone ingestion ED BW AT LADD slope risk
(megkg) (gday) (yrs) (kg) (yrs) (ingkg-d) (pet mgkg-d) cancer nsks dioxin TEQ 130 140 30 70 70 111E-06 150000 2E-01 cancer risk from TEQs
nondioxin-like PCBs 52E+04 140 30 70 70 00447 i 2 9E-02 cancer risk nondioxinlike PCBs 2E-01 excess cancer risk lifetime
ADD(mgkg-d) RfD oral(1254) HI noncancer risks nondioxin-like PCBs 52E+04 140 30 70 30 01044 000002 5219 rounding to one significant figure
5000 noncancer risk (chronic)
9 year child who consumes PCB contaminated fish once per week for one summer cone ingestion ED BW AT LADD slope risk
(megkg) (gweek) (weeks) (kg) (days) (mgkg-d) (per mgkg-d) cancer nsks dioxin TEQ 130 1825 13 30 25550 402E-09 150000 6E-04 cancer risk from TEQs
nondioxin-like PCBs 52E+04 1825 13 30 25550 000016 2 3E-04 cancer risjc nondioxinlike PCBs 9E-04 cancer risk due to dose
from a short-term exposure RfD oral(1254)
ADD(mgkg-d) subchronic ffl noncancer risks nondioxin-like PCBs 52E+04 1825 13 30 92 00449 5E-05 897 rounding to one significant figure
900 noncancer risk (subchronic)
- barcode 10818
- barcodetext SDMS Doc ID 10818
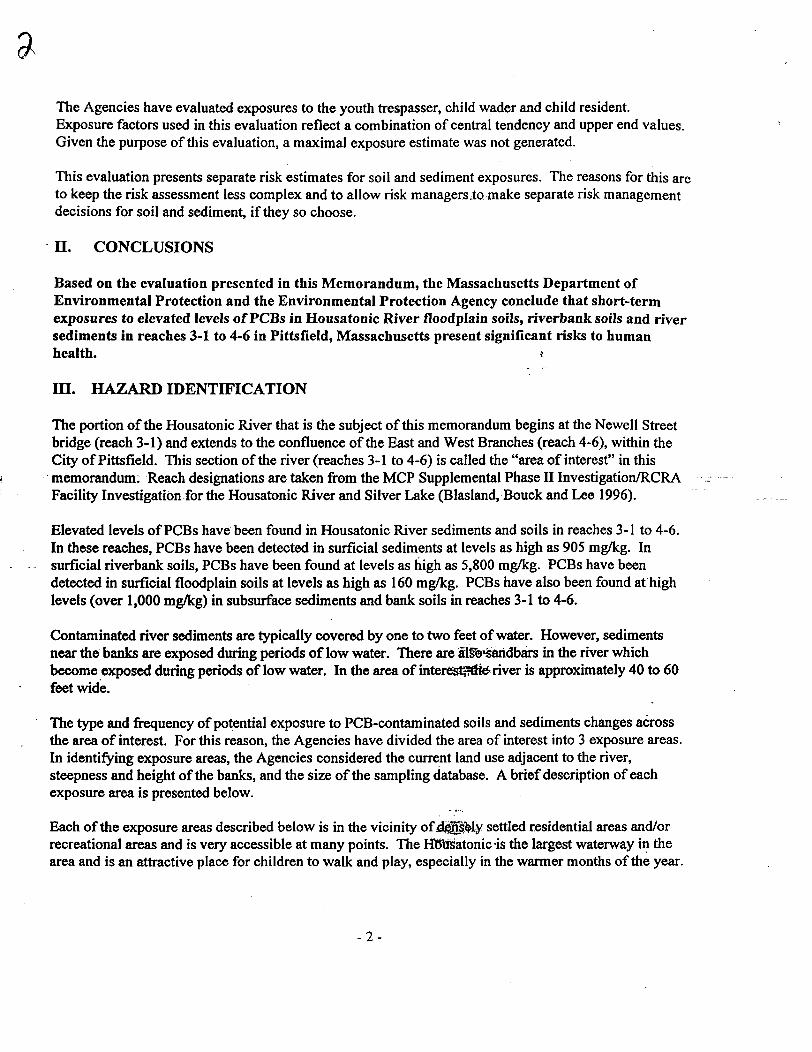
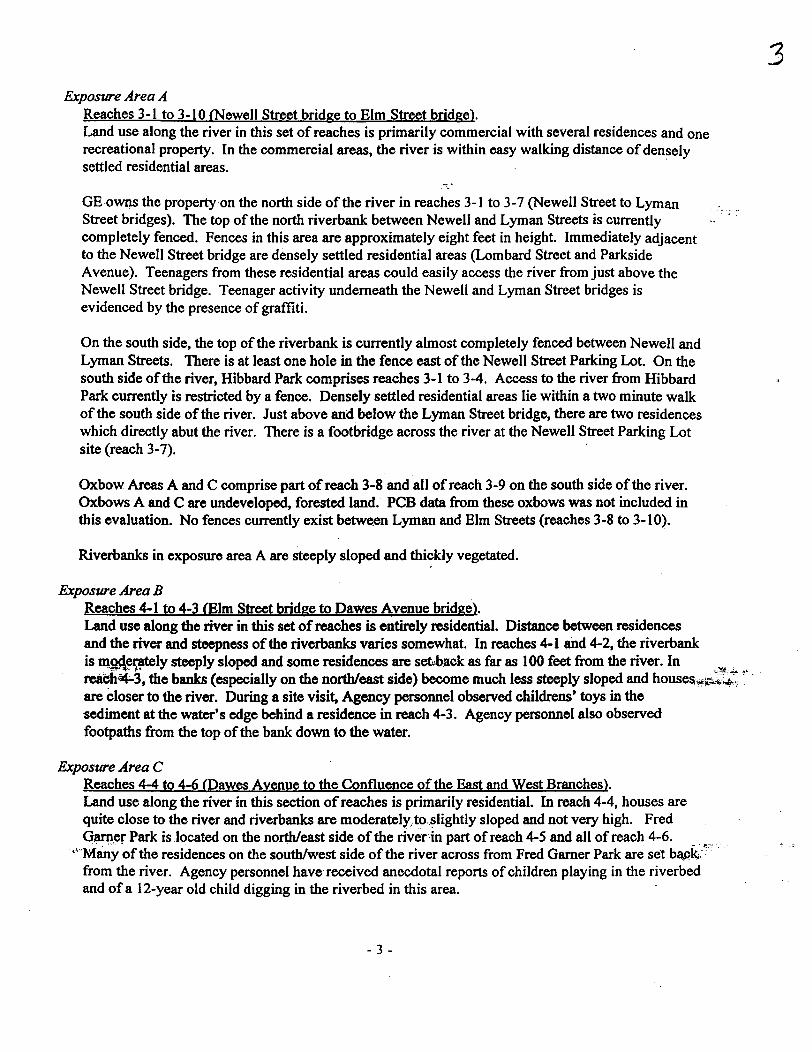
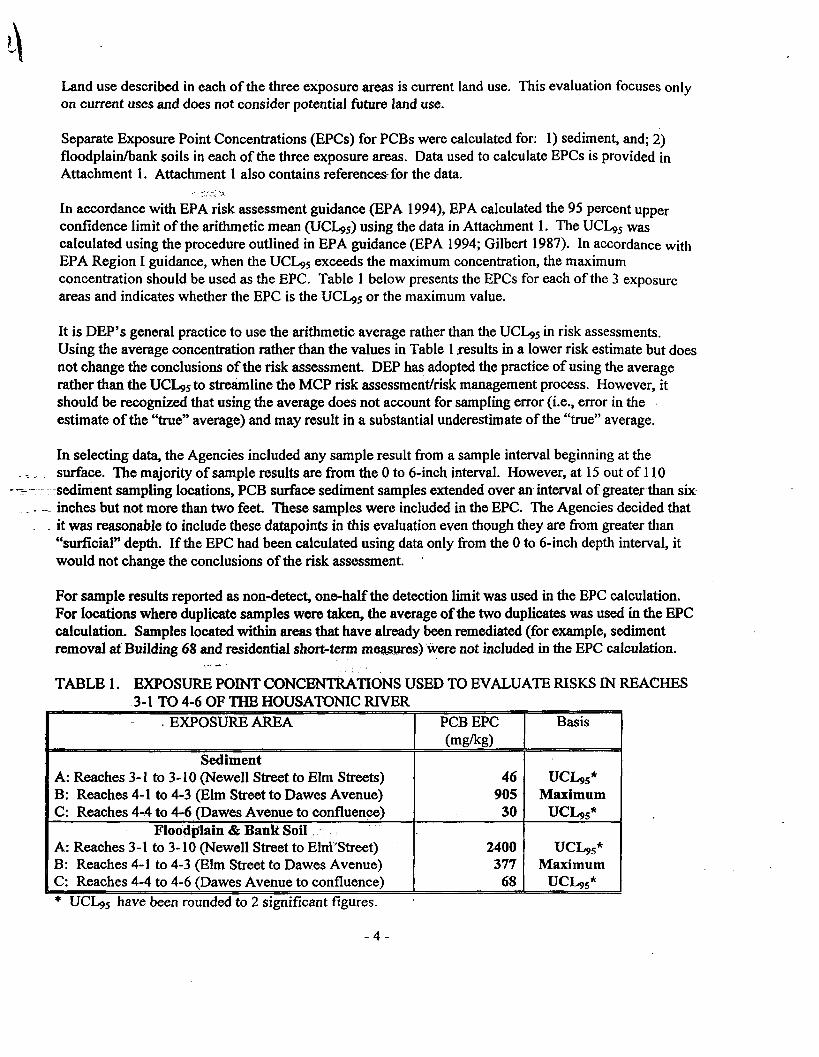
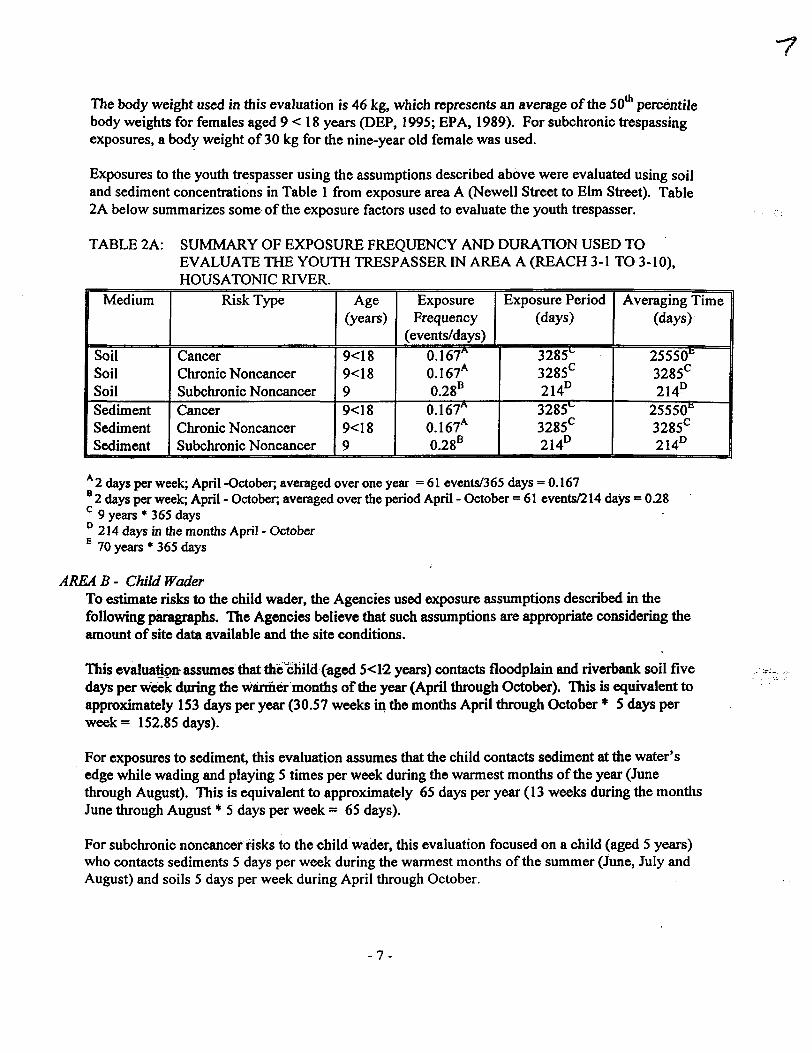
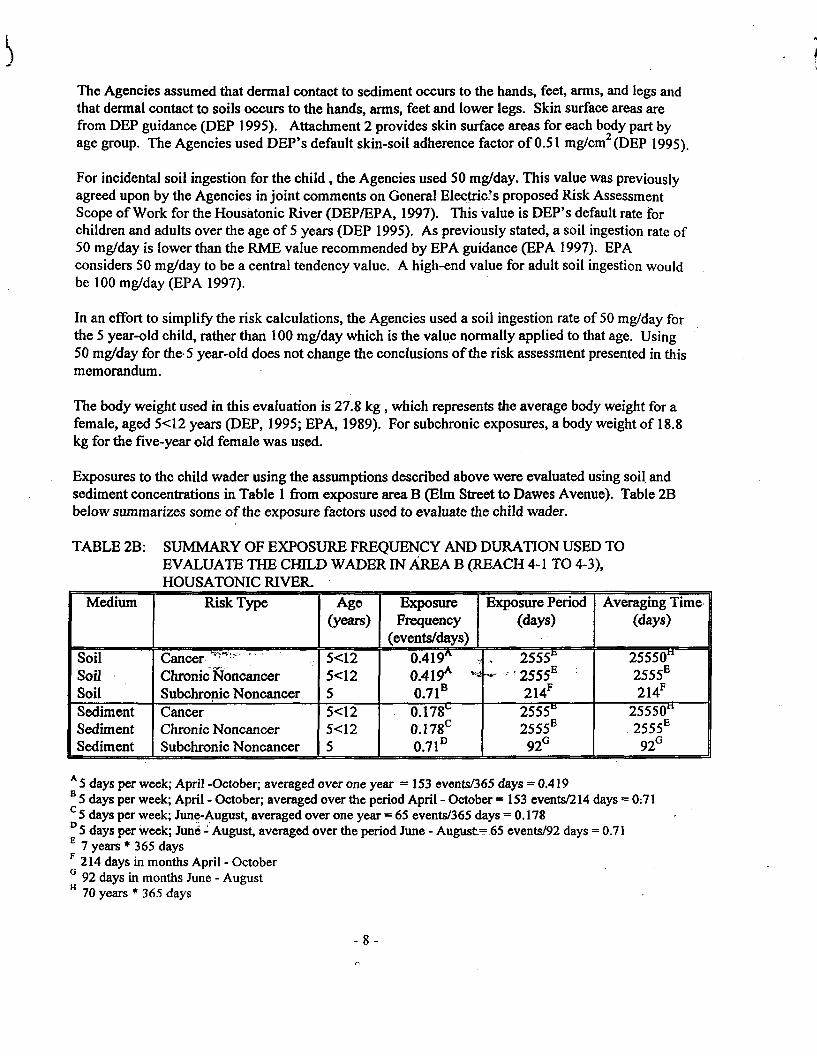
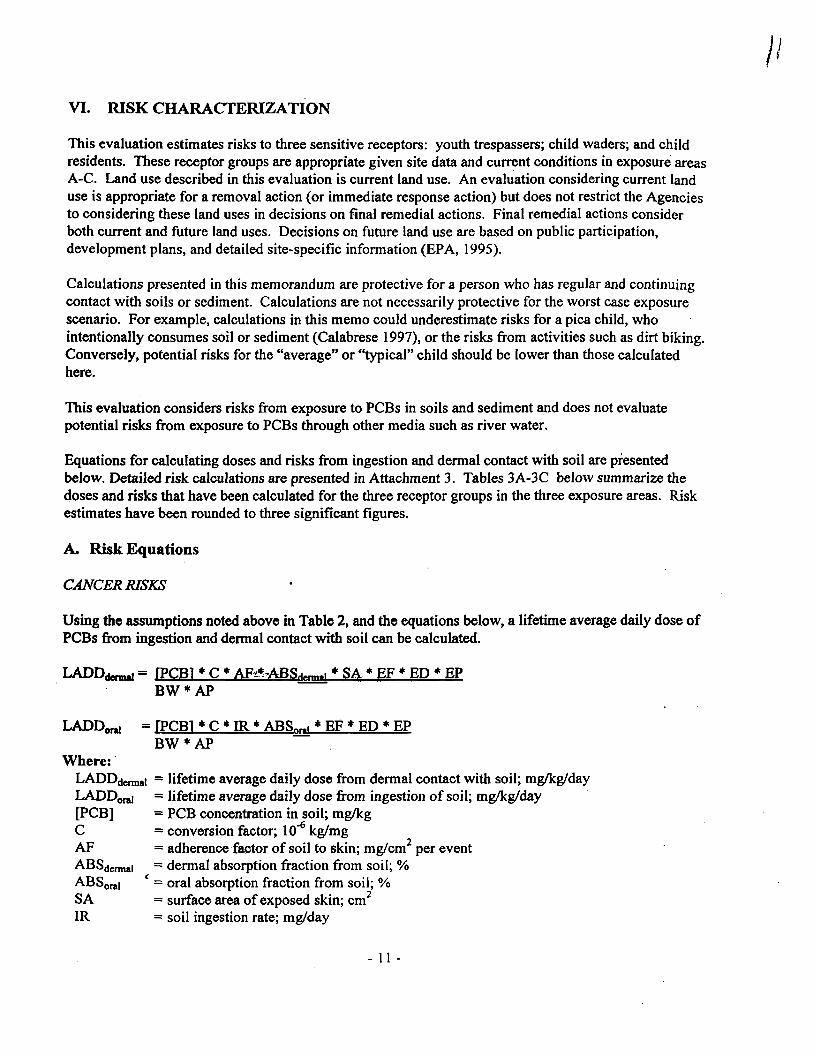
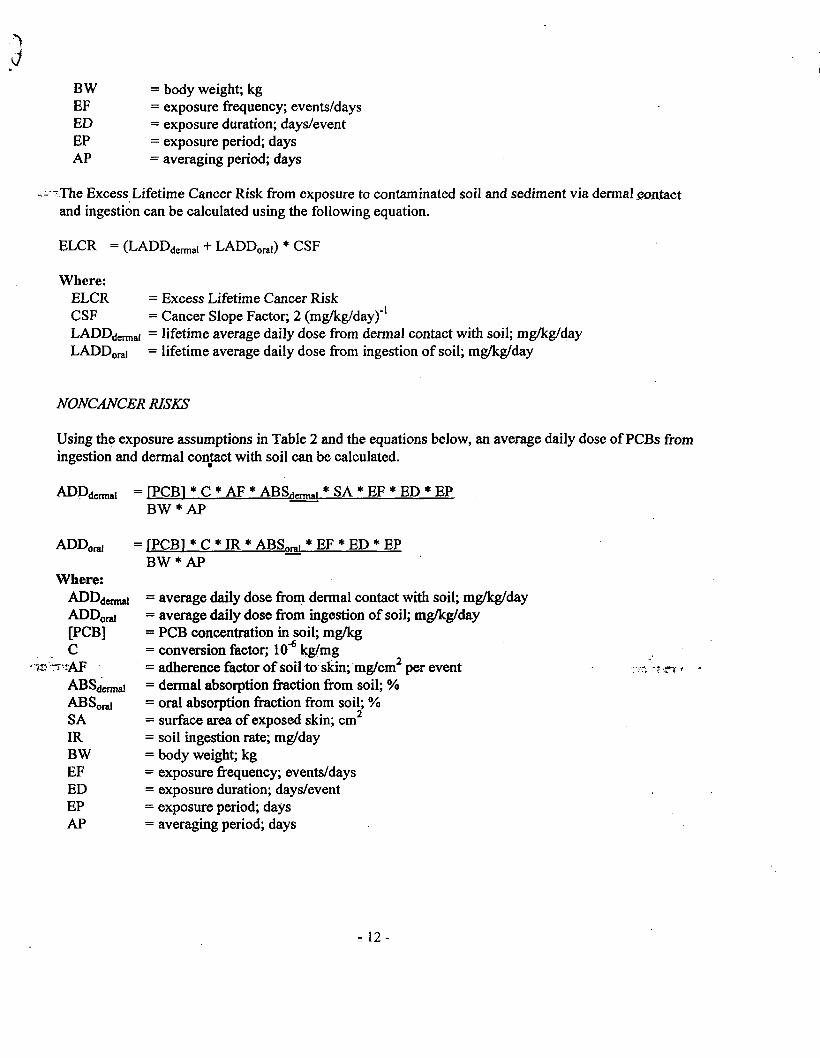
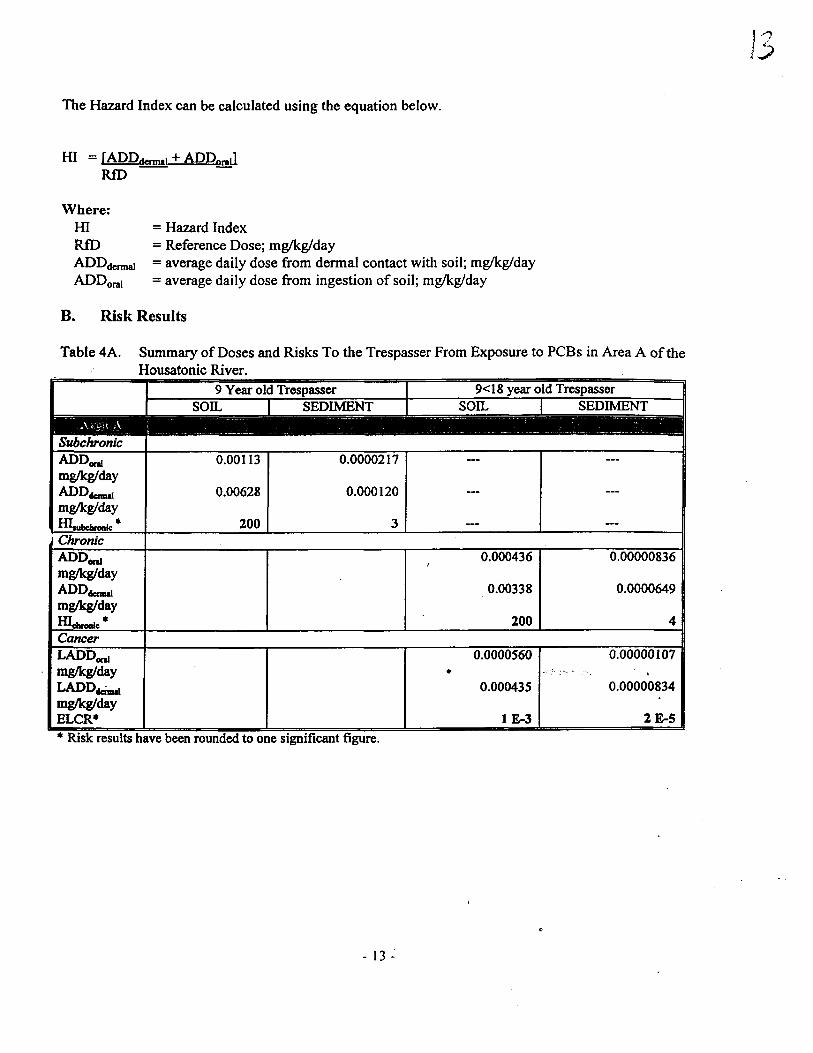
The Hazard Index can be calculated using the equation below
HI = RfD
Where HI = Hazard Index RfD = Reference Dose mgkgday ADDderma] = average daily dose from dermal contact with soil mgkgday ADDora| = average daily dose from ingestion of soil mgkgday
B Risk Results
Table 4A Summary of Doses and Risks To the Trespasser From Exposure to PCBs in Area A of the Housatonic River
Subchronic ADD^ 000113 00000217 mgkgday
000628 0000120 mdash mdash
mgkgday Hlnibehronic 200 3 Chronic
0000436 000000836 mgkgday
000338 00000649 mgkgday
200 4 Cancer LADD^ 00000560 000000107 mgKgaay
0000435 000000834 mgkgday ELCR 1E-3 2E-5 Risk results have been rounded to one significant figure
- 13shy
Table 4B Summary of Doses and Risks to the Child Wader (aged 5lt12 years) From Exposure to PCBs in Area B of the Housatonic River
5 year-old Child
mgkgday ADDdenMl
mgkgday HIubchronic
Chronic ADDoral
mgkgday
mgkgday
Cancer
mgkgday
mgkgday ELCR
Risk results have been rounded to one significant gifiire
0000284 0000290
000149 000222
90 100
00000284 00000290
0000149 0000222
4E-4 5E-4
Table 4C Summary of Doses and Risks to the Child Resident (aged 1lt6 years) From Exposure to PCBs in Area C of the Housatonic River
5 year old Child
Subchronic ADD^ 0000252 0000113 mgkgday ADD 0000543 0000344 mgkgday
20 9HIlaquoubchronic Chronic ADD^ mgkgday ADD^ mdash mdash mgkgday HIchHMUc
Cancer LADD^ mgkgday
bull S i -rLADDdennia
mgkgday ELCR
Risk results have been rounded to one significant figure
1lt6 Year old Child
mdash
0000192 00000366
0000323 00000879
30 6
00000137 000000261
0obOQ231 000000628
7E-5 2E-5
- 14shy
Federal RCRA CERCLA Risk Management Criteria This analysis focuses on whether children or teenagers could receive enough dose through short-term exposures to present an unacceptable risk Risk managers should note that exposure periods used in this analysis to evaluate residential cancer and noncancer risks (5 years) are shorter than those typically used for evaluating residential areas Risk managers should take this into account when considering the management actions connected with risks
As shown in Tables 4A-C above exposure to PCB-contaminated soils and sediments in each of the three Exposure Areas presents risks higher than levels at which EPA considers taking action EPA is justified in taking action when the excess lifetime cancer risk exceeds a range of 10 to 10 EPA is justified in taking action when a noncancer Hazard Index exceeds one
Moreover PCB concentrations found in Housatonic River sediments bank soils and floodplain soils exceed the EPA action level of 1 ragkg for residential soils and 10-25 mgkg for industrial soils (EPA 1990) Concentrations in soils also exceed DEPs default (Method 1) cleanup standard for residential and commercialindustrial soils of 2 mgkg (310 CMR 400985(6))
Exposure Area A Newell to Elm Streets PCB-contaminated sediments in Exposure Area A (Newell to Elm Streets) pose noncancer risks to the youth trespasser that are roughly 3 times higher than the level at which EPA is justified in taking action (ie Hazard Index greater than one) Cancer risks from sediment exposure are within the risk range at which EPA is justified in taking action (ie 106 to 104)
Chronic (9-year exposure) and subchronic (3-month exposure) noncancer Hazard Indices from soil exposure to the youth trespasser in Exposure Area A are approximately 200 times greater than the level at which EPA is justified in taking action (ie Hazard Index greater than one) PCB-contaminated soils in Exposure Area A pose cancer risks to the youth trespasser that are roughly 10 times higher than the EPA risk range (ie 106 to 104)
Exposure Area B Elm to Dawes Avenue PCB-contaminated sediments in Exposure Area B (Elm to Dawes Streets) pose chronic (7-year) and subchronic (3-month) risks to the child wader thatare over 100 times theJexeLat which EPA is justified in taking action (ie Hazard Index greater than one) Cancer risks from sediment exposure to the child wader are approximately 5 times higher than the EPA risk rangeie 10 to 10 )
Chronic (7-year) and subchronic (3-month) noncancer risks from soil exposure to the child wader in Exposure Area B are over 70 times higher than the level at which EPA is justified in taking action (ie Hazard Index greater than one) Cancer risks to the child wader from soil exposure are roughly 4 times higher than the EPA risk range (ie 106 to 104)
Exposure Area C Dawes to the Confluence PCB-contaminated sediments in Exposure Area C pose chronic (5-year) and subchronic (3-month) noncancer risks to the child resident that are over 6 times the level at which EPA is justified in taking action (ie Hazard Index greater than one) Cancer risks to the child resident from exposure to sediments are within the risk range at which EPA is justified in taking action (ie 106 to 104)
- 15shy
Chronic (5-year) and subchronic (3-month) noncancer risks to the child resident from exposure to PCB-contaminated soils in Exposure Area C are approximately 20 times higher than the level at which EPA is justified in taking action (ie Hazard Index greater than one) Cancer risks to the child resident from soil exposure is within the risk range at which EPA is justified in taking action (ie lO^tolO4)
MCP Risk Management Criteria
As stated previously in this memorandum it is DEPs practice to use the arithmetic average concentration for the EPC rather than the UCL95 or the maximum as was used to calculate risks presented in Tables 4A-C above DEP generated cancer risk estimates using the average as the EPC Results are contained in spreadsheets in Attachment 4 The following sections discuss the application of MCP risk management criteria to the risk estimates presented in Attachment 4
Under the Massachusetts Contingency Plan (MCP) hazardous waste sites must be remediated such that long-term risks do not pose significant risk of harm to human health Significant risk exists if the excess lifetime cancer risk exceeds the MCP risk limit of 1 x 10⁵ or if the noncancer hazard index (HI) exceeds the MCP risk limit of one (310 CMR 400993(6))
The MCP states that conditions at a disposal site pose an Imminent Hazard based upon the potential for cancer effects if the estimated excess lifetime cancer risk (ELCR) calculated for the short period of time under evaluation is greater than a cancer risk limit of 1 x 10⁵ (310 CMR 400955(2)(b)(l)) The MCP also provides that a HI limit of 10 is used to evaluate imminent hazards when the level of uncertainty inherent in a Reference Dose is high (greater than a factor of 10)- When the level of uncertainty inherent in a Reference Dose is low (less than or equal to a factor of 10) a HI limit of one is used (310 CMR 400955(2)(c)) In this evaluation it is appropriate to use a HI limit of 10 to evaluate imminent hazards from chronic and subchronic exposures to PCBs because the level of uncertainty inherent in each of the chronic and subchronic PCB RfDs is greater than 10 (IRIS 1998 HEAST 1997) Imminent hazards are levels of risk at which the MCP requires an Immediate Response Action to abate prevent or eliminate the imminent hazard
Cancer Risks As shown in Attachment 4 the ELCR calculated for exposure to soils in each of the three exposure areas exceeds the MCP risk limibfofSignificanfrisk to human health and exceeds the MCP Imminent Hazard risk limit For sediments the ELCR in Area B exceeds the MCP Imminent Hazard risk limit
Therefore it can be concluded that
bull PCB-contaminated soils in Exposure Areas A-C pose significant risk of harm to human health and an Imminent Hazard based upon the potential for cancer health effects
bull PCB-contaminated sediments in Exposure Area B pose significant risk of harm to human health and an Imminent Hazard based upon the potential for cancer health effects
NonConcer Risks As shown in Attachment 4 the His calculated for soils and sediment in each of the three exposure areas exceed the MCP risk limit for significant risk to human health In Area A the HI for soil exceeds the
e
- 16shy
MCP risk limit for an Imminent Hazard In Area B the HI for sediments also exceeds the MCP risk limit for an Imminent Hazard Therefore it can be concluded that
bull PCB-contaminated soils and sediments in exposure areas A-C pose significant risk of harm to human health based upon the potential for noncancer health effects
bull PCB-contaminated soils in exposure area A pose an Imminent Hazard to human health based upon the potential for noncancer health effects
bull PCB-contaminated sediments in exposure area B pose an Imminent Hazard to human health based upon the potential for noncancer health effects
If conditions at a site constitute an Imminent Hazard based on the potential for either cancer or noncancer health effects the MCP requires an Immediate Response Action to abate prevent or eliminate the Imminent Hazard
C Other Risk CharacterizationRisk Management Considerations
In order to make a judgment as to whether a specific dose level poses a health risk the level of uncertainty in the risk assessment along with qualitative information should be considered in addition to risk results This is discussed in more detail in the paragraphs which follow
1 Characterization of PCB Contamination
a)deg The number of soil and sediment samples available for the area of interest is one uncertainty about the risks associated with the exposure activities evaluated There are large numbers of sediment and soil samples available for each exposure area However each exposure area is also fairly large EPAs sampling effort in riverbank and floodplain soils was biased towards areas with high exposure potential but not necessarily to areas with high PCB concentration (EPA 1998a) Thus EPA samples may not represent the highest concentrations present Use of the UCLps or the maximum concentration provides a conservative estimate of the concentrations to which a receptor is exposed However it is possible that additional sampling could indicate that even higher PCB levels are present in the area
b) In this evaluation samples were included in the EPC only if they began at the surface In other words a sample result from the interval 6 to 12 inches would not have been included in the EPC In at least one stretch of the river (Newell to Elm Streets) there are samples from just below the 6-inch depth interval with PCB concentrations in the thousands of parts-per-million (Blasland Bouck amp Lee 1997) The EPCs used in this evaluation do not reflect these high PCB concentrations at depth Because of the dynamic nature of the river it is possible that these highly-contaminated sediments could become exposed at the surface where a receptor could come into contact with them If this is the case then this evaluation could underestimate actual risks
c) Another uncertainty about the risks evaluated in this memorandum is that some of the sediment data was collected from locations that are covered by shallow water for part of the year This may over or underestimate the PCB concentration in sediments at the waters edge that a receptor may come into contact with on a regular and continuing basis
- 17shy
d) It is possible that this evaluation could underestimate actual exposures and risks to the youth trespasser because PCB floodplain data from Oxbow Areas A and C were not included in the EPCs As stated previously Oxbows Area A and C are located in reaches 3-8 and 3-9
2 Exposure Assessment
a) The youth trespasser evaluated in this memorandum could receive additional exposures from PCBs present in his or her residential yard It is possible that a youth trespasser who receives PCB exposure to the sediments floodplain soils or bank soils may in fact have higher exposures and risks than estimated in this evaluation because of exposure to other sources of PCBs in other areas
b) This analysis does not consider risks from fish consumption Currently there is a fish consumption advisory in place for all fish species in the area of concern However there is no enforcement mechanism in the advisory and no monitoring of the advisorys effectiveness in preventing exposure Currently 37 of male and 31 of female Pittsfield residents surveyed by the Massachusetts Department of Public Health reported eating freshwater fish (not necessarily from the Housatonic) (MA DPH 1997) The fish consumption advisory is communicated by a brochure distributed when individuals receive fishing licenses In addition the advisory is posted on some locations on the river However young people under 16 years old can fish without a license and they may walk to and fish from locations that are not posted If individuals ignore the advisory or are not aware of it their cumulative risk may be much higher than the risks presented in this evaluation Risks from consuming Housatonic River fish were not considered in this memorandum However for purposes of providing supplemental information bullto EPA risk managers Appendix A to this memorandum contains risk calculations prepared by EPA for fish consumption assuming full use of the Housatonic River fishing resource
c) The exposure period evaluated for the child resident (7 years) may underestimate the actual exposure -that a resident may receive because it does not account for continuing exposure a resident may receive after age 12 Moreover PCBs have been present in the area of interest for many years already making it likely that exposure has already occurred for many years bull
d) In this evaluation it is assumed that a receptor is exposed to either soil or sediment and not both Because of the nature of the activity assumed to occur on the riverbanks and at the waters edge a receptor would actually be exposed to both soil and sediment as heshe climbs up and down the bank to the waters edge In areas A and C PCB concentrations in bank and floodplain soils are higher than in sediments If a receptor is contacting both soil and sediment then hisher risks would be different than the estimated risks presented in this evaluation
e) This analysis uses a dermal adherence value of 051 mgcm2 and an incidental soil ingestion rate for children 6 years and older of 100 mgday and 50 mgday for adults There are not good quantitative estimates for soil ingestion for children between the ages of 6 and 18 Limited data on children playing in wet soils suggest that dermal adherence could be 1 mgcm2 (EPA 1992) or higher (Kissel 1996) If the risk calculations in this evaluation had assumed a soil ingestion of 200 mgday for children up to age 12 100 mgday for youth trespassers and a dermal adherence of 1 mgcm2 then the risks would be about 2 times those presented here For example the noncancer hazard index would be roughly 300 for the 9-year old contacting soil in area A and roughly 500 for the 5-year old contacting sediment in area B
- 18shy
A choice of more conservative but still reasonable factors given the uncertainty in the application of the scientific information to site conditions could double the risks calculated in this memorandum
3 PCB Toxicity
a) Because of a lack of data this evaluation does not consider potential risks from exposure to dioxin-like PCBs Dioxin-like PCBs are PCB congeners which resemble dioxin (ie 2378- bdquo tetrachlorodibenzo-p-dioxin) in structure and toxicity If dioxin-like PCBs are present the risks could be much greater than those calculated The presence of highly chlorinated PCBs such as Aroclor 1260 in the area of interest makes the presence of dioxin-like PCBs a strong possibility
b) In many risk assessments doses received by laboratory animals in toxicity studies are substantially higher than estimated doses received by exposed receptors In this risk assessment some of the estimated dose rates received by exposed receptors are similar to dose rates received in the noncanccr PCB toxicity studies Therefore it can be concluded that there is less uncertainty about potential o noncancer effects of PCB exposure at this site than in risk assessments for many other sites
- 19shy
REFERENCES
ATSDR 1996 Public Health Implications ofPCB Exposures Agency for Toxic Substances and Disease Registry US Department of Health and Human Services Atlanta GA and US Environmental Protection Agency Washington DC December 1996
ATSDR 1997 Toxicological Profile for Polychlorinated Biphenyls Update prepared by Research Triangle Institute for the US Department of Health and Human Services Agency for Toxic Substances and Disease Registry September 1997
TechLaw Inc 1998 Draft Sediment Sampling Data for Samples collected during September through November 1998 Data collected by TechLaw Inc for EPA under EPA Contract No 68-W4-0013 and EPA Work Assignment No R01012 April 6 1998
Blasland Bouck and Lee 1996 Supplemental Phase IIRCRA Facility Investigation Report for Housatonic River and Silver Lake perpared by Blasland Bouck and Lee for General Electric January 1996
Blasland Bouck and Lee 1997 Building 68 Area Removal Action Work Plan prepared by Blasland Bouck and Lee on behalf of General Electric May 1997
Calabrese 1997 Soil Ingestion A Concern for Acute Toxicity in Children Calabrese EJ Stanek^EJ James RC et al Environmental Health Perspectives 1051354-58 December 1997
ChemRisk 1997 Work Plan for the Ecological Risk Assessment of the Housatonic River Site Volume II Appendix A Sampling Maps prepared by ChemRisk on behalf of General Electric May 24 1997
DEP 1992 Documentation For The Risk Assessment Shortform Residential Scenario Massachusetts Department of Environmental Protection Office of Research and Standards and the Bureau of Waste Site Cleanup Policy BWSCORS-142-92 October 1992
DEP 1995 Guidance For Disposal Site Risk Chatiacterization In Support of the Massachusetts Contingency Plan Interim Final Policy BWSCORS-95-141 Massachusetts Department of Environmental Protection Bureau of Waste Site Cleanup and Office of Research and Standards July 1995
DEPEPA 1997 Joint DEPEPA Technical and Review Comments on General Electric Proposal for Human Health Risk Assessment of the Housatonic River August 13 1997
EPA 1989 Risk Assessment Guidance for Superfund Volume I - Human Health Evaluation Manual (Part A) Interim Final US Environmental Protection Agency Office of Emergency and Remedial Response EPA5401-89002 December 1989
EPA 1990 A Guide on Remedial Actions at Superfund Sites with PCB Contamination EPA Office of Solid Waste and Emergency Response Directive 93554-01 August 1990
- 2 0 shy
EPA 1992 Dermal Exposure Assessment Principles and Applications Interim Report Exposure Assessment Group Office of Health and Environmental Assessment US Environmental Protection Agency EPA6008-9101 IB January 1992
EPA 1994 EPA Region One Waste Management Division Risk Updates Number 2 August 1994
EPA 1995 Land use in the CERCLA Remedy Selection Process Memorandum from Elliott P Laws to Directors of Waste Management Division OSWER Directive 93557-04 Office of Solid Waste and Emergency Response May 25 1995
EPA 1996 PCB Cancer Dose-Response Assessment and Application to Environmental Mixtures National Center for Environmental Assessment Office of Research and Development US EPA EPA600P-96001F September 1996
EPA 1997 Exposure Factors Handbook Volume General Factors US Environmental Protection Agency Office of Research and Development EPA600P-95002Fa August 1997
EPA 1998 Dermal Workgroup Response to GEs Challenge to the Soil Dermal Absorption Value for PCBs of 14 EPA Interoffice Memorandum from EPA Dermal Workgroup to Mary Ballew Region I RCRA Program January 27 1998
EPA 1998a General Electric - PCB Testing Results for Samples collected for EPA by Roy F Weston in March 1998 Memorandum from Peter Philbrook EPA Environmental Services Division to Susan Svirsky EPA March 23 1998
Gilbert 1987 Statistical Methods for Environmental Pollution Monitoring RO Gilbert Van Nostrand Reinhold NY 1987
HEAST 1997 Health Effects Assessment Summary Tables EPA Office of Solid Waste and Emergency Response 92006-303 (97-1) EPA-540-R-97-036 PB97-921199 July 1997
IRIS 1998 EPA Integrated Risk Information System 1998
Mass DPH 1997 Housatonic River Area PCB Exposure Assessment Study Final Report Massachusetts Department of Public Health Bureau of Environmental Health Assessment Environmental Toxicology Unit September 1997
Wester 1993 Percutaneous absorption of PCBs from soil In vivo rhesus monkey in vitro human skin and binding to powdered human stratum corneum RC Wester HI Maibach L Sedik et al Journal of Toxicology and Environmental Health 39375-82
-21 shy
this is uprchSM doc
ATTACHMENT 1
Data used to calculate Exposure Point Concentrations
)HOUSATONIC RIVER SEDIMENT Newell Street to Elm Street Area A sediments
STATION SO-9-G 3-1A-3A 3-2A-1 HCSE-5 3-5A-3 S09F
S09E1 S09E2 3-6A-1 3-6A S09D BBS09D S09C S09B 3-7B S09A HCSE-15 3-7D-CRD 3-6C-18 3-6C-66 3-6C-20 3-6C-55 3-6C-22 3-6C-49 3-6C-48 3-6C-27 3-6C-79 3-6C-35 3-6C-38 3-6C-62 3-6C-41 3-6C-65 3-6C-63 3-6C-43 3-6C-44 3-6C-45 3-6C-46 3-6C-47 3-1 A 3-2B 3-4A 3-5D 3-7E 3-8A HCSE-4
ID DEPTH0-0405-6 inches0-4 inches0-101
05-6 inches0-031
0-050-0505-6 inches0-050-030-050-050-0505-6 inches0-050-180-4 inches0-60-60-60-60-60-60-60-50-70-840-840-60-60-60-60-60-60-60-70-60-60-60-60-60-605-6 inches0-16
DATASOURC GEECO 597
GEECO 597 GEECO 597
GEECO 597 GEECO 597
GEECO 597 GEECO 597 GEECO 597
GEECO 597 GEECO 597 GEECO 597 GEECO 597 GEECO 597 GEECO 597
GEECO 597 GEECO 597 GEECO 597
GEECO 597 BLDG68 597 BLDG68 597 BLDG68 597 BLDG68 597 BLDG68 597 BLDG68 597 BLDG68 597 BLDG68 597 BLDG68 597
BLDG68 597 BLDG68 597
BLDG68 597 BLDG68 597 BLDG68 597 BLDG68 597 BLDG68 597 BLDG68 597 BLDG68 597 BLDG68 597 BLDG68 597 ATK ATK ATK ATK ATK
GEECO 597 GEECO 597
cone PCB (ppm) 3400 060 1000 010
6640 140
3000 052 490 030
6700 094 055 570 140 1600 10000 780 2700 120
14000 070 1640 024 1020 2010 120 450 135 036 135 016 102
6170 170 314 334 029 006 170 015 063 180 1580 1500
ND Ln RGBs 353 last modifie -051 051198 230 -230 420 034 340 -065 159 -120 420 -006 -060 174 034 277 461 205 330 018 494 -036 280 -143 232 300 018 150 030 -102 030 -183 002 412 053 114 121 -124 -281 053 -190 -046 059 276 271
S10B1 0-05 GEECO 597 730 199 S10B 0-05 GEECO 597 9000 450 BBS10B 0-05 GEECO 597 1400 264 3-3B-1 05-6 inches GEECO 597 954 226 3E-3 0-15 GEECO 597 860 215 3-8C 05-6 inches GEECO 597 590 177 3-9A 05-6 inches GEECO 597 140 034 HCSE-A6 02-08 T 3-7 SUP PH 14000 494 3-9B-1 05-6 inches GEECO 597 568 174 HCSE-2 0-16 GEECO 597 1000 230 3-9D 05-6 inches GEECO 597 075 -029 3-1 OB 05-6 inches GEECO 597 440 148 3-1 OC 0-05 GEECO 597 960 226 3-10C-1 05-6 inches GEECO 597 8540 445 S10A 0-05 GEECO 597 810 209 3-1 OD 05-6 inches GEECO 597 180 059 HCSE-1 o 0-15 GEECO 597 320 116 3-8C 0-6 ATK 2520 323 3-8E 0-6 ATK 140 034 3-9FF 0-6 ATK 220 079 3-9F 0-6 ATK 1270 254 3-1 OD 0-6 ATK 500 161 3-1 OE 0-6 ATK 190 064
mean 1666 1136 c~nipie variance 96431 3345 v iple stdev 3105 1186 maximum 14000 minimum 006 n 6800 68
Gilbert UCL 45489 Gilbert Mean 21939 Hstat 32125
Elm Street to Dawes Avenue Area B sediments PCB
STATION ID DEPTH DATA SOURC ic(ppm) ND Ln PCBs 4-1A-CRD 0-4 inches GEECO 597 123 481 HCSE-16 0-11 GEECO 597 025 -139 4-2A 05-6 inches GEECO 597 93 223 HCSE-17 0-18 GEECO 597 17 283 4-2B 0-05 GEECO 597 33 350 bull 4-2B-1 05-6 inches GEECO 597 17 283 BBS11 0-05 GEECO 597 22 309 4-3B S11
05-6 inches0-051
GEECO 597 GEECO 597
51 130
163 487
HCSE-18C 0-025 GEECO 597 31 113 HCSE-18B 0-025 GEECO 597 51 393 HCSE-18 0-05 GEECO 597 905 681 4-3A 05-6 inches GEECO 597 16 047 HCSE-18D 0-033 GEECO 597 16 047 HCSE-18A 0-025 GEECO 597 17 283
mean 8906 267 sample variance 265987 420 sample stdev 22948 205 maximum 90500 minimum 025 n 1500 1500
Gilbert UCL 1521077 Gilbert Mean 118141 Hstat 46633
Dawes to the confluence Area C sediments-- ^ PCB
STATION ID DEPTH DATA SOURC conc(ppm) ND Ln PCBs ^ i 05-6 inches GEECO 597 26 096 HCSE-19 0-20 GEECO 597 33 119 4-4C 05-6 inches GEECO 597 36 128 4-4B 0-05 GEECO 597 32 347 MD 05-6 inches GEECO 597 - 98 -=228 V4E 0-0 51 GEECO 597 093 -007 1-5A 05-6 inches GEECO 597 92 222 4-5A() 0-0 51 GEECO 597 16 047 HCSE-20 0-19 GEECO 597 53 167 4-5A-1 05-6 inches GEECO 597 101 231 BBS12 0-05 GEECO 597 24 318 S12 0-05 GEECO 597 28 333 4-5C-1 05-6 inches GEECO 597 1318 258 4-5E 0-05 GEECO 597 47 155 4-5B 05-6 inches GEECO 597 149 270 4-6B 0-05 GEECO 597 17 053 4-6A 05-6 inches GEECO 597 228 313 4-6C 05-6 inches GEECO 597 105 235 4-6D 05-6 inches GEECO 597 78 205 4-6F 05-6 inches GEECO 597 56 172 4-6G 0-05 GEECO 597 17 283 4^c 0-6 ATK 69 193 4 J 0-6 ATK 373 362 4-6H 0-6 ATK 18 059 4-5G 0-6 ATK 164 280 4-5F 0-6 ATK 142 265 4-6J 0-6 ATK 132 488
mean 1619 216 sample variance ----- v63145 ^ 128 sample stdev 2513 113 maximum 13200 minimum 093 n 2700 2700
Gilbert UCL 29580 Gilbert Mean 16361 Hstat 267088
ND - samples where ND was reported were listed as 12 the sample detection limit ATK = Data from AT Kearney GEECO 597 = Work Plan for the Ecological Risk Assessment of the Housatonic River Site Volume II by ChemRisk P ^G68 59 Building 68 Removal Action Work Plan May 1997 by BBL 1 _-7 Supplemental Phase II RCRA Facility Investigation Report for the Housatonic River and Silver Lake Table 3-7 196
GE Housatonic River Bank and Floodplain Data
Newell Street to Elm Street Area A soils last modified PCS 051198
Location Type Depth Cone Report Ln Cone ND
BE-0043-A Bank 0 to 6 250 Weston98 092 BW-0030-A Bank 0 to 6 2700 WestonQS 330 BE-0040-A Bank 0 to 6 580000 Weston9S 86Z BE-0041-A Bank 0 to 6 100000 Weston98 691shyBE-0042-A Bank 0 to 6 021 Weston98 -156 BE-0044-A Bank 0 to 6 488 Weston98 158 BE-0045-A Bank 0 to 6 028 Weston98 -127 BE-0046-A Bank 0 to 6 115 Weston98 014 BW-0031-A Bank 0 to 6 269 Weston98 099 HR-EB2 Bank 0 to 6 60000 ECO-RA 597 640 BW-0032-A Bank 0 to 6 215 Weston98 077 BW-0035-A Bank 0 to 6 11000 Weston98 470 BW-0038-A Bank 0 to 6 730 Weston98 199 BW-0037-A Bank 0 to 6 170 Weston98 053 BW-0036-A Bank 0 to 6 1100 Weston98 240 BW-0034-A Bank 0 to 6 5900 Weston98 408 HR-EB1 Bank 0 to 6 1240 ECO-RA 597 252 BW-0033-A Bank 0 to 6 447 Weston98 150 BE-0039-A Bank 0 to 6 14000 Weston98 494 19-4-1 4D Flood Plain 0 to 6 430 ECO-RA 597 146 19-4-1 4A Flood Plain 0 to 6 620 ECO-RA 597 182 19-4-1 4B Flood Plain 0 to 6 430 ECO-RA 597 146 19-4-1 4C Flood Plain 0 to 6 4700 ECO-RA 597 385 I8-24-5A Flood Plain 0 to 6 3800 ECO-RA 597 364 I8-24-5B Flood Plain 0 to 6 070 ECO-RA 597 -036 I8-24-5C Flood Plain 0 to 6 210 ECO-RA 597 074 BW-0029-A Bank 0 to 6 4300 Weston98 376 BW-0028-A Bank 0 to 6 015 Weston98 -190_ BW-0040-A Bank 0 to 6 3600 Weston98
mean 27477 233 sample variance 117334457 625 sample stdev 108321 250 maximum 580000 minimum 015 n 2900 2900
Gilbert UCL 2393253 Gilbert Mean 233360 Hstat 4928
Elm Street to Dawes Avenue Area B soils
Location
lb-laquo+-6-1 BE-0020-A BE-0014-A BE-0018-A BE-0017-A BE-0016-A BE-0015-A BE-0013-A BE-0034-A BE-0012-A BE-0021-A HR-EB4 HR-EB5 BE-0019-A HR-EB3 BE-0033-A BE-0022-A BE-0023-A BE-0025-A BE-0026-A BE-0027-A F X)24-A Bt-0028-A BE-0029-A BE-0031-A BE-0032-A BE-0030-A
mean variance sample stdev maximum minimum n
Gilbert UCL Gilbert Mean H statistic
Type
Flood plain Bank Bank Bank Bank Bank Bank Bank Bank Bank Bank Bank Bank Bank Bank Bank Bank Bank Bank Bank Bank Bank Bank Bank Bank Bank Bank
Depth
0 to 6 0 to 6 0 to 6 Otofi 0 to 6 0 to 6 0 to 6 0 to 6 0 to 6 0 to 6 0 to 6 0 to 6 0 to 6 0 to 6 0 to 6 0 to 6 0 to 6 0 to 6 0 to 6 0 to 6 0 to 6 0 to 6 0 to 6 0 to 6 0 to 6 0 to 6 0 to 6
PCB Cone
010100 010188 010100 17017000 020200 141499 18018000 010100 17017000 33033000 39039000
3770377000 2680268000 32032000 000077 28928966 242499 040455 010122 010100 46046000 14014000 343400 010100 030366 010100 65065000
3572 736324
8581 37700
007 2700
Report
ECO-RA 597 Weston98 Weston98 Weston98 Weston98 Weston98 Weston98 Weston98 Weston98 Weston98 Weston98 ECO-RA597 ECO-RA 597 Weston98 ECO-RA 597 Weston98 Weston98 Weston98 Weston98 Weston98 Weston98 Weston98 Weston98 Weston98 Weston98 Weston98 Weston98
bullbull
Ln Cone ND
-230 -171 -230 283 -163 040 289 -230 283 350 366 593 559 347 -266 337 091 -081 -208 -230 383 264 122 -230 -102 -230 417
087 813 285
2700
2857310 139253
5403
Dawes Avenue to the confluence of the Housatonic with the West Branch Area C soils PCB
Location Type Depth Cone Report Ln Cone ND I7-2-45A Flood Plain 0 to 6 12 ECO-RA 597 248 I7-2-45B Flood Plain 0 to 6 10 ECO-RA 597 230 I7-2-45C Flood Plain 0 to 6 30 ECO-RA 597 340 I7-2-33A Flood Plain 0 to 6 12 ECO-RA 597 248 I7-2-33B Flood Plain 0 to 6 49 ECO-RA 597 389 I7-2-33B-1 Flood Plain 0 to 6 62 ECO-RA 597 182 I7-2-33B-2 Flood Plain 0 to 6 16 ECO-RA 597 277 I7-2-33B-6 Flood Plain 0 to 6 34 ECO-RA 597 353 I7-2-33C Flood Plain 0 to 6 46 ECO-RA 597 153 I7-2-33D Flood Plain 0 to 6 36 ECO-RA 597 128 I7-2-32A Flood Plain 0 to 6 92 ECO-RA 597 452 I7-2-32A-5 Flood Plain 0 to 6 25 ECO-RA 597 ltQ92 I7-2-32B Flood Plain 0 to 6 24 ECO-RA 597 318 I7-3-7A-1 Flood Plain 0 to 6 12 ECO-RA 597 248 I7-3-7A Flood Plain 0 to 6 82 ECO-RA 597 441 I7-3-7A-2 Flood Plain 0 to 6 160 ECO-RA 597 508 I7-3-7B Flood Plain 0 to 6 24 ECO-RA 597 318 I7-3-7C Flood Plain 0 to 6 30 ECO-RA 597 340 I7-3-6C-12 Flood Plain 0 to 6 125 ECO-RA 597 253 I7-3-6C-10 Flood Plain 0 to 6 46 ECO-RA 597 383 I7-3-6C Flood Plain 0 to 6 62 ECO-RA 597 413 I7-3-6A Flood Plain 0 to 6 27 ECO-RA 597 330 I7-3-6B Flood Plain 0 to 6 40 ECO-RA 597 369 I7-2-25C Flood Plain 0 to 6 74 ECO-RA 597 200 I7-2-25B Flood Plain 0 to 6 56 ECO-RA 597 172 I7-2-25A Flood Plain 0 to 6 39 ECO-RA 597 366 I7-3-1A Flood Plain 0 to 6 12 ECO-RA 597 248 17-3-1 B Flood Plain 0 to 6 12 ECO-RA 597 248 17-3-1 C Flood Plain 0 to 6 33 ECO-RA 597 119 17-3-1 F Flood Plain 0 to 6 79 ^ECO-RA 597 207 17-1 -3A Flood Plain 0 to 6 07 ECO-RA 597 -036 16-1 -67B Flood Plain 0 to 6 64 ECO-RA 597 186 16-1 -67A Flood Plain 0 to 6 44 ECO-RA 597 378 16-1 -66A Flood Plain 0 to 6 15 ECO-RA 597 271 16-1 -66B Flood Plain 0 to 6 34 ECO-RA 597 353 17-1 -4A Flood Plain 0 to 6 8 ECO-RA 597 208 16-1 -64A Flood Plain 0 to 6 40 ECO-RA 597 369 16-1 -64B Flood Plain 0 to 6 1 ECO-RA 597 000 16-1 -62A Flood Plain 0 to 6 62 ECO-RA 597 182 16-1 -62B Flood Plain 0 to 6 12 ECO-RA 597 248
17-2-20-19 Flood Plain 0 to 6 349 SITE EXAC 695 355 17-2-20-1 Flood Plain 0 to 6 395 - SITE EXAC 695 368 I7-2-20-3 Flood Plain 0 to 6 57 SITE EXAC 695 174 P 9-20-2 Flood Plain 0 to 6 17 SITE EXAC 695 283
-20-12 Flood Plain 0 to 6 29 SITE EXAC 695 106 17-2-20-11 Flood Plain 0 to 6 26 SITE EXAC 695 096 I7-2-20-6 Flood Plain 0 to 6 4 SITE EXAC 695 139 17-2-20-16 Flood Plain 0 to 6 22 SITE EXAC 695 079 I7-2-3-2 Flood Plain 0 to 6 12 bull Sim-EXAC 695 018 BE-0011-A Bank 0 to 6 300 Weston98 340 BE-0010-A Bank 0 to 6 180 Weston98 289 BW-0023-A Bank 0 to 6 29 Weston98 107 BW-0025-A Bank 0 to 6 400 Weston98 369 BW-0027-A Bank 0 to 6 830 Weston98 442 BW-0026-A Bank 0 to 6 270 Weston98 330 BW-0024-A Bank 0 to 6 165 Weston98 280 BE-0009-A Bank 0 to 6 290 Weston98 337 BE-0004-A Bank 0 to 6 480 Weston98 387 BE-0008-A Bank 0 to 6 280 Weston98 333 HR-EB6 Bank 0 to 6 31 ECO-RA597 114 HR-EB7 Bank 0 to 6 07 ECO-RA 597 -037 BE-0002-A Bank 0 to 6 650 Weston98 417 BW-0021-A Bank 0 to 6 290 Weston98 337 BE-0003-A Bank 0 to 6 140 Weston98 264 BE-0007-A Bank 0 to 6 01 Weston98 -230 P--0001 -A Bank 0 to 6 41 Weston98 141 c -0005-A Bank 0 to 6 250 Weston98 322 BE-0006-A Bank 0 to 6 02 Weston98 -149 BW-0022-A Bank 0 to 6 590 Weston98 408 BW-0008-A Bank 0 to 6 130 Weston98 256 BW-0020-A Bank 0 to 6 370 Weston98 361 BW-0019-A Bank 0 to 6 340 Weston98 353 BW-0002-A Bank 0 to 6 690 Weston98 423 BW-0004-A Bank 0 to 6 480 L West$n98 387 BW-0003-A Bank 0 to 6 210 Weston98 304 BE-0037-A Bank 0 to 6 24 Weston98 089 BW-0001-A Bank 0 to 6 41 Weston98 142 BW-0006-A Bank 0 to 6 130 Weston98 256 BE-0036-A Bank 0 to 6 230 Weston98 314 BE-0035-A Bank 0 to 6 210 Weston98 304
BW-0005-A Bank 0 to 6 82 Weston98 210 BAMXX)9-A Bank 0 to 6 120 Weston98 248 BW-0007-A Bank 0 to 6 91 Weston98 221 BW-0018-A Bank 0 to 6 470 Weston98 385 BW-0015-A Bank 0 to 6 02 Weston98 -190 BW-0017-A Bank 0 to 6 360 Weston98 358 BW-0016-A Bank 0 to 6 100 Weston98 230 BW-0013-A Bank 0 to 6 01 Weston98 -230 BW-O014-A Bank 0 to 6 - 01 Weston98 -230 BW-0010-A Bank 0 to 6 180 Weston98 289 BW-0012-A Bank 0 to 6 01 Weston98 -230 BW-0011-A Bank 0 to 6 200 Weston98 300
mean 2310 236 sample variance 63598 268 sample stdev 2522 164 maximum 16000 minimum 010 n 9200 9200
Gilbert UCL 67810 Gilbert Mean 40448 Hstat 30098
ND - samples where ND was reported were listed as 12 the sample detection limit
ECO-RA 597 = Work Plan for the-Ecological Risk Assessments the Housatonic River Site Volume II May 24 1997 by Chem Risk SITE EXCAVATION PLAN 95-03-47-4 dated 695 Note Flood plain samples selected were those samples located within the 1 ppm isopleth that were not excavated or capped during short term measures or immediate response actions performed by GE Weston98 = Samples collected by Weston in March 1998
ATTACHMENT 2
Table of Skin Surface Areas by Age Group
Part of the Body Skin Surface Area (cm) Age9lt18
Hands 7462 Arms 18638 Feet 10710 Lower Legs 17563
Age 9 Hands 5618 Arms 13038 Feet 8056 Lower Legs 12169
Age 5lt12 Hands 51602 Arms 12926 Feet 7365 Lower Legs 11301 Legs 28252
Age5 Hands 4440 Arms 10906 Feet 5687 Lower Legs 8662 Legs 21656
Age 1lt6 Hands ~ 3650 Arms 8617 Feet 4578 Lower Legs 6735 Legs 16837
1 Skin Surface Areas are 50th percentile values for females (DEP 1995)
ATTACHMENT 3
Spreadsheets showing risk calculations
RISK CALCULATIONS PCB Exposure in Reaches 3-1 to 4-6 Housatonlc River
REACH A 3-1 TO 3-10 NEWELL TO ELM Trespasser Age 9lt18 - CANCER Trespasser Age 9lt18 - CHRONIC NONCANCER Trespasser Age 9 - SUBCHRONIC Trespasser Age 9lt18 - CANCER Trespasser Age 9lt18 - CHRONIC NONCANCER Trespasser Age 9 - SUBCHRONIC
REACH B 4-1 TO 4-3 ELM TOD AWES
Wader Age 5lt12 - CANCER Wader Age 5lt12 - CHRONIC NONCANCER Wader Age 5 - SUBCHRONIC Wader Age 5lt12 - CANCER Wader Age 5lt12 - CHRONIC NONCANCER Wader Age 5 - SUBCHRONIC
REACH C 4-4 TO 4-6 DAWES TO CONFLUENCE Young Resident Age 1lt 6 - CANCER Young Resident Age 1 lt 6 - CHR NONCANCER Young Resident Age 5 - SUBCHRONIC Young Resident Age 1 lt 6 - CANCER Young Resident Age 1lt 6 - CHR NONCANCER Young Resident Age 5 - SUBCHRONIC
Media
Soil Soil Soil Sediment Sediment Sediment
Media
Soil Soil Soil Sediment Sediment Sediment
Media
Soil Soil Soil Sediment Sediment Sediment
ELCR
983E-04
188E-05
ELCR
355E-04
503E-04
ELCR
737E-05
178E-05
HI
1910445 1481659
3661686 2839847
HI
8879105 7425684
1256323 2413448
HI
2580036 157254
6226499 9133987
(L)ADDoral mgkg-d
56054E-05 43597E-04 11304E-03 10744E-06 83562E-06 21667E-05
ADDoral mgkg-d
28423E-05 28423E-04 70840E-04
- 28986E-05 28986E-04 17005E-03
ADDoral mgkg-d
13734E-05 19228E-04 25196E-04 26125E-06 36575E-05 11282E-04
L)ADDdermal EPC RfD CSF mgkg-d mgkg mgkg-d (mgkg-d)-1
43520E-04 240000 2E-05 2 33S49E-03 240000 2E-05 2 62779E-03
tsect3414E-06 240000
4600 5E-05 2E-05
2 f2
sectlt4878E-05 12033E-04
4600 4600
2E-05 5E-05
2 f
ADDdermal EPC RfD CSF mgkg-d mgkg mgkg-d (mgkg-d)-1
14916E-04 37700 2E-05 pound
14916E-03 37700 2E-05 pound
30044E-03 37700 5E-05 4
422228E-04 90500 2E-05 422228E-03 90500 2E-05 f
4 10367E-02 90500 5E-05
ADDdermal EPC RfD CSF mgkg-d mgkg mgkg-d (mgkg-d)-1
23123E-05 6700 2E-05 2 32373E-04 6700 2E-05 gt 53431 E-04 6700 5E-05 t 62825E-06 3000 2E-05
- 8J955E-05 3000 2E-05 34388E-04 3000 5E-05
this Is UD rchsxls
RISK CALCULATIONS PCB Exposure in Reaches 3-1 to 4-6 Housatonic River
REACH A 3-1 TO 3-10 NEWELL TO ELM
Trespasser Age 9lt18 - CANCER Trespasser Age 9lt18 - CHRONIC NONCANCER Trespasser Age 9 - SUBCHRONIC Trespasser Age 9lt18 - CANCER Trespasser Age 9lt18 - CHRONIC NONCANCER Trespasser Age 9 - SUBCHRONIC
REACH B 4-1 TO 4-3 ELM TOD AWES
Wader Age 5lt12 - CANCER Wader Age 5lt12 - CHRONIC NONCANCER Wader Age 5 - SUBCHRONIC Wader Age 5lt12 - CANCER Wader Age 5lt12 - CHRONIC NONCANCER Wader Age 5 - SUBCHRONIC
REACH C 4-4 TO 4-6 DAWES TO CONFLUENCE
Youqg Resident Age 1lt 6gtT CANCER Youflg Resident Age 1lt 6 - CHR NONCANCER Young Resident Age 5 - SUBCHRONIC Young Resident Age 1 lt 6 - CANCER Young Resident Age 1 lt 6 - CHR NONCANCER Young Resident Age 5 - SUBCHRONIC
^
kgmg
100E-06 100E-06 100E-06 100E-06 100E-06 100E-06
C kgmg
100E-06 100E-06 100E-06 100E-06 100E-06 100E-06
C kgmg
100E-06 100E-06 100E-06 100E-06 100E-06 100E-06
IR mgd
IR mgd
IR mgd
50 50 50 50 50 50
50 50 50 50 50 50
100 100 100 100 100 100
EF evd
EF evd
EF evd
0167 0167 0283 0167 0167 0283
1
0419 0419 0707 0178 0178 0707
0419 0419 0707 0178 0178 0707
ED dev
ED dev
ED dev
EP days
1 1 1 1 1 1
EP days
1 1 1 1 1 1
EPdays
bull bull bull bull bull bull
3285 3285 214
3285 3285 214
2555 2555 214
2555 2555
92
1825 1825 214
1825 1825
92
RAF-o
RAF-o
RAF-o
RAF-d
1 014 1 014 1 014 1 014 1 014 1 014
RAF-d
bull 014 bull 014 bull 014 bull 014 bull 014 bull 014
RAF-d
014 014 014 014 014 014
BW AP
kg days
46 25550 46 3285 30 214 46 25550 46 3285 30 214
BW AP kg days
278 25550 278 2555 188 214 278 25550 278 2555 188 92
BW AP
kg days 146 25550 146 1825 188 214 146 25550
146 1825
188 92
this Is up_rchsxls
v
RISK CALCULATIONS PCB Exposure in Reaches 3-1 to 4-6 Housatonic River
REACH A 3-1 TO 3-10 SA AF NEWELL TO ELM cm2d mgcm2
Trespasser Age 9lt18 - CANCER 5437 051 Trespasser Age 9lt18 - CHRONIC NONCANCER 5437 051 Trespasser Age 9 shy SUBCHRONIC 3889 051 Trespasser Age 9lt18 shy CANCER 5437 051 Trespasser Age 9lt18 - CHRONIC NONCANCER 5437 051 Trespasser Age 9 - SUBCHRONIC 3889 051
REACH B 4-1 TO 4-3 SA AF ELM TO DAWES cm2d mgcm2 Wader Age 5lt12 - CANCER 3675 051 Wader Age 5lt12 - CHRONIC NONCANCER 3675 051 Wader Age 5 shy SUBCHRONIC 2970 051 Wader Age 5lt12 shy CANCER 5370 051 Wader Age 5lt12 - CHRONIC NONCANCER 5370 051 Wader Age 5 - SUBCHRONIC 4269 051
bull REACH C 4-4 TO 4-6 SA AF DAWES TO CONFLUENCE cm2d mgcm2
Young Resident Age 1lt 6 - CANCER 2358 051 Young Resident Age 1 lt 6 - CHR NONCANCER 2358 051 Young Resident Age 5 - SUBCHRONIC 2970 051 Young Resident Age 1 lt 6 - CANCER 3368 051 Young Resident Age 1lt 6 - CHR NONCANCER 3368 051 Young Resident Age 5 - SUBCHRONIC 4269 051
this is UD rchixls
g
ATTACHMENT 4
Spreadsheets showing risk calculations using Arithmetic Average PCB Concentrations for the EPCs
RISK CALCULATIONS Using AVERAGE PCB concentration as EPC REACH A 3-1 TO 3-10 NEWELL TO ELM
Trespasser Age 9lt18 - CANCER Trespasser Age 9lt18 - CHRONIC NONCANCER Trespasser Age 9 - SUBCHRONIC Trespasser Age 9lt18 - CANCER Trespasser Age 9lt18 - CHRONIC NONCANCER Trespasser Age 9 - SUBCHRONIC
REACH B 4-1 TO 4-3
Wader Age 5lt12 - CANCER Wader Age 5lt12 - CHRONIC NONCANCER Wader Age 5 - SUBCHRONIC Wader Age 5lt12 - CANCER Wader Age 5lt12 - CHRONIC NONCANCER Wader Age 5 - SUBCHRONIC
REACH C 4-4 TO 4-6
Young Resident Age 1lt 6 - CANCER Young Resident Age 1lt 6 - CHR NONCANCER Young Resident Age 5 - SUBCHRONIC Young Resident Age 1lt 6 - CANCER Young Resident Age 1lt 6 - CHR NONCANCER Young Resident Age 5- SUBCHRONIC
Media
Soil Soil Soil Sediment Sediment Sediment
Media
Soil Soil Soil Sediment Sediment Sediment
Media
Soil Soil Soil Sediment Sediment Sediment
ELCR
105E-04
638E-06
ELCR
315E-05
462E-05
ELCR
233E-05
887E-06
HI ADDoral ADDdermal EPC RfD CSF
mgkg-d mgkg-d mgkg mgkg-d mgkg-d)-1
59903E-06 46509E-05 27480 2E-05 2 218746 4991 9E-05 38757E-04 27480 2E-05 2
16965 12943E-04 71882E-04 27480 5E-05 2 36382E-07 28247E-06 1669 2E-05 2
1328555 30318E-06 23539E-05 1669 2E-05 2 103037 78612E-06 43657E-05 1669 5E-05 2
HI ADDoral ADDdermal EPC RfD CSF mgkg-d mgkg-d mgkg mgkg-d (mgkg-d)-1
25191E-06 13220E-05 3580 2E-05 A
48431617 26990E-05 14164E-04 3580 2E-05 47051445 67270E-05 28530E-04 3580 5E-05
26624E-06 20416E-05 8906 2E-05 2 1236333 28525E-05 21874E-04 8906 2E-05 2 2375046 - 16735E-04 10202E-03 8906 5E-05 2
HI ADDoral ADDdermal EPC RfD CSF
mgkg-d mgkg-d mgkg mgkg-d (mgkg-d)-1 43354E-06 72991 E-06 2266 2E-05 2
8725911 65031 E-05 10949E-04 2266 2E-05 2
5318471 85216E-05 18071 E-04 2266 5E-05 2
13021E-06 31312E-06 1602 2E-05 t 332495 19531 E-05 46968E-05 1602 2E-05
4877549 60245E-05 18363E-04 1602 5E-05
RISK CALCULATIONS Using AVERAGE PCB concentration as EPC REACH A 3-1 TO 3-10 NEWELL TO ELM
Trespasser Age 9lt18 - CANCER Trespasser Age 9lt18 - CHRONIC NONCANCER Trespasser Age 9 - SUBCHRONIC Trespasser Age 9lt18 - CANCER Trespasser Age 9lt18 - CHRONIC NONCANCER Trespasser Age 9 - SUpoundCHRONIC
REACH B 4-1 TO 4-3
Wader Age 5lt12 - CANCER Wada Age 5lt12 - CHRONIC NONCANCER Wader Age 5 - SUBCHRONIC Wader Age 5lt12 - CANCER Wader Age 5lt12 - CHRONIC NONCANCER Wader Age 5 - SUBCHRONIC
REACH C 4-4 TO 4-6
Young Resident Age 1lt 6 - CANCER Young Resident Agegt1 lt 6 - CHR NONCANCER Young Resident Age 5 - SUBCHRONIC Young Resident Age 1 lt 6 - CANCER Young Resident Age 1lt 6 - CHR NONCANCER Young Resident Age 5- SUBCHRONIC
C kgmg
100E-06 100E-06 100E-06 100E-06 100E-06 100E-06
C kgmg
100E-06 100E-06 100E-06 100E-06 100E-06 100E-06
C kgmg
100E-06 100E-06 100E-06 100E-06 100E-06 100E-06
R mgd
IR mgd
IR mgd
50 50 50 50 50 50
50 50 50 50 50 50
100 100 100 100 100 100
EF evd
EF evd
EF evd
0167 0167 0283 0167 0167 0283
0419 0419 0707 0178 0178 0707
0419 0419 0707 0178 0178 0707
ED dev
ED dev
ED dev
EP RAF-o days
1 3285 1 3285 1 214 1 3285 1 3285 1 214
EP RAF-o days
1 2565 1 25sect5 1 214 1 2555 1 2555 1 92
EP RAF-o days
bull 1825 bull 1825 bull 214 bull 1825 bull 1825 bull 92
RAF-d
1 014 1 014 1 014 1 014 1 014 1 014
RAF-d
1 014 1 014 014 014 bull 014 014
RAF-d
bull 014 bull 014 bull 014 bull 014 bull 014
014
BW AP
kg days
46 27375 46 3285 30 214 46 27375 46 3285 30 214
BW AP
kg days
278 27375 278 2555 188 214 278 27375 278 2555 188 92
BW AP
kg days
146 27375 146 1825 188 214 146 27375 146 1825 188 92
thU is up_rchsxls
RISK CALCULATIONS Using AVERAGE PCB concentration as EPC REACH A 3-1 TO 3-10 SA AF NEWELL TO ELM cm2d mgcm2 Trespasser Age 9lt18 - CANCER 5437 051 Trespasser Age 9lt18 - CHRONIC NONCANCER 5437 051 Trespasser Age 9 - SUBCHRONIC 3889 051 Trespasser Age 9lt18 - CANCER 5437 051 Trespasser Age 9lt18 - CHRONIC NONCANCER 5437 051 Trespasser Age 9 - SUBCHRONIC 3889 051
SA AF REACH B 4-1 TO 4-3 cm2d mgcm2 Wader Age 5lt12 - CANCER 3675 051 Wader Age 5lt12 - CHRONIC NONCANCER 3675 051 Wader Age 5 - SUBCHRONIC 2970 051 Wader Age 5lt12 - CANCER 5370 051 Wader Age 5lt12 - CHRONIC NONCANCER 5370 051 Wader Age 5 - SUBCHRONIC 4269 051
SA AF REACH C 4-4 TO 4-6 cm2d mgcm2
Young Resident Age 1lt 6 - CANCER 2358 051 Young Resident Age 1lt 6 - CHR NONCANCER 2358 051 Young Resident Age 5 - SUBCHRONIC 2970 051 Young Resident Age 1 lt 6 - CANCER 3368 051 Young Resident Age 1lt 6 - CHR NONCANCER 3368 051 Young Resident Age 5- SUBCHRONIC 4269 051
Appendix A Memo on Potential Human Health Risks from Consuming Fish from the Housatonic River in Massachusetts
United States Boston Massachusetts 02203 Environmental Protection Agency (617)565-3420 New England Region JF Kennedy Federal Building
MEMORANDUM
DATE May 141998
SUBJ Potential Human Health Risks from Consuming Fish from the Housatonic River in Massachusetts
FROM Mary BaUew Environmental Scientist EPA TO Bryan Olson Project Manager Office of Site Remediation and Restoration EPA
I INTRODUCTION
This memo provides calculations and a limited discussion of potential risks from consuming fish from the Housatonic River in Massachusetts Currently there is a fishing advisory on the Housatonic which may help to limit fish consumption
EL CONCLUSIONS
Consumption of fish in the Housatonic river even for periods as short as one summer presents a significant risk to human health
DL HAZARD IDENTIFICATION
For the Housatonic River in Massachusetts there is-afish consumption advisory in place for all fish species However there is no enforcement mechanism in the advisory and no monitoring of the advisorys effectiveness in preventing exposure Currently 37 of male and 31 of female Pittsfield residents surveyed by the Massachusetts Department of Public Health reported eating freshwater fish (not necessarily from the Housatonic) (MA DPH 1997) The fish consumption advisory is communicated by a brochure distributed when individuals receive fishing licenses In addition the advisory is posted on some locations on the river However young people under 16 years old can fish without a license and they may walk to and fish from locations that are not posted The river has numerous access points by foot or by boat Under the fishing advisory catching and releasing the fish is allowed which adds to the difficulty of monitoring its effectiveness If individuals ignore the advisory or are not aware of it their cumulative risk may be represented by the risks presented in this memo
GE collected young of year1 fish to monitor changes (trends) in PCB levels over time not to represent the type offish people were likely to eat Since these fish were about six months old (Finklestein 1998) they were too small to eat GE reported that composites of young of year fish (pumpkinseeds largemouth bass-and yellow perch) caught in 1994 near New Lenox Road (just downriver of Pittsfield) in the Housatonic ranged from 22 to 35 mg PCBs per kilogram (ppm) of whole fish composite Similarly fish composites at Woods Pond (12 miles downriver of GE) ranged from 3 to 58 ppm (GE 1994) So although Woods Pond contained high levels of PCBs the fish in sections of the river closer to Pittsfield contained comparable levels For example the 69 largemouth bass sampled at New Lenox Road averaged 31 ppm and the 70 largemouth bass sampled at Woods Pond averaged 23 ppm (young of year results GE 1994)
In 1994 the National Biological Survey of the US Geological Survey (USGS) collected 28 largemouth bass from Woods Pond which is a wide shallow section of the Housatonic River PCB levels in 24 whole fish ranged from a minimum of 27 ppm to a maximum of 206 ppm and averaged 100 ppm (not adjusted for lipid) Four additional muscle tissue samples ranged from 13 to 70 ppm PCBs (Attachment Al) Woods Pond is twelve miles downriver from the GE facility and the sediment levels of PCBs in Woods Pond average 27 ppm (personal communication Dean Tagliaferro April 1998) The dominant Aroclors2 found in the fish resemble Aroclors 1254 and 1260 which are the environmentally modified forms of the original Aroclor 1260 released from GE
In 1997 EPA-New England asked the EPA Office of Research and Development for technical assistance to perform congener-specific3 analysis of the USGS fish samples Since this was the only congener-specific data for fish available for the Housatonic River this data was selected for these risk calculations The USGS had a limited amount of data on other species however EPA chose the largemouth bass for congener analysis because they are a popular game species The largemouth bass caught by the USGS were all of a size that would provide good fillets In
1 Young of year fish are those less than one year old
2 PCB mixtures manufactured in the United States carried the trademark Aroclor followed by a four-digit number the first two digits are 12 and the last two digits indicate the percent chlorine by weight For example Aroclor 1260 was manufactured using 60 chlorine Aroclor 1016 is an exception because it contains 41 percent chlorine by weight (EPA 1996) Once released into the environment distribution and bioaccumulation of an Aroclor can change the character of the mixture so that it may no longer resemble the original mixture (EPA 1996)
3 Each PCB molecule consists oftwo 6-carbon rings with one chemical bond joining a carbon from each ring -imagine sunglasses with hexagonal frames) Chlorine can attach to any of the other 10 carbons There are 209 QSgible
arrangements called congeners The number and position of chlorines determine a PCB molecules physical and chemical properties Congeners are numbered 1 to 209 The coplanar congeners those with the two rings aligned on the same plane have dioxin-like properties (EPA 1996) Congener specific data improves our ability to identify the presence of bioaccumulated PCBs
contrast the GE young of year fish were too small to eat
IV DOSE RESPONSE
Toxicology To determine whether exposure to PCBs in fish from the Housatonic River in Massachusetts presents a potential risk to human health EPA evaluates the cancer and noncancer risks associated with PCB exposure To evaluate the cancer risk EPA uses the 95 upper confidence limit of the linear-slope factor (also known as the cancer slope factor) of 2 (mgkgday)1 for PCBs (IRIS 1998) The fish ingestion scenario involves ingestion of bioaccumulated PCBs Ingestion offish contaminated with these PCBs may result in a dose greater than that which occurred in the toxicity studies used to develop the potency estimates (EPA 1996) For that reason EPA estimates the risk of consuming bioaccumulated PCBs using the Toxic Equivalence Factor (TEF) approach (outlined in EPA 1996) The TEFs are ratios for certain PCB congeners that when multiplied by each congeners concentration in fish tissue and the cancer slope factor for dioxin yield an estimate of the carcinogenicity of the bioaccumulated PCBs in the fish Because of its toxicity the cancer slope factor for dioxin is very high 150000 (mgkgday)1 so even small concentrations of these dioxin-like PCBs in the fish can present a cancer risk
In the cancer study for Aroclor 1260 on which the slope factor is based a 12-month exposure produced approximately the same cancer potency as a full two-year exposure This suggests that a less than lifetime exposure could have significant risk implications (EPA 1996)
To evaluate chronic noncancer risks EPA used a Reference Dose (RfD) of 2 x 10⁵ mgkgday for Aroclor 1254 (IRIS 1998) To evaluate subchronic noncancer risks EPA used the subchronic RfD of 5 x 10⁵ mgkgday for Aroclor 1254 (HEAST 1997) Reference Doses for Aroclor 1254 were used because they are the closest ones applicable to the type of PCB mixture found in the
- Housatonic River (Aroclor 1260) The toxicity of Aroclor 1254 is much more similar to^Jtbajt of Aroclor 1260 than the toxicity of Aroclor 1016 (the other choice for an EPA accepted RfD) The toxicity study on which the RfDs are based was conducted over a shorter-term time frame (5 years) The subchronic exposure period evaluated in this memorandum (one summer) is consistent with that used in the toxicity study The critical effects for the chronic and subchronic RfDs are immunologic and reproductive effects In addition PCBs have been associated with deficits in learning and neurological effects (see ATSDR 1996 for a recent review)
A relative absorption factor (RAF) of 100 was used for oral absorption of PCBs from fish bull bull (DEP 1992) An RAF of 100 means that the assumed absorption of PCBs from ingestion of
Housatonic fish is equal to the absorption of PCBs in the laboratory toxicity studies
Data Analysis Of the available fish data only the 1994 USGS 24 whole fish and 4 tissue samples were tested for dioxin like PCBs (see data in attachment AL spreadsheets) The whole fish samples included skin organs and all other tissues For the muscle tissue samples USGS removed about 100 grams of muscle tissue and attached skin (about 2 inches wide 4 inches long and 1 inch deep) from the back of the fish directly above the gut (Steven Smith personal communication 1998)
To compare the fish on the same basis EPA adjusted the whole fish data to its equivalent in fish tissue thus
(ppm PCBs in whole fish divided by lipid in each fish) x 100 = micrograms of PCB per gram of fat
The concentration of PCBs in fish muscle tissue equivalents were determined using the lipid normalized concentration of PCBs and the average lipid found in the four fish tissue samples (approximately 1) While the use of lipid normalization data is not recommended in all cases4 the lipid approximation of 1 was considered to be reasonable given the very low levels of lipid in whole fish (087-58)
Following the procedure outlined in EPA 1996 EPA multiplied the concentrations of the shyindividual PCB dioxin-like congeners by the toxic equivalence factors (TEFs) appropriate to each This product called dioxin toxic equivalents (TEQs) is calculated for each tissue sample
Next EPA calculated the 95 upper confidence limit of the mean (Gilbert 1987) concentration for the non-dioxin PCBs and the dioxin-like PCBs These calculations resulted in a UCLs of 00013 for TEQs and 522 ppm for nondioxin PCBs These were the exposure point concentrations used with the exposure factorsrtocalculate the risks of consuming the fish Eleven of-the 13 dioxin-like PCBs were detected in fish samples used for this risk evaluation -gt --
V EXPOSURE ASSESSMENT
Currently the waters of the Housatonic are under a fishing advisory by the Commonwealth of Massachusetts The calculations for the adult fisher and subsistence fisher that follow assume that
4For human health risk assessment adjusting for lipid requires site-specific samples offish muscle tissue or fillet in addition to the data on whole fish A standardized (not site-specific) lipid adjustment is not appropriate because the lipid levels of the fish may have been affected by the site contamination Also the adjustment does not make biological sense unless the contaminant sequesters in the fat
lib
people do not adhere to the advisory
The calculations for the child fisher represent the short-term PCS doses and risks that a child could receive during one summer of consuming contaminated fish caught between GE and the Woods Pond Dam on the Housatonic River in Massachusetts
Adult Fisher To estimate risks to the adult fisher EPA used exposure assumptions that consider the amount of site data available and the site conditions The exposure assumptions described below are reflective of the Reasonable Maximum Exposure (RME) for adult residents who consume contaminated fish
These calculations assume that an adult fisher5 consumes a daily average of 26 grams offish over the course of 365 days per year (Ebert et al 1993) This could represent 3 or 4 (8shyounce) fish meals per month throughout a year or 7 (8-ounce) fish meals per month during the warmer months (April through October) A daily average of 26 grams represents the 95th percentile offish consumption for all water bodies in Maine (Ebert et al 1993) Because the Housatonic is the largest water body in the region and an attractive resource this value is appropriate This value was previously agreed upon by the Agencies in joint comments on General Electrics proposed Risk Assessment Scope of Work for the Housatonic River GE did not dispute this value (DEPEPA 1997)
The body weight used in this evaluation is 70 kg which represents the average body weight for an adult (EPA 1989)
Subsistence Fisher To estimate risks to the subsistsacefisher EPA used exposure assumptions that consider the amount of site data available and-the site conditions The exposure assumptions described below are appropriate for a sensitive subpopulation that is highly exposed
These calculations assume that a subsistence fisher5 consumes a daily average of 140 grams of fish over the course of 365 days per year This could represent 4 or 5 (8-ounce) fish meals per week during a year The daily average of 140 grams per day was estimated by EPA Office of Water staff based on a review of the literature on fish consumption by Native Americans and subsistence anglers (EPA 1995) Given site conditions this value is appropriate for subsistence fishers as a whole a particular ethnic group or tribe of Native
This is a person who has adult body weight and who would ingest adult-sized portions of fish For example for a thirty year exposure duration this could be a person who ate fish each year when they were between the ages of 18 and 48
Americans may consume more fish This value for subsistence fish consumption was previously agreed upon by the Agencies in joint comments on General Electrics proposed Risk Assessment Scope of Work for the Housatonic River GE did not dispute this value (DEPEPA 1997)
The body weight used in this evaluation is 70 kg which represents the average body weight for an adult (EPA 1989)
Childfisher To estimate the subchronic risks to the child fisher EPA used exposure assumptions that consider the amount of site data available and the site conditions The exposure assumptions described below are reflective of short term exposures and do not represent the RME
These calculations assume that the child fisher (age9 years) consumes one small (6- or 7shyounce) fish meal per week during the summer months (June July August) EPA assumes 13 weeks per summer (June July and August)
The one summer exposure period used in this evaluation is shorter than the 30-year exposure period (for cancer risks) typically evaluated by EPA as part of the RME The purpose of this calculation is to examine whether short term exposures could provide enough dose and present enough risk at some point later in life to be a concern
For fish ingestion for the child fisher EPA used 1825 gweek This is the same value for residential fish consumption mentioned above and adjusted to a weekly consumption rate (26 gday 365 daysyr divided by 52 weeksyr)
The body weight used in these calculations is 30 kg which represents an average of the 50th
percentile body weightierfemales age 9 years (DEP^ 1995 EPA 1989)
TABLE 1 Exposure factors used to calculate the potential risks from fishing on the Housatonic River
EXPOSURE PARAMETER VALUE
body weight (kg) adult or subsistence fisher 70 body weight (kg) age 9 years 30
exposure duration subchronic (weeks) 13 exposure duration (years) 30
fish ingcstion rate (gday) adults 26 fish ingestion rate (gday) subsistence fishers 140 fish ingestion rate (gwcck) children 1825
averaging time (days) cancer 25550 averaging time (days) chronic noncancer 10950 averaging time (days) subchronic noncancer 92
VL RISK CHARACTERIZATION
A Risk Calculations
CANCER RISKS e
Using the assumptions noted above in Table 1 and the equations below a lifetime average daily dose of PCBs from ingestion offish can be calculated
= fPGBl C IR ED BWAT
LADDlaquoi
Where
LADD^ = lifetime average daily dose from ingestion offish mgkgday [PCS] = PCB concentration in fish figkg C = conversion factor 106
IR = fish ingestion rate gday BW = body weight kg ED = exposure duration years AT F= averaging time period over which exposure is averaged - days or years
The Excess Lifetime Cancer Risk (ELCR) from ingestion of fish can be calculated using the following equations
ELCR = (LADD^J CSF (for cancer risks less than 1 in 100)
ELCR = 1- exp (-LADD^ CSF) (for cancer risks greater than 1 in 100)
Where ELCR = Excess Lifetime Cancer Risk CSF = Cancer Slope Factor 2 (mgkgday)-1 for nondioxin-like PCBs and 150000
(mgkgday)-1 fordioxinTEQs LADD^ = lifetime average daily dose from ingestion of fish exp = e raised to the power of x where x is the product of the dose and the cancer slope factor
NONCANCER RISKS
Using the exposure assumptions in Table 1 and the equations below an average daily dose of PCBs from ingestion offish can be calculated
= fPCBI C IR ED BWAT
Where
= average daily dose from ingestion of fish mgkgday [PCB] = PCB concentration in fish ngkg C = conversion factor 106
IR = fish ingestion rate gday or gweek BW = body weight kg ED = exposure duration weeks or years AT = averaging time period over which exposure is averaged - days or years
The Hazard Index can be calculated using the equation below
HI = [ADD ] RfD
Where HI = Hazard Index RfD = Reference Dose mgkgday
= average daily dose from ingestion of fish mgkgday
B Risk Results
RCRA CERCLA Risk Management Criteria
The cancer risks for the adult fisher and the subsistence fisher whom consume PCB contaminated fish are two orders of magnitude (100 times) or more above the EPA cancer risk range (discussed in EPA 1991) of 106 to 104 (see tables attached) and this justifies EPA in taking an (remedial or removal) action
Even a child who consumes one fish meal a week over the course of one summer has a cancer risk from that short term exposure which is nine times higher than the EPA cancer risk range of 106 to 10 and this justifies EPA in taking an action
The chronic noncancer risks for the adult fisher and the subsistence fisher whom consume PCB contaminated fish are over 900 times the risk (ie a chronic Hazard Index of 1) at which EPA is justified in taking an action
The noncancer risks (subchronic) for a child who consumes one fish meal a week over the course of one summer are over 800 times the risk (ie a subchronic Hazard Index of 1) at which EPA is justified in taking an action
If adults or children are consuming the fish on a regular basis they have a significant risk of cancer or noncancer health effects
C Discussion of Risk Characterization
Discussion Related to Exposure Scenarios The exposure period evaluated for the child fisher (one summer) may underestimate the actual exposure that a child may receive because it does not account for continuing exposure Moreover PCBs have been present in the residential areas in Pittsfield for many years already making it likely that exposure via some other environmental media has already occurred
The exposure period selected for evaluation of cancer effects is one summer for the child fisher However different assumptions about the exposure period have a significant impact on the risk results As the exposure period increases the cancer risk estimate increases For evaluating cancer risks one could easily justify using a longer exposure period than the ones selected Also typically the calculation of cancer risks attributable to fish consumption may involve some weighting of child and adult exposures which may make the risks higher than those calculated for
the adult alone
The risk calculations may not be conservative enough for ethnic groups whose members consume the whole fish Also particular Native American or ethnic groups may consume more fish than noted in the subsistence fishing calculations
Pre-natal exposure to PCBs as well as post-natal exposure to PCBs via breast milk may have higher risks than those noted Early stages of development may have an extra sensitivity to the effects of PCBs (reviewed in EPA 1993 IRIS 1998)
Toddlers consuming fish may have higher risks than those noted because of the large doses that these fish would provide given the small body size of a toddler Also the toddler may be more sensitive to the developmental effects of PCBs
Discussion Related to Toxicity and Exposure The cancer risks from the dioxin-like PCBs was about twice the risks from PCBs (without the properties of dioxin) This illustrates the importance of performing congener specific analysis of PCBs for estimates of cancer risk
The PCB doses from eating the fish even for as short a period as one summer are higher than the doses at which monkeys showed marked reproductive effects (Arnold et al 1995) and effects on cognitive behavior (Rice 1995 1997 Rice and Hayward 1997 Rice et al 1996) and activity (reviewed in EPA 1993) This suggests that there may be no safety margin between the exposure estimates for people who eat fish from the Housatonic river and the exposures in the monkey studies which show adverse health effects
The risks from consuming the fish are substantial If the fishing advisory is effective then there is no risk from the fish However a report in the literature suggests that fishing advisories are violated regularly (Tilden et al 1997)6 And-sbmepeople in the area may have consumed fish from the Housatonic before the fishing advisory was in place (about 10 years ago)
In sum doses estimated for children and adults who ingest contaminated fish from the Housatonic river are higher than those received by the monkeys in the PCB noncancer toxicity study that demonstrated adverse health effects This is true even in the case of children who ingest contaminated fish over the course of one summer These exposure estimates raise significant concerns regarding potential health effects in children and adults who ingest contaminated fish from the Housatonic river
6Tilden estimates that in one year as many as 47 million people ate Great Lakes sport fish despite long standing (since the mid-70s) state fishing advisories
10
REFERENCES
Arnold et al 1995 Toxicological Consequences ofAroclor 1254 Ingestion by Female Rhesus (Macaca mulatto) Monkeys Part 2 Reproduction andlnfant Findings Arnold DL Bryce F McGuire PF et al Fd Chem Toxic 33457-74
ATSDR1996 Public Health Implications ofPCBs December 1996
DEP 1992 Documentation For The Risk Assessment Shortform Residential Scenario Massachusetts Department of Environmental Protection Office of Research and Standards and the Bureau of Waste Site Cleanup Policy BWSCORS-142-92 October 1992
DEP 1995 Guidance For Disposal Site Risk Characterization In Support of the Massachusetts Contingency Plan Interim Final Policy BWSCORS-95-141 Massachusetts Department of Environmental Protection Bureau of Waste Site Cleanup and Office of Research and Standards July 1995
DEPEPA 1997 Joint DEPEPA Technical and Review Comments on General Electric Proposal for Human Health Risk Assessment of the Housatonic River August 13 1997
Ebertetal 1993 Estimating Consumption of Freshwater Fish among Maine Anglers EbertES Harrington NW Boyle KJ et al North American Journal of Fisheries Management 13737-45 1993
EPA 1989 Risk Assessment Guidancefor Superfund Volume I - Human Health Evaluation Manual (Part A) Interim Final US Environmental Protection Agency Office of Emergency and Remedial Response EPA5401-89002 December 1989
EPA 1991 Role of the Baseline Risk Assessment in Superjund Remedy Selection Decisions USEPA OSWER Directive 93550-30 April 22 1991
EPA 1993 Workshop Report on Developmental Neurotoxic Effects Associated with Exposure to PCBs VSEPA Risk Assessment Forum EPA63 OK-92004 May 1993
EPA 1995 Water Quality Guidance for the Great Lakes System Supplementary Information Document (SID) USEPA Office of Water EPA-820-B-95-001 March 1995 p 575
EPA 1996 PCBs Cancer Dose-Response Assessment and Application to Environmental Mixtures NCEA ORD EPA600P-96001F
Finklestein 1998 Personal communication Ken Finklestein NOAA May 111998
GE 1994 Preliminary draft MCP Supplemental Phase II InvestigationRCRA Facility Investigation of Housatonic River and Silver Lake Tables 8 through 10
Gilbert 1987 Statistical Methods for Environmental Pollution Monitoring RO Gilbert Van
11
Nostrand Reinhold NY 1987
HEAST 1997 Health Effects Assessment Summary Tables EPA Office of Solid Waste and Emergency Response 92006-303 (97-1) EPA-540-R-97-036 PB97-921199 July 1997
IRIS 1998 EPA Integrated Risk Information System a database 1998
Mass DPH 1997 Housatonic River Area PCB Exposure Assessment Study Final Report Massachusetts Department of Public Health Bureau of Environmental Health Assessment Environmental Toxicology Unit September 1997
Rice 1995 Neurotoxicity of Lead Methylmercury andPCBs in Relation to the Great Lakes DC Rice Environmental Health Perspectives 103(Supplement9)71-87 1995
Riceetal 1996 Lessons for Neurotoxioology from SelectedModel Compounds SGOMSEC Joint Report Rice DC de Duffard AME Duffard R et al Environmental Health Perspectives 104(Supplement 2)205-15
Rice 1997 Effect of Postnatal Exposure to a PCB Mixture in Monkeys on Multiple Fixed Interval-Fixed Ratio Performance DC Rice Neurotoxicology and Teratology 19429-34
Rice and Hayward 1997 Effects of Postnatal Exposure to a PCB Mixture in Monkeys on Nonspatial Discrimination Reversal and Delayed Alternation Performance Rice DC Hayward S Neurotoxicology 18479-94 1997
Smith 1998 Personal communication with Steven Smith USGS April 28 1998
Tagliaferro 1998 Personal communication Dean Tagliaferro EPA removals program April 1998
Tilden et al 1997 Health Advisories for Consumers of Great Lakes Sport Fish Is the Message Being Received Tilden J Hanrahan LP Anderson H et al Environmental Health Perspectives 1051360-65 1997
Tilson et al 1990 Polychlorinated Biphenyls and the Developing Nervous System Cross-species Comparisons Tilson HA Jacobson JL Rogan WJ Neurotoxicology and Teratology 12239-248 1990J
12
ATTACHMENT A1
Spreadsheets showing raw data and UCL calculations
13
Congener specific PCB concentrations and TEQs in largemouth bass collected from Woods Pond MA last modified 51098 PCBs
Fish refershyence
ppm PCBs
Lipid in Lipid AP raquosampx3 Dioxin-like ODngeners(ppm)
number total whole fish]
BO I B02 B03 B04 805
57 206 65 117 75
225 381 161 106 285
PCBsg
25333 54068 40373 110377 26316
I 1242
lt05 ltQ5 lt05
bullraquo
1248
-lt05 lt05 lt05
-
f
11035 60
Hshy
1260
96 30 57 -
77 1JT 1
ft 0001 0 a 0
105
042 052 017 033 026
1W 1 1 181061 iy^J 156
amp03S 0$43 0013 0037 002
26 33 12 2 2 17
^T^fPWJ bull shyamp0|7-MI
lt$amp$ OJWS$$ Q$$tff
046 06
021 042 034
032 041 015 03 024
lt 3
MpoundregL 0i0lt)33 00005 00014 0001$
31 42 016 3 3 26
pv09601$ 0045 011 0gt0amp7
y ootnoi2 0043 0087 0071
B06 63 579 10881 Hshy - 1 - a shy 027 002 16 001 034 025 001$ 2 7 00$ 007 B07 BOS B09
71 31 157
335 241 433
21194 12863 36259
lt05 w
lt05
lt05 -
lt05
sa Mshy
sa 33 -
69
0 0 0
021 023 039
0015 001amp 01032
13 16 25
ampG0ampJ 0gt00$)5 Oytj^fs
024 029 044
018 021 031
00012 00Q1 00022
2 2 4 34
00$7ao$6 011
005 0059 0089
BIO Bll B12
69 56 196
1 89 202 344
bull 3650 8 27723 56977
ltQ5 lt05 lt05
lt05 lt05 lt05
36 30 110
33 26 86
0 0 0
019 018 046
0016 00150037
14 12 2 9
lt 60^ c s
0101 j 0021
025 021 052
02 016 037
0001amp
bull 6^001 00027
18 15
4
amp04 0-gtQ4lf s
012
OJ554vamp$iirgti
oii B14 27 1 7 15882 - - 0 0 3 0026 2 0009S 04 03 00014 2 9 a097 007^ B15 77 329 23404 lt05 lt05 42 35 0 025 0022 1 7 010-14 003 023 00021 2 2 0072 0062 B19 110 399 27569 Hshy - bdquo 0 051 0044 3 0 17 056 039 00022 4 012 ou B20 121 2 13 56808 lt05 lt05 61 60 0 033 027 2 0$$ 045 032 00022 3 3 013 00$ B21 B22
198 89
369 246
53659 36179
lt05 lt05
lt05 lt05
110 4$
88 41
0001 0
053 026
0046 0022
33 17
0lt0i ipxOi
063 032
043 023
00024 00017
4 2 24
014 077
013 0067
B23 B24 B25
130 168 87
3 18 355 238
40881 47324 36555
lt05 ltQ5 lt05
lt05 lt05 lt05
7$ 95 48
51 73 39
- 0 0
036 043 025
0031 003amp
0ois
23 27 15
4gtk^5shyamp$ampbulllt bull000
038 05 03
028 035 022
00015 00021 00013
23 35 21
0073 011 007
0083 01
0064 B31
B33
47
50
139
139 33813
35971 lt05 lt05
lt05 lt05
24 26
23
24 p 0
015
014 0 0 1 rlaquo^ 00096
086
068 iiiSt6igt058i
019
019
014
014 0000 QJQOQ5
14
14
0046 00Si
004 ^ 0^39^ gt
B34 121 0872 13876 1 lt-05 lt05 62 59 0 031 0023 19 00amp1 042 03 0^0005 33 01 1 $poundamp muscle tissue
B13 138 0577 2391 7 lt05 lt05 79 59 o 0045 00031 023 ampQ04 005 0037 Q0005 039 001 00082 B16 70 1 86 37634 lt05 lt05 35 35 0 019 001S 13 028 023 amp0024 21 0075 0057 B17 41 1 19 34454 lt05 lt05 21 20 0 012 001 064 017 0 13 00012 12 0044 0034 B18 13 2 039 33846 lt05 lt05 72 6 0 0036 00025 019 000B 0047 0045 00005 034 0024 00075
1 i- isn refer- ppm TEFs and TEQ s for tested con jeners r umof TEQs 1 ence PCBs
number total Lipid 77 105 114 118106 126 156 167 169 170 189 157 (mg TEQkg meg TEQ meg TEQ Lnconc rruCTOgram whole fish () 00005 0000] 0 0005 J_0 0001 0 1 00005 000001 001 00001 00001 00005 whole fish) gfat g tissue TEQs PCBVg tissue Ln PCB
BO I 57 22 5 OE+00 4E-05 2E-05 3E-04 2amp02 2E-04 3E-06 2E-05 3Eraquo04 IE-OS SB-OS 00026 0 1174 00012 -675 2533 323 B02 206 3 81 6E-07 5E-05 2E-05 3E-04 2Elt03 3E-04 4E-06 3E-05 4ampQ4 2E-05 laquoamp05 00032 00850 00008 -707 5407 399 B03 65 1 61 OE+00 2E-05 7E-C6 IE-04 7E-04 IE-04 2E46 5E-06 2E-05 5E-06 bull2E^)5 00010 00638 00006 -736 4037 3 70 i B04805
117 75
1 06 28 5
OE+00 OE+00
3E-05 3E-05
2E-05 1E-05
2E-04 2E-04
1B-OJ IE-OS
2E-04 2E-04
3E-06 2E-06
IE-OS 2E-05
3amp04 3E-04
IE-OS 9E-0(
bull4amp054ms
00021 00017
0 1965 00582
00020 00006
-623 -7 45
11038 26 32
470 327
B06 63 5 79 OE+00 3E-05 1E-05 2E-04 1E-03 2E-04 3E-06 2E-04 3E-Q4 9E-0( 4E-OS 00019 00322 00003 -804 1088 239 B07 71 3 3 5 OE+00 2E-05 8E-06 1L-04 1E-03 IE-04 2E-Q6 IE 05 2ErC4 6E-0lt 3E-05 00015 00443 00004 -772 21 19 305 BOS 31 2 4 ] OE+00 2E-05 9E-06 2b-04 9E-04 IE-04 2E-0lt$ IE-OS 2E-Q4 7E-0( 3E-05 00015 00616 00006 -739 1286 2 55 B09 157 4 33 OE+00 4E-05 2E-05 3E-04 2E-03 2E-04 3E-06 2E-05 3E-lt4 1E-0 4Z45 00026 00611 0 0006 -7 40 36 26 359 BI O 69 1 89 OE+00 2E-05 8E-06 IE 04 1E-03 IE-04 2E-06 2E-05 2E-Q4 6E-Oi 3E-05 00015 00807 00008 -712 3651 3 60) BH 56 202 OE+00 2E-05 8E-06 1E-04 IE-OS IE-04 2E-06 IE-OS 2ErQ4 SE-Or 7amp05 00014 00712 00007 -725 2772 332 B12 196 3 44 OE+00 5E-05 2E-05 3E-04 2E-03shy 3E-04 4E-06 3E-05 4amp04 1E-0 ^E-05 0 0032 0 0934 00009 -6 98 56 98 404 B14 27 1 7 OE+00 3E-05 IE-OS 2E-04 1E-03 2E-04 SR-Q6 IE-OS 3ErQ4 1E-0 4U-Q5 00018 0 1046 00010 -686 1588 277 B15 77 329 OE+00 3E-05 IE-OS 2E-04 1E4raquo 2E-05 2E-06 2E-05 2E-04 7E-0( SE-05 00019 00578 0 0006 -7 46 23 40 3 15 B19 110 3 99 OE+00 5E-05 2E-05 3E-04 2E-03 3E-04 4E-06 2E-05 4E-Q4 1E-0-) ^amp05 00028 00713 00007 -725 2757 3 32 B20 121 2 13 OE+00 3E-05 IE-04 2E-04 2E-OS 2E-04 3E-06 2E-05 3ErQ4 1E-01) 5E-05 00025 0 1177 00012 -675 5681 404 B21 198 369 5E-07 5E-05 2E-05 3E-04 2E-03 3E-04 4E-06 2E-05 4ErltJ4 IE-OS 7amp05 00031 00853 00009 -707 5366 398 B22 89 246 OE+00 3E-05 IE-OS 2E-04 IE-03 2E-04 2E^5 2E-05 2ampG4 8E-05 3amp05 00019 00787 00008 -715 36 18 359 B23 130 3 18 OE+00 4E-05 2E-05 2E-04 2B4raquo 2E-04 3Elt06 2E-05 2E-Q4 7E-Oo 4amplaquoJ 00023 00713 00007 -7 25 40 88 371 B24 168 3 55 OE+00 4E-05 2E-05 3E-04 2E-03 3E-04 4E-06 2E-05 4E-Q4 IE-OS SE-05 00027 00765 00008 -717 4732 386 B25 87 2 38 QE+QO 3E-05 9E-06 2E-04 9E-04 2E-04 2E-06 IE-OS 2E-04 7E-Oo 3E-OS 00015 00642 00006 -735 3655 360
B31 47 1 39 OE+QO 2E-05 5E-06 9E-05 3amp04 IE-04 1amp06 5E-06 IE-04 SE-Oo 2ElaquoOS 00009 00656 00007 -733 33 81 3 52
B33 50 1 39 OE+CO 1E-05 5E-06 7E-05 6E-04 IE-04 1E-06 5E-06 IE-04 5E-06 2E-05 00009 00671 00007 -731 3597 358
B34 12 087 OE-00 3E-05 1E-05 2E-04 8E03 2E-04 3E^6 5E-06 3E^34 IE-OS 4E-OS 00089 10247 00102 -458 13876 493
muscle tissue mg TEQskg Us le i |
B13 138 0 58 OE+00 5E-06 2E06 2E-05 4amp-04 3E-05 4E-07 5E-06 4E-05 1E-06 4E-06 0 0005 00005 -7 59 138 262
B16 70 1 86 QE+00 2E-05 9E-06 IE-04 IE-Mr IE-04 2E-Q6 2E-05 2E-04 8E-06 3E-OS 00016 00016 -646 70 42 5
B17 41 1 19 OE+00 1E-05 5E-06 6E-05 6E-04 9E-05 1E^06 IE-OS IE-04 4E-06 7E^)5 00010 00010 -696 41 371 B18 132 0 39 OE+00 4E-06 1E-06 2E-05 IE-04 2E-05 5E-07 5E-06 3ampQ5 2E-06 4E-06 0 0002 0 0002 -841 132 2 5 8
GSD 0 66 GSD 061 ave lipid n 28 n 28 muscle tissue H statistic 2 0923 H statistic 20502
95 UCL of the TEQs 00013 95UCLPCBs 522 meg TEQg tissue meg PCBg tissue
max TEQs 00102 max PCBs 1388
ATTACHMENT A2
Spreadsheets showing risk calculations
14
Potential risks from ingesting largemouth bass from the Housatonic River (Woods Pond area) in Massachusetts on a regular basis last modified 51498 The concentrations are based upon the 95 UCL of the mean concentration in muscle tissue
adult who consumes PCB contaminated fish cone ingestion ED BW AT LADD slope risk
(megkg) (gday) (yrs) (yrs) (mgkg-d) (per mgkg-d) (kg)cancer risks dioxin TEQ 130 26 30 70 70 206E-07 150000 3E-02 cancer risk from TEQs
nondioxin-like PCBs 52E+04 26 30 70 70 00083 2 2E-02 cancer risk nondioxinlike PCBs bull 5E-02 excess cancer risk lifetime
ADD(mgkg-d) RfD oral(1254) HI noncancer risks nondioxin-like PCBs 52E-H)4 26 30 70 30 00194 000002 969 rounding to one significant figure
1000 noncancer risk (chronic)
subsistence fisher who consumes PCB contaminated fish cone ingestion ED BW AT LADD slope risk
(megkg) (gday) (yrs) (kg) (yrs) (ingkg-d) (pet mgkg-d) cancer nsks dioxin TEQ 130 140 30 70 70 111E-06 150000 2E-01 cancer risk from TEQs
nondioxin-like PCBs 52E+04 140 30 70 70 00447 i 2 9E-02 cancer risk nondioxinlike PCBs 2E-01 excess cancer risk lifetime
ADD(mgkg-d) RfD oral(1254) HI noncancer risks nondioxin-like PCBs 52E+04 140 30 70 30 01044 000002 5219 rounding to one significant figure
5000 noncancer risk (chronic)
9 year child who consumes PCB contaminated fish once per week for one summer cone ingestion ED BW AT LADD slope risk
(megkg) (gweek) (weeks) (kg) (days) (mgkg-d) (per mgkg-d) cancer nsks dioxin TEQ 130 1825 13 30 25550 402E-09 150000 6E-04 cancer risk from TEQs
nondioxin-like PCBs 52E+04 1825 13 30 25550 000016 2 3E-04 cancer risjc nondioxinlike PCBs 9E-04 cancer risk due to dose
from a short-term exposure RfD oral(1254)
ADD(mgkg-d) subchronic ffl noncancer risks nondioxin-like PCBs 52E+04 1825 13 30 92 00449 5E-05 897 rounding to one significant figure
900 noncancer risk (subchronic)
- barcode 10818
- barcodetext SDMS Doc ID 10818
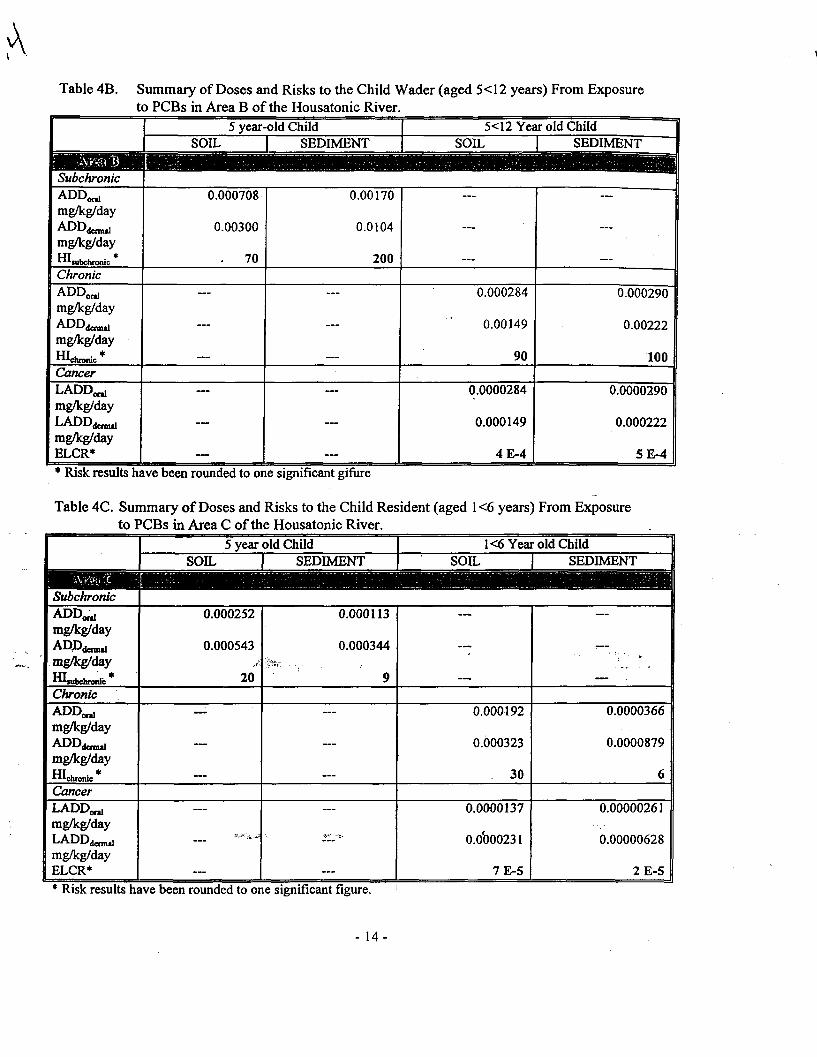
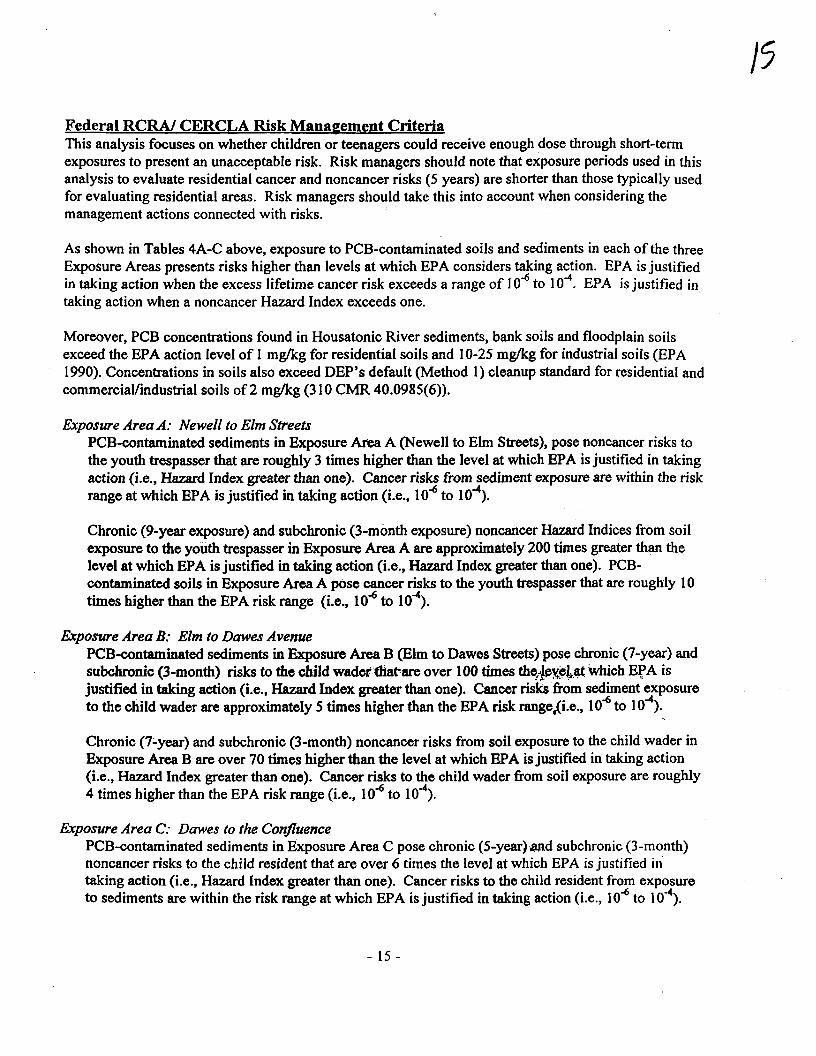
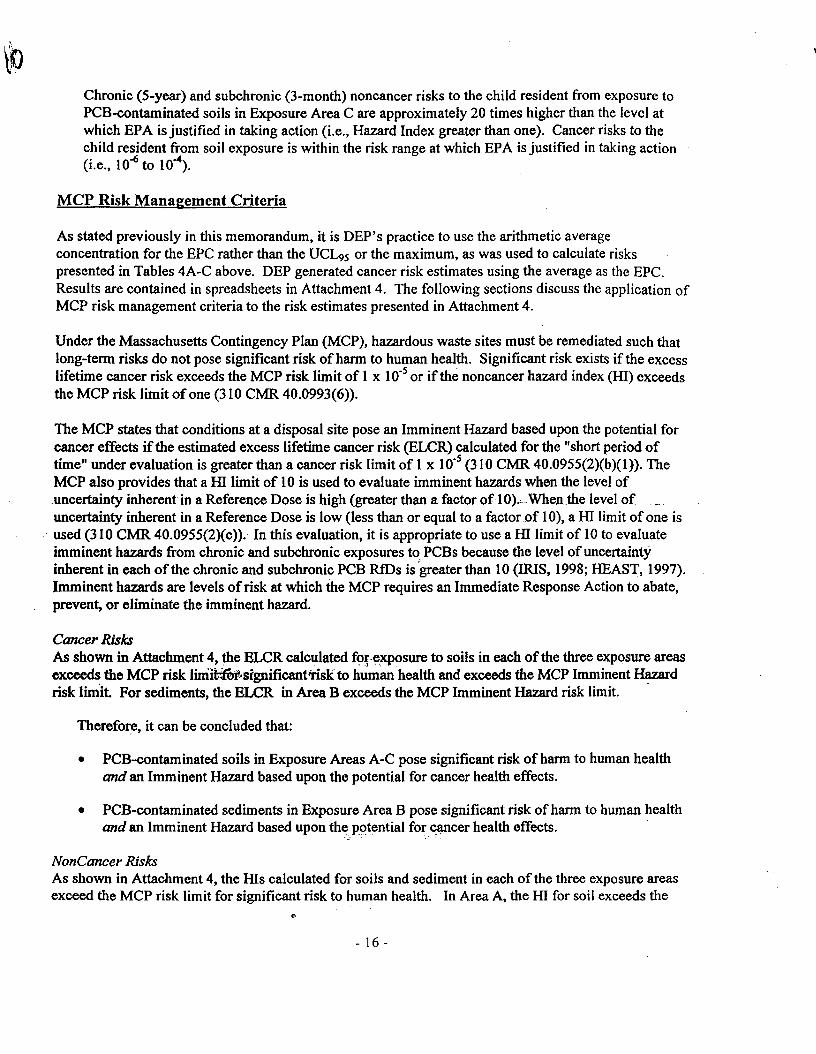
REFERENCES
ATSDR 1996 Public Health Implications ofPCB Exposures Agency for Toxic Substances and Disease Registry US Department of Health and Human Services Atlanta GA and US Environmental Protection Agency Washington DC December 1996
ATSDR 1997 Toxicological Profile for Polychlorinated Biphenyls Update prepared by Research Triangle Institute for the US Department of Health and Human Services Agency for Toxic Substances and Disease Registry September 1997
TechLaw Inc 1998 Draft Sediment Sampling Data for Samples collected during September through November 1998 Data collected by TechLaw Inc for EPA under EPA Contract No 68-W4-0013 and EPA Work Assignment No R01012 April 6 1998
Blasland Bouck and Lee 1996 Supplemental Phase IIRCRA Facility Investigation Report for Housatonic River and Silver Lake perpared by Blasland Bouck and Lee for General Electric January 1996
Blasland Bouck and Lee 1997 Building 68 Area Removal Action Work Plan prepared by Blasland Bouck and Lee on behalf of General Electric May 1997
Calabrese 1997 Soil Ingestion A Concern for Acute Toxicity in Children Calabrese EJ Stanek^EJ James RC et al Environmental Health Perspectives 1051354-58 December 1997
ChemRisk 1997 Work Plan for the Ecological Risk Assessment of the Housatonic River Site Volume II Appendix A Sampling Maps prepared by ChemRisk on behalf of General Electric May 24 1997
DEP 1992 Documentation For The Risk Assessment Shortform Residential Scenario Massachusetts Department of Environmental Protection Office of Research and Standards and the Bureau of Waste Site Cleanup Policy BWSCORS-142-92 October 1992
DEP 1995 Guidance For Disposal Site Risk Chatiacterization In Support of the Massachusetts Contingency Plan Interim Final Policy BWSCORS-95-141 Massachusetts Department of Environmental Protection Bureau of Waste Site Cleanup and Office of Research and Standards July 1995
DEPEPA 1997 Joint DEPEPA Technical and Review Comments on General Electric Proposal for Human Health Risk Assessment of the Housatonic River August 13 1997
EPA 1989 Risk Assessment Guidance for Superfund Volume I - Human Health Evaluation Manual (Part A) Interim Final US Environmental Protection Agency Office of Emergency and Remedial Response EPA5401-89002 December 1989
EPA 1990 A Guide on Remedial Actions at Superfund Sites with PCB Contamination EPA Office of Solid Waste and Emergency Response Directive 93554-01 August 1990
- 2 0 shy
EPA 1992 Dermal Exposure Assessment Principles and Applications Interim Report Exposure Assessment Group Office of Health and Environmental Assessment US Environmental Protection Agency EPA6008-9101 IB January 1992
EPA 1994 EPA Region One Waste Management Division Risk Updates Number 2 August 1994
EPA 1995 Land use in the CERCLA Remedy Selection Process Memorandum from Elliott P Laws to Directors of Waste Management Division OSWER Directive 93557-04 Office of Solid Waste and Emergency Response May 25 1995
EPA 1996 PCB Cancer Dose-Response Assessment and Application to Environmental Mixtures National Center for Environmental Assessment Office of Research and Development US EPA EPA600P-96001F September 1996
EPA 1997 Exposure Factors Handbook Volume General Factors US Environmental Protection Agency Office of Research and Development EPA600P-95002Fa August 1997
EPA 1998 Dermal Workgroup Response to GEs Challenge to the Soil Dermal Absorption Value for PCBs of 14 EPA Interoffice Memorandum from EPA Dermal Workgroup to Mary Ballew Region I RCRA Program January 27 1998
EPA 1998a General Electric - PCB Testing Results for Samples collected for EPA by Roy F Weston in March 1998 Memorandum from Peter Philbrook EPA Environmental Services Division to Susan Svirsky EPA March 23 1998
Gilbert 1987 Statistical Methods for Environmental Pollution Monitoring RO Gilbert Van Nostrand Reinhold NY 1987
HEAST 1997 Health Effects Assessment Summary Tables EPA Office of Solid Waste and Emergency Response 92006-303 (97-1) EPA-540-R-97-036 PB97-921199 July 1997
IRIS 1998 EPA Integrated Risk Information System 1998
Mass DPH 1997 Housatonic River Area PCB Exposure Assessment Study Final Report Massachusetts Department of Public Health Bureau of Environmental Health Assessment Environmental Toxicology Unit September 1997
Wester 1993 Percutaneous absorption of PCBs from soil In vivo rhesus monkey in vitro human skin and binding to powdered human stratum corneum RC Wester HI Maibach L Sedik et al Journal of Toxicology and Environmental Health 39375-82
-21 shy
this is uprchSM doc
ATTACHMENT 1
Data used to calculate Exposure Point Concentrations
)HOUSATONIC RIVER SEDIMENT Newell Street to Elm Street Area A sediments
STATION SO-9-G 3-1A-3A 3-2A-1 HCSE-5 3-5A-3 S09F
S09E1 S09E2 3-6A-1 3-6A S09D BBS09D S09C S09B 3-7B S09A HCSE-15 3-7D-CRD 3-6C-18 3-6C-66 3-6C-20 3-6C-55 3-6C-22 3-6C-49 3-6C-48 3-6C-27 3-6C-79 3-6C-35 3-6C-38 3-6C-62 3-6C-41 3-6C-65 3-6C-63 3-6C-43 3-6C-44 3-6C-45 3-6C-46 3-6C-47 3-1 A 3-2B 3-4A 3-5D 3-7E 3-8A HCSE-4
ID DEPTH0-0405-6 inches0-4 inches0-101
05-6 inches0-031
0-050-0505-6 inches0-050-030-050-050-0505-6 inches0-050-180-4 inches0-60-60-60-60-60-60-60-50-70-840-840-60-60-60-60-60-60-60-70-60-60-60-60-60-605-6 inches0-16
DATASOURC GEECO 597
GEECO 597 GEECO 597
GEECO 597 GEECO 597
GEECO 597 GEECO 597 GEECO 597
GEECO 597 GEECO 597 GEECO 597 GEECO 597 GEECO 597 GEECO 597
GEECO 597 GEECO 597 GEECO 597
GEECO 597 BLDG68 597 BLDG68 597 BLDG68 597 BLDG68 597 BLDG68 597 BLDG68 597 BLDG68 597 BLDG68 597 BLDG68 597
BLDG68 597 BLDG68 597
BLDG68 597 BLDG68 597 BLDG68 597 BLDG68 597 BLDG68 597 BLDG68 597 BLDG68 597 BLDG68 597 BLDG68 597 ATK ATK ATK ATK ATK
GEECO 597 GEECO 597
cone PCB (ppm) 3400 060 1000 010
6640 140
3000 052 490 030
6700 094 055 570 140 1600 10000 780 2700 120
14000 070 1640 024 1020 2010 120 450 135 036 135 016 102
6170 170 314 334 029 006 170 015 063 180 1580 1500
ND Ln RGBs 353 last modifie -051 051198 230 -230 420 034 340 -065 159 -120 420 -006 -060 174 034 277 461 205 330 018 494 -036 280 -143 232 300 018 150 030 -102 030 -183 002 412 053 114 121 -124 -281 053 -190 -046 059 276 271
S10B1 0-05 GEECO 597 730 199 S10B 0-05 GEECO 597 9000 450 BBS10B 0-05 GEECO 597 1400 264 3-3B-1 05-6 inches GEECO 597 954 226 3E-3 0-15 GEECO 597 860 215 3-8C 05-6 inches GEECO 597 590 177 3-9A 05-6 inches GEECO 597 140 034 HCSE-A6 02-08 T 3-7 SUP PH 14000 494 3-9B-1 05-6 inches GEECO 597 568 174 HCSE-2 0-16 GEECO 597 1000 230 3-9D 05-6 inches GEECO 597 075 -029 3-1 OB 05-6 inches GEECO 597 440 148 3-1 OC 0-05 GEECO 597 960 226 3-10C-1 05-6 inches GEECO 597 8540 445 S10A 0-05 GEECO 597 810 209 3-1 OD 05-6 inches GEECO 597 180 059 HCSE-1 o 0-15 GEECO 597 320 116 3-8C 0-6 ATK 2520 323 3-8E 0-6 ATK 140 034 3-9FF 0-6 ATK 220 079 3-9F 0-6 ATK 1270 254 3-1 OD 0-6 ATK 500 161 3-1 OE 0-6 ATK 190 064
mean 1666 1136 c~nipie variance 96431 3345 v iple stdev 3105 1186 maximum 14000 minimum 006 n 6800 68
Gilbert UCL 45489 Gilbert Mean 21939 Hstat 32125
Elm Street to Dawes Avenue Area B sediments PCB
STATION ID DEPTH DATA SOURC ic(ppm) ND Ln PCBs 4-1A-CRD 0-4 inches GEECO 597 123 481 HCSE-16 0-11 GEECO 597 025 -139 4-2A 05-6 inches GEECO 597 93 223 HCSE-17 0-18 GEECO 597 17 283 4-2B 0-05 GEECO 597 33 350 bull 4-2B-1 05-6 inches GEECO 597 17 283 BBS11 0-05 GEECO 597 22 309 4-3B S11
05-6 inches0-051
GEECO 597 GEECO 597
51 130
163 487
HCSE-18C 0-025 GEECO 597 31 113 HCSE-18B 0-025 GEECO 597 51 393 HCSE-18 0-05 GEECO 597 905 681 4-3A 05-6 inches GEECO 597 16 047 HCSE-18D 0-033 GEECO 597 16 047 HCSE-18A 0-025 GEECO 597 17 283
mean 8906 267 sample variance 265987 420 sample stdev 22948 205 maximum 90500 minimum 025 n 1500 1500
Gilbert UCL 1521077 Gilbert Mean 118141 Hstat 46633
Dawes to the confluence Area C sediments-- ^ PCB
STATION ID DEPTH DATA SOURC conc(ppm) ND Ln PCBs ^ i 05-6 inches GEECO 597 26 096 HCSE-19 0-20 GEECO 597 33 119 4-4C 05-6 inches GEECO 597 36 128 4-4B 0-05 GEECO 597 32 347 MD 05-6 inches GEECO 597 - 98 -=228 V4E 0-0 51 GEECO 597 093 -007 1-5A 05-6 inches GEECO 597 92 222 4-5A() 0-0 51 GEECO 597 16 047 HCSE-20 0-19 GEECO 597 53 167 4-5A-1 05-6 inches GEECO 597 101 231 BBS12 0-05 GEECO 597 24 318 S12 0-05 GEECO 597 28 333 4-5C-1 05-6 inches GEECO 597 1318 258 4-5E 0-05 GEECO 597 47 155 4-5B 05-6 inches GEECO 597 149 270 4-6B 0-05 GEECO 597 17 053 4-6A 05-6 inches GEECO 597 228 313 4-6C 05-6 inches GEECO 597 105 235 4-6D 05-6 inches GEECO 597 78 205 4-6F 05-6 inches GEECO 597 56 172 4-6G 0-05 GEECO 597 17 283 4^c 0-6 ATK 69 193 4 J 0-6 ATK 373 362 4-6H 0-6 ATK 18 059 4-5G 0-6 ATK 164 280 4-5F 0-6 ATK 142 265 4-6J 0-6 ATK 132 488
mean 1619 216 sample variance ----- v63145 ^ 128 sample stdev 2513 113 maximum 13200 minimum 093 n 2700 2700
Gilbert UCL 29580 Gilbert Mean 16361 Hstat 267088
ND - samples where ND was reported were listed as 12 the sample detection limit ATK = Data from AT Kearney GEECO 597 = Work Plan for the Ecological Risk Assessment of the Housatonic River Site Volume II by ChemRisk P ^G68 59 Building 68 Removal Action Work Plan May 1997 by BBL 1 _-7 Supplemental Phase II RCRA Facility Investigation Report for the Housatonic River and Silver Lake Table 3-7 196
GE Housatonic River Bank and Floodplain Data
Newell Street to Elm Street Area A soils last modified PCS 051198
Location Type Depth Cone Report Ln Cone ND
BE-0043-A Bank 0 to 6 250 Weston98 092 BW-0030-A Bank 0 to 6 2700 WestonQS 330 BE-0040-A Bank 0 to 6 580000 Weston9S 86Z BE-0041-A Bank 0 to 6 100000 Weston98 691shyBE-0042-A Bank 0 to 6 021 Weston98 -156 BE-0044-A Bank 0 to 6 488 Weston98 158 BE-0045-A Bank 0 to 6 028 Weston98 -127 BE-0046-A Bank 0 to 6 115 Weston98 014 BW-0031-A Bank 0 to 6 269 Weston98 099 HR-EB2 Bank 0 to 6 60000 ECO-RA 597 640 BW-0032-A Bank 0 to 6 215 Weston98 077 BW-0035-A Bank 0 to 6 11000 Weston98 470 BW-0038-A Bank 0 to 6 730 Weston98 199 BW-0037-A Bank 0 to 6 170 Weston98 053 BW-0036-A Bank 0 to 6 1100 Weston98 240 BW-0034-A Bank 0 to 6 5900 Weston98 408 HR-EB1 Bank 0 to 6 1240 ECO-RA 597 252 BW-0033-A Bank 0 to 6 447 Weston98 150 BE-0039-A Bank 0 to 6 14000 Weston98 494 19-4-1 4D Flood Plain 0 to 6 430 ECO-RA 597 146 19-4-1 4A Flood Plain 0 to 6 620 ECO-RA 597 182 19-4-1 4B Flood Plain 0 to 6 430 ECO-RA 597 146 19-4-1 4C Flood Plain 0 to 6 4700 ECO-RA 597 385 I8-24-5A Flood Plain 0 to 6 3800 ECO-RA 597 364 I8-24-5B Flood Plain 0 to 6 070 ECO-RA 597 -036 I8-24-5C Flood Plain 0 to 6 210 ECO-RA 597 074 BW-0029-A Bank 0 to 6 4300 Weston98 376 BW-0028-A Bank 0 to 6 015 Weston98 -190_ BW-0040-A Bank 0 to 6 3600 Weston98
mean 27477 233 sample variance 117334457 625 sample stdev 108321 250 maximum 580000 minimum 015 n 2900 2900
Gilbert UCL 2393253 Gilbert Mean 233360 Hstat 4928
Elm Street to Dawes Avenue Area B soils
Location
lb-laquo+-6-1 BE-0020-A BE-0014-A BE-0018-A BE-0017-A BE-0016-A BE-0015-A BE-0013-A BE-0034-A BE-0012-A BE-0021-A HR-EB4 HR-EB5 BE-0019-A HR-EB3 BE-0033-A BE-0022-A BE-0023-A BE-0025-A BE-0026-A BE-0027-A F X)24-A Bt-0028-A BE-0029-A BE-0031-A BE-0032-A BE-0030-A
mean variance sample stdev maximum minimum n
Gilbert UCL Gilbert Mean H statistic
Type
Flood plain Bank Bank Bank Bank Bank Bank Bank Bank Bank Bank Bank Bank Bank Bank Bank Bank Bank Bank Bank Bank Bank Bank Bank Bank Bank Bank
Depth
0 to 6 0 to 6 0 to 6 Otofi 0 to 6 0 to 6 0 to 6 0 to 6 0 to 6 0 to 6 0 to 6 0 to 6 0 to 6 0 to 6 0 to 6 0 to 6 0 to 6 0 to 6 0 to 6 0 to 6 0 to 6 0 to 6 0 to 6 0 to 6 0 to 6 0 to 6 0 to 6
PCB Cone
010100 010188 010100 17017000 020200 141499 18018000 010100 17017000 33033000 39039000
3770377000 2680268000 32032000 000077 28928966 242499 040455 010122 010100 46046000 14014000 343400 010100 030366 010100 65065000
3572 736324
8581 37700
007 2700
Report
ECO-RA 597 Weston98 Weston98 Weston98 Weston98 Weston98 Weston98 Weston98 Weston98 Weston98 Weston98 ECO-RA597 ECO-RA 597 Weston98 ECO-RA 597 Weston98 Weston98 Weston98 Weston98 Weston98 Weston98 Weston98 Weston98 Weston98 Weston98 Weston98 Weston98
bullbull
Ln Cone ND
-230 -171 -230 283 -163 040 289 -230 283 350 366 593 559 347 -266 337 091 -081 -208 -230 383 264 122 -230 -102 -230 417
087 813 285
2700
2857310 139253
5403
Dawes Avenue to the confluence of the Housatonic with the West Branch Area C soils PCB
Location Type Depth Cone Report Ln Cone ND I7-2-45A Flood Plain 0 to 6 12 ECO-RA 597 248 I7-2-45B Flood Plain 0 to 6 10 ECO-RA 597 230 I7-2-45C Flood Plain 0 to 6 30 ECO-RA 597 340 I7-2-33A Flood Plain 0 to 6 12 ECO-RA 597 248 I7-2-33B Flood Plain 0 to 6 49 ECO-RA 597 389 I7-2-33B-1 Flood Plain 0 to 6 62 ECO-RA 597 182 I7-2-33B-2 Flood Plain 0 to 6 16 ECO-RA 597 277 I7-2-33B-6 Flood Plain 0 to 6 34 ECO-RA 597 353 I7-2-33C Flood Plain 0 to 6 46 ECO-RA 597 153 I7-2-33D Flood Plain 0 to 6 36 ECO-RA 597 128 I7-2-32A Flood Plain 0 to 6 92 ECO-RA 597 452 I7-2-32A-5 Flood Plain 0 to 6 25 ECO-RA 597 ltQ92 I7-2-32B Flood Plain 0 to 6 24 ECO-RA 597 318 I7-3-7A-1 Flood Plain 0 to 6 12 ECO-RA 597 248 I7-3-7A Flood Plain 0 to 6 82 ECO-RA 597 441 I7-3-7A-2 Flood Plain 0 to 6 160 ECO-RA 597 508 I7-3-7B Flood Plain 0 to 6 24 ECO-RA 597 318 I7-3-7C Flood Plain 0 to 6 30 ECO-RA 597 340 I7-3-6C-12 Flood Plain 0 to 6 125 ECO-RA 597 253 I7-3-6C-10 Flood Plain 0 to 6 46 ECO-RA 597 383 I7-3-6C Flood Plain 0 to 6 62 ECO-RA 597 413 I7-3-6A Flood Plain 0 to 6 27 ECO-RA 597 330 I7-3-6B Flood Plain 0 to 6 40 ECO-RA 597 369 I7-2-25C Flood Plain 0 to 6 74 ECO-RA 597 200 I7-2-25B Flood Plain 0 to 6 56 ECO-RA 597 172 I7-2-25A Flood Plain 0 to 6 39 ECO-RA 597 366 I7-3-1A Flood Plain 0 to 6 12 ECO-RA 597 248 17-3-1 B Flood Plain 0 to 6 12 ECO-RA 597 248 17-3-1 C Flood Plain 0 to 6 33 ECO-RA 597 119 17-3-1 F Flood Plain 0 to 6 79 ^ECO-RA 597 207 17-1 -3A Flood Plain 0 to 6 07 ECO-RA 597 -036 16-1 -67B Flood Plain 0 to 6 64 ECO-RA 597 186 16-1 -67A Flood Plain 0 to 6 44 ECO-RA 597 378 16-1 -66A Flood Plain 0 to 6 15 ECO-RA 597 271 16-1 -66B Flood Plain 0 to 6 34 ECO-RA 597 353 17-1 -4A Flood Plain 0 to 6 8 ECO-RA 597 208 16-1 -64A Flood Plain 0 to 6 40 ECO-RA 597 369 16-1 -64B Flood Plain 0 to 6 1 ECO-RA 597 000 16-1 -62A Flood Plain 0 to 6 62 ECO-RA 597 182 16-1 -62B Flood Plain 0 to 6 12 ECO-RA 597 248
17-2-20-19 Flood Plain 0 to 6 349 SITE EXAC 695 355 17-2-20-1 Flood Plain 0 to 6 395 - SITE EXAC 695 368 I7-2-20-3 Flood Plain 0 to 6 57 SITE EXAC 695 174 P 9-20-2 Flood Plain 0 to 6 17 SITE EXAC 695 283
-20-12 Flood Plain 0 to 6 29 SITE EXAC 695 106 17-2-20-11 Flood Plain 0 to 6 26 SITE EXAC 695 096 I7-2-20-6 Flood Plain 0 to 6 4 SITE EXAC 695 139 17-2-20-16 Flood Plain 0 to 6 22 SITE EXAC 695 079 I7-2-3-2 Flood Plain 0 to 6 12 bull Sim-EXAC 695 018 BE-0011-A Bank 0 to 6 300 Weston98 340 BE-0010-A Bank 0 to 6 180 Weston98 289 BW-0023-A Bank 0 to 6 29 Weston98 107 BW-0025-A Bank 0 to 6 400 Weston98 369 BW-0027-A Bank 0 to 6 830 Weston98 442 BW-0026-A Bank 0 to 6 270 Weston98 330 BW-0024-A Bank 0 to 6 165 Weston98 280 BE-0009-A Bank 0 to 6 290 Weston98 337 BE-0004-A Bank 0 to 6 480 Weston98 387 BE-0008-A Bank 0 to 6 280 Weston98 333 HR-EB6 Bank 0 to 6 31 ECO-RA597 114 HR-EB7 Bank 0 to 6 07 ECO-RA 597 -037 BE-0002-A Bank 0 to 6 650 Weston98 417 BW-0021-A Bank 0 to 6 290 Weston98 337 BE-0003-A Bank 0 to 6 140 Weston98 264 BE-0007-A Bank 0 to 6 01 Weston98 -230 P--0001 -A Bank 0 to 6 41 Weston98 141 c -0005-A Bank 0 to 6 250 Weston98 322 BE-0006-A Bank 0 to 6 02 Weston98 -149 BW-0022-A Bank 0 to 6 590 Weston98 408 BW-0008-A Bank 0 to 6 130 Weston98 256 BW-0020-A Bank 0 to 6 370 Weston98 361 BW-0019-A Bank 0 to 6 340 Weston98 353 BW-0002-A Bank 0 to 6 690 Weston98 423 BW-0004-A Bank 0 to 6 480 L West$n98 387 BW-0003-A Bank 0 to 6 210 Weston98 304 BE-0037-A Bank 0 to 6 24 Weston98 089 BW-0001-A Bank 0 to 6 41 Weston98 142 BW-0006-A Bank 0 to 6 130 Weston98 256 BE-0036-A Bank 0 to 6 230 Weston98 314 BE-0035-A Bank 0 to 6 210 Weston98 304
BW-0005-A Bank 0 to 6 82 Weston98 210 BAMXX)9-A Bank 0 to 6 120 Weston98 248 BW-0007-A Bank 0 to 6 91 Weston98 221 BW-0018-A Bank 0 to 6 470 Weston98 385 BW-0015-A Bank 0 to 6 02 Weston98 -190 BW-0017-A Bank 0 to 6 360 Weston98 358 BW-0016-A Bank 0 to 6 100 Weston98 230 BW-0013-A Bank 0 to 6 01 Weston98 -230 BW-O014-A Bank 0 to 6 - 01 Weston98 -230 BW-0010-A Bank 0 to 6 180 Weston98 289 BW-0012-A Bank 0 to 6 01 Weston98 -230 BW-0011-A Bank 0 to 6 200 Weston98 300
mean 2310 236 sample variance 63598 268 sample stdev 2522 164 maximum 16000 minimum 010 n 9200 9200
Gilbert UCL 67810 Gilbert Mean 40448 Hstat 30098
ND - samples where ND was reported were listed as 12 the sample detection limit
ECO-RA 597 = Work Plan for the-Ecological Risk Assessments the Housatonic River Site Volume II May 24 1997 by Chem Risk SITE EXCAVATION PLAN 95-03-47-4 dated 695 Note Flood plain samples selected were those samples located within the 1 ppm isopleth that were not excavated or capped during short term measures or immediate response actions performed by GE Weston98 = Samples collected by Weston in March 1998
ATTACHMENT 2
Table of Skin Surface Areas by Age Group
Part of the Body Skin Surface Area (cm) Age9lt18
Hands 7462 Arms 18638 Feet 10710 Lower Legs 17563
Age 9 Hands 5618 Arms 13038 Feet 8056 Lower Legs 12169
Age 5lt12 Hands 51602 Arms 12926 Feet 7365 Lower Legs 11301 Legs 28252
Age5 Hands 4440 Arms 10906 Feet 5687 Lower Legs 8662 Legs 21656
Age 1lt6 Hands ~ 3650 Arms 8617 Feet 4578 Lower Legs 6735 Legs 16837
1 Skin Surface Areas are 50th percentile values for females (DEP 1995)
ATTACHMENT 3
Spreadsheets showing risk calculations
RISK CALCULATIONS PCB Exposure in Reaches 3-1 to 4-6 Housatonlc River
REACH A 3-1 TO 3-10 NEWELL TO ELM Trespasser Age 9lt18 - CANCER Trespasser Age 9lt18 - CHRONIC NONCANCER Trespasser Age 9 - SUBCHRONIC Trespasser Age 9lt18 - CANCER Trespasser Age 9lt18 - CHRONIC NONCANCER Trespasser Age 9 - SUBCHRONIC
REACH B 4-1 TO 4-3 ELM TOD AWES
Wader Age 5lt12 - CANCER Wader Age 5lt12 - CHRONIC NONCANCER Wader Age 5 - SUBCHRONIC Wader Age 5lt12 - CANCER Wader Age 5lt12 - CHRONIC NONCANCER Wader Age 5 - SUBCHRONIC
REACH C 4-4 TO 4-6 DAWES TO CONFLUENCE Young Resident Age 1lt 6 - CANCER Young Resident Age 1 lt 6 - CHR NONCANCER Young Resident Age 5 - SUBCHRONIC Young Resident Age 1 lt 6 - CANCER Young Resident Age 1lt 6 - CHR NONCANCER Young Resident Age 5 - SUBCHRONIC
Media
Soil Soil Soil Sediment Sediment Sediment
Media
Soil Soil Soil Sediment Sediment Sediment
Media
Soil Soil Soil Sediment Sediment Sediment
ELCR
983E-04
188E-05
ELCR
355E-04
503E-04
ELCR
737E-05
178E-05
HI
1910445 1481659
3661686 2839847
HI
8879105 7425684
1256323 2413448
HI
2580036 157254
6226499 9133987
(L)ADDoral mgkg-d
56054E-05 43597E-04 11304E-03 10744E-06 83562E-06 21667E-05
ADDoral mgkg-d
28423E-05 28423E-04 70840E-04
- 28986E-05 28986E-04 17005E-03
ADDoral mgkg-d
13734E-05 19228E-04 25196E-04 26125E-06 36575E-05 11282E-04
L)ADDdermal EPC RfD CSF mgkg-d mgkg mgkg-d (mgkg-d)-1
43520E-04 240000 2E-05 2 33S49E-03 240000 2E-05 2 62779E-03
tsect3414E-06 240000
4600 5E-05 2E-05
2 f2
sectlt4878E-05 12033E-04
4600 4600
2E-05 5E-05
2 f
ADDdermal EPC RfD CSF mgkg-d mgkg mgkg-d (mgkg-d)-1
14916E-04 37700 2E-05 pound
14916E-03 37700 2E-05 pound
30044E-03 37700 5E-05 4
422228E-04 90500 2E-05 422228E-03 90500 2E-05 f
4 10367E-02 90500 5E-05
ADDdermal EPC RfD CSF mgkg-d mgkg mgkg-d (mgkg-d)-1
23123E-05 6700 2E-05 2 32373E-04 6700 2E-05 gt 53431 E-04 6700 5E-05 t 62825E-06 3000 2E-05
- 8J955E-05 3000 2E-05 34388E-04 3000 5E-05
this Is UD rchsxls
RISK CALCULATIONS PCB Exposure in Reaches 3-1 to 4-6 Housatonic River
REACH A 3-1 TO 3-10 NEWELL TO ELM
Trespasser Age 9lt18 - CANCER Trespasser Age 9lt18 - CHRONIC NONCANCER Trespasser Age 9 - SUBCHRONIC Trespasser Age 9lt18 - CANCER Trespasser Age 9lt18 - CHRONIC NONCANCER Trespasser Age 9 - SUBCHRONIC
REACH B 4-1 TO 4-3 ELM TOD AWES
Wader Age 5lt12 - CANCER Wader Age 5lt12 - CHRONIC NONCANCER Wader Age 5 - SUBCHRONIC Wader Age 5lt12 - CANCER Wader Age 5lt12 - CHRONIC NONCANCER Wader Age 5 - SUBCHRONIC
REACH C 4-4 TO 4-6 DAWES TO CONFLUENCE
Youqg Resident Age 1lt 6gtT CANCER Youflg Resident Age 1lt 6 - CHR NONCANCER Young Resident Age 5 - SUBCHRONIC Young Resident Age 1 lt 6 - CANCER Young Resident Age 1 lt 6 - CHR NONCANCER Young Resident Age 5 - SUBCHRONIC
^
kgmg
100E-06 100E-06 100E-06 100E-06 100E-06 100E-06
C kgmg
100E-06 100E-06 100E-06 100E-06 100E-06 100E-06
C kgmg
100E-06 100E-06 100E-06 100E-06 100E-06 100E-06
IR mgd
IR mgd
IR mgd
50 50 50 50 50 50
50 50 50 50 50 50
100 100 100 100 100 100
EF evd
EF evd
EF evd
0167 0167 0283 0167 0167 0283
1
0419 0419 0707 0178 0178 0707
0419 0419 0707 0178 0178 0707
ED dev
ED dev
ED dev
EP days
1 1 1 1 1 1
EP days
1 1 1 1 1 1
EPdays
bull bull bull bull bull bull
3285 3285 214
3285 3285 214
2555 2555 214
2555 2555
92
1825 1825 214
1825 1825
92
RAF-o
RAF-o
RAF-o
RAF-d
1 014 1 014 1 014 1 014 1 014 1 014
RAF-d
bull 014 bull 014 bull 014 bull 014 bull 014 bull 014
RAF-d
014 014 014 014 014 014
BW AP
kg days
46 25550 46 3285 30 214 46 25550 46 3285 30 214
BW AP kg days
278 25550 278 2555 188 214 278 25550 278 2555 188 92
BW AP
kg days 146 25550 146 1825 188 214 146 25550
146 1825
188 92
this Is up_rchsxls
v
RISK CALCULATIONS PCB Exposure in Reaches 3-1 to 4-6 Housatonic River
REACH A 3-1 TO 3-10 SA AF NEWELL TO ELM cm2d mgcm2
Trespasser Age 9lt18 - CANCER 5437 051 Trespasser Age 9lt18 - CHRONIC NONCANCER 5437 051 Trespasser Age 9 shy SUBCHRONIC 3889 051 Trespasser Age 9lt18 shy CANCER 5437 051 Trespasser Age 9lt18 - CHRONIC NONCANCER 5437 051 Trespasser Age 9 - SUBCHRONIC 3889 051
REACH B 4-1 TO 4-3 SA AF ELM TO DAWES cm2d mgcm2 Wader Age 5lt12 - CANCER 3675 051 Wader Age 5lt12 - CHRONIC NONCANCER 3675 051 Wader Age 5 shy SUBCHRONIC 2970 051 Wader Age 5lt12 shy CANCER 5370 051 Wader Age 5lt12 - CHRONIC NONCANCER 5370 051 Wader Age 5 - SUBCHRONIC 4269 051
bull REACH C 4-4 TO 4-6 SA AF DAWES TO CONFLUENCE cm2d mgcm2
Young Resident Age 1lt 6 - CANCER 2358 051 Young Resident Age 1 lt 6 - CHR NONCANCER 2358 051 Young Resident Age 5 - SUBCHRONIC 2970 051 Young Resident Age 1 lt 6 - CANCER 3368 051 Young Resident Age 1lt 6 - CHR NONCANCER 3368 051 Young Resident Age 5 - SUBCHRONIC 4269 051
this is UD rchixls
g
ATTACHMENT 4
Spreadsheets showing risk calculations using Arithmetic Average PCB Concentrations for the EPCs
RISK CALCULATIONS Using AVERAGE PCB concentration as EPC REACH A 3-1 TO 3-10 NEWELL TO ELM
Trespasser Age 9lt18 - CANCER Trespasser Age 9lt18 - CHRONIC NONCANCER Trespasser Age 9 - SUBCHRONIC Trespasser Age 9lt18 - CANCER Trespasser Age 9lt18 - CHRONIC NONCANCER Trespasser Age 9 - SUBCHRONIC
REACH B 4-1 TO 4-3
Wader Age 5lt12 - CANCER Wader Age 5lt12 - CHRONIC NONCANCER Wader Age 5 - SUBCHRONIC Wader Age 5lt12 - CANCER Wader Age 5lt12 - CHRONIC NONCANCER Wader Age 5 - SUBCHRONIC
REACH C 4-4 TO 4-6
Young Resident Age 1lt 6 - CANCER Young Resident Age 1lt 6 - CHR NONCANCER Young Resident Age 5 - SUBCHRONIC Young Resident Age 1lt 6 - CANCER Young Resident Age 1lt 6 - CHR NONCANCER Young Resident Age 5- SUBCHRONIC
Media
Soil Soil Soil Sediment Sediment Sediment
Media
Soil Soil Soil Sediment Sediment Sediment
Media
Soil Soil Soil Sediment Sediment Sediment
ELCR
105E-04
638E-06
ELCR
315E-05
462E-05
ELCR
233E-05
887E-06
HI ADDoral ADDdermal EPC RfD CSF
mgkg-d mgkg-d mgkg mgkg-d mgkg-d)-1
59903E-06 46509E-05 27480 2E-05 2 218746 4991 9E-05 38757E-04 27480 2E-05 2
16965 12943E-04 71882E-04 27480 5E-05 2 36382E-07 28247E-06 1669 2E-05 2
1328555 30318E-06 23539E-05 1669 2E-05 2 103037 78612E-06 43657E-05 1669 5E-05 2
HI ADDoral ADDdermal EPC RfD CSF mgkg-d mgkg-d mgkg mgkg-d (mgkg-d)-1
25191E-06 13220E-05 3580 2E-05 A
48431617 26990E-05 14164E-04 3580 2E-05 47051445 67270E-05 28530E-04 3580 5E-05
26624E-06 20416E-05 8906 2E-05 2 1236333 28525E-05 21874E-04 8906 2E-05 2 2375046 - 16735E-04 10202E-03 8906 5E-05 2
HI ADDoral ADDdermal EPC RfD CSF
mgkg-d mgkg-d mgkg mgkg-d (mgkg-d)-1 43354E-06 72991 E-06 2266 2E-05 2
8725911 65031 E-05 10949E-04 2266 2E-05 2
5318471 85216E-05 18071 E-04 2266 5E-05 2
13021E-06 31312E-06 1602 2E-05 t 332495 19531 E-05 46968E-05 1602 2E-05
4877549 60245E-05 18363E-04 1602 5E-05
RISK CALCULATIONS Using AVERAGE PCB concentration as EPC REACH A 3-1 TO 3-10 NEWELL TO ELM
Trespasser Age 9lt18 - CANCER Trespasser Age 9lt18 - CHRONIC NONCANCER Trespasser Age 9 - SUBCHRONIC Trespasser Age 9lt18 - CANCER Trespasser Age 9lt18 - CHRONIC NONCANCER Trespasser Age 9 - SUpoundCHRONIC
REACH B 4-1 TO 4-3
Wader Age 5lt12 - CANCER Wada Age 5lt12 - CHRONIC NONCANCER Wader Age 5 - SUBCHRONIC Wader Age 5lt12 - CANCER Wader Age 5lt12 - CHRONIC NONCANCER Wader Age 5 - SUBCHRONIC
REACH C 4-4 TO 4-6
Young Resident Age 1lt 6 - CANCER Young Resident Agegt1 lt 6 - CHR NONCANCER Young Resident Age 5 - SUBCHRONIC Young Resident Age 1 lt 6 - CANCER Young Resident Age 1lt 6 - CHR NONCANCER Young Resident Age 5- SUBCHRONIC
C kgmg
100E-06 100E-06 100E-06 100E-06 100E-06 100E-06
C kgmg
100E-06 100E-06 100E-06 100E-06 100E-06 100E-06
C kgmg
100E-06 100E-06 100E-06 100E-06 100E-06 100E-06
R mgd
IR mgd
IR mgd
50 50 50 50 50 50
50 50 50 50 50 50
100 100 100 100 100 100
EF evd
EF evd
EF evd
0167 0167 0283 0167 0167 0283
0419 0419 0707 0178 0178 0707
0419 0419 0707 0178 0178 0707
ED dev
ED dev
ED dev
EP RAF-o days
1 3285 1 3285 1 214 1 3285 1 3285 1 214
EP RAF-o days
1 2565 1 25sect5 1 214 1 2555 1 2555 1 92
EP RAF-o days
bull 1825 bull 1825 bull 214 bull 1825 bull 1825 bull 92
RAF-d
1 014 1 014 1 014 1 014 1 014 1 014
RAF-d
1 014 1 014 014 014 bull 014 014
RAF-d
bull 014 bull 014 bull 014 bull 014 bull 014
014
BW AP
kg days
46 27375 46 3285 30 214 46 27375 46 3285 30 214
BW AP
kg days
278 27375 278 2555 188 214 278 27375 278 2555 188 92
BW AP
kg days
146 27375 146 1825 188 214 146 27375 146 1825 188 92
thU is up_rchsxls
RISK CALCULATIONS Using AVERAGE PCB concentration as EPC REACH A 3-1 TO 3-10 SA AF NEWELL TO ELM cm2d mgcm2 Trespasser Age 9lt18 - CANCER 5437 051 Trespasser Age 9lt18 - CHRONIC NONCANCER 5437 051 Trespasser Age 9 - SUBCHRONIC 3889 051 Trespasser Age 9lt18 - CANCER 5437 051 Trespasser Age 9lt18 - CHRONIC NONCANCER 5437 051 Trespasser Age 9 - SUBCHRONIC 3889 051
SA AF REACH B 4-1 TO 4-3 cm2d mgcm2 Wader Age 5lt12 - CANCER 3675 051 Wader Age 5lt12 - CHRONIC NONCANCER 3675 051 Wader Age 5 - SUBCHRONIC 2970 051 Wader Age 5lt12 - CANCER 5370 051 Wader Age 5lt12 - CHRONIC NONCANCER 5370 051 Wader Age 5 - SUBCHRONIC 4269 051
SA AF REACH C 4-4 TO 4-6 cm2d mgcm2
Young Resident Age 1lt 6 - CANCER 2358 051 Young Resident Age 1lt 6 - CHR NONCANCER 2358 051 Young Resident Age 5 - SUBCHRONIC 2970 051 Young Resident Age 1 lt 6 - CANCER 3368 051 Young Resident Age 1lt 6 - CHR NONCANCER 3368 051 Young Resident Age 5- SUBCHRONIC 4269 051
Appendix A Memo on Potential Human Health Risks from Consuming Fish from the Housatonic River in Massachusetts
United States Boston Massachusetts 02203 Environmental Protection Agency (617)565-3420 New England Region JF Kennedy Federal Building
MEMORANDUM
DATE May 141998
SUBJ Potential Human Health Risks from Consuming Fish from the Housatonic River in Massachusetts
FROM Mary BaUew Environmental Scientist EPA TO Bryan Olson Project Manager Office of Site Remediation and Restoration EPA
I INTRODUCTION
This memo provides calculations and a limited discussion of potential risks from consuming fish from the Housatonic River in Massachusetts Currently there is a fishing advisory on the Housatonic which may help to limit fish consumption
EL CONCLUSIONS
Consumption of fish in the Housatonic river even for periods as short as one summer presents a significant risk to human health
DL HAZARD IDENTIFICATION
For the Housatonic River in Massachusetts there is-afish consumption advisory in place for all fish species However there is no enforcement mechanism in the advisory and no monitoring of the advisorys effectiveness in preventing exposure Currently 37 of male and 31 of female Pittsfield residents surveyed by the Massachusetts Department of Public Health reported eating freshwater fish (not necessarily from the Housatonic) (MA DPH 1997) The fish consumption advisory is communicated by a brochure distributed when individuals receive fishing licenses In addition the advisory is posted on some locations on the river However young people under 16 years old can fish without a license and they may walk to and fish from locations that are not posted The river has numerous access points by foot or by boat Under the fishing advisory catching and releasing the fish is allowed which adds to the difficulty of monitoring its effectiveness If individuals ignore the advisory or are not aware of it their cumulative risk may be represented by the risks presented in this memo
GE collected young of year1 fish to monitor changes (trends) in PCB levels over time not to represent the type offish people were likely to eat Since these fish were about six months old (Finklestein 1998) they were too small to eat GE reported that composites of young of year fish (pumpkinseeds largemouth bass-and yellow perch) caught in 1994 near New Lenox Road (just downriver of Pittsfield) in the Housatonic ranged from 22 to 35 mg PCBs per kilogram (ppm) of whole fish composite Similarly fish composites at Woods Pond (12 miles downriver of GE) ranged from 3 to 58 ppm (GE 1994) So although Woods Pond contained high levels of PCBs the fish in sections of the river closer to Pittsfield contained comparable levels For example the 69 largemouth bass sampled at New Lenox Road averaged 31 ppm and the 70 largemouth bass sampled at Woods Pond averaged 23 ppm (young of year results GE 1994)
In 1994 the National Biological Survey of the US Geological Survey (USGS) collected 28 largemouth bass from Woods Pond which is a wide shallow section of the Housatonic River PCB levels in 24 whole fish ranged from a minimum of 27 ppm to a maximum of 206 ppm and averaged 100 ppm (not adjusted for lipid) Four additional muscle tissue samples ranged from 13 to 70 ppm PCBs (Attachment Al) Woods Pond is twelve miles downriver from the GE facility and the sediment levels of PCBs in Woods Pond average 27 ppm (personal communication Dean Tagliaferro April 1998) The dominant Aroclors2 found in the fish resemble Aroclors 1254 and 1260 which are the environmentally modified forms of the original Aroclor 1260 released from GE
In 1997 EPA-New England asked the EPA Office of Research and Development for technical assistance to perform congener-specific3 analysis of the USGS fish samples Since this was the only congener-specific data for fish available for the Housatonic River this data was selected for these risk calculations The USGS had a limited amount of data on other species however EPA chose the largemouth bass for congener analysis because they are a popular game species The largemouth bass caught by the USGS were all of a size that would provide good fillets In
1 Young of year fish are those less than one year old
2 PCB mixtures manufactured in the United States carried the trademark Aroclor followed by a four-digit number the first two digits are 12 and the last two digits indicate the percent chlorine by weight For example Aroclor 1260 was manufactured using 60 chlorine Aroclor 1016 is an exception because it contains 41 percent chlorine by weight (EPA 1996) Once released into the environment distribution and bioaccumulation of an Aroclor can change the character of the mixture so that it may no longer resemble the original mixture (EPA 1996)
3 Each PCB molecule consists oftwo 6-carbon rings with one chemical bond joining a carbon from each ring -imagine sunglasses with hexagonal frames) Chlorine can attach to any of the other 10 carbons There are 209 QSgible
arrangements called congeners The number and position of chlorines determine a PCB molecules physical and chemical properties Congeners are numbered 1 to 209 The coplanar congeners those with the two rings aligned on the same plane have dioxin-like properties (EPA 1996) Congener specific data improves our ability to identify the presence of bioaccumulated PCBs
contrast the GE young of year fish were too small to eat
IV DOSE RESPONSE
Toxicology To determine whether exposure to PCBs in fish from the Housatonic River in Massachusetts presents a potential risk to human health EPA evaluates the cancer and noncancer risks associated with PCB exposure To evaluate the cancer risk EPA uses the 95 upper confidence limit of the linear-slope factor (also known as the cancer slope factor) of 2 (mgkgday)1 for PCBs (IRIS 1998) The fish ingestion scenario involves ingestion of bioaccumulated PCBs Ingestion offish contaminated with these PCBs may result in a dose greater than that which occurred in the toxicity studies used to develop the potency estimates (EPA 1996) For that reason EPA estimates the risk of consuming bioaccumulated PCBs using the Toxic Equivalence Factor (TEF) approach (outlined in EPA 1996) The TEFs are ratios for certain PCB congeners that when multiplied by each congeners concentration in fish tissue and the cancer slope factor for dioxin yield an estimate of the carcinogenicity of the bioaccumulated PCBs in the fish Because of its toxicity the cancer slope factor for dioxin is very high 150000 (mgkgday)1 so even small concentrations of these dioxin-like PCBs in the fish can present a cancer risk
In the cancer study for Aroclor 1260 on which the slope factor is based a 12-month exposure produced approximately the same cancer potency as a full two-year exposure This suggests that a less than lifetime exposure could have significant risk implications (EPA 1996)
To evaluate chronic noncancer risks EPA used a Reference Dose (RfD) of 2 x 10⁵ mgkgday for Aroclor 1254 (IRIS 1998) To evaluate subchronic noncancer risks EPA used the subchronic RfD of 5 x 10⁵ mgkgday for Aroclor 1254 (HEAST 1997) Reference Doses for Aroclor 1254 were used because they are the closest ones applicable to the type of PCB mixture found in the
- Housatonic River (Aroclor 1260) The toxicity of Aroclor 1254 is much more similar to^Jtbajt of Aroclor 1260 than the toxicity of Aroclor 1016 (the other choice for an EPA accepted RfD) The toxicity study on which the RfDs are based was conducted over a shorter-term time frame (5 years) The subchronic exposure period evaluated in this memorandum (one summer) is consistent with that used in the toxicity study The critical effects for the chronic and subchronic RfDs are immunologic and reproductive effects In addition PCBs have been associated with deficits in learning and neurological effects (see ATSDR 1996 for a recent review)
A relative absorption factor (RAF) of 100 was used for oral absorption of PCBs from fish bull bull (DEP 1992) An RAF of 100 means that the assumed absorption of PCBs from ingestion of
Housatonic fish is equal to the absorption of PCBs in the laboratory toxicity studies
Data Analysis Of the available fish data only the 1994 USGS 24 whole fish and 4 tissue samples were tested for dioxin like PCBs (see data in attachment AL spreadsheets) The whole fish samples included skin organs and all other tissues For the muscle tissue samples USGS removed about 100 grams of muscle tissue and attached skin (about 2 inches wide 4 inches long and 1 inch deep) from the back of the fish directly above the gut (Steven Smith personal communication 1998)
To compare the fish on the same basis EPA adjusted the whole fish data to its equivalent in fish tissue thus
(ppm PCBs in whole fish divided by lipid in each fish) x 100 = micrograms of PCB per gram of fat
The concentration of PCBs in fish muscle tissue equivalents were determined using the lipid normalized concentration of PCBs and the average lipid found in the four fish tissue samples (approximately 1) While the use of lipid normalization data is not recommended in all cases4 the lipid approximation of 1 was considered to be reasonable given the very low levels of lipid in whole fish (087-58)
Following the procedure outlined in EPA 1996 EPA multiplied the concentrations of the shyindividual PCB dioxin-like congeners by the toxic equivalence factors (TEFs) appropriate to each This product called dioxin toxic equivalents (TEQs) is calculated for each tissue sample
Next EPA calculated the 95 upper confidence limit of the mean (Gilbert 1987) concentration for the non-dioxin PCBs and the dioxin-like PCBs These calculations resulted in a UCLs of 00013 for TEQs and 522 ppm for nondioxin PCBs These were the exposure point concentrations used with the exposure factorsrtocalculate the risks of consuming the fish Eleven of-the 13 dioxin-like PCBs were detected in fish samples used for this risk evaluation -gt --
V EXPOSURE ASSESSMENT
Currently the waters of the Housatonic are under a fishing advisory by the Commonwealth of Massachusetts The calculations for the adult fisher and subsistence fisher that follow assume that
4For human health risk assessment adjusting for lipid requires site-specific samples offish muscle tissue or fillet in addition to the data on whole fish A standardized (not site-specific) lipid adjustment is not appropriate because the lipid levels of the fish may have been affected by the site contamination Also the adjustment does not make biological sense unless the contaminant sequesters in the fat
lib
people do not adhere to the advisory
The calculations for the child fisher represent the short-term PCS doses and risks that a child could receive during one summer of consuming contaminated fish caught between GE and the Woods Pond Dam on the Housatonic River in Massachusetts
Adult Fisher To estimate risks to the adult fisher EPA used exposure assumptions that consider the amount of site data available and the site conditions The exposure assumptions described below are reflective of the Reasonable Maximum Exposure (RME) for adult residents who consume contaminated fish
These calculations assume that an adult fisher5 consumes a daily average of 26 grams offish over the course of 365 days per year (Ebert et al 1993) This could represent 3 or 4 (8shyounce) fish meals per month throughout a year or 7 (8-ounce) fish meals per month during the warmer months (April through October) A daily average of 26 grams represents the 95th percentile offish consumption for all water bodies in Maine (Ebert et al 1993) Because the Housatonic is the largest water body in the region and an attractive resource this value is appropriate This value was previously agreed upon by the Agencies in joint comments on General Electrics proposed Risk Assessment Scope of Work for the Housatonic River GE did not dispute this value (DEPEPA 1997)
The body weight used in this evaluation is 70 kg which represents the average body weight for an adult (EPA 1989)
Subsistence Fisher To estimate risks to the subsistsacefisher EPA used exposure assumptions that consider the amount of site data available and-the site conditions The exposure assumptions described below are appropriate for a sensitive subpopulation that is highly exposed
These calculations assume that a subsistence fisher5 consumes a daily average of 140 grams of fish over the course of 365 days per year This could represent 4 or 5 (8-ounce) fish meals per week during a year The daily average of 140 grams per day was estimated by EPA Office of Water staff based on a review of the literature on fish consumption by Native Americans and subsistence anglers (EPA 1995) Given site conditions this value is appropriate for subsistence fishers as a whole a particular ethnic group or tribe of Native
This is a person who has adult body weight and who would ingest adult-sized portions of fish For example for a thirty year exposure duration this could be a person who ate fish each year when they were between the ages of 18 and 48
Americans may consume more fish This value for subsistence fish consumption was previously agreed upon by the Agencies in joint comments on General Electrics proposed Risk Assessment Scope of Work for the Housatonic River GE did not dispute this value (DEPEPA 1997)
The body weight used in this evaluation is 70 kg which represents the average body weight for an adult (EPA 1989)
Childfisher To estimate the subchronic risks to the child fisher EPA used exposure assumptions that consider the amount of site data available and the site conditions The exposure assumptions described below are reflective of short term exposures and do not represent the RME
These calculations assume that the child fisher (age9 years) consumes one small (6- or 7shyounce) fish meal per week during the summer months (June July August) EPA assumes 13 weeks per summer (June July and August)
The one summer exposure period used in this evaluation is shorter than the 30-year exposure period (for cancer risks) typically evaluated by EPA as part of the RME The purpose of this calculation is to examine whether short term exposures could provide enough dose and present enough risk at some point later in life to be a concern
For fish ingestion for the child fisher EPA used 1825 gweek This is the same value for residential fish consumption mentioned above and adjusted to a weekly consumption rate (26 gday 365 daysyr divided by 52 weeksyr)
The body weight used in these calculations is 30 kg which represents an average of the 50th
percentile body weightierfemales age 9 years (DEP^ 1995 EPA 1989)
TABLE 1 Exposure factors used to calculate the potential risks from fishing on the Housatonic River
EXPOSURE PARAMETER VALUE
body weight (kg) adult or subsistence fisher 70 body weight (kg) age 9 years 30
exposure duration subchronic (weeks) 13 exposure duration (years) 30
fish ingcstion rate (gday) adults 26 fish ingestion rate (gday) subsistence fishers 140 fish ingestion rate (gwcck) children 1825
averaging time (days) cancer 25550 averaging time (days) chronic noncancer 10950 averaging time (days) subchronic noncancer 92
VL RISK CHARACTERIZATION
A Risk Calculations
CANCER RISKS e
Using the assumptions noted above in Table 1 and the equations below a lifetime average daily dose of PCBs from ingestion offish can be calculated
= fPGBl C IR ED BWAT
LADDlaquoi
Where
LADD^ = lifetime average daily dose from ingestion offish mgkgday [PCS] = PCB concentration in fish figkg C = conversion factor 106
IR = fish ingestion rate gday BW = body weight kg ED = exposure duration years AT F= averaging time period over which exposure is averaged - days or years
The Excess Lifetime Cancer Risk (ELCR) from ingestion of fish can be calculated using the following equations
ELCR = (LADD^J CSF (for cancer risks less than 1 in 100)
ELCR = 1- exp (-LADD^ CSF) (for cancer risks greater than 1 in 100)
Where ELCR = Excess Lifetime Cancer Risk CSF = Cancer Slope Factor 2 (mgkgday)-1 for nondioxin-like PCBs and 150000
(mgkgday)-1 fordioxinTEQs LADD^ = lifetime average daily dose from ingestion of fish exp = e raised to the power of x where x is the product of the dose and the cancer slope factor
NONCANCER RISKS
Using the exposure assumptions in Table 1 and the equations below an average daily dose of PCBs from ingestion offish can be calculated
= fPCBI C IR ED BWAT
Where
= average daily dose from ingestion of fish mgkgday [PCB] = PCB concentration in fish ngkg C = conversion factor 106
IR = fish ingestion rate gday or gweek BW = body weight kg ED = exposure duration weeks or years AT = averaging time period over which exposure is averaged - days or years
The Hazard Index can be calculated using the equation below
HI = [ADD ] RfD
Where HI = Hazard Index RfD = Reference Dose mgkgday
= average daily dose from ingestion of fish mgkgday
B Risk Results
RCRA CERCLA Risk Management Criteria
The cancer risks for the adult fisher and the subsistence fisher whom consume PCB contaminated fish are two orders of magnitude (100 times) or more above the EPA cancer risk range (discussed in EPA 1991) of 106 to 104 (see tables attached) and this justifies EPA in taking an (remedial or removal) action
Even a child who consumes one fish meal a week over the course of one summer has a cancer risk from that short term exposure which is nine times higher than the EPA cancer risk range of 106 to 10 and this justifies EPA in taking an action
The chronic noncancer risks for the adult fisher and the subsistence fisher whom consume PCB contaminated fish are over 900 times the risk (ie a chronic Hazard Index of 1) at which EPA is justified in taking an action
The noncancer risks (subchronic) for a child who consumes one fish meal a week over the course of one summer are over 800 times the risk (ie a subchronic Hazard Index of 1) at which EPA is justified in taking an action
If adults or children are consuming the fish on a regular basis they have a significant risk of cancer or noncancer health effects
C Discussion of Risk Characterization
Discussion Related to Exposure Scenarios The exposure period evaluated for the child fisher (one summer) may underestimate the actual exposure that a child may receive because it does not account for continuing exposure Moreover PCBs have been present in the residential areas in Pittsfield for many years already making it likely that exposure via some other environmental media has already occurred
The exposure period selected for evaluation of cancer effects is one summer for the child fisher However different assumptions about the exposure period have a significant impact on the risk results As the exposure period increases the cancer risk estimate increases For evaluating cancer risks one could easily justify using a longer exposure period than the ones selected Also typically the calculation of cancer risks attributable to fish consumption may involve some weighting of child and adult exposures which may make the risks higher than those calculated for
the adult alone
The risk calculations may not be conservative enough for ethnic groups whose members consume the whole fish Also particular Native American or ethnic groups may consume more fish than noted in the subsistence fishing calculations
Pre-natal exposure to PCBs as well as post-natal exposure to PCBs via breast milk may have higher risks than those noted Early stages of development may have an extra sensitivity to the effects of PCBs (reviewed in EPA 1993 IRIS 1998)
Toddlers consuming fish may have higher risks than those noted because of the large doses that these fish would provide given the small body size of a toddler Also the toddler may be more sensitive to the developmental effects of PCBs
Discussion Related to Toxicity and Exposure The cancer risks from the dioxin-like PCBs was about twice the risks from PCBs (without the properties of dioxin) This illustrates the importance of performing congener specific analysis of PCBs for estimates of cancer risk
The PCB doses from eating the fish even for as short a period as one summer are higher than the doses at which monkeys showed marked reproductive effects (Arnold et al 1995) and effects on cognitive behavior (Rice 1995 1997 Rice and Hayward 1997 Rice et al 1996) and activity (reviewed in EPA 1993) This suggests that there may be no safety margin between the exposure estimates for people who eat fish from the Housatonic river and the exposures in the monkey studies which show adverse health effects
The risks from consuming the fish are substantial If the fishing advisory is effective then there is no risk from the fish However a report in the literature suggests that fishing advisories are violated regularly (Tilden et al 1997)6 And-sbmepeople in the area may have consumed fish from the Housatonic before the fishing advisory was in place (about 10 years ago)
In sum doses estimated for children and adults who ingest contaminated fish from the Housatonic river are higher than those received by the monkeys in the PCB noncancer toxicity study that demonstrated adverse health effects This is true even in the case of children who ingest contaminated fish over the course of one summer These exposure estimates raise significant concerns regarding potential health effects in children and adults who ingest contaminated fish from the Housatonic river
6Tilden estimates that in one year as many as 47 million people ate Great Lakes sport fish despite long standing (since the mid-70s) state fishing advisories
10
REFERENCES
Arnold et al 1995 Toxicological Consequences ofAroclor 1254 Ingestion by Female Rhesus (Macaca mulatto) Monkeys Part 2 Reproduction andlnfant Findings Arnold DL Bryce F McGuire PF et al Fd Chem Toxic 33457-74
ATSDR1996 Public Health Implications ofPCBs December 1996
DEP 1992 Documentation For The Risk Assessment Shortform Residential Scenario Massachusetts Department of Environmental Protection Office of Research and Standards and the Bureau of Waste Site Cleanup Policy BWSCORS-142-92 October 1992
DEP 1995 Guidance For Disposal Site Risk Characterization In Support of the Massachusetts Contingency Plan Interim Final Policy BWSCORS-95-141 Massachusetts Department of Environmental Protection Bureau of Waste Site Cleanup and Office of Research and Standards July 1995
DEPEPA 1997 Joint DEPEPA Technical and Review Comments on General Electric Proposal for Human Health Risk Assessment of the Housatonic River August 13 1997
Ebertetal 1993 Estimating Consumption of Freshwater Fish among Maine Anglers EbertES Harrington NW Boyle KJ et al North American Journal of Fisheries Management 13737-45 1993
EPA 1989 Risk Assessment Guidancefor Superfund Volume I - Human Health Evaluation Manual (Part A) Interim Final US Environmental Protection Agency Office of Emergency and Remedial Response EPA5401-89002 December 1989
EPA 1991 Role of the Baseline Risk Assessment in Superjund Remedy Selection Decisions USEPA OSWER Directive 93550-30 April 22 1991
EPA 1993 Workshop Report on Developmental Neurotoxic Effects Associated with Exposure to PCBs VSEPA Risk Assessment Forum EPA63 OK-92004 May 1993
EPA 1995 Water Quality Guidance for the Great Lakes System Supplementary Information Document (SID) USEPA Office of Water EPA-820-B-95-001 March 1995 p 575
EPA 1996 PCBs Cancer Dose-Response Assessment and Application to Environmental Mixtures NCEA ORD EPA600P-96001F
Finklestein 1998 Personal communication Ken Finklestein NOAA May 111998
GE 1994 Preliminary draft MCP Supplemental Phase II InvestigationRCRA Facility Investigation of Housatonic River and Silver Lake Tables 8 through 10
Gilbert 1987 Statistical Methods for Environmental Pollution Monitoring RO Gilbert Van
11
Nostrand Reinhold NY 1987
HEAST 1997 Health Effects Assessment Summary Tables EPA Office of Solid Waste and Emergency Response 92006-303 (97-1) EPA-540-R-97-036 PB97-921199 July 1997
IRIS 1998 EPA Integrated Risk Information System a database 1998
Mass DPH 1997 Housatonic River Area PCB Exposure Assessment Study Final Report Massachusetts Department of Public Health Bureau of Environmental Health Assessment Environmental Toxicology Unit September 1997
Rice 1995 Neurotoxicity of Lead Methylmercury andPCBs in Relation to the Great Lakes DC Rice Environmental Health Perspectives 103(Supplement9)71-87 1995
Riceetal 1996 Lessons for Neurotoxioology from SelectedModel Compounds SGOMSEC Joint Report Rice DC de Duffard AME Duffard R et al Environmental Health Perspectives 104(Supplement 2)205-15
Rice 1997 Effect of Postnatal Exposure to a PCB Mixture in Monkeys on Multiple Fixed Interval-Fixed Ratio Performance DC Rice Neurotoxicology and Teratology 19429-34
Rice and Hayward 1997 Effects of Postnatal Exposure to a PCB Mixture in Monkeys on Nonspatial Discrimination Reversal and Delayed Alternation Performance Rice DC Hayward S Neurotoxicology 18479-94 1997
Smith 1998 Personal communication with Steven Smith USGS April 28 1998
Tagliaferro 1998 Personal communication Dean Tagliaferro EPA removals program April 1998
Tilden et al 1997 Health Advisories for Consumers of Great Lakes Sport Fish Is the Message Being Received Tilden J Hanrahan LP Anderson H et al Environmental Health Perspectives 1051360-65 1997
Tilson et al 1990 Polychlorinated Biphenyls and the Developing Nervous System Cross-species Comparisons Tilson HA Jacobson JL Rogan WJ Neurotoxicology and Teratology 12239-248 1990J
12
ATTACHMENT A1
Spreadsheets showing raw data and UCL calculations
13
Congener specific PCB concentrations and TEQs in largemouth bass collected from Woods Pond MA last modified 51098 PCBs
Fish refershyence
ppm PCBs
Lipid in Lipid AP raquosampx3 Dioxin-like ODngeners(ppm)
number total whole fish]
BO I B02 B03 B04 805
57 206 65 117 75
225 381 161 106 285
PCBsg
25333 54068 40373 110377 26316
I 1242
lt05 ltQ5 lt05
bullraquo
1248
-lt05 lt05 lt05
-
f
11035 60
Hshy
1260
96 30 57 -
77 1JT 1
ft 0001 0 a 0
105
042 052 017 033 026
1W 1 1 181061 iy^J 156
amp03S 0$43 0013 0037 002
26 33 12 2 2 17
^T^fPWJ bull shyamp0|7-MI
lt$amp$ OJWS$$ Q$$tff
046 06
021 042 034
032 041 015 03 024
lt 3
MpoundregL 0i0lt)33 00005 00014 0001$
31 42 016 3 3 26
pv09601$ 0045 011 0gt0amp7
y ootnoi2 0043 0087 0071
B06 63 579 10881 Hshy - 1 - a shy 027 002 16 001 034 025 001$ 2 7 00$ 007 B07 BOS B09
71 31 157
335 241 433
21194 12863 36259
lt05 w
lt05
lt05 -
lt05
sa Mshy
sa 33 -
69
0 0 0
021 023 039
0015 001amp 01032
13 16 25
ampG0ampJ 0gt00$)5 Oytj^fs
024 029 044
018 021 031
00012 00Q1 00022
2 2 4 34
00$7ao$6 011
005 0059 0089
BIO Bll B12
69 56 196
1 89 202 344
bull 3650 8 27723 56977
ltQ5 lt05 lt05
lt05 lt05 lt05
36 30 110
33 26 86
0 0 0
019 018 046
0016 00150037
14 12 2 9
lt 60^ c s
0101 j 0021
025 021 052
02 016 037
0001amp
bull 6^001 00027
18 15
4
amp04 0-gtQ4lf s
012
OJ554vamp$iirgti
oii B14 27 1 7 15882 - - 0 0 3 0026 2 0009S 04 03 00014 2 9 a097 007^ B15 77 329 23404 lt05 lt05 42 35 0 025 0022 1 7 010-14 003 023 00021 2 2 0072 0062 B19 110 399 27569 Hshy - bdquo 0 051 0044 3 0 17 056 039 00022 4 012 ou B20 121 2 13 56808 lt05 lt05 61 60 0 033 027 2 0$$ 045 032 00022 3 3 013 00$ B21 B22
198 89
369 246
53659 36179
lt05 lt05
lt05 lt05
110 4$
88 41
0001 0
053 026
0046 0022
33 17
0lt0i ipxOi
063 032
043 023
00024 00017
4 2 24
014 077
013 0067
B23 B24 B25
130 168 87
3 18 355 238
40881 47324 36555
lt05 ltQ5 lt05
lt05 lt05 lt05
7$ 95 48
51 73 39
- 0 0
036 043 025
0031 003amp
0ois
23 27 15
4gtk^5shyamp$ampbulllt bull000
038 05 03
028 035 022
00015 00021 00013
23 35 21
0073 011 007
0083 01
0064 B31
B33
47
50
139
139 33813
35971 lt05 lt05
lt05 lt05
24 26
23
24 p 0
015
014 0 0 1 rlaquo^ 00096
086
068 iiiSt6igt058i
019
019
014
014 0000 QJQOQ5
14
14
0046 00Si
004 ^ 0^39^ gt
B34 121 0872 13876 1 lt-05 lt05 62 59 0 031 0023 19 00amp1 042 03 0^0005 33 01 1 $poundamp muscle tissue
B13 138 0577 2391 7 lt05 lt05 79 59 o 0045 00031 023 ampQ04 005 0037 Q0005 039 001 00082 B16 70 1 86 37634 lt05 lt05 35 35 0 019 001S 13 028 023 amp0024 21 0075 0057 B17 41 1 19 34454 lt05 lt05 21 20 0 012 001 064 017 0 13 00012 12 0044 0034 B18 13 2 039 33846 lt05 lt05 72 6 0 0036 00025 019 000B 0047 0045 00005 034 0024 00075
1 i- isn refer- ppm TEFs and TEQ s for tested con jeners r umof TEQs 1 ence PCBs
number total Lipid 77 105 114 118106 126 156 167 169 170 189 157 (mg TEQkg meg TEQ meg TEQ Lnconc rruCTOgram whole fish () 00005 0000] 0 0005 J_0 0001 0 1 00005 000001 001 00001 00001 00005 whole fish) gfat g tissue TEQs PCBVg tissue Ln PCB
BO I 57 22 5 OE+00 4E-05 2E-05 3E-04 2amp02 2E-04 3E-06 2E-05 3Eraquo04 IE-OS SB-OS 00026 0 1174 00012 -675 2533 323 B02 206 3 81 6E-07 5E-05 2E-05 3E-04 2Elt03 3E-04 4E-06 3E-05 4ampQ4 2E-05 laquoamp05 00032 00850 00008 -707 5407 399 B03 65 1 61 OE+00 2E-05 7E-C6 IE-04 7E-04 IE-04 2E46 5E-06 2E-05 5E-06 bull2E^)5 00010 00638 00006 -736 4037 3 70 i B04805
117 75
1 06 28 5
OE+00 OE+00
3E-05 3E-05
2E-05 1E-05
2E-04 2E-04
1B-OJ IE-OS
2E-04 2E-04
3E-06 2E-06
IE-OS 2E-05
3amp04 3E-04
IE-OS 9E-0(
bull4amp054ms
00021 00017
0 1965 00582
00020 00006
-623 -7 45
11038 26 32
470 327
B06 63 5 79 OE+00 3E-05 1E-05 2E-04 1E-03 2E-04 3E-06 2E-04 3E-Q4 9E-0( 4E-OS 00019 00322 00003 -804 1088 239 B07 71 3 3 5 OE+00 2E-05 8E-06 1L-04 1E-03 IE-04 2E-Q6 IE 05 2ErC4 6E-0lt 3E-05 00015 00443 00004 -772 21 19 305 BOS 31 2 4 ] OE+00 2E-05 9E-06 2b-04 9E-04 IE-04 2E-0lt$ IE-OS 2E-Q4 7E-0( 3E-05 00015 00616 00006 -739 1286 2 55 B09 157 4 33 OE+00 4E-05 2E-05 3E-04 2E-03 2E-04 3E-06 2E-05 3E-lt4 1E-0 4Z45 00026 00611 0 0006 -7 40 36 26 359 BI O 69 1 89 OE+00 2E-05 8E-06 IE 04 1E-03 IE-04 2E-06 2E-05 2E-Q4 6E-Oi 3E-05 00015 00807 00008 -712 3651 3 60) BH 56 202 OE+00 2E-05 8E-06 1E-04 IE-OS IE-04 2E-06 IE-OS 2ErQ4 SE-Or 7amp05 00014 00712 00007 -725 2772 332 B12 196 3 44 OE+00 5E-05 2E-05 3E-04 2E-03shy 3E-04 4E-06 3E-05 4amp04 1E-0 ^E-05 0 0032 0 0934 00009 -6 98 56 98 404 B14 27 1 7 OE+00 3E-05 IE-OS 2E-04 1E-03 2E-04 SR-Q6 IE-OS 3ErQ4 1E-0 4U-Q5 00018 0 1046 00010 -686 1588 277 B15 77 329 OE+00 3E-05 IE-OS 2E-04 1E4raquo 2E-05 2E-06 2E-05 2E-04 7E-0( SE-05 00019 00578 0 0006 -7 46 23 40 3 15 B19 110 3 99 OE+00 5E-05 2E-05 3E-04 2E-03 3E-04 4E-06 2E-05 4E-Q4 1E-0-) ^amp05 00028 00713 00007 -725 2757 3 32 B20 121 2 13 OE+00 3E-05 IE-04 2E-04 2E-OS 2E-04 3E-06 2E-05 3ErQ4 1E-01) 5E-05 00025 0 1177 00012 -675 5681 404 B21 198 369 5E-07 5E-05 2E-05 3E-04 2E-03 3E-04 4E-06 2E-05 4ErltJ4 IE-OS 7amp05 00031 00853 00009 -707 5366 398 B22 89 246 OE+00 3E-05 IE-OS 2E-04 IE-03 2E-04 2E^5 2E-05 2ampG4 8E-05 3amp05 00019 00787 00008 -715 36 18 359 B23 130 3 18 OE+00 4E-05 2E-05 2E-04 2B4raquo 2E-04 3Elt06 2E-05 2E-Q4 7E-Oo 4amplaquoJ 00023 00713 00007 -7 25 40 88 371 B24 168 3 55 OE+00 4E-05 2E-05 3E-04 2E-03 3E-04 4E-06 2E-05 4E-Q4 IE-OS SE-05 00027 00765 00008 -717 4732 386 B25 87 2 38 QE+QO 3E-05 9E-06 2E-04 9E-04 2E-04 2E-06 IE-OS 2E-04 7E-Oo 3E-OS 00015 00642 00006 -735 3655 360
B31 47 1 39 OE+QO 2E-05 5E-06 9E-05 3amp04 IE-04 1amp06 5E-06 IE-04 SE-Oo 2ElaquoOS 00009 00656 00007 -733 33 81 3 52
B33 50 1 39 OE+CO 1E-05 5E-06 7E-05 6E-04 IE-04 1E-06 5E-06 IE-04 5E-06 2E-05 00009 00671 00007 -731 3597 358
B34 12 087 OE-00 3E-05 1E-05 2E-04 8E03 2E-04 3E^6 5E-06 3E^34 IE-OS 4E-OS 00089 10247 00102 -458 13876 493
muscle tissue mg TEQskg Us le i |
B13 138 0 58 OE+00 5E-06 2E06 2E-05 4amp-04 3E-05 4E-07 5E-06 4E-05 1E-06 4E-06 0 0005 00005 -7 59 138 262
B16 70 1 86 QE+00 2E-05 9E-06 IE-04 IE-Mr IE-04 2E-Q6 2E-05 2E-04 8E-06 3E-OS 00016 00016 -646 70 42 5
B17 41 1 19 OE+00 1E-05 5E-06 6E-05 6E-04 9E-05 1E^06 IE-OS IE-04 4E-06 7E^)5 00010 00010 -696 41 371 B18 132 0 39 OE+00 4E-06 1E-06 2E-05 IE-04 2E-05 5E-07 5E-06 3ampQ5 2E-06 4E-06 0 0002 0 0002 -841 132 2 5 8
GSD 0 66 GSD 061 ave lipid n 28 n 28 muscle tissue H statistic 2 0923 H statistic 20502
95 UCL of the TEQs 00013 95UCLPCBs 522 meg TEQg tissue meg PCBg tissue
max TEQs 00102 max PCBs 1388
ATTACHMENT A2
Spreadsheets showing risk calculations
14
Potential risks from ingesting largemouth bass from the Housatonic River (Woods Pond area) in Massachusetts on a regular basis last modified 51498 The concentrations are based upon the 95 UCL of the mean concentration in muscle tissue
adult who consumes PCB contaminated fish cone ingestion ED BW AT LADD slope risk
(megkg) (gday) (yrs) (yrs) (mgkg-d) (per mgkg-d) (kg)cancer risks dioxin TEQ 130 26 30 70 70 206E-07 150000 3E-02 cancer risk from TEQs
nondioxin-like PCBs 52E+04 26 30 70 70 00083 2 2E-02 cancer risk nondioxinlike PCBs bull 5E-02 excess cancer risk lifetime
ADD(mgkg-d) RfD oral(1254) HI noncancer risks nondioxin-like PCBs 52E-H)4 26 30 70 30 00194 000002 969 rounding to one significant figure
1000 noncancer risk (chronic)
subsistence fisher who consumes PCB contaminated fish cone ingestion ED BW AT LADD slope risk
(megkg) (gday) (yrs) (kg) (yrs) (ingkg-d) (pet mgkg-d) cancer nsks dioxin TEQ 130 140 30 70 70 111E-06 150000 2E-01 cancer risk from TEQs
nondioxin-like PCBs 52E+04 140 30 70 70 00447 i 2 9E-02 cancer risk nondioxinlike PCBs 2E-01 excess cancer risk lifetime
ADD(mgkg-d) RfD oral(1254) HI noncancer risks nondioxin-like PCBs 52E+04 140 30 70 30 01044 000002 5219 rounding to one significant figure
5000 noncancer risk (chronic)
9 year child who consumes PCB contaminated fish once per week for one summer cone ingestion ED BW AT LADD slope risk
(megkg) (gweek) (weeks) (kg) (days) (mgkg-d) (per mgkg-d) cancer nsks dioxin TEQ 130 1825 13 30 25550 402E-09 150000 6E-04 cancer risk from TEQs
nondioxin-like PCBs 52E+04 1825 13 30 25550 000016 2 3E-04 cancer risjc nondioxinlike PCBs 9E-04 cancer risk due to dose
from a short-term exposure RfD oral(1254)
ADD(mgkg-d) subchronic ffl noncancer risks nondioxin-like PCBs 52E+04 1825 13 30 92 00449 5E-05 897 rounding to one significant figure
900 noncancer risk (subchronic)
- barcode 10818
- barcodetext SDMS Doc ID 10818
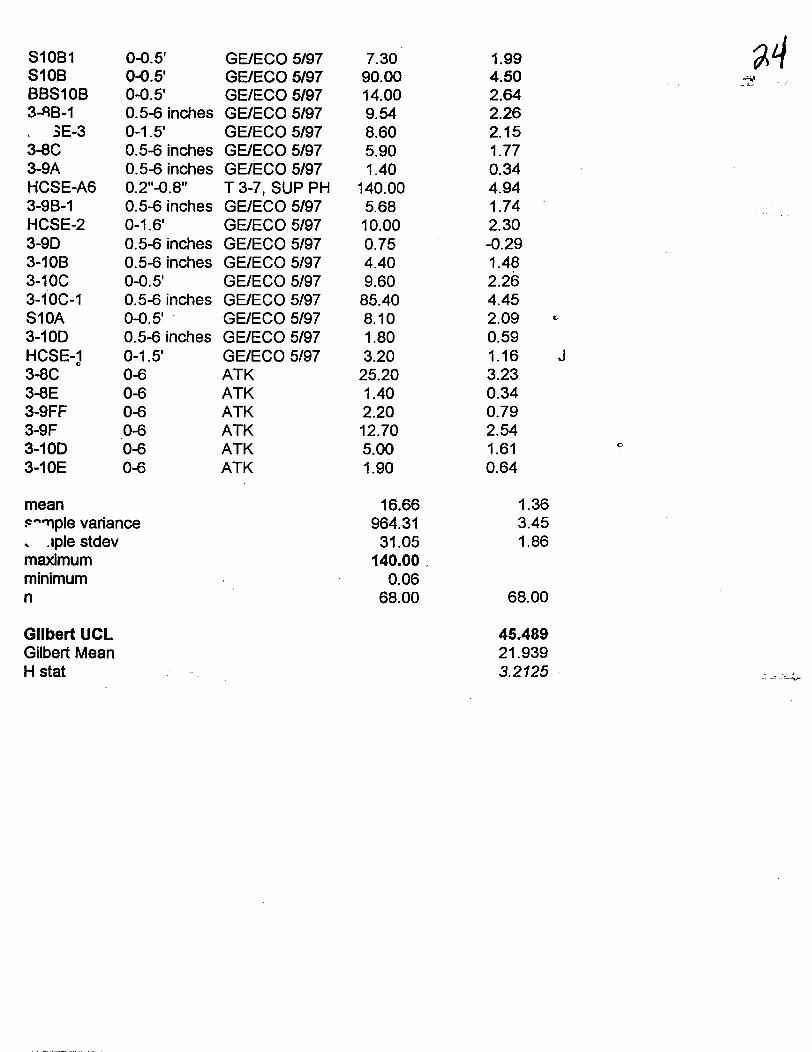
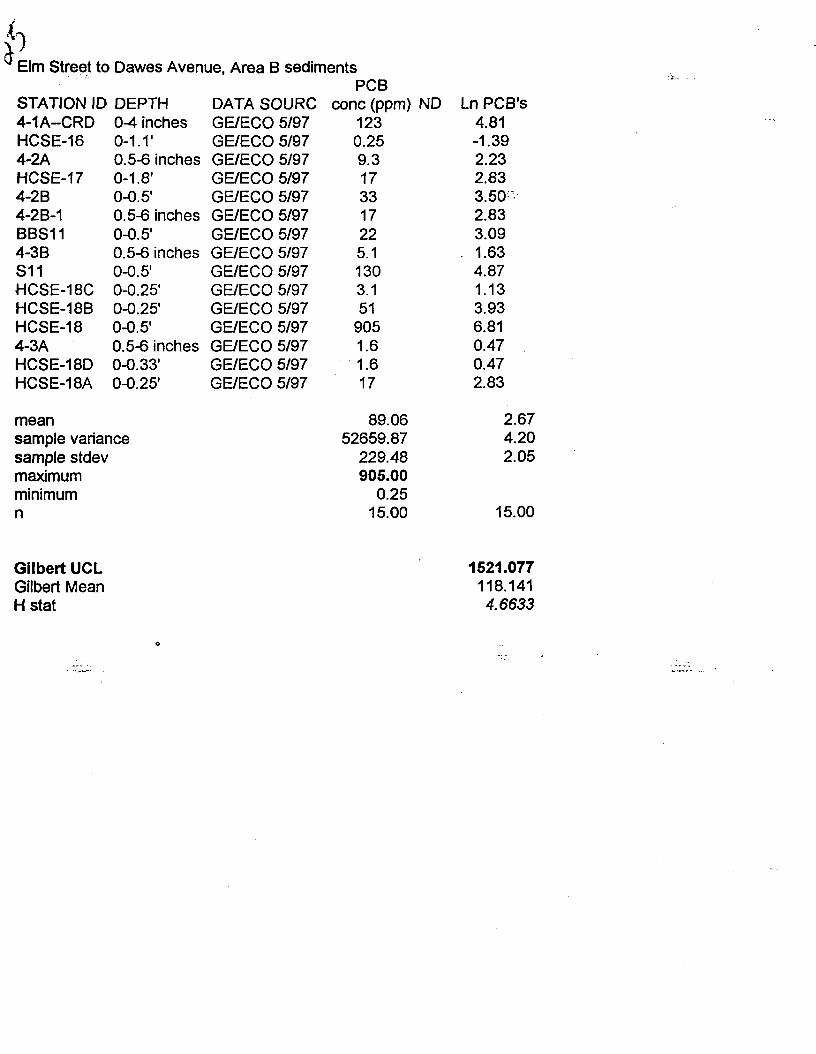
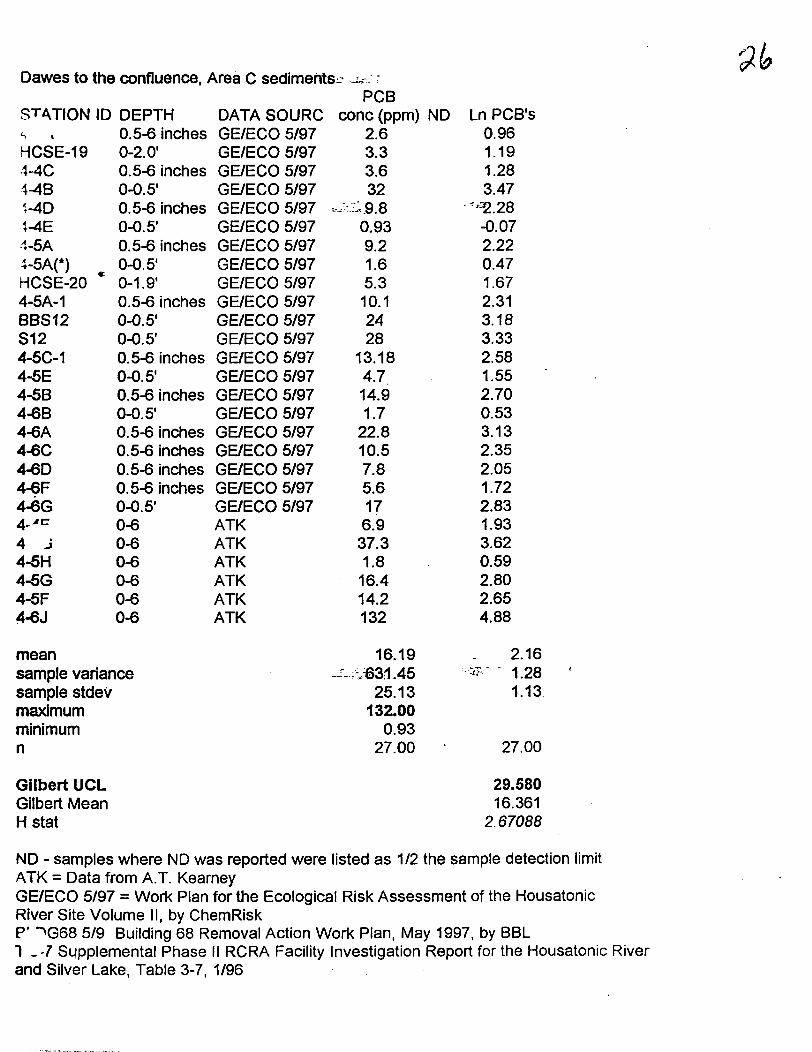
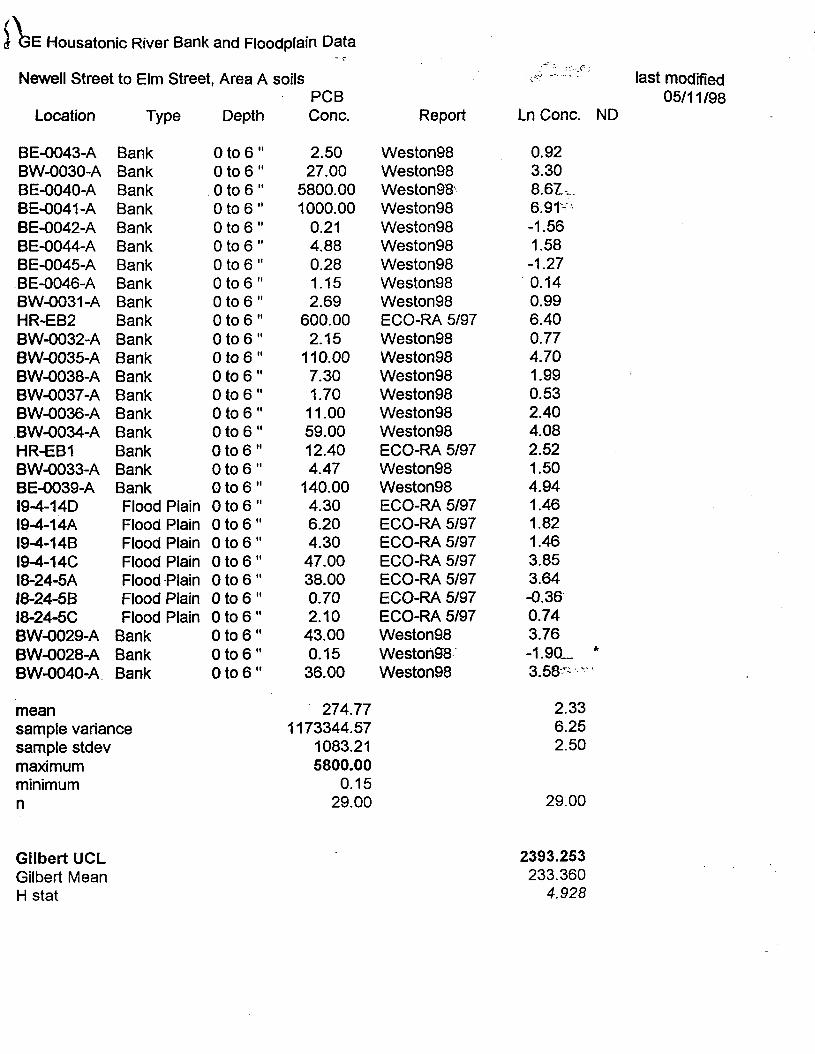
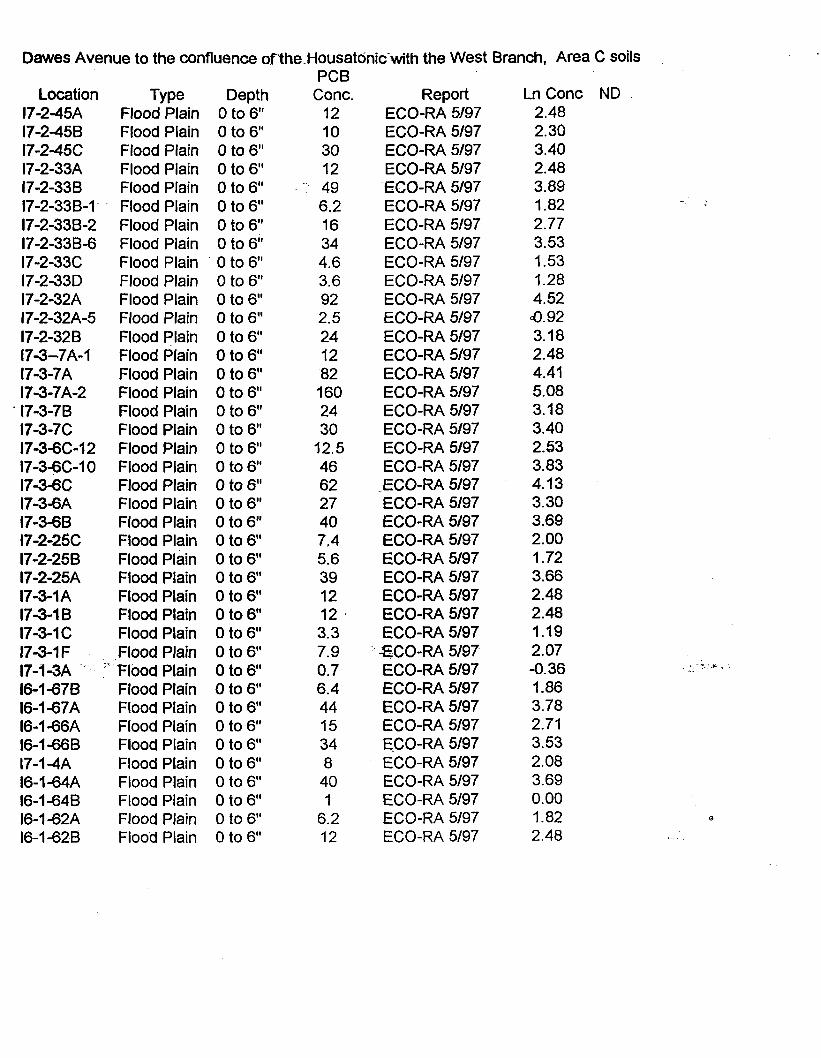
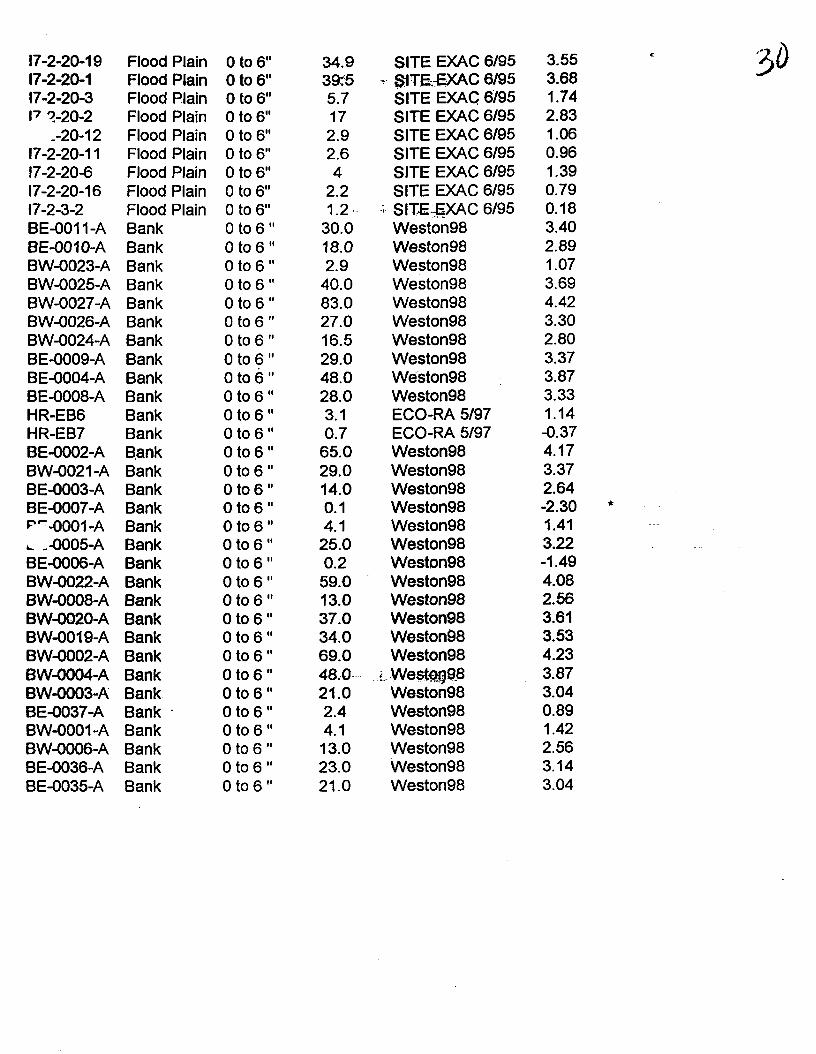
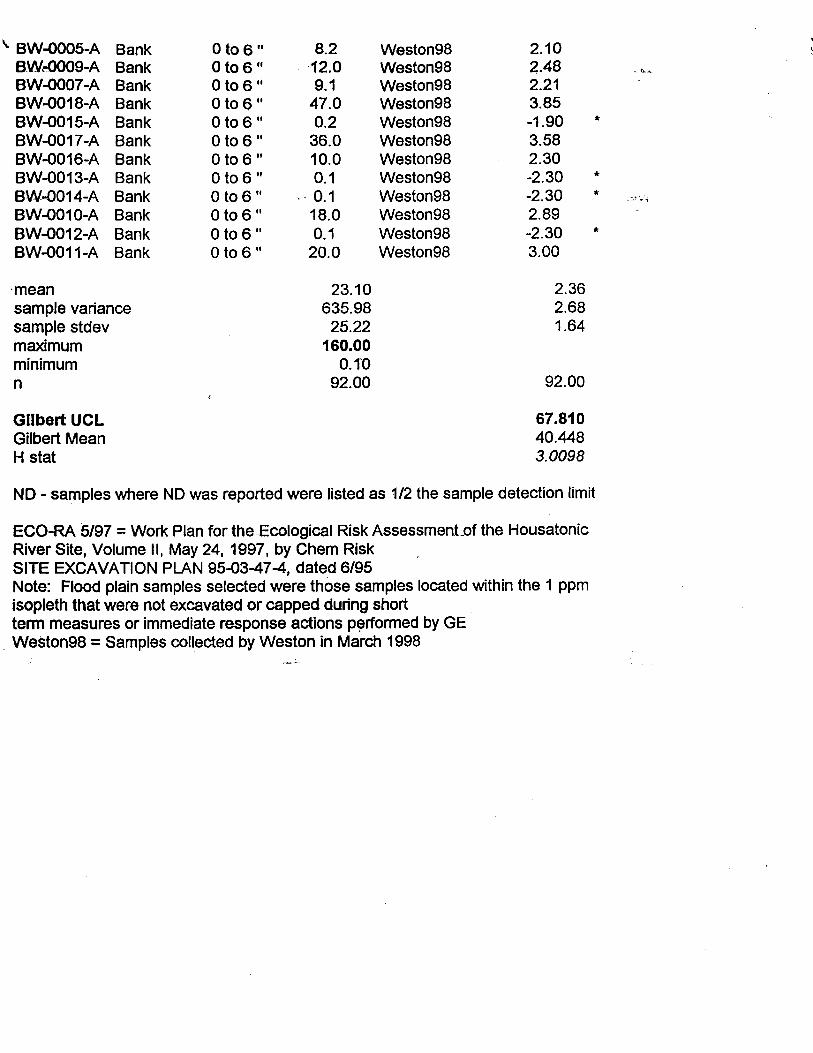
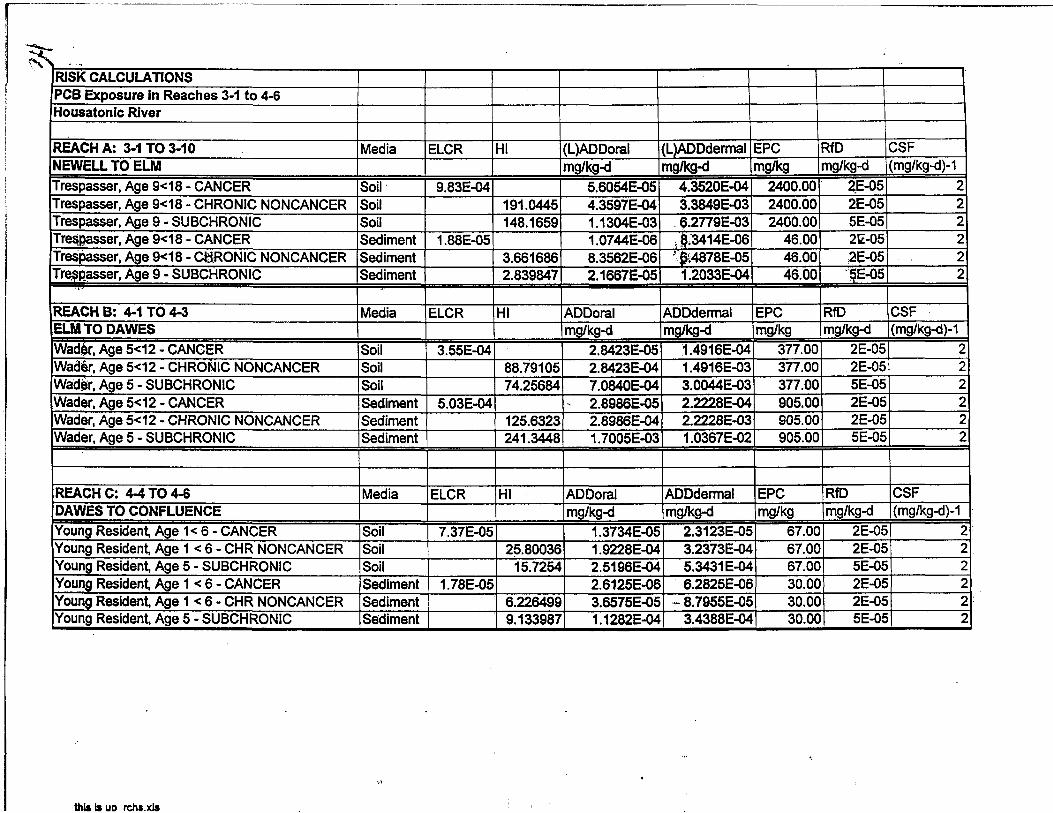
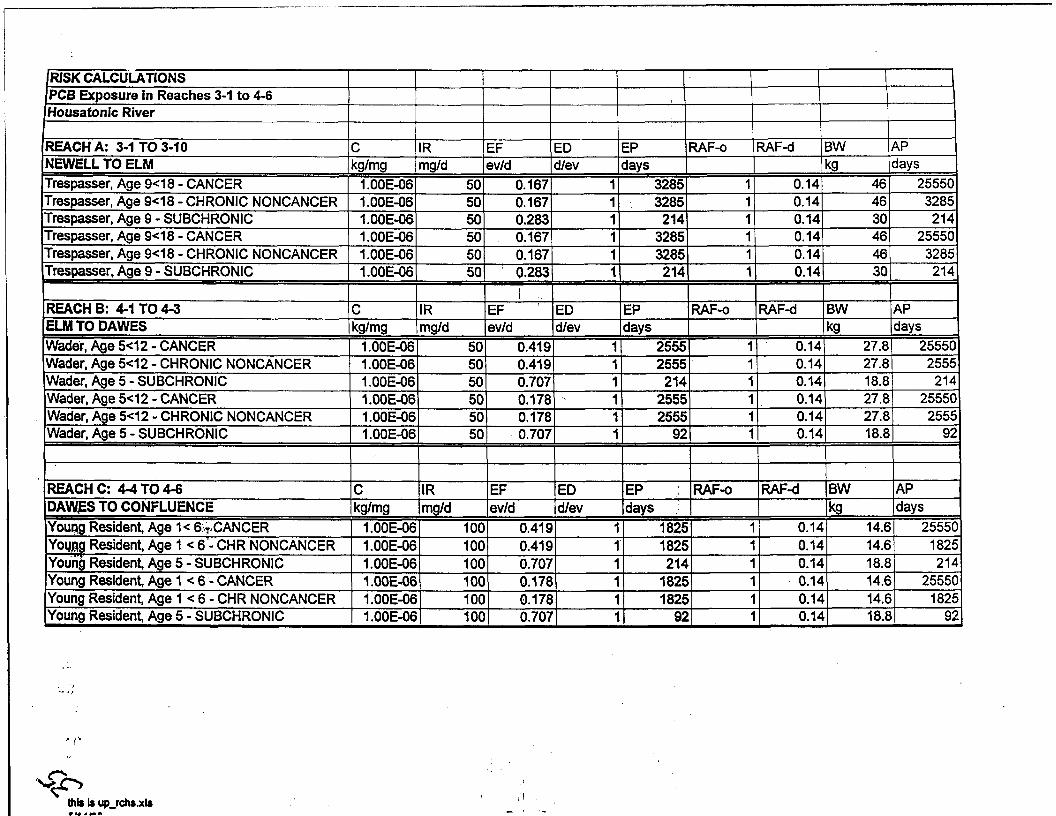
RISK CALCULATIONS PCB Exposure in Reaches 3-1 to 4-6 Housatonic River
REACH A 3-1 TO 3-10 NEWELL TO ELM
Trespasser Age 9lt18 - CANCER Trespasser Age 9lt18 - CHRONIC NONCANCER Trespasser Age 9 - SUBCHRONIC Trespasser Age 9lt18 - CANCER Trespasser Age 9lt18 - CHRONIC NONCANCER Trespasser Age 9 - SUBCHRONIC
REACH B 4-1 TO 4-3 ELM TOD AWES
Wader Age 5lt12 - CANCER Wader Age 5lt12 - CHRONIC NONCANCER Wader Age 5 - SUBCHRONIC Wader Age 5lt12 - CANCER Wader Age 5lt12 - CHRONIC NONCANCER Wader Age 5 - SUBCHRONIC
REACH C 4-4 TO 4-6 DAWES TO CONFLUENCE
Youqg Resident Age 1lt 6gtT CANCER Youflg Resident Age 1lt 6 - CHR NONCANCER Young Resident Age 5 - SUBCHRONIC Young Resident Age 1 lt 6 - CANCER Young Resident Age 1 lt 6 - CHR NONCANCER Young Resident Age 5 - SUBCHRONIC
^
kgmg
100E-06 100E-06 100E-06 100E-06 100E-06 100E-06
C kgmg
100E-06 100E-06 100E-06 100E-06 100E-06 100E-06
C kgmg
100E-06 100E-06 100E-06 100E-06 100E-06 100E-06
IR mgd
IR mgd
IR mgd
50 50 50 50 50 50
50 50 50 50 50 50
100 100 100 100 100 100
EF evd
EF evd
EF evd
0167 0167 0283 0167 0167 0283
1
0419 0419 0707 0178 0178 0707
0419 0419 0707 0178 0178 0707
ED dev
ED dev
ED dev
EP days
1 1 1 1 1 1
EP days
1 1 1 1 1 1
EPdays
bull bull bull bull bull bull
3285 3285 214
3285 3285 214
2555 2555 214
2555 2555
92
1825 1825 214
1825 1825
92
RAF-o
RAF-o
RAF-o
RAF-d
1 014 1 014 1 014 1 014 1 014 1 014
RAF-d
bull 014 bull 014 bull 014 bull 014 bull 014 bull 014
RAF-d
014 014 014 014 014 014
BW AP
kg days
46 25550 46 3285 30 214 46 25550 46 3285 30 214
BW AP kg days
278 25550 278 2555 188 214 278 25550 278 2555 188 92
BW AP
kg days 146 25550 146 1825 188 214 146 25550
146 1825
188 92
this Is up_rchsxls
v
RISK CALCULATIONS PCB Exposure in Reaches 3-1 to 4-6 Housatonic River
REACH A 3-1 TO 3-10 SA AF NEWELL TO ELM cm2d mgcm2
Trespasser Age 9lt18 - CANCER 5437 051 Trespasser Age 9lt18 - CHRONIC NONCANCER 5437 051 Trespasser Age 9 shy SUBCHRONIC 3889 051 Trespasser Age 9lt18 shy CANCER 5437 051 Trespasser Age 9lt18 - CHRONIC NONCANCER 5437 051 Trespasser Age 9 - SUBCHRONIC 3889 051
REACH B 4-1 TO 4-3 SA AF ELM TO DAWES cm2d mgcm2 Wader Age 5lt12 - CANCER 3675 051 Wader Age 5lt12 - CHRONIC NONCANCER 3675 051 Wader Age 5 shy SUBCHRONIC 2970 051 Wader Age 5lt12 shy CANCER 5370 051 Wader Age 5lt12 - CHRONIC NONCANCER 5370 051 Wader Age 5 - SUBCHRONIC 4269 051
bull REACH C 4-4 TO 4-6 SA AF DAWES TO CONFLUENCE cm2d mgcm2
Young Resident Age 1lt 6 - CANCER 2358 051 Young Resident Age 1 lt 6 - CHR NONCANCER 2358 051 Young Resident Age 5 - SUBCHRONIC 2970 051 Young Resident Age 1 lt 6 - CANCER 3368 051 Young Resident Age 1lt 6 - CHR NONCANCER 3368 051 Young Resident Age 5 - SUBCHRONIC 4269 051
this is UD rchixls
g
ATTACHMENT 4
Spreadsheets showing risk calculations using Arithmetic Average PCB Concentrations for the EPCs
RISK CALCULATIONS Using AVERAGE PCB concentration as EPC REACH A 3-1 TO 3-10 NEWELL TO ELM
Trespasser Age 9lt18 - CANCER Trespasser Age 9lt18 - CHRONIC NONCANCER Trespasser Age 9 - SUBCHRONIC Trespasser Age 9lt18 - CANCER Trespasser Age 9lt18 - CHRONIC NONCANCER Trespasser Age 9 - SUBCHRONIC
REACH B 4-1 TO 4-3
Wader Age 5lt12 - CANCER Wader Age 5lt12 - CHRONIC NONCANCER Wader Age 5 - SUBCHRONIC Wader Age 5lt12 - CANCER Wader Age 5lt12 - CHRONIC NONCANCER Wader Age 5 - SUBCHRONIC
REACH C 4-4 TO 4-6
Young Resident Age 1lt 6 - CANCER Young Resident Age 1lt 6 - CHR NONCANCER Young Resident Age 5 - SUBCHRONIC Young Resident Age 1lt 6 - CANCER Young Resident Age 1lt 6 - CHR NONCANCER Young Resident Age 5- SUBCHRONIC
Media
Soil Soil Soil Sediment Sediment Sediment
Media
Soil Soil Soil Sediment Sediment Sediment
Media
Soil Soil Soil Sediment Sediment Sediment
ELCR
105E-04
638E-06
ELCR
315E-05
462E-05
ELCR
233E-05
887E-06
HI ADDoral ADDdermal EPC RfD CSF
mgkg-d mgkg-d mgkg mgkg-d mgkg-d)-1
59903E-06 46509E-05 27480 2E-05 2 218746 4991 9E-05 38757E-04 27480 2E-05 2
16965 12943E-04 71882E-04 27480 5E-05 2 36382E-07 28247E-06 1669 2E-05 2
1328555 30318E-06 23539E-05 1669 2E-05 2 103037 78612E-06 43657E-05 1669 5E-05 2
HI ADDoral ADDdermal EPC RfD CSF mgkg-d mgkg-d mgkg mgkg-d (mgkg-d)-1
25191E-06 13220E-05 3580 2E-05 A
48431617 26990E-05 14164E-04 3580 2E-05 47051445 67270E-05 28530E-04 3580 5E-05
26624E-06 20416E-05 8906 2E-05 2 1236333 28525E-05 21874E-04 8906 2E-05 2 2375046 - 16735E-04 10202E-03 8906 5E-05 2
HI ADDoral ADDdermal EPC RfD CSF
mgkg-d mgkg-d mgkg mgkg-d (mgkg-d)-1 43354E-06 72991 E-06 2266 2E-05 2
8725911 65031 E-05 10949E-04 2266 2E-05 2
5318471 85216E-05 18071 E-04 2266 5E-05 2
13021E-06 31312E-06 1602 2E-05 t 332495 19531 E-05 46968E-05 1602 2E-05
4877549 60245E-05 18363E-04 1602 5E-05
RISK CALCULATIONS Using AVERAGE PCB concentration as EPC REACH A 3-1 TO 3-10 NEWELL TO ELM
Trespasser Age 9lt18 - CANCER Trespasser Age 9lt18 - CHRONIC NONCANCER Trespasser Age 9 - SUBCHRONIC Trespasser Age 9lt18 - CANCER Trespasser Age 9lt18 - CHRONIC NONCANCER Trespasser Age 9 - SUpoundCHRONIC
REACH B 4-1 TO 4-3
Wader Age 5lt12 - CANCER Wada Age 5lt12 - CHRONIC NONCANCER Wader Age 5 - SUBCHRONIC Wader Age 5lt12 - CANCER Wader Age 5lt12 - CHRONIC NONCANCER Wader Age 5 - SUBCHRONIC
REACH C 4-4 TO 4-6
Young Resident Age 1lt 6 - CANCER Young Resident Agegt1 lt 6 - CHR NONCANCER Young Resident Age 5 - SUBCHRONIC Young Resident Age 1 lt 6 - CANCER Young Resident Age 1lt 6 - CHR NONCANCER Young Resident Age 5- SUBCHRONIC
C kgmg
100E-06 100E-06 100E-06 100E-06 100E-06 100E-06
C kgmg
100E-06 100E-06 100E-06 100E-06 100E-06 100E-06
C kgmg
100E-06 100E-06 100E-06 100E-06 100E-06 100E-06
R mgd
IR mgd
IR mgd
50 50 50 50 50 50
50 50 50 50 50 50
100 100 100 100 100 100
EF evd
EF evd
EF evd
0167 0167 0283 0167 0167 0283
0419 0419 0707 0178 0178 0707
0419 0419 0707 0178 0178 0707
ED dev
ED dev
ED dev
EP RAF-o days
1 3285 1 3285 1 214 1 3285 1 3285 1 214
EP RAF-o days
1 2565 1 25sect5 1 214 1 2555 1 2555 1 92
EP RAF-o days
bull 1825 bull 1825 bull 214 bull 1825 bull 1825 bull 92
RAF-d
1 014 1 014 1 014 1 014 1 014 1 014
RAF-d
1 014 1 014 014 014 bull 014 014
RAF-d
bull 014 bull 014 bull 014 bull 014 bull 014
014
BW AP
kg days
46 27375 46 3285 30 214 46 27375 46 3285 30 214
BW AP
kg days
278 27375 278 2555 188 214 278 27375 278 2555 188 92
BW AP
kg days
146 27375 146 1825 188 214 146 27375 146 1825 188 92
thU is up_rchsxls
RISK CALCULATIONS Using AVERAGE PCB concentration as EPC REACH A 3-1 TO 3-10 SA AF NEWELL TO ELM cm2d mgcm2 Trespasser Age 9lt18 - CANCER 5437 051 Trespasser Age 9lt18 - CHRONIC NONCANCER 5437 051 Trespasser Age 9 - SUBCHRONIC 3889 051 Trespasser Age 9lt18 - CANCER 5437 051 Trespasser Age 9lt18 - CHRONIC NONCANCER 5437 051 Trespasser Age 9 - SUBCHRONIC 3889 051
SA AF REACH B 4-1 TO 4-3 cm2d mgcm2 Wader Age 5lt12 - CANCER 3675 051 Wader Age 5lt12 - CHRONIC NONCANCER 3675 051 Wader Age 5 - SUBCHRONIC 2970 051 Wader Age 5lt12 - CANCER 5370 051 Wader Age 5lt12 - CHRONIC NONCANCER 5370 051 Wader Age 5 - SUBCHRONIC 4269 051
SA AF REACH C 4-4 TO 4-6 cm2d mgcm2
Young Resident Age 1lt 6 - CANCER 2358 051 Young Resident Age 1lt 6 - CHR NONCANCER 2358 051 Young Resident Age 5 - SUBCHRONIC 2970 051 Young Resident Age 1 lt 6 - CANCER 3368 051 Young Resident Age 1lt 6 - CHR NONCANCER 3368 051 Young Resident Age 5- SUBCHRONIC 4269 051
Appendix A Memo on Potential Human Health Risks from Consuming Fish from the Housatonic River in Massachusetts
United States Boston Massachusetts 02203 Environmental Protection Agency (617)565-3420 New England Region JF Kennedy Federal Building
MEMORANDUM
DATE May 141998
SUBJ Potential Human Health Risks from Consuming Fish from the Housatonic River in Massachusetts
FROM Mary BaUew Environmental Scientist EPA TO Bryan Olson Project Manager Office of Site Remediation and Restoration EPA
I INTRODUCTION
This memo provides calculations and a limited discussion of potential risks from consuming fish from the Housatonic River in Massachusetts Currently there is a fishing advisory on the Housatonic which may help to limit fish consumption
EL CONCLUSIONS
Consumption of fish in the Housatonic river even for periods as short as one summer presents a significant risk to human health
DL HAZARD IDENTIFICATION
For the Housatonic River in Massachusetts there is-afish consumption advisory in place for all fish species However there is no enforcement mechanism in the advisory and no monitoring of the advisorys effectiveness in preventing exposure Currently 37 of male and 31 of female Pittsfield residents surveyed by the Massachusetts Department of Public Health reported eating freshwater fish (not necessarily from the Housatonic) (MA DPH 1997) The fish consumption advisory is communicated by a brochure distributed when individuals receive fishing licenses In addition the advisory is posted on some locations on the river However young people under 16 years old can fish without a license and they may walk to and fish from locations that are not posted The river has numerous access points by foot or by boat Under the fishing advisory catching and releasing the fish is allowed which adds to the difficulty of monitoring its effectiveness If individuals ignore the advisory or are not aware of it their cumulative risk may be represented by the risks presented in this memo
GE collected young of year1 fish to monitor changes (trends) in PCB levels over time not to represent the type offish people were likely to eat Since these fish were about six months old (Finklestein 1998) they were too small to eat GE reported that composites of young of year fish (pumpkinseeds largemouth bass-and yellow perch) caught in 1994 near New Lenox Road (just downriver of Pittsfield) in the Housatonic ranged from 22 to 35 mg PCBs per kilogram (ppm) of whole fish composite Similarly fish composites at Woods Pond (12 miles downriver of GE) ranged from 3 to 58 ppm (GE 1994) So although Woods Pond contained high levels of PCBs the fish in sections of the river closer to Pittsfield contained comparable levels For example the 69 largemouth bass sampled at New Lenox Road averaged 31 ppm and the 70 largemouth bass sampled at Woods Pond averaged 23 ppm (young of year results GE 1994)
In 1994 the National Biological Survey of the US Geological Survey (USGS) collected 28 largemouth bass from Woods Pond which is a wide shallow section of the Housatonic River PCB levels in 24 whole fish ranged from a minimum of 27 ppm to a maximum of 206 ppm and averaged 100 ppm (not adjusted for lipid) Four additional muscle tissue samples ranged from 13 to 70 ppm PCBs (Attachment Al) Woods Pond is twelve miles downriver from the GE facility and the sediment levels of PCBs in Woods Pond average 27 ppm (personal communication Dean Tagliaferro April 1998) The dominant Aroclors2 found in the fish resemble Aroclors 1254 and 1260 which are the environmentally modified forms of the original Aroclor 1260 released from GE
In 1997 EPA-New England asked the EPA Office of Research and Development for technical assistance to perform congener-specific3 analysis of the USGS fish samples Since this was the only congener-specific data for fish available for the Housatonic River this data was selected for these risk calculations The USGS had a limited amount of data on other species however EPA chose the largemouth bass for congener analysis because they are a popular game species The largemouth bass caught by the USGS were all of a size that would provide good fillets In
1 Young of year fish are those less than one year old
2 PCB mixtures manufactured in the United States carried the trademark Aroclor followed by a four-digit number the first two digits are 12 and the last two digits indicate the percent chlorine by weight For example Aroclor 1260 was manufactured using 60 chlorine Aroclor 1016 is an exception because it contains 41 percent chlorine by weight (EPA 1996) Once released into the environment distribution and bioaccumulation of an Aroclor can change the character of the mixture so that it may no longer resemble the original mixture (EPA 1996)
3 Each PCB molecule consists oftwo 6-carbon rings with one chemical bond joining a carbon from each ring -imagine sunglasses with hexagonal frames) Chlorine can attach to any of the other 10 carbons There are 209 QSgible
arrangements called congeners The number and position of chlorines determine a PCB molecules physical and chemical properties Congeners are numbered 1 to 209 The coplanar congeners those with the two rings aligned on the same plane have dioxin-like properties (EPA 1996) Congener specific data improves our ability to identify the presence of bioaccumulated PCBs
contrast the GE young of year fish were too small to eat
IV DOSE RESPONSE
Toxicology To determine whether exposure to PCBs in fish from the Housatonic River in Massachusetts presents a potential risk to human health EPA evaluates the cancer and noncancer risks associated with PCB exposure To evaluate the cancer risk EPA uses the 95 upper confidence limit of the linear-slope factor (also known as the cancer slope factor) of 2 (mgkgday)1 for PCBs (IRIS 1998) The fish ingestion scenario involves ingestion of bioaccumulated PCBs Ingestion offish contaminated with these PCBs may result in a dose greater than that which occurred in the toxicity studies used to develop the potency estimates (EPA 1996) For that reason EPA estimates the risk of consuming bioaccumulated PCBs using the Toxic Equivalence Factor (TEF) approach (outlined in EPA 1996) The TEFs are ratios for certain PCB congeners that when multiplied by each congeners concentration in fish tissue and the cancer slope factor for dioxin yield an estimate of the carcinogenicity of the bioaccumulated PCBs in the fish Because of its toxicity the cancer slope factor for dioxin is very high 150000 (mgkgday)1 so even small concentrations of these dioxin-like PCBs in the fish can present a cancer risk
In the cancer study for Aroclor 1260 on which the slope factor is based a 12-month exposure produced approximately the same cancer potency as a full two-year exposure This suggests that a less than lifetime exposure could have significant risk implications (EPA 1996)
To evaluate chronic noncancer risks EPA used a Reference Dose (RfD) of 2 x 10⁵ mgkgday for Aroclor 1254 (IRIS 1998) To evaluate subchronic noncancer risks EPA used the subchronic RfD of 5 x 10⁵ mgkgday for Aroclor 1254 (HEAST 1997) Reference Doses for Aroclor 1254 were used because they are the closest ones applicable to the type of PCB mixture found in the
- Housatonic River (Aroclor 1260) The toxicity of Aroclor 1254 is much more similar to^Jtbajt of Aroclor 1260 than the toxicity of Aroclor 1016 (the other choice for an EPA accepted RfD) The toxicity study on which the RfDs are based was conducted over a shorter-term time frame (5 years) The subchronic exposure period evaluated in this memorandum (one summer) is consistent with that used in the toxicity study The critical effects for the chronic and subchronic RfDs are immunologic and reproductive effects In addition PCBs have been associated with deficits in learning and neurological effects (see ATSDR 1996 for a recent review)
A relative absorption factor (RAF) of 100 was used for oral absorption of PCBs from fish bull bull (DEP 1992) An RAF of 100 means that the assumed absorption of PCBs from ingestion of
Housatonic fish is equal to the absorption of PCBs in the laboratory toxicity studies
Data Analysis Of the available fish data only the 1994 USGS 24 whole fish and 4 tissue samples were tested for dioxin like PCBs (see data in attachment AL spreadsheets) The whole fish samples included skin organs and all other tissues For the muscle tissue samples USGS removed about 100 grams of muscle tissue and attached skin (about 2 inches wide 4 inches long and 1 inch deep) from the back of the fish directly above the gut (Steven Smith personal communication 1998)
To compare the fish on the same basis EPA adjusted the whole fish data to its equivalent in fish tissue thus
(ppm PCBs in whole fish divided by lipid in each fish) x 100 = micrograms of PCB per gram of fat
The concentration of PCBs in fish muscle tissue equivalents were determined using the lipid normalized concentration of PCBs and the average lipid found in the four fish tissue samples (approximately 1) While the use of lipid normalization data is not recommended in all cases4 the lipid approximation of 1 was considered to be reasonable given the very low levels of lipid in whole fish (087-58)
Following the procedure outlined in EPA 1996 EPA multiplied the concentrations of the shyindividual PCB dioxin-like congeners by the toxic equivalence factors (TEFs) appropriate to each This product called dioxin toxic equivalents (TEQs) is calculated for each tissue sample
Next EPA calculated the 95 upper confidence limit of the mean (Gilbert 1987) concentration for the non-dioxin PCBs and the dioxin-like PCBs These calculations resulted in a UCLs of 00013 for TEQs and 522 ppm for nondioxin PCBs These were the exposure point concentrations used with the exposure factorsrtocalculate the risks of consuming the fish Eleven of-the 13 dioxin-like PCBs were detected in fish samples used for this risk evaluation -gt --
V EXPOSURE ASSESSMENT
Currently the waters of the Housatonic are under a fishing advisory by the Commonwealth of Massachusetts The calculations for the adult fisher and subsistence fisher that follow assume that
4For human health risk assessment adjusting for lipid requires site-specific samples offish muscle tissue or fillet in addition to the data on whole fish A standardized (not site-specific) lipid adjustment is not appropriate because the lipid levels of the fish may have been affected by the site contamination Also the adjustment does not make biological sense unless the contaminant sequesters in the fat
lib
people do not adhere to the advisory
The calculations for the child fisher represent the short-term PCS doses and risks that a child could receive during one summer of consuming contaminated fish caught between GE and the Woods Pond Dam on the Housatonic River in Massachusetts
Adult Fisher To estimate risks to the adult fisher EPA used exposure assumptions that consider the amount of site data available and the site conditions The exposure assumptions described below are reflective of the Reasonable Maximum Exposure (RME) for adult residents who consume contaminated fish
These calculations assume that an adult fisher5 consumes a daily average of 26 grams offish over the course of 365 days per year (Ebert et al 1993) This could represent 3 or 4 (8shyounce) fish meals per month throughout a year or 7 (8-ounce) fish meals per month during the warmer months (April through October) A daily average of 26 grams represents the 95th percentile offish consumption for all water bodies in Maine (Ebert et al 1993) Because the Housatonic is the largest water body in the region and an attractive resource this value is appropriate This value was previously agreed upon by the Agencies in joint comments on General Electrics proposed Risk Assessment Scope of Work for the Housatonic River GE did not dispute this value (DEPEPA 1997)
The body weight used in this evaluation is 70 kg which represents the average body weight for an adult (EPA 1989)
Subsistence Fisher To estimate risks to the subsistsacefisher EPA used exposure assumptions that consider the amount of site data available and-the site conditions The exposure assumptions described below are appropriate for a sensitive subpopulation that is highly exposed
These calculations assume that a subsistence fisher5 consumes a daily average of 140 grams of fish over the course of 365 days per year This could represent 4 or 5 (8-ounce) fish meals per week during a year The daily average of 140 grams per day was estimated by EPA Office of Water staff based on a review of the literature on fish consumption by Native Americans and subsistence anglers (EPA 1995) Given site conditions this value is appropriate for subsistence fishers as a whole a particular ethnic group or tribe of Native
This is a person who has adult body weight and who would ingest adult-sized portions of fish For example for a thirty year exposure duration this could be a person who ate fish each year when they were between the ages of 18 and 48
Americans may consume more fish This value for subsistence fish consumption was previously agreed upon by the Agencies in joint comments on General Electrics proposed Risk Assessment Scope of Work for the Housatonic River GE did not dispute this value (DEPEPA 1997)
The body weight used in this evaluation is 70 kg which represents the average body weight for an adult (EPA 1989)
Childfisher To estimate the subchronic risks to the child fisher EPA used exposure assumptions that consider the amount of site data available and the site conditions The exposure assumptions described below are reflective of short term exposures and do not represent the RME
These calculations assume that the child fisher (age9 years) consumes one small (6- or 7shyounce) fish meal per week during the summer months (June July August) EPA assumes 13 weeks per summer (June July and August)
The one summer exposure period used in this evaluation is shorter than the 30-year exposure period (for cancer risks) typically evaluated by EPA as part of the RME The purpose of this calculation is to examine whether short term exposures could provide enough dose and present enough risk at some point later in life to be a concern
For fish ingestion for the child fisher EPA used 1825 gweek This is the same value for residential fish consumption mentioned above and adjusted to a weekly consumption rate (26 gday 365 daysyr divided by 52 weeksyr)
The body weight used in these calculations is 30 kg which represents an average of the 50th
percentile body weightierfemales age 9 years (DEP^ 1995 EPA 1989)
TABLE 1 Exposure factors used to calculate the potential risks from fishing on the Housatonic River
EXPOSURE PARAMETER VALUE
body weight (kg) adult or subsistence fisher 70 body weight (kg) age 9 years 30
exposure duration subchronic (weeks) 13 exposure duration (years) 30
fish ingcstion rate (gday) adults 26 fish ingestion rate (gday) subsistence fishers 140 fish ingestion rate (gwcck) children 1825
averaging time (days) cancer 25550 averaging time (days) chronic noncancer 10950 averaging time (days) subchronic noncancer 92
VL RISK CHARACTERIZATION
A Risk Calculations
CANCER RISKS e
Using the assumptions noted above in Table 1 and the equations below a lifetime average daily dose of PCBs from ingestion offish can be calculated
= fPGBl C IR ED BWAT
LADDlaquoi
Where
LADD^ = lifetime average daily dose from ingestion offish mgkgday [PCS] = PCB concentration in fish figkg C = conversion factor 106
IR = fish ingestion rate gday BW = body weight kg ED = exposure duration years AT F= averaging time period over which exposure is averaged - days or years
The Excess Lifetime Cancer Risk (ELCR) from ingestion of fish can be calculated using the following equations
ELCR = (LADD^J CSF (for cancer risks less than 1 in 100)
ELCR = 1- exp (-LADD^ CSF) (for cancer risks greater than 1 in 100)
Where ELCR = Excess Lifetime Cancer Risk CSF = Cancer Slope Factor 2 (mgkgday)-1 for nondioxin-like PCBs and 150000
(mgkgday)-1 fordioxinTEQs LADD^ = lifetime average daily dose from ingestion of fish exp = e raised to the power of x where x is the product of the dose and the cancer slope factor
NONCANCER RISKS
Using the exposure assumptions in Table 1 and the equations below an average daily dose of PCBs from ingestion offish can be calculated
= fPCBI C IR ED BWAT
Where
= average daily dose from ingestion of fish mgkgday [PCB] = PCB concentration in fish ngkg C = conversion factor 106
IR = fish ingestion rate gday or gweek BW = body weight kg ED = exposure duration weeks or years AT = averaging time period over which exposure is averaged - days or years
The Hazard Index can be calculated using the equation below
HI = [ADD ] RfD
Where HI = Hazard Index RfD = Reference Dose mgkgday
= average daily dose from ingestion of fish mgkgday
B Risk Results
RCRA CERCLA Risk Management Criteria
The cancer risks for the adult fisher and the subsistence fisher whom consume PCB contaminated fish are two orders of magnitude (100 times) or more above the EPA cancer risk range (discussed in EPA 1991) of 106 to 104 (see tables attached) and this justifies EPA in taking an (remedial or removal) action
Even a child who consumes one fish meal a week over the course of one summer has a cancer risk from that short term exposure which is nine times higher than the EPA cancer risk range of 106 to 10 and this justifies EPA in taking an action
The chronic noncancer risks for the adult fisher and the subsistence fisher whom consume PCB contaminated fish are over 900 times the risk (ie a chronic Hazard Index of 1) at which EPA is justified in taking an action
The noncancer risks (subchronic) for a child who consumes one fish meal a week over the course of one summer are over 800 times the risk (ie a subchronic Hazard Index of 1) at which EPA is justified in taking an action
If adults or children are consuming the fish on a regular basis they have a significant risk of cancer or noncancer health effects
C Discussion of Risk Characterization
Discussion Related to Exposure Scenarios The exposure period evaluated for the child fisher (one summer) may underestimate the actual exposure that a child may receive because it does not account for continuing exposure Moreover PCBs have been present in the residential areas in Pittsfield for many years already making it likely that exposure via some other environmental media has already occurred
The exposure period selected for evaluation of cancer effects is one summer for the child fisher However different assumptions about the exposure period have a significant impact on the risk results As the exposure period increases the cancer risk estimate increases For evaluating cancer risks one could easily justify using a longer exposure period than the ones selected Also typically the calculation of cancer risks attributable to fish consumption may involve some weighting of child and adult exposures which may make the risks higher than those calculated for
the adult alone
The risk calculations may not be conservative enough for ethnic groups whose members consume the whole fish Also particular Native American or ethnic groups may consume more fish than noted in the subsistence fishing calculations
Pre-natal exposure to PCBs as well as post-natal exposure to PCBs via breast milk may have higher risks than those noted Early stages of development may have an extra sensitivity to the effects of PCBs (reviewed in EPA 1993 IRIS 1998)
Toddlers consuming fish may have higher risks than those noted because of the large doses that these fish would provide given the small body size of a toddler Also the toddler may be more sensitive to the developmental effects of PCBs
Discussion Related to Toxicity and Exposure The cancer risks from the dioxin-like PCBs was about twice the risks from PCBs (without the properties of dioxin) This illustrates the importance of performing congener specific analysis of PCBs for estimates of cancer risk
The PCB doses from eating the fish even for as short a period as one summer are higher than the doses at which monkeys showed marked reproductive effects (Arnold et al 1995) and effects on cognitive behavior (Rice 1995 1997 Rice and Hayward 1997 Rice et al 1996) and activity (reviewed in EPA 1993) This suggests that there may be no safety margin between the exposure estimates for people who eat fish from the Housatonic river and the exposures in the monkey studies which show adverse health effects
The risks from consuming the fish are substantial If the fishing advisory is effective then there is no risk from the fish However a report in the literature suggests that fishing advisories are violated regularly (Tilden et al 1997)6 And-sbmepeople in the area may have consumed fish from the Housatonic before the fishing advisory was in place (about 10 years ago)
In sum doses estimated for children and adults who ingest contaminated fish from the Housatonic river are higher than those received by the monkeys in the PCB noncancer toxicity study that demonstrated adverse health effects This is true even in the case of children who ingest contaminated fish over the course of one summer These exposure estimates raise significant concerns regarding potential health effects in children and adults who ingest contaminated fish from the Housatonic river
6Tilden estimates that in one year as many as 47 million people ate Great Lakes sport fish despite long standing (since the mid-70s) state fishing advisories
10
REFERENCES
Arnold et al 1995 Toxicological Consequences ofAroclor 1254 Ingestion by Female Rhesus (Macaca mulatto) Monkeys Part 2 Reproduction andlnfant Findings Arnold DL Bryce F McGuire PF et al Fd Chem Toxic 33457-74
ATSDR1996 Public Health Implications ofPCBs December 1996
DEP 1992 Documentation For The Risk Assessment Shortform Residential Scenario Massachusetts Department of Environmental Protection Office of Research and Standards and the Bureau of Waste Site Cleanup Policy BWSCORS-142-92 October 1992
DEP 1995 Guidance For Disposal Site Risk Characterization In Support of the Massachusetts Contingency Plan Interim Final Policy BWSCORS-95-141 Massachusetts Department of Environmental Protection Bureau of Waste Site Cleanup and Office of Research and Standards July 1995
DEPEPA 1997 Joint DEPEPA Technical and Review Comments on General Electric Proposal for Human Health Risk Assessment of the Housatonic River August 13 1997
Ebertetal 1993 Estimating Consumption of Freshwater Fish among Maine Anglers EbertES Harrington NW Boyle KJ et al North American Journal of Fisheries Management 13737-45 1993
EPA 1989 Risk Assessment Guidancefor Superfund Volume I - Human Health Evaluation Manual (Part A) Interim Final US Environmental Protection Agency Office of Emergency and Remedial Response EPA5401-89002 December 1989
EPA 1991 Role of the Baseline Risk Assessment in Superjund Remedy Selection Decisions USEPA OSWER Directive 93550-30 April 22 1991
EPA 1993 Workshop Report on Developmental Neurotoxic Effects Associated with Exposure to PCBs VSEPA Risk Assessment Forum EPA63 OK-92004 May 1993
EPA 1995 Water Quality Guidance for the Great Lakes System Supplementary Information Document (SID) USEPA Office of Water EPA-820-B-95-001 March 1995 p 575
EPA 1996 PCBs Cancer Dose-Response Assessment and Application to Environmental Mixtures NCEA ORD EPA600P-96001F
Finklestein 1998 Personal communication Ken Finklestein NOAA May 111998
GE 1994 Preliminary draft MCP Supplemental Phase II InvestigationRCRA Facility Investigation of Housatonic River and Silver Lake Tables 8 through 10
Gilbert 1987 Statistical Methods for Environmental Pollution Monitoring RO Gilbert Van
11
Nostrand Reinhold NY 1987
HEAST 1997 Health Effects Assessment Summary Tables EPA Office of Solid Waste and Emergency Response 92006-303 (97-1) EPA-540-R-97-036 PB97-921199 July 1997
IRIS 1998 EPA Integrated Risk Information System a database 1998
Mass DPH 1997 Housatonic River Area PCB Exposure Assessment Study Final Report Massachusetts Department of Public Health Bureau of Environmental Health Assessment Environmental Toxicology Unit September 1997
Rice 1995 Neurotoxicity of Lead Methylmercury andPCBs in Relation to the Great Lakes DC Rice Environmental Health Perspectives 103(Supplement9)71-87 1995
Riceetal 1996 Lessons for Neurotoxioology from SelectedModel Compounds SGOMSEC Joint Report Rice DC de Duffard AME Duffard R et al Environmental Health Perspectives 104(Supplement 2)205-15
Rice 1997 Effect of Postnatal Exposure to a PCB Mixture in Monkeys on Multiple Fixed Interval-Fixed Ratio Performance DC Rice Neurotoxicology and Teratology 19429-34
Rice and Hayward 1997 Effects of Postnatal Exposure to a PCB Mixture in Monkeys on Nonspatial Discrimination Reversal and Delayed Alternation Performance Rice DC Hayward S Neurotoxicology 18479-94 1997
Smith 1998 Personal communication with Steven Smith USGS April 28 1998
Tagliaferro 1998 Personal communication Dean Tagliaferro EPA removals program April 1998
Tilden et al 1997 Health Advisories for Consumers of Great Lakes Sport Fish Is the Message Being Received Tilden J Hanrahan LP Anderson H et al Environmental Health Perspectives 1051360-65 1997
Tilson et al 1990 Polychlorinated Biphenyls and the Developing Nervous System Cross-species Comparisons Tilson HA Jacobson JL Rogan WJ Neurotoxicology and Teratology 12239-248 1990J
12
ATTACHMENT A1
Spreadsheets showing raw data and UCL calculations
13
Congener specific PCB concentrations and TEQs in largemouth bass collected from Woods Pond MA last modified 51098 PCBs
Fish refershyence
ppm PCBs
Lipid in Lipid AP raquosampx3 Dioxin-like ODngeners(ppm)
number total whole fish]
BO I B02 B03 B04 805
57 206 65 117 75
225 381 161 106 285
PCBsg
25333 54068 40373 110377 26316
I 1242
lt05 ltQ5 lt05
bullraquo
1248
-lt05 lt05 lt05
-
f
11035 60
Hshy
1260
96 30 57 -
77 1JT 1
ft 0001 0 a 0
105
042 052 017 033 026
1W 1 1 181061 iy^J 156
amp03S 0$43 0013 0037 002
26 33 12 2 2 17
^T^fPWJ bull shyamp0|7-MI
lt$amp$ OJWS$$ Q$$tff
046 06
021 042 034
032 041 015 03 024
lt 3
MpoundregL 0i0lt)33 00005 00014 0001$
31 42 016 3 3 26
pv09601$ 0045 011 0gt0amp7
y ootnoi2 0043 0087 0071
B06 63 579 10881 Hshy - 1 - a shy 027 002 16 001 034 025 001$ 2 7 00$ 007 B07 BOS B09
71 31 157
335 241 433
21194 12863 36259
lt05 w
lt05
lt05 -
lt05
sa Mshy
sa 33 -
69
0 0 0
021 023 039
0015 001amp 01032
13 16 25
ampG0ampJ 0gt00$)5 Oytj^fs
024 029 044
018 021 031
00012 00Q1 00022
2 2 4 34
00$7ao$6 011
005 0059 0089
BIO Bll B12
69 56 196
1 89 202 344
bull 3650 8 27723 56977
ltQ5 lt05 lt05
lt05 lt05 lt05
36 30 110
33 26 86
0 0 0
019 018 046
0016 00150037
14 12 2 9
lt 60^ c s
0101 j 0021
025 021 052
02 016 037
0001amp
bull 6^001 00027
18 15
4
amp04 0-gtQ4lf s
012
OJ554vamp$iirgti
oii B14 27 1 7 15882 - - 0 0 3 0026 2 0009S 04 03 00014 2 9 a097 007^ B15 77 329 23404 lt05 lt05 42 35 0 025 0022 1 7 010-14 003 023 00021 2 2 0072 0062 B19 110 399 27569 Hshy - bdquo 0 051 0044 3 0 17 056 039 00022 4 012 ou B20 121 2 13 56808 lt05 lt05 61 60 0 033 027 2 0$$ 045 032 00022 3 3 013 00$ B21 B22
198 89
369 246
53659 36179
lt05 lt05
lt05 lt05
110 4$
88 41
0001 0
053 026
0046 0022
33 17
0lt0i ipxOi
063 032
043 023
00024 00017
4 2 24
014 077
013 0067
B23 B24 B25
130 168 87
3 18 355 238
40881 47324 36555
lt05 ltQ5 lt05
lt05 lt05 lt05
7$ 95 48
51 73 39
- 0 0
036 043 025
0031 003amp
0ois
23 27 15
4gtk^5shyamp$ampbulllt bull000
038 05 03
028 035 022
00015 00021 00013
23 35 21
0073 011 007
0083 01
0064 B31
B33
47
50
139
139 33813
35971 lt05 lt05
lt05 lt05
24 26
23
24 p 0
015
014 0 0 1 rlaquo^ 00096
086
068 iiiSt6igt058i
019
019
014
014 0000 QJQOQ5
14
14
0046 00Si
004 ^ 0^39^ gt
B34 121 0872 13876 1 lt-05 lt05 62 59 0 031 0023 19 00amp1 042 03 0^0005 33 01 1 $poundamp muscle tissue
B13 138 0577 2391 7 lt05 lt05 79 59 o 0045 00031 023 ampQ04 005 0037 Q0005 039 001 00082 B16 70 1 86 37634 lt05 lt05 35 35 0 019 001S 13 028 023 amp0024 21 0075 0057 B17 41 1 19 34454 lt05 lt05 21 20 0 012 001 064 017 0 13 00012 12 0044 0034 B18 13 2 039 33846 lt05 lt05 72 6 0 0036 00025 019 000B 0047 0045 00005 034 0024 00075
1 i- isn refer- ppm TEFs and TEQ s for tested con jeners r umof TEQs 1 ence PCBs
number total Lipid 77 105 114 118106 126 156 167 169 170 189 157 (mg TEQkg meg TEQ meg TEQ Lnconc rruCTOgram whole fish () 00005 0000] 0 0005 J_0 0001 0 1 00005 000001 001 00001 00001 00005 whole fish) gfat g tissue TEQs PCBVg tissue Ln PCB
BO I 57 22 5 OE+00 4E-05 2E-05 3E-04 2amp02 2E-04 3E-06 2E-05 3Eraquo04 IE-OS SB-OS 00026 0 1174 00012 -675 2533 323 B02 206 3 81 6E-07 5E-05 2E-05 3E-04 2Elt03 3E-04 4E-06 3E-05 4ampQ4 2E-05 laquoamp05 00032 00850 00008 -707 5407 399 B03 65 1 61 OE+00 2E-05 7E-C6 IE-04 7E-04 IE-04 2E46 5E-06 2E-05 5E-06 bull2E^)5 00010 00638 00006 -736 4037 3 70 i B04805
117 75
1 06 28 5
OE+00 OE+00
3E-05 3E-05
2E-05 1E-05
2E-04 2E-04
1B-OJ IE-OS
2E-04 2E-04
3E-06 2E-06
IE-OS 2E-05
3amp04 3E-04
IE-OS 9E-0(
bull4amp054ms
00021 00017
0 1965 00582
00020 00006
-623 -7 45
11038 26 32
470 327
B06 63 5 79 OE+00 3E-05 1E-05 2E-04 1E-03 2E-04 3E-06 2E-04 3E-Q4 9E-0( 4E-OS 00019 00322 00003 -804 1088 239 B07 71 3 3 5 OE+00 2E-05 8E-06 1L-04 1E-03 IE-04 2E-Q6 IE 05 2ErC4 6E-0lt 3E-05 00015 00443 00004 -772 21 19 305 BOS 31 2 4 ] OE+00 2E-05 9E-06 2b-04 9E-04 IE-04 2E-0lt$ IE-OS 2E-Q4 7E-0( 3E-05 00015 00616 00006 -739 1286 2 55 B09 157 4 33 OE+00 4E-05 2E-05 3E-04 2E-03 2E-04 3E-06 2E-05 3E-lt4 1E-0 4Z45 00026 00611 0 0006 -7 40 36 26 359 BI O 69 1 89 OE+00 2E-05 8E-06 IE 04 1E-03 IE-04 2E-06 2E-05 2E-Q4 6E-Oi 3E-05 00015 00807 00008 -712 3651 3 60) BH 56 202 OE+00 2E-05 8E-06 1E-04 IE-OS IE-04 2E-06 IE-OS 2ErQ4 SE-Or 7amp05 00014 00712 00007 -725 2772 332 B12 196 3 44 OE+00 5E-05 2E-05 3E-04 2E-03shy 3E-04 4E-06 3E-05 4amp04 1E-0 ^E-05 0 0032 0 0934 00009 -6 98 56 98 404 B14 27 1 7 OE+00 3E-05 IE-OS 2E-04 1E-03 2E-04 SR-Q6 IE-OS 3ErQ4 1E-0 4U-Q5 00018 0 1046 00010 -686 1588 277 B15 77 329 OE+00 3E-05 IE-OS 2E-04 1E4raquo 2E-05 2E-06 2E-05 2E-04 7E-0( SE-05 00019 00578 0 0006 -7 46 23 40 3 15 B19 110 3 99 OE+00 5E-05 2E-05 3E-04 2E-03 3E-04 4E-06 2E-05 4E-Q4 1E-0-) ^amp05 00028 00713 00007 -725 2757 3 32 B20 121 2 13 OE+00 3E-05 IE-04 2E-04 2E-OS 2E-04 3E-06 2E-05 3ErQ4 1E-01) 5E-05 00025 0 1177 00012 -675 5681 404 B21 198 369 5E-07 5E-05 2E-05 3E-04 2E-03 3E-04 4E-06 2E-05 4ErltJ4 IE-OS 7amp05 00031 00853 00009 -707 5366 398 B22 89 246 OE+00 3E-05 IE-OS 2E-04 IE-03 2E-04 2E^5 2E-05 2ampG4 8E-05 3amp05 00019 00787 00008 -715 36 18 359 B23 130 3 18 OE+00 4E-05 2E-05 2E-04 2B4raquo 2E-04 3Elt06 2E-05 2E-Q4 7E-Oo 4amplaquoJ 00023 00713 00007 -7 25 40 88 371 B24 168 3 55 OE+00 4E-05 2E-05 3E-04 2E-03 3E-04 4E-06 2E-05 4E-Q4 IE-OS SE-05 00027 00765 00008 -717 4732 386 B25 87 2 38 QE+QO 3E-05 9E-06 2E-04 9E-04 2E-04 2E-06 IE-OS 2E-04 7E-Oo 3E-OS 00015 00642 00006 -735 3655 360
B31 47 1 39 OE+QO 2E-05 5E-06 9E-05 3amp04 IE-04 1amp06 5E-06 IE-04 SE-Oo 2ElaquoOS 00009 00656 00007 -733 33 81 3 52
B33 50 1 39 OE+CO 1E-05 5E-06 7E-05 6E-04 IE-04 1E-06 5E-06 IE-04 5E-06 2E-05 00009 00671 00007 -731 3597 358
B34 12 087 OE-00 3E-05 1E-05 2E-04 8E03 2E-04 3E^6 5E-06 3E^34 IE-OS 4E-OS 00089 10247 00102 -458 13876 493
muscle tissue mg TEQskg Us le i |
B13 138 0 58 OE+00 5E-06 2E06 2E-05 4amp-04 3E-05 4E-07 5E-06 4E-05 1E-06 4E-06 0 0005 00005 -7 59 138 262
B16 70 1 86 QE+00 2E-05 9E-06 IE-04 IE-Mr IE-04 2E-Q6 2E-05 2E-04 8E-06 3E-OS 00016 00016 -646 70 42 5
B17 41 1 19 OE+00 1E-05 5E-06 6E-05 6E-04 9E-05 1E^06 IE-OS IE-04 4E-06 7E^)5 00010 00010 -696 41 371 B18 132 0 39 OE+00 4E-06 1E-06 2E-05 IE-04 2E-05 5E-07 5E-06 3ampQ5 2E-06 4E-06 0 0002 0 0002 -841 132 2 5 8
GSD 0 66 GSD 061 ave lipid n 28 n 28 muscle tissue H statistic 2 0923 H statistic 20502
95 UCL of the TEQs 00013 95UCLPCBs 522 meg TEQg tissue meg PCBg tissue
max TEQs 00102 max PCBs 1388
ATTACHMENT A2
Spreadsheets showing risk calculations
14
Potential risks from ingesting largemouth bass from the Housatonic River (Woods Pond area) in Massachusetts on a regular basis last modified 51498 The concentrations are based upon the 95 UCL of the mean concentration in muscle tissue
adult who consumes PCB contaminated fish cone ingestion ED BW AT LADD slope risk
(megkg) (gday) (yrs) (yrs) (mgkg-d) (per mgkg-d) (kg)cancer risks dioxin TEQ 130 26 30 70 70 206E-07 150000 3E-02 cancer risk from TEQs
nondioxin-like PCBs 52E+04 26 30 70 70 00083 2 2E-02 cancer risk nondioxinlike PCBs bull 5E-02 excess cancer risk lifetime
ADD(mgkg-d) RfD oral(1254) HI noncancer risks nondioxin-like PCBs 52E-H)4 26 30 70 30 00194 000002 969 rounding to one significant figure
1000 noncancer risk (chronic)
subsistence fisher who consumes PCB contaminated fish cone ingestion ED BW AT LADD slope risk
(megkg) (gday) (yrs) (kg) (yrs) (ingkg-d) (pet mgkg-d) cancer nsks dioxin TEQ 130 140 30 70 70 111E-06 150000 2E-01 cancer risk from TEQs
nondioxin-like PCBs 52E+04 140 30 70 70 00447 i 2 9E-02 cancer risk nondioxinlike PCBs 2E-01 excess cancer risk lifetime
ADD(mgkg-d) RfD oral(1254) HI noncancer risks nondioxin-like PCBs 52E+04 140 30 70 30 01044 000002 5219 rounding to one significant figure
5000 noncancer risk (chronic)
9 year child who consumes PCB contaminated fish once per week for one summer cone ingestion ED BW AT LADD slope risk
(megkg) (gweek) (weeks) (kg) (days) (mgkg-d) (per mgkg-d) cancer nsks dioxin TEQ 130 1825 13 30 25550 402E-09 150000 6E-04 cancer risk from TEQs
nondioxin-like PCBs 52E+04 1825 13 30 25550 000016 2 3E-04 cancer risjc nondioxinlike PCBs 9E-04 cancer risk due to dose
from a short-term exposure RfD oral(1254)
ADD(mgkg-d) subchronic ffl noncancer risks nondioxin-like PCBs 52E+04 1825 13 30 92 00449 5E-05 897 rounding to one significant figure
900 noncancer risk (subchronic)
- barcode 10818
- barcodetext SDMS Doc ID 10818
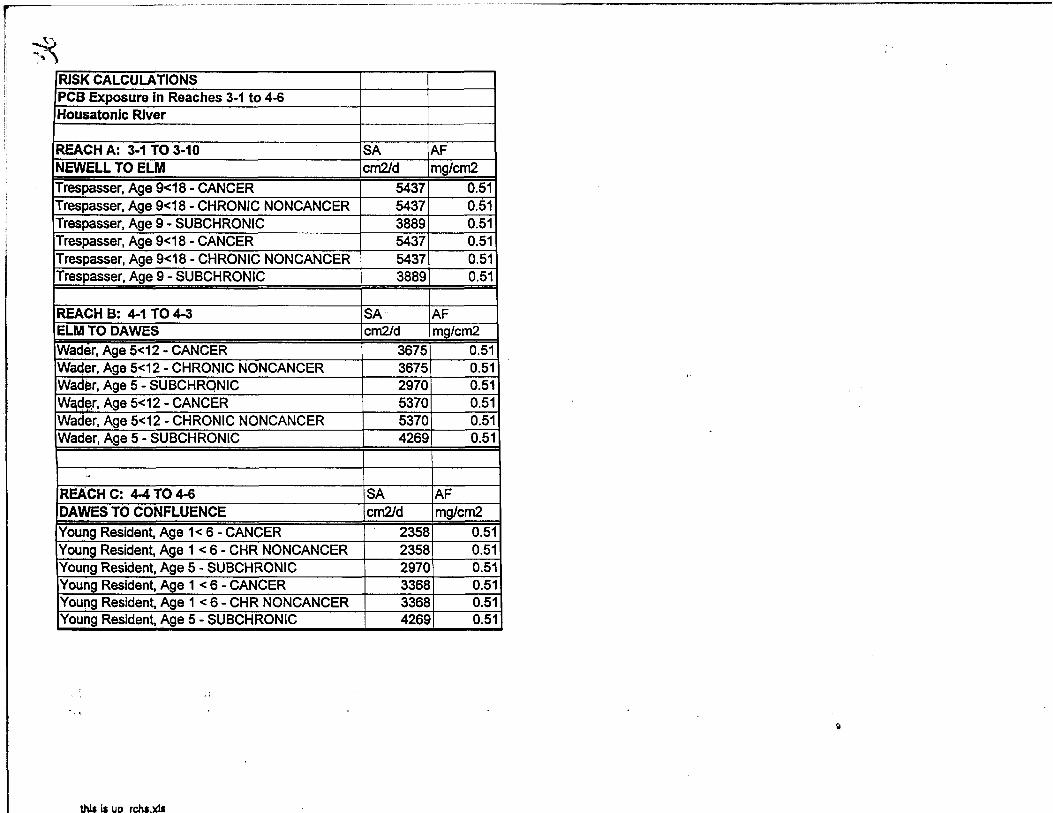
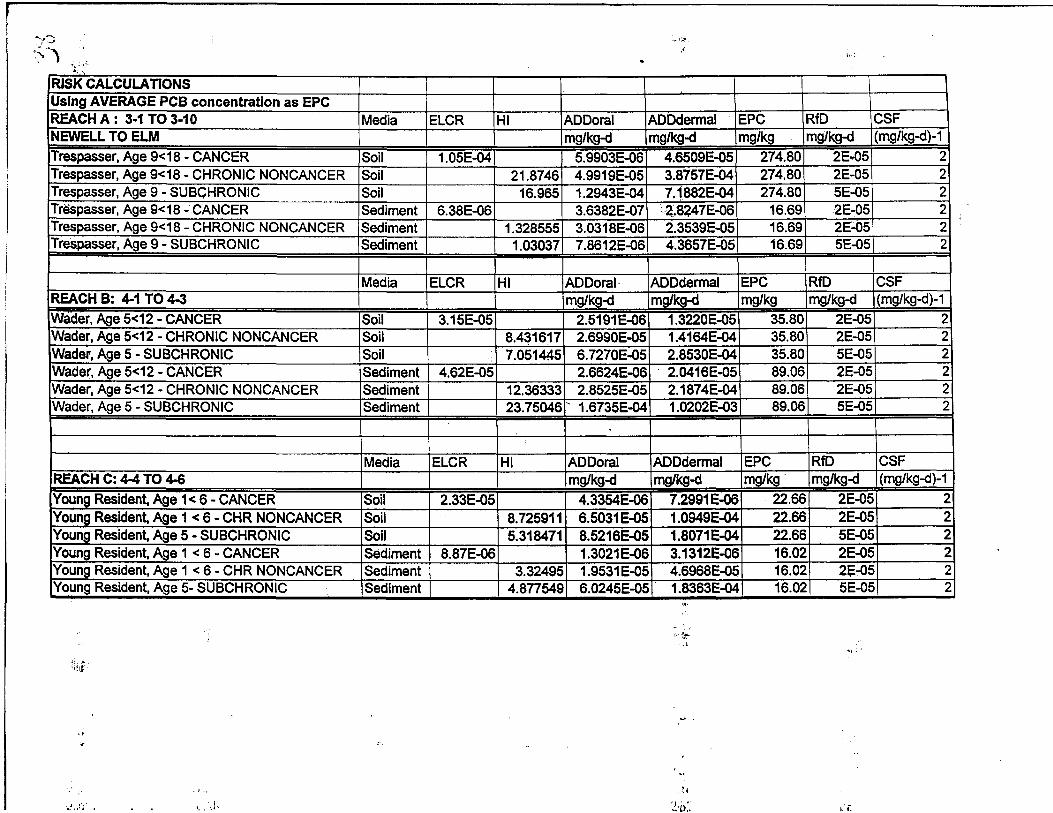
RISK CALCULATIONS Using AVERAGE PCB concentration as EPC REACH A 3-1 TO 3-10 NEWELL TO ELM
Trespasser Age 9lt18 - CANCER Trespasser Age 9lt18 - CHRONIC NONCANCER Trespasser Age 9 - SUBCHRONIC Trespasser Age 9lt18 - CANCER Trespasser Age 9lt18 - CHRONIC NONCANCER Trespasser Age 9 - SUBCHRONIC
REACH B 4-1 TO 4-3
Wader Age 5lt12 - CANCER Wader Age 5lt12 - CHRONIC NONCANCER Wader Age 5 - SUBCHRONIC Wader Age 5lt12 - CANCER Wader Age 5lt12 - CHRONIC NONCANCER Wader Age 5 - SUBCHRONIC
REACH C 4-4 TO 4-6
Young Resident Age 1lt 6 - CANCER Young Resident Age 1lt 6 - CHR NONCANCER Young Resident Age 5 - SUBCHRONIC Young Resident Age 1lt 6 - CANCER Young Resident Age 1lt 6 - CHR NONCANCER Young Resident Age 5- SUBCHRONIC
Media
Soil Soil Soil Sediment Sediment Sediment
Media
Soil Soil Soil Sediment Sediment Sediment
Media
Soil Soil Soil Sediment Sediment Sediment
ELCR
105E-04
638E-06
ELCR
315E-05
462E-05
ELCR
233E-05
887E-06
HI ADDoral ADDdermal EPC RfD CSF
mgkg-d mgkg-d mgkg mgkg-d mgkg-d)-1
59903E-06 46509E-05 27480 2E-05 2 218746 4991 9E-05 38757E-04 27480 2E-05 2
16965 12943E-04 71882E-04 27480 5E-05 2 36382E-07 28247E-06 1669 2E-05 2
1328555 30318E-06 23539E-05 1669 2E-05 2 103037 78612E-06 43657E-05 1669 5E-05 2
HI ADDoral ADDdermal EPC RfD CSF mgkg-d mgkg-d mgkg mgkg-d (mgkg-d)-1
25191E-06 13220E-05 3580 2E-05 A
48431617 26990E-05 14164E-04 3580 2E-05 47051445 67270E-05 28530E-04 3580 5E-05
26624E-06 20416E-05 8906 2E-05 2 1236333 28525E-05 21874E-04 8906 2E-05 2 2375046 - 16735E-04 10202E-03 8906 5E-05 2
HI ADDoral ADDdermal EPC RfD CSF
mgkg-d mgkg-d mgkg mgkg-d (mgkg-d)-1 43354E-06 72991 E-06 2266 2E-05 2
8725911 65031 E-05 10949E-04 2266 2E-05 2
5318471 85216E-05 18071 E-04 2266 5E-05 2
13021E-06 31312E-06 1602 2E-05 t 332495 19531 E-05 46968E-05 1602 2E-05
4877549 60245E-05 18363E-04 1602 5E-05
RISK CALCULATIONS Using AVERAGE PCB concentration as EPC REACH A 3-1 TO 3-10 NEWELL TO ELM
Trespasser Age 9lt18 - CANCER Trespasser Age 9lt18 - CHRONIC NONCANCER Trespasser Age 9 - SUBCHRONIC Trespasser Age 9lt18 - CANCER Trespasser Age 9lt18 - CHRONIC NONCANCER Trespasser Age 9 - SUpoundCHRONIC
REACH B 4-1 TO 4-3
Wader Age 5lt12 - CANCER Wada Age 5lt12 - CHRONIC NONCANCER Wader Age 5 - SUBCHRONIC Wader Age 5lt12 - CANCER Wader Age 5lt12 - CHRONIC NONCANCER Wader Age 5 - SUBCHRONIC
REACH C 4-4 TO 4-6
Young Resident Age 1lt 6 - CANCER Young Resident Agegt1 lt 6 - CHR NONCANCER Young Resident Age 5 - SUBCHRONIC Young Resident Age 1 lt 6 - CANCER Young Resident Age 1lt 6 - CHR NONCANCER Young Resident Age 5- SUBCHRONIC
C kgmg
100E-06 100E-06 100E-06 100E-06 100E-06 100E-06
C kgmg
100E-06 100E-06 100E-06 100E-06 100E-06 100E-06
C kgmg
100E-06 100E-06 100E-06 100E-06 100E-06 100E-06
R mgd
IR mgd
IR mgd
50 50 50 50 50 50
50 50 50 50 50 50
100 100 100 100 100 100
EF evd
EF evd
EF evd
0167 0167 0283 0167 0167 0283
0419 0419 0707 0178 0178 0707
0419 0419 0707 0178 0178 0707
ED dev
ED dev
ED dev
EP RAF-o days
1 3285 1 3285 1 214 1 3285 1 3285 1 214
EP RAF-o days
1 2565 1 25sect5 1 214 1 2555 1 2555 1 92
EP RAF-o days
bull 1825 bull 1825 bull 214 bull 1825 bull 1825 bull 92
RAF-d
1 014 1 014 1 014 1 014 1 014 1 014
RAF-d
1 014 1 014 014 014 bull 014 014
RAF-d
bull 014 bull 014 bull 014 bull 014 bull 014
014
BW AP
kg days
46 27375 46 3285 30 214 46 27375 46 3285 30 214
BW AP
kg days
278 27375 278 2555 188 214 278 27375 278 2555 188 92
BW AP
kg days
146 27375 146 1825 188 214 146 27375 146 1825 188 92
thU is up_rchsxls
RISK CALCULATIONS Using AVERAGE PCB concentration as EPC REACH A 3-1 TO 3-10 SA AF NEWELL TO ELM cm2d mgcm2 Trespasser Age 9lt18 - CANCER 5437 051 Trespasser Age 9lt18 - CHRONIC NONCANCER 5437 051 Trespasser Age 9 - SUBCHRONIC 3889 051 Trespasser Age 9lt18 - CANCER 5437 051 Trespasser Age 9lt18 - CHRONIC NONCANCER 5437 051 Trespasser Age 9 - SUBCHRONIC 3889 051
SA AF REACH B 4-1 TO 4-3 cm2d mgcm2 Wader Age 5lt12 - CANCER 3675 051 Wader Age 5lt12 - CHRONIC NONCANCER 3675 051 Wader Age 5 - SUBCHRONIC 2970 051 Wader Age 5lt12 - CANCER 5370 051 Wader Age 5lt12 - CHRONIC NONCANCER 5370 051 Wader Age 5 - SUBCHRONIC 4269 051
SA AF REACH C 4-4 TO 4-6 cm2d mgcm2
Young Resident Age 1lt 6 - CANCER 2358 051 Young Resident Age 1lt 6 - CHR NONCANCER 2358 051 Young Resident Age 5 - SUBCHRONIC 2970 051 Young Resident Age 1 lt 6 - CANCER 3368 051 Young Resident Age 1lt 6 - CHR NONCANCER 3368 051 Young Resident Age 5- SUBCHRONIC 4269 051
Appendix A Memo on Potential Human Health Risks from Consuming Fish from the Housatonic River in Massachusetts
United States Boston Massachusetts 02203 Environmental Protection Agency (617)565-3420 New England Region JF Kennedy Federal Building
MEMORANDUM
DATE May 141998
SUBJ Potential Human Health Risks from Consuming Fish from the Housatonic River in Massachusetts
FROM Mary BaUew Environmental Scientist EPA TO Bryan Olson Project Manager Office of Site Remediation and Restoration EPA
I INTRODUCTION
This memo provides calculations and a limited discussion of potential risks from consuming fish from the Housatonic River in Massachusetts Currently there is a fishing advisory on the Housatonic which may help to limit fish consumption
EL CONCLUSIONS
Consumption of fish in the Housatonic river even for periods as short as one summer presents a significant risk to human health
DL HAZARD IDENTIFICATION
For the Housatonic River in Massachusetts there is-afish consumption advisory in place for all fish species However there is no enforcement mechanism in the advisory and no monitoring of the advisorys effectiveness in preventing exposure Currently 37 of male and 31 of female Pittsfield residents surveyed by the Massachusetts Department of Public Health reported eating freshwater fish (not necessarily from the Housatonic) (MA DPH 1997) The fish consumption advisory is communicated by a brochure distributed when individuals receive fishing licenses In addition the advisory is posted on some locations on the river However young people under 16 years old can fish without a license and they may walk to and fish from locations that are not posted The river has numerous access points by foot or by boat Under the fishing advisory catching and releasing the fish is allowed which adds to the difficulty of monitoring its effectiveness If individuals ignore the advisory or are not aware of it their cumulative risk may be represented by the risks presented in this memo
GE collected young of year1 fish to monitor changes (trends) in PCB levels over time not to represent the type offish people were likely to eat Since these fish were about six months old (Finklestein 1998) they were too small to eat GE reported that composites of young of year fish (pumpkinseeds largemouth bass-and yellow perch) caught in 1994 near New Lenox Road (just downriver of Pittsfield) in the Housatonic ranged from 22 to 35 mg PCBs per kilogram (ppm) of whole fish composite Similarly fish composites at Woods Pond (12 miles downriver of GE) ranged from 3 to 58 ppm (GE 1994) So although Woods Pond contained high levels of PCBs the fish in sections of the river closer to Pittsfield contained comparable levels For example the 69 largemouth bass sampled at New Lenox Road averaged 31 ppm and the 70 largemouth bass sampled at Woods Pond averaged 23 ppm (young of year results GE 1994)
In 1994 the National Biological Survey of the US Geological Survey (USGS) collected 28 largemouth bass from Woods Pond which is a wide shallow section of the Housatonic River PCB levels in 24 whole fish ranged from a minimum of 27 ppm to a maximum of 206 ppm and averaged 100 ppm (not adjusted for lipid) Four additional muscle tissue samples ranged from 13 to 70 ppm PCBs (Attachment Al) Woods Pond is twelve miles downriver from the GE facility and the sediment levels of PCBs in Woods Pond average 27 ppm (personal communication Dean Tagliaferro April 1998) The dominant Aroclors2 found in the fish resemble Aroclors 1254 and 1260 which are the environmentally modified forms of the original Aroclor 1260 released from GE
In 1997 EPA-New England asked the EPA Office of Research and Development for technical assistance to perform congener-specific3 analysis of the USGS fish samples Since this was the only congener-specific data for fish available for the Housatonic River this data was selected for these risk calculations The USGS had a limited amount of data on other species however EPA chose the largemouth bass for congener analysis because they are a popular game species The largemouth bass caught by the USGS were all of a size that would provide good fillets In
1 Young of year fish are those less than one year old
2 PCB mixtures manufactured in the United States carried the trademark Aroclor followed by a four-digit number the first two digits are 12 and the last two digits indicate the percent chlorine by weight For example Aroclor 1260 was manufactured using 60 chlorine Aroclor 1016 is an exception because it contains 41 percent chlorine by weight (EPA 1996) Once released into the environment distribution and bioaccumulation of an Aroclor can change the character of the mixture so that it may no longer resemble the original mixture (EPA 1996)
3 Each PCB molecule consists oftwo 6-carbon rings with one chemical bond joining a carbon from each ring -imagine sunglasses with hexagonal frames) Chlorine can attach to any of the other 10 carbons There are 209 QSgible
arrangements called congeners The number and position of chlorines determine a PCB molecules physical and chemical properties Congeners are numbered 1 to 209 The coplanar congeners those with the two rings aligned on the same plane have dioxin-like properties (EPA 1996) Congener specific data improves our ability to identify the presence of bioaccumulated PCBs
contrast the GE young of year fish were too small to eat
IV DOSE RESPONSE
Toxicology To determine whether exposure to PCBs in fish from the Housatonic River in Massachusetts presents a potential risk to human health EPA evaluates the cancer and noncancer risks associated with PCB exposure To evaluate the cancer risk EPA uses the 95 upper confidence limit of the linear-slope factor (also known as the cancer slope factor) of 2 (mgkgday)1 for PCBs (IRIS 1998) The fish ingestion scenario involves ingestion of bioaccumulated PCBs Ingestion offish contaminated with these PCBs may result in a dose greater than that which occurred in the toxicity studies used to develop the potency estimates (EPA 1996) For that reason EPA estimates the risk of consuming bioaccumulated PCBs using the Toxic Equivalence Factor (TEF) approach (outlined in EPA 1996) The TEFs are ratios for certain PCB congeners that when multiplied by each congeners concentration in fish tissue and the cancer slope factor for dioxin yield an estimate of the carcinogenicity of the bioaccumulated PCBs in the fish Because of its toxicity the cancer slope factor for dioxin is very high 150000 (mgkgday)1 so even small concentrations of these dioxin-like PCBs in the fish can present a cancer risk
In the cancer study for Aroclor 1260 on which the slope factor is based a 12-month exposure produced approximately the same cancer potency as a full two-year exposure This suggests that a less than lifetime exposure could have significant risk implications (EPA 1996)
To evaluate chronic noncancer risks EPA used a Reference Dose (RfD) of 2 x 10⁵ mgkgday for Aroclor 1254 (IRIS 1998) To evaluate subchronic noncancer risks EPA used the subchronic RfD of 5 x 10⁵ mgkgday for Aroclor 1254 (HEAST 1997) Reference Doses for Aroclor 1254 were used because they are the closest ones applicable to the type of PCB mixture found in the
- Housatonic River (Aroclor 1260) The toxicity of Aroclor 1254 is much more similar to^Jtbajt of Aroclor 1260 than the toxicity of Aroclor 1016 (the other choice for an EPA accepted RfD) The toxicity study on which the RfDs are based was conducted over a shorter-term time frame (5 years) The subchronic exposure period evaluated in this memorandum (one summer) is consistent with that used in the toxicity study The critical effects for the chronic and subchronic RfDs are immunologic and reproductive effects In addition PCBs have been associated with deficits in learning and neurological effects (see ATSDR 1996 for a recent review)
A relative absorption factor (RAF) of 100 was used for oral absorption of PCBs from fish bull bull (DEP 1992) An RAF of 100 means that the assumed absorption of PCBs from ingestion of
Housatonic fish is equal to the absorption of PCBs in the laboratory toxicity studies
Data Analysis Of the available fish data only the 1994 USGS 24 whole fish and 4 tissue samples were tested for dioxin like PCBs (see data in attachment AL spreadsheets) The whole fish samples included skin organs and all other tissues For the muscle tissue samples USGS removed about 100 grams of muscle tissue and attached skin (about 2 inches wide 4 inches long and 1 inch deep) from the back of the fish directly above the gut (Steven Smith personal communication 1998)
To compare the fish on the same basis EPA adjusted the whole fish data to its equivalent in fish tissue thus
(ppm PCBs in whole fish divided by lipid in each fish) x 100 = micrograms of PCB per gram of fat
The concentration of PCBs in fish muscle tissue equivalents were determined using the lipid normalized concentration of PCBs and the average lipid found in the four fish tissue samples (approximately 1) While the use of lipid normalization data is not recommended in all cases4 the lipid approximation of 1 was considered to be reasonable given the very low levels of lipid in whole fish (087-58)
Following the procedure outlined in EPA 1996 EPA multiplied the concentrations of the shyindividual PCB dioxin-like congeners by the toxic equivalence factors (TEFs) appropriate to each This product called dioxin toxic equivalents (TEQs) is calculated for each tissue sample
Next EPA calculated the 95 upper confidence limit of the mean (Gilbert 1987) concentration for the non-dioxin PCBs and the dioxin-like PCBs These calculations resulted in a UCLs of 00013 for TEQs and 522 ppm for nondioxin PCBs These were the exposure point concentrations used with the exposure factorsrtocalculate the risks of consuming the fish Eleven of-the 13 dioxin-like PCBs were detected in fish samples used for this risk evaluation -gt --
V EXPOSURE ASSESSMENT
Currently the waters of the Housatonic are under a fishing advisory by the Commonwealth of Massachusetts The calculations for the adult fisher and subsistence fisher that follow assume that
4For human health risk assessment adjusting for lipid requires site-specific samples offish muscle tissue or fillet in addition to the data on whole fish A standardized (not site-specific) lipid adjustment is not appropriate because the lipid levels of the fish may have been affected by the site contamination Also the adjustment does not make biological sense unless the contaminant sequesters in the fat
lib
people do not adhere to the advisory
The calculations for the child fisher represent the short-term PCS doses and risks that a child could receive during one summer of consuming contaminated fish caught between GE and the Woods Pond Dam on the Housatonic River in Massachusetts
Adult Fisher To estimate risks to the adult fisher EPA used exposure assumptions that consider the amount of site data available and the site conditions The exposure assumptions described below are reflective of the Reasonable Maximum Exposure (RME) for adult residents who consume contaminated fish
These calculations assume that an adult fisher5 consumes a daily average of 26 grams offish over the course of 365 days per year (Ebert et al 1993) This could represent 3 or 4 (8shyounce) fish meals per month throughout a year or 7 (8-ounce) fish meals per month during the warmer months (April through October) A daily average of 26 grams represents the 95th percentile offish consumption for all water bodies in Maine (Ebert et al 1993) Because the Housatonic is the largest water body in the region and an attractive resource this value is appropriate This value was previously agreed upon by the Agencies in joint comments on General Electrics proposed Risk Assessment Scope of Work for the Housatonic River GE did not dispute this value (DEPEPA 1997)
The body weight used in this evaluation is 70 kg which represents the average body weight for an adult (EPA 1989)
Subsistence Fisher To estimate risks to the subsistsacefisher EPA used exposure assumptions that consider the amount of site data available and-the site conditions The exposure assumptions described below are appropriate for a sensitive subpopulation that is highly exposed
These calculations assume that a subsistence fisher5 consumes a daily average of 140 grams of fish over the course of 365 days per year This could represent 4 or 5 (8-ounce) fish meals per week during a year The daily average of 140 grams per day was estimated by EPA Office of Water staff based on a review of the literature on fish consumption by Native Americans and subsistence anglers (EPA 1995) Given site conditions this value is appropriate for subsistence fishers as a whole a particular ethnic group or tribe of Native
This is a person who has adult body weight and who would ingest adult-sized portions of fish For example for a thirty year exposure duration this could be a person who ate fish each year when they were between the ages of 18 and 48
Americans may consume more fish This value for subsistence fish consumption was previously agreed upon by the Agencies in joint comments on General Electrics proposed Risk Assessment Scope of Work for the Housatonic River GE did not dispute this value (DEPEPA 1997)
The body weight used in this evaluation is 70 kg which represents the average body weight for an adult (EPA 1989)
Childfisher To estimate the subchronic risks to the child fisher EPA used exposure assumptions that consider the amount of site data available and the site conditions The exposure assumptions described below are reflective of short term exposures and do not represent the RME
These calculations assume that the child fisher (age9 years) consumes one small (6- or 7shyounce) fish meal per week during the summer months (June July August) EPA assumes 13 weeks per summer (June July and August)
The one summer exposure period used in this evaluation is shorter than the 30-year exposure period (for cancer risks) typically evaluated by EPA as part of the RME The purpose of this calculation is to examine whether short term exposures could provide enough dose and present enough risk at some point later in life to be a concern
For fish ingestion for the child fisher EPA used 1825 gweek This is the same value for residential fish consumption mentioned above and adjusted to a weekly consumption rate (26 gday 365 daysyr divided by 52 weeksyr)
The body weight used in these calculations is 30 kg which represents an average of the 50th
percentile body weightierfemales age 9 years (DEP^ 1995 EPA 1989)
TABLE 1 Exposure factors used to calculate the potential risks from fishing on the Housatonic River
EXPOSURE PARAMETER VALUE
body weight (kg) adult or subsistence fisher 70 body weight (kg) age 9 years 30
exposure duration subchronic (weeks) 13 exposure duration (years) 30
fish ingcstion rate (gday) adults 26 fish ingestion rate (gday) subsistence fishers 140 fish ingestion rate (gwcck) children 1825
averaging time (days) cancer 25550 averaging time (days) chronic noncancer 10950 averaging time (days) subchronic noncancer 92
VL RISK CHARACTERIZATION
A Risk Calculations
CANCER RISKS e
Using the assumptions noted above in Table 1 and the equations below a lifetime average daily dose of PCBs from ingestion offish can be calculated
= fPGBl C IR ED BWAT
LADDlaquoi
Where
LADD^ = lifetime average daily dose from ingestion offish mgkgday [PCS] = PCB concentration in fish figkg C = conversion factor 106
IR = fish ingestion rate gday BW = body weight kg ED = exposure duration years AT F= averaging time period over which exposure is averaged - days or years
The Excess Lifetime Cancer Risk (ELCR) from ingestion of fish can be calculated using the following equations
ELCR = (LADD^J CSF (for cancer risks less than 1 in 100)
ELCR = 1- exp (-LADD^ CSF) (for cancer risks greater than 1 in 100)
Where ELCR = Excess Lifetime Cancer Risk CSF = Cancer Slope Factor 2 (mgkgday)-1 for nondioxin-like PCBs and 150000
(mgkgday)-1 fordioxinTEQs LADD^ = lifetime average daily dose from ingestion of fish exp = e raised to the power of x where x is the product of the dose and the cancer slope factor
NONCANCER RISKS
Using the exposure assumptions in Table 1 and the equations below an average daily dose of PCBs from ingestion offish can be calculated
= fPCBI C IR ED BWAT
Where
= average daily dose from ingestion of fish mgkgday [PCB] = PCB concentration in fish ngkg C = conversion factor 106
IR = fish ingestion rate gday or gweek BW = body weight kg ED = exposure duration weeks or years AT = averaging time period over which exposure is averaged - days or years
The Hazard Index can be calculated using the equation below
HI = [ADD ] RfD
Where HI = Hazard Index RfD = Reference Dose mgkgday
= average daily dose from ingestion of fish mgkgday
B Risk Results
RCRA CERCLA Risk Management Criteria
The cancer risks for the adult fisher and the subsistence fisher whom consume PCB contaminated fish are two orders of magnitude (100 times) or more above the EPA cancer risk range (discussed in EPA 1991) of 106 to 104 (see tables attached) and this justifies EPA in taking an (remedial or removal) action
Even a child who consumes one fish meal a week over the course of one summer has a cancer risk from that short term exposure which is nine times higher than the EPA cancer risk range of 106 to 10 and this justifies EPA in taking an action
The chronic noncancer risks for the adult fisher and the subsistence fisher whom consume PCB contaminated fish are over 900 times the risk (ie a chronic Hazard Index of 1) at which EPA is justified in taking an action
The noncancer risks (subchronic) for a child who consumes one fish meal a week over the course of one summer are over 800 times the risk (ie a subchronic Hazard Index of 1) at which EPA is justified in taking an action
If adults or children are consuming the fish on a regular basis they have a significant risk of cancer or noncancer health effects
C Discussion of Risk Characterization
Discussion Related to Exposure Scenarios The exposure period evaluated for the child fisher (one summer) may underestimate the actual exposure that a child may receive because it does not account for continuing exposure Moreover PCBs have been present in the residential areas in Pittsfield for many years already making it likely that exposure via some other environmental media has already occurred
The exposure period selected for evaluation of cancer effects is one summer for the child fisher However different assumptions about the exposure period have a significant impact on the risk results As the exposure period increases the cancer risk estimate increases For evaluating cancer risks one could easily justify using a longer exposure period than the ones selected Also typically the calculation of cancer risks attributable to fish consumption may involve some weighting of child and adult exposures which may make the risks higher than those calculated for
the adult alone
The risk calculations may not be conservative enough for ethnic groups whose members consume the whole fish Also particular Native American or ethnic groups may consume more fish than noted in the subsistence fishing calculations
Pre-natal exposure to PCBs as well as post-natal exposure to PCBs via breast milk may have higher risks than those noted Early stages of development may have an extra sensitivity to the effects of PCBs (reviewed in EPA 1993 IRIS 1998)
Toddlers consuming fish may have higher risks than those noted because of the large doses that these fish would provide given the small body size of a toddler Also the toddler may be more sensitive to the developmental effects of PCBs
Discussion Related to Toxicity and Exposure The cancer risks from the dioxin-like PCBs was about twice the risks from PCBs (without the properties of dioxin) This illustrates the importance of performing congener specific analysis of PCBs for estimates of cancer risk
The PCB doses from eating the fish even for as short a period as one summer are higher than the doses at which monkeys showed marked reproductive effects (Arnold et al 1995) and effects on cognitive behavior (Rice 1995 1997 Rice and Hayward 1997 Rice et al 1996) and activity (reviewed in EPA 1993) This suggests that there may be no safety margin between the exposure estimates for people who eat fish from the Housatonic river and the exposures in the monkey studies which show adverse health effects
The risks from consuming the fish are substantial If the fishing advisory is effective then there is no risk from the fish However a report in the literature suggests that fishing advisories are violated regularly (Tilden et al 1997)6 And-sbmepeople in the area may have consumed fish from the Housatonic before the fishing advisory was in place (about 10 years ago)
In sum doses estimated for children and adults who ingest contaminated fish from the Housatonic river are higher than those received by the monkeys in the PCB noncancer toxicity study that demonstrated adverse health effects This is true even in the case of children who ingest contaminated fish over the course of one summer These exposure estimates raise significant concerns regarding potential health effects in children and adults who ingest contaminated fish from the Housatonic river
6Tilden estimates that in one year as many as 47 million people ate Great Lakes sport fish despite long standing (since the mid-70s) state fishing advisories
10
REFERENCES
Arnold et al 1995 Toxicological Consequences ofAroclor 1254 Ingestion by Female Rhesus (Macaca mulatto) Monkeys Part 2 Reproduction andlnfant Findings Arnold DL Bryce F McGuire PF et al Fd Chem Toxic 33457-74
ATSDR1996 Public Health Implications ofPCBs December 1996
DEP 1992 Documentation For The Risk Assessment Shortform Residential Scenario Massachusetts Department of Environmental Protection Office of Research and Standards and the Bureau of Waste Site Cleanup Policy BWSCORS-142-92 October 1992
DEP 1995 Guidance For Disposal Site Risk Characterization In Support of the Massachusetts Contingency Plan Interim Final Policy BWSCORS-95-141 Massachusetts Department of Environmental Protection Bureau of Waste Site Cleanup and Office of Research and Standards July 1995
DEPEPA 1997 Joint DEPEPA Technical and Review Comments on General Electric Proposal for Human Health Risk Assessment of the Housatonic River August 13 1997
Ebertetal 1993 Estimating Consumption of Freshwater Fish among Maine Anglers EbertES Harrington NW Boyle KJ et al North American Journal of Fisheries Management 13737-45 1993
EPA 1989 Risk Assessment Guidancefor Superfund Volume I - Human Health Evaluation Manual (Part A) Interim Final US Environmental Protection Agency Office of Emergency and Remedial Response EPA5401-89002 December 1989
EPA 1991 Role of the Baseline Risk Assessment in Superjund Remedy Selection Decisions USEPA OSWER Directive 93550-30 April 22 1991
EPA 1993 Workshop Report on Developmental Neurotoxic Effects Associated with Exposure to PCBs VSEPA Risk Assessment Forum EPA63 OK-92004 May 1993
EPA 1995 Water Quality Guidance for the Great Lakes System Supplementary Information Document (SID) USEPA Office of Water EPA-820-B-95-001 March 1995 p 575
EPA 1996 PCBs Cancer Dose-Response Assessment and Application to Environmental Mixtures NCEA ORD EPA600P-96001F
Finklestein 1998 Personal communication Ken Finklestein NOAA May 111998
GE 1994 Preliminary draft MCP Supplemental Phase II InvestigationRCRA Facility Investigation of Housatonic River and Silver Lake Tables 8 through 10
Gilbert 1987 Statistical Methods for Environmental Pollution Monitoring RO Gilbert Van
11
Nostrand Reinhold NY 1987
HEAST 1997 Health Effects Assessment Summary Tables EPA Office of Solid Waste and Emergency Response 92006-303 (97-1) EPA-540-R-97-036 PB97-921199 July 1997
IRIS 1998 EPA Integrated Risk Information System a database 1998
Mass DPH 1997 Housatonic River Area PCB Exposure Assessment Study Final Report Massachusetts Department of Public Health Bureau of Environmental Health Assessment Environmental Toxicology Unit September 1997
Rice 1995 Neurotoxicity of Lead Methylmercury andPCBs in Relation to the Great Lakes DC Rice Environmental Health Perspectives 103(Supplement9)71-87 1995
Riceetal 1996 Lessons for Neurotoxioology from SelectedModel Compounds SGOMSEC Joint Report Rice DC de Duffard AME Duffard R et al Environmental Health Perspectives 104(Supplement 2)205-15
Rice 1997 Effect of Postnatal Exposure to a PCB Mixture in Monkeys on Multiple Fixed Interval-Fixed Ratio Performance DC Rice Neurotoxicology and Teratology 19429-34
Rice and Hayward 1997 Effects of Postnatal Exposure to a PCB Mixture in Monkeys on Nonspatial Discrimination Reversal and Delayed Alternation Performance Rice DC Hayward S Neurotoxicology 18479-94 1997
Smith 1998 Personal communication with Steven Smith USGS April 28 1998
Tagliaferro 1998 Personal communication Dean Tagliaferro EPA removals program April 1998
Tilden et al 1997 Health Advisories for Consumers of Great Lakes Sport Fish Is the Message Being Received Tilden J Hanrahan LP Anderson H et al Environmental Health Perspectives 1051360-65 1997
Tilson et al 1990 Polychlorinated Biphenyls and the Developing Nervous System Cross-species Comparisons Tilson HA Jacobson JL Rogan WJ Neurotoxicology and Teratology 12239-248 1990J
12
ATTACHMENT A1
Spreadsheets showing raw data and UCL calculations
13
Congener specific PCB concentrations and TEQs in largemouth bass collected from Woods Pond MA last modified 51098 PCBs
Fish refershyence
ppm PCBs
Lipid in Lipid AP raquosampx3 Dioxin-like ODngeners(ppm)
number total whole fish]
BO I B02 B03 B04 805
57 206 65 117 75
225 381 161 106 285
PCBsg
25333 54068 40373 110377 26316
I 1242
lt05 ltQ5 lt05
bullraquo
1248
-lt05 lt05 lt05
-
f
11035 60
Hshy
1260
96 30 57 -
77 1JT 1
ft 0001 0 a 0
105
042 052 017 033 026
1W 1 1 181061 iy^J 156
amp03S 0$43 0013 0037 002
26 33 12 2 2 17
^T^fPWJ bull shyamp0|7-MI
lt$amp$ OJWS$$ Q$$tff
046 06
021 042 034
032 041 015 03 024
lt 3
MpoundregL 0i0lt)33 00005 00014 0001$
31 42 016 3 3 26
pv09601$ 0045 011 0gt0amp7
y ootnoi2 0043 0087 0071
B06 63 579 10881 Hshy - 1 - a shy 027 002 16 001 034 025 001$ 2 7 00$ 007 B07 BOS B09
71 31 157
335 241 433
21194 12863 36259
lt05 w
lt05
lt05 -
lt05
sa Mshy
sa 33 -
69
0 0 0
021 023 039
0015 001amp 01032
13 16 25
ampG0ampJ 0gt00$)5 Oytj^fs
024 029 044
018 021 031
00012 00Q1 00022
2 2 4 34
00$7ao$6 011
005 0059 0089
BIO Bll B12
69 56 196
1 89 202 344
bull 3650 8 27723 56977
ltQ5 lt05 lt05
lt05 lt05 lt05
36 30 110
33 26 86
0 0 0
019 018 046
0016 00150037
14 12 2 9
lt 60^ c s
0101 j 0021
025 021 052
02 016 037
0001amp
bull 6^001 00027
18 15
4
amp04 0-gtQ4lf s
012
OJ554vamp$iirgti
oii B14 27 1 7 15882 - - 0 0 3 0026 2 0009S 04 03 00014 2 9 a097 007^ B15 77 329 23404 lt05 lt05 42 35 0 025 0022 1 7 010-14 003 023 00021 2 2 0072 0062 B19 110 399 27569 Hshy - bdquo 0 051 0044 3 0 17 056 039 00022 4 012 ou B20 121 2 13 56808 lt05 lt05 61 60 0 033 027 2 0$$ 045 032 00022 3 3 013 00$ B21 B22
198 89
369 246
53659 36179
lt05 lt05
lt05 lt05
110 4$
88 41
0001 0
053 026
0046 0022
33 17
0lt0i ipxOi
063 032
043 023
00024 00017
4 2 24
014 077
013 0067
B23 B24 B25
130 168 87
3 18 355 238
40881 47324 36555
lt05 ltQ5 lt05
lt05 lt05 lt05
7$ 95 48
51 73 39
- 0 0
036 043 025
0031 003amp
0ois
23 27 15
4gtk^5shyamp$ampbulllt bull000
038 05 03
028 035 022
00015 00021 00013
23 35 21
0073 011 007
0083 01
0064 B31
B33
47
50
139
139 33813
35971 lt05 lt05
lt05 lt05
24 26
23
24 p 0
015
014 0 0 1 rlaquo^ 00096
086
068 iiiSt6igt058i
019
019
014
014 0000 QJQOQ5
14
14
0046 00Si
004 ^ 0^39^ gt
B34 121 0872 13876 1 lt-05 lt05 62 59 0 031 0023 19 00amp1 042 03 0^0005 33 01 1 $poundamp muscle tissue
B13 138 0577 2391 7 lt05 lt05 79 59 o 0045 00031 023 ampQ04 005 0037 Q0005 039 001 00082 B16 70 1 86 37634 lt05 lt05 35 35 0 019 001S 13 028 023 amp0024 21 0075 0057 B17 41 1 19 34454 lt05 lt05 21 20 0 012 001 064 017 0 13 00012 12 0044 0034 B18 13 2 039 33846 lt05 lt05 72 6 0 0036 00025 019 000B 0047 0045 00005 034 0024 00075
1 i- isn refer- ppm TEFs and TEQ s for tested con jeners r umof TEQs 1 ence PCBs
number total Lipid 77 105 114 118106 126 156 167 169 170 189 157 (mg TEQkg meg TEQ meg TEQ Lnconc rruCTOgram whole fish () 00005 0000] 0 0005 J_0 0001 0 1 00005 000001 001 00001 00001 00005 whole fish) gfat g tissue TEQs PCBVg tissue Ln PCB
BO I 57 22 5 OE+00 4E-05 2E-05 3E-04 2amp02 2E-04 3E-06 2E-05 3Eraquo04 IE-OS SB-OS 00026 0 1174 00012 -675 2533 323 B02 206 3 81 6E-07 5E-05 2E-05 3E-04 2Elt03 3E-04 4E-06 3E-05 4ampQ4 2E-05 laquoamp05 00032 00850 00008 -707 5407 399 B03 65 1 61 OE+00 2E-05 7E-C6 IE-04 7E-04 IE-04 2E46 5E-06 2E-05 5E-06 bull2E^)5 00010 00638 00006 -736 4037 3 70 i B04805
117 75
1 06 28 5
OE+00 OE+00
3E-05 3E-05
2E-05 1E-05
2E-04 2E-04
1B-OJ IE-OS
2E-04 2E-04
3E-06 2E-06
IE-OS 2E-05
3amp04 3E-04
IE-OS 9E-0(
bull4amp054ms
00021 00017
0 1965 00582
00020 00006
-623 -7 45
11038 26 32
470 327
B06 63 5 79 OE+00 3E-05 1E-05 2E-04 1E-03 2E-04 3E-06 2E-04 3E-Q4 9E-0( 4E-OS 00019 00322 00003 -804 1088 239 B07 71 3 3 5 OE+00 2E-05 8E-06 1L-04 1E-03 IE-04 2E-Q6 IE 05 2ErC4 6E-0lt 3E-05 00015 00443 00004 -772 21 19 305 BOS 31 2 4 ] OE+00 2E-05 9E-06 2b-04 9E-04 IE-04 2E-0lt$ IE-OS 2E-Q4 7E-0( 3E-05 00015 00616 00006 -739 1286 2 55 B09 157 4 33 OE+00 4E-05 2E-05 3E-04 2E-03 2E-04 3E-06 2E-05 3E-lt4 1E-0 4Z45 00026 00611 0 0006 -7 40 36 26 359 BI O 69 1 89 OE+00 2E-05 8E-06 IE 04 1E-03 IE-04 2E-06 2E-05 2E-Q4 6E-Oi 3E-05 00015 00807 00008 -712 3651 3 60) BH 56 202 OE+00 2E-05 8E-06 1E-04 IE-OS IE-04 2E-06 IE-OS 2ErQ4 SE-Or 7amp05 00014 00712 00007 -725 2772 332 B12 196 3 44 OE+00 5E-05 2E-05 3E-04 2E-03shy 3E-04 4E-06 3E-05 4amp04 1E-0 ^E-05 0 0032 0 0934 00009 -6 98 56 98 404 B14 27 1 7 OE+00 3E-05 IE-OS 2E-04 1E-03 2E-04 SR-Q6 IE-OS 3ErQ4 1E-0 4U-Q5 00018 0 1046 00010 -686 1588 277 B15 77 329 OE+00 3E-05 IE-OS 2E-04 1E4raquo 2E-05 2E-06 2E-05 2E-04 7E-0( SE-05 00019 00578 0 0006 -7 46 23 40 3 15 B19 110 3 99 OE+00 5E-05 2E-05 3E-04 2E-03 3E-04 4E-06 2E-05 4E-Q4 1E-0-) ^amp05 00028 00713 00007 -725 2757 3 32 B20 121 2 13 OE+00 3E-05 IE-04 2E-04 2E-OS 2E-04 3E-06 2E-05 3ErQ4 1E-01) 5E-05 00025 0 1177 00012 -675 5681 404 B21 198 369 5E-07 5E-05 2E-05 3E-04 2E-03 3E-04 4E-06 2E-05 4ErltJ4 IE-OS 7amp05 00031 00853 00009 -707 5366 398 B22 89 246 OE+00 3E-05 IE-OS 2E-04 IE-03 2E-04 2E^5 2E-05 2ampG4 8E-05 3amp05 00019 00787 00008 -715 36 18 359 B23 130 3 18 OE+00 4E-05 2E-05 2E-04 2B4raquo 2E-04 3Elt06 2E-05 2E-Q4 7E-Oo 4amplaquoJ 00023 00713 00007 -7 25 40 88 371 B24 168 3 55 OE+00 4E-05 2E-05 3E-04 2E-03 3E-04 4E-06 2E-05 4E-Q4 IE-OS SE-05 00027 00765 00008 -717 4732 386 B25 87 2 38 QE+QO 3E-05 9E-06 2E-04 9E-04 2E-04 2E-06 IE-OS 2E-04 7E-Oo 3E-OS 00015 00642 00006 -735 3655 360
B31 47 1 39 OE+QO 2E-05 5E-06 9E-05 3amp04 IE-04 1amp06 5E-06 IE-04 SE-Oo 2ElaquoOS 00009 00656 00007 -733 33 81 3 52
B33 50 1 39 OE+CO 1E-05 5E-06 7E-05 6E-04 IE-04 1E-06 5E-06 IE-04 5E-06 2E-05 00009 00671 00007 -731 3597 358
B34 12 087 OE-00 3E-05 1E-05 2E-04 8E03 2E-04 3E^6 5E-06 3E^34 IE-OS 4E-OS 00089 10247 00102 -458 13876 493
muscle tissue mg TEQskg Us le i |
B13 138 0 58 OE+00 5E-06 2E06 2E-05 4amp-04 3E-05 4E-07 5E-06 4E-05 1E-06 4E-06 0 0005 00005 -7 59 138 262
B16 70 1 86 QE+00 2E-05 9E-06 IE-04 IE-Mr IE-04 2E-Q6 2E-05 2E-04 8E-06 3E-OS 00016 00016 -646 70 42 5
B17 41 1 19 OE+00 1E-05 5E-06 6E-05 6E-04 9E-05 1E^06 IE-OS IE-04 4E-06 7E^)5 00010 00010 -696 41 371 B18 132 0 39 OE+00 4E-06 1E-06 2E-05 IE-04 2E-05 5E-07 5E-06 3ampQ5 2E-06 4E-06 0 0002 0 0002 -841 132 2 5 8
GSD 0 66 GSD 061 ave lipid n 28 n 28 muscle tissue H statistic 2 0923 H statistic 20502
95 UCL of the TEQs 00013 95UCLPCBs 522 meg TEQg tissue meg PCBg tissue
max TEQs 00102 max PCBs 1388
ATTACHMENT A2
Spreadsheets showing risk calculations
14
Potential risks from ingesting largemouth bass from the Housatonic River (Woods Pond area) in Massachusetts on a regular basis last modified 51498 The concentrations are based upon the 95 UCL of the mean concentration in muscle tissue
adult who consumes PCB contaminated fish cone ingestion ED BW AT LADD slope risk
(megkg) (gday) (yrs) (yrs) (mgkg-d) (per mgkg-d) (kg)cancer risks dioxin TEQ 130 26 30 70 70 206E-07 150000 3E-02 cancer risk from TEQs
nondioxin-like PCBs 52E+04 26 30 70 70 00083 2 2E-02 cancer risk nondioxinlike PCBs bull 5E-02 excess cancer risk lifetime
ADD(mgkg-d) RfD oral(1254) HI noncancer risks nondioxin-like PCBs 52E-H)4 26 30 70 30 00194 000002 969 rounding to one significant figure
1000 noncancer risk (chronic)
subsistence fisher who consumes PCB contaminated fish cone ingestion ED BW AT LADD slope risk
(megkg) (gday) (yrs) (kg) (yrs) (ingkg-d) (pet mgkg-d) cancer nsks dioxin TEQ 130 140 30 70 70 111E-06 150000 2E-01 cancer risk from TEQs
nondioxin-like PCBs 52E+04 140 30 70 70 00447 i 2 9E-02 cancer risk nondioxinlike PCBs 2E-01 excess cancer risk lifetime
ADD(mgkg-d) RfD oral(1254) HI noncancer risks nondioxin-like PCBs 52E+04 140 30 70 30 01044 000002 5219 rounding to one significant figure
5000 noncancer risk (chronic)
9 year child who consumes PCB contaminated fish once per week for one summer cone ingestion ED BW AT LADD slope risk
(megkg) (gweek) (weeks) (kg) (days) (mgkg-d) (per mgkg-d) cancer nsks dioxin TEQ 130 1825 13 30 25550 402E-09 150000 6E-04 cancer risk from TEQs
nondioxin-like PCBs 52E+04 1825 13 30 25550 000016 2 3E-04 cancer risjc nondioxinlike PCBs 9E-04 cancer risk due to dose
from a short-term exposure RfD oral(1254)
ADD(mgkg-d) subchronic ffl noncancer risks nondioxin-like PCBs 52E+04 1825 13 30 92 00449 5E-05 897 rounding to one significant figure
900 noncancer risk (subchronic)
- barcode 10818
- barcodetext SDMS Doc ID 10818
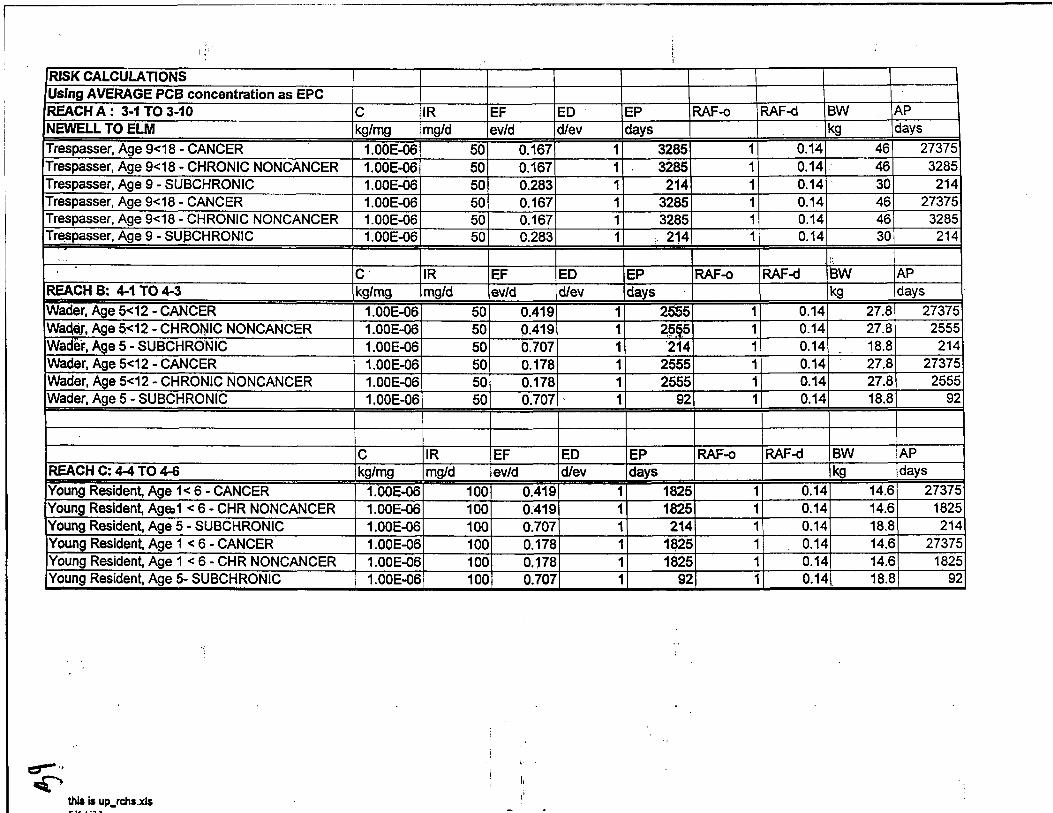
RISK CALCULATIONS Using AVERAGE PCB concentration as EPC REACH A 3-1 TO 3-10 NEWELL TO ELM
Trespasser Age 9lt18 - CANCER Trespasser Age 9lt18 - CHRONIC NONCANCER Trespasser Age 9 - SUBCHRONIC Trespasser Age 9lt18 - CANCER Trespasser Age 9lt18 - CHRONIC NONCANCER Trespasser Age 9 - SUpoundCHRONIC
REACH B 4-1 TO 4-3
Wader Age 5lt12 - CANCER Wada Age 5lt12 - CHRONIC NONCANCER Wader Age 5 - SUBCHRONIC Wader Age 5lt12 - CANCER Wader Age 5lt12 - CHRONIC NONCANCER Wader Age 5 - SUBCHRONIC
REACH C 4-4 TO 4-6
Young Resident Age 1lt 6 - CANCER Young Resident Agegt1 lt 6 - CHR NONCANCER Young Resident Age 5 - SUBCHRONIC Young Resident Age 1 lt 6 - CANCER Young Resident Age 1lt 6 - CHR NONCANCER Young Resident Age 5- SUBCHRONIC
C kgmg
100E-06 100E-06 100E-06 100E-06 100E-06 100E-06
C kgmg
100E-06 100E-06 100E-06 100E-06 100E-06 100E-06
C kgmg
100E-06 100E-06 100E-06 100E-06 100E-06 100E-06
R mgd
IR mgd
IR mgd
50 50 50 50 50 50
50 50 50 50 50 50
100 100 100 100 100 100
EF evd
EF evd
EF evd
0167 0167 0283 0167 0167 0283
0419 0419 0707 0178 0178 0707
0419 0419 0707 0178 0178 0707
ED dev
ED dev
ED dev
EP RAF-o days
1 3285 1 3285 1 214 1 3285 1 3285 1 214
EP RAF-o days
1 2565 1 25sect5 1 214 1 2555 1 2555 1 92
EP RAF-o days
bull 1825 bull 1825 bull 214 bull 1825 bull 1825 bull 92
RAF-d
1 014 1 014 1 014 1 014 1 014 1 014
RAF-d
1 014 1 014 014 014 bull 014 014
RAF-d
bull 014 bull 014 bull 014 bull 014 bull 014
014
BW AP
kg days
46 27375 46 3285 30 214 46 27375 46 3285 30 214
BW AP
kg days
278 27375 278 2555 188 214 278 27375 278 2555 188 92
BW AP
kg days
146 27375 146 1825 188 214 146 27375 146 1825 188 92
thU is up_rchsxls
RISK CALCULATIONS Using AVERAGE PCB concentration as EPC REACH A 3-1 TO 3-10 SA AF NEWELL TO ELM cm2d mgcm2 Trespasser Age 9lt18 - CANCER 5437 051 Trespasser Age 9lt18 - CHRONIC NONCANCER 5437 051 Trespasser Age 9 - SUBCHRONIC 3889 051 Trespasser Age 9lt18 - CANCER 5437 051 Trespasser Age 9lt18 - CHRONIC NONCANCER 5437 051 Trespasser Age 9 - SUBCHRONIC 3889 051
SA AF REACH B 4-1 TO 4-3 cm2d mgcm2 Wader Age 5lt12 - CANCER 3675 051 Wader Age 5lt12 - CHRONIC NONCANCER 3675 051 Wader Age 5 - SUBCHRONIC 2970 051 Wader Age 5lt12 - CANCER 5370 051 Wader Age 5lt12 - CHRONIC NONCANCER 5370 051 Wader Age 5 - SUBCHRONIC 4269 051
SA AF REACH C 4-4 TO 4-6 cm2d mgcm2
Young Resident Age 1lt 6 - CANCER 2358 051 Young Resident Age 1lt 6 - CHR NONCANCER 2358 051 Young Resident Age 5 - SUBCHRONIC 2970 051 Young Resident Age 1 lt 6 - CANCER 3368 051 Young Resident Age 1lt 6 - CHR NONCANCER 3368 051 Young Resident Age 5- SUBCHRONIC 4269 051
Appendix A Memo on Potential Human Health Risks from Consuming Fish from the Housatonic River in Massachusetts
United States Boston Massachusetts 02203 Environmental Protection Agency (617)565-3420 New England Region JF Kennedy Federal Building
MEMORANDUM
DATE May 141998
SUBJ Potential Human Health Risks from Consuming Fish from the Housatonic River in Massachusetts
FROM Mary BaUew Environmental Scientist EPA TO Bryan Olson Project Manager Office of Site Remediation and Restoration EPA
I INTRODUCTION
This memo provides calculations and a limited discussion of potential risks from consuming fish from the Housatonic River in Massachusetts Currently there is a fishing advisory on the Housatonic which may help to limit fish consumption
EL CONCLUSIONS
Consumption of fish in the Housatonic river even for periods as short as one summer presents a significant risk to human health
DL HAZARD IDENTIFICATION
For the Housatonic River in Massachusetts there is-afish consumption advisory in place for all fish species However there is no enforcement mechanism in the advisory and no monitoring of the advisorys effectiveness in preventing exposure Currently 37 of male and 31 of female Pittsfield residents surveyed by the Massachusetts Department of Public Health reported eating freshwater fish (not necessarily from the Housatonic) (MA DPH 1997) The fish consumption advisory is communicated by a brochure distributed when individuals receive fishing licenses In addition the advisory is posted on some locations on the river However young people under 16 years old can fish without a license and they may walk to and fish from locations that are not posted The river has numerous access points by foot or by boat Under the fishing advisory catching and releasing the fish is allowed which adds to the difficulty of monitoring its effectiveness If individuals ignore the advisory or are not aware of it their cumulative risk may be represented by the risks presented in this memo
GE collected young of year1 fish to monitor changes (trends) in PCB levels over time not to represent the type offish people were likely to eat Since these fish were about six months old (Finklestein 1998) they were too small to eat GE reported that composites of young of year fish (pumpkinseeds largemouth bass-and yellow perch) caught in 1994 near New Lenox Road (just downriver of Pittsfield) in the Housatonic ranged from 22 to 35 mg PCBs per kilogram (ppm) of whole fish composite Similarly fish composites at Woods Pond (12 miles downriver of GE) ranged from 3 to 58 ppm (GE 1994) So although Woods Pond contained high levels of PCBs the fish in sections of the river closer to Pittsfield contained comparable levels For example the 69 largemouth bass sampled at New Lenox Road averaged 31 ppm and the 70 largemouth bass sampled at Woods Pond averaged 23 ppm (young of year results GE 1994)
In 1994 the National Biological Survey of the US Geological Survey (USGS) collected 28 largemouth bass from Woods Pond which is a wide shallow section of the Housatonic River PCB levels in 24 whole fish ranged from a minimum of 27 ppm to a maximum of 206 ppm and averaged 100 ppm (not adjusted for lipid) Four additional muscle tissue samples ranged from 13 to 70 ppm PCBs (Attachment Al) Woods Pond is twelve miles downriver from the GE facility and the sediment levels of PCBs in Woods Pond average 27 ppm (personal communication Dean Tagliaferro April 1998) The dominant Aroclors2 found in the fish resemble Aroclors 1254 and 1260 which are the environmentally modified forms of the original Aroclor 1260 released from GE
In 1997 EPA-New England asked the EPA Office of Research and Development for technical assistance to perform congener-specific3 analysis of the USGS fish samples Since this was the only congener-specific data for fish available for the Housatonic River this data was selected for these risk calculations The USGS had a limited amount of data on other species however EPA chose the largemouth bass for congener analysis because they are a popular game species The largemouth bass caught by the USGS were all of a size that would provide good fillets In
1 Young of year fish are those less than one year old
2 PCB mixtures manufactured in the United States carried the trademark Aroclor followed by a four-digit number the first two digits are 12 and the last two digits indicate the percent chlorine by weight For example Aroclor 1260 was manufactured using 60 chlorine Aroclor 1016 is an exception because it contains 41 percent chlorine by weight (EPA 1996) Once released into the environment distribution and bioaccumulation of an Aroclor can change the character of the mixture so that it may no longer resemble the original mixture (EPA 1996)
3 Each PCB molecule consists oftwo 6-carbon rings with one chemical bond joining a carbon from each ring -imagine sunglasses with hexagonal frames) Chlorine can attach to any of the other 10 carbons There are 209 QSgible
arrangements called congeners The number and position of chlorines determine a PCB molecules physical and chemical properties Congeners are numbered 1 to 209 The coplanar congeners those with the two rings aligned on the same plane have dioxin-like properties (EPA 1996) Congener specific data improves our ability to identify the presence of bioaccumulated PCBs
contrast the GE young of year fish were too small to eat
IV DOSE RESPONSE
Toxicology To determine whether exposure to PCBs in fish from the Housatonic River in Massachusetts presents a potential risk to human health EPA evaluates the cancer and noncancer risks associated with PCB exposure To evaluate the cancer risk EPA uses the 95 upper confidence limit of the linear-slope factor (also known as the cancer slope factor) of 2 (mgkgday)1 for PCBs (IRIS 1998) The fish ingestion scenario involves ingestion of bioaccumulated PCBs Ingestion offish contaminated with these PCBs may result in a dose greater than that which occurred in the toxicity studies used to develop the potency estimates (EPA 1996) For that reason EPA estimates the risk of consuming bioaccumulated PCBs using the Toxic Equivalence Factor (TEF) approach (outlined in EPA 1996) The TEFs are ratios for certain PCB congeners that when multiplied by each congeners concentration in fish tissue and the cancer slope factor for dioxin yield an estimate of the carcinogenicity of the bioaccumulated PCBs in the fish Because of its toxicity the cancer slope factor for dioxin is very high 150000 (mgkgday)1 so even small concentrations of these dioxin-like PCBs in the fish can present a cancer risk
In the cancer study for Aroclor 1260 on which the slope factor is based a 12-month exposure produced approximately the same cancer potency as a full two-year exposure This suggests that a less than lifetime exposure could have significant risk implications (EPA 1996)
To evaluate chronic noncancer risks EPA used a Reference Dose (RfD) of 2 x 10⁵ mgkgday for Aroclor 1254 (IRIS 1998) To evaluate subchronic noncancer risks EPA used the subchronic RfD of 5 x 10⁵ mgkgday for Aroclor 1254 (HEAST 1997) Reference Doses for Aroclor 1254 were used because they are the closest ones applicable to the type of PCB mixture found in the
- Housatonic River (Aroclor 1260) The toxicity of Aroclor 1254 is much more similar to^Jtbajt of Aroclor 1260 than the toxicity of Aroclor 1016 (the other choice for an EPA accepted RfD) The toxicity study on which the RfDs are based was conducted over a shorter-term time frame (5 years) The subchronic exposure period evaluated in this memorandum (one summer) is consistent with that used in the toxicity study The critical effects for the chronic and subchronic RfDs are immunologic and reproductive effects In addition PCBs have been associated with deficits in learning and neurological effects (see ATSDR 1996 for a recent review)
A relative absorption factor (RAF) of 100 was used for oral absorption of PCBs from fish bull bull (DEP 1992) An RAF of 100 means that the assumed absorption of PCBs from ingestion of
Housatonic fish is equal to the absorption of PCBs in the laboratory toxicity studies
Data Analysis Of the available fish data only the 1994 USGS 24 whole fish and 4 tissue samples were tested for dioxin like PCBs (see data in attachment AL spreadsheets) The whole fish samples included skin organs and all other tissues For the muscle tissue samples USGS removed about 100 grams of muscle tissue and attached skin (about 2 inches wide 4 inches long and 1 inch deep) from the back of the fish directly above the gut (Steven Smith personal communication 1998)
To compare the fish on the same basis EPA adjusted the whole fish data to its equivalent in fish tissue thus
(ppm PCBs in whole fish divided by lipid in each fish) x 100 = micrograms of PCB per gram of fat
The concentration of PCBs in fish muscle tissue equivalents were determined using the lipid normalized concentration of PCBs and the average lipid found in the four fish tissue samples (approximately 1) While the use of lipid normalization data is not recommended in all cases4 the lipid approximation of 1 was considered to be reasonable given the very low levels of lipid in whole fish (087-58)
Following the procedure outlined in EPA 1996 EPA multiplied the concentrations of the shyindividual PCB dioxin-like congeners by the toxic equivalence factors (TEFs) appropriate to each This product called dioxin toxic equivalents (TEQs) is calculated for each tissue sample
Next EPA calculated the 95 upper confidence limit of the mean (Gilbert 1987) concentration for the non-dioxin PCBs and the dioxin-like PCBs These calculations resulted in a UCLs of 00013 for TEQs and 522 ppm for nondioxin PCBs These were the exposure point concentrations used with the exposure factorsrtocalculate the risks of consuming the fish Eleven of-the 13 dioxin-like PCBs were detected in fish samples used for this risk evaluation -gt --
V EXPOSURE ASSESSMENT
Currently the waters of the Housatonic are under a fishing advisory by the Commonwealth of Massachusetts The calculations for the adult fisher and subsistence fisher that follow assume that
4For human health risk assessment adjusting for lipid requires site-specific samples offish muscle tissue or fillet in addition to the data on whole fish A standardized (not site-specific) lipid adjustment is not appropriate because the lipid levels of the fish may have been affected by the site contamination Also the adjustment does not make biological sense unless the contaminant sequesters in the fat
lib
people do not adhere to the advisory
The calculations for the child fisher represent the short-term PCS doses and risks that a child could receive during one summer of consuming contaminated fish caught between GE and the Woods Pond Dam on the Housatonic River in Massachusetts
Adult Fisher To estimate risks to the adult fisher EPA used exposure assumptions that consider the amount of site data available and the site conditions The exposure assumptions described below are reflective of the Reasonable Maximum Exposure (RME) for adult residents who consume contaminated fish
These calculations assume that an adult fisher5 consumes a daily average of 26 grams offish over the course of 365 days per year (Ebert et al 1993) This could represent 3 or 4 (8shyounce) fish meals per month throughout a year or 7 (8-ounce) fish meals per month during the warmer months (April through October) A daily average of 26 grams represents the 95th percentile offish consumption for all water bodies in Maine (Ebert et al 1993) Because the Housatonic is the largest water body in the region and an attractive resource this value is appropriate This value was previously agreed upon by the Agencies in joint comments on General Electrics proposed Risk Assessment Scope of Work for the Housatonic River GE did not dispute this value (DEPEPA 1997)
The body weight used in this evaluation is 70 kg which represents the average body weight for an adult (EPA 1989)
Subsistence Fisher To estimate risks to the subsistsacefisher EPA used exposure assumptions that consider the amount of site data available and-the site conditions The exposure assumptions described below are appropriate for a sensitive subpopulation that is highly exposed
These calculations assume that a subsistence fisher5 consumes a daily average of 140 grams of fish over the course of 365 days per year This could represent 4 or 5 (8-ounce) fish meals per week during a year The daily average of 140 grams per day was estimated by EPA Office of Water staff based on a review of the literature on fish consumption by Native Americans and subsistence anglers (EPA 1995) Given site conditions this value is appropriate for subsistence fishers as a whole a particular ethnic group or tribe of Native
This is a person who has adult body weight and who would ingest adult-sized portions of fish For example for a thirty year exposure duration this could be a person who ate fish each year when they were between the ages of 18 and 48
Americans may consume more fish This value for subsistence fish consumption was previously agreed upon by the Agencies in joint comments on General Electrics proposed Risk Assessment Scope of Work for the Housatonic River GE did not dispute this value (DEPEPA 1997)
The body weight used in this evaluation is 70 kg which represents the average body weight for an adult (EPA 1989)
Childfisher To estimate the subchronic risks to the child fisher EPA used exposure assumptions that consider the amount of site data available and the site conditions The exposure assumptions described below are reflective of short term exposures and do not represent the RME
These calculations assume that the child fisher (age9 years) consumes one small (6- or 7shyounce) fish meal per week during the summer months (June July August) EPA assumes 13 weeks per summer (June July and August)
The one summer exposure period used in this evaluation is shorter than the 30-year exposure period (for cancer risks) typically evaluated by EPA as part of the RME The purpose of this calculation is to examine whether short term exposures could provide enough dose and present enough risk at some point later in life to be a concern
For fish ingestion for the child fisher EPA used 1825 gweek This is the same value for residential fish consumption mentioned above and adjusted to a weekly consumption rate (26 gday 365 daysyr divided by 52 weeksyr)
The body weight used in these calculations is 30 kg which represents an average of the 50th
percentile body weightierfemales age 9 years (DEP^ 1995 EPA 1989)
TABLE 1 Exposure factors used to calculate the potential risks from fishing on the Housatonic River
EXPOSURE PARAMETER VALUE
body weight (kg) adult or subsistence fisher 70 body weight (kg) age 9 years 30
exposure duration subchronic (weeks) 13 exposure duration (years) 30
fish ingcstion rate (gday) adults 26 fish ingestion rate (gday) subsistence fishers 140 fish ingestion rate (gwcck) children 1825
averaging time (days) cancer 25550 averaging time (days) chronic noncancer 10950 averaging time (days) subchronic noncancer 92
VL RISK CHARACTERIZATION
A Risk Calculations
CANCER RISKS e
Using the assumptions noted above in Table 1 and the equations below a lifetime average daily dose of PCBs from ingestion offish can be calculated
= fPGBl C IR ED BWAT
LADDlaquoi
Where
LADD^ = lifetime average daily dose from ingestion offish mgkgday [PCS] = PCB concentration in fish figkg C = conversion factor 106
IR = fish ingestion rate gday BW = body weight kg ED = exposure duration years AT F= averaging time period over which exposure is averaged - days or years
The Excess Lifetime Cancer Risk (ELCR) from ingestion of fish can be calculated using the following equations
ELCR = (LADD^J CSF (for cancer risks less than 1 in 100)
ELCR = 1- exp (-LADD^ CSF) (for cancer risks greater than 1 in 100)
Where ELCR = Excess Lifetime Cancer Risk CSF = Cancer Slope Factor 2 (mgkgday)-1 for nondioxin-like PCBs and 150000
(mgkgday)-1 fordioxinTEQs LADD^ = lifetime average daily dose from ingestion of fish exp = e raised to the power of x where x is the product of the dose and the cancer slope factor
NONCANCER RISKS
Using the exposure assumptions in Table 1 and the equations below an average daily dose of PCBs from ingestion offish can be calculated
= fPCBI C IR ED BWAT
Where
= average daily dose from ingestion of fish mgkgday [PCB] = PCB concentration in fish ngkg C = conversion factor 106
IR = fish ingestion rate gday or gweek BW = body weight kg ED = exposure duration weeks or years AT = averaging time period over which exposure is averaged - days or years
The Hazard Index can be calculated using the equation below
HI = [ADD ] RfD
Where HI = Hazard Index RfD = Reference Dose mgkgday
= average daily dose from ingestion of fish mgkgday
B Risk Results
RCRA CERCLA Risk Management Criteria
The cancer risks for the adult fisher and the subsistence fisher whom consume PCB contaminated fish are two orders of magnitude (100 times) or more above the EPA cancer risk range (discussed in EPA 1991) of 106 to 104 (see tables attached) and this justifies EPA in taking an (remedial or removal) action
Even a child who consumes one fish meal a week over the course of one summer has a cancer risk from that short term exposure which is nine times higher than the EPA cancer risk range of 106 to 10 and this justifies EPA in taking an action
The chronic noncancer risks for the adult fisher and the subsistence fisher whom consume PCB contaminated fish are over 900 times the risk (ie a chronic Hazard Index of 1) at which EPA is justified in taking an action
The noncancer risks (subchronic) for a child who consumes one fish meal a week over the course of one summer are over 800 times the risk (ie a subchronic Hazard Index of 1) at which EPA is justified in taking an action
If adults or children are consuming the fish on a regular basis they have a significant risk of cancer or noncancer health effects
C Discussion of Risk Characterization
Discussion Related to Exposure Scenarios The exposure period evaluated for the child fisher (one summer) may underestimate the actual exposure that a child may receive because it does not account for continuing exposure Moreover PCBs have been present in the residential areas in Pittsfield for many years already making it likely that exposure via some other environmental media has already occurred
The exposure period selected for evaluation of cancer effects is one summer for the child fisher However different assumptions about the exposure period have a significant impact on the risk results As the exposure period increases the cancer risk estimate increases For evaluating cancer risks one could easily justify using a longer exposure period than the ones selected Also typically the calculation of cancer risks attributable to fish consumption may involve some weighting of child and adult exposures which may make the risks higher than those calculated for
the adult alone
The risk calculations may not be conservative enough for ethnic groups whose members consume the whole fish Also particular Native American or ethnic groups may consume more fish than noted in the subsistence fishing calculations
Pre-natal exposure to PCBs as well as post-natal exposure to PCBs via breast milk may have higher risks than those noted Early stages of development may have an extra sensitivity to the effects of PCBs (reviewed in EPA 1993 IRIS 1998)
Toddlers consuming fish may have higher risks than those noted because of the large doses that these fish would provide given the small body size of a toddler Also the toddler may be more sensitive to the developmental effects of PCBs
Discussion Related to Toxicity and Exposure The cancer risks from the dioxin-like PCBs was about twice the risks from PCBs (without the properties of dioxin) This illustrates the importance of performing congener specific analysis of PCBs for estimates of cancer risk
The PCB doses from eating the fish even for as short a period as one summer are higher than the doses at which monkeys showed marked reproductive effects (Arnold et al 1995) and effects on cognitive behavior (Rice 1995 1997 Rice and Hayward 1997 Rice et al 1996) and activity (reviewed in EPA 1993) This suggests that there may be no safety margin between the exposure estimates for people who eat fish from the Housatonic river and the exposures in the monkey studies which show adverse health effects
The risks from consuming the fish are substantial If the fishing advisory is effective then there is no risk from the fish However a report in the literature suggests that fishing advisories are violated regularly (Tilden et al 1997)6 And-sbmepeople in the area may have consumed fish from the Housatonic before the fishing advisory was in place (about 10 years ago)
In sum doses estimated for children and adults who ingest contaminated fish from the Housatonic river are higher than those received by the monkeys in the PCB noncancer toxicity study that demonstrated adverse health effects This is true even in the case of children who ingest contaminated fish over the course of one summer These exposure estimates raise significant concerns regarding potential health effects in children and adults who ingest contaminated fish from the Housatonic river
6Tilden estimates that in one year as many as 47 million people ate Great Lakes sport fish despite long standing (since the mid-70s) state fishing advisories
10
REFERENCES
Arnold et al 1995 Toxicological Consequences ofAroclor 1254 Ingestion by Female Rhesus (Macaca mulatto) Monkeys Part 2 Reproduction andlnfant Findings Arnold DL Bryce F McGuire PF et al Fd Chem Toxic 33457-74
ATSDR1996 Public Health Implications ofPCBs December 1996
DEP 1992 Documentation For The Risk Assessment Shortform Residential Scenario Massachusetts Department of Environmental Protection Office of Research and Standards and the Bureau of Waste Site Cleanup Policy BWSCORS-142-92 October 1992
DEP 1995 Guidance For Disposal Site Risk Characterization In Support of the Massachusetts Contingency Plan Interim Final Policy BWSCORS-95-141 Massachusetts Department of Environmental Protection Bureau of Waste Site Cleanup and Office of Research and Standards July 1995
DEPEPA 1997 Joint DEPEPA Technical and Review Comments on General Electric Proposal for Human Health Risk Assessment of the Housatonic River August 13 1997
Ebertetal 1993 Estimating Consumption of Freshwater Fish among Maine Anglers EbertES Harrington NW Boyle KJ et al North American Journal of Fisheries Management 13737-45 1993
EPA 1989 Risk Assessment Guidancefor Superfund Volume I - Human Health Evaluation Manual (Part A) Interim Final US Environmental Protection Agency Office of Emergency and Remedial Response EPA5401-89002 December 1989
EPA 1991 Role of the Baseline Risk Assessment in Superjund Remedy Selection Decisions USEPA OSWER Directive 93550-30 April 22 1991
EPA 1993 Workshop Report on Developmental Neurotoxic Effects Associated with Exposure to PCBs VSEPA Risk Assessment Forum EPA63 OK-92004 May 1993
EPA 1995 Water Quality Guidance for the Great Lakes System Supplementary Information Document (SID) USEPA Office of Water EPA-820-B-95-001 March 1995 p 575
EPA 1996 PCBs Cancer Dose-Response Assessment and Application to Environmental Mixtures NCEA ORD EPA600P-96001F
Finklestein 1998 Personal communication Ken Finklestein NOAA May 111998
GE 1994 Preliminary draft MCP Supplemental Phase II InvestigationRCRA Facility Investigation of Housatonic River and Silver Lake Tables 8 through 10
Gilbert 1987 Statistical Methods for Environmental Pollution Monitoring RO Gilbert Van
11
Nostrand Reinhold NY 1987
HEAST 1997 Health Effects Assessment Summary Tables EPA Office of Solid Waste and Emergency Response 92006-303 (97-1) EPA-540-R-97-036 PB97-921199 July 1997
IRIS 1998 EPA Integrated Risk Information System a database 1998
Mass DPH 1997 Housatonic River Area PCB Exposure Assessment Study Final Report Massachusetts Department of Public Health Bureau of Environmental Health Assessment Environmental Toxicology Unit September 1997
Rice 1995 Neurotoxicity of Lead Methylmercury andPCBs in Relation to the Great Lakes DC Rice Environmental Health Perspectives 103(Supplement9)71-87 1995
Riceetal 1996 Lessons for Neurotoxioology from SelectedModel Compounds SGOMSEC Joint Report Rice DC de Duffard AME Duffard R et al Environmental Health Perspectives 104(Supplement 2)205-15
Rice 1997 Effect of Postnatal Exposure to a PCB Mixture in Monkeys on Multiple Fixed Interval-Fixed Ratio Performance DC Rice Neurotoxicology and Teratology 19429-34
Rice and Hayward 1997 Effects of Postnatal Exposure to a PCB Mixture in Monkeys on Nonspatial Discrimination Reversal and Delayed Alternation Performance Rice DC Hayward S Neurotoxicology 18479-94 1997
Smith 1998 Personal communication with Steven Smith USGS April 28 1998
Tagliaferro 1998 Personal communication Dean Tagliaferro EPA removals program April 1998
Tilden et al 1997 Health Advisories for Consumers of Great Lakes Sport Fish Is the Message Being Received Tilden J Hanrahan LP Anderson H et al Environmental Health Perspectives 1051360-65 1997
Tilson et al 1990 Polychlorinated Biphenyls and the Developing Nervous System Cross-species Comparisons Tilson HA Jacobson JL Rogan WJ Neurotoxicology and Teratology 12239-248 1990J
12
ATTACHMENT A1
Spreadsheets showing raw data and UCL calculations
13
Congener specific PCB concentrations and TEQs in largemouth bass collected from Woods Pond MA last modified 51098 PCBs
Fish refershyence
ppm PCBs
Lipid in Lipid AP raquosampx3 Dioxin-like ODngeners(ppm)
number total whole fish]
BO I B02 B03 B04 805
57 206 65 117 75
225 381 161 106 285
PCBsg
25333 54068 40373 110377 26316
I 1242
lt05 ltQ5 lt05
bullraquo
1248
-lt05 lt05 lt05
-
f
11035 60
Hshy
1260
96 30 57 -
77 1JT 1
ft 0001 0 a 0
105
042 052 017 033 026
1W 1 1 181061 iy^J 156
amp03S 0$43 0013 0037 002
26 33 12 2 2 17
^T^fPWJ bull shyamp0|7-MI
lt$amp$ OJWS$$ Q$$tff
046 06
021 042 034
032 041 015 03 024
lt 3
MpoundregL 0i0lt)33 00005 00014 0001$
31 42 016 3 3 26
pv09601$ 0045 011 0gt0amp7
y ootnoi2 0043 0087 0071
B06 63 579 10881 Hshy - 1 - a shy 027 002 16 001 034 025 001$ 2 7 00$ 007 B07 BOS B09
71 31 157
335 241 433
21194 12863 36259
lt05 w
lt05
lt05 -
lt05
sa Mshy
sa 33 -
69
0 0 0
021 023 039
0015 001amp 01032
13 16 25
ampG0ampJ 0gt00$)5 Oytj^fs
024 029 044
018 021 031
00012 00Q1 00022
2 2 4 34
00$7ao$6 011
005 0059 0089
BIO Bll B12
69 56 196
1 89 202 344
bull 3650 8 27723 56977
ltQ5 lt05 lt05
lt05 lt05 lt05
36 30 110
33 26 86
0 0 0
019 018 046
0016 00150037
14 12 2 9
lt 60^ c s
0101 j 0021
025 021 052
02 016 037
0001amp
bull 6^001 00027
18 15
4
amp04 0-gtQ4lf s
012
OJ554vamp$iirgti
oii B14 27 1 7 15882 - - 0 0 3 0026 2 0009S 04 03 00014 2 9 a097 007^ B15 77 329 23404 lt05 lt05 42 35 0 025 0022 1 7 010-14 003 023 00021 2 2 0072 0062 B19 110 399 27569 Hshy - bdquo 0 051 0044 3 0 17 056 039 00022 4 012 ou B20 121 2 13 56808 lt05 lt05 61 60 0 033 027 2 0$$ 045 032 00022 3 3 013 00$ B21 B22
198 89
369 246
53659 36179
lt05 lt05
lt05 lt05
110 4$
88 41
0001 0
053 026
0046 0022
33 17
0lt0i ipxOi
063 032
043 023
00024 00017
4 2 24
014 077
013 0067
B23 B24 B25
130 168 87
3 18 355 238
40881 47324 36555
lt05 ltQ5 lt05
lt05 lt05 lt05
7$ 95 48
51 73 39
- 0 0
036 043 025
0031 003amp
0ois
23 27 15
4gtk^5shyamp$ampbulllt bull000
038 05 03
028 035 022
00015 00021 00013
23 35 21
0073 011 007
0083 01
0064 B31
B33
47
50
139
139 33813
35971 lt05 lt05
lt05 lt05
24 26
23
24 p 0
015
014 0 0 1 rlaquo^ 00096
086
068 iiiSt6igt058i
019
019
014
014 0000 QJQOQ5
14
14
0046 00Si
004 ^ 0^39^ gt
B34 121 0872 13876 1 lt-05 lt05 62 59 0 031 0023 19 00amp1 042 03 0^0005 33 01 1 $poundamp muscle tissue
B13 138 0577 2391 7 lt05 lt05 79 59 o 0045 00031 023 ampQ04 005 0037 Q0005 039 001 00082 B16 70 1 86 37634 lt05 lt05 35 35 0 019 001S 13 028 023 amp0024 21 0075 0057 B17 41 1 19 34454 lt05 lt05 21 20 0 012 001 064 017 0 13 00012 12 0044 0034 B18 13 2 039 33846 lt05 lt05 72 6 0 0036 00025 019 000B 0047 0045 00005 034 0024 00075
1 i- isn refer- ppm TEFs and TEQ s for tested con jeners r umof TEQs 1 ence PCBs
number total Lipid 77 105 114 118106 126 156 167 169 170 189 157 (mg TEQkg meg TEQ meg TEQ Lnconc rruCTOgram whole fish () 00005 0000] 0 0005 J_0 0001 0 1 00005 000001 001 00001 00001 00005 whole fish) gfat g tissue TEQs PCBVg tissue Ln PCB
BO I 57 22 5 OE+00 4E-05 2E-05 3E-04 2amp02 2E-04 3E-06 2E-05 3Eraquo04 IE-OS SB-OS 00026 0 1174 00012 -675 2533 323 B02 206 3 81 6E-07 5E-05 2E-05 3E-04 2Elt03 3E-04 4E-06 3E-05 4ampQ4 2E-05 laquoamp05 00032 00850 00008 -707 5407 399 B03 65 1 61 OE+00 2E-05 7E-C6 IE-04 7E-04 IE-04 2E46 5E-06 2E-05 5E-06 bull2E^)5 00010 00638 00006 -736 4037 3 70 i B04805
117 75
1 06 28 5
OE+00 OE+00
3E-05 3E-05
2E-05 1E-05
2E-04 2E-04
1B-OJ IE-OS
2E-04 2E-04
3E-06 2E-06
IE-OS 2E-05
3amp04 3E-04
IE-OS 9E-0(
bull4amp054ms
00021 00017
0 1965 00582
00020 00006
-623 -7 45
11038 26 32
470 327
B06 63 5 79 OE+00 3E-05 1E-05 2E-04 1E-03 2E-04 3E-06 2E-04 3E-Q4 9E-0( 4E-OS 00019 00322 00003 -804 1088 239 B07 71 3 3 5 OE+00 2E-05 8E-06 1L-04 1E-03 IE-04 2E-Q6 IE 05 2ErC4 6E-0lt 3E-05 00015 00443 00004 -772 21 19 305 BOS 31 2 4 ] OE+00 2E-05 9E-06 2b-04 9E-04 IE-04 2E-0lt$ IE-OS 2E-Q4 7E-0( 3E-05 00015 00616 00006 -739 1286 2 55 B09 157 4 33 OE+00 4E-05 2E-05 3E-04 2E-03 2E-04 3E-06 2E-05 3E-lt4 1E-0 4Z45 00026 00611 0 0006 -7 40 36 26 359 BI O 69 1 89 OE+00 2E-05 8E-06 IE 04 1E-03 IE-04 2E-06 2E-05 2E-Q4 6E-Oi 3E-05 00015 00807 00008 -712 3651 3 60) BH 56 202 OE+00 2E-05 8E-06 1E-04 IE-OS IE-04 2E-06 IE-OS 2ErQ4 SE-Or 7amp05 00014 00712 00007 -725 2772 332 B12 196 3 44 OE+00 5E-05 2E-05 3E-04 2E-03shy 3E-04 4E-06 3E-05 4amp04 1E-0 ^E-05 0 0032 0 0934 00009 -6 98 56 98 404 B14 27 1 7 OE+00 3E-05 IE-OS 2E-04 1E-03 2E-04 SR-Q6 IE-OS 3ErQ4 1E-0 4U-Q5 00018 0 1046 00010 -686 1588 277 B15 77 329 OE+00 3E-05 IE-OS 2E-04 1E4raquo 2E-05 2E-06 2E-05 2E-04 7E-0( SE-05 00019 00578 0 0006 -7 46 23 40 3 15 B19 110 3 99 OE+00 5E-05 2E-05 3E-04 2E-03 3E-04 4E-06 2E-05 4E-Q4 1E-0-) ^amp05 00028 00713 00007 -725 2757 3 32 B20 121 2 13 OE+00 3E-05 IE-04 2E-04 2E-OS 2E-04 3E-06 2E-05 3ErQ4 1E-01) 5E-05 00025 0 1177 00012 -675 5681 404 B21 198 369 5E-07 5E-05 2E-05 3E-04 2E-03 3E-04 4E-06 2E-05 4ErltJ4 IE-OS 7amp05 00031 00853 00009 -707 5366 398 B22 89 246 OE+00 3E-05 IE-OS 2E-04 IE-03 2E-04 2E^5 2E-05 2ampG4 8E-05 3amp05 00019 00787 00008 -715 36 18 359 B23 130 3 18 OE+00 4E-05 2E-05 2E-04 2B4raquo 2E-04 3Elt06 2E-05 2E-Q4 7E-Oo 4amplaquoJ 00023 00713 00007 -7 25 40 88 371 B24 168 3 55 OE+00 4E-05 2E-05 3E-04 2E-03 3E-04 4E-06 2E-05 4E-Q4 IE-OS SE-05 00027 00765 00008 -717 4732 386 B25 87 2 38 QE+QO 3E-05 9E-06 2E-04 9E-04 2E-04 2E-06 IE-OS 2E-04 7E-Oo 3E-OS 00015 00642 00006 -735 3655 360
B31 47 1 39 OE+QO 2E-05 5E-06 9E-05 3amp04 IE-04 1amp06 5E-06 IE-04 SE-Oo 2ElaquoOS 00009 00656 00007 -733 33 81 3 52
B33 50 1 39 OE+CO 1E-05 5E-06 7E-05 6E-04 IE-04 1E-06 5E-06 IE-04 5E-06 2E-05 00009 00671 00007 -731 3597 358
B34 12 087 OE-00 3E-05 1E-05 2E-04 8E03 2E-04 3E^6 5E-06 3E^34 IE-OS 4E-OS 00089 10247 00102 -458 13876 493
muscle tissue mg TEQskg Us le i |
B13 138 0 58 OE+00 5E-06 2E06 2E-05 4amp-04 3E-05 4E-07 5E-06 4E-05 1E-06 4E-06 0 0005 00005 -7 59 138 262
B16 70 1 86 QE+00 2E-05 9E-06 IE-04 IE-Mr IE-04 2E-Q6 2E-05 2E-04 8E-06 3E-OS 00016 00016 -646 70 42 5
B17 41 1 19 OE+00 1E-05 5E-06 6E-05 6E-04 9E-05 1E^06 IE-OS IE-04 4E-06 7E^)5 00010 00010 -696 41 371 B18 132 0 39 OE+00 4E-06 1E-06 2E-05 IE-04 2E-05 5E-07 5E-06 3ampQ5 2E-06 4E-06 0 0002 0 0002 -841 132 2 5 8
GSD 0 66 GSD 061 ave lipid n 28 n 28 muscle tissue H statistic 2 0923 H statistic 20502
95 UCL of the TEQs 00013 95UCLPCBs 522 meg TEQg tissue meg PCBg tissue
max TEQs 00102 max PCBs 1388
ATTACHMENT A2
Spreadsheets showing risk calculations
14
Potential risks from ingesting largemouth bass from the Housatonic River (Woods Pond area) in Massachusetts on a regular basis last modified 51498 The concentrations are based upon the 95 UCL of the mean concentration in muscle tissue
adult who consumes PCB contaminated fish cone ingestion ED BW AT LADD slope risk
(megkg) (gday) (yrs) (yrs) (mgkg-d) (per mgkg-d) (kg)cancer risks dioxin TEQ 130 26 30 70 70 206E-07 150000 3E-02 cancer risk from TEQs
nondioxin-like PCBs 52E+04 26 30 70 70 00083 2 2E-02 cancer risk nondioxinlike PCBs bull 5E-02 excess cancer risk lifetime
ADD(mgkg-d) RfD oral(1254) HI noncancer risks nondioxin-like PCBs 52E-H)4 26 30 70 30 00194 000002 969 rounding to one significant figure
1000 noncancer risk (chronic)
subsistence fisher who consumes PCB contaminated fish cone ingestion ED BW AT LADD slope risk
(megkg) (gday) (yrs) (kg) (yrs) (ingkg-d) (pet mgkg-d) cancer nsks dioxin TEQ 130 140 30 70 70 111E-06 150000 2E-01 cancer risk from TEQs
nondioxin-like PCBs 52E+04 140 30 70 70 00447 i 2 9E-02 cancer risk nondioxinlike PCBs 2E-01 excess cancer risk lifetime
ADD(mgkg-d) RfD oral(1254) HI noncancer risks nondioxin-like PCBs 52E+04 140 30 70 30 01044 000002 5219 rounding to one significant figure
5000 noncancer risk (chronic)
9 year child who consumes PCB contaminated fish once per week for one summer cone ingestion ED BW AT LADD slope risk
(megkg) (gweek) (weeks) (kg) (days) (mgkg-d) (per mgkg-d) cancer nsks dioxin TEQ 130 1825 13 30 25550 402E-09 150000 6E-04 cancer risk from TEQs
nondioxin-like PCBs 52E+04 1825 13 30 25550 000016 2 3E-04 cancer risjc nondioxinlike PCBs 9E-04 cancer risk due to dose
from a short-term exposure RfD oral(1254)
ADD(mgkg-d) subchronic ffl noncancer risks nondioxin-like PCBs 52E+04 1825 13 30 92 00449 5E-05 897 rounding to one significant figure
900 noncancer risk (subchronic)
- barcode 10818
- barcodetext SDMS Doc ID 10818
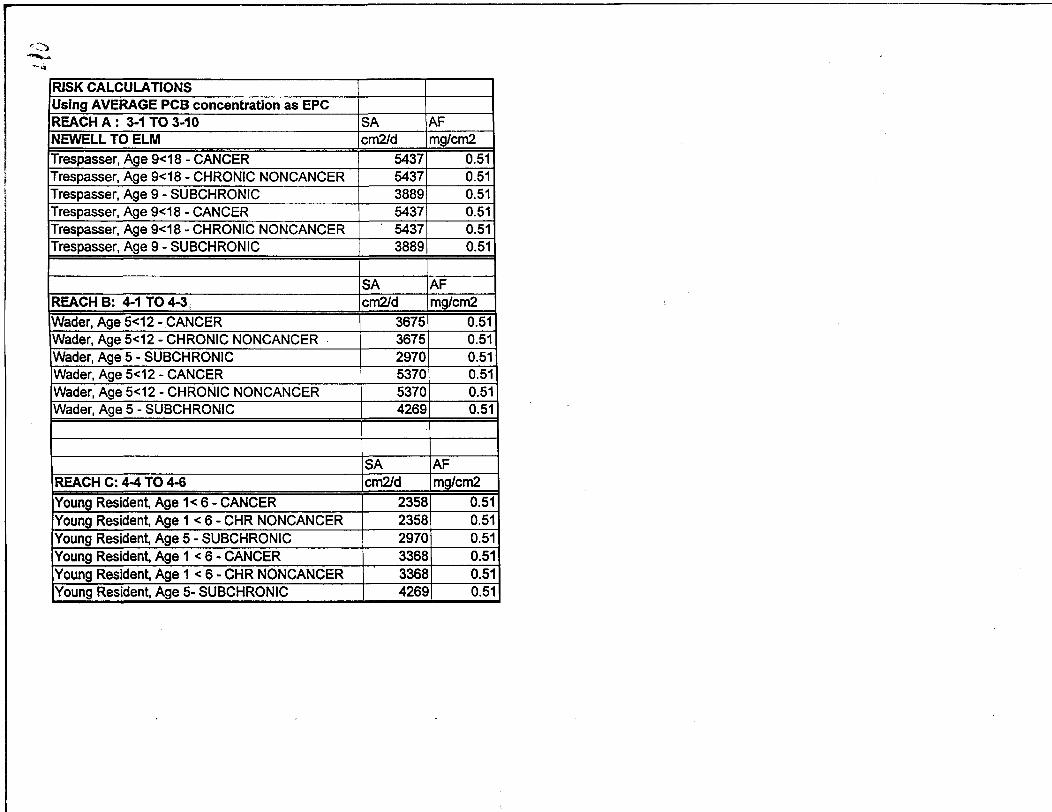
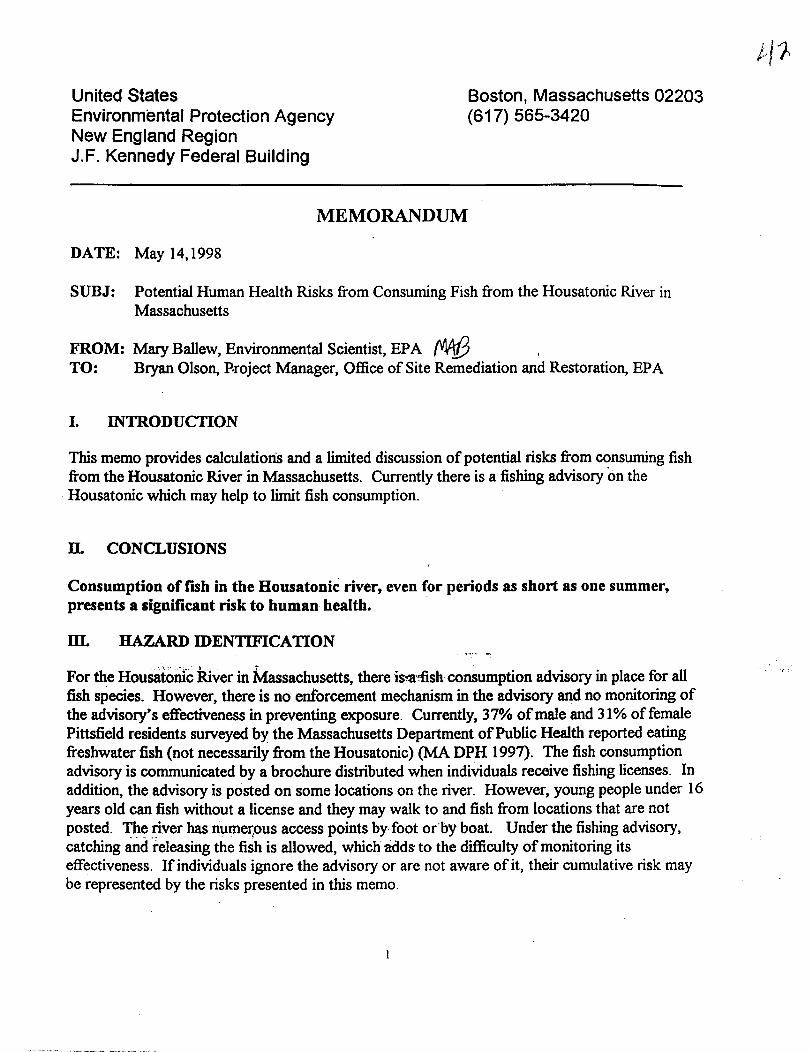
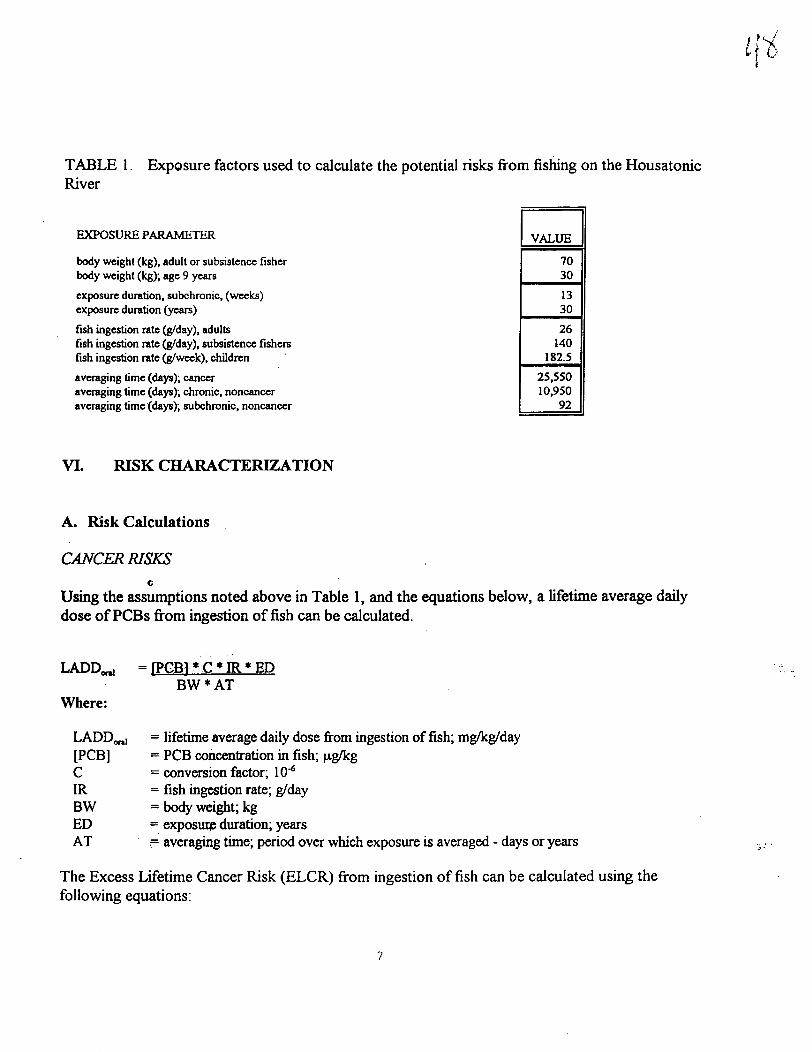
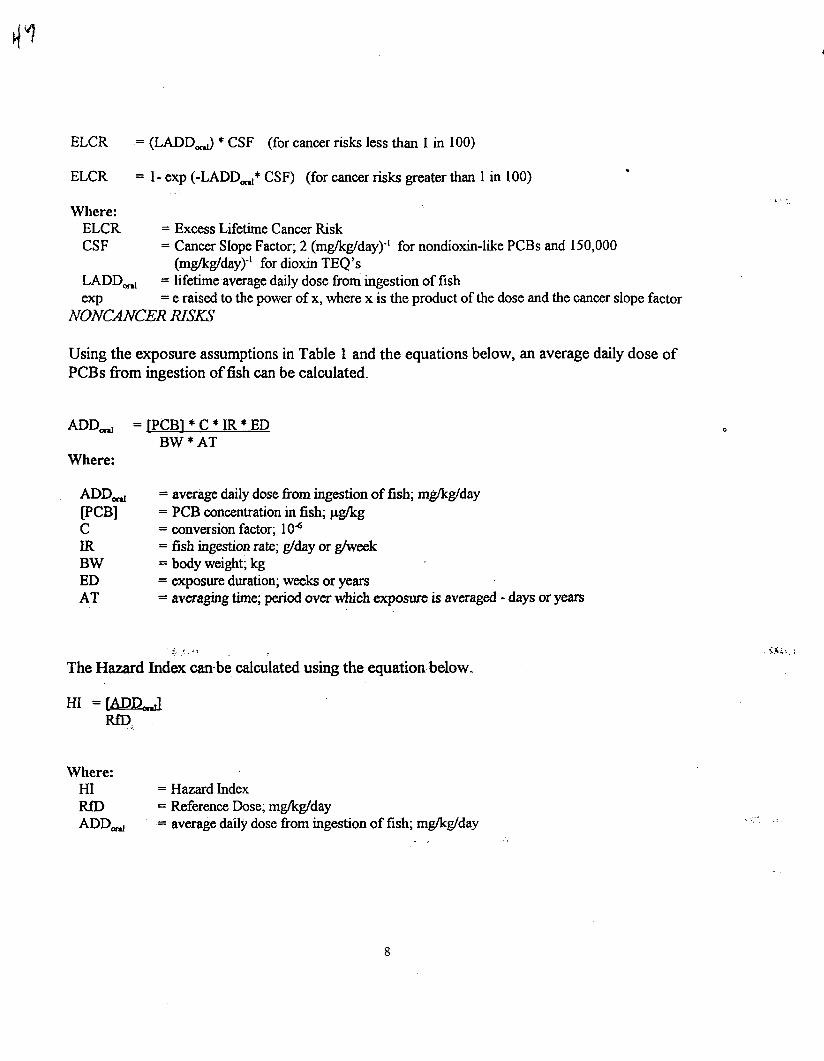
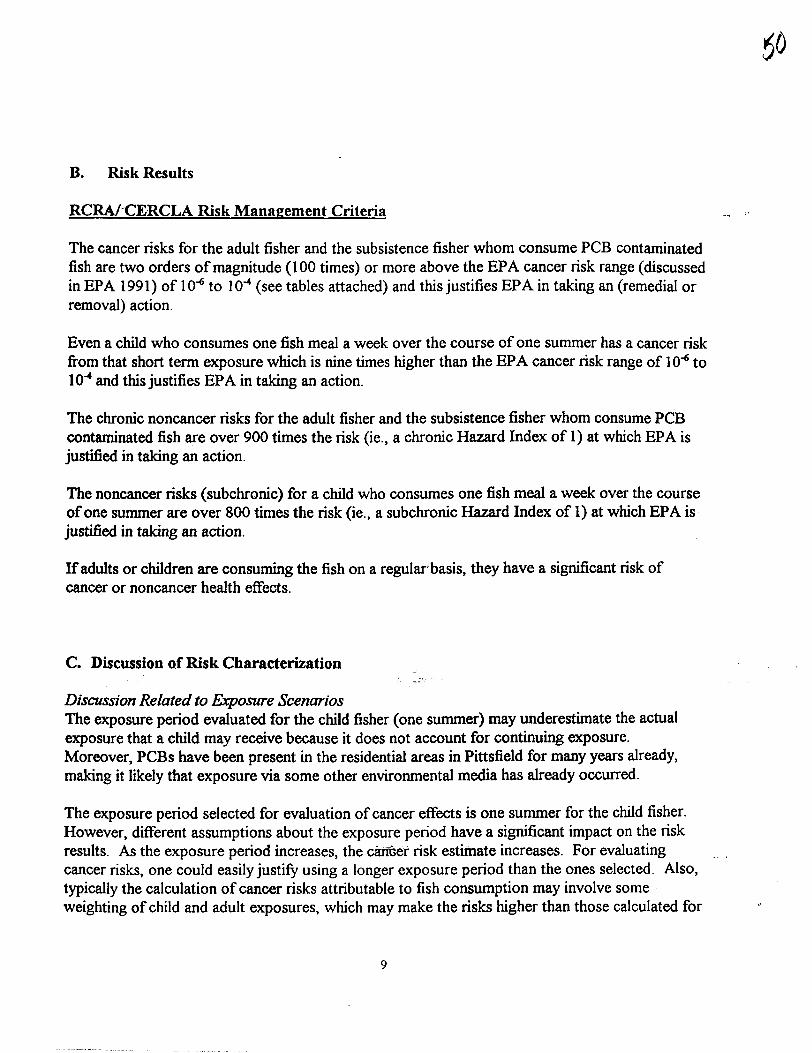
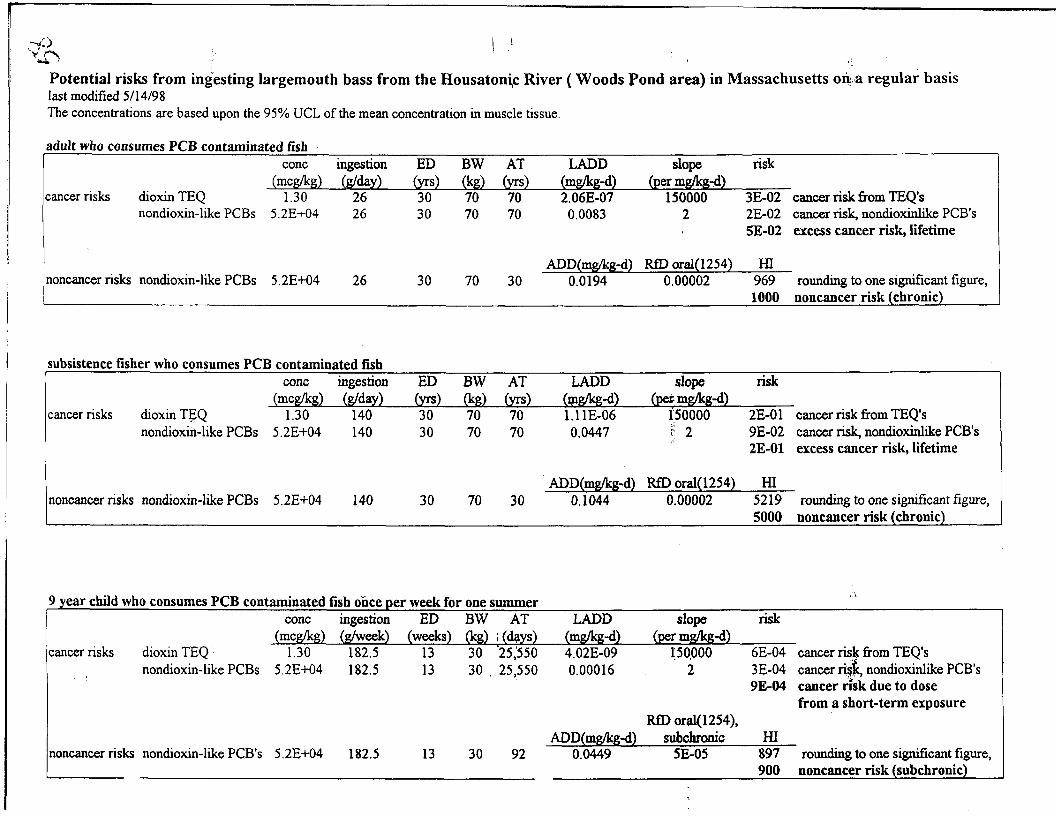