
SILTFLUX Literature Review - Environmental Protection Agency
112
www.epa.ie Report No. SILTFLUX Literature Review Authors: D. Lawler, A. Rymszewicz, L. Conroy, J . O’Sullivan, M. Bruen, J. Turner, M. Kelly-Quinn 176
-
Upload
khangminh22 -
Category
Documents
-
view
0 -
download
0
Transcript of SILTFLUX Literature Review - Environmental Protection Agency

www.epa.ie
Report No.
SILTFLUX Literature ReviewAuthors: D. Lawler, A. Rymszewicz, L. Conroy, J. O’Sullivan, M. Bruen, J. Turner, M. Kelly-Quinn
176

ENVIRONMENTAL PROTECTION AGENCY
The Environmental Protection Agency (EPA) is responsible for protecting and improving the environment as a valuable asset for the people of Ireland. We are committed to protecting people and the environment from the harmful effects of radiation and pollution.
The work of the EPA can be divided into three main areas:
Regulation: We implement effective regulation and environmental compliance systems to deliver good environmental outcomes and target those who don’t comply.
Knowledge: We provide high quality, targeted and timely environmental data, information and assessment to inform decision making at all levels.
Advocacy: We work with others to advocate for a clean, productive and well protected environment and for sustainable environmental behaviour.
Our Responsibilities
Licensing
We regulate the following activities so that they do not endanger human health or harm the environment:
• waste facilities (e.g. landfills, incinerators, waste transfer stations);
• large scale industrial activities (e.g. pharmaceutical, cementmanufacturing, power plants);
• intensive agriculture (e.g. pigs, poultry);
• the contained use and controlled release of Genetically Modified Organisms (GMOs);
• sources of ionising radiation (e.g. x-ray and radiotherapyequipment, industrial sources);
• large petrol storage facilities;
• waste water discharges;
• dumping at sea activities.
National Environmental Enforcement
• Conducting an annual programme of audits and inspections
of EPA licensed facilities.
• Overseeing local authorities’ environmentalprotection responsibilities.
• Supervising the supply of drinking water by public watersuppliers.
• Working with local authorities and other agenciesto tackle environmental crime by co-ordinating a
national enforcement network, targeting offenders andoverseeing remediation.
• Enforcing Regulations such as Waste Electrical andElectronic Equipment (WEEE), Restriction of HazardousSubstances (RoHS) and substances that deplete the ozonelayer.
• Prosecuting those who flout environmental law and damagethe environment.
Water Management
• Monitoring and reporting on the quality of rivers, lakes,transitional and coastal waters of Ireland and groundwaters;measuring water levels and river flows.
• National coordination and oversight of the WaterFramework Directive.
• Monitoring and reporting on Bathing Water Quality.
Monitoring, Analysing and Reporting
on the Environment
• Monitoring air quality and implementing the EU Clean Airfor Europe (CAFÉ) Directive.
• Independent reporting to inform decision making by nationaland local government (e.g. periodic reporting on the State ofIreland’s Environment and Indicator Reports).
Regulating Ireland’s Greenhouse Gas Emissions
• Preparing Ireland’s greenhouse gas inventories and projections.
• Implementing the Emissions Trading Directive, for over 100of the largest producers of carbon dioxide in Ireland.
Environmental Research and Development
• Funding environmental research to identify pressures,inform policy and provide solutions in the areas of climate,water and sustainability.
Strategic Environmental Assessment
• Assessing the impact of proposed plans and programmes onthe Irish environment (e.g. major development plans).
Radiological Protection
• Monitoring radiation levels, assessing exposure of people inIreland to ionising radiation.
• Assisting in developing national plans for emergencies arisingfrom nuclear accidents.
• Monitoring developments abroad relating to nuclear installationsand radiological safety.
• Providing, or overseeing the provision of, specialist radiationprotection services.
Guidance, Accessible Information and Education
• Providing advice and guidance to industry and the public onenvironmental and radiological protection topics.
• Providing timely and easily accessible environmentalinformation to encourage public participation in environmental decision-making (e.g. My Local Environment, Radon Maps).
• Advising Government on matters relating to radiologicalsafety and emergency response.
• Developing a National Hazardous Waste Management Plan toprevent and manage hazardous waste.
Awareness Raising and Behavioural Change
• Generating greater environmental awareness and influencingpositive behavioural change by supporting businesses,communities and householders to become more resourceefficient.
• Promoting radon testing in homes and workplaces andencouraging remediation where necessary.
Management and structure of the EPA
The EPA is managed by a full time Board, consisting of a Director General and five Directors. The work is carried out across five Offices:
• Office of Environmental Sustainability
• Office of Environmental Enforcement
• Office of Evidence and Assessment
• Office of Radiological Protection
• Office of Communications and Corporate Services
The EPA is assisted by an Advisory Committee of twelve members who meet regularly to discuss issues of concern and provide advice to the Board.

EPA RESEARCH PROGRAMME 2014–2020
SILTFLUX Literature Review
(2010-W-LS-4)
EPA Research Report
Prepared for the Environmental Protection Agency
by
University College Dublin and Coventry University
Authors:
Damian Lawler, Anna Rymszewicz, Liz Conroy, John O’Sullivan, Michael Bruen, Jonathan Turner and Mary Kelly-Quinn
ENVIRONMENTAL PROTECTION AGENCYAn Ghníomhaireacht um Chaomhnú Comhshaoil
PO Box 3000, Johnstown Castle, Co. Wexford, Ireland
Telephone: +353 53 916 0600 Fax: +353 53 916 0699Email: [email protected] Website: www.epa.ie

ii
EPA RESEARCH PROGRAMME 2014–2020Published by the Environmental Protection Agency, Ireland
ISBN: 978-1-84095-645-0 February 2017
Price: Free Online version
© Environmental Protection Agency 2017
ACKNOWLEDGEMENTSThis report is published as part of the EPA Research Programme 2014–2020. The programme is financed by the Irish Government and administered by the Environmental Protection Agency, which has the statutory function of co-ordinating and promoting environmental research.
The project team would like to acknowledge the very valuable input from the project steering committee, Professor Des Walling, Professor John Quinton, Professor Steve Ormerod, Dr Martin McGarrigle, Catherine Bradley, Colin Byrne, Marie Archbold, Wayne Trodd, Donal Daly and Alice Wemaere. In addition, the expert advice of Dr Martin O’Grady in the early stages of the project was invaluable.
DISCLAIMERAlthough every effort has been made to ensure the accuracy of the material contained in this publication, complete accuracy cannot be guaranteed. Neither the Environmental Protection Agency nor the authors accept any responsibility whatsoever for loss or damage occasioned, or claimed to have been occasioned, in part or in full, as a consequence of any person acting, or refraining from acting, as a result of a matter contained in this publication. All or part of this publication may be reproduced without further permission, provided the source is acknowledged.
The EPA Research Programme addresses the need for research in Ireland to inform policymakers and other stakeholders on a range of questions in relation to environmental protection. These reports are intended as contributions to the necessary debate on the protection of the environment.

iii
Project Partners
Professor Michael BruenSchool of Civil Engineering, UCD Dooge Centre for Water Resources Research and UCD Earth InstituteUniversity College DublinBelfieldDublin 4IrelandTel: +353 1 716 3212Email: [email protected]
Dr John O’SullivanSchool of Civil Engineering, UCD Dooge Centre for Water Resources Research and UCD Earth InstituteUniversity College DublinBelfieldDublin 4IrelandTel: +353 1 716 3213Email: [email protected]
Associate Professor Mary Kelly-QuinnSchool of Biology and Environmental Science, and UCD Earth InstituteUniversity College DublinBelfieldDublin 4IrelandTel.: +353 1 716 2337Email: [email protected]
Dr Jonathan TurnerSchool of Geography and UCD Earth InstituteUniversity College DublinBelfieldDublin 4IrelandTel. +353 1 716 8175Email: [email protected]
Professor Damian LawlerCentre for Agroecology, Water and ResilienceJames Starley BuildingCoventry UniversityCoventry CV1 5FBTel: +44 2477 651674Email: [email protected]
Ms Anna RymszewiczSchool of Civil Engineering, UCD Dooge Centre for Water Resources ResearchUniversity College DublinBelfieldDublin 4IrelandEmail: [email protected]
Dr Liz ConroySchool of Biology and Environmental Science, and UCD Earth InstituteUniversity College DublinBelfieldDublin 4IrelandEmail: [email protected]


v
Contents
Acknowledgements ii
Disclaimer ii
Project Partners iii
List of Figures vii
List of Tables x
Executive Summary xiii
1 Introduction 1
2 Fine Sediment Sources, Delivery and Budgets 4
2.1 Sediment Sources and Delivery 4
2.2 River Bank Erosion as a Suspended Sediment Source 9
2.3 Deposition and Mobilisation 14
2.4 Construction Activities 14
2.5 External Discharges, Urban Drainage, Wastewater Treatment Plants and Farmyard Drains 15
3 Physical and Chemical Impacts of Fine River Sediments in Fluvial Systems 17
3.1 Importance and Processes 17
3.2 In-stream Processes 17
3.3 Sediment-associated Pollutants 21
3.4 Impacts on River Morphology 23
3.5 Impacts on Riverine Structures 24
3.6 Downstream Effects of Siltation in Rivers, Lakes, Reservoirs and Harbours 24
4 Ecological Impacts of Fine River Sediments in Fluvial Systems 27
4.1 Introduction 27
4.2 Periphyton and Macrophytes 27
4.3 Macroinvertebrates 31
4.4 Fish 33
5 Measuring and Monitoring Suspended Sediment Concentrations and Loads 35
5.1 Introduction 35
5.2 Manual Sampling 36

vi
SILTFLUX Literature Review
5.3 Acoustic Doppler Current Profiler Method 38
5.4 Automatic Sampling for Suspended Sediment Concentration Time Series 38
5.5 Turbidimetric Instrumentation 40
5.6 Optical Backscatter Sensor Instrumentation 43
5.7 Laser In Situ Scattering and Transmissometry 44
5.8 Remote Sensing of Suspended Sediment Concentration 45
5.9 Estimation of Suspended Sediment Loads 45
6 Suspended Sediment Concentrations, Fluxes and Yields 49
6.1 Introduction 49
6.2 Ireland 49
6.3 Britain and Northern Europe 51
7 Storm-Event and Seasonal Suspended Sediment Dynamics 56
7.1 Storm-Event Suspended Sediment Dynamics 56
7.2 Hysteresis 56
7.3 Seasonal Changes in Suspended Sediment Fluxes 58
7.4 Longer Term Changes 60
8 Effects of Land Use and Climate Change on Sediment Fluxes 61
8.1 Introduction 61
8.2 Climate Change with Particular Reference to Ireland 61
8.3 Land Use 62
9 Management Implications 66
9.1 Reducing Sediment Load 66
9.2 Monitoring the Effectiveness of Measures 68
9.3 The Use of Modelling for the Design and Evaluation of Measures 68
10 Standards and Targets 69
References 71
Abbreviations 93

vii
List of Figures
Figure 1.1. Suspended sediment in the River Alne, Warwickshire 2
Figure 1.2. Suspended sediment of a very different colour (and probably source) in the River Alne, Warwickshire, at the same bridge site as shown in Figure 1.1, but looking upstream 2
Figure 2.1. Example of an advanced classification system for potential hillslope and river channel suspended sediment sources 4
Figure 2.2. Sediment connectivity in the fluvial system 5
Figure 2.3. Natural and anthropogenic catchment and river processes that affect sediment dynamics 6
Figure 2.4. Eroding arable fields – an example of a sediment source in Shropshire, UK 6
Figure 2.5. The conceptual basis of the fingerprinting technique used to establish suspended sediment sources in the PSYCHIC study 7
Figure 2.6. The conceptual framework that underpins the numerical INCA-Sed of Jarritt and Lawrence (2006) 8
Figure 2.7. Sediment budget examples from catchments in central England 9
Figure 2.8. River bank erosion on the River Allow, Ireland, is a sediment source 11
Figure 2.9. Eroding river banks around a sedimentation zone on the River South Tyne, Northumberland 11
Figure 2.10. World river bank erosion rates with respect to drainage basin area 12
Figure 2.11. River bank erosion as a sediment source in a reach-scale budget 12
Figure 2.12. River bank erosion events detected automatically with the PEEP system on the River Severn 13
Figure 3.1. Turbid waters at high flow in the River Alne, near Little Alne, Warwickshire, UK 17
Figure 3.2. Turbid conditions in the urban Bournbrook stream, River Tame catchment, Birmingham 17
Figure 3.3. Sediment infiltration mechanisms 18
Figure 3.4. The hyporheic zone 19
Figure 3.5. The relationship between stream power and sediment size in UK stream types: upland (Type I), small chalk (Type 2) and sandstone/limestone (Type 3) 19
Figure 3.6. Downstream change in the hydraulic properties of the River Dart, south-west England 20

viii
SILTFLUX Literature Review
Figure 3.7. Decline in oxygen supply rate with the accumulation of fine sediment within artificial redds 21
Figure 3.8. Sediment pollution event in the nearshore zone derived from erosion of a coastal catchment during an intense Mediterranean rainstorm, east-central Spain, 24 August 1997 23
Figure 3.9. The continuum of channel planform variants of alluvial river morphology along an energy gradient is closely related to predominant sediment load and channel stability 24
Figure 4.1. Negative impacts of anthropogenically enhanced sediment on lotic aquatic systems 27
Figure 4.2. Schematic showing the mechanisms by which macroinvertebrates are affected (directly and indirectly) by suspended, deposited and saltating sediment particles 32
Figure 5.1. Schematic of SSC cross-sectional variations 36
Figure 5.2. Schematic cross-sectional variation in flow velocity, SSC and sediment flux 36
Figure 5.3. Vertical distribution of concentration of various particle sizes in a stream section 37
Figure 5.4. Time-integrating suspended sediment sampler for collecting large amounts of suspended sediment for composition analysis 39
Figure 5.5. Infiltration basket for capturing fine sediment in gravel river beds 39
Figure 5.6. Declining water clarity in Lake Tahoe, measured using the Secchi disk 40
Figure 5.7. Turbidity versus SSC: calibration for the urbanised area at James Bridge, River Tame, Birmingham, UK 42
Figure 5.8. Turbidity versus SSC: calibration for the large Skaftá river, south Iceland 43
Figure 5.9. Dependence of light absorbance on sediment particle size 44
Figure 5.10. Effect of particle size on OBS response 44
Figure 5.11. Examples of SSC–Q relationships for two British rivers 46
Figure 5.12. Relationships between suspended sediment and area-weighted Q for several named British rivers 46
Figure 6.1. Catchments that have been studied in recent sediment-related Irish studies 50
Figure 6.2. Observed sediment yield (bedload and suspended load) data as a function of catchment area for UK rivers 52
Figure 6.3. Downstream changes in optical water quality in six rivers in Wisconsin (USA) and New Zealand 55
Figure 7.1. SSC response dynamics: SSC leading the flow and the classic positive hysteresis and first-flush model of sediment dynamics 57

ix
D. Lawler et al. (2010-W-LS-4)
Figure 7.2. Classic suspended sediment dynamics in response to storm-event discharge changes on the River Dart, south-west England 58
Figure 7.3. The typical suspended sediment dynamic response in the urbanised River Tame catchment (Birmingham, UK) is negative, anticlockwise hysteresis, in which peak SSCs occur just after the flow maximum 59
Figure 7.4. Clockwise hysteresis and anticlockwise hysteresis (the most common loops in the Q–turbidity relationship) for the River Tame, Birmingham 59

x
List of Tables
Table 1.1. Initially proposed thresholds of SSCs for different effects on fish 1
Table 1.2. Characteristics of fine sediments from selected UK rivers 3
Table 2.1. Typical catchment sediment sources, and the likely variation in a downstream direction 5
Table 2.2. Sediment sources for several south-west England catchments (delivery to watercourses in kg/ha per year), with information on source types for each catchment 10
Table 2.3. Summary of studies that have documented an increase in SSs downstream of river crossing construction sites 15
Table 2.4. Major point sources of sediment 15
Table 3.1. Selected examples of sediment-associated contaminants, their sources and their effects on fluvial systems 22
Table 3.2. Bedform classification system 25
Table 3.3. Alluvial depositional environments in which fine sediments may accumulate 25
Table 4.1. The ecological impact and sources of suspended and deposited sediment in rivers 28
Table 4.2. The effects of varying the concentrations of and the duration of exposure to suspended sediment on periphyton and macrophytes 29
Table 4.3. The effects of varying the concentrations of and the duration of exposure to suspended sediment on macroinvertebrates 30
Table 4.4. The effects of varying the concentrations of and the duration of exposure to sediment on fish 31
Table 6.1. Summary of Irish sediment yields reported in the scientific literature 50
Table 6.2. The Walling catchment typology: links to suspended sediment yield 53
Table 6.3. The WFD catchment typology: links to suspended sediment yield 53
Table 6.4. The new “Natural England” typology: links to catchment suspended sediment yield 54
Table 8.1. Some effects of land cover changes on catchment characteristics 63
Table 8.2. Total net rainfall, runoff and soil loss resulting from 30 storms between 28 May 1980 and 27 February 1981 in Nacogdoches, Texas 64
Table 9.1. Reducing mobilisation of sediment from agricultural activities 67
Table 9.2. Reducing delivery of mobilised sediment to watercourse 67

xi
D. Lawler et al. (2010-W-LS-4)
Table 9.3. Some estimated sediment reduction efficiencies 67
Table 9.4. Reducing sediment export from urban areas to watercourses 68
Table 9.5. Estimates of reduction efficiencies of best management practices for urban sediment 68
Table 10.1. Proposed target and critical suspended sediment yields for various catchment types in England and Wales 69
Table 10.2. Examples of standards/regulations for various countries 70


xiii
Executive Summary
Sediment is a natural and dynamic component of river catchment systems, in which it is transported as bedload and/or suspended load, depending on the relationship between flow conditions, sediment supply and the structure, density, size and shape of materials. Although sediment does not feature explicitly within the Water Framework Directive (WFD), the ecological focus of the legislation with regard to surface waters means that the role of sediment as an essential component of the sustainable management of aquatic systems is recognised. Suspended sediment particles are typically < 63 μm in diameter, but can be much coarser (up to 2 mm in diameter in extreme events). The delivery of sediment to rivers is dependent on a range of factors including catchment soil type, vegetation cover, land use, hillslope hydrological processes, flow pathways, topographic setting and the presence/absence of buffer zones, such as floodplains, which can decouple hillslopes from river channels. In healthy fluvial systems, sediment provides the basis for diverse aquatic ecosystems through nutrient cycling and replenishment, as well as by forming the contributing materials from which aquatic habitats are constructed in river beds and especially in banks. Too much silt, however, can lead to the obstruction of channels, the smothering of habitats, ingress into the bed and the reduction of light penetration in the water column and at the bed, potentially leading to deoxygenation and environmental deterioration. The presence of elevated fine sediment may also degrade biological habitats through its biological oxygen demand (BOD) and the contaminants adsorbed to the sediments, and loss of habitat heterogeneity. Consequently, macroinvertebrate diversity and abundance is susceptible to change either directly, through effects on survivorship, growth, feeding, etc., or indirectly, through the alterations in habitat structure. Fish are also adversely affected by excessive sediment levels. Increased turbidity can cause gill irritation or reduce feeding activity by impairing visual range. Chemically active silt fractions (< 63 μm in diameter) can also act as important carriers of potentially hazardous nutrients and contaminants, dioxins and heavy metals. Sand deposition from the water column can
“seal” the surface of valuable gravel habitats, while silt particles (< 63 μm in diameter) can infiltrate the gravel matrix; these effects can significantly reduce the permeability and porosity of spawning gravels, suppress oxygen supply rates, hinder the removal of toxins from redds and reduce egg hatching and larval survival rates. Sediment infiltration can also negatively affect microbial processes in the hyporheic zones with consequences for biodiversity and ecosystem functioning, which may impact on groundwater quality. Therefore, the effective management of aquatic systems is critically linked to understanding sediment transport and storage pathways.
While sediment is transported into river bodies through the natural processes of erosion and deposition, anthropogenic activities can also generate high sediment loadings. For example, human activities can lead to the deposition of soil as a result of the erosion of banks, due to trampling by livestock (known as “poaching”), the removal of riparian vegetation, the ploughing of land, deforestation/tree harvesting and land drainage schemes. The main route by which sediment is transported to water bodies is through drainage networks, but non-channelised surface wash flow can also be important, especially in arable contexts. Interflow and groundwater pathways can also be important in some settings.
This review summarises the key issues that affect the role of fine sediment in fluvial systems, with a focus on northern Europe, the UK and Ireland, which will be of most relevance to the SILTFLUX project. The review includes definitions of fine sediment; descriptions of typical sediment sources and delivery mechanisms; overviews of the impacts of sediment (e.g. for organisms and downstream systems); descriptions of monitoring and analytical methodologies; details of fine sediment fluxes and yields for rivers in Ireland and comparable river catchments in the UK and elsewhere in Europe; a summary of the crucial dynamics of storm-event and seasonal suspended sediment transport; details of land use and climate change effects on sediment fluxes; and a discussion of the management implications of sediment.


1
1 Introduction
Sediment is an integral and dynamic component of healthy fluvial systems (Yarnell et al., 2006) and it plays a significant role in the geomorphological, hydrological and ecological functioning of a river (Kemp et al., 2011). However, its roles as a direct pollutant and as a vector of contaminant transport are now being increasingly recognised internationally (Ballantine et al., 2008; Collins et al., 2011). Indeed, excessive sedimentation is the number-one cause of water quality violations in the USA (Downing 2005). Metal and insecticide contaminants are also leading causes of violations, and most of these contaminants are bound to suspended sediment (Downing, 2008a). The management of sediment input to rivers is now a priority in many countries. This must recognise that the impact of sediment can be both due to suspended sediment in the water column and deposited sediment on the bed of river channels, lakes and estuaries. Many authorities have suggested maximum suspended sediment concentrations (SSCs), and Table 1.1 summarises some of these initial thresholds for fish. The Irish Environmental Protection Agency (EPA) has identified deteriorating water quality as the major environmental challenge and, in general, river pollution has increased since the late 1970s (Toner et al., 2000). Similarly, the England Catchment Sensitive Farming Delivery Initiative recognised “40 priority catchments in April 2006 where stakeholders require assistance to improve the protection of aquatic habitats” (Collins et al., 2010a). Catchment Sensitive Farming officers now assess contamination impacts, including those from sediment, and support stakeholders with the implementation of good practice on farms.
The aim of this literature review is to summarise the key issues affecting the role of fine sediment in fluvial systems, with a focus on northern Europe, the UK and Ireland, which are of most relevance to the SILTFLUX project. While the review primarily focuses on suspended sediments, deposited sediments are also considered. The review includes definitions of fine sediment; descriptions of typical sediment sources and delivery mechanisms; overviews of the impacts of sediment (e.g. for organisms and downstream systems); descriptions of monitoring and analytical methodologies; details of sediment fluxes and yields for rivers in Ireland and comparable catchments in the UK and elsewhere in Europe; a summary of the crucial dynamics of storm-event and seasonal sediment transport; details of land use and climate change effects on sediment fluxes; and a discussion of the management implications of sediment. Most of the data are contained in supporting figures and tables.
There are already numerous and widely available international and European or UK-based literature reviews on suspended sediment transport, its impacts and associated pollutants, which have been published in the last 8 years and to which the reader is referred for details of specific issues (Collins and Walling, 2004; Lawler, 2005a; Owens, 2005; Owens et al., 2005, 2006; Walling et al., 2008; Gray and Gartner, 2009; Lawler et al., 2009; Taylor and Owens, 2009; Collins et al., 2011; Kemp et al., 2011; Owens and Xu, 2011; Vanmaercke et al., 2011). Therefore, reference is made to these sources as appropriate, and this review concentrates on the key issues relevant to the EPA-funded SILTFLUX research project.
Table 1.1. Initially proposed thresholds of SSCs for different effects on fish (Collins et al., 2012)
Thresholds (mg/L) for least, probable and definite effects Source
Least effects: high protection, best conditions
Probable effects: moderate protection, moderate conditions
Definite effects: low protection, poor conditions
< 25 25–80 > 80 EIFAC (1964)
< 25 26–80 > 80 Alabaster and Lloyd (1982)
< 30 30–85 > 83 Wilber (1983)
0 1–100 > 100 DFO (1983)

2
SILTFLUX Literature Review
In the context of this review, fine sediment (or suspended sediment) is defined operationally as sediment particles that are suspendable in the river water column (Figure 1.1 and Figure 1.2) and can ingress into gravel river beds; these particles typically range from 1 to 250 μm in diameter. For example, Walling et al. (2000) found that the particle diameter for > 95% of the suspended sediment load (SSL) sampled in most of the rivers in the Humber and Tweed basins in north-east England is < 63 μm (i.e. most are silt- and clay-sized particles). The median particle diameter, D50, ranged from 4.1 to 13.5 μm. Clay-sized particles (< 2 μm) accounted for 15–25% of SSL. A compilation of typical particle diameter distributions and organic content for bed and suspended sediment for several rivers in England and Wales is given in Table 1.2 (Buss, 2009).
Furthermore, Droppo (2003) argued that a broadening of suspended sediment definitions, from those that reflect purely physical characteristics to those that include biological and chemical information, is now required. For example, suspended sediment can often flocculate in aquatic systems if chemical and biological conditions are favourable, and these flocs will have different hydrodynamic properties, entrainment thresholds and settling characteristics (see, for example, Williams et al., 2008).
The SSCs are normally measured in g/L or mg/L, while sediment fluxes are defined in, for example, kg per second (kg/s) or tonnes (t) per year. Longer term suspended sediment yields are usually normalised for catchment area to facilitate inter-basin comparisons and are presented as t/km2 per year. Field soil erosion rates are often given on the smaller scale of kg per hectare (kg/ha) per year (or t/ha per year).
Figure 1.1. Suspended sediment in the River Alne, Warwickshire. Flow from right to left (photo: Damian Lawler). Figure 1.2. Suspended sediment of a very different
colour (and probably source) in the River Alne, Warwickshire, at the same bridge site as shown in Figure 1.1, but looking upstream. Flow towards camera (photo: Damian Lawler).

3
Tabl
e 1.
2. C
hara
cter
istic
s of
fine
sed
imen
ts fr
om s
elec
ted
UK
rive
rs (s
ourc
e: B
uss,
200
9)
Riv
erSe
dim
ent t
ype
Org
anic
con
tent
(%)
Part
icle
siz
e di
strib
utio
n (%
)R
efer
ence
Sand
(0.0
63–
2 mm
)Si
lt (0
.000
4–0.
062 m
m)
Cla
y (<
0.00
39 m
m)
Oth
er
Upl
and
stre
ams
(impe
rmea
ble
stra
ta)
Upp
er 3
0 cm
of
chan
nel b
ed23
3.5
0.6
Mila
n et
al.
(200
0)
Sm
all c
halk
stre
ams
with
low
rain
fall
854.
90.
6
Low
land
lim
esto
ne a
nd s
ands
tone
st
ream
s45
7.4
1.7
Riv
er T
est,
Ham
pshi
re, E
ngla
ndA
ccum
ulat
ed
sedi
men
t fro
m
artifi
cial
redd
19.7
of <
2 m
m10
% <
2 m
mG
reig
et a
l. (2
005)
Riv
er A
ran,
Pow
ys, W
ales
7.5
of <
2 m
m15
.7%
< 2
mm
Riv
er It
hon,
Pow
ys, W
ales
5.3
of <
2 m
m28
.9%
< 2
mm
Riv
er B
lack
wat
er, H
amps
hire
, E
ngla
nd3.
4 of
< 2
mm
12.2
% <
2 m
m
Riv
er F
rom
e, D
orse
t, E
ngla
ndS
uspe
nded
5–60
Farr
and
Cla
rke
(198
4)
Riv
er T
est,
Ham
pshi
re, E
ngla
ndS
uspe
nded
25–4
0 du
ring
sum
mer
an
d au
tum
n lo
w fl
ows;
15
–25
durin
g w
inte
r an
d sp
ring
high
flow
s
Aco
rnle
y an
d S
ear
(199
9)
Bed
sed
imen
tS
umm
er lo
w fl
ows
(Jun
e–S
epte
mbe
r): s
uspe
nded
se
dim
ent (
< 0.
25 m
m)
acco
unte
d fo
r 70–
90%
; au
tum
n flo
ods
(Oct
ober
): co
arse
r sed
imen
t (0.
25–4
mm
) ac
coun
ted
for m
ore
Upp
er P
iddl
e, D
orse
t, E
ngla
ndFi
ne b
ed
sedi
men
t12
.2W
allin
g an
d A
mos
(1
999)
Littl
e S
tour
, Ken
t, E
ngla
nd<
250
μm
surfi
cial
fine
se
dim
ent
13.8
(SD
4.3
5, n
= 5
1)S
patia
lly a
nd te
mpo
raril
y co
nsis
tent
(D50
= 5
8.75
μm
; S
D =
6.2
5 μm
)
Woo
d an
d A
rmita
ge (1
999)
SD, s
tand
ard
devi
atio
n.

4
2 Fine Sediment Sources, Delivery and Budgets
2.1 Sediment Sources and Delivery
2.1.1 Context
Identifying sediment sources is extremely important. Collins and Walling (2004) have constructed a typology of likely sources (Figure 2.1), and argue that “an improved understanding of catchment suspended sediment sources represents a prerequisite (our italics) for assisting the design and implementation of targeted management strategies for controlling off-site sediment-associated environmental problems”. However, defining the provenance and types of fine sediment sources is very difficult and for many catchments these are largely unknown. Even within a given basin, dominant source locations may vary over time with different meteorological, hydrological and antecedent events. Typical fine sediment sources and how their relative dominance may change in a downstream direction in a catchment are listed in Table 2.1 for humid temperate environments. Such sources, however, must be viewed in contexts of the catchment and connectivity, as illustrated in Figures 2.2–2.4.
In addition, “information on sediment delivery to watercourses is urgently required to test and evaluate existing diffuse pollution models” (Collins et al., 2010a). Section 2.1.2 briefly summarises typical approaches adopted to identify or, rather, infer (Collins and Walling, 2004) catchment sediment sources, sediment routing and the processes that transport the sediment to the channel, that is, source-to-river connectivity.
2.1.2 Methods of identifying and locating suspended sediment sources
Several direct and indirect approaches for estimating sediment sources exist, as reviewed by Collins and Walling (2004), and a combination of methods can be most effective. Sediment “fingerprinting”, through chemically “matching” likely source sediment with transported suspended sediment, has proved especially useful: its conceptual basis is shown in Figure 2.5. Multi-parameter or mixed model approaches to fingerprinting, as adopted by Walling et al. (2008) and Collins et al. (2010a) have become
Figure 2.1. Example of an advanced classification system for potential hillslope and river channel suspended sediment sources (after Collins and Walling, 2004).
Instream Suspended Sediment Load
River channelsources of suspended sediment
Primary sources stream banksstream bed
Secondary sourcesalluvial deposits
Hillslopesources of suspended sediment
Primary sourcessheetwashrillinggullyingtramplingtreethrowmass movement
Secondary sourceshillslope/collovialdeposits
Links from hillslope to streamroads, paths, tracks, wheel ruts, drains
redeposition
remobilisationremobilisation
Near Near
Far Far
redeposition
remobilisation

5
D. Lawler et al. (2010-W-LS-4)
Table 2.1. Typical catchment sediment sources, and the likely variation in a downstream direction (adapted from Sear et al., 2003)
Upper course Middle course Lower course
Rock fall Valley side slope Overland flow
Scree slope Terrace slope Tributaries
Debris flow Soil creep Cultivated farmland
Landslide Floodplain erosion Wind-blown soils
Freeze–thaw Tributary stream Construction sites
Sheet flow Cultivated farmland Urban runoff
Rills and gullies Field drains and ditches Gravel workings
Overgrazed, burnt or rabbit-infested areas Urban runoff Marine sediments (estuaries)
Ditches (forest and road) Ditches (forest and road)
Quarries Mining and gravel extraction
Figure 2.2. Sediment connectivity in the fluvial system (Crown copyright – Sear et al., 2003).

6
SILTFLUX Literature Review
Figure 2.3. Natural and anthropogenic catchment and river processes that affect sediment dynamics (Crown copyright – Sear et al., 2003).
Figure 2.4. Eroding arable fields – an example of a sediment source in Shropshire, UK (photo: Damian Lawler).

7
D. Lawler et al. (2010-W-LS-4)
popular as methods of identifying catchment sediment sources.
There are a number of models for predicting sediment sources and sediment delivery from catchments, and linking them to in-stream sediment transport. A recent promising numerical model is the dynamic, process-based INCA-Sed (the Integrated Catchment Model for Sediments) (Jarritt and Lawrence, 2006). Its conceptual basis is shown in Figure 2.6. INCA-Sed works at a daily time step, and was tested by Lazar et al. (2010) in the River Lugg, a tributary of the River Wye in Wales. It was found that “diffuse soil loss” was the most important sediment generation process in the Lugg, although, in this case, SSCs were relatively low and unlikely to cause significant ecological impacts. It was also tested in four catchments in Finland by Rankinen et al. (2010) and was found to correctly reproduce the observed spatial and temporal sediment dynamics.
2.1.3 Sediment budgets and sediment delivery ratios
Measures of soil erosion rate cannot be used to infer rates of sediment delivery to stream channels
because significant deposition of sediment usually occurs (1) before it reaches the drainage network and (2) within the river channel upstream of the sediment flux monitoring station. The percentage of sediment leaving a catchment, relative to that eroded from the catchment, is called the sediment delivery ratio (SDR), defined as:
SDR = (100 SSY/E) × 100 (Equation 2.1)
In Equation 2.1, SSY is the fluvial suspended sediment yield per unit catchment area at some downstream river gauging point in the catchment (t/km2 per year) and E is the spatially averaged catchment erosion rate (t/km2 per year).
In a small catchment SDRs can be as low as 15%, and these can be even lower in larger catchments, in which numerous sediment storage opportunities exist, at between 5 and 10% (Walling, 1983). Occasionally, a “hillslope SDR” is defined, which is the percentage of sediment eroded from slopes that reaches the river.
Quantifying the relative importance of different sediment sources allows a sediment budget to be constructed. A good example is provided by Walling et al. (2002) for the small lowland agricultural catchments of the Rosemaund and Lower Smisby in central
Storm rainfall
Mobilisation ofsediment from individual sources
Mixing of mobilisedsediment duringsediment delivery
Suspended sedimentload at catchmentoutlet
Surface soils under woodland
Surface soils under pasture
Surface soils under cultivation
Channel banks andsubsurface sources of sediment
Comparison of catchment source material fingerprintproperties of suspended sediment samples and individual catchment source materials.
Sediment source apportionment
Figure 2.5. The conceptual basis of the fingerprinting technique used to establish suspended sediment sources in the PSYCHIC study (adapted from Walling et al., 2008a).

8
SILTFLUX Literature Review
England (Figure 2.7). Even in these tiny catchments (< 3.6 km2), the SDRs were only 17% and 20%, respectively, suggesting that the vast majority (≥ 80%) of the fine sediment produced in the catchment slope headwater areas was stored at locations up-catchment of the river monitoring sites, such as in fields and the channel (Figure 2.7), although field drains carried little sediment.
Table 2.2 shows how multiple catchments can be separately assessed for their contribution to total sediment delivery, with additional evidence added for different source types (Collins et al., 2010a).
2.1.4 Sources and sediment pathways
Taylor and Owens (2009) compiled data that suggested that diffuse sediment from agricultural sources is responsible for 75.7% of all sediment supplied to rivers across England and Wales. Eroding channel banks (for an Irish example, see Figure 2.8) were responsible for a further 15.5% of sediment, with the remainder coming from urban sources (5.8%) and point sources (3.0%) (e.g. from wastewater treatment works). In the UK, arable fields can be key contributors of fine sediment: “sediment loss from cultivated fields has been accentuated by a number of factors including
a shift towards more autumn-sown cereals which exposes bare tilled soils to the risk of erosion by winter rainfall and the expansion of maize production” (Collins et al., 2010a) (e.g. Figure 2.9). In the Midlands in England, Chapman et al. (2005) identified sub-surface drainage (macro pore flow through cracked soils) as a key mechanism for transporting fine sediment from fields to streams. They also identified drains as a major mechanism for transporting fine sediment: in one of their catchments, drains contributed over half the annual sediment load.
2.1.5 Connectivity of catchments and channels
There must be good surface or sub-surface hydraulic connections that link eroding terrain parcels to the drainage network (i.e. strong connectivity) if abundant sediment is to reach the river channels (e.g. Figure 2.2). Indeed, Lane et al. (2007) showed, for the first time anywhere, that catchment topography and “hydrological connection discriminates both presence/absence and abundance of juvenile brown trout populations”. This finding, based on work in the Eden catchment, Cumbria, could have wide ramifications elsewhere. For example, “if topographic control
precipitation
soilwater
groundwater
surfacerunoff
water inflowto reach
detachedsediment
sediment inputto reach
suspendedsediment
bedsediment
settling/entrainment
bankerosion
down-streamexport
upstream import
pointsourceinputs
flow erosion
splash erosion
infiltrationexcess
saturationexcess
infil
tratio
n ra
tepe
rcol
atio
n
in-st ream phaseLand p hase
Figure 2.6. The conceptual framework that underpins the numerical INCA-Sed of Jarritt and Lawrence (2006) [after Lazar et al. (2010)].

9
D. Lawler et al. (2010-W-LS-4)
mediates the watershed to stream linkage, land use impacts can only be appreciated with respect to their position in the landscape. This is of practical importance as locations of high connectivity should be a primary objective in targeting watershed restoration measures to where they will deliver most instream benefits” (Dugdale and Lane, 2006).
2.2 River Bank Erosion as a Suspended Sediment Source
River bank erosion events can introduce significant quantities of fine sediment into stream channels (e.g. Figure 2.8 and Figure 2.9). Indeed, Collins et al. (2010a) argue that “there is increasing evidence for the role of eroding channel banks as an important sediment source in fluvial systems” (based on
evidence from Church and Slaymaker, 1989; Collins et al., 1997; Lawler et al., 1999; Walling and Collins, 2005; Walling et al., 2008). World river bank erosion rates have been tabulated by Lawler (1993) and plotted against drainage basin area, as shown in Figure 2.10 (Lawler et al., 1997). Rates vary widely for a given catchment area, from 0.04 m/year for small catchments (< 10 km2) to 1 km/year for very large basins, such as the lower Mississippi (106 km2) (Figure 2.10).
Bank sediment contributions can be modelled within a sediment budget framework [e.g. using the PSYCHIC model (Collins et al., 2007, 2009)]; however, in the field, this is challenging, even within a short river reach, as shown in Lawler et al. (1997) (Figure 2.11). This partly reflects the vast range of bank erosion processes possible (see below). It also reflects an
Rosemaund
In-field 129.5 t/km2
Field to channel 267.6 t/km2
In channel storage 1.5 t/km2
Output 81.9 t/km2
Channel banks 9.4 t/km2
Subsurface erosion 4.5 t/km2
Gross surface erosion 466.6 t/km2
Field drains
Lower Smisby
In-field 112.4 t/km2
Field to channel 214.7 t/km2
In channel storage 0.9 t/km2
Output 80.3 t/km2
Channel banks 5.5 t/km2
Subsurface erosion 2.3 t/km2
Gross surface erosion 400.5 t/km2
Field Drains
Figure 2.7. Sediment budget examples from catchments in central England (Walling et al., 2002).

10
Tabl
e 2.
2. S
edim
ent s
ourc
es fo
r sev
eral
sou
th-w
est E
ngla
nd c
atch
men
ts (d
eliv
ery
to w
ater
cour
ses
in k
g/ha
per
yea
r), w
ith in
form
atio
n on
sou
rce
type
s fo
r ea
ch c
atch
men
t (ad
apte
d fr
om C
ollin
s et
al.,
201
0a)
Sub-
catc
hmen
tSe
dim
ent y
ield
(kg/
ha p
er y
ear)
Past
ure
tops
oils
aC
ultiv
ated
tops
oils
aD
amag
ed ro
ad v
erge
sbC
hann
el b
anks
/sub
-sur
face
so
urce
sb
Sew
age
trea
tmen
t wor
ksb
200
700
200
700
200
700
200
700
200
700
Bru
e16
9–18
559
1–64
742
8–57
014
96–1
995
0–2
0–7
16–2
456
–84
0–2
0–7
Car
y14
6–16
251
1–56
730
–42
104–
146
20–2
470
–84
82–9
028
7–31
52–
67–
21
Hal
se W
ater
94–1
0732
7–37
636
9–39
612
92–1
386
20–2
470
–84
2–6
7–21
0–4
0–14
Isle
158–
173
554–
607
63–8
822
0–30
818
–26
63–9
158
–62
203–
217
4–8
14–2
8
Par
rett
131–
145
457–
509
135–
162
472–
567
22–3
077
–105
46–5
016
1–17
52–
67–
21
Tone
181–
189
635–
660
85–1
1629
8–40
622
–30
77–1
0542
–46
147–
161
0–4
0–14
Upp
er P
arre
tt22
9–23
680
0–82
910
1–11
335
2–39
64–
814
–28
34–3
811
9–13
32–
67–
21
Yeo
33–4
011
4–14
020
7–25
272
3–88
354
–62
189–
217
56–6
019
6–21
02–
67–
21
a Cal
cula
ted
usin
g th
e ar
ea o
f the
sub
-cat
chm
ent u
nder
the
land
use
in q
uest
ion
base
d on
the
AD
AS
land
use
dat
abas
e.b C
alcu
late
d us
ing
the
tota
l sub
-cat
chm
ent a
reas
pro
vide
d by
the
UK
Env
ironm
ent A
genc
y us
ing
the
Floo
d Es
timat
ion
Han
dboo
k.

11
D. Lawler et al. (2010-W-LS-4)
Figure 2.8. River bank erosion on the River Allow, Ireland, is a sediment source (photo: J.J. O’Sullivan).
Figure 2.9. Eroding river banks around a sedimentation zone on the River South Tyne, Northumberland (photo courtesy of the Northern Echo).

12
SILTFLUX Literature Review
Figure 2.10. World river bank erosion rates with respect to drainage basin area (adapted from Lawler et al., 1997).
10 10 10 10 10 10
Drainage Basin Area - A (km2)
0 1 2 3 4 5 6 7
Published rates Ilston sites Devon Streams
0.01
0.05
0.1
0.5
1
5
10
50
100
500
Ban
k E
rosi
on R
ate
- E
b (m
/yea
r)
Eb = 0.0245 A0.45
10 10
Sediment supply from bank failure and
lateral bank erosion
Input of sediment from upstream
Export of sediment to downstream
Lateralexchangeof sediment
Change in amount of sediment storedin reach
q ins
q outs
q lats
s
q banks
s = q in - q out + q bank + q lats s s s
Figure 2.11. River bank erosion as a sediment source in a reach-scale budget (adapted from Thorne, 1991).
13
D. Lawler et al. (2010-W-LS-4)
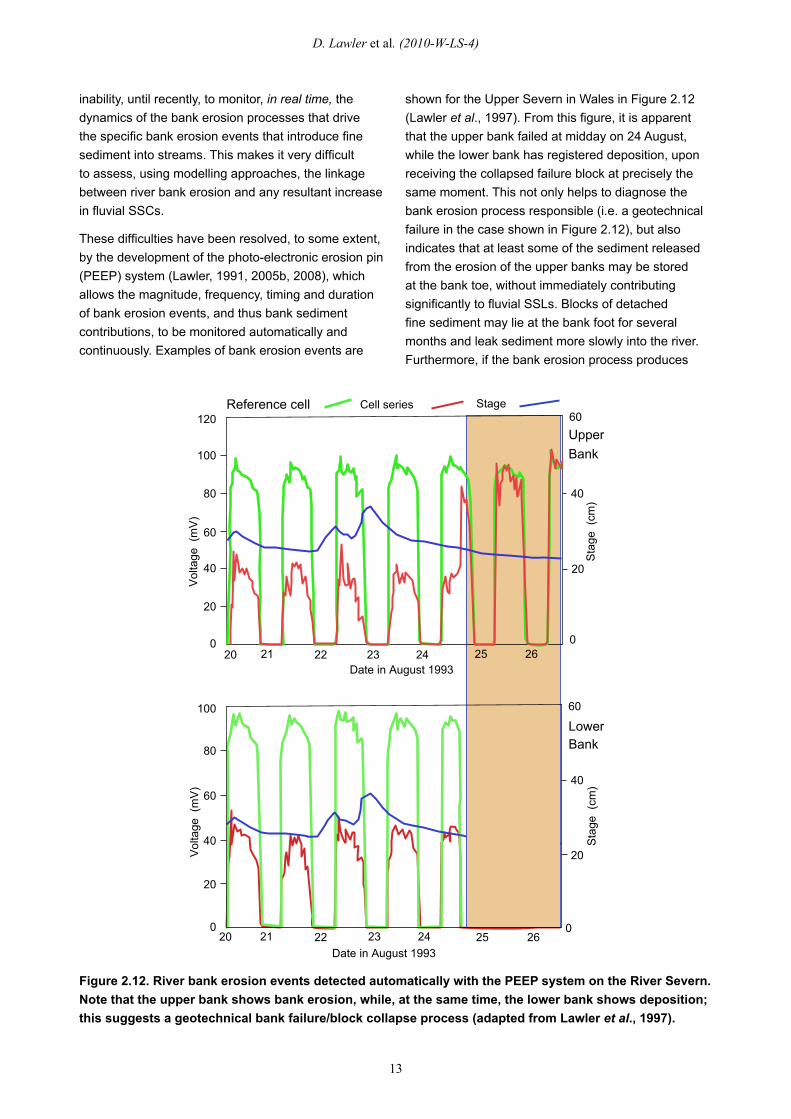
inability, until recently, to monitor, in real time, the dynamics of the bank erosion processes that drive the specific bank erosion events that introduce fine sediment into streams. This makes it very difficult to assess, using modelling approaches, the linkage between river bank erosion and any resultant increase in fluvial SSCs.
These difficulties have been resolved, to some extent, by the development of the photo-electronic erosion pin (PEEP) system (Lawler, 1991, 2005b, 2008), which allows the magnitude, frequency, timing and duration of bank erosion events, and thus bank sediment contributions, to be monitored automatically and continuously. Examples of bank erosion events are
shown for the Upper Severn in Wales in Figure 2.12 (Lawler et al., 1997). From this figure, it is apparent that the upper bank failed at midday on 24 August, while the lower bank has registered deposition, upon receiving the collapsed failure block at precisely the same moment. This not only helps to diagnose the bank erosion process responsible (i.e. a geotechnical failure in the case shown in Figure 2.12), but also indicates that at least some of the sediment released from the erosion of the upper banks may be stored at the bank toe, without immediately contributing significantly to fluvial SSLs. Blocks of detached fine sediment may lie at the bank foot for several months and leak sediment more slowly into the river. Furthermore, if the bank erosion process produces
Figure 2.12. River bank erosion events detected automatically with the PEEP system on the River Severn. Note that the upper bank shows bank erosion, while, at the same time, the lower bank shows deposition; this suggests a geotechnical bank failure/block collapse process (adapted from Lawler et al., 1997).
Date in August 1993
0
20
40
60100
80
60
40
20
0
LowerBank
UpperBank
Vol
tage
(m
V)
Sta
ge (
cm)
Reference cell Cell series Stage
Sta
ge (
cm)
Vol
tage
(m
V)
0
20
40
60120
100
80
60
40
20
0
Date in August 199320
21 22 23 24 25 26
21 22 23 24 25 26
20

14
SILTFLUX Literature Review
fine sediment particles or aggregates, perhaps through freeze–thaw and desiccation processes followed by fluvial entrainment, then erosion processes can immediately and significantly elevate SSCs. Lawler et al. (1997) suggested catchment-scale differences in bank erosion process dominance, namely that freeze–thaw processes dominate in the upper reaches of a catchment, where banks are wetter and subject to more frost; fluid entrainment dominates in the middle reaches, where stream powers may peak (Barker et al., 2009); and in the lower reaches, where banks are large and fine grained, geotechnical failure is the most common cause of erosion. Therefore, it is possible that, in cases where bank erosion processes are significant contributors to the sediment budget, more immediate suspended sediment responses are likely in the middle and upper reaches of catchments.
2.3 Deposition and Mobilisation
Flowing water can detach, transport and deposit sediment, whether in overland flow or in channels. Critical shear stress is an important index which characterises this process (Storm et al., 1990). The shear stress required for detachment is typically much greater than required for transport: Foster (1982) reported that the critical shear stress required for the flow detachment of a certain soil was 2.9 N/m2, while the critical shear stress required for the transport of the same soil was <0.5 N/m2. Critical shear stress is related to soil shear strength in cohesive soils and is influenced by salinity (Kelly and Gularte, 1981). Lyle and Smerson (1965) reported that critical shear stress is related to plasticity index, percentage clay, mean particle size, dispersion ratio, vane shear strength, organic matter content, cation exchange capacity and the calcium–to–sodium ratio. Smerdon and Beasley (1961) developed regression equations relating critical shear stress to many of these soil properties. In channels, sediment can move, suspended in the turbulent water column, or can roll downstream on the bed of the channel. The latter is called “bed-load” and Yalin (1963) developed an equation to describe the transport rates. Sediment moving along the bed may form characteristic waves and these can influence the hydraulic resistance of the channel (Wang et al., 2011).
The most widely used method for determining critical shear stress is the Shields diagram (Storm et al.,
1990). The original Shields diagram used a time and spatially averaged dimensionless shear stress and a particle Reynold’s number calculated at the bed. However, it does not apply to sediment particles of low specific gravity and small diameter. Mantz (1977) extended the Shields diagram for smaller particles, but both approaches require iteration. Yalin (1977) introduced a change of variables, defining a modified Shields function, which could be used without the need for iteration.
The movement of relatively large-grained sediments tends to be associated with less frequent but more intense flows, and can be modelled using typical statistical distributions of extremes (Valyrakis et al., 2011). Entrainment is influenced by the velocity profile in the boundary layer (Le Roux, 2010). Scour may occur at specific structures, such as flow deflector vanes used to improve conditions for fish (Rodrigue-Gervais et al., 2010), arched culverts (Crookston and Tullis, 2011) and weirs dal (Muller et al., 2011), which change the flow direction or increase its velocity.
2.4 Construction Activities
Road construction activities in the vicinity of watercourses are potential sources of sediment input, which may originate from the associated earthworks, including blasting; the pumping of water from the construction site; exposed soil banks resulting from excavations or vegetation removal; soil storage areas; or the construction of road crossings (Vice et al., 1969; Barton, 1977; Beshta, 1978; Extence, 1978; Cline and Forest, 1983; Embler and Fletcher, 1983; Duck, 1985; Ellis et al., 1987a; Barrett et al., 1995; Maltby et al., 1995; Luce and Black, 1999; Wellman et al., 2000; Lane and Sheridan, 2002; Bruen et al., 2006; Cerdà, 2007; Purcell et al., 2012). Pipeline crossings are especially troublesome zones for fine sediment ingress into rivers and fluvial sediment impact assessment methodologies have recently been presented by Lawler and Wilkes (2015) for these types of impacts. The risk from the construction of road crossings is also high; the available data on road crossings and suspended solids (SSs) are summarised in Table 2.3. Culverting appears to pose a higher risk of sediment than the use of clear span bridges (Cocchiglia et al. 2012). The limited studies that relate these sediment inputs from road crossing to effects on aquatic

15
D. Lawler et al. (2010-W-LS-4)
communities include Extence (1978) and Cocchiglia et al. (2012). Post-construction, sediment and various other pollutants have been detected in motorway drainage (Maltby et al., 1995, e.g. Bruen et al., 2006a).
2.5 External Discharges, Urban Drainage, Wastewater Treatment Plants and Farmyard Drains
Most of the sediment input to rivers from point sources is associated with local rainfall events, typically with the intense but relatively short-duration rainstorms. Such point sources include urban stormwater drainage, sewer or wastewater treatment plant (WWTP) overflows, road runoff and farmyard drainage (Table 2.4).
Sediment delivery from WWTP discharges, particularly in areas with combined sewers, and urban stormwater drainage systems is complicated by the effects of deposition within the pipe networks and subsequent mobilisation during storm flows (Walling et al., 2003a).
Much of the sediment can be contained in settling and storage tanks on site, particularly if tanks are designed to accommodate the “first flush” load (Walling, 2006). However the organic content and nutrients in wastewaters may have a greater effect than sediment on stream ecology (Horowitz, 1991).
Sediment concentrations in urban stormwater depend on whether the urban area is residential, commercial or mixed. Median event mean concentrations tend to be in the range of 100 to 300 mg/L, but values as high as 1240 mg/L have been observed in residential areas (Van Rompaey et al., 2001). Total suspended solids (TSSs) are typically reduced in stormwater by detention or settling ponds (Carter and Berg, 1983; Sarangi et al., 2004; Richards et al., 2008). The process of urbanisation initially produces a large increase in sediment load as land is cleared for construction (Wolman, 1967). This sediment load will decline as more impermeable surfaces are built. However, the reduction in the sediment load in the stream may result in channel erosion, and a deepening
Table 2.3. Summary of studies that have documented an increase in SSs downstream of river crossing construction sites
Crossing type SS concentration (mg/L) before construction/control
SS concentration (mg/L) during construction
Note Reference
Culvert < 5 1390 Maximum values
Barton (1977)
Pipeline 7 7620 Maximum Tsui and McCart (1981)
Bridge foundations
3.2 15.8 Mean Cline et al. (1983)
Culvert 3–17 75–81 Range Cline et al. (1983)
Culvert < 30 60–130 Range Embler and Fletcher (1983)
Unknown 35 179 Mean Barrett et al. (1995)
Culvert 144 1237 Maximum values
Lane and Sheridan (2002)
Unknown 5 15 Maximum values
Chen et al. (2009)
Culvert < 20 70 Maximum Purcell et al. (2012)
Table 2.4. Major point sources of sediment
Point source Reference
Urban stormwater drainage Carter and Berg (1983), Sarangi et al. (2004), Richards et al. (2008)
WWTP discharges Walling et al. (2003a)
Road runoff Walling (1983), Croke et al. (2006), Desta et al. (2007)
Farmyard drainage Van Oost et al. (2000), Krasa et al. (2010)

16
SILTFLUX Literature Review
and widening of the urban channel, if the bed material permits (Leopold, 1973). Some examples from the USA are listed by O’Driscoll (2010).
Roads are sources of sediment in runoff. In urban areas, the runoff is mainly to the urban stormwater system, but in rural areas it discharges to local streams, perhaps after some treatment in, for example, a settling/attenuation pond or wetland (Schutes et al., 2001). In one UK study, damaged road verges contributed up to 20% of the sediment from catchments, and this contribution seems to have
increased over time (Collins et al., 2010b). A “first flush” effect of heavy metals is typical of runoff from busy highways (Walling, 1983), regardless of whether the road is unsealed (Croke et al., 2006) or sealed (Ellis et al., 1987b). Bruen et al. (2006) reviewed the typical constituents of highway runoff and their impacts, and Desta et al. (2007) described a study in Ireland, in which all TSS measurements in road runoff were considerably less than 1000 mg/L. In rural areas, the sediment loads in farmyard runoff can be reduced by deposition in either natural or constructed wetlands (Van Oost et al., 2000; Krasa et al., 2010).

17
3 Physical and Chemical Impacts of Fine River Sediments in Fluvial Systems
3.1 Importance and Processes
Despite the potential negative physical impacts of suspended sediment (the ecological impacts are discussed in Chapter 4), a little suspended sediment can limit water clarity and, therefore, the over-production of algae. Fluvial suspended sediment data can also help to identify catchment processes, such as:
1. upstream sediment mobilisation and hence data that can provide alerts to potential erosion problems, including the liberation and delivery processes (e.g. soil erosion, rilling and gullying, and landslide and debris flow significance) that route fine sediment to downstream receptors;
2. catchment erosion and sediment yields (e.g. for reservoir design purposes);
3. downstream sedimentation (e.g. in lakes, nearshore zones and harbours);
4. sediment fluxes and any associated delivery of contaminants to receptors.
However, the presence of fine sediment in catchment and fluvial systems can also have undesirable environmental impacts, because sediment can change the physical, chemical and biological properties of aquatic ecosystems. These impacts depend on the
SSCs in the water column; the particle size and shape distribution; particulate behaviour and ingress into river bed gravels; sediment quality; sediment-associated contaminants; sediment fluxes; and storage characteristics/dynamics in the floodplain (Walling et al., 1999; Coulthard and Macklin, 2003; Walling et al., 2003b; Dennis et al., 2009), channel bed and hyporheic zone.
3.2 In-stream Processes
Once in the channel, and especially once suspended in the water column in sufficient quantities, particulate matter can make the water turbid, at both high (Figure 3.1) and low flow, especially in urban settings (Figure 3.2). This reduces the level of light that can reach the bed and affects aquatic habitats and organisms, especially predation for fish (Walling and Fang, 2003), as discussed in Chapter 4. Methods for modelling the factors that control photosynthetically active radiation in rivers, including turbidity, have recently been developed using the Benthic Light Availability Model (Julian et al., 2008a,b).
Sediment can also have physical abrasive “sandblasting” effects on organisms (e.g. damage to fish gills; see section 4.4) and on riverine structures, such as bridges, intakes and turbines. In addition, sediment physically interacts with the river channel
Figure 3.1. Turbid waters at high flow in the River Alne, near Little Alne, Warwickshire, UK. Flow from right to left (photo: Damian Lawler).
Figure 3.2. Turbid conditions in the urban Bournbrook stream, River Tame catchment, Birmingham (photo: Damian Lawler).

18
SILTFLUX Literature Review
in a number of other ways (Lawler and Fairchild, 2010). “Sedimentation” (or “siltation”) refers to the development of a layer of fine sediment over the bed surface. “Sediment infiltration” (or “colmation”, as it is known in the environmental engineering literature) is the process by which fine sediment moves into the gravel bed structure itself (Figure 3.3). “Accumulation” is the summation of this infiltration process over time (Sear et al., 2008).
In the Hyporheic Handbook, Lawler et al. (2009) briefly summarise the processes involved in sediment infiltration: “in the water column, fine sediment movements are driven by two main processes: (i) gravity-driven infiltration that includes simple Stokes-type settling; and (ii) advection of fine material into the
bed by fluid turbulence. All else being equal, coarser and heavier particles will drop out of suspension first, giving natural spatial and temporal size segregation in the resulting deposits. Particle shape is also a key factor, as the less spherical a particle, the slower it will settle.” If fine particles flocculate they can settle in an unpredictable manner.
The hyporheic zone is the zone in which groundwater and surface water mix beneath and around the channel bed (Alley et al., 2002) (Figure 3.4). This zone is especially vulnerable to sediment ingress problems (see, for example, Sear et al., 2008; Lawler et al., 2009). This partly relates to a difficulty in flushing out fine sediment once it has become ingressed into the bed gravels. Data from a sample of UK stream beds,
Figure 3.3. Sediment infiltration mechanisms (Sear et al., 2008).

19
D. Lawler et al. (2010-W-LS-4)
shown in Figure 3.5, suggest that there is a reasonably inverse relationship between specific stream power (a measure of the energy available per unit area of a river bed) and the percentage of sediment of < 1 mm in diameter (Milan et al., 2000). If this is the case in general, it should be possible to use the high-resolution (60 m longitudinal spacing) catchment-scale quantifications of downstream changes in channel elevation, slope, bankfull discharge, and gross and specific stream power, produced for 32 UK rivers using the Combined Automated, Flood, Elevation and Stream Power (CAFES) system of Barker et al. (2009), as a basis to predict the fine sediment content of river
beds (e.g. Figure 3.6). The resulting data could then be employed to help identify, in combination with other indices, hot-spots of ecological sensitivity.
Fine sediment in gravels can also consume oxygen and, therefore, significantly reduce organisms’ oxygen supply (Greig et al., 2007) (see section 4.3.1). Figure 3.7 shows that a simple doubling of sediment accumulation rate in artificial redds can reduce oxygen supply by an order of magnitude (Greig, 2004). Sedimentation also changes channel geometry, and if reductions in channel capacity are significant, then flow velocities (and shear stresses) will increase to
Hyporheic ZoneGroundwaterflow
Groundwaterflow
watertable watertable
Stream
Figure 3.4. The hyporheic zone.
Figure 3.5. The relationship between stream power and sediment size in UK stream types: upland (Type I), small chalk (Type 2) and sandstone/limestone (Type 3) (after Milan et al., 2000).
Upland
Small chalkSandstone /Limestone
Perc
enta
ge si
zed
unde
r 1 m
m
Total Stream power (Wm-2)1 10 100 1000 10000
1
10
100

20
SILTFLUX Literature Review
Figure 3.6. Downstream change in the hydraulic properties of the River Dart, south-west England. Sites of erosion are likely to relate to peak stream power, which in many catchments occurs in mid-basin, in which the optimum combination of water surface slope and bankfull discharge [median annual discharge (QMED), i.e. 2-year return period flow] is found, as in the River Dart in this example. The full derivation of variables was performed using the CAFES methodology (Barker et al., 2009). The results shown here are from Barker et al. (2009). Sediment deposition and associated impacts are likely at stream confluences and in areas of low stream power, at which particle settling velocities are achieved (Buss, 2009).

21
D. Lawler et al. (2010-W-LS-4)
balance the continuity equation. This can be beneficial in some cases (e.g. to flush out accumulated fine sediment), but it can also increase channel erosion and bedform instability, perhaps undesirably.
Because of these negative impacts, and those discussed in Chapter 4, organisations around the world have established limits for SSCs, turbidity and/or sediment fluxes. For example, the UK Technical Advisory Group (UKTAG, 2008) suggested that the guideline standard for annual mean SSs in freshwaters should be 25 mg/L; this is consistent with the EU Freshwater Fish Directive (Lazar et al., 2010). The EU Water Framework Directive (WFD) required EU Member States to achieve “good ecological status” for rivers by 2015, and this status was defined by Collins et al. (2007) in terms of the guideline annual average SSC of 25 mg/L of the EU Freshwater Fish Directive. Other suggested SSC thresholds are given in Table 1.1.
3.3 Sediment-associated Pollutants
The role of sediments in the transport and dispersal of river pollutants has received considerable attention since the 1970s. Gibbs (1973) and Martin and Meybeck (1979), for example, suggested that more
than 90% of pollutants are transported with sediments and, more recently, Turner et al. (2008) showed that between 71% [copper (Cu)] and 99% [arsenic (As), lead (Pb) and zinc (Zn)] of selected heavy metals were sediment bound in waters buffered by calcareous soils, under high wash sediment loads (up to 10,000 mg/L). Significant amounts of the nutrients nitrogen and phosphorus have also been widely reported for sediment-borne fluxes in British and Irish catchments (see, for example, Foster et al., 1996). However, in a review of the controls on nutrient fluxes in British rivers, Walling et al. (2001) emphasised that the “precise magnitude of the sediment-associated component will vary from river to river in response to local conditions including relief, geology and land use, the hydro- meteorological conditions and the relative importance of point source inputs”. Similarly, at a reach scale, the morphological controls governing sediment dynamics strongly influence the transport and storage of radiothorium downstream of a mining release (Graf et al., 1991), while Droppo et al. (2011) have demonstrated that bacterially induced fine sediment flocculation can lead to an increase in the “downwards flux” of contaminated sediment, which promotes elevated pathogen distribution in bed sediments at a patch scale (see, for example, Cho et al., 2010).
Figure 3.7. Decline in oxygen supply rate with the accumulation of fine sediment within artificial redds. These data are based on Greig, 2004.
1000
100
10
1
0.1
0.01
0.001
0.00010 20 40 60 80 100
Total sediment accumulation (kg m )
Oxy
gen
supp
ly r
ate
(mg
O
egg
ho
ur
) Test Redd 1
Test Redd 2
Ithon Redd 1
Ithon Redd 2
Blackwater Redd 1
-2
2-1
-1

22
SILTFLUX Literature Review
There have been numerous reviews and case-study papers on the variety and source of sediment-associated pollutants’ distribution and effects in aquatic environments; a number of these are summarised in Table 3.1. Notably, relatively few investigations have been conducted in Ireland, although Herr and Gray (1997), and a follow-up study by Gaynor and Gray (2004), did report elevated levels of sediment-associated Cu, Pb and Zn as a result of acid mine drainage in the Avoca catchment, south-east Ireland, and Regan et al. (2012) have estimated phosphorus exports of 0.88 to 8.8 kg/ha per year from agricultural soils in Ireland, based on total phosphorus soil values (after McGrath et al., 2001) and soil erosion modelling (Van Oost et al., 2006).
Pollutants can be introduced as particulates that move as part of the saltating load, but are more often transported in association with the “chemically active”, fine (< 63-µm diameter) sediment fraction, in suspension (Horowitz, 1991), through a variety of processes (adsorption, absorption and precipitation) (see Figure 3.8). Sediment-associated pollutant concentrations are therefore strongly influenced by particle size, while total pollutant fluxes are primarily governed by pollutant mobilisation, coupled with sediment supply and hysteresis dynamics (Bradley and Cox, 1990); thus, very significantly, most sediment-associated pollutant transport occurs during storm events (Horowitz et al., 1999; Horowitz, 2006; Edwards and Withers, 2008). The disassociation of pollutants from the dissolved,
Table 3.1. Selected examples of sediment-associated contaminants, their sources and their effects on fluvial systems (adapted from NRC, 2003; Owens et al., 2005; Taylor and Owens, 2009). Brief details of research conducted in Ireland are given in Italics
Pollutant Sources and distribution Environmental impacts Selected examples
Metals and metalloids (Ag, Cd, Cu, Co, Cr, Hg, Ni, Pb, Sb, Sn, Tl, Zn, As)
Mining including catastrophic release, industry, acid rock/mine drainage, sewage treatment, urban runoff, pesticides
Toxicological effects
Oxidisation leading to de-oxygenation
Potentially long residence times (102–103 years)
Diffuse source of labile contaminants and prone to physical reworking
Herr and Gray (1997)/Gaynor and Gray (2004) (Ochre precipitates in the Avoca River)
Miller (1997), Macklin et al. (2003), Walling et al. (2003b)
Nutrients (P, N) Agricultural and urban runoff, wastewater and sewage treatment
Eutrophication Regan et al. (2012) (Review of P exports from tillage)
Kiely (2007) (P exports from grasslands)
Organic compounds including pesticides, herbicides, hydrocarbons, PCBs, PAHs, dioxins
Agriculture, pest control, industry, sewage, landfill, urban runoff, forest fires, incineration
Toxic impacts, including carcinogenesis
Endocrine disruption affecting sex hormones and reproductivity
Environmental persistence and bioaccumulation
Thomas (1990), Potter et al. (1994), Warren et al. (2003)
Xenobiotica and antibiotics Sewage treatment works, industry, agriculture
Steroid hormones (e.g. androgens and oestrogens)
Sewage treatment works Endocrine disruption Taylor and Harrison (1999)
Radionuclides (137Cs, 238Pu, 239Pu, 240Pu, 235U, 238U, 230Th, 99Tc)
Nuclear power industry, military, geology, food irradiation
Microbes, including pathogens (Escherichia coli, faecal coliforms)
Agricultural runoff, sewage, landfill
Formation of flocs leads to bed concentration of pathogens
Jamieson et al. (2004), Cho et al. (2010), Droppo et al. (2011)
Ag, silver; Cd, cadmium; Co, cobalt; Cr, chromium; Cs, caesium; Hg, mercury; N, nitrogen; Ni, nickel; P, phosphorus; PAH, polycyclic aromatic hydrocarbon; PCB, polychlorinated biphenyl; Pu, plutonium; Sb, antimony; Sn, tin; Tc, technetium; Th, thorium; Tl, thallium; U, uranium.

23
D. Lawler et al. (2010-W-LS-4)
aqueous phase generally reduces their bioavailability and environmental impact. However, fine sediments continue to represent a risk to the environment through their ingestion and, importantly, represent a major secondary source of pollution. The diffuse nature of the sediment-associated pollutants stored in the channel, and the channel marginal and floodplain sedimentary environments, makes them more difficult to manage (Owens et al., 2005). Moreover, some pollutants with long residence times (up to 1000 years) can be re-introduced to surface waters, through chemical exchange and channel re-working, long after their initial release into the fluvial environment (Miller, 1997; Macklin et al., 2003; Dennis et al., 2009). In many instances, keeping rivers “clean” of fine sediment should, therefore, enhance their ability to flush through pollutants, leading to significant environmental benefits in the medium term.
3.4 Impacts on River Morphology
Form–sediment interactions can result in distinctive channel planforms (Figure 3.9) and bedforms (Table 3.2), which are largely governed by sediment calibre and supply rate, together with local flow conditions. Although sediment moves through a channel, bedform assemblages, such as riffle-pool sequences, are equilibrium forms that are morphologically stable and provide habitats for aquatic species
(Brown and Brussock, 1991; EA, 2009). Sediment transfer also promotes short- and long-term storage of fine-grained sediment in a variety of alluvial depositional settings (Table 3.3). Typically, channel form–sediment dynamics are dominated by bedload sediment characteristics, but fine sediment can be an important constituent of mixed bed channels, in which it is stored in the interstices of coarser channel substrate and deposited on bar tops during waning high flows (Church, 2006). Fine sediment can build up (sometimes detrimentally) in channel pools and in the lee of in-channel obstructions, such as woody debris and man-made structures. In the upper portion of alluvial channel banks, fine sediment plays an important morphological role, because of its hydraulic and cohesive properties, and provides a store for nutrients and, in some cases, contaminants. Fine sediment predominates in the alluvial sedimentary environments of low-energy systems. Morphologically, these river systems are typically laterally stable and can display anabranching, anastomosing (sensu Nanson and Knighton, 1996) planforms, characterised by multiple, hydraulically independent channels separated by stable, vegetated floodplain islands. These equilibrium channel planforms are now rare, because of human disturbance and modification, but rudimentary morphological elements in the form of channel islands can still be found across north-west Europe, including in Irish catchments such as those
Figure 3.8. Sediment pollution event in the nearshore zone derived from erosion of a coastal catchment during an intense Mediterranean rainstorm, east-central Spain, 24 August 1997 (photo: Damian Lawler).

24
SILTFLUX Literature Review
of the Rivers Shannon (County Limerick) and Boyne (County Meath), and are highly developed in parts of the River Lee (County Cork).
3.5 Impacts on Riverine Structures
Suspended sediment particulates can be sharp and angular, and abrade in-stream structures such as bridges, flood defences, hydroelectric power turbines (e.g. in Iceland and Norway) and dam surfaces, particularly spillway chutes (Huang, 2006). They can also clog water intakes, creating problems in water treatment works and increasing the costs of sediment removal. Floodplain and main channel sedimentation can also become problematic. Turbulent diffusion can contribute greatly to sediment transport (Shiono, 2011), and the abrasion of coarse sediment during transport may produce fine silt (Sklar et al., 2006).
3.6 Downstream Effects of Siltation in Rivers, Lakes, Reservoirs and Harbours
Siltation processes can have a significant impact on fluvial systems and water resource management in river catchments, and can also account for the low SDRs reported for many river basins (see section 2.3). Fine sediments are temporarily stored in-channel, in substrate interstices and bar tails (section 3.5). Artificial channels, such as drainage ditches (also known as field drains), both capture and supply fine sediment from agricultural land (Forster and Abrahim, 1985). An increase in the drain density will improve hydrological and sediment connectivity, but can lead to elevated particulate phosphorus transfer to aquatic ecosystems (Blann et al., 2009) and high sediment yields.
Figure 3.9. The continuum of channel planform variants of alluvial river morphology along an energy gradient is closely related to predominant sediment load and channel stability (after Brierley and Fryirs, 2005, p. 121).
low sinuosity fine-grained
fine-grainedmeandering
sand bedmeandering
wanderinggravel bed
wanderingsand bed
boulder bed gravel bedbraided
sand bedbraided
anastomosingfine-grained
Incr
easi
ng E
nerg
y -
-->
Decreasing grain size and stream power -->

25
D. Lawler et al. (2010-W-LS-4)
Table 3.2. Bedform classification system (modified from Church and Jones, 1982a, and Knighton, 1998)
Bedform Dimensions Shape Behaviour and occurrence
Small-scale forms (10–2–102 m)
(1) Sand-bed rivers
Ripples λ < 0.6 m; H < 0.04 m Triangular profile, sharp crest perpendicular to flow direction
Generally restricted to sediment finer than 0.6 mm
Dunes λ is 4- to 8-fold higher than flow depth; H is up to 1/3 of flow depth
Curved crests Upstream slope may be rippled, coarse grains deposited at crest, flow separation occurs
Plane bed Flat surface Super critical flow, Froude No. > 1
Antidunes H is dependent on flow depth/velocity
Sinusoidal profile Antidunes move upstream, sediment moves downstream
(2) Gravel-bed rivers
Pebble clusters 0.1–1 m Linear in direction of flow Large obstacle particle with smaller stoss particle
Transverse ribs 1–10 m Transverse to direction of flow Repeated ridges of coarse particles, spacing proportional to largest particle in ridge crest
Riffle/pool sequence
1–10 m Transverse to direction of flow Alternative deep (pool) and shallow (riffles) spaced in relation to channel width
Step/pool systems
1–10 m Transverse to direction of flow Star-like sequence formed in steep channels, steps formed coarse material, spacing ≈2- to 3-times the channel width
Large-scale forms (101–103 m)
Bars Length comparable to channel width
Variable Longitudinal bars, form in channel centre and elongated in direction of flow
Transverse bars, lobe shape with relatively steep downstream face
Point bars, form in meandering channels because of secondary flow
Diagonal bars, bank attached bars running obliquely across channel
Mid-channel bars, common in braided channels
λ, wavelength; H, height.
Table 3.3. Alluvial depositional environments in which fine sediments may accumulate (modified from Church and Jones, 1982b, and Hoey, 1992)
Depositional site Name Characteristics
Within channel Transient channel deposit Temporarily stagnant bedload deposits including ripples, dunes, transverse ribs, pebble clusters and steps
Alluvial bars Lag deposits of coarser sediment including riffles, mid-channel bars and sedimentation zone
Channel margin Lateral deposits Point bars that form on the inside of meander bends
Floodplain Vertical accretion deposits A comparatively flat alluvial depositional landform that forms as a result of deposition of fine-grained suspended load of overbank floodwaters; provides sediment storage space for drainage basin
Piedmont Alluvial fans A cone-shaped depositional feature that occurs because of a sudden reduction in sediment transport capabilities owing to an abrupt change from confined to unconfined conditions, or a sudden decrease in slope; sediment grain size decreases rapidly with distance from fan apex
River mouth Deltas Morphological feature formed when a river enters a sea or lake and deposits its load; characteristics of sediment supply determine morphology

26
SILTFLUX Literature Review
Fine sediments naturally accumulate in natural catchment sinks, such as lakes, flood basins and estuaries, but can be affected by changes in sediment supply. For example, Lake Tahoe, on the California/Nevada border, has traditionally attracted many tourists; however, this tourism is being threatened by an apparent increase in turbidity resulting from an increase in the sediment and nutrient supply (Langlois et al., 2005; Simon et al., 2008). In artificially constructed reservoirs and impounded rivers, the effects of siltation can also have a detrimental impact on storage capacity, particularly if trap efficiencies are underestimated; this impacts upon a variety of uses, such as flood control, domestic water supply,
irrigation, recreation and fish farming. Siltation can also exert pressure on dam walls, increasing the risk of dam failure; while these events are rare, they can have catastrophic downstream effects, because of the mobilisation of trapped fine sediment (e.g. Evans, 2000, 2007).
Harbours and marinas often suffer from fine sediment accumulation, which leads to high maintenance costs for dredging and the disposal of spoil, particularly if it is contaminated (Owens, 2005). These effects can result from the downstream deposition of fine sediment (Mitchell, 2005; Pontee and Cooper, 2005), together with the re-suspension of fine sediment from tidal flats (Dobereiner and McManus, 1983).

27
4 Ecological Impacts of Fine River Sediments in Fluvial Systems
4.1 Introduction
Excessive sediment inputs can have detrimental effects on fluvial systems, negatively impacting biota in a variety of complex direct and indirect ways (Figure 4.1), from reducing primary productivity to altering faunal abundance, diversity and community structure. The key papers documenting such effects on aquatic biota are summarised in Table 4.1, whilst Table 4.2, Table 4.3 and Table 4.4 summarise the available studies that have considered the influence of sediment concentration and the duration of exposure.
4.2 Periphyton and Macrophytes
4.2.1 Periphyton
Periphyton is, to some extent, more susceptible to effects resulting from elevated sediment levels than macrophytes. Suspended and saltating solids alter light penetration within the water column, and thereby reduce primary production (Van Nieuwenhuyse and LaPerriere, 1986; Lloyd et al., 1987) and lead to a decrease in periphyton biomass (Davies-Colley et al., 1992; Quinn et al., 1992; Francoeur and Biggs, 2006;
Figure 4.1. Negative impacts of anthropogenically enhanced sediment on lotic aquatic systems. Rectangles represent physicochemical effects, ovals represent direct and long-term biological and ecological responses (after Kemp et al., 2011). BOD, biological oxygen demand.

28
SILTFLUX Literature Review
Table 4.1. The ecological impact and sources of suspended and deposited sediment in rivers (modified from Wood and Armitage, 1997, and Jones et al., 2011)
Impact Sediment type Source Reference(s)
Primary producers
Absence of rooted vegetation D China clay extraction Nuttall and Bielby (1973)a
Elimination of macrophytes D Channelisation Brookes (1986)a
Reduced productivity, biomass and organic content
S and D Placer gold mining Van Nieuwenhuyse and LaPerriere (1986), Davies-Colley et al. (1992)b,c
Reduced species diversity and organic content S and D Road construction Cline et al. (1982)b
Reduced organic content D Impoundment Graham (1990)c
Macroinvertebrates
Reduced abundance D Drought – abstraction Wright and Berrie (1987), Wood and Petts (1994)a
Reduced abundance and diversity D China clay extraction Nuttall (1972), Nuttall and Bielby (1973)a
Reduced abundance and diversity S and D Desilting operation Doeg and Koehn (1994)e
Reduced species diversity D Removal of riparian vegetation
Armstrong et al. (2005)e
Reduced species density S and D Placer gold mining Quinn et al. (1992)c
Reduced species density S and D Induced in field experiment Angradi (1999), Zweig and Rabeni (2001)b
Reduced species density and diversity D Water filtration facility Erman and Ligon (1988)
Reduced richness D Agriculture Lemly (1982)b
Reduced taxon and EPT richness D Induced in field experiment Matthaei et al. (2006)c
Altered composition and reduced EPT richness (patch scale)
D Bank erosion Larsen et al. (2009)a
Reduced EPT richness D Agricultural Kaller and Hartman (2004)b
Altered functional composition/reduced abundance of filterers
D Induced in field experiment Bo et al. (2007)f
Impaired filter-feeding and reduced metabolic rate of mussels
S Induced in experiment Aldridge et al. (1987)b
Altered community structure/reduced density/increased drift
S and D Induced in experiment Rosenberg and Wiens (1978); Larsen and Ormerod (2010)d,a
Altered community structure D Road construction Extence (1978)a
Altered community structure S and D Agriculture Richards et al. (1993)a
Decreased density of functional feeding groups and increased density of gathers.
D Natural Rabení et al. (2005)b
Altered richness, abundance, community composition, trait diversity and trait composition
D Induced in field experiment Larsen et al. (2011)a
Altered species/EPT density, richness and abundance
D Altered land use Niyogi et al. (2007)c
Reduced egg hatching D Induced in experiment Kefford et al. (2010)e
Increased drift
Increased Baetis mayflies drift
D and Sa
D
Induced in field experiment Culp et al. (1986)
Gibbins et al. (2005)a

29
D. Lawler et al. (2010-W-LS-4)
Impact Sediment type Source Reference(s)
Fish
Reduced abundance
Reduced abundance
D and S
D
Desilting operation
Agriculture
Doeg and Koehn (1994)e
Berkman and Rabeni (1987)b
Decline in salmonid spawning habitat quality D Natural Carling and McCahon (1987)b
Decline in salmonid spawning habitat quality D Coal mining Turnpenny and Williams (1980), Lisle (1989)a,b
Decline in salmonid spawning habitat quality
Reduced survival of salmonid eggs
D
D
Impoundment
Water filtration facility
Sear (1993)a
Erman and Ligon (1988)b
Reduced survival of salmonid eggs D Agriculture Soulsby et al. (2001)a
Reduced survival of salmonid embryos D Laboratory and field experiments
Greig et al. (2005)a
Reduced alevin survival D Laboratory and field experiments
O’Connor and Andrew (1998)g
Reduced survival to pre-eyed, eyed and hatched stages
D Induced in field experiment Julien and Bergeron (2006)d
Increased mortality of sac fry D Placer gold mining Reynolds et al. (1989)d
Decreased growth and survival of juveniles D Induced in field experiment Suttle et al. (2004)b
Reduced length and mass D Induced in field experiment Shaw and Richardson (2001)d
aCountry of study: UK.bCountry of study: USA.cCountry of study: New Zealand.dCountry of study: Canada.eCountry of study: Australia.fCountry of study: Italy.gCountry of study: Ireland.D, deposited sediment; D and Sa, deposited and saltating sediment; EPT, index named after the orders Ephemeroptera, Plecoptera and Trichoptera; S, suspended sediment.
Table 4.1. Continued
Table 4.2. The effects of varying the concentrations of and the duration of exposure to suspended sediment on periphyton and macrophytes (from Bilotta and Brazier, 2008)
Organism SSC (mg/L) Exposure time (hours)
Effect on organism Reference
Macrophytes and algae
8 – 3–13% reduction in primary production Lloyd et al. (1987)b
40 – 13–50% reduction in primary production
Lloyd et al. (1987)b
200 – 50% reduction in primary production Van Nieuwenhuyse and LaPerriere (1986)b
2100 – No primary production Van Nieuwenhuyse and LaPerriere (1986)b
Phytoplankton 10 1344 40% reduction in algal biomass Quinn et al. (1992)c
Aquatic moss 100 504 Extensive abrasion of leaves Lewis (1973)a
500 168 Severe abrasion of leaves Lewis (1973)a
Periphyton 100 – Enhanced growth and filament length (low-flow velocities)
Birkett et al. (2007)b
200 – Significant reduction in biomass and filament length
Birkett et al. (2007)b
0–6500 – Abrasive damage and reduced biomass Francoeur and Biggs (2006)c
aCountry of study: UK.bCountry of study: USA.cCountry of study: New Zealand.

30
SILTFLUX Literature Review
Table 4.3. The effects of varying the concentrations of and the duration of exposure to suspended sediment on macroinvertebrates (from Bilotta and Brazier, 2008, Collins et al., 2011, Jones et al., 2011)
Organism SSC Exposure time (hours)
Effect on organism Reference
Cladocera and Copepoda 300–500 mg/L 72 Clogging of gills and gut Alabaster and Lloyd (1982)g
Diptera > 50 mg/L – Feeding inhibition Kurtak (1978), Gaugler and Molloy (1980)b
Plecoptera/Trichoptera 1.5 mg/L 336 Feeding inhibition Hornig and Brusven (1986)b
Bivalvia 600 mg/L Intermittent exposure Feeding inhibition/reduced metabolism
Aldridge et al. (1987)b
Cladocera 82–392 mg/L 72 Reduced reproduction and survival rates
Robertson (1957)b
Chironomids 300 mg/L 2016 90% reduction in population size
Gray and Ward (1982)b
Benthic invertebrates 62 mg/L 2400 77% reduction in population size
Wagener and LaPerriere (1985)b
Benthic invertebrates 743 mg/L 2400 85% reduction in population size
Wagener and LaPerriere (1985)b
Invertebrates Pulses 456 Reduced abundance and richness
Shaw and Richardson (2001)d
Invertebrates 550–700 kg/50 m stream reach
840 Reduced richness, increased drift
Matthaei et al. (2006)c
Invertebrates 0.6–1.8 kg/m2 456 Reduced overall abundance and trait diversity
Larsen et al. (2011)a
Ephemeroptera, Plecoptera, Trichoptera
7.3–12.3% – Reduced relative abundance
Bryce et al. (2010)b
Stream invertebrates 130 mg/L 8760 40% reduction in species diversity
Nuttall and Bielby (1973)a
Benthic invertebrates 8 mg/L 2.5 Increased rate of drift Rosenberg and Wiens (1978)d
Invertebrates 8–177 mg/L 1344 26% reduction in invertebrate drift
Quinn et al. (1992)c
Macroinvertebrates 133 mg/L 1.5 Drift increased (by 7-fold) Doeg and Milledge (1991)e
Ephemeroptera 2680 mg/L – Increased drift Ciborowski et al. (1977)d
Amphipoda Trichoptera > 2000 mg/L Varying exposure times
Drift and survival unaffected Molinos and Donohue (2009)f
Mayfly (leptophlebiid) 1000 NTU 336 Mortality unaffected Suren et al. (2005)c
Odonata 1000–1500 NTU 1 Reduced feeding efficiency Kefford et al. (2010)e
1000 NTU 1 Increased survival Kefford et al. (2010)e
aCountry of study: UK.bCountry of study: USA.cCountry of study: New Zealand.dCountry of study: Canada.eCountry of study: Australia.fCountry of study: Ireland.gCountry of study: Germany.NTU, nephelometric turbidity units.

31
D. Lawler et al. (2010-W-LS-4)
Birkett et al., 2007), species diversity and organic content (Cline et al., 1982; Graham, 1990). In addition, an increase in flow and sediment levels can cause an increase in abrasion (Lewis, 1973; Francoeur and Biggs, 2006) and scouring (Steinman and McIntire, 1990); this reduces the attractiveness of periphyton to algal grazers (Graham, 1990).
4.2.2 Macrophytes
Macrophytes are easily abraded by suspended sediments, but their presence can actually enhance the deposition and accretion of fine sediments (Wood and Armitage, 1997), which may ultimately lead to their elimination if substantial sediment accumulation occurs (Nuttall and Bielby, 1973). Macrophyte beds can reduce flow rates, thereby leading to an increase in sediment accumulation and a decrease in turbidity; this, in turn, leads to an increase in light availability and enhanced macrophyte growth (Madsen et al., 2001). The seasonal growth of in-stream and marginal
macrophytes also leads to increases in channel roughness and water depth (Hearne and Armitage, 1993), thereby creating habitat diversity (Armitage, 1995). However, any decrease in macrophyte abundance can destabilise sediments leading to sediment resuspension (Madsen et al., 2001).
4.3 Macroinvertebrates
Macroinvertebrates have the capacity to withstand occasional increases in deposited, saltating and suspended sediment levels (Ryan, 1991). However, increases in the levels of anthropogenically derived sediment reduce species abundance and diversity, and alter community structure. Moreover, as macroinvertebrates are a significant food source for fish, any changes in species abundance, diversity or quality will directly impact on fish populations. The various mechanisms of sediment impact on macroinvertebrates are illustrated in Figure 4.2.
Table 4.4. The effects of varying the concentrations of and the duration of exposure to sediment on fish (from Bilotta and Brazier, 2008, Collins et al., 2011)
Organism Sediment concentration (mg/L)
Exposure time (hours)
Effect on organism Reference
Atlantic salmon 20 – Increased foraging activity Robertson et al., 2007c
Atlantic salmon 60–180 – Avoidance behaviour/increased foraging activity
Robertson et al., 2007c
Chinook salmon
488 96 50% mortality of smolts Stober et al., 1981b
Chinook salmon
207,000 1 100% mortality of juveniles Newcomb and Flagg, 1983b
Sockeye and Coho salmon
800–47,000 – 80% reduction in successful egg fertilisation at sediment concentration of > 9000 mg/L
Galbraith et al., 2006bc
Coho salmon 2000–3000 192 Reduced feeding efficiency and immunity
Redding et al., 1987b
Coho salmon 400,000 96 Physical damage to gills; stress response
Lake and Hinch, 1999bc
Rainbow trout 47 1152 10% mortality of incubating eggs Slaney et al., 1977c
Rainbow trout Pulses 456 Reduced growth Shaw and Richardson, 2001c
Brown trout 5838 8670 85% reduction in population size Herbert and Merkins, 1961a
Arctic grayling 25 24 6% mortality of sac fry Reynolds et al., 1989c
Arctic grayling 65 24 15% mortality of sac fry Reynolds et al., 1989c
Arctic grayling 185 72 41% mortality of sac fry Reynolds et al., 1989c
aCountry of study: UK.bCountry of study: USA.cCountry of study: Canada.

32
SILTFLUX Literature Review
4.3.1 Mechanisms by which deposited sediment affect macroinvertebrates
Studies have shown that deposited sediment can affect invertebrates as a result of burial (Wood et al., 2001, 2005), altered benthic substrate composition, interstical infilling, bed instability (Kaufmann et al., 2009), reduced refugia availability (Lancaster and Hildrew, 1993) and oxygen depletion (Swan and Palmer, 2000; Stead et al., 2004), which restricts the depth to which some invertebrates can penetrate deposited sediment. Sedentary species, such as the freshwater pearl mussel Margaritifera margaritifera (L), are particularly susceptible to deposited sediment accumulation that limits interstitial sediment oxygen supply (Geist and Auerswald, 2007; Osterling et al., 2008). Kaller and Hartman (2004) suggested a
threshold level for EPT diversity in excess of 0.8–0.9% fine sediment (< 0.25 mm) substrate accumulation.
4.3.2 Mechanisms by which suspended sediment affect macroinvertebrates
Suspended sediment affects macroinvertebrates by clogging (Alabaster and Lloyd, 1982) and abrasion of feeding mechanisms (Kurtak, 1978; Gaugler and Molloy, 1980; Hornig and Brusven, 1986; Aldridge et al., 1987); reduced feeding leads to reduced reproduction (Robertson, 1957), population size (Gray and Ward, 1982; Wagener and LaPerriere, 1985), and species abundance, richness (Shaw and Richardson, 2001) and diversity (Nuttall and Bielby, 1973). Suspended sediment reduces light penetration, thereby affecting invertebrate food sources, habitats
Figure 4.2. Schematic showing the mechanisms by which macroinvertebrates are affected (directly and indirectly) by suspended, deposited and saltating sediment particles (modified from Jones et al., 2011).
33
D. Lawler et al. (2010-W-LS-4)
and visual predators. Severe sediment loading may increase mortality rates (Hynes, 1970).
Macroinvertebrates can utilise behavioural responses to protect delicate structures (Kurtak, 1978); for example, they may retract filter combs or switch food source [e.g. Brachycentrus (Trichoptera) switches from trapping food particles with filtering limbs (Gallepp, 1974) to grazing under conditions of high SSCs (Voelz and Ward, 1992)]. However, these behavioural responses may have implications for feeding and growth rates.
4.3.3 Combined effects of suspended and deposited sediment on macroinvertebrates
Invertebrate drift is a natural process in fluvial systems, which expedites the movement of invertebrates among patches. Whilst moving particles may contribute to the dislodgement of invertebrates (Culp et al., 1983), the behavioural responses exhibited by some species suggest that increased drift may be used by invertebrates to evade the negative impacts (e.g. burial and clogging) of suspended, saltating or deposited particles (Ciborowski et al., 1977; Culp et al., 1986; Gibbins et al., 2007, Molinos and Donohue, 2009). An increase in invertebrate drift can reduce the benthic density and richness (Culp et al., 1983; Doeg and Milledge, 1991; Suren and Jowett, 2001; Larsen and Ormerod, 2010) of some sediment-sensitive taxa, while the abundance of sediment-tolerant taxa may be unaffected or, indeed, may increase (Kreutzweiser et al., 2005).
4.4 Fish
Extensive research has been undertaken into the impact of fine sediment on fish (Turnpenny and Williams, 1980; Berkman and Rabeni, 1987; Carling and McCahon, 1987; Erman and Ligon, 1988; Lisle, 1989; Reynolds et al., 1989; Sear, 1993; Doeg and Koehn, 1994; O’Connor and Andrew, 1998; Shaw and Richardson, 2001; Soulsby et al., 2001; Suttle et al., 2004; Greig et al., 2005; Julien and Bergeron, 2006), which reflects their economic importance (Ryan, 1991). Most fish can tolerate short-term naturally occurring increases in sediment levels; however, some species, such as salmonids, are highly sensitivity to sediment (Waters, 1995). The main mechanisms by
which sediment affects fish are described by Kemp et al. (2011).
4.4.1 Effects of deposited sediment on salmonids
A decline in the quality of spawning habitats because of deposited fine sediment infiltration (Turnpenny and Williams, 1980; Carling and McCahon, 1987; Sear, 1993) has repercussions for egg survival and subsequent fish recruitment (Wood and Armitage, 1997). The deposition of fine sediment within redds, in the areas in which they infiltrate the gravel voids, reduces gravel permeability and porosity, and thereby adversely affects egg and alevin survival through diminished oxygen supply (Turnpenny and Williams, 1980; Erman and Ligon, 1988; Reynolds et al., 1989; O’Connor and Andrew, 1998; Argent and Flebbe, 1999; Shaw and Richardson, 2001; Soulsby et al., 2001; Armstrong et al., 2003; Greig et al., 2005; Julien and Bergeron, 2006; Heywood and Walling, 2007). The presence of sediment-associated oxygen-consuming material (Greig et al., 2005; Dumas et al., 2007) and/or the inadequate removal of metabolic waste from incubating eggs can also be an issue. Conversely, coarser particles, which form a seal in the upper redd layer, can reduce fry emergence rates (Crisp, 1993). Fry and older fish may be affected by habitat alterations, such as a reduction/loss of juvenile rearing habitats and reduced water depths within pool areas, which are essential for adult salmonids, as a result of infilling due to the deposition of fine sediment (Waters, 1995).
4.4.2 Effects of suspended sediment on salmonids
The effects of suspended sediment on salmonids can be categorised as behavioural, sub-lethal or lethal, depending on the SSC and the exposure time. Behavioural responses range from an alarm reaction, the abandonment of cover to the avoidance of sediment fluxes (Servizi and Martens, 1991). Sub-lethal effects are more wide ranging and include a reduction in the tolerance to toxicants (Lloyd et al., 1987), a decrease in disease resistance (Redding et al., 1987), damaged gills (Herbert and Merkins, 1961; Redding et al., 1987), the interruption of gas exchange and osmoregulation (Bruton, 1985; Waters, 1995), the disruption of development (Suttle et al.,

34
SILTFLUX Literature Review
2004) and a delay in growth (Shaw and Richardson, 2001; Sutherland and Meyer, 2007). Lethal effects due to long-term exposure to high SSCs can lead to a population-level response resulting in an increase in mortality rates (Stober et al., 1981) and the loss of species from affected reaches (Birtwell et al., 1984).
4.4.3 Sedimentcharacteristicsthatinfluenceecological effects
Interactions between sediment sources and associated contaminants, the sediment concentration, the duration of exposure to sediment, and sediment particle size and chemical composition, along with the sensitivity of the particular taxa, certain life-history traits and species life-stage are all important factors that determine the ecological effects of sediment (Swietlik et al., 2003; Bilotta and Brazier, 2008; Collins et al., 2011).
4.4.4 Particle size and geochemical composition
Sediment geochemistry, which is influenced by soil type and catchment geology, and its physical characteristics, including the size, shape and angularity of particles, will also influence ecological impacts. For a given turbulence condition and sediment type with identical particle densities and shapes, smaller particles usually stay in suspension for longer than larger particles (Schindl et al., 2005). Under low-flow conditions, fine particles remain close to or at the water column surface (Schindl et al., 2005); this affects the respiratory and feeding mechanisms of invertebrates and fish. Coarse particles settle out of the water column (Schindl et al., 2005), which potentially affects salmonid redds and invertebrate habitats, as previously described (Greig et al., 2005).
4.4.5 Concentration and duration of exposure
Whilst extremely low concentrations of sediment can negatively affect aquatic species, the duration of exposure (Tables 4.2–4.4) is also a critical factor (Newcombe and McDonald, 1991; Newcombe and Jensen, 1996; Swietlik et al., 2003; Cocchiglia et al., 2012b). Short-term exposure may result in ephemeral effects, whereas long-term exposure will result in
sustained impacts on biota (Collins et al., 2011). A meta-analysis study by Newcombe and McDonald (1991) found that the ranked response of aquatic biota was poorly correlated with SSC and more strongly correlated with sediment intensity (the product of sediment concentration and the duration of exposure). This suggests that both the concentration and the duration of exposure need to be assessed in order to predict the effects of sediment on aquatic biota. Studies on the effects of sediment on fish have shown increases in foraging activity and avoidance behaviour (Robertson et al., 2007), gill damage (Lake and Hinch, 1999), effects on the mortality of eggs, fry and smolts (Slaney et al., 1977; Stober et al., 1981; Reynolds et al., 1989), and reductions in feeding efficiency (Redding et al., 1987), egg fertilisation (Galbraith et al., 2006) and growth rates (Shaw and Richardson, 2001) depending on sediment concentration and the duration of exposure.
4.4.6 Sediment and associated contaminants
As previously stated, fine sediment is a natural and vital component of aquatic ecosystems (Wood and Armitage, 1997; Owens et al., 2005) that ensures habitat heterogeneity and ecosystem functioning (Yarnell et al., 2006). However, anthropogenically derived fine sediment fluxes can alter temporal and spatial fluvial sediment dynamics significantly, and increase the delivery and transport of sorbed contaminants, including nutrients, heavy metals, pesticides and pathogens, with the < 63-µm sediment fraction to aquatic systems (Salomons and Forstner, 1984; Stone and Droppo, 1994; Owens et al., 2001, 2005).
The concomitant effects of the sedimentation and nutrient enrichment that are associated with managed and cultivated catchments may result in additive, antagonistic or synergistic biological responses as a result of complex interactions between these stressors (Lemly, 1982; Townsend et al., 2008; Matthaei et al., 2010). Some studies suggest that temporal patterns of sediment and nutrient disturbances drive ecosystem response to multiple stressors (Molinos and Donohue, 2010), whist others have shown that localised catchment modifications due to “poaching” and/or bank erosion may result in reach- and patch-scale ecological impacts (Larsen et al., 2009).

35
5 Measuring and Monitoring Suspended Sediment Concentrations and Loads
5.1 Introduction
It has long been known that it is difficult to estimate fluvial SSLs (“silt fluxes”) accurately and precisely (see, for example, Walling and Webb, 1981a; Ferguson, 1987). At the simplest level, it requires the determination of river discharge (Q) and spatially and temporally representative SSCs. Thus, the instantaneous SSL in kg/s, is given by:
SSL = Q × SSC (Equation 5.1)
In Equation 5.1, Q is the water discharge in m3/s and SSC is the instantaneous suspended sediment concentration in g/L (i.e. kg/m3).
The estimation of sediment fluxes over a given period requires the integration of this simple equation over time, and this is discussed in Section 5.9. River discharge measurement techniques are well reviewed elsewhere (see, for example, Hershey, 1999). However, the robust estimation of fluvial SSCs is far from simple. Therefore, this section focuses on the methodologies, techniques and instrumentation available for the estimation of SSC in rivers.
Ideally, the best way to obtain the most accurate estimates of SSC is to sample river waters by hand at very high resolution in (1) time, in order to capture variations related to hydrograph events (e.g. take samples at 15-min intervals before, during and after storms); and (2) space, that is, take samples from water surface to river bed, in order to embrace the entire water column, and across the full channel width to account for any cross-sectional variation in SSC, which is especially pronounced in large rivers with low turbulence and coarse suspended sediment particle size distribution. Repeated field sampling missions should then be followed by the laborious processing of thousands of water samples in a laboratory to determine SSCs. However, although this might be possible for short-term studies, for long-term investigations of fluxes, the resources required for this highly labour-intensive approach would be impracticable. Thus, various compromises have to be made; these problems, solutions and alternative approaches and methodologies are outlined in this
section, although all approaches benefit from an initial reconnaissance study, as summarised below.
5.1.1 The value of reconnaissance suspended sediment data
Manually collected, reconnaissance SSC or turbidity data – especially from repeat “storm-chasing” runs during elevated SSCs – can give vital information, at an early stage, on key indicators of the sediment transport system, and can help with planning a more spatially and temporally intensive sampling and monitoring campaign; this is vital for the accurate and precise estimation of suspended sediment fluxes. Key indicators include:
1. approximate fluvial SSCs;
2. suspended sediment particle size distribution (this can give an indication of the sediment sources, and help to predict likely cross-sectional variations in SSC); along with information on fluvial SSCs, this information can help to guide the selection of the most appropriate turbidity meters, which can be geared towards specific ranges of SSCs and particle size distributions (e.g. via their beam intensity or the wavelength of the instrument);
3. suspended sediment composition, which can indicate likely sediment sources;
4. the extent of any width or depth variation in SSC across the gauging cross-section;
5. catchment-scale and downstream changes in SSC, which can provide clues on the locations of sediment sources, storage and conveyance losses, and can inform decision-making with regard to the choice of sites for monitoring stations;
6. Q data; if such data are available or estimable, preliminary instantaneous SSL data can be obtained using Equation 5.1 and used as guidance for later turbidity meter and automatic water sampler installation, siting and intake, and instrument head locations (e.g. for channel-edge sampling).

36
SILTFLUX Literature Review
Reconnaissance runs throughout the catchment more widely (not just of the stream network itself) during rainstorms can also help to identify key sediment sources and delivery processes.
5.2 Manual Sampling
5.2.1 Cross-sectional variations in SSC
It has long been known that significant cross-sectional variations in SSCs exist (e.g. Guy and Norman, 1970; Horowitz et al., 1989): SSCs generally increase towards the bed, especially for coarser particles, and towards the channel centre (Figure 5.1 and Figure 5.2). Figure 5.3 shows data supporting this, and although datasets are rare, channel centre SSCs can be twice that of those at the channel edge in some large rivers (Nordin and Richardson, 1971). Acoustic
Doppler current profiler (ADCP) data have recently helped to define spatial patterns in cross-sections and, for flux investigations, SSC could ideally be representative of the whole cross-section, but this is rarely possible to achieve with high temporal resolution monitoring. Normally, just a single, fixed or floating, intake or monitoring point is placed at the channel edge. Therefore, especially in large rivers of low turbulence and/or with coarse suspended sediment in which strong lateral and vertical SSC gradients develop, the following three additional procedures can be introduced to help attain the most accurate and representative values of suspended sediment flux:
1. Attempts should be made to achieve a spatially representative position for the intake or monitoring point (e.g. not in a turbid “hot-spot”).
Figure 5.1. Schematic of SSC cross-sectional variations.
Depth-integratingsampler
unmeasuredstrip
unmeasuredstrip
SuspendedSedimentConcentration
Velocity ofWater flow
SuspendedSedimentFlux
0 0 0
cs
vv cs
Figure 5.2. Schematic cross-sectional variation in flow velocity, SSC and sediment flux.

37
D. Lawler et al. (2010-W-LS-4)
2. SSCs at this single point should be compared with those from occasional depth-integrated manual sampling points across the channel width.
3. If the single-point concentration value tends to significantly over- or underestimate cross-sectional average concentrations, a suitable correction/calibration factor should be determined and applied.
5.2.2. Sampling to detect cross-sectional variation in suspended sediment
For very turbulent flows, or for fine suspended sediment size distributions, lateral and vertical variability in SSC will normally be less notable than cross-sectional variation. Sediment mixing is also likely to vary with stage for a given cross-section, although few datasets demonstrate this. To check for sediment mixing, spatial sampling should be done with specially designed point- or depth-integrated isokinetic samplers (Guy and Norman, 1970; Davis, 2005 in Sabol et al., 2010), as pioneered by the United States Geological Survey (USGS).
Isokinetic sampling
The key feature of a USGS isokinetic sampler is that the bottle is allowed to fill through only a carefully machined and chamfered 6-mm special nozzle that, if pointed upstream, allows water to flow into the sampler at the same velocity (±10%) as water passing
around the sampler. This is called “isokinetic sampling” and is very important for representative suspended particulate sampling.
Isokinetic sampling is described in Glickman (2000) as “any technique for collecting airborne (waterborne) particulate matter in which the collector is so designed that the air stream (water stream) entering it has a velocity equal to that of the air (water) passing around and outside the collector. The advantage of isokinetic sampling consists in its freedom from the uncertainties due to selective collection of the larger, less easily deflected particulates. In principle, an isokinetic sampling device has a collection efficiency of unity for all sizes of particulates in the sampled air or water”.
At each vertical, such samplers need to be lowered at an even rate to the bed and raised again to the surface. This allows sampling of most of the water column, except the lowest few centimetres (e.g. the lowest 9 cm for the US DH-48 sampler). Transits through the water column are repeated, if necessary, at the same vertical until the bottle is approximately 70% full, thus avoiding overfilling, which can bias the sample. This is called the “equal transit rate” method (Guy and Norman, 1970; Edwards and Glysson, 1999; Gray and Gartner, 2009).
This vertical sampling procedure is then repeated at “no less than 3 and usually 5 to 10 verticals in a given cross section” (Dunne and Leopold, 1978) to capture the lateral variations in SSC (in a similar way as is done for stream gauging using impeller
Figure 5.3. Vertical distribution of concentration of various particle sizes in a stream section (after Nordin and Richardson, 1971).
50 100 150
9
8
7
6
5
4
3
2
1
0
Dis
tanc
e ab
ove
stre
ambe
d (m
)
Scale of suspended sediment concentration
0 100 200 300
< 0
.002
mm
0.00
2 –
0.0
16 m
m
0.01
6 –
0.0
62 m
m
0.62
– 0
.125
mm
0.12
5 –
0.25
mm
>0.
26 m
m
(parts/million)
Water surface
Water velocity(cm/sec)

38
SILTFLUX Literature Review
or electromagnetic current meters). Point samplers can be used to sample at only given depths for each vertical.
In shallow rivers, depth-integrating samplers can be fitted to a wading rod (e.g. US DH-48 sampler developed by the USGS) and hand-lowered to the bed by a fieldworker in waders or a drysuit. In deep rivers, depth-integrated sampling will need to be carried out from boats or at bridges by deploying the sampler on a long rod or cable.
Samples are transferred into plastic sample bottles, sealed and labelled, and transported back to the laboratory for analysis of SSC. To do this, samples of known volume are simply filtered normally through 0.45-μm filter membranes. Vacuum filtration can be used if clogging of the filter paper/membrane occurs. SSC can be calculated as follows:
SSC = wt/vol (Equation 5.2)
In Equation 5.2, “wt” is the dry weight of sediment (in g) and “vol” is the water sample volume (in L). (Note that organic material may need to be removed to determine the minerogenic component of the suspended material.)
5.2.3 Time-integrating samplers
To collect larger samples of suspended sediment for chemical analysis (e.g. for source tracing), time-integrating samplers are available. These are tubes with intake and outflow nozzles at the upstream and downstream ends, respectively. These samplers can be left in the flow for some time to collect sediment, which settles in the sampler (Figure 5.4). A useful video showing the use of these samplers is available on YouTube (http://www.youtube.com/watch?v=PnSm4hNAJ4Q).
Infiltration baskets can also be inserted into river beds to measure the accumulation of fine sediment. The mass and composition of the fine sediment can be quantified upon removal of the basket. An example from Heywood and Walling (2007) is shown in Figure 5.5.
5.3 AcousticDopplerCurrentProfilerMethod
The principles of the ADCP (essentially acoustic backscatter) method, which is used to estimate
SSCs (as a spin-off from the normal usage of ADCP for velocity profiling), are outlined by Gray and Gartner (2009). Wall et al. (2006) describe the typical procedures used to estimate fluvial and tidal SSCs from ADCP measurements. They stress that, although ADCPs were not designed for SSC measurements, they can be useful, but only after considerable investment in time and appropriate software to obtain a suitable transfer function between the acoustic signal and SSC (see also Filizola and Guyot, 2004). A particular strength of the technique is its ability to produce a “snapshot” of cross-sectional variation in SSC, especially for larger rivers.
5.4 Automatic Sampling for Suspended Sediment Concentration Time Series
Many authors have argued that suspended sediment data were traditionally collected using a range of manual sampling devices and that “the associated logistical problems and financial constraints mean that most manual sampling strategies fail to coincide with the main periods of sediment transport, i.e., flood events” (Collins and Walling, 2004). Such sampling programmes, if used alone, significantly underestimate actual suspended sediment fluxes and yields. Thus, although manual sampling can provide very useful data on spatial variations in SSC across, and between, single cross-sections and catchments, it is rarely sufficient to provide the necessary high-resolution time series of SSC, which are absolutely crucial for accurate and precise estimates of sediment fluxes and SSC.
The deployment of automatic water samplers (AWSs) is one way to address this need to sample at high temporal resolution. AWSs can be placed next to rivers in waterproof and vandal-proof housings, and set up to automatically extract water samples at, for example, 30-minute, 60-minute or 3-hour intervals (depending on the aims and resources of the study, and the flashiness of the river flow regime) and store the water samples in a crate on site. Crates are replaced at intervals, and the samples are retrieved and transported to the laboratory for processing and filtration. AWSs can be seen in action on YouTube (at: http://www.youtube.com/watch?v=kQl1qk7z8do).
However, the deployment of “passive” AWSs is likely to generate numerous samples at low flow and low SSC,

39
D. Lawler et al. (2010-W-LS-4)
Figure 5.4. Time-integrating suspended sediment sampler for collecting large amounts of suspended sediment for composition analysis (after Collins et al., 2010).
typically 1 m long
typically 10 cm diameter
Bed of channel
4 mm dia 4 mm dia
Figure 5.5. Infiltration basket for capturing fine sediment in gravel river beds (photo: Liz Conroy).

40
SILTFLUX Literature Review
and very few samples at high flow when suspended sediment fluxes peak. In many catchments, 95% of the sediment flux occurs only 10% of the time, normally during high-flow events. Therefore, it is important to use active, programmable AWSs (such as the ISCO, American Sigma or EPIC models), which can, if desired, lie dormant during periods of low flow/turbidity when sediment transport is minimal, and activate only if linked stage and/or turbidity triggers are exceeded. Such event-actuated sampling avoids the unnecessary use of valuable crated bottles, and saves them for the vital samples taken during key sediment transport events, which are fundamental to accurate sediment flux estimation. Of course, for completeness, some low-turbidity samples are desirable.
The intakes for AWSs are normally fixed at a single point in the cross-section near the bank (below the water level at all times, but above the level at which fine sediment clogging or damage by bedload transport may occur); however, floating intakes can also be used for sampling at a consistent proportional depth.
Although AWSs can provide strong datasets on SSCs and therefore SSLs, they have three disadvantages: (1) a relatively low frequency of sampling, typically limited by crates of no more than 24 bottles; (2) the lack of available capacity for sampling sequences of floods, when the bottles have already been filled by sampling from the initial event; and (3) the generatation of large volumes of samples that have to be processed and filtered in the laboratory before
estimates of SSC can be obtained. Turbidity metres can ease these problems considerably, and are discussed below.
5.5 Turbidimetric Instrumentation
5.5.1 Introduction
Turbidity “is an expression of the optical property of a medium which causes light to be scattered and absorbed rather than transmitted in straight lines through the sample” (American Public Health Association et al., 1995). Turbidimetry is a surrogate method for estimating SSC. However, the field is hampered by a lack of consistency with regard to units, sensors and calibration techniques, and there are many papers on these issues (e.g. Lawler, 2005a; Lawler, 2015). Turbidity used to be monitored manually by lowering a Secchi disk into the water, and simply noting the depth at which the disk markings became invisible to an observer on the surface (usually in a boat); although this is a subjective method, it provided the crucial long-running dataset (Figure 5.6) that was used to address the well-publicised problems of increasing turbidity over the last few decades in Lake Tahoe on the California/Nevada border (Jassby et al., 1999), which led to legal disputes with loggers in an attempt to prevent the loss of amenity resources in a key tourist area.
However, as reviewed by Gray and Gartner (2009) and Lewis (1996), many relevant and more modern techniques for measuring turbidity are now available.
Figure 5.6. Declining water clarity in Lake Tahoe, measured using the Secchi disk. The clarity decrease (turbidity increase) is thought to have been driven by fine sediment discharge from the surrounding lake catchment as a result of, for example, logging activities (after Jassby et al., 1999).

41
D. Lawler et al. (2010-W-LS-4)
The units of measurement are typically FTU (formazin turbidity units) or NTU (nephelometric turbidity units). One of the longest running investigations of turbidity was carried out in the USA by Jones and Schilling (2011); these authors demonstrated that sediment load decreased during the 20th century and recommended focusing management on reducing mobilisation.
5.5.2 The turbidimetry principle
The principle of turbidimetry is essentially simple: a beam, normally in the infra-red (IR) spectrum, of constant and known initial intensity, is emitted from a very high specification light-emitting diode (the kind used on aircraft control panels), and transmitted to an appropriate IR sensor across a known gap through which river water is allowed to pass. Particles within the gap, such as fine sediment, scatter or absorb some of the photons in the beam. This attenuates the beam intensity, as recorded by the sensor in the instrument. This reduction in the IR light recorded by the sensor is directly related to the concentration of suspended matter in the light path.
It is well known, however, that transmittance and scatter are functions not just of SSC, but also the “number, size, colour, index of refraction, and shape of suspended particles” (Gray and Gartner, 2009). Particle size distribution is a key issue: a given mass (or concentration) of fine sediment will cause greater light scattering (and therefore beam attenuation) than the same mass of coarser sediment. Fine sediment has a greater specific surface area than the same mass of coarse sediment, and the particle specific surface area and roughness largely control the light scattering ability of sediment (Ward and Chikwanha 1980; Lawler, 2005a). Indeed, data from Ward and Chikwanha (1980) show that, for the same SSC (1000 mg/L), particles in the 12- to 18-μm diameter range absorb an order of magnitude more light than particles in the 30- to 50-μm diameter range. Thus, if the particle size distribution of the SSL varies in space and time, this will affect the applicability of the calibration relationship.
5.5.3 Turbidity meters
Turbidity meters can be used as hand-held portable devices for “snapshot” measurements and vital, early field reconnaissance. However, their real value lies in the automated monitoring of SSC. Because of typically
rapidly changing SSCs – capturing which is beyond the capability of hand-sampling or even AWSs – much contemporary research on suspended sediment dynamics and fluxes is based on the automatic and high-resolution monitoring of turbidity as a surrogate variable for SSC (see, for example, Lawler, 2005a; Walling, 1974).
The great advantage of measuring water turbidity is that it can now be monitored automatically using electronic turbidity meters, such as the Partech IR40 and IR15 instruments, which are connected to data loggers. Data loggers (e.g. those manufactured by Campbell Scientific Ltd) can be programmed to simply scan and store turbidity data at high resolution (e.g. 15-minute frequency), or to store, if desired, the average of several scans if logger memory capacity is limited. Hence, it can much more usefully capture changing suspended sediment transport, including peaks, troughs and flat-lining in the SSC signal. These attributes are essential for the robust quantification of sediment concentrations and hence fluxes; in addition, the time-dependent sediment behaviour with respect to other events can aid understanding of sediment dynamics and sources.
Turbidity meters can be mounted directly in the river (normally at the channel edge), although they can be vulnerable to damage from large floating objects, clogging by organic and other debris, or bio-fouling of the optics (e.g. with algae). Therefore, such instruments require periodic (e.g. weekly) cleaning in order to preserve the integrity of measurements. Some turbidity meter models are self-cleaning, with a motorised optics wiper system powered by an on-site battery or solar panel. To obviate some of the difficulties of in-stream deployment, turbidity instrumentation can instead be installed in bankside housings away from potential sources of mechanical damage and vegetation fouling. In such cases, river water can be automatically withdrawn by pump or vacuum and directed to the instrument in this “safe house” (e.g. England and Wales Environment Agency automatic water quality monitoring stations; Lawler et al., 2006).
Turbidity meters work especially well at sites in which little seasonal or storm-event change in suspended sediment composition takes place; this should be assessed in any detailed investigation. However, any uncertainties regarding the role of such confounding variables locked into the turbidimetry principle are

42
SILTFLUX Literature Review
usually outweighed by the huge advantages of the continuous high-resolution datasets obtained.
Turbidity meters can also be deployed in the tidal zone (often a zone of repeated sediment deposition and re-erosion) to monitor the magnitude and migration of the estuarine turbidity maximum which, in turn, can partly be a function of fluvial sediment flux (e.g. Mitchell et al., 2003).
5.5.4 Laboratoryandfieldcalibrationofturbidimetric instrumentation
Data are often reported directly in FTU or NTU. However, for many geomorphological or sediment transport investigations, there is a need to report results in terms of SSLs or fluxes. This entails calibration, which can be difficult. Generic calibration factors between turbidity and SSC do exist, and can be provided by instrument manufacturers. However, it is preferable to derive a site-specific calibration factor for turbidity based on known SSCs, because turbidity–SSC relationships typically vary widely from river to river, station to station and over time, largely in response to changes in the composition of the SSL (see, for example, the field calibrations illustrated in Figure 5.7 and Figure 5.8).
There are a number of possible approaches to calibration. Laboratory procedures to derive calibrations are given in Lawler and Brown (1992) and Old et al. (2003).
Conventional calibrations used to be made with formazin, which is a polymer that was developed in 1926. Although formazin is considered a carcinogen, it is still used as a primary standard today (Sadar, 1998), and can be used for calibration as an alternative to sediment from the river or catchment being monitored. An effective method is simply to match up SSCs from samples withdrawn by on-site AWSs with synchronous, usually automated, turbidity meter measurements made as close as possible to the sampler intake point. If this is not possible, then large quantities of turbid water can be taken from the river for laboratory calibration purposes. Another option is to mix up a stock solution of turbid water using fine sediment (e.g. in the 1- to 250-μm diameter range) derived from likely, suspendable sediment sources upstream of the intended monitoring site (e.g. from river banks, exposed bars, fine bed sediment in pools, field poaching sites, farm tracks or hillslope gullies). The first step of calibration involves measuring the turbidity of a stock solution with the maximum expected SSC (e.g. 1000 mg/L). This stock is then sequentially diluted by adding distilled water in known volumes to produce a range of turbidity values (e.g. 20 values) until the lowest turbidity value is reached. Associated turbidity meter readings are taken for each known SSC. These high-to-low turbidity measurements minimise noise in the calibration by avoiding the need to add fresh sediment – possibly of a different particle size distribution – to the solution.
Figure 5.7. Turbidity versus SSC: calibration for the urbanised area at James Bridge, River Tame, Birmingham, UK (Lawler et al., 2006).
SSC
(mg/
L)
Turbidity (NTU)

43
D. Lawler et al. (2010-W-LS-4)
Manufacturers of turbidity instrumentation (e.g. Hach or Partech) can supply generic calibration factors, stock calibration solutions and gel slides which have a fixed assemblage of particles embedded within them, for a range of sediment concentrations. Such gel slides can be placed between the turbidity meter beam source and the sensor.
5.6 Optical Backscatter Sensor Instrumentation
The optical backscatter sensor (OBS) and nephelometer are similar to turbidity meters except that these instruments directly measure the amount of light or IR scattered by particles in the water column, rather than beam attenuation itself. For OBS instruments, backscatter is measured at 180° to the incident beam, that is, OBS instruments measure the IR radiation that is reflected back to the emitting sensor from particles approximately 0.5–30 cm from the front of the device, and outputs can be monitored automatically to create a useful time series of SSCs (e.g. Ruhl et al., 2001).
As for turbidity meters, the particle size distribution of suspended sediment influences OBS instrument turbidity measurements. For example, “one gram of silt, with a grain size of 10 microns, suspended in a
litre of water (SSC = 1000 mg l–1) might produce an OBS signal of 1 Volt; whereas a gram of sand with a grain size of 100 microns would produce only a 0.25-Volt signal, with other factors such as shape and mineral composition being the same” (Downing, 2008b). This is illustrated for a range of particle size distributions in Figure 5.9 and Figure 5.10.
A typical OBS field monitoring procedure is helpfully described by Chappell et al. (2011, p. 94) as follows:
At this station an OBS-3+SB-2.5-T4 turbidity probe (D & Instruments / Campbell Scientific Inc., Logan, USA) mounted on a self-cleaning Hydro-Wiper device (Zebra-Tech Ltd, Nelson, New Zealand) was attached to a protective steel manifold. A CR1000 data-logger (Campbell Scientific Inc., Logan, USA) was used to monitor turbidity every 30 seconds (on both 0–2000 and 0–4000 Nephelometric Turbidity Units or NTU ranges), with the average stored every 1 minute. Averaging and storage was changed to every 10 minutes after the first month of monitoring. A relation-ship between turbidity (NTU) and suspended sediment concentration (mg l–1) was estab-lished using water samples collected from the Ramu River over the ranges of 37 to 810 NTU and 74 to 2676 mg l–1.
Figure 5.8. Turbidity versus SSC: calibration for the large Skaftá river, south Iceland (Old et al., 2005a).
0 1 2 3 4 5 6 7
2
4
6
8
10
12
0
Turbidity measurement (Volts)
Sus
pend
ed s
edim
ent c
once
ntra
tion
(g/L
)

44
SILTFLUX Literature Review
5.7 Laser In Situ Scattering and Transmissometry
Laser in situ scattering and transmissometry (LISST) instrumentation also provides key information on sediment transport (e.g. Melis et al., 2003; Old et al., 2006; Gray and Gartner, 2009). LISST instruments are widely used by the USGS (e.g. Gray and Gartner, 2009) and are increasingly being used in Europe (e.g. Thonon and Van der Perk, 2003). In particular, LISST sensors usefully provide particle size distribution information for the suspended sediment in 32
logarithmically spaced size classes (Thonon and Van der Perk, 2003), within a total range of 1.5–250 μm (which is a typical fluvial suspended sediment range). Particle size distribution information may be used to pinpoint sediment source types or locations and pathways, and hence identify the key contributors to and explanations for any SSL problems in upstream catchments.
Different LISST instrument models are available for different contexts (e.g. oceanic or fluvial) and various size classes. For example, the Sequoia model
Figure 5.10. Effect of particle size on OBS response (Downing, 2008b).
10000
5000
1000
500
100 10 50 100 500 1000 5000 10,000 50,000 100,000
Suspended sediment concentration (mg/L)
OB
S o
utpu
t (m
V)
CLAY
SAND
SILT
SILT
1.0
0.3
0.1
0.0330 100 300 1000 3000 10 ,000
Suspended sediment concentration (mg/L)
Ligh
t abs
orba
nce
(i c) < 5 µm
6 - 8 μm12-18 µm
30-50 µm
Figure 5.9. Dependence of light absorbance on sediment particle size (after Lawler, 2005a).

45
D. Lawler et al. (2010-W-LS-4)
(see http://www.sequoiasci.com/) is a “streamlined isokinetic version of the LISST-100X developed for river sediment monitoring. The instrument senses the river current velocity using a pitot tube and adjusts (sampler) intake velocity to match. The river water is thus pumped through the instrument at the same speed as the water flowing around the instrument, making the sampling isokinetic”; this helps to ensure representative sampling. Data are transmitted from the submersible sensor head to a data logger on the bank.
As with turbidity meters, LISST optics should be cleaned at approximately weekly intervals to remove biological fouling, algal growth etc., and more frequently under some conditions (e.g. tidal rivers).
5.8 Remote Sensing of Suspended Sediment Concentration
It is also possible to obtain useful data on the spatial variation of SSCs of surface and near-surface waters using remote sensing imagery from appropriate satellite, helicopter or fixed-wing airborne platforms (see, for example, Ruhl et al., 2001). Advanced very high resolution radiometers (AVHRR) from satellites have proved very useful in this regard (e.g. San Francisco Bay; see Ruhl et al., 2001). Such imagery is especially helpful for large-scale water bodies, rivers and estuaries because it can show, for example, turbidity hot spots and high-turbidity plume dynamics, especially in a relative sense. The imagery and AVHRR reflectance has to be calibrated against actual SSC values obtained using other methods in order to deliver usable data on SSCs (see, for example, Ruhl et al., 2001). This is done by synchronous sampling or monitoring at the same place and time of the image capture.
5.9 Estimation of Suspended Sediment Loads
5.9.1 Introduction
As shown in Equation 5.1, SSLs are derived from the product of SSC and Q. Although apparently simple, the calculation of fluvial sediment fluxes is fraught with difficulty, and the process is often referred to as an “estimation”. Suspended sediment flux estimates need to maximise accuracy (i.e. proximity to the actual value) and precision (i.e. high repeatability). Problems include the following:
1. The many non-linearities in the sediment transport system, especially with regard to the relationship between Q and SSC (Figure 5.11), which are often power functions (e.g. Figure 5.12), are problematic.
2. There are problems related to the temporal variability of river flows and the variable SSC for a given flow. Sediment rating curves show that SSC can vary by 2 to 3 orders of magnitude for a given flow [as in Figure 5.11 from Walling and Webb (1981a)]. This is quite different from a stage-discharge rating equation in which, in the absence of geometrical changes of the channel at the gauging station, a given stage is always associated with the same discharge (notwithstanding rising and falling limb water surface slope differences as the flood wave passes).
3. Most suspended sediment transport occurs over a very limited time. For example, Walling et al. (1992) found, for the River Exe at Thorverton in south-west England for the 1978–1980 period, that 50% of the SSL was present just 1% of the time, and 90% of the total SSL was present only 5% of the time. It is crucial, therefore, to sample or monitor during such key periods. Typically, this leads to huge scattering with regard to Q–SSC relationships (sediment rating curves).
4. There are characteristically log–linear relationships between Q and SSC.
5. Hysteresis effects drive different SSCs for a given flow (during storm events and different seasons).
6. Cross-sectional SSC variations may complicate single-point (e.g. channel-edge) sampling or monitoring, etc.
7. Changing sediment particle size distribution effects, during and between storm events and seasons, can degrade simple relationships between turbidity and SSC.
Ensuring that sampling/monitoring is quasi-continuous is key to estimating SSLs. Walling and Webb’s (1981a) pioneering study demonstrated the importance of this by using a re-sampling approach on data from the River Creedy in Devon, England. They first computed “true” SSLs from a master high-resolution dataset, obtained from samples collected at 60-minute intervals. They then compared these values with those

46
SILTFLUX Literature Review
Figure 5.11. Examples of SSC–Q relationships for two British rivers (after Walling and Webb, 1981b).
1
River Tyneat Bywell1959-1961
April - October October
- April
Discharge (m3/s)
Sus
pend
ed s
edim
ent c
once
ntra
tion
(mg/
L)
500
50
5
5 50 500
1000
100
10
1
1 10 100Discharge (m3/s)
Sus
pend
ed s
edim
ent c
once
ntra
tions
(mg/
L) River ExeatThorverton(1971-1973)
April - SeptOctober - March
3 10 100 1000
10
100
1000
5000
Figure 5.12. Relationships between suspended sediment and area-weighted Q for several named British rivers (after Walling and Webb, 1981b).
10,000
5,000
4,000
2,000
1,000
0.01 0.02 0.05 0.1 0.2 0.5 1 2 5
4a7
5
13
14
1
3
3
River / Stream
3,000
500400
300
200
100
5040
30
20
10
54
3
2
10.001 0.002 0.005
17
4b
17
11a
11a
12
8
1011b 9
15
4b810
5
1513
7
96
17
4a
Sus
pend
ed s
edim
ent c
onc.
(mg/
L)
1 White Cart 3 Clyde 4a Tyne (summer) 4b Tyne (winter) 5 Rother 6 Slapton Wood Stream 7 Creedy 8 Exe 9 Dart10 Ystwyth11a Rosebarn summer11b Rosebarn winter12 Coachwater Drain13 Wye14 Severn15 Usk17 Crew
1
11b
14___
Discharge (m3s-1km-2)

47
D. Lawler et al. (2010-W-LS-4)
obtained from sampling at successively longer time intervals (e.g. daily, weekly, 2-weekly intervals) to mimic a low-resolution field investigation. Such studies demonstrate that very large load errors can arise with low temporal resolution sampling (see, for example, Walling and Webb, 1981a, 1985).
Several methods have been evaluated rigorously by Walling and Webb (1981a, 1985), and further examinations of the statistical methodologies involved have been published by Ferguson (1987) and Clarke (1990a, b). Phillips et al. (1999) evaluated 22 SSL estimation equations for catchments in northern England.
However, the problems associated with SSL estimation persist and more recent examinations include those by Webb et al. (1997), who investigated British rivers; Phillips et al. (1999), who examined rivers in the UK and showed that errors are magnified in larger catchments; Horowitz (2003), who, on the basis of sediment rating curves for US and European rivers, recommended that sampling is done on a hydrological, rather than a calendar, basis to minimise errors; Crowder et al. (2007), who studied SSL–Q relationships for US Midwest basins; and Brown et al. (2010), who used multiple load estimation approaches for basins in the UK, Germany and the Netherlands. As Moatar and Meybeck (2005) argued, some of these issues also apply to nutrient load estimation: “concentration data are still commonly the limiting factor on the quality of river flux estimates”.
5.9.2 High-resolution monitoring method: interpolation approaches
The most effective and accurate method of deriving total SSLs is field intensive and involves automated high-resolution, quasi-continuous sampling or monitoring, at sampling intervals that are short enough to ensure that SSC or flow does not change significantly (i.e. it is “safe” to interpolate Q and SSC between sample values). This interval is often set at between 10 and 30 minutes (commonly 15 minutes) in small- to medium-scale catchments in which flows and suspended sediment fluxes can change quickly (e.g. drainage basin area of < 1000 km2). Examples of such high-resolution studies in the UK include those of Lawler (2005b, 2006) and Old et al. (2003, 2006), and an example of such a study in Iceland is provided by Lawler et al. (2003). The monitoring period should also
be sufficiently long to be representative of longer term sediment transport conditions, and include a range of hydrological and meteorological events, especially storm sequences during which most sediment transport occurs.
Total suspended sediment load, (Ltot,) is then evaluated as the flux integral over a given period, as in Ferguson (1987):
(Equation 5.3)
In Equation 5.3, in SI unit terms, Ltot is the total SSL over time (in kg/s), T is the time (in seconds) over which loads are calculated, δt is the fixed sampling or monitoring interval used (in seconds), Ci is the instantaneous SSC (in g/L or kg/m3) at time i, and Qi is the water discharge at time i (in m3/second).
A number of variants of Equation 5.3 exist, depending on data (Q and SSC) availability and national conventions (see, for example, Horowitz, 2003).
5.9.3 Sediment rating curve method: extrapolation techniques
If automatic, continuous monitoring of turbidity is not practicable, then a reasonable, but less accurate and precise, alternative involves the use of sediment rating curves. These have been exhaustively discussed by numerous investigators from several disciplines (e.g. Walling and Webb, 1981a; Ferguson, 1986, 1987; Horowitz, 2008), so only a brief discussion is given here. Based on a limited period of sampling, a relationship is obtained between Q and SSC. The most common form is a log–log power function of the form:
SSC = aQb (Equation 5.4)
In Equation 5.4, a and b are coefficients determined empirically through regression.
The sediment rating relationship is then applied to a high-resolution discharge time series to produce values for the SSLs transported over a given period. Separate sediment rating curves are sometimes used to cater for (1) lower or higher flows; (2) any significant differences between rising and falling limbs of a hydrograph; or (3) seasonal variations in SSC for a given flow (see Figure 5.11). However, the sediment rating curve method has attracted controversy, partly because the relationship between Q and SSC is normally characterised by huge scattering and
Ltot = i=1
T /δT∑ Ci.Qi.δt

48
SILTFLUX Literature Review
uncertainty (see, for example, Figure 5.11), and the SSC values used are, of course, estimates. Ferguson (1987) recommends the use of a statistical correction factor if log–log sediment rating curves are used.
Figure 5.11 (Walling and Webb, 1981b) shows a cluster of log–log regression lines for 17 rivers (many in western or upland Britain), which demonstrates that for discharges normalised for catchment areas ranging
from 0.001 to 5 m3/second per km2, SSCs varied from 1 to 5000 mg/L. The value of exponent b (from Equation 5.4) for British rivers ranged from 0.3 to 2.0, and typically, was approximately 1.2. It was tentatively suggested by Walling and Webb (1981a) that lowland clay catchments have high a values and low b values and, conversely, upland catchments with resistant lithology are characterised by low a values and high b values.

49
6 Suspended Sediment Concentrations, Fluxes and Yields
6.1 Introduction
Material is delivered from catchments to downstream river reaches, floodplains, reservoirs, lakes, and tidal zones and seas in three main forms: suspended sediment, bedload and dissolved load (solutes). Exceptionally high SSCs can result. For example, a concentration of 500,000 mg/L was observed in the Rio Puerco, New Mexico, USA, by Dunne and Leopold (1978) (i.e. the sample was half sediment by weight). High SSCs, well above 2000 mg/L, have also been sampled in glacial rivers (e.g. Lawler et al., 2003) and a Mediterranean river (see Turner et al. 2008), but in humid temperate environments, concentrations tend to be lower, often < 1000 mg/L. A range of SSC values with respect to discharge is shown for several UK rivers in Figures 5.11–5.12.
In terms of total river loads, suspended sediment is often the most important flux, although its importance varies widely across the globe and over time. Typically, in humid temperate environments, the percentages of different sediment outputs are as follows: 50% suspended sediment; 45% solutes; and 5% bedload (Walling and Webb, 1981a). Coarse bed material may move on only a few occasions per annum in such catchments. However, in mountain and, especially, glacial rivers, bedload fluxes can account for 50% of total output. In these types of rivers, high and variable discharges and stream powers, and an almost limitless supply of loose, coarse gravels in the subglacial and extraglacial zones and braid plains, combine to allow the drainage system to access and transport large volumes of bedload material downstream. However, in these cold environments, in which chemical reaction rates are low, and runoff is rapid (reducing solute acquisition opportunities), dissolved loads may be as low as 5% of total sediment output.
This chapter summarises some of the available suspended sediment transport data for Irish rivers, and for similar environments in the UK and northern Europe.
6.2 Ireland
6.2.1 Existing research on suspended sediment release to Irish waters
Only a limited number of sediment flux studies have been undertaken in Ireland compared with other Eurpoean countries (Vanmaercke et al., 2011), and no comprehensive countrywide Irish study has yet been undertaken, unlike in, for example, the UK (e.g. Cooper et al., 2008; Walling et al., 2008b). The implementation of the EU WFD (2000/60/EC) has been the principal driver for suspended sediment research in Ireland. The integrated approach, which links water quality to catchment management, that is required according to this legislation has resulted in an increase in the number of studies investigating sediment levels in Irish catchments. Relevant studies are shown in Figure 6.1. All studies, apart from the “Eutrophication from Agricultural Sources” and “Pathways” projects, are ongoing.
Measured Irish sediment yields range from 2.1 to 48.4 t/km2 per year (Table 6.1) and are relatively low in comparison with those reported for other European countries (Vanmaercke et al., 2011). Data related to lake sediments confirm these low sediment levels. As an example, Jordan et al. (2002), in a study of Friary Lough (in Northern Ireland), reported reasonably constant yields of approximately 10 t/km2 per year. Sediment yields throughout the 20th century of between 14 and 58 t/km2 per year were estimated by Huang and O’Connell (2000) in a study of Ballydoo Lough (Connemara).
The annual mean SSCs reported as part of the Agricultural Catchments Programme (ACP) (Sherriff et al., 2015) are lower than the annual mean Freshwater Fish Directive guideline value of 25 mg/L. Furthermore, as reported by Sherriff et al. (2015) and Thompson et al. (2014), event-based exceedances in Irish catchments are typically limited to short durations. These, however, can be associated with significant

50
SILTFLUX Literature Review
sediment loadings and can present issues during sensitive periods of potential salmon migration and spawning. These patterns of sediment mobilisation are consistent with those reported by Harrington
and Harrington (2013), obtained from studies of the Bandon and Owenabue Rivers in south-west Ireland. For example, Harrington and Harrington (2010) estimated that 28% of the annual sediment flux of the
Figure 6.1. Catchments that have been studied in recent sediment-related Irish studies. “Eutrophication from Agricultural Sources” refers to EPA project 2000-LS-2.1.1a-M1; “Pathways” refers to EPA project 2007-WQ-CD-1-S1. ACP, Agricultural Catchments Programme; CIT, Cork Institute of Technology; OPW, Office of Public Works data.
Table 6.1. Summary of Irish sediment yields reported in the scientific literature
Catchment Area (km2) Sediment yield (t/km2 per year) Reference
Corduff 3.34 6.07–22.28 Sherriff et al. (2015)
Mount Stewart 7.52 6.7 Thompson et al. (2014)
Timoleague 7.9 3.95–14.92 Sherriff et al. (2015)
Dunleer 9.4 13.5–41.8 Melland et al. (2012), Sherriff et al. (2015)
Castledockrell 11 2.11–23.1 Melland et al. (2012), Sherriff et al. (2015)
Ballycanew 11.4 6.65–48.39 Sherriff et al. (2015)
Dripsey 15.24 9.8–16.1 Kiely et al. (2007)
Glenamong 17.91 16 May et al. (2005)
Mattock 20.96 44 Thompson et al. (2014)
Clarianna 29.8 8.5 Kiely et al. (2007)
The Oona 84.5 29–41 Kiely et al. (2007)
Owenabue 103 25.6 Harrington and Harrington (2013)
Bandon 424 14.2 Harrington and Harrington (2013)

51
D. Lawler et al. (2010-W-LS-4)
Owenabue River was transported over only 5% of the time.
As expected, peak SSCs for agricultural catchments are typically reported during storm events. For example, Harrington and Harrington (2013) reported maximum SSCs of between 837 mg/L and 979 mg/L in their study catchments, which are characterised predominantly by pasture land use. Peak SSCs for the ACP grassland catchments reported by Sherriff et al. (2015) range from 419 to 1020 mg/L. These values are comparable to those reported for catchments primarily used for arable farming, which have a higher potential for soil loss from increased tillage operations that expose bare soils. For example, Sherriff et al. (2015) reported peak SSCs of 221 to 2141 mg/L for this land use type.
However, there is an increasing recognition that sedi-ment loadings from pasture lands can be increased by poor animal husbandry and land management. This includes, but is not limited to, overgrazing and soil poaching by livestock, particularly around gateways and at drinking points on land or adjacent to rivers. These factors have been shown to adversely affect Irish freshwater systems (Conroy et al., 2016). Bank erosion caused by livestock poaching is also problematic in Irish catchments and is one of the factors that contributed to elevated sediment loadings in the Bush catchment, Northern Ireland (Evans et al., 2006).
Moreover, the erosion of upland peatland because of overgrazing by sheep can contribute to sediment loadings (Allot et al., 2005; May et al., 2005). This is a particular problem in upland peat catchments in Ireland. Significantly, sediment from these catchments is characterised by high levels of particulate organic carbon (Ryder et al., 2014), which can be more damaging to the ecological status of receiving waters than other types of sediment.
An increase in suspended sediment loadings can also occur during forestry clearfelling (Allott et al., 2005, Rodgers et al., 2011) and windrowing (Clarke et al., 2015) operations. Increases in peak SSC, from 88 mg/L before windrowing to 502 mg/L during windrowing operations, were reported by Clarke et al. (2015) and illustrate that forestry operations can produce SSC levels that are comparable to the upper range of those for agricultural catchments.
Although suspended sediment yields in Ireland are relatively low in comparison with those reported for other European countries (Vanmaercke et al., 2011), Irish catchments are often characterised by the presence of sensitive habitats, including Atlantic salmon spawning grounds and freshwater pearl mussel beds (National Parks and Wildlife Service, 2008), and, therefore, the ecological impacts of elevated sediment levels are particularly significant. Ireland must, therefore, develop adequate regulations for sediment control. Data from Irish sediment research (Figure 6.1) continue to contribute to the characterisation and understanding of the processes that influence the mobilisation and delivery of fine sediments from source to receptor. This knowledge, combined with sediment yield data from Irish catchments, will be essential for the establishment of standards in a regulatory framework for sediment control.
6.3 Britain and Northern Europe
Relationships between suspended sediment yields, bedload and catchment areas for British rivers were derived by Sear et al. (2003) and are shown in Figure 6.2. SSLs, in t/year, tend to be higher than bedload fluxes, and are linked to the area of the catchment (A), in km2, as shown in Equations 6.1 (for small “sediment source” catchments of < 100 km2) and 6.2 (for large catchments of < 100 km2):
SSL = 11.64A1.16 (n = 60, r2 = 0.63) (Equation 6.1)
SSL = 31.04A1.04 (n = 44, r2 = 0.48) (Equation 6.2)
Note that the exponent for large catchments (i.e. 1.04) is lower than that for smaller catchments (i.e. 1.16); this probably reflects the declining erosion (sediment production) and increasing sediment storage opportunities in a downstream direction.
Cooper et al. (2008) and Collins et al. (2009) have produced some very useful suspended sediment yield data, which map to over 100 British catchments in south-western England, southern and mid-Wales, the Midlands and the Pennines [including many data from the Natural Environment Research Council’s Land Ocean Interaction Study (NERC LOIS) programme], and southern Scotland. This compilation, based on lake sediment accumulation data and fluvial suspended sediment transport estimates, shows that suspended sediment yields vary from 2 to 160 t/km2

52
SILTFLUX Literature Review
per year, with the highest yields observed in northern Britain (in the Pennines and the Lake District) and in northern and mid-Wales .
Cooper et al. (2008) attempted to link suspended sediment yields to catchment characteristics and three different typologies (the Walling system, the WFD system and a new typology created by the authors of the study) within a combined geographical information system and digital elevation model framework. Table 6.2 shows the relationship between suspended
sediment yields and the Walling typology (Walling et al., 2008b): the highest suspended sediment yields were found for upland, low-impact catchments (types 1 and 2; see Table 6.2). For the WFD typology, 16 catchment types (of the 44 types in the WFD definition) were represented in the British dataset. The highest yields tended to be generated from mid-altitude, extra-small and small catchments (Table 6.3).
The new typology developed by Cooper et al. (2008) is shown in Table 6.4; from this table, it is clear that
Figure 6.2. Observed sediment yield (bedload and suspended load) data as a function of catchment area for UK rivers (after Sear et al., 2003).
100000
10000
1000
100
10
1
00.001 0.01 0.1 1 10 100 1000 10000
BED LOAD
SOIL EROSIONSUSPENDED LOAD
SOILEROSION
RESERVOIRS BED LOAD
Catchment Area (km )2
Sed
imen
tLo
ad(t
onne
s/ye
ar)
SUSPENDED LOAD
1000000
From catchments with Area < 100 km
Bed L = 5.85 A (n=33, r = 0.31)
Suspended L = 11.64 A (n=60, r = 0.63)
From catchments with Area > 100 km
Bed L = 2.50 A (n=7, r = 0.41)
Suspended L = 31.04 A (n=44, r = 0.48)
2
2
1.08
1.16
1.16
1.04
2
2
2
2

53
D. Lawler et al. (2010-W-LS-4)
Table 6.2. The Walling catchment typology: links to suspended sediment yield (adapted from Cooper et al., 2008).
Type Altitude Impact Size Yield (t/km2 per year)
< 3 3–7 7–23 23–56 56–90 > 90 Total
1 Mid Low XS 1 2 2 2 5 9 21
2 Mid Low S 1 2 3
3 Mid Agric XS 1 3 4
4 Mid Agric S 3 3
6 Low Low XS 1 1
7 Low Agric XS 7 3 10
8 Low Agric S 3 2 6 7 1 19
9 Low Agric M 3 4 9 7 2 2 27
10 Low Agric L 1 4 1 3 9
11 Low Urban XS 1 1
12 Low Urban S 1 1 1 3
Impact is characterised as “low”, “agricultural” or “urban”. The replacement of “geology” by “impact” in the typology of Walling broadly replaces “siliceous” and “organic” with “low impact”, and “calcareous” with “agricultural”, with the “urban” classification being new. The catchments are classified according to mean altitude (low: < 200 m; mid: 200–600 m; high: > 600 m) and size (XS: < 10 km2; S: 10–100 km2; M: 100–1000 km2; L: 1000–10,000 km2; XL: > 10,000 km2).
Table 6.3. The WFD catchment typology: links to suspended sediment yield (UKTAG, 2008). This typology is based on three catchment characteristics (altitude, size and geometry) (adapted from Cooper et al., 2008)
Type Altitude Size Geology Yield (t/km2 per year) Total
< 3 3–7 7–23 23–56 56–90 > 90
1 Low S SI 2 1 1 4
2 Low S CA 3 2 4 8 17
4 Low M SI 1 1 1 3
5 Low M CA 3 4 3 2 1 13
8 Low L CA 1 4 1 6
10 Mid S SI 3 2 5
11 Mid S CA 1 1 1 3
13 Mid M SI 4 2 1 7
14 Mid M CA 2 1 3
16 Mid L SI 1 2 3
17 Mid L CA 1 1
37 Low XS SI 2 2
38 Mid XS SI 1 2 1 4 2 6 16
40 Low XS CA 3 2 3 8
41 Mid XS CA 2 2 4
44 Mid XS OR 1 1 1 3 6
The catchments are classified according to mean altitude (low: < 200 m; mid: 200–600 m; high: > 600 m), size (XS: < 10 km2; S: 10–100 km2; M: 100–1000 km2; L: 1000–10,000 km2; XL: > 10,000 km2) and dominant geology. Geology is classified by the British Geological Survey as SI, CA, OR or SA (Kinniburgh and Newell, 2003). The SI and CA classes relate to solid geology, while the OR and SA classes are based on near-surface characteristics. CA, calcareous; OR, organic; SA, saline; SI, siliceous.

54
SILTFLUX Literature Review
the two highest classes of suspended sediment yields are delivered from catchments classed as “hip” (high impermeable peat; 16 catchments) and “lip” (low impermeable peat; two catchments). The authors also use this new typology to estimate suspended sediment yields across England and Wales from catchment typology information generated by national databases of catchment characteristics on a 1-km2 grid scale (Figure 6.3).
However, British suspended sediment yields are low by world standards and compared with mountain and glacial catchments in northern Europe. For example, Lawler (2003) showed that the approximately 100-km2 glacierised basin of Jökulsá á Sólheimasandi in southern Iceland delivers suspended sediment yields of 10,000 t/km2 per year, and suspended sediment yields for glacial catchments of similar orders of magnitude have been analysed by Gurnell et al. (1996). However, the relatively low sediment fluxes of well-vegetated humid temperate environments can still lead to significant negative impacts on fluvial hydroecology (see Chapter 4).
An excellent compilation and analysis of sediment yield data for the whole of Europe, including Ireland, has recently been published by Vanmaercke et al. (2011). This was based on a dataset of over 29,000 catchment-years and 1794 sites (507 reservoirs and 1287 gauging stations), for drainage basin areas ranging from 0.01 to 1,360,000 km2. They found that the lowest sediment yields were in the flat areas
of western, northern and central Europe: these catchments accounted for half of the low sediment yields (< 40 t/km2 per year) in the database, and approximately 80% of the sediment yields of < 200 t/km2 per year.
Vanmaercke et al. (2011) also found a statistically significant (p < 0.05) inverse relationship (as others have in smaller-scale studies) between catchment area and sediment yield. This relationship emerged for most climatic zones, including zones classified as “Atlantic”, according to their classification, which are of most relevance to Irish environments. This suggests that sediment storage opportunities increase downstream, as steep topography gives way to relatively low and flat landscapes where sediments can be deposited at slope bases, in floodplains or on channel bars and beds. Generally, they found stronger relationships between climate and sediment yield, than between topographic indices and sediment yield.
In a survey of downstream water clarity in three unregulated catchments in New Zealand and Wisconsin, USA, Julian et al. (2008a) found that turbidity increased (and clarity decreased) along the channel length to a zone approximately 70% along the continuum; after this point (i.e. further downstream), turbidity declined slightly (Figure 6.3). This is consistent with the mid-basin peak in-stream power modelled by Lawler (1992) and validated by Barker et al. (2009), thought to result from enhanced bed instability and river bank erosion.
Table 6.4. The new “Natural England” typology: links to catchment suspended sediment yield (adapted from Cooper et al., 2008)
Altitude Permeable/ impermeable
Geology Index Yield (t/km2 per year) Total
< 3 3–7 7–23 23–56 56–90 > 90
Low Permeable Chalk LPC 6 7 3 16
Low Permeable Other LPO 1 16 19 5 2 43
Low Impermeable Other LIO 3 5 8 1 17
Low Impermeable Peat LIP 1 1 2
High Permeable Other HPO 1 1 2
High Impermeable Other HIO 2 1 2 5
High Impermeable Peat HIP 1 4 2 9 16
The first letter in the index classification refers to altitude with H and L referring to high (> 330 m) and low (< 330 m) altitudes, respectively. The middle letter relates to the Standard Percentage Runoff with P and I referring to permeable and impermeable catchments, respectively. The third letter refers to the Hydrology of Soil Types soil classification, with C, P and O describing chalk, peat and other soil classes, respectively. HIP, high impermeable peat; LIP, low impermeable peat.

55
D. Lawler et al. (2010-W-LS-4)
Figure 6.3. Downstream changes in optical water quality in six rivers in Wisconsin (USA) and New Zealand (Julian et al., 2008a).
Bea
n at
tenu
atio
n co
effic
ient
, c (m
–1)
Normalised river length (% of total length)

56
7 Storm-Event and Seasonal Suspended Sediment Dynamics
7.1 Storm-Event Suspended Sediment Dynamics
Suspended sediment yields are useful, but unless attempts are made to understand the sources, delivery, processes and dynamics of sediment transfer from sources to rivers, then management initiatives aimed at sediment control could be less targeted; it may be more difficult to engage potentially sceptical stakeholders and farmers, and such initiatives may be problematic to implement and possibly fund. A consideration of sediment dynamics is thus crucial for the understanding of the sediment system, and thereby informing any management solutions. This section summarises the typical dynamics of sediment responses in river systems.
Although significant suspended sediment pulsing can occur independently of Q variation in some catchments (e.g. glacierised basins; see Lawler and Brown, 1992; Lawler, 2005b), numerous empirical studies have shown that, in humid temperate environments, most suspended sediment is transported during storm events (e.g. Walling, 1974; Walling and Webb 1981b; Old et al., 2003, 2006; Owens, 2009). Indeed, in many catchments, most suspended sediment flux is transported in just a few events, mainly during and soon after rainstorms. For example, Old et al. (2003) showed that 40% of annual SSL in the Bradford Beck urban stream is transported during only approximately 1% of the year, and Horowitz (2008) reported that > 94% of the fluvial fine sediment transported in Atlanta, USA, occurs during storm events occupying < 20% of the time. It is, therefore, vital that, in any suspended sediment investigation, maximum resources are devoted to high temporal resolution monitoring and/or sampling of SSCs during such high-flow (or other turbidity-generating) events.
7.2 Hysteresis
One of the most common sediment-related responses to occur during storm events, especially in small catchments, is the rapid rise in SSCs during the rising limb of the hydrograph, then a peak ahead
of the flow maximum, before a quick decline. This is the classic response described by the “first-flush model” (Figure 7.1 and Figure 7.2). If SSC is plotted against synchronous discharge, a classic positive (i.e. clockwise) hysteresis relationship often emerges, as is shown by, for example, Walling and Webb (1981a) and Walling (1997).
7.2.1 Intra-storm hysteresis effects
A common attribute of catchment sediment systems is positive hysteresis, by which the maximum SSC precedes the flow peak (e.g. Stubblefield et al., 2007). Thus, SSCs are already falling by the time of the flow peak, suggesting that channel hydraulics are not the only variables that influence suspended sediment transport.
Walling (1974), and many others since, have argued that this positive hysteresis is driven by the early flushing of readily accessible, but finite, supplies of loose erodible fine sediment in the catchment. This applies particularly to supplies from river bank erosion, which can be more pronounced early in the storm, when rising flood waters “attack” bank materials that have previously been weakened by weathering and preconditioning processes, such as freeze–thaw action (Hill, 1973, study in Northern Ireland; Lawler et al., 1997; Lawler, 2005) (see Chapter 2). Loose, highly erodible, exposed sediment sources are often widely available on catchment surfaces (e.g. from arable fields and poaching sites), and these supplies can be relatively quickly entrained during the start-up phase of the storm. However, these supplies are also quickly depleted – a concept known as “sediment exhaustion” – leaving little available fine sediment for transport in the later stages of the hydrograph.
Positive hysteresis may also arise because of “baseflow dilution”, that is, waters arriving later in the storm via sub-surface baseflow routes can be sediment poor because the potential for erosion and entrainment of fine sediment is limited by low through-flow velocities.

57
D. Lawler et al. (2010-W-LS-4)
This first-flush concept is now enshrined in numerical sediment transport models and those for other contaminants [e.g. the Storm Water Management Model of the United States Environmental Protection Agency (USEPA); see Akan and Houhhtalen, 2003]. Such models allow for the accumulation of sediments and/or contaminants between storm events; these supplies are then very quickly entrained by rainfall or river flows early in the storm event, leaving few supplies for the recessional limb of the hydrograph.
7.2.2 Inter-storm hysteresis effects
Positive hysteresis is also evident on weekly timescales if multiple storm events occur. For example, Figure 7.2 shows that for a sequence of storm discharge rises, successive SSC peaks tend to progressively decline, despite flow maxima that are of similar magnitudes. This can also lead to multiple clockwise hysteresis loops.
Figure 7.1. SSC response dynamics: SSC leading the flow (top panel) and the classic positive hysteresis and first-flush model of sediment dynamics (bottom panel) (after Lawler et al., 2006).
0
10
20
30
40
50
60
70
80
90
100
0
20
40
60
80
100
120
140
160
180
0 5 10 15 20 25 30
Susp
ende
d se
dim
ent c
once
ntra
tion
(mg/
L)
Dis
char
ge (m
3 )
Time (hours)
SSC
Discharge
0
20
40
60
80
100
120
140
160
180
0 10 20 30 40 50 60 70 80 90 100
Discharge (m3/s)
Susp
ende
d se
dim
ent c
once
ntra
tions
(mg/
L)SSC
Discharge
suspendedsedimentleadsflow
sedimentexhaustion

58
SILTFLUX Literature Review
7.2.3 Negative, anticlockwise hysteresis
It is important to stress that the first-flush model, although commonly applicable, is not entirely ubiquitous. For example, studies by Heidel (1956) and Asselman et al. (2003) on the Rhine, and Lawler et al. (2006) on the urbanised River Tame, have shown that negative, anticlockwise hysteresis, in which peak SSCs occur just after the flow maximum (e.g. Figure 7.3), can also be a typical response. For the Tame, although some clockwise hysteresis responses emerged, anticlockwise hysteresis was by far the most common response (Figure 7.4). Lawler et al. (2006) quantified the magnitude and direction of hysteresis for these events with a simple hysteresis index, and suggested a range of hypotheses to account for the anticlockwise hysteretic behaviour, including:
1. sediment-wave versus water-wave translation differences (Heidel, 1956; Marcus, 1989; Bull, 1997; Knight, 2005), i.e. wave celerity phenomena;
2. distal sediment sources that take a long time to arrive in the channel, as Heidel (1956) observed;
3. biofilm break-up late in the hydrograph, releasing trapped sediment;
4. combined sewer overflows, which spill late in storm events.
One possibility is the lack of baseflow dilution in urban catchments, because the necessary basin water storage for strong baseflows to occur on recessional
hydrograph limbs is largely restricted by highly impervious urban surfaces, such as concrete, glass, steel, tarmac, brick and stone.
Thus, hysteresis, both positive and negative, is very common in fluvial sediment transport systems. One implication of hysteresis is that it makes predictions of SSCs from Q using a rating curve approach very difficult (see Section 5.9).
7.3 Seasonal Changes in Suspended Sediment Fluxes
For humid temperate environments, there have been surprisingly few studies devoted to seasonal changes in SSCs or fluxes. This is in contrast to the numerous investigations of seasonal changes in glacierised catchments, in which the high flows of the summer-melt season are matched by very high SSCs and loads (e.g. Lawler et al., 2003; Old et al., 2005; Stott et al., 2009).
Exceptions include the work of the Exeter group led by Walling (Walling, 1974, 1988; Walling and Webb, 1981a) on Devon rivers. These studies showed that, perhaps surprisingly, summer SSC values tend to be higher than winter values (e.g. Figure 5.11). This was thought to be because the inter-arrival time for summer storms is usually much longer than that for winter storms, allowing a longer period for the preparation of fine sediment supplies ready for removal from catchment and river bank surfaces and delivery to the river mainstem. Such preparation processes may
26 27 28
30
20
10
0
3000
2000
1000
Dis
char
ge (
m )
Suspended sedim
ent conc. (mg/L)
3
Discharge
suspended sediment concentration
December 1974
25
afterWalling et al 1981
Figure 7.2. Classic suspended sediment dynamics in response to storm-event discharge changes on the River Dart, south-west England (after Walling and Webb, 1981a).

59
D. Lawler et al. (2010-W-LS-4)
include desiccation-related cracking of field soil and, especially, bank materials (see, for example, Lawler et al., 1997). This may be exacerbated by a tendency for intense convective storms and storms with greater raindrop diameters to strike in summer. Seasonal suspended sediment hysteresis was also noted for mountain streams that drain to Lake Tahoe (California–Nevada border, USA) by Stubblefield et al. (2007).
Although winter suspended sediment concentrations may be lower, suspended sediment yields may be higher, given the higher river discharges and the tendency for rainstorms to fall on bare arable fields from which soil particulates can be entrained more easily. Kemp et al. (2011) show a useful example of this for agricultural catchments, and with respect to seasonally changing cultivation patterns and risk periods for fish at different life stages.
Figure 7.3. The typical suspended sediment dynamic response in the urbanised River Tame catchment (Birmingham, UK) is negative, anticlockwise hysteresis, in which peak SSCs occur just after the flow maximum (after Lawler et al., 2006).
50
45
40
35
30
25
20
15
10
5
0
Dis
char
ge (m
3 )
500
400
300
200
100
00 12 24 36
Time (hours)
River Tame at Water Orton
Turbidity (FTU)
Figure 7.4. Clockwise hysteresis and anticlockwise hysteresis (the most common loops in the Q–turbidity relationship) for the River Tame, Birmingham (after Lawler et al., 2006).
3 April
4 April
Discharge (m3/s)
Turb
idity
(FTU
)
100
200
300
400
500
00 1 2 3 4 5 6

60
SILTFLUX Literature Review
7.4 Longer Term Changes
Changes in suspended sediment yields over decadal and century timescales have been considered, but less intensively. For example, Walling et al. (2003) studied sediment cores from lakes and reservoirs in order to reconstruct suspended sediment yields over the previous 150 years for the Ouse and Tweed river catchments in northern England. The sediment yields for the Ouse generally increased after 1963, which reflects the intensification of agriculture at this time. For the Tweed, suspended sediment yields were higher in the earlier period of the study, which the authors ascribed to afforestation and switches from pasture to arable land use in the 1940s and 1950s. Climate apparently had little effect on either catchment. Walling and Fang (2003) analysed data from a selection of the world’s rivers and reported a decreasing trend for sediment concentrations; they concluded that reservoir sedimentation played the largest role in controlling sediment flux to oceans.
Lawler et al. (2003) found that sediment yields in three Icelandic glacierised basins were amongst the highest in the world, at approximately 10,000 t/km2 per year. However, in general, these yields decreased during the 1973–1992 period examined, and, although meltwater season sediment transport increased, this appeared to be more than offset by decreased river flows and sediment transport in spring and autumn, leading to a net reduction in suspended sediment yields. Walling (2005) identified a trend for decreasing suspended sediment yields for world river basins, which was ascribed to the impact of dams and reservoirs on sediment storage. Horowitz (2010) documented a decline in suspended sediment fluxes in the Mississippi River from 1981 to 2007, and suggested that this resulted from a reduction in sediment supply (rather than discharge) associated with the emplacement of artificial structures, but also improved land management. Conversely, fine sediment generation appears to be increasing in some catchments, including that of Lake Tahoe (Jassby et al., 1999).

61
8 Effects of Land Use and Climate Change on Sediment Fluxes
8.1 Introduction
The sediment yield of a basin depends on numerous factors including rainfall, storm runoff, basin relief, size and morphology, tectonics, bedrock lithology and structure, topography, soil type, land cover/use and climate (Milliman and Syvitski, 1992; Gordeev et al., 1996; Inman and Jenkins, 1999; Farnsworth and Milliman, 2003; Molina et al., 2008). This chapter looks at the impact of climate change and land use on sediment fluxes. Land use and climate change (along with runoff) are the only factors that influence sediment yield that are subject to change over relatively short periods. It is therefore important to understand and be able to predict the impacts of these factors on sediment yields.
Every catchment’s sediment yield will change uniquely in response to alterations in climate and land use. This often leads to difficulties with regard to making general statements on how a particular change in a certain characteristic of a catchment will affect that catchment’s sediment yield. As noted above, land use and climate change are only two of a number of variables that influence the sediment yield of a basin. There are numerous examples in the literature of increasing and decreasing sediment yields of different catchments undergoing the same change in land use (e.g. Bakker et al., 2008; Hunter and Walton, 2008). Some basins are better able to cope with changes by remobilising stored sediment in times of deficit (Walling, 1999), while some intensive land use changes may occur in areas of poor connectivity with the river channel, and therefore will not affect the sediment yield of the basin at all. It is important to keep this in mind when trying to identify the likely effects of land use and climate changes on sediment yield.
To accurately determine why sediment fluxes change, it is necessary to have a detailed understanding of past and present information on sediment fluxes, land uses and climatic conditions (Houben et al., 2006).
8.2 Climate Change with Particular Reference to Ireland
Over the course of the 20th century, the global-average surface temperature increased by 0.6°C (±0.2°C) (Betts, 2002; McElwain and Sweeney, 2003) and overland precipitation increased by 1% (Kiely, 1999). Global mean temperatures are predicted to have increased by between 1.4°C and 5.8°C by the end of the 21st century, with a corresponding increase in global mean precipitation of 2.4% per 1°C increase in temperature (Betts, 2002; Jasper et al., 2004; Fealy and Bates, 2009).
Enhanced hydrological cycles (leading to increases in the rates of precipitation and the rates of evaporation and runoff) are expected for parts of the northern latitudes, including western Europe (Kiely, 1999). In recent decades, there has been an increase in mean precipitation, as well as more frequent heavy precipitation events over the majority of land in northern Europe (Steele-Dunne et al., 2008).
While it is uncertain whether or not the trend in Irish temperatures over the previous century matches those identified by the Intergovernmental Panel on Climate Change, the Irish climate, in general, is following similar projections to those predicted by global climate models (McElwain and Sweeney, 2003; Fealy and Bates, 2009).
Ireland and Great Britain have experienced an enhancement of hydrological cycles and a stronger seasonality than before, in precipitation and streamflow, is becoming evident (Kiely, 1999; Betts, 2002); furthermore, even more apparent seasonality is predicted for the 21st century (Arnell and Reynard, 1996; Pilling and Jones, 2002; Fealy and Bates, 2009). February, March and October are the wettest months and appear to be getting wetter, while May, August and September tend to be the driest (McElwain and Sweeney, 2003), although extreme events of higher magnitudes are occurring more frequently

62
SILTFLUX Literature Review
in September and October (Kiely, 1999). Winter precipitation in Ireland is expected to increase by between 6% and 13% over the next 40 years, and summer precipitation is expected to remain unchanged or decrease by up to 8% (Betts, 2002).
There is some debate regarding the possible future spatial variations in precipitation in Ireland (Fealy and Bates, 2009), but Kiely (1999) noted that there was a significant increase in precipitation on the west coast of Ireland since 1975, with little or no increase in the east. Charlton et al. (2006) predicted a decrease in runoff in the east and south-east, and stated that an increase in the north-west is likely.
With regard to the possible future combination of temporal and spatial variations in Irish precipitation, McElwain and Sweeney (2003) and Charlton et al. (2006) have acknowledged that there are likely to be increases in the north-west in winter and decreases in the south-east in summer.
Observational records suggest that both the frequency of occurrence and the intensity of extreme events is increasing (Fealy and Bates, 2009). Kiely (1999) provided evidence that the number of extreme events in Ireland has increased since 1975 (although this probably has more to do with the natural climate variability/influence of the North Atlantic Oscillation rather than global climate change). Murphy and Charlton (2008) and Fealy and Murphy (2009) predicted that the frequency of extreme events (of both high and low magnitudes) will increase over the course of the 21st century.
8.2.1 Effects of climate change on sediment fluxes
More intense rainfall patterns are expected to result in increased runoff, which, in turn, will transport more non-point source runoff into waterways (Kiely, 1999; Dornblaser and Striegl, 2009) resulting in an altered nutrient balance and greater levels of turbidity (Penck et al., 2009). More importantly, most sediment is delivered to water bodies during low-frequency storm events; therefore, an increase in the frequency of events is likely to lead to an increase in sediment concentrations/loads (Hunter and Walton, 2008; Scheurer et al., 2009).
Thodsen et al. (2008) discussed the secondary effects that climate will have on sediment yields. An increase in temperature will change the growing and sowing seasons for many crops, in turn changing the temporal and total erodibility of the soil in which they grow. Growing periods for river macrophytes and plants will be extended and this will alter the sediment transport dynamics within the river channel.
The majority of stream flow/runoff values, and hence sediment yields, predicted for the 21st century were based on the assumption that catchment characteristics will remain constant. This assumption is unrealistic as land uses may, and inevitably will, change in the future; such changes will alter the runoff behaviour in catchments and the associated sediment delivery to water bodies.
8.3 Land Use
Moderate land use can double or triple the sediment yields of a basin, while intensive land use can increase yields by an order of magnitude (Saunders and Young, 1983).
Erosion processes create the supply of sediment, while factors and processes such as basin slope, runoff, and hillslope/river channel linkage (Foulds and Macklin, 2006) influence the transport of this sediment. Agricultural land use changes, changes in forest management practices and climate change have led to an increase in erosion rates (Scheurer et al., 2009). Global soil erosion potential is estimated to have increased by 17% during the 20th century because of the development of arable land (Yang et al., 2003).
The amount of sediment that actually reaches the river channel, relative to the amount available for transport, is denoted by the SDR (Walling, 1997; Asselman et al., 2003); this value is unique for each catchment. Some land conditions are more susceptible to erosion than others, while some are better than others at transporting sediment. Changes in land use/cover alter the erosion and transport processes of a catchment; this, in turn, will alter the SDR and, ultimately, the sediment yield. Table 8.1 shows some of the different effects that land cover changes can have on the hydrological characteristics of a catchment.

63
D. Lawler et al. (2010-W-LS-4)
8.3.1 Dominant global agricultural land uses/coversandinfluences
Agriculture can have a major impact on sediment fluxes in a basin. The clearance of protective vegetative land cover, for example by the use of machinery on fields (Scheurer et al., 2009) or the degradation of land by animal pastures, leaves the soil exposed to erosion and creates drainage pathways over the land, allowing for more rapid and larger volumes of sediment transport. Agricultural practices can affect a landscape’s water retention potential and its infiltration capacity (Bronstert et al., 1999).
Ward et al. (2009) found that in the Meuse catchment (Western Europe), the primary factor controlling long-term changes in sediment yield was the conversion of forests to arable land. Furthermore, the expansion and intensification of agriculture, which consumed and decreased basin buffer strips, is thought to have increased fine sediment loads in rivers in Alpine regions (Scheurer et al., 2009).
It is assumed that changes in agricultural management and precipitation patterns have increased the sediment yield in the Danube catchment by 30–50% (Scheurer et al., 2009), while the sediment dynamics of the Waipaoa River in New Zealand were severely affected by the large-scale clearance of forest and the subsequent conversion of the land to pasture during the late 19th and early 20th centuries (Gomez
et al., 2007). Bakker et al. (2008) reported substantial decreases in sediment export to rivers in Europe because of the conversion of marginal agricultural arable land to forests, grasslands and scrublands.
8.3.2 Urbanisation
Urbanisation within a basin will induce a hydrological change, as natural land is replaced by impermeable or hard cover layers; this will increase runoff and alter the flood peak of the basin. These changes have implications for the sediment yield of the basin: soil previously available for erosion may be concealed, thus reducing erosion processes and leaving less sediment available for transport.
A study carried out by Inman and Jenkins (1999) identified that the extensive hard cover of the streets and river channels of the Los Angeles urban area has significantly reduced the sediment yield. Urbanisation of a basin in California led to a 20-fold decrease in the SSC, with respect to discharge, in the river by a non-linear dilution process due to changes in the hydrological regime (Warrick and Rubin, 2007).
However, large increases in sediment yields and concentrations can occur in basins undergoing urbanisation, as a result of construction activity (Chen, 1974; Walling, 1974; Warnock and Lagoke, 1974). Chen (1974) found that erosion rates were over 50-times higher in urbanising basins compared
Table 8.1. Some effects of land cover changes on catchment characteristics (modified from Bronstert et al., 1999)
Change of land cover Affected catchment characteristics
Urbanisation (increase of impermeable areas) No soil storage
Accelerated runoff concentration
Deforestation Less canopy storage and root depth
Less litter storage
Reduced infiltration capacity
Forest damage (by acid rain) Less canopy storage
Consolidation of farmland (re-allocation and rationalisation) Less soil and canopy storage
Reduced surface storage
Accelerated runoff concentration
Intensive agricultural usage (soil compaction, use of heavy machinery)
Reduced infiltration capacity
Reduced ponding storage
Accelerated runoff concentration
Change in vegetation composition (triggered by climate change or by anthropogenic activities)
Changed canopy storage and root depth
Changed soil parameters, e.g. infiltration capacity

64
SILTFLUX Literature Review
with natural basins in the eastern USA. SSLs in Canadian streams were three- to five-times higher in basins undergoing urbanisation than in rural basins in neighbouring streams of approximately equal size (Warnock and Lagoke, 1974). Walling (1974) found that sediment loads and concentrations in a basin near Exeter, UK, increased by 5- to 10-fold and five-fold, respectively, during construction in an area comprising 25% of the basin.
8.3.3 Forestry
Forested catchments have the best natural water storage capacity and lowest runoff yields of all catchment types (Bronstert et al., 1999). Sediment is often “trapped” (deposited) in forests, breaking the link between flow paths and the river channel (Van Rompaey et al., 2002). The unique features of forest cover, such as root systems, litter layers and canopies, are much more effective than most agricultural crops at protecting soil from water erosion (Chang et al., 1982).
Piégay et al. (2004) noted that afforestation appears to reduce sediment supply. During a study in France, Liébault et al. (2005) found that an unvegetated basin frequently had SSCs higher than 300 g/L, whereas a forested basin of the same size had a maximum SSC of 35 g/L.
The sediment yield of a catchment can increase significantly (by up to 1300%) with increasing rainfall after deforestation (Foulds and Macklin, 2006). As with urbanisation, deforestation results in a change in the hydrologic response of a catchment (Bronstert et al., 1999). Deforestation can leave land susceptible to
erosion, landslides and mudslides, which can cause further elevations of SSCs by, in some cases, up to nine times that of the undisturbed levels (Fredriksen, 1970).
The sediment yield rates of a basin in New Zealand, which was tracked, harvested and burnt, were eightfold higher than the yield rate of a nearby forested control basin (O’Loughlin et al., 1980). The first flush of sediment from a forested basin that had undergone patch-cutting and road construction had a peak SSC that was 250-fold higher than would have been expected from the basin if it had remained undisturbed, and sediment concentrations consistently remained above pre-deforestation levels (Fredriksen, 1970). In Ireland, conifer tree harvesting and windrowing, in preparation for replanting, resulted in elevated episodic inputs of sediment to watercourses that exceeded water quality standards, with the largest releases near the end of the operations (Clarke et al., 2015; Kelly-Quinn et al., 2016).
Aside from the direct effects of deforestation, it has been shown that the release of suspended sediment into streams because of secondary sources, such as forest roads, tracks and landings, resulted in the most widespread water quality problems in basins in the USA in circa 1970 (USEPA, 1975; Anderson et al., 1976; Swanston and Swanson, 1976). It should be noted, however, that Lees et al. (1997) found that sediment yields can increase significantly immediately after afforestation and claim that other UK studies have shown order-of-magnitude increases in sediment yield relative to pre-afforestation levels; however, these instances are rare and probably involve a spatial element.
Table 8.2. Total net rainfall, runoff and soil loss resulting from 30 storms between 28 May 1980 and 27 February 1981 in Nacogdoches, Texas (modified from Chang et al., 1982)
Forest condition Net rainfall (mm) Runoff (mm) Soil loss (kg/ha)
SUS DEP Total
Undisturbed forest 359.6 7.4 4.2 6.5 10.7
Thinned forest 377.8 17.0 11.6 5.5 17.1
Clearcut (a) 430.4 41.7 42.5 113.3 155.8
Clearcut chopped 459.4 81.4 75.8 189.2 265.0
Clearcut KG bladed 459.4 137.3 2201.6 1260.0 3461.6
Clearcut cultivated 459.4 119.0 1009.4 2414.0 3423.4
DEP, deposited sediment; SUS, suspended sediment.

65
D. Lawler et al. (2010-W-LS-4)
Table 8.2 shows the effects of various destructive forest practices on runoff and soil loss. These data prove that the sediment supply and transport levels increase with an increasing intensity of deforestation.
8.3.4 Otherlandusesandissues:fire,miningand population changes
The land uses discussed so far are the most common and general in global terms. However, there are many other events and types of land use that can change the land. For example, fire, grassland, shrubland, mining and changes in population can dramatically alter the sediment yield of a basin.
An increase in the frequency of fires will leave more forest soil susceptible to erosion (Dornblaser and Striegl, 2009). Soil exposed by fire can become a source of sediment, particularly coarse sediment (Fredriksen, 1970), as the filtering/trapping action of the original vegetation is negated. Warrick and Rubin (2007) noted that sediment discharge and SSCs increased as a result of an increase in the frequency of upland wildfires in California, while Peart et al. (2009) showed that hill fires increase storm-period SSCs.
Fiener and Auerswald (2006) highlighted the potential of grassed waterways with regard to reducing sediment delivery: grassed waterways led to a 93% reduction in sediment delivery from an experimental
plot in Germany. However, strong gully formation can occur in unmanaged grasslands (Bakker et al., 2008), which are more sparsely covered than managed grasslands.
The widespread conversion of arable land to shrubland in Amendoeira, Portugal, during the 1960s resulted in large decreases in sediment export (Bakker et al., 2008). In a study by Molina et al. (2008), it was found that surface vegetation exerted a first-order control on sediment yield. O’Loughlin et al. (1980) discussed the benefits of a riparian strip with regard to reducing sediment export to river channels.
Piégay et al. (2004) and Walling (2006) referred to the negative effects that mining can have on sediment yields in a basin, the latter acknowledging it as a key driver of increased sediment loads. Lewin and Macklin (1987) coined the phrase “active transformation” to reflect the morphological impacts of large-scale sediment releases as a result of mining, although this primarily relates to coarse (rather than fine) sediment loads.
Jinze (1991) and Walling (1997) noted the historical impacts of rising populations on sediment loads. For example, Jinze (1991) showed that population increases have, historically, been related to sediment loads, but that under managed conditions this is not the case.

66
9 Management Implications
Management measures should seek to achieve some combination of (1) a reduction in the sediment load that enters or is carried by a river; and (2) a reduction of the impact of that sediment. It is useful to classify management measures according to the physical process they seek to address. The main physical processes that contribute to SSCs are detachment, mobilisation, advection/dispersion and deposition. Management measures that influence these processes will affect the amount of sediment in rivers.
9.1 Reducing Sediment Load
9.1.1 Rural areas
Management measures seek to (1) reduce the amount of sediment detached from parent material; (2) reduce the mobilisation of such sediment; and (3) prevent the transport of any mobilised sediment into a watercourse, as outlined below:
1. Sediment is detached from its parent material by any combination of (1) the impact of falling raindrops, (2) erosion by flowing water (Ballantine et al., 2009) and (3) bank collapse:
(a) Raindrop impact has been studied by Sharma et al. (1993), Salles et al. (2000), Thompson et al. (2001), Gao et al. (2005) and Kinnell (2011). It may be influenced by wind speed and direction (Erpul et al., 2004). The effects of raindrop impact are reduced by cover crops or mulching (Meyer et al., 1970; Jennings and Jarrett, 1984; Albaladejo Montoro et al., 2000; Grismer, 2007). Lal (1984) has reviewed mulching in the tropics. A special case is the use of greenwaste mulch to control the amount of sediment in surface runoff from landfill sites, although it increased dissolved oxygen concentration (Brodie and Misra, 2009). The effects of raindrop impact are reduced if infiltration occurs (Walker et al., 2007).
(b) Erosion by flowing water can be reduced in a field by regrading slopes by, for example, contour terracing, in order to reduce flow velocities. Bank erosion in channels has been studied by Odgaard, (1984), Green et al. (1999), Riedel et al. (2005) and Kessler et al. (2012); in the study by Kessler et al. (2012), lidar techniques were used. Erosion can be influenced by sub-surface flows on hillslopes (Fox and Wilson, 2010) and piping (Hagerty and Spoor, 1989). Van Eps et al. (2004) developed a bank erosion hazard index based mainly on bank angle, root depth and bank material. However, Segura and Booth (2010) also demonstrated relationships between erosion and the geomorphic setting and degree of urbanisation. Bank erosion can be reduced by restoring the natural character of the stream (Chen et al., 2005); by installing special guide vanes (Bhuiyan et al., 2010); by bank-side vegetation (see, for example, Abam, 1993), particularly on bends (Hagerty and Spoor, 1989); by rock armouring (Bogen and Bösnes, 2004); and by using flow redirection structures (Yescas et al., 2011) and structures made from large woody debris (Shields Jr et al., 2004).
2. Mobilisation normally occurs as a result of turbulent flowing water; the turbulence is related to the depth and velocity of flow. Sediment mobilisation is often associated with the mobilisation of phosphorus (Ballantine et al., 2009). The process was modelled (using the PSYCHIC model) by Davison et al. (2008) and evaluated by Stromqvist et al. (2008). A special case of mobilisation is the disturbance of settled sediments; this can have chemical as well as physical effects (Eggleton and Thomas, 2004).
3. The sediment in flowing water can be prevented from reaching a stream by (1) disconnecting the drainage from the stream, (2) retarding the flow so

67
D. Lawler et al. (2010-W-LS-4)
that sediment settles or (3) storing the water for a certain period, allowing the sediment to settle. Riparian buffer strips are a common measure used to prevent sediment in overland flow from reaching a stream channel. Wenger (1999) recommended a minimum width of 30 m for these buffer strips, mainly to ensure a healthy biota, but acknowledged that wider buffer strips may be necessary on steeper slopes. Detention pond removal efficiencies are in the range of 50–90% (Hartigan, 1988; Schueler et al., 1992).
Measures for reducing the mobilisation of sediments from agriculture and the delivery of sediments to watercourses are summarised in Table 9.1 and Table 9.2. The performances, in terms of sediment reduction efficiency, of selected measures are shown in Table 9.3.
9.1.2 Urban areas
Some common measures for reducing sediment export from urban areas to watercourses are listed in Table 9.4. Street sweeping is performed in most urban areas and, depending on the method used, can be effective at removing particles as small as 10 µm in diameter (CASQA, 2003). With regard to efficiency, street sweeping measures can remove up to 70% of total solids (Schilling, 2005). Hallock (2007) reviewed performance data from a number of studies and summarised the sediment removal efficiencies of some commonly adopted measures (Table 9.5). However, quantifying sediment loads can be difficult because of the possibility of deposition and re-suspension of sediment in pipe systems. Rabinovich and Kalman (2011) reviewed the factors that can influence particle transport in pipes.
Table 9.1. Reducing mobilisation of sediment from agricultural activities
Measure Reference
Cover crops Krutz et al. (2009)
Crop residue management or straw mulching Ritter and Shirmohammadi (2001)
Straw bales or wattles, which can also be used as sediment traps Baxter (2008)
Contour terracing Al Ali et al. (2008)
Careful design of farm and forest roads including choice of location far from riparian zone
Anderson et al. (2011)
Table 9.2. Reducing delivery of mobilised sediment to watercourse
Measure Reference
Buffer strip Dillaha and Inamdar (1997), Wenger (1999), Owens et al. (2007), Grace III and Davis (2010)
Sediment trap (in channel) Konwinski (1978)
Wetland (natural or constructed) Zierholz et al. (2001)
Vegetated filter strip Abu-Zreig et al. (2004), Verstraeten et al. (2006)
Check dams Shieh et al. (2007), Boix-Fayos et al. (2008)
Silt fences Barrett and Malina (2004)
Streambank protection Van Eps et al. (2004), Simon et al. (2008)
Table 9.3. Some estimated sediment reduction efficiencies (Evans and Corradini, 2001)
Measure Estimated efficiency (%)
Crop residue management 64
Vegetated buffer strips 58
Cover crops 15
Terraces and diversions 71
Streambank protection 76

68
SILTFLUX Literature Review
9.2 Monitoring the Effectiveness of Measures
Muleta (2010) used field measurements, obtained using an extensive range of measures, to calibrate a model, based on the Soil Water Assessment Tool (SWAT), that could be used to predict the effectiveness of such measures over a wider spatial area. Similar modelling was done by Bracmort et al. (2004, 2006). Sediment source tracking can be used to evaluate the effectiveness of measures (Minella et al., 2008). However, the results of specific field investigations can depend on the spatial scale of the study (e.g. Delmas et al., 2012). Barrett and Malina (2004) reviewed the effectiveness of silt fence measures.
9.3 The Use of Modelling for the Design and Evaluation of Measures
In the USA, the KINEROS and SWAT models have been used to simulate the effectiveness of soil conservation measures (Arabi et al., 2007; Van Liew et al., 2007). In Europe, the EUROSEM–GRIDSEM modelling system was developed for a similar purpose (Morgan et al., 1994; Botterweg et al., 1998; Morgan et al., 1998; Kinnell, 1999). It was initially evaluated for European catchments (Folly et al., 1999), but has since been more widely used, for example in China (Cai et al., 2005), Kenya (Mati et al., 2006), Costa Rica, Nicaragua and Mexico (Veihe and Al, 2001). It has also been compared with both KINEROS and SWAT (Smith et al., 1995).
Table 9.4. Reducing sediment export from urban areas to watercourses
Measure Reference
Sediment traps Verstraeten et al, (2006)
Swales Shaw and Kuo (2001), Barrett and Malina (2004), Barrett et al. (2004)
Retention/detention ponds Hartigan (1988), Schueler et al. (1992)
Street sweeping CASQA (2003), Schilling (2005)
Curb inlet filters Smith et al. (2007)
Table 9.5. Estimates of reduction efficiencies of best management practices for urban sediment (Hallock, 2007)
Measure Average efficiency (%) No. of studies
Catch basin 52 2
Centrifugal separator 12 2
Constructed wetlands 72 13
Dry ponds, vegetated 69 7
Filter strips 64 7
Porous pavement 71 8
Infiltration basins 85 4
Street sweeping 74 2
Wet ponds 56 31

69
10 Standards and Targets
Table 1.1, at the beginning of this review, lists some of the initial sediment limits, which were based on varying ecological impacts. Collins et al. (2011) listed international sediment targets for river catchment management, while APEM (2007) and Cooper et al. (2008) discussed UK requirements. A special report for the Canadian Council of Ministers gives standards for Canada (CCME, 2001). Foster et al. (2011) used palaeolimnological analyses to estimate sedimentation rates in water bodies prior to agricultural intensification in the mid-20th century to assist with setting sediment standards. Rose et al. (2011) addressed the wider picture for European lakes since AD 1850.
Table 10.1 shows proposed target and critical suspended sediment yields for various catchment types in England and Wales, while Table 10.2 demonstrates the diversity of the approaches taken and the turbidity limits set by a sample of regulations related to different regions. Note, for instance, that Australia and New Zealand differentiate between catchments on the basis of altitude. In addition, New Zealand now has targets for deposited sediment (Clapcott et al., 2011).
Table 10.1. Proposed target and critical suspended sediment yields for various catchment types in England and Wales (Cooper et al., 2008; Collins et al., 2011)
Catchment type Target suspended sediment yield (t/km2 per year) (lower quartile)
Critical suspended sediment yield (t/km2 per year) (upper quartile)
High impermeable peat 50 > 150
Low impermeable peat No data No data
Low impermeable (non-peat, non-chalk) 40 > 70
Low impermeable (non-peat, non-chalk) 20 > 50
High impermeable (non-peat, non-chalk) 10 > 20
High permeable (non-peat, non-chalk) No data No data
Low chalk 2 > 5

70
Tabl
e 10
.2. E
xam
ples
of s
tand
ards
/regu
latio
ns fo
r var
ious
cou
ntrie
s
Dire
ctiv
e/R
egul
atio
nC
ount
ry/s
tate
/regi
onSS
sTu
rbid
ity
Fres
hwat
er F
ish
Dire
ctiv
e (7
8/65
9/E
EC
and
200
4/44
/EC
)E
urop
ean
Uni
on≤
25 m
g/L
(apa
rt fro
m e
xcep
tiona
l con
ditio
ns e
.g. fl
oods
and
dro
ught
s)
Can
adia
n E
nviro
nmen
tal
Qua
lity
Gui
delin
es fo
r P
rote
ctio
n of
Fre
shw
ater
A
quat
ic L
ife (C
CM
E, 2
007)
Can
ada
Low
flow
:
< 2
5 m
g/L
abov
e ba
ckgr
ound
(< 2
4 ho
urs
expo
sure
)
< 5
mg/
L ab
ove
back
grou
nd (>
24
hour
s bu
t < 3
0 da
ys e
xpos
ure)
Hig
h flo
w:
< 2
5 m
g/L
abov
e ba
ckgr
ound
whe
n ba
ckgr
ound
s ar
e >
25 b
ut <
250
mg/
L
< 1
0% a
bove
bac
kgro
und
whe
n ba
ckgr
ound
is >
250
mg/
L
Ala
ska
Wat
er Q
ualit
y S
tand
ards
(AD
EC
, 201
6)A
lask
a (U
SA
)Th
e pe
rcen
tage
acc
umul
atio
n of
fine
sed
imen
t bet
wee
n 0.
1 an
d 4.
0 m
m in
the
grav
el b
ed o
f wat
ers
used
by
anad
rom
ous
or re
side
nt fi
sh fo
r spa
wni
ng m
ay n
ot
be in
crea
sed
mor
e th
an 5
% b
y w
eigh
t abo
ve n
atur
al c
ondi
tions
and
mus
t not
ex
ceed
a m
axim
um o
f 30%
by
wei
ght (
grai
n si
ze a
ccum
ulat
ion
grap
h)
In a
ll ot
her s
urfa
ce w
ater
s no
sed
imen
t loa
ds (s
uspe
nded
or d
epos
ited)
that
can
ca
use
adve
rse
effe
cts
on a
quat
ic a
nim
al o
r pla
nt li
fe, o
r the
ir re
prod
uctio
n or
ha
bita
t may
be
pres
ent
May
not
exc
eed
25 N
TU
abov
e na
tura
l
Nat
iona
l Rec
omm
ende
d W
ater
Q
ualit
y C
riter
ia (U
SE
PA, 2
007)
US
A S
uspe
nded
and
set
tleab
le s
olid
s sh
ould
not
redu
ce th
e de
pth
of th
e co
mpe
nsat
ion
poin
t for
pho
tosy
nthe
tic a
ctiv
ity b
y >
10%
from
the
seas
onal
ly
esta
blis
hed
norm
for a
quat
ic li
fe
Ore
gon
Dep
artm
ent o
f Wat
er
Qua
lity
Sta
ndar
ds (O
rego
n D
EQ
, 200
5)
Ore
gon
(US
A)
≤ 10
% c
umul
ativ
e in
crea
se
rela
tive
to u
pstre
am c
ontro
l
Aus
tralia
and
New
Zea
land
G
uide
lines
for F
resh
wat
er
and
Mar
ine
Wat
er Q
ualit
y (A
NZE
CC
, 200
0)
Aus
tralia
:
Sou
th-e
aste
rn u
plan
d (>
150
- to
< 15
00-m
al
titud
e)2–
25 N
TU
Sou
th-e
aste
rn lo
wla
nd (<
150
-m a
ltitu
de)
6–50
NTU
Sou
th w
este
rn u
plan
d an
d lo
wla
nd10
–20
NTU
Trop
ical
upl
and
and
low
land
2–15
NTU
Sou
th c
entra
l upl
and
and
low
land
1–50
NTU
New
Zea
land
:
Upl
and
(> 1
50- t
o <
1500
-m a
ltitu
de)
4.1
NTU
Low
land
(< 1
50-m
alti
tude
)5.
6 N
TU

71
References
Abam, T.K.S., 1993. Bank erosion and protection in the Niger Delta. Hydrological Sciences Journal 38: 231–241.
Abu-Zreig, M., Rudra, R.P., Lalonde, M.N. et al., 2004. Experimental investigation of runoff reduction and sediment removal by vegetated filter strips. Hydrological Processes 18: 2029–2037.
Acornley, R.M. and Sear, D.A., 1999. Sediment transport and siltation of brown trout (Salmo trutta L.) spawning gravels in chalk streams. Hydrological Processes 13: 447–458.
ADEC (Alaska Department of Environmental Conservation), 2016. Water Quality Standards. Water Division, Alaska Department of Environmental Conservation. Available online: http://dec.alaska.gov/commish/ regulations/pdfs/18%20AAC%2070.pdf (accessed 25 May 2016).
Akan, A.O. and Houghtalen, R.J., 2003. Urban Hydrology, Hydraulics, And Stormwater Quality: Engineering Applications And Computer Modeling. John Wiley and Sons, New York, NY.
Alabaster, J. and Lloyd, D., 1982. Finely divided solids. In Alabaster, J.S. and Lloyd, D.S. (eds), Water Quality Criteria For Freshwater Fish. Butterworth, London, pp. 1–20.
Al Ali, Y., Touma, J., Zante, P. et al., 2008. Water and sediment balances of a contour bench terracing system in a semi-arid cultivated zone (El Gouazine, Central Tunisia). Hydrological Sciences Journal 53: 883–892.
Albaladejo Montoro, J., Alvarez Rogel, J., Querejeta, J. et al., 2000. Three hydro-seeding revegetation techniques for soil erosion control on anthropic steep slopes. Land Degradation and Development 11: 315–325.
Aldridge, D.W., Payne, B.S. and Miller, A.C., 1987. The effects of intermittent exposure to suspended solids and turbulence on three species of freshwater mussels. Environmental Pollution 45: 17–28.
Alley, W.M., Healy, R.W., Labaugh, J.W. and Reilly, T.E., 2002. Flow and storage in groundwater systems. Science 296: 1985–1990.
Allott, N., Mcginnity, P. and O’Hea, B., 2005. Factors influencing the downstream transport of sediment in the Lough Feeagh catchment, Burrishoole, Co. Mayo, Ireland. Freshwater Forum 23: 126–138.
American Public Health Association, American Water Works Association and Water Environment Federation, 1995. Standard Methods for the Examination of Water and Wastewater. Port City Press, Baltimore, MD.
Anderson, H.W., Hoover, M.D. and Reinhart, K.G., 1976. Forests And Water. Effects of Forest Management on Floods, Sedimentation and Water Supply. USDA Forest Service General Technical Report PSW – 18. Service, U.F., Berkeley, CA.
Anderson, C.J., Lockaby, J. and Graeme, B., 2011. The effectiveness of forestry best management practices for sediment control in the Southeastern United States: A literature review. Southern Journal of Applied Forestry 35: 170–177.
ANZECC, 2000. Aquatic ecosystems – rationale and background information, Chapter 8. Australian and New Zealand Guidelines for Fresh and Marine Water Quality. Paper No. 4, Vol. 4. Australian and New Zealand Environment and Conservation Council and Agriculture and Resource Management Council of Australia and New Zealand. The Australian Water Association, St Leonards, NSW.
APEM, 2007. Review of UKTAG Proposed Standard for Suspended Solids. Final Report. APEM, Stockport, UK.
Arabi, M., Frankenberger, J.R., Engel, B.A. and Arnold, J.G., 2007. Representation of agricultural conservation practices with SWAT. Hydrological Processes 22:3042-3055.
Argent, D. and Flebbe, P., 1999. Fine sediment effects on brook trout eggs in laboratory streams. Fisheries Research 39: 253–262.
Armitage, P., 1995. Faunal community change in response to flow manipulation. In Harper, D. and Ferguson, A. (eds), The Ecological Basis for River Management. Wiley, Chichester, UK, pp. 59–78.
Armstrong, J.D., Kemp, P.S., Kennedy, G.J.A. et al., 2003. Habitat requirements of atlantic salmon and brown trout in rivers and streams. Fisheries Research 62: 143–170.
Armstrong, K., Storey, A. and Davies, P., 2005. Effects of catchment clearing and sedimentation on macroinvertebrate communities of cobble habitat in freshwater streams of southwestern Australia. Journal of The Royal Society of Western Australia 88: 1–11.

72
SILTFLUX Literature Review
Arnell, N.W. and Reynard, N.S., 1996. The effects of climate change due to global warming on river flows in Great Britain. Journal of Hydrology 183: 397–424.
Asselman, N.E.M., Middelkoop, H. and Van Dijk, P.M., 2003. The impact of changes to the climate and land use on soil erosion, transport and deposition of suspended sediment in the River Rhine. Hydrological Processes 17: 3225–3244.
Bakker, M.M., Govers, G., Van Doorn, A. et al., 2008. The response of soil erosion and sediment export to land-use change in four areas of Europe: the importance of landscape pattern. Geomorphology 98: 213–226.
Ballantine, D.J., Walling, D.E., Collins, A.L. and Leeks, G.J.L., 2008. The phosphorus content of fluvial suspended sediment in three lowland groundwater-dominated catchments. Journal of Hydrology 357: 140–151.
Ballantine, D., Walling, D.E. and Leeks, G.J.L., 2009. Mobilisation and transport of sediment-associated phosphorus by surface runoff. Water, Air, and Soil Pollution 196: 311–320.
Barker, D.M., Lawler, D.M., Knight, D.W. et al., 2009. Longitudinal distributions of river flood power: The combined automated flood, elevation and stream power (CAFES) methodology. Earth Surface Processes and Landforms 34: 280–290.
Barrett, M.E. and Malina, J.F., 2004. Monitoring data on effectiveness of sediment control techniques. In Sehlke, G., Hayes, D.F., and Stevens, D.K. (eds), Proceedings of the 2004 World Water and Environmetal Resources Congress: Critical Transitions in Water and Environmetal Resources Management, Salt Lake City, Utah, United States, pp. 1–10.
Barrett, M., Malina, J., Charbeneau, R. and Ward, G., 1995. Effects of Highway Construction and Operation on Water Quality and Quantity in an Ephemeral Stream in the Austin, Texas Area. Austin. Technical Report CRWR 262, Center for Research in Water Resources, Bureau of Engineering Research, The University of Texas at Austin. Available online: https://repositories.lib.utexas.edu/bitstream/handle/2152/6739/ crwr_onlinereport95-7.pdf (accesssed 25 May 2016).
Barrett, M.E., Lantin, A. and Austrheim-Smith, S., 2004. Storm water pollutant removal in roadside vegetated buffer strips. Transportation Research Record 1890: 129–140.
Barton, B.A., 1977. Short-term effects of highway construction on the limnology of a small stream in southern Ontario. Freshwater Biology 7: 99–108.
Baxter, R., 2008. Wattles and other sediment control devices. Erosion Control 15: 44–51.
Berkman, H.E. and Rabeni, C.F., 1987. Effect of siltation on stream fish communities. Environmental Biology of Fishes 18: 285–294.
Beshta, R.L., 1978. Long-term patterns of sediment production following road construction and logging in the Oregon coast range. Water Resources Research 14: 1011–1016.
Betts, N.L., 2002. Climate change in Northern Ireland, water resources. In Smyth, A., Montgomery, I., Favis-Mortlock, D. and Allen, S. (eds), Implications of Climate Change for Northern Ireland: Informing Strategy Development. Sniffer, Edinburgh, UK.
Bhuiyan, F., Hey, R.D. and Wormleaton, P.R., 2010. Bank-attached vanes for bank erosion control and restoration of river meanders. Journal of Hydraulic Engineering 136: 583–596.
Bilotta, G.S. and Brazier, R.E., 2008. Understanding the influence of suspended solids on water quality and aquatic biota. Water Research 42: 849–861.
Birkett, C., Tollner, E. and Gattie, D., 2007. Total suspended solids and flow regime effects on periphyton development in a laboratory channel. Transactions of the American Society of Agricultural and Biological Engineers 50: 1095–1104.
Birtwell, I., Hartman, G., Anderson, B. et al., 1984. A Brief Investigation of Arctic Grayling (Thymallus arcticus) and Aquatic Invertebrates in the Minto Creek Drainage, Mayo, Yukon Territory: An Area Subjected to Placer Mining. Canadian technical report of fisheries and aquatic sciences, Vancouver, Canada.
Blann, K.L., Anderson, J.L., Sands, G.R. and Vondracek, B., 2009. Effects of agricultural drainage on aquatic ecosystems: a review. Critical Reviews In Environmental Science and Technology 39: 909–1001.
Bo, T., Fenoglio, S., Malacarne, G. et al., 2007. Effects of clogging on stream macroinvertebrates: an experimental approach. Limnologica 37: 186–192.
Bogen, J. and Bösnes, T.E., 2004. The impact of erosion protection work on sediment transport in the River Graelva, Norway. In Golosov, V., Belyaev, V. and Walling, D.E. (eds), Sediment Transfer through the Fluvial System. IAHS Press, Wallingford, UK, pp. 155–164.
Boix-Fayos, C., De Vente, J., Martinez-Mena, M. et al., 2008. The impact of land use change and check-dams on catchment sediment yield. Hydrological Processes 22: 4922–4935.

73
D. Lawler et al. (2010-W-LS-4)
Botterweg, P., Leek, R., Romstadc, E. and Vatnc, A., 1998. The EUROSEM-GRIDSEM modeling system for erosion analyses under different natural and economic conditions. Ecological Modelling 108: 115–129.
Bracmort, K.S., Arabi, M., Engel, B.A. et al., 2004. Modeling the Long-Term Impacts of BMPs in an Agricultural Watershed. Paper number 042173, 2004 ASAE Annual Meeting, Ottawa, ON, Canada, 2473–2483. The American Society of Agricultural and Biological Engineers, St. Joseph, MI.
Bracmort, K.S., Arabi, M., Frankenberger, J.R. et al., 2006. Modelling long-term water quality impact of structural BMPs. Transactions of the ASABE 49: 367–374.
Bradley, S.B. and Cox, J.J., 1990. The significance of the floodplain to the cycling of metals in the River Derwent catchment, U.K. Science of the Total Environment 97/98: 441–454.
Brierley, G.J. and Fryirs, K.A., 2005. Geomorphology and River Management. Blackwell Publishing, Malden, USA.
Brodie, I.M. and Misra, R.K., 2009. Evaluation of greenwaste mulch to control runoff quality from landfill sites during frequent storms. Water, Air, and Soil Pollution 201: 75–85.
Bronstert, A., Bürger, G., Heindrich, M. et al., 1999. Effects of climate change influencing storm runoff generation: basic considerations and a pilot study in Germany. In Balabanis, P., Casale, R., Bronstert, A. and Samuels, P. (eds), The Impact of Climate Change on Flooding and Sustainable River Management: Proceedings of the Final Ribamod Workshop, 1999, Wallingford. Office For Official Publications of the European Communities, Luxembourg, pp. 325–340.
Brookes, A., 1986. Response of aquatic vegetation to sedimentation downstream from river channelisation works in England and Wales. Biological Conservation 38: 351–367.
Brown, A.V. and Brussock, P.P., 1991. Comparisons of benthic invertebrates between riffles and pools. Hydrobiologia 220: 99–108.
Brown, L.E., Cooper, L., Holden, J. and Ramchunder, S.J., 2010. A comparison of stream water temperature regimes from open and afforested moorland, Yorkshire Dales, northern England. Hydrological Processes 24: 3206–3218.
Bruen, M., Johnson, P., Kelly-Quinn, M. et al., 2006. Impact Assessment of Highway Drainage on Surface Water Quality (2000-MS-13-M2): Synthesis Report. Environmental Protection Agency, Johnstown Castle, Ireland.
Bruton, M.N., 1985. The effects of suspensoids on fish. Hydrobiologia 125: 221–241.
Bryce, S., Lomnicky, G. and Kaufmann, P., 2010. Protecting sediment-sensitive aquatic species in mountain streams through the application of biologically based streambed sediment criteria. Journal of the North American Benthological Society 29: 657–672.
Bull, L.J., 1997. Relative velocities of discharge and sediment waves for the River Severn, UK. Hydrological Sciences Journal 42: 649–660.
Buss, E.A., 2009. The Hyporheic Handbook, Integrated Catchment Science Programme. Environment Agency, Bristol, UK.
Cai, Q.G., Wang, H., Curtinc, D. and Zhua, Y., 2005. Evaluation of the EUOROSEM model with single event data on steeplands in the three gorges reservoir areas, China. Catena 59: 19–33.
Carling, P. and Mccahon, C., 1987. Natural siltation of brown trout (Salmo trutta L.) spawning gravels during low-flow conditions. In Greig, J. and Kemper, J. (eds), Regulated Streams Advances in Ecology. Plenum Press, New York, NY.
Carter, D.L. and Berg, R.D., 1983. Buried pope system for controlling erosion and sediment loss on irrigated land. Soil Science Society of America Journal 47: 749–752.
CASQA (California Stormwater Quality Association), 2003. Stormwater Best Management Practice Handbook. Available online: https://www.casqa.org/sites/default/files/BMPHandbooks/BMP_Municipal_Complete.pdf (accessed (21 May 2016).
CCME (Canadian Council of Ministers of the Environment), 2001. Canadian Sediment Quality Guidelines for the Protection of Aquatic Life. Canadian Environmental Quality Guidelines. Winnepeg, Canada. Available online: http://ceqg-rcqe.ccme.ca/en/index.html (accessed 20 May 2016).
CCME (Canadian Council of Ministers of the Environment), 2007. A Protocol for the Derivation of Water Quality Guidelines for the Protection of Aquatic Life. In: Canadian environmental quality guidelines, 1999, Canadian Council of Ministers of the Environment, 1999, Winnipeg. Available online: http://ceqg-rcqe.ccme.ca/download/en/220 (accessed 20 May 2016).
Cerdà, A., 2007. Soil water erosion on road embankments in eastern Spain. Science of the Total Environment 378: 151–155.

74
SILTFLUX Literature Review
Chang M., Roth F. A., Hunt E. V., 1982. Sediment production under various forest-site conditions. In Proceedings of the First Scientific General Assembly of the International Association of Hydrological Sciences (IAHS), Recent Developments in the Explanation and Prediction of Erosion and Sediment Yield (Ed. D.E. Walling), Exeter, UK, 137, pp 13–22.
Chapman, A.S., Foster, I.D.L., Lees, J.A. et al., 2005. Sediment delivery from agricultural land to rivers via subsurface drainage. Hydrological Processes 19: 2875–2897.
Chappell, N.A., Tych, W., Shearman, P. et al., 2011. River sediment monitoring for baseline and change characterisation: a new management tool for the Ramu River communities in Papua New Guinea. In Walling, D.E. (ed.), Sediment Problems and Sediment Management in Asian River Basins. IAHS Publ. 349. IAHS Press, Wallingford, UK, pp. 92–102.
Charlton, R., Fealy, R., Moore, S. et al., 2006. Assessing the impact of climate change on water supply and flood hazard in ireland using statistical downscaling and hydrological modelling techniques. Climatic Change 74: 475–491.
Chen, C.N., 1974. Effect of land development on soil erosion and sediment concentration in an urbanizing basin. In Effects of Man on the Interface of the Hydrological Cycle with the Physical Environment, IAHS Publ. 113, pp. 150–157. Available online: http://hydrologie.org/ redbooks/a113/iahs_113_0150.pdf (accessed 20 May 2016).
Chen, Y., Bhatia, S.K., Buchanan, J. et al., 2005. Effectiveness of Stream Restoration in Reducing Stream Bank Erosion: The Case of Batavia Kill Stream Restoration Projects, New York. American Society of Civil Engineers, Williamsburg, VA, USA, pp. 1439–1450.
Chen, Y., Viadero, R.C., Wei, X. et al., 2009. Effects of highway construction on stream water quality and macroinvertebrate condition in a mid-Atlantic highlands watershed, USA. Journal of Environmental Quality 38: 1672–1682.
Cho, K.H., Pachepsky, Y.A., Kim, J.H. et al., 2010. Release of Escherichia coli from the bottom sediment in a first-order creek: experiment and reach-specific modeling. Journal of Hydrology 391: 322–332.
Church, M., 2006. Bed material transport and the morphology of alluvial river channels. Annual Review of Earth and Planetary Science 34: 325–354.
Church, M. and Jones, D., 1982a. Bed material transport and the morphology of alluvial river channels. In Hey, R.D., Barhust, J.C. and Thorne, C.R. (eds), Gravel Bed Rivers. Wiley, Chichester, UK.
Church, M. and Jones, D., 1982b. Channel bars in gravel bed rivers. In Hey, R.D., Barhurst, J.C. and Thorne, C.R. (eds), Gravel Bed Rivers. Wiley, Chichester, UK, pp. 291–338.
Church, M. and Slaymaker, O., 1989. Disequilibrium of holocene sediment yield in glaciated British Columbia. Nature 337: 452–454.
Ciborowski, J.J.H., Pointing, P.J. and Corkum, L.D., 1977. Effect of current velocity and sediment on drift of mayfly Ephemerella subvaria Mcdunnough. Freshwater Biology 7: 567–572.
Clapcott, J.E., Young, R.G., Harding, J.S., Mattaei, C.D., Quinn, J.M. and Death, R.E. (2011). Sediment Assessment Methods: Protocols and Guidelines for Assessing the Effects of Deposited Fine Sediment on In-stream Values. Cawthron Institute, Nelson, New Zealand.
Clarke, R.T., 1990a. Bias and variance of some estimators of suspended sediment load. Hydrological Sciences 35: 253–261.
Clarke, R.T., 1990b. Statistical characteristics of some estimators of sediment and nutrient loadings. Water Research 26: 2229–2233.
Clarke, J., Kelly-Quinn, M., Blacklocke, S. et al., 2015. The effect of forest windrowing on physico-chemical water quality in Ireland. Science of the Total Environment 514: 155–169.
Cline, L.D. and Forest, R.M., 1983. Effects of Highway Construction on Water Quality and Biota in an Adjacent Colorado Mountain Stream. USDA Forest Service, Fort Collins, CO.
Cline, L.D., Short, R.A. and Ward, J.V., 1982. The influence of highway construction on the macroinvertebrates and epilithic algae of a high mountain stream. Hydrobiologia 96: 149–152.
Cline, L.D., Short, R.A., Ward, J.V. et al., 1983. Effects of Highway Construction on Water Quality and Biota in an Adjacent Colorado Mountain Stream. US Department of Agriculture, Forest Service, Report No RM-429. US Department of Agriculture, Forest Service, CO.
Cocchiglia, L., Curran, S., Hannigan, E. et al., 2012. Evaluation of the effects of fine sediment inputs from stream culverts on brown trout egg survival through field and laboratory assessments. Inland Waters 2: 47–58.
Collins, A.L. and Walling, D.E., 2004. Documenting catchment suspended sediment sources: problems, approaches and prospects. Progress in Physical Geography 28: 159–196.

75
D. Lawler et al. (2010-W-LS-4)
Collins, A.L., Walling, D.E. and Leeks, G.J.L., 1997. Fingerprinting the origin of fluvial suspended sediment in larger river basins. Combining assessment of spatial provenance and source type. Geografiska Annaler: Series A, Physical Geography 79: 239–254.
Collins, A.L., Strőmqvist, J., Davison, P.S. and Lord, E.I., 2007. Appraisal of phosphorus and sediment transfer in three pilot areas identified for the catchment sensitive farming initiative in England: application of the prototype psychic model. Soil Use and Management 23: 117–132.
Collins, A.L., Anthony, S.G., Hawley, J. and Turner, T., 2009. Predicting potential change in agricultural sediment inputs to rivers across England and Wales by 2015. Marine and Freshwater Research 60: 626–637.
Collins, A.L., Walling, D.E., Webb, L. and King, P., 2010a. Apportioning catchment scale sediment sources using a modified composite fingerprinting technique incorporating property weightings and prior information. Geoderma 155: 249–261.
Collins, A.L., Walling, D.E., Stroud, R.W. et al., 2010b. Assessing damaged road verges as a suspended sediment source in the Hampshire Avon catchment, southern United Kingdom. Hydrological Processes 24: 1106–1122.
Collins, A.L., Naden, P.S., Sear, D.A. et al., 2011. Sediment targets for informing river catchment management: international experience and prospects. Hydroiological Processes 25: 2122–2129.
Collins, A.L., Zhang, Y., Mcchesney, D. et al., 2012. Sediment source tracing in a lowland agricultural catchment in Southern England using a modified procedure combining statistical analysis and numerical modelling. Science of the Total Environment 414: 301–317.
Conroy, E., Turner, T.N., Rymszewicz, A. et al., 2016. The impact of cattle access on ecological water quality in streams: examples from agricultural catchments within Ireland. Science of the Total Environment 547: 17–29.
Cooper, D.M., Naden, P.S., Old, G. and Laize, C., 2008. Development Of Guideline Sediment Targets To Support Management Of Sediment Inputs Into Aquatic Systems (NERR008). Natural England Research Report NERR008, Natural England, Sheffield, UK.
Coulthard, T.J. and Macklin, M.G., 2003. Modeling long-term contamination in river systems from historical metal mining. Geology 31: 451–454.
Crisp, D.T., 1993. The ability of UK salmonid alevins to emerge through a sand layer. Journal of Fish Biology 43: 656–658.
Croke, J., Mockler, S., Hairsine, P. and Fogarty, P., 2006. Relative contributions of runoff and sediment sources within a road prism and implications for total sediment delivery. Earth Surface Processes and Landforms 31: 457–468.
Crookston, B.M. and Tullis, B.P.M., 2011. Incipient motion of gravel in a bottomless arch culvert. International Journal of Sediment Research 26: 15–26.
Crowder, D.W., Demissie, M. and Markus, M., 2007. The accuracy of sediment loads when log-transformation produces nonlinear sediment load-discharge relationships. Journal of Hydrology 336: 250–268.
Culp, J.M., Walde, S.J. and Davies, R.W., 1983. Relative importance of substrate particle-size and detritus to streambenthic macroinvertebrate microdistribution. Canadian Journal of Fisheries and Aquatic Sciences 40: 1568–1574.
Culp, J.M., Wrona, F.J. and Davies, R.W., 1986. Response of stream benthos and drift to fine sediment deposition versus transport. Canadian Journal of Zoology 64: 1345–1351.
Davis, B.E., 2005. A Guide to the Proper Selection and Use of Federally Approved Sediment and Water-Quallity Samplers. USGS, Reston, VA.
Davies-Colley, R.J., Hickey, C.W., Quinn, J.M. and Ryan, P.A., 1992. Effects of clay discharges on streams. 1. Optical properties and epilithon. Hydrobiologia 248: 215–234.
Davison, P.S., Withers, P.J.A., Lord, E.I. et al., 2008. PSYCHIC – A process-based model of phosphorus and sediment mobilisation and delivery within agricultural catchments. Part 1: Model description and parameterisation. Journal of Hydrology 350: 290–302.
Delmas, M., Pak, L.T., Cerdan, O. et al., 2012. Erosion and sediment budget across scale: A case study in a catchment of the European loess belt. Journal of Hydrology 420–421: 255–263.
Dennis, I.A., Coulthard, T.J., Brewer, P. and Macklin, M.G., 2009. The role of floodplains in attenuating contaminated sediment fluxes in formerly mined drainage basins. Earth Surface Processes and Landforms 34: 453–466.
Desta, M.B., Bruen, M., Higgins, N. and Johnston, P., 2007. Highway runoff quality in Ireland. Journal of Environmental Monitoring 9: 366–371.
DFO (Department of Fisheries and Oceans), 1983. A Rationale for the Suspended Solids Standards for Yukon Streams Subject to Placer Mining. Report to Interdepartmental Committee on Placer Mining, New Westminster, Canada.

76
SILTFLUX Literature Review
Dillaha, T.A.I. and Inamdar, S.P., 1997. Buffer zones as sediment traps or sources. In Haylock, N.E., Burt, T.P., Goulding K.W.T. et al. (eds), Buffer Zones: Their Processes and Potential in Water Protection. Proceedings of the International Conference on Buffer Zones, Quest Environmental, Harpenden, UK.
Dobereiner, C. and Mcmanus, J., 1983. Turbidity maximum migration and harbour siltation in the Tay estuary. Canadian Journal of Fisheries and Aquatic Sciences 40: 117–129.
Doeg, T.J. and Koehn, J.D., 1994. Effects Of Draining and desilting a small weir on downstream fish and macroinvertebrates. Regulated Rivers Research and Management 9: 236–278.
Doeg, T.J. and Milledge, G.A., 1991. Effect of experimentally increasing concentration of suspended sediment on macro-invertebrate drift. Australian Journal of Marine and Freshwater Research 42: 519–526.
Dornblaser, M.M. and Striegl, R.G., 2009. Suspended sediment and carbonate transport in the Yukon River basin, Alaska: fluxes and potential future responses to climate change. Water Resources Research 45: W06411.
Downing, J., 2005. Turbidity monitoring. Chapter 24 in Down, R.D. & Lehr, J.H. (eds.) Environmental Instrumentation and Analysis Handbook, John Wiley.
Downing, J., 2008a. Comparison of Suspended Solids Concentration (SSC) and Turbidity. Campbell Scientific Inc., Application Note Code: 2QAA. Available online: https://s.campbellsci.com/documents/br/technical-papers/ obs_ssc-turbidity.pdf (accessed 23 May 2016).
Downing, J., 2008b. Effects of Sediment Size on OBS Measurements. Campbell Scientific Inc., Logan, UT.
Droppo, I.G., 2003. A new definition of suspended sediment: implications for the measurement and prediction of sediment transport. In Bogen, J., Fergus, T. and Walling, D.E. (eds), Erosion and Sediment Transport Measurement in Rivers: Technological and Methodological Advances. Proceedings of the Oslo Workshop, June 2002. IAHS Publ. 283, IAHS Press, Wallingford, UK, pp. 3–12.
Droppo, I.G., Krishnappan, B.G., Liss, S.N. et al., 2011. Modelling sediment-microbial dynamics in the South Nation River, Ontario, Canada: Towards the prediction of aquatic and human health risk. Water Research 45: 3797–3809.
Duck, R., 1985. The effect of road construction on sediment deposition in Loch Earn, Scotland. Earth Surface Processes and Landforms 10: 401–406.
Dugdale, L.J. and Lane, S.N., 2006. Catchment scale structuring of Atlantic salmon and brown trout juvenille populations by topographically controlled hydrological connectivity, The Association of Rivers Trust 15th International Salmonid Conference, 17–20 October, Newcastle, UK.
Dumas, J., Bassenave, J., Jarry, M. et al., 2007. Effects of fish farm effluents on egg-to-fry development and survival of brown trout in artificial redds. Journal of Fish Biology 70: 1734–1758.
Dunne, T. and Leopold, L.B., 1978. Water in Environmental Planning. W.H. Freeman, San Francisco, CA.
EA, 2011. Sediment Matters. A Practical Guide to Sediment and its Impact in UK Rivers. UK Environment Agency, Publication code: SCHO0411BTWE-E-E. Available online: https://www.gov.uk/government/publications/sediment-matters (accessed May 2016).
Edwards, A.C. and Withers, P.J.A., 2008. Transport and delivery of suspended solids, nitrogen and phosphorus from various sources to freshwaters in the UK. Journal of Hydrology 350: 144–153.
Edwards, T.K. and Glysson, G.D., 1999. Field Methods For Measurement Of Fluvial Sediment. U.S. Geological Survey, Techniques of Water-Resources Investigations, Book 3, Chapter C2. Available online: https://pubs.usgs.gov/twri/twri3-c2/html/pdf.html (accessed May 2016).
Eggleton, J. and Thomas, K.V., 2004. A review of factors affecting the release and bioavailability of contaminants during sediment disturbance events. Environment International 30: 973–980.
EIFAC (European Inland Fisheries Advisory Commission), 1964. Water Quality Criteria for European Freshwater Fish: Report on Finly Divided Solids and Inland Fisheries. EIFAC Technical Report No. 1. FAO, Rome.
Ellis, J., Revitt, D., Harrop, D. and Beckwith, P., 1987a. The contribution of highway surfaces to urban stormwater sediment and heavy metals. Science of the Total Environment 59: 339–349.
Ellis, J., Revitt, D., Harrop, D. and Beckwith, P., 1987b. The contribution of highway surfaces to urban stormwater sediments and metal loadings. Science of the Total Environment 33: 245–257.
Embler, P. and Fletcher, M., 1981. Effects of Highway Construction on Stream Turbidity and Suspended Solids: A Case Study. FHWA/PC-81/3. Federal Highway Administration, Washington, DC.
Erman, D.C. and Ligon, F.K., 1988. Effects of discharge fluctuation and the addition of fine sediment on stream fish and macroinvertebrates below a water-filtration facility. Environmental Management 12: 85–97.

77
D. Lawler et al. (2010-W-LS-4)
Erpul, G., Gabriels, D. and Norton, L.D., 2004. Wind effects on sediment transport by raindrop-impacted shallow flow: a wind-tunnel study. Earth Surface Processes and Landforms 29: 955–967.
Evans, J.E., 2000. Lessons from a dam failure. Ohio Journal of Science 100: 121–131.
Evans, J.E., 2007. Sediment impacts of the 1994 failure of Ivex Dam (Chagrin River, NE Ohio): A test of channel evolution models. Journal of Great Lakes Research 33: 90–102.
Evans, B.M. and Corradini, K.J., 2001. BMP Pollution Reduction Guidance Document. Bureau of Watershed Conservation, Pennsylvania Dep[artment of Environmental Protection. Available online: http://www.mapshed.psu.edu/Downloads/BMPManual.pdf (accessed 23 May 2016).
Evans, D.J., Gibson, C.E. and Rossell, R.S., 2006. Sediment loads and sources in heavily modified Irish catchments: A move towards informed management strategies. Geomorphology 79: 93–113.
Extence, C., 1978. The effects of motorway construction on an urban stream. Environmental Pollination 17: 245–252.
Farnsworth, K.L. and Milliman, J.D., 2003. Effects of climatic and anthropogenic change on small mountainous rivers: the Salinas River example. Global and Planetary Change 39: 53–64.
Farr, I.S. and Clarke, R.T., 1984. Reliability Of suspended-load estimates in chalk streams. Archiv für Hydrobiologie 102: 1–19.
Fealy, R. and Bates, R., 2009. A review of global climate projections and likely scenarios for Ireland. In Kelly, B. and Stack, M. (eds), Climate Change, Heritage and Tourism: Implications for Ireland’s Coast and Inland Waterways. The Heritage Council, Kilkenny.
Fealy, R. and Murphy, C., 2009. The likely physical impacts of future climate change on inland waterways and the coastal environment in Ireland. In Kelly, B. and Stack, M. (eds), Climate Change, Heritage and Tourism: Implications for Ireland’s Coast and Inland Waterways. The Heritage Council, Kilkenny.
Ferguson, R.I., 1986. River loads underestimated by rating curves. Water Resources Research 22: 74–76.
Ferguson, R.I., 1987. Accuracy and precision of methods for estimating river loads. Earth Surface Processes and Landforms 12: 95–104.
Fiener, P. and Auerswald, K., 2006. Seasonal variation of grassed waterway effectiveness in reducing runoff and sediment delivery from agricultural watersheds in temperate Europe. Soil and Tillage Research 87: 48–58.
Filizola, N. and Guyot, J.L., 2004. The use of doppler technology for suspended sediment discharge determination in the River Amazon. Hydrological Sciences Journal 49: 143-.
Folly, A., Quinton, J.A. and Smith, R.E., 1999. Evaluation of the EUROSEM Model using data from the Catsop watershed, the Netherlands. Catena 37: 507–519.
Forster, D.L. and Abrahim, G., 1985. Sediment deposits in drainage ditches – A cropland externality. Journal of Soil and Water Conservation 40: 141–143.
Foster, G.R., 1982. Modelling the erosion process. Hydrologic Modelling of Small Watersheds. ASAE, Washington, DC.
Foster, I.D.L., Baban, S.M.J., Wade, S.D. et al., 1996. Sediment-associated phosphorus transport in the Warwickshire River Avon, UK. In Walling, D.E. and Webb, B.W. (eds), Erosion and Sediment Yield: Global and Regional Perspectives. International Association of Hydrological Sciences, Rennes, France.
Foster, I.D.L., Collins, A.L., Naden, P.S. et al., 2011. The potential for paleolimnology to determine historic sediment delivery to rivers. Journal of Paleolimnology 45: 287–306.
Foulds, S.A. and Macklin, M.G., 2006. Holocene land-use change and its impact on river basin dynamics in Great Britain and Ireland. Progress in Physical Geography 30: 589–604.
Fox, G.A. and Wilson, G.V., 2010. The role of subsurface flow in hillslope and stream bank erosion: a review. Soil Science Society of America Journal 74: 717–733.
Francoeur, S. and Biggs, B., 2006. Short-term effects of elevated velocity and sediment abrasion on benthic algal communities. Developments in Hydrobiology 185: 59–69.
Fredriksen, R.L., 1970. Erosion and Sedimentation Following Road Construction and Timber Harvest on Unstable Soils in three small Western Oregon Watersheds. U.S. Department of Agriculture, Portland, OR.
Galbraith, R., Maclsaac, E., Macdonald, J. and Farrell, A., 2006a. The effect of suspended sediment on fertilization success in sockeye (Oncorhynchus nerka) and coho (Oncorhynchus kisutch) salmon. Canadian Journal of Fisheries and Aquatic Sciences 63: 2487–2494.
Gallepp, G., 1974. Diel periodicity in behaviour of the caddisfly, Brachycentrus americanus (Banks). Freshwater Biology 4: 193–204.
78
SILTFLUX Literature Review
Gao, B., Walter, M.T., Steenhuis, T.S. et al., 2005. Investigating raindrop effects on transport of sediment and non-sorbed chemicals from soil to surface runoff. Journal of Hydrology 308: 313–320.
Gaugler, R. and Molloy, D., 1980. Feeding inhibition in black fly larvae (Diptera: Simuliidae) and its effects on the pathogenicity of Bacillus thuringiensis var. israelensis. Environmental Entomology 9: 704–708.
Gaynor, A. and Gray, N.F., 2004. Trends in sediment metal concentrations in the River Avoca, south-east Ireland. Environmental Geochemistry and Health 26: 411–419.
Geist, J. and Auerswald, K., 2007. Physicochemical stream bed characteristics and recruitment of the freshwater pearl mussel (Margaritifera margaritifera). Freshwater Biology 52: 2299–2316.
Gibbins, C., Scott, E., Soulsby, C. and McEwan, I., 2005. The relationship between sediment mobilisation and the entry of baetis mayflies into the water column in a laboratory flume. Hydrobiologia 533: 115–122.
Gibbins, C., Vericat, D., Batalla, R.J. and Gomez, C.M., 2007. Shaking and moving: low rates of sediment transport trigger mass drift of stream invertebrates. Canadian Journal of Fisheries and Aquatic Sciences 64: 1–5.
Gibbs, R.J., 1973. Mechanisms of trace metal transport in rivers. Science 180: 71–73.
Glickman, T. S., 2000. Glossary of Meteorology, 2nd edition. American Meteorological Society.
Gomez, B., Carter, L. and Trustrum, N.A., 2007. A 2400 yr record of natural events and anthropogenic impacts in inter-correlated terrestrial and marine sediment cores: Waipaoa Sedimentary System, New Zealand. Geological Society of America Bulletin 119: 1415–1432.
Gordeev, V.V., Martin, J.M., Sidorov, I.S. and Sidorova, M.V., 1996. A reassessment of the Eurasian river input of water, sediment, major elements, and nutrients to the Arctic Ocean. American Journal of Science 296: 664–691.
Grace III, J.M. and Davis, E.L., 2010. Efficacy of buffer zones in disconnecting roads and streams in the coastal plain. ASABE Paper No. 1008434, 2010 Annual International Meeting of the American Society of Agricultural and Biological Engineers, Pittsburgh, PA.
Graf, W.L., Clark, S.L., Kammerer, M.T. et al., 1991. Geomorphology of heavy metals in the sediments of Queen Creek, Arizona, USA. Catena 18: 567–582.
Graham, A.A., 1990. Siltation of stone-surface periphyton in rivers by clay-sized particles from low concentrations in suspension. Hydrobiologia 199: 107–116.
Gray, J.R. and Gartner, J.W., 2009. Technological advances in suspended-sediment surrogate monitoring. Invited Paper, Water Resources Research, 45. W00D29, doi:10.1029/2008WR007063, 20 p.
Gray, L.J. and Ward, J.V., 1982. Effects of sediment releases from a reservoir on stream macro-invertebrates. Hydrobiologia 96: 177–184.
Green, T.R., Beavis, S.G., Dietrich, C.R. and Jakeman, A.J., 1999. Relating stream-bank erosion to in-stream transport of suspended sediment. Hydrological Processes 13: 777–787.
Greig, S.M., 2004. An Investigation into the Processses and Factors Affecting the Ability of UK Spawning Gravels to Support the Respiratory Requirements of the Atlantic Salmon (Salmo salar) Embryos. PhD thesis, University of Southampton, Southampton, UK.
Greig, S.M., Sear, D.A. and Carling, P.A., 2005. The impact of fine sediment accumulation on the survival of incubating salmon progeny: implications for sediment management. Science of the Total Environment 344: 241–258.
Greig, S.M., Sear, D.A. and Carling, P.A., 2007. A review of factors influencing the availability of dissolved oxygen to incubating salmonid embryos. Hydrological Processes 21: 323–334.
Grismer, M.E., 2007. Soil restoration and erosion control: quantitative assessment and direction. Transactions of the ASABE 50: 1619–1626.
Gurnell, A., Hannah, D. and Lawler, D.M., 1996. Suspended sediment yield from glacier basins. In Walling, D.E. and Webb, B.W. (eds), Erosion and Sediment Yield: Global and Regional Perspectives. Proceedings of the Exeter Symposium, July 1996. IAHS, Wallingford, UK.
Guy, H.P. and Norman, V.W., 1970. Field Methods for Measurement of Fluvial Sediment. USGS, Reston, VA.
Hagerty, D.J. and Spoor, M.F., 1989. Alluvial stream bank erosion – A 10-year study. In Wang, S.Y. (ed.) Sediment Transport Modeling. Proceedings of the International Symposium of the ASCE, New Orleans, LA, USA, 14–18 August 1989. American Society of Civil Engineers, New York, NY, pp. 594–599.
Hallock, D., 2007. Efficiency of Urban Best Management Practices – A Literature Review. Publication No 07-03-009, Washington State Department of Ecology, US. Available online: www.ecy.wa.gov/biblio/0703009.html (accessed May 2016).

79
D. Lawler et al. (2010-W-LS-4)
Harrington, S.T. and Harrington, J.R., 2010. Turbidity, suspended sediment concentrations and fluxes for the River Owenabue in the South Western River Basin District (SWRBD), Ireland. Irish IHP and ICID National Committees Hydrology Conference. Available online: http://studylib.net/doc/5903476/ (accessed 24 May 2016).
Harrington, S.T. and Harrington, J.R., 2013. An assessment of the suspended sediment rating curve approach for load estimation on the Rivers Bandon and Owenabue, Ireland. Geomorphology 185: 27–38.
Hartigan, J.P., 1988. Basis for design of wet detention basin BMPs. In Design of Urban Runoff Quality Controls. Prodeedings of an Engineering Foundation Conference on Current Practice and Design Criterial for Urban Quality Control, Potosi, MO, USA, 10–15 July 1988. American Society of Civil Engineers, New York, NY.
Hearne, J.W. and Armitage, P.D., 1993. Implications of the annual macrophytes growth cycle on habitats in rivers. Regulated River Research and Management 8: 313–322.
Heidel, S.G., 1956. The progressive lag of sediment concentration with flood waves. Transactions of the American Geophysical Union 37: 56–66.
Herbert, D.W. and Merkins, J.C., 1961. The effect of suspended mineral solids on the survival of trout. International Journal of Air and Water Pollution 5: 46–55.
Herr, C. and Gray, N.F., 1997. Metal contamination of riverine sediments below the Avoca mines, south east Ireland. Environmental Geochemistry and Health 19: 73–82.
Hershey, R.W., 1999. Hydrometry: Principles and Practices. John Wiley & Sons, Chichester, UK.
Heywood, M.J.T. and Walling, D.E., 2007. the sedimentation of salmonid spawning gravel in the Hampshire Avon Catchment, UK: implications for the dissolved oxygen content of intragravel water and embryo survival. Hydrological Processes 21: 770–788.
Hoey, T.B., 1992. Temporal variations in bedload transport rates and sediment storage in gravel-bed rivers. Progress in Physical Geography 16: 319–338.
Hooke, J.M., 1980. Magnitude and distribution of rates of river bank erosion. Earth Surface Processes and Landforms 5: 143–157.
Hornig, C.E. and Brusven, M.A., 1986. Effects of suspended sediment on leaf processing by Hesperophylax occidentalis (Trichoptera: Limnephilidae) and Pteronarcys californica (Plecoptera: Pteronarcidae). Great Basin Naturalist 46: 33–38.
Horowitz, A., 1991. A Primer on Sediment-Trace Element Chemistry. US Geological Survey. Available online: http://pubs.usgs.gov/of/1991/0076/report.pdf (accessed 24 May 2016).
Horowitz, A.J., 2003. An evaluation of sediment rating curves for estimating suspended sediment concentrations for subsequent flux calculations. Hydrological Processes 17: 3387–3409.
Horowitz, A.J., 2006. The effect of the “Great Flood of 1993” on subsequent suspended sediment concentrations and fluxes in the Mississippi River Basin, USA. In Rowan, J.S., Duck, R.W. and Werritty, A. (eds), Sediment Dynamics and the Hydromorphology of Fluvial Systems. IAHS Press, Wallingford, UK.
Horowitz, A.J., 2008. Determining annual suspended sediment and sediment-associated trace element and nutrient fluxes. Science of the Total Environment 400: 315–343.
Horowitz, A.J., 2010. A quarter century of declining suspended sediment fluxes in the Mississippi River and the effect of the 1993 flood. Hydrological Processes 24: 13–34.
Horowitz, A.J., Elrick, K.A. and Hooper, R.C., 1989. A comparison of instrumental dewatering methods for the separation and concentration of suspended sediment for subsequent trace-element analysis. Hydrological Processes 3: 163–184.
Horowitz, A.J., Meybeck, M., Idlafkih, Z. and Biger, E., 1999. Variations in trace element geochemistry in the Seine River Basin based on floodplain deposits and bed sediments. Hydrological Processes 13: 1329–1340.
Houben, P., Hoffmann, T., Zimmermann, A. and Dikau, R., 2006. Land use and climatic impacts on the Rhine system (Rheinlucifs): quantifying sediment fluxes and human impact with available data. Catena 66: 42–52.
Huang, X.B., 2006. Abrasion of dam surface by high-velocity sedimment-laden flow and effect of aeration on abrasion resistance. Dams and Reservoirs, Societies and Environment in the 21st Century. In Proceedings of the International Symposium on Dams in the Societies of the 21st Century, 22nd International Congress on Large Dams (ICOLD), Barcelona, Spain, 1: 755–765.
Huang, C.C. and O’Connell, M., 2000. Recent land use and soil erosion history within a small catchment in Connemara, western Ireland: evidence from lake sediments and documentary sources. Catena 41: 293–335.

80
SILTFLUX Literature Review
Hunter, H.M. and Walton, R.S., 2008. Land-use effects on fluxes of suspended sediment, nitrogen and phosphorus from a river catchment of the Great Barrier Reef, Australia. Journal of Hydrology 356: 131–146.
Hynes, H., 1970. The ecology of stream insects. Annual Review of Entomology 15: 25–42.
Inman, D.L. and Jenkins, S.A., 1999. Climate change and the episodicity of sediment flux of small California rivers. Journal of Geology 107: 251–270.
Jamieson, R.C., Lee, J.H., Kostaschuk, R. and Gordon, R.J., 2004. Persistence of enteric bacteria in alluvial streams. Journal of Environmental Engineering and Science 3: 203–212.
Jarritt, N.P. and Lawrence, D.S.L., 2006. Simulating fine sediment delivery in lowland catchments: model development and application of INCA-Sed. In Owens, P.N. and Collins, A.J. (eds), Soil Erosion and Sediment Redistribution in River Catchments: Measurement, Modelling and Management. CAB International, Wallingford, UK, 207–214.
Jasper, K., Calanca, P., Gyalistras, D. and Fuhrer, J., 2004. Differential impacts of climate change on the hydrology of two Alpine river basins. Climate Research 26: 113–129.
Jassby, A.D., Goldman, C.R., Reuter, J.E. and Richards, R.C., 1999. Origins and scale dependence of temporal variability in the transparency of Lake Tahoe, California-Nevada. Limnology and Oceanography 44: 282–294.
Jennings, G.D. and Jarrett, A.R., 1985. Laboratory evaluation of mulches in reducing erosion. Transactions of the ASAE 28: 1466–1470.
Jinze, M., 1991. The impact of environmental change and conservation measures on erosion and sediment loads in the Yellow River Basin. In Sediment and Stream Water Quality in a Changing Environment: Trends and Explanation. Proceedings of the Vienna Symposium, August 1991. IAHS Press, Wallingford, UK, pp. 47–52.
Jones, C.S. and Schilling, K.E., 2011. From agricultural intensification to conservation: sediment transport in the Raccoon River, Iowa, 1916–2009. Journal of Environmental Quality 40: 1911–1923.
Jones, J.I., Murphy, J.F., Collins, A.L. et al., 2011. The impact of fine sediment on macro-invertebrates. River Research and Applications 28: 1055–1071.
Jordan, P., Rippey, B. and Anderson, J., 2002. The 20th century whole-basin trophic history of an inter-drumlin lake in an agricultural catchment. Science of the Total Environment 297: 161–173.
Julian, J.P., Seegert, S.Z., Powers, S.M. et al., 2008a. Light as a first-order control on ecosystem structure in a temperate stream. Ecohydrology 4: 422–432.
Julian, J.P., Stanley, E.H. and Doyle, M.W., 2008b. Basin-scale consequences of agricultural land use on benthic light availability and primary production along a sixth-order temperate river. Ecosystems 11: 1091–1105.
Julien, H. and Bergeron, N., 2006. Effect of fine sediment infiltration during the incubation period on Atlantic salmon (Salmo salar) embryo survival. Hydrobiologia 563: 61–71.
Kaller, M. and Hartman, K., 2004. Evidence of a threshold level of fine sediment accumulation for altering benthic macroinvertebrate communities. Hydrobiologia 518: 95–104.
Kaufmann, P.R., Larsen, D.P. and Faustini, J.M., 2009. Bed stability and sedimentation associated with human disturbances in Pacific northwest streams. Journal of the American Water Resources Association 45: 434–459.
Kefford, B., Zalizniak, L., Dunlop, J. et al., 2010. How are macroinvertebrates of slow flowing lotic systems directly affected by suspended and deposited sediments? Environmental Pollution 158: 543–550.
Kelly, W.E. and Gularte, R.C., 1981. Erosive resistance of cohesive soils. Transactions of the American Society of Civil Engineers Hydraulics Division 107: 1211–1224.
Kelly-Quinn, M., Bruen, M., Harrison, S. et al., 2016. HYDROFOR Project Synthesis Report: Assessment of the Impacts of Forest Operations on the Ecological Quality of Water. Environmental Protection Agency, Johnstown Castle, Ireland.
Kemp, P., Sear, D., Collins, A. et al., 2011. The impacts of fine sediment on riverine fish. Hydrological Processes 25: 1800–1821.
Kessler, A.C., Gupta, S.C., Dolliver, H.A.S. and Thoma, D.P., 2012. Lidar quantification of bank erosion in Blue Earth County, Minnesota. Journal of Environmental Quality 41: 197–207.
Kiely, G., 1999. Climate change in Ireland from precipitation and streamflow observations. Advances in Water Resources 23: 141–151.
Kiely, G., 2007. Phosphorus, Nitrogen and Suspended Sediment Loss from Soil to Water from Agricultural Grassland. Environmental Protection Agency. Available online: http://erc.epa.ie/safer/iso19115/ displayISO19115.jsp?isoID=23 (accessed 4 May 2012).

81
D. Lawler et al. (2010-W-LS-4)
Kiely, G., Morgan, G., Quishi, X. et al., 2007. Eutrophication from Agricultural Sources (Phosphorus and Nitrogen), Sub-Project: Soil and Phosphorus: Catchment Studies. Environmental Protection Agency, Johnstown Castle, Ireland.
Kinnell, P.I.A., 1999. Discussion on the European soil erosion model (EUROSEM): a dynamic approach for predicting sediment transport from fields and small catchments. Earth Surface Processes and Landforms 24: 563–565.
Kinnell, P.I.A., 2011. Raindrop-induced saltation and the enrichment of sediment discharged from sheet and interrill erosion areas. Hydrological Processes 26: 1449–1456.
Kinniburgh, D.G. and Newell, A.J., 2003. Water Framework Directive: Lake Typology Based on the BGS 1:625,000 and 1:250,000 Digital Solid Geological Maps. ESRI Arcview legend prepared for the Environment Agency, Bristol, UK.
Knight, D.W., 2005. Sediment transport in rivers with overbank flow. Sichuan Daxue Xuebao (Gongcheng Kexue Ban)/Journal of Sichuan University (Engineering Science Edition) 37: 16–29.
Knighton, A., 1998. Fluvial Forms and Processes. Arnold, London.
Konwinski, G.R., 1979. Sediment traps in channels – design procedures and performance. Agricultural Engineering 60: 30.
Krasa, J., Dostal, T., Vrana, K. and Plocek, J., 2010. Predicting spatial patterns of sediment delivery and impacts of land-use scenarios on sediment transport in Czech catchments. Land Degradation & Development 21: 367–375.
Kreutzweiser, D.P., Capell, S.S. and Good, K.P., 2005. Effects of fine sediment inputs from a logging road on stream insect communities: a large-scale experimental approach in a Canadian headwater stream. Aquatic Ecology 39: 55–66.
Krutz, L.J., Locke, M.A. and Steinriede Jr, R.W., 2009. Interactions of tillage and cover crop on water, sediment, and pre-emergence herbicide loss in glyphosate-resistant cotton: implications for the control of glyphosate-resistant weed biotypes. Journal of Environmental Quality 38: 1240–1247.
Kurtak, D.C., 1978. Efficiency of filter feeding of black fly larvae (Diptera simuliidae). Canadian Journal of Zoology 56: 1608–1623.
Lake, R.G. and Hinch, S.G., 1999a. Acute effects of suspended sediment angularity on juvenile coho salmon (Oncorhynchus kisutch). Canadian Journal of Fisheries and Aquatic Sciences 56: 862–867.
Lal, R., 1984. Mulch requirements for erosion control with the no-till system in the tropics: a review. In Challenges in African Hydrology and Water Resources. Proceedings of the Harare Symposium, July 1984. IAHS Press, Wallingford, UK, pp. 475–484.
Lancaster, J. and Hildrew, A.G., 1993. Characterizing in-stream flow refugia. Canadian Journal of Fisheries and Aquatic Sciences 50: 1663–1675.
Lane, P.N. and Sheridan, G.J., 2002. Impact of an unsealed forest road stream crossing: water quality and sediment sources. Hydrological Processes 16: 2599–2612.
Lane, S.N., Burt, T.P., Dixon, J. et al., 2007. Demonstration of the mediation by surface hydrological connectivity of the influence of landscape factors on instream ecology. Geophysical Research Abstracts 9: 07434.
Langlois, J.L., Johnson, D.W. and Mehuys, G.R., 2005. Suspended sediment dynamics associated with snowmelt runoff in a small mountain stream of Lake Tahoe (Nevada). Hydrological Processes 19: 3569–3580.
Larsen, S. and Ormerod, S.J., 2010. Low-Level effects of inert sediments on temperate stream invertebrates. Freshwater Biology 55: 476–486.
Larsen, S., Vaughan, I.P. and Ormerod, S.J. 2009. Scale-dependent effect of fine sediments on temperate headwater invertebrates. Freshwater Biology 54: 203–219.
Larsen, S., Pace, G. and Ormerod, S., 2011. Experimental effects of sediment deposition on the structure and function of macroinvertebrate assemblages in temperature streams. River Research and Applications 27: 257–267.
Lawler, D.M., 1991. A new technique for the automatic monitoring of erosion and deposition rates. Water Resources Research 27: 2125–2128.
Lawler, D.M., 1992. Process dominance in bank erosion systems, In Carling, P.A. and Petts, G.E. (eds), Lowland Floodplain Rivers: Geomorphological Perspectives. John Wiley, Chichester.
Lawler, D.M., 1993. Needle ice processes and sediment mobilization on river banks: the River Ilston, West Glamorgan, UK. Journal of Hydrology 150: 81–114.
Lawler, D.M., 2005a. Spectrophotometry: Turbidity and nephelometry. In Worlsfold, P.J., Townshedn, A. and Poole, C.F. (eds), Encyclopedia of Analytical Science. Elsevier, London, UK.
82
SILTFLUX Literature Review
Lawler, D.M., 2005b. The importance of high-resolution monitoring in erosion and deposition dynamics studies: Examples from estuarine and fluvial systems. Geomorphology 64: 1–23.
Lawler, D.M., 2008. Advances in the continuous monitoring of erosion and deposition dynamics: developments and applications of the new PEEP-3T system. Geomorphology 93: 17–39.
Lawler, D.M. 2016. Turbidity, turbidimetry and nephelometry, In: Reference Module in Chemistry, Molecular Sciences and Chemical Engineering, Chapter 11006. Elsevier, London, UK.
Lawler, D.M. and Brown, R.M., 1992. A simple and inexpensive turbidity meter for the estimation of suspended sediment concentrations. Hydrological Processes 6: 159–168. .
Lawler, D.M. and Fairchild, I.J., 2010. New developments in process understanding and modelling in geomorphology: Introduction and overview. Earth Surface Processes and Landforms 35: 1247–1250.
Lawler, D.M. and Wilkes, M.A. 2015. Towards improved fluvial sediment impact assessment (FSIA) approaches within environmental impact assessments. Croatian Geographical Bulletin (Hrvatski Geografski Glasnik), 77/2, pp.7−31.
Lawler, D.M., Thorne, C.R. and Hooke, J.M., 1997. Bank erosion and instability. In Thorne, C.R., Hey, R.D. and Malcolm, D.N. (eds), Applied Fluvial Geomorphology for River Engineering and Management. Wiley, Chichester, UK.
Lawler, D.M., Grove, J.R., Couperthwaite, J.S. and Leeks, G.J.L., 1999. Downstream change in river bank erosion rates in the Swale–Ouse system, northern England. Hydrological Processes 13: 977–992.
Lawler, D.M., McGregor, G.R. and Phillips, I.D., 2003. Influence of atmospheric circulation changes and regional climate variability on river flow and suspended sediment fluxes in southern Iceland. Hydrological Processes 17: 3195–3223.
Lawler, D.M., Foster, I.D.L., Petts, G.E. et al., 2006. Suspended Sediment Dynamics for June Storm Events in the Urbanized River Tame, UK. IAHS Press, Wallingford, UK, pp. 96–103.
Lawler, D.M., Cardenas, B., Old, G.H. and Sear, D.A., 2009. Geomorphology and sediments of the hyporheic zone. The Hyporheic Handbook. A Handbook on the Groundwater–Surface Water Interface and Hyporheic Zone for Environment Managers. Environment Agency, Bristol, UK.
Lazar, A.N., Butterfield, D., Futter, M.N. et al., 2010. An assessment of the fine sediment dynamics in an upland river system: INCA-Sed modifications and implications for fisheries. Science of the Total Environment 408: 2555–2566.
Lees, J., Foster, I., Jones, D. et al., 1997. Sediment yields in a changing envrionment: a historical reconstruction using reservoir bottom-sediments in three contrasting small catchments, North York Moors, UK. In Human Impact on Erosion and Sedimentation. Proceedings of the Rabat Symposium, April 1997. IAHS, Wallingford, UK, pp. 169–179.
Lemly, A., 1982. Modification of benthic insect communities in polluted streams: combined effects of sedimentation and nutrient enrichment. Hydrobiologia 87: 229–245.
Leopold, L.B., 1973. River channel change with time – an example. Geological Society of America Bulletin 84: 1845–1860.
Le Roux, J.P., 2010. A comparison of velocity profiles in unidirectional currents and the wave boundary layer: implications for sediment entrainment. Sedimentary Geology 232: 84–90.
Lewin, J. and Macklin, M.G., 1987. Metal mining and floodplain sedimentation in Britain. In Gardiner, V. (ed.), International Geomorphology 1986. John Wiley, Chichester, UK.
Lewis, K., 1973. The effects of suspended coal particles on the life forms of the aquatic moss Eurhynchlium riparioides (Hebw). I. The gametophyte plant. Freshwater Biology 3: 251–257.
Lewis, J., 1996. Turbidity-controlled suspended sediment sampling for runoff-event load estimation. Water Resources Research 32: 2299–2310.
Liébault, F., Gomez, B., Page, M. et al., 2005. Land-use change, sediment production and channel response in upland regions. River Research and Applications 21: 739–756.
Lisle, T.E., 1989. Sediment transport and resulting deposition in spawning gravels, north coastal California. Water Resources Research 25: 1303–1319.
Lloyd, D., Koenings, J. and La Perriere, J., 1987. Effects of turbidity in fresh waters of Alaska. North American Journal of Fisheries Management 7: 18–33.
Luce, C.H. and Black, T.A., 1999. Sediment production from forest roads in western Oregon. Water Resources Research 35, 1079–1092.
Lyle, W.M. and Smerson, E.T., 1965. Relation of compaction and other soil properties to erosion resistance of soils. Transactions of the ASAE 8, 419–422.

83
D. Lawler et al. (2010-W-LS-4)
McElwain, L. and Sweeney, J., 2003. Climate change in Ireland – Recent trends in temperature and precipitation. Irish Geography 36: 97–111.
McGrath, D., Carton, O.T., Diamond, S. et al., 2001. Investigations of Animal Health Problems at Askeaton, Co. Limerick. Part 3: Soil Herbage,Feed and Water. Teagasc, Johnstown Castle Research Centre, Wexford.
Macklin, M.G., Brewer, P.A., Balteanu, D. et al., 2003. The long term fate and environmental significance of contaminant metals released by the January and March 2000 mining tailings dam failures in Maramures County, Upper Tisa Basin, Romania. Applied Geochemistry 18, 241–257.
Madsen, J., Chambers, P., James, W. et al., 2001. The interaction between water movement, sediment dynamics and submersed macrophytes. Hydrobiologia 444: 71–84.
Maltby, L., Forrow, D.M., Boxall, A.B.A. et al., 1995. The effects of motorway runoff on freshwater ecosystems: 1. Field study. Environmental Toxicology and Chemistry 14(6): 1079–1092.
Mantz, P.A., 1977. Incipient transport in fine grains and flakes by fluids-extended Shield’s diagram. Journal of the Hydraulics Division 103: 601–615.
Marcus, W.A., 1989. Lag-time routing of suspended sediment concentrations during unsteady flow. Geological Society of America Bulletin 101: 644–651.
Martin, J.M. and Meybeck, M., 1979. Elemental mass-balance of material carried by major world rivers. Marine Chemistry 7: 173–206.
Mati, B.M., Morgan, R.P.C. and Quinton, J.N., 2006. Soil erosion modelling with EUROSEM at Embori and Mukogodo catchments, Kenya. Earth Surface Processes and Landforms 31: 579–588.
Matthaei, C., Weller, F., Kelly, D. and Townsend, C., 2006. Impacts of fine sediment addition to tussock, pasture, dairy and deer farming in New Zealand. Freshwater Biology 51: 2154–2172.
Matthaei, C., Piggott, J. and Townsend, C., 2010. Multiple stressors in agricultural streams: interactions among sediment addition, nutrient enrichment and water abstraction. Journal of Applied Biology 47: 639–649.
May, L., Place, C., O’Hea, B. et al., 2005. Modelling soil erosion and transport in the Burrishoole Catchment, Newport, Co. Mayo, Ireland. Freshwater Forum 23: 139–154.
Melis, T.S., Topping, D.J. and D.M., R., 2003. Testing laser-based sensors for continuous in situ monitoring of suspended sediment in the Colorado River, Arizona. In Erosion and Sediment Transport Measurement in Rivers: Technological and Methodological Advances. IAHS, Wallingford, UK.
Melland, A.R., Mellander, P. A, Murphy, P.N.C. et al., 2012. Stream water quality in intensive cereal cropping catchments with regulated nutrient management. Environmental Science and Policy 24: 58–70.
Meyer, L.D., Wischmeier, W.H. and Foster, G.R., 1970. Mulch rates required for erosion control on steep slopes. Soil Science Society of America Journal 34: 928–931.
Milan, D.J., Petts, G.E. and Sambrook, H., 2000. Regional variations in the sediment structure of trout streams in southern England: benchmark data for siltation assessment and restoration. Aquatic Conservation: Marine and Freshwater Ecosystems 10: 407–420.
Miller, J.R., 1997. The Role of fluvial geomorphic processes in the dispersal of heavy metals from mine sites. Journal of Geochemical Exploration 58: 101–118.
Milliman, J.D. and Syvitski, J.P.M., 1992. Geomorphic/tectonic control of sediment discharge to the ocean: the importance of small mountainous rivers. Journal of Geology 100: 525–544.
Minella, J.P.G., Walling, D.E. and Merten, G.H., 2008. Combining sediment source tracing techniques with traditional monitoring to assess the impact of improved land management on catchment sediment yields. Journal of Hydrology 348: 546–563.
Mitchell, S.B., 2005. Discussion on ‘The effect of fresh water flow on siltation in the Humber estuary, Northeast UK’ by Pontee NI, Whitehead PA and Hayes CM (ECSS vol. 60, 241–249). Estuarine Coastal and Shelf Science 62: 725–729.
Mitchell, S.B., Lawler, D.M., West, J.R. and Couperthwaite, J.S., 2003. Use of continuous turbidity sensor in the prediction of fine sediment transport in the turbidity maximum of the Trent estuary, UK. Estuarine Coastal and Shelf Science 58: 645–652.
Moatar, F. and Meybeck, M, 2005. Compared performances of different algorithms for estimating annual nutrient loads discharged by the eutrophic River Loire. Hydrological Processes 19: 429–444.
Molina, A., Govers, G., Poesen, J. et al., 2008. Environmental factors controlling spatial variation in sediment yield in a central Andean mountain area. Geomorphology 98: 176–186.

84
SILTFLUX Literature Review
Molinos, J.G. and Donohue, I., 2009. Differential contribution of concentration and exposure time to sediment dose effects on stream biota. Journal of the North American Benthological Society 28: 110–121.
Molinos, J. and Donohue, I., 2010. Interactions among temporal patterns determine the effects of multiple stressors. Ecological Applications 20: 1794–1800.
Morgan, R.P.C., Quinton, J.C. and Rickson, R.J., 1994. Modelling methodology for soil-erosion assessment and soil conservation design – The EUROSEM approach. Outlook on Agriculture 23: 5–9.
Morgan, R.P.C., Quinton, J.N., Smith, R.E. et al., 1998. The European soil erosion model (EUROSEM): A dynamic approach for predicting sediment transport from fields and small catchments. Earth Surface Processes and Landforms 23: 527–544.
Muleta, M., 2010. Evaluating effectiveness of best management practices to control accelerated sedimentation of the Morro Bay estuary. In Proceedings of the 2010 Watershed Management Conference: Madison, Wisconsin. American Society of Civil Engineers, pp. 1190–1201.
Muller, S., Guiraud, P. and Line, A., 2011. Particle bed deformation in front of a weir induced by subcritical laminar flow. Journal of Hydraulic Research 49: 194–204.
Murphy, C. and Charlton, R., 2008. Climate change and water resources in Ireland. In Sweeney, J. (ed.) Climate Change: Refining the Impacts. Environmental Protection Agency, Johnstown Castle, Ireland.
Nanson, G.C. and Knighton, A.D., 1996. Anabranching rivers: their cause, character and classification. Earth Surface Processes and Landforms 21: 217–239.
National Parks and Wildlife Service, 2008. The Status of EU Protected Habitats and Species in Ireland. Conservation Status in Ireland of Habitats and Species Listed in the European Council Directive on the Conservation of Habitats, Flora and Fauna 92/43/EEC. Department of the Environment, Heritage and Local Government, Ireland.
Newcomb, T.W. and Flagg, T.A., 1983. Some effects of Mt. St. Helens volcanic ash on juvenile salmon smolts. US National Marine Fisheries Service Review 45: 8–12.
Newcombe, C.P. and Jensen, J.O.T., 1996. Channel suspended sediment and fisheries: a synthesis for quantitative assessment of risk and impact. North American Journal of Fisheries Management 16: 693–727.
Newcombe, C.P. and McDonald, D.D., 1991. Effects of suspnded sediments on aquatic ecosystems. North American Journal of Fisheries Management 11: 72–82.
Niyogi, D., Koren, M., Arbuckle, C. and Townsend, C., 2007. Stream communities along a catchment land-use gradient: subsidy-stress responses to pastoral development. Environmental Management 39: 213–225.
NRC, 2003. Bioavailability of Contaminants in Soils and Sediments. Processes, Tools and Applications. National Academies Press, Washington, DC.
Nuttall, P.M., 1972. The effects of sand deposition upon the macroinvertebrate fauna of the River Camel, Cornwall. Freswater Biology 2: 181–186.
Nuttall, P.M. and Bielby, G.H., 1973. The effect of china-clay wastes on stream invertebrates. Environmental Pollution 5: 77–86.
O’Connor, W.C.K. and Andrew, T.E., 1998. The effects of siltation on Atlantic salmon, Salmo salar L., embryos in the River Bush. Fisheries Management and Ecology 5: 393–401.
O’Driscoll, M., Cllinton, S., Jefferson, A. et al., 2010. urnbanization effects on watershed hydrology and in-stream processes in the southern United States. Water 2: 605–648.
O’Loughlin, C.L., Rowe, L.K. and Pearce, A.J., 1980. Sediment yield and water quality responses to clearfelling of evergreen mixed forests in western New Zealand. In Proceedings of the Helsinki Symposium on the the Influence of Man on the Hydrological Regime with Special Reference to Representative and Experimental Basins, PIHS-AISH Publication No. 130, 285-292.
Odgaard, A.J., 1984. Bank Erosion Control Contribution Of Stream Sediment Load. Iowa Institute of Hydraulic Research, Report No. 280, 92pp. Available online: http://www.iihr.uiowa.edu/wp-content/uploads/2013/06/IIHR280.pdf (accessed May 2016).
Old, G.H., Leeks, G.J.L., Packman, J.C. et al., 2003. The impact of a convectional summer rainfall event on river flow and fine sediment transport in a highly urbanised catchment: Bradford, West Yorkshire. Science of the Total Environment 314–316: 495–512.
Old, G.H., Lawler, D.M. and Snorrason, A., 2005. Discharge and suspended sediment dynamics during two jokulhlaups in the Skafta river, Iceland. Earth Surface Processes and Landforms 30: 1441–1460.

85
D. Lawler et al. (2010-W-LS-4)
Old, G.H., Leeks, G.J.L., Packman, J.C. et al., 2006. River flow and associated transport of sediments and solutes through a highly urbanised catchment, Bradford, West Yorkshire. Science of the Total Environment 360: 98–108.
Oregon DEQ (Oregan Department of Environmental Quality), 2010. Turbidity Technical Review: Summary of Sources, Effects, and Issues Related to Revising the Statewide Water Quality Standard for Turbidity. State of Oregon Department of Environmental Quality. Available online: http://www.deq.state.or.us/wq/standards/docs/Turbidity/10-WQ-022.pdf (accessed 23 May 2016).
Osterling, E.M., Greenberg, L.A. and Arvidsson, B.A., 2008. Relationship of biotic and abiotic factors to recruitment patterns in Margaritifera margaritifera. Biological Conservation 141: 1365–1370.
Owens, P.N., 2005. Conceptual models and budgets for sediment management at the river basin scale. Journal of Soils and Sediments 5: 201–212.
Owens, P.N., 2009. Adaptive management frameworks for natural resource management at the landscape-scale: implications and applications for sediment resources. Journal of Soils and Sediments 9: 578–593.
Owens, P. and Xu, Z., 2011. Recent advances and future directions in soils and sediments research. Journal of Soils and Sediments 11: 875–888.
Owens, P., Walling, D., Carton, J. et al., 2001. Downstream changes in the transport and storage of sediment associated contaminants (P, Cr and PCBs) in agricultural and industrialised drainage basins. Science of the Total Environment 266: 177–186.
Owens, P., Batalla, R., Collins, A. et al., 2005. Fine-grained sediment in river systems: environmental significance and management issues. River Research and Applications 21: 693–717.
Owens, P.N., Duzant, J.H., Deeks, L.K. et al., 2006. The use of buffer features for sediment and phosphorus retention in the landscape: implications for sediment delivery and water quality in river basins. In Sediment Dynamics and the Hydromorphology of Fluvial Systems, Proceedings of a symposium held in Dundee, UK, July 2006. IAHS Press, Wallingford, UK, pp. 223–230.
Owens, P.N., Duzant, J.H., Deeks, L.K. et al., 2007. Evaluation of contrasting buffer features within an agricultural landscape for reducing sediment and sediment-associated phosphorus delivery to surface waters. Soil Use and Management 23: 165–175.
Peart, M.R., Hill, R.D. and Fok, L., 2009. Environmental change, hillslope erosion and suspended sediment: some observations from Hong Kong. Catena 79: 198–204.
Penck, M., Brophy, J. and Nash, R., 2009. Likely implications for the natural heritage of Ireland’s coast and inland waterways. In Kelly, B. and Stack, M. (eds), Climate Change, Heritage and Tourism: Implications for Ireland’s Coast and Inland Waterways. The Heritage Council, Kilkenny.
Phillips, J.M., Webb, B.W., Walling, D.E. and Leeks, G.J.L., 1999. Estimating the suspended sediment loads of rivers in the LOIS study area using infrequent samples. Hydrological Processes 13: 1035–1050.
Piégay, H., Walling, D.E., Landon, N. et al., 2004. Contemporary changes in sediment yield in an alpine mountain basin due to afforestation (the upper Drôme in France). Catena 55: 183–212.
Pilling, C.G. and Jones, J.A.A., 2002. The impact of future climate change on seasonal discharge, hydrological processes and extreme flows in the upper Wye experimental catchment, Mid-Wales. Hydrological Processes 16: 1201–1213.
Pontee, N.I. and Cooper, N.J., 2005. Including estuaries in shoreline management plans. Proceedings of the Institution of Civil Engineers – Maritime Engineering 158: 33–40.
Potter, D., Clarius, T.M., Wright, A.S. and Watson, W.P., 1994. Molecular dosimetry of DNA-adducts in rainbow-trout (Oncorhynchus mykiss) exposed to benzo(a)pyrene by different routes. Archives of Toxicology 69: 1–7.
Purcell, P., Bruen, M., O’sullivan, J. et al., 2012. Water quality monitoring during the construction of the M3 motorway in Ireland. Water and Environment Journal 26: 175–183.
Quinn, J.M., Davies-Colley, R.J., Hickey, C.W. et al., 1992. Effects of clay discharges on streams. Hydrobiologia 248: 235–247.
Rabení, C.F., Doisy, K.E. and Zweig, L.D., 2005. Stream invertebrate community functional responses to deposited sediment. Aquatic Science 67: 395–402.
Rabinovich, E. and Kalman, H., 2011. Threshold velocities of particle-fluid flows in horizontal pipes and ducts: literature review. Reviews in Chemical Engineering 27: 215–239.
Rankinen, K., Thouvenot-Korppoo, M., Lazar, A. et al., 2010. Application of catchment scale sediment delivery model INCA-Sed to four small study catchments in Finland. Catena 83: 64–75.

86
SILTFLUX Literature Review
Redding, J.M., Schreck, C.B. and Everest, F.H., 1987. Physiological effects on coho salmon and steelhead of exposure to suspended solids. Transactions of the American Fisheries Society 116: 737–744.
Regan, J.T., Fenton, O. and Healy, M.G., 2012. A review of phosphorus and sediment release from Irish tillage soils, the methods used to quantify losses and current state of mitigation practice. Proceedings of the Royal Irish Academy: Biology and Environment, 112B: 157–183.
Reynolds, J.B., Simmons, R.C. and Burkholder, A.R., 1989. Effects of placer mining discharge on health and food habits of Arctic grayling. Water Resources Bulletin 25: 625–635.
Richards, C., Host, G.H. and Arthur, J.W., 1993. Identification of predominant environmental factors structuring stream macroinvertebrates communities within a large agricultural catchment. Freshwater Biology 29: 285–294.
Richards, R.P., Baker, D.B., Crumrine, J.P. et al., 2008. Thirty-year trends in suspended sediment in seven Lake Erie tributaries. Journal of Environmental Quality 37: 1894–1908.
Riedel, M.S., Brooks, K.N. and Verry, E.S., 2005. Quantifying Sediment Loading from Stream Bank Erosion in Pastures. American Society of Agricultural and Biological Engineers, Atlanta, GA.
Ritter, W.F. and Shirmohammadi, A., 2001. Agricultural Nonpoint Source Pollution: Watershed Management and Hydrology. Lewis Publishers, New York, NY.
Robertson, M., 1957. The Effects of Suspended Material on the Productive Rate of Daphnia Magna. Institute of Marine Science, University of Texas, pp. 265–277.
Robertson, M.J., Scruton, D.A. and Clarke, K.D., 2007. Seasonal effects of suspended sediment on the behaviour of juvenile Atlantic salmon. Transactions of the American Fisheries Society 136: 822–828.
Rodgers, M., O’Connor, M., Robinson, M. et al., 2011. Suspended solid yield from forest harvesting on upland blanket peat. Hydrological Processes 25: 207–216.
Rodrigue-Gervais, K., Biron, P.M. and Lapointe, M.F., 2010. Temporal development of scour holes around submerged stream deflectors. Journal of Hydraulic Engineering 137: 781–785.
Rose, N., Morley, D., Appleby, P. et al., 2011. Sediment accumulation rates in European lakes since AD 1850: trends, reference conditions and exceedence. Journal of Paleolimnology 45: 447–468.
Rosenberg, D.M. and Wiens, A.P., 1978. Effects of sedimentation on macrobenthic invertebrates on a northern Canadian river. Water Research 12: 753–763.
Ruhl, C.A., Schoellhamer, D.H., Stumpf, R.P. and Lindsay, C.L., 2001. Combined use of remote sensing and continuous monitoring to analyse the variability of suspended-sediment concentrations in San Francisco Bay, California. Estuarine Coastal and Shelf Science 53: 801–812.
Ryan, P.A., 1991. Environmental effects of sediment on New Zealand streams: A Review. New Zealand Journal of Marine and Freshwater Research 25: 207–221.
Ryder, E., De Eyto, E., Dillane, M. et al., 2014. Identifying the role of environmental drivers in organic carbon export from a forested peat catchment. Science of the Total Environment 490: 28–36.
Sabol, T.A., Topping, D.J. and Griffiths, R.E., 2010. Field evaluation of sediment-concentration errors arising from non-isokinetic intake efficiency in depth-integrating suspended-sediment bag samplers: Ninth Federal Interagency Sedimentation Conference, Las Vegas, NV. Available online: http://acwi.gov/sos/pubs/2ndJFIC/Contents/P23_SABOL_02_23_10.pdf (accessed 25 May 2016)
Sadar, M., 1998. Turbidity Standards. Hach Technical Information Series — Booklet No. 12. Available online: www.hach.com/asset-get.download-en.jsa?code=61799 (accessed May 2016).
Salles, C., Poesen, J. and Govers, G., 2000. Statistical and physical analysis of soil detachment by raindrop impact: rain erosivity indices and threshold energy. Water Resources Research 36: 2721–2729.
Salomons, W. and Forstner, U., 1984. Metals in the Hydrocycle. Springer-Verlag, New York, NY.
Sarangi, A., Madramootoo, C.A. and Cox, C., 2004. A decision support system for soil and water conservation measures on agricultural watersheds. Land Degradation and Development 15: 49–63.
Saunders, I. and Young, A., 1983. Rates Of surface processes on slopes, slope retreat and denudation. Earth Surface Processes and Landforms 8: 473–501.
Scheurer, K., Alewell, C., Bänninger, D. and Burkhardt-Holm, P., 2009. Climate and land-use changes affecting river sediment and brown trout in Alpine countries – a review. Environmental Science and Pollution Research 16: 232–242.
Schilling, J.G., 2005. Street Sweeping – Report No 1 State of the Practice. Prepared for Ramsey–Washington Metro Watershed District, North St. Paul, Minnesota, 2005. Available online: http://www.worldsweeper.com/Street/Studies/pdf/RamseyReport1StateofPractice.pdf (accessed 20 May 2016).

87
D. Lawler et al. (2010-W-LS-4)
Schindl, G., Studnicka, M., Eckelhart, A. and Summer, W., 2005. Hydrological and instrumentation apsects of monitoring and analysing suspended sediment transport crossing international borders. In Walling, D.E. and Horowitz, A.J. (eds), Sediment Budgets 1. Proceedings of Symposium 51 held during the Seventh IAHS Scientific Assembly at Foz do Iguaco, Brazil, 3–9 April 2005. IAHS, Wallingford, UK, pp. 227–240.
Schueler, T.R., Galli, J., Herson, L., Kumble, P. and Shepp, D., 1991. Developing effective BMP systems for urban watersheds. Urban Nonpoint Workshops. New Orleans, Louisiana. January 27-29, 1991.
Schutes, R., Revitt, D., Scholes, L. et al., 2001. An experimental constructed wetland system for the treatment of highway runoff in the UK. Water Science and Technology 44: 571–579.
Sear, D.A., 1993. Fine Sediment infiltration into gravel spawning beds within a regulated river experiencing floods. ecological implications for salmonids. Regulated Rivers Research and Management 8: 373–390.
Sear, D.A., Newson, M.D. and Thorne, C.R., 2003. Guidebook of Applied Fluvial Geomorphology. Department of Environment and Rural Affairs and Environment Agency, Swindon, UK.
Sear, D.A., Frostick, L.B., Rollinson, G. and Lisle, T., 2008. The significance and mechanics of fine-sediment infiltration and accumulation in gravel spawning beds. In Sear, D. and Devries, P. (eds), Salmon Spawning Habitat in Rivers: Physical Controls, Biological Responses and Approaches to Remediation. American Fisheries Society, Bethesda, MD, pp. 149–174.
Segura, C. and Booth, D.B., 2010. Effects of geomorphic setting and urbanization on wood, pools, sediment storage, and bank erosion in puget sound streams. Journal of the American Water Resources Association 46: 972–986.
Servizi, J.A. and Martens, D.W., 1991. Effect of temperature, season and fish size on acute lethality of suspended sediments to coho salmon (Oncorhynchus kisutch). Canadian Journal of Fisheries and Aquatic Sciences 48: 493–497.
Sharma, P.P., Gupta, S.C. and Foster, G.R., 1993. Predicting soil detachment by raindrops. Soil Science Society of America Journal 57: 674–680.
Shaw, E.A. and Richardson, J.S., 2001. Direct and indirect effects of sediment pulse duration on stream invertebrate assemblages and rainbow trout (Oncorhynchus mykiss) growth and survival. Canadian Journal of Fisheries and Aquatic Sciences 58: 2213–2221.
Shaw, L.Y. and Kuo, J.-T., 2001. Field test of grassed swale performance in removing runoff pollution. Journal of Water Resources Planning and Management 127: 168–171.
Sherriff, S.C., Rowan, J.S., Melland, A.R. et al., 2015. Investigating suspended sediment dynamics in contrasting agricultural catchments using ex situ turbidity-based suspended sediment monitoring. Hydrology and Earth System Sciences 19: 3349-3363.
Shieh, C.-L., Guh, Y.-R. and Wang, S.-Q., 2007. The application of range of variability approach to the assessment of a check dam on riverine habitat alteration. Environmental Geology 52: 427–435.
Shields F.D. Jr, Morin, N. and Cooper, C.M., 2004. Large woody debris structures for sand-bed channels. Journal of Hydraulic Engineering 130: 208–217.
Shiono, K., 2011. Pollutant And sediment transport caused by turbulent diffusion in rivers and estuaries. Advances Materials Research 374–377: 1750–1757.
Simon, A., Bankhead, N., Mahacek, V. and Langendoen, E., 2008. Quantifying existing and potential reductions in sediment loads from streambanks. In Babcock, R. Jr, and Walton, R. (eds), World Environmental and Water Resources Congress 2008. American Society of Civil Engineers, Reston, VA.
Sklar, L.S., Dietrich, W.E., Foufoula-Georgiou, E. et al., 2006. Do gravel bed river size distributions record channel network structure? Water Resources Research 42: W06D18.
Slaney, P.A., Halsey, T.G. and Tautz, A.F., 1977. Effect of Forest Harvesting Practices on Spawning Habitats of Stream Salmonids in the Centennial Creek Watershed, Report No. 73, British Columbia Ministry of Environment, Fish and Wildlife Branch, Fisheries Management, Vancouver, Canada.
Smerdon, E.T. and Beasley, R.P., 1961. Critical tractive forces in cohesive soils. Agricultural Engineering 42: 26–29.
Smith, C.S., Lejano, R.P., Ogunseitan, O.A. and Hipp, J.A., 2007. Cost effectiveness of regulation-compliant filtration to control sediment and metal pollution in urban runoff. Environmental Science and Technology 41: 7451–7458.
Smith, R.E., Goodrich, D.C. and Quinton, J.N., 1995. Dynamic, distributed simulation of watershed erosion – The KINEROS2 and EUROSEM models. Journal of Soil and Water Conservation 50: 517–520.
Soulsby, C., Youngson, A.F., Moir, H.J. and Malcolm, I.A., 2001. Fine sediment influence on salmonid spawning habitat in a lowland agricultural stream: a preliminary assessment. Science of the Total Environment 265: 295–307.
88
SILTFLUX Literature Review
Stead, T., Schmid-Araya, J. and Hildrew, A., 2004. The contribution of subsurface invertebrates to benthic density and biomass in a gravel stream. Hydrobiologia 160: 171–191.
Steele-Dunne, S., Lynch, P., Mcgrath, R. et al., 2008. The impacts of climate change on hydrology in Ireland. Journal of Hydrology 356: 28–45.
Steinman, A.D. and Mcintire, C.D., 1990. Recovery of lotic periphyton communities after disturbance. Environmental Management 14: 598–604.
Stober, Q.J., Ross, B.D., Melby, C.L. et al., 1981. Effects of Suspended Volcanic Sediment on Coho Chinook Salmon in the Toule and Cowlitz Rivers in Seattle. University of Washington, Seattle, WA, p. 147.
Stone, M. and Droppo, I.G., 1994. In-channel surficial fine-grained sediment laminae: Part II: Chemical characteristics and implications for contaminant transport in fluvial systems. Hydrological Processes 8: 113–124.
Storm, D.E., Barfield, B.J. and Ormsbee, L.E., 1990. Final Report. Hydrology and Sedimentology of Dynamic Rill Networks. University of Kentucky, Lexington, KY.
Stott, T.A., Owens, P.N., Forrester, B.J. et al., 2009. Suspended sediment fluxes in the Castle Creek Glacier proglacial zone, Cariboo Mountains, British Columbia. Innovations in Practice 3: 49–70.
Stromqvist, J., Collins, A.L., Davison, P.S. and Lord, E.I., 2008. PSYCHIC – a process-based model of phosphorus and sediment transfers within agricultural catchments. Part 2. A preliminary evaluation. Journal of Hydrology 350: 303–316.
Stubblefield, A.P., Reuter, J.E., Dahlgren, R.A. and Goldman, C.R., 2007. Use of turbidometry to characterize suspended sediment and phosphorus fluxes in the Lake Tahoe basin, California, USA. Hydrological Processes 21: 281–291.
Suren, A.M. and Jowett, I.J., 2001. Effects of deposited sediment on invertebrate drift: an experimental study. New Zealand Journal of Marine and Freshwater Research 35: 725–737.
Suren, A.M., Martin, M.L. and Smith, B.J., 2005. Short-term effects of high suspended sediments on six common New Zealand stream invertebrates. Hydrobiologia 548: 67–74.
Sutherland, A. and Meyer, J., 2007. Effects of increased suspended sediment on growth rate and gill condition of two southern Appalachian minnows. Environmental Biology of Fish 80: 389–403.
Suttle, K.B., Power, M.E., Levine, J.M. and McNeely, C., 2004. How fine sediment in riverbeds impairs growth and survival of juvenile salmonids. Ecological Applications 14: 969–974.
Swan, C. and Palmer, M., 2000. What drives small-scale spatial patterns in lotic meiofauna communities? Freshwater Biology 44: 109–121.
Swanston, D.N. and Swanson, F.J., 1976. Timber harvesting, mass erosion, and steepland forest geomorphology in the Pacific Northwest. In Coates, D.R. (ed.) Geomorphology and Engineering. Dowden, Hutchinson & Ross, Inc., Stroudsberg, PA, pp. 199–221
Swietlik, W., Berry, W., Gardner, T. et al., 2003. Developing Water Quality Criteria for Suspended and Bedded Sediments (SABS). Potential Approaches. A U.S. EPA Science Advisory Board Consultation. Available online: https://www.epa.gov/sites/production/files/2015-10/documents/sediment-report.pdf (accessed 20 May 2016).
Taylor, K.G. and Owens, P.N., 2009. Sediments in urban river basins: a review of sediment-contaminant dynamics in an environmental system conditioned by human activities. Journal of Soils and Sediments 9: 281–303.
Taylor, M.R. and Harrison, P.T.C., 1999. Ecological effects of endocrine disruption: current evidence and research priorities. Chemosphere 39: 1237–1248.
Thodsen, H., Hasholt, B. and Kjærsgaard, J.H., 2008. The influence of climate change on suspended sediment transport in Danish rivers. Hydrological Processes 22: 764–774.
Thomas, P., 1990. Teleost model for studying the effects of chemicals on female reproductive endocrine function. Journal of Experimental Zoology 4: 126–128.
Thompson, A.L., Ghidey, F. and Regmi, T.P., 2001. Raindrop energy effects on chemical and sediment transport. Transactions of the American Society of Agricultural Engineers 44: 835–841.
Thompson, J., Cassidy, R., Doody, D.G., et al., 2014. Assessing suspended sediment dynamics in relation to ecological thresholds and sampling strategies in two Irish headwater catchments. Science of The Total Environment 468–469: 345–357.
Thonon, I. and Van Der Perk, M., 2003. Measuring suspended sediment characteristics using a LISST-ST in an embanked flood plain of the River Rhine. In Bogen, J., Fergus, T. and Walling, D.E. (eds), Erosion and Sediment Transport Measurements in Rivers: Technological and Methodological Advances. IAHS Publ No. 283, IAHS Press, Wallingford, UK.

89
D. Lawler et al. (2010-W-LS-4)
Thorne, C.R., 1992. Field Assessment Techniques For Bank Erosion Modeling. Final Report to US Army European Research Office by the Department of Geography, University of Nottingham. Available online: http://www.dtic.mil/dtic/tr/fulltext/u2/a250806.pdf (accessed 20 May 2016).
Toner, P., Bowman, J., Clabby, K. et al., 2000. Water Quality In Ireland, 2001–2003. Environmental Protection Agency, Johnstown Castle, Ireland. Available online: http://www.epa.ie/pubs/reports/water/waterqua/ EPA_water_quality_2001-3.pdf (accessed 20 May 2016).
Townsend, C.R., Uhlmann, S.S. and Matthaei, C.D., 2008. Individual and combined responses of stream ecosystems to multiple stressors. Journal of Applied Ecology 45: 1810–1819.
Tsui, P.T.P. and McCart, P.J., 1981. Effects of stream-crossing by a pipeline on the benthic macroinvertebrate communities of a small mountain stream. Hydrobiologia 79: 271–276.
Turner, J.N., Brewer, P.A. and Macklin, M.G., 2008. fluvial-controlled metal and as mobilisation, dispersal and storage in the Rio Guadiamar, SW Spain and its implications for long-term contaminant fluxes to the donana wetlands. Science of the Total Environment 394: 144–161.
Turnpenny, A.W. and Williams, R., 1980. Effects of sedimentation on the gravels of an industrialised river system. Journal of Fish Biology 17: 681–693.
UKTAG (UK Technical Advisory Group on the Water Framework Directive), 2008. Proposals for Environmental Quality Standards for Annex VIII Substances. Available online: http://www.wfduk.org/sites/default/files/Media/Environmental%20standards/Specific%20pollutants%20proposals_Final_010608.pdf (accessed 20 May 2016).
USEPA (United States Environmental Protection Agency), 1975. Logging Road and Protection of Water Quality. USEPA, Water Division, Region X, Seattle, WA.
USEPA (United States Environmental Protection Agency), 1980. Turbidity: Water Quality Standards, Criteria Summaries, A Compilation of State/ Federal Criteria. USEPA, Office of Water Regulations and Standards, Washington DC.
USEPA (United States Environmental Protection Agency), 2007. National Recommended Water Quality Criteria – aquatic life criteria table. Available online: https://www.epa.gov/wqc/national-recommended-water-quality-criteria-aquatic-life-criteria-table (accessed 2 November 2016).
Valyrakis, M., Diplas, P. and Dancey, C.L., 2011. Entrainment of coarse grains in turbulent flows: An extreme value theory approach. Water Resources Research 47: W09512.
Van Eps, M.A., Formica, S.J., Morris, T.L. et al., 2004. Using a bank erosion hazard index (BEHI) to estimate annual sediment loads from streambank erosion in the West Fork White River watershed. In Proceedings of Self-Sustaining Solutions for Streams, Wetlands, and Watersheds, Paper No. 701P0904. American Society of Agricultural and Biological Engineers, St. Joseph, MI.
Van Liew, M.W., Veith, T.L., Bosch, D.D. and Arnold, J.G., 2007. Suitability of SWAT for the conservation effects assessment project: comparison on USDA agricultural research watersheds. Journal of Hydrologic Engineering 12: 173.
Van Nieuwenhuyse, E.E. and Laperriere, J.D., 1986. Effects of placer gold mining on primary production in subartic streams of Alaska. Water Resources Bulletin 22: 91–99.
Van Oost, K., Govers, G. and Pjj, D., 2000. Evaluating the effects of changes in landscape structure on soil erosion by water and tillage. Landscape Ecology 15: 577–589.
Van Oost, K., Govers, G., De Alba, S. and Quine, T.A., 2006. Tillage erosion: a review of controlling factors and implications for soil quality. Progress in Physical Geography 30: 443–66.
Van Rompaey, A., Verstraeten, G., Van Oost, K. et al., 2001. Modelling mean annual sediment yield using a distributed approach. Earth Surface Processes and Landforms 26: 1221–1236.
Van Rompaey, A.J.J., Verstraeten, G., Van Oost, K. et al., 2002. Modelling mean annual sediment yield using a distributed approach. Earth Surface Processes and Landforms 26: 1221–1236.
Vanmaercke, M., Poesen, J., Verstraeten, G. et al., 2011. Sediment yield in Europe: spatial patterns and scale dependency. Geomorphology 130: 142–161.
Veihe, A. and Al, E., 2001. Modelling of event based soil erosion in Costa Rica, Nicaragua and Mexico: evaluation of the EUROSEM model. Catena 44: 187–203.
Verstraeten, G., Poesen, J., Gillijns, K. and Govers, G., 2006. The use of riparian vegetated filter strips to reduce river sediment loads: an overestimated control measure? Hydrological Processes 20: 4259–4267.

90
SILTFLUX Literature Review
Vice, R., Guy, H. and Ferguson, G., 1969. Sediment Movement in an Area of Suburban Highway Construction, Scott Run Basin, Fairfax County, Virginia, 1961–64. Geological Survey Water Supply Paper 1591-E. United States Government Printing Office, Washington, DC. Available online: http://pubs.usgs.gov/wsp/1591e/report.pdf (accessed 22 May 2016)
Voelz, N.J. and Ward, J.V., 1992. Feeding habits and food resources of filter-feeding Trichoptera in a regulated mountain stream. Hydrobiologia 231: 187–196.
Wagener, S.M. and Laperriere, J.D., 1985. Effects of placer mining on the invertebrate communities of interior Alaska. Freshwater Invertebrate Biology 4: 208–214.
Walker, J.D., Walter, M.T., Parlange, J.-Y. et al., 2007. Reduced raindrop-impact driven soil erosion by infiltration. Journal of Hydrology 342: 331–335.
Wall, G.R., Nystrom, E.A., and Litten, S., 2006. Use of an ADCP to compute suspended-sediment discharge in the tidal Hudson River, New York. U.S. Geological Survey Scientific Investigations Report 2006-5055. Available online: http://pubs.usgs.gov/sir/2006/5055/ (acessed May 2016).
Walling, D.E., 1974. Suspended sediment production and building activity in a small British Basin. Effects of Man on the Interface of the Hydrological Cycle with the Physical Environment. IAHS Publication 113, pp. 137–144. Available online: http://hydrologie.org/redbooks/a113/iahs_113_0137.pdf (accessed 20 May 2016)
Walling, D.E., 1983. The sediment delivery problem. Journal of Hydrology 65: 209–237.
Walling, D.E., 1988. Erosion and sediment yield research – some recent perspectives. Journal of Hydrolgy 100: 113–141.
Walling, D.E., 1997. The response of sediment yields to environmental change. In Human Impact on Erosion and Sedimentation. Proceedings of the Rabat Symposium, April 1997. IAHS, Wallingford, UK.
Walling, D.E., 1999. Linking land use, erosion and sediment yields in river basins. Hydrobiologia 410: 223–240.
Walling, D.E., 2005. Tracing suspended sediment sources in catchments and river systems. Science of the Total Environment, 344(1–3), 159–184.
Walling, D.E., 2006. Human impact on land–ocean sediment transfer by the world’s rivers. Geomorphology 79: 192–216.
Walling, D.E. and Amos, C.M., 1999. Source, storage and mobilisation of fine sediment in a chalk stream system. Hydrological Processes 13: 323–340.
Walling, D.E. and Collins, A.L., 2005. Suspended sediment sources in British rivers. Proceedings of Symposium S1 held during the Seventh IAHS Scientific Assembly at Foz do Iguacu, Brazil, April, IAHS Publ. 291, pp. 123–133.
Walling, D.E. and Fang, D., 2003. Recent trends in the suspended sediment loads of the world’s rivers. Global and Planetary Change 39: 111–126.
Walling, D.E. and Foster, I.D.L., 1975. Variations in the natural chemical concentration of river water during flood flows, and the lag effect: some further comments. Journal of Hydrology 26: 237–244.
Walling, D.E. and Webb, B.W., 1981a. The reliability of suspended sediment load data (River Creedy, UK). In Erosion and Sediment Transport Measurement, Proceedings of the Florence Symposium, June 1981. IAHS–AISH Publ. 133, IAHS, Wallingford, UK, pp. 177–194.
Walling, D.E. and Webb, B.W., 1981b. Water Quality (British Rivers). British Rivers: 126–169.
Walling, D.E. and Webb, B.W., 1985. Estimating the discharge of contaminants to coastal waters by rivers – some cautionary comments. Marine Pollution Bulletin 16: 488–492.
Walling, D.E., Webb, B.W. and Woodward, J.C., 1992. Some sampling considerations inthe design of effective strategies for monitoring sediment-associated transport. In Bogen, J. (ed.), Erosion and Sediment Transport Monitoring Programmes in River Basins, Proceedings of the Oslo Symposium, August 1992. IAHS Publ. 210, IAHS Press, Wallingford, UK.
Walling, D.E., Owens, P.N. and Leeks, G.J.L., 1999. Rates of contemporary overbank sedimentation and sediment storage on the floodplains of the main channel systems of the Yorkshire Ouse and River Tweed, UK. Hydrological Processes 13: 993–1009.
Walling, D.E., Owens, P.N., Waterfall, B.D. et al., 2000. The particle size characteristics of fluvial suspended sediment in the Humber and Tweed catchments, UK. Science of the Total Environment 251–252: 205–222.
Walling, D.E., Russell, M.A. and Webb, B.W., 2001. Controls on the nutrient content of suspended sediment transported by British rivers. Science of the Total Environment 266: 113–123.
Walling, D.E., Russell, M.A., Hodgkinson, R.A. and Zhang, Y., 2002. Establishing sediment budgets for two small lowland agricultural catchments in the UK. Catena 47: 323–353.
Walling, D.E., Owens, P.E., Carter, J. et al., 2003a. Storage of sediment-associated nutrients and contaminants in river channel and floodplain systems. Applied Geochemistry 18: 195–220.

91
D. Lawler et al. (2010-W-LS-4)
Walling, D.E., Owens, P.N., Carter, J. et al., 2003b. Storage of sediment-associated nutrients and contaminants in river channel and floodplain systems. Applied Geochemistry 18: 195–220.
Walling, D.E., Collins, A.L. and Stroud, R.W., 2008a. Tracing suspended sediment and particulate phosphorus sources in catchments. Journal of Hydrology 350: 274–289.
Walling, D.E., Webb, B.W. and Shanahan, J., 2008b. Investigations into the Use of Critical Catchment Sediment Yields for Assessing and Managing Fine Sediment Inputs into Aquatic Ecosystems (NERR007). Natural England Research Report NERR007. Natural England, Sheffield, UK.
Wang, X.Y., Yang, Q.Y., Lu, W.Z. and Wang, X.K., 2011. Effects of bed load movement on mean flow characteristics in mobile gravel beds. Water Resources Management 25: 2781–2795.
Ward, P.R.B. and Chikwanha, R., 1980. Laboratory measurements of sediment by turbidity. Journal of the Hydraulics Division 106: 1041–1053.
Ward, P.J., Van Balen, R.T., Verstraeten, G. et al., 2009. the impact of land use and climate change on late holocene and future suspended sediment yield of the Meuse catchment. Geomorphology 103: 389–400.
Warnock, R.G. and Lagoke, R.G., 1974. Suspended sediments from urban development. In Effects of Man on the Interface of the Hydrological Cycle with the Physical Environment. IAHS Publ. 113, pp. 117–122. Available online: http://hydrologie.org/redbooks/a113/iahs_113_0117.pdf (accessed 22 May 2016).
Warren, N., Allan, I.J., Carter, J.E. et al., 2003. Pesticides and other micro-organic contaminants in freshwater sedimentary environments – a review. Applied Geochemistry 18: 159–194.
Warrick, J.A. and Rubin, D.M., 2007. Suspended-sediment rating curve response to urbanization and wildfire, Santa Ana River, California. Journal of Geophysical Research 112: F02018.
Waters, T., 1995. Sediment in Streams: Sources, Biological Effects and Controls (American Fisheries Society Monograph). American Fisheries Society, Bethesda, MD.
Webb, B.W., Phillips, J.M., Walling, D.E. et al., 1997. Load estimation methodologies for British rivers and their relevance to the LOIS RACS(R) programme. Science of the Total Environment 194: 379–389.
Wellman, J., Combs, D. and Cook, S., 2000. Long-term impacts of bridge and culvert construction or replacement on fish communities and sediment characteristics of streams. Journal of Freshwater Ecology 15: 317–328.
Wenger, S., 1999. A Review of the Scientific Literature on Riparian Buffer Width, Extent and Vegetation. Office of Public Service and Outreach, Institute of Ecology, University of Georgia Institute of Ecology Athens, GA. Available online: http://www.lerf.eco.br/img/publicacoes/1999_11%20A%20review%20of%20the%20scientific%20literature%20on%20riparian%20buffer%20width.pdf (accessed 20 May 2016).
Wilber, C.G., 1983. Turbidity in the Aquatic Environment: An Environmental Factor in Fresh and Oceanic Waters. C.C. Thomas, Springfield, IL.
Williams, N.D., Walling, D.E. and Leeks, G.J.L., 2008. An analysis of the factors contributing to the settling potential of fine fluvial sediment. Hydrological Processes 22: 4153–4162.
Wolman, M.G., 1967. A cycle of sedimentation and erosion in urban river channels. Geografiska Annaler. Series A, Physical Geography 49: 385–395.
Wood, P.J. and Armitage, P.D., 1997. Biological effects of fine sediment in the lotic environment. Environmental Management 21: 203–217.
Wood, P.J. and Armitage, P.D., 1999. Sediment deposition in a small lowland stream - management implications, Regulated Rivers: Research and Management 15: 199–210.
Wood, P.J. and Petts, G.E., 1994. Low flows and recovery of macroinvertebrates in a small regulated chalk stream. Regulated River Research and Management 1: 303–316.
Wood, P.J., Vann, A.R. and Wanless, P.J., 2001. The response of Melampophylax mucoreus (Hagen) (Trichoptera: Limnephilidae) to rapid sedimentation. Hydrobiologia 455: 183–188.
Wood, P.J., Toone, J., Greenwood, M.T. and Armitage, P.D., 2005. The response of four lotic marcoinvertebrate taxa to burial by sediments. Archiv für Hydrobiologie 163: 145–162.
Wright, J.F. and Berrie, A.D., 1987. Ecological effects of groundwater pumping and a natural drought on the upper reaches of a chalk stream. Regulated Rivers Research and Management 1: 145–160.
Yalin, M.S., 1963. An expression for bed-load transportation. Transactions of the American Society of Civil Engineers Hydraulics Division 89: 221–250.
Yalin, M.S., 1977. Mechanics of Sediment Transport. Pergamon Press, Toronto.
Yang, D., Kanae, S., Oki, T. et al., 2003. Global potential soil erosion with reference to land use and climate changes. Hydrological Processes 17: 2913–2928.

92
SILTFLUX Literature Review
Yarnell, S., Mount, J. and Larsen, E., 2006. The influence of relative sediment supply on riverine habitat heterogeneity. Geomorphology 80: 310–324.
Yescas, A., Williams, D.T. and Norman, K., 2011. Bank stabilization by redirective structures on the Santa Clara river, Ventura County, Ca. In Beighley, R.E. and Killgore, M.W. (eds), World Environmental and Water Resources Congress 2011. American Society of Civil Engineers, Palm Springs, CA, pp. 1981–1990.
Zierholz, C., Prosser, I.P., Fogarty, P.J. and Rustomji, P., 2001. In-stream wetlands and their significance for channel filling and the catchment sediment budget, Jugiong Creek, New South Wales. Geomorphology 38: 221–235.
Zweig, L.D. and Rabeni, C.F., 2001. Biomonitoring for deposited sediment using benthic invertebrates: a test on 4 Missouri streams. Journal of the North American Benthological Society 20: 643–657.

93
Abbreviations
ACP Agricultural Catchments ProgrammeADCP Acoustic Doppler current profilerAs ArsenicAVHRR Advanced very high resolution radiometersAWS Automatic water samplerCAFES Combined Automated, Flood, Elevation and Stream Power (system)Cu CopperD50 Median particle diameterEPA Environmental Protection AgencyFTU Formazin turbidity unitsINCA-Sed Integrated Catchment Model for SedimentsIR Infra-redLISST Laser in situ scattering and transmissometryNTU Nephelometric turbidity unitsOBS Optical backscatter sensorPb LeadPEEP Photo-electronic erosion pinQ River dischargeSDR Sediment delivery ratioSS Suspended solidSSC Suspended sediment concentrationSSL Suspended sediment loadSSY Suspended sediment yieldSWAT Soil Water Assessment ToolTSS Total suspended solidUSEPA United States Environmental Protection AgencyUSGS United States Geological SurveyWFD Water Framework DirectiveWWTP Wastewater treatment plantZn Zinc


AN GHNÍOMHAIREACHT UM CHAOMHNÚ COMHSHAOIL
Tá an Ghníomhaireacht um Chaomhnú Comhshaoil (GCC) freagrach as an
gcomhshaol a chaomhnú agus a fheabhsú mar shócmhainn luachmhar do
mhuintir na hÉireann. Táimid tiomanta do dhaoine agus don chomhshaol a
chosaint ó éifeachtaí díobhálacha na radaíochta agus an truaillithe.
Is féidir obair na Gníomhaireachta a roinnt ina trí phríomhréimse:
Rialú: Déanaimid córais éifeachtacha rialaithe agus comhlíonta
comhshaoil a chur i bhfeidhm chun torthaí maithe comhshaoil a
sholáthar agus chun díriú orthu siúd nach gcloíonn leis na córais sin.
Eolas: Soláthraímid sonraí, faisnéis agus measúnú
comhshaoil atá ar ardchaighdeán, spriocdhírithe agus
tráthúil chun bonn eolais a chur faoin gcinnteoireacht ar
gach leibhéal.
Tacaíocht: Bímid ag saothrú i gcomhar le grúpaí eile
chun tacú le comhshaol atá glan, táirgiúil agus cosanta go
maith, agus le hiompar a chuirfidh le comhshaol
inbhuanaithe.
Ár bhFreagrachtaí
Ceadúnú
Déanaimid na gníomhaíochtaí seo a leanas a rialú ionas nach ndéanann siad
dochar do shláinte an phobail ná don chomhshaol:
• saoráidí dramhaíola (m.sh. láithreáin líonta talún, loisceoirí, stáisiúin
aistrithe dramhaíola);
• gníomhaíochtaí tionsclaíocha ar scála mór (m.sh. déantúsaíocht
cógaisíochta, déantúsaíocht stroighne, stáisiúin chumhachta);
• an diantalmhaíocht (m.sh. muca, éanlaith);
• úsáid shrianta agus scaoileadh rialaithe Orgánach Géinmhodhnaithe
(OGM);
• foinsí radaíochta ianúcháin (m.sh. trealamh x-gha agus radaiteiripe,
foinsí tionsclaíocha);
• áiseanna móra stórála peitril;
• scardadh dramhuisce;
• gníomhaíochtaí dumpála ar farraige.
Forfheidhmiú Náisiúnta i leith Cúrsaí Comhshaoil
• Clár náisiúnta iniúchtaí agus cigireachtaí a dhéanamh gach bliain ar
shaoráidí a bhfuil ceadúnas ón nGníomhaireacht acu.
• Maoirseacht a dhéanamh ar fhreagrachtaí cosanta
comhshaoil na n-údarás áitiúil.
• Caighdeán an uisce óil, arna sholáthar ag soláthraithe uisce phoiblí,
a mhaoirsiú.
•Obair le húdaráis áitiúla agus le gníomhaireachtaí eile chun dul i ngleic
le coireanna comhshaoil trí chomhordú a dhéanamh ar líonra
forfheidhmiúcháin náisiúnta, trí dhíriú ar chiontóirí, agus trí mhaoirsiú a
dhéanamh ar leasúchán.
• Cur i bhfeidhm rialachán ar nós na Rialachán um Dhramhthrealamh
Leictreach agus Leictreonach (DTLL), um Shrian ar Shubstaintí
Guaiseacha agus na Rialachán um rialú ar shubstaintí a ídíonn an
ciseal ózóin.
• An dlí a chur orthu siúd a bhriseann dlí an chomhshaoil agus a dhéanann
dochar don chomhshaol.
Bainistíocht Uisce
• Monatóireacht agus tuairisciú a dhéanamh ar cháilíocht aibhneacha,
lochanna, uiscí idirchriosacha agus cósta na hÉireann, agus screamhuiscí;
leibhéil uisce agus sruthanna aibhneacha a thomhas.
• Comhordú náisiúnta agus maoirsiú a dhéanamh ar an
gCreat-Treoir Uisce.
• Monatóireacht agus tuairisciú a dhéanamh ar Cháilíocht an Uisce Snámha.
Monatóireacht, Anailís agus Tuairisciú ar
an gComhshaol
• Monatóireacht a dhéanamh ar cháilíocht an aeir agus Treoir an AE
maidir le hAer Glan don Eoraip (CAFÉ) a chur chun feidhme.
• Tuairisciú neamhspleách le cabhrú le cinnteoireacht an rialtais náisiúnta
agus na n-údarás áitiúil (m.sh. tuairisciú tréimhsiúil ar staid Chomhshaol
na hÉireann agus Tuarascálacha ar Tháscairí).
Rialú Astaíochtaí na nGás Ceaptha Teasa in Éirinn
• Fardail agus réamh-mheastacháin na hÉireann maidir le gáis cheaptha teasa a ullmhú.
• An Treoir maidir le Trádáil Astaíochtaí a chur chun feidhme i gcomhair
breis agus 100 de na táirgeoirí dé-ocsaíde carbóin is mó in Éirinn.
Taighde agus Forbairt Comhshaoil
• Taighde comhshaoil a chistiú chun brúnna a shainaithint, bonn eolais a
chur faoi bheartais, agus réitigh a sholáthar i réimsí na haeráide, an uisce
agus na hinbhuanaitheachta.
Measúnacht Straitéiseach Timpeallachta
• Measúnacht a dhéanamh ar thionchar pleananna agus clár beartaithe ar an
gcomhshaol in Éirinn (m.sh. mórphleananna forbartha).
Cosaint Raideolaíoch
• Monatóireacht a dhéanamh ar leibhéil radaíochta, measúnacht a
dhéanamh ar nochtadh mhuintir na hÉireann don radaíocht ianúcháin.
• Cabhrú le pleananna náisiúnta a fhorbairt le haghaidh éigeandálaí ag
eascairt as taismí núicléacha.
• Monatóireacht a dhéanamh ar fhorbairtí thar lear a bhaineann le saoráidí
núicléacha agus leis an tsábháilteacht raideolaíochta.
• Sainseirbhísí cosanta ar an radaíocht a sholáthar, nó maoirsiú a dhéanamh
ar sholáthar na seirbhísí sin.
Treoir, Faisnéis Inrochtana agus Oideachas
• Comhairle agus treoir a chur ar fáil d’earnáil na tionsclaíochta agus don
phobal maidir le hábhair a bhaineann le caomhnú an chomhshaoil agus leis
an gcosaint raideolaíoch.
• Faisnéis thráthúil ar an gcomhshaol ar a bhfuil fáil éasca a chur ar fáil
chun rannpháirtíocht an phobail a spreagadh sa chinnteoireacht i ndáil leis
an gcomhshaol (m.sh. Timpeall an Tí, léarscáileanna radóin).
• Comhairle a chur ar fáil don Rialtas maidir le hábhair a bhaineann leis
an tsábháilteacht raideolaíoch agus le cúrsaí práinnfhreagartha.
• Plean Náisiúnta Bainistíochta Dramhaíola Guaisí a fhorbairt chun dramhaíl
ghuaiseach a chosc agus a bhainistiú.
Múscailt Feasachta agus Athrú Iompraíochta
• Feasacht chomhshaoil níos fearr a ghiniúint agus dul i bhfeidhm ar athrú
iompraíochta dearfach trí thacú le gnóthais, le pobail agus le teaghlaigh a
bheith níos éifeachtúla ar acmhainní.
• Tástáil le haghaidh radóin a chur chun cinn i dtithe agus in ionaid
oibre, agus gníomhartha leasúcháin a spreagadh nuair is gá.
Bainistíocht agus struchtúr na Gníomhaireachta um
Chaomhnú Comhshaoil
Tá an ghníomhaíocht á bainistiú ag Bord lánaimseartha, ar a bhfuil
Ard-Stiúrthóir agus cúigear Stiúrthóirí. Déantar an obair ar fud cúig cinn
d’Oifigí:
• An Oifig um Inmharthanacht Comhshaoil
• An Oifig Forfheidhmithe i leith cúrsaí Comhshaoil
• An Oifig um Fianaise is Measúnú
• An Oifig um Cosaint Raideolaíoch
• An Oifig Cumarsáide agus Seirbhísí Corparáideacha
Tá Coiste Comhairleach ag an nGníomhaireacht le cabhrú léi. Tá dáréag
comhaltaí air agus tagann siad le chéile go rialta le plé a dhéanamh ar ábhair
imní agus le comhairle a chur ar an mBord.

www.epa.ie
Identifying PressuresFine sediment delivery to rivers is increasingly recognised internationally as a substantial water quality and hydro-ecological problem. The SILTFLUX project aimed to improve knowledge of fine sediment delivery as a pollution pressure in Irish rivers. The project has studied sediment flux dynamics with respect to key flow events and their actual and potential ecological impacts in different Irish river systems that are subject to variable land-use pressures. The SILTFLUX Literature Review distils the current knowledge of these effects and of methodologies for reducing their impacts in conditions typical of Ireland.
Informing PolicyThe SILTFLUX project will help inform environmental management and policy in the setting of standards for suspended sediment fluxes and concentrations appropriate for the protection of sensitive catchments in Ireland. The SILTFLUX Literature Review synthesises the considerable international debate that has surrounded the basis for establishing such standards, particularly on the issues of (i) whether they should be based on sediment loads, suspended sediment concentrations, deposited sediment or all three, and (ii) how such standards can account for the biological impacts of both transported and deposited sediment. Addressing these issues in a framework that is easily and reliably measurable and which lends itself to monitoring on a national scale remains a challenge.
Developing SolutionsThe SILTFLUX project has also identified the benefits of suspended sediment reduction possible from a broad range of measures and land management practices, to support the development of mitigation policies. A review of the published literature and existing measured data was undertaken to establish an initial “state of the art” position. The SILTFLUX Literature Review was international in scope but included key foci on information that was relevant to the conditions and pressures experienced in Irish catchments. Existing sediment datasets from the literature, as well as the projects own data, were compiled in a database that identifies the range of fluxes to be expected in Irish river systems.
EPA Research Report 176
SILTFLUX Literature Review
Authors: D. Lawler, A. Rymszewicz, L. Conroy, LT. O’Sullivan, M. Bruen, J. Turner, M. Kelly-Quinn
EPA Research: McCumiskey House, Richiew, Clonskeagh, Dublin 14.
Phone: 01 268 0100 Twitter: @EPAResearchNews Email: [email protected]
EPA Research Webpageswww.epa.ie/researchandeducation/research/