FIEL C ZT - World Bank Documents & Reports
242
Report No. 22078-TA The United Republic of Tanzania Public Expenditure Review FY00 (In Two Volumes) Volume I: Main Report January 2001 Government of Tanzania and The World Bank Macrocconomics 2, Africa Region FIEL C ZT Public Disclosure Authorized Public Disclosure Authorized Public Disclosure Authorized Public Disclosure Authorized Public Disclosure Authorized Public Disclosure Authorized Public Disclosure Authorized Public Disclosure Authorized
-
Upload
khangminh22 -
Category
Documents
-
view
1 -
download
0
Transcript of FIEL C ZT - World Bank Documents & Reports

Report No. 22078-TA
The United Republic of TanzaniaPublic Expenditure Review FY00(In Two Volumes)
Volume I:Main Report
January 2001
Government of TanzaniaandThe World BankMacrocconomics 2, Africa Region
FIEL C ZT
Pub
lic D
iscl
osur
e A
utho
rized
Pub
lic D
iscl
osur
e A
utho
rized
Pub
lic D
iscl
osur
e A
utho
rized
Pub
lic D
iscl
osur
e A
utho
rized
Pub
lic D
iscl
osur
e A
utho
rized
Pub
lic D
iscl
osur
e A
utho
rized
Pub
lic D
iscl
osur
e A
utho
rized
Pub
lic D
iscl
osur
e A
utho
rized

Ci 'VERNMTENT FISCAL. YEAR
July 1 - June 30 (FY00 or 1999/00 = July 1, 1999 to June 30, 2000)
CURRENCY EQUIVALENTS
Currency Unit = Tanzanian Shilling (T Sh)Interbank Maiket mid-rate: US$1.00 = T Sh 8/7.0 (April 16, 2001)
ABBREVIATIONS AND ACRONYNIS
ADT average daily traffic N1ECTA National Examiinations Council ofAfDB African Development Bank T.anzarfiaAIDS Acquired Immune Deficiency Syndrome NBC National Bank of CommerceAITF Agricultural Lnputs Trust Fund NGO non governmental ofganizationASYCUDA Computerized Customs Reporting and O&E organizational and efficiency (reviews)
Recording System (IJNCTAD) O&M operations and maintenanceBEMP Basic Education Master Plan OC other chargesBOP Balance of Payment OECD Organization for Economic CooperationBOT Bank of Tanzania and DevelopmentCBMS Cash Budget Management Systems OUT Open University of TanzaniaCG Consultative Group PAYE pal as yon earCSRP Civil Service Reform Programme PE personnel emolumentsDANIDA Danish International Development PER Public Expenditure Review
Agency PFP Policy Framework PaperDEO District Education Officer PHC Primarv Healtlh CareDMO District Medical Officer PSWB Public Sector Wage BillDMT District, Municipal and Town Councils PT.R pupil teacher ratioESAF Enhanced Structural Adjustment Facility REO Regional Engineer's OfficeESP Education Sector Programme REPFB Rolling Plan and Forward BudgetFAO Food and Agriculture Organization SAC Structural Adjustment CreditGDP gross domestic product SAL Structural Adjustment LendingGNP gross national product SGR Strategic Grain ResenreGOT Government of Tanzania SIP Sector Investment ProgramHIPC Highly Indebted Poor Countries Debt SPA Special Program of Assistance
Initiative SSA Sub-Saharan AfricaHIV Human Immuno-deficiencv Virus STD Sexually Transmitted DiseaseIDA International Development Association TAC Tanzania Audit CorporationIMF International Monetary Fund TANESCO Tanzania Electric Supply CompanyIRP Integrated Roads Project TAZARA Tanzania Zambia Harbours AuthorityMAC Ministry of Agriculture and Cooperatives TB TuberculosisMANTEP Educational Management Training THA Tanzania Harbours Authority
Institute TRA Tanzania Revenue AuthorityMOEC Ministry of Education and Culture TRC Tanzania Railways CorporationMOF Ministry of Finance TTC Teacher Training CollegesMOH Ministry of Health UDSM University of Dar es SalaamMSTHE Ministry of Science, Teclmology and UNDP United Nations Development Program
Higher Education UPE Uriversal Primary EducationMTEF Medium Term Expenditure Framework VAT Value Added Tax
Vice President Callisto MadavoDirector: James W. AdamsSector Manager: Frederick KilbvTask Team Leader: Belmo Ndulu

CONTENTS
1. PER PROCESS FOR FY00 ................................................................... 1.
1.1 AN OVERVIEW OF PER FY00 ................................................................... 1...1.2 TECHNICAL STUDIES IN SUPPORT OF IMPROVED BUDGET MANAGEMENT ............................................ 21.3 IMPLEMENTATION OF PER FY00 ................................................................... 4..1.4 LESSONS AND PROSPECTUS OF WORK FOR PERFYOI ...................................................................F. 5 .
2. REVIEW OF FISCAL PERFORMANCE ................................................................... 9
2.1 INTRODUCTION ............... 9.................................................... 92.2 AGGREGATE FISCAL DEVELOPMENTS ................................................................... 9
Domestic Revenue and Foreign Inflows .................................................................... 9..Government Expenditures .................................................................... 1..Deficit Financing .................................................................... 13..Budget Implementation .................................................................... 1.
2.3 SECTORAL ALLOCATIONS AND PRIORITIZATION ................................................................... 152.4 OPERATIONAL EFFICIENCY ................................................................... 19.
Public Sector Reform Program ................................................................... 2D.Availabilitv of Resourcesfor Operations and Maintenance ....................................... 2.0Predictabilitv ofResource Availability ................................................................... 22
2.5. OPERATIONAL EFFICIENCY - FINDINGS OF THE COMPTROLLER AND AUDITOR GENERAL ... 26Introduction..226.Main Findings .. 27..
2.6 ASSESSMENT OF INSTITUTIONS FOR IMPROVED BUDGET PERFORMANCE .9
2.7 ROAD FUND MANAGEMENT. 34.Background .. 34..Key Issues on Road Fund Management .. 34
3. SYSTEMIC FISCAL ISSUES. 3
3.1 THE PLIGHT OF THE DEVELOPMENT BUDGET ..................................................................... 3.83.2 DESIRABLE LEVEL OF REVENUE MOBILIZATION ..................................................................... 413.3 FISCAL RESTRAINT AND CASH BUDGET MANAGEMENT SYSTEM ..................................................... 433.4 MACROECONOMIC STABILITY AND DEBT SUSTAINABILITY .............................................................. 453.5 CO-EXISTENCE OF OVERALL FISCAL SURPLUS SIDE BY SIDE WRITH UNDER-FUNDING OF PRIORITY
SECTORS .. 46..3.6 CONCERN ON ABSORPTIVE CAPACITY CONSTRAINT WITH INCREASING RESOURCES .463.7 EARMARKING OF REVENUE AND THE EFFECTIVENESS OF BUDGET MANAGEMENT .473.8 PREDICTABILITY OF DONOR RESOURCES. 47
4. FISCAL POLICY AND THE MACROECONOMIC CONTEXT .49
4.1 INTRODUCTION ........................................................ .49.4.2 LINKS BETWEEN PUBLIC AND PRIVATE ACTIVITIES. ...................................................... 504.3 RESOIJRCES LIKELY TO BE AVAILABLE TO THE GOVERNMENT FY01 - FY03 .................................. 514.4 THE GUIDELINES DOCUMENT ...................................................... . 53.4.5 ASPECTS OF DOMESTIC CREDIT. ...................................................... 54.4.6 FISCAL OPTIONS ...................................................... .56..4.7 CONCLIJSION ........................................................ 5
5. EDUCATION SECTOR .6.
5.1 BASIC EDUCATION ........... 6..

5.1.1. Scope of the PER FY00 ........................... 60.5.1.2 Recent Development& ......................... 6D.5.1.3 Expenditure Trends. ......................... 61.5.1.4 Performance Trends ......................... 62.5.1.5 Regional Variation ......................... 63.5.1.6 Budget and Expenditure Projections ......................... 6.45.1.7 Next Steps .......................... .4.
5.2 HIGHER AND TECHNICAL EDUCATION ................................................................ 665.2.1 Recent Developments and Education Policy Context ............................................................ 665.2.2 Sub-Sector Performance 1994-2000 ................................................................. 6 A5.2.3 Financing of Higher Education ................................................................ 685.2.4 Analysis of Efficiency and Effectiveness of Higher and Technical Education ...................... 725.2.5 Review of Higher and Technical Education Sub-Sector Expenditure .:. ..................................... 755.2.6 Policy Recommendations ................................................................ 78
6. HEALTH SECTOR ...................................................................
6.1 INTRODUCTION .DBackground..80.Health Sector Reforms .
6.2 HEALTH POLICY OBJECTIVES.. .
6.3 STATUS OF THE HEALTH SYSTEM . L
6.4 PUBLIC EXPENDITURE PERFORMANCE .82
Background .. 82.Analysis of Expenditure Trends in the Health Sector .. 82Sub-Sector Budget Allocations .. 83.Analysis ofHealth Sector Funding Requirement ... 84Priority Areas .. 84..Proposals for the FYO Budget .. 86.
7. WATER SECTOR ................... K
7.1 INTRODUCTION ................. 8Water Sector PER Objectives for FY01 ................................................ 827PER Study Approach and Methodology ................................................. 7
7.2 ISSUES RELATED TO BUDGET PERFORMANCE FOR FY98-FYOO ................................................ 87Total Budget .................................................. 87Capital Budget Issues ................................................ .8 .Recurrent Budget Issues ................................................ . 8.Budget Ceiling ................................................ . 89..Impact oJfExpenditure on Water Sector Development ........................................... 89
7.3 INSTITUTIONAL FRAMEWORK AND CAPACITY BUILDING ................................................ 9.0
Main Institutional Administrative Issues and Concerns .......................................... 917.4 CURRENT STATUS OF WATER SECTOR PERFORMANCE ........................................... . 91
Surface Water ........ .91Groundwater ......... 92..Rainfall ......... 92..Rural Water Supply ........ .. 92.Urban Water Supplv and Sewerage .. 9 3.Irrigation .. 9...... 9.Hydropower Generation ......... 94.Conflicts in Jater Uses ......... 95.
7.5 WATER SECTOR POLICY OBJECTIVES AND PRIORITIES FOR THE FY01I ......... _ ...... .......... 95
The Development and Water Sector Vision .................................................... 95Ministry of Water Mission and Water Sector Policy Objectives .................................... 96Water Sector Priorities for FY01 ...................................................... 9.6.Optionsfor Imiproving the Impact of the Budget on the Water Sector ......... .............................. ....... 9 7Reforms Ntot Well Captured in the Current Budgeting ...................................................... 97

Ongoing Resource Deployment Reform .......................................................................... 98Measures to Reduce Aid Dependency and Enhance Optimal Utilization ofResources ...................... 98Water Sector Budget Outlook for FY01 .......................................................................... 98
8. ROADS SECTOR .......................................................................... DD
8.1 THE RoAD NETWORK IN TANZANIA. lO8.2 GOVERNMENT VISION FOR THE ROADS DEVELOPMENT .1008.3 ROLE OF PARENT MINISTRIES . 1018.4 THE ROAD FUND.1018.5 THE "NEW" MOW AND TANROADS .1028.6 MOW OVERALL EXPENDITURE PERFORMANCE FY98-FY00 .1028.7 MOW EXPENDITURE ON ROADS. 1.038.8 LOCAL AUTHORITIES EXPENDITURE ON ROADS. 1048.9 DONOR COMMUNITY RESOURCES FOR ROADS .1058.10 RECOMMENDATIONS. SW .....*e*** .......................................................... 106
9. AGRICULTURE ........................................... 1.D
9.1 OBJECTIVES OF THE FY0 I AGRICULTURAL SECTOR PER .......................................... 1089.2 PERFORMANCE OF THE AGRICULTURAL SECTOR .1089.3 BUDGET PERFORMANCE FY98-FYOO .1109.4 CONSTRAINTS AND FUTURE PROSPECTS OF THE AGRICULTURE SECTOR. 1.1 9.5 RESOURCES AVAILABLE TO THE AGRICULTURAL SECTOR. 1.129.6 PRIORITY AREAS FOR UTILIZING MEAGER RESOURCES .1139.7 POLICY RECOMMENDATIONS .113
10. JUSTICE .US... 1
10.1 INTRODUCTION. 1.15
10.3 MAJOR ISSUES.1.1510.4 GOVERNMENT EXPENDITURE ON MJCA .11610.5 ALLOCATIONS WITHIN THE MJCA .11710.6 ACTUAL RECURRENT EXPENDITURE BY DEPARTMENTS AND ZONES .1 11710.7 RECOMMENDATIONS .120
ANNEXES:ANNEX 1: MINUTES OF CONSULTATIVE PER MEETINGANNEX 2: DATATABLES:
Table 2.1: Govemnment Revenue and Extemnal Grants, FY95 - FY00 ....................................................... 10Table 2.2: Foreign Inflows - Grants and Loans, FY95 - FY00 ....................................................... 11Table 2.3: Government Expenditures, FY95 - FY99 ....................................................... 1.1Table 2.4: Civil Service Employment, FY97-FY99 (December of each year) ............................................ 12Table 2.5: Civil Service Average Salaries, FY97-FY99 ........................................................ 12Table 2.6: Financing of the Fiscal Deficit, FY95 - FY00 ....................................................... 13Table 2.7: Sources of Budget Shocks ....................................................... 14.Table 2.8: Sectoral Shares in Total Recurrent Expenditures - Actual ....................................................... 15Table 2.9: Sectoral Growth Rates of Recurrent Expenditures - Actual ....................................................... 16Table 2.10: Sectoral Shares in Total Development Expenditures - Actual .......................................... ..... -16Table 2.11: Recur rent Expenditure in the Priority Sectors. 1997/99-FYOO ................................................. 18Table 2.12: Change in Allocations and Exchequer Releases to Priority Sectors. FY00 (July-February).... 18Table 2.13: Development Expenditure in the Priority Sectors (as % of total recurrent expenditure),
1997/98-FYO ................ 19..Table 2.14: Sectoral expenditures on OC and PE, FY99-FYOO ................ 21Table 2.15: Key Institutional Arrangement and Expenditure Outcome& ........... ........... ......................... 29Table 2.16: Revenue Collected by Treasury but not included hi the Road Fund (Tsh. million) .35

Table 2.17: Road Fund (fuel levy) Collection, FY97 - FY00 (Tsh. Million) .............................................. 35Table 3.1: Marginal Effective Tax Rate on Capital for Foreign Firms (Applying Uganda's Non-Tax
Parameters to Kenya and Tanzania) ............................................................................. 42Table 3.2: Marginal Effective Tax Rate Cost of Production for Foreign Finms (Applying Uganda's Non-
Tax Parameters to Kenya and Tanzania) ............................................................................ 42Table 4.1: Budget allocation as share of requirement for priority activities in various sectors (%) ............ 53Table 4.2: Financial variables in % of GDP .............................................................................. 55Table 5.1: Share of Actual Recurrent Budget Expenditure, 1992/93 - FY99 ............................................. 61Table 5.2: Performance Indicators in Primary Education ............................................................................ 62Table 5.3: Perfonnance Indicators in Secondary Education ........................................................................ 63Table 5.4: Performance Indicators in the Teacher Training Sub-Sector ...................................................... 63Table 5.5: Regional Variation on Selected Performance Indicators ........... ................................................. 64Table 5.6: Main Problem Areas and Suggested Remedies for Higher Education and Technical
Development in Tanzania .............................................................................. .7.1.Table 5.7: Teacher-Student Ratios in Selected Higher and Technical Education ........................................ 73Table 5.8: Proportion of Funds Allocated to Various Expenditure Items for Universities in Africa, Europe
and UDSM ...... 74..Table 5.9: Main Efficiency Problem Areas and Suggested Remedies for Higher and Technical Education
in Tanzania ....... 74..Table 5.10: Trends in Higher and Technical Education Funding in Tanzania 1993-1999(%) ....... 75Table 5.11: : Tanzania: Higher and Technical Education Expenditure By Purpose: 1993-1999 Percent of
Sub-Vote (Actual, %) ............................................................................ 7.6..Table 5.12: Trends in Government Development Expenditure in Higher and Technical ............................ 77Table 5.13: Predictability of Resource Flows to Higher and Technical Education in Tanzania (°/O) 1994-
1999* ............................................................................ 78Table 6.1: Government Budgets and Actual Expenditures for Health Sector in Billion Tanzania Shillings.
.................................................................................................................................................... .83.Table 6.2: Sub-services/Functions Breakdown of Government Recurrent Budget for Health - FY99 ....... 84Table 6.3: Funds Requirements and Proposed Allocation of Funds for Priority and Activities in the Health
Sector. (Millions of Tshs) ............................................................................ 85.Table 7.1: Projected Total Budget Outlook for FY01 - 2003/04 ................................................................. 9.8Table 7.2: Breakdown of Capital Budget Outlook for FY01 ....................................................................... 99Table 7.3: Breakdown of Recurrent Budget Outlook for FY0O1 ................................................................... 99Table 8.1: Road Network by Type Surface and Condition (in km) .................................. ......................... 1.00Table 8.2: Government allocation of resources to the road sector (in mill. Tsh.) ...................... ............... 103Table 8.3: Resources allocation for road maintenance and rehabilitation (mil. Tsh.) ................................ 104Table 8.4: Road Fund collection and allocation to MOW and PMO/MRALG (in mill. Tsh.) ................... 105Table 8.5: Flow of resource form donors (in mil. Tsh.) ........................................................................... 105Table 9.1: Agriculture GDP and Growth Rates (in constant 1992 prices) ................................................. 1 08Table 9.2: Cash Crops Production (in metric tons) ... ........................................................................ l09Table 9.3: Recurrent Budget for FY98-FYOO (Mil. Tsh) ....................................................................... llITable 10.1: Actual Government Expenditure on MJCA, FY98 and FY99 (Million Tsh. and Percentages)
........................................................................................................................... ................... 116.Table 10.2: Distribution of MJCA Expenditure by Departments (million Tshs) ....................................... 1 17Table 10.3: Actual Recurrent Expenditure in the Judiciary Department in terms of PE and OC (in
percentage) ............................................................................ 118Table 10.4: Development Expenditure on MCJA (TShs. Million and %) ................................................. 119

PREFACE
As in previous years, the FY00 Public Expenditure Review (PER) process had the twinobjectives of (a) providing support to the Government of Tanzania in the preparation ofits budget and Medium Term Expenditure Framework (MTEF) and (b) undertaking anexternal evaluation of Tanzania's budget performance. The process was led by theMinistry of Finance. The program of work for PER FY00 was carried out with financialand technical support from various donors, including the World Bank, European Union,UNDP, DFID, Denmark, Sweden, Switzerland, and Finland. This report presents themain outputs of the FY00 PER process in Tanzania in two volumes.
Volume I consists of three major parts: Part 1 describes the main features of the PERprocess as implemented during FY00. Part 2 presents the main findings emerging from areview of fiscal performance and public expenditure management in Tanzania. Inaddition, part 2 contains a discussion of systemic fiscal issues that are critical toenhancing the efficiency and effectiveness of public expenditures in Tanzania. Part 3contains summaries of the updates of sectoral expenditure reviews which wereundertaken by the priority sector ministries with the support of local and internationalconsultants. The sectors covered include education, health, water, agriculture, works,lands and justice. The volume also contains a data annex and the minutes of theconsultative PER meeting held in May 2000.
Volume II presents the Government's MTEF for FY01 - FY03, which was discussed atthe consultative meeting in May 2000. The MTEF consists of a description of themacroeconomic context, a cross sectoral MTEF which provides the resource envelopesfor individual sectors, and sector MTEFs of the priority sectors, i.e., education, health,water, works, agriculture, justice and lands. In addition, the MTEF also contains adetailed discussion of the public sector reform program and the HIV/AIDS pandemic,which is clearly identified as a key challenge for Tanzania's development efforts whichrequires a multi-sectoral approach to contain its spread.
This report is a joint effort of the Government of Tanzania and a team consisting of aWorking Group drawn from the World Bank, other UN agencies, bilateral donors,research/academic institutions and NGOs. The joint-donor mission in November!December 1999 consisted of: Benno Ndulu (mission leader, AFMTZ), Philip Mpango,Ben Tarimo (AFMTZ); Sumana Dhar, Robert Utz (AFTM2); Hamisi Mwinyimvua(University of Dar es Salaam); Frans van Rijn (Netherlands Embassy), CharlottaNorrby (Swedish Embassy), Torben Lindqvist (Danish Embassy) and Stevan Lee(DFID). A follow-up mission in March-April, 2000 was launched to assist theGovernment to prepare the cross-sector MTEF and sector MTEFs.
The report was written under the supervision of Frederick Kilby, Sector Manager,AFTM2 and Peniel Lyimo, Deputy Permanent Secretary, Ministry of Finance,Government of Tanzania. Allister Moon, Senior Economist, ECSPE, and AnandRajaram, Senior Economist, PRMPS, provided valuable comments and direction aspeer reviewers.
The document was produced by Patrick Mamboleo under the guidance of RoboidCovington (AFTM2).


PART I
THE PER PROCESS


1. PER PROCESS FOR FY0O
1.1 AN OVERVIEW OF PER FY00
1.1 The PER Working Group (PER WG), led by the Ministry of Finance, met inAugust 1999 to agree on the prospectus for the FYOO PER. The group involves sectorministries, donor representatives, academic and research organizations, the private sector,and representatives of civic organizations. The main activities of the PER process forFYOO were focused on three main objectives: (i) to provide direct support to theGovernment budgeting process, with particular emphasis on the preparation of the budgetguidelines and the Medium Term Expenditure Framework (MTEF), (ii) to monitor thecomposition of expenditure allocation and effectiveness vis-a-vis what was agreed in theprevious budget and MTEF, and (iii) to support the development of budget managementsystems and address key systemic issues in fiscal management.
1.2 The PER activities were organized in two phases. In the first phase (AugustDecember) the focus was on undertaking analysis which would provide advice to theBudget Guidelines Committee and guide the updating of sector MTEFs. In the latter,studies were commissioned to obtain updated cost estimates for priority sectors' activitiesand project financial requirements for the delivery of desirable packages of services. Thepriority sectors included education, health, water, agriculture, rural roads and for the firsttime judiciary and lands. As in the previous years, the final activity in the first phase isthe assessment of the effectiveness of public spending, which also feeds into thepreparation of the budget guidelines. This was carried out by an independent mission ledby the Bank with emphasis on assessing aggregate fiscal balance, allocative efficiencyand equity in the composition of spending, and technical efficiency in the use of budgetedresources. In addition, the mission also identified some of the critical systemic issueswhich impinge on the efficacy of budget management.
1.3 The Working Group organized itself into a Macro Group and several sectorgroups. The macro group focused on ensuring that expenditure plans are consistent with aprudently projected resource envelope and overall macroeconomic stability. It was alsocharged with the task to provide on advice how resources availed through budget supportand HIPC debt relief can be properly reflected in the financing of pro-poor expenditures.Furthermore, the group provided advice to the BG Committee on cross sectorprioritization of expenditure allocation based on a variety of Government of Tanzania(GoT) documents. projections of the resource envelope and analysis.
1.4 In the second phase the focus was on preparation of the sector MTEFs and abroadened dialogue amongst all stakeholders on past performance, the next budget frameand the medium term public spending framework. The PER Working Group organized its
I

support around priority sector working groups, which also interacted with the macrogroup to ensure consistency with the cross sector allocations and the projected aggregateresource envelope. Since simultaneously the GoT continued to hold consultations withthe IMF on the macroeconomic frame projections, the macro group took this informationinto account to advise on any further revisions to the guidelines.
1.5 The second phase ended with a PER consultative meeting, which is an openforum to review the previous and current spending programs; review prioritization inexpenditure allocation across sectors in the next budget year as well as the coming threeyears; and identify critical issues for further improvement of the budget process. Like inthe past the participation was very broad and open as the detailed report on the meeting inthis volume shows. The meeting also drew lessons from the just ending PER process andproposed improvements of the process for the following year.
1.6 The PER process closed with the last meeting of the PER Working Group in June2000, after finalization of the budget and revisions to the MTEF. This meeting reviewedinputs from the consultative PER deliberations and discussed a preliminary PER agendafor the next fiscal year.
1.2 TECHNICAL STUDIES IN SUPPORT OF IMPROVED BUDGET MANAGEMENT
1.7 The PER WG commissioned and funded several studies to address selected issuesin budget preparation and management, and in medium term strategic resource allocation.
(i) Assessment of Aggregate Fiscal Sustainability: Analysis of aggregate fiscalsustainability, carried out by a consultant from Oxford University, helpedunderpin the resource envelope projections for FYOI-03. Particular attention waspaid to the effects of projected expenditure expansion with additional resourcesfrom HIPC debt relief and continued expansion of new flows. A key issue was towhat extent can the relief and new flows finance increased spending sustainably.T he analysis also assessed the debt sustainability requirements of a newborrowing program after relief has been secured so as to avoid a relapse tounsustainable debt levels.
(ii) Analysis of Development Budget and Counterpart Funding: A major weaknessof the development budget is that actual disbursements have tended to fall farshort of donor commitments. One of the critical constraints to the disbursementof project funding, the dominant donor financing modality of the developmentbudget is non-availability or delayed release of counterpart funding for projectssupported by multilateral institutions. A study carried out by a local researchinstitution, ESRF, reviewed the procedures and donor practices as well as theGovernment budget and planning processes to identify the main problems behindlow out-turn of the development budget and the place of counterpart funding inthis problem
(iii) Review of Program - Project Support Balance: The overall objective of thisanalysis was to collect information on the past and current composition ofexternal assistance between program and project support, and to identify theimperatives for shifting it in favor of program support. More specifically to (i)
2

document current policies and practices of the main donors in the allocation ofexternal assistance, (ii) to identify the main requirements (e.g. prudentaccountability and management systems) to induce the desired shift from projectto programn support, (iii) to analyze the magnitude of development spendingoverheads, such as the cost of project management units (PMUs) and technicalassistance (TA) (iv) to gather perceptions on the issue of fungibility of projectsupport. This task was done by bilateral donors as part of a joint World Bank-bilateral donors PER mission.
(iv) Poverty Monitoring Indicators and International Development Targets (IDTs):The development of poverty monitoring indicators is crucial for monitoringeffectiveness of poverty reduction programs and tracking progress in achievinggovernment commitments to IDTs. Furthermore, under the Local governmentReform Program (LGRP) performance indicators are necessary for adopting resultorientation in the operation of district block grants and for needs assessment inblock grant allocation. The PER process provides an opportunity to mainstreamthis approach through sector MTEFs and subsequent assessment of achievementsin each sector. It was agreed that this work be done by a local consultant(REPOA) partly based on related work on the achievability of the IDTs inTanzania undertaken by OPM and REPOA as part of a wider DFID-commissioned study to feed into the World Development Report 2000.
(v) Tracking of the Road Fund: The aim was to examine the entire processgoverning the operation of the Road Fund, and more generally, the managementof road maintenance in Tanzania at a time when new institutions responsible forthese are being set up. The study analyzed the collection and utilization of theRoad Fund resources over the last three fiscal years and the capacity andmanagement procedures which were applied for those in order to identify theproblems which need to be addressed under the new structures and procedures.
(vi) PER FY99 update work: The broad objectives of the exercise included doing areview of recent developments in each of the priority sectors by sub-sectoralcomponents and institutional arrangements as well as roles of other stakeholders(private and public). Other considerations included making an assessment of howthe sector in question performed relative to installed capacity; making anobjective professional assessment of the quality of service delivery from theperspective of users of the service or product; defining needs and priorities forthe sector; providing an update of what is a reasonable package of service andwhat it takes to deliver this package (come out with strategic costing over themedium term constrained by the resource envelope) and recommend availableoptions.
(vii) Update of Cross-sector and Sector MTEFs: The work program for PER FY00included updating the cross-sector and sector MTEFs. The work of developing thecross-sector MTEF was led by the macro sub-group of the PER working groupfocusing on projecting the resource envelope (including resources expected to befreed from debt service obligation under HIPC debt relief initiative) for MTEF.This entailed an analysis of Tanzania's revenue effort and checking forconsistency of the resource envelope with the agreed medium term

macroeconomic frame and soliciting data on projected disbursements by donorsover the medium term. The macro group also examining expenditureprioritization to ensure that it is consistent with the agreed macroeconomicobjectives as well as economic infrastructure and social service improvements forpoverty reduction. The exercise of developing sector MTEFs was confined to thepriority sectors including education, health, water, agriculture, roads as in theprevious year and two additional priority sectors - Judiciary and Lands. Thestrategy of gradually extending the MTEF coverage is guided by the objective ofensuring quality of the MTEFs in an environment of limited human capacities inthis area. The sector MTEFs were put together by the sector groups from thesector ministries as was the case during PER FY99. However, prior hands-on-training of Government staff involved was conducted. The training focused onreviewing existing planning and budget processes and developing detailed steps tobe followed in the preparation of MTEF based budgets. The Ministry of Financealso issued a common format to be followed by all priority sector ministries inpreparing the sector MTEF and budget for FY01. The MTEF training wasorganized by the Economic and Social Research Foundation (ESRF) under IDFsupport for capacity building with the help of a foreign consultant.
1.8 The program of work for PER FY00 was carried out with the help of financial andtechnical support from various donors, including The World Bank, European Union,L,NDP, DFID, Denrnark, Sweden, Switzerland, and Finland.
1.3 IMPLEMENTATION OF PER FY00
1.9 The strategy adopted to implement PER FY00 was to consolidate and deepen theapproach adopted since PER FY98. The principal idea was to build on strengthenedcollaboration and partnership invigorated under the PER process for FY99. Theimplementation process was steered by a broadened PER working group under thechairmanship of the Deputy Permanent Secretary, Ministry of Finance. In addition to theoriginal members of the working group from the priority sectors (health, education,water, roads, and agriculture), Planning Commission, Ministry of RegionalAdministration and Local Governments, research and academic institutions (ESRF,REPOA, University of Dar es Salaam) and donors, participation in the broadened PERworking group included representatives of the judiciary, private sector, and civil societyorganizations. The aim of broadening the participatory PER process was to open up thebudget process to stakeholders outside the Government. However, since it is not possibleto have all stakeholders participating in the PER working group, the PER FY00 processalso targeted to initiate more consultations, especially broad based consultations, withparticular focus at the lower levels - regional, district, etc. involving grass-rootrepresentation, to discuss key public expenditure policies and programs and discuss onhow to improve the effectiveness of public expenditure. Regular briefings on the PERwork were also carried out during the DAC donors quarterly meetings.
1.10 Learning from the experience of PER FY99 the PER process for FY00 wasimplemented in two phases. Phase I focused on providing direct support to theGovernment budgeting process particularly by providing inputs into the preparation ofthe Budget Guidelines and the development of the medium term expenditure frame for
4

FY01 -03. A significant part of the effort in implementing PER during FY00 was directedat updating expenditure plans for the priority sectors covered by the PER for FY99. Themain aim of these activities was to prepare more comprehensive Budget Guidelineswhich integrate sector plans and checks these for overall consistency with the aggregateprojections of resource envelopes and macroeconomic stability. These were then used toupdate the sector MTEFs and donor financing plans. The updating of sector MTEFs werepreceded by training of budget officers from the priority sectors and the central ministriesso as to improve on the quality of the MTEFs. Specific studies were also commissionedunder PER FY00 and included (i) an in-depth analysis of the development budget andcounterpart funding requirement (ii) as survey of donor attitudes towards program andproject aid support, and (iii) tracking the Road Fund. The PER working group alsoserved to peer review the outputs of the PER FY99 update work and the specifictechnical studies.
1.11 The second phase began by fielding a joint World Bank-bilateral donors missionduring November-December 1999 to focus on the traditional evaluative function of thePER. This subsequently formed the basis of broader PER consultations in May 2000during which the GoT presented an MTEF for FY01 to FY03, and a draft budget framefor FY01 for review by donors and other stakeholders. The purpose of the review was tosolicit agreement to the two frames and commitment of donor support in the context ofthese frames. The meeting also reviewed budget performance since the last PER,discussed fiscal issues emerging from both the evaluation of budget performance andfrom the set of technical studies.
1.4 LESSONS AND PROSPECTUS OF WORK FOR PER FY01
(1) There were delays in issuing the Budget Guidelines (The BudgetGuidelines for FY01-03 were issued in April 2000) partly due to slippagein completing some of the PER FY99 update work but morefundamentally due to late re-constitution of the Budget GuidelinesCommittee. It is therefore important for the future to have a clearly setPER timetable that dovetails well with the budget cycle and also to ensurethat such a timetable is adhered to. In principle the target should be toundertake the technical studies quite early (August to December), thenmount the PER main mission during November -December so as to feedinto the preparation of the Budget Guidelines to be issues in early Januaryand finally hold the PER consultative meeting with all stakeholders duringearly May.
(2) All stakeholders continued to attach high significance to the PER processand initiatives both in terms of active participation in the PER workinggroup and financing the technical studies. The enthusiasm with the PERexercise is good for consensus building and coordination on budget issuesand needs to be nurtured.
(3) MoF did send the right signals to the line ministries on the significance tobe attached to PER process as a whole and MTEF initiative in particular.Sector ministries responded very well and actually produced much
5

improved sector MTEFs compared to the previous ones. Supervision andcoordination of the sector groups by senior officials preferably in thesector ministries will continue to be necessary to entrench the MTEF aspart of the GoT reform program. To guarantee sustainability of the processand GoT taking the lead it will be important to ensure continued activeinvolvement of both the Budget and Policy Analysis Divisions of MoF,Planning Commission, Tanzania Revenue Authority (TRA), BoT, IMFand major bilateral donors in the PER working group. Equally, morevisible participation by the private sector and NGOs will be key toimproving the process further.
(4) Although a lot of useful documents are generated by the PER process, it isgenerally the case that the contents and findings are not fully exploited anddisseminated. Thus for the next PER it might be useful to consider holdingone or two stakeholder dissemination workshops prior to the main PERconsultative meeting.
(5) Finally, the next cycle of the PER should consider initiating studies in thefollowing areas: (i) fiscal decentralization focusing on the process and itssubstantive link to the budget management system (ii) sector specificexpenditure tracking down to the service delivery units, and (iii)evaluation of public expenditure on a quarterly basis. Particularly to trackpoverty related expenditure in relation to PRSP and HIPC.
6

PER FY00 SUPPORTING ACTIVITIES
S/N STUDY / ACTIVITY i SUPPORT TO GoT FINANCIERPROVIDED BY
01 Aggregate Fiscal Sustainability * Mr. David Bevan, * DFIDUniversity of Oxford
02 Analysis of the Development * ESRF + DenmarkBudget & Counter-partFunding
03 Poverty Monitoring Indicators * REPOA * UNDP
04 Road Fund Tracking Study * Louis Berger S.A. Paris * EU
05 PER FY99 Update work:* Education * Oxford Policy Management * Sweden & World Bank
& University of DSM
* Health * Beatrice Aswiena (Kenya) * DFID
* Water * ESRF * Finland
* Agriculture * ESRF 4 World Bank
* Trunk & Regional Roads * COWI Consult + Norway
* District Roads * REPOA * SDC
* Justice & Constitutional * ERB- University of DSM * DenmarkAffairs
06 MTEF FYOO-FY03:* Development of Macro- * PER Macro Group
MTEF
* Development of Sector * PER Sector GroupsMTEFs
* MTEF Training * Elizabeth Muggeridge, * DFIDAfrica Consulting
07 External Evaluation of Budget World Bank, DFID, NetherlandsPerformance Embassy, Swedish Embassy,
____ Danish Embassy
7


PART II
REVIEW OF FISCAL PERFORMANCE, FISCAL POLICYAND SYSTEMIC FISCAL ISSUES
8


2. REVIEW OF FISCAL PERFORMANCE
2.1 INTRODUCTION
2.1 This chapter provides a review of fiscal developments and expendituremanagement issues and covers the fiscal year FY99 and the first eight months of fiscalyear FY00. The first four sections focus mainly on fiscal performance. The analysis isbroken down into three distinct areas of fiscal performance - aggregate fiscal discipline,strategic allocation, and technical efficiency. This is followed by a review of the mainfindings of the Report of the Controller and Auditor General for the financial year ended30th June, 1998.
2.2 The analysis of fiscal performance is followed by a review of the institutionalsetup for expenditure management. The analysis is guided by a frarnework whichsuggests which institutional factors are important for good expenditure performance andwe assess to what extent these factors are present in the Tanzanian system and whetherthey are yielding the expected results. Particular attention is also paid to recent reformsthat took place in the area of expenditure management.
2.3 The paper concludes by presenting the main results of a tracking study of roadfunds that was undertaken as part of the PER process. Recent work on poverty andgrowth in Tanzania has highlighted the crucial importance of road infrastructure to enablerural communities, which are home to the majority of Tanzania's population and have thehighest incidence of poverty, to enhance their income earning capability throughexpanded access to regional markets and trade. The establishment of the Roads Fund wasdesigned as an important instrument to support road maintenance and the purpose of thetracking study was to identify whether the availability of funds for the road sector hasindeed increased and contributes to improved maintenance of the road network.
2.2 AGGREGATE FISCAL DEVELOPMENTS
Domestic Revenue and Foreign Inflows
2.4 Total revenue as a percentage of GDP continued its decline from the peak of13.5% of GDP reached in FY97 to 12.0% in FY98 and to 11.5% in FY99. In FY00,revenue declined further to 11.2 percent of GDP. In FY99 tax revenue was only 10.3percent of GDP and non-tax revenue was 1.2 percent of GDP. Underlying the decline intax revenue over the past few years are substantial reductions in external taxes, relativelylarge tax incentives for new investments, the continued downsizing of the parastatalsector, and sluggish private sector growth which has not yet yielded enough revenue tocompensate for lost revenue from the shrinking parastatal sector. In FY99, the bulk of
9

the revenue shortfall was accounted for by a sharp decline in revenue from other taxes,which declined from 1.8 percent of GDP in FY98 to only 1.2 percent of GDP in FY99.This is mainly the result of the streamlining of the tax system and the elimination of anumber of nuisance taxes. Increasing tax revenue is the key challenge in the area of fiscalmanagement, given the substantial expenditure requirements that arise in connection withGovernment's role of providing infrastructure services and basic social services insupport of economic growth and poverty reduction. The medium-term program ofstrengthening tax administration is ongoing and expected to yield tangible results in thenear future. In addition to administrative improvements, the streamlining of taxexemptions is another potential source for additional revenue generation.
Table 2.1: Government Revenue and External Grants, FY95 - FYOO
Central Government rtiokn s, 5FY95 FY96 FY97 FY98" FY99 FYOO
Total Revenue 12.5% 13.2% 13.5% 12.0% 11.5% 11.2%
Tax Revenue 11.3% 113% 11.9% 11.0% 10.3% 9.9%
Taxes on imports and exports 3.6% 3.8% 3.5% 3.6%
Sales and excise taxes on local 2.7% 2.8% 3.1% 2.7% 2.7%goodsIncome taxes 3.3% 3.1% 3.0% 2.9% 2.7%
Other taxes 1.9% 1.9% 2.1% 1.8% 1.2%
Non tax revenue 1.2% 1.9% 1.6% 1.0% 1.2% 1.2%/1 Likely OutturnSource: IMF, Tanzanian authorities
2.5 The decline in domestic revenue was only partly offset by increases in officialdevelopment assistance in the form of grants and concessional loans (net ofamortization). During fiscal year FY99 these inflows increased to 4.4 percent from 4.0percent of GDP in FY98 and further to 4.8 percent in FYOO. The increase in FY99 is dueto a recovery of grants from 3.0 percent of GDP in FY98 to 4.0 percent of GDP in FY99and which are expected to remain at that level in FYOO. Net inflows from foreign loanson the other hand declined from 1 percent of GDP in FY98 to 0.4 percent in FY99,mainly because of a drop in disbursements of program lending.
10

Table 2.2: Foreign Inflows - Grants and Loans, FY95 - FYOO
_Y5 Y9m6 - FY97 FY98 ; Y-9 FYOO/1
Grants and Loans 2.9% 1.0% 3.1% 4.0% 4.4% 4.8%
Grants 2.0% 2.2% 3.6% 3.0% 4.0% 4.0%Program 0.8% 1.0% 1.8% 0.7% 1.2% 1.9Project 1.2% 1.2% 1.8% 2.3% 2.8% 2.2
Foreign loans (net) 0.9% -1.2% -0.5% 1.0% 0.4% 0.8%
Foreign loans (loan 2.4% 0.2% 0.8% 2.1% 1.6%
disbursements)Program loans (import 1.2% 0.0% 0.5% 1.3% 0.6%
support)
Development project loans 1.3o 0.1% 0.3% 0.8% 1.1/Amortization -1.6% -1.4% -1.3% -1.1% -1.2%
/I Likely OutturnSource: IMF, Tanzanian authorities
Government Expenditures
2.6 Government spending stabilized in FY98, claiming 14.9% of GDP, after decliningsteadily in previous years from 18.3 percent in FY95. In FYOO, expenditures increased by1 percent of GDP. Although there was little change in recurrent expenditures betweenFY98 and 1998/99, there was a significant shift from wages and salaries to expenditureson other goods and services.
Table 2.3: Government Expenditures, FY95 - FY99
Central Govemment Operations FY95 FY96 FY97 FY98 FY99 FYOOI/
Total expenditure and net lending 18.3% 17.6% 15.1% 14.8% 14.9% 15.9%15.1% 14.0% 12.5% 11.0% 10.9% 12.0%
Recurrent expenditureWages and salaries 4.2% 4.6% 4.7% 4.2% 3.7% 4.2%
3.4% 3.3% 2.6% 2.2% 1.6% 1.6%Interest payments
Domestic 2.2% 2.3% 1.7% 1.0% 0.6% 1.1%
Foreign 1.2% 1.0% 0.9% 1.3% 1.0% 0.5%
Other goods and services and transfers 7.5% 6.1% 5.1% 4.5% 5.7% 6.2%3.2% 3.6% 2.6% 3.8% 4.0% 3.9%
Development expenditure and netlending
o/w Expenditure financed domestically 0.8% 0.2/ 0.5% 0.5/ 0.3% 0.30/I Likely OutturnSource: IMF, Tanzanian authorities2.7 Since average salaries increased in nominal terms only by 1.3 percent in FY99and the number of civil servants was reduced by another 2.7%, expenditures on wagesand salaries remained more or less constant in nominal terms, implying a decline in
I1

expenditures on wages and salaries as a percentage of GDP from 4.2 percent in FY98 toonly 3.7 percent in FY99. Salary increases below the rate of inflation have led to realincome losses for civil servants of up to 35 percent since FY96. However, after furtherreal wage losses in FY99, in FYOO Government started the implementation of its MediumTerm Pay Policy by granting salary increases ranging between 16 and 65 percent, withthe higher increases being accorded to technical personnel and middle and uppermanagement. In addition, the reduction in staff numbers was only 1.3 %, significantlyless than in previous years. These large pay increases combined with only smallreductions in the staffing levels led to a projected increase in the wage bill in FYOO bymore than 30 percent and an increase in expenditures on salaries and wages from 3.7percent of GDP in FY99 to 4.3 percent of GDP in FY99.
Table 2.4: Civil Service Employment, FY97-FY99 (December of each year)Salarv Scale FY97 FY98 FY99 FY99 FY98 FY99 FY99
Staff in absolute numbers Percentage changeTGOS 39216 35651 34806 35001 -9.1% -2.4% 0.6%TGS 189720 63787 63310 59994 -0.7% -5.2%TGTS Included 122215 118868 119566 -2.7% 0.6%
in TGSTPSW - TGPSW 37741 36190 34821 36448 -4.1% -3.8% 4.7%
OTHERS 18947 12785 11381 8837 -32.5% -11.0% -22.4%TOTAL 285624 270628 263186 259846 -5.3% -2.7% -1.3%Source: CSD
Table 2.5: Civil Service Average Salaries, FY97-FY99Salary Scale FY97 FY98 FY99 FY99 FY98 FY99 FY99TGOS 33707 37703 38212 47220 11.9% 1.4% 23.6%TGS 47099 57313 57625 78067 0.5% 35.5%TGTS Included 56314 57073 80162 1.3% 40.5%
in TGSTPSW + TGPSW 65002 60506 61400 70925 -6.9% 1.5% 15.5%/6
OTHERS 35344 115878 108011 167861 227.9% -6.8% 55.4%TOTAL 47498 54684 55387 74143 15.1% 1.3% 33.9%Source: CSD
2.8 In FY99, savings on wages were used to increase expenditures on goods andservices from 4.5 percent of GDP in FY98 to 5.7 percent in FY99. In FYOO, theincreases in wages and salaries without a parallel increase in resource availability haveled to a crowding out of expenditures for other charges during the first eight months ofthe financial year.
2.9 Expenditures on interest payments declined from 2.2 percent in FY99 to 1.6percent in FYOO, as a result of a fall in both domestic and foreign interest payments.During FYOO, foreign interest payments are projected to fall substantially from 1 percentof GDP to 0.5 percent of GDP. However, this decline in foreign interest payments isoffset by an increase in domestic interest payments to one percent of GDP. About fourpercent of GDP or a little more than one fourth of the overall budget is spent ofdevelopment expenditures, most of which is foreign financed. However, problems with
12

the proper integration of development expenditures in the budget continue. Data onofficial development expenditures collected by UNDP indicate that official developmentassistance is about 12 percent of GDP, indicating that still only about one third of alldevelopment assistance to Tanzania is captured in the budget.
Deficit Financing
2.10 Following the introduction of the cash budget in 1996, Tanzania recordedcontinuous budget surpluses (after grants) in the past three years. In FY99, the surpluswas 0.3 percent of GDP. In FY00 a small budget deficit in the magnitude of 0.6 percentof GDP was registered. However, taking into account net inflows from foreign loans,which also constitute development assistance and contain a significant grant element, thesurplus for FY99 increases to 0.8 percent of GDP and the deficit for FY00 turns into asmall surplus of 0.2 percent of GDP. These surpluses have allowed Government toreduce its outstanding debt with the domestic banking and non-banking institutions andalso repay arrears to a significant extent.
Table 2.6: Financing of the Fiscal Deficit, FY95 - FY00
Central Govemment Operations FY95 FY96 FY97 FY98 FY99 Y100/1
Overall balance before grants (checks -5.9% -4.3% -1.6% -2.8% -3.5% -4.7%issued or commitment basis)Overall balance after grants (checks -3.9% -2.2% 2.0% 0.2% 0.5% -0.6%issued or commitment basis)Overall balance after grants (checks -5.0% -3.0% 1.9% 0.2% 0.3% -0.6%cleared or cash basis)Foreign loans (net) 0.9% -1.2% -0.5% 1.0% 0.4% 0.8%
Overall balance after grants and -4.1% -4.2% 1.3% 1.1% 0.8% 0.2%foreign loans (checks cleared or cashbasis)Domestic (net) 3.3% 3.3% -0.7% -0.4% -0.2% -0.1%
Bank 2.10%° 2.7% -0.4% -0.9% 0.0%
Non bank (net of amortization) 1.2% 0.6% -0.3% 0.5% -0.1%
Privatization Funds 0.0% 0.5% 0.3% 0.1% 0.2%0.8% 0.4% -0.9% -0.8% -0.8%Change in arrears
/I Likely OutturnSource: IMF, Tanzanian authorities
Budget Implementation
2.11 Previous Public Expenditure Reviews have highlighted the lack of predictabilityof budget releases as one of the main problems afflicting the budget process in Tanzania.This unpredictability of resource flows from the Treasury to spending units has a directimpact on the allocative and operational efficiency of the budget system, which will bediscussed in subsequent sections. At the aggregate level, it is instructive to analyze thesources of shocks to government revenue and to trace its effects on the variousexpenditure items.
13

Table 2.7: Sources of Budget Shocks
FY97 FY98 FY99
Budget Outturn Outturn Budget Outturn Outturn! Budget Outturn Outturnl/ Budget Budget Budget
TShm % TShm % TShm %
Total Resources 703142 685630 98% 800200 700969 88% 779786 799100 102%Domestic Revenue 563756 572030 101% 671500 619083 92% 699521 689500 99%Import Support 139386 113600 82% 128700 81886 64% 80265 109600 137%
Less First Claim 371075 399776 108% 422500 421831 100% 435360 431378 99%Expenditures
Debt Service and 185710 200548 108% 196500 203024 103% 190578 210900 111]%ArrearsWages and Salaries 185365 199228 107% 226000 218807 97% 244782 220478 90%
Available Resources forOtherExpend. And Dom. Dev. 332067 285854 86% 377700 279138 74% 344426 367722 107%
Total Other and 387822 311897 80% 518400 410348 79% 562898 471000 84%Development
Other Goods and 260831 187327 72% 274300 223763 82% 298433 340900 114%ServicesDevelopment 126990 124570 98% 244100 186585 76% 264465 130100 49%
Residual (checks issued) -55755 -26043 47% -140700 -131210 93% -218472 -103278 47%Adj. To cash and other 6600 -15900itemsResidual (checks cleared) -55755 -26043 47% -140700 -124610 89% -218472 -119178 55%
FinancingofResidual 55755 26043 47% 140800 124612 89% 218472 119217 55%Foreign Project 48152 63900 133% 149400 174362 117% 229000 117717 51%FinancingDomestic Financing 7603 -37857 -498% -8600 -49750 578% -10528 1500 -14%
Source: Data provided by authorities and staff estimates
2.12 Compared to the previous two years, when resource availability from domesticrevenue and import/budget support was below the budget estimates, for FY99 theresource availability from these sources was in fact slightly above the estimated amounts,mainly on account of higher than projected import/budget support from donors in theform of grants and loans.
2.13 First claim expenditures consisting of debt service payments and payments forwages and salaries were also within the resource envelope provided by the budget.However, while payments for wages and salaries were considerably less than wasbudgeted, this was offset by higher than estimated debt service payments. This isreminiscent of FY98, where there also was an apparent trade-off between under spendingon supply votes and increased debt service payments.
2.14 As a result of the positive developments on the side of resource availability andthe containment of first claim expenditures within the limits provided by the budget,
14

available resources for expenditures on account of "other charges" and for domesticdevelopment expenditure was seven percent higher than estimated in the budget. Thishigher resource availability translated directly into higher spending on goods and services(14 percent above budget) and domestically funded development expenditures (88percent above budget). As in previous years, total development expenditures funded fromboth domestic and foreign sources, was again significantly below the budgeted amounts.In fact, the discrepancy for FY99 amounted to about 50 percent and was thusconsiderably higher than in previous years.
2.15 Overall, compared to previous years FY99 represents a significant improvementwith respect to the predictability and availability of funds for financing operations andmaintenance and domestic development expenditure.
2.3 SECTORAL ALLOCATIONS AND PRIORITIZATION
2.16 Table 2.8 shows the sectoral distribution of actual recurrent expenditures for theperiod FY96 - FY00. In FY99, debt service payments from the consolidated funddeclined significantly, which led to a reduction of the share of consolidated fund servicesin total recurrent expenditures from 37.2 percent in FY98 to only 30 percent in FY99.During the first eight months of FY00, the share of consolidated fund service payments intotal recurrent expenditures increased slightly to 33 percent. In FY99, most of the savingsfor reduced debt service payments were used to increase expenditures in administration,the social services, and the productive sectors. In the administrative sector, thePresident's Office, the Ministry of Foreign Affairs, and the Ministry of Finance saw thelargest increases in recurrent expenditure. Much of the increase in expenditures by theMinistry of Finance is explained by the centralization of payments for electricity. In thesocial sectors, the shares of the Ministry of Health and the Ministry of Science,Technology, and Higher Education increased from 4.1 percent to 4.8 percent and from3.1 to 4.2 percent, respectively. Unfortunately, the allocation to regions for the deliveryof basic social services declined from 17.2 to 16.6 percent and the share of the Ministryof Education declined also from 2.7 percent to 2.5 percent. In the productive sectors,expenditures of all three Ministries covered increased significantly, Agriculture by 0.6percentage points, Industries and Trade by 0.2 percentage points, and Tourism, NaturalResources, and Environment by 0.7 percentage points. Data for the first eight months ofFY00 imply relative gains by the defense sector and the social sectors, with reductions inthe share of all other sectors.
Table 2.8: Sectoral Shares in Total Recurrent Expenditures - Actual
Sector FY96 FY97 FY98 FY99 FYOO*Administration 16.8% 10.7% 12.3% 16.5% 12.3%Defense And Security 19.1% 18.7% 17.0% 17.0% 17.7%Social Services 28.4% 26.2% 27.6% 29.5% 32.7%Economic Services 1.6% 4.6% 3.3% 3.1% 2.2%Productive 4. 1%o 2.7% 2.6% 4.0% 2.1%Consolidated Fund Service 29.9% 37.0% 37.20/o 30.0% 33.0%
Grand Total 100.0% 100.0% 100.0% 100.0% 100.0%* July to FebruarySource: Appropriation Accounts for data up to FY99. Flash Reports for FY00
15

2.17 Table 2.9 shows nominal growth rates of actual expenditures. Throughout theperiod FY97-FYOO, social services were the only sector whose expenditures grewconsistently faster than overall government expenditures. Defense expenditures increasedat about the same rate as overall expenditures during most years, while the other sectorssaw significant variations in their expenditure levels over the past five years. DuringFY99, the administrative and productive sectors received the biggest increases among allsectors. However, during the first eight months of FY00 expenditure cuts affected mainlythese two sectors and economic services.
Table 2.9: Sectoral Growth Rates of Recurrent Expenditures - ActualSector FY97 FY98 FY99 FY00*Administration -14.0% 36.6% 52.8% -18.1%Defense And Security 32.0% 8.2% 14.0% 14.4%Social Services 24.7% 25.7% 21.3% 21.9%Economic Services 286.3% -14.3% 5.4% -23.3%Productive -11.4% 14.6% 74.7% -42.0%Consolidated Fund Service 67.3% 20.0% -8.3% 20.7%Grand Total 35.1% 19.3% 13.8% 9.7%* July to FebruarySource: Appropriation Accounts for data up to FY99. Flash Reports for FYOo
2.18 With respect to development expenditures, there was a significant reorientation ofexpenditure patterns from administration to the social sectors. While in FY98, theMinistries of Finance, Defense and National Security and the Prime Minister's Officereceived significant resources for development purposes, in FY99 their share wasdrastically reduced. On the other hand, the Ministry of Water, which in FY98 onlyreceived 0.6 percent of the development budget received in FY99 17.3 percent of thedevelopment budget. The Ministries of Health and Education as well as the Regions alsosaw significant increases in their share of the development budget in FY99. However,given the multitude of problems with the capturing of information on developmentexpenditures which are mainly financed by donors, the information from the developmentaccounts needs to be considered with great caution. As many development expendituresfunded by donors are not captured in the budget estimates and the appropriation accounts,it is difficult to ascertain the true distribution of development expenditures across sectors.Changes in the coverage of donor expenditures are also a possible source of apparentchanges in sectoral allocations of development expenditures.
Table 2.10: Sectoral Shares in Total Development Expenditures - ActualSector FY96 FY97 FY98 FY99Administration 21.4% 49.0% 24.2% 1.4%Defense And Security 1.3% 0.9% 0.2% 0.0%Social Services 37.5% 26.0% 22.5% 49.6%Economic Services 23.1% 21.7% 40.1% 40.2%Productive 16.7% 2.5% 13.0% 8.8%Consolidated Fund Service 0.0% 0.0% 0.0% 0.0%Grand Total 100.0%/ 100.0% 100.0% 100.0%Source: Appropriation Accounts
2.19 In the following we examine allocations to the priority sectors in more detail. Inthe first instance we examine whether the share of expenditures allocated to the priority
16

sectors has increased during the past two years and whether allocations to the prioritysectors were respected during budget implementation. Priorities for budget allocations aredefined in the Government's budget guidelines. Prior to FY99, the RPFB had emphasizedresource allocation to four priority sector groups: social services, infrastructure, law andorder and environment. However, as the budget guidelines for FY99 state "not mucheffort has been put in translating Government priorities into strategic options given theobvious limitations of the resource envelope." The budget for FY99 was the first tobenefit fully from the newly introduced PER process and Government's intention was to"fully fund and accord protection status to few strategic expenditures within prioritysectors." For FY99, the priority areas defined in the budget guidelines include:
* Roads * Education. Water * Agriculture* Energy * Law and Order* Health
2.20 In addition to these priority areas, the national population census 1998, paymentof utility bills (to be paid centrally by MoF) and the settlement of arrears were otherpriorities defined for FY99. The expenditure priorities of FY00 were similar, with Landissues, the implementation of the Civil Service Reform, the payment of debts, generalelections, and the implementation of the LGRP added to the priorities. In the context ofthe PER process and Government's focus on poverty reduction, these priority sectorshave been further narrowed down to those areas that are likely to have the biggest impacton poverty reduction, i.e., rural roads, water, basic health, primary education, agriculturalresearch and development and extension and the Judiciary.
2.21 Table 2.11 shows the development of actual recurrent expenditures for the prioritysectors for the period FY98 to FY00, both as shares of discretionary expenditures as wellas in nominal growth rates. Throughout the period, actual expenditures on prioritysectors grew slightly faster than expenditures on non-priority sectors. This led to anincrease in the share of discretionary expenditures going to the priority sectors from 42.8percent in FY97 to 46.7 percent in FY00. Growth rates of actual expenditures varysignificantly across the various priority areas. During FY99, the nominal growth ofexpenditures in the Judiciary and Education Sector was actually below the averagegrowth rate of discretionary expenditures and in FY00 only education sector expenditureswere above the average growth rate of discretionary expenditures.
2.22 Table 2.12 presents a more detailed analysis of priority expenditures during thefirst eight months of FY00. The budget estimates indicated significant increases inallocations for "other charges" to the priority sectors. In particular, allocations for "othercharges" to local governments for social services were more than doubled in FY00,reflecting partly the shift of responsibilities to Local Governments for the management ofsocial service delivery under the Local Government Reform Program. However,comparing actual exchequer releases to the priority sectors for the first eight months ofFY00 to exchequer releases during the same period in FY99 shows that exchequerreleases are significantly below the budgeted increases. Instead of the budgeted increasefor OC to local governments by 221.7 percent, the actual increase during the first eightmonth of FY00 was only 158.5 percent. For all other priority areas, exchequer releases
17

during the first eight months of FY00 were actually less than during the same period ofFY99.
Table 2.11: Recurrent Expenditure in the Priority Sectors, 1997/99-FYOOFY97 FY98 FY99 FYOO* FY97 FY98 FY99 FYOO*As share of discretionary expenditure Nominal annual growth rate
Judiciary 1.0% 1.1% 1.0% 0.7% 34% 26% 17% -23%Agriculture & 3.3% 2.9% 3.3% 1.2% 18% 5% 47% -62%LivestockEducation/i 21.1% 22.1% 18.9% 25.9% 25% 25% 9% 43%Works (plus Road 6.5% 5.9% 8.2% 5.2% 349% 9% 77% -33%Fund)/!.Lands, Hous.,& Urb. 0.1% 0.1% 0.5% 0.5% -63% 25% 381% 9%Dev.Water/i 2.9% 3.1% 3.3% 3.4% 21% 27% 37% 9%Health"] 8.9% 10.5% 10.6% 10.4% 32% 40% 29% 2%
Total Priority 42.8% 44.6% 44.8% 46.7% 40% 24% 28% 9%Total Discretionary 100.0% 100.0% 100.0% 100.0% 21% 19% 28% 4%/1 includes transfers to districts* July - February
On the other hand, the implementation of the pay reform program led to a significantincrease in exchequer releases for personal emoluments during the first eight months ofFYOO. As a consequence of the local government reform program, there were furthertransfers of staff from various priority ministries and regions to local governments. Thisresulted in lower than average increases in PE releases for these spending units, while theexchequer releases to local governments as well as to the ministries of education andhealth were above the average increase of PE by 30.5 percent.
Table 2.12: Change in Allocations and Exchequer Releases to Priority Sectors, FYOO (July-February)
change over Juiy-Feb FY99Ministry!Department PE IPE OC OC OC+PE OC+PE'
Estimate Actual Estimate Actual Estimate ActualJudiciary 39.2% 24.0% 151.6% -51.5% 78.4% -8.1%Ministry of Education 9.4% 36.8% 20.0% -77% 13.8% 14.6%Ministry of Health -4.9% 32.7% 2 10.7% 26.5%o 9.4 -22.9%Ministry of Water 5.0% 20.8% 12.0% -49.4% 7.4% -22.8%Regions (Social -18.3% 11.4% 49.4% -57.4% -11 .9% -8.1%Services) I 1Local Government 1.9% 41.3% 221.7% 158.5% 12.1% 47.7%(Social Services)Ministry of Agriculture -1.4% -39.9% 7.5% -81.6% 2.6% -65.2%and Co-operatives |I_ I
GRAND TOTAL 3.6% 30.5% !49.3% / -7.3% 27.5% 8.5%Source: Ministry of Finance, Policy Analysis Department
Differences to the changes shown in table 14 are due to different methods of calculation. While in this table thechange in exchequer releases during the first eight months is computed. in table 14 data for 1999/2000 are extrapolatedand compared to'actual expenditures in the previous year.
18

2.23 As mentioned elsewhere, development expenditures recorded in the budgetestimates and in the appropriation accounts give only a very incomplete picture of actualdevelopment expenditures, the majority of which is donor financed. This is even moretrue for the priority sectors, as most donor support typically concentrates on these sectors.In many cases, donor support is directly provided to the ministries or to local authoritieswithout ever being properly recorded in the budget accounts. Keeping in mind thesecaveats, the share of the development budget going to the priority sectors has increasedsteadily during the past three years. While in FY98 only 31.1 of the development budgetwas allocated to the priority sectors, in FY00, 61.7 percent were allocated to thesesectors. Parallel to increases in allocations were increases in actual expenditures.However, the prioritization is less pronounced in actual development expenditures than inthe estimates. The share of actual development expenditures (recorded in theappropriation accounts) increased from 19.9 percent in FY98 to 42.9 percent in FY99.
Table 2.13: Development Expenditure in the Priority Sectors (as % of total recurrentexpenditure), 1997/98-FYOOVOTE HOLDER FY98 FY99 FY00
budget actual budget actual budget actual
Judiciary 0.0 0.0 0.0 0.0 0.0Agr. & Livestock 1.8 _6. 8.4 7.0 13.4Education 2.6 6.9 4.2 6.8 10.3Works & Trans 15.2 0.0 19.6 14.0 16.7Lands, Housing 0.4 0.0 0.0 0.0 0.2Water, Energy 2.5 0.6 11.7 6.7 10.1Health 8.6 6.3 8.2 8.5 10.9TOTAL 31.1 19.9 52.0 42.9 61.7
2.4 OPERATIONAL EFFICIENCY
2.24 This section discusses cross cutting issues that affect the operational efficiency inall sectors. Operational efficiency concerns the question of whether the public sector isable to achieve the planned and budgeted for service delivery objectives and whether itdoes so in an efficient manner. Sector specific indicators of operational efficiency arediscussed in the sector PERs. However, although performance budgets have beendeveloped for all ministries, relatively little progress has been made in developing outputand outcome indicators which would allow the monitoring of the impact of publicexpenditures and thus assess technical efficiency. Nonetheless, there is ample evidencethat service delivery is poor in most parts of the public sector and that efficiency in thepublic sector is low. From a budget perspective, the key constraints to operationalefficiency were (a) insufficient resource availability for expenditures on operations andmaintenance, (b) unpredictability of resource availability for vote holders, and (c) civilservice wages that are for the middle and upper level civil servants significantly belowthose in the private sector. Improvements in these areas are essential if other measuressuch as the introduction of performance management systems and the implementation ofanti-corruption measures are to achieve their intended purposes.
19

Public Sector Reform Program
2.25 A well motivated, efficient, honest, performance-oriented civil service is the keydeterminant of technical efficiency in the delivery of public services. Between 1993 and1998 Government has been implementing the Civil Service Reform Program which hasachieved the following results:2
* The civil service workforce was reduced from roughly 354,600 in FY94 to about264,000 by FY99;
* The salary structures were rationalized and decompressed, the old scheme with 196grades under 23 scales as reduced to 45 grades under four scales;
* 36 inequitably and non-transparently awarded allowances were eliminated orconsolidated into the revised salary structure; and
* greater control was gained over the wage bill and the integrity of the payroll wasrestored.
2.26 However, the reforms undertaken under the CSRP did not lead to significantincreases in civil service take home pay. The increase in average real pay by 75 percentin real terms over the period FY94 to FY98 was mainly the result of the consolidation ofallowances into the salary structure rather than real increases in take home pay. Indeed,during the last three years, middle and upper level civil servants experienced real incomelosses of up to 35 percent. This led to a further widening of the gap between public andprivate sector salaries and gives rise to a multitude of problems such as low motivation,vulnerability to petty bribery, or moonlighting. While pay reform by itself will noteliminate all problems in the public sector, it is nonetheless a necessary condition forother reforms under the Public Sector Reform Program to be effective.2.27 The Public Sector Reform Program (PSRP) extends and carries forward theCSRP. The program comprises three phases and extends over the period 2000-2011:
Phase 1: Installing a Strategic Process for Sustainable PerformanceImprovement (2000-2004);
Phase 2: Institution a Performance Management Culture (2005-2011); and
Phase 3: Establishing Quality Improvement Cycles (2009-201 1).
2.28 The core of Phase 1 are measures to improve the incentive structure and to createa close link between performance and budgets. In particular, the operationalization of the"Performance Improvement Model" includes strategic planning, annual performanceplanning and budgeting linked to the overall government budget process, systematicexecution of plans and budgets with a focus on service improvements, and monitoring,evaluation, and reporting.
Availability of Resources for Operations and Maintenance
2.29 Insufficient allocations for operation and maintenance expenditures are the secondmajor problem affecting public sector efficiency. The introduction of the cash budget has
2URT. Pay Reform Implementation Study: Operationalizing the Medium Term Public Service Pay Policy. Draft FinalReport. 21 May 1999.
20

aggravated the problem of a shortage of funds for operations and maintenance. Underenforced tight resource constraints, expenditures for operations and maintenance have therole of the residual, i.e., these expenditures are only funded from what remains aftertaking care of statutory payments such as debt service and wages and salaries. However,at a more fundamental level, under-funding of operations and maintenance has its originin two problems frequently encountered in public expenditure management. The first isthe undertaking of investment projects without properly taking into account the requiredfinancial resources for operations and maintenance. Examples are the road net work,where even following the increase in resources made available through the Roads Fund, itis estimated that these resources are only sufficient to properly maintain about one fourthof the existing roads network in Tanzania. Another example is Tanzania's extendedhealth network. Public resources are neither sufficient to properly maintain physicalstructures of hospitals, dispensaries, and health centers nor to provide adequate amountsof drugs, thus limiting the capacity of these facilities to provide effective services. Thesecond problem arises from an over-ambitious expansion of service delivery targets and adefinition of the role of government wvhich is not compatible with available resources.This leads to a squeezing of operations and maintenance expenditures, which are thenspread too thinly across the public sector as to allow effective service delivery.
2.30 FY99 represented a turning point with regard to the provision of funds foroperation and maintenance. After a period of continuous decline, which saw expenditureson goods and services plunge from 7.5 percent of GDP in FY95 to only 4.5 percent inFY98, FY99 was the first year that saw an increase in expenditures by more than onepercent of GDP and for FY00, expenditures on goods and services are expected toincrease to 6.2 percent of GDP. While this reversal in the downward trend of operationand maintenance expenditures is very welcome, it remains yet to be established to whatextent these increased expenditures indeed translated to improved service delivery.
2.31 The share of OC in total expenditure increased for all sectors and with theexception of the administrative sector, exchequer releases for Other Charges were abovethe budgeted amounts. During the first eight months of FY00, increases in expenditureson wages and salaries in combination with revenue shortfalls led to a serious crowdingout of expenditures on Other Charges. Overall, actual expenditure for Other Chargeswere only three fourth of the budgeted amounts and the share of actual Other Charges intotal expenditures declined significantly during the fiscal year.
Table 2.14: Sectoral expenditures on OC and PE, FY99-FYOOFY99 FYOO*
Share of OC Actual as % of Estimate Share of OC Actual as % of Estimatein Total PE oc in Total PE OC
Administration 84% 92% 95% 75% 108% 66%Defense and 46% 93% 127% 39% 109% 88%SecuritySocial Services 41% 98% 122% 34% 133% 93%Economic 88% 86% 131% 88% 108% 61%ServicesProductive 71% 88% 156% 56% 71% 60%Total 58% 95% 115% 50% 119% 74%*July to February
21

Predictability of Resource Availability
2.32 A consequence of the cash budget is the unpredictability of available resources foroperation and maintenance expenditures. Figure 1 graphs monthly data on tax revenue,interest payments and expenditures on "other goods and services." Expenditures on "othergoods and services" show large month on month fluctuations, driven mainly byfluctuations in revenue and lumpy interest payments.
Figure 1: Tax Revenue, Interest Payments, and Expenditure on Other Goods and Services
MortNy Revenue and Expenditure, FY98 Monthly Revenus and Expenditure, FY99
7600D_ TaxRebenje, 8(1C00 TaxRevenue50000,. 60004C000 0 OtherGoods_ Other Goods303000- -o- andservioes 400 2ndsErvice20000 -- Interest 2000 n iteest1 COOO paynient -- , jnpaymant
0 --- 0 - -
1 3 5 7 9 11 1 3 5 7 9 11
2.33 We also examine how theseaggregate fluctuations were passed on Figure 2: Ratio of Actual to Budgetedto spending units. The purpose of this Expenditures on OC for Priority and Non-analysis is to (a) identify cash Priority Sectors, January - September 1999management patterns with respect to 300%
releases to individual vote holders, (b) 25 --%
establish whether the priority sectors 200%
of health, education, water, agriculture,and the regions differ from those of 5 0_
non-priority sectors, and (c) gauge to l00%what extent monthly cash releases to 50 -- _ministries are distorted by the cash 0% ybudget system currently in place in t0 2Z
Tanzania. The main instrument for the - Prioity --- Non-Prnonty (excl. Finance)
analysis is to trace the ratio of actual to -
budgeted releases on "other charges" Source: Tanzanian Authoritiesfor FY99 and the first eight months ofFY00.
2.34 We start the analysis by looking at overall releases on "other charges" for priorityand non-priority ministries before we proceed to the more detailed analysis of selectedpriority and non-priority ministries.3 Exchequer releases to the Ministry of Finance areexcluded from all aggregates. since funds initially allocated to the Ministry of Finance are
In this analysis, exchequer releases to the following Ministries are included: Ministry of Education and Culture,Ministry of Health, Ministry of Agriculture and Cooperatives, Ministry of Water. the Judiciary as well as exchequerreleases to the regions and local governments in the areas of social services.
22

used to affect reallocations during the year and inclusion of data on the Ministry ofFinance would thus distort the analysis of allocations and exchequer releases to spendingunits. Road Fund expenditures are also excluded since they are fimded from earmarkedresources and thus outside the normal allocation process. During FY99, until April 1999monthly exchequer releases for "other charges" for both priority and non-priority sectorswere significantly above budgeted amounts. Thereafter, for the last two months of FY99exchequer releases to the priority sectors were significantly below estimates and for thefirst eight months of FYOO, exchequer releases to both priority and non-priority sectorswere below the estimated amounts. The volatility of exchequer releases to the prioritysectors is significantly higher than that of non-priority sector releases. Given the overallpattern of overall resource availability in FY99, priority sectors have benefited more fromadditional resources for other charges than the non-priority sectors. However, for the firsteight months of FYOO, the shortfall of overall resource availability for other chargescompared to estimates has affected priority sectors more than non-priority sectors. Thesepatterns appear to indicate that priority sectors are given a certain priority in theallocation of additional resources but are not protected in the case of resource shortfalls.While in FY99, priority sectors received 34 percent of all exchequer releases for "othercharges," in FYOO this share fell to only 25 percent of a shrinking overall allocation.
2.35 Figures 4 and 5 show the ratio of actual exchequer releases to budget estimates fora sample of priority and non-priority spending units, respectively. From the visualinspection of expenditure patterns for priority and non-priority sectors severalobservations emerge:
* Month to month expenditure releases are highly variable for both priority andnon-priority Ministries.
* Monthly expenditure patterns across Ministries are not synchronized, possiblyreflecting lumpy procurements.
* Single month releases can claim a significant of the total annual budgetallocation to a particular Ministry. For example, in the case of the Ministry ofWater the budget release in March was higher than the budgeted amount forthe whole year for the particular Ministry.
* From the mission's discussions with sector Ministries and local authorities, itappears that the variation in monthly releases does not necessarily reflect theMinistries' financial requirements. This indicates some scope for improvedmanagement of budgetary releases across Ministries, even within the limitsimposed by the cash budget management system.
* Ministries smooth volatility in monthly releases to a certain extent through theuse of supplier credit and accumulation of arrears. These are typically settledonce higher releases than budgeted are received.
23

2.36 Figure 3 shows the ratio of actual to budgeted expenditure releases in theeducation and health sectors at the Ministerial, regional, and district level. The educationsector benefited more from additional resources than the health sector. For both sectors,the regional levels received the biggest increases compared to budgeted amounts, whilethe Ministerial level benefited least from additional exchequer releases compared to thebudget estimates.
Figure 3: Ratio of Actual to Estimates for Other Charges - Education and Health Sectors
rIRealth Sector Expencitures Edication Sector Expendtures
4000 .FY99Q 500.0 ~ FY99Q 1
300.0 FI1~ Iji.i Y9902 400.0 F9Q200.0 0 FY9903 FY300.0
100.0 FYY99Q4 FY99 10 _ _240 00Y
MoH Regions Districts FY0002 MoC RgosDtit FYOOQ2
24

Figure 4: Priority Ministries - Ratio of Actual to Estimates for Other Charges:
3 00% _ _ ................... _ . .. _I 3000/% - -- __.__
250% ----- ~ - - ~ 20~~~~~~~~~~~~~~~~~0,
2500%----- - - -
100% A- - - -- - ---
0% ! 0/
us Zfi z ' Z u ' '' 7 @ Z -' us z -' us z -'
-...- Total (excL. Finance and Road Fund)! -- -.. Total (exci. Finance and Road Fund)j
- Ministry of Health + Ministry of Education
600% 16 00
5000'- 0-- -- 0A i-i2l0/o0l~--W--A :-100
400'/. j - - -/300%~~~~~~~~~~~80
200%400%.
100% Ao 7- --- 2000/° i .
A- .. Total (excl. Finance and Road Fund) ---- A - Total (exc; Finance and Road Fund)
+-Ministry of Agnculture and Co-operathes. + Ministry of Water
600% 3 - - - - 0 -------- - -- -600°.., + ~ ~ ~ ~ ~ 00 - j-50/ -_ -_ --- -- -,
500% 3 00t
400% 2 S0C% __ --\ -
2 DO% ~~~~~~~~~~~~~100%' 0% 5I ------- A100% ~A--;- 0%
O °/o O co o7~ a o 5 4 a o ni7oZCi n-7 i
- -A --- Total (excl. Finance and Road Fund)- ------- Total (excl. Finance and Road Fund)+ Regions I + Local Govemment
25

Figure 5: Non-Priority Ministries - Ratio of Actual to Estimates for Other Charges:
2000/. 200%_-_..____..______.__._.___..0A A
'150%- A A 150% - __
100%° 100% 50%. ^,^. 50%-
50%. ~ ~ ~ ~ ~ ~ ~~~00% ,, I I, XI 0% /o ^i , , , '
z >
| . ,.. Total (excl. Finance and Road Fund) l - Total (excl. Finance and Road Fund)
. i + President's Office and Cabinet Secretaat Ministry of Foreign Affairs & Int Co-operation
200%__ 250%
150".o -1 ,s>^.^.A.^ 200. -t150%-- I -*. s.10o% A 4
50<0-~ ~ ~ ~ ~ ~~~~~10 .A '0
50o
' 0 , a e
-.. Total (excl. Finance and Road Fund)' --.. Total (excl. Finance and Road Fund)
; _ Defence lMinistry of Science, Tech.& Higher Education
2.5. OPERATIONAL EFFICIENCY - FINDINGS OF THE COMPTROLLER AND AUDITORGENERAL
Introduction
2.37 The analysis of the extent of compliance to prudential budget managementprocedures and regulations by the Government was undertaken as one of the keyobjectives of the PER99 evaluative work. The analysis was based on informationcollected from the Controller and Auditor General's (CAG) reports for the FY94 - FY97and discussions with the Office of the Controller and Auditor General (OCAG),interviews with a sample of central government vote holders and local governmentofficials, and from a meeting involving a cross section of stakeholders. The PER FY00updates the PER99 analysis, based on information from the FY98 CAG reports for thecentral government and local authorities.
2.38 As for PER99, the analysis of the CAG reports is intended to: establish theprevalence of qualified or adverse audit opinions issued by CAG; identify the maincauses of these unfavorable audit opinions; assess the extent of responsiveness to audit
26

queries and follow up action by vote holders; and analyze and explain the patterns forexcess spending or under-funding of votes.
Main Findings
2.39 Audit certificates of accounts and statements issued by CAG continued to bepredominantly adverse although there was some improvement in FY98 for ministries(Table 1). For regions and local governments the state of the accounts deterioratedtremendously in FY98 with none of the regions receiving a clean certificate and themajority of local governments receiving adverse opinions and qualified certificates.Whereas qualified opinions indicate some points of objection by CAG, the accountsreceiving adverse opinion are deemed not to represent a true and fair status of therespective votes. As noted in the PER99, the votes which received adverse certificateshad major errors in their accounts and statements submitted for audit, and did not havethe required bank reconciliation statements to support the appropriation accounts.
2.40 In FY98, 46 percent of the ministries' accounts received adverse opinion, 12percent received qualified certificate, while 42 percent received clean certificate (TableAl). Thus. 54 percent of the ministries' accounts received qualified certificate andadverse opinion, showing a slight improvement compared to an average of 60 percent forthe period FY94 - FY97. All (100 percent) accounts of the regional governments receivedadverse opinion in FY98, signaling a significant deterioration compared to the average of67 percent during FY94 - FY97. During FY98 114 final accounts of local authoritieswere audited, 2 of which were for FY97 and 1 for FY96. 60 percent of these accountswere declared adverse, 19 percent received qualified certificates, while only 21 percentwere pronounced clean. The share of district council accounts receiving an adverseopinion wvas 63 percent and higher than the share of urban councils receiving an adverseopinion(42 percent). This may point towards greater capacity constraints in districtcouncils. Overall the status of the local government accounts worsened in FY98, with 79percent of the audited statements receiving either a qualified or adverse opinion in FY98compared to an average of 76 percent for FY94 - FY97. As PER99 well noted, theworsening of the trend in the quality of certificates issued by CAG to regions and localgovernments signifies the continued prevalence of the underlying problems of budgetmanagement more generally and accounting problems more specifically.
2.41 The FY98 was also marked by the continued prevalence of expenditures that arenot vouched or improperly vouched. However, incidences of unvouched expendituresdecreased slightly in FY98 while those of improperly vouched expenditures increased.Improperly vouched expenditures increased from 3.7 percent of total in FY94 to 6.8percent in FY98 while unvouched expenditures decreased from 1.9 percent of total inFY94 to 1.06 percent in FY98 (Table 2). Overall, the share of non-vouched andimproperly vouched expenditures out of the total, rose to 8.8 percent in FY98 from 5.5percent in FY94. Absence of payment vouchers and other documentary evidence tosubstantiate the authenticity of expenditures was cited by CAG to be the major reasonbehind this rise.
2.42 Widespread incidences of embezzlement of cash and stores remained high andcontinued to raise concern in FY98. The magnitude of cash and stores losses decreasedslightly from 0.26 percent of total expenditure in FY97 to 0.15 percent in FY98 (Table 3).
27

Embezzlement of cash and stores remain high mainly on account of non-production ornon-completion of bank reconciliation statements and poor procurement and storesmanagement.
2.43 Weak controls, extra budgetary expenditures and irregularities have beenobserved to be the main causes behind poor certification and losses (PER99). Inparticular, the immediate and underlying causes for the most frequent audit queries arenoted to include: incidences of excess votes; failure by the accounting officers toreconcile bank accounts; inadequate supporting documentation of expenditures; failure tofollow approved procurement procedures; and failure of purchasing units to account forpurchases, and cash and store losses. Dishonesty and lack of technical manpowercapacity especially in the ranks of accountants and auditors constrains the effort to reduceaudit queries.
2.44 Excess spending increased in FY98, but overall they were significantly lower thansavings. Excess spending occurs in specific votes and is either a result of additionalspending on a line item in excess of the budget allocation or unauthorized reallocationsacross specific line items. As noted in PER99, the problem of excess spending appearsnot to be widespread and has been put under control through the strict application of thecash budget system. The magnitude of excesses have been relatively low except forFY96, which had a budget overrun due to funding of the general elections (Table 4).Saving or "surplus" problems continued to be much more widespread and morepronounced for development than the recurrent budgets. Expenditure saving slightlydeclined for recurrent budget but significantly increased for development budget duringFY98 compared to FY97. Reasons for the occurrence of savings or surpluses include:unrealistic estimates; projects, which face poor implementation due to under-funding orother implementation bottlenecks; unrecorded expenditures; non-recording or non-charging of aid expenditure for some projects to the accounts hence making it appear assavings against the appropriate estimated provision; and failure to fully account for aidreceived in the form of goods, materials and equipment (PER999).
2.45 The response to CAG's audit queries improved slightly for the ministries butworsened for the regions in FY98. As for the period FY94 - FY97, satisfactory repliesand subsequent redress by vote holders to queries from OCAG continued to be a verysmall proportion of the total queries issued in FY98. On average, only about 13 percentof queries issued were replied to in FY98, a slight increase over the period FY94-FY97when an average of 10 percent of issued queries were replied to (Table 5). This suggeststhat little or no action seems to have been taken by accounting officers to rectify therecurring weaknesses in expenditure control and other compliance issues. Theimplication of this situation is that in many cases the proper utilization of public fundscan not be ascertained, and unless the offenders are sanctioned, little or no improvementwill be recorded. However, as noted in PER99 a major cause of non-responsiveness to theCAG's queries is the absence of the will to enforce accountability and a lack ofappropriate legal instruments for enforcement. The review of the Exchequer Ordinance isexpected to provide for more effective enforcement of compliance to audit disclosures.However, the law itself may not be sufficient, unless it is accompanied by a change in theoperative culture to more accountable and transparent behavior in the civil service and bybringing such accountability increasingly into the public domain. Involvement of the
28

press, donors, political institutions, and non-governmental organizations in the review ofpublic expenditure effectiveness will serve as strong stimulants of prudence andaccountable behavior.
2.6 ASSESSMENT OF INSTITUTIONS FOR IMPROVED BUDGET PERFORMANCE
2.46 Expenditure management and public sector performance at the three levels ofbudget performance is critically influenced by the institutional arrangements andprocesses used for budgeting and expenditure management. This section discusses someof the key institutional arrangements underlying public finance management and providesa brief overview of recent initiatives to strengthen the institutional framework for publicfinance management. Table 15 provides an overview of institutional arrangements thataffect public finance performance. In addition to institutional arrangements affectingdirectly public finance management (shown in column one of table 15), accountabilityand transparency are the other key ingredients to ensure improved public financeperformance.
Table 2.15: Key Institutional Arrangement and Expenditure OutcomesInstitutional arrangements Accountability TransparencyI. Aggregate Fiscal DisciplineA. Macro framework and Ex-post reconciliation Published
coordination mechanisms Sanctions Made PublicB. Dominance of central ministries Openness of financial markets Freedom of the pressC. Formal constraintsD. Hard budget constraintsE. Comprehensiveness of budget11. PrioritizationA. Forward estimates Reporting on outcomes PublishedB. Comprehensiveness of the budget Ex-post evaluations Freedom of the pressC. Flexibility of line agencies Hard budget constraints Made publicD. Breadth of consultations Technical capacity of parliament ComprehensibleE. Use of objective criteriaIll. Technical EfficiencyA. Civil service pay and merit-based Clarity of purpose/task Published
recruitment/promotion Chief executive tenure Made publicB. Managerial autonomy of line Financial accounts, audits Freedom of the press
agencies Client surveysC. Predictability of resource flow Contestabilitv in service Delivery
Source: Ed Campos, Sanjay Pradhan, "Budgetary Institutions and Expenditure Outcomes - Binding Govemments toFiscal Performance" Policy Research Working Paper 1646, The World Bank. September 1996
2.47 At the aggregate level, the institutional set up is currently dominated by the cashbudget management system, which gives overriding power to the Ministry of Finance andthe Central Bank to establish monthly aggregate expenditure levels and enforce a hardbudget constraint. However, the cash budget management system imposes significantcosts in the form of reduced operational efficiency and will need to be replaced by moreflexible and robust mechanisms which can support improved efficiency and servicedelivery capacity while ensuring aggregate fiscal discipline. However, it is widelyaccepted that the relaxation of the cash budget system will be gradual to avoid therecurrence of large fiscal imbalances. Such a gradual approach could involve the moveto a quarterly commitment system as well as the relaxation of the cash budget constraints
29

for MDAs that are part of the performance management pilot. As the cash budget systemis relaxed, the Medium Term Expenditure Framework will gain even greater significanceas it provides a three year macro framework for estimating resource availability fromboth domestic and foreign sources and to coordinate expenditure planning andmanagement. While the cash budget system limits the benefits of a MTEF approach, theuse of the MTEF since FY99 nonetheless has already led to improvements in budgetaryplanning and allocations. Equally important, its introduction while the cash budget is stillin place provides the opportunity for learning by doing with limited risks and will thusfacilitate the eventual move away from the cash budget system.
2.48 At the level of strategic allocations, the PER/MTEF process provides a frameworkfor wider participation in the budgeting process. Government has opened up the processto provide the opportunity for various stakeholders to provide inputs to the process ofmaking strategic allocations. At present, the allocation process is heavily influenced bydonors through the MDF and HIPC conditionalities. However, the goal should be tofurther strengthen domestic participation in the allocation process to ensure that localpriorities are catered to and that poverty is addressed in an effective way. Limitedtechnical capacity both in the executive arm of Government as well as in Parliamentlimits the application of objective criteria in the allocation process. However, it isexpected that training provided in the framework of the MTEF as well as support by localresearch institutes and external consultants in the preparation of Public ExpenditureReviews will lead to strengthened capacities in this area.
2.49 Institutional problems at the level of operational efficiency are still severe andlimit effective service delivery. Efforts under the Public Sector Reform Program areintended to overcome some of these institutional bottlenecks. However, it is alsonecessary that these bottlenecks are taken into account during the process of budgetaryplanning and that Government refrains from undertaking activities before institutionaland human resource constraints are reduced.
2.50 In the following section we provide an overview of the status of various initiativesthat are intended to improve the institutional framework for budget management inTanzania.
Strengthening Financial Management and Accountability
2.51 The PER process is now focusing on raising and monitoring the efficacy of thepublic expenditure after having achieved some significant success in promoting greaterfocus on priority sectors as well as OC in budget allocations. Emphasis is being placed onrolling out the Integrated Financial Management Systems to widen coverage; introductionand widening the adoption of Performance Budgeting; strengthening the public auditsystem, follow ups and public disclosure; and implementation of performanceimprovement plans under the Public Service Reform Program. These measures will bebuttressed by the amendment of the Exchequer Ordinance, splitting it into two acts. theFinancial Management Act and the Public Audit Act.
30

Computerized Financial Accounting System
2.52 An Integrated Financial Management System (Platinum) has been introduced toall Ministries. In addition, the IFMS has also been introduced in TRA and 19 TRAoffices and sub-treasuries in the districts. While Ministries are connected on-line to thecentral Platinum server through a wide area network (WAN), the 19 remote sitesexchange data with the center through a dial-up network.
2.53 It is also planned to implement in a phased manner a new Financial Managementand Accounting Framework based on Platinum SQL for all Local Government Councils.Preparation for implementation is currently underway in 28 Councils.
2.54 Training in the use of the IFMS has been provided to staff in the Ministries anddistricts, as well as to staff in the Office of the Controller and Auditor General.
2.55 The Budget Manager module of the Platinum system also allows for multi-yearbudgets, profiling year 1 by month (or quarter) and years 2 and 3 in total, which allowsfor the eventual integration of the Medium Term Expenditure Framework into thecomputerized IFMS. In addition, the coding of expenditures and revenues in the newchart of accounts already includes codes for objectives, targets, and activities, in order tomake the IFMS compatible with the introduction of performance budgeting.
2.56 It is foreseen that starting July 1, 2001 only IFMS is used as governrmentbudgeting, accounting, and financial information system, with no fiscal transactionstaking place outside the IFMS.
Creating the Legal Framework for Improved Public Finance Management
2.57 A new accounting circular was issued in July 1999 to enable the use of the IFMSand cash budget management. In light of the ongoing reforms, the Exchequer Ordinancethat currently provides the legal basis for public finance management has becomeinadequate. To further streamline public finance management and to create the legalbasis for new public finance management approaches, two new bills, the Public AuditBill and the Public Finance Management Bill will be tabled in Parliament during its June2000 session. Implementing regulations will be issued in August 2000. The newlegislation will also entail improvements in the framework for public procurement.
Performance Budgeting
2.58 Performance budgeting was introduced to seven ministries in 1998 on a pilotbasis. In 1999, the pilot was extended and performance budgets were prepared by allMinistries in 1999. A review of the experience with performance budgeting yielded thefollowing main conclusions:4
* Most spending agencies did not adhere to the set ceilings. Only eleven (11) ministriesout of twenty-five (25) and one (1) independent department out of sixteenth (16),adhered to the set ceilings. This shows a weakness of prioritization of targets.
Report on the Performance Budgcting Evaluation Workshop, held at Bahari Beach Hotel from 2-3 August. 1999
31

* Most spending agencies did not prioritize their objectives and its justification asrequired.
* Lack of clarity and consistency of objectives, policies/strategies and targets.* Shortfalls in the budget guidelines for FY00 regarding PE ceilings of parastatals
which were not separated from ministerial "OC".* It is clear that the conceptual framework of performance budget has taken root.* The technical side of performance budgeting through target tables was generally
stronger than the planning side through a strategic framework. The weakest areabeing that of presenting the objectives in priority and annual targets as well asidentification of activities.
* There is a lack of clarity and sequence of thinking from general to particular and viceversa. i.e. the link between the strategic framework, 3 year targets and annual targetsis lacking.
* There is inadequate integration of personnel dealing with the planning and budgetaryparts of performance budgeting, (i.e., personnel dealing with PE preparation andOC/Planning).
2.59 In order to facilitate performance budgeting in the coming years, GoT issued inAugust 1999, a performance budgeting operations manual, which provides detailedinstructions on the process and technical requirements for preparing a performancebudget as well as the framework for monitoring and reviewing the performance budget.
2.60 Performance auditing would be a logical complement to the introduction ofperformance budgeting. Although the Office of the Controller and Auditor General iseager to expand its audits to cover this new area, the OCAG currently lacks resources,manpower, and skills to carry out such audits effectively.
Donor Coordination
2.61 Tanzania is one of the main recipients of external assistance in Sub-SaharanAfrica. On average Tanzania receives about US$ 900 million per year from externalsources. This amount is slightly over 10 percent of GDP. However, not all of the inflowspass through the exchequer system to support the Government budget. It is estimated thatabout 70 percent of such external resources go directly to the projects supported bydonors.
2.62 Every donor has different processes and strategies of channeling the resources tothe targeted projects. The multiplicity of these has made donor coordination a tedious onerequiring more capacity at the Ministry of Finance. Donors have different accountingsystems, different disbursement modalities and different financial years. To harmonizethe multiplicity of the donor accounting systems, there are plans to integrate donorfacilities in the new Integrated Financial Management System (IFMS) using the Platinumsoftware.
2.63 In addition, the Government is now taking the lead in preparing a countryassistance strategy referred to as Tanzania Assistance Strategy (TAS). This is a broadbased framework which encompasses all the donor interventions in the country in acoordinated manner. In such an endeavor, the Government will list its priorities, talke
32

stock of its domestic resource envelope to determine the resource gap which then canform the basis for negotiations with donors.
2.64 Another promising approach to ensure greater integration of donor resources intooverall government programs is the development of sector development programs andbasket funding arrangements. Sector development programs have been developed for theroads and the health sector and are under preparation for the education sector. Basketfunding arrangements support the strengthening of the TRA as well as theimplementation of the Local Government Reform Program.
Reducing Corruption
2.65 Corruption in various forms and at various levels of Government is a majorobstacle to achieving operational efficiency in the delivery of public services. In order toreduce corruption, Government under the leadership of the Prevention of CorruptionBureau (PCB) has developed a comprehensive anti-corruption strategy, which iscurrently in the process of being operationalized and will be implemented over thecoming years.
Strengthening the Office of the Comptroller and Auditor General
2.66 The Office of the Comptroller and Auditor General (OCAG) plays a key role inensuring accountability for the use of public resources in Tanzania. In FY00, the OCAGhas received a significant increase in budgetary resources which allowed an accelerationin the audit process. The audit report for the financial year FY98 has been published withless delay (15 months after the end of the financial year) than in previous years and therewas a significant reduction in the backlog of audits of local Governments. The mainissue is now on the effective follow-up to the OCAG report. This must entail botheffective prosecution and sanctions for problems identified by the OCAG and theimplementation of measures that prevent the recurrence of problems highlighted by theOCAG.
33
2.7 ROAD FUND MANAGEMENT
Background
2.67 The roads sector is one of the central sectors in the Tanzania economy and iscrucial for the sustainability of the country's economic development. The road sectorhandles about 70 percent of internal freight, 64 percent of transit cargo and is a majormode of passenger transport. The strategic nature of the sector has made the Governmentof Tanzania accord it and other infrastructure investments a high priority. The TanzaniaVision 2025 considers the development of the road network absolutely essential forpromoting development, particularly rural development.
2.68 The administration of the road network falls under two separate ministries. TheMinistry of Works (MOW) which administers trunk and regional roads, and the Ministryof Regional Administration and Local Governments (MRALG) which, through localauthorities administers district, urban and feeder roads. The management of trunk roadconstruction, rehabilitation, and maintenance is, from February 2000, managed by anexecutive road agency - TANROADS. In terns of financing of upgrading, rehabilitationand maintenance there is participation of both the Government and donors at all levels ofthe sector. There is also the participation of the private sector and communities in roadmaintenance. The main source of finance for maintenance and operations is the RoadFund, which is funded from as a fuel user charge and shared at the ratio of 70:30 betweenWOW and MRALG. The focus of this section of the report is to assess the effectivenessin the management of the Road Fund.
Establishment of the Road Fund
2.69 The Road Fund was established after the approval of the Amendment No.2 to the1985 Road Tolls Act on December 23, 1998. This is the fund "into which shall be paid allmonies collected as roads toll imposed on diesel and petrol, transit fees, heavy vehiclelicenses, vehicle overloading fees, or any other source at the rate or rates to bedetermined by Parliament from time to time." The amendment vested the administrationof the Road Fund to the Road Fund Board, to be composed of a Chairman and eightmembers, four of them representing the private sector. The Road Fund Board wasofficially inaugurated on August 27, 1999, after which it organized the Secretariat,including the appointments of TANROADS Chief Executive in November 1999 andRoad Fund manager and accountant in January 2000. There are several pertinent issuesthat need to be considered as the Government gears toward ensuring that more resourcesare availed for funding road rehabilitation and maintenance.
Key Issues on Road Fund Management
Sources of Roads Fund Revenue
2.70 Before the amendment of the Road Tolls Act of 1985, fuel levy was the onlvsource of revenue for the Road Fund. Although the Road Tolls Act was amended twoyears ago to include in the Road Fund more sources of revenue, so far these additional
34

sources have not contributed to the fund. The proceeds of these sources have instead beenallocated by the Treasury to other expenditures. Table 16 shows the amounts of revenuecollected from transit fees, heavy vehicle license fees and vehicle overloading fees, whichwere not deposited in the road fund account.
Table 2.16: Revenue Collected by Treasury but not included in the Road Fund (Tsh.million)
Revenue Source FY98 FY99 FY00*Transit fees 624 800 | 5Heavv vehicle license fees 652 604 0.6Vehicle overloading fees 1014 658 1 5.0TOTAL 2290 2062 1635
* Up to December 1999.Source: Louis Berger S.A (2000) - PER study on Tracking of the Roads Fund
The Fuel Levy rate
2.71 There is also concern about the rate of the fuel levy. The levy was Tsh. 7 per literin 1991 but was raised to Tsh. 70 per liter in July 1998, and has remained at that level todate. In real terms, the rate has actually declined and may not be serving well theintended purpose. Expressed in US dollars, for example, the rate varied between 2.0 centsin early 1992 and 10.6 cents in late 1998. Since this peak, the rate did not follow thedepreciation of the shilling and now represents only 8.8 cents (Louis Berger S.A, 2000 -PER study on Tracking of the Roads Fund). Aside from administrative problems relatedto tax evasion due to illegal fuel business, the fixed nature of the rate of fuel levy innominal terms explains why the road fund revenue has been almost stagnant over time(Table 17) and declined in real terms.
Table 2.17: Road Fund (fuel levy) Collection, FY97 - FY00 (Tsh. Million)
FY97 FY98 FY99 l FY00 lRoad Fund (Total fuel levy collected) 33936 36703 38395 25898
* Up to December 1999. Estimated collection for FY00 is Ths. 38.847 million.Source: Louis Berger S.A (2000) - PER study on Tracking of the Roads Fund
Revenue Collection and Releases of Road Fund
2.72 The Road Fund collection and release procedure is as follows: first, the amountscollected by the Tanzania Revenue Authority (TRA) in the Dar es Salaam region aredeposited directly into the Road Fund Collection account at the Bank of Tanzania (BOT),while the amounts collected in the remaining 19 regions are banked in commercial banksand eventually transferred to the Pay Master General (PMG) account at BOT. Second, thereleases of revenue from the PMG account to the Road Fund Collection account, andfrom the Road Fund Collection account to the MOW Road Fund account and MRALGRoad Fund account depend on the directives of the PMG/Permanent Secretary in theMinistry of Finance. Third, the releases of revenue from the MOW Road Fund account toregional engineers' accounts at NMB and from MRALG Road Fund account to the
35

District Councils' accounts at NMB are done under the directive of the accountingofficers in the respective ministries.
2.73 Although the procedure above is very clear, in practice there has been a problemof non-release or shortfalls in the release of funds by the Treasury. During FY97 toFY99, for example, a total of Tsh. 109,034 million was collected as fuel levy, but out ofthis only Tsh. 81,946 million were actually released by Treasury to MOW and MRALG.The balance of Tsh. 27,088 millions or 24.8 percent of total collection, which representsalmost one year of collection, was not transferred to the respective ministries. In FY00the untransferred Dalance stood at Ths. 9,108 million or 35.2 percent of total collection asof December 1999. This makes total untransferred collection during FY97 to December1999 stand at Tsh. 36,196 million. Although the Government has promised to remit theoutstanding untransferred balance before the next financial year, the withholding or delayin releasing these funds must have had implications in terms of the delays in road worksimplementation and payment of various contractors.
2.74 There were also problems related to the distribution and timing of the releases ofroad fund revenue. Results of the tracking study of the Road Fund indicate that thedistribution ratios between the two ministries (MOW and MRALG) were not respected inFY97 and FY98. During these two years MOW received 82.26 percent and 84.8 percentrespectively, instead of the scheduled 80 percent. However, the 70:30 ratio has beenrespected since FY99. It is also noted that in FY97 there was no release during the firstquarter of the fiscal year and at the end of the second quarter only 31.25 percent of theannual total was released. In FY98 the situation improved mainly because of a majorrelease on July 10, 1997. However, only 46.9 of the annual total was released at the endof the first two quarters.
Basic Problems of the Fuel Levy Collection Process and Recommendations toImprove the Process
2.75 Two basic problems are noted as regards fuel levy collection process. Theproblems are: first, the process is complicated with too many entities involved and longtransit time for the funds in the banking system. Significant interest earnings are lostduring this process. The other problem is that the time taken by the whole process is quitelong and under the full control of the Permanent Secretary - Treasury, which makes thetime of the release quite unpredictable. This results in serious cash flow problems duringthe implementation of the road maintenance contracts.
2.76 The following suggestions would help improve the collection process andrevenues collected. First, the Road Fund Board should enter into formal agreements witheach agency in charge of collecting a given type of road toll/levy for the transfer of thefunds collected on a regular and guarantied basis. Second, TRA should transfer the fuellevy directly to the Road Fund Board account without going though the Treasury whichwill receive all corresponding information on the movements of funds. Third, The RoadFund Board should arrange to receive the funds from TRA in the regions in order to beable to secure and maximize any interest generated between the time of collection and ofexpenditure of the funds. Fourth, the overload fines should be centralized on the RoadsFund account as soon as collected by the Weigh Bridge units. Lastly, the fuel levy shouldbe increased whenever there is a significant depreciation of the shilling, so as to offset the
36

impact of the depreciation on real Road Fund revenue. In the short term, this could beachieved without increasing the total fuel retail price by reallocating the taxes collectedon fuel between TPDC, TIPER, energy fund, excise duty and road toll in order toincrease the share of the later at the expense of some others.
37


3. SYSTEMIC FISCAL ISSUES
3.1 THE PLIGHT OF THE DEVELOPMENT BUDGET
3.1 Budget analytical work done under the public expenditure review process (PER)for FY98 and FY99 revealed a number of disturbing features of the development budgetin Tanzania. First, there is a significant divergence between commitments anddisbursements and within the fiscal year releases of funds are erratic constraining properplanning of commitments. Generally actual disbursements are much less than what wasoriginally provided for. The divergence is marginally higher for the foreign financingcomponent (55% - 95%) than for the local component (49% -98%). The divergence isalso higher for the regions (52% - 89%) than for the ministries (23% - 85%). There is alsoa wide divergence between budgeted and disbursed amounts partly due to lack ofcounter-part funding.
Chart 3: Actual Development Expenditure (% of Budget)
Chart iAclual De- elopm eat Expenditure (% of Budget)
400400 ______i
-s O O '"0 NI ,e t~~ ~+ 0 M Instries.Depts & Regions
15 o .~. _ I~~~~~~~~~~~~~~~~~~~~~~~~~N O ns t re s.., D. . __. d_ Rcgi
I0 __
19596 1996/97 7 90/98 9 998/99
Ye~ars
3.2 Data on actual development expenditure of regions for FY96-FY99 as aproportion of total development expenditure shows that its share is not only small anderratic (annual average of 8.6 percent of total development expenditure) but also declinedfrom 13.0 percent for FY96 to only 5.1 percent in FY97, only to recover partly to 9.9percent by FY99 probably reflecting the recent decentralization drive. In addition, mostregions did not receive any funds for development expenditure during the first 8 monthsof FY00 and delays of up to 6 months were experienced in FY99 and the releases weresporadic hampering planning of commitments. In terms of regional distribution, analysisof available data also suggests a skewed distribution of the development budget partly
38

reflecting donor preferences in selecting geographic areas of operation. For example,over the period FY96-FY99, four regions (Mara, Kagera, Rukwa and Mwanza) aloneaccounted for about 61.1 percent of the annual development expenditure by region.
3.3 Analysis of the development budgets and actual outtums by source of funding(local or foreign) shows that the development budget is heavily donor-funded to the tuneof very close to 80 percent. This reliance on foreign financing has also been increasing inrecent years from 58.8 percent in FY96 to 91.9 percent in FY99 coinciding with theperiod of applying the cash budget system focused on the recurrent budget. In addition, itis also apparent that there are fairly wide divergences between the budgeted amount(proxy for commitments) and actual outtum (proxy for disbursements) both by donorsand government. The experience of the last four years suggest that overall, developmentexpenditure has been off-budget by an average of 73 percent. Generally the foreigncomponent exhibits a higher variance (79.6 percent off-budget) compared to the localcomponent which has on average been off-budget by 67 percent.
3.4 Variations of development expenditureswithin the fiscal year are also very significant Chart4DevelopmentExpend.
and move closely with the releases of foreign 0o0% -
finance. Quarterly development expenditures 809 ao5_ C ,.
reflect closely the pattern observed for 60% -:- C FY96
development grants and concessional loans, 40% FY97
with most of the expenditure being recorded 20% U
either in the second or fourth quarter. This a 02 Q3
probably reflects the end of the fiscal year of Idonors as mentioned before, and associated disbursement and reporting requirements.No separate data are available to allow the breakdown of development expenditure intodomestically and foreign financed components. However, the share financed fromdomestic resources is typically small and closely linked to foreign financed expenditures,usually in the form of counterpart funding,
3.5 Second, the development budget is characterized by a preponderance of extrabudgetary financing particularly at regional and local government levels. Interviews withthe Coast region officials, for example, revealed that there is a wide variation of modesfor supporting development activities. One category of donors channels the funds throughthe regional office. The second category of donors sends finance directly to the districtsor to the district council through the ministry responsible; while the third categorybypasses the concemed ministry, region and district authorities by sending moneydirectly to the projects which they implement with the help of project management units.Still other donors channel resources directly to the bank accounts of groups (e.g. women)implementing a project.
3.6 The third issue relates to inadequate provision of counter-part funding which isneeded to trigger committed finance of development projects especially by themultilateral institutions. The issue of counterpart funding relates to the requirement bydonors that the Government makes available some resources to complement and triggercommitted donor finance of development projects. This applies more so for multilateraldonors, as most bilateral donors do not have the counter-part funding requirement.However, the level of counterpart funding requirement varies across donors ranging from
39

5 - 15 percent. One problem is that the basis of such levels is not quite apparent. But aneven greater problem is that the Government has been unable to provide for thecounterpart funds thereby inducing delays in donor disbursements or non-disbursementaltogether. A reduction of the magnitude of counterpart funding requirement and agradual shift towards generalized budget support will certainly help alleviate the problemof disbursement. However, this requires a solid financial management system to be inplace to obviate the need for tight donor controls of development project financing.
3.7 The fourth issue relates to problems in the development budget process andweaknesses in implementation capacity. The development budget process is thwarted bynumerous problems as identified in a study commissioned by the PER Working Group:(i) The number of institutions involved in determining the budget is large and the processoperates at different levels right from the central ministries through line ministries, to thelocal governments, communities and specific enclave projects.
(ii) The guidelines for the preparation of the Medium Term Plan and ExpenditureFramework do not provide sufficient guidance for prioritization in the developmentbudget. Delays in issuance of the Budget Guidelines put strain on those responsible forpreparing ministerial budgets. The Budget Guidelines also do not show how the ceilingsfor this component of the budget are arrived at, as most of it is based on guess work onwhat level and type of support is likely to emerge. Compliance to the BG themselves isnot observed, again partly due to the high level of uncertainty of financing.
(iii) There are capacity constraints in the institutions concerned (planning units inministries and the budget division in MoF and local authorities) which cause delays inproject execution and unclear assessments of what is intended for a given period. Thecapacity problems also affect success in project implementation due to weaknesses indesign; project management and monitoring of implementation, especially at the localgovernment level.
(iv) A more serious implementation problem relates to weaknesses in the procurementsystem, which holds up progress in implementation. This problem is particularly acute inthe roads sector. The capacity of handling procurement is weak partly because asignificant number of supplies officers were trained a long time ago and their skillprofiles have not evolved with the changing requirements of modem procurementsystems. Moreover, there are weaknesses in the procurement law, which hampertransparency and prudence. These weaknesses are now being addressed under a proposedamendment to the law.
(v)There are also problems of coordination between the roles of MoF and PLANCOMespecially on sectoral issues. Since sector specialists in PLANCOM were not transferredto MoF, with the shift in the responsibility for this component of the budget, sector issuesare not adequately addressed partly because the limited capacity in MoF tends to be pre-occupied with the recurrent budget. The criteria used in selecting development projects inthe budget is also not transparent. There are also problems of integration between thecentral government and local government budgeting that is still evolving.
40

3.2 DESIRABLE LEVEL OF REVENUE MOBILIZATION
3.8 In determining the desirable level and the modalities of domestic revenuemobilization the Govermment typically has to strike a balance between meeting demandsfor higher public expenditure, and therefore higher revenue mobilization, and lowertaxation of private incomes. Tanzania has a relatively low tax revenue-GDP ratio, whichlies considerably below the average for Sub-Saharan Africa of 16.4 percent. Estimatesindicate that the revenue potential of the Tanzanian economy might be currently six tonine percentage points higher than what is currently achieved, i.e. between 17 and 20percent of GDP. However, it is also clearly understood that realizing this revenuepotential is an extremely tedious and slow process, which is likely to take a considerablenumber of years to achieve.
3.9 The demand for higher revenue mobilization comes from the severe under-funding of basic social services such as primary health and education and of physicalinfrastructure services, which have been identified as being essential to economic growthand progress in sustainable human development. It also arises from the desire for greaterself-financing and low donor dependence in the longer term. The key arguments forincreasing revenue would thus be that it would have high payoffs in terms of facilitatinggrowth and reducing poverty on a sustainable basis. The argument for higher revenue isalso closely intertwined with the provision of foreign aid by donors and the issue ofunsustainable aid intensity. A central assumption underlying most donor assistance isthat their resources are additional to whatever funds can be mobilized efficientlydomestically, rather than substituting for domestic revenue. As a result of the decision toprotect expenditure to social sectors, the share of expenditure allocated to these sectors asa percentage of discretionary expenditure has shown an upward trend in recent years,rising from 17.1 percent in FY96 to 22.2 percent and 24.7 percent in FY97 and FY98,respectively. This increase has been realized largely on account of increased donorsupport. The important issue here is that a permanent solution to the problem of under-funding of government operations cannot be found in ever increasing but only inincreased domestic resource mobilization and their efficient use. Further reductions in taxexemptions, rationalization of the tax regime and improvement in tax administration tocurb tax evasion are some of the important measures that are required to help broaden thetax base and increase tax revenue.
3.10 On the other hand there are costs to large transfers of private resources togovernment. The cost of higher revenue mobilization in this regard are two-fold. Firstly,taxation withdraws resources from the private sector and households and thus hassignificant opportunity costs. Secondly, taxation may introduce inefficiencies into theincentive system of an economy.
3.11 When the tax burden falls on a narrow base, those shouldering such a burdendisproportionately will be aggrieved leading to poor compliance. The issue of thewithdrawal of resources from the private sector is accentuated by the fact that in Tanzaniathe easily accessible tax base is relatively small and tax evasion wide spread, whichincreases the tax burden on the few tax payers. To provide a comparative view of the taxburden faced by the businesses we present some information on the marginal effectivetax rates (METR), as shown in a recent World Bank study on Uganda, Kenya, and
41

Tanzania. The METR in effect measures the impact of the tax regime on the net businessprofit and activity. The study distinguishes between the effects on the cost of capital andon the cost of production. Overall Tanzania's METR for the manufacturing sector's costof capital, at 40 percent, is the highest in East Africa (Kenya 28.8 percent and Uganda33.8 percent). Taxes on machinery, inventories and land are particularly high. In the caseof tourism, Tanzania's METR on capital and cost of production for foreign firms liessignificantly above Kenya's, the main competitor but below that for Uganda. The higherMETR for manufacturing leads to the frequent expressions by manufacturers of an overlyhigh tax burden. The key challenge in this area is thus to increase tax revenue withoutincreasing the METR. This calls for a need to broaden the tax base and reduce taxevasion as well as exemptions.
Table 3.1: Marginal Effective Tax Rate on Capital for Foreign Firms (Applying Uganda'sNon-Tax Parameters to Kenya and Tanzania)
Uganda Kenya TanzaniaManufacturing
Buildings 38.9 1.9 25.6Machinery -3.9 12.3 31.0Inventory 59.0 69.0 61.9Land 32.8 27.5 39.0
Aggregate 33.8 28.8 40.0
Tourism
Buildings 36.5 0.9 15.9Machinery -1.8 10.0 28.5Inventory 59.0 69.0 61.9Land 32.8 27.5 39.0Aggregate 32.6 7.5 21.9
Table 3.2: Marginal Effective Tax Rate Cost of Production for Foreign Firms (ApplyingUganda's Non-Tax Parameters to Kenya and Tanzania)
Uganda Kenya TanzaniaManufacturing
Capital 33.8 28.8 40.0Labor 10.0 0.1 4.0Fuel 174.0 62.0 25.4Overall 30.7 21.5 28.8
TourismCapital 32.6 7.5 21.9Labor 10.0 0.1 4.0Fuel 174.0 62 25.4Overall 29.9 7.2 17.0
Source: Chen and Reinikka. 1999
3.12 Distortions may arise in the incentive regime due to excessively high taxes. In thepast, reform efforts have aimed at reducing these inefficiencies, which have led to adecline in the tax revenue-GDP ratio for many African economies. The focus of many of
42

these reforms was clearly on efficiency without paying sufficient attention to theimplications for revenue and public finance. Here the assumption was that eitherdistortionary taxes would be replaced by non-distortionary taxes and thus reformns wouldbe revenue neutral, or could actually increase tax revenue through enhanced complianceas tax rates were reduced.
3.13 It is important to point out that the key factor deterrnining the desirability ofdomestic resource mobilization efforts has to be the effectiveness and efficiency of publicspending. If efficiency is low, it is clearly undesirable to increase resource flows to thepublic sector, unless it is ensured that increased resource flows are necessary and willlead to increased efficiency in public service delivery. This argument is closelyassociated with enhanced willingness to pay taxes when quality and quantity of servicedelivery by the public sector improves. This further strengthens the argument for publicsector efficiency as a precondition for increasing resource mobilization. On the otherhand, it also cautions against using the budget excessively as an instrument forredistribution, since if the perceived service delivery to those who pay taxes goes down,their willingness to pay taxes may also decline.
3.3 FIsCAL RESTRAINT AND CASH BUDGET MANAGEMENT SYSTEM
3.14 The cash budget management system was introduced in FY97 to impose fiscaldiscipline on the spending units and enforce limits on aggregate spending in line withcollected revenue and external aid disbursed through the exchequer system. Since itsintroduction the GoT has succeeded to inject considerable discipline into the budgetprocess. The cash budget system has also been successful from a macro perspective in thesense that it has by and large managed to curb budget deficits (before and after grants)that were characteristic of the Tanzania budget prior to its introduction, and generatedsurpluses averaging I percent of GDP thereafter. The cash budget system has alsofacilitated the recent sharp reduction in the rate of inflation from almost 35 percent in1995 to 6 percent in March 2000.
3.15 However, the cash budget system has also entailed significant costs particularly inthe form of unpredictable funding of essential public services leading to wide monthlyswings in the funding of government operations to match revenue availability.Commitments against government obligations, apart from the wage bill and debt service,have had to be in a monthly time frame restricting the scope for activity planning. Thereare particularly large quarterly and monthly variations of the "Other Charges" (OC)which arise from the large variations in releases for this item of expenditure. Personalemoluments and debt service are the first claim, so the brunt of fluctuations in thereleases from domestic and disbursement of external aid under the cash budgetmanagement system is borne by the other charges. As a result of the unpredictableavailability of finance, service delivery in all sectors has been erratic although priorityactivities within priority social sectors (education, health, water, roads and agriculture)have now been protected. Generally, the capacity of the Government to provide adequatephysical infrastructure and to provide all Tanzanians with access to basic social serviceshas been restricted to cash availability with insignificant use of domestic credit to smooththe monthly gaps. The cash budget era has also been marked by failure to respectsectoral and economic allocations as approved by Parliament as expenditure programs
43

were under-funded due to revenue shortfalls. This is particularly manifested in thesqueeze on expenditures on other charges especially on materials and supplies, as well ascounterpart funds for donor funded development projects. These items have typicallybeen treated as residuals in making cash-based exchequer releases. The consequence hasbeen to impinge upon both allocative efficiency and budget predictability. For the systemof performance budget to operate effectively, the predictability of budget allocations willhave to improve.
3.16 In order to mitigate some of the negative effects of cash budgeting, borrowing tosmooth fluctuations resulting from unpredictable monthly revenue flows is one recoursebut the law restricts advances. In the absence of large cash floats such smoothing islimited. Moreover within the month there is a bunching of releases towards the end ofeach month as these releases are predicated on actual cash availability. With VAT andincome tax collections gravitating towards end month due dates, the actual releasesfollow the same patterns. Given that uncertainty in the final out-turn poses a risk, suchtemporary deficit financing may be converted to increased stock of indebtednessviolating the commitment to reducing it. An issue that has been raised by some observersis whether such a risk is significant given that overall the country has managed to runbudget surpluses for three years now and that sustainable fiscal deficit levels are hardly indanger of being violated.
3.17 The Government has also recently allowed a number of Ministries to operate withthree-months commitments instead of monthly commitments. This should improve thecapacity of these Ministries for rational budget implementation. However, this decision tomove to a three months commitment system presupposes that the problems associatedwith the application of the cash budget are mainly due to volatility in the timing andforecasting of receipts. This timing issue, month to month volatility in receipts and errorsin forecast can in principle be dealt with in several other ways, including the adoption ofquarterly cycle in place of the monthly cycle or by using short term borrowing,adjustments in one period for the prior's deficit/surplus, and substantive reserve funds tosmoothen out spending patterns. Nevertheless, it is also fundamental to consider whetheror not the inconsistency and budget slippage in the application of the cash budget systemare due to "emergency spending needs", wasteful spending, poor coordination in budgetmanagement between the BoT and MoF, or reflect a lack of realism in the budget itself.That is, besides the timing issue it is equally important to ensure that the budgetallocations reasonably reflect the true commitments that the Government has undertakenand address other important sources of budget slippage otherwise the problems willpersist. The government has therefore to continue not only to cement hard budgetsafeguards and inject discipline and sanctions into the budget process but also right-sizeits budget. These can be achieved by implementing a solid MTEF and rigorously applyIFMS to provide a timely and meaningful accounting data. The Ministry of Finance willneed to closely watch whether the relaxation of monthly cash budgeting requirementsinterferes with maintaining overall fiscal discipline and macroeconomic stability.
44

3.4 MACROECONOMIC STABILITY AND DEBT SUSTAINABILITY
3.18 A positive decision has been reached by financiers, which will allow Tanzaniaaccede to the enhanced HIPC relief. The interim relief will be available from the lastquarter of FY01 onwards when the Government plans to reach the completion point.Thereafter the full HIPC relief is expected. This change has profound influences both onthe resource envelope projections and on the deepening of recent progress in expenditureprioritization, given the poverty-focus of the enhanced HIPC initiative. We focus here onthe implications for the size of the resource envelope and the level of aggregate spending.The Governrment is aware of the continuing evolution of the procedures governing HIPCagreements and used existing guidelines for projecting the MTEF scenarios, aware thatadjustments may need to be made.
3.19 The interim HIPC relief, through IDA and IMF grants, will enable the country tofree up a sizeable amount of its own resources for servicing multilateral debt ( estimatesused in the current MTEF projections are $60 million for FY01 rising to about $110million after reaching the completion point). The additional relief over that availed underthe interim arrangement will be due to reduced debt service for bilateral debt when theParis Club relief associated with terms for enhanced relief becomes effective afterreaching the completion point. Interest on external debt tapers down after FY01. The neteffect on expenditure projections from the above relief in combination with increasedrevenue effort is to raise it from the likely out-turn of 17 percent of GDP for FY00 to20.3% of GDP in FY03, a full three percentage points of a growing GDP.
3.20 Partly related to the above is a significant change in the projected size of the fiscaldeficit to accommodate increased expenditure enabled by the relief and smaller increasesin project grants. Given that the HIPC relief will be in the form of budgetary support,long-term, and irrevocable once the completion point is approved, the risks associatedwith the related expansion of the fiscal deficit (after grants) are not significant. Theprojected deficit after grants will rise from the projected actual of-0.4 percent in FY00 to-1 4 percent of GDP in FY03. The fiscal deficit before grants will rise to nearly -6percent over the corresponding period approximately its size in FY95, the increase beingfully financed by an increase in external grants and very soft loans. This size of thedeficit appears to be sustainable, given the real GDP growth projections ranging between5 and 6.6 percent for the period and the fairly steady flow of relief from the HIPCarrangement. Barring any major surprises from offsetting large cuts of bilateral aid, thissituation is basically sustainable. A sample of donors interviewed during the PER missionconfirmed additionally of HIPC support. The section on macroeconomic review dealsextensively with the issue of debt sustainability after HIPC, where new borrowing iscontracted. This form of financing is basically non inflationary.
3.21 One possible downside effect of this shift in fiscal stance, however, is that it islikely to increase relatively more expenditures on goods and services that are typicallynot traded internationally, leading to the strengthening of the shilling and reducing thecompetitiveness of Tanzanian goods. The resultant shift in the relative profitabilityagainst producing for export for example would lead to loss in the base for robust growth.The Bank of Tanzania could begin focusing immediately on effective strategies forprudent sterilization against such effects.
45

3.5 CO-EXISTENCE OF OVERALL FISCAL SURPLUS SIDE BY SIDE WITH UNDER-FUNDING OF PRIORITY SECTORS
3.22 There is continued concern over the co-existence of overall fiscal surplus (aftergrants) side by side with under-funding of priority sectors. The perception is that theGovernment is putting monies away (building up reserves) and/or availing it to theprivate sector through the domestic banking system (by reducing its stock of domesticdebt with the banking system) while government expenditures and net lending remainedaround 15.1 percent of GDP for FY97 to FY99. It may be argued that a shift of resourcesfrom the budget to the private sector may raise overall effectiveness in the theirutilization, if as presumed, the private sector is a better user. However, given the veryslow movement of these resources from the banking system to the productive sector, asreflected by loan to deposit ratios ranging between 30 and 50 percent, the shift may notbe de facto happening. Moreover a rise in gainful absorption of these resources by theprivate sector depends also on the absorptive capacity of the private sector, which can beenhanced only if supportive infrastructure and better public service delivery can befinanced.
3.23 The Government has projected a rise in the budget deficit to 1 percent of GDP(after grants) in the next three years (MTEF) to address this concem. This target is withina prudent range. The PER report for FY99 estimates sustainable fiscal deficit levels (aftergrants), given the growth projections of 5 percent per annum and sustainable level ofindebtedness of the country, at 2 percent of GDP. If the current level of the externalgrants to GDP is maintained at four percent (made more likely by the prospective HIPCresources), then a fiscal deficit- of 2 percent as a proportion of GDP would not seemimprudent. Key to sustained price stability is that deficits are not financed throughexcessive increase in net domestic assets.
3.6 CONCERN ON ABSORPTIVE CAPACITY CONSTRAINT WITH INCREASINGRESOURCES
3.24 Another issue relates to the concern regarding possible limited absorptive capacityof the Govemment for much larger expenditures. Available projections for FY01 - FY03show a considerable rise in the share of government expenditure to GDP from the current15.1 percent to 16.2 percent in FY03, against the backdrop of projected economic growthto the tune of 6.5 percent by the end of this period. This is not a small increase indeed andwill be financed through higher domestic revenue and the expected rise in external grants-mainly from enhanced HIPC debt relief A large part of this expenditure increase is onaccount of the much higher projected external grants and an allowance for a fiscal deficitafter grants averaging 0.8 percent over the FY01 - FY03 period in contrast to theestimated surplus of 0.3 percent in FY99. This increase is equivalent to 1.1 percentagepoints of a much larger GDP base. Currently the priority sector financing needs, basedon the MTEF and related supportive technical studies, are grossly under-funded andabsorption should not be a problem. Total available finance meets approximately only 60percent of requirements. This is particularly so given that the workforce in the civilservice has been starved of supplies for delivery of service. It can be contended that evenwith improved cost-efficiency in public service delivery the current ratio of other chargesto personal emoluments remains far below the desirable level. Comparable efficiency
46

ratios in Tanzania during the 1960s, when public service delivery was efficient, othercharge as a percentage of discretionary recurrent expenditure (netting out debt service)averaged 65 percent. However, the main concern with the absorptive capacity is whetherthe expected increase in external financing will yield the anticipated results, with a degreeof accountability and transparency needed to provide comfort to new forms of financing- budget support and sector-wide programs.
3.7 EARMARKING OF REVENUE AND THE EFFECTIVENESS OF BUDGET
MANAGEMENT
3.25 Revenue earmarking for specific expenditures is on an upward trend in Tanzania.The most significant among the earmarking arrangements is the Road Fund. Other formsof earmarking include retention of user charges for specific public services such aseducation, health, land services and natural resources. These add to the more traditionalforms of retention of revenue collected by local authorities/governments. This form ofbudget management found justification in the effort to protect these expenditures fromsystem-wide resource allocation pressures and in compliance to the multiple leveljurisdiction over taxation powers.
3.26 There are three main reasons for starting to pay greater attention to this system ofbudget management before it mushrooms in an unwieldy fashion. First and foremost is toavoid undernining strategic budget allocations across sectors and geographical locations.Tanzania has just embarked on strengthening the strategic expenditure allocation systemthrough adoption of an MTEF , the rising earmarking trend only serves to undermine thiseffort and making greater transparency of the budget more difficult to achieve.
3.27 Secondly it is more difficult to enforce overall cross sector and within sectorallocations with the greater autonomy associated with revenue retention systems. It is notfar fetched to think of the use of such retained revenue in a manner that is not consistentwith national prioritization scheme.
3.28 Thirdly and perhaps the most worrisome potential effect in the continuedexpansion in earmarking, is the likelihood of imposing excessive burdens on specificusers of public services, as the relevant sectors strive to raise the resource envelopewithin their control. Many of the services so provided have useful positive externalities,whose financing burden should be more widely shared. The temptation for keeping onraising the road toll, for example, in order to raise the size of Road Fund are immense andwould have dire consequences of excessive cost to the operators. The alternative could beto channel additional resources to the Road Fund from increased allocations from thePMG account and integrating donor finance into the Fund.
3.8 PREDICTABILITY OF DONOR RESOURCES
3.29 Tanzania is one of the major recipients of external assistance as compared to anumber of other countries in Sub-Saharan Africa. On average Tanzania receives aboutUS$ 900 million per year from external sources. Most of the external resources have beenused for technical assistance, capital budget, balance of payments support and on foodaid. This amount is slightly over 10 percent of GDP. However, not all of the inflows pass
47

through the exchequer system to support the Government budget. It is estimated thatabout 70 percent of such external resources go directly to the projects supported bydonors. Every donor has his own strategy of channeling the resources to the targetedprojects (A detailed review of donor attitudes towards program and project aid is given inAnnex I). The multiplicity of these resources has made donor coordination a tedious onerequiring more capacity at the Ministry of Finance. Donors have different accountingsystems, different disbursement modalities and different financial years.
3.30 To harmonize the multiplicity of the donor accounting systems, there are plans tointegrate donor facilities in the new Integrated Financial Management System (IFMS)using the Platinum software. In addition, the Govermnent is now in preparing theTanzania Assistance Strategy (TAS). This is a broad based framework which aims toencompass all the donor interventions in the country in a coordinated manner. In such anendeavor, the Government will list its priorities, take stock of its domestic resourceenvelope to determine the resource gap which forms the basis for negotiation with donorsfor support.
3.31 The cut in governrnent expenditure, especially development expenditure, has attimes been necessitated not only by unpredictability of counterpart funds, but also byunpredictability of donor finances, particularly those that went directly to the projectswithout passing through the budget or being recorded by the Government. The extent ofintegration of donor resources into the budget, for example, was 19 percent in FY95, 12percent in FY96, 28 percent in FY97 and 33 percent in FY98 (PER FY99 Issues Paper).Moreover, actual releases of resources as compared to those budgeted have shown a largevariance for the development budget. Between FY95 and FY98, for example, theshortfall of donor disbursements ranged between 42 percent and 79 percent of budgetprojections, while local counterpart funding shortfalls ranged between 16 percent and 76percent. The problem of unpredictability of the budget, either due to shortfalls in localcounterpart funds, non-adherence to conditions for donor disbursement, inaccurateprojections, or unrecorded donor support, is among issues that are at the core of thedebate on how to strengthen the government-donor partnership in development and havebeen treated at greater length in the earlier sections.
48


4. FISCAL POLICY AND THE MACROECONOMICCONTEXT
4.1 INTRODUCTION
4.1 Over the last several years the Government of Tanzania has run a tight fiscalpolicy through the instrument of a cash budget with a domestic budget surplus. Theconsequence has been a fairly rapid but orderly process of disinflation, with the rate ofinflation coming down to an annualized rate of around 7% by the end of 1999. While it isessential to consolidate this achievement so that there is no return to the double-digitinflation of earlier years, it is nonetheless no more than a precursor to the real agenda ofgrowth and poverty reduction. Growth is important not only in its own right but as amechanism for reducing poverty both directly and indirectly via the enhanced socialspending it permits. The sources of this growth will inevitably lie in private enterprise,with the government attempting to minimize factors that may inhibit this and promotethose that encourage it. The latter factors include not only the regulatory and marketenvironment, but also macroeconomic policies bearing on investment, saving, liquidityand credit.
4.2 There are two types of circumstance in which designing macroeconomic policy isrelatively straightforward in principle, however hard to execute in practice. One is whenthe economy is suffering from excessive fiscal deficits, rapid monetary growth, highinflation, and a lack of private credit. The imperative then is to reduce the deficit, whichpermits the other problems to be addressed. The second circumstance is when there hasbeen an extended history of steady growth in a stable policy environment, in which casethe imperative is to maintain the policy regime. Tanzania is currently in neither of theseconfigurations, but in transition between the two. While this is a satisfactory interimoutcome, given the country's earlier policy history, it does make the current design ofpolicy more difficult.
4.3 The crucial short run choice is over the volume of resources the government candevote to its spending programs without crowding out the recovery of private activity.There is also the closely related question, which is how many resources can the privatesector use? Addressing either question requires us to form a view of how private andpublic activities are related. The next section of this paper briefly reviews the majormechanisms involved, from a perspective reflecting current conditions in Tanzania.Section 3 reviews the resources available to government, and Section 4 considers howthis information is deployed in the Guidelines for the Preparation of the MTEF. Section5 reviews the domestic credit position, Section 6 discusses options for the government'sfiscal stance and Section 7 concludes.
4.4 To keep the discussion in the text reasonably brief, a substantial amount ofmaterial is relegated to three annexes. Annex 1 provides background on developments inthe real economy, including some discussion of our incomplete information. Annex 2contains a conceptual discussion of fiscal policy issues, and particularly of the
49

importance of separating the domestic from the external components of the fiscal deficit.Annex 3 provides a discussion of debt sustainability.
4.5 It should be stressed at the outset that the Tanzanian authorities have done a greatdeal of effective work to produce a coherent and consistent budget frame, whichincorporates the best available information on revenue projections as well as a largevolume of sectoral work on priorities. This process has undergone an impressivecumulative development over the last couple of years, but remains an ongoing one.Against this background, these notes are intended to highlight some issues forconsideration and possible further development of this process.
4.2 LiNKs BETWEEN PUBLIC AND PRIVATE ACTIVrITES
4.6 These are many, varied, and mainly familiar, including most notably taxation andother forms of de facto confiscation5, and the whole panoply of regulation and law, buthere we focus on three other mechanisms. These are the competition for credit, the realexchange rate, and supply side effects.
4.7 It may seem obvious that there is direct competition for domestic credit, so thatincreased use of it by government will crowd out private sector access one-for-one. Weare also often in the habit of thinking that the private use of credit is intimately related toinvestment. Hence the concern that government borrowing may crowd out privateinvestment and ultimately growth. There are qualifications to this view however. Mostimportant, there is nothing to ensure that the banking system will remain fully lent if thegovernment reduces its borrowing. If private borrowers are deemed not to becreditworthy, the system simply becomes more liquid and the loan-deposit ratio falls.This has evidently happened in Tanzania, though it is difficult to be precise about thedegree, since the fall in loans also reflected the cleaning out of non-performing parastatalloans. Second, much of the credit advanced to the private sector in Tanzania is for traderather than for investment. Investment tends to be financed from an enterprise's ownresources or, in cases where the outputs will generate foreign exchange (such as mining)from external sources. Thus, especially in the short run, withdrawal of government mayneither induce increased access to credit by the private sector, and even if it does, thismay have a very muted impact on investment activity. Finally, a rapid expansion ofprivate sector credit might in any case be problematic. Since the banking system lacksexperience in risk assessment, the alternative to rather limited lending might be a rush oflending leading to an unacceptably high bad-debt ratio.
4.8 When a government obtains access to increased resources from external donorsand spends some part of this on non-tradable goods, this will tend to induce appreciationof the real exchange rate (so-called 'Dutch Disease'), unless there are offsetting effectson supply. Provided the aid flow is likely to continue over a relatively long horizon, thisis just a necessary cost of accessing the additional resources. It might be of particularconcern when it is hoped to develop some types of non-traditional exports and this mighthave some bearing on how the aid is used; however, it seems most unlikely that it would
While taxes are the most important single mechanism for "crowding out" private activity - by removing privatepurchasing power - their share in GDP is difficult to raise quickly. Hence, the burden they impose is a relatively fixedfeature in the short run.
50

ever be a ground for rejecting incremental aid flows. To do so would be analogous torefusing to exploit a newly discovered mineral resource on the ground that theconsequential exports would damage the interests of other exporters. Supposing that it isagreed that it is appropriate, nationally, to utilize the additional resources, then someagents in the economy must raise their expenditures. The key point is that these DutchDisease effects are in no way specific to government involvement. Exactly the same issuearises for transfers of external resources to NGOs operating in-country, or to increasedprivate spending if the government passed the aid on to the private sector via tax cuts orincreased credit. What matters is that the nation is able to spend more and that part of thisspending is on non-tradable. In brief, the real exchange rate issue is a feature of acceptingthe resource inflow, not of any link between this and the level of government spending.
4.9 The argument in the preceding paragraph must be qualified to the extent thatsome forms of spending are likely to have supply side effects. Especially if these comeinto operation quickly, the real exchange rate consequences of the inflow will be mutedand may even be reversed. For example, a program of rehabilitation of roads couldremove bottlenecks and lead to an expansion, inter alia, of the production of non-tradablein excess of the increased demand for them. This argument leads on to the more generalpoint that private and public activities are frequently complementary, so that the privatesector may not be best served by a contraction in public sector spending. This isparticularly likely to be true in Tanzania, where many forns of govemment spending arelow by the standards of comparable countries.
4.3 RESOuRCES LIKELY TO BE AVAILABLE TO THE GOVERNMENT, FYO1 - FY03
Domestic revenue
4.10 It is convenient to scale the main fiscal magnitudes relative to GDP. The series fordomestic revenue as a share of GDP given in the Guidelines6 of February differsomewhat from those in the Poverty Reduction and Growth Facility document of March.Since the revenue figures are largely the same, there must be some difference in thetreatment of GDP. However, both show revenue growing modestly as a share of GDPover the years FY00 (provisional out-turn) and the three years projected for the MTEF.
4.11 Here we work with the figures in the Guidelines, which are 12.4% for the currentyear, and 12.6%, 12.8% and 13.0% for the MTEF period 7. The present figure is modestby the standards of comparable countries, and the assumed growth of revenues, at 0.2percent of GDP a year, also does not seem excessively ambitious. However, it has to benoted that this ratio has averaged 12.4% over the last decade, and while it has variedsubstantially year on year, it has been trend-less. The authorities are not planning any
6 Guidelines for the Prepardtion of the Medium Term Expenditure Plan and Framework 2000/01 - 2002/03, MOF andPlanning Commission, February 2000.
PRGF has 11.5%, 11.6%. 12.0% and 12.2%.
51

major tax reforms, but are relying mainly on reduced exemptions and increasedadministrative efficiency to deliver the revenue gains8.
4.12 On past performance, this may prove difficult to deliver. It may depend to amarked extent on the form which growth takes. Some sectors (mining, manufacturing)are easier to tax than others (subsistence agriculture). The Guidelines anticipates growthover MTEF period at annual rates of 6.1%, 6.6% and 6.8%, with mining growing at threetimes the average, manufacturing at twice the average and agriculture at a little over halfthe average. This type of compositional shift should make it easier to raise the tax sharewithout raising tax rates, which are already quite high. The baseline assumptions in theDecision Point document for the enhanced HIPC Initiative (March) assume somewhatlower growth, but, more importantly, they assume that agriculture and manufacturingboth grow at close to the average rate (mining is again assumed to grow substantiallyfaster). This configuration of growth would make raising the revenue performance ratherharder. In any event, it would be worth developing a more disaggregated method offorecasting revenues, both to obtain more refined inputs into the MTEF and also topermit closer monitoring of perforrmance.
Aid
4.13 Whereas the Guidelines envisage some uplift in domestic revenue as a share ofGDP, the converse is true for aid flows. Abstracting from the interim relief under HIPC(0.2% this year and then 0.6%, 0.6% and 0.5%), these are shown as declining sharply(6.2% in the current year, and then 3.1%, 2.9% and 2.0%). However this contraction ofresources simply reflects the lack of forward commitment by many donors and is heavilyconcentrated on project finance in the development budget. If we strip out the foreignfinanced part of the development budget, we are left with a flow of import support at2.8% in the current year, and then 3.1%, 2.9% and 2.0%. There are also some rathersmall changes in domestic financing (from a small domestic surplus to a balanceddomestic budget). The net effect for recurrent expenditure plus the locally financedcomponent of the development budget is to follow the likely out-turn at 13.5% of GDPthis year with figures of 13.9%, 13.9% and 14.0% over the MTEF horizon. In effect, themodest growth of domestic revenues plus HIPC plus the somewhat more relaxeddomestic fiscal stance is fully neutralized (after the first year) by the anticipated erosionof program aid.
4.14 However, this erosion is most unlikely to happen. There is a strong case forbasing the MTEF projections on the most likely scenario, which is that program aid willin fact continue at similar relative levels to the present ones. To take a more conservativeview would only be justified either if there were strong grounds for believing that aid cutswere probable, or there were grounds for thinking that regular upward revision ofspending ceilings is allocatively less costly than infrequent downward revisions. By wayof contrast, the HIPC Decision Point document assumes very substantial inflows of newresources in this period, so that the NPV of debt to exports actually rises quite rapidly inthe first few years after HIPC relief.
The 'built in elasticity' of many taxes is somewhat less than one, so that revenue tends to rise proportionately lessthan the relevant tax base. This means that the tax authorities sometimes have to ~run to stay stillW in terms of revenueshares.
52

4.15 Handling this forecasting issue is difficult, and made more so by the fact thatthere are many relatively predetermined calls on govenmment resources (debt service,wages). This has the consequence of levering relatively small proportional adjustments intotal resources into much larger proportional changes in discretionary spending. Forexample, if the level of program assistance in the last year of the MTEF remained at thelevel around 3% of GDP as in earlier years, and these resources were used on thediscretionary category of goods and services, spending on the category could be raised bynearly 15%. In any event, forecasting resources is necessarily risky, but the risk is two-sided, and not minimized by excessive caution.
4.4 THE GUIDELINES DOCUMENT
4.16 The Guidelines document has a rather complex set of functions. It is at the heartof the two-way process between the spending ministries and the central economicauthorities of the government. However, given the commitment to transparency andparticipation, it also offers a window on that process for other participants and affectedparties. One function that is common to both these roles is that of demonstrating therelation between the derivation of priorities and the budgetary outcomes. In manyrespects, the Guidelines is an admirable document, and very clearly constructed;however, there is room for improvement, particularly in this last regard.
4.17 Tables are provided relating the "funds requirements and proposed allocations"for the various priority sectors. The logic leading to the selection of the priority sectorsthemselves seems clear enough. However, it remains obscure what governs thedistinction between priority and non-priority activities within these sectors. It is alsoobscure how prioritization affects the budget allocation process. This may be a matter ofsubstance, that is if the concept of prioritization is poorly articulated with the process ofbudget allocation. Alternatively, this link may be well established, in which case what isrequired is merely a clearer exposition of it in the document. To illustrate the point,consider the information abstracted from the Guidelines in Table 1 for a number ofpriority sectors.
4.1 8 The startling thing about this table is the lack of any pattern. Sometimesallocations are very far below requirements, sometimes they exceed them. In some casesthe ratio for a sector is stable over time, suggesting that the severity of rationing isconstant: in others it falls or rises. It does not seem as if the term "requirement" has anystable interpretation, either between sectors, or within a sector over time. This means thatthe role of the MTEF in matching limited funds to those activities which have the highestpay-offs or are otherwise felt to be most urgent is very inscrutable to the outside observer.Hidden within the table, there is however one pattern, which is that a particular ratio for asector in a given year is usually applied across all activities in the sector.
53

Table 4.1: Budget allocation as share of requirement for priority activities in various sectors(%)___ _
FYOO FYO I FY02 FY03
Education 63 90 111 142Health* 53 66/85 94/109 127/141Water 35 47 34 50Agriculture 32 38 36 38Roads (National/Regional) 109 83 85 85(District/Urban) 87 82 82 80Energy 19 25 28 30Judiciary 40 45 45 46
* Health includes activities which were not listed in the requirements but which received priority allocations. The lowerfigure gives the ratio ignoring these expenditures, the higher includes them.
4.19 For example, the ratio of 63% applied to education in FY00 was applieduniformly across primary, secondary and higher education as well as the inspectorate. Ifthe "requirements" entry for each of these sub-sectors reflected careful considerationwithin the sector - so that a uniform benefit/cost cut-off had been applied, then uniformrationing would be appropriate. However, the rather random behavior of a sector's ratiosover time makes that seem implausible.
4.20 In any event, there seems to be considerable scope to develop this linkagebetween the prioritization process and the budget allocation more systematically.
4.5 ASPECTS OF DOMESTIC CREDIT
4.21 It has been remarked that, for a number of years, the ratio of various moneymeasures to GDP has been falling in Tanzania. This is a potential cause for concern fortwo reasons. The first is that it robs government of opportunities to obtain seignoragerevenues in a non-inflationary way. The other, of wider significance, is that we normallyanticipate economic development to be accompanied and indeed facilitated by a processof financial deepening and this involves a rising money to GDP ratio. A falling ratio isthen a signal of financial ill health. It may reflect a lack of confidence in the domesticcurrency, so that agents economize in holding it, possibly by substituting internationalcurrency. Alternatively, it may be a response to financial repression, where veryunfavorable terms make the formal financial sector an unattractive intermediary. In eithercase, high transactions costs are imposed on economic activity. When these conditionsare reversed by successful policies of stabilization and liberalization, we would expectthe demand for money to recover, but possibly quite slowly and after a lag as confidenceis re-established.
4.22 Both of these phenomena were present in Tanzania, and both have been reversedby policy reform. The financial system is therefore likely to be in a transitional phase,which may be further complicated by the process of privatization. Table 4.2 presents anumber of summary statistics for the last five years, again using GDP as a scalingdevice9. The liberalization had also led to dramatic shifts in the composition of broadmoney (currency, and the various types of deposits - demand, savings, time and foreign
End of year value as per cent of GDP for the preceding year.
54

currency), but by 1995 these seemed to have settled down. Hence the table starts fromthat year and does not explore this compositional issue.
4.23 There are several disturbing features of the data in this table. First, there is thecontinued decline in the money income ratio well into the post liberalization period. Overthe three years 1995 to 1998, this ratio was falling at an average annual rate of 11 percent. There are signs that this is now stabilizing however. The behavior of reserve moneyis included as a memorandum item. It followed a very similar path, pretty stable at 41%of M3. This reflects the loss of seignorage referred to earlier. Also, since the bulk of MOis currency outside the banking system, this has also fallen sharply relative to GDP.
Table 4.2: Financial variables in % of GDP1995 1996 1997 1998 1999'1
Monetary Survey
Broad Money (M3) 24.9 21.7 19.7 18.2 19.0
Net Foreign Assets 5.5 7.7 8.5 8.3 9.7Net Domestic Assets 19.4 14.0 11.2 9.9 9.4
Credit to Government 9.2 7.9 5.1 4.8 5.6Credit to Private Sector 5.4 3.1 3.5 4.3 4.7Other 4.8 3.0 2.7 0.9 -1.0
Memo item (MO) 10.4 8.9 7.8 7.4 8.0
Commercial Banks"_Domestic Deposits 17.7 15.4 14.2 13.2 13.0
Of which, by private 13.8 13.0 12.3 11.2 11.3
Total Domestic Lending 9.0 3.9 3.9 4.5 4.9Of which, to private 5.4 3.1 3.5 4.3 4.8
Govemnment Securities 5.6 6.8 5.2 5.5 5.1Cash and Deposits with BOT 2.2 1.9 1.3 2.0 1.6Foreign Assets 5.6 4.8 5.0 4.7 4.8
Lending to deposit ratio (%O/) 50.5 25.3 27.7 33.7 37.9
4.24 On the asset side of the monetary survey, the steep decline that is the necessarycounterpart to the fall in the money income ratio is not uniformnly distributed. The netforeign asset ratio in fact showed steady growth at an average rate of 15%. This reflectedin part the drive to raise the net international reserve position. In consequence, the fall inthe domestic asset ratio is really precipitate: it has more than halved over the period, withmost of this happening in the first two years. This was the consequence of sharpreductions in credit to government and the 'other' component that includes parastatals.The private credit ratio followed a U-shaped path.
O For Monetary Survey, end December 1999, for Commercial Banks, end September 1999.The table does not provide an exhaustive breakdown of all liabilities and assets, so the listed components of thebalance sheet do not sum to zero.
12 These are for domestic deposits and loans only so differ slightly from those calculated by BOT.
55

4.25 Further light is thrown on this evolution by the figures for the commercial banks.The domestic deposit ratio fell quite sharply, but this was largely due to a contraction inthe official component, with the private deposit ratio holding up quite well. Totaldomestic lending fell sharply in the first year, but the loans to the private sector,unsurprisingly, were almost identical to the private credit component of the monetarysurvey. It is worth noting that the commercial banks hold foreign assets of the same orderas their total lending to the private sector and usually somewhat larger. The loan todeposit ratio fell from a value of a little over 50% in 1995 (probably not unreasonable forwhat is essentially a deposit banking system) to a very low level of about half that in1996 and 1997 before making a partial recovery in 1998 and 1999.
4.26 While it seems most illuminating to present these data in the form of ratios toGDP, it is worth stressing that private credit has indeed expanded rapidly albeit from avery low base. Over the four years from the end of 1996 it has risen in nominal terms atannual rates of 39%, 48% and 26%, or from Tsh 116.6 billion to Tsh 302.2 billion. Sincethe cumulative inflation over this period was 37%, the growth in real private creditaveraged 24% per annum over these three years.
4.27 To summarize all this information, what seems to have happened is that thegovernment has made a major withdrawal from its previous reliance on domestic credit,but this has had a rather limited effect of "crowding the private sector back in". On thecontrary, private sector engagement with the financial system, relative to GDP, seems tohave been relatively invariant to these changes. Hence the reduction in governmentengagement has simply led to a contraction in the scale of financial intermediation. Thebanking system is currently under-lent and over-liquid. There are a number of reasonswhy this may be the case. As inflation has fallen, there has been little downward shift ineither loan or deposit rates. This has had the effect of turning real deposit rates fromheavily negative to - just - positive, but only in the last six months. It may eventuallylead to increased private domestic deposits. However, the other effect has been to raisereal loan rates from moderate to high levels, which may have replaced quantitative creditrationing with rationing by price. In addition spreads have remained wide and thebanking system is inexperienced in risk assessment for loans to the productive sectors.All these difficulties seem to be common across countries following financialliberalization. It is not clear why, but an extended transition period seems to be necessary.Presumably both the deposit ratio and the loan to deposit ratio will pick up in the future:the difficulty is in gauging when this might happen.
4.28 The upshot of this quick overview of money and credit is highly ambiguous. Amajor reduction in the government's use of domestic credit has produced a rapidproportional expansion in private credit, but since the base for this expansion was sosmall, this private response has still been small relative to the scale of the stimulus. Inaddition, the earlier financial liberalization and disinflation have still to feed through intothe terms and conditions on which credit is available. The system seems to be very farfrom equilibrium, but it is hard to judge the rate at which it will move. We consider theimplications further in the following section.
56

4.6 FISCAL OPTIONS
4.29 It is argued in Annex 2 that fiscal options can conveniently be thought of bypartitioning the overall deficit into the component that can be financed externally (onconcessional terms) and the component that requires domestic financing. Further, Annex3 argues that it is desirable for Tanzania to accept as large an external deficit as donorsare prepared to finance. For any given choice of domestic deficit, this implies thatadditional aid should automatically be spent. In turn, the considerations determining whatan appropriate level of the domestic deficit might be are not contingent on the level ofexternal finance that is available.
4.30 In examining these considerations, we assume that the government can useadditional resources effectively, i.e. that it has not reached its implementation limits.Then the choice of a value for the deficit depends on what levels of monetary expansion,build-up of foreign exchange reserves, and expansion of credit to the private sector aredesired.
4.31 The strategy in the Guidelines is currently designed to switch fiscal policy fromthe fairly substantial domestic surplus that has been run in recent years, on the order of1% of GDP, to a much lower level in the current year and in the first year of the MTEF,and to (domestic) budget balance thereafter. However, this switch is less complete thanmight appear. There is a general contingency built in, which behaves rather oddly: itmoves from 0.4% of GDP in FY01 up to 0.9% in FY02 before falling back to 0.3% inFY03. Apart from being inexplicably volatile, these numbers are large. In thisconfiguration they also represent an unsatisfactory device. There are really threepossibilities. First, they could remain unspent, in which case the government will reallybe running a domestic budget surplus, not a balance. Second, they could be deployed inface of some genuine unforeseen events, but it is wildly implausible that these wouldhave expenditure implications of this pattern. Third, they could end up being spent butaccording to the exercise of ministerial muscle rather than the allocational proceduresembedded in the MTEF. If the intention is to smooth spending in the expectation ofuneven revenue flows, that should be signaled, rather than calling the device acontingency. Since the revenue fall in the final year is most likely an artifact of theforecasting procedure, as already noted, the "contingency" is in fact likely to remain highin the third year of the MTEF. This would exacerbate the problem of either effectivelyrunning a substantial surplus, or having resources whose deployment might not be subjectto the full rigor of prioritization within the MTEF.
4.32 Foreign exchange reserves are already at the target value of four months imports.While there is some evidence that the decline in the demand for money relative to GDPhas been halted and may even have reversed, it would not be wise - yet - to rely on afalling velocity of circulation. Hence the prudent rate of monetary expansion wouldinvolve a stable velocity, so that the authorities can plan for the money supply to rise inline with nominal GDP at the target rates for inflation and real growth. This would placethe expansion at around 11% per annum over the MTEF period. Since additions toforeign exchange reserves will only be required to match the growth of imports (topreserve the 4 month ratio), a balanced budget implies that the bulk of this permissiblemonetary expansion should be available for private credit. This in turn could imply a
57

continued very rapid expansion of private credit, but now from the somewhat enhancedbase generated by the previous expansion. The scale of this potential expansion is likelyto cause problems for the commercial banks in identifying creditworthy customers. Ifthey are inclined to lend regardless, that poses problems for the authorities in supervisingthe banks. On the other hand, the commercial banks may react by failing to expand theirloan portfolio at the implied rate.
4.33 In these circumstances, there is quite a compelling case that the governmentshould choose to run a modest domestic deficit rather than a balanced budget; this wouldenable it to increase spending on the under-funded recurrent budget and improve servicedelivery. It is not clear, given the credit position just described, that it would riskcrowding out desirable private activity. This is not to deny that there needs to be adequateprovision for further expansion in private credit. Indeed the capacity to do this is alreadybuilt into the present, highly liquid, system. The question is rather how much credit theprivate sector is plausibly going to require, and whether it is likely that it will be able touse the whole increase in domestic credit over the next several years.
4.7 CONCLUSION
4.34 There has been much progress over the past year, both in consolidating theachievements of macroeconomic policy and in developing the budget process. Inparticular, the move from a domestic budget surplus towards balance is timely, though itis for consideration whether the shift could be carried a little further still. However, thetransitional status of the Tanzanian economy makes macroeconomic managementparticularly difficult at present, and it will be important for the authorities to remainflexible. Within the MTEF itself, there is also scope for rethinking the use of thecontingency item, and for improving the transparency of the link between prioritizationand the budget allocation process.
58

PART III
SECTORAL PUBLIC EXPENDITURE ISSUES
59


5. EDUCATION SECTOR
5.1 BASIC EDUCATION
5.1.1. Scope of the PER FY00
5.1 The FY00 Public Expenditure Reviews (PER) for the basic education sub-sectorand other priority sectors were commissioned by the Government of Tanzania's PERWorking Group during the first half of FY00 to form the basis for the Government ofTanzania's FY01 budget and FY01 - FY03 medium term expenditure framework(MTEF).
5.2 The education sector PER is explicitly an update of the FY99 review. It is basedon the broad framework of the FY99 PER and updates the findings based on the latestavailable statistics. The PER FY00 differs from the FY99 review by providing asystematic assessment of the activities which the education ministries will need toundertake to generate a high quality input to the medium-term expenditure framework forFY01.
5.1.2 Recent Developments
5.3 Three main developments in the form of sector initiatives have taken place sincethe FY99 PER was produced. The initiatives are: the local government reform program(LGRP), the school mapping, and the Education Sector Development Program (ESDP).The LGRP will lead to major challenges for education sector planners as it shiftsresponsibility for resource allocation from central to local authorities. Starting aroundmid-2000, districts will be allocated an education block grant which they can use at theirdiscretion to strengthen education services. In the past, these funds were tied to teachers'salaries. Now the decision on the proportion of funds which should be used to fundsalaries will be made by the districts themselves. Districts will be held accountable by thegovernment against a set of agreed service standards. This change is intended to enhanceefficiency and effectiveness in the provision of education services.
5.4 School mapping describes the process of information gathering and communityconsultation during which information on a wide range of education issues is collectedthrough district wards. Fifteen districts have already been mapped, with the balanceexpected to be complete by end-2001. The ESDP is a means through which Tanzania canaddress some of the profound inefficiencies which beset the sector. Though still to befinalized, the ESDP provides an impetus to develop a coherent sector strategy, and tohelp government cut back the high management costs which it experiences throughuncoordinated donor projects in the sector.
5.5 These three developments will have far-reaching implications for the sector. TheLGRP provides a basis for the redistribution of teachers, since districts will be held
60

accountable for service standards and will have incentives to redeploy teachers fromsurplus to deficit areas. It should also lead to an improved balance of spending betweensalaries and other charges. The school mapping process will support these changes. Dataproduced by the district exercises can be used to validate and update existing planninginformation, and the micro-plans generated under the process will galvanize localcommunity support for education. The ESDP should see a significant increase in thedevelopment funds available to the sector.
5.6 Although each of these initiatives will have an impact on planning at the centrallevel, the contribution of the LGRP and ESDP is difficult to estimate. Planning for bothprograms is still underway, so it is important that planners within MoEC keep themselvesinformed of progress in the development of these activities.
5.1.3 Expenditure Trends
5.7 Recurrent Expenditure: Total government recurrent expenditure on educationhas increased in real terms over the last 10 years. Expenditure has increased in real termsand on a per capita basis. An average of 24 percent of total government recurrentexpenditure is spent on education, although compared to other countries the absoluteamount spent is still low. The largest share of government recurrent expenditure goes toprimary education. In 1998, 62 percent of total recurrent funding to the sector was spenton primary education, compared to 51 percent in 1992. Real government recurrentexpenditure per primary pupil has increased by around 40 percent since 1992. At publicsecondary schools, real recurrent expenditure per pupil has fallen by around 50 per centsince 1992. At teacher education colleges, real recurrent expenditure per pupil has morethan doubled since 1995.
Table 5.1: Share of Actual Recurrent Budget Expenditure, 1992/93 - FY9992/93 93/94 94/95 9596 96197 97/98 98/99
Primary 0.51 0.52 0.63 0.65 0.67 0.67 0.62Secondary 0.15 0.14 0.10 0.07 0.07 0.09 0.07Teacher Education 0.05 0.04 0.03 0.02 0.02 0.03 0.02Higher & Technical 0.20 0.23 0.20 0.21 0.20 0.17 0.24Administration and other 0.09 0.07 0.05 0.05 0.04 0.05 0.05Total nominal 1.00 1.00 1.00 1.00 1.00 1.00 1.00
5.8 Development Expenditure: Development expenditure is sourced mainly fromforeign donors. A small amount, 8 percent, of the total government development budget(including foreign funding) goes to education, mostly to primary'3. Parents are the mainfinanciers of primary education, spending more per pupil than government. At secondarylevel they fund at par with government. In absolute terms parents pay more for secondaryeducation than they do for primary, since the cost of secondary education is much higherthan that of primary education.
5.9 Expenditure Management Issues: Development expenditure is disbursedintermittently from central government to the districts. The rationale for allocation is notclear at either central or district level. A significant portion of public and private
These figures may be underestimated due to incomplete coverage.
61

allocations to the sector are not spent on education. Districts retain a significant portion(57 per cent) of the universal primary education fee rather than allowing it to be retainedat school level as per government policy. In addition, some 41 per cent of governmentrecurrent allocations for other charges (e.g. text books, etc) may be spent outside thesector'4 . District councils tend to generate and remit resources to education.
5.1.4 Performance Trends
5.10 Despite this rise in resource availability, the performance of the sector hascontinued to disappoint:
In primary education, all major indicators (see Table 5.2) show a deteriorationagainst the annual average results for the previous five years. Nor does the trendof this deterioration appear to be declining.
Table 5.2: Performance Indicators in Primary Education5-year average (1993- Performance in Government target1997) 1998 (by 2003)
Total Government spending (TSh bn) 74.49 74.84Total enrollment 3.943.579 4,042.568 t.b.cPupil-teacher ratio/2 37 39 45Gross enrolment ratio 78% 77% 85%Net enrolment ratio 56.2% 56.5% 70%Completion rate SI-SIV 87.3% 86.8% 95%Completion rate SI-SVII 68.0% 66.5% 95%Non-salary cost per pupil (TSh) 518 744 10,000Total cost per pupil (TSh) 18,452 18,253 21,000SVII-Form I Transition rate 15.2% 15.0% 20.0%Drop out rate 6.6% 6.6%o 3%Primary School Exam Passes - boys 26.32% (1) 25.9% 60%
-girls 14.01 (1) 13.0% 60%
-total 20.17% (I) 19.4% 60%Notes:1. Figures for 1997 only.2. There is some debate within MoEC about the accuracy of PTR data.3. MoEC reporting of total enrolment ratios appears inconsistent with same data by gender.
* In secondary education. which has in fact suffered a fall in resource availabilityas funds are redirected towards primary education, performance indicators haveimproved. Concern still exists, however, about the low level of exam passes inthe secondary sub-sector. Seminaries (private and accounting for seven per centof all secondary schools) achieve pass rates at least double that of the rest of thesub-sector (public and private), so there is substantial scope for performanceimprovement.
14 PC op cit
62

Table 5.3: Performance Indicators in Secondary Education5-year average Performance Government(1993-1997) in 1998 target (by 2003)
Total govemment spending (TSh bn) 8.67 8.49 t.b.c.Total Enrolment 206,845 226,903 t.b.c.Pupil-teacher ratio 18.06 19.41 t.b.c.Survival rate FI-FVI 14.4% 27.0% (1) t.b.c.Non-salary cost per pupil (TSh) 12,091 11,480 t.b.c.Total cost per pupil (TSh) 39,813 33,098 t.b.c.Form Four Exam (pass at 1-111) 23.65% 29.00% t.b.c.Form Six Exam (pass at 1-111) 71.42% 75.80% t.b.c.
Notes:I. FY98
In teacher training, efficiency continues to fall as the number of trainers has not fallenin line with declines in the number of students. As a result, the trainee/teacher ratio inteacher training colleges has halved in the past five years. Also, there is evidence thata large number of teacher training graduates do not actually become teachers, so thestate's investment in their training is, to some extent, wasted.
Table 5.4: Performance Indicators in the Teacher Training Sub-Sector5-year Performance Government
average in 1998 target (by(1993-1997) 2003)
No. of students 14,179 6,614 t.b.cFirst year students 5,891 1,838 t.b.cPercentage of first years 41% 28% t.b.cStudents per college 394 189 t.b.cFirst year students per college 163 53 t.b.cFinal year students as a percentage of all students 47% 28% t.b.cSuccessful graduates per college 203 87 t.b.cStudents per staff member 14 7 t.b.cStaff 1,060 940 t.b.cNumber of colleges 36 35 t.b.c
5.11 With funding having increased and performance still declining, it seems clear thatadditional resources will not generate an improvement in performance in the sector unlessthe sector can strengthen its internal efficiency to generate improvements in performance.
5.1.5 Regional Variation
5.12 There is substantial variation in performance between different regions. Table 5.5shows the average, highest and lowest regional values for two key indicators ofperformance. As shown, Kagera has only 43 percent of its school-age boys in primaryschool, whilst Kilimanjaro has managed to enroll 71 percent. Dar es Salaam has managedan impressive 81 per cent net enrolment rate for its girls, while Kagera manages just 46percent.
63

Table 5.5: Regional Variation on Selected Performance Indicatorsboys girls Total
Net Regional Enrolment Rates: Highest value 71 81 76National average 56 58 57Lowest value 43 46 45
PSLE passes at regional level: Highest value 44.67% 27.47% 34.66%National average 25.94% 13.02% 19.43%Lowest value 15.26% 5.94% 10.32%
5.13 As was emphasized in the FY99 PER, such levels of regional variation suggestthat there is considerable scope for improvements in efficiency and effectiveness, andthat there may be inequitable allocation of resources. Furthermore, they suggest that theremay be opportunities for regional targeting of investment and effort to raise some of thekev performance indicators. The situation in Kagera, for example, clearlv warrants urgentattention.
5.1.6 Budget and Expenditure Projections
5.14 Projections of the likely costs of sector spending proposals and resourceavailability were made using the same model used in the FY99 education sector PER.Taking a base case scenario, which uses the Ministry of Finance's own GDP projections,it is clear that there will be insufficient funds available to meet the cost of government'spolicy objectives and targets for the sector. Even under a more optimistic scenario,which assumes significant efficiency improvements (the main efficiency driver in thesystem is the PTR) and increased development resources, partly through the HIPC IIinitiative, a financing gap is likely.
5.15 The results of these projections are, perhaps, surprising given the resources whichMoEC has dedicated to sector planning over the past few years. A wide range of reports- most notably the basic education masterplan (BEMP) - has identified the keyopportunities in the education sector. In principle, these reports should have providedsufficient information to produce a viable and sustainable medium term financingstrategy.
5.16 In practice, however, these studies have not resulted in a coherent and sustainablesector strategy. The reason is that they did not place enough emphasis on practicalaspects of planning. In particular, there has been a lack of prioritization of activities, anda lack of insight into appropriate sequencing of activities.
5.1.7 Next Steps
5.17 The Education PER review concludes that there are six priority areas for actionwhich the Basic Education sub-sector must address if it is to provide future generations ofTanzanians with the types of skills needed by the country in the twenty-first century:
* Since the current spending proposals (implied by current policy targets) ofthe Ministry of Education and culture cannot be met from governmentresources, even under optimistic revenue assumptions, a revised series ofspending proposals needs to be developed.
64

* Despite increased funding, the performance of the sector has continued todecline. This demonstrates that the sector needs to place at least as muchemphasis on its internal efficiency as it does on seeking additionalresources.
* Within the various sub-sectors, major opportunities to improve sectorperformance will come from:
* In primary education, the reallocation of teaching posts and double shiftteaching in urban areas (note, however, that additional funding is probablyneeded to facilitate the redeployment of teachers);
* In secondary education, addressing the low number of places available inthe sub-sector and identifying the reasons for the disparity between results inseminary and public schools;
* In teacher training, cutting back facilities and numbers of trainers (perhapsre-deploying some to the primary and secondary sectors), and tying traineesto periods of teaching.
* The sector has not provided a comprehensive and coherent statement ofpriorities within the sub-sector. Without such an explicit indication ofpriorities, the sector will find it difficult to respond to disruptions infinancing. The MOEC must produce such a statement, which should beguided by technical advice on the appropriate sequencing of activities, as amatter of urgency.
* The school mapping exercise provides the sector with an opportunity toenhance its planning capacity, including by focussing on district levelplanning issues. But the amount of information being generated by thestudies threatens to overwhelm the statistics unit of the ministry. Urgentattention needs to be given to the question of how such information shouldbe coded and stored, and how collection approaches can be harmonized toensure comparability of data.
* The statistics collected by the ministry allow for a comprehensiveassessment of sector performance. But the annual BEST document does notmake the most of these opportunities. The document needs to be updated toallow the comparison of key performance indicators, and should include acommentary by the ministry explaining why performance has changed overthe 12 months.
65

5.2 HIGHER AND TECHNICAL EDUCATION
5.2.1 Recent Developments and Education Policy Context
5.18 Reforms in the education sector were part and parcel of the economic reforms thatstarted in 1986 a la Bretton Woods Institutions. The reforms began with the adoption ofthe First Economic Recovery Program (ERPI). Tanzania mainland was the first toundertake these reforms followed by Zanzibar two years later. The main key issues ofthese reforms for the education sub-sector were access, quality, financing and efficiency.However, various sectoral reviews in the Education Sector Development Program(ESDP) and in the Education Public Expenditure Review (EPER) have not addressed thereform issues at all the levels of the education sector: primary, secondary and tertiary.The lower two sub-sectors continued to receive greater reform and planning attention.The broad Education and Training Policy (ETP) was therefore started in 1995 toharmonize all activities in the education sector so that the benefits of reforms reach all thethree levels. The ETP objectives were quality improvement; increasing access toeducation for women and other disadvantaged groups and areas; broadening the financialbase for education and training; enhancing of partnership in the provision of educationincluding decentralization of authority and responsibilities; integration of formal and non-formal education and facilitation of the culture for job creation and self employment. TheHigher Education Expenditure Review thus derives its framework from and is consistentwith the ETP broad objectives.
5.19 Less attention to the tertiary sub-sector has led to deliberate constriction ofdemand due to the failure to accommodate the higher supply of quality students foradmission; high cost of delivery of tertiary education; input oriented management ratherthan result oriented; and unguaranteed comparable quality of inputs. Higher EducationDevelopment (BED) should, therefore, receive resource priority to address theseproblems whose solutions are defined as strategies in the medium term policy andregarded as a future thrust of achieving both internal and extemal efficiency targets. It isnoteworthy that the plans for quality higher and technical education, and generalinvestment in skilled human capital continue to be developed in the context of poorquality secondary education. The Higher and Technical Education macro-policies aretherefore set to serve and address problems of lower sub-sectors. In this light, theNational Council for Technical Education (NACTE) is intended to deal with issues ofcoordination, curriculum quality control, accreditation and licensing as solutions to theproblems.
5.2.2 Sub-Sector Performance 19942000
5.20 The sub-sector performance during the 1994-2000 was generally low.* There has been low university enrolments (both public and private) that can be
translated into a low participation rate of 0.27 gross enrolment ratio for anational population of about 32 million people.
* With respect to Technical Colleges, student enrolments were generally low.Technical education had also imbalances in the ratio of
66

engineers/technologists, technicians and craftsmen. The present ratio is 1:2:14instead of the target 1:5:25 accepted intemationally and by regionalcomparisons.
* The 13 tertiary institutions (besides the three public universities) classified ashigher education institutions are spread over 10 ministries. As such expansioncoordination has not been easy or is non-existent.
* Tanzania has also smaller pool of students which inputs into higher educationthan its neighboring countries. Tanzania maintains a low participation rates insecondary education, currently at 5 percent of the age cohort, as compared to11% in Uganda and 25% in Kenya. The transition rate from primary tosecondary education is 15%. Within the secondary education the transitionrate from 0-level to A-level is 15%, as each year, only about 6,500 studentsgraduate from high school out of whom about 30 percent get formal admissionto universities and by the time other tertiary institutions get their share, thepool gets quite thin.
i The demand for higher education in Tanzania is low. The four highereducation institutions (i.e., University of Dar es Salaam, Sokoine Universityof Agriculture, Institute of Finance Management and the Open University ofTanzania) enroll a small fraction of the candidates with the minimumqualification for entry. University of Dar es Salaam on its part takes anaverage of 20% of the applicants with at least minimum required points.
* The state of equity balance is likely to deteriorate due to the introduction ofcost sharing and the liberalization of private secondary schools. A WorldBank (1995) Social Sector Review noted that in 1994 only 1% of theTanzanian "real poor" were likely to have completed secondary educationcompared to over 11% of the "better off'. Grosh and Forgy (I994)15 estimatethat the top 20% of the population, in terms of wealth consume 40% of allgovernment spending on education.
* With respect to gender balance, female students have continued to be the un-favored group despite their higher rates of return on education. There havebeen imbalances in terrns of enrolment proportions in higher education,between higher learning institutions, and between faculties/disciplines.Enrolment ratios in higher education in the 1994-2000 period have rangedbetween 17% and 21%. Between higher learning institutions, FY99 saw thelowest enrolment proportion of 8% being recorded by the technical collegeswhile the highest of 26% being recorded by the private universities. Asregards faculties/disciplines, female proportions were: B.Sc. general with 5%,B.Sc. Geology with 7%, Computer Science with 6%, Engineering with 5%
'5 Grosh, M. and Forgy. B. (1994) -Incidence of Selected Social Services in Tanzania", The World Bank: Dar esSalaam.
67

and Agricultural Engineering with 0%. The higher education institutions arecommitted to actively correcting the gender imbalances as shown in theirinstitutional transformation program plans. However, it has to be realized thatthe problem of low intake of female candidates has its roots in the wholeeducation system right from the primary and secondary levels.
* The issue of fragmentation and compartmentalization of knowledge has poseda major critique of the Tanzania higher education. For example, the EducationSector Reform and Development Program appraisal mission of 1999 observedthat the education system is diffused and widely distributed such that the basicsciences are taught at three University campuses of Muhimbili UniversityCollege of Health Science (MUCHS), Sokoine University of Agriculture(SUA) and University of Dar es Salaam (UDSM) resulting in duplication andpoor synergy. This is also true for the tertiary institutes majoring inCommerce and Accountancy courses.
* Issues of quality of outputs or graduates are normally related to issues ofhigher education system external efficiency and productivity. They are alsorelated to broad higher education impact, outcomes and client satisfaction.The "Report of the Committee of the Development of a University inNorthern Rhodesia (the Lockwood Report of 1964)" vindicates the argumentthat higher education institutions in Tanzania need to be sufficiently maturenot to be unduly concerned about international standards. They have to berelevant first to their own people. Despite the above positive opinions therehas been dissatisfaction with the product of the system as graduates cannothold to a job and they show unsatisfactory work performance. The institutionsappear to be aware of the problems posed by poor quality, yet they are tied toseveral structural problems which need resolution.
* Regarding postgraduate training at the level of Masters Degree and Ph.D.,there has been low enrolment. The enrolment of postgraduate students isaround 550 for the four institutions: UDSM, SUA, IFM and IDM although theplanned enrolment for UDSM alone is 600 by the end of 1999. Expansion ofpostgraduate training is necessary to provide greater access to higher leveleducation for qualifying Tanzanian candidates and to ensure maximumutilization of the available resources. Increase in enrolment at this level willalso promote research capacity and competence.
5.2.3 Financing of Higher Education
5.21 For recurrent expenditure, higher education major financing source has been thecentral government, followed by internally generated funds. Financial income for highereducation during the period 1993 to 1999 did not decline in nominal terms though as aproportion of GDP and Government recurrent expenditure the proportion has remainedstable at around 0.5% and 4% respectively. Recurrent expenditure per student was Tsh.2800 and Tsh. 1914 for 1980 and 1993 respectively. These figures are quite high when
68

compared with other countries in the region. This situation suggests two things. First, thealmost impossibility of private individuals affording to pay for higher education withoutsubsidy in the light of low income levels and high cost of higher education relative to per-capita income. Second, the regional comparisons and trends tend to suggest that highereducation expenditures in Tanzania are highly inefficient mainly because of lowenrolments.
5.22 Almost all university faculties and institutes have been engaged in consultancyservices and income generation. However, poor record keeping within the institutions anddepartments makes it difficult to establish how much is generated. For example, in FY97UDSM alone generated around Tshs. 335,530,631 from this source; a figure equal to5.3% of approved government budget to UDSM in the same year.
5.23 During phase three of cost sharing, the government introduced student loans to berepayable after the completion of studies. Also based on cost-sharing policy, institutionshave introduced fees for private sponsored students. However, due to small size of thelabor market and declining employment opportunities in the formal sector the probabilityof the loan repayments may be low. On the other hand the response rate for privatelysponsored candidates has been very low. Indeed, according to the UDSM PrivateStudents Fees Report (1998) during the academic year FY98 only 46 private studentsresponded, representing less than 10% of admissions.
5.24 A major source of financing higher education activities especially capacitybuilding and institutional strengthening has been donor funding, since for several yearsthe government has not funded research costs and other development costs in highereducation. Major donor sources include NORAD (Norway), DANIDA (Denmark),British Council (UK), Commonwealth, DutchJMHO (Netherlands), DAAD (Gernany),GTZ (Germany), Netherlands, Irish Aid/HE, (Ireland) NUFU (Norway), SwissGovernment Belgian Government, International Development Research Center ofCanada (IDRC) and UJNDP. Experience with donor funding is that there has been atendency of changing focus over time and this has already posed problems related tosustainability and continuity of the donor funding source.
5.25 By 1985, the salary of a senior academic was lower than what a trained graduatecould earn after six years of service in several public parastatals. New salary scales forteaching staff in higher education institutions under the Ministry of Science andTechnology and Higher Education became operative in July 1999. Otherwise Universitysalaries had remained stagnant. The salaries have of late improved more rapidly thansalaries in other areas. The academic monthly salaries now range between 15 and over 40times the (annual) per capita GDP. Yet the low value of University salaries, whenconverted into dollars is a source of dissatisfaction and subsequent brain-drain amongacademics. In comparison with salaries outside the country given in dollar terms, aprofessor at UDSM, for example, was receiving US$ 1,000 per month in FY00 while thelowest level of assistant lecturer was receiving USS350 per month.
5.26 Suggested Remedies: Performance improvement in the sub-sector requires thefollowing remedial actions, which are shown also in Table 5.6.
* Deliberate effort to increase overall sub-sector resources through educationlevy measures;
69

* Control of course/program content through an accreditation body;
* Creating a body to rationalize the existing capacity/institutions;
* Introduce and implement affirmative measures to address gender imbalance inenrolment;
* Strengthen the higher Education Accreditation Council to monitor quality, andprovide enabling environment for curricular reviews and staff professionalgrowth;
* Allow institutions to be independent and autonomous;
* Rationalize governnent resources to higher education and encourageparticipation of private sector.
70


Table 5.6: Main Problem Areas and Suggested Remedies for Higher Education andTechnical Development in Tanzania
Problem Cause(s) RemediesSmall sizes of Lack of co-ordination, lack of * Creating a body to rationalize existingInstitutions centralized allocation of capacity.
resources, lack of rationalization. * Survey of institutions and options for theirsurvival.
+ Retaining only well performing institutionsfor support and making them cost-efficient;redefining government role from a providerand enabler to regulator and stimulator.
Low enrolment High costs in public Universities * Increase budgetary allocation to 5% ofLack of space and general GNP.capacity under utilization. * Amalgamation of small institutions.
* Better utilization of staff.* Involvement of third parties in financing
higher education* Encouraging off-campus students.* Targeting resources toward physical plant
and facilities expansion.* Reduce management costs* Strengthen distant learning
Low quality Lack of quality control and * Strengthen the Higher Educationmonitoring, lack of curricula Accreditation Council.reviews, lack of teacher * Provide enabling environment.specialized skills. * Retain Academic Staff.
* Introduce output/student based fundingmechanisms
* Overhaul Curricula.
Skewed Gender * Historical trends * Co-ordinate efforts between MOEC andEnrolment MSTHE on sensitization
* Formal and non-formal * Resocializationsocialization process. * Expansion and diversification of physical
and pedagogical facilities in scienceschools.
* Lack of sensitization * Pre-enrolment science courses for girls;* Unbalanced physical and * Provide girls scholarships.
pedagogical facilities in * Remedial science for girls.schools/colleges.
71

Lack of * Heavy dependency on * Introduce Higher Education Act withInstitutional govermment. contractual relationships;Transfonnations * Appointees of govemment. * Create own staff regulations and terms of
services;* Lack of vision/mission. * Council and Boards to have greater
authority;* Lack of framework for * Students to be sponsored on mutually
supervisory, regulation, agreed upon terms using capitation grant.guidance, quality assurance,and incentives.
Under-finding Low budgetary allocation and * Rationalize level of governmentlow private sector participation. contribution;
* Introduce legally protected student loansscheme;
* Introduce Education Levy;* Encourage private sector to establish and
maintain institutions, provide loans andscholarships, provide part time employmentto students;
* Encourage and reward income generationactivities in institutions.
5.2.4 Analysis of Efficiency and Effectiveness of Higher and Technical Education
5.27 The efficiency of the higher education system can be measured in many ways, butit is common to look at the utilization of human, physical and financial resources. In thiscase we are interested in unit costs, staff-student ratios, capacity utilization and transitionand wastage rates for the sub-sector. These indicators tend to suggest that there areinefficiencies that need to be addressed.
5.28 Capacity Utilization: Higher education institutions need to utilize efficientlytheir fixed and variable resources and assets so as to cut down the unit costs. The mostvaluable fixed resources are the teaching facilities, the learning resources and the utilities.Data from UDSM transformation program (1999) suggest for example that no room isfully utilized. Room utilization rates are: 68% at UDSM (main campus); 43% at MUCHSand 89% at UCLAS.
5.29 Teacher-Students Ratios: The teacher-student ratio is one of the basic criteriafor optimal utilization of the available teaching, research and consultancy resources.Table 3.7 suggests that the ratios are generally high by regional average, mainly becauseof low enrolments and small size institutions. This trend results in high unit costs andhigh proportion expenditure on personal emoluments as compared to expenditure onother charges within an institution.
5.30 High-Unit Costs: One of the challenges facing both the government and theinstitutions is to reduce the high unit costs due to low student/staff ratios. Tanzania highereducation unit costs are higher than those found in other African Universities. By 1997the unit costs at UDSM and SUA were US$ 6,071 and US$ 10,188 respectively. On theother hand the average public per unit expenditure per student also remains high atUS$3,300 for SUA and at US$ 2,800 for UDSM. During the same period the unit costs in
72

comparable countries were: University of Zimbabwe, US$4,308; US$3,298 at Universityof Zambia and they were US$1,325 at Kenyatta in Kenya (GoT, MSTHE, 1998)16.
Table 5.7: Teacher-Student Ratios in Selected Higher and Technical EducationFY97 FY98 FY99
UDSM 1:7 1:7 1:7SUA 1:5 1:6 1:3MUCHS 1:2 1:2 1:5
UCLAS 1:3 1:5 1:3DIT 1:14 1:15 1:10MOSHI CO-OP 1:2 1:2 1:2KARUME - 1:10 1:9
IFM 1:11 1:17
Source: Computed from MOSTHE Basic Statistics (1999)
Wastage: 1991 1992 1993 1994 1995 1996 1997Arts (0.10) (0.07) 0.04 0.03 (0.14) (0.15) (0.06)
Commerce (0.24) (0.20) (0. 9) (0.23) (0.15) (0.14) (0.14)
Education (0.17) (0.07) (0.00) (0.13) (0.13) (0.12) (0.07)
Engineering (0.1 1 ) (0.10) (0.17) (0.08) (0.05) (0.15) (0. 1 9)
Law (0.04) (0.07) (0.02) (0.01) (0.07) (0.00) (0.05)
Science (0.50) (0.44) (0.39) (0.48) (0.38) (0.34) (0.32)
Phartnacy (0.48) (0.53) (0.63) (0.49) (0.38) (0.04) (0.60)
Nursing - - - - (0.52) (0.62) (0.70)
Medicine (0.47) (0.54) (0.49) (0.56) (0.33) (0.31) (0.20)
Dentistry - - - (0.44) (0.61) (0.40) N.A
Source: Computed from Cohort progression reports and undergraduate Students' performance reports.Notes: Cohort length is 3 years for Law, Arts, Commerce and Science; 4 years for Engineering and Education and 5years for Medicine and Dentistry.
5.31 Analysis of Personal Emoluments and Other Charges: Interestingly, theproportion of expenditure covering students' welfare in higher learning institutions hasremained high (over 20%) and growing even after introduction of student loans, whichare supposed to meet accommodation and catering costs. In terms of the pattern ofspending, Tanzania compares favorably with Belgium and France. but badly with otherAfrican countries, Japan and Sweden. Students' welfare takes a high budget of UDSMwhen compared with industrialized countries. Funds for operational costs are smaller inTanzania often at the cost of education quality. Cost sharing through the Student LoanScheme is yet to prove effective. This is because, graduates through this program havenot started repaying the funds from the loans they received. At the same time, thegovernment has not established an effective mechanism to track down graduates so as toget the money back nor has the revolving fund account been established. Within the
16 United Republic of Tanzania (1998) "Financial Sustainability of Higher Education: A Report of the Task Force on
Financial Sustainability of Higher Education in Tanzania'. MSTHE: Dar es Salaam.
73

institutions themselves Personal Emolument (PE) consume a high proportion of publicallocations as compared to the share of other charges (OC).
Table 5.8: Proportion of Funds Allocated to Various Expenditure Items for Universities inAfrica, Europe and UDSM.Item Africa Belgium and Japan and UDSM
France SwedenPersonal Emoluments 46 75 48 68Student Welfare 31 4 7 20Operating costs and material 23 21 45 12
100 100 100 100Source: URT (1998) Financial Sustainability of Higher Education in Tanzania, p. 60.
5.32 Suggested Remedies: Performance improvement in higher education requires thefollowing actions shown also in Table 5.9.
* Dramatic increase in enrolment,* Rationalization of institutions and capacity utilization;* Improved management of institutions and reduce managerial costs;* Establishing mechanism to track down loaned money from graduates;* Increased employment opportunities;* Establishing strategies that will lower unit costs.
Table 5.9: Main Efficiency Problem Areas and Suggested Remedies for Higher andTechnical Education in TanzaniaProblem Cause(s) RemediesHigh tuition and welfare costs + High Unit Cost * Establish strategies that will
: Increasing cost of living, lower unit costs; Reduce* Increasing managerial managerial costs; Reduce
costs. Poverty among Tanzanians.
Difficulties in recovering * Lack of mechanisms to * Establish mechanism bystudent loans. track down graduates. Act of Parliament to track
down loaned money fromgraduates;
* Many of the graduates do * Increase employmentnot secure sufficiently well opportunitiespaying jobs to pay the loans
* Promote and support selfemployment initiatives.
Under-utilized institutions and Unmet needs for middle cadre * Rationalize institutions;Uncoordinated courses personnel. Establish an Accreditation body
for Awards and control ofcourse content (curriculum).
High Wastage Rates Weak candidates; poor teaching * Tighten entrance criteriamethods/poor assessment tools. and validate assessment
tools;* Provide teacher
professional development.
74

5.2.5 Review of Higher and Technical Education Sub-Sector Expenditure:1993-1999
5.33 Funding of Higher Education in Tanzania involves a multiple of sources. Theseinclude the Union Government (for both the Mainland and Zanzibar since HigherEducation is a Union matter), the Government of Zanzibar, external donors, privatesector entities, parents, beneficiaries (either in the form of "own" funds or student loanswhich have to be repaid), Non-Governmental Organizations, the institutions themselvesthrough income generation contributions as well as the general populace through meansthat do not involve traditional tax and non tax revenue generation measures of the centralgovernment. An example of such means is the proposed education levy.
5.34 Regarding funding of Higher and Technical Education through Governmentbudgetary Operations, four issues are examined. These include Government RecurrentExpenditure, Government Development Expenditure, Donor funding and other forms offunding. The analysis focuses on structure and predictability of resource flows.
5.35 Government recurrent expenditure: Table 5.10 shows trends in the funding ofHigher and Technical education from recurrent budget for the years FY94-FY99. Innominal terms government recurrent expenditure has been increasing annually bybetween 7% and 57.9% between 1994/5 and 1998/9 while in real terms the increase hasbeen between 0.6% and 46.7%, respectively. The proportion of Higher and TechnicalEducation funding in total government recurrent budget shows an unsystematic pattern,initially rising from 3.3% in 1993/4 to 4.2% in 1994/5 before declining steadily to 3.7%during 1997/8. A sharp up turn to 4.7% of total recurrent government budget isexperienced in 1998/9, as part of concerted government efforts to revamp the socialservices sector. Out of total GDP, Higher and Technical education received 0.5%annually between 1993/4 and 1996/7. This proportion shrunk to 0.4% in 1997/8 beforerising to 0.6%.
Table 5.10: Trends in Higher and Technical Education Funding in Tanzania 1993-1999(%).Year Govt. Recurrent Expenditure annual Higher and Technical Education
changes Funding as proportion ofNominal Real Govt. Recurrent GDP
Budget1993/4 - - 3.3 0.51994/5 +48.0 +31.4 4.2 0.51995/6 +10.0 +9.1 3.9 0.51996/7 +17.1 +8.7 3.9 0.51997/8 +7.0 +0.6 3.7 0.41998/9 -57.9 +46.7 4.7 0.6
Source: Own Computations from data inl URT. Appropriation Accounts. Ministry of Science. Technology and Higher Education (various).2.URT/World Bank (PER)(1999).
5.36 The analysis of the allocation of Government recurrent expenditure is attemptedby decomposing the expenditure into personal emoluments (personnel expenses) andother charges. In Higher education, personnel expenses excluding teachers' salaries haveconstituted a paltry proportion of the budget. It has ranged between 0.02% during 1998/9and 0.3% for the years 1994/5 and 1995/6. Direct student costs (excluding student loans)
75

have claimed on average 27% between 1993/4 and FY00 ranging from a low rate of14.9% in FY00 to a high 42.4% during 1994/5. With regard to Technical education,personnel expenses have averaged 10.5% between 1993/4 and FY00, the lowestproportion being 3.5% in 1995/6 and highest being 16.6% during 1996/7. Direct studentcosts ranged from 0.1% during 1995/6 (closure) to a high 35.1% during 1993/4. Studentsin Technical education do not receive student loans as a matter of policy. On averagepersonnel expenses consume around 5% of the government recurrent expenditurechanneled to Higher and Technical education. In Higher education the average is around0.2% while for Technical education it is around 10.5%. Student costs (excluding studentloans) also feature significantly. Table 5.11 summarizes the information.
Table 5.11:: Tanzania: Higher and Technical Education Expenditure By Purpose: 1993-1999 Percent of Sub-Vote (Actual, %)
1993/4 1994/5 1995/6 1996/7 1997/8 1998/9 1999/0A: HIGHER EDUCATION
Personnel expenses 0.2 0.3 0.3 0.05 0.02 0.04 0.09Student costs(Welfare/allowances excl.student loans) 31.1 42.4 22.3 30.5 22.4 24.9 14.9
B: TECHNICAL EDUCATIONPersonnel expenses 12.3 16.0 2.5 16.6 10.1 10.9 4.8Student costs(no loans issued) 35.1 31.9 0.1 24.1 3.7 20.8 16.1
C: A VERA GEPersonnel expenses 6.3 8.2 1.4 8.3 5.1 5.5 2.4Student costs 33.1 37.2 11.2 27.3 30.3 22.9 15.5
Notes: FY00 estimatesSource: Own computations from Appropriation Accounts, Ministry of Science Technology and Higher Education(MSTHE) (various)
5.37 Government Development Expenditure: Government development expenditureon Higher and Technical education has remained almost at same level for the periodunder study (both in proportion to total government development expenditure and to GDPas Table 3.13 shows). Historically much of the development expenditure in Higher andTechnical education has been foreign financed and has not been mainstreamed in thegovernment budgetary process. Thus the reflections of government developmentexpenditure was very small compared to the investments that were observed to be takingplace in the institutions.
5.38 As a proportion of total government development expenditure, Higher andTechnical education allocation was in the order of 0.4% during 1994/5, 1996/7 and1998/9. Only during 1995/6 did it rise to 0.5%.
5.39 In GDP terms, Higher and Technical education development budget expenditureremained at 0.01% for the entire 1994/5 - 1998/9 period. Government developmentexpenditure declined from 1.8% in 1994/5 to 0.2% in the following year before pickinggradually to 0.5% during 1996/7 and peaking to 2.5% during 1998/9.
76

Table 5.12: Trends in Government Development Expenditure in Higher and TechnicalYear As % of Total Govt. As % of GDP
Development Exp.THE GDE
1994/5 0.4 0.01 1.81995/6 0.5 0.01 0.21996/7 0.4 0.01 0.51998/9 0.4 0.01 2.5
Notes: THE = Technical and Higher Education allocationGDE = Govt. Development ExpenditureSource: Own Computations from MSTHE and URT/World Bank documents.
5.40 A notable feature from Table 5.12 is that even when Government developmentexpenditure increased during 1998/9 (as proportion of GDP) there was no corresponding(or any) increase to the allocation to Higher and Technical education. Within the sub-sector, allocation has tended to favor higher education, receiving 98.2% of total sub-sector allocation during 1994/5; 70.5% during 1995/6; 76.1% during 1997/8 and 91.2%during 1998/9 (computations from sources in Table 5.12).
5.41 Donor Funding in Higher and Technical Education: The expenditure byDonors in Higher and Technical education follows the pattern of the budget as a whole -funding development programs.
5.42 Tracking donor funds in the main government budgetary framework has been atraditional difficulty in the past. However, despite recent efforts to reflect donor funds inthe government budget, tracking is still not an easy task. For the years we could maketwo observations: One, the proportion of local (government) funds is less than donorfunds e.g. for 1994/5 local funds made up only 13.9% of total development funds to thesub-sector. The proportion improved to 58.7% during 1995/6 and to a further 69% during1998/9. Secondly, foreign financing was fully directed to Higher education with none totechnical education.
5.43 Recent moves in other sectors e.g. health promise to keep better records and bettermonitoring of donor expenditures through creation of a common basket. Thoughexperience with common basket funding is limited, it might be a useful approach fordonor funding of Higher and Technical education.
5.44 Other Sources of Finance for Higher and Technical Education: The group of"other sources" includes private, own funding, student loans, NGOs, etc. The fundingfrom this group is the most difficult to track as information is very scattered. Howevergiven recent reforms in the economy in general and education sector in particular, this isthe source that is expected to play a leading role in the future. A comprehensive study onthe potentialities of this source will be most welcome. Perhaps one can make remarks onone source that is the student loan scheme. A weakness like low (or no) recovery rates isnot only experienced in Tanzania but also in other African countries like Kenya,Zimbabwe, Botswana, etc. A comprehensive evaluation will shed more light.
5.45 Predictability of Resource Flows to Higher and Technical Education: Thissection analyzes predictability of resources to the sub-sector from three sources:government recurrent budget, government development budget and donor financing (for
77

years with complete data). Table 5.13 summarizes the results. With regard toGovernment Recurrent expenditure, on average about 87% of the approved estimates areactually disbursed and spent. The lowest score was 81.7% during 1995/6 and the highestwas 96.9% during 1998/9. Donor finances do not usually fund recurrent expenditure. Thepredictability of development expenditure differs substantially between government anddonor sources. The average success rate for the former is 77.6% (highest, 100% during1998/9; lowest, 24.6% during 1995/6); while for the latter it is 34% (highest, 100%during 1994/5; lowest, 0% during 1997/8) (as reflected in Appropriation Accounts).
Table 5.13: Predictability of Resource Flows to Higher and Technical Education inTanzania (%) 1994-1999*Year Recurrent Expenditure Development Expenditure
Govt. Donor Govt. Donor1994/5 88.0 n.a 97.3 100.01995/6 81.7 n.a 24.6 5.71997/8 80.4 n.a 88.5 0.01998/9 96.9 n.a 100.0 30.0
Note: *Computed as actual expenditure as a proportion of approved estimates.Source: Own computations from Appropriation Accounts MSTHE (various)
5.46 Government recurrent financing scores highly in terms of predictability. This isnot very surprising given the fact that the budget cycle in Tanzania allows a foresight inthe likely allocation through the indicative ceilings given to programmes. With respect todonor financing common observations have included lack of honouring already madecommitments and delayed disbursements within the financial year.
5.47 Predictability of resources in Zanzibar is equally low, as the budgeted sum hasbeen declining from year to year e.g. from TShs. 463 million during 1992/3 to TShs. 230million during FY00. Predictability ranged between 30% (FY00 for first seven months tothe highest 96.3% recorded during 1997/8).
5.2.6 Policy Recommendations
5.48 In view of the analysis the following are the recommendations:
* In the short and medium terms Higher and Technical education has to be seento be demand-driven. Measures which address this, are immediateimprovement of sub-sector management, institutional development andcapacity building - i.e., strengthening of capacity to monitor progress andachievement in the sub-sector.
* To institute mechanisms for constant monitoring of sub-sector expenditures.
* To pool resource allocation in order to effect co-ordination/rationalization inan efficient manner.
* Formulation of a masterplan for Higher and Technical education in order tosynchronize programs and institutional plans. This will lead to implementableprograms of activities.
* To sensitize on the need for extra budgetary resources for financing Higherand Technical education (e.g. through supporting education levy initiatives).
78

* In the short term cost effectiveness has to be emphasized especially throughexpanding enrolments in existing institutions in order to increase capacityutilization, with due attention to increasing educational opportunities forwomen at the tertiary level.
79


6. HEALTH SECTOR
6.1 INTRODUCTION
Background
6.1 The Health Sector has registered remarkable progress since the 1967 ArushaDeclaration. The sector's emphasis has been on rural health development as a strategy forequitable distribution of health services. Despite the general improvement in the healthand family status, the low growth of the economy particularly in the early 1980s withassociated poor health services resulted into high infant and maternal mortality rates.Analysis of disease patterns and trends show that over 70 percent of life years lost inTanzania are caused by the top ten major diseases, which are communicable butpreventable, such as malaria, diarrhea, prenatal/maternal conditions and HIV/AIDSrelated diseases.
Health Sector Reforms
6.2 Major reforms have been initiated and proposed by the ministry to rationalize theroles and responsibilities in the provision and financing of the health services. Thereforms will focus on ensunng a more transparent, cost-effective use of existing andfuture resources through emphasis on priorities towards outcomes rather than inputs; andon improving delivery, quality and impact of essential health care to the poor. It isnoteworthy that, the health sector reform is embedded in the wider context of Civilservice and local government reforms.
6.3 Regarding the use of resources, a disproportionate amount is spent on personalemoluments (over 70%), at the expense of resources allocated towards the actual deliveryof health services. Moreover, despite the government's emphasis on equitable distributionof health services, available evidence indicates that the personnel distribution heavilyfavors the urban areas consisting of about 20% of the population and yet served by about70% of the total workforce.
6.2 HEALTH POLICY OBJECTIVES
6.4 The overall objective of the Government of Tanzania's health policy is to improvethe health and well-being of all Tanzanians with a focus on those most at risk and toencourage the health system to be more responsive to the needs of the people. To achieveits overall objective, the Government of Tanzania aims to:
(i) Reduce infant mortality rates from 88/1000 live births (1997) to 84/1000 livebirths by the year 2002. Reduce maternal mortality rates from the range of 200-700/100,000 live births (1997) to the range of 200-500/100,000 live births by theyear 2002. GoT also expects to increase life expectancy of males from 49 years asat 1997 to 50 years by 2002 and for females from 51 years to 52 years, through the
80

provision of adequate and equitable maternal and child health services, promotionof adequate nutrition, control of communicable and preventable diseases andtreatment of common conditions of illness
(ii) Ensure that quality health services are available and accessible to all in urban andrural areas within reachable distances at low travel costs (from 72% as at 1984 to90% by 2002)
(iii) Move towards self sufficiency and equitable distribution of human resources bytraining all cadres required at all levels
(iv) Sensitize the community on common preventable health problems and improvecapacity at all levels of society to assess, analyze problems and design appropriateaction through genuine community involvement (from 50% as at 1996 to 80% by2002)
(v) Promote awareness in government and community at large that health problemscan only be adequately addressed through multi-sectoral co-operation and sectorwide approaches
(vi) Create awareness through family health promotion that responsibility for one'shealth rests squarely with the able bodied individually as an integrated part of thefamily.
6.3 STATUS OF THE HEALTH SYSTEM
6.5 The Health System Network: The Tanzanian health network consists about 4844facilities that are well distributed across the country. Out of these facilities, 2877 belongto the government. Out of the government owned facilities, 284 are health centers and2512 dispensaries providing primary care services. These are in turn linked to 81hospitals that include district and regional hospitals as well as Muhimbili Nationalreferral and teaching hospital. Where governrnent district hospitals do not exist, the areasare served by voluntary agency hospitals that are supported financially by the governmentthrough subventions. However, most of the government facilities are reported to be inneed of heavy rehabilitation.
6.6 Human Resources: The health sector workforce is large and young consisting ofabout 67500. However, this figure does not include the unemployed health professionalswhose number is reported to be significant. About 50% are reported to be either lowlytrained or unskilled. About 73% are employed in government facilities while another 7%are seconded by GoT to Voluntary Agency hospitals hence GoT employs 80% of thisworkforce, spending over 70% of its recurrent budget on personal emoluments. Whereasthe government spends a large percentage of its recurrent budget on personal emolumentsfor the health work workers, productivity is low.
6.7 Drugs and other medical supplies: It has been estimated that the countryrequires about US$1.23 per capita to meet its drug needs. A household survey has alsoestablished that on average Tanzanians spend about US$ 3 per capita of their income onpurchase of drugs (MOH, 1998). The Ministry of Health has declared drugs allocation aprotected item on the budget. However, studies have shown that more funds are spent on
81

provision of drug kits for health centers and dispensaries as opposed to drugs forhospitals that are traditionally more expensive (Pavignani 1998).
6.8 Financial Resources: The health sector is mainly funded by the exchequer,donors and contributions from members of the community. Donors mainly supportvertical programs like EPI, control of STDs and HIV/AIDS and the TB and Leprosyprograms among others. There has been failures by some of the donors to release all theirfinancial commitment to the health sector in several occasions. Trends in the governmentexpenditure on health therefore indicate a notable under-funding at all levels of thesector.
6.4 PUBLIC EXPENDITURE PERFORMANCE
Background
6.9 The FY00 public expenditure review is a follow up of the last PER exercisesconducted in 1997 and 1998. It aimed at supporting the preparation of the Medium TermExpenditure Framework (MTEF) in order to strengthen budget management in Tanzaniaspecifically in the health sector. A number of studies (e.g. Recurrent cost projections,Performance Indicators, Expenditure Tracking, PER FY98 and costing of the EssentialDistrict Health Package) have already been carried out in the health sector. PER FY00aimed at building on the previous studies to provide room towards accuratemeasurements of spending trends needed to analyze the effectiveness of fiscalinterventions and system evolution.
Analysis of Expenditure Trends in the Health Sector
6.10 For the past two years, the amount of funds released was more than what wasbudgeted for the sector (Table 3.15). This was due to shortage of drugs in most of healthfacilities, which forced the government to allocate extra funds to the sector. The increaseswere around 23.75 percent in FY98 and FY99, while the actual expenditures in the samefinancial years were over and above the budget. In FY98 and FY99 actual expenditureswere about 9.08 and 14.04 percent over the respective budgets. Expenditure trends atregional and district levels are difficult to obtain as they are aggregated with othersectors' expenditures. However, it is estimated that the Ministry of Health expenditurealone accounts between the range of 40-50 percent of all public health expenditures.
82

Table 6.1: Government Budgets and Actual Expenditures for Health Sector in BillionTanzania Shillings.
FY98 FY99 FY00 Actual/budget (%)Budget Actual Budget Actual Budget Actual 1997/8 199819
(Feb.2000)
Recurrent ExpenditureMoH 22.03 25.86 28.90 37.15 31.60 18.59 117.00 128.55Regions 7.25 7.25 8.40 8.40 9.24 4.80 100.00 100.00Local 12.90 12.90 14.90 13.98 16.39 8.131 100.001 93.80governmentTotal Recurrent 42.18 46.01 52.20 59.53 57.23 31.52 109.08 114.04Development ExpenditureMoH | Local 1.97 1.97 2.00 1.99 3.38 1.00 100.00 99.61
Foreign 23.99 3.25 19.49 9.60 20.00 1.37 13.54 49.28Regions/Local 1.38 1.38 1.36 1.26 0.40 0.20 100.00 92.64governmentTotal 27.34 6.60 22.85 12.86 23.78 2.58 24.13 56.26DevelopmentTotal Health 69.52 52.61 75.05 72.39 81.31 33.90 75.67 96.45
Source: Ministry of Finance.
Sub-Sector Budget Allocations
6.11 Table 6.2 shows the MoH's FY99 budget allocations across sub-sectors of centraladministration and roles of hospitals and institutions under the ministry. The sub-sectorbreakdown shows that 40.7% of the total spending was allocated to hospitals to maintainthe already existing infrastructure, 4.65% to National Institute of Medical Research andthe Tanzania Food and Nutrition Center. Muhimbili Medical Center alone consumes17.3% of the Ministry's budgetary allocation. This situation suggests that theGovernment policy on giving priority to primary health care (PHC) is not yet in place asfar as allocation of resources is concerned. However, this might be because theGovernment has to fund salaries and maintaining the existing health infrastructure. Theexplanation above could not take into account the allocations in regions and localgovernment where most of preventive activities take place.
6.12 A critical analysis of PE costs reveals that a substantial amount is spent onDistrict Designated Hospital and Voluntary Agency owned hospitals. Subventions tothese hospitals are mainly in the form of seconded personnel. It is high time now torethink whether the Government should continue to subsidize Voluntary Agency healthfacilities. There is a need to review the coverage of health facilities to identify scope forrationalization, particularly where mission and government facilities overlap. This willform the basis for review of policies regarding subventions.
83

Table 6.2: Sub-services/Functions Breakdown of Government Recurrent Budget for Health- FY99
PE* | OC* Total lBn. % Bn. % Bn. %Shs. Shs. Shs.
MoH Admin/Central** 2.40 18.60 13.40 83.60 15.80 54.90Muhimbili Medical Center 4.20 32.60 0.80 5.00 5.00 17.40KCMC hospital 0.90 7.00 0.40 2.50 1.30 4.50District Designated Hospitals (DDH) 2.03 15.80 0.60 4.00 2.63 9.10Bugando Hospital 0.52 4.04 0.40 2.50 0.92 3.20Muhimbili Orthopaedic Institute 0.31 2.41 0.10 0.60 0.41 1.40Ocean Road Cancer Institute 0.21 1.63 0.10 0.60 0.31 1.10Voluntary Agency (VA) hospitals 1.10 8.50 0.05 0.30 1.15 4.00National Institute for Medical 0.80 6.22 0.09 0.60 0.85 2.90Research (NIMR)Tanzania Food and Nutrition Center 0.40 3.11 0.05 0.30 0.45 1.60(TFNC)TOTAL 12.87 100% 16.03 100% 28.82 100%
*PE are personal emoluments, OC are other charges. Drugs costs have been allocated to various levels of health carebased on information supplied by Medical Stores Department.**MOH/Admin/Central includes MOH administration, accounts, planning and nursing sections, the GovemmentChemist service and Tanzania Food Commission.
Analysis of Health Sector Funding Requirement
6.13 The definition of sector funding "needs" has to be set in the context of what mightbe affordable at the country's level of development and incomes. The WorldDevelopment Report (1993) recommends US$ 12 per capita for provision of a basicpackage of health services in developing countries. Based on this assumption, the overallfunding needs for the health sector in Tanzania would be US$ 360 million based on the1999 population figures of about 30 million people.
6.14 In order to run services at optimal levels, about US$ 150-180 million is requiredfor the sector (Pavignani 1998, HERA 1999). It is, however, estimated that currently lessthan US$ 100 million is available to the sector from all sources, with the Government ofTanzania and donors providing the bulk of the resources. Based on various assumptions.the cost of running the government Health sector is estimated at US$ 126 million in 2001rising to about US$ 132 million in 2002.
Priority Areas
6.15 In order to improve the delivery of health services, the priority will be tostrengthen the delivery of the essential district health package as well as to arrest thefurther deterioration of the physical facilities. Provision of drugs will continue to be aprotected item in the budget. The following priority areas are therefore recommended.
1. Drugs and essential medical supplies2. Kerosene for storage of vaccines in rural areas3. Essential hospital equipment and supplies4. Strengthening of the referral system
84

5. Equipment for safe motherhood for all levels (vaccines, delivery beds and kitsetc)
6. Conditional survey of physical facilities and equipment and prioritization forurgent rehabilitation of the most critical ones
7. Mechanisms for introduction of CHF and cost sharing to lower level facilitiesMechanisms for implementation of the National Insurance Fund.
Table 6.3: Funds Requirements and Proposed Allocation of Funds for Priority andActivities in the Health Sector. (Millions of Tshs).Priority Area/Activity Estimates Projections
1999/0 200011 2001/2 2002/3Reqts. Propsd. Reqts. Propsd. Reqts. Propsd.
Alloc. Alloc. Alloc.
Drugs 9500.00 17600.0 11610.4 19360.0 18178.9 20134.4 25474.5Essential Medical Supplies 2664.63 5500.0 3627.07 6000.0 5634.43 6240.0 7894.5Essential hospitals equipment 3197.55 6500.0 4286.54 7000.0 6573.5 7280.0 9210.29and reagents (diagnosticequipment X-ray inclusive)EPI - Kerosene 266.46 600.0 395.68 700.0 657.35 728.0 921.03Utilities for hospital and 53.26 120.0 79.14 150.0 140.86 156.0 197.36Training InstitutionsStrengthening referral hospitals - 1065.85 2500.0 1648.67 3000.0 2817.22 3120.0 3947.27provide PHC units with drugs,equipment and trained staffDefine the referral functions of 639.51 1500.0 989.20 2000.0 1878.14 2080.0 2631.51secondary and tertiary curativeservices (referral facilities nolonger attend health center cases)Counterpart funds for the 639.51 400.0 263.79 200.0 187.81 208.0 263.15introduction of CHF and costsharing to lower level healthfacilities _
Start up cost and counterpart 266.46 200.0 131.89 100.0 93.91 104.0 131.58funds for introduction ofNational Health InsuranceImmunization of 2 years kids for 266.46 1874.40 1079.6 1187.2071% to 75%.
HIV/AIDS awareness campaign 0.00 4846 4731.0 4680.00Total recurrent 15973.84 34920.0 29752.8 38510.0 41972.7 40050.4 56538.4Total development 2874.75 20840.0 4422.68 23670.0 4375.0 24616.8 4375.0Total resources priority areas 18848.59 55760.0 34175.4 62180.0 46347.7 64667.2 60913.4
6.16 Apart from the above items, other areas of priority that are required fordeveloping institutional infrastructure for sustainability in health care delivery are:
1. Improved health education strategies2. Development and institutionalization of the health sector reform strategies.
85

Proposals for the FYO1 Budget
6.17 To make the budget preparation realistic and to help achieve the stated goals andobjectives and improve the output, the following proposals are recommended:
1. Reduce the number of unskilled staff and institute mechanisms for rationaldistribution of staff by transferring some skilled staff to PHC. This will have atwofold effect of releasing resources as well as addressing the issue of qualityof services provided in the PHC units.
2. Strengthen supervisory teams to check on treatment protocols and irrationalprescriptions.
86

7. WATER SECTOR
7.1 INTRODUCTION
Water Sector PER Objectives for FY01
7.1 The objective of the FY00 PER for the water sector was to provide a brief updateof water policy objectives and budget performance, issues and options in the water sectorduring 1997/9 - FY00. The update focuses specifically on the current status andperformance of rural and urban water supply and water resources management during thepast three years. Also, the review provides a budget outlook for FY01 and indicativeexpenditure plans for the Ministry of Water for at least the next three years (FY01 -FY03), linked to the expected water sector outputs. Options for improving the impact ofthe budget on the water sector performance are also mentioned in this PER. Thus theFY00 PER for the water sector was to assist the Govemment (MOF) in the preparation ofthe FY01 Financial Year Budget Guidelines and the MTEF for FY01 - FY03.
PER Study Approach and Methodology
7.2 The study's approach and methodology aimed at capacity building in PERanalysis in the Ministry of Water and maximization of the transfer of skills to counterpartstaff.
7.2 ISSUES RELATED TO BUDGET PERFORMANCE FOR FY98-FYOO
Total Budget
7.3 The budget performance for the Ministry of Water between FY98 to FY00showed an oscillating but poor budget track in actual expenditures. The trend indicatesthat the commitment of the GoT budget to Ministry of Water has been very low, not onlyin terms of its allocations, but more important in terms of what actually is availed to thesector.
Capital Budget Issues
7.4 Over time, the GoT budget has increasingly become dependent on donor funds, atan average of about 60 percent, to finance its annually planned (total) budgets for theMinistry of Water. For example, more than 90% of the approved development budget forFY99 to the ministry has originated from foreign sources. Specific development budgetissues observed include:
* Declining planned, approved and actual development budget expenditure;* High dependency on foreign funds and inadequate local funds in capital
budget;
87

* Increasing difficulties in commitment of counterpart funds for developmentprojects; and
* Declining trend and high divergence between donor commitment anddisbursement.
Recurrent Budget Issues
7.5 The recurrent budget accounted for about 50% of total actual expenditure duringthe 1998/9 - FY00 period. More than 70 percent of released local funds to the Ministrywere spent for payment of PE. For this reason, the Ministry's service delivery andundertaking of activities such as operation and maintenance (O&M) of infrastructures,which are often financed by other charges (OC), have been under-financed. Althoughmost urban water supply and Sewerage systems are autonomously operating and generatetheir own income, they still consume a large share of the recurrent budget throughsalaries of senior staff and O&M, especially the electricity bill, which is still borne by theGoT. Specific recurrent budget issues include:
* Oscillating planned, approved and actual recurrent expenditure;a Recurrent expenditure by service or output levels is dominated by rural and
urban sector. While the rural sector consumes high budget on O&M expenses,the urban sector's recurrent budget is expended for sanitation/sewerageactivities.
7.6 Personnel Emoluments (PE): There has been a systematic increase in PE,mainly due to the increasing seniority and promotions of the ministry's staff; andcontinued reliance on many casual laborers comprising of gauge readers, pump attendantsand watchmen who are employed on temporary basis mainly in the major water schemesand different water basins to collect data on water resources and do other manual works.The rising trend of wage bill implies that the PE budget destined to pay staff willcontinue to increase directly with staff's seniority and promotions.
7.7 Other Charges (OC): The expenditure for other charges by the servicelevels/outputs indicates that between FY98 and FY00, the water drilling agency (DDCA)- a subcontractor to the Water Resources Division, has been leading by claiming about66.6% of the total OC released to Ministry of Water. Water drilling is followed by theCentral Water Store (10%). In fact, the OC for DDCA and the Central Water Store(CWS) used to be very small in the past, but in FY98 and FY99, the DDCA and CWSclaimed a considerable amount of the MDF resources allocated to development projectsto address the El Nino based water crisis experienced in Dar es Salaam. Next in terms ofclaiming resources were divisions such as rural water supply (8.3%), urban water supply(4.5%) and others 10.3%.
7.8 Generally, the Ministry of Water utilizes OC to most of the casual laborersemployed by the Water Resources Management Division. Casual laborers aretemporarily employed (some for much longer time), most of them are semi- or unskilled(particularly the gauge readers and technicians), and are paid under OC and not under PE.However, there has been insufficiency of funds (other charges) for operation andmaintenance of water pumps, resulting into defective pumping systems.
88

Budget Ceiling
7.9 Though well understood and planned for, the water sector development is heldback by poor budget disbursement by both the exchequer and donors. As such, most ofthe water problems have been and will continue to roll over for many fiscal years.Notably, the budget ceiling criteria which is applied by the Government is outdated andmay derail the performance budgeting approach because it defeats/contradicts with theperformnance-oriented spirit in the sense that no strategic plan can be comprehensivelyimplemented with such an expenditure approach. Therefore, a revised framework tointegrate the budget ceiling with budget perfornance is required.
Impact of Expenditure on Water Sector Development
7.10 Public expenditure investment include not only additions to water supply plant,machinery and equipment but also intangible components of services such as refinedmanagement and institutional facilities, improved quality of water supply as well asadditions to the stock of human capital through training, etc. The important achievementthat emerges from this study is the establishment of the prerequisite local water supplyand sewerage services capability. These include improved infrastructure and supportinstitutions, which facilitate the development of the water sector. Specific realizationscomprise the following:
7.11 Sector fiscal discipline is in order: The Ministry of Water knows its expenditurepriorities and how to use resource to attain the long-term water sector goals. For example,in the FY99 PER Report, a lot of financing gaps were identified. The gaps were expectedto be addressed by the PER FY00. The gaps were prioritized from level 1 to 5 and totaledTshs. 15,197,956,000. Some of the activities have already been implemented and othershave to be reviewed for inclusion in the next budget proposal.
7.12 Review of Water Policy 1991 has been completed smoothly: The review ofRural Supply (a component of the 1991 National Water Policy) has been completed andhas incorporated a view of strengthening the rural authorities for development andmanagement of the rural water supply services. The rural water supply policy focuses oncommunity participation in conceiving, planning, construction, operation, maintenance,and ownership of their rural water supply schemes. The policy provides full involvementof users at all stages of the project cycle and is based and guided by social, economic,environmental and sustainability principles.
7.13 Some rural water supply strategies have started to be implemented:
* A few Water Users Associations/Trusts/Companies have been legallyestablished. Ownership has already been transferred to these water userentities/companies.
* Participatory Approach applied in strengthening the local community tomanage and run their own water supply schemes in sustainable manner hasbeen adopted. This approach provides for legal registration by thecommunities to operate and maintain their organization legally.
89

7.14 Urban Water and Sanitation Sector projects favored and showing sign of goodperformance: On Urban Water and Sanitation, the government has built up necessaryinstitutional framework to support water sector development. The institutional impact hasbeen the establishment of independent water authorities, with their own boards in all 20
regional headquarters. With effect from 1 st January 1998 the Minister of Water declaredall 18 UWSDs to be Urban Water Supply and Sewerage Authorities (UWSAs) indifferent levels of development and categories. For instance, five of the boards (Arusha,Dar/Kibaha, Moshi, Mwanza and Tanga) are completely autonomous. They do notdepend on Government subvention for O&M, except for the capital or developmentexpenditures.
7.15 The government sees the strengthening of rural and urban water supply authoritiesas advantageous since it aims to build the capacity of local authorities for self-financingand ensure the sustainability of service delivery. The success of the process willeventually reduce the burden of providing water and sanitation services by the centralgovernment.
7.16 Sector focus and shift in water sector policy priorities in the public expenditure:Since 1991 the Government has been emphasizing urban development, with a focus onUrban Water infrastructure rehabilitation. The sub-sector has been consuming over 50%of the resource allocation, in terms of both local and foreign funding. The foreign inputcomponent has been in urban water development.
7.17 Rural water has had a 20% allocation share. However, TAS and HIPC initiativesintend to support a shift towards water resource management and rural water supply. Inthe wake of HIPC and TAS, sector-spending prioritization has to be earmarked to therehabilitation of inoperative rural water schemes while handing over the same to thepeople, thereafter.
7.3 INSTITUTIONAL FRAMEWORK AND CAPACITY BUILDING
7.18 The Tanzanian government has set up an adequate institutional framework toimplement major water sector policy objectives and strategies. The role of the Ministry ofWater is also changing from that of being a service provider to being a facilitator,regulator and promoter of rural and urban water supply and sanitation/sewerage services.However, it has weak vertical and horizontal linkages. It is not conducive for either thecentral or local government to fully manage, co-ordinate and execute the developmentactivities pertaining to the sector all over the country.
7.19 The human resources development has been halted mainly due to lack of fundsfor capacity building activities such as training. The capacity building/training budget islocated in the development/capital component, which is not forthcoming as planned orauthorized. Attrition of the staff due to retirement, retrenchment, death, ill-motivation andvoluntary termination of services has further eroded the sector of its most needed humanresources. For instance, in the 5 years to come, all the heads of divisions and some unitswill be legally obliged to retire. This implies that no replacement will be accomplished.Due to this adverse situation, division will either be managed by under-qualified people,or will resort to expertise consultancy, which seem to be more expensive than the costrequired to develop the existing human resource.
90

7.20 Unfortunately, recruitment of staff into the water sector was suspended for severalyears. The employment permit was delayed and interviews for the post applicants areprolonged by the Civil Service Commission (CSC), alleging that there is no money toconvene such an interview. Also, the Ministry of Water has a backlog of about 800 (eighthundred staff) to be promoted by the CSC, which is claiming to suffer from budgetaryfinancial inadequacy.
Main Institutional Administrative Issues and Concerns
7.21 The following are major institutional and administrative issues and concerns forthe Water sector:
* Weak institutional set-up coupled by inadequate working tools, facilities andequipment, machinery and poor transport facilities, combined with aninefficient provision of water services and poor communication system withinthe sector.
* Shortages of adequate personnel to manage water and sanitation programs(i.e., inadequate trained, skilled and motivated staff). This issues is connectedto the restricted recruitment of staff, retaining of the required qualifiedprofessional and technical staff in the face of competitive attractions in thenon-public sectors and poor supply of the adequately trained personnel.
* It is difficult to equitably allocate water rights among competing users for theoverall socio-economic development of Tanzania, while at the same timepromoting sustainable development and management of water resources.
* Inadequate financial resources for water sector development.
7.4 CURRENT STATUS OF WATER SECTOR PERFORMANCE
Surface Water
7.22 Tanzania has an abundance of inland waters with several large lakes and rivers tomeet most of the present needs. However, differences in topography, rainfall pattern andclimate account for the existing variation in the availability of water in different parts ofthe country. Specific surface water issues include:
* Scarcity, misuse and wastage of water pose a serious and growing threat tosustainable development and protection of the environment.
* Increased human activities in the various catchment areas, competing andconflicting demands and land use are also impacting on the available waterresources in a number of ways. Such ongoing activities are causingdeterioration of the catchment areas at many places with consequent changesto runoff patterns and water balance.
* The water resources are unevenly distributed nationally in space and time, andare scarce in many areas. Also, there is high variability in rainfall, diverseclimatic conditions and geographical features. Rivers and lakes generally rise
91

during the rainy season and recede during the dry season. Generally, Tanzaniais relatively dry.
* Conservation of surface water sources against increasing pollution anddegradation of the environment.
Groundwater
7.23 Groundwater potential in the country is variable. It is one of the major sources ofwater, particularly in the semi-arid areas but still remains being not well established anddeveloped. In general, the natural groundwater quality in Tanzania is good, acceptable formost use. Specific groundwater issues include:
* High salinity (chloride) causes high evaporation rate and poor drainage,hardness and corrosion due to high carbon dioxide.
* High concentration of iron or fluoride is a common problem only in the areasurrounding the Rift valley system where volcanic chemicals contaminate thegroundwater.
. Lack of surveyed adequate data and information and mismanagement ofresources.
Rainfall
7.24 Tanzania has high annual rainfall. However, rainwater harvesting is mostly usedas a supplement to other water supply sources in most parts of the country. Severaldifferent types of rainwater storage facilities such as tanks, dams and charcoals, havebeen constructed at various levels from institutions to households. Rainwater harvestingfrom rooftops in rural areas is gradually gaining momentum although on a very smallscale. Therefore rainwater-harvesting tank construction could be a novel idea that willeventually be applied on a large scale.
* Erratic and highly unreliable rainfalls and data.* Poor rooftop construction of the harvesting systems.* Lack of proper operation and regular maintenance of the harvesting systems.
Rural Water Supply
7.25 The current official estimates of water supply coverage of the rural population isabout 48.5% of the rural population that has access to safe drinking water within awalking distance of 400m served through different types of schemes. The main ruralwater supply issues and concerns include:
* There is a growing demand for water supply by rapidly growing ruralpopulation. Therefore, rehabilitation and investment or development of thewater sector should match with such demand.
92
* Identification of available water resources potentials, including rainwaterharvesting, increased number of shallow wells, dams and charcoals, that canbe developed throughout the entire country in the wet and dry season,including both surface and groundwater, and springs.
* Protection and conservation of water sources and promotion of efficient use ofwater to ensure the sustainability of water schemes.
* Protection and conservation of water sources and promotion of efficient use ofwater to ensure the sustainability of water schemes.
* Promotion of the existing rural water through cost management system by ashift from the concept of free water to cost sharing.
* Promote private sector participation (local government authorities and otherprivate stakeholders) to ensure successful hand over from the centrallymanaged large rural water supplies to autonomous entities.
* Promote co-ordination of the stakeholders in the water sector. The MOW hasto ensure that local governments develop adequate capacities to assistcommunities take over the management and operation and maintenance ofrural schemes.
Urban Water Supply and Sewerage
7.26 Currently, there are 62 registered urban centers in Tanzania, out of which 20 areregional administrative headquarters. There are also 52 minor urban settlements in thecountry with some form of piped water system. The water supplies in these towns areinadequate in both the quantities produced and the coverage of the distribution network.
7.27 The sewerage coverage is about 10% and only in a few urban areas (e.g. Dar esSalaam, Arusha. Moshi, Mwanza. Tanga, Tabora and Dodoma). The sewerage system inthese urban areas cover central business areas and are in poor condition. In the rest of theurban areas and other unserviced areas, septic tanks and pit latrines are commonly used.Poor excreta disposal in urban areas is the major cause of pollution of water sources,hence the source of various intestinal diseases.
7.28 The process of strengthening of rural and urban water supply authorities aims tobuild the capacity of local authorities for self-financing and ensure sustainability of theservice delivery. The success of the process will eventually reduce the burden to thecentral government of providing water and sanitation services. This is an effective moveof ensuring the sustainability of the water and sanitation services in the country, that callsfor the process to be intensified. Specific urban water supply and sewage system issuesand concerns include:
* Ever-increasing demand from various socio-economic activities and rapidincrease in the urban population (estimated a more than 6% p.a.) in almost alltowns;
93

* All urban centers in Tanzania face frequent and critical water supply shortagesdue to leakage and wastage of aged water and sewerage infrastructures. Thereis an urgent need to combat and minimize leakage and wastage.
* Deterioration of the water quality due to industrial and household pollution;which also increases operational costs. The promotion of research andtechnologies for the management of wastewater, with a view of protectingwater resources and defluoridation, which will improve the quality of thewater to be served to the people;
* Urgent need of identification of available water resources potentials and thedemands. Identification of the potential for rainwater harvesting and thepromotion of the technology among the urban people with a view ofincreasing availability of water;
* Emphasizing demand management approaches especially in water scarceareas and during drought periods.
Irrigation
7.29 Of the total 43 million hectares suitable for agricultural production in Tanzania,only about 6.3 million hectares are under cultivation. The irrigation potential in Tanzaniais estimated to be over one million hectares. However, the area under irrigation is about175,000 hectares only, of which 120,000 hectares are under small-holder irrigation. Ofthe irrigated areas, about 69,000 hectares are irrigated in the Pangani basin and about30,000 hectares in the Rufiji basin.
7.30 The Main Irrigation Issues and Concerns include:- Irrigation is the largest consumptive water user and makes the greatest impact
on net water resources.D Irrigators are reported to be often in conflict with each other, and with other
water resource users.
Hydropower Generation
7.31 The hydroelectric power potential in Tanzania is estimated at 4.7 GW, out ofwhich only 12% has been developed. Over 70 percent of electrical power capacity isgenerated at hydropower plants on Ruaha and Pangani rivers, with a total installedcapacity of 280 MW and 97 MW, respectively. However, a substantial amount of thenational electricity is generated at two hydro-electric power plants, at Kidatu (204MW)and Mtera (80MW), which together make up 76% of installed hydropower capacity or51% of the total installed capacity (555MW) for the national grid system. The waterflows to these power plants are regulated by the Mtera reservoir with a nominal livestorage capacity of 3,200 million Cubic Meters and Kidatu with live storage capacity of125 million cubic meters.
94

7.32 Main Hydropower Generation Issues and Concerns include:
* Provision of the necessary hydrological information base for the planning,development and operation of hydropower system;
* Optimal allocation that benefits the whole spectrum of social-economicdemands; and
* Regulating the operation of hydropower reservoirs and at the same timemanaging and regulating all other water uses.
Conflicts in Water Uses
7.33 There exist several types of conflicts in water use for irrigation. There areconflicts between users in the same category. This is mostly common for irrigators andalso upstream users causing inconveniences to downstream users, either in one furrowsystem or several furrow systems. Other conflicts are between users of differingcategories such as between irrigation and domestic water supply, especially in the dryseason when most of the water is used for irrigation; between irrigators and hydropower,whereby hydropower producers blame the upstream irrigators for massive losses of waterand poor water management. Generally, irrigation downstream the major dams is affectedby these conflicts, which occur mainly because of uncoordinated regulation policies.There are also other conflicts such as those between irrigators and pastoralists, whichmainly involve land issues and notable by livestock migrating from place to place andtrespassing agricultural lands.
7.34 Further, the linkages between regular and adequate provision of safe and treateddrinking water, the individual's health status, as well as the quality and level of industrialand commercial output of goods and services in the country require an in-depthunderstanding and hence empirical investigation.
7.5 WATER SECTOR POLICY OBJECTIVES AND PRIORITIES FOR THE FY01
The Development and Water Sector Vision
7.35 The overall long-term goal of socio-economic development for Tanzania by theyear 2025 is to attain sustainable human development with all the prerequisites forachieving a fully developed economy. The Tanzanian society of 2025 must have freeditself from abject poverty and attained a high quality of life for all people, meaning that:people will have attained respectable levels of incomes, enhanced ownership of assets,reduced vulnerability, enhanced and increased power over their own future. One of theachievements expected by the year 2025 is an increase of access to safe water from 50percent to 90 percent of the population. In specific terms, we may believe that people,looking 25 years ahead would opt for a water future where:
* Accessibility and provision of safe water for drinking and sanitation isensured;
95

* Water supplies are adequate to support agricultural and non-agriculturalproduction activities;
* The negative effects of droughts and floods are minimized;
* The use of water for human purposes takes care of and protects theenvironment and creatures that require water; and
* Conflicts over water do not develop, neither at the local level, in the regionnor internationally.
Ministry of Water Mission and Water Sector Policy Objectives
7.36 The mission of the Ministry of Water has always been to achieve sustainabledevelopment and management of water resources for the benefit of all Tanzanians,socially and economically. The broad Water Sector Policy objectives are: - to increasehealth and productivity of the population through the provision of safe and adequatewater supply and sanitation services to the maximum number of people; to provideeffective water supply and waste water disposal services to commerce and industry tohelp maintain their productivity, as well as recognizing agricultural, power generationand recreational needs; and to identify and preserve water sources and catchment areas.7.37 To achieve the above water policy target, the government has proposed severalpolicy strategies as follows:
* Promoting community participation, cost sharing and cost recovery in ruralwater supply activities;
* Maintaining, rehabilitating water schemes and securing of new capitalinvestment;
• Promoting the use of appropriate technology;
* Encouraging private enterprise to develop and intensify privatization;
* Enhancing human resource development;* Developing water sources for urban and rural areas;
* Improving efficiency in the sector;
* Improving the environmental sustainability of water supplies;
* Promoting conservation measures and proper management of water resources;
* Undertaking institutional reform, evolving new organizational structures,enhancing capacity and promoting decentralization; and
* Reviewing the regulatory and legal framework.
Water Sector Priorities for FY01
7.38 In implementing these strategies, the government will be guided by the followingwater sector's funding priorities set in FY01, which have been identified as follows:
96

* Rehabilitation of networks for planning and design for:
* Provision of institutional support to rural based water user communities.
* Hydrological network.
* Hydrogeological network.
* Rehabilitation of drilling equipment and earth-moving equipment for watersupply and sewerage systems.
* Development of new water sources (Drilling of bore holes and construction ofdams).
* Rehabilitation of rural water supply scheme and completion of ongoing ruralwater supply projects (earning little budget money)
* Rehabilitation of rural water supply and sewerage services;
* Rehabilitation of drilling equipment and earth-moving equipment for ruralwater supply and sewerage services.
- Establishment of water-user entities in the rural area.
l Rehabilitation and Expansion of Urban water supply and sewerage systemswith respect to population growth and other economic activities. That is,develop new water sources for urban water supplies and sewerage services inurban areas where social and economic activities are expanding.
* Enhance capacity building, recruitment of manpower and retraining of staff(engineers, technicians, managerial professionals and other experts).
* Intensification of water quality control and monitoring.
* Enhance environment management and conservation measures.
Options for Improving the Impact of the Budget on the Water Sector
7.39 At the moment, more funds are needed to enable the GoT to implement the watersector development projects and to accomplish the institutional reforms before it becomesa facilitator, regulator and promoter of water supply and sanitation services in Tanzania.However, the following observations depict the water sector developments.
Reforms Not Well Captured in the Current Budgeting
7.40 It was noted earlier that the budget performance for the Ministry of Waterbetween FY98 to FY00 marked an oscillating and poor track due to low commitment ofthe GoT budget to Ministry of Water. This has partly been the consequence of dependingupon the budget ceiling determined by the GoT (through MOF) to instill realistic fiscaldiscipline through the cash budget system. However, declining and low flows ofresources may signify a shift of government policy from a provider of public service topolicy formulation, promoter and facilitator. The Ministry of Water's role is stillreforming from traditional service provider to a facilitator, regulator and promoter of
97

rural and urban water supply and sewerage services. Lack of understanding of this reformand bureaucratic budget procedures may lead to poor budgetary prioritization.
Ongoing Resource Deployment Reform
7.41 Ongoing Govermnent initiatives are aimed at increasing efficiency in managingurban water supply and sanitation. All the 20 regional headquarters have independentwater authorities, with their own boards. Five of the boards (Arusha, Dar/Kibaha, Moshi,Mwanza and Tanga) are completely autonomous - not depending on Governmentsubvention for O&M. Urban Sector Rehabilitation Program (USRP) project is to furtherconsolidate the management of these boards through the establishment of more reliablewater sources. As a result, an expansion of the area served with water supply will befacilitated so that the revenue base can be widened. This will sooner or later free thecentral government's financial resources and manpower to be used elsewhere.
Measures to Reduce Aid Dependency and Enhance Optimal Utilization of Resources
7.42 The above analysis has demonstrated the problem relating to increasingdependency on donor funds for the water sector's development. The Ministry of Waterhas over time designed strategies aimed at reducing foreign aid dependency. Many ofthese strategies have aimed at reducing the need for foreign money to finance waterresource management activities and enhancing optimal utilization of water resources. Theenvisaged strategy is to transfer water supply and sanitation facilities from centralownership to the beneficiaries by creating an enabling environment for public companies,user entities/trustees, and the community to participate. Specific water sector strategiesinclude:
* Use of village committees;
* Village water fund;
* Income generating activities; and
* Human resource development.
Water Sector Budget Outlook for FY01
7.43 The above water sector priorities can be approximated into major Ministry ofWater functions, activities and measurable output indicators such as water and sanitationservices, coverage to rural population or number of people in urban areas who will haveaccess to safe water within the stated time period. Based on water sector policies,strategies and priorities, the budget outlook is provided in Tables 7.1, 7.2 and 3.20 asfollows:
Table 7.1: Projected Total Budget Outlook for FY01 - 2003/04Year FY00 FY01 - FY02 FY03Recurrent 2,803,825,000 4,218,933,420 5,371,601,328 6,839,193,217Capital 21,508,512,000 32,239,570,500 34,901,088,819 34,875,994,320Total 24,312,337,000 36.458,503,920 46,229,382,971 41,715,187,537
98

Table 7.2: Breakdown of Capital Budget Outlook for FY01Code Service Levels Local Foreign Total101 Administration & General 15,013,296 0 15,013,296102 Finance and Accounts 0 0 0103 Policy and Planning 81,174,124 94,358,567 175,532,691201 Water RJAss and Exploration 1,000,955,428 9,500,000,000 10,500.955,428202 Central Water Store 100,426,000 0 100,426,000203 Water Laboratory 250,702,000 424,000,157 674,702,157301 Urban Water and Sewerage 1,501,000,466 10,583,508,764 13,084,935,230302 Central Water Board 101,000,000 158,767,118 259,767,118401 Rural Water Supply 505,128,043 2,088,154,702 2,593,282,751501 Water Resource Institute 200,192,029 600,789,000 800,981,029601 Water Drilling 1,034,400,800 4,000,000,000 5,034,400,800TOTAL CAPITAL OUTLOOK 4,789,992,186 27,449,578,314 32,239,570,500
Table 7.3: Breakdown of Recurrent Budget Outlook for FY01Code Service Levels Total Recurrent PE OC101 Administration & General 291,491,593 109,107,142 182,384,451102 Finance and Accounts 68,988,888 30,253,999 38,734,888103 Policy and Planning 113,690,906 60,256,180 53,434,726201 Water RJAss and Exploration 920,659,239 556,512,071 364,147,168202 Central Water Store 73,120,250 40,548,860 32,571,390203 Water Laboratory 197,386,954 53,889,456 143,497,498301 Urban Water and Sewerage 1,050,344,697 589,020,682 461,324,015302 Central Water Board 109,607,431 66,995,864 42,611,567401 Rural Water Supply 919,045,226 450,332,663 468.712,563501 Water Resource Institute 234,166,550 109,866,592 124,299,958601 Water Drilling 240,431,686 111,579,884 128,851,802TOTAL RECURRENT OUTLOOK 4,218,933,420 2,218,363,393 2,040,570,026
99


8. ROADS SECTOR
8.1 THE ROAD NETWORK IN TANZANIA
8.1 The road network in Tanzania comprises approximately 84930 km of roads, outof which, 10230 km (12%) are trunk, 24700 km (29%) are regional and 50000 km (59%)are district (Table 8.1). According to the Ministry of Works (MOW) estimates roadnetwork consist of 10840 km (13%) good, 20803 km (24%) fair and 53287 km (63%)poor condition. About 38% of trunk roads and 1% of regional roads are paved, whileabout 62% of trunk roads and 99% of regional roads are unpaved. The bulk of the roadnetwork (63%) requires rehabilitation. Only 37% of the road network requires routineand/or normal period maintenance. This in turn has important budgetary implication.Table 3.21 presents currently available information on the length and condition of theroad network as presented in the survey carried out in May 1999.
Table 8.1: Road Network by Type Surface and Condition (in km)Type of Road Condition of Road Network 1999
Good Fair Poor TotalTrunk Roads
Paved 2317 (59%) 1163(30%) [441(11%) 3921 (100%)Unpaved 776 (12%) 2858 (45%) 2675 (42%) 6309 (100%)
Total Trunk Roads 3093 (30%) 4021 (39%/) 3116 (30%) 10230 (100%)Regional Roads
Paved 22 (10%) 116 (70%) 45 (20%) 223 (100%)Unpaved 2100(9%) l 5731 (23%) 16646 (68%) 24477 (100%)
Total Regional Roads 2122 (9%) |5887 (24%) 16691 (68%) 24700 (100%)3. DISTRICT ROADSTotal District Roads 3995 (8%) 9755 (20%) l 36250(73%) 50000(100%)
TOTAL ROADS 9210(11%) 19663 (23%) l 56057 (66%) 84930 (100%)Source: Ministry of Works
8.2 GOVERNMENT VISION FOR THE ROADS DEVELOPMENT
8.2 The road sector is one of the central sectors in the Tanzania economy and iscrucial for the sustainability of the country's economic development. The share of roadtransport in overall GDP is about 5%, while the share of transport equipment in grossfixed capital formation is about 37%. Road transport is a major mode of passengertransport, and also handles about 70% of the internal freight traffic and 64% of the transitcargo. In addition, road transport dominates other modes of transport in terms ofemployment creation. The vastness of the country and the dispersed nature of thepopulation, business and economic activities add to the strategic importance of the roadssector to the country.8.3 The Tanzania Development Vision 2025 accords very high priority to investmentin infrastructures. Specifically, the development of the road network is judged to be
100

absolutely essential for promoting rural development. Within the context of the Vision,the road sector is required to facilitate wealth creation and equitable distribution of thebenefits arising from growth. The roads sector is also required to facilitate the creation ofa strong, diversified, resilient and competitive economy, promote rural development,stimulate investment and other income generating activities and ensure widerparticipation by the Tanzanian community in markets.
8.4 The Government's mission and vision for the development of the sector is thusfocused at improving the national road network. In this case the Government agrees thatno sustainable and meaningful socio-economic development can take place in the regionsand villages while the condition of roads is bad. Poor roads will not allow for the fullexploitation of the national human and natural resources that would lead to a highergrowth of the economy. An improved national road network would consist of roads thatare good for vehicles to drive on under all whether conditions. Also it would offer theshortest possible road link between different geographical locations, both in urban andrural areas, to facilitate production, distribution and marketing of all kinds of goods andservices.
8.3 ROLE OF PARENT MINISTRIES
8.5 The responsibility of administration and management of the road network ispresently shared between MOW and MRALG. However, from 1 't July 2000, the newsemi-autonomous road agency "TANROADS" took over the maintenance anddevelopment role of MOW. MOW manages the trunk and regional roads, includingplanning, designing, constructing, improving and maintaining the roads hereunder. Onthe other hand, MRALG is responsible for allocating and distributing resources from theRoad Fund to the districts, where the local administration is responsible for roadmaintenance and development. GoT is committed to remaining the principle financier ofmaintenance, rehabilitation, and upgrading activities. On the other hand, the abovementioned activities are to be carried out by independent contractors and not byGovernment departments or agencies.
8.4 THE ROAD FUND
8.6 The Government has adopted a new institutional structure for the roads sector.Under the new set up, the government has amended the Road Toll Act in order to create adedicated Roads Fund, a Road Fund Board and a road agency - TANROADS. Thecurrent act provides for ring fencing of revenues from the road toll so that they will beused primarily for maintenance works for trunk, regional, district and feeder roads. Theroad funds are being managed by the Road Fund Board, which includes private sectorrepresentatives to ensure that the interests of the stakeholders are addressed in themaintenance of roads.
8.7 The Road Fund is dedicated to the maintenance and upgrading of trunk, regionaland district roads. Revenue for this fund is obtained from a user charge on fuelconsumers. Under this system, the road users are charged a fuel levy of Tshs 80 per literof fuel (Tshs. 70 per liter before the FY01 budget) The funds are collected by the oilcompanies at the time that the fuel leaves the bonded warehouse. These funds are paid tothe Commissioner of Customs who deposits them into the Road Fund Account of the
101

MOW (70%) for trunk and regional and the MRALG (30%) for district and feeder roads.Of these allocations, only 10% may be used for development of the road networkwhereas the remainder is earmarked for maintenance operations.
8.8 The road fund has in previous years been managed by the MOW. In line with thecurrent changes in the institutional set up, where the Road Fund Board has been created,the Road Fund is managed by a Board which is also the policy organ for directing theactivities of the road agency TANROADS.
8.5 THE "NEW" MOW AND TANROADS
8.9 The ongoing institutional reforms have a bearing on the future role of the MOWin the road sub-sector. The Road Fund Board is replacing the MOW role of managing theresources form the Road Fund. Establishment of the TANROADS on the other hand hastaken away the MOW responsibilities of maintaining, rehabilitating and upgrading thetrunk and regional roads. The ongoing Local Government reforms will also change thenature of resource flows from the Central Government to Local Authorities. Under thenew structure resources from the road fund will flow in the form of block grants to theLocal Authorities. This will replace the current practice of allocating the funds throughthe MRALG.
8.10 In view of the above changes, the role of MOW has been limited to policyformulation, strategic planning and regulation of the TANROADS and Road Fund Board,including donor co-ordination.
8.6 MOW OVERALL EXPENDITURE PERFORMANCE FY98-FYOO
8.11 Despite the observed growth in Government's revenue and subsequent allocationto MOW, total allocations have fluctuated over the past few years. In most cases actualreleases have been far less than originally budgeted. This has been the case for both thedevelopment and recurrent budget as shown in Table 8.2. In FY98 for instance, only 63%of development budget and 77% of recurrent budget were made available. During theFY99 no allocation was made to the MOW development budget. This can partly beexplained by priority that was given to emergency repairs of roads following EL-NINOrains in that year. Again in FY99, actual recurrent allocation to MOW was higher thanthe budgeted amount by 2% due to the fact that development funds were dedicated to themaintenance of road infrastructure that was destroyed by the EL-NINO rains. To a largeextent these variations have affected the ability of the ministry to meet its financialobligations on road maintenance and rehabilitation. Table 8.2 gives the allocation ofresources to the road sector for FY98 to FY00.
102

Table 8.2: Government allocation of resources to the road sector (in mill. Tsh.)FY98 FY99 FY00
Budget Actual Actual Budget Actual Actual Approveas % as % d BudgetBudget Budget
1. Total Domestic Revenue 695300 661233 95% 733276 689325 95% 777200
2. Allocation to MinistriesDevelopment 24471 12711 52% 8000 4307 54% 20000Recurrent 563682 528300 94% 622444 453800 73% 787085
2. Allocation to MOWDevelopment 3952 2500 63% - - - 2927Recurrent 23046 17779 77% 37189 38091 102% 32485
Rec. Alloc. To MOWof which PE 1568 2384 152% 1932 1858 96% 2479of which OC 21478 15395 72% 35257 36233 103% 30006
Total 26998 20279 75% 37189 38091 102% 35412
Allocation to RoadsDevelopment 3952 2500 63% - - - 2927Recurrent 20358 15835 78% 23083 19334 84% 26391
Total 24310 18335 75% 23083 19334 84% 29318
Roads as % of Ministries 4% 3% 4% 4% 4%
Rev. from the Road FundTotal collections 33745 17000 52% 46000 38395 83% 40476Allocation to MOW 20000 15000 75% 32250 31777 99% 28333
Alloc. to MOW of whichDevelopment (10%) 2000 1500 75% 3225 3178 99% 2833Recurrent (90%/6) 18000 13500 75% 29025 28599 99% 25500
Source: Ministry of Works.
8.7 MOW EXPENDITURE ON ROADS
8.1 2 MOW expenditure on roads (i.e. trunk and regional roads) over the past few yearshas centered on three main areas: Emergency maintenance of roads such as those causedby EL-NINO rains during FY98; Roads maintenance of rehabilitation/upgrading; andImplementation of priority and upgrading projects (ongoing projects under IRP).
8.13 From Table 8.3 it can be observed that for the two years FY98 and FY 99, moreemphasis has been on the roads rehabilitation (i.e. 63% and 56% of the total respectively)as compared roads maintenance ( i.e. 37% and 44% of the total respectively). Again,when one looks at the actual expenditure on maintenance and rehabilitation, it is clearthat trunk roads has received higher weight than regional roads. This confirms theimportance of the trunk roads as the main transport arteries and the priority on theseroads being based on the population served, agricultural output, mining, tourism, andimpact on regional co-operation.
103

Table 8.3: Resources allocation for road maintenance and rehabilitation (mil. Tsh.)FY98 FY99 FY00Budget Actual Actual Budget Actual Actual Approv
as % as % BudgetBudget Budget
Road maintenanceTrunk Roads 11057 7391 67% 12250 15627 128% 37251Regional Roads 8914 4028 45% 15310 8982 59% 10151
Total maintenance 19971 11419 57% 27560 24609 89% 47402
Road rehabilitationTrunk Roads 25493 17388 68% 42622 29264 69% 30716Regional Roads __ .._ 1937 2010
-Total rehabilitation 25493 19325 76% 42622 31274 73% 32521
GRAND TOTAL 45464 30744 68% 70182 55883 80% 79923
TotalMaintenance % 37% 44%Rehabilitation % 63% 56%
Source: Ministrv of Works
8.8 LOCAL AUTHORITIES EXPENDITURE ON ROADS
8.14 LAs expenditure on roads is for district and rural roads, where the councils hasthe responsibility of managing these roads under the co-ordination of the MRALG(formerly by the PMO). In this case "district roads" comprise roads that link districtheadquarters with ward centers, important centers within the district and importantcenters within the high class road. While the MOW figures show that district roadsconstitute 59% of the total road network, data from 1999 survey by Inter Consult indicatethat district roads constitute 33.6 of the total road network in Tanzania. Lack of firm dataon the road network in Tanzania has a negative implication for the management of thenetwork in terms of planning road works and ensuring effective budgeting.
8.15 The Condition of most district roads, feeder and urban roads in Tanzania is verypoor with very few of them providing year-round access. Estimates show that about 60%of the district and feeder road networks are impassable to motor vehicles throughout theyear due to missing bridges and culverts, and short interspersed stretches of native badsoils along a big portion of the district roads. It is estimated that 90% of the district roadsand feeder roads are not accessible by motor vehicles during the rain season. The majortask facing the district roads is rehabilitation due to damages caused by the EL-NINOrains.
8.16 The budget for district and rural roads is met by a combination of subventionsform the central government through MRALG and councils own revenues. Whileresources from the central government are used for development purposes, resourcesfrom the district and urban councils are used for maintenance purposes. Disbursement fordevelopment purpose has been minimal and even the greater part of the maintenanceexpenditure is met by the Road Fund. Table 8.4 shows the distribution of the Road Fund
104

for trunk and regional roads (Ministry of Works), and for district and rural roads (PrimeMinister's Office and Ministry of Regional Administration and Local Government).
Table 8.4: Road Fund collection and allocation to MOW and PMO/MRALG (in mill. Tsh.)
Year Total Collection of Allocations toRoad Fund (1) MOW (2) PMO/MRALG (3) 3/1 (%)
1991/92 3741.9 2464.3 616.1 16%
1992/93 6840.8 5337.3 1334.3 20%
FY94 14272.2 8515.4 2317.0 17%
FY95 21198.5 16265.6 3796.9 18%
FY96 28307.5 16000.0 4000.0 14%
FY97 25398.8 15998.4 3450.0 14%
FY98 33745.3 14999.8 2600.0 8%
FY99 38365.5 29818.7 12779.3 33%
FY00 22275.4* . 4252.0** ..Note: * Collection from July 1999 to January 2000, ** Allocation up to February 2000. Figures beginning from FY99are allocations to MRALG.Source: MOW. PMO and MRALG
8.17 It is clear from Table 8.4 that the allocations of the Road Fund have remained lessthan 20% over the past five years except for the FY99 when they were about 33%. It canalso be noted that before FY99 not the total amount of Road Fund collected in each yearwas disbursed to MOW and PMO. Some funds from this source were diverted to otheruses. The situation improved only recently in FY99 when the Road Fund Board wasformed to oversee the collection and distribution of the Road Fund.
8.9 DONOR COMMUNITY RESOURCES FOR ROADS
8.18 Table 8.5 shows the donor commitment for trunk and regional roads in terms ofthe amount budgeted and the actual amount disbursed. It is worth to note here that thereare some district roads that receive donor funding although not reflected in Table 8.5.
Table 8.5: Flow of resource form donors (in mil. Tsh.)
Type FY98 FY99 I FY00Budget Actual % Budget Budget Actual % Budget ] Budget
Trunk Roads 1740 1324 76% 3450 2733 79% 4000Regional Roads 39895 2807 7% 47698 16382 34% 27758Total Donor 41635 4131 10% 51148 19115 37% 31758Source: Ministry of Works
8.19 Table 8.5 indicates that actual amounts disbursed were far less than the budgetedamounts for FY98 and FY99. The deviations between the budgeted amounts and actualdisbursements for regional roads ranged from 93% to -66%, while for trunk roads theyranged from -24% to -21% for FY98 and FY99, respectively. Much of the deviations canbe explained by delays in the release of funds due to delays in finalizing of the
105

institutional changes for the management of the road sector. These institutional changeswere related to:
* Establishment of a dedicated road fund for the maintenance of the roadnetwork;
* Establishment of the roads board for the management of the road fund andto regulate the use, maintenance and development of the road network; and
* Establishment of the road agency that will be responsible for themaintenance and development of the trunk road and regional road network.
8.20 The big variation between committed and disbursed amounts has widely beenshown by the EU and the World Bank. This variation reflects basically the inability ofthe MOW to access the funds from the donor community. Some of the reasons that havecontributed to this situation are: failure to provide down payment of full amount of thecounterpart funds by the Government; delays in the institutional reforms mentionedabove; delays in procurements which have resulted in cost overruns; and delays in thedisbursement of the road fund which leads to a low absorption of the funds because oftime constraint and seasonal rains that are not conducive for road maintenance, especiallyfor gravel and earth roads.
8.10 RECOMMENDATIONS
8.21 Detailed assessment of the impact of the past road maintenance operations, withparticular emphasis on whether the expenditures have created the desired benefits, isimportant. It would appear that the unpaved road network is deteriorating despiteincreased maintenance funding, and the effects of very spread and limited maintenancemay in fact be negligible and possibly wasted.
8.22 Detailed annual road condition and traffic surveys to monitor impact of roadmaintenance operations, and create basis for selecting and prioritizing a strategic roadnetworks that must receive full maintenance. is crucial. Condition surveys must includesome forms of scientific evidence to support visual inspections and limit impact ofsubjective opinions and possible other motives to show a road in good condition. Detailedannual road condition surveys with some degree of scientific evidence are required toeffectively monitor the development, and in particular to identify expenditures that do notproduce the expected results or benefits. Normally, annual road surveys should beundertaken by an outside evaluator in order to firmly establish money used for roadmaintenance is well spent.
8.23 In order to fund the road sector as required two approaches are suggested: eitherto increase Road Fund revenues or to scale down the level of ambition for the roadnetwork and maintenance policy. It has, however, been shown that the road fund iscapable of generating surplus recurrent funding to bridge the financing gap fordevelopment expenditure in the next two fiscal years where the bulk of the investment isrequired. This would require a temporal relaxation of the road fund statute depicting thatonly 10% may be used for development activities. However, where it is not easy to raiseroad fund revenues, the second option should be taken.
106

8.24 Dedication of the Road Fund to the maintenance and development of a strategicroad network, as opposed to the present split between MOW and MRALG. These fundsshould be released on time and sufficiently in order to implement planned projects andprograms on road network.
8.25 There is a need for a detailed assessment of the status of implementation ofdevelopment projects with donor commitments, including verification of need for GoTcounterpart funding (also for projects with 100% donor funding where compensation andpossibly relocation of utilities is still required); and preparation of realistic time schedulefor individual project implementation. The objective here is to ensure the availabilitycounterpart funding, possibly by postponing some projects until they become affordableor by increasing the development expenditure from the national budget.
107

9. AGRICULTURE
9.1 OBJECTIVES OF THE FY01 AGRICULTURAL SECTOR PER.
9.1 The overall objective of the FY01 agricultural sector PER was to provide inputsinto the preparation of the budget guidelines, the budget for FY01 and sector MTEF forFY01-FY03. This PER also devoted particular attention to the relationship betweenbudget allocations and the poverty alleviation as well as food security. Specific tasksincluded: (i) review of recent performance of the sector, (ii) assessment of the availableresources and major constraints (iii) analysis of the sector plan and budget for FY01 and(iv) recommending options.
9.2 PERFORMANCE OF THE AGRICULTURAL SECTOR
9.2 Generally, agricultural performance for the past three years was positive, despitethe existence of various impediments. Agricultural GDP grew at a rate of 2.2% (Table9.1) in 1997 but declined to 1.9% in 1998 because of adverse whether conditions (BOT,1999) and also due to some imperfections in the operations of the liberalized cropmarkets.
Table 9.1: Agriculture GDP and Growth Rates (in constant 1992 prices)Agricultural GDP Growth rates
Sub sector (Tsh. Bill) (% per year)1996 1997 1998 1985-90 1990-95 1995-98 1997 1998
Main food Crops 323.1 269.9 350.3 4.3 3.0 3.5 -16.5 29.7Other Food Crops 136.5 140.3 144.2 3.0 2.8 2.9 2.7 2.8Export Crops 67.2 64.2 77.4 1.8 7.7 5.4 2.7 1.9Live Stock 94.3 96.8 98.7 3.0 2.5 2.7 -4.5 2.6Forestry/Hunting 45.6 46.8 47.4 2.7 2.6 2.6 2.7 1.2Fishing 41.2 42.8 44.3 3.0 3.7 3.4 3.7 3.5Agricultural GDP 709.0 662.8 764.3 3.5 3.3 3.3 2.4 1.9
Source: MAC:
Food Crops
9.3 Production of cereals and non-cereals increased from 3111 and 2775 thousandmetric tons in FY97 to 4271 and 3750 thousand metric tons in FY99, equivalent to anincrease of 37% and 33% respectively. Total food production increased by 35%.Performance of most food crops during FY99, was poor, mainly due to poor rainfall,which was accompanied by long periods of dry spells. Food production dropped by 7%from 7971 to 7440 thousand metric tons with paddy and wheat registering the bigger fallsin production.
9.4 Production of food crops in the country during the 1997-1999 period wasgenerally affected by unfavorable whether conditions: rains were either too little, toomuch. late and /or rained for only a short period. The production of cereals wasforecasted to increase by 5% during FY00, as opposed to a fall in non-cereal crops of 3%.However, overall total food production was expected to increase by 1%.9.5 Food insecurity continued to be a major problem and recurring phenomenon indifferent parts of the country. Physical and economic access to sufficient. safe and
108

nutritious food to meet dietary needs and food preferences for an active health liferemained outside the reach of the majority of the people. Although food production hasbeen marginally increasing over the past three years, and in some years exceeding theoverall food requirements, the nutritional energy requirements were far from being meton a sustainable basis. During the normal agricultural production years, some parts of thecountry were able to produce sufficient food crops while others registered short falls.
9.6 Over-dependence on rain-fed agriculture, adverse climatic conditions laborshortage in rural areas due to rural-urban migration among the youths and increasingincidence of HIV/AIDS infection, were among the frequently cited factors thatcontributed immensely to food insecurity in Tanzania. Other factors included lack ofsubsidies for agro-inputs, lack of credit, frequent institutional changes and at the policylevel - the relative emphasis on social sectors compared to economic sectors.
Cash Crops
9.7 Output performance of all cash crops was negative except for coffee, sugar andcashew-nuts. Cashew-nut production grew by 39% in FY98 from 67500 metric tons theprevious season and by 13% to 105000 metric tons in FY99. The growth in production ofcoffee and sugar increased from negative 12% and 27% to 13% and 31% respectively.The crops whose production fell persistently are cotton and sisal. Cotton production fellfrom 66661 metric tons in FY98 to 24169 metric tons in FY99 (about 64% compared to27% in the year earlier). During the same period, sisal production fell by 19 and 25percent respectively. Similarly, growth in production of tea and tobacco declined from33% and 44% registered in FY98 to - 16% and -13% in FY99 respectively.
Table 9.2: Cash Crops Production (in metric tons)Year/Crop Coffee Cotton* Sisal Tea Cashew- Tobacco Pyrethrum Sugar
nutFY97 42000 90697 22000 19767 67000 35379 600 116300FY98 37000 66661 20000 26206 93173 51014 400 85000FY99 41900 24169 15000 22000 105000 44264 500 111040FYO0** 50000 54300 20000 26000 110000 56000 1000 120000% change -12.0 -26.5 -9.0 33.0 39.0 44.0 -33.0 -27.0FY97-FY98 I_Io% change 13.0 -63.7 -25.0 -16.0 13.0 -13.0 25.0 31.0
FY98-FY99* I bale lint cotton 181kgs it EstimatesSource: MAC, Budget Speech, FYOO.
9.8 The observed decline in coffee production was mainly on account of bad weathercoupled with low use of inputs while the decline in production of cotton was caused byfailure of co-operatives to pay farmers promptly, bad weather conditions and increasinginput prices. By contrast, the impressive performance in the production of cashew-nutsand tobacco was due to good weather condition, availability of inputs and liberalizationof marketing.9.9 Foreign exchange earnings from exports of coffee, cotton and sisal declined overthe period 1996-1998 while that from cashew-nuts, tea and tobacco increased. The topearners of foreign exchange earnings remained to be coffee, cotton and the stronglycoming up cashew-nuts.
109

Livestock
9.10 The general performance of the meat sub-sector during the FY99 period wassatisfactory relative to local demand. About 268700 tons of meat were produced in FY 99compared to 260000 tons in FY98. The target of meat production for FY00 was 300000tons. Milk production increased from both traditional (rural) and commercial sector.During FY98 about 670 liters of milk were produced compared to 600 liters of milkproduced in FY97. Production of day-old chicks was below the national requirement of10 million by 2 million due to poor quality of feed, frequent disease outbreak and rapidrise of feed prices. The capacity of animal feed industry stood at 381000 metric tonswhile actual production was 280000 metric tons in FY97. Overall, the livestock sectorcontributed about 13% of GDP.
Co-operatives
9.11 The number of co-operatives increased from 4515 in FY96 to 4538 in FY98.Despite the increase in number of registered co-operatives, only 3.7% of all registered co-operatives' accounts were audited compared to 25% in FY96. Activities undertaken bythe co-operatives directorate in MAC, including inspection and supervision of primarysocieties and co-operatives, establishment of Inspection Fund, and establishment CreditCo-operative Societies (SACCOS), were scaled-up during FY98.
9.12 MAC in collaboration with the Bank of Tanzania (BOT) continued with theprocess of designing strategies to establish financial institutions to support the co-operatives sector including the establishment of additional SACCOS to cover most partsof the country. This is in addition to the supervision of banks owned by co-operatives.The co-operatives that have their own banks include Kilimanjaro Native Co-operativeUnion (KNCU) (Kilimanjaro Co-operative Bank started in 1996), VUASU, and NyanzaCo-operative Union (NCU). The objective has been to address the problems faced byprimary societies including fierce competition from private crop buyers and lack ofsufficient financial resources.
9.3 BUDGET PERFORMANCE FY98-FYOO
9.13 A declining Recurrent Budget: Generally, recurrent expenditure for the agriculturesector declined during FY99. However, actual expenditure for some of the sub-votestended to exceed the approved budget estimates. For instance actual expenditure on FoodSecurity exceeded approved expenditure by 347.2%. This over expenditure on foodsecurity is broadly ascribed to food deficits occasioned by the El Nino rains of 1997 andearly 1998. However, it is also clear that the largest share of the expenditure went tofinance crop development, co-operative development and administration.
110

Table 9.3: Recurrent Budget for FY98-FYOO (Mil. Tsh)Sub votelProgram FY98 FY99 FYOO**
Actual % of Actual % of ActualExpenditure Budget Expenditure Budget Expenditure
101 Administration & General 2302.1 112.0 2253.6 162.0 457.3102 Finance and Accounts 38.9 58.6 71.3 89.0 2.7103 Policy and Planning 79.4 52.8 91.4 55.0 49.3104 Agric. Training Institute 255.1 34.0 0.3201 Crop Development 5936.0 161.3 3634.2 69.0 836.5301 Research and Development 1588.6 79.4 1617.8 91.4 82.6401 Co-op. & Inst. Development 1440.6 109.8 1874.0 115.5 842.5501 National Food Security 1040.4 92.1 6138.8 547.2 0.0601 Livestock Development 16.5 0.6 2369.7 75.0 0.02TOTAL 10142.8 95.6 18306.0 119.5 2271.1
Note ** Actual Expenditure for July-DecemberSources MAC, Appropriations Accounts and Appendix 3.1
9.14 Both the Co-operative and Crop Development Departments spent the lion's shareof the entire budget of the ministry (Table 9.3). By contrast the Agricultural TrainingInstitute and Livestock Development Department suffered from inadequate resources.whereas food security received no funds at all.
9.4 CONSTRAINTS AND FUTURE PROSPECTS OF THE AGRICULTURE SECTOR
9.15 Due to numerous constraints agricultural production and productivity hasremained rather low and consequently the country is still a net food importer andrecipient of food aid. Several cross-cutting impediments to accelerated agriculturaldevelopment, which are detailed in the recent Agricultural Memorandum (World Bank,2000) include: inadequate budgetary allocations; poor state of rural infrastructure;inadequate rural financing; poor technology development and transfer; multiple levies,fees, and taxes; seasonal labor shortage; uncertainties about land ownership and use;issues concerning water availability for irrigation and livestock use; and low privatesector participation in agricultural production.
9.16 Constraints on food crops sub-sector include: unfair food trade practices; arbitrarycrop movement bans; impact of food imports on domestic prices; and unprofitable inputuse. The critical constraints currently facing the co-operative sub-sector include: lack ofcapital/credit facilities; employees without relevant skills/qualifications; and financialmismanagement. These weaknesses facilitate existence of rampant thefts and frauds.Most people still view co-operatives as government institutions with weak control and nofollow-up.
9.17 Prospects for the future growth of the sector depend on the intensification ofproduction. Most of the growth in per capita output in agriculture will have to come frommore intensive use of existing resources. But this can not be possible if farmers continueto depend on rainfall and weather conditions. Although the liberalization process has laidthe foundation for the private sector to increasingly participate in agriculturaldevelopment activities, further success will hinge on the ability of macro policies toadequately address inadequacies related to the five 'ins' namely: incentives, institutions,infrastructure information and inputs. This will enhance productivity andcompetitiveness in the sector and will contribute towards the transformation of farming
111

practices. Successful intensification of agriculture will therefore depend on completingthe reform agenda and sustaining a sound policy framework on both the macro andsectoral levels; reversing the present low level of productivity; building the rural assetbase and inter-linkages. The components of this framework will entail making higherinvestment in infrastructure particularly rural roads, research and extension; buildingand/or maintaining efficient institutions; using livestock resources efficiently; efficientservice delivery; dealing with decentralization issues in a pragmatic manner; conservingthe environment; and developing human resources. These will need to be accompaniedby the creation of an appropriate legal framework.
9.5 RESOURCES AVAILABLE TO THE AGRICULTURAL SECTOR
Physical Resources
9.18 Tanzania is endowed with a vast land resource suitable for crop production. Ofthe total 43 million hectares suitable for crop production in Tanzania, only 6.3 millionhectares are cultivated (MAC's Agricultural and Livestock Policy FY97). With anestimated population of 32 million, land availability in Tanzania is not a constrainingfactor in the short run. Though there are some areas in Tanzania where population densityis high, such population is not limited by existing regional boundaries considering thatthey are free to move to areas where population density is still much lower. However,there is need to device appropriate policies, strategies and incentives for theimplementations of incentives aimed at ensuring proper usage of land and waterresources.
Human Resources in MAC
9.19 The MAC has well-educated personnel with the appropriate capacity to run andimplement agricultural policies and plans. Most of the educated personnel are found inresearch and training departments/institutes. For instance, there are over 350 MACemployees who are highly trained research scientists (60% have MScs and Ph.Ds). Otheremployees are graduates of Agricultural Institutes in the country with the majorityholding diplomas and certificates. These are mostly livestock and agriculture fieldauxiliaries and other supporting staff.
Financial Resources for MAC
9.20 Based on the budget frame for FYOO-FY02, MAC expected to spend a total ofThs. 4.2 billion on extension services with support from IDA, AfDB and the Governmentof Netherlands. MAC also expected to spend about Tsh. 4.7 billion on research anddevelopment in the medium-term. The World Bank committed USD 21.8 million for afive-year period running up to year 2003 while other donors pledged a total of USD 23.1million during the same period. A total Tsh. 2.1 billion was expected to be used onregulatory services, particularly giving priority to the control of epidemics and infectiousdiseases, sanitary control, quality control and standards, and inspection of pests anddiseases. This was to be co-financed by the MAC and the German Government.However, German assistance declined considerably (from 1.5% in FY98 to 0.02% in
112

FY00) hence calling for the GoT increase resources on regulatory services. The WorldBank has been the major financier of the Agricultural Information and Statistics (AIS)activities and the outlook seems to have been very promising. World Bank Funding onAIS increased from 25.7% in FY 98 to 35% in FY00. MAC also expected to spend Tsh.1.2 billion to promote and strengthen co-operatives in the medium-terrn.
Potential Sources of Financing for MAC
9.21 Local Sources: The potential areas for generating local funds for the MACinclude, foundation seed farms, seed quality control, livestock movement permits,secondary markets and holding grounds, meat inspection and primary markets, pastureseed and hay production, permits for livestock and hides export, training institutes, andresearch centers. If all these revenue sources were fully operational, MAC estimates thatas much as Tsh. 1.8 billion can be collected annually.
9.22 Foreign Sources: Under the Multilateral Debt Fund and the HIPC Initiatives theMAC, like other ministries, is faced with a challenge to come up with concrete proposalsto utilize these debt relief funds for the sectors development. Thus, this is one importantarea for acquisition of foreign resources which MAC has to capitalize on.
9.6 PRIORITY AREAS FOR UTILIZING MEAGER RESOURCES
9.23 The major objectives of the Government with respect to the agriculture sector areto (i) ensure basic food security for the nation and improve the standard of nutrition andliving conditions in rural areas (ii) provide support services to the agriculture sectorwhich cannot be provided efficiently by the emerging private sector, and (iii) increaseforeign exchange earning through promoting increased exportation of agriculturalproduce and output of agro-based industries.
9.24 Achieving these objectives will entail giving priority to strengthening policyformulation, rehabilitation of research, extension and training facilities, and enhancinginstitutional reforms and capacity building in MAC. It will also require continued fundingof support services that promote and facilitate environmentally sustainable economicgrowth and sustainable development in the rural areas, higher income for the ruralpeople, growth in agricultural exports, and environmentally and sustainable use of landresources.
9.7 POLICY RECOMMENDATIONS
* The Government needs to facilitate and encourage private sector involvementin agribusiness and agricultural services coupled with a renewed emphasis onuse of improved agricultural technologies, improved farming techniques andpromotion of rural financial services.
* The Government through the Co-operatives Department in the MAC shouldtake the lead to promote and strengthen the co-operative sub-sector through (i)the provision of training to workers, members, and the public at largeespecially on credit management, delivery and recovery systems, and (ii) thepromotion and establishment of SACCOS.
113

* The Govermment needs to design strategies and mechanisms, which willenable Tanzania to disengage gradually from donor dependency as far asfunding of economic development in general, and of agricultural sectorspecifically is concerned. This is necessary to avoid leading the country into avicious dependency trap.
* The effective implementation of budget requires the government and donorsto collaborate in ensuring that a sector-wide approach to planning and aid co-ordination is adopted. Coordinated donor support to coherent sector programsthat address both recurrent expenditure and investment requirements of eachsector in line with the Tanzania Assistance Strategy (TAS) and the HighlyIndebted Poor Countries (HIPC) initiatives will be absolutely essential.
114


10. JUSTICE
10.1 INTRODUCTION
10.1 The Ministry of Justice and Constitutional Affairs (MJCA) is composed of threeindependent departments, namely, the Attorney General's Chambers, Judiciary and the LawReform Commission of Tanzania. The Attorney General's Chambers is headed by the DeputyAttorney General and the Permanent Secretary, while the Registrar of the Court of Appealand two Executive Secretaries head the Judiciary and the Law Reform Commission ofTanzania, respectively.
10.2 The Justice and Judiciary departments are independent in accordance to observanceand upholding of the doctrine of Separation of Powers, and institution of the principle ofChecks and Balances. The Judiciary is supposed to perform its duties independently, withoutinterference from the Executive and Legislative branches of govemment; and to be able tocheck the powers of the other two branches of the government.
10.2 VISION
10.3 The vision of the MJCA is a component part of the Tanzania's Development Vision2025 which among other things, aspires to develop a society that has the following attributes:Peace, political stability, national unity, and social cohesion; Democracy as well as politicaland social tolerance; Good governance, rule of law, integrity and moral uprightness; Thehighest level of ingenuity, self confidence and self esteem; Peace centered development;Economic and social justice; Equal opportunity to all citizens to participate in contribute tothe development of the nation , paying attention to minority and disadvantaged groups insociety; A strong, diversified, resilient and competitive economy which can effectively copewith the challenges of the development goal and confidently adapt to changing market andtechnological conditions in the increasing liberalized and globalized world economy; andsustainable development endeavor.
10.4 The Ministry's Vision which upholds, and is also commensurate with the attributes ofthe Vision 2025 aspires to have a society in which there is: speedy dispensation of justice;affordability and access to access justice for all social groups; integrity and professionalismof legal officers; enhanced independence of the Judiciary; and a legal and regulatoryframework, and jurisprudence of high standards, which are responsive to social, political andtechnological trends at both national and international level.
10.3 MAJOR ISSUES
10.5 The main issues which need to be addressed currently include:
(i) Updating and harmonizing the legal and regulatory framework;
(ii) Enhancing the independence of the judiciary and integrity of legal officers;
(iii) Strengthening the management and co-ordination of legal sector institutions;
115

(iv) Enhancing the competence and motivation of the personnel in public legalinstitutions
(v) Improving pre-service training and constantly upgrading legal skills of lawofficers in the public service to enable them cope up with new challenges in themarket economy and new liberal constitution regime;
(vi) Enhancing access to legal services for the poor and disadvantaged;
(vii) Developing and maintaining an enabling and conducive work environment forthe public legal officers.
10.6 In addition to addressing these problems, refonns in the legal sector must also aim atmaking the legal sector responsive to social, political, economic technologicaltransformation. The challenges currently facing the legal sector include:
(i) The changing social culture of the people due to urbanization and theexpanding and intensifying interaction with other cultures, which requires amore dynamic family law.
(ii) The new pluralistic democratic political environment coupled with themovement towards participatory management of socio-economic development
(iii) The expanding institutionally complex private sector led market economy. Thelegal framework needs to change to facilitate regulation of corporate behavior,to protect consumer interests, and timely resolution of civil and commercialdisputes, and
(iv) The rapidly growing electronic commerce creates many business transactionsnot requiring the use of ordinary paperwork. Thus the nature of evidenceadmissible in court must be redefined.
10.4 GoVERNMENT EXPENDITURE ON MJCA
10.7 The public legal sector, in this case the three departments of the MJCA, has for alongtime been accorded a verv low priority in the allocation of budgetary resources. Table10.1 shows approved and actual expenditure for FY98 and FY99.
Table 10.1: Actual Government Expenditure on MJCA, FY98 and FY99 (Million Tsh. andPercentages)
Item FY98 FY99Approved Actual Approved Actual
Recurrent Expenditure 458190.8 428384.4 550923.8 547388.7Ministries 339,912.0 311,065.2 430,019.3 418,416.0Regions 118,278.8 117,319.2 120,904.5 128,972.7Development Expenditure 300,548.6 82,894.7 187,277.8 90,159.0Total Government Expenditure 758739.4 511279.1 511279.1 637547.7MJCA development Expenditure 331.9 24.4 248.9 4.9MJCA Recurrent Expenditure 5540.9 5507.7 7592.6 7374Total MJCA Expenditure 5872.8 5532.1 7841.5 7378.9MJCA Share in Total Recurfent 1.21 1.3 1.4 1.3ExpenditureMJCA Share in Total Development 0.11 0.05 0.13 0.01ExpenditureMJCA share of Total Government 0.77 1.08 1.5 1.2Expenditure I___I_I
Note: Data from MJCA indicate that the ministry's recurrent expenditure tor FY99 was only 7306.5.Source: Ministry of Finance Files
116

10.8 According to Table 10.1 the share of the legal sector in the total government actualexpenditure increased only marginally from 1.08% in FY/98 to 1.2% in FY99. The increasewas partly for meeting the cost of white paper exercise and paying debts. The share of thesector in government actual recurrent expenditure remained more or less constant at 1.3%,while that of development expenditure dropped drastically from 0.05 in FY98 to 0.01 inFY99. A large part of it came from donors. Low allocations for development expenditure inthe MJCA can be accounted for by the fact that it was not among the priority sectors prior toFY00. The implication of this is the increased potential of doing away with marginalizationof the MJCA in terms of budget allocation, and hence, the possibility of improving thequantity and quality of the services provided by the public legal sector.
10.5 ALLOCATIONS WITHIN THE MJCA
10.9 The small budget in the MJCA is allocated and spent independently in the threedepartments based on their different functions.
10.10 Table 3.30 shows that within the ministry, the budget expenditure is distributed intothe three independent departments. The judiciary department received over 70% of thebudgeted allocations during FY98 and FY99. Over the same period the AGC departmentreceived less than 30% while the Law Reform Commission received less than 2% of thebudgeted resources for MJCA. Most of the expenditure in the departments were directed intorecurrent expenditure with only the AGC department having some small developmentexpenditure. The other two departments had no development expenditure during the twofiscal years.
Table 10.2: Distribution of MJCA Expenditure by Departments (million Tshs)Department FY98 FY99 FYOO*
Total MJCA ExpenditureJustice Department's Total Expenditure 914.4 1934.7 528.7Recurrent Expenditure 890.0 1929.3Development Expenditure 24.4 4.92Department's share of MJCA Expenditure 16 5% 26.4%
Law Reform Commission Total Expenditure 102.4 86.5 44.5Recurrent Expenditure 102.4 86.5Development Expenditure 0.00 0.00Departnent's share of MJCA Expenditure 1.9% 1.2%
Judiciary Department's Total Expenditure 4515.3 5290.7 2244.2Recurrent Expenditure 4515.3 5290.7Development Expenditure 0.00 0.00Department's share of MJCA Expenditure 81.6% 72.4%
Source: Budget Estimates Documents for the respective years.Actual expenditures for the period between July 1999 and January.
10.6 ACTUAL RECURRENT EXPENDITURE BY DEPARTMENTS AND ZONES
10.11 This section analyses recurrent expenditure of the various sub-departments and zonesin each of the three departments of the MJCA. The analysis is made so as to reveal the areasin which recurrent expenditure was actually made and in reference to the roles which thelegal sector is expected to play in the country particularly during reforms.
117

Table 10.3: Actual Recurrent Expenditure in the Judiciary Department in terms of PE and OC(in percentage)Sub-Department/Zonal FY98 FY99 Budget FY00
PE% OC% PE% OC% PE% OC%1. Admiinistation and 29.8 70.2 28.8 71.2 14.1 85.9General Expenditure2. High Court 73.2 26.8 19.5 80.5 7.1 92.93. Court of Appeal 32.5 67.5 11.6 88.4 15.3 84.74. District Courts 0.0 0.0 0.0 100.0 60.4 39.65. Primary Courts 100.0 0.0 75.1 24.9 56.5 43.56. Anisha Zone 86.3 13.7 67.9 32.17. Dar es Salaam Zone 91.2 8.8 78.5 21.5 76.3 23.78. Dodoma Zone 83.3 16.7 67.0 33.0 66.2 33.89. Mbeya Zone 89.6 10.4 79.5 20.5 71.4 28.610. Mtwara Zone 82.6 17.4 83.6 16.4 74.5 25.5I1. Mwanza Zone 86.1 13.9 78.7 21.3 78.0 22.012. Tabora Zone 88.5 11.5 130.5 -30.5 67.0 33.013. Tanga Zone 84.6 15.4 66.2 33.8 67.5 32.514. Bukoba Zone 80.5 19.5 75.5 24.5 62.4 37.6lS. Songea Zone 85.4 14.6 76.7 23.3 68.1 31.916. Moshi Zone 85.6 14.4 73.6 26.4 77.2 22.8
7. Total Recurrent Exp. 62.9 37.1 53.7 46.3 51.8 48.2Note: PE= Personal EmolumentOC= Other Charges* Budget estimatesSource: MJCA's Budget Estimates for respective Departnent
10.12 The Judiciary Department's expenditure is distributed into various sub-departmentsand zones as shown in Table 10.3 In general the proportion of personal emoluments (PE)expenditure dominates (over 70% on average) in all cases except in the Administration andGeneral Department, District Courts and the Court of Appeal. Otherwise the rest of thedepartments and zones have relatively smaller proportions of other charges (OC) expenditure.The effects of such small OC expenditure is to have staff being paid salaries but with noequipment and facilities to enable them perform their duties efficiently. A large number ofpending cases and the general decline in the quality of services provided by the judiciarydepartment is partly due to this problem.
10. 13 Overall, in FY98 and FY99 the department's actual recurrent expenditure wasconcentrated in the Administration and General expenditure (over 44%), followed by Primarycourts (about 15%). However, looking, for instance, at the department's FY99 approvedbudget (i.e. govemment commitment) it is shown that most (over 40%) of the departmentsrecurrent funds would have gone to Primary Courts followed by the Administration andGeneral expenditure (about 17%). The above noted actual expenditures, therefore, was areversal of what would appear to have been put as a priority i.e. funding the primary courtsactivities and in the process administering justice to the rural people. In fact, while the currentexpenditure for the Administration and General Expenditure increased, in FY99, by 286%from the approved expenditure of Tshs 814.6 million to actual expenditure of Tshs. 2,333.3million; the corresponding figures for the Primary Courts show a remarkable decrease as theactual expenditure of Tshs 805.7 million was only about 44% of the approved budget of Tshs1848.5 million.
118

Table 10.4: Development Expenditure on MCJA (TShs. Million and %)FY98 FY99 FY00Approved Actual Approved ActualBudget Budget
MCJA Development Expenditure of which 331.9 24.4 248.9 4.9(i) Local (%/6) 0 0 0(ii) Foreign 100 100 100 100
Govcrmuents Total Dev. Expenditure 300,548.6 51718 187,277.8 82,894.7MCJA share of Total Dev. Expenditure
0.11 0.05 0.13 0.01Expenditure by Departments AG Chamber
Total 310.9 24.4 248.9 4.9ShareOf 93.7 100 100 100
___ ___ ___ ___ ___ ___ ___ M ICA
JudiciaryTotal 21.0 Nil. Nil. Nil.Share of 6.3 0 0 0MJCA ____
Law ReformCommissionTotal Nil Nil Nil NilShare () ) 0 0
Source: MJCA's Budget Estimates for respective Departments
10.14 In the case of the High Court its actual recurrent expenditure for the FY99 was only66% of the approved budget. A slight decline in the corresponding shares was observed forthe Court of Appeal, as well as Mtwara and Tabora High Court zones. The rest of the HighCourt zones had substantially higher actual expenditures compared to the approved budgets.Overall, the departments recurrent actual expenditure of Tshs. 5290.7 million for FY99 washigher, 116.4% than the approved expenditure. The increase was actually due to increasedelection petitions most of which were heard at High court and Court of Appeal. The need toclear such political cases explains partly the increased resource allocations to these courts.However, this appears to have been done at the expense of under funding the primary courtsmost of which are dealing with settling various disputes and criminal cases for the majority ofpeople. Such a practice tends to defeat the objective of bringing social and economic justiceto all people. The budget estimates for FY00 however have addressed this problem by givingmore weight to primary courts with a share of 44% of the department's total recurrentexpenditure.
10.15 Part of the differences between the actual and approved recurrent expenditure arisesfrom the fact that the government has been injecting funds, in say, the Judiciary for thepurposes of paying debts, enabling the court activities to continue and other expenses. Theseexpenditures which do not fall within the original budget estimates are sometimes included inthe expenditure as OC and in certain cases they are not included.
10.16 Like most other ministries, the MJCA has been receiving very little or nodevelopment funds. Only recently has the MJCA been included in the cluster of prioritysectors, which include education, health, water, roads, agriculture and lands. Most of thedevelopment funding to the MJCA as showvn in Table 3.32 has been coming from the donorcommunity.
119

10.7 RECOMMENDATIONS
i) Establish a planning and policy unit in the Ministry and in the threedepartments. However, this unit should be part of the new directorate ofresearch and library services, which has been approved by the Government.
ii) Increase government financing to the legal sector so as to improve remunerationand complementary resources availability,
iii) Call for more donor financing in development expenditures, particularly intraining, equipment acquisition, construction and rehabilitation of officebuildings and strengthening of libraries and record keeping,
iv) Adopt disputes solving, mechanisms, so as to reduce burden on the formalcourts,
v) Respective departments to undertake internal cost-cutting exercises,
vi) Allow for recruitment of staff, particularly professional legal staff,
vii) Improve the budgetary process by allowing the registrar of the Court of Appealand the Executive Secretary to the Law Reform Commission of Tanzaniaparticipate in the budget discussions in the Inter-ministerial TechnicalCommittee.
120

ANNEX I:
PUBLIC EXPENDITURE REVIEW FY00 CONSULTATIVEMEETING: KARIMJEE HALL, DAR ES SALAAM
(May 2-3, 2000)
RECORD OF PROCEEDINGS
Welcoming Note
1. Mr. Peter Ngumbullu, Permanent Secretary (PS), Ministry of Finance began bywelcoming all the participants to the PER FY00 consultative meeting. Noted that thebroad participation goes a long way to consolidate the partnership approach todevelopment agreed between the Government of Tanzania and her development partnersa few years back. The PS recognized the presence of Mr. James Adams, The World BankCountry Director for Tanzania and Uganda and co-chairman of the consultative meeting;and Mr. Gerard G. Johnson - Assistant Director International Monetary Fund (IMF), EastAfrican Division who was in the country leading the IMF mission to review the PovertyReduction and Growth Facility (PRGF) program. The PS also thanked the PER WorkingGroup, now expanded to include almost all stakeholders, for the tremendous progressmade under Govermment leadership to oversee the implementation of the PER process forFY00.2. Prior to inviting the Guest of honor to formally open the meeting, the PSsummarized the work program for PER FY00 to have included the following technicalstudies and activities:
(i) Overall Fiscal Sustainability study(ii) Analysis of the Development Budget: Performance and Issues(iii) Road Fund Tracking study(iv) Poverty Monitoring Indicators study(v) PER - Education, Health, Water, Roads, Agriculture and Judiciary(vi) MTEF Training in 12 Ministries(vii) Mainstreaming Gender in the Government Budget(viii) Joint World Bank - Bilateral Donors PER Mission(ix) Development of the cross-sector MTEF(x) Development of the TAS and PRSP
Noted that all the activities in the work program have been implemented successfully
Official Opening
121

3. The Deputy Minister for Finance Hon. Abdisalaam Issa Khatib (MP) opened themeeting on behalf of the Minister for Finance Hon. Daniel Yona (MP). The DeputyMinister expressed gratitude to the organizers for inviting the Minister for Finance toopen the PER FY00 consultative meeting.
4. Noted that the PER FY00 process consolidated and deepened the new approachfocusing mainly on providing direct support to the Government's budgeting process.
5. The Minister was encouraged that the now broadened and participatory PERprocess has opened up the budget process to stakeholders outside the government (privatesector, civil society, and research/academic institutions).
6. Emphasized that the Government values the consultative meeting as it provides aunique forum to all stakeholders to discuss key public expenditure policies and programs.
7. Appreciated the advantages of the MTEF approach in terms of ensuring (i)aggregate fiscal discipline (ii) allocation of resources in accordance with strategicpriorities, and (iii) efficient and effective use of resources in budget execution.Consequently, the Minister indicated that the plan of the Government is to extend theMTEF to cover all ministries and regions by fiscal year 2001/02. The Deputy Ministerpleaded to donors to adopt the MTEF in making their commitments.
8. Informed the meeting that the Government has added the Judiciary, Lands andHIlV/AIDS to the list of priority sectors / areas (i.e. education, health, agriculture, water,roads and energy). Also indicated that the Government also places high priority onactions to uphold good governance particularly on the implementation of the anti-corruption strategy and strengthening public financial management systems.
9. Noted that Tanzania has qualified for the enhanced HIPC debt relief initiative tothe tune of US$ 2 billion in net present value terms to be delivered over a period of 10 -20 years. In addition, Tanzania has also been provided with debt relief by the Paris Club(US$ 390 million). The Minister expressed gratitude to all the development partners forthe strong support and also to the people of Tanzania who shouldered the pre-requisitequalifications to the HIPC relief including the austerity of the ESAF program. TheMinister reiterated the GoT's commitment to utilizing the resources from the debt reliefinitiatives to improve the delivery of social services and infrastructure.
10. Also registered the GoT's appreciation to all the partners collaborating on theMDF arrangement, and expressed hope that the MDF and other donor programs will besustained to enable the Governrnent to make quicker progress in funding the prioritysectors.
11. Informed the meeting that the IFMS is now operational in all ministries,government departments and agencies. This has substantially improved the control ofexpenditures and preparation of accounts. The Government plans to roll out the IFMS tothe local authorities to cover 22 of them in FY01. The minister was encouraged that the
122

health sector basket partners are using IFMS and urged other donors to channel theirresources through the IFMS considering that the IFMS ensures transparency andaccountability in public financial management.
12. Concluded by emphasizing that the Government accords very high priority tobuilding a strong partnership with all key stakeholders in promoting socio-economicdevelopment of Tanzania while ensuring Government ownership and leadership. TheMinister lauded the joint visit to Tanzania by 4 Ministers for International DevelopmentCooperation from Netherlands, UK, Norway and Germany in the framnework of theUTSTEIN initiative, which focuses on deepening the poverty reduction impact ofdevelopment assistance and simplifying coordination and implementation throughstrengthening recipient leadership, improving and rationalizing donor systems andincreasing value for money.
Vote of Thanks
13. Mr. James W. Adams, Country Director (CD) for Tanzania and Uganda - WorldBank, and Co-Chairman of the PER FYOO consultative meeting, thanked the Minister forFinance for a thoughtful opening speech. The CD then made the following majorobservations:
Compared to five years ago, the PER process has been revolutionized from beingexclusive and dominated by the WB and IMF to being an important participatoryprocess involving Government, donors, private sector and civil society. LaudedGovernment leadership, commitment and broadening up of the process as being ahallmark of the PER and whole budget process. The CD emphasized that the PERprocess itself needs to be strengthened further together with the MTEF.
* The budget process is of central importance in the process of economicadvancement. Thus, sustaining the gains that Tanzania has made on themacroeconomic front over the last few years requires that the Government keepsguard on ensuring efficient and effective utilization of available budgetaryresources.
* Although the MoF has began to reach out the sector ministries to strengthen thebudget process through the IFMS and MTEF, there is a lot still to be done toimprove financial accountability in the budget management system. In this regardwhat is required is capacity building to (i) make the MoF much stronger inmanaging the budget process, and, (ii) address capacity constraints at the locallevel as decentralization proceeds.
* The Government has set up a robust budgetary process by broadeningparticipation in the process. While five years ago the discussion on budgetperfornance and management issues were confined to the Government, WorldBank and IMF, it is remarkable that the process has now been opened up to otherdonors, civil society and Parliament - including members from the opposition
123

parties. The Government has also implemented tough decisions. All these need tobe recognized and appreciated during the PER consultations particularly bycritics. However, the Government needs to sustain budget discipline.
P1: Macroeconomic Context of the MTEF
Presentation
* The Acting Permanent Secretary - Planning Commission, reviewed themacroeconomic performance of the Tanzania economy over the past five years(1994 - 1999), drawing out specific emerging issues that have a bearing on thePER process. The review highlighted the following:
* Tanzania's economy appears to be stabilizing and hence poised for higher levelsof growth in the long-run. From a low GDP growth rate of 1.4 percent in 1994,GDP growth has steadily risen to 4.8 percent in 1999. Growth recovery hasmostly been driven by macroeconomic reforms that Tanzania has beenimplementing in recent years. Though encouraging, the upturn in GDP growth isstill low to have significant impact on poverty eradication. Besides consolidatingand sustaining macroeconomic reforms, the achievement of higher growth willrequire (i) improved performance of agriculture (ii) strengthening theenvironment for private investments in the pacemakers for growth - particularlymining and tourism (iii) further privatization and restructuring of industrial sector.
* The anti-inflation stance has paid off. From the peak of 35.5 percent in 1994,inflation declined steadily to 6.3 percent in February 2000, mainly due to tightmonetary and fiscal stance pursued during the period. This stance needs to bemaintained, coupled with increased production of food so as to reduce inflationfurther to level consistent with inflation level in Tanzania's major tradingpartners.
* Tanzania has made considerable progress in restoring fiscal discipline andchanneling public resources toward defined priority areas. However, the level ofrevenue mobilization remains low mainly due to an extremely low domesticrevenue base. This severely limits the Government's capacity to provide basicservices to its people. The reduction in the fiscal deficit (before grants) is almostentirely attributed to reductions in Government expenditures (excludingamortization), since domestic revenues as a proportion of nominal GDP havedeclined over time.
* The introduction of the cash budget system has reinforced discipline inGovernment expenditure. However, as a result of massive expenditure cuts madein trying to match expenditure to revenue availability, most Governmentobligations, apart from the wage bill and debt service have had to be cutsubstantially. In the process, service delivery in all sectors has been affected,
124

although priority activities with priority social sectors (education, health, water,roads and agriculture) have now been protected.
* The Government intends to continue to undertake prudent fiscal measures toensure macroeconomic stability. More stabilization efforts will focus onenhancing revenue collections through expanding the tax base and rationalizationof the tax system. Stringent budgetary measures will continue to be exercised inorder to ensure that expenditures match available resources. The integratedfinancial management system will be strengthened to enhance efficiency,effectiveness and transparency in expenditure management.
* The growth of the extended broad money (M3) declined from 37.7 percent inFY95 to 11.0 percent in FY99, and may decline to 9.2 percent by end-June 2000.The rapid decline in money supply growth, led to a rapid decline in the rate ofinflation, which in turn contributed positively towards stability of the exchangerate.
* The performance of credit growth, particularly credit to the productive sectors,has not been impressive after liberalization. Commercial banks have shownincreasing aversion to lending, preferring to hold risk free assets such as TreasuryBills, partly because of high risks in lending, difficulties on the part ofcommercial banks to assess the credit worthiness of private borrowers andproblems associated with the handling of commercial disputes. The establishmentof a Credit Information Bureau to provide information on credit worthiness ofprospective borrowers and the establishment of a Commercial Court to speed upthe settlement of commercial disputes, are expected to improve the situation.
* The spread between lending and deposit rates continues to be unduly high. Boththe concentration of new banks in major urban centres and the restructuring of theNational Bank of Commerce, including the closure of its remote branches, hasdeprived rural areas of financial services. This requires a deliberate strategy forassisting the rural sector through the provision of micro-finance services. Therecently finalised Rural and Micro-finance policy and a revision of the Bankingand Financial Institutions Act later this year to provide for a legal framework forregulation and supervision of micro-finance institutions, are some of thestrategies.
* The bulk of Tanzania's export sector remains traditional agriculturalcommodities, accounting for about two thirds of the total export value.Consequently, a large portion of the export bundle remains vulnerable to vagariesof weather and adverse movements in the world commodity prices, and henceleading to a weak balance of payments position. Liberalization of mineral trade,pursuit of macroeconomic stability and removal of foreign exchange restrictionsare expected to generated more foreign exchange from mineral exports andtourism.
125

* Core functions of the Government have been redefined to include maintenance oflaw and order, provision of basic social and economic infrastructure, and creationof an enabling environment for the private sector and other economic agents toinvest in productive economic activities. The Government now focuses on policyformulation and economic management, investing in core functions and providinglegal and regulatory frameworks. Several institutional changes with a bearing onprivate sector development have also been made.
* The Vision 2025 will be implemented in phases of three years starting fromFY02. Preparation of programs and projects will be undertaken during FY01.Other processes, i.e. PRSP, TAS and PER will be instruments of implementingthe Vision, which provides the umbrella framework for guiding developmentpolicy formulation, prioritization of development programs and projects andsetting development goals and targets in the medium term.
P2: Fiscal Policy and the Macroeconomic Context
Presentation
* A consultant for the PER Working Group from Oxford University, Mr. David Bevan,summarized the Tanzania FY00 fiscal policy issues and the macroeconomic context.Specific issues addressed included, a review of links between public and privateactivities from a perspective reflecting current conditions in Tanzania, the resourcesavailable to govemment, Guidelines for the Preparation of the MTEF, the domesticcredit position, and options for the government's fiscal stance. The reviewhighlighted the following:
- Over the last several years, the Government of Tanzania has run a tight fiscal policythrough the instrument of a cash budget, with a domestic budget surplus. Theconsequence has been a fairly rapid but orderly process of disinflation, with theannual rate of inflation coming down to around 7% by the end of 1999. While it isessential to consolidate this achievement so that there is no return to the double-digitinflation of earlier years, it is nonetheless no more than a precursor to the real agendaof growth and poverty reduction. Growth is important not only in its own right but asa mechanism for reducing poverty both directly and indirectly via the enhanced socialspending it permits. The sources of this growth will inevitably lie in privateenterprise, with the government attempting to minimize factors that may inhibit thisand promote those that encourage it. The latter factors include not only the regulatoryand market environment, but also macroeconomic policies bearing on investment,saving, liquidity and credit.
* Tanzania is currently in transition between the economy suffering from excessivefiscal deficits, rapid monetary growth, high inflation, and a lack of private credit inwhich the imperative is to reduce the deficit so as to permit other problems to beaddressed; and the economy in which there has been an extended history of steadygrowth in a stable policy environment, where the imperative is to maintain the policy
126

regime. The crucial short run choice in terms of policy design for the economy in thisinterim outcome is over the volume of resources that the government can devote to itsspending programs without crowding out the recovery of private activity, while at thesame time addressing the question related to the amount of resources that the privatesector can actually put into use.
* There is nothing to ensure that the banking system will remain fully lent if thegovernment reduces its borrowing. If private borrowers are deemed not to becreditworthy, the system simply becomes more liquid and the loan-deposit ratio falls.This has evidently happened in Tanzania, though it is difficult to be precise about thedegree, since the fall in loans also reflected the cleaning out of non-performingparastatal loans.
* Much of the credit advanced to the private sector in Tanzania is for trade rather thanfor investment. Investment tends to be financed from an enterprise's own resourcesor, in cases where the outputs will generate foreign exchange (such as mining) fromexternal sources. Thus, especially in the short run, withdrawal of government mayneither induce increased access to credit by the private sector, and even if it does, thismay have a very muted impact on investment activity.
- A rapid expansion of private sector credit might be problematic. Since the bankingsystem lacks experience in risk assessment, the alternative to rather limited lendingmight be a rush of lending leading to an unacceptably high bad-debt ratio.
* When a government obtains access to increased resources from external donors andspends some part of this on non-tradable goods, this will tend to induce appreciationof the real exchange rate (the so-called 'Dutch Disease'), unless there are offsettingeffects on supply. The Dutch Disease effects are in no way specific to governmentinvolvement. Exactly the same issue arises for transfers of external resources toNGOs operating in-country, or to increased private spending if the governmentpassed the aid on to the private sector via tax cuts or increased credit. What matters isthat the nation is able to spend more and that part of this spending is on non-tradables.The real exchange rate issue is a feature of accepting the resource inflow, not of anylink between this and the level of government spending.
* Some forms of spending are likely to have supply side effects. Especially if thesecome into operation quickly, the real exchange rate consequences of the inflow willbe muted and may even be reversed. For example, a program of rehabilitation ofroads could remove bottlenecks and lead to an expansion of the production of non-tradables in excess of the increased demand for them. This entails that private andpublic activities are frequently complementary, so that the private sector may not bebest served by a contraction in public sector spending. This is particularly likely to betrue in Tanzania, where many forms of government spending are low by the standardsof comparable countries.
127

* The MTEF for the next three years shows revenue growing modestly as a share ofGDP. The shares are 12.4% for the current year (FY00), and 12.6%, 12.8% and13.0% for the MTEF period (FY01 - FY03). The present figure is modest by thestandards of comparable countries, and the assumed growth of revenues, at 0.2percent of GDP a year, also does not seem excessively ambitious. However, it has tobe noted that this ratio has averaged 12.4% over the last decade, and while it hasvaried substantially, it has been trend-less. At the same time the authorities are notplanning any major tax reforms, but are relying mainly on reduced exemptions andincreased administrative efficiency to deliver the revenue gains.
* It would be worth developing a more disaggregated method of forecasting revenues,both to obtain more refined inputs into the MTEF and also to permit closermonitoring of performance. This would involve analyzing the compositional shift ofgrowth in various sectors.
* There is a strong case for basing the MTEF projections on the most likely scenario,which is that program aid will in fact continue at similar relative levels to the presentones. To take a more conservative view would only be justified either if there werestrong grounds for believing that aid cuts were probable, or there were grounds forthinking that regular upward revision of spending ceilings is allocatively less costlythan infrequent downward revisions. Budget Guidelines projections are pessimistic,while the HIPC Decision Point document assumes very substantial inflows of newresources in this period. It should be noted that forecasting resources is necessarilyrisky, but the risk is two-sided, and not minimized by excessive caution.
The logic leading to the selection of the priority sectors themselves seems clearenough. However, it remains obscure what governs the distinction between priorityand non-priority activities within these sectors. It is also obscure how prioritizationaffects the budget allocation process. Allocation to a number of priority sectors asindicated in the Budget Guidelines document lack of any pattern. Sometimesallocations are very far below requirements, sometimes they exceed them. In somecases the ratio for a sector is stable over time, suggesting that the severity of rationingis constant: in others it falls or rises. It does not seem as if the term "requirement" hasany stable interpretation, either between sectors, or within a sector over time. Thismeans that the role of the MTEF in matching limited funds to those activities whichhave the highest pay-offs or are otherwise felt to be most urgent is very inscrutable tothe outside observer. There thus seems to be considerable scope to develop thislinkage between the prioritization process and the budget allocation moresystematically.
* The ratio of various money measures to GDP has been falling in Tanzania. A fallingratio is a signal of financial ill health. It may reflect a lack of confidence in thedomestic currency, so that agents economize in holding it, possibly by substitutinginternational currency. Alternatively, it may be a response to financial repression,where very unfavorable terms make the formal financial sector an unattractiveinternediary. In either case, high transactions costs are imposed on economic activity.
128

When these conditions are reversed by successful policies of stabilization andliberalization, the demand for money is expected to recover, but possibly quite slowlyand after a lag as confidence is re-established.
* Private credit has indeed expanded rapidly albeit from a very low base. Over the fouryears from the end of 1996 it has risen in nominal terms at annual rates of 39%, 48%and 26%, or from Tsh 116.6 billion to Tsh 302.2 billion. Since the cumulativeinflation over this period was 37%, the growth in real private credit averaged 24% perannum over these three years. A major reduction in the government's use of domesticcredit has produced a rapid proportional expansion in private credit, but since the basefor this expansion was so small, this private response has still been small relative tothe scale of the stimulus. In other words, the Government withdrawal from itsprevious reliance on domestic credit has had a limited effect of "crowding the privatesector back in", since private sector engagement with the financial system, relative toGDP. seems to have been relatively invariant to these changes. Hence the reduction ingovernment engagement has simply led to a contraction in the scale of financialintermediation. The banking system is currently under-lent and over-liquid.
* It is desirable for Tanzania to accept as large an external deficit as donors areprepared to finance. For any given choice of domestic deficit, this implies thatadditional aid should automatically be spent. In turn, the considerations determiningwhat an appropriate level of the domestic deficit might be are not contingent on thelevel of extemal finance that is available, rather on the extent to which thegovernment can use additional resources effectively (i.e. the Government has notreached its implementation limit). Then the choice of a value for the deficit dependson what levels of monetary expansion, build-up of foreign exchange reserves, andexpansion of credit to the private sector are desired.
* There are three possibilities in relation to keeping a contingency allocation in thebudget. First, they could remain unspent, in which case the govemment will berunning a domestic budget surplus, not a balance. Second, they could be deployed inface of some genuine unforeseen events, but it is wildly implausible that these wouldhave expenditure implications of this pattern. Third, they could end up being spentbut according to the exercise of ministerial muscle rather than the allocationprocedures (based on prioritization) embedded in the MTEF. If the intention is tosmooth spending in the expectation of uneven revenue flows, that should be signaled,rather than calling the device a contingency.
* There is a compelling case that the govermment should choose to run a modestdomestic deficit rather than a balanced budget; to enable it to increase spending onthe under-funded recurrent budget and improve service delivery. It is not clear, giventhe already highly liquid financial system and credit position now, that it would riskcrowding out desirable private activity given. The question is rather how much creditthe private sector is plausibly going to require, and whether it is likely that it will beable to use the whole increase in domestic credit over the next several years.
129

Discussion/Comments on P1 and P2
* Noted, by an IMF official, that it is true that Tanzania was still in a transitional stage.The country could only run the deficit if foreign reserves can finance it or if enoughresources are expected from donors. However, experience has shown that there is arisk of enough inflows not forthcoming. Agreed with the observation that budgetsurplus has failed to crowd-in private sector credit, but noted that this was mainlybecause of high lending rates and risk aversion. Bank credit in Tanzania is muchlower at 5% of GDP, unlike the Sub-Saharan average of 14% of GDP, indicating thatthe country still had a long way to go in increasing lending. However, despite allthese, IMF thinking was that running deficit was probably not a viable proposition.
Concerns/comments by the donor community:
* Even though the MTEF projects a reasonably small deficits in three years, there is,however, a big contingency which may translate into large surpluses, at the timewhen public services are under-funded. Some amount of deficit ought to be allowed,to make increased public funding possible, especially in sectors like roads whoseallocation has been disappointingly low.
* There is an urgent need to use existing resources to improve existing programs andresource allocation through the budget.
Comments and concerns by members of Parliament.
* Expressed delight on the way Tanzania was, through the PER process, building a verygood base for dialogue - especially on how to chart out ways of reducing poverty andimproving welfare of the people.
. Expressed concern as to how real are Tanzania's plans given the problem ofinconsistency between revenue collection and delivery of visible development.
* There is poor translation of macro achievements into real improvement in life (e.g.,4% grow-th in agriculture reflects growth in which crops when all crops are currentlyperforming poorly?).
* Actual expenditure in development budget does not reflect budget as approved by theParliament.
* In order to have accountability there must be good governance in place. However, tohave good governance calls for having an opposition from the political front, andother stakeholders in the society; and respecting the rule of law while shunningpolitical patronage and corrupt practices.
* There is a need to re-examine the cash budget system. Much as it has succeeded inreducing budget excesses, this has been done at the expense of disregard to the budgetas approved by the Parliament. In addition the cash budget has severely reducedservice delivery capacity of the Government by making monthly resource availability
130

unpredictable. There is thus a need to set the limit of deviations of allocations throughthe cash budget vis-a-vis the approved allocations.
* Agriculture in Tanzania can do a lot to bring growth and development especially inrural areas. If Tanzania is to cross the international poverty line, then there is a needto revive agriculture, especially through more funding of research and extensionservices, irrigation, and better use of inputs. An agro-investment master-plan, whichis well funded and supervised, is important if agriculture is to grow at the envisaged 8percent. Also important are improvements in rural roads and credit to the sector; andensuring that there are organized markets for both cash and food crops.
* There is a need to consider the effect of energy tariffs on macro and microenterprises, with the view to revising them downwards.
* There is a need to put in place mechanisms to monitor mineral prospecting andtrade/marketing rules if Tanzania is to benefit more from these economic activities.
Comments/concerns by the private sector:
• Although Tanzania has done major policy changes, there are still lags in putting inplace an enabling environment and regulatory framework that conforms to thecountry's move to a market economy. Lack of regulatory framework makes lending arisky business, thus curtailing the availability of credit to "risky" areas where loanrecovery is uncertain.
* Privatization of the banking system is almost complete, yet there is no singledevelopment bank to cater for long-term investment and other development orientedprojects. To promote agriculture, the country also needs an agricultural bank with afocus on rural credit.
* The private sector is still very young. It cannot make itself the engine of growth. Thegovernment has a role to build capacity in the sector, to help it grow and becomeefficient.
* There are studies that have shown that the Tanzania shilling is overvalued; the rate ofovervaluation being 1.1 percent per month since 1994. This has had effect onproducer prices, lowering them by 70 percent in real terms. This in turn has reducedcompetition and investment in agricultural and export related activities because oflow retum.
* Tanzania seems to have its priorities upside-down. Allocations to agriculture are notreflective of the role of agriculture, which is the main engine of the economy,employing 80 percent of the population. Failure to focus on agriculture will not allowGDP growth to go beyond the current 4.8 percent. Moreover, because ofcomplementarity (raw materials, income/demand, etc.), poor performance inagriculture will also affect negatively performance in the industrial sector. There isthus a need to enhance growth in productive sectors or sectors that generate wealth ifpoverty is to be reduced.
131

* There has been a serious compression of demand in the Tanzanian economy. Whereasmoney/GDP ratio has been declining, tax/GDP ratio has been rising. This situationhas affected profitability of most economic activities. The Government ought tostimulate the economy by focusing on the real side of the economy, especially fiscalstimulation involving sensible government spending on the productive side of theeconomy (roads, etc.) and reduction of nuisance taxes especially on raw materialswhile at the same time widening the tax base through encouraging growth andreducing tax evasion/leakage.
* Noted by TRA official that revenue fluctuations are going to fall as the economyexpands and production in taxable areas expands. This means, therefore, that taxreforms have to be implemented gradually, otherwise the stability of governmentrevenue will be affected.
P3: Enhancing Efficiency in the Public Sector
Presentation
* The presentation by the Permanent Secretary - Civil Service Department (CSD)highlighted the following:
* Public Service Reform Program is a continuation of the Civil Service ReformProgram (CSRP) 1993 - 1999, which focused on restructuring, cost cutting andinstitution building. The achievements of CSRP include: 25.7 percent reduction inworkforce from350,000 to 260,000; reduction of ministerial divisions; training of25,000 civil servants; launch of the Local Government Reforrn Program; andrestructuring of regional administration reducing staff from 14,000 to 2,000.
* The overall purpose of the PSRP is to continue reforming the public sector so that itprovides support to the attainment of a high rate of economic growth and delivery ofquality public services within priority sectors that conform to public expectations forvalue, satisfaction, and relevance by end 2011. The aims of the program reflect theGovernment's vision of the future public service as stated in the National Vision2025. The Public Service will be an institution of excellence playing a pivotal role inachieving sustained economic growth and prosperity, and eradication of poverty inthe 21" century.
* The program development objective is to improve accountability, transparency andresource management for service delivery. The public service intends to deliverefficiently and effectively the Government's economic and social programs on acontinuous and sustainable basis. In the medium-term (Phase 1), this developmentobjective will be underpinned by the policy shift to outsource services to the privatesector and to local authorities and the strategic theme to deliver quality publicservices under severe budgetary constraints. The program intends also to implement amedium term pay policy, implement job evaluationlre-grading exercise, efficientlyreduce employment, develop the Public Service Commission, build capacity throughtraining and retooling, and improve records management, IT and communications.The Global Distance Learning Network (GDLN), an integral part of the public
132

service reform program, was recently introduced in Tanzania. The network's center(GDLC), based at IFM, is intended to be part of a global knowledge-sharing networkto strengthen the capacity of public and private decision-makers and implementers todesign, plan and manage economic and social development policies.
* Enhancing technical efficiency and public service organizations (MDAs) involves: (i)adopting and operationalizing Performance Improvement Model (PIM), whichintroduces results oriented management through performance improvementmanagement systems; (ii) training ministries on PIM and empowering and energizingministries to implement it; (iii) strengthening capacity and performance orientation inMDAs; (iv) rigorous application of meritocratic recruitment principles in personnelmanagement; (v) putting in place an effective monitoring and evaluation system forinstitutional and individual performance; (vi) putting in place a fair compensationsystem and competitively remunerated public servants on the basis of medium termpay policy; (vii) introduction and application of Selective Accelerated SalaryEnhancement (SASE) and Performance Improvement Funds (PIF) to strategicallyplanned areas; (viii) operationalizing job evaluation and reducing distortions; and (ix)capacity building through training institutions - e.g., PSC, IDM and GDLC.
* The PSRP total budget stands at $ 106.7 million. Commitments so far amount to $73.1 million, with the difference between total budget and commitments representingthe shortfall. More donors are invited to contribute to the program, which is to belaunched in June 2000.
Discussion
* Equal opportunities for men and women does not mean equal representation, butpresence of representation. This has not always been the case in the Tanzania's civilservice. The new public service reform program ought to also focus on tackling thegender imbalance problem. CSD has to address the issue of incentives like hugetravel allowances.
* Decline in accountability was noted. The report of the Controller and Auditor Generalshowed poor certification in terms of adverse or qualified opinion. This wasexplained by embezzlement of cash and store, poor record keeping, etc. However, nofollow-ups, sanctions and prosecutions are taking place. If donors have to channeltheir funds through the budget (basket funding, programns, etc) this trend has tochange.
* Duration of civil service reform is long and the cost is high but the results areunsatisfactory. The exercise seems to be very long and expensive and heavily basedon the borrowed funds or grants from donors (WB and others). It is advisable that,instead of using the money to pay external consultants it is better to use the money forcompensating retrenched employees and pay better those remaining.
* It was also noted that jobs that have been reduced have not released enough resourcesfor training other remaining staffs and improve services offered by the public sector.
133

Also sustainability of the civil service reform process was questioned as it dependson borrowed funds or grants from donors.
Review of Fiscal Performance - An External Evaluation
Presentation:
* The presentation was done jointly by members of the PER Mission - one from TheWorld Bank and another from the Embassy of Sweden
* The analysis of fiscal performance was broken down into three distinct areas:aggregate fiscal discipline, strategic allocation, and technical efficiency.
* Aggregate fiscal discipline: Domestic Revenue is still low standing at 11.5 percentof GDP in FY99 and FY00. Net foreign inflows in the form of grants andconcessional loans increased from 4 percent of GDP to 4.4 percent in FY99 and areprojected to further rise to 4.8 percent in FY00. The net foreign inflows contributed toa budget surplus of 0.3 percent of GDP in FY99. However, the budget situation isprojected to tum into a deficit of 0.5 percent of GDP in FY00 due to increased publicexpenditure. Wage bill has shrunk from 4.2 percent of GDP to 3.7 due to civil servantretrenchment. However, the wage bill is projected to increase to 4.3 percent of GDPin FY00 because of the Pay Reform Program. After a continuous decline over the pastfew years, expenditure on other charges increased for the first time in FY99 to 5.7percent of GDP up from 4.5 percent in FY98. During FY99, deviation of actual frombudgeted figures at the aggregate level were less than in previous years.
- Strategic allocation: Priority sectors (education, health, rural roads, water,agriculture and the Judiciary) benefited from the increase in other charges. The shareof discretionary expenditures going to priority sectors increased form 42.8 percent inFY97 to 46.7 percent in FY00. Likewise, the share of development expenditureshifted to the priority sectors from 31.1 percent in FY98 to 61.7 percent in FY00.However, foreign development expenditure is still not captured in the govermnment'saccounts.
* Technical Efficiency: Operational efficiency and service delivery remainsconstrained by low wages and salaries, insufficient of funds for operations andmaintenance, and the unpredictability of resource availability due to the cash budgetsystem in place. This trend is likely to change due to the recent increase in civilservice salaries and expenditures on operations and maintenance.
* Fiscal management efficiency is still weak. Audit certificates of accounts andstatements issued by CAG continued to be predominantly adverse although there wassome improvement in FY98 for ministries. Government continued theimplementation of institutional reforms which are likely to considerably strengthenfiscal management. The ongoing reforms include the implementation of theIntegrated Financial Management System, the legislation reforms underlyingfinancial management, strengthening of the MTEF process, introduction ofperformnance management systems and budgeting, strengthening of the auditor
134

general, the development of an Anti Corruption Strategy, and enhance integration offoreign aid into the budget process through the development of the TanzaniaAssistance Strategy, Sector Development Programs in Health, Education, and Roadsand basket funding arrangements in support of the Local Government ReformProgram and the strengthening of the TRA.
P5: Systemic Fiscal Issues
Presentation:
* The presentation was done jointly by members of the PER Mission - one from TheWorld Bank and another from DFID, highlighting eight major emerging andcontinuing issues in fiscal management which need to be addressed.
* The plight of the Development Budget: The development budget is in a veryworrying state. Budget analytical work done under the PER FY00 process revealedfour major disturbing features of the development budget in Tanzania. First, there issignificant divergence between commitments and disbursements; and within the fiscalyear, releases of funds are erratic constraining proper planning of commitments.Second, the development budget is characterized by a preponderance of extrabudgetary financing particularly at regional and local government levels. Third,provision of counter-part funding, which is needed to trigger committed finance ofdevelopment projects especially by the multilateral institutions, is inadequate. Lastbut not least, are the problems in the development budget process and the weaknessesin implementation capacity. The problems include a large number of institutionsinvolved; guidance for prioritization is not provided sufficiently in the Medium TermPlan and Expenditure Framework; capacity constraints in the institutions concerned;weaknesses in the procurement system; and the problem of coordination between theroles of MOF and PLANCOM especially on sectoral issues.
. Desirable Level of Revenue Mobilization: The dilemma is how to reconcileTanzania's low tax effort with a relatively small easily accessible tax base. TheGovernment in determining the desirable level and modalities for domestic revenuemobilization typically has to strike a balance between meeting demands for higherpublic expenditure, and therefore higher revenue mobilization, and lower taxation ofprivate incomes. The demand for higher revenue mobilization comes from the severeunder-funding of basic social services such as primary health and education and ofphysical infrastructure services, which have been identified as impediments toeconomic growth and progress in sustainable human development. It also arises fromthe desire for greater self-financing and low donor dependence in the longer term. Onthe other hand, the costs to large transfer of private resources to government are two-fold: withdrawal of resources from the private sector and inefficiency into theincentive system of an economy. It is important to point out that the key factordetermining the desirability of domestic resource mobilization efforts has to be theeffectiveness and efficiency of public spending.
* Fiscal Restraint and Cash Budget Management System: The cash budgetmanagement system was introduced in FY97 to impose fiscal discipline on the
135

spending units and enforce limits on aggregate spending in line with collectedrevenue and external aid disbursed through the exchequer system. Despite the goodobjective, the system has entailed significant costs particularly in the form ofunpredictable funding of essential public services leading to wide monthly swings inthe funding of government operations to match revenue availability. In order tomitigate some of the negative effects of cash budgeting, borrowing to smoothfluctuations resulting from unpredictable monthly revenue flows is one recourse butthe law restricts advances. However, the Government has recently allowed a numberof Ministries to operate with three-month commitments instead of monthly ones.
* Macroeconomic Stability and Debt Sustainability: A positive decision has beenreached by financiers, which will allow Tanzania accede to the enhanced HIPC relief.The interim HIPC relief, through IDA and IMF grants, will enable the country to freeup a sizable amount of its own resources for servicing multilateral debt. Given thatthe HIPC relief will be in the form of budgetary support, long-term, and irrevocableonce the completion point is approved, the risks associated with the related expansionof the fiscal deficit (after grants) are not significant. One possible downside effect ofthis shift in fiscal stance, however, is that it is likely to increase relatively moreexpenditures on goods and services that are typically not traded internationally,leading to the strengthening of the shilling and reducing the competitiveness ofTanzanian goods.
- Co-existence of Overall Fiscal Surplus Side by Side with Under-funding ofPriority Sectors: The perception is that the Government is putting monies away(building up reserves) and/or availing it to the private sector (a better user) throughthe domestic banking system. However, a rise in gainful absorption of these resourcesby the private sector depends on the absorptive capacity of the private sector, whichcan be enhanced only if supportive infrastructure and better public service deliverycan be financed.
* Concern on Absorptive Capacity Constraint with Increasing Resources: Thisissue relates to the concern regarding possible limited of absorptive capacity of theGovernment for much larger expenditures. Currently the priority sector financingneeds, based on the MTEF and related supportive technical studies, are grossly under-funded and absorption should not be a problem. Total available finance meetsapproximately only 60 percent of requirements.
* Earmarking of Revenue and the Effectiveness of Budget Management: Revenueearmarking for specific expenditures is on an upward trend in Tanzania. The mostsignificant among the earmarking arrangements is the Road Fund. Other forms ofearmarking include retention of user charges for specific public services such aseducation, health, land services and natural resources. There are three reasons forstarting to pay greater attention to the system of budget management before itmushrooms in an unwieldy fashion: to avoid undermining strategic budget allocationsacross sectors and geographical locations; the difficulty of enforcing overall crosssector and within sector allocation with the greater autonomy associated with revenueretention systems; and the likelihood of imposing excessive burdens on specific users
136

of public services, as the relevant sectors strive to raise the resource envelope withintheir control.
* Predictabilitv of Donor Resources: Tanzania is one of the major recipients ofexternal assistance in Sub-Saharan Africa. However, donor co-ordination is tediousand requires more capacity at the Ministry of Finance. Donors have differentaccounting systems, different disbursement modalities and different financial years.To harmonize the multiplicity of the donor accounting systems, there are plans tointegrate donor facilities in the new Integrated Financial Management System (IFMS)using the Platinum software. In addition, the Government is now taking the lead inpreparing a country assistance strategy referred to as Tanzania Assistance Strategy(TAS). Unrecorded donor support is also among issues that are at the core of thedebate on how to strengthen the government-donor partnership in development.
Discussion/Comments On P4 And P5
* About 70% of the donor assistance are extra-budgetary. Donor countries need to doaway with this situation. However, this calls for improvement in financialmanagement and accountability. The scaring number of adverse opinion and qualifiedcertificates need to be reduced.
* It was noted that about 17% of the donors development assistance (DDA) to Tanzaniais charged to non development programs. Corruption absorb the big part of the abovementioned share of DDA. Also expatriate and technical remuneration claims asubstantial amount of it. On one hand the GOT needs to do whatever possible to stopcorruption, and on the other hand, Donors needs to asses the amount of DDA thatgoes back in the forn of expatriate and technical remuneration.
* Fiscal policy is used in many countries in the world to address economic growth andcompetitiveness of the players in production. It is also high time for Tanzania to dothe same. For instance there has been a practice of Government agencies to raise feeson inputs for the productive sector. If this is not coordinated it will discourageinvestment and production in productive sector.
* None inclusion of various fees in the Road Fund was noted. Also counterpart fundingis a serious problem. Low levels of counterpart funding lead to the loss of donorassistance. So, the Government needs to raise the level of counterpart funding.
* While the Government is trying to raise revenue, tax exemptions have beenincreasing, at the same time the tax effort is very low. Also, it was noted that, there isno serious control of the government expenditure. The question was raised onwhether the productive sector should be squeezed in favor of conspicuousconsumption.
* Not sure whether the figures/numbers on the donor funds that go through the budgetare well captured. Figures/numbers are definitely high since much of the figures arenow captured in the MDF basket funds. PER WG should try to investigate whetherthere can be any possibility of predicting donor funds.
137

* Inclusion of Judiciary in priority sectors was welcomed by the participants. However,it was noted that allocation to the sector is to small to reflect it as a priority sector.
* There is a persistence in making mistakes in the development budget. Deviationsbetween budgeted and actual development expenditure have been so consistent butthere has been no learning. While resources are there and others come in (throughdonor assistance) actual development expenditure has been far less than the budgetedamount. Solutions suggested to this are: First, as a sector develop, credibledevelopment program it should get more resources. Secondly, Government agents,ministries and departments should get earmarked resources since it gives themautonomy in terms of controlling the source of resources.
P6: HIV/AIDS AS A DEVELOPMENT PROBLEM
Presentation - by Planning Commission
* During the early 1980's when the rate of HIV/AIDS infection was low the diseasewas considered an exclusive concern of the health sector. Curative and preventivemeasures were solely left to the ministries and institutions responsible for healthaffairs. As the infection rates gain momentum and more information becomesavailable, it became evident that the disease is a global and multi-sectoral problemthat impacts all sectors of society. The fight against HIV/AIDS requires the jointeffort of entire international and local community.
* HIV/AIDS represents a serious crisis for development in large parts of the developingworld where it is rapidly reversing social and economic achievements. TheHIV/AIDS epidemic has spread with ferocious speed. HIV/AIDS has now infected 50million people worldwide. More than 16 million have died, 2.6 million in 1999 alone.Today, about 36 million people are estimated to be living with HIV/AIDS, 95% ofthem in developing countries
* In most affected countries HIV/AIDS is swiftly dismantling the developmentachievements of the post 50 years. Life expectancy is now declining in manycountries after decades of progress. In several nations it has been shortened by 10years. Adult mortality rate has risen by 50% in many countries and by 100% in mostaffected countries. Child mortality rates have doubled in many countries and coulddouble again if HIV/AIDS continues unchecked. The rapid rise in adult deaths isleaving a large number of orphans, 11.2 million worldwide, 10.7 million of them inAfrica alone.
* Recent World Bank estimates suggest that HIV/AIDS has a substantial negativeimpact on economic growth. In general, it is the 15-49 age group that isdisproportionately affected by HIV/AIDS epidemic. Through its impact on the laborforce, HIV/AIDS diminishes productivity just as developing countries need tobecome more competitive to cope with rapid globalization. All sectors are affected.HIV/AIDS illness and care reduces time and labor used in vital work of agriculture.HIV/AIDS also undermine PSD development by removing skilled labor, increasingexpenditure, and reducing revenues.
138

* HIV/AIDS overtaxes social systems and the health and educational development thatthe poor need to escape poverty. Across Africa HIV/AIDS has drained skilledmanpower in every sector, which was scarce to begin with. Teachers and student aredying or leaving school because they can longer afford it, have fallen ill, or becausethey are needed at home or to care for the sick. Health care system in many countriesare stretched beyond their limits as they deal with a growing number of HIV/AIDSpatients and the loss of health personnel to illness and death. HIV/AIDS has alsocaused the loss of policy makers and managers for the overall operation of theGovernment.
* Women in general, and girls in particular, are biologically and socially morevulnerable to HIV/AIDS and are disproportionately infected and affected by theepidemic. Women and girls also bear the greatest burden of care; families often takegirls out of school to care for the sick relatives or assume family responsibilities,jeopardizing recent gains in health, nutrition and girls' education. It is worth to noteis that, HIV/AIDS particularly targets the poor. The epidemic has overwhelmingly hitthe world's poor countries and those with the greatest disparities of income.
* HIV/AIDS has been in Tanzania for about 17 years now. The number of adultHIV/AIDS infection in Tanzania in 1997 is estimated to be 1.5 million (NACP,1998). Given the fatality of the illness, and with 1.5 million infected productiveadults, the HIV/AIDS epidemic can no longer be viewed as just a health problem, ithas to be recognized as a development problem. In terms of geographical distributionthe five leading regions in HIV/AIDS cases are Mbeya, Dar es Salaam, Kilimanjaro,Mwanza and Kagera.
- The Way Out: As it has been shown HIV/AIDS is a multi-sectoral problem both interms of its causes as well as its solution. Therefore the fight against AIDS requires amultisectoral approach/program that addresses all fronts and involves all the socialeconomic agencies both at the country, regional, and global levels. At the countrylevel the obvious actors are the Government (central and local), the private sector, thecivil society including non governmental organizations (NGOs), communities andhouseholds. The war against HIV/AIDS must be fought on three fronts, curative,preventive and promotive activities.
* Tanzania has adopted the MTP III as our comprehensive multisectoral program forHIV/AIDS control. MTP III is a multisectoral unti-HIV/AIDS program thataddresses all frontiers and tries to involve all important actors. However, while MTPIII is an important anti-HIV/AIDS program for Tanzania, it is not adequate for thepurpose as it is unable and it was not meant to address some of the critical factors thatare known to cause/influence the spread of HIV/AIDS. Other supportive framneworkssuch as the Development Vision 2025, the Poverty Eradication Strategy, the PovertyReduction Strategy under HIPC initiative etc. will assist in mobilizing politicalsupport and the masses for participating in activities that will eventually fight thespread of HIV/AID.
* Some important constraints to consider: Both MTP III and Vision 2025 were passedbefore the end of 1999. But their effective implementation is yet to begin. While thedetailed implementation plans are still under preparation, implementation work will
139

require massive resources particularly budgetary resources and the supply of thoseresources is the most challenging problem being faced.
Discussion/Comments on P6
* The inclusion of the HIV/AIDS in the PER as the main issue was welcomed by theparticipants. It was noted that many programs including MTP3 have been put forwardto deal with the problem but with not much success. It was proposed that: (i) Politicalleaders should speak out clear and louder. HIV/AIDS should come out clearly inevery meeting, seminar, workshop, etc. (ii) MoF should approach the donors on whatthey can do to tackle this problem (iii) Develop new international coordination withother African countries to combat the issue internationally. (iv) Interest of the donorsto help combat HIV/AIDS, through more local network funding.
* Observation on the problem has been as follows: (i) Intensification of the proposedfocus on multisectoral HIV/AIDS approach. Indicate how the available funds willhelp to combat the problem. (ii) Most of the institutions dealing with the problemmay not have enough capacity to deal with the problem. So they need assistance interms of human capacity. (iii) Indicators should be set so that progress can bemonitored and assessed. (iv) Systematization and human rights should be put in placewhile fighting the problem.
* Much more details of HIV/AIDS from the sectoral paper is needed. HIV/AIDS is theproblem that should be addressed by the Government. Government should come outwith a clear plan of how to deal with the problem. 'What should a nation do when it isin a war?' 'It should mobilize resources for the war'. Why seeking money which wecan't disburse? HIV/AIDS should be moved to the top of the agenda and henceattract more resources. It was noted that ADB is ready to cooperate with other donorsto help the Government to strengthen HIV/AIDS control programs.
* Numbers/figures should be given in terms of caring HIV/AIDS affected person orcaring orphan. The budget should indicate whether we are going in the right directionor not. It was noted that more than 16% of the affected people are children. Care andcounseling should involve everybody in the community.
* People in laboratories are limited. Also facilities for screening are limited, henceincrease the spread of the problem.
* There are success stories in reducing HIV/AIDS cases in some countries like Ugandaand Senegal. Studies by GTZ have shown a decline in HIV/AIDS cases in someregion ofTanzania. For instance, 10 years experience for Mbeya has shown thatHIV/AIDS figures have gone down from 20% to 15%, and from 15% to 5% forsyphilis. The decline in these figures shows that there is a way to reduce the extentof the problem.
* Things to be noted by the Government: (i) Intensify awareness program. (ii) Enactlegislation that can punish those who deliberately spread HIV/AIDS. (iii) Properfunding of the programs that are against HIV/AIDS. (iv) Stop those people who claimto have cure for aids as they draw away the resources of the poor people.
140

P7: CROSS-SECTOR MTEF
Presentation - By the Commissioner for Policy Analysis, Ministry of Finance
* The fiscal year FY01 will be the second year since the introduction of MTEFapproach to the Tanzania budget planning process linking policy, planning andbudgeting in a medium term framnework. This MTEF is built on the foundation of theprojected resource envelope and expenditure priorities consistent with the agreedmacroeconomic and sectoral objectives. The presence of HIPC debt relief as well asthe continued inflow of donor support has helped to enhance the predictability of theresource envelope for the budget. Resulting from this enhanced resource level, theexpenditure allocations in the next MTEF particularly for priority sectors andactivities, have been increased significantly when compared to allocations to othersectors and activities. The first MTEF for Tanzania was confined only to the fivepriority sectors (education, health, water, agriculture and roads). During the PER FYFY99 consultative meeting it was felt that there was a need to extend the coverage ofthe MTEF to other sectors on the basis that the exercise needs to be seen in thecontext of the broader public sector management reform and therefore has to involveall sectors of the government, including the Ministry of Finance and PlanningCommission.
* In analyzing sectoral allocations, expenditure is divided into the following mainsectors: Administration, Law and Order, Social Service, Economic Service, andConsolidated Fund Service (CFS). The analysis focus is on two dimensions,: sectoralallocation by shares, and deviations of actual sectoral expenditure from budgetedsectoral allocations.
* Sectoral allocation by shares: During the past two years (i.e. FY98 and FY99).average shares of actual spending as a percentage of the actual total sectoral recurrentexpenditure were: CFS (33.6%), social services (28.5%). productive services (3.3%),economic services (3.2%), Law and Order (17.0%), and administration (14.4%).Comparing the two years, the shares of recurrent expenditure on Social Services, andLaw and Order increased while shares of the other four sectors decreased. Increase inexpenditure shares on Social Services shows the Government's commitment towardimproving social service delivery. With regard to development expenditures theaverage shares were: Administration (12.7%), Law and Order(0.1%), Social Services(36.2%), Economic services (40.1%), Productive services (10.9%), and CFS (0.0%).The much faster increase in the actual development expenditure on social servicesand economic services reflects the Government's intention to develop the two keysectors.
* Deviations of actual sectoral expenditure from budgeted sectoral allocations:Under this, most of the sectors under-spent. The highest under-spending occurred inEconomic Services (-30.6%) while the highest and only over-spending occurred inCFS (+22.2%) for the same period. Looking at the deviations for the two respectiveyears. deviations for FY98 range from -30.6% to +22.2% while for the year FY99range from -9.0% (for Administration) to +3.6% (for Social Services). This shows
141

that actual sectoral recurrent expenditure for FY99 was more consistent with thebudgeted allocations than the year earlier.
* Outstanding Priority Sector Issues: Notwithstanding recent gains in somemacroeconomic variables, there are outstanding problems in the sectors. Suchproblems are manifested in the following outcomes. (i) The continued downwardtrend in the status of human development indicators and quality of social servicesparticularly in education, health, nutrition, water and sanitation. (ii) Weak and lowgrowth of the agriculture sector relative to its potential. (iii) Inadequate investment inphysical infrastructure notably transport, marketing and processing. (iv) Vulnerablebalance of payments position due to adverse developments in the internationalenvironment such as a decline in commodity prices, rising import prices and erraticrecovery of the export sector. (v) Lack of micro-finance services.
* Along with the broader objective of enhancing sustainable economic growth andpoverty eradication, the Government will address those problems through the MTEFprocess.
The overall objectives of the government for priority sectors up to the year 2002/03:
* For the education sector the overall objectives continued to be: to increase enrolmentof pupils in primary education by 10% annually; to increase transition rate of primaryto secondary level from 15% to 21%; to improve the quality of teachers through in-service and pre-service training at the rate of 30% annually; to increase enrolment inhigher learning institutions, promote gender equity and improve training; and toincrease the capacity and improve inspection services coverage from 50% to 70%.
* For the health sector, the main thrust of the MTEF for FYOI-FY03, is to improveprimary health care by focusing on equity with emphasis on capacity building,improvement of service delivery and provision of drugs, medical supplies andHIV/AIDS educational contact.
* For the water sector the overall objective is to increase access to clean, safe andadequate water supply by at least 9% points for the rural population and 7% points forthe urban population.
* For the agricultural sector, the government will continue to avail public resources tothe sector's strategic priority activities, namely: extension services, research,regulatory services, promotion of functioning co-operative societies, marketinginformation and agricultural statistics, early warning systems and food securitymanagement.
* For the road sub-sector, issues that have high priority include: road maintenance of anupgraded network; implementation of priority rehabilitation and upgrading projects;and rehabilitation and maintenance of rural roads under the local governmentauthorities' jurisdiction.
* With regard to the land sector, priority will be given to the key areas directly relatedto the operationalization of the new land policy and law. These key areas are landresource management; land tenure security enhancement; land information
142

management, and speeding up the processes for issuing land titles and resolution ofland disputes.
* Good governance in the context of this MTEF includes: enforcing law and order (inparticular the judiciary); general election; the national population census;implementation of the National Vision 2025; the anticorruption strategy; and thecontrol and audit.
The Budget Frame
* Specific Consideration in Developing the Budget Frame: Specific considerationsthat guided the development up of the budget frame were as follows: (i) the draftbudget frame prepared by the MOF was adopted as the baseline scenario, (ii) theresource envelope as projected in the baseline scenario was re-examined to correct forthe declining tax effort (tax/GDP ratio) over time, (iii) the upper case scenario is toinclude additional resource projection from the enhanced HIPC and the possibleoffsets between expected resources from the MDF and the HIPC debt relief, (iv)projections of external resources (loans and grants) were based on likely turn-outfigures informed through questionnaire survey of all DAC donors, (v) the level of thefiscal deficit ought to be consistent with the government macroeconomic policies toensure sustained macroeconomic stability, and (vi) exchange rate of Tshs. 750 to theUSD is an underestimate.
- Underlying Assumptions of the Budget Frame: The macroeconomic policy targetsfor the MTEF FY01 - FY03 underlie assumptions that guided the development of thebudget frame: (i) Real economic growth of 5.8% in 2000 rising progressively to6.9% by the year 2003, (ii) Consumer price inflation of 5.0% is expected to declineconsistent with the inflation trend of the trading partners, (iii) Revenue collection istargeted at 13.0 percent of GDP at market price in FY03 (iv) A decline in broadmoney supply (M3), (v) Increase in foreign reserves to the equivalent of 4 months ofimports of goods and services by end 2000, and (vi) An average exchange rate ofbetween Tshs. 800-850 to one USD is projected for FY01.
* Resource Allocation Criteria: In terms of the criteria used to allocate additionalresources the following principles were applied: (i) Priority areas should be thebeneficiaries of additional resources after funding PE, general elections, nationalpopulation census and build-up to the government pension fund (ii) Additionalresources should fund non-wage expenditures - both OC (recurrent expenditure) anddevelopment expenditure (iii) Priority activities within priority sectors should betargeted in allocating expenditures so as to have the maximum impact on povertyreduction (iv) Allocations to non-priority sectors were to be maintained at the samelevel in real terms. (v) The division between PE and OC be such that all additionalresources allocated to the priority sectors were to go to OC (vi) In deciding theallocations between sectors, the same proportions as in the Budget Guidelines wereapplied. (vii) As regards allocation within sectors, use was made of the sectordevelopment programs and studies/reports that were commissioned to updateexpenditure plans for the priority sectors covered by the PER FY99.
Discussion and Comments on P7
143

* The major source of funds allocated to the roads sector is the Road Fund but this doesnot cover all requirements. There should be additional funds for developmentpurposes of roads from the Government budget.
* Private sector is neither involved in the PER process nor the MTEF preparationalthough it is involved in paying taxes and creating jobs. There is need of includingprivate sector in the permanent PER Macro group.
* It was also noted that there is inconsistency in numbers in the cross sector MTEFespecially for the education sector and health sector numbers.
* Allocation to priority sectors (specifically agriculture and roads) is so minimal that itdoes not reflect priority of the sectors. For instance allocation to roads is not enoughto cover required road maintenance targets, hence leading to fast deterioration of theroad network.
* Clarification on the participation of the private sector in the PER process was made asfollows: "Private sector participate full in the PER Working Group but not in the PERMacro Group, but the final numbers/figures are presented to the PER WG, in whichthe private sector is represented. However, in the future the private sector will berepresented in the PER Macro group.
* Clarification on the Road Fund was as follows: Road Fund numbers are indicative.Further more Tsh. 5/= billion. has been set as the provision for development budget inthe roads sector. However, one has to note that given fixed nature of resourceenvelope, trade-offs would mean shifting of resources from one sector in order to addto the other.
* In the future there is a need to see whether it is possible to reallocate resources fordevelopment purposes to the maintenance of roads in case there are shortfalls on therecurrent side.
P8: EDUCATION SECTOR MTEF
Presentation - By Permanent Secretary Ministry of Education and Culture
* The education sector has formulated several policies including the Education andTraining Policy, Higher Education Policy, Science and Technology Policy andTechnical Education Policy. The implementation of these policies has triggered thedevelopment of the Education Sector Development Program (ESDP). The ESDPprovides for an opportunity to address issues and problems caused by large numbersof uncoordinated development programs/projects. It strengthens sector managementby bringing all donor and govermment funding capital and recurrent within a singleplanning and implementation framework in support of an agreed sector strategy.
* General Trend of Education Financing: The sub-sector financing shows that basiceducation is mainly financed by the Central Government, followed by external donorsand parents. Donor contribution in the education sector appear to be increasing, withgrowing priority given to basic education. A number of initiatives are underway thatmight help to increase funding of the sector. These include the following: a national
144

education levy; household involvement in site construction/rehabilitation ofclassrooms and teachers houses; contribution to a revolving fund for textbook, and acontribution to the cost of school inspection; and district education trust funds.
* For recurrent expenditure: The major financing source has been the CentralGovernment. These are categorized into PE, OC and student direct costs. Since thefinancial year 1992/93, the Government introduced cost sharing in phases. Total realgovernment expenditure has increased over the last 10 years. However, public sectorspending on education is low (only 2.6% of GDP) compared with other countries likeKenya (6.1%), Uganda (2.9%) and South Africa (6.4%). Between 1993 and 1998 theshare allocated to primary education rose from 51% (1993) to 67% in 1998, fallingslightly to 62% in 1999. Secondary education received 7% of the sector budget in1999 compared to 15%, six years earlier, a reduction of 53%. The shares of therecurrent budget allocated to teachers training and administration have fallen by 60%and 44% respectively. Expenditure on Higher and Technical education almoststagnated up to 1997 with slight improvement in 1999. The pattern of recurrentexpenditure shows that in primary education, personal emoluments have averaged96% of total government recurrent expenditure since 1995, in secondary education, ithas averaged 63%, while in teacher training it has averaged 69% of govermnentrecurrent expenditure since 1996.
* As regards development expenditure, for several years the Government has notfunded research costs in higher education. The donor community has been the mainsource of financing the cost of research and other development costs in highereducation. In real terms, development expenditure on education appears to beincreasing, albeit from a low level, considering the sector's share of the recurrentbudget.
* Mobilization of Funds: For some time, the financing burden for the education sectorhas been shifting from public to private sources. There are other sources of financingwhich include: (i) District Education Trust Funds - under ESDP, each district isrequired to establish a District Education Trust Fund primarily for financingeducation activities. (ii) Education Levy - it is envisaged that the fund would servethe resource mobilization function and the grant and resource allocation function.
* Performance Indicators in Basic, Secondary, Teacher Training, Higher andTechnical Education: In general, the performance of the basic education sub-sectorhas declined and that of secondary education has improved even if the overall resultsare still poor. In teacher training, internal efficiency has fallen by half, while inHigher and Technical education the student/teacher ratio still remains very low. It liesbetween 1:4 and 1:1 in some courses like nursing.
* Sector Priorities: The establishment of the Education Sector Development Program(ESDP), within the Tanzania Development Vision 2025. aims at achieving highquality livelihood for all Tanzanians through realization of Universal PrimaryEducation, the eradication of illiteracy and attainment of quality human resourcesrequired to effectively respond to the developmental challenges of a changingenvironment. The Medium Term Plan therefore tries to bring on board priorityprograms that are logical bases as well as catalysts that strengthen the effective and
145

efficient implementation of programs. The Medium Term Plan is aimed at the learner.However, prioritization in any sector is inevitable particularly in the context of scarceresources while competing needs are numerous. The thrust of the Medium Term Planis to enhance learning achievement. This period the ESDP will address the followingpriorities: to improve the learning environment at all levels; to strengthen themanagement capacity at national, district, and institutional levels; to improveEducation Management Inforrnation System (EMIS); and to control the spread ofHIV/AIDS/STI through the education system.
* Sector Main Problems: The problems include: Low enrolment rates, low quality,low transition, inequitable provision of services, high costs, low parentalcontributions and effective demand for education, weak quality control in highereducation, and low patterns of expansion for higher education.
* Expenditure Projections: The government has decided to accord high priority to theeducation sector, which is a symbol of recognition of its pivotal role in thedevelopment of the nation. The education share of the discretionary budget had beenrising since independence.
P9: THE HEALTH SECTOR - MTEF
Presentation - by the Permanent Secretary Ministry of Health
- The Health System Network: The Tanzanian health network consists about 4844facilities that are well distributed across the country of these facilities, 2877 belong tothe government. Analysis of Disease (1995 Study) patterns and trends show that theburden of disease is mainly concentrated on communicable and preventable diseasesthat can be controlled through effective preventive and promotive health programs atdistrict and primary levels.
- Health Sector Reforms: The ministry initiated and proposed major reforms in thesector to rationalize the roles and responsibilities in the provision and financing ofhealth services.
* Health Policy Objectives: The overall objective of the Government of Tanzania'shealth policy is to improve health and well-being of all Tanzanians with a focus onthose most at risk and to encourage the health system to be more responsive to theneeds of the people.
* Specific Objectives: To achieve its overall objective, the Government of Tanzaniaaims to (i) reduce infant and maternal mortality, morbidity and increase lifeexpectancy; (ii) ensure that quality health services are available and accessible; (iii)move towards self sufficiency and equitable distribution of human resources bytraining all cadres required at all levels; (iv) sensitize the community on commonpreventable health problems and improve capacity at all levels of society; (v) promoteawareness in government and community at large that health problems can only beadequately addressed through multi-sectoral co-operation and sector wideapproaches; (vi) create awareness through family health promotion that responsibilityfor one's health rests squarely with the able-bodied individuals as an integrated part
146

of the family; and (vii) public/private mix will be promoted in the delivery of healthservices.
* Immediate Objectives: The Ministry of Health, following the thrust of the on-goinghealth reforms, will take the process forward in the Plan of Work with the followingunderlying immediate objectives: (i) priority attention to improved access, equalityand efficiency of primary health (district level) services; (ii) strengthen and reorientsecondary and tertiary services delivery to support primary health care services; (iii)improve the capacity for policy development and analysis, development of guidelinesfor national implementation, performance monitoring and evaluation, legislation andregulation of service delivery and health professionals; (vi) implement a humanresource program to train adequate numbers of health staff to manage the services(primary, secondary and tertiary); (v) strengthen the national support systems forpersonnel management. drugs and supplies, medical equipment and physicalinfrastructure management, transport management and communication; (vi) increasedand varied financing sources for health care delivery and improved financialmanagement; (vii) increased private sector involvement in the delivery of publichealth services; and (viii) within the sector-wide approach, improve the relationshipbetween all partners, and institute mechanisms to ensure that support to the healthsector is addressed in its totality with sharing of information and actions.
* Implementation Strategies: In order to meet the challenges of providing healthservices within the Health Sector Reform agenda, eight inter-linked strategies havebeen developed to address the above mentioned immediate objectives. The ideabehind these strategies are that: (i) more resources will be injected into the healthsystem and existing resources will be used efficiently; (ii) resources will bedistributed more equitably; (iii) priorities, objectives and standards will be clearlydefined and monitored; (iv) managers at all institutional levels will have greaterauthority in the planning, allocation and use of available resources; (v) staff will bebetter motivated through improvement in working environment; and (vi) drugs andessential supplies to be made available as required.
* In order to implement these strategies, a phased three-year development program ofwork has been developed.
* Priority Areas: The priority areas focus on facilitating and strengthen the delivery ofhealth services to comply with the essential district health package as well as to arrestthe further deterioration of the physical facilities. The following priority areas aretherefore recommended: (i) drugs and essential medical supplies; (ii) kerosene forstorage of vaccines in rural areas; (iii) essential hospital equipment and supplies; (iv)strengthening of the referral system; (v) equipment for safe motherhood for all levels;(vi) conditional survey of physical facilities and equipment and prioritization forurgent rehabilitation of the most critical ones; (vii) mechanisms for introduction ofCHF and cost sharing to lower level facilities; (viii) mechanisms for implementationof the National Insurance Fund; (ix) improved health education strategies; and (x)development and institutionalization of the health sector reform strategies.
* The following are the key components pertaining the above priority areas and whichneed to be strengthened: (i) Sector Financing; (ii) Sector Monitoring and Evaluation;
147

(iii) Sector Financial Management; (iv) District Health Management; and (v) HealthNetwork Rationalization.
* Health Sector Overall Expenditure Performance FY1997-2000: In the past 2 yearsand half of the current fiscal year, the amount of funds released was more than whatwas budgeted for the sector. This was intended to alleviate the shortage of drugs inmost of health facilities.
* Financial Resources and Medium Term Framework for the 2000-2003: Thegovernment, donors and contributions from members of the community mainly fundthe health sector. Donors mainly support vertical programs. Trends in the governmentexpenditure on health therefore indicate a notable under-funding at all levels of thesector.
* Way Forward (2000-2003): (i) Planned activities in year one shall be budgetedwithin existing resource envelope; (ii) New reform activities will continue to befunded over and above committed and tied funding by donors and government,partners and other donors; (iii) This year, most of the reform activities will beintegrated into the Annual Development and Recurrent Expenditure books; (iv) TheMOH will continue with the introduction of policy objectives and targets that willallow identification of scarce resources and the need for greater inputs over time; (v)MOH will continue to emphasize on the need to integrate vertical programs intosectoral and district plans and budgets so that most of the vertical program funds arereflected in government budget books in order to develop comprehensive health plansat all levels; (vi) The MOH will continue with its efforts to assist the regions anddistricts to build their capacity in planning, management and supervision; and (vii)MTEF will eventually show an integrated budget frame for all activities.
Discussion/Comments on P8 and P9
* There is a need to link the Education and Health MTEF document with the TASdocument.
* Performance indicators in education are worrying. One wonders why so muchresources (money) have been put in to the education sector without makingdifference. There is a need of reconsidering the main problems facing the sector onceagain.
* There is a need to study why primary education is under performing as compared tosecondary education
* There is poor management of the resources available in the education sector and notthe issue of cutting down administration. It is noted that there is under spending of themoney provided to the sector (by Swedish and other donors).
* Problem of data inconsistencies between the cross sector MTEF and sector MTEFsfigures.
* Education fund is contributed indirectly and directly by levies. However, donors wereasked to assist in developing this fund.
148

* Human resources need to be considered as a priority area.
* There is a very long list of priorities in the education sector. Hence, translation ofpriorities and objectives into expenditure is not consistent with overall resourceenvelope. There is need of redefining the absolute priorities consistent with theresource envelope.
* No development expenditure for development of teachers although it is a priorityarea in the education sector.
PlO: WATER SECTOR - MTEF
Presentation - by the Permanent Secretary Ministry of Water.
* National Goal: The national goal focuses on universal access to safe water by theyear 2025. This goal shall be fulfilled through proper, efficient exploitation of waterresources for enhanced socio-economic development by providing clean, safe andadequate water and wastewater disposal system.
X Vision: The Ministry of Water aims to achieve sustainable water resourcesdevelopment and management which is responsive to the needs, interests andpriorities of the Tanzania population including men and women, both in rural andurban areas.
* Mission: The Mission of the Ministry of Water is to ensure water resourcesmanagement and developments are carried out in collaboration with all stakeholdersin an economic, environment and social sustainable manner. To fulfill this, the MOWwill undertake the following:
* Facilitation, co-ordination, monitoring and regulation provision of water andsanitation services to the public with a gender perspective.
* Formulate a realistic, comprehensive, dynamic and gender sensitive water policywhich takes into account other related policies,
* Develop competent sector professionals of high integrity.
* Medium Term Objectives: The main focus for the water sector during FY01 - FY03will be to rehabilitate and expand and expand water and sanitation facilities, andinstall efficient management to bring the service level from 48.5% to 50% of the ruralpopulation and from 68% to 70% of the urban sector by year 2002/03. This will beachieved by fulfilling the following objectives. (i) Revision of the National WaterPolicy by year 2001, (ii) Facilitation of the sustainable provision of adequate, safeand clean water for different social groups in rural and urban areas between years2000 and 2003: rural areas (from 48.5% to 55% of population coverage) and urbanareas (from 68% to 75% of population coverage). (iii) Facilitation of the developmentof urban sewerage and drainage facilities forn 10% population coverage in 2000 to25% population coverage by the year 2003. (iv) Improvement of water resourcesmonitoring infrastructure from 20% in 2000 to 40% by the year 2003. (vi) Protectionof water resources in order to control pollution levels from 30% in 2000 to 10% byyear 2003. (vii) Development of professionals of high integrity with gender capacities
149

for effective and efficient development and management of Water Sector from 60%in 2000 to 80% by the year 2003.
* Medium Term Expenditure Strategies: (i) Facilitation, regulation, promotion of theparticipation of the private sector and composition of the Water ResourcesManagement Policy, as a part of the National Water Policy. (ii) Construction andrehabilitation of Water Schemes in rural areas, starting with semi-arid areas/regions.(iii) Rehabilitation and expansion of water schemes in urban and peri-urban areas -regional and district headquarters. (iv) Rehabilitate and expand the schemes forsanitation services in urban areas to meet the demand. (v) Rehabilitation andexpansion of hydrometric and meteorological network for the sake of reliabledatabase for realistic sector planning. (vi) Establishment of environmentalconservation and pollution control networks for water sources. (vii) Training ofgender sensitive and competent professionals for the water sector, technicians,engineers and water resources scientists.
P11: ROAD SECTOR - MTEF
Presentation - by the Permanent Secretary Ministry of Works
* The road network in Tanzania comprises approximately 85,000 km of roads,classified into three overall categories: trunk roads; regional roads including essentialThis year's MTEF of the Ministry of Works (MOW) differs from last year's by itsinclusion of institutional changes in the road sector, specifically the creation ofTANROADS. The new organization is a semi-autonomous executive agencydedicated to the management of the road network and execution of futuremaintenance and rehabilitation of the road network.
* district and feeder roads; and district and feeder roads.
- According to the MOW estimates, only 15% of the trunk and 10% of regional roadswere in good condition prior to the commencement of IRP in 1990. Althoughprogress has been achieved on the paved trunk roads, the following deficiencies haveoccurred: (i) While the number of km paved trunk road in good condition hasincreased, the overall percentage of trunk roads in good condition has decreased by3% from 1997 to 1999. (ii) There has been a significant decrease in the number of kmof trunk road in fair condition, with a corresponding increase of those in poorcondition. (iii) The number of km of regional roads in good condition has beenreduced from 18% in 1997 to 15% in 1999. (iv) There has been a 2% decrease in thenumber of km of regional roads in fair condition. (v) There has been a 5% increase inthe number of km of regional roads in poor condition. This informnation paints a rathernegative picture of the achievements in the road sector. However, it is difficult todraw any conclusions as to the effectiveness of the road maintenance carried out. Thisis due to the consequences of El Nino weather phenomenon in FY98 and the mode ofsurvey which relies on visual inspection, and thus which is prone to subjectiveinterpretation.
* Vision: The Tanzania development vision 2025 accords very high priority toinvestment in infrastructure. In particular, the development of the road network is
150

judged to be absolutely essential for promoting rural development. Consequently, theGovernment's mission and vision for the development of the sector is focused atimproving the national road network.
* Organization and Management of the Road Sector: In order to strengthen theorganization and the management of the sector the government embarked on varioussteps: the FY99 transfer of the responsibility for maintenance and development ofdistrict roads to the Ministry of Regional Administration and Local Government(previously under the Prime Minister's Office); the adoption of a new institutionalstructure for the road sector through amendment of the Roads Toll Act in order tocreate a dedicated Road Fund to be managed by a Road Fund Board; and theestablishment of a semi-autonomous road agency TANROADS under the ExecutiveAgencies Act which will be responsible for road maintenance and development of theroad network (previously under the department of roads-MOW).
* Review of the past expenditure performance FY98 - FY00:
* The level of expenditure by the Ministry of Works has fluctuated in both real andnominal terms. Comparison of actual releases with budgeted funds shows that actualreleased funds have in most cases been far less than the budgeted amounts. This hasalso been the case for both the development and recurrent budget. In FY00 however,recurrent costs surpassed the budget by 2% due to the fact that the development fundswere dedicated to the maintenance of road infrastructure that was destroyed by ElNino.
* In FY 98, actual non-salary expenditures were less than the budgeted amounts formost sub-votes. The ratio of actual PE allocations to budget was close to or above100% except for sub-vote 103 (Policy) FY99 shows a different picture: overall,releases for non-salary expenditures (other charges) were higher than the budgetedamounts; on average, there was a shortfall in the total PE actual allocations to budget.There were many cases of over-expenditure in most sub-votes, the largest being inSub-vote 102 (Finance and Accounts). The road sub-vote is still given the top priorityin the Ministry of Works, receiving more than 90% of total resources.
* Over the past three years, govermment expenditure in the roads sector has focusedmainly on three main areas: emergency maintenance of roads such as those damagedby El-Nino rains during FY98; maintenance of the rehabilitated/upgraded roadnetwork; and implementation of priority rehabilitation and upgrading projects. For theperiod FY98 and FY99, the actual allocation of funds for road maintenance activitiesaveraged about 57% and 89% of the road maintenance budget, respectively. As aproportion of the total maintenance and rehabilitation budget, actual expenditure onroad maintenance averaged 37% and 44% respectively during the same period. Theactual allocation of funds for road rehabilitation was 76% and 73% of the budget inFY98 and FY99. As a proportion of the total budget, funds allocated for rehabilitationaveraged 63% and 56% during the same period.
* The Medium Term Expenditure Framework: According to the revenueprojections, there will be a significantly reduced resource envelope for the roadssector. This conclusion is based on the Tshs 22,443 million collected as Road Fund
151

revenue up to 3 1st January, 2000 and the identical growth rates as those used in thebudget guidelines. For this reason, measures will have to be taken either to enhancerevenue collection, or to readjust expenditure plans downward in accordance with therevenue shortfall. There are three options for implementing the above measures:controlling fuel smuggling and dumping; changing the tax structure on fuel productsto raise the fuel levy; or limiting Road Fund resources to the maintenance of astrategic road network. The distribution of the Road Fund resources betweenmaintenance and development is based on the proposed distribution set out in theRoad Fund Act as well as that which is determined by the government. According tothe distribution: maintenance of Trunk and Regional Roads receives 63%;development of Trunk and Regional Roads 7%; maintenance of District, Rural,Feeder Roads 27%; and development of District, Rural Feeder Roads 3%. Accordingto the budget guidelines for the period FYOI-FY03 the roads sector will continuegiving high priority to the following areas: road maintenance of upgraded network;implementation of priority rehabilitation and upgrading projects; and rehabilitationand maintenance of rural roads under local Government authorities jurisdiction underMRALG.
Budget Strategy for the Road Sector: In order for Ministry of Works to achieve itsstrategic objectives in the road sector for the coming three years with the resourcesavailable, the following actions need to be taken: dedication of Road Fund tomaintenance and development of the strategic network; conducting detailed annualroad condition and traffic survey; putting in place measures to control fuel dumpingand smuggling; assessment of impact of past maintenance efforts; and change the taxstructure for petroleum products.
P12: JUSTICE & CONSTITUTIONAL AFFAIRS - MTEF
Presentation - by the Permanent Secretary Ministry of Justice and Constitutional affairs
* An efficient, fair and transparent system of justice is crucial for securing andperpetuating an enabling environment for the peaceful and dynamic social andpolitical development and prosperity of the nation. This is the main reason why theGovernment is committed to institute and execute the reformn and development of thelegal and judicial service in the country.
* Vision and Mission: The vision of the Ministry for the next three years is accessibleand timely justice for all. In line with the overall vision the Mission of the Ministry isthe development of social justice, equality and rule of law, constitutionalism,fundamental human rights, equality and social justice, equality of all before the law,ethical and fair conduct by law enforcement officers, accessibility and affordability oflegal services for all citizens, efficient and timely resolution of disputes, transparencyand accountability.
* Government Expenditure on MJCA: The MJCA has for a long been accorded avery low priority in the allocation of budgetary resources, the provision of the basicinfrastructure and facilities, and in public esteem generally. Between the years FY98and FY99, the share of MJCA in total government actual expenditure increased only
152

marginally from 1.08% to 1.2%. The share of the sector in government actualrecurrent expenditure remained more or less constant at 1.3%, while that ofdevelopment expenditure dropped drastically from 0.05% in FY98 to 0.01 in FY99.Within the Ministry, the budget expenditure is distributed into the three independentdepartments: the Judiciary Department, the Justice Department and the Law ReformCommission. The Judiciary department got the largest share, over 70% of the budgetof the FY98 and FY99 fiscal years. The AGC department got less than 30% of thebudget during the period while the Law Reform Commission share was less than 2%only. Most of the expenditure in the departments was directed into recurrentexpenditure with only the AGC department having some small developmentexpenditure. Like most other ministries, the MJCA has been receiving very little orno development funds. Only recently has the MJCA been included in the cluster ofpriorities, which include such other institutions as social services, infrastructure andagriculture. Most of the development funding to the MJCA has been coming from thedonor community.
* Performance Indicators of the MJCA: These include efficiency, effectiveness,outcome indicator and the work process indicator. Available inforrnation suggeststhat efficiency is at a reasonable status. Effectiveness is still hindered by inadequatefunds while the outcome indicator reveals the presence of corruption problems in thesector. The work process indicator suggests that justice administration in the countryis hindered by a small budget especially from other charges (OC) allocated to thedepartments.
C Characteristics of the Tanzanian Legal Sector: In general, the Tanzanian legalsector is characterized by the following defects: managerial problems; lowcompetence at the lower levels and morale of public sector legal personnel;inadequate number of professionally trained legal personnel in some specializedareas; constrained independence and low integrity of the judicial system; ignoranceand poverty of the majority of the citizens; and excessively limited and poorlymaintained work environment for all public institutions in the legal sector.
* Major Issues: Given the defects of the Tanzanian legal system, the main issues,which at present must be addressed are: (I) updating and harmonizing the legal andregulatory framework; (ii) strengthening the management and co-ordination of legalsector institutions; (iii) enhancing the competence and motivation of personnel inpublic legal institutions; (v) improving pre-service training and constantly upgradinglegal skills of law officers in the public service to enable them cope up with newchallenges in the market economy and a new liberal constitution regime; (vi)enhancing access to legal services for the poor and disadvantaged; (vii) developingand maintaining an enabling and conducive work environment for public legalofficers.
* In addition to addressing these problem, reforms in the legal sector must also aim atmaking the legal sector responsive to social, political, economic and technologicaltransformation.
* Major Problems: The major problems include: financial problem - the budgetaryresource allocation to the MJCA has always been far too low to enable the ministry
153

perform its functions effectively; shortage of staff - this problem is very serious,especially in the AGC department; lack of training; low pay; poor state of officebuildings, office equipment and office supplies; corruption; and shortage/poor libraryfacilities.
* Priorities: In order to realize the objectives of National Development Vision (Vision2025) which aims at higher economic growth led mainly by the private sector, goodgovemance, rule of the law, peace, stability, equity and the fight against corruption,there is need to address the following priorities: (i) the fundamental priority is toincrease the funding of the MJCA (ii) to improve the work environment (iii) toimprove remuneration, payment to court assessors, allowances and other approvedbenefits; (iv) to develop and implement strong in-service training programs (v)recruitment of more staff; (vi) to procure vehicles for supervision (vii) to establishand update the legal database and information systems; (viii) to rehabilitate andfurnish and equip court buildings and offices; (ix) to improve pre-service training inthe country; (x) to educate the masses about various legal aspects; and (xi) tostrengthen the commercial court.
* Projection for Future Budgets: The projection is based on the assumption that theMJCA which is currently included in the PER - Poverty Eradication will togetherwith social service sector such as education, health and water, be identified as prioritysectors, eligible for additional resources to be available through the HIPC initiativesand the TAS arrangement. It is assumed that the government will recognize theexpanded role of the public Ministry of Justice, and will be prepared to increaseresource allocation to the MJCA. It is assumed that the budget (in nominal terms) willincrease by 25 percent.
P13: AGRICULTURE SECTOR - MTEF
Presentation - by the Permanent Secretary Ministry of Agriculture & Cooperatives
* The Tanzanian economy depends on agriculture and therefore the sector'sperformance determines how the overall economy performs. The sector contributesabout 50% of the GDP, providing about 75% of Tanzania's foreign exchangeearnings. The sector also provides employment to about 80% of the population themajority of whom live in the rural areas.
* The General Performance Trend of the Agricultural Sector: The performance ofthe sector has not been impressive in recent years in its role as an engine of growth,reduction of poverty and source of food security. The agricultural GDP has onlygrown at an average rate of 3.3 percent per annum since 1985.
* Vision: On the basis of the National Vision 2025 for Food and Agriculture, theMinistry of Agriculture and Cooperatives (MAC), acting as a catalyst for agriculturaland cooperative development, aspires to be: action oriented, professionally staffedand managed, dynamic, innovative and efficient, and provider of services that aredemand driven, cost effective and environmnentally friendly.
154

* Mission: The mission of MAC is thus to formulate sound policies, provide soundregulatory frameworks and support services as well as technical advice to farners andto the private sector for a sustainable growth and poverty reduction.
* Objectives: The MAC objectives in respect to agricultural development are asfollows: (i) to review and formulate sound agricultural policies in order to ensure theright direction towards developing the sector; (ii) to provide support services tofarmers and other institutions in order to improve technological know how which willfacilitate increased agricultural production, productivity and quality; (iii) to providethe regulatory framework and services in order to sustain agricultural industrialgrowth; (iv) to provide technical services in agricultural farming in order to promoteeffective use of resources for sustainable agricultural development; (v) to develophuman resources within the sector in order to increase the productivity of labor and toimprove ability, awareness and morale; (vi) to provide assistance to co-operativedevelopment particularly in areas of human resource development and institutionalcapacity building without effect on their independence; and (vii) to provide theenabling environment for private sector participation in agricultural production,processing and marketing.
* Policies: To achieve the stated goals and objectives, instruments employed includethe following strategies: (i) to improve the agricultural extension and advisoryservices; (ii) to raise the efficiency and reduce the cost of production through use ofappropriate technology; (iii) to regulate and control quality and standards ofagricultural outputs and inputs; (iv) to coordinate agriculture and livestock research togenerate appropriate technology; (v) to improve supervision and inspection ofcooperatives (unions and societies); (vi) to institute cost sharing in research andtraining activities; (vii) to facilitate the cooperative movement through intensive andextensive member education on obligations and rights; and (viii) to train requiredmanpower for their efficient and effective delivery of agricultural support services.
* General Budgetary Performance: The share of MAC in the total governrmentexpenditure (both recurrent, development, and donor financed) has declined since theearly 1990s. In 1990/91, MAC received about 5.1% of the expenditure. The share in1991/92 and FY96 fluctuated in 3 and 4 percent. Between FY98, FY99 and FY00, theshare was 2.1, 4.1 and 4.3 respectively.
* Financial Resources to the Agricultural Sector: The agricultural sector is financedby the government, development partners (bilateral and multilateral), NGOs, retentionschemes and contribution from crop commodity industries. The Ministry haslaunched a number of initiatives so as to increase funding in the agricultural sectorparticularly in areas of research and inputs.
* Achievements against Objectives and Targets: (i) a new organizational structurebased on the core functions is in place and functioning; (ii) rationalization of MACand decentralization of extension services to the councils; (iii) privatization ofparastatals under MAC for increased production is on-going; (iv) private sectordevelopment; (v) review and harmonization of the several acts and regulations hasbeen completed; (vi) participating in TAS and HIPC initiatives; (vii) taking part in
155

preparing the Poverty Reduction Strategy Paper (PRSP); and (viii) several otherprograms/projects are under implementation.
* Medium Term Expenditure Framework (FY01 - FY03): The medium termobjectives for the sector based on the MTEF planning model are as follows: (i) toensure basic food security for the nation and to improve national standards ofnutrition and living in the rural areas through increased production growth rates of atleast 4% and 4% and 5% per annum for food crops and livestock productsrespectively; (ii) to promote and encourage the production and export of agriculturaland livestock produce to increase foreign exchange earnings and the supply of cropsand livestock raw materials, their by-products and residues to the local industries; (iii)to develop human resources within the sector and introduce new technologies in orderto increase the productivity of labor and land; (iv) to promote integrated andsustainable use and management of natural resources such as land, soil and watervegetation in order to conserve the environment; (v) to provide support services to theagricultural sector, which cannot be provided efficiently by the private sector.
Policies and Strategies:
* The sector's goal and policy objectives as contained in the agricultural and livestockpolicy and the Co-operative development policy of 1997 remain the pillars inredefining the roles of Ministry and the emerging private sector in the development ofthe agricultural sector in the country. The policy direction is based on economicreforms to increase the role for private sector participation in agriculture and thedisengagement of the government form commercial activities and direct productionfunction in the agriculture sector.
* Currently, there are two categories of agricultural sector strategies. The strategies toimplement the sector policies; and the strategies to implement the MAC MediumTerm Strategic Plan 1999-2004.
* Priorities: The following are priority areas and expenditure items for the MACwhere public resources need to be invested: (i) strengthening policy forrnulation,analysis, review and monitoring of agriculture sector development; (ii) strengthenagricultural data on information system; (iii) the rehabilitation of research, extensionand training facilities; (iv)enhance institutional reforms and capacity building inMAC; (v) complete and consolidate the on-going agricultural development projects;and (vi) support sustainable agricultural development activities.
* Conclusion: The agriculture sector operates as an integral part of a large economicsystem. Hence a sound performance of the agricultural sector depends on theefficiency and effectiveness of the other sectors. The other sectors in turn require astrong agricultural sector for achieving social objectives. Thus, the linkages are verycritical.
P14: LAND SECTOR - MTEF
Presentation - by the Permanent Secretary Ministry of Lands & Human Settlement
156

* Land is the ultimate resource, for without it, life on earth, as well as economicdevelopment cannot be sustained. Economic activities directly related to landresource utilization account for over 80% of Tanzania's GDP. The sector alsoprovides more than 85% of national employment. Unfortunately, the majority ofpeople in Tanzania hold land under customary or deemed rights of occupancy,whereby the security of tenure was until recently, not secured compared to thegranted right of occupancy which was the preserve of the few. Rapid populationincrease compounded the problem of security of land tenure in urban areas andcompounded conflicts in land use. Urban population now is estimated to account for30% of the total population of Tanzania.
* Problems: Among the many problems of land management experienced in rapidlyurbanizing Tanzania are the following: shortage of planned land; massive growth ofunplanned areas; lack of security of tenure for the majority of urban dwellers;problems of land administration to the extent of not knowing what is going on in themarket; wide breach of land use regulations by developers and the inability of publicauthorities to enforce regulations, inadequate and uncoordinated land information;and emergence of parallel, unofficial and poorly understood and documented landsdelivery system.
- Ministerial Vision: To achieve efficient delivery of high quality land developmentservices and a multipurpose cadastral information system for sustainable economicdevelopment and growth.
* Challenges: Poor land administration and management; poor record keeping; demandfor plots being greater than supply; delay in the issuance and registration of titles;inability to provide serviced land; unmanaged urban population growth in relation totown planning and in the provision of housing services; and slow speed in theprovision of housing services in the rural areas.
* Mission: The main mission of the Ministry of Lands and Human SettlementsDevelopment can thus be summarized as follows: to administer and manage landrelated issues (ownership, value, use etc.), to provide effective and efficient landdelivery services; to administer and regulate cadastral surveys, hydrographic surveys,and mapping activities in the country; and to create enabling environment andinstitutional framework to support the human settlements development process.
* Objectives: To facilitate realization of the mission of the Ministry of Lands andHuman Settlements Development, the budget plan focuses over a period of threeyears with the following key set of objectives: excellency in service delivery;increasing revenue collection; and creation of an effective institutional and financialframework for the development of sustainable settlements.
* Strategies: To publicize the Land Act No. 4 of 1999 and the Village Land Act No. 5of 1999 and undertake special training; to have an effective land administration andmanagement system; to establish an integrated and automated land informationsystem; to establish a land register and data bank system; to improve the land deliverysystem; to issue and register titles promptly; to ensure that town planning is ahead ofurban growth; to ensure that land use plans are adhered to; to embark on partnership
157

with urban dwellers to improve the management of towns and cities; to promoteresearch and development in technologies for low cost housing construction; topromote the establishment of building finance societies; and to create a corruptionfree working environment.
* Review of FY00 Performance: The operational objectives are: ensuring excellencyin service delivery; promoting appropriate use of land resources so as to increaserevenue by 31%; and the creation of an effective institutional and financialframework for the development of sustainable settlements. On all three fronts therehave been tremendous achievements. The quality of land Management and servicedelivery has given hope for excellency. Revenue collection by end of February 2000had increased by 12% compared to the same period of FY99 or had attained 75% ofthe FY00 estimated level.
* Budget Estimates for year 2000101: The ministry's budget estimates are based onthe objectives, targets and related activities covering the period of three years (2000/1to 2002/3). Proposed financial requirements are at Tshs. 936 billion over the next tenyears. 10% of this amount is to be contributed by Government and the balance of90% by donors and the private sector. According to the proposal, government needsto spend Tshs. 13.7 billion in the year 2001/02 and Tshs. 13.27 billion in 2002/03.other charges (OC), in addition to the payment of personnel emoluments (PE).
* The Ministry realizes the constrains against obtaining the proposed expenditureallocations and therefore focuses on narrower but more realistic targets. Donor andprivate sector support to back up government financial projections and proposals isextremely vital. Such focusing has taken account of the following priority sequence:(i) components that are pre-conditions for operationalization of the new land laws; (ii)projects that facilitate basic planning across sectors; and (iii) projects that facilitatepoverty reduction and promote sound economic management. Implementation ofsome of the components has already started.
Discussion/Comments on P10, P11, P12, P13 and P14
* "Development means roads". If you can not connect the country you can not reducepoverty, improve social services, and you can not develop the economy. It isworrying to note that allocation for road maintenance is minimal and even theallocation to the sector as the whole does not reflect its priority. Rural roads are notgiven weight in the Roads MTEF. A paper on the rural roads is missing. There is aneed of having a specific paper for the rural roads in the PER workshop.
* Tanzania has very fertile land but imports food. The major problem is that of policy.There is a need to link agriculture with land. investment in agriculture does notreceive the same weight as industry. There is a need to make leases on landirrevocable and change the relevant laws to facilitate the use of land as capital. It wasalso noted that the process of acquiring takes too long (3-4 years). This discouragesboth local and foreign investment in high scale agriculture.
* Budget allocation to the agriculture sector should be proportional to its contribution tothe economy. Removal of VAT on agricultural machinery is necessary for the
158

development of the sector. Also, free movement of food from one region to another,and from one country to another is important for the development of the sector.
* Private sector involvement in the water sector should receive more weight. For thecity of Dar es Salaam the provision of water could be subdivided to different privateproviders.
* The Government is fighting corruption, but one has to note that fighting corruptionneeds a well functioning judiciary system. Also a well function judiciary system willencourage private investment in different areas of the economy; especially foreigndirect investment. There is thus a need of paying more attention to the judiciarysystem in terms of resource allocation so that it can play the role it is supposed toplay.
* All our budgets are fire-fighting brigades waiting for fire to erupt. A more integratedbudget where everybody gets a fair share of the cake is needed. There is a need to fitthe shares to the three arms of the Government. Parliamentary allocations should berespected. We need to refocus future budgets to give more weight todevelopment/production aspects and not only to consumption. For priority sectors, webetter look at the unit cost and not the total amount.
Summary of Major Emerging Issues
HIV/AIDS epidemic: The HIV/AIDs epidemic is a serious multi-sectoral developmentproblem in Tanzania. Fighting it requires that (i) the top political leadership putsHIV/AIDS on top of the national development agenda; (ii) top political leaders must takethe lead by speaking about the severity of the problem and plead to the people, especiallythe youths, to change their sexual behavior; (iii) articulate a cohesive strategy on how tofight the epidemic including a medium term costing of priority actions to be taken fromcentral to community level; (iv) establish a mechanism for cross-sectoral coordination;and (v) full scale mobilization of resources (local and foreign) just like in a liberation warsituation.
Translate macro-stability into improved welfare and reduced poverty: Tanzania hasnow largely achieved macroeconomic stability. However, there is a tension betweengood macroeconomic performance and translating this into a real improvement of welfareof the people at the micro level. The issue then is what it takes to move forward: (i) it isterribly important to maintain and sustain stable macroeconomic fundamentals enhancedby additional resource availability from HIPC and other debt relief initiatives; (ii) moreinvestment (domestic and foreign) directed to agriculture, rural infrastructure and socialservice provision is key and a more effective development program is urgently required;and (iii) the private sector should be encouraged and enabled to take the lead.
Need to re-examine the use of the cash budget system. The cash budget system hassucceeded in reducing budget excesses, but this has been done at the expense ofdiminishing the authorizing role of the budget as approved by the parliament. Inaddition, the cash budget has severely reduced the service delivery capacity of theGovernment by making monthly resource availability unpredictable. There is thus a need
159

to set the limit of deviations of allocations through the cash budget vis-a-vis the approvedallocations.
Strengthening Accountability: The issue of accountability needs a further push toensure that resources are better managed and accounted for. This entails increasedfollow-ups sanctions and prosecutions of those found to be involved in embezzlementand losses of public resources - something that will give donors confidence to channeltheir resources through budget.
Improve Governance: Improvement in accountability calls good governance, whichrecognizes the role of opposition at the political front, and the role of other stakeholderson the country. Good governance also calls for recognition of the rule of law, and shunspolitical patronage and corrupt practices.
Improve Revenue Collection and Tax Equity: Fiscal deficits have declined but mainlydue to cuts in government expenditure rather than increases in revenue collection. Thereis need to increase revenue mobilization and to raise the tax effort in the long-run.Improvements in tax administration and further streamlining of the tax system should bea priority so as to broaden the tax base while at the same time reducing the burden on taxpayers. Random raising of fees by government agencies is a concern that needs to beaddressed since the practice may lead to tax evasion and discouragement of investment,especially in productive sectors.
Enhance Transparency of the Budgeting Process: The nature and process ofallocation of resources to various sectors is not transparent. Some priority sectors areallocated more than they require when allocation to others are stagnant or increasemarginally - e.g. allocations to the road and agriculture sectors.
Minimize Earmarking of Revenue: Earmarking of revenue creates problems in termsof coordination and prioritization and should be minimized.
Improve Integration of Donor Resources in the Development Budget: Poorintegration of donor resources into the Govt. budget is worrisome to the extent that itundermines the accountability and the credibility of the development budget. Donorsneed to ensure that their flows are captured in the budget. Government on her part needsto intensi'fy the fight against corruption and increase further accountability andtransparency.
Efficient Implementation of the Public Sector Reform Program is Crucial: There isconcern that civil service reforns are not encompassing enough and too slow. Inparticular, staff reductions are too limited to create sufficient savings for effective salaryincreases without crowding out other expenditures. PSRP needs to be well integratedwith other reforms and should pay more attention to the gender dimension and createequal opportunities for women to participate and accede to higher levels of the civilservice.
Fiscal Deficit Policy: There is a need to consider whether a balanced budget (or surplusbudget) is beneficial to the economy: Given the level of expenditure that is currently
160

supported by the economy and the low level of domestic demand, there may be a need fora small deficit. However, there are worrying issues - i.e. , whether foreign reserves cansupport this deficit if resources from external sources (donors) are not forthcoming in themagnitudes expected; and whether contingent allocation will not generate furthersurpluses.
Move from project to budget support: Improvements in financial management andaccountability should enable donors to employ increasingly aid modalities such as basketfunding, sector development programs, and general budget support and limit the numberof discrete projects.
Prioritization is still a problem in some sectors, i.e., the identification of absolute orkey priorities that will make a difference in terms of improving perfornance indicators.The translation of objectives and priorities into expenditures in consistency with theoverall resource envelope is still a problem in some sectors.
Broaden Participation in PER Macro and Sectoral Working Groups: Even thoughthe private sector is represented in PER Working Group, its participation needs to beextended into the Macro-Working group that is responsible for drawing the budget frameand the underlying assumptions. Enhanced participation in sector working groups byinterested stakeholders is desirable.
Support Private Sector Development for Economic Growth: Private sectordevelopment requires Government attention and support through the creation of anenabling environment for the participation of the private sector in the economy, includingappropriate regulation.
Private sector contributions in the social sectors need to be given more attention.
Enhance Funding for Road Maintenance: Resources from the Road Fund are greatlyinsufficient for adequate road maintenance. It is thus imperative to consider options forproviding additional resources for road maintenance, e.g., through the provision of fundsfrom the general budget or through a shift of donor funds from road development to roadmaintenance.
No improvement in Education: Despite the fact that a lot of resources have beeninjected into education there is no noticeable improvement. This highlights the point thatwith enhanced resource availability from various sources for the priority sectors, there isalso an urgent need to improve monitoring of service delivery to ensure that additionalresources are used to improve outcomes.
Link sector MTEFs with TAS: There is need to link the sectoral MTEFs with the TASdocument and other initiatives.
161

List of Participants
No. I NAME | TITLE/OFFICEA. GOVERNMENT1. Mr. Peter Ngumbullu P. Secretary - Ministry of Finance2. Mr. Peter B. Barie Permanent Secretary - Min. of Agriculture Culture3. Ms. Janet Bitegeko Ministry of Agriculture & Cooperatives4. Mr. Bedason A. Shallanda Ministry of Finance5. Mr. Gray Mgonja Ministry of Finance6. Mr. Jerome J. Buretta Ministry of Finance
7. Mr. Peniel Lvimo Ministry of Finance8. Mr. Prosper J. Mbena Ministry of Finance9. Ms. Elipina Mlaki Ministry of FinanceJO. Mr. Likolo Ndalamei Ministry of Finance, Zambia11. Mr. Daud M. Msangi Ministry of Finance12. Mr. E. Mwaipaja Ministry of Finanice13. Mr. H.S. Makundi Ministry of MNRT
14. Mr. Frans Ronsholt Ministry of Finance15. Mr. Raphael Mollel Permanent Secretary, Prime Minister's Office16. Dr. Enos S. Bukuku Prime Minister's Office17. Mr. A. R. M. S. Rajab Permanent Secretary - Vice President's Office18. Prof. Hamphrey P. B. Moshi Ministry of Finance19. Ms. Joyce Mapunjo Ag. Conmmissioner- Treasunr20, Ms. Salome I. Sijaona Permanent Secretary - MRALG21. Mr. Alfred L. P. Kabagire MRALG22. Mr. Richard Mkumbo Ministry of Health23. Ms. Mariam J. Mwaffisi Ministry of Health24. Mr. Laston T. Msongole Planning Comnmssion25. Ms. Mwantumu Malale Permanent Secretary -Community Development, Women &
Children26. Mr. Ngeli Kilangwa Prime Minister's Office27. Mr. Basil Kaunga Prime Minister's Office28. Mr. Iziraiah Mukaruka Vice President's Office29. Mr. R.A. Moshy Ag. Permanent Secretary, Min. Energy & Minerals30. Mr. S. Odunga Permanent Secretarv - Ministry of Works31. Mr. Gilbert J. Kinvero Ministry of Works32. Mr. V. Katabwa Ministrv of Works33. Mr. S.H. Mwiru Ministrv of Science Technology & Higher Education34. Ms. Catherine Joseph Ministry of Agriculture & Cooperatives35. Mr. E. E. Maimu Civil Service Departnent36. Mr. George D. Yambesi Civil Service Department37. Mr. J Rugumyamheto Civil Service Department38. Mr. William Kleiman Civil Service Department39. Mr. Amantius Msole Tanzania Revenue Authority40. Mr. M.G. Kamugisha Tanzania Revenue Authority41. Mr. B. Luanda Judiciary42. Mr. M. Abisai Judiciary43. Mr. B.A. Mahiza Planning Commission44. Mr. Aloysius G.T. Nyenza Ministry of Water45. Mr. G. Nilsen Ministry Works46. Mr. Ahmad Mbegu Ministry of Science Tech & Higher Education47. Mr. A. S. Ndeki Commissioner for Education - MOEC
162

48. Mr. D. M. S. Mmari Permanent Secretary - Ministry of Lands49. Mr. G. Saelie Ministry of Water50. Mrs. D. R. Makani Ministry of Justice & Constitutional Affairs51. Mr. John C. Millinga Ministry of Justice & Constitutional Affairs52. Mr. Kulwa S. Massaba Ministry of Justice & Constitutional Affairs53. Mr. Seith J. Makundi Ministry of Lands54. Mr. Benard S. Mchomvu Permanent Secretary, Home Affairs55. Mr. F.E. Mbonde MRALG56. Mr. A. N. M Idama Ministry of Education & Culture
B. PARASTATAL/NGOs57. Mrs. C. Kiliaki Bank of Tanzania58. Mr. Charles M. Chenza Bank of Tanzania59. Mr. Ali A. Mfuruki hifotech Computers Ltd.60. Dr. Brian Cooksey TADGREG61. Mr. Arnold B. S, Kilewo Private Sector Foundation62. Dr. Servacius B. Likwelile REPOA63. Dr. Haji Semboja ESRF64. Mr. Malik Jaffer Aga Khan Foundation65. Mr. A.E. Musiba TCCIA66. Mr. I.S. Hatibu Bakwata67. Ms. Joan A. Nkya Christian Social Services Comission68. Mr. N. Gotecha CTJ69. Mr. Salum Shamte Tanzania Chamber of Agriculture & Livestock70. Prof. Samuel M. Wangwe Economic & Social Research Foundation64. Mr. Dunstan Mrutu Tanzania Private Sector Foundation
C. MEMBERS OF PARLIAMENT71. Hon. Dr. Omari S. Kizango Member of Parliament72. Hon. Makidara Mosi Member of Parliament73. Hon. Y.K. Mahmoud Member of Parliament74. Hon. W. H. Shellukindo Member of Parliament75. Hon. J.W. Chevo Member of Parliament76. Hon. Gerald J. Ngotolainyo Member of Parliament77. Hon. J.C. Semwaiko Member of Parliament78. Hon. Aripa Marealle Member of Parliament79. Ms. Phoebe 0. Mmbaga Parliament of Tanzania74. Hon. Philip A. Magani Member of Parliament
D. DONORS80. Ms. Riikka Laatu Counsellor - Embassy of Finland81. Ritra Jolkkonen Ambassador - Embassy of Finland82. Mr. Patrick E. Doaaghty ILO83. Mr. Van Banimng Netherlands Embassy84. Mr. William Mitchelle Canadian High Commission85. Ms. Rose A. Mushi CIDA86. Ms. Ame Olsen Norwegian Embassy87. Mr. Peter Beck Christiansen European Commission88. Mr. Alex Baum EU Delegation89. Ms.Valerie Leach UNDAF Adviser90. Mr. Udo Etukudo UNDP91. Ms. Dorothy Nsherenguzi SDC92. Ms. Theresia Genda SDC
163

93. Mr. Olivier Burki SDC94. Mr. Ephrem Kirenga SDC95. Mr. Antoine Heudre Embassy of France96. Mr. Sten Rylander Swedish Embassy - SIDA97. Ms. Karsten Lund Jorgensen Danish Embassy98. Mr. Oddvarjokobsen UNDP99. Mr. Alessandro Faichetto Embassy of Italy100. Leutenegger Jean-Jacques Embassy of Switzerland101. Mr. Teferi Seyoum UNFPA102. Mr. Frans van Rijn Embassy of Netherlands103. Mr. Zoya Potapora Russian Embassy104. Mr. Richard K. Ndaskoi SDC105. Mr. Mitsuaki Furukawa JICA106. Mr. Jackson Biswaro JICA107. Dr. Rolf Drescher Gernan Embassy108. Dr. Christine McNab Swedish Embassy109. Mr. Gilbert Kajuna USAID110. Mr. Ronan Corvin Embassy Ireland111. Mr. Masashi Kono Embassy of Japan112. Mr. T. Lindqvist Danish Embassy113. Mr. Gunnar Foreland Norway Embassy114. Mr. Heuts Philip Belgian Embassy115. Mr. Nicklaus Zingg Counsellor (Dev) Embassv of Switzerland116. Mr. M. Stein Olson USAID117. Mr. Stafford Baker USAID - Ag. Director118. Ms. Charlotta Norrby Economist -Embassy of Sweden119. Mr. Peter L. Hansen Ambassador - Denmark120. Ms. Rebekka van Roemburg Royal Netherlands of Embassy121. Ms. Amina A. Ali Ireland Aid122. Ms. Fiona Shera DFID123. Mr. John P. Snell Deputy Representative. FAO124. Dr. Jorgen Levin Gothemburg University, Sweden125. Mr. Steven Lee Economic Adviser - DFID126. Mr. G.G. Johnson IMF127. Mr. H. Hirschhofer IMF128. Mr, Tsidi M. Tsikata IMF129. Mr. Peter Mwanakatwe African Development Bank130. Mr. James Adams World Bank131. Prof. Benno Ndulu World Bank132. Dr. BenTarimo World Bank133. Dr. Philip Mpango World Bank134. Dr. Emmanuel Malangalila World Bank135. Dr. Rest Lasway World Bank136. Mr. Emrmnanuel Mungunasi World Bank137. Mr. Vedasto Rwechungura World Bank138. Mr. Donald Hamilton World Bank139. Mr. George M. Kabelwa World Bank140. Dr. Hamisi H. Mwinvimvua World Bank141. Dr. Robert Utz World Bank142. Dr. Mushiba Nyamazana World Bank - Zambia
E. ACADEMIC143. Prof. Anselm Lwoga Sokoime University of Agriculture - Morogoro
164

144. Prof. L. Luhanga Vice Chancellor- University of Dares Salaam145. Prof. G. Mmari Vice Chancellor - Open University of Tanzania146. Prof. Nehemiah E. Osoro Universitv of Dar es Salaam147. Prof. Robert Mabele University of Dar es Salaam (ERB)148. Mr. P. Mwanakatwe African Development Bank149. Mr. David Bevan Oxford University
F. MEDIA150. Mr. Ongeni John Habari151. Ms. Koiya Kibanga DTV152. Mr. Christopher Mfinanga DTV153. Mr. Fumbuka Ng'wanakilala The Guardian154. Mr. Gervas J.Luganda The Democrat155. Mr. Saidi Msonda The guardian156. Mr. Nicholaus Mbaga TVT157. Mr. Masoud Nassor Masoud Business Times158. Mr. Abduel Elinaza Busines Times159. Mr. A.O. Kombo CEN.TV160. Mr. Freddy Maro Daily News161. Ms. Agatha Mshanga TVT162. Mr. Assah Mwambene Daily News163. Mr. Hussein Iddi CTN164. Mr. Kuringe Mongi CTN165. Mr. Perege Gumbo Financial Times/Guardian166. Mr. Safina Mohamed Maelezo167. Mr. Willy Kitima Business Times168. Mr. David Luninze BBC World Service169. Mr. B. Lugwishe The African170. Mr. Joseph Bendu The Democrat171. Ms. Premy Kibanga The East African
165

ANNEX 2: DATA
166

Table 1: Tanzania Key Indicators
S/N Indicator Unit 1990 1991 1992 1993 1994 1995 1996 1997 199 1999 2000*
I Populafionl2 iions 24.6 25.3 26.0 26.7 27.5 28.3 29.1 30.0 30.9 31.9 33.0olw Mainland/2 Millions 23.9 24.6 25.3 265. 26.7 27.5 28.3 29.1 30,0 30.9 31.9
2 GOP GrowVtZ |6 6.2 2.8 1.8 0a1 1.4 3.6 4.2 3.3 4.0 4.5 5.03 Inflationl2 efo 35.8 28.7 21.8 24-0 33.5 27.4 21.0 16,1 12.9 7.8 6.04 Exchange Rate/2 TZSIUS$ 197.6 222.5 301.9 414.5 509.6 574.8 580.0 6248 6654.7 720.0 800.05l Exportsl2 Mul. USS 336.9 342.9 410.6 437.0 519.4 682.9 763.8 752.0 58.5 540.9 650.0
$ lmports/2 Mit. US$ 1170.5 1219.1 1300.6 1282.8 1309.3 1340.5 1212.6 1148.0 1366.0 1418.6 1350.07 Current Account Bslance12 Mii. US$ -558.9 -736.1 -800.1 -1022.0 -711.0 -646.4 -461.3 -555.1 -946.6 -881.9 -784.88 Balance of Paymentsl2 Mil. US$ -200.0 -260.0 -228.1 -634.4 -401.3 -386.0 -245.0 -556.0 -615.7 -411.3 -274.89 Average Deposit RateJ2 96 26.0 26.0 26.0 24.0 25.0 21.0 15.7 10.0 9.0 8.0 9.010 Average Lending Rate/2 % 26.0 26.0 30.0 30.0 31.5 35.5 33.5 26.5 24.0 20.0 20,0
t 1 Growth in Money Supply (M3)J2 % 43.3 26.9 42.7 39.3 35.5 32.2 8.7 13.3 10.8 8.0 12.012 Foreign Reserves/2 Mil. US$ 238.9 301.2 458.5 271.9 431.8 288.s 500.6 636.7 689.0 690.0 700.013 External Debt/2 Bil. US$11 5,6 6.0 5.9 7.5 8.0 8.4 7.6 8.0 7.8 7.5 7.31 4 Total Domestic Revenue/l Bilt TZS 94.7 137.1 173.6 164.1 242.4 331.2 448.4 572.0 627.5 689.3 810.315 Tax Revenue/i oil. TZS 81.5 118.3 153.4 146.4 220.4 299.9 383.7 505.4 586.2 616.3 728.716 Non-Tax Revenue/I Oil. TZS 13.2 18.8 20.2 17.7 22.1 31.3 64.6 66.7 41.3 73.0 81.617. Total Expenditurell Bit. TZS 127.9 201.2 223.8 337.9 410.5 453.4 500,1 730.9 856.2 927.7 1180.718 Recurrent Expenditurell Bil. TZS 111.6 163.0 191 2 273.2 335.8 386.6 470.0 606.3 669.6 791.2 933.819 Development Expenditurell Bii. TZS 15.3 36.2 32.5 64.7 74.7 66.8 30.1 124.0 196.6 136.5 246.920 Grants/1 Bil. TZS 27.7 22.9 32.8 58.3 76.9 67.3 46.9 115,4 119.4 169.9 235.621 Fiscal Balancell Bil. TZS -33.2 -64.1 -50.2 -173.18 -168.1 -122. 2 -51.7 -158 8 -228.7 -238.4 -70.422 Foreign Direct Investmerit2 Mu., US$ 0.0 0.0 12.0 20.0 50. 150.9 148.6 154.6 172.2 183.8 196.23 Toursrm Earnings/2 Mii. US$ 65.0 94.7 120.0 146.8 192.1 258.1 322.0 392.4 570.0 733.3 S43.424 Gross Domestic Savingsl2 Oii. TZS 78 6 114.1 131.3 46.7 -3.6 75.4 271,0 328.2 360.0 390.0 422.625 Gross Investments/2 Bit. TZS 214.0 282.4 369.4 429.6 561.8 591,9 620.6 692.4 827.1 880.0 936.326 p er cApita lncome/2 1USS 160.9 180 7 167.0 149.2 156.2 176.9 210.3 235.6 257.0 270.0 283.6
Notes: /1 Fiscal Year is used, and it ends on June 30th of the mentioned year.12 Calendar year is used, and it ends on December 3l th,* If calendar year, data are projections and if fiscal year, data are estimates.Average Deposit rates: Annual average rate on six months depositAverage Lending rates: Annual average rate on short term loansExports: Merchandise ExportsImports: Merchandise ImportsGross Investments: Gross fixed capital formation
Sources; The Planning Commission, The United Republic of Tanzania, Economic Survey, various issues.Bureau of Statistics, Planning Corrmission, National Accounts of Tanzania, various issues.The Bank of Tanzania, Economic Bulletin, various issues.The Bank of Tanzania, Economic and Operatians Report, variou5 issues
167

Table 2: Balance of Payments(in mAit6ios 01 US dol1as).
Items 1900 _1531 19921 1393 iss_ ' 193Os _ 1939 19"7 1996 19ss*
Current Account -559.0 7361. -7C81 -1022 0 .7 111 44,4 .413 -6Sl 4416 4tC2.0|
Goods -778.5 ,6 5 .919.t -35.6 -790.0 8575? ,448.9 -395.4 .77. -877.7Exports (lob) 407.. 362. 3 397.0 439.3 519.4 682.9 763.8 752.6 5'8.5 5409Imports ) 1186.3 1227.6l 1316.6 1274.9 1309.3 1340.5 1212.6 1148. 1366.0 1418.6
Serves -157,2 .157.5 .169.1 .389.9 -85.1 -216.9 -278.8 .306.4 -452.6 -225Receipts 130.6 142.1 167.5 310t. 418.2 52. 9 537.1 493.8 537.0 640.9Payments 287.8 299.6 336.6 700.7 503.3 799. 15.9 800.2 989.6 865
Income -185.0 .184.2 -225 4 -147 S 1223.5 110.3 -72.0 .122.8 -124.2 -75.2Receipts 5.9 79 8.1 21.4 30.9 31.t 41.5 44.9 48.3 56.0Payrrents 190.9 192.1 233.5 169.0 153,4 142.1 113.5 167.7 172.5 131.2
Currer.t rarrslers 561.1 4709 606.0 351.1 266.5 338 4 338.4 269.6 4077 315.Infows 592.7 503.5 641.0 381.1 311.5 370.7 370.7 337.2 448.1 439.2
Government 538.4 480.3 506.2 370.9 215.0 236.0 2360 238.8 279.5 305.2Private 54.3 23.2 134.8 10.2 96.5 134.7 134.7 99 4 100.6 134.0
Outdows 31.0 32.6 35.0 30.0 25.0 32.3 32.3 67.7 40.4 123.3
Cap8talAccount 327.2 353.1 298.2 200.6 262.6 191.0 151.0 166.9 276.0 303.1
Captaltransfers 3272 353.1 2982 200.6 262.6 191.0 191.0 166.0 276.0 303.1nflows 327.2 353 1 296.2 200.6 2626 19t.0 191.0 166.9 276.0 303 1
Ouclows 0.0 0 0 0.0 0.0 a.0 0. 0.0 0.0 0.0 0.0Acqusitonldsposa)s of nvn-produced 0.0 0 C 0.0 0 0 0.0 0.0 0.0 0.0 0.0 0.0non-ftancbil asseG
Financtal Account 42. 117.9 107.3 57.0 -106.8 13S.5 0.3 -136.4 57.0 225.2
Dorectinveslment 0 C 00 12.0 20C 50.0 150.0 1405 157.8 172.2 1834Abroad 0 o 0 0 0.o 0.0 0 .0 0.0 0 0.0 0In Tanzania 0.0 CQ 12.0 200 50.0 150.0 140.5 157.6 172.2 183 6
Per1otn invesrtnt 0.0 0 0.0 0 0 0.0 00 0 0 0.0 0.0 0 0
Other investmrent 42.3 1179 953 37.0 56.9 -10.5 -148.2 -294.2 -75.2 41.8tnf15hov etranial resources 236.9 21. 331.9 615.| 434.5 437.4 316.6 4168 438.0 479.9
Disbursement of Govemment loans 223 5 260.5 267. 5 372.4 274.2 244 1 224.9 269.8 239.2 319 6Tre tIcrttdAn otelf nanciallovws 13.4 10.5 64.4 143 2 122.1 1419 71.0 119.4 134.5 78.4Disbursement of loans to coer sectors 0 0.0 0.0 99 8 36.2 S14 1 t6.7 23.0 63.9 70.5
Outfow offinancil resources 194.0 153 1 236.6 578.4 591.3 447. 466.7 711.0 513.2 438.2Re pymenLolgovemmentloans 16.8 1457 2366 498.1 491.3 272.5 361.| 757.6 593.1 4470Tradecreditandotherfinancial flows 25.8 74 1.0 68.4 75.6 162.6 43.1 -107.5 -1364 -55.8Repayment otloans by otrer sectors 0.0 0. 0 11.9 24.4 12.0 61.8 52.0 47.4 50.5
Errors and omisslons 47.s 33.1 -105.3 27.6 94.0 -70.1 25.0 -31.5 .42.1 -77.7
Overall Balance -141. -232.1 -4D7.| -736.7 -461.3 -386.0 -245.0 -556.1 415.7 -411.3
FinancIng 141.6 232.1 407.9 736.7 461.3 386.0 245.0 556.1 615.7 411.3
NetReserve assero(- increase) -139 -653 -253.5 157.3 -770 60.1 -165.3 -844 -11.1 .1214SCFAR 0.0 0.0 0.0 0.1 0.0 0.0 0.0 0.1 -0.1 0.0Except"crnal financing 261 317 506.1 570 3 530.3 325 9 410.3 640.4 626.9 5327
Arrears 100.2 344.7 206.7 199 0 294 269.4 312.2 130.9 130.0 116.4Rescheduling 155.8 00 138 7 136.6 144 00 co 00 1S92 1753 116.2Oebtlorgv.eness 11.0 0.0 28.0 23.5 236 00 0.0 194 51.4 1159Use or Fund credit 144 -27.1 135.7 70.4 00 0.0 0.0 00 0.2 0.1Grantssborrowingfor8OPpurposes . . 149.8 73.6 56.5 98.1 156.3 169.1 184.1
Financing gap . . 0.0 00 0.0 0 0 0.O 0 0. 0 0
Memorandum Items:GDP(mp)lt.72S 1 607.762.00 2.125,325.00 2.796.640.00 3.452,560.00 4.281.600.00 5.047, 69.76 6,281,976.00GOP(mp) Uilt. tUSD 3443.8 37681 4.042 21 3,967.14 t 170.36 4,065.74 5952.91 6.994 67 7 594.43 8,450.50CAB6toP -16.2 .19.5 -17.4 -25.8 -17.1 -13.3 -7.7 -7.9 -12.5 .10.2CABIGOP (excl. currentoricialtransfers) .31.9 -323 -30.0 .35 1 .22.2 -18 1 -11.7 -11.4 -16.1 -13.8Gross Olncrl Reserves 192.8 242. 394.3 22803 331.3 270.9 441.1 623.1 S99.0 775.6Weelts Imr 6. 8. 12. 60a 9.5 6.6 11.3 -16.6 .13.2 -17
* Pro vision al
Source Balance of PaymentsO Department Ofthe Bank ofTanzanra.
168

Tbal. 3: SUMMARY or CEENTRAL GOVERNMENT OPERATIONS4(In ,Oillolns ol Tananfla shilings)
Fy99 F678 FY6t FY94 FY90 FY11 FYW2 FY93 I FY94 FY95 F| 96 FYt7 FY1 FY19 FY69
rot la RNevee 20,931.0W 31,09B D0 46,431.60 71,790.00 94,69500 1 32.2000 173,566.00 1 64,110.06 e 42,444.00 331,240.00 440,373.00 572,030.00 6 19.003.00 69,325.&0 777.644.30Tax 1evenue 19,66100 29,1t400 42.557 03 63pR5 00 P 1. 471 00 18,39700 153,356 00 146,420D00 D 203055.00 299,900ao 39a3.7 44 00 509,355.00 566,*22.00 616,244.00 65.107.00NoOl, taOernOo 1,170 00 1.914,00 3,074.00 8.705 00 13.184.00 14,061)00 20,210.00 17.69. 223,006.00 31.34D009 G4,620 00 S6,575 00 52.901.00 73,041.00 9l237.6 0
I (0lalrxpeadlluOe an0 Net Lending 32.373 0G 47.445 60 3,368.00 93,990.00 126,142 00 151,863 00 194,891 00 305,059.00 3)0.910 0o 395,60/ 0 420,522 uO 5S,0099 00 730,326.00 819,339.40 1,17.6,77.79H-o-M renl epe.nditwe 26,912.00 35.146 00 51.896600 78,119.00 103,066 00 135,375 00 162,286 00 240g94900 296.22100 345,915 00 415,140 00 4, 543,751,00 6a2,812,40 9080656, 40Dst 16,p-0td exoendluoe and 5,463.00 12,299.00 21,472,00 15.975.00 22,376 00 106,4a8.00 32,605.00 64,700.0D 7 4,66 00 49,692.00 5,382.00 26,400.00 106.585,00 936,524.00 359,913.39
p rt o0f len fendog
G- oalalICe (Chedk, -sned) (11,54 2 co (6.3.0 (24,937.00) (32,34 00 31,907 56) (10,690 D 21,235600 ( 040,949 06 j136,466 60J (fi4.36 0D) 21,85100 96,931.00 111,253.0) (36,094.40 p91, 134.4Adj,4~Ir n.. ; 11 1 ro 900, 054 Oblel 3.2DS,DD. (2,026 .00) (2.9S2.00) (3 .6 40d.00J (4 .129 00) (0755 7S00) (0t ,8070.6D) 6,625.60 t36. 15 3.00 50,049.0 0 2,445 .06 (36,512.00 6 3,033 00 (52,041.00 (14,09i.00
10,14; (6,1)~~~~~~~~~~~~~~~~~~~~~~~~~~~~~~~~~~~~~~~~~~~~~~~~~~~~~~~~~~9,650 3,1DD(a500
4wa101,94 60,446(669669.FIcOnOid( (8.337 00) (610.3a3 001 (3g9,9)900) (25653 60Co 5,71 6 o0 ( 27,37S5oO (23.15 oo6 (134,321 00( ( 1697190oo) ( 13,710800) 1 20,33b.00 20,410 .06 (S91,920.e0 ( 692.052.9 (045,601.44Oj-,l- lo 919 (01e0 916019) (4,9460) l1t.020.oo (t2(0.00) 13.923 00) 4,291.00 11.47100 (03,63600 (51.957 ) 40,225 60 74./3300 136.303 00 8.10500 39,934.60 c216,447.40)
I tIalar |)!S 8,337 00 9.384 00 29.91900 D 25,52 c0 35.7755 r O 2,37S Z73.695 Oq 134,32160 165O,219O 125,735.00 64,634 06 (20.419.00 187,496.00 179,42200 153,204.00
6016,nm TII,9 . 11,401 00 15,909.00 20,965 00 2,7,664.00 22,6600 32,1O86.09 0,313.60 76,9090,0 905,552.00 4D.09200 110,95.00 169,646.00 94.157,.0Fo1 09 t 0tnc.ng, -0 17 2,2>2 00 2.401 00 7,318 00 (3,245 00) 1.469 00 6,98s 00 22,676.02 29,436 06 47.754 00 (31.958 00 (34.000 00) (4.0.0 69 (19.6b4.00) 38,017.00DnelIc00, Drrro.w,g 6, I 15 DO 4,563 00 6,692.00 6,112.60 6,563 00 4 ,359 96) (32.277 oo) 46,572 0o 40,646.00 58,1D1.00 52,652 00 (52.770.00 3,570.00 28,160.00 (19.000.,c
Ar;fsp rtLGP at nrtrte
Total R .ue 16.0 103 99 123 129 135 136 (02 114 11.9 I23 134 13a1 12,3 12,4To ofev,rue 15.1 9.0 9.1 108 1007 136 120 9.t 104 (0.7 II 1 11. 62 11.7 10.101ri70l0envru 60 0.6 0.9 15 1 7 IS 6 1.1 10 1.1 10 96 .1. 1.4 1.5
ToW f-fpendft0ne and4Net4Lend90 g 24.8 15.7 15.7 16.1 160 19.3 19.3 100 17.5 141 122 120 155 16.2 186Rzecu1lOlRexpendOume 207 61.0 11.1 134 131 13.7 127 040 139 124 12.0 114 11.5 12.7 129D revelo.nt expeneftr. 4nd 4.2 4 1 4.6 2 7 2 9 1 7 2.0 4.0 3 5 1 6 0 2 0,7 4.0 2.5 5.7
c61t ot )endtog
00er300 t00anCe (c6Ieks I6sued) -. 9 -5 4 -s.6 -3 S 4 2 1 9 -17 -4.6 ,6.0 -2.3 08 1.3 .2.4 2.2 6.2Ad4u.kor.eloorcns. and olef 2 5 O 7 .0.6 - 6 .0 5 .0.9 -O I 0.4 f.7 1.B 2.7 -0.9 1.3 t6.2 .9
4erns (nno 00 0.0 0.0 0.0 0.6 00 0 00 00 0.0 0 O.0 0.0 0.0 O.OO39e,ro 0a000c6 (66.66ks9c.er4 .64 -6. 1 .6.4 -4.4 .4 .7 2.8 -18 -9 . .86 -0.5 3 25 0 -1. -43 J7.lO1osalI b(o9nce(411060919) ..| .18 .24 .02 n05 04 09 -5.1 *2.4 1.5 22 3.2 0,2 1,0 4J7
?0an61n1 6.4 6.0 6.4 4 4 4 7 2 9 1.8 0.4 7., 4.5 1 9 .0.6 40 2.4 2,4
Eo1os1 g(ants .- 3.0 3 4 3 6 3.6 2 3 2 6 3 6 3.6 3 8 1.4 t.9 2.5 3.2 1,.Foreign FinalIcing, net/t 1.7 o0. 1 6 -06 0.2 0 9 0.9 10 2.2 .1 4 .1.0 -1,1 1.4 -0.6 112Oomesc Bofrowing 4.7 1.5 1.4 6.4 0 9 *0.4 *2.5 2.9 1.9 2.1 1.S .11 0.1 -0.3 .0.3
Memo tnem.GDP at 1amrkelprice5(liCaI YCeaWS) 130,302 00 302.68000 466.10000 525,133.00 67110550 87J4,799 50 1,132,755 53 1,441.840 00 1i.66,54359 S ,4600.93.00 3,124,600,00 3,367,079.0 4.710,741.75 5,620,622.25 6,261,474.50
7 06141de, 1,e(gn g0ants prdor to FY87ComopWU0o6ns of p116entages br0 FYS6, FY099 4nd FY0 0re based on GDP enlirnates 10f the resp1c06e y700s
So.so. The Tanzanian athiorfloos
169

Table 4a: Budget Frame For 1999/2000 - 2002/03 (Accounting)1999/2000 1999/2000 2000/01 2001/02 2002/2003REV.EST Likely Outturn Proj. Proj. Proj.
1. Total Resou rces _______ _______________ ___ 1,168,343,00 l1,399,811.66 - - 1,523,809.22 1,512,605.60
Domestic revenue - -~ 777,200.0( 881,953.00 993,923.0 1,120,707.00Imporl support/OGL _ _ _ 173.700;0C 164,841.2( 162,280.13 156,018.18
Project loans and grants _ ____ 214,943.0 275,475.5( 296,737.9' 159,389.53HIPC interim relief-Multilateral _ ____ 10,500.0( 46,061.6( 53,893.7- 59,007.26HIPC interim relief-Paris Club _ 16,480.0( 16,974.4( 17,483.6Non Bank BorrowingBank Borrowing _ . (8.000.00) _ _ _ .Adjustmncnt to cash (0.0 0.( 0.(Privatisation Funds 15,000.3C
11. Total Expenditure 1,168,343.00 1,399,811.66 1,523,809.22 1,512,605.60
Recurrent Expenditure 930,000.00 1,061,836.10 1 ,150,313.25 1,274,521.82CFS _ __ 253,562.00 279,662.0( 265,600.0 285,800.00
Debt service 198,100(.00 221,200.0 202,100.0 218,300.00interest 106,500.00 124,500.0( 103,000.0 119,200.0amortization_ 91,600.00 96,700.0 99,100.0 99,100.01
Others _ 55,462.00 58,462.0( 63.500.0( 67,500.0Recurrent Exp.(exclxCFS) _-C_ ___S 660,038.00 774,884.1( 884,713.2' 988,721.8
o/w Salaries & wages 287,287.20 __ 315,850.6( 356,812.7' 396,504.55____ Other Charges ________ ___ 168,156.80 218,189.4 273,641.9 332,146.0Designated Items* _ _ 190,794.00 208,644.0 - 214,258.5( 260,071.16
Payment of Arrears 16,400.0 7,290.0( _ .Contigency 17,000.0( 21,758.0 23,694.2
Development Expenditure _. _ 238,343.00 320,975.56 351,737.9, 214,389.53Projects 238,343.00 320,975.5( 351,737.9 214,389.53
Local 23,400.00 36,000.0(1 45,000.0 45,000.0Songo songo energy Fund 9,500.0 10,000.0 10,000.0
Foreign __________ ________ _________ 214,943.00 275,475.5 296,737.9 159,389.53Other Programme Assistance ,__ __ __ ____ _ __._._ .
Includes Special Expenditure, Road Fund, Parastatal Wages, TRA and Retention Schine* Starting 1998/99, Electricity Bill is included in the Special Expenditure
170

Table 4b: Budget Frame For 199912000 - 2002103 (Accounting) As % of GDP
199912000 2000/2001 200112002 200212003Likely Proj. Proj. Proj.
Outturn
I. Total Resources 18.6 20.0 19.6 17.5
Domestic revenue 12.4 12.6 12.8 13.0Import support/OGL 2.8 2.4 2.1 1.8Project loan and grants 3.4 3.9 3. 1.8HIPC interim relief-Multilateral 0.2 0.7 0.7 0.7HIPC interim relief-Paris Club 0.0 0.2 0.2 0.2Non Bank Borrowing 0.0 0.0 0.0 0.0Bank Borrowing -0.1 0.0 0.0 0.0Adjustment to cash 0.0 0.0 0.0 0.0Privatisation Funds 0.0 0.2 0.0 0.0
II. Total Expenditure 18.6 20.0 19.6 17.5
Recurrent Expenditure 14.8 15.2 14.8 14.8
CFS 4.0 4.0 3.4 3.3Debt service 3.2 3.2 2.8 2.5
interest 1.7 1.8 1.3 1.4amortization 1.5 1.4 1.3 1.1
Others 0.9 0.8 0.8 0.8
Recurrent Exp.(excl CFS) 10.5 11.1 11.4 11.5o/w Salaries & wages 4.6 4.5 4.6 4.6
Other Charges 2.7 3.1 3.5 3.9Designated Items 3.0 3.0 2.8 3.0
Payment of Arrears 0.3 0.1 0.0 0.0
Contigency 0.0 0.2 0.3 0.3
Development Expenditure 3.8 4.6 4.5 2.5
Projects 3.8 4.6 4.5 2.5Local 0.4| 0.5 0.6 0.5
Songo songo energy Fund 0.0 0.1 0.1 0.1Foreign 3.4 3.9 3.8 1.8
Other Programme Assistance 0.0 0.0 0.0 0.0
171

Table Sa: Budget Frame For 199912000 . 2002103 (Analytical)mill. shs.
199912000 200012001 2001/2002 2002V2003Likely Outturn Ceilings Proj. Proj.
Domestc revenue 777,200.00 881,953.00 993,923.00 1.120,707.00ONV Road Toll 40,475.73 41.337.17 43,554.65 45,114.93
Retention FundTotal Expenditure 1,060.343.00 985,183.10 1.089,239.00 1,212,937.75
Recurrent expenditure 822,000.00 939,683.10 1,039,239.00 1,162,937.75Interest on external debt 36,500.00 67,500.00 46,000.00 62,200.00Interest on domestc debt 70,000.00 57,000.00 57,000.00 57,000.00Wages/salaries 287,287.20 315,850.60 356,812.75 396,504.59
Goodslservices/transfers 428,212.80 499,332.50 579,426.25 647,233.16olw Road Fund 40,475.73 41,337.17 43,554.65 45,114.93
Special exp. 117,818-27 114,517.18 130,480.96 170,868.66CFS (Others) 55,462.00 58,462.00 63,500.00 67,500.00TRAParastatal WagesRetention Scheme 32,500.00 36,150.92 37,000.00 40,000.00Election Costs 13,800.00 32,200.00Census 40,000.00Other Charges 168,156.80 216,665.23 264,890.63 323,749.58
Development expenditure 238,343.00 45,500.00 50,000.00 50,000.00Projects 238,343.00 36,000.00 40,000.00 40,000.00
Local 23,400.00 36,000.00 40,000.D 40,000.00Foreign 214,943.00
Other Programme AssistanceEnergy Fund Songo songo 9,500.00 10,000.00 10,000.00
Overall deficit (checks issued) - before grant (283.143.00) (103,230.10) (95.316.00) (92,230.75)
Grants 266,603.00 185,600.00 190,300.00 144,000.00import supportlOGL 119,200.00 142,800.00 146,400.00 100,000.00project grants 136,903.00HIPC interim relief 10,500.00 42,800.00 43,900.00 44,000.00
Overall deficit (checks issued) - after grants (16,540.00) 82,369.90 94,984.00 51,769.25
Adjustment (0.00) . .
Overall deficit (checks cleared) (16,540.00) 82,369.90 94,984.0 51,769.25
Financing 16,540.00 (82,369.90) (94,984.00) (51,769.25)Foreign 40,940.00 (22.100.00) (22,600.00) (22,600.00)
Programmme loans 54,500.00 74,600.00 76,500.00 76,500.00project loan 78,040.00amortization (91,600.00) (96,700.00) (99,100.00) (99,100.00)
Local (net) (8,000.00) (17,000.00)Bank (net) (8,000.00) (17,000.00)Non-bank
borrowing |amorteation
Privatisation Funds .Change in Arrears (16,400.00) (15,000.00)Contigency (28,269.90) (72,384.00) (29.169.25)
Financing Gap (0.00) (0.00)
memo item:GDPmp 6,280,400.00 6,996.680.00 7,756,799.00 8,619.665.00OC for distribution 372,750.80 440,870.50 515,926.25 579,733.16Primary Deficit(checks issued) (176.643.00) 21,269.90 7,684.00 26,969.25Government Saving(checks issued) (44.800.00) (57,730.10) (45.316.00) (42,230.75)
% of GDP (0.01) (0.01) (0.01) (0-00)
Source: The Tanzanian authorities
172

Table Sb: Budget Frame For 199U12000 * 200203 (Analytical) % of GOP
1999/2000 2000101 2001102 2002/03Likely Ceilings Proj. Proj.Outturn
Domestic revenue 12.38 S2.61 12.81 13.00OAN Road Fund 0.64 0.59 0.56 0.52
Retention Fund -Total Expenditure 16.88 14.08 14.04 14.7
Recurrent expenditure 13.09 13.43 13.40 13.49Interest on external debt 0.58 0.96 0.59 0.72interest on domestic debt 1.11 0.81 0.73 0.66Wages/salaries 4.57 4.51 4.60 4.60
Goodstservicesitransfers 6.82 7.14 7.47 7.51t(w Road Fund 0.64 0.59 0.56 0.52
Special exp. 1.88 1.64 1.68 1.98CFS (Others) 0.88 0.84 0.82 0.78TRA . .Parastatal Wages .- -.Retention Scheme 0.52 0.52 0.48 0.46
Other Charges 2.68 3.10 3.41 3.76Development expenditure 3.80 0.65 0.64 0.5a
Projects 3.80 0.51 0.52 0.46Local 0.37 0.51 0.52 0.46Foreign 3.42
Other Programme Assistance . .
Overall deficit (checks issued) - befo (4.51) (1.48) (1.23) (1.07)
Grants 4.25 2.65 2.45 1.67import supportSOGL 1.90 2.04 1.89 1.15project grants 2.18HIPC interim relief 0.17 0.61 0.57 0.51
Overall deficit (checks issued) - afte (0.26) 1.18 1.22 0.60
Adjustment - - .
Overall defic't (checks cleared) (0.26) 1.18 1.22 0.60
Financing 0.26 (1t183 (1.22) (0.60)Foreign 0.65 (0.32) (0.29) (0.26)
import support loans 0.87 1.07 0.99 0.89project loan 1.24 .amortration (1.46) (1.38) (1.28) (1.15)
Local (net) (0.13) (0.24) .Bank (net) (0.13) (0.24) .Non-bank .
borrowingamortization
Privatisation Funds .Chenge in Arrears (.26) (0.21)
memno:GDPmp 6,280,400.00 6,996,680.00 7,756,799.00 8,619,665.00
Primary Oeficit(checks issed) (2.81) 030 0.10 0.31Govemment Saving(checks issued) (0.71) (0.83) (0.58) (0.49)
Source: Table 5a
173

Tabl. $a: RECURRENT EXPENDITJRE BY MINISTRIESIOEPARTMSENTS INCLUDINO TRANSFERS TO LOCAL GOVERNMENT
V ots. rMstinbtrnolyOcp.rl t 1 X1t990 1 55tp2 000 905o6o1 -- 200110 2 200Ye s
. FRCVIStONALACTUAL LIKE£ur1T31UtN CEILINt3 PROJECTIN C
26 Ad5mrrst1ation VICEPRESIDENT 15.284.5048,00 270.31 t,585.00 28S.702.St48.40 297.579.625.1Z 310,II t9t2.7
17 Admirisw1on Rgontror st Poslib= Pafies 2.5072S.6t76.00 2.577.242.754.00 ,S237,76U.t01.20 3.007,31 ,47n.2s8 ,187 987.6e
30 Ao5;ci1t4tion P,osidws Oftc. d Cabinet Secrsetiat S.b37.035,t3.CO 6.S-o.o25.J0S.005 6 55.139.875.45 6,945,744.D44 92 7.346,0015324.t1
31 AVicstOio vbe president. 40r.. 422.532.09 50 4*3t.410Q,72.00 457.77t.111.60 47 4,577,72S.3 493Ot.0714.7s
32 Armai rscmsoo Prc cidoers of ce- Chit Servmc Devorstroenl 2.245.5513.556.00 1.490.644912.00 1.5$0.!80,017.20 1.657081171.26336 1.t?42.t755.923
33 Acrnmf trbon Ethics Secrearit t 139.796.t25.OC 171,611,300-00 1956.465.91.00 205.4S9.211.56 215t012.557 15
34 AdmAnitIain Minitri of Foleilgn Affairs, InO C& O 5.c 145.025.042,009 00 t1.71,765,256.0S 12,3e5,405,430.O 12 09S.203.831 12 13,443,230.135 46
35 Adirrinistratio Permanent Cormmission of Enquiry 25.547252.00 2S11,tT,0554,0S 306,S8t1,!71.20 315,067,454.80 324,256.17355
36 Adminstrtion CMI Soence Commnission 143,a36.9250O 167,S18.692,W5 490.999,99960 517,.44,415665 545."07.46e.78
37 Atmoisntatlon Prio, 'iniste8's Office *,21,! 7.J6D00 1.905.93648e400 20.14.278.945.40 2.097,251,a05o65 2.185203,e42.zs
40 Adminisration Jdkiary 3259.484.416.00 7,424.595,43600 7.809.741.703.80 0,050,786,2I6.36 8.306,293>s03.79
41 AS,MilitStr.fn Ministry of 2Jcitt and Constitutioncd Affirs c,024,30 455o 1,0S,0263544 00 1.1t1,214,420 1,16.924.021.92 1t235.375,746 O
42 Adlucist100,t- 015c. of tn0 Speake. 5,366.348,293.00 4,987,341.436 00 5.200.749.441.80 5.460.109,2404 S.45.65,632217
40 Ar4rnio,si110- E,,chequer and Audit Deparleenlt Sr4.637,771 00 1.074,516.73200) 1.635.5.t'6 60 1.712.290.117.00 1.9520702533
50 AdrainistSon Mcnjs,tryr.FinSnce VOTE50 37,438.72S.211.0X 4.730.936,020.00 4,405,113.725.91 4.640.116,934.40 4,U89,2203225.31
50,istt of Fi,nsoe SPECLAL 57.057.831.22.55 0.O5 0.05 0.11
Accountmtll Gen0 1rs Ofrice 1,032.6305300.DO 2544.sa7.3e0o.0 2.66t.263,065 00 2.7U4.938.552.0S
zTaczann Revenue Authorily 20.977.00S,XOC.0 23.074.705.000.53 25.t32.170,000.00 27,920.3t7,5000.0
51 Adm1i5,stoaWn Mii-trcy SHcrner 45 5.104l51.35Z 05 3.656,270,15400 4,073 477.113.20 4.235 619264.40 4,393.069,94467
54 Adrnilillu.iOn Rad. Tanzania 1.202.9068,45.00 1.220,262,70800 1,289,960.634.40 1,344.528,031.56 1,402.39483,.15
SS Adkni.fl.fdinc 7Tanza,io flhsstne,l C0.Ae 401 ,77.725.0C 169,5S4 752.00 255,408.242.6C 267,458,031 St 200.235.505.10
Sr ASn,ins.li- ntins.i, o1 RegionSl A4,,i!niWcto. *nd L.o. G. g394,0.755 00 1.13a554d300.X0 1.2065.99.35. 00 1,279,313,319 46 t,356.072.116.65
57 AdministraSSl MinisIry i Defesse an National SeNce 1.375612.057OD 654.485,716.00 692.372.065.aD 735,1.757594 759.962.W3 46
59 Admrinstration L.. Reform Cmris sbo 86 465,341.00 173,S95.112.00 2t3.t.14.60 27. 3t3,560.72 213.751.979.4i
60 AdmmliSilrti(fl IndqsVal Court Of Tanzania 134,g96,027.00 165.245,00.00 239,786.020.00 251.813,713.60 264453.060.so
61 Adonris31rcli5 OlelCommisos 1,578,314,478.00 13,!65,057,676.00 32,06,310,5595 4,011,930,451.39 4.166.210,559.80
63 AdminstrlcboLn Local Govenrrst l SeMNce Ccrrns icn t 174,949,402.00 201.521t.454,00 254. 103,594.20 266,141983..16 270.902,675.46
66 A5ins 7rathot P5sidenors C5c.. - Pblnning Comrmission 2.,247,925,168500 1332s5550.00 1,374,521.012.5S0 41.419.301,1901.24 I a66.616,442.99
Admenftsibtl Regions 0a.4K0567.101.00 7,684,071,549.05 9,502.913.745.79 9.618.6t59334,23 10,52596.408S,.67
AMrOiOlslOal,01 L.ccl Gove.rmenl 4,746.841,914.500 8.552,51,9395D 59,990.795.035.95 8.990,795,0355 0,990,75,035.95
VOTE 33.35.55.50.C05,6S.b.foIe1 155,5.45.Os45045205 tCS,246,265,tO.05 13,1S51.5C9,.46.20 1S0.113.243.43B.20 tt;,s6r.,64,170.34
30 Defence and Secun1 Doefhc. 72,534,0t9,147.00 8O,a84,429,40S.CO S5 002.715,579 05 89.327,775,979.05 93.205.341,979 05
39 D2eence 0nc4 Secu1t0 y Tre Nabiono St0ice 11,73S,466.972.00 10,921.231,116500 11 ,6D3.65.671.80 52.049,123.471.80 12.517,237,051 .80
25 Defence 8ndScuc,ty Poic, Foce 3C24,4010.00 32.5Q,22.376 34.T1.90.75.0 5.28.937.95540 373507.479.5612.4
29 DeOlnce and Secrnty nismry o1 Homse Arirs . Plisons 16 440,501.017.00 17,325,509.315.o0 18.543,502.161.55 1O.50.15,124.00 20.55165.540.4.15
Sub.Total 14.040,52.545.55 141.713,004,21.-05 1513541.83.703.4 105,506,942.455,55 163,500,727,046.41
46 S0o.1c cisl ec Micl,y .1 Edccao r 16,456,6055554 00 1 ,737 402,103.00 22.597.4317513.90 25.530.233.111.20 30.143.!75.10C.Oe
52 Social s-5cs Mbislry or Health 23.135.390.U44.00 2.397.977.450.X 31.664.650,249.00 *1,t40,273.227805 52,359S1.1D24
53 Src.i seMces Ministry SI Co,mhnnio Dc. Gi,5der t. Cult.,. 1.742,412.515.0 1 095.039.72.00 1,177.556.299.60 I.2237331.4942.0 1.315,039.243 96
t5 Scoia serees Mritstry of Latour and You4h Developmeni 1.5e22 779,954.00 1 543,34,644.00 51,2836335,652.40 2.075.561.158.00 2.356.554.315.2a
67 51oc0! I05N4c5 Teachees SeNike C51n1issiOl 117,301,54.DO 221.772.54435 273704.441.20 333.$44 566.40 412026,729 1s
4t S ocal s0n i10s M11j517y0l 50,115cc. TecS.5 HorE on .155is.ry, e. Science. TchS High,, Ed,C1 .1 20,50.404 07.55 24.345,101,571.72 .555355543 75 29.525.5 .25
49 Social SeNices Ministryof Waler 5.050.704.34005 2,953.742.240.00 4.453.700.292.05 l .174,953,4C9.30 7,112,500,51249
Socialser,,es Regions 11.444.9380.264rS 10124,03.203.00 1,441.444.205.51 14.651.676,145.37 17.611.313.050.12
Social 4 Nice, L.ccal GoeO,mcn-t 10S0,75,791,351.00 144134.0517.I58.D0 16.,610.393 405.73 174.3S6337t11.47 155.169.225.366.74
Sub.TolI 17T5.410,047,897.00 221,355.755,8.5 76..s0.352,755.69 2S5.s5,055,s95.oS 339.614,729.406.3l
So 51on1- servces 2 I Jin,clryetWoIk2 33.747.209 465.50 32,444.09.136 00 34,899,260.482.85 344514095955 37,543,50.11S33
48 Economi c Srvice0 inisos .to Lards & Hcman Sertlem1trs Dcc 2.S11,972,625.00 2,714.920.276 00 2.991,115,045.0 3.240 7Gi.2980 0 3,562776.697 27
55 Economic saries M 1in1istry Of Energy I'd Min er48s 2.202.25,330 1.732.327,614500 2,212.,71.000.40 2.417.950.1t5.54 2 647,029,3t22.17
62 Ecofonmic s0rices Mirfisty of Communicm nors and Transport 1 0.330.89,s95.005 5,465.309,736.00 7.126.55504.4.O 7,775,769,502.'4 a 502.777,405 SO
Ecollormic .rvice Electricty bill . . . .
56 Echonor0i swr4ces SMinistry ot ReLoiral Admi AnS Ixal G0.1 11 ,51aS05,O000.00 12.404.044.732.00 12.635,146,969 20 13 S,55,146,96e 60 16,009,112.3$0026
Econom.w c r-ces Lo 90- 5001001e0t 1.490.422.463.50 2.117.235 39.500 2.261.213,700 e0 2.332.992.323.e4 23413,304.37927
Sub Trwi 62.251,25590511.00 57,070,211,045.00 62.11115,77.6 .30 Ts.04.,5230 ?0,671.57235.SO
69 pFodwcc Mt1inistry o1 Nctut.l Reso,rces Sad Teium 8,626.11.967 C 6133.53548.50 7.155.34,Y592.40 .6205,226,935,00 n .134.009.924.78
43 Procb. Ministr tA015AaricJture and Co-opefafive 1$,597 5e,0s32 0 7,95,536.132.00 8.570,25r,0u5.60 50406243,21560 S557,9S6.061.
44 PPoducinve Ministry of Industries and Ttade 3352,796,S91.20 1.327.499.164.00 1,440.025,52.t20 1 1,53,250,535 00
Sub.-Totl 2.9576.4S0 1*.n 19.t99,219,100 17,10,s632,243.20 t1136,202 01 W l945.3264.H.31
SALARY INCREASE . 290,64,993.020 13 55,741.9S64.77.45
RECRUITMESN7T 2.500.000.00DDo, 400.0.000005.00 5,300,06S.555.00
INSURANCE 9.475351S 000 00 2n.175.95.620.0D 32.15.332C,2.
[TOTAL MINK CONTINGENCY 0 2.6S43.56. S 1.75.0 35 259537
.7O-AI.4l541TiclRIES5t3P75 562.49575t1220.ZO 542.21172t.12.05 U 742.25903720073 555i354675.69
174

TablIe 61: RECURRENT EXPENDII'URE BY MINISTRIES/DEPARTMENTS INCLUDING TRANSFERS TO LOCAL GOVERNMENT
Vote _______ _____________ Ministry/Depattment 1998/99 1999/2000 2000/01 2001/02 2002103PROVISIONA LIKELY CEILING PROJEC PROJE
L ACTUAL OUTTURN TION CTION
26 Administrationl _ VICE PRESIDENT _ | 0.03 0.05 0.04 0.04 0.0427 Administration Registrar of Political Parties _ -- 0.46 0.49 0.44 0.41 0.4030 Adtinistration President's Office and Cabiuict Secretariat 1.00 .14 1.02 0.94 0.91
-- A Adntinistration Vice President's Office 0_____ -_ OX.8 0.08 0.07 0.06 0.0632 Administration President's Office - Civil Service Department 0,40 0,27 0.25 0.22 0.2233 - AdMinistration Ethics Secretauiat_ 0.02 0.03 0.03 0.03 0.0334 Administration Ministry of Foreign Affairs & Int. Co-operation_ 2.60 6C _ 2116 1.93 1.74 1,6735 Adiiiinistration_ Permanent Connmissioni of Enquiry 0.04 0 05 00. 04 0.0436 Adninistration Civil Servicc CoCimnssion 0.03 0.03 0.08 0.07 0.0737 Administrationr Pime Minister's Office --__ 0.86 0 35 0 31] 0.28 0.274U Admirnistration Judiciary _ 0.93 1.30 1.22 1.08 1.0341 Administration Ministsy of Justice aind Consditutional A-ffairs _ 0.36 0.20 0.18 0.16 0.15
j2Adminuistration 0 __ Office of the Speaker ____ _ 0.5 0.92 0. 82 0.73 0.70-45 Administiaotn___ _ Exchequer auld Au Departmlen t __ 16 0.20 0.25 0.23 0.22
St) Administration Ministry of Finance VOTE 50 6.64 0.87 0.69 0.63 0,61Ministry of Finance SPECIAL 10.23 (.00 0.0 0 0.0 0.00
__ __ _____________ Accountant General's Office 0.00 0.19_ 0.40 0.36 0.35________l_____ . Tanzania Revenue Authority - 0.00 3.87 3.59 3.42 3.47
5 1 Administration Ministry of Home Affairs 0.91 0.71 0.63 0.57 0.5554 Adminiistration Radio Tanzania 0.2 l )2 0 0.20 0.18 .1755 Administration Tanzania Investnetit Centre 0.09 0.03 0.04 0.04 0.03-5-6-S--_ Admlinistration Ministry of Regional Admiinistration and Local 0.10 ()21 0.19 0.17 0.17
Govemment57 | Administration Ministr of Defense and National Service -0.33 0.12 -0.1 0.10 0.0959j Admilnistration Law Reform Commission 00_ 0.2 0.03 0.03 0.03 0.0360) Administration Indlustrial Court of Tannia _ 0.02 0.03 0.04 0.03 0.03-61 Admnistration Electoral Commissioni 0.28 2.56 4.99 0.54 0.5263 Admlinistration_ Local Governmenit Service Commission_ 0.03 0 04 0.04 0.04 0.0366,(, Administrationl President's Office - Plauulin0g Commission 0.40 0.24 0.21 5.58 0.23
_Adininistration Regions _1_ _41 1_481 1 __3013
175

_ Administrationl Local lGovenmncit 0.84 1.58 1.40 1.21 1.12____________.____ VOTE 33,35,55,59,60.63 0.00 0.(0 0.00 0.00 0.00
____ Sub-Total - 29.52 19.41 2(1.73 20.22 14.5138 Dcfencc and Sccurity Defence 12.87 14.92 13.36 12.03 11.573'9 Dcfence and Sccurity The National Scrvicc 2.08 -- 2.01 1.81 1.62 1.5528 _ _DcSsefe and Securily Police Forc6 5.37 6.01 5.40 4.84 4.6329 Defence and Security Miniistry of Honic Affairs - Prisonis 2.92 3.20 2.89 2.63 2.55
Sub-Total - 23.24 26.14 23.46 21.13 20.3146 Social scrvices Minhistry of Educatioui _ 2.93 3.46 3.53 3.44 3.7452 Social services Ministry of Healli_ 4.11 4.13 4.93 5.62 6.5453 Social services Ministry of Conuiiuiiity Dcv. Gender & Culture 0.3 1 0.20 0.18 0.17 0.1665 Social services _ _Ministry of Labour and Youth Developmcnt - -32 0.30 0.29 0.28 0.3067 Social services Teacher's Scrvice Comiiiission_ 0.02 0.04 0.04 0.04 0.0568 Social services Ministry of Science, Tcch.& Higher Education 2.75 3.70 3.79 4.16 4.95
-49 Social scrvices Ministry of Water 0.90 0.54 0.69 0.70 0.88Social services Regions __ 2.04 ___ 7 2.09 1.97 2.19Social services Local Goveniment 17.76 26.58 25.63 23.49 23.36
Sub-Total _ 31.13 40.83 41.19 39.87 42.1747 Economic services 2/ Ministly of Works 5.99 5.99 5.43 4.91 4.664X~ Economic services Ministry of Lands & Humiain Settlemiients Dcv, 0.52 0.50 0.47 0.44 0.4458 Economic services Ministry of Energy aid Minerals 0.39 0.33 0.34 0.33 0.3362 Economic services Ministry of Conmnmications anid Transport 1.83 1.19 1.11 1.05 1.06
Economiiic scrvices Electricity bill 0.00 0.00 0.00 0.00 0.0056 Economitic services Ministry of Regionail Adin. And Local Govt. 2.04 - 2.29 1.97 1.80 1.99
coiixiixc scrvices -Loal govemmct i 0.26 0.39 0.35 0.31 0.30Sub-Total _ __ 11 .04 1t0.69 9.67 8.84 8.78
69 Productivc Ministry of Natural Resources and Tourism 1.53 1.22 1.11 1.03 1.0143 Productivc Ministry of Agriculturc_and Co-operaitivs 2.95 1.47 1.33 1.22 1.1944 Productivc __ Ministry of Industrics and Trade - _-_---0.59 0.24 0.22 0.21 0.21
Su b-Total 5.07 2.93 2.67 2.45 2.40_________.__._ SALARY INCREASE |__ ();0)(0.00 0.00 3.99 6.92
___-_ _ RECRUITMENT 0.M0 0.00 0.39 0.54 0.68INSURANCE _ 0.0( 0.00 1.48 2.72 3.98CONTINGENCY 0.0( 0.00 0.41 0.24 0.24
T OTAL MINISTRIESIDEPTS 1 00.4 _______- l0000 10.00 100.00 100.00 100.001Sotirce; Table 6a__
176

Table 7a: RECURRENT EXPENDITURE BY REGIONS
vote1998199 1992000 2000101 2001102 20021
__ _ _ _________ Pov. Actual LUkelyOturm CEILINOS Pro]. ProL
70 Arusna ,182,264.300.00 1,286,258,640.00 1,642,711,236.29 1.740,121.591.53 2.026.089.672.3771 PWani 669,877.400.00 745,512,956.00 982,363,356.78 1.041,239,650.93 1,119,674,1 18.6572 Dodomna 874,370,B0.00 976,256,964.00 1.271,023,777.11 1,355,95B,3i6.24 1.685.603,881.5973 Iringa 1,042,837.600.00 1,116.400,980.00 1,393.427,262.80 1,464,740,739.09 1,734.041.913.0874 Kigoma 709,706,100.00 758,156,732.00 1,009,117,582.15 1,081,789,56Z06 1.197.013.950.7075 Kiimanjaro 1,011,491,100.00 1,097.623.456.00 1,375,183,854.71 1,452.843,278.13 1.70t1649.457.4376 Lindi 705,977,800.00 759,434,068.00 955,1198633.14 998,142,430.67 1.153,232,108.5677 Mara 807,830,600.00 875.535.272.00 1.0833569,650-20 1.126,866,305.67 1.261.048.046.4278 Mbeya 827,246,100 00 866.138,316.00 1.176,483,945.80 1,265,210,386.37 1,572.011,139.4079 Morogoro 1.055,890,500.00 1.158,719,632.00 1.497.355,686.19 1,594.207,940.26 1,915.100,w65.0180 Mtwara 713,453,600.00 811,056,720.00 1,047,184,775.35 1,099,589,193.66 1,181,933,508.1381 Mwanza 1,064,283.300.00 1.183,829,336.00 1,493,648,056.06 1,562,595,202.88 1,692,217,1153182 Ruvuma 746.538.800.00 829,635,304.00 1,039,929,917.21 1,089,076,406.22 1.194.750.742.4783 Shinyanga 990,965,680000 1,085,666,204.00 1,387.065,610.58 1,460,006,368.45 1,701,683,617.8984 Singida 651,275,000.00 698,963,358D00 898,421.496.09 948,806,869.70 1,063.430.787.3085 Tabora 868,373,400 00 929,529.012.00 1.215,353,445.17 1,296,339,262.10 1,520.387,142.8086 Tanga 995,996,400.00 1,033,666,32800 1,309,070.609.47 1,383,869,366.39 1,635,831.327.9387 Kagera 630,188,500.00 739.604,212.00 955,645,566 36 1,005,889,279.42 1,158.063,698.6788 Dar es Salaam 229,313,400.00 279,510.298.00 402,996.480.17 428,613,163.99 550,916,840.4589 Ru1ra 633,2 13,500.00 576.607.048.00 808,687,895.80 871,460.665.83 1,071.412 121.62= Total Regions 16,411,094,000.00 17,808,104,832.00 22,944,368,041.40 24,270,365,979.60 28,137,011,855.9
Source. The Tanzanian authorities
Table 7b: RECURRENT EXPENDITURE BY REGIONS (in pementages)
Vote1998199 199912000 2000101 2001102 2002103
_ ______________ _ Ptov. Actual Likely Olturn CEILINGS Proj. Prol.
70 Arusha 7.2 7.2 7.2 7.2 7.271 Pwani 4.1 4.2 4 3 4.3 4.072 Dodoma 5.3 5.5 5.5 5.6 6.073 lnnga 64 63 6.1 6.0 6274 Kigoma 4 3 4 3 4 4 4.5 4.375 Kilimanjaro 6.2 6 2 6 0 6.0 6 076 Lindi 4 3 4 3 4.2 4.1 4177 Mara 4.9 4 9 4 7 4.6 4.578 Mbeya 5.0 4 9 5 1 5.2 5.679 Morogoro 6.4 6.5 6 5 6 6 880 Mtwara 43 46 46 45 4281 Mwanza 65 66 65 64 6062 Ruvuma 4.5 4.7 4.5 4.5 4.283 Shinyanga 6 0 61 6 0 6 0 6 084 Singida 4 0 3 9 3 9 3.5 3885 Tabora 5 3 5 2 5 3 5.3 5.486 Tanga 6.1 5 8 5.7 5.7 5 887 Kagera 3 8 4 2 4 2 4 2 4188 DaresSalaam 1.4 t 6 1.8 18 2.089 Rukwa 3.9 3 2 3.5 36 3.8
total Regions 100.0 180.0 100.0 100.0 100.0
Source: Table 7a
177

Table Ea: RECURRENT EXPENOITURE BY DISTRICT COUNCILS
Vote1998t99 199912000 2000101 2001102 2002ro3
_ _ ________ Prov. Actual Likely Olturn CEILINGS Pro]. Proj.
70 Arusha 5,521,966,075.17 8,882,024,609.00 10,700.130,904.31 11,693.623,729.13 13.129,323,8626.71 Pwani 3.099.510.332.22 5,611,006,210.W0 6,472Z446,683.69 6,917,842.47255 7,533,369.151.6872 Dodorria 3,933,569,070.00 5,931,967,147.00 6,691,728,01320 7,030,858,496.85 7,505.205,7122873 Iringa 5,069,176,570.06 7,441,058,680.00 8,321,306,14252 8,716,492,434.58 9,263,7514a5.5174 Kigoma 3,460,938.26235 5,046,093,248.o0 5,871,158,929.77 6,290,830,837.86 6,885,643,124.7975 Kilimanjaro 6,942,569,646.75 10,331,495,432.00 11,635,077,289.87 12,277,353.629.28 13,142,902,410.4075 Lndi 2,600,759,497.52 4,069603,258.00 4,805,233,941.61 5,216,929.287,14 5,779,495,737.5177 Mara 4,455,030,987.50 6,424,364,070.00 7,341,449,060.59 7,786.875,532.40 8,407,139,6624078 Mbeya 6,260,829,005 13 9,059,893,849.00 10,148,305,887.61 10,612,266,275.07 11,278,828,046.1179 Morogoro 4.693,718,791.21 7,180,196,680.00 8,051,537,269.68 8,441,995,178.87 8,937.622,917.3680 Mtwara 3,353,770,170.72 5,238,440,999.00 5,962,677,934.48 6,302,976,721.67 6,781.494,079.3281 Mwanza 6,193,181,39244 8,966,733,91800 9,942,000,066.24 10,338,872,842.99 10,897,107,431.3182 Ruvurra 3,767,377.838.82 5,974.817,224.00 6,771,203,47335 7,173,518,179.74 7.719,673,690.3783 Shinyanga 5,014,458,11568 7,418,453,212.00 8,435,813.088.72 8.923,274,315.15 9,608,656,759.5484 Singida 2,991,498,982.63 4,531,602,137.00 5,337,016,534.80 5,608,503,728.79 5,437,9Q6,091.9885 Tabora 3,410,069,236.71 4.68e,086,094.00 5.314,549,309 38 5,618,557,628.15 6,039,155,843.1186 Tanga 4,911,125,325 57 7,449,226,546 00 8,449,648,62&61 8,946,346,338.07 9,628,507,465.8687 Kagera 5,129,646,064,24 7,503,174,014.00 8,591,525,047.13 9,158,079,354.08 9.933,133,552.8988 Dar es Salaarn .89 Rukwa 3,404,369,635.63 3,534,194,440.00 4,033,099,007 19 4,289,781,348.00 4.639,335,108.33
Total District 84,213,585,000.36 126,282,631,767.00 142,876,907,212.78 1 161.644,978,130.3S 163,698,2S2,163.64
Source: The Tanzanian authorities.
Table 8b: RECURRENT EXPENDITURE BY DISTRICT COUNCILS (in percentages)
Vote Region 1998199 199912000 2000101 2001102 2002V03Prov. Actual Likely Oturn CEILINGS Proj. Prof.
70 Arusha 6 6 71 7 S 7.7 8 071 Pwani 3.7 45 4.5 46 4672 Dodoma 4.7 4,7 4.7 4.6 4673 Iringa 6.0 59 5,8 5.8 5774 Kigoma 41 40 4.1 4.2 4275 Kilimanjaro 8 2 8.2 81 81 8.076 Lindi 3.1 3.2 34 3.4 3.577 Mara 53 51 51 51 5178 Mbeya 74 7.2 71 7.0 6979 Morogoro 5.6 57 56 56 5580 Mtwara 4 0 4 2 4.2 4,2 4.181 Mwanza 7.4 72 70 6.8 6.782 Ru-vuma 4.5 4.8 4 7 4.7 4 783 Shnyanga 6 0 5 9 5 9 5.9 5 984 Singida 3.6 3 6 3.7 3.8 3 985 Tabora 4.0 37 3.7 3.7 3.786 Tanga 5 8 5 9 5 9 5.9 5 987 Kagera 61 6 0 6.0 6 0 6.188 Dar es Salaam 00 0G0 0.0 0.0 a 089 Rukwa 4 0 2.8 2.8 2.8 2.8
_Totat oistrict 100.0 100.0 100.0 100.0 100.0
Source: Table 8a
178
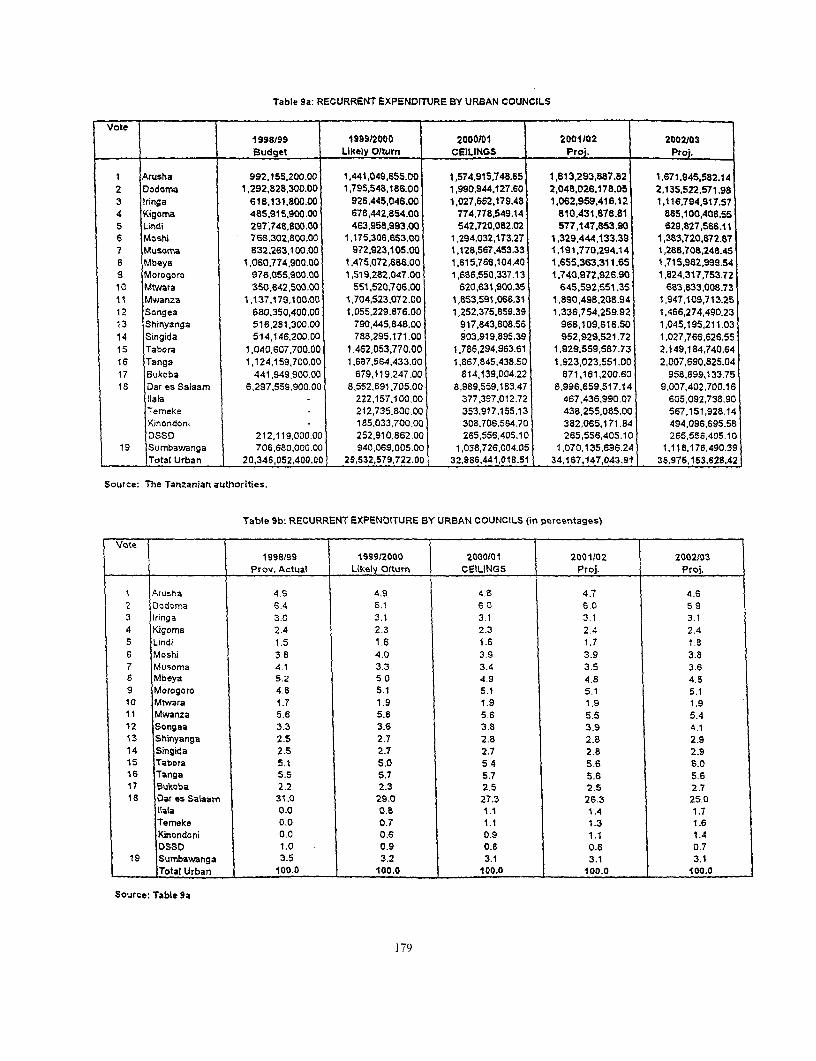
Table 9a: RECURRENT EXPENDITURE BY URBAN COUNCILS
Vote1998/99 1999/2000 2000101 2001102 2002103Budget Likely Olturn CEILINGS Proj. Proj.
I Arusha 992.155,200.00 1.441,049,655.00 1,574.915,748.65 1,613,293,687.82 1,671.945.582.142 Dodoma 1,292,828,300.00 1,795,548,186.00 1,990,944,127.60 2,048,026,178.05 2.135.522,571.983 Iringa 618,131,800.00 926,445,046.00 1,027,662.179.48 1,062,959.416.12 1.116,794,917.574 Kigorna 485,915,900.00 678,442,854.00 774,778,549.14 810,431.878.81 865,100,406.555 Lindi 297 748,800.00 463.958,993.00 542,720,082.02 577,147,853.90 629,827,566.116 Moshi 766.302.800.00 1,175.306.653.00 1.294,032.173.27 1.329,444,133.39 1,383,720.872.877 Musoma 632,263,100.00 972f923,105.00 1,128,567,453.33 1,191,770.294.14 1,288,708,248.456 Mbeya 1,060,774,900.00 1.475,072,888.00 1,615,766,104.40 1,655,363,311.65 1,715,982,999.549 Motogoro 978,055,900.00 1,519,282,047.00 1t,66,550,337.13 1.740.972,926.90 1,824,317,753.7210 Mtwara 350,842,500.00 551,520,706.00 620,631,900.35 645,592,551.35 683,833,008.7311 Mwanza 1,137,179,100.00 1,704,523,072.00 1,853,591,068.31 1,890,498,208.94 1,947,109,713.2512 Songea 680,350,400.00 1,055,229,876.00 1,252,375,859.39 1,336,754,259.92 1,466,274,490.2313 Shinyanga 516,281,300.00 790,445,848.00 917,843,808.56 968,109,616.50 1,045,195,211.0314 Singida 514,146,200.00 788,295,171.00 903,919,895.39 952,929,521.72 1.027,766,626.5515 Tabora 1,040,607,700.00 1,462,053,770.00 1,786,294.963.61 1,929,559,587.73 2.149,184.740.6416 Tanga 1,124,159,700.00 1,587,564,433.00 1,867,845,438.50 1,923,023,551.00 2,007.690.825.0417 Bukoba 441,949,900.00 679,119,247.00 814,139,004.22 871,161,200.60 958,699,133.7518 Dar es Salaam 6,297.559,900.00 8,552,891,705.00 8,989,559.183.47 8,996,659,517.14 9,007,402,700.16
llala 222,157,100.00 377,397,012.72 467,436,990.07 605,092,738.90Temeke 212,735,800.00 353,917,155.13 438,255,085.00 567,151,928.14Kinondoni . 185,033,700.00 308,706,564.70 382,065,171.84 494.096,695.58DSSD 212,119,000.00 252.910,862.00 265,556,405.10 265,556,405.10 265,556,405.10
19 Sumbawanga 706,680,000.00 940,069,005.00 1,038,726,004.05 1,070,135,696.24 1,118,178,490.39, Total Urban 20,346,052,400.0 29,532,579,722.00 32,986,441,018.51 34,167,147,043.91 36,975,153,628.42
Source: The Tanzanian authorities.
Table 9b: RECURRENT EXPENDITURE BY URBAN COUNCILS (in percentages)
Vote1998199 1999/2000 2000(01 2001102 2002103
Prov. Actual Likely Ofturn CEILiNGS Proj. Proj.
I Arusha 4.9 4,9 4.8 4.7 4.62 Dodoma 6.4 6.1 6.0 6 0 593 tringa 3.0 3.1 3.1 3.1 3.14 Kigoma 2.4 2.3 2.3 2.4 2.4S Lindi 1.5 1.6 1.6 1.7 1.86 Moshi 3 8 4.0 3.9 3.9 3.87 Musorna 4.1 3 3 3.4 3.5 3.68 Mbeya 5.2 5.0 4.9 4.8 4.89 Morogoro 4.8 5.1 5.1 5.1 5.110 Mtwara 1.7 1.9 1.9 1.9 1.911 Mwanza 5.6 5.8 5.6 5.5 5.412 Songea 3.3 3.6 3.8 3.9 4.113 Shnyanga 2.5 2.7 2.8 2.8 2.914 Singida 2.5 2.7 2.7 2.8 2.915 Tabora 5.1 5.0 5.4 5.6 6.016 Tanga S.5 5.7 5.7 5.6 5.617 Bukoba 2.2 2.3 2.5 2.5 2.718 Dar es Salaam 31.0 29.0 27.3 26.3 25.0
llaaa 0.0 0.8 1.1 1.4 1.7Temeke 0.0 0.7 1.1 1.3 1.6Kinondoni 0.0 0.6 0.9 1.1 1.4DSS0 1.0 - 0.9 0.8 0.8 0.7
19 Surnbawanga 3.5 3.2 3.1 3.1 3.1Total Urban 100.0 100.0 100.0 100.0 100.0
Source: Table 9a
179

Table lOa: DEVELOPMENT EXPENDITURE.MINISTRIES
VOTE MtNISTRYtREGION l98a99 t999200D 2000t01 200102 2002/03._________________________________ Budget Likuly Otun I Celtings Pro. Pro).
26 VICE PRESIDENT27 Registrar of Political Parties28 Police Force29 Ministry of Home Aftairs -Prisons30 Presidents Office and Cabinet Secretariat 3,000,000,000 2,195,671,212 2,679,320,763 500,0o00000 200,000,00031 Vice Presidents Office 032 Presidents Office - Civil SeMce Oepartment 500,000,000 365,945,202 500,000,000 500.000, 500,0,00033 Ethics Secretaiat34 Ministry of Foreign Affairs & Int Co-operation35 Permanent Commission of Enquiry36 Crvil Service Commission37 Prime Ministers Office 200,000,000 146.376,061 20,080,000 363,621,880 416,950,50538 Defence39 The National Service40 Judiciary 409,307,832 500,000,000 450,000,00041 Ministry of Justice and Constitutional Affairs42 Office of the Speaker43 Ministry of Agriculture and Co-operatives 2,437,500,020 1.783,982,B60 2,555,329,062 2,943,708,405 3.200,000,00044 Ministry of Industries and Trade 045 Exchequer and Audit Department 0 50,000,000 50,008,000 50,000,00046 Ministry of Education 2,131,250,000 1,559,841,424 2,234,274,898 4,407,658,156 4,434,552,96647 Ministry of Works 4,000,000,000 2,927,561,616 5,000,000,000 6,000,000,000 6, 000, 000, 00048 Ministry of Lands & Human Settlements Dev. 500,000,000 365,945,202 1.024,170,064 1,033,944,754 1,040,515,86549 M inistry of Water 3,225,008,000 2,360,346,553 3,212,738,251 3,500,000,000 3,500,000,00050 Mrinistry ol Finance VOTE 50 1,322,000,000 967,559, 114 1,450,000,080 2,000,000200 1,518 116, 20251 Ministry of Home Affairs 052 Ministry of Health 3,375,000,000 2,470,130,114 3,538,147,932 3,500,000.000 3,500,000,00053 Ministry of Community Dev. Gender & Culture 0 352,480,609 500,000,00054 Radio Tanzania 1,600,000,ODO 1,171,024,647 500000, 000 500,000,008 500,000.00055 Tanzania Investment Centre 056 Ministry of Regional Adm &Local Govt. 193,750,008 141,803,766 290,625,00 387,500,002 389,864,46257 Ministry of Defense and National Service 1,000,000,000 731,890,404 1,000,000800 1,000,008,000 1,000,008,00058 MiNstry of Energy and Minerals 1,743,750,000 1,276,233,892 1,828,043,09B 1,828,043.098 2,000,000,00059 Law Reform Commission60 Industrial Court of Tanzania61 Electoral Comrnission62 Ministry of Communications and Transport 302,020,002 300,000.00263 Local Government Service Commission65 Ministry of Labour and Youth Development66 President's Office- Planning Commission 500,000,000 365,945,202 500,00a,000 500,000,008 508,00,00867 Teacher's Service Commission 0B8 Ministry of Science, Tech.& Higher Education 1,743,750,080 1,278,233,892 1,828,043,098 1,828,8043,098 2,00i,000,00069 Ministry of Natural Resources and Tourism
Total Ministries 27,472,000,000 20,106,493,182 28,800,000,000 32,000,000,000 32,000,000,000
NOTE
180

Table 10b: Development Expenditure Ministries (in percentage)
VOTE MinistrylRegion 1998199 1999100 2000101 1 2001102 2002103Budget Likely Otturn CeDings Proi. Proj.
26 Vice President's Office . .27 Registrar of Political Parties28 Police Force29 Ministry of Home Affairs - Prisons .- - -30 President's Office and Cabinet Secretariat 10.9 10.9 9.3 1.6 0.631 Vice President's Office .32 President's OfRice - Civil Service Department 1.8 1.8 1.7 1.6 1.633 Ethics Secretariat . . -34 Ministry of Foreign Affairs & Int. Co-operation35 Permanent Commission of Enquiry36 Civil Service Commission - - -
37 Prime Minister's Office 0.7 0.7 0.7 1.1 1.338 Defence .39 The National Service .40 Judiciary 1.4 1.6 1.441 Ministry of Justice and Constitutional Affairs - -
42 Office of the Speaker ,43 Ministry of Agriculture and Co-operatives 8.9 8.9 8.9 9.2 10.044 Ministry of Industries and Trade - - - -45 Exchequer and Audit Department - 0.2 0.2 0.246 Ministry of Education 7.B 7.8 7.8 13.8 13.947 Ministry ofWorks 14.6 14.6 17.4 18.7 18.748 Ministry of Lands & Human Settlements Dev. 1.a 1.8 3.6 3.2 3.349 Ministry of Water 11.7 11.7 11.2 10.9 10.950 Ministry of Finance VOTE 50 4.8 4.8 5.0 6.2 4.751 Ministry of Home Affairs - - -52 Ministry of Health 12.3 12.3 12.3 10.9 10.953 Ministry of Community Dev. Gender & Culture - - 1.1 1.654 Radio Tanzania 5.5 5.8 1.7 1.6 1.655 Tanzania Investment Centre - - - -
56 Ministry of Regional Adm.&Local Govt. 0.7 0.7 1.0 1.2 1.257 Ministry of Defense and National Service 3.6 3.6 3.5 3.1 3.158 Ministry of Energy and Minerals 6.3 5.3 6.3 5.7 6.259 Law Reform Commission - - - - -
60 Industrial Court of Tanzania ,61 Electoral Commission . .62 Ministry of Communications and Transport 0.9 0.963 Local Government Service Commission - -65 Ministry of Labour and Youth Development -66 President's Office - Planning Commission 1.8 1.8 1.7 1.6 1.667 Teachers Service Commission - - -68 Ministry of Science, Tech.& Higher Education 6.3 6.3 6.3 5.7 6.269 Ministry of Natural Resources and Tourism - - -
Total Ministries 100,0 100.0 100.0 100.0 100.0
NOTE: Based on iocal component only.Source: Table I Oa
181

Table 1Ia: Development Expenditure-Regions
199912000 199912000 2000101 2001102 2002103Budget Likely O/tum Ceilings Proj. Pro.
70 Arusha 343,570,000 251,455,586.14 549.712,000.00 610,791,111.11 610,791,111.1171 Pwani 205,342,000 150,287,839.36 328,547,200.00 365,052,444.44 365,052,444.4472 Dodoma 196,285,000 143,659,107.97 314,056,000.00 348,951,111.11 348,951,111.1173 lInga 249,342,000 182,491,017.14 398,947,200.00 443,274,666.67 443,274,666.6774 Kigoma 167,228,000 122,392,568.50 267,564,800.00 297,294,222.22 297,294,222.2275 Kilimanjaro 252,342,000 184,686,688.35 403,747,200.00 448,608,000.00 448,608,000.0076 Undi 213,342,000 156,142,962.59 341,347,200W00 379,274,666.67 379,274,666.6777 Mara 218,785,000 160,126,642.06 350,056,000.00 388,951,111.11 388,951,111.1178 Mbeya 348,456,000 255,031,602.65 557,529,600.00 619,477,333.33 619,477,333.3379 Morogoro 212,785,000 155,735,299.64 340,456,000.00 378,284,444.44 378,284,444.4480 Mtwara 194,785,000 142,561,272.36 311,656,000.00 346,284,444.44 346,284,444.4481 Mwanza 278,899,000 204,123,501.81 446,238,400.00 495,820,444.44 495,820,444.4482 Ruvuma 199,228,000 145,813,061.43 318,764,800.00 354,183,111.11 354,183,111.1183 Shinyanga 240,899,000 176,311,666.46 385,438,400.00 428,264,888.89 428,264,888.8984 Singida 139,228,000 101,899,637.18 222,764,800.00 247,516,444.44 247,516,444.4485 Tabora 237,042,000 173,488,765.17 379,267,200.00 421,408,000.00 421,408,000.0086 Tanga 256,342,000 187,614,249.97 410,147,200.00 455,719,111.11 455,719,111.1187 Kagera 237,342,000 173,708,332.29 379,747,200.00 421,941,333.33 421,941,333.3388 Dares Salaam 118,530,000 86,750,969.60 189,648,000.00 210,720,000.00 210,720,000.0089 Rukwa 190,228,000 139,226,047.79 304,364,800.00 338,183,111.11 338,183,111.11
Total Regions 4,500,000,000 3,293,506,818 7,200,000,000 8,000,000,000 8,000,000,000
Note: Based on local component only.Source: The Tanzanian authorities.
Table 1lb: Development Expenditure-Regions (in percentage)
199912000 199912000 2000101 2001102 2002103_ Budget Likely Ottum Ceilings Proj. Proj.
70 Arusha 7.6 7.6 7.6 7.6 7.671 Pwani 4.6 4.6 4.6 4.6 4.672 Dodoma 4.4 4.4 4.4 4.4 4.473 Iringa 5.5 5.5 5.5 5 5 5.574 Kigoma 3.7 3.7 3.7 3.7 3.775 Kilimanjaro 5.6 5.6 5.6 5.6 5.676 Lindi 4.7 4.7 4.7 4.7 4.777 Mara 4.9 4.9 4.9 4.9 4.978 Mbeya 7.7 7.7 7.7 7.7 7.779 Morogoro 4.7 4.7 4.7 4.7 4.780 Mtwara 4.3 4.3 4.3 4.3 4.381 Mwanza 6.2 6.2 6.2 6.2 6.282 Ruvuma 4.4 4.4 4.4 4.4 4.483 Shinyanga 5.4 5.4 5.4 5.4 5.484 Singida 3.1 3.1 3.1 3.1 3.185 Tabora 5.3 5.3 5.3 5.3 5.386 Tanga 5.7 5.7 5.7 5.7 5.787 Kagera 5.3 5.3 5.3 5.3 5.388 Dar es Salaam 2.6 2.6 2.6 2.6 2.689 Rukwa 4.2 4.2 4.2 4.2 4.2
I Total Regions 100.0 100.0 100.0 100.0 100.0
NOTE: Based on local component onlySource: Table 11a
182

Table 12a: Sectoral Recurrent Allocation 199912000 - 2002/03______.__ -V T
__ __ I998199 _ -_- _- ' ' -- _ 1999100) __ _ _ _ _ _ _
______________ PE ACT PE EST OC ACT OC EST Total Act. Total Est. P5 OC Total
Mitsis1r-ie.sApqrniiioiit 11,792,943,974 _ 13 273,114,771 141,315,041,053 127,950,8()02,5 |53,107,985,127 141,223,956,92i 1 5;7071540,420 191,10,381,400 206, 817,921,82Cl_____11.s ~ _ 3,040,952,077- 3,507,237,20C 5,449,615,[)2424 8,490,567,101 6.263,580,845 4.654.0u4,54s.3g 3.030,067,OOb 7,684,071,549,39Loecal (iovcnauceii 4,746,841,914 -4,778,-770-,-600 ? ___._ 4,7f,4 ,917~4 ~4 778:7ii,60 8.562,66 l1,9(5) -___'___'___:_- 8,562,-661S,95'fTikit- ,346,557,746-35 3,346,557,7416,.35 -3,36,06-7,70 - 6,2-7,964,98 6,276,964,96
3,369,067,700Urban roulicils _ . _ __ _ _ _ __ _ _ _ 1,409,702,900 2,285,696,9787
1,400,284,167.65 1,409,702,900 I - 1,400,284,167.65 - 2,285,696,987
Security__cu__, .___ _ _______ ___._I
l)efentceandlSe'.urity -_ _ _ _ _ _ _ _ _ _ _ _ _ _ __ _ _
MTinis6rii ,/I)i cnet 70,133,382,1 S 75,541,249,711 GO,82Y,156,8816 47,742,400,389 136,9i2,539,041 123,283,650,100 85,15t,077,8t6 56,562,006,400 141,-713,84,2TotlDefenice and 70,133,382,154 75,541,249,711 ,2~im 742130,062,939,040 123,28,60101 8 '51,07 5,5206400 141,713,084,216
SecuritySosciall Se7tUrs_
Euationl _ _ ___ _ _______ MEinistriLDpaLntni '3,595,248,9)26 ~ 9,615,855,9i0C 22,504,781,911 3,426,077,sou 32,100,030,8370 33,041,93 13,710,079,51 25,332,503,300 39,042,582,831l{egioii~~~~, 5,043,975,55 64-9T,1-76,89-6 2625-,174 9-1-8097 ,39 8,69, 15 5,3 7 __ 7,30629.9 I7,2,2 0,1,0 8,3,2
Local ,ovemiriLt 67.069,374,672 67,520,503,440 4,985,195,103 3,312.308,914 72,05459 ,22 ,354 2s 078 6,l27 13,1 --- 6,720-,2 118,923,08,276-- tn-lt 663,99,8462,1 S14,354,005,269 4,057,948,814 2b, 19,456.68 58,048,795,4238 ,24,72s.8x 8,94,167,26'I 9,26,600 9 42
1 hhan0'oun11N 1f 3,0)78.3528-,061.11 fl163, I,-,498,370j ~927~,246,289 -6 16,089-,458 16 140574303 S~,8..6 1882,120,5) 1,40330 2,781586
it-lac29tl4
MInlstrwl/DL irtincril 2,356,805f1832 11 9445,335$,200 22,C785,735321,0i IC '65,858, 2IC32,3i.N69 8,64071938,20G 3205,4159,860 113 521,521,8 00 23 970,67,60Rcgions 1.41 IJ,993,88 1.28 1,624,294,224 656,2~~94,96 20,5,9.02072884.8186523291 8,T29,799,35~3 ~70-9,401,600 9,3,00,95.0
Lou~1 G n~n~Yit I 6~67,343,667.34 I ,8, 58i ,4,9,758 2,7,6.61.1,'6-42,43.87,708,203-,0254 1 ,0,-92,6-28-,02-8,800 2223,32771)i-s ir-i ct -1 3,4 97,7-11,65-2.21 1358-8,501,317. 1,014,8 071753 67104,i7 14~,512,1 98,9535.14 14,26.5,199 1451,2744 ,876~,902,200 16,38,02,4
Urlxuii 3,269,632,0T313 3-9,62-i4,54-270 23,3,73 5.-3,5-01 ,443,597,4 ~3,445,646;,895.48 -5-,9 T153 75 1, -M26,60 5845,913Councils
S-TtAM 058396366 23945,75,24- 22-7957 136,996,193,26 43216,32213.86 3, 4,949ii5483 32,020,2547i.3 2,49921i 5,7,0,94.03,Witter
183

. ,6,645,I-- I ,716,305,060C 3,434,5-(,16(1) -- 79,914-,000 5,050 4,34 -- 2,56,219,600-I-,S-2,37s 1,001,704,40 2,953,742,240
Ministries/D)epartwIFcnt
Region.s 783,885,49.60 902,385,6-80 364,6)X,3i31i2,365,610.50 I14,493,802.60 1,014,751,290.50
Iocal (iovcmunient- 15,190,926.30 9,377,847,700 692,388,20(8.80 -460),042,869.70 10,007,579,135.10 9,37,890,5693.70 1,913,J83,53 ,065,097,70 2,978,281,235_ District _ T7498,72X.695.h7 7,549,167,398 _ 563,604,0011.96 374,474,895.94 8C062,332,f697.63 7,923,642,294.44 1,831,643,843 1.033,587,300 2,865,231,143
llirbaui Counllcil. 1,816,462,230.163 1,828,680,301.50 128,784,206.84 5,5S67973.-76 1,945,246,437.4-7 1,914,248,27. 26 8,539,692 3_51,4 1 050,092Sb-Tot.l 11,715,721,595.90 11,996,538,980 4,491,05n5,61.81 1,452,322,480.21 IG,,206,i77,277U 13,448,861,460.20 3,865,221,375| 2066,802,100 S1932,0222Sub__ .t _1 ' '1 '-15-1 _,3N -11,9 ",8.9 ' _,9 ,68f __ _. ' !_.023,475
SocialOthiers 1,433,183,173 1,0,6,0) 2,131,00-9,329g 70,8,1) 3,563,192,502 2!,2(15,-846-,9009 1, 921, 16 4,720 816,941,80i 2,738,106,520
Totl _Soil Sectors tt5,985,900,273 118,079,794,4(0 59,4Z4,147,fi3tl 46,6 7,8 175,147 164,77 159),51,529,74.6 G61,880,230,200 221,390,759,674.61
Elconomic Infrastructure
Mini.str iLsf l)aIInenI 1,857,313, 265 1,935,046,80 3 409,396,20() 48, 35,285,100 45,265,709,465 50,470,331,906 2,741 ,322,5 42,148,391,30 44,889,713,868Recgionsis_ __]()_
-- I-ocal (iovrmweoit - 97,904,861 1,105,289,700 - 9-2,5 17,0()2296,671,400 1,490,422,463 1,40 1,961,10 I1,583,865,293 534,067,100 2,117,932,393Oistri ct 989,302,937.41 895,284.657 317,939,257.62 240,303,834 1,207,242,195.03 1,135,588,497 I ,196,86,441 360,686,300 1,557,553,741Uirbhan 2)08,60 1,0)23.59 21 0(,005,043 74,57X,344.3X 56,367,566 283,180,267.97 266,372,609 386,997,852 173,380,800 560,378,652
SUI).Tot,uaI = 2,955,218,125 3,U41,336,50(1 43,8009,913,801 4,1,96,50H 4C,756,131,)92 51,872,293,fK)0 4,325,187,861 42,682,458,400 47,007,646,261O~thIi -- __ ______- ___ _ .______ __- ___. ____}
Ministrits0)½aririini 22,140875 70620 13,304,633,973 11,459,176,000 I S 4451 157,623 14,334,8822 2.822,628,780 8,139,936,900 10,962,565,680
iRcgionis --- (1)__ , . ('I) . X , s b (2)
Local Govcmmc ----
liistrict - _ _ _ _ _ _ _ _ _~ ~ ~ ~ ~ ~ ~~_ _ _ _ _ _ _ _ _ - _ _ _ _ _ . _ _ _ _ __ _ ,_ _ _ __ _ _ ._ _ _ _ _ _
Urbaul Councils
Sub-Toltal 2,140,523,643 2,N75,70G,20t 130433,972 1 1,459,176,400 15,445,157,621 14,334,882,200 2,822,628,780 8,139,936,900 10,962,565,680
Totali ECoflonifjc = 5,o74 1,774 S,916, 042,700 57, 105,547,773 G0,291, 132,505 62,201,2X9,547 66 _ ,20 7, 1 75;3711 7,14781G6,641 50,822,395,300 57,970,211,941
184

Infrastructure _______ _ _ __ _ _
Productivc ___ _____-___
Ministries/I)epartnilcnt 9,287,327 ,71 10,550,319,10 19,289, 152,971 12 ,375,2 8,40 28,576,480,690 22,925,607,500 6,553, 69,144 9,345,719,700 15,899,288,844Regions
________ _____ (') - (I) _____________ - __________ (2) _______ ________- -2Local Gov-cninent
Disrict .t _Urban Counci s
Totai Produtv 287 327718 10,550,3191-00 19,289,152,970 i2 ,375,288 41 28,576,480,688 22,925,607,500 6,553,569,144 9,345,719,700 15,899,288,844Salary IncreanseRecruitment _1-
--
IlsuranceContingency ____ ________________
Grand Total 220,tl83,0X9,8i84 231 ,646,f5282 343,412,661,33f6 297,813 ,784, 45 563,495,751,220 529,460,313,427 287,287,200 ,00 372,750 800,000 660,038,000,000
Source: Tlhe manzanian AuthoritiesNote: I I ._.
/1 Road Fund allocation to Ministry of Regional Administration and ILocal (Covenunicnit as well as Nlnistry of Work.s is included in OC./2 Assumptions tor distribution of OC and lE for regions and local governncmt are as fillows
Education 72% IIlealth 18% tWater 10%
/3 Assumptions lor distribution between urban and district councils Ibr PE and OC arc as follows
UJiban 19.5% . .I)istrict 80.5%
Urban 18.6%District 81.4%
/4 ODC allocations dlo not iicltude parastatal wages whichi is captured in thde special expeinditure
.___. _______ _________ __ I I .
185

Table 12b: Sectoral Recurrent Allocation 1999/2000 - 2002/03 (in percentage) _
______ 1998199- _ __- _ _ _ _ r 199100 _ __ _
PE ACT PE EST OC ACT OC EST Total Act. Total Est. PE OC-- Total
A dm inistration __ _ _ _ _ _ _ ___ _ _ _ _ __ _ _ _ _ __ _ _ __ _ _ _
Ami5 .4 T5.7 41.2 - 43.() --27.2 26.7 )IY - 5.5- - 513 3 1.3
M inistries/Departmnenl _ _ _ _ _ _ _ _ _ _ _ _ _ _ _ _ _ _ _ _ _ _ _ _ __ _ _ _ _ _ _ _ _ _ _ _ _ _ _ __ _ _ _ _ _ _ _ _
Reginincs/l)cpar- I 1.4 _ .I5 16 0.9 -1 5 2 - 1.6 O.X 12
,ocal Govcrunent 2.2 2.1 0.0 (.0 0.8 0.9 3.0 0.0 1.3
D)i.tiict 1.5 -- - 1.5 0.0 0.0 06 0.6 2.2 0.0 1.0
Urban 0.6i ().6 ° n- 0. 0.2 0.3 0.8 0.0 ___ 0.3
ComncilsTotal Administration 8. 9.3 42.7 ____ 43. -29._ 28.8 1.152.1 33.8
DNfencc and Security _________ _. _ _ _ _
31.9 32.6 17,7 16.0 23.2 23.3 29.6 15.2 21.5
Ministries/Departnent
Total Defenic and 3 9 32.617.7 16. I 23.2 23.3 29.6 15.2 6 21.5
Secu rity__ _ _ _ _ __ _ _ _ __ _ _ _ _ _ _ _ _ ___ _ _ _ ___ _ _ _ _ _ _ __ _ _ _ _ _ _ _
Social Scetor.s _
Educatioin4.4 4.2 6.6 7.9 5.7 6.2 4.8 6.8 5.9
Ministries/I )tpurtment -___-_2X __ OS __ __ 1_________°_I_O.Z_0.
kcgioii ~~~~2.6 ____2~.8 - 0.8 ___ . 15A. ____ .1 0.2 0.A
Local mvcmnuLcnt 30.5 29.1 ~ 1.5- _1 1. 12.X -3.4 1 37.5 3.0 18.0
DI)Sthct 24.5 23.S 1.2 I 10.3 10- l o.31.0 2.5 14.!
--- )li(lt-)~ _- .9_ _--5.7 1 0.3 0.2 2.5 2.6 6.6 0.5 3.1
Sulh-Tot_l- 37.4 36.1 8.8 9,2 20.0 21.0 42.4 10.0 - 24.1
. _ ._ 6.1 - 5 4 4. 3.4
Rgi-ons - _ 0 6 0.7 0.2 0- 0.4 03 3.0 0.2 1.4
Local iovcnuiLenl t 7.6 7.3 0.4 0.3 3.2 _. 3.3_ 6.8 0.7 3.4
District 6.1 5.9 .3 0.2 2.6 2.7 5 1 0.5.
- lbfin~-- _ _ 0.1 =1.5 1.4 01 0. 0. 18 0.2 0.
Councils
186

Sulb-Tot.al = .3 9.U 6.6 __ 5.7 7 -- 1 19_ 8.2
Watcr _ ~_____ _ __ _ ___ _ __ _____ _ ____
.. 7 0 .7 1.0.3 0 (.9 0.5 0.7 0.3 0.4Ministrics/Depailment _________ __ ________ ______ ____
_ _____ .o4 0.4. _ _ 0.2 0.2 02 0.0 0.0 0.CL.-CalJoven ni l 4.2 4.0 _ .2 0_2 1. __ 19 0:.7 0.3--- O'S
~ Di.stri _ 3.4 3.3 0.2 0_ _ _ .1 1.4 15.____1 _ 04Urhan ~~ 0.8 0.D 8 0.0 °0°.---0 -- 0.3 - -0.4 0 0.0 0.0
CouncilSSub-Toal l T 5.3- 1 5.2 .3 ~ -- ( --1.- 5 - -~ -2.9 - -- 2.5 ' 1.-3 4 U.6 0.9
SociaWOthers .7 (.2 0.6 1 0.4 (0.7 0.2 .4
Tooa-l SialSects __5_r_ 51.03 517. 55.5 _____________ 33.3
Economi ic lnfrastuctureRoads
_____ 0.8 0.8 12.6 {-- 16.3 8.0 _ __'3.5 1_6 113 6.3Minis(ries/D)cpartnmeni
Regions _ -0.0 O- - ().() - (. 0.n - o -o7 _. 0. 0.0Local Govenim 3 -o U 0.3._ __ 0.3 ().3 0.6 0.1 0.3
---1isricF -- 0.4.4 0.3 (01 0.2 -- 0.2 0.4 0.1 0.2l_rbll. 0.1 0.1 * 0.1 0.0 _ .1
Councilssul-To(tal 1.31.3 12.8 10.4 8.3 _ _ , 1.5 11.51
Otlers1_( 1.2 3.9 3. _ 2.7 2.7 i7__I 02 1.
Ministrics/Dcparmenlm,-gio.n 0.- 0.0 0.0 0.0 _ 0u.0 0.0 - .o 0.0 0.0 0.0
Local (iovernmnnit __(( 0 0.0 0.0 -(.() 0.( (.0 __ 0. 0.0- 5src -l .() 0).0) 0.0_ - 0).0 ~- 0. 0.03 0.l) 0 .() 0.0
__ H~i 0.0._ 0)( .0 l3.0 0.0 0.0 0.0 0).0 0.0 0.0C otlicils
_Sulb-Tltal_ 1(3 1.2 Z _ 3.9 = 3.8 2;7 __2.7_ -1.0 _ 2.2 I.7
Total Ecunomke -2.3 - -_ Z 26 I 6.6J - -11 0 - 1252.5 13.6 8.Infrastructure
187

_ _ - 4.2 - 4.6 - __ 5.6 .2- 5.1 4.3 2.3 2.4Miistrics/i)epartuien_
Itegiois ___ 0.0 _ 0o.0 0.()--- -__ 0.0 0.0 0.0 0.0 0.0 ______ 0.0IoalGovrrnicnt 0.0_, )0 ___ _ 0.0_ 0.0 0 (.0 0. __(10) 0.0 - 0.0 -___
_)iTric _ 0 00 _______ --_ 0 _0_ _ 0 . 0. 0.0Urban 0.0 0.0 0.0 0.0 0 ) (.0 0.0 0.0 0.0
Counclvilsil otal Productive -. -__ 4.6 .3 2.3 2.5 2.4Salary_increase ~ 0.0 __ 0.0 __ _ ___ 0.0 0.0) ---- 0-0 - 0.0 0 O.O
uteriTl 0:0 D 0.0 (10.0.0 __ (0 0.0 0.0 0.0 0.0 -- 0.0lnsuraiinc 0.0 0.0 00.0 00 _( _0 0. 0.0Cenrgc y 0.0 0.0 0.0 (.0 (.0 0.0 0.0 0.(Grand Total 100.0 100.0 I J-o() 100. 100.0 100.0
Su c:T bc a -- _____- __ ___ __ __ __ ___ __ _ __ ____ ____ _._
188

Table 13a: Sectoral Development Allocation 2000/2001 - 2002/03Ministrics/Departments
1998/99 199912/000 2000/01 2001/02 2002/03Budget likcly 0/turn Ceilings Projection Projection
AdministrationMinistries/Department 193,750,000.00 5,354,327,223.82 6,579,253,595.06 5,653,602,488.70 5,024,931,168.82
Defcncc and Security _ ___ _Ministries/Dcpartment _ __ 731,890,404.10 1,000,000,000.00 1,000,000,000.00 1,000,000,000.00
Total Defcncc antl Security 193,7501,6000.0(0I 6,086,217,627.92 7,579,253,595.06 6,653,602,488.70 6,024,931,168.82
Social Sectors_EducationMinistries/Dcp"' mnt 3,875,000,000.0() 2,836,07_,315.) 4,062.317,996.51 6,235,701,254.02 6,434,552,965.83
Health Healh _ __, _ _____ ___ _ _ _ _ _ _ _ ___.___ _ _ __ _
Ministics/Dcpartmcnt 3 375,(00),(000.()00 2,47(0,1 3(0,11385 3,538,147,932.44 3,500,000,000,00 3,500,000,000.00
_ae ._.- _-I______ _ .__ ______ _ __ _________Watcr-Ministries/Dcpartnmcnt 3,225,000,000.00 2,360,346,553.23 3,212,738,251.22 3.500,000,000.00 3,500,000,000.00
tal So 8cial Sectcs 1r_ (_I,475,0(l,tl1.1 7,666,551,982.99 11,813,204,10.17 _13,235,701,254.02 13,434,552,965.83
Economic Infrastucturc__(Lands and Energy) _ _ _ ___ _
Ministiics/Dcparlincnt _ 2,243,750,00).00 4,569,740,710.62 7,52,213,162.49 9,161,987,852.29 9,340,515,865.45
Total Economic Infrastucture 2,243,750,000.00 4,569,740,710.62 7,852,213,162.49 9,161,987,852.29 9,340,515,865.45
Prodluctive _ _ _ __ _ _ _ __ _ _ ___ =__ __ _ __ _ _ _ _ _ _ _ _ _ _ _ _ _ _ _ _ _
Mhlistries/Dcpament 2,437,500,000.00 1,783,982,860.00 2,555,329,062.32 2,948,708,405.00 3,200,000,000.00
Total 15,350,00IJ,000.0l0 20,106,493,181.53 28,800,000,000.04 32,000,000,000.10Notc: Bascd on domestic component_
Sorcc: Te __Taza_niAn ut__orities
189

Table 13b: Sectoral Development Allocation 2000/2001 -2002/03Ministries/Departments (in percentage)
1998/99 1999/2000 2000101 2001/02 2002/03Budget Likely 0/turn Ceilings Projection Projection
AdministrationMinistries/Department 1.3 26.6 22.8 17.7 15.7
Defense and SecurityMinistries/Department 0.0 3.6 3.5 3.1 3.1
Total Defense and Security 1.3 30.3 26.3 20.8 18.8
Social SectorsEducationMinistries/Department 25.2 14.1 14.1 19.5 20.1
HealthMinistries/Department 22.0 12,3 12.3 10.9 10.9
WaterMinistries/Department 21.0 11.7 11.2 10.9 10.9
Total Social Sectors 68.2 38.1 37.5 41.4 42.0
Economic Infrastucture(Lands and Energy)
Ministries/Department 14.6 22.7 27.3 28.6 29.2
Total Economic Infrastructure 14.6 22.7 27.3 28.6 29.2
ProductiveMinistries/Department 15.9 8.9 8.9 9.2 10.0
Total 100.0 100.0 100.0 100.0 100.0
Note: Based on domestic componentSource: Table 13b
190

Table 14a: Sectoral Development Allocation 199912000- 2002103Regions/Local Government
1999/2000 2000101 2001102 2002103Likely Olturn Ceilings Projectfon Projection
Administration 996,941,588.73 1,894,813,398.76 1,663,400,622.18 1.506,232,792.20
Social SectorsEducation 464,558,056.26 1,015,579,499.12 1,558,925,313.50 1,608,638,241.45
Health 404,615,081.26 884,536,983.11 875,000,000.00 875,000,000.00
Water 386,632,188.76 803,184,562.80 875,000,000.00 875,000,000.00
Total Social Sectors 1,255,805,326.28 2,703,301,045.04 3,308,925,313.50 3,358,638,241.45
Economic Infrastructure 748,537,900.33 1,963,053,290.62 2,290,496,963.07 2,335,128,966.35
Productive 292,222,003.13 638,832,265.58 737,177,101.25 800,000,000.00
Total 3,293,506,818.47 7,200,000,000.00 8,000,000,000.00 8,000,000,000.00
Note: Based on domestic componentSource: The Tanzanian Authorities
Table 14b: Sectoral Development Allocation 200012001 - 2002103Regions/Local Government (in percentage)
199912000 2000101 2001102 2002103Likely Olturn Ceilings Projection Projection
Administration 30.3 26.3 20.8 18.8
Social SectorsEducation 14.1 14.1 19.5 20.1
Health 12.3 12.3 10.9 10.9
Water 11.7 11.2 10.9 10.9
Total Social Sectors 38.1 37.5 41.4 42.0
Economic Infrastucture 22.7 27.3 28.6 29.2
Productive 8.9 8.9 9.2 10.0
Total 100.0 100.0 100.0 100.0
NOTE:Note: Based on domestic componentSource: Table 14a
191

Table 15a: Summary of Funds Requirements and Proposed AllocationFfor Priority Activities In Some Sectors
(In Mlilions of Tshs.)
199912000 2000101 2001102 2002103Requirement LikelyOlturn Requirement Prop. Allocation Requirement Prop. Allocation Requirement Prop Allocatlon
Education 107,775.10 40,447.17 111,172.75 59,060.14 115,674.72 76,349.32 120,301.71 98,808.20
Health 46,680.00 24,724.70 55,760.00 41,613.62 62,180.00 56,840.86 64,667.20 75,048.04
Water 8,706.00 4,813.78 11,260.00 8,860.37 16,930.00 10,533.32 17,607.20 13,381.26
Judiciary 6,852.90 3,412.65 7,194.00 4,426.72 7,503.70 4,758.45 7,803.85 4,963.96
Election 16,174.00 13,800.00 31,406.00 32,000.00 - 3,943.62 - 4,100.00
Agriculture 15,252.00 6,059.87 12,443.00 7,258.80 13,120.00 8,122,53 13,644.80 8,891.20
Energy 5,382.00 2,580.12 5,435.82 3,538.39 5,490.18 3,743.64 5,709.79 4,145.46
Roads 46,000.00 46,955.61 50,000.00 41,337.17 52,000.00 43,554.65 54,080.00 45,114.93
Lands 850.00 365.95 1,050.00 1,024.17 1,150.00 1,033.94 1,196.00 1,040.52
Controller and auditor 1,085.40 730.06 1,413.40 1,323.87 1,597.90 1,400.30 1,806.30 1,481.32General
TOTAL 254,757.40 143,889.89 287,134.97 200,443.25 275,646.50 210,280.63 286,816.84 258,974.89
Source: The Tanzanian Authorities
192

Table 1 5b: Summary of Funds Requirements and Proposed Allocationfor Priority Activities In Some Sectors
(In Percentage)
199912000 200012001 2001102 2002103Requirement Li_ely 0tturn Requirement Prop. Allocation Requirement Prop. Allocation Requirement Prop. Allocation
Education 42.3 28.1 38.7 29.5 42.0 36.3 41.9 38.5
Health 18.3 17.2 19.4 20.8 22.6 27.0 22.5 29.2
Water 3.4 3.3 3.9 4.4 6.1 5.0 6.1 5.2
Judiciary 2.7 2.4 2.5 2.2 2.7 2.3 2,7 1.9
Election 6.3 9.G 10.9 16.0 0.0 1.9 0.0 1.6
Agriculture 6.0 4.2 4.3 3.6 4.8 3.9 4.8 3.5
Energy 2.1 1.8 1.9 1.8 2.0 1.8 2.0 1.6
Roads 18.1 32.6 17.4 20.6 18.9 20.7 18.9 17.6
Lands 0.3 0.3 0.4 0.5 0.4 0.5 0.4 0.4
Controller and auditor 0.4 0.5 0.5 0.7 0.6 0.7 0.6 0.6General
TOTAL 100.0 100.0 1000 100.0_ 100.0 100.0 100.0 100.0
Source: Table 15a
193

t.1b. 46*: 9-.4o, E.p-)di7- by Mn0I)Opn.7 InIIUAn8. 7,01.,. L-, O-o..-.,
V.1. I ltlwma~~~~~~~~~~~1889 2000__________ ~~~~mIO.'wp. I Lik4SO0 oc.cy Uul C408 _______
70Ado1,5.rl(,c VI0. F-lod.o,. 007,. 37.68,04.00n00 147.000.0o0(0 on 5.3114.0401,(53 93,575230800 1016.7,10.20000 270.319.569131) W78h3,30840 807.644.072,00 3.728SN91.40414I7AdNg4.t5.l(o IleglcOor .lP.4Vo8 Po.o4o I0,598,87,0.0 2,522.39.105000 2.502.06.081800 I8,324.904.00 2.600S.91.600.01) 2,877,242.7040 DO7,0061,20320 2.115,873.118.00 2,131Z764.1011,20
30 As' sh-. P,..ddr. f0111c..odC.bI0.lSo8Ili7120.481,702,00 5.508,540.21 1.50 6.631.035.9f3.0O 267.037,5508.0 5.037.788.200.00 41.108.425,70800o 274.710.303.40 I.293.410.40.5 8580805437 AdmwdOm,.o MAc. PI"d,Ill. Offio 81,093.509000 34,7374.591799 4322802,0890.0 164,439.372172 Oa 26A.077.110399 433,410,972.99 172,017.235.00 285.100,06.00 457.771.137.81032 A40.5.So,b- P7eMdhTsOOIo..CMv 8cp'on 275,034,070,00 7.500.040.680 00 2,245.502.5S6.80 433.50 172.03 7.067,085.600000 l,493.644,072.0 455,26S417 .8 7,125.67'300.60 7.0(80080.50.2033 Ad.k4i8.boo EiNksSe0etaUt. 27.978,994,00 111.917,831 OC), f3g.705.825.9D 44,2011,700.00 127.409,6(0)99 171.611.399.00 46,411,705-0(0 70.054,i76,03 if.185,45007.11134 Ad4o9o(.1lo,. M0,OoFoolo8.. 5 Cbs,5*tl 331.17.7,322,0.0 17,290,562,081.101 iV4,87,043 ?.00.9 3,404,004.050 00 8,o7n.s87,2w00Oa 1179.0 2SA59.29 2.822191.758 so 8.5608308.07n00 1.385.40.430.111035 Adc.IW8.S,.N Po,-no.oCoccm78o.. of 0nqw5 00,800.027.8 (4004l.231.00 209.547,252.00 159,259.104.03 ¶3i,040,609.99 201.107.964.I0) 707,225.741.20 730,759,728.00 3011.11011.171,2030 Ad.100.11wo CIOAI.,Mm ccnI,Io20.340.4.9449 K8A07,551A0 143,036.0925 00 44.091.792.00 122,322,0009 DO i7,0f60(002.O0 480920.301.80 444.073.018.00 48011.MM,0001)37 Adc94740skn M7l.*7O
1Om..0( 515,050,021.800 4.310.096,02900 4.031.017,80000 (;01.331.288.03 1,204,604,000.l0 7.005.028.008.00 827.207,052,40 1.302.007.718.00 2.8814.778.14040
40 A8m,9lI0.11on J09101..3 2.7538.284,4781 2.6,39990 5.359,404.41600 2,G037.745,&36.00 3.412,649,600 00 7,024,395,439 09 3.792.222.t27.00 4,017.4011,578,00 7,808.748.7058041 TAdmoallsow MO.7.fy of .7-11C .o Co0hnbolull Afaw,10 245,873.033 OD 1,778.152.470 00 2,024.306,40500O :30f.328R.844.50 718,6807.29.8 7.000.020.54 050 370.300,2801.20 767.170.92M.01) i141,214.648.0042 AdmWir4,Oo0o 059offlet tespohw. 7.544,810,23.0() 2.827520.90500 5.289,346.293.00 .0,32303 2,000.980,450099 40987.3800436,O0 2.101.757.072780 3.0730006,304.11( 0.105.740.441.8045 Admi,4t50000 Eodhequsw 4d AuitDeOI8578U 242,444,717.00 631,193.00 0 UO 874.031.713.00 344.754.032.0) 730.997.050.02 7.074,010.7T37.0 36079.00.801' au l,273.0865508.08 .3,78150SI) Ad,snill,allon Mf07s0y off5.ooO VOTE 50 885.004.710.00 30.752.73,4902 W9 37.438,728.211.99 7,038,505,32D 00 3,545.S7Z,7V00.0 4,720,928,029.00 489,82,590.9 ,08m2083. 4.4805,8330.nS11
Minisfry of l0c0, SPECIAL. 57.647,931,262 0) 57,047,037.292.99 0.99 9.99 0,00 .005
Ae,o50(t Ge-89s OM-c 7,03Z.020,050.50 1,0322.30,090.00 8o9.800,000.00 78044.567.8100,018 2,544,847,10100O8aoo9. Octnco A.1ho17y 20.971,990,09.00 20.077.990,000.00 23,074.700.50.91) 21,074,M0111,000,0
51 0
4 ,0,i,099o 7241 ff0007A00000c24,509,590,03) 4.275,0I7.705 00 5.7(14,183,325.00 1.410.820,184.00 2.830.242.9D000 3,858.270.184.00 7.407,7145.03220 2,580,702,52600 407,7*53554 A4 fk,000 7.d.T-7,084. 285,330,2060.0 0(8.838.730.00 1.203,854S0,0)59 303.U94,000.0 95,09,9.92830,392.700.8 280.803,838.40 099.488,788.00 t,M0.0e.824.40,5% 04n4r0o501o 5cc,0n748o,0c07Co 39,570.704.00 452.458.927500 491.017.73,0.9 51,907,452.99 737,5763D.39D9 700.554.752.00 04,570,424.00 200030.078.11D 278.400243.0
00 Ado,94,000on M0990 s.f R.olcnM Adki.Ir.5.O *M7 [.-0 .1 40.037.750.0o 499.9909.000990 539.440.759.99 %13.70504,300.00 7.8301,504.30199 - t,308,8000.350. 7.206,086008.857A8cl,5,ftaall 01ir of 40f.0,- OcOsoiO- 591055 01,559,537,00 i7.74.057.000 OD 7.075072,007.00 7320,597.274.99) 515,898,400.01 054.480.778.00 145.527.101.99 04449400237-2,00080
59 Ado,I*.W..o L". R.50). C.oo0,Wval 27,752.2680.08 50.723,087.05 86.4115,341.0o 00.203.472.00 77.631.700.00 07,0.19 0506539 00.M8.802.0 2087.36I4.1104860 A8ntIr,10s7oo .dftl (,00Cow 7107780.5 25,299.297.00 799,255,0495DO 134.990,077.00 37.452.000.00 727.783,8099.9 165.245.800.00 30,324,1099.80 200.467.428.00 230,780.024.007 Adn.7rV8*ol, 0c7.C,o
41c 301,400.478.08 l,538.0334.000.00 1.578,314.478 00 00.007,078.00 73,999,090.000.99 73,865,037.075.99 69,310.990.00 32.O99000,008,60 32.0118.3il811.1109
03Ad N b,.OOo L-,d0Gwo0,72.c. C708o(1Is40 35,005107.Q8 13,4,215 74,049,442 00 5091,07.54.00 7508602,8089D 281,57i,454.00) 53.403.714128 290.034.078.0 254.702,5.200460 Admlo,c03loo 3 Pht,d70 Offl~- Pt.-nnC0cMM7740 313,525,1800.9 1,874,499,909550 2,247.P25,16000 802,537,605.99 703,642.00000 1.3282,9056999 033.7310.539.91 742.800,474.00 1.374.IZ,lXG*.6
Adn.IW,loeno 6.000). 3,D065052,0339 5.7,75040 8.4900.567.01.00 4,054,004,540.99 3,038.087,5000.00 7,584,07754991) 4.589,704,771.45 4.0,286,0088N.24 9.803I1113.745.710Aftw,ialon.o LomW Gov.,,on0 4,748,847.514.00 4,7460,04.914.00 a,M0.661,28939 320.00259 8000785.825.9 *11.8,950
VI2TE 33.35.5550.50.,03
550.70707 ~~~~~~~~~~~~~~~~~~10,099,737.700.99 140.764,400.071,00 708.345,394040Z 00 2.4,0,0,9 74.399.978,200.00 000.590.365.10sl.04 30.307.487.200.40 180,78'1,72.084.3 1133,11611808,344L]
37 OolOn- .0 .8. 1080-. 37,8118,759,350.00 34,715,329,791 50 7,2,0077 48,3-44,420.400.99 23090,0.9 00.804.420,4903 505215089 52080009 0,.80.2710.8701.0025 D0000. -dSe88 Th. S,,ACI t770 5.444,53,200.0 65,280,503,802 510 I77.70.466.072 08 7,0777213,70.108 3,994.29000(000 10,02t7,337, I1700 7.367,0017,071.80 41,255,578,4080.0O 11.021I.W61189720 e S178o ..88438 P.C.75( 18,278,934.526.00 17,054,407,378,00 30.243,401,004 00 27,000,774.078.99 11,614.109,400.00 32.582,224,378.00 22,527.020.7249.0 i225500,370.540.010 4800.9.029 o3oloooodOSo MOi,ty of H- AU8*48 P77,,8 0.480.824,992.5 79508.256,027.710 804050010 ,521,402,310.99 0,003,4507,900.00 1732520,0991316.100 8,047,473431.80 9,8100.038.738,00 1&6Qq4.0Zf#1.s0
0.,l..101.7 ~~~~~~~~~~~~~~~74.933,383.154.00 608.828.78,8186008 491Z8,82.838.4000 00.108,077.870.00 69.462,0044W.80.8 147.71381141,214180 6680,089,887D.48 91305.7,0 I0,641,115.76411
45 S-1 '-,4- m'U 84450 oEl.ooO 0.000,79200.2000 7.306.050.630389 18,490,5.995,00.5 12,718,1110.502.01) 6.078,003.990.9 18,737.402,702.00 73,354.750.521.99 90.24.077.891200 22.887.437,672.0052 Soo.lswOOC.4o M8480y0of40817h 2,350.050,832.0 20,795.332.012.00 23.135,390.844.00 3.805,7550.80.00 10,052,521,59. 2.7,7.00.00 41,070.473.8800 700.78900 388064,00,2411.0153 SolM.6 oo(o.-- ml04".lc oC- o4y13D- G,0,407147,o870.50007.0 1,033.813,99099 1,742,472.05.11D 821711710.072 103,320200.39.9 l,05.020,8735a 078.3095.880.0 171,2K0O44.01) 9.177.008.288.05 Sn,i.7.$740, fm1Ilry 7I.4b050,,d Ysoh D..Ilp.-Io 724,583,059.00 l.0w 995.0022050 l.020.774.004.1l0 980,44.54.048.0 003.027,6050. 1.9306425,8046.00( I.M,111 7,300.40 707,416.252.03 t.638.33882.41107 IS.d.I *A.e,4 T .. 78. NW 78..-8o C780,8887 47.030.010,00 70.354591008 tVA17,2874 00 08.T49.804 00 752.022.20999 221.772.004,00 73.237,387.20 203.487.0180.00 371.70.441.2600 S-cV.7,o.e, M10lryol50oCI-,7co5O & 7igh. 8duc.70) 448.422,83-4.00 g507.0,255 754006.90 821,511,075.00 I0,101.1197.5000.5 20,883.408,575.00 017.508.828.75 2.3237,574.580,0 5.4810.7049 S0.c4 .oMoo M8440y.57o Wallr,07.4,107 3,034.50141350,05 5,90.704.340.00 7 95,~03.7.1409DO 1,0017104,400.00 2,953.742.240.00 2.040.020.732.00 2,404,710.921,00 4.453.700.W0030
Sod47 5874700 ROGICIs 7.8308084,80800 3,04.5023,130 0 7 l.44034,02503 OU 8,707,227.f82.05 1.418 77,10J0.00 70,1724.033,203.99 0.742.087.242753 4,209j,I)7.834 1-3.441.444.280.015047.7 8se470 L-of 77,,.07700 03.151.00.9~23.00 8.023.5082,059 00 799.535.7135i.5.00 128,334,170,350.0 14.799,040.099.09 144,134,617J5158. i36.1101.5011,81010 240,011,1130.070,63 184.678.330.400.73
SubS.rl.1. 910,950.099.270.00 58,42A. t47,027.00 116,410.047,6571.00 1085,60,118.483100 47,880,234.200.00 227,39078.70091200 707,480.00868000 01,I)4.207,900.2l 204.641103613j760.0
47 r.-mlc. rs4oC.101,obyolW40. 1,657,11U.2115.00 31,850,090,200.03 23,707,2809,405.99 2,478,277.0339.9 30,005,59,00I29 20 2,484,0160,1260.9 2,803.24i.721.80 37.068,78k5.20.0 34,86804.46,12.8045 S Holo,so 170yfAO nllo S.7887em"I. D. 481,407.420.09 2,437,577,086.50 2,01l.072.825.00 709,594.578.91) 2,900,332.700.08 2,718,0211,2711.,0 744,024,300,6 2.247.005.448 2.07.01611,040k.9858 E0c9978 ,,, 8.400 707 of8oy .400ara.Mc 23,432.440.00 1,070,002,854 50 2.282.200.303.00 478,442.56800 99 .303,885,100.00 l,782.327,M.080. 502.3244.00040 7.710.001.37100 2.Z730.28010,4052 E.om 0v.osrlv It8yOfomeu.Ooxd ?7aflsp00l l.327.028.7e2.00 8,992.255,033.50 70.320.00,085.50 1,635,59401M.02.9 4,2a7819 0.405.300,726990 17.77721210 .0..37i,1100 7.1120,116.481.80
aft.7o,r4c I0I0 759 Eooo,loerl of50 010107.I Mm Aod .wc.7G-L4 11,5701,550,599.9 llt .518.5000.000,fo 326.044.732.09 72,142,11)300.59900 712,404.844.732.o9 275,`1464018.40 72.399.000.040.8 73.818,40,81010,3
Fo0,o,7 se74, Lom 900,88078( l.O07'804,0I DO 329351770,0029 7,490,422,403.00 1.592.005.292.99 52A.007.10D.00 0.7 17.93,22.30OO l.603.2 s.8560 5081,155.182.00 2.287.273I.7A08Sub-Tot., 8,500.144,735.00 07,100.047.278.99 02,200,289,861,08 7,1147,11I0,940.00 608.22,306,300.00 07812.211.840.00 7.804.37,4710I0 846200601,3638W 278.8.770
05 P7o,0010s sni.nlry 01 N.t.,74 R088008. .nd Touds87 ,,032,52!.1547.0D 0,753(45.3223009 0.202,101.447.00D 2,400.499.684.08 4, 148,787.900800 0,013.235.4&0.0 2.5890760.902.48 4.005.500.89100 7.l15.346.8814043 P-od-050 ,,isv 1. A708010.7r5077d Co.870700008 7.257.293.07800 9.390,297.954990 70,507.5981.82000 3,002,83,32,00 4.275.003.008.80 1.800.5286.13200 2.00,706.700.80 4.703471.36080 0.570,507,008.48 Pv00,clh0 I,,03.08 071d8(,8088 lud 77l.4 200.7809.10.99 3,14600.5975,505 3,352,79169.11.05 404.450,304.00 033,0340,000.00 7,322.490.104.00 424,017.002.20 1.015.23.80140.00 1.440.026,08120
00.D70101 9 8.707.227,78.80 1.8,8,7.0 2.7.8.9.0 08380140 ,4,1.00 18,499.208.044,8 4,4*1,247.101.20 70,211411111,4104.8LI 11714.107.0&2111.3toIiny I808
(5-00.-co 2.6000.00.0m0. 2.5008000.000809I-anC,00 9,405.51SAW0.01) 8.475,5170,008.90
-y04c0 2.943.008.009.30 2 003,060,9.3003,-n T08.7 220300000 43,41 00i,336.00 00~63.407 707 ~20.00 287787,.200,00009 2840112,920.100,05 027,3900 7300000 500388.1 4 86777
S..,,:l Th. Ttnlahwf AoO7o7j8O
194

C.M.C4l6 1eb. i.: 16 6105 -6..o -I6. y 690 4.t"wav.5loen I-noiOoOo T-.04154 1.06 0.-9,00- -.E100.010 .54 'eor od 011,6. Ch.-ge. 0O0'
26 Ad.ol 6.66., VIS.p14.Id..,6010 87.758,336.40 ZO,W78,621266 207.079,025. 12 67,754,330 40 222.410.566.04 315.19460.4421 A4,o17406d06 615 01 666of Pollics! Pu0eI 1,561.233.20 2,995.425.240.04 3,097,316,473282 I11891.Z33220 3,175,15O,756.48, 3567.1141,661.6
30 AoI4a6or, 61 f601 and. Cs.5,1 lSeorOl. 274,716),362.40 8,7.2.615 .945,744,044.62 2?4,716.362.40 1,071.266,141.21 7,346.006,924.01A1 596.1-500 Xi". P-664,91600606 172.661,235.60 302.266.4A9.76 474.617r,725 .36 172,661.235.612 320,349.479.15 463.6151714.757 Ado.Wr.k04
60n- P,40t066Cm64S0*.044.1weneI 405,290412.60 1,202,545,645.76 1,607.616.383.36 455,245,417,60 1.,26e61061174 76 1,742,I175042.33
23 AA,5,459600 Ehic's-WO65s 46411 755 05 156,097.426 so 205,465,211509 46.411,765.00 168.600.972.15 215.013.057.1534 Ad-Welplion0 MS*by of1Foreign AlIaS & 156 .qnboa 3.622,0458,56 90,077.1635.672.32 1Z02066,23151.12 3,2,9066,7566 6.2.31396 13,442,&0.135.46
A5 An4eo P.9n4Cfl14oP., VI ta"%d" 16l.222143 260 144.1145.311.88 3is,367,454.69 167.2:22,t43.20 157,034,030.38 324,256,173.5636 Ad o4*ho, l6 $,Ne,5 C69,54i%Wm 46.626 3410 0 410,718,035.06 617.6414.41666t 46.P236,201.60 46694,661,11i1 0A5.667.496676
27 Ads,0o5g4 Pd.o. PAr.4.e1 0606 063,391602 40 l.465,853,603.28 2,697,255,(65.96 631,35?,652,40 1,552.600.190.46 2,1165,260.0412.6640 AdlrdoS.t.o J4W0l-ly 3,792,333,12f go 4,756.455.5590 0 8.050,78UIS1.36 V972.333,1127.80 4.513,M6,275,99 6,306,242.453.J6Al 5A4On96.415.6 MhI5.Vy t J.,VMedC066onwulhnAf Ak. 575,350.5628-10 607,529,734.72 1.1866.44.021 62 176,240,266.20 355,640,45096 1,236,370.746.0642 hdn"04O0. Om. , 01.60 6 o.4 5.' 2,191,7$t1,137 AG 3,256.426.202.24 0,459.109,340.04 Z,191.7S),137.60 3,4153644,464.37 564560.633I.53745 AdmoVk5#m WIN Mddi 0666 e065666.56046 301.662.578666 I.250.27,497.340i I,762.260.117 fi5 361,693,67 609 1.431,315,204.76 I.762,3067,683.3050 AdoolttOO9 1,,6 f11.. VOTE 50 464.362,Se66DO 4,0151722,346 40 ,6.40,116,934 40 450,303,560.00 4.400.624,746.3t 4,869,220.33S.31
Mihflryoth.foso. SPECIAL. 0.1 5.01
Aosot.f Gen.,W. Oft. 600.040,00D009 2.00 1,53.660065 2.066,20063.EO.12 000,00,000.0 2.M,6646,652.06 2j764936.526657.0690.6164696 504lho410 2542. 160.1061)Da 25,392,170,M On2.2.57605 27,934,347.000.00
SI 1A41s"0465066 Mint,05of 64o.6.A1160 l.467.774.5.3 20 ,444412 4.7228615,344.40 1.447.774,563.20 2,60S,265,241.47 4.363,046.944.6704 A45,6o .d.T.mwo,6 260553.863440 064.0241,iO3.18 1,344,529,036.6 360.5613,633440 I,02i.aas.944.75 6403645155 Adn,1o1Vmoa40 T.mt. k5, IO0e04 Conte 54.275.4245 3U 12,676,6170(A 267,451.031 As 54.574.6424 60 225.692.3,4.0 260,236.664.60O55 A&M6.0
4sSOo MWsl.j of R6105 lAd4nir.0-1o .0d Los.1 Gw,no,l . ,276,313.316 48 1,219,3i15,311946 l.5.7,166,3!IA072,1l6.65
57 A5Wo.Vo.064 lo66146 of0.616.. .046.5o Se-,ft. 145,537,1611.50 579.605,531.54 72?l5,16356.%4 145,627,14%.80 454,434,966.60 759.66206.4655 Adm%,1141065 l.a. Oktfoo 069o,llSIo 151,076,082 62 106.306.670. 67 207.343.t562.72 l01.676.062SO0 12653.4 2113.78f,974.4160 Ad0.44*5466 moul"01d C0osoo To4 350.1 35.324.6DO000 212,405.1136 $a 751,83,713.6 30,324,625.50 220.226.,400.55 254,563.069.666 I&4-,04.06664 to" EOI4COOI.64- 08,310,55960 3,943,5669,81.59 ,6..0413 69,3115.55.611 4,$50,06.090 00 4.164,210056.6063 Ad01,0*0o,a L0o0.0 G6e061 500400001 ,1015411, 53.463.776 20 2 12.678.20469M 206.141.563.116 52,465,736.20 335,456,667.29 2741,002.475.46056 A4n0*llrana P1.90adn0061M. -P1610,alSC.ollSOM6 6532l35,53a 65 40,747,242,25244 41,410.341,601.24 632.1205.38.00 1,234,476,04.90 11.8666,0144099
A006141546.U R104l61 4.506,704,770 45 4,713,5906.57 74 9,614,606,241.23 4,869.706.776.40 0,41389,4.525.22 11,02.691625.11 II1AdslooS
40 1651006,6,016,5575,0-05- .64,0052.9 .690.766,535.65 65079656
VOTE 13.35,6.5.95.62.63 ...
514,.Th1.1 26.2~~~~~~~~~~~~~~~~~~3,70,417.26.410 1158,74ZfZ76.164.10 160,1113,13,43.4.20 36.276.417,263.40 84.497,746,116,64 616,6,1#4ki?6,24
is 0.lm"oo.nd SAMMY1 120690 s6,552.II5,97O.00 36,775.620,000.09 90,327,775,970.05 56,552,lI16,79.09 42,603,236,500.6 93,205,346.67.0,430 D.10406 ond Sooo61y the N.60641516o40 7,207,067,671.6 4.51.1125.60000 12.49,173,4711.60 7.387,653,6711.60 0.146,24520.309 12,517,027.051.80211 (1.1 *90d0*6941 P.#"66040. 2.121,520.724 50 13,406,417,170 60 35,063.937.656.40 22,121.520,724.110 151165.629,807.64 37,307.411616l1Z.4629 V011600 and S.oo,oll MOis6rY of lio. A6.0s6- Ptoon, 6,547,413,431.60 15,555,C32,7153.00 19,503,1105.1134.110 6,947.472,431.10 111,611,145.9713.3 26.654.6616'55
S.b.T.66l 55,951,566,407,46 67.611746,4973.60 166.640.642,416.56 05,666,6O,807.A 74.666,430,246.96 1396,2,6A
40 7.09 eNotl00 MaslaO7,lEAcebwo t3.354,759.521.0M 12.145.472.056 64 2056575111 13,354.750.571.60 16,780,11 1.560 48 30143.67,5.116.08W2 Tddf 5015600 5161066 of 4.lu 4,079,413,653 00 37.600.696.014.80 41.740,273.227 62 4,075.413.653.06 48.559.117.447.24 !2Z6345.311.106.3452 3 50401406 5111 575600Wor 61417wit 0. 62n.0, A904066 978.305,655.60 259,02s,6372M 11,237,W4.31%425 974.1345.655.93 236.133.52562 1.3130.53,2436as 5n001-1014060 iitv Lab16
56.4010,4'03Y t65l06066p46 1.038.617.30040 1.026,643,627.660 2,075.566.508.00 1.1336,917-v.30. 1.247.637.014.66 2,364,554315.24
67 t S.a.4 6015406 To..,*hW. StW,le Cm.161660 73,2337,357 25 265),07,309.20 222.644.569.40 232.33.352.20 22379,29.76.66 412,626.720,1ea ToddA 601140. M04sSy of 94040., IftS 6 vHlla.o tdwb.5o 07,566,625.75 2.0,6,3. 30.656,359,063,75 967,594,626.71 38,658.090026S.00 39.6256.616.964.2510 S1004 .t.so*. lAWAryofVW.1a 3.049.634.732009 3,125.343.6r?.30 5.174.5693.46.30 7,0406,62,723.56 5,562,646.755.46 7.1112.566.6$1.40
S25046615r4071 Region% 9.142,671.242 15 5,5064.464.653.22 14,651,679,i45.27 6,1147667,2421Z5 4,466,634.60707 17.611,3123,050.l221,061005600 1,00 Gooal5ooo i350.61,508,6756 0 365586.626.063.57 174,36,23)7,611.47 125.60131506.875m6 523,27,717,4909.4 166.149.226,.3464
0.5.006.6 447.416.669.50665 ~~~~~~~~~~~~~~~~~~156,474.6411.6645 1,656666,51,46,%6564 172.1211,18,423172 2336114,726.4632t
41 E0010011 006140 27 fM0,6SoWW~k 2.603.241,272250 33.49.46.204.2.65 36.451.460.550,45 2,609,2411.127.69 54,64446,1623 37.543,6642l 16.2248 E0,onmlo ef%fte 4061 060*yoLw.6o4.666416465o1
60o661o
1 309 744.034,30462 2,51l6,744,093.28 3,250,709,266 05 744,034.304,60 2.816,154.392,47 2.293Z770.657.27
56 E0-.00005406 winie6y of 0.,Uy odtA e.m. 5003,364,050.40 1.9115,553.406.44 2,417,9486.165 4 592.364,666.4 2,145,464,565,77 2.647.6725.62 IT52 E-ornf10 0.0,4e6 K0Inier.6YoC.oOoa4Vom en1.12I9010o 1,71 0.371.217 AO 6.055.566.344.64 7,776,766.662.44 1,717,371,211ta0 6,75-5,455,0.16.0 6,202777.408.69
ec1m. W1101406 01ao6d171420 10-0.1601054-0 MlnUYof R701610100A10- Ald Looel Col. 275.148,966.66 IN5500.00 1355.5046.9568.0 275,1146.9606,0 15.123,96.0.2169 16.0906.llZ3%5.2EonOOiO -001560 104 01006 .03,15059 669,925,770.34 X7,32,92,326.54 1163,06.51596.80 750,331,609.6? 2,413.364.379.77
S.6-rot.1 ~~~~~~~~~~~~~~~7.666,207,47500 66,086.624.646.26 li6.64.j3.112.2129 3,656,567,472,06 621.174,364.1163,90 70,070.072.3311.6
00 P540-11- 0600670 of N1046001-6*0.651.00,06 Z,509,7896,620.4 0.20.0436,064.90 7,620,226.363.00 2,566.76.935.40 5,544,300,6026 34 ,134.6081,824.7443 Po04.ofv 1,1.4,5 o65A10cu151r6 669 Cw060.460. 3,566.79.J68690 0 173.819,43000 5.545,604,210606 3,69,66,79666sa 5.66.209,213 06 6,557.969a.04164 4 K4,ooC1,b060o6yW6l.de.6., 4oIlad 424,672.642.2D 116966'89,649.09 1,54f.506,93202 424.9772,62.20 1.225.577.696 3, 1651.356,635.0
So9.lo,,1ol 6,661,247.606 20 '16,3211,46,482.65 14,262.3893.42,6 6,5611.247,6011.20 lZ.444,070,120.1S 14,3463246721,3lS.Isry5soo..... Z9,846.9930,20A43 2,4.606.2 57169676 55.741,2696677.65Flem441,01 4,50,00.095.09 4,000,50906O004 0,0610,006.066,00 0,004,66,066.01556dn.0 20,17.9060.63009 20,179,69.,626.M0 32,075,036226.06 32076,630.320.00c0.601000 1,750,6325.7.22 1T5.356,2.256.22 ,9.29719 1,9653,36701.50
a6,6___1101._66613764.t0O g01 __66.64462632,04_73 742309,6237 ~255,72 4046565 66 64669 92 750-c1 It'. 19n04066n 64610950
195

7.bt. l4o: RtECUREERT EXFE44DlTURE BY MI40sTR4Es0D0EAftTM044 TS INCLUDI0O TRANSFERS TO LOC.R LOOVENE * P.ETPERSONAL EROLUMENI'SP rE AM3 OTHER CHAROES '00-
Vol TsT0/00 _S0412000 200
I s rFTO044,O0.i Aeloal 040447 004ieW4,t- C1410 _ --rv r E 0ac 1 T4.4 E 00 1.1oc FE 0 C 0001
20 A444,4rdoo Vlc Prcd.4Wt 0444.. 02 004 0.03 03 0.07 0 Q0 00 3 0.00 Q0427 AdmIn drotbn O0 0400rnrd Porb P0l\teg 0.QD 0.75 0.46 0 1.0Q5 0.49 0.00 0 08t4430 Admn,f rt8cn 0.54 Ot 4 d C 4n41 Srcetdan11 0-°0 1.00 1.0° 0.09 2.33 1.14 0.09 1.93 1.0231 AdaIlo*.On 040. PnnoIo. 0.04 O 0.0S 0.00 11 0 e0 0.05 0.00 0.0732 A dmWlor .lnn P700id0nt0f0046
0 n.CM Se Doepa,bnl.1 007 040 0.1n 0.41 037 0.14 0.34 0.533 Ad otaon EOlIo,S.a0 01 003 0.02 0.02 O,0 0.03 OOl 0.0D 0.0334 |odmpwrskoon M 0 ofFem4gnAflrsASfll.Coopaon 1.3 3 29 2. 1.7 3.17 2.13 1.21 2.02 1.0335 0Adm4d0cn Pn'n'onlICn.nmI044mo4 En4uh6 .O O04 0.04 0, 0. 05 0.05 0.05 004 040S30 d,4.o S'40onI00 0.04 00 0.0O3 0.02 0.00 0.03 004 0.14 0.0037 1Am.drOnI*teos .f P.004 0.23 1 .2 0.0 0.21 0.4 0.35 0.20 0.42 0.3140 AdmOITI*o& Judbbr7 1.25 0.73 0.03 1.20 1.34 1 :n 1 20 4.3D 1.2241 Ad|misraleon Mhb4y odJustce nd ComsIuOlon.IAffAs 0.11 0.52 0.3 Q 13 0.20 0.20 0.12 0.23 0Oi42 AdmiNsr.0-on Ofk o.T rlh Spe.A 0 70 1.11 0.05 0.73 I.44 0.92 0.09 0. 94 .2
40 AdOO,4*.Oon 0004~~h -dA.01At84040100440.- .4 0.40 012 0.00.20 0.1 0.301 020A0 |dmIdsbOl.Sn Mkhhy.0BFhF oo. VOTE SO o.34 4070 e.64 0.36 4 0.07 .aS .20 0.O00104101704 T .f`h SPECIAL 0.00 4.70 40.23 0.O 0.0 0.O00 0.0 0.00 0.00
AeooImlIGe0rJn 0s40.e 000 0.DO 0.W 0 00 0.41 01 0.10 0.e0 0.40TeN4. nh 5Ym.u Aub.n1y 0.00 00 0.0 0.00 023 2.07 0.W 7.07 3.59
S4 AdMWstrOdon MhItryof Home IAfI. 0 37 1.25 004 0,49 0 90.7 0.47 079 0.03S4 Adm4O rian Tn 0TnleInve 0 3..2. 0.34 023 0.42 020 0.20
54 Rdmdve. Tln rwm o R Adh3rz 0n2 .2 ca oenel o Zo} oOo 4 loD 7059 Adn,64T."'n 1-T.5 m ICalb.onC00 0 .02 0.43 0.00 0.02 4. 0.03 0.03 a00 0 .04d5 A4dO. 'a* KW kVduP0 of CoulA Ad .0400 -0 I..4 G- -. a 0042 044 0.10 0,00 3.4 0.24 0.00 0.37 0.4007 AdZi.Nr* o Mi:y of Defa.. and Nm onl l 0 02o504 00 2 0.33 0 .0 0.20 0.2 0.00 0.17 .4456 AdoI,*atgn Lord Rol"on Comm400issi 0"0 0 02 0.0 0.03 0.03 0.03 0.03 0.03 0.03600 A4n41441404 4n0j404 Cm" of TR14*911. 00.1 003 002 0.0 0.00 0.03 0.04 0.00 0.0001 Admr *.0b- Elftt06trC"0lvain .0.0 0 45 02 0. 0 02 4 002 0.1 43.O103 Adn*4*.bon L00WO03BN- N*C01fl.4 02004 0.03 0.00.0.4002 0. 00 0.0400 Adniis,0,Inor P1.4440hrs OIn'. flo.o4g 4200010440n 0.17 0.00.00.40.7024 .20 0.23 0.24
Adm,o4Irm*o.o Re.00003 4.204.0 .04 1.2 1.40 4.2 .6 1.41 1.40Ado,i,4s0r0o LOT44430u emt4no 3.10 0.0 0.004 2.00 020 4.00 2.00s 0.00 4.4
VOTE 330,5055.5900,003 0.00 0 000 00 0 0 o. 0.00 0.00 0..I
Sub.ToI.I 8.90 4Z74 2.062 10.07 2004 40.441 .82 314.4 21.7
38 ruFnce M40O s0pur7 4t.4fnc0 17.1a 101 4207 40.00 260 144. 2 00.04 40.00 13.30 DT -n4d S.nnly Th-.N40on Seare. I .47 1 03 2.00 2 01 2.33 3 4.0420 D0e440t .d S.0C.0 P1`0r Fr.o4 0345. S07 7.33 43 6.04 7.00 3.S IS29 000oo -4d See"t Minihry olHr meAffrs. Pds.. 3.00 2 321 2.03 2 3. 3 20 2.03 4 2.00
Vub-Tn.Il 21.87 17. 2. 24 20.00 1211 2014 201114 1 1 234
40 Soeda -4.01. Mhhr. .o Ed-..Oon .4"3 245 203 4943 230 3.40 4.23 2.00 |.0352 SooIdu-40.c MhIry0ofC mity 4.07 000 4.4 4.0 7. e O, 4.13 4.20 8 .4 4.0353 Socal enAc s MWM4Col mo,447 0.v GurderAC2h0 032 0.30 034 032 0.20 03. 0.08 0.0d50oia soa . 01044 Mht70414of t nd Youth DeveR.p0n4 0.33 032 0.32 0.34 00 0.20 0.33 0.24 O2007 S00444 ..r..e. tI_ .- 04cc C-n4ol.n 0.02 0.02 0.02 0.02 000 004 0. 02 000 0.0400 Sa al me04o.n Mhhby01 Sd-..4 Teh4. High. Ed0.0n 0.20 4 38 2.75 0.32 7.02 3.70 0.31 7.10 3.7040 Sort40.40. MhNhyr 041 0.73 40 0.0 0. 0.39 0.54 0 074 0100S0.181 Wm":9 0t.g1r0s 3.00 400 2.004 3.30.0 40 2.0 43"30SOsti Ins Relilrzos 3 se 1 oe 2 1 3 j 0 5d s 87 2 83 1 Sl 2 1~~~~~~~~~~~~~~~~~~~a 1 7 85004400140.0 I.0044007R440004.4 42. 202 47170 45.02 0.r, 20.0 43.00 83 2103
Sric T.ot.1 07 70 17 J166 62 24.27 40.03 61023 2673 41L
47 Ec omic ser4o.I 27 Mhbtry otWcdrs 0.4 929 5.99 00 44 1.77 5.99 0442 0.90 5.4340 EcOoR,IMnoomern r Mhh4.400L0 Huma S 0tlements Dev 0.3 0 71 052 0.| 0.79 .00 0.24 09 0.4758 Eo ,Irmswm. MhhtyofEnrgy nMdMher4 0.1 0.54 0.39 0. 0 0.33 05 05.2 05462 Eeeh.no. 4o Mh. Ccm-un c4 d Tr..pt0. 0 eo 2.02 1.03 0.57 1.0 4.10 0.54 4 1.114
000E 401* 3540., E404n4 4000 0.ID 0.00 0402 0.00 4.000 .00956 000004* ur.lc 016840140o Re1ob nu . And Loo4 GoeL 000 3.35 2.04 0.00 4.70 .20 0. 3.70 1.07Eo00omk eaN 1000'sov mmeol 0.00 0. 024 0 1 021 0. 0.3 0. 0.30S.ubTo.I1 0.32 413 less 104 2.45 19J4 10 6927.l 1I174 007
69 P odnu.o ly 407of N0.PU,.R.,04es andTn.0,m 005 4 97 403 0.0 4.b3 422 0.2 4.40 1.T43 Prodool by040of A9 40wl4.. .54 C.opolOORn 3 27 2.3 20 .040 .7 I.3444344 Pro.*,ovt M nl of Irulwb4i..04Tad 003 092 059 0.14 0.36 024 0 .4 031 M'utrTo44 4.22 012 607 2 2.0 3.4. 2.1 3s t .l7
ry r7'nce.0n 0oW 0.00 00 0. 0.00 0 ,1W O0.ecln71cnel 0.00 0.0 0.00 0W 0.W .70 O 0.30
4n0-0.0.00 003 0000 a000 0.0.100 3.0 0.0 .4Co0gn 7ecy 0.00 00 00 000 7. 0.D4 0.00 0.41drad To0.4 ,co.w 10.00 1o00 100.00W 1000.00, 4I00 I0.4 404.00
So.re.: Tabl. I04
196

.-.Co.l400d T.649 lgb: Reoatr.OtOEp.oodfore by b stoSe4bDep.4ments Inelud1 1.e Tml0.4to I.0 L. V1 .rIOmeIO (tb p..0003lgPefofod Ellumot, *P6 3d OUher Chl,g4s OC
- t0 22002203e IllWnS5trUDet Ttmenl _ P^DINONSdll),a e prcK Ion
P oc TdOl PE C 01il
2S Adt4l0,tr.. VACE PRESIDENT 0 02 O 0 0 O O a 000 0.0427 A&mWtl,-I an R.oo4ooo d Pdtalk P.dde 0.00 0.7 0 41 00 070 0 4030 Ad&,4tllob5 P-edlocc, 00,. r.4 Cbhet Soe7tvio t 0.D 17.1 004 0.07 I 73 0.9131 Aftini,l6.000 Vice. pePdn,Orc 0.00 0.0 00 004 00I 00622 Adl"A C. P- Cd M Offioc-CI Senkc. 00p40t 0.13 0 31 022 ) 1 0.31 0.2233 Adl,800i t.0,0 ErtN" S4oco.1dc O0O1 0.04 0 03 0 01 0 04 D0334 Ad,8,to4iOoo MWdAN rf For.lg. iAlf0w. ,0t Cooxr io-t 1.01 2 30 | 74 00| 2.20 1 A135 Aftl,I1e0-o P-on. C-roei4o. d Enf.oy 000 0.04 0 0 0 04 004 0.420 AZZ09f0o0 COOO.rccoC.oc-o.o.01 0.12 a0a 0 00 212 00037 Adftlrt.n-on Pn,e Mm-les. Off-ce 01 0 3 0.2 0.0 10 0o740 Acflccag40Oo JodidorT 10 10 1010 10o4 000 11 1 02s 41f A,8,OaloVf4n MbicoofJojo4&ie ond C9cOfo0 oI M4 , 01 OI 0C2 016 A 1 021 042 Admob6..ol Oflf, d th00 Spe07 e 0,31 0.8. 0 7 O 1 0.84 0.745 AcOoco.IOan r.chegoo 4d ALK4t D.p.clnn 0 10| 0.35 0 2 0.0 D 3 0 22S0 Adc*OMl0n Micltly of io,n VOTE50O 1 14 100I 0 6 I0n 10 I 0 a 6
M44.f,y or 40onorr SPECAL 000 0 00 00 0.00 0.00 000
A0 m,o4nfGec. 0t5ar DI I | O3 0 0 0 0 10 0.5 0 3T r. R-eveue Athry7 00 000 3 0.00 6 8 3.47
sI Acbr40it,jAto- MiN.0y of H00,, Afi. 0.4 0 71 0 07 032 0 70 0 054 ARci,flcaS- R. .io
T.rv7c, OI1 020 0o1 S10 025 01I
55 AdcioA,.O.. T7.oo.,v. 1es.6e0tC.0*. 000 06 a04 001 000 003So Adwlo*a06cioo 64/0461f e
0o0IA,8,Anntoon. endLooIGooeOsenO 0. 0332 017 0.00 030 0. 7
57 A00lnlStrOOof McootcyOlDeOno9eao0144904000 00 01 0.10 004 0.1 0.00SD AflHltmt..on Lb Ft4..c.omi.s4on O00 002 003 002 0 060 AdcOcgoI4,.-to Indcti-lCo. & T7.a 001 00 1 0.0 I 001 0O 0.061 AdwA4lofrabon Ekctoo..lCovnh ion 00 21 I 0 O 5 002 1.001 0.63 A wdnc6raOon Loca G--srmeot S-. Commo In 00. 000 0.04 0.01 0.06 0 r6 Adnnitco4.- P009.d.W. OI 04 PlooN6gCoocoio 0 1f 10 000 0. 1 0.20| 0.2
A40
01044Oon Rego-I 1723 0 30 1221 123 3 I1A00ooO4000oe Loc.IG0ce,n,.- 2I 0 O01 121 227 o0 II
VOTE 330 3,55560,63 00 00o 00 00 00 00
SbT0.04 4.0 31.07 2 701. 14.61
30 Dd0 ,o.d0cooo, DdOen. 1 I 100 1203 027 104 11.5039 OOo cod S0u.K Tte N.l I Sc-- 0 2 a0 0.2 10129 OcloC d, S-ccofy Potoc Fo--- 030 20 4.84 5.5 27 4.6229 Dd--en S-e y Moi*1/ of H- All.- oNroe 221 200 263 220 2S4 2.
Sub-T. 24.4 176 21.10 2Z44 3.2 21
40 Ooc ul.ero:e . Mfni4tyldeoo 207 3 20 3 44 337 4 2.0402 SOoo,IOIXNooIo MocI4rf H.Ah00 1.97 56 1.02 11
53 SoonjeNcei M.t. of Co_oroy Drr GenObc & CoOoe 027 0 I 07 0 25 0 016S S_u =4001e,. Mkiory ol Laboc .rd Yto, DevedOo-oOf 0 7 0 27 0.20 0 2 0.2 0.267 S-coo 946e0 T794,0', S-. C-C niiC n 002 .O7I 0 04 0.02 0 00500 O .S DeL MiNEty ool n Tedh * liSghEduc* on 0 27 7 71 41 024 9 40640 S.d1 rycicos MoioyolWMe. 0 01 00 05 124 0
R006 40199 0 -40 200 140 0.7 231 2 071S .I.1 nco. Lc.cd Gwernmert 360 0 I011 23 24 34 1200 23
Sub-700.0 4.4 0. 00.07 4U 4±0, 4t1
t7 Eoonomc- -nrioel 27 Miniv4 or WY5 . 0.73 0 74 4 . 0 0 '70 40 44 Ecenorrie 9400049 Miitcy of L.nd. & rm n44etdem eD 020 0.00 044O 0 0.00 056 E-o,mk -Nioe0 MEity yf E-y 00d Mio7 00 0. 0 00 5 0.00
E-oc -IooO- Eleetyi4Y tn00 2 1o a 00 0.0 0 05 0 01
Ec-olc,-,os L.10 0490-409 047 017 031 04 0.1 03SLrb-T.10 2.1S 16. 7 3.04 1. 16.44 *.79
60 Poodk,WI Milonloy 00 N0404I ll-.90ce 40d To-l. 0 70 0.2 0.02 0.65 1 10143 |,0/,1/c Ob MLory
0of Agncv7u. -d Co4e04009 1 0 1.34 1 2 0.0 0. 0.109
44 Z6,0,0,h. Mir46y of b t10ile. cdT lTrd. 00 0.29 0.21 01.1 0.30 0.20Suo4Thf0. 1.0 2.34 2.4C I., 0.6 2.4
S9110N S004 . 1 0 00 2.0 144 0 6R-b,n7mxt 12 0.00 0.64 0 3 0 a0.61-9060 00 0.0 2.7 0.0 00 3.00CaOOO4001 0 0.00 0 24 0.4 0 02
_______ GRAND TOTAL _09.0 004. 100.0 10. 160.6 100.9
S0070 T.b00 164
197

IA61
4 .. �alv -01 7i 'R.C.C44" -VE -Q-. -.1 va. I C il. I Z C �"ewo 71 -.. ewruel Wit"01tO 9:9'091, lig 86N *Ad 66 LB Pit E61, 9 16 Cs"'106 69i 69 09, 169 i�z 09 109,00,U1 ISCU, 9I 1 09 C60 1.9 boo 0 051 Ica I I La �l ctol I 11 �% .1 It I C, lt� ISE 68 194:19VQZ4 la isc Etc �l I c6, t I El WOZI, ea 991 tk'td ac SLI tso,t Iz 196 St6 Out I 3 &so 016 " I II 091 IN CO, za t.9 Cot El CC 5tu .90 c qs 19, Ica ot -,,c e1, " ot ttissvtsk EC QO 0 1 01 00 EOS -5L ZA 51 -SL I I 9 lat ZI 'IO 1-1 SEE IS Z SAC C5Z 91 WS SIVSSI 50 OLC 911 Oz I tt I Z. .0k I I CZ A;C �V �. IL C l, zi, DIE .'t, "I :11 CIA I
C%a�owt G I ; �!I�zrn.-C.C L to wwoll I 11 11 I 11 11 11 11. 111 11 s1lial ISI 11 .� �L. 01, 11 IL I .1 SE. SOS - I 11 , I 1.0 U, "III �11 0`5c 1. . MI .1 I'l III 6
ES Act I, :1 , ., S�5 ESt"" L ez lsi It"Ot 108 s PC K I � I"S I"I I11A"I 11 11 OF "I ... I I...... S. "ON 'a, se SC 06 'LC C EB, ", I C R, B,C " Cat a S,� L" ." I� IOL 690'909 I0 CEI UD go so "I'm 1 C9 919 16.fe. I B, I LPa . I I'll :C ISS! 111:111�11 I'D IQZ. 61 M`v �zl Us II VIVZS, 11 IIt, CIO .1, �I Itol ato CIE 10 WS 51 L lag el 696 �10 IGZ ."C., 1
4, a SOL. 11 C,9.89E,900 I Est tot ot C9591,96 to Nt�zuysc 6- 9,t It, IRS 'Em, tc K, 680 SC as 01 5 SW isEI 'Z' .1 CS, COZZ 5, 9 So t 61 III ZLI ZOG QQ 90 "CSC ODE 16 Is I suo ISE IfIll"Olas C
.U la El ML I 11 St C ...... III ""S., C,OIZE .01"m 9. ISS " C 0. I 01 11 I� KI I!f�. 1. Cal III 11 11 III I ZZ 1. IL CIZ ICE C.1 lo LQVII6 "Z BO 9-C KI OPIs I"V., St otqzts DI I I 1�z :s1t, X1 IL Ois zoc ses'ow GO :IR 6 B I Z 099 sst lit 90 990 AIR I&II SB cso 116 91 1 et 910 CID 0 l LS IS, Dn sg IH� )SE 06 n wa w 09i it 095 SSZ 1. C i
1. I..O.660, I it IN-601-40 Oa IDE ttt a 's &�Z;o Ez, I 9 gi I'n OaC 1. lot IN 66C C I wo 919 voz 9C9" Alit LOGI W ocz t', to I.C It. A 11 VI ozo S6 � 9 9, C 1OZ .11'C O'e"OZ taS L tC Se wvsst v CB �s aic Za I I 1� "I �Ir .,Z In llq t0V9 2L 00 "9Z, O El E C..NI I LCC Lic CICott Es, Os ste'ta'i k szi CLG�tqt VC, I's ZCVSZO Rp slt SDC tzt 00 I19 Ill It 6 II.
O. VOlr9.E`I OZ .11 lll�L$l OZO OZEI:01. I Id III IDS .1 C. 15, IS I 10C C ZSt O,,Z LI Ots- "Z 0. S,::1A. It II EI .1, KI . It" CI "S III all 1�1 III "I LI CIA lII III alA, a oz, I dom uoz" t0."O'S Z, tcg 110 ut L,n5o't Z E60 H 5Z oz og 11 I qc CZ, BE L 9I. C 0 ot CE9 zo. 15t 64 161YEOP "Z 11tv O" . . 10 112 21�11 11 I I 111.1 I 11 111NIZ%111 .Z 11 1 C6 Ela �Zl EA 49 la. al 4 6st I 6 iK t9v BCZZ, adOEz gn at Ps mg el 9 A sk Ofie tDo 08 . 1. I II W9 909 ILI LOC41996'9Ze 11 11. :11 ID. P S06SOLOS L2UV.SO9II IL
C, giz cla::% so 'L400"'p, 09 066 coz et 00 OIZ PC 6691 51 6ZI WO 919 LI' .9 "I �o 15, css: got "jsetfi�:SltI ft 16VICN0 As ON coz a I IS Is 969 EL I 9 I6z CDZ a Az 9 10 OL V 6L 1 491 00 I;I zts HE -f-O". 1la Z99,6at"Q4 t 11 att, Ut" 11 LGWSZQFS CGI6- VVIal lt�.L III L-I 11 "I 11611, 11 1, O "B ., S I", L I I ., I .ISO N. SZ9 11 cl IS I 1� I.9, I A �l I"I lat KIWSAVUL 9.61VEI. 1.1 Oea 6UOpL,1Qt,A $I tat'DO I 11 I 11I .,.. 66 001 596 tn 11 EL�Olcl,�I� "IIIIIIIt . Ut 0, De Egi IC I m I 0 LOS 151 CEI OS IS9 BEE A "I C16 699 66 CC att 90t LE9 I 0 01 I SLG OZZ zo 11 96 EC .1 cOCILIVOWSSCI 11 limall. :1 IOL ILI PI I S OZO 080'tL I IL :,C ozO O O ,Lot: I :: 96 t Os 16C IO; Az I ILlltl�ZO WC 1 06 U0 WS BS I .1 9N I I C 91 K 19O 116 CCI 1. 61 C�tl 961 EO ZO I LiZ C6 I 6g �. 1. i 11.1 ,a ICa 056 $U' I 10' x ED EM's C Is to SGZ Oa O. Z, ace Bit Z" Ot Z40'"' ZZZ St P. t9i - OI C Ai % VZA& C' i IL 6tfi Si la �Sl oat 11 L. DI I lal III AC"--tLZZZ 11sw iteilt at ZRC .0c I
LI SIKLOC olI ol-DO - - - - - -
:,I, lq.L P ..... ..
OT94,11 '-folow II jj-� -UB� rjll7ajWZ� 60-� -i-C -0211.0 `29 Or -oviowlawl 9, oml� .. r -L 4. 6B, m C-zv. -.-Q�wq Wcom
000010IF915 wooo 09, pz It SIR 'CZ P 00001 SSC O' IL aClOt' III 00 001 WS�611 C' 119EOLCkk 00 OUS C" US m SBC SE ,I S Oa oo i,QL Z, C OD ml sli "I 00 w I GIs t I I C.Qo 94to I'att M aos L Is I Z " 2, C 0 L:gtt CCC 00 w, GDO Z m oc, �to 00 009 "Z P, I 00 oot oi I 09 00
6s, lez on bq�i Ith IL I)c%G twi vtc mmolOVS1. Be 005 zt 1 49 6 I 000 Z I Z ltD P aE I 00 0 00 9 I I 0 1 9c aco Ica O GO Go 00, . Cl� a I Z� S�1� 161, C OtB.0 act 99VEtoI 00 00I 90C zt G. It, I 111:11 11 lo 001111ol I so 116 6ct C 00 0o, SOO W off B, C 11 G. ... 118 OL 9 00 OOL'910'99l 00 M. cs� SIC 0-I 1100 ciffaziaz OD 000 IL9 OZ 0 C Go C. L � Is C B CS L B oq it, 'a gt, ca, .,C 10 1. III D� . (ACI St. 1. al L lot tat 00.1 ill"t G .11" aI S.00 9SE COO R669 00 000 006 'Z 90 gi I Lt II zz tat ct I ist 00 000 SIZ139 W occooltz 00 OOE HE osc 00 OOE ac, ae I 00 Mt as"t" B,8-
QQ ooc SOS BE . .1' i1i 11, Go DOG E'Ut to00 IQZ'Qgg sea I Oa 000 QZZ Z, 6I asuo,I M 006 89Z E Bo 89t Z.6 " Go .' 'O' El 919 ISL ZIC ou WaS96 066 00 Om s 'L 00 lxo IO lIEG 00 001 oocecz QC WO.So WC eall-S EDG0 "C SEP Sze 00 000 ooz C t S9 s III I I 00 OOZ W. �t Ca �IL�Cla "t" G. W' I �LI O� KI 00 CQU at S 9" au Oct 19L I C D. Mt ti I s, O GO omw %t 50 Dow Lisa,.,Gout a talI M owzst 61 5' oze P0 1 00 000 oot i Z 09 alp L-91 1.9 DEM, 11 III P.. . Z 0000CE9090 I oil 0 C' II.004,mw I-" 1.0 11 I0, :�O H ol 0 0 ":�IIS11�111�t W M I, 0.. "Is 00 00- sts I Z LI 'Do 00 000 OLO I C 9Z LOL 6�1 Zgt ea Gos tiO16I IL tswae 96t DOD0vtSI" W B to Et 00 00 0 out ROE 9E .- m 0900 cillstI 00 , I W mt�ooq I L St IOSUL9 US 00 001 066 Et L 0 czt go, OBZ Oa 00S W, so W Dol I 0 C6 00 M, o0z Z69 0000 zio 0 1 .,C. 61AG. .1�111'1 1010 41 0, L.1%11111�, 00 ou, ozo 9 t 86 �IO c5c 69C 00 Mt N 99. �O ILt 910 IEZ M 00t 51 C LU M C01 SO' DS 00 ON IOU NC 00 0011111 .0 "I 1.1 .1 � .1 �, 11 IA- ol00 It 1, sEg "I 00 00, "I 11 I I ALI 11" oom 00I'6 19 06 ol Ptit o oo"8�m 16 9ZE 953 ZtZ 00 006 Oto"OO DO CO, OL9�0, Ob NI on vl� GO Om III sst 000054 S L LGG LDIA, I'D 'aL 0. 'oG. .. 1. 000 oos St oci I'S C. Go, 0, sbz C ooootboozpE 00 ooc Cap CZ I 000ol Qt�"' Pino 890k,mg,"C: t 00 009 cWtv 4' 'au el I 6 W 00TS06 Z I C 11 C,., 1010 (D110 I ...
ZECBWI 16 Z91 659'toz ogoot 16, 'IQi 00 60, ots 11 no COO ice oc� 00 000 kzs act 00 001 UP-Z A 1100 UVOS& OsL CO 00 001 Se ot oss ASt 6 00 ODO 006 .1 1. 'CZ GCZ OLE 11L"a w I G. .,.K, "" ou D. GIG ., DG., "wP., B1,005'.'B" wats", I 11
,I 'a I 0 101, 11"I� IL ottelitz 00 009 110 110I uo oo; I'D .1 w0st 00 000 soz 9'6'1 Uea w ool'st 6 I. 11 C, O, 00 ON-tO LOS 00 OOE10 I IP C11t,61 11 DDII, o1i :111, C, : I� 11 11 kg, .9 Go ASP
00 G. u(N u St IL, 0 Itot ± ooooooit OLq W �oi �&t A, a. u I nt: Z I � Do DOS '05 O" 00ousmoss, Z t'O C 11 11 �111 IZA I Sef oa 00 69, 00 ooz 05Z 1 C 00 WC EC ��CSOZC 00 ML log gt. DO WE El Pill I I L
9sa zi V91i M COO Des St II GW.I 01 "I 11a CSZ Z" Du WE Z �IL., tgsjut"g2gLj- 2n II SE 6 oC bQuQ tlSs 01 I -98 IEC, 0-c U t-- 10 0-c kk-OU- �l GO 00-0 4 L TIEN,
I", -Civ �S�C-

...Continued Table 17a: Recurrent Expendiure-Regions
20V2/2003Administration Heath _ Educathn TOTAL
FE - - oC-- - PR u c --- - -FE -- C -70 Anlsha 339,367,593. 366,088,s2s-6 T 709, 928,361.77 326,839,4464 4 10,714,891.79 273,150,853.W 2,026,089 672.71 Pwani 310,341,262.48 248,066,455 28 222,738,872.38 174,624,689.18 14,300,253.94 149,602.585.39 1,119,674,118.6572 Dodoma 281,587,391.58 269,512,540.24 495,426,379.14 326,31B,090 34 16.271,796 48 296,487,683.81 1,685,603,881.5973 Iringa 293,196,551 02 280,737,215 81 637,306,338 39 250,980,173 00 8,328,654.59 263,492,980.27 i.734,041,S13.0874 Kigoma 185,823,479.86 2 t8,481,718 29 397,141,746 61 212,399,142 60 9,825,852.12 174,243,011.21 1,197,913,950.7075 Kilimanjaro 308,552,751.08 253,223,076.47 628,D21329,15 2468,33,639.76 1o,203,99858 252,815,462.41 1701B,649,457.4376 Lmndi 226,958,422.87 224,488,611 19 3s9.810,487.67 1 7,229,846 70 6,878,690,86 137,869,049.28 1,153,232,108.5677 Mara 254,683,093.29 300,203,084.19 435,131,517.07 m59625,707 47 8,444,390.24 202,960,254.16 1,261,048,046.4278 Mbeya 243,449,610.47 345,080,37087 387,756,651.43 281,85,589 39 9,816,12990 304,021,78734 1,572,011,139.4079 Morogoro 313,412.844.00 234.250,855 70 629,662,511.04 522.372,584 23 11,824,918.56 203.576,851 49 1,915,100s565.0180 Mtwara 206,645,096.43 275,468,616 47 380,267,776.61 184,794,207 20 3,412,367 96 126,345,543.46 1,181,933,608.1381 Mwanza 311,255,560.21 392,779,978.88 598,254,981. 11 89,463,148.20 10,922,01648 289,541,430.43 1,692,217,115.3182 Ruvuma 166,338,345.00 274,193,662 62 487,231,223 77 121,633,559 85 15,111,700 43 130,242,250.81 1,194,750,742 4783 Shinyanga 254,889,154.94 416,131,688.81 582,732,326.49 190,634,737.02 9,565,562.78 247,730,147.86 1,701,683,617 8984 Singida 201,046,969.48 232,541,237 87 343,078,507 46 136,347,761.08 4,333,786.85 146,082,524.55 1,063,430,787.3085 Tabora 229,635,993.94 261,509,278.32 512,151,311.31 345,590,944.69 3,275,907 35 168,223.707.19 1.520,387,142.8086 Tanga 262,961,975.90 283,260,626 25 590,440,781 92 241,457,1t1 .30 9,510,686.58 248.200,075.98 1,635.831.327 9387 Kagera 253,385,267.51 278,547,924 95 301,517,758 75 77,242,292 16 10,109,021 33 237,281,433.96 1,158,083,698.6788 DaresSalaam 126,840,055.51 265.343,940.24 11,51174463 3,054.075.29 144,167,024.78 550,916,840.4589 Rukwa 116.333,357.84 219,084,62173 257,691,460.69 319,217,476.82 5,493,216.87 153,591,987.66 1,071,412,12162
Total Regions 4,886.704,776,86 5,638,994.029.22 8.s96,289,322.78 4,318,99-,162.07 1862987,918.96 4,149,626,645.91 28,137,011,859.7S
Source The Tanzanian Authonties
199

* -. - s@ _^ctwo . < 7 CzCs - ,S c u o _ e o 3 N~ ~ ~ ~ ~ ~ ~~~~~~~~C a >>W C-oS<cs=Ws s xv o<c. -c OO -
8NNSbovC\v-oNxae_ 0WwOvzzNo\zootcEMo0'
O 8 .. . O % > ~C h - a a abS- °1 8>> -WWeKs5O-
8 S > - S>x>zo we<>e JC.>0aC )_ Eo0 hh_..S CX-CCs-- . 4 ;_weev -__
°c > :a wc ~ c-w - X w_o O __nF ' ;C > .o ' uxw.
c 0- _ Q° <= _~~~~~~~~~~~~~~~~~
*-~~~~~~~~~~ xC C >>o -< ow Cw C _r 8~ C>.~ ;o Nxx*
w~~~~ e t C. C. NC Cv C..- N ~atb N SOX0 W XOXv0_u°OeC f .Q X lIU' C C OV
g N s : O,v _;> v_ _ W t. I < 0$ O_ O rsso sN ws o i _N OE< NO _ S8O~ ~~~~~~~~~~~~~~~.
.5wXww_<4Xw<N_eC XXNNo C: sWXeO0
= O O S o4 X _ z .N o w O C.v_vjo_aN°S~>>~N>-0vwvw
O < O o A oX _ o - SwXCi<a>>X_8E>W>o o_oczwow-swc
8 s_N>X_o>V NaX S_O oo so°a o>X_fL
g w z 2 0 0o W C0W - N0
O 0 X w W s 0 z _ ° S ' ° > ° - ~l _0

...Continued Table 17b: Rccurrent Expenditure-Regions (Percentage)
200212003Administration Health Education TOTAL
PE OC PE OC PE OC
70 Arusha 6.9 6.5 7.9 7.6 5.7 6.6 7.271 Pwani 6.4 4.4 2.5 4.0 7.7 3.6 4.072 Dodoma 5.8 4.8 5.5 7.6 8.7 7.1 6.073 Iringa 6,0 5.0 7.1 5.8 4.5 6.3 6.2
74 Kigoma 3.8 3.9 4.4 4.9 5.3 4.2 4.375 Kilimanjaro 6.3 4.5 7.0 5.8 5.5 6.1 6.076 Lindi 4.6 4.0 4.0 4.6 3.7 3.3 4.177 Mara 5.2 5.3 4.9 1.4 4.5 4.9 4.578 Mbeya 5.0 6.1 4.3 6.5 5.3 7.3 5.6
79 Morogoro 6.4 4.2 7.0 12.1 6,3 4.9 6.880 Mtwara 4.2 4.9 4.2 4.3 4.5 3.0 4.281 Mwanza 6.4 7.0 6.7 2.1 5.9 7.0 6.082 Ruvuma 3.4 4.9 5.4 2.8 8.1 3.1 4.283 Shinyaniga 5.2 7.4 6.5 4.4 5.1 6.0 6.084 Singida 4.1 4.1 3.8 3.2 2.3 3,5 3.885 Tabora 4.7 4.6 5.7 8.O 1.8 4.1 5.486 Tanga 5.4 5.0 6.6 5.6 5.1 6.0 5.887 Kagera 5.2 4.9 3.4 1.8 5.4 5.7 4.188 Dar es Salaan 2.6 4.7 0.( 0.3 1.6 3.5 2.089 Rukwa 2.4 3.9 2.9 7.4 2.9 3.7 3.8
Total Regions 100.0 1W0.0 1001 W0.0 100.0 10(0.0 100.0
Source: Table 17a
201

= 0' ° t(O > G35>S i=
.~. 000 0. .. . . @s _b, 0, 0_N
.00 00.~000 a .oobso8o.oo 00.- 0
N" - 0*.00_w __ _00 1 ._
tO1O 0'0t00to00 00-x OtO 00N.
So000000000000 Oo.00.o..S0 0S88888080000 o8O88_
_S.^'0 0w 000_ 0_00Sg 0 if
0 - 0 OtotoOO_O.3..1 O_ w ot_a o
0000w- 9, OtOJOt. 00 00 Y 0-_z° E 000a- 0 ;"- 0 0 0o < sa . .> ,

...Con2nuoe I obl. 18.: R0, rr-nE Exp..d;wo.D0tridc Coafndis 2 s99nooo
Ed ... on lI2ol2-h Ro_.d, I WYI.r Ad4n,ntr.li7o TOQl(
PE OC PE (3 PE OC PE OC Pi5 PEl OCArsa 5,445,481,510 00 1,614,655,400 00 74137,305,729.00 133,049.600.00 93,070,279L 00 29,41 ,000.00 163,7537,62.00 50.050,500.00 604,346,917.00 7,053,95,109.00 I,S2S,066,500 00
pw'- 3,558,4.46,480000 42S,668,700 00 024,922,738.00 I01,327,100 00 70,133,122 00 26,116,500 OD 99,099,114 00 65,3D,S00.00 436,941,636.00 4.989,5S3,110.00 621.4235100.00Uode&na 4,249,73Y,q96 00 349,707,400.00 805,478,252 00 67,154,900.00 36,641,215.00 33,645,50003 107,273,363 00 69,793,500 00 212,534,03100 5,411,665,847.00 520,301,300.002wmoR 5,586,914,143.00 427,738,900.00 724,993,519 00 87,649,000.00 Y9.305,915 00 2t,662,500.0D 127,932,666 00 30,051,100.00 336,950,937.00 6,S66t,57,I0.00 574,901,500.00
K .rgoma3,539,1 70,87S 00 528,907,000o00 533,662,962 00 74,466,00D 00 46,139,993 00 10,207,40000 39,442,934.00 60,536,900.00 193,559,i81.00 4,371,9753948.00 674,1 i 7,300.00
K dilil 3n!ra ax 7,406,763.022 00 472,553,500.00 1,30S,879,24S.00 170,092,400.00 80,500,051.00 51,870,500.00 167,188,809 00 65,182,800 00 600,384,302.00 9,563,796,232.00 767,699,200.0O
L,do4 2,579.484.226.00 308,633,300.00 593,665,97500 104,296,100 00 40,125,020.00 14,680,800 00 112,X38,940 00 83,609,900 00 232,468,997.00 3,55,533,1358.00 51,220,100.00
Mwr,r 4,092,673,207.69 432,774,700.00 5S2,806,79100 96,061,100 00 59,561,252.00 8,018,600.00 53,118,075.00 09,221,300.00 241,231,065.00 5.798,1S80370.00 626175,700.00Mboy3. 6,749,226,960.00 720,537,100.00 947,724,422 00 67,954,600.00 S6,040,9S0.00 20,063,700.00 85,036,755.00 24,225,400 00 360,276,022.00 S,22S,313,049.00 031,500,000.00
MOorogoro 5,063,374,627 00 455,145,500 00 795,510,769.00 79,053,9000 00 106,519,384.00 20,435,000.00 82,709,142.00 36,207,500 00 540,260,S5S 00 6,583,374,780.00 591,S21,900.00Mtw ra 3,952,4908,07 00 380,353,500.00 538,200,299.00 65,.735,900 00 24,370,806,00 12.195,900.00 52,818,250 00 60,771,100.00 150,497,109.00 4,718,304,599 00 520,056,400.00MA wru-7 6,569,264,616 00 400,970,900 00 2,.2I,852,023 00 76.69,700 00 76,057,943 00 11,511,300 00 1310,02,599 00 39,21 00,DO 00 452,467.217 00 S,350,461,218.00 616,272,700.00
Rlivaw- 9 4,475,433,864 00 319,216,200.00 652,070,703.D0 120,222,100 00 45,992,461,00 5 W077,30000 87,423,799.00 45,0216,000 00 234,511,607.00 5,496,240,424.00 470,576,800.00Shinyaga 5,370,912,672.00 594,865,100.00 876,552,726.00 95,153,000 00 53,744.374.00 a,775,000.00 87,429,092 00 49,036,300.00 2S2,2S5,948.00 6.669,823,812.00 748,629.400.00
S 6gid. 3,140,609,164 00 226,268,800.00 607,220,196.00 242,971,700 00 49,025,313.00 6,893,900 00 83,649,814.00 95,070,000.00 179,093,250.00 4,060,397,737.00 471,204,400.00
'I ab.rs 3,271,209,146 00 509,131,200 00 649,434,330.00 69.20,900 00 47,438,143.00 9,707,700 00 77,001,063.00 34,310,800 00 220,172,812 00 4.265,655,494.00 422.430,600 00
T.oga S,0 22,265,578 00 488,762,200.00 965.234,608000 1128,F1,S00 00 06,639,352 00 35,470,306.00 1 14,783,241,00 39,164,700 00 580,094,687.00 6,767,017,346.00 602.209,000.00
Kagem 5,716,234,294 00 499,668,800 00 720,532.629 00 142,35,400 00 39,727,975.00 12,689,200 00 69,255,417.00 64,574,600.00 247,551,709.00 6,7S3,2S2,014.60 719,092,000.00D.res2a1an- . .Rsbk- 2,354,224,059 00 223,12I,S000.0 553.274,639 00 66,173,000.00 64,805,861 00 15,654,000 00 67,091.098 00 30,273,300.00 164,436,603.00 3,208,912,340.00 325,202,100.00
Tohl2 9D. 0_,934,167,26700 9.260,605,000.00 14.511,127,440 00 1,876,902.20D 00 1,196,867,44100 360,606,300 00 21,832i.643,84300 1,033,587,300.00 6 .,276,964,968.00 112,750,770,967 9 22,531,8600,800.00
S3o,-rs T . Z.9,,a AAhmbornoes
203

44 - 44
W -I O C G W Co-Z_ OwO -I-§ -00' 0040' 00we w 0 08 0 1 00,0o 04 t0^ .s 0 s
=04 p0So .0<O>9wwS
00 o 0 0S o '0~ o~ 0S 14c 4 ° _. _1~4 0 . _ _ _.
00 ° _0 4o wo os o o .
ow @oovx^°oo'oo.o8 _0 _
,0 00w 0O, 0 4 0 00 0- 0 O0'ww ln <
00 000 - 00000 WX 0 _- O0_V.100 , ,0- 00_ 0 V000 -X0000 W00 0 __
|0 _ r00 - oo- o. 0
- - 0C0e0 CX£XO04 0 00 0 0_W _X. |
S S S Vs O 9 _ O _ _ O O O S S0- _00_0000 - o 0 __0
000_, ,9 OOOooO*sooO o_ __0 00,0 0oo 00 -4
00< -O0g000-000000N00°<00 . 0.0N0 °° Y0X0 00° v
_8 OOo=ooSoO-gooo - c00
w0 t O 00a 000__ 0xW00r ° ° 0 Vo 00 x 4
-4 N 0-0w -0-So 0. N' vv 1 0_
00 ~ t 0 9 . 0o OOOo°,0 oo <
,~~~~~ ~~ .00w SN_o NsQ_w V ~ ~ ~ 0 _0e 0N o8 t ,0. -, 4_
C0IasO 0O00e0§0oa
WC w00 N0 o-o 0 1<-<f)°
00000000C 000000c0c0_000W0° w eb
w 4-J g o oo 408o o.a_o S0800 o00 o0.0 _00 0 000
s 6 >u , ._2 0.4-0-0 00C\ >,,

..C-nn-d I Wl. ID.: Regumrnt ES.p,nditura-DIstk1c C.M.M,l 2001R32
_ d,tion _ _ H.IUh R oads $_Wler A,Iuihit,UOn TotalPiS 1( PiR 6E C1 __ PE oc PE 3C PE PE PiE OC
Anrs6o 5,717,755,585.50 3,35,930,208.22 784,671,015 45 745,066,666 75 97,72S,7S4 55 44,249,701.55 17 194 1,366. I0 141,713,066.i5 - 634,564,262.S5 7,406,656,014.45 4,286,967,714.68
Pwwu 3,736,410,804.00 890,955,246.47 866,168,895.90 563 ,6G0,25.63 73,639,77S.10 39,293,030.85 104,054,069 70 184,921,104.10 . 45S,7Bg,717.80 5,239,062,265.50 1,678,780,207.05Dodo,rol 4,462,225,95530 726,940,07.94 045,752,164 60 373,535,102.00 38,473,275 75 50,620,629.47 112,637,031 IS 197,613,42S.08 223,160,732.55 5,682,249,139.3S 1,348,609.357.50Irung. 5,866,259,850 15 889,022,727 98 761,243,194 95 4S7,529,251 86 93,834,210.75 43,123,561 61 134,329,299 30 87,351,854.13 3 53,798,4S3.85 7,209,465,09.00 i,507,027,395,58
Ku'0m-a 3,716,129,421 90 1,099,292,919.08 560,346,110.10 414.,201,568.40 4S,446,992 65 15,357,329.01 62,415,080.70 171,404,275,96 203,237,140 05 4,590,574,745.40 1,>00,256,092.46KiIirnjar,s 7,777,102,013 10 9S2,166,461.09 I,374,323,210.40 990,601.769 95 S4,609,053.55 70,040,603.96 175,548,249.45 184,55S,60469 630,403,517.10 10.041,986,043.60 2.235,367,585.681.md, 2,708,458,437.30 641,470.809.20 623,349,273.75 580.125,267 8S 42,131,271.00 22,087.6S8.91 118,480,887 00 236,733.205.25 244,092,446.85 3,736,512,315 90 1,480,416,971 24Mara 5,137,098,967.35 S99,489,254.76 579,92,430.55 534,3198.00.75 62,539,293.60 12,564,216.00 55,773,978.75 252,904,472 39 253,292,618.25 6,088,097,788.50 1.698,777,743,90Mbq.y 7,086,608,245.00 1,497,581,487 00 995.1 10,643.10 I 77,99 ,266 19 90,351,397.50 28,380.983.14 89,288,592.75 68,591,836.50 378.289,823 10 8,639,728,701.40 1,972,537,573.62Moog,oso 5,316,545,30S 35 945,985,250.85 835,286,307 45 444,726,865 65 111,845,353.20 30,745,049 51 86,8144,599.10 102,744,485.83 567,273,900,90 6,917,793,519.00 1,524,201,659.875
W4.ro 4,150,122,978.75 792,614,206 69 5f5j110,313 95 365,642,210 9S 25,589,409.30 18,349,084 87 55,459,162 55 172,067,390 22 I SS,021,964 45 4,9S4,303,828,95 1.548,672,892.72Mus-n3z 6,897,727,.67 80 1,016,288,776 68 1,174,795,464.15 426,570,435 10 79,860,840 15 17,319,084 34 140,509,528.95 110,710,067 97 . 475,090,577.05 8.767,984,278.90 1,70,880,364.09R--m,o 4,699,205,557 20 663,352,247.57 605,522,630.15 601,462,822 71 40,292,084 05 8,842,869 02 91,794,978.45 128,307,795 24 . 246,237,187.35 5,771,052,445.20 1,402,465,734.54Sh6myorg 5,639,457,275.60 1,216,381,806.71 920,3W0,362.30 529,26S,604.21 56,431,592 70 13,202,241 71 91,800,546.60 141,106,579.92 7295,245,245.40 7.003,315,002.60 1,919,959,31Z.55S nids4 3,297,639,622.20 470,282,468.66 637,581,205 80 795,250,213 21 52,316,575 65 10,372,072.27 87,032,354.70 269,181.350.81 188,047,912.50 4,263,417,623.85 I,S45,086,104.94T.b,,, 3,435,189,603.30 642,505,656.43 601,906,046.50 305,360.532.96 49,810,050 15 14,605,515.S9 80,0501,116.15 97,147,654 27 231,101,452.60 4,470,938,260.70 t,119,619,159A45Tsga 5,262,878,856 90 1,015,855,009.62 1,013,496,422 40 660,865,819.60 90,971,319.60 33,366,89304 120,522.403 05 110,890,994.53 617,499,421.35 7,105,368,423.30 1,840,977.914.77Koorg. 6.002,046,008.70 1,038,523,547.10 746,059,249 95 795,181,797.0w 41,714,373 75 19,091,269.01 72,697.187.05 182,836,626 23 259.929,294.45 7,122,446,114.70 2,035,633.239 38DUr salissrs . . . . ,R,akwo 2,471,935,261.95 443,082,135.83 586,188,370.95 365,073,408.38 68,130,154.05 23,551,896 50 70,445,652 90 55,715,S70.28 . 172,658,517.15 3,369,357,957.00 920,423,391.00Total DztAM 93,380,875,630 35 19,247,628,498.69 15,236,683,820.40 10,439,876,306.22 1,256,710,813.05 542,662,987 56 1,923,226,035 15 2,926,50D,742 53 _ 6,590,813,216.40 110,550509,5153 3 53,1 S6,668,615 00
Sowr-e Twanaian Afltoriloe
205

-Co- -ue IS. R.k ... E. tni1Isid Cnii 2062103
gdu¢Uon ~~~~ ~ ~ ~~~~Hadlh R..ds _Wat1r Atd.Misr.ti.n Tt
FE oc PE OC PE OC PE OC PF PE PE OCAr slsh 5,71-7,755,585.50 4,363,21S,196.36 784,671,015.45 I ,125,641,972.70 97,723,734.55 49559,665.73 171,941,366.1i 154248,633.56 - 614,564,262.S5 7,406,656,014.45 5,722,667,868.35
POani 3,736,410,804 00 1,158,374,147.23 866,168,895.90 S51,499,644 14 73,639,778.10 44,008,194.36 104,054,069 70 240,424,900.25 458,788,717.80 5,239,062,265.50 2,294,306.886.18
3odo,ma 4,462,225,935.30 945,000,269.38 845,752,164.W6 564,334,452.01 38,473,275 75 56,695,105.01 11 ,637,031.!5 256,926,806.53 223,160,732.55 5,682.249,139.35 1,822,956,572.93
ittoga 5,866,259,850.15 1,155,S61,586.17 761 ,243,194.95 736,556,087.26 93,834,210.75 48,29R,389.01 134,329,299.30 I 113,570,384.07 353,798,483.85 7,209,465,039.00 2,054,286,446.51
Ki"nwa 3,716,129,42190 1,429,244,064.45 560,346,110610 625,773,090.32 48,446,992.65 17,200,208.49 62,415,080.7D 222,851,061613 203,237,140.05 4,590,574,745.40 2,295,068,379.39
Kdiwlnjgo 7,777,102,01110 1,276,962,273.16 1,374,323,210.40 1,496,594,842.09 84,609,053.55 87,405,550.35 175,548,249.45 239,953,701 20 630,403,517.10 l0,041,9R6,043.60 3,100,916,366.80
Liwdi 2,700,458,437 30 034,007,324.76 623,349,273.75 876,449,558.26 42,131,271 .00 24,738,211.58 118,480,087.00 307,780,327.01 244,092,446.85 3,736,512,315.90 2,042,9S3,421.61
M sIr4 5,137,098,967.35 1,169,469,625.51 579,392,9306.5 5 07,246,950.38 62,539,193.60 13,5 1,921.92 55,773,9787.5 32S,813,376 09 , 253,292,618.25 6,080,097,780.50 2,319,041,873.90
M e.yo 7,086,6BS.245 00 I,947,078,35R 56 995,110,643.10 571,054,710.12 90,351,397.50 31,786,701.11 89,288,592.75 69,179,574.87 , 378.289,S23 10 8,639,728,701.45 2,639,099,344.66
M or6obog 5,316,543,358 35 1,229,921,336 52 835,286,307.45 671,890,514.95 111 ,S45,353.20 34,434,455.45 86,844,599.10 133,583,091.43 567,273,900.90 6,917,793,519.00 2,069,829,398.36
tv.ra 4,150,122.978 75 1,030,516,189.67 565,110,313.95 552,409,922.49 25,589,409.30 20,550,975.05 55,459,162.50 223,713,163 11 . 158,021,964.45 4,954,303,823.95 1,827,190,250.37
Mwanza 6,897,727,867 60 I,321,326,351.35 1,174,795,464 15 644,459,895.32 79,860,840.15 19,397,374.46 140,509,528 95 143,939,531.29 475,090,577.85 8,767,984,278.90 2,129,123,152.41
Rlivill-ia 4,699,205,557 20 862,456,444.52 685,522,638 13 909,441,596 95 49,292,084.05 9,904,013.31 91,794,97S 45 166,8019,190.39 246,237.187.35 5,771,052,445.20 1,948,621,245.17
Shmy-ag. 5,639,457,255 60 1,607.479,979.13 920,380,362 30 799,615,755 69 56,431,592.70 14,786,510.72 91,800,546 60 183,459,511.39 , 295,245,245.40 7,003,315,002.60 2,605,341,756.94
S0,gid. 3,297,639,622 20 6l1,437,056.74 637,581,205 80 1,201,458,954 93 52,316,578 65 11,616,720.94 87,832,304.70 349,975,735 52 188,047,912.50 4,263,417,623.85 2,174,488,468.13
Tah7ora 3,435,189,603 30 835,352,779.86 631,906,046 50 582,200,237 60 49,810,050.15 16,358,177.79 80,351,116,1I 126,306,379.15 231,181,452.60 4,478,933,268.70 1,560,217,574.4i
T.pga ,262,07,8056 90 1,320,762,389.75 1,013,496,422 40 990,43 1,864 ')I 90,971,319.60 59,770,025.21 120,522,403 O5 144,174,762.69 617,499,421.35 7,105,368,423.30 2,523,139,042.56
K02ger 6,002,046,000 70 1,350,234,S55.26 746,059,249.99 1,201,355,592.20 41,714,373 75 21,382,221.29 72,697,1S7 .5 237,714,769.44 259,929,294.45 7,122,446,114.70 2,810,6S7,438.19
D. 43,,Ia -,.
zuiwk 2,471.935,261 95 576,072,504.21 586,180,370.95 556.683.080095 68,110,154,05 26,378,124 08 70,443,632.90 111,443.362.09 172,658.517.15 3,369.357,957.00 1,269,977,151.33
101A D6Oicts 973,300,873.63035 25,024,775,7520641 5 236,683,82040 I 5,772,498,723.75 1,256,710,R13.05 607,782,546.06 1,923,226,035. I 3,804,885,616.26 . 6,590,813,216,40 1 118,388,309,51535 45,209,942,6381
Sowrce: Txezoimn AlItharifio
206

1.00 lsh R-nrrron, ftprndft0ur-DOJl,0 1'.-o,,, 40999 jO-,lo8t.)
Odomli.,, J0.OIO, 00,04,~~~~~~~~~~~~~~~~~~~~~~~~R.d W.t,. Ad 4o04*o____d_____ T.0.l00sha EFde>ts. 6 - OC 80i.3tO, 0C R PE DC PE (0C FE1 PE Pr oC
A.,SO 6.2 070 32 .94.0 140 601 7.3 0.0 I0 4.2 1443
IW D 34 47 4A 3.4 20 54 43 64 12.0 5.1 36 S.0
DA0n,0. 49 36 4 6 3 2 1 6 2'9 50 54 °33 39 4.7 4.6
0.4 4 0 44 I47 2 3 10I 34 S's 00 502 0.4 4 .
Kr6,000 414 3S 03 42 2.0 45 3.3 57 44 35 4.41 53
t,1,00,006,90 3 49 47 92 30 97 021 9 9 .74 9.0 83 6.3
U.d. 3.t 3 33 4 .243 a 5.6 0 3s9 30 41
tlus0 06 33 4.1 49 24 29 29 3 7t5 44 33 4.9
Mbm,yo 7.7 04 69 09 30 78 3 1 b5.4 7.4 7.0 60.
M-oIm 56 40 5 *63 34 44 4.9 4 77.4 M 1.7
644,60,0 4. 30 3.9 3.7 33 27 76 2.4 2 4.0 4Nf 0-. 70 53 01 4a 21 4.9 7. 30 39 3.9 7.5 4.9
K000 4. 30 47 4.3 4.2 24 5.1 86 34 44 4.0 3.8
shinoYooo 60 6 65 57 2 4.1 3 67 0.0 .7 60 2.
0i.e.0. 34 4.1 4.4 41 2.3 16 6.5 1.7 36 27 3.1 3.7
T1.00 3 9 3 54 20 2 40 4. 9 30 8.2 4.2 4 1 34Tm . 5.51 3I I3 .3 I 6O 3 '.9 . 0S 3.6
4000, 63 57 3.3 4.0 1 3 4.1 7.7 64 . 6.1 0.
00,0000480, 0.n 00 .o 0.0 0u 20 0.0 0.0 0. 0.0 0.° 0.o
R.t6, 3. 12 41 22 314 3.6 4.4 22 2 3.4 4.1 26TD¢a Ilsi0 lod O Ib o In o ooOl.olo o on 1.00 0, lo e 10 00TlWi40,0001- 420.0 400.0 400 0 400.0 0000 4220 4000 402oo0 40. 00.4 400.0 400.0
Tom1 1 3914. 77.003923:.000.36 3,332,150900.00 13.0,132.l0 o00 037.322.900.00 1,.84.324,30 00 290 071,00 00 1.324,307,5000 430,764.90000 .22.370o 0000 4,596000.600 00 99,662 ,37300.36 .4917.00.100.00
IUe, =-, 0-0n 0 70 s_0a 7, -1 823.1. 2.74% 03% 975% , % 83% 708 so00 r2%
SOIT bl. 16.
...Co.in-,d T.ble 10: Recur..t Eop.ndAuoei,drni.t C.wlsd 2000001 (PoOcenb.o)
_ Edu..on 04h4 - _-al Ro.d 00.4cr A d t n 6 4 on s ToAd.0_ __
An~~~~~~~~~~ ~ ~~~~ ~~~~~ sha F, O E O CPE OC PE or P E oc FE r os7A-3hi 0.0 00 0 0 0 aO) 0a 0 O I On 0 | 9 0 000
P-ri a ~~~~~~~~~~~00 0.0 a0 0 0 20 00 Oo 0 0 0a 0.0 0.0
DP do. . 0 .0 0 .0 a 0 0 0 a 0 0n O 00 0 0 .0 0 0 0 0
.nga 0.0 0.0 0.0 0 0 0.0 00 00 90 00 0 0
Kig009 0.0 00 00 o.o 0 0 0.0 0 0 00 0. 00 00
K0,40,04 0.0 00 00 000 000 0. 00 0 OO 0. 0.0 0.0
Lmd0 0.0 0 0 00 0 0 0 0 O 00 0D 0.0 00M,0 0.0 0o 0 00 .0 00 0. °° OOo 00
Mbey, 0.0 00 00 0 00 n 0 0 00 00 00 00Mwooa 0.0 0.0 a0 0 0.0 0 00 0.0 00 0.0 0.0M,so 0. 00 0 00 0.0 00 0. oO 00 00 0.
M4o. 0 00 00 00 00 00 00 00 00 00
MW- a 0.0 00 0 0 0 C 00 00 00 00 0.0 00
000-6,6 00 00 00 0O a0 00 0 0.0 0.0 0.0 0.0
S41453i 00 00 00 00 00 00 O0 .0 0.0 0.0 0.0
SOri 0.0 00 O0 00 O. 00 0e0 0.0 0.0 e0.
1403-g4 . 0 0 0 a 0 0.O 0. 0.o 0.0
1sSgid 0.0 O 0.0 0.0 00 0.0 2 0 0.0 O.0 00 .0
Rk.bs01 0. 00 0 0. 0.0 00 00 0.0 0.0 0.0 0.0T0400, 00 2 00 0.0 0. 0 00 00 0 0 0.0 0.0 0.0 O.
T04440,004,4, ~~~~~~~~~~ ~~~ ~ ~ ~ ~~~ ~~0.0 00 0 a0 00 0 2 0.0 0 c0 0 .0 0 0 :oo .Total DMsheI .o a 0 b 00 O 13 0 0 Ot a a A 0a 0.
Memo Item.:Tsb3 L-1 0 i-t0 4 413.207,102,218 35 18,955207,097 Di 20,.05563,92795 7.4132ee,57s5S9 1,663,058,557 65 598,15,152 00 2.008,642,717.75 2,440,340,23024 2,36i,003 75 8.98,434,049.00 440,405,362,400.45 20,4046.98572 83
000290000000008s Poron,84g8 07104,4 Local .X _ - ,
S-0T8 T1b6e 1G8
207

...Continued Table 18b: Recurrent E6panditutDistricl Councils 2000t10 (Percentage)
Education Health Roadt Water Administration TotalPE OC PE OC PE OC PE oc PE oC PE OC
Anisha 1 17.4 5.1 7 1 718 8.2 6.9 4.8 9.6 6.: 13.4PwarI 4.0 4 6 5.7 5 4 5.9 7.2 5 4 6.3 7.0 4.4 5.0Dodorna 4 6 3.8 5.6 3.6 31 9.3 5.9 6.8 3,4 4.6 4.1Inng3 6.3 4.6 5 0 4 7 7 5 7.9 7 . 3 0 5.4 6.1 4 5Kigoma 4 0 5.7 3.7 4.0 3.9 2.8 3.2 5.9 3.1 3.9 5.2KlinanlaTo 8.3 5.1 9.0 9 5 6.7 14.4 9 1 6.3 9.6 8.5 6.5Lindi 2 9 3.3 4.1 Sc 3.4 4.1 6.2 6.1 3.7 3.2 4.4Mara 55 4.7 3.8 51 500 2.2 2.9 8.6 3.8 5.1 61Mbeya 7 6 7.8 6.5 3.6 7 2 5.2 4 6 2.3 5.7 7.3 6.2Morogoro 5 7 4.9 5.5 4.3 8.9 5.7 4.5 3 5 8.6 5.8 4.6Mlwara 4 4 4.1 3.7 3.5 2.0 3.4 2.9 5.9 2.4 4.2 4.1Mwanza 7A4 5.3 7 7 4 1 6.4 3.2 7,3 3.6 7.2 7.4 4.8Ruvuma 5 0 3.4 4.5 5.6 3.5 1.6 4.6 4,4 3 7 4.9 4.1Shinyanga 6 0 6.4 6 0 5 t 4 5 2 4 468 4.8 4.5 5.9 5.aSingUda 3.5 2.4 4 2 7.6 4.2 1.9 4.6 9.2 2.9 3.6 4.4Tabora 3.7 3.3 4 5 3 7 4.0 2.7 4.2 3.3 3.5 3.8 3.4Tanga 5.6 5.3 6.7 6 3 7 2 9.6 6.3 3.8 9.4 6.0 5.5Kagera 6.4 5.4 4.9 7 6 3.3 3.5 3.8 6.2 3.9 6.0 6 0Dares Salaam 0.0 0.0 0.0 0.0 0.0 0.0 0 0 0.0 0.0 0.0 0.0Rukwa 2.6 2.3 3.8 35 5.4 4.3 3.7 2.9 2.6 2.8 27Total Ditd4cts 100.0 100 0 100.0 100 0 100.0 100.0 100.0 100.0 130.0 100.0 100.0
Memo Iers: .Total Local Go 113.207,102 218 35 i8,955.201,697.ot 20.56,5.63,927 95 7,413 266,57s.59 1,663,058,557 65 598 155,152 00 2,008,842,711 .75 2,440,340,338.24 2,361,003 75 6,968,434,049.o0 146,455,362,468.45 29,406,99.762 83Urban Councils 682 0.82 0.74 0.83 0.76 0.81 0 96 0.96 0.73 0.81 0 83
Source: oTablo 11ta
-..Continu.d T.ble 18b: Rec-r,ert ExpendHsne4)istriut Councils 2001102 (Perurnta.eg
Educalion OrHath OC_ _n_ Road WalPE AdD nistretion Total _OC_ _
PE 00 PE 00 PE 00 PE 00 PE 00 PE 0Amsha 0.0 0.0 00 0.0 0 0 0.0 0.0 0.0 0.0 0 0.0Pwani 0.0 0.0 0 0 0.0 0.0 0.0 0.0 0.0 0.0 0.0 0.0Dodoma 0.0 00 0.0 0.0 0.0 0.0 0.0 0.0 0.0 0.0 0.0Innga 0 0 0 0 0.0 0 0 0.0 0.0 0.0 0 0 0.0 0.0 0.0Kigoma 0.0 0 0 0.0 0.0 0.0 0.0 0.0 0.0 0.0 0.0 0.0Kilimanjaro 0.0 0 0 0 0 0 0 0 0 0.0 0.0 0.0 0.0 0.0 0.0Lindi 0.0 0 0 0.0 0.0 0.0 0.0 0.0 0.0 0.0 0.0 0.0Mara 0.0 0. 0.0 0.0 06 0.0 0 0 0.0 0.0 0.0 0.0Mbeya 0.0 0.0 0.0 0 0 0.0 00 0 0 0.0 0.0 0.0 0.0Moroogro 0 0 0.0 .O0 0 0 0 O 0 0 0.0 0.0 0.0 0.0 0.0Mtwara 0 0 0.6 0 0 0 0 0.0 0.0 0.0 0 0 0.0 0.0 0.0Mwanza 0 0 0,0 0 0 0 0 0.0 0.0 0.0 0.0 0.0 6.0 0.0Ruvuma 0.0 0.0 0 0 0.0 0.0 0.0 0.0 0.0 0.0 0.0 0.0Shinyanga 0.0 0.0 0 0 0 0 0 0 0.0 0.0 0.0 0.0 6.0 0.0Singida 0 0 0 0 0 0 0 0 0.0 0.0 0.0 0 0 0.0 0.0 0.0Tatora 0.0 0.0 0 0 0 0 0.6 0.0 0.0 0.0 0.0 0.0 0.0Tanga 0.0 0.0 0 0 0 0 0.0 0.0 0.0 0.0 0.0 0.0 0.0Krgena 121 2 122.4 136 1 120.3 132 3 123.5 104.6 103.6 136.4 123.7 120.1Dar es Salaam 0.0 00 0 0 0.0 0.0 0.0 0.0 0.0 0.0 0.0 0.0Ru1wa 0 0 0.0 0 0 0 0 0.0 0.0 0.0 0.0 D.0 00 0.0Total Regions 0 0 O.D 0 0 0.0 0.0 0.0 0.0 0 0 0.0 0.0 0.0
Memo llems:Total Local GOo 113,207,102,218 35 23.558,443,429.61 20,585,563.927.95 11,995,412,250.05 1 .663,058,557.65 669,933,770.24 2,008.842,711 75 3,032,973,255.91 2,361,003.75 8,986,434.,049.00 t46,465,362,468.45 39.256,762,705.81Urban Councls . .-
Sou,ce: Table 1ia
208

to O
w , Se >w o 000 w 440 to00'o0 < >swD
0 O4 .
_- 0s03 . '.-o>O4:1
ovl _0 0 to '0t0't.4to'
00' 8_ow< ws>w>wZ m 1s
0' o>oK soD_ DV-
o ~ ~ ~ ~ ~ ~ ~ ~ ~ ~ t
_., to 0
C~~~~~~~~~~~~~~~~~~~~~~~~~~~~~~~~~
_' _, 00t0'' Ot0tt O WO 00_ W tVotoDD '_000.Yn 0''t0tt0 _'t00,-:: 0' 00 to _
0 O .0 0 0. CC'< W 0.0 W D0 -0 0'.D W. = 0.C 010_
to 8 -vwuwX>w
0 0. O0 .0D 0'to.to0'G I Y< b 0 D O _
- 00 00 8 y 0°bOY>' 00* 0-30 0 W _ 0' 0' -<O. Wo

Table 19a: RECURRENT EXPENDITURE-URBAN COUNCILS 198/99
Educ40n Health Roads Waler Ad n,ulio To4alPEI Ot PE Oc PE oc PE] . PE . PE *
1. AuruOa R6el830.R0000 19,905.000.00 241..60,500 0 I7,0o0.o0OO 10.358.4000 0 4.099.000 00o 01,.30,7W.00 080,425.200.0( - 3KN,O00.0o2 DOndorra 094,9076.900 00 22,.725.I100.00 251,93 5.200oo0 9M 0.31000 00 1.2.5D,3D.030 3,000,000,000 14 ,433,9000 5.411,WO o00 7B.529.000.Do 1 .252.J78,300.0o 40.80.800.00
3 10.0 432.701 ,2000 W 8,soi.700.00 4,8617.1 0000 W 0 o, ,20WO .24.7200.00 4.64,0.00.00 8.002,800 0 44.733.60).00 507.001.00.00 30.029.000,)4 E olu 34,11,000 00 I9,874.500.00 70.242.68000 5.30000000 1.1..436.1.00. 2.600,000.00 2,451.09W 00 1.,292,200 00 40.191,400.00 20.,24.600.00
L |ind, 052,654.4000O I0R98.000.00 73.02t3W0000 141980,000O 17.130,4001,0 2,97U.700o00 27.509,00800 270.33.100 00 27,315,10.006 Mnoshl 4S7.005.70.00 It,518,00000 174,735.700 00 1.0.13 200 00 18.162.300.00 4,002,000.00 2.059.90000 55,56,.00000 731.249.0r.00 2t.753.20.007 MoSomIs 58 E .59.400 00 37,916,5000 113,006,400 00 6,062 200 00 7.I.0000W 1.713,500.00 2.S .9.400.o0 0.007.700.00 700.770.000.0 40.492.,00.000 MItre. 531.829,200.00 19,351 40000 120.23300000 W .300.000 00 13.370,000.00 3.0R0.000.00 3,351.1 G 00 53.220.400 00 1,00,013.50i2.00 1 07061,400.009 MnIror o 7J3.413,4DO.00 23,484.600 00 127,152.9000 O1.M00700 W00 la,0e1.99000 4.0998.700 00 2312.800 00 51.220.900.00 935.191,000.00 42.t04,0C0.0010 Mlwea. 220.563.600.00 12.012.900 00 79,924,900 00 5.240,700.09 10.014,200 W 2.813,400W00 1,80,0500 00 12.3J4.800 0300,787,100.0 20.075,000.00
M1.1 Uwa. 0 *23.776,600 00 22,405,000 00 21I1.552.100 00 3.000.000 O 1.490.300 00 2,000.000 00 72,50.100 00 1,109.774.l00.00 27.405,000.0012 songe. SDt,400,500 00 43.8990300.00 59,506,700.00 15 404.000.00 8.1.23.600.00 9950,300. 2.1Z71.600 00 41.01.3,200.00 MAMA71#0.00 00,378.00.001 Shi.yafga 073,7037.00 27.1.1,700.00 62.641.000.00 7 584.D000. 7.31 1500.DO 1,.650,000.00 38.253.40.W0 409.229.800.00 30,25l,70.001.4 Sinzida 351..999t00,00 20.003. 00 00 00,928,008.00 111.04.70000 .10,000D00 229.00 00 1.300.000 00 34.0Q3.000.00 475.918,800.00 34,227.00,001 S T9bol0 707,291.000 0, 90,300,800.00 126 120,200 00 7 M 3O.000 1. T6.102.9w 00 4.055.100 00 1,740.DOO W0 2,559,400 00 8S,129.100.00 937,202.000.0W 1.05.40S.100.80
16 Oa,a 71 5.080,500 00 27,641.300.00 291,7"4800 00 10,120,000 00 7.014.300.0 2,775,000.00 1.744.500 00 o7.180.300W00 l.003.523.400.00 40.138.310,001 k7 oba 323.959.200 00 31Et4.050000 1.2M Du 72r3.1 090 3.636.50000 760,00D.00 2.420.200 00 17.391.6W0.00 402,101.70WOO 39.048.2300.0010 0D4 es 491-51 4 .35.709,700.00 128,018.700 W 1, 1 50,675,300 DO 58,91.,000 00 75.405.700.00 S,877.000 00 46.6 .a1 .000 7,971.000 00 3.662.5M 00 434.701.400 0 W .098.,02,200.00 300.S7,700.01 9 llaiR
20 ero rke21 0010
0S0S 212.119,000 00 212,119.000.00 .19 Orr0b.aago 403.073.90000 1.0.197.1.00.00 90.100.1000 3.070.000 0 20.270,300 00 1,604.50000 2.R 41E5SOD W 71.007.000.00 8000.70.300.00 25,801,700.00
_ Tula U.b.n 13,003,242.200.00 809.7 1.309.08 5,7070223.100.00 2117.794.300.00 279.377,000.00 08.30,20.00 8 67,998.300.00 1S0,122,000.00 330,930.09.00 oo 1,37,4.73,400.00 1470000.00 109507 0w0.00
Sou.ce OarURO,Sln AuIhorr11.11
T.ble 1.9h RECURRENT EOPENOITURE-UR .AN COUNCILS 1M901.9
_ tdus^sion _ - H lth Road. Walee A.M lSUM.allon 8PE OC PE OC PE OC PE OC PE OC PE OC
2 Dodomea 0.4 3.7 806 4.3 4, 50.3 21.2 358 0.0 S.7 0.4 4.03 long7a 3.1 2.S 286 49t 30 0 t2 10.2 00 0.0 3. I 3.4
4 61000 2. 3.11 2.1. 24 4.1 48 00 00| 2.9 0.4| 2.4 3.0
S ILilui 1.1 0.2 2.0 85 .1 5.2 0. 0. 00] 2.0j 1,4 3.00 |Moshl 3.5 2.2 4.7 4. 9|0.5 9 0 0. 0. °0.2 4. I. 5,27 |Mosorra 00Z O 2 3 O J 2 2 S 3 O O | O | 9 4 3.0| 4.0 5.
0 MIWYO 0.0 10.0 0.0 5.3 5.4~44 3 2 IS
9 MOgOlO 5.3 39 J 48 80 89 0 00 75 S3.2 4.0 4.
1.0 |MIraSl 1.8 20 2 2 2.4 38 6. 0. 0.0OO 6 1 0.0 0,7 2.2I |M.anea 5.0 32 0 S7 1.4 0.0 3.0 0.0 020 00 5.3 5.7 3.1
12 000008e 30 72 1.0 71. 0.0 1.0 0.0 00 80 2,0 J23 t.1 K3 0igo. 2.7 4.4 I 7 30 26 2.9 0 0 0 0.0 2.0 2.4 4.0
1.4 Si rgi7a 2.I 4 4 2 7 5 1. 0.4 0.0 0.0 4.2 2.3 2.4 43.
M.9 04.Oh9 51 149 34 34 5.9 .2 0.0 . 9.3 .2 4. 131.
1. 04000 s 4.5 79 4.0 2 5 4.9 0.0 0.0 S 4. S.G 4.5
1. 0bey8s .3 5.2 I 5 3.3 I 3 00 00 09 1.3 a 2.1 4.4
1.9 M00, Sa1agam 31.4 21.3 31.0 27.1a 26.0 Ia4 005 52.7 . 31. 4.3 22.3
19 11410 0.0 00 0 0. 0D 00 0 0 000 0.0 0. ..
20 1.1,11110 0. 0 0 0 00 0. 00 0 |OO 0 00 0.0 0.0 0.0 0.0
21. Kinonldoni 0.0 0.0 0.D 0 00 0.0 0,0 3.D0 0 0 0.0 0.0 0.0 0.0| S 0.0 0.0 0.7 0 D| 9 O0 0 .0 0 .0 .0 0.0 1.1 0.0
1I |Suaersuga 3.5 3.0 25 .6| 103 65 0. 00 6.0 02 3.5 2.0
T7olalUrban 100.0 IW0.0 '°°°. 1.00.0 IM. ID.0 100.A0 00 1.00.0 IO0O.0 1.00.0 10. 0,
Memo 1112S: | Total 1Eol Got. 77905923000 335215890t 1.38 6e 12000 927504900 1I04024200 29607140 132450 7500 430D764900 1t257 0500200000 082 537300 4 4971 .010o
OrSOn CIun ls a1. 18T 277 29% 15% 19% 0% 4% 1.9 30S 204 1.9
Suo-rr ae TOr, .0
210

...Co.IiO.0 .,.bl0. 1b: REC13RRIENTE tXPEON1ITUtCURbAN COUNCILS 80800oo
I__________ -durallon __________________ Ro-ds- 84.4119 90400nd1il.l.04 Totrd
PE OC PE oc PE OC PE PEI Pi OCAnTshw ItZ1~ 2 0.65,21tt00 60,356,2000DO 360.40tS,d4 oo 25.DO00,6000 D 15,606.J 0 S 9.179,200 0W - 14.052.051.00 8.3424514.255. U-,535,404.00
200 no 308,08 1 11ItO.400.1t3tt.00 70.42 r,7ToO0Oo 3J1.,Js2,.18t000OD 2 s .71 s,900 00 7, 29,6 00 5.721,800,00 21.530.346 00 17. 700.4W00 . t8 t0.518.,37.00 t,470.471.St,00 120S .00.007 00 If i,8o 580.030.1tl6.00 530604,00,.00 1i28,451,000 W 24,500,000)00 I 1.903,03, 00 1,750,000.00 . . 108.297.343.00 34500.246.009 10.154.D3.00
200 0,00,04 K445,614,420 00 72,119,700 00 10.018,057Doo 6.201.$50000 14.000.312.00 3,009.0000O 32.615,265.00 597.112.04,00 017 11,18,11100.0S0W LrrdK 236,243,01.00 47.34J,100 00 03.796.374.00 39.434,7Q 000 25.979,096 00 6.256,0000 oD .3.005.8t22z00 370,0800.83.00 04,073O.tl(0.0000 Mrs1 h4 7,403.06 on 69,017,60DbO 248.670.31 I Ob 20.254.00 00 24.442.069 00 3,652,000,00 11.t68.273.00 1.002,3t3.053.00 62.9235t00.00
700 Mom,os 590,502.61 1.00 97,516.900.W I39.729,t91.00 4.*.352,400 00 9,219,702.00 4.Si7,100 00 86,01.51 .00 812,536.705.00 147.346400.00
0.00 0000 1 10.081.20300 73,825.700.00 167.0SS,16200 II8.0DO8000 17.44.9420no 620,00000 006.060.941.00 1.8t2.5531t.00 935.191.700.009 00 M-90,0r CI055,.61.07l 00 92,.000 0000 189.929..34 00 26.571,400 00 26.489.491 00 7.750.00DI00 tS.061.3I1.00 I1900.,351.147.00 1t20920.300.00
1D 00M ... 514.039012.00 30.#92,000.00 1I4.475,705 00 Mo.18M5.20doo.y 1203.135.0o 3.103,00.00 S0,312.M4 00 A92,200.706.00 50.31,1000.00800 D M0."/, 1,808.000,370.00 60.s33.40000 223.3295.22 00 15,700,000,00 626.457.00 2.490.200 00 9S1,423300 1,86109709,472.00 04.72.00.00
1200 S Oooga 060e.44.917.00 12s.4$6.0(0.00 03.193.165.0 61.991.300 00 6,052,0,s o0 2.85Q,7,oo00 $1.23.42900 0;7113,.276,00 904.2,60.o0
I 200 Sb angs S128.009,400.00 09.410.800.00 80.010.5880 S t1 ,2B80.400 00 15.449.511100 3..900,000 Oa t I12,1 o00 57s.r77,..00 t4114.0.3,2008490 S00Qd. 443.725.414.00 054,05.200.00 8l7.t059,059.00 46.18.700 00 5.707,26400 13.047,100.00 90.0654 00 00.300.471.00 123.0^2700.09
1 S000 29800 045.554.357 00 248,458,to.00 155,758.915 00 54,940.000 00 11,348,209 aQ 13.549,00D 00 82.000,00 00 122,421.349 00 1,130.112*.07.00 320.040.600.00
16.00 TEns 009.192.190 00 99,341,900.40 410.022.01 00D 23796060.000 oo 0 3o.900.00 2.103,100 00 171,509.7090 Pd 06 1.561.862 io 120.041.400.00
8700 000obs 414,.04.706.00 182,447,200.00 77.617.155 00 13,01.2700 co 5,040,907.00 1.042.00000 33,704.479.00 551.227.247W00 127t902.000.00
a000 W 0l es SAI04m 0.241,241.017 00 5,830,000 00 I,640.S63,303 00 80,001.D0o 00 177275.0tl 0 5,00000o0 60.009.344.00 . 466,0.08 0 6.53 20003t.000.00
80 8110a 129.055,40000 7J3.101,70.00 20.O.00.000 . 22.257,10Doo
20 00 Te,m,. 70.972,0000 11 7.423.02 o0 20.,000,00 00 4.340,000.00 .121735,800.0021 00 KIn.ndoni 09.00.200.00 68,114,500.00 20,000.000 00 . 111.033,700.00
US70 . . 252.910.862.00 . . . . 252.910,4D2.D02200 0.-n,-wng. 597.045.713 00 52.610.1000 o 127.22.706300 17.0177.30J00 37.54,5.97.00 6,202,000 00 2.248.515 00 99.899,207.00 864.008.. 0.099 4060,4 04.0
_ TOM DlOSIlol. _ 1,002,120,5S0.00 1.044.03.370.00 _ ,094.171,5.00 I 751,1A280D700 3S0,90.002.00 173.300,I00.00 11 ,035,092.00 J 1,510,400.00 I 2,24,0.00 I 2 441;.0 20 720 02 o. 082,W290S.00
501,1(0 T.-.Wnitf A.lo-des
..,ContO...d TA18 1gb: RECIJRRENT EXPENDITURE-URRAI COUNCILS 1900/00
_ . . Edue^Don Uealt!w _ Roads ~~~~~~~~~~~~~~~~~ ~~ Wat r ~~~~~ Adm inssUalio^~~~~~1.1imTDT OTA
PE OC PE OC PE OC PE 0 PO PE OC
8 AiIISSO 4.2 32 7. 4 s.: 0.1 000
3 00092 84058 3. 2.0 2 5 3 2 .00 0.0A Rioma 2 4 3.9 2 0 008 30 1 t7 0 0 0 0 00
S 4 132 4 4 3 20 100 0 0 0.0 1 4 30
0 0M-os 34 3.2 49 2. 026 2 1 0.0 00 00 7 3..0 SiI 00u1000 21 0,3 2 7 00O 2.' 20 06 00 0.0 3.1 3,1 5.38 0M05. 59 4.0 3 3 8 4.5 3 6 OO 0.0 0.0 S.2 3.39 At0100,- r g0 3 S S 30 I 4 0 0 S O.2 5.2 4,610 M8or. 6 1 2.1 2 62 22 3 S a a a O 2 2 0 2.o
88 00,82 0. 3.0s 5 4 281 02 8 4 00 0.0 00 8.S 0.9 3.0
82 557nyong3 27 5.4 17 I0 40 2.7 OO 02 00 2.7 2.0 4.8
84 S0,nd. 23 30 2 0.8 1. 7.9 00 00 00 *2 2. 44
85 1.0014 4.5 825 21 73 20 70 00 28.1 0.0 5.4 4.3 11.7~~~~~~~~~~~~~~~~~~~~~~~~~~~~~~~~o 0 i86 Tw.g0 .9 2A.4 0 7 2 2. 801 0 00 20 1.0 0.0 4.517 Oouok. 2 2 1 I 8 I J 0 9 0.0 0. 00 1.5 2,1 4.6I8 c Oec So,W-nn J3 I 0.2322 3 I 0 2 9 7J 0 00 20 4 31, 0.r
I9 llal 0.0 70 0D 0 7 C00 8.5 0.0 0 0 0.0 0 .0 7.922 1T0,0ko 00 2e 00 I5N 0D0 IS a0 820 eo 0.0 0.0 7.0
28 1 Inonoom 0.0 13 D 0 9 0 0 1105 0 0.0 O 0. 0.0 6eDSSo 0 0 0 0 00 0.0 0.0 0.0 0.0 0.0 0.9 0.0
12 S0umb0,0a0 0 3.2 2,6 25 23 0.7 3.6 0.2 0. 800.O 4.4 3.2 2.7Tolo 83,48000 1.08200.0 100. 0080080 00800 100,0 100.0I
00M.0 Items:T08l LoNa8 Go.W 107g84626727 11100720000 19W05290970 2623DZ3800 1853665293 534057800 1W913185JJ5 80D500702 2241575 o55048J380 139401297N09 1S33013900U_IOf 0001-o,l0,1 4 18 17% 2A, _ 20% 24% 32% 48 2% 100% 27X 81 169
Sou.re TWle 10e
211

.. Con..ni.d T.bl. 1b: RECURRENT E4PEN0ITURE URE3AN COUNCIL5 Z0061O5
_ 8 Ed,... I88 1i2._ th R i .1 TOTfAL-PE Dc PE OC PE OC PE OC PE PE oc
1.00 A-bah 8S,3,3.0 l3470686 7,1. 36645 41,657,066 327 16.38616 6.016.609274 . 16,6.010 .1.38877 8,095)88802 00 Oo.no 1323. 420.877o.0 143.668.18.35 347.:ft.797.40 42.918,278 75 18,456,7 17.80 3.1750.05.1 22.60,565.66O 466.01 .60039 . 725,5,28..90 1,753,9U,955 0 23840,172.3030tl0 144 61 3.35.75 80.8 100,717.485 57 734.073.550,D3 40.523.9621 9 2.4O8.24a 15 7,701,00768 . 113,712,210.15 87.412,7518.30 14D,242,471.184 00 K,goma 471.045.141 60 135.504.933.21 106908.959 *5 IO.333,45262 14,767,527.60 1,972,5066 5 .34,2646,6175 M6139.950,7 147qlO62 .445.00 Lhd 248.055,991I05 69.027.599.9 87.98. 102 70 50.712,110 31 27,278869n80 4 100.21511 35.558.318.10 M8AMMA4528 143.,40.82t.376 00 MZotli 679,7t3,700.00 110.887,537.61 261i,03.526.55 33,748.41 24 25,665.012.45 2,393,538.73 . . 780.459,586.85 I."47T.002.205103 41,628.957.827,00 Ja-wa 62 0.02.741.55 183.223.4O.74 146.716.385,55 75,569,922 8J 9754,17.10 2,80,529.S . . 0,315.274.05 864,61,54025 0.28153,812.06a 00 Mb Y. 1.166.5306263 IS 138,334,540.51 175.407.857.10 22.684.773.67 18,03il289.10 4,115.942.63 . .8,373.438.0$ 1,450.630,847.40 865,105.257.809 .0 Moro-ooC 1.708,654,124 55 173,983.05.12 199,426,325.70 4 T,600.I 62 27.811,965.55 5,079,388.04 . . 123,t85.418.55 1.452.879,8343.5 2,S76.2¢s2.78
160o l.- 322,739.80788 7.750.540.44 120.169.53 25 30,016.25055 14,052.I2,25 2,033.898,05 . 52,201,318.20 s86,62017,s.87t 108t3.88.,708801100 M,a"', I.209.58,888 50 125.008.803 8t 28.066.9,83 to 26.160.639 53 657,7796.5 5,632.089 30 . . 203.550.284,15 1.700,789,44S.8 152.801.822.7112 00 Soos72 e1.07 .n 24A,234.4Z1.55 90.502.844 25 103,295.035 25 70,302.57.25 1,068.362 77 . . 86.30D.350.45 03.,977.83D.40 34.3,98,19,.913 00 Shny.Qo. 538.334.433 00 186.911.32.56 90.842.343 80 1.806.666.45 16.221.9M6 55 2.556.079 4 . . 64.157.768.65 708,68,s30.40 208.277.278.184 400 Shigdo 465.911,747 70 12D.,27,785 96 ,23,757.0811 5 76,965.01 39 6.076,648 20 8,942.213.4 . . 101,84,388.70 807.684,784.S
206,33Sil05 ,o4
506 18008 6e57.8632.84 e6 466,8 3.420.52 :8,570.423 75 9 ,545,57558 11,915.703.45 8.8n,08 1. I 1 V.1612S1.65 2 7726.4 ,.44 l.1e8688,6111-so 864,42.0,S.1176 00 38.g. 1.017.625,557 90 1I6.852.433.72 430,S23.118 90 39,65.864 63 11.375.603 *0 1.37,165 50 . 180.179,684.4S 1.839.703,974.GS 228.141,481,857 700 BuSob 456.544,94 30 21 ,2176.029 68 81,498.012 7S 22.997 534 95 5.292.952.35 1,6.830 27 35,452.702.95 578,788.680.15 245.550.834,877.8on C., 6 S.lu, 6.598.604,075.85 106953.924.68 1.122,906,46,1 5 16,664,494 01 123.530.763 65 5,277,02.S4 63.009.8P1 20 490,004.621.40 8.058.863,740.25 80.895,445.2210 123 .1 242.406,S .117 12i .ull.103 3" 13.1006098 17 .7.391M.0I722660 Innee 133.346.531.85 195,66t.2s5 00 13, 10a.098,I7 117699.269895 353.917.155.1327 00 Kh,ond)" 182,100,440.60 I I,498.017 96 1a.106,6098.7 IT0870S5S4.tD
OS51D . . 2 t65556.40510 . . . . . . 28s5550.406.1009 06 SOfbl... v. 62.3897.998 6S 988848.637 113,G26,951.15 260455.610 86 39.423.265 35 4.117,263 64 . 2,361.0Ga370 7% 104,90.3066 8P7.04.985.25 37or2841 .82
______ To018 U78 88.26,22U8,88.08 3, ,469 480.88894 6.248.888,157.SS 1,6151 ,809, .7I 4.6..47,44.6.0 1. 6 ,34.67. _ 856.61.676.6 16.4612 t 028 2,301.563.76 2.317.628.822.68 28,e@t,582.885.l 6 2,21"8.088,4!
SouTce: lan,hoonn Aulbol8ms
.,..C onb-nud4 TbbS. 19b: RECURRENT EXPENO0TURE-URBAN COUNCILS 2000101
_685588 04 - IOTAI_0 . 7 01U(2 3P , C0 PE _ , O PE 0 PEI i P_O
2 odomD 6.2 4.1 6.S 3. 4 S .3 2.6 6 00 SS 2 .3Or"0 3.I 2. 25 3.2 3 60 . 6.0 00 00 4.7346760,7.4 3.8 20 08 36 1 63 0D 0 .0 1.4 22 3.05 .660 7.2 2.8 16 47 60 36 o 8 0.0 5. t4 2674,s 5 5.2 40 2.2 6.3 2.7 0 0.0 60o 7.7 8861007 2.7 5.3 21 60 2.4 3.6 0.0 0 60 3.8 S.1 S'S
YM
*e78 5. 40 3 3 I 4 . 36 00 00 0 0 3.85.2 49 S.o,o0oS 5 5.0 3 2 3 8 6.8 46 0. 0 66 0.0 5.2 5.2 4.
I6 Mlw~18 5 17 27 2.2 2 4 30 5 18 0 0 0 0.0 2.2 1.257 Mw...a 68 56 54 2. 0.2 154 0.0 o0 .0 *.512500908 2. 6 70 7 1 0 7 8 1.6 06 000 0.8 3.6
S3 hin goa 27 5.4 2 7 7 5 4 a 2 20 20 522.565oo82D. 2 57 7.8 0. 6.6 5. 4.2 2.S 4.2
157T9684 4 135 3 7 3 29 7.8 0. 31 7 0.0 5.4 4.2 72.716 7n=8 Sl 5 .4 3.2 28 1.6 0.0 00 0.0 75 5. 4.617 2ukob 22 6.7 1 7.8 5,3 66 dO( 0.0 60 1 S 2.t 4.818 03r88 08186sm 3231 6.3 322 I 3 30.3 2.0 73 6 0 0.0 20.4 31. 8.816.9 80 7 0 7 60 878 5 0 0. O.0 0.0 6.8 7.7216 emeke 0.0 700 000 75e .6 675 6.6 53.0 6.0 8,0 8.5 7.227 KIncdool 8D 03 0 9 I .00 1.5 00 0.6 00.0 0.0 8.2
3SS33 0.0 0.0 5 0 .0 D 0 0 6 0 6 8.0 8.8 0.819 S."b'bo.108 3 2 2.8 2 5 2.2 8.7 3. 0 0. 8.600 0 4.4 5.2 2.7T7047 UrbS. 160.6 10. 0 100.0 100.6 70.0 100.0 100.0 100.0 100.9 10,0
M.., ntoms:706 Lo ... G I. A 1 320 1`02126 t6626s567 20s50563028 7953280576 1656860 8 596815i7 2 20086440338 23064 8666434 748 460 2840888783_ U4,anCcur ooo5*,S _988 10 58% 26% 77 26% 10% 4% 4% 1 00% 2 77C4 Ie9 17%
So770 18678Tbl 18a
212

...C.0-nud 1.bW 19b: RECURRENtT EJIPENDITURE URBAN COUNCILS 2D01/W2
. . ~~~~~~~~~~ ~~Educalign - H.d1h RdW.I,dmnfllon1 wAL
f D2 rush t62.s34,#8.90P io,g22c j pli o7,c 9dS i /!4 is PEI 5,3.03c PE OC PE I 5.2.s PE S PE i745 20¢
Z 00 DM.oa t.ZJ9,Q0877.80 t78,472,3.55A 347.961 797.40 53 340.9J7.09 19.405.117.80 4.200.1T.30 2ZAW60f65.40 58.015.166 82 12 li.99>.D0 it75M7,553 294 05S22.7$
3w 00 .Irnis l 73325,'75580 125,176.572.85 t34.813,550.W0 50,717,956 J8 12.498,Z41 35 6,625.1 28.60. 113.72,210.15 878,419,758.30 RS,194.53 82
4 00 Kio"rn 4Tt.0<5,14100O 108.412.098 93 108,908,959,35 V.64,915Y 71 14.757,527 50 Z,ZD9,Z07 41 .. 34.24 ,D28 ZS on."Is7630.70 U93,484,222,tl
5 oo LWmd1 248,055,0III.05 t 10,647.,18.4i 87,08819Z 70 63.02a.346 t6 Z7.278. s90 *0 4.59t.23e.6a 35 J,558a71160 318,4711452AS m752.0409.ZS
6 00 Mo:hI 879,r73,7810.00 137.816.405AI 201.103,826WSS 41,944.751.90 25.E6S5.0U45 Z,580,763 37 .. 180-459.5015.11 t.l<7.002205.S Ul2,4S1,027J74
1 00 Mr som 820,02 7,7414.5 SS 27.71 8,ew9 66 1 49,718 ,3tS SS 93,92 1,9fi2 g 7 9. 754.1 87 10 3 .3 5793 .05 . .S0. ,22s.es 8b8,91 2,540.25 324.954,753,82
a8 W kMb.ys 1 I D3530,203.15 171 ,928,87Z .03 175.4017 857.10 Z8,i31 9,136 zs I a.3J1 ,289 10 o 4*,W09,855 9 7 9'7.3 tX438 05 1,450,830,8147.40 204,732,484.25
9 oC M-t-ol aIS,1 Z865A4 55 "41,274.608.19 1t97,428,325.19 S9.152.569 2fi 27.eilIsss ss 5,668,9 f4 61 . . 23,005,418 SS 1,459,1I.11,84.3s 2811,01113.2,S
10" 00 Utwa 329,759,8017.010 o9,184.9S2 2' 120.199.53 25 37.309.379 fi2 14.052.512,25 2.211,98t 22 5 2.628.316 20 Slt8620,1f .301 12.4.77t380.JS
Ii 00 M. Shia e o z0,55,8 50 .361. 112 49 286,90,5,83 i0 32.51 3,O 82 657.179 as e 821,940W0 20DtSSO.294.1 t S 700.7n,.44s,80 181,70a,7113.34
I Z 00 Sonoea 72D,e72,DS1 .as 30Z.30X.777.28 90,502,844 25 1258,11D.076,54 7,30.,587.Z 212.0Z5f 3X 85,300.350.45 *03, T7,539.80 43t.778,420,12I 3 00 Shw1ar ga ~~~S538,334 .4330 oO ZZ,02,71X2.zs *0.,i42,343.90 23 J371,66 s | z 'I ,966. 55 2,862,808 61 416,8 709,544,s73.40 Z55,s4J,0z0.10
U4 oo rSmItma 46 ,9i1.747 70 149,673,489.54 IZ),752,011.95 'a65,5 IT G,16648 20 f D.D15.279 11 . 1DI.644.336.70 seI7,s814.7s4.55 255.344,727.17
1S 00 T.W 3b07 88,32,04 85 58001,1N357.94 16S,578,423.75 '"C "J.7 7.1 DS.1.73* ,490,84 337 39,641 9S 128,542.416.4S 1188S85 737,610,260.2316 W Tano? L o a ,6z5 ,55 Z 90 2~~~31 1110.691 so 430,52 3,118 go90 23X,5 9 1 35.D 0 2 5,2.3 6D h4S 18973940 28S,51 9,5N.35
I?W 9 A.b. 453,S44.942 I .0 62.584.0900z2 810,498.012 75 28,582.451 12 5,292,95235 1.206,04s 90 SS,452,702.05 51151`17806.Z ".35 9,72,591.25
la 00 D., el 5^1a.,h 6,5$9.604,D75115 t3.614,0158,51 1.722908, *61 I5 S 0.7 s t 40 56 122.13X,75J 55 3.610.267 49 63,009,8 II ZO0 490.004.621 .40 18,958.883.740.25 37."5,77N.1to 0D §11 .. J01,380,905.19 II N1389.014 92 . 14.63t,06995 .. 467,43G4,N0.07'a 00 Trm 1 6S.?32,0103 . 43517T.zo9s 5t 4.6Or,059 95 14.f.64.7046 .I 4Z94,255,085.00
2So rono 2262.33263.94 . "l.OW083/ 94 . s,651,069 95 . 2 w2,085, 84oS60 . . 6,5,c.- 265,558 405,10
19 oo S.b-mr7 6Z6,9.119791 55 122.853.77"S 5' 3 ) rs26fs O?Sw.6. 4 3.23253 ,rr,2.w. 23§ )7 0,9.6 5 9774552 6 310*_ Toe-t RrgOtn- 1s,,2s,2X6,5ts. 7 4,310,t1X,Z.sZ . s.X4u,t,07.s ,s.$.6 40.3i,?7,t4^.40 6z7,1e,z6a 6,r6,t!0 106.47Z.513.37 2,31C,003.75 t,3Xts2.'Z$ 2. it S2 39 ,1 io,
3-mee Tomnb.h A.thorilies
,.Co.t.n..d T.ble 1 9b:RECaJRRENT EXPENDI1URE-UtBAN COUNCILS 1001102
_ f @l-gs Hevhh Rgad- Waler Adn fi-bthon IOT^LP.PEi OC PEi O FOC PEI O 'I PEEr PE OC
li~~~~~~ ~ ~ ~~~~~ ~ Ami 4. .P_ 3 "I a i 3: 0 S. .. O 85,_S -2Dodm 63 6 S 3 26 * 4 1 O 2*2 4 8
s~~~~~~ ~ ~ ~~ ~ ~ ~~ ~ ~ ~~ ~ ~ ~~~~~~~~~ rrn 3 .9ZS 3 I6x° O. 4. 7. 2.
K t on .- 2.4 2 0 o I 0 0 D.a. o 1A . 2. 2 3.7L I,,,1 1.3 2 a I 6, 4 0 6 0 . 0 1.5 I'a 2.2
6 Moshl 3.4 3.2 4.9 21 2 2 .0 0 0 7. S1 1.0W lsr 3 1 5 3 Z76 o G. 6DD . 0 a 3. 5: . .S.
MI*v r 5i 40 3 3 16 *S J6 0 ° ° 38 52 3.49 h.0-oo 5 a 3 7 a 4 5 00 0. 1 0.0 5.2 s04
°10 mt.*. 17 2. 2 12 24 35 d I0.0G 0 0 0.0 2.2 It21rs on-' 3 l 36 2 ^ Z D Z 0s.0 a a o 0 8.5 *1 31
1 ^ | smgids 2 J 3.5 2 3 6 r s 5 7 9 o o 0 0 0.0 4.2 2.5 4.2~~~~~~~~~~~~~~~~~~22 0 25 4
t6I 53."b- 45 1S 483 1 3 32 22 9 178°° 9o7 0O° T. 12 4 t
17'uobe 2.3 5 r S I 81 o C0 00 00 tS 2.
.91 ,.. n.o 7 0 0 oo 97a 00 IISC0o 0 0.0 a*0 7.7
20Temeke o | 38 0.0 15 6 a0I. a "IJ.O. 00 a0 00 7.22 1 rnnor0J53 009 a 0 0 11.S 0 a 0 0 0 0 0.0 0 .
{ OSSO 00 0.0 5'3 00 00 00~~~~~~O Ia O 00 00o o :o1015urbswm7 ~~~ ~ ~~~~3 | 2 ZS I. 97300 0 0 . 32 2.7
|tord btN Z sol4 I ~1132C7 102211| 23$SS4434 30 20555563s Z8 O 99541 2 z5 t305 8 5 669937 0821) | J329135 1 0 40988*4 0 14b455362468t 325ZS0N2a0
213

...C.o.non.d T.b0. 15b: RECURRENT EXPENDITURE-UREBAN COUNCILS 2000103
_ ctRlon Helth a Wa. T AdminiOl1lies IOIAL____________ ~~~~~~~~PEI 09I P6 OC PEI DC PEI Dc Pe oc 6o
I ArosS. 102.434.570 SI. 153.245.60507~ ~~~ 37,1.664 731.4 I 636 10,5 1. 6 . . 18673156.3316, 4360677S 11IU2 Ddo4e I.236,420,677.80 2J2,040,148,11 34794177.40 06935E1145 9 *,4M,117.80 4,704,120. 18 Z2,60fi,8fiS.40 732.4324.4 t . 125 509929, t9 1.753.594.556.30 361.527.1S.U3 1,1. 6el 7.335,75s0o 162.746.134.23 134.873,550 00 65.966,57901 12.458.241.35 660,144.0 . . . IIJ.712,315.IS 671.4109.7.30 234t 75,159.2t4 0.jon,. 471,045,141.00 2l8,g60,74I.S0 i06.908.05.IS 160.67697 7 14.761.527 60 2,474,312.30 . 34.,24.02825 520.167. 4s.36 234.132,751.5
S I,nrIl ~~~~~~~24&.656,091.05 143,858,595.0i 67.966.157.70 01.040.211.13 27.2 6.8050.0 5,143,307.32 .- 35.515.374AE) 368.O1l.452.06 230.541.1i0340S M951, 80.713,7o0000 1790181797.24 251.103.826.55 54534415.00 25.065.612.45 3.002.454 go 100.29.58645 1.14S,372.0S.65 230.768,007.22I1 u,som 620.027.741.55 294,004,518 00 14.710,38535 122,112.501.3t 9,754,187.10 3,713.658.22 90.315.22S05a 8,4413.540.25 421.694,708.206 MOos. 1.15.S30.2631A 223.S53,068.93 178,407,857.10 36,656.044 53 18,319.289,10 S,153.03 68 . 90,373.43500 1,450,430.(47.40 20,35,122.149 Mologo 1.104,6S4,124.S5 281,137,100.97 169,420,325 70 76,029,225 04 27.013,9i6555 6,371.554 36 . . . 123,9.5410.65 4453.67934.30 Y4.427,910.37
10 MIs 1329.739,807.0 I 15.S3,7556 4 120,1959,3S25 48,507.734 79 14,052.512.25 2,55.346.01 . , . 52.626,3J1.20 51f,420,191.30 t67.012.,17.43I I MOO,nOS I.7n 05,02S0.50 202,000.321.74 26.6995.683.10 42,272.653 19 457,759.65 2.047.792.62 . . . 703,550,294.15 1.100.709.445.0 246,3"7.207es12 SoTle 720.872.057.85 393.03.650%.35 90.502.,44 25 16fD1 3.I6 82 7,36,52.72 5 7.343.6i74 26 . . 85.300.3SO.4S 003.077 39.00 3.6,4.50,00.431Shiny0n 538,334,433 00 302,026.02613 00.42.343.6 s 30.394.305.8Z 1,71.fi SS 3.200.345.6f . . . 64,167,7$6.65 700,eS84530.45 IJS.030.600.03
|4 5fd M 45 ,9 11,747.70 t 4,57,76f.27 12J,752,011.95 124 ,366,DSJI2 6.00 .6,f400 11.217,112.61 . . . 1 01,t4,J60.70 607.964.304.55 J34,t91,9S2.00I 7 Tolal. a87,632,074 65 754,316.034.01 163.579.423.75 t47.677.300.53 0 119157035 I I.1135,13 74 . 43,931.553 06 . 12g.542,416 45 1.1*91.48.60.90 957.316,122.146 lTon" l.01 7.92S.SS7 90 301,809.353.54 430.523.118 90 64.I2.6954.5 * 11.375.603.40 2.304.540.40 . . 180.17g,604 4S I ,630J03.974.6* 3060,04a0.230
10 | Rkob. 454,544,94 1 30 341,396.310.92 81,498,012 75 37,161,431.59 5.292.952.35 .35 ,,775It . . . 35.452.702.05 576.70e.059.35 370.1919524.40IDI 7 56111bn 4,556,004,07585 17,700,311.06 1,722,906.4681 S 726.27,949 27 123.138.763.65 4.110.fi99 S 3,005,1120 . . 4950,004,621 42 0,958,063,740.25 48,230,952.911 1151 . 3951.2 17Z6.49 . 190.26.04 06. 16.442.798.35 .050,002.736.92 Oonmke . 215,4"0,2305Z . 3916616.5M 24 . 16,442.703 5S 19,066,294'03 342.lSl.625,I421K 0ondo0 . 294,253,857.21 . 8J3.400.D40.o2 . 16,442.798J . . 494609804N.S
OSSD . . 265,5S6,405,10 . . . . 2S,550.405.1019 S-,mb-Ong. 626,897,998,65 355.7291 SJ.48 133.962511.IS 45,981.00.69 39.423.255.35 5,104.067 . . 2,361,003 75 104,99536 35 907,204.585 Zs 210,703,005.14
Tof l Re ion, 11.020.23660.0 6.6094,409,600 6.34680,107.65 3.e23,427,05& 93 406.347,744.46 142.043,276.60 05,010,C76.60 138,43,000.94 2,361,003.70 2,317.426,132.60 20,67.3.0,96 3606546671.31
Scuice To,,,991.nAulSorsoes
...CofmlimC41 T.bl. 1sb: RECURRENT EXPENDITURE.URBAN COUNCILS 2000103
__________- Pf DC PEI PE PEI oc PE Pt PE 3OC4.3 3.37. .3 4.5. 0.006 . 6. 5.6.Z Qndom 6.3 4.1 65s 3 4 45 i.36 24 4 54 5 .0 5.2 6.2 4.4
K lrha 43.1 2. 0.5 33 J.6 1.0 0.0 00 0. .0 3 J. 3.04 2Klgom 2.4 5 20 0. 36 173 0.3 0. o0 IA 2.2 3.0
S (mol I3. 2.0 16 41 f.7 3 6 0 6.0 5.0 .5 1.4 2.93 4 3 2 49 2.7 i 3 2.1 0 0 0.6 05. 75 4.1 3.63.1 5.3 27 6 0 2 7 0 0 00 0 3.0 3. I,.3
51Mbel 9.6 4 0 3 3 1 6 4.5 30 0.0 0.0 S.0 5.2 3.49 Mololofo 6 5S 3 7 3. e6 4O 0.5 0.0 0.0 5.2 6.2 4.4
.7 2.2 2 2 24 3.5 1.5 0.0 0.0 3.6 2.3 1.2 2.1-1 . wzn* 61 3.6 54 .1 2 6 ..4 0.0 00 0 | 0 .1 3.l
12| o 361 7.0 1.7 53 10 I1.6 0.r 9.0 0.0 30 3 .2 7.013 Shiny7a65 27 5.4 I.7 I. 40 22 0.0 0I0 0. 2.7 2.5 4.264 5 4445823 2. S3. 6 1.5 7.59 0 6.0 0.0 4. 2 2.5 4.215 7664 4 5 Ill5 3. 7.5 0.0 31.7 00 5.4 4.2 12.115T 3uob 2 0 0 I. .1 42611579 SI 0 4 00 3.2 30I 16 no 50 6.5 . 6,0 4.712490008 7.~ ~ ~~~~~~~~~3 00I S1.3 0.91 000. 01.3,4.8 Dr e, Sno a1.es, 31 3 2 6 3 30 3 2 73 6 6.0 0.0 20.4 31.9 60.
19 11a1. 0.o 7 0 0 97 .6 11. s o 0.0 0.0 0.0 6.0 7.720 TenOeke 0.0 30 0.0 156 00 11.S 00 13.0 0.0 0. 9.0 7.221 Kinondonl 0.0 5. 1 6 1 00 115 0. 0.0 0.0 0.0 0.02
0SSD d.0 °°. 50 00 0.0 00 .0 00 00 00 .0 019 S,rb*ga .2 7.0 25 23 9.7 3.6 0 0 O00.0 4.4 3 .2 2 7
TollReglons 100,b I.2 100.0 .0 10010 100 1006 100 00 100.0 100.0 I00.0
Memo llems:T ol-I.0O5IDoul G 1IiJ32071226 3047029475415 20565543976 1 7729492 7 1S53055556 750325523 2006542712 3943315497 230104 6964 34049 1"4443360240 3311S543314U CO600IIS Ga 60ci *s 30% 10 26% 11% 24% 19% % 4% 1 00% 27% 15% 4%
So.-e: Table ISO
214

Table 204: DOv0opmm4t E.peaditure-Knistdf.si
_ ~ 1999l0 199512000 2080i 2001/02 2002M03_ Local F0lgn Ll o ... I foc Dn Local Facet,, Local _oeigo
26 Ad.NIntcohb.n Vice Prcs,dcrs. Offce27 Ad-MIo4bolo Re9obVr of Po.bcA ParfIs30 Adninisb^ o0 P- 1d00f, omce and C.binet 8o-roanaf. 3.000,000.0000031 Ad ncslo4bn Vice PresdenC s Office 2,422,079.000.00 2,045,806,003.3732 |dmmis4bdo P-ed-en0s f0ic. - CMI STo/e 0.paMr-enl 352.0E6,0600. 000000,000.00 298,162,3o00 S33 Admmfsrba0or Ethics Set-atfal34 A'dmmlb eon Mi.by f F-eig Aff,ir IL I8t C-r C .oan35 Admmnisbroon Pemrnvanl C-omme.on o' EnouLy30 Ad-1*s49o.a CrI S0.0/ce Crmmossioc37 Adft,sioOaf Pn pd.. Mf-den. off8ce 52.77,6i3,000 00 200,000,000 00 4,457,948,144.Z2 209,668,025 63 413,621,87&70 418,145,732 se40 Adaad.tNUo- Jodici-ry41 Ad' nil*olo Mlinsyyof Ju,tce aodConebbhflonlAOfair, 248,924,00000 210.292,5953742 A4dmimbron Off1c1 0f tre Speaker45 Admftstboo Exceqouer od A.dd fVarrent50 Adon,"Stain, Mhostryo Fhtance VOTE 50 39,887,452,000 00 1,322.000,000 00 33,692,358, 878 38 .51 AdWcinf."ono Minlsby of ora. Aff b.r54 Admo,i*41on RadIoTaeania 1,600,000,0000055 Adainisralvon Ta74 b. lnvteement ConereSS Admini,r4con MII,byof RgaIln1Adm eLocal Go.t 100,000.000.DO 193,7S0,00O 00 290,625.00000 387.500,000 00 389,884.481.7257 AdhaInl.0.lon MoIsOy ofDefe.n.and NationalS-.c- 1,000DD0,000 0059 Adm,lrbn.f on Lawr Relorm Comanf,o.n60 Adci-ofr.oon Indoobi.9 Cpurt of Tac0n.61 AdmNmrr.fron ElcIc,31 Co,rmmlhon63 Ada,inl*9oo Local Goc-o ent S.c-A. Coceei.s.o86 AdoiN,trabon PreSIden7. Offie - Plam.ng Comnisi1on 969,875.000 00 S00,000,000.0N 819,239,746.63 . .
Sub-Tot-l 100,600,000.00 49,186,980,060o0 6,214,760,080. 41,623.877,486.48 600,28.8025.63 So01,124, 0708 . 606,0101Y4.6.4
30 Dcc dnd00c 0 0,c Cloeen39 Delon. 404 09000ff e N. Oabooof Salcoce20 Scfce and 000007 cP0ce F- w29 0010en0 aol Sedul,y Mh,isby of H-oae Affair. - Pn.ons
sub.Totaf . O 0 0 .
486 Soao1 .ervi. Mmit0ry.of Eduooio t,100,000.000.00 9,758.977,000 00 2,131,250 000 00 8.243,270,384.53 2.234,274.898 08 4,407,658,155.59 4434'.552.955.8352 S.ooaOlMNeces Mhisb-yo 1 H401 2,000,000,000.00 19,487,694,000 00 3.375,000,000.00 16,460,9d0,533 44 3,538,147,932.44 6,979.869,220.00 7.022,459.242.0853 Soddt yr1040 Mi.0r of C -tomuly Dev. Gender & Col.Ire 2.35B,000,000.00 2,000,216 23404 60 SOoale rxces Mnistbyof Ldoour and Youbl Development i,700,000,000 00 - 1,435,980,046.4f -67 Social servico T.achers Se...ce Cnm ralosin00 Social -ervi-e. Mmc of Socl-, ThTe & Hlghw Ed.ca.on 8OO,Ou,000.0o 3,790,450,000 00 7,743,750,000 00 3,201.746,463 73 1,828,043,098.43 3.606,265,733 87 3,28,270,608.4149 So.a Iconxct. MWis6oy of Wor 2,000,000,00D 00 28.710,188,060 00 3,225,000,00000 24,251,091,267 11 3,2 2,738,251.22 6 329.673.2Y6.50 o 388,268,259.24
S.I Tof,a 6*000.0 ,0O000 66,019,317,000.00 10,476,000,000.W0 68,690,279,089.28 10,913,204,1e8f7 . 21.323,466t436.76 . 21,43,e7i748.57
47 EO.oocrio er-c.coo MnWi/y of W.*. 51,143.812.000 00 4.000,000,OO 00 43,204,080,791 .9248 Eco.oo- sNen i o M"try o Land, &s Huraen SMcn-t Dev 5-0,000,00300 - 524,170,004.07 1 ,034.054,609 26 1,040,364,332.1 t08 Ec,e -cicoeinas MWioy orfEncrgy sod Mincalo 000,000,000 DO 22 92,659,0000 00 1,743,7500003.00 19,307,515,184 S 1i,802,043,098 43 3.008,265,703.67 3,628270.8N8.4102 E o09nomh oe00cO M,s yl Oof CamorncaooardTranoorl 9.20,000.0000 00 - 7,771.i10,3D8.81
Sob-Total 96.00,000,00 923,277,478,800.60 ; ,2434760,000.00 70,340.8306,346.2 2,362,213,16249 . 4,64C0320,462903 4,688,934,940.67
09 PNodoobve Mris y of N. u-1l Rsouroc0 00d Tounsm 7,600,737,00 On - 6,486,001,800 0O-43 Prod-cbve Mstry of Agn.,tune and Co-ope-al00 1,00O,000.00 00 20,850,010,000 o 2,437,500,000.00 17.611,8S3,25974 2,5550329,062 32 0,041.0186,8 89 5 ,071,776,119.2844 Produde MeNistry of Indutries and Trad. 320.000.000.00 - 270,200,491.09 . -S.b-Tola1 1,000,000,00C.00 2,523,917.000.00 2,437,600,000.00 24,347,106,660.*2 2,956,328,062.32 . 6,0444,061,09.9 . *071,7765119.28
_ .TolalJ,t tricc 9,600,000,000.00 227,076,81,60000 21A.472,000.,00.00 11,0II 21,8 16,221,030,43060, _ 21,05.2043727.20 32.000,00o,00w.o
Sc,ir-e The Tacoonian Aulhonbes
215

,0 aLI >. >
o~~~~~~~~~~~~~~~~ . .4 . . .o . . . L .
_ ' -- - *'0*_
O ~~ W OJj . J = 0A
O~ ~ IA' is' ;'- ' _ - s '''''~ ' '''''''-
o w w e W o w . D .0 I-wQ
I

Table 2ta: Development Expenditure-Regions
.199S/99 199912000 2000101 2001/D2 2002103Local Foregin Local Foreign Local Foreign Local Foreygin Local foreign
70 Arusha 105,000,W00.00 2,O00.000,000.00 319,720,000.Co 1.680.371,819.31 360,000,000.00 400.000,000.00 400,000,000.0O71 Pwani 105,000,000.00 439.617,000.00 319,720,000.00 371,339,2B5.54 360,000.000.00 400,000.000.00 400,0O,000.0072 Dodoma 105,000,000.00 2,104,239,000.00 319,720,000.00 1,777,421,033.84 360,000,000.00 400.000,000.00 400,000,000.007 3 Irlnga 105,000,000.00 1,217,000,000.00 319,720,000o00 1.027,902,752.05 360.000,000.00 - 400.000.000.00 - 400.000,000.0074 Kigoma 105,000,000.00 179.458.000.00 319,720,000D00 151,585,643.97 360,000,000.00 400,000,000.00 400,000,000,007 5 Kilimanjaro 105.000,000.00 - 31'.720,000.00 360.0,000000 0t 400,000,000.00 . 400,000,00O.0076 Lindi 105.000.000.00 267.000,000.00 319,720.000.00 225,531,137.80 360,000,000.00 400.000,000 00 400.000C,oo0077 Mare 1105,000,0O0.DO 2,585,127,000.00 319,720,000,00 2,183,620,351.57 360.000.000.00 400000,000.00 , 400,000.000.0070 Mbeya tOS,000,00O.DD 1 40,000,000.00 319,720,000.00 118,256,027.35 360,000,000.00 400,000.000.00 400.000000.007 9 Morogoro 105,000,000.00 938,655,000,00 319.720,000.00 792,868,652.53 3600000,000.00 400000.00.00 . 40,00.0.COO.0080 Mtwara 105.000,000.00 850,000.0P0.00 319,720,000,00 549,045,841 27 360.000,000.00 400,000,000.00 400,0O,O00.00I8 Mwanza 105.000,000.00 793.654,000.00 319.720,000.00 670,388.350.94 360,000.000.00 400.000.00.00 400.000,OOO.00
8 2 Ruvuma 105,000,000.00 230,823,000.00 319.720.000,00 194.972.935.72 360,000,000.00 400,000.O.00 400.000,000.006 3 Shinyanga 105.000,000.00 600.000.000.00 319,720,000.00 506,F11,545.79 360,000.000.00 400,000,000.00 400,000,000.0084 Singlda 1O5.000,000.00 300.00.000 00 319,720.000.00 253,405,772 90 36000.,0000 400,000.000.00 400,000,000.0085 labora 105.000,000.00 - 319,720.000.00 - 360.000.000.00 400.000.0000 W 400.000,ooo.0086 Tanga 105.000.000.00 600,000,0O0.00 319.720.000.00 506.811,545.79 360.000,000.00 400,000,000.00 400,000.000.0087 Kagera 105.000.DOO .00 6.266.503,000.00 319.720,000.00 5,293,226,786.90 360.000,000.00 400.000,000.00 400.000.000.008e Dar es Salaam 105.000.0C0.00 7,897.805.000.00 319,720,000.00 6.671,164,600.69 360,0W,000.00 . 400,000.000.00 400.0O,O000.0089 Rukwa 105,000.000.0 179.458,000.00 319.720.000.00 151.585,643.97 360,000,000.00 400,0,0W .00 . 400.000.000.00
I_______ Total Regions 2,100,000,000.00 27,389,339,000.00 6,394,400,000.00 23,135,388,728.03 7,200,000,000.00 . 8,000,000,000,0 ' ,000,000,000.00 I
Source: The Tanzanian Authorties
Table 21b: Development Expenditure-Regions (in percentage)
199t199 199912000 2000/01 200V02 200MLocal Foreign Local Foreign Local Foreign Local Foreign Local Foreign
70 Arusha 5.0 73 5.0 7.3 5.00 S 5.071 Pwani 5.0 1.6 5.0 1.6 5.0 - 5 O 5.072 Dodoma 5.0 7.7 5 0 7.7 5.0 . 5.0 . 5.073 |rifga 5.O 4.4 5.0 4.4 5.0 S5.0 5.074 Kigoma 5.0 0.7 5.D 0.7 5.0 . 5.0 . 5.D75 Kilmanjaro 5.0 0.0 50 0.0 5.0 5.0 . 5.076 LjrIdi 5.0 1.0 5.0 1.0 5.0 5.0 . 5,077 Mara 5.0 9.4 5.0 9.4 5.0 - 5.0 . 5.070 Mtbeya 5.0 0.5 5.0 0.5 5.0 . 5.0 . 5.079 Morogoro 5.0 3.4 50 3.4 5.0 . 5.0 . 5.080 Mtwara 5.0 2.4 50 2.4 5.0 . 5.0 . 5.081 Mwanoa 5.0 2.9 50 2.9 5.0 5.0 - 5.082 Ruvuma 5.0 0.8 50 0.9 5s. . 5s0 5.083 Shlnyanga 5.0 2.2 50 2.2 5.0 - 5.0 . 5.084 Singida 5.0 1.1 50 1.1 5.0 50 . 5.0d5 Tabora 5.0 0.0 50 0.0 5.0 5.0 . 5.086 Tanga 5.0 2.2 5.0 2.2 5.0 . 5.0 . 5,087 Kagere 5.0 22.9 5.0 22.9 50 . 5.0 . 5.088 Der es Salaam 5.0 28.8 5.0 26.8 5.0 . 5.0 . 5.O89 Riukwa 5.0 0.7 5 0 0.7 5.0 . 5.0 . 5.0
Total Regions 100.0 100.0 100.0 100,0 100.0 100.0 100.0
Source Table 21a
217

Table 22a: Foreign Assistance Cash Flow-____-r______--_____._____ (in Mill. US S.) .
DO Type Budget Projection Projection ProjectionDonor Type 1998/99 1999,00 2000/01 2001/02
ADBIADF Project 23.1 17.33 12.99 9.75BOP Support 40.0 30.00 22.50 16.88
BADEA Project 3.9 2.89 2.17 1.62EU Project 21.6 18.33 12.83 8.98
SOP Support 37.9 26.11 5.00 5.00IDA Project 115.5 86.63 64.97 48.73
BOP Support 40.0 33.00 24.75 21.26KUWAIT FUND Project 1.5 1.16 0.87 0.65OPEC FUND Project 1.5 1.16 0.87 0.65UNDP Project 7.7 7.70 7.70 7.70Total Multilateral 292.7 224.3 154.6 121.2
Project 174.8 135.2 102.4 78.1BOP Support 117.9 89.1 52.3 43.1
BELGIUM Project 4.5 4.47 4.47 4.47CANADA Project 3.9 3.85 3.85 3.85DENMARK Project 33.4 33.42 33.42 33.42
MDF 3.3 3.30 3.30 3.3FINLAND Project 4.2 4.24 4.24 4.24
MDF 5.0 5.00 4.5 3.5GERMANY Project 6.0 6.01 6.01 6.01IRELAND Project 4.6 4.62 4.62 4.62
MDF 2.0 2.00 2.00 1.0JAPAN Project 15.4 15.40 15.40 15.40
CIS 8.0 8.00 6.00 6.00NETHERLANDS Project 13.1 13.09 13.09 13.09
MDF 9.5 9.50 7.13 4.6NORWAY Project 26.7 26.72 26.72 26.72
MDF 2.7 2.7 2.7 2.7SWEDEN Project 36.5 36.50 36.50 36.50
MOF 8.3 6.0 4.0 2.0SWITZERLAND Project 3.9 3.85 3.85 3.85
BOP 6.7 6.00 4.50 3.27UK Project 7.7 7.70 7.70 7.70
SOP 8.0 6.00 4.50 3.90MDF 20.0 17.00 16.50 8.0
USATotal Bilateral 233.4 225.4 215.0 198.2
Project 159.9 159.9 159.9 159.9CIS 8.0 8.0 6.0 6.0BOP 14.7 12.0 9.0 7.2MDF 50.8 45.5 40.1 25.1
Grand Total 526.0 449.6 369.6 319.4Project 334.6 295.0 262.2 237.9CIS 8.0 8.0 6.0 6.0BOP 132.6 101.1 61.3 50.3
Assumptions:Programme assistance Inciuding MDF is assumed to decline by 1S percent from 1998199 base.Foreign loans are projected to decline by 15 percent from 1998/99 base.Project grants are projected to increase by 15 percent each year.Exchange rate: 199912000 is Tshs. 705 per S. 2000/01 is Tshs. 715 per S and year 2001J02 is 720 per S.
Source: The Tanzanian Authorities
218

Table 22b: Foreign Assistance Cash Flow(in percent) _____ _
Donor Type Budget 1998/99 Projection Projection Projection1999/00 2000/01 2001/02
ADB/ADF Project 4.4 3.9 3.5 3.1BOP Support 7.6 6.7 6.1 5.3
BADEA Project 0.7 0.6 0.6 0.'EU Project 4.1 4.1 3.5 2.8
BOP Support 7.2 5._ 1.4 1.6IDA Project 22.0 19.3 17.6 15.3
BOP Support 7.6 7.3 6.7 6.7KUWAIT FUND Project 0.3 0.3 0.2 0.2OPEC FUND Project 0.3 0.3 0.2 0.2UNDP Project I 5 1.7 2.1 2.4Total Multilateral 55.6 49.9 41.8 38.0
Project 33.2 30.1 27.7 24.4BOP Support 22.4 19. 14.1 13.5
BELGIUM Project O.8 I.C 1.2 1.4CANADA Project 0.7 0.9 1.0 1.2DENMARK Project 6.4 7.4 9.0 10.5
MDF 0.6 0.7 0.9 1.0FINLAND Project 0.L 0.9 1.1 1.3
MDF I_ _ .C_ 1.2 1.1GERMANY Project I_.] 1.3 1.6 1.9IRELAND Project 0.9'___ 1.2 1.4
MDF 0.4 0_4 0.5 0.3JAPAN Project 2.9 3.4 4.2 4.8
CIS I_ _ 1._ 1.6 1.9NETHERLANDS Project 2.5 2.9 3.5 4.1
MDF 1_._ 2_.1 1.9 1.4NORWAY Project 5.1 5.9 7.2 8.4
MDF 0.5 0.6 0.7 0.8SWEDEN Project 6.9 8.1 9.9 11.4
MDF 1.6 1.3 1.1 0.6SWITZERLAND Project 0.7 0.9 1.0 1.2
BOP 1.3 1.3 1.2 1.0UK Project 1.5 1.1 2.1 2.4
BOP 1.5 1.3 1.2 1.2I ______________________ MDF 3.8 3.8 4.5 2.5USA 0.0 0.0 0.0 0.0Total Bilateral 44.4 50.1 58.2 62.0
._____________________ Project 30.4 35.6 43.2 50.1CIS 1.5 1.8 1.6 1.9BOP 2.8 2.7 2.4 2.2MDF 9.7 10.1 10.9 7.9
Grand Total 100.0 100.0 100.9 100.0Project 63.6 65.6 70.9 74.5CIS 1.5 1.8 1.6 1.9BOP 25.2 22.5 16.6 15.8
Assumptions:Programme assistance including MDF is assumed to decline by 15 percent from 1998/99 base.Foreign loans are projected to decline by 15 percent from 1998/99 base.Project grants are projected to increase by 15 percent each year.Exchange rate: 1999/2000 is Tshs. 705 per $, 2000/01 is Tshs. 715 per $ and year 2001/02 is 720 per $.Source: Table 22
219

Table 23a: Summary Of Audit Certificates IssuedAccounts and Statements awarded Accounts and Statements awarded Accounts and statements issued anClean Certificate Qualified Certificate Adverse OpinionFY94 FY95 FY96 FY97 Y;94 FY95 FY96 FY97 FY94 FY95 FY96 F97
Total Ministries 46 40 69 48 40 8 24 10 4 if 61 53 55 92 43TotalMinistries(percent) 39.3 33.6 51.1 35.8 42.6 4.8 20.2 7.4 3.0 11.7 52.1 44.5 40,7 61.2 45.7Total Regions 28 24 31 20 0 4 4 8 10 0 43 52 41 46 60Total Regions (percent) 37.3 30.0 38.8 26.3 0 5.3 5.0 10.0 13.2 0 57.0 65.0 51.3 60.5 100Local Authorities (LAs) 6 9 8 20 23 7 8 9 30 20 13 22 23 37 65TotalLAs(percent) 23.1 23.1 20.0 23.0 21.5 26.9 20.5 22.5 34.5 18.6 50.0 56.4 57.5 42.5 59.8
Table 24: Unvouched and Improperly-Vouched ExpendituresYEAR UNVOUCHED IMPROPERLY-VOUCHED TOTAL UNVOUCHED & TOTAL EXP.
IMPROPERLY-VOUCHEDAbsolute Values Percent of Total Absolute Values Percent ol Total Absolute Values Percent of Total
Exp. Exp. Exp.FY94 5,225,000,000 1.87 10,250,000,000 3.67 15,475,000,000 5.54 279,139,409,583FY95 2,788,700,000 0.54 5,609,200,000 1.08 8,397,900,000 1.61 520,752,632,680FY96 1,344,000,000 0.45 13,903,000,000 4.62 15,247,000,000 5.07 300.791,759,110
FY97 6,005,000,000 1.60 25,676,000,000 6.84 31,68t,000,000 8.44 375,291,200,370
FY98 5,464,849,265 1.06 40,363,465,604 7.80 45,828,314,869 8.85 517682490317
TABLE 25: Cash and Stores Losses (in TSh)YEAR TOTAL EXPENDITURE TOTAL LOSS OF CASH AND STORES TOTAL LOSS AS PERCENT OF TOTAL
EXPENDITUREF;Y94 279,139,409,583 787,477,521 0.28FY95 520,752,632,680 301,508,742 0.06FY96 300,791,759,110 72,960,000 0.02FIY97 375,291,200,370 971,000,000 0.26FY98 517,682,490,317 751,151,042 0.15
220

Table 26: Summary of Excess and Saving (FY94-FY98)ExcessMINISTRIES/DEPT Recurrent DevelopmentAND REGIONS FY94 FY95 FY96 FY97 FY98 FY94 FY95 FY96 FY97 FY98
TFOTAL MINISTRIES 7.252.813,726 231,660,281 13,753,752,829 3,939,311,177 1,996,893 1,482,172,148 495,717,400 91,627,%8
TOTAL REGIONS 2.073,135,528 1,053,361,504 197.277,935 16,697,877 3,634,386 674,583,542
GRANT) TO'TAIL 9,325,949,254 1,285,021,785 13,753.752.829 197.277,935 3,956,009,054 5,631,279 1,482.172.148 495,717,400 91,629,768 674,583,542
SavdingRecurTent DevelopnsentFY94 FY95 FY96 FY97 FY98 FY94 FY95 FY96 FY97 FY98
TOTAL MINISTRIES 744,473,926 7,974,082,682 33,615,424,377 56,929,568,019 42,293,204,841 49,482,765,434 83,480,905,337 98,358.808,804 70,140,688,278 188,792,388,216
TOTAL REGIONS 47,135,447 1.745,0S1,589 S.713,193,045 1,453.556,604 665,075,203 2,901,945,10S 7,140,424,291 17,983,182,827 8,787,275,582 17,012,093,826
GTRAND TOTAL 792.209,373 9,719,164,271 42,328,618,422 58,383,129,623 44,958,280,044 52,384,510,542 90,621,229,628 116,341,991,631 78,927,963,860 205,804,42,042
Table 27: Summary of Queries Issued and Percentages Replied and Not RcpliedFV94 FY95 FY96 FY97 FY98
MIflNISTRIES/DEP NO. OF NOT REPLILI) NO. ()F NOT REPLIED NO. OF NOT EPLIED NO. OF NOT REPLIED NO. OF NOT REPLIED
AND REGIONS QUERIES REPLIED (percent) QUERIES REPLIED (percent) QUERIES REPLIED (percent) QUERIES REPLIED (percent) QUERIES REP]IED (percent)
(percent) (percent) (percent) (percent) (percent)
TOTAL 3266 91.2 8.8 2338 86.0 14.0 1790 92.2 7.8 1640 90.1 9.9 1824.0 80.9 19.1
MINISTRIESTOTALREGIONS 2954 84.5 15.5 2424 84.2 15.8 1590 92.5 7.5 1434 90.2 9.8 1265.0 96.8 3.2
GR.ANDTOTAI. 6220 88.0 12.0 4762 85.1 14.9 3330 92.3 7.7 3074 90.1 9.9 3089.0 874 12.6
Table 28: ESSENTIAL ITEMS FOR PRIORITY SECTORS- FY00tVOTE SUBVOTE ITEM DESCRIPTION P.E. O.C. TOTAL
1. BASIC EDUCATION:70-S9 101 ** all O.C .Subvention to Local Authorities 79,607,472,000 11,106,720,30(0 90,714,192,300
70-89 204 2012 Examination expenses in the RAS budget 92,314,600 555,947,400 648,262,00046 301 all MoEC - Basic Educ.Subvote O.C. 58,368,700 10,282.800 68,651,50046 501 all MoEC - Teacher Educ.Subvote O.C. 1,890,973,200 860,975,500 2,751,948,70046 202 all MoEC - 75% of lInspectorate Subvote O.C. 541,730,800 241,118,200 782,849,000
46 2201 30630 Subvention to Institute of Addult Education 413,812,700 2,966,0)00 416,778,70046 101 30625 Subvention to Nat. Examination Council 241,509,500 529,000,000 770,509,50067 all all 75% of TSC O.C. 51,52 1,500 1 14,016,700 165,538,200Total Basic Education 82,897,703,000 13,421,026,900 96,318,729,900
2. PRIMARY HEALTH:170-89 1101** all O.C.Subvention to LocalAuthorities 114,503,602,400 | 2,628,028,800 |17,131,631,200j52 1201 [1709 _ l.ocal Authorities drugs allocation (kits)
221

budgeted under Moll 6,600,000.(000 6.600,000,00052 301 all MoH Preventive Subvote O.C. 311,613,500 3,637,0 11,100 3,948,624,60070-89 302 all [Regions Preventive Subvote O.C. 197,546,400 903,278,900 11,100,825,300Total Primary Health 15,012,762,300 13,768,318,800 28,781,081,1003. WATER
49 401 all MoWater O.C. 1,802,120,900 1,001,704,400 2,803,825,30070-89 204 1803/181 Regions O.C. items 18,462,900 56,680,300 75,143,200
Total Water 3,228,963,600 2,123,482,400 5,352,446,0004. RURAL ROADS70-89 101 all O.CSubveion to Local Authorities 880,213,900 360,686,300 1,240,900,20056 [202 2301 Road Fund budgeted for Districts - 13,988,700,000 13,988,700,00047 701 all MoW -Rural Roads Subvote O.C. 356,351,000 7,329,900 363,680,900Total Rural Roads 1,236,564,900 14,356,716,200 15,593,281,1005. JUJDICIARY
140 [all jall 1AII O.C. un(der Judiciary Department 14,034,703,600 13,912,649,600 17,947,353,2006. AGRICULTURE RESEARCH AND EXTENSION43 301 all MoA - Research Development Subvote 654,157,500 774,550,000 1.428,707,500
O.C.
43 201 all MoA - Crops Development Suibvote O.C. 3,350,707,800 1,961,588,900 5,312,296,70043 401 all MoA - Cooperative Development Subvote 402,098,000 1,330,043,100J 1,732,141,100
O.C.43 601 all MoA - Livestock Devt. Subvote O.C. 2,506,087,700 686,866,600 3,192,954,300Total Agriculture Research and Extension 6,913,051,000 4,753,048,600 11,666,099,6007. HIV/AIDSI _ _
Total Priority Sectors 113,323,748,400 52,335,242,500 165,658,990,900* MoF to look into mechanism that will ensure easy veritication of allocation fo r HIV/AIDS in the year FY01 budget.** Breakdown for subvention to Local Authorities is found in Appendices to Volume III of Estimate Book.
222