FewNLU: Benchmarking State-of-the-Art Methods for Few ...
16
Proceedings of the 60th Annual Meeting of the Association for Computational Linguistics Volume 1: Long Papers, pages 501 - 516 May 22-27, 2022 c 2022 Association for Computational Linguistics FewNLU: Benchmarking State-of-the-Art Methods for Few-Shot Natural Language Understanding Yanan Zheng * 12 , Jing Zhou * 1 , Yujie Qian 3 , Ming Ding 1 , Chonghua Liao 1 Jian Li 1 , Ruslan Salakhutdinov 4 , Jie Tang †12 , Sebastian Ruder † 5 , Zhilin Yang †16 1 Tsinghua University, 2 BAAI, 3 MIT CSAIL, 4 Carnegie Mellon University, 5 Google Research, 6 Shanghai Qi Zhi Institute {zyanan, jietang, zhiliny}@tsinghua.edu.cn, [email protected], [email protected] Abstract The few-shot natural language understanding (NLU) task has attracted much recent attention. However, prior methods have been evaluated under a disparate set of protocols, which hin- ders fair comparison and measuring progress of the field. To address this issue, we intro- duce an evaluation framework that improves previous evaluation procedures in three key aspects, i.e., test performance, dev-test corre- lation, and stability. Under this new evalua- tion framework, we re-evaluate several state- of-the-art few-shot methods for NLU tasks. Our framework reveals new insights: (1) both the absolute performance and relative gap of the methods were not accurately estimated in prior literature; (2) no single method domi- nates most tasks with consistent performance; (3) improvements of some methods diminish with a larger pretrained model; and (4) gains from different methods are often complemen- tary and the best combined model performs close to a strong fully-supervised baseline. We open-source our toolkit, FewNLU, that imple- ments our evaluation framework along with a number of state-of-the-art methods. 12 1 Introduction Few-shot learning for natural language understand- ing (NLU) has been significantly advanced by pretrained language models (PLMs; Brown et al., 2020; Schick and Schütze, 2021a,b). With the goal of learning a new task with very few (usually less than a hundred) samples, few-shot learning benefits from the prior knowledge stored in PLMs. Various few-shot methods based on PLMs and prompting have been proposed (Liu et al., 2021b; Menon et al., 2021; Gao et al., 2020). * The authors have contributed equally to this work. † Corresponding Authors. 1 Leaderboard: https://fewnlu.github.io 2 Code available at https://github.com/THUDM/ FewNLU Although the research of few-shot NLU is devel- oping rapidly, the lack of a standard evaluation protocol has become an obstacle hindering fair comparison between various methods on a com- mon ground and measuring progress of the field. While some works (Schick and Schütze, 2021b; Menon et al., 2021) experimented with a fixed set of hyper-parameters, prior work (Perez et al., 2021; Zhang et al., 2020) noted that such a setting might be exposed to the risk of overestimation . 3 Other works (Liu et al., 2021b; Gao et al., 2020; Perez et al., 2021) proposed to use a small development set to select hyper-parameters, but their evaluation protocols vary in a few key aspects (e.g., how to construct data splits), which in fact lead to large differences as we will show (in Section 4.2). The above phenomena highlight the need for a com- mon protocol for the evaluation of few-shot NLU methods. However, the fact that few-shot learn- ing is extremely sensitive to subtle variations of many factors (Dodge et al., 2020; Gao et al., 2020) poses challenges for designing a solid evaluation protocol. In this work, aiming at addressing the aforemen- tioned challenge, we propose an evaluation frame- work for few-shot NLU. The evaluation framework consists of a repeated procedure—selecting a hyper- parameter, selecting a data split, training and eval- uating the model. To set up a solid evaluation framework, it is crucial to specify a key design choice—how to construct data splits for model se- lection. We conduct a comprehensive set of ex- periments to answer the question. Specifically, we propose a “Multi-Splits” strategy, which randomly splits the available labeled samples into training and development sets multiple times, followed by aggregating the results from each data split. We show that this simple strategy outperforms several 3 This is because the fixed hyper-parameters are selected according to practical considerations, which are informed by the test set performance from previous evaluations. 501
-
Upload
khangminh22 -
Category
Documents
-
view
1 -
download
0
Transcript of FewNLU: Benchmarking State-of-the-Art Methods for Few ...

Proceedings of the 60th Annual Meeting of the Association for Computational LinguisticsVolume 1: Long Papers, pages 501 - 516
May 22-27, 2022 c©2022 Association for Computational Linguistics
FewNLU: Benchmarking State-of-the-Art Methodsfor Few-Shot Natural Language Understanding
Yanan Zheng∗12, Jing Zhou∗1, Yujie Qian3, Ming Ding1, Chonghua Liao1
Jian Li1, Ruslan Salakhutdinov4, Jie Tang†12, Sebastian Ruder† 5, Zhilin Yang†161Tsinghua University, 2BAAI, 3MIT CSAIL,
4Carnegie Mellon University, 5Google Research, 6Shanghai Qi Zhi Institute{zyanan, jietang, zhiliny}@tsinghua.edu.cn,
[email protected], [email protected]
Abstract
The few-shot natural language understanding(NLU) task has attracted much recent attention.However, prior methods have been evaluatedunder a disparate set of protocols, which hin-ders fair comparison and measuring progressof the field. To address this issue, we intro-duce an evaluation framework that improvesprevious evaluation procedures in three keyaspects, i.e., test performance, dev-test corre-lation, and stability. Under this new evalua-tion framework, we re-evaluate several state-of-the-art few-shot methods for NLU tasks.Our framework reveals new insights: (1) boththe absolute performance and relative gap ofthe methods were not accurately estimated inprior literature; (2) no single method domi-nates most tasks with consistent performance;(3) improvements of some methods diminishwith a larger pretrained model; and (4) gainsfrom different methods are often complemen-tary and the best combined model performsclose to a strong fully-supervised baseline. Weopen-source our toolkit, FewNLU, that imple-ments our evaluation framework along with anumber of state-of-the-art methods. 1 2
1 Introduction
Few-shot learning for natural language understand-ing (NLU) has been significantly advanced bypretrained language models (PLMs; Brown et al.,2020; Schick and Schütze, 2021a,b). With the goalof learning a new task with very few (usually lessthan a hundred) samples, few-shot learning benefitsfrom the prior knowledge stored in PLMs. Variousfew-shot methods based on PLMs and promptinghave been proposed (Liu et al., 2021b; Menon et al.,2021; Gao et al., 2020).
∗The authors have contributed equally to this work.†Corresponding Authors.
1Leaderboard: https://fewnlu.github.io2Code available at https://github.com/THUDM/
FewNLU
Although the research of few-shot NLU is devel-oping rapidly, the lack of a standard evaluationprotocol has become an obstacle hindering faircomparison between various methods on a com-mon ground and measuring progress of the field.While some works (Schick and Schütze, 2021b;Menon et al., 2021) experimented with a fixed setof hyper-parameters, prior work (Perez et al., 2021;Zhang et al., 2020) noted that such a setting mightbe exposed to the risk of overestimation .3 Otherworks (Liu et al., 2021b; Gao et al., 2020; Perezet al., 2021) proposed to use a small developmentset to select hyper-parameters, but their evaluationprotocols vary in a few key aspects (e.g., how toconstruct data splits), which in fact lead to largedifferences as we will show (in Section 4.2). Theabove phenomena highlight the need for a com-mon protocol for the evaluation of few-shot NLUmethods. However, the fact that few-shot learn-ing is extremely sensitive to subtle variations ofmany factors (Dodge et al., 2020; Gao et al., 2020)poses challenges for designing a solid evaluationprotocol.
In this work, aiming at addressing the aforemen-tioned challenge, we propose an evaluation frame-work for few-shot NLU. The evaluation frameworkconsists of a repeated procedure—selecting a hyper-parameter, selecting a data split, training and eval-uating the model. To set up a solid evaluationframework, it is crucial to specify a key designchoice—how to construct data splits for model se-lection. We conduct a comprehensive set of ex-periments to answer the question. Specifically, wepropose a “Multi-Splits” strategy, which randomlysplits the available labeled samples into trainingand development sets multiple times, followed byaggregating the results from each data split. Weshow that this simple strategy outperforms several
3This is because the fixed hyper-parameters are selectedaccording to practical considerations, which are informed bythe test set performance from previous evaluations.
501

baseline strategies in three dimensions: (1) the testset performance of the selected hyper-parameters;(2) correlation between development set and truetest set performance; and (3) robustness to hyper-parameter settings.
We then take a step further to re-evaluate recentstate-of-the-art few-shot NLU methods under thiscommon evaluation framework. Our re-evaluationleads to several key findings summarized in Sec-tion 2.
To aid reproducing our results and benchmarkingfew-shot NLU methods, we open-source FewNLU,a toolkit that contains implementations of a numberof state-of-the-art methods, data processing utili-ties, as well as our proposed evaluation framework.
To sum up, our contributions are as follows.1. We introduce a new evaluation framework of
few-shot NLU. We propose three desiderata offew-shot evaluation and show that our frame-work outperforms previous ones in these aspects.Thus our framework allows for more reliablecomparison of few-shot NLU methods.
2. Under the new evaluation framework, we bench-mark the performance of recent methods indi-vidually as well as the best performance witha combined approach. These benchmarks re-flect the current state of the art and will serve asimportant baselines for future research.
3. Throughout our exploration, we arrive at severalkey findings summarized in Section 2.
4. We open-source a toolkit, FewNLU, to facilitatefuture research with our framework.
2 Summary of Findings
For reference, we collect our key findings here anddiscuss each of them throughout the paper.
Finding 1. Our proposed Multi-Splits is a morereliable data-split strategy than several baselineswith improvements in (1) test performance, (2) cor-relation between development and test sets, and (3)stability w.r.t. the number of runs.
Finding 2. The absolute performance and the rela-tive gap of few-shot methods were in general notaccurately estimated in prior literature. It highlightsthe importance of evaluation for obtaining reliableconclusions. Moreover, the benefits of some few-shot methods (e.g., ADAPET) decrease on largerpretrained models.
Finding 3. Gains of different methods are largelycomplementary. A combination of methods largely
outperforms individual ones, performing close to astrong fully-supervised baseline with RoBERTa.
Finding 4. No single few-shot method dominatesmost NLU tasks. This highlights the need for thedevelopment of few-shot methods with more con-sistent and robust performance across tasks.
3 Related Work
The pretraining-finetuning paradigm (Howard andRuder, 2018) shows tremendous success in few-shot NLU tasks. Various methods have been devel-oped such as [CLS] classification (Devlin et al.,2018), prompting-based methods with discreteprompts (Schick and Schütze, 2021b; Gao et al.,2020) or continuous prompts (Liu et al., 2021b;Shin et al., 2020; Li and Liang, 2021; Lester et al.,2021), and methods that calibrate the output distri-bution (Yang et al., 2021; Zhao et al., 2021).
The fact that few-shot learning is sensitive tomany factors and thus is extremely unstable (Liuet al., 2021a; Lu et al., 2021; Zhang et al., 2020;Dodge et al., 2020) increases the difficulty of few-shot evaluation. Several works address evaluationprotocols to mitigate the effects of instability: Gaoet al. (2020) and Liu et al. (2021b) adopt a held-outset to select models. Perez et al. (2021) proposedK-fold cross-validation and minimum descriptionlength evaluation strategies. Our work differs fromthese works on few-shot evaluation in several as-pects: (1) we propose three metrics to evaluate datasplit strategies; (2) while most prior work proposedevaluation protocols without justification, we con-duct comprehensive experiments to support our keydesign choice; (3) we formulate a general evalu-ation framework; (4) our re-evaluation under theproposed framework leads to several key findings.
Though there have been a few existing few-shotNLP benchmarks, our work is quite different interms of the key issues addressed. FLEX (Bragget al., 2021) and CrossFit (Ye et al., 2021) stud-ied principles of designing tasks, datasets, andmetrics. FewGLUE (Schick and Schütze, 2021b)is a dataset proposed for benchmarking few-shotNLU. CLUES (Mukherjee et al., 2021) pays at-tention to the unified format, metric, and the gapbetween human and machine performance. Whilethe aforementioned benchmarks focus on “whatdata to use” and “how to define the task”, our workdiscussed “how to evaluate” which aims at estab-lishing a proper evaluation protocol for few-shotNLU methods. Since FewNLU is orthogonal to the
502
aforementioned prior work, it can also be employedon the data and tasks proposed in previous work.
4 Evaluation Framework
Formally, for a few-shot NLU task, we have a smalllabeled set Dlabel = {(xi, yi)}Ni and a large test setDtest = {(xtest
i , ytesti )}i where N is the number of
labeled samples, xi is a text input (consisting ofone or multiple pieces), and yi ∈ Y is a label. Thegoal is to finetune a pretrained model with Dlabel toobtain the best performance on Dtest. An unlabeledset Dunlab = {xunlab
i }i may additionally be used bysemi-supervised few-shot methods (§5.1).
4.1 Formulation of Evaluation Framework
Our preliminary results (in Appendix §A.1) showthat using a fixed set of hyper-parameters (Schickand Schütze, 2021a,b) is sub-optimal, and model se-lection is required. It motivates us to study a morerobust evaluation framework for few-shot NLU.The goal of an evaluation framework is twofold:(1) benchmarking few-shot methods for NLU taskssuch that they can be fairly compared and evalu-ated; and (2) obtaining the best few-shot perfor-mance in practice. In light of the two aspects, wepropose the few-shot evaluation framework in Al-gorithm 1.
The framework searches over a hyper-parameterspace H to evaluate a given few-shot method M ,obtaining the best hyper-parameter setting h? andits test set results. 4 The measurement for each his estimated by performing training and evaluationon multiple data splits (obtained by splitting Dlabelaccording to a strategy) and reporting their averagedev set results. Finally, the method is evaluatedon Dtest using the checkpoints corresponding toh?. For benchmarking, we report the average andstandard deviation over multiple test set results.Otherwise, that is, to achieve a model with thebest practical performance, we re-run on the entireDlabel with h?.
The framework requires specifying a key designchoice—how to construct the data splits, which wewill discuss in §4.2.
4For simplicity and ease of use, we use grid search forsearching the hyper-parameter space H and identify criticalhyper-parameters to limit its size. More complex search meth-ods such as Bayesian Optimization (Snoek et al., 2012) couldbe used to search over larger hyper-parameter spaces.
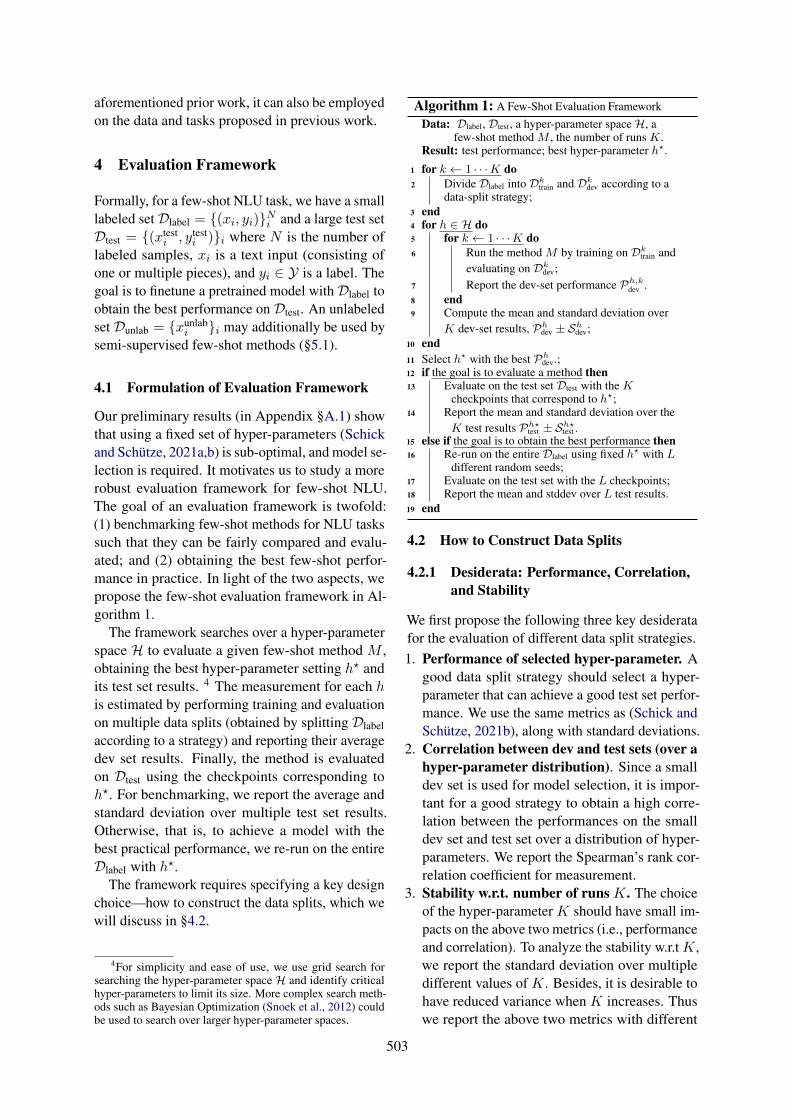
Algorithm 1: A Few-Shot Evaluation FrameworkData: Dlabel, Dtest, a hyper-parameter spaceH, a
few-shot method M , the number of runs K.Result: test performance; best hyper-parameter h?.
1 for k ← 1 · · ·K do2 Divide Dlabel into Dk
train and Dkdev according to a
data-split strategy;3 end4 for h ∈ H do5 for k ← 1 · · ·K do6 Run the method M by training on Dk
train andevaluating on Dk
dev;7 Report the dev-set performance Ph,k
dev .8 end9 Compute the mean and standard deviation over
K dev-set results, Phdev ± Sh
dev;10 end11 Select h? with the best Ph
dev.;12 if the goal is to evaluate a method then13 Evaluate on the test set Dtest with the K
checkpoints that correspond to h?;14 Report the mean and standard deviation over the
K test results Ph?test ± Sh?
test .15 else if the goal is to obtain the best performance then16 Re-run on the entire Dlabel using fixed h? with L
different random seeds;17 Evaluate on the test set with the L checkpoints;18 Report the mean and stddev over L test results.19 end
4.2 How to Construct Data Splits
4.2.1 Desiderata: Performance, Correlation,and Stability
We first propose the following three key desideratafor the evaluation of different data split strategies.1. Performance of selected hyper-parameter. A
good data split strategy should select a hyper-parameter that can achieve a good test set perfor-mance. We use the same metrics as (Schick andSchütze, 2021b), along with standard deviations.
2. Correlation between dev and test sets (over ahyper-parameter distribution). Since a smalldev set is used for model selection, it is impor-tant for a good strategy to obtain a high corre-lation between the performances on the smalldev set and test set over a distribution of hyper-parameters. We report the Spearman’s rank cor-relation coefficient for measurement.
3. Stability w.r.t. number of runs K. The choiceof the hyper-parameter K should have small im-pacts on the above two metrics (i.e., performanceand correlation). To analyze the stability w.r.t K,we report the standard deviation over multipledifferent values of K. Besides, it is desirable tohave reduced variance when K increases. Thuswe report the above two metrics with different
503

values of K and the standard deviation of testscores over K runs.
4.2.2 Data Split StrategiesWe consider several data split strategies. Some areproposed by previous work, including K-fold crossvalidation (CV) (Perez et al., 2021), minimum de-scription length (MDL) (Perez et al., 2021), andbagging (BAG) (Breiman, 1996). We also considertwo simple strategies worth exploring, includingrandom sampling (RAND) and model-informedsplitting (MI). And we propose a new data splitstrategy, Multi-Splits (MS). Besides, we also ex-periment a special case of CV when K equals thenumber of labeled sample, which is leave-of-outcross validation (LOOCV). Since LOOCV takesmuch longer time and suffers from efficiency prob-lem, we only experimented on several tasks andleft the results in Appendix A.2.4. They all fit intothe pipeline of the proposed framework in §4.1:1. K-fold CV equally partitions Dlabel into K
folds. Each time, it uses the kth fold for vali-dation and the other K − 1 folds for training.
2. MDL assigns half of Dlabel as the joint trainingdata and equally partitions the other half into Kfolds. Each time, it uses the kth fold for vali-dation, and all its previous k − 1 folds togetherwith the joint training data for training.
3. Bagging samples N × r (r ∈ (0, 1] is a fixed ra-tio) examples with replacement from the labeledsample as the training set, leaving samples thatdo not appear in the train set for validation.
4. Random Sampling performs random samplingwithout replacement from Dlabel twice, respec-tively sampling N × r and N × (1− r) data asthe training and development sets.
5. Model-Informed Splitting computes represen-tations of each labeled example using a model,and clusters them into two distinct sets, respec-tively as the training and development sets. 5
6. Multi-Splits randomly splits Dlabel into trainingand development sets using a fixed split ratio r.Essentially, these data split strategies differ in
several key aspects.1. For CV and MDL, K controls the number of
runs and the split ratio. For Multi-Splits, BAGand RAND, the split ratio is decoupled from Kand is controlled by r. For MI, the split ratio andnumber of runs depend on Dlabel.
5Specifically, we used a BERT-Base model to encode dataand take the [CLS] representations.
#Train #Dev
CV (K − 1)×N/K N/KMDL N/2 + N(k − 1)/(2K) N/(2K)BAG N × r > (N × (1− r))RAND N × r N × (1− r)Multi-Splits N × r N × (1− r)
Table 1: Number of examples of training and develop-ment sets for different strategies. N : number of labeleddata, K: number of runs, k: the kth split for MDL; r:split ratio. MI is omitted since its number of examplesdepends on the dataset.
2. They use a different amount of data for trainingand development sets as Table 1 shows.
3. There are cases when CV and MS share the samesplit ratio. The difference is that MS allowsoverlap between splits while CV does not.
4. BAG allows duplicated training data, whileRAND and Multi-Splits do not. The trainingand development sets do not overlap for BAGand Multi-Splits but overlap for RAND.In the limit, our Multi-Splits is similar to leave-
P -out cross-validation (LPOCV; Celisse, 2014)6
where LPOCV runs(NP
)times (P is the number
of dev set examples) while Multi-Splits runs Ktimes. As K increases, Multi-Splits gradually ap-proaches LPOCV. Since it is impossible to enumer-ate the large number of possible splits in practice,Multi-Splits can be viewed as a practical versionof LPOCV. Compared to the strategy of (Gao et al.,2020) that uses multiple datasets, our Multi-Splitsuses multiple data splits for a single dataset. Itis thus more practical as in real-world scenarios,it is hard to obtain multiple labeled datasets fora true few-shot problem; otherwise, it could beformulated as a fully-supervised learning problem.The strategy in (Liu et al., 2021b) is a special caseof Multi-Splits when K = 1, which suffers fromhigher variance.
4.2.3 Experimental SetupTo evaluate different data split strategies, we exper-iment on the FewGLUE benchmark (Schick andSchütze, 2021b). We evaluate strategies based onthe widely used prompt-based few-shot methodPET (Schick and Schütze, 2021b) with DeBERTaas the base model.7 We run experiments on thesame tasks with the same hyper-parameter space
6Leave-P -out cross-validation uses P data examples asthe development set and the remaining data examples as thetraining set. This is repeated on all ways to cut the labeleddataset in a development set and a training set.
7We fixed the parameters of DeBERTa’s bottom one-thirdlayers due to GPU memory limitations, which did not affectthe performance much in our preliminary experiments.
504

BoolQ RTE WiC CB MultiRC WSC COPA Avg.Acc. Acc. Acc. Acc. F1 F1a EM. Acc. Acc
CV 82.71 ±1.29 77.80 ±2.25 64.42 ±1.63 90.18 ±2.31 87.52 ±2.20 80.08 ±1.15 45.02 ±1.46 82.45 ±3.71 92.25 ±1.71 78.72MDL 76.43 ±7.12 83.94 ±1.49 63.68 ±3.38 84.38 ±5.13 82.03 ±5.69 77.63 ±1.20 43.81 ±1.32 81.49 ±3.95 89.50 ±3.32 77.00BAG 81.77 ±1.48 77.98 ±1.56 65.56 ±3.26 87.50 ±6.90 77.15 ±13.76 79.62 ±1.26 43.60 ±1.98 85.34 ±2.87 88.75 ±3.10 77.62RAND 78.79 ±5.40 82.13 ±0.91 59.60 ±3.89 86.16 ±3.05 74.04 ±12.94 80.14 ±2.20 44.88 ±4.45 84.38 ±2.99 90.75 ±3.59 76.89MI 78.25 ±1.59 77.35 ±4.06 64.66 ±1.48 88.84 ±1.71 84.75 ±4.32 76.75 ±0.44 40.95 ±0.10 83.41 ±6.00 78.75 ±8.06 75.44
MS 82.67 ±0.78 79.42 ±2.41 67.20 ±1.34 91.96 ±3.72 88.63 ±4.91 78.20 ±1.86 42.42 ±3.04 84.13 ±4.87 89.00 ±2.94 79.00
Table 2: Test performance of different data-split strategies with PET on FewGLUE (K=4).Larger scores means thestrategy effectively selects a model that achieves better test set performance.
BoolQ RTE WiC CB MultiRC WSC COPA Avg.CV -0.0497 0.8561 0.8184 0.5286 0.2283 0.1507 0.5668 0.4427MDL -0.1143 0.7806 0.6326 0.3274 0.1910 0.1278 0.6342 0.3685BAG 0.5533 0.8714 0.9572 0.6809 0.6340 0.2550 0.7491 0.6716RAND 0.7453 0.7602 0.8048 0.6764 0.3253 0.0795 0.9004 0.6131MI 0.5651 0.6832 0.7780 0.6618 0.6651 0.0200 0.5902 0.5662
MS 0.7079 0.8266 0.9464 0.7558 0.4983 0.3986 0.8997 0.7190
Table 3: Correlation results of different data-split strategies with PET on FewGLUE (K=4). Larger values meansthe strategy is better at selecting the best test results using dev sets.
to ensure a fair comparison; in this experimentwe search learning rate, evaluation ratio, promptpattern and maximum training step. More experi-mental details are in Appendix A.2.
4.2.4 Main Results and AnalysisTable 2, Table 3 and Figure 1 show the main resultswith 64 labeled samples.
It is noteworthy that we also experimented with32 labeled samples and have observed that varyingthe number of labeled examples does not affect thefollowing conclusion (see Appendix A.2).Test Performance and Correlation. From bothTable 2 and Table 3, we find that Multi-Splitsachieves the best average test set performance aswell as the best average correlation among all strate-gies. We analyze them as follows:8
1. Multi-Splits uses fewer labeled samples for train-ing (i.e., 128) while CV and MDL use more (i.e.,192 and 176). Despite using more training data,both CV and MDL do not perform better. Thisindicates few-shot performance is limited by notbeing able to select the best model rather thannot having sufficient training data. Both CV andMDL use fewer data for validation (i.e., 64 and32) than Multi-Splits (i.e., 128), thus leading topoor correlation.
2. Although Multi-Splits and BAG use the samenumber of training data (i.e., 128), there could beduplication in the training set of BAG, making it
8In the following explanation, the numbers refer to thetotal training/development data covering K=4 runs.
2 4 8 16
0.40.20.00.20.40.6
Correlation on BoolQ
2 4 8 16
0.6
0.8
Correlation on RTE
2 4 8 16
0.50
0.75
Correlation on COPA
2 4 8 160.74
0.78
0.82
Performance on BoolQ
2 4 8 160.72
0.76
0.80
0.84Performance on RTE
2 4 8 16
0.86
0.88
0.90
Performance on COPA
2 4 8 16
2
4
6
Test STD on BoolQ
2 4 8 16
2.5
5.0
7.5
Test STD on RTE
2 4 8 16
2
4
6
Test STD on COPA
CV MDL Multi-Splits
Figure 1: Test performance, correlation and standarddeviation along with different K on BoolQ, RTE, andCOPA tasks under different strategies. A smooth andstable dot-line indicates the setting is insensitive to thechoice of K.
poor in diversity and further leading to lower testperformance, compared to Multi-Splits. This in-dicates diversity of training sets is crucial whenconstructing few-shot data splits.
3. RAND uses similar-sized dev and train sets toBAG and MS but performs worse in test perfor-mance. Since there could be overlap betweentrain and dev sets, the model may have memo-rized data, leading to poor test performance.
4. MI constructs very different train and dev sets.Overfitting on one of them and validating onthe other pose more challenges for the few-shotmethod on out-of-distribution tasks.
Stability w.r.t. the number of runs K. Figure 1shows the results on stability. In light of limitedcomputation resources, we only experiment with
505
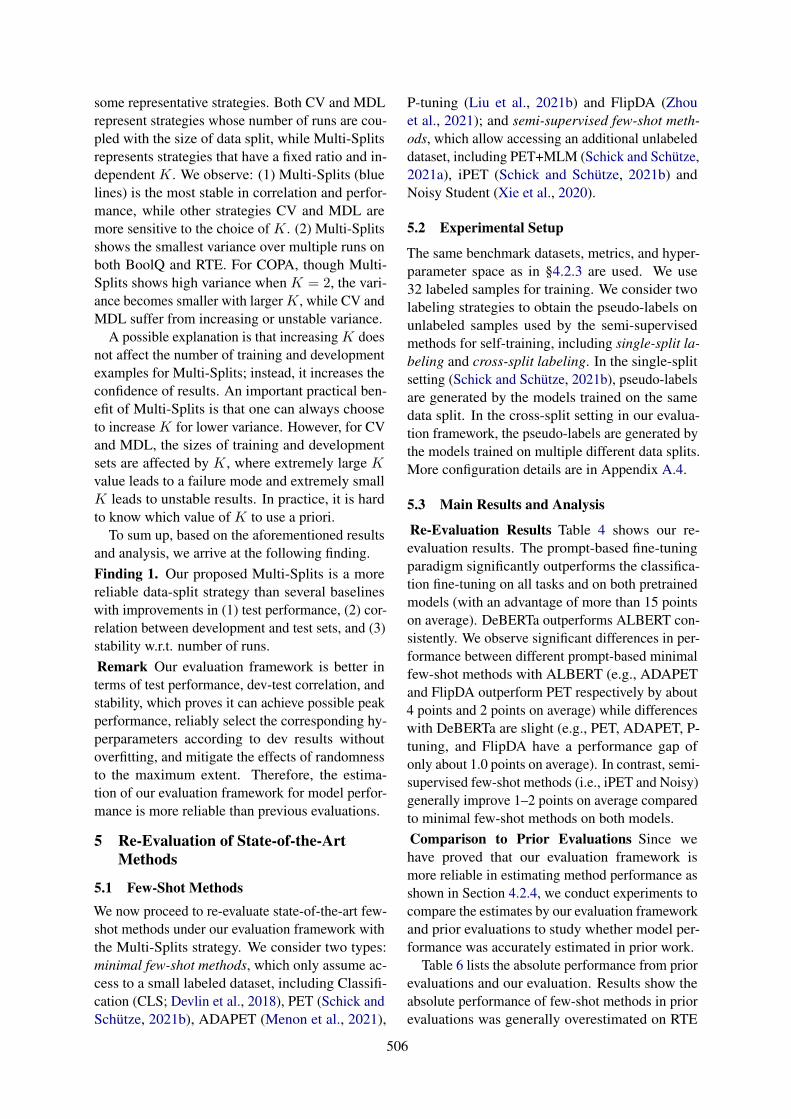
some representative strategies. Both CV and MDLrepresent strategies whose number of runs are cou-pled with the size of data split, while Multi-Splitsrepresents strategies that have a fixed ratio and in-dependent K. We observe: (1) Multi-Splits (bluelines) is the most stable in correlation and perfor-mance, while other strategies CV and MDL aremore sensitive to the choice of K. (2) Multi-Splitsshows the smallest variance over multiple runs onboth BoolQ and RTE. For COPA, though Multi-Splits shows high variance when K = 2, the vari-ance becomes smaller with larger K, while CV andMDL suffer from increasing or unstable variance.
A possible explanation is that increasing K doesnot affect the number of training and developmentexamples for Multi-Splits; instead, it increases theconfidence of results. An important practical ben-efit of Multi-Splits is that one can always chooseto increase K for lower variance. However, for CVand MDL, the sizes of training and developmentsets are affected by K, where extremely large Kvalue leads to a failure mode and extremely smallK leads to unstable results. In practice, it is hardto know which value of K to use a priori.
To sum up, based on the aforementioned resultsand analysis, we arrive at the following finding.Finding 1. Our proposed Multi-Splits is a morereliable data-split strategy than several baselineswith improvements in (1) test performance, (2) cor-relation between development and test sets, and (3)stability w.r.t. number of runs.Remark Our evaluation framework is better interms of test performance, dev-test correlation, andstability, which proves it can achieve possible peakperformance, reliably select the corresponding hy-perparameters according to dev results withoutoverfitting, and mitigate the effects of randomnessto the maximum extent. Therefore, the estima-tion of our evaluation framework for model perfor-mance is more reliable than previous evaluations.
5 Re-Evaluation of State-of-the-ArtMethods
5.1 Few-Shot MethodsWe now proceed to re-evaluate state-of-the-art few-shot methods under our evaluation framework withthe Multi-Splits strategy. We consider two types:minimal few-shot methods, which only assume ac-cess to a small labeled dataset, including Classifi-cation (CLS; Devlin et al., 2018), PET (Schick andSchütze, 2021b), ADAPET (Menon et al., 2021),
P-tuning (Liu et al., 2021b) and FlipDA (Zhouet al., 2021); and semi-supervised few-shot meth-ods, which allow accessing an additional unlabeleddataset, including PET+MLM (Schick and Schütze,2021a), iPET (Schick and Schütze, 2021b) andNoisy Student (Xie et al., 2020).
5.2 Experimental Setup
The same benchmark datasets, metrics, and hyper-parameter space as in §4.2.3 are used. We use32 labeled samples for training. We consider twolabeling strategies to obtain the pseudo-labels onunlabeled samples used by the semi-supervisedmethods for self-training, including single-split la-beling and cross-split labeling. In the single-splitsetting (Schick and Schütze, 2021b), pseudo-labelsare generated by the models trained on the samedata split. In the cross-split setting in our evalua-tion framework, the pseudo-labels are generated bythe models trained on multiple different data splits.More configuration details are in Appendix A.4.
5.3 Main Results and Analysis
Re-Evaluation Results Table 4 shows our re-evaluation results. The prompt-based fine-tuningparadigm significantly outperforms the classifica-tion fine-tuning on all tasks and on both pretrainedmodels (with an advantage of more than 15 pointson average). DeBERTa outperforms ALBERT con-sistently. We observe significant differences in per-formance between different prompt-based minimalfew-shot methods with ALBERT (e.g., ADAPETand FlipDA outperform PET respectively by about4 points and 2 points on average) while differenceswith DeBERTa are slight (e.g., PET, ADAPET, P-tuning, and FlipDA have a performance gap ofonly about 1.0 points on average). In contrast, semi-supervised few-shot methods (i.e., iPET and Noisy)generally improve 1–2 points on average comparedto minimal few-shot methods on both models.Comparison to Prior Evaluations Since wehave proved that our evaluation framework ismore reliable in estimating method performance asshown in Section 4.2.4, we conduct experiments tocompare the estimates by our evaluation frameworkand prior evaluations to study whether model per-formance was accurately estimated in prior work.
Table 6 lists the absolute performance from priorevaluations and our evaluation. Results show theabsolute performance of few-shot methods in priorevaluations was generally overestimated on RTE
506

BaseModels
Few-ShotMethods
BoolQ RTE WiC CB MultiRC WSC COPA Avg.Acc. Acc. Acc. Acc. F1 F1a EM. Acc. Acc
ALBERT
CLS 55.01 53.97 50.82 67.97 52.18 59.95 18.86 52.64 64.25 53.74±2.95 ±5.49 ±3.02 ±18.29 ±10.30 ±10.69 ±9.80 ±10.25 ±9.36
PET 76.70 72.83 53.87 84.38 62.56 76.51 36.46 80.05 81.75 70.74±1.85 ±1.30 ±4.47 ±4.47 ±7.66 ±1.52 ±2.13 ±2.53 ±4.03
ADAPET 79.24 74.28 58.07 92.86 89.99 77.24 37.17 78.85 81.75 74.40±1.42 ±3.57 ±2.96 ±1.46 ±3.91 ±1.99 ±2.64 ±4.51 ±3.95
P-tuning 76.55 63.27 55.49 88.39 84.24 75.91 38.01 78.85 85.25 71.81±2.68 ±3.63 ±1.21 ±3.72 ±5.15 ±1.74 ±0.78 ±1.76 ±3.30
FlipDA 77.95 70.85 57.17 83.93 74.30 76.05 35.68 79.57 87.50 72.57±2.60 ±2.71 ±2.59 ±4.37 ±13.23 ±1.33 ±1.44 ±1.82 ±3.70
PET+MLM3 76.83 71.48 52.39 83.93 67.37 75.15 35.68 81.97 85.75 71.36±1.18 ±1.64 ±1.44 ±5.05 ±8.31 ±0.34 ±1.10 ±1.82 ±3.40
iPET(single)3,4 74.29 72.35 54.78 84.67 76.92 76.33 37.72 77.80 84.00 71.58±4.10 ±3.71 ±3.93 ±3.18 ±5.44 ±1.18 ±2.58 ±2.79 ±6.02
Noisy(single)3,4 76.11 72.62 54.11 84.38 72.57 76.59 37.00 79.17 83.50 71.54±2.16 ±2.80 ±1.98 ±5.60 ±11.84 ±1.40 ±2.34 ±3.31 ±3.34
iPET(cross)3,4 76.83 74.28 58.35 83.48 73.86 75.71 37.30 76.44 83.25 72.05±1.39 ±4.31 ±2.42 ±2.68 ±2.48 ±2.14 ±2.71 ±2.78 ±4.19
Noisy(cross)3,4 75.64 75.27 56.43 84.82 77.79 77.11 38.25 80.53 83.00 72.84±1.82 ±1.97 ±2.67 ±4.49 ±8.46 ±1.49 ±0.92 ±7.17 ±4.76
DeBERTa
CLS 59.49 49.55 54.08 68.30 60.10 75.42 34.23 53.13 85.25 60.07±1.74 ±2.23 ±2.15 ±3.96 ±10.14 ±2.39 ±5.02 ±5.17 ±2.22
PET 82.67 79.42 67.20 91.96 88.63 78.20 42.42 84.13 89.00 79.00±0.78 ±2.41 ±1.34 ±3.72 ±4.91 ±1.86 ±3.04 ±4.87 ±2.94
ADAPET 81.28 82.58 66.50 89.73 86.63 77.88 43.05 85.34 88.75 79.01±1.26 ±2.44 ±2.11 ±6.08 ±7.29 ±2.55 ±3.60 ±2.13 ±4.43
P-tuning 82.25 82.22 66.22 94.20 91.76 78.45 43.78 85.10 86.50 79.48±0.85 ±1.23 ±1.18 ±2.25 ±3.30 ±1.46 ±3.93 ±4.87 ±3.70
FlipDA 83.52 80.14 65.28 95.09 93.57 80.21 46.67 85.34 90.50 80.37±0.35 ±1.93 ±1.56 ±2.68 ±2.62 ±1.35 ±0.82 ±3.27 ±1.00
PET+MLM3 82.80::::83.30 58.23 90.18 87.18 77.05 40.63 81.73 85.75 77.05
±0.97 ±2.40 ±4.98 ±3.09 ±6.17 ±1.80 ±1.64 ±5.77 ±3.40
iPET(single)3,4 81.27 81.11 64.75 89.88 87.70::::79.99
::::45.23 82.93 90.83 78.90
±1.61 ±1.89 ±4.27 ±5.01 ±6.52 ±1.94 ±2.19 ±3.76 ±2.79
Noisy(single)3,4 81.60 81.95 65.97::::91.67 89.17 79.85 45.10 84.46 90.67 79.65
±1.54 ±2.01 ±2.44 ±2.33 ±2.95 ±1.22 ±2.58 ±2.49 ±2.53
iPET(cross)3,4::::83.45 83.12
::::69.63 91.52
::::90.72 79.92 44.96
::::86.30
:::::93.75 81.40
±0.90 ±1.04 ±2.15 ±3.05 ±2.68 ±1.11 ±3.13 ±1.64 ±2.99
Noisy(cross)3,4 82.19 81.95 68.26 90.18 86.74 79.48 44.20 83.41:::::93.75 79.98
±0.65 ±0.51 ±1.12 ±2.31 ±3.00 ±2.53 ±4.14 ±4.18 ±3.30
DeBERTaOur Best3,4 84.0 85.7 69.6 95.1 93.6 81.5 48.0 88.4 93.8 85.441
(few-shot) ±0.55 ±0.63 ±2.15 ±2.68 ±2.62 ±0.76 ±0.99 ±2.82 ±2.99
RoBERTaRoBERTa 5
(fully sup.) 86.9 86.6 75.6 98.2 - 85.7 - 91.3 94.0 88.33
DeBERTaDeBERTa 2
(fully sup.) 88.3 93.5 - - - 87.8 63.6 - 97.0 -
1 For comparison with RoBERTa (fully sup.), the average of Our Best (few-shot) 85.17 excludes MultiRC-EM and CB-F1.2 The fully-supervised results on DeBERTa are reported in https://github.com/THUDM/GLM.3 Unlabeled data are used.4 The ensemble technique is used.5 The RoBERTa (fully-sup.) results by (Liu et al., 2019). RoBERTa-large has less parameters than DeBERTa-xxlarge-v2.
Table 4: Re-evaluation of few-shot methods on ALBERT and DeBERTa under our evaluation framework with Multi-Splitsstrategy on test set of our setup. For iPET and Noisy Student, (cross) and (single) respectively means cross-split labeling andsingle-split labeling strategies as introduced in §5.2. “Our Best (few-shot)” is the results achieved by a combination method asintroduced in §5.4. Globally best results for each task are in bold. Best results for minimal few-shot methods are underlined.:::Best
:::::results
:::for
::::::::::::semi-supervised
:::::::few-shot
::::::methods are marked with wavelines.
BoolQ RTE WiC CB MultiRC WSC COPAMinimal Few-Shot Methods PET ADAPET PET FlipDA ADAPET ADAPET PETTraining Paradigm iPET(cross) Noisy(cross) iPET(cross) single Noisy(cross) Noisy(single) iPET(cross)+ MLM X - - - - - -
Table 5: The combination of methods that achieves the best few-shot performance for each task. There are five minimal few-shotmethods and five training paradigms as combined options, as §5.4 illustrates. “+MLM” means adding an additional MLM loss.
507

Methods RTE WiC COPAPrev. Ours Prev. Ours Prev. Ours
PET 69.80 72.83 52.40 53.87 95.00 81.75
ADAPET 76.50 74.28::::54.40
::::58.07 89.00 81.75
P-tuning 76.50 63.27::::56.30
::::55.49 87.00 85.25
FlipDA 70.67 70.85 54.08 57.17 89.17 87.50
+MLM 62.20 71.48 51.30 52.39 86.70 85.75
iPET 74.00 72.35 52.20 54.78 95.00 84.00
Table 6: Comparison of prior evaluations and our eval-uation. We report the absolute performance of differentmethods respectively from previous evaluation (Prev.)and our evaluation framework (Ours.) on RTE, WiCand COPA tasks. The results are based on ALBERT.Results of previous evaluation are taken from the orig-inal papers, including ADAPET (Menon et al., 2021),P-tuning (Liu et al., 2021b), FlipDA (Zhou et al., 2021)and iPET (Schick and Schütze, 2021b). Since (Schickand Schütze, 2021a) reported results of PET+MLM ondifferent tasks, we re-experimented on the same tasksunder the same setting as (Schick and Schütze, 2021a).
::::Wave
:::::lines and underlines indicate examples of inaccu-
rate estimates of relative gaps in prior works (see textfor details).
and COPA. Similar findings have been highlightedin prior works (Perez et al., 2021; Zhang et al.,2020), and our evaluation framework confirms thefindings under a more reliable setup. This resultsfrom a more reliable evaluation procedure that em-phasizes dev-test correlation to prevent overfitting(discussed in Section 4.2).
Besides, the relative gaps between differentmethods were not accurately estimated by the priorreported numbers. For example, according to thereported results in prior works, ADAPET outper-forms P-Tuning on COPA and P-Tuning beatsADAPET on WiC, while our evaluation reveals theopposite. On one hand, this is because prior resultswere obtained under a less reliable evaluation pro-cedure (discussed in Section 4.2). Deviation in theestimates of absolute performance contributes toinaccuracy in the estimates of relative performance.On the other, prior experiments were not conductedunder a shared evaluation procedure. These twofactors are corrected by our re-evaluation under themore reliable proposed framework.
To sum up, our re-evaluation compares all meth-ods on a common ground, revealing the following:
Finding 2. The absolute performance and the rela-tive gap of few-shot methods were in general notaccurately estimated in prior literature. This iscorrected by our new evaluation framework withimproved reliability. It highlights the importanceof evaluation for obtaining reliable conclusions.
Moreover, the benefits of some few-shot methods(e.g., ADAPET) decrease on larger pretrained mod-els like DeBERTa.
5.4 What is the Best Performance Few-ShotLearning can Achieve?
We further explore the best few-shot performanceby combining various methods, and evaluating un-der our evaluation framework. For combined op-tions, we consider five minimal few-shot methods(i.e., CLS, PET, ADAPET, P-tuning, and FlipDA),five training paradigms (i.e., single-run, iPET (sin-gle/cross), and Noisy Student (single/cross)), andthe addition of a regularized loss (+MLM). We ex-periment with all possible combinations and reportthe best for each task.
“Best (few-shot)” in Table 4 achieves the bestresults on all tasks among all methods. Existingfew-shot methods can be practically used in com-bination. Compared to RoBERTa (fully-sup) (Liuet al., 2019), the performance gap has been furthernarrowed to 2.89 points on average.9 Compared toDeBERTa (fully-sup), there is still a sizeable gapbetween few-shot and fully-supervised systems.
We list the best-performing combination for eachtask in Table 5. The best combinations are very dif-ferent across tasks, and there is no single methodthat dominates most tasks. PET and ADAPET aswell as iPET and Noisy Student are about equallypreferred while cross-split labeling and no regular-ization term perform better. We thus recommendfuture work to focus on the development of meth-ods that achieve consistent and robust performanceacross tasks. We summarize the following findings:Finding 3. Gains of different methods are largelycomplementary. A combination of methods largelyoutperforms individual methods, performing closeto a strong fully-supervised baseline on RoBERTa.However, there is still a sizeable gap between thebest few-shot and the fully-supervised system.Finding 4. No single few-shot method dominatesmost NLU tasks. This highlights the need for thedevelopment of few-shot methods with more con-sistent and robust performance across tasks.
6 FewNLU Toolkit
We open-source FewNLU, an integrated toolkitdesigned for few-shot NLU. It contains implemen-
9Note that the gap could be larger since RoBERTa-Largehas a smaller number of parameters than DeBERTa, andRoBERTa (fully-sup) does not incorporate additional ben-eficial techniques such as ensembling or self-training.
508
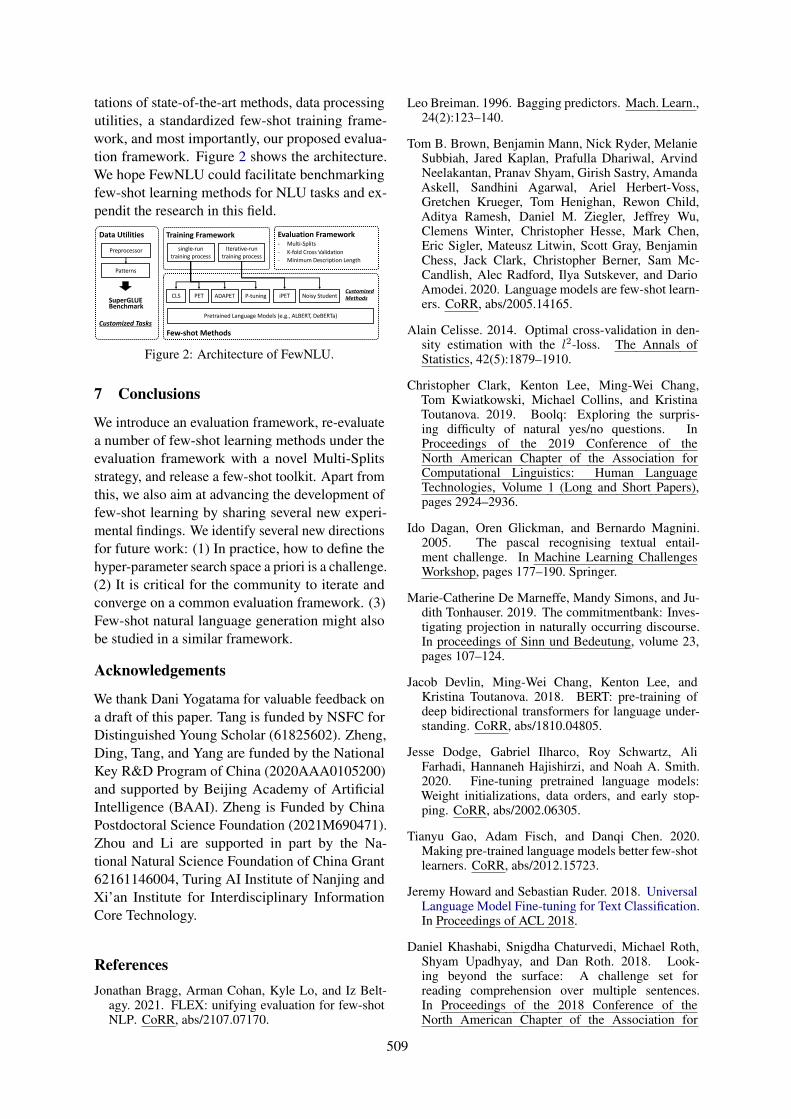
tations of state-of-the-art methods, data processingutilities, a standardized few-shot training frame-work, and most importantly, our proposed evalua-tion framework. Figure 2 shows the architecture.We hope FewNLU could facilitate benchmarkingfew-shot learning methods for NLU tasks and ex-pendit the research in this field.
Evaluation Framework- Multi-Splits- K-fold Cross Validation- Minimum Description Length
Training FrameworkIterative-run
training processsingle-run
training process
Few-shot Methods
CLS PET ADAPET P-tuning iPET Noisy Student
Data Utilities
Pretrained Language Models (e.g., ALBERT, DeBERTa)
Preprocessor
Patterns
SuperGLUEBenchmark
Customized Tasks
Customized Methods
Figure 2: Architecture of FewNLU.
7 Conclusions
We introduce an evaluation framework, re-evaluatea number of few-shot learning methods under theevaluation framework with a novel Multi-Splitsstrategy, and release a few-shot toolkit. Apart fromthis, we also aim at advancing the development offew-shot learning by sharing several new experi-mental findings. We identify several new directionsfor future work: (1) In practice, how to define thehyper-parameter search space a priori is a challenge.(2) It is critical for the community to iterate andconverge on a common evaluation framework. (3)Few-shot natural language generation might alsobe studied in a similar framework.
Acknowledgements
We thank Dani Yogatama for valuable feedback ona draft of this paper. Tang is funded by NSFC forDistinguished Young Scholar (61825602). Zheng,Ding, Tang, and Yang are funded by the NationalKey R&D Program of China (2020AAA0105200)and supported by Beijing Academy of ArtificialIntelligence (BAAI). Zheng is Funded by ChinaPostdoctoral Science Foundation (2021M690471).Zhou and Li are supported in part by the Na-tional Natural Science Foundation of China Grant62161146004, Turing AI Institute of Nanjing andXi’an Institute for Interdisciplinary InformationCore Technology.
ReferencesJonathan Bragg, Arman Cohan, Kyle Lo, and Iz Belt-
agy. 2021. FLEX: unifying evaluation for few-shotNLP. CoRR, abs/2107.07170.
Leo Breiman. 1996. Bagging predictors. Mach. Learn.,24(2):123–140.
Tom B. Brown, Benjamin Mann, Nick Ryder, MelanieSubbiah, Jared Kaplan, Prafulla Dhariwal, ArvindNeelakantan, Pranav Shyam, Girish Sastry, AmandaAskell, Sandhini Agarwal, Ariel Herbert-Voss,Gretchen Krueger, Tom Henighan, Rewon Child,Aditya Ramesh, Daniel M. Ziegler, Jeffrey Wu,Clemens Winter, Christopher Hesse, Mark Chen,Eric Sigler, Mateusz Litwin, Scott Gray, BenjaminChess, Jack Clark, Christopher Berner, Sam Mc-Candlish, Alec Radford, Ilya Sutskever, and DarioAmodei. 2020. Language models are few-shot learn-ers. CoRR, abs/2005.14165.
Alain Celisse. 2014. Optimal cross-validation in den-sity estimation with the l2-loss. The Annals ofStatistics, 42(5):1879–1910.
Christopher Clark, Kenton Lee, Ming-Wei Chang,Tom Kwiatkowski, Michael Collins, and KristinaToutanova. 2019. Boolq: Exploring the surpris-ing difficulty of natural yes/no questions. InProceedings of the 2019 Conference of theNorth American Chapter of the Association forComputational Linguistics: Human LanguageTechnologies, Volume 1 (Long and Short Papers),pages 2924–2936.
Ido Dagan, Oren Glickman, and Bernardo Magnini.2005. The pascal recognising textual entail-ment challenge. In Machine Learning ChallengesWorkshop, pages 177–190. Springer.
Marie-Catherine De Marneffe, Mandy Simons, and Ju-dith Tonhauser. 2019. The commitmentbank: Inves-tigating projection in naturally occurring discourse.In proceedings of Sinn und Bedeutung, volume 23,pages 107–124.
Jacob Devlin, Ming-Wei Chang, Kenton Lee, andKristina Toutanova. 2018. BERT: pre-training ofdeep bidirectional transformers for language under-standing. CoRR, abs/1810.04805.
Jesse Dodge, Gabriel Ilharco, Roy Schwartz, AliFarhadi, Hannaneh Hajishirzi, and Noah A. Smith.2020. Fine-tuning pretrained language models:Weight initializations, data orders, and early stop-ping. CoRR, abs/2002.06305.
Tianyu Gao, Adam Fisch, and Danqi Chen. 2020.Making pre-trained language models better few-shotlearners. CoRR, abs/2012.15723.
Jeremy Howard and Sebastian Ruder. 2018. UniversalLanguage Model Fine-tuning for Text Classification.In Proceedings of ACL 2018.
Daniel Khashabi, Snigdha Chaturvedi, Michael Roth,Shyam Upadhyay, and Dan Roth. 2018. Look-ing beyond the surface: A challenge set forreading comprehension over multiple sentences.In Proceedings of the 2018 Conference of theNorth American Chapter of the Association for
509
Computational Linguistics: Human LanguageTechnologies, Volume 1 (Long Papers), pages 252–262.
Brian Lester, Rami Al-Rfou, and Noah Constant. 2021.The power of scale for parameter-efficient prompttuning. CoRR, abs/2104.08691.
Hector Levesque, Ernest Davis, and Leora Mor-genstern. 2012. The winograd schema chal-lenge. In Thirteenth International Conference onthe Principles of Knowledge Representation andReasoning. Citeseer.
Xiang Lisa Li and Percy Liang. 2021. Prefix-tuning: Optimizing continuous prompts for genera-tion. CoRR, abs/2101.00190.
Jiachang Liu, Dinghan Shen, Yizhe Zhang, Bill Dolan,Lawrence Carin, and Weizhu Chen. 2021a. Whatmakes good in-context examples for gpt-3? CoRR,abs/2101.06804.
Xiao Liu, Yanan Zheng, Zhengxiao Du, Ming Ding,Yujie Qian, Zhilin Yang, and Jie Tang. 2021b. GPTunderstands, too. CoRR, abs/2103.10385.
Yinhan Liu, Myle Ott, Naman Goyal, Jingfei Du, Man-dar Joshi, Danqi Chen, Omer Levy, Mike Lewis,Luke Zettlemoyer, and Veselin Stoyanov. 2019.Roberta: A robustly optimized bert pretraining ap-proach. arXiv preprint arXiv:1907.11692.
Yao Lu, Max Bartolo, Alastair Moore, SebastianRiedel, and Pontus Stenetorp. 2021. Fantasticallyordered prompts and where to find them: Over-coming few-shot prompt order sensitivity. CoRR,abs/2104.08786.
Rakesh R. Menon, Mohit Bansal, Shashank Srivastava,and Colin Raffel. 2021. Improving and simplifyingpattern exploiting training. CoRR, abs/2103.11955.
Subhabrata Mukherjee, Xiaodong Liu, Guoqing Zheng,Saghar Hosseini, Hao Cheng, Greg Yang, Christo-pher Meek, Ahmed Hassan Awadallah, and Jian-feng Gao. 2021. CLUES: few-shot learning eval-uation in natural language understanding. CoRR,abs/2111.02570.
Ethan Perez, Douwe Kiela, and Kyunghyun Cho.2021. True few-shot learning with language models.CoRR, abs/2105.11447.
Mohammad Taher Pilehvar and José Camacho-Collados. 2018. Wic: 10, 000 example pairs forevaluating context-sensitive representations. CoRR,abs/1808.09121.
Melissa Roemmele, Cosmin Adrian Bejan, and An-drew S Gordon. 2011. Choice of plausible alter-natives: An evaluation of commonsense causal rea-soning. In AAAI Spring Symposium: LogicalFormalizations of Commonsense Reasoning, pages90–95.
Timo Schick and Hinrich Schütze. 2021a. Exploitingcloze-questions for few-shot text classification andnatural language inference. In EACL, pages 255–269. Association for Computational Linguistics.
Timo Schick and Hinrich Schütze. 2021b. It’s not justsize that matters: Small language models are alsofew-shot learners. pages 2339–2352.
Taylor Shin, Yasaman Razeghi, Robert L. Logan IV,Eric Wallace, and Sameer Singh. 2020. Auto-prompt: Eliciting knowledge from language mod-els with automatically generated prompts. CoRR,abs/2010.15980.
Jasper Snoek, Hugo Larochelle, and Ryan P Adams.2012. Practical bayesian optimization of ma-chine learning algorithms. Advances in neuralinformation processing systems, 25.
Alex Wang, Yada Pruksachatkun, Nikita Nangia,Amanpreet Singh, Julian Michael, Felix Hill, OmerLevy, and Samuel R. Bowman. 2019a. Superglue:A stickier benchmark for general-purpose languageunderstanding systems. In NeurIPS.
Alex Wang, Amanpreet Singh, Julian Michael, FelixHill, Omer Levy, and Samuel R. Bowman. 2019b.GLUE: A multi-task benchmark and analysis plat-form for natural language understanding. In ICLR(Poster). OpenReview.net.
Qizhe Xie, Minh-Thang Luong, Eduard H. Hovy, andQuoc V. Le. 2020. Self-training with noisy studentimproves imagenet classification. In CVPR, pages10684–10695. IEEE.
Shuo Yang, Lu Liu, and Min Xu. 2021. Free lunch forfew-shot learning: Distribution calibration. In ICLR.OpenReview.net.
Qinyuan Ye, Bill Yuchen Lin, and Xiang Ren. 2021.Crossfit: A few-shot learning challenge for cross-task generalization in nlp.
Tianyi Zhang, Felix Wu, Arzoo Katiyar, Kilian Q.Weinberger, and Yoav Artzi. 2020. Revisiting few-sample BERT fine-tuning. CoRR, abs/2006.05987.
Tony Z. Zhao, Eric Wallace, Shi Feng, Dan Klein,and Sameer Singh. 2021. Calibrate before use: Im-proving few-shot performance of language models.CoRR, abs/2102.09690.
Jing Zhou, Yanan Zheng, Jie Tang, Jian Li, and ZhilinYang. 2021. Flipda: Effective and robust data aug-mentation for few-shot learning.
510
A Appendix
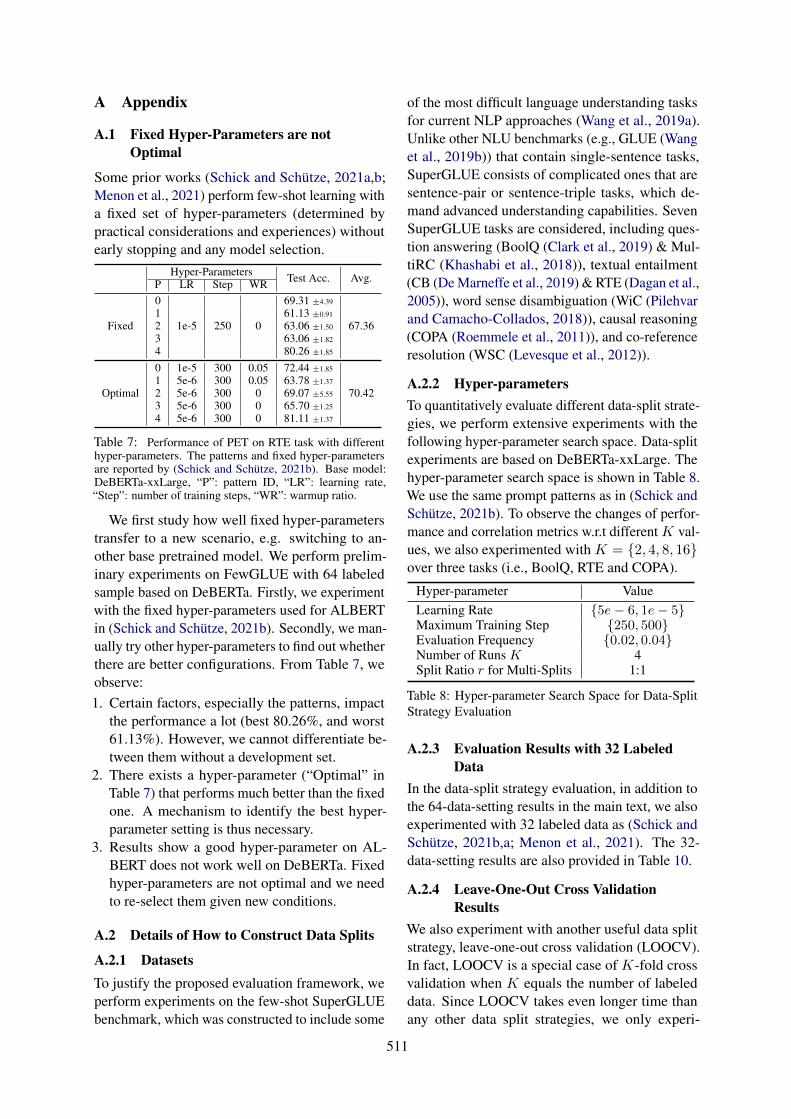
A.1 Fixed Hyper-Parameters are notOptimal
Some prior works (Schick and Schütze, 2021a,b;Menon et al., 2021) perform few-shot learning witha fixed set of hyper-parameters (determined bypractical considerations and experiences) withoutearly stopping and any model selection.
Hyper-Parameters Test Acc. Avg.P LR Step WR
Fixed
0
1e-5 250 0
69.31 ±4.39
67.361 61.13 ±0.91
2 63.06 ±1.50
3 63.06 ±1.82
4 80.26 ±1.85
Optimal
0 1e-5 300 0.05 72.44 ±1.85
70.421 5e-6 300 0.05 63.78 ±1.37
2 5e-6 300 0 69.07 ±5.55
3 5e-6 300 0 65.70 ±1.25
4 5e-6 300 0 81.11 ±1.37
Table 7: Performance of PET on RTE task with differenthyper-parameters. The patterns and fixed hyper-parametersare reported by (Schick and Schütze, 2021b). Base model:DeBERTa-xxLarge, “P”: pattern ID, “LR”: learning rate,“Step”: number of training steps, “WR”: warmup ratio.
We first study how well fixed hyper-parameterstransfer to a new scenario, e.g. switching to an-other base pretrained model. We perform prelim-inary experiments on FewGLUE with 64 labeledsample based on DeBERTa. Firstly, we experimentwith the fixed hyper-parameters used for ALBERTin (Schick and Schütze, 2021b). Secondly, we man-ually try other hyper-parameters to find out whetherthere are better configurations. From Table 7, weobserve:1. Certain factors, especially the patterns, impact
the performance a lot (best 80.26%, and worst61.13%). However, we cannot differentiate be-tween them without a development set.
2. There exists a hyper-parameter (“Optimal” inTable 7) that performs much better than the fixedone. A mechanism to identify the best hyper-parameter setting is thus necessary.
3. Results show a good hyper-parameter on AL-BERT does not work well on DeBERTa. Fixedhyper-parameters are not optimal and we needto re-select them given new conditions.
A.2 Details of How to Construct Data Splits
A.2.1 DatasetsTo justify the proposed evaluation framework, weperform experiments on the few-shot SuperGLUEbenchmark, which was constructed to include some
of the most difficult language understanding tasksfor current NLP approaches (Wang et al., 2019a).Unlike other NLU benchmarks (e.g., GLUE (Wanget al., 2019b)) that contain single-sentence tasks,SuperGLUE consists of complicated ones that aresentence-pair or sentence-triple tasks, which de-mand advanced understanding capabilities. SevenSuperGLUE tasks are considered, including ques-tion answering (BoolQ (Clark et al., 2019) & Mul-tiRC (Khashabi et al., 2018)), textual entailment(CB (De Marneffe et al., 2019) & RTE (Dagan et al.,2005)), word sense disambiguation (WiC (Pilehvarand Camacho-Collados, 2018)), causal reasoning(COPA (Roemmele et al., 2011)), and co-referenceresolution (WSC (Levesque et al., 2012)).
A.2.2 Hyper-parametersTo quantitatively evaluate different data-split strate-gies, we perform extensive experiments with thefollowing hyper-parameter search space. Data-splitexperiments are based on DeBERTa-xxLarge. Thehyper-parameter search space is shown in Table 8.We use the same prompt patterns as in (Schick andSchütze, 2021b). To observe the changes of perfor-mance and correlation metrics w.r.t different K val-ues, we also experimented with K = {2, 4, 8, 16}over three tasks (i.e., BoolQ, RTE and COPA).
Hyper-parameter ValueLearning Rate {5e− 6, 1e− 5}Maximum Training Step {250, 500}Evaluation Frequency {0.02, 0.04}Number of Runs K 4Split Ratio r for Multi-Splits 1:1
Table 8: Hyper-parameter Search Space for Data-SplitStrategy Evaluation
A.2.3 Evaluation Results with 32 LabeledData
In the data-split strategy evaluation, in addition tothe 64-data-setting results in the main text, we alsoexperimented with 32 labeled data as (Schick andSchütze, 2021b,a; Menon et al., 2021). The 32-data-setting results are also provided in Table 10.
A.2.4 Leave-One-Out Cross ValidationResults
We also experiment with another useful data splitstrategy, leave-one-out cross validation (LOOCV).In fact, LOOCV is a special case of K-fold crossvalidation when K equals the number of labeleddata. Since LOOCV takes even longer time thanany other data split strategies, we only experi-
511

BoolQ RTE WiC
Multi-SplitsPerf. 82.67
±0.7879.42±2.41
67.20±1.34
Corr. 0.7079 0.8266 0.9464
CVPerf. 82.71
±1.2977.80±2.25
64.42±1.63
Corr. -0.0497 0.8561 0.8184
LOOCVPerf. 80.20
±5.6363.91±5.37
62.40±4.70
Corr. -0.8001 -0.5070 0.1998
Table 9: Test performance and correlation results ofleave-one-out cross validation on BoolQ, RTE and WiCtasks with 64 labeled examples.
mented on three tasks, including BoolQ, RTEand WiC tasks. Both performance and correla-tion results are shown in Table 9. Our resultsshow that compared to other strategies, LOOCVachieved worse test performance as well as cor-relation. LOOCV only uses a single instance forvalidation each time, and thus leads to poor corre-lation and random model selection. As a result, theperformance estimation is subject to much random-ness.
A.3 How to Define the Hyper-parameterSearch Space
Aside from how to construct the data splits, anotherimportant question for the evaluation frameworkis how to define the hyper-parameter search space.We left this question in the future work. However,we did several preliminary experiments that couldreveal certain insights into the problem.
A.3.1 Should We Search Random Seeds?We focus on two types of factors that affect few-shot evaluation, hyper-parameters and randomness.Randomness could cause different weight initial-ization, data splits, and data order during training.Empirically, how randomness is dealt with differsdepending on the use case. In order to obtain thebest possible performance, one could search oversensitive random factors such as random seeds.However, as we focus on benchmarking few-shotNLU methods, we report mean results (along withthe standard deviation) in our experiments in orderto rule out the effects of randomness and reflect theaverage performance of a method for fair compari-son and measurement.
A.3.2 ExperimentsExperimental Setup To examine how a certainfactor affects few-shot performance, we assign mul-tiple different values to a target factor while fixing
other hyper-parameters. We report the standard de-viation over the multiple results. Larger values in-dicate that a perturbation of the target factor wouldlargely influence the few-shot performance and thefactor thus is crucial for searching. We experimenton BoolQ, RTE, CB, and COPA tasks. Consid-ered factors include: sample order during training,prompt pattern, training batch size, learning rate,evaluation frequency, and maximum train steps.Results and Analysis Results are in Table 11. Wemark values larger than a threshold of 2.0 in bold.We can see that the prompt pattern is the most in-fluential factor among all, indicating the design orselection of prompt patterns is crucial. Trainingexample order also significantly affects the perfor-mance. The evaluation frequency affects the scoreon the small development but not on the test set.We speculate that a lower frequency selects a modelwith better performance on the small developmentset, but the gains do not transfer to the test set be-cause of partial overfitting. To conclude:
Finding 5. We recommend to at least search overprompt patterns during hyper-parameter tuning,and it is also beneficial to search others. All com-parison methods should be searched and comparedunder the same set of hyper-parameters.
A.3.3 Detailed ConfigurationFor a given task and a target factor, we fixed thehyper-parameters to be the best-performing onesobtained in Section 4.2, and assigned multiple val-ues for the target factor. For the prompt pattern,we assigned it with the same values as (Schick andSchütze, 2021b). Possible values for other hyper-parameters are in Table 12.
A.4 Details of Re-EvaluationA.4.1 MethodsThe five considered minimal few-shot methods areintroduced as follows.1. Classification is a conventional finetuning algo-
rithm, which uses the hidden states of a special[CLS] token for classification.
2. PET is a prompt-based finetuning algorithm. Ittransforms NLU problems into cloze problemswith prompts, and then converts the cloze out-puts into the predicted class.
3. ADAPET is based on PET and decouples thelosses for the label tokens. It proposes a label-conditioned masked language modeling (MLM)objective as a regularization term.
512

(a) Results of test performance of the selected hyper-parameter.
BoolQ RTE WiC CB MultiRC WSC COPA Avg.Acc. Acc. Acc. Acc. F1 F1a EM. Acc. Acc
CV 77.29 75.63 55.56 89.29 80.66 78.61 42.26 78.37 90.00 74.61±3.32 ±4.26 ±1.06 ±3.86 ±14.87 ±0.84 ±2.07 ±4.26 ±2.45
MDL 79.29 75.87 53.53 79.61 59.25 75.77 37.30 77.82 76.25 69.82±6.01 ±5.19 ±0.58 ±5.42 ±11.27 ±4.72 ±6.27 ±4.19 ±12.50
Multi-Splits 78.11 79.42 61.72 83.04 70.93 78.23 41.45 74.52 84.75 73.62±2.63 ±1.79 ±3.10 ±6.66 ±13.40 ±1.24 ±1.74 ±3.96 ±2.12
(b) Results of correlation between the development and training sets.
BoolQ RTE WiC CB MultiRC WSC COPA Avg.CV 0.4134 0.6759 0.4189 0.0938 0.1061 -0.1683 0.6567 0.3138
MDL 0.6394 0.5687 -0.0732 0.2127 0.1690 0.0741 0.1100 0.2429
Multi-Splits 0.5347 0.6911 0.8448 0.7232 0.6280 0.0853 0.4531 0.5657
Table 10: Evaluation results of different few-shot data-split strategies with PET on FewGLUE (K=4) under the same datasetting as (Schick and Schütze, 2021b,a; Menon et al., 2021) with 32 labeled data. Larger scores indicate that a data-split strategyeffectively selects a model that achieves better test-set performance. The best results for each task are denoted in bold.
Hyper-params BoolQ RTE COPA CB
DevSet
Train Order 3.64 4.01 2.17 2.21/6.09Prompt Pattern 3.44 10.28 5.80 3.18/4.07Train Batch 3.34 1.33 2.64 1.01/5.87Learning Rate 0.00 1.63 1.97 1.56/4.56Eval Freq 2.39 2.96 2.73 0.45/0.82
TestSet
Train Order 0.87 1.87 2.17 3.01/4.73Prompt Pattern 2.85 10.03 2.65 6.45/7.08Train Batch 2.44 1.09 0.72 0.89/1.32Learning Rate 0.17 0.65 0.52 4.82/7.25Eval Freq 0.84 0.53 1.18 0.77/2.07
Table 11: Analysis of different factors on BoolQ, RTE, CBand COPA using PET and DeBERTa. The metric is standarddeviation. Hyper-parameters are set the best-performing onesobtained in §5 while the target factor is assigned with multiplevalues. “Train Order”: training sample order; “Train Batch”:total train batch size; “Eval Freq”: evaluation frequency.
Hyper-parameter ValueLearning Rate {6e− 6, 8e− 6, 1e− 5}Evaluation Frequency {0.02, 0.04, 0.08}Training Batch Size {8, 16, 32, 64}Sample Order Seed {10, 20, 30, 40, 50, 60, 70, 80}
Table 12: Hyper-parameter Search Space for CrucialFactor Evaluation
4. P-tuning is also based on PET and automati-cally learns continuous vectors as prompts viagradient update.
5. FlipDA is similar to PET but uses both labeleddata and augmented data for training. The aug-mented data are automatically generated by tak-ing labeled data as inputs. 10
The three semi-supervised few-shot methods areintroduced as follows.1. PET+MLM is based on PET and additionally
adds an auxiliary language modeling task per-formed on unlabeled dataset. It was first pro-
10In our experiments, we use the best checkpoints searchedwith PET as the classifier for data selection.
posed by (Schick and Schütze, 2021a) to resolvecatastrophic forgetting.
2. iPET is a self-training method. It iteratively per-forms PET for multiple generations. At the endof each generation, unlabeled data are assignedwith pseudo-labels by the fully-trained model,and will be used for training along with traindata in the next generation.
3. Noisy Student is similar to iPET with the differ-ence that Noisy Student injects noises into theinput embeddings of the model.
A.4.2 Hyper-parameter Search SpaceThe hyper-parameter search space for other few-shot methods are shown in Table 17.
A.4.3 The Searched Best Hyper-parametersWe list the searched best hyper-parameter configu-ration for different tasks and methods in Table 13,Table 14, Table 15, Table 16.
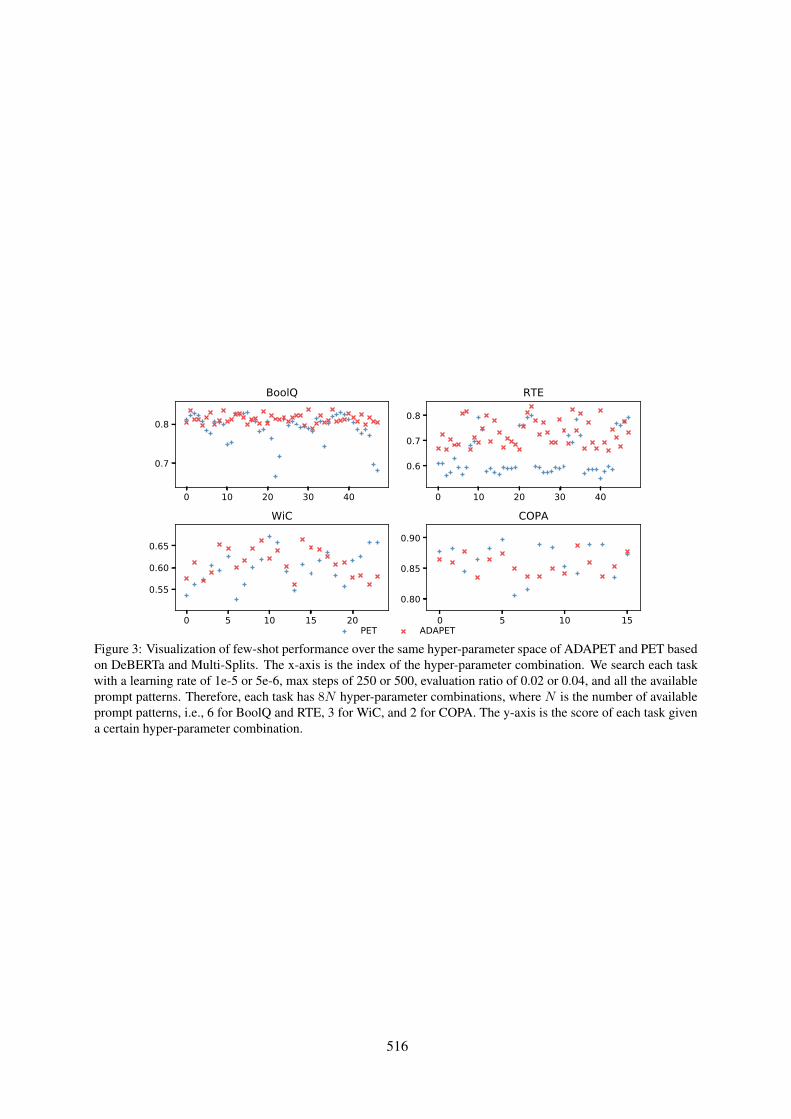
A.4.4 More Discussion on ADAPETSince it is observed ADAPET shows less improve-ment on DeBERTa than it has achieved on AL-BERT, we further discuss the phenomena by rais-ing the question what other differences it has made.We respectively visualize the few-shot performancedistribution over the same hyper-parameter spaceof PET and ADAPET in Figure 3. We observethat PET is more likely to obtain extremely bad
11As recommended in (Zhou et al., 2021), we fix one maskratio for each dataset, i.e., 0.3 for BoolQ, MultiRC, and WSC,0.5 for RTE and CB, and 0.8 for COPA and WiC. We fixone fill-in strategy for each dataset, i.e., “default” for BoolQ,RTE, WiC, CB, and WSC, “rand_iter_10” for MultiRC, and“rand_iter_1” for COPA.
513
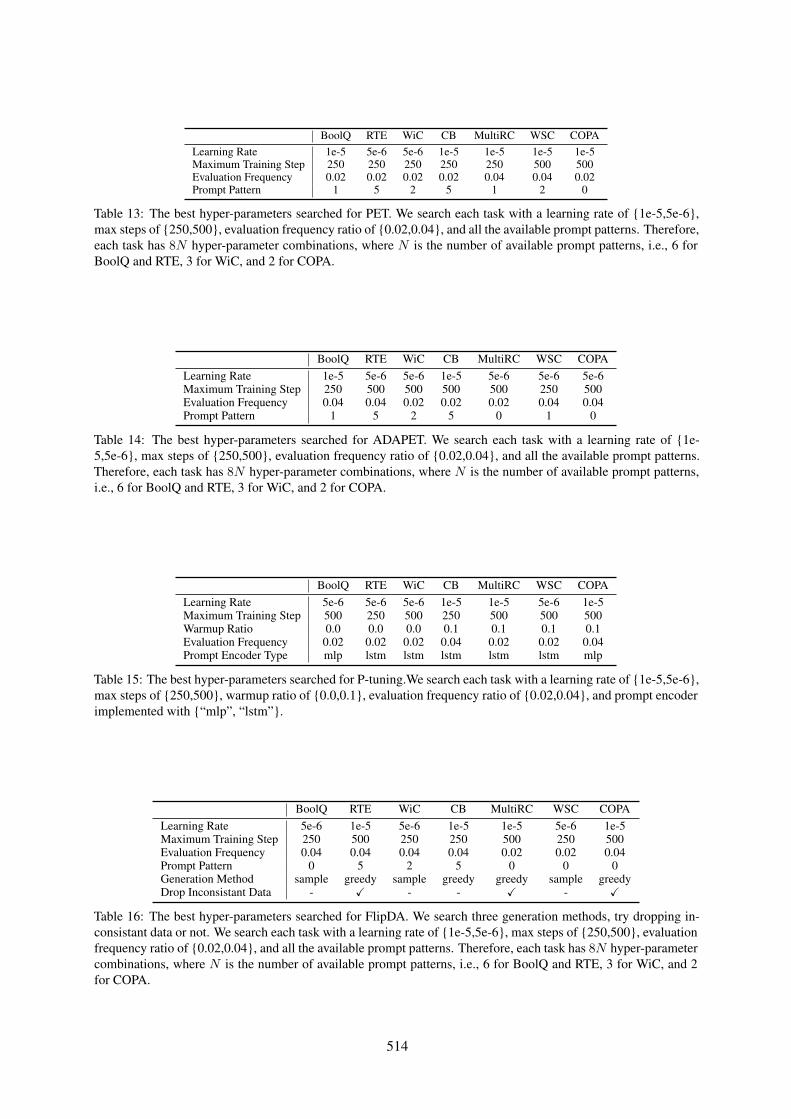
BoolQ RTE WiC CB MultiRC WSC COPALearning Rate 1e-5 5e-6 5e-6 1e-5 1e-5 1e-5 1e-5Maximum Training Step 250 250 250 250 250 500 500Evaluation Frequency 0.02 0.02 0.02 0.02 0.04 0.04 0.02Prompt Pattern 1 5 2 5 1 2 0
Table 13: The best hyper-parameters searched for PET. We search each task with a learning rate of {1e-5,5e-6},max steps of {250,500}, evaluation frequency ratio of {0.02,0.04}, and all the available prompt patterns. Therefore,each task has 8N hyper-parameter combinations, where N is the number of available prompt patterns, i.e., 6 forBoolQ and RTE, 3 for WiC, and 2 for COPA.
BoolQ RTE WiC CB MultiRC WSC COPALearning Rate 1e-5 5e-6 5e-6 1e-5 5e-6 5e-6 5e-6Maximum Training Step 250 500 500 500 500 250 500Evaluation Frequency 0.04 0.04 0.02 0.02 0.02 0.04 0.04Prompt Pattern 1 5 2 5 0 1 0
Table 14: The best hyper-parameters searched for ADAPET. We search each task with a learning rate of {1e-5,5e-6}, max steps of {250,500}, evaluation frequency ratio of {0.02,0.04}, and all the available prompt patterns.Therefore, each task has 8N hyper-parameter combinations, where N is the number of available prompt patterns,i.e., 6 for BoolQ and RTE, 3 for WiC, and 2 for COPA.
BoolQ RTE WiC CB MultiRC WSC COPALearning Rate 5e-6 5e-6 5e-6 1e-5 1e-5 5e-6 1e-5Maximum Training Step 500 250 500 250 500 500 500Warmup Ratio 0.0 0.0 0.0 0.1 0.1 0.1 0.1Evaluation Frequency 0.02 0.02 0.02 0.04 0.02 0.02 0.04Prompt Encoder Type mlp lstm lstm lstm lstm lstm mlp
Table 15: The best hyper-parameters searched for P-tuning.We search each task with a learning rate of {1e-5,5e-6},max steps of {250,500}, warmup ratio of {0.0,0.1}, evaluation frequency ratio of {0.02,0.04}, and prompt encoderimplemented with {“mlp”, “lstm”}.
BoolQ RTE WiC CB MultiRC WSC COPALearning Rate 5e-6 1e-5 5e-6 1e-5 1e-5 5e-6 1e-5Maximum Training Step 250 500 250 250 500 250 500Evaluation Frequency 0.04 0.04 0.04 0.04 0.02 0.02 0.04Prompt Pattern 0 5 2 5 0 0 0Generation Method sample greedy sample greedy greedy sample greedyDrop Inconsistant Data - X - - X - X
Table 16: The best hyper-parameters searched for FlipDA. We search three generation methods, try dropping in-consistant data or not. We search each task with a learning rate of {1e-5,5e-6}, max steps of {250,500}, evaluationfrequency ratio of {0.02,0.04}, and all the available prompt patterns. Therefore, each task has 8N hyper-parametercombinations, where N is the number of available prompt patterns, i.e., 6 for BoolQ and RTE, 3 for WiC, and 2for COPA.
514

Method Hyper-Parameter Value
CLSLearning Rate (DeBERTa) {1e− 5, 5e− 6}Learning Rate (ALBERT) {1e− 5, 2e− 5}Maximum Training Step {2500, 5000}
PET/ADAPET
Learning Rate (DeBERTa) {5e− 6, 1e− 5}Learning Rate (ALBERT) {1e− 5, 2e− 5}Maximum Training Step {250, 500}
Evaluation Frequency {0.02, 0.04}
P-tuning
Learning Rate (DeBERTa) {5e− 6, 1e− 5}Learning Rate (ALBERT) {1e− 5, 2e− 5}Maximum Training Step {250, 500}
Evaluation Frequency {0.02, 0.04}Warmup Ratio {0.0, 0.1}
Prompt Encoder Type {mlp, lstm}
FlipDA
Learning Rate (DeBERTa) {5e− 6, 1e− 5}Learning Rate (ALBERT) {1e− 5, 2e− 5}Maximum Training Step {250, 500}
Evaluation Frequency {0.02, 0.04}DA Method {greedy,sample,beam}
Drop Inconsistant Data {yes, no}Mask Ratio Fixed 11
Fill-in Strategy Fixed 9
iPET/Noisy
Unlabeled Data Number 500Increasing Factor 3.0
Sample Ratio (single-split) 1.0Sample Ratio (cross-split) 2/3Dropout Rate for Noisy 0.05
Table 17: Hyper-parameter Space for Re-Evaluation
task method g1 g2 g3
WiC Multi-Patterns 60.11 ±5.64 60.19 ±4.12 59.66 ±4.27
Best-Pattern 64.21 ±2.58 64.18 ±4.61 63.37 ±6.29
RTE Multi-Patterns 65.08 ±10.07 69.20 ±7.13 71.46 ±5.59
Best-Pattern 79.39 ±2.75 81.95 ±1.04 83.12 ±1.42
Table 18: The performance results of iPET on both WiCand RTE at every generation (g1, g2, and g3). Each experi-ment uses either ensemble over all patterns (Multi-Patterns)or ensemble over the only best pattern (Best-Pattern). Thisexperiment is conducted with 1000 unlabeled data and anincreasing factor 5.
results on BoolQ and RTE, while ADAPET showsstable results. It suggests that ADAPET appearsto be more robust to the hyper-parameters, andoverall achieves good performance regardless ofhyper-parameter selection. However, ADAPET isless inclined to produce better peak results. Tosum up, we can conclude: Loss regularization (e.g.,ADAPET (Menon et al., 2021)) enhances stabilityw.r.t. hyper-parameters.
A.4.5 More Discussion on Semi-supervisedFew-shot Methods
We focus on semi-supervised methods that itera-tively augment data (i.e., iPET and Noisy Student),which have demonstrated promising results on bothmodels in Table 4. Several key points for their suc-cess are especially discussed.1. For semi-supervised methods such as iPET
and Noisy Student, it is time-consuming whensearching over a large hyper-parameter space foreach generation. We directly use the searchedbest hyper-parameters for PET in each gener-ation. From Table 4, we can see that theirresults show advantages over PET (by morethan 1 points). It suggests that the best hyper-parameters can be transferred to such methods,to reduce the cost of time and computational re-sources. If we search for each generation, resultsmight be even better.
2. Comparing the single-split labeling strategy, thecross-split labeling strategy works better. As theresults show, both iPET (cross) and Noisy (cross)outperform iPET (single) and Noisy (single) inmost tasks on both models.
3. Another simple and effective technique is ourproposed ensemble labeling strategies. (Schickand Schütze, 2021b) utilizes the ensemble resultsover all patterns to label unlabeled data, since itis hard to select patterns. Under the Multi-Splitsstrategy, self-training methods can recognize thebest pattern, and only ensemble trained modelsfor the best pattern when labeling unlabeled data.Table 18 shows the results of iPET on WiC andRTE tasks, respectively ensemble over multiplepatterns or ensemble over the only best pattern.We can see that results of ensemble with thebest pattern significantly outperform results ofensemble with all patterns at every generation.
515
0 10 20 30 40
0.7
0.8
BoolQ
0 10 20 30 40
0.6
0.7
0.8
RTE
0 5 10 15 20
0.55
0.60
0.65
WiC
0 5 10 15
0.80
0.85
0.90
COPA
PET ADAPET
Figure 3: Visualization of few-shot performance over the same hyper-parameter space of ADAPET and PET basedon DeBERTa and Multi-Splits. The x-axis is the index of the hyper-parameter combination. We search each taskwith a learning rate of 1e-5 or 5e-6, max steps of 250 or 500, evaluation ratio of 0.02 or 0.04, and all the availableprompt patterns. Therefore, each task has 8N hyper-parameter combinations, where N is the number of availableprompt patterns, i.e., 6 for BoolQ and RTE, 3 for WiC, and 2 for COPA. The y-axis is the score of each task givena certain hyper-parameter combination.
516