FERTILIZER SUBSIDIES: A STUDY OF POLICY EFFECTS ON MAIZE IN KENYA.
109
密级: 论文编号: 中国农业科学院 学位论文 肯尼亚玉米化肥补贴政策影响研究 FERTILIZER SUBSIDIES: A STUDY OF POLICY EFFECTS ON MAIZE IN KENYA. 博 士 研 究 生:OCHOLA, R.V.Odhiambo 指 导 教 师:聂风英 研究员 申请学位类别:管理学硕士 专 业:农业资源利用 研 究 方 向:农业政策补贴 培 养 单 位:农业信息研究所 研究生院 2015年5月
Transcript of FERTILIZER SUBSIDIES: A STUDY OF POLICY EFFECTS ON MAIZE IN KENYA.

密级: 论文编号:
中国农业科学院
学位论文
肯尼亚玉米化肥补贴政策影响研究
FERTILIZER SUBSIDIES: A STUDY OF POLICY EFFECTS ON
MAIZE IN KENYA.
博士研究生:OCHOLA, R.V.Odhiambo
指 导 教 师:聂风英 研究员
申请学位类别:管理学硕士
专 业:农业资源利用
研 究 方 向:农业政策补贴
培 养 单 位:农业信息研究所
研究生院
2015年5月

Secrecy: No.
Chinese Academy of Agricultural Sciences
Dissertation
TITLE
FERTILIZER SUBSIDIES: A STUDY OF POLICY EFFECTS ON
MAIZE IN KENYA.
MSc.Candidate:OCHOLA, R.V. Odhiambo
Supervisor: Nie Feng ying
Major: Utilization Sciences of
Agricultural Resources
Specialty: Fertilizer Subsidy Policy
Effects on Maize in Kenya.
Unit: AgriculturalInformation
Institute
May 2015

独创性声明
本人声明所呈交的论文是我个人在导师指导下进行的研究工作及取得的研究成果。尽我所知,
除了文中特别加以标注和致谢的地方外,论文中不包含其他人已经发表或撰写过的研究成果,
也不包含为获得中国农业科学院或其它教育机构的学位或证书而使用过的材料。与我一同工作
的同志对本研究所做的任何贡献均已在论文中作了明确的说明并表示了谢意。
Declaration of Originality
I hereby declare that this thesis was composed and originated entirely by myself under the guidance of
my supervisor. To the best of my knowledge, in addition to information derived from the published and
unpublished works of others that has been acknowledged in the text and a list of references is given in
the bibliography, the thesis does not contain any other published or unpublished research work by others,
or any materials for another degree or diploma from the Chinese Academy of Agricultural Sciences and
other educational institutions. The works contributed by other colleagues have been stated and
acknowledged.
关于论文使用授权的声明
本人完全了解中国农业科学院有关保留、使用学位论文的规定,即:中国农业科学院有权保留
送交论文的复印件和磁盘,允许论文被查阅和借阅,可以采用影印、缩印或扫描等复制手段保
存、汇编学位论文。同意中国农业科学院可以用不同方式在不同媒体上发表、传播学位论文的
全部或部分内容。
Authorized Use Agreement
I fully understand the regulations concerning reservation and usage of the thesis in the Chinese
Academy of Agricultural Sciences: CAAS retains the right to keep the copies and disks of the thesis,
allow it to be accessed and borrowed, and compose it by photocopy and scan. CAAS can also
disseminate and publish the full and part of the thesis in different ways and on different media.
学生签名/Student‘s signature: Ochola, Robert Vicky Odhiambo Date: 28th May, 2015
导师签名/Supervisor‘s signature: Prof. Nie Feng ying Date: 28th May, 2015

I
摘 要
“加速农资准入国家计划” (NAAIAP)补贴项目成立于 2006 年,是一种安全保障计划,旨在
解决贫困农户中的粮食不安全和贫困问题。本研究利用截面数据,通过对 200名农民数据进行线
性回归分析,多项类别变量回归分析和 Probit分析而得,数据来自于 2009/2010季度农业的数据,
由此估算 NAAIAP 项目对塔纳河北面的贫困和弱势农户的补贴影响。研究中包含和排除的控制错
误集中在农民实际上已经收到凭证。观察指出,那些具有小学教育水平的老年男性农民,其主要的
收入来源是农业,收入水平达平均 1美元一天。这些农民平均拥有 4英亩土地,其中只有一半是
用于生产,并且没有金融服务,主要归因于缺乏抵押品和低水平的年销售收入,同时存在路边市场
和一般信息不对称。模型结果表明, 各种由使用化肥而得的收入的投资回报对过去的化肥使用,
在合适的季节使用化肥以及公共财政支持,如集团储蓄,具有敏感的残余效应。因此这些发现证
实本研究的重要性,能为政策制定者提供更深的洞察力,并提供有价值关于政策的影响,设计和规
划目标的实现的信息。
关键词:化肥,补贴,小户型农户,政策,商业,加速农资准入国家计划,肯尼亚

II
ABSTRACT
The National Accelerated Agricultural Inputs Access Programme (NAAIAP) a subsidy programme
established in 2006 was envisioned as a safety net programme that would address the problem of food
insecurity and poverty among resource poor farmers. This study using cross-sectional data obtained
from 200 farmers employs Linear Regression, Multinomial Logistic and Probit analysis and data from
the 2009/2010 agricultural season to estimate the subsidy effects of the NAAIAP program on poor and
vulnerable farmers of Tana River Sub-County. To control for errors of inclusion and exclusion the study
focused on those farmers who had actually received vouchers. Observations point to predominantly
aging male farmers with primary level of education and whose main source of income was farming
earning them an average of $1 a day. These Farmers owning on average four(4) acres lack titles to their
pieces of land for which only half was utilized for production, had not accessed financial services
despite such services being within reach a factor that could be attributed to their lack of collateral and
low levels of realized annual incomes from sales though roadside markets and general information
asymmetries. Model results show that returns on investments to various income categories from using
use of fertilizer is sensitive to residual effects of previous fertilizer application, timing or use of fertilizer
during the right season, and communal financial support structures such as group saving. These findings
therefore confirm the importance of this study providing deeper insight to policy makersand providing
valuable information which has implications on policy, design, targeting and programme
implementation.
Key words: Fertilizer, Subsidy, Smallholder farmer, Policy, Commercialization, NAAIAP, Kenya.

III
TABLE OF CONTENTS
Chapter 1 Introduciton ........................................................................................................... 1
1.1 INTRODUCTION .................................................................................................... 1
1.1.1 Background......................................................................................................... 1
1.1.2 Agricultural sector policies................................................................................. 6
1.2 Problem Statement .................................................................................................. 11
1.3 Research Objective ................................................................................................. 12
1.4 Research Question................................................................................................... 12
1.5 Research Hypothesis ............................................................................................... 12
1.6 Justification for the study ........................................................................................ 13
1.7 Conceptual Framework ........................................................................................... 14
1.8 Scope of the study ................................................................................................... 16
1.9 Definition of Terms ................................................................................................. 16
1.10 Limitations to the study......................................................................................... 17
Chapter 2 LITERATURE REVIEW .................................................................................... 18
2.1 Fertilizer Subsidies and Input Use .......................................................................... 19
2.2 ―Smart‖ Subsidies ................................................................................................... 21
2.2.1 Design of ―Smart‖ Subsidy Programmes ......................................................... 21
2.3 Maize Value Chain and Fertilizer Subsidies ........................................................... 23
Chapter 3 STATUS OF THE FERTILIZER AND MAIZE SECTORS IN KENYA ........... 32
3.1 Status of The Fertilizer Sector In Kenya ................................................................. 32
3.1.1 Fertilizer and Fertilizer subsidy Policy in Kenya ............................................. 33
3.1.2 Major developments in the fertilizer sector ...................................................... 34
3.1.3 Evolution of maize marketing in Kenya ........................................................... 36
3.1.4 Fertilizer demand and supply trends................................................................. 38
3.1.5 Fertilizer production and consumption ............................................................. 39
3.1.6 Drivers of Fertilizer Supply and Demand......................................................... 43
3.1.7 Fertilizer types and cost .................................................................................... 45
IV
3.1.8 Fertilizer subsidies Programs in African Countries .......................................... 46
3.1.9 Smart Subsidies ................................................................................................ 47
3.2. The National Accelerated Agricultural Inputs Access Programme (NAAIAP) ..... 51
3.2.1 Overview Of The Programme .......................................................................... 51
3.2.2 Project Components.......................................................................................... 52
3.3 The Status of The Maize Subsector In Kenya......................................................... 53
3.3.1 Maize production .............................................................................................. 54
3.3.2 Technical efficiency and allocative efficiency.................................................. 57
3.3.3 Maize marketing ............................................................................................... 58
3.3.4 Maize consumption........................................................................................... 60
Chapter 4 DATA ANALYSIS ........................................................................................... 63
4.1 Study Area ............................................................................................................... 63
4.2 Agriculture in Tana River County ........................................................................... 64
4.2.1 Farming Systems in Tana River County. .......................................................... 64
4.2.2 Sample frame .................................................................................................... 64
4.3 Types and Sources of data....................................................................................... 66
4.4 Data analysis ........................................................................................................... 66
4.5 Econometric Model ................................................................................................. 66
4.6 Model 1: Estimating Fertilizer subsidy effects on Household income; The
Multinomial Approach ..................................................................................................... 67
4.6.1 Model 1Results ................................................................................................. 69
4.7 Model 2: Estimating Fertilizer subsidy effects on Commercialization; The Probit
Approach. ......................................................................................................................... 71
4.7.1 Model 2 Results ................................................................................................ 72
4.7.2 Determinants of Commercialization................................................................. 72
4.8 Definition of Variables ............................................................................................ 74
Chapter 5 FINDINGS AND DISCUSSION ........................................................................ 77
5.1 Descriptive Statistics ............................................................................................... 77
5.1.1 Background information ................................................................................... 77
V
Chapter 6 CONCLUSION AND RECOMMENDATION .................................................. 85
REFERENCES .................................................................................................................... 88
ACKNOWLEDGEMENT ................................................................................................... 96

VI
LIST OF FIGURES
Figure 1-1 .Kenya‘s Agriculture growth (real GDP) .......................................................... 1
Figure 1-2 Conceptual Framework of the NAAIAP Programme ..................................... 15
Figure 1-3 Conceptual Framework for the study.............................................................. 16
Figure 3-1 Economic (GDP) and Agricultural (Value Added) growth 1960 - 2014......... 33
Figure 3-2 Price of DAP in Mombasa and Nakuru (Constant 2007 KSh. per 50Kg bag) 38
Figure 3-3 Fertilizer Consumption in Kg/Ha of arable land ............................................ 39
Figure 3-4 Fertilizer ―Double‖Value chain....................................................................... 40
Figure 3-5 Trends in Consumption, Commercial Imports and Donor Imports of
Fertilizers in Kenya 1990/91 - 2010/11 ........................................................................ 41
Figure 3-6 Trends in the consumption of various Fertilizer products. ............................. 42
Figure 3-7 Fertilizer Supply Chains in Kenya. ................................................................. 45
Figure 3-8 World Fertilizer Consumption (Kg/Ha) .......................................................... 46
Figure 3-9 The Concept of Access Gap ............................................................................ 48
Figure 3-10 Price and quantity effects of a subsidy.......................................................... 49
Figure 3-11 Deadweight loss and Inefficiencies of a Subsidy.......................................... 50
Figure 3-12 Cropping zones of Kenya ............................................................................. 54
Figure 3-13 Fertilizer adoption and maize production costs in Kenya. ............................ 58
Figure 3-14 Maize value chain in Kenya.......................................................................... 60
Figure 3-15 Trends in Kenya‘s Maize production and consumption. ............................... 61
Figure 4-1 Location of the Study Area ............................................................................. 63
VII
LIST OF TABLES
Table 1-1 Key Crop Production Statistics .......................................................................... 2
Table1-2 Categories** Of Agricultural Land ('000 Hectares) ............................................ 2
Table 1-3 Gross Marketed Production At Current Prices 2006 - 2012 (Ksh.. Million)...... 3
Table 1-4 Maize Production ('000 Tonnes) And Average Prices (Ksh.. Per 100kg) To
Producers 2006 - 2012. ................................................................................................... 3
Table 1-5 Value Of Agricultural Inputs, 2005 - 2012 (Ksh. '000) ...................................... 5
Table1-6 Transitional Milestones In Agricultural Policy Reforms ..................................... 6
Table 3-1 Evolution Of Maize And Fertilizer Market Policy Reforms Starting In 1988 . 34
Table 3-2 Summary Of Key Policy Issues In The Fertilizer Markets .............................. 37
Table 3-3 Distribution Of Fertilizer Use Consistency By Agro Ecological Zones........... 41
Table 3-4 Fertilizer Usage By Smallholder Farmers ........................................................ 42
Table 3-5 Agricultural Input Indices, 2009 - 2013 ........................................................... 43
Table 3-6 Value Of Purchased Agricultural Inputs, 2009 - 2013 (Ksh.. Millions) ........... 44
Table 3-7 Market Prices For Fertilizer – National Cereals Produce Board ...................... 45
Table 3-8 Government Subsidized Fertilizer Distribution: Oct – Nov. 2012 ................... 47
Table 3-9 Reforms In The Maize Market 1979 to 2012 ................................................... 53
Table 3-10 Variation Of Maize Productivity By Agro-Regional Zone ............................. 55
Table 3-11 Average Maize Production From 2005 - 2009 ............................................... 56
Table 3-12 Maize Production, Consumption And Domestic Values (2004 - 2010) ......... 56
Table 3-13 .8Maize Production, Pricing And Marketing (2009 - 2013)........................... 57
Table 3-14 Sale To Marketing Boards Of Selected Crops, 2009 - 2013 .......................... 58
Table 3-15 Production And Transport Cost Of Maize To Nairobi.................................... 59
Table 3-16 Comparison Of Yields, Costs And Returns For Maize In Kenya And Uganda ..... 59
Table 4-1 Crop Statistics Tana River County.................................................................... 64
Table 4-2 .NAAIAP Inputs Distributed To Farmers In Galole Division .......................... 65
Table 4-3 Sample Villages Selected Through Purposive Sampling ................................. 65
Table 4-4 Number Of Farmers Sampled Per Village ........................................................ 66

VIII
Table 4-5 Multinomial Logit Regression Results For Annual Household Income .......... 69
Table 4-6 Probit Regression Results For Commercialization........................................... 72
Table 4-7 Description Of Variables .................................................................................. 74
Table 5-1 Descriptive Statistics For Farmers Personal Information ................................. 77
Table 5-2 Descriptive Statistics Group Membership And Activity .................................. 78
Table 5-3 Descriptive Statistics Land Ownership And Production .................................. 79
Table 5-4 Descriptive Statistics Type And Access To Financial Service.......................... 81

IX
ABBREVIATIONS AND ACRONYMS
AATF African Agricultural Technology Fund
AFC Agricultural Finance Corporation
AFC Agricultural Finance Corporation
AFRICOG African Center for Open Governance
AGMARK Agricultural Markets Development Trust
AGRA Alliance for a Green Revolution In Africa
ASAL Arid and Semi-Arid Lands
ASALs Arid and Semi-Arid Lands
ASDS Agricultural Sector Development Strategy
C.I.F Cost Insurance and Freight
CAN Calcium Ammonium Nitrate
CSRP/KMDP Cereal Support Programme/Kenya Maize Development Programme
DAP Diammonium Phosphate
DDCs District Development Committees
DFRD District Focus for Rural Development
ECA East and Central Africa
EEC/WB European Economic Commission/World Bank
ERS Economic Recovery Strategy
FAO Food and Agriculture Organization
FAOSTAT FAO Statistics
FBOs Faith Based Organization
FISP Farm Input Subsidy Programme
FRS Famine Relief Stocks
GBHL Grain Bulk Handlers Limited
GDP Gross Domestic Product
GoK Government of Kenya
HYVs High Yielding Varieties
IADP Integrated Agricultural Development Programme
IFDC International Fertilizer Development Center
IFIs International Financial Institutions
IFPRI International Food Policy Research Institute
IMF International Monetary Fund
KEBS Kenya Bureau of Standards
KENFAP Kenya National Federation of Agricultural Producers

X
KFA Kenya Farmers Association
KGGCU Kenya Grain Growers Cooperative Union
Kgs Kilograms
KIPPRA Kenya Institute Of Public Policy Research and Analysis
KNTC Kenya National Trading Corporation
KRDS Kenya Rural Development Strategy
KTDA Kenya Tea Development Authority
MAFAP Monitoring African Food and Agricultural Policies
MAP Monoammonium Phosphate
MOP Muriate of Potash
MT Metric Tonnes
NAAIAP National Accelerated Agricultural Inputs Access Programme
NARC National Rainbow Coalition
NCPB National Cereals and Produce Board
NEP National Extension Programme
NGOs Non-Governmental Organizations
NPK Nitrogen Phosphorus Potasium Fertilizer
NTBs Non-Tariff Barriers
OPV Open Pollinated Variety
PRSP Poverty Reduction Strategy Paper
SAPs Structural Adjustment Programs
SGR Strategic Grain Reserves
SRA Strategy for Revitalization of Agriculture
SSA Sub - Saharan Africa
STATA Data Analysis and Statistical Software
T&V Training and Visit
US$ United States Dollar
USAID United States Agency for International Development
VAT Value Added Tax
WFP World Food Programme
中国农业科学院硕士学位论文 Chapter 1
1
Chapter 1 Introduciton
1.1 INTRODUCTION
“The rest of the world is fed because of the use of good seed and inorganic fertilizer, full stop. This
technology has not been used in most of Africa. The only way you can help farmers get access to it is
give it away free or subsidize it heavily.” Stephen Carr, former World Bank Specialist on Sub-Saharan
African Agriculture, quoted in Dugger, 2007.
1.1.1 Background
1.1.1.1 An overview of the Agriculture sector in Kenya
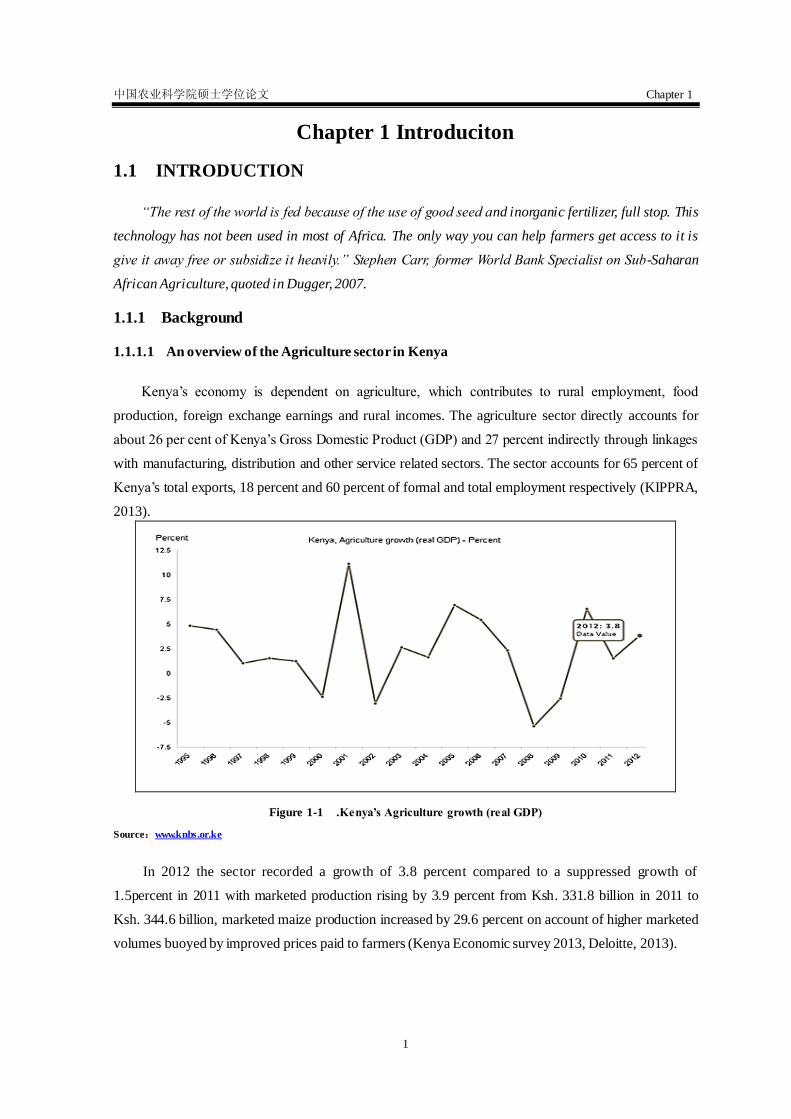
Kenya‘s economy is dependent on agriculture, which contributes to rural employment, food
production, foreign exchange earnings and rural incomes. The agriculture sector directly accounts for
about 26 per cent of Kenya‘s Gross Domestic Product (GDP) and 27 percent indirectly through linkages
with manufacturing, distribution and other service related sectors. The sector accounts for 65 percent of
Kenya‘s total exports, 18 percent and 60 percent of formal and total employment respectively (KIPPRA,
2013).
Figure 1-1 .Kenya’s Agriculture growth (real GDP)
Source:www.knbs.or.ke
In 2012 the sector recorded a growth of 3.8 percent compared to a suppressed growth of
1.5percent in 2011 with marketed production rising by 3.9 percent from Ksh. 331.8 billion in 2011 to
Ksh. 344.6 billion, marketed maize production increased by 29.6 percent on account of higher marketed
volumes buoyed by improved prices paid to farmers (Kenya Economic survey 2013, Deloitte, 2013).

中国农业科学院硕士学位论文 Chapter 1
2
Table 1-1 Key Crop Production Statistics
Commodity 2011 2012 % change
Tea ('000 Tonnes) 377.9 369.4 -2.2
Coffee ('000 Tonnes) 36.3 49.0 35
Fresh Horticultural Produce ('000 Tonnes) 216.2 205.7 -4.9
Maize (Million Bags) 34.4 40.0 16.3
Wheat ('000 Tonnes) 105.9 162.7 53.6
Rice ('000 Tonnes) 80.2 83.6 4.2
Source. Kenya Economic Survey 2013.
Total maize output in Kenya has for a long time been determined by maize yield levels per unit
area and maize statistics have both captured total planted area and productivity as key indicators for
food security in a country whose food security needs are closely tied to the levels of annual maize
production. Kenya being a primarily agriculture based economy performance in the maize subsector
(Table 1-1) has had great bearing on both food security and overall economic growth. Kenya is a
country whose land mass is 80% arid and semi-arid less than 12% of the entire land mass is considered
high potential and suitable for maize production;The(table 1-2)breakdown of the categories of
agricultural land and its spread over 8 provinces (these have now been replaced by counties). Of the
entire total land area only 13% is considered high potential, 6% medium and 81% is low potential land.
Table1-2 Categories** Of Agricultural Land ('000 Hectares)
Province High
potential
Medium
potential
Low
potential
Total Other land Total land
area
Central 909 15 41 965 353 1,318
Coast 373 796 5,663 6,832 1,472 8,304
Eastern 503 2,189 11,453 14,145 1,431 15,576
Nairobi 16 - 38 54 14 68
North –
Eastern
- - 12,690 12,690 - 12,690
Nyanza 1,218 34 - 1,252 - 1,252
Rift Valley 3,025 123 12,220 15,368 1,515 16,883
Western 741 - - 741 82 823
TOTAL 6,785 3,157 42,105 52,047 4,867 56,914
Source: Economic Survey, 2014 ** The three categories are defined as follows *High Potential – annual rainfall of 857.5mm or
more ** Medium Potential – annual rainfall of 735mm-857.5mm and ***Low Potential – annual rainfall of 612.5mm or less.
Increasing maize production in Kenya has been approached both from the farm level and national
level. At the farm level, productivity and maximization of available farm size has been a major focus,
while at the national level overall output and enhancing the productivity potential of fragile land
ecosystems has been top priority. Producing higher yields on available land potential (Table 1-2) has
therefore remained a major focus for research and policy makers in an effort to generate extra
production to feed the nation.
中国农业科学院硕士学位论文 Chapter 1
3
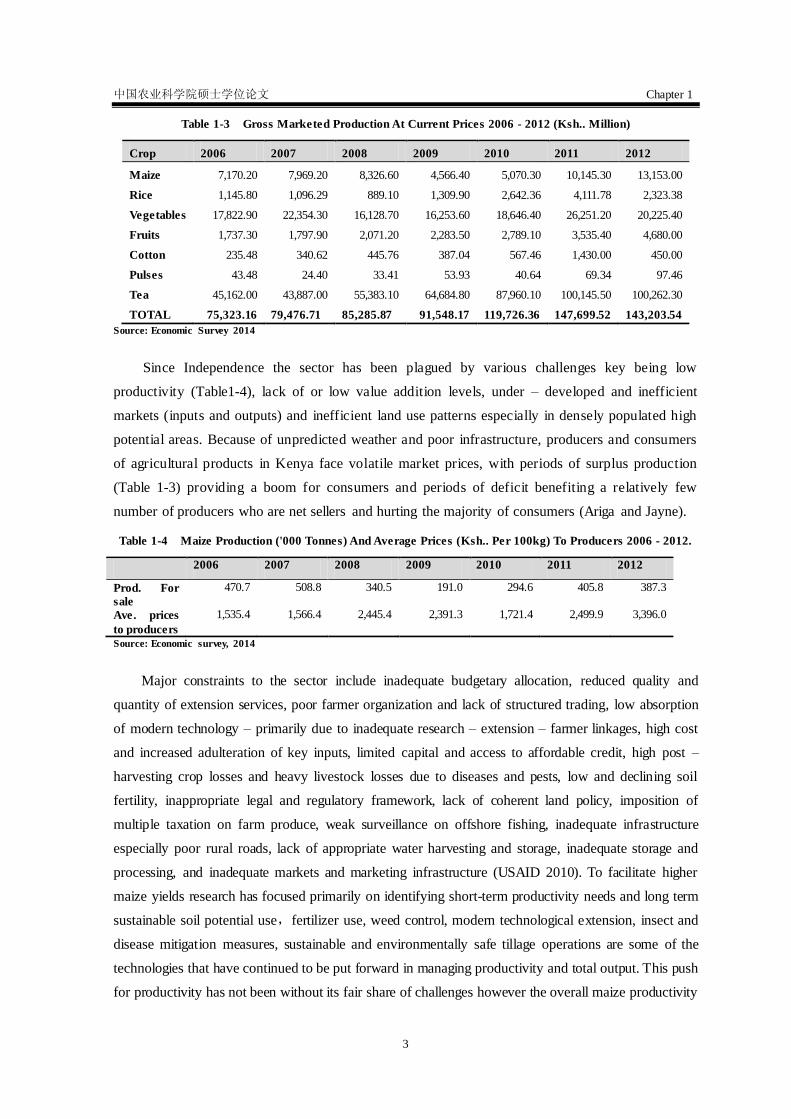
Table 1-3 Gross Marketed Production At Current Prices 2006 - 2012 (Ksh.. Million)
Crop 2006 2007 2008 2009 2010 2011 2012
Maize 7,170.20 7,969.20 8,326.60 4,566.40 5,070.30 10,145.30 13,153.00
Rice 1,145.80 1,096.29 889.10 1,309.90 2,642.36 4,111.78 2,323.38
Vegetables 17,822.90 22,354.30 16,128.70 16,253.60 18,646.40 26,251.20 20,225.40
Fruits 1,737.30 1,797.90 2,071.20 2,283.50 2,789.10 3,535.40 4,680.00
Cotton 235.48 340.62 445.76 387.04 567.46 1,430.00 450.00
Pulses 43.48 24.40 33.41 53.93 40.64 69.34 97.46
Tea 45,162.00 43,887.00 55,383.10 64,684.80 87,960.10 100,145.50 100,262.30
TOTAL 75,323.16 79,476.71 85,285.87 91,548.17 119,726.36 147,699.52 143,203.54
Source: Economic Survey 2014
Since Independence the sector has been plagued by various challenges key being low
productivity (Table1-4), lack of or low value addition levels, under – developed and inefficient
markets (inputs and outputs) and inefficient land use patterns especially in densely populated high
potential areas. Because of unpredicted weather and poor infrastructure, producers and consumers
of agricultural products in Kenya face volatile market prices, with periods of surplus production
(Table 1-3) providing a boom for consumers and periods of deficit benefiting a relatively few
number of producers who are net sellers and hurting the majority of consumers (Ariga and Jayne).
Table 1-4 Maize Production ('000 Tonnes) And Average Prices (Ksh.. Per 100kg) To Producers 2006 - 2012.
2006 2007 2008 2009 2010 2011 2012
Prod. For
sale
470.7 508.8 340.5 191.0 294.6 405.8 387.3
Ave. prices
to producers
1,535.4 1,566.4 2,445.4 2,391.3 1,721.4 2,499.9 3,396.0
Source: Economic survey, 2014
Major constraints to the sector include inadequate budgetary allocation, reduced quality and
quantity of extension services, poor farmer organization and lack of structured trading, low absorption
of modern technology – primarily due to inadequate research – extension – farmer linkages, high cost
and increased adulteration of key inputs, limited capital and access to affordable credit, high post –
harvesting crop losses and heavy livestock losses due to diseases and pests, low and declining soil
fertility, inappropriate legal and regulatory framework, lack of coherent land policy, imposition of
multiple taxation on farm produce, weak surveillance on offshore fishing, inadequate infrastructure
especially poor rural roads, lack of appropriate water harvesting and storage, inadequate storage and
processing, and inadequate markets and marketing infrastructure (USAID 2010). To facilitate higher
maize yields research has focused primarily on identifying short-term productivity needs and long term
sustainable soil potential use,fertilizer use, weed control, modern technological extension, insect and
disease mitigation measures, sustainable and environmentally safe tillage operations are some of the
technologies that have continued to be put forward in managing productivity and total output. This push
for productivity has not been without its fair share of challenges however the overall maize productivity

中国农业科学院硕士学位论文 Chapter 1
4
and food security situation has continued to rise over the years from a low of 1,143,000MT in 1960 to
2,600,000MT in 2012 (http://www.indexmundi.com/ ). Production of maize is expected to rise even
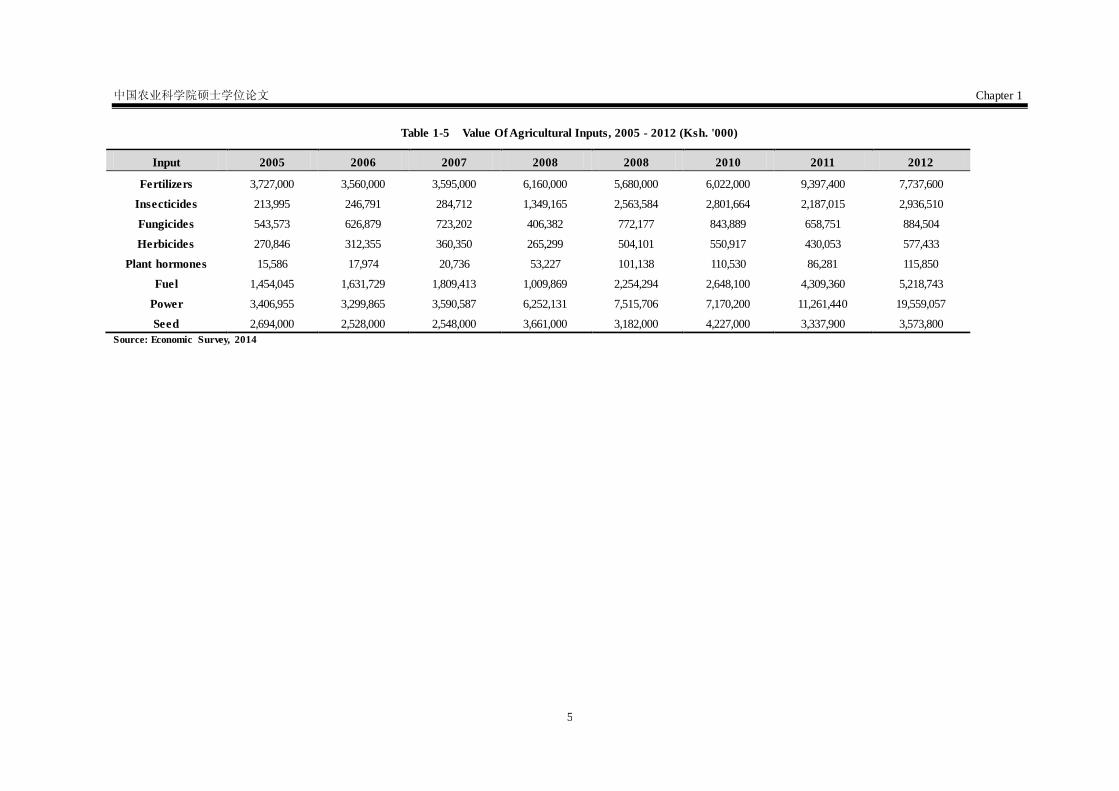
further with the introduction of key government incentives like fertilizer and seed subsidies (Table 1-5).
The effect of these subsidies is specifically targeted at increasing productivity and production at the
household level.
中国农业科学院硕士学位论文 Chapter 1
5
Table 1-5 Value Of Agricultural Inputs, 2005 - 2012 (Ksh. '000)
Input 2005 2006 2007 2008 2008 2010 2011 2012
Fertilizers 3,727,000 3,560,000 3,595,000 6,160,000 5,680,000 6,022,000 9,397,400 7,737,600
Insecticides 213,995 246,791 284,712 1,349,165 2,563,584 2,801,664 2,187,015 2,936,510
Fungicides 543,573 626,879 723,202 406,382 772,177 843,889 658,751 884,504
Herbicides 270,846 312,355 360,350 265,299 504,101 550,917 430,053 577,433
Plant hormones 15,586 17,974 20,736 53,227 101,138 110,530 86,281 115,850
Fuel 1,454,045 1,631,729 1,809,413 1,009,869 2,254,294 2,648,100 4,309,360 5,218,743
Power 3,406,955 3,299,865 3,590,587 6,252,131 7,515,706 7,170,200 11,261,440 19,559,057
Seed 2,694,000 2,528,000 2,548,000 3,661,000 3,182,000 4,227,000 3,337,900 3,573,800
Source: Economic Survey, 2014
中国农业科学院硕士学位论文 Chapter 1
6
Enhancing the performance of smallholders through promotion of intensive farming is critical to
future agricultural growth. This includes the provision of quality and timely support services including
extension to promote good agricultural practices, optimal usage of modern inputs, infrastructural
development to reduce post-harvest losses and overall cost of doing business, and storage facilities. It is
expected however that with productivity improvement comes surplus production and a need to
exchange surplus produce for cash income to support the smallholder basic needs.
Kenya‘s agricultural sector comprises six major sub–sectors which include industrial crops, food
crops, horticulture, livestock, fisheries and forestry. According USAID (2010) basing on 2008 statistics
and production values the sub sectors can be valued as indicated below:
Industrial crops including tea (US$ 738 million); coffee, (US$ 91 million); sugar (US$ 164
million); pyrethrum (US$ 1.2 million); sisal (US$ 19 million); tobacco and coconuts.
Food crops include maize (US$ 951 million) and wheat (US$ 136 million); rice (US$ 16
million); beans (US$ 174 million).
Horticultural products – vegetables, flowers and fruits (US$ 2.4 billion) both domestic and
export.
Livestock – dairy (US$ 1.5 billion) and beef (US$ 1.0 billion)
Fish – both fresh water and marine fish (US$ 120 million)
1.1.2 Agricultural sector policies
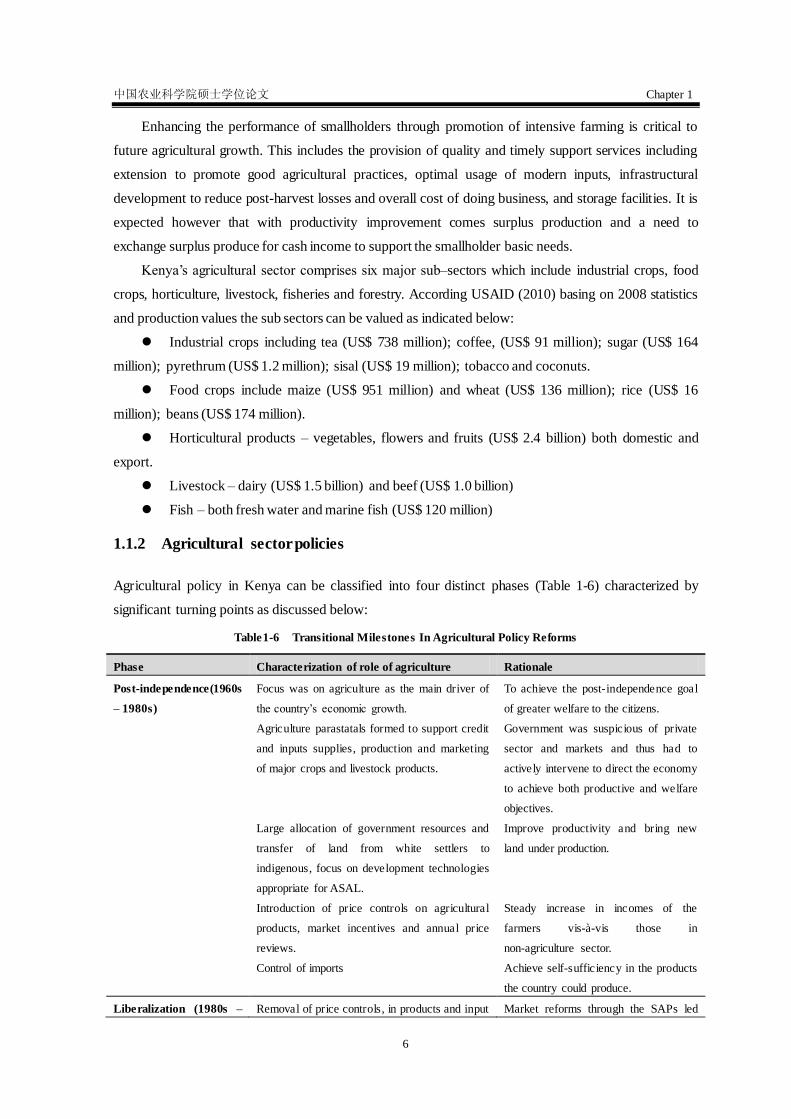
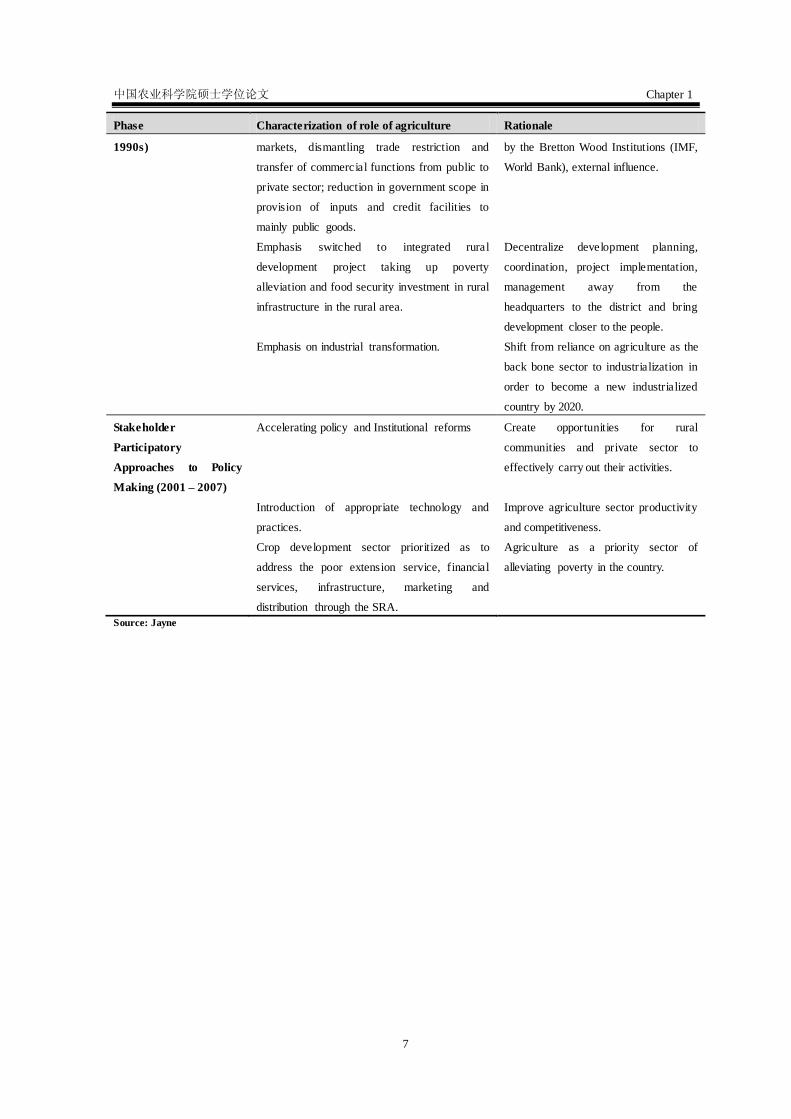
Agricultural policy in Kenya can be classified into four distinct phases (Table 1-6) characterized by
significant turning points as discussed below:
Table1-6 Transitional Milestones In Agricultural Policy Reforms
Phase Characterization of role of agriculture Rationale
Post-independence(1960s
– 1980s)
Focus was on agriculture as the main driver of
the country‘s economic growth.
To achieve the post-independence goal
of greater welfare to the citizens.
Agriculture parastatals formed to support credit
and inputs supplies, production and marketing
of major crops and livestock products.
Government was suspicious of private
sector and markets and thus had to
actively intervene to direct the economy
to achieve both productive and welfare
objectives.
Large allocation of government resources and
transfer of land from white settlers to
indigenous, focus on development technologies
appropriate for ASAL.
Improve productivity and bring new
land under production.
Introduction of price controls on agricultural
products, market incentives and annual price
reviews.
Steady increase in incomes of the
farmers vis-à-vis those in
non-agriculture sector.
Control of imports Achieve self-sufficiency in the products
the country could produce.
Liberalization (1980s – Removal of price controls, in products and input Market reforms through the SAPs led
中国农业科学院硕士学位论文 Chapter 1
7
Phase Characterization of role of agriculture Rationale
1990s) markets, dismantling trade restriction and
transfer of commercial functions from public to
private sector; reduction in government scope in
provision of inputs and credit facilities to
mainly public goods.
by the Bretton Wood Institutions (IMF,
World Bank), external influence.
Emphasis switched to integrated rural
development project taking up poverty
alleviation and food security investment in rural
infrastructure in the rural area.
Decentralize development planning,
coordination, project implementation,
management away from the
headquarters to the district and bring
development closer to the people.
Emphasis on industrial transformation. Shift from reliance on agriculture as the
back bone sector to industrialization in
order to become a new industrialized
country by 2020.
Stakeholder
Participatory
Approaches to Policy
Making (2001 – 2007)
Accelerating policy and Institutional reforms Create opportunities for rural
communities and private sector to
effectively carry out their activities.
Introduction of appropriate technology and
practices.
Improve agriculture sector productivity
and competitiveness.
Crop development sector prioritized as to
address the poor extension service, financial
services, infrastructure, marketing and
distribution through the SRA.
Agriculture as a priority sector of
alleviating poverty in the country.
Source: Jayne

中国农业科学院硕士学位论文 Chapter 1
8
Before 1964 (The Colonial Period)
Agricultural policy mainly focused on the Colonial agricultural systems and protecting the interests
of the colonial masters with little attention if any paid to African agriculture. Priority was placed on
enhancing and facilitating acquisition of prime land for white settlement and establishing key crops that
would be the reserve of the white colonial masters. European farmers and settlers were supported to
establish and undertake agricultural activities in the agriculturally rich areas of the country with
exclusive land ownership rights. Africans were alienated through control of labour supply through poll
taxation and development of residence labour (squatter system), legal control of production of specific
crops (sisal, coffee, wheat, dairy), Africans were legally restricted from occupying particular areas and
agriculture was then restricted to limited cultivation around restricted residential villages or ―reserves‖
where the colonial masters also determined the type and extent of crop production. Pricing, marketing
and credit policies were used to subsidize settler agricultural production and stifle African agriculture.
These policies generated problems of landlessness and land degradation.
Nzuma, (2013) Citing Brown, (1970) indicates that to effectively implement agricultural policy,
extension and research divisions were established in the then Department of agriculture. The
establishment of these divisions then encouraged the development of sisal, coffee, and pyrethrum
industries for the large scale European farmers. To control production and marketing, several production
and marketing boards/organizations were formed to organize production and marketing and set a basis
for economic growth and achievement of agricultural policy objectives. These boards included; the
Kenya Co-operative Creameries (1931) for dairy products, the Coffee Board (1933) for coffee, and the
Pyrethrum board (1938) to oversee the production and marketing of pyrethrum. Other existing boards
established during this period included the sisal board, the flax board, the passion fruit board, and the
pigindustry board.
In 1950 with the introduction of the Swynnerton plan of 1954 a major shift in the agricultural
policy environment occurred. With emphasis on increased expenditure on extension, research, credit
and market development to support commercial farming, this plan gave life to post – war policies which
saw the implementation of water supplies, soil conservation, farming systems research, livestock
development, and fertilizer and pasture research. However this plan did little to improve African
settlement problems and it also highly discouraged land fragmentation, it also gave co – operative
marketing great importance although it was felt that marketing was too important to be entrusted to
Africans. This eventually resulted in the establishment of marketing boards to control the marketing
system. Some of the boards that were formed in this period include the Coffee Marketing Board in 1946,
the Tea Board in 1951, the maize and produce control board in 1950, the wheat board in 1952, and the
cotton lint and seed marketing board in 1955 (Nzuma, 2013).
1964 to 1980s (The post-independence period)
Immediately after independence and against the backdrop of restrictive regulations in the pre
independence period overall economic and agricultural policy was influenced by the need for
self-determination and rapid economic growth for all citizens. Agricultural policy at this time was
中国农业科学院硕士学位论文 Chapter 1
9
concern with supporting a smooth transfer of prime land from white settlers to indigenous Kenyans with
help from state – supported agencies in the production and marketing of produce (such as NCPB for
maize) (Ariga and Jayne). It was widely believed that to achieve rapid economic development a lot of
focus needed to be placed on the improvement of the agricultural sector and to enable citizens to freely
engage in farming and take up the opportunities for production that had been left by the colonial masters.
The government therefore emphasized equitable allocation of land, greater access to productive land,
and bringing of new land into agricultural production. Marketing and pricing of agricultural products,
research and development, extension and livestock production became key aspects of the overall
government policy. Focus on research and extension to maintain and increase productivity and
development of livestock through ranching and conservation of natural resources was emphasized
alongside maintenance of rural infrastructure. This periodsaw a rapid establishment of parastatals to
support production and marketing of major crops such as coffee, tea, sisal, pyrethrum, cotton, sugar, rice,
maize, wheat and livestock products. Cooperative societies like Kenya Farmers Association (KFA)
provided inputs to farmers, credit support was provided through Agricultural Finance Corporation
(AFC).
Research and development focused on producing technologies that were relevant to the vast Arid
and Semi-Arid Lands (ASALs) like small-scale irrigation and the use of water harvesting technologies.
These policies were implemented through programs such as Smallholder Production Service Program
(SPSP) and Integrated Agricultural Development Programme (IADP). The effect of these policies was
that agricultural productivity and cash crop production increased with a resultant growth in GDP of 6%.
The downside however was that this period saw an increase in instances of bad governance, corruption
and rent seeking resulting in indebtedness and poor service delivery to farmers. Marketing monopolies
mushroomed resulting from state owned enterprises having exclusive rights to certain cash crop trade
regulation and pricing.
1980s to 1990s (The liberalization period)
The challenges that emerged from the post-independence period created a need for restructuring
state owned enterprises to provide better services and to eliminate monopolistic tendencies that were
hampering efficient operation of markets. In the 1980s the government therefore introduced market-led
reforms (commonly known as SAPs – Structural Adjustment Programs) partly as a result of the pressure
from external development partners‘ insistence on financial reforms and reduction in state control on
state owned enterprises. Market liberalization involved removal of price controls in product and input
markets, dismantling of trade restrictions and transfer of commercial functions from the public to
private sector. In addition there was marked reduction in government services like extension, marketing,
dipping of cattle, credit and artificial insemination.
A main characteristic of this period was the District Focus for Rural Development (DFRD) a
programme introduced in 1983 to transfer planning and implementation of rural development projects

中国农业科学院硕士学位论文 Chapter 1
10
from the ministries to the local level with the District taking up the role of ruraldevelopment planning,
project implementation, coordination and management of development resources through its District
Development Committees (DDCs). With the support of development partners districts could also invest
in rural infrastructure like storage facilities, rural access roads and marketing facilities. In 1983 and
1991 saw the approval of the National Extension Programme (NEP) I and II which introduced a new
extension methodology the T & V (Training and Visit).
The inability to compete in a more liberal environment saw the collapse of key state owned
enterprises formed during the post-independence period. DFRD resulted in improvement and access of
services to the rural areas to some extent. However due to the lack of participatory policy and
development planning process, the private sector and the rural clientele could not determine the
direction and priority areas of focus in government planning and project implementation. Capacity
constraints also ensured that the private sector was unable to take up the roles initially carried out by the
state owned enterprises. This had the effect of exposing farmers to market forces and cost-sharing in
services, something that lead to uncertainties and poor performance due to inadequate market
information and investment asymmetries.
1990s to 2000s (The participatory stakeholder period)
The lack of involvement of the private sector in the liberalization and the planning and
implementation of government projects created a need for a platform that would bring together the
government and the private sector. With the experience from the reform period the government also saw
the need to involve the private sector using participatory methodologies so that the private sector could
effectively take up the roles that were given up by the government. To provide a framework for
participatory development the government published the Poverty Reduction strategy Paper (PRSP) in
2001. This was done through a consultative process that brought together the public, private and civil
society groups led by the International Financial Institutions (IFIs). This saw the government
committing to create opportunities for rural community development and the private sector to operate
efficiently and effectively and accelerating policy and institutional reforms particularly on the legislative
and regulatory reforms that created bottlenecks in private sector involvement.
Through its Kenya Rural Development Strategy (KRDS) the government sought to improve
agricultural sector productivity and competitiveness through adoption of appropriate technologies and
practices. The government recognized the need for stakeholder involvement in rural development
through the multi – sector approach. The KRDS brought together Non – Governmental Organizations
(NGOs), private sector, religious groups, civil societies, and other development partners.
The year 2003 saw the installation of a new government, the National Rainbow Coalition (NARC)
and with it saw the renewed spirit for economic recovery through tabling of the Economic Recovery
Strategy (ERS) a precursor of the PRSP. ERS proposed macroeconomic stability, strengthening of
institutions of governance, rehabilitation and expansion of physical infrastructure and investment in
human capital. The productive sectors of agriculture, trade and industry, and tourism were to be the

中国农业科学院硕士学位论文 Chapter 1
11
prime movers of economic growth (GoK, 2004a). In the Agricultural sector the main policy document
for implementing the ERS was the Strategy for Revitalization of Agriculture (SRA).
Kenya‘s overall guiding policy is the Vision 2030, a national long – term development blue – print
to create a globally competitive and prosperous nation with a high quality of life by 2030, that aims to
transform Kenya into a newly industrializing, middle income country providing a high quality of life to
all its citizens by 2030 in a clean and secure environment (www.vision2030.go.ke). The vision is
anchored on three key pillars (Economic, social and political governance) of which agriculture falls
within the economic pillar. At sector level agricultural development is guided by the Agricultural
Sector Development Strategy – ASDS (2009 – 2020) which came into effect in June 2009. The ASDS
aims to increase agricultural productivity, commercialization and competitiveness of the agricultural
commodities to enable sector contribute to the national goals of food security, increased export for
foreign exchange earnings and employment creation. The ASDS seeks to progressively reduce
unemployment and poverty, and to spur agriculture back to growth trends (ASDS 2010). The vision of
the ASDS is: A food – secure and prosperous nation and its overall goal is to achieve an average growth
rate of 7 percent per year over the next 5 years through its strategicmission of creating an innovative,
commercially oriented and modern agriculture (ASDS, 2010).
The government has also developed specific commodity specific policies to address key challenges
and constraints. These Include Food and Nutrition Policy (2007); National Cassava Industrial Policy
(2007); National Seed Industry Policy; Horticultural Policy (2007); National Agricultural Sector
Extension Policy; National Oil Seeds Industry Development Policy; National Rice Development
Strategy (2008-2018); Sessional Paper on Cereals and Produce (Draft); And Nut Crops Development
Policy among Others (USAID 2010). Other key sector challenges include diminishing agricultural land,
over-reliance on rain fed agriculture, poor cropping choices, poor extension services, and disorganized
markets. Solutions for these challenges can be found in land consolidation, long term land leasing,
making farming commercial, ensuring that technology matches the changing environment, production
of drought tolerant crops, diversifying eating habits; crop insurance; organized markets that will
discover prices more transparently, and improved quality to reduce post-harvest losses.
1.2 Problem Statement
Agriculture which is the backbone of many economies in the world today and especially so in the
Sub – Saharan Africa is characterized by low technological innovation and a resounding little if any,
improvement in yield per unit area of land in the last 40 years. These problems in agricultural
productivity growth have been made even worse by climate change, Agricultural sector policy
implementation, crop pest and diseases, inadequate and inefficient irrigation technologies and
unsustainable farming systems.
These underlying problems have ensured that in addition to numerous biotic and abiotic production
中国农业科学院硕士学位论文 Chapter 1
12
constraints the productivity of small holder farmers in SSA remains low (AATF, 2010) some of these
productivity constraints could be mitigated using simple technologies like water harvesting and
conservation, supplementary irrigation, plastic mulch and micro – irrigation, land management practices
and policies, revamping agricultural extension, post – harvest loss technologies, labor productivity
enhancing, disease resistant and high yielding maize varieties, dry land technologies, integrated farming
systems that combine fish, livestock and crops and use of organic and inorganic fertilizers to improve
crop yield. Dowardet al., (2007) highlights the factors limiting smallholder agriculture in Malawi as
being high levels of poverty, low productivity, increased vulnerability, seasonality, high dependence on
maize, price fluctuation, land pressure, poor market development and infrastructure, fragility of casual
labor markets and ‗coping strategies‘ of poor people.
Crop production the major driver for rural development in most African countries is closely linked
to land productivity. Soil being the medium for plant growth and stability is critical for crop production
and is a key factor determining land productivity. Studies by ECA (2003) show that soils in SSA are
naturally low in nitrogen and deficient in phosphorus, sulphur, magnesium and zinc. In addition, low
soil depth reduces crop anchorage and ability to extract nutrients and water.
Food security concerns are currently escalating in Sub – Saharan Africa due to poor soil
management practices on the fragile soils (Omotayu, 2009) Global hotspots of soil degradation with
high priority of soil restoration and C sequestration include SSA, Central and South Asia, China, the
Andean Region, the Caribbean, and the acid savannas of South America(Lal,2004). As the world moves
towards a larger population of close to 9 billion people by 2050 the future of tropical agriculture lies in
the reclamation and bringing to better use fragile soils which make up a big part of the soils in Sub
Saharan Africa.
1.3 Research Objective
This study seeks to (1) determine the effects of ―Smart‖ (government) fertilizer subsidy programs
on the annual income of farmers in the maize sector, (2) Effects of determinants/factors that affect
commercialization of smallholder farmers, (3) analyze policy implications of fertilizer subsidy
programmes in light of their effectiveness and justification in smallholder farming.
1.4 Research Question
Does participation in a ―Smart‖ (government) fertilizer subsidy program have any effect on
incomes and market commercialization in the smallholder maize sector? Are the effects substantial
enough to justify the effectiveness of government funded subsidy programs?
1.5 Research Hypothesis
Small-holder farmers are defined as those marginal and sub marginal farm households whose
contribution to the total value of agricultural output is significant in many countries. Many countries are

中国农业科学院硕士学位论文 Chapter 1
13
currently implementing agricultural and poverty reduction strategies that explicitly support the linkage
to and inclusion of smallholders in markets. It is however not certain the efficacy of such strategies to
the overall welfare of the farmer especially if the programs do not translate into sustainable benefits
through the market led approaches. It is believed that investments in modern technology and entering
new markets that may provide smallholders with better prospects can be extremely difficult due to the
need for economies of scale. This study seeks to prove that public investments in smallholder farmers
through smart subsidies can enable farmers to establish their presence in the market and thus break the
poverty cycle.
1.6 Justification for the study
Approximately 1.5 billion people are engaged in smallholder agriculture across the world. They
include 75% of the world‘s poorest people whose food, income, and livelihood prospects depend on
agriculture. They mainly live in rural communities (Ferris S., Robbins P., Best R., Seville D., Buxton A.,
Shriver J., & Wei E., 2014). Studies from several countries in Africa and Asia show that 50-70% of
smallholders are not transitioning from subsistence to commercial farming (Ferris S., Robbins P., Best
R., Seville D., Buxton A., Shriver J., & Wei E., 2014). Agriculture remains the best opportunity for the
estimated 1.5 to 2 billion people living in smallholder households to escape poverty (Ferris S., Robbins
P., Best R., Seville D., Buxton A., Shriver J., & Wei E., 2014). In developing countries a
significantnumber of the working population residein rural areas and depend on agriculture fortheir
livelihood (Sharma V. P., Jain D., & De S., 2012). Today, agricultural developmentis seen not just as a
vehicle for supportingindustrialization, but also as a modeof inclusive growth, pro-poor
economicdevelopment, food security andenvironmental sustainability [ibid]. However, Farmers face
several marketing constraints these include infrastructure: lack of physical infrastructure reflected in
inaccessible roads, lack of market facilities, power and electricity. Inputs: lack of and/or access to
quality seeds and other inputs including production andtrading capital. Post-harvest losses: High levels
of post-harvest losses. Assembly cost: lack of economies of scale leading to high cost of assembly.
Quality of produce: high levels of crops rejected at both farm level and at company warehouses
because products did not meet market standards. In some cases, farmers were not compensated for
rejected products. Risk: high levels of price and market uncertainty. Market information: unreliable
information on market trends or scheduling of production decisions to meet market needs. Farmers and
other market intermediaries were not aware of important information on prices and marketing, grades
and standard information further up the marketing chain (Freeman H.A, & Silim S.S, undated). The cost
of acquiring information is high, rural assemblers face high opportunity costs, lack of alternative market
outlets and the cost of finding and/negotiating with alternative markets is too high, market
intermediaries misinform farmers, farmers and market intermediaries rely on their own funds to finance
production and trading activities, farmers lose cash due to high cost of enforcing contracts and
production and marketing are characterized by high levels of uncertainty [ibid]. The smallholder
中国农业科学院硕士学位论文 Chapter 1
14
agriculture sector remains unprofitable and is characterized bylow uptake of improved farm inputs,
weak linksto markets, high transport costs, few farmerorganizations, poor quality control and lackof
information on markets and prices (Chirawa E, & Matita M., 2012). Farmers sell early part of
theirmaize but a greater proportion of maize is soldin the beginning of the marketing season making
households vulnerable to the effects ofchanges in food prices especially where realizedharvests were not
sufficient to meet householdrequirements [ibid]. The income gained from farm production mainly goes
to household consumption since the main target of thehouseholds is ensuring food sufficiency and
security (Balcha Y., 2013). Studies show that income growth generated by agriculture is up to four times
more effective in reducing poverty than growth in other sectors (Ferris S., Robbins P., Best R., Seville
D., Buxton A., Shriver J., & Wei E., 2014).Moving from push (selling what you grow) to pull (selling
what the consumer demands) however requires significant supply chain coordination [ibid].Statistically,
50% of smallholders will not be able to link to a commercial market [ibid]. Therefore, it is important to
keep in mind that the challenge is not merely of creating linkages to lucrative markets, but also of
adequately assessing smallholder conditions, including their market options and methods of optimizing
their market performance—all while ensuring thatthat these options are manageable for the
smallholders[ibid]. According to analysis from several market-focused teams, most smallholder farmers
in areas such as Sub-Saharan Africa rarely have enough surpluses to sell in the marketplace because of
limited land size and poor access to technologies that can improve productivity [ibid].
Use of modern technology is seen as the key to achieving the ―African Green Revolution‖ dream
for the continent. With the key to food security being in the hands of smallholder farmers, use of
modern technology has to be affordable to the majority who remain poor and vulnerable to changes in
the output and input markets. Governments in Africa have been implementing Farm Input Subsidy
Programmes (FISP) on and off from the early 1980s with mixed results in various countries. The case of
Malawi is cited as one of the most successful case studies of the use of ―smart‖ subsidies for increased
productivity and production. Malawi has however met certain challenges in its implementation that call
for closer analysis and understanding, key question being the sustainability of FISP programs and
linking farmers to more sustainable support systems after achieving increased production. This study
therefore seeks to examine the effects of ―smart‖ fertilizersubsidies and their effects on the farmer and
their relationship with the output market and whether these subsidies can create a sustainable
environment for smallholder farmers to thrive.
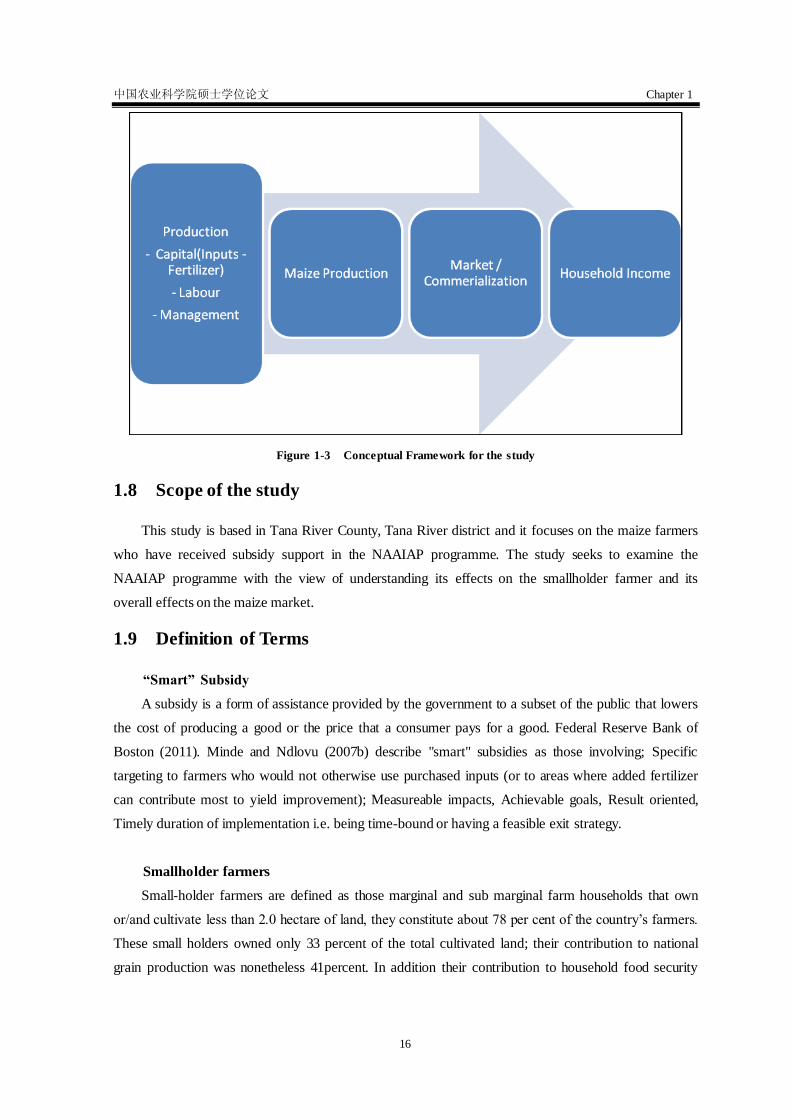
1.7 Conceptual Framework
The relational and causal aspects of the study will be based on the assumption that fertilizer
subsidies are a significant reduction in the production costs of a farm and that they also enhance a
farmers decision to produce a surplus for consumption and marketing.
Households are assumed to maximize utility with respect to consumption ( ),
production ( ), input use ( ), sales ( ), and purchase ( ) of each good i=1,2…N. Goods

中国农业科学院硕士学位论文 Chapter 1
15
consumed include self-produced agricultural goods, market commodities and leisure goods. Agricultural
products ( ) use labor and other variable inputs and land ( ). Stands for market price, is
the endowment of good i, represents exogenous transfers and other incomes and and
correspond to household consumption and production characteristics respectively.
The cash constraint states that all purchases of the household must be
less than or equal to sales and other exogenous income ( ) such as remittances. The resource balance
equation states that the consumed and sold quantity cannot exceed
production, endowment and purchased quantity of each good i. In the case of inputs , the resource
balance states that sales, input use and consumption cannot exceed endowment and purchase quantity of
each input i. corresponds to the production function that relates all inputs and outputs.
Fertilizer subsidies affect the farmer‘s expenditure on inputs the study thus seeks to isolate the
effect of fertilizer subsidies on the cost of inputs and the resultant advantages it offers to the farmer in
terms of higher productivity, reduced operational costs and market participation in the maize value chain
This relational concept can best be illustrated by the framework below. This framework is the
authors own development.
Figure 1-2 Conceptual Framework of the NAAIAP Programme
Legend Voucher Redemption
中国农业科学院硕士学位论文 Chapter 1
16
Figure 1-3 Conceptual Framework for the study
1.8 Scope of the study
This study is based in Tana River County, Tana River district and it focuses on the maize farmers
who have received subsidy support in the NAAIAP programme. The study seeks to examine the
NAAIAP programme with the view of understanding its effects on the smallholder farmer and its
overall effects on the maize market.
1.9 Definition of Terms
“Smart” Subsidy
A subsidy is a form of assistance provided by the government to a subset of the public that lowers
the cost of producing a good or the price that a consumer pays for a good. Federal Reserve Bank of
Boston (2011). Minde and Ndlovu (2007b) describe "smart" subsidies as those involving; Specific
targeting to farmers who would not otherwise use purchased inputs (or to areas where added fertilizer
can contribute most to yield improvement); Measureable impacts, Achievable goals, Result oriented,
Timely duration of implementation i.e. being time-bound or having a feasible exit strategy.
Smallholder farmers
Small-holder farmers are defined as those marginal and sub marginal farm households that own
or/and cultivate less than 2.0 hectare of land, they constitute about 78 per cent of the country‘s farmers.
These small holders owned only 33 percent of the total cultivated land; their contribution to national
grain production was nonetheless 41percent. In addition their contribution to household food security

中国农业科学院硕士学位论文 Chapter 1
17
and poverty alleviation is disproportionately high and is increasing. Moreover, as the national
population increases, so does the number of small holdings Singh et al.,(2002).
1.10 Limitations to the study
The NAAIAP programme is implemented in 104 districts across the country. This study focuses
only on one of the NAAIAP Counties and is further narrowed down to three sites (villages) within the
county. The study was also not able to exhaustively cover all the farmers who had benefited from this
programme due to limited time and resources.

中国农业科学院硕士学位论文 Chapter 2
18
Chapter 2 LITERATURE REVIEW
Farmers in developing countries generally face bigger risk than their counterparts in the
industrialized countries. Small holders, because of their low resource endowment, tend to be highly
vulnerable to production risks due to natural conditions and climatic shocks, as well as to the marketing
risks due to price fluctuation, opportunistic buying behavior etc. Bijman et al.,(2007). In order to better
understand what makes smallholder farmers "small" it is useful to consider the lens of poverty as the
key attribute of smallholder production. In turn, poverty can be defined as asset scarcity, in all of its
dimensions, including natural, physical, financial, human and social. In Kenya, for example, only 4% of
poor have access to credit through banks and another 3% through cooperatives Badiane et al., (1997).
Small-holder farmers are defined as those marginal and sub marginal farm households that own or/and
cultivate less than 2.0 hectare of land, they constitute about 78 per cent of the country‘s farmers. These
small holders ownonly 33 percent of the total cultivated land; their contribution to national grain
production was nonetheless 41per cent. In addition their contribution to household food security and
poverty alleviation is disproportionately high and is increasing. Moreover, as the national population
increases, so does the number of small holdings Singh et al.,(2002). Smallholder contribution to the
total value of agricultural output is significant in many countries of Asia. Small farmers are
characterized by smaller application of capital but higher use of labor and other family owned inputs,
and a generally higher index of cropping intensity and diversification Thapa G, (2010). Small holder
families constitute more than half of the national population [..] these small holder families nonetheless
constitute more than half of the nation‘s totals of hungry and poor Singh et al.,(2002). Despite their
constrained resources and their greater vulnerability to diverse happenings, the smallholding farmers
use farm inputs to a proportionately greater extent than the large holding farmers Singh et al.,(2002).
Smallholder farming is important in terms of poverty reduction, food security and wider rural
economic development in developing countries. Their importance derives from their prevalence, their
role in agricultural and economic development and the concentration of poverty in rural areas. Most
smallholders are vulnerable to economic and climatic shocks and spread their risk by diversifying their
sources of livelihood, often including significant off-farm income generating activities. Investments in
alternative crops and entering new markets that may provide them with better prospects can be
extremely difficult due to the need for economies of scale. Many countries have agricultural and poverty
reduction strategies that explicitly support the inclusion of smallholders in markets KENFAP, (2011).
The agriculture sector contributes 26% directly to gross domestic product (GDP) and 27% indirectly
through linkages with service and manufacturing sectors. The sector contributes 65% of export earnings
in the country. The smallholders' farmers in Kenya account for 75% of the agricultural output and 70%
of marketed agricultural produce. Lack of finance or appropriately packaged financial services pose
great challenge to smallholder agricultural productivity in Kenya [making] it difficult for farmers to
procure inputs needed to increase farm productivity KENFAP, (2011).Little progress can probably be

中国农业科学院硕士学位论文 Chapter 2
19
achieved in small holder farming in Africa without addressing the problems associated with soil and
land degradation. About 55% of Africa‘s land area is unsuitable for agriculture. Only 11% of the
continent, spread over many countries, has high quality soil that can be effectively managed to sustain
more than double its current population. Most of the remaining arable land is of medium or low
potential with at least one major constraint for agriculture. This land is at high risk of degradation under
low input system Jama et al., (2008).
2.1 Fertilizer Subsidies and Input Use
Fertilizer contributes to increase crop production in several ways. First, by replenishing nutrients [..]
Second, fertilizer enables adoption of high-yielding varieties (HYVs) [..] Third, in the nutrient-poor
soils of the tropics, fertilizer use can increase both crop yields and biomass (IFPRI). Studying the logic
of the food tightrope problem leads to the identification of the following approaches in dealing with it -
reducing farmers input costs through input subsidies. In the short run, however, the food price tightrope
can be a major constraint to development in poor rural economies. Governments have tried to address
this through different combinations of input subsidies, output price subsidies for farmers and for
consumers, and social protection to raise the incomes of the poor Dorward et al.,. With the partial or
complete removal of explicit subsidies to smallholders, hybrid maize seed purchases and fertilizer use
declined in the early 1990s in this region and population growth has outpaced grain production growth
in most of eastern and southern Africa Eleni. G. (2009). The use of inorganic fertilizers is one way to
improve crop yields in developing countries outside those in Africa. The use of fertilizer accounted for a
50-75% increase in crop yields from the mid - 1960. Unfortunately, in Africa only a small proportion of
farmers use fertilizers and the amounts used are often inadequate. On average each hectare receives less
than 9kg of nitrogen and 6kg of phosphorus. Typical crop requirements per hectare are at least 60kg of
nitrogen and 30kg of phosphorus. Chemical fertilizer use per hectare of farmland in Africa is about 10%
of the world‘s average, by far the lowest. Fertilizer use is low largely because of its high cost and it
contributes significantly to the unprofitable nature of smallholder farming that is often seen in much of
Africa. Few subsistence farmers can afford to use fertilizers, which in many parts of Africa can cost
nearly four times as much as they do in North America or Europe Jama B. and Pizarro G. (2008). SSA
displays a combination of high soil nutrient deficits and very low fertilizer use (3% globally; 7kg/ha
compared to 150kg/ha in Asia) that comes from a set of failures on input and output markets. On the
demand side, poor price incentives, high seasonal and variable production due to increasing rainfall
variability, lack of liquidity, credit or insurance and lack of knowledge about fertilizer undermine
farmers capacity to adopt the technology or to reap the benefits of its use[..]on the supply side. They
have also had negative impacts on the development of the private sector and on competition, when
distribution schemes and procurement procedure did not encourage them; they have become highly
politicized, too costly and as such unsustainable in the long run. Druilhe Z et al., (2012). Since 1980,
fertilizer consumption in Africa has increased only 0.64%, even though the population grew by 75%.
中国农业科学院硕士学位论文 Chapter 2
20
Because of low use of inputs, yield increase with improved crop varieties is estimated at 88% in Asia
but only 28% in Africa. Jama B. and Pizarro G. (2008).It is worth mentioning that African smallholder
farmers use too little fertilizer because they lack information on how to use fertilizer effectively and
profitably, because they are risk averse in the face of uncertain rainfall, or because they lack the cash to
pay for it because of low income and poorly functioning credit markets Minot N. et al., (2009).
The causes [of low fertilizer use] range from lack of credit, long distance between farmers and the
nearest fertilizer retailer, weak market infrastructure, and lack of government support Ariga et al., Duflo
et al., (2009) in a study on nudging farmers to use fertilizers in Kenya found out that small time-limited
reductions in the cost of purchasing fertilizer at the time of harvest induce substantial increases in
fertilizer use, as much as considerable larger price cuts later in the season. Gurara and Oslami (2012) In
a similar study in Malawi found that in the absence of the fertilizer input subsidy program, fertilizer
intake is expected to fall significantly. A study by Holden and Lunduka (2010) based on household
survey data shows that only about 20% of households are willing to buy a full package at the market
price (Mk 9000) in June -July 2009 while close to 90% are willing to buy it at subsidized price (Mk
1000).Many farmers in Kenya do not use fertilizer (95%), citing lack of financing as a constraint;
however with government and NGO projects, fertilizer use is seen to be increasing steadily Awuor, T.M.
(2003).The poverty and human development report of 2007(R&AWG (2007)) showed that 87% of
Tanzanian farmers interviewed by the research and analysis group [failed to use fertilizers] due to the
high costs of agricultural inputs and services Msuya E.E. et al., (2008). Widespread use of fertilizer on
maize by smallholder farmers is constrained by problems of profitability and affordability Dorward and
Chirwa(2011). Jayne et al., (2003) also found out that there are opportunities to reduce domestic
marketing costs through [..] reducing port fees, coordinating the timing of fertilizer clearance from the
port with up-country transport, reducing transport cost through the port, rail, and road improvements,
reducing high fuel taxes, and reducing the uncertainty associated with government distribution
programs that impose additional marketing costs on traders. Estimated reductions in farm-gate price of
fertilizer [...] range from 11to 18%.
Studies have found out that the maize price has the expected positive and significant effect on
adoption and intensity of use of fertilizer. A 1% increase in maize price increases the probability of
fertilizer adoption by 5% and fertilizer use among adopters by 1.04%. A.D Alene et al., (2008)
Government‘s policy environment and public investment in support of input market development
[...] have been successful in rationing fertilizer use and productivity of smallholder maize production
Ariga J. et al., (2010). In many countries, the withdrawal of state input delivery systems has led to
reduction in fertilizer use as commercial distribution systems compete with subsidized government
programs Ariga et al.,.
Studies on factors driving the increase in fertilizer use by smallholder farmers in Kenya find out
that liberalization of input and maize markets and public investment in support of smallholder
agriculture, leading to rapid private - sector investment in fertilizer retailing and maize marketing,
which in turn has increased farmers‘ use of fertilizer on maize, geographic differences in

中国农业科学院硕士学位论文 Chapter 2
21
agro-ecological potential are also fundamental factors influencing whether farmers use fertilizer or not.
Fertilizer price levels, household resource endowments, and education also influence producers‘
decisions on fertilizer use Ariga J. et al., (2010), female-headed households used fertilizer more
intensively than male headed households in Tanzania Winter-Nelson And Temu(2005). Modern variety
adoption has a positive and significant impact on the intensity of fertilizer use, variety adopters using
12% more fertilizer per ha than non-adopters. The probability of adoption of fertilizer tends to decrease
with access to land per capita and the intensity of fertilizer use decreases even significantly with land
per capita with a 1% increase in land per capita reducing fertilizer use among adopters by 0.3% .
Distance to the fertilizer market has a negative and significant impact on adoption. Since fertilizer
markets are more distant than output markets, there is considerable potential to increase fertilizer use
through improved input distribution system A.D Aleneet al., (2008)
Fertilizer subsidies can decrease the many risks that resource poor farmers have and therefore can
play an important role in increasing their food production Jama B. and Pizarro G. (2008). Input subsidies
can rapidly address or help with many, but not all of the supply and demand problems. They most
immediately and importantly increase profitability of on-farm use and, if sufficiently large, can bring
down the price sufficiently to also address the affordability problem( Dorward et al.,.)
2.2 “Smart” Subsidies
A subsidy is a form of assistance provided by the government to a subset of the public that lowers
the cost of producing a good or the price that a consumer pays for a good. Federal Reserve Bank of
Boston, (2011). Smart subsidies are mechanisms to provide subsidized goods and services designed
both to promote market development and to enhance the welfare of the poor. Below–market-cost
provision of goods and services, generally by private-sector suppliers, from which the poor in particular
are likely to benefit Minot N. et al., (2009). Minde and Ndlovu (2007b) describe "smart" subsidies as
those involving; Specific targeting to farmers who would not otherwise use purchased inputs (or to areas
where added fertilizer can contribute most to yield improvement); Measureable impacts Achievable
goals Result oriented Timely duration of implementation i.e. being time-bound or having a feasible exit
strategy. Minot N. et al., (2009) proposes that governments can avoid the mistakes of the past by
implementing "smart subsidies" which are [implemented through input vouchers] designed to target the
poor and to support, rather than undercut, the development of private input distribution markets.
2.2.1 Design of “Smart” Subsidy Programmes
Well-designed subsidies have the potential to bring about a more equitable distribution of
economic well-being than that generated by an unfettered free-market economy. Subsidies may
simultaneously generate a more just distribution of economic well-being while also promoting efficient
operation of the market economy. Federal Reserve Bank of Boston (2011). A common approach to
designing smart subsidies for fertilizer use involves input vouchers. The idea is simple. Farmers are

中国农业科学院硕士学位论文 Chapter 2
22
given vouchers that they can take to local, often small scale, private input suppliers to acquire fertilizer
(or seed or pesticides). The cost of the fertilizer for the farmer is reduced by the value of the voucher.
The supplier having provided fertilizer to the farmer in exchange for the voucher and any additional
cash cost beyond the value of the voucher, takes the voucher to a bank or other designated agency and is
reimbursed for its value, plus a handling fee Minot N. et al., (2009).Voucher programs provide an
opportunity to train farmers and input suppliers on efficient and profitable fertilizer use. Under this
system, farmers are given vouchers that let them acquire fertilizer cheaper from private input suppliers.
Thus a, voucher is an income transfer, which can promote investment. The vouchers are also a way to
guarantee a demand for fertilizer which in turn ensures a reliable fertilizer supply Minot and
Benson ,(2009)
IFPRI found out that it appears that one of the benefits of the voucher program was that it
developed links between rural farmers and input suppliers. Liverpool-Tasie S.L (IFPRI), (2012).
Voucher or coupon system can be an effective way of rationing and targeting subsidy access to
maximize incremental production and economic and social gains, with opportunities for innovative
public/private partnerships to develop input supply and demand systems-but there are many practical
and political challenges in programme design and implementation to increase efficiency, control costs
and limit patronage and fraud Doward et al., (2008). Policy interventions are thus needed to encourage
smallholder farmers to increase the yield of their traditional crops, as well as modern varieties, and
fertilizer subsidies in the form of vouchers and the most direct policy tool that planners have at their
disposal. Jama B. and Pizarro G, (2008).
Input subsidies are not a quick fix for dealing with high food and fertilizer prices, their design and
sustainable implementation must promote smallholders incremental access to and productive use of
inputs, build sustainable demand and private sector supply, and be integrated with other policies for
increasing agricultural productivity, rural development and management of incremental production to
provide rural people with reliable improvements in food access and real incomes Doward et al., (2008).
Druilhe Z et al., (2012) indicates that available evidence, albeit very limited, suggests that such
programmes have been effective in raising fertilizer use, average yields and agricultural production but
that their success is highly dependent on implementation. Market-smart subsidies can provide rapid
gains coupled with good rains, monitoring, learning and adjustments should be made for long run
sustainability especially in terms of better targeting and involvement of the private sector. Subsidies
should also be embedded as part of the wider agricultural development strategy. If fertilizer subsidies
are a cost - effective way of assisting the rural poor, they can be justified on equity grounds. If they help
farmers offset these constraints and reach optimal application rates such that the additional farm income
exceeds the cost of the subsidy program then they can be justified on efficiency grounds Minot N. et al.,
(2009).
Druilhe Z et al., (2012) Conclude that policy makers should adopt clear and non - contradictory
objectives that are aligned with their national food security objectives,[to] develop targeted packages for
a variety of agro-ecologic contexts and farming systems and combine these with complementary

中国农业科学院硕士学位论文 Chapter 2
23
services to raise farmers demand. Procurement and distribution of subsidized fertilizers should enhance
and not inhibit input market development. Fertilizer subsidies design needs to be improved to raise their
efficiency and allow tacking other dimensions of food insecurity Druilhe Z et al.,(2012). In the case of
Kenya initially the government used agro-vets to distribute the NAAIP fertilizer through the voucher
system but the agro-vets later withdrew from the programme since the government took too long to
honor these vouchers. Farmers also found the procedure put in place for acquiring these subsidies very
long, hectic and bureaucratic, yet open to abuse. The subsidies were poorly distributed, with some
regions receiving the inputs belatedly, forcing poor farmers to sell to large scale farmers who had the
money and capacity to store till the next season. Owuor B.,(2010)
It is important to note that subsidies will impact input and output markets and interact with trade
policies, and yielding positive outcomes is not given. When inputs and output markets do not work,
there might nonetheless be a case for subsidies, and this might well be the situation in SSA Druilhe Z et
al., (2012).
2.3 Maize Value Chain and Fertilizer Subsidies
Fertilizer subsidies can be an instrument to increase productivity in SSA Druilhe Z et al., 2012.
When it comes to smallholder subsistence farming, maize receives the bulk of fertilizers Crawford et al.,
(2006). There is a statistically significant relationship between adoption of improved maize production
practices and maize yields Olubandwa et al., (2010). Results show that the overall mean technical
efficiency is estimated at 49 percent [..] there is a 51 percent scope for increasing maize production
using the present technology. One percent increase in fertilizer is estimated to increase yield by 0.17
percent Kibaara, (2005). In many countries, especially those where fertilizer supplies were not
constrained, fertilizer subsidies have promoted rapid growth in fertilizer use and food production [..] the
most successful examples are China, India, Indonesia, Mexico, Nigeria, Saudi Arabia, Turkey and
Venezuela.[..] in those countries, especially in Sub-Saharan Africa, where fertilizer use levels are low
and nutrient mining is contributing to environmental damage through soil degradation and deforestation,
as strong case can be made for fertilizer subsidies especially P2O5 fertilizer, to restore and sustain soil
fertility Bumb et al., IFPRI(1996). Increasing fertilizer uptake is an important component in raising crop
yields on the continent- on average, farmers in sub-Saharan Africa use about 13kilograms(kg) of
fertilizer nutrients per hectare (ha) of arable land compared with the developing country average of
94kg/ha Minot N. et al.,(2009).
Msuya E.E. et al.,(2008) in a study to explains productivity variation among smallholder maize
farmers in Tanzania shows that smallholder productivity is very low and highly variable, ranging from
0.01t/ha to 6.77t/ha averaging 1.19t/ha. Technical efficiencies of smallholder maize farmers range from
0.011 to 0.910 with a mean of 0.606. Low levels of education, lack of extension services, limited capital,
land fragmentation, and unavailability and high input prices are found to have negative effect on
technical efficiency.
中国农业科学院硕士学位论文 Chapter 2
24
Fertilizer subsidies in sub-Saharan Africa are intended to increase agricultural production and
ensure development of the fertilizer market. It is a paradox that fertilizer adoption in sub Saharan Africa
is low, given the high rate of return with fertilizer use and the high levels of land degradation and
nutrient mining related to agricultural production Vondolia et al., (2012). Improving the profitability of
fertilizer use in maize production requires lower fertilizer prices, higher maize prices and/or efficiency
in fertilizer use Dorward et al.,(2011). Increased use of inorganic fertilizer and of hybrid and open
pollinated varieties (OPV) maize varieties is one important, widely recognized and, in principle,
relatively simple way of increasing maize productivity Dorward et al.,(2011). In one of the best moves
from the [Kenyan] government, agricultural subsidies were offered [in 2008] and farmers who benefited
felt a sigh of relief. Indeed the government subsidies in terms of agricultural inputs helped to boost food
security in most of the regions they were distributed in Owuor B., (2010). In Malawi the [FISP subsidy
program] has been successful in terms of increasing maize output and yield [..] Malawi started
registering surplus maize output to the tune of more than 1 million ton per annum since the
implementation of the program. Maize yield has doubled from 1.6ton/ha in 2000 to 2005 to 2.27 in
2009/10. Gurara et al.,(2012). The estimated benefit cost ratios [in Malawi] ranged from 0.76 to 1.36.
These estimates demonstrate that with good management the program can yield favorable economic
returns.
Maize is the most important food crop as well as a cash crop for many Kenyan Smallholders, and
modern input use has always been a critical policy issue for Kenya. Maize is grown on over 1.5million
ha, with a total average annual production of over 2.5millon metric tons. A.D Alene et al., (2008). Maize
consumption is estimated at 98kilograms per person per year, which translates to roughly 30 to 34
million bags (2.7 to 3.1 million metric tons) per year Nyoro et al.,. Adoption of improved maize
production practices among small scale farmers is essential for increased maize production and
consequently food security, poverty alleviation and growth in Kenya's economy. This is because small
scale farmers contribute to 70% of the maize produced in the country. The ability and willingness of
these farmers to adopt improved production practices may have been affected by the introduction of
agricultural reforms which stemmed from Structural Adjustment Programmes resulting in cut backs in
government expenditure. Adijah Olubandwa et al., (2010). Since maize will remain a crucial part of the
food security equation even while the agricultural economies of the region diversify, continued
investments in both maize research and market institutions, some of which must be public, are essential
Smale et al.,. (2003)
In studies focusing on technology adoption in Kenya current results show that 69% of respondents
have land less than 3acres and produce less than 10 bags of maize per acre way below the expected
average of 25 bags per acre. Results also show that in Lugari district where 56.7% adopted extension
packages yields realized were higher with 41.7% harvesting more than 20 bags of maize per acre. Most
of the farmers in Lugari district (91.7%) planted and (93.3%) top dressed their maize with fertilizer
Olubandwa et al., (2010).
The maize value chain provides Kenyans with their most critical staple food. On average Kenyans

中国农业科学院硕士学位论文 Chapter 2
25
consume 103kg/capita of maize annually and only 75% of this consumption is produced domestically.
While 25% of Kenyans domestic production is done on large scale commercial farms, there are also
approximately 2.1 million smallholder households producing maize. Maize contributes approximately
3% or USD 942M to Kenya's GDP annually A.D Alene et al., (2008). The proportion of households
selling maize increased from 35% of households in 1996/97 to 49% in 2006/07Nyoro et al.,. According
to a KARI survey in the early 1990s 41% of the small farmers nationwide sold maize. This figure was
as high as 69% in the 'highlands' area, and as low as 14-38% in the lowlands, dry mid-altitude, moist
mid-altitude, and dry transitional regions. Approximately 40% of maize produced in Kenya is marketed
A.D Alene et al., (2008).Most farmers sell their maize at farm-gate 73.1% Kirimi et al., (2010) High
potential maize zone - Trans Nzoia, Uasin Gishu, Nakuru, Bomet, and the upper elevation divisions of
Kakamega. In this region, roughly 70% of households sell maize; mean household sale are in the range
of 3 tons. According to the Tegemeo surveys, there are clear income differences between the groups of
small-scale households that sell vs buy maize. The households that are sellers of maize have annual per
capita incomes that are nearly double that of maize buying households (Ksh.. 30,396 vs Ksh.. 17,450).
The poorest 25 percent of rural households spend a larger proportion of their income on food (71%)
than the wealthiest 25% of households (59%) Nyoro et al.,. Maize purchases amounted to 28% of
annual household income for the poorest quartile of farmers. Consistent with the observation that many
farmers sell some maize right after harvest to satisfy their cash needs, maize price does not influence
market participation decisions. However, marketed supply increases with maize price, once participation
decisions are made A.D Alene et al., (2008).
The increased proportion of households selling maize may be partially due to a major rise in the
use fertilizer on maize over the 1997 to 2007 period, which has contributed to maize productivity gains;
54% of households used fertilizer on maize in 1997 compared to 70% in 2007Kirimi L, et al.,( 2011).
Given Kenyans preference for maize as a staple food and Kenya‘s high level of maize importation, this
figure could grow if the production and marketing system could be improved A.D Alene et al.,
(2008).The development of financial services for fertilizer use in maize production requires that maize
be profitable, that small holders have other sources of cash income to repay fertilizer [or/and input]
loans when they consume the majority of the maize that they produce and that very low cost systems are
used for loan disbursement and recovery Dorward et al.,(2011). Other studies have also established that
providing better access to markets is likely to induce smallholders to commercialize Azam et al., (2012).
Agricultural markets operate in dynamic environment which is greatly influences by supply and
demand forces. KENFAP (2011).Transformations in agri-food systems provide prospects for improving
livelihoods of many farmers through enhanced participation in commercial agriculture. Otieno et al.,
(2009). One of the [main] constraints to smallholder agriculture is investment in maize market
development are constrained by low traded volumes and thin markets (with large quantities of maize
produced in Malawi consumed within households and villages never reaching the market), so relatively
small changes in national production may lead to large changes in market supply and, with relatively
inelastic demand, high price variability. And this leads to government interventions in maize market.

中国农业科学院硕士学位论文 Chapter 2
26
Dorward et al.,(2011). Market access plays an essential role in assuring better income and welfare levels
for smallholder producers, and thus contributes to poverty alleviation. By raising incomes, markets
increase purchasing power, which creates demand for consumer goods and, thus, enhances welfare. In
addition, by creating demand for production inputs and investment goods, markets promote economic
growth Azam et al., (2012). Price signals are important factors in determining a farmer‘s decision to
participate in fertilizer markets, Ariga et al., using the Mundlak-Chamberlain device found out that it is
evident that households facing higher fertilizer prices have lower probability of participation, while
those facing higher maize output prices have higher probability of participation in fertilizer markets.
Omiti J. et al.,(2007)while studying the strategies to promote market oriented smallholder agriculture in
developing countries found out that at village level, market participation is hampered by poor quality
and high cost of inputs, high transaction costs, high market charges and unreliable market information.
Olwande J. et al.,(2012) in examining market participation among poor rural households in Kenya
found that any hope for the poor to participate in markets and make any meaningful gains from
agriculture lies in improving productivity of their land as well as improving their access to land.
Dorward et al.,(2009) mentions that subsidy impacts on production and consumption by many
households will not be fully reflected by changes in the quantities bought and sold in food markets, and
this may dampen market effects of subsidies when measured in absolute terms. However the significant
quantities of produce that are consumed within the farm households without reaching markets also
means that produce markets may be very thin, so that small changes in production can lead to very large
changes in market supply and demand, making markets very unstable. This can be important for
understanding the food market impacts of input subsidies. Olwande J. et al.,(2012). Limited ability to
produce surpluses for the market, as observed in the low volumes they produce and sell, implies low
levels of adoption of productivity enhancing inputs such as fertilizers and improved seed varieties.
Market infrastructure and institutional aspects of market access are crucial for improving opportunities
of smallholders for increased market participation and in addition to determining market orientation;
infrastructural and institutional conditions have a significant bearing on scale of small holder production.
Tung D.X & Costales A., (2007)
While there is a general agreement that improving market access and commercialization of
smallholders will help induce greater investment, productivity and income, there remains several
challenges in making progress, some of these challenges include identification of output markets and
types of commodities that can enable large numbers of smallholders to improve their incomes;
identification of which markets and commodities can provide significant opportunities for the poor and
identification of constraints to and interventions that are important for improving access to markets by
the poor Olwande J. et al.,(2012). It is also worth noting that price and amount of output are key
determinants of the percentage of farm produce that is sold Otieno et al.,(2009). Omiti J. et al.,(2007)
found out that there is a higher degree of commercialization in peri-urban villages compared to remote
rural villages. The proportion of farmers who participate in markets is lower than actual output sold, the
main market channels are brokers in peri-urban villages, and open air markets in rural areas.

中国农业科学院硕士学位论文 Chapter 2
27
Results show that conditional price elasticity of marketed supply is 3.91, implying that a 1%
increase in maize price increases maize supply by 3.91% among sellers. Bahta S., & Bauer S., (2012).
Studies by A.D Alene et al., (2008)in this area have also found similar results with conditional price
elasticity of marketed supply of 1.67, implying that a 1% increase in maize prices increases maize
supply by 1.67% among sellers.
The price of maize, arable land size, extension contracts, off farm income and road condition to the
nearest town positively increased the amount of sales in crop markets. Consistent with the observation
that many farmers sell some food crops right after harvest to satisfy their cash needs, maize price does
not influence crop market participation decisions. However, marketed supply increases with maize price,
once participation decisions are made. Bahta S.et al.,., (2012).
Agricultural input credit was found to have a positive and significant effect on participation, with
credit worthy farmers having 19% greater likelihood of market participation. While maize supply
declines with distance to the maize market, both maize market participation and supply decline with
distance to the fertilizer market. Farmers located far from the maize markets supply 62% less maize and
farmers far from the fertilizer markets supply 73% less maize than farmers living closer to these markets.
This confirms that fertilizer markets are less accessible and hence fertilizer use is too low to meet
production thresholds for market participation and to increase marketed supply. Group marketing has a
positive and significant impact on marketed supply. Maize participants belonging to maize marketing
groups supply 56% more maize than participants who do not belong to the group. The probability of
adoption of fertilizer decreases significantly with age [in addition] older farmers also have lower
likelihood of participation in output markets. A.D Alene et al., (2008)
Even when the policy and legal environment is supportive and enabling, farmers may still be
experiencing constraints in obtaining market access. The small size of their holdings, their limited
resource endowments, the high risks they face, and their lack of (market) information may hamper
access to and competitiveness in markets. The biggest challenge facing Kenya‘s maize sub sector is
therefore to continuously strive to raise productivity while reducing production and marketing cost.
[There is need to solve this challenge] by identifying certain practices and technology uses that
contribute to productivity growth, such findings would be important for extension and outreach
programs targeted to small farmers (Nyoro et al.).
Sub Saharan Africa‘s smallholders are positioned to be significant beneficiaries of the improving
opportunities in agricultural markets (Livingston G., Schonberger S., & Delaney S., 2011). The
theoretical efficiency advantages of smallholder production systems - in the absence of scale economies
for input and output markets - for most crops, particularly in countries with relatively high capital costs
relative to labour – are well known (Binswanger and Rosenzweig, 1986, Hazell et. al. 2007 cited in
(Livingston G., Schonberger S., & Delaney S., 2011). This theoretical Sub-Saharan Africa‘s women and
men smallholder farmers are poised to be a key driver of future economic growth and poverty reduction
if the challenges faced which translate into high levels of risk can be overcome [ibid]. Growing global
demand for agricultural products means, SSA‘s smallholders should be major beneficiaries of these

中国农业科学院硕士学位论文 Chapter 2
28
opportunities if they can increase their productivity through increased on-farm investments to
increasingly orientate their production towards farming as a business, and when appropriate to form
collective farmer organizations to facilitate this [ibid]. Africa needs an agricultural sector that is
commercially oriented and internationally competitive. The competitiveness of Africa‘s producers at the
farm level derives mainly from very low returns to labor (reflecting the absence of alternative
employment opportunities in rural areas) and limited use of purchased inputs (which results in
significant soil nutrient mining) (FAO &The World Bank, 2009). Agricultural productivity in Sub
Saharan Africa has also been stagnant because of low use of inputs that originates from low incomes
from agriculture, associated with inaccessible markets for farmers (IREN, 2008). By boosting the
productivity of smallholders, governments and donors can increase food production and rural
employment; reduce rural poverty through the commercialization of subsistence agriculture; and more
effectively empower women (Landesa, 2014). Increasingly, agricultural commercialization is seen as a
potential pathway out of poverty for these smallholder cultivators (Sharma V. P., Jain D., & De S., 2012).
Enhancing productivity and commercialization among smallholder farmers is widely perceived as a key
strategy for rural development, poverty reduction, and food security in Sub-Saharan Africa (World Bank,
2008 cited in Abate G. T., Francesconi G. N. & Getnet K., 2013). For productivity gains to be achieved,
smallholder farmers need to have better access to technology and improve their technical efficiency
(Abate G. T., Francesconi G. N. & Getnet K., 2013). The research evidence shows that access to markets
have a positive impact in agricultural transformation, since commercial farming system has a market
oriented production objective (Balcha Y., 2013).
In Kenya the agricultural sector plays a critical role in the economy especially to millions of rural
populations that depend on small-scale agriculture for food and income (Kirui O.K, & Njiraini G.W.,
undated). The sector contributes to about 24 percent of the Gross Domestic Product (GDP) and supports
up to 70 per cent of population that engage directly in it (Kirui O.K, & Njiraini G.W., undated). Meeting
the challenges of eliminating food insecurity and improving rural incomes in Kenya will require
transformation and transition out of the semi-subsistence, low-input, low-productivity farming systems
that currently characterize much of rural Kenya [ibid].
Commercial transformation of subsistence agriculture is an indispensable pathway towards
economic growth and development for many agriculture dependent developing countries (Von Braun
1994 Pingali and Rosegrant, 1995; Timmer 1997 cited in (Goshu D. Kassa B. & Ketema M., 2012).
Agricultural commercialization may be defined as the proportion of agricultural production that is
marketed (Govereh J., Jayne T.S, &Nyoro J., 1999; Govereh et al, 1995). Sokoni (2007:3) defined
commercialization of smallholder production as ―a process involving the transformation from
production for household subsistence to production for the market (Abera G., 2009). Hazell et al.
(2007:4) found out that most definitions refer to agricultural commercialization as ―the degree of
participation in the output markets with the focus very much on cash incomes (Abera G., 2009). In most
literature, a farm household is assumed to be commercialized if it is producing a significant amount of
cash commodities, allocating a proportion of its resources to marketable commodities, or selling a

中国农业科学院硕士学位论文 Chapter 2
29
considerable proportion of its agricultural outputs (Immink and Alarcon, 1993; Strasberg et al. 1999
cited in (Demeke L.B, &Haji J., 2014). The commonly accepted concept of commercialization is,
therefore, that commercialized households are targeting markets in their production decisions, rather
than being related simply to the amount of product they would likely sell due to surplus production
(Pingali and Rosegrant 1995 cited in (Demeke L.B, &Haji J., 2014). The commercialization of
agriculture refers to the production of agricultural products to meet specific demands with the sale of
fresh or processed product to consumers or to manufacturers in the case of raw material for industries
(Demeke L.B, &Haji J., 2014). A broader definition of agriculture commercialization was provided by
Jayne (Jayne et al., 2011) in which they define small holder commercialization as the virtuous cycle in
which farmers intensify their use of productivity enhancing technologies on their farms, achieve greater
output per unit of land and labor expended, produce greater surpluses (or transition from deficit to
surplus producers), expand their participation in markets and ultimately raise their incomes and living
standards (Adong A, Muhumuza T, &Mbowa S, 2014). Commercialization of agriculture involves a
transition from subsistence-oriented to increasingly market-oriented patterns of production and input
use (Govereh J., Jayne T.S, & Nyoro J., 1999). According to Penny (1969) commercialization is the
process whereby a subsistence farmer and his farm firm become increasingly involved with both the
product market and the factor market (Coward E.W Jr, 1969). Agricultural commercialization also
includes the supply, to farmers, of inputs for production (Demeke L.B, &Haji J., 2014) citing Abbott,
1987). Pingali and Rosegrant (1995) define agricultural commercialization as extending beyond the
marketing of agricultural output to include the product choice and input use decisions that are based on
the principles of profit maximization (Adong A, Muhumuza T, &Mbowa S, 2014).
The benefits of small holder commercialization to farming households are usually accredited to
increased household incomes (Adong A, Muhumuza T, &Mbowa S, 2014). The first-order effects of
commercialization are mainly income and employment effects that are directly reflected in household
welfare (Jaleta M., Gebremedhin B., & Hoekstra D., 2009). Increased income generated through
increased agricultural productivity is invested in schooling and the development of non-farm rural
enterprises, creating important new opportunities for employment and higher incomes in rural areas
(Ideas Foundation, 2009). The second-order effects include health and nutrition aspects usually
contingent on the level of income attained through the existing level of commercialization (Jaleta M.,
Gebremedhin B., & Hoekstra D., 2009). Agricultural commercialization leads to a more specialized
pattern of production at the household level (ibid quoting Timmer, 1997). The third-order (or usually
known as higher order) effects are the macro-economic and environmental effects that go beyond
household level [ibid]. Smallholder commercialization also typically leads to an increased diversity of
marketed commodities at a national level and increased specialization at regional and farm level
(Pingali and Rosegrant 1995; Timmer 1997; Kurosaki 2003 cited in (Balcha Y., 2013). Commercializing
smallholder agriculture is an indispensable pathway towards economic growth and development for
most developing countries relying on the agricultural sector (von Braun 1995; Pingali and Rosegrant
1995; Timmer 1997cited (Jaleta M., Gebremedhin B., & Hoekstra D., 2009). Moreover,
中国农业科学院硕士学位论文 Chapter 2
30
commercialization has a linking power between input and output sides of a market (Jaleta M.,
Gebremedhin B., & Hoekstra D., 2009). When smallholders commercialize, developing countries with
large population shares in the agricultural sector can generate more income, thus economic growth
[ibid]. Increased income in the agricultural sector raises demand for manufactured goods and services in
the other sectors of the economy, thus stimulating further growth [ibid]. Moreover, possible linkage of
smallholder commercialization to the export market could enhance foreign currency earnings and
improve the balance of payments [ibid]. Commercialization may also increase employment, especially
when labour demanding high-value commodities are targeted [ibid].
Agricultural commercialization can broadly be looked at from two perspectives: a rise in the share
of marketed output; or of purchased inputs per unit of output [(Kirui O.K, & Njiraini G.W., undated). In
essence, agricultural commercialization can occur on the output side of production with increased
marketed surplus, or on the input side with increased use of purchased inputs (Kirui O.K, & Njiraini
G.W., undated). On the output side, commercialization is a measured as a ratio of the value of
agricultural sales to the value of agricultural production while it is measured as a ratio of the value of
inputs acquired from market to the value of agricultural production on the input side [ibid]. Technically,
agricultural commercialization entails a shift from subsistence production to a more complex
market-based production and consumption system that leads to the strengthening of the linkages
between input and output sides of a market (Kirui O.K, & Njiraini G.W., undated).
Agricultural commercialization usually takes a long transformation process from subsistence to
semi-commercial and then to a fully commercialized agriculture (Pingali and Rosegrant 1995 cited in
(Jaleta M., Gebremedhin B., & Hoekstra D., 2009). Commercialization can be viewed as bi-dimensional:
increased market production and increased use of purchased factors of production (Coward E.W Jr,
1969). The commonly accepted concept of commercialization is that commercialized households are
targeting markets in their production decisions, rather than being related simply to the amount of
product they would likely sell due to surplus production (Pingali and Rosegrant, 1995 cited in (Goshu D.
Kassa B. & Ketema M., 2012). The Food and Agriculture Organization (FAO) has categorized farmers
into three different groups based on the marketable surplus as a percentage of total production in the
following manner (FAO, 1989). 1) Subsistence farmers: Marketable surplus under 25% of the total
production. 2) Transition farmers: Marketable surplus ranging between 25-50% of total production. 3)
Commercial farmers: Marketable surplus more than 50% of the total production (Mahaliyanaarachchi
R.P, & Bandara R.M.A.S., 2006). The usual path of commercialization of smallholder agriculture starts
with growth in the marketable surplus of staples (Gebre-Ab N, undated). This could continue until it
becomes the dominant portion of the total output of the household, or, there could be a diversification of
the marketed portion into staples and other food crops [ibid]. Another route consists of combining
production of staples for own consumption with production of cash crop for the market [ibid]. Both,
these routes, or, any variant of them, are the processes that took place in Asia's economic development
[ibid]. A third, and an unusual path is the replacement of subsistence production by cash crop production;
a direct switch over from subsistence to market production [ibid]. Wharton (1963:48) refers to situations

中国农业科学院硕士学位论文 Chapter 2
31
of: subsistence, semi-subsistence, semi-commercial and commercial—as points on the degree of
commercialization continuum (Coward E.W Jr, 1969). Abercrombie (1961:1), following Yudelman,
also conceptualizes four stages. Beginning with pure subsistence production the following three stages
are described: There are still, however, many communities where, although some sales or barter
transactions take place, the production of a small surplus above subsistence requirements is largely
unintentional and the result of an occasional particularly favorable season (stage two) [ibid]. A third
stage in the transition from subsistence to market agriculture is where the regular production of a
marketable surplus is aimed at, but the main emphasis is still on subsistence production. In the final
stage, production for the market predominates over subsistence [ibid].
Agricultural marketing systems have changed and continue to change as a result of globalization
and liberalization as well as demographic factors, particularly urbanization (Onumah G., Davis J., Kleih
U.,&Proctor F., 2007). These changes have led to the emergence of new market players and created new
market opportunities but have also exposed producers to increased risks in terms of uncertain access to
markets, price instability and the risk of counterparty non-performance [ibid]. It is difficult for small
farmers to participate in commercial agriculture unless they find ways to improve their bargaining
power and reduce transaction costs (Sharma V. P., Jain D., & De S., 2012). Commercialization enhances
the links between the input and output sides of agricultural markets (Goshu D. Kassa B. & Ketema M.,
2012). A key premise of commercialization as a development strategy is that markets provide increased
incomes to households who are able to maximize the returns to land and labor through market
opportunities, using earned income for household consumption in ways that are more efficient than
subsistence production (Asuming-Brempong S, Anarfi J.K, Aurthur S. & Asante S., 2013).It is
evidenced that policy, technological, organizational and institutional interventions aimed at promoting
commercial transformation of subsistence agriculture should follow two-pronged approach; improving
market orientation of smallholders at production level, and facilitating market entry and participation of
household in output and input markets (Gebremedhin and Jaleta, 2010 cited in (Goshu D. Kassa B. &
Ketema M., 2012). The current reality shows that commercialization of smallholder farming is not yet
high enough to enable farmers benefit from increased income and the farmers are not yet out of the
subsistence-oriented agriculture.From the perspective of a smallholder farmer, commercial agriculture
involves high costs of modern inputs such as better seeds, fertilizers, irrigation and agrochemicals. In
the absence of input and credit markets, farmers find it difficult to purchase what they need (Sharma V.
P., Jain D., & De S., 2012). Output markets are under-developed and fragmented and have acute
shortages of post-harvest infrastructure, leading to high volatility in their prices and large losses [ibid].
Studies have shown that small holder farmers when supported can be key in agriculture
commercialization and most importantly the fruits of agriculture led growth are more widely shared
when small holder farmers participate (Pingali and Rosegrant, 1995; World Bank, 2009 cited in Adong
A, Muhumuza T, &Mbowa S, 2014).

中国农业科学院硕士学位论文 Chapter 3
32
Chapter 3 STATUS OF THE FERTILIZER AND MAIZE SECTORS IN KENYA
3.1 Status of The Fertilizer Sector In Kenya
Agricultural Policy concerns in Kenya revolve around the following key areas:
Increasing Smallholder productivity and income: Smallholders account for close to 80% of
Kenya‘s agricultural subsector and this has far reaching implications on productivity, production and
incomes of a great part of the population. Low productivity reflected in low yields is a major cause of
high per unit production costs for most smallholder farmers. A major cause of low productivity has
always been the lack of access to modern high productive technologies like seeds and fertilizers.
However on the other hand poor institutions, marketing bottlenecks and poor storage facilities have also
limited the urge for farmers to produce more.
Enhancing food security and equity and reducing extreme hunger: Food security in Kenya is
hampered by a myriad of factors however one of the key limiting factors to improved food security and
the attainment of equitable distribution of food in the country has been over – reliance on rain fed
agriculture. In areas where rain – fed agriculture is the primary determinant of production droughts and
floods have acted to prevent consistent production and in many cases have resulted in increase in the
number of the extremely hungry even in areas where production has been sufficient to achieve food
security. Less than 7% of agricultural land in Kenya is under irrigation and as much as 83% of the land
is either arid or semi – arid and classified as low potential areas. These low potential areas however are
a resource that can come under production given appropriate technological knowhow.
Intensification of smallholder production, Farming as business and commercialization:
Farming for business and linking farmers to markets is seen as one way of enhancing production and
intensification of smallholder technological advancement. Markets function as resource allocating
agents and thus provide capital resources to farmers through which agricultural development and
improvements can be initiated and sustained. Compared to other countries Kenya still has a narrow base
of products due to limited diversification and low value addition for agricultural exports. Weak vertical
and horizontal integrations have tended to make incomes from agricultural products vulnerable to
international market pricefluctuations and dynamic trends.
Kenya still has an opportunity to exploit opportunities that arise from agro processing, regional
markets and encouraging private – sector – led development. However addressing major constraints to
commercialization, investment and diversification which include ineffective extension and delivery
systems for research, limited financial support to the sector, lack of credit to small holder farmers,
limited production options, limitation in technology access and operation scale.
The performance of the Kenyan economy is closely tied to the performance of the agricultural
sector. In many cases the effects of external and internal shocks on the agricultural sector like droughts,
floods or disease and pest outbreaks has tended to negatively affect the overall economic performance

中国农业科学院硕士学位论文 Chapter 3
33
as is shown below (Figure 3-1).
Figure 3-1 Economic (GDP) and Agricultural (Value Added) growth 1960 - 2014
Source. World Bank (http://data.worldbank.org/
3.1.1 Fertilizer and Fertilizer subsidy Policy in Kenya
Evolution of agricultural Inputs policy in Kenya
The experience of Kenya shows how a stable policy environment can foster an impressive private
sector response that supports smallholder agricultural productivity and poverty alleviation (Minde et al.,
2008). The Kenyan Government over time has encouraged farmers to use fertilizers through creating
and sustaining a relatively stable policy environment, financing infrastructure and supporting fertilizer
markets. From 1974 to 1984 the government gave agricultural input marketing monopoly to Kenya
Farmers Association and credit provision was solely through the Agricultural Finance Corporation (AFC)
As a result, the Government had extensive controls over imports, pricing, and marketing o fertilizer
using policy instruments such as price subsidies, price control, licensing of importers and distributors
and import quotas (Gugerty and Cook 2009, Ariga and Jayne, Yamano and Arai, 2010). This monopoly
impeded market development by stifling competition. Widespread corruption and bureaucratic costs led
to a policy change in 1972 that saw the creation of another state agency Kenya National Trading
Corporation (KNTC), tasked with importing fertilizers for distribution by KFA (Ariga and Jayne). In the
later part of the 1980s the government begun allowing other firms to enter an albeit highly regulated
fertilizer market. Fertilizer traders were to abide by official prices and the state influenced competition
through strict trade licensing requirements and control of the allocation of scarce foreign exchange to
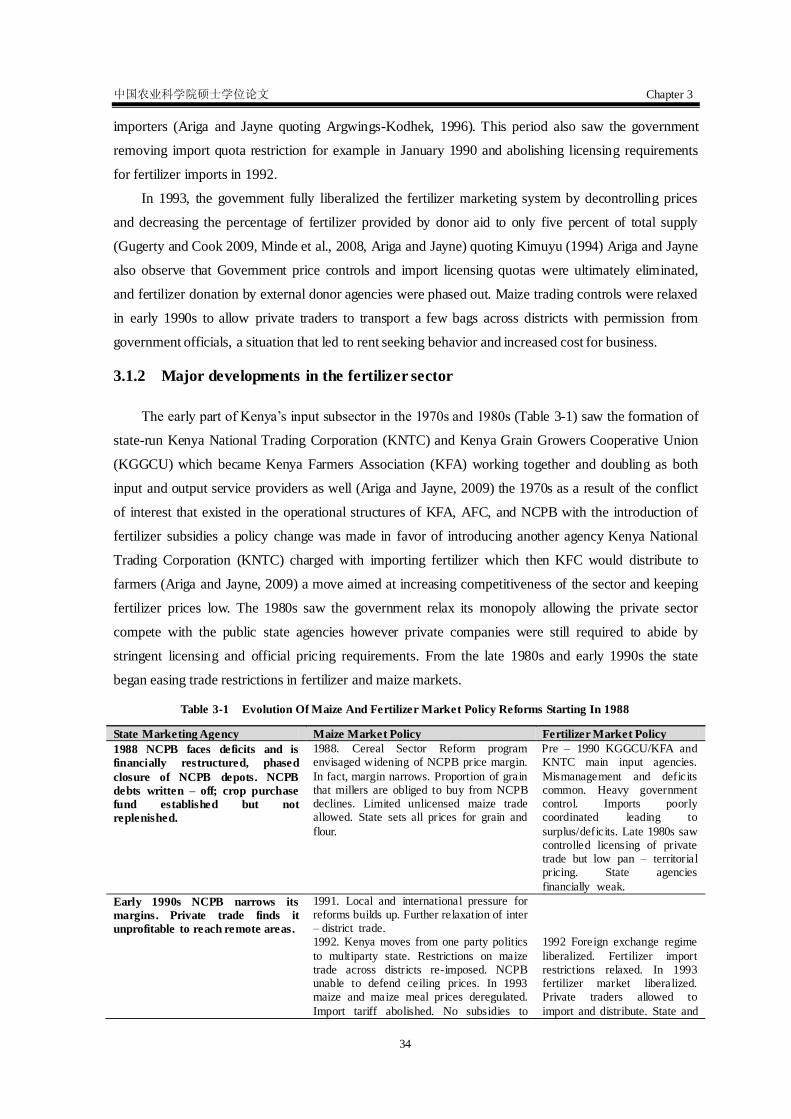
中国农业科学院硕士学位论文 Chapter 3
34
importers (Ariga and Jayne quoting Argwings-Kodhek, 1996). This period also saw the government
removing import quota restriction for example in January 1990 and abolishing licensing requirements
for fertilizer imports in 1992.
In 1993, the government fully liberalized the fertilizer marketing system by decontrolling prices
and decreasing the percentage of fertilizer provided by donor aid to only five percent of total supply
(Gugerty and Cook 2009, Minde et al., 2008, Ariga and Jayne) quoting Kimuyu (1994) Ariga and Jayne
also observe that Government price controls and import licensing quotas were ultimately eliminated,
and fertilizer donation by external donor agencies were phased out. Maize trading controls were relaxed
in early 1990s to allow private traders to transport a few bags across districts with permission from
government officials, a situation that led to rent seeking behavior and increased cost for business.
3.1.2 Major developments in the fertilizer sector
The early part of Kenya‘s input subsector in the 1970s and 1980s (Table 3-1) saw the formation of
state-run Kenya National Trading Corporation (KNTC) and Kenya Grain Growers Cooperative Union
(KGGCU) which became Kenya Farmers Association (KFA) working together and doubling as both
input and output service providers as well (Ariga and Jayne, 2009) the 1970s as a result of the conflict
of interest that existed in the operational structures of KFA, AFC, and NCPB with the introduction of
fertilizer subsidies a policy change was made in favor of introducing another agency Kenya National
Trading Corporation (KNTC) charged with importing fertilizer which then KFC would distribute to
farmers (Ariga and Jayne, 2009) a move aimed at increasing competitiveness of the sector and keeping
fertilizer prices low. The 1980s saw the government relax its monopoly allowing the private sector
compete with the public state agencies however private companies were still required to abide by
stringent licensing and official pricing requirements. From the late 1980s and early 1990s the state
began easing trade restrictions in fertilizer and maize markets.
Table 3-1 Evolution Of Maize And Fertilizer Market Policy Reforms Starting In 1988
State Marketing Agency Maize Market Policy Fertilizer Market Policy
1988 NCPB faces deficits and is
financially restructured, phased
closure of NCPB depots. NCPB
debts written – off; crop purchase
fund established but not
replenished.
1988. Cereal Sector Reform program envisaged widening of NCPB price margin.
In fact, margin narrows. Proportion of grain that millers are obliged to buy from NCPB declines. Limited unlicensed maize trade allowed. State sets all prices for grain and
flour.
Pre – 1990 KGGCU/KFA and KNTC main input agencies.
Mismanagement and deficits common. Heavy government control. Imports poorly coordinated leading to
surplus/deficits. Late 1980s saw controlled licensing of private trade but low pan – territorial
pricing. State agencies
financially weak.
Early 1990s NCPB narrows its
margins. Private trade finds it
unprofitable to reach remote areas.
1991. Local and international pressure for reforms builds up. Further relaxation of inter
– district trade.
1992. Kenya moves from one party politics
to multiparty state. Restrictions on maize
trade across districts re-imposed. NCPB unable to defend ceiling prices. In 1993 maize and maize meal prices deregulated.
Import tariff abolished. No subsidies to
1992 Foreign exchange regime
liberalized. Fertilizer import
restrictions relaxed. In 1993 fertilizer market liberalized. Private traders allowed to
import and distribute. State and
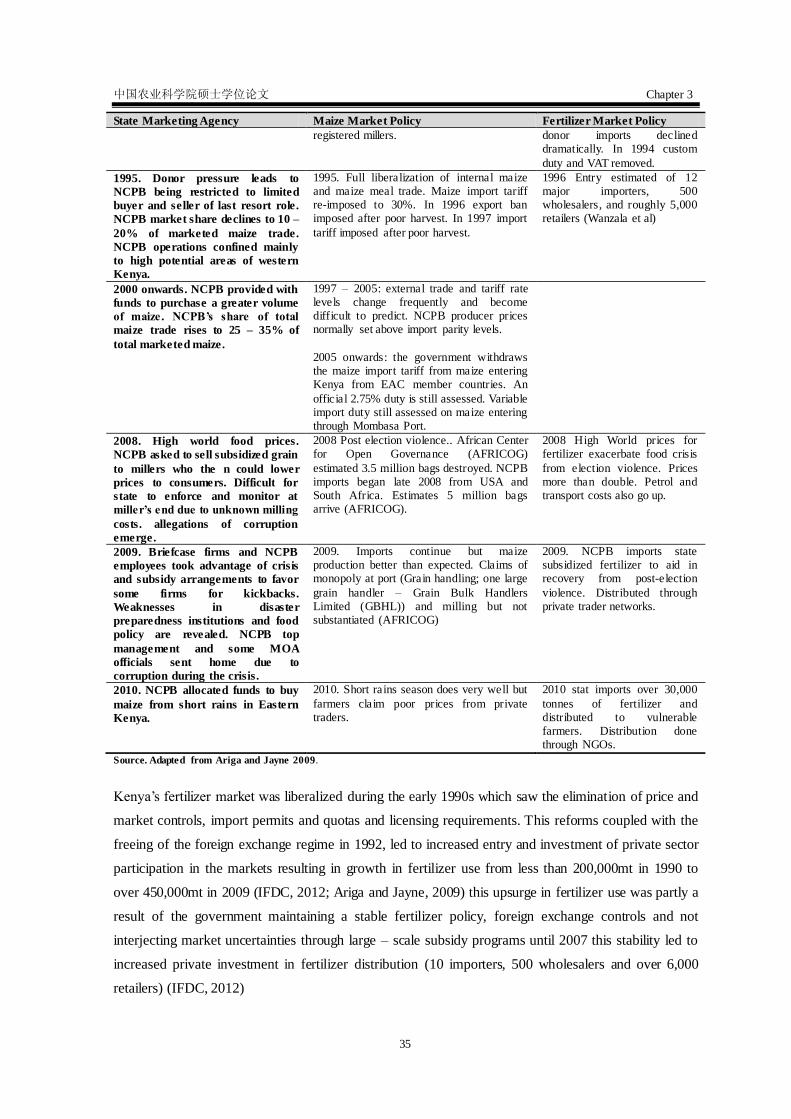
中国农业科学院硕士学位论文 Chapter 3
35
State Marketing Agency Maize Market Policy Fertilizer Market Policy
registered millers. donor imports declined dramatically. In 1994 custom
duty and VAT removed.
1995. Donor pressure leads to
NCPB being restricted to limited
buyer and seller of last resort role.
NCPB market share declines to 10 –
20% of marketed maize trade.
NCPB operations confined mainly
to high potential areas of western
Kenya.
1995. Full liberalization of internal maize and maize meal trade. Maize import tariff re-imposed to 30%. In 1996 export ban
imposed after poor harvest. In 1997 import
tariff imposed after poor harvest.
1996 Entry estimated of 12 major importers, 500 wholesalers, and roughly 5,000
retailers (Wanzala et al)
2000 onwards. NCPB provided with
funds to purchase a greater volume
of maize. NCPB’s share of total
maize trade rises to 25 – 35% of
total marketed maize.
1997 – 2005: external trade and tariff rate levels change frequently and become difficult to predict. NCPB producer prices normally set above import parity levels.
2005 onwards: the government withdraws the maize import tariff from maize entering Kenya from EAC member countries. An
official 2.75% duty is still assessed. Variable import duty still assessed on maize entering through Mombasa Port.
2008. High world food prices.
NCPB asked to sell subsidized grain
to millers who the n could lower
prices to consumers. Difficult for
state to enforce and monitor at
miller’s end due to unknown milling
costs. allegations of corruption
emerge.
2008 Post election violence.. African Center for Open Governance (AFRICOG)
estimated 3.5 million bags destroyed. NCPB imports began late 2008 from USA and
South Africa. Estimates 5 million bags arrive (AFRICOG).
2008 High World prices for fertilizer exacerbate food crisis
from election violence. Prices more than double. Petrol and
transport costs also go up.
2009. Briefcase firms and NCPB
employees took advantage of crisis
and subsidy arrangements to favor
some firms for kickbacks.
Weaknesses in disaster
preparedness institutions and food
policy are revealed. NCPB top
management and some MOA
officials sent home due to
corruption during the crisis.
2009. Imports continue but maize production better than expected. Claims of monopoly at port (Grain handling; one large
grain handler – Grain Bulk Handlers Limited (GBHL)) and milling but not substantiated (AFRICOG)
2009. NCPB imports state subsidized fertilizer to aid in recovery from post-election
violence. Distributed through private trader networks.
2010. NCPB allocated funds to buy
maize from short rains in Eastern
Kenya.
2010. Short rains season does very well but
farmers claim poor prices from private traders.
2010 stat imports over 30,000
tonnes of fertilizer and distributed to vulnerable farmers. Distribution done through NGOs.
Source. Adapted from Ariga and Jayne 2009.
Kenya‘s fertilizer market was liberalized during the early 1990s which saw the elimination of price and
market controls, import permits and quotas and licensing requirements. This reforms coupled with the
freeing of the foreign exchange regime in 1992, led to increased entry and investment of private sector
participation in the markets resulting in growth in fertilizer use from less than 200,000mt in 1990 to
over 450,000mt in 2009 (IFDC, 2012; Ariga and Jayne, 2009) this upsurge in fertilizer use was partly a
result of the government maintaining a stable fertilizer policy, foreign exchange controls and not
interjecting market uncertainties through large – scale subsidy programs until 2007 this stability led to
increased private investment in fertilizer distribution (10 importers, 500 wholesalers and over 6,000
retailers) (IFDC, 2012)

中国农业科学院硕士学位论文 Chapter 3
36
3.1.3 Evolution of maize marketing in Kenya
Before liberalization
This period was mainly marked by state control of production and marketing through marketing
boards. The government set producer and mill prices with pan – territorial and pan – seasonal prices
adjusted once per year at the beginning of the marketing season. The governments marketing agent,
National Cereals and Produce Board, held a long standing monopoly on internal and external grain trade.
Informal, private and trade across district boundaries and cross – border trade was illegal and highly
regulated by the government. Traders were required to obtain permits for specific movement and
transportation of grain across district boundaries.
During the Liberalization period (1987/88)
The cereal sector reforms which begun with the introduction of the structural adjustment
programmes in 1987. These reforms saw the introduction of market reforms, legalization of cross border
maize trade with limitations on the quantity of maize permissible across districts being raised gradually.
This period also saw a reduction in the oversight role of NCPB in the maize sector. The Liberalization
process that begun in the late 1980s was only complete in 1993 with the elimination of movement and
price controls on maize trading, deregulation of maize and maize meal prices, elimination of direct
subsidies on maize sold to registered millers, NCPB becoming buyer and seller of last resort,
introduction and acceleration of private sector participation, government intervention through
imposition of variable import tariff and financing of NCPB operations to facilitate the governments
price stabilization policy through domestic purchasing of maize at support prices and maintaining
strategic grain reserve stocks.
The goal of liberalization was to streamline the role of government in the market sector while
offloading some of the critical roles to the private sector. This policy has had major effects on the maize
industry over the past 20 years. The expectation was to raise competition by encouraging more private
sector participation in the market and thereby reducing marketing cost along the maize value chain.
However over the years and depending on how the liberalization process was implemented risks and
costs in private investments have increased and in many cases the expectation that the private sector
would take up certain roles initiallyundertaken by the government did not happen.
After liberalization
In the period following liberalization of the maize subsector changes occasioned by the change in
operations have created mixed results. There appears to have evolved a very competitive, processing,
wholesaling, and retailing actors with large – scale milling sector emerging as outright winners albeit
retaining their concentration in major regions.
A complex marketing chain has also supplanted the basic marketing chain that existed prior to
liberalization. Karanja et al., posits that on average maize market reforms led to decrease in maize prices
and subsequent negative effect on input use and maize productivity. This impact on productivity is much
lower in lowlands that in highlands because the effect of price is transmitted mainly through the effect

中国农业科学院硕士学位论文 Chapter 3
37
on fertilizer use and the lowlands are relatively low users of fertilizers (Karanja et al.,).
Table 3-2 Summary Of Key Policy Issues In The Fertilizer Markets
Policy Description Effect
Regulation Fertilizer Bill drafted but not enacted. Kenya
Bureau of Standards (KEBS) to regulate quality
at all levels in the chain Regional
harmonization.
Weak quality control at retail and capacity of
KEBS limited, selling from open bags, some
underweight bags and mislabeling.
Subsidy.
Smart versus
distribution by
the state
Combination of smart (50% price at private
agro – dealer) and subsidized fertilizers
distributed directly to all farmers by Gok
(Emergency)
GoK imports are ad – hock and disruptive to
private sector sales. Late delivery to farmers.
Farmers in remote areas not accessed by limited
GoK retail Stores/depots.
Macroeconomic.
Exchange rate
and monetary
policy
Free Foreign Exchange regime since 1993. In
2011 to early 20102 increased devaluation of
currency against dollar.
Imports more expensive (fertilizer). However,
world prices transmitted well to local markets.
More difficult for smaller importers to access
foreign currency (large amounts and lack of
international links)
Trade.
Tarifs on imports
and/or exports.
Non-Tariff
Barriers (NTBs)
No. Tariffs on fertilizer. However, port costs are
high and there is a reimbursable value – added
tax (VAT) on services and transport. NTBs exist
across borders.
Recovery time of VAT on services significant
for importers (Hidden cost)
Price and market
controls
No price fixation by GoK. However, GoK tries
to influence price through pan – territorial price
subsidies. No restrictions on market entry.
Private sector is competitive. GoK direct
imports affect smaller players.
Credit/Finance Competitive banking sector. Collateral
requirements, GoK AGRA and Equity Bank
Created a risk – sharing partnership through
credit guarantee schemes.
Lower interest rates with credit guarantee.
General rates are high in market, and banks are
risk – averse to agriculture, limiting use of
credit by small – scale participants.
Extension and
training
Extension agents and farmers not well – versed
in different fertilizer technologies
Use less efficient fertilizer based on out – of –
date recommendations. Soil acidity increased
from overusing some N fertilizers in some areas
without liming. Low yields due to nutrient
imbalance and depletion.
Source. IFDC 2012
Inflation-adjusted prices, the margin between cost, insurance and freight (c.i.f) and wholesale fertilizer
prices in Nakuru, have been declining from 1990 to 2006 (Figure3-2) after which due to increases in
energy and raw material prices and growth in demand from emerging markets and the biofuel sector in
USA and Europe, global fertilizer prices increased rapidly in 2007 and skyrocketed in 2008.

中国农业科学院硕士学位论文 Chapter 3
38
Figure 3-2 Price of DAP in Mombasa and Nakuru (Constant 2007 KSh. per 50Kg bag)
Source. KNBS
3.1.4 Fertilizer demand and supply trends
Fertilizer supply for most African countries is driven by government policy, finance and
infrastructure while the demand has primarily been a function of the farmer‘s capacity to acquire
fertilizers, availability of water and farmers knowledge of fertilizer use (Minde et al., 2010)
Studies in this area have reported mixed result with countries like Benin recording insignificant
changes in fertilizer market structures, no improvements in access to and rising prices of fertilizer
leading in application rates lower than those recommended by extension agents (Kormawa et al., 2003)
their conclusions being that factors influencing fertilizer use comprised farm size, social capital,
frequency of extension contacts, and use of complementary inputs. The basic issue now remains
whether farmer demand alone can be expected to create sufficient fertilizer supply, or whether sufficient
supply is necessary to allow demand to be expressed in fertilizer purchases at the farm level (Larson and
Frisvold, 1996) however the authors agree that there is substantial evidence that the physical availability
of fertilizers to farmers, in the right quantities and at the right time of the year, remains a fundamental
constraint to increasing fertilizer use in Sub-Saharan Africa.

中国农业科学院硕士学位论文 Chapter 3
39
Figure 3-3 Fertilizer Consumption in Kg/Ha of arable land
Source. Authors compilation (Data from http://data.worldbank.org/)
Destabilizing factors prevalent in the fertilizer economy of most Sub – Saharan African countries
pose a major challenge to the development of the sector. First much of the sub – Saharan Africa suffers
from acute shortage of water and rain fed agriculture is not reliable. Second with variations in
production systems and agronomic environments synchronizing productivity to maximize output still
remains a challenge. Third although fertilizer prices may be well transmitted to regional markets price
variations remain due to frequent changes in the world market. Fourth, with infrastructure in many
developing African countries dilapidated, cost of fertilizer tends to rise from the port of entry increasing
distribution costs, reducing profitability and affordability.
Market access has also been found to increase a farmer‘s demand (Njehia, 1994) and there are
opportunities to reduce domestic marketing costs through reducing port fees, transport inconveniences,
road infrastructure limitations, high fuel taxes and uncertainties in the government input distribution
programs that impose additional marketing costs on traders (Jayne et al., 2003) the authors using the
willingness to pay approach believe that price reductions of 11 to 18% which could be achieved from
these reductions if passed on to farmers would increase farmers effective demand.
3.1.5 Fertilizer production and consumption
An analysis of the production and demands within the fertilizer distribution value chain can best be
illustrated by the double value chain.

中国农业科学院硕士学位论文 Chapter 3
40
Figure 3-4 Fertilizer “Double”Value chain
Source. IFDC 2012
First the input value chain, which includes production trade and consumption by farmers and
Second the output value chain spanning crop production by farmers, transformation, marketing and
consumption. Kenya is not endowed with mineral resources for fertilizer manufacture. Like most SSA
Countries, Kenya depends on the international markets for its fertilizers as local production is limited.
Studies in various parts of the country and regionally have shown availability of rock phosphate, natural
gas and guano which could be used in the manufacture of fertilizers, the regional fertilizer market is not
sufficient to justify investments in production facilities, in part because exports of locally produced
fertilizers cannot compete with cheaper Arab Gulf products at current prices. There is some local
blending by Mea Ltd, and Athi River Mining Ltd, which formulate blends for various crops and soils
(IFDC, 2012).
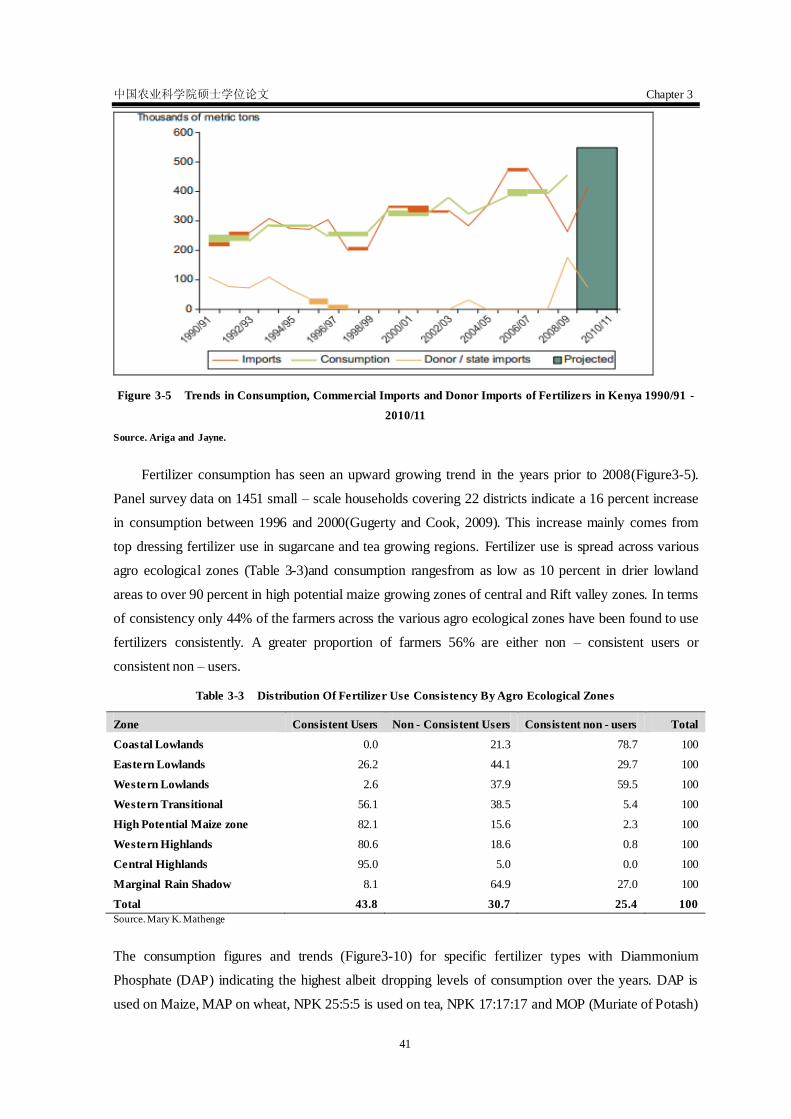
中国农业科学院硕士学位论文 Chapter 3
41
Figure 3-5 Trends in Consumption, Commercial Imports and Donor Imports of Fertilizers in Kenya 1990/91 -
2010/11
Source. Ariga and Jayne.
Fertilizer consumption has seen an upward growing trend in the years prior to 2008(Figure3-5).
Panel survey data on 1451 small – scale households covering 22 districts indicate a 16 percent increase
in consumption between 1996 and 2000(Gugerty and Cook, 2009). This increase mainly comes from
top dressing fertilizer use in sugarcane and tea growing regions. Fertilizer use is spread across various
agro ecological zones (Table 3-3)and consumption rangesfrom as low as 10 percent in drier lowland
areas to over 90 percent in high potential maize growing zones of central and Rift valley zones. In terms
of consistency only 44% of the farmers across the various agro ecological zones have been found to use
fertilizers consistently. A greater proportion of farmers 56% are either non – consistent users or
consistent non – users.
Table 3-3 Distribution Of Fertilizer Use Consistency By Agro Ecological Zones
Zone Consistent Users Non - Consistent Users Consistent non - users Total
Coastal Lowlands 0.0 21.3 78.7 100
Eastern Lowlands 26.2 44.1 29.7 100
Western Lowlands 2.6 37.9 59.5 100
Western Transitional 56.1 38.5 5.4 100
High Potential Maize zone 82.1 15.6 2.3 100
Western Highlands 80.6 18.6 0.8 100
Central Highlands 95.0 5.0 0.0 100
Marginal Rain Shadow 8.1 64.9 27.0 100
Total 43.8 30.7 25.4 100
Source. Mary K. Mathenge
The consumption figures and trends (Figure3-10) for specific fertilizer types with Diammonium
Phosphate (DAP) indicating the highest albeit dropping levels of consumption over the years. DAP is
used on Maize, MAP on wheat, NPK 25:5:5 is used on tea, NPK 17:17:17 and MOP (Muriate of Potash)

中国农业科学院硕士学位论文 Chapter 3
42
on coffee, and special fertilizers are used on horticultural crops particularly in the flower industry.
Cereals production consumes the bulk of the 150,000 tones closely followed by horticulture, which
takes up 65,000 tons. Coffee and tea take up to 40,000 and 30,000 tons respectively, while the
remainder is taken up by other small crops.
Figure 3-6 Trends in the consumption of various Fertilizer products.
Source. IFDC 2012.
Trends in the Usage of various fertilizer products (Figure 3-10) indicates a rising trend from 2006/07
that peaks in 2008/09 and then drops and levels out in the successive years of 2009 to 2011. The main
increase in use has been as a result of increased use of NPK 17:17:17 and NPK 25:5:5:5.
Table 3-4 Fertilizer Usage By Smallholder Farmers
Percent of farming households not using inorganic fertilizer and reasons 1997 2007 2010
Did not use Fertilizer (% of hh) 36.6 24.1 30.5
Reasons for not using (% of hh)
Unaffordable 47.6 44.8 51.5
Unavailable 0.0 0.0 0.8
No Need to use 10.6 21.0 32.8
Uses organic fertilizer 21.3 24.7 11.9
Other Reasons 20.5 9.6 3
Total 100 100 100
Source. Lillian Kirimi
The greatest constraint to fertilizer use remains the affordability (Table 3-4) indicating that with
increased low cost and subsidized fertilizers the rate of technology adoption is expected to rise. The
import prices of fertilizer at the port of Mombasa are 45% to 55% of the farm gate fertilizer price,
internal costs for fertilizer however include transportation and handling, storage and interest charges for
financing the fertilizer purchases, and charges for transit losses, and bagging (Nyoro, 2002). Rising
gradually over the years is the figure of those who see no need to use any fertilizer. This could be

中国农业科学院硕士学位论文 Chapter 3
43
attributed to the lack of knowledge on fertilizer use causing misuse and in many instances poor
performance of crops. Kenya‘s fertilizer Consumption fairly matches imports, with donor support
dwindling over the years.
3.1.6 Drivers of Fertilizer Supply and Demand
Fertilizer demand is closely related to cereal production. Global production was 866 million tonnes
in 1961 and rose to 2.2billion tonnes in 2010. Similarly, global fertilizer use increased almost six fold
during the same period from 3.2mt in 1961 to 170Mt in 2011. In the next five years, global fertilizer
consumption is projected to increase at the rate of 2.5% to reach 188Mt of nutrients in 2015
(Prud‘homme, Heffer and Olegario IFA).
Farmers demand for fertilizer in the world is influenced largely by the farmer‘s capacity to invest
in fertilizer use, commodity and fertilizer prices, profitability of fertilizer use, crop yield response to
fertilizer and availability of complementary inputs. Other factors include continued world population
growth, increased income, and resulting diet diversification,biofuel development, limited immediately
available additional land, increased recycling of organic nutrient sources, and improved nutrient use
efficiency among others (Prud‘homme, Heffer and Olegario IFA, Minde et al., 2010) Positive price
elasticities of supply, higher prices induce greater production, which further stimulates demand for
purchased inputs, including labour (Nyoro, 2002). The value of input volume and price indices
agricultural inputs (Table 3-5) across the period from 2009 to 2013. Whereas the overall agricultural
price index rose from 193.3 in 2012 to 215.5 in 2013(Economic Survey, 2014) both the quantum and
price indices for fertilizer dropped marginally due to government interventions in the supply of the
commodity to farmers through its National Cereals and Produce Board (NCPB) and the NAAIAP
programme. This benefit in lower input prices of fertilizer and purchased seeds is however counter
balanced with increased power and fuel prices with quantum indices rising from 68.7 to 84.1 between
2012 and 2013.
Table 3-5 Agricultural Input Indices, 2009 - 2013
Index Input 2009 2010 2011 2012 2013
Quantum
indices
Fertilizer 162.5 205.8 198.6 106.0 114.5
Fuel and
Power
49.3 61.6 67.8 68.7 84.1
Purchased
Seed
118.4 166.1 191.9 120.2 118.7
Price Indices Fertilizer 204.8 198.1 255.5 259.8 250.5
Fuel and
Power
135.9 147.5 179.2 230.9 232.0
Purchased
Seed
88.4 90.6 102.2 100.8 116.4
Source: Economic Survey, 2014
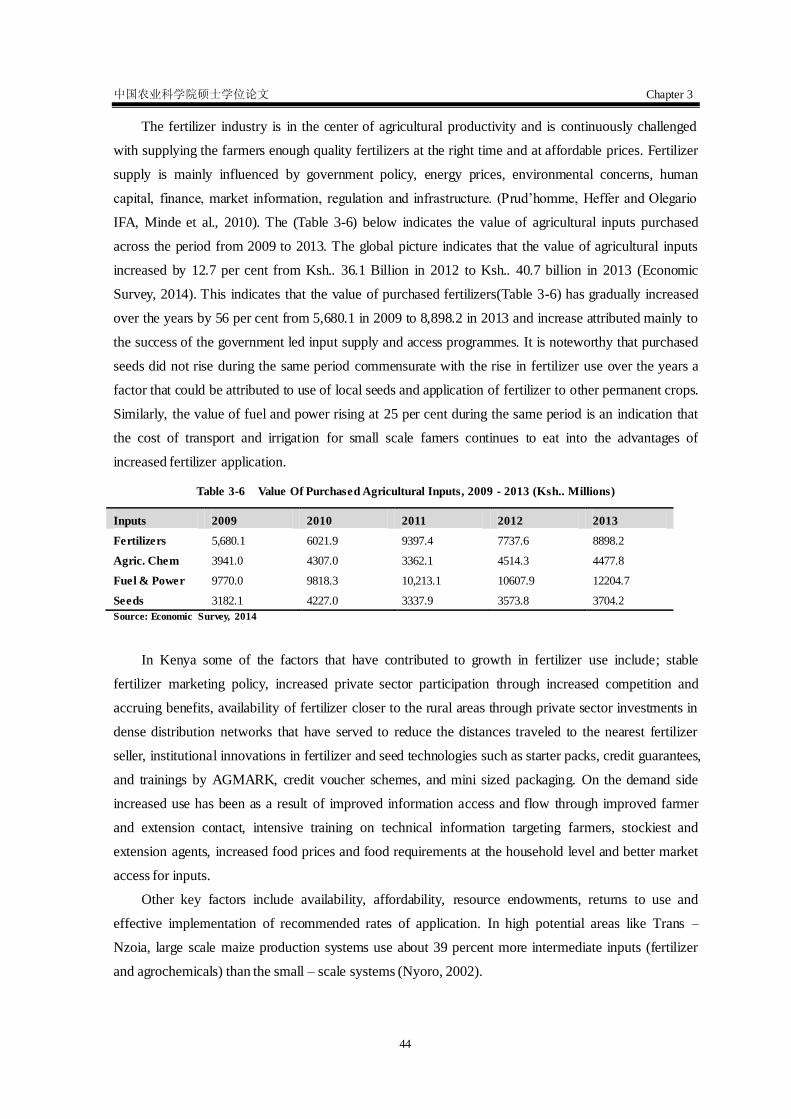
中国农业科学院硕士学位论文 Chapter 3
44
The fertilizer industry is in the center of agricultural productivity and is continuously challenged
with supplying the farmers enough quality fertilizers at the right time and at affordable prices. Fertilizer
supply is mainly influenced by government policy, energy prices, environmental concerns, human
capital, finance, market information, regulation and infrastructure. (Prud‘homme, Heffer and Olegario
IFA, Minde et al., 2010). The (Table 3-6) below indicates the value of agricultural inputs purchased
across the period from 2009 to 2013. The global picture indicates that the value of agricultural inputs
increased by 12.7 per cent from Ksh.. 36.1 Billion in 2012 to Ksh.. 40.7 billion in 2013 (Economic
Survey, 2014). This indicates that the value of purchased fertilizers(Table 3-6) has gradually increased
over the years by 56 per cent from 5,680.1 in 2009 to 8,898.2 in 2013 and increase attributed mainly to
the success of the government led input supply and access programmes. It is noteworthy that purchased
seeds did not rise during the same period commensurate with the rise in fertilizer use over the years a
factor that could be attributed to use of local seeds and application of fertilizer to other permanent crops.
Similarly, the value of fuel and power rising at 25 per cent during the same period is an indication that
the cost of transport and irrigation for small scale famers continues to eat into the advantages of
increased fertilizer application.
Table 3-6 Value Of Purchased Agricultural Inputs, 2009 - 2013 (Ksh.. Millions)
Inputs 2009 2010 2011 2012 2013
Fertilizers 5,680.1 6021.9 9397.4 7737.6 8898.2
Agric. Chem 3941.0 4307.0 3362.1 4514.3 4477.8
Fuel & Power 9770.0 9818.3 10,213.1 10607.9 12204.7
Seeds 3182.1 4227.0 3337.9 3573.8 3704.2
Source: Economic Survey, 2014
In Kenya some of the factors that have contributed to growth in fertilizer use include; stable
fertilizer marketing policy, increased private sector participation through increased competition and
accruing benefits, availability of fertilizer closer to the rural areas through private sector investments in
dense distribution networks that have served to reduce the distances traveled to the nearest fertilizer
seller, institutional innovations in fertilizer and seed technologies such as starter packs, credit guarantees,
and trainings by AGMARK, credit voucher schemes, and mini sized packaging. On the demand side
increased use has been as a result of improved information access and flow through improved farmer
and extension contact, intensive training on technical information targeting farmers, stockiest and
extension agents, increased food prices and food requirements at the household level and better market
access for inputs.
Other key factors include availability, affordability, resource endowments, returns to use and
effective implementation of recommended rates of application. In high potential areas like Trans –
Nzoia, large scale maize production systems use about 39 percent more intermediate inputs (fertilizer
and agrochemicals) than the small – scale systems (Nyoro, 2002).
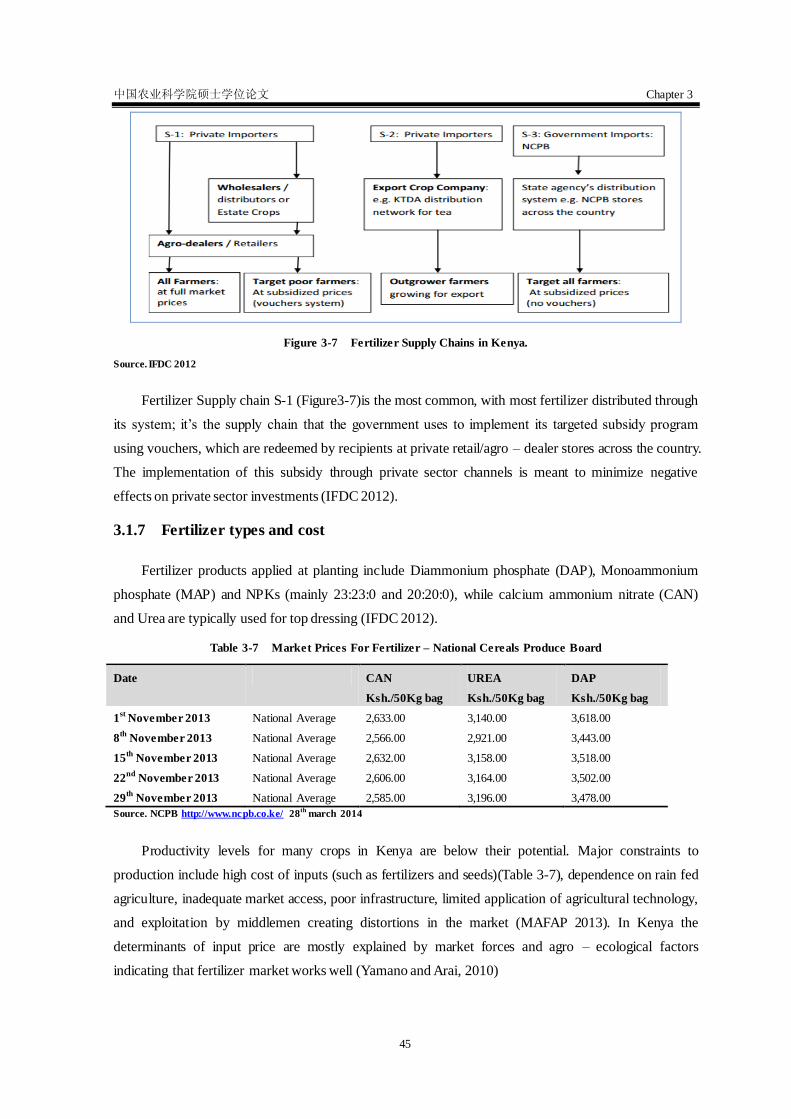
中国农业科学院硕士学位论文 Chapter 3
45
Figure 3-7 Fertilizer Supply Chains in Kenya.
Source. IFDC 2012
Fertilizer Supply chain S-1 (Figure3-7)is the most common, with most fertilizer distributed through
its system; it‘s the supply chain that the government uses to implement its targeted subsidy program
using vouchers, which are redeemed by recipients at private retail/agro – dealer stores across the country.
The implementation of this subsidy through private sector channels is meant to minimize negative
effects on private sector investments (IFDC 2012).
3.1.7 Fertilizer types and cost
Fertilizer products applied at planting include Diammonium phosphate (DAP), Monoammonium
phosphate (MAP) and NPKs (mainly 23:23:0 and 20:20:0), while calcium ammonium nitrate (CAN)
and Urea are typically used for top dressing (IFDC 2012).
Table 3-7 Market Prices For Fertilizer – National Cereals Produce Board
Date CAN
Ksh./50Kg bag
UREA
Ksh./50Kg bag
DAP
Ksh./50Kg bag
1st November 2013 National Average 2,633.00 3,140.00 3,618.00
8th
November 2013 National Average 2,566.00 2,921.00 3,443.00
15th
November 2013 National Average 2,632.00 3,158.00 3,518.00
22nd
November 2013 National Average 2,606.00 3,164.00 3,502.00
29th
November 2013 National Average 2,585.00 3,196.00 3,478.00
Source. NCPB http://www.ncpb.co.ke/ 28th
march 2014
Productivity levels for many crops in Kenya are below their potential. Major constraints to
production include high cost of inputs (such as fertilizers and seeds)(Table 3-7), dependence on rain fed
agriculture, inadequate market access, poor infrastructure, limited application of agricultural technology,
and exploitation by middlemen creating distortions in the market (MAFAP 2013). In Kenya the
determinants of input price are mostly explained by market forces and agro – ecological factors
indicating that fertilizer market works well (Yamano and Arai, 2010)

中国农业科学院硕士学位论文 Chapter 3
46
3.1.8 Fertilizer subsidies Programs in African Countries
Fertilizer subsidies in African countries have been common since the early 1980s however during the
1990s under the vast structural adjustment initiatives implemented by many African countries, many of
these programs came to an end. The recent food crisis, high food prices, population growth and reduced
soil fertility have however seen a resurgence of interest in fertilizer subsidy programs.
Figure 3-8 World Fertilizer Consumption (Kg/Ha)
Source: http://www.indexmundi.com/
Unlike many parts of the developed world Sub Saharan Africa experiences the twin challenges of
low soil fertility and low fertilizer use. Fertilizer consumption varies by country (Figure3-8). The shade
of the country corresponds to the magnitude of the indicator. The darker the shade the higher the value.
The country with the highest value in the world is Qatar, with a value of 3,191.67Kg/Ha and that with
the lowest value is Niger, with a value of 0.39Kg/Ha. Kenya averages 32.5 Kg/Ha. When compared to
Asia which uses over 150Kg/Ha, SSA trails at a mere 7kg/ha and accounts for 3% of global fertilizer
consumption. This low fertilizer use partly a result of poor price incentives, lack of information on
fertilizer use, lack of credit facilities and in some cases poor rainfall and cultural practices inhibit
farmers from using fertilizers. On the supply side poor road networks which increase the cost of
transportation and distribution, lack of credit, underdeveloped supply networks and agro dealerships,
and poorly implemented subsidy programs hinder availability of fertilizers at critical times of demand.

中国农业科学院硕士学位论文 Chapter 3
47
Table 3-8 Government Subsidized Fertilizer Distribution: Oct – Nov. 2012
REGION/
DEPOTS
QUANTITY TOTAL
COST
QUANTITY TOTAL
COST
QUANTITY TOTAL COST
NPK (23:23:0) Fertilizer
Distribution – 100,000 X 50Kgs
NPK (17:17:0) Fertilizer
Distribution – 100,000 X
50Kgs
DAP Fertilizer Distribution
18,000 MT – 360,000 X 50Kgs
NORTH RIFT 19,360 7,667,270 13,000 176,580 100,000 39,410,901
SOUTH RIFT 20,600 7,423,791 21,160 7,647,643 95,140 31,555,565
LAKE BASIN
AND
WESTERN
19,980 8,399,530 20,300 8,282,970 60,640 25,433,909
NAIROBI &
EASTERN
12,480 2,864,819 15,420 3,625,665 31,600 7,088,455
NORTHERN
REGIONS
26,700 8,221,212 29,560 9,215,318 70,820 21,966,183
COAST 880 89,751 560 89,751 1,800 133,480
TOTAL
GRANTS
100,000 34,666,373 100,000 34,037,926 360,000 125,588,493
Source. GoK 2013
Studies on this subject show that whereas there is limited information, subsidies have been
effective in raising fertilizer use, average yields and agricultural production (Druilhe, Z. and
Barreiro-Hurlé, J. 2012.). Farmers demand for fertilizers and the physical capacity to make fertilizers
available (Table 3-8) have been cited as the two key issues that determine improvements in fertilizer use
in SSA (Larson & Frisvold 1996) quoting Gunvant Desai (Deai and Gandhi, 1990; Heisey, P.W., and W.
Mwangi,1996). Emphasize the four processes that determine changes in fertilizer consumption as being
1) those that influence the agronomic potential for fertilizer use; 2) those that convert the potential into
farmers‘ effective demand for fertilizers; 3) those that determine the growth of aggregate fertilizer
supply; and 4) those that develop the fertilizer distribution system.
3.1.9 Smart Subsidies
Agricultural subsidies as defined by Wikipedia (www.wikipedia.org) are government subsidies paid
to farmers and agribusinesses to supplement their income, manage the supply of agricultural
commodities, and influence the cost and supply of such commodities. The samewebsite defines a
subsidy as a form of financial or in kind support extended to an economic sector (or institution, business,
or individual) generally with the aim of promoting economic and social policy. Fowler et al., (2010)
defines Subsidies as a mechanism for reducing cost for a market actor, through cost – sharing with a
development agency, in order to achieve a particular development objective. Subsidies are intended to
improve access to agro-inputs, raise farm incomes, improve household and national food security and
increase private sector participation in agro-input markets. Opinion literature is divided on the

中国农业科学院硕士学位论文 Chapter 3
48
effectiveness of subsidies with two clear schools of thought emerging; whereas such interventions tend
to involve a lot of public investment and distort or markets to achieve desired political and social ends,
for those supporting pro – poor market and small holder development, the capacity of such initiatives to
promote greater inclusion and capacity for the most vulnerable is desirable.
Figure 3-9 The Concept of Access Gap
Source. De Silva and Tuladhar 2006
The market efficiency gap is the difference between what markets actually achieve under existing
conditions and what they can achieve if market barriers are removed (De Silva and Tuladhar, 2006) To
bridge this gap effective competition, private services, and market oriented policies and regulations are
necessary to create a level playing field particularly for new market entrants. The access gap on the
other hand refers to people and places that remainbeyond the limits of the market due to inadequate
income levels or its skewed distribution (De Silva and Tuladhar, 2006). In order to bridge the access gap
interventions in the form of subsidies are used by governments in developing countries to encourage
consumption and service providers to invest in these sectors.
Fertilizer subsidies can broadly fall into both production subsidy and consumer/consumption
subsidy categories. As a production subsidy it encourages suppliers to increase the output (or sale) of a
particular product by partially offsetting the production costs or losses. The objective of production
subsidies being to expand production (or sale) of a particular product more than the market would
promote, but without raising the final price to the consumer. As a consumption subsidy it subsidizes the
behavior of consumers allowing that no matter how impoverished, all should be allowed access to
certain (in most cases basic) commodities.
Agricultural subsidies can be considered narrow lump – sum transfers that are easily identifiable
and have a clear intent. They are monetary transfer from governments to individuals and institutions
with the intent of improving productivity and access to technology. Lump-sum subsidies implies that the

中国农业科学院硕士学位论文 Chapter 3
49
government takes away some fixed amount of money regardless of the individuals behavior and will
thus shift the budget line outward (Varian, 2005). Subsidies work by lowering the price of a good,
making national goods more competitive against foreign goods, thereby reducing foreign competition.
Competitive equilibrium is a state of balance between buyers and suppliers, in which the quantity
demanded of a good equals the quantity supplied at a specific price. When the quantity demanded
exceeds the equilibrium quantity, price falls; conversely, a reduction in the supply of a good beyond
equilibrium quantity implies an increase in the price.
Figure 3-10 Price and quantity effects of a subsidy.
The effect of a subsidy (Figure3-10)is to shift the supply and demand curve to the right (i.e.
increases the demand or supply) by the amount (Q*-Qs) of the subsidy. If a consumer is receiving the
subsidy, a lower price(P*-Ps) of a good resulting from the marginal subsidy on consumption increased
demand, shifting the demand curve to the right. If a supplier is receiving the subsidy, an increase in the
price (revenue) resulting from the marginal subsidy on production results increases supply, shifting the
supply curve to the right.

中国农业科学院硕士学位论文 Chapter 3
50
Figure 3-11 Deadweight loss and Inefficiencies of a Subsidy
Assuming a perfectly competitive equilibrium market, a subsidy increases the supply of the
good beyond the equilibrium competitive quantity. The imbalance creates ―deadweight loss‖(DWL)
(Figure 3-11), this is defined as the amount by which the cost of the subsidy exceeds the gains of the
subsidy. The magnitude of the deadweight loss is dependent on the size of the subsidy. This is
considered a market failure, or inefficiency.
Smart subsidies are designed with the objective of addressing the shortcomings of universal
subsidies. Baltzer and Hansen, (2012) observe that to be ―smart‖ subsidy programmes should adhere to
a number of design principles, which can be summarized as follows;
Targeting specific farmers. Smart subsidies should target specific farmers, who are not already
applying agricultural inputs and the poorest and most vulnerable households. This prevents the risk of
displacing commercial input sale and maximizes pro – poor access and growth.
Market – Based Solutions. Smart subsidies should utilize and support private input supply
networks rather than compete or supplant them. This ensures efficiency of input delivery as well as
increases the likelihood that the programme has a sustained impact after its termination.
Exit Strategy. Smart subsidies should be time bound with credible exit strategies to put a time
limit on the support. This not only prevents patronization by political interests but also facilitates long
term stability. Exit strategies also help to check cost of the programme and aid in evaluation.
Many authors agree that any justification for or evaluation of smart subsidies should be on the
basis of the economic principles of efficiency, equity and sustainability (Baltzer and Hansen,2012).
Efficiency: This compares the economic costs of delivering inputs to farmers to the benefits of
input use in terms of higher production and productivity. In many cases the high cost of inputs has failed
to match the low adoption of agricultural inputs for profitable investment. Market failures caused
mainly by credit constraints, imperfect competition and risks have also prevented farmers from
accessing inputs and therefore realizing the economic potential.

中国农业科学院硕士学位论文 Chapter 3
51
Equity: In cases where smallholder farmers cannot access inputs due to the high costs involved
smart subsidies can help in promoting equality through proper targeting of subsidies to specific
categories of people especially the poorest and most vulnerable. Smallholderfarmers are however not
only constrained by market failure factors but in most cases they lack complementary resources, skills,
scale of operation, productive assets, or the financial resources to pay even the subsidized prices, to
make effective use of the subsidized inputs (Baltzer and Hansen, 2012).
Sustainability. Smart subsidy programs involve a huge transfer of value from public resource to
smallholder farmers. This represents a foregone cost in offering other public goods by the government
to society. Subsidy programs remain sustainable if they can be run over a long period of time without
strain to public resources and without forgoing or diverting resources from other critical and basic
sectors of the economy.
Long term sustainability hinges greatly on efficiency and equity this will prevent cases of the
programs growing inefficient and less equitable and eventually becoming unsustainable. To prevent the
risk of smart subsidies becoming unsustainable they must be designed as a temporary measure with
clear exit strategies for termination of the programme. In the best case scenario smart subsidies should
essentially be to ―jump – start‖ resource poor farmers and stimulate the inputs market. For instance if
the programme helps farmers accumulate substantial productive and financial assets through a series of
surplus harvest, the farmer will be in a position to fully afford and finance full – priced inputs from their
own savings and production working capital. This will then stimulate the input supply chain to become
more competitive and thus lowering prices in the long run to make them more accessible to the
smallholder farmer.
3.2. The National Accelerated Agricultural Inputs Access Programme
(NAAIAP)
3.2.1 Overview Of The Programme
The NAAIAP programme was initiated in the year 2007 by the Government of Kenya through the
Ministry of Agriculture to address low farm productitivity by offering targeted subsidy in the form of
technical inputs to 2.5million resource poor farmers in order for them to incrase yield and production to
meet household food security and generate surpluses for increased household incomes.
The primary objective of NAAIAP is to improve farm inputs (fertilizera and seed) access and
affordability for smallholder farmers to increase usage and thus enhance foodsecurity/availabiltiy to the
household level and generate incomes from sales of surplus produce.
The programme aims at
i. Improving agricultural productivity and output at farm level for 2.5 million smallholder
farmers with one hectare or less of land.
ii. Mobilizing farmers resources and promote efficiency in their utilization and re-invest in
agriculture.
中国农业科学院硕士学位论文 Chapter 3
52
The programme also targets farmers with increased incomes to access affordable (subsidized)
credit to enable them access farm inputs. Since inception the proghramme has disbursed over 502,469
input vouchers to 521,515 beneficiaries to producer and average of 8.7 million bags of (90Kg) maize
valued at Ksh.. 18 billion in 40 Counties. In addition, a total of 15,743 beneficiaries (14,814 small
farmers; 746 agro dealers; and 183 other value chain players) have accessed Ksh.. 1.575 billion as credit
to boost their agricultural production activities.
3.2.2 Project Components
Kilimo Plus Kits (Inputs Grant)
This grant is administered using e-coupons/smart vouchers. The coupon enables the farmer to get
inputs from accredited stockists (trained for the purpose). Stockists will redeem the vouchers from the
project. A stakeholder forum will be held at the district level to vet and authorize grants to deserving
farmers and approve payment vouchers. After one season these farmers are expected to graduate to the
next category and participate in Kilimo Biashara(farming as a commercial entity).
Kilimo Biashara Package (Commercial Packs)
This package targets the somewhat better endowed farmers who are already involved in
economically viable enterprises but are constrained by lack of basic inputs such as fertilizer,
agrochemicals, animal feeds, etc. these farmers will access inputs at cost and have access to subsidized
credit from financial institutions. The government guarantees 10% of the amount to be loaned to the
farmers by the private financial institutions. They will also be trained and assisted to continue with
economically viable enterprises for re-investment purposes. The project will enhance the credit
guarantee available by Ksh.. 200million to increase loan fundsby upto Ksh.. 2 billion.
Agribusiness promotion and Kilimo Insurance
Agribusiness encompasses promotion of modern farming and refers to the commecialization of
farm producteio. Networking to enhance the use of appropriate innovation in agricultural machinery and
farming methods, and techniques for achieving economies of scale in production, diversification of
products and the creation of new markets for consumption and global trade. This is a key component in
helping farmers to commercialize and put in place sustainability and livelihood resilience mechanisms.
Under this component linkages with service providers on crop index based insurance that will
enable the beneficiaries of Kilimo Plus to access input in the event of adverse weather leading to crop
failure or significantly reduce yields will be initiated. The service will be pegged on a premium of 5%
value of inputs issued to beneficiaries as is the current practice. Total crop failure warants supply of a
full inputs package. The contracted service provider puts in place a simplified and transparednt
compensation scheme for the purpose.
Soil Testing
There is need to carry out soil testing to generate information on soil nutrient status andacidity to
enable development of soil specific fertilizer recommendation for crops. Thiscomponet undertakes
strategic soil testing in 100 districts to generate specifice fertilizer recommendation for maize, potatoes
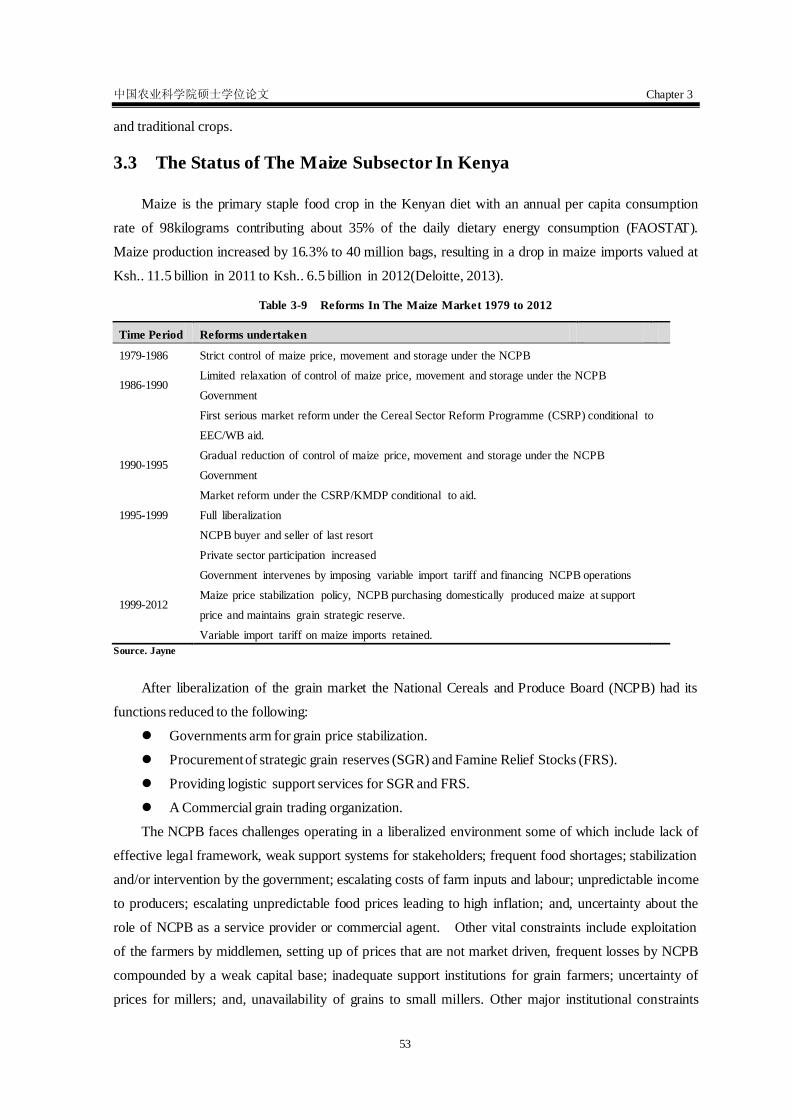
中国农业科学院硕士学位论文 Chapter 3
53
and traditional crops.
3.3 The Status of The Maize Subsector In Kenya
Maize is the primary staple food crop in the Kenyan diet with an annual per capita consumption
rate of 98kilograms contributing about 35% of the daily dietary energy consumption (FAOSTAT).
Maize production increased by 16.3% to 40 million bags, resulting in a drop in maize imports valued at
Ksh.. 11.5 billion in 2011 to Ksh.. 6.5 billion in 2012(Deloitte, 2013).
Table 3-9 Reforms In The Maize Market 1979 to 2012
Time Period Reforms undertaken
1979-1986 Strict control of maize price, movement and storage under the NCPB
1986-1990 Limited relaxation of control of maize price, movement and storage under the NCPB
Government
First serious market reform under the Cereal Sector Reform Programme (CSRP) conditional to
EEC/WB aid.
1990-1995 Gradual reduction of control of maize price, movement and storage under the NCPB
Government
Market reform under the CSRP/KMDP conditional to aid.
1995-1999 Full liberalization
NCPB buyer and seller of last resort
Private sector participation increased
Government intervenes by imposing variable import tariff and financing NCPB operations
1999-2012 Maize price stabilization policy, NCPB purchasing domestically produced maize at support
price and maintains grain strategic reserve.
Variable import tariff on maize imports retained.
Source. Jayne
After liberalization of the grain market the National Cereals and Produce Board (NCPB) had its
functions reduced to the following:
Governments arm for grain price stabilization.
Procurement of strategic grain reserves (SGR) and Famine Relief Stocks (FRS).
Providing logistic support services for SGR and FRS.
A Commercial grain trading organization.
The NCPB faces challenges operating in a liberalized environment some of which include lack of
effective legal framework, weak support systems for stakeholders; frequent food shortages; stabilization
and/or intervention by the government; escalating costs of farm inputs and labour; unpredictable income
to producers; escalating unpredictable food prices leading to high inflation; and, uncertainty about the
role of NCPB as a service provider or commercial agent. Other vital constraints include exploitation
of the farmers by middlemen, setting up of prices that are not market driven, frequent losses by NCPB
compounded by a weak capital base; inadequate support institutions for grain farmers; uncertainty of
prices for millers; and, unavailability of grains to small millers. Other major institutional constraints

中国农业科学院硕士学位论文 Chapter 3
54
include disorganized storage facilities for farmers; lack of institutional mechanisms for price setting
(causing poor price signaling effects); inadequate credit to farmers (inadequate support from AFC);
under capitalization of NCPB to serve as buyer of last resort; de – institutionalization of regulation of
quality and standards in the grain sector; and, weak government monitoring system and regulatory
mechanism. The current prevailing situation has seen the NCPB purchase maize at prices that have been
much higher than the prevailing market prices (Nyoro, 2002) in many instances farmers fail to take
advantage of the free market prices and instead hold their produce to sell to NCPB. This has resulted in
cases of aflatoxin infected maize as a result of poor storage of maize in areas like Tana River County.
Lack of adequate research funding, poor research – extension – farmer linkage, low private
investments in maize research and development, and high human capital turn – over are sector problems
that must receive adequate attention and resolve (Karanja et al., ).
3.3.1 Maize production
Maize in Kenya is grown virtually in all altitudes from the sea level at the coastal area to over
16000 m above sea level in the Kenya highlands (Figure3-12); the major production regions are
concentrated around the South Western regions of the country. With two rainfall seasons most farmers
utilize the long rainy season in March to plant either late maturing varieties in the moist transitional and
high tropical climatic areas or early maturing varieties for farmers in the semi – arid and dry transitional
climatic zones.
Figure 3-12 Cropping zones of Kenya
Source. FAO 2011
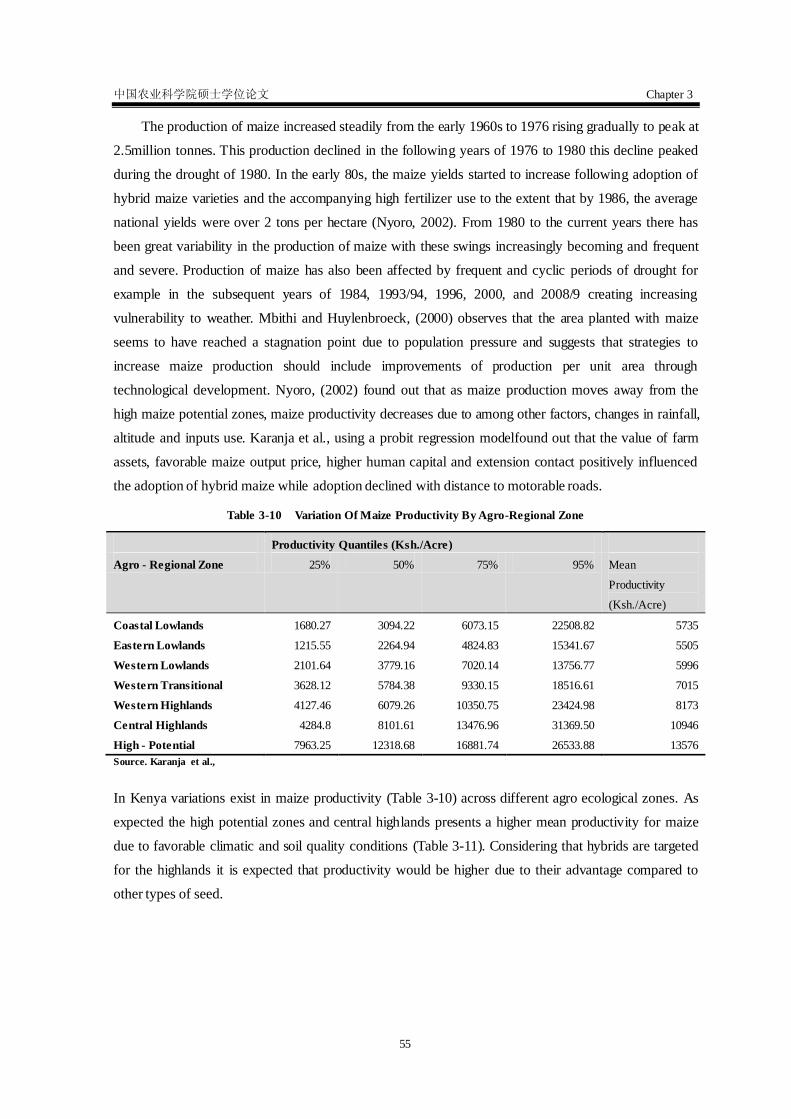
中国农业科学院硕士学位论文 Chapter 3
55
The production of maize increased steadily from the early 1960s to 1976 rising gradually to peak at
2.5million tonnes. This production declined in the following years of 1976 to 1980 this decline peaked
during the drought of 1980. In the early 80s, the maize yields started to increase following adoption of
hybrid maize varieties and the accompanying high fertilizer use to the extent that by 1986, the average
national yields were over 2 tons per hectare (Nyoro, 2002). From 1980 to the current years there has
been great variability in the production of maize with these swings increasingly becoming and frequent
and severe. Production of maize has also been affected by frequent and cyclic periods of drought for
example in the subsequent years of 1984, 1993/94, 1996, 2000, and 2008/9 creating increasing
vulnerability to weather. Mbithi and Huylenbroeck, (2000) observes that the area planted with maize
seems to have reached a stagnation point due to population pressure and suggests that strategies to
increase maize production should include improvements of production per unit area through
technological development. Nyoro, (2002) found out that as maize production moves away from the
high maize potential zones, maize productivity decreases due to among other factors, changes in rainfall,
altitude and inputs use. Karanja et al., using a probit regression modelfound out that the value of farm
assets, favorable maize output price, higher human capital and extension contact positively influenced
the adoption of hybrid maize while adoption declined with distance to motorable roads.
Table 3-10 Variation Of Maize Productivity By Agro-Regional Zone
Productivity Quantiles (Ksh./Acre)
Agro - Regional Zone 25% 50% 75% 95% Mean
Productivity
(Ksh./Acre)
Coastal Lowlands 1680.27 3094.22 6073.15 22508.82 5735
Eastern Lowlands 1215.55 2264.94 4824.83 15341.67 5505
Western Lowlands 2101.64 3779.16 7020.14 13756.77 5996
Western Transitional 3628.12 5784.38 9330.15 18516.61 7015
Western Highlands 4127.46 6079.26 10350.75 23424.98 8173
Central Highlands 4284.8 8101.61 13476.96 31369.50 10946
High - Potential 7963.25 12318.68 16881.74 26533.88 13576
Source. Karanja et al.,
In Kenya variations exist in maize productivity (Table 3-10) across different agro ecological zones. As
expected the high potential zones and central highlands presents a higher mean productivity for maize
due to favorable climatic and soil quality conditions (Table 3-11). Considering that hybrids are targeted
for the highlands it is expected that productivity would be higher due to their advantage compared to
other types of seed.

中国农业科学院硕士学位论文 Chapter 3
56
Table 3-11 Average Maize Production From 2005 - 2009
Province Area Under Crop (Ha) Production (90Kg/bag) Yield (Bags/ha) Population
Rift Valley 644,895.00 13,225,039.00 20.50 10,066,805.00
Nyanza 262,453.00 3,711,215.00 14.10 5,442,711.00
Eastern 462,401.00 3,903,141.00 8.40 5,668,123.00
Western 225,302.00 4,163,878.00 18.50 4,334,282.00
Coast 129,379.00 1,079,383.00 8.30 3,325,307.00
Central 157,063.00 1,047,879.00 6.70 4,383,743.00
North Eastern 2,525.00 5,520.00 2.20 2,310,757.00
Nairobi 1,053.00 6,420.00 14.40 3,138,369.00
Source. Karanja et al.
In Kenya 90% of the rural population households grow maize in predominantly small-scale and
these smallholder farmers account for 75% of overall production (Table 3-12).
Table 3-12 Maize Production, Consumption And Domestic Values (2004 - 2010)
Maize Production, Consumption and Domestic Values
Year 2004 2005 2006 2007 2008 2009 2010
Area Planted (Ha Mil.) 1.8 1.7 1.8 1.6 1.7 1.8 2.0
Production (MT Mil.) 2.4 2.9 3.2 2.9 2.3 2.4 3.4
(Bags. Mil.) 27 32, 36 32 26 27 38
Value Ksh. Bil. 40 44 47 52 66 70 62
US$ Mil. 538 589 626 697 877 854 750
Consumption (MT Mil.) 2.8 2.8 2.9 3.0 3.2 3.2 3.2
Surplus/(Deficits)(MT) (0.4) 0.1 0.3 (0.1) (0.9) (0.8) 0.2
Source. Adapted from USAID. Staple food value chains. Kenya country report 2010 and Economic Review of Agriculture 2011.
Kenya has been self-sufficient in maize production with the 1.8 million hectares producing
2.4million tones against a national demand figure of 36million bags annually (FAO 2011). Maximum
crop production in a good season is about 34 million tonnes and drops to 18milllion tonnes during
drought years. The Food Security Assessment Report (GoK, March 2013) indicates that production in
terms of Ha increased from 2,131,887 Ha in 2011 to 2,266,196 Ha in 2012 while production increased
from 37, 529,694 bags of 90 Kg in 2011 to 40,037,090 bags of 90 Kg in 2012. In a report released on
24th October 2013 and reported in the Business Daily on the 27th October 2013 Tegemeo Institute
reported that Kenya‘s maize production fell one third during the harvesting season due to poor rains,
delay in planting and low use of fertilizers reducing the country‘s maize output by 33.4 per cent. This
shortfall the report indicated means consumers would suffer high food prices, the report said that
farmers produced 28.9 million bags of maize during the long rains season, against an initial projection
of 43.4 million bags for the 2013/14 crop season. This level of performance leaves the country with a
shortfall of 14 million bags, given an annual national consumption of between 40million and 43.5
million bags. This shortfall is further attributed to highly depressed rainfall during the June – August
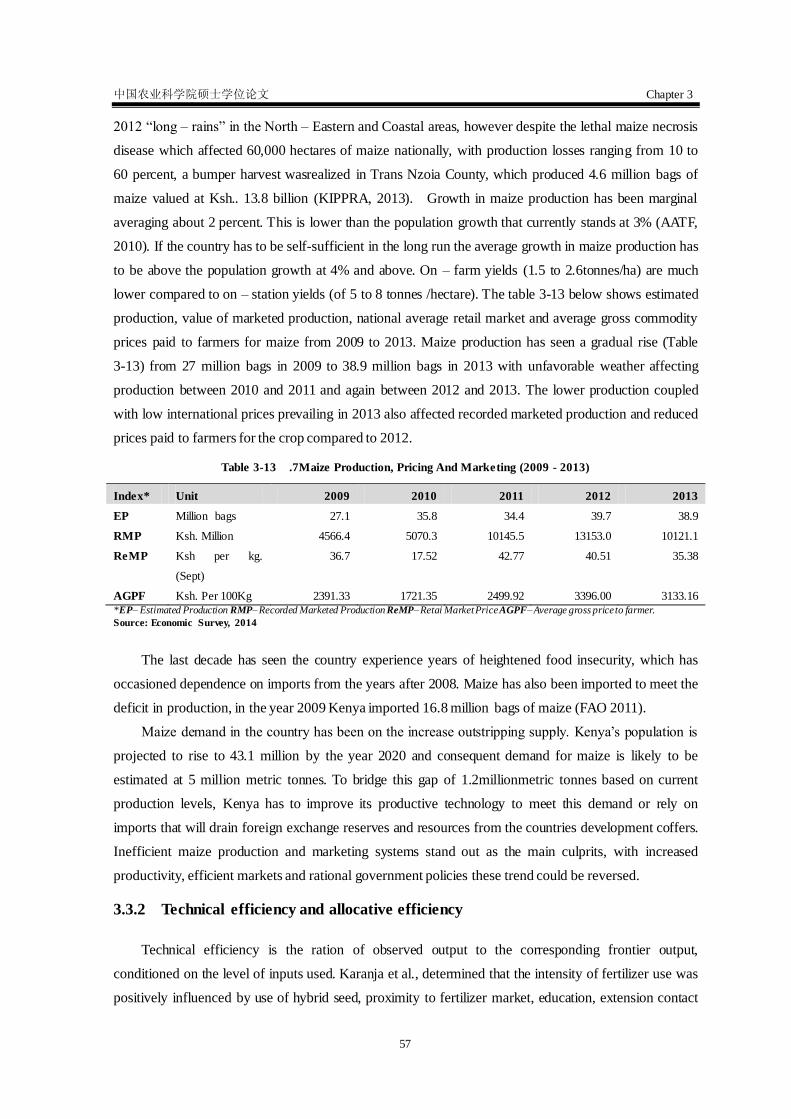
中国农业科学院硕士学位论文 Chapter 3
57
2012 ―long – rains‖ in the North – Eastern and Coastal areas, however despite the lethal maize necrosis
disease which affected 60,000 hectares of maize nationally, with production losses ranging from 10 to
60 percent, a bumper harvest wasrealized in Trans Nzoia County, which produced 4.6 million bags of
maize valued at Ksh.. 13.8 billion (KIPPRA, 2013). Growth in maize production has been marginal
averaging about 2 percent. This is lower than the population growth that currently stands at 3% (AATF,
2010). If the country has to be self-sufficient in the long run the average growth in maize production has
to be above the population growth at 4% and above. On – farm yields (1.5 to 2.6tonnes/ha) are much
lower compared to on – station yields (of 5 to 8 tonnes /hectare). The table 3-13 below shows estimated
production, value of marketed production, national average retail market and average gross commodity
prices paid to farmers for maize from 2009 to 2013. Maize production has seen a gradual rise (Table
3-13) from 27 million bags in 2009 to 38.9 million bags in 2013 with unfavorable weather affecting
production between 2010 and 2011 and again between 2012 and 2013. The lower production coupled
with low international prices prevailing in 2013 also affected recorded marketed production and reduced
prices paid to farmers for the crop compared to 2012.
Table 3-13 .7Maize Production, Pricing And Marketing (2009 - 2013)
Index* Unit 2009 2010 2011 2012 2013
EP Million bags 27.1 35.8 34.4 39.7 38.9
RMP Ksh. Million 4566.4 5070.3 10145.5 13153.0 10121.1
ReMP Ksh per kg.
(Sept)
36.7 17.52 42.77 40.51 35.38
AGPF Ksh. Per 100Kg 2391.33 1721.35 2499.92 3396.00 3133.16 *EP– Estimated Production RMP– Recorded Marketed Production ReMP– Retai Market Price AGPF– Average gross price to farmer.
Source: Economic Survey, 2014
The last decade has seen the country experience years of heightened food insecurity, which has
occasioned dependence on imports from the years after 2008. Maize has also been imported to meet the
deficit in production, in the year 2009 Kenya imported 16.8 million bags of maize (FAO 2011).
Maize demand in the country has been on the increase outstripping supply. Kenya‘s population is
projected to rise to 43.1 million by the year 2020 and consequent demand for maize is likely to be
estimated at 5 million metric tonnes. To bridge this gap of 1.2millionmetric tonnes based on current
production levels, Kenya has to improve its productive technology to meet this demand or rely on
imports that will drain foreign exchange reserves and resources from the countries development coffers.
Inefficient maize production and marketing systems stand out as the main culprits, with increased
productivity, efficient markets and rational government policies these trend could be reversed.
3.3.2 Technical efficiency and allocative efficiency
Technical efficiency is the ration of observed output to the corresponding frontier output,
conditioned on the level of inputs used. Karanja et al., determined that the intensity of fertilizer use was
positively influenced by use of hybrid seed, proximity to fertilizer market, education, extension contact
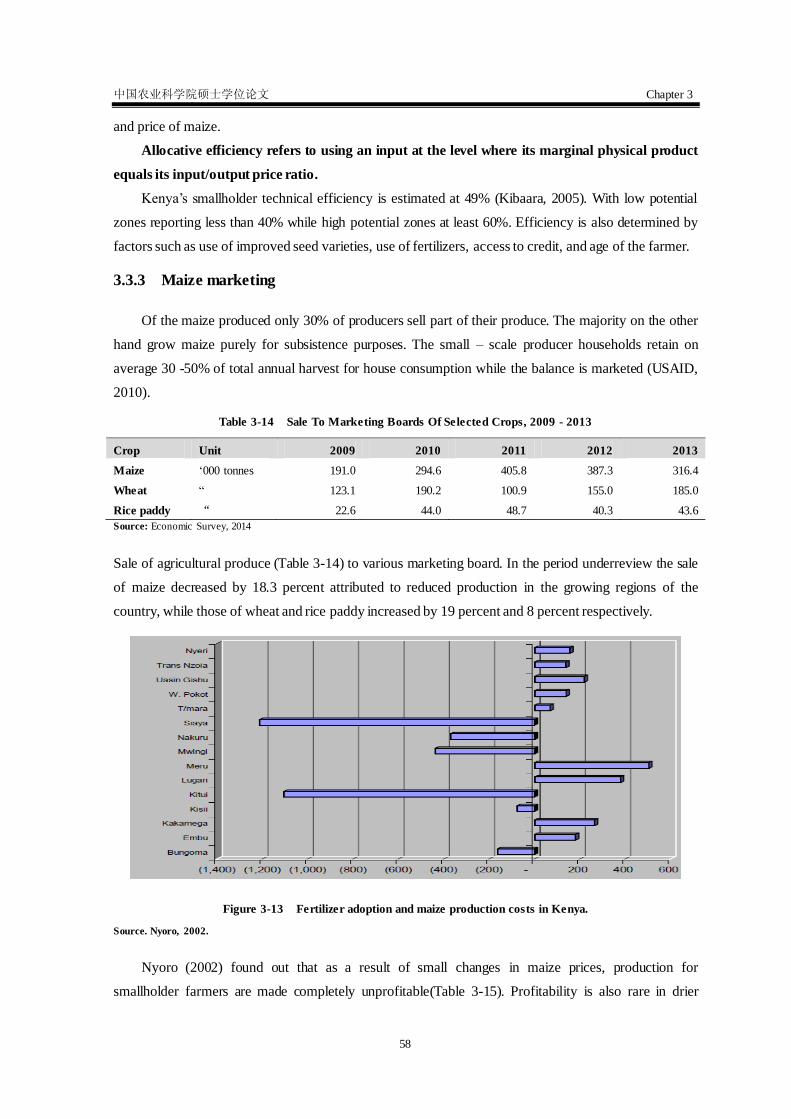
中国农业科学院硕士学位论文 Chapter 3
58
and price of maize.
Allocative efficiency refers to using an input at the level where its marginal physical product
equals its input/output price ratio.
Kenya‘s smallholder technical efficiency is estimated at 49% (Kibaara, 2005). With low potential
zones reporting less than 40% while high potential zones at least 60%. Efficiency is also determined by
factors such as use of improved seed varieties, use of fertilizers, access to credit, and age of the farmer.
3.3.3 Maize marketing
Of the maize produced only 30% of producers sell part of their produce. The majority on the other
hand grow maize purely for subsistence purposes. The small – scale producer households retain on
average 30 -50% of total annual harvest for house consumption while the balance is marketed (USAID,
2010).
Table 3-14 Sale To Marketing Boards Of Selected Crops, 2009 - 2013
Crop Unit 2009 2010 2011 2012 2013
Maize ‗000 tonnes 191.0 294.6 405.8 387.3 316.4
Wheat ― 123.1 190.2 100.9 155.0 185.0
Rice paddy “ 22.6 44.0 48.7 40.3 43.6
Source: Economic Survey, 2014
Sale of agricultural produce (Table 3-14) to various marketing board. In the period underreview the sale
of maize decreased by 18.3 percent attributed to reduced production in the growing regions of the
country, while those of wheat and rice paddy increased by 19 percent and 8 percent respectively.
Figure 3-13 Fertilizer adoption and maize production costs in Kenya.
Source. Nyoro, 2002.
Nyoro (2002) found out that as a result of small changes in maize prices, production for
smallholder farmers are made completely unprofitable(Table 3-15). Profitability is also rare in drier

中国农业科学院硕士学位论文 Chapter 3
59
parts of the country such as Kitui, Mwingi and Siaya and in a few small-scale dominated production
systems such as Nakuru, Kisii and Bungoma that are traditional surplus maize production areas
(Figure3-13).Fertilizer adoption rates, quantities and types of fertilizer influence domestic maize
production costs and productivity (Nyoro, 2002).
Table 3-15 Production And Transport Cost Of Maize To Nairobi
Mbale Iganga Kapchorwa
Farm gate cost Ksh./Bag 765.00 675.00 675.00
Handling costs Ksh./Bag 225.00 247.00 372.00
Transport Cost Ksh./Bag 213.00 168.00 238.00
Total Cost to Kisumu 1,203.00 1,090.00 1,285.00
Distance to Nairobi Km 345 345 345
Transport Costs Ksh./Km 0.60 0.60 0.60
Transport Costs to Nairobi Ksh./Bag 207.00 207.00 207.00
Maize Costs in Nairobi Ksh./Bag 1,410.00 1,297.00 1,492.00
Average Costs 1,400.00
Source. Nyoro, 2002
The average cost of production per 90 kg bag of maize (Table 3-16) varies with location in Kenya.
However high adoption rates of fertilizers are necessary but not sufficient for maize productivity, they
need to be accompanied by use of reasonable quantities of the fertilizers (Nyoro, 2002).
Table 3-16 Comparison Of Yields, Costs And Returns For Maize In Kenya And Uganda
Bungoma
Kenya
Mbale
Uganda
Lugari
Kenya
Iganga
Uganda
Kitale
Kenya
Kapchorwa
Uganda
Yields in Bag/Acre 13 18 17 21 25 26
Price Ksh./Bag 1,000 765 1,000 675 1,100 649
Revenue 13,500 13,770 17,000 14,175 27,500 16,874
Fixed Costs 1,125 1,000 1,250 1,000 3,750 1,250
Labour Inputs 2,332 3,400 1,662 3,975 1,685 4,800
Non Labor Inputs Ksh. 8,150 5,696 10,655 6,250 14,285 8,838
Total Costs 11,607 10,096 13,567 11,225 19,720 14,888
Cost (Ksh. per Bag) 860 561 798 535 789 573
Profit(Ksh./bag) 140 204 202 140 311 76
Profit Margin 14% 27% 20% 21% 28% 12%
Source. Nyoro, 2002
The price of fertilizer is a key constraint to smallholder farmers with most farmers complaining of
high fertilizer prices, a factor they say is important to the adoption and use of fertilizers (Nyoro, 2002).
Value cost analysis indicates that one shilling invested in fertilizer use on maize raised 5.86 shillings
worth of maize output (Karanja et al.,)

中国农业科学院硕士学位论文 Chapter 3
60
3.3.4 Maize consumption
Maize consumption in Kenya has been estimated to be 98 Kilograms per person per year, and this
figure has for many years served as the basis for the computation of food balance sheets and other
estimates of national cereal import requirements (Muyanga et al., citing Nyoro, 2004). In a survey done
on consumption of cereals in urban areas Maize products provided the greatest contribution to staple
diets in terms of kilograms consumed, however maize consumption has declined since 1995 from 41.8%
to 32.4% of staple carbohydrate expenditures between 1995 and 2003 (Muyanga et al.,undated). maize
products account foralmost half of the carbohydrate expenditures for all income groups in the urban
areas an amount estimated at Ksh.. 126 per month.
Figure 3-14 Maize value chain in Kenya.
Soure.Kirimi et al, 2011
Note: the shaded boxes signify the main channels in terms of volume during this phase of the marketing season. The thickness of the
arrow signifies the volume of flow. Dashed lines represent minor flows.

中国农业科学院硕士学位论文 Chapter 3
61
Studies by Mukumbu and Jayne, 1994 indicate that 1) consumer preferences and maize meal
consumption patterns largely reflect the influence of food policies. 2) Consumer subsidies on refined
maize meal in Kenyan have not necessarily promoted food security, because they have entrenched a
relatively high – cost marketing system and impeded the development oflower-cost channels from
developing. 3) Posho meal consumption in urban areas appears to be negatively related to household
income, while shifted meal is positively related to income. 4) The time requirement to process and
acquire posho meal appears to be an important factor influencing its consumption, highlighting the
importance of convenience and competing demands on household members time., and 5) Market
reforms that allow consumer preferences to be better articulated through the food distribution system
may improve access to food, productivity gains in agricultural systems and growth in employment and
income distribution from shifts in volumes.
These findings are in line with those of Munyaga et al., who find a significant shift in maize meal
consumption in urban areas. Their findings point to the fact that even though posho meal consumption
declined from 46 to 17 percent of maize meal consumption on average, it continues to constitute an
important commodity among the poor. This indicates that whole maize meal has inferior good attributes
(Mukumbu and Jayne 1994). The low – income group consume posho meal because it is relatively
cheaper compared to shifted maize meal, however with the narrowing of the price of shifted meal
between 1995 and 2003, this may account for why consumption of posho has declined over this period.
Large millers have also reduced the degree of refinement of their products in response to great
competition from the posho millers since the market liberalization process of the mid-1990s.
Figure 3-15 Trends in Kenya’s Maize production and consumption.
Source. Authors computation from various sources.
Studies done by Mukumbu and Jayne (1994) show that more than 30 per cent of households
consume whole meal. Over 50 percent of the maize meal is consumed by those households earning less
than Ksh.. 4,000 per month in the form of hammer milled posho meal contrasted to only 23% by
中国农业科学院硕士学位论文 Chapter 3
62
households earning more than Ksh.. 12,000. In the same study price and convenience emerged as the
two most important factors that affected consumer choice for any given maize meal. More than 64
percent of households chose shifted maize meal because it was convenient and 60 percent of those who
consumed whole meal chose it because it was cheaper.

中国农业科学院硕士学位论文 Chapter 4
63
Chapter 4 DATA ANALYSIS
4.1 Study Area
This study will be carried out in the major high potential maize growing areas of the country with a
major focus on Tana River county primarily because of the potential of the county in irrigated maize
production and its high levels of poverty provide a good basis for the study of the effectiveness of
subsidies in poverty alleviation and developing vulnerable smallholder farmers to participate in
markets.The study area is located in Tana River County which lies south west of Kenya in the former
coast province with the coordinates 1。 30‘ S 40
。 0‘ E and covers an area of 35,375.8 square kilometers
(13,658.7 sq mi) with a population of 240,075 according to the 2009 census. (www.wikipedia.org). The
major ethnic groups are the Pokomo, many of whom are farmers, and the Orma and Wardei, who are
predominantly nomadic. The country is generally dry and prone to drought with rainfall being eratic.
The county has two rainy seasons with the long rains occurring in March – May and the short rains
October – December.
Figure 4-1 Location of the Study Area
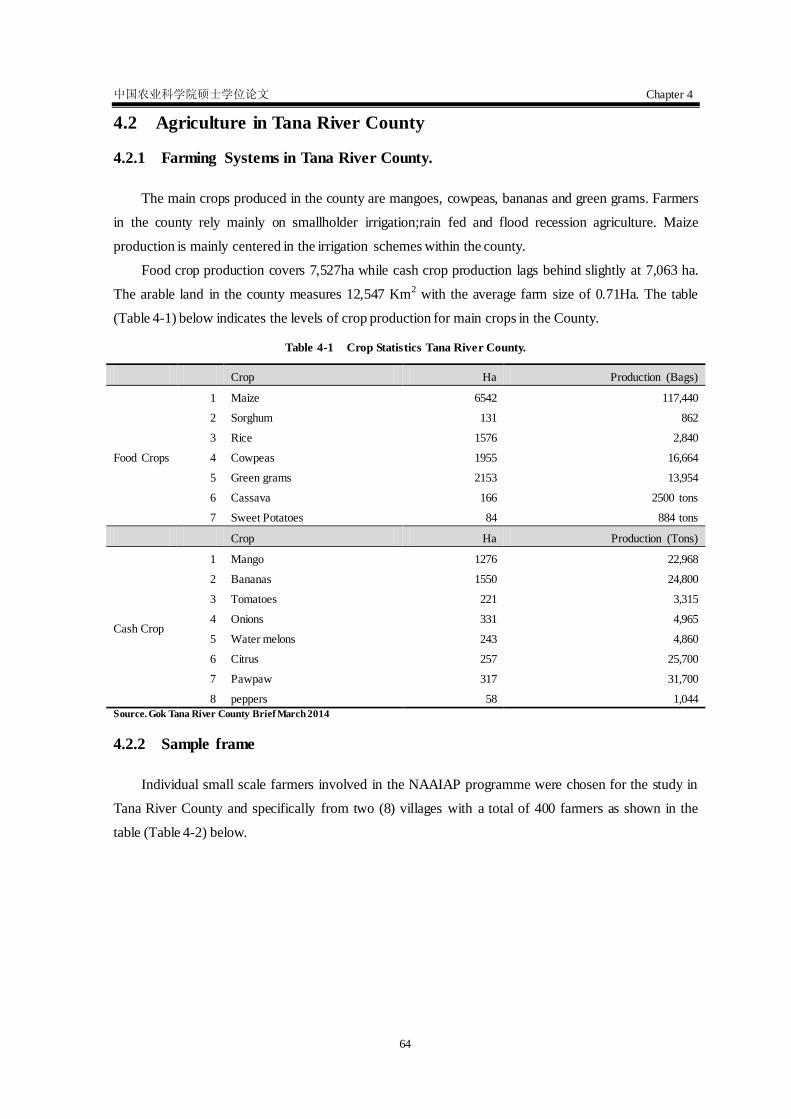
中国农业科学院硕士学位论文 Chapter 4
64
4.2 Agriculture in Tana River County
4.2.1 Farming Systems in Tana River County.
The main crops produced in the county are mangoes, cowpeas, bananas and green grams. Farmers
in the county rely mainly on smallholder irrigation;rain fed and flood recession agriculture. Maize
production is mainly centered in the irrigation schemes within the county.
Food crop production covers 7,527ha while cash crop production lags behind slightly at 7,063 ha.
The arable land in the county measures 12,547 Km2 with the average farm size of 0.71Ha. The table
(Table 4-1) below indicates the levels of crop production for main crops in the County.
Table 4-1 Crop Statistics Tana River County.
Crop Ha Production (Bags)
Food Crops
1 Maize 6542 117,440
2 Sorghum 131 862
3 Rice 1576 2,840
4 Cowpeas 1955 16,664
5 Green grams 2153 13,954
6 Cassava 166 2500 tons
7 Sweet Potatoes 84 884 tons
Crop Ha Production (Tons)
Cash Crop
1 Mango 1276 22,968
2 Bananas 1550 24,800
3 Tomatoes 221 3,315
4 Onions 331 4,965
5 Water melons 243 4,860
6 Citrus 257 25,700
7 Pawpaw 317 31,700
8 peppers 58 1,044
Source. Gok Tana River County Brief March 2014
4.2.2 Sample frame
Individual small scale farmers involved in the NAAIAP programme were chosen for the study in
Tana River County and specifically from two (8) villages with a total of 400 farmers as shown in the
table (Table 4-2) below.
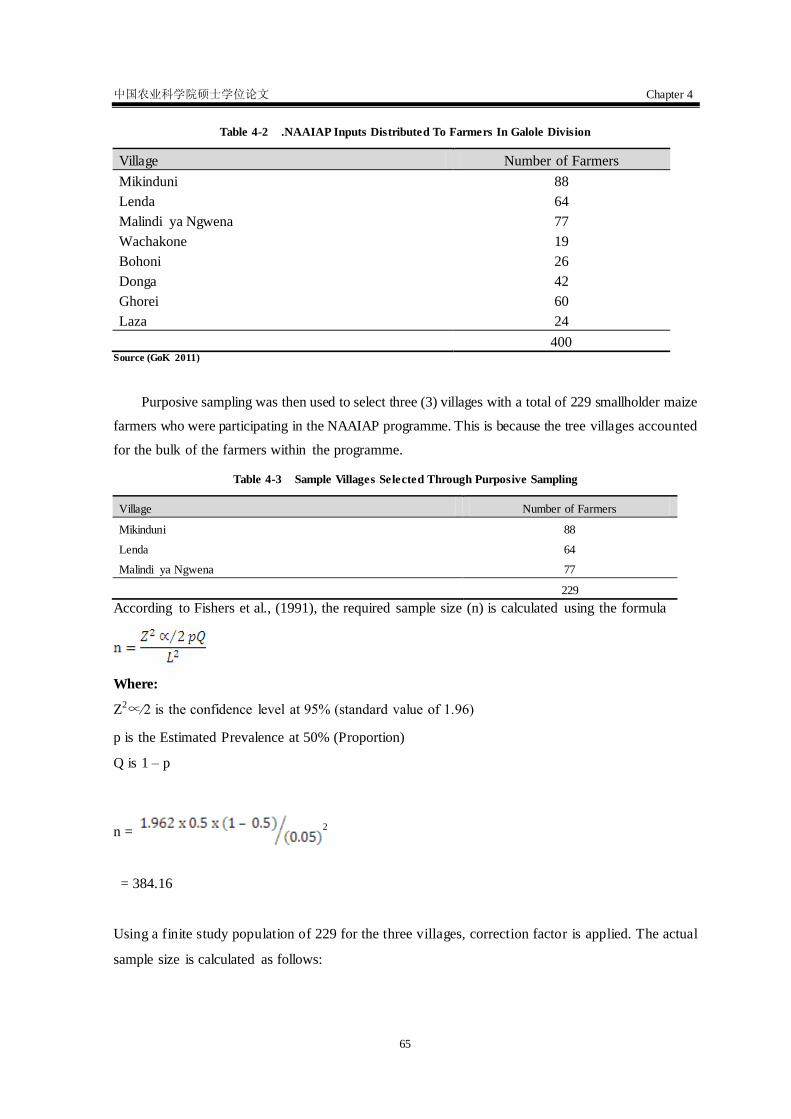
中国农业科学院硕士学位论文 Chapter 4
65
Table 4-2 .NAAIAP Inputs Distributed To Farmers In Galole Division
Village Number of Farmers
Mikinduni 88
Lenda 64
Malindi ya Ngwena 77
Wachakone 19
Bohoni 26
Donga 42
Ghorei 60
Laza 24
400 Source (GoK 2011)
Purposive sampling was then used to select three (3) villages with a total of 229 smallholder maize
farmers who were participating in the NAAIAP programme. This is because the tree villages accounted
for the bulk of the farmers within the programme.
Table 4-3 Sample Villages Selected Through Purposive Sampling
Village Number of Farmers
Mikinduni 88
Lenda 64
Malindi ya Ngwena 77
229
According to Fishers et al., (1991), the required sample size (n) is calculated using the formula
Where:
Z2∝∕2 is the confidence level at 95% (standard value of 1.96)
p is the Estimated Prevalence at 50% (Proportion)
Q is 1 – p
n = 2
= 384.16
Using a finite study population of 229 for the three villages, correction factor is applied. The actual
sample size is calculated as follows:

中国农业科学院硕士学位论文 Chapter 4
66
n=
Which is the reciprocal of
Where
n is the actual sample size.
N is the study population = 229
Therefore actual sample size n = = = 143
Sample factor = (1/229) x 143 = 0.624454
Table 4-4 Number Of Farmers Sampled Per Village
Village Number of Farmers Sample Factor Number of farmers sampled
Mikinduni 88 0.624454 54.95197
Lenda 64 0.624454 39.96507
Malindi ya Ngwena 77 0.624454 48.08297
229 143
4.3 Types and Sources of data
Data for this research was obtained from available cross sectional project data at the county level
and secondary information was derived from existing records held at the Agribusiness Market
Development and information and Environment and land development sections of the Ministry Of
Agriculture offices in Kenya and Tegemeo Institute of Egerton University Kenya.
4.4 Data analysis
In order to carry out data analysis, coding of questionnaire was done. Descriptive analysis using
STATA Version 12 was done. Quantitative analysis was also done using STATA Version 12 software.
STATA is a general – purpose statistical software package with capabilities including data management,
statistical analysis, graphics, simulations and custom programming.
4.5 Econometric Model
Under the assumption of perfect markets, market prices are exogenous to a household and all
products (output and inputs) are tradable. consequently, market prices reflects the true opportunity cost
of products and serve as the prices upon which household consumption and production decisions are
based. In such settings it does not matter whether a household consumes its own products or sells them
and buys it necessary consumption items with the resultant income; consequently, we can treat the

中国农业科学院硕士学位论文 Chapter 4
67
households‘ production and consumption decisions as solved sequentially. First the households
determine what to produce given output and input prices as well as household-specific characteristics,
determine the households income, which then serves as part of its budget constraint in its consumption
decisions. (Liverpool-Tasie S.L (IFPRI Discussion paper 01194) (2012). The analysis is based on a
simple static model of an agricultural household where a household seeks to maximize a utility function
of net revenue subject to a production constraint function .
4.6 Model 1: Estimating Fertilizer subsidy effects on Household income;
The Multinomial Approach
The assumption that each individual i is rational and chooses a set of goods from a consumption
bundle implies a multinomial model that can be estimated as follows. Let denote the indirect
utility that would be obtained by selecting the jth treatment where j = 0,1,2….J and * /
ij i j j ij ijIU z l (1)
Where is the exogenous covariates associated with parameters and which are the
independently and identically distributed error terms. This equation also incorporates a latent factor
for the unobserved characteristics and is assumed to be independent of the error term .
is a set of binary variables representing the observed treatments choice and = ………
and = . The probability distribution of the effects of a treatment can be summarized as / / /
1 1 1 2 2 2Pr( | , ) ( , ,...... )j i i i i i i i J J iJb z l g z l z l z l (2)
Where g is an appropriate multinomial probability distribution function defined as follows /
/
1
exp( )Pr( | , )
1 exp( )
i j j ij
j j i j
i k k ik
k
z lb z l
z l
(3)
The dependent variable of choice is household income. The multi-variate regression is estimated as
follows;
0 1 2 3 4 5 6i i i i i i i iI HH FC GR MK FS Q (4)
Where: is the household income per year (in Ksh..) given that the poor and vulnerable farmers
in Tana River rely on farming as their main source of livelihood, changes in income are better explained
by the impact of subsidies. The other reason being that because this is a household that had not before
received any form of support in terms of subsidies their baseline income would be a good measure of
their initial marginal livelihood state.
Explanatory variables include, Vector HH which represents household characteristics including age,
education, household size, and farm size. Farmers demand for fertilizer is influenced largely by the
farmer‘s capacity to invest in fertilizer use, commodity and fertilizer prices, profitability of fertilizer use,
crop yield response to fertilizer and availability of complementary inputs. These factors are largely
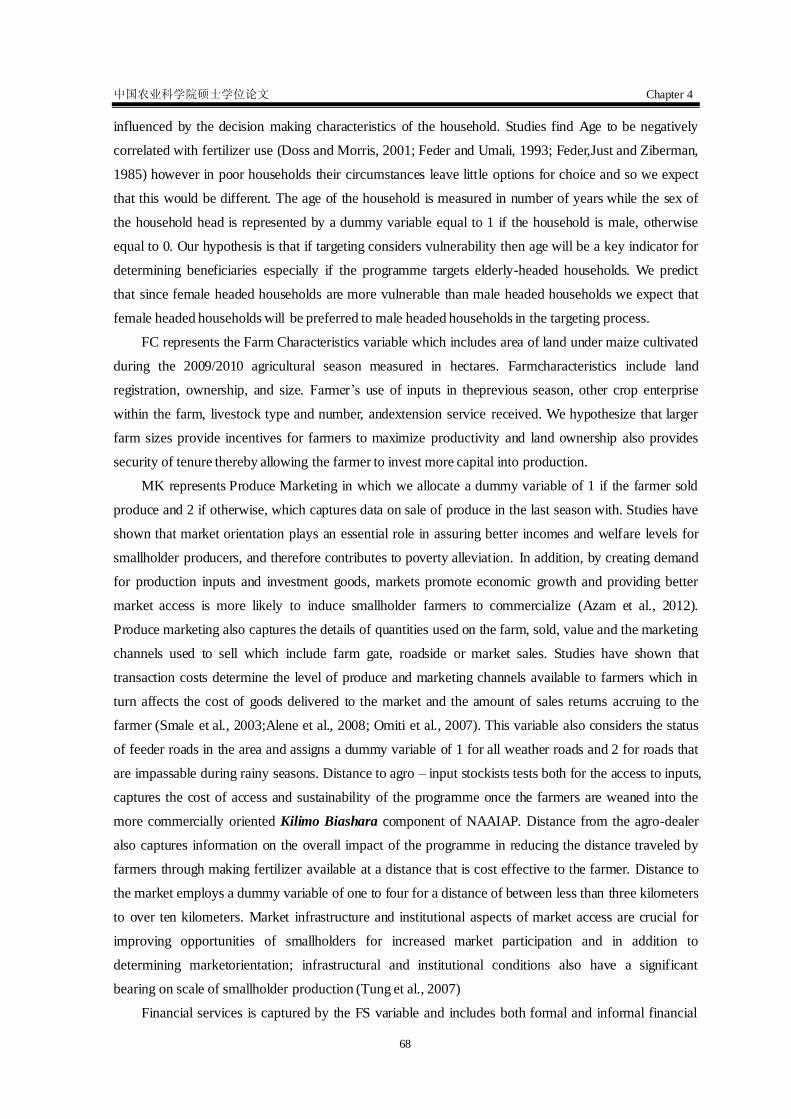
中国农业科学院硕士学位论文 Chapter 4
68
influenced by the decision making characteristics of the household. Studies find Age to be negatively
correlated with fertilizer use (Doss and Morris, 2001; Feder and Umali, 1993; Feder,Just and Ziberman,
1985) however in poor households their circumstances leave little options for choice and so we expect
that this would be different. The age of the household is measured in number of years while the sex of
the household head is represented by a dummy variable equal to 1 if the household is male, otherwise
equal to 0. Our hypothesis is that if targeting considers vulnerability then age will be a key indicator for
determining beneficiaries especially if the programme targets elderly-headed households. We predict
that since female headed households are more vulnerable than male headed households we expect that
female headed households will be preferred to male headed households in the targeting process.
FC represents the Farm Characteristics variable which includes area of land under maize cultivated
during the 2009/2010 agricultural season measured in hectares. Farmcharacteristics include land
registration, ownership, and size. Farmer‘s use of inputs in theprevious season, other crop enterprise
within the farm, livestock type and number, andextension service received. We hypothesize that larger
farm sizes provide incentives for farmers to maximize productivity and land ownership also provides
security of tenure thereby allowing the farmer to invest more capital into production.
MK represents Produce Marketing in which we allocate a dummy variable of 1 if the farmer sold
produce and 2 if otherwise, which captures data on sale of produce in the last season with. Studies have
shown that market orientation plays an essential role in assuring better incomes and welfare levels for
smallholder producers, and therefore contributes to poverty alleviation. In addition, by creating demand
for production inputs and investment goods, markets promote economic growth and providing better
market access is more likely to induce smallholder farmers to commercialize (Azam et al., 2012).
Produce marketing also captures the details of quantities used on the farm, sold, value and the marketing
channels used to sell which include farm gate, roadside or market sales. Studies have shown that
transaction costs determine the level of produce and marketing channels available to farmers which in
turn affects the cost of goods delivered to the market and the amount of sales returns accruing to the
farmer (Smale et al., 2003;Alene et al., 2008; Omiti et al., 2007). This variable also considers the status
of feeder roads in the area and assigns a dummy variable of 1 for all weather roads and 2 for roads that
are impassable during rainy seasons. Distance to agro – input stockists tests both for the access to inputs,
captures the cost of access and sustainability of the programme once the farmers are weaned into the
more commercially oriented Kilimo Biashara component of NAAIAP. Distance from the agro-dealer
also captures information on the overall impact of the programme in reducing the distance traveled by
farmers through making fertilizer available at a distance that is cost effective to the farmer. Distance to
the market employs a dummy variable of one to four for a distance of between less than three kilometers
to over ten kilometers. Market infrastructure and institutional aspects of market access are crucial for
improving opportunities of smallholders for increased market participation and in addition to
determining marketorientation; infrastructural and institutional conditions also have a significant
bearing on scale of smallholder production (Tung et al., 2007)
Financial services is captured by the FS variable and includes both formal and informal financial

中国农业科学院硕士学位论文 Chapter 4
69
services available and accessible to the farmer, distance to the nearest financial service provider, access
which is assigned a dummy variable value of 1 for access and 0 for otherwise. For those that have
accessed financial services this variable also captures the type of financial service preferred by the
farmer. Major constraints to production by smallholder farmers includes high cost of inputs, inadequate
market access, poor infrastructure and exploitation by middle men (MAFAP, 2013), financial services
therefore give farmers the requisite capacity to access inputs and capital to invest in production. We
hypothesize that farmers demand for fertilizer is closely correlated to the farmer‘s capacity to access
credit given the availability of these input services at the right time and affordable prices.
Q is a vector of other control variables. The model controls for households participation in the
labour market, ownership of household business, remittances, region and rainfall. Given that
participation in the labour market, ownership of household business, and remittances all affect the level
of a household‘s affordability of inputs. Region and rainfall are controlled for given that the farmers are
all from Tana River County and that rain fed agriculture is close to non-existent in this region.
The Multinomial Logit (MNL) model offers certain advantages in treatments where there are
unobserved products attributes, it is a preferred method where the dependent variable in question is
nominal and is made up of more than two categories.
In this study we use cross sectional data from the 2009/2010 agricultural season NAAIAP
programme beneficiaries collected from households in Tana River County, specifically Tana River
Sub-County covering a total of 1,000 beneficiary households. A sample of 200 households is used for
analysis.
4.6.1 Model 1Results
The table below (Table 4-5) gives a summary of the regression results for the Multinomial Logit
model to determine the effects of fertilizer subsidy on household income for various categories of small
scale farmers.
Table 4-5 Multinomial Logit Regression Results For Annual Household Income
Annual Household income
Ksh. Ksh. Ksh. Ksh.
<20,000 20,001–
30,000
30,001-
40,000 >40,001
Constant 19.093 -17.458 0.486 31.304
(-0.01) (-0.03) (-0.1) (-0.01)
Gender -0.099 -0.923 0.098 0.735
(-0.16) (-1.47) (-0.16) (-1.19)
Age 0.337 -0.427 0.333 0.395
(-1.14) (-1.54) (-1.1) (-1.46)
Marital Status 0.525 1.24* 1.636** -1.06*
(-0.99) (-2.05) (-2.64) (-1.81)
Educ. Level of H/hold -0.492* -0.169 -0.306 0.192
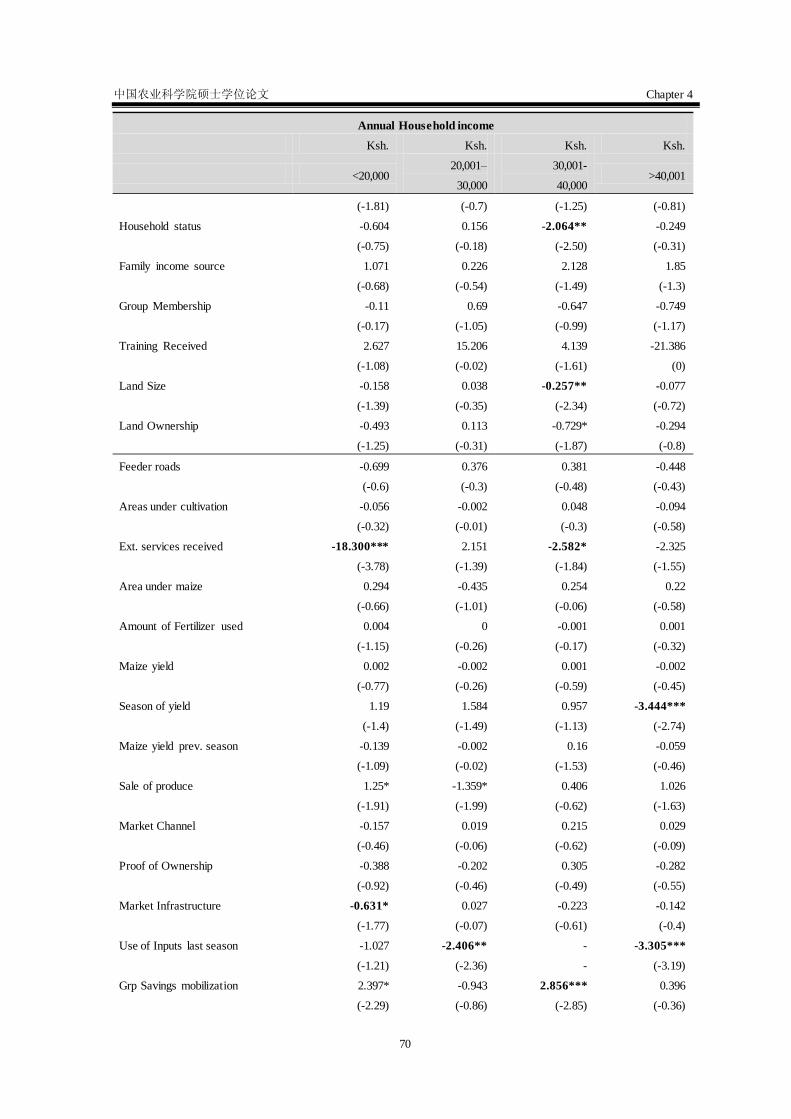
中国农业科学院硕士学位论文 Chapter 4
70
Annual Household income
Ksh. Ksh. Ksh. Ksh.
<20,000 20,001–
30,000
30,001-
40,000 >40,001
(-1.81) (-0.7) (-1.25) (-0.81)
Household status -0.604 0.156 -2.064** -0.249
(-0.75) (-0.18) (-2.50) (-0.31)
Family income source 1.071 0.226 2.128 1.85
(-0.68) (-0.54) (-1.49) (-1.3)
Group Membership -0.11 0.69 -0.647 -0.749
(-0.17) (-1.05) (-0.99) (-1.17)
Training Received 2.627 15.206 4.139 -21.386
(-1.08) (-0.02) (-1.61) (0)
Land Size -0.158 0.038 -0.257** -0.077
(-1.39) (-0.35) (-2.34) (-0.72)
Land Ownership -0.493 0.113 -0.729* -0.294
(-1.25) (-0.31) (-1.87) (-0.8)
Feeder roads -0.699 0.376 0.381 -0.448
(-0.6) (-0.3) (-0.48) (-0.43)
Areas under cultivation -0.056 -0.002 0.048 -0.094
(-0.32) (-0.01) (-0.3) (-0.58)
Ext. services received -18.300*** 2.151 -2.582* -2.325
(-3.78) (-1.39) (-1.84) (-1.55)
Area under maize 0.294 -0.435 0.254 0.22
(-0.66) (-1.01) (-0.06) (-0.58)
Amount of Fertilizer used 0.004 0 -0.001 0.001
(-1.15) (-0.26) (-0.17) (-0.32)
Maize yield 0.002 -0.002 0.001 -0.002
(-0.77) (-0.26) (-0.59) (-0.45)
Season of yield 1.19 1.584 0.957 -3.444***
(-1.4) (-1.49) (-1.13) (-2.74)
Maize yield prev. season -0.139 -0.002 0.16 -0.059
(-1.09) (-0.02) (-1.53) (-0.46)
Sale of produce 1.25* -1.359* 0.406 1.026
(-1.91) (-1.99) (-0.62) (-1.63)
Market Channel -0.157 0.019 0.215 0.029
(-0.46) (-0.06) (-0.62) (-0.09)
Proof of Ownership -0.388 -0.202 0.305 -0.282
(-0.92) (-0.46) (-0.49) (-0.55)
Market Infrastructure -0.631* 0.027 -0.223 -0.142
(-1.77) (-0.07) (-0.61) (-0.4)
Use of Inputs last season -1.027 -2.406** - -3.305***
(-1.21) (-2.36) - (-3.19)
Grp Savings mobilization 2.397* -0.943 2.856*** 0.396
(-2.29) (-0.86) (-2.85) (-0.36)
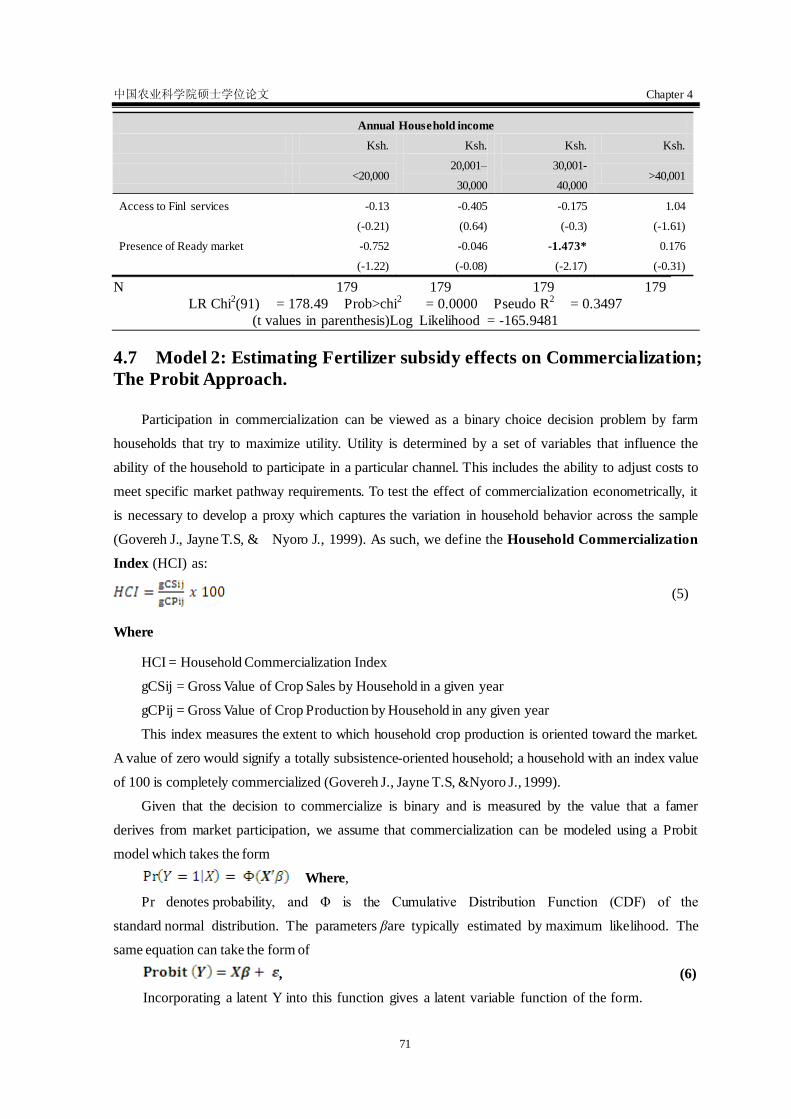
中国农业科学院硕士学位论文 Chapter 4
71
Annual Household income
Ksh. Ksh. Ksh. Ksh.
<20,000 20,001–
30,000
30,001-
40,000 >40,001
Access to Finl services -0.13 -0.405 -0.175 1.04
(-0.21) (0.64) (-0.3) (-1.61)
Presence of Ready market -0.752 -0.046 -1.473* 0.176
(-1.22) (-0.08) (-2.17) (-0.31)
N 179 179 179 179
LR Chi2(91) = 178.49 Prob>chi2 = 0.0000 Pseudo R2 = 0.3497
(t values in parenthesis)Log Likelihood = -165.9481
4.7 Model 2: Estimating Fertilizer subsidy effects on Commercialization;
The Probit Approach.
Participation in commercialization can be viewed as a binary choice decision problem by farm
households that try to maximize utility. Utility is determined by a set of variables that influence the
ability of the household to participate in a particular channel. This includes the ability to adjust costs to
meet specific market pathway requirements. To test the effect of commercialization econometrically, it
is necessary to develop a proxy which captures the variation in household behavior across the sample
(Govereh J., Jayne T.S, & Nyoro J., 1999). As such, we define the Household Commercialization
Index (HCI) as:
(5)
Where
HCI = Household Commercialization Index
gCSij = Gross Value of Crop Sales by Household in a given year
gCPij = Gross Value of Crop Production by Household in any given year
This index measures the extent to which household crop production is oriented toward the market.
A value of zero would signify a totally subsistence-oriented household; a household with an index value
of 100 is completely commercialized (Govereh J., Jayne T.S, &Nyoro J., 1999).
Given that the decision to commercialize is binary and is measured by the value that a famer
derives from market participation, we assume that commercialization can be modeled using a Probit
model which takes the form
Where,
Pr denotes probability, and Φ is the Cumulative Distribution Function (CDF) of the
standard normal distribution. The parameters βare typically estimated by maximum likelihood. The
same equation can take the form of
, (6)
Incorporating a latent Y into this function gives a latent variable function of the form.

中国农业科学院硕士学位论文 Chapter 4
72
, ~(0,σ²) Where, (7)
Y can be viewed as an indicator of whether the latent variable is positive or negative
=
Therefore, is the unobservable variable representing a farmer/households discrete decision to
or not to participate in the market. X is the vector of all independent variables hypothesized to affect this
decision and is a vector parameter to be estimated. The variable represents the response variable
for status of household commercialization which takes the value of 1 if the household sells and 0 if the
household makes no sales.
4.7.1 Model 2 Results
The table below (Table 4-6) gives the results of the Probit regression analysis for determinants of
commercialization.
Table 4-6 Probit Regression Results For Commercialization
Variable Coef. Std. Err. Z P > |z| Marginal
Effects
Gender -0.227 0.219 -1.04 0.300 -0.099
Age -0.039 0.094 -0.42 0.674 -0.016
Education Level -0.117 0.908 -1.29 0.196 -0.049
Annual Household Income 0.029 0.101 0.29 0.769 0.017
Group Membership -0.141 0.231 -0.61 0.540 -0.052
Training Received 1.167 0.945 1.24 0.217 0.303
Land Size -0.056 0.037 -1.51 0.131 -0.021
Land Ownership -0.240 0.133 -1.81 0.070* -0.083
Land Under Cultivation 0.086 0.579 1.48 0.138 0.034
Extension Services 0.554 0.493 1.12 0.261 0.209
Area Under Maize 0.199 0.143 1.40 0.163 0.080
Maize Yield -0.000 0.000 -0.22 0.822 0.000
Season of Yield .0653 0.313 2.08 0.037** 0.222
Marketing Channel 0.167 0.117 1.43 0.153 0.069
Status of Feeder roads -1.516 0.292 -1.76 0.078* -0.184
Distance to nearest Agro dealer -0.375 0.152 -2.48 0.013***
Use of Fertilizers -0.217 0.334 -0.65 0.515
Access to financial service -0.038 0.221 -0.17 0.862
Ready surplus market -0.169 0.194 -0.87 0.384
***,**,* implies statistically significant at 1%,5% and 10% level respectively. Log likelihood -109.149, Pseudo R2 = 0.12, Wald Chi Square (19)
= 29.99, Prob >chi2 = 0.052, Number of observations = 186
4.7.2 Determinants of Commercialization
There are a number of factors affecting the commercialization process in agriculture. Someof them
could be named as rapid growth of economies in the both developing anddeveloped countries,

中国农业科学院硕士学位论文 Chapter 4
73
introducing of new technologies, market expansion, marketliberalization, urbanization, rapid increase of
demand for food, decreasing of farmingpopulation, liberalized and open economic policies, bilateral and
multilateral economicagreements, developed infrastructure facilities in farming areas and
governmentagricultural policies. In the developing economies of South Asia where commercialization
has resulted into highly sophisticated value chains and ―supermarkets‖, drivers of agricultural
commercialization include rising incomes,changing dietary consumption patterns,urbanization, female
labor forceparticipation, changing demographicsand the growth in export opportunities.As smallholders
progress from subsistence towards market orientation, the success and failure of the process is
influenced by several environmental (like socio-economic factors), farm level (like farm resources) and
individual (like skills). Farmer-specific characteristics, household size, asset endowment, access to
non-farm income, and transaction cost related indicators such as distance to the nearest market town age
and gender significant in influencing commercialization. Among the farm specific variables the farm
level determinants of increasing commercialization are the rising opportunity costs of family labour and
increased market demand for food and other agricultural products, fertilizer and planting materials
distance to bank and the number of crop enterprisesgrown by the farmer are significant in influencing
commercialization. The study finds anegative significant effect of distance on market participation.
Results further show that, amongcapital endowment variables, education level, non-farm as well as total
farm incomepositively influence the commercialization process. Among the institutional factors,
access to credit, infrastructure, and input distributionare found to be most important, and most of these
determinants are in thepublic domain. Credit, infrastructure, extension, and education are all provided
by thestate. The driving forces generally behindcommercialization include population growth and
demographic change; urbanization; development ofinfrastructure and market institutions; development
of the non-farm sector and broader economy; risinglabor opportunity costs; and macroeconomic, trade,
and sectoral policies affecting these forces (vonBraun, Bouis, and Kennedy 1994; Pingali and Rosegrant
1995). At the local level, commercialization isalso affected by many factors, including agro-climatic
conditions and risks; access to markets andinfrastructure; community and household resource and asset
endowments; development of localcommodity, input, and factor markets; laws and institutions; and
cultural and social factors affectingconsumption preferences, production, and market opportunities and
constraints (Pender, Ehui, and Place2006). Similarly, improved access to roads, land areaand quality,
and livestock increase the likelihood of maize selling. Collective action (farmer groups) as well as use
of ICT tools (mobile phones)significantly and positively affected commercialization.Maize production
is the only factorsignificantly increasing maize sales. Overcoming the commercialization barrier
requires an upgrading process that includes investment in local infrastructure, strengthening of business
services, and improving farmer skills.Farm size and irrigation has positive implication on households‘
market participation of horticultural crops. The size of land allocated for horticultural crops affected the
smallholder commercialization of horticultural crops positively and significantly. There are also
exogenous forces that drivecommercialization and these include populationand demographic change,
urbanization,availability of new technologies, infrastructureand market creation, macroeconomic and

中国农业科学院硕士学位论文 Chapter 4
74
tradepolicies. These factors affect commercializationby altering the conditions of commodity supplyand
demand, output and input prices, transactioncosts and risks that farmers, traders and othersin the
agricultural production and marketingsystem have to cope with.
4.8 Definition of Variables
The Table below (Table 4-7) provides information on the variables that were used in this study.
Table 4-7 Description Of Variables
Variable Description Measurement Expected
Sign
Gender Gender of the household head 1 Male
2 Female
+
Age Age of the Household Head 1 < 20,
2= 21-30,
3=31-40,
4=41-50,
5 =51-60,
6= 60 >
+
Marital Status
Marital Status of Household 1=widowed
2=single
3=married
+/-
Household status
Household head 1=male
2=Female
+
Family income source Sources of family income 1=farming
2=employment
3=employment
4=business
+
Proof of Ownership
Availability of land title deed 1=yes
0=no
+
Amount of Fertilizer used
Quantity of fertilizer applied Kilograms +
Sale of produce Farmer sold produce 1=yes
0=no
+
Maize yield prev. season Maize production in previous season Kilograms +
Group Savings
mobilization
Group undertakes savings 1=yes
0=no
+
Education Level Education of the Household head 1 = None
2 = Incomplete
Primary
3 = Completed
Primary
4 = Incomplete
+
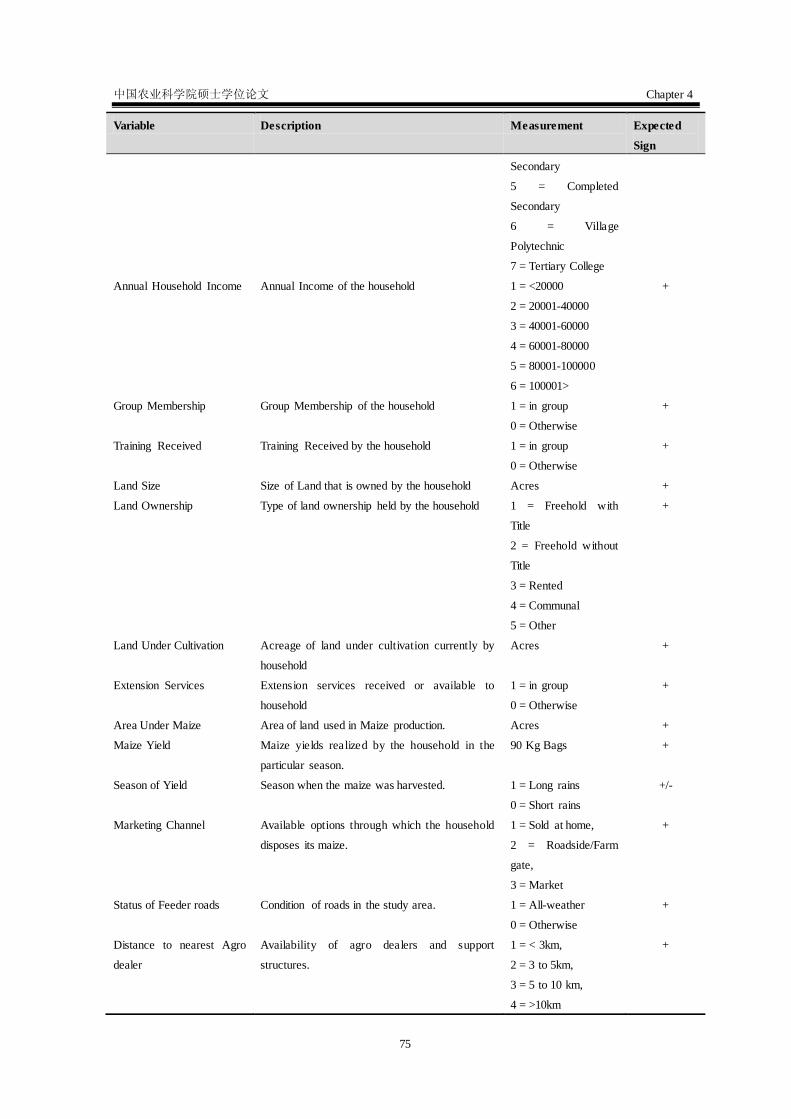
中国农业科学院硕士学位论文 Chapter 4
75
Variable Description Measurement Expected
Sign
Secondary
5 = Completed
Secondary
6 = Village
Polytechnic
7 = Tertiary College
Annual Household Income Annual Income of the household 1 = <20000
2 = 20001-40000
3 = 40001-60000
4 = 60001-80000
5 = 80001-100000
6 = 100001>
+
Group Membership Group Membership of the household 1 = in group
0 = Otherwise
+
Training Received Training Received by the household 1 = in group
0 = Otherwise
+
Land Size Size of Land that is owned by the household Acres +
Land Ownership Type of land ownership held by the household 1 = Freehold with
Title
2 = Freehold without
Title
3 = Rented
4 = Communal
5 = Other
+
Land Under Cultivation Acreage of land under cultivation currently by
household
Acres +
Extension Services Extension services received or available to
household
1 = in group
0 = Otherwise
+
Area Under Maize Area of land used in Maize production. Acres +
Maize Yield Maize yields realized by the household in the
particular season.
90 Kg Bags +
Season of Yield Season when the maize was harvested. 1 = Long rains
0 = Short rains
+/-
Marketing Channel Available options through which the household
disposes its maize.
1 = Sold at home,
2 = Roadside/Farm
gate,
3 = Market
+
Status of Feeder roads Condition of roads in the study area. 1 = All-weather
0 = Otherwise
+
Distance to nearest Agro
dealer
Availability of agro dealers and support
structures.
1 = < 3km,
2 = 3 to 5km,
3 = 5 to 10 km,
4 = >10km
+

中国农业科学院硕士学位论文 Chapter 4
76
Variable Description Measurement Expected
Sign
Use of Fertilizers The household‘s use of fertilizer in farming. 1 = yes
0 = otherwise
+
Access to financial service Ability of farmer to access formal financial
services
1 = yes
0 = Otherwise
+
Ready surplus market Availability of ready market for surplus produce. 1 = yes
0 = Otherwise
+
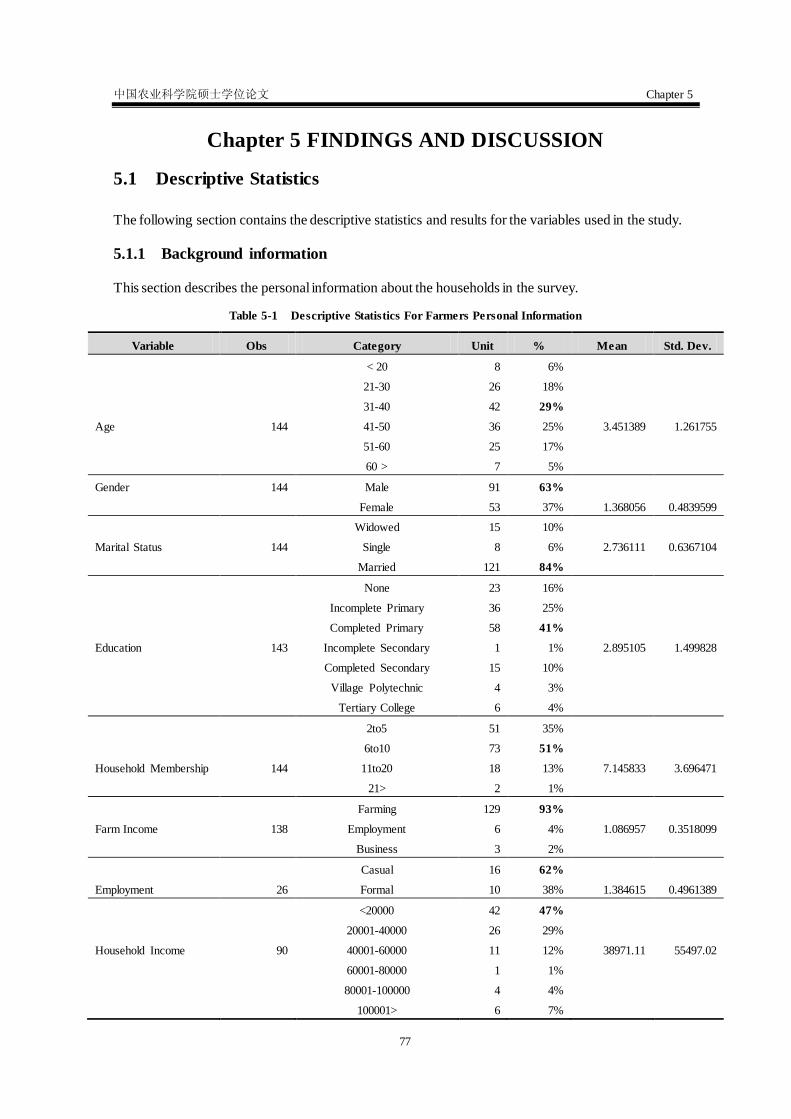
中国农业科学院硕士学位论文 Chapter 5
77
Chapter 5 FINDINGS AND DISCUSSION
5.1 Descriptive Statistics
The following section contains the descriptive statistics and results for the variables used in the study.
5.1.1 Background information
This section describes the personal information about the households in the survey.
Table 5-1 Descriptive Statistics For Farmers Personal Information
Variable Obs Category Unit % Mean Std. Dev.
< 20 8 6%
21-30 26 18%
31-40 42 29%
Age 144 41-50 36 25% 3.451389 1.261755
51-60 25 17%
60 > 7 5%
Gender 144 Male 91 63%
Female 53 37% 1.368056 0.4839599
Widowed 15 10%
Marital Status 144 Single 8 6% 2.736111 0.6367104
Married 121 84%
None 23 16%
Incomplete Primary 36 25%
Completed Primary 58 41%
Education 143 Incomplete Secondary 1 1% 2.895105 1.499828
Completed Secondary 15 10%
Village Polytechnic 4 3%
Tertiary College 6 4%
2to5 51 35%
6to10 73 51%
Household Membership 144 11to20 18 13% 7.145833 3.696471
21> 2 1%
Farming 129 93%
Farm Income 138 Employment 6 4% 1.086957 0.3518099
Business 3 2%
Casual 16 62%
Employment 26 Formal 10 38% 1.384615 0.4961389
<20000 42 47%
20001-40000 26 29%
Household Income 90 40001-60000 11 12% 38971.11 55497.02
60001-80000 1 1%
80001-100000 4 4%
100001> 6 7%

中国农业科学院硕士学位论文 Chapter 5
78
The average age of the smallholder farmer in Kenya is estimated at 60years, this survey found out
that over 50% of the farmers interviewed and who benefited from the subsidy programme were between
the ages of 31 to 50 years comparing well to the national average age and indicating that the farmers in
Tana River are relatively younger that those in the other parts of the country. Of the 144 farmers
interviewed in this study 63% were males indicating that men were more involved in decision making in
the family and agriculture. These findings are also consistent with religious factors prevalent in the
study area that tend to put men in the forefront on matters involving contact with the outside world and
decision making especially where representation is required. Consistent with the age bracket a majority
of the farmers interviewed (84%) were married, and most being in their youthful stage of life revealed a
lot of eagerness to provide for their families and succeed in agriculture which is a major source of
income for the family.
The study found out that consistent with the low levels of education in the county
(http://www.crakenya.org/county/tana-river/) a majority of the farmers had only Completed Primary
education. A big proportion of the farmers is noted with concern did not have (16%) or had not
completed the initial basic level of education (25%) a fact that impinges heavily on the level of
information access and utilization of modern farming techniques among the smallholder farmer.
The study found out that the county has relatively big Household sizes averaging six (6) to ten (10)
persons per household (accounting for 51%), while this offers an advantage in terms of labour it also
presents a challenge in food security and nutrition given the many mouths to feed. This is further
confirmed by the fact that very few of the farms income is diversified, with the study finding out that
over 90% of the farms income depends on the products from the farm. This exposes the farmers‘
vulnerability to market conditions and weather and climate change effects. For the farmers who venture
out of the farm to seek for employment (and this is only a small proportion 26 out of 144) 62% engage
in casual jobs that do not provide the needed income security to the family and are not well paying
enough to be able to invest back to the farm for improved productivity and economies of scale.
Consistent with the level of poverty prevailing in the county (70.9%
http://www.crakenya.org/county/tana-river), the study found out that the mean annual Household
income was Ksh.. 38,000 (USD 457) or USD 1.20 per day, with a majority earning less that Ksh..
20,000(USD 240) or USD 0.70 per day.
Table 5-2 Descriptive Statistics Group Membership And Activity
Variable Obs Category Unit % Mean Std.
Dev.
Group Membership 144 Member 97 67% 0.4705281 1.326389
Non Member 47 33%
Willingness to join group 111 Willing 106 95% 0.2083436 1.045045
Not Willing 5 5%
Activities of the group 107 Savings 17 16% 0.7558623 2.457944
Credit 24 22%
Production &
Marketing 66 62%

中国农业科学院硕士学位论文 Chapter 5
79
Common interest groups (CIGs) are farmer organizations established to promote special group
interests within the communities. Groups formed under the CIG format aim at alleviating poverty,
enhancing food security, and improving access to inputs and extension services. Farmers in Tana River
country recognize the need to belong (95%) and the essence of participating (67%) in groups and do so
mainly for improving production and marketing of produce (62%). Groups are important community
structures tor mobilizing savings and availing safe and affordable credit to group members. This aspect
of group membership has however not found much root in the county as the results indicate that only
16% and 22% join groups for savings and credit. Agricultural input subsidies therefore bridge the gap
that lack of savings and access to cheap credit tends to create. However for the long term CIGs need to
enhance savings and avail affordable credit to its members through cereal banks and small-scale table
banking projects. NAAIAP has within it a component of resource mobilization and savings through
cereal banking groups that help farmers save their produce during times of plenty and through the
warehouse receipting system avail credit to farmers with produce stock as collateral. This concept is
picking up with farmers finding out that they could borrow funds for use during critical periods like
planting when the farmer needs to purchase seeds and fertilizers.
Table 5-3 Descriptive Statistics Land Ownership And Production
Variable Obs Category Unit Per。 % Mean Std. Dev.
Freehold with Title 3 2%
Freehold without Title 59 41%
Land ownership 143 Rented 18 13% 3.006 1.003
Communal 60 42%
Other 3 2%
Whether farmer uses
inputs 144 Use Inputs 141 98% 1.020 0.143
Don‘t Use inputs 3 2%
Type of Inputs used in the
last 6 months 140 Fertilizer 22 16% 3.078571 1.303387
Manure 21 15%
Certified seed 47 34%
Own Seed 24 17%
Pesticides 26 19%
Landsize 144 4.102431 11.59358
Area Cultivated 143 2.984266 11.64919
Extension Services Rec. 144 1.118056 0.3238002
Area Under maize 144 1.277083 0.6633744
Amount of inputs used 144 45.97222 17.58414
Maizeyield 144 10.52455 9.675623
Maize Production 144 0.9472094 0.870806
中国农业科学院硕士学位论文 Chapter 5
80
Land is critical factor of production in agriculture. Land ownership in Tana River is therefore
critical for security of enterprise and for sustainability of production. Smallholder land sizes in Tana
River County were found to range averagely at 4 acres per household. This is due to the fact that the
county has huge tracts of land and a relatively sparse population averaging 6 persons per square
kilometer. However not all of this land is consistently put into good production use as the study found
out on average only one half to three quarters of the land (2.9acres) is cultivated with crops in any given
season. Land ownership also provides collateral with which to access credit and other related services.
The study found out that almost all of the land in the county is either held freehold without title (41%)
or is held in trust by the community as communal land (42%) consistent with the fact that almost all the
land in the county is either Trust land or communal land. Of great interest was the fact that almost all
the farmers interviewed for this study agreed that they use inputs (98%) consisting mainly of certified
seed (34%) this is interesting given the low levels of credit and savings within the farmer community
and low household incomes. One reason for this high use of inputs especially certified seed could be the
provision of the same through subsidy programmes run by Kenya Red Cross, National Irrigation Board
and the Ministry of Agriculture that provide seed at critical planting seasons to the poor and vulnerable
members of the community.
Extension service delivery is provided mainly by the Ministry of Agriculture, extension message
delivery enables the farmers to make informed decisions and to access relevant and current market and
production trend information for improved food production and food security. With limited education
levels within the county extension service delivery is constrained in its choice of delivery methods and
is in most cases limited to Training and Visit to farms by extension agents. In the recent past however
CIGs have been used to train farmers and deliver extension messages to groups of farmers who then
serve as model farmers to the other members of the community. Learning takes place through transfer of
practical knowledge among farmers who might not know how to read and write and these model
farmers can then use the knowledge obtained from CIGs to pass on the same to their siblings and
neighbors in a local language that is comprehensible to the illiterate farmers. The study found out that
most of the farmers reported that they had received extension services from the ministry of Agriculture
extension agents which is commendable given the low levels of staff in the county, the poor road
infrastructure and the sparsely spread villages.
The study found out that of the four (4) acres that were under cultivation at least one (1) acre was
put under maize production with some farmers putting as much as three (3) acres of the total area under
production under maize. These findings are consistent with the national statistics that indicate that most
farmers grow maize at least once in the two seasons in Kenya. Whereas it is important to note that the
county is hot and dry a large portion of the maize crop is grown under irrigation or flood recession along
the river.
Use of certified seed is seen to approach the recommended 10kgs per acre with the findings
showing that of the average use of certified maize seed was 46Kgs giving an average of 15kgs per acre
given the average available area under maize production. Given this high level of certified maize seed
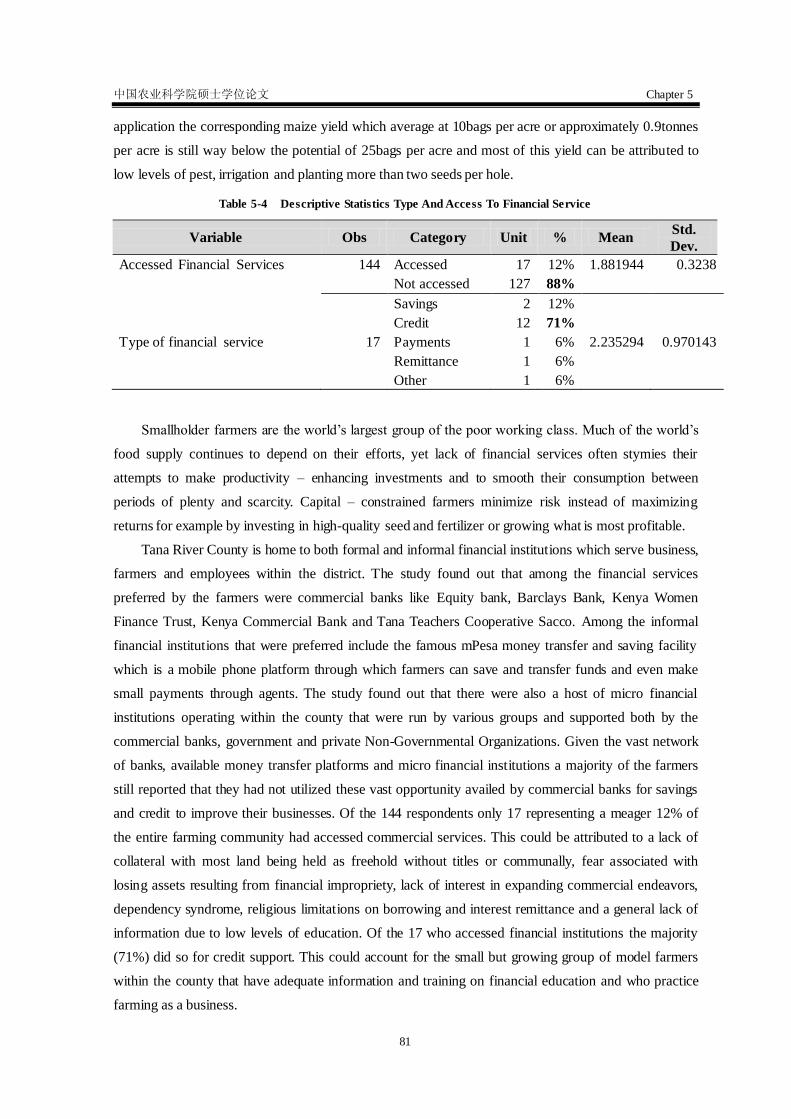
中国农业科学院硕士学位论文 Chapter 5
81
application the corresponding maize yield which average at 10bags per acre or approximately 0.9tonnes
per acre is still way below the potential of 25bags per acre and most of this yield can be attributed to
low levels of pest, irrigation and planting more than two seeds per hole.
Table 5-4 Descriptive Statistics Type And Access To Financial Service
Variable Obs Category Unit % Mean Std.
Dev.
Accessed Financial Services 144 Accessed 17 12% 1.881944 0.3238
Not accessed 127 88%
Savings 2 12%
Credit 12 71%
Type of financial service 17 Payments 1 6% 2.235294 0.970143
Remittance 1 6%
Other 1 6%
Smallholder farmers are the world‘s largest group of the poor working class. Much of the world‘s
food supply continues to depend on their efforts, yet lack of financial services often stymies their
attempts to make productivity – enhancing investments and to smooth their consumption between
periods of plenty and scarcity. Capital – constrained farmers minimize risk instead of maximizing
returns for example by investing in high-quality seed and fertilizer or growing what is most profitable.
Tana River County is home to both formal and informal financial institutions which serve business,
farmers and employees within the district. The study found out that among the financial services
preferred by the farmers were commercial banks like Equity bank, Barclays Bank, Kenya Women
Finance Trust, Kenya Commercial Bank and Tana Teachers Cooperative Sacco. Among the informal
financial institutions that were preferred include the famous mPesa money transfer and saving facility
which is a mobile phone platform through which farmers can save and transfer funds and even make
small payments through agents. The study found out that there were also a host of micro financial
institutions operating within the county that were run by various groups and supported both by the
commercial banks, government and private Non-Governmental Organizations. Given the vast network
of banks, available money transfer platforms and micro financial institutions a majority of the farmers
still reported that they had not utilized these vast opportunity availed by commercial banks for savings
and credit to improve their businesses. Of the 144 respondents only 17 representing a meager 12% of
the entire farming community had accessed commercial services. This could be attributed to a lack of
collateral with most land being held as freehold without titles or communally, fear associated with
losing assets resulting from financial impropriety, lack of interest in expanding commercial endeavors,
dependency syndrome, religious limitations on borrowing and interest remittance and a general lack of
information due to low levels of education. Of the 17 who accessed financial institutions the majority
(71%) did so for credit support. This could account for the small but growing group of model farmers
within the county that have adequate information and training on financial education and who practice
farming as a business.
中国农业科学院硕士学位论文 Chapter 5
82
NAAIAP in recognition of this prevalent lack of financial literacy among farmers has taken a two
pronged solution profile to this problem. The programme has introduced farming as a business training
modules through its Agribusiness development officers at the State Department of Agriculture sub
county level and is also working with commercial banks to provide accessible and low interest credit to
farmers through its Kilimo biashara programs that seek to link farmers to credit. Kilimo biashara offers
collateral to farmers through offering banks credit guaranteed funds for any funds that will be loaned to
farmers though the facility. Kilimo biashara is a low interest capital package for better endowed
enterprise-oriented farmers who are constrained by capital.
Results for the MNL are presented in Table 4-5. Annual household income is used as a measure
of the level of poverty and vulnerability at the household level. Contrary to programme design and
objectives our results indicate that at lower levels of annual household income only sales and group
savings correlate positively to annual income. Education levels, market infrastructure and group
membership were significant but did not contribute positively to increased household incomes amongst
the very poor. In very low level income households what is sold at the farm gate contributed to a very
large extent to the family income and in most cases due to the formalities of credit availability and low
levels of education groups become an important and in many ways a sole source of credit for
reinvestment into agriculture,partly accounting for the highly negative but significant relationship
between extension services and household income. Studies done (Hahlbrock and Hockmann, 2011) in
Russia, support the fact that group affiliation has a positive effect on the performance of the farm.
Similar studies in Mali (Baden, 2014) find that group members were more empowered than
non-members in the realms of decision-making over agricultural income, access to credit, technology
transfer and freedom of movement. Farming households store, sell or consume on farm production. The
potential for and wisdom of storing, consuming or selling and saving the earnings from retail purchases
are determined primarily by the spread between farm gate and retail market prices, shifts in this
relationship between these prices from one season to the next affect farmers profoundly and group
saving not only provide financial security and a low cost form of insurance but provide a viable option
for smoothing out market volatility effects.
In the middle incomes category marital status and group savings were found to be significant and
positively affected annual household incomes with household status, land size, use of inputs, group
membership and having a ready outputs market remained significant but did not have a positive
influence on household incomes. Studies (Uneze, 2013) confirm that savings is important for
accumulation of capital required to generate future incomes and as such group savings have been shown
to be vital for securing credit and low interest loans. In a predominantly polygamist Islamic community
like the one in which this studies were carried out marital status is commensurate with larger families
and more labour and thus more income, given that women and children are known to be most active in
farm work. The study found out that in the middle income category land size is also a significant
At higher levels of household income only sales had a positive and significant effect on income

中国农业科学院硕士学位论文 Chapter 5
83
this could be attributed to the fact that at higher levels of income farmers are better linked to and
integrated into the market than lower income farmers and thus are already experiencing the benefits of
commercialization. Whereas season of yield and use of inputs were found to have a significant impact
on the incomes of this category of farmers this effect was found to be indirect. This could explain the
fact that most farmers at these levels of household incomes find fertilizer purchase and use extremely
unaffordable with each purchase having a direct negative effect and sometimes leaving a huge impact
on household income and this could account for the reasons why farmers at these levels of poverty and
vulnerability fail to use these inputs. This being a predominantly arid and semi-arid area commodity
markets are also prone to shocks (droughts and relief supplies) that cause crop prices to behave in
―contra-seasonal‖ manner.
When controlled for use of fertilizer in the last six months season of yield assumed positive
significance of the low income farmer group. For farming communities that depend on the fluctuating
commodity markets where the relationship between the seasonal production and prices greatly affect
household incomes, cyclical seasonal price quantity variations in the markets therefore determine to
what extent the farmer can recoup investments and derive benefits from market sales and farming.
Similar scenarios prevail for the middleincome category of farmers with sales becoming significant as
well. Thus the covariance of price and farm incomes, and the opportunities and ability to produce
inter-temporally at reasonable cost determines the extent of transitory benefits of fertilizer use.
The results of probit model estimation for the determinants of the probabilities of households
engaging in commercialized farming or not given participation in the NAAIAP programme are
presented in Table 4-6. Maximum likelihood method was used to determine the decision of the
household to commercialize. The marginal effects were used to explain the results due to the difficulty
in interpretation associated with unobserved y* variables. Model Chi square tests given appropriate
degrees of freedom indicate that the overall goodness of fit of the probit model are statistically
significant at 5% probability level. Pseudo R2 values indicate that the explanatory variables in the
regression explain 12% variations in the likelihood of farmers within the project to commercialize.
Results obtained from the probit estimation indicate that the probability of a farmer who
participates in the programme commercializing is influenced by Land Ownership, Season of Yield,
Status of Feeder roads, and Distance to nearest Market/Agro dealer. The study finds out that with
the exception of Land size and Land ownership all the other independent variables had the expected
signs.
Land Ownership was also significant with without the expected positive sign and effect on
commercialization at 10% level. Results indicate that commercialization is predicted to fall by 7% for
every land that is owned by the farmers in Tana River County. Land ownership in the county is
primarily public, meaning that most of the land in the county is government land with a very small
proportion of trust and private land holding. The effect of lack of title ownership is seen as a deterrent
for investments and a hindrance in accessing capital from financial institutions thus impacting
中国农业科学院硕士学位论文 Chapter 5
84
negatively on commercialization.
Season of yield is found to be significant at 5% and with the expected positive sign. Given the
unpredictable nature of the rains in the Arid and Semi-arid areas and with most farmers planting crops
along the river that is subject to seasonal flooding it makes sense for seasonality to affect productivity
through its impacts on flood recession agriculture. The study finds that a change in season results in a
4% change in the probability of farmers commercializing. Similar findings by (Pender J, & Alemu D.,
2007) citing Pender, Ehui, and Place2006) support the role of agro climatic conditions on the extent of
commercialization among smallholder farmers.
Status of feeder roads in the county was found to have the expected sign and significance at 1%
level. A kilometer of improved feeder roads would probably results in increased commercialization
within the county of up to 8%. Surplus production does not reach markets due to lack of reliable
infrastructure. Given the vital role of roads in enhancing access to markets and reducing transaction
costs, an increase in the investment of public funds in the improvement of roads and other market
enhancing structures and facilities will ensure that vulnerable farmers not only earn more from their
sales but access necessary inputs on time and at a reduced cost all of which impact positively on their
production and productivity. These findings are consistent with those of other studies (Jagwe JN, 2011;
Jha D., & Hojjati B., 1993) on the effect of transaction costs and infrastructure on agricultural
transformation.
Tana River County has centralized partly formal fresh produce market that are located in the major
towns. It is also very common to find Agro – dealers locating their stores in the market centers as well.
This study finds that distance to markets/Agro – dealers is found to negatively affect commercialization
as is expected and is highly significant at 1%. The study finds out that for every additional Kilometer
away from the market/Agro-dealer the farmer loses a 1% chance of accessing the markets and realizing
the benefits of commercial agriculture. Given that agricultural products are perishable any additional
increase in distance compromises quality and therefore price of the product. In addition to the effects of
and losses resulting from poor state of feeder roads, the farmer risks losing not just quality of produce
but also incurring additional transaction costs as well. These findings are consisted with those of
(Gebremedhin B., &Jaleta M., 2012; Jagwe JN, 2011) on the effects of transaction costs on the
participation of farmers in the market.

中国农业科学院硕士学位论文 CONCLUSION AND RECOMMENDATION
85
Chapter 6 CONCLUSION AND RECOMMENDATION
The National Accelerated Agricultural Inputs Access Program (NAAIAP) was designed by the
Kenyan government as safety net program for poor farmers who did not have adequate financial
resource to purchase farm inputs during every production cycle and to address the issues of extreme
hunger and poverty in line with the MDGs. This program was intended to benefit those households that
were before then using insufficient or no fertilizer and seeds for their production. However, results from
our analysis indicate that even within the poor and vulnerable farmers such a blanket program fails to
achieve its objectives given the disparities and resource endowments in the various groups of farmers
due to their productive capacity and income levels. Contrary to programme design and objectives our
results indicate that at lower levels of annual household income only sales and group savings correlate
positively to annual income In the middle incomes category marital status and group savings were
found to be significant and at higher levels of household income only sales had a positive and
significant effect on income. Market access plays an essential role in assuring better income and welfare
levels for smallholder producers, and thus contributes to poverty alleviation. The majority of the
smallholders in Kenya cultivate their farms for subsistence and very little of this production gets to the
market. These results are consistent with previous research studies (Azam et al., 2012; Omitiet al.,2007
and Tung and Costales, 2007) on smallholder market access who found out that by creating demand for
production inputs and investment goods, markets promote economic growth. In addition Market
linkages, support infrastructure and structures that are friendly to the poor and vulnerable. However at
village level, market participation is hampered by poor quality and high cost of inputs, high transaction
costs, high market charges and unreliable market information.However significant provision of inputs to
poor farmers may be to reduce their production costs market infrastructure and institutional aspects of
market access are crucial for improving opportunities of smallholders for increased market participation
and in addition to determining market orientation; infrastructural and institutional conditions have a
significant bearing on scale of small holder production.This study proposed the introduction and/or
strengthening of Farmer Saving groups (FSGs) which are self-managed community-based groups
composed of between 10 and 20 members that provide basic financial services to their members as a
key component of the NAAIAP program. These groups respond directly to felt needs within the
community through provision of secure saving platforms, basic loaning facilities with flexible terms and
some form of insurance against fluctuations in the market. These groups offer simple and cost effective
entry level financial services to people who are poor or isolated from mainstream financial service
providers.
Agricultural transformation in small holder agriculture takes the form of moving farmers from a
subsistence existence to a commercial oriented type of production. In order to do this governments must
put in place policies that enhance agricultural transformation and which create a more market friendly

中国农业科学院硕士学位论文 CONCLUSION AND RECOMMENDATION
86
environment to farmers both to access and participate in agricultural markets. NAAIAP is one such
programme that was initiated by the government of Kenya to help solve the twin problems of on farm
productivity and spur commercialized agriculture that would result in reinvestments in improved agro
production systems. These goals though noble have been difficult to achieve due to information
asymmetries existing between the desired and the actual situation affecting poor and vulnerable farmers
in the semi and arid areas of Kenya where this programme is also implemented. This study finds out that
key determinant of commercialization is distance to markets/Agro-dealer outlets was the most
significant factor that influences a farmer‘s ability to commercialize production. Distance affects not
only a farmer‘s physical access to the produce market but also hinders access to the inputs market as
well. Many farmers opt to sell their produce at lower than market prices due to disincentives to market
access like distance. Government policies should therefore aim to reduce this distance through policies
that enhance physical ability to access markets. In many parts of Kenya farmers through use of ICTs
like mobile phones have been able to access markets beyond their physical locations, policies that
support and enhance this type of capacity to farmers should also be pursued by the government. Land
was found to be one of the determinants of commercialization among farmers within the NAAIAP
programme. Land is a critical factor of production and therefore the size and quality of land are key to
productivity. Larger tracts of land under prudent management produce more relative to small pieces of
land under similar conditions. Land however is a finite resource that should be utilized well for
production, and this can be achieved through intensity and sustainable use. Policies that enhance
sustainable and maximum use of land potential should therefore be put in place to ensure smallholders
derive maximum benefits from their productive units. Land ownership as a major determinant of
commercialization confirms the need for security of tenure in smallholdings. Land being both a
productive and a capital resource enhances a farmer‘s assets and therefore ensures their credit worth.
Limited access to credits has ensured that many smallholder farmers remain small a major reason being
the inability to access loans from commercial entities and micro financial institutions due to lack of
collateral security. With secure land tenure systems farmers are given the confidence to enhance
production and invest in their production units. Policy interventions aimed at supporting farmers to
obtain titles for their pieces of land are necessary to provide security of tenure to smallholder farmers.
Land determines the quantity of output per unit of productive land a farmer can achieve. Productive
land is influences by a farmer‘s ability to put available land into productive use. A major constraint to
putting larger tracts of land to productive can be identified as lack of capital to invest in modern
technology or lack of adequate labour to till available land. Other factors include a lack of incentives
and mixed price signals from agricultural markets. Supported through relevant policies that enhance
market information access and capital to purchase or hire labour and equipment, it is expected that
farmers will put more land under production than is currently available. Land productivity should also
be encouraged through the use of modern inputs and irrigation to maximize available land potential.
Agro – climatic conditions affect productivity and are a major determinant of commercialization among
smallholder farmers. Season of production affects not just the quantity and quality of rainfall and
中国农业科学院硕士学位论文 CONCLUSION AND RECOMMENDATION
87
available moisture but crop pests and the prevailing market conditions. Farmers are greatly affected by
seasonality of production a factor that has been blamed for keeping smallholder farmers poor. Return to
investment remains cyclical therefore rendering farmers unable to plan their investments, save or
achieve credit worthy status in major financial institutions. Policy interventions that enhance seasonal
production planning, investments in storage, and produce banks are necessary to ensure that farmers
achieve a more stable returns to investment cycle and spur investment. Investments into small scale
value addition to improve keeping quality will also ensure that farmers can access higher level markets
and join the supermarket supply chain. Status of roads is a significant factor in determining
commercialization given that most small scale farmers are located in the rural areas that are far removed
from urban areas where infrastructure conditions are relatively better. This lack of proper all weather
roads subjects farmers to additional transaction costs when they seek markets that are mainly located in
urban areas. The poor road networks also ensures that even when buyers are capable of accessing the
farmers produce they may not have the incentive to do so preferring instead more accessible suppliers.
In Tana River it is not uncommon for huge sections of farms to be cut off due to floods or impassable
roads resulting from heavy rains that wash away roads that link the farmer to the market. Policy
interventions that ensure market access roads are established, maintained and improved are critical for
commercialization as they attract buyers and ensure easy access to produce markets.

中国农业科学院硕士学位论文 REFERENCES
88
REFERENCES
1. Abate G. T., Francesconi G. N. and Getnet K. (2013), ―Impact of agricultural cooperatives on
smallholders‘ technical efficiency: evidence from Ethiopia‖, Euricse Working Paper n. 50 | 13
2. Abera G., (2009 ). Commercialization of smallholder farming: determinants and welfare outcomes;
a cross – sectional study in Enderta district, Tigrai, Ethiopia. Unpublished Master thesis, University
of Agder, Kristiansand, Norway.
3. Adong A, Muhumuza T, &Mbowa S, (2014). Smallholder food crop commercialization in Uganda:
panel survey evidence from Uganda. Research Series no. 116. Economic Policy Research Center.
Makerere, Kampala, Uganda.
4. Ariga J, & Jayne TS,(2009). Private Sector Responses to Public Investments and Policy Reforms:
The Case of Fertilizer and Maize Market Development in Kenya. IFPRI Discussion Paper 00921.
Washington DC. http://www.ifpri.org/sites/default/files/publications/ifpridp00921.pdf
5. Ariga J, Jayne TS, & Njukia S, (2010). Staple food prices in Kenya. COMESA Policy seminar
paper. AAMP. http://ageconsearch.umn.edu/bitstream/58559/2/AAMP_Maputo_26_%20Kenya.pdf
6. Ariga J, Jayne TS, Kibaara B, & Nyoro JK, (2008). Trends and Patterns in Fertilizer Use By
Smallholder Farmers in Kenya, 1997-2007. Working Paper Series No. 28. Nairobi, Kenya:
Tegemeo Institute. http://fsg.afre.msu.edu/kenya/Ariga-Jayne-2008_ConferencePaper_FINAL.pdf
7. Ariga, J. Jayne, T, Nyoro, J. 2006. Factors Driving Fertilizer Growth in Kenya, 1990 – 1995:
Sustaining the Momentum and Lessons for Broader Replicability in Sub-Saharan Africa. Working
paper 24, Tegemeo Institute, Egerton University.
8. Asuming-Brempong S, Anarfi J.K, Aurthur S. and Asante S. (2013). Determinants of
Commercialization of Smallholder Tomato and Pineapple Farms in Ghana. American Journal of
Experimental Agriculture 3(3):606-630, 2013.
9. Awuor, T.M. 2003. Competitiveness of Maize from Western Kenya and Eastern Uganda in Kisumu
Town of Kenya. Unpublished Thesis
10. Azam M, Imai KS, & Gaiha R, (2012). Agricultural Supply Response and Smallholders Market
Participation -the Case of Cambodia. RIEB Discussion Paper. Kobe University Japan.
11. Baden S, (2014). Women's economic empowerment and collective action in agriculture: new
evidence and measurement challenges. Policy Briefs 68 Future Agricultures. April 2014.
http://www.future-agricultures.org/policy-engagement/policy-briefs/1862-women-s-economic-emp
owerment-and-collective-action-in-agriculture-new-evidence-and-measurement/file
12. Bahta S., & Bauer S., 2012.Policy options for improving market participation and sales of
smallholder crop producers: a case study of the Free State province of South Africa. African
Journal of Agricultural Research Vol. 7(24) pp. 3525-3533. June, 2012
13. Balcha Y., (2013). Prospects of Transforming subsistence agriculture into sustainable livelihoods: A
case – study of the Ribb Sub-catchment, Ethiopia. Unpublished Masters Thesis. Uppsala
中国农业科学院硕士学位论文 REFERENCES
89
University, Uppsala.
14. Banful AB, (2011). Old Problems in the New Solutions? Politically Motivated Allocation of
Program Benefits and the ―New‖ Fertilizer Subsidies. World Development, 39(7), 1166–1176.
15. Bijman J. G. Ton, G. Meijerink. 2007. Empowering Smallholder farmers in markets; national and
international policy initiatives. WUR. Wageningen.
16. Chibwana C, Fisher M, & Shively G, (2010). Land allocation effects of agricultural input subsidies
in Malawi. Purdue University, West Lafayette, IN.
17. Chirawa E, & Matita M., (2012). Factors influencing smallholder commercial farming in Malawi:
A case of NASFM Commercialisation initiatives. Policy Brief 051. February 2012. Future
Agricultures.
18. Coady D, Grosh M, & Hoddinott J, (2002). Targeting of Transfers in Developing Countries:
Review of Experience and Lessons, Social Safety Net primer series, Social Protection Anchor.
http://siteresources.worldbank.org/SAFETYNETSANDTRANSFERS/Resources/281945-1138140
795625/Targeting_En.pdf
19. Coward EW Jr, (1969). The subsistence to commercial transition in agricultural development.
Retrospective Theses and dissertations. Paper 3566. Iowa state university.
20. Crawford EW, Jayne TS, & Kelly AV, (2006). Alternative Approaches for Promoting Fertilizer Use
in Africa. Agriculture and Rural Development discussion paper 22. World Bank.
21. Demeke L.B, &Haji J., (2014). Econometric analysis of factors affecting market participation of
smallholder farming in Central Ethiopia. Journal of Agricultural Economics, Extension and Rural
development ISSN-2360-798X: Vol. 2(6): pp 094-104, June 2014. Spring Journals.
22. Dorward A, Chirwa E, & Jayne T, (2011). Malawi‘s Agricultural Inputs Subsidy Programme over
2005-2009. In: Chuhan-Pole, P and Angwafo, M, (eds.), Yes Africa can : Success stories from a
dynamic continent. Washington D.C.: World Bank.
23. Dorward A, Kydd J, & Poulton C, (2007) Price intervention in Sub-Saharan African agriculture:
can an institutionalist view alter our conception of the costs and benefits? In: Koning, N. and
Pinstrup-Andersen, P., (eds.), Agricultural trade liberalization and the least developed countries.
Dortrecht, Netherlands: Springer.
24. Dorward A., C. Ephraim, Boughton D., Crawford E., Jayne T., Slater R., Kelly V. &Tsoka M.,
2008.Towards „smart‟ subsidies in agriculture? Lessons from recent experience in Malawi. Natural
Resource Perspectives
25. Doss CR, & Morris ML, (2001). How does gender affect the adoption of agricultural innovations?
The case of improved maize technology in Ghana. Agricultural Economics, 25(1), 27-39.
http://ageconsearch.umn.edu/bitstream/176934/2/agec2001v025i001a008.pdf
26. Druilhe Z, & Hurle JB, (2012). Fertilizer subsidies in sub-Saharan Africa. ESA Working Paper No.
12-04. July 2012. FAO
27. Dugger CW, (2007). Ending Famine, Simply by Ignoring Experts, New York Times,December 2.
28. Eleni G, (2009). A market for all farmers: Market institutions and smallholder participation. The
中国农业科学院硕士学位论文 REFERENCES
90
center for effective global action. UC. Berkeley.
29. Eleni. G. 2009. A market for all farmers: Market institutions and smallholder participation. The
center for effective global action. UC. Berkeley.
30. Eskola E., (undated). Commercialisation and Poverty in Tanzania: Household-level Analysis.
Discussion papers. Department of Economics. University of Copenhagen. Denmark
31. FAO & The World Bank (2009). Awakening Africas sleeping giant; Prospects for commercial
agriculture in guinea savannah zone and beyond. World Bank, Washington, DC, USA.
32. Feder G, & Umali DL,(1993). The adoption of agricultural innovations: A Review. Technological
Forecasting and Social Change, 43, 215-239.
33. Feder G, Just RE, & Zilberman D, (1985). Adoption of Agricultural Innovations in Developing
Countries: A Survey. Economic Development and Cultural Change, 33(2), 255-298.
34. Ferris S., Robbins P., Best R., Seville D., Buxton A., Shriver J., & Wei E., (2014). Linking
Smallholder farmers to markets and the implications for extension and advisory services. MEAS
Disucssion Paper series.
35. Filipski M, and Taylor JE, (2012). A Simulation Impact Evaluation of Rural Income Transfers in
Malawi and Ghana. Journal of Development Effectiveness Volume 4, Issue 1, pp. 109-129, 2012.
http://www.ipc-undp.org/pub/IPCOnePager150.pdf
36. Freeman H.A, & Silim S.S (undated) Commercialization of Smallholder Irrigation: Economic and
Social Implications in Semiarid Areas of Eastern Kenya.
37. Gebre-Ab N, (undated). Commercialization of smallholder agriculture in Ethiopia.
38. Gebremedhin B., &Jaleta M., (2012). Market orientation and market participation of smallholders
in Ethiopia: Implications for Commercial Transformation. Selected paper for presentation at the
International association of Agricultural Economists (IAAE) Triennial conference, Brazil.
39. Gebreselassie S, & Sharp K, (2008). Commercialisation of smallholder agriculture in selected
Tef-growing areas of Ethiopia. Future Agricultures. March 2008.
40. Goshu D. Kassa B. & Ketema M. (2012). Measuring smallholder commercialization Decisions and
interactions in Ethiopia. Journal of Economics and sustainable development. Vol. 3, No. 13, 2012.
41. Govereh J., Jayne T.S, & Nyoro J., (1999) Smallholder commercialization, interlinked markets
and food crop productivity: Cross – Country evidence in eastern and southern Africa. Michigan
State University.
42. Government of Kenya,(2006). The National Accelerated Agricultural Inputs Access Program:
Program Design and Implementation Proposal. Nairobi, Kenya.
43. Gugerty MK, & Cook. J, (2009). Political Economy of Fertilizer Policy in Kenya. Brief. Seattle:
Evans School Policy Analysis and Research, University of Washington.
44. Gurara D. Z, & Salami A.O, (2012). Towards Sustaining Malawi‘s Farm Input Subsidy Program‖.
Africa Economic Brief. Volume 3, Issue 4.
45. Hahlbrock K, & Hockmann H, (2011). Influence of the intergration of agroholdings with Russian
farms on total factor productivity and its subcomponents. Institute of agricultural development in
中国农业科学院硕士学位论文 REFERENCES
91
central and Eastern Europe (IAMO). GEWISOLA Germany.
46. Ideas Foundation, (2009). Smallholder food production and poverty. Principles for a financial
coordination mechanism (FCM) to support smallholder farmers. Ad hoc advisory group to the
Madrid conference on food security chaired by prof. Jeffery Sachs. January 26,2009
47. IFDC,(2012). Kenya Fertilizer Assessment. June 2012. IFDC. USA.
http://www.amitsa.org/wp-content/uploads/bsk-pdf-manager/203_KENYA-FERTILIZER-ASSESS
MENT.PDF
48. IFPRI, (2011). Malawi strategy support program (MaSSP). International Food Policy Research
Institute (IFPRI) Policy Note 5. March 2011.Washington DC.
http://www.ifpri.org/sites/default/files/publications/masspn5.pdf
49. IFPRI, (2012). Nigeria strategy support program II. Impact of fertilizer subsidies on the
commercial fertilizer sector in Nigeria: Evidence from previous fertilizer subsidy schemes.
International Food Policy Research Institute (IFPRI) Policy Note 34. October 2012. Washington
DC. http://www.ifpri.org/sites/default/files/publications/nssppn34.pdf
50. Ihle R &Cramon-TaubadelS.. Country and border effects in the transmission of maize prices in
eastern Africa: evidence from a semi-parametric regression model.
51. IREN, (2008). Report on the Pan Africa Workshop on Service Delivery to smallholder Farmers.
Theme: Improving the life of smallholders through services. Held on May 18-21, 2008 at Safari
Park Hotel, Nairobi – Kenya. Inter Regional Economic Network.
52. Jagwe JN, (2011). The impact of transaction costs on the participation of smallholder farmers and
intermediaries in the banana markets of Burundi, Democratic Republic of Congo and Rwanda.
Unpublished Phd. Thesis. University of Pretoria.
53. Jaleta M., Gebremedhin B., & Hoekstra D., (2009). Smallholder commercialization: Process,
determinants and Impact. Discussion Paper No. 18. Improving productivity and market success of
Ethiopian farmers improving market opportunities. International Livestock Research Institute.
Addis Ababa, Ethiopia.
54. Jama B, & Pizzarro G, (2008). Agriculture in Africa: Strategies to improve and sustain smallholder
production systems. UNDP, New York USA.
55. Jama B. and Pizarro G. agriculture in Africa. Strategies to improve and sustain smallholder
production systems. 2008. United nations development program, New York, USA.
56. Jayne, T.S., T. Yamano, M. Weber, D. Tschirley, R. Benfica, A. Chapoto, and B. Zulu. 2003.
Smallholder income and land distribution in Africa: Implications for poverty reduction strategies.
Food policy 28: 253-275.
57. Jha D., & Hojjati B., (1993). Fertilizer use on smallholder farms in Eastern province Zambia.
Report 94, International Food Policy Research Institute, Washington DC.
58. KENFAP 2011.The role of warehouse receipt system and financial services in improving produce
marketing by smallholder farmers in Kenya.
59. KENFAP, (2011).The role of warehouse receipt system and financial services in improving

中国农业科学院硕士学位论文 REFERENCES
92
produce marketing by smallholder farmers in Kenya.
http://www.esfim.org/wp-content/uploads/ESFIM-Case-Studies-WRS-REPORT-Shared-during-the
-validation-workshop.pdf
60. Kibaara B. Technical Efficiency in Kenya‟s maize production: The stochastic frontier approach.
Nairobi, Kenya: Tegemeo institute of Agricultural Development and Policy, 2005b.
http://www.tegemeo.org/documents/policy/Tegemeo_PolicyBrief06.pdf(accessed 18th April 2013).
61. Kibaara B.W.2005.Technical Efficiency in Kenyan‟s Maize Production: An application of the
Stochastic Frontier Approach. Unpublished Thesis.
62. Kilimo News, the official journal of the ministry of agriculture, July– September 2012. (accessed
on 22nd May 2013)
63. Kimuyu P, (1994). Evaluation of the USAID/Kenya Fertilizer Pricing and Marketing Reform
Program. USAID/Kenya, Nairobi.
64. KIPPRA, (2013). Kenya Economic report 2013. Kenya Institute for Public Policy Research and
Analysis. Nariobi Kenya.
http://www.kippra.org/downloads/Kenya%20Economic%20Report%202013.pdf
65. Kiratu NM, Ngigi M, & Mshenga P.M, (2014). Perception of smallholder farmers towards the
kilimo plus subsidy program in Nakuru north district, Kenya. IOSR Journal of Agriculture and
Veterinary Science. Volume 6, issue 6(Jan.2014),pp.28-32.
66. Kirimi L, Sitko N, Jayne T.S, Karin F, Muyanga M, Sheahan M, Flock J &Bor G. 2011.A farm
gate-to-consumer value chain analysis of Kenya‟s maize marketing system. Tegemeo Institute of
agricultural policy and development. WPS 44/2011. Egerton University.-
67. Kirimi L., Sitko N., Jayne T.S, Karin F., Milu M. Sheahan M., Flock J., and Bor G. Kenya‟s maize
value chain: Toward strategic interventions to address national policy challenges. A paper
presented during the Tegemeo Institute Conference Karen, Nairobi, 27th October, 2010.
68. Kirui O.K, & Njiraini G.W. (undated). Determinants of agricultural commercialization among the
rural poor: The role of ICT and collective action initiatives and gender perspectives in Kenya.
Center for development research. University of Bonn. Bonn.
69. Landesa, (2014). Issue Brief: Smallholder Farming and Achieving Our Development Goals.
Landesa Rural Development Institute. July 2014.
70. Lessons from recent experience in Malawi. Natural Resource Perspectives.
71. Levy S, & Barahona C, (2002). Main report of the evaluation program: 2001-2002 targeted inputs
program. London: Department for International Development.
72. Liverpool-tasie S.L (IFPRI Discussion paper 01194) (2012), Targeted Subsidies and private market
participation. An assessment of fertilizer demand in Nigeria
73. Livingston G., Schonberger S., &Delaney S., (2011): Sub – Saharan Africa: The state of
smallholders in Agriculture. Conference on new directions for smallholder agriculture. IFAD,
Rome.
74. Luo Y, & Tung RL, (2007). International expansion of emerging market enterprises: a springboard
中国农业科学院硕士学位论文 REFERENCES
93
perspective. Journal of International Business Studies, 38, 481-498.
http://www.palgrave-journals.com/jibs/journal/v38/n4/pdf/8400275a.pdf
75. MAFAP, (2013). Review of food and agricultural policies in Kenya. MAFAP Country Report
Series, FAO, Rome, Italy. http://www.fao.org/3/a-at553e.pdf
76. Mahaliyanaarachchi R.P, Bandara R.M.A.S (2006). Commercialization of Agriculture and role of
agricultural extension. Sabaragamuwa University Journal, Vol. 6, no. 1, pp 13-22
77. Mather D, & Jayne TS, (2011). The Impact of State Marketing Board Operations on Smallholder
Behavior and Incomes: The Case of Kenya. International Development Working Paper 119. East
Lansing, Michigan: Michigan State University. http://fsg.afre.msu.edu/papers/idwp119.pdf
78. Minde I, Jayne TS, Crawford E, Ariga J, & Govereh J, (2008). Promoting Fertilizer Use in Africa:
Current Issues and Empirical Evidence from Malawi, Zambia and Kenya, Policy Synthesis 83,
Department of Agricultural Economics, Michigan State University, Lansing, Michigan.
http://fsg.afre.msu.edu/inputs/documents/resakss_fertilizer_comparative_countries.pdf
79. Ministry of Agriculture, (2011). Final Report: NAAIAP Program Evaluation. Nairobi, Kenya:
Government of Kenya.
80. Minot N, & Benson T, (2009). Fertilizer Subsidies in Africa: Are Vouchers the Answer? IFPRI
Issue Brief 60. Washington, DC: International Food Policy Research Institute.
http://www.ifpri.org/sites/default/files/publications/ib60.pdf
81. Odame H, & Muange E, (2012). Can Agro-dealers deliver the green revolution in Kenya? Future
Agricultures Policy Brief No.45. Future Agricultures Consortium DFID UK.
http://r4d.dfid.gov.uk/PDF/Outputs/futureagriculture/FAC_Policy_Brief_No45.pdf
82. Omiti J, & Nyanamba T, (2007). Using social protection policies to reduce vulnerability and
promote economic growth in Kenya. Futures Discussion Paper 012. DFID UK.
http://www.future-agricultures.org/publications/research-and-analysis/discussion-papers/27-using-s
ocial-protection-policies-to-reduce-vulnerability-and-promote-economic-growth-in-kenya/file
83. Onumah G., Davis J., Kleih U., &Proctor F., (2007). Empowering smallholder farmers in markets:
Changing agricultural marketing systems and innovative responses by producer organizations.
MPRA Paper No. 25984.
84. Otieno D.J, Omiti J., Nyanamba T., McCullough E. 2009: Market Participation by vegetable
farmers in Kenya: A comparison of rural and peri-urban areas. African Journal of Agricultural
Research Vol. 4(5), pp. 451-460, May 2009
85. Owuor B., 2010.The maize subsector in Kenya: Mending the Granary. Heinrich Boll Stiftung East
and horn of Africa
86. Pender J, & Alemu D. (2007). Determinants of Smallholder Commercialization of Food Crops.
Theory and Evidence from Ethiopia. IFPRI Discussion Paper 00745. International Food Policy
Research Institute. Washington, USA.
87. Peter K, & Rotich G, (2013). Factors Affecting the Effectiveness of the Supply Chain of Subsidized
Fertilizer in Kenya: A Case Study of the National Cereals and Produce Board. International Journal

中国农业科学院硕士学位论文 REFERENCES
94
of Social Sciences and Entrepreneurship, 1(7), 1–25.
http://www.ijsse.org/articles/ijsse_v1_i7_140_165.pdf
88. Republic of Kenya, (2009). The National Accelerated Agricultural Input Access Program
(NAAIAP): Program Design and Implementation Framework 2009/2010, Nairobi: Ministry of
Agriculture
89. Schroeder C, Onyango, K‘Oloo, Nar Bahadur R., Jick NA, Parzies HK, and Gemenet DC. 2013.
Potentials of Hybrid Maize Varieties For Small Holder Farmers In Kenya: A review based on
SWOT analysis. African Journal of Food Agriculture Nutrition and development Vol. 13 No.2 April
2013.
90. Sharma V. P., Jain D., & De S., (2012). Managing agricultural commercialization for inclusive
growth in South Asia. Briefing Paper Number 6, 2012. Global Development Network Agriculture
policy series.
91. Sheahan M, Black R, & Jayne TS, (2013). Are Kenyan farmers‘ under-utilizing fertilizer?
Implications for input intensification strategies and research. Food Policy, 41, 39–52.
http://ageconsearch.umn.edu/bitstream/126739/2/SheahanEtAl.pdf
92. Singh R.B, Kumar. P, Woodhead T. 2002. Smallholder farmers in India: Food security and
Agricultural Policy. FAO. Bangkok, Thailand.
93. Smale M, Jayne T, (2003): Maize in Eastern and southern Africa: ―seeds‖ of success in Retrospect.
Environment and production technology division. IFPRI, Washington D.C. U.S.A.
http://www.fao.org/docs/eims/upload/166420/Smale,Jayne.pdf
94. Smale M., Jayne T. 2003: Maize in Eastern and southern Africa: “seeds” of success in Retrospect.
Environment and production technology division. IFPRI, Washington D.C. U.S.A
95. Tadesse G, &Guttormsen A, (undated). Commercializing smallholders through interlinked
contracts: prospects and challenges in the rift valleys of Ethiopia. Norwagian University of Life
sciences. Norway.
96. Thapa G, 2010. Smallholder or family farming in transforming economies of Asia and Latin
America. Challenges and opportunities. IFAD.
97. The Federal Reserve Bank of Boston and the aspen institute 2011: Smart Subsidy for community
development
98. Tirkaso WT, (2013). The role of agriculture commercialization for smallholders productivity and
food security: an empirical study in Rural Ethiopia. Masters thesis no 827 – ISSN 1401-4084.
Uppsala. Swedish University of Agricultural Sciences.
99. Tung D.X &Costales A., 2007: Market participation of smallholder poultry producers in Northern
Vietnam. Research Report Pro-poor Livestock Policy initiative. A living from Livestock.
100. Tung DX, & Costales A, (2007): Market participation of smallholder poultry producers in Northern
Vietnam. Research Report Pro-poor Livestock Policy initiative. A living from Livestock.
http://www.fao.org/ag/AGAinfo/programmes/en/pplpi/docarc/rep-hpai_marketparticipation.pdf
101. Uneze CU, (2013). Socio-Economic determinants of savings in cooperatives by farmers of selected
中国农业科学院硕士学位论文 REFERENCES
95
agricultural group lending schemes in Anambra state, Nigeria. Greener Journal of Agricultural
Sciences. Vol3 (5), pp.384-390, May 2013.
www.gjournals.org/GJAS/.../2013/May/031913531%20Uneze.pdf
102. Vondolia G.K., Eggert H., & Stage J., 2012.Nudging Boserup? The impact of fertilizer subsidies on
investment in Soil and water conservation. Environment for Development
103. www.Idex Mundi.com Kenya Corn production by year (1960 – 2012)
(http://www.indexmundi.com/agriculture/?country=ke&commodity=corn&graph=production
(accessed on 22nd May 2013)
104. www.Kilimo.go.ke. Republic of Kenya, Ministry of Agriculture, website ―Kenya is food secure –
23/03/2013‖http://www.kilimo.go.ke/index.php?option=com_content&view=article&id=548:kenya
-is-food-secure&catid=149:news&Itemid=46
105. Yamano K, & Arai A, (2010). Fertilizer Policies, Price, and Application in East Africa. GRIPS
Discussion Paper 10-24.GRIPS National Graduate Institute For Policy Studies. Japan.

中国农业科学院硕士学位论文 ACKNOWLEDGEMENT
96
ACKNOWLEDGEMENT
I am grateful to God for the good health and well-being that were necessary to complete this study.
I wish to express my sincere thanks to the Chinese Government through the Chinese Scholarship
Council for providing the necessary scholarship funding for my studies in China. I place on record my
sincere thanks to the Graduate School of the Chinese Academy of Agricultural Sciences led by Ms. Pan
Dong Fang and her able team of Ms. Grace, Ms. Sally and Ms. Oliver for admission into the Masters
Programme and for the continued support and encouragement. I am also grateful to Prof. Nie Fengying
and Prof. Fang Cheng (EST) my able supervisors to whomI will be extremely thankful and indebted for
sharing their expertise and sincere and valuable guidance and encouragement through my entire study. I
take this opportunity to express gratitude to all staff and students of the Institute of Agricultural
InformationMs. Jiaqi, Ms. Bi, Ms. Gure, Ms. Sun, Mr. Zhang, Mr. Liu, Mr. Zhou and Ms. Huang
Yangfang for their help and support. My sincere gratitude also go to my fellow international students Mr.
Nobeji, Mr. Eliamoni, Ms. Gbete, Mr. Samesh, Mr. Daninga and Mr. Charles from whom advice and
support was sort on numerous occasions than can be mentioned. I will forever be grateful to my
belovedwife Sofia, son Wise and daughter Precious for their perseverance, support and encouragement
through the dark and happy times that punctuatedmy entire study period. This effort will remain my gift
to you forever. Finally, I also place on record, my sense of gratitude to one and all, who directly or
indirectly, lent a hand in this study or other aspects of my stay and study in China, you will forever be
remembered and cherished for your kind heart and support.