FEMISE RESEARCH PRO G R A M M E
24
FDI in the Mediterranean Region: a Comparison with CEE Experience FEMISE RESEARCH PRO G R A M M E This text has been drafted with financial assistance from the Commission of the European Communities. The views expressed herein are those of the authors and therefore in no way reflect the offical opinion of the Commission Sergio Alessandrini & Laura Resmini University Luigi Bocconi, Milano, Italia January 2000
-
Upload
khangminh22 -
Category
Documents
-
view
1 -
download
0
Transcript of FEMISE RESEARCH PRO G R A M M E
FDI in the Mediterranean Region: a Comparison
with CEE Experience
F E M I S E R E S E A R C H P R O G R A M M E
This text has been drafted with financial assistance from the Commission of the European Communities. The viewsexpressed herein are those of the authors and therefore in no way reflect the offical opinion of the Commission
Sergio Alessandrini & Laura ResminiUniversity Luigi Bocconi, Milano, Italia
January 2000

1
EUROPEAN FDI IN THE MEDITERRANEAN REGION: A COMPARISON WITH CEEEXPERIENCE(*)
Sergio Alessandrini and Laura Resmini
"L. Bocconi" University, Milan (Italy)
January, 2000
1. The Association Agreements: a new challenge for FDI
The main characteristic of the Association Agreements with the EU is theacknowledgement of the dynamic effects of investments, both domestic and foreignones. The transitory period of 12 years is sufficiently long for implementing theadjustment measures and for preparing the Southern Mediterranean countries to thecompetitive environment imposed by the globalisation of markets. The domesticenterprises, actually protected by high tariffs and customs duties, will have the time toimplement the appropriate adjustment policies and to reap the opportunities of tradeliberalisation (Pace, 1997). Considering the inevitability and the urgency of suchchoices, it seems therefore suitable the decision of Morocco and Tunisia to immediatelysign the new Association Agreements. They encouraged the structural adjustmentprogrammes, reducing the domestic and external imbalances, strengthening the financialsystem and introducing new codes for attracting FDI (Brown, Deardoff and Stern,1997;Chatti, 1999; Hamdouch, 1996).
The benefits of the opening up of the economies – this is the main rationale ofthe economic integration – are directly associated to the timely adjustment to the neweconomic environment and to the capacity of the local system to adapt its performanceand its structure to the conditions dictated by the international markets. Theseadjustments will be possible and self-sustaining when motivations for investment andentrepreneurial abilities support the reallocation of productive factors (Hoekman andKonan, 1999).
The dynamic of investments is therefore a crucial element in order to maximisethe benefits of regional integration (Reiffers, 1997). It depends on the ability to build aconvincing development strategy on the existing competitive advantages (in staticsense) or to reallocate the available resources in order to create new competitiveadvantages (in dynamic sense). These two strategies are complementary. From thispoint of view, FDI – that in some countries, such as Tunisia and Egypt, accounts forup to 20 percent of the total capital expenditures) may be a crucial factor fostering themodernisation and the social development.
(*) A preliminary version of this paper has been presented at the ERF Sixth Annual Conference, Cairo
28-31 October, 1999. The authors are grateful to all participants at the seminar, Carlo Altomonteand Ali Bayar for helpful comments and suggestions. Usual disclaim applies. Although the paper isthe result of a common work, S. Alessandrini wrote sections from 1-4, while L. Resmini isresponsible for section 5 and 6.
2
The aim of this paper is to analyse the determinants of FDI in the Mediterraneanregion. In particular, we are interested in comparing the recent experience of theMediterranean (MED) countries with that of the Central and Eastern Europeancountries (CEECs). Both groups of countries signed Association Agreements with theEU. Moreover, the recent up-surge of FDI flows into the CEECs raised some concernsabout the future patterns of FDI in the Mediterranean region. The paper is organised asfollow. Section 2 deals with an important issue for the MED countries: theprogressively marginalisation of the region as recipient of FDI flows and stocks,marginalisation that could become more and more severe because of the toughercompetition between MED and CEE countries as location of FDI. Although confirmedby existing data, it is worth to keep in mind that official statistics are based on criteriaand rules of recording of the phenomena that depend on the country of origin anddestination. These conceptual asymmetries contributed to the alleged marginalisationof the MED region as recipient of FDI. Section 3 summarises recent trends and data onFDI in the Mediterranean region, focusing on main home and host countries. Section 4briefly reviews the existing literature on the determinants of FDI in the MED region.Section 5 explores and analyses what factors best explain foreign investments from aquantitative point of view. The analysis, based on a three-dimensional panel data base,compares the behaviour of two important sources of FDI, i.e. European Union andUnited States of America, not only in the MED region, but also in CEE. Section 6provides some conclusions.
2. The marginalisation of the Mediterranean region: missing FDI or missingfigures?
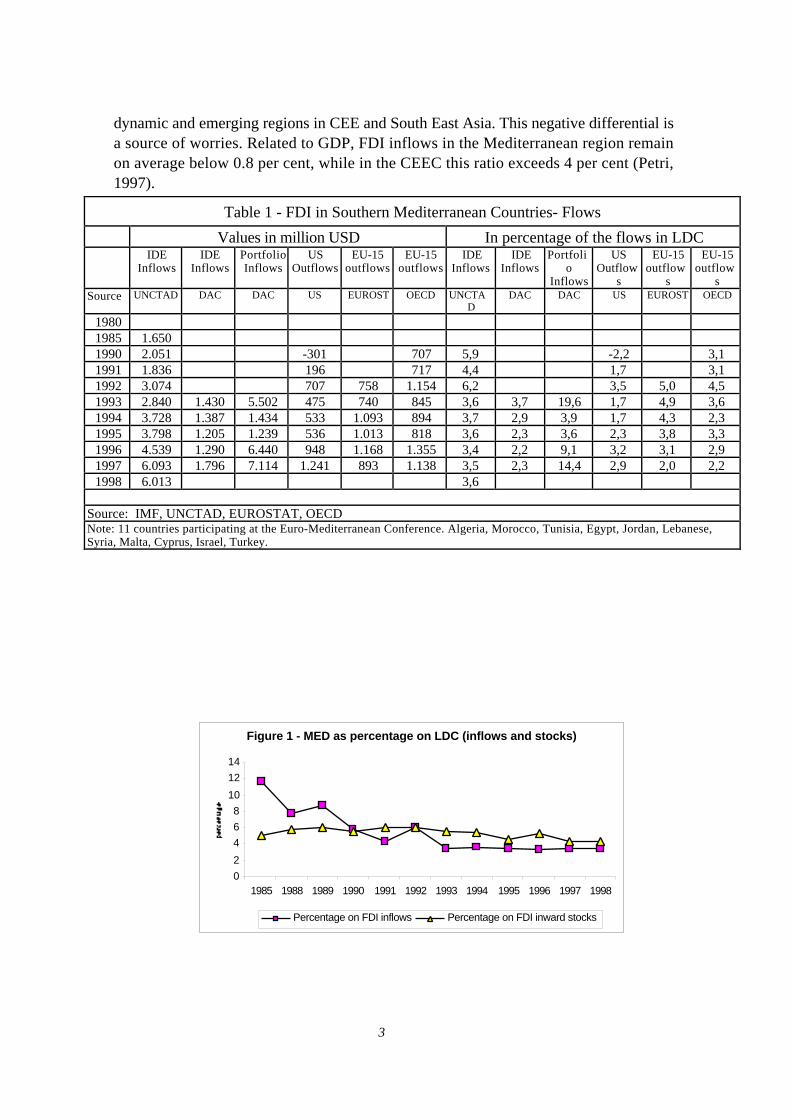
According to the last World Investment Report (1999)1, the most authoritativesource of information on FDI, in 1998 the Southern Mediterranean Countries, as agroup, have attracted 6.0 billions USD, i.e. 3.6 per cent of the total FDI inflows in thedeveloping countries. Notwithstanding the increase of inflows since 1996, the share ofthe Mediterranean region continued its decreasing trend during the Nineties (figure 1).
The current experience differs significantly across countries, given theirheterogeneous nature. Egypt, that was the main host country during the Eighties, hasbeen replaced in the first half of this decade by Turkey and, in the most recent years,by Israel. Algeria evidenced a stagnation of new foreign investments and itsconcentration in the energy sector. Only Morocco, Tunisia and Malta show anincreasing trend during the decade.
This uneven distribution of FDI among countries did not prevent the gradualmarginalisation of the region, that Petri (1997) in one of the few analysis on the geo-economic aspects of capital movements into the area, ascribes to the limitedattractiveness of these countries, in particular when they are compared with the more 1 It is published annually by UNCTAD, Division on Transnational Corporation and Investments,Geneva.
3
dynamic and emerging regions in CEE and South East Asia. This negative differential isa source of worries. Related to GDP, FDI inflows in the Mediterranean region remainon average below 0.8 per cent, while in the CEEC this ratio exceeds 4 per cent (Petri,1997).
Table 1 - FDI in Southern Mediterranean Countries- Flows
Values in million USD In percentage of the flows in LDCIDE
InflowsIDE
InflowsPortfolioInflows
USOutflows
EU-15outflows
EU-15outflows
IDEInflows
IDEInflows
Portfolio
Inflows
USOutflow
s
EU-15outflow
s
EU-15outflow
sSource UNCTAD DAC DAC US EUROST OECD UNCTA
DDAC DAC US EUROST OECD
19801985 1.6501990 2.051 -301 707 5,9 -2,2 3,11991 1.836 196 717 4,4 1,7 3,11992 3.074 707 758 1.154 6,2 3,5 5,0 4,51993 2.840 1.430 5.502 475 740 845 3,6 3,7 19,6 1,7 4,9 3,61994 3.728 1.387 1.434 533 1.093 894 3,7 2,9 3,9 1,7 4,3 2,31995 3.798 1.205 1.239 536 1.013 818 3,6 2,3 3,6 2,3 3,8 3,31996 4.539 1.290 6.440 948 1.168 1.355 3,4 2,2 9,1 3,2 3,1 2,91997 6.093 1.796 7.114 1.241 893 1.138 3,5 2,3 14,4 2,9 2,0 2,21998 6.013 3,6
Source: IMF, UNCTAD, EUROSTAT, OECDNote: 11 countries participating at the Euro-Mediterranean Conference. Algeria, Morocco, Tunisia, Egypt, Jordan, Lebanese,Syria, Malta, Cyprus, Israel, Turkey.
Figure 1 - MED as percentage on LDC (inflows and stocks)
0
2
4
6
8
10
12
14
1985 1988 1989 1990 1991 1992 1993 1994 1995 1996 1997 1998
Percentage on FDI inflows Percentage on FDI inward stocks

4
Table 2 - FDI in Southern Mediterranean Countries- Stocks
Values in million USD In percentage of the flows in LDCIDE Stocks US Stocks EU-15 Stocks IDE Stocks US Stocks EU-15 Stocks
Source UNCTAD US OECD UNCTAD US OECD1980 6.171 4,61985 12.375 5,21990 21.401 2.641 2.471 5,8 2,5 2,31991 22.845 2.784 3.052 6,2 2,4 2,61992 26.155 3.607 4.408 6,2 2,6 3,61993 28.848 4.738 6.216 5,8 3,0 4,91994 33.318 4.290 6.808 5,6 2,4 4,51995 36.392 4.892 7.589 4,7 2,4 4,01996 40.931 5.748 7.976 5,3 2,4 3,61997 47.024 6.859 8.068 4,5 2,4 3,21998 53.038 4,3
Source: UNCTAD, OECDNote: 11 countries participating at the Euro-Mediterranean Conference. Algeria, Morocco, Tunisia,Egypt, Jordan, Lebanese, Syria, Malta, Cyprus, Israel, Turkey.
In order to improve the comprehension of this phenomenon, it would benecessary to analyse more in detail FDI flows and determinants at country, both homeand host ones, and sector level. However, an accurate analysis of the external growth ofthe transnational enterprises is prevented by the deficiencies of statistical data, ofteninadequate, heterogeneous and partial. The utilisation of data drawn from the monetaryflows of the balance of payment statistics, tends to stress the cyclical reversals and, inthe opinion of the authors, to underestimate the real contribution of the investmentinitiatives carried on by the transnational enterprises.
In quantitative terms, large asymmetries are found between home and hostreporting countries, due to the modalities of imputation of profits; in several casesprofits are reinvested in the foreign subsidiary (without a corresponding capitalmovement, but with an effective participation of the transnational enterprise in thehost country); alternatively, the foreign partner supplies investment goods and licenceswhich are reported in kind or credits without affecting the ownership structure.
These strategic decisions, as well as inadequate reporting, are the sources ofquantitative asymmetries that prevent the correct interpretation and understanding ofthe role of foreign enterprises. A reconciliation with the economic analysis shouldtherefore be encouraged. As an example, large asymmetries are found in the time seriesprepared by investing countries, mainly from OECD and EUROSTAT, and thoseprepared by the host countries, utilised by UNCTAD in his yearly report. The totalinflows in the Mediterranean countries should mirror the outflows from the industrialcountries reported by OECD and EUROSTAT, as far as the EU is concerned2. Butthis is not the case, since inflows reported in UNCTAD statistics exceed always theoutflows declared by OECD countries. The differences are relevant, as shown in thetable 1 and 2.
2 For example, the situation found in the FDI inflows of Israel, in 1997 the UNCTAD report clearlyunderlines a FDI inflow of 3.4 billions USD and goes further in commenting positively the 30 per cent
5
An improvement in the quality of FDI statistics is recommendable, in order todifferentiate the cyclical dynamics of the 1990s. The reduction of FDI outflows fromthe American enterprises seems more sensitive in the first half of the nineties, while thefinancial contribution of the European enterprises has shown an increasing trend in thefinal part of the decade. Are these changes linked to the Partenariat initiatives? Therecent developments that mark a positive change of direction, have not avoided themarginalisation of the region in the decisions of the American and European enterprises.For the European the reduction of the share is below 3%, from 5% in 1990. This Ushaped trend is clearly visible also in portfolio investment flows, that for their natureare much more erratic and sensitive to the profitability conditions.
Although data on inward stocks of FDI are not available for all countries, theiranalysis offers a further contribution to the understanding of FDI patterns in the MEDregion. According to UNCTAD (1999) figures, the stock of foreign investments in theSouthern Mediterranean region exceeded 53 billions USD in 1998 but the share of theregion in the total inward FDI stock in developing countries contracted less than 4,5percent, compared to 6,2 percent in 1990 or to 5.2 percent in 1985 (se Figure 1). Egyptstill remains the country with the most important stock of FDI, more than 15 billionsUSD in 1997, followed by Israel (11.8 billions) and Turkey (6.4 billions). On thecontrary the position of Algeria has been now surpassed by Tunisia (with 3.4 billionsUSD) and by Morocco .
3. FDI in the Mediterranean region: motivations and patterns
The strategic behaviour of TNCs investing into the area has changed over time, aswell as motivations. In the previous two decades foreign investments aimed atovercoming custom protectionism. The set up of a production plant within the localmarket strengthened the margins of competitiveness towards foreign exporters, orreinforced the special links with local partners through subcontracting or joint-venturing. Significant examples of this kind of investment strategy are the contracts ofexploration and oil extraction with SONATRAC in Algeria and a number of foreignparticipation registered in Egypt or Turkey in the production and assembling of severalconsumer goods for the domestic markets. These obstacles have not been stilleliminated and the degree of effective protection of the region is higher than that ofother developing countries or transition economies of Central Europe.
increase to the previous year. But this value is adding together FDI and portfolio investments and soone can explain the asymmetry with similar data provided by OECD, which applies rigorously the IMFdefinition (foreign control at least 10 percent of the property). The same Bank of Israel, in its annualreport, specifies that “Nonresidents' investment flows in 1997 amounted to $ 3.7 billion, a rise of morethan 30 percent from the 1996 level; 45 percent was direct investment, and the rest was portfolioinvestment in the Tel Aviv Stock Exchange (TASE) and in Israeli shares traded abroad” (Annual Report1997, page 150).
6
The privatisation process and the reduction of the state intervention in theeconomy are also contributing to modify the strategic behaviour of foreign enterprisesin many countries, especially in Central and Eastern Europe. In the Mediterraneanregion, however, the privatisation process has been delayed too much and has been tooslow, worsening the competitiveness of local enterprises relative to those located inother more dynamic regions, such as Central Europe, to mention the nearest one,(Hoekman and Djankov, 1996), or Latin America.
Ultimately, the overall production system of the region still remains prudent ordubious on the benefits of the changing relationships with Europe, since the firstAssociation agreements were signed in 1994 (before the conference of Barcelona) withTunisia and Morocco, followed three years later by Jordan, Palestinian territories andrecently by Egypt. Only in the former three countries we have noticed an increase ofFDI inflows, but given their size, the effects are limited and locally defined. Much moreimportant seems to be the agreement with Egypt, signed in 1999. It is expected that itwill generate more radical changes in the European direct investment patterns, eventhough they are not yet visible in the statistical data.
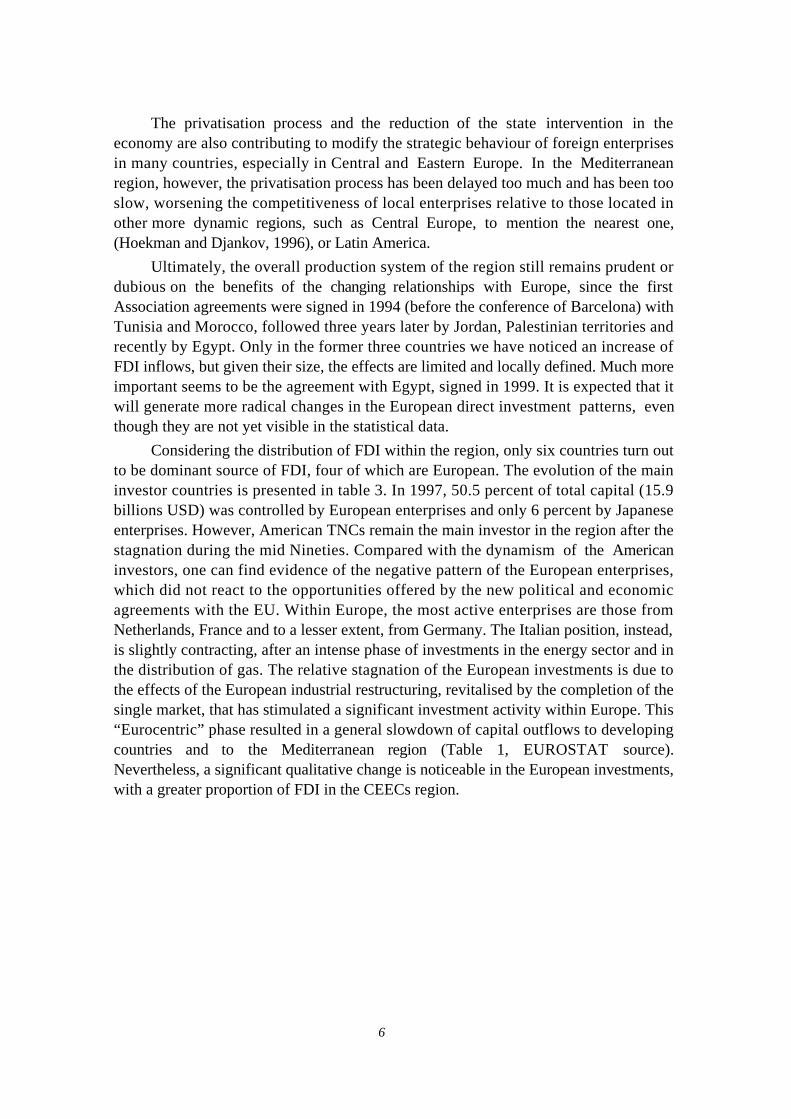
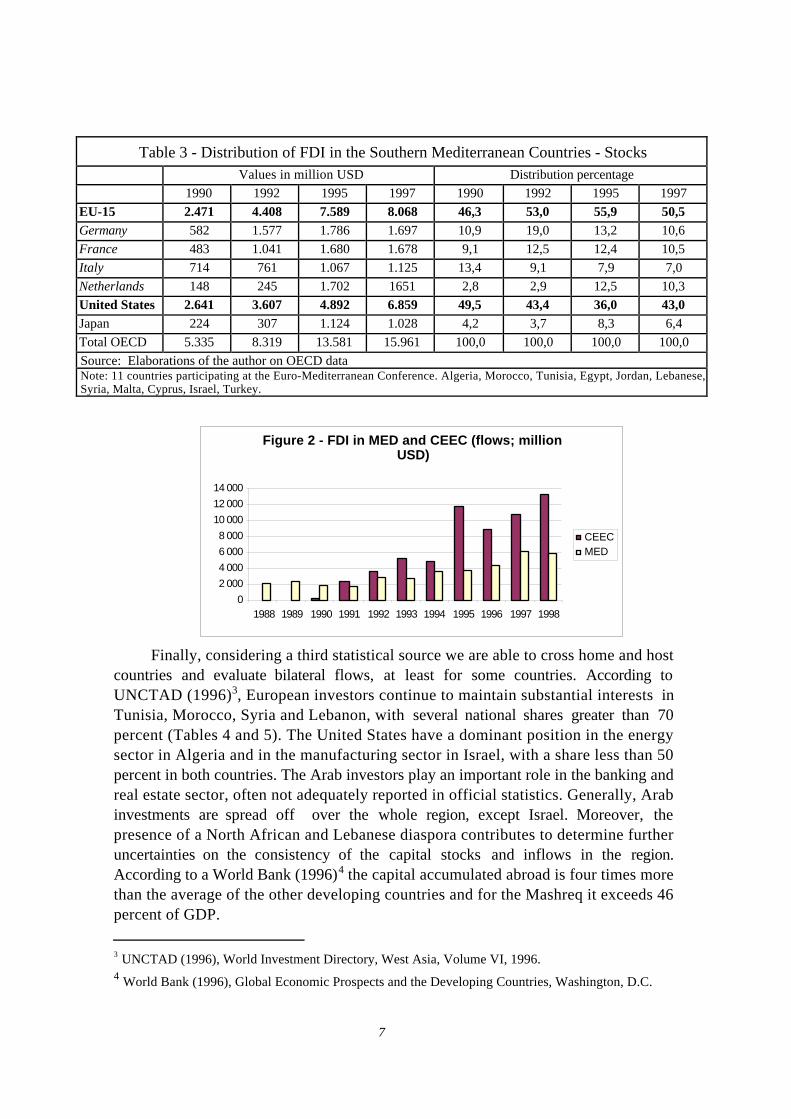
Considering the distribution of FDI within the region, only six countries turn outto be dominant source of FDI, four of which are European. The evolution of the maininvestor countries is presented in table 3. In 1997, 50.5 percent of total capital (15.9billions USD) was controlled by European enterprises and only 6 percent by Japaneseenterprises. However, American TNCs remain the main investor in the region after thestagnation during the mid Nineties. Compared with the dynamism of the Americaninvestors, one can find evidence of the negative pattern of the European enterprises,which did not react to the opportunities offered by the new political and economicagreements with the EU. Within Europe, the most active enterprises are those fromNetherlands, France and to a lesser extent, from Germany. The Italian position, instead,is slightly contracting, after an intense phase of investments in the energy sector and inthe distribution of gas. The relative stagnation of the European investments is due tothe effects of the European industrial restructuring, revitalised by the completion of thesingle market, that has stimulated a significant investment activity within Europe. This“Eurocentric” phase resulted in a general slowdown of capital outflows to developingcountries and to the Mediterranean region (Table 1, EUROSTAT source).Nevertheless, a significant qualitative change is noticeable in the European investments,with a greater proportion of FDI in the CEECs region.
7
Table 3 - Distribution of FDI in the Southern Mediterranean Countries - StocksValues in million USD Distribution percentage
1990 1992 1995 1997 1990 1992 1995 1997EU-15 2.471 4.408 7.589 8.068 46,3 53,0 55,9 50,5Germany 582 1.577 1.786 1.697 10,9 19,0 13,2 10,6France 483 1.041 1.680 1.678 9,1 12,5 12,4 10,5Italy 714 761 1.067 1.125 13,4 9,1 7,9 7,0Netherlands 148 245 1.702 1651 2,8 2,9 12,5 10,3United States 2.641 3.607 4.892 6.859 49,5 43,4 36,0 43,0Japan 224 307 1.124 1.028 4,2 3,7 8,3 6,4Total OECD 5.335 8.319 13.581 15.961 100,0 100,0 100,0 100,0Source: Elaborations of the author on OECD dataNote: 11 countries participating at the Euro-Mediterranean Conference. Algeria, Morocco, Tunisia, Egypt, Jordan, Lebanese,Syria, Malta, Cyprus, Israel, Turkey.
Figure 2 - FDI in MED and CEEC (flows; million USD)
0
2 000
4 000
6 000
8 000
10 000
12 000
14 000
1988 1989 1990 1991 1992 1993 1994 1995 1996 1997 1998
CEECMED
Finally, considering a third statistical source we are able to cross home and hostcountries and evaluate bilateral flows, at least for some countries. According toUNCTAD (1996)3, European investors continue to maintain substantial interests inTunisia, Morocco, Syria and Lebanon, with several national shares greater than 70percent (Tables 4 and 5). The United States have a dominant position in the energysector in Algeria and in the manufacturing sector in Israel, with a share less than 50percent in both countries. The Arab investors play an important role in the banking andreal estate sector, often not adequately reported in official statistics. Generally, Arabinvestments are spread off over the whole region, except Israel. Moreover, thepresence of a North African and Lebanese diaspora contributes to determine furtheruncertainties on the consistency of the capital stocks and inflows in the region.According to a World Bank (1996)4 the capital accumulated abroad is four times morethan the average of the other developing countries and for the Mashreq it exceeds 46percent of GDP.
3 UNCTAD (1996), World Investment Directory, West Asia, Volume VI, 1996.4 World Bank (1996), Global Economic Prospects and the Developing Countries, Washington, D.C.

8
Table 4 - Distribution of FDI in the Southern Mediterranean Countries - Flows - Values percentages
Morocco Tunisia Israel Turkey1992 1995 1989 1992 1994 1990 1996
EU 57,6 59,7 57,1 80,5 21,3 67,7 84,7Germany 1,9 2,5 7,0 0,3 1,4 7,8 5,9
France 23,5 24,8 19,2 9,0 0,9 36,0 61,8
Italy 2,0 1,4 9,9 61,9 2,6 3,5 1,1
Spain 18,8 6,6 7,7 0,1 0,5
Netherlands 4,4 8,7 0,0 0,0 8,0 1,8 8,8
United Kingdom 2,0 8,5 0,0 0,0 5,4 15,4 4,3
Sweden 0,0 1,4 0,1 0,1 0,0 0,0 0,0
USA 6,8 11,6 17,0 11,7 52,8 6,9 4,7Japan 0,1 2,5 0,1 0,0 0,0 5,5 0,5Arab Countries 11,7 13,0
Total 100,0 100,0 100,0 100,0 100,0 100,0 100,0
Source: UNCTAD (1996) and original sources updated by the author.Israel: Ministry of Trade and Investment. Tunisia: Ministry of International Cooperation and ForeignInvestment, Tunisia Investment Promotion Agency. Algeria:Agence de Promotion, de Soutien ae the Suivi desInvestissements.Marocco: Ministére des Finances ET des Investissements Extérieurs. Egypt: Egyptian GeneralAuthorioty for Investment. Turkey: Undersecretariat of the Treasury.
Table 5 - Distribution of FDI in the Southern Mediterranean countries - Stocks - Values percentages
Egypt Syria Lebanon Tunisia Algeria1995 1993 1993 1994 1995
EU 40,4 81,9 99,5 70,0 23,2Germany 4,5 36,4 -7,0 3,9
France 6,0 44,6 111,9 23,4 5,3
Italy 5,8 30,9 13,4
Spain 0,4 4,5
Netherlands 2,8 0,0 0,1 0,0 0,0
United Kingdom 8,7 0,0 0,1 0,0 0,0
Sweden 5,2
USA 16,7 0,6 53,0Japan 4,6 0,0 0,0 0,0 0,0
100,0 100,0 100,0 100,0 100,0Source: UNCTAD (1996)
The sectoral distribution of FDI is concentrated in a limited number of sectors:energy and mining in Algeria, Syria and Egypt; basic manufacturing, tourism andinfrastructures (Egypt, Tunisia, Jordan), labour intensive sectors (Tunisia, Morocco,Turkey) and electronics and other high tech sectors but only in Israel. Generally,Southern Mediterranean countries, tend to attract investments in activities scale andcapital intensive, that contributes to expand the production but that involves a modesttechnological transfer (Petri, 1997). These factors affect the specialisation of the region

9
and its differentiation with other LDC regions. Petri (1997) derives this conclusion onanecdotal literature (with few quantitative support) and estimates that only one thirdof the investment projects really improves the technological abilities of the region.This implies that opportunities to generate new foreign investments remain tied tonatural resource endowments. This peculiar specialisation hinders the impact of FDI ontechnological and organisational knowledge, a cause explaining the slow regionaldevelopment compared with the positive experience of the South East Asia and LatinAmerica.
4. The factors of attractiveness in the Mediterranean region: a preliminarysurvey of the literature
Which are the causes of the insufficient attractiveness of the Mediterraneancountries? A first answer should be related to the motivations of the transnationalenterprises. The economic literature agrees on two precise motivations correspondingto two different strategies of internationalisation of enterprises. Markusen (1995) andMichalet (1996, 1997) distinguish two investment strategies, defined respectively as“horizontal” and “vertical”. The horizontal strategy characterises foreign investmentswhich aim to secure an advantage when the host country opens up its domestic market.Therefore, FDI can be considered as an extension of the export strategy, and it can bealso defined as “market seeking” since its target is local markets (Dunning, 1992). Thedistinction is however arbitrary and deceptive since a horizontal FDI can be theconsequence not only of the opening up of the domestic market of the host country,but also of its excessive protection that forces foreign investors to produce locally andjump the tariffs and other barriers to trade. Products supplied in host markets, thetechnology incorporated into the plants and the marketing strategies are generallysimilar to those used in the home country. This presupposes the similarity of theenvironmental conditions and the structural characteristics of the two countries.
On the contrary, the vertical strategy implies a new production system whichspecialises in one particular phase of the production process and foreign enterprisesaim at lowering the production costs. This strategy can be identified with "efficiencyseeking" FDI. The choice of the host country is then explained by the factorendowment. Vertical-type FDI is intersectorial and is supported by the pricedifferential of factors of production, while Horizontal-type FDI supports intra-sectortrade flows and generates differentiated products on the regional markets.
Michalet (1997) emphasises that horizontal FDI is more frequent in Morocco,Tunisia, Turkey and Egypt. Therefore, the size and growth of the market are the maindeterminants of investment decisions. However, the target market not necessarilycorresponds to the domestic one. It often includes other markets within the region.This implies that foreign investors consider the host country as a bridge to enterregional market through a “hub and spokes” pattern. This fact questions the abovementioned traditional dichotomy of FDI strategies: horizontal and vertical FDI can notbe considered as two clearly differentiated strategies since they often overlap. The host
10
country must guarantee not only the access to a market, both domestic and regional,with a sufficient dimension, but also the presence of cheaper factors of production inorder to make convenient the local production and the exporting activity into the regionor the rest of the world. The selectivity and the competition among multinationalenterprises seem therefore to reduce the possibilities of locating into a limited numberof countries, as it happened for the CEEC and it is going to take place also for theMediterranean region. In the group of countries inquired by Michalet, foreign investorsseem to prefer Turkey, Hungary and the Poland, that are included in the group of theCore countries. The author concluded that other Mediterranean countries have apotential vocation for FDI, not completely exploited. The author endorses thehypothesis of a complementary relation between Mediterranean and CEE countriesbecause of the different motivations declared by the transnational enterprises investinginto the two areas: they see opportunities for horizontal investments in Morocco,Tunisia and Egypt, and for vertical investments in CEE.
Asked on the factors that influence the location and the choice of the hostcountry, transnational enterprises place at the first places the economic and politicalstability followed by the dimension of the market. The political and economicstability has a dimension that should inspire the legal and institutional framework: itmust be stable, transparent and reliable. These conditions are important and theirabsence induces the enterprises to suspend their investment decisions or limits theirfinancial commitments. Therefore, Michalet’s survey confirms the traditionalhypothesis of TNCs risk averted. The availability of skilled labour, rather than lowlabour costs, is the third variable that affect investors’ attractiveness and it should beconnected to the type of investment, the introduction of more complex technologies, aswell as the tendency to externalise an increasing number of production phases.Mediterranean countries’ poor structural conditions reinforce the risk ofmarginalisation of the area, if the adoption of corrective measures aimed at modernisingthe domestic production and labour market continues to be postponed. Such a risk isreal also in those countries that succeed in attracting foreign investors in the sixties andthe seventies. It seems that the current competitive model driven by the globalisationcontrasts with the old logic of tariff protectionism. Of growing importance is also theneed for communications and infrastructure that allow the transfer of information andgoods. Financial incentives rank last in the list of the factors of attractiveness quotedby MNEs, with the exception of manufacturing and assembling activities, such as OPTin the textile-apparel sector.
5. The econometric model
In this section we explore and analyse what factors best explain foreign directinvestments into CEE and the MED region. From a theoretical point of view, FDIarises from a combination of industrial organisation motives that result in a number ofactivities being placed under common ownership and control, and comparativeadvantage reasons that cause these activities to be located in different countries and

11
regions (Krugman, 1995). Whilst there are no reasons to expect that factors determiningFDI in Central and Eastern Europe are different from those promoting FDI in theMediterranean countries, much less is know about the relative strength of these factorsin the two regions. In fact, there is little econometric evidence about the factorsdetermining inward investments in both regions5. However, quantitative analysis of thefactors determining flows of FDI is useful to establish whether and what governmentpolicies can influence FDI. This section is devoted to shed light onto this issues byassessing and comparing factors affecting the pattern of FDI in the two regions in aframework of a standard location choice model.
In doing this, we utilise European Union and American outward stocks of FDIfor the years 1990-1997 in a panel data study of its determinants in eight CentralEuropean countries – i.e. the Visegrad ones, Bulgaria, Estonia, Romania and Slovenia –and 11 Mediterranean countries – i.e. Algeria, Cyprus, Egypt, Israel, Jordan, Lebanon,Malta, Morocco, Syria, Tunisia and Turkey. This framework allows us to includeexogenous fixed effects for each host countries, since both regions hide large differenceswithin them. It also allows for some variation in the behaviour of the investors,depending on their country of origin, i.e. European Union or United States. Althoughthis panel is constrained in one dimension by the absence of the sectoral distribution ofFDI, it remains a rich source of information because of the considerable cross-sectionaldifferences between the countries included in it.
5.1 The independent variables
An important aspect of any econometric analysis is the specification of themodel. The choice of the variables has been dictated by the literature on thedeterminants of FDI in the developing countries, as summarised by Caves (1996) andSingh and Jun (1996). Unfortunately, it has sometimes been constrained by theavailability of data. The independent variables have been chosen to reflect theattractiveness of the host economies as potential locations for foreign investors.
According to the market size hypothesis, FDI in any period is assumed to be afunction of the size of the target market: the larger the market, the more opportunitiesit offers to foreign investors. However, given the long-run nature of FDI, expectedmarket growth may be a more accurate factor in determining the distribution of FDIamong regions and countries. Since it is difficult to measure investors’ expectations, wecontrol for market potential by considering the inward stocks of FDI relative to 5 A small number of econometric studies on the determinants of FDI have recently been undertaken inCentral and Eastern Europe (Lansbury et al. 1996; Holland and Pain, 1998; Resmini 1999 andAltomonte, 2000). As far as the MED region is concerned, Petri (1997) estimated a regression model todetermine how the level of FDI and stock market capitalization compare with international norms. Hefound that there is great potential for expanding FDI into the region and that large gaps actually existbetween the Med countries and similar economies elsewhere. Michelet (1999) reporting the results of asurvey, concluded that the MED countries are actually excluded by the “core countries”, i.e. by thatgroup of countries whose characteristics are able to attract foreign investments regardless the country oforigin and the economic activities. Whilst such empirical evidence is informative, it does not provide afull explanation of recent patterns of investments in the MED region.
12
population. Moreover, we introduce as explanatory variable the growth rate of theGDP, a variable that has been used in several studies (Wang and Swain, 1995; Hollandand Pain, 1998; Singh and Jun, 1996).
A number of studies have suggested that investments in developing countriesare also positively affected by the degree of openness of the host economy. Thisimplies that foreign investors prefer countries with relatively liberal trade regimes,possibly within region with free trade agreements (Blomstrom and Kokko, 1997).Existing business linkages and knowledge of local markets may help foreign firms,especially small and medium-sized ones, to take advantages of the opportunitiespresented by a rapidly evolving market structure. In order to investigate whether thestock of investments by individual countries in Central Europe and in the MED regionhas been influenced by trade linkages, we use a measure defined as the share of trade(exports plus imports) in each of the host economies accounted for by trade with theinvesting economies. In addition, we include a measure of the growth rate of the GDPof the trading partners of each host economy, weighted by trade shares, to test whetherinvestment decisions are influenced by trade arrangements that allows the entrance inneighbouring markets.
Profit-maximising multinationals may decide to de-localise production plantsoverseas to exploit manufacturing cost advantages, in terms of both labour costs orproximity to natural resources. The neo-classical theory of the determinants of FDIsuggests that host countries' labour supply influences foreign investors' locationdecisions through the labour cost and the quality of the skills of the labour force.Locations with low labour costs and/or highly skilled labour force are expected to bemore attractive for foreign investors, particularly for firms producing labour intensivegoods. Unfortunately, time-series data about labour costs and productivity are notreadily available in most of the countries included in the sample. Therefore, we try todraw the importance of labour cost as an explanatory variable for FDI inward stocksindirectly through the level of education. The proximity to natural resource hypothesisis tested through the country specific fixed effects.
There is a general belief that a conducive business environment is necessary forattracting FDI. The long-term nature of FDI makes it very sensitive to risk withrespect to portfolio investments. It may take several years before a foreign investmentbecomes profitable, so investors want to be assured of the economic and politicalstability of the host countries, globally considered. We proxy the business environmentcharacteristics with an index, the Operation Risk Index (ORI), computed by aconsultancy agency (Bery S.A). A panel of 105 experts from around the worldevaluates each country on the basis of a wide range of factors, including politicalcontinuity, attitude toward foreign investors, enforceability of contracts, infrastructureand local management. This qualitative index ranges from 0 (prohibitive risk) to 100(operation conditions very closed to those existing in the industrialised countries). Anumber of studies have already used this index as a proxy of country risk in a inter-country perspective, with good results (Singh and Jun, 1996; Resmini, 1999 andAltomonte, 2000).
13
Finally, industrial location theory (Markusen and Venables, 1999), both atregional and international level, suggests that the main force driving location decisions isthe strength of existing manufacturing activities. Manufacturers gain from locating incloser proximity because of external economies; moreover, a country with a strongconcentration of manufacturing activities is more likely to have an adequate labour pooland supply network to support industrial activity. Manufacturing development hasbeen measured by the share of manufacturing in total GDP.
To summarise, the estimated model assumes the following form:
ijtjtjtijtjtjtjtijjt
ijt uGTPMANTRADEORIEDUGPOP
FDI+++++++= 6543210)( ααααααα
where:
1997,...,1990
Tunisia Turkey, Syria, R.,Slovak Slovenia, Romania, Poland,
Morocco, Malta, Israel, Hungary, Estonia, Egypt, R.,Czech Cyprus, Bulgaria, Algeria,
,
=
==
t
j
USAEUi
FDI ijt denotes outward stock of FDI from country i to country j at time t, POPjt is thepopulation level of the host country, Gjt denotes the GDP growth rate of the hostcountry j, ORIjt measures the country risk, EDUjt is the level of tertiary education(percentages), TRADEijt captures the intensity of trade linkages between home andhost countries, MANjt is the share of the industry in the GDP and GTPjt is the growthrate of the trade partners of the host economies6. All variables are in log form. Inestimation we allow for country specific effects within host countries, j0α , since both
regions hide large differences within them. We also control for home country specificeffects ( i0α ). Not wishing to suppress useful information about some form of
interdependence among countries, a seemingly unrelated regression model has beenchosen (Matyas, Sevestre, 1996).
5.2 Expected sign of the explanatory variables
The first question to address is whether the expected signs of the explanatoryvariables conform with the theoretical prediction of the determinants of FDI.
On a priori grounds, it is expected that FDI reacts positively to the market sizehypothesis. Therefore, we would expect that the relationship between FDI per capitaand the percentage growth of GDP is positive. Moreover, if multinationals locatedproduction facilities in Central Europe or in some of the MED countries to takeadvantages of growing regional markets, also the sign of the coefficient of GTP will bepositive. 6 See data appendix for details on sources and definitions.
14
The coefficient of EDU may be positive or negative. It is expected to benegative if foreign investors prefer less educated, and thus cheaper, workers. A positivesign, instead, would indicate a preference for more productive, and thus more expensivelabour force.
The sign of the coefficient of the country risk is expected to be positive sinceeconomically and politically stable countries offer more guarantees to foreign investors.
A well developed manufacturing sector sounds attractive for foreign firms sincethe exploitation of agglomeration economies may increase efficiency and, then, profits.Nevertheless, MAN could also have a negative sign since an increase in the size of themanufacturing sector might also be a sign of a tougher competition. Foreign investmentsdriven by the search of strategic assets may be negatively affected by an increase in thesize of the manufacturing sector, since it becomes more and more difficult to gainmarket share while pre-empting competitors from doing likewise. Moreover, intransition countries this variable must be interpreted with further caution. Privatisationand industry restructuring process may negatively affect the size of the manufacturingsector. If foreign firms are attracted by restructured sectors, the sign of the coefficientof MAN will be negative.
Finally, there are no prior assumptions regarding the sign of the coefficient ofTRADE. Barriers to trade increase the costs associated with serving a foreign marketthrough exports, stimulating direct investments as a substitute for trade. In this case wewould expect a negative relation between TRADE and FDI. On the other hand, tradeand FDI may be complement, as multinationals tend to generate a high level of tradebetween parent and affiliate firms. If this influence dominates, it is likely that the signof the coefficient of TRADE is positive. If the two forces balance, the coefficient willtend to be close to zero.
5.3 Results
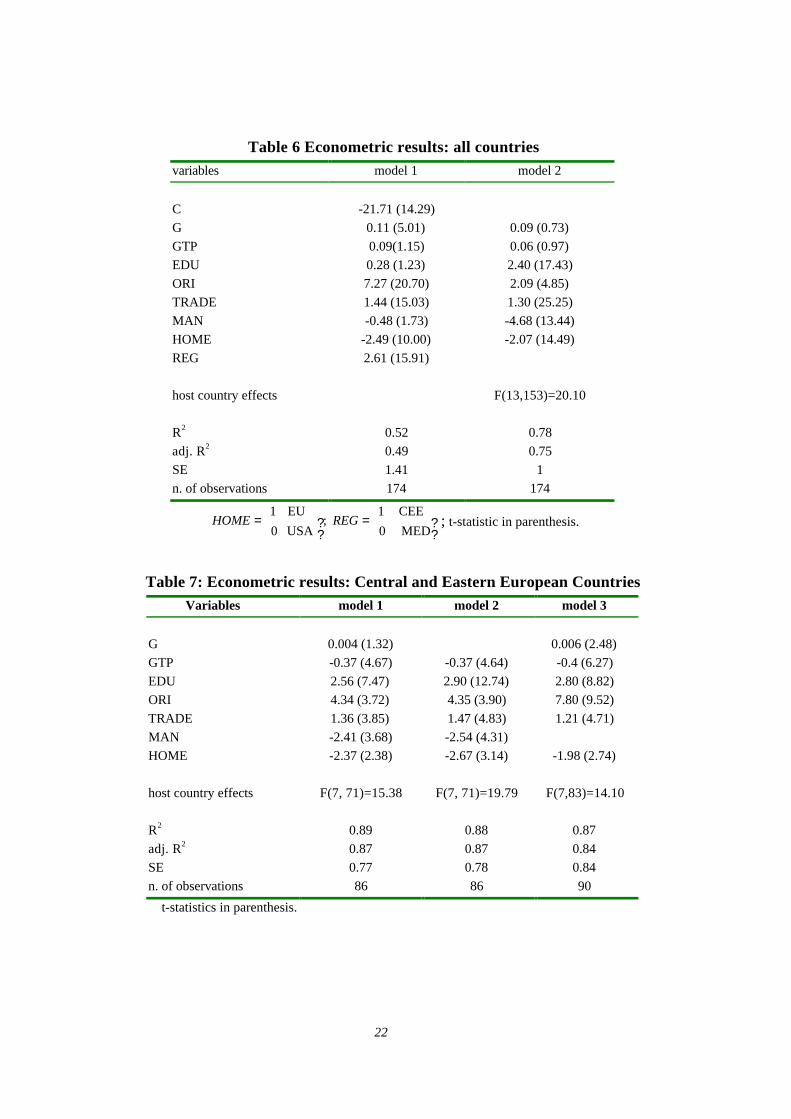
Tables from 6 to 9 show the results of the econometric analysis. We firstestimated the determinants of FDI by pooling all observations in a single sample (table6). This analysis allows us to detect two important sources of heterogeneity in thedeterminants of FDI: region specific effects, picked up by the REG dummy, and homecountry specific effects, caught by the HOME dummy. Both are statisticallysignificant at the one per cent level. We thus plunged into these specific effects. First ofall, we split the original sample into two sub-regional ones (CEECs and MED ones) inorder to detect potential structural changes in the determinants of FDI due to regionspecific effects. Because of the presence of several missing values, panels are notbalanced and the number of countries included may vary according to the availability ofdata. The resulting coefficients for the CEECs and the MED ones are reported in tables7 and 8, respectively. Secondly,. we allow for separate slope coefficients among homecountries within each sub-region since heterogeneity can give rise to bias if slopehomogeneity is imposed. The results are reported in table 9.
Concerning CEECs, the fit of the equations seems good, with an adjusted R2
higher than 0.80. All equations include separate intercepts for each host countries and adummy variable to control for home country effects. Both are statistically significant.
15
The first column (model 1) reports the parameter estimates obtained for thebasic model including all the explanatory variables. Only one variable, that is, thegrowth rate of the host economies, is statistically insignificant with a coefficient veryclosed to zero, suggesting that market size effects are adequately captured byconditioning on the population level. The growth rate of the trading partners has anegative coefficient close to zero. This result, can be explained partly by the fact thatFDI have been targeted mainly to the domestic markets and not to the regional ones,and partly by the “Eurocentric” phase of the European foreign investments discussedin section 37.
The coefficient of EDU is positive, indicating that foreign firms prefer locationswith highly skilled labour force, even though this implies higher wages. This does notmean that low labour costs do not play a role as determinants of FDI, since CEE isgenerally considered as low cost area with respect to Western Europe and the UnitedStates as well. Rather, this result confirms that the productivity gap between home andhost countries is not very pronounced (Lankes and Venables, 1996). Also thecoefficient of TRADE is positive and greater than one, indicating that bilateral traderelations are important to stimulate FDI. The negative sign shown by MAN is notsurprisingly since in transition countries privatisation and restructuring processes haveplayed an important role as determinants of FDI8. ORI coefficient is very high,suggesting that foreign firms investing in Central and Eastern Europe are veryconcerned about risk.
In column 2 we dropped the insignificant growth rate variable. There is littlechange in the coefficients on most of the remaining variables. Finally in column 3, weestimated the original model without the degree of development of the manufacturingsector variable (MAN). The exclusion of this variable causes the size and thesignificance of the coefficient on risk country variable to increase markedly, suggestingthat the effects of the restructuring process may have also been picked up by thecountry risk measure. Moreover, we observe the growth rate variable becomessignificant, even though the coefficient remains very small.
The formulation of the model seems to be appropriate also for the Med region,since it explains about two third of the variation in the dependent variable (table 8).However, the signs of the coefficients do not always agree with the underlyingeconomic theory. Market size effects are correctly picked up by the specification ofthe dependent variable, as in the CEE panel. However, regional markets are here moreimportant than in Central and Eastern Europe. The coefficient of GTP is small but 7 European investments into CEE accounts for about 80 per cent of total investments. At first sight, onecould think that this wrong sign might be the result of some multicollinearity with other variables,especially the home country dummy. This last, however, picks up only behavioral differences betweenEU and United States, rather than structural differences. Multicollinearity with host country dummies,instead, can not be excluded, since most of the countries included in the sample trade among them.8 Again, multicollinearity with host country variables can not be excluded, since the size of themanufacturing sector depends on the industrial structure of each host countries. In fact, MAN show apositive sign in the restricted model (equal intercept across countries). However, restrictions can not beaccepted at the conventional level of significance. In order to minimize multicollinearity, we droppedMAN in model 3.
16
significant at the one per cent level of confidence. The sign of the country risk variableis not coherent with the economic theory since ORI shows a negative but significantsign. This would indicate that FDI per capita stock decreases as country risk decreases,being other things equal. This surprising result may be explained partly by the fact thatmost FDI in the MED region has always been resource specific and natural resourceseeker investors localise wherever resources are available, regardless of the presence ofother factors of attraction (Dunning, 1998). Partly, it might be due to the specificationof the country risk variable, not suitable to explain risks that foreign investors face inthe MED region. It has been argued that one of the major problem of many Medcountries is the legitimacy of the Governments. In several countries it seems to be alack of consensus and an absence of dialogue with dissenters. Recently, the situationhas not changed substantially. “The ensuing huge social problems interact with theother factors to create an endemic instability which discourages foreign investors”(ERF, 1999) since governability and the consequent capacity to gain consensus withinlaw is frequently perceived to be an indicator of long-run stability. ORI, by definition,catches prevalently economic stability, being based on economic variables rather thanon political and social indicators.
Also the size of the manufacturing sector seems to affect negatively the stock ofFDI, as previously obtained in Central and Eastern Europe panel. According to recentstudies (Petri, 1997) the bulk of new FDI projects undertaken in the MED regionrepresent relatively large-scale, capital intensive undertakings in mining and quarrying,industry and infrastructure and in particular petrochemical plants, cement factories andpower plants. All these sectors are characterised by a strong presence of large firms andby a tough competition due to the need to exploit economies of scale to becomecompetitive. Thus, foreign investments in the MED region may hide strategic objective(first mover advantages, natural resource control, etc.). Finally, EDU and TRADE arestatistically significant with the expected sign. However, TRADE coefficient is smallerthan that previously obtained in the CEE panel. Overall, coefficient signs do not changeacross the specifications of the model. Host country intercepts are positive and the nullhypothesis of equal country intercepts can be rejected at the conventional level ofsignificance as in the case of the CEECs. Differently from the previous panel, countryintercepts are now catching up the importance of resource specific FDI. Home countryeffects are always significant.
In order to test the existence of a different sensitivity of FDI coming fromdifferent country of origin, to the explanatory variables, we re-estimated the basicmodel relaxing the hypothesis of equal slope coefficients among investors. The resultsare reported in table 9. The null hypothesis of equal slope coefficients can not berejected in CEE panel. In the Med region, however, FDI coming from Western Europereacts to the explanatory variables differently from American outward FDI stocks.These differences concern two variables, i.e. country risk and the regional marketpotential. While European investors seem to be risk neutral, since the coefficient isclosed to zero, though always negative, American FDI stock are more sensitive to therisk country, even though in a surprising way: ceteris paribus, an increase in the degreeof economic stability reduces FDI stock per capita of about 6.6 per cent. This result
17
implies that economic stability may compensate the lack of governability for mostEuropean investors, while American investors prefer political to economic stability.Finally, Western European FDI are less sensitive to regional market potential thanAmerican investors.
6. Conclusions
This study was designed to identify the factors that would explain the patternsand the determinants of FDI in the Mediterranean region during 1990-1997. The mostimportant fact characterising this period has been the extension of the AssociationAgreements to most of the countries belonging to the region. It was thought that theseagreements would have given a new boost to foreign direct investments into the region,penalised by the emerging of the countries of Central and Eastern Europe aspreferential partners of the EU. We take into consideration this potential competitionby comparing the factors determining FDI in the MED region with those attracting FDIin Central and Eastern Europe.
Attracting FDI has been one of the key policy goals of Central Europeangovernments and today everybody agrees that FDI has been an important vehicle toaccelerate enterprise modernisation and restructuring by introducing new technologies,management techniques and marketing practices. In other words, Central and EasternEurope experience demonstrates that it is important to understand what drives foreigninvestors in order to exploit scarce resources most effectively.
According to our empirical analyses, natural resource endowment stillrepresents an important factor of attraction of FDI, relative to Central and EasternEurope. Moreover, foreign investors have been attracted in the MED region by marketconsiderations, concerning not only the single national markets, but also the regionalone. This effect is stronger than in Central and Eastern Europe, suggesting that a deeperregional integration may sound attractive to foreign enterprises, mainly if the parentfirm is located in the United States. The availability of high skilled labour is anotherimportant factor of attraction for foreign investors provided that wage differentialsbetween home and host countries prevail on productivity differentials. Trade withmajor investors countries also matters, even though the derived effect appearssomewhat smaller than found in Central Europe. This implies that an improvement intrade relationships with the EU – as envisaged by the Association Agreements – wouldhave a positive impact on FDI patterns. The impact of the development of themanufacturing sector variable on FDI is less clear, because of the presence ofmulticollinearity that weakens the econometric results. According to our analysis,strategic motivations may boost foreign investors to prefer less developed sectors. Thismay imply that the degree of development actually got by the manufacturing sector inthe MED region is not adequate to attract other firms, both domestic and foreign. Afurther increase in the number of foreign firms could accelerate the formation ofagglomeration economies. Country risk deserves further considerations. A conducivebusiness environment is certainly important for foreign investors, as the experience ofCentral and Eastern Europe demonstrates. This result is however coherent with

18
previous analysis. In the MED region, this is not sufficient, since economic stabilitymust be accompanied by political stability in order to affect positively FDI inwardstocks not related to natural resource exploitations. This result implies that the MEDcountries should concentrate their efforts on getting a higher level of “governabilityattractiveness” (ERF, 1999) in order to attract a higher number of foreign investments.
19
Bibliography
Alessandrini S. (1999) "Obiettivi e strategie della politica mediterranea: un processo diregionalizzazione in evoluzione", in relazione Milano
Altomonte, C. (2000), Economic variables and the institutional framework: the case ofFDI in transition countries”, TNCs, forthcoming.
Blomstrom, M. and Kokko A. (1997), “Regional integration and foreign directinvestment”, NBER working paper No. 6019.
Brown D., Deardoff A: and Stern R. (1997), "Some Economic Effects of the Free TradeAgreement between Tunisia and the European Union" in Galal A. and HoekmanB. (eds.), Regional Partners in Global Markets: Limits and Possibilities of theEuro-Med Agreements, Centre for Economic Policy Research and the EgyptianCenter for Economic Studies, London and Cairo.
Caves, R. (1996), Multinational firms and economic analysis, 2nd edition, CambridgeUniversity Press.
Chatti R. (1999), "Free trade Agreement between Tunisia and the European Union: doincreasing returns to scale and imperfect competition matter?", paper presented atthe Workshop on "The Dynamics of New Regionalism in MENA: Integration,Euro-Med Partnership Agreements and After", Cairo, Egypt, February 1999.
Dunning J.H. (1981), International Production and the Multinational Enterprise,London, George Allen and Unwin.
Dunning J.H. (1992), Multinational Enterprises and the Global Economy, AddisonWesley, London.
Dunning J.H. (1993), "The prospects for foreign direct investment in Eastern Europe"in Aritsan, P., Rojec M., and Svetlicic M. (Eds.), Foreign Investment in Centraland Eastern Europe, New York, St. Martin Press.
Dunning J.H. (1998), “Location and the multinational enterprise: a neglected factor?”,Journal of International Business Studies, vol. 29, n. 1.
Economic Research Forum, (1999), Economic Trends in the MENA region, ERF, IlCairo.
Gujarati, D.N. (1995), Basic econometrics, McGraw-Hill International Edition.
Hamdouch B. (1996), "Perspectives d'une zone de libre-échange entre le Maroc etl'UE", Reflects et Perspectives, Bruxelles, octobre
Hoekman B. e Djankov S.(1996), "Catching up with Eastern Europe The EuropeanUnion's Mediterranean Free Trade Initiative", World Bank Policy Research WP.1562.
Hoekman B. e Konan (1999), "Deep Integration, Nondiscrimination and Euro-Mediterranean Free Trade", IMF WP99/ (Washington: International MonetaryFund).

20
Holland, D. and Pain N. (1998), “The diffusion of innovations in Central and EasternEurope: a study of the determinants and impact of foreign direct investment”,NIESR, discussion paper n. 137.
Konan D., Maskus K. (1997), "A computable General Equilibrium Analysis ofEgyptian Trade Liberalisation scenarios" in Galal A. e Hoekman B. (eds.)"Regional Partners in Global Markets: Limits and Possibilities of the Euro-MedAgreements", London, CEPR.
Krugman, P. (1995), “International Trade Theory and Policy”, in G. Grossman and K.Rogoff (eds.) Handbook of international economics, vol. III, Elsevier, NorthHolland.
Lankes, H.P. and Venables A. (1996), “Foreign direct investment in economictransition: the changing pattern of investments”, Economics of Transition, vol. 4.
Lansbury, M., Pain, N. and Smidkova K. (1996), “Foreign direct investmnet in CentralEurope since 1990: an econometric study”, in National Institute Economic Review,No. 156.
Markusen J. (1995), "The boundaries of multinational enterprises and the theory ofinternational trade", Journal of Economic Perspectives, n. 9.
Markusen, J. And Venables A. (1999), “Foreign direct investment as a catalyst forindustrial development"” European Economic Review, n. 43.
Matyas L., Sevestre P. (1996), The Econometrics of Panel Data, Kluwer.
Michalet C.A. (1997), Investissements étrangers: les économies du sud de laMéditerranée sont-elles attractives?, Monde Arabe Maghreb-Machrek, decembre.
Pace R. (1997), "The European Union's Next Mediterranean Enlargement: Challengesand Uncertainties, Jean Monnet Working Papers in Comparative and InternationalPolitics, Department of Political Studies, University of Catania, January 1997.
Petri P.A. (1997), Trade Strategies for the Southern Mediterranean, OECDDevelopment Centre, Technical Papers No. 127 (OCDE/GD/(97)195, December.
Reiffers J.L. (1997), La Méditerranée aux portes de l'an 2000, Institut de laMéditerranée, Economica, Marseille.
Resmini, L. (1999), “The determinants of foreign direct investments in the CEECs: newevidence from sectoral patterns”, LICOS discussion paper n. 83.
Singh H. Jun K.W. (1995), "Some new evidence on determinants of foreign directinvestment in developing countries", the World Bank, working paper.
Wang, Z:Q., Swain N. (1995), “The determinants of foreign direct investment intransforming economies: empirical evidence for Hungary and China”,Weltwirtschaftliches Archiv, 131(2).

21
Data Appendix
FDI – stock data for 1990-1997 from OECD, International direct investment statisticsyearbook, various years.
POP – Global Development Finance & World Development Indicators, World Bank.
G – GDP growth (annual %), Global Development Finance & World DevelopmentIndicators, World Bank.
GTP – GDP per capita growth of trading Partners (weighted average by trade share),IMF: Directions of Trade (trade data); Global Development Finance & WorldDevelopment Indicators (GDP per capita growth).
EDU – School enrollment, tertiary (% gross), Global Development Finance & WorldDevelopment Indicators.
TRADE – jj
ijij
XM
XM
++
, where Mij is the year value of imports from the ith investor
country to the jth home country; Xij is the year value of exports from the the ith
investor country to the jth home country, and Mj and Xj are the yearly total valueof imports and exports in the home country (IMF, Direction of trade statistics,1999).
MAN – share of GDP created by the manufacturing sector; World Bank, Worlddevelopment indicators for Mediterranean countries and OECD, Short EconomicIndicators, for Central and Eastern Europe countries.
ORI – Operation Risk Index, Bery S.A. weighted average of the following 15 criteria(weighting in parenthesis): policy continuity (3), Attitude: foreign investors andProfits (1.5), Degree of privatisation (1.5.), Monetary inflation (1.5), Balance ofPayments (1.5), Bureaucratic delays (1), Economic growth (2.5), Currencyconvertibility (2.5), Enforceability of contracts (2.5), Labour cost, productivity(2), Professional services and Contractors (0.5), Communications andTransportation (1), Local management and partners (1), Short-term credits (2),Long term loans and Venture capital (2). ORI ranges from 0 (unacceptablebusiness conditions) to 100 (stable environment typical of an advancedindustrialised economy).
22
Table 6 Econometric results: all countriesvariables model 1 model 2
C -21.71 (14.29)G 0.11 (5.01) 0.09 (0.73)GTP 0.09(1.15) 0.06 (0.97)EDU 0.28 (1.23) 2.40 (17.43)ORI 7.27 (20.70) 2.09 (4.85)TRADE 1.44 (15.03) 1.30 (25.25)MAN -0.48 (1.73) -4.68 (13.44)HOME -2.49 (10.00) -2.07 (14.49)REG 2.61 (15.91)
host country effects F(13,153)=20.10
R2 0.52 0.78adj. R2 0.49 0.75SE 1.41 1n. of observations 174 174
??�
���=
??�
���=
MED 0
CEE 1 ;
USA 0
EU 1REGHOME ; t-statistic in parenthesis.
Table 7: Econometric results: Central and Eastern European CountriesVariables model 1 model 2 model 3
G 0.004 (1.32) 0.006 (2.48)GTP -0.37 (4.67) -0.37 (4.64) -0.4 (6.27)EDU 2.56 (7.47) 2.90 (12.74) 2.80 (8.82)ORI 4.34 (3.72) 4.35 (3.90) 7.80 (9.52)TRADE 1.36 (3.85) 1.47 (4.83) 1.21 (4.71)MAN -2.41 (3.68) -2.54 (4.31)HOME -2.37 (2.38) -2.67 (3.14) -1.98 (2.74)
host country effects F(7, 71)=15.38 F(7, 71)=19.79 F(7,83)=14.10
R2 0.89 0.88 0.87adj. R2 0.87 0.87 0.84SE 0.77 0.78 0.84n. of observations 86 86 90
t-statistics in parenthesis.

23
Table 8 Econometric results: Mediterranean countriesVariables model 1 model 2 model 3
G -0.11 (1.10)GTP 0.93 (3.60) 0.82 (3.70) 0.84 (3.07)EDU 2.67 (3.56) 1.77 (3.78) 2.42 (7.20)ORI -3.91 (3.10) -4.61 (5.84) -3.79 (6.37)TRADE 0.94(4.70) 0.79 (5.25) 0.49 (4.35)MAN -6.18 (3.26) -3.00 (2.72)HOME -1.17 (3.09) -0.94 (2.95) -1.07 (4.63)
host country effects F(4,68)=18.18 F(5,76)=13.14 F(7,111)=6.88
R2 0.7 0.69 0.69adj. R2 0.65 0.64 0.65SE 0.99 1.02 1.08n. of observations 80 88 114
t-statistics in parenthesis.
Table 9 Additional econometric results: home country effectsVariables CEE Med region
G 0.006 (2.15) -0.04 (0.80)GTP -0.31 (3.16) 1.73 (5.91)EDU 2.78 (6.65) 2.61 (3.88)ORI 6.60 (6.38) -5.93 (7.15)TRADE 1.21 (4.21) 0.54 (1.33)MAN -4.99 (3.66)
HOME -7.94 (1.72) -16.96 (5.49)G*HOME -0.001 (0.18) -0.13 (0.77)GTP*HOME 0.07 (0.45) -1.4 (4.70)EDU*HOME -0.19 (0.39) -0.36 (0.43)ORI*HOME 1.72 (1.67) 5.70 (6.30)TRADE*HOME -0.31 (0.76) -2.03 (1.32)
host country effects F(7,71)=9.10 F(4,62)=19.63
R2 0.87 0.79adj. R2 0.83 0.73SE 0.88 0.88n. of observations 90 80
HOME =
1 EU
0 USA. Consequently, USA coefficients are those of the explanatory
variables, while EU coefficients are those of the explanatory variables plus the differentialslope coefficients, i.e. those of the multiplicative dummies, provided that they are statisticallysignificant. (Gujarati, 1995). t-statistics in parenthesis.