CcpA coordinates central metabolism and biofilm formation in Staphylococcus epidermidis
Upload
khangminh22Category
view
0download
0
RNI: DELENG/2005/15153RNI: DELENG/2005/15153 No: DL(E)-01/5079/14-16No: DL(E)-01/5079/14-16Publication: 15Publication: 15thth of every month of every month Licensed to post without pre-payment Licensed to post without pre-payment U(E) 28/2014-16U(E) 28/2014-16Posting: 19Posting: 19thth/20/20thth of every month at NDPSO of every month at NDPSO Rs.100Rs.100
Volume X, Issue 02, February 2014 THE MONTHLY MAGAZINE ON POSITIONING, NAVIGATION AND BEYOND
ISSN
0973-2
136
ISSN
0973-2
136
Cycle 24 andCycle 24 and
SBAS impactsSBAS impactsAlso
LiDARGeodesyGISUrban Planning

SD27_CMPL_Nikon_Feb_Ad_AS.indd 1 19-Jan-14 11:36:32 PM

GNSS spoken here[GPS/GLONASS/BeiDou/Galileo/OmniSTAR®]
One family, many solutions. Trust Trimble GNSS OEM for all your high precision applications.precision applications.
L1L1BD910
GPS,, GLONASSS,,BeBeiDiDDououou,, GaGaGalililileleleoo
LL1/L222222222222BD920
GPGPS, GLOLOLOOLOLOOLOLOLOOOOOOONASS
LL1/L2222222
L1/L2 + HeadingBD982
GPS, GLONASS, BeiDou,OmniSTAR, Heading
EnclosureBX982
GPS, GLONASS,BeiDou, OmniSTAR,
Heading
L1/L2 + WiFi +3GBD920-W3G
GPS, GLONASS
S L3 CDMA ICD. Trimble cannot guarantee full compatibility. There is no public GLONASSAll other trademarks are the property of their respective owners. TPC-088 (01/14)© C© CCopopyright 2014, Trimble. All rights reserved. A
w.trimble.com/gnss-inertialwww
mble GNSS OEMTrim
L1/L2/L5BD970/BD930GPS, GLONASS,BeiDou, Galileo
SD26_CMPL_Trimble_Jan_Ad_AS.indd 1 18-Dec-13 1:28:55 PM

Articles
Solar cycle 24 and SBAS impacts N SUARD, F CARVALHO, E RIFA, M MABILLEAU, E ROBERT AND P YAYA 8 Vision-based sensor for relative navigation ALEXANDRE POLLINI 16 TUSAGA-Aktif: Delivering benefi ts to Turkey SEDAT BAKICI
AND CETIN MEKIK 19 Space-based Precipitation Radar for Spatio-temporal Hydrology Analysis M RIZALUDIN
MAHMUD, SHINYA NUMATA, HIROSHI MATSUYAMA, TETSURO HOSAKA AND MAZLAN HASHIM 35 GIS & GPS in micro-spatial location analysis of solid waste disposal sites DR ANAND GOPAGANI, DR DEEPTHI GUNTUKA AND PROF VIJAYA BHOLE 42
This issue has been made possible by the support and good wishes of the following individuals and companies Alexandre Pollini, Anand Gopagani, Cetin Mekik, Deepthi Guntuka, E Rifa, E Robert, F Carvalho, Hiroshi Matsuyama, Mazlan Hashim, M Mabilleau, M Rizaludin Mahmud, N K Agrawal, N Suard, P Yaya, Sedat Bakici, Shinya Numata, Tetsuro Hosaka and Vijaya Bhole and; Foif, HiTarget, Javad, KCS Trace Me, MicroSurvey, Nikon, NRSC, Navcom, NovAtel, Pentax, Rohde & Schwarz, Supergeo, Trimble, and many others.
COLOPHON AND CONTENTS
Mailing Address
A 002, Mansara Apartments
C 9, Vasundhara Enclave
Delhi 110 096, India.
Phones +91 11 22632607, 98102 33422, 98107 24567
Fax +91 11 22632607
[information] [email protected]
[editorial] [email protected]
[advertising] [email protected]
[subscriptions] [email protected]
Web www.mycoordinates.org
In this issueCoordinates Coordinates Volume 10, Issue 02, February 2014
Coordinates is an initiative of cGIT that aims to broaden the
scope of positioning, navigation and related technologies.
cGIT does not neccesarily subscribe to the views expressed
by the authors in this magazine and may not be held
liable for any losses caused directly or indirectly due to the
information provided herein. © cGIT, 2014. Reprinting with
permission is encouraged; contact the editor for details.
Annual subscription (12 issues) [India] Rs.1,200
[Overseas] US$80
Printed and published by Sanjay Malaviya on behalf of
Centre for Geoinformation Technologies at A221 Mangal
Apartments, Vasundhara Enclave, Delhi 110096, India.
Editor Bal Krishna
Owner Centre for Geoinformation Technologies
Designed at Spring Design ([email protected])
Printer Thomson Press India Ltd., B 315, Okhla Phase I,
New Delhi - 110020, India
This issue of Coordinates is of 60 pages, including
cover.
Columns
My Coordinates EDITORIAL 6 Review OPEN SERIES MAP, SURVEY OF INDIA 48 News GNSS 49 LBS 50 GALILEO UPDATE 52 IMAGING 53
GIS 54 INDUSTRY 56 Mark your calendar MARCH 2014 TO NOVEMBER 2014 58

www.navcomtech.com
StarFire Rapid Recovery Keeps You Going
Maximize Your Uptime
Worksite conditions are seldom perfect and GNSS signal outages can cause costly delays, but NavCom will help get you up and running again with StarFire Rapid Recovery.
NavCom’s new StarFire Rapid Recovery feature helps you bridge GNSS signal interruptions by allowing you to quickly regain StarFire ac-curacy up to 5cm once the GNSS signal is reacquired. NavCom’s StarFire Network, a Global Satellite Based Augmentation System, provides
for redundancy to ensure system availability and position accuracy.
We understand that in order to do the job right, you need the right tools and NavCom’s suite of StarFire productivity tools including StarFire
June_013_Navcom_Ad_AS.indd 1 30-May-13 5:11:49 PM

ADVISORS Naser El-Sheimy PEng, CRC Professor, Department of Geomatics Engineering, The University of Calgary Canada, George
Cho Professor in GIS and the Law, University of Canberra, Australia, Professor Abbas Rajabifard Director, Centre for SDI and Land
Administration, University of Melbourne, Australia, Luiz Paulo Souto Fortes PhD Associate Director of Geosciences, Brazilian Institute of
Geography and Statistics -IBGE, Brazil, John Hannah Professor, School of Surveying, University of Otago, New Zealand
MYCOORDINATES
Satellite Based Augmentation System gets another boost,
As India joins USA, Japan and Europe to implement the operational SBAS.
GAGAN (GPS Aided GEO Augmented Navigation) achieves RNP 0.1 certifi cation on December 30, 2013.
Type 2 message will be available in February 2014.
This enables Indian Flight Information Region (FIR) to support satellite based augmentation services for precision navigation by suitably equipped aircraft.
GAGAN has its own advantages and challenges too,
Being the fi rst SBAS in equatorial ionospheric region
There are reasons to cheer by the aviation sector,
However, equally important will be
The potential GAGAN holds for the non-aviation applications
Like in marine and terrestrial navigation, LBS, urban planning, agriculture, etc.
As the benefi ts of using the system shall be immense.
Bal Krishna, [email protected]
GAGAN certification
6 | CoordinatesCoordinates February 2014

SD26_CMPL_Hi-Target_Jan_Ad_AS.indd 1 26-Dec-13 3:53:39 PM

GNSS
The solar activity generates Electromagnetic radiations and
Energetic Charged Particles in addition to the Galactic Cosmic Radiation that directly impact the earth magnetosphere and then the ionosphere. There are some regular cyclic activities (a daily one in relation to the sunlight presence, a 27 days one in relation to the Sun rotation, an approximately 11 years one in relation to the Sun Dynamo effect called solar cycle) but there are also solar events such as Sun Flares, Solar Proton Ejections, Coronal Mass Ejection … that create irregularities in particles radiation fl ow impacting the earth magnetic and ionosphere activities: these impacts are called storms. It has to be known that the delay between the solar event and its impact on earth varies according to its nature:• The electromagnetic wave
impact is quasi immediate.• The Energetic Particles impact
is in a ten minute range.• A solar wind impact is observable on
earth in a 2 or 3 day range delay.
These events have great impact on navigation systems such as sudden changes in the ionosphere delays, increased gradients and/or sudden changes in navigation signal strength often coupled with ionosphere scintillations effect causing navigation signal loss of lock. These impacts observed at the navigation signal reception have then an induced impact in the system applications such as Satellites Based Augmentation Systems (SBAS) in terms of availability and continuity of services.
The risk to face a major magnetosphere event was observed to depend on the time in the solar cycle, the higher risk being in the 2 or 3 years after the peak of the solar activity (on fi gure 1 -0.5 is the solar cycle start, 0 is the solar cycle maximum and 0.5 is the solar cycle end).
Figure 2: We are now approching the peak of solar cycle 24 that is predicted to occur in the Fall 2013 [2].
To take a maximum of benefi t of such situation, Eurocontrol has contracted in 2009 a study with Egis Avia leading a consortium composed of CLS, CNES, DSNA/DTI, ENAC, M3Systems aiming at characterising the impact of the solar
Solar cycle 24 and SBAS impactsThis paper presents briefl y the recent (From Q1 2011 to Q1 2013) evolution of the solar and ionosphere/magnetosphere activities, the data collection network set for Eurocontrol and the CNES Navigation and Time Monitoring Facility, the different observations done on EGNOS and WAAS and some analyses performed to characterize these observations
Norbert SuardSenior Expert, CNES Navigation System Division, CNES, Toulouse, France
Françoise CarvalhoPropagation Team, Radiofrequency Division, CNES, Toulouse, France
Etienne RifaSYNERGIE, Toulouse, France
Mikael MabilleauCNS project Engineer, Egis Avia, Toulouse, France
Emilien RobertNavigation expert, Eurocontrol, Brussels, Belgium
Philippe YayaProject Manager, CLS, Toulouse, France
Figure 1: Risk of Storm occurence along a solar cycle - Level severe ap=179 [1]
Figure 2: Solar Cycle 24 monthly SSN - prediction [2] vs observations [3]
8 | CoordinatesCoordinates February 2014

activity on civil aviations GNSS based applications for different phases of fl ight during the next period of maximum solar activity and at developing, validating and assessing performance of adequate mitigation actions for the different phases of fl ight impacted [4]. The fi rst part of this study was a bibliography on past events and the defi nition of a data collection network to support impact of solar cycle 24 events over the ECAC region (Figure 3).
We are now in the second part of the study where the data collection network has been set up and is delivering information enabling to analyse the impact at receiver level and to validate the modelisation done for different ionosphere scenarii to assess the impact at user service levels.
On a second hand CNES has set up in 2010 a facility (NTMF – Navigation and Time Monitoring Facility) aiming at assessing on a regular basis the performances achieved by different navigation systems such as GPS or GLONASS and in the future GALILEO and by the different Satellite Based Augmentation Systems. At the beginning, only EGNOS and its time function, WAAS and GPS performances were assessed but now after a ramp up phase, other SBAS GAGAN and MSAS have been added to the NTMF and GLONASS is expected to be so in the coming months.
These two initiatives enable to observe the recent solar and ionosphere/magnetosphere activities and the impact on SBAS and to perform relevant analyses. Several events were monitored and analysed but this
paper focuses on only some of them for which the impact was more or less important (August, September, October 2011, March and July 2012).
Facilities
Eurocontrol Ionosphere Data Collection and Products
The Network
The data collection network (Figure 4) is done by a fi le transfer protocol from several public networks delivering RINEX observation fi les sampled at 1 or 30 seconds enabling to have:• A large scale network based
on IGS, EUREF and national networks for large effects
• Some small scale networks in some areas (Toulouse, Madrid. Canary Islands) for more local effects
• Completed when relevant by additional stations from the EDCN [5] and EGNOS networks [6], integration of additional EGNOS stations is foreseen in 2013
In addition to these observations, data from some Ionosphere Scintillation Monitors (ISM) belonging to ESA MONITOR project [7] can be used in the analyses.
Products and External data
Data from the different sensors are processed to provide Eurocontrol and partners with• TEC and TEC gradient maps• ROTI, STEC, Rate of TEC parameters• loss of L1 (S1Nb) and L2
(S2Nb) measurements• S4 and sigmaPhi parameters
Some external and public data are also used:• Geomagnetic data
▪ Kp index (Planetary; from 0 to 9) ▪ ap index (High latitude; from
0 for quiet to over 200 nT for severe extreme storms)
▪ Dst index (equatorial)• Solar data
▪ Sun Spot Number (SSN) ▪ Radio fl ux ▪ Proton fl ux ▪ X-ray fl ux
CNES Navigation and Time Monitoring Facility
CNES NTMF is able to collect different sources of data and to process them in order to evaluate the performances at different levels for different key parameters by comparison. For a particular key parameter, the same method and the same tool is used for each system and the quality of the results is ensured thanks to the possibility to run in parallel two tools developed on the same requirements but by two different teams.
The different performances that are currently monitored in the NTMF are:• Accuracy, Integrity, Availability,
Continuity of each system• System offset to UTC (EGNOS
time only for the moment)• Interface compliance to
standard (MOPS DO229 for SBAS, ICD200 for GPS)
In addition to these parameters that are currently only available on an internal private CNES web site, NTMF is able to deliver on a public FTP server [8] and in the right RINEX format SBAS messages that were broadcasted by EGNOS (Europe), GAGAN (India), MSAS (Japan), WAAS (USA) and even SDCM PRN125 (Russia).
Figure 3: EC AC region and its location among magnetic zones
Figure 4: Sta tions used for Eurocontrol Study – summer 2012 (red: 1s sampling, green: 30s, circle: EGNOS RIMS)
CoordinatesCoordinates February 2014 | 9

Solar and Ionosphere activities from 2011
Solar Activity
The solar activity can be characterised daily by the daily SSN or the daily F10.7 index. The latter measures the noise level generated by the sun at a wavelength of 10.7 cm at the earth’s orbit at local noon at the Penticton Radio Observatory in Canada. On Figure 5, both indices are plotted over a long period. The recent period is plotted on Figure 6.
Both SSN and F10.7 indices have variations mainly due to the solar rotation, but the high values are moderate regarding previous cycles and no important spike is highlighted for the moment, events that occurred were not exceptional. Nevertheless we will see later that some impacts on magnetosphere were observed.
Ionosphere/magnetosphere activity
Several indices exist to rank the ionosphere/magnetosphere activity, but for the purpose of this section only the 3-hour ap index, directly related to Kp in order to have a linear scale, is used. Eight values are provided per day. In order to determine the level of activity in the day, we simply look for the maximum over each day (fi gure 7 and 8).
The table 1 is used to defi ne the status of the ionosphere.
Only one extreme storm has been recorded from the beginning of solar cycle 24, and several were observed in the severe+ category:• 05/04/2010: ap reached 179 nT
(not analysed in this paper)• 05/08/2011: ap reached 179 nT (partly
analysed in this paper)• 24&25/10/2011:
ap reached 154 nT (analysed in this paper)
• 09/03/2012: ap reached 207 nT, the highest magnetic event of cycle 24 until now, just at the limit of the extreme classifi cation (analysed in this paper)
• 15/07/2012: ap reached 132 nT (partly analysed in this paper)
In addition there were several occurrences of other storm categories (table 2).
Particular attention has to be paid on the fact that these fi gures do not represent exactly the number of storm events due to the
fact that some storms can occur over two consecutive days.
In order to demonstrate that the impact is not in a simple relation to the intensity of a storm, an event in September 2011 will be also documented.
Observations
A. 05/08/2011 event
Figure 9: The storm began in the evening of the 5th of August and had continued in the morning of the 6th.
As no important activity occurred on that day, the 4th of August is used as a referenced day for both EGNOS and WAAS.
If we have a look at the service availability daily maps, we can observe a reduction for the two systems (fi gure 10).
At both locations (fi gure 11), the vertical protection levels were higher when the storm occurred and degradation was really time correlated with the high values of the magnetic index. For WAAS, the
Figure 5: SSN f rom 1932 and F10.7 from 1947
Figure 6: SSN and F10.7 from 01/01/2011
Figure 7: Max 3 hour ap from cycle 24 start
Figure 8: Max 3 hour ap from 01/01/2011
Ionosphere condition Kp Index 3-hour ap
index (nT)Quiet 0-1 <7Unsettled 2 7 to <15Active 3 15 to <27Minor storm 4 27 to <48Major storm 5 48 to <80Severe storm 6 80 to <132 Severe+ 7 132 to <207 Extreme 8 207 to <400 Extreme + 9 400
Table 1: ionosphere activity defi nition
Storm level 2011 2012 2013Q1Minor 26 47 10Major 19 21 4Severe 4 12 1
Severe+ 3 1 0Extreme 0 1 0
Extreme + 0 0 0
Table 2 : number of stormy days by level
10 | CoordinatesCoordinates February 2014

SD26_CMPL_KCS-Trace-me_Jan_Ad_AS.indd 1 11/01/14 1:57 PM

intersection of the user/satellite path with the ionosphere layer modelled as an ellipsoid with a 350 km constant height above WGS84 [9].
B. 26/09/2011 event
Figure 12: The storm began in the middle of the afternoon of the 26th
and had continued until the beginning of the day after. We can observe a more active magnetosphere on the rest of the 27th fi nishing by a major storm. Over that period, the ap index reached only 92 nT as a maximum
As no important activity occurred on that day, the 25th of September is used as a referenced day for both EGNOS and WAAS.
Figure 13: Degradation in the service availability is observed for both systems but even if the intensity of the event was less important than during the August event, degradation is more important for both systems.
At each location (fi gure 14), the vertical protection levels were degraded during the storm: either higher (Colorado Spring) than the day before or not computed (Washington, Tromsoe). The impossibility to compute a protection level is due to numerous Ionosphere
Grid Points set to Not Monitored in the vicinity of these locations reducing the number of usable satellites under the minimum number (four) required to be able to compute a position solution. We can observe also at Tromsoe an additional degradation in the evening of the 27th of September when a sub storm occurred.
C. 24&25/10/2011 event
The storm began after 18:00 UTC on the 25th and had continued until 06:00 UTC the day after (fi gure 15). On the period, the ap index reached 154 nT as maximum.
As no important activity occurred on that day, the 23rd of October is used as a referenced day for both EGNOS and WAAS.
Figure 9 : Kp evolution from 04 to 06 Aug 2012
Figure 12: Kp evolution from 25 to 27 Sep 2011
Figure 15: Kp evolution from 23 to 25 Oct 2011
Figure 16: WAAS (top) & EGNOS (bottom) daily availability maps 23/10 to 25/10/2011
Figure 13: WAAS (top) & EGNOS (bottom) daily availability maps 25/09 to 27/09/2011
Figure 14: Vertical error (blue) and protection level (green) at Colorado Spring (top), Washington (middle) & Tromsoe – Norway (bottom)
Figure 10: WAAS (top) & EGNOS (bottom) daily availability maps 04/08 to 06/08/2011
Figure 11: Vertical error (blue) and protection level (green) at Washington (top) & Tromsoe - Norway (bottom)
protection in the ionosphere domain (GIVE) were set to high values while for EGNOS, some Ionosphere Grid Points in the North of Europe were set to Not monitored, reducing the number of satellites usable for this type
of precision approach service. Note that a satellite is usable for the precision approach services when the ionosphere delay affecting its path to the user can be corrected by the ionosphere information sent by an SBAS i.e. there are enough monitored IGP in the surrounding of its ionosphere pierce point (IPP) corresponding to the
12 | CoordinatesCoordinates February 2014

Degradation of service availability is observed for both systems (fi gure 16). For WAAS the Canada and Alaska were impacted on the 24th while the day after, the degradation is observed on the whole service area. For EGNOS (even if the map for the third day is provided by a different tool due to a regular tool issue), the degradation was also observed but with less impact.
At each location (fi gure 17), the vertical protection levels were degraded during the
storm: either higher than the day before or not computed due to the lack of usable satellites. The periods without position at Kiruna with EGNOS was very short compared to the outage observed at Colorado Springs and Washington (several hours).
For EGNOS, additional information over ECAC is available (fi gures 18 to 22).
The ionospheric perturbation was visible by a TEC enhancement at the auroral oval on the ECAC region in the evening of October 24, with values up to 40 TECU above the TEC of the day before, near 21h35TU, over Sweden. Large scale smoothed TEC gradients of 0.2 mm/km were observed. The loss of L2 lock when L1 present, increased up to 60% at certain grid points of the auroral oval
and was of a quasi 20% ratio over Iceland and Greenland (fi gure 20).
The mean variation of SigmaPhi measured at Sodankyla (Finland) and
plotted from the 21st of Otober to the 27th pointed out a clear enhancement in the evening of the 24th and beginning of 25th.
The polar plots of SigmaPhi parameter from the 23rd to the 25th
show that satellites that were in the North but also in some others directions were affected (clear blue)
D. 09/03/2012 event
Figure 23: The storm began in the morning of the 8th and achieved its maximum one day later and fi nished in the evening of the same day. On this period, the ap index reached 207 nT as maximum.
The 10th of March is used as reference day.
Degradation of service availability is observed for both systems (fi gure 24), mainly on the 9th
(Alaska and West Canada for WAAS, Iceland and North of Scandinavia for
EGNOS). Nevertheless, the impact is less important than for Aug, Sep or Oct 2011 event. It has to be noted that both systems were upgraded between last quarter of 2011 and March event to improve their reliability during ionosphere events ([10], [11]).
No local degradation has been observed at US locations used
Figure 17: Vertical error (blue) and protection level (green) at Colorado Spring (top), Washington (middle) & Kiruna – Sweden (bottom)
Figure 20: L2 loss ratio - 24/10 /2011
Figure 21: mean SigmaPhi (black curve), spline of mean (red curve), 2σconfi dence interval (green curve)
Figure 23: Kp evolution from 08 to 10 Mar 2012
Figure 24: WAAS (top) & EGNOS (bottom) daily availability maps from 08 to 10 mar 2012
Figure 25: Vertical error (blue) and protection level (green) at Tromsoe – Norway
Figure 22: SigmaPhi at Sodankyla
Figure 18: TEC comparison - 24/10 to 23/10/2011
Figure 19: TEC gradient over ECAC - 24/10/2011
CoordinatesCoordinates February 2014 | 13

in the NTMF to monitor WAAS performances. At Tromsoe, degradation is observed late in the evening of the 8th and in the morning of the 9th due to some high GIVE or not monitored IGP (figure 25).
The main characteristics of the event on March 9th are a TEC enhancement in Southern Europe, with values 30 TECU above the TEC at the same hour on March 6th, the last quiet day before. The large scale gradients were up to 0.1 mm/km at different places, half of what was observed for the October event (figure 26 and 27).
Over the period between the 6th and the 12th of March, especially the 7th, 9th and 10th March, the SigmaPhi is well correlated to the ap index for the Sodankyla station. But, for the Svalbard station which is much higher in latitude this is not the case because the most intense perturbation of SigmaPhi occurred during the 8th of March (fi gure 28).
E. 15/07/2012 event
Figure 29: The storm began on the 14th evening, achieved its maximum 24 hours later and has continued until the 16th in the afternoon.
The activity was calm on the 13th; this day is chosen as reference day.
No real degradation was observed for WAAS (fi gure 30). EGNOS was slightly impacted on the 14th at its northern edge and a little bit more on the 15th (towards Iceland area).
Figure 31: Some degradation is observed at Tromsoe on the 15th during the night and in the afternoon.
Duration of the degradation is not so important than the
one for previous event.
F. Qualitative synthesis and discussion
A qualitative assessment of the impact of each event has been established in regards to the importance of the degradations observed
in the availability maps (table 3).
The use of ap (or Kp) index is suitable for detecting ionosphere/magnetosphere events. A clear relation can be highlighted between the loss of dual frequency data in L2 codeless technique and this index [4], but it is not possible based on the analyses presented here to forecast the importance of the outage caused by the detected event. Indeed, no relation can be put in evidence between the impact importance and intensity (max ap) of the illustrated events.
The effects of 2012 events are less important than those of 2011. It is not sure that this can merely be explained by the modifi cations brought to both system releases ([10] & [11]). Some other factors are likely to play a role such as the gradient of activity, solar events type and energetic particle fl ux arriving on Earth, as well as the GPS constellation situation over the stations network. Part of these factors and observed parameters will be taken into account to defi ne scenarios for modelling the impact at service level [12].
Figure 26: TEC comparison - 09/03 to 06/03/2012
Figure 27: TEC gradient over ECAC - 09/03/2012
Figure 28: mean SigmaPhi (black curve), spline of mean (red curve), 2σ confi dence interval (green curve) at Svalbard (top) and Sodankyla (bottom)
Figure 29: Kp evolution from 14 to 16 Jul 2012
Figure 30: WAAS (top) & EGNOS (bottom) daily availability maps from 13 to 15 Jul 2012
Figure 31: Vertical error (blue) and protection level (green) at Tromsoe – Norway
Event Max ap WAAS EGNOS05/08/2011 179 ++ +26/09/2011 92 +++ ++24/10/2011 154 ++++ ++09/03/2012 207 + +15/07/2012 132 0 +
Table 3: Event impact synthesis
14 | CoordinatesCoordinates February 2014

Conclusions
This paper shows that the solar activity is lower than previous cycles (as it has been forecasted for more than a couple of years now). Nevertheless, the ionosphere and magnetosphere activities are onset and storms occur. Even if no extreme+ event was detected from the beginning of the current solar cycle, some severe storms and an extreme one occurred. Their impact on WAAS and EGNOS was observed but it has to be noted that the importance of the observed impact is not in a mere direct relation to the intensity of the storm.
As current and future work in the scope of the study performed for Eurocontrol, it is expected to have a better modeling of this impact on the civil aviations GNSS based applications, including SBAS thanks to the observations performed with the Eurocontrol Ionosphere Data Collection network.
Acknowledgment
Part of the activities developed to achieve some results presented in this paper, were created by EUROCONTROL for the SESAR Joint Undertaking within the frame of the SESAR Programme co-fi nanced by the EU and EUROCONTROL. The opinions expressed herein refl ect the authors view only. The SESAR Joint Undertaking is not liable for the use of any of the information included herein. The analyses cover only the fi rst quarter of 2013 as this work was presented at ENC-GNSS 2013 (23-25 April, Vienna, Austria).
References[1] N. Suard and al, Assessment of
an Ionosphere Storm Occurrence Risk, Proceedings of the European Navigation Conference 2011, London
[2] NASA Solar Cycle prediction team, http://solarscience.msfc.nasa.gov/predict.shtml, updated 01/04/2013
[3] SIDC-team, World Data Centre
for the Sunspot Index, http://www.sidc.be/sunspot-data/
[4] F. Carvalho and al, GEOPOS workshop on ionosphere, Oct 2012, Paris
[5] EGNOS Data Collection Network by Eurocontrol, http://edcn2.pildo.com/home/
[6] EDAS (EGNOS Data Access Service), http://www.gsa.europa.eu/egnos/edas
[7] Y. Béniguel and al, Ionospheric Effects on GNSS Performance, NAVITEC 2012, December 2012. ESTEC, Noordwijk, ESA MONITOR project, http://monitor.estec.esa.int/Monitor/
[8] ftp://serenad-public.cnes.fr/SERENAD0/FROM_NTMF/MSG/
[9] User Guide for EGNOS application developers, Ed 2, 15/12/2011
[10] Iono Robustness” Upgrade to Increase WAAS Reliability, http://www.faa.gov/waas/news/
[11] http://www.essp-sas.eu/downloads/hfeyhu/service_notice_3_v01_01_egnos_upgrades_in_q1_2012.pdf
[12] E. Robert, Eurocontrol Space Weather Activities, Space Weather Workshop, Boulder, CO – April 2012
SD27_CMPL_MundoGEO_Feb_Ad_AS.indd 1 28-Jan-14 6:34:41 PM
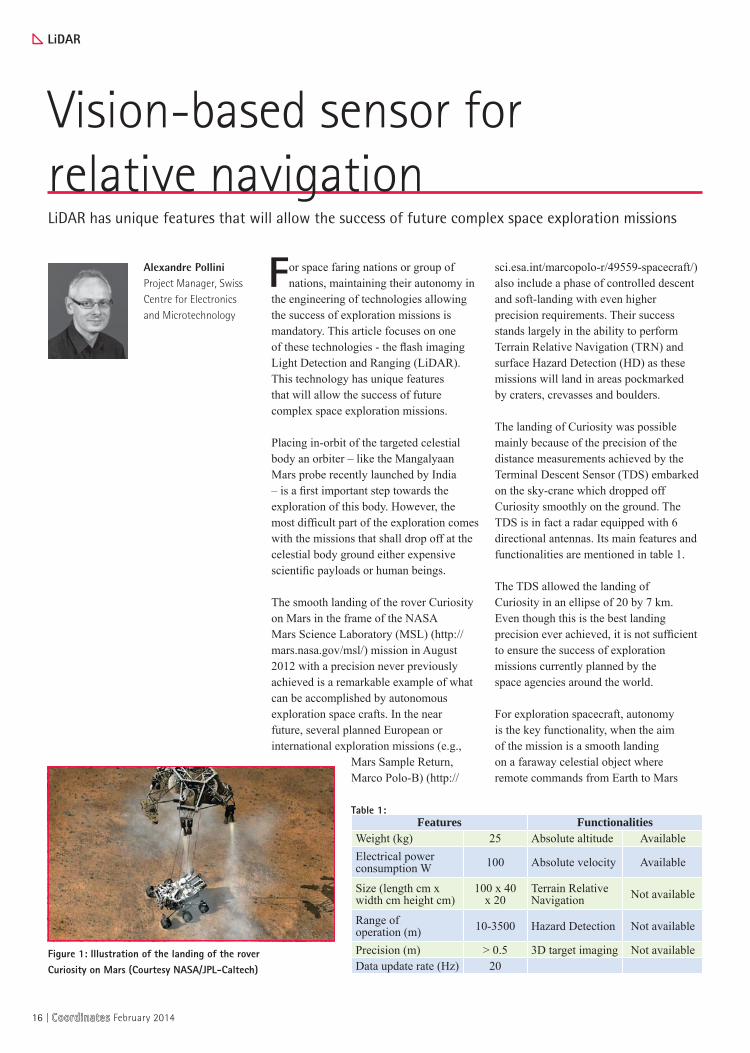
For space faring nations or group of nations, maintaining their autonomy in
the engineering of technologies allowing the success of exploration missions is mandatory. This article focuses on one of these technologies - the fl ash imaging Light Detection and Ranging (LiDAR). This technology has unique features that will allow the success of future complex space exploration missions.
Placing in-orbit of the targeted celestial body an orbiter – like the Mangalyaan Mars probe recently launched by India – is a fi rst important step towards the exploration of this body. However, the most diffi cult part of the exploration comes with the missions that shall drop off at the celestial body ground either expensive scientifi c payloads or human beings.
The smooth landing of the rover Curiosity on Mars in the frame of the NASA Mars Science Laboratory (MSL) (http://mars.nasa.gov/msl/) mission in August 2012 with a precision never previously achieved is a remarkable example of what can be accomplished by autonomous exploration space crafts. In the near future, several planned European or international exploration missions (e.g.,
Mars Sample Return, Marco Polo-B) (http://
sci.esa.int/marcopolo-r/49559-spacecraft/) also include a phase of controlled descent and soft-landing with even higher precision requirements. Their success stands largely in the ability to perform Terrain Relative Navigation (TRN) and surface Hazard Detection (HD) as these missions will land in areas pockmarked by craters, crevasses and boulders.
The landing of Curiosity was possible mainly because of the precision of the distance measurements achieved by the Terminal Descent Sensor (TDS) embarked on the sky-crane which dropped off Curiosity smoothly on the ground. The TDS is in fact a radar equipped with 6 directional antennas. Its main features and functionalities are mentioned in table 1.
The TDS allowed the landing of Curiosity in an ellipse of 20 by 7 km. Even though this is the best landing precision ever achieved, it is not suffi cient to ensure the success of exploration missions currently planned by the space agencies around the world.
For exploration spacecraft, autonomy is the key functionality, when the aim of the mission is a smooth landing on a faraway celestial object where remote commands from Earth to Mars
Vision-based sensor for relative navigationLiDAR has unique features that will allow the success of future complex space exploration missions
Alexandre PolliniProject Manager, Swiss Centre for Electronics and Microtechnology
Figure 1: Illustration of the landing of the rover Curiosity on Mars (Courtesy NASA/JPL-Caltech)
Features FunctionalitiesWeight (kg) 25 Absolute altitude AvailableElectrical power consumption W 100 Absolute velocity Available
Size (length cm x width cm height cm)
100 x 40 x 20
Terrain Relative Navigation Not available
Range of operation (m) 10-3500 Hazard Detection Not available
Precision (m) > 0.5 3D target imaging Not availableData update rate (Hz) 20
Table 1:
LiDAR
16 | CoordinatesCoordinates February 2014

the benchmark, the MSL TDS must be improved by the following factors:• The maximum mass has to
be divided by a factor 6,• The power consumption has to
be decreased by a factor 3,• The total size has to be
decreased by a factor 4,• At the same time, the ranging precision
has to be improved by a factor 50.
The proximity sensor performances should allow
to reach a landing precision of 30 by 30 m (MSL is 20,000 by 7,000 m).
In addition to these performances, allowing a precise relative navigation spacecraft-asteroid and making precise topographic and geodesic characterization, the proximity sensor must provide surface hazards detection and avoidance capability. A device with such capabilities will play an essential role for the success of NEO
needs at least 3 minutes and 7 seconds to reach the exploration spacecraft. This is by far too long to ensure the success of a mission where some sub-phases of the entry, descent and landing last only a few seconds.
New requirements are surfacing in relation with the ambitious objectives of new exploration missions. An example of such a mission is the Marcopolo-R mission planned by the European Space Agency (ESA). The mission’s main objective is to collect ground samples on a Near Earth Object (NEO) and to bring them back to Earth.
The scenario of Marcopolo-R is split in several sub-phases either focused on the characterization of the asteroid or on the landing and on the collection of samples.
Marcopolo-R (http://sci.esa.int/marcopolo-r/49560-mission-operations/) mission operations description defi nes the requirements related to each sub-phases. The table 2 summarizes the characterization sub-phases main parameters.
The table 3 summarizes the proximity navigation sub-phases main parameters.
The defi nition of the parameters above shows the performances that must be achieved by the proximity sensor. These performances have to be provided with limited resources (e.g., power supply, total sensor size, total weight, etc.,) for the proximity sensor. The features of
Figure 2: Summary of the Marcopolo-R asteroid characterization sub-phases (Courtesy: ESA, Astrium)
Sub-phase Global characterization
Local characterization
Proximity Sensor type Altimeter 3D mapperRange of operation (m) < 6000 , > 4000 < 300 , > 200Precision (m) < 1 < 0.1Horizontal resolution (m) - < 0.2Data update rate (Hz) > 2 > 2Vertical velocity (m/s) < 1.5 -
Table 2
Sub-phase Sampling descent rehearsal (SDR)
Descent and sampling (SAM)
Proximity Sensor type Inclinometer InclinometerRange of operation m < 250 , > 100 < 100 , > 5Precision m < 0.05 < 0.05Horizontal resolution m To be defi ned To be defi nedData update rate Hz > 2 > 2Vertical velocity m/s < 1.8 < 0.11 m/s
Table 3
Figure 3: Summary of the Marcopolo-R proximity navigation sub-phases (Courtesy: ESA, Astrium)
CoordinatesCoordinates February 2014 | 17

space missions. A proximity sensor with the features above is technologically not mature today to be embarked on a mission to Mars in the close future.
It appears to the space community that a sensor with such features can play an important role in other space applications. Applications often quoted are- rover navigation (as a replacement for the stereo-vision camera used so far), situational awareness sensor and rendezvous-docking operations.
A new space application can make profi t of the proximity sensor with the features quoted above- the Active Debris Removal (ADR). ADR missions will become more and more important in the future to maintain an access to space at reasonable risks.
The numbers are breathtaking. Today, amongst the objects orbiting the Earth in the geostationary orbit, 70% of them is garbage. It represents 958 objects in January 2013 (Space News October 28 2013). Collisions between debris and active satellite already happened in Low Earth Orbits (LEO).
The remedy to the situation illustrated on the left above where the sustainable exploitation of space would not be possible is to send ADR missions. ADR missions will allow reaching the situation depicted on the right where debris are either parked in specifi c garbage orbits or destroyed in the atmosphere through controlled de-orbiting.
ADR missions are split in three main phases- the rendezvous phase between
the chaser (the spacecraft sent to catch debris) and the debris, the capture phase where the chaser catches the debris and the orbit-change phase. For each of these phases, enabling technologies must be used to achieve the necessary operations. There is currently a consensus in the scientifi c community for the identifi cation of the technologies that will allow the success of ADR missions. They are listed in the fi gure below. Vision-based and LiDAR are the top ranked technologies for proximity navigation.
LiDAR – or more precisely imaging LiDAR, is the technology which offers all the features of the adequate proximity sensor. Other technologies propose only a subset of them (e.g., radar, passive camera).
Figure 4: On the left, the current debris situation orbiting Earth if not debris mitigation missions are sent in the future. On the right, the situation with debris mitigation missions (courtesy from ESA).
Figure 5: ADR key technologies (according to ESA, DLR (Deutches Zentrum für Luft-und Raumfahrt), CNES (CNES : Centre National d’Etudes Spatiales).
There are two families of imaging LiDAR technology- the fl ying spot and the fl ash technologies. The fi rst step in the design of an imaging LiDAR is the choice between the fl ash and fl ying-spot architectures. Considering the optical budget, the available optical power from the illumination source is spread in larger solid-angle in a fl ash architecture (http://www.fosternav.net/), implying more demanding constraints on the detector sensitivity to maintain equal ranging and imaging performances with fl ying-spot architectures. However, considering system’s complexity, fl ash architectures makes it possible to avoid the scanning subsystem of the fl ying-spot architectures. The progresses in major fl ash LiDAR subsystems, e.g., in
miniaturized high energy pulsed lasers, compact microchip lasers, continuous-wave laser modules and photodetector arrays makes this LiDAR architecture a solution that will become the most relevant to address the tough challenges of future space missions.
18 | CoordinatesCoordinates February 2014

GEODESY
Continuously Operating Reference Stations (CORS) networks have been
utilized for the last two decades in most developed and some developing countries by surveyors, geomatics and earth scientists and engineers. They handle Global Navigation Satellite System (GNSS) data which support three dimensional positioning not only for surveyors but also for any works in need of high accuracy and time effi ciency such as meteorologists, geophysical and geological engineers, construction engineers and so on (http://www.ngs.noaa.gov/CORS/). They have been implemented to contribute towards very high accuracy geodetic tasks since the late 1980s (Evans et al, 2002). The network based positioning provides geometric strength, reference datum stability and of course redundancy to geodetic methods; this is why CORS have become popular globally. Although these CORS networks are extremely useful in providing high accuracy positioning, they are not time effi cient, that is, it is not possible to obtain instantaneous accurate positions, requiring static positioning hours of point occupations and later post-processing. This made CORS networks unpopular for engineering-type surveys (Mekik, 2004).
Real Time Kinematic positioning ability was added to CORS networks (or rather passive/static CORS networks at the beginning of 2000) which made a worldwide breakthrough in concept and effi ciency of positioning (Bock et al, 2002; Rizos et al., 2003; Eren, 2005; Rizos, 2007; Grejner-Brzezinska et al. 2007). These types of CORS Networks are called RTK CORS, CORS-Active and so on to distinguish them from the old type of passive CORS networks. (Rizos et al, 2003, Wübbena et
al, 2001, Retscher, 2002). A CORS Service Provider, who sells user subscriptions, manages the CORS whose Service Provider chooses the Network RTK method the server will use. Therefore, this choice will ultimately infl uence the quality of RTK solution that can be achieved at the rover. The network is cogitated in a way that it provides data to GPS rover receivers by continuously monitoring and correcting the positional data from the GNSS satellite constellations (URL 2). The transmission of the correction factors via the internet and monitoring and reporting the timing errors to the central computing component allows for real time correction and adjustment of the coordinates to allow the rover to perform the its job higher level of accuracy (Lachapelle et al, 2002; Cruddace et al, 2002; Bray and Greenway, 2004).
Providing that RTK could be carried out in a perfect environment, with no atmospheric biases and no satellite orbit bias, there would be no need to restrict the range between a base station and the rover. Unfortunately, the Earth’s environment is never a perfect environment for GPS. This environment leads to distance dependent errors which restrict the range at which a rover can compute an RTK position fi x. Atmospheric delays are the main error sources for medium-range relative positioning, hence the main challenge for a NRTK system is the computation and representation of atmospheric delay errors for users. The major difference between the methods is that they use different approaches to make corrections for the rovers. (URL 2).
The network consists of several GNSS stations interconnected by reliable
TUSAGA-Aktif: Delivering benefits to TurkeyThis paper gives the infrastructure of the Turkish RTK CORS Network called TUSAGA-Aktif established by Istanbul Kultur University in association with the General Directorate of Land Registration and Cadastre and the General Command of Mapping and sponsored by the Turkish Scientifi c and Technical Research Agency (TUBITAK)
Sedat BakiciGeneral Directorate of Land Registration and Cadastre, Head of Geomatics Admin., Ankara, Turkey
Cetin MekikBulent Ecevit University, Engineering Faculty, Dept. of Geomatics Eng., Zonguldak, Turkey
CoordinatesCoordinates February 2014 | 19

communications to enable real time computations and control. Each station, as a minimum, requires a receiver, an antenna, communications and a power supply. In most cases a computer is installed additionally for data transmission and control. In ideal cases a supplementary confi guration is used for reliability or ’back up’ reasons. Additionally a user interface is required to confi gure and maintain the network. This may be realized remotely e.g. by radio communication or by mobile phones or via internet connection. An offl ine network that provides the information to the user for post-processing, the stored data fi les use ‘RINEX’ format (Wübbena and Willlgalis, 2001). There are a few methods to compute and transmit the corrections given as:
Virtual Reference Station (VRS):
The RTK CORS server collects satellite observations from the CORS Network, performs calculations, and sends RTK corrections to the rover. There are a few RTK correction techniques available, namely Virtual Reference Station method, FKP method and MAC method (Wanninger, 2002). The Virtual Reference Station (VRS) corrections are optimized for the rover position at the beginning of the RTK session. If the rover then moves a considerable distance within the same session (i.e. without disconnecting and reconnecting) the corrections might not be appropriate for the new rover location (Landau et al., 2003). With the Virtual Reference Station method the rover does not receive any observations related to a real reference station. Instead all correction relating to rover’s position comes from the virtual reference station (Wanninger, 1999; Vollath et al 2000, 2001, 2002, 2003; Roberts et al, 2004).
Area Correction Parameters Method (FKP: Flächen-Korrektur Parameter):
This method creates area correction parameters represented as simple planes (East- West and North-South gradients) that are valid for a limited area around a single reference station. The FKP method is a broadcast method and does not require the RTK rover to send its current position to the network central server (simplex communication suffi ces). Instead, the server models the distance dependant errors
and sends RTK data from one reference station within the network to the rover, along with the model (Wübbena et al., 2001). In this method the server computes the network solution (so called FKP) to reduce the distance dependent errors. Thus the network solution is not optimized for the rover’s position and might be limiting the RTK solution. In this method the correction parameters computed at the server are assumed that the distance dependent errors change linearly between reference stations. However, interpolation errors will occur at the rover if the true errors are non-linear. This can result in poor position quality or problems in the ambiguity fi xing. To resolve this issue, the user can disconnect and start a new session to generate a new reference station, or the server may automatically generate a new reference station. However, (in either case) generating new reference stations can cause jumps in position and accuracy. Therefore, the user can end up with inconsistent positions and accuracies throughout their survey. (Wubbena et al., 2001, 2004; Vollath et al., 2000, 2001, 2002, 2004).
Master Auxiliary Concept (MAC):
In this approach the RTK CORS server sends full raw observations and coordinate information for a single reference station, the Master Station, for all other stations in the network, the ambiguity-reduced data of every reference station. Therefore, it maximizes the use of all satellite data to calculate the best possible RTK solution. The Master Auxiliary Concept gives the rover the fl exibility to perform either a simple interpolation of the network corrections like FKP, or a more rigorous calculation (e.g. calculate multiple baselines from the auxiliary reference stations). This means the rover can monitor the RTK solution and change its calculation on-the-fl y to optimize the RTK solution. The rover has the possibility to adapt to the prevailing atmospheric conditions by using an appropriate number of reference stations. The MAC corrections allow the rover to measure a baseline to the master station – a real reference station (Brown et al., 2006).
This article gives a detailed information on the Turkish RTK CORS Network, CORS-TR Network, later changed its
name to TUSAGA-Aktif Network, and its infrastructure. TUSAGA-Aktif Network has been established by Istanbul Kultur University in association with the General Directorate of Land Registration and Cadastre of Turkey and the General Command of Mapping of Turkey and sponsored by the Turkish Scientifi c and Technical Research Agency (TUBITAK).
As with all CORS networks established all around the world, the TUSAGA-Aktif (CORS-TR) networks aims to determine positions fast, economically and reliably with cm accuracy within minutes, even seconds. However, TUSAGA-Aktif also targets to provide a means to model the atmosphere (troposphere and ionosphere), to predict weather (Roberts et al, 2005; Musa et al, 2005) and to monitor plate tectonics with mm-level accuracy leading to improvement of earthquake prediction and early warning systems (Brownjohn et al, 2004) and to determine datum transformation parameters between the old system ED50 (European Datum-1950) and ITRF97 (NADCON, 2004; Kempre et al, 2006).
Establishing TUSAGA-Aktif (CORS-TR) network
A comprehensive prototype (benchmark) test was carried out in Turkey in the Marmara region (roughly 300 x 150 km) in order to optimize the network design, to test different RTK techniques, the GNSS receivers and control center software packages. As far as the network-base RTK CORS is concerned, this is probably one of the most comprehensive prototype tests in the world (see Eren et al, 2009).
After conducting the prototype test, it is decided, accounting for geographical conditions of Turkey, that reference stations are a) to be established in city centers in
order to meet intense user demands, b) to be on rigid grounds, c) easily accessible for logistic purposes, d) close to energy and
communication facilities, e) to be situated in a way that plate
tectonics are suitable to monitor andf) to be apart less than 100 km (ibid, 2009).
20 | CoordinatesCoordinates February 2014

According to these criteria a total of 147 reference station locations are determined (see Figure 1).
All the TUSAGA-Aktif reference stations are named in accordance with IGS regulations having only four characters. Table 1 lists all the station names and locations including the four in Northern Cyprus.
The types of monumentation of all 146 reference stations are decided upon ground and regional conditions. Concrete pillar are chosen for rigid ground stations while galvanized steel pillars are constructed for roof tops and roof terraces. However, the heights of pillar change in terms of where they are put up. 86 of them are 2m tall concrete pillars, including the ground pillars (see Figure 2) while 58
pillars on roof terraces are 3m (see Figure 3) and only 3 of them on roof tops is 4 m galvanized steel pillars (see Figure 4)
Controlling the TUSAGA-Aktif
Two control stations (Master and Auxiliary) are established both in the capital city of Turkish Republic, Ankara. Master Control Station is situated in the Photogrammetry and Geodesy Administration of the General Directorate of Land Registration and Cadastre of Turkey and the Auxiliary Control Station in headquarters of the General Command of Mapping of Turkey (see Figure 5).
All the data from TUSAGA-Aktif reference stations are automatically sent via internet to these control centers in which the network computations and positioning corrections are carried out and send them to users in the fi eld. Control centers have a robust central software as well as servers. This software carries out these functions:- Connecting all reference stations
and transferring observations,
- Computing coordinates of reference stations ,
- Modeling errors, computing corrections and broadcasting to rover stations (users),
- RTK services,- Web services,- Monitoring rovers,- Storing all the data,
Table 2 lists all the hardware and software contents of both Master and Auxiliary Control Stations which both have a capability of computing and sending real time kinematic GPS corrections. The software for control stations is provided by Trimble VRS SW and originally designed for 250 NetR5 reference stations and consists of GPSNet, RTKNet, Webserver, Rover Integrity, Coordinate Monitor and Data Storage modules. It is capable of computing corrections for ionosphere, troposphere, multipath and orbit, and also can broadcast positional correction computed using FKP, VRS and MAC techniques.
For the communication between the control center and rovers RTCM 3.0 and higher protocols are used and thus GSM (cellular phones), NTRIP over GPRS/EDGE and radio links are utilized. NTRIP NTRIP is a protocol for streaming Global Navigation Satellite System (GNSS) data over the Internet. Based on the Hypertext Transfer Protocol HTTP/1.1. NTRIP began as an RTCM standard designed for disseminating differential correction data (e.g in the RTCM-104 format) or other kinds of GNSS streaming data to stationary or mobile users over the Internet, allowing simultaneous PC, Laptop, PDA, or receiver connections to a broadcasting host. NTRIP is designed to be an open non-proprietary protocol and has
Figure 1. Locations of TUSAGA-Aktif reference stations
Figure 2. Concrete pillar (2 m)
Figure 3. Galvanized steel pillar (3 m)
Figure 4. Galvanized steel pillar (4 m from the base of roof) Figure 5. Master Control Station and its schematic representation
CoordinatesCoordinates February 2014 | 21

No Station Name Province County No Station
Name Province County No Station Name Province County
1 ADAN Adana Yüregir 51 ERZR Erzurum Merkez 101 MIDY Mardin Midyat2 ADIY Adiyaman Merkez 52 ESKS Eskisehir Merkez 102 MUGL Mugla Merkez3 AFYN A.Karahisar Merkez 53 DINA Afyon Dinar 103 MURA Van Muradiye4 AGRD Agri Merkez 54 FASA Ordu Fatsa 104 MUUS Mus Merkez5 AKDG Yozgat Akdagmadeni 55 FEEK Adana Feke 105 NAHA Ankara Nallihan6 AKSI Antalya Akseki 56 FETH Mugla Fethiye 106 NEVS Nevsehir Merkez7 AKHR Konya Aksehir 57 FINI Antalya Finike 107 NIGD Nigde Merkez8 AKSR Aksaray Merkez 58 GEME Sivas Gemerek 108 ONIY Osmaniye Merkez9 AMAS Amasya Merkez 59 GIRS Giresun Merkez 109 OZAL Van Özalp10 ANMU Içel Anamur 60 GUMU Gümüshane Merkez 110 POZA Adana Pozanti11 ANRK Ankara Merkez 61 GURU Sivas Gürün 111 RDIY Tokat Resadiye12 ANTL Antalya Merkez 62 GYUR KKTC Güzelyurt 112 RHIY Erzincan Refahiye13 ANTE Gaziantep Sehitkamil 63 HAKK Hakkari Merkez 113 RZE1 Rize Merkez14 ARPK Malatya Arapkir 64 HALP Konya Halkapinar 114 SALH Manisa Salihli15 ARDH Ardahan Merkez 65 HARC Bursa Harmancik 115 SAMN Samsun Merkez16 ARTV Artvin Merkez 66 HATA Hatay Antakya 116 SARY Tekirdag Saray17 AYD1 Aydin Merkez 67 HYMN Ankara Haymana 117 SARV Karaman Sariveliler18 AYVL Balikesir Ayvalik 68 HEND Sakarya Hemindek 118 SEND Hakkari Semdinli19 BALK Balikesir Merkez 69 HINI Erzurum Hinis 119 SIHI Eskisehir Sivrihisar20 BAND Balikesir Bandirma 70 HORS Erzurum Horasan 120 SIRT Siirt Merkez21 BTMN Batman Merkez 71 IGIR Igdir Merkez 121 SLEE Istanbul Sile22 BAYB Bayburt Merkez 72 INEB Kastamonu Inebolu 122 SILF Mersin Silifke23 BEYS Konya Beysehir 73 ISPA Isparta Merkez 123 SINP Sinop Merkez24 BILE Bilecik Merkez 74 ISTN Istanbul Bakirköy 124 SIRN Sirnak Merkez25 BING Bingöl Merkez 75 IZMI Izmir Konak 125 SIVS Sivas Merkez26 BOGZ Yozgat Bogazliyan 76 IZMT Kocaeli Izmit 126 SIVE Sanliurfa Siverek27 BOLU Bolu Merkez 77 KRBK Safranbolu Merkez 127 SUNL Çorum Sungurlu28 BOYT Sinop Boyabat 78 KAMN Karaman Merkez 128 SURF Sanliurfa Merkez29 BURS Bursa Osmaniye 79 KAPN Konya Karapinar 129 SSEH Sivas Susehri30 CMLD Ankara Çamlidere 80 KARB Istanbul Karaburun 130 TVAN Bitlis Tatvan31 CANA Çanakkale Merkez 81 KRS1 Kars Merkez 131 TEKR Tekirdag Merkez32 CANK Çankiri Merkez 82 KSTM Kastamonu Merkez 132 TOKA Tokat Merkez33 CATK Van Çatak 83 KAYS Kayseri Melikgazi 133 TRBN Trabzon Merkez34 CAVD Burdur Cavdir 84 KESA Edirne Kesan 134 TUFA Adana Tufanbeyli35 CESM Izmir Çesme 85 KLIS Kilis Merkez 135 TNCE Tunceli Merkez36 CIHA Konya Cihanbeyli 86 KIRL Kirklareli Merkez 136 UDER Erzurum Uzundere37 CORU Çorum Merkez 87 KIRI Kirikkale Merkez 137 USAK Usak Merkez38 DATC Mugla Datça 88 KIKA Manisa Kirkagaç 138 VAAN Van Merkez39 DEIR Manisa Demirci 89 KIRS Kirsehir Merkez 139 VEZI Samsun Veziköprü40 DENI Denizli Merkez 90 KNYA Konya Selçuklu 140 VIRA Sanliurfa Viransehir41 DIDI Aydin Didim 91 KLUU Konya Kulu 141 BASK Van Baskale42 DIPK KKTC Dipkarpaz 92 KURU Bartin Kurucasile 142 YENC Çanakkale Yenice43 DIVR Sivas Divrigi 93 KUTA Kütahya Merkez 143 YOZT Yozgat Merkez44 DIYB Diyarbakir Merkez 94 LEFK KKTC Lefkosa 144 YUNK Konya Yunak45 EDIR Edirne Merkez 95 MGOS KKTC Magosa 145 ZONG Zonguldak Merkez46 EKIZ K.Maras Ekinözü 96 MALY Malatya Merkez 146 AHGK Ankara Merkez47 ELAZ Elazig Merkez 97 MALZ Mus Malazgirt 48 EMIR Afyon Emirdag 98 MARA K.Maras Merkez 49 ERGN Diyarbakir Ergani 99 MARD Mardin Merkez 50 ERZI Erzincan Merkez 100 MRSI Mersin Merkez
Table 1. Station names and their locations
22 | CoordinatesCoordinates February 2014

gained word-wide recognition as a useful means of transporting GNSS data. Wireless Internet services and Mobile IP Networks like GSM, GPRS, EDGE, or UMTS are all quite capable of carrying NTRIP streams.
The TUSAGA-Aktif (CIRS-TR) network equipped with NetR5 reference stations and control centers provides RTK GPS positioning 24 hours a day all over Turkey and the North Cyprus.
All the reference stations is geographically divided into four regions and thus four GPSnet servers (plus 4 auxiliary servers) in the Master Control Center (Figure 6). Each server is backed with an auxiliary server which automatically takes over the work in case of any failure in the main server. The control centers collect RINEX data from the reference stations in 1 second interval for an hour and 30 seconds intervals for 24 hours, and precise ephemerid data are automatically uploaded by the system.
The Master and Auxiliary Control Centers broadcast the coordinate correction using VRS CMR+, VRS RTCM 3.1, SAPOS FKP 2.3, RTCM3Net (MAC) and DGPS techniques. A separate webrouter transfers all the data from the reference stations to the main GPSnet servers
Contents Mstr AuxDL140G3 Dual-Core X5110 3.00 GHZ-1x4mb 1gb 80gb SATA 1U Rack; Windows 2003 Server 8 4
DL140G3 Dual-Core 2x X5110 3.00 GHZ-1x4MB 1GB 80GB SATA 1U Rack; Windows 2003 Server; 2x1GB FBD 2 1
NAS HP DL380 2TB SATA Storage Server; Dual-Core; 1GB DIMM; 2x1GB FBD 1 1
StorageWorks Backup Unit with Smart Array 1 117” LCD TFT Flat Panel Monitor 10 5CISCO 2811 Router with VPN encryption; 2x DSL interface 1 124-port unmanaged switch 1 119” 16-port KWM switch 1 119” 42U Server Max cabin with FAN and Thermostat module 1 119” Rack console with 17” TFT display, keyboard, mouse, touchpad 1 1HP A4 laser printer 1 1
Trimble VRS SW (including GPSNet, RTKNet, webserver, Rover Integrity, Coordinate Monitor and data storage) for 150 GNSS stations/nodes
1 1
Microsoft Offi ce (including MS Access) 1 1Working table 3 3VNCe SW 11 5IPCluster SW 2 1
Table 2. Contents of Master and Auxiliary Control Stations.
and auxiliary webrouter in real time. A secondary webrouter is designed to step in as an auxiliary in case of any failure. All the correction broadcasting is maintained through NTRIP Caster and CORSIZ program developed by GRAFTEK INC. manages the users and records all the user information. Furthermore, user or rovers are monitored by the software called CORSTAK implemented by GRAFTEK INC. over Google EarthTM in real time (Figure 7)
For static GPS data, a webserver software is run on webrouter and users can obtain RINEX data for observation time and time interval for any reference station. A TB hotswap RAID (plus an auxiliary) is formed on a NAS (Network Attached Storage) server, storing RINEX data (in Hatanaka format), reports, log fi les and hourly registry back-ups from all the servers.
Reference stations
A total of 146 The TUSAGA Aktif reference stations are established in the fi eld with baseline separation
of 70-100 km as deduced from the prototype test. (Figure 8)
For every reference station, a GPS cabinet is specially designed for TUSAGA Aktif project. These cabinets have glass doors when used indoors or steel doors on outside use. They are designed to work independent of mains electricity problems, fed on 12 Volt DC batteries; in other words, main grid electricity is only used for charging these batteries which can go on working for 48 hours without any electricity charging. Naturally different battery amperes had to be applied depending on the general temperature values of the region where reference stations are. (Figure 9 left)
Each cabinet contains a) 1 Victron Bluepower charger/power unit, b) 1 Trimble NetR5 GNSS receiver, c) 1 Sarian DR6410 Router/switch (ADSL/EDGE), d) 1 LVD voltage protection detector, e) lightning arrester for telephone and antenna lines and f) fuses and electronic cabling assembly. (Figure 9 right)
The antennas used on all the reference stations are Trimble Zephyr Geodetic IITM and Radome is also installed on antennas where snow load is expected. All the antennas are placed on pillars
Figure 6. Reference stations and their server regions
Figure 7. Monitoring users in real time
CoordinatesCoordinates February 2014 | 23

leveled by special tripods with fi xed height, yielding an extremely precise and standard antenna height.
All the stations possess static IPs and VPN tunnel (internal IP) communication via CISCO routers. However, in case of any router problem, the system is planned to also work with static IPs through a standard regular router.
Communication
The communication between the control centers and stations are maintained by duplex ADSL and GPRS/EDGE. For this purpose, the Master Control Center has 20Mbit and the Auxiliary 10 Mbit metro internet connection. Moreover it is possible to connect each reference station via GPRS/EDGE.
After carrying out intensive test it is found out that approximately 15 stations do not high quality line connections as the other. The metro connections in the control centers experience some data loss and slowing down especially during the peak times; however, this does not affect the RTK GPS tasks badly because the missing RINEX data are automatically replaced by the back-up ones kept in the centers.
Figure 8. The network of TUSAGA Aktif reference stations
Figure 9. Reference station cabinet (left) and schematic representation of cabinet components (right)
The data send by each reference stations are about 700 byte per second and the total amount data from the stations to the control centers is approximately 1.2 Mbit; concurrently daily RINEX data recorded at 1 second interval 20 Gb while RINEX data (in Hatanaka format) at 30 sec interval is 239 Mb.
TUSAGA-Aktif test results
The precise coordinates of TUSAGA-Aktif reference stations were calculated in ITRF 2005 datum and at the observation epoch utilizing two-weeks data of all the reference stations together with the IGS stations such as GRAS, GRAZ, KIT3, KOSG, MATE, NICO, NOT1, NSSP, ONSA, SOFI, VILL, WTZR, ZECK. The computations were carried out by using Bernese 5.0 and GAMIT software packages together with precise ephemeris.
As of January 31, 2010, all the reference stations are completed except 1 stations in Northern Cyprus. When the system was in the test stage, there were over 4000 users benefi ting from the system throughout Turkey to determine their precise coordinates by RTK or post processing techniques. The number has decreased to 2000 since the fi rst half of 2011 when the fee has been introduced to use the system. Users are able to determine their precise coordinates in matters of seconds.
For the purpose of testing the system, 808 points with their precisely known ITRF2005.00 coordinates are taken into account because they are homogenously scattered around the country in both
urban and rural areas. Table 3 lists all the results obtained from the test.
In Table 3 it can be seen that the largest standard deviation, as expected, is obtained in the height component while the values of nothing and easting components are comparable. The following Figure 10a, b and c give error distributions of the measurements in northing, easting and height components.
The TUSAGA-Aktif network commenced working in 2009 and the number of users are increasing exponentially. At the beginning of 2010 the daily user number has reach 350-370 rover on average, and the instantaneous user number in the range of 100-130, evenly scattered over Turkey in terms of their location. However, the frequency in user is high in the Marmara
Northing m) Easting (m) Height (m)No. of Measurements 808 808 808Smallest Difference -0.4990 -0.3280 -0.3077Largest Difference 0.2178 0.3092 0.2687
Average -0.0153 -0.0103 -0.0266Standard Deviation 0.042542438 0.03816926 0.090720529
Table 3. Statistics of the Measurements
Figure 10a. Error distribution in Northing component
Figure 10b. Error distribution in Easting component
Figure 10c. Error distribution in Height component
24 | CoordinatesCoordinates February 2014
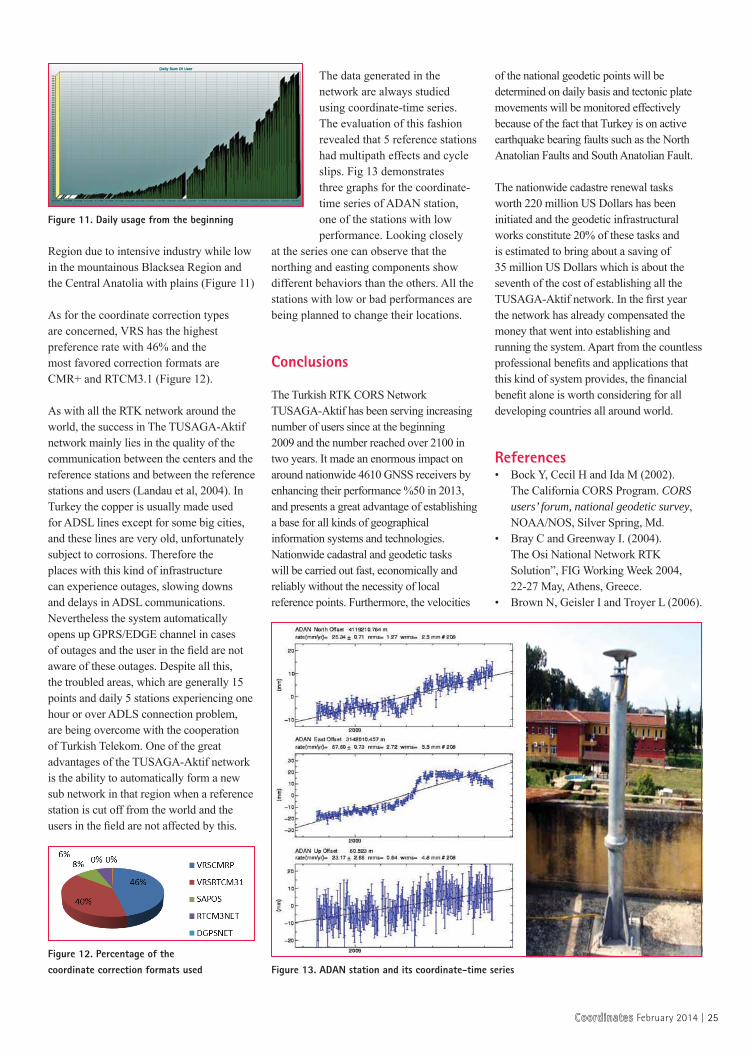
Region due to intensive industry while low in the mountainous Blacksea Region and the Central Anatolia with plains (Figure 11)
As for the coordinate correction types are concerned, VRS has the highest preference rate with 46% and the most favored correction formats are CMR+ and RTCM3.1 (Figure 12).
As with all the RTK network around the world, the success in The TUSAGA-Aktif network mainly lies in the quality of the communication between the centers and the reference stations and between the reference stations and users (Landau et al, 2004). In Turkey the copper is usually made used for ADSL lines except for some big cities, and these lines are very old, unfortunately subject to corrosions. Therefore the places with this kind of infrastructure can experience outages, slowing downs and delays in ADSL communications. Nevertheless the system automatically opens up GPRS/EDGE channel in cases of outages and the user in the fi eld are not aware of these outages. Despite all this, the troubled areas, which are generally 15 points and daily 5 stations experiencing one hour or over ADLS connection problem, are being overcome with the cooperation of Turkish Telekom. One of the great advantages of the TUSAGA-Aktif network is the ability to automatically form a new sub network in that region when a reference station is cut off from the world and the users in the fi eld are not affected by this.
The data generated in the network are always studied using coordinate-time series. The evaluation of this fashion revealed that 5 reference stations had multipath effects and cycle slips. Fig 13 demonstrates three graphs for the coordinate-time series of ADAN station, one of the stations with low performance. Looking closely
at the series one can observe that the northing and easting components show different behaviors than the others. All the stations with low or bad performances are being planned to change their locations.
Conclusions
The Turkish RTK CORS Network TUSAGA-Aktif has been serving increasing number of users since at the beginning 2009 and the number reached over 2100 in two years. It made an enormous impact on around nationwide 4610 GNSS receivers by enhancing their performance %50 in 2013, and presents a great advantage of establishing a base for all kinds of geographical information systems and technologies. Nationwide cadastral and geodetic tasks will be carried out fast, economically and reliably without the necessity of local reference points. Furthermore, the velocities
of the national geodetic points will be determined on daily basis and tectonic plate movements will be monitored effectively because of the fact that Turkey is on active earthquake bearing faults such as the North Anatolian Faults and South Anatolian Fault.
The nationwide cadastre renewal tasks worth 220 million US Dollars has been initiated and the geodetic infrastructural works constitute 20% of these tasks and is estimated to bring about a saving of 35 million US Dollars which is about the seventh of the cost of establishing all the TUSAGA-Aktif network. In the fi rst year the network has already compensated the money that went into establishing and running the system. Apart from the countless professional benefi ts and applications that this kind of system provides, the fi nancial benefi t alone is worth considering for all developing countries all around world.
References• Bock Y, Cecil H and Ida M (2002).
The California CORS Program. CORS users’ forum, national geodetic survey, NOAA/NOS, Silver Spring, Md.
• Bray C and Greenway I. (2004). The Osi National Network RTK Solution”, FIG Working Week 2004, 22-27 May, Athens, Greece.
• Brown N, Geisler I and Troyer L (2006).
Figure 11. Daily usage from the beginning
Figure 12. Percentage of the coordinate correction formats used Figure 13. ADAN station and its coordinate-time series
CoordinatesCoordinates February 2014 | 25

RTK Rover Performance using the Master-Auxiliary Concept, Journal of Global Positioning System, 5:135-144.
• Brownjohn JM, Rizos C, Tan GH, Pan TC (2004). Real-time long-term monitoring and static and dynamic displacements of an offi ce tower, combining RTK GPS and accelerometer data. 1st FIG Int. Symp. on Engineering Surveys for Construction Works & Structural Engineering.
• Cruddace P, Wilson I, Greaves M, Euler H-J, Keenan R., Wübbena G. (2002). The Long Road To Establishing A National Network RTK Solution”, FIG XXII International Congress, Session no. TS5.6, 19-26 April, Washington, USA.
• Evans AG, Swift ER, Cunningham JP, Hill RW, Blewitt G, Yunck TP, Lichten SM, Hatch RR, Malys S, Bossler J (2002), The Global Positioning System Geodesy Odyssey, Navigation, 49: 7-34.
• Eren K., (2005).The Establishment of Saudi CORS and SGD-2000 Geodetic Network, Ministry of Municipal and Rural Affairs, Saudi Arabia.
• Eren K, Uzel T, Gulal E, Yildirim O, Cingoz A (2009). Results from a Comprehensive Global Navigation Satellite System Test in the CORS-TR Network; Case Study. J. Surv. Engrg., 135: 10-18
• Grejner-Brzezinska DA, Kashani I, Wielgosz P, Smith DA, Spencer PSJ, Robertson DS, Mader GL (2007). Effi ciency and reliability of ambiguity resolution in network-based real-time Kinematic GPS., J. Surv. Eng., 133: 56-65.
• Kempe C, Alfredsson A, Engberg LE, Lilje M (2006). Correction model to rectify distorted co-ordinate system. XXIII FIG Congress.
• Lachapelle G, Ryan S, Rizos C (2002). Servising the GPS User, chapter 14 in Manual of Geospatial Science and Technology, J. Bossler, J. Jenson, R. McMaster & C Rizos (eds.), Taylor & Francis Inc., pp. 201-215.
• Landau H, Vollath U, Chen X, Allison T (2004). Benefi ts of Modernized GPS/Galileo to RTK Positioning Presented at GNSS 2004 The 2004 International Symposium on GNSS/GPS Sydney, Australia 6–8 December 2004
• Mekik C (2004). Positioning with Real Time Kinematic GPS Network (Netwrok RTK). Presented in Sypm.
on Geodetic Network in Engineering Surveys by Turkish National Geodesy Commission, Karaelmas University., Zonguldak, Turkey, pp. 202-207.
• NADCON (2002). North American Datum Conversion Utility, NOAA Technical Memorandum NOS NGS-50, USA, 2004
• Retscher G (2002), Accuracy Performance of Virtual Reference Station Networks, Journal of Global Positioning System, 1: 40-47.
• Rizos C, Yan T, Omar S, Musa T (2003). Implementing network RTK: the SydNET CORS infrastructure. The 6th Internation Symposium on Satellite Navigation Technology Including Mobile Positioning and Location Services, Melborne, Australia, 22-25 July.
• Rizos, C. (2007). “Alternative to current GPS-RTK services and some implications for CORS infrastructure and operations,” GPS Solut., 11:(3), 151-158.
• Rizos C, Yan T, Omar S,Musa T. (2003). Implementing Network-RTK: the SydNET CORS infrastructure, SatNav 2003, the 6th International Symp. On Satellite Nav. Tech. Including Mobile Pos. & Location Services, 22-25, July, Melbourn, Australia.
• Roberts C, Zhang K, Rizos C, Kealy A, Ge L, Ramm P, Hale M, Kinlyside D, Harmcombe P (2004). An investigation of improved atmospheric modelling for large scale high-precision positioning based on GNSS CORS networks in Australia, Journal of GPS, 3: 218-225
• URL 1 (2010). http://www.ngs.noaa.gov/CORS. Continously Operating Reference Station (CORS).
• URL 2. (2010).http://www.cors.com.au/technical-info/cors-network. South Australian CORS Network
• Vollath U., A. Deking, H. Landau, C. Pagels, and B. Wagner (200)., Multi-Base RTK Positioning using Virtual Reference Stations, Proceedings of the 13th International Technical Meeting of the Satellite Division of the Institute of Navigation, Salt Lake City, Utah, USA, September.
• Vollath U, Deking A, Landau H, Pagels C (2001). Long Range RTK Positioning using Virtual Reference Stations, Proceedings of the International Symposium on Kinematic
Systems in Geodesy, Geomatics and Navigation, Banff, Canada, June.
• Vollath U, Landau H, Chen X (2002). Network RTK – Concept and Performance, Proceedings of the GNSS Symposium, Wuhan, China, November.
• Vollath U., H. Landau, and X. Chen (2003). Network RTK versus Single Base RTK – Understanding the Error Characteristics, Proceedings of the 15th International Technical Meeting of the Satellite Division of the Institute of Navigation, Portland, Oregon, USA, September.
• Vollath U, Sauer K, Amarillo F, Pereira J (2003). Three or Four Carrier- How Many are Enough?, Proceedings of the ION GPS/GNSS Satellite meeting, September 9-12, Portland, Oregon, USA, pp. 1470-1477
• Vollath U, Patra R, Chen X, Landau H, Allison T (2004). Galileo/Modernized GPS: A New Challenge to Network RTK, Proceedings of the ION GPS/GNSS Satellite meeting, September, Long Beach, California, USA, pp. 21-24.
• Wanninger L (1999). The Performance of Virtual Reference Stations in Active Geodetic GPS-networks under Solar Maximum Conditions, Proceedings of the National Technical Meeting of the Satellite Division of the Institute of Navigation, ION GPS/1999 (September 1999, Nashville, USA), pp. 1419 – 1427.
• Wübbena G, Willgalis S (2001). State Space Approach for Precise Real Time Positioning in GPS Reference Networks, International Symp. On Kinematic Systems on Geodesy, Geomatics and Navigation, KIS-01, 5-8 June, Banff, Canada.
• Wübbena G, Bagge A, Schmitz M (2001). Network-Based Techniques for RTK Applications, the GPS Symposium, GPS JIN 2001, GPS Society, Japan Institute of Navigation, 14-16 Nov., Tokyo, Japan.
• Wanninger L (2002). Virtual Reference Stations for Centimeter-Level Kinematic Positioning, Proceedings of ION GPS 2002, 1400-1407, Portland, Oregon, USA.
• Wübbena G, Schmitz M, Bagge A (2004). Precise Kinematic GPS Processing and Rigorous Modeling of GPS in a Photogrammetric Block Adjustment, Geo++® GmbH, D-30827 Garbsen, Germany.
26 | CoordinatesCoordinates February 2014

SD27_CMPL_Javad-Gatefold_Feb_Ad_AS.indd 1 28-Jan-14 5:52:04 PM

SD27_CMPL_Javad-Gatefold_Feb_Ad_AS.indd 2 28-Jan-14 5:52:05 PM

SD27_CMPL_Javad-Gatefold_Feb_Ad_AS.indd 3 28-Jan-14 5:52:05 PM
SD27_CMPL_Javad-Gatefold_Feb_Ad_AS.indd 4 28-Jan-14 5:52:06 PM

SD27_CMPL_Javad-Gatefold_Feb_Ad_AS.indd 5 28-Jan-14 5:52:06 PM

SD27_CMPL_Javad-Gatefold_Feb_Ad_AS.indd 6 28-Jan-14 5:52:06 PM

SD27_CMPL_Javad-Gatefold_Feb_Ad_AS.indd 7 28-Jan-14 5:52:07 PM

SD27_CMPL_Javad-Gatefold_Feb_Ad_AS.indd 8 28-Jan-14 5:52:07 PM

M Rizaludin MahmudPhD Candidate, Graduate School of Urban Environmental Sciences, Tokyo Metropolitan University, Japan
Assc Prof Dr Shinya NumataFaculty of Urban Environmental Sciences, Tokyo Metropolitan University, Japan
Assc Prof Dr Hiroshi MatsuyamaFaculty of Urban Environmental Sciences, Tokyo Metropolitan University, Japan
Dr Tetsuro HosakaFaculty of Urban Environmental Sciences,Tokyo Metropolitan University, Japan
Prof Dr Mazlan HashimDirector Institute of Geospatial Technology,Universiti Teknologi Malaysia
Spatio-temporal rainfall changes at tropics had raised concern among
scientists. However, comprehensive studies at catchment scale of Southeast Asia where the combined regional and local factor is a tough task to be carried out due to the inherent limitations of rainfall data sources especially in the remote, upper part and diffi cult access of the watershed. Often the hydrological analysis and reports informed less information [e.g. 1] regarding those areas which are getting more signifi cant for the regional application. Therefore, an alternative support is strongly recommended to improve the spatio-temporal rainfall analysis and fi ll the gaps of knowledge in this watershed environmental niche.
The opportunities provided by the space-based precipitation radar are signifi cant to satisfy the raising issues. It provides temporal measurement, higher spatial gridded information, cost effective and convenient data inter-operability. There are increasing open source options for such information from wide range of satellites such as Tropical Rainfall Measuring Mission (TRMM), Meteosat, and GOSAT. Their potential to the local watershed application had been immensely studied by many researchers for the past decades [e.g., 2,3]. With the launch of the new Global Precipitation Mission in 2014, there is bright prospect of such rainfall measurement options to become one of the rainfall information sources at global scale. Nevertheless, comprehensive use of this kind of data at local Peninsular Malaysia especially in upper hilly watershed remains less explored.
There are two main issues addressed in this paper. First is the current spatio-temporal condition of rain gauge measurement in hilly catchment of Peninsular Malaysia,
and second is to explore how the space-based precipitation data could support to anticipate the sparse coverage and data inter-operability issues. In correspondence of both issues, two preliminary analyses were carried out. First, the spatial distribution and effi ciency of rain gauge in hilly forested catchment of Peninsular Malaysia is evaluated with respect to the land use and elevation information using Geographical Information System (GIS) approach. Second, the spatial pattern of rainfall changes is analysed using the TRMM satellite information.
Materials and method
Study site description
Peninsular Malaysia is located in Southeast Asia and experiences humid tropics climate through the year. The hilly and mountainous catchment in Peninsular Malaysia is highly dominated by dipterocarp and montane forest. The elevation ranged from 400m up to the highest peak of 2191m of Mount Tahan. The rainfall distribution pattern over Peninsular Malaysia is strongly infl uenced by the regional wind fl ows, and therefore, it is signifi cant to describe them based on the seasonal monsoon fl ows [4]. Rainfall patterns experienced by Peninsular Malaysia are determined by two main monsoon seasons, the northeast monsoon (November to March) and southwest monsoon (May to September).
Orographic and convective rainfall types characterized the rainfall in hilly catchment through the year. From 1977 to 2001, Peninsular Malaysia produced about 580 cubic km of natural renewable water resources, where 97.6% were generated
Space-based precipitation radar for spatio-temporal hydrology analysisThis study informs the potential and opportunities of space-based precipitation radar to fi ll the gaps of knowledge on spatio-temporal rainfall patterns for hydrology and related fi elds in tropical region
GIS
CoordinatesCoordinates February 2014 | 35

from surface water and only a small amount was generated from groundwater recharge (2.4%) [5]. The hilly catchment is pivotal for freshwater resources and also hydroelectric generation. Thus, there are about 20 reservoirs that resulted from the streamfl ow by hilly catchment areas. Figure 1 depicts the study area and its hydrological description.
Using GIS approach for rain gauge spatial distribution and effi ciency analysis in hilly catchment
Major hilly and mountainous watershed areas in four states, namely Kelantan, Selangor, Perak, Pahang, and Terengganu were analysed, and 85% of hilly watershed is located in these four states. A total of 571 rain gauge information was collected from various sources, mainly Meteorological Department and Department of Irrigation and Drainage. The fi rst step of this analysis is determining the spatial rain gauge distribution over the watershed areas by using land cover types and elevation. Elevation information is obtained from Shuttle Radar Topography Mission (SRTM) 90m grid resolution and the height is transferred to local datum. Cross tabular overlay analysis of rain gauge against the land use and forest elevation is implemented.
The next step is to analyse the effi ciency of the rain gauge which is located in the hilly catchment nearby area (~1.5km radius distance). Five indicators were then used to determine the effi ciency of those rain gauges. Those indicators are; (i) Telemetry, (ii) Data logger, (iii) Automatic Operation, (iv) Ownership and (v) International Organization of Standardization (ISO) status. It is suggested that effective rain gauge should possess all those characteristics. The score of each indicator is then plotted using radar chart analysis. A perfect score of 50 indicates 100% effi ciency of the rain gauge network system. Figure 2a shows the summary of the methodology fl ow.
Precipitation change analysis using space-based TRMM precipitation radar data
13 years of satellite observation period from 1998 to 2010 were acquired from the TRMM for this analysis. TRMM 3B43 Version 6 global data product is subset to the local area coverage and projected to the local projection and coordinate system. Then, the monthly rain rate was obtained and the annual basis co-effi cient of variation (COV) was computed. Long term in-situ
rainfall and evaporation records (>25 years) are also included for supporting the satellite analysis. Figure 2b illustrates the processing fl ow of the methodology.
Results
Rain gauge distribution spatial analysis against land use and elevation
Table 1 presents the general classifi cation of rain gauge distribution over major land cover in the four states. Based on the GIS spatial analysis, it showed that the proportion rain gauges located in the forested areas of the watershed were only 12% (Table 1). Further analysis indicates that apart from this 12% proportion, rain gauges coverage over higher elevation forest (300 – 1200m) experienced sparse distribution (Table 2). Spatial analysis also revealed that the hilly watershed in the west part of Peninsular Malaysia is more sparsely monitored compared to the east part. This is confi rmed with a detailed view on three major hilly catchments in Kuala Kangsar, Hulu Perak and Kinta where most rain gauges were located in non-forested areas (Figure 3).
Rain gauge effi ciency in hilly watershed areas
Figure 4 showed the radar chart analysis on the effi ciency of the rain gauge, located in the hilly watershed areas and 1.5km from it. The fi gure illustrates imbalance scores in all indicators, especially the ISO standard. The overall performance of the rain gauge was only 40% (Table 3). Considering that one of the most critical criteria is the ability of the rain gauge to log and transmit data via telemetry, only 63% of the rain gauge distribution or 14 rain gauges is available to provide rainfall data effectively. This analysis indicates that effective assessment of hilly watershed is a challenging task due to intangible daunting conditions to obtain rainfall information.
From the results, it strongly suggests that there are gaps that must be fulfi lled in rainfall measurement especially on the remote, thick and upper hilly areas and forested watershed. By referring to the recent evidence of the local
Figure 1: Precipitation zone in Peninsular Malaysia and forest elevation (Source for Precipitation Zone: [20] Dept. of Irrigation and Drainage)
Figure 2a: GIS approach method for rain gauge distribution and effi ciency analysis
Figure 2b: Rain rate changes analysis using TRMM data methodology
36 | CoordinatesCoordinates February 2014

rainfall spatial variations changes [6,7] it showed that the local hydrological patterns become more unpredictable and intensive studies is strongly needed. A space-based precipitation radar such as Tropical Rainfall Measuring Mission (TRMM) can be useful support systems in this situation, due to its advantages
of cost effective operations and data handling complexity, which is suitable with the condition of the developing region which has limited resources and communication system effi ciency.
Hilly watershed rain rate changes analysis
From the previous analysis, Hulu Perak watershed is one of the areas which had less rain gauge distribution as well as low rain gauge effi ciency scores. The mountainous range reached 1500 m from mean sea level and 90 is covered by the tropical rainforest. It was one of a critical catchment in West Peninsular
Malaysia and the main sources of streamfl ow for three major reservoirs which used to generate the hydroelectric turbines and other reservoirs for agricultural and freshwater resources. TRMM satellite data was used to analyse the rain rate which limited to be portrayed by rain gauge information.
Monthly basis COV indicated that for the past 13 years signifi cant rainfall pattern changes was identifi ed in the months of January and February (Figure 5). Spatial pattern map showed that obvious changes occurred at the upper part of the watershed, with an elevation of more than 1000 meter and gradually lower towards the lower elevation
Landuse Rain Gauges (Count)
Percentage (%)
Forest 67 12 Agriculture 370 65
Built Up 134 23
Table 1: Rain gauge distribution vs major land cover
Forest Types Forest Elevation(m) *a.s.l
Rain Gauges(Count)
Percentage(%)
Upper Montane >1200 9 13 Lower Montane 950-1200 3 4 Upper Hill Dipterocarp 750-950 4 6Hill Dipterocarp 300-750 6 9 Lowland <300 45 68
Table 2: Rain gauges distributions vs forest elevation
Figure 3: Rain gauges distribution on different forest elevation in Kelantan, Perak, Selangor, Terengganu and Pahang
SD27_CMPL_Supergeo_Feb_Ad_AS.indd 1 19-Jan-14 10:52:16 PM

(Figure 6). High amount of rainfall had occurred in two separate periods. First is 1999-2001 and the second is 2006-2007. Since January and February are not the typical wet season of this region, there are possibilities that the changes may be due to the infl uence of external continental factors [8] or seasonal local monsoon shifting changes.
Further, analysis with the global Oceanic Nino Index (ONI) record from the Climate Prediction Center of the National Weather Service, US had indicated that the increased rainfall amount in January and February coincide with the high magnitude ocean cold due to La-Nina event in 1999, 2000, 2006 and 2008 (Figure 7). La Nina phenomena resulted in wet conditions in Southeast Asia [10] and in 1999 several other areas in the world were severely affected [11]. On the other hand, significant evidence of local climate change also had been detected through the individual rain gauge analysis term of increased of longer rainy days (Figure 8) and increased evaporation (Figure 9).
Discussion
There are three main issues discussed:I) The spatial rain gauge
analysis obtained in this study suggest that appropriate utilization of various spatial data and satellite precipitation information in GIS environment can effectively support the hilly watershed productivity assessment. The rain gauge spatial distribution and effi ciency reports could be distributed to the local authority or responsible agencies concerned with related matters. Signifi cant measures can be immediately taken and improvement of the existing water management system can be conducted precisely. Eventually, a successful integration of spatial and geoinformation science into sustainable practice of hilly watershed hydrology in this country faced great challenges in terms of human resources capacity as well as substantial fi nancial resources. It was recommended that a sustainable and practical framework should be created that adept in reaching the success attained by the developed countries such as Japan (AMEDAS system), Australia and others.
II) Studying the output of hilly watershed rainfall changes, this study also confi rmed that the extent of the impact of climate change on a local scale has increased their variations at spatial location and time. For record, there are growing trends of frequent water induced disasters reported over the past 15 years [e.g. 12, 13]. One of the most recent disaster was a fl ood that resulted due to extreme heavy rainfall in hilly watershed areas. One of
the areas is Cameron Highlands, a hilly area of Malaysia [14], and the second is the lowland high urban settlement areas of Ipoh [15]. Thus, the ability of satellite-based precipitation to provide valuable information, since rain gauge measurement was limited, provided
Figure 4: Radar chart analysis on the effi ciency of rain gauges located in the hilly watershed and 1.5km near it. The performance of each indicator is scaled from 0 to 100%. Perfect score for each indicator is 100%.
Figure 6: (a) Hulu Perak watershed elevation, b) TRMM Rain rate co-effi cient of variation (COV) in the month of February (1998-2010)
Figure 7: Total satellite derived rainfall in January and February and *Global Oceanic Nino Index (ONI) from 1998 to 2010. (*Source: [21] NOAA National Weather Service – Climate Prediction Center)
Figure 5: Monthly basis co-effi cient of variation (COV) on rain rate derived from the Space-based Precipitation Radar of TRMM at three different upper
Figure 8: Time series of rainy days pattern from 1947-2011
Figure 9: Time-series of the evaporation from meteorological stations from 1961 to 2009
38 | CoordinatesCoordinates February 2014
opportunities to realize the effective climate change and natural hazards planning, mitigation and assessment.
III) Successful utilization of space-based precipitation radar which set for global scale basis measurement at local scale environment requires intensive validation and calibration efforts. Even though the preliminary assessment of TRMM rain rate data in Peninsular Malaysia suggests positive correlation with discreet rain gauge [16], however its actual accuracy when converted into rainfall estimates are remained unexplored. Moreover, the rainfall intensity, pattern and seasonality in this region are highly dynamic [6, 7]. A direct use of space-based precipitation radar data into hydrology models revealed that uncertainties vary within geographical conditions and latitudes [9, 17, 18, 19].
Conclusion
The current status of rain gauge distribution spatial analysis in major hilly watershed in Peninsular Malaysia, and the potential of space-based precipitation radar have been presented in this study. The spatial analysis revealed that the rain gauge distribution had sparse coverage on hilly watershed and possessed inadequate effi ciency for effective spatial based monitoring. The second analysis indicates that there are signifi cant monthly rainfall changes on the upper part of the hilly watershed for the last 13 years which occurred occasionally in different years of 1999, 2000, 2001, 2006 and 2009. This phenomenon can be associated with the cold temperature of La-Nina. The study informed the potential and opportunities of space-based precipitation radar to fi ll the gaps of knowledge on spatio-temporal rainfall behavior for hydrology and related fi elds.
Acknowledgement
We would like to thank everyone who directly or non-directly involved in this study. High appreciation is devoted to the data provider, Malaysian Meteorological Department, Department of Irrigation and Drainage, National Space Administration (NASA) and Institute of Industrial Science, University of Tokyo.
References[1] Monthly abstract of Meteorological
Observations, July, 1999, Malaysia Meteorological Service.
[2] Su, F., Hong, Y. and Lettenmaier, D. P. (2007). Evaluation of TRMM Multisatellite Precipitation Analysis (TMPA) and Its Utility in Hydrologic Prediction in the La Plata Basin, 9(4), 622-640. J. Hydrometeorology. Vol. 9, doi: 10.1175/2007JHM944.1.
[3] Shrestha, M. S., Artan, G. A., Bajracharya, S. R., and Sharma, R. R. (2008). Using Satellite-Based Rainfall Estimates for Streamfl ow Modelling: Bagmati Basin. J. Flood Risk Management. Volume 1, Issue 2: 89-99.
[4] Wong, C. L., Venneker, R., Uhlenbrook, S., Jamil, A. B. M. and Zhou,Y. (2009). Variability of Rainfall in Peninsular Malaysia. Hydrol. Earth Syst. Sci. Discuss. 6: 5471-5503.
[5] FAO (2005). Freshwater Resources. Population Division of the Department of Economic and Social Affairs of the United Nations Secretariat, World Bank.
[6] Diong Jeong Yik, Subramaniam Moten, Munirah Ariffi n and Siva Shangari Govindan. (2010). Trends in Intensity and Frequency of Precipitation Extremes in Malaysia from 1951 to 2009, Technical Reports, Malaysia Meteorological Department.
[7] Jamaludin Suhaila, Abd Aziz Jemain (2012). Spatial Analysis of Daily Rainfall Intensity and Concentration Index in Peninsular Malaysia. Theoretical Application Climatology. 108: 235-245.
[8] Fredolin T. Tangang, Liew Juneng, Ester Salimun, Kwan Meng Sei, Loh Juile and Halimatun Muhamad. (2012), Climate Change and Variability over Malaysia: Gaps in Science and Research Information, Sains Malaysiana 41 (11) : 1355-1366.
[9] Mahmud M.R. & Hashim M. (2010). Determination of Forest Water Yield in Malaysian Tropical Watershed using Calibrated Satellite-based Rainfall Data, IEEE Int. CSSR 2010, Kuala Lumpur, Malaysia.
[10] National Space Administration (NASA) Earth Observatory Offi cial Website. The Effects of La Nina. http://earthobservatory.nasa.gov./Features/LaNina/la_nina_2.php
[11] Michael H. Glantz. (2002). La Nina and Its Impacts: Facts and Speculation. United Nations University Press.
[12] Dept. of Irrigation and Drainage. (2007a). District of Muar and Batu Pahat, Introduction of Flood Hazard Mapping. Dept. of Irrigation and Drainage Malaysia Special Report.
[13] Dept. of Irrigation and Drainage. (2007b). Laporan Taklimat Banjir Segamat, 2006/2007. Dept. of Irrigation and Drainage Malaysia Special Report.
[14] New Straits Times Online Press (2013). Audrey Dermawan. Mud Flood Kills 3, One Missing in Cameron Highlands. 23 October 2013.
[15] New Straits Times Online Press (2013). Roshidi Abu Samah. 1151 victims in Perak. 23 October 2013
[16] Varikoden, H., Samah, A. A., and Babu, C. A. (2010). Spatial and Temporal Characteristics of Rain Intensity in the Peninsular Malaysia Using TRMM Rain Rate. J. Hydrology. 387:312-319. doi:10.1016/j.jhydrol.2010.04.023.
[17] Nishat, B. and Rahman, S. M. (2009). Water Resources Modeling of the Ganges-Brahmaputra-Meghna River Basins using Satellite Remote Sensing Data. JAWRA Journal of the American Water Resources Association. 45: 1313–1327.
[18] Tobin, K. J., and Bennett, M. E. (2008a). Using SWAT to Model Streamfl ow in Two River Basins with Ground and Satellite Precipitation Data. J. American Water Resources Association. Volume 45: Issue 1, 253-271.
[19] M. Rizaludin Mahmud, and M. Hashim. (2012). Operational Satellite-Based Watershed Monitoring Systems (SAWMOS) for Large Humid Tropical Catchment Environment. 2011 IEEE Colloqium on Humanities, Science and Engineering (CHUSER).
[20] Dept. of Irrigation and Drainage Malaysia. (1989). Average Annual and Surface Water Resources of Peninsular Malaysia. No.12, Water Resources Publication.
[21] NOAA Climate Prediction Center (2013). Historical El Nino/ La Nina episodes (1950-present). Online information. http://www.cpc.ncep.noaa.gov/products/analysis_monitoring/ensostuff/ensoyears.shtml
CoordinatesCoordinates February 2014 | 39
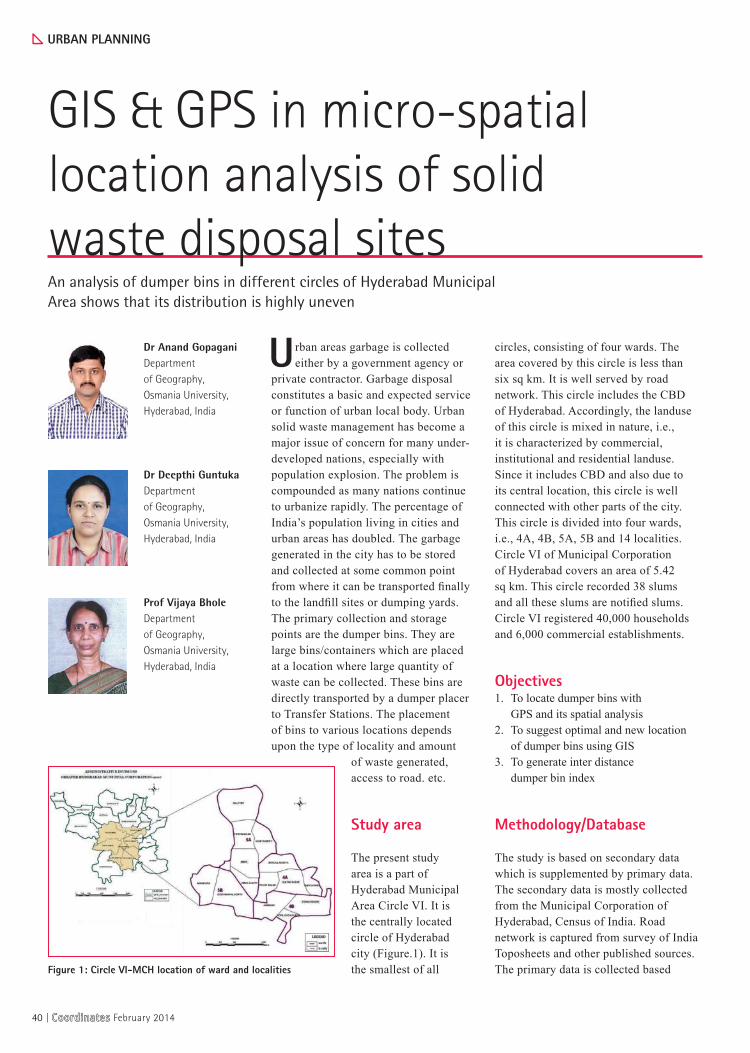
Urban areas garbage is collected either by a government agency or
private contractor. Garbage disposal constitutes a basic and expected service or function of urban local body. Urban solid waste management has become a major issue of concern for many under-developed nations, especially with population explosion. The problem is compounded as many nations continue to urbanize rapidly. The percentage of India’s population living in cities and urban areas has doubled. The garbage generated in the city has to be stored and collected at some common point from where it can be transported fi nally to the landfi ll sites or dumping yards. The primary collection and storage points are the dumper bins. They are large bins/containers which are placed at a location where large quantity of waste can be collected. These bins are directly transported by a dumper placer to Transfer Stations. The placement of bins to various locations depends upon the type of locality and amount
of waste generated, access to road. etc.
Study area
The present study area is a part of Hyderabad Municipal Area Circle VI. It is the centrally located circle of Hyderabad city (Figure.1). It is the smallest of all
circles, consisting of four wards. The area covered by this circle is less than six sq km. It is well served by road network. This circle includes the CBD of Hyderabad. Accordingly, the landuse of this circle is mixed in nature, i.e., it is characterized by commercial, institutional and residential landuse. Since it includes CBD and also due to its central location, this circle is well connected with other parts of the city. This circle is divided into four wards, i.e., 4A, 4B, 5A, 5B and 14 localities. Circle VI of Municipal Corporation of Hyderabad covers an area of 5.42 sq km. This circle recorded 38 slums and all these slums are notifi ed slums. Circle VI registered 40,000 households and 6,000 commercial establishments.
Objectives1. To locate dumper bins with
GPS and its spatial analysis2. To suggest optimal and new location
of dumper bins using GIS3. To generate inter distance
dumper bin index
Methodology/Database
The study is based on secondary data which is supplemented by primary data. The secondary data is mostly collected from the Municipal Corporation of Hyderabad, Census of India. Road network is captured from survey of India Toposheets and other published sources. The primary data is collected based
GIS & GPS in micro-spatial location analysis of solid waste disposal sitesAn analysis of dumper bins in different circles of Hyderabad Municipal Area shows that its distribution is highly uneven
Dr Anand GopaganiDepartment of Geography, Osmania University, Hyderabad, India
Dr Deepthi GuntukaDepartment of Geography, Osmania University, Hyderabad, India
Prof Vijaya BholeDepartment of Geography, Osmania University, Hyderabad, India
Figure 1: Circle VI-MCH location of ward and localities
URBAN PLANNING
40 | CoordinatesCoordinates February 2014

SD26_CMPL_FOIF_Jan_Ad_AS.indd 1 06-Jan-14 11:02:30 AM
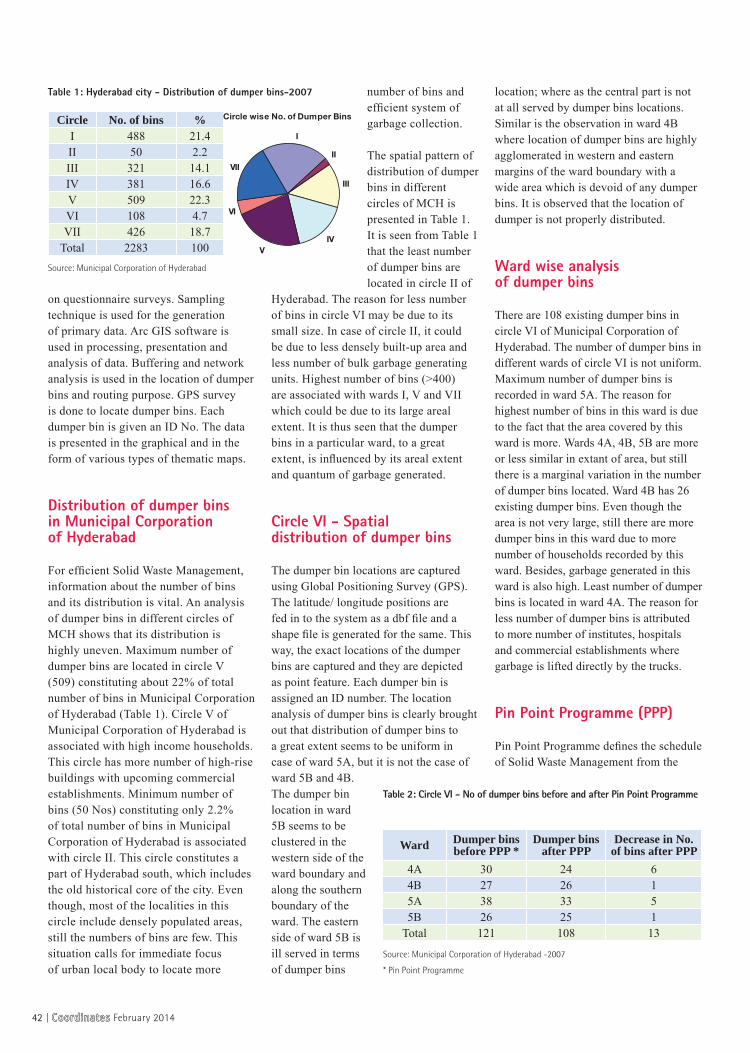
on questionnaire surveys. Sampling technique is used for the generation of primary data. Arc GIS software is used in processing, presentation and analysis of data. Buffering and network analysis is used in the location of dumper bins and routing purpose. GPS survey is done to locate dumper bins. Each dumper bin is given an ID No. The data is presented in the graphical and in the form of various types of thematic maps.
Distribution of dumper bins in Municipal Corporation of Hyderabad
For effi cient Solid Waste Management, information about the number of bins and its distribution is vital. An analysis of dumper bins in different circles of MCH shows that its distribution is highly uneven. Maximum number of dumper bins are located in circle V (509) constituting about 22% of total number of bins in Municipal Corporation of Hyderabad (Table 1). Circle V of Municipal Corporation of Hyderabad is associated with high income households. This circle has more number of high-rise buildings with upcoming commercial establishments. Minimum number of bins (50 Nos) constituting only 2.2% of total number of bins in Municipal Corporation of Hyderabad is associated with circle II. This circle constitutes a part of Hyderabad south, which includes the old historical core of the city. Even though, most of the localities in this circle include densely populated areas, still the numbers of bins are few. This situation calls for immediate focus of urban local body to locate more
number of bins and effi cient system of garbage collection.
The spatial pattern of distribution of dumper bins in different circles of MCH is presented in Table 1. It is seen from Table 1 that the least number of dumper bins are located in circle II of
Hyderabad. The reason for less number of bins in circle VI may be due to its small size. In case of circle II, it could be due to less densely built-up area and less number of bulk garbage generating units. Highest number of bins (>400) are associated with wards I, V and VII which could be due to its large areal extent. It is thus seen that the dumper bins in a particular ward, to a great extent, is infl uenced by its areal extent and quantum of garbage generated.
Circle VI - Spatial distribution of dumper bins
The dumper bin locations are captured using Global Positioning Survey (GPS). The latitude/ longitude positions are fed in to the system as a dbf fi le and a shape fi le is generated for the same. This way, the exact locations of the dumper bins are captured and they are depicted as point feature. Each dumper bin is assigned an ID number. The location analysis of dumper bins is clearly brought out that distribution of dumper bins to a great extent seems to be uniform in case of ward 5A, but it is not the case of ward 5B and 4B. The dumper bin location in ward 5B seems to be clustered in the western side of the ward boundary and along the southern boundary of the ward. The eastern side of ward 5B is ill served in terms of dumper bins
location; where as the central part is not at all served by dumper bins locations. Similar is the observation in ward 4B where location of dumper bins are highly agglomerated in western and eastern margins of the ward boundary with a wide area which is devoid of any dumper bins. It is observed that the location of dumper is not properly distributed.
Ward wise analysis of dumper bins
There are 108 existing dumper bins in circle VI of Municipal Corporation of Hyderabad. The number of dumper bins in different wards of circle VI is not uniform. Maximum number of dumper bins is recorded in ward 5A. The reason for highest number of bins in this ward is due to the fact that the area covered by this ward is more. Wards 4A, 4B, 5B are more or less similar in extant of area, but still there is a marginal variation in the number of dumper bins located. Ward 4B has 26 existing dumper bins. Even though the area is not very large, still there are more dumper bins in this ward due to more number of households recorded by this ward. Besides, garbage generated in this ward is also high. Least number of dumper bins is located in ward 4A. The reason for less number of dumper bins is attributed to more number of institutes, hospitals and commercial establishments where garbage is lifted directly by the trucks.
Pin Point Programme (PPP)
Pin Point Programme defi nes the schedule of Solid Waste Management from the
Source: Municipal Corporation of Hyderabad
Circle No. of bins %I 488 21.4II 50 2.2III 321 14.1IV 381 16.6V 509 22.3VI 108 4.7VII 426 18.7
Total 2283 100
Table 1: Hyderabad city - Distribution of dumper bins-2007
Ward Dumper binsbefore PPP *
Dumper binsafter PPP
Decrease in No. of bins after PPP
4A 30 24 64B 27 26 15A 38 33 55B 26 25 1
Total 121 108 13
Table 2: Circle VI - No of dumper bins before and after Pin Point Programme
Source: Municipal Corporation of Hyderabad -2007
* Pin Point Programme
42 | CoordinatesCoordinates February 2014

specifi ed dumper bin locations on a daily basis and shift wise regularly. In this programme, each vehicle is tracked for route and waste collection in this route, and transfer it to the Transfer Station and fi nally the waste is shifted from there to the Jawahar Nagar dump yard. This programme ensures solid waste collection vehicle-wise and route–wise.
The distribution of dumper bins in circle VI of MCH revealed variations in term of its distribution. An analysis of dumper bins before and after Pin Point Programme is done here. This Programme aims toward effi cient and sustainable Solid Waste Management. Keeping this in view, it is expected that the number of bins should increase after the implementation of Pin Point Programme for increasing capacity and effi ciency of garbage storage and collection. Contrary to this expectation, it is seen that the number of dumper bins decrease from 121 to 108 after the implementation of
Station (TTS) in south. The garbage from Circle VI is mostly transported to Imlibun Transfer Station, except the dumper bins located in the northern part of the study area (Figure) which is associated with Ward 5A. It includes localities like Hill Fort, Fathemaidan, Gunfoundry, Abids, Abids south. The reason for transferring garbage from dumper bins to the Tankbund Transfer Station is due to its proximal location. Garbage from only one dumper bin in Ward 4A is transferred to Tankbund Transfer Station (fi gure 2).
Inter bin distance analysis
An analysis of the distance between one dumper bin and another is very important in the collection and transportation of garbage. As seen from Table 4, there are 108 dumper bins in Circle VI. The distance matrix of these 108 dumper bins in different wards is shown in Table 4. The distance between one bin and another is as high as 469 mt (Ward 4A, bin ID 58) and as low as 60 mt (Ward 5A, bin ID 93).
As seen from Table 4, the distance between the nearest dumper bins vary from ward to ward. Out of 108 dumper bins, only 10 bins are located within a distance of <100 mt, constituting 9.25% only. Out of these 10 bins, 7 bins are located in Ward 4B and three in Ward 5A. On the other hand, there are 9 bins which are located at the distance >400 mt constituting 8.33% of the total number of the dumper bins. Maximum
Pin Point Programme. The purpose behind reducing the number of bins is to increase the collection effi ciency and that can be achieved by effi cient transportation, i.e., increasing number of tricycle.
As seen from Table 2, it is observed that highest number of decrease in dumper bins is reported especially by Ward 4A (6 Nos). No removal of dumper bins is recorded by Ward 5A.
The effi ciency of collecting garbage cans is assessed by computing the number of houses that are covered by each dumper bin. It is seen from Table 3 that the number of houses covered per bin is highest in Ward 4A (223 Nos) and least in 5B (172 Nos). The higher ratio of houses to bin is more in Ward 4A and 4B, which is due to the fact that these wards are densely populated areas.
Dumper bin location and transfer station
The garbage from door-to-door collection is dumped into the dumper bins which ultimately are transported to the Transfer Station (TS). The garbage from Circle VI is transported to two nearest Transfer Stations, i.e., Imlibun Transfer Station (ITS) in north and Tankbund Transfer
Ward No. Dumper bins after PPP No. of Houses No. of
Houses/Bin4A 24 5375 2234B 26 5425 2085A 33 5900 1785B 25 4300 172
Total 108 21000 194Source: Computed based on MCH data
Table 3: Circle VI- No of houses per dumper bin
Figure 2: Circle VI-MCH dumper bins and transfer stations
Ward No.
Inter distance (mts) Dumper bin (No. s)Total<100 100-200 200-300 300-400 >400
4A0 2 10 11 1 24
(0) (8.39) (41.66) (45.83) (4.16) (100)
4B7 4 5 2 8 26
(26.94) (15.38) (19.23) (7.69) (30.76) (100)
5A3 3 13 14 0 33
(9.09) (9.09) (39.39) (42.43) (0) (100)
5B0 10 14 1 0 25
(0) (40) (56) (4) (0) (100)
Total10 19 42 28 9 108
(9.25) (17.59) (38.88) (25.95) (8.23) (100)
Table 4: Circle VI-Distance to the nearest dumper bin-2007
Source: Computed based on MCH data
Figures in the brackets are percentages
CoordinatesCoordinates February 2014 | 43

distance shows that nearly ¼th of dumper bins are located at a distance range of <100 mt. It is due to the fact that the dumper bins are mostly agglomerated in the eastern periphery of the ward. In Ward 5A, most of the dumper bins are located within a range of 200-300 mt. The larger inter bin distance is due to the fact that the area
covered by this ward is more.
Location analysis of dumper bins
As seen earlier, there are 108 dumper bins located in Circle VI. Generally one dumper
bin is located at a place, but it is seen in the study area that in different locations, more than a single dumper bin is placed. It is seen that at places the number of bins are more than one. The number of bins at a place is determined based on the quantum of garbage generated, number of houses and houses holds, road conditions, etc.
A cursory glance at Table 5 shows that out of 108 dumper bins in Circle VI, 48 bins are placed at a single location where as in 22 locations two bins are located at a single place. In four locations, three dumper bins are located side-by-side, making a total of 12 bins. Only at
No of bins at single locationPlate 1 Single bin
Plate 3 Three bins
Plate 2 Two bins
Plate 4 Four bins
number of dumper bins is located within a range of 200-300 mt. Ward-wise analysis of inter distance between dumper bins shows that in Ward 4A, there are no bins located within a distance of <100 mt. Nearly half (45.83%) of the dumper bins in Ward 4A are located in inter bin distance range of 300-400 mt. In Ward 4B, inter bin
Ward No.No. of Bins
Totalsingle two three four
4A 9 6 1 -- 24
4B 5 4 3 1 26
5A 17 8 -- -- 33
5B 17 4 -- -- 25
Total 48 22 12 4 108
Table 5: Circle VI - No of dumper bins at single location
Source: Computed based on FigureFigure 3: Circle VI-MCH location analysis of dumper bins
44 | CoordinatesCoordinates February 2014

SD24_CMPL_November_013_NRSC_Ad_AS.indd 1 05/11/13 9:02 PM

one place were 4 dumper bins placed adjacent to each other. (Plate 1, 2, 3, 4)
The location of dumper bins as seen from Figure 3 reveals that the number of dumper bins in each location is not the same. In Ward 4A, nine locations are associated with single bins whereas in six places, there are two bins placed in a single location. There is only one place with three bins located at the margin of Sultan Bazar, Troop Bazar locality. There are no sites with four bins in Ward 4A. In Ward 4B, single bins are located in only
5 locations, whereas double bins are located
in 4 locations and three bins are placed in three locations. The uniqueness of Ward 4B is that it is the only ward where 4 bins are located at a place that is in Jambagh locality. Two bins located at a single point in Ward 4B are associated with localities like Badchowdi, Jambagh, Esamiabazar which are densely populated areas. In Ward 5A, 17 locations are registered as single bins whereas 8 places are recorded as double bins. The circle being commercial and institutional in nature, nowhere in Ward 5A are three and four bins located in a place. At 17
places in Ward 5B, single bins are located whereas in four places, double bins are located. No place with three and four bins is seen in this ward.
Locality-wise analysis of dumper bins revealed that maximum number of single dumper bins is located in Aghapura locality of Ward 5B. The problem of garbage collection and storage in this locality is substantiated by the fact that it is one of the largest localities with more number of premises and units. Only in one place are two dumper bins placed at a single location. Gunfoundry locality in Ward 5A is the only locality with a
distinction of not having more than one dumper bin located in a single point. Esamia Bazaar locality in Ward 4B is the only locality where three dumper bins are placed in a single location. Ward 5A and 5B are do not have localities with 3 or 4 bins at a single point.
Optimal location of proposed dumper bins
The distribution of dumper bins with a radius of 100 mt is shown in fi gure 4. The radius of 100 mt is considered here as an ideal distance from the point of view of collection of garbage. Buffering is used here as a decision support mechanism in the identifi cation of gaps in the location of existing dumper bins. The location of dumper bins with a buffer of 100 mt radius revealed that there are gaps existing where new dumper bins can be located. It is observed from the fi gure that overlap in certain places. An attempt has been made to identify new locations based on the existing gaps.
An analysis of existing dumper bins based on buffering technique revealed that there are certain gaps in the location of dumper bins (Figure 4). To identify new locations of dumper bins, buffers are drawn (100 mt) around dumper bins. Taking into consideration the transportation network, garbage generation, new location of dumper bins are proposed. Already Figure 4: Circle VI-MCH distribution of dumper bins
Ward No. No. of proposed bins Locality names4A 2 Boggulagunta, Troopbazar4B 2 Jambagh, Esamia bazar5A 1 Hillfort5B 2 Goshamahal north, Aghapura
Table 7: Circle VI -Location of proposed bins
Source: Based on (fi gure 5)
Ward No. No. of Existing bins No. of Proposed bins Total4A 24 2 264B 26 2 285A 33 1 355B 25 2 27
Total 108 7 115
Table 8: Circle VI – Existing and proposed bins
Source: Based on (fi gure 5)
Ward No. Name of the Locality
NO. OF BINS1 2 3 4
5A Hillfort 6 2 - -5A Fathemaidan 4 1 - -5A Abids 2 2 - -5A Abids south 2 2 - -5A Gunfoundry 3 - - -5B Aghapura 11 1 - -5B Goshamahal 6 3 - -4A Boggulakunta 5 1 - -4A Troopbazar 2 2 - -4A Sultan bazaar 1 1 1 -4A Badichowdi 1 3 - -4B Jambagh 1 2 1 14B Isamia Bazar 3 2 2 -4B Gowliguda 1 - - - Total 48 22 4 1
Table 6: Circle VI- Locality wise distribution of dumper bins
Source: Computer-based MCH data
46 | CoordinatesCoordinates February 2014

there are 108 dumper bins in Circle VI. Seven more new dumper bin locations are identifi ed. In Ward 4A, two new bins have been proposed, one at Boggulagunta and another at Troop Bazaar.
With two proposed dumper bins, the number of dumper bins in Ward 4A will be increased from 24 to 26. In Ward 4B also, two new places have been proposed for the location of dumper bins - one at Jambagh and another at Esamia Bazaar. The total number of dumper bins in Ward 4B will be increasing from 26 to 28. In Ward 5B, the proposed location of dumper bins are at Aghapura, Goshamahal north. With these two new proposed locations, the total number of bins will increase from 25 to 27 in Ward 5B (Figure 5). In Ward 5A, only one location has been identifi ed in the Hillfort locality. Even though this ward is very big, the proposed location is only one due to the fact that, this ward has large number of bulk garbage generating units where the garbage is collected at the door step. Besides, the number of households is also less as compared to other wards.
Conclusion
It is observed that the location of the dumpers has not been properly distributed. Ward wise analysis revealed that the number of dumper bins to a great extent has been influenced by quantum of garbage generation and areal extent of the ward. The ratio of houses to bin is related to the density of population. The inter distance
matrix of dumper bins revealed that there is a wide variation. The four bins at single location are related to density of population. Buffer analysis revealed the gaps and overlaps in the location of bins. Based on buffering technique new location of dumper bins is proposed on terms of inter bin distance.
References • Shekdar. 1999 Municipal Solid
Waste Management – the Indian perspective Journal of Indian Association for Environmental Management, 26 (2): 100–108.
• Mungai, G. 1998. “Solid Waste Management and its environmental impact in Kenya”. In: Solid Waste Management: critical issues for developing countries, edited by Elizabeth Thomas-Hope, 159-167. Kingston: Canoe Press, 1998.
• Integrated Urban Environment Improvement Project for the Bangalore City, Detail Project Report submitted to NORAD, March, 1998, Prepared by Bangalore Development Authority
(BDA), Centre for Environment Education (CEE), Technology Informatics Design Endeavour (TIDE).
• De Man, W.H.E., 1988. Establishing a Geographical Information Systems in relation to its use: A process of strategic choice. International Journal of Geographical Information Systems, Vol. 2, No. 3, pp. 245-261.
• Scholten, H.J. and Padding, P., 1990. Working with Geographic Information System in policy environment. Environment and Planning B, Vol. 16, pp. 405-416.
• Gupta, R.D., P.K. Garg and M. Arora, 2001, A GIS Based Decision Support System for Developmental Planning in Dehradun District, Journal Indian Cartographer, Vol. 21.
• Roy, A.K., P.K. Champati Ray and R.C. Lakhera, 1992, A New Horizon of GIS Application and Integrated Approach in Geosciences, Proceedings of the Silver Jubilee Seminar, IIRS, Dehradun, India, pp. 34-40.
• Abdul Wahid Gazali and Aziz Muda, 1998, Solid Waste Management Planning in Local Authorities in Malaysia, A Need for an Integrated Planning, Fakulti Sains dan Pengajian Alam Sekitar, Universiti Putra Malaysia.
• Agamuthu P., 1977, Introduction to Solid Waste, in Effective Solid Waste Management, Editor: Agamuthu P. and Nather Khan, Ecotone Management Sdn.Bhd. Malaysia, pp.1-1 to 1-6.
• Kota Kinabalu City Hall, 2000, Integrated Solid Waste Management Strategy, Sustainable Urban management Project – Sabah, Project Funded by DANCED and Malaysian Government, Kota Kinabalu City Hall.
• Bartone, C. 2000. Strategies for Improving Municipal Solid Waste Management: Lessons from World Bank Lending and CWG Activities. Workshop on Planning for Sustainable and Integrated Solid Waste Management, Manila, 18-22 September 2000. Washington, DC: Urban Management Division, World Bank.
Figure 5: Circle VI-MCH existing and praposed dumper bins
CoordinatesCoordinates February 2014 | 47

N K AgrawalFormer Director, Indian Institute of Surveying and Mapping (STI), Hyderabad, India
It is good to note that the above map is available on glossy paper and price at Rs. 85/- only. The critique is given in the following points:
Under the heading NOTES. The two notes are given:• Note 2, Heights are in metres and
above Indian Mean Sea Level.• Note 4, The triangulated heights and
contours in this sheet have not been adjusted to the heights of the spirit leveled bench marks and may not be strictly in accordance with them.
It appears that Note no. 2 has been given in view of the map being on WGS 84 datum. It would therefore be appropriate to make it clear in the notes that Vertical datum in this map is Indian Mean Sea Level.
This map has been published as “1st Edition 2012”. I have a copy of the same map which was published as “1st Edition 2006” published under the direction of previous surveyor general Major General M. Gopal Rao. The anomaly needs correction.
It is good to note that qualifi cations of the Surveyor General do not appear on the map whereas these appeared in the previous map, 1st Edition 2006.
In the COMPILATION INDEX, it is shown that western half part of map marked A and C, has been compiled from 1:25000 scale maps surveyed during 1971-72. Eastern half marked B has been compiled from 1:50000 scale map surveyed during 1972-73. Maps 56K/11/NE 1st Edition 1998 and 56K/11/SE 1st Edition 2000 on 1:25000 scale comprising eastern half marked B. It is hard to imagine as to why these maps surveyed during 1996-97 were not used to compile the map under review.
Open series map No. E 44 M 11 (56 K / 11), 1: 50,000 scale,1st Edition 2012, Survey of India
It is certainly improper to use 1:50000 map of 1972-73 survey ignoring 1996-97 survey maps on 1:25000 scale. This has resulted in many errors/omissions in the map under review. This needs to be explained to user public by the concerned authorities as tax payer’s money is involved.
Colour scheme needs improvement. Temples, mosques, churches etc. shown in black seem obliterated due to dark colour of building blocks.
Temples, mosques, churches etc. are being shown in black. It will be better if these are shown in red as s being done earlier. Needs reconsideration.
It will be better if due importance to DISTRICT and STATE is given by showing them as Heading as was being done earlier. It is felt that due consideration and attention is paid to all laid down principles given in chapters of Survey of India.
REVIEW
ENC-GNSS 2014Technology – Innovation – Business
European Navigation Conference 2014
The Netherlands Institute of Navigation (NIN) is pleased to invite you to the annual European Navigation Conference that will be held 15 - 17 April 2014
in the World Trade Center in Rotterdam, The
Netherlands.
With the Galileo system emerging, the conference will focus on technology, innovation and the transfer to business applications in the Position, Navigation and Timing (PNT) sector.
Conference Secretariat ENC-GNSS 2014: Sylvia Minten, T +31 (0)6 1660 3947, E [email protected]
For more information and registration, please visit our website www.enc-gnss2014.com
Supported BySupported By
Platinum SponsorsPlatinum Sponsors
SponsorsSponsors
Media PartnersMedia Partners
phphototogograraphphy:y: EESASA -- JJ.. HuHuarart t
Gold SponsorsGold Sponsors
European Space Agency and its ESA Business Incubation Centres
Vaderlandsch Fonds ter aanmoediging van ‘s-Lands Zeedienst
SD27_CMPL_ENC-GNSS 2014_Feb_Ad_AS.indd 1 24-Jan-14 8:13:13 PM

NEWS - GNSS
GAGAN passes certifi cation milestone
30th December 2013 is an important milestone in the history of Indian civil aviation as initial certifi cation of GAGAN (GPS Aided GEO Augmented Navigation) has been issued by DGCA and India joins the elite club of countries along with USA, Japan and Europe to implement the operational SBAS (Satellite Based Augmentation System). The certifi cation will enable Indian Flight Information Region (FIR) to support satellite based augmentation services for precision navigation by suitably equipped aircraft. Airports Authority of India (AAI), plans to develop closely spaced routes that will allow increase in capacity, reduce fuel burns through fl exible routings and ensure satellite based approaches to every runway end, thereby reducing the dependence on costlier ground based navigation systems. The transition from ground to satellite based systems will; however depend on the time that will be required for all airlines to operate the suitably equipped aircraft.
The GAGAN certifi cation challenge was addressed through the establishment of expert Technical Review Team (TRT) by DGCA comprising experts from DGCA, AAI, ISRO, Indian Institute of Science, Bangalore, and experts from system integrators from abroad. The TRT worked in collaboration over two years to ensure that GAGAN system met the safety critical standards for its usage in civil aviation. ISRO/AAI developed Operation testing and evaluation tools to analyze the GAGAN performance over Indian region. Indian region lies within equatorial anomaly region and posed challenges that were not experienced by other SBAS providers.
U.S. FAA downgrades India aviation rating
U.S. authorities have downgraded India's aviation safety rating, citing a lack of safety oversight, meaning Indian carriers cannot increase fl ights to the US and face extra checks for existing ones. India's government said it expected to resolve by March all concerns raised by the U.S. Federal Aviation Administration, including appointing an adequate number of fl ight operation
inspectors, and would approach the U.S. regulator for a review of its decision.
According to the US regulator, "The FAA has determined that India at this time is not in compliance with the international standards for aviation safety oversight," India joins countries such as Indonesia, the Philippines and Bangladesh that have a Category 2 rating. As of November 22, the FAA kept 81 of the 96 countries reviewed in Category 1. http://in.reuters.com
Enhanced Differential Loran to back-up GNSS successfully tested
Dutch company Reelektronika has developed and successfully tested Enhanced Differential Loran (eDLoran) to back-up GNSS. When piloting deep-draught vessels bound for Rotterdam - where the pilot boards about 35 miles off the coast - the Dutch Pilots' Corporation (Nederlands Loodswezen) currently makes use of a portable, autonomous navigation aid based on GNSS. By law, ships navigating the Eurogeul and Maasgeul shipping channels in the North Sea are required to carry an autonomous navigation system.
Totally independent of GNSS and working in a completely different part of the spectrum (100 kHz), eDLoran uses signals transmitted by towers in England, France and Germany. Based on these signals, a location can be determined with an accuracy of better than 5 metres, meeting the Government Port Approach Systems specifi cation. The test system that has been implemented includes an eDLoran reference station and eDLoran receivers for the pilots.
No GLONASS stations in US without Pentagon’s approval
US President Barack Obama has signed a bill hindering the construction of GLONASS stations on the US territory. The document rules that the matter requires the Secretary of Defense and the Director of National Intelligence to report the case to Congress fi rst. Under the Republican-proposed bill, the Pentagon and CIA chiefs are to provide assurances that GLONASS stations will not be used for
spying against the US or for improving the effi ciency of Russian weapons, the New York Times says. The signing was preceded by protracted debates between various US agencies and departments.
In 2012, Russia’s Roscosmos space agency announced plans to build eight monitoring stations on US soil to improve the accuracy of GLONASS. Russia has 19 ground-based GLONASS stations on its own territory. http://voiceofrussia.com
Lack of plow information due to faulty GPS
The New York City Sanitation Commissioner said a map that showed unplowed streets on the Upper East Side was due to a faulty GPS system. It was on a salt spreader, and also blamed traffi c problems for streets not being plowed. The city’s map showed no plowing at all on numerous Upper East Side streets – specifi cally east-west streets from 59th Street to 67th Street east of Lexington Avenue. www.vosizneias.com
Dark matter surrounding earth a possibility
In a major breakthrough, a GPS expert has discovered more grounds to believe that the earth can indeed be surrounded by an invisible halo of dark matter - the stuff that possesses mass and yet can't be seen. After analysing nine months of data collection from global navigation satellite systems, GPS expert Ben Harris of the University of Texas found that his measurement of earth's mass came in at between 0.005 and 0.008 percent larger than the "offi cial" mass measurements as quoted by the International Astronomical Union (IAU). www.business-standard.com
Isro to launch three IRNSS satellites this year
The Indian Space Research Organisation (Isro) will launch three satellites belonging to the Indian Regional Navigation Satellite System (IRNSS) constellation this year. IRNSS is an independent regional navigation satellite system designed to provide position information in the
CoordinatesCoordinates February 2014 | 49
Indian region and 1,500 km around the Indian mainland. www.dnaindia.com
BeiDou declares full FOC
Chinese BeiDou Navigation Satellite System (BDS) has declared full operational capability (FOC) for its regional service. The BDS program also released two new technical documents, including an updated interface control document (ICD) that describes the second civil signal, B2I, and a “BDS Open Service Performance Standard (version 1.0).”
Fighting climate change with GPS mapping
Indigenous communities in Indonesia are using GPS technology to demarcate the boundaries of their ancestral lands; a move many believe could also help mitigate the negative effects of climate change. Indonesia's dense forests are home to an estimated 50-70 million indigenous people, and 10 percent of all known plant species, according to AMAN and the Rainforest Action Network, a non-profi t international environmental advocacy group headquartered in San Francisco.
More than 600 cases for land rights have been fi led in Indonesian courts by indigenous communities in the past three years, according to the Tebtebba Foundation (Indigenous Peoples' International Centre for Policy Research and Education), based in the Philippines. These advocates of sustainability and tribal rights hope the two- and three-dimensional maps will help the thousands of diverse aboriginal groups to guard the health of the environments they depend on for survival. www.irinnews.org
800 GPS-fi tted ambulances in rural Jammu & Kashmir
Around 800 ambulances fi tted with GPS would be made available for patients in rural areas in Jammu and Kashmir, India. People in rural areas would only need to dial the toll-free number 102 to avail ambulance services fi tted with GPS under the National Rural Health Mission (NRHM) www.business-standard.com
NEWS - LBS
Tracking underground fi refi ghters
The KTH Royal Institute of Technology in Stockholm has developed sensor-equipped footwear that, using sensors inside the heel of a boot, makes it possible for incidents commanders to follow fi refi ghters' movements independent of the infrastructure they're working in. The system includes advanced sensors such as accelerometer and gyroscope plus a processor. It can withstand shock and extremely high temperatures and remains operational where GPS positioning systems fail. A wireless module worn on the shoulder sends the data to operational command, which provides incident commanders the precise information about responders' location and movements. The system has been tested successfully with fi refi ghters in real time, 25 meters below ground. www.fi reengineering.com
Enhanced LBS by AT&T & Sabre
AT&T and Sabre are developing and testing solutions that will utilize AT&T’s newly enhanced Location Information Services (LIS) – Hybrid, which allows developers to build geo-aware mobile applications. The companies are exploring how device-based location information services can help airlines, airport retailers, and other travel-related companies deliver intelligent, predictive and personalized services throughout a traveler’s journey. It has the ability to defi ne custom geofences (a virtual perimeter within a geographic area) in any shape or size, both indoors and out, using cellular, GPS and Wi-Fi information shared by the user from their devices. The app might alert airline staff when a high-status passenger is still clearing security when her fl ight is due to depart; or notifi es travelers of special promotions as they approach an airport bookstore.
Sensor Platforms adds pedestrian dead reckoning
Sensor Platforms has added Pedestrian Dead Reckoning (PDR) to its FreeMotion™ Library, enabling applications such as indoor navigation, activity monitoring, and LBS in mobile devices. The PDR algorithms allow accurate position results using only the mobile device sensors, without
the aid of GPS, Wi-Fi, or maps. Sensor Platforms’ PDR solution is sensor fusion-enabled to handle magnetic anomalies in real-world environments and context awareness-enhanced. Employing context capabilities allows for naturalistic changes in device placement (in-hand front, at-side, in-pocket, etc.) without compromising performance. With the FreeMotion PDR Library, typical position estimates stay accurate to within 5 percent of distance traveled. Sensor Platforms utilizes context in order to separate the actual travel direction of the user (called bearing) from the device orientation. Other unique features include false-step mitigation, stair-elevation tracking, and in-elevator transport. As with all Sensor Platforms products, the PDR Library is both sensor and platform agnostic. www.pddnet.com
Malaysia launches tracking system
A special satellite tracking system will be implemented in Malaysia that will enable authorities to monitor taxis and passengers to lodge complaints immediately. Taxis will soon be equipped with GPS technology, allowing the government to not only direct a taxi to a waiting customer, but also monitor a driver’s habits. Known as the Centralised Taxi Service System (CTSS), it is currently being developed by the Land Public Transport Commission (SPAD) and is slated for rollout in the Klang Valley in the third quarter of this year. www.thejakartapost.com
Cellular providers to submit report on LBS
Department of Telecom (DoT),India has asked cellular operators - Bharti Airtel, Idea Cellular, Reliance Communications and BSNL, to submit reports for accuracies achieved by them in implementing location-based services. DoT said operators were asked to submit the compliance report with respect to accuracies achieved so far by them, which can be used as input for deciding the methodology of measurement and for preparing roadmap for implementation of the accuracies. In 2011, government had made it mandatory for telecom service providers to introduce location based services across the country within three years. PTI
50 | CoordinatesCoordinates February 2014

+ Integrated HDR camera allows combination of brilliant colours with high-resolution scan data
+ The fastest laser-scanner over 1 million points/second
+ Eyesafe laser class 1
+ IP53 dust & water resistance
Scanning System S-3180V3D laser measurement system
www.pentaxsurveying.com/en/
TI Asahi Co., Ltd.International Sales Department4-3-4 Ueno Iwatsuki-Ku, Saitama-ShiSaitama, 339-0073 JapanTel.: +81-48-793-0118Fax. +81-48-793-0128E-mail: [email protected]
www.lawrenceandmayo.co.in
Authorized Distributor in IndiaLawrence & Mayo Pvt. Ltd.274, Dr. Dadabhai Naoroji Rd.Mumbai 400 001 IndiaTel: +91 22 22 07 7440Fax: +91 22 22 07 0048E-mail: [email protected]
SD27_CMPL_Pentax_Feb_Ad_AS.indd 1 19-Jan-14 10:38:06 PM

Galileo updateGalileo satellites locate aircraft by GPS
Galileo satellites have recently achieved fi rst successful in-fl ight tracking of a test machine using aircraft-generated longitude, latitude and altitude. A pair of Galileo test receivers was used aboard the aircraft, the same kind currently employed for Galileo fi eld-testing.
The evaluations were scheduled during periods in November when all four Galileo satellites were visible in the sky. Positioning fi xes require at least four satellites. The receivers fi xed the airplane’s position and determined key variables such as the position, velocity and timing accuracy, time to fi rst fi x, signal-t- noise ratio, range error and range-rate error. Test fl ights were also conducted during takeoff, straight-and-level fl ight at a constant speed, circling maneuvers, straight-and-level fl ight with alternating speeds, turns with a maximum bank angle of 60 degrees, pull-ups and push-overs, as well as approaches and landings. The satellites also allowed positioning to be carried out at speeds up to 245 knots. www.ainonline.com
European Satellite Navigation Galileo services will start at the end of 2014
Galileo and Copernicus, the EU Earth monitoring programme, are in decisive phases this year. With the launch of six additional Galileo satellites, Europeans will soon be able to enjoy their own satellite navigation system. The fi rst Copernicus satellite launch in March will also enable considerable progress in improving maritime security, climate change monitoring and providing support in emergency and crisis situations. The progress in both programmes was announced by Vice President Antonio Tajani recently. Galileo services should be available, subject to fi nalising all technical
issues, at the end of 2014/beginning of 2015. http://europa.eu/rapid
Czechs to test Galileo satellite system for jamming
The tests of the European Galileo navigation system's resistance to jamming will take place in one of military training areas in the Czech Republic, Czech Defense Ministry's spokesman Jan Pejšek told ČTK. The Prague-seated agency has assigned the test operation to the Czech National Security Offi ce (NBU), which, on its part, invited the Defense Ministry to cooperate on it because the military has both jammers and training grounds suitable to test Galileo.
ESA says it won’t be penalized for Galileo delays
The European Space Agency will not be subject to fi nancial penalties following the one-year delay in the launch of Galileo satellites because the commission did not sign an industrial contract with the agency for the Galileo work, ESA Director-General Jean-Jacques Dordain said recently. Under the European Commission’s agreement with ESA, the commission pays for ESA’s staff costs and ESA acts as technical manager for the program. But the industrial contract to build the coming Galileo satellites was not an ESA-EU affair.
EC Vice President Antonio Tajani in October warned that fi nancial penalties to those building Galileo would cover the cost overruns due to the one-year delay in launching the system. He did not specify the amount, and his remarks appeared to be aimed at ESA as much as the industrial consortium led by OHB AG of Germany and Surrey Satellite Technology Ltd. of Britain. www.spacenews.com
In-car ads based on location
BMW’s iDrive infotainment system could become a lot more annoying as the company is developing a location-based advertising service. Dubbed the "virtual marketplace of the future,” the project aims to deliver "location-based offers and services relevant to a specifi c route and fi nal destination. The system is currently being tested on a 7-Series prototype.
Nokia's Here launches community mapping pilot in India
Nokia’s mapping business Here has launched a community mapping pilot in India. Here will combine its industrial data collection methods with a crowd mapping initiative. With a team of more than 1,000 people in India, the regional Here will work directly with handpicked local experts from universities. To maintain accuracy and ensure map quality, Here has built a community map moderation system to verify edits before integrating them into the base map. The project in India is part of an ongoing series of pilot programmes for community mapping capabilities. www.telecompaper.com
Honda to join Google alliance
Honda Motor Co. shall join an alliance of companies that will work with Google Inc. on technological innovations for inboard automotive information networks, such as GPS. Other automakers in the Open Automotive Alliance include Audi AG, General Motors Co. and Hyundai Motor Group. The alliance plans to incorporate Google's Android operating system into automotive communications systems. http://ajw.asahi.com
Location-Based Big Data Solutions by GCS and Global Touchpoints
GCS, a geoanalytics company, is teaming with Global Touchpoints Inc. to develop Big Data solutions combining business intelligence and geospatial analytics for state and local government agencies. Both will be targeting government offi ces with Big Data challenges related to healthcare, energy/utilities, and water resource management. www.Touchpointsinc.com
52 | CoordinatesCoordinates February 2014

NEWS - IMAGING
ScanEx RDC began to distribute COSMO-SkyMed radar images in Russia. For now on ScanEx RDC is capable of providing data received from all operating commercial ERS radar satellites! http://press.scanex.ru/
EU’s fi rst Sentinel to launch ‘in April’
Copernicus will fl y a constellation of satellites known as the Sentinels to take a continuous “health check” on the planet and to acquire data that can help inform and enforce EU policies. It has been announced that the fi rst spacecraft in the series will go into orbit, most likely, in early April. Sentinel 1a will use radar to map the surface of the Earth. A key role will be to provide rapid damage maps to enable emergency services and aid agencies to respond to natural disasters such as earthquakes and severe fl ooding events. www.bbc.co.uk/
Belgian consortium to build Vietnamese EOS
A consortium of Belgian aerospace companies including QinetiQ Space have signed a pre-contract agreement with the Vietnam Academy of Science and Technology (VAST). The contract consists of the construction of the satellite, ground station and test facilities, the training of Vietnamese partners, and the operation of the satellite for one year. Alongside the aerospace company from Kruibeke, the Walloon companies Spacebel and Amos are also part of the entirely Belgian consortium. www.spacenv.qinetiq.com
Italian Predator B UAVs to get maritime wide-area search capability
The Italian Air Force (Aeronautica Militare Italiana [AMI]) is to upgrade its General Atomics Aeronautical Systems, Inc (GAASI) MQ-9 Predator B medium-altitude long-endurance (MALE) UAVs with a new maritime radar mode for search-and-rescue (SAR) duties. The AMI’s six MQ-9s will have their Block 30 Lynx Synthetic Aperture Radar/Ground Moving Target Indicator (SAR/GMTI) multimode radars enhanced with a maritime wide-area search (MWAS) mode that is optimised for detecting and imaging
very small vessels, such as those used by migrants crossing the Mediterranean Sea from North Africa. www.janes.com
French-UAE intel satellite deal in doubt
A United Arab Emirates (UAE) deal to purchase two intelligence satellites from France worth almost 3.4 billion dirhams (US $930 million) is in jeopardy after the discovery of what was described as “security compromising components.
A high-level UAE source said the two high-resolution Pleiades-type Falcon Eye military observation satellites contained two specifi c US-supplied components that provide a back door to the highly secure data transmitted to the ground station. www.defensenews.com
Ground-based UAV radar at fi ve sites by US Army
The US Army plans to install a new ground-based sense and avoid (GBSAA) network at fi ve installations by 2016 to ensure its UAVs can deconfl ict with other aircraft in domestic airspace. The fi ve sites are Fort Hood in Texas, Fort Riley in Kansas, Fort Stewart in Georgia, Fort Campbell in Kentucky, and Fort Drum in New York. The army decided to develop GBSAA as a more effi cient means of complying with Federal Aviation Administration (FAA) regulations for fl ying in domestic airspace. The FAA requires aircraft in domestic airspace to be able to ‘sense and avoid’, a problem for unmanned aircraft with no pilot in the cockpit.
Army, LAPAN agree to develop rockets
The Indonesian Army (TNI AD) and the National Institute of Aeronautics and Space (LAPAN) signed a Memorandum of Understanding (MoU) to develop missiles, rockets, and unmanned aerial vehicles. LAPAN will develop technologies for rockets, remote sensing satellites, atmospheric sciences and technology for unmanned aerial vehicles for spying and monitoring activities to support the state defense. www.antaranews.com
First professional grade civilian mapping UAS successful
Applanix Corp and American Aerospace Advisors Inc have completed a successful series of test fl ights of AAAI’s RS-16 platform equipped with Applanix’ DMS-UAV aerial photogrammetry payload. This is the fi rst successful mission for a long-endurance UAS (unmanned aerial system) capable of producing professional grade, directly georeferenced mapping imagery for civilian applications such as pipeline monitoring, power line and emergency response mapping. Tests were conducted over restricted airspace in the state of New Jersey. A joint team from Applanix and AAAI planned and fl ew a sequence of missions to evaluate the capabilities of the UAS. www.applanix.com
Beijing to step up aerial surveys of disputed islands
The State Oceanic Administration (SOA) will conduct regular aerial patrols over all islands claimed by China, intensifying air and sea surveillance in the East and South China seas. The SOA recently issued instructions for patrols that will be supported by high-resolution aerial photography and video and new aerial remote sensing technology. The most important islands will be surveyed at least twice a year. www.scmp.com
China’s HD earth observation satellite is on
China’s high-defi nition earth observation satellite “Gaofen 1” is now in operation. It is expected to play an important role in disaster relief, resources, and environmental survey. It is China’s fi rst high-resolution remote sensing satellite, was launched into space in April. It be followed into space by another four satellites before the end of 2016, forming a high-defi nition earth observation system. http://english.cri.cn/
ScanEx RDC starts to spread COSMO-SkyMed radar images in Russia
ScanEx Research & Development Center and the Italian e-GEOS company have signed a reseller agreement, under which
53 | CoordinatesCoordinates February 2014

NEWS - GIS
Views sought on the implementation of the INSPIRE
The European Commission, Directorate-General Environment, is inviting comments on the implementation of the Infrastructure for Spatial Information in the European Community (INSPIRE) Directive (2007/2/EC).
The consultation is being held seven years after the Directive came into force to assess whether actions being taken to establish a spatial information infrastructure are still on course to meet the Directive’s objectives. Views are sought from stakeholders including INSPIRE national contact points, regional and local public authorities who produce or use spatial data and services, the academic sector, the private sector and European citizens.
The questionnaire covers issues such as user or producer experiences of spatial data and services; the use of EU, national and regional geo-portals as gateways to spatial data and services; co-ordination efforts by the EU and national governments to implement INSPIRE; and evaluation of its cost-effi ciency. Other questions relate to the major challenges, benefi ts and drawbacks of INSPIRE and its positive or negative effects on environmental and other policies such as eGovernment.
3D National Topographic Model for Singapore
In an attempt to make exchange and utilization of topographic information among agencies easier, the Singapore Land Authority is heading a government-backed program to build up a 3D national topographic model! The initiative will include data acquisition both on ground and in the air. The SLA is trying to create a more effi cient 3D topographic database that will allow better maintenance to keep all 3D data updated all the time.
The model will be highly helpful in meeting needs such as fl ight path planning, fl ood risk modeling and
environment and coastal protection! A key dataset produced from this project will be the National Digital Elevation Model (DEM). Already, SLA has received many requests from Agencies on this for their planning, operational and developmental needs
ERC funds IIASA crowdsourcing project
The European Research Council has awarded a highly competitive Consolidator Grant to Steffen Fritz, leader and creator of IIASA’s citizen science project, Geo-Wiki. The €1.4 million grant will build upon work conducted as part of IIASA’s Geo-Wiki project, an interactive online project which involves citizen scientists in global land cover research. It will take the team’s research from the computer to the real world, building a global network of citizen scientists to provide on-the-ground data such as photographs and land-cover and land-use classifi cations.
Previous work by the Geo-Wiki team has produced improved cropland maps based on crowdsourced data from volunteers who classify land cover data from high-resolution satellite imagery. Previous research from the team shows that in fact, non-experts can be just as good as experts in performing some of these tasks, such as recognizing human impact on a landscape. www.iiasa.ac.at
Donation for prevention of violent, road-traffi c injuries
The Jamaica National Building Society Foundation has boosted the progress of the University Hospital of the West Indies (UHWI) Data Mapping Project in the sum of $6.8 million.
The project, which is in collaboration with the Ministry of Health, the Violence Prevention Alliance and Mona GeoInformatics, will, among other things, seek to chart and analyse the burden of violence and motor vehicle-related injuries on hospital services across the island, with emphasis on the UHWI. http://jamaica-gleaner.com
CIO and Amity Univ MoU
A memorandum of understanding (MoU) has been signed between Central Informatics Organisation (CIO) from the Kingdom of Bahrain and Amity University from India. The MoU will encompass many promising benefi ts which will refl ect positively on the CIO in particular and the Kingdom in general. The MoU also comprehends the CIO as a distinguished partner in the region and supporting many of the organisational programmes especially training programmes, building technical capacity and other benefi ts. The MoU also demonstrates the infl uence of the Kingdom of Bahrain represented by the CIO in the GIS fi eld which complimented many regional and international organizations desire to cooperate with the organisation.
Japanese public and private sectors to help set up geographical database
A central government ministry in Japan is preparing to compile a hodgepodge database of infrastructure locations, fl ows of people and other geographical information for improved disaster management measures, such as where to send disaster victims and how to transport relief supplies. The database, to be set up by the Ministry of Internal Affairs and Communications, will be compiled from information provided by local governments and private-sector companies. The ministry also plans to make the database available to the public to encourage the development of new business ventures. The ministry, which allocated 1.4 billion yen in the fi scal 2014 draft budget to help build the system, plans to start operating it fully in 2016. http://ajw.asahi.com
Marine Mapping Program in Ireland
Ireland’s Minister for Natural Resources, Fergus O’Dowd, has set out details of upcoming projects in the National Marine Mapping Programme (INFOMAR), and pledged Government commitment of €15m ($21m) for the next fi ve years, for the continuation of what he called “the most valuable resource for marine
54 | CoordinatesCoordinates February 2014

www.microsurvey.com +1 250 707 0000
Because it’s easy to use, provides the clearest results, and offers the most flexibility of any least squares program.
While some surveyors may be confident in the solutions produced by their instrumentation, a true professional surveyor considers it critical that they apply a least squares adjustment to every survey.
Download a free demo from our website: www.microsurvey.com
® MicroSurvey is registered in the U.S. Patent and Trademark Office by MicroSurvey Software Inc.
V7
August_013_Microsurvey_Ad_AS.indd 1 02-Aug-13 10:48:18 PM

NEWS - INDUSTRY
Juniper Systems’ rugged handheld computer goes fi shing
Rugged handheld computers from Juniper Systems are being used to help protect native species of fi sh in rivers in the US. The Utah Division of Wildlife Resources (DWR) is managing an invasive fi sh removal program. Using a Juniper handheld device loaded with custom fi sheries software, fi eld scientists monitored native fi sh species and removed invasive fi sh along the Green River, near scenic Dinosaur National Monument. The researchers rode along in a boat with electrodes protruding into the water. The electrodes send out an electrical current, temporarily stunning the fi sh, which subsequently fl oat to the surface, where they are netted and inspected. www.junipersys.com
NovAtel’s GAJT® GPS Anti-Jam Antenna for Canadian Army
NovAtel has announced that Public Works and Government Services Canada (PWGSC) has selected its GAJT-700ML antenna for testing on Canadian Army armored vehicles. The GAJT-700ML is the world’s fi rst single-unit GPS anti-jam antenna system for land vehicles. The testing is being conducted through PWGSC’s Build in Canada Innovation Program (BCIP). NovAtel was selected to participate under the BCIP’s “safety and security” priority area. PWGSC will procure a number of GAJT-700MLs on behalf of the Department of National Defense (DND). The Directorate of Land Requirements (DLR) with the assistance of the Quality Engineering Test Establishment (QETE) and the Land Force Trials and Evaluation Unit (LFTEU) will oversee all testing on DND’s behalf. www.novatel.com
Hexagon Topcon agreement
Hexagon AB and Topcon have announced an agreement for Hexagon to purchase Veripos, which operates a network of more than 80 GNSS reference stations through its subsidiary TerraStar. The regulatory announcement explains that Hexagon, Topcon Europe B.V.
and Topcon Corporation have entered into a memorandum of understanding (MoU) related to Veripos, Inc.
Hydrography Geospatial Data Management and Production System for Malaysia
The Hydrographic Directorate of the Royal Malaysian Navy (HDRMN) has a mandate to collect measurements using modern techniques, and provide adequate and timely hydrographic information to support safety of navigation, national development, defense and security, and numerous other activities related to the use of Malaysia’s marine environment.
CARIS and local Alliance Partner OKENOS Sdn. Bhd. were selected to implement a Hydrographic Geospatial Data Management and Production System (HGDMPS) at the National Hydrographic Centre (NHC). The enterprise GIS, comprised of Bathy DataBASE and HPD, will allow NHC to increase organizational capability for the management of elevation datasets, production of multiple paper and electronic chart types from a single database source, and improve the sharing of spatial information through a Marine Spatial Data Infrastructure (MSDI).
Epson electronics teams with Geodetics for INS
Epson Electronics America has partnered with Geodetics Inc of San Diego, California, for production of a new variant of its Geo-iNAV product, which is a fully-integrated GPS-aided inertial navigation system that provides real-time, high-precision positioning and navigation for manned and unmanned air, sea and ground vehicles. It combines GPS and proprietary sensor fusion technologies to achieve centimeter-level real-time positioning and navigation for dynamic platforms.
Garmin updated GPSMAP series with GPSMAP 64 range
Garmin have unveiled the latest update to its GPSMAP handhelds. The GPSMAP 64 sports a 2.6 in colour display which, enhanced internal memory to 4GB and
research and development in Ireland and beyond”. Covering some 125,000 square kilometers of underwater territory, the INFOMAR project is producing new mapping and integrated products covering the Irish maritime space. It provides seabed surveys, which are used in all activities from planning for offshore renewable energy projects to ensuring shipping lanes are safely charted. www.maritime-executive.com
KCSC in Spatial Information Market Vietnam
The Korea Cadastral Survey Corporation (KCSC) will export its spatial information technology to Vietnam. It will establish a comprehensive land information management system. The US$3.5 million project is a part of the offi cial development aid of the Korea International Cooperation Agency (KOICA) in Vietnam, and is scheduled to be completed in 2015. The corporation is going to move ahead with the project on a public-private cooperation basis in conjunction with the Korea Research Institute for Human Settlements and some small to mid-sized enterprises. www.businesskorea.co.kr
SuperGIS Desktop 3.2
Supergeo Technologies has announced the release of SuperGIS Desktop 3.2, the newest desktop GIS software. It integrates abundant GIS tools, helping GIS users from various domains develop a professional platform to effectively geoprocess and analyze, display, edit, manage, and query spatial data. www.supergeotek.com
SGI conducts survey at Indo-Myanmar border
To settle the existing border dispute at the Manipur sector of the Indo-Myanmar border, Surveyor General of India (SGI) conducted a survey. An offi cial team of the SGI currently camping at Moreh, the border town of Manipur at the border with Myanmar has been conducting the survey. The team is conducting the inspection with the help of satellite imagery. www.nagalandpost.com
56 | CoordinatesCoordinates February 2014
The 864-channel TRE-3 receiver, recently announced by JAVAD GNSS, can simultaneously access all current GNSS signals, with room to spare for multiple-channel tracking of select signals, according to the company. The new product offers many features, including:• Three ultra wide-band (100 MHz)
fast sampling and processing, programmable digital fi lters and superior dynamic range. After 12-bit digital conversion, nine separate digital fi lters are shaped for each of the nine GPS L1/Galileo E1, GPS L2, GPS L5/Galileo E5A, GLONASS L1, GLONASS L2, Galileo E5B/BeiDou B2/GLONASS L3, Galileo altBoc, Galilee E6/BeiDouB3/QZSS LEX, and BeiDou B1 bands.
• Each band consists of a combination of a digital cascaded integrator-comb (CIC) fi lter and a digital fi nite impulse response (FIR) fi lter (up to 60-th order) where signal selection is performed.
• Two types of digital in-band anti-jamming fi lters (automatic 80-th order and “user selectable” 256-th order).
• Multiple channels to acquire and track each satellite signal. For example, 20 channels can be assigned to acquire the GPS L1 signal, each spaced one millisecond apart. Up to 5 channels can be assigned to track each signal, each with different fi lter parameters and tracking strategies. This supports acquiring and tracking weaker signals in diffi cult conditions, especially under trees and canopy — potentially using up to the 864 channels available in the receiver! Several patents are pending.
• 80 dB out-of-band interference rejections: high dynamic range of wide RF bands and highly rectangular digital fi lters make the receiver much more
resistant to out-of-band jamming.• High-speed high-dynamic automatic gain control (AGC) to respond to interferences and signal variations.
• Programmable fi lter width.• Highly stable digital fi lters.• Improved GLONASS inter-
channel bias performance.• New multipath rejection technique.• 60-MHZ-wide Galileo altBoc band
takes advantage of the full benefi t of this signal. Its multipath resistance is improved even beyond that of the company’s new multipath reduction technique, it asserts.
• 864 GNSS channels allow tracking all current and future satellite signals.
• Three wide-band RF sections enable monitoring spectrums and interferences in three 100-MHz-wide bands.
• TRE-3 can track and decode the QZSS LEX signal messages, making it a unique product on the market in this regard, according to the company.
• Features for time -transfer applications: In time sources where the zero crossing of the input frequency defi nes the exact moment of the time second, the receiver monitors zero crossings and accurately defi nes the moment of the time second. An external time interval measurement unit is not required to measure zero crossing and 1-PPS offset.
• Embedded calibrator measures phase and code delays of each of the nine bands in timing applications. External calibration is not required.
TRE-3 is form, pin-out, and command compatible with the company’s earlier TRE-G3T receiver. It uses 8-Watts of power, compared to 4-Watts of the TRE-G3T
Nine GNSS frequencies available through new JAVAD GNSS receiver
a quad helix antenna with dual GPS and GLONASS support. www.garmin.com
ASR Workbench for Software Defi ned Radio Module by Loctronix
Loctronix Corporation has launched ASR Workbench, a development toolset for the
company’s recently released ASR-2300 software-defi ned radio (SDR) module. The ASR-2300 is a function-rich SDR for high-performance positioning, navigation and timing (PNT), and communication applications. It is a Windows-based Integrated Development Environment (IDE) for SDR applications development and testing.
Bluesky Soars with UltraCam Eagle
Aerial mapping company Bluesky is taking to the skies with a new large format digital aerial photogrammetric camera. Purchased from Microsoft’s photogrammetry division the UltraCam Eagle has a larger image footprint and a higher rate of image capture than other cameras on the market. www.bluesky-world.com
CHC introduces CGO Software
CHC released CHC Geomatics Offi ce (CGO), a software solution dedicated to post processing static and kinematic GNSS raw data. It supports GPS+GLONASS+BeiDou data in various raw data formats and is compatible with major brands allowing a seamless integration with an existing pool of equipment. www.chcnav.com
Mexican Positioning Contract for Veripos
Veripos has been awarded a three-year contract by Marinsa de Mexico SA de CV of Cd Del Carmen, for provision of services aboard two anchor-handling tug supply (AHTS) vessels, Amethyst and Turquoise. Operating in the Bay of Campeche in Mexico, both vessels are being provided with Veripos’s Standard2 dual beam service featuring both GPS and Glonass capabilities while signifi cantly increasing observational redundancy to ensure more robust positioning accuracies of better than 1 meter. www.maritime-executive.com
Northrop Grumman gets $200 million DoD contract
Northrop Grumman has emerged as the second-biggest winner of
Department of Defense contract. As per a $200 million sole-source, partial-foreign military sales, indefi nite-delivery/indefi nite-quantity contract to carry out “acquisition and sustainment” for the Embedded Global Positioning System Inertial Navigation System (EGI), Northrop will be responsible to work on platform
CoordinatesCoordinates February 2014 | 57

MARK YOUR CALENDAR
March 2014Munich Satellite Navigation Summit 2014Munich Satellite Navigation Summit 2014
25 – 27 MarchMunich, Germanywww.munich-satellite-navigation-summit.org
ASPRS 2014 Annual Conference ASPRS 2014 Annual Conference 23 - 28 March Louisville, Kentucky USAwww.asprs.org
April 2014ENC-GNSS 2014ENC-GNSS 2014
14 – 17 AprilRotterdam, The Netherlandswww.enc-gnss2014.com
SPAR InternationalSPAR International14-17 April 2014Colorado Springs, CO, USAhttp://www.sparpointgroup.com/international/
Interexpo GEO-Siberia 2014Interexpo GEO-Siberia 201416 - 18 AprilNovosibirsk, Russiahttp://expo-geo.ru/event/27_Interexpo-GEO-Siberia-2013
IGRSM 2014IGRSM 201421 - 22 April Kuala Lumpur, Malaysiahttp://www.igrsm.com/igrsm2014/
2014 International Satellite Navigation Forum2014 International Satellite Navigation Forum23 – 24 AprilMoscow, Russiahttp://eng.glonass-forum.ru
9thth National GIS Symposium in Saudi Arabia National GIS Symposium in Saudi Arabia28 - 30 April 2014Dammam, Saudi Arabiahttp://www.saudigis.org/default.aspx
May 2014China Satellite Navigation ConferenceChina Satellite Navigation Conference
May 2014Nanjing, Chinahttp://www.beidou.org/english/index.asp
IEEE/ION Position Location and IEEE/ION Position Location and Navigation SymposiumNavigation Symposium
5 – 8 May 2014Monterey, CAwww.ion.org
Esri Africa User ConferenceEsri Africa User Conference6 – 8, May 2014Cape Town, South Africawww.esri.com/events/auc
Annual Baska GNSS ConferenceAnnual Baska GNSS Conference7 – 9 May 2014 Baska, Krk Island, Croatiarenato.fi [email protected]
MundoGEO Connect 2014MundoGEO Connect 20147 – 9 MaySao Paulo, Brazilhttp://mundogeoconnect.com/2014/en/
GNSS: Principles, Augmentations GNSS: Principles, Augmentations and Evolutions of EGNOSand Evolutions of EGNOS
12-23 May 2014Toulouse, [email protected]
GEO BusinessGEO Business28 – 29 May 2014London, UKwww.geobusinessshow.com
June 2014Hexagon Conference 2014Hexagon Conference 2014
2 – 5 June Las Vegas USAhttp://hxgnlive.com/
ION Joint Navigation Conference 2014 ION Joint Navigation Conference 2014 16 – 19 June Orlando, United Stateswww.ion.org/jnc
INSPIRE Conference INSPIRE Conference 16-20 June 2014Aalborg, Denmarkhttp://inspire.jrc.ec.europa.eu/events/conferences/inspire_2014/
5thth International Conference International Conference on Cartography and GISon Cartography and GIS
15 – 21 June 2014Riviera, Bulgarihttp://iccgis2014.cartography-gis.com/Home.html
XXV FIG CongressXXV FIG Congress16 – 21 JuneKuala Lumpur, Malaysiawww.fi g.net
International Congress on International Congress on Remote Sensing and GISRemote Sensing and GIS
25-27 June 2014Casablanca, Moroccohttp://siggtcasablanca.univcasa.ma/
July 2014GI Forum 2014GI Forum 2014
1 – 4 July 2014Salzburg, Austriawww.gi-forum.org
Esri International User ConferenceEsri International User Conference14 – 18 July 2014San Diego, USAwww.esri.com
October 2014ISGNSS2014ISGNSS2014
22 - 24 OctoberJeju Island, Korea www.isgnss2014.org
November 2014Trimble Dimensions 2014Trimble Dimensions 2014
3 - 5, November Las Vegas, USAwww.trimbledimensions.com
integration, modernization, fl ight test support, technical support, training, engineering, and other efforts associated with EGI. The EGI system according to the Navy is a small, reliable, light weight unit which contains full Precise Position Service GPS on a single standard electronic module, plus a state-of-the-art Ring Laser Gyro inertial navigation system. www.hispanicbusiness.com
MDA signs contract with US Air Force
MacDonald, Dettwiler and Associates Ltd has signed a contract valued at US$4.9 million under its Indefi nite Delivery/Indefi nite Quantity (IDIQ) agreement with the U.S Air Force (USAF), to continue operational support and further enhance the fl ight path safety system that aids the design of airport approach and departure fl ight paths. Originally announced in February 2012, the value of contracts awarded to-date under the IDIQ agreement totals approximately US$13.8 million. http://blogs.ottawacitizen.com
AECOM selects Trimble Software to manage global construction projects
AECOM, providers of professional, technical and management support services for transportation, facilities, environment, energy, water and government, will deploy several solutions from Trimble’s Design-Build-Operate (DBO) software portfolio to improve project workfl ows, increase visibility and accuracy, and enhance team collaboration for construction projects. http://buildings.trimble.com
Trimble Navigation Assigned Patent
Trimble Navigation has been assigned a patent (8,614,642) developed by two co-inventors for methods and apparatus “for processing a set of GNSS signal data derived from signals of a fi rst set of satellites having at least three carriers and signals of a second set of satellites having two carriers.” The co-inventors are Nicholas Charles Talbot, Ashburton, Australia, Ulrich Vollath, Ismaning, Germany. www.4-traders.com
58 | CoordinatesCoordinates February 2014

Gain perspective in real-world GNSS simulationThe GNSS simulator in the ¸SMBV100A vector signal generator
www.rohde-schwarz.com/ad/smbv-gnss
¸SMBV-GNSS
September_013_Rhode and Schwarz_Ad_AS.indd 1 04/09/13 2:46 PM

YOU ARE DESCENDED FROM GENIUS. DO THEM PROUD.Like great thinkers of the past, engineers are at the forefront of creating inventions
that change our world. NovAtel’s three new OEM6 high precision receivers – containing our most advanced positioning technology – will help you push the
boundaries of possibility. The new OEM638 receiver card, ProPak6 enclosure and SMART6 integrated receiver/antenna provide the multi-constellation tracking,
configurability and scalability for solutions you are working on today and for your inventions to come in the future. Visit novatel.com/6 to learn more.
Integrate success into your .
September_013_NovAtel_Ad_AS.indd 1 03/09/13 2:02 PM
Copyright © 2022 FDOKUMEN