A 3D perfectly matched medium from modified maxwell's equations with stretched coordinates
Upload
khangminh22Category
view
1download
0
RNI: DELENG/2005/15153RNI: DELENG/2005/15153 No: DL(E)-01/5079/14-16No: DL(E)-01/5079/14-16Publication: 15Publication: 15thth of every month of every month Licensed to post without pre-payment Licensed to post without pre-payment U(E) 28/2014-16U(E) 28/2014-16Posting: 19Posting: 19thth/20/20thth of every month at NDPSO of every month at NDPSO Rs.150Rs.150
Volume XI, Issue 12, December 2015Volume XI, Issue 12, December 2015 THE MONTHLY MAGAZINE ON POSITIONING, NAVIGATION AND BEYOND THE MONTHLY MAGAZINE ON POSITIONING, NAVIGATION AND BEYOND
ISSN
0973-2
136
SURVEYING • GNSS • POSITIONING
BETTER FUTUREStudying the past for aStudying the past for a
SD49_CMPL_December 2015.indd 1 12/12/15 4:42 pm

Untitled-1 1 23/10/15 11:17 amSD49_CMPL_December 2015.indd 2 12/12/15 7:14 am

SD42_CMPL_Navcom_May_Ad_AS.indd 1 11/05/15 8:28 pmSD49_CMPL_December 2015.indd 3 12/12/15 7:14 am

Articles
Non-invasive modelling of a monumental masonry aqueduct ELAIOPOULOS MICHAIL, FABRIZI MARCO, GENTILI MARIO,
POCHETTINO ANNA STELLINA, SCIBETTA ROBERTO, ZECCA GIUSEPPE, ANCONA LEONARDO AND AGNIESZKA SMIGIEL 8 Deformation Analysis of the Territory of Bulgaria from GNSS observations KERANKA VASSILEVA AND GEORGI VALEV 12 Necessity of a European strategic plan 16 Nepal Climate Data Portal in the Context of Spatial Data Infrastructure RISHIRAJ
DUTTA, SUSANTHA JAYASINHE AND SENAKA BASNAYAKE 22 Comparative study on Cadastral Surveying using Total Station and High Resolution Satellite Image PRAVESH YAGOL, ELIZA SHRESTHA, LAXMI THAPA, MUKUNDA POUDEL AND GANESH PRASAD BHATTA 35 Zone Based Indoor Location Using GNSS Simulators LISA PERDUE, HIRO SASAKI AND JOHN FISCHER 42
This issue has been made possible by the support and good wishes of the following individuals and companies Agnieszka Smigiel, Ancona Leonardo, Axelle Pomies, Elaiopoulos Michail, Eliza Shrestha, Fabrizi Marco, Ganesh Prasad Bhatta, Gentili Mario, Georgi Valev, Keranka Vassileva, Hiro Sasaki, John Fischer, Laxmi Thapa, Lisa Perdue, Mukunda Poudel, Pochettino Anna Stellina, Pravesh Yagol, Rishiraj Dutta, Scibetta Roberto, Senaka Basnayake, Susantha Jayasinhe and Zecca Giuseppe; Antcom, Eos-GNSS, HiTarget, Javad, Microsurvey, Navcom, Pentax, South, Trimble, and many others.
COLOPHON AND CONTENTS
Mailing Address
A 002, Mansara Apartments
C 9, Vasundhara Enclave
Delhi 110 096, India.
Phones +91 11 22632607, 98102 33422, 98107 24567
Fax +91 11 22632607
[information] [email protected]
[editorial] [email protected]
[advertising] [email protected]
[subscriptions] [email protected]
Web www.mycoordinates.org
In this issueCoordinates Coordinates Volume 11, Issue 12, December 2015
Coordinates is an initiative of CMPL that aims to broaden the
scope of positioning, navigation and related technologies.
CMPL does not neccesarily subscribe to the views expressed
by the authors in this magazine and may not be held
liable for any losses caused directly or indirectly due to the
information provided herein. © CMPL, 2015. Reprinting with
permission is encouraged; contact the editor for details.
Annual subscription (12 issues)
[India] Rs.1,800 [Overseas] US$100
Printed and published by Sanjay Malaviya on behalf of
Coordinates Media Pvt Ltd
Published at A 002 Mansara Apartments, Vasundhara
Enclave, Delhi 110096, India.
Printed at Thomson Press (India) Ltd, Mathura Road,
Faridabad, India
Editor Bal Krishna
Owner Coordinates Media Pvt Ltd (CMPL)
Designed at Spring Design ([email protected])
Columns
My Coordinates EDITORIAL 6 Conference 2ND INTERNATIONAL SYMPOSIUM ON DISASTER MANAGEMENT 26 Old Coordinates 48 News
GNSS 45 GALILEO UPDATE 46 GIS 49 SNIPPETS 50 LBS 51 IMAGING 52 INDUSTRY 56 Mark your calendar JANUARY 2016 TO NOVEMBER 2016
This issue of Coordinates is of 60 pages, including cover.
SD49_CMPL_December 2015.indd 4 12/12/15 7:14 am

SD49_CMPL_South_Dec15_Ad_AS.indd 1 11/12/15 1:55 pmSD49_CMPL_December 2015.indd 5 12/12/15 7:14 am

ADVISORS Naser El-Sheimy PEng, CRC Professor, Department of Geomatics Engineering, The University of Calgary Canada, George
Cho Professor in GIS and the Law, University of Canberra, Australia, Professor Abbas Rajabifard Director, Centre for SDI and Land
Administration, University of Melbourne, Australia, Luiz Paulo Souto Fortes PhD Associate Director of Geosciences, Brazilian Institute of
Geography and Statistics -IBGE, Brazil, John Hannah Professor, School of Surveying, University of Otago, New Zealand
MYCOORDINATES
As the world’s diplomats
Grapple in Paris to clinch the climate deal
At United Nations Conference on Climate Change,
Delhi and Beijing
Scramble for strategies
To deal with air pollution
Of unprecedented levels.
Though emergency measures are being taken
From shutting down the schools
To restricting vehicular traf� c � ow,
Health appears to be an immediate casualty
In our pursuance of ‘development’.
With a hope to breathe in fresh air,
Coordinates wishes 2016 a year of good health, peace and prosperity
To our readers, authors and advertisers.
Bal Krishna, [email protected]
In search of fresh air
6 | CoordinatesCoordinates December 2015
SD49_CMPL_December 2015.indd 6 12/12/15 7:14 am

+ Integrated HDR camera allows combination of brilliant colours with high-resolution scan data
+ The fastest laser-scanner over 1 million points/second
+ Eyesafe laser class 1
+ IP53 dust & water resistance
Scanning System S-33331118880000VVVVVVVVV3D laser measurement system
www.pentaxsurveying.com/en/
TI Asahi Co., Ltd.International Sales Department4-3-4 Ueno Iwatsuki-Ku, Saitama-ShiSaitama, 339-0073 JapanTel.: +81-48-793-0118Fax: +81-48-793-0128E-mail: [email protected]
www.lawrenceandmayo.co.in
Authorized Distributor in IndiaLawrence & Mayo Pvt. Ltd.274, Dr. Dadabhai Naoroji Rd.Mumbai 400 001 IndiaTel.: +91 22 22 07 7440Fax: +91 22 22 07 0048E-mail: [email protected]
SD42_CMPL_Pentax-Scanning_May_Ad_AS.indd 1 4/28/2015 11:44:30 AMSD49_CMPL_December 2015.indd 7 12/12/15 7:14 am

the monument. Finally, some simple visualization and interrogation techniques are used to evidence planarity, verticality, co-planarity, shape and dimensions of the structure’s south façade.
Studying the past for a better future
Cultural heritage is present everywhere. Its structural control, documentation and
This paper illustrates the combination of non-invasive surveying
methodologies for the modeling of an old masonry aqueduct bridge, the “Ponti della Valle”, as a support to its structural analysis. The photogrammetric technique of Structure for Motion is used to process photograms taken from speci� ed positions; the created dense point cloud is then edited in order to meet the geometry visualization’s needs prescribed by the engineering team of
SURVEYING
conservation is one of human’s main duties (UNESCO 2013). In this contest, researchers continually are working to identify methodologies that guarantee accurate information regarding shape, state and dimensions, noninvasive, fast as possible and secure for the surveying operators. These techniques often integrate even multidisciplinary sciences like geomatics, information technology statistics and machine learning in order to entail results needed in good time manner.
Within the methodology presented in this paper and according to the criteria and rules of the structural analysis, it is possible achieve a signi� cate support in order to properly conserve structural heritage, and to estimate situations, sometimes critical, as well as eventual planning and maintenance efforts and costs, control and restoration.
The case study
Vanvitelli’s masonry aqueduct is located in the central Italy, near Caserta city, it has been constructed during in the second mid of the 17th century by Luigi Vanvitelli under the orders of King Charles III of Spain (� gures 1a and 1b). It is considered a structure of considerable architectonical merit both because it belongs to the monumental complex of the Caserta’s royal palace and due to its massive and technologically advanced for the time characteristics. The bridge is at the moment perfectly conserved, has a length of 529 meters, made of three rows of arches that reach a height of 55 meters at its highest part. The structure was nominated “World Heritage Site” by UNESCO in 1997.
Non-invasive modelling of a monumental ma sonry aqueductThis paper illustrates the combination of non-invasive surveying methodologies for the modeling
of an old masonry aqueduct bridge, the “Ponti della Valle”, as a support to its structural analysis
Elaiopoulos MichailDivision “Research and Environment”, CSI Management S.r.l., V.le C. Pavese 305 – Rome (Italy)
Fabrizi MarcoDivision “Research and Environment”, CSI Management S.r.l., V.le C. Pavese 305 – Rome (Italy)
Gentili MarioDivision “Research and Environment”, CSI Management S.r.l., V.le C. Pavese 305 – Rome (Italy)
Pochettino Anna StellinaDivision “Research and Environment”, CSI Management S.r.l., V.le C. Pavese 305 – Rome (Italy)
Scibetta RobertoDivision “Research and Environment”, CSI Management S.r.l., V.le C. Pavese 305 – Rome (Italy)
Zecca GiuseppeDivision “Research and Environment”, CSI Management S.r.l., V.le C. Pavese 305 – Rome (Italy)
Ancona LeonardoOffi ce for the management of the Royal park and the Vanvitelli’s Aqueduct, Museum complex of Caserta, Italian Ministry
of Cultural Heritage and Activities and Tourism
Dr Agnieszka SmigielDepartment of Art History and cultural heritage, University of Cagliari, Via Università, Cagliari - Italia
8 | CoordinatesCoordinates December 2015
SD49_CMPL_December 2015.indd 8 12/12/15 7:14 am

The choice of the best surveying approach
For this case study some serious constraints connected with the accessibility of the site and impossibility to install invasive surveying pillars did not permit the use of traditional surveying routines like total stations. Laser scanning was rejected during the evaluation of the various techniques mainly because in short distances there was a very steep, almost vertical visually while good visual was too far for laser scanning and among too many obstacles. Terrestrial photogrammetry in this context has been considered the best approach, absolutely noninvasive for the structure, secure as did not consider interaction between the structure and any operator, accurate enough as only qualitative considerations were needed and fast enough to respond the monument’s management needs (Guidi et al 2004). This choice was further supported by recent bibliography proving the far by now consolidated combination between photogrammetry and Cultural Heritage (Bay et al 2008, ). Then, both commercial and open source software that proved a signi� cant success in the � eld of three-dimensional surveying was evaluated in order to de� ne the solution that best meets this case’s needs (Westoby MJ 2012, Barazzetti et al 2011, Lisein et al 2013). Within this evaluation Agisoft Photoscan, representing the Structure for Motion algorithms, has been chosen for its analytical robustness, its relatively easy application, the reasonable elaboration times and the most important, the quality of the results demonstrated in various pushed works.
SFM data surveying and processing
One of the most important phases in this work has been the accurate preparation of the photogrammetric surveying. During this activity, the relation between best distance from the object, focal length, ground sampling distance (GSD) and sensor’s resolution permitted identify the best positions needed to achieve an
Figure 1a: Actual state of the Vanvitelli’s masonry aqueduct
Figure 1b: Artistic representation of the bridge
Figure 2: The three order of acquisition
CoordinatesCoordinates December 2015 | 9
SD49_CMPL_December 2015.indd 9 12/12/15 7:14 am

adequate around a centimeter a priori precision. With this information three parallel acquisitions have been made all of them using vertical overlapping of at least 60% (� gure 2) (Kraus, K., 2007).
Immediately after the image acquisition a visual inspection of al images was needed in order to decide which of them were able to satisfy the quality criteria and undergo the data processing. Finally, 39 photos where elaborated for the south facade undergoing the well-known routine of photo alignment, sparse cloud generation, dense cloud generation and texturing. Even if in this case only the dense point cloud
was needed the � nal textured result is shown in � gure 3. Around 25 ground control points have been surveyed in NRTK mode have been surveyed mainly in visible parts to the top of the bridge in order to add robustness and prevent deformative behavior of the whole model.
The � nal point cloud has been exported having 5 million points (� gure 4). The point cloud has then imported for ulterior editing in Cloud Compare open source software. Using a volume point density, the point cloud has been decimated without lowing the information level to one million of points having an average distance of 1 cm, more than
enough for the scope of this project. The registered and georeferenced global point cloud, has then been roto-translated in order to orientate one of its axis parallel the bridges façade. Thus, the obtained modi� ed coordinates have been introduced in a surface plotting software in order to represent its shape and morphology using color scales that led to an easy interpretation by the structural department.
The � nal product of this analysis is presented in � gure 5. In this elaborate, color scale has been used in order represent the level of each area evidencing co-planarity, verticality and the geometry’s overall regularity; thus, red colors represent zone more exposed with respect to blue areas that show the reference plane positioned to the bridge’s axis of symmetry. In the same way, a contouring algorithm that permitted a numerical lever curves has been used in order to permit local comparison of the various parts, this elaborate is shown in � gure 6.
An additional quite useful data needed for the structural analysis regards the estimation of the vertical sections of the façade (� gure 8). For this elaborate, the dance, decimated point cloud has been interrogated, sectioning it with a reference plane characterized by a 20 cm width, positioned vertically and in a normal direction with respect to the façade. All points belonging to the overlapping space between the reference plane and the façade’s point cloud (vertical sections or sub clouds) have been elaborated in in order to plot them in three dimension and to calculate trend lines. In this way 28 sections have been obtained and plotted as shown in � gure 7 where the displacement are in “meters equivalent”. This methodological approach must be considered as a valid tool for the structural department experts and consultants, whose experience is irreplaceable.
Conclusion and result’s discussion
The described methodology represents a synthesis of a simple but quite efficient
Figure 3: The fi nal textured result
Figure 4: The fi nal point cloud
Figure 5: Co-planarity and geometric regularity representation
Figure 6: Co-planarity and geometric regularity evaluation by level curves (isolines)
10 | CoordinatesCoordinates December 2015
SD49_CMPL_December 2015.indd 10 12/12/15 7:14 am

synergy between more processing algorithms with photogrammetry. It also evidences how new technologies can represent a valid support to the structural analysis of masonry monumental facades, using a risk-free surveying strategy, absolutely noninvasive for the monument, of relatively fast application and economically convenient. Great part of the elaboration procedure has been done using open-source software while the photogrammetric survey has been executed using a commercial reflex camera. Among the proven advantages of the chosen methodology, the adequate
resolution, precision and operational simplify have to be mentioned confirming it as a quite efficient way to obtain three-dimensional modelling and analysis of monumental facades.
Future evolutions
The methodology can be further improved with the integration of machine learning algorithms in order to enhance ef� ciency and accuracy to obtain ulterior results in, at least, two applications. The � rst one regards the detection, classi� cation and codi� cation
of the structural behavior of a site using a not supervised neural network. The second one is the implementation of genetic algorithms in order to signi� cantly improve mathematical procedures like the point cloud � ltering, editing and interpolation, and thus, to achieve higher quality in all results.
Bibliography
Barazzetti, L., Forlani, G., Remondino, F., Roncella, R., Scaioni, M., 2011. “Experiences and achievements in automated image sequence orientation for close-range photogrammetric projects.” Proc. of Videometrics, Range Imaging and Applications XI,
Figure 8: Example of four vertical section of the structure: S06, S07, S08, S09.
SPIE Optical Metrology, Vol. 80850F-1-13. DOI: 10.1117/12.890116
Westoby MJ, Brasington J, Glasser NF et al. (2012) . ‘Structure-from-Motion’ photogrammetry: A low-cost, effective tool for geoscience applications. Geomorphology vol. 179, 300-314. DOI: 10.1016/j.geomorph.2012.08.021
Lisein F., Pierrot-Deseilligny M, Bonnet S., Lejeune P., 2013, “A Photogrammetric Work� ow for the Creation of a Forest Canopy Height Model from Small Unmanned Aerial System Imagery” 4, 922-944; doi:10.3390/f4040922, ISSN 1999-4907.
Kraus, K., 2007. Photogrammetry: Geometry from Image and Laser Scans. Walter de Gruyter, 459 pp. ISBN: 978-3-11-019007-6
Operational Guidelines for the Implementation of the World Heritage Convention, 2013. United Nations Educational, Scienti� c and Cultural Organisation. WHC. 13/01,July 2013. URL: http://www.unesco.beniculturali.it/index.php?it/7/linee-guida
Agisoft Photocan user manual: Profesional edition, version 0.9.0 Di Loreto M., 2006.
Bay H., Ess A., Tuytelaars T., Van Gool L., 2008. “SURF: Speeded Up Robust Features”, Computer Vision and Image Understanding (CVIU), Vol. 110, No. 3, pp. 346–359, 2008. DOI: 10.1016/j.cviu.2007.09.014
Guidi. G.; Beraldin, J.A.; Atzeni, C. High accuracy 3D modelling of cultural heritage: The digitizing of Donatello. IEEE Trans. Image Process. 2004, 13, 370-380
Figure 7: The 28 vertical sections of the structure
CoordinatesCoordinates December 2015 | 11
SD49_CMPL_December 2015.indd 11 12/12/15 7:14 am

The territory of Bulgaria is one within the Balkan Peninsula region with
active tectonics and seismotectonics. A number of geodynamical investigations try to give an adequate interpretation of the obtained results (Burch� el et al., 2006), (Kotzev et al., 2006), (Matev, 2011), (Milev, Dabovski, 2006), etc.
Global Navigation Satellite Systems (GNSS) have been recently used for geodetic observations and determination of the earth crust movements in millimetre level. Velocity vectors of located GNSS stations can be estimated and their behaviour can be analyzed. Except station behaviour also surface deformations are of interest for the earth movements of blocks or large areas.
The present study is an attempt to contribute to the geokinematics of the territory of Bulgaria by means of Finite Elements Method (FEM) on the base of estimated GNSS station coordinates in different observational epochs.
Finite elements method for space
At present the � nite elements method is used successfully in the analysis of movements of stations, which are results from GNSS data processing in order to be obtained strain tensors and strain accumulation (Bogusz et al., 2013), (Deniz, Ozener, 2010), (Hu
et al., 2004), (Valev, Kastreva, 2006), (Valev, Vassileva, 2000). Here this method is developed and applied for deformation analysis in the space - determination of principal deformations and their directions as an appropriate method for large territories. The � nite elements (triangles) for different observational epochs are formed in such a way that they are not overlapped.
First the ellipsoidal station coordinates , and h of point P in space are transformed
into Cartesian coordinates P0 (X0, Y0, Z0) of the projected onto the ellipsoid point P0
(Valev, 1987) by the well known formulas.
Let X0, Y0 and Z0 are the Cartesian coordinates of point P0, which point is the piercing of the normal line through point P with the ellipsoid. Point P0 must satisfy both the equation of meridian ellipse and the equation of the normal line through the point P (X, Y, Z) to this ellipse, namely
(1)
(2)
where r0 is the radius of the parallel, which passes through point P0, r' is the distance from point P to the Z axis and they are calculated as follows
(3)
After elimination of Z0 from
Deformation analysis of the Territory of Bulgaria from GNSS observationsThe present study is an attempt to contribute to the geokinematics of the
territory of Bulgaria by means of Finite Elements Method (FEM) on the base of
estimated GNSS station coordinates in different observational epochs
Professor Keranka Vassileva, PhDNational Institute of Geophysics, Geodesy and Geography, Bulgarian Academy of Science, Sofi a, Bulgaria
Professor Georgi Valev, D.Sc.Konstantin Preslavsky University of Shumen, Shumen, Bulgaria
GNSS
12 | CoordinatesCoordinates December 2015
SD49_CMPL_December 2015.indd 12 12/12/15 7:14 am

equations (1) and (2) an equation of 4th degree is obtained:
(4)
where
(5)
and e, e’ are the � rst and second eccentricity of the meridian ellipse.
The Ferrari method is the most convenient for the solution of equation (4) as it is a method for reducing the solution of an equation of degree 4 to the solution of one cubic and two quadratic equations. After solution of these equations the root ro is obtained and finally the Cartesian station coordinates (X0, Y0, Z0 ) of point P0 are calculated by
(6)
where
The azimuths i,k of the ellipsoidal triangle chords (baselines) between triangle apexes i and k of the � nite elements are obtained from the following relationship:
(7)
where
b(- sin , cos , 0) and t(-sin .cos , -sin .sin , cos ) are vectors b and t of the natural trihedron on the ellipsoid and ri,k(Xk – Xi, Yk – Yi, Zk – Zi) is the radius–vector ri,k .
The lengths of the ellipsoidal chords Si,k between triangle apexes i and k are determined by the known relationships for the space, i.e.
(8)
Linear deformations mi,j, mj,k, mk,i (i, j, k – triangle apexes) of respective triangle sides S, S’ between two observation epochs t and t’ are calculated as follows:
(9)
Following relations are used for obtaining the principal deformations
(10)
where a, b are the maximal and minimal deformations, – the angle between direction a of the maximal deformation and direction of the respective triangle side, i.e. = – a..
Finally, the linear deformations m of the triangle sides are obtained from the following equations
(11)
Semi-axes of the ellipses of deformations a, b (Valev, 1995), (Kastreva, 2000) are obtained by use of linear deformations m of either triangle side, i.e.
(12)
(13)
(14)
Finally the principal deformations a and b (major and minor) and their directions are determined from
(15)
GPS data processing of BULiPOS reference network
As an appropriate method for deformation analysis based on GNSS data for large territories the proposed � nite elements model is applied for the territory of Bulgaria using estimated Cartesian coordinates of BULiPOS GNSS network stations (Milev et al., 2014). Stations of the BULiPOS GNSS network are shown in � gure 1.
One week GPS data from each of the � ve years 2009 - 2013 of BULiPOS network stations have been processed with Bernese software, version 5.0. Ten IGS stations have been involved in the processing. The estimated Cartesian coordinates of the stations have been transformed in ETRF2000 by applying ETRF components of the Eurasia plate rotation pole. These relative to the Eurasia stable plate station coordinates have been used in the � nite elements model.
Figure 1: Confi gured fi nite elements
CoordinatesCoordinates December 2015 | 13
SD49_CMPL_December 2015.indd 13 12/12/15 7:14 am

Application of FEM for the BULiPOS reference network
The � nite elements have been con� gured using all BULiPOS stations on the territory of Bulgaria and the nearest three IGS stations – BUCU, ISTA, ORID from all together 10 IGS stations, as it is shown in � gure 1.
All together 21 � nite elements (triangles) have been formed. The ETRF2000 coordinates X, Y, Z of all stations in each year have been transformed into ellipsoidal station coordinates , , h and then they have been transformed into Cartesian station coordinates (X0, Y0, Z0) onto the ellipsoid used. The (X0, Y0, Z0) station coordinates have been used for determination of the ellipsoidal chords (baselines) between stations on the ellipsoid by formula (7), which are actually triangle sides of every � nite element in each year. According to the formula (11) linear deformations of all triangle sides have been determined using obtained lengths of triangle sides from all � ve years in all combinations between � ve year’s results. Deformations of compression and extension of triangle sides obtained by formula (11) are shown in yellow colour in � gure 2 for the longest time period of four years 2009-2013.
The smallest relative movements are obtained between station BUCU-TARN, TARN-STAR, ORID-ROZH, ORID-MONT and ROZH-YAMB, which are between 0,005÷0,015.10-
7 and that corresponds to the extension of 0,1÷0,2mm for all the mention sides except BUCU-TARN, which is compressed. Considering the obtained results for the west part of Bulgaria where they show an extension in direction north-south it can be concluded that there is a good agreement with the directions of estimated GPS velocities of movement from other studies (Burch� el et al., 2006; Georgiev et al., 2011; Kotzev et al., 2008; Matev, 2011; Zagorchev, 2011) and the results con� rm the belonging of south-west Bulgaria to the Aegean extensional zone. The largest relative movements are obtained between stations STAR and LOVE – extension of amount of 1,031.10-7 and between stations
STAR and YAMB – compression of amount of 1,316.10-7. In fact these are 9,6mm, respectively - 11,3 mm linear deformations. For most of the � nite element’s sides there is no disagreement of the obtained deformations in all time spans studied except a few of them.
Magnitudes and directions of the principal deformations of each � nite element are obtained by formula (15). They are calculated for time spans 2009-2013, 2010-2013 and 2011-2013. The magnitudes and directions of the principal deformations for the longest time span 2009-2013 are shown in � gure 3.
The obtained results for the three time spans agree very well except for the � nite elements including stations with very small movements (Love, Burg) and with the problematic station Varn. Deformations in north-west and in part of central Bulgaria show extension in north-south direction and compression in south-west to the north-east direction. Central-east and south-east part of the country are under compression with different directions of particular areas. The largest deformations of compression appear in central Bulgaria, close to station Star in direction north-west to south-east.
Figure 2: Deformations of compression and extension of fi nite element sides for time span 2009-2013
Figure 3: Principal deformations for the longest time span 2009-2013
14 | CoordinatesCoordinates December 2015
SD49_CMPL_December 2015.indd 14 12/12/15 7:14 am

Conclusion
The � nite elements model in space is applied for deformation analysis of whole territory of Bulgaria for the � rst time. On the base of the obtained linear deformations of � nite element sides (Figure 2), their analysis and comparison it could be generalized and suggested that in northern Bulgaria (Moesia platform) there is compression, in west Bulgaria – extension with direction north-south, in central Bulgaria (Maritsa basin) – extension and in east-south Bulgaria – compression. On the base of the obtained principal deformations (Figure 3) several areas of compressions and extensions could be distinguished but not quite clear. Generally it can be suggested that deformations in part of central, central-east and south-east Bulgaria are of compression, in north-west, south-west and in part of central Bulgaria – of extension, which agree with the linear deformations. More stations over the territory of the country will contribute to better clari� cation of deformation processes.
Acknowledgements
We would like to thank the team of IPOS LtD for kindly provided us all necessary GNSS data for the processing.
References
Bogusz, J., A. Klos, M. Figurski, M. Jarosinski, B. Kontny, 2013. Investigation of the reliability of local strain analysis by means of the triangle modelling. Acta Geodyn. Geomater., Vol. 10, No. 3 (171), 293–305, 2013 DOI: 10.13168/AGG.2013.0029
Burch� el, B. C., R. W. King, A., Todosov, V., Kotzev, N., Durmurdzanov, T., Sera� movski, B., Nurce, 2006. GPS results for Macedonia and its importance for the tectonics of the Southern Balkan extensional regime, Tectonophysics, 413, 239–248.
Deniz, I., H. Ozener, 2010. Estimation of strain accumulation of densi� cation
network in Northern Marmara Region, Turkey. Nat. Hazards Earth Syst. Sci., 10, 2135–2143, 2010 www.nat-hazards-earth-syst-sci.net/10/2135/2010/ doi:10.5194/nhess-10-2135-2010
Hu, Y., K. Wang, J. He, J. Klotz, G. Khazaradze, 2004. Three-dimensional viscoelastic � nite element model for postseismic deformation of the great 1960 Chile earthquake. Journal of geophysical research, Vol. 109, B12403, doi:10.1029/2004JB003163, 2004
Kastreva, P., 2000. A way for de� ning the deformations according to the method of the � nal elements and its application to the geodynamic network “Krupnik”. Reports of Geodesy, Warsaw University of Technology, No 4(49), 229-233.
Kotzev, V., R. Nakov, Tz. Georgiev, B.C. Burch� el, R.W. King, 2006. Crustal motion and strain accumulation in western Bulgaria, Tectonophysics, 413, 127–145.
Kotzev, V., R.W. King, B.C. Burch� el, A. Todosov, B. Nurce, R. Nakov. (2008). Crustal motion and strain accumulation in the South Balkan Region Inferred from GPS Measurements, in Husebye, E., ed., Earthquake monitoring and seismic hazard mitigation in Balkan countries:
Proceedings of the NATO Advanced Research Workshop on Earthquake Monitoring and Seismic Hazard Mitigation in Balkan Countries, Borovetz, Bulgaria, 11–18 September 2005: NATO Science Series IV: Earth and Environmental Sciences. Volume 81, 19–43.
Matev, K., 2011. GPS constrains on current tectonics of southwest Bulgaria, northern Greece and Albania. Thesis, Doctor of university of Grenoble, 203pp.
Milev, G., Dabovski, C. (Eds), 2006. Geodynamics of the Balkan Peninsula, Monograph, Reports on Geodesy, Warsaw University of Technology, Institute of Geodesy and Geodetic Astronomy, 647 pp.
Milev, G., K. Vassileva, I. Milev, R. Pelovski, I. Andreev, G. Gerova, 2014. Current status and activities of Satellite Ground-Based System EUPOS and EUPOS-BG. SES 2013, Proceedings of Ninth Scienti� c Conference “Space, Ecology, Safety”, 163-173.
Valev, G., 1987. Projection of points onto the earth ellipsoid. Geodesy, Cartography and Land Management, 4, 6-11. (in bulg.)
Valev, G., 1995. Another approach to derive the parameters of the ellipse of deformations. Geodesy, Cartography and Land Management, 2-3, 15-19 (in bulg.)
Valev, G., P. Kastreva, 2006. Stress strain analysis of the Balkan Peninsula. Balkan Peninsula monograph, Reports on Geodesy, Warsaw University of Technology, No 5(80), 2006, 597-605.
Valev G., K. Vassileva, 2000. Application of Different Models of Adjustment to the Processing of Geodetic Measurements on Geodynamic Poligons. Reports of Geodesy, Warsaw University of Technology, No 4(49), 219-227.
Zagorchev, I. (2011). Cenozoic Block Rotations in the Balkan Peninsula. Proceedings of 3rd International Symposium of the Black Sea region, 1-10 October, 2011, Bucharest, Romania, 220-222.
Generally it can
be suggested that
deformations in part
of central, central-east
and south-east Bulgaria
are of compression, in
north-west, south-west
and in part of central
Bulgaria – of extension,
which agree with the
linear deformations
CoordinatesCoordinates December 2015 | 15
SD49_CMPL_December 2015.indd 15 12/12/15 7:14 am

The concern of the European downstream industry
The justi� cation for the Galileo Programme relies on a two fold objective:• To achieve independence and
autonomy for Europe in relation to non-European GNSSs
• To win a signi� cant share of the huge and continuously growing worldwide GNSS downstream market - the market of technologies, applications and services based on satellite positioning, navigation and timinig
The GNSS downstream market continues to be one of the most promising markets in terms of European growth, with anannual growth rate of the global GNSS market of about +7% per year. The core and the enabled GNSS markets are expected to reach around EUR 110 billion and EUR 290 billion respectively by 2023 (see GSA’s GNSS Market Report 2015).
However, Europe is not gaining an adequate share of this market. The current European share of the global market is approximately 20% - if not lower – compared to a traditional European share of 33% for any other global high-tech sector. Europe’s GNSS market share is even declining. In the mature GNSS applications markets, 80% of well-established market owners are of US origin. Further more, the size and growth of Chinese industry, which has already in just a few years outperformed European industry in the � eld of telecommunications, is particularly worrying. As things stand, in a few years, it will be dif� cult or nearly impossible for European Industry to survive in the highly competitive GNSS global market.
Unless an effective and long-term strategy is put in place during the Galileo early services exploitation phase (2016-2020), the window of opportunity for European industry to bene� t from the current GNSS market boom will soon be closed.
Europe’s goal of achieving GNSS autonomy is also at risk. To have Galileo fully and sustainably operational is indeed a necessary, but not suf� cient condition to achieve autonomy. Economic and social dependence on GNSS increases together with the market, and Galileo is just one of three new GNSS solutions complementing America’s GPS: most of the applications do not require four GNSS constellations and GPS, GLONASS (Russian Global Satellite Navigation System) and BeiDou (Chinese Global Satellite Navigation System) are already inplace. GPS is the common standard. Russia has regulated the use of GLONASS in all equipment sold in its territory. BeiDou bene� ts from a matchless internal market demand in China. Finally, due to the decrease of the industrial base in Europe, much Galileo equipment including critical elements may not be manufactured in Europe. Europe could thus depend on the capacity and strategy of non-European providers.
The targeted European autonomy will be achieved if and only if Galileo is widely used with equipment designed and manufactured in Europe, as well as applications and services developed in Europe.
The socio-economic expectations will be met if and only if European industry succeeds in winning a reasonable share of the global GNSS downstream market.
Growth, competitiveness and job creation in Europe must remain the main objective of the European GNSS Programmes. Return of investments–and consequently growth, competitiveness and job creation–can only be expected from the downstream sector.
The industry of GNSS-based applications and services must be placed at the heart of a Galileo-and EGNOS-based economy to ensure a full return of investments in European GNSS infrastructure.
The existing and near operational European GNSS systems, EGNOS and Galileo, offer outstanding possibilities for the downstream sector and could generate signi� cant growth opportunities. However, Europe’s GNSS downstream industry suffers from a dramatic competitive disadvantage vis-à-vis worldwide competitors who have bene� ted from strong institutional support for decades and have increased their supremacy year after year.
In the US, Russia, China, and Japan, dedicated national strategies exist indeed to support competitiveness of their down- stream industry and enhance GNSS market take up, including massive funding for R&D and manufacturing capabilities, regulations and public procurement.
Hereafter are some examples of combined institutional support actions implemented by Europe’s competitors:• Large and continued military
applications R&D programme, which helps to underpin the investments of companies in commercial and civil applications
Necessity of a European strategic planIn this paper Galileo Services offers an input to the general debate about the role of a coordinated industrial
policy to support the European economy and the contribute to the competitiveness of European enterprises
GNSS
16 | CoordinatesCoordinates December 2015
SD49_CMPL_December 2015.indd 16 12/12/15 7:14 am

• Investments equivalent to several tens of millions of euros for manufacturing capabilities, which supports the development of industry
• Massive procurements equivalent to several billions of euros from the public sector, as anchor customer, which radically boosts private investment
• Regulations, such as giving preference to indigenous GNSS equipment and services
It is crucial for Europe to promptly provide European GNSS downstream industry with the means to become competitive in the global market and create industrial leadership.
The creation or strengthening of European champions able to compete on an equal basis in the worldwide market is necessary.
The opportunities ahead
The game is not over. There are a number of key GNSS applications and services markets – including the most promising services and applications markets in terms of growth potential and strategic markets– in which European Industry must position itself (see Figure 1).
In particular, European equipment and industries have a strong reputation for quality and reliability. The leading position of Europe in GNSS security and resilience domains should be strengthened, as it is critical for today’s and tomorrow’s markets.
There are a lot of unexplored opportunities for GNSS applications and services in Europe.
The potential and capabilities of all global constellations (GPS, Galileo, GLONASS and BeiDou) –leveraging in particular the key European GNSS differentiators (Improved performance, authentication, high precision, robustness and security) also in a multi-constellation environment -offer opportunities that Europe must not miss.
They include:• Opportunity to develop new GNSS-
based positioning, navigation and timing applications and services
• Opportunity to create new industrial activities in Europe and, with them, hundreds of thousands of jobs
A strategic plan to develop the GNSS downstream sector in europe
The European Union must establish a strategic plan aiming at enhancing European GNSS downstream industry competitiveness and fostering European GNSS uptake.
This strategic plan must include an industrial policy in which the public and private sectors coordinate their efforts to develop new technologies, applications, services and industries in Europe.
A comprehensive and assertive industrial policy is essential to develop Europe’s GNSS downstream sector and must aim to:• Protect and strengthen the existing
European industry and foster the emergence of European champions in key GNSS applications and
services markets, including strategic domains and domains with signi� cant growth potential
• Support European downstream industry competitiveness and help European companies to gain market share in the GNSS global market
• Foster the design, development and manufacture of European GNSS based technologies, applications and services in Europe
Such a strategic plan must also aim at supporting coordination between existing National or European initiatives to maximise synergy and ef� ciency, and minimise duplication. Any new support action initiated by the institutions must be consistent with the existing supportactions.
The Commission GNSS Action Plan 2010 to foster the development and adoption of satellite navigation applications using EGNOS and Galileo is a � rst step in that direction.
Figure 1: Promising GNSS services and applications markets © Olivier Guin/Galileo Services
CoordinatesCoordinates December 2015 | 17
SD49_CMPL_December 2015.indd 17 12/12/15 7:14 am

Europe can benefi t from the particular mandates and skills of its institutions
The role of European institutions in the growth process is especially decisive in times of economic and � nancial crisis. All stakeholders of the European GNSS Programmes must organise themselves and combine their strengths to give a chance to Europe to take a signi� cant part of this growth and indirectly recover some of the massive investments in infrastructure made by Europe-tax payer money.
European institutions, in particular the European Parliament, the European Commission, the European GNSS Agency and the European Space Agency, must work together and combine their particular skills and competences in a pragmatic way, to guarantee the full success of the European GNSS Programmes from upstream to downstream, and European industry’s competitiveness.
Defi nition and establishment of a european strategic plan
Purpose of a strategic plan to develop the GNSS downstream sector in europe
European institutions must establish a strategic plan to support the development of a competitive GNSS downstream industry in Europe, building on competitive advantages offered by the European GNSS, and at the same time recognizing multi-constellation opportunities for European industry.
This strategic plan must include an industrial policy to increase
European GNSS downstream industry’s presence in the different application markets by de� ning:• Clear and quantitative objectives in
terms of European industry position in the market with targets in terms of market share, revenue, and job creation or strategic expectations
• Clear support actions from European institutions (e.g. public procurement, regulations) with associated milestones to reach these objectives
• Key performance indicators (KPIs) to assess the achievement of these objectives
Figure 2: GNSS application generic value chain © Olivier Guin/Galileo Services
Figure 3: Generic product development process © Olivier Guin/Galileo Services
18 | CoordinatesCoordinates December 2015
SD49_CMPL_December 2015.indd 18 12/12/15 7:14 am

An industrial policy includes any kind of action from the institutions that has an impact on the industry (ref. next section). The identi� ed support actions should be shared between the different institutional bodies according to their particular skills and competence.
European institutions can help to mitigate the technology risks, the marketing risks, the financing risks and the regulatory risks. The risks associated with the main market segments should be classified in order to identify the main challenges and threats that market players have to deal with in each segment (currently and in the short, medium and long terms). The assessment of these risks will indicate the nature and the size of the effort required from dedicated institutional actions devoted to the European GNSS downstream sector.
Each time European institutions take an initiative impacting the downstream sector (e.g. to include GNSS in a regulation, to launch evolutions of the European GNSS infrastructure and services), it is crucial to assess at the same time the potential impact on the European downstream players, in terms of competitiveness, business and jobcreation. This must be a major criterion in the decision process.
The industrial policy must address each element of the GNSS downstream value chain (see Figure 2) and cover the whole product development process (see Figure 3) so as to enhance the opportunities for genuine European products to emerge.
The � rst version of such a plan must be established by the start of the Galileo early services exploitation phase (2016-2020), and must embrace the full duration of the Galileo early services exploitation phase as a minimum.
It must be a multi-annual plan putting actions and targets into the required global perspective.Annual plans must be adjustments to the long term plan to describe detailed actions for the year to come. The � ve year plan must be revised each year accordingly. From 2021, the future version must align with the � nancial perspectives of the European institutions and cover 7 years (Multi-annual Financial Framework).
Recommendations on key support actions from the european institutions
A number of key support actions can be undertaken by public institutions to support market penetration and development. Some actions with examples of programmatic instruments/elements to support the competitiveness of European industry are described below. Note that many of them already exist, but are not always implemented for the GNSS downstream sector.
Galileo Services urges co-ordinated actions in the areas identi� ed in Figure 3. Without these actions, Europe will have funded a GNSS system that will not be used as intended and where the main downstream actors are not European.
Different kinds of actions – legal, institutional, organisational, political or business-oriented – must be undertaken and combined depending on the application domain being considered and the targeted objectives: targets in terms of market share, revenue, and job creation or strategic expectations.
Permanent forum between institution & industry• Creation of a forum enabling the
public and private stakeholders to regularly interact (please refer to section 4 of this paper)
Figure 4: Examples of key support actions from the institutions © Olivier Guin/Galileo Services
Europe needs to do everything to deliver a fully operational Galileo system by 2020. Any delays beyond that will seriously impact the uptake of Galileo, and important design investments already made by the downstream industry based on the assumptions stated by the EU institutions would be rendered obsolete. Furthermore, a clear and consistent roadmap for the European GNSS systems and their services must be established and shared with European companies. For instance, a risk exists where Galileo PRS, Galileo Commercial Service and EGNOS could compete with services operated today by European industry. The European institutions must regularly share their plans regarding European GNSS services and all relevant information related to Galileo System design with European industry to ensure that European companies can benefit from EGNOS and Galileo services to maintain and strengthen their market position.
CoordinatesCoordinates December 2015 | 19
SD49_CMPL_December 2015.indd 19 12/12/15 7:14 am

Legal and regulatory framework• Reinforcement of the regulatory and
legal framework to facilitate and encourage European GNSS use in Europe, favouring and incentivising the European GNSS downstream industry, while ensuring that asso- ciated standardisation bodies and certi� cation entities anticipate and support industry developments
Provision of market intelligence• Provision of market analyses and
speci� c business cases allowing identi� cation of opportunities or key markets in which European Industry must position itself: either the most promising service and application markets in terms of growth potential or strategic markets
Promotion & awareness• Communication actions towards
decision makers, procurement agencies and industry to increase their awareness of GNSS applications and services, and of the speci� c advantages of European GNSS services (e.g. authenticated Open Service, Commercial Service and Public Regulated Service)
• Promotion and awareness raising campaigns to stimulate the take-up of possible users by helping to clarify their requirements (cities, regions, various industrial sectors, etc.) and targeted to promising domains– in terms of window of opportunity and volume – demonstrating European GNSS differentiators and showcasing European industry skills to stimulate European and non-European markets, clarify their requirements and focus procurements
Public procurement & federation ofregional and national user needs• Large scale public procurement in some
key sectors (e.g. critical infrastructure, defence and security) to decrease market risk, support competitiveness, and boost private investment in GNSS technology
• Federation of regional and national needs and coordination of procurement plans for European GNSS products and services at the European level, to create continental-scale markets in Europe and deliver associated economies of scale
• Leveraging on ad hoc take up actions, such as Pre Commercial Procurement (PCP) and Public Procurement of Innovation (PPI) to facilitate the adoption of GNSS solutions
Establishment of user groups• Establishment of user groups to
capture common requirements and develop adequate services to comply with requirements, and avoiding over specifying of services
Establishment of partnership with market owners• Support to the establishment of
partnership with market owners such as MNOs (Mobile Network Operators), infrastructure operators, content providers, or insurance companies, so as to stimulate the opportunities by clarifying the need for European GNSS applications in key economic sectors and there by improve Europe’s competitive position and enhance access to major global markets
Support to international cooperation and global market access• Carefully establish international
cooperation favouring European industry interests, involving non- European partners when providing either opportunities for market penetration beyond Europe’s borders or speci� c skills and/or technology not available in Europe, and setting up adequate Intellectual Property Rights (IPR) policies
• Support to global market access by providing knowledge on export markets and trade agreements, and by organising trade missions and providing support to exports
Technical support & IPR strategy• Provision of technical expertise
on European GNSS infrastructure, systems, and signals for R&D, standardisation and certi� cation activities to (a) support the development of equipment and services embedding European GNSS speci� c features and promote and foster the uptake of speci� c European GNSS features such as ionospheric models, longer code, authentication and EGNOS Data Access Service (EDAS)
• Availability of laboratories and technical experts to support application developers
• Continuous monitoring of technology state-of-the-art in all technologies related to GNSS applications (e.g. signal processing, clocks)
• Establishment of an IPR Policy preserving European industry interests and guaranteeing reciprocity with other GNSS constellations and associated services
Availability of necessary skills• Encourage universities and
other educational and research institutions in Europe to strengthen their activities within GNSS technology in support of industry
Support to research & development• Public institutions must contribute
to the R&D effort for: Key enabling technologies, such
as clocks, improved antennas or signal processing technologies for European GNSS receivers
Critical technologies, applications and services based on end user requirements, such as
European institutions must establish a strategic
plan to support the development of a competitive
GNSS downstream industry in Europe, building on
competitive advantages offered by the European
GNSS, and at the same time recognizing multi-
constellation opportunities for European industry
20 | CoordinatesCoordinates December 2015
SD49_CMPL_December 2015.indd 20 12/12/15 7:14 am

reliability, robustness, security and high performance
• Address the GNSS application layer in complementary and ef� cient R&D programmes, such as Horizon 2020, Fundamental elements, Fast Track to Innovation at EU level or ARTES 3-4 and GSTP at ESA level which together provide the key to the development of the GNSS downstream sector
• Continuous open calls to encourage the emergence of innovative ideas and foster technology research, what ever the domain and the technology area
• Launch R&D calls for proposals on a yearly basis (Note the absence of FP7 GNSS applications R&D budget from 2011 to 2014 – the dedicated FP7 budget being exhausted due to extensive cuts leaving only EUR 100 million in the GNSS FP7 budget line, instead of the EUR 350 million agreed at the outset. Note also the EC plans to launch H2020 calls for proposals for Galileo applications R&D every two years.) to ensure continued innovation and market development
• Reduction of time to market, crucial in the innovation process, through for example: Fast procurement for R&D
activities –maximum time limit of 4 months from the proposal submission to the contract signature
Use of an Authorization to Proceed to allow the industrialists to start R&D at their own risk before the contractis awarded
• Simpli� cation of the administrative burden of EU R&D programmes, which many consider are extremely time and resource consuming or even discouraging, in particular for SMEs
• Importance to clearly place IPR under the control of the proposer in all R&D Programmes
Standardisation, certifi cation, testingfacilities• Support to the standardisation work
in relevant domains as well as the certi� cation process for safety/security critical applications, addressing in particular the speci� c features of European GNSS (e.g. authentication, robustness and security)
• To ensure the existence or facilitate the access to test facilities, particularly in strategic domains
• Update, replacement or augmentation of existing standards – implicitly based on conventional technology or GPS – with alternatives to facilitate and promote the use of Galileo and EGNOS
Demonstrations and operational pilot projects• Setting up of Demonstrations
and Operational Pilot Projects focusing on implementation of GNSS solutions tightly integrated in the real operational user work� ow, involving all value chain actors, and highlighting EGNOS and Galileo differentiators
• Establishment and maintenance of a set of market-driven demonstration centres in cooperation with relevant market owners to enhance the adoption of European GNSS-based solutions and overall market penetration
Manufacturing capabilities• Support to the development
of manufacturing capabilities for strategic sectors
Specifi ccase of start-UPS and SMES• Additional instruments
speci� cally tailored to SME, like the EU SME Instrument to be contemplated, for instance: Fast procurement
‘purchase order type’ Simpli� ed payment plan with
increased up-front payment Fast track for garage box
innovative ideas Funding mechanisms to bridge
the “valley-of-death” between the R&D step and the industrialisation/market development leading to the with- drawal of many SMEs at the end of the R&D phase
Innovative co-funding concepts for SMEs as a kind of Return On Investment (ROI) in case of commercial success
Investors’ Fora while capitalizing on Pilot Customers’ � rst feedback on experience
Dedicated support on IPR at the outset of a project: IPR intentions, status and ownership plans
• Need to pursue start-up � nancing and explore new co-funding concepts involving potential investors or customers
References
The proposals and discussions in this paper are backed up by the following publications of the European Commission and its Agencies, the European Parliament, the European Space Agency and Galileo Services:• “European GNSS Programmes
& European Transport Policy”, EC/GS Meeting, 2 October 2014, EC premises, Brussels
• “Necessity of a European industry policy to develop the European GNSS downstream sector”, ESAPB-NAV, 1 October 2014, ESA Headquarters, Paris
• GS position paper “Satellite Navigation Applications Realizing the Ambitions of EU 2020”, 2011
• “Manifesto for a more committed Europe towards the development of GNSS Applications”, 2010
• REG (EU) No 1285/2013 of 11 December 2013 on the implementation and exploitation of European satellite navigation systems
• GNSS Market Report, Issue 4, European GNSS Agency
• European Parliament resolution of 15 January 2014 on reindustrialising Europe to promote competitiveness and sustainability
• EC COM (2013) 108 “EU space industrial policy releasing the potential for economic growth in the space sector”, 28 February 2013
• EC COM/2010/0308 “Action Plan on Global Navigation Satellite System (GNSS) Applications”, 14 June 2010
The paper also has a concluding section “Galileo Services Forum” explaining the purpose and the plans of the forum. For further information: Axelle Pomies, Galileo Services Permanent Representative, [email protected]
CoordinatesCoordinates December 2015 | 21
SD49_CMPL_December 2015.indd 21 12/12/15 7:14 am

SDI
With the growing concerns of global climate change and its impacts
on the environment, the importance of spatial data infrastructure (SDI) play a crucial role in offering accessibility to climate data and information to researchers interested in addressing the issues related to climate change. This paper describes a climate data portal developed for Nepal in the context of linking it with Spatial Data Infrastructure with the aim of reducing costs of climate data and improving data quality, making data more accessible to the users, while at the same time increasing the bene� t of using available data. The proposed approach tries to design an SDI based approach capable of monitoring, detecting, and predicting climate change so as to enable effective decision making. It will also ensure the best sharing and exchange between partners and stakeholders so that they are interactively connected to use the data ef� ciently and in a � exible manner.
Introduction to Nepal Climate Data Portal
It is a known fact that in the today’s world internet plays a crucial role in exchanging large amounts of spatial data. Professional data centers have found secure ways to share their data resources with peers and third-party users, either as a free service or as a commercial activity (van der Wel, 2005). The GIS community has been working tirelessly to make spatial data available through internet. Therefore, it is worth considering the need for having
a data infrastructure for conducting any climatological and meteorological research (van der Wel, 2005). A meteorological data infrastructure can be developed by taking the guidance from any existing Spatial Data Infrastructure (SDI). Environmental problems demand decision making and monitoring tools that are based on readily available and accessible spatial data.
Therefore, open access to accurate and representative climate information has a huge impact on awareness raising, especially issues concerning with climate change and climate variability. Availability of climatic data is identi� ed as one of the most important elements under the United Nations Framework Convention on Climate Change (UNFCCC) and its subsequent Kyoto Protocol to combat unprecedented climate change. In addition, access to meteorological/climatological database via a web portal is essential for understanding the climate change impacts in climate sensitive sectors such as agriculture and food security; water resources; biodiversity; health; and so on which is of utmost importance for sector speci� c policymakers, planners, stakeholders, end users and for the general public to plan their routing works.
The Nepal Climate Data Portal is designed to facilitate the analysis of historical climate/meteorological data as well as future climate scenarios in different geographical setting in the country using a publicly accessible web based interface. It is also designed to be a rather sophisticated calculator with its own meteorological
Nepal climate data portal in the context of Spatial Data InfrastructureThe proposed approach tries to design an SDI based approach capable of monitoring,
detecting, and predicting climate change so as to enable effective decision making
Dr Rishiraj DuttaTechnical Specialist (Department of Climate Change & Climate Risk Management), Asian Disaster Preparedness Center,
Samsen Nai, Phayathai, Bangkok, Thailand
Susantha JayasinheClimate Data Analyst (Department of Climate Change & Climate Risk Management), Asian Disaster Preparedness Center,
Samsen Nai, Phayathai, Bangkok, Thailand
Dr Senaka BasnayakeHead (Department of Climate Change & Climate Risk Management), Asian Disaster Preparedness Center, Samsen
Nai, Phayathai, Bangkok, Thailand
22 | CoordinatesCoordinates December 2015
SD49_CMPL_December 2015.indd 22 12/12/15 7:14 am

database to produce maps, time-series charts or downloadable data. It uses simple language to represent arithmetic and statistical operations like a spreadsheet. The intended audience for the web portal are research scientists, meteorologists, hydrologists university students, sector speci� c decision makers and anyone who needs to understand past and future (projected) weather and climate patterns in the country. The web portal allows and facilitates the clients to purchase historical meteorological data, which are being collected and maintained by Department of Hydrology and Meteorology (DHM) for over several decades.
Objectives of Designing the Portal
Understanding vulnerability and impacts associated with climate change and climate variability in different climate sensitive sectors in different climatic zones is key for managing risks of weather and climate disasters and taking appropriate proactive adaptation measures for climate change. As the current degree of vulnerability and impacts to communities in Nepal and their resilience depend on physical, environmental, social and economic aspects, analysis of historical meteorological information on different temporal and spatial scales is of vital importance.
It is equally important to provide future climate change scenarios using state-
of-the-art dynamical downscaling tools such as PRECIS (Providing Regional Climates for Impacts Studies-Model), RegCM4 (Regional Climate Model-4) and WRF (Weather Research and Forecasting-Model) at high spatial resolution. This will allow scientists and researchers to quantify the projected potential changes in mean climate and its extremes, which would help policy makers, planners and stakeholders for taking proactive adaptation measures in the vulnerable sectors such as agriculture, water, energy, health, etc.
Asian Disaster Preparedness Center and Bjerknes Centre for Climate Research (BCCR), Norway, in association with
Faculty of Geo-Information Science and Earth Observation (ITC), University of Twente, The Netherlands and The Energy and Resources Institute (TERI), India, have implemented a project on “Climate Data Digitization and Downscaling of Climate Change Projections in Nepal: Strengthening Capacity for Managing Climate Change” that was funded by Asian Development Bank (ADB). The ADPC team worked jointly with the Department of Hydrology and Meteorology (DHM) and Tribhuvan University in Nepal. The Climate Data Portal was of� cially launched in August 2012. Several technical and capacity building trainings were conducted for DHM for long term sustainability of the data portal.
Design, Structure and Features of Nepal Climate Data Portal
Stakeholders were involved in the development of the portal throughout the project implantation stage. At the technical level, there was a close alignment between the requirements of the Nepal Climate Data Portal for historical climate data and projected future climate scenarios. The portal was designed with the aim of providing users with an integrated platform to access climate data and the ability to compare historical and projected climate information and data (Figure 1). Sahana Eden Humanitarian Open Source Software platform had been used for developing the portal and Python 2.6, R, R multicore library, RPostgreSQL, rpy2, PIL, xvfb, PyQT4, QTWebKit were used to design it. The Portal allows the users to view the climate data on an interactive map and generate different information products including exporting the raw data.
Information Products
The Nepal Climate Data Portal produces various information products from observed, gridded and projected climate data to cater to the needs of different stakeholders (Figure 2). It is seen that technical experts and climate professionals prefer raw data for their own analysis while other professionals, such as government of� cials, policymakers Figure 1: Architecture of Nepal Climate Data Portal
The portal developed for
Nepal already addresses
the functionality to
effectively manage
climate data through data
ingestion, extraction and
metadata management
which is also within
the required WMO
standards of 2014
CoordinatesCoordinates December 2015 | 23
SD49_CMPL_December 2015.indd 23 12/12/15 7:14 am

and sector speci� c planners prefers analyzed end products such as maps and charts. The Nepal Climate Data Portal provides the following data types based on speci� c queries:
• Pont (observed) and Gridded Climate Data (observed and projected) in .dat (ASCII) and netCDF (where appropriate) formats;
• Maps visualizing gridded observed climatic variables (Monthly/Seasonal/Annual) in GIF and PNG image formats;
• Time series plots of modeled climate parameters (present-
day and future scenarios) in GIF and PNG image formats.
Features of the Web Portal
The Nepal Climate Data Portal has been designed for providing better access to the historical meteorological/climatological data and future climate scenarios of the country. Therefore, the portal is provided with features which includes:
• Performing as a sophisticated web-based calculating engine with its own database;
• Facilitating the analysis of climatological/meteorological, geographical and projection data using a publicly accessible web-based interface;
• Producing maps, time-series charts or downloadable CSV data;
• Allowing additional climate data in netCDF format to be uploaded into the portal through its user interface.
However, raw observed meteorological/climatological time series data are accessible on purchase. The portal also includes information on pricing options as speci� ed by the DHM. Users will be able to purchase the data directly from the site with payments being made of� ine to DHM of� ce or Bank.
Usability and Applicability of Nepal Climate Data Portal
Climate data has been extensively used to assess the impacts of climate change and to identify the degree of vulnerability in climatic sensitive sectors such as agriculture, water, energy, health, etc. Therefore researchers, scientists, academics, sector speci� c planners and policy makers will be bene� ted from the Portal in terms of carrying out activities such as:• Research and Developments;• Assessing impacts and vulnerability
in climate sensitive sectors such as agriculture, water resources, energy, health, etc.;
• Developing adaptation strategies for vulnerable sectors;
• Infrastructure planning such as adaptation measures and;
• Contingency planning.
Considering Nepal Climate Data Portal as a Climate Based Spatial Data Infrastructure (CSDI)
To understand the climate system, one must understand a wide range of complex processes occurring over time. It can be naturally induced or man-made. Therefore, to understand such processes taking place
Figure 2: User friendly interface and some information products that are derived from the Nepal Climate Data Portal
24 | CoordinatesCoordinates December 2015
SD49_CMPL_December 2015.indd 24 12/12/15 7:14 am

and its impacts and consequences, a wide variety of climate related information are required that needs to be routinely maintained, stored, managed and analyzed within a system. Such a system can be considered within the ambit of a spatial data infrastructure (SDI). The Nepal Climate Data Portal may be one such system which can be called as the Climate Base Spatial Data Infrastructure (CSDI). The portal developed for Nepal already addresses the functionality to effectively manage climate data through data ingestion, extraction and metadata management which is also within the required WMO standards of 2014. Considering the portal as a CSDI will open up data sharing needs of the agencies based on cooperative relationships. It will further enable DHM in collecting and integrating climate related data from various sources which will help analyze and validate data and information for effective decision making. Integrating data from various sources will increase the effectiveness of the system while at the same time will reduce the duplication and increase cost effectiveness. According to Sharma and Acharya (2004), the aggregation and integration of fundamental data sets and framework data sets should solve the purpose of National Spatial Data Infrastructure (NSDI) for Nepal and should pave the way for easy accessibility of data and resources thereby making the works of user’s community more simple, ef� cient and effective. Therefore, efforts should be made to integrate already available climate and geospatial databases including the CSDI to address the needs and concerns of the end-users. Not only is access to climate data and information needs to be linked or integrated within the SDI framework, so is the capacity of national institutions, leadership and civil society to determine what climate data and information is needed for adaptation-related decision-making (UNFCCC 2008; Dutta and Jayasinghe 2015). This can
be further stated in the guiding policy statement on the importance of building a CSDI in Nepal and its probable links to make it operational as described under Nepal‘s NSDI framework.
Improving the Capacity of Department of Hydrology and Meteorology (DHM)
It is very important to improve the capacity of DHM in the context of maintaining the portal so that it is sustainable and its functioning remains effective. The work implemented in Nepal tried to address the ways to improve the climate data collection process of DHM to meet future challenges based on the country needs. Based on the assessments carried out in the country, it was found that the current network of meteorological stations needs to be further expanded for better coverage of meteorological data, enhancing infrastructure, and upgrading equipment’s as well as increasing human resource needs for improving DHM. Time to time capacity building of DHM staffs would help maintain the sustainability of the portal with better ef� ciency.
Acknowledgement
The authors wish to acknowledge Asian Development Bank (ADB) for � nancial assistance to develop Nepal Climate Data Portal for DHM, Nepal. They also wish to thank Ms. Cindy Malvicini, Senior Water Resources Specialist, Environment, Natural Resources and Agriculture Division (SAER) of ADB for valuable guidance during the project period. They also wish to extend their gratitude to the Ministry of Environment Science and Technology, Government of Nepal for granting the project “Climate Data Digitization and Downscaling of Climate Change Projections in Nepal”
under “TA7173-NEP: Strengthening Capacity for Managing Climate Change” to Department of Hydrology and Meteorology of Nepal.
References
Asian Development Bank (2013). Nepal: Strengthening Capacity for Managing Climate Change and the Environment: Climate Data Digitization and Downscaling of Climate Change Projections in Nepal. Technical Assistance Report, 2013. Project Number: TA7173-NEP.
Dutta, R. and Jayasinghe, S. (2015). Integrating Spatial Data Infrastructure in Monitoring Climate Change Impacts: A Research Oriented Approach. Approach (TS-3: SDI Development; Commission: 2 of the International Federation of Surveyors (FIG), and Technical Commission: IV, Working Group: 4 of the International Society for Photogrammetry and Remote Sensing (ISPRS)). Peer Reviewed and published in the Proceedings of the International Workshop on the Role of Land Professionals and SDI in Disaster Risk Reduction: In the Context of Post 2015 Nepal Earthquake, Kathmandu, Nepal, 25 – 27 November, 2015.
Sharma, R.K. and Acharya, B.R. (2004). Spatial Data Infrastructure for Prosperous Nepal. Technical Session 2-Spatial Information Management Promoting Sustainable Development, 3rd FIG Regional Conference, Jakarta, Indonesia; 3-7 October, 2004.
UNFCCC (2007). Climate Change: Impacts, Vulnerabilities and Adaptation in Developing Countries. Available at unfccc.int/resource/docs/publications/impacts.pdf
Van der Wel, Frans J.M. (2005). Spatial Data Infrastructure for Meteorological and Climatic Data. Meteorological Applications, 12: pp. 7 – 8 (DOI: 10.1017/S1350482704001471).
WMO (2014). Climate Data Management System Speci� cations. Version 1.0.
Efforts should be made to integrate already available
climate and geospatial databases including the CSDI
to address the needs and concerns of the end-users
CoordinatesCoordinates December 2015 | 25
SD49_CMPL_December 2015.indd 25 12/12/15 7:14 am

The 2nd International Symposium on Disaster Management was an
invite-only event held over 3 days at the University of Melbourne which attracted over 130 attendees from across Australia, and internationally from 14 countries. The theme of the event was ‘Working Together for a Better World’ and key sessions of the event were dedicated to discussions on: Global Disaster Management, Mission Critical Communications, Disaster Management Platforms and Technology, Emergency Management, Trends and Issues in Disaster Management, Disaster Recovery and Reconstruction, and Community Resilience. The event was chaired by CDMPS Director, Prof. Abbas Rajabifard, and was supported by several national and international partners including The University of Melbourne, Carlton Connect, GSDI, IBM Research Australia, Emergency Management Victoria, UN-GGIM, FIG, CSDILA, APCO International, Victorian Spatial Council, BNHCRC and Coordinates Magazine as a media partner.
Symposium aim and objectives
The aim of the Symposium was to present and discuss the latest innovations, research and practice related to disaster management, and establish connections for future research and collaboration.
Five key objectives were identi� ed for the event:• To present the latest innovation,
research and practice• To exchange ideas• To establish and extend partnerships• To develop a future research agenda• To contribute to knowledge
Quick statistics of ISDM 2015• Over 130 attendees • Attendees from 14 countries• 6 3 presenters
• 13 key topics• 4 workshops
Highlights of the event
The Minister for Emergency Services, the Honourable Jane Garrett of� cially opened the symposium on Tuesday 13th October. The Minister gave a talk which emphasised the importance of organisational collaboration and community engagement and resilience in the context of disaster management.
The ISDM event coincided with the International day for Disaster Risk Reduction which is held on October 13 each year. The day celebrates how people and communities are reducing their exposure to disasters, and aims to also raise awareness about the importance of Disaster Risk Reduction (DRR). To mark the occasion, presentations at ISDM on this day focused on community resilience and disaster risk reduction activities and research.
At the symposium the Emergency Management Commissioner of Victoria Craig Lapsley of� cially launched the new document ‘A Modern Emergency Management System for Victoria’ during his keynote talk within the plenary session on emergency management. Commissioner Lapsley � rst spoke on the vision for emergency management in Victoria, Australia, and the challenges faced in disaster situations which require the community to survive, adapt and grow, before launching the strategy. The strategy outlines what community resilience is and how this understanding can be used to develop a resilience-based approach to emergency management in the context of Victoria today.
The ISDM event attracted delegated from 14 countries worldwide, and from a large
range of organisations and sectors across Australia including representation from a range of sectors including local, state and federal government, industry, and academia. Notably, at Federal level in attendance was a representative from the Department of Foreign Affairs and Trade (DFAT), and a representative from the Department of Communications. At the Victorian level, attendees included representatives from: the of� ce of the Productivity Commissioner, Emergency Management Victoria (including the Emergency Management Commissioner), the Department of Justice (including the Inspector General of Emergency Management), and the Country Fire Authority (including the CFA Chief Of� cer).
Outcomes
The discussions throughout the event, including panel discussions and workshops, yielded a broad range of ideas and focus areas to concentrate on for future research and collaborative activities. By bringing together a range of experts from countries around the world with different perspectives and experience, the opportunity for researchers, industry members and government representatives to work closely together to maximise return was presented, and the event acted as a platform for new connections and ongoing relationships to be established. These actions strengthened and mirrored the theme of the event – working together for a safer world.
The event has also emphasized the commitment of the University to addressing disaster management issues and achieving a resilient society in line with the grand challenges, and additionally has highlighted the importance of engagement between government, industry and academia, and the community – at a local, national and international level.
Working together for a safer worldReport on the 2nd international symposium on disaster management, October 12-14, 2015 - Melbourne
CONFERENCE
26 | CoordinatesCoordinates December 2015
SD49_CMPL_December 2015.indd 26 12/12/15 7:14 am

TRIUMPH-2--
SD49_CMPL_Javad-Gatefold_Dec15_Ad_AS.indd 1 06/12/15 10:24 amSD49_CMPL_December 2015.indd 27 12/12/15 7:14 am

30 miles
5 milesyour own base station far base station
TRIUMPH-2
TRIUMPH-2
30 miles
5 milesyour own base station far base station
TRIUMPH-2
TRIUMPH-2
30 miles
5 milesyour own base station far base station
TRIUMPH-2
TRIUMPH-2
Ambiguity resolu-tion is faster and more reliable
Ambiguity resolution is more difficult and less reliable
SD49_CMPL_Javad-Gatefold_Dec15_Ad_AS.indd 2 06/12/15 10:24 amSD49_CMPL_December 2015.indd 28 12/12/15 7:14 am

1
SD49_CMPL_Javad-Gatefold_Dec15_Ad_AS.indd 3 06/12/15 10:24 amSD49_CMPL_December 2015.indd 29 12/12/15 7:14 am

2
SD49_CMPL_Javad-Gatefold_Dec15_Ad_AS.indd 4 06/12/15 10:24 amSD49_CMPL_December 2015.indd 30 12/12/15 7:14 am

3
SD49_CMPL_Javad-Gatefold_Dec15_Ad_AS.indd 5 06/12/15 10:24 amSD49_CMPL_December 2015.indd 31 12/12/15 7:14 am

4
SD49_CMPL_Javad-Gatefold_Dec15_Ad_AS.indd 6 06/12/15 10:24 amSD49_CMPL_December 2015.indd 32 12/12/15 7:14 am

30 miles
5 milesyour own base station far base station
TRIUMPH-2
TRIUMPH-2
TRIUMPH-2
True 5 Hz RTK at roverNo extrapolation!
SD49_CMPL_Javad-Gatefold_Dec15_Ad_AS.indd 7 06/12/15 10:24 amSD49_CMPL_December 2015.indd 33 12/12/15 7:14 am

SD49_CMPL_Javad-Gatefold_Dec15_Ad_AS.indd 8 06/12/15 10:24 amSD49_CMPL_December 2015.indd 34 12/12/15 7:14 am

Pravesh YagolCadastral Survey Division, Survey Department, Minbhawan, Kathmandu, Nepal
Eliza ShresthaCadastral Survey Division, Survey Department, Minbhawan, Kathmandu, Nepal
Laxmi ThapaCadastral Survey Division, Survey Department, Minbhawan, Kathmandu, Nepal
Mukunda PoudelCadastral Survey Division, Survey Department, Minbhawan, Kathmandu, Nepal
Ganesh Prasad BhattaCadastral Survey Division, Survey Department, Minbhawan, Kathmandu, Nepal
SURVEYING
Recent technological advancements have shown that even RTK GPS and
satellite imageries with high resolution can also be used for the cadastral surveying. Cadastral mapping using GPS Technologies and High Resolution Satellite Imagery are increasingly renowned in many developing countries of the world, substituting the traditional graphical Surveying method. The accuracies between the cadastral data obtained by RTK GPS technology are comparable with those acquired by conventional EDM/Total Station surveying for most cadastral purposes (Wan et al., 1999). The emerging new satellite technologies have brought revolutionary changes in the � eld of GIS-based Cadastral mapping system facilitating high resolution satellite images of 0.5 m (GeoEye-1) or even 0.34 m (GeoEye-2) spatial resolution. Creation and updating of cadastral maps, multifunctional cadastral data as land value maps and descriptions of study area in an economical manner are some of the potential use of HRSI in Cadastral works (Nisanci and Yomrahoglu, 2002). Study shows that HRSI such as QuickBird and IKONOS imagery are accurate enough for mapping purpose up to scale 1:5000 (Büyüksalih and Jacobsen, 2005). It is possible to achieve an accuracy of +/- 2 meters using 1 m resolution satellite imagery and GPS controls (Cay et al.)
Background
The cadastral mapping of the entire Nepal, completed in 1996 using graphical plane
table surveying technique, was mainly carried out for the � scal/revenue purposes. Due to urbanization and population growth, the value of land is increasing rapidly and those graphical cadastral maps are not adequate to re� ect the real � eld situation in the urban areas. Due to the scale constraint, the cadastral maps prepared by graphical cadastral surveying method does not satisfy the land owners as they are asking for the accuracy of centimeter of land in the front face of their land parcel. The maps are in very ruin condition due to the continuously used and improper documentation. Even the land owners are asking for the recording and documentation of 3D real estate objects. Also, Survey Department has supported FIG’s Cadastre Vision 2014. Considering these facts, SD has prepared its Logical Framework Plan (10 years from � scal year 2005/2006) and one of the outputs after ten year will be the replacement of traditional technology with digital cadastral system for effective service delivery in cadastral related organizations in Nepal (Survey Department, 2006). Cadastral Survey Branch under Survey Department has introduced digital technology for data acquisition in Banepa Municipality as a piloting. After the success of this technology in piloting phase, the Program has been continued in other urban areas and improvements are going on. The traditional plane tabling method has been replaced by modern numerical cadastral surveying method using total station instruments and the cadastral database has been developed in fully digital environment.
Comparative study on Cadastral Surveying using Total Station and High Resolution Satellite ImageThis study proposes the comparative study of Cadastral boundary Surveying
and mapping using Total Station and Satellite Imageries in Nepal
CoordinatesCoordinates December 2015 | 35
SD49_CMPL_December 2015.indd 35 12/12/15 7:14 am

But the pace of surveying activities is very slow and it seems impossible to achieve the progress as per LFP.
With continual research and development remote sensing (satellite image), techniques and systems developed have become more reliable, cheaper and more productive making satellite image more attractive for a range of surveying solutions. The question then arises that if satellite image is offering high quality data, can this technology be accurate and viable enough to compete with Total Station methods? Can this technology be used for boundary surveys, most notably boundary de� nitions and rede� nitions? This case study is oriented to answer these questions.
Objectives
This project has centered its research on the comparative study of parcel boundary delineation from total station and High Resolution satellite imagery. The main purpose of the case study survey is to investigate the use of High Resolution satellite imagery for boundary survey in the context of cadastral mapping in Nepal.
Study Area
The location of the study area in Figure 1 is Charpane village which is located in the Birtamode Municipality - 4, Jhapa former charpane VDC - 8. It lies in the Eastern region of Nepal over the Terai belt. The village has almost � at terrain and because of the fertile soil, the land is mostly used for agriculture, effecting the urbanization to be minimal in the
study area. The extent of study area spans from 26° 35’ 31.10”N to 26° 35’ 50.76” N and 87° 57’ 8.16”E to 87° 57’ 31.05”E. Charpane village area consists of agricultural parcels predominantly while the settlements are meagerly distributed.
Datasets
3 sets of data were used for the study above viz., 3rd order Control points, Total Station survey data and GeoEye HRSI. Third order Control points were obtained from Geodetic Survey Division, Survey Department, Government of Nepal. Cadastral Survey data acquired by Total station were obtained from Surveying-Mapping Section of Survey Of� ce Chandragadi, Jhapa. A total of 102 parcels covering an area of 20.50 hectares of � at land were considered for the comparison and analysis. GeoEye Satellite Image of resolution 0.5m acquired on 14th March 2014 was used for the study. The image was, radiometrically as well as geometrically corrected and obtained from Topographical Survey Division, Survey Department, Government of Nepal.
Methodology
The methodology used in this study is shown in Figure 2 Initially, � eld survey using total station was carried out to obtain Ground Control points for geo-referencing the high resolution processed satellite Image. Further survey points were collected to delineate the parcel boundary. Secondly, geo-referenced satellite image were
used for extraction of cadastral boundaries. Existing cadastral maps dating back to 1965 A.D collected from Department of Land Information & Archive (DOLIA) were outdated and surveyed without control points i.e. arbitrarily, hence was not used for the comparison. Thus the parcels acquired from different sources were used for comparison later.
Acquisition of Cadastral Data by Total Station
The study area comprised of existing geodetic control points (GCP) established by Geodetic Branch of Survey Department. However, these points were not adequate for conducting digital cadastral survey by total station. Furthermore, suf� cient & well spread control points were required for geo-referencing the satellite image. Therefore, additional control points were established to meet the requirement of acquiring cadastral data using total station.
With ample amount of control points covering the study area, the collection of survey points were carried out. Prior to the traditional method of pegging or marking the parcel corners, respective land owners were asked to determine their boundary during adjudication. Re� ectors were mounted on these demarked boundary corners and measured by the total station. Likewise successive parcel boundary points were recorded on the total station for delineation of parcel boundary.
The collected boundary points recorded on the total station were transferred into
Figure 1: Loc ation of Study Area Figure 2: Methodology
36 | CoordinatesCoordinates December 2015
SD49_CMPL_December 2015.indd 36 12/12/15 7:14 am

the computer via cable. Appropriate software was used to convert the total station � le to CSV (comma separated value) � le. This � le was loaded into the GIS environment via GIS software ARCGIS 10.3, which was further used for processing and analysis. These data were stored in a prede� ned database schema to prepare the cadastral database. Parcel boundaries were delineated with the help of sketch made during the collection of survey points. Also the information related to the parcel such as land owner, address, type of land, etc. were stored in
the attribute table of the respective parcel. Later the completed database is used for publishing notice, preparing � eld book, land ownership certi� cates etc. Thus, the � nal output is a database, where the parcel and its related documents are stored, which can be printed on a paper.
The � nal output were printed in form of maps in order to carry out the � eld veri� cation to determine the � aws during measurements or data processing. Parcels were veri� ed on the � eld and errors during measurements or processing were
identi� ed. Later these errors were checked and corrected and hence � nalized to be used for providing service to the public.
Acquisition of Cadastral Data by HRSI
For this study purpose, we used 0.5 m resolution panchromatic GeoEye image. Since the image was previously radiometrically and geometrically corrected no further processing were required except for geo-referencing. For this GCPs were collected during control point densi� cation for enhancing the positional accuracy of the image. The control points were collected by � eld observation using total station with reference to the existing third order control point established by Geodetic Survey Branch. The control points collected were well distributed over the study area and suf� cient enough for the image to be georeferenced.
Sometimes the location information delivered by the satellite image are inadequate, and the data does not align
Figure 3: Cadastral map prepared by total station Survey
Cre
atio
n B
igFi
sh-c
p.be
SD30_CMPL_Linertec_May_Ad_AS.indd 1 26/04/14 11:59 AMSD49_CMPL_December 2015.indd 37 12/12/15 7:14 am

be concluded that Cadastral mapping using HRSI requires less time than mapping done by the total station.
Resource Comparison
For the parcel boundary delineation using Total Station, more human resources and machinery equipment are involved in the activities like detail � eld observation and data processing, whereas less manpower with few machinery equipment can delineate parcel boundary using Satellite Image. The Figure 5 shows human resources involved in this study using both the Total Station and HRSI method.
Area Comparison
The parcels derived from the GeoEye image (0.5m) were used for analysis
properly with � eld data. To ensure the locational accuracy the satellite image was aligned or georeferenced using the GCP acquired during � eld observations by total station. First order transformation was used for mapping each raster point to the target location as the satellite image was preprocessed before its procurement. About 15 control points were used in this process to increase the overall accuracy of the transformation as shown in Figure 4.
After geo-referencing the satellite image, parcels were digitized and veri� ed on the map by overlaying the parcel boundary obtained from total station survey. Furthermore, mismatch of the parcel boundaries acquired from different sources were compared as stated in the next section.
Result and Analysis
Time Comparison
The Table 1 & 2 shows the detail time involvement for deriving parcel using Total Station method and HRSI method respectively. Parcel Boundary delineation using Total Station requires intensive � eld observation thus consuming more cost and more time on � eld, whereas Parcel Boundary delineation using Satellite Image involves less � eld work and is economical compared to the method using total station.
It took 27 days for the total station method to delineate the parcel boundary and prepare its map while the same process was completed in 16 days by using Satellite Image. Hence it can
Figure 4: Control points for orientation of satellite Image
SN Task Name Duration1 Control Survey 7 days
2 Detail Observation and data processing 18 days
3 Map printing 2 days Total 27 days
Table 1: Time Analysis for Parcel delineation by TS
SN Task Name Duration
1 Densi� cation of Control Point 4 days
2 Preparation of OrthoImage 3 days
3 Digitization 1 day
4 Field Veri� cation and Parcel Identi� cation 6 days
5 Data Processing and Map Making 2 days
Total 16 days
Table 2: Time Analysis for Parcel delineation by HRSI
Figure 5: Human Resources required by TS & HRSI method
Figure 6: Plot on Number of parcels against the percentage error of area in GeoEye HSRI w.r.t TS Survey
38 | CoordinatesCoordinates December 2015
SD49_CMPL_December 2015.indd 38 12/12/15 7:14 am

and compared with the parcels obtained from total station survey, as these data were used as reference area for the comparison. Matching parcels from both the layers were extracted and used for the analysis. A total of 102 parcels were extracted from the satellite image and used for comparison with the matching parcels derived from Total Station Survey.
The Figure 6 illustrates the percentage error ensued during mismatch between the two parcel layers derived from Total Station Survey and HRSI. It can be stated that 90 % of the parcels can be marked with less than 5% error using HRSI.
Also when observing the facts from the Table 3 , 67 % Parcels (68 Parcels) derived from the GeoEye image had area deviation less than 1 % with respect to TS Survey which shows an accurate match between two parcel layers. Around 23 % Parcels (23 Parcels) derived from the GeoEye Image had an area deviation
between 1% and 3% w.r.t TS Survey which shows a minimal mismatch between these two parcel layers. However, very low percentage i.e around 4 % Parcels (4 parcels) derived from GeoEye Image had an area deviation between 3% and 5 % w.r.t TS Survey which indicates mismatch between two layers and considered to be a large deviation. These large deviations are due to several factors creating hindrance in derivation of parcels from the Satellite image such as unclear parcel boundaries and high canopy cover over the boundaries.
Perimeter Comparison
The perimeter of the derived parcels from GeoEye and TS Survey were used for the analysis. A total of 102 parcels were extracted from the satellite image and used for comparison with the matching parcels derived from Total Station Survey.
The Figure 7 shows the percentage error comparison of perimeter between two
layers of parcels derived from GeoEye image and TS Survey. Observing the steep declination, it can be stated that larger no of parcels can be matched with higher accuracy between the two layers.
When observed in the Table 4, 76% Parcels (78 Parcels) derived from GeoEye had perimeter deviation less than 1% w.r.t to TS Survey which shows an accurate match between two parcel layers. Around 22% Parcels (22 Parcels) derived from GeoEye image had perimeter deviation between 1 % and 3% which shows a minimal mismatch between these two parcel layers. Only 1% Parcels derived from GeoEye had perimeter deviation between 3% and 5% w.r.t TS Survey which indicates small mismatch between two layers.
Position Comparison
Positional Accuracy of the parcel boundary derived from GeoEye Image and TS Survey were assessed by identifying the shift in position of the parcels Centroid coordinates calculated in terms of distance between them .A total of 102 parcels were extracted from the satellite image and used for comparison with the matching parcels derived from Total Station Survey. Centroid Coordinates of each parcel derived from TS Survey as well as parcel derived from GeoEye image were calculated and the distance
%Error No of Parcels Percentage<1 78 761-3 22 223-5 1 1>5 1 1
Total 102 100
Table 4: Comparison of Perimeter deviation w.r.t TS Survey in GeoEye HRSI
%Error No of Parcels Percentage<1 68 66.671-3 23 22.553-5 4 3.92>5 7 6.86
Total 102 100
Table 3: Comparison of Area deviation w.r.t TS Survey in GeoEye HRSI
Figure 7: Plot on Number of parcels against the percentage error of perimeter in GeoEye HSRI w.r.t TS Survey
Though the obtained results from the comparison of two
techniques in delineating the parcel boundaries shows
good potential for HRSI’s use in cadastral survey, higher
accuracy cannot be achieved as that of the total station
CoordinatesCoordinates December 2015 | 39
SD49_CMPL_December 2015.indd 39 12/12/15 7:14 am

between the centroids of the corresponding parcel boundary was measured using the Euler’s Distance Formula (1):
(1)
Where d is the shift in meters,(x,y) is the coordinate value of the pointFrom Table 5, we can observe that 84% Parcels (86 Parcels) derived from GeoEye image had centroid shift less than 1 m w.r.t TS Survey which shows an accurate match between these two parcels. About 15 % Parcels derived from GeoEye image had centroid shift between 1% and 3% which shows a minimal mismatch between these two parcel layers. Only 1 % Parcels had centroid shift between 3% and 5% indicating mismatch between two layers. From this it can be depicted that more number of parcels can be derived with acceptable accuracy using HRSI.
Limitations
The study was carried out under favorable conditions and circumstances for which the tough part can go neglected. Some of the limitations that govern this study are as follows:i. Study area comprised of � at
lands, mostly agricultural � elds with almost no settlements.
ii. Considerably large parcel plots were used for the comparison.
iii. Image acquired was of during harvesting season where the parcel boundary could be easily depicted.
iv. The best digitization of the parcel boundary among three digitizers were used for the comparison.
Conclusions
Todays’ emerging new Satellite Technologies with high resolution has proved to be a boon in the � eld of land surveying for cadastral mapping with high accuracy, cost effective and time ef� cient manner. High Resolution satellite imagery provides clear identi� cation of parcel boundaries and other features due to which conventional and traditional method of cadastral mapping is shifting towards more advanced, reliable and economic methods. This study incorporates the potential use of High Resolution satellite image for indirect land surveying for cadastral survey /resurvey to achieve high accuracy with low cost and within small timeframe.
The principle objective of the project is to compare the cadastral survey done by High Resolution satellite image and that by Total Station in context of Nepal. Comparisons between parcel boundaries derived from total station Survey and HRSI shows good potential of the later for Cadastral Survey. For this, various attributes of the derived parcels such as area, perimeter and position from both techniques were compared along with human resource involved and time for the completion of task.
The comparisons shows that around 80% of the parcel boundary can be derived with acceptable accuracy and precision meeting the standards of cadastral Survey. In addition, use of HRSI will result in faster updating of Cadastral maps in more economical and convenient manner. From the above � ndings it’s clear that use of HRSI can reduce the Cost, Time and Human resources as compared to the total Station method.Also the parcel boundary can be derived with acceptable accuracy with the use of HRSI
However, large deviations in parcel areas were due to unclear boundaries with similar spectral response, high canopy cover over the boundaries. etc.
Recommendations
Though the obtained results from the comparison of two techniques in delineating the parcel boundaries shows good potential for HRSI’s use in cadastral survey, higher
Shift (m) No of Parcels Percentage<1 86 841-3 15 153-5 1 1>5 0 0
Total 102 100
Table 5: Comparison of position Deviation w.r.t. TS survey and GeoEye HRSI
Figure 8: Plot on Number of parcels against the percentage error of position in GeoEye HSRI w.r.t TS Survey
High Resolution satellite
imagery provides clear
identification of parcel
boundaries and other
features due to which
conventional and
traditional method of
cadastral mapping is
shifting towards more
advanced, reliable and
economic methods
40 | CoordinatesCoordinates December 2015
SD49_CMPL_December 2015.indd 40 12/12/15 7:14 am

accuracy cannot be achieved as that of the total station. There are some limitations to this technique as it solely relies on visual interpretation. In case of highly dense settlement area, shadow region, high canopy cover, unclear boundaries due to similar spectral re� ectance, small parcel etc. similar accuracy cannot be achieved.
Every techniques has its own � aws and bene� t. To obscure the � aws of one with the bene� ts of the other would be the best option to overcome any task with high accuracy at minimal cost. Similar an integrated approach of both the techniques can be used to achieve higher accuracy in an economical manner and can even fasten the process. Furthermore, as aimed at the beginning of the project, introducing the GPS technology for cadastral survey could have enhanced more realistic picture of technologies intervention for expediting cadastral surveying.
Acknowledgements
The authors would like to express sincere gratitude to to Mr. Amir Neupane, Of� ce
Head, Survey Of� ce Chandragadhi, Jhapa and his entire team for their support. The authors thank Mr. Kamal Ghimire, Chief Survey Of� cer, Survey Department for providing us High Resolution Satellite Image to carry out this project and guiding us throughout the project duration. The project team would like to extend heartfelt thankfulness to Survey Department for providing us the opportunity to carry out this project and all the staff of Cadastral Survey Division, for their constant support and encouragement.
References[1] T. Cay, O. Corumluoglu and F.
Iscan, “A Study on Productivity of Satellite Images in the Planning Phase of Land Consolidation Projects,” presented at the XXth ISPRS Congress “Geo-Imagery Bridging Continents”, Istanbul, Turkey, 2004.
[2] G. Büyüksalih and K, Jacobsen, “Optimized Geometric Handling of High Resolution Space Images,” ASPRS annual convention, Baltimore, p.9, 2005.
[3] Z. Ali, “Assessing Usefulness of High-Resolution Satellite Imagery (HRSI) in GIS-based Cadastral Land Information System,” Journal of Settlements and Spatial Planning, 3(2), pp. 93-96, 2012.
[4] Z. Ali, A. Tuladhar and J. Zevenbergen, “An integrated approach for updating cadastral maps in Pakistan using satellite remote sensing data,” International Journal of Applied Earth Observation and Geoinformation, 18, pp. 386-398, 2012
[5] S. S. Rao, J. R. Sharma, S. S. Rajasekhar, D. S. P. Rao, A. Arepalli, V. Arora., Kuldeep, R. P. Singh and M. Kanaparthi., “Assessing Usefulness Of High-Resolution Satellite Imagery (HRSI) for Re-Survey Of Cadastral Maps,” ISPRS Annals of the Photogrammetry, Remote Sensing and Spatial Information Sciences, Volume II-8, 2014.
The paper was presented at FIG - ISPRS workshop, 2015: International Workshop on Role of Land Professionals and SDI in Disaster Risk Reduction: In the Context of Post 2015 Nepal Earthquake. Kathmandu, Nepal, 25th - 27th November, 2015
GNSS + InertialPrecise Positioning and Orientation
THE TRIMBLE BD935-INS:A PRECISION GNSS + INERTIAL MODULE DELIVERING RTK AND ORIENTATION IN REAL TIME
The BD935-INS is a compact module that integrates triple frequency GNSS and MEMS Inertial sensors to provide precise real-time position and attitude.
FOR HIGH-PERFORMANCE, PRECISE POSITIONING IN A COMPACT, MOBILE-READY DESIGN• 336 Channels • GPS, GLONASS, Galileo and BeiDou• Integrated 3-D MEMS Sensors• 100Hz RTK Position and Orientation• Also available in IP67 enclosure
The BD935-INS module features a high accuracy GNSS receiver for precise position and an integrated MEMS inertial sensor package for 3-D orientation to serve applications requiring position and attitude. The GNSS + Inertial combination delivers more stability and robustness than GNSS alone.
© Copyright 2015, Trimble. All rights reserved. All other trademarks are the property of their respective owners. TPC103 (08/15)
Trimble GNSS OEMInTech.trimble.com
60mm x 67mm
SD45_CMPL_Trimble-GNSS_Aug_Ad_AS.indd 1 13/08/15 4:24 amSD49_CMPL_December 2015.indd 41 12/12/15 7:14 am

Indoor positioning is highly desired for many applications, including personnel
tracking for safety in normally unmanned locations. There are several methods and technologies available to achieve accurate indoor position and location but the majority relies on dedicated, specialized equipment or modi� cations to achieve this goal. With the growing number of devices that contain GPS receivers it is practical to develop a system that will allow indoor positioning using these already available receivers.
GPS repeaters are typically used as a solution to bring GPS signals indoor. A traditional repeater consists of installing a GPS antenna outdoor along with an ampli� er, and running a loss low coaxial cable to the indoor space with a radiating antenna or using a leaky-coaxial cable to transmit the signal to a wider area. There are several issues with this approach. The � rst is that any GPS receiver that receives the repeated signal will believe that it is in the location of the outdoor antenna, not the actual indoor position. This can make it dif� cult to locate people, especially if they are underground or if the indoor position is far away from the outdoor GPS antenna location. Secondly, if the system is using a leaky cable to supply the signal to the user, the signal will be strongest near the antenna ampli� er which is typically located in an outdoor location, and could disrupt GPS for users in the local area.
The Intelligent Repeater System overcomes these issues. An outdoor antenna is installed anywhere with a clear view of the sky. Rather than attaching the antenna directly to an ampli� er and antenna system in a
traditional repeater system, the antenna in an Intelligent Repeater System is attached to a data collection and synchronization unit. The information about the live sky signals is collected and accurate 10MHz and 1PPS signals are produced. These signals can be used by a GNSS simulator to recreate the live sky signals, but instead of generating signals that would correspond to the outdoor antenna location, the generated location can be programmed to simulate a position anywhere in the world into the indoor zone.
Using the Intelligent Repeater System, personnel or equipment can be located within a given zone, making critical response times shorter, improving safety, and providing more accurate information than a traditional repeater system.
This paper describes the data collection, the synchronization methods, and the GNSS RF signal generation capability of the Intelligent Repeater System.
Zone based indoor location using GNSS simulatorsThis paper describes the data collection, the synchronization methods, and the
GNSS RF signal generation capability of the Intelligent Repeater System
Lisa PerdueApplications Engineer, Spectracom Corp., USA
Hironori SasakiDirector of Solutions Architecture, Spectracom Corp., USA
John FischerChief Technology Offi cer, Spectracom Corp., USA
POSITIONING
Figure 1: Intelligent Repeater System – Single Zone
42 | CoordinatesCoordinates December 2015
SD49_CMPL_December 2015.indd 42 12/12/15 7:14 am
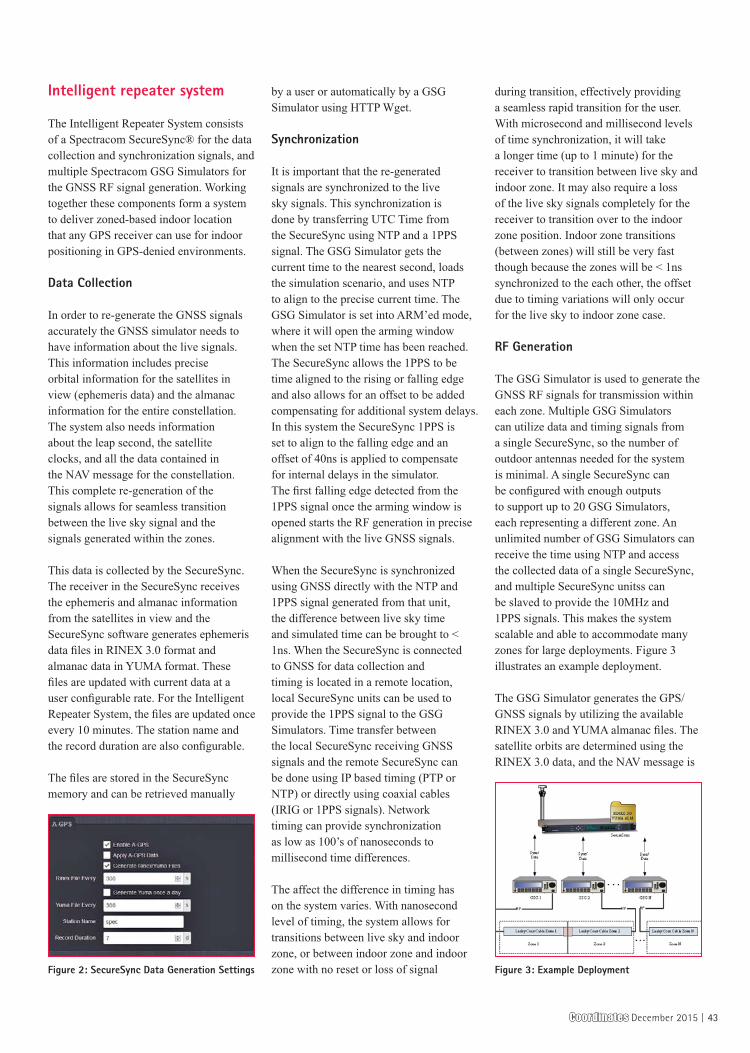
Intelligent repeater system
The Intelligent Repeater System consists of a Spectracom SecureSync® for the data collection and synchronization signals, and multiple Spectracom GSG Simulators for the GNSS RF signal generation. Working together these components form a system to deliver zoned-based indoor location that any GPS receiver can use for indoor positioning in GPS-denied environments.
Data Collection
In order to re-generate the GNSS signals accurately the GNSS simulator needs to have information about the live signals. This information includes precise orbital information for the satellites in view (ephemeris data) and the almanac information for the entire constellation. The system also needs information about the leap second, the satellite clocks, and all the data contained in the NAV message for the constellation. This complete re-generation of the signals allows for seamless transition between the live sky signal and the signals generated within the zones.
This data is collected by the SecureSync. The receiver in the SecureSync receives the ephemeris and almanac information from the satellites in view and the SecureSync software generates ephemeris data � les in RINEX 3.0 format and almanac data in YUMA format. These � les are updated with current data at a user con� gurable rate. For the Intelligent Repeater System, the � les are updated once every 10 minutes. The station name and the record duration are also con� gurable.
The � les are stored in the SecureSync memory and can be retrieved manually
by a user or automatically by a GSG Simulator using HTTP Wget.
Synchronization
It is important that the re-generated signals are synchronized to the live sky signals. This synchronization is done by transferring UTC Time from the SecureSync using NTP and a 1PPS signal. The GSG Simulator gets the current time to the nearest second, loads the simulation scenario, and uses NTP to align to the precise current time. The GSG Simulator is set into ARM’ed mode, where it will open the arming window when the set NTP time has been reached. The SecureSync allows the 1PPS to be time aligned to the rising or falling edge and also allows for an offset to be added compensating for additional system delays. In this system the SecureSync 1PPS is set to align to the falling edge and an offset of 40ns is applied to compensate for internal delays in the simulator. The � rst falling edge detected from the 1PPS signal once the arming window is opened starts the RF generation in precise alignment with the live GNSS signals.
When the SecureSync is synchronized using GNSS directly with the NTP and 1PPS signal generated from that unit, the difference between live sky time and simulated time can be brought to < 1ns. When the SecureSync is connected to GNSS for data collection and timing is located in a remote location, local SecureSync units can be used to provide the 1PPS signal to the GSG Simulators. Time transfer between the local SecureSync receiving GNSS signals and the remote SecureSync can be done using IP based timing (PTP or NTP) or directly using coaxial cables (IRIG or 1PPS signals). Network timing can provide synchronization as low as 100’s of nanoseconds to millisecond time differences.
The affect the difference in timing has on the system varies. With nanosecond level of timing, the system allows for transitions between live sky and indoor zone, or between indoor zone and indoor zone with no reset or loss of signal
during transition, effectively providing a seamless rapid transition for the user. With microsecond and millisecond levels of time synchronization, it will take a longer time (up to 1 minute) for the receiver to transition between live sky and indoor zone. It may also require a loss of the live sky signals completely for the receiver to transition over to the indoor zone position. Indoor zone transitions (between zones) will still be very fast though because the zones will be < 1ns synchronized to the each other, the offset due to timing variations will only occur for the live sky to indoor zone case.
RF Generation
The GSG Simulator is used to generate the GNSS RF signals for transmission within each zone. Multiple GSG Simulators can utilize data and timing signals from a single SecureSync, so the number of outdoor antennas needed for the system is minimal. A single SecureSync can be con� gured with enough outputs to support up to 20 GSG Simulators, each representing a different zone. An unlimited number of GSG Simulators can receive the time using NTP and access the collected data of a single SecureSync, and multiple SecureSync unitss can be slaved to provide the 10MHz and 1PPS signals. This makes the system scalable and able to accommodate many zones for large deployments. Figure 3 illustrates an example deployment.
The GSG Simulator generates the GPS/GNSS signals by utilizing the available RINEX 3.0 and YUMA almanac � les. The satellite orbits are determined using the RINEX 3.0 data, and the NAV message is
Figure 2: SecureSync Data Generation Settings Figure 3: Example Deployment
CoordinatesCoordinates December 2015 | 43
SD49_CMPL_December 2015.indd 43 12/12/15 7:14 am

� lled using the data from the RINEX and YUMA � les. This is a standard function of the GSG Simulator and therefore no special � rmware or customization of the simulator software is needed. Both the SecureSync and the GSG Simulator are COTS products con� gured for use in the Intelligent Repeater System.
The sources for both the NTP server and the Download server in the GSG Simulator can be selected. Both of these can be set to a SecureSync or to an internet server. Figure 4 shows the NTP and Download server con� guration.
When the SecureSync has a multi-GNSS receiver installed, it can simultaneous collect the data from multiple constellations simultaneously. GSG Simulators can then generate signals for any and all constellations that have been received by the SecureSync, enabling multi-frequency, multi-constellation signal re-generation for multiple indoor zones. Currently these constellations include GPS, GLONASS, BeiDou, and QZSS. In the future the system will support Galileo as well.
Zones
Careful planning, installation and commissioning is required to ensure the appropriate power levels within each zone. If the signals are too strong, users transitioning to adjacent zones will be dif� cult, and the generated signals could leak out of the indoor areas into the outdoor locations where users are utilizing live sky signals. The users in this proximity could be negatively and unexpectedly affected. On the other hand, if the signals are too weak, the user receiver might not pick up the indoor positioning signals in some areas of the zone, or the transition from zone to zone may take longer than expected or desired. Planning the zones based on the leaky cable or antenna deployment is absolutely necessary. During installation, a
known receiver can be used to measure the received signals within the zones. Using this information it is possible to adjust the power levels from each GSG Simulator so that the power level of the � rst zone is 2dB less than the power level of the second zone at the transition point between zones. This will allow the receiver to move from zone to zone with quick transition times, avoiding the situation where the receiver would have to completely lose the signal from one zone before picking up the next zone’s signal. Using GSG Simulators allows the power to be adjusted with a 0.1 dB resolution in each zone, so the power levels can be carefully con� gured and optimized during installation and commissioning.
The Intelligent Repeater System can be deployed to provide GNSS coverage into areas that do not normally receive GNSS signals. By creating zones in an underground area or within a building to differentiate � oors or rooms, it is possible to locate personnel and assets to within a certain zone. Zone sizes can be set based on the area to be covered and the number of GSG Simulators deployed.
System Monitoring
In-Zone Monitoring
A GNSS receiver can be placed in each zone and monitored for the correct power level and position. This will allow for complete monitoring of the system from the signal generation to the signal distribution and transmission. The receivers in the zone can be monitored wirelessly or with an existing network. With large deployments, this option could become cost prohibitive and may be dif� cult to monitor but many of the functions could be automated to assist the user
Equipment Monitoring
The SecureSync and the GSG Simulators in the system can also be monitored for status and errors over network connections. A monitoring software can be installed on a network computer and can check the status of the SecureSync synchronization, data generation and NTP status remotely.
The same monitoring software can also verify the GSG Simulator uptime, power level set, and the satellites generated. Remotely rebooting the SecureSync and GSG Simulator is also possible, to simplify maintenance procedures.
When the system is installed on individual local networks without LAN connection, network monitoring cannot be used. In this case the SecureSync can check the basic status of the GSG Simulators and report any errors using a single sum alarm via an installed relay card that can be sent to a local monitoring system.
Conclusion
Bringing GNSS signals indoors is a common solution to indoor positioning. A traditional GNSS repeater system can be used for this purpose but comes with several signi� cant limitations. By dividing the coverage area into zones, personnel and assets can be located to the resolution of the zones. However, a traditional repeater system has several drawbacks. The need for an outdoor antenna for each zone indoor can rapidly drive up the system costs. Additionally, in some installations, it may not be possible to get permissions or licenses from landowners to install antennas in convenient locations above ground. Furthermore, the re-radiated position could be several hundred meters away from the actual position. On the other hand, the Intelligent Repeater System uses COTS products that can overcome these issues and still provide a reliable alternative that works with any GNSS receiver. By deploying the Intelligent Repeater System in an environment that does not normally receive GNSS signals, the safety of responders and maintenance personnel in the area is greatly improved, especially in the situations where they need to be located quickly and accurately. The � exibility and reliability of the Intelligent Repeater System make it a practical solution that can be deployed as part of building or underground infrastructure either during initial construction or as an addition to the area.
The paper was presented at International Symposium on GNSS 2015, Kyoto, Japan, November 16-19, 2015
Figure 4: GSG Simulator Server Settings
44 | CoordinatesCoordinates December 2015
SD49_CMPL_December 2015.indd 44 12/12/15 7:14 am

NEWS - GNSS
GSA Announces Horizon 2020 European GNSS Grants
The European GNSS Agency (GSA) has announced on October 27, 2015 the evaluation results of its second Horizon 2020 call for Galileo applications. Some 13 projects made the main list to be funded, receiving grants totaling nearly €24.9 million (US$27.5 million).
In its second round, Horizon 2020, which represents the European Union’s framework program for research and innovation, focused on “innovation actions” and received 91 total submissions. Funding went to those proposals that best showed “a signi� cant focus toward impacting global markets with strong innovation and the incorporation of new knowledge,” according to the GSA. The teams associated with the 13 selected proposals comprise 95 different participants that will receive funding this round.
Of the 91 submissions, 45 fell under the category of European GNSS (E-GNSS)
applications, 31 under the topic of Small and Medium Enterprise (SME) Based European GNSS applications, and 15 under the topic of “releasing the potential of European GNSS applications through international cooperation.” E-GNSS applications received the lion’s share of funds: eight projects covering transport, surveying, LBS, agriculture, emergency services, and other professional applications were recommended to receive nearly €20.4 million.
Three SME-based E-GNSS projects were approved for €2.9 million in funding, addressing applications in niche markets and business models, mass market LBS products, market testing, and so on. Two projects were awarded €2.7 million to develop innovative international applications highlighting E-GNSS services.
Two Galileo satellites arrive in French Guiana for Arianespace’s year-ending Soyuz mission
The satellites for Arianespace’s 12th � ight in 2015 – which will close out the
company’s record year of launch activity – have arrived in French Guiana with delivery of the latest two European Galileo navigation platforms to be lofted by Soyuz. Scheduled for sometime in December, the upcoming medium-lift Soyuz mission with its pair of Galileo satellites will conclude Arianespace’s busiest launch activity year ever involving all three members of its launcher family – which also includes the heavy-lift Ariane 5 and lightweight Vega. http://spaceref.com/news/
China to set up BDS international maritime surveillance centre
China is planning to build an international maritime surveillance centre in its major Tianjin port city to monitor and assess the accuracy of BEIDOU. The surveillance centre will monitor and assess the accuracy, operating situation and signal quality of the system and report to users on the sea, ensuring high quality BDS service,” said Chai Jinzhu, an of� cial with the ministry’s north China sea maritime insurance centre.
SD42_CMPL_EOS-GNSS_May_Ad_AS.indd 1 11/05/15 12:42 pmSD49_CMPL_December 2015.indd 45 12/12/15 7:14 am

Galileo updateGalileo satellites set for year-long Einstein experiment
Europe’s � fth and sixth Galileo satellites - subject to complex salvage manoeuvres following their launch last year into incorrect orbits - will help to perform an ambitious year-long test of Einstein’s most famous theory. Galileos 5 and 6 were launched together by a Soyuz rocket on 22 August 2014. But the faulty upper stage stranded them in elongated orbits that blocked their use for navigation.
ESA’s specialists moved into action and oversaw a demanding set of manoeuvres to raise the low points of their orbits and make them more circular.
“The satellites can now reliably operate their navigation payloads continuously, and the European Commission, with the support of ESA, is assessing their eventual operational use,” explains ESA’s senior satnav advisor Javier Ventura-Traveset.
“In the meantime, the satellites have accidentally become extremely useful scienti� cally, as tools to test Einstein’s General Theory of Relativity by measuring more accurately than ever before the way that gravity affects the passing of time.”
Although the satellites’ orbits have been adjusted, they remain elliptical, with each satellite climbing and falling some 8500 km twice per day. It is those regular shifts in height, and therefore gravity levels, that are valuable to researchers.
Albert Einstein predicted a century ago that time would pass more slowly close to a massive object. It has been veri� ed experimentally, most signi� cantly in 1976 when a hydrogen maser atomic clock on Gravity Probe A was launched 10 000 km into space, con� rming the prediction to within 140 parts in a million.
Atomic clocks on navigation satellites have to take into account they run faster in orbit than on the ground - a few tenths of a microsecond per day, which would give us navigation errors of around 10 km per day. This new effort takes advantage of the passive hydrogen maser atomic clock aboard each Galileo, the elongated orbits creating varying time dilation, and the continuous monitoring thanks to the global network of ground stations. “Moreover, while the Gravity Probe A experiment involved a single orbit of Earth, we will be able to monitor hundreds of orbits over the course of a year,” explains Javier.
“This opens up the prospect of gradually re� ning our measurements by identifying and removing systematic errors. Eliminating those errors is actually one of the big challenges.
“For that we count on the support of Europe’s best experts plus precise tracking from the International Global Navigation Satellite System Service, along with tracking to centimetre accuracy by laser.”
The results are expected in about one year, projected to quadruple the accuracy on the Gravity Probe A results. http://www.spacedaily.com/reports/
Under an arrangement made by the Maritime Safety Administration, the north China sea maritime insurance centre has been working on the construction and operation of the surveillance centre. http://economictimes.indiatimes.com
Magnetic protein may provide animals with navigation information
Although the ability of biological entities to register magnetic � elds is fairly well accepted, the means by which they do so hasn’t been de� nitively identi� ed. A lot of attention has focused on cases where small clusters of iron are formed within cells. But researchers in China � gured that a protein might exist that could act as a magnetic sensor. So they screened the Drosophila genome for one that � t the bill—and found it.
A couple of different models have been postulated to explain the biological basis of magnetosensing. Cryptochromes (Cry) are light-sensing proteins used by birds to orient and navigate using the Earth’s magnetic � eld. Although these can sense the inclination of the geomagnetic � eld, they cannot detect polarity and thus cannot function as a compass.
Scientists thus assumed that another protein must be involved, likely one that binds to iron (which can detect polarity and thus can function as a compass). So they scanned a database of the Drosophila genome for genes encoding proteins that (a) bind to iron; (b) are expressed in the head (where Cry is); and (c) are found within the cell, rather than on the cell membrane (again, that’s where Cry is). They identi� ed nine candidates in this in silico search, but only one bound to the Drosophila cryptochrome. Bingo: the Drosophila magnetoreceptor protein, dMagR.
Like cryptochromes, genes for MagR are found in all animal species. In addition to Drosophila, Cry/MagR complexes were found in butter� ies, pigeons, mole rats, minke whales, and humans. Further examination of the complex puri� ed from pigeon retina revealed that it consists of a linear core of iron-containing MagR
46 | CoordinatesCoordinates December 2015
SD49_CMPL_December 2015.indd 46 12/12/15 7:14 am

proteins surrounded by a sheath of Cry proteins. As a unit, the complex acts as a light-dependent biocompass, capable of detecting the polarity, intensity, and inclination of the Earth’s geomagnetic � eld. It has an intrinsic magnetic moment, as veri� ed by the fact that it orients parallel to an enhanced external magnetic � eld. http://arstechnica.com/science/
GPS Ground System security upgraded
The ground system for the U.S. Air Force’s PNT satellites recently received a software update and security upgrade under a two-year-old contract with Lockheed Martin. Known as the GPS Intrusion Protection Reinforcement, the updates enable greater data protection within the Air Force’s current Operational Control Segment, which serves as the ground system for the Air Force’s GPS satellites. The updates also resolve equipment obsolescence issues.
ULA drops out of GPS III launch competition
The United Launch Alliance (ULA) send-off of the 12th GPS Block IIF satellite scheduled for next February 3 may turn out to be the last GPS launch for the Boeing/Lockheed Martin joint venture — at least for a while.
ULA did not submit a bid to launch of GPS III
In a statement released on November 16, ULA said that it would be “unable to submit a compliant bid for GPS III-X launch services.” The company blamed its decision on the lack of Atlas rockets due to restrictions imposed by the 2015 National Defense Authorization Act, which continued a ban on Russian-built RD-180 engines imposed following Russia’s annexation of Crimea.
Russia’s Glonass-M navigation satellite planned for launch in late December
The Russian navigation satellite Glonass-M is planned for launch from the Plesetsk space center in north Russia in
late December. The satellite will be orbited by a Soyuz-2 carrier rocket with the Fregat booster. The Glonass-M satellite, which has No. 51, will replace the satellite that has operated for three years above the warranty term in the Russian navigational orbital grouping. http://tass.ru/en/science/
Azerbaijan can join Russia’s GLONASS system
Azerbaijan doesn’t rule out the possibility of joining Russia’s GLONASS satellite navigation system in the future, head of Azercosmos JSC Rashad Nabiyev said.
Azerbaijan’s participation in this project is not currently on the agenda, but it is well possible if the sides reach a corresponding agreement, he added. http://en.trend.az
Russia to Install 48 Glonass Navigation Stations in 36 Countries
“The installation of 48 GLONASS measurement stations are in Russia’s plans in the country and abroad and it’s planned that 36 countries will begin in cooperation,” Oleg Gorshkov said recently during an innovative technologies forum in Moscow. http://sputniknews.com
Karutin Named General Designer of GLONASS Program
Russian President Vladimir Putin has approved the appointment of Sergey Karutin, deputy director of the Central Research Institute of Machine Building and head of its PNT Center responsible for GLONASS operations, to serve as the new general designer of the Russian GNSS program.
In his new role, Karutin will undertake the “comprehensive work of further developing the system,” according to Russian Deputy Prime Minister Dmitry Rogozin in charge of the nation’s defense and space industry.
His position is one of 21 supervisors of key Russian scienti� c and military projects who will be included in the Military-Industrial Commission of the Russian Federation.
GPS for autistic boys during school in the US
The Long Island parents of two autistic boys have out� tted their sons with GPS tracking devices to wear at school in case they run away.
Brian and Dayann McDonough say their sons have wandered from home and school repeatedly. The Merrick parents initially were met with resistance from school of� cials who were concerned about how the GPS devices would affect other students’ privacy.
North Merrick school of� cials now say they’re allowing the use of the devices as long as there’s no audio element that could jeopardize con� dentiality to special education students.
The devices can send a text and email noti� cation of a location change. http://www.fox5ny.com
Air Force launches 11th GPS IIF satellite
The Air Force successfully launched the 11th GPS IIF satellite into orbit Oct. 31, according to Air Force Space Command.
The Boeing-built satellite was launched at 12:13 p.m. Eastern Time from Cape Canaveral Launch Station 41 in Florida using an Atlas V 401 launch vehicle.
In addition to the GPS IIF satellites, Space Command has GPS IIAs, 12 GPS IIRs and seven GPS IIR-Ms in orbit. These satellites are operated by Air Force Space Command’s 50th Space Wing at Schriever Air Force Base, Colorado. Space command plans to launch one more GPS IIF satellite. Testing is underway for the GPS III satellite, which prime contractor Lockheed Martin vows will have three times better accuracy and eight times improved anti-jamming capabilities, and it should be the � rst GPS satellite that will be interoperable with other global navigation satellite systems. But the launch of the � rst GPS III satellite has been delayed until 2017 because of problems with the satellites’ navigation system, which is being built by subcontractor Exelis. http://www.airforcetimes.com
CoordinatesCoordinates December 2015 | 47
SD49_CMPL_December 2015.indd 47 12/12/15 7:14 am

OLD COORDINATES
In Coordinates10 years before…
mycoordinates.org/vol-1-issue-7-december-05/
48 | CoordinatesCoordinates December 2015
SD49_CMPL_December 2015.indd 48 12/12/15 7:14 am

NEWS - GIS
Enhanced mapping system for 911 emergency dispatchers
Two computers sat side-by-side at a recent demonstration showing the mapping available to Kane County Emergency Communications (KaneComm) dispatchers before and after the county’s GIS department completed enhancements to better serve people calling 911 for help. Emergency dispatchers now see what the caller sees, Deputy Director Michelle Guthrie said.
The equipment is the same but the software now provides detailed maps along with aerial photos showing where a 911 call is made from a cell phone, Guthrie said. Emergency dispatchers no longer have to jump from screen to screen to � nd maps pinpointing locations, saving a lot of time, Guthrie said. The software also provides closer locations to cell towers for � rst responders to � nd anyone who needs help, she said. www.chicagotribune.com
OGC and ASPRS to collaborate on geospatial standards
The Open Geospatial Consortium (OGC) and the American Society for Photogrammetry and Remote Sensing (ASPRS) have agreed to work together more closely in the application and promotion of standards and best practices for the location and geospatial industries.
“The advancement of standards and best practices in areas such as point clouds bene� ts from the partnership of key organizations,” said Mark Reichardt, OGC’s president and CEO. “We are deeply appreciative of the alliance recently established between ASPRS and OGC. This alliance encourages our respective members to join forces in collaborative activity that will result in bene� ts for the whole global community as photogrammetry and remote sensing grow in importance.”
“Both the OGC and the ASPRS have long-established roles in the expanding � eld of location and geospatial technologies,” said Michael Hauck, ASPRS’s Executive Director. www.spacedaily.com
The Swedish Hydrographic Offi ce chooses CARIS
The Swedish Maritime Administration (SMA) has chosen CARIS Hydrographic Production Database (HPD) as the new system to meet the Hydrographic Of� ce’s current and future requirements. With HPD the Hydrographic Of� ce will have the latest and most ef� cient system for the management of spatial data and the ef� cient production of paper and electronic charts. Ef� ciently and securely migrating data and transitioning the work force to a new system while continuously
ensuring safety at sea is vital for the Hydrographic Of� ce, who represents Sweden as a member of the International Hydrographic Organization (IHO).
Gateway to maps for Europe takes centre stage at EC
National Mapping, Cadastral and Land Registry Authorities have demonstrated how their maps and land information can help the European Commission to achieve the EU’s priorities.
Recently concluded two-week Maps for Europe event in Brussels focused on the use of geospatial data to better understand information related to people and places. It was organised by EuroGeographics, the membership association for European National Mapping, Cadastral and Land Registry Authorities in collaboration with Eurostat, the statistical of� ce of the European Union, under the patronage of European Commissioner Marianne Thyssen.
According to Director General of Eurostat, “The goal of the European Location Framework is to deliver authoritative, interoperable, cross-border data to bene� t both the public and private sectors. It builds upon the success of the INSPIRE Directive and will clearly have a positive impact upon policymaking within the Commission.”
SD49_CMPL_Ip-Solutions_Dec15_Ad_AS.indd 1 11/12/15 6:45 pmSD49_CMPL_December 2015.indd 49 12/12/15 7:14 am

Marine airgun noise could cause turtle trauma
Scientists from the University of Exeter are warning of the risks that seismic surveys may pose to sea turtles. Widely used in marine oil and gas exploration, seismic surveys use airguns to produce sound waves that penetrate the sea � oor to map oil and gas reserves.
The review, published in the journal Biological Conservation, found that compared to marine mammals and � sh, turtles are largely ignored in terms of research attention and are often omitted from policy guidelines designed to mitigate the environmental risks of seismic surveys.
Possible rami� cations for turtles include behavioural changes and exclusion from critical habitats as well as potential auditory damage, as turtle hearing ranges overlap with airgun frequencies. In addition, turtles are known to become entangled in gear towed behind the survey vessel, which can lead to drowning.
Lead author Sarah Nelms from the Centre for Ecology and Conservation at the University of Exeterís Penryn Campus in Cornwall said: ìBy talking to oil and gas companies, seismic operators and on-board Marine Mammal Observers, as well as academics and conservationists, we had a great opportunity to gather a broad spectrum of opinions, not just one side of the story. This allowed us to access information that was not available in the published literature.
The researchers also examined policy guidelines for the mitigation of risk to marine life in seismic surveys and assessed peer-reviewed literature on the topic.
Our study reveals the potential for seismic surveys to cause behavioural changes and physical harm to turtles and we are calling for more research to urgently � ll the crucial
knowledge gaps that were highlighted during our review, said Ms Nelms.
During a survey, specialised ships simultaneously � re multiple airguns while towing multiple hydrophone streamers, which can cover an area up to 700m wide and 12km long, to capture the returning sound waves. Researchers involved in the study received reports of turtles becoming entangled in the trailing tail buoys and developed a turtle guard which has been voluntarily installed by some operators. Further research could help make such preventative measures mandatory in the future.
Senior author Professor Brendan Godley, also from the University of Exeterís Centre for Ecology and Conservation, said: ìSeismic surveys are occurring in the waters of at least 50 countries in which marine turtles are present and they are becoming increasingly widespread. Given the conservation status of turtles, we feel that it is important and timely to assess the level of threat posed by this global activity and highlight knowledge gaps to direct future research efforts.
There is a great deal that could be done proactively to help improve the status quo. We are standing by to work with seismic companies and others in the oil and gas sector to this end.
The researchers hope that their � ndings will assist with the development of policies to minimise the impact of seismic surveys on marine turtle populations, for example ensuring that they are not carried out during sensitive times or in critical areas, such as during breeding seasons or in foraging grounds.
This work was supported by NERC and the Darwin Initiative. pressof� [email protected]
SNIPPETS
AT A GLANCE
Mr Paul Verhoef has been appointed as Director of Galileo Programme and Navigation-Related Activities.
Russia and Peru strategic partnership treaty signed
Rolta OnPoint enhances emergency response capabilities
Nokia Networks helps Zain address the digital transformation
Bundeswehr Acquires TanDEM-X Global Elevation Model
Beta version of European Data Portal launched
exactEarth invests in Australian SIoT startup
Massachusetts launches Wildlife Climate Action Tool
NASA to develop FireSat to locate wild� res across the globe
€26.5 million for GMES & Africa initiative
Hera Systems to launch 9 CubeSats
Hexagon, Huawei join forces for smart city solutions
Trimble plans to acquire AGRI-TREND
GSAT-15 Communications Satellite Successfully Launched
Canada to access Sentinel data
Garmin Quickdraw Contours to improve existing � shing maps
HERE partners with Oracle for logistics service providers
Cardno introduces remote sensing data analytics services in the US
50 | CoordinatesCoordinates December 2015
SD49_CMPL_December 2015.indd 50 12/12/15 7:14 am

NEWS - LBS
Uber Signs a mapping deal with TomTom
TomTom has signed a global, multi-year agreement to provide maps and traf� c data for the Uber driver app. It will be implemented in more than 300 cities around the world. http://fortune.com
Singapore Tourism Board launches digital services for Chinese tourists
Chinese visitors to Singapore can now explore the city with the help of WeChat and Baidu Connect, with the launch of the Singapore Tourism Board’s (STB) suite of digital and mobile services for this market on Oct 21.
The launch comes as Internet penetration reaches 668 million people in China, of which 89 per cent of these users access the Internet from their mobile devices.
The digital and mobile services launched by STB include the new YourSingapore WeChat and Baidu Connect that will
provide consumers with real-time location-based services to help them explore Singapore. www.channelnewsasia.com
Ola partners MapmyIndia for better navigation
Taxi aggregator Ola has partnered with MapmyIndia by acquiring a multi-year licence. This “� rst-of-its-kind” partnership in the country would also enable consistent map updates from MapmyIndia to Ola, making the data rich and relevant, he said. http://gadgets.ndtv.com
Google maps now available offl ine in india
Google India has announced that its Maps app will be available of� ine with features such as voice-based turn-by-turn navigation while in of� ine mode. At Google I/O 2015, the company had revealed plans to bring of� ine search to its Maps app and had stressed it was aimed mainly for “emerging markets” where Internet connection was spotty, and data
charges were expensive, as navigation via GPS was independent of mobile networks.
The launch of of� ine Maps in India comes just days after Google of� cially introduced the feature on Android. While of� ine Maps were available previously on the app, features including of� ine navigation and search features are some of the additions. For using an of� ine map, users will need to download the map of an area on the device, and it will continue to work when there’s no connectivity. Once an area has been saved for of� ine access, users can also enable turn-by-turn driving directions as well as search for speci� c destinations even when there is no Internet connection.
The company explains that when a connection is found, Maps will switch to online automatically and will allow users to access the full version of the app such as live traf� c conditions for the current route. It’s worth noting that Google Maps will only download of� ine areas on the device when on a Wi-Fi connection. http://gadgets.ndtv.com/
SD49_CMPL_December 2015.indd 51 12/12/15 7:14 am

ISRO-ASI initiative for remote surveillance of heritage structures
Indian Space Research Organization (ISRO) and Archeological Survey of India (ASI) have joined hands to create a repository of satellite-based surveillance photographs on 3,000-plus nationally protected monuments initially and later add 1,50,000-odd heritage structures across the country.
ISRO has also been entrusted with the job of � ling high resolution digital images of each site and its peripheral areas to spot illegal structures that have mushroomed in the neighbourhood of protected monuments and heritage buildings in the last 50 years. These satellite pictures will come handy for ASI to identify the worst affected areas and take corrective action. The ISRO-ASI combine will be carry out remote sensing surveillance of all the monuments and prepare maps that clearly demarcate the prohibited and regulated zones around these monuments.
A standard operating procedure (SOP) using high resolution satellite data as primary source and employing state-of the-art geo-spatial technology and open source tools has been developed for operational use by ASI. The project is already in advanced stage of completion in the state of Karnataka and soon will be extended to the rest of country. Data from Cartosat-1, Cartosat-2 and Resources at LISS IV are being used to create the database on heritage sites and monuments. Three management zones (protected, prohibited and regulated) around the heritage site are delineated using GIS tool after locating the site or monument on the satellite image. All land use features within each zone are precisely mapped. http://timeso� ndia.indiatimes.com/
NEWS - IMAGING
Drone fl ight over Lingaraj temple creates a fl utter
A drone capturing images of the 11th century Lingaraj Temple drew attention of servitors of the shrine and led to suspicion over motive behind the photography.
Some of the temple of� cials also registered a complaint with the police but eventually, it turned out to be part of a Smart City Project work of the Bhubaneswar Municipal Corporation in India.
The photographer, Ranjit Kamble who represents Goregoan-based IBI Group, was questioned and the � rm’s authorisation to capture images was veri� ed by Lingaraj Police. After the authentication, Kamble was allowed to go along with his photography devices. www.newindianexpress.com
Indian student bags Germany’s Green Talents Award
Arun Prasad Kumar currently pursuing a PhD in Earth Remote Sensing and Geo-Information, Technology from the department of earth and space sciences of the Indian Institute of Space Science and Technology is the only Indian among the 27 winners from more than 90 countries to bag a ‘Green Talents Award’ at the 7th Green Talents 2015.
Green Talents - International Forum for High Potentials in Sustainable Development, hosted yearly by the German federal ministry of education and research (BMBF), calls for applications from all over the world from young visionaries to come up with innovative concepts to make the planet sustainable.
Kumar’s thesis focuses on ‘species-level classi� cation and biophysical characterisation of mangroves using hyperspectral remote sensing’. The thesis also incorporates socio-economic awareness initiatives to give more insight to the local community regarding the bene� ts of mangroves and to implement conservation activities in the study area. www.hindustantimes.com
ViviSat remote sensing license approved
ViviSat LLC has announced that the Commercial Remote Sensing Regulatory Affairs Of� ce of the National Oceanic and Atmospheric Administration, an agency of the Department of Commerce, has granted it a license to provide space based remote sensing on up to 10 of its Mission Extension Vehicles (MEVs).
ViviSat’s MEV will utilize these remote sensing capabilities to visually image its clients’ satellites during rendezvous and docking operations while providing on-orbit life extension services. The MEVs will operate in geostationary orbit. www.businesswire.com
China launches latest remote sensing satellite
China has successfully launched a remote sensing satellite, Yaogan—29 which will focus on experiments on survey of land, crop yields and disaster relief.
The satellite will be used for experiments, land surveys, crop yield estimates and disaster relief. However, western analysts believe the series of satellites are of a military nature, using electronic intelligence, electro—optical and synthetic aperture radar sensing equipment. www.thehindu.com
Correlator3D™ version 6.3 by SimActive
SimActive has announced Correlator3D™ version 6.3 with an expanded UAV enterprise offering. A new � oating licensing option allows computers on the same network to seamlessly borrow licenses from a pool, increasing transferability for enterprise requirements. Multi-language support is also introduced with this version. www.simactive.com
Phase One Industrial Releases Software Development Kit 8.3.3
Phase One Industrial has released Phase One Software Development Kit (SDK)
52 | CoordinatesCoordinates December 2015
SD49_CMPL_December 2015.indd 52 12/12/15 7:14 am

8.3.3 in Linux, Windows and Mac OS versions. This SDK provides tools that enable users to build custom applications to control the way Phase One aerial cameras capture and process images. It enables users to precisely control which parameters to apply -- such as capture frequency, exposure values and white balance while capturing or processing images from a Phase One aerial camera. The Phase One SDK includes interface components for custom applications to work with the Phase One cameras in a production set up. http://industrial.phaseone.com/
Govt requests Japan to extend minerals surveying project
Remote sensing is a minerals prospecting technique using aircrafts or satellites.
Deputy permanent secretary in MMEWR, Obolokile Obakeng made the appeal at a seminar on sustainable development of mineral resources in Botswana’s mining sector.
The seminar was co-hosted by MMEWR and the Japanese Ministry of Economy, Trade and Industry (METI), through the Japan Oil, Gas and Metals National Corporation (JOGMEC).
The remote sensing project started in July 2008 after the signing of a memorandum of agreement between Botswana Geological Survey and JOGMEC, as well as the establishment of the JOGMEC Geological Remote Sensing Centre in the Department of Geological Survey (DGS) premises in Lobatse and another one in Gaborone for use by SADC member states. www.mmegi.bw
Gwinnett commissioners renew aerial photography contract
Gwinnett Commissioners agreed earlier this month to the renewal of digital oblique aerial photographic imagery and viewing software on an annual contract with Pictometry International Corporation for $173,527. www.ajc.com
GAIL launches Bhuvan- GAIL Portal
In order to address the pipeline security concern, GAIL (India) Limited in collaboration with National Remote Sensing Centre (NRSC), a unit of Indian Space Research Organization (ISRO, has launched an innovative surveillance geo-portal called “Bhuvan-GAIL portal” utilizing space technology for its pipeline application. Despite all challenges, GAIL has proved that the space technology can be ef� ciently used for monitoring the pipeline Right of Use (RoU). GAIL has over 13000 Km of Pipeline network wherein monthly monitoring of pipeline ROU at present is being carried out through Helicopter surveys. GAIL will start live satellite monitoring of the pipeline RoU by January 2016 and is also looking for alternative methods like advance Unmanned Ariel Vehicle (UAV) which can also be integrated with this system.
GAIL also developed an innovative mobile application, from which the
AUSTRALIA
AFRICA
AMERICA
EUROPE
ASIA
GNSS- creating a global village
Register by
Jan 17, 2016
to receive
the early rate!
SD49_CMPL_Munich_Dec15_Ad_AS.indd 1 11/12/15 4:53 pmSD49_CMPL_December 2015.indd 53 12/12/15 7:14 am

pictures of the exception taken locally from any mobile describing the actual scenario can be uploaded instantly to the portal. A report system integrated with this Bhuvan-GAIL portal can send alerts to the relevant executives via SMS and email regarding the changes noted along the ROU and also arrival of any new satellite imagery. To establish the technical feasibility of utilizing space technology for its pipeline applications, GAIL started the study with Imageries from Indian Satellites and later shifted to very high resolution foreign satellites. www.gailonline.com/
FAA recommends drone registration
The US Federal Aviation Administration (FAA) has released a list of recommendations for how to better monitor recreational use of the machines.
Under the proposal, most drone owners would have to register the machines with the federal government, which would place the information in a national database in what would be the � rst time for such requirements. https://nakedsecurity.sophos.com
DJI Introduces Company’s First Agriculture Drone
DJI has announced the launch of a smart, crop-spraying agricultural drone.
The DJI Agras MG-1 is dustproof, water-resistant and made of anti-corrosive materials. It can be rinsed clean and folded up for easy transport and storage after use.
The eight-rotor Agras can load more than 10 kilograms of liquid for crop-spraying and can cover between seven and 10 acres per hour. It is over 40 times more-ef� cient than manual spraying. The drone can � y up to eight meters per second and adjusts spraying intensity to � ying speed, ensuring even coverage.
The Agras features DJI’s industry-leading � ight-control system and microwave radar to ensure centimeter-level accuracy. www.dji.com
DOST eyes rice suffi ciency via remote sensing technologies
Netherlands donates U.S.$7 Million
The Netherlands and FAO are expanding their collaboration in the area of water management with a $7 million donation by the Dutch government to support the use of remote sensing technology in helping water-scarce countries in the Near East and Africa monitor and improve the way they use water for crop production. http://allafrica.com
NDRF inks pact with NRSC to get satellite data
In order to obtain the vital “third eye” to tackle disasters, the NDRF has inked a pact with the National Remote Sensing Centre which will provide the force with geo-spatial and other satellite data for sharpening its relief and rescue operations.
A MoU was signed in this regard by National Disaster Response Force chief O P Singh and senior NRSC Scientist Bhanumurthy.
During the recent 2015 Asian Conference on Remote Sensing, Dr. Enrico Paringit, explained that through the said technology, experts can make an inventory of the agricultural resources and immediately discover any irregularities in the crops before these spread. Paringit is the program leader of the Department of Science and Technology’s (DOST) Disaster Risks Exposure Assessment for Mitigation (DREAM), Philipines.
“The El Niño phenomenon was detected using remote sensing technologies,” says Paringit while explaining the bene� ts of remote sensing technologies in
the areas of agriculture, forestry, and disaster mitigation.
Remote sensing is the technology used in getting information on an object or phenomenon without making any physical contact. It is done through aerial scanning of a location or through satellite images. “We can say that remote sensing is more like feeling without touching,” says Paringit.
Under the DREAM program which Paringit heads, DOST will be sending two microsatellites in two years starting 2016 to enable the remote transmission of data. These images will be veri� ed using data coming from other sources.
The new partnership will allow the force to access the NRSC, Hyderabad and the Indian Space Research Organisation’s (ISRO) technical database on disaster management support to not only prepare for the onslaught of a natural disaster but also while preparing the physical response to such calamities. http://newsworldindia.in
Drone register features app detailing permitted fl ying areas
Every drone or remotely piloted aircraft (RPA) over one kilo in weight would be required to sign up, with the legislation also applying to model aircraft, Mr James, formerly Defence Forces deputy chief of staff, told the Drones, Data X conference in Westport, Co Mayo. The new drone register, which will be one of the � rst of its kind in Europe, will be up and running soon, according to Irish Aviation Authority director of safety regulation Ralph James. www.irishtimes.com
54 | CoordinatesCoordinates December 2015
SD49_CMPL_December 2015.indd 54 12/12/15 7:14 am

A deal at UN meet paves way for satellite tracking of aircraft
A deal reached at a U.N. meeting opens the way for satellite tracking of airliners, a major breakthrough motivated by the mystery disappearance of a Malaysia Airlines jetliner last year.
The agreement allows nations to set aside radio frequencies so that airplanes can be tracked by satellite - not just from the ground.
Under current radar-based systems, the movement of planes is monitored by land-based systems, leaving around 70 percent of the world’s surface uncovered, according to the International Telecommunications Union, the U.N. communications agency. Modern planes that can send what are known as Automatic Dependent Surveillance-Broadcast, or ADS-B, signals to the ground are now on track to send signals to satellites too — with implementation expected by 2017.
The accord to set aside the 1087.7-1092.3 MHz radio frequency for satellite tracking of planes came at the World Radiocommunication Conference, an international gathering organized every four years by the ITU. International civil aviation regulator ICAO has pushed for satellite tracking of aircraft, as long as current safety measures aren’t jeopardized. www.asianage.com
NISAR mission biggest collaboration of ISRO and NASA
The NASA-ISRO Synthetic Aperture Radar (NISAR) mission will be the biggest collaboration between the two space agencies yet, said a senior scientist from NASA recently. The mission involves building a 2,600 kg satellite that will “effectively make a time-lapse movie of the earth” while keeping a close eye on disturbances in the ecosystem, ice-sheet collapses and natural hazards. http://indianexpress.com
Rapidlasso receives “Green Asia Award” at ACRS 2015
At the Asian Conference on Remote Sensing 2015 (ACRS 2015) held in Manila, rapidlasso GmbH was honored with the “Green Asia Award” by the Chinese Society of Photogrammetry and Remote Sensing (CSPRS). This award is given to a paper that directs Asia towards a greener future using remote sensing technology. This year’s award commends rapidlasso GmbH on advancing the area of LiDAR processing through their PulseWaves effort. PulseWaves is a vendor-neutral full waveform LiDAR data exchange format and API that simplifies access to full waveform data and allows researchers to focus on algorithms and share results. In the future this technology may prove valuable to improve biomass estimates for carbon credit programs such as the TREEMAPS project of WWF. http://rapidlasso.com
SD42_CMPL_Antcom_May_Ad_AS.indd 1 4/27/2015 1:35:08 PMSD49_CMPL_December 2015.indd 55 12/12/15 7:15 am

NEWS - INDUSTRY
NovAtel to Develop WAAS G-III
U.S. Federal Aviation Administration (FAA) and NovAtel have exercised a bi-lateral option to produce a Wide Area Augmentation System (WAAS) G-III – Galileo prototype receiver to advance research on multi-GNSS constellation operation.
The new receiver will operate in the WAAS reference station test environment while maintaining core NovAtel WAAS G-III functionality for GPS and the U.S. satellite-based augmentation system (SBAS) signal processing. The prototype receiver will also add functionality to support tracking and demodulating associated navigation data for Galileo satellites including:• Galileo E1 and E5a tracking• ephemeris and almanac reporting/
processing from E1 or E5a• automatic channel assignments• time solution computed from Galileo• correlator information for signal
deformation on Galileo signals
The WAAS G-III – Galileo prototype receiver will be built on NovAtel’s existing WAAS G-III receiver hardware and application software and delivered as a � eld-loadable � rmware package.
SANDIS upgrades with Leica
Engineering and surveying company SANDIS has upgraded its capabilities with the purchase of 15 Leica Geosystems CS20 Controllers powered by Leica Captivate software. The Leica CS20 Controller, coupled with a Leica Geosystems total station, enables accurate electronic distance measuring and displays the 3D data captured on its screen. The controllers include an integrated BT module designed for long-range robotic total station communication, a 5-megapixel internal camera and an integrated DISTO for accurate distance measuring.
Satlab SL600 & SL-55
The Satlab SL600 con� guration incorporates several eye-catching
features. The receiver board is the same as found in the latest Trimble receivers on the market: the BD970, utilizing the 220-channel Maxwell 6 ASIC. This is a very good, proven receiver board. As tested, the integrated radio modem is a PacCrest XDL, with a maximum output of 2 Watts. On-board power is supplied by two hot-swappable 10,000 mAh batteries. A reasonable 1Gb of internal memory is good for many days of recording raw GNSS data for post processing.
SL-55 data collector with the ever-popular Carlson SurvCE software. The SL-55 is a Windows Mobile handheld with an 806MHz processor, 256MB of RAM and an 8GB internal Flash drive, with a micro-SD card slot. It’s equipped with WiFi as well as Bluetooth communications, which the latter allowed me wireless accessibility to the SL-600 base and rover. The battery life is a little less stunning as compared to the SL-600 at only 8 hours, but the battery is user accessible and � eld replaceable for long days.
M12M Concurrent GNSS PNT Replacement Receiver Module
Jackson Labs Technologies, Inc has announced the availability of the M12M Replacement Receiver GNSS module. The module uses an 8th generation GNSS timing-enabled receiver allowing 72 GNSS channel reception with any two GNSS systems being received simultaneously, is form-� t-function compatible to the very popular legacy Motorola M12M and M12+ Timing and Navigation receivers, and adds easy con� gurability via USB ports as well as DIP switches and various status displays. GPS, GLONASS, BeiDou, QZSS, and SBAS signals can be received.
The M12M Replacement Receiver supports NMEA, Motorola Binary, uBlox Binary, as well as SCPI (GPIB) communication protocols for easy con� guration and monitoring, and is designed to allow plug-and-play retro� t of equipment designed for the legacy Motorola receivers, as well as provide
an easy design-in for new customer applications. www.marketwire.com
OriginGPS Introduces the Smallest Multi-GNSS Modules
OriginGPS has announced the launch of a new family of products, the � rst of which is the ORG1510-MK, the world’s smallest fully integrated multi-GNSS (GPS, Glonass and BeiDou) module. The miniature low-power architecture supports an update rate of up to 10Hz and contains onboard � ash, making it the perfect GNSS component for devices that require fully-featured components with small footprints, such as UAVs designed to follow action sports and other fast-moving activities or wearables. It contains the MediaTek MT3333 chip, which supports the fastest update position calculation rate of all leading modules. The chip also contains an onboard � ash memory that does not erase when power is off. http://m2mworldnews.com
Telit secures $220 million supply contracts with tier-one automotive OEMs
Telit Communications PLC has recently secured supply agreements for its cellular modules with two tier-one automotive suppliers, with expected revenues of up to $33 million.
These agreements are the 5th and 6th such supply agreements Telit has secured over the past 12 months representing in aggregate up to $220 million of revenues over the life of the agreements. Supply periods range from four to six years with shipments on one contract already begun and peak volumes being reached in 2018, with deliveries into the U.S., Germany, Japan, China and Korea. http://m2mworldnews.com
Trimble Field Link Adds GNSS Capabilities
Trimble has announced that its mechanical, electrical, and plumbing (MEP) construction layout software, Trimble® Field Link, can now be used
56 | CoordinatesCoordinates December 2015
SD49_CMPL_December 2015.indd 56 12/12/15 7:15 am

with the Trimble R8s GNSS receiver. This addition extends Trimble’s portfolio of positioning and scanning solutions for MEP contractors. The solution enables MEP contractors to take advantage of GNSS technology when performing outdoor construction layout tasks including utility, open deck, or long distance � eld layout, while using software designed for the MEP construction layout process. The Trimble Field Link software offers an easy-to-use interface for MEP contractors to view and locate their layout points with a robotic total station, a GNSS receiver or both. buildings.trimble.com
Hexagon Geospatial to develop information services using OS data
Ordnance Survey and Hexagon Geospatial have announced a new agreement, with a shared focus on enabling Hexagon Smart M.Apps to support key initiatives such as Smart Cities. Through the new agreement, Ordnance Survey content, including aerial imagery, will be a part of the Hexagon Smart M.App experience, delivering a wide range of innovative information services.
This provides geospatial solution providers with an opportunity to develop Hexagon Smart M.Apps to address targeted industry concerns.
3-D indoor mapping; 007 Spectre series
Kozo Keikaku Engineering Inc. has signed a partnership agreement with Munich-based NavVis GmbH to sell and market NavVis’s products, services and value-added services in Japan. One of the products is the M3 Trolley, a 3-D indoor mapping system that captures and digitalizes all details of a building with high-resolution images (16 megapixels) and 3-D point clouds. Applicable to any type of building or underground mall, indoor digitalization automatically processes the captured data and a 3-D map can be opened in any web browser using IndoorViewer. www.japantimes.co.jp
Trimble Acquires Telog Instruments
Trimble has acquired privately held Telog Instruments, Inc. based in Victor, New York. The acquisition extends Trimble’s smart water strategy by adding advanced water management technology and productivity solutions to the portfolio.
Telog, founded in 1984, manufactures a suite of wireless remote monitoring, analytics and data acquisition systems that are used by thousands of water, wastewater and stormwater management utilities and private contractors throughout North America. www.TrimbleWater.com
Story Map Navigates Cause and Effects of Climate Change
Esri, released an interactive map illustrating the earth’s natural and human systems and how they have changed—and will change—over time. With the Atlas for a Changing Planet Story Map, scientists, policy makers, planners, and activists can examine detailed spatial information that is critical for adapting to a warmer future.
Atlas for a Changing Planet explores a sample of maps, imagery, and data from Esri ArcGIS Online. The Story Map covers � ve themes: understanding natural systems, mapping human systems, mapping ocean impacts, predicting the future, and international cooperation.
The Story Map also models data from the National Center for Atmospheric Research (NCAR) in three scenarios. With this data, users navigate the Story Map to see projected changes in temperature and precipitation based on the level at which greenhouse gas emissions increase or decrease over time.
FARO® launches new FOCUS3D X 30 Laser Scanner
FARO Technologies, Inc has announced the release of the new FARO Focus3D X 30 Laser Scanner.
With a scanning range of up to 30 meters, the Focus3D X 30 is ideal for a variety of short-range scanning applications such as architectural preservation, as-built documentation, building information modelling (BIM), engineering, facility management and forensics. The ultra-portable Focus3D X 30 enables fast, straightforward and accurate measurements of interiors, such as small architectural façades, complex structures, crime scenes, mechanical rooms, and production and supply facilities.
OPAL-ECR 3D LiDAR by Neptec Technologies
Neptec Technologies Corp. has announced the OPAL-ECR (Enhanced Close Range), a new addition to its OPAL™ 2.0 family of rugged, obscurant-penetrating 3D LiDAR scanners. It is speci� cally designed for real-time applications in low-re� ectivity target environments (like coal or iron ore), for distances up to 240 meters. It is well suited for use in automation and collision avoidance applications on stacker/reclaimers, shiploaders, excavators, haul trucks and other heavy machinery, and for applications where reliable and predictable detection of targets, even with low re� ectivity, is essential. www.neptectechnologies.com
HERE powers connected navigation for Volvo Cars
Volvo Cars has chosen HERE to power connected navigation for the next-generation in-car control system for new and future Volvo models as part of a multi-year agreement between the two companies.
Volvo’s in-car system, called Sensus, offers customers a fully connected experience and incorporates advanced maps and services enabled by the HERE location cloud to provide drivers with smart guidance both in and out of the car. The � rst model featuring the new Sensus system is the XC90, Volvo’s new luxury SUV which started shipping earlier this year. https://company.here.com
CoordinatesCoordinates December 2015 | 57
SD49_CMPL_December 2015.indd 57 12/12/15 7:15 am

MARK YOUR CALENDAR
June 2016HxGN LIVE
13 - 16 JuneAnaheim,USAhttp://hxgnlive.com/anaheim
6th International Conference on Cartography & GIS
13-17 JuneAlbena, Bulgariawww.iccgis2016.cartography-gis.com
2016 Esri International User Conference27 June to 1 July San Diego, USAwww.esri.com
July 2016ISPRS - PRAGUE 2016
12 - 19 JulyPrague, Czech Republichttp://www.isprs2016-prague.com/
September 2016ION GNSS+ 2016
12 - 16 September Portland, Oregon USAwww.ion.org
EUROGEO 201629 - 30 SeptemberUniversity of Malaga,Spainwww.eurogeography.eu/conference-2016-malaga/
October 2016INTERGEO 2016
11 - 13 OctoberHamberg, Germanywww.intergeo.de
37th Asian Conference on Remote Sensing (ACRS)
17 - 21 October Colombo, Sri Lankawww.acrs2016.org
November 2016Trimble Dimension 2016
7-9 NovemberLas Vegas, USAhttp://www.trimbledimensions.com/
INC 2016: RIN International Navigation Conference
8 - 10 November Glasgow, Scotlandhttp://www.rin.org.uk/Events/4131/INC16
GSDI 2015 World Conference 28 November - 2 December Taipei, Taiwan http://gsdiassociation.org/index.php/homepage/gsdi-15-world-conference.html
January 2016International Remote Sensing Conference
17 - 20 JanuarySaudi Arabiawww.irsc-sa.org
February 2016NRSC User Interaction Workshop
3 - 4 February Hyderabad, Indiahttp://www.nrsc.gov.in/uim2016/index.html
EuroCOW 2016 Workshop10 - 12 FebruaryLausanne,Switzerlandwww.eurocow.org
March 2016Munich Satellite Navigation Summit 2016
1 - 3 MarchMunich, Germanywww.munich-satellite-navigation-summit.org
April 2016IGRSM 2016
13 - 14 April 2016Kuala Lumpur, Malaysiahttp://www.igrsm.com/igrsm2016
Interexpo GEO-Siberia-201620 - 22 AprilNovosibirsk, Russiawww.expo-geo.com
May 2016XPONENTIAL 2016
2 – 5 MayNew Orleans, USAwww.xponential.org/auvsi2016/public/enter.aspx
FIG Working Week 20162 - 6 MayChristchurch, New Zealandwww.fi g.net/fi g2016/call.htm
10th Annual RIN Baska GNSS Conference8 - 10 MayBaska, Krk Island, Croatiawww.rin.org.uk
NAVITECH 201610 - 13 MayMoscow, Russiawww.navitech-expo.ru/en/
GEO Business 201624 - 25 MayLondon, UKhttp://geobusinessshow.com
European Navigation Conference30 May - 02 JuneHelsinki, Finlandwww.enc2015.eu
YES! I want my
I would like to subscribe for (tick one)
First name .........................................................................
Last name ..........................................................................
Designation .......................................................................
Organization .....................................................................
Address ...............................................................................
...............................................................................................
City ................................... Pincode .................................
State ................................ Country .................................
Phone .................................................................................
Fax .......................................................................................
Email ...................................................................................
I enclose cheque no. ......................................................
drawn on ...........................................................................
date .................................. towards subscription
charges for Coordinates magazine
in favour of ‘Coordinates Media Pvt. Ltd.’
Sign .................................. Date .......................................
Mail this form with payment to:
CoordinatesA 002, Mansara Apartments
C 9, Vasundhara Enclave
Delhi 110 096, India.
If you’d like an invoice before sending your
payment, you may either send us this completed
subscription form or send us a request for
an invoice at [email protected]
Rs.1800/US$100 Rs.3000/US$170 Rs.4300/US$240
SD49_CMPL_December 2015.indd 58 12/12/15 7:15 am

SD47_CMPL_Hi-Target_Oct_Ad_AS.indd 1 12/10/15 2:04 amSD49_CMPL_December 2015.indd 59 12/12/15 7:15 am

SD49_CMPL_Trimble_Dec15_Ad_AS.indd 1 11/12/15 5:08 pmSD49_CMPL_December 2015.indd 60 12/12/15 7:15 am
Copyright © 2022 FDOKUMEN