Fault-tolerant weld line detection for automatic inspection of storage tanks based on distance and...
6
Fault-Tolerant Weld Line Detection for Automatic Inspection of Storage Tanks Based on Distance and Visual Information Fusion Elyson A. N. Carvalho, Benedito A. Luciano, Raimundo C. S. Freire Electrical Engineering Department Federal University of Campina Grande – UFCG Campina Grande-PB, Brazil [email protected] Lucas Molina, Eduardo O. Freire Electrical Engineering Department Federal University of Sergipe – UFS São Cristóvão-SE, Brazil [email protected] Abstract –Quality control, cost reduction and above all, human and environmental safety are great reasons that stimulate the investments in technologies like automatic inspection. The automatic inspection of weld lines in storage tanks is of special interest, due to the fact that such tanks are currently used to store harmful products. For a reliable inspection it is necessary to accurate detect the weld line position. In this paper the development of a system to perform weld line detection in storage tanks is proposed. Two redundant systems, based on different physical principles, distance and visual information, are implemented and tested. Such systems make use of a fault-tolerant estimation process based on the α-β filter. Finally, the outputs of the two redundant systems are fused, aiming at to increase the confidence and performance of the system. Keywords – Weld line detection, distance sensors, image processing, α-β filter, fault-tolerant estimation. I. INTRODUCTION Quality control, cost reduction and above all, human and environmental safety are great reasons that stimulate the investments in technologies like automatic inspection. The automatic inspection of weld lines in storage tanks is of special interest, due to the fact that such tanks are currently used to store harmful products. Such tanks should be frequently inspected to assure the integrity of their physical structure. In this context, robotic inspection systems became a reality in such sector, allowing a more confident inspection, through minimizing the human error probability, and carrying out such process faster and at lower costs. The development of methods to enable inspection of such tanks at lower costs, with greater safety and in a shorter time than present methods has been sought [1]. Taking into account this necessity of the industrial sector, in this work is proposed the development; implementation and testing of a system to perform the weld line detection for automatic inspection of storage tanks. A way to perform the non-destructive inspection of weld lines is based on the emission of high-frequency ultrasonic waves, propagating in solid environments. Such ultrasonic waves are emitted in several angles through the reservoir structure, propagating around it. When there are air bubbles inside the weld line, the ultrasonic waves are reflected, allowing the fault detection. This kind of process is already in use, but its confidence is affected when it is not possible to guarantee that the sensor is positioned at the center of the weld line. At this point it is important to state that the detection of faults inside of the weld line structure is beyond the scope of this work. It is focused only in the reliable detection of the weld line position, which is important information to guide the positioning of the ultrasonic sensor used to detect the faults inside the structure of the weld line. As sensory information is incomplete and imprecise, due to noise, limited sensor resolution and imprecise conversion of its physical measurements, a unique sensor will not be able to deal with all kind of situations that it might be exposed during its operation. Richardson and Marsh [2] presented a mathematical proof that the inclusion of new sensors in a sensory system may improve, but will never deteriorate its performance, in other words, the result obtained fusing data from several sensors are more reliable than the data from each sensor. Accordingly to [3], the use of fusion of information provided by different sensors may produce several benefits, like uncertainty and errors reduction and increasing spatial and time coverage. To accomplish the task of weld line detection with a higher confidence level, two redundant systems, based on different physical principles, in this case distance and visual information, are implemented and tested. Such systems make use of a fault-tolerant estimation process [4][5] based on the α-β filter [6]. In the context of this work, weld line detection means to measure the orientation and the position of the weld line with respect to the inspection sensor. Finally, the outputs of such redundant systems should be fused, aiming at to increase the confidence and performance of the system [7]. I2MTC 2009 - International Instrumentation and Measurement Technology Conference Singapore, 5-7 May 2009 978-1-4244-3353-7/09/$25.00 ©2009 IEEE
-
Upload
independent -
Category
Documents
-
view
1 -
download
0
Transcript of Fault-tolerant weld line detection for automatic inspection of storage tanks based on distance and...

Fault-Tolerant Weld Line Detection for Automatic Inspection of Storage Tanks Based on Distance and
Visual Information Fusion
Elyson A. N. Carvalho, Benedito A. Luciano, Raimundo C. S. Freire
Electrical Engineering Department Federal University of Campina Grande – UFCG
Campina Grande-PB, Brazil [email protected]
Lucas Molina, Eduardo O. Freire Electrical Engineering Department
Federal University of Sergipe – UFS São Cristóvão-SE, Brazil
Abstract –Quality control, cost reduction and above all, human and environmental safety are great reasons that stimulate the investments in technologies like automatic inspection. The automatic inspection of weld lines in storage tanks is of special interest, due to the fact that such tanks are currently used to store harmful products. For a reliable inspection it is necessary to accurate detect the weld line position. In this paper the development of a system to perform weld line detection in storage tanks is proposed. Two redundant systems, based on different physical principles, distance and visual information, are implemented and tested. Such systems make use of a fault-tolerant estimation process based on the α-β filter. Finally, the outputs of the two redundant systems are fused, aiming at to increase the confidence and performance of the system. Keywords – Weld line detection, distance sensors, image processing, α-β filter, fault-tolerant estimation.
I. INTRODUCTION
Quality control, cost reduction and above all, human and environmental safety are great reasons that stimulate the investments in technologies like automatic inspection. The automatic inspection of weld lines in storage tanks is of special interest, due to the fact that such tanks are currently used to store harmful products. Such tanks should be frequently inspected to assure the integrity of their physical structure.
In this context, robotic inspection systems became a reality in such sector, allowing a more confident inspection, through minimizing the human error probability, and carrying out such process faster and at lower costs.
The development of methods to enable inspection of such tanks at lower costs, with greater safety and in a shorter time than present methods has been sought [1].
Taking into account this necessity of the industrial sector, in this work is proposed the development; implementation and testing of a system to perform the weld line detection for automatic inspection of storage tanks.
A way to perform the non-destructive inspection of weld lines is based on the emission of high-frequency ultrasonic
waves, propagating in solid environments. Such ultrasonic waves are emitted in several angles through the reservoir structure, propagating around it. When there are air bubbles inside the weld line, the ultrasonic waves are reflected, allowing the fault detection.
This kind of process is already in use, but its confidence is affected when it is not possible to guarantee that the sensor is positioned at the center of the weld line.
At this point it is important to state that the detection of faults inside of the weld line structure is beyond the scope of this work. It is focused only in the reliable detection of the weld line position, which is important information to guide the positioning of the ultrasonic sensor used to detect the faults inside the structure of the weld line.
As sensory information is incomplete and imprecise, due to noise, limited sensor resolution and imprecise conversion of its physical measurements, a unique sensor will not be able to deal with all kind of situations that it might be exposed during its operation.
Richardson and Marsh [2] presented a mathematical proof that the inclusion of new sensors in a sensory system may improve, but will never deteriorate its performance, in other words, the result obtained fusing data from several sensors are more reliable than the data from each sensor.
Accordingly to [3], the use of fusion of information provided by different sensors may produce several benefits, like uncertainty and errors reduction and increasing spatial and time coverage.
To accomplish the task of weld line detection with a higher confidence level, two redundant systems, based on different physical principles, in this case distance and visual information, are implemented and tested. Such systems make use of a fault-tolerant estimation process [4][5] based on the α-β filter [6]. In the context of this work, weld line detection means to measure the orientation and the position of the weld line with respect to the inspection sensor.
Finally, the outputs of such redundant systems should be fused, aiming at to increase the confidence and performance of the system [7].
I2MTC 2009 - International Instrumentation and Measurement Technology Conference Singapore, 5-7 May 2009
978-1-4244-3353-7/09/$25.00 ©2009 IEEE

II. THE PROPOSED APPROACH
In this section the proposed approach will be explained in details. First, in subsection A the approach based on distance information is presented. Then, the visual information based approach is introduced. In the sequence the fault-tolerant estimation process is explained, and the section ends with the presentation of the data fusion process used in this work.
A. Distance Information Based Approach
As can be seen in Fig. 1, the weld lines found in storage tanks present a bigger thickness that of the plates that they are joining. This weld layer that exceeds the metallic surface level is called reinforcement layer, and it is about 5 mm of height. So, using distance sensors it is possible to accurate detect the weld line position.
In [8] the use of an array of infrared distance sensors, as
shown in Fig. 2, was proposed.
The resolution of the systems used to perform weld line
detection based on distance sensors is low, due to the size of them [9]. As a way to increase the resolution of the system, and consequently, its precision and exactness, the Sinc Interpolation will be used. Using Sinc Interpolation, and under ideal circumstances, it is possible to entirely recover a signal from its samples [10][11].
Accordingly with the Nyquist’s Sample Theorem, samples of a band-limited signal, gathered at a fixed and known sampling period, are enough to allow a complete recover of the signal, if the sampling frequency, Ωs, is at least two times greater than the signal bandwidth, ΩN.
The sampled signal, xs(t), may be represented by:
( ) [ ] ( )∑∞
−∞=
−=n
s nTtnxtx δ (1)
where x[n] stands for the sequence of samples, n is the sample number at the sequence, δ is the impulse function, and T is the sampling period.
If the Nyquist’s sample theorem holds, and the sampling period is known, the signal may be recovered from its samples. In order to do this, the sequence of samples must be passed through a continuous-time low-pass filter with a
cutoff frequency, ΩC, between ΩN e Ωs-ΩN, which was conveniently selected as ΩC=Ωs/2=π/T [10][11].
In the time domain this process is equivalent to:
( ) [ ] ( )[ ]∑∞
−∞=
−=n
r TnTtnxtx /sinc (2)
where xr is the recovered signal. With the recovered signal it is possible to detect its peak,
which should correspond to the center of the weld line. To detect the weld line position and orientation deviations
(ε and φ) with respect to the position of the inspection sensor, two arrays of infrared distance sensors are necessary. They should be positioned as shown in Fig. 4. Knowing the weld line center positions εf and εr, calculated using the front and rear arrays respectively, and the distance separating both arrays (d), it is possible to know the weld line orientation using
( )2
rf εεε
+= (3)
( )⎥⎦
⎤⎢⎣
⎡ −= −
drf εε
ϕ 1tan (4)
B. Visual Information Based Approach
The visual information based approach is presented in the sequence. First, a robust texture based segmentation method is used to identify the image pixels which are part of the weld line. Then a modified Hough transform, first introduced in [13] is used to find the coordinates (ρ and θ) which best represents the weld line that appears in the image.
B.1. The Segmentation Method
The segmentation method proposed is based on texture information acquired through the second central moment [12]. The entropy maximization of a one-dimensional histogram is used, but, as proposed in [13], the histogram is made from a vector representing a sampling of standard deviations of non-overlapping regions, which cover the entire original image.
As shown in [13], this segmentation method does not need the histogram equalization step, and the choice of the threshold is optimal in sense of entropy maximization as showed by Kapur [14].
B.2. The Modified Hough Transform
The Hough Transform is a classical method to detect curves in binary images, widely used and studied by several authors. An overview about this subject is found in [15].
The weld line may be considered as a straight line, which can be considered in several ways. The most suitable one is the parametric equation of the straight line:
θθρ sincos yx += (5)
Fig. 2. Sensor arrangement to perform weld line detection.
Fig. 1. Weld line and metallic plate profile.
The input to the Hough Transform is a binary image, obtained from the segmentation step.
Different from the classical Hough Transform, in which the most voted set of parameters (ρ, θ) is chosen as the ones whose better represents the weld line, the modification inserted by Molina [13], consists in to select a set of them.
In this approach, each vector θi (composed by each column of the accumulators matrix), independently, is submitted to a fitting process with a window function, which identify the lines found in the image that do not correspond to the weld line, and, thus, reduces the sensitivity to biased noises.
A valid observation window is determined to each vector θ. Then, the search for the window with the lowest variance in the related values of ρ is made, with the objective to find a similar voting for different values of ρ in the same θi. The value of θ with the lowest variance in the observation window and that, at the same time, has a minimum amplitude of considered voting, is the θ that better represents the weld line in the image, and the corresponding value of ρ is the average point of the observation window that got the lowest variance in the previously described analysis [13].
Considering that origin is the inferior left corner of the image, the ε and φ parameters of interest may be calculated from ρ and θ using equations (6) and (7):
θ
θρε
sin
cos2
2
wh −
−= (6)
⎪⎩
⎪⎨
⎧
<−
>+=
0 if ,2
0 if ,2
θθπθθπ
ϕ (7)
where h is the image height and w is the image width.
C. The Fault-Tolerant Estimation Process
The two approaches developed to perform the detection of weld lines are able to calculate the two parameters of interest. But, in both cases, under certain circumstances, may be impossible to detect the weld line. In the case of the distance information approach, for example, sometimes the reinforcement layer is not continuous. So, the distance information approach will fail. However, the parameters of interest could be measured even in this situation if some kind of data estimation process is used.
Similar considerations can be made in the case of the vision information based approach. A fault, in this case, may occur due to illuminations problems or the dirt accumulation over the tank surface.
In order to increase the confidence of the obtained parameters, the use of an estimation process based on the α-β filter [6] is proposed to be used as a post-processing step to both of the approaches previously presented.
The α-β filter, with proper α-β parameters, is the optimal solution of the Kalman filtering process for the stationary
target tracking problem in steady-state [6]. The α-β filter may be used if the following parameters may be considered as constants [6]:
• Sampling period; • Measurement noise variance; • Acceleration.
Consider the relative motion between the inspection sensor and the weld line center as a target, and suppose that such target has a linear motion which can be described by the following equations:
( ) ( ) ( ) ( )kTkTkk wvxx 200 2
11 ++=+ (8)
( ) ( ) ( )kTkk wvv 01 +=+ (9) where T0 is the sampling period and w(k) is the unknown acceleration of the target.
The target position is observable through measurements performed by the infrared arrays or obtained using the image processing scheme presented in subsection B. Such measurements may be modeled by the following equation:
( ) ( ) ( )kkk nxz += (10) where n(k) is the measurement noise.
Considering the specific case of this work, the α-β filter equations are presented in the sequence: Linear motion equations:
( )( )
( )( )
( )( )⎥⎦
⎤⎢⎣
⎡+⎥
⎦
⎤⎢⎣
⎡=⎥
⎦
⎤⎢⎣
⎡++
kkv
Tkk
kk
ωθρ
θρ
011 (11)
Measurement:
( ) ( )( ) ( )kkk
kc
c nz +⎥⎦
⎤⎢⎣
⎡=
θρ (12)
Prediction: ( )( )
( )( )
( )( )⎥⎦
⎤⎢⎣
⎡+⎥
⎦
⎤⎢⎣
⎡=⎥
⎦
⎤⎢⎣
⎡++
kkkkv
Tkkkk
kkkk
|ˆ|ˆ
|ˆ|ˆ
|1ˆ|1ˆ
0 ωθρ
θρ (13)
Estimation: ( )( )
( )( )
( ) ( )( ) ( )⎥⎦
⎤⎢⎣
⎡+−++−+
+⎥⎦
⎤⎢⎣
⎡++
=⎥⎦
⎤⎢⎣
⎡++++
kkkkkk
kkkk
kkkk
c
c
|1ˆ1|1ˆ1
|1ˆ|1ˆ
1|1ˆ1|1ˆ
θθρρ
αθρ
θρ (14)
( )( )
( )( )
( ) ( )( ) ( )⎥⎦
⎤⎢⎣
⎡+−++−+
+⎥⎦
⎤⎢⎣
⎡=⎥
⎦
⎤⎢⎣
⎡++++
kkkkkk
Tkkkkv
kkkkv
c
c
|1ˆ1|1ˆ1
|ˆ|ˆ
1|1ˆ1|1ˆ
0 θθρρβ
ωω (15)
Accordingly with [6], the tracking index Λ is given by:
αβ−
=Λ1
22 (16)
The relationship between the optimal α-β parameters is obtained by:
( ) ααβ −−−= 1422 (17) Combining (16) and (17) the optimal values of the α-β
parameters may be explicitly obtained in terms of Λ, by: ( )( )
8848 22 Λ+Λ+Λ−Λ+Λ−=α (18)
484 22 Λ+ΛΛ−Λ+Λ=β (19)

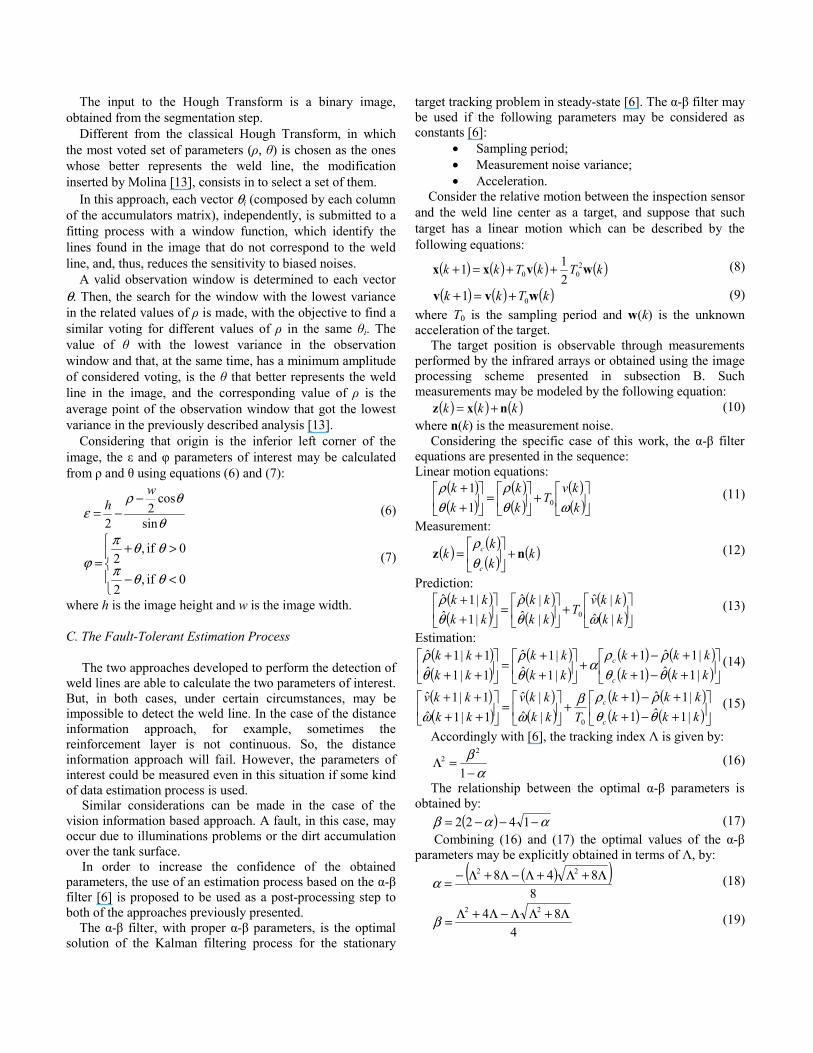
The proposed fault-tolerant estimation proin Fig. 3 in the form of a block diagramattention must be dedicated to the vector r(residual vector. The residual is defined abetween the output of the system and the using the model of the system [4]. In this cvector is given by:
( ) ( ) ( )kkkk |1ˆ11 +−+=+ xzr When the sensory system fails in the me
parameters ε and φ, the residual value growvalue is crossed, a fault is detected. comparison is performed by the “Decision When a fault is detected, the “Decision signalizes the “Estimation” block thatobservation vector is not reliable. In this casphase of the α-β Filter is not executed, anobtained in the output of the prediction phasethe output vector of parameters [5][16].
D. Data Fusion
The parameters obtained by each approactolerant estimation process should be fused more, the confidence of the weld line detectio
In [7], a simple estimator is presented. availability of two measurements of the sameach one acquired by a different sensor, that noise of each sensor may be assumed as zeronoise and that the source of information is sestimator in the sense that it minimizes therror, is given by:
21
1221ˆVV
VzVzz++=
where V1 and V2 are the sensor’s measuremenHowever, the data source here consider
which prevent the use of (21). Neverthelsmooth and slowly movement of the operation, the data source changes slowconsidered as being almost static. So, inspusing the variance of the first difference of ththe variance of the data itself, a sub-opproposed and described by:
Fig. 3. Fault-tolerant estimation proce
ocess is presented m. Some special (k), known as the as the difference output estimated
case, the residual
(20) easurement of the ws. If a threshold
This threshold Making” block.
Making” block t the available se, the estimation nd the prediction e is considered as
ch after the fault-to increase, even on system [2][3]. Considering the
me source (z1, z2), the measurement o-mean Gaussian static, an optimal he mean squared
(21)
nts variances. red is not static, less, due to the platform during
wly and may be ired by (21) and he data instead of ptimal fusion is
21
1221 ~~~~
ˆVV
VzVzz++=
where 1~V and 2
~V are the variances the data provided by the two availab
III. RESU
The positioning of the sensorsdetection and inspection processes is
Several laboratorial experiments the performance of the two proposed
A. Distance Information Based A
In the case of the distance informinitial tests consisted in detect the which should correspond to the pereinforcement layer. A sample ofpresented in Fig. 5. The result for presented in Fig. 5a, considered as a the result for a real weld profile is pr
Using results (like those presentethe front and rear arrays of infraequations (3) and (4), the parametwere obtained. The results of one operformed under laboratory conditiothe considered experiment a sine mthe sensory platform with respect to
Fig. 5. Sinc interpolator results from the fiprofile (*) acquired by the front (left) and
sensors.
Fig 4. Sensors positioning. (1) Infraredinspection sensor (3) Camera (4) Cam
lateral view
ess.
(22)
of the first difference of le approaches.
ULTS
s used in the weld line s shown in Fig. 4. were performed to verify
d approaches.
Approach Results
mation based approach the center of the weld line,
eak of the profile of its f the obtained results is
an ideal weld profile is Gaussian curve [17], and
resented in Fig. 5b.
ed in Fig. 5) provided by ared sensors (Fig.4) and ters of interest, ε and φ, f the several experiments
ons are shown in Fig. 6. In movement was made with
the weld line.
fteen samples of the weld line rear (right) arrays of infrared
d distance sensor (2) Ultrasonic mera view. a) Top view b) Left
w.

B. Visual Information Based Approach Results
In the case of the visual information approach, several experiments were carried out based on images obtained from weld lines of storage tanks using a VGA resolution digital camera. The images were processed using the method previously mentioned and a detailed description of it may be found in [13].
The result of one experiment is shown in Fig. 7. Initially, the original gray level image is presented. The resultant image of the binarization process is shown in the sequence, where it is possible to notice an elongated object whose thickness is similar to the one of the weld line shown in the image. Finally, the resultant straight line obtained using the proposed method is plotted over the original image.
The results obtained by the visual information based
approach are presented in Fig. 8. Such results corresponds to the same experiment considered in the case shown in Fig. 6, where results from the distance information approach are shown. So, the results presented in Fig. 6 and Fig. 8 corresponds to the same experiment, but the results shown in Fig. 6 are based on distance information and those presented in Fig. 8 are based on visual information.
As can be seen in Fig. 8, a few jumps can be noticed in the curves, and they should correspond to failures in the measurement process, mainly due to illumination problems. Some high-frequency noise is also present. But such noise is much lower than in the case of the data provided by the distance information based approach, shown in Fig. 6.
C. Fault-Tolerant Estimation Process Results
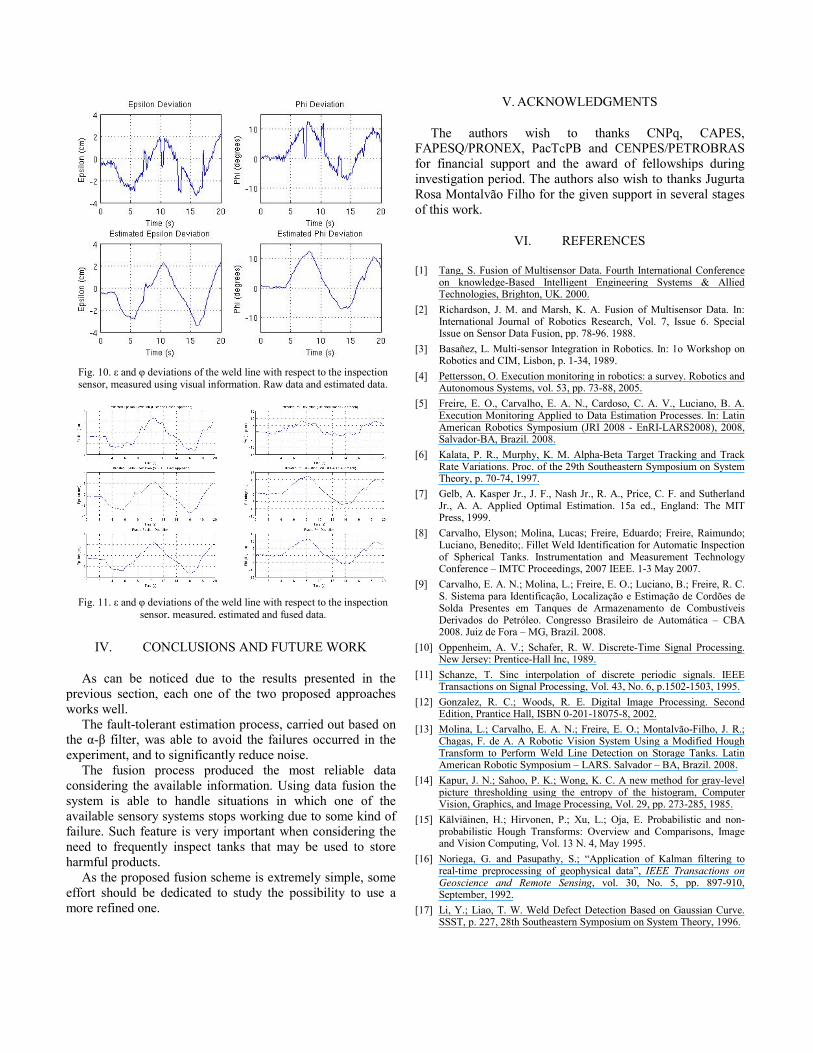
The result of the application of fault-tolerant estimation process to the data obtained using the distance information based approach is shown in Fig. 9, while similar results considering data provided by the visual information based approach are shown in Fig. 10.
As can be noticed, in both cases, the fault-tolerant estimation process was able to smooth the curves and to avoid the failures occurred during the experiment.
D. Data Fusion Results
The results of the data fusion process between the data provided by the two available approaches are presented in Fig. 11.
The obtained data after the fusion process are the most reliable considering the available data.
Fig. 9. ε and φ deviations of the weld line with respect to the inspection
sensor, measured using data provided by the front and rear arrays of infrared sensors. Raw data and estimated data.
Fig. 8. ε and φ deviations of the weld line with respect to the
inspection sensor, measured using visual information.
Fig. 6. ε and φ deviations of the weld line with respect to the inspection
sensor, measured using data provided by the front and rear arrays of infrared sensors.
Fig. 7. Visual information approach results. From the left to the right: original gray level image; binarized image; detected weld line plotted
over to the original image.
IV. CONCLUSIONS AND FUTURE WORK
As can be noticed due to the results presented in the previous section, each one of the two proposed approaches works well.
The fault-tolerant estimation process, carried out based on the α-β filter, was able to avoid the failures occurred in the experiment, and to significantly reduce noise.
The fusion process produced the most reliable data considering the available information. Using data fusion the system is able to handle situations in which one of the available sensory systems stops working due to some kind of failure. Such feature is very important when considering the need to frequently inspect tanks that may be used to store harmful products.
As the proposed fusion scheme is extremely simple, some effort should be dedicated to study the possibility to use a more refined one.
V. ACKNOWLEDGMENTS
The authors wish to thanks CNPq, CAPES, FAPESQ/PRONEX, PacTcPB and CENPES/PETROBRAS for financial support and the award of fellowships during investigation period. The authors also wish to thanks Jugurta Rosa Montalvão Filho for the given support in several stages of this work.
VI. REFERENCES
[1] Tang, S. Fusion of Multisensor Data. Fourth International Conference on knowledge-Based Intelligent Engineering Systems & Allied Technologies, Brighton, UK. 2000.
[2] Richardson, J. M. and Marsh, K. A. Fusion of Multisensor Data. In: International Journal of Robotics Research, Vol. 7, Issue 6. Special Issue on Sensor Data Fusion, pp. 78-96. 1988.
[3] Basañez, L. Multi-sensor Integration in Robotics. In: 1o Workshop on Robotics and CIM, Lisbon, p. 1-34, 1989.
[4] Pettersson, O. Execution monitoring in robotics: a survey. Robotics and Autonomous Systems, vol. 53, pp. 73-88, 2005.
[5] Freire, E. O., Carvalho, E. A. N., Cardoso, C. A. V., Luciano, B. A. Execution Monitoring Applied to Data Estimation Processes. In: Latin American Robotics Symposium (JRI 2008 - EnRI-LARS2008), 2008, Salvador-BA, Brazil. 2008.
[6] Kalata, P. R., Murphy, K. M. Alpha-Beta Target Tracking and Track Rate Variations. Proc. of the 29th Southeastern Symposium on System Theory, p. 70-74, 1997.
[7] Gelb, A. Kasper Jr., J. F., Nash Jr., R. A., Price, C. F. and Sutherland Jr., A. A. Applied Optimal Estimation. 15a ed., England: The MIT Press, 1999.
[8] Carvalho, Elyson; Molina, Lucas; Freire, Eduardo; Freire, Raimundo; Luciano, Benedito;. Fillet Weld Identification for Automatic Inspection of Spherical Tanks. Instrumentation and Measurement Technology Conference – IMTC Proceedings, 2007 IEEE. 1-3 May 2007.
[9] Carvalho, E. A. N.; Molina, L.; Freire, E. O.; Luciano, B.; Freire, R. C. S. Sistema para Identificação, Localização e Estimação de Cordões de Solda Presentes em Tanques de Armazenamento de Combustíveis Derivados do Petróleo. Congresso Brasileiro de Automática – CBA 2008. Juiz de Fora – MG, Brazil. 2008.
[10] Oppenheim, A. V.; Schafer, R. W. Discrete-Time Signal Processing. New Jersey: Prentice-Hall Inc, 1989.
[11] Schanze, T. Sinc interpolation of discrete periodic signals. IEEE Transactions on Signal Processing, Vol. 43, No. 6, p.1502-1503, 1995.
[12] Gonzalez, R. C.; Woods, R. E. Digital Image Processing. Second Edition, Prantice Hall, ISBN 0-201-18075-8, 2002.
[13] Molina, L.; Carvalho, E. A. N.; Freire, E. O.; Montalvão-Filho, J. R.; Chagas, F. de A. A Robotic Vision System Using a Modified Hough Transform to Perform Weld Line Detection on Storage Tanks. Latin American Robotic Symposium – LARS. Salvador – BA, Brazil. 2008.
[14] Kapur, J. N.; Sahoo, P. K.; Wong, K. C. A new method for gray-level picture thresholding using the entropy of the histogram, Computer Vision, Graphics, and Image Processing, Vol. 29, pp. 273-285, 1985.
[15] Kälviäinen, H.; Hirvonen, P.; Xu, L.; Oja, E. Probabilistic and non-probabilistic Hough Transforms: Overview and Comparisons, Image and Vision Computing, Vol. 13 N. 4, May 1995.
[16] Noriega, G. and Pasupathy, S.; “Application of Kalman filtering to real-time preprocessing of geophysical data”, IEEE Transactions on Geoscience and Remote Sensing, vol. 30, No. 5, pp. 897-910, September, 1992.
[17] Li, Y.; Liao, T. W. Weld Defect Detection Based on Gaussian Curve. SSST, p. 227, 28th Southeastern Symposium on System Theory, 1996.
Fig. 11. ε and φ deviations of the weld line with respect to the inspection
sensor, measured, estimated and fused data.
Fig. 10. ε and φ deviations of the weld line with respect to the inspection sensor, measured using visual information. Raw data and estimated data.