Fate and spatial distribution of Pb, Cd, Cu and Zn in the water ...
7
* Corresponding author: [email protected] Fate and spatial distribution of Pb, Cd, Cu and Zn in the water column and in the surface sediment of Indonesian Estuary (Citarum River Estuary) Nurul Fahimah 1,* , Katharina Oginawati 2 , and Suharyanto 2 1 Master’s Program of Environmental Engineering Department, Institute Technology Bandung, Jl. Ganesha No. 10, Bandung 2 Environmental Management Technology Research Group, Environmental Engineering Department, Institute Technology Bandung, Jl. Ganesha 10 Bandung Abstract. The Citarum River Estuary is an area where mixing among seawater and freshwater occurs since directly connected with the Java Sea. The different condition in estuary will affect heavy metal concentrations in the dissolved phase and suspended/deposited in sediment phase. In this study, fates and distributions from Pb, Cd, Cu and Zn were analyzed along 2 km from estuary mouth. Samples were analyzed by Flame AAS. The study began with water/sediment quality assessments, and fate and distribution analyses with Adsorption Capacity Indices (ACI), Dissolved Transport Indice (DTI), Koc, Kow, spatial distribution in water (3D) and sediment (2D) using MATLAB, and statistical analysis (ANOVA/Kruskal-Wallis). In conclusion, heavy metals sequence from the highest pollution level in water were: Zn > Pb > Cu > Cd, and in sediment were: Cd > Pb > Zn > Cu. Pb, Cd, Cu, and Zn had a tendency to be in sediment compared to water (ACI = 99.69% – 99.89%; DTI = 0.109% – 0.309%), slightly mobile (log Koc = 3.11 – 3.58), and hydrophobic (log Kow = 3.35 – 3.87). Pb and Cd showed significantly different concentrations in water columns (surface/midst/base) (p<0.05), in contrast to Cu and Zn. Pb, Cd, Cu, and Zn had insignificant concentration difference based on zone division from estuary mouth, both in water and sediment. 1 Introduction The Citarum River is a polluted river in the world subsequent to the River Sarno, Italy [1]. According to Southeast Asia Greenpeace and Wahana Lingkungan Hidup Indonesia (Walhi) on Indonesian Minister of Health (2018), heavy metals are one of the main contaminants that affect to the water quality of the Citarum River. The downstream area of the Citarum River is an area that has a considerable opportunity to cause to be experienced the negative impacts of the heavy metal presences. Those conditions can occur because the pollutant in the upstream will stream following streamline area to the downstream area of the river. The downstream area (also called “estuary”) of Citarum River is located in Bekasi Regency and is directly related to the Java Sea so that there will be a mixing of the seawater and the freshwater. The mixing processes will influence on the fate and the distribution of heavy metals through the processes of adsorption-desorption, deposition-resuspension, and distribution which are influenced by physicochemical parameters in the estuary. Estuary is characterized by the high levels of turbidity, salinity, and ionic strength [2]. Increased ionic strength causes stronger tensile between particles so that the ability to adsorb heavy metals gets stronger. Najamuddin (2017) argues that Pb is absorbed in salinity 12-30 ‰ and Zn in 0.5-3.0 ‰ in Jeneberang River Estuary, Makassar [3]. Based on the background, the researcher conducts the study with the deeper study of the fate and distribution of heavy metals found in the Citarum River Estuary. The purposes of this study were to analyze the fate of heavy metals and the water-sediment distribution, as well as to analyze the concentration distribution of heavy metals due to the mixing in the estuary. 2 Methodology The study was conducted in the Citarum River Estuary, Muara Gembong District, Bekasi Regency, West Java Province. Geographically, the location was located between 5° 56’ 25.80" S to 5° 56' 8.13" S and 106° 59' 18.19 " E to 107° 0' 19.57" E. The study was conducted on April 28, 2018 (at 13:46 – 16:15) and on April 29, 2018 (at 11:07 – 13:04) during the rainy season and the low tide condition. The sampling points consisted of 3 zones (1 st zone: the zone closest to the Java Sea which had high salinity; 2 nd zone: the zone between 1 st zone and 3 rd zone; as well as 3 rd zone: the zone with the farthest distance from the ,0 Web of Conferences https://doi.org/10.1051/e3sconf/20 E3S 148 2014 2019 8070 ETMC and RC EnvE (2020) 0 07 70 7 © The Authors, published by EDP Sciences. This is an open access article distributed under the terms of the Creative Commons Attribution License 4.0 (http://creativecommons.org/licenses/by/4.0/).
-
Upload
khangminh22 -
Category
Documents
-
view
0 -
download
0
Transcript of Fate and spatial distribution of Pb, Cd, Cu and Zn in the water ...
* Corresponding author: [email protected]
Fate and spatial distribution of Pb, Cd, Cu and Zn in the water column and in the surface sediment of Indonesian Estuary (Citarum River Estuary)
Nurul Fahimah1,*, Katharina Oginawati2, and Suharyanto2
1 Master’s Program of Environmental Engineering Department, Institute Technology Bandung, Jl. Ganesha No. 10, Bandung 2 Environmental Management Technology Research Group, Environmental Engineering Department, Institute Technology
Bandung, Jl. Ganesha 10 Bandung
Abstract. The Citarum River Estuary is an area where mixing among seawater and freshwater occurs since
directly connected with the Java Sea. The different condition in estuary will affect heavy metal
concentrations in the dissolved phase and suspended/deposited in sediment phase. In this study, fates and
distributions from Pb, Cd, Cu and Zn were analyzed along 2 km from estuary mouth. Samples were
analyzed by Flame AAS. The study began with water/sediment quality assessments, and fate and
distribution analyses with Adsorption Capacity Indices (ACI), Dissolved Transport Indice (DTI), Koc, Kow,
spatial distribution in water (3D) and sediment (2D) using MATLAB, and statistical analysis
(ANOVA/Kruskal-Wallis). In conclusion, heavy metals sequence from the highest pollution level in water
were: Zn > Pb > Cu > Cd, and in sediment were: Cd > Pb > Zn > Cu. Pb, Cd, Cu, and Zn had a tendency to
be in sediment compared to water (ACI = 99.69% – 99.89%; DTI = 0.109% – 0.309%), slightly mobile (log
Koc = 3.11 – 3.58), and hydrophobic (log Kow = 3.35 – 3.87). Pb and Cd showed significantly different
concentrations in water columns (surface/midst/base) (p<0.05), in contrast to Cu and Zn. Pb, Cd, Cu, and
Zn had insignificant concentration difference based on zone division from estuary mouth, both in water and
sediment.
1 Introduction
The Citarum River is a polluted river in the world
subsequent to the River Sarno, Italy [1]. According to
Southeast Asia Greenpeace and Wahana Lingkungan
Hidup Indonesia (Walhi) on Indonesian Minister of
Health (2018), heavy metals are one of the main
contaminants that affect to the water quality of the
Citarum River.
The downstream area of the Citarum River is an area
that has a considerable opportunity to cause to be
experienced the negative impacts of the heavy metal
presences. Those conditions can occur because the
pollutant in the upstream will stream following
streamline area to the downstream area of the river. The
downstream area (also called “estuary”) of Citarum
River is located in Bekasi Regency and is directly related
to the Java Sea so that there will be a mixing of the
seawater and the freshwater. The mixing processes will
influence on the fate and the distribution of heavy metals
through the processes of adsorption-desorption,
deposition-resuspension, and distribution which are
influenced by physicochemical parameters in the
estuary. Estuary is characterized by the high levels of
turbidity, salinity, and ionic strength [2]. Increased ionic
strength causes stronger tensile between particles so that
the ability to adsorb heavy metals gets stronger.
Najamuddin (2017) argues that Pb is absorbed in salinity
12-30 ‰ and Zn in 0.5-3.0 ‰ in Jeneberang River
Estuary, Makassar [3].
Based on the background, the researcher conducts
the study with the deeper study of the fate and
distribution of heavy metals found in the Citarum River
Estuary. The purposes of this study were to analyze the
fate of heavy metals and the water-sediment distribution,
as well as to analyze the concentration distribution of
heavy metals due to the mixing in the estuary.
2 Methodology
The study was conducted in the Citarum River Estuary,
Muara Gembong District, Bekasi Regency, West Java
Province. Geographically, the location was located
between 5° 56’ 25.80" S to 5° 56' 8.13" S and 106° 59'
18.19 " E to 107° 0' 19.57" E. The study was conducted
on April 28, 2018 (at 13:46 – 16:15) and on April 29,
2018 (at 11:07 – 13:04) during the rainy season and the
low tide condition.
The sampling points consisted of 3 zones (1st zone:
the zone closest to the Java Sea which had high salinity;
2nd zone: the zone between 1st zone and 3rd zone; as well
as 3rd zone: the zone with the farthest distance from the
, 0Web of Conferences https://doi.org/10.1051/e3sconf/20E3S 148 2014
20198070
ETMC and RC EnvE (2020) 0 0770 7
© The Authors, published by EDP Sciences. This is an open access article distributed under the terms of the Creative Commons Attribution License 4.0 (http://creativecommons.org/licenses/by/4.0/).
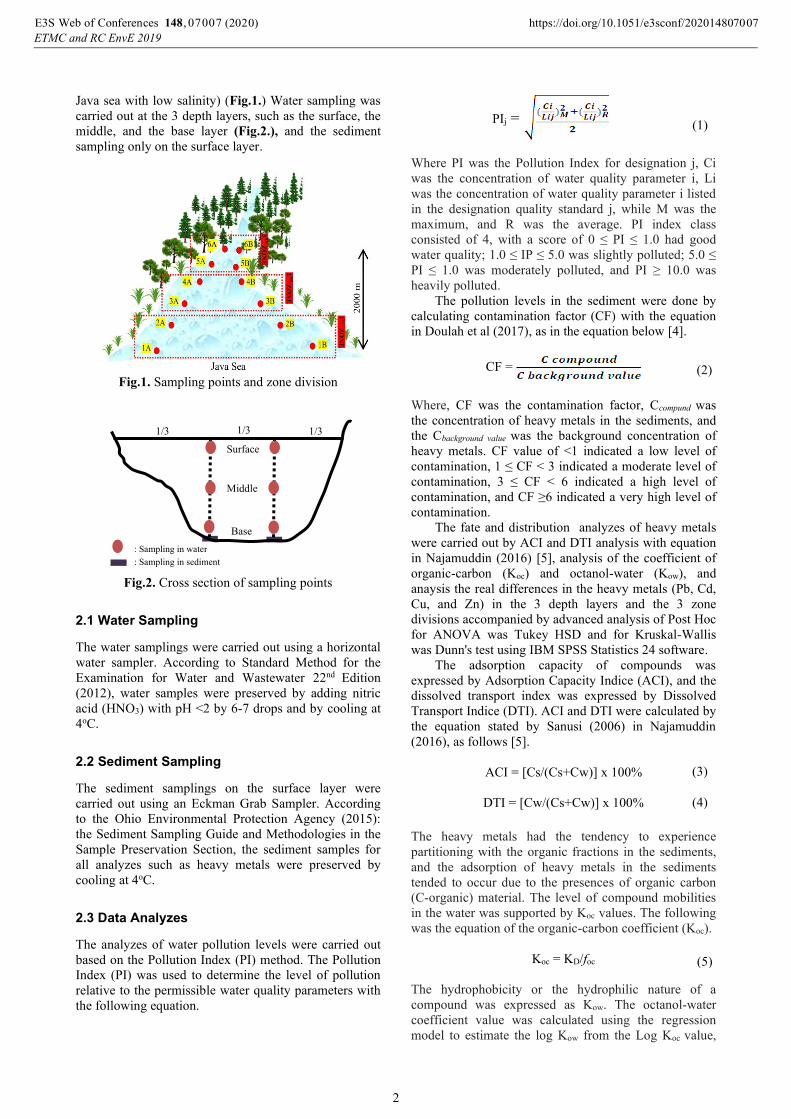
Java sea with low salinity) (Fig.1.) Water sampling was
carried out at the 3 depth layers, such as the surface, the
middle, and the base layer (Fig.2.), and the sediment
sampling only on the surface layer.
Fig.1. Sampling points and zone division
Fig.2. Cross section of sampling points
2.1 Water Sampling
The water samplings were carried out using a horizontal
water sampler. According to Standard Method for the
Examination for Water and Wastewater 22nd Edition
(2012), water samples were preserved by adding nitric
acid (HNO3) with pH <2 by 6-7 drops and by cooling at
4oC.
2.2 Sediment Sampling
The sediment samplings on the surface layer were
carried out using an Eckman Grab Sampler. According
to the Ohio Environmental Protection Agency (2015):
the Sediment Sampling Guide and Methodologies in the
Sample Preservation Section, the sediment samples for
all analyzes such as heavy metals were preserved by
cooling at 4oC.
2.3 Data Analyzes
The analyzes of water pollution levels were carried out
based on the Pollution Index (PI) method. The Pollution
Index (PI) was used to determine the level of pollution
relative to the permissible water quality parameters with
the following equation.
PIj =
Where PI was the Pollution Index for designation j, Ci
was the concentration of water quality parameter i, Li
was the concentration of water quality parameter i listed
in the designation quality standard j, while M was the
maximum, and R was the average. PI index class
consisted of 4, with a score of 0 ≤ PI ≤ 1.0 had good
water quality; 1.0 ≤ IP ≤ 5.0 was slightly polluted; 5.0 ≤
PI ≤ 1.0 was moderately polluted, and PI ≥ 10.0 was
heavily polluted.
The pollution levels in the sediment were done by
calculating contamination factor (CF) with the equation
in Doulah et al (2017), as in the equation below [4].
CF =
Where, CF was the contamination factor, Ccompund was
the concentration of heavy metals in the sediments, and
the Cbackground value was the background concentration of
heavy metals. CF value of <1 indicated a low level of
contamination, 1 ≤ CF ˂ 3 indicated a moderate level of
contamination, 3 ≤ CF ˂ 6 indicated a high level of
contamination, and CF ≥6 indicated a very high level of
contamination.
The fate and distribution analyzes of heavy metals
were carried out by ACI and DTI analysis with equation
in Najamuddin (2016) [5], analysis of the coefficient of
organic-carbon (Koc) and octanol-water (Kow), and
anaysis the real differences in the heavy metals (Pb, Cd,
Cu, and Zn) in the 3 depth layers and the 3 zone
divisions accompanied by advanced analysis of Post Hoc
for ANOVA was Tukey HSD and for Kruskal-Wallis
was Dunn's test using IBM SPSS Statistics 24 software.
The adsorption capacity of compounds was
expressed by Adsorption Capacity Indice (ACI), and the
dissolved transport index was expressed by Dissolved
Transport Indice (DTI). ACI and DTI were calculated by
the equation stated by Sanusi (2006) in Najamuddin
(2016), as follows [5].
ACI = [Cs/(Cs+Cw)] x 100%
DTI = [Cw/(Cs+Cw)] x 100%
The heavy metals had the tendency to experience
partitioning with the organic fractions in the sediments,
and the adsorption of heavy metals in the sediments
tended to occur due to the presences of organic carbon
(C-organic) material. The level of compound mobilities
in the water was supported by Koc values. The following
was the equation of the organic-carbon coefficient (Koc).
Koc = KD/foc
The hydrophobicity or the hydrophilic nature of a
compound was expressed as Kow. The octanol-water
coefficient value was calculated using the regression
model to estimate the log Kow from the Log Koc value,
Surface
1/3
L
1/3 L
1/3
L
Base
: Sampling in water
Middle
: Sampling in sediment
(1)
(2)
(3)
(4)
(5)
, 0Web of Conferences https://doi.org/10.1051/e3sconf/20E3S 148 2014
20198070
ETMC and RC EnvE (2020) 0 0770 7
2
the equation was obtained from Baker et al. (1997) in
Boethling and Mackay (2000) which stated that the
equation applied to various chemical compounds. The
model equation was as follows [6].
Log Koc = 0,903 log Kow + 0,094
ANOVA/Kruskal-Wallis analysis to analyze the real
differences in the heavy metals (Pb, Cd, Cu, and Zn) in 3
depth layers and 3 zone division accompanied by the
advanced analysis of Post Hoc for ANOVA was Tukey
HSD and for Kruskal-Wallis was Dunn's test using IBM
SPSS Statistics 24 software.
The spatial distributions were made by MATLAB
software, with the function "pcolor3 (X, Y, Z, V)" for
the water compartment, which was the function for
plotting the volume of 3D data. For the sediments, the
function used was "pcolor (X, Y, V)", that was function
for plotting 2D square patches defined by 3 variables.
3 Results and Discussion
3.1 Water and Sediment Quality
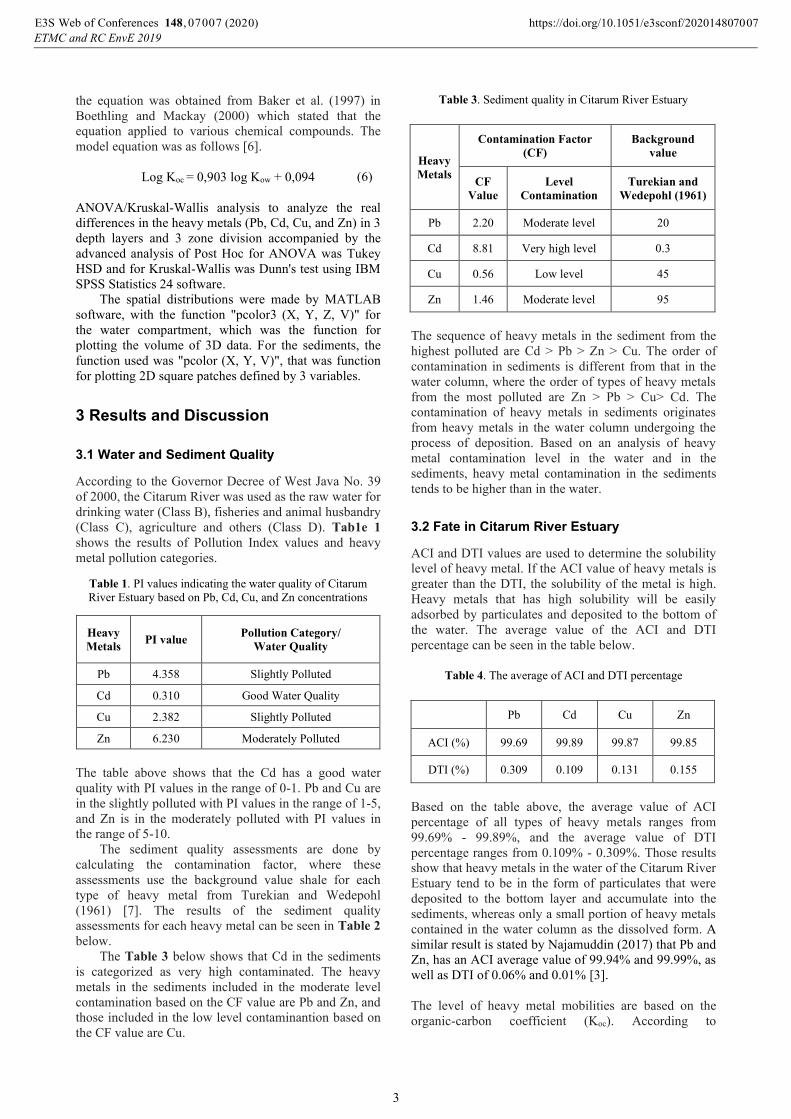
According to the Governor Decree of West Java No. 39
of 2000, the Citarum River was used as the raw water for
drinking water (Class B), fisheries and animal husbandry
(Class C), agriculture and others (Class D). Tab1e 1
shows the results of Pollution Index values and heavy
metal pollution categories.
Table 1. PI values indicating the water quality of Citarum
River Estuary based on Pb, Cd, Cu, and Zn concentrations
Heavy
Metals PI value
Pollution Category/
Water Quality
Pb 4.358 Slightly Polluted
Cd 0.310 Good Water Quality
Cu 2.382 Slightly Polluted
Zn 6.230 Moderately Polluted
The table above shows that the Cd has a good water
quality with PI values in the range of 0-1. Pb and Cu are
in the slightly polluted with PI values in the range of 1-5,
and Zn is in the moderately polluted with PI values in
the range of 5-10.
The sediment quality assessments are done by
calculating the contamination factor, where these
assessments use the background value shale for each
type of heavy metal from Turekian and Wedepohl
(1961) [7]. The results of the sediment quality
assessments for each heavy metal can be seen in Table 2
below.
The Table 3 below shows that Cd in the sediments
is categorized as very high contaminated. The heavy
metals in the sediments included in the moderate level
contamination based on the CF value are Pb and Zn, and
those included in the low level contaminantion based on
the CF value are Cu.
Table 3. Sediment quality in Citarum River Estuary
Heavy
Metals
Contamination Factor
(CF)
Background
value
CF
Value
Level
Contamination
Turekian and
Wedepohl (1961)
Pb 2.20 Moderate level 20
Cd 8.81 Very high level 0.3
Cu 0.56 Low level 45
Zn 1.46 Moderate level 95
The sequence of heavy metals in the sediment from the
highest polluted are Cd > Pb > Zn > Cu. The order of
contamination in sediments is different from that in the
water column, where the order of types of heavy metals
from the most polluted are Zn > Pb > Cu> Cd. The
contamination of heavy metals in sediments originates
from heavy metals in the water column undergoing the
process of deposition. Based on an analysis of heavy
metal contamination level in the water and in the
sediments, heavy metal contamination in the sediments
tends to be higher than in the water.
3.2 Fate in Citarum River Estuary
ACI and DTI values are used to determine the solubility
level of heavy metal. If the ACI value of heavy metals is
greater than the DTI, the solubility of the metal is high.
Heavy metals that has high solubility will be easily
adsorbed by particulates and deposited to the bottom of
the water. The average value of the ACI and DTI
percentage can be seen in the table below.
Table 4. The average of ACI and DTI percentage
Pb Cd Cu Zn
ACI (%) 99.69 99.89 99.87 99.85
DTI (%) 0.309 0.109 0.131 0.155
Based on the table above, the average value of ACI
percentage of all types of heavy metals ranges from
99.69% - 99.89%, and the average value of DTI
percentage ranges from 0.109% - 0.309%. Those results
show that heavy metals in the water of the Citarum River
Estuary tend to be in the form of particulates that were
deposited to the bottom layer and accumulate into the
sediments, whereas only a small portion of heavy metals
contained in the water column as the dissolved form. A
similar result is stated by Najamuddin (2017) that Pb and
Zn, has an ACI average value of 99.94% and 99.99%, as
well as DTI of 0.06% and 0.01% [3].
The level of heavy metal mobilities are based on the
organic-carbon coefficient (Koc). According to
(6)
, 0Web of Conferences https://doi.org/10.1051/e3sconf/20E3S 148 2014
20198070
ETMC and RC EnvE (2020) 0 0770 7
3
Armanpour and Bing (2015), the Koc value for very
mobile was <15 l / kg; for mobile which is 15-75 l/kg,
for moderately mobile which is 75-500 l/kg; for slightly
mobile which isi 500-4000 l/kg; and immobile which is
>4000 l/kg [8]. Table 5 shows the organic-carbon
coefficient (Koc) of Pb, Cd, Cu, and Zn.
Table 5. Organic-carbon coefficient (Koc)
Log Koc dan Koc
Pb Cd Cu Zn
Log Koc 3.11 3.58 3.55 3.44
Koc 1294 3775 3557 2760
Table 5 above shows that the average Koc value for all
types of heavy metals (Cd, Cu, Zn, Pb in sequence from
the highest Koc) has the level of mobility that is slightly
mobile. Pb, Cd, Cu, and Zn found in the Citarum River
Estuary has slight mobility so that Pb, Cd, Cu, and Zn in
the Citarum River Estuary are easily adsorbed, degraded
and settle in the sediments. Therefore, heavy metals tend
to be in the sediments rather than in the water, and are
likely to have high bioavailability in the organisms.
Heavy metals in the sediments can accumulate to living
organisms when foraging in the sediments.
The octanol-water coefficient (Kow) also indicates the
hydrophobic nature of the chemical compound.
According to Karickhoff et al. (1979) and Noordsij et al.
(2003), hydrophobic compounds (low solubility in the
water) have a log Kow value >0 and hydrophilic
compounds (high solubility in the water) have a log Kow
value <0 [9].
Table 6. Octanol-water coefficient (Kow)
Log Kow dan Kow
Pb Cd Cu Zn
Log Kow 3.35 3.87 3.84 3.72
Kow 2250 7365 6894 5206
Table 6 above shows that Pb, Cd, Cu, and Zn have a log
Kow value >0 (positive), meaning that Pb, Cd, Cu, and
Zn have the hydrophobic or lipophilic character (prefer
fat) so that they have the solubility higher in the octanol
area than in the water. Heavy metals that have a high log
Kow value will have the potential to process the
bioconcentration of heavy metals in the aquatic
organisms. According to Sikdar and Kundu (2018),
bioconcentration in lipid tissue occurs in the process of
exchanging compounds from the water column (uptake
of chemical compounds not through food or oral
consumption) and the degree of bioconcentration is
influenced by the hydrophobicity of the chemical
compounds obtained from the evaluation of the octanol-
water coefficient value [10].
3.3 Spatial Distributions
In Fig.3, it is clear that most high concentrations of
heavy metals are found in the base layer. Those
indicated that the addition processes originated from the
surface sediment. However, the vertical distribution
pattern is only clearly visible at the mouth of the estuary
(0 m) because the location was most affected by the
stirring process from the sea tidal effect so that the
resuspension sediment and desorption processes are
greater (see the distribution of Cd). the results of
ANOVA/Kruskal-Wallis analysis show that only Pb and
Cd have significant differences in the average
concentration in 3 layers of the water which were
significant (p<0.05) and significant differences found in
the middle-surface and base-surface layers based on the
Post Hoc test. Those results indicated that Pb and Cd
have increased concentrations with increasing the depth
from the surface to the bottom of the water. The high
concentrations in the bottom of water come from the
surface sediment that were experiencing resuspension
(Distribution of Pb and Cd can be seen in Fig.4).
Sediment resuspension will increase TSS concentration
and turbidity. Heavy metals that were bound with TSS
are desorption, resulting the increasing of heavy metals
dissolved in the water colums.
Zhang et al. (2018) argue that in the estuary
environment, heavy metals can be partitioned into
particle phases of the sediment, where heavy metals can
be absorbed by particulate matter in the particulate phase
and deposited into the sediments, while metals can be
released back into the water column from the sediment
by resuspension [11]. Dippong et al. (2017) suggest that
the concentration of Pb and Cd had increased with
increasing the depth from the surface to the bottom of
the water which was thought to be due to the release of
metal ions into the water column based on the oxidation-
reduction reaction in the sediment [12].
In contrast to heavy metals Cu and Zn, which do not
have a significant differences in depth layers because the
Cu and Zn concentration in the water column were
thought to not only originate from the process of
remobilization of sediments, but it was suspected that
there were still anthropogenic sources from community
activities that cause the concentration of Cu and Zn
metals to fluctuate in the water column. This was also
supported by the pollutant index of Cu which was
classified as slightly contaminated in the water column,
and Zn which was classified as moderately polluted in
the water column.
Cu pollutants that were high are dominant in the
surface layer and middle layer of Citarum River Estuary.
It was also suspected that high rainfall in April 2018
caused the concentration of heavy metals entering the
water body to increase due to the erosion of land and
heavy metal sources presented in the atmosphere that
entered the body of water through rain.
While zinc (Zn) was thought to originate from
effluent domestic waste because Zn was contained in
shampoos and detergent formulas. In addition, Zn can
also be sourced from dyes in ship paint, so that Zn in
estuary water whose livelihood as fishermen was thought
to be caused by the release of anti-fouling coatings on
ship paints around the study area.
, 0Web of Conferences https://doi.org/10.1051/e3sconf/20E3S 148 2014
20198070
ETMC and RC EnvE (2020) 0 0770 7
4
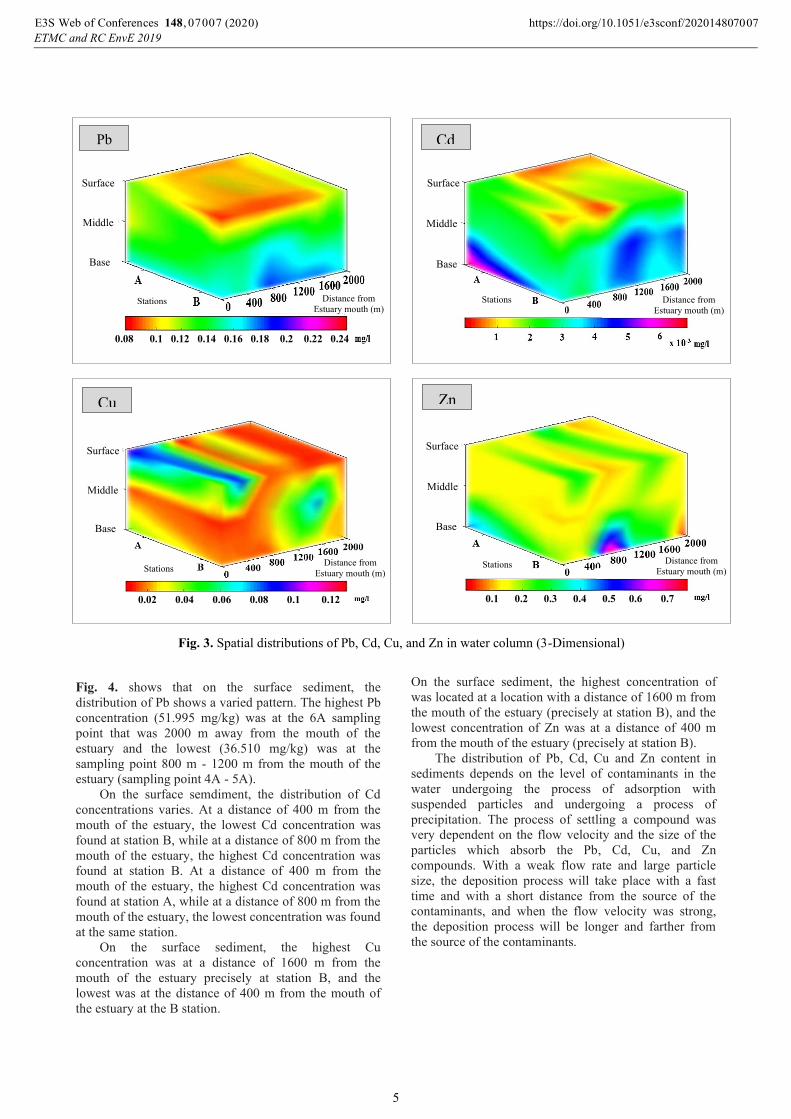
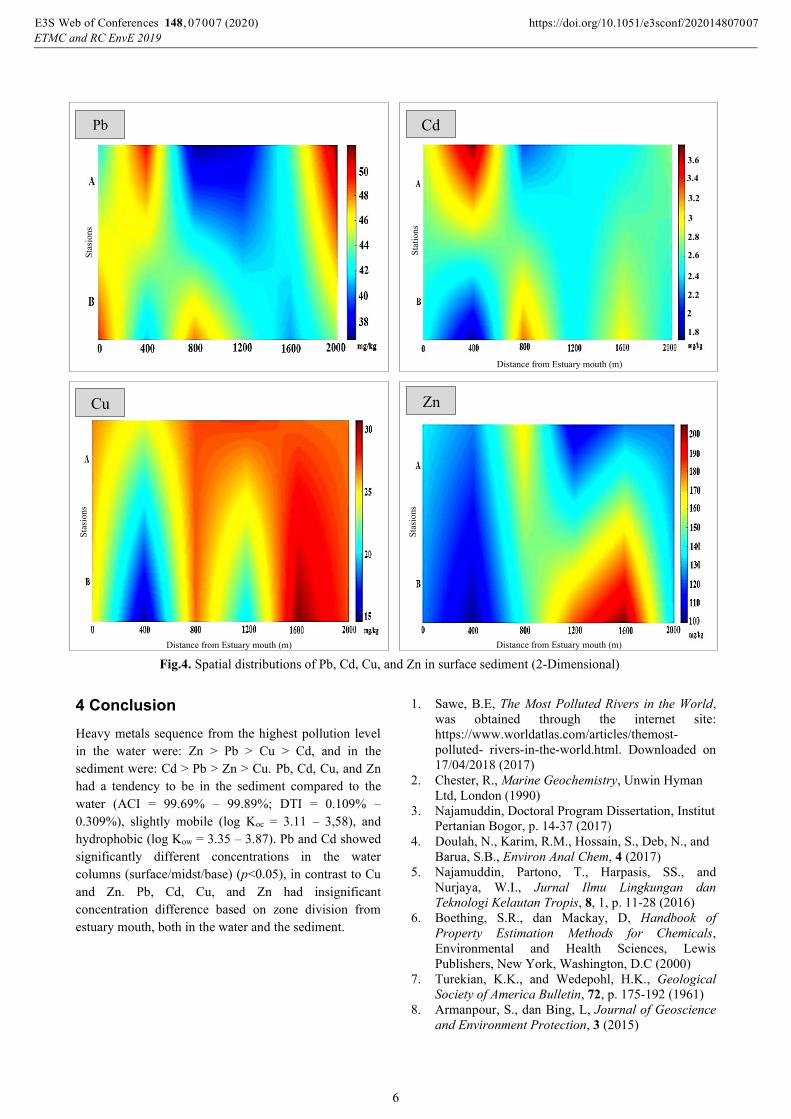
Fig. 4. shows that on the surface sediment, the
distribution of Pb shows a varied pattern. The highest Pb
concentration (51.995 mg/kg) was at the 6A sampling
point that was 2000 m away from the mouth of the
estuary and the lowest (36.510 mg/kg) was at the
sampling point 800 m - 1200 m from the mouth of the
estuary (sampling point 4A - 5A).
On the surface semdiment, the distribution of Cd
concentrations varies. At a distance of 400 m from the
mouth of the estuary, the lowest Cd concentration was
found at station B, while at a distance of 800 m from the
mouth of the estuary, the highest Cd concentration was
found at station B. At a distance of 400 m from the
mouth of the estuary, the highest Cd concentration was
found at station A, while at a distance of 800 m from the
mouth of the estuary, the lowest concentration was found
at the same station.
On the surface sediment, the highest Cu
concentration was at a distance of 1600 m from the
mouth of the estuary precisely at station B, and the
lowest was at the distance of 400 m from the mouth of
the estuary at the B station.
On the surface sediment, the highest concentration of
was located at a location with a distance of 1600 m from
the mouth of the estuary (precisely at station B), and the
lowest concentration of Zn was at a distance of 400 m
from the mouth of the estuary (precisely at station B).
The distribution of Pb, Cd, Cu and Zn content in
sediments depends on the level of contaminants in the
water undergoing the process of adsorption with
suspended particles and undergoing a process of
precipitation. The process of settling a compound was
very dependent on the flow velocity and the size of the
particles which absorb the Pb, Cd, Cu, and Zn
compounds. With a weak flow rate and large particle
size, the deposition process will take place with a fast
time and with a short distance from the source of the
contaminants, and when the flow velocity was strong,
the deposition process will be longer and farther from
the source of the contaminants.
Fig. 3. Spatial distributions of Pb, Cd, Cu, and Zn in water column (3-Dimensional)
Cu
Distance from
Estuary mouth (m)
Surface
Middle
Base
Stations
Zn
Distance from
Estuary mouth (m)
Base
Middle
Surface
Stations
Surface
Middle
Base
Distance from
Estuary mouth (m)
Pb
Stations
Cd
Distance from
Estuary mouth (m)
Surface
Middle
Base
Stations
0.08 0.1 0.12 0.14 0.16 0.18 0.2 0.22 0.24
0.02 0.04 0.06 0.08 0.1 0.12 0.1 0.2 0.3 0.4 0.5 0.6 0.7
, 0Web of Conferences https://doi.org/10.1051/e3sconf/20E3S 148 2014
20198070
ETMC and RC EnvE (2020) 0 0770 7
5
4 Conclusion
Heavy metals sequence from the highest pollution level
in the water were: Zn > Pb > Cu > Cd, and in the
sediment were: Cd > Pb > Zn > Cu. Pb, Cd, Cu, and Zn
had a tendency to be in the sediment compared to the
water (ACI = 99.69% – 99.89%; DTI = 0.109% –
0.309%), slightly mobile (log Koc = 3.11 – 3,58), and
hydrophobic (log Kow = 3.35 – 3.87). Pb and Cd showed
significantly different concentrations in the water
columns (surface/midst/base) (p<0.05), in contrast to Cu
and Zn. Pb, Cd, Cu, and Zn had insignificant
concentration difference based on zone division from
estuary mouth, both in the water and the sediment.
References
1. Sawe, B.E, The Most Polluted Rivers in the World,
was obtained through the internet site:
https://www.worldatlas.com/articles/themost-
polluted- rivers-in-the-world.html. Downloaded on
17/04/2018 (2017)
2. Chester, R., Marine Geochemistry, Unwin Hyman
Ltd, London (1990)
3. Najamuddin, Doctoral Program Dissertation, Institut
Pertanian Bogor, p. 14-37 (2017)
4. Doulah, N., Karim, R.M., Hossain, S., Deb, N., and
Barua, S.B., Environ Anal Chem, 4 (2017)
5. Najamuddin, Partono, T., Harpasis, SS., and
Nurjaya, W.I., Jurnal Ilmu Lingkungan dan
Teknologi Kelautan Tropis, 8, 1, p. 11-28 (2016)
6. Boething, S.R., dan Mackay, D, Handbook of
Property Estimation Methods for Chemicals,
Environmental and Health Sciences, Lewis
Publishers, New York, Washington, D.C (2000)
7. Turekian, K.K., and Wedepohl, H.K., Geological
Society of America Bulletin, 72, p. 175-192 (1961)
8. Armanpour, S., dan Bing, L, Journal of Geoscience
and Environment Protection, 3 (2015)
Fig.4. Spatial distributions of Pb, Cd, Cu, and Zn in surface sediment (2-Dimensional)
Sta
sions
Pb
Distance from Estuary mouth (m)
Sta
tions
Cd
Distance from Estuary mouth (m)
Sta
tio
ns
Distance from Estuary mouth (m)
Sta
sio
ns
Cu S
tati
on
s
Distance from Estuary mouth (m)
Sta
sio
ns
Zn
1.8
2
2.2
2.4
2.6
2.8
3
3.2
3.4
3.6
, 0Web of Conferences https://doi.org/10.1051/e3sconf/20E3S 148 2014
20198070
ETMC and RC EnvE (2020) 0 0770 7
6
9. Karickhoff, S.W., Brown, D.S., dan Scott, T.A,
Water Research, 13 (1979)
10. Sikdar, S., dan Kundu, M., ChemBioEng Reviews,
Vol. 5 (2018)
11. Zhang, J., Zhou, F., Chen, C., Sun, X., Shi, Y.,
Zhao, H., and Chen, F., PloS ONE Journal, 13, 8, 1-
25 (2018)
12. Dippong, T., Mihali, C., Goga, F., and Cical, E,
Studia UBB Chemia, 1, 213-228 (2017)
, 0Web of Conferences https://doi.org/10.1051/e3sconf/20E3S 148 2014
20198070
ETMC and RC EnvE (2020) 0 0770 7
7