but Not Shallow – Networks Avoid the Curse of Dimensionality
Upload
independentCategory
view
0download
0
lable at ScienceDirect
Biomaterials 35 (2014) 2558e2567
Contents lists avai
Biomaterials
journal homepage: www.elsevier .com/locate/biomateria ls
Leading opinion
Measuring stem cell dimensionality in tissue scaffolds
Tanya M. Farooque, Charles H. Camp Jr., Christopher K. Tison 1, Girish Kumar,Sapun H. Parekh 2, Carl G. Simon Jr. *
Biosystems & Biomaterials Division, National Institute of Standards & Technology, 100 Bureau Drive, Gaithersburg, MD 20899, USA
a r t i c l e i n f o
Article history:Received 5 December 2013Accepted 22 December 2013Available online 15 January 2014
Keywords:3D cell cultureBone marrow stromal cellCell-material interactionsCell shapeNanofiberTissue engineering
* Corresponding author. Tel.: þ1 301 975 8574; faxE-mail address: [email protected] (C.G. Simon).
1 Current address: Luna Innovations, Inc., 706 For22903, USA.
2 Current address: Molecular Spectroscopy DepartmPolymer Research, Ackermannweg, 10, 55128 Mainz,
0142-9612/$ e see front matter Published by Elsevierhttp://dx.doi.org/10.1016/j.biomaterials.2013.12.092
a b s t r a c t
Many scaffold systems have evolved for tissue engineering and in vitro tissue models to provide a 3D(three-dimensional) microenvironment that enables cells to behave more physiologically. We hypothe-sized that cells would adopt morphologies with more 3D character during culture in scaffolds ascompared to planar substrates. Cell shape and function are tightly linked and effects of scaffold nicheproperties on cell shape and dimensionality are important for directing cell function. Herein, primaryhuman bone marrow stromal cells (hBMSCs) were cultured in 6 different scaffolds and on a planarcontrol substrate. hBMSCs were imaged using 3D confocal microscopy, and 3D image analyses were usedto assess hBMSC shape and dimensionality. A characteristic gyration tensor ellipsoid was calculated forhBMSCs in the different scaffolds which enabled hBMSC dimensionality to be classified based on shape. A“Dimensionality Matrix” was developed that showed that hBMSC shape and dimensionality wereinfluenced by scaffold properties, and that scaffolds could drive hBMSCs into 1D, 2D or 3D shapes. Inaddition, the hBMSC Z-Depth was measured to determine if hBMSCs became less flat during culture inscaffolds. Z-Depth results showed that all 6 scaffolds caused an increase in cell Z-Depth compared to the2D planar substrate. These results demonstrate that hBMSCs take on morphologies with greater 3Dcharacter in scaffolds than on a planar substrate and that scaffold properties can be adjusted to modifycell dimensionality. In addition, biomaterialists can use this measurement approach to assess andcompare scaffold design modifications as they strive to create optimal cell niches that provide a 3Dmicroenvironment.
Published by Elsevier Ltd.
1. Introduction
Many scaffolds have been advanced as 3D systems for tissueengineering, drug screening and in vitro tissue models [1,2]. Theseinclude, among others, collagen gels [3,4], matrigel [5,6], fibrin gels[7], porogen-leached scaffolds [8,9], gas-foamed scaffolds [10,11],nanofiber scaffolds [12e14], freeform-fabricated scaffolds [15,16],poly(ethylene glycol) hydrogels [17e19], self-assembled peptidegels [20,21], decellularized extracellular matrix (ECM) [22,23] andspheroid culture [24,25]. Scaffolds are used to provide a 3Dmicroenvironment for cells that is a more natural milieu for cellsthan planar tissue culture polystyrene (TCPS) plates. It is suggestedthat the 3D microenvironment enables cells to behave morephysiologically, or to behave more closely to how they behave
: þ1 301 975 4977.
est Street, Charlottesville, VA
ent, Max Planck Institute forGermany.
Ltd.
in vivo. The terms “3D culture” and “3D scaffold” suggest that cellshape may have more 3D character during culture in a scaffold thatprovides a 3D microenvironment.
Cells exist within and interact with their microenvironment, thecell niche, and the structural, chemical and mechanical propertiesof their niche can direct cell function [26]. Cells are highlyresponsive to the structural properties of their surroundings suchas topographical surface features and 3D structure [13,16,27,28].Substrate properties influence the energetics of cellesubstrate in-teractions causing changes in cell shape [29,30]. Structural queuesin the cell environment can guide cells into morphologies thatdirect their function and there is a strong link between cell shapeand cell function [31e35]. The dimensionality of the cell niche willalso influence cell shape and function [1,13,36e38]. For instance,cells on planar surfaces may adopt a planar morphology or becomepolarized with all matrix adhesions on their basolateral surface. Incontrast, cells in a 3D niche may take on a 3D morphology anddevelop matrix contacts in multiple planes, enabling them to formextensions in 3D space. Further, cell dimensionality can influencesignal transduction, where flatter cell morphologies cause in-homogeneities in the distribution of membrane-bound signaling
T.M. Farooque et al. / Biomaterials 35 (2014) 2558e2567 2559
molecules [39]. Thus, scaffold properties will dictate cell nichedimensionality and 3D cell shape, which will ultimately influencecell behavior.
Despite the interest in scaffolds, the physical effects of scaffoldson cell shape and dimensionality have not been described. There isnot a clear approach to compare scaffold niche dimensionalitieswhichmakes it challenging to improve scaffold designs so that theyprovide the proper microenvironment for cells. For these reasons,we have developed an approach for measuring cell dimensionalityduring culture in scaffolds. Primary human bone marrow stromalcells (hBMSCs) were cultured in a variety of scaffolds and imagedusing 3D confocal fluorescence microscopy. Since hBMSCs adoptcomplex morphologies that are difficult to assess, a characteristicellipsoid was fit to each hBMSC using a gyration tensor calculation.A “Dimensionality Matrix” was developed to assess the gyrationtensor ellipsoids and classify them as 1D, 2D or 3D. In addition,other cell shape metrics, such as the cell Z-Depth, which assesseshow deeply hBMSCs penetrated into the Z-direction, have beenmeasured to determine the effect of different scaffolds on hBMSCdimensionality.
2. Methods and materials
2.1. Cell culture
Primary human bone marrow stromal cells (hBMSCs) (also known as mesen-chymal stem cells) were obtained from Tulane Center for Gene Therapy (Dr. DarwinProckop, isolated from iliac crest of a healthy 29 year old female, Donor 7038) [40].hBMSCs were cultured in a-minimum essential media (Invitrogen) containing 16.5%by volume fetal bovine serum (Atlanta Biologicals), 4 mmol/L L-glutamine (Invi-trogen), and 1% by volume of Penicillin/Streptomycin (Cellgro). hBMSCs weretrypsinized (0.25% by mass containing 1 mmol/L ethylenediaminetetraacetate(EDTA), Invitrogen) at 70% confluency and seeded onto the various scaffolds studied.Passage 5 hBMSCs were used for all experiments. hBMSCs were cultured at 37 �Cunder 5% CO2 (by volume) before fixation and staining for image analysis.
2.2. Collagen Gel
Collagen gels were fabricated from Type I collagen (PureCol, 3 mg/mL, bovine,Advanced BioMatrix) under sterile conditions using 8 parts collagen and 1 part 10�Dulbecco’s Modified Eagle’s Medium (Sigma) neutralized to pH 7.2 with 0.1 mol/L ofNaOH. hBMSCs were mixed with the collagen solutions (1 mL) and plated into TCPSwells (12-well plate). Collagenwas allowed to gel for 2 h at 37 �C (2.6 mm thicknessand 22 mm dia.) which encapsulated the hBMSCs at a density of 2 � 104 cells/well(2�104 cells/cm3). hBMSCs in collagen gels were cultured 24 h in 1.5 mL of medium.Previous work showed that these collagen gel preparations can make fibrils ofdiameter of 435 nm [41].
2.3. PCL-SC (PCL spun-coat films)
PCL (poly(ε-caprolactone), relative molecular mass 80 000 g/mol, Sigma) solu-tions (10% by mass in glacial acetic acid) were spun-coated (1000 rpm, 30 s) ontoTCPS dishes (100mmdia.), air-dried, annealed at 60�C for 30 s and hot-punched intoPCL-SC film disks (20 mm dia.) [13]. PCL-SC disks were affixed to the bottom of 12-well TCPS plates with silicon grease, sterilized with ethylene oxide (AndersonProducts), degassed 1 d (house vacuum), incubated 2 d in complete medium (withserum), seeded with hBMSCs (2 � 104 cells/well) and cultured 24 h in medium(1.5 mL).
2.4. PCL-SNF (“Small” PCL nanofiber scaffolds)
PCL was dissolved at 10% by mass in 3:1 volume ratio chloroform: methanol for“Small” nanofiber scaffold fabrication (PCL-SNF). PCL-SNF were electrospun(18 gauge needle, 2 mL/h, 16.5 kV) onto 20 mm dia. TCPS disks [13], affixed to thebottom of 12-well TCPS plates with silicon grease, sterilized with ethylene oxide,degassed 1 d (house vacuum), incubated 2 d in complete medium (with serum),seeded with hBMSCs (2 � 104 cells/well) and cultured 24 h in medium (1.5 mL). Allnanofiber scaffold mats completely covered the TCPS so that hBMSCs seeded ontothe scaffolds came into contact with the nanofibers and did not touch the TCPSsubstrates below.
2.5. PCL-BNF (“Big” PCL nanofiber scaffolds)
PCL was dissolved at 30% by mass in 9:1 volume ratio chloroform: methanol for“Big” nanofiber scaffold fabrication (PCL-BNF). PCL-BNF were electrospun (18 gaugeneedle, 0.5 mL/h, 15 kV) onto 9 mm dia. TCPS disks [13], affixed to the bottom of 48-well TCPS plates with silicon grease, sterilized with ethylene oxide, degassed 1 d
(house vacuum), incubated 2 d in complete medium (with serum), seeded withhBMSCs (1 � 104 cells/well) and cultured 24 h in medium (0.5 mL).
2.6. PDLLA-NF (PDLLA nanofiber scaffolds)
PDLLA (poly(D, L-lactic acid), relative molecular mass 100 000 g/mol, SurModics)was dissolved at 15% by mass in hexafluoroisopropanol (1,1,1,3,3,3-hexasfluoro-2-propanol) for nanofiber scaffold fabrication (PDLLA-NF). PDLLA-NF were electro-spun (18 gauge needle, 1.5 mL/h, 15 kV) onto 9mm dia. TCPS disks [13], affixed to thebottom of 48-well TCPS plates with silicon grease, sterilized with ethylene oxide,degassed 2 d (house vacuum), pre-wetted 1 min under house vacuum in completemedium (with serum), seeded with hBMSCs (1�104 cells/well) and cultured 24 h inmedium (0.5 mL).
2.7. PCL-FFF (PCL freeform-fabricated scaffolds)
Freeform fabricated scaffolds (5 mm dia., 2 mm height, 300 mm strut diameter,500 mm strut spacing, 0�/90� lay-down pattern) made by precision extrusiondeposition using PCL (relative molecular mass 43,000e50,000 g/mol, Sigma) werepurchased from 3D Biotek (PCL-FFF) (13; 15; 16). PCL-FFF were put into 96-well non-tissue culture treated polystyrene plates, sterilized with ethylene oxide, degassed2 d (house vacuum), pre-wetted 1 min under house vacuum in complete medium(with serum), seeded with hBMSCs (5�103 cells/well) and cultured 24 h in medium(0.2 mL).
2.8. PEGTM (poly(ethylene glycol) tetramethacrylate gels)
Four-arm PEG (total relative molecular mass 20,000 g/mol, each arm 5000 g/mol, JenKem Technology) was mixed with methacrylic anhydride (20-fold molarexcess, Sigma) and microwaved (consumer model) for 10 min to prepare poly(-ethylene glycol) tetramethacrylate (PEGTM) [19]. Under sterile conditions, PEGTMsolution [50 mL of 10% by mass PEGTM and 0.05% by mass Irgacure 2959 photo-initiator (Ciba Chemicals) in 0.1 mol/L phosphate buffered saline (PBS)] containinghBMSCs (106 cells/mL) was placed in cylindrical Teflon molds (5 mm dia., 3 mmheight) and photopolymerized (365 nm light, 2 mW/cm2, 15 min). PEGTM gels withcells were cultured 4 h in 96-well TCPS plates with medium (0.2 mL) before fixationand staining.
2.9. Scaffold characterization
Scanning electron microscopy (SEM) was used to determine the fiber diameterfor PCL-SNF, PCL-BNF and PDLLA-NF and to determine strut diameter and strutspacing for PCL-FFF. Scaffolds were sputter-coated with gold for 90 s and imaged(SEM, 15 kV, Hitachi s-4700eII FE-SEM). Fiber diameters were determined by elec-tron micrograph image analysis using ImageJ software (NIH). PEGTM gel moduluswas measured by uniaxial static compressive load (strain rate of 0.03 mm/s, Dy-namic Mechanical Analyzer, TA Instruments, calculated from slope of the linear fitfor 5%e10% strain) [19]. Gravimetry was used to measure total porosity of PCL-FFFscaffolds using an equation, “Total porosity ¼ 1 � [(m/d)/v]”, where “m” is mass ofthe scaffold (g), “d” is PCL density (1.1 g/mL), and “v” is volume of scaffold (mL)(caliper measurements).
2.10. Fluorescent staining of hBMSCs and imaging
After indicated cell culture times, scaffolds with cells were washed with PBS andfixed with 3.7% by volume formaldehyde (in PBS) for 15 min, permeabilized with0.5% by volume Triton X-100 for 10 min, and then stained with Alexa Fluor 546-phalloidin (20 nmol/L) and 40 ,6-diamindo-2-phenylindole, dihydrochloride (DAPI,5 mg/L) in 2% by mass bovine serum albumin and 20 mmol/L Trizma-HCl buffer tostain for F-actin and nuclei, respectively (Invitrogen). For PEGTM, nuclei werestained with TOPRO-3 (carbocyanine monomer nucleic acid stain, 1 mmol/L) insteadof DAPI. hBMSCs were imaged by confocal microscopy using a 40�water immersionobjective (0.8 N.A.) on a Ziess LSM 510, or a 63�water immersion objective (0.9 N.A.)or a 20� dry objective (0.7 N.A.) on a Leica SP5 II confocal microscope. High reso-lution z-stacks of images (0.2e0.5 mm z-step size, except for cells in PEGTM, whichwas at 2 mm z-step size) of hBMSCs were captured for each scaffold type. Care wastaken to image single hBMSCs that were not near the scaffold boundaries and thatwere not touching other cells (one nucleus per object). Images were 8-bit with apixel resolution of 512 � 512 or greater (line averaging was n ¼ 2e4). Fifteen cellswere imaged for each scaffold type (n ¼ 15 cells).
2.11. Data sources
Confocal image stacks for hBMSCs in PCL-SC, Collagen Gel, PCL-SNF and PCL-BNFwere collected anew for the current work. Image stacks for hBMSCs in PDLLA-NF[13], PCL-FFF [16] and PEGTM [19] were collected previously and analyzed fordimensionality herein. Note that hBMSCs from the same donor were cultured underidentical conditions in all cases.
2.12. hBMSC image analysis: Cell Area and Z-depth
For calculating Cell Area and Z-Depth, z-stacks of tif images were compiled into3D renderings with x, y, and z dimensions using ImageJ (xeyez coordinates). Since
T.M. Farooque et al. / Biomaterials 35 (2014) 2558e25672560
cells in scaffolds had random orientations in 3D space, they were aligned first totheir major plane (within 5�) and second to their major axis to enable data com-parisons. For alignment to their major plane, 3D cell renderings were positionedsuch that the Cell Area in the xey view was maximized. This was done using the“Untilt” plugin for ImageJ [42]. The 3D renderings were further aligned to theirmajor axis such that the longest axis in the xey view was parallel to the y-axis. Thiswas performed manually in ImageJ. Note that it was not necessary to align PEGTMcells because they were nearly spherical and did not have a major axis or plane.
After aligning the 3D cell renderings, a new set of z-slice tifs was created usingthe ImageJ “Reslice” function. For determining Cell Area, a z-projection based onmaximum intensity was created, the z-projectionwas thresholded, and the Cell Areain the z-projectionwas determinedwith ImageJ. The selected threshold ranged from4 to 107 (selecting “dark background” in ImageJ) and varied due to the wide range ofsubstrates in which hBMSCs were imaged. Imaging an hBMSC on a partiallyreflective PCL-SC surface gave a much different background than an hBMSC imagedin a transparent hydrogel such as PEGTM or Collagen Gel. For determining Z-Depth,each tif image in the z-stack was rotated 90� on the y-axis using the ImageJ “3DProject” function to create the zey view and thresholded. Themaximum thickness ofthe cell along the z-axis in the zey view was measured in ImageJ using the “mini-mum Feret diameter” measurement (defined herein as “Z-Depth”).
2.13. hBMSC image analysis: cell volume
In order to measure the cell volume, 3D renderings (xeyez coordinates) of z-stacks were aligned first to their major plane and second to their major axis using acombination of “Untilt” and manual rotation as described above. After aligning the3D cell renderings, a new z-stack of tifs was created by re-slicing the renderingdown the z-axis using the “Reslice” function in ImageJ. The tif images werethresholded between 3 and 83 (selecting “dark background” in ImageJ) and the CellArea in each slice was measured in ImageJ. The selected background varied due tothe wide range of substrates in which hBMSCs were imaged. For determining cellvolume, the “Cell Area in each slice” was multiplied by the “slice thickness”, andthese products were summed for each slice in the z-stack.
2.14. hBMSC image analysis: gyration tensor
A gyration tensor calculation generates a characteristic ellipsoid that approxi-mates the average spatial distribution of a cloud of data points [43e47] and has beenused previously to characterize the shape of polymers [43,44,47], peptides [45] andmicelles [46] and red blood cells [48]. Herein, we develop a new gyration tensorapplication in assessing cell dimensionality. For calculation of the principal mo-ments of the gyration tensor, no cell alignment was required (neither un-tilting normanual rotation). The original cell image z-stack was thresholded to create binaryimages. The threshold range was between 1 and 72 (selecting “dark background”image in ImageJ) and varied due to the wide range of substrates in which hBMSCswere imaged. For each z-slice, cell outlines were created and the position vectors, r(converted to length units), were generated for each voxel in the 3D cell outline. Tocalculate the gyration tensors, Sij, the position vectors of each cell were centeredabout its mass (CM) to measure the deviation of the cell from its center and toneglect effects due to cell orientation:
Sij ¼ 1N
XN
k¼1
�rðkÞi � rðCMÞ
i
��rðkÞj � rðCMÞ
j
�; S ¼
0@
Sxx Sxy SxzSyx Syy SyzSzx Szy Szz
1A (1)
The principal moments (eigenvalues), L1, L2, and L3, of the gyration tensor, S, werecalculated, where L1 < L2 < L3. The square roots of the eigenvalues ðL0:51 ; L0:52 ; L0:53 Þ arethe characteristic semi-axis lengths (radii) of the ellipsoid that describes the shape ofthe cell, while the eigenvectors of S describe the cell’s original orientation.
For generating cell imageswith overlaid gyration tensors, the surface renderings ofhBMSCs generated in ImageJ using the “3D Viewer” plugin function [49] wereexported as “wavefronts” (a series of a set of points along the same surface) anduploaded into Matlab (Mathworks, Inc.) to recreate the surface renderings of the cells.In addition, the eigenvalues and eigenvectors of the gyration tensor were uploadedinto Matlab to plot the characteristic ellipsoid of hBMSCs over the cell rendering.
2.15. Image analysis: control ellipsoids
In order to provide perspective for 3D cell shape measurements, analyses werealso performed on control ellipsoids, the simplest of which were 2D “Disk”, 3D“Sphere” and 1D “Rod” structures. The relative lengths of the 3 semi-axes repre-senting these control ellipsoids were 1:16:16 for Disk, 16:16:16 for Sphere and1:1:16 for Rod. Coordinates (xeyez) for the control shapes were generated in ImageJand shape analysis was conducted on the control ellipsoids as described above forthe hBMSCs. For control ellipsoids, values with units (Cell Area, Z-Depth, Cell Vol-ume and Li) were not meaningful since the size of the control ellipsoids was arbi-trary. However, the unit-less values that are ratios ðL0:51 =L0:53 ; L0:52 =L0:53 Þ can bedirectly compared to the values for hBMSCs. Additional control ellipsoids (15 intotal) with systematically varied dimensions were used to construct a “Dimen-sionality Matrix” as described in the Results.
2.16. Statistics
Fifteen cells were imaged and analyzed for each of the seven substrates exam-ined (n ¼ 15 cells). Data is presented as mean � standard deviation (S.D.) and sig-nificancewas defined as p< 0.05 using one-way analysis of variance (1-way ANOVA)with Tukey’s test for multiple comparisons.
3. Results
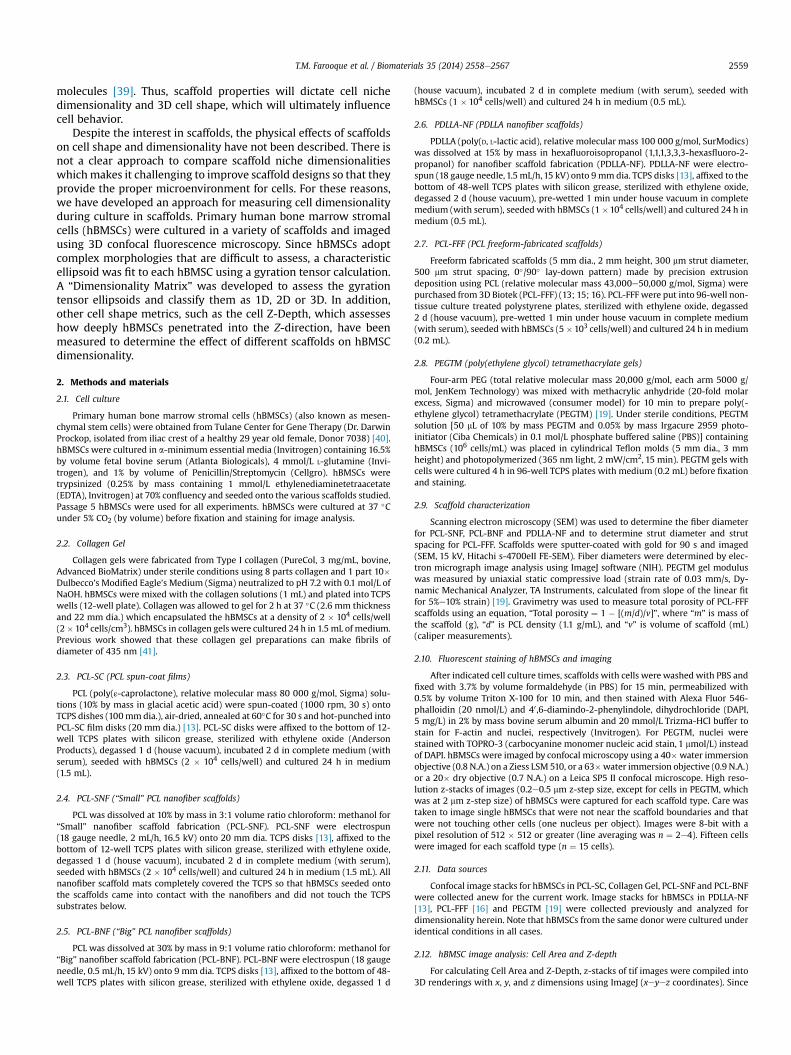
hBMSC dimensionality was assessed for the planar substrate(PCL-SC) and 6 scaffolds (Collagen Gel, PCL-SNF, PCL-BNF, PDLLA-NF, PCL-FFF, PEGTM) (Fig. 1, Table 1). hBMSCs are a well-characterized adult stem cell preparation that can become osteo-genic, adipogenic and chondrogenic [40], and hBMSCs are theleading stem cell candidate for skeletal tissue engineering [50]. Forscaffolds, 3D collagen gels (Collagen Gel) are of interest since theyare the most widely used 3D cell culture model [3,51]. Cells weremixed with the collagen prior to gelation to suspend them in 3D.“Small” [PCL-SNF, poly(ε-caprolactone) small nanofibers] and “big”(PCL-BNF) diameter nanofiber scaffolds (Table 1) were included todetermine effects of nanofiber diameter on dimensionality. Nano-fiber scaffolds are of interest since they support BMSC osteogenicdifferentiation [13,52e55] and mimic the structure of extracellularmatrix (ECM) [12,14,56]. Nanofiber scaffolds made from a secondpolymer, PDLLA-NF, were used to determine how polymer chem-istry influenced dimensionality. Freeform fabricated PCL scaffolds,PCL-FFF, consist of 300 mm PCL struts stacked upon one another inalternating 0� and 90� angles. PCL-FFF scaffolds have a reproduciblestructure [15] and serve as a reference material [57]. For a PCLplanar control, spun-coat PCL films (PCL-SC) were included. Finally,poly(ethylene glycol) tetramethacrylate gels (PEGTM) were usedsince they are a synthetic hydrogel scaffold that can induce osteo-genic differentiation of hBMSCs [19]. A culture time of 24 h wasused for all scaffolds (except PEGTM). One day is sufficient for thehBMSCs to attain a stable morphology, but short enough that theydon’t have time to build their own ECM. For PEGTM, hBMSCs werecultured 4 h and previous work showed that hBMSC shape did notchange from 4 h through 2 weeks of culture [19].
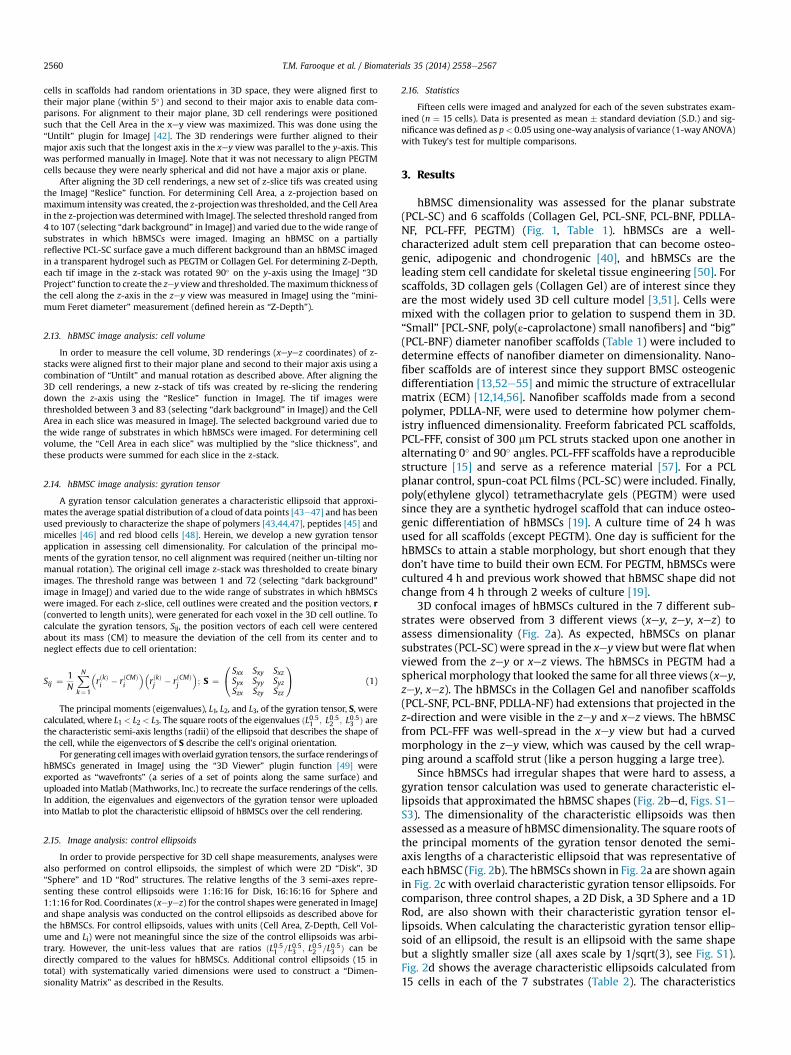
3D confocal images of hBMSCs cultured in the 7 different sub-strates were observed from 3 different views (xey, zey, xez) toassess dimensionality (Fig. 2a). As expected, hBMSCs on planarsubstrates (PCL-SC) were spread in the xey view but were flat whenviewed from the zey or xez views. The hBMSCs in PEGTM had aspherical morphology that looked the same for all three views (xey,zey, xez). The hBMSCs in the Collagen Gel and nanofiber scaffolds(PCL-SNF, PCL-BNF, PDLLA-NF) had extensions that projected in thez-direction and were visible in the zey and xez views. The hBMSCfrom PCL-FFF was well-spread in the xey view but had a curvedmorphology in the zey view, which was caused by the cell wrap-ping around a scaffold strut (like a person hugging a large tree).
Since hBMSCs had irregular shapes that were hard to assess, agyration tensor calculation was used to generate characteristic el-lipsoids that approximated the hBMSC shapes (Fig. 2bed, Figs. S1eS3). The dimensionality of the characteristic ellipsoids was thenassessed as ameasure of hBMSC dimensionality. The square roots ofthe principal moments of the gyration tensor denoted the semi-axis lengths of a characteristic ellipsoid that was representative ofeach hBMSC (Fig. 2b). The hBMSCs shown in Fig. 2a are shown againin Fig. 2c with overlaid characteristic gyration tensor ellipsoids. Forcomparison, three control shapes, a 2D Disk, a 3D Sphere and a 1DRod, are also shown with their characteristic gyration tensor el-lipsoids. When calculating the characteristic gyration tensor ellip-soid of an ellipsoid, the result is an ellipsoid with the same shapebut a slightly smaller size (all axes scale by 1/sqrt(3), see Fig. S1).Fig. 2d shows the average characteristic ellipsoids calculated from15 cells in each of the 7 substrates (Table 2). The characteristics
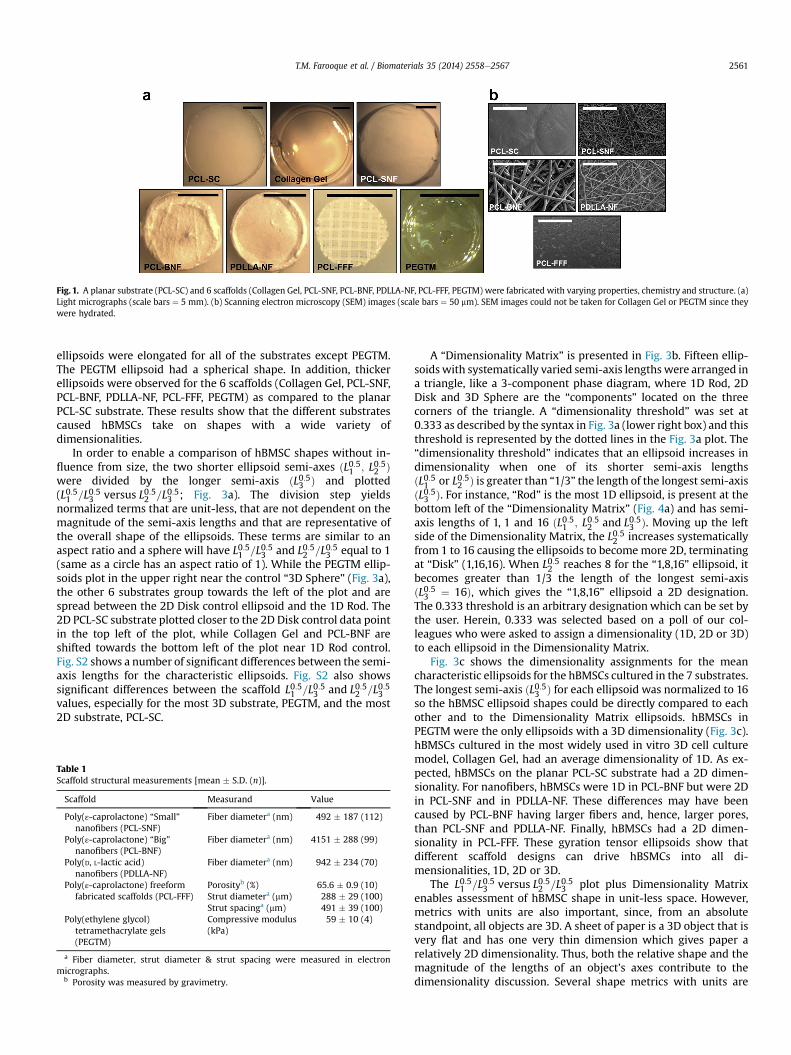
Fig. 1. A planar substrate (PCL-SC) and 6 scaffolds (Collagen Gel, PCL-SNF, PCL-BNF, PDLLA-NF, PCL-FFF, PEGTM) were fabricated with varying properties, chemistry and structure. (a)Light micrographs (scale bars ¼ 5 mm). (b) Scanning electron microscopy (SEM) images (scale bars ¼ 50 mm). SEM images could not be taken for Collagen Gel or PEGTM since theywere hydrated.
T.M. Farooque et al. / Biomaterials 35 (2014) 2558e2567 2561
ellipsoids were elongated for all of the substrates except PEGTM.The PEGTM ellipsoid had a spherical shape. In addition, thickerellipsoids were observed for the 6 scaffolds (Collagen Gel, PCL-SNF,PCL-BNF, PDLLA-NF, PCL-FFF, PEGTM) as compared to the planarPCL-SC substrate. These results show that the different substratescaused hBMSCs take on shapes with a wide variety ofdimensionalities.
In order to enable a comparison of hBMSC shapes without in-fluence from size, the two shorter ellipsoid semi-axes ðL0:51 ; L0:52 Þwere divided by the longer semi-axis ðL0:53 Þ and plotted(L0:51 =L0:53 versus L0:52 =L0:53 ; Fig. 3a). The division step yieldsnormalized terms that are unit-less, that are not dependent on themagnitude of the semi-axis lengths and that are representative ofthe overall shape of the ellipsoids. These terms are similar to anaspect ratio and a sphere will have L0:51 =L0:53 and L0:52 =L0:53 equal to 1(same as a circle has an aspect ratio of 1). While the PEGTM ellip-soids plot in the upper right near the control “3D Sphere” (Fig. 3a),the other 6 substrates group towards the left of the plot and arespread between the 2D Disk control ellipsoid and the 1D Rod. The2D PCL-SC substrate plotted closer to the 2D Disk control data pointin the top left of the plot, while Collagen Gel and PCL-BNF areshifted towards the bottom left of the plot near 1D Rod control.Fig. S2 shows a number of significant differences between the semi-axis lengths for the characteristic ellipsoids. Fig. S2 also showssignificant differences between the scaffold L0:51 =L0:53 and L0:52 =L0:53values, especially for the most 3D substrate, PEGTM, and the most2D substrate, PCL-SC.
Table 1Scaffold structural measurements [mean � S.D. (n)].
Scaffold Measurand Value
Poly(ε-caprolactone) “Small”nanofibers (PCL-SNF)
Fiber diametera (nm) 492 � 187 (112)
Poly(ε-caprolactone) “Big”nanofibers (PCL-BNF)
Fiber diametera (nm) 4151 � 288 (99)
Poly(D, L-lactic acid)nanofibers (PDLLA-NF)
Fiber diametera (nm) 942 � 234 (70)
Poly(ε-caprolactone) freeformfabricated scaffolds (PCL-FFF)
Porosityb (%) 65.6 � 0.9 (10)Strut diametera (mm) 288 � 29 (100)Strut spacinga (mm) 491 � 39 (100)
Poly(ethylene glycol)tetramethacrylate gels(PEGTM)
Compressive modulus(kPa)
59 � 10 (4)
a Fiber diameter, strut diameter & strut spacing were measured in electronmicrographs.
b Porosity was measured by gravimetry.
A “Dimensionality Matrix” is presented in Fig. 3b. Fifteen ellip-soidswith systematically varied semi-axis lengths were arranged ina triangle, like a 3-component phase diagram, where 1D Rod, 2DDisk and 3D Sphere are the “components” located on the threecorners of the triangle. A “dimensionality threshold” was set at0.333 as described by the syntax in Fig. 3a (lower right box) and thisthreshold is represented by the dotted lines in the Fig. 3a plot. The“dimensionality threshold” indicates that an ellipsoid increases indimensionality when one of its shorter semi-axis lengthsðL0:51 or L0:52 Þ is greater than “1/3” the length of the longest semi-axisðL0:53 Þ. For instance, “Rod” is the most 1D ellipsoid, is present at thebottom left of the “Dimensionality Matrix” (Fig. 4a) and has semi-axis lengths of 1, 1 and 16 ðL0:51 ; L0:52 and L0:53 Þ. Moving up the leftside of the Dimensionality Matrix, the L0:52 increases systematicallyfrom 1 to 16 causing the ellipsoids to become more 2D, terminatingat “Disk” (1,16,16). When L0:52 reaches 8 for the “1,8,16” ellipsoid, itbecomes greater than 1/3 the length of the longest semi-axisðL0:53 ¼ 16Þ, which gives the “1,8,16” ellipsoid a 2D designation.The 0.333 threshold is an arbitrary designation which can be set bythe user. Herein, 0.333 was selected based on a poll of our col-leagues who were asked to assign a dimensionality (1D, 2D or 3D)to each ellipsoid in the Dimensionality Matrix.
Fig. 3c shows the dimensionality assignments for the meancharacteristic ellipsoids for the hBMSCs cultured in the 7 substrates.The longest semi-axis ðL0:53 Þ for each ellipsoid was normalized to 16so the hBMSC ellipsoid shapes could be directly compared to eachother and to the Dimensionality Matrix ellipsoids. hBMSCs inPEGTM were the only ellipsoids with a 3D dimensionality (Fig. 3c).hBMSCs cultured in the most widely used in vitro 3D cell culturemodel, Collagen Gel, had an average dimensionality of 1D. As ex-pected, hBMSCs on the planar PCL-SC substrate had a 2D dimen-sionality. For nanofibers, hBMSCs were 1D in PCL-BNF but were 2Din PCL-SNF and in PDLLA-NF. These differences may have beencaused by PCL-BNF having larger fibers and, hence, larger pores,than PCL-SNF and PDLLA-NF. Finally, hBMSCs had a 2D dimen-sionality in PCL-FFF. These gyration tensor ellipsoids show thatdifferent scaffold designs can drive hBSMCs into all di-mensionalities, 1D, 2D or 3D.
The L0:51 =L0:53 versus L0:52 =L0:53 plot plus Dimensionality Matrixenables assessment of hBMSC shape in unit-less space. However,metrics with units are also important, since, from an absolutestandpoint, all objects are 3D. A sheet of paper is a 3D object that isvery flat and has one very thin dimension which gives paper arelatively 2D dimensionality. Thus, both the relative shape and themagnitude of the lengths of an object’s axes contribute to thedimensionality discussion. Several shape metrics with units are
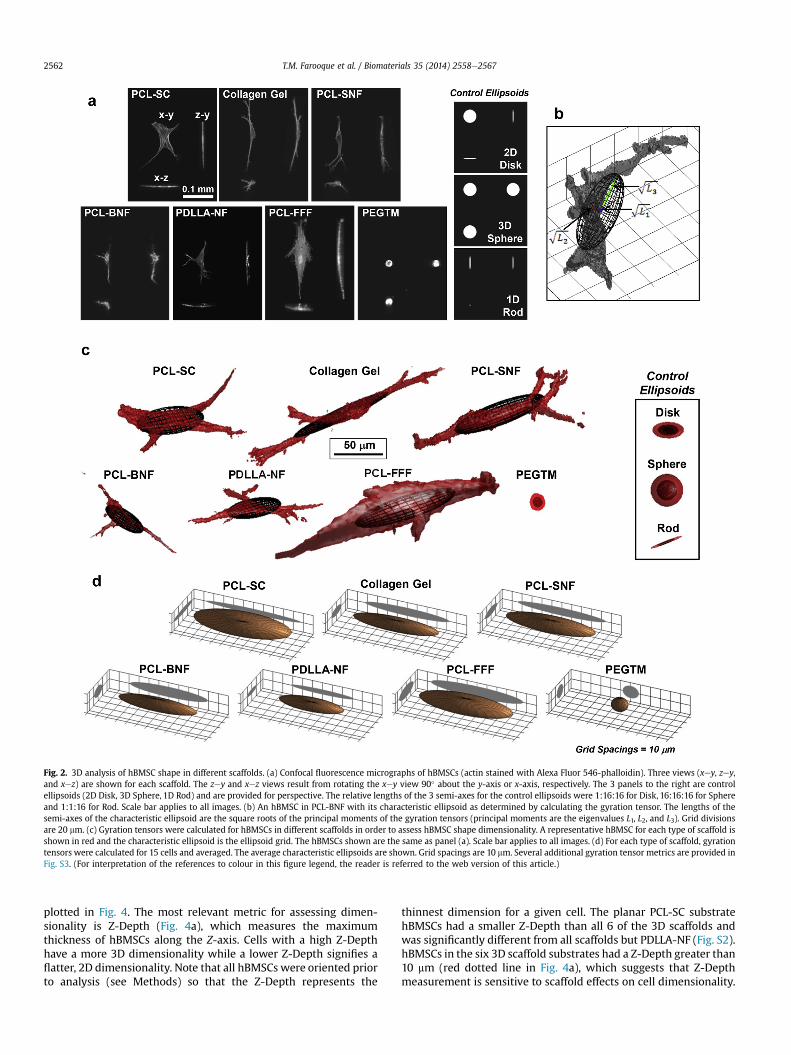
Fig. 2. 3D analysis of hBMSC shape in different scaffolds. (a) Confocal fluorescence micrographs of hBMSCs (actin stained with Alexa Fluor 546-phalloidin). Three views (xey, zey,and xez) are shown for each scaffold. The zey and xez views result from rotating the xey view 90� about the y-axis or x-axis, respectively. The 3 panels to the right are controlellipsoids (2D Disk, 3D Sphere, 1D Rod) and are provided for perspective. The relative lengths of the 3 semi-axes for the control ellipsoids were 1:16:16 for Disk, 16:16:16 for Sphereand 1:1:16 for Rod. Scale bar applies to all images. (b) An hBMSC in PCL-BNF with its characteristic ellipsoid as determined by calculating the gyration tensor. The lengths of thesemi-axes of the characteristic ellipsoid are the square roots of the principal moments of the gyration tensors (principal moments are the eigenvalues L1, L2, and L3). Grid divisionsare 20 mm. (c) Gyration tensors were calculated for hBMSCs in different scaffolds in order to assess hBMSC shape dimensionality. A representative hBMSC for each type of scaffold isshown in red and the characteristic ellipsoid is the ellipsoid grid. The hBMSCs shown are the same as panel (a). Scale bar applies to all images. (d) For each type of scaffold, gyrationtensors were calculated for 15 cells and averaged. The average characteristic ellipsoids are shown. Grid spacings are 10 mm. Several additional gyration tensor metrics are provided inFig. S3. (For interpretation of the references to colour in this figure legend, the reader is referred to the web version of this article.)
T.M. Farooque et al. / Biomaterials 35 (2014) 2558e25672562
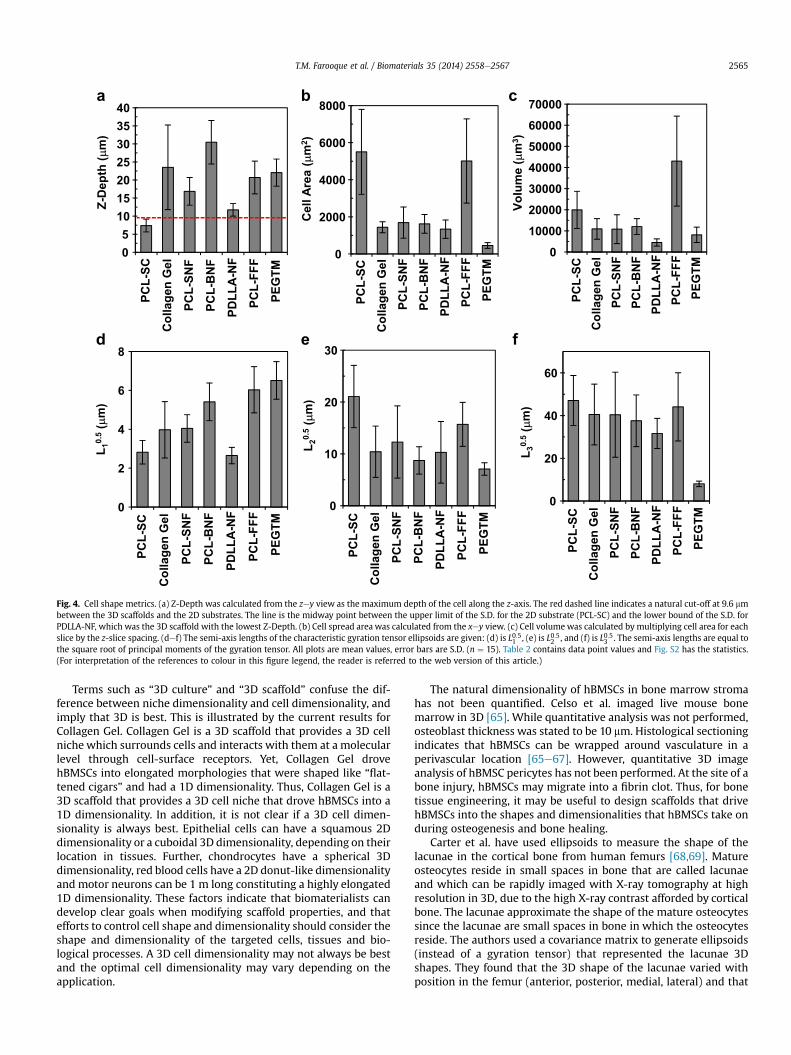
plotted in Fig. 4. The most relevant metric for assessing dimen-sionality is Z-Depth (Fig. 4a), which measures the maximumthickness of hBMSCs along the Z-axis. Cells with a high Z-Depthhave a more 3D dimensionality while a lower Z-Depth signifies aflatter, 2D dimensionality. Note that all hBMSCs were oriented priorto analysis (see Methods) so that the Z-Depth represents the
thinnest dimension for a given cell. The planar PCL-SC substratehBMSCs had a smaller Z-Depth than all 6 of the 3D scaffolds andwas significantly different from all scaffolds but PDLLA-NF (Fig. S2).hBMSCs in the six 3D scaffold substrates had a Z-Depth greater than10 mm (red dotted line in Fig. 4a), which suggests that Z-Depthmeasurement is sensitive to scaffold effects on cell dimensionality.
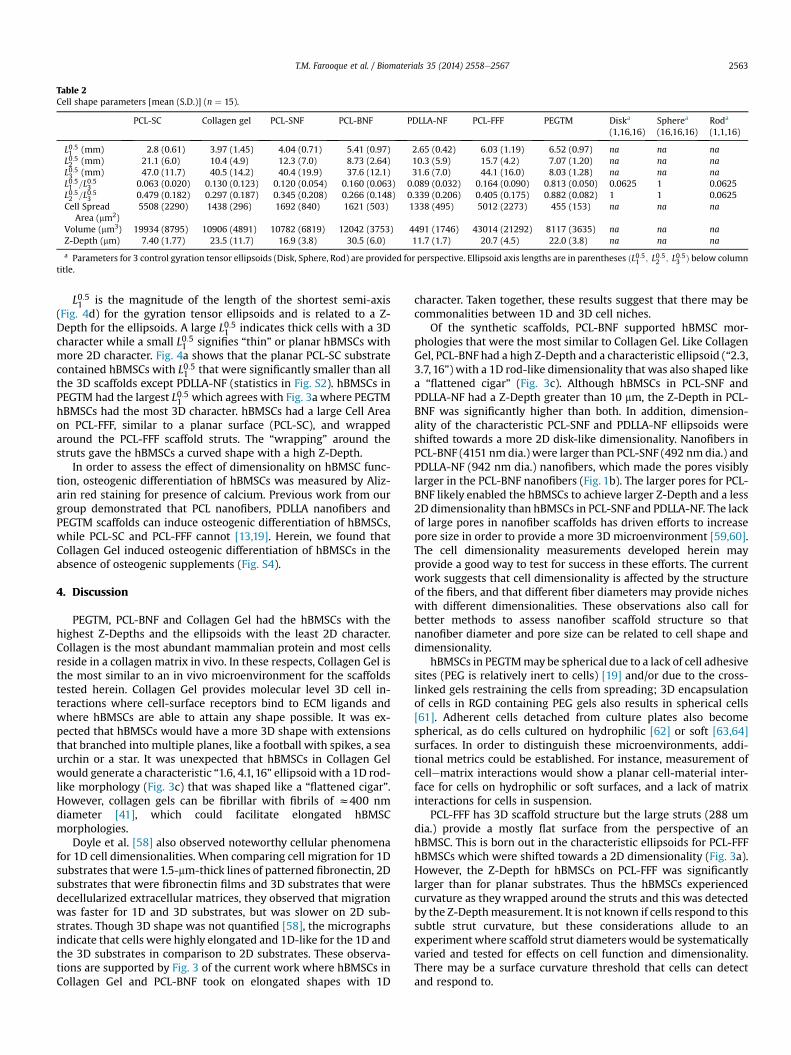
Table 2Cell shape parameters [mean (S.D.)] (n ¼ 15).
PCL-SC Collagen gel PCL-SNF PCL-BNF PDLLA-NF PCL-FFF PEGTM Diska
(1,16,16)Spherea
(16,16,16)Roda
(1,1,16)
L0:51 (mm) 2.8 (0.61) 3.97 (1.45) 4.04 (0.71) 5.41 (0.97) 2.65 (0.42) 6.03 (1.19) 6.52 (0.97) na na naL0:52 (mm) 21.1 (6.0) 10.4 (4.9) 12.3 (7.0) 8.73 (2.64) 10.3 (5.9) 15.7 (4.2) 7.07 (1.20) na na naL0:53 (mm) 47.0 (11.7) 40.5 (14.2) 40.4 (19.9) 37.6 (12.1) 31.6 (7.0) 44.1 (16.0) 8.03 (1.28) na na naL0:51 =L0:53 0.063 (0.020) 0.130 (0.123) 0.120 (0.054) 0.160 (0.063) 0.089 (0.032) 0.164 (0.090) 0.813 (0.050) 0.0625 1 0.0625L0:52 =L0:53 0.479 (0.182) 0.297 (0.187) 0.345 (0.208) 0.266 (0.148) 0.339 (0.206) 0.405 (0.175) 0.882 (0.082) 1 1 0.0625Cell Spread
Area (mm2)5508 (2290) 1438 (296) 1692 (840) 1621 (503) 1338 (495) 5012 (2273) 455 (153) na na na
Volume (mm3) 19934 (8795) 10906 (4891) 10782 (6819) 12042 (3753) 4491 (1746) 43014 (21292) 8117 (3635) na na naZ-Depth (mm) 7.40 (1.77) 23.5 (11.7) 16.9 (3.8) 30.5 (6.0) 11.7 (1.7) 20.7 (4.5) 22.0 (3.8) na na na
a Parameters for 3 control gyration tensor ellipsoids (Disk, Sphere, Rod) are provided for perspective. Ellipsoid axis lengths are in parentheses ðL0:51 ; L0:52 ; L0:53 Þ below columntitle.
T.M. Farooque et al. / Biomaterials 35 (2014) 2558e2567 2563
L0:51 is the magnitude of the length of the shortest semi-axis(Fig. 4d) for the gyration tensor ellipsoids and is related to a Z-Depth for the ellipsoids. A large L0:51 indicates thick cells with a 3Dcharacter while a small L0:51 signifies “thin” or planar hBMSCs withmore 2D character. Fig. 4a shows that the planar PCL-SC substratecontained hBMSCs with L0:51 that were significantly smaller than allthe 3D scaffolds except PDLLA-NF (statistics in Fig. S2). hBMSCs inPEGTM had the largest L0:51 which agrees with Fig. 3a where PEGTMhBMSCs had the most 3D character. hBMSCs had a large Cell Areaon PCL-FFF, similar to a planar surface (PCL-SC), and wrappedaround the PCL-FFF scaffold struts. The “wrapping” around thestruts gave the hBMSCs a curved shape with a high Z-Depth.
In order to assess the effect of dimensionality on hBMSC func-tion, osteogenic differentiation of hBMSCs was measured by Aliz-arin red staining for presence of calcium. Previous work from ourgroup demonstrated that PCL nanofibers, PDLLA nanofibers andPEGTM scaffolds can induce osteogenic differentiation of hBMSCs,while PCL-SC and PCL-FFF cannot [13,19]. Herein, we found thatCollagen Gel induced osteogenic differentiation of hBMSCs in theabsence of osteogenic supplements (Fig. S4).
4. Discussion
PEGTM, PCL-BNF and Collagen Gel had the hBMSCs with thehighest Z-Depths and the ellipsoids with the least 2D character.Collagen is the most abundant mammalian protein and most cellsreside in a collagen matrix in vivo. In these respects, Collagen Gel isthe most similar to an in vivo microenvironment for the scaffoldstested herein. Collagen Gel provides molecular level 3D cell in-teractions where cell-surface receptors bind to ECM ligands andwhere hBMSCs are able to attain any shape possible. It was ex-pected that hBMSCs would have a more 3D shape with extensionsthat branched into multiple planes, like a football with spikes, a seaurchin or a star. It was unexpected that hBMSCs in Collagen Gelwould generate a characteristic “1.6, 4.1, 16” ellipsoid with a 1D rod-like morphology (Fig. 3c) that was shaped like a “flattened cigar”.However, collagen gels can be fibrillar with fibrils of z400 nmdiameter [41], which could facilitate elongated hBMSCmorphologies.
Doyle et al. [58] also observed noteworthy cellular phenomenafor 1D cell dimensionalities. When comparing cell migration for 1Dsubstrates that were 1.5-mm-thick lines of patterned fibronectin, 2Dsubstrates that were fibronectin films and 3D substrates that weredecellularized extracellular matrices, they observed that migrationwas faster for 1D and 3D substrates, but was slower on 2D sub-strates. Though 3D shape was not quantified [58], the micrographsindicate that cells were highly elongated and 1D-like for the 1D andthe 3D substrates in comparison to 2D substrates. These observa-tions are supported by Fig. 3 of the current work where hBMSCs inCollagen Gel and PCL-BNF took on elongated shapes with 1D
character. Taken together, these results suggest that there may becommonalities between 1D and 3D cell niches.
Of the synthetic scaffolds, PCL-BNF supported hBMSC mor-phologies that were the most similar to Collagen Gel. Like CollagenGel, PCL-BNF had a high Z-Depth and a characteristic ellipsoid (“2.3,3.7, 16”) with a 1D rod-like dimensionality that was also shaped likea “flattened cigar” (Fig. 3c). Although hBMSCs in PCL-SNF andPDLLA-NF had a Z-Depth greater than 10 mm, the Z-Depth in PCL-BNF was significantly higher than both. In addition, dimension-ality of the characteristic PCL-SNF and PDLLA-NF ellipsoids wereshifted towards a more 2D disk-like dimensionality. Nanofibers inPCL-BNF (4151 nm dia.) were larger than PCL-SNF (492 nm dia.) andPDLLA-NF (942 nm dia.) nanofibers, which made the pores visiblylarger in the PCL-BNF nanofibers (Fig. 1b). The larger pores for PCL-BNF likely enabled the hBMSCs to achieve larger Z-Depth and a less2D dimensionality than hBMSCs in PCL-SNF and PDLLA-NF. The lackof large pores in nanofiber scaffolds has driven efforts to increasepore size in order to provide a more 3D microenvironment [59,60].The cell dimensionality measurements developed herein mayprovide a good way to test for success in these efforts. The currentwork suggests that cell dimensionality is affected by the structureof the fibers, and that different fiber diameters may provide nicheswith different dimensionalities. These observations also call forbetter methods to assess nanofiber scaffold structure so thatnanofiber diameter and pore size can be related to cell shape anddimensionality.
hBMSCs in PEGTMmay be spherical due to a lack of cell adhesivesites (PEG is relatively inert to cells) [19] and/or due to the cross-linked gels restraining the cells from spreading; 3D encapsulationof cells in RGD containing PEG gels also results in spherical cells[61]. Adherent cells detached from culture plates also becomespherical, as do cells cultured on hydrophilic [62] or soft [63,64]surfaces. In order to distinguish these microenvironments, addi-tional metrics could be established. For instance, measurement ofcellematrix interactions would show a planar cell-material inter-face for cells on hydrophilic or soft surfaces, and a lack of matrixinteractions for cells in suspension.
PCL-FFF has 3D scaffold structure but the large struts (288 umdia.) provide a mostly flat surface from the perspective of anhBMSC. This is born out in the characteristic ellipsoids for PCL-FFFhBMSCs which were shifted towards a 2D dimensionality (Fig. 3a).However, the Z-Depth for hBMSCs on PCL-FFF was significantlylarger than for planar substrates. Thus the hBMSCs experiencedcurvature as they wrapped around the struts and this was detectedby the Z-Depthmeasurement. It is not known if cells respond to thissubtle strut curvature, but these considerations allude to anexperiment where scaffold strut diameters would be systematicallyvaried and tested for effects on cell function and dimensionality.There may be a surface curvature threshold that cells can detectand respond to.
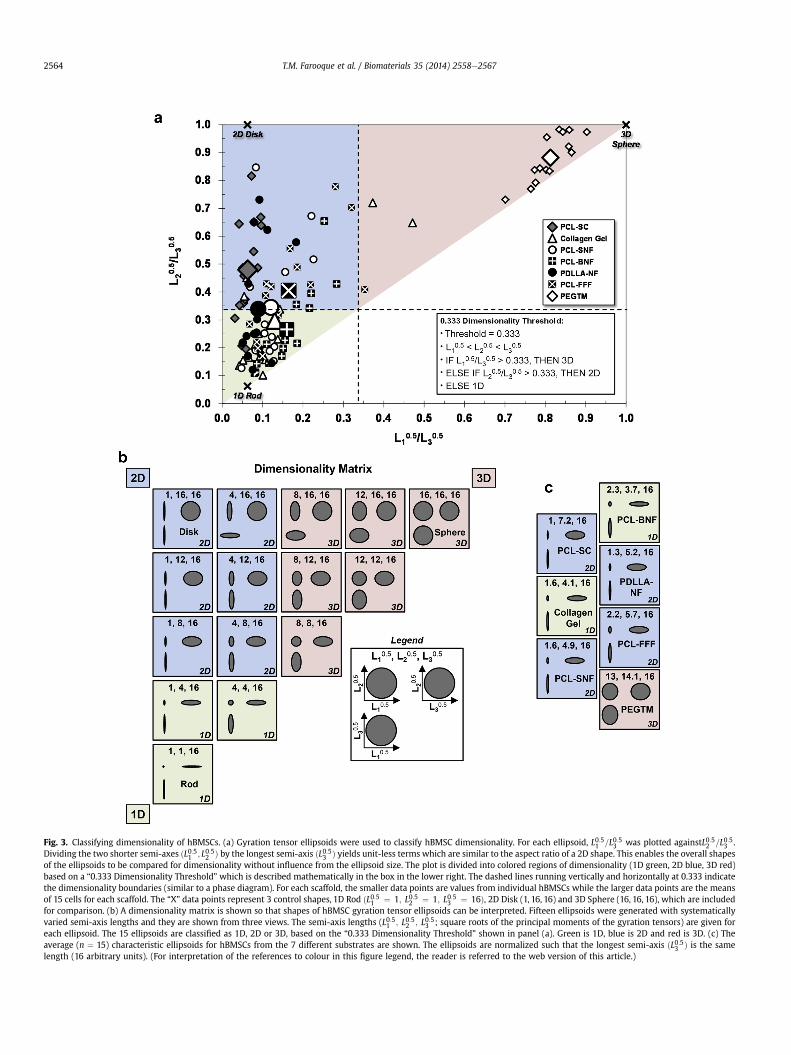
Fig. 3. Classifying dimensionality of hBMSCs. (a) Gyration tensor ellipsoids were used to classify hBMSC dimensionality. For each ellipsoid, L0:51 =L0:53 was plotted againstL0:52 =L0:53 .Dividing the two shorter semi-axes ðL0:51 ; L0:52 Þ by the longest semi-axis ðL0:53 Þ yields unit-less terms which are similar to the aspect ratio of a 2D shape. This enables the overall shapesof the ellipsoids to be compared for dimensionality without influence from the ellipsoid size. The plot is divided into colored regions of dimensionality (1D green, 2D blue, 3D red)based on a “0.333 Dimensionality Threshold” which is described mathematically in the box in the lower right. The dashed lines running vertically and horizontally at 0.333 indicatethe dimensionality boundaries (similar to a phase diagram). For each scaffold, the smaller data points are values from individual hBMSCs while the larger data points are the meansof 15 cells for each scaffold. The “X” data points represent 3 control shapes, 1D Rod ðL0:51 ¼ 1; L0:52 ¼ 1; L0:53 ¼ 16Þ, 2D Disk (1, 16, 16) and 3D Sphere (16, 16, 16), which are includedfor comparison. (b) A dimensionality matrix is shown so that shapes of hBMSC gyration tensor ellipsoids can be interpreted. Fifteen ellipsoids were generated with systematicallyvaried semi-axis lengths and they are shown from three views. The semi-axis lengths (L0:51 ; L0:52 ; L0:53 ; square roots of the principal moments of the gyration tensors) are given foreach ellipsoid. The 15 ellipsoids are classified as 1D, 2D or 3D, based on the “0.333 Dimensionality Threshold” shown in panel (a). Green is 1D, blue is 2D and red is 3D. (c) Theaverage (n ¼ 15) characteristic ellipsoids for hBMSCs from the 7 different substrates are shown. The ellipsoids are normalized such that the longest semi-axis ðL0:53 Þ is the samelength (16 arbitrary units). (For interpretation of the references to colour in this figure legend, the reader is referred to the web version of this article.)
T.M. Farooque et al. / Biomaterials 35 (2014) 2558e25672564
0
2
4
6
8
PCL-
SC
Col
lage
n G
el
PCL-
SNF
PCL-
BN
F
PDLL
A-N
F
PCL-
FFF
PEG
TM
L 10.
5(µµ
m)
0
10
20
30PC
L-SC
Col
lage
n G
el
PCL-
SNF
PCL-
BN
F
PDLL
A-N
F
PCL-
FFF
PEG
TM
L 20.
5(µ
m)
0
20
40
60
PCL-
SC
Col
lage
n G
el
PCL-
SNF
PCL-
BN
F
PDLL
A-N
F
PCL-
FFF
PEG
TM
L 30.
5( µ
m)
0
10000
20000
30000
40000
50000
60000
70000
PCL-
SCC
olla
gen
Gel
PCL-
SNF
PCL-
BN
FPD
LLA
-NF
PCL-
FFF
PEG
TM
Volu
me
(µm
3 )
05
10152025303540
PCL-
SC
Col
lage
n G
el
PCL-
SNF
PCL-
BN
F
PDLL
A-N
F
PCL-
FFF
PEG
TM
Z-D
epth
(µm
)
0
2000
4000
6000
8000
PCL-
SC
Col
lage
n G
el
PCL-
SNF
PCL-
BN
F
PDLL
A-N
F
PCL-
FFF
PEG
TM
Cel
l Are
a (µ
m2 )
d e f
b ca
Fig. 4. Cell shape metrics. (a) Z-Depth was calculated from the zey view as the maximum depth of the cell along the z-axis. The red dashed line indicates a natural cut-off at 9.6 mmbetween the 3D scaffolds and the 2D substrates. The line is the midway point between the upper limit of the S.D. for the 2D substrate (PCL-SC) and the lower bound of the S.D. forPDLLA-NF, which was the 3D scaffold with the lowest Z-Depth. (b) Cell spread area was calculated from the xey view. (c) Cell volume was calculated by multiplying cell area for eachslice by the z-slice spacing. (def) The semi-axis lengths of the characteristic gyration tensor ellipsoids are given: (d) is L0:51 , (e) is L0:52 , and (f) is L0:53 . The semi-axis lengths are equal tothe square root of principal moments of the gyration tensor. All plots are mean values, error bars are S.D. (n ¼ 15). Table 2 contains data point values and Fig. S2 has the statistics.(For interpretation of the references to colour in this figure legend, the reader is referred to the web version of this article.)
T.M. Farooque et al. / Biomaterials 35 (2014) 2558e2567 2565
Terms such as “3D culture” and “3D scaffold” confuse the dif-ference between niche dimensionality and cell dimensionality, andimply that 3D is best. This is illustrated by the current results forCollagen Gel. Collagen Gel is a 3D scaffold that provides a 3D cellniche which surrounds cells and interacts with them at a molecularlevel through cell-surface receptors. Yet, Collagen Gel drovehBMSCs into elongated morphologies that were shaped like “flat-tened cigars” and had a 1D dimensionality. Thus, Collagen Gel is a3D scaffold that provides a 3D cell niche that drove hBMSCs into a1D dimensionality. In addition, it is not clear if a 3D cell dimen-sionality is always best. Epithelial cells can have a squamous 2Ddimensionality or a cuboidal 3D dimensionality, depending on theirlocation in tissues. Further, chondrocytes have a spherical 3Ddimensionality, red blood cells have a 2D donut-like dimensionalityand motor neurons can be 1 m long constituting a highly elongated1D dimensionality. These factors indicate that biomaterialists candevelop clear goals when modifying scaffold properties, and thatefforts to control cell shape and dimensionality should consider theshape and dimensionality of the targeted cells, tissues and bio-logical processes. A 3D cell dimensionality may not always be bestand the optimal cell dimensionality may vary depending on theapplication.
The natural dimensionality of hBMSCs in bone marrow stromahas not been quantified. Celso et al. imaged live mouse bonemarrow in 3D [65]. While quantitative analysis was not performed,osteoblast thickness was stated to be 10 mm. Histological sectioningindicates that hBMSCs can be wrapped around vasculature in aperivascular location [65e67]. However, quantitative 3D imageanalysis of hBMSC pericytes has not been performed. At the site of abone injury, hBMSCs may migrate into a fibrin clot. Thus, for bonetissue engineering, it may be useful to design scaffolds that drivehBMSCs into the shapes and dimensionalities that hBMSCs take onduring osteogenesis and bone healing.
Carter et al. have used ellipsoids to measure the shape of thelacunae in the cortical bone from human femurs [68,69]. Matureosteocytes reside in small spaces in bone that are called lacunaeand which can be rapidly imaged with X-ray tomography at highresolution in 3D, due to the high X-ray contrast afforded by corticalbone. The lacunae approximate the shape of the mature osteocytessince the lacunae are small spaces in bone in which the osteocytesreside. The authors used a covariance matrix to generate ellipsoids(instead of a gyration tensor) that represented the lacunae 3Dshapes. They found that the 3D shape of the lacunae varied withposition in the femur (anterior, posterior, medial, lateral) and that
T.M. Farooque et al. / Biomaterials 35 (2014) 2558e25672566
the lacunae were flatter and smaller in older donors (<50 yearsversus >50 years) [68,69]. When the ellipsoid semi-axis ratiosfrom the human femur lacunae were plotted on the“ðL0:51 =L0:53 vs: L0:52 =L0:53 Þ” graph in Fig. 3a, the data were groupedaround the mean value for Collagen Gel (data not shown). Thesedata suggest that mature human osteocytes residing in corticallacunae have a 1D shape that is similar to hBMSCs in Collagen Gel.
In regard to using cell shape for predicting cell fate, consider-ation of the effect of hBMSC dimensionality on hBMSC function iswarranted (Fig. S5). PCL-SNF, PCL-BNF, PDLLA-NF, PEGTM andCollagen Gel induced osteogenic differentiation of hBMSCs in theabsence of osteogenic supplements, while PCL-SC and PCL-FFF didnot. The 2Dmetric “Cell Area” correlatedwith these outcomes sincescaffolds that induced a small spread area (<2000 mm2) alsoinduced differentiation. With the exception of PCL-FFF, scaffoldsthat induced a high Z-Depth (>10 mm) also induced osteogenicdifferentiation. In regard to hBMSC characteristic ellipsoid dimen-sionality, all three dimensionalities, 1D, 2D and 3D, could becorrelated to osteogenic differentiation. However, a 2D dimen-sionality had the least correlation with osteogenic differentiation.These results suggest that dimensional and structural cues in thecellular microenvironment can contribute to hBMSC lineage se-lection through effects on cell shape and dimensionality. Scaffoldsniches that drove hBMSCs into morphologies with a small spreadarea (<2000 mm2), a high Z-Depth (>10 mm) and a 1D or 3Ddimensionality, correlated with induction of hBMSC osteogenicdifferentiation.
An advantage of the gyration tensor calculation is that it rep-resents complex 3D cell shapes with a characteristic ellipsoid thatcan be assigned a dimensionality. However, there is a metaphorthat begins with “wemodeled a cowwith a sphere”which satirizesthe impracticality of highly simplified scientific models. The“spherical cow” is strikingly similar to modeling cells with ellip-soids. The ellipsoid model ignores the finer cellular structure,removes branches and is a simplification. However, it provides animportant first step to analyzing cell dimensionality and a languagefor discussing the issue of scaffold effects on cell dimensionality.
Important directions for future work are to increase the numberof cells imaged and to assess hBMSC dimensionality in additionalscaffold systems. Due to the laborious nature of collecting confocalz-stacks, the current work assessed 15 cells in each scaffold. Theadequacy of the sample size was assessed by randomly splitting thedata sets into two groups (one of 8 cells and one of 7 cells), re-calculating the means and comparing to the means from theentire data set of 15 cells. When this was done for the dimen-sionality metrics, the means of the two random groupings differedby less than 10% from the original set of 15, demonstrating that thesample size of 15 was adequate. Automation of confocal imageacquisition could enhance throughput to generate larger data setsof z-stacks to improve the analytic rigor.
Lord Kelvin, after whom the unit of temperature was named, iscredited with stating that “you cannot improve something if youcannot measure it”. Likewise, measurement of 3D cell shape indifferent scaffold designs represents a general approach that maybe used to engineer improved synthetic cell niches. Improvementsto scaffold designs are achieved by changing scaffold propertiessuch as chemistry, mechanics and structure. Measurement of theeffects of these scaffold property modifications on cell dimen-sionality represents a way to quantitatively and objectivelycompare the cell niches in different scaffolds.
5. Conclusions
The dimensionality of stem cells has been assessed for a planarcontrol surface and in 6 scaffolds with different properties. Two
shape metrics were the focus of the dimensionality assessments.The first was a gyration tensor calculation that generated a char-acteristic ellipsoid for each hBMSC. The ellipsoid was assessed fordimensionality in unit-less space where overall hBMSC shape wasevaluated without considering the absolute hBMSC size. The sec-ond was a Z-Depth measurement of the maximum thickness ofhBMSCs along the Z-axis. The Z-Depth was a magnitude basedmetric for assessing cell dimensionality and had units (mm). Thecharacteristic ellipsoids showed that scaffold properties affectedhBMSC dimensionality and that a wide variety of hBMSC di-mensionalities, 1D, 2D or 3D, could be achieved by varying thescaffold properties. In addition, the hBMSC Z-Depth in all thescaffolds was higher than for the 2D planar control. These resultsdemonstrate that scaffold properties can be tailored to regulatehBMSC dimensionality. In addition, the characteristic ellipsoid andZ-Depth analyses provide an approach to assess the effects ofscaffold niches on cell dimensionality. Finally, these measurementscan be used by tissue engineers to improve synthetic cell niches byenabling measurement and comparison of cell dimensionality indifferent scaffold designs.
Acknowledgments
TMF, CHC, CKT, GK and SHP were supported by NIST-ARRA-NRC,NIST-NRC and NIH-NIST-NRC Research Associateships. The SEMimages were provided byWojtek Tutak and Sumona Sarkar at NIST.The hBMSCs employed in this work were purchased from theTulane Center for Gene Therapy (NCRR-NIH P40RR017447). Thanksto David Simmons (University of Akron) for suggesting a gyrationtensor to assess dimensionality. The “standard deviation” (S.D.) isthe same as the “combined standard uncertainty of the mean” forthe purposes of this work. This article, a contribution of NIST, is notsubject to US copyright. Certain equipment and instruments ormaterials are identified in the paper to adequately specify theexperimental details. Such identification does not imply recom-mendation by NIST, nor does it imply the materials are necessarilythe best available for the purpose.
Appendix A. Supplementary data
Supplementary data related to this article can be found at http://dx.doi.org/10.1016/j.biomaterials.2013.12.092
References
[1] Cukierman E, Pankov R, Stevens DR, Yamada KM. Taking cell-matrix adhesionsto the third dimension. Science 2001;294:1708e12.
[2] Abbott A. Cell culture: biology’s new dimension. Nature 2003;424:870e2.[3] Hall HG, Farson DA, Bissell MJ. Lumen formation by epithelial-cell lines in
response to collagen overlay e a morphogenetic model in culture. P Natl AcadSci 1982;79:4672e6.
[4] Baker EL, Bonnecaze RT, Zaman MH. Extracellular matrix stiffness and archi-tecture govern intracellular rheology in cancer. Biophys J 2009;97:1013e21.
[5] Kleinman HK. Preparation of basement membrane components from EHStumors. Curr Protoc Cell Biol 2001: May [Chapter 10], p 10.2.1e10.
[6] Spence JR, Mayhew CN, Rankin SA, Kuhar MF, Vallance JE, Tolle K, et al.Directed differentiation of human pluripotent stem cells into intestinal tissuein vitro. Nature 2011;470:105e9.
[7] Chen X, Aledia AS, Ghajar CM, Griffith CK, Putnam AJ, Hughes CC, et al. Pre-vascularization of a fibrin-based tissue construct accelerates the formation offunctional anastomosis with host vasculature. Tissue Eng Part A 2009;15:1363e71.
[8] Xu HHK, Carey LE, Simon CG. Premixed macroporous calcium phosphatecement scaffold. J Mater Sci Mater Med 2007;18:1345e53.
[9] Chatterjee K, Sun L, Chow LC, Young MF, Simon Jr CG. Combinatorial polymerscaffold libraries for screening cell-biomaterial interactions in 3D. Adv Mater2008;20:2037e43.
[10] Shea LD, Wang D, Franceschi RT, Mooney DJ. Engineered bone developmentfrom a pre-osteoblast cell line on three-dimensional scaffolds. Tissue Eng2000;6:605e17.
T.M. Farooque et al. / Biomaterials 35 (2014) 2558e2567 2567
[11] Chatterjee K, Kraigsley AM, Bolikal D, Kohn J, Simon Jr CG. Gas-foamed scaf-fold gradients for combinatorial screening in 3D. J Funct Biomater 2012;3:173e82.
[12] Li WJ, Laurencin CT, Caterson EJ, Tuan RS, Ko FK. Electrospun nanofibrousstructure: a novel scaffold for tissue engineering. J Biomed Mater Res2002;60:613e21.
[13] Kumar G, Tison CK, Chatterjee K, Pine PS, McDaniel JH, Salit ML, et al. Thedetermination of stem cell fate by 3D scaffold structures through the controlof cell shape. Biomaterials 2011;32:9188e96.
[14] Jin G, Prabhakaran MP, Ramakrishna S. Stem cell differentiation to epidermallineages on electrospun nanofibrous substrates for skin tissue engineering.Acta Biomater 2011;7:3113e22.
[15] Darling AL, Sun W. 3D microtomographic characterization of precisionextruded poly-epsilon-caprolactone scaffolds. J Biomed Mater Res B ApplBiomater 2004;70:311e7.
[16] Kumar G, Waters MS, Farooque TM, Young MF, Simon Jr CG. Freeform fabri-cated scaffolds with roughened struts that enhance both stem cell prolifera-tion and differentiation by controlling cell shape. Biomaterials 2012;33:4022e30.
[17] Kloxin AM, Kasko AM, Salinas CN, Anseth KS. Photodegradable hydrogels fordynamic tuning of physical and chemical properties. Science 2009;324:59e63.
[18] Chatterjee K, Lin-Gibson S, Wallace WE, Parekh SH, Lee YJ, Cicerone MT, et al.The effect of 3D hydrogel scaffold modulus on osteoblast differentiation andmineralization revealed by combinatorial screening. Biomaterials 2010;31:5051e62.
[19] Parekh SH, Chatterjee K, Lin-Gibson S, Moore NM, Cicerone MT, Young MF,et al. Modulus-driven differentiation of marrow stromal cells in 3D scaffoldsthat is independent of myosin-based cytoskeletal tension. Biomaterials2011;32:2256e64.
[20] Haines-Butterick L, Rajagopal K, Branco M, Salick D, Rughani R, Pilarz M, et al.Controlling hydrogelation kinetics by peptide design for three-dimensionalencapsulation and injectable delivery of cells. P Natl Acad Sci 2007;104:7791e6.
[21] Kopesky PW, Vanderploeg EJ, Sandy JS, Kurz B, Grodzinsky AJ. Self-assemblingpeptide hydrogels modulate in vitro chondrogenesis of bovine bone marrowstromal cells. Tissue Eng Part A 2010;16:465e77.
[22] Atala A, Bauer SB, Soker S, Yoo JJ, Retik AB. Tissue-engineered autologousbladders for patients needing cystoplasty. Lancet 2006;367:1241e6.
[23] Petersen TH, Calle EA, Zhao L, Lee EJ, Gui L, Raredon MB, et al. Tissue-engi-neered lungs for in vivo implantation. Science 2010;329:538e41.
[24] Kale S, Biermann S, Edwards C, Tarnowski C, Morris M, Long MW. Three-dimensional cellular development is essential for ex vivo formation of humanbone. Nat Biotechnol 2000;18:954e8.
[25] Vinci M, Gowan S, Boxall F, Patterson L, Zimmermann M, Court W, et al.Advances in establishment and analysis of three-dimensional tumorspheroid-based functional assays for target validation and drug evaluation.BMC Biol 2012;10:29.
[26] Hoggatt J, Scadden DT. The stem cell niche: tissue physiology at a single celllevel. J Clin Invest 2012;122:3029e34.
[27] Dalby MJ, Gadegaard N, Tare R, Andar A, Riehle MO, Herzyk P, et al. Thecontrol of human mesenchymal cell differentiation using nanoscale symmetryand disorder. Nat Mater 2007;6:997e1003.
[28] Unadkat HV, Hulsman M, Cornelissen K, Papenburg BJ, Truckenmüller RK,Carpenter AE, et al. An algorithm-based topographical biomaterials library toinstruct cell fate. P Natl Acad Sci 2011;108:16565e70.
[29] DingY, Sun J, RoHW,WangZ, Zhou J, LinNJ, et al. Thermodynamic underpinningsof cell alignment on controlled topographies. Adv Mater 2011;23:421e5.
[30] Chiang MY, Yangben Y, Lin NJ, Zhong JL, Yang L. Relationships among cellmorphology, intrinsic cell stiffness and cellesubstrate interactions. Bio-materials 2013;34:9754e62.
[31] Folkman J, Moscona A. Role of cell shape in growth control. Nature 1978;273:345e9.
[32] Watt FM, Jordan PW, O’Neill CH. Cell shape controls terminal differentiation ofhuman epidermal keratinocytes. P Natl Acad Sci 1988;85:5576e80.
[33] Chen CS, Mrksich M, Huang S, Whitesides GM, Ingber DE. Geometric control ofcell life and death. Science 1997;276:1425e8.
[34] McBeath R, Pirone DM, Nelson CM, Bhadriraju K, Chen CS. Cell shape, cyto-skeletal tension, and RhoA regulate stem cell lineage commitment. Dev Cell2004;6:483e95.
[35] Treiser MD, Yang EH, Gordonov S, Cohen DM, Androulakis IP, Kohn J, et al.Cytoskeleton-based forecasting of stem cell lineage fates. P Natl Acad Sci2010;107:610e5.
[36] Hakkinen KM, Harunaga JS, Doyle AD, Yamada KM. Direct comparisons of themorphology, migration, cell adhesions, and actin cytoskeleton of fibroblasts infour different three-dimensional extracellular matrices. Tissue Eng Part A2011;17:713e24.
[37] Ribeiro A, Vargo S, Powell EM, Leach JB. Substrate three-dimensionality in-duces elemental morphological transformation of sensory neurons on aphysiologic timescale. Tissue Eng Part A 2012;18:93e102.
[38] Khetan S, Guvendiren M, Legant WR, Cohen DM, Chen CS, Burdick JA.Degradation-mediated cellular traction directs stem cell fate in covalentlycrosslinked three-dimensional hydrogels. Nat Mater 2013;12:458e65.
[39] Rangamani P, Lipshtat A, Azeloglu EU, Calizo RC, Hu M, Ghassemi S, et al.Decoding information in cell shape. Cell 2013;154:1356e69.
[40] Dominici M, Le Blanc K, Mueller I, Slaper-Cortenbach I, Marini F, Krause D,et al. Minimal criteria for defining multipotent mesenchymal stromal cells.The International Society for Cellular Therapy position statement. Cytotherapy2006;8:315e7.
[41] Kreger ST, Bell BJ, Bailey J, Stites E, Kuske J, Waisner B, et al. Polymerizationand matrix physical properties as important design considerations for solublecollagen formulations. Biopolymers 2010;93:690e707.
[42] Cooper J. The untilt stack plugin for ImageJ. Available from: URL: http://rsbweb.nih.gov/ij/plugins/untilt-stack/index.html; 2011.
[43] Theodorou DN, Suter UW. Shape of unperturbed linear polymers: poly-propylene. Macromolecules 1985;18:1206e14.
[44] Hasizadeh S, Plotkin SS, Linhananta A. Improved measures for the shape of adisordered polymer to test a mean-field theory of collapse. Macromolecules2011;44:6182e97.
[45] Vymetal J, Vondrasek J. Gyration- and inertia-tensor-based collective co-ordinates for metadynamics. Application on the conformational behavior ofpolyalanine peptides and Trp-cage folding. J Phys Chem A 2011;115:11455e65.
[46] Daful AG, Avalos JB, Mackie AD. Model shape transitions of micelles: spheresto cylinders and disks. Langmuir 2012;28:3730e43.
[47] Rawdon EJ. Physical knot theory: the study of sizes and shapes of polymers.In: Kauffman LH, Lambropoulou S, Jablan S, Przytycki JH, editors. Introductorylectures on knot theory. Singapore: World Scientific Publishing Company;2012. pp. 457e82.
[48] Fedosov DA, Pan W, Caswell B, Gompper G, Karniadakis GE. Predicting humanblood viscosity in silico. P Natl Acad Sci 2011;108:11772e7.
[49] Ollion J, Cochennec J, Loll F, Escudé C, Boudier T. TANGO: a generic tool forhigh-throughput 3D image analysis for studying nuclear organization. Bioin-formatics 2013;29:1840e1.
[50] Robey PG. Cell sources for bone regeneration: the good, the bad, and the ugly(but promising). Tissue Eng Part B Rev 2011;17:423e30.
[51] Lee MY, Kumar RA, Sukumaran SM, Hogg MG, Clark DS, Dordick JS. Three-dimensional cellular microarray for high-throughput toxicology assays. P NatlAcad Sci 2008;105:59e63.
[52] Smith LA, Liu X, Hu J, Ma PX. The influence of three-dimensional nanofibrousscaffolds on the osteogenic differentiation of embryonic stem cells. Bio-materials 2009;30:2516e22.
[53] Smith LA, Liu X, Hu J, Wang P, Ma PX. Enhancing osteogenic differentiation ofmouse embryonic stem cells by nanofibers. Tissue Eng Part A 2009;15:1855e64.
[54] Ruckh TT, Kumar K, Kipper MJ, Popat KC. Osteogenic differentiation of bonemarrow stromal cells on poly(epsilon-caprolactone) nanofiber scaffolds. ActaBiomater 2010;6:2949e59.
[55] Nguyen LT, Liao S, Chan CK, Ramakrishna S. Enhanced osteogenic differenti-ation with 3D electrospun nanofibrous scaffolds. Nanomedicine (Lond)2012;7:1561e75.
[56] Abrams GA, Goodman SL, Nealey PF, Franco M, Murphy CJ. Nanoscaletopography of the basement membrane underlying the corneal epithelium ofthe rhesus macaque. Cell Tissue Res 2000;299:39e46.
[57] National Institute of Standards and Technology. Report of investigation,reference material 8394, tissue engineering reference scaffolds for cell culture.Available from: URL: https://www-s.nist.gov/srmors/view_detail.cfm?srm¼8394; 2013.
[58] Doyle AD, Wang FW, Matsumoto K, Yamada KM. One-dimensional topog-raphy underlies three-dimensional fibrillar cell migration. J Cell Biol2009;184:481e90.
[59] Teo WE, Liao S, Chan CK, Ramakrishna S. Remodeling of three-dimensionalhierarchically organized nanofibrous assemblies. Curr Nanosci 2008;4:361e9.
[60] Soliman S, Sant S, Nichol JW, Khabiry M, Traversa E, Khademhosseini A.Controlling the porosity of fibrous scaffolds by modulating the fiber diameterand packing density. J Biomed Mater Res A 2011;96:566e74.
[61] Huebsch N, Arany PR, Mao AS, Shvartsman D, Ali OA, Bencherif SA, et al.Harnessing traction-mediated manipulation of the cell/matrix interface tocontrol stem-cell fate. Nat Mater 2010;9:518e26.
[62] Kennedy SB, Washburn NR, Simon CG, Amis EJ. Combinatorial screen of theeffect of surface energy on fibronectin-mediated osteoblast adhesion,spreading and proliferation. Biomaterials 2006;27:3817e24.
[63] Discher DE, Janmey P, Wang YL. Tissue cells feel and respond to the stiffness oftheir substrate. Science 2005;310:1139e43.
[64] Semler EJ, Lancin PA, Dasgupta A, Moghe PV. Engineering hepatocellularmorphogenesis and function via ligand-presenting hydrogels with gradedmechanical compliance. Biotechnol Bioeng 2005;89:296e307.
[65] Lo Celso C, Fleming HE, Wu JW, Zhao CX, Miake-Lye S, Fujisaki J, et al. Live-animal tracking of individual haematopoietic stem/progenitor cells in theirniche. Nature 2009;457:92e6.
[66] Sacchetti B, Funari A, Michienzi S, Di Cesare S, Piersanti S, Saggio I, et al. Self-renewing osteoprogenitors in bone marrow sinusoids can organize a he-matopoietic microenvironment. Cell 2007;131:324e36.
[67] Méndez-Ferrer S, Michurina TV, Ferraro F, Mazloom AR, Macarthur BD,Lira SA, et al. Mesenchymal and haematopoietic stem cells form a unique bonemarrow niche. Nature 2010;466:829e34.
[68] Carter Y, Thomas CD, Clement JG, Peele AG, Hannah K, Cooper DM. Variationin osteocyte lacunar morphology and density in the human femurea syn-chrotron radiation micro-CT study. Bone 2013;52:126e32.
[69] Carter Y, Thomas CD, Clement JG, Cooper DM. Femoral osteocyte lacunardensity, volume and morphology in women across the lifespan. J Struct Biol2013;183:519e26.
Copyright © 2022 FDOKUMEN