Farnesoid X receptor inhibits glucagon-like peptide-1 production by enteroendocrine L cells
13
ARTICLE Received 27 Mar 2015 | Accepted 25 May 2015 | Published 2 Jul 2015 Farnesoid X receptor inhibits glucagon-like peptide-1 production by enteroendocrine L cells Mohamed-Sami Trabelsi 1,2,3,4 , Mehdi Daoudi 1,2,3,4 , Janne Prawitt 1,2,3,4 , Sarah Ducastel 1,2,3,4 , Ve ´ronique Touche 1,2,3,4 , Sama I. Sayin 5,6 , Alessia Perino 7 , Cheryl A. Brighton 8 , Yasmine Sebti 1,2,3,4 , Je ´ro ˆme Kluza 2,9 , Olivier Briand 1,2,3,4 , He ´le `ne Dehondt 1,2,3,4 , Emmanuelle Vallez 1,2,3,4 , Emilie Dorchies 1,2,3,4 , Gre ´gory Baud 1,2,10,11 , Valeria Spinelli 1,2,3,4 , Nathalie Hennuyer 1,2,3,4 , Sandrine Caron 1,2,3,4 , Kadiombo Bantubungi 1,2,3,4 , Robert Caiazzo 1,2,10,11 , Frank Reimann 8 , Philippe Marchetti 2,9 , Philippe Lefebvre 1,2,3,4 , Fredrik Ba ¨ckhed 5,6,12 , Fiona M. Gribble 8 , Kristina Schoonjans 7 , Franc ¸ois Pattou 1,2,10,11 , Anne Tailleux 1,2,3,4 , Bart Staels 1,2,3,4 & Sophie Lestavel 1,2,3,4 Bile acids are signalling molecules, which activate the transmembrane receptor TGR5 and the nuclear receptor FXR. BA sequestrants (BAS) complex bile acids in the intestinal lumen and decrease intestinal FXR activity. The BAS–BA complex also induces glucagon-like peptide-1 (GLP-1) production by L cells which potentiates b-cell glucose-induced insulin secretion. Whether FXR is expressed in L cells and controls GLP-1 production is unknown. Here, we show that FXR activation in L cells decreases proglucagon expression by interfering with the glucose-responsive factor Carbohydrate-Responsive Element Binding Protein (ChREBP) and GLP-1 secretion by inhibiting glycolysis. In vivo, FXR deficiency increases GLP-1 gene expression and secretion in response to glucose hence improving glucose metabolism. Moreover, treatment of ob/ob mice with the BAS colesevelam increases intestinal proglucagon gene expression and improves glycaemia in a FXR-dependent manner. These findings identify the FXR/GLP-1 pathway as a new mechanism of BA control of glucose metabolism and a pharmacological target for type 2 diabetes. DOI: 10.1038/ncomms8629 1 European Genomic Institute for Diabetes (EGID), FR 3508, Lille F-59000, France. 2 Universite ´ de Lille, Lille F-59000, France. 3 INSERM UMR 1011, Lille F-59000, France. 4 Institut Pasteur de Lille, Lille F-59000, France. 5 Wallenberg Laboratory/Sahlgrenska Center for Cardiovascular and Metabolic Research, Sahlgrenska University Hospital, Gothenburg 413445, Sweden. 6 Department of Molecular and Clinical Medicine, University of Gothenburg, Gothenburg 41345, Sweden. 7 Institute of Bioengineering, School of Life Sciences, Ecole Polytechnique Fe ´de ´rale de Lausanne, Lausanne CH-1015, Switzerland. 8 Cambridge Institute for Medical Research and Institute of Metabolic Sciences, Addenbrooke’s Hospital, Hills Road, Cambridge CB2 0XY, UK. 9 INSERM U 837, Lille Cedex F- 59045, France. 10 Centre de Bio-Pathologie, Plate-forme de Biothe ´rapie, Banque de Tissus, Centre Hospitalier Re ´gional Universitaire, Lille F-59000, France. 11 INSERM UMR 859, Lille F-59000, France. 12 Section for Metabolic Receptology and Enteroendocrinology, Novo Nordisk Foundation Center for Basic Metabolic Research, Faculty of Health Sciences, University of Copenhagen, Copenhagen 2200, Denmark. Correspondence and requests for materials should be addressed to B.S. (email: [email protected]). NATURE COMMUNICATIONS | 6:7629 | DOI: 10.1038/ncomms8629 | www.nature.com/naturecommunications 1 & 2015 Macmillan Publishers Limited. All rights reserved.
-
Upload
independent -
Category
Documents
-
view
3 -
download
0
Transcript of Farnesoid X receptor inhibits glucagon-like peptide-1 production by enteroendocrine L cells
ARTICLE
Received 27 Mar 2015 | Accepted 25 May 2015 | Published 2 Jul 2015
Farnesoid X receptor inhibits glucagon-likepeptide-1 production by enteroendocrine L cellsMohamed-Sami Trabelsi1,2,3,4, Mehdi Daoudi1,2,3,4, Janne Prawitt1,2,3,4, Sarah Ducastel1,2,3,4, Veronique
Touche1,2,3,4, Sama I. Sayin5,6, Alessia Perino7, Cheryl A. Brighton8, Yasmine Sebti1,2,3,4, Jerome Kluza2,9,
Olivier Briand1,2,3,4, Helene Dehondt1,2,3,4, Emmanuelle Vallez1,2,3,4, Emilie Dorchies1,2,3,4, Gregory Baud1,2,10,11,
Valeria Spinelli1,2,3,4, Nathalie Hennuyer1,2,3,4, Sandrine Caron1,2,3,4, Kadiombo Bantubungi1,2,3,4,
Robert Caiazzo1,2,10,11, Frank Reimann8, Philippe Marchetti2,9, Philippe Lefebvre1,2,3,4, Fredrik Backhed5,6,12,
Fiona M. Gribble8, Kristina Schoonjans7, Francois Pattou1,2,10,11, Anne Tailleux1,2,3,4, Bart Staels1,2,3,4
& Sophie Lestavel1,2,3,4
Bile acids are signalling molecules, which activate the transmembrane receptor TGR5 and the
nuclear receptor FXR. BA sequestrants (BAS) complex bile acids in the intestinal lumen and
decrease intestinal FXR activity. The BAS–BA complex also induces glucagon-like peptide-1
(GLP-1) production by L cells which potentiates b-cell glucose-induced insulin secretion.
Whether FXR is expressed in L cells and controls GLP-1 production is unknown. Here, we
show that FXR activation in L cells decreases proglucagon expression by interfering with the
glucose-responsive factor Carbohydrate-Responsive Element Binding Protein (ChREBP) and
GLP-1 secretion by inhibiting glycolysis. In vivo, FXR deficiency increases GLP-1 gene
expression and secretion in response to glucose hence improving glucose metabolism.
Moreover, treatment of ob/ob mice with the BAS colesevelam increases intestinal
proglucagon gene expression and improves glycaemia in a FXR-dependent manner. These
findings identify the FXR/GLP-1 pathway as a new mechanism of BA control of glucose
metabolism and a pharmacological target for type 2 diabetes.
DOI: 10.1038/ncomms8629
1 European Genomic Institute for Diabetes (EGID), FR 3508, Lille F-59000, France. 2 Universite de Lille, Lille F-59000, France. 3 INSERM UMR 1011, LilleF-59000, France. 4 Institut Pasteur de Lille, Lille F-59000, France. 5 Wallenberg Laboratory/Sahlgrenska Center for Cardiovascular and Metabolic Research,Sahlgrenska University Hospital, Gothenburg 413445, Sweden. 6 Department of Molecular and Clinical Medicine, University of Gothenburg, Gothenburg41345, Sweden. 7 Institute of Bioengineering, School of Life Sciences, Ecole Polytechnique Federale de Lausanne, Lausanne CH-1015, Switzerland.8 Cambridge Institute for Medical Research and Institute of Metabolic Sciences, Addenbrooke’s Hospital, Hills Road, Cambridge CB2 0XY, UK. 9 INSERMU 837, Lille Cedex F- 59045, France. 10 Centre de Bio-Pathologie, Plate-forme de Biotherapie, Banque de Tissus, Centre Hospitalier Regional Universitaire,Lille F-59000, France. 11 INSERM UMR 859, Lille F-59000, France. 12 Section for Metabolic Receptology and Enteroendocrinology, Novo Nordisk FoundationCenter for Basic Metabolic Research, Faculty of Health Sciences, University of Copenhagen, Copenhagen 2200, Denmark. Correspondence and requests formaterials should be addressed to B.S. (email: [email protected]).
NATURE COMMUNICATIONS | 6:7629 | DOI: 10.1038/ncomms8629 | www.nature.com/naturecommunications 1
& 2015 Macmillan Publishers Limited. All rights reserved.
Bile acids (BAs) are amphipathic molecules derived fromcholesterol, synthesized and conjugated in the liver, storedin the gallbladder, expelled in the intestinal lumen after
meal ingestion and further metabolized by the gut microbiotainto secondary BAs. Initially considered to be dietary lipiddetergents, BAs are now recognized as signalling moleculeswhich, through binding and activation of the membrane receptorTGR5, the nuclear receptors vitamin D receptor, Pregnane XReceptor and Farnesoid X Receptor (FXR, NR1H4), play key rolesin the control of energy homeostasis1. Secondary bile acidsare more potent ligands for TGR5 (affinity for TGR5:LCA4DCA4CDCA4CA) than for FXR (affinity for FXR:CDCA4DCA¼ LCA4CA) (for review, see refs 1,2).
TGR5, a G protein-coupled receptor, first described as aregulator of cytokine production in a human monocyte cell line3,was also shown to promote glucagon-like peptide-1 (GLP-1)secretion in response to BA by intestinal enteroendocrine L cells4.Although representing o1% of the intestinal epithelial cells,enteroendocrine cells play key roles in the regulation of energymetabolism through their capacity to secrete various bio-activepeptides. After food ingestion, the incretins GLP-1 and glucose-dependent insulinotropic polypeptide are secreted by L and Kcells, respectively, and subsequently potentiate postprandialinsulin secretion by pancreatic b cells in response to glucose,the so-called incretin effect5. Even though the insulinotropicproperty of GLP-1 is maintained, its secretion in response to ameal is decreased in type 2 diabetic patients6,7. This observationhas led to the development of DPP-IV inhibitors that increaseGLP-1 half-life and GLP-1 mimetics, which improve glucosehomeostasis with less risk for hypoglycemia.
Together with TGR5, FXR controls BA-induced signallingpathways. FXR, predominantly expressed in the liver andintestine, was first identified as a regulator of hepatic BAmetabolism through the induction of small heterodimer partner(SHP) in the liver and fibroblast growth factor 15 (FGF15) inthe intestine, resulting in the subsequent inhibition of therate-limiting enzyme in hepatic BA synthesis, cholesterol7a-hydroxylase (CYP7A1) and the regulation of BA transporters(for review, see refs 8,9). FXR in the liver also plays a modulatoryrole in the regulation of lipid and glucose homeostasis. FXRactivation with the synthetic agonist GW4064 decreases hepaticgluconeogenic gene expression and increases glycogenesis10 thusimproving glucose homeostasis in diabetic mice. In thepostprandial state, FXR activation in hepatocytes also inhibitsthe induction of glycolytic gene expression by glucose throughnegative interference with the carbohydrate response elementbinding protein ChREBP (also known as MlxIPL)11,12. Recentstudies have highlighted a metabolic role of non-hepatic andspecifically intestinal FXR in mice under pathophysiologicalconditions such as obesity13–16. Indeed, oral treatment ofhigh-fat-diet-fed mice with GW4064 promotes hyperglycaemiaand obesity13, whereas an opposite effect is observed uponintraperitoneal injection of the drug10. Moreover, in two differentmodels of obesity, whole-body FXR deficiency improvedmetabolic parameters, an effect not observed in hepatocyte-specific FXR-deficient animals14. Furthermore, intestinal specificFXR-deficient mice are protected against diet-induced obesity andnon-alcoholic fatty liver disease15,16. These studies also identifieda crucial role of the intestinal microbiota in BA signalling byregulating the ratio of BAs with agonist or antagonist activity onFXR. Indeed, the primary BA tauro beta-muricholic acid(TbMCA), whose levels are elevated in germ-free (GF) mice,acts as an FXR antagonist to improve glucose metabolism viaintestinal FXR15,17. Finally, BA pool composition is modulated byBA sequestrants (BAS) (for review, see ref. 18). BAS, such ascolesevelam, are anion exchange resins that trap BAs in the
intestinal lumen. Initially used for their cholesterol-loweringeffects, they have more recently been shown to act as antidiabeticdrugs2,14,19. In diabetic db/db mice, BAS administrationdeactivates intestinal FXR and increases glucose clearance inperipheral tissues19. Among the proposed action mechanism ofBAS is a TGR5-mediated increase of GLP-1 secretion in diet-induced obese mice20,21. In addition to their acute effects onGLP-1 secretion, BAS-bound BAs enhance proglucagon geneexpression through TGR5, another mechanism via which thistransmembrane receptor regulates GLP-1 production20.
Whether FXR is expressed and plays a role in L cells has notbeen reported yet. Using the murine GLUTag L cell line, humanintestinal biopsies and different mouse models, we demonstratethat FXR is expressed and functional in enteroendocrine L cells.In mice and in human ex vivo intestinal biopsies, activatedFXR downregulates proglucagon mRNA levels. In vitro, FXRactivation decreases both proglucagon mRNA and protein levelsby interfering with ChREBP-mediated glucose-induction ofproglucagon mRNA levels. FXR activation also inhibits theglycolysis pathway translating into decreased intracellular ATPlevels, contributing to a decreased GLP-1 secretion in response toglucose. In vivo, FXR deficiency increases proglucagon mRNAlevels and glucose-induced GLP-1 secretion in chow diet-fedmice, whereas the protective effect of FXR deficiency onglycaemic control in high-fat-fed mice is blunted by the GLP-1receptor (GLP-1R) antagonist Exendin-4(9-39). Finally, treat-ment of ob/ob mice with colesevelam improves glycaemia at leastin part by an FXR-dependent increase of proglucagon mRNAlevels.
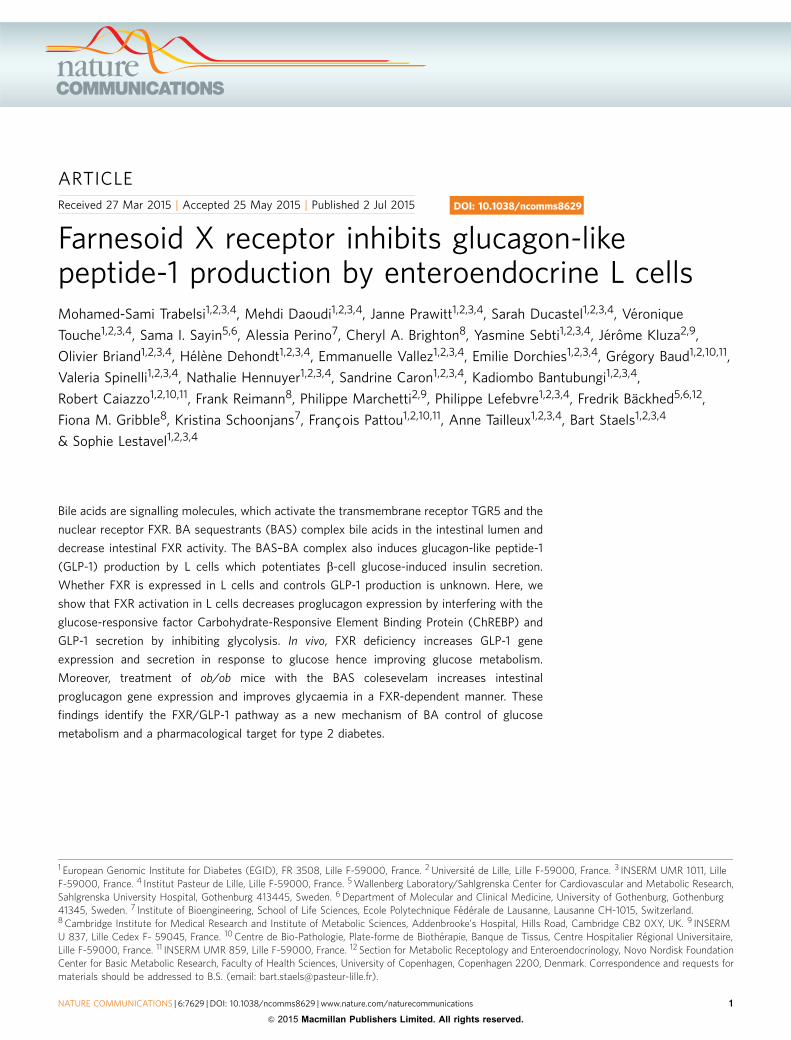
ResultsFXR decreases proglucagon mRNA levels in mice and humans.Previous studies have reported high expression of FXR inintestinal epithelial cells22,23. However, its expression inenteroendocrine L cells has not yet been assessed. We analyseFxr expression in L cells sorted by fluorescence-activated cellsorting (FACS) from transgenic proglucagon-VENUS mice24,25.FACS-sorted Lþ cells were separated from L cells with a purity495% (ref. 24). As expected, the Fxr gene is more abundantlyexpressed in ileal non-L cells (ileum L� ) than in colonic non-Lcells (colon L� ) (Fig. 1a). Surprisingly, compared with non-Lcells, Fxr expression is higher in L cells from the ileum (ileumLþ ) and, albeit nonsignificantly, the colon (colon Lþ ) (Fig. 1a).Confocal microscopy analysis on human intestinal biopsies revealthat FXR is expressed in GLP-1-positive cells from the jejunum(Fig. 1b, Supplementary Movie 1) and colon (SupplementaryFig. 1a).
To assess whether FXR activation controls the production ofGLP-1, one of the major bio-active peptides produced by L cells,8-week-old C57Bl6-J wild-type mice were daily treated by gavagewith the FXR agonist GW4064 (30 mpk) for 5 days. As expectedFgf15 mRNA levels increase after FXR agonist treatment(Supplementary Fig. 1b), whereas proglucagon mRNA levelsdecrease in both the ileum and colon (Fig. 1c). Since treatmentwith GW4064 modulates the bile acid pool composition leadingto lower amount of TGR5 activators13, proglucagon mRNA levelswere measured in intestines of Tgr5� /� mice treated during 5days with GW4064 (30 mpk). FXR activation significantlydecreases proglucagon mRNA levels in the ileum of Tgr5� /�mice and to a lesser extent in the colon, suggesting a crosstalkbetween FXR and TGR5 in the colon, but not the ileum (Fig. 1d).This finding is consistent with elevated levels of secondary BAthat activate TGR5 in the colon. In addition, primary murineintestinal epithelial cells treated ex vivo with GW4064(5 mmol l� 1) also exhibited decreased proglucagon mRNA levels
ARTICLE NATURE COMMUNICATIONS | DOI: 10.1038/ncomms8629
2 NATURE COMMUNICATIONS | 6:7629 | DOI: 10.1038/ncomms8629 | www.nature.com/naturecommunications
& 2015 Macmillan Publishers Limited. All rights reserved.
(Fig. 1e) showing that in addition to changes in bile acid poolcomposition, FXR activation directly decreases proglucagon geneexpression. As FXR is also expressed in human intestinal L cells(Fig. 1b), human jejunal biopsies were treated with GW4064(5 mmol l� 1). FXR activation results in the expected inductionof mRNA levels of FGF19, the human FGF15 orthologue(Supplementary Fig. 1c), whereas proglucagon gene expressiondecreases (Fig. 1f).
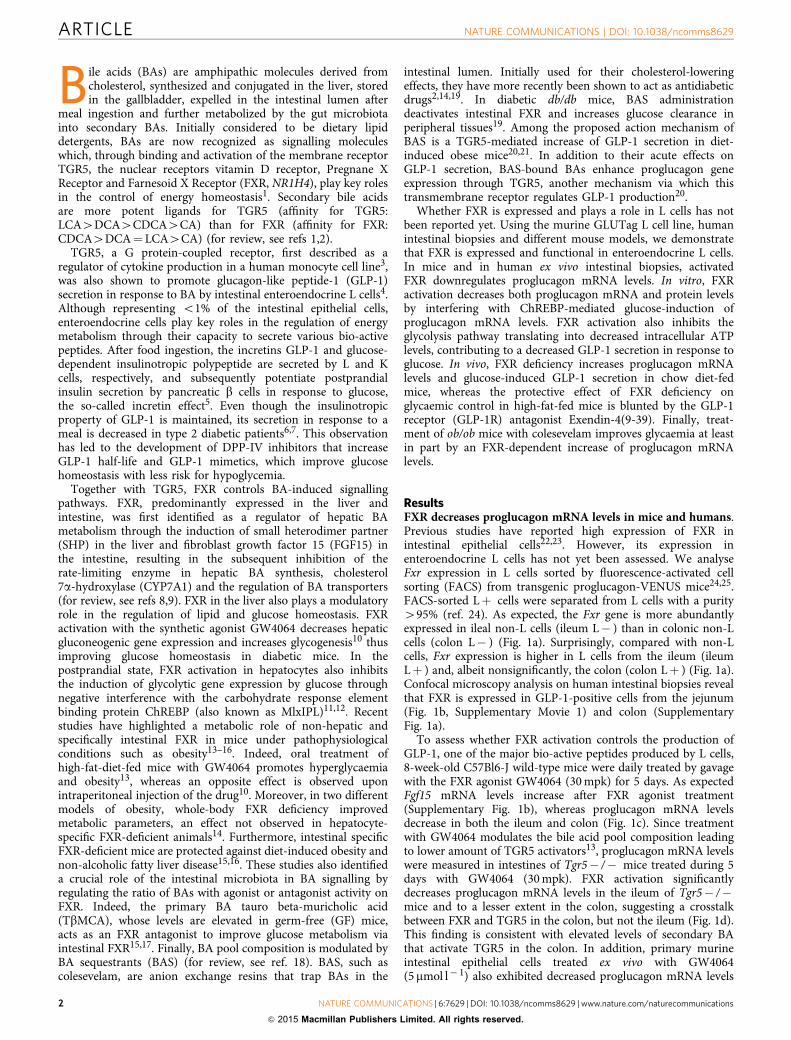
FXR activation decreases proglucagon expression in vitro. Tostudy the mechanisms underlying the regulation of proglucagongene expression by FXR, the well-characterized murine L-cellmodel GLUTag was used26,27. FXR mRNA (Fxr Ct¼ 28;cyclophilin Ct¼ 22) and protein are expressed and enriched inthe nuclear fraction (Fig. 2a). Moreover, incubation of GLUTagcells with increasing concentrations of GW4064 results in theinduction of the FXR target genes Shp (Fig. 2b) and Fgf15(Fig. 2c). Similar as in human and murine hepatocytes11,28,
GW4064 treatment (5 mmol l� 1) increases FXR mRNA andprotein expression, whereas siRNA knockdown of FXR decreases450% FXR mRNA (Fig. 2d) and protein levels (Fig. 2e).The induction of Fgf15 by GW4064 decreases by 10-fold insiFxr-transfected GLUTag cells (Fig. 2f). Altogether, these dataindicate the presence of functional FXR in GLUTag cells.
Incubation of GLUTag cells for 24 h with increasing concen-trations of GW4064 or with GW4064 (5 mmol l� 1) for differenttimes in standard culture glucose concentrations (5.6 mmol l� 1)decreases proglucagon mRNA levels in a dose- and time-dependent manner with a maximum effect at 5 mmol l� 1
(Fig. 3a), a concentration often used to study FXR activation12,28,after 24 h of treatment (Fig. 3b). Moreover, a similar decrease isobserved with the natural FXR ligand chenodeoxycholic acid(CDCA, 100 mmol l� 1) (Supplementary Fig. 2a). Using primercombination covering exon 2 to intron 2 of the proglucagon gene,a similar decrease of proglucagon pre-mRNA levels is observed,suggesting that FXR negatively regulates proglucagon genetranscription (Supplementary Fig. 2b). GW4064 incubation
c Proglucagon
GW4064
Vehicle
1.5
2.0d
TGR5KO-GW4064
TGR5KO-VehProglucagon
***
1.5
mR
NA
rel
ativ
e le
vels
a
0.0
1.0
2.0
3.0
mR
NA
rel
ativ
e le
vels
**
Fxr
ColonIleum
b
DAPI
FXR/GLP-1/DAPIGLP-1
FXR
f
0.0
0.5
1.0
1.5
mR
NA
rel
ativ
e le
vels
Proglucagon
GW4064
DMSO
***
*****
0.0
0.5
1.0
mR
NA
rel
ativ
e le
vels
e Proglucagon
GW4064
DMSO
*
0.0
0.5
1.0
1.5
mR
NA
rel
ativ
e le
vels
0.0
0.5
1.0
L+ L+L– L–
Colon ColonIleum Ileum
Figure 1 | FXR decreases proglucagon mRNA levels in mice and in human. (a) Fxr expression by qPCR in FACS-sorted proglucagon-negative
and proglucagon-positive cells from the ileum (ileum L� ; ileum Lþ ) and colon (colon L� ; colon Lþ ) of GLU-VENUS mice (n¼ 3).
(b) Twelve-micrometre-thick slices from human jejunal biopsies were incubated with antibodies against FXR (in green) and GLP-1 (in red). Nuclei
are in blue. Co-expression in GLP-1-positive cells (dotted line) was assessed on a confocal microscope. Representative of three different FXR/GLP-1
immunostaining experiments. Scale bar, 2 mm. Proglucagon qPCR on cDNA from ileum and colon of 8-week-old wild-type (c) or Tgr5� /� (d) mice
treated by gavage for 5 days with GW4064 (30 mpk; n¼ 5 mice per group. Data are represented as mean ±s.d. (e) Proglucagon qPCR on cDNA from
isolated primary intestinal epithelial cells from two wild-type mice ex vivo treated for 24 h with DMSO or with GW4064 (5mmol l� 1). (f) Proglucagon qPCR
on cDNA of human jejunal biopsies from four normoglycemic patients ex vivo treated for 16 h with DMSO or with GW4064 (5mmol l� 1). Data are
represented as mean ±� s.e.m. Student’s t-test, *Pr0.05, **Pr0.01 and ***Pr0.001.
NATURE COMMUNICATIONS | DOI: 10.1038/ncomms8629 ARTICLE
NATURE COMMUNICATIONS | 6:7629 | DOI: 10.1038/ncomms8629 | www.nature.com/naturecommunications 3
& 2015 Macmillan Publishers Limited. All rights reserved.
decreases proglucagon mRNA and protein levels in siCtrl cells,whereas such a decrease is not observed in siFxr cells, indicatingthat FXR is required for the decrease of proglucagon geneexpression upon GW4064 treatment (Fig. 3c,d).
FXR inhibits glucose-induced proglucagon expression. It haspreviously been shown that glucose induces proglucagon geneexpression in GLUTag L cells26. Moreover, in hepatocytes, FXRactivation inhibits the induction of glycolytic and lipogenic genes
by glucose12. To determine whether FXR activation also inhibitsthe glucose response in L cells, GLUTag cells were cultured for12 h in glucose-free medium and subsequently incubated inmedium containing lactate (10 mmol l� 1), glucose (5.6 mmol l� 1)or 2-deoxyglucose (5.6 mmol l� 1; Fig. 4a). As expected26, glucoseincreases proglucagon gene expression (Fig. 4a). 2-Deoxyglucose,a non-metabolised glucose analogue, does not increaseproglucagon mRNA levels, highlighting that glucose metabolismis mandatory for the glucose-induced proglucagon geneexpression. Moreover, FXR activation for 24 h with either
GLUTag
55 kDa
a b
mR
NA
rel
ativ
e le
vels
0.0
1.0
2.0
3.0
4.0*
*
Shp
*
mR
NA
rel
ativ
e le
vels
10
0
15
20
25*****
Fgf15***
c d
0.5
1.0
1.5
2.0
§§§
**
Fxr
§§§
mR
NA
rel
ativ
e le
vels GW4064
DMSO
5
0.0
siFxrsiCtrl
f
siFxrsiCtrl0
50
100
150***
Fgf15
§§§
mR
NA
rel
ativ
e le
vels
GW4064
DMSOe
FXR
43 kDa
55 kDa
GW4064
siCtrl
+
FX
R/β
-act
in p
rote
in(a
rbitr
ary
unit)
siCtrl siFxr
0.0
0.5
1.0
1.5
2.0
2.5*
***
FXR
§§§
§§§
GW4064
DMSO
+– –
DMSO
GW40
64 (0
.1 μM
)
GW40
64 (1
μM)
GW40
64 (5
μM)
GW40
64 (1
0 μM
)
DMSO
GW40
64 (0
.1 μM
)
GW40
64 (1
μM)
GW40
64 (5
μM)
GW40
64 (1
0 μM
)
β-Actin
siFxr
MW
Hep
G2
Tot.
Cyt
.
Nuc
.
Figure 2 | FXR is expressed and functional in GLUTag L cells. (a) Representative western blot of four experiments performed with fractioned protein
extracts from GLUTag cells. Total proteins from HepG2 are used as control. Shp (b) and Fgf15 (c) qPCRs on cDNA from GLUTag cells treated for 24 h with
GW4064 (0.1, 1, 5 and 10mmol l� 1). Data are represented as mean ± s.d. One-way analysis of variance (ANOVA) followed by Tukey’s post hoc test.
*Pr0.05, **Pr0.01 and ***Pr0.001 versus DMSO (n¼ 3; performed three times). (d) Fxr qPCR on cDNA from GLUTag cells electroporated with siCtrl or
siFxr and treated for 24 h with GW4064 (5mmol l� 1; n¼ 3; performed three times). (e) Representative western blot of four experiments performed on
protein extracts from GLUTag cells electroporated with a siCtrl or with a siFxr and treated for 24 h with GW4064 (5mmol l� 1; upper panel) and
quantification (lower panel) of FXR from four western blots (n¼ 3). (f) Fgf15 qPCR on cDNA from GLUTag cells electroporated with siCtrl or siFxr and
treated for 24 h with GW4064 (5 mmol l� 1; n¼ 3; performed three times). Data are represented as mean ± s.d. Two-way ANOVA analysis followed by
Bonferronni’s post hoc test. *Pr0.05, **Pr0.01 and ***Pr0.001 versus DMSO of transfection-matched condition and yyyPr0.001 versus siCtrl of
treatment-matched condition.
ARTICLE NATURE COMMUNICATIONS | DOI: 10.1038/ncomms8629
4 NATURE COMMUNICATIONS | 6:7629 | DOI: 10.1038/ncomms8629 | www.nature.com/naturecommunications
& 2015 Macmillan Publishers Limited. All rights reserved.
GW4064 or CDCA inhibits proglucagon gene expression only inL cells incubated in standard (5.6 mmol l� 1), but not in lowglucose concentrations (Fig. 4a).
As ChREBP is a glucose-sensitive transcription factor activatedby glucose metabolites29 and since FXR activation interferes withthe ChREBP-mediated induction of glycolytic enzyme geneexpression by glucose in hepatocytes12, we next assessedwhether this regulatory mechanism is operational also inL cells. Using L cells isolated from GLU-VENUS mice, ChREBPis found to be expressed at higher levels in L cells than innon-L cells (Fig. 4b). Moreover, ChREBP is also expressed inGLUTag L-cells (Fig. 4b insert). FXR immunoprecipitation fromcytoplasmic and nuclear protein fractions demonstrates thatChREBP and FXR physically interact or are in the samecomplexes in high glucose conditions (Fig. 4c), similar as inhepatocytes12. Finally, siRNA knockdown of ChREBP, resultingin Z50% decrease of Chrebp mRNA levels (SupplementaryFig. 3), prevents the induction of proglucagon mRNA levels byglucose (Fig. 4d). FXR activation by GW4064 inhibits the increaseof proglucagon mRNA levels by glucose in siCtrl transfected cells,whereas this effect is not observed in ChREBP knockdown cells.
Taken together, these data demonstrate that glucosemetabolism through the glycolysis pathway is necessary for theglucose-dependent ChREBP-mediated increase of proglucagongene expression, which is inhibited upon FXR activation.
FXR decreases glycolysis and glucose-induced GLP-1 secretion.GLP-1 secretion in response to glucose occurs, at least inpart, through glucose metabolism by glycolysis24,30,31. DNAmicroarray followed by Gene Ontology analysis was performedon GW4064-treated GLUTag cells. Interestingly, GW4064treatment downregulates the expression of several glycolyticgenes leading to a significant inhibition of this pathway(P¼ 4.33� 10� 6; Fig. 5a). This decrease translates into lowerbasal and glucose-enhanced intracellular ATP levels (Fig. 5b).GW4064 treatment does not decrease mitochondrial mass asassessed by the Mitotracker Green assay (Fig. 5c). However,glycolytic capacity assessed by measurement of the extracellularacidification rate (ECAR) after oligomycin treatment is lower inGW4064 pre-treated cells (Fig. 5d). In parallel, FXR activationdecreases basal- and ATP-dependent oxygen consumption rates(OCR) in GW4064-treated cells (Supplementary Fig. 4) likelyreflecting the decrease in activity of the global glycolysis pathwayas also suggested by the microarray results. Finally, FXRactivation results in lower basal and glucose-induced GLP-1secretion (Fig. 5e). As GW4064 does not modulate KCl-inducedGLP-1 secretion (Fig. 5e), it is unlikely that FXR modulateselectrogenic events and that its action occurs rather upstream ofmembrane depolarization. Even though initial reports suggestedthat the SGLT-1/electrogenic pathway is the main mechanismby which glucose induces GLP-1 secretion in primary intestinal
a
0.0
0.5
1.0
1.5
**
Proglucagon
***
mR
NA
rel
ativ
e le
vels
c
1.5 ProglucagonNS
GW4064
DMSO
0.0
0.5
1.0
1.5
**
2412Time (h)
Proglucagon
mR
NA
rel
ativ
e le
vels
GW4064
b
d
22 kDa
GW4064
siCtrl
+– +–
mR
NA
rel
ativ
e le
vels
siCtrl siFxr
0.0
0.5
1.0**
β-Actin
Proglucagon
43 kDa
Pro
gluc
agon
/β-a
ctin
pro
tein
(arb
itrar
y un
it)
siCtrl0.0
0.5
1.0
1.5
2.0
2.5
**
NS
DMSO
GW40
64 (1
μM)
GW40
64 (5
μM)
GW40
64 (1
0 μM
)
GW40
64 (0
.1 μM
) 0 6
siFxr
siFxr
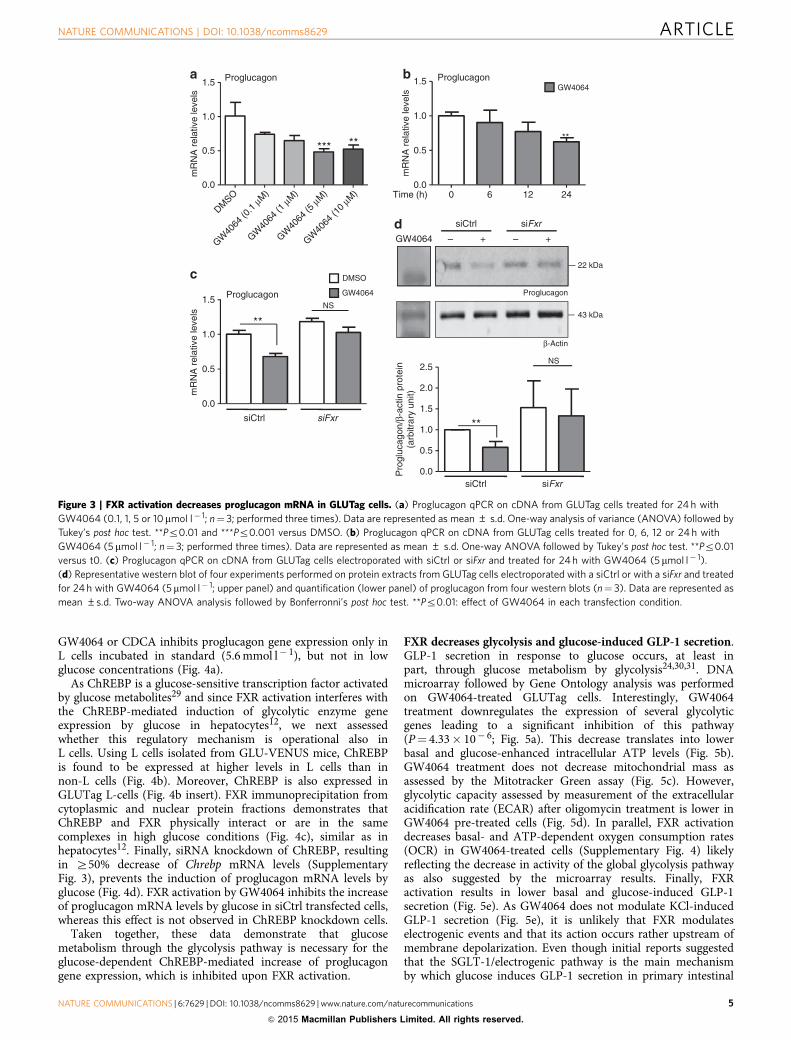
Figure 3 | FXR activation decreases proglucagon mRNA in GLUTag cells. (a) Proglucagon qPCR on cDNA from GLUTag cells treated for 24 h with
GW4064 (0.1, 1, 5 or 10mmol l� 1; n¼ 3; performed three times). Data are represented as mean ± s.d. One-way analysis of variance (ANOVA) followed by
Tukey’s post hoc test. **Pr0.01 and ***Pr0.001 versus DMSO. (b) Proglucagon qPCR on cDNA from GLUTag cells treated for 0, 6, 12 or 24 h with
GW4064 (5 mmol l� 1; n¼ 3; performed three times). Data are represented as mean ± s.d. One-way ANOVA followed by Tukey’s post hoc test. **Pr0.01
versus t0. (c) Proglucagon qPCR on cDNA from GLUTag cells electroporated with siCtrl or siFxr and treated for 24 h with GW4064 (5mmol l� 1).
(d) Representative western blot of four experiments performed on protein extracts from GLUTag cells electroporated with a siCtrl or with a siFxr and treated
for 24 h with GW4064 (5mmol l� 1; upper panel) and quantification (lower panel) of proglucagon from four western blots (n¼ 3). Data are represented as
mean ±s.d. Two-way ANOVA analysis followed by Bonferronni’s post hoc test. **Pr0.01: effect of GW4064 in each transfection condition.
NATURE COMMUNICATIONS | DOI: 10.1038/ncomms8629 ARTICLE
NATURE COMMUNICATIONS | 6:7629 | DOI: 10.1038/ncomms8629 | www.nature.com/naturecommunications 5
& 2015 Macmillan Publishers Limited. All rights reserved.
epithelial cells24,27, recent observations on perfused rat ileumsindicate that, in addition to the SGLT-1 pathway, the glucosemetabolism-mediated pathway contributes to the full GLP-1secretion response to glucose30,31. Therefore, the response toglucose (5.6 mmol l� 1) with or without the GLUTs inhibitorphloretin on GLP-1 secretion in murine ileal biopsies was tested.Glucose alone induces GLP-1 secretion by tissue explants fromvehicle-treated mice, whereas co-incubation with phloretincompletely blocked the glucose response (Fig. 5f). Moreover,in vivo GW4064 treatment (5 days, 30 mpk) prevents the increasein glucose-induced GLP-1 secretion by the ileum ex vivo (Fig. 5f),but is without effect in the presence of phloretin (Fig. 5f),indicating that glucose transport by the GLUT-transporterappears mandatory for the inhibitory effect of FXR activationon the GLP-1 response to glucose.
Taken together, these data show that FXR activation decreasesthe glycolysis pathway leading to decreased ATP levels and alower GLP-1 secretion in response to glucose.
Fxr deficiency increases proglucagon mRNA and GLP-1 levels.FXR-deficient mice display elevated proglucagon mRNA levels inthe ileum and colon (Fig. 6a) and enhanced active GLP-1 plasmaconcentrations 15 min after oral glucose administration (Fig. 6b).Since conventionally raised (CONV-R) and GF mice display
different FXR antagonist:agonist ratios leading to FXR inhibitionin GF mice17, proglucagon mRNA levels were compared inCONV-R and GF WT and FXR-deficient mice. As expected17,Fgf15 gene expression is repressed in GF compared withCONV-R mice, similar to that in Fxr� /� mice (Fig. 6c).Moreover, CONV-R Fxr� /� mice display higher proglucagonmRNA levels compared with CONV-R Fxrþ /þ mice (Fig. 6d),whereas in GF mice, FXR deficiency no further modulatesproglucagon mRNA levels (Fig. 6d). In vitro incubation ofGLUTag cells with TbMCA (100 mmol l� 1) decreases Fgf15 geneexpression (Fig. 6e) and increases proglucagon gene expression(Fig. 6f), suggesting a crosstalk between BA, FXR and microbiotain the regulation of proglucagon gene expression in L cells.
Thus, modulation of endogenous FXR ligands by themicrobiota may influence proglucagon gene expression in anFXR-dependent manner.
FXR deficiency improves glycaemia through the GLP-1R pathway.It is well known that FXR deficiency protects mice againstdiet-induced obesity and improves glucose homeostasis14,32,33.To test the metabolic impact of the FXR/GLP-1 pathway in apathophysiological context, Fxrþ /þ and Fxr� /� mice werefed a high-fat diet (HFD) during 6 weeks before metabolictests with or without the GLP-1R antagonist Exendin-4(9-39).
d
1.5
2.0Proglucagon
* **
mR
NA
rel
ativ
e le
vels
GW4064
DMSO
§§§
c
GW4064 5 μMGlc ++++
IP-FXR
a
GW4064
CDCA
DMSO
Lactate
§§§
2-DeoxyglucoseGlucose
0.0
0.5
1.0
1.5
2.0Proglucagon
mR
NA
rel
ativ
e le
vels
***
§§§
***
b
0
1
2
3
4Chrebp
*
**
mR
NA
rel
ativ
e le
vels
ColonIleum
GLUTagWB ChREBP
-95 kDa
0.0
0.5
1.0
Glc
siCtrl
+ ++ +
siChrebpNuc.Cyt.
WB FXR
55 kDa-
WB ChREBP
95 kDa-
L– L–L+ L+
MW
Cyt
.
Nuc
.
–
– –++– – – –
–
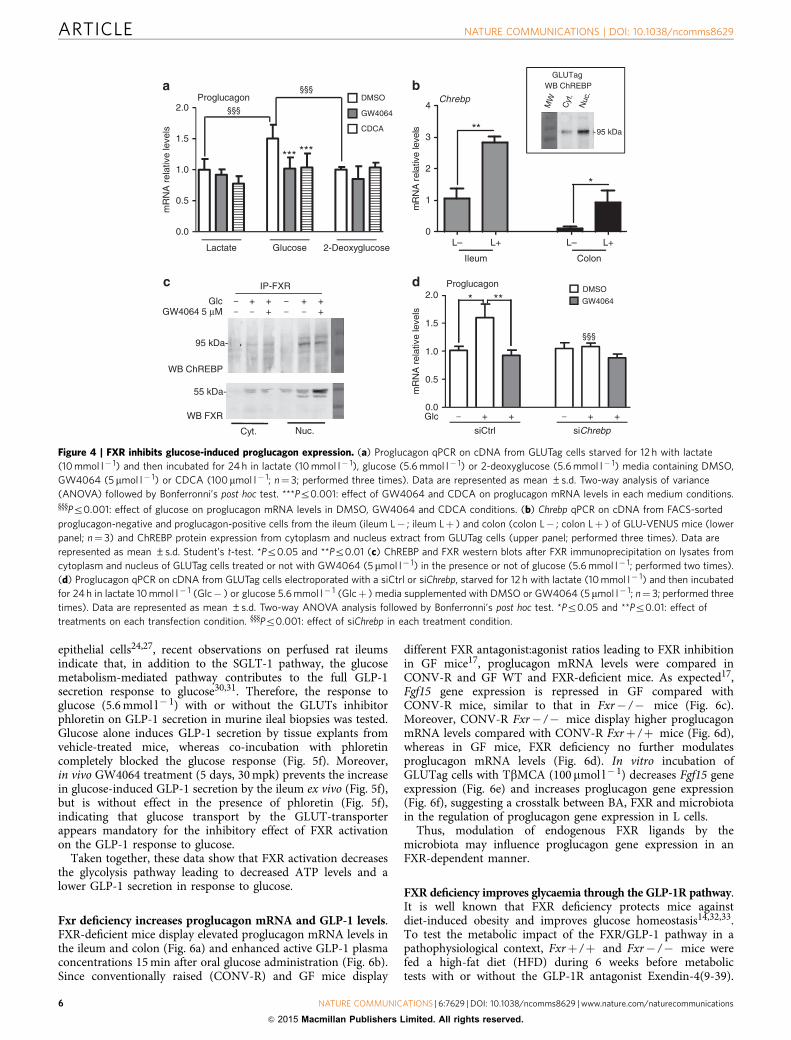
Figure 4 | FXR inhibits glucose-induced proglucagon expression. (a) Proglucagon qPCR on cDNA from GLUTag cells starved for 12 h with lactate
(10 mmol l� 1) and then incubated for 24 h in lactate (10 mmol l� 1), glucose (5.6 mmol l� 1) or 2-deoxyglucose (5.6 mmol l� 1) media containing DMSO,
GW4064 (5 mmol l� 1) or CDCA (100mmol l� 1; n¼ 3; performed three times). Data are represented as mean ±s.d. Two-way analysis of variance
(ANOVA) followed by Bonferronni’s post hoc test. ***Pr0.001: effect of GW4064 and CDCA on proglucagon mRNA levels in each medium conditions.yyyPr0.001: effect of glucose on proglucagon mRNA levels in DMSO, GW4064 and CDCA conditions. (b) Chrebp qPCR on cDNA from FACS-sorted
proglucagon-negative and proglucagon-positive cells from the ileum (ileum L� ; ileum Lþ ) and colon (colon L� ; colon Lþ ) of GLU-VENUS mice (lower
panel; n¼ 3) and ChREBP protein expression from cytoplasm and nucleus extract from GLUTag cells (upper panel; performed three times). Data are
represented as mean ±s.d. Student’s t-test. *Pr0.05 and **Pr0.01 (c) ChREBP and FXR western blots after FXR immunoprecipitation on lysates from
cytoplasm and nucleus of GLUTag cells treated or not with GW4064 (5mmol l� 1) in the presence or not of glucose (5.6 mmol l� 1; performed two times).
(d) Proglucagon qPCR on cDNA from GLUTag cells electroporated with a siCtrl or siChrebp, starved for 12 h with lactate (10 mmol l� 1) and then incubated
for 24 h in lactate 10 mmol l� 1 (Glc� ) or glucose 5.6 mmol l� 1 (Glcþ ) media supplemented with DMSO or GW4064 (5 mmol l� 1; n¼ 3; performed three
times). Data are represented as mean ±s.d. Two-way ANOVA analysis followed by Bonferronni’s post hoc test. *Pr0.05 and **Pr0.01: effect of
treatments on each transfection condition. yyyPr0.001: effect of siChrebp in each treatment condition.
ARTICLE NATURE COMMUNICATIONS | DOI: 10.1038/ncomms8629
6 NATURE COMMUNICATIONS | 6:7629 | DOI: 10.1038/ncomms8629 | www.nature.com/naturecommunications
& 2015 Macmillan Publishers Limited. All rights reserved.
b
GW4064
DMSO
0
1
2
3
**
Glucose
**
NS
§§
+
Rel
ativ
e A
TP
leve
ls
aMicroarray fold changebetweenDMSO- and GW4064-treated cells
: –1.11 to –1.30
: < –1.50: –1.31 to –1.40
GLP-1
Sur1
Glc
Glyceraldehyde-3-P
1,3-biP-glycerate
3-P-glycerate
2-P-glycerate
P-enolpyruvate
Pyr Lactate
Hk2
Glc6P
Cacna1g
Kir6.2Gpi1
Aldo a
Gapdh
Fru1,6biP
Aldo c
Pgk1
Pgam1
Eno1-4
Ldha
DHAP
Tpi1
Fru6P
Pfkp,m,l
Ca2+
Ca2+
Mitochondria
cMitotracker green
dCA D
DMSO GW4064 5 µM
GW4064DMSO
0
1
2
3
4
KClGlc
**
***
§§§
§§§
Secretagogue
Rel
ativ
eG
LP-1
sec
retio
n
e f GW4064Vehicle
0
5
10
15
129
12
10
99
GLP-1
**
§§§
Phloretin 0.5 mMGlucose 5.6 mM ++
++++
pmol
l–1
per
mic
rogr
ampr
otei
n
§§§
Mitotracker green
DMSO
GW4064
CTRL
C 2-DeoxyglucoseA GlucoseB Oligomycin D Rotenone/antimycin
Time (min)
00
5
10
15
15 45 60 7530
CA B D
EC
AR
(mpH
min
–1 p
er10
,000
cel
ls) ***
§§§
§§§§§§
**
↑ATP
– –– –
–––
–
1041031021011000
20
40
60
80
100
% o
f max
FL1-H
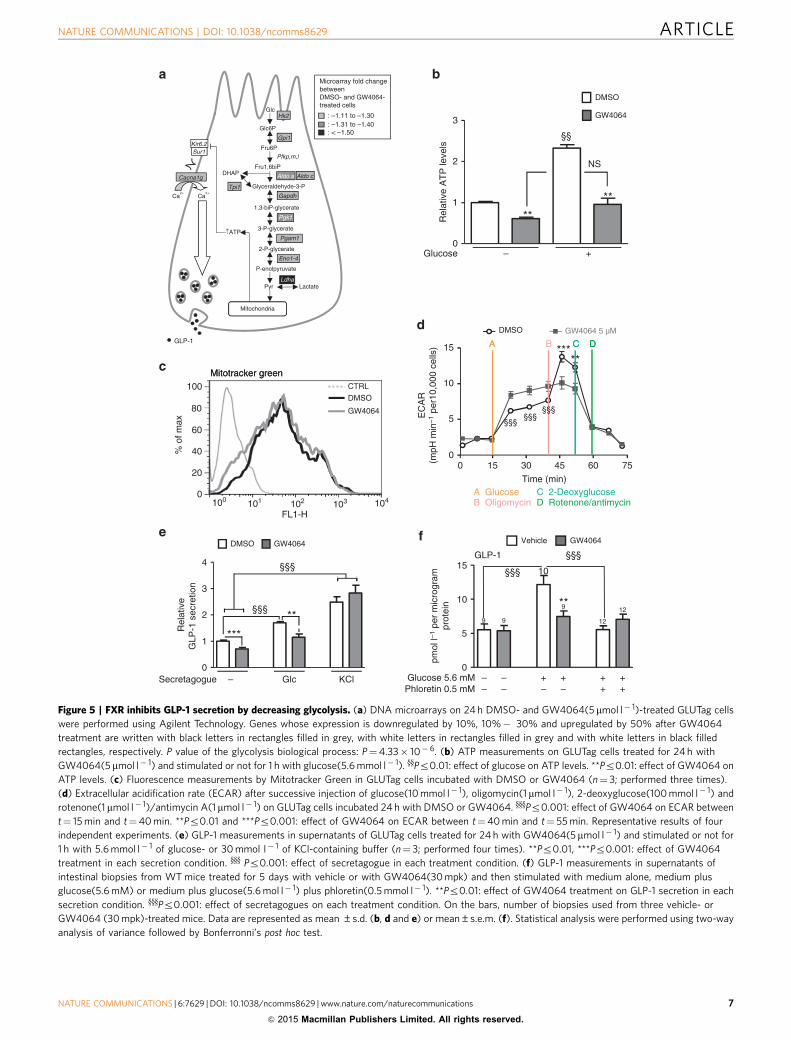
Figure 5 | FXR inhibits GLP-1 secretion by decreasing glycolysis. (a) DNA microarrays on 24 h DMSO- and GW4064(5mmol l� 1)-treated GLUTag cells
were performed using Agilent Technology. Genes whose expression is downregulated by 10%, 10%� 30% and upregulated by 50% after GW4064
treatment are written with black letters in rectangles filled in grey, with white letters in rectangles filled in grey and with white letters in black filled
rectangles, respectively. P value of the glycolysis biological process: P¼4.33� 10� 6. (b) ATP measurements on GLUTag cells treated for 24 h with
GW4064(5mmol l� 1) and stimulated or not for 1 h with glucose(5.6 mmol l� 1). yyPr0.01: effect of glucose on ATP levels. **Pr0.01: effect of GW4064 on
ATP levels. (c) Fluorescence measurements by Mitotracker Green in GLUTag cells incubated with DMSO or GW4064 (n¼ 3; performed three times).
(d) Extracellular acidification rate (ECAR) after successive injection of glucose(10 mmol l� 1), oligomycin(1 mmol l� 1), 2-deoxyglucose(100 mmol l� 1) and
rotenone(1 mmol l� 1)/antimycin A(1mmol l� 1) on GLUTag cells incubated 24 h with DMSO or GW4064. yyyPr0.001: effect of GW4064 on ECAR between
t¼ 15 min and t¼40 min. **Pr0.01 and ***Pr0.001: effect of GW4064 on ECAR between t¼40 min and t¼ 55 min. Representative results of four
independent experiments. (e) GLP-1 measurements in supernatants of GLUTag cells treated for 24 h with GW4064(5mmol l� 1) and stimulated or not for
1 h with 5.6 mmol l� 1 of glucose- or 30 mmol l� 1 of KCl-containing buffer (n¼ 3; performed four times). **Pr0.01, ***Pr0.001: effect of GW4064
treatment in each secretion condition. yyy Pr0.001: effect of secretagogue in each treatment condition. (f) GLP-1 measurements in supernatants of
intestinal biopsies from WT mice treated for 5 days with vehicle or with GW4064(30 mpk) and then stimulated with medium alone, medium plus
glucose(5.6 mM) or medium plus glucose(5.6 mol l� 1) plus phloretin(0.5 mmol l� 1). **Pr0.01: effect of GW4064 treatment on GLP-1 secretion in each
secretion condition. yyyPr0.001: effect of secretagogues on each treatment condition. On the bars, number of biopsies used from three vehicle- or
GW4064 (30 mpk)-treated mice. Data are represented as mean ±s.d. (b, d and e) or mean±s.e.m. (f). Statistical analysis were performed using two-way
analysis of variance followed by Bonferronni’s post hoc test.
NATURE COMMUNICATIONS | DOI: 10.1038/ncomms8629 ARTICLE
NATURE COMMUNICATIONS | 6:7629 | DOI: 10.1038/ncomms8629 | www.nature.com/naturecommunications 7
& 2015 Macmillan Publishers Limited. All rights reserved.
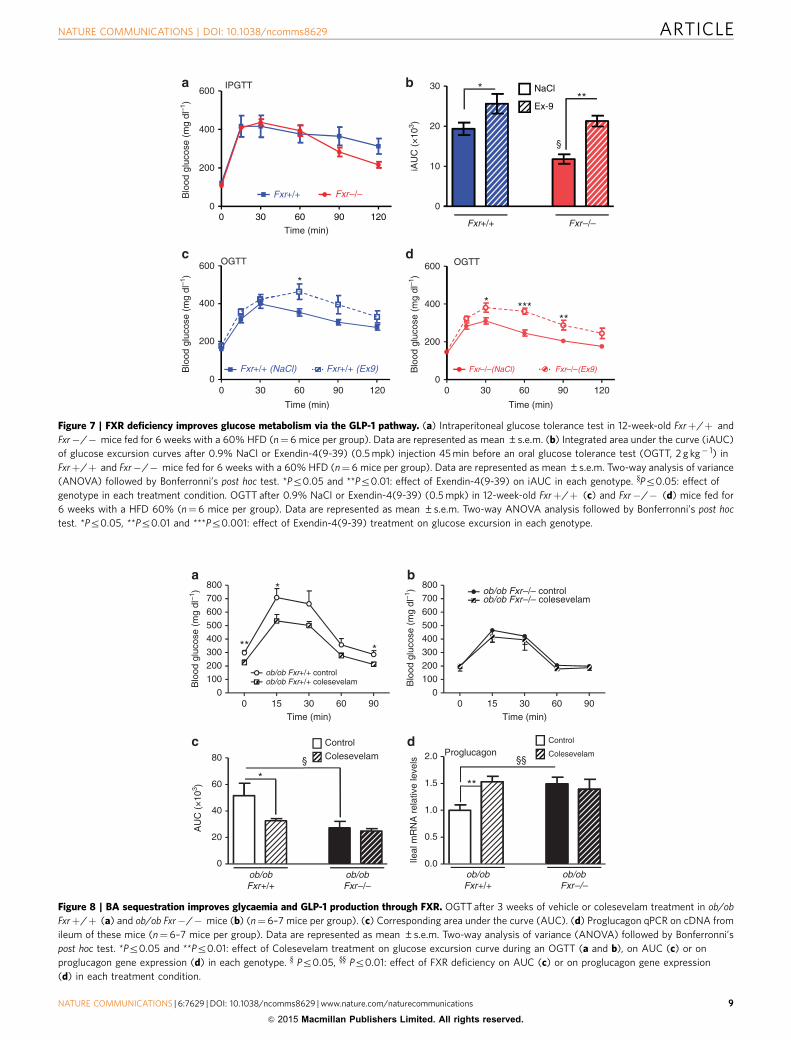
After 6 weeks of diet, Fxrþ /þ mice gain 44% of their initialbody mass, whereas, as expected14,32,33, high-fat-fed Fxr� /�mice only gain 23%. Intraperitoneal GTT (2 g kg� 1) reveals onlya minor, nonsignificant decrease in glucose excursion curve inFxr� /� versus Fxrþ /þ mice (Fig. 7a). However, whenchallenged with an oral glucose bolus (2 g kg� 1), Fxr� /�mice display an improved glucose tolerance compared withFxrþ /þ mice (45% decrease in integrated area under the curve(iAUC), Pr0.05, Fig. 7b) reflecting a role of the intestine inthe regulation of glucose homeostasis by FXR. To assess theinvolvement of the GLP-1 pathway in this improvement, theGLP-1R antagonist Exendin-4(9-39) was administered beforethe oral glucose gavage test. Glucose tolerance worsens inExendin-4(9-39)-treated mice of both genotypes (Fig. 7b–d)with a more pronounced effect in Fxr� /� mice (Fig. 7b, þ 30%in iAUC in Fxrþ /þ versus þ 80% in iAUC in Fxr� /� mice),hence abolishing the beneficial effect on oral glucose tolerance ofFXR deficiency.
These results show that the GLP-1/GLP-1R pathwaycontributes to the improved glucose homeostasis upon FXRdeficiency.
BAS improve glycaemia and GLP-1 production by FXR. To testthe response to pharmacological targeting of the FXR/GLP-1pathway, ob/ob Fxrþ /þ and ob/ob Fxr� /� mice were treatedfor 2 weeks with colesevelam, a BAS known to deactivateintestinal FXR23. As expected, BAS administration inhibits FXRactivity in the ileum and colon as reflected by repression of Fgf15gene expression (Supplementary Fig. 5a,b). BAS improves glucosemetabolism after an OGTT in ob/ob Fxrþ /þ mice, an effect notobserved in ob/ob Fxr� /� mice (Fig. 8a–c). Moreover, BASadministration increases proglucagon gene expression in theileum (Fig. 8d) and colon (Supplementary Fig. 5c) only in ob/obFxrþ /þ mice, an effect which may contribute to the improvedglucose control.
DiscussionUsing transgenic VENUS mice expressing the reporter gene onlyin proglucagon-positive cells and human biopsies, we showthat FXR is not only expressed in the enterocyte but also inL cells, where its activity was demonstrated by agonist-inducedregulation of two bona fide FXR target genes, Fgf15 and Shp.
Fxr –/–
Fxr +/+GLP-1 secretion
0
2
4
6
8
10
**
pmol
l–1
b
0
1
2
3
*
*
mR
NA
rel
ativ
e le
vels
Fxr –/–
Fxr +/+
Proglucagona
dFxr –/–Fxr +/+
mR
NA
rel
ativ
e le
vels
Proglucagon
2.0
2.5
Fxr –/–
Fxr +/+
1.5 Fgf15 §§
**
mR
NA
rel
ativ
e le
vels
c
CONV-R GF0.0
0.5
1.0
1.5**
0.0
0.5
1.0
e
TβMCA
DMSO
GW4064
0.0
0.5
1.0
1.55
10152025 Fgf15
***
**
mR
NA
rel
ativ
e le
vels
f
0.0
0.5
1.0
1.5
2.0Proglucagon
**
**
mR
NA
rel
ativ
e le
vels TβMCA
DMSO
GW4064
ColonIleum
CONV-R GF
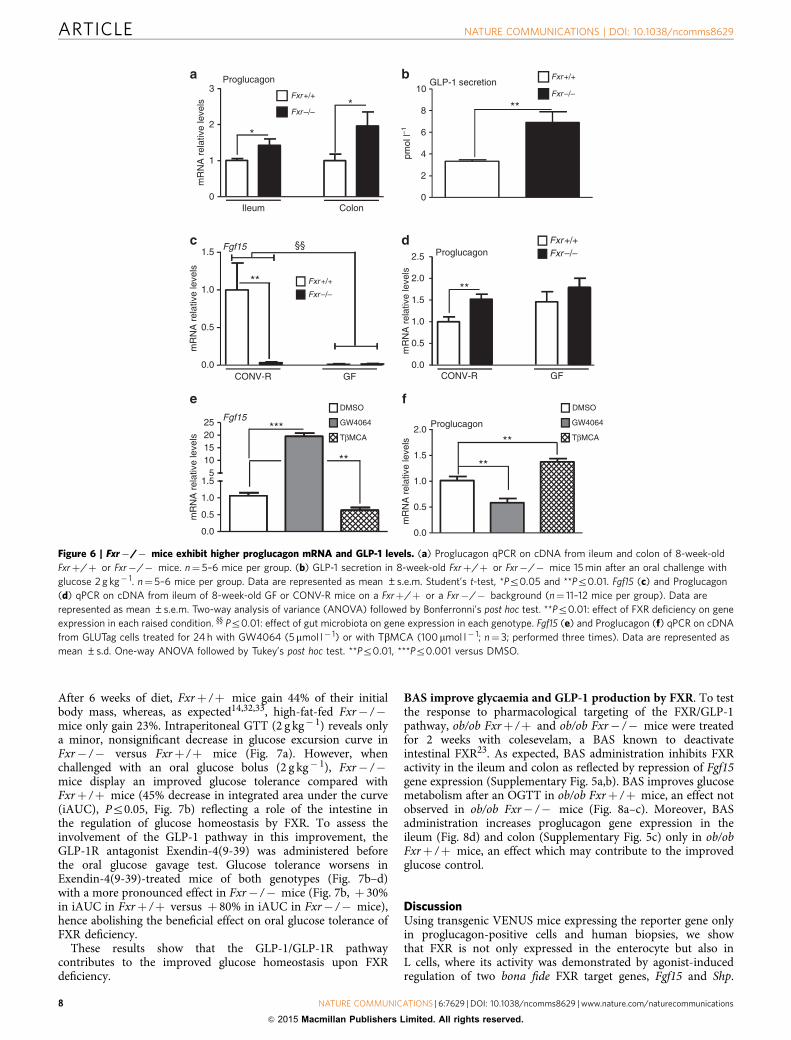
Figure 6 | Fxr�/� mice exhibit higher proglucagon mRNA and GLP-1 levels. (a) Proglucagon qPCR on cDNA from ileum and colon of 8-week-old
Fxrþ/þ or Fxr�/� mice. n¼ 5–6 mice per group. (b) GLP-1 secretion in 8-week-old Fxrþ/þ or Fxr�/� mice 15 min after an oral challenge with
glucose 2 g kg� 1. n¼ 5–6 mice per group. Data are represented as mean ±s.e.m. Student’s t-test, *Pr0.05 and **Pr0.01. Fgf15 (c) and Proglucagon
(d) qPCR on cDNA from ileum of 8-week-old GF or CONV-R mice on a Fxrþ/þ or a Fxr�/� background (n¼ 11–12 mice per group). Data are
represented as mean ±s.e.m. Two-way analysis of variance (ANOVA) followed by Bonferronni’s post hoc test. **Pr0.01: effect of FXR deficiency on gene
expression in each raised condition. yy Pr0.01: effect of gut microbiota on gene expression in each genotype. Fgf15 (e) and Proglucagon (f) qPCR on cDNA
from GLUTag cells treated for 24 h with GW4064 (5mmol l� 1) or with TbMCA (100mmol l� 1; n¼ 3; performed three times). Data are represented as
mean ±s.d. One-way ANOVA followed by Tukey’s post hoc test. **Pr0.01, ***Pr0.001 versus DMSO.
ARTICLE NATURE COMMUNICATIONS | DOI: 10.1038/ncomms8629
8 NATURE COMMUNICATIONS | 6:7629 | DOI: 10.1038/ncomms8629 | www.nature.com/naturecommunications
& 2015 Macmillan Publishers Limited. All rights reserved.
0
10
20
30
Fxr–/–Fxr+/+
*
§
**
iAU
C (
×10
3 )
b
d600 OGTT
a
0
200
400
600
Time (min)
Fxr+/+ Fxr–/–
IPGTT
Blo
od g
luco
se (
mg
dl–1
)
Blo
od g
luco
se (
mg
dl–1
)
Blo
od g
luco
se (
mg
dl–1
)
c600
*
OGTT
******
Time (min)
0
200
400
Fxr–/–(Ex9)Fxr–/–(NaCl)
0 30 60 90 120 0 30 60 90 1200
200
400
Time (min)
Fxr+/+ (NaCl) Fxr+/+ (Ex9)
0 30 60 90 120
NaCl
Ex-9
Figure 7 | FXR deficiency improves glucose metabolism via the GLP-1 pathway. (a) Intraperitoneal glucose tolerance test in 12-week-old Fxrþ/þ and
Fxr�/� mice fed for 6 weeks with a 60% HFD (n¼6 mice per group). Data are represented as mean ±s.e.m. (b) Integrated area under the curve (iAUC)
of glucose excursion curves after 0.9% NaCl or Exendin-4(9-39) (0.5 mpk) injection 45 min before an oral glucose tolerance test (OGTT, 2 g kg� 1) in
Fxrþ/þ and Fxr�/� mice fed for 6 weeks with a 60% HFD (n¼ 6 mice per group). Data are represented as mean ±s.e.m. Two-way analysis of variance
(ANOVA) followed by Bonferronni’s post hoc test. *Pr0.05 and **Pr0.01: effect of Exendin-4(9-39) on iAUC in each genotype. yPr0.05: effect of
genotype in each treatment condition. OGTT after 0.9% NaCl or Exendin-4(9-39) (0.5 mpk) in 12-week-old Fxrþ/þ (c) and Fxr�/� (d) mice fed for
6 weeks with a HFD 60% (n¼6 mice per group). Data are represented as mean ±s.e.m. Two-way ANOVA analysis followed by Bonferronni’s post hoc
test. *Pr0.05, **Pr0.01 and ***Pr0.001: effect of Exendin-4(9-39) treatment on glucose excursion in each genotype.
a
ob/ob Fxr+/+ colesevelam
0 15 30 60 900
100
200
300
400
500
600
700
800
***
*
Time (min)
Blo
od g
luco
se (
mg
dl–1
)
Blo
od g
luco
se (
mg
dl–1
)
ob/ob Fxr+/+ control
b
0 15 30 60 900
100
200
300
400
500
600
700
800
Time (min)
ob/ob Fxr–/– colesevelamob/ob Fxr–/– control
d
1.5
2.0 Proglucagon§§
Ileal
mR
NA
rel
ativ
e le
vels
Colesevelam
Control
**
c
60
80 § Colesevelam
Control
*
0.0
0.5
1.0
0
20
40
AU
C (
×10
3 )
ob/obFxr–/–
ob/obFxr–/–
ob/obFxr+/+
ob/obFxr+/+
Figure 8 | BA sequestration improves glycaemia and GLP-1 production through FXR. OGTT after 3 weeks of vehicle or colesevelam treatment in ob/ob
Fxrþ/þ (a) and ob/ob Fxr�/� mice (b) (n¼6–7 mice per group). (c) Corresponding area under the curve (AUC). (d) Proglucagon qPCR on cDNA from
ileum of these mice (n¼ 6–7 mice per group). Data are represented as mean ±s.e.m. Two-way analysis of variance (ANOVA) followed by Bonferronni’s
post hoc test. *Pr0.05 and **Pr0.01: effect of Colesevelam treatment on glucose excursion curve during an OGTT (a and b), on AUC (c) or on
proglucagon gene expression (d) in each genotype. y Pr0.05, yy Pr0.01: effect of FXR deficiency on AUC (c) or on proglucagon gene expression
(d) in each treatment condition.
NATURE COMMUNICATIONS | DOI: 10.1038/ncomms8629 ARTICLE
NATURE COMMUNICATIONS | 6:7629 | DOI: 10.1038/ncomms8629 | www.nature.com/naturecommunications 9
& 2015 Macmillan Publishers Limited. All rights reserved.
Both in vitro, ex vivo and in vivo, in mice as well as in humanintestines, activated FXR decreases proglucagon mRNA levels.This decrease is the result of FXR activation in L cells rather thanan indirect effect of bile acid pool modification after FXRactivation.
ChREBP is a transcription factor activated by glucosemetabolites. As previously evoked by microarray data25, wedemonstrate by quantitative PCR (qPCR) analysis that ChREBPis expressed to a higher extent in murine intestinal L cells than innon-L cells. Moreover, glucose induction of proglucagon mRNAlevels26 is inhibited by FXR activation. We identify here thatglucose-induced proglucagon gene expression is dependent onglucose metabolism and mediated by ChREBP, identifying a rolefor ChREBP in enteroendocrine L cells in the control ofproglucagon gene expression. FXR physically interacts or iscomplexed to ChREBP in L cells, a result also observed in humanhepatocytes where FXR activation inhibits the glucose-inducedglycolytic gene expression by ChREBP12. These observations arein accordance with an overall decrease of the glycolysis pathwayafter FXR activation in GLUTag cells similar to that in humanhepatocytes.
Glucose sensing by L cells and subsequent secretion of GLP-1involves both ATP-independent and -dependent pathways24,30,31.The ATP-independent mechanism is mediated by theco-transport of Naþ and glucose through the membranetransporter SGLT-1 (refs 27,31,34,35) and glucose binding tothe taste receptors Tas1R2 and Tas1R3 (ref. 36). The electrogeniccurrent generated by the Naþ entrance is sufficient to depolarizeL-cell membranes leading to GLP-1 secretion. This mechanismhas been shown to be involved in glucose-induced GLP-1secretion in GLUTag cells, in perfused rat ileum and also inprimary intestinal epithelial cells24,27,31,34. The ATP-dependentpathway involves glucose metabolism by glycolysis, thusincreasing intracellular ATP levels, closure of the voltage-dependent KATP-dependent channel, membrane depolarization,intracellular Ca2þ increase and GLP-1 secretion. Such amechanism is involved in glucose-induced GLP-1 secretion inGLUTag cells27, in perfused rat ileum31 but not in primaryintestinal epithelial cells27. We show that FXR activation does notdecrease the expression of Sglt1, Tas1r2, Tas1r3 in GLUTag cells.Moreover, FXR activation did not change KCl-induced GLP-1
secretion, but lowered GLP-1 secretion in response to both lowand high glucose concentrations. Glucose transport by GLUTtransporters is required for intracellular ATP production in Lcells24. Indeed, incubation of murine intestinal biopsies with theGLUTs inhibitor phloretin prevented glucose-induced GLP-1secretion. FXR activation prevented glucose-induced GLP-1secretion in isolated murine ileal biopsies to a similar extent asphloretin. To delineate the mechanisms underlying the decreaseof ATP-dependent GLP-1 secretion by FXR, we assessed theactivity of the glycolysis pathway and the functionality ofmitochondria in GLUTag cells. FXR activation decreasedintracellular ATP levels, independent of a decrease inmitochondrial mass or defective mitochondria, as seen withMitotracker Green and OCR experiments. ECAR measurementsafter ATP-synthase inhibition with oligomycin showed thatGW4064-treated cells have a lower capacity to metabolizeglucose, which translates into lower ATP-dependent oxygenconsumption. Altogether, these results show that FXR activationdecreases the transcription of glycolytic enzymes not only inhuman hepatocytes12, but also in enteroendocrine L cells leadingto a decrease in intracellular ATP levels and ATP-dependentGLP-1 secretion in response to glucose.
An increasing body of evidence shows that BA pool size andcomposition control glucose homeostasis through BA receptors.Although their action through the transmembrane receptorTGR5 is likely to occur rapidly after food ingestion, activationof the nuclear receptor FXR induces a more delayed response thusleading to a shift between early postprandial positive effects ofTGR5 activation and delayed effects through FXR activation. FXRactivation in the intestine increases FGF15/19 secretion which, inaddition to its role in the regulation of BA synthesis, reducesadiposity, increases brown adipose tissue energy expenditureand improves the metabolic rate in different obese murinemodels37,38. In contrast, recent studies in obese mice highlightthat intestinal FXR antagonism results in improved energyhomeostasis15,16,39. Indeed, recently identified as endogenous BAFXR antagonists in GF mice17, TbMCA and TaMCA inactivateintestinal FXR15,39 and protect mice against diet-induced obesityand improve glucose metabolism15,39. Treatment of GLUTag cellswith CDCA, a natural FXR agonist, decreased, whereas TbMCAincreased proglucagon gene expression. In agreement with thesefindings, GF mice express higher intestinal levels of proglucagonthan CONV-R mice40. In addition, we show here that the increaseof intestinal proglucagon mRNA upon FXR deficiency requiresthe gut microbiota since FXR deficiency in GF mice does notfurther enhance proglucagon mRNA levels. Assessing thedialogue between bile acids, gut microbiota and FXR in L cellscould be an interesting way to increase GLP-1 production.
Whole-body and intestinal FXR-deficient mice are protectedagainst obesity and have an improved glucose metabolism14,15. Byusing the GLP-1R antagonist Exendin-4(9-39), we demonstratethat the improved glucose metabolism in Fxr� /� mice fed aHFD implies the GLP-1 pathway. BASs are resins which complexBA, preventing ileal BA re-absorption and driving BA to thecolon thus facilitating their elimination41,42. Initially used fortheir cholesterol-lowering effect, BAS treatment has been shownto lower blood glucose in T2D patients (for review, see ref. 43).Among the proposed mechanisms, FXR deactivation increasesenergy expenditure in obese mice2,14,41. Another mechanism mayrely on the TGR5-mediated increase in GLP-1 production andsecretion. In the colon, which contains the highest density ofGLP-1 expressing cells, BAS-bound BA increase proglucagonmRNA levels and meal-induced GLP-1 secretion thus improvingglucose metabolism in high-fat-fed mice20,21. In this study, wedemonstrate a role also for FXR in the response to colesevelamresulting in an increase of proglucagon mRNA levels in ileum and
L-cellactivated FXR
IntracellularATP
Glycolysispathway
Colesevelam
GLP-1
ProglucagonProduction Secre
tion
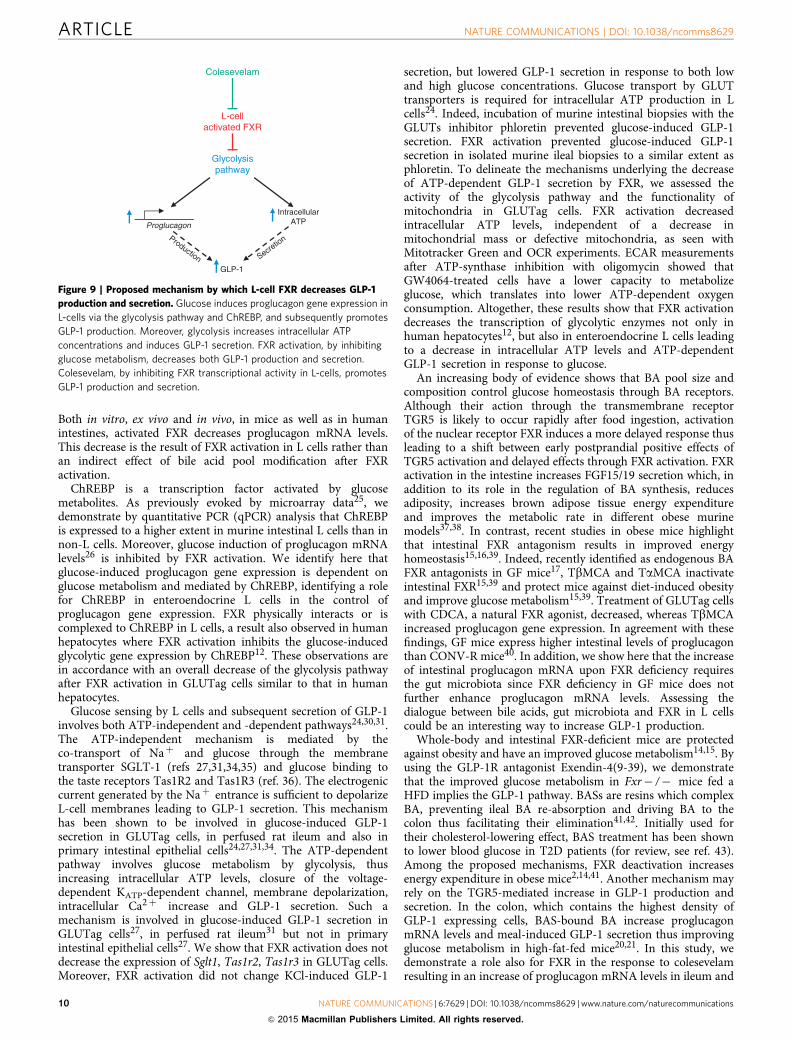
Figure 9 | Proposed mechanism by which L-cell FXR decreases GLP-1
production and secretion. Glucose induces proglucagon gene expression in
L-cells via the glycolysis pathway and ChREBP, and subsequently promotes
GLP-1 production. Moreover, glycolysis increases intracellular ATP
concentrations and induces GLP-1 secretion. FXR activation, by inhibiting
glucose metabolism, decreases both GLP-1 production and secretion.
Colesevelam, by inhibiting FXR transcriptional activity in L-cells, promotes
GLP-1 production and secretion.
ARTICLE NATURE COMMUNICATIONS | DOI: 10.1038/ncomms8629
10 NATURE COMMUNICATIONS | 6:7629 | DOI: 10.1038/ncomms8629 | www.nature.com/naturecommunications
& 2015 Macmillan Publishers Limited. All rights reserved.

colon translated to an improved response to oral glucosesuggesting that compounds with TGR5 agonist–FXR antagonistactivity may be most optimal to enhance incretin production.
Taken together, our results demonstrate that FXR activationdecreases glycolysis and ATP production, which, in turn,decreases proglucagon transcription and GLP-1 secretion inresponse to glucose. In pathophysiological conditions, thebeneficial effect of FXR deficiency is, at least in part, related tothis newly identified FXR/GLP-1 pathway. Our study furtherprovides a novel molecular mechanism contributing to thebeneficial effects of BAS on glucose control in T2DM throughincreased GLP-1 production upon FXR deactivation in intestinalL cells (Fig. 9). Thus, inhibiting FXR in L cells through a changein BA pool composition or through combination TGR5-agonistand FXR-antagonist treatment could be a promising approach totreat T2DM.
MethodsChemicals and reagents. The DPP-4 inhibitors diprotin A, FFA-free bovineserum albumin (BSA), CDCA, TbMCA, exendin-4(9-39), phloretin, DMSOand CMC were purchased from Sigma-Aldrich (St Quentin-Fallavier, France).Sitagliptin was purchased from MSD. The synthetic FXR agonist GW4064 waspurchased from Tocris (R&D Systems, Lille, France). For in vitro or ex vivoexperiments, CDCA, TbMCA and GW4064 were dissolved in dimethylsulfoxide(DMSO) at 0.1% final. For in vivo experiments, GW4064 was dissolved in 1%carboxymethylcellulose (CMC) and Exendin-4(9-39) was dissolved in NaCl 0.9%.Chow and high fat diets were purchased from UAR (A04, Villemoison/Orge,France). Colesevelam–HCl was a kind gift of Daiichi Sankyo.
Animal models and experimental protocols. Eight-week-old C57Bl6/J maleFxrþ /þ , Fxr� /� , ob/ob Fxrþ /þ , ob/ob Fxr� /� littermates (INSERMU1011), 12-week-old C57Bl6/J male Tgr5� /� (CNRS/INSERM/ULP, Illkirch)and WT mice (Charles River Laboratories, Wilmington, MA), fed a chow diet, werehoused in a temperature-controlled room (22 �C) on a 12-h light–dark cycle.GLU-VENUS, germ-free (GF) and conventionally raised (CONV-R) mice werehoused as previously stated17,40. Wild-type (eight mice per group) and Tgr5� /�(five mice per group) mice were gavaged for 5 days with 1% CMC containing ornot GW4064 (30 mpk). After randomization in four groups based on age and bodyweight, C57Bl6/J male mice deficient (Fxr� /� ) or not (Fxrþ /þ ) for FXR werefed a standard chow diet (five to six mice per genotype) or a high-fat diet (12 mice
per genotype). Age-matched C57Bl6/J male mice germ-free (GF) or conventionalraised (CONV-R), on Fxrþ /þ or Fxr� /� backgrounds (11–12 mice per group)were fed a standard chow diet (Labdiet). Eight-week-old C57Bl6/J male Fxrþ /þand Fxr� /� mice on a leptin-deficient (ob/ob) background (six to seven mice pergroup) were fed ad libitum during 3 weeks with a standard diet (UAR A04,Villemoison/Orge, France) supplemented or not with 2% of colesevelam–HCl.Eight-week-old Fxrþ /þ and Fxr� /� mice (12 mice per genotype) received aHFD (D12492; Research Diets; 60% kcal fat) and controls received a chow diet for6 weeks. Body weight was monitored weekly and glucose tolerance tests weremeasured as previously described14. Briefly, after 6 h fasting, mice were injectedwith NaCl 0.9% (n¼ 6 mice per group) containing or not Exendin-4(9-39)(0.5 mpk, n¼ 6 mice per group) 45 min before intragastric glucose gavage(2 g kg� 1). One week later, the same mice were subjected to intraperitoneal glucoseinjection (2 g kg� 1). Glycaemia were measured at 0, 15, 30, 60, 90 and 120 minafter either glucose gavage or intraperitoneal injection. For the in vivo GLP-1experiments, mice were fasted 6 h, gavaged with sitagliptin (25 mpk) 45 min beforea glucose bolus (2 g kg� 1). Fifteen minutes after glucose gavage, blood (250 ml) wassampled by retro-orbital venipuncture under isoflurane anaesthesia and plasmaGLP-1 was measured as described below.
After 6 h fasting, mice were killed by cervical dislocation. Ileum (correspondingto the five terminal centimetres of the small intestine) and colon were washed oncewith phosphate-buffered saline (PBS), opened longitudinally on ice and theintestinal mucosa was scrapped and snap-frozen in liquid nitrogen. The experimenton GLU-VENUS mice was approved by local ethics committees and conformed toUnited Kingdom Home Office regulations, the experiment on Tgr5� /� micewere approved by the local animal experimentation committee of the Canton deVaud (license no. 2614) and the experiment on GF/CONV-R mice was performedwith protocols approved by the University of Gothenburg Animal StudiesCommittee. All the other experimental protocols were approved by the LillePasteur Institute Ethical committee and carried out in agreement with EuropeanUnion (EEC no. 07430).
Ex vivo studies. GLP-1 secretion on murine intestinal biopsies. Murine ilealbiopsies from WT mice treated for 5 days with CMC or GW4064 (30 mpk) wereisolated as previously described4. Briefly, after 6 h fasting, mice were killed bycervical dislocation. The last 8 cm of the small intestine, corresponding to theileum, was placed in cold Hank’s Balance Salt Solution (HBSS, Lonza) containing2% horse serum (Life Technologies). Peyer’s patches were removed and the ileumwas opened longitudinally and cut into 5-mm-long pieces. Pieces were washed5� in cold HBSS plus 2% horse serum and then incubated for 10 min at 4 �Cin HBSS containing 2% horse serum and 1,4-dithiothreitol (DTT, 1 mmol l� 1).After additional washing in cold HBSS plus 2% horse serum, ileum pieces weredistributed in 48-well plates and stabilized for 3 h at 37 �C in Iscove’s ModifiedDulbecco Medium (Life Technologies) containing 10% fetal calf serum (LifeTechnologies). After 30 min glucose deprivation in DMEM No Glc medium,a 1 h-GLP-1 secretion test in response to DMEM without glucose, to DMEM withglucose (5.5 mmol l� 1) or in response to DMEM with glucose (5.6 mmol l� 1)plus phloretin (0.5 mmol l� 1) was performed at 37 �C in DMEM plus 1% DPP-4inhibitor (Ile-Pro-Ile, Sigma-Aldrich). Finally, medium was removed, centrifugedfor 5 min at 4 �C at 13,000g and immediately frozen at � 80 �C. GLP-1 content inculture medium was measured as described below. The remaining tissue waswashed in cold PBS and frozen at � 80 �C in NaOH 2 N. Protein content wasassessed according to BCA’s method (Thermoscientific).
Culture and immunostaining on human intestinal biopsies. Fresh humanjejunum biopsies from normoglycemic subjects were obtained with informedconsent as part of the A Biological Atlas of Severe Obesity (ABOS) study(ClinicalTrials.gov; NCT01129297). Mucosa were dissociated from musculosa andcut into small pieces of 1 cm2 before treatment for 16 h with DMSO or GW4064(5 mmol l� 1) in RPMI mediumþGlutaMAX-1 (catalogue (Cat.) No. 61870-010,Life Technologies) containing glucose (11 mmol l� 1), sodium pyruvate(1 mmol l� 1) and supplemented with 10% FBS (Life Technologies) andpenicillin/streptomycin (10,000 U l� 1 per 10 mg l� 1) in a 37 �C, 5% CO2
controlled atmosphere. RNA extraction and qPCR analysis were performed asdescribed below.
Table 1 | Mouse small interfering RNA sequences used insiRNA experiments.
Targeted gene Dharmacon Smartpool sequences (50-30)
Fxr GAAACUUCCUGCCGGACAUGUGUAAAUCUAAACGGCUAGAUUUGUGCCGGACGGGAUUGCCAGGAGUGCCGGCUAA
Mlxipl CAUCCGACCUUUAUUUGAAAAGAGGCGGUUCAAUAUUAGCAGCUGCGGGAUGAAAUAUCAUGGAGAUAUCAGAUUU
Table 2 | qPCR primer sequences.
Species Gene Forward (5’-3’) Reverse (5’-3’)
Mouse Fgf15 GAGGACCAAAACGAACGAAATT ACGTCCTTGATGGCAATCGShp AGGAACCTGCCGTCCTTCTG CTCAGCCACCTCGAAGGTCAProglucagon GATCATTCCCAGCTTCCCAG CTGGTAAAGGTCCCTTCAGCExon/Intron proglucagon CACTTCCACTCACAGATCATTCC CTTCAGACTCTTACCGGTTCCTCFxr CCTGAGAACCCACAGCATTT GTGTCCATCACTGCACATCC
Human Proglucagon GTTCCCAAAGAGGGCTTGCT GTTGCCAGCTGCCTTGTACCFGF19 GGAGGAAGACTGTGCTTTCGA GAAGAGCCTAGCCATGTGTAAC
NATURE COMMUNICATIONS | DOI: 10.1038/ncomms8629 ARTICLE
NATURE COMMUNICATIONS | 6:7629 | DOI: 10.1038/ncomms8629 | www.nature.com/naturecommunications 11
& 2015 Macmillan Publishers Limited. All rights reserved.
For immunohistochemical analysis, human jejunal biopsies were overnight(O/N) fixed with paraformaldehyde 4% (Sigma) before incubation with 20%sucrose during 20 h and further inclusion in Jung Tissue Freezing Medium (Jung)and storage at � 80 �C before processing. Twelve-micrometre-thick slices werepost-fixed in methanol/acetone 50/50 (v/v) for 10 min at � 20 �C. After two washesin Tris/NaCl buffer (TRIZMA-Base (20 mmol l� 1, Sigma)/NaCl (150 mmol l� 1,VWR), pH 7.6), an antigen retrieval step was performed (520 W, 5 min; 160 W,10 min) in citrate buffer (ThermoScientific). After permeabilization during 10 min(Tris/NaCl/0.1% TRITON X100), unspecific protein binding sites were masked byDako Protein Block (DAKO) during 2 h at room temperature. Then, the sampleswere incubated O/N with mouse anti-human GLP-1 (SC-73508, Santa CruzBiotechnology) and rabbit anti-human FXR (Ab28676, Abcam) antibodies (1/100)at 4 �C. The next day, immunoreactive cells were revealed after incubation withgoat anti-mouse IgG Alexa 568 (for GLP-1) and goat anti-rabbit IgG Alexa 488(for FXR; dilutions: 1/200, Molecular Probes) and photographies were taken with aconfocal microscope (LSM 710 Zeiss). Image analysis was performed using theImageJ software (version 1.46c; WS Rasband, National Institutes of Health,Bethesda, MD, USA, http://rsb.info.nih.gov/ij/).
In vitro studies. Cell culture and treatment. The mouse enteroendocrine L cell lineGLUTag was kindly provided by D.J. Drucker (University of Toronto, Toronto,Canada) and grown in DMEMþGlutaMAX-1 medium (Cat. No. 21885-025,Invitrogen) containing glucose (5.6 mmol l� 1), sodium pyruvate (1 mmol l� 1) andsupplemented with 10% FBS. For treatments, 42 h cultured cells were incubated for24 h in DMEMþGlutaMAX-1 medium (Cat. No. 21885-025, Invitrogen) withglucose (5.6 mmol l� 1), sodium pyruvate (1 mmol l� 1) and supplemented with0.2% BSA containing TbMCA (100 mmol l� 1), CDCA (100 mmol l� 1) or GW4064(5mmol l� 1) during 24 h unless specified. In some experiments, cells were deprivedof glucose by a 12 h incubation in glucose-free medium (DMEM GLUTamax,Cat. No. 11966-025), supplemented with 1% glutamine, sodium pyruvate(1 mmol l� 1), 0.2% BSA and sodium lactate (10 mmol l� 1) before FXR activationin either lactate (10 mmol l� 1)-, glucose (5.6 mmol l� 1)- or 2-deoxyglucose(5.6 mmol l� 1)-containing medium.
Transient transfection assays. Cells were electroporated using the NeonTransfection System (Life Technologies) with small interference RNA againstrandom (siCtrl), Fxr (siFxr) or Mlxipl (siChrebp) sequences (smart pool sequencesobtained from Dharmacon (Thermoscientific, Illkirch, France); see Table 1).A total 140,000 electroporated cells cm� 2 seeded into 24-well plates during 42 hwere treated as described above.
GLP-1 secretion assays, ATP and mitotracker-FACS measurement. Aftertreatment, GLUTag cells were starved for 30 min in glucose-free Krebs/phosphatebuffer (NaCl (120 mmol l� 1), KCl (5 mmol l� 1), MgCl2 (0.25 mmol l� 1), CaCl2(0.5 mmol l� 1) and NaHCO3 (2.2 mmol l� 1), pH 7.2) supplemented with diprotinA (100 mmol l� 1) and 0.2% BSA. Cells were subsequently stimulated for 1 h withKrebs buffer with or without glucose (5.6 mmol l� 1) or with a Krebs bufferenriched with KCl (30 mmol l� 1). The cell supernatants were then transferred intoice-cold microtubes containing an equal volume of diprotin A (100 mmol l� 1) inKrebs buffer and centrifuged at 1,500g, 4 �C for 5 min. Cells were lysed in NaOH(0.8 mol l� 1) under agitation and total protein content was determined using theBCA Protein Assay Kit (Pierce). Active 7-37 and 7-36 amide GLP-1 were measuredwith an enzyme-linked immunosorbent assay kit (EGLP-35K; Merck-Millipore)using Mithras Technology (Berthold) and normalized to the total quantity ofcellular proteins. ATP measurement (Cell Titre Glow, Promega) on GLUTag cellsin response to glucose (5.6 mmol l� 1) was performed in the same condition asGLP-1 secretion assays according to the manufacturer’s protocol and luciferaseactivity was measured using Viktor apparatus (PerkinElmer). To estimatemitochondrial quantity, 24 h DMSO- and GW4064-treated GLUTag cells werewashed with PBS, trypsinized and incubated at 37 �C for 20 min with 100 nmol l� 1
MitoTracker Green FM (Molecular Probes). Samples were washed 3� in PBS andsubjected to flow cytometric analysis on a FACSCalibur apparatus (BectonDickinson, San Jose, CA).
Analysis of oxygen consumption and glycolytic rates. Measurements of OCR andECAR in GLUTag cells were performed using the XF24 analyser (SeahorseBioscience). A total 4� 104 GLUTag cells per well were seeded in XF24 V7microplates for 42 h before GW4064 treatment for 24 h. OCR and ECAR weremeasured in Seahorse assay buffer containing basic glucose-free DMEM medium(pH 7.4). The following compounds and concentrations were added successively:glucose (10 mmol l� 1); oligomycin (1 mmol l� 1); 2-deoxyglucose (100 mmol l� 1);rotenone (1 mmol l� 1) and antimycin A (1 mmol l� 1).
Co-immunoprecipitation and western blot analysis. GLUTag cells wereglucose-deprived for 12 h and then treated 24 h with DMSO or with GW4064(5mmol l� 1) in the presence of lactate (10 mmol l� 1) or glucose (5.6 mmol l� 1).After three washes in ice-cold PBS, cells were scrapped in ice-cold PBS containingprotease inhibitors (1� , Roche). Cells were centrifuged for 5 min at 3,500g at 4 �C.One volume of the cell lysis buffer (KCl (10 mmol l� 1), TRIS HCl pH 7.9(10 mmol l� 1), DTT (0.5 mmol l� 1), MgCl2 (1.5 mmol l� 1), PIC 0.1%),corresponding to the cell volume was added and cells were incubated on ice during15 min. Cells were then centrifuged for 1 min at 11,500g at 4 �C. Supernatants werecollected (that is, cytoplasmic fraction) and pellets were lysed in modified RIPAbuffer (TRIS HCl pH 7.4 (50 mmol l� 1), NaCl (150 mmol l� 1), 0.25% DOC, 0.5%
NP40, EDTA (1 mmol l� 1), 0.1% PIC) 30 min on ice. After centrifugation(5 min at 13,000g at 4 �C) supernatants corresponding to the nuclear fraction werecollected. After a pre-clearing step in which protein fractions were incubated withprotein A agarose beads (1 h 30 min at 4 �C), cells were centrifuged (5 min at 1,000gat 4 �C) and 200 mg of protein were immunoprecipitated (O/N at 4 �C) withantibody against FXR (2 mg). Then immunocomplexes were captured with 100 mlprotein A agarose beads 3 h at 4 �C, centrifuged 1 min at 1,000g and washedthree times with 800 ml of RIPA modified buffer. Beads were resuspended in2� migration buffer and heated for 3 min at 100 �C.
Western blots were generated as previously described29 and incubated withproglucagon (SC-80730, Santa Cruz), FXR (PP-9033A, R&D), ChREBP (NovusBiological, NB400-135) or b-actin (SC-1616, Santa Cruz) antibodies (diluted:1/500). After 1 h incubation with horseradish peroxydase-conjugated secondaryantibodies (1/3,000, Sigma), protein revelation was performed using the enhancedchemiluminescence FEMTO Plus reagents (ECL FEMTO, Thermofischer) byautoradiography (Camera Gbox, SynGene) and band intensity was measured(GeneTools software, SynGene).
Microarray analysis. GLUTag cells were treated or not with GW4064(5 mmol l� 1) for 24 h and four RNA samples of each treatment condition werehybridized on mouse GEP 8� 60 K arrays. Scanning clusters and data acquisitionwere carried out following the manufacturer’s instructions (Agilent, One-colourmicroarray Gene Expression Analysis). Data processing and analysis wereperformed using the Genespring Software. Biological Processes Analysis wasperformed using Gene Ontology Biological Processes on the Genomatix Software(Genomatix, Deutschland). Data are deposited at EBI under the E-MTAB-2199number.
RNA extraction and quantification by qPCR. Total RNAs from FACS-isolatedcells were isolated using a micro-scale RNA isolation kit (RNAeasy, Qiagen,Crawley, UK) and were reverse transcribed according to standard protocols using aPeltier Thermal Cycler-225 (MJ Research, Waltham, MA, USA). Quantitative PCRwith reverse transcription was performed with 7900 HT Fast Real-Time PCRsystem (Applied Biosystems, Foster City, CA, USA). PCR reactions mix consistedof first-strand cDNA template, primers (TaqMan gene expression assays, AppliedBiosystems) and PCR Master mix (Applied Biosystems). Fxr gene expression wascompared with that of b-actin measured on the same sample, in parallel, on thesame plate, giving a cycle threshold difference (DCT) for Fxr gene minus b-actin.
Total RNAs from GLUTag cells, mouse and human epithelial cells wereextracted using Extract-All Reagent (Eurobio, Courteboeuf, France) according tothe manufacturer’s protocol. After DNAse treatment (Fermentas, St Remy LesChevreuse, France), total RNA (0.5–1 mg) was reverse transcribed using High-Capacity Multiscribe Reverse Transcriptase (Applied Biosystems, St Aubin, France)according to the manufacturer’s protocol. qPCR with reverse transcription wasperformed using the Master MIX SYBR Green Brillant Fast III (Agilent) on aMX4000 apparatus (Stratagene) using specific oligonucleotides (see Table 2). Theresults are presented using the DDCt method normalized to a reference gene(Cyclophilin for in vitro and ex vivo experiments and TFIIB for in vivoexperiments). Controls were set at 1 and all conditions were expressedcomparatively to control.
Data analysis. In vitro experiments were performed in triplicates and repeated atleast three times. The in vitro and ex vivo data are presented as mean±s.d. Thein vivo data are presented as mean±s.e.m. All statistical analyses were performedusing two-tailed Student’s t-test or one-way analysis of variance followed byTukey’s post hoc test or two-way analysis of variance followed by Bonferronni’spost hoc test and stated in the figure legends. P values r0.05 were considered assignificant.
References1. Porez, G., Prawitt, J., Gross, B. & Staels, B. Bile acid receptors as targets for
the treatment of dyslipidemia and cardiovascular disease. J. Lipid Res. 53,1723–1737 (2012).
2. Prawitt, J., Caron, S. & Staels, B. Glucose-lowering effects of intestinal bile acidsequestration through enhancement of splanchnic glucose utilization. TrendsEndocrinol. Metab. 25, 235–244 (2014).
3. Kawamata, Y. et al. A G protein-coupled receptor responsive to bile acids.J. Biol. Chem. 278, 9435–9440 (2003).
4. Thomas, C. et al. TGR5-mediated bile acid sensing controls glucosehomeostasis. Cell Metab. 10, 167–177 (2009).
5. Baggio, L. L. & Drucker, D. J. Biology of incretins: GLP-1 and GIP.Gastroenterology 132, 2131–2157 (2007).
6. Nauck, M., Stockmann, F., Ebert, R. & Creutzfeldt, W. Reduced incretin effectin type 2 (non-insulin-dependent) diabetes. Diabetologia 29, 46–52 (1986).
7. Nauck, M. A. et al. Preserved incretin activity of glucagon-like peptide 1[7-36 amide] but not of synthetic human gastric inhibitory polypeptide inpatients with type-2 diabetes mellitus. J. Clin. Invest. 91, 301–307 (1993).
8. Lefebvre, P., Cariou, B., Lien, F., Kuipers, F. & Staels, B. Role of bile acids andbile acid receptors in metabolic regulation. Physiol. Rev. 89, 147–191 (2009).
ARTICLE NATURE COMMUNICATIONS | DOI: 10.1038/ncomms8629
12 NATURE COMMUNICATIONS | 6:7629 | DOI: 10.1038/ncomms8629 | www.nature.com/naturecommunications
& 2015 Macmillan Publishers Limited. All rights reserved.
9. Mazuy, C., Helleboid, A., Staels, B. & Lefebvre, P. Nuclear bile acid signalingthrough the farnesoid X receptor. Cell. Mol. Life Sci. 72, 1631–1650 (2014).
10. Zhang, Y. et al. Activation of the nuclear receptor FXR improves hyperglycemiaand hyperlipidemia in diabetic mice. Proc. Natl Acad. Sci. USA 103, 1006–1011(2006).
11. Duran-Sandoval, D. et al. Glucose regulates the expression of the farnesoidX receptor in liver. Diabetes 53, 890–898 (2004).
12. Caron, S. et al. Farnesoid X receptor inhibits the transcriptional activity ofcarbohydrate response element binding protein in human hepatocytes. Mol.Cell. Biol. 33, 2202–2211 (2013).
13. Watanabe, M. et al. Lowering bile acid pool size with a synthetic farnesoidX receptor (FXR) agonist induces obesity and diabetes through reduced energyexpenditure. J. Biol. Chem. 286, 26913–26920 (2011).
14. Prawitt, J. et al. Farnesoid X receptor deficiency improves glucose homeostasisin mouse models of obesity. Diabetes 60, 1861–1871 (2011).
15. Li, F. et al. Microbiome remodelling leads to inhibition of intestinal farnesoidX receptor signalling and decreased obesity. Nat. Commun. 4, 2384 (2013).
16. Fang, S. et al. Intestinal FXR agonism promotes adipose tissue browning andreduces obesity and insulin resistance. Nat. Med. 21, 159–165 (2015).
17. Sayin, S. I. et al. Gut microbiota regulates bile acid metabolism by reducing thelevels of tauro-beta-muricholic acid, a naturally occurring FXR antagonist. CellMetab. 17, 225–235 (2013).
18. Kuipers, F., Bloks, V. W. & Groen, A. K. Beyond intestinal soap—bile acids inmetabolic control. Nat. Rev. Endocrinol. 10, 488–498 (2014).
19. Meissner, M. et al. Bile acid sequestration reduces plasma glucose levels indb/db mice by increasing its metabolic clearance rate. PLoS ONE 6, e24564(2011).
20. Harach, T. et al. TGR5 potentiates GLP-1 secretion in response to anionicexchange resins. Sci. Rep. 2, 430 (2012).
21. Potthoff, M. J. et al. Colesevelam suppresses hepatic glycogenolysis byTGR5-mediated induction of GLP-1 action in DIO mice. Am. J. Physiol.Gastrointest. Liver Physiol. 304, G371–G380 (2013).
22. Inagaki, T. et al. Regulation of antibacterial defense in the small intestine by thenuclear bile acid receptor. Proc. Natl Acad. Sci. USA 103, 3920–3925 (2006).
23. Stroeve, J. H. M. et al. Intestinal FXR-mediated FGF15 production contributesto diurnal control of hepatic bile acid synthesis in mice. Lab. Invest. 90,1457–1467 (2010).
24. Reimann, F. et al. Glucose sensing in L cells: a primary cell study. Cell Metab. 8,532–539 (2008).
25. Habib, A. M. et al. Overlap of endocrine hormone expression in the mouseintestine revealed by transcriptional profiling and flow cytometry.Endocrinology 153, 3054–3065 (2012).
26. Daoudi, M. et al. PPARb/d activation induces enteroendocrine L cell GLP-1production. Gastroenterology 140, 1564–1574 (2011).
27. Parker, H. E. et al. Predominant role of active versus facilitative glucosetransport for glucagon-like peptide-1 secretion. Diabetologia 55, 2445–2455(2012).
28. Berrabah, W. et al. The glucose sensing O-GlcNacylation pathway regulates thenuclear bile acid receptor FXR. Hepatology 59, 2022–2033 (2013).
29. Filhoulaud, G., Guilmeau, S., Dentin, R., Girard, J. & Postic, C. Novel insightsinto ChREBP regulation and function. Trends Endocrinol. Metab. 24, 257–268(2013).
30. Mace, O. J., Schindler, M. & Patel, S. The regulation of K- and L-cell activity byGLUT2 and the calcium-sensing receptor CasR in rat small intestine. J. Physiol.590, 2917–2936 (2012).
31. Kuhre, R. E., Frost, C. R., Svendsen, B. & Holst, J. J. Molecular mechanisms ofglucose-stimulated GLP-1 secretion from perfused rat small intestine. Diabetes64, 370–382 (2015).
32. Bjursell, M. et al. Ageing Fxr deficient mice develop increased energyexpenditure, improved glucose control and liver damage resembling NASH.PLoS ONE 8, e64721 (2013).
33. Ryan, K. K. et al. FXR is a molecular target for the effects of vertical sleevegastrectomy. Nature 509, 183–188 (2014).
34. Gribble, F. M., Williams, L., Simpson, A. K. & Reimann, F. A novel glucose-sensing mechanism contributing to glucagon-like peptide-1 secretion from theGLUTag cell line. Diabetes 52, 1147–1154 (2003).
35. Reimann, F. et al. Characterization and functional role of voltage gated cationconductances in the glucagon-like peptide-1 secreting GLUTag cell line.J. Physiol. 563, 161–175 (2005).
36. Geraedts, M. C. P. et al. Transformation of postingestive glucose responses afterdeletion of sweet taste receptor subunits or gastric bypass surgery. Am. J.Physiol. Endocrinol. Metab. 303, E464–E474 (2012).
37. Tomlinson, E. et al. Transgenic mice expressing human fibroblast growthfactor-19 display increased metabolic rate and decreased adiposity.Endocrinology 143, 1741–1747 (2002).
38. Fu, L. et al. Fibroblast growth factor 19 increases metabolic rate and reversesdietary and leptin-deficient diabetes. Endocrinology 145, 2594–2603 (2004).
39. Kaur, A. et al. Loss of Cyp8b1 improves glucose homeostasis by increasingGLP-1. Diabetes 64, 1168–1179 (2014).
40. Wichmann, A. et al. Microbial modulation of energy availability in the colonregulates intestinal transit. Cell Host Microbe 14, 582–590 (2013).
41. Prawitt, J. & Staels, B. Bile acid sequestrants: glucose-lowering mechanisms.Metab. Syndr. Relat. Disord. 8, S3–S8 (2010).
42. Staels, B. & Kuipers, F. Bile acid sequestrants and the treatment of type 2diabetes mellitus. Drugs 67, 1383–1392 (2007).
43. Fonseca, V. A., Handelsman, Y. & Staels, B. Colesevelam lowers glucose andlipid levels in type 2 diabetes: the clinical evidence. Diabetes Obes. Metab. 12,384–392 (2010).
AcknowledgementsWe wish to thank Meryem Tardivel and Anne-Sophie Drucbert of BiCeL-IFR114 Facilityfor access to systems and technical advice. B.S. is a member of the Institut Universitairede France. M.-S.T. was supported by a grant from the French Ministry for Education andResearch. V.S. was supported by grant from the ‘‘Fondation pour la Recherche’’ (FRM).This work was supported by grants from Region Nord-Pas de Calais, INSERM, A.N.R.(FXREn), Universite Lille 2, Universite Lille Nord de France and European GenomicInstitute for Diabetes (EGID, ANR-10-LABX-46). Y.S. was supported by grant from theLille Metropole Communaute Urbaine (LMCU). F.M.G, F.R. and C.A.B. are fundedby the Wellcome Trust (WT088357/Z/09/Z, WT084210/Z/07/Z and the WT PhDprogramme in Metabolic and Cardiovascular Disease).
Author contributionsM.-S.T., A.T., B.S. and S.L. conceived and designed the experiments; M.-S.T., J.P., V.T.,E.D., E.V., S.D., Y.S., V.S., J.K., P.M., C.A.B., A.P. and S.I.S. acquired the data; M.-S.T.,M.D., O.B., S.I.S., Y.S., J.K., B.S. and S.L. analysed and interpreted the data; M.-S.T.,B.S. and S.L. drafted the manuscript; M.-S.T., F.M.G., A.T., B.S. and S.L. revised themanuscript for important intellectual content; M.-S.T., S.S., S.C., K.B., P.L., C.A.B. andV.T. participated in the statistical analysis; S.L. and B.S. obtained the funding; M.-S.T.,V.T., H.D., E.D., E.V., N.H., R.C., G.B., S.S., A.P., F.R., F.M.G., A.T., K.S., F.B. andF.P. gave technical and material supports; B.S. and S.L. supervised the study.
Additional informationSupplementary Information accompanies this paper at http://www.nature.com/naturecommunications
Competing financial interests: The authors declare no competing financial interests.
Reprints and permission information is available online at http://npg.nature.com/reprintsandpermissions/
How to cite this article: Trabelsi, M.S. et al. Farnesoid X receptor inhibits glucagon-likepeptide-1 production by enteroendocrine L cells. Nat. Commun. 6:7629doi: 10.1038/ncomms8629 (2015).
NATURE COMMUNICATIONS | DOI: 10.1038/ncomms8629 ARTICLE
NATURE COMMUNICATIONS | 6:7629 | DOI: 10.1038/ncomms8629 | www.nature.com/naturecommunications 13
& 2015 Macmillan Publishers Limited. All rights reserved.