Temporal Patterns of Glucagon and Its Relationships ... - MDPI
17
Citation: Göbl, C.; Morettini, M.; Salvatori, B.; Alsalim, W.; Kahleova, H.; Ahrén, B.; Tura, A. Temporal Patterns of Glucagon and Its Relationships with Glucose and Insulin following Ingestion of Different Classes of Macronutrients. Nutrients 2022, 14, 376. https:// doi.org/10.3390/nu14020376 Academic Editor: Clive J. Petry Received: 18 December 2021 Accepted: 12 January 2022 Published: 16 January 2022 Publisher’s Note: MDPI stays neutral with regard to jurisdictional claims in published maps and institutional affil- iations. Copyright: © 2022 by the authors. Licensee MDPI, Basel, Switzerland. This article is an open access article distributed under the terms and conditions of the Creative Commons Attribution (CC BY) license (https:// creativecommons.org/licenses/by/ 4.0/). nutrients Article Temporal Patterns of Glucagon and Its Relationships with Glucose and Insulin following Ingestion of Different Classes of Macronutrients Christian Göbl 1 , Micaela Morettini 2 , Benedetta Salvatori 3 , Wathik Alsalim 4 , Hana Kahleova 5 , Bo Ahrén 4 and Andrea Tura 3, * 1 Department of Obstetrics and Gynaecology, Medical University of Vienna, 1090 Vienna, Austria; [email protected] 2 Department of Information Engineering, Università Politecnica delle Marche, 60131 Ancona, Italy; [email protected] 3 CNR Institute of Neuroscience, 35127 Padova, Italy; [email protected] 4 Department of Clinical Sciences, Faculty of Medicine, Lund University, 22184 Lund, Sweden; [email protected] (W.A.); [email protected] (B.A.) 5 Physicians Committee for Responsible Medicine, Washington, DC 20016, USA; [email protected] * Correspondence: [email protected]; Tel.: +39-049-829-5786 Abstract: Background: glucagon secretion and inhibition should be mainly determined by glucose and insulin levels, but the relative relevance of each factor is not clarified, especially following ingestion of different macronutrients. We aimed to investigate the associations between plasma glucagon, glucose, and insulin after ingestion of single macronutrients or mixed-meal. Methods: thirty-six participants underwent four metabolic tests, based on administration of glucose, protein, fat, or mixed-meal. Glucagon, glucose, insulin, and C-peptide were measured at fasting and for 300 min following food ingestion. We analyzed relationships between time samples of glucagon, glucose, and insulin in each individual, as well as between suprabasal area-under-the-curve of the same variables (ΔAUC GLUCA , ΔAUC GLU , ΔAUC INS ) over the whole participants’ cohort. Results: in individuals, time samples of glucagon and glucose were related in only 26 cases (18 direct, 8 inverse relationships), whereas relationship with insulin was more frequent (60 and 5, p < 0.0001). The frequency of significant relationships was different among tests, especially for direct relationships (p ≤ 0.006). In the whole cohort, ΔAUC GLUCA was weakly related to ΔAUC GLU (p ≤ 0.02), but not to ΔAUC INS , though basal insulin secretion emerged as possible covariate. Conclusions: glucose and insulin are not general and exclusive determinants of glucagon secretion/inhibition after mixed-meal or macronutrients ingestion. Keywords: glucagon determinants; glucagon shape; nutrients; individual associations; glucose; proteins; lipids; mixed meal; glucose homeostasis; mathematical modeling 1. Introduction Glucagon is a hormone secreted by the pancreatic alpha cells, and it is a key factor in glucose regulation [1]. In fact, already some decades ago it was shown that glucagon levels increase at low glycemic levels with consequent stimulation of glycogenolysis and gluconeogenesis by the liver, indicating that such glucagon-based counter-regulation mech- anisms are crucial for preventing hypoglycemia [2–4]. In more recent years, the interest in studying glucagon considerably increased due to the discovery of several actions of metabolic relevance, especially for the maintenance of the glucose homeostasis [1]. As an example, it was suggested that glucagon is involved in the paracrine regulation of the neighboring beta cells: since alpha cells are located in close proximity to the beta cells, it is possible that there is a functional crosstalk between these two islet cell types [1]. In this respect, one study demonstrated that insulin secretion from isolated beta cells was Nutrients 2022, 14, 376. https://doi.org/10.3390/nu14020376 https://www.mdpi.com/journal/nutrients
-
Upload
khangminh22 -
Category
Documents
-
view
4 -
download
0
Transcript of Temporal Patterns of Glucagon and Its Relationships ... - MDPI
�����������������
Citation: Göbl, C.; Morettini, M.;
Salvatori, B.; Alsalim, W.; Kahleova,
H.; Ahrén, B.; Tura, A. Temporal
Patterns of Glucagon and Its
Relationships with Glucose and
Insulin following Ingestion of
Different Classes of Macronutrients.
Nutrients 2022, 14, 376. https://
doi.org/10.3390/nu14020376
Academic Editor: Clive J. Petry
Received: 18 December 2021
Accepted: 12 January 2022
Published: 16 January 2022
Publisher’s Note: MDPI stays neutral
with regard to jurisdictional claims in
published maps and institutional affil-
iations.
Copyright: © 2022 by the authors.
Licensee MDPI, Basel, Switzerland.
This article is an open access article
distributed under the terms and
conditions of the Creative Commons
Attribution (CC BY) license (https://
creativecommons.org/licenses/by/
4.0/).
nutrients
Article
Temporal Patterns of Glucagon and Its Relationships withGlucose and Insulin following Ingestion of Different Classesof MacronutrientsChristian Göbl 1, Micaela Morettini 2, Benedetta Salvatori 3, Wathik Alsalim 4, Hana Kahleova 5 , Bo Ahrén 4
and Andrea Tura 3,*
1 Department of Obstetrics and Gynaecology, Medical University of Vienna, 1090 Vienna, Austria;[email protected]
2 Department of Information Engineering, Università Politecnica delle Marche, 60131 Ancona, Italy;[email protected]
3 CNR Institute of Neuroscience, 35127 Padova, Italy; [email protected] Department of Clinical Sciences, Faculty of Medicine, Lund University, 22184 Lund, Sweden;
[email protected] (W.A.); [email protected] (B.A.)5 Physicians Committee for Responsible Medicine, Washington, DC 20016, USA; [email protected]* Correspondence: [email protected]; Tel.: +39-049-829-5786
Abstract: Background: glucagon secretion and inhibition should be mainly determined by glucoseand insulin levels, but the relative relevance of each factor is not clarified, especially followingingestion of different macronutrients. We aimed to investigate the associations between plasmaglucagon, glucose, and insulin after ingestion of single macronutrients or mixed-meal. Methods:thirty-six participants underwent four metabolic tests, based on administration of glucose, protein,fat, or mixed-meal. Glucagon, glucose, insulin, and C-peptide were measured at fasting and for300 min following food ingestion. We analyzed relationships between time samples of glucagon,glucose, and insulin in each individual, as well as between suprabasal area-under-the-curve of thesame variables (∆AUCGLUCA, ∆AUCGLU, ∆AUCINS) over the whole participants’ cohort. Results: inindividuals, time samples of glucagon and glucose were related in only 26 cases (18 direct, 8 inverserelationships), whereas relationship with insulin was more frequent (60 and 5, p < 0.0001). Thefrequency of significant relationships was different among tests, especially for direct relationships(p ≤ 0.006). In the whole cohort, ∆AUCGLUCA was weakly related to ∆AUCGLU (p ≤ 0.02), but not to∆AUCINS, though basal insulin secretion emerged as possible covariate. Conclusions: glucose andinsulin are not general and exclusive determinants of glucagon secretion/inhibition after mixed-mealor macronutrients ingestion.
Keywords: glucagon determinants; glucagon shape; nutrients; individual associations; glucose;proteins; lipids; mixed meal; glucose homeostasis; mathematical modeling
1. Introduction
Glucagon is a hormone secreted by the pancreatic alpha cells, and it is a key factorin glucose regulation [1]. In fact, already some decades ago it was shown that glucagonlevels increase at low glycemic levels with consequent stimulation of glycogenolysis andgluconeogenesis by the liver, indicating that such glucagon-based counter-regulation mech-anisms are crucial for preventing hypoglycemia [2–4]. In more recent years, the interestin studying glucagon considerably increased due to the discovery of several actions ofmetabolic relevance, especially for the maintenance of the glucose homeostasis [1]. Asan example, it was suggested that glucagon is involved in the paracrine regulation of theneighboring beta cells: since alpha cells are located in close proximity to the beta cells,it is possible that there is a functional crosstalk between these two islet cell types [1]. Inthis respect, one study demonstrated that insulin secretion from isolated beta cells was
Nutrients 2022, 14, 376. https://doi.org/10.3390/nu14020376 https://www.mdpi.com/journal/nutrients
Nutrients 2022, 14, 376 2 of 17
lower than that from beta cells in the presence of alpha cells [5], though other factorsproduced by the alpha cells may have played a role in the beta-cell function. Other specificstudies investigating the role of glucagon in beta-cell function examined isolated islets frommice with genetic deletion of glucagon receptors, showing that glucose-stimulated insulinsecretion was impaired [6]. In addition, insulin secretion was overstimulated in mice withbeta-cell overexpression of the glucagon receptor [7]. Glucagon was also proved to havehypolipidemic effects, causing decrease in triglyceride and cholesterol, and increase in freefatty acid oxidation [8–11].
What factors affect glucagon secretion, and its inhibition following food ingestion?It was suggested that glucagon secretion and inhibition are regulated by both intrinsicand paracrine mechanisms, but their relative significance and operating conditions arestill partly debated. Furthermore, the intrinsic and paracrine regulation mechanisms arenot mutually exclusive: they operate in parallel to control glucagon secretion [12]. At lowglycemia, the secretion of glucagon is stimulated by intrinsic mechanisms triggered byglucose, which involve different Na+ and Ca2+ channels [13–15]. When circulating glucoselevel rises, glucagon secretion is suppressed in healthy individuals, whereas in type 2diabetes the suppression of glucagon may be impaired [16]. Glucagon suppression is againdue to several intrinsic mechanisms, such as alpha-cell membrane depolarization, whichdetermines Na+ and Ca2+ channels closing [17]. Insulin was the first paracrine factor fromthe beta cells to show evidence for inhibitory action on glucagon secretion [18]. Some stud-ies also demonstrated that GABA (released as well from the beta cells) can inhibit glucagonsecretion by activation of the GABA(A) receptor [19]. Somatostatin, secreted by the pan-creatic delta cells, was also proposed as potent inhibitor not only for insulin, but also forglucagon secretion, under hyperglycemic conditions. Indeed, glucagon secretion increasesin alpha cells with knockout of the somatostatin receptor 2, this highlighting somatostatinas a mediator for the glucose-based inhibition of glucagon secretion [20,21]. Other stud-ies suggested that glucose can inhibit glucagon secretion by somatostatin-independentpathways [22,23], and it was also reported that glucagon inhibition by insulin may involvestimulation of somatostatin secretion [24]. Furthermore, autonomic nerves, both sympa-thetic and parasympathetic, may stimulate glucagon secretion [25]. Adrenaline may alsostimulate glucagon [26]. As regards incretin hormones, they may have opposite effects:the glucagon-like peptide (GLP-1) inhibits glucagon secretion [27], whereas the glucose-dependent insulinotropic polypeptide (GIP) stimulates it [28], although these effects aredependent on glucose levels.
This large body of studies therefore shows that several factors affect glucagon secretionor suppression. However, despite some still controversial aspects, it can be summarizedthat the two main factors involved in glucagon regulation (operating through variousdistinct physiological mechanisms) appear glucose and insulin. In spite of this, the relativecontribution of each of the two factors is not fully understood. Especially, it was notelucidated if the contribution of glucose and insulin to glucagon secretion or suppressionfollowing food ingestion may depend on the class of the ingested macronutrients. Infact, in some of our previous human studies [29,30], we found differences in the glucagonprofiles following separate ingestion of glucose, protein, fat, and a mixture of them. Forexample, the glucagon release in response to glucose or fat ingestion was reduced comparedto the fasting condition, whereas it was increased in response to protein or mixed mealingestion [30]. However, the degree of association of these changes with glucose and insulinlevels was not investigated. In this study, we therefore revisited the data of study [30]to analyze the possible associations of glucagon with glucose and insulin following theingestion of the indicated macronutrients, both over the entire participants’ cohort andat individual participant’s level. In addition, since we hypothesized that the shape of thehormones temporal curves may influence the investigated associations, we also analyzedthe glucagon curves shape following the different macronutrients ingestion.
Nutrients 2022, 14, 376 3 of 17
2. Materials and Methods2.1. Participants
In this study, we analyzed 18 participants with normal glucose tolerance (NGT) and18 patients with type 2 diabetes. The main characteristics of the study participants weredescribed in detail before [30]. Briefly, healthy participants were 11 males and 7 females,had age of 62 ± 5 (mean ± standard deviation) years, and BMI of 25 ± 2 kg/m2. Patientswith type 2 diabetes were 13 males and 5 females, had age of 63 ± 5 years, and BMIof 27 ± 4 kg/m2. They were not under treatment with any pharmacological glucose-lowering therapy. Diabetes duration was 3 ± 2 years. The study was approved by theEthics Committee in Lund, Sweden (approval number: 2011/361, 23 August 2011). Allparticipants gave written informed consent before the study, which was registered atclinicaltrials.gov (NCT01366794). The study was conducted using good clinical practiceand in accordance with the Declaration of Helsinki.
2.2. Study Design, Procedures and Measures
This study had randomized crossover design. The 36 participants were studied on4 occasions, separated by 4–8 weeks, thus for a total of 144 metabolic tests. At each studysession, after an overnight fast two baseline blood samples were taken. Then, participantsingested in randomized order one of the following macronutrients: glucose (330 kcal = 83 g;Skåne University Hospital Pharmacy, Lund, Sweden); protein mixture (110 kcal = 30 g; ISOWHEY protein, consisting of milk and egg proteins; Dahlblads Nutrition AB, Stenkullen,Sweden); fat emulsion (110 kcal = 24 mL; Calogen® Neutral, consisting of 50% long-chaintriglycerides and 50% water; Nutricia AB, Stockholm, Sweden); the same macronutrientsgiven together as a liquid mixed meal test, with 550 kcal (glucose 330 kcal, protein 110 kcaland fat 110 kcal). The proportions of the macronutrients were selected to represent acommon meal with 60% carbohydrate, 20% protein, and 20% fat. Water was ingestedsimultaneously with each load to standardize the ingested volume to 400 mL. All mealswere consumed within 5 min. Blood samples were taken during a 300 min period aftereach metabolic test. Specifically, glucagon was measured at fasting and at 10, 30, 45, 60, 90,120, 180, and 300 min following the food ingestion. Glucose, insulin, and C-peptide weremeasured at five additional time points (5, 20, 75, 150, 240 min).
Glucagon was measured using a recently developed sandwich ELISA, based on mono-clonal antibodies against both the C- and N-terminal regions of glucagon, which was shownto have higher specificity and reliability than that of previously used methods [30]. Theassay (Mercodia, Uppsala, Sweden; No. 10-1271-01) was therefore specific for pancreaticglucagon and showed 4.4% and 0.8% cross-reactivity with oxyntomodulin and glicentin,respectively, but with no other peptide. Detection limit was 1 pmol/L, whereas intra-assayand interassay coefficient of variation (CV) were 3.3–5.1% and 7.3–9.4%, respectively, rang-ing from low to high concentrations. Glucose was measured using the glucose oxidasemethod. Insulin was analyzed using ELISA (Mercodia; No. 10-1113). The sensitivity ofthe assay was 0.75 pmol/L, with intra-assay and interassay CV of 2.8–4.0% and 2.6–3.6%,respectively. C-peptide was analyzed using double antibody RIA (Merck Millipore, Bil-lerica, MA, USA; No. HCP-20K) based on a specific monoclonal C-peptide antibody. Thesensitivity of the assay was 0.02 nmol/L, with intra-assay and interasssay CV of 2.4–9.3%and 6.4%. Further details were reported in our previous study [30].
2.3. Calculations
The 0–300 min areas under the curve (AUC) of the variables of interest were calculatedusing the trapezoid rule (i.e., approximating the region under the graph of the curve bytrapezoids, and calculating the sum of their area). The suprabasal component of AUC(∆AUC) was computed as the AUC subtracted by the fasting value of the variable for theanalyzed time interval.
As reported in the original study [30], we exploited appropriate mathematical mod-eling approach to analyze the metabolic tests. Each test was in fact analyzed by a model
Nutrients 2022, 14, 376 4 of 17
yielding the assessment of insulin secretion rate and of different aspects of beta-cell func-tion [31]. In addition, pairs of metabolic tests can be analyzed simultaneously by anothermodel, representing an evolution of the previous beta-cell function model, designed toassess the effect of incretins on insulin secretion (analysis of an oral glucose tolerance testand corresponding isoglycemic intravenous glucose infusion test, taken as reference) [32].In our previous investigation [30], the glucose test was taken as the reference test, whereaseach of the other three metabolic tests (protein, fat, and mixed meal) was the second test ineach test pair, analyzed by the model [32]. This approach allowed the assessment of thespecific component of insulin secretion potentiation due to fat, protein, and mixed meal,compared to that of glucose alone. In the present investigation, however, for simplicitywe calculated the overall potentiation factor in each of the four metabolic tests, includingthe potentiation induced by glucose, and the potentiation (or depotentiation) due to thedifferent macronutrients.
Specifically, for each macronutrient test, the main model-based parameters analyzedin the present investigation were the beta-cell glucose sensitivity (average slope of thedose-response function, describing the static relationship between insulin secretion andglucose concentration), and the insulin secretion potentiation factor ratio (ratio betweenthe potentiation value at test end and at test beginning). In addition, for a more completepicture of the beta-cell function, in this analysis we also included further parameters notreported previously, i.e., the beta-cell rate sensitivity (marker of early insulin secretion), andthe insulin secretion at prescribed glucose reference values (5, 6, 7 mmol/L) [31]. From themodel-derived insulin secretion rate, we calculated the total insulin secretion. Insulin clear-ance was calculated, at each time sample of the metabolic tests, as the ratio between insulinsecretion rate and plasma insulin concentration, as recently suggested [33]. The assessmentof the main parameters of glucose homeostasis was completed with the calculation of theinsulin sensitivity during the metabolic tests, through the ISIcomp index [34].
In this study, we also analyzed the glucagon shape. We classified each glucagon curveaccording to the number of fluctuations during the test. Precisely, one fluctuation wasdefined as a change in the trend of the glucagon curve, i.e., a change from an increasingpattern to a decreasing pattern, or the opposite situation.
2.4. Statistical Analyses
AUC, ∆AUC, and basal (fasting) values of the variables of interest, as well as themodel-based parameters, were compared among the different metabolic tests by Analysisof Variance (ANOVA) and pairwise comparison, with Benjamini & Hochberg correction formultiple comparisons.
Linear regression analysis was used to assess the possible individual association be-tween glucagon and glucose, and between glucagon and insulin, in each metabolic testfor the single subject. Furthermore, in the whole participants’ cohort, we analyzed theassociation of the suprabasal glucagon AUC (∆AUCGLUCA) with the corresponding vari-able for glucose and insulin, i.e., ∆AUCGLU and ∆AUCINS (in addition, we consideredtotal insulin secretion and ∆AUC of C-peptide, i.e., ∆AUCCP). This analysis was accom-plished by regression performed through linear mixed-effect model approach, wherebythe participant’s identification number was included as a random effect. In this analysis,we had to report a modified R2 (marginal R2). We also performed stepwise regressionanalysis to determine possible further determinants of ∆AUCGLUCA other than ∆AUCGLUand ∆AUCINS, thus yielding an optimal model based on minimization of the Akaike’sinformation criterion (AIC).
Chi-square test, with Yates’s continuity correction, was used to assess possible differ-ences in categorical data. Precisely, it was used to assess possible differences in the numberof significant regressions between glucagon and glucose on one side and glucagon andinsulin on the other side, as well as in the number of the indicated significant regressionsamong the different metabolic tests. Chi-square test was also used in the shape analysis toassess differences in the number of glucagon curve fluctuations.
Nutrients 2022, 14, 376 5 of 17
The statistical distribution of any continuous variable was assessed, and natural loga-rithmic transformation was performed in the case of skewed distribution before statisticaltesting. The two-sided significance level was set at 5% (p < 0.05). Values are reported asmean ± standard error (SE) unless otherwise specified. Statistical analysis was performedwith R (version 3.6.3, The R Foundation for Statistical Computing, Vienna, Austria), andcontributed packages.
3. Results3.1. Plasma Concentrations of Glucagon, Glucose, Insulin and C-Peptide
Fasting values, AUC and ∆AUC for plasma glucagon, glucose, insulin, and C-peptidein the whole participants’ cohort after the mixed meal and the single macronutrients testsare reported in Table 1.
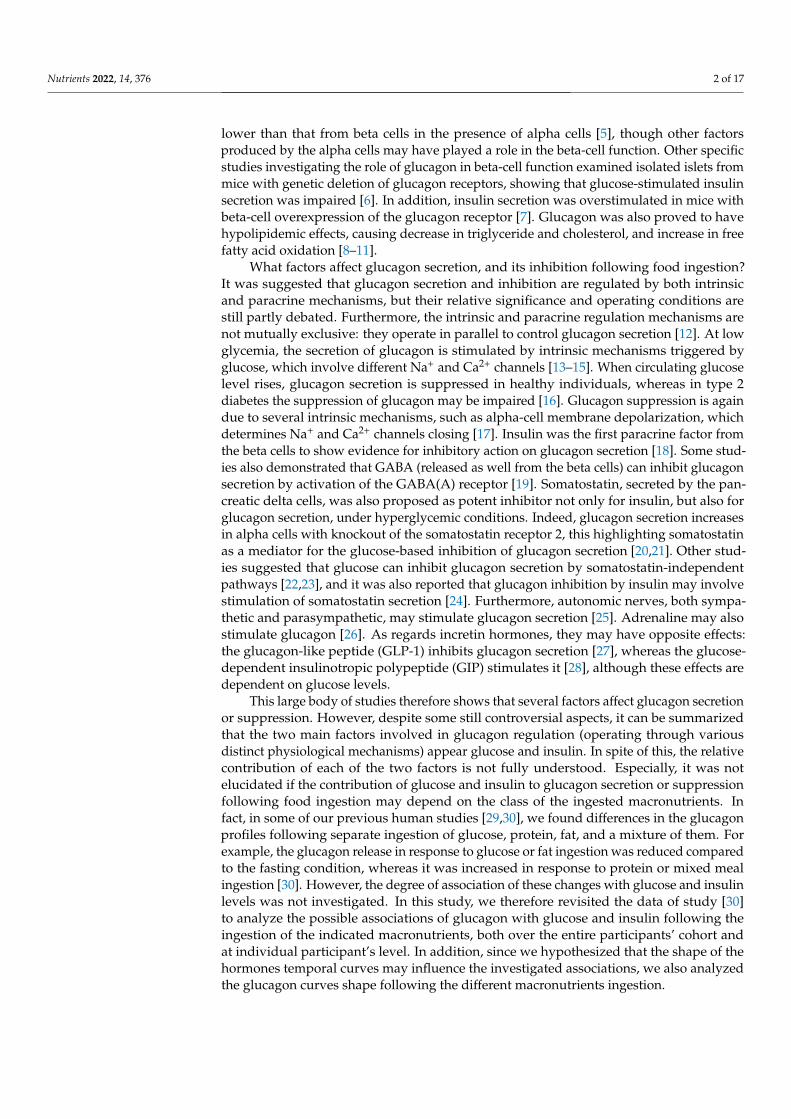
Table 1. Fasting values, area under the curve (300 min), and related suprabasal component (AUC and∆AUC, respectively) for plasma glucagon, glucose, insulin, and C-peptide, after ingestion of a mixedmeal or single macronutrients in a cohort of 36 subjects (18 subjects with normal glucose toleranceand 18 subjects with type 2 diabetes). Data are mean ± SE.
Mixed Meal Glucose Protein Fat
Fasting valuesGlucagon (pmol/L) 6.99 ± 0.53 7.94 ± 0.82 7.64 ± 0.62 7.36 ± 0.55Glucose (mmol/L) 6.23 ± 0.25 6.43 ± 0.26 6.18 ± 0.20 6.20 ± 0.16Insulin (pmol/L) 45.32 ± 6.22 47.44 ± 5.23 42.06 ± 5.81 3 35.32 ± 5.51 4,5
C-peptide (pmol/L) 0.50 ± 0.04 0.49 ± 0.04 0.50 ± 0.05 0.44 ± 0.04AUC values
Glucagon (pmol/L·h) 50.87 ± 3.51 25.34 ± 1.78 1 72.24 ± 4.39 2,3 32.78 ± 2.22 4,5,6
Glucose (mmol/L·h) 36.40 ± 1.78 38.67 ± 1.74 1 30.65 ± 0.91 2,3 31.90 ± 0.81 4,5,6
Insulin (pmol/L·h) 1362.9 ± 195.7 839.7 ± 109.9 1 340.2 ± 48.1 2,3 142.8 ± 23.8 4,5,6
C-peptide (pmol/L·h) 6931 ± 508 6244 ± 492 1 3127 ± 265 2,3 2110 ± 186 4,5,6
∆AUC valuesGlucagon (pmol/L·h) 17.58 ± 2.66 −11.02 ± 2.77 1 35.54 ± 3.49 2,3 −1.39 ± 1.38 4,5,6
Glucose (mmol/L·h) 5.26 ± 0.97 6.52 ± 1.08 −0.27 ± 0.52 2,3 0.89 ± 0.51 4,5
Insulin (pmol/L·h) 1136.3 ± 169.2 602.5 ± 90.8 1 129.9 ± 31.6 2,3 −33.8 ± 8.9 4,5,6
C-peptide (pmol/L·h) 2118.3 ± 420.7 3819.4 ± 365.8 1 553.1 ± 143.4 2,3 −81.3 ± 65.0 4,5
1 p < 0.05 between Glucose and Mixed Meal; 2 between Protein and Mixed Meal; 3 between Protein and Glucose;4 between Fat and Mixed Meal; 5 between Fat and Glucose; 6 between Fat and Protein.
Fasting values for glucagon, glucose and C-peptide were not different among macronu-trients tests, whereas those for insulin showed some differences, suggesting not negligibleintrasubject variability in terms of basal insulin secretion and/or insulin clearance. Atconverse, AUCs were all different (p ≤ 0.0004). Similarly, ∆AUCs were typically differ-ent among tests (p ≤ 0.04), though not all differences reached statistical significance for∆AUCGLU and ∆AUCCP.
As regards ∆AUCGLUCA, in more details, it was positive in 86 out of the 144 totalnumber of tests (32, 9, 34, 11, in mixed meal, glucose, protein, fat tests, respectively), andit was negative in the remaining 58 cases (4, 27, 2, 25, respectively). Thus, ∆AUCGLUCAwas mainly positive in meal and protein tests, whereas it was mainly negative in glucoseand fat tests. Of note, the proportion of positive vs. negative cases in each metabolic testwas found significantly different, according to the chi-square test (p ≤ 0.002). On average,∆AUCGLUCA was therefore negative for glucose and fat tests (lower in the former), andpositive for mixed meal and protein tests (higher in the latter; see Table 1). As expected,based on the illustrated findings, ∆AUCGLUCA was markedly different between each pairof tests (p ≤ 0.0003), except for glucose and fat tests comparison, where the difference wasslight (p = 0.04).
Nutrients 2022, 14, 376 6 of 17
3.2. Insulin Secretion/Beta-Cell Function, Insulin Sensitivity, Insulin Clearance
Insulin secretion, beta-cell function, insulin sensitivity and insulin clearance are re-ported in Table 2. Total insulin secretion was different among the four metabolic tests(p ≤ 0.01). Precisely, it was higher in the mixed meal test, then progressively lower inglucose, protein, and fat tests. Fasting insulin secretion essentially reflected the differencesobserved in plasma insulin.
Table 2. Main metabolic parameters after ingestion of a mixed meal or single macronutrients in acohort of 36 subjects (18 subjects with normal glucose tolerance and 18 subjects with type 2 diabetes).Data are mean ± SE.
Mixed Meal Glucose Protein Fat
Insulin secretionFasting insulin secretion
(pmol·min·m−2) 61.31 ± 5.09 60.84 ± 5.32 59.30 ± 5.68 54.22 ± 4.90 4,5
Total insulin secretion (nmol·m−2) 53.24 ± 4.15 47.29 ± 3.91 1 23.07 ± 2.03 2,3 15.60 ± 1.42 4,5,6
Beta-cell functionGlucose sensitivity
(pmol min−1·m−2·mM−1) 54.93 ± 7.69 46.17 ± 9.64 35.40 ± 6.17 2,3 7.81 ± 2.94 4,5,6
Rate sensitivity (pmol·m−2·mM−1) 535.7 ± 176.9 199.7 ± 44.0 512.1 ± 190.8 181.6 ± 68.5 4
Potentiation factor ratio (unitless) 1.46 ± 0.15 1.28 ± 0.15 1.15 ± 0.39 2,3 0.76 ± 0.05 4,5
Insulin secretion at reference glucoseAt. 5 mmol/L (pmol·min·m−2) 79.96 ± 10.10 63.56 ± 6.62 40.49 ± 4.58 3 43.78 ± 5.28 5
At. 6 mmol/L (pmol·min·m−2) 128.91 ± 13.94 107.00 ± 11.66 60.43 ± 6.81 2,3 50.48 ± 4.91 4,5
At. 7 mmol/L (pmol·min·m−2) 181.25 ± 20.06 152.88 ± 20.51 91.39 ± 9.85 2,3 58.37 ± 5.95 4,5,6
Other metabolic parametersInsulin sensitivity, ISIcomp (unitless) 7.74 ± 1.00 8.68 ± 1.20 17.39 ± 2.36 2,3 31.22 ± 4.21 4,5,6
Insulin clearance (average)(L·min−1·m−2) 1.32 ± 0.30 1.37 ± 0.17 1 1.81 ± 0.20 2,3 3.14 ± 0.45 4,5,6
1 p < 0.05 between Glucose and Mixed Meal; 2 between Protein and Mixed Meal; 3 between Protein and Glucose;4 between Fat and Mixed Meal; 5 between Fat and Glucose; 6 between Fat and Protein.
Beta-cell function parameters showed somehow heterogeneous behavior, as glucosesensitivity was typically different among tests (p ≤ 0.02, except for mixed meal vs. glucosecomparison), with the same progressive variation from mixed meal test to fat test asobserved for insulin secretion. The potentiation factor ratio showed instead less significantdifferences, and the rate sensitivity was typically similar among tests, with only onecomparison showing significant difference (mixed meal vs. fat tests). Insulin secretion atreference glucose values showed again heterogeneous results, as it was different in themajority of comparisons at 7 mmol/L (p ≤ 0.004), whereas less differences were shown at 5and 6 mmol/L.
Insulin sensitivity (ISIcomp) was markedly different in almost all comparisons (p < 0.0001),with only mixed meal vs. glucose test not showing significant difference. It was higher infat, then progressively decreased in protein, glucose, and meal. Insulin clearance, as averagevalue during the 300 min interval of the metabolic tests, was different in all comparisons(p ≤ 0.01), with the same sequence of magnitude shown by ISIcomp.
3.3. Individual Associations in All Tests of Glucagon vs. Glucose, Insulin, C-Peptide, and InsulinSecretion
In regression analysis in the single participants, glucagon showed significant directrelationship with glucose in 18 cases, out of the 144 total number of cases (Table 3). Di-rect relationship with insulin was observed in a much higher number of cases (60 cases,p < 0.0001). Inverse relationship between glucagon and glucose was observed in only8 cases, and similarly for glucagon and insulin (5 cases). R2 values (mean ± SE and range)are reported in Table 3.
Nutrients 2022, 14, 376 7 of 17
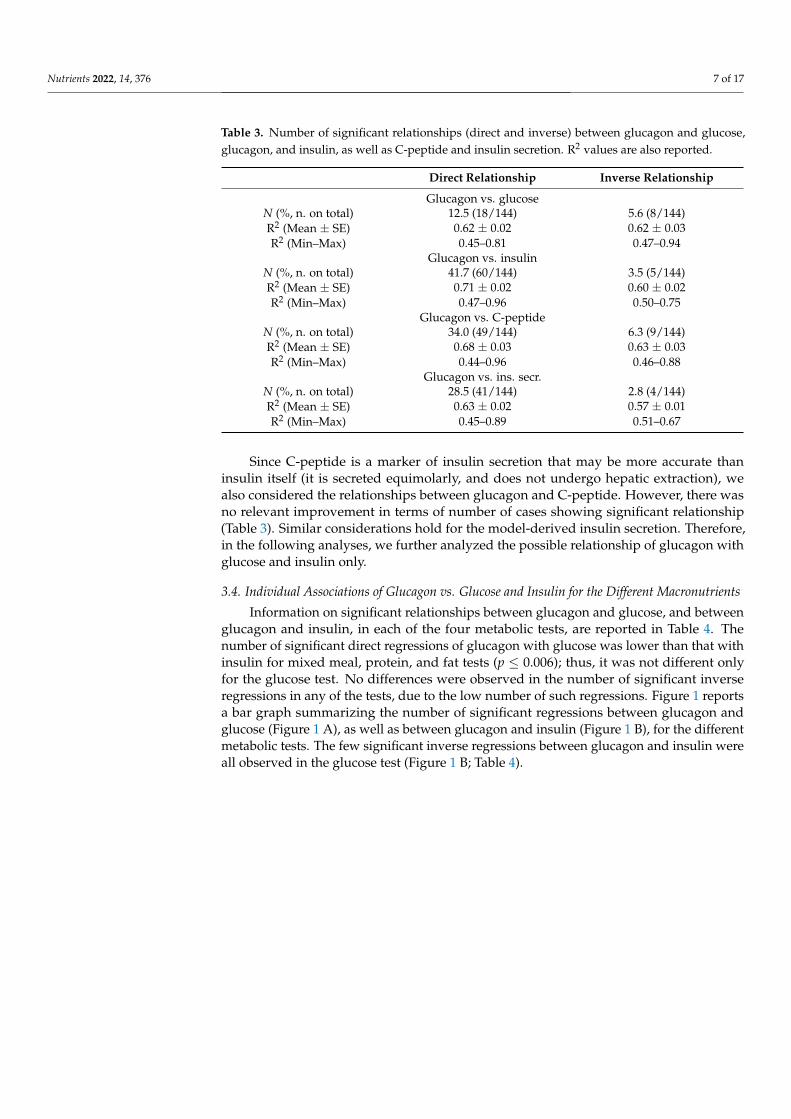
Table 3. Number of significant relationships (direct and inverse) between glucagon and glucose,glucagon, and insulin, as well as C-peptide and insulin secretion. R2 values are also reported.
Direct Relationship Inverse Relationship
Glucagon vs. glucoseN (%, n. on total) 12.5 (18/144) 5.6 (8/144)R2 (Mean ± SE) 0.62 ± 0.02 0.62 ± 0.03R2 (Min–Max) 0.45–0.81 0.47–0.94
Glucagon vs. insulinN (%, n. on total) 41.7 (60/144) 3.5 (5/144)R2 (Mean ± SE) 0.71 ± 0.02 0.60 ± 0.02R2 (Min–Max) 0.47–0.96 0.50–0.75
Glucagon vs. C-peptideN (%, n. on total) 34.0 (49/144) 6.3 (9/144)R2 (Mean ± SE) 0.68 ± 0.03 0.63 ± 0.03R2 (Min–Max) 0.44–0.96 0.46–0.88
Glucagon vs. ins. secr.N (%, n. on total) 28.5 (41/144) 2.8 (4/144)R2 (Mean ± SE) 0.63 ± 0.02 0.57 ± 0.01R2 (Min–Max) 0.45–0.89 0.51–0.67
Since C-peptide is a marker of insulin secretion that may be more accurate thaninsulin itself (it is secreted equimolarly, and does not undergo hepatic extraction), wealso considered the relationships between glucagon and C-peptide. However, there wasno relevant improvement in terms of number of cases showing significant relationship(Table 3). Similar considerations hold for the model-derived insulin secretion. Therefore,in the following analyses, we further analyzed the possible relationship of glucagon withglucose and insulin only.
3.4. Individual Associations of Glucagon vs. Glucose and Insulin for the Different Macronutrients
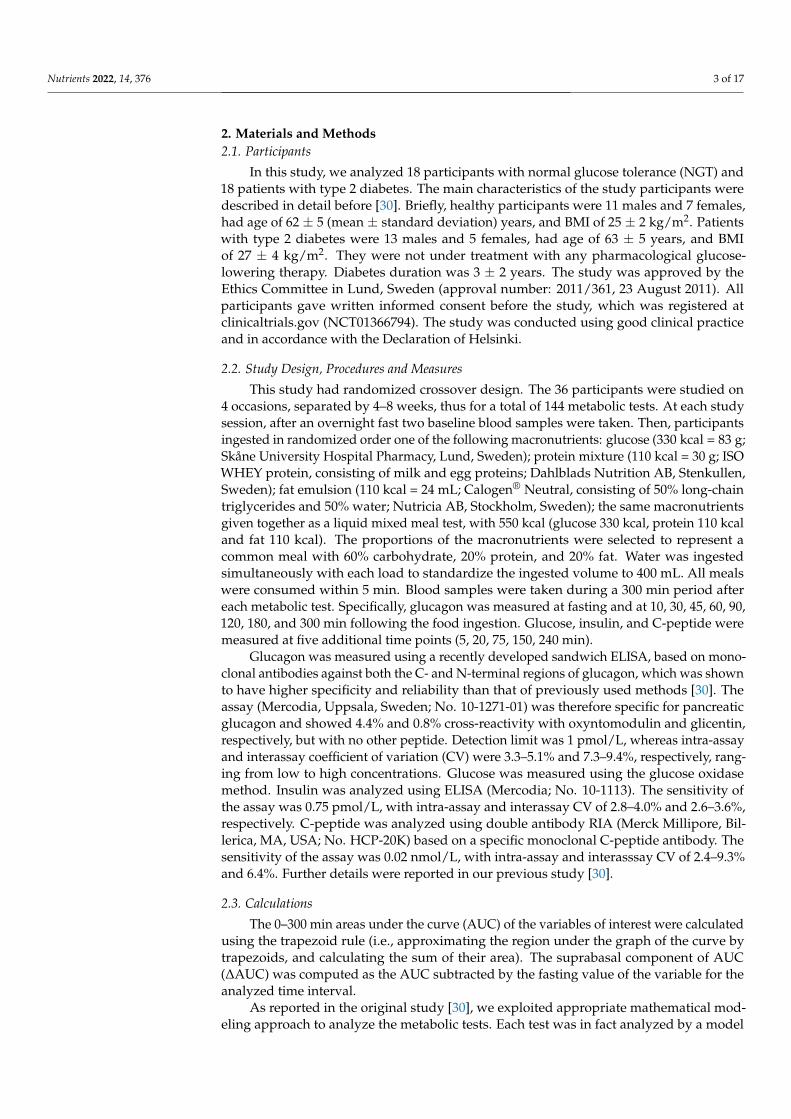
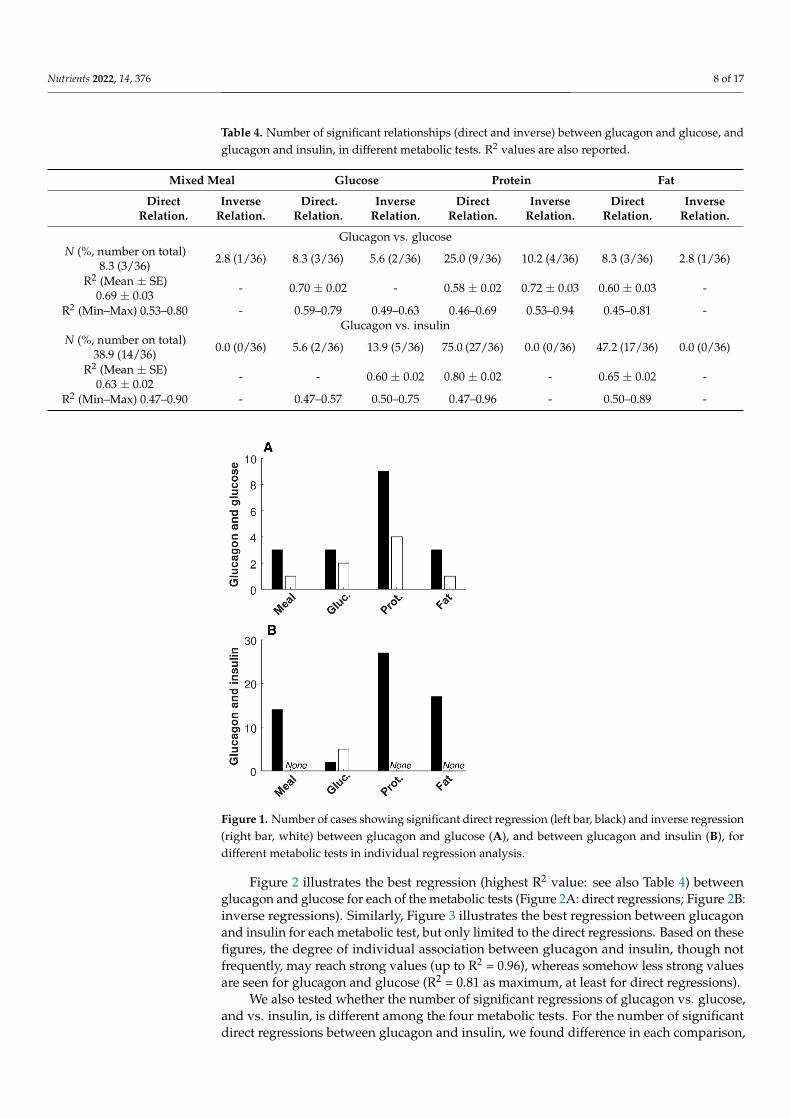
Information on significant relationships between glucagon and glucose, and betweenglucagon and insulin, in each of the four metabolic tests, are reported in Table 4. Thenumber of significant direct regressions of glucagon with glucose was lower than that withinsulin for mixed meal, protein, and fat tests (p ≤ 0.006); thus, it was not different onlyfor the glucose test. No differences were observed in the number of significant inverseregressions in any of the tests, due to the low number of such regressions. Figure 1 reportsa bar graph summarizing the number of significant regressions between glucagon andglucose (Figure 1 A), as well as between glucagon and insulin (Figure 1 B), for the differentmetabolic tests. The few significant inverse regressions between glucagon and insulin wereall observed in the glucose test (Figure 1 B; Table 4).
Nutrients 2022, 14, 376 8 of 17
Table 4. Number of significant relationships (direct and inverse) between glucagon and glucose, andglucagon and insulin, in different metabolic tests. R2 values are also reported.
Mixed Meal Glucose Protein Fat
DirectRelation.
InverseRelation.
Direct.Relation.
InverseRelation.
DirectRelation.
InverseRelation.
DirectRelation.
InverseRelation.
Glucagon vs. glucoseN (%, number on total)
8.3 (3/36) 2.8 (1/36) 8.3 (3/36) 5.6 (2/36) 25.0 (9/36) 10.2 (4/36) 8.3 (3/36) 2.8 (1/36)
R2 (Mean ± SE)0.69 ± 0.03
- 0.70 ± 0.02 - 0.58 ± 0.02 0.72 ± 0.03 0.60 ± 0.03 -
R2 (Min–Max) 0.53–0.80 - 0.59–0.79 0.49–0.63 0.46–0.69 0.53–0.94 0.45–0.81 -Glucagon vs. insulin
N (%, number on total)38.9 (14/36) 0.0 (0/36) 5.6 (2/36) 13.9 (5/36) 75.0 (27/36) 0.0 (0/36) 47.2 (17/36) 0.0 (0/36)
R2 (Mean ± SE)0.63 ± 0.02
- - 0.60 ± 0.02 0.80 ± 0.02 - 0.65 ± 0.02 -
R2 (Min–Max) 0.47–0.90 - 0.47–0.57 0.50–0.75 0.47–0.96 - 0.50–0.89 -Nutrients 2022, 14, x FOR PEER REVIEW 8 of 17
Figure 1. Number of cases showing significant direct regression (left bar, black) and inverse
regression (right bar, white) between glucagon and glucose (A), and between glucagon and insulin
(B), for different metabolic tests in individual regression analysis.
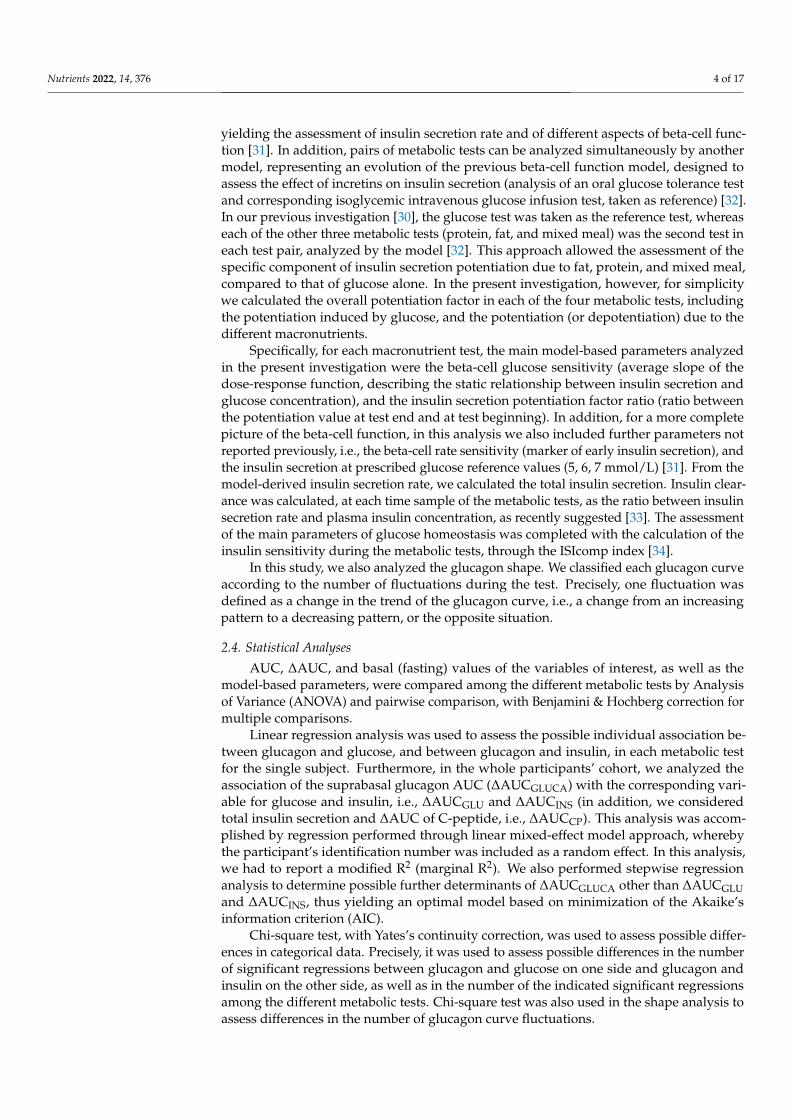
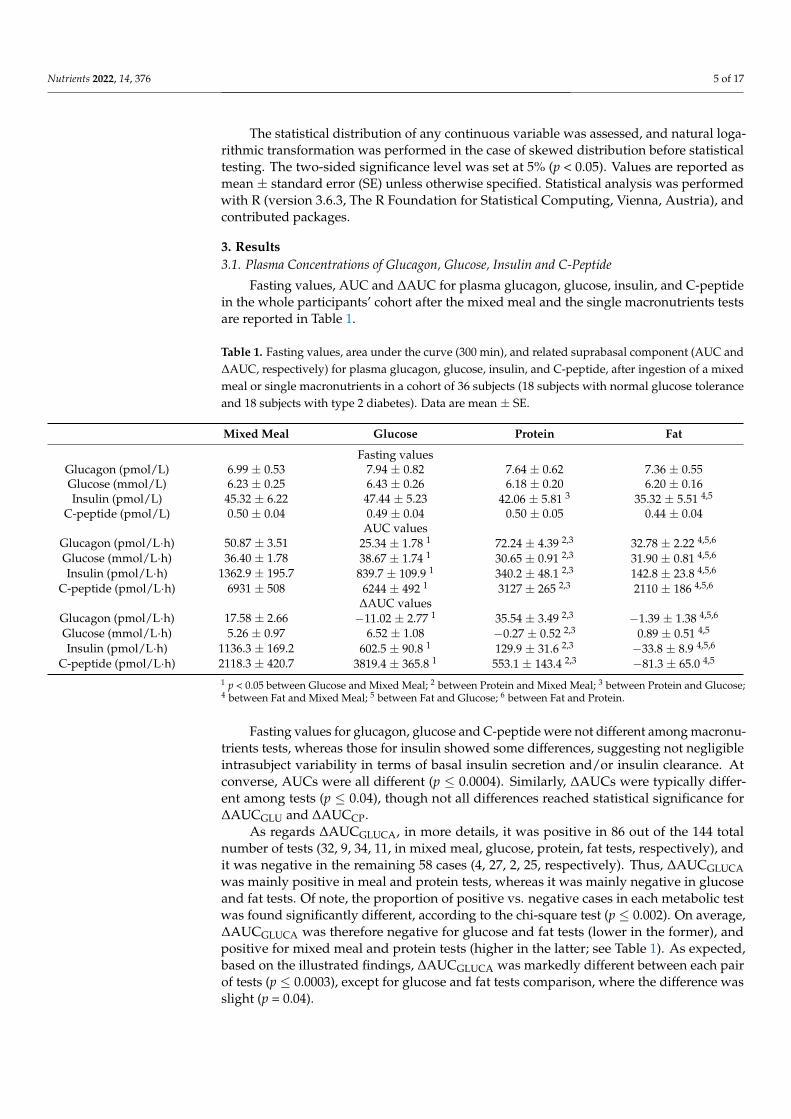
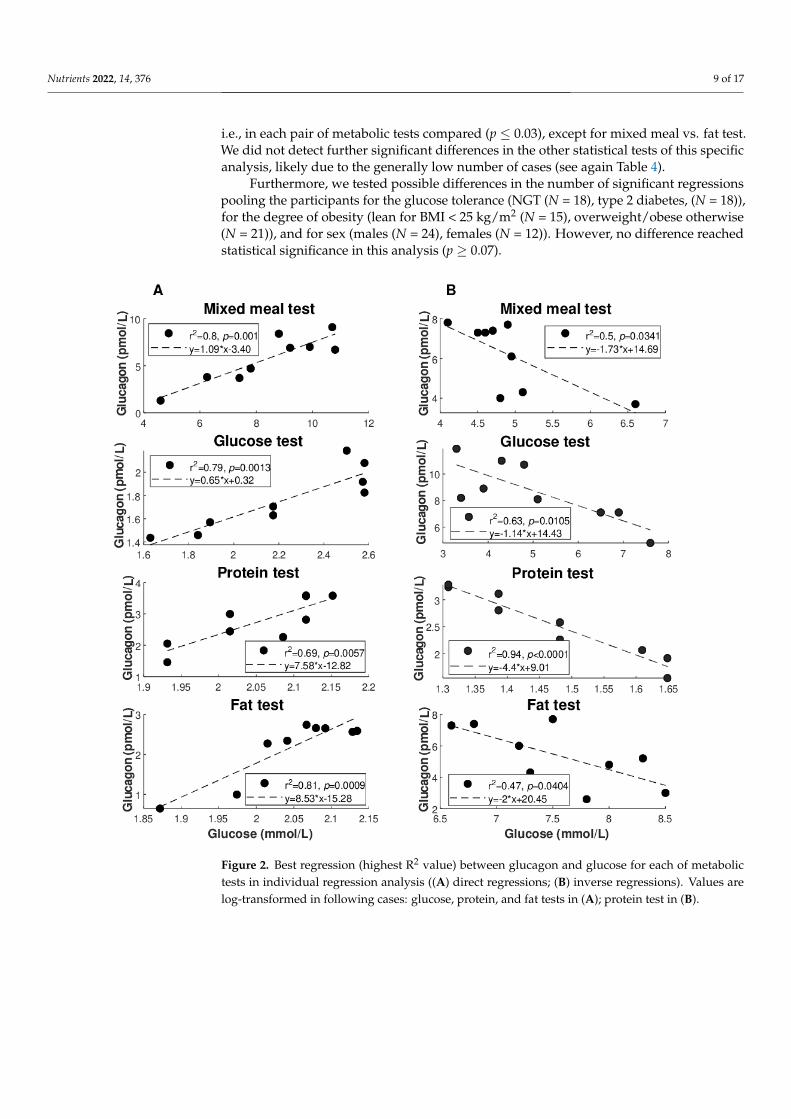
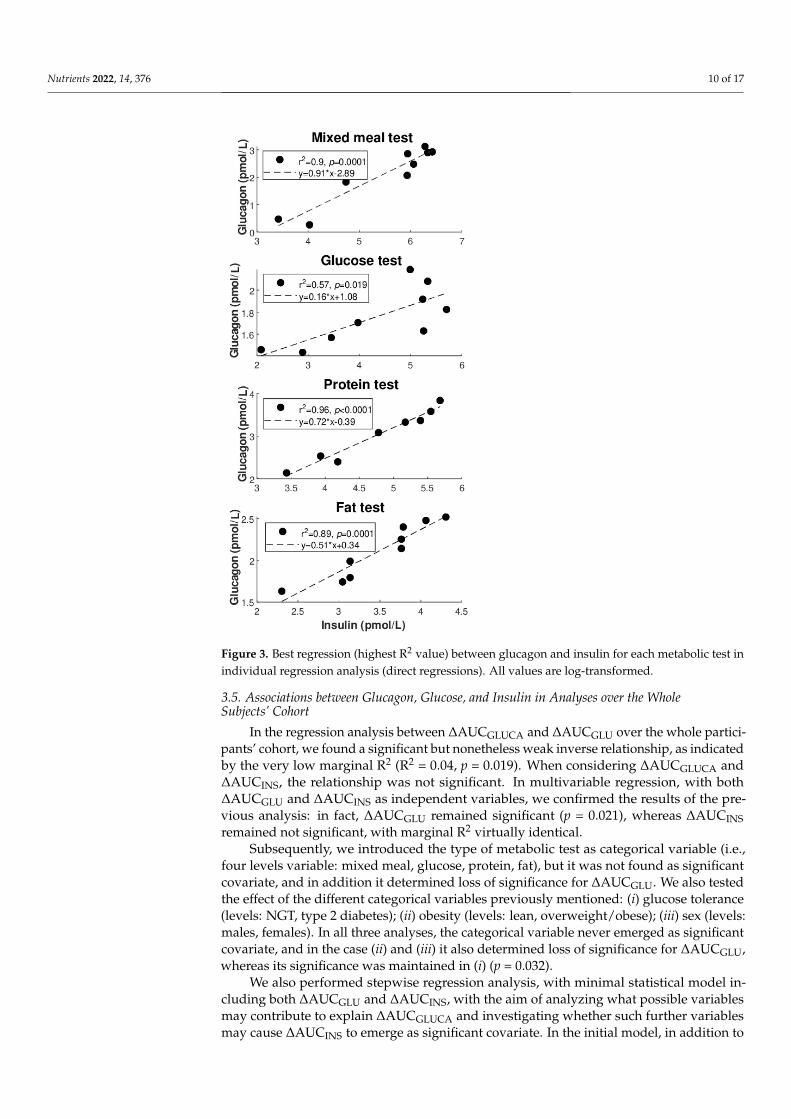
Figure 2 illustrates the best regression (highest R2 value: see also Table 4) between
glucagon and glucose for each of the metabolic tests (Figure 2A: direct regressions; Figure
2B: inverse regressions). Similarly, Figure 3 illustrates the best regression between
glucagon and insulin for each metabolic test, but only limited to the direct regressions.
Based on these figures, the degree of individual association between glucagon and insulin,
though not frequently, may reach strong values (up to R2 = 0.96), whereas somehow less
strong values are seen for glucagon and glucose (R2 = 0.81 as maximum, at least for direct
regressions).
Figure 1. Number of cases showing significant direct regression (left bar, black) and inverse regression(right bar, white) between glucagon and glucose (A), and between glucagon and insulin (B), fordifferent metabolic tests in individual regression analysis.
Figure 2 illustrates the best regression (highest R2 value: see also Table 4) betweenglucagon and glucose for each of the metabolic tests (Figure 2A: direct regressions; Figure 2B:inverse regressions). Similarly, Figure 3 illustrates the best regression between glucagonand insulin for each metabolic test, but only limited to the direct regressions. Based on thesefigures, the degree of individual association between glucagon and insulin, though notfrequently, may reach strong values (up to R2 = 0.96), whereas somehow less strong valuesare seen for glucagon and glucose (R2 = 0.81 as maximum, at least for direct regressions).
We also tested whether the number of significant regressions of glucagon vs. glucose,and vs. insulin, is different among the four metabolic tests. For the number of significantdirect regressions between glucagon and insulin, we found difference in each comparison,
Nutrients 2022, 14, 376 9 of 17
i.e., in each pair of metabolic tests compared (p ≤ 0.03), except for mixed meal vs. fat test.We did not detect further significant differences in the other statistical tests of this specificanalysis, likely due to the generally low number of cases (see again Table 4).
Furthermore, we tested possible differences in the number of significant regressionspooling the participants for the glucose tolerance (NGT (N = 18), type 2 diabetes, (N = 18)),for the degree of obesity (lean for BMI < 25 kg/m2 (N = 15), overweight/obese otherwise(N = 21)), and for sex (males (N = 24), females (N = 12)). However, no difference reachedstatistical significance in this analysis (p ≥ 0.07).
Nutrients 2022, 14, x FOR PEER REVIEW 9 of 17
Figure 2. Best regression (highest R2 value) between glucagon and glucose for each of metabolic
tests in individual regression analysis ((A) direct regressions; (B) inverse regressions). Values are
log-transformed in following cases: glucose, protein, and fat tests in (A); protein test in (B).
Figure 2. Best regression (highest R2 value) between glucagon and glucose for each of metabolictests in individual regression analysis ((A) direct regressions; (B) inverse regressions). Values arelog-transformed in following cases: glucose, protein, and fat tests in (A); protein test in (B).
Nutrients 2022, 14, 376 10 of 17Nutrients 2022, 14, x FOR PEER REVIEW 10 of 17
Figure 3. Best regression (highest R2 value) between glucagon and insulin for each metabolic test in
individual regression analysis (direct regressions). All values are log-transformed.
We also tested whether the number of significant regressions of glucagon vs. glucose,
and vs. insulin, is different among the four metabolic tests. For the number of significant
direct regressions between glucagon and insulin, we found difference in each comparison,
i.e., in each pair of metabolic tests compared (p ≤ 0.03), except for mixed meal vs. fat test.
We did not detect further significant differences in the other statistical tests of this specific
analysis, likely due to the generally low number of cases (see again Table 4).
Furthermore, we tested possible differences in the number of significant regressions
pooling the participants for the glucose tolerance (NGT (N = 18), type 2 diabetes, (N = 18)),
for the degree of obesity (lean for BMI < 25 kg/m2 (N = 15), overweight/obese otherwise (N
= 21)), and for sex (males (N = 24), females (N = 12)). However, no difference reached
statistical significance in this analysis (p ≥ 0.07).
3.5. Associations between Glucagon, Glucose, and Insulin in Analyses over the Whole Subjects’
Cohort
In the regression analysis between ΔAUCGLUCA and ΔAUCGLU over the whole
participants’ cohort, we found a significant but nonetheless weak inverse relationship, as
indicated by the very low marginal R2 (R2 = 0.04, p = 0.019). When considering ΔAUCGLUCA
and ΔAUCINS, the relationship was not significant. In multivariable regression, with both
ΔAUCGLU and ΔAUCINS as independent variables, we confirmed the results of the
Figure 3. Best regression (highest R2 value) between glucagon and insulin for each metabolic test inindividual regression analysis (direct regressions). All values are log-transformed.
3.5. Associations between Glucagon, Glucose, and Insulin in Analyses over the WholeSubjects’ Cohort
In the regression analysis between ∆AUCGLUCA and ∆AUCGLU over the whole partici-pants’ cohort, we found a significant but nonetheless weak inverse relationship, as indicatedby the very low marginal R2 (R2 = 0.04, p = 0.019). When considering ∆AUCGLUCA and∆AUCINS, the relationship was not significant. In multivariable regression, with both∆AUCGLU and ∆AUCINS as independent variables, we confirmed the results of the pre-vious analysis: in fact, ∆AUCGLU remained significant (p = 0.021), whereas ∆AUCINSremained not significant, with marginal R2 virtually identical.
Subsequently, we introduced the type of metabolic test as categorical variable (i.e.,four levels variable: mixed meal, glucose, protein, fat), but it was not found as significantcovariate, and in addition it determined loss of significance for ∆AUCGLU. We also testedthe effect of the different categorical variables previously mentioned: (i) glucose tolerance(levels: NGT, type 2 diabetes); (ii) obesity (levels: lean, overweight/obese); (iii) sex (levels:males, females). In all three analyses, the categorical variable never emerged as significantcovariate, and in the case (ii) and (iii) it also determined loss of significance for ∆AUCGLU,whereas its significance was maintained in (i) (p = 0.032).
We also performed stepwise regression analysis, with minimal statistical model in-cluding both ∆AUCGLU and ∆AUCINS, with the aim of analyzing what possible variablesmay contribute to explain ∆AUCGLUCA and investigating whether such further variablesmay cause ∆AUCINS to emerge as significant covariate. In the initial model, in addition to
Nutrients 2022, 14, 376 11 of 17
∆AUCGLU and ∆AUCINS, we included basal (fasting) and total insulin secretion, beta-cellglucose and rate sensitivity, potentiation factor ratio, insulin sensitivity (ISIcomp), andaverage insulin clearance. We also included all the categorical variables previously de-scribed, i.e., metabolic test, glucose tolerance, obesity, sex. In the final model, in addition to∆AUCGLU and ∆AUCINS included by default (minimal model), the stepwise procedure se-lected basal insulin secretion, metabolic test, and glucose tolerance, with final R2 (adjusted)of 0.30 and p < 0.0001, and with slight improvement (decrease) of the Akaike’s AIC equalto 4.7%, compared to that of the initial model. However, ∆AUCINS did not gain signifi-cance, and ∆AUCGLU lost significance as well, but the role of insulin somehow emergedin terms of insulin secretion at basal (showing inverse relationship with ∆AUCGLUCA). Inthe stepwise regression with only ∆AUCGLU as minimal model, the stepwise procedureincluded the same variables as before, with similar values for adjusted R2, p, and AIC.Of note, ∆AUCGLU was again not significant. Consistently, without any minimal model,neither ∆AUCGLU nor ∆AUCINS were selected by the stepwise procedure, which againselected only basal insulin secretion, and metabolic test plus glucose tolerance as categoricalcovariates (adjusted R2 = 0.31, p < 0.0001, AIC reduction of 6.3%). If basal insulin secretionis replaced by insulin secretion at reference glucose value (see Table 2), in the case of glucoseat 5 or 6 mmol/L (5–6 mmol/L being the typical range of basal glycemia in nondiabeticpeople), again the stepwise procedure selects such insulin secretion parameter for theoptimal model. In this case, only metabolic test is selected as further covariate.
3.6. Shape Analysis of the Glucagon Curves
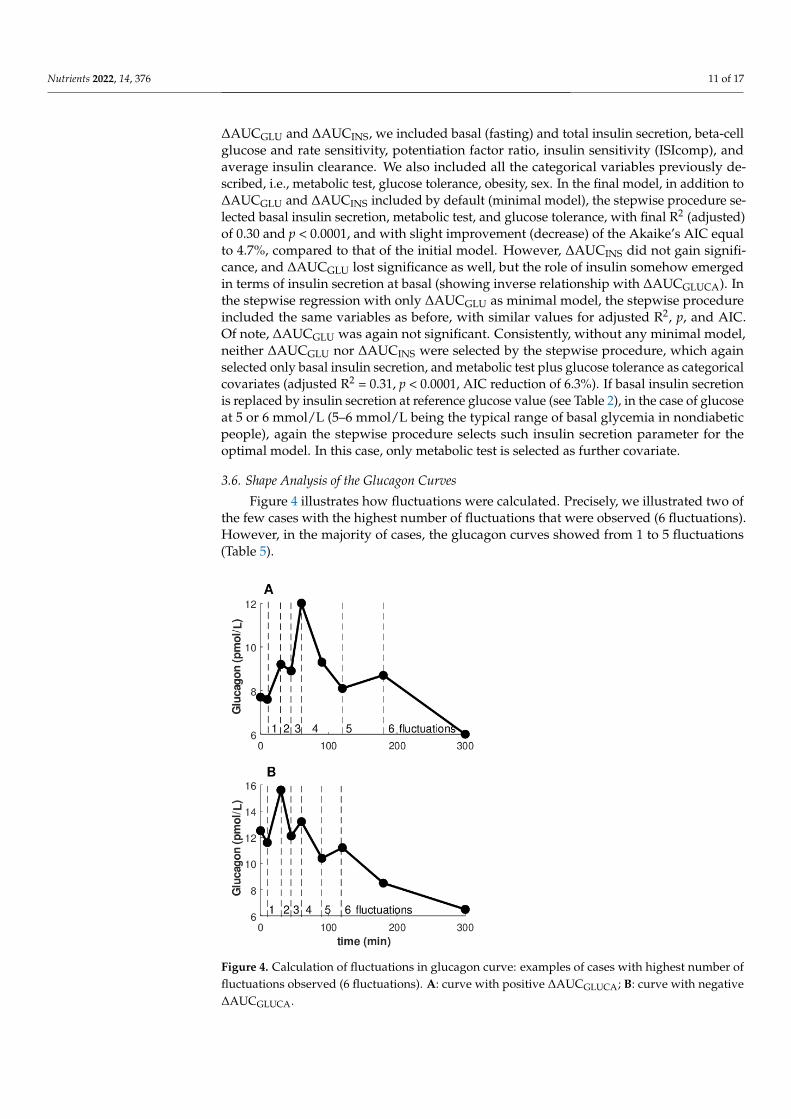
Figure 4 illustrates how fluctuations were calculated. Precisely, we illustrated two ofthe few cases with the highest number of fluctuations that were observed (6 fluctuations).However, in the majority of cases, the glucagon curves showed from 1 to 5 fluctuations(Table 5).
Nutrients 2022, 14, x FOR PEER REVIEW 12 of 17
Figure 4. Calculation of fluctuations in glucagon curve: examples of cases with highest number of
fluctuations observed (6 fluctuations). A: curve with positive ΔAUCGLUCA; B: curve with negative
ΔAUCGLUCA.
Table 5. Number of fluctuations of glucagon curves in different metabolic tests.
Mixed Meal Glucose Protein Fat
ΔAUCGLUCA
Positive
ΔAUCGLUCA
Negative
ΔAUCGLUCA
Positive
ΔAUCGLUCA
Negative
ΔAUCGLUCA
Positive
ΔAUCGLUCA
Negative
ΔAUCGLUCA
Positive
ΔAUCGLUCA
Negative
Number of fluctuations (%, number on total)
1 6.3 (2/32) 0.0 (0/4) 0.0 (0/9) 7.4 (2/27) 55.9 (19/34) 0.0 (0/2) 36.7 (4/11) 12.0 (3/25)
2 12.5 (4/32) 25.0 (1/4) 11.1 (1/9) 25.9 (7/27) 2.9 (1/34) 50.0 (1/2) 18.2 (2/11) 24.0 (6/25)
3 31.3 (10/32) 25.0 (1/4) 33.3 (3/9) 48.1 (13/27) 32.4 (11/34) 0.0 (0/2) 18.2 (2/11) 24.0 (6/25)
4 28.1 (9/32) 50.0 (2/4) 33.3 (3/9) 14.8 (4/27) 5.9 (2/34) 50.0 (1/2) 9.1 (1/11) 8.0 (2/25)
5 21.9 (7/32) 0.0 (0/4) 22.2 (2/9) 3.7 (1/27) 0.0 (0/34) 0.0 (0/2) 9.1 (1/11) 20.0 (5/25)
4. Discussion
In this study, we analyzed the possible associations of glucagon with glucose and
insulin following ingestion of different macronutrients. The main aim was to investigate
the relative contribution of glucose and insulin as determinants of glucagon release or
inhibition following food ingestion. Precisely, we aimed to evaluate if glucose and insulin
relationships with glucagon may depend on the type of macronutrient ingested. To our
knowledge, this is the first study analyzing the associations of glucose and insulin with
glucagon in relation to all three main classes of macronutrients, in isolation and in
combination, i.e., glucose, proteins, lipids, and the mixed meal.
We found that the combined ingestion of the macronutrients (mixed meal), and the
simple protein ingestion, typically determine stimulation of glucagon release compared
to the fasting condition, rather than inhibition. In contrast, for glucose and fat ingestion,
we observed that glucagon inhibition was more frequent than stimulation, though
stimulation was still observed not rarely. When analyzing the relationship of glucagon
with glucose and with insulin in each participant, and for each metabolic test, for glucose
we found a modest number of significant associations, both direct and inverse (18 and 8
out of the 144 total metabolic tests, respectively). For insulin, more cases were observed,
Figure 4. Calculation of fluctuations in glucagon curve: examples of cases with highest number offluctuations observed (6 fluctuations). A: curve with positive ∆AUCGLUCA; B: curve with negative∆AUCGLUCA.
Nutrients 2022, 14, 376 12 of 17
Table 5. Number of fluctuations of glucagon curves in different metabolic tests.
Mixed Meal Glucose Protein Fat
∆AUCGLUCAPositive
∆AUCGLUCANegative
∆AUCGLUCAPositive
∆AUCGLUCANegative
∆AUCGLUCAPositive
∆AUCGLUCANegative
∆AUCGLUCAPositive
∆AUCGLUCANegative
Number of fluctuations (%, number on total)1 6.3 (2/32) 0.0 (0/4) 0.0 (0/9) 7.4 (2/27) 55.9 (19/34) 0.0 (0/2) 36.7 (4/11) 12.0 (3/25)2 12.5 (4/32) 25.0 (1/4) 11.1 (1/9) 25.9 (7/27) 2.9 (1/34) 50.0 (1/2) 18.2 (2/11) 24.0 (6/25)3 31.3 (10/32) 25.0 (1/4) 33.3 (3/9) 48.1 (13/27) 32.4 (11/34) 0.0 (0/2) 18.2 (2/11) 24.0 (6/25)4 28.1 (9/32) 50.0 (2/4) 33.3 (3/9) 14.8 (4/27) 5.9 (2/34) 50.0 (1/2) 9.1 (1/11) 8.0 (2/25)5 21.9 (7/32) 0.0 (0/4) 22.2 (2/9) 3.7 (1/27) 0.0 (0/34) 0.0 (0/2) 9.1 (1/11) 20.0 (5/25)
We found some significant differences comparing the number of curves with increasingnumber of fluctuations. For the glucagon curves characterized by positive ∆AUCGLUCA,differences were detected comparing 1 vs. 2 fluctuation curves, as well as 1 vs. 5, 2 vs. 3,3 vs. 5 (p ≤ 0.01). Of note, 3 fluctuations and 1 only fluctuation were the most commoncurve shapes (26 and 25 curves out of 86 curves, respectively). For the glucagon curveswith negative ∆AUCGLUCA, differences were between 1 vs. 2, 1 vs. 3, 3 vs. 4, and3 vs. 5 fluctuations (p ≤ 0.03). The most common curve shape was 3 fluctuations (20 of58 curves). When considering the four metabolic tests separately, significant differences inthe number of the fluctuations were rarer (likely partially due to lower statistical power).Curiously, only in the protein test, for the glucagon curves with positive ∆AUCGLUCAseveral significant differences were observed: 1 fluctuation vs. all other shape types exceptfor 3 fluctuations (p < 0.0001), and 3 fluctuations again vs. all other shape types exceptobviously for 1 fluctuation (p ≤ 0.01).
4. Discussion
In this study, we analyzed the possible associations of glucagon with glucose andinsulin following ingestion of different macronutrients. The main aim was to investigatethe relative contribution of glucose and insulin as determinants of glucagon release orinhibition following food ingestion. Precisely, we aimed to evaluate if glucose and in-sulin relationships with glucagon may depend on the type of macronutrient ingested. Toour knowledge, this is the first study analyzing the associations of glucose and insulinwith glucagon in relation to all three main classes of macronutrients, in isolation and incombination, i.e., glucose, proteins, lipids, and the mixed meal.
We found that the combined ingestion of the macronutrients (mixed meal), and thesimple protein ingestion, typically determine stimulation of glucagon release compared tothe fasting condition, rather than inhibition. In contrast, for glucose and fat ingestion, weobserved that glucagon inhibition was more frequent than stimulation, though stimulationwas still observed not rarely. When analyzing the relationship of glucagon with glucose andwith insulin in each participant, and for each metabolic test, for glucose we found a modestnumber of significant associations, both direct and inverse (18 and 8 out of the 144 totalmetabolic tests, respectively). For insulin, more cases were observed, at least in terms ofdirect relationship (60 direct and 5 inverse). Interestingly, the frequency of direct relation-ship of glucagon with glucose, and with insulin as well, was typically different among thefour metabolic tests, whereas significant differences among tests were not reached for theinverse relationship, likely due to the low number of cases. These findings suggest that,although glucose and insulin are typically considered as the main determinants of glucagonrelease or inhibition, acting with several distinct mechanisms [1,15,24,27], the relevanceof both glucose and insulin role may be somehow less strong than generally believed(especially glucose). Therefore, it cannot be excluded that other factors, independent (atleast partially) from glucose and insulin levels, may have a role comparable to that ofglucose or insulin in determining stimulation or inhibition of glucagon release. In addition,our findings suggest that the relative contribution of the glucagon determinants following
Nutrients 2022, 14, 376 13 of 17
food ingestion may be largely dependent on the class of nutrients ingested, since stronglyheterogeneous results were observed for the analyzed four types of meals. Thus, aminoacids may be other glucagon determinants, at least after mixed meal or protein ingestion.In addition, further candidate glucagon determinants may be those related to autonomicstimulation, as briefly mentioned previously [25].
To corroborate the findings obtained in single individuals, we performed regressionanalyses over the whole participants’ cohort. These analyses, though not totally in agree-ment with the individual analyses (i.e., role of insulin here found even weaker than thatof glucose), overall confirmed that the contribution of glucose and insulin in determin-ing glucagon levels may be limited, and, especially, possibly dependent on the type ofmacronutrient ingested. This was in fact suggested by the inclusion of the metabolic testcategorical variable in the optimal model for the prediction of the glucagon levels. Of note,in these analyses a role emerged for basal rather than total insulin secretion, despite onemay have expected the latter rather than the former. This may imply a more important rolefor basal insulin secretion as regulator of the alpha cell than the dynamic change in insulinafter an oral challenge. However, the present study should be considered as the basis forfuture studies, aimed to determine, ideally, all factors involved in glucagon release andinhibition, and their relative contribution in relation to the type of food ingested. Indeed,since glucagon has progressively emerged as a crucial contributor of glucose homeostasis,accurate identification of the effects on its release or inhibition of different types of dietaryhabits (i.e., based on different relative composition of the nutrients) may be relevant for theprevention of type 2 diabetes (or to avoid further metabolic derangement in people alreadywith diabetes). The importance of precision nutrition in metabolic disturbances, includ-ing type 2 diabetes, was recently emphasized in the general context of precision diabetesmedicine [35,36]. Thus, a deep understanding of the dietary habits regarding the effectson glucagon may be beneficial, possibly being of help for the identification of the mostappropriate individualized diet prescriptions, specifically tailored for the single patient.
Limited comparison is possible with previous studies. In our previous study [30],based on the same participants’ cohort of the current investigation, the analysis of glucagonwas not among the main aims. Glucagon was analyzed, but mainly in terms of differencesamong the metabolic tests, with no analysis of its associations with other variables, whichinstead was the focus of this new study. In an earlier study of our research group [29],with again administration of different macronutrients, some glucagon information wasagain reported, but similar considerations as for the study [30] hold. In the study byYabe D. et al., [37], glucagon was investigated in both nondiabetic and type 2 diabetesparticipants, similarly to our study. For each participant, an oral glucose tolerance testand a mixed meal test was performed. Significant relationships were found betweenthe area under the curve of glucose and that of glucagon and insulin for specific timeintervals. This agrees with the findings of our AUC-based analyses in terms of significantrelationships between glucagon and glucose, whereas we did not find relationships withinsulin, differently to the study [37]. This partial disagreement may be due to severalreasons, among which the duration of the metabolic tests (120 min only vs. 300 min in ourtests), and the methodology to perform the regression analyses. In fact, in study [37] theemphasis was on the possible effects of glucagon and insulin on glucose, rather than theeffects of glucose and insulin on glucagon, which is the focus of our current study. Thisaffects the role assigned to independent and dependent variables in the regression analysis,and results can be influenced accordingly. In study [37], AUC-based analyses were notcorroborated by the individual analyses.
In this study, we also analyzed glucagon shape, as this may provide complementaryinformation to the findings from the regression analyses. In fact, the relevance of the shapeanalysis in metabolism was recently emphasized in several studies, at least for the glucosecurve (see for instance the review study [38]). However, shape analyses were found ofimportance even for the study of the insulin and C-peptide curves [39], and hence wehypothesized that the analysis of glucagon may have provided relevant information. We
Nutrients 2022, 14, 376 14 of 17
found that the glucagon curves in our dataset are extremely heterogeneous, showing fromfew to many fluctuations (up to a number of fluctuations almost equal to the maximumobservable, in relation to the number of time samples collected). This further underliesthe heterogeneous behavior of the glucagon kinetics following food ingestion. In addition,since the frequency of the different shape categories was not always similar among thedifferent types of metabolic tests, this further corroborated the conclusions previouslyillustrated in terms of heterogeneity of glucagon behavior, for the different macronutrients.To our knowledge, no further study quantitatively analyzed the glucagon curves shape,and this is another novelty of our study.
In one of our previous studies [40], we observed that during an oral glucose tolerancetest the association between glucagon and insulin appears more evident when consideringplasma C-peptide rather than plasma insulin. As mentioned previously, this may bedue to the reason that plasma C-peptide could be a marker of insulin secretion moreaccurate than plasma insulin, since C-peptide is secreted equimolarly with insulin, butat difference with insulin it does not undergo hepatic extraction. Since hepatic extractioncan vary among subjects and may also show temporal variations in the single individualduring a metabolic test, this may act as confounding factor for the role of insulin in theanalysis of the relationships with other hormones, such as glucagon. For this reason, inour first set of regression analyses, we also considered C-peptide, as well as model-basedinsulin secretion, which again is derived by plasma C-peptide rather than plasma insulin.However, in this study we did not appreciate relevant advantages in using C-peptide (orC-peptide-based insulin secretion) in place of insulin. Therefore, the subsequent analyseswere performed in fact with insulin. The study [40] proposed a model for the assessment ofthe sensitivity of glucagon to insulin inhibition. However, the present study revealed thatthe application of such modeling approach may not be always appropriate, since in manycases the individual relationship between glucagon and insulin appears missing. Thus, infuture studies, the model of study [40] may still be applied, but only to those patients/testswhere the glucagon-insulin relationship is present.
The sample size of this study was not large, and this should be acknowledged asa limitation. On the other hand, such sample size appears reasonable in relation to thecomplex experimental protocol, requiring four metabolic tests in separate days for each par-ticipant, and including healthy people that are typically more difficult to recruit, especiallyin elaborate and time-demanding study protocols, as in the present investigation (with eachtest lasting five hours). In relation to the long duration of each metabolic test, and the largenumber of time samples per test, we can claim that the analyses in the single individualsare robust. Instead, it is correct to acknowledge that in the analyses over the whole cohorta larger sample size would have been beneficial; in fact, it cannot be excluded that theweak relationships between glucagon, glucose, and insulin, observed in such whole cohortanalyses, may improve somehow when studying larger datasets. This advocates for theneed of future studies in the field. In relation to the sample size issue, in the whole cohortanalyses we did not perform separate investigations for the different groups of partici-pants (i.e., NGT and type 2 diabetes participants, as well as lean and overweight/obese,male, and female participants), to limit the risk for critical loss of statistical power in theanalyses. Nonetheless, the role of the indicated participants’ categories was considered byintroducing appropriate categorical variables, as previously described.
In conclusion, in metabolic tests based on the administration of different macronu-trients, we analyzed the associations between glucagon, glucose and insulin, while alsoconsidering in some analyses the possible contribution of insulin sensitivity and secretion,beta-cell function, and insulin clearance. We also assessed the shape of the glucagon curves.We found that the glucagon time patterns are highly heterogeneous, and the relationshipwith glucose and insulin is typically not strong, except in few individual cases. This sug-gests that the role of glucose and insulin as determinants of glucagon release or inhibitionfollowing food ingestion is likely less strong than often suggested in previous investiga-tions, and in addition it may strongly depend on the class of nutrients ingested. Further
Nutrients 2022, 14, 376 15 of 17
studies are needed to identify in detail all main determinants of glucagon release/inhibitionand their relative relevance depending on the food composition. This may be importantfor the appropriate assessment of the effects of different diet regimes on glucagon andmay contribute to the identification of the optimal dietary strategy, likely varying amongindividuals, for delaying or preventing the onset of type 2 diabetes, or for preventingworsening of dysglycemia in people already suffering from diabetes.
Author Contributions: Conceptualization, A.T., H.K. and B.A.; methodology, A.T., C.G.; investiga-tion, A.T., C.G., M.M. and B.S.; data curation, W.A. and B.A.; writing—original draft preparation,A.T., C.G., M.M. and B.S.; writing—review and editing, W.A., H.K. and B.A. All authors have readand agreed to the published version of the manuscript.
Funding: The original study was supported by grants from Swedish Research Council (6834), RegionSkåne, Skåne University Hospital and the Faculty of Medicine, Lund University.
Institutional Review Board Statement: The study was approved by the Ethics Committee in Lund,Sweden (approval number: 2011/361, 23 August 2011).
Informed Consent Statement: All participants gave written informed consent before the study,which was registered at clinicaltrials.gov (NCT01366794). The study was conducted using goodclinical practice and in accordance with the Declaration of Helsinki.
Data Availability Statement: Data are available upon reasonable request to Prof. Bo Ahrén. Theyare not publicly available due to data protection concerns related to privacy issues.
Acknowledgments: Authors are grateful to laboratory technician Kristina Andersson and researchnurse Bertil Nilsson at the Department of Clinical Sciences, Lund, for their expert technical assistancewhen the metabolic tests were performed. Authors also wish to thank Giovanni Pacini for hishelpful suggestions.
Conflicts of Interest: The authors declare no conflict of interest.
References1. Ahrén, B. Glucagon–Early breakthroughs and recent discoveries. Peptides 2015, 67, 74–81. [CrossRef] [PubMed]2. Gerich, J.E.; Schneider, V.; Dippe, S.E.; Langlois, M.; Noacco, C.; Karam, J.H.; Forsham, P.H. Characterization of the glucagon
response to hypoglycemia in man. J. Clin. Endocrinol. Metab. 1974, 38, 77–82. [CrossRef]3. Bolli, G.B.; Dimitriadis, G.D.; Pehling, G.B.; Baker, B.A.; Haymond, M.W.; Cryer, P.E.; Gerich, J.E. Abnormal glucose counter-
regulation after subcutaneous insulin in insulin-dependent diabetes mellitus. N. Engl. J. Med. 1984, 310, 1706–1711. [CrossRef][PubMed]
4. Cryer, P.E. Glucose counterregulation in man. Diabetes 1981, 30, 261–264. [CrossRef] [PubMed]5. Pipeleers, D.G.; Schuit, F.C.; in’t Veld, P.A.; Maes, E.; Hooghe-Peters, E.L.; Van de Winkel, M.; Gepts, W. Interplay of nutrients and
hormones in the regulation of insulin release. Endocrinology 1985, 117, 824–833. [CrossRef] [PubMed]6. Sørensen, H.; Winzell, M.S.; Brand, C.L.; Fosgerau, K.; Gelling, R.W.; Nishimura, E.; Ahren, B. Glucagon receptor knockout mice
display increased insulin sensitivity and impaired beta-cell function. Diabetes 2006, 55, 3463–3469. [CrossRef]7. Omar, B.; Sörhede-Winzell, M.; Ahrén, B. Conditional glucagon receptor overexpression has multi-faceted consequences for
beta-cell function. Metabolism 2014, 63, 1568–1576. [CrossRef] [PubMed]8. Gromada, J.; Chabosseau, P.; Rutter, G.A. The α-cell in diabetes mellitus. Nat. Rev. Endocrinol. 2018, 14, 694–704. [CrossRef]9. Guettet, C.; Rostaqui, N.; Mathé, D.; Lecuyer, B.; Navarro, N.; Jacotot, B. Effect of chronic glucagon administration on lipoprotein
composition in normally fed, fasted and cholesterol-fed rats. Lipids 1991, 26, 451–458. [CrossRef]10. Guettet, C.; Mathé, D.; Navarro, N.; Lecuyer, B. Effects of chronic glucagon administration on rat lipoprotein composition. Biochim.
Biophys. Acta 1989, 1005, 233–238. [CrossRef]11. Prip-Buus, C.; Pegorier, J.P.; Duee, P.H.; Kohl, C.; Girard, J. Evidence that the sensitivity of carnitine palmitoyltransferase
I to inhibition by malonyl-CoA is an important site of regulation of hepatic fatty acid oxidation in the fetal and newbornrabbit. Perinatal development and effects of pancreatic hormones in cultured rabbit hepatocytes. Biochem. J. 1990, 269, 409–415.[CrossRef] [PubMed]
12. Briant, L.; Salehib, A.; Vergaria, E.; Zhanga, Q.; Rorsmana, P. Glucagon secretion from pancreatic a-cells. Upsala J. Med. Sci. 2016,121, 113–119. [CrossRef] [PubMed]
13. Zhang, Q.; Ramracheya, R.; Lahmann, C.; Tarasov, A.; Bengtsson, M.; Braha, O.; Braun, M.; Brereton, M.; Collins, S.; Galvanovskis,J.; et al. Role of KATP channels in glucose-regulated glucagon secretion and impaired counterregulation in type 2 diabetes. Cell.Metab. 2013, 18, 871–882. [CrossRef] [PubMed]
Nutrients 2022, 14, 376 16 of 17
14. Zhang, Q.; Chibalina, M.V.; Bengtsson, M.; Groschner, L.N.; Ramracheya, R.; Rorsman, N.J.; Leiss, V.; Nassar, M.A.; Welling, A.;Gribble, F.M.; et al. Na+ current properties in islet α- and β-cells reflect cell-specific Scn3a and Scn9a expression. J. Physiol. 2014,592, 4677–4696. [CrossRef]
15. Yu, Q.; Shuai, H.; Ahooghalandari, P.; Gylfe, E.; Tengholm, A. Glucose controls glucagon secretion by directly modulating cAMPin alpha cells. Diabetologia 2019, 62, 1212–1224. [CrossRef]
16. Lund, A.; Bagger, J.I.; Christensen, M.; Knop, F.K.; Vilsbøll, T. Glucagon and type 2 diabetes: The return of the alpha cell. Curr.Diabetes Rep. 2014, 14, 555. [CrossRef]
17. Bonner, C.; Kerr-Conte, J.; Gmyr, V.; Queniat, G.; Moerman, E.; Thévenet, J.; Beaucamps, C.; Delalleau, N.; Popescu, I.; Malaisse,W.J.; et al. Inhibition of the glucose transporter SGLT2 with dapagliflozin in pancreatic alpha cells triggers glucagon secretion.Nat. Med. 2015, 21, 512–517. [CrossRef]
18. Ostenson, C.G. Regulation of glucagon release: Effects of insulin on the pancreatic A2-cell of the guinea pig. Diabetologia 1979,17, 325–330. [CrossRef]
19. Rorsman, P.; Berggren, P.O.; Bokvist, K.; Ericson, H.; Möhler, H.; Ostenson, C.G.; Smith, P.A. Glucose-inhibition of glucagonsecretion involves activation of GABAA-receptor chloride channels. Nature 1989, 341, 233–236. [CrossRef]
20. Cejvan, K.; Coy, D.H.; Efendic, S. Intra-islet somatostatin regulates glucagon release via type 2 somatostatin receptors in rats.Diabetes 2003, 52, 1176–1181. [CrossRef]
21. Strowski, M.Z.; Parmar, R.M.; Blake, A.D.; Schaeffer, J.M. Somatostatin inhibits insulin and glucagon secretion via two receptorssubtypes: An in vitro study of pancreatic islets from somatostatin receptor 2 knockout mice. Endocrinology 2000, 141, 111–117.[CrossRef] [PubMed]
22. Vieira, E.; Salehi, A.; Gylfe, E. Glucose inhibits glucagon secretion by a direct effect on mouse pancreatic alpha cells. Diabetologia2007, 50, 370–379. [CrossRef] [PubMed]
23. Cheng-Xue, R.; Gómez-Ruiz, A.; Antoine, N.; Noël, L.A.; Chae, H.Y.; Ravier, M.A.; Chimienti, F.; Schuit, F.C.; Gilon, P. Tolbutamidecontrols glucagon release from mouse islets differently than glucose: Involvement of K(ATP) channels from both α-cells andδ-cells. Diabetes 2013, 62, 1612–1622. [CrossRef]
24. Vergari, E.; Knudsen, J.G.; Ramracheya, R.; Salehi, A.; Zhang, Q.; Adam, J.; Asterholm, I.W.; Benrick, A.; Briant, L.J.B.; Chibalina,M.V.; et al. Insulin inhibits glucagon release by SGLT2-induced stimulation of somatostatin secretion. Nat. Commun. 2019, 10, 139.[CrossRef] [PubMed]
25. Ahrén, B.; Taborsky, G.J., Jr. The mechanism of vagal nerve stimulation of glucagon and insulin secretion in the dog. Endocrinology1986, 118, 1551–1557. [CrossRef] [PubMed]
26. Ahrén, B. Avoiding hypoglycemia: A key to success for glucose-lowering therapy in type 2 diabetes. Vasc. Health Risk Manag.2013, 9, 155–163. [CrossRef]
27. Gromada, J.; Franklin, I.; Wollheim, C.B. Alpha-cells of the endocrine pancreas: 35 years of research but the enigma remains.Endocr. Rev. 2007, 28, 84–116. [CrossRef]
28. Christensen, M.; Vedtofte, L.; Holst, J.J.; Vilsbøll, T.; Knop, F.K. Glucose-dependent insulinotropic polypeptide: A bifunctionalglucose-dependent regulator of glucagon and insulin secretion in humans. Diabetes 2011, 60, 3103–3109. [CrossRef]
29. Ohlsson, L.; Alsalim, W.; Carr, R.D.; Tura, A.; Pacini, G.; Mari, A.; Ahrén, B. Glucose-lowering effect of the DPP-4 inhibitorsitagliptin after glucose and non-glucose macronutrient ingestion in non-diabetic subjects. Diabetes Obes. Metab. 2013, 15, 531–537.[CrossRef]
30. Alsalim, W.; Tura, A.; Pacini, G.; Omar, B.; Bizzotto, R.; Mari, A.; Ahrén, B. Mixed meal ingestion diminishes glucose excursion incomparison with glucose ingestion via several adaptive mechanisms in people with and without type 2 diabetes. Diabetes Obes.Metab. 2016, 18, 24–33. [CrossRef]
31. Mari, A.; Tura, A.; Gastaldelli, A.; Ferrannini, E. Assessing insulin secretion by modeling in multiple-meal tests: Role ofpotentiation. Diabetes 2002, 51 (Suppl S1), S221–S226. [CrossRef]
32. Tura, A.; Muscelli, E.; Gastaldelli, A.; Ferrannini, E.; Mari, A. Altered pattern of the incretin effect as assessed by modelling inindividuals with glucose tolerance ranging from normal to diabetic. Diabetologia 2014, 57, 1199–1203. [CrossRef]
33. Gastaldelli, A.; Abdul Ghani, M.; DeFronzo, R.A. Adaptation of Insulin Clearance to Metabolic Demand Is a Key Determinant ofGlucose Tolerance. Diabetes 2021, 70, 377–385. [CrossRef]
34. Matsuda, M.; De Fronzo, R.A. Insulin sensitivity indices obtained from oral glucose tolerance testing: Comparison with theeuglycemic insulin clamp. Diabetes Care 1999, 22, 1462–1470. [CrossRef]
35. de Toro-Martín, J.; Arsenault, B.J.; Després, J.P.; Vohl, M.C. Precision Nutrition: A Review of Personalized Nutritional Approachesfor the Prevention and Management of Metabolic Syndrome. Nutrients 2017, 9, 913. [CrossRef] [PubMed]
36. Chung, W.K.; Erion, K.; Florez, J.C.; Hattersley, A.T.; Hivert, M.F.; Lee, C.G.; McCarthy, M.I.; Nolan, J.J.; Norris, J.M.; Pearson, E.R.;et al. Precision Medicine in Diabetes: A Consensus Report from the American Diabetes Association (ADA) and the EuropeanAssociation for the Study of Diabetes (EASD). Diabetes Care 2020, 43, 1617–1635. [CrossRef] [PubMed]
37. Yabe, D.; Kuroe, A.; Watanabe, K.; Iwasaki, M.; Hamasaki, A.; Hamamoto, Y.; Harada, N.; Yamane, S.; Lee, S.; Murotani, K.; et al.Early phase glucagon and insulin secretory abnormalities, but not incretin secretion, are similarly responsible for hyperglycemiaafter ingestion of nutrients. J. Diabetes Its Complicat. 2015, 29, 413–421. [CrossRef] [PubMed]
38. Bergman, M.; Abdul-Ghani, M.; DeFronzo, R.A.; Manco, M.; Sesti, G.; Fiorentino, T.V.; Ceriello, A.; Rhee, M.; Phillips, L.S.; Chung,S.; et al. Review of methods for detecting glycemic disorders. Diabetes Res. Clin. Pract. 2020, 165, 108233. [CrossRef] [PubMed]

Nutrients 2022, 14, 376 17 of 17
39. Tura, A.; Morbiducci, U.; Sbrignadello, S.; Winhofer, Y.; Pacini, G.; Kautzky-Willer, A. Shape of glucose, insulin, C-peptide curvesduring a 3-h oral glucose tolerance test: Any relationship with the degree of glucose tolerance? Am. J. Physiol. Regul. Integr. Comp.Physiol. 2011, 300, R941–R948. [CrossRef]
40. Morettini, M.; Burattini, L.; Göbl, C.; Pacini, G.; Ahrén, B.; Tura, A. Mathematical Model of Glucagon Kinetics for the Assessmentof Insulin-Mediated Glucagon Inhibition During an Oral Glucose Tolerance Test. Front. Endocrinol. 2021, 12, 611147. [CrossRef]