Szabó et al.: Applying artificial mycorrhizae in planting urban ...

Factors Influencing Urban Tree Planting Program Growth and Survival in Florida,
United States
Andrew K. Koeser, Edward F. Gilman, Maria Paz, and Chris Harchick

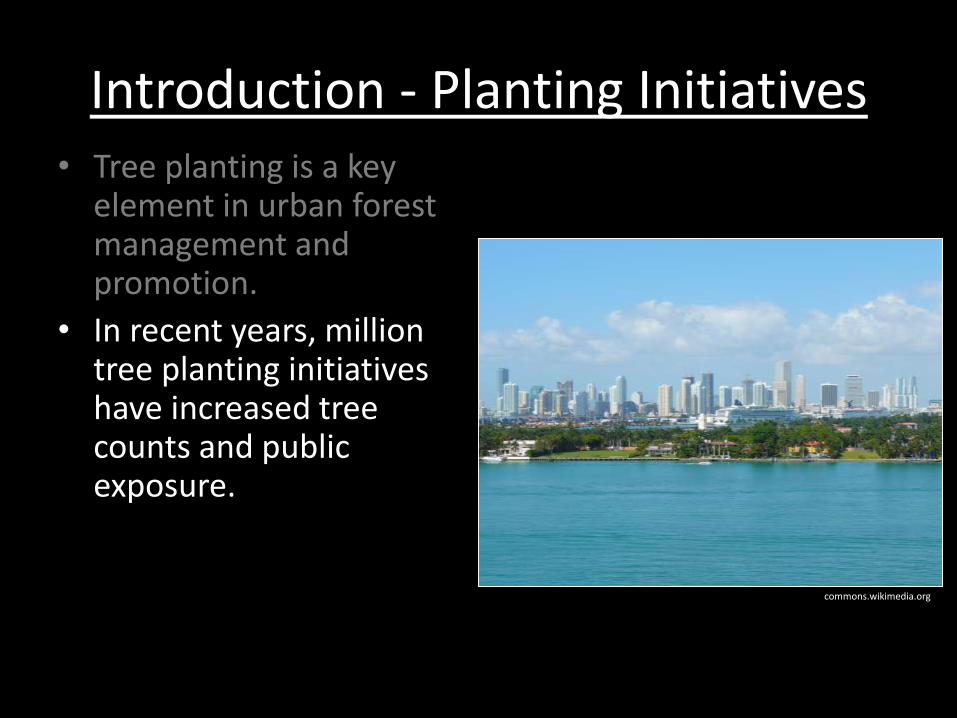
Introduction - Planting Initiatives• Tree planting is a key
element in urban forest management and promotion.
• In recent years, Million Tree planting initiatives have increased tree counts and public exposure.
• However, many note the need to go beyond number of trees planted when assessing success.
Introduction - Planting Initiatives• Tree planting is a key
element in urban forest management and promotion.
• In recent years, million tree planting initiatives have increased tree counts and public exposure.
• However, many note the need to go beyond number of trees planted when assessing success.
commons.wikimedia.org


Introduction - Planting Initiatives• Tree planting is a key
element in urban forest management and promotion.
• In recent years, Million Tree planting initiatives have increased tree counts and public exposure.
• However, many note the need to go beyond number of trees planted when assessing success.
htt
p:/
/clt
amp
a.co
m
htt
p:/
/ww
w.g
asto
ngo
v.co
m
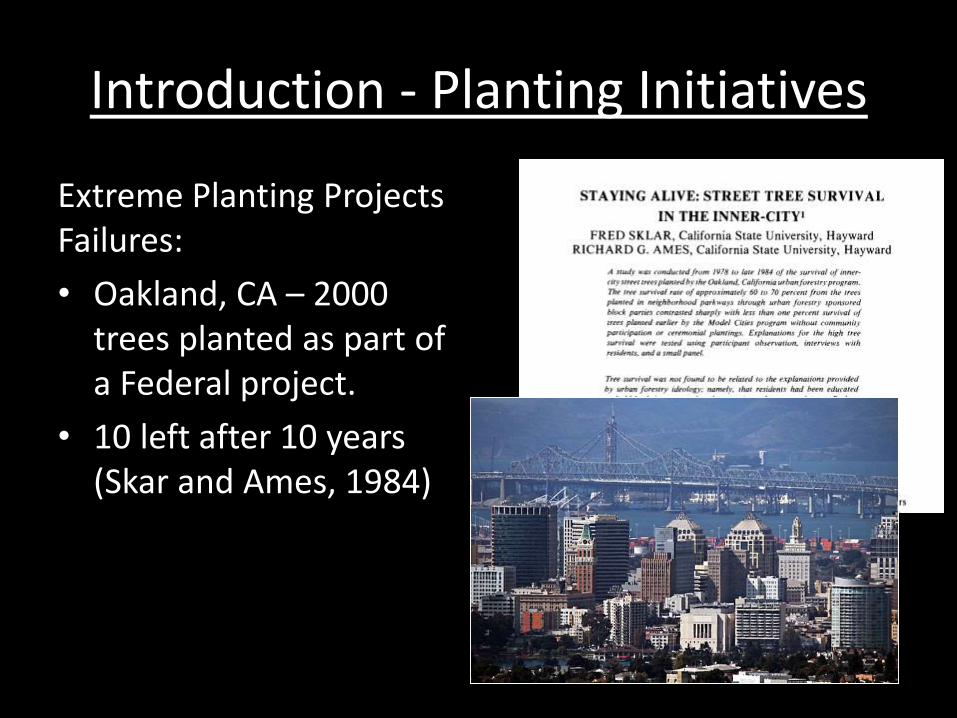
Introduction - Planting Initiatives
Extreme Planting Projects Failures:
• Oakland, CA – 2000 trees planted as part of a Federal project.
• 10 left after 10 years (Skar and Ames, 1984)

Introduction - Planting Initiatives
Extreme Planting Projects Failures:
• Beijing, China– 750 trees planted using a novel transplant method.
• 17-37% mortality less than 11 weeks after planting (Yang and McBride, 2003)
http://en.wikipedia.org

en.wikipedia.org
Factors Influencing Urban Tree Planting Program Growth and Survival in Florida, United States

Sites Sampled
• Past FFS-funded community planting projects.
• 26 sites selected from 150 projects with active managers/records
• Sample stratified to include sites from temperate to sub-tropic regions
• Trees were installed 20 to 64 months prior to study

Sites Sampled
Florida Forest Service Grant Requirements• Florida #1 grade trees• Inspection in the
weeks following planting
• Inspection one year following planting
• Replacement required for dead and missing trees
lake.ifas.ufl.edu

Site Factors
• Site type
• Soil compaction
• Presence/absence of irrigation
• Presence/absence of staking materials
ww
w.am
erican-law
ns.co
m
htt
p:/
/ww
w.i4
exit
guid
e.co
mfo
rum
.sky
scra
per
pag
e.co
m
Street
Open Lawn
Highway

• Site type
• Soil compaction
• Presence/absence of irrigation
• Presence/absence of staking materials
Site Factors
http
://ww
w.saw
grassvillagepvb
.com
htt
p:/
/ww
w.a
far.
com
Park
Parking Lot

Site Factors
• Site type
• Soil compaction
• Presence/absence of irrigation
• Presence/absence of staking materials
erad
tbah
satz
19
84
.2k0
0.c
om

Site Factors
• Site type
• Soil compaction
• Presence/absence of irrigation
• Presence/absence of staking materials
tvglandscaping.co.uk

Site Factors
• Site type
• Soil compaction
• Presence/absence of irrigation
• Presence/absence of staking materials

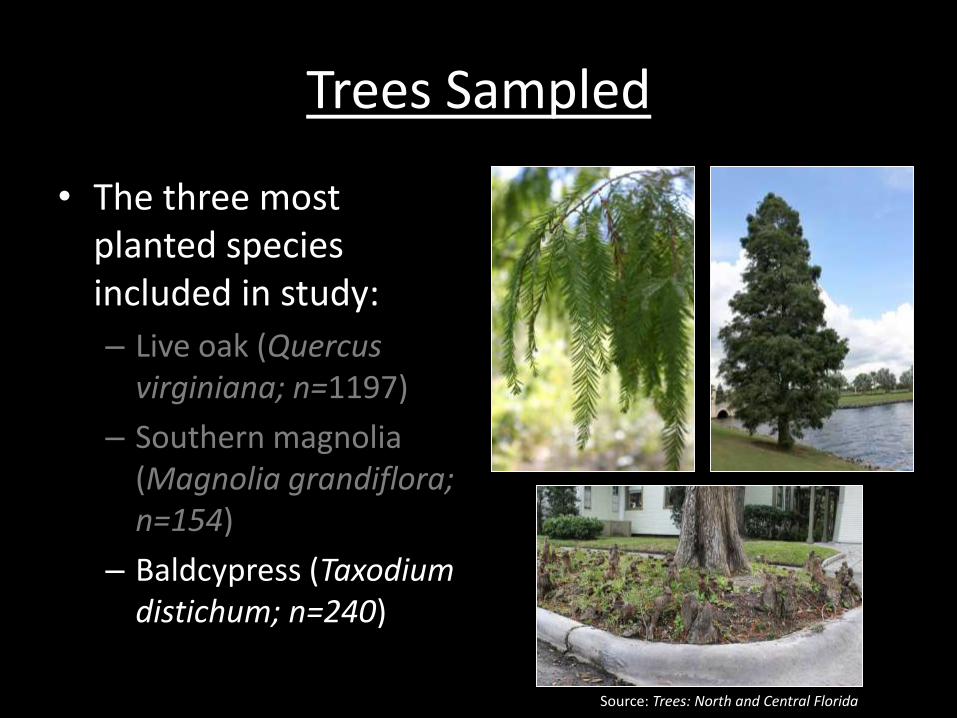
Trees Sampled
• The three most planted species included in study:
– Live oak (Quercusvirginiana; n=1197)
– Southern magnolia (Magnolia grandiflora; n=154)
– Baldcypress (Taxodiumdistichum; n=240)
htt
p:/
/ww
w.n
wao
nlin
e.co
m/

Trees Sampled
• The three most planted species included in study:
– Live oak (Quercusvirginiana; n=1197)
– Southern magnolia (Magnolia grandiflora; n=154)
– Baldcypress (Taxodiumdistichum; n=240)
Source: Trees: North and Central Florida

Trees Sampled
• The three most planted species included in study:
– Live oak (Quercusvirginiana; n=1197)
– Southern magnolia (Magnolia grandiflora; n=154)
– Baldcypress (Taxodiumdistichum; n=240)
Source: Trees: North and Central Florida
Trees Sampled
• The three most planted species included in study:
– Live oak (Quercusvirginiana; n=1197)
– Southern magnolia (Magnolia grandiflora; n=154)
– Baldcypress (Taxodiumdistichum; n=240)
Source: Trees: North and Central Florida

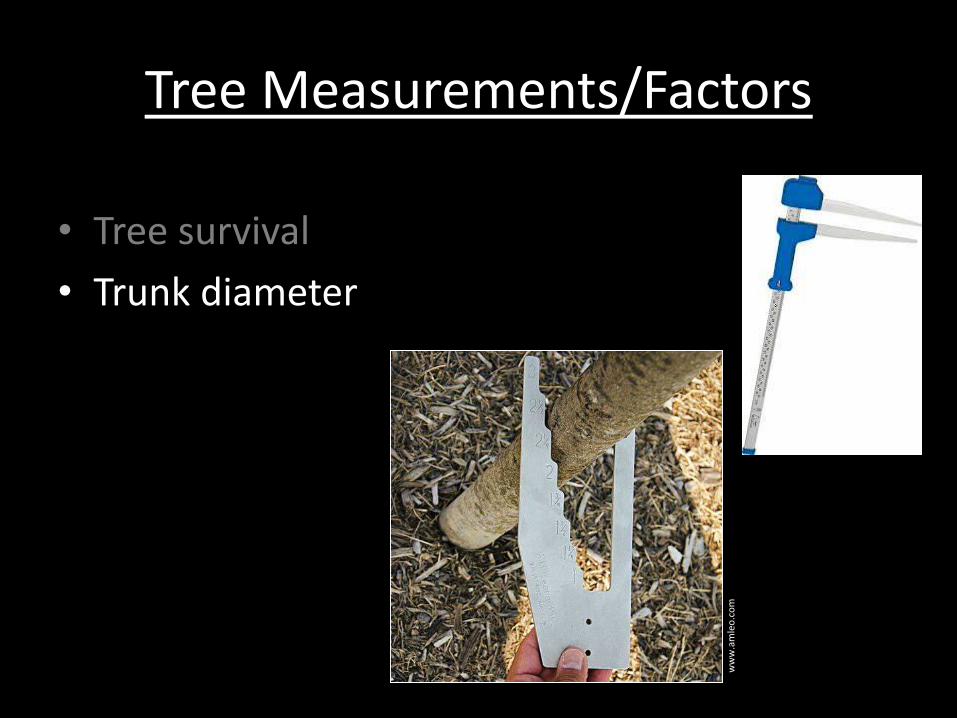
Tree Measurements/Factors
• Tree survival
• Trunk diameter
• Canopy condition (1-4)
• Percentage live crown
• Leans
• Rooting firmness rating (1-5)
city
bu
ilder
bo
okc
lub
.org
Tree Measurements/Factors
• Tree survival
• Trunk diameter
• Canopy condition (1-4)
• Percentage live crown
• Leans
• Rooting firmness rating (1-5)
ww
w.a
mle
o.c
om

Tree Measurements/Factors
• Tree survival
• Trunk diameter
• Canopy condition (1-4)
• Percentage live crown
• Leans
• Rooting firmness rating (1-5)
ww
w.p
ub
lic.a
su.e
du
Heat Damage –Southern Magnolia

Tree Measurements/Factors
• Tree survival
• Trunk diameter
• Canopy condition (1-4)
• Percentage live crown
• Leans
• Rooting firmness rating (1-5)

Tree Measurements/Factors
• Tree survival
• Trunk diameter
• Canopy condition (1-4)
• Percentage live crown
• Leans
• Rooting firmness rating (1-5)

Tree Measurements/Factors
• Tree survival
• Trunk diameter
• Canopy condition (1-4)
• Percentage live crown
• Leans
• Rooting firmness rating (1-5)

Tree Measurements/Factors
• For live oak only, compared balled and burlap to container
• Southern magnolia and baldcypress were container grown

Data Analysis
• Logistic regression proved problematic with data set.
• Assessed survival as a series of experiment-wise error rate adjusted Pearson’s chi-squared tests (prop.test function)
• Modeled growth using multiple regression with the lm function.

Results-Survival
Species
Irrigated Non-irrigated SignificantDifferenceZ% Survival n % Survival n
Live oak 97.5 717 94.2a 1017 **
Baldcypress 94.1 135 86.0b 250 .
Southern magnolia 97.7 132 73.8c 103 ***
zSignificance Codes: “***” = 0.001; “**” = 0.01; “.” = 0.10
Survival by Species and Presence/Absence of Irrigation
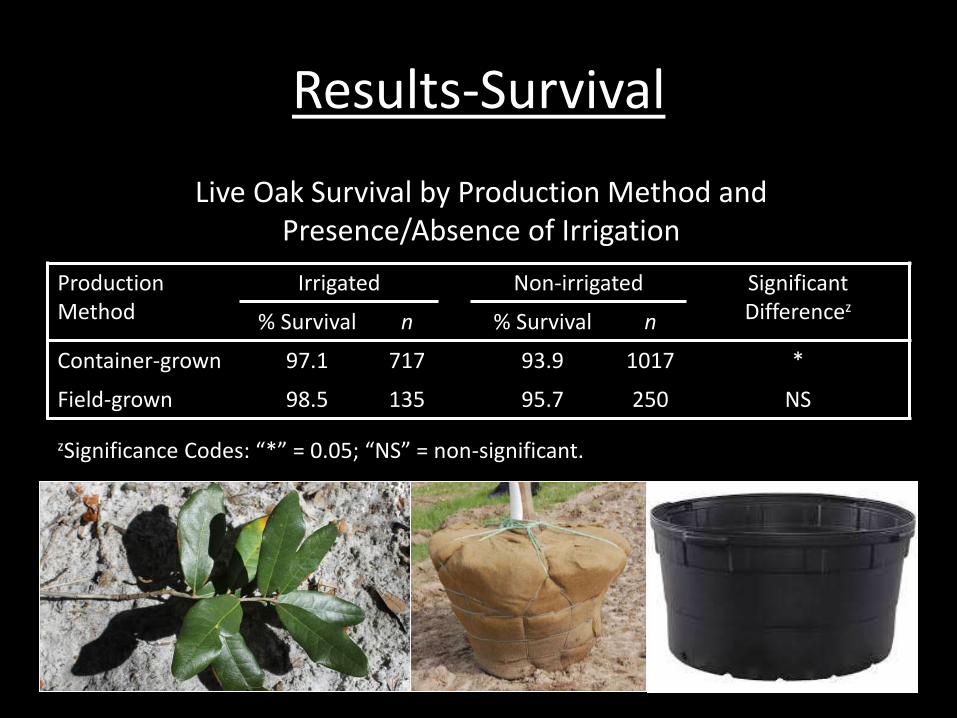
Results-Survival
ProductionMethod
Irrigated Non-irrigated SignificantDifferencez
% Survival n % Survival n
Container-grown 97.1 717 93.9 1017 *
Field-grown 98.5 135 95.7 250 NS
zSignificance Codes: “*” = 0.05; “NS” = non-significant.
Live Oak Survival by Production Method and Presence/Absence of Irrigation

Results – Live Oak GrowthFactor Coefficient SE P value 95% CI lower 95% CI upper
Intercept 0.909 0.074 <0.0001 0.7651 1.0535
Geographic region-North 0.215 0.018 <0.0001 0.1798 0.2507
Geographic Region-South 0.212 0.017 <0.0001 0.1778 0.2456
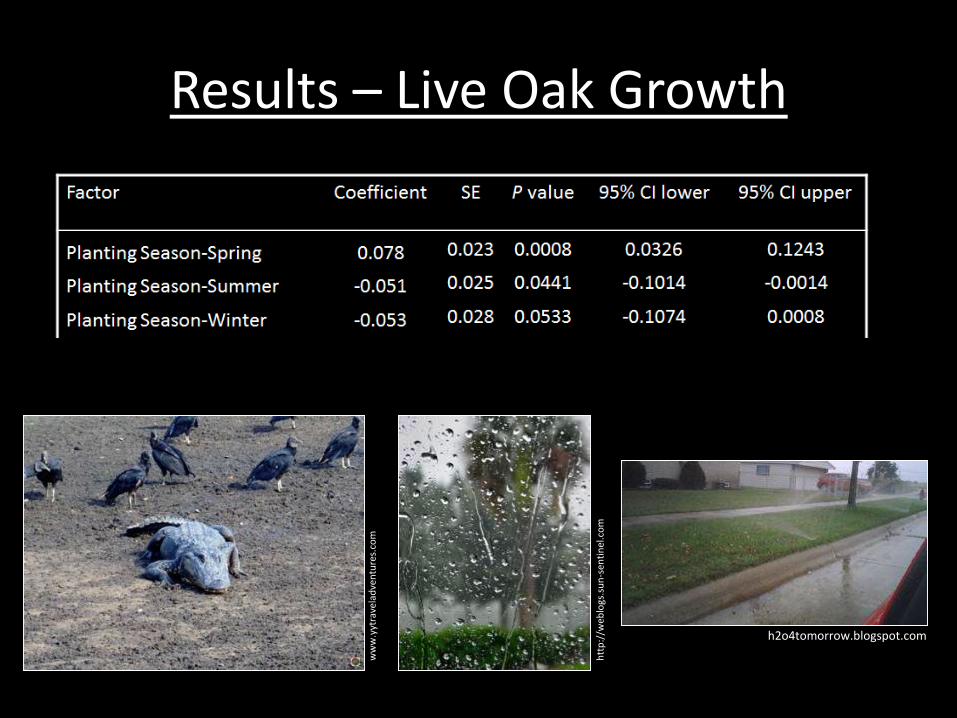
Planting Season-Spring 0.078 0.023 0.0008 0.0326 0.1243
Planting Season-Summer -0.051 0.025 0.0441 -0.1014 -0.0014
Planting Season-Winter -0.053 0.028 0.0533 -0.1074 0.0008
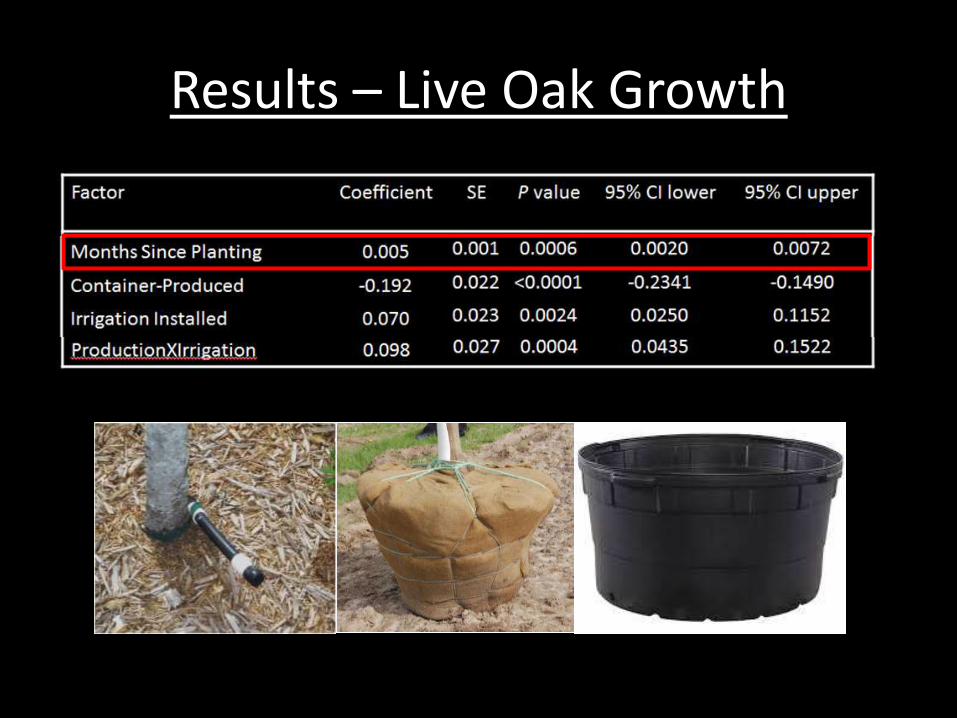
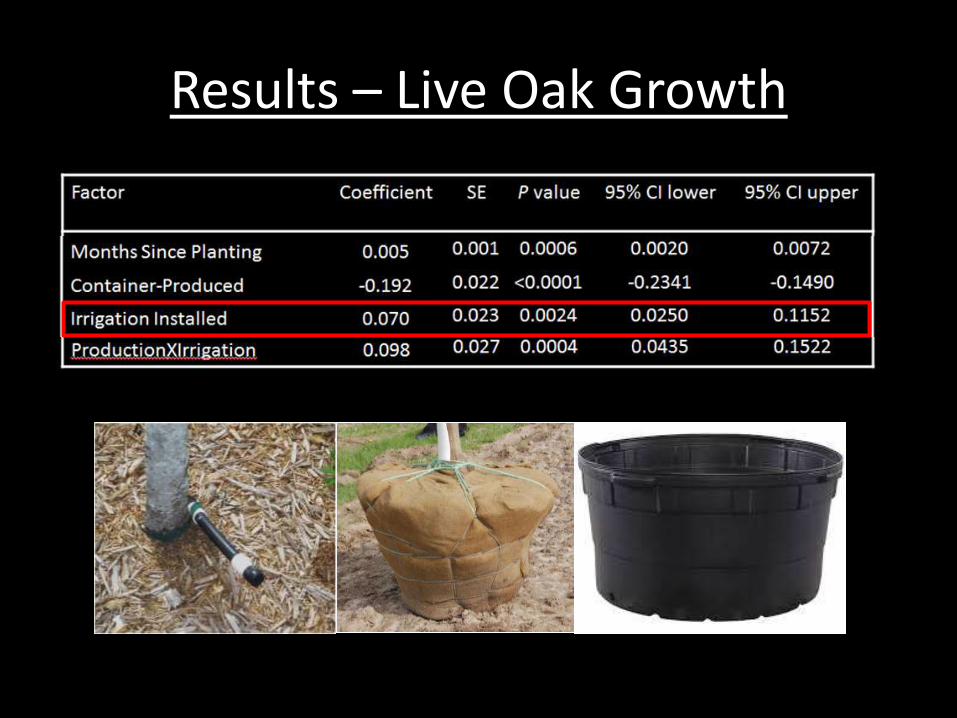
Months Since Planting 0.005 0.001 0.0006 0.0020 0.0072
Container-Produced -0.192 0.022 <0.0001 -0.2341 -0.1490
Irrigation Installed 0.070 0.023 0.0024 0.0250 0.1152
Firmness Rating 0.171 0.007 <0.0001 0.1570 0.1854
Initial Caliper 0.092 0.005 <0.0001 0.0823 0.1024
Site Type – Open Lawn -0.076 0.015 <0.0001 -0.1051 -0.0460
Site Type – Street -0.153 0.023 <0.0001 -0.1977 -0.1082
ProductionXIrrigation 0.098 0.027 0.0004 0.0435 0.1522
Adjusted R2 = 0.68
Results – Live Oak Growth
htt
p:/
/web
logs
.su
n-s
enti
nel
.co
m
ww
w.y
ytra
vela
dve
ntu
res.
com
h2o4tomorrow.blogspot.com

Results – Live Oak Growth
Results – Live Oak Growth

Results – Live Oak Growth
Results – Live Oak Growth

Results – Live Oak Growth

Results-Survival
ProductionMethod
Irrigated Non-irrigated SignificantDifferencez
% Survival n % Survival n
Container-grown 97.1 717 93.9 1017 *
Field-grown 98.5 135 95.7 250 NS
zSignificance Codes: “*” = 0.05; “NS” = non-significant.
Live Oak Survival by Production Method and Presence/Absence of Irrigation
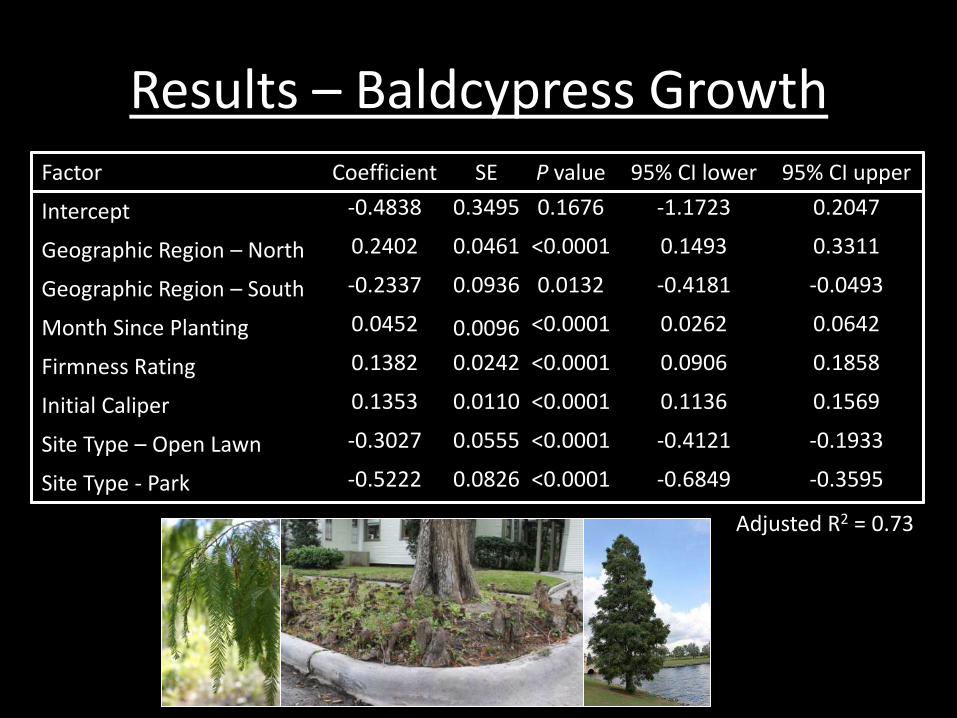
Results – Baldcypress GrowthFactor Coefficient SE P value 95% CI lower 95% CI upper
Intercept -0.4838 0.3495 0.1676 -1.1723 0.2047
Geographic Region – North 0.2402 0.0461 <0.0001 0.1493 0.3311
Geographic Region – South -0.2337 0.0936 0.0132 -0.4181 -0.0493
Month Since Planting 0.0452 0.0096 <0.0001 0.0262 0.0642
Firmness Rating 0.1382 0.0242 <0.0001 0.0906 0.1858
Initial Caliper 0.1353 0.0110 <0.0001 0.1136 0.1569
Site Type – Open Lawn -0.3027 0.0555 <0.0001 -0.4121 -0.1933
Site Type - Park -0.5222 0.0826 <0.0001 -0.6849 -0.3595
Adjusted R2 = 0.73
Irrigation not in final model??

Results-Survival
Species
Irrigated Non-irrigated SignificantDifferenceZ% Survival n % Survival n
Live oak 97.5 717 94.2a 1017 **
Baldcypress 94.1 135 86.0b 250 .
Southern magnolia 97.7 132 73.8c 103 ***
zSignificance Codes: “***” = 0.001; “**” = 0.01; “.” = 0.10
Survival by Species and Presence/Absence of Irrigation
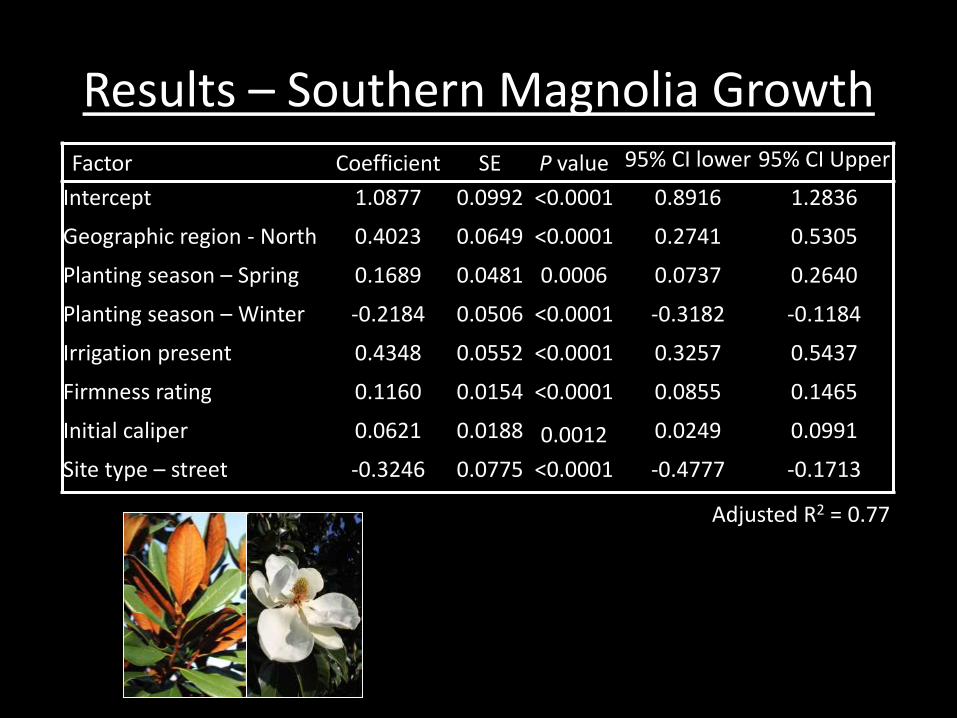
Results – Southern Magnolia GrowthFactor Coefficient SE P value 95% CI lower 95% CI Upper
Intercept 1.0877 0.0992 <0.0001 0.8916 1.2836
Geographic region - North 0.4023 0.0649 <0.0001 0.2741 0.5305
Planting season – Spring 0.1689 0.0481 0.0006 0.0737 0.2640
Planting season – Winter -0.2184 0.0506 <0.0001 -0.3182 -0.1184
Irrigation present 0.4348 0.0552 <0.0001 0.3257 0.5437
Firmness rating 0.1160 0.0154 <0.0001 0.0855 0.1465
Initial caliper 0.0621 0.0188 0.0012 0.0249 0.0991
Site type – street -0.3246 0.0775 <0.0001 -0.4777 -0.1713
Adjusted R2 = 0.77

Results – Southern Magnolia GrowthFactor Coefficient SE P value 95% CI lower 95% CI Upper
Intercept 1.0877 0.0992 <0.0001 0.8916 1.2836
Geographic region - North 0.4023 0.0649 <0.0001 0.2741 0.5305
Planting season – Spring 0.1689 0.0481 0.0006 0.0737 0.2640
Planting season – Winter -0.2184 0.0506 <0.0001 -0.3182 -0.1184
Irrigation present 0.4348 0.0552 <0.0001 0.3257 0.5437
Firmness rating 0.1160 0.0154 <0.0001 0.0855 0.1465
Initial caliper 0.0621 0.0188 0.0012 0.0249 0.0991
Site type – street -0.3246 0.0775 <0.0001 -0.4777 -0.1713

Conclusions
• Overall establishment rate = 93.6% (20-64 months after planting; n = 2354).

Conclusions
93.6% puts these projects among the most successful in literature:
• 91% (932) – Iowa (Tompson et al., 2004)
• 91.3% (45,094) – New York, NY (Lu et al., 2010)
• 95-96% (1163) – Philadelphia, PA (Jack-Scott, 2011)

Conclusions
93.6% puts these projects among the most successful on record:
• 91% (932) – Iowa (Tompson et al., 2004)
• 91.3% (45,094) – New York, NY (Lu et al., 2010)
• 95-96% (1163) – Philadelphia, PA (Jack-Scott, 2011)
Caveat: FL plantings include replacements up to 1 year after planting

Conclusions
• On-site irrigation most important to container-grown live oak and Southern magnolia
• Field-grown live oak out-performed similar container-grown material (seen in earlier studies by Gilman and Masters, 2010)

en.wikipedia.org
Questions?
Copyright © 2022 FDOKUMEN