


Bahasa
Halaman
Hukum


Factors Influencing Urban Tree Planting Program Growth and Survival in Florida,
United States
Andrew K. Koeser, Edward F. Gilman, Maria Paz, and Chris Harchick

Introduction - Planting Initiatives• Tree planting is a key
element in urban forest management and promotion.
• In recent years, Million Tree planting initiatives have increased tree counts and public exposure.
• However, many note the need to go beyond number of trees planted when assessing success.
Introduction - Planting Initiatives• Tree planting is a key
element in urban forest management and promotion.
• In recent years, million tree planting initiatives have increased tree counts and public exposure.
• However, many note the need to go beyond number of trees planted when assessing success.
commons.wikimedia.org


Introduction - Planting Initiatives• Tree planting is a key
element in urban forest management and promotion.
• In recent years, Million Tree planting initiatives have increased tree counts and public exposure.
• However, many note the need to go beyond number of trees planted when assessing success.
htt
p:/
/clt
amp
a.co
m
htt
p:/
/ww
w.g
asto
ngo
v.co
m
Introduction - Planting Initiatives
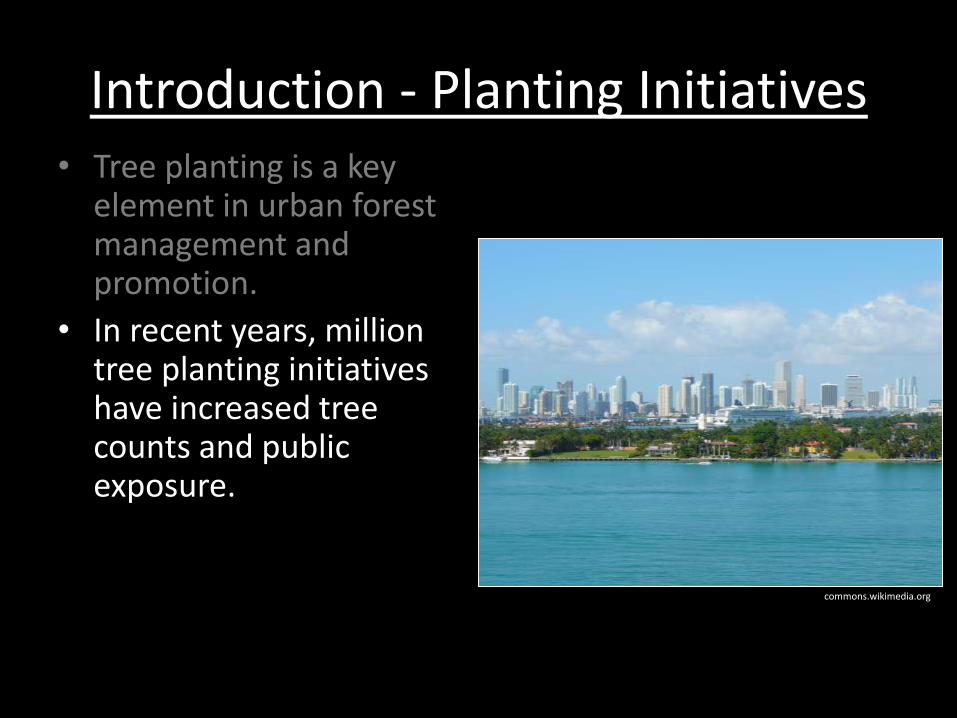
Extreme Planting Projects Failures:
• Oakland, CA – 2000 trees planted as part of a Federal project.
• 10 left after 10 years (Skar and Ames, 1984)

Introduction - Planting Initiatives
Extreme Planting Projects Failures:
• Beijing, China– 750 trees planted using a novel transplant method.
• 17-37% mortality less than 11 weeks after planting (Yang and McBride, 2003)
http://en.wikipedia.org

en.wikipedia.org
Factors Influencing Urban Tree Planting Program Growth and Survival in Florida, United States

Sites Sampled
• Past FFS-funded community planting projects.
• 26 sites selected from 150 projects with active managers/records
• Sample stratified to include sites from temperate to sub-tropic regions
• Trees were installed 20 to 64 months prior to study

Sites Sampled
Florida Forest Service Grant Requirements• Florida #1 grade trees• Inspection in the
weeks following planting
• Inspection one year following planting
• Replacement required for dead and missing trees
lake.ifas.ufl.edu

Site Factors
• Site type
• Soil compaction
• Presence/absence of irrigation
• Presence/absence of staking materials
ww
w.am
erican-law
ns.co
m
htt
p:/
/ww
w.i4
exit
guid
e.co
mfo
rum
.sky
scra
per
pag
e.co
m
Street
Open Lawn
Highway

• Site type
• Soil compaction
• Presence/absence of irrigation
• Presence/absence of staking materials
Site Factors
http
://ww
w.saw
grassvillagepvb
.com
htt
p:/
/ww
w.a
far.
com
Park
Parking Lot

Site Factors
• Site type
• Soil compaction
• Presence/absence of irrigation
• Presence/absence of staking materials
erad
tbah
satz
19
84
.2k0
0.c
om

Site Factors
• Site type
• Soil compaction
• Presence/absence of irrigation
• Presence/absence of staking materials
tvglandscaping.co.uk

Site Factors
• Site type
• Soil compaction
• Presence/absence of irrigation
• Presence/absence of staking materials

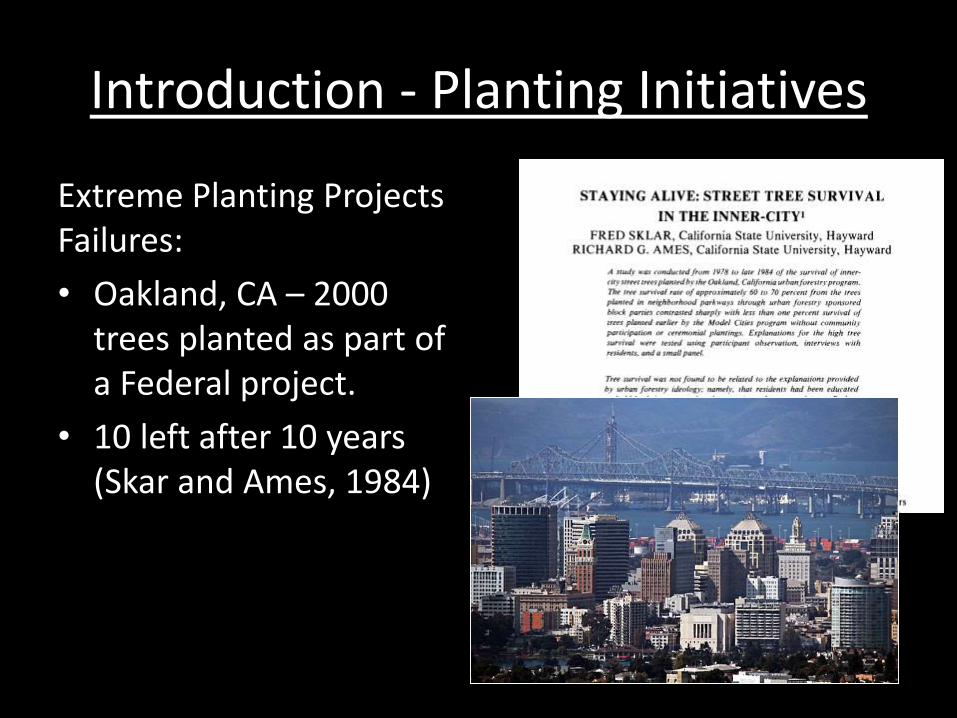
Trees Sampled
• The three most planted species included in study:
– Live oak (Quercusvirginiana; n=1197)
– Southern magnolia (Magnolia grandiflora; n=154)
– Baldcypress (Taxodiumdistichum; n=240)
htt
p:/
/ww
w.n
wao
nlin
e.co
m/

Trees Sampled
• The three most planted species included in study:
– Live oak (Quercusvirginiana; n=1197)
– Southern magnolia (Magnolia grandiflora; n=154)
– Baldcypress (Taxodiumdistichum; n=240)
Source: Trees: North and Central Florida

Trees Sampled
• The three most planted species included in study:
– Live oak (Quercusvirginiana; n=1197)
– Southern magnolia (Magnolia grandiflora; n=154)
– Baldcypress (Taxodiumdistichum; n=240)
Source: Trees: North and Central Florida
Trees Sampled
• The three most planted species included in study:
– Live oak (Quercusvirginiana; n=1197)
– Southern magnolia (Magnolia grandiflora; n=154)
– Baldcypress (Taxodiumdistichum; n=240)
Source: Trees: North and Central Florida

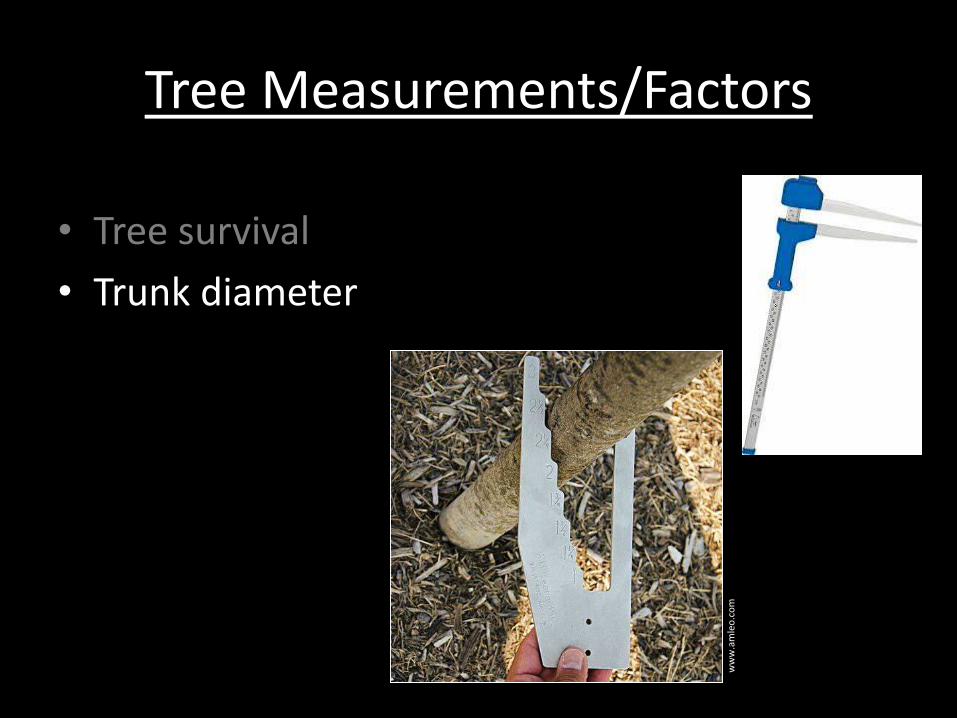
Tree Measurements/Factors
• Tree survival
• Trunk diameter
• Canopy condition (1-4)
• Percentage live crown
• Leans
• Rooting firmness rating (1-5)
city
bu
ilder
bo
okc
lub
.org
Tree Measurements/Factors
• Tree survival
• Trunk diameter
• Canopy condition (1-4)
• Percentage live crown
• Leans
• Rooting firmness rating (1-5)
ww
w.a
mle
o.c
om

Tree Measurements/Factors
• Tree survival
• Trunk diameter
• Canopy condition (1-4)
• Percentage live crown
• Leans
• Rooting firmness rating (1-5)
ww
w.p
ub
lic.a
su.e
du
Heat Damage –Southern Magnolia

Tree Measurements/Factors
• Tree survival
• Trunk diameter
• Canopy condition (1-4)
• Percentage live crown
• Leans
• Rooting firmness rating (1-5)

Tree Measurements/Factors
• Tree survival
• Trunk diameter
• Canopy condition (1-4)
• Percentage live crown
• Leans
• Rooting firmness rating (1-5)

Tree Measurements/Factors
• Tree survival
• Trunk diameter
• Canopy condition (1-4)
• Percentage live crown
• Leans
• Rooting firmness rating (1-5)

Tree Measurements/Factors
• For live oak only, compared balled and burlap to container
• Southern magnolia and baldcypress were container grown

Data Analysis
• Logistic regression proved problematic with data set.
• Assessed survival as a series of experiment-wise error rate adjusted Pearson’s chi-squared tests (prop.test function)
• Modeled growth using multiple regression with the lm function.

Results-Survival
Species
Irrigated Non-irrigated SignificantDifferenceZ% Survival n % Survival n
Live oak 97.5 717 94.2a 1017 **
Baldcypress 94.1 135 86.0b 250 .
Southern magnolia 97.7 132 73.8c 103 ***
zSignificance Codes: “***” = 0.001; “**” = 0.01; “.” = 0.10
Survival by Species and Presence/Absence of Irrigation
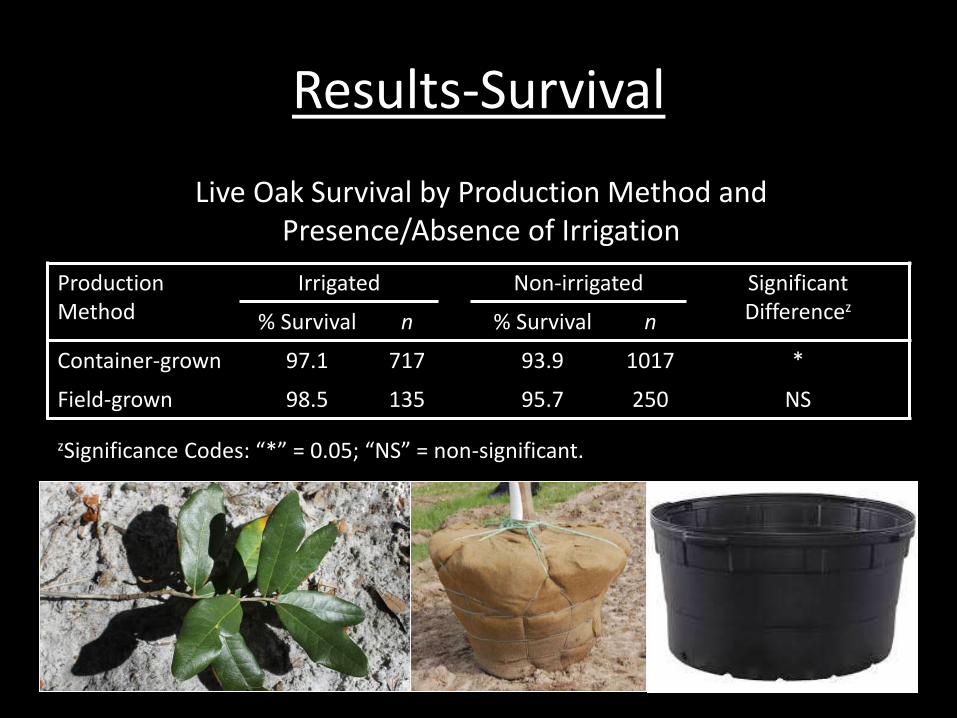
Results-Survival
ProductionMethod
Irrigated Non-irrigated SignificantDifferencez
% Survival n % Survival n
Container-grown 97.1 717 93.9 1017 *
Field-grown 98.5 135 95.7 250 NS
zSignificance Codes: “*” = 0.05; “NS” = non-significant.
Live Oak Survival by Production Method and Presence/Absence of Irrigation

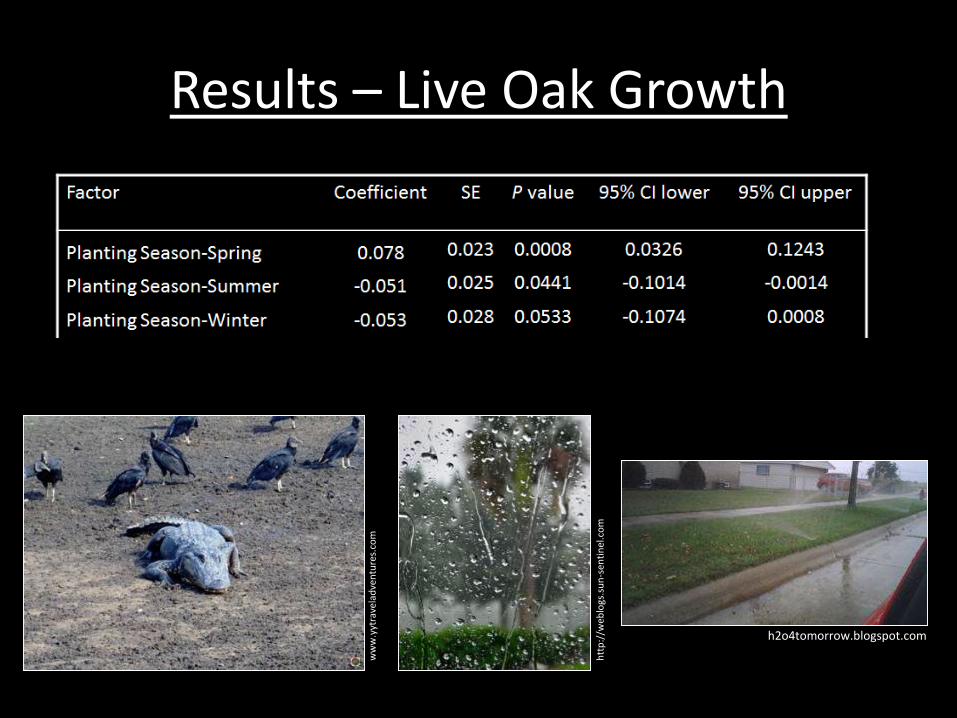
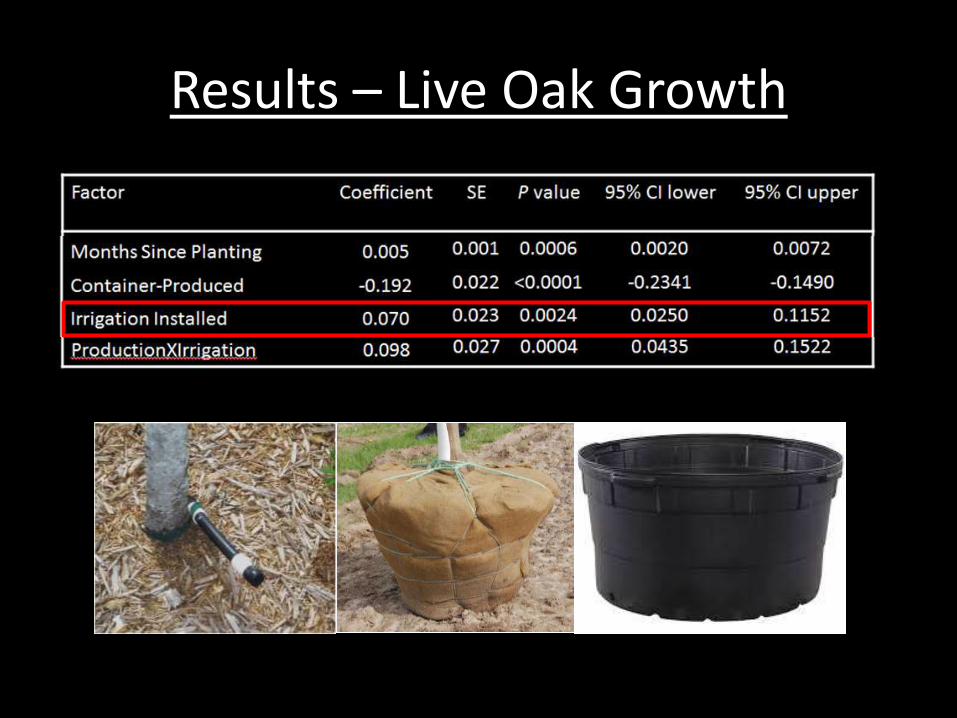
Results – Live Oak GrowthFactor Coefficient SE P value 95% CI lower 95% CI upper
Intercept 0.909 0.074 <0.0001 0.7651 1.0535
Geographic region-North 0.215 0.018 <0.0001 0.1798 0.2507
Geographic Region-South 0.212 0.017 <0.0001 0.1778 0.2456
Planting Season-Spring 0.078 0.023 0.0008 0.0326 0.1243
Planting Season-Summer -0.051 0.025 0.0441 -0.1014 -0.0014
Planting Season-Winter -0.053 0.028 0.0533 -0.1074 0.0008
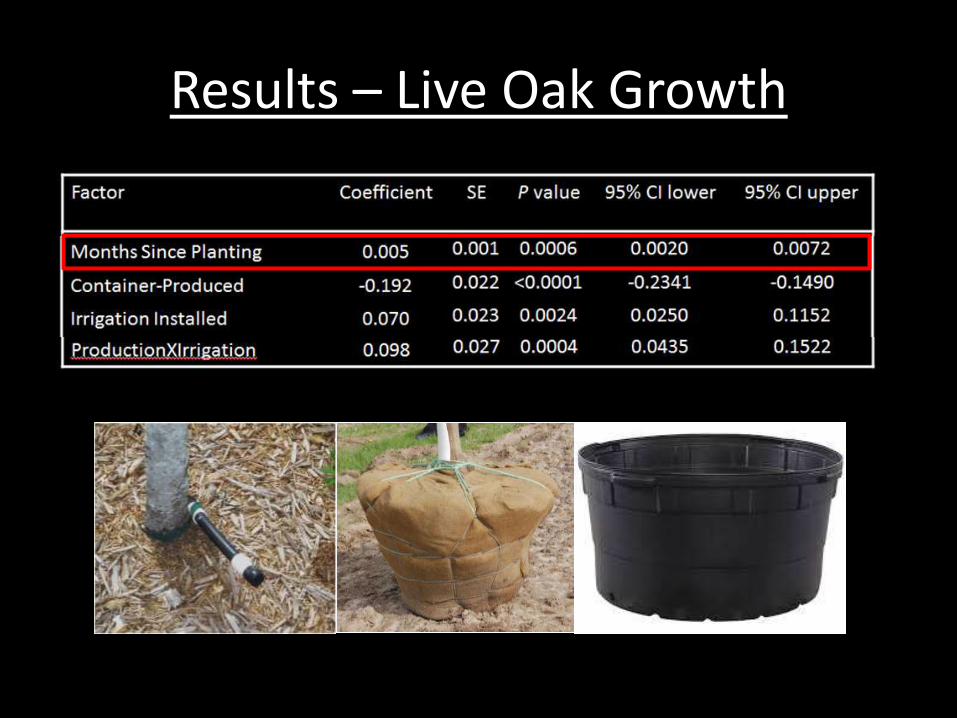
Months Since Planting 0.005 0.001 0.0006 0.0020 0.0072
Container-Produced -0.192 0.022 <0.0001 -0.2341 -0.1490
Irrigation Installed 0.070 0.023 0.0024 0.0250 0.1152
Firmness Rating 0.171 0.007 <0.0001 0.1570 0.1854
Initial Caliper 0.092 0.005 <0.0001 0.0823 0.1024
Site Type – Open Lawn -0.076 0.015 <0.0001 -0.1051 -0.0460
Site Type – Street -0.153 0.023 <0.0001 -0.1977 -0.1082
ProductionXIrrigation 0.098 0.027 0.0004 0.0435 0.1522
Adjusted R2 = 0.68
Results – Live Oak Growth
htt
p:/
/web
logs
.su
n-s
enti
nel
.co
m
ww
w.y
ytra
vela
dve
ntu
res.
com
h2o4tomorrow.blogspot.com

Results – Live Oak Growth
Results – Live Oak Growth

Results – Live Oak Growth
Results – Live Oak Growth

Results – Live Oak Growth

Results-Survival
ProductionMethod
Irrigated Non-irrigated SignificantDifferencez
% Survival n % Survival n
Container-grown 97.1 717 93.9 1017 *
Field-grown 98.5 135 95.7 250 NS
zSignificance Codes: “*” = 0.05; “NS” = non-significant.
Live Oak Survival by Production Method and Presence/Absence of Irrigation
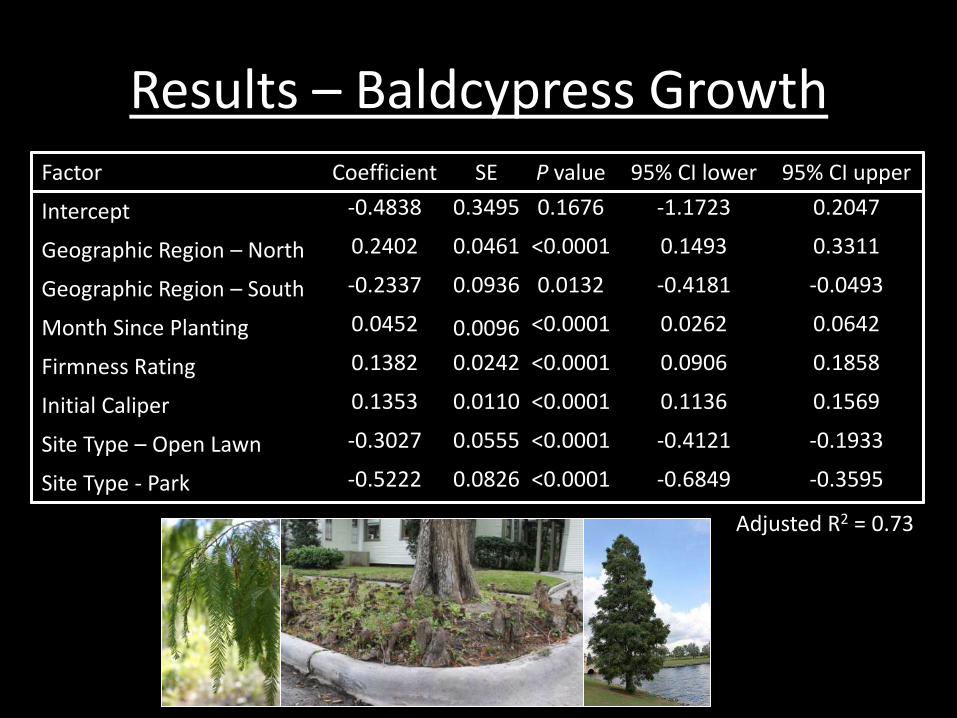
Results – Baldcypress GrowthFactor Coefficient SE P value 95% CI lower 95% CI upper
Intercept -0.4838 0.3495 0.1676 -1.1723 0.2047
Geographic Region – North 0.2402 0.0461 <0.0001 0.1493 0.3311
Geographic Region – South -0.2337 0.0936 0.0132 -0.4181 -0.0493
Month Since Planting 0.0452 0.0096 <0.0001 0.0262 0.0642
Firmness Rating 0.1382 0.0242 <0.0001 0.0906 0.1858
Initial Caliper 0.1353 0.0110 <0.0001 0.1136 0.1569
Site Type – Open Lawn -0.3027 0.0555 <0.0001 -0.4121 -0.1933
Site Type - Park -0.5222 0.0826 <0.0001 -0.6849 -0.3595
Adjusted R2 = 0.73
Irrigation not in final model??

Results-Survival
Species
Irrigated Non-irrigated SignificantDifferenceZ% Survival n % Survival n
Live oak 97.5 717 94.2a 1017 **
Baldcypress 94.1 135 86.0b 250 .
Southern magnolia 97.7 132 73.8c 103 ***
zSignificance Codes: “***” = 0.001; “**” = 0.01; “.” = 0.10
Survival by Species and Presence/Absence of Irrigation
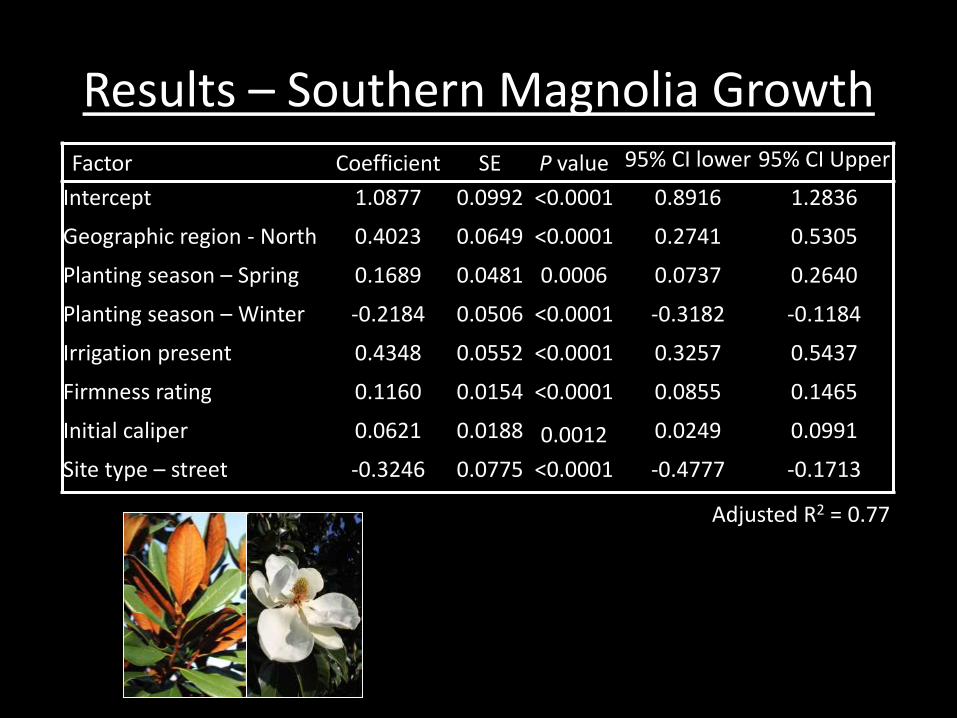
Results – Southern Magnolia GrowthFactor Coefficient SE P value 95% CI lower 95% CI Upper
Intercept 1.0877 0.0992 <0.0001 0.8916 1.2836
Geographic region - North 0.4023 0.0649 <0.0001 0.2741 0.5305
Planting season – Spring 0.1689 0.0481 0.0006 0.0737 0.2640
Planting season – Winter -0.2184 0.0506 <0.0001 -0.3182 -0.1184
Irrigation present 0.4348 0.0552 <0.0001 0.3257 0.5437
Firmness rating 0.1160 0.0154 <0.0001 0.0855 0.1465
Initial caliper 0.0621 0.0188 0.0012 0.0249 0.0991
Site type – street -0.3246 0.0775 <0.0001 -0.4777 -0.1713
Adjusted R2 = 0.77

Results – Southern Magnolia GrowthFactor Coefficient SE P value 95% CI lower 95% CI Upper
Intercept 1.0877 0.0992 <0.0001 0.8916 1.2836
Geographic region - North 0.4023 0.0649 <0.0001 0.2741 0.5305
Planting season – Spring 0.1689 0.0481 0.0006 0.0737 0.2640
Planting season – Winter -0.2184 0.0506 <0.0001 -0.3182 -0.1184
Irrigation present 0.4348 0.0552 <0.0001 0.3257 0.5437
Firmness rating 0.1160 0.0154 <0.0001 0.0855 0.1465
Initial caliper 0.0621 0.0188 0.0012 0.0249 0.0991
Site type – street -0.3246 0.0775 <0.0001 -0.4777 -0.1713

Conclusions
• Overall establishment rate = 93.6% (20-64 months after planting; n = 2354).

Conclusions
93.6% puts these projects among the most successful in literature:
• 91% (932) – Iowa (Tompson et al., 2004)
• 91.3% (45,094) – New York, NY (Lu et al., 2010)
• 95-96% (1163) – Philadelphia, PA (Jack-Scott, 2011)

Conclusions
93.6% puts these projects among the most successful on record:
• 91% (932) – Iowa (Tompson et al., 2004)
• 91.3% (45,094) – New York, NY (Lu et al., 2010)
• 95-96% (1163) – Philadelphia, PA (Jack-Scott, 2011)
Caveat: FL plantings include replacements up to 1 year after planting

Conclusions
• On-site irrigation most important to container-grown live oak and Southern magnolia
• Field-grown live oak out-performed similar container-grown material (seen in earlier studies by Gilman and Masters, 2010)

en.wikipedia.org
Questions?
Top Related
Copyright © 2022 FDOKUMEN

