F-18 fluorodeoxyglucose uptake and water-perfusable tissue fraction in assessment of myocardial...
12
ORIGINAL ARTICLE F-18 fluorodeoxyglucose uptake and water-perfusable tissue fraction in assessment of myocardial viability Hidehiro Iida • Ulla Ruotsalainen • Maija Ma ¨ki • Merja Haaparnata • Jo ¨rgen Bergman • Liisa-Maria Voipio-Pulkki • Pirjo Nuutila • Kazuhiro Koshino • Juhani Knuuti Received: 8 November 2011 / Accepted: 18 June 2012 / Published online: 15 July 2012 Ó The Author(s) 2012. This article is published with open access at Springerlink.com Abstract Objectives 15 O-water-perfusable tissue fraction (PTF) has been shown to be a potential index for assessing myocar- dial viability in PET, an alternative to 18 F-fluorodeoxy- glucose (FDG). This study aimed to directly compare these two independent methods in assessing myocardial viability in patients with abnormal wall motion. Methods PET study was performed on 16 patients with previous myocardial infarction, before coronary artery bypass graft operation (CABG). The protocol included a 15 O-carbonmonoxide static, a 15 O-water dynamic and an 18 F-FDG dynamic scan, during the euglycemic hyperins- ulinemic clamp. Echocardiography was performed at the time of PET and 5–12 months after the CABG, and the wall motion recovery was evaluated on segmental and global bases. Consistency between PTF and 18 F-FDG was evaluated visually and also in a quantitative manner. Pre- dictive values for the wall motion recovery were also compared between the two approaches. Results The image quality of 18 F-FDG was superior to that of 15 O-water. The qualitative PTF showed significantly smaller defects than 18 F-FDG, and the quantitative PTF showed slightly greater values than 18 F-FDG in the infarcted region. The two methods were, however, consistent visually and also quantitatively. The predictive values of the wall motion recovery were almost equal between the two approaches. The absolute 18 F-FDG uptake was varied in normal segments, and predictive values for the wall motion recovery by the absolute 18 F-FDG was less (accuracy: 80 %) compared with those by the relative 18 F-FDG (accuracy: 87 %) and the quantitative PTF (accuracy: 89 %). Conclusion Despite the small sample size, PTF appears to give consistent results with the 18 F-FDG approach, and might be an alternative viability assessment. Keywords Myocardial viability Á Chronic myocardial infarction Á 18 F-FDG Á Water perfusable tissue fraction Á Positron emission tomography Introduction Successful coronary reperfusion by thrombolysis, angio- plasty, or bypass graft surgery is often associated with improvement of myocardial contractile function in patients with coronary disease, suggesting the presence of dys- functional but viable myocardium within the area of abnormal wall motion [1–3]. Several techniques have been proposed for detecting the reversibly injured myocardium in the clinical setting including single photon emission computed tomography (SPECT) with 201 Tl or 99m Tc-MIBI, H. Iida Á M. Haaparnata Á J. Bergman Á P. Nuutila Á J. Knuuti Turku PET Center, Turku University Central Hospital, 20520 Turku, Finland H. Iida (&) Á K. Koshino Department of Investigative Radiology, National Cerebral and Cardiovascular Center Research Institute, 5-7-1 Fujishiro-dai, Suita, Osaka 565-8565, Japan e-mail: [email protected] U. Ruotsalainen Á M. Ma ¨ki Á L.-M. Voipio-Pulkki Department of Nuclear Medicine, Turku University Central Hospital, 20520 Turku, Finland U. Ruotsalainen Department of Signal processing, Tampere University of Technology, 33720 Tampere, Finland L.-M. Voipio-Pulkki Departments of Medicine, Helsinki University Central Hospital, 00029 Helsinki, Finland 123 Ann Nucl Med (2012) 26:644–655 DOI 10.1007/s12149-012-0631-2
-
Upload
independent -
Category
Documents
-
view
0 -
download
0
Transcript of F-18 fluorodeoxyglucose uptake and water-perfusable tissue fraction in assessment of myocardial...

ORIGINAL ARTICLE
F-18 fluorodeoxyglucose uptake and water-perfusable tissuefraction in assessment of myocardial viability
Hidehiro Iida • Ulla Ruotsalainen • Maija Maki • Merja Haaparnata •
Jorgen Bergman • Liisa-Maria Voipio-Pulkki • Pirjo Nuutila •
Kazuhiro Koshino • Juhani Knuuti
Received: 8 November 2011 / Accepted: 18 June 2012 / Published online: 15 July 2012
� The Author(s) 2012. This article is published with open access at Springerlink.com
Abstract
Objectives 15O-water-perfusable tissue fraction (PTF) has
been shown to be a potential index for assessing myocar-
dial viability in PET, an alternative to 18F-fluorodeoxy-
glucose (FDG). This study aimed to directly compare these
two independent methods in assessing myocardial viability
in patients with abnormal wall motion.
Methods PET study was performed on 16 patients with
previous myocardial infarction, before coronary artery
bypass graft operation (CABG). The protocol included a15O-carbonmonoxide static, a 15O-water dynamic and an18F-FDG dynamic scan, during the euglycemic hyperins-
ulinemic clamp. Echocardiography was performed at the
time of PET and 5–12 months after the CABG, and the
wall motion recovery was evaluated on segmental and
global bases. Consistency between PTF and 18F-FDG was
evaluated visually and also in a quantitative manner. Pre-
dictive values for the wall motion recovery were also
compared between the two approaches.
Results The image quality of 18F-FDG was superior to that
of 15O-water. The qualitative PTF showed significantly
smaller defects than 18F-FDG, and the quantitative PTF
showed slightly greater values than 18F-FDG in the infarcted
region. The two methods were, however, consistent visually
and also quantitatively. The predictive values of the wall
motion recovery were almost equal between the two
approaches. The absolute 18F-FDG uptake was varied in
normal segments, and predictive values for the wall motion
recovery by the absolute 18F-FDG was less (accuracy: 80 %)
compared with those by the relative 18F-FDG (accuracy:
87 %) and the quantitative PTF (accuracy: 89 %).
Conclusion Despite the small sample size, PTF appears
to give consistent results with the 18F-FDG approach, and
might be an alternative viability assessment.
Keywords Myocardial viability � Chronic myocardial
infarction � 18F-FDG � Water perfusable tissue fraction �Positron emission tomography
Introduction
Successful coronary reperfusion by thrombolysis, angio-
plasty, or bypass graft surgery is often associated with
improvement of myocardial contractile function in patients
with coronary disease, suggesting the presence of dys-
functional but viable myocardium within the area of
abnormal wall motion [1–3]. Several techniques have been
proposed for detecting the reversibly injured myocardium
in the clinical setting including single photon emission
computed tomography (SPECT) with 201Tl or 99mTc-MIBI,
H. Iida � M. Haaparnata � J. Bergman � P. Nuutila � J. Knuuti
Turku PET Center, Turku University Central Hospital,
20520 Turku, Finland
H. Iida (&) � K. Koshino
Department of Investigative Radiology, National Cerebral and
Cardiovascular Center Research Institute, 5-7-1 Fujishiro-dai,
Suita, Osaka 565-8565, Japan
e-mail: [email protected]
U. Ruotsalainen � M. Maki � L.-M. Voipio-Pulkki
Department of Nuclear Medicine, Turku University Central
Hospital, 20520 Turku, Finland
U. Ruotsalainen
Department of Signal processing, Tampere University of
Technology, 33720 Tampere, Finland
L.-M. Voipio-Pulkki
Departments of Medicine, Helsinki University Central Hospital,
00029 Helsinki, Finland
123
Ann Nucl Med (2012) 26:644–655
DOI 10.1007/s12149-012-0631-2

echocardiography during dobutamine stimulation, and
flow-metabolism imaging with positron emission tomog-
raphy (PET). Of these, 18F-FDG and PET [4–7] have been
considered to be the gold standard. Commonly, increased18F-FDG uptake relative to blood flow has been judged as a
sign of preserved myocardial viability. The advantages of18F-FDG PET include the good quality of the images and
high accumulation of the tracer into dysfunctional but
viable myocardium. Image quality can further be improved
by performing the studies during euglycemic hyperinsuli-
nemic conditions [8]. It is suggested that the maximized18F-FDG uptake makes the tracer distribution proportional
to the amount of viable myocardium.18F-FDG is on the other hand a marker of glucose
uptake, which depends on a number of physiologic factors
such as myocardial work load, metabolic conditions of the
subject and hormones, suggesting limitations of utilizing18F-FDG PET for the viability assessment. Indeed, it has
been demonstrated that the normalized uptake of 18F-FDG
relative to a control region is more accurate in predicting
wall motion recovery after coronary artery bypass graft
surgery [9].
An alternative approach has been proposed, employing15O-labeled radiotracers [10–13]. This enables the direct
measurement of the proportion of 15O-water perfusable
tissue that is capable of exchanging water rapidly. The
water perfusable tissue fraction (PTF, g/ml) was defined as
the fraction of the water-perfusable tissue within a given
volume of region-of-interest (ROI), and is measured from
the kinetic analysis on the 15O-carbonmonoxide and 15O-
water data sets. Similarly, the perfusable tissue index (PTI)
was defined as the proportion of the 15O-water perfusable
tissue within the total anatomical tissue that was measured
from the transmission (tissue density) scan. These para-
metric values were originally assessed for given ROIs. A
qualitative, myocardial distribution of radioactive water at
a later phase reasonably corresponded to a relative PTF
distribution [13], which was also shown to be consistent
with the relative distribution of FDG accumulation in an
experimental pig model of old myocardial infarction [14].
More recently, sophisticated computer programs have
provided functional parametric images of quantitative PTF
and PTI from a single dynamic PET image obtained fol-
lowing intravenous 15O-water [15–17].
There can be tradeoffs between the 18F-FDG and PTF
(and PTI) approaches, in terms of the total study duration,
radiation dose, cost of the procedure, image quality, sen-
sitivity to various error sources, etc. There have, however,
been no direct comparisons between 18F-FDG and PTF in
the assessment of myocardial viability in a clinical patient
population. Against this background, we performed a head-
to-head comparison between 18F-FDG uptake and PTF
in patients with chronic coronary artery disease who
underwent revascularization. Consistency between 18F-
FDG and PTF studies was evaluated both visually and in a
quantitative manner. Predictive value of wall motion
recovery after successful revascularization therapy was
also compared between the two measures.
Materials and methods
Subjects
The study group consisted of 16 patients (15 males and 1
female). In 10 of them, a myocardial infarction was
diagnosed previously both by electrocardiographic and
enzymatic criteria. In the other 6 patients, chronic left
ventricular dysfunction and an occluded major coronary
artery were detected but there were no confirmed data
available on previous myocardial infarction. The patient
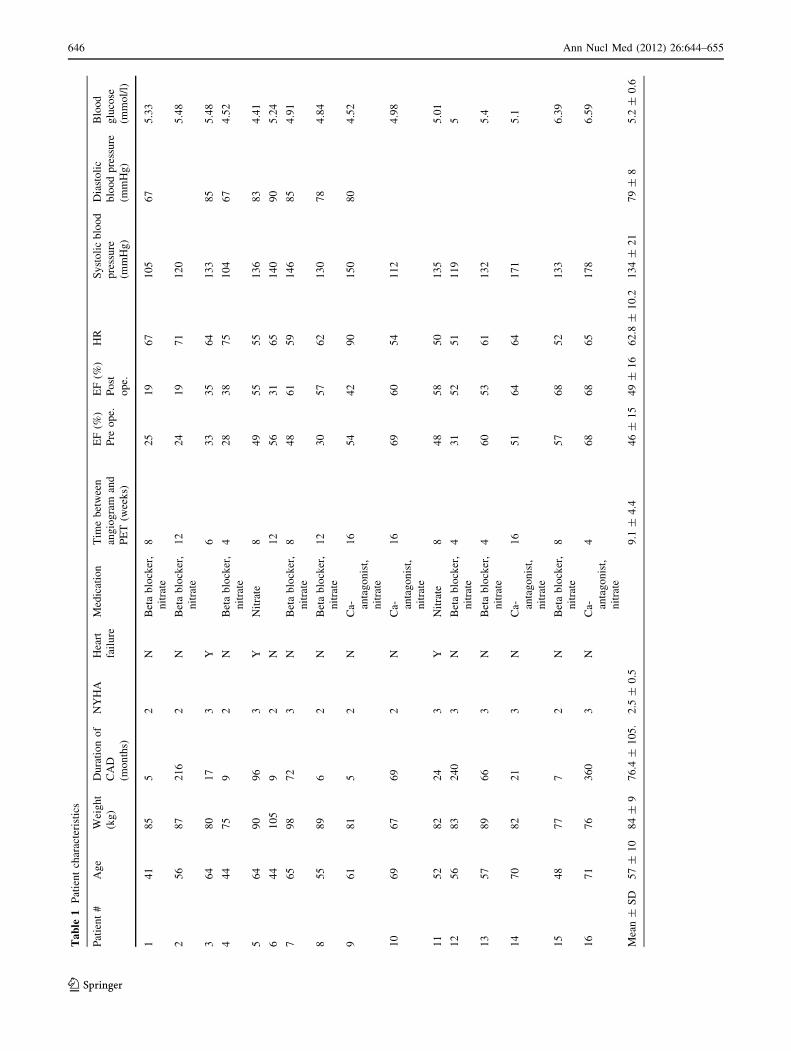
characteristics are summarized in Table 1. All patients
had stable, angiographically confirmed coronary artery
disease and a permanent wall motion abnormality at rest.
Three had diabetes mellitus, and three had heart failure.
The interval between the acute event and the PET study
was more than 5 months. All of them underwent coronary
artery bypass grafting (CABG) after the PET imaging.
There was no particular change in the patient’s symptoms
between the time of the PET study and the time of
CABG. The study was approved by the Ethics Committee
of the Turku University Central Hospital, Turku City,
Finland [8/1993 § 153 (dated 19.10.1993)]. All studies
were performed in accordance with the ethical standards
laid down in the Declaration of Helsinki and subsequent
guidelines at Turku University. Informed consent was
given by each patient prior to his inclusion in the study.
No subjects have any particular issues that might reveal
their identity.
Study design
All patients underwent coronary angiography, radionuclide
ventriculography, 201Tl SPECT, echocardiography, and
PET imaging before the CABG. The PET imaging included
scans with 15O-carbonmonoxide, 15O-water and 18F-FDG
during euglycemic hyperinsulinemic clamp (see Fig. 1).
Angiography was performed 9.1 ± 4.4 weeks before the
PET study (all within 4 months). Echocardiography was
performed on the same day of the PET imaging and
repeated 5–12 months after CABG. Wall motion recovery
was then evaluated for each dysfunctional segment in the
preoperative study, and this was compared with the results
from the PET and SPECT imaging. The consistency of
different PET images was also evaluated.
Ann Nucl Med (2012) 26:644–655 645
123
Ta
ble
1P
atie
nt
char
acte
rist
ics
Pat
ien
t#
Ag
eW
eig
ht
(kg
)
Du
rati
on
of
CA
D
(mo
nth
s)
NY
HA
Hea
rt
fail
ure
Med
icat
ion
Tim
eb
etw
een
ang
iog
ram
and
PE
T(w
eek
s)
EF
(%)
EF
(%)
HR
Sy
sto
lic
blo
od
pre
ssu
re
(mm
Hg
)
Dia
sto
lic
blo
od
pre
ssu
re
(mm
Hg
)
Blo
od
glu
cose
(mm
ol/
l)
Pre
op
e.P
ost
op
e.
14
18
55
2N
Bet
ab
lock
er,
nit
rate
82
51
96
71
05
67
5.3
3
25
68
72
16
2N
Bet
ab
lock
er,
nit
rate
12
24
19
71
12
05
.48
36
48
01
73
Y6
33
35
64
13
38
55
.48
44
47
59
2N
Bet
ab
lock
er,
nit
rate
42
83
87
51
04
67
4.5
2
56
49
09
63
YN
itra
te8
49
55
55
13
68
34
.41
64
41
05
92
N1
25
63
16
51
40
90
5.2
4
76
59
87
23
NB
eta
blo
cker
,
nit
rate
84
86
15
91
46
85
4.9
1
85
58
96
2N
Bet
ab
lock
er,
nit
rate
12
30
57
62
13
07
84
.84
96
18
15
2N
Ca- an
tag
on
ist,
nit
rate
16
54
42
90
15
08
04
.52
10
69
67
69
2N
Ca- an
tag
on
ist,
nit
rate
16
69
60
54
11
24
.98
11
52
82
24
3Y
Nit
rate
84
85
85
01
35
5.0
1
12
56
83
24
03
NB
eta
blo
cker
,
nit
rate
43
15
25
11
19
5
13
57
89
66
3N
Bet
ab
lock
er,
nit
rate
46
05
36
11
32
5.4
14
70
82
21
3N
Ca- an
tag
on
ist,
nit
rate
16
51
64
64
17
15
.1
15
48
77
72
NB
eta
blo
cker
,
nit
rate
85
76
85
21
33
6.3
9
16
71
76
36
03
NC
a- anta
go
nis
t,
nit
rate
46
86
86
51
78
6.5
9
Mea
n±
SD
57
±1
08
4±
97
6.4
±1
05
.2
.5±
0.5
9.1
±4
.44
6±
15
49
±1
66
2.8
±1
0.2
13
4±
21
79
±8
5.2
±0
.6
646 Ann Nucl Med (2012) 26:644–655
123

PET studies
PET scans were performed in 2D using an ECAT 931-08/
12 scanner (CTI/Siemens Inc., Knoxville, Tenn.) [18]. This
scanner enables 15 planes of data to be acquired in an axial
field-of-view (FOV) of 10.5 cm. All emission and trans-
mission sinograms were reconstructed with a Hanning filter
with a cutoff frequency of 0.3. This resulted in a spatial
resolution of 8.4 ± 0.7 mm full width at half maximum
(FWHM) for the emission data and 7.7 ± 0.7 mm FWHM
for the transmission data at the center of the FOV with the
slice thickness of 6 mm.
All subjects fasted for at least 10 h before the PET
scanning. Medications were continued as noted in Table 1.
Patients lay supine on the scanner bed with their arms out
of the FOV. Two catheters were placed, one in the ante-
cubital vein for infusion of saline or glucose and insulin
and 15O-water and another in the radial vein of the con-
tralateral hand that was warmed with air temperature of
70 �C for sampling of arterialized venous blood. During
the whole study period, insulin was infused continuously as
previously described to maintain the euglycemic hype-
rinsulinemic condition [8, 19, 20]. The rate of insulin
infusion was 1 mU/kg/min. During hyperinsulinemia,
euglycemia was maintained by infusing 20 % glucose. The
rate of the glucose infusion was adjusted according to
plasma glucose concentrations measured every 5–10 min
from arterialized venous blood. Blood samples were taken
at 30-min intervals for determination of insulin, free-fatty
acid, and lactate concentrations.
A 20-min transmission scan was performed by exposure
of the external ring source of 68Ge. These data were used to
correct for subsequent emission scans for photon absorp-
tion in the body, and to estimate the density distribution.
After the transmission scan, the blood pool was imaged by
inhalation of 15O-labeled carbon monoxide. 15O-carbon
monoxide of approximately 3.7 GBq was administered for
2 min, and a 4 min, single frame emission acquisition was
initiated at 2 min after the end of 15O-carbonmonoxide
inhalation. Venous blood samples were taken every 2 min
during the scan, and the 15O-carbonmonoxide concentra-
tion in whole blood was measured using a NaI well counter
cross calibrated with the scanner.
After a 15-min period to allow for decay of 15O-radio-
activity to background levels, 15O-water was infused and a
dynamic PET scan was started using a previously reported
protocol [21, 22]. Briefly, 15O-water in 5-ml saline was
infused into the antecubital vein at a constant rate for a
period of 2 min. Total administration dose was 1.5 GBq. A
20 frame dynamic PET scan was started at the initiation of
the infusion, and lasted for 6 min. The scan sequence
consisted of 6 9 5 s, 6 9 15 s, and 8 9 30 s.
Metabolic imaging was then performed using 18F-FDG.18F-FDG (240 ± 40 MBq) was infused intravenously over
2 min, and dynamic scanning was initiated at the start of
infusion. This scan lasted for 60 min.
PET data analysis
All sinograms were corrected for tissue attenuation and
reconstructed using a Filtered Back Projection method.
Images were transferred to a Linux workstation, and further
analyses were performed using the dedicated image analysis
packages (Dr. View; Asahi-Kasei, Tokyo) and in-house
software programs.
A blood volume image was calculated using the 15O-
carbonmonoxide emission data, in which the original
image was divided by the average of the blood counts
measured by the well counter. Images of extravascular
density were created by subtracting images of the blood
volume from the corresponding transmission images after
conversion of the latter to tissue density.
The 15O-water dynamic images were integrated over the
period of 15O-water administration, and the blood volume
was subtracted as previously described [11, 23, 24]. These
images (the build-up or BU phase images) were considered
to qualitatively illustrate the regional distribution of myo-
cardial blood flow. The 15O-water dynamic images were
also integrated over the washout period, and the blood
volume was similarly subtracted. These images (the
washout or WO phase images) were considered to corre-
spond to the qualitative distribution of PTF [11, 13].
Quantitative values of MBF, PTF, and the arterial blood
volume (Va) were calculated for each segment (see below)
according to the non-linear least squares fitting as validated
previously [21]. The arterial input function was estimated
from the left-ventricular time-activity curve, in which the
limited recovery of left-ventricular chamber activity and
the spillover from myocardium were corrected as reported
previously [22, 25]. The adoption of PTF in this model has
implications for the interpretation of MBF values, such that
the measurement exclusively represents the mean regional
flow to that mass of the tissue within the ROI that is
Fig. 1 Schematic diagram of the study protocol. Tr indicates the
transmission scan. The second transmission scan was used to confirm
that the patient did not move during the period
Ann Nucl Med (2012) 26:644–655 647
123

capable of exchanging water rapidly, i.e., that mass of
tissue defined by PTF. This method provides regional
blood flow only to the perfusable tissue, and has units of
ml/min/g of perfusable tissue. In areas of myocardial
infarction, this MBF represents the regional flow to the
residual water-perfusable tissue. Another blood flow has
also been calculated in this study as a product of MBF and
PTF, which should represent the average blood flow to the
volume of ROI (i.e., ml/min/ml of ROI). MBFt is adopted
to describe this parameter.
The absolute glucose consumption was calculated from
the 18F-FDG uptake for each segment by the graphical
analysis [8]. The relative glucose or 18F-FDG uptake, as
well as the relative MBF images, was also calculated by
normalizing the absolute quantitative values to the refer-
ence segment in each study. The reference segment was
defined as the normal region (or closest to the normal)
according to the findings of coronary angiography and
echocardiography. The reference segment was the lateral
wall in 14 studies, and anteroseptal segment in 2 studies.
Regions-of-interest
The myocardium was divided into eight segments accord-
ing to the previously described criteria [8], namely the
anterior basal, anterior, anteroseptal, lateral, inferoseptal,
apical, inferior, and posteroseptal regions. Of these, the last
seven segments were included in this analysis. ROIs were
drawn for each of the seven segments manually on trans-
axial tomographic images of 18F-FDG, and these ROIs
were projected onto all other PET images.
Visual analysis
Consistency of the defect between different images was
evaluated for the segments described above. The defect
severity was graded visually into 4 levels and its consis-
tency was compared at each segment. Approximately the
following limits are used in the visual classification: nor-
mal: 100–75 % of reference, mild: 75–50 %, severe:
50–25 % and complete:\25 % of activity in the reference
segment. Consistency of the defect was evaluated between
the approaches, namely the 18F-FDG image versus the 15O-
water washout phase image (i.e., the qualitative PTF), the15O-water build-up phase image (i.e., qualitative MBF)
versus the 18F-FDG image, and 15O-water build-up phase
image versus qualitative PTF image. The predictive values
of the wall motion recovery after the revascularization
were also compared among the approaches. In this analy-
sis, the normal and mild defect segments were considered
to be viable in all measures except for the qualitative PTF
image, in which only the completely normal segment was
assigned to be viable.
Quantitative analysis
The glucose consumption values (absolute and relative)
were plotted as a function of the absolute MBF (MBFt).
The glucose consumption values were also compared with
PTF.
Coronary angiography
All patients underwent selective coronary angiography by
standard techniques. The cine tapes were analyzed by an
experienced radiologist. A 50 % or greater reduction in the
diameter in a major epicardial branch was considered
significant.
Echocardiography
Two-dimensional echocardiography (Acuson 128XP/5,
Acuson Inc or Aloka SSD 870, Aloka Inc) was performed
on the same day as PET according to the semiquantitative
method recommended by the American Society of Echo-
cardiography Committee on Standards, but the segmental
subdivision was modified to correspond to the PET studies
[8]. Echocardiograms were analyzed by a blinded experi-
enced physician. The results of individual prerevascular-
ization and postrevascularization echocardiograms were
ultimately verified by comparison of videotape recordings.
Wall motion and thickening were scored according to the
following scale: 1, normal; 2, hypokinetic wall motion with
systolic thickening; 3, akinetic wall motion with no systolic
thickening; and 4, dyskinetic wall motion and no systolic
thickening.
After the revascularization, improvement of contractile
function was diagnosed if systolic thickening (corre-
sponding to a score of 1 or 2) became apparent in a seg-
ment that had been akinetic or dyskinetic or if normal
motion was detected in a previous dysfunctional segment.
Improvement in function was acknowledged only if it was
apparent in a central area of the segment. Special attention
was focused on the anteroseptal segments because post-
surgical wall motion abnormalities are common in this
area. Thus, appearance of postoperative anteroseptal
hypokinesia was regarded as normal, and improvement was
recognized only if systolic thickening became apparent in a
previously akinetic or dyskinetic segment or if hypokinesia
was normalized.
Radionuclide ventriculography
A gated, blood-pool, radionuclide ventriculography was
performed in two views. Six hundred cycles (10 min) were
collected after injection of 740 MBq of [99mTc]-labeled
human serum albumin. The left anterior oblique view was
648 Ann Nucl Med (2012) 26:644–655
123

used for ejection fraction calculations. A Siemens-Orbiter
gamma camera (Siemens Gammasonics, IL, USA) was
used, and ejection fractions were calculated with the
Gamma-11 program (Nuclear Diagnosis, Stockholm,
Sweden).
Analytical procedures
Plasma glucose was determined in duplicate by the glucose
oxidase method using an Analox GM7 (Analox Instru-
ments LTD, London, England) glucose analyzer. Serum
insulin was measured by radioimmunoassay kit (Pharma-
cia, Uppsala, Sweden).
Statistical analysis
Independent variables were compared by analysis of vari-
ance. All results are expressed as the mean and one stan-
dard deviation (SD). Sensitivity, specificity, and positive
and negative predictive values of functional recovery were
calculated for the measures. To test different threshold
values in quantitative MBF, quantitative PTF and quanti-
tative 18F-FDG uptake in predicting functional recovery,
the discriminant analysis of SAS statistical program was
used (SAS Institute Inc., Cary, N.C.). Receiver operating
characteristic (ROC) analysis was also applied for assess-
ment of FDG uptake and PTF in differentiating function-
ally recovered from non-recovered segments.
Results
Hemodynamic and other parameters are summarized in
Table 1. Plasma glucose and insulin concentrations were
6.0 ± 1.0 mmol/l and 12 ± 3 mU/l in the fasting state.
During clamp serum insulin concentrations increased to
79 ± 19 mU/l. The plasma glucose concentrations were
5.2 ± 0.6 mmol/l during the PET studies (Table 1).
In total, 105 of the 112 segments in the 16 patients were
included in the final analysis. The remaining 7 segments,
mostly inferior, were excluded because they were out of FOV
in the PET study. In the preoperative echocardiography, 48
segments had normal wall motion and of the 57 dysfunctional
segments, 35 were hypokinetic, 17 were akinetic and 5 were
dyskinetic. In the revascularization, 54 of the 57 dysfunc-
tional segments were successfully revascularized.
In the postoperative echocardiography, 81 segments
were normal, 6 were hypokinetic, 13 akinetic and 5 were
dyskinetic. Thus, 34 (60 %) of the initially dysfunctional
revascularized segments recovered (partially in one) and 20
(35 %) segments did not show functional improvement. In
the 3 non-revascularized segments, wall motion was
unchanged in two and worsened in one.
The preoperative ejection fraction was 45.7 ± 15.1 %
(range from 24 to 69 %). Postoperatively the ejection
fraction was slightly higher (49 ± 16 %) but the difference
was not significant. However, the average wall motion
score in echocardiography was significantly improved by
revascularization (preoperatively 0.8 ± 0.9 vs. postopera-
tively 0.45 ± 0.9, p = 0.001). Furthermore, the number of
segments recovered per patient was significantly associated
with increased global left ventricular ejection fraction
(r = 0.65, p = 0.0065).
Figure 2 shows examples of calculated images obtained
from typical two studies, demonstrating the extravascular
tissue density (Dev), blood volume (VB), 15O-water image
at a washout phase (i.e., the qualitative PTF), and 18F-FDG
uptake. In case 1, both PTF and FDG images showed a
large defect in the anterior wall region, and these two
images were considered to be consistent in all segments.
No recovery of wall motion was detected after revascu-
larization. In case 2, the anterior, anteroseptal and apical
walls were akinetic. The FDG and PTF images indicated
preserved myocardial viability in the former two segments
but scar in the apex. After the revascularization, the ante-
rior and anteroseptal segments were completely recovered
but no change was detected in the apex.
Consistency of the defect scores defined by the visual
analysis is summarized in Table 2. The qualitative MBF
(15O-water build-up phase images) and the qualitative PTF
(15O-water washout phase image) agreed in general with
the 18F-FDG images. It should, however, be noted that the
qualitative PTF image tended to show less severe defects,
and resulted in milder defect scores in 14 segments com-
pared with the 18F-FDG images. The 15O-water images at
the build-up phase (qualitative MBF) showed considerably
larger defects as compared with PTF and 18F-FDG.
The predictive values for the wall motion recovery
resulted from the visual analysis are summarized in
Table 3, in which the optimal defect score was determined
so as to provide the best predictive accuracy for each
parameter. The best sensitivity was obtained with18F-FDG, but the specificity of 18F-FDG was slightly lower
than that of qualitative PTF. The accuracy was almost
equal between the 18F-FDG and qualitative PTF image
analysis.
Defects were frequently seen (12 of 15 cases) in the
qualitative PTF images in the apical segment. Of these, 7
segments showed recovery, while the other 5 did not. All 3
segments assigned to be viable in the apex by the quali-
tative PTF image demonstrated recovery. In the 18F-FDG
image, 7 segments were assigned to be scar (out of 15) in
the apex, of which 1 segment showed recovery. All
segments (8 segments) assigned as normal or viable in the
apical segment by the 18F-FDG showed wall motion
recovery.
Ann Nucl Med (2012) 26:644–655 649
123

Figure 3 shows the absolute and relative glucose uptake
as a function of the absolute MBF, in which the flow per
volume (i.e., the transmural flow) was adopted to the
myocardial flow (i.e., the MBF estimated from the 15O-
water kinetic analysis was multiplied by PTF) [10, 11, 13].
The variability of absolute glucose uptake from patient to
patient was larger as compared to relative values. Thus, the
relation was diverged at the normal MBF range. On the
other hand, the relative 18F-FDG uptake which was nor-
malized in each subject to the control segment was rather
constant at the range: MBFt [ 0.5 ml/min/ml. The relative18F-FDG uptake showed a large variation at the range of
MBFt between 0.3 and 0.5 ml/min/ml, and was decreased
linearly with the MBFt for MBFt \ 0.3 ml/min/ml. There
was no significant correlation between absolute glucose
uptake and PTF, while a significant correlation was
observed if the relative 18F-FDG uptake was compared
with PTF (p \ 0.001) (Fig. 4).
Predictive values for the wall motion recovery resulted
from the quantitative analysis are summarized in Table 4
and Fig. 5. The most accurate results were obtained using
the limit values of 0.62 ml/min/g in MBF, 0.34 ml/min/ml
in MBFt, 0.51 g/ml in PTF, 34.4 mol/100 g/min in the
absolute 18F-FDG uptake and 67 % in the relative 18F-FDG
uptake. The positive predictive values obtained with the
different variables were nearly equal among the variables.
However, the absolute 18F-FDG uptake and MBF showed
clearly lower negative predictive values than relative 18F-
FDG uptake and PTF values. Figure 6 shows the results of
ROC analysis for FDG uptake and PTF. The ROC analysis
demonstrated greater area under the curve in relative rather
than absolute values for both FDG and PTF. The area under
Case #1
(PT538)
Case #2
(PT722)
FDG PTFrelative VB Dev
Fig. 2 Example images of extra-vascular tissue density (Dev), the
blood volume (VB), 15O-water washout phase (WO, or qualitative
PTF), and 18F-FDG uptake, obtained from 2 typical cases. In case 1,
the wall motion was irreversible in the anterior wall segment (arrow,
a), which was well predicted by both WO and FDG as complete
defect. In case 2, wall motion was reduced in the anterior wall (arrow,
b), but was not improved in the apex (arrow, c). These were also
consistent with the findings in both WO and FDG. Image quality of18F-FDG was better than that of WO, but both images provided
consistent results
650 Ann Nucl Med (2012) 26:644–655
123

the curve was slightly greater with PTF rather than relative
FDG. Combination of FDG with MBF is of interest in
terms of the improved accuracy in determining wall motion
recovery. The best accuracy was obtained by the
combination of relative 18F-FDG uptake and relative MBF
(Table 4).
There were 4 errors in PTF (out of 15) in the apical
segment, in which PTF was below the threshold value
(values ranged from 0.41 to 0.48 g/ml) and assigned not to
be viable, although the wall motion was recovered or
normal in the preoperative study. Similarly 18F-FDG
showed error in 3 apical segments, in which the values
were below the threshold level, although the wall motion
was normal or reversible.
Discussion
The present study demonstrated a direct comparison
between the 18F-FDG and PTF approaches in the assess-
ment of myocardial viability in a clinical patient popula-
tion. Despite the small number of subjects (n = 16), it was
shown that the relative uptake of 18F-FDG well correlated
with the quantitative PTF. In the visual evaluation,
although the image quality was superior with 18F-FDG than
the 15O-water-based qualitative PTF images, the two ima-
ges were consistent with each other. Furthermore, both
images of relative 18F-FDG uptake and PTF (as well as the
qualitative washout phase images for 15O-water) well
predicted the wall motion recovery after successful revas-
cularization in the dysfunctional segments. The area under
the curve in the ROI analysis also demonstrated similar
values between the relative FDG uptake and PTF. The
accuracy appeared to be similar between the 18F-FDG and
PTF measurements, both in the visual and quantitative
analyses.
Use of 18F-FDG and PET is often considered the best
approach for myocardial viability assessment. This is lar-
gely attributed to the clear contrast of the 18F-FDG accu-
mulation in the myocardium, particularly during the insulin
clamp condition, and further due to the high sensitivity of
the PET device as compared with the conventional SPECT
camera. The accurate image reconstruction of PET tech-
nique including the attenuation correction by means of the
transmission scan and the significantly smaller contribution
of scatter are regarded as other reasons.
It should, however, be noted that the absolute glucose
consumption was variable in the normal segment as shown
in Figs. 3 and 4. This suggests that the myocardial 18F-
FDG uptake is not maximized even during the insulin
clamp condition. Previous studies also demonstrated that
the glucose uptake is influenced by several physiological
factors [26], even during the hyperinsulinemic condition
[27]. Thus, accuracy in the viability assessment appeared to
be poorer with the absolute measurement of myocardial18F-FDG uptake as compared with the relative uptake (see
Figs. 5, 6; Table 4), as has already been reported by Knuuti
Table 2 Image consistency as evaluated by the defect score by visual
analysis
FDG uptake vs. qualitative PTF or 15O-water washout phase image
FDG PTF
0 1 2 3 Total
0 73 1 2 0 76
1 6 7 0 1 14
2 0 4 1 0 5
3 0 2 2 6 10
Total 79 14 5 7 105 Concordance = 83 %
Qualitative MBF or 15O-water build-up phase vs. FDG uptake
MBF FDG
0 1 2 3 Total
0 65 3 0 1 69
1 2 4 0 0 6
2 8 4 3 2 17
3 1 3 2 7 13
Total 76 14 5 10 105 Concordance = 75 %
Qualitative MBF or 15O-water build-up vs. qualitative PTF or 15O-
water washout phase
MBF PTF
0 1 2 3 Total
0 68 0 0 1 69
1 5 1 0 0 6
2 6 8 3 0 17
3 0 5 2 6 13
Total 79 14 5 7 105 Concordance = 74 %
Table 3 Results of visual analysis in terms of evaluating wall motion
recovery
Images Sensitivity
(%)
Specificity
(%)
PPV
(%)
NPV
(%)
Accuracy
(%)
FDG uptake 97 70 85 93 87
Qualitative
MBF (15O-
water
build-up)
82 75 90 60 80
Qualitative
PTF (15O-
water
washout)
88 85 91 81 87
Upper values correspond to only dysfunctional segments, and lower
to total segments
Ann Nucl Med (2012) 26:644–655 651
123

et al. [28]. Use of relative uptake of 18F-FDG (or glucose)
normalized to a control segment in each subject was
therefore suggested for the assessment of myocardial via-
bility. However, the normalization procedure requires a
definition of a control segment, which is sometimes sub-
jective and might become a critical procedure, particularly
in patients with multiple vessel disease.
The present study showed that the accuracy to predict the
functional outcome was improved (the best among the
comparisons) when the 18F-FDG was combined with per-
fusion imaging (Table 4). This was probably attributable to
the presence of sub-endocardial scars, which might have
been assigned as viable because of increased accumulation
of 18F-FDG in the residual tissue (due to the variation). The
addition of MBF to PTF is of interest. However, due to the
limited number of subjects, further systematic studies are
needed with larger number of subjects.
15O-water perfusable-tissue fraction
15O-water is a diffusible and chemically inert tracer [29].
The early distribution after the administration of 15O-water
Fig. 3 Relation between18F-FDG uptake and absolute
myocardial blood flow
determined by means of15O-water PET. Left: absolute
uptake of 18F-FDG which was
calculated using the arterial
input function. Right: relative
uptake of 18F-FDG to a control
region. MBFt denotes ml of
blood per minutes per ml of
regions-of-interest adopted to
this plot
Fig. 4 Relation between the
water-perfusable tissue fraction
(PTF, g/ml) versus 18F-FDG
uptake (Left: absolute 18F-FDG
uptake. Right: relative 18F-FDG
uptake)
Table 4 Results of quantitative analysis in terms of evaluating wall motion recovery
Images Sensitivity (%) Specificity (%) PPV (%) NPV (%) Accuracy (%)
18F-FDG uptake (relative) 94 75 86 88 8718F-FDG uptake (absolute) 76 85 90 68 80
Quantitative MBF 68 90 92 62 76
Quantitative PTF 91 85 91 85 89
Quantitative MBFt 82 90 93 75 85
Glucose (relative) ? MBF 97 85 92 94 93
Upper values correspond to only dysfunctional segments, and lower to total segments
652 Ann Nucl Med (2012) 26:644–655
123

reflects the regional blood flow [24, 30]. On the other hand,
rapid clearance from high flow areas and further uptake
into low flow areas cause the myocardial 15O-water dis-
tribution, after a sufficient long period, to be proportional
to the tissue distribution which is perfused by water [10].
The PTF value estimated from the kinetic 15O-water PET
data should represent quantitatively the density of tissue
that is capable of rapidly exchanging water within the PET
study period. It is hypothesized that the PTF corresponds to
the amount of the reversibly injured myocardium in the
region of hypocontractile function. This hypothesis is close
to the one made for the 18F-FDG PET study, in which the
glucose consumption is nearly maximized during the
hyperinsulinemic euglycemic condition, so that 18F-FDG
accumulation highlights only the myocardial tissue that is
not infarcted. Consistency between the two approaches,
found in this study, suggests the validity of these hypoth-
eses for both techniques.
In the visual analysis, we observed that the size of the
defect in the 15O-water washout phase (qualitative PTF)
image was significantly less, and the defect score was
smaller than that of 18F-FDG (Table 2). Therefore, the
most accurate predictive values were obtained when only
the completely normal segments were considered to be
viable with the qualitative PTF image, while both normal
and mild defects were assigned to be viable with 18F-FDG.
Also the quantitative PTF values had significant offsets as
compared with 18F-FDG in regions of myocardial infarc-
tion (Fig. 4, right). The reason for these is not clear, but is
possibly due to the diffusion of 15O-water from the per-
fusable tissue into the scar regions, or reduced 18F-FDG
uptake at the border region close to the scar tissue. Despite
this difference, the predictive values for the wall motion
recovery were almost equal in both the visual and quanti-
tative analyses.
There are some practical advantages in the PTF and/or
PTI approaches for the viability assessment as compared
with 18F-FDG. Rapid kinetics of 15O-water allows a short
scan, which has the logistical advantage of increasing
patient throughput. The short half-life further makes the
study repeatable within a short interval, and decreases the
radiation dose. The total study duration may be within a
half hour including the transmission, 15O-carbonmonoxide
and 15O-water scans, if the protocol is optimized [25]. The
advent of relatively inexpensive equipment dedicated to
the production of 15O-labeled tracers should make this
Fig. 5 Absolute and relative 18F-FDG uptake and water-perfusable tissue fraction (PTF) in control segments (C) and in revascularized segments.
Arrows correspond to the threshold values to discriminate between the recovered (R) and non-recovered (NR) (see text)
Fig. 6 ROC analysis for wall motion recovery after successful coronary artery bypass graft surgery in patients with hypocontractile function
Ann Nucl Med (2012) 26:644–655 653
123

approach more acceptable to clinical centers. The major
limitation of the 15O-water technique was considered as the
poor statistics, which is largely due to the short scan period
and short half life of 15O. This study, however, demon-
strated that information derived from the 15O-water study is
essentially consistent with that obtained from the 18F-FDG
study. Further development of the image reconstruction
technique is highly appreciated to improve the image
quality, as has been successfully demonstrated by Katoh
et al. [31]. The short half-life also requires the installation
of a 15O-dedicated cyclotron in the same facility, as15O-labeled tracers cannot be delivered from other centers
unlike 18F-FDG. There is also concern that the 15O tech-
nique is probably sensitive to patient movement during the
study, and thus a sophisticated algorithm needs to be
developed to correct for any possible movement during the
study.
PTF was originally introduced to compensate for the
partial volume effect, as a parameter that represents the
fractional mass of water-perfusable tissue within the selected
ROI. The magnitudes hold the same also for the FDG uptake
values, as well as the washout-phase, and the build-up phase
images.
In theory, PTF can be affected by heterogeneous flow
distribution surrounding the infarction, causing systematic
underestimation in PTF [32], as has been demonstrated by
Herrero and coworkers [33]. They reported that PTF could
be underestimated by as much as 25 % [33], when the tissue
contained 4 different flows with minimum flow level
[0.10 ml/min/g. However, they also demonstrated in the
same report that in the case of a mixture of extremely low
flow tissue (e.g., MBF \ 0.01 ml/min/g), which should
correspond to scar tissue, the estimated PTF values well
represented the fraction of only the high flow tissue. Thus,
although further investigations will need to include a direct
histological and/or histochemical comparison, PTF can still
be a reasonable index to represent the fraction of non-scar
tissue around the myocardial infarction. The work by Her-
rero suggested that the perfusion was low enough in the scar
tissue to be neglected within the PET examination period.
Limitations of this study
Significant defects were frequently seen in the apical seg-
ment in the 15O-water washout image (i.e., the qualitative
PTF image). The reason for this may be patient movement
during the PET studies, particularly between the 15O-car-
bonmonoxide and 15O-water scans. This artificial defect
was less in the quantitative PTF values, in which values
were estimated basically without the 15O-carbonmonoxides
blood volume. There were still 4 segments that showed
errors in quantitative PTF in the apical region (all below
the threshold value) for the wall motion recovery. This was
probably due to the smallest thickness and/or the largest
wall motion in the apical segment. Note that both PTF and18F-FDG can be underestimated in the segment in a thin
structure and with the wall motion. An independent
threshold value may have to be defined for both techniques
in this segment.
Future prospects
The 15O-water image at the build-up phase was used as the
qualitative MBF image, and the 15O-water washout phase
image as the qualitative PTF. This study demonstrated that
the washout phase image alone well predicted the wall
motion recovery, as accurate as quantitative PTF estimates
and 18F-FDG. Recently proposed techniques that calculate
the functional images of quantitative MBF and PTF [15,
17, 34] should also be evaluated. Adequacy of such tech-
nique including the application of the 3D acquisition
should also be evaluated for different PET devices and
image reconstruction programs.
No software alignment program was applied in this
study, to correct for the possible movement of the patient
between the scans. Further study is required to correct for
the movement, as has been done in a recent study [35].
It should be noted that the quantitative PTF values and
relative 18F-FDG uptake are dependent on the ROI size due
to the partial volume effect. For instance, the use of wider
ROIs causes a reduction in values. Therefore, the ROI size
probably needs to be standardized for each segment. In
addition, the reference values and threshold values for
viability may need to be defined at each segment.
Conclusion
This study demonstrates that although the image quality is
superior with 18F-FDG than with 15O-water, the 15O-water
perfusable tissue fraction (PTF) was consistent with the
qualitative analysis of 18F-FDG uptake, in terms of the
agreement in the defect identification and the assessment of
myocardial viability. The image quality is superior with18F-FDG than with 15O-water, but PTF provided enough
information eventually to predict the wall motion recovery
after successful revascularization in patients with old
myocardial infarction.
Acknowledgments We are greatly indebted to the staff of The Turku
PET Center, Turku University Central Hospital, Finland, in particular
Mr. Mika Klemetsso and Vesa Oikonen for the computer assistance.
We also thank Mr. S. Sekiguchi from Asahi-kasei, co, Tokyo, Japan,
for supplying the general-purpose image analysis package, Dr. View.
This work was supported by Sigrid Juselius Foundation, Finnish
Foundation for Cardiovascular Research, Finland, and a grant from the
Ministry of Health, Labour and Welfare (MHLW), Japan.
654 Ann Nucl Med (2012) 26:644–655
123

Conflict of interest None of the authors have any conflict of interest
to disclose.
Open Access This article is distributed under the terms of the
Creative Commons Attribution License which permits any use, dis-
tribution, and reproduction in any medium, provided the original
author(s) and the source are credited.
References
1. Rahimtoola SH. A perspective on the three large multicenter
randomized clinical trials of coronary bypass surgery for chronic
stable angina. Circulation. 1985;72(6 Pt 2):V123–35.
2. Braunwald E, Rutherford JD. Reversible ischemic left ventricular
dysfunction: evidence for the ‘‘hibernating myocardium’’. J Am
Coll Cardiol. 1986;8(6):1467–70.
3. Rahimtoola SH. The hibernating myocardium. Am Heart J.
1989;117(1):211–21.
4. Marshall RC, Tillisch JH, Phelps ME, et al. Identification and
differentiation of resting myocardial ischemia and infarction in
man with positron computed tomography, 18F-labeled fluorode-
oxyglucose and N-13 ammonia. Circulation. 1983;67(4):766–78.
5. Schwaiger M, Brunken R, Grover-McKay M, et al. Regional
myocardial metabolism in patients with acute myocardial
infarction assessed by positron emission tomography. J Am Coll
Cardiol. 1986;8(4):800–8.
6. Tillisch J, Brunken R, Marshall R, et al. Reversibility of cardiac
wall-motion abnormalities predicted by positron tomography.
N Engl J Med. 1986;314(14):884–8.
7. Tamaki N, Yonekura Y, Yamashita K, et al. Positron emission
tomography using fluorine-18 deoxyglucose in evaluation of cor-
onary artery bypass grafting. Am J Cardiol. 1989;64(14):860–5.
8. Knuuti MJ, Nuutila P, Ruotsalainen U, et al. Euglycemic hype-
rinsulinemic clamp and oral glucose load in stimulating myo-
cardial glucose utilization during positron emission tomography.
J Nucl Med. 1992;33(7):1255–62.
9. Knuuti MJ, Saraste M, Nuutila P, et al. Myocardial viability:
fluorine-18-deoxyglucose positron emission tomography in pre-
diction of wall motion recovery after revascularization. Am Heart
J. 1994;127(4 Pt 1):785–96.
10. Iida H, Rhodes CG, de Silva R, et al. Myocardial tissue fraction-
correction for partial volume effects and measure of tissue via-
bility. J Nucl Med. 1991;32(11):2169–75.
11. Yamamoto Y, de-Silva R, Rhodes CG, et al. A new strategy for
the assessment of viable myocardium and regional myocardial
blood flow using 15O-water and dynamic positron emission
tomography. Circulation. 1992;86(1):167–78.
12. de Silva R, Yamamoto Y, Rhodes CG, et al. Preoperative pre-
diction of the outcome of coronary revascularization using pos-
itron emission tomography. Circulation. 1992;86(6):1738–42.
13. Iida H, Tamura Y, Kitamura K, Bloomfield PM, Eberl S, Ono Y.
Histochemical correlates of 15O-water-perfusable tissue fraction
in experimental canine studies of old myocardial infarction.
J Nucl Med. 2000;41(10):1737–45.
14. Teramoto N, Koshino K, Yokoyama I, et al. Experimental pig
model of old myocardial infarction with long survival leading to
chronic left ventricular dysfunction and remodeling as evaluated
by PET. J Nucl Med. 2011;52(5):761–8.
15. Watabe H, Jino H, Kawachi N, et al. Parametric imaging of
myocardial blood flow with 15O-water and PET using the basis
function method. J Nucl Med. 2005;46(7):1219–24.
16. Harms HJ, de Haan S, Knaapen P, Allaart CP, Lammertsma AA,
Lubberink M. Parametric images of myocardial viability using a
single 15O–H2O PET/CT scan. J Nucl Med. 2011;52(5):745–9.
17. de Haan S, Harms HJ, Lubberink M, et al. Parametric imaging of
myocardial viability using oxygen-15 labelled water and PET/
CT: comparison with late gadolinium enhanced CMR. Eur J Nucl
Med Mol Imaging. 2012 (in press).
18. Spinks TJ, Araujo LI, Rhodes CG, Hutton BF. Physical aspects of
cardiac scanning with a block detector positron tomograph.
J Comput Assist Tomogr. 1991;15(5):893–904.
19. DeFronzo RA, Tobin JD, Andres R. Glucose clamp technique: a
method for quantifying insulin secretion and resistance. Am J
Physiol. 1979;237(3):E214–23.
20. Nuutila P, Koivisto VA, Knuuti J, et al. Glucose-free fatty acid
cycle operates in human heart and skeletal muscle in vivo. J Clin
Invest. 1992;89(6):1767–74.
21. Iida H, Takahashi A, Tamura Y, Ono Y, Lammertsma AA.
Myocardial blood flow: comparison of oxygen-15-water bolus
injection, slow infusion and oxygen-15-carbon dioxide slow
inhalation. J Nucl Med. 1995;36(1):78–85.
22. Iida H, Rhodes CG, de Silva R, et al. Use of the left ventricular
time-activity curve as a noninvasive input function in dynamic
oxygen-15-water positron emission tomography. J Nucl Med.
1992;33(9):1669–77.
23. Iida H, Kanno I, Takahashi A, et al. Measurement of absolute
myocardial blood flow with H215O and dynamic positron-emission
tomography. Strategy for quantification in relation to the partial-
volume effect. Circulation. 1988;78(1):104–15.
24. Araujo LI, Lammertsma AA, Rhodes CG, et al. Noninvasive
quantification of regional myocardial blood flow in coronary artery
disease with oxygen-15-labeled carbon dioxide inhalation and
positron emission tomography. Circulation. 1991;83(3):875–85.
25. Iida H, Miura S, Shoji Y, et al. Noninvasive quantitation of
cerebral blood flow using oxygen-15-water and a dual-PET sys-
tem. J Nucl Med. 1998;39(10):1789–98.
26. Buxton DB, Schelbert HR. Measurement of regional glucose
metabolic rates in reperfused myocardium. Am J Physiol. 1991;
261(6 Pt 2):H2058–68.
27. Maki M, Luotolahti M, Nuutila P, et al. Glucose uptake in the
chronically dysfunctional but viable myocardium. Circulation.
1996;93(9):1658–66.
28. Knuuti MJ, Nuutila P, Ruotsalainen U, et al. The value of
quantitative analysis of glucose utilization in detection of myo-
cardial viability by PET. J Nucl Med. 1993;34(12):2068–75.
29. Kety SS. The theory and applications of exchange of inert gas at
the lungs and tissues. Pharmacol Res. 1951;3:1–41.
30. Bergmann SR, Fox KA, Rand AL, et al. Quantification of
regional myocardial blood flow in vivo with H215O. Circulation.
1984;70(4):724–33.
31. Katoh C, Ruotsalainen U, Laine H, et al. A new iterative
reconstruction method based on median root prior in quantifica-
tion of myocardial blood flow and oxygen metabolism with PET.
J Nucl Med. 1999;40(5):862–7.
32. Huang S, Mahoney D, Phelps M. Quantitation in positron emis-
sion tomography: 8. Effect of non-linear parameter estimation on
functional images. J Comput Assist Tomogr. 1987;11:314–25.
33. Herrero P, Staudenherz A, Walsh JF, Gropler RJ, Bergmann SR.
Heterogeneity of myocardial perfusion provides the physiolog-
ical basis of perfusable tissue index. J Nucl Med. 1995;36(2):
320–7.
34. Harms HJ, Knaapen P, de Haan S, Halbmeijer R, Lammertsma
AA, Lubberink M. Automatic generation of absolute myocardial
blood flow images using [15O]H2O and a clinical PET/CT
scanner. Eur J Nucl Med Mol Imaging. 2011;38(5):930–9.
35. Koshino K, Watabe H, Hasegawa S, Hayashi T, Hatazawa J, Iida
H. Development of motion correction technique for cardiac
(15)O-water PET study using an optical motion tracking system.
Ann Nucl Med. 2009;24(1):1–11.
Ann Nucl Med (2012) 26:644–655 655
123


![CYCLOTRON PRODUCED RADIONUCLIDES:GUIDANCE ON FACILITY DESIGN AND PRODUCTION OF [18F]FLUORODEOXYGLUCOSE (FDG)](https://static.fdokumen.com/doc/165x107/631647d8c32ab5e46f0db468/cyclotron-produced-radionuclidesguidance-on-facility-design-and-production-of-18ffluorodeoxyglucose.jpg)