Extreme Magnesium Isotope Fractionation at Outcrop Scale Records the Mechanism and Rate at which...
26
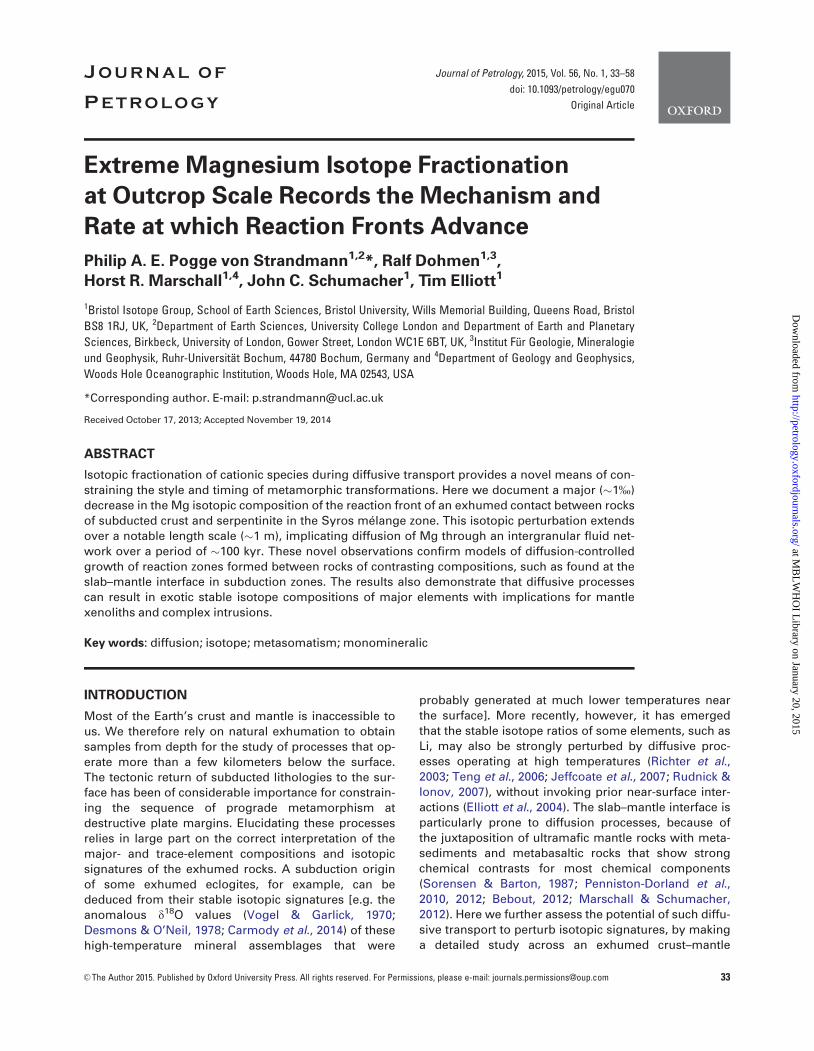
Extreme Magnesium Isotope Fractionation at Outcrop Scale Records the Mechanism and Rate at which Reaction Fronts Advance Philip A. E. Pogge von Strandmann 1,2 *, Ralf Dohmen 1,3 , Horst R. Marschall 1,4 , John C. Schumacher 1 , Tim Elliott 1 1 Bristol Isotope Group, School of Earth Sciences, Bristol University, Wills Memorial Building, Queens Road, Bristol BS8 1RJ, UK, 2 Department of Earth Sciences, University College London and Department of Earth and Planetary Sciences, Birkbeck, University of London, Gower Street, London WC1E 6BT, UK, 3 Institut Fu ¨ r Geologie, Mineralogie und Geophysik, Ruhr-Universita ¨ t Bochum, 44780 Bochum, Germany and 4 Department of Geology and Geophysics, Woods Hole Oceanographic Institution, Woods Hole, MA 02543, USA *Corresponding author. E-mail: [email protected] Received October 17, 2013; Accepted November 19, 2014 ABSTRACT Isotopic fractionation of cationic species during diffusive transport provides a novel means of con- straining the style and timing of metamorphic transformations. Here we document a major (1%) decrease in the Mg isotopic composition of the reaction front of an exhumed contact between rocks of subducted crust and serpentinite in the Syros me ´ lange zone. This isotopic perturbation extends over a notable length scale (1 m), implicating diffusion of Mg through an intergranular fluid net- work over a period of 100 kyr. These novel observations confirm models of diffusion-controlled growth of reaction zones formed between rocks of contrasting compositions, such as found at the slab–mantle interface in subduction zones. The results also demonstrate that diffusive processes can result in exotic stable isotope compositions of major elements with implications for mantle xenoliths and complex intrusions. Key words: diffusion; isotope; metasomatism; monomineralic INTRODUCTION Most of the Earth’s crust and mantle is inaccessible to us. We therefore rely on natural exhumation to obtain samples from depth for the study of processes that op- erate more than a few kilometers below the surface. The tectonic return of subducted lithologies to the sur- face has been of considerable importance for constrain- ing the sequence of prograde metamorphism at destructive plate margins. Elucidating these processes relies in large part on the correct interpretation of the major- and trace-element compositions and isotopic signatures of the exhumed rocks. A subduction origin of some exhumed eclogites, for example, can be deduced from their stable isotopic signatures [e.g. the anomalous d 18 O values (Vogel & Garlick, 1970; Desmons & O’Neil, 1978; Carmody et al., 2014) of these high-temperature mineral assemblages that were probably generated at much lower temperatures near the surface]. More recently, however, it has emerged that the stable isotope ratios of some elements, such as Li, may also be strongly perturbed by diffusive proc- esses operating at high temperatures (Richter et al., 2003; Teng et al., 2006; Jeffcoate et al., 2007; Rudnick & Ionov, 2007), without invoking prior near-surface inter- actions (Elliott et al., 2004). The slab–mantle interface is particularly prone to diffusion processes, because of the juxtaposition of ultramafic mantle rocks with meta- sediments and metabasaltic rocks that show strong chemical contrasts for most chemical components (Sorensen & Barton, 1987; Penniston-Dorland et al., 2010, 2012; Bebout, 2012; Marschall & Schumacher, 2012). Here we further assess the potential of such diffu- sive transport to perturb isotopic signatures, by making a detailed study across an exhumed crust–mantle V C The Author 2015. Published by Oxford University Press. All rights reserved. For Permissions, please e-mail: [email protected] 33 J OURNAL OF P ETROLOGY Journal of Petrology, 2015, Vol. 56, No. 1, 33–58 doi: 10.1093/petrology/egu070 Original Article at MBLWHOI Library on January 20, 2015 http://petrology.oxfordjournals.org/ Downloaded from
-
Upload
uni-frankfurt -
Category
Documents
-
view
0 -
download
0
Transcript of Extreme Magnesium Isotope Fractionation at Outcrop Scale Records the Mechanism and Rate at which...
Extreme Magnesium Isotope Fractionation
at Outcrop Scale Records the Mechanism and
Rate at which Reaction Fronts Advance
Philip A. E. Pogge von Strandmann1,2*, Ralf Dohmen1,3,
Horst R. Marschall1,4, John C. Schumacher1, Tim Elliott1
1Bristol Isotope Group, School of Earth Sciences, Bristol University, Wills Memorial Building, Queens Road, Bristol
BS8 1RJ, UK, 2Department of Earth Sciences, University College London and Department of Earth and Planetary
Sciences, Birkbeck, University of London, Gower Street, London WC1E 6BT, UK, 3Institut Fur Geologie, Mineralogie
und Geophysik, Ruhr-Universitat Bochum, 44780 Bochum, Germany and 4Department of Geology and Geophysics,
Woods Hole Oceanographic Institution, Woods Hole, MA 02543, USA
*Corresponding author. E-mail: [email protected]
Received October 17, 2013; Accepted November 19, 2014
ABSTRACT
Isotopic fractionation of cationic species during diffusive transport provides a novel means of con-
straining the style and timing of metamorphic transformations. Here we document a major (�1%)
decrease in the Mg isotopic composition of the reaction front of an exhumed contact between rocks
of subducted crust and serpentinite in the Syros melange zone. This isotopic perturbation extends
over a notable length scale (�1 m), implicating diffusion of Mg through an intergranular fluid net-
work over a period of �100 kyr. These novel observations confirm models of diffusion-controlled
growth of reaction zones formed between rocks of contrasting compositions, such as found at theslab–mantle interface in subduction zones. The results also demonstrate that diffusive processes
can result in exotic stable isotope compositions of major elements with implications for mantle
xenoliths and complex intrusions.
Key words: diffusion; isotope; metasomatism; monomineralic
INTRODUCTION
Most of the Earth’s crust and mantle is inaccessible to
us. We therefore rely on natural exhumation to obtain
samples from depth for the study of processes that op-
erate more than a few kilometers below the surface.
The tectonic return of subducted lithologies to the sur-face has been of considerable importance for constrain-
ing the sequence of prograde metamorphism at
destructive plate margins. Elucidating these processes
relies in large part on the correct interpretation of the
major- and trace-element compositions and isotopic
signatures of the exhumed rocks. A subduction origin
of some exhumed eclogites, for example, can bededuced from their stable isotopic signatures [e.g. the
anomalous d18O values (Vogel & Garlick, 1970;
Desmons & O’Neil, 1978; Carmody et al., 2014) of these
high-temperature mineral assemblages that were
probably generated at much lower temperatures near
the surface]. More recently, however, it has emerged
that the stable isotope ratios of some elements, such as
Li, may also be strongly perturbed by diffusive proc-esses operating at high temperatures (Richter et al.,
2003; Teng et al., 2006; Jeffcoate et al., 2007; Rudnick &
Ionov, 2007), without invoking prior near-surface inter-
actions (Elliott et al., 2004). The slab–mantle interface is
particularly prone to diffusion processes, because of
the juxtaposition of ultramafic mantle rocks with meta-sediments and metabasaltic rocks that show strong
chemical contrasts for most chemical components
(Sorensen & Barton, 1987; Penniston-Dorland et al.,
2010, 2012; Bebout, 2012; Marschall & Schumacher,
2012). Here we further assess the potential of such diffu-
sive transport to perturb isotopic signatures, by making
a detailed study across an exhumed crust–mantle
VC The Author 2015. Published by Oxford University Press. All rights reserved. For Permissions, please e-mail: [email protected] 33
J O U R N A L O F
P E T R O L O G Y
Journal of Petrology, 2015, Vol. 56, No. 1, 33–58
doi: 10.1093/petrology/egu070
Original Article
at MB
LW
HO
I Library on January 20, 2015
http://petrology.oxfordjournals.org/D
ownloaded from

contact using the major element magnesium. In add-
ition, we demonstrate how the length scale and shape
of measured diffusion profiles can be used to extract in-
formation on the mechanisms and time scales involved
in the growth of reaction zones.Bulk diffusion can occur on many different scales
within silicate rocks (Watson, 1991; Watson & Baxter,
2007). Major elements such as Mg and Fe have repeat-
edly been shown to diffusively exchange in silicate min-
erals (interdiffusion) (Chakraborty, 1997), and Mg may
also diffuse on larger scales in bulk-rock processes
(Sanford, 1982; Miller et al., 2009). However, advectivemetasomatism must also be considered as an add-
itional operating mechanism; some geochemical stud-
ies on reaction zone rocks have altogether neglected
the effects of diffusion and interpreted their formation
as solely controlled by advection, with far-reaching con-
sequences for their geochemical interpretation(Breeding et al., 2004).
Experimental and natural studies have shown that
the diffusion of species along a chemical potential gra-
dient can be accompanied by isotopic fractionation, be-
cause the lighter isotopes will diffuse faster than the
heavier ones (Richter et al., 2003). Of all the major elem-ents Mg isotopes are ideally suited to reveal the effects
of diffusion because of their large relative mass
differences and commonly occurring strong chemical
potential gradients in nature. Experiments have demon-
strated Mg isotope fractionations as great as 8% by
chemical diffusion (Richter et al., 2008). Natural rock
studies have shown fractionations on millimeter scalesbetween juxtaposed felsic and mafic rocks (Teng et al.,
2011; Chopra et al., 2012), and researchers have
inferred fractionation during diffusive replacement of
Hþ during xenolith degassing (Pogge von Strandmann
et al., 2011), and Mg–Fe interdiffusion in olivine
(Dauphas et al., 2010). Therefore diffusion of majorelements is a significant process during metamorphism
and metasomatism, not only because it determines
changes in mineral assemblages from thin section to
outcrop scale, but also because it has the potential to
significantly alter stable isotope ratios of minerals and
rocks.
FIELD AREA AND SAMPLE PETROGRAPHY
The island of Syros displays a sequence of rocks of the
lower unit of the Attic–Cycladic Crystalline Complex
(Durr et al., 1978). The major part of the island is com-
posed of interlayered pelitic schists and marbles dip-
ping north to NE (Hecht, 1984; Keiter et al., 2011). Thenortheastern part of the island comprises a melange
zone composed of metagabbros, eclogites, glauco-
phane schists, meta-plagiogranites, serpentinites and
metasediments embedded in a chlorite-rich mafic–
ultramafic matrix. It mainly preserves a blueschist- to
eclogite-facies metamorphic overprint along with manywell-exposed contacts between contrasting lithologies
that are characterized by the formation of reaction
zones, also called blackwalls (Ridley, 1984; Okrusch &
Brocker, 1990; Seck et al., 1996; Brocker & Enders, 2001;
Marschall et al., 2006). Metamorphic peak conditions
were estimated at 470–520�C and 1�3–2�1 GPa by several
researchers for various rock types (Okrusch & Brocker,1990; Trotet et al., 2001; Rosenbaum et al., 2002; Keiter
et al., 2004). The P–T conditions reported for the forma-
tion of the Syros blackwalls by Breeding et al. (2004)
(1�17–1�23 GPa, 500–550�C), Marschall et al. (2006)
(0�62–0�72 GPa, 400–430�C) and Miller et al. (2009)
(1�2 GPa, 430�C) show that the northern Syros melange
was exhumed from depths of about 55–75 km and expe-rienced incursion of hydrous fluids at shallower depths
of 25–35 km.
A detailed suite of samples was studied from the
northern end of Lıa Beach on the northwestern side of
Syros (37�29�419’N, 024�54�089’E; elevation 8 m above
sea level). The sequence represents a continuous ex-posure of a 1–2 m thick reaction zone located between
metavolcano-sedimentary schists and a large (�50 m),
continuous lens of serpentinite (Figs 1 and 2; Miller
et al., 2009).
We analysed a profile of 16 well-characterized
whole-rock samples from the reaction zone formed at
blueschist-facies conditions at the contact of serpentin-
ite and metavolcaniclastic rock (garnet–phengite–
epidote–glaucophane schist). Samples were collected
by Miller et al. (2009) using a diamond-tipped rock saw
to obtain three continuous sections of samples that to-
gether cover a complete section across the reaction
zone (Fig. 1). The samples studied were taken from
�2 cm wide slabs cut perpendicular to the sections; that
is, slabs oriented parallel to the initial lithological con-
tact. The distance from the contact given for each sam-
ple depicts the distance of the centre of the 2 cm slab to
the initial contact. Both contacts (upper and basal) are
still intact and accessible in the outcrop. However, no
single complete section from the schist into the serpent-
inite could be sampled, so that the complete profile had
to be reconstructed from three overlapping sections
that were taken within a distance of a few meters
(Fig. 1). Reconstruction of the relative positions of the
three sections was achieved based on field relations
and petrography.
The reaction zone has been subdivided into the fol-
lowing five zones, based on their mineralogy (Milleret al., 2009): Zone I (unaltered metavolcaniclastic rock),
Zone II (glaucophaneþ chloriteþ epidote), Zone III
(omphaciteþ epidoteþ chlorite), Zone IV (chlorite
schist), and Zone V (serpentinite) (Figs 2 and 3, Table 1).
It should be noted that some zones were mislabelled in
the original tables 1 and 3 of Miller et al. (2009),whereas they are correctly described and labelled in
their text and figures. The correct zones are indicated in
Fig. 2. The distances for single samples listed by Miller
et al. (2009) are simple measurements along the
sampled profiles. In this study, we adjusted these
distances to represent the distance of each sample
from the initial garnet–glaucophane schist to the
34 Journal of Petrology, 2015, Vol. 56, No. 1
at MB
LW
HO
I Library on January 20, 2015
http://petrology.oxfordjournals.org/D
ownloaded from

Fig. 1. Simplified geological map of the northern part of Syros (after Keiter et al., 2011) The study locality is at the western sideof northern Syros in the Bay of Lıa. The schematic sketch map depicts the field relations at Lıa beach showing the contact betweenthe metavolcaniclastic schist, the reaction zone and the serpentinite. PSI, PSII and PSIII indicate the three studied sections (seetext). Samples SY551 and SY552 are from the interior of the serpentinite body at distances of 5 and 10 m from the contact,respectively.
Journal of Petrology, 2015, Vol. 56, No. 1 35
at MB
LW
HO
I Library on January 20, 2015
http://petrology.oxfordjournals.org/D
ownloaded from
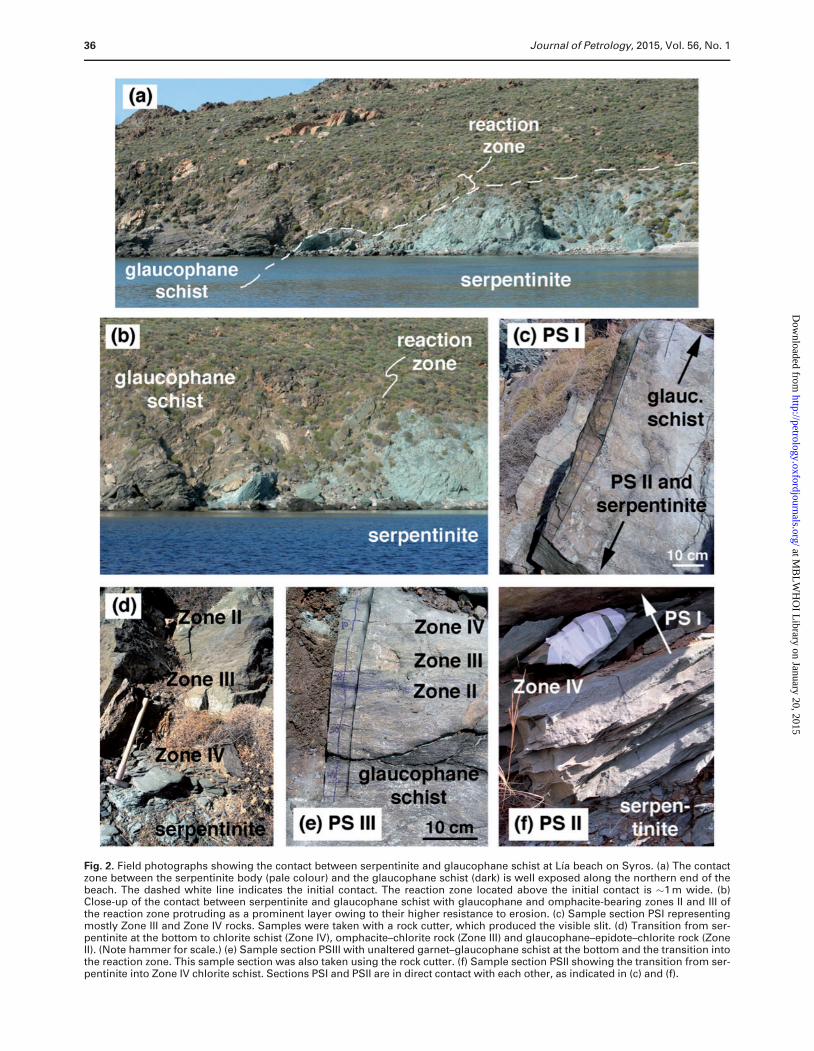
Fig. 2. Field photographs showing the contact between serpentinite and glaucophane schist at Lıa beach on Syros. (a) The contactzone between the serpentinite body (pale colour) and the glaucophane schist (dark) is well exposed along the northern end of thebeach. The dashed white line indicates the initial contact. The reaction zone located above the initial contact is �1 m wide. (b)Close-up of the contact between serpentinite and glaucophane schist with glaucophane and omphacite-bearing zones II and III ofthe reaction zone protruding as a prominent layer owing to their higher resistance to erosion. (c) Sample section PSI representingmostly Zone III and Zone IV rocks. Samples were taken with a rock cutter, which produced the visible slit. (d) Transition from ser-pentinite at the bottom to chlorite schist (Zone IV), omphacite–chlorite rock (Zone III) and glaucophane–epidote–chlorite rock (ZoneII). (Note hammer for scale.) (e) Sample section PSIII with unaltered garnet–glaucophane schist at the bottom and the transition intothe reaction zone. This sample section was also taken using the rock cutter. (f) Sample section PSII showing the transition from ser-pentinite into Zone IV chlorite schist. Sections PSI and PSII are in direct contact with each other, as indicated in (c) and (f).
36 Journal of Petrology, 2015, Vol. 56, No. 1
at MB
LW
HO
I Library on January 20, 2015
http://petrology.oxfordjournals.org/D
ownloaded from

serpentinite contact. This, of course, does not change
the relative distances between samples within the pro-
files, which were correctly listed in table 1 of Miller et al.
(2009).
Zone I represents the metavolcaniclastic rock (origin-
ally basaltic to intermediate tuffs) consisting of glauco-phane (Gln)þ epidote (Ep)þphengite (Ph)þgarnet (Grt)
with accessory rutile (Rt) and ilmenite (Ilm). Quartz is
present as inclusions in garnet (Grt). Chlorite (Chl) is re-
stricted to haloes replacing Grt in samples further away
from the reaction zone (Fig. 4a and b). Samples closer
to the reaction zone show a more advanced replace-
ment of Grt by Chl and Ph, which is interpreted asthe increasing influence of the mineral replacement of
the reaction zone (Fig. 4b and c). In those samples,
Chl also appears in the GlnþEp matrix of the rocks
(Fig. 4c).
Zone II represents the reaction zone in contact with
the Zone I schist. It consists of GlnþEpþOmp andminor albite (Ab) and tourmaline (Tur). Rutile is
replaced by titanite (Ttn). No Grt is present, but
pseudomorphs of ChlþGlnþEp after Grt have approxi-
mately the same abundance as Grt has in Zone I rocks
(Fig. 4d).
Zone III is defined by the occurrence of omphacite
(Omp), whereas Gln is absent or restricted to pseudo-morphs after Grt (Fig. 4e–h). The assemblage present in
all samples from this zone is OmpþChlþEp with minor
Ab and Ttn. Pseudomorphs after Grt are present and
show a similar abundance to Zone II (Fig. 4e and g). The
abundance of Chl in the samples increases continu-
ously through Zone III towards the serpentinite
(Fig. 4e–h). Samples closer to Zone IV show only minor
or no Omp and Ab and lower abundances of Ep. The
transition from Zone III to Zone IV is characterized by
the disappearance of Ep (Fig. 4h).
Zone IV is the zone that is in contact with the serpent-
inite and consists of chlorite schist. Gln and Omp areabsent from this zone, and no pseudomorphs after Grt
could be identified with any certainty (Fig. 4h–n). Chl is
darker green and more Fe rich in vicinity to Zone III, but
is continuously paler and more Mg rich as the contact
to the serpentinite is approached (Fig. 4h–n). The chlor-
ite schist contains Ttn at the contact with Zone III (Fig.
4h–k). In its central part the Ti phase is Rt (Fig. 4i–m),whereas in contact with the serpentinite an opaque
phase is present (Fig. 4m and n).
Zone V represents the serpentinite, which consists of
antigorite intergrown with small magnetite grains and
larger (millimeter-sized) chromite grains (Fig. 4o and p).
Some samples show an undeformed mesh texture ofantigorite and magnetite (Fig. 4p), which is typical for
undeformed serpentinized peridotite. Veins in the ser-
pentinite (Fig. 4o and p) contain some Tlc and Chl, but
are dominated by Atg. Talc and Chl occur only in close
vicinity to the reaction zone. Samples taken at larger
distances from the contact consist of antigoriteþmagnetite.
The Syros reaction zone represents interaction of
crustal and mantle components and is considered an
analogue for processes occurring at the slab–mantle
interface (Miller et al., 2009; Marschall & Schumacher,
2012). The metamorphic relationships in the Syros mel-
ange are complex, occur at relatively low temperatures
Fig. 3. Modal composition of samples investigated in this study. Sample numbers and petrographic zones are indicated. Mineralproportions are given in per cent by mass, as calculated from mineral and whole-rock chemistry and volume estimates from thinsections. Modified from Miller et al. (2009). Mineral abbreviations follow Whitney & Evans (2010) and are as follows: Ab, albite; Atg,antigorite; Chl, chlorite; Ep, epidote; Gln, glaucophane; Grt, garnet; Ilm, ilmenite; Omp, omphacite; Opq, opaque phases; Ph, phen-gite; Rt, rutile; Tlc, talc; Ttn, titanite; Tur, tourmaline.
Journal of Petrology, 2015, Vol. 56, No. 1 37
at MB
LW
HO
I Library on January 20, 2015
http://petrology.oxfordjournals.org/D
ownloaded from
and pressures (�430�C, �1�2 GPa), and are thought to
reflect diffusion of chemical components (e.g. Mg, Cr,
Ni) perpendicular to the contact, driven by activity con-
trasts between the juxtaposed rocks (i.e. across the
slab–mantle boundary). The metamorphic reactions led
to increased porosity in the chlorite-rich zone, which in
turn allowed porous flow parallel to the contact, which
leached and transported fluid-mobile elements [e.g.
large ion lithophile elements (LILE) and Si]. Fluid-immo-
bile elements (e.g. Al, Ti, Y and Zr) have demonstrably
maintained their initial abundances, whereas elements
such as Ca, Sr and the light rare earth elements (LREE)
are concentrated owing to the stabilization of Ca-min-
erals and monazite at intermediate points in the reac-
tion zone (Miller et al., 2009). This behaviour highlights
the different, and partially unrelated, behaviour ex-
hibited by different elements in a single profile, owing
to differing elemental properties, and the changing
chemical gradients caused by the stabilization of differ-
ent minerals.
Petrographic evidence from thin sections shows that
Zones II, III and IV sequentially replace the initial assem-
blage of Zone I. Reaction zone growth is initiated by an
influx of MgO into the metavolcanic rock right at the
serpentinite contact, which produced a very thin re-
placement sequence similar to the assemblages foundin the mature Zones II, III and IV: a layer of chlorite at
the serpentinite contact, followed by OmpþChlþEp
(¼Zone III assemblage) and GlnþChlþEp (¼Zone II as-
semblage). These zones grew as more MgO entered
from the serpentinite, but at the same time the earlier
formed Zone II assemblage would be replaced by aZone III assemblage and the Zone III assemblage by
Zone IV chlorite, as all three zones grow wider and
replace the unaltered metavolcanic garnet–glauco-
phane schist of Zone I.
ANALYTICAL METHODS
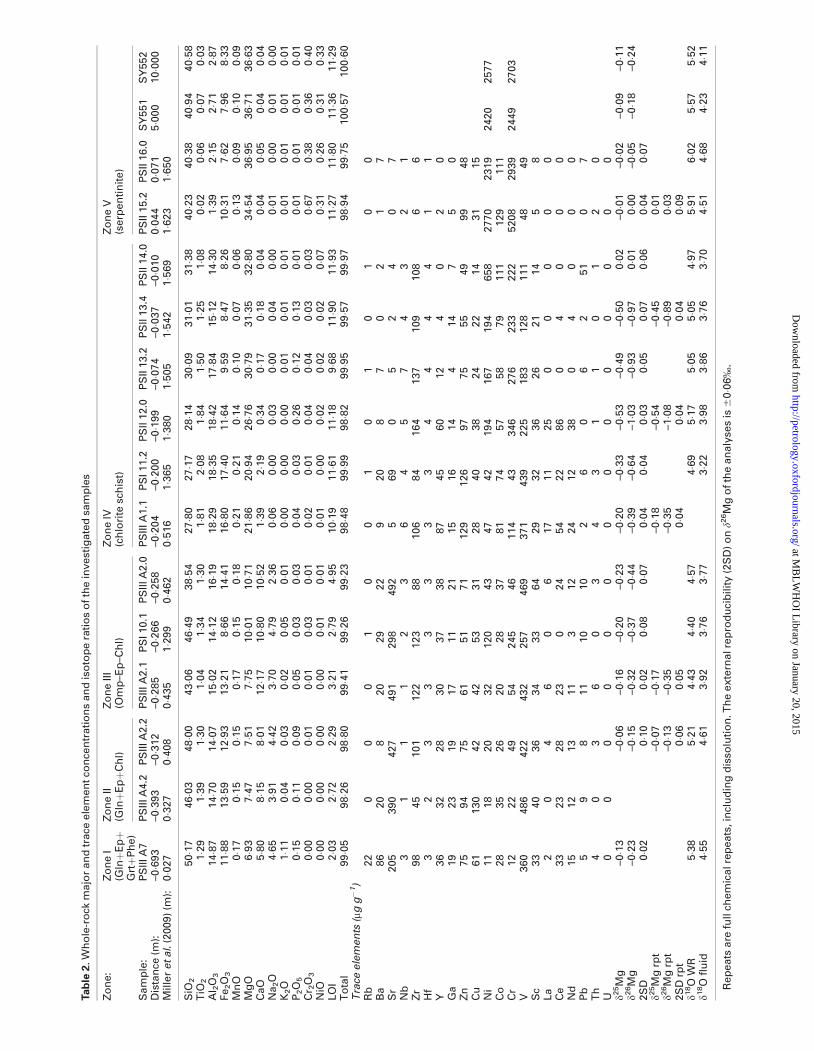
Whole-rock major and trace element concentrationswere determined on powdered samples by X-ray fluor-
escence; the data are reported in Table 2.
Mg isotope ratios were analysed on the same pow-
ders. The purification and analytical methods have
been described in detail elsewhere (Pogge von
Strandmann et al., 2011, 2012). Briefly, samples were
purified using a two-stage cation exchange chemistry(AG50W X-12) with 2�0M HNO3 as eluent. Mineral sep-
arates were analysed by the same method, except
where the Ti/Mg ratio was very high, in which case an
additional column using TRU-Spec resin was applied to
quantitatively remove Ti (Pogge von Strandmann et al.,
2012). Samples were analysed by multi-collector induct-ively coupled mass spectrometry (MC-ICP-MS) on a
Thermo Finnigan Neptune system, with an Elemental
Scientific Inc. Apex-Q introduction system.
Measurements were bracketed by the standard DSM-3
(Galy et al., 2003), and are reported as the per mil devi-
ation from that standard. Analytical reproducibility on
d26Mg is 60�06%, as shown by repeated analyses ofseveral different international rock standards (Pogge
von Strandmann et al., 2011).
For O isotope analyses, whole-rock sample powders
were pressed into pellets using a Quick KBr pellet press,
and analysed by infrared-laser fluorination technique
(ILFT) (CO2 laser) by Dr Zhengrong Wang at YaleUniversity using methods described previously (Eiler
et al., 1996; Wang et al., 2011). For each sample three
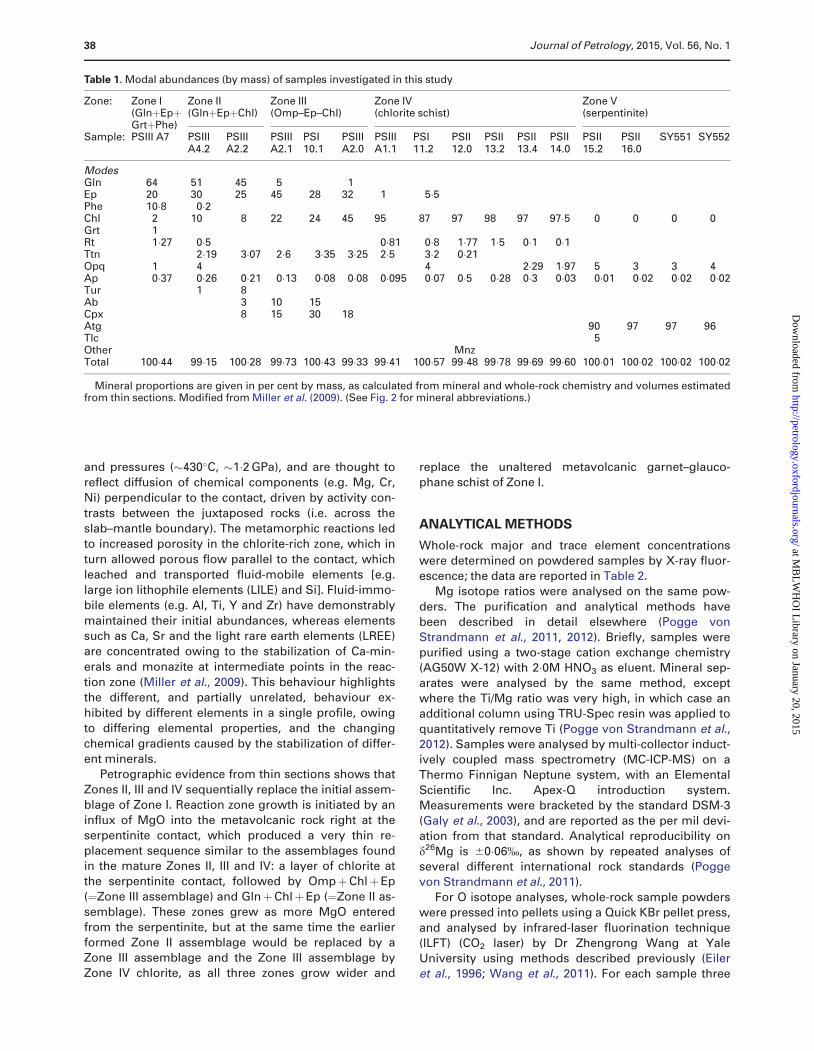
Table 1. Modal abundances (by mass) of samples investigated in this study
Zone: Zone I Zone II Zone III Zone IV Zone V(GlnþEpþGrtþPhe)
(GlnþEpþChl) (Omp–Ep–Chl) (chlorite schist) (serpentinite)
Sample: PSIII A7 PSIIIA4.2
PSIIIA2.2
PSIIIA2.1
PSI10.1
PSIIIA2.0
PSIIIA1.1
PSI11.2
PSII12.0
PSII13.2
PSII13.4
PSII14.0
PSII15.2
PSII16.0
SY551 SY552
ModesGln 64 51 45 5 1Ep 20 30 25 45 28 32 1 5�5Phe 10�8 0�2Chl 2 10 8 22 24 45 95 87 97 98 97 97�5 0 0 0 0Grt 1Rt 1�27 0�5 0�81 0�8 1�77 1�5 0�1 0�1Ttn 2�19 3�07 2�6 3�35 3�25 2�5 3�2 0�21Opq 1 4 4 2�29 1�97 5 3 3 4Ap 0�37 0�26 0�21 0�13 0�08 0�08 0�095 0�07 0�5 0�28 0�3 0�03 0�01 0�02 0�02 0�02Tur 1 8Ab 3 10 15Cpx 8 15 30 18Atg 90 97 97 96Tlc 5Other MnzTotal 100�44 99�15 100�28 99�73 100�43 99�33 99�41 100�57 99�48 99�78 99�69 99�60 100�01 100�02 100�02 100�02
Mineral proportions are given in per cent by mass, as calculated from mineral and whole-rock chemistry and volumes estimatedfrom thin sections. Modified from Miller et al. (2009). (See Fig. 2 for mineral abbreviations.)
38 Journal of Petrology, 2015, Vol. 56, No. 1
at MB
LW
HO
I Library on January 20, 2015
http://petrology.oxfordjournals.org/D
ownloaded from
Tab
le2
.W
ho
le-r
ock
ma
jor
an
dtr
ace
ele
me
nt
con
cen
tra
tio
ns
an
dis
oto
pe
rati
os
of
the
inv
est
iga
ted
sam
ple
s
Zo
ne
:Z
on
eI
Zo
ne
IIZ
on
eIII
Zo
ne
IVZ
on
eV
(Glnþ
Epþ
Grtþ
Ph
e)
(Glnþ
Epþ
Ch
l)(O
mp
–Ep
–Ch
l)(c
hlo
rite
sch
ist)
(se
rpe
nti
nit
e)
Sa
mp
le:
PS
IIIA
7P
SIIIA
4.2
PS
IIIA
2.2
PS
IIIA
2.1
PS
I1
0.1
PS
IIIA
2.0
PS
IIIA
1.1
PS
I1
1.2
PS
II1
2.0
PS
II1
3.2
PS
II1
3.4
PS
II1
4.0
PS
II1
5.2
PS
II1
6.0
SY
55
1S
Y5
52
Dis
tan
ce(m
):–0�6
93
–0�3
93
–0�3
12
–0�2
85
–0�2
66
–0�2
58
–0�2
04
–0�2
00
–0�1
99
–0�0
74
–0�0
37
–0�0
10
0�0
44
0�0
71
5�0
00
10�0
00
Mille
re
ta
l.(2
00
9)
(m):
0�0
27
0�3
27
0�4
08
0�4
35
1�2
99
0�4
62
0�5
16
1�3
65
1�3
80
1�5
05
1�5
42
1�5
69
1�6
23
1�6
50
SiO
25
0�1
74
6�0
34
8�0
04
3�0
64
6�4
93
8�5
42
7�8
02
7�1
72
8�1
43
0�0
93
1�0
13
1�3
84
0�2
34
0�3
84
0�9
44
0�5
8T
iO2
1�2
91�3
91�3
01�0
41�3
41�3
01�8
12�0
81�8
41�5
01�2
51�0
80�0
20�0
60�0
70�0
3A
l 2O
31
4�8
71
4�7
01
4�0
71
5�0
21
4�1
21
6�1
91
8�2
91
8�3
51
8�4
21
7�8
41
5�1
21
4�3
01�3
92�1
52�7
12�8
7F
e2O
31
1�8
81
3�5
91
2�9
31
3�2
18�6
61
4�4
11
6�8
01
7�4
01
1�6
49�5
98�4
78�2
61
0�3
17�6
27�9
68�3
3M
nO
0�1
70�1
50�1
50�1
70�1
50�1
80�2
10�2
10�1
40�1
00�0
70�0
60�1
30�0
90�1
00�0
9M
gO
6�9
37�4
77�5
17�7
51
0�0
11
0�7
12
1�8
62
0�9
42
6�7
63
0�7
93
1�3
53
2�8
03
4�5
43
6�9
53
6�7
13
6�6
3C
aO
5�8
08�1
58�0
11
2�1
71
0�8
01
0�5
21�3
92�1
90�3
40�1
70�1
80�0
40�0
40�0
50�0
40�0
4N
a2O
4�6
53�9
14�4
23�7
04�7
92�3
60�0
60�0
00�0
30�0
00�0
40�0
00�0
10�0
00�0
10�0
0K
2O
1�1
10�0
40�0
30�0
20�0
50�0
10�0
00�0
00�0
00�0
10�0
10�0
10�0
10�0
10�0
10�0
1P
2O
50�1
50�1
10�0
90�0
50�0
30�0
30�0
40�0
30�2
60�1
20�1
30�0
10�0
10�0
10�0
10�0
1C
r 2O
30�0
00�0
00�0
10�0
10�0
30�0
10�0
20�0
10�0
40�0
40�0
30�0
30�6
70�3
80�3
60�4
0N
iO0�0
00�0
00�0
00�0
00�0
10�0
10�0
10�0
00�0
20�0
20�0
20�0
70�3
10�2
60�3
10�3
3L
OI
2�0
32�7
22�2
93�2
12�7
94�9
51
0�1
91
1�6
11
1�1
89�6
81
1�9
01
1�9
31
1�2
71
1�8
01
1�3
61
1�2
9T
ota
l9
9�0
59
8�2
69
8�8
09
9�4
19
9�2
69
9�2
39
8�4
89
9�9
99
8�8
29
9�9
59
9�5
79
9�9
79
8�9
49
9�7
51
00�5
71
00�6
0T
race
ele
me
nts
(mg
g�
1)
Rb
22
00
01
00
10
10
10
0B
a8
62
08
20
29
22
92
08
70
21
7S
r2
05
39
04
27
49
12
98
49
25
69
05
24
07
Nb
31
11
23
64
57
43
21
Zr
98
45
10
11
22
12
38
81
06
84
16
41
37
10
91
08
66
Hf
32
33
33
33
44
44
11
Y3
63
22
83
03
73
88
74
56
01
24
02
0G
a1
92
31
91
71
12
11
51
61
44
14
75
0Z
n7
59
47
56
15
17
11
29
12
69
77
55
54
99
94
8C
u6
11
30
42
42
53
31
28
40
38
24
22
14
31
15
Ni
11
18
20
32
12
04
34
74
21
94
16
71
94
65
82
77
02
31
92
42
02
57
7C
o2
83
52
62
02
83
78
17
45
75
87
91
11
12
91
11
Cr
12
22
49
54
24
54
61
14
43
34
62
76
23
32
22
52
08
29
39
24
49
27
03
V3
60
48
64
22
43
22
57
46
93
71
43
92
25
18
31
28
11
14
84
9S
c3
34
03
63
43
36
42
93
23
62
62
11
45
8L
a2
04
60
61
71
12
50
00
00
Ce
33
23
28
23
02
45
42
28
60
40
00
Nd
15
12
13
11
31
22
41
23
80
40
00
Pb
59
81
11
01
02
60
62
51
07
Th
40
36
03
43
11
01
20
U0
00
00
00
00
00
00
0d2
5M
g–0�1
3–0�0
6–0�1
6–0�2
0–0�2
3–0�2
0–0�3
3–0�5
3–0�4
9–0�5
00�0
2–0�0
1–0�0
2–0�0
9–0�1
1d2
6M
g–0�2
3–0�1
5–0�3
2–0�3
7–0�4
4–0�3
9–0�6
4–1�0
3–0�9
3–0�9
70�0
10�0
0–0�0
5–0�1
8–0�2
42
SD
0�0
20�1
00�0
20�0
80�0
70�0
40�0
40�0
30�0
50�0
70�0
60�0
40�0
7d2
5M
grp
t–0�0
7–0�1
7–0�1
8–0�5
4–0�4
50�0
1d2
6M
grp
t–0�1
3–0�3
5–0�3
5–1�0
8–0�8
90�0
32
SD
rpt
0�0
60�0
50�0
40�0
40�0
40�0
9d1
8O
WR
5�3
85�2
14�4
34�4
04�5
74�6
95�1
75�0
55�0
54�9
75�9
16�0
25�5
75�5
2d1
8O
flu
id4�5
54�6
13�9
23�7
63�7
73�2
23�9
83�8
63�7
63�7
04�5
14�6
84�2
34�1
1
Re
pe
ats
are
full
che
mic
alre
pe
ats
,in
clu
din
gd
isso
luti
on
.T
he
ex
tern
alre
pro
du
cib
ilit
y(2
SD
)o
nd2
6M
go
fth
ea
na
lyse
sis
60�0
6%
.
at MB
LW
HO
I Library on January 20, 2015
http://petrology.oxfordjournals.org/D
ownloaded from
repeats were analysed, and results are given in Table 2.
The 2 standard deviations (2SD) for the three repeats
varied between 0�04 and 0�24% for the set of samples
investigated here.
RESULTS
The �10�5 m profile through the reaction zone exhibits
an MgO decrease of over a factor of five, from �37 wt %to �7 wt % concentrated in �0�5 m across the contact
between the serpentinite and the metavolcanic schist
(Fig. 5). Other elements exhibit diverse behaviour
related to a number of processes: diffusion owing to
single chemical activity gradients, leaching by fluid
flow, or concentration owing to mineral growth (Milleret al., 2009).
Both the serpentinite and the unaltered schist
sampled at distance from the contact have Mg isotope
ratios similar to that of the Bulk Silicate Earth (d26Mg ��0�21%; Handler et al., 2009; Bourdon et al., 2010; Teng
et al., 2010; Pogge von Strandmann et al., 2011). The
chlorite-rich zone on the crustal side of the contact (re-action Zone IV), however, exhibits significantly lighter
Mg isotope ratios (d26Mg � �1%; Table 2), concentrated
within �20 cm of the profile. Zone III has d26Mg values
intermediate between the anomalously light ratios of
Zone IV and the ‘pristine’ ratios of Zones I and II (Fig. 5).
The unaltered rocks at distance from the contactshow very similar d18O values of þ5�4 6 0�1% for the
glaucophane schist and þ5�5 6 0�2% for the serpentinite
(Table 2). A slight decrease is observed in d18O through-
out Zones II–IV to the initial contact, where the chlorite
schist has a value of þ4�97 6 0�08% (Fig. 6). A negative
excursion to the smooth decrease is found in Zone III,
which shows values of�þ4�5%. In contrast, d18O valuesin the serpentinite increase towards the lithological con-
tact and are highest (þ6�0 6 0�2%) where the serpentinite
is in contact with the chlorite schist of Zone IV (Fig. 6).
The d18O values of hydrous fluids in equilibrium with
each sample throughout the profile were also calcu-
lated to evaluate the O isotope profile independent of
the changes in the modal compositions of the rocks.The calculation is based on the modal composition of
the rocks and temperature-dependent mineral–fluid
fractionation factors, taking into account the mineral
compositions and calculating fractionation in solid
solutions from endmembers (Zheng, 1991, 1993a,
1996). The values were calculated for T¼ 430�C, whichis the temperature of formation of the reaction zone
(Miller et al., 2009). The calculated fluid shows a high
d18O value in Zones I and II and in Zone V in samples
close to the contact. Zone V samples at a greater dis-
tance from the contact would be in equilibrium with flu-
ids of lower d18O values. Zone III and IV fluids showlower d18O values by �0�7% compared with Zones II
and V (Fig. 6). One sample shows an additional �0�5%negative excursion.
Some similarities exist between the shape of the Mg
isotope profile and the calculated fluid d18O profile, but
this is contrasted by significant differences between the
two. Both profiles show low values in Zones III and IVand an increase in Zone V towards the contact.
Nevertheless, the drop from high to low in the O isotope
profile occurs on the serpentinite side of the contact,
whereas the drop from high to low in the Mg isotope
profile occurs within the chlorite schist. The lowest
d26Mg values are found in Zone IV, whereas the d18Ovalues of Zone III are equally as low as in Zone IV.
Overall, there is no correlation between the d26Mg and
the d18O compositions (Fig. 7).
DISCUSSION
Mg and O isotope fractionation mechanismsA theoretical possibility is that the reaction zone could
have formed at the seafloor prior to subduction.
Chlorite–talc-rich reaction zones and Ca-rich alteration
products (rodingites) have been described from the sea-
floor, where they occur at the contact between mafic
(gabbro) and ultramafic (serpentinite) rocks (Bach et al.,
2013). If the observed chemical and mineralogical suc-cession formed prior to subduction this would mean
that the observed isotopic anomalies would have to be
ascribed to that same pre-subduction process.
However, the reaction zone has equilibrated under
high-pressure metamorphic conditions, as evident from
the mineral assemblages. Also, replacement of garnetand glaucophane by chlorite and phengite shows that
at least part of the metasomatic activity must have
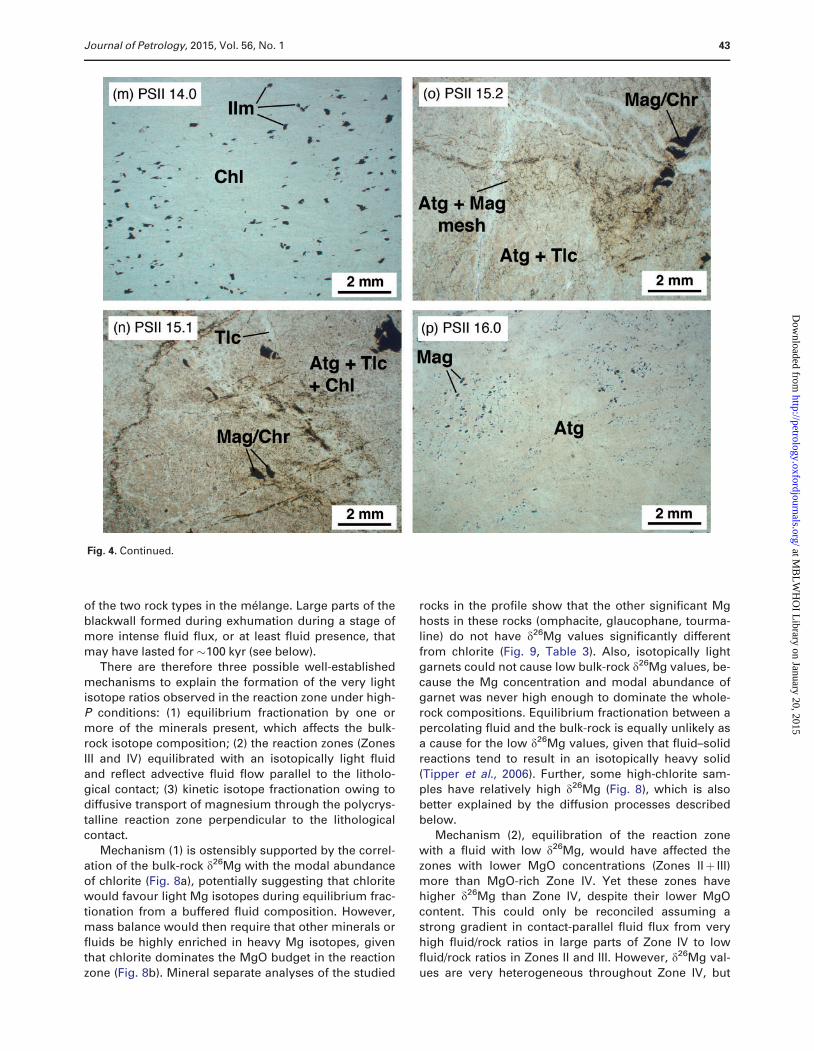
Table 3. Mg isotope ratios of mineral separates
Distancefromcontact (cm)
d25Mg(%)
2SD d26Mg(%)
2SD
A2.1 (Zone III) –28�5Omp –0�15 0�06 –0�29 0�07
rpt –0�16 0�05 –0�30 0�05Chl –0�20 0�05 –0�38 0�04
rpt –0�16 0�03 –0�31 0�05Gln –0�28 0�05 –0�55 0�04
rpt –0�32 0�03 –0�62 0�02A2.2 (Zone II) –31�2Omp –0�09 0�03 –0�20 0�02
rpt –0�11 0�04 –0�24 0�04Chl –0�15 0�03 –0�28 0�02
rpt –0�15 0�03 –0�32 0�02Gln –0�10 0�03 –0�17 0�01
rpt –0�12 0�06 –0�24 0�05Tur –0�03 0�05 –0�06 0�03A4.1 (Zone II) –36�6Chl –0�16 0�02 –0�30 0�02
rpt –0�14 0�05 –0�26 0�03Gln –0�17 0�05 –0�30 0�03
rpt –0�11 0�03 –0�23 0�01Tur –0�01 0�04 –0�04 0�04A7 (Zone I) –69�3Gln –0�17 0�03 –0�30 0�06
rpt –0�15 0�04 –0�30 0�10Chl –0�12 0�02 –0�24 0�03Phe –0�24 0�04 –0�46 0�03Grt –0�90 0�01 –1�72 0�01
rpt –0�83 0�01 –1�61 0�01
40 Journal of Petrology, 2015, Vol. 56, No. 1
at MB
LW
HO
I Library on January 20, 2015
http://petrology.oxfordjournals.org/D
ownloaded from

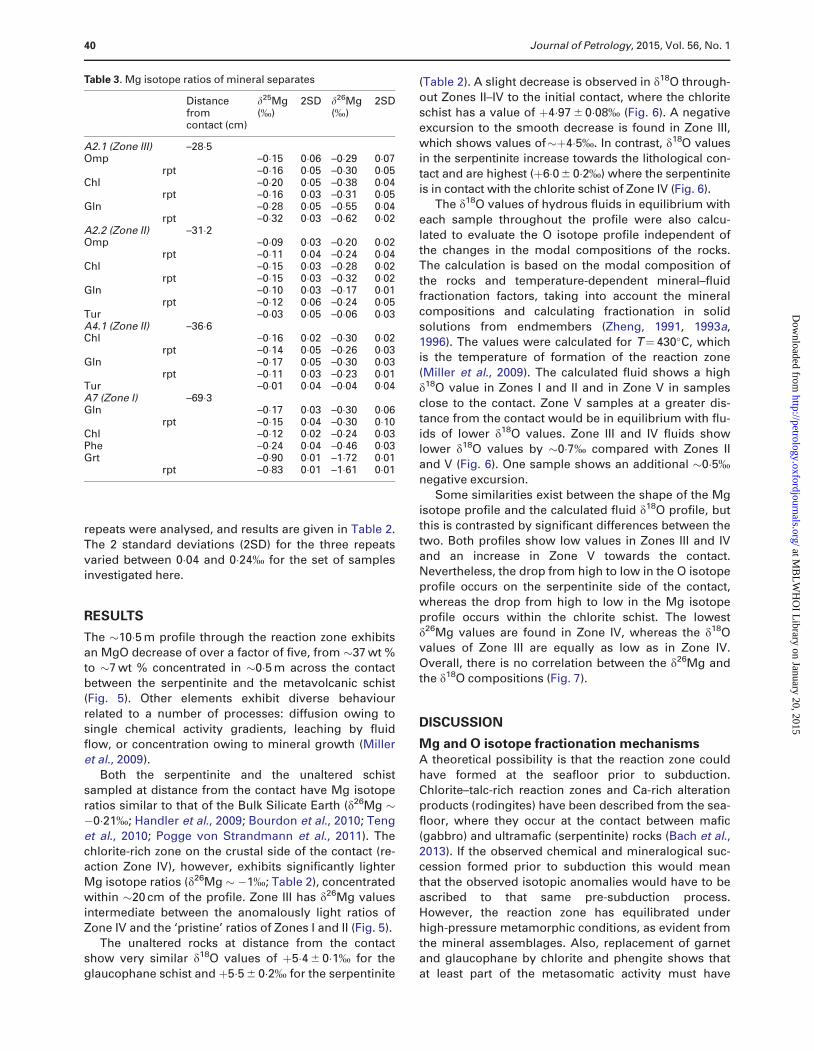
Fig. 4. Photomicrographs depicting the textural and mineralogical changes throughout the reaction zone. All images are orientedeast–west with their long axis parallel to the serpentinite–schist contact; they are all displayed at the same scale, representing11�2 mm�8�3 mm. (Note 2 mm scale bar in all images.) (a) Sample A7.1 (Zone I; �0�693 m; section PSIII) consisting of glaucophane(Gln; blue, prismatic), phengite (Ph; colorless), epidote (Ep; anhedral beige aggregates with high refractive index), ilmenite (Ilm;opaque), rutile (Rt; small, dark) and garnet (Grt; large, sand-colored, subhedral grains with fractures). Incipient chlorite (Chl; green)formation is evident at the margin and within cracks in the garnet blasts. (b) Sample A6.1 (Zone I; �0�447 m; section PSIII) domi-nated by Gln and Ep; chloritization of Grt is more progressed than in A7.1. Ph and Chl are restricted to pseudomorphs after Grt. (c)Sample A5.1 (Zone I; �0�420 m; section PSIII) dominated by Gln and Ep with Grt partially replaced by Chl and Ph. The euhedral Glnintergrown with Chl and Ph in the haloes around Grt should be noted. Chl also appears in the Ep–Gln matrix. (d) Sample A4.1 (ZoneII; �0�366 m; section PSIII) dominated by Gln and Ep, with Grt entirely replaced by Chl and Ph. Rt partially replaced by titanite (Ttn).(e) Sample A2.1 (Zone III; �0�285 m; section PSIII) dominated by Ep, Chl and omphacite (Omp; short prismatic, pale green, high re-fractive index) and minor albite (Ab, colorless). Gln is mostly restricted to pseudomorphs after Grt. (f) Sample 10.1 (Zone III;�0�266 m; section PSI) dominated by Omp, Ep, Chl, Ab and Ttn. Grt pseudomorphs, Ph and Gln are absent. The texture is isotropic.(g) Sample A2.0 (Zone III; �0�258 m; section PSIII) dominated by Chl, Ep, Omp, Ttn and minor Ab. Gln is restricted to some pseudo-morphs after Grt. (h) Sample A1.2 (Zone III–IV; �0�234 m; section PSIII) shows the transition between Zone III and Zone IV. Theupper part of the image (facing sample A2.0 in the profile) shows Ep with Ttn and Chl, whereas the lower part (facing sample A1.1in the profile) consists of Chl and Ttn with minor Ab and apatite (Ap; colorless). (i) Sample A1.1 (Zone IV; �0�204 m; section PSIII)consists of Chl, Ttn, Rt and Ap. (j) Sample 12.0 (Zone IV; �0�199 m; section PSII) consists of Chl, Ttn, Rt and Ap. (k) Sample 13.2(Zone IV; �0�074 m; section PSII) consists of Chl, Rt and Ap. This sample shows a reduced grain size and stronger foliation com-pared with sample 12.0. (l) Sample 13.4 (Zone IV; �0�037 m; section PSII) consists of Chl, an opaque phase (Ilm?), Rt and Ap. (m)Sample 14.0 (Zone IV; �0�010 m; section PSII) consists of Chl and an opaque phase (Ilm?). The decrease in color intensity of the Chlfrom 12.0 to 14.0, owing to an increase in Mg/Fe ratio towards the serpentinite, should be noted. (n) Sample 15.1 (Zone V;þ0�017 m; section PSII) consists of antigorite serpentine (Atg), talc (Tlc), Chl and opaque phases (magnetite, chromite?). (o) Sample15.2 (Zone V; þ0�044 m; section PSII) consists of Atg, Tlc, Mag and chromite. An Atg–Mag mesh texture is visible in the central andlower left parts of the image, which is typical of undeformed, serpentinized peridotite. (p) Sample 16.0 (Zone V; þ0�071 m; sectionPSII) consists of Atg and an opaque phase (magnetite?).
Journal of Petrology, 2015, Vol. 56, No. 1 41
at MB
LW
HO
I Library on January 20, 2015
http://petrology.oxfordjournals.org/D
ownloaded from

occurred after the rocks had reached their peak meta-
morphic P–T conditions. Metasomatic activity at condi-
tions of 430�C and 1�2 GPa is evident from the
recrystallized assemblage. Large, metasomatic tourma-line intergrown with omphacite and other high-P black-
wall minerals are further evidence for the high-pressure
metasomatic activity. However, no evidence can be pre-
sented to disprove the possibility that some of the
chemical exchange between serpentinite and metavol-
canic rocks had already occurred prior to subduction.Nevertheless, we consider this unlikely for the following
reasons: the unaltered, mantle-like d18O value of the
serpentinite argues against seafloor serpentinization, as
seafloor alteration typically leads to a strong decrease
or increase of d18O (depending on temperature) and to
the formation of large talc or rodingite zones (Bach
et al., 2013). In addition, the preserved mesh texture in
the serpentinite shows that the ultramafic rock was notsubjected to penetrative deformation after serpentiniza-
tion of the peridotite precursor, and hence argues for a
relatively late stage of serpentinization. A possible
source of peridotite in the Syros melange sequence is
the mantle wedge above the subducting slab (Miller
et al., 2009; Marschall & Schumacher, 2012). This inter-pretation would suggest that the metavolcanic rock and
the peridotite were tectonically juxtaposed, possibly at
peak pressure conditions (2�0 GPa), followed by ser-
pentinization of the peridotite and mutual exhumation
Fig. 4. Continued.
42 Journal of Petrology, 2015, Vol. 56, No. 1
at MB
LW
HO
I Library on January 20, 2015
http://petrology.oxfordjournals.org/D
ownloaded from
of the two rock types in the melange. Large parts of the
blackwall formed during exhumation during a stage of
more intense fluid flux, or at least fluid presence, that
may have lasted for �100 kyr (see below).
There are therefore three possible well-established
mechanisms to explain the formation of the very lightisotope ratios observed in the reaction zone under high-
P conditions: (1) equilibrium fractionation by one or
more of the minerals present, which affects the bulk-
rock isotope composition; (2) the reaction zones (Zones
III and IV) equilibrated with an isotopically light fluid
and reflect advective fluid flow parallel to the litholo-
gical contact; (3) kinetic isotope fractionation owing todiffusive transport of magnesium through the polycrys-
talline reaction zone perpendicular to the lithological
contact.
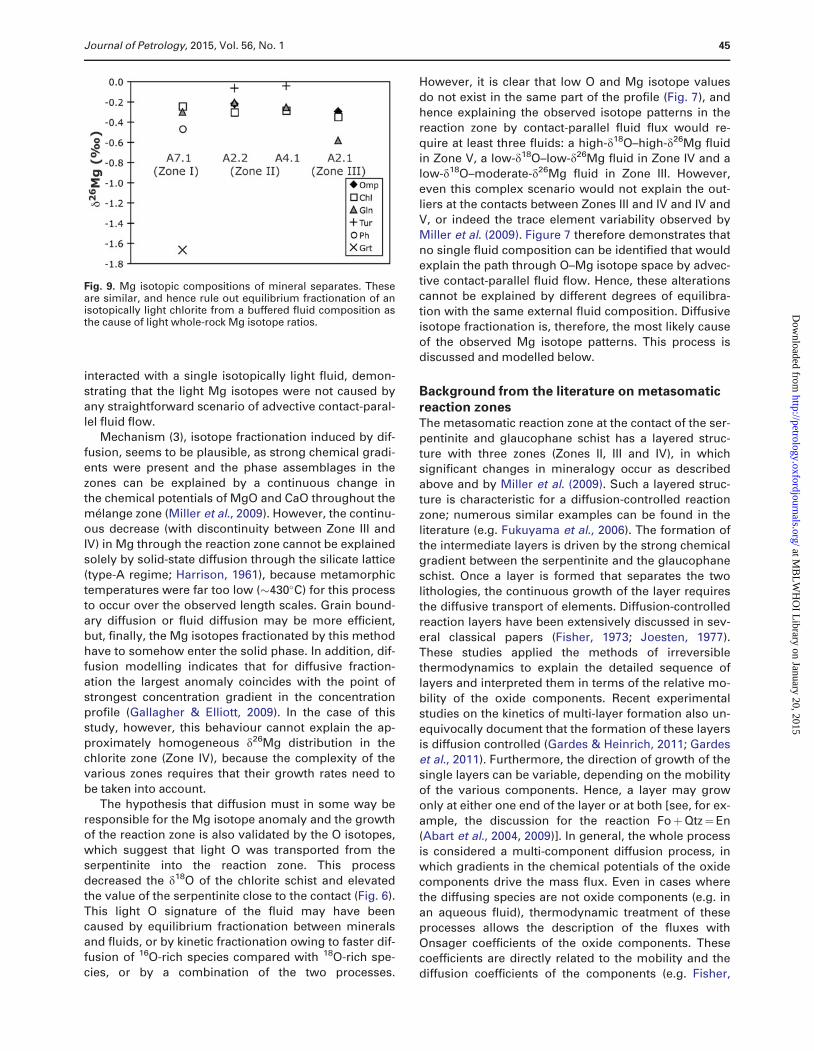
Mechanism (1) is ostensibly supported by the correl-
ation of the bulk-rock d26Mg with the modal abundance
of chlorite (Fig. 8a), potentially suggesting that chloritewould favour light Mg isotopes during equilibrium frac-
tionation from a buffered fluid composition. However,
mass balance would then require that other minerals or
fluids be highly enriched in heavy Mg isotopes, given
that chlorite dominates the MgO budget in the reaction
zone (Fig. 8b). Mineral separate analyses of the studied
rocks in the profile show that the other significant Mg
hosts in these rocks (omphacite, glaucophane, tourma-
line) do not have d26Mg values significantly different
from chlorite (Fig. 9, Table 3). Also, isotopically light
garnets could not cause low bulk-rock d26Mg values, be-
cause the Mg concentration and modal abundance ofgarnet was never high enough to dominate the whole-
rock compositions. Equilibrium fractionation between a
percolating fluid and the bulk-rock is equally unlikely as
a cause for the low d26Mg values, given that fluid–solid
reactions tend to result in an isotopically heavy solid
(Tipper et al., 2006). Further, some high-chlorite sam-
ples have relatively high d26Mg (Fig. 8), which is alsobetter explained by the diffusion processes described
below.
Mechanism (2), equilibration of the reaction zone
with a fluid with low d26Mg, would have affected the
zones with lower MgO concentrations (Zones IIþ III)
more than MgO-rich Zone IV. Yet these zones havehigher d26Mg than Zone IV, despite their lower MgO
content. This could only be reconciled assuming a
strong gradient in contact-parallel fluid flux from very
high fluid/rock ratios in large parts of Zone IV to low
fluid/rock ratios in Zones II and III. However, d26Mg val-
ues are very heterogeneous throughout Zone IV, but
Fig. 4. Continued.
Journal of Petrology, 2015, Vol. 56, No. 1 43
at MB
LW
HO
I Library on January 20, 2015
http://petrology.oxfordjournals.org/D
ownloaded from

they vary systematically as a function of distance from
the contact. They do not show a constant value as
would be expected from complete equilibration of this
zone with an external fluid. In fact, the sample closest to
the contact has a higher d26Mg value than the initial
value. In addition, to explain the O isotope patterns, thisfluid would also have had to have low d18O values, yet
low d26Mg and low d18O are observed in different zones.
Zones III and IV would have to be in equilibrium with a
fluid with a d18O of �þ3�8% (with one lower outlier at
�þ3�2%). Zones III and IV were apparently both affected
by enough fluid flow to completely equilibrate thewhole-rocks with the fluid for oxygen isotopes.
However, it should be noted that Mg isotopes in Zone III
are not as low as in Zone IV, despite the much lower
MgO abundance, which should have facilitated the
isotopic overprint. Also, in this model, a second,
high-d18O–high-d26Mg fluid would be required to ex-
plain the isotopically heavy signatures in Zone V in thevicinity of the contact. The combined d18O and d26Mg
data hence show that the reaction zone cannot have
Fig. 5. Profile across the reaction zone for MgO and d26Mg.Mass balance d26Mg was calculated using constant silicate andfluid d26Mg, and varying the silicate MgO (see text for details).Zone divisions and their mineralogy are from Miller et al.(2009), and are described in the text.
Fig. 6. O isotopic composition of whole-rock samples throughthe reaction zone (green) and calculated hydrous fluid in equi-librium with measured whole-rock values (red). Mg isotopeprofile (blue) displayed for comparison. The green and bluehorizontal bars depict the initial compositions of the rocks priorto the formation of the reaction zone.
Fig. 7. Whole-rock O vs Mg isotopic compositions of samplesfrom the various petrographic zones connected by arrowedlines in order of their position along the profile. Unaltered ser-pentinites of Zone V and glaucophane schist of Zone I havevery similar d18O and d26Mg values, and no correlation existsbetween O and Mg isotopes throughout the profile.
Fig. 8. (a) Correlation of bulk silicate d26Mg with wt % chloritein the rock; (b) correlation of chlorite wt % vs MgO. Deviationsfrom linear trends of % chlorite with d26Mg and MgO suggestthat diffusion is operating (see text for details).
44 Journal of Petrology, 2015, Vol. 56, No. 1
at MB
LW
HO
I Library on January 20, 2015
http://petrology.oxfordjournals.org/D
ownloaded from
interacted with a single isotopically light fluid, demon-
strating that the light Mg isotopes were not caused by
any straightforward scenario of advective contact-paral-
lel fluid flow.Mechanism (3), isotope fractionation induced by dif-
fusion, seems to be plausible, as strong chemical gradi-
ents were present and the phase assemblages in the
zones can be explained by a continuous change in
the chemical potentials of MgO and CaO throughout the
melange zone (Miller et al., 2009). However, the continu-ous decrease (with discontinuity between Zone III and
IV) in Mg through the reaction zone cannot be explained
solely by solid-state diffusion through the silicate lattice
(type-A regime; Harrison, 1961), because metamorphic
temperatures were far too low (�430�C) for this process
to occur over the observed length scales. Grain bound-
ary diffusion or fluid diffusion may be more efficient,but, finally, the Mg isotopes fractionated by this method
have to somehow enter the solid phase. In addition, dif-
fusion modelling indicates that for diffusive fraction-
ation the largest anomaly coincides with the point of
strongest concentration gradient in the concentration
profile (Gallagher & Elliott, 2009). In the case of thisstudy, however, this behaviour cannot explain the ap-
proximately homogeneous d26Mg distribution in the
chlorite zone (Zone IV), because the complexity of the
various zones requires that their growth rates need to
be taken into account.
The hypothesis that diffusion must in some way be
responsible for the Mg isotope anomaly and the growthof the reaction zone is also validated by the O isotopes,
which suggest that light O was transported from the
serpentinite into the reaction zone. This process
decreased the d18O of the chlorite schist and elevated
the value of the serpentinite close to the contact (Fig. 6).
This light O signature of the fluid may have beencaused by equilibrium fractionation between minerals
and fluids, or by kinetic fractionation owing to faster dif-
fusion of 16O-rich species compared with 18O-rich spe-
cies, or by a combination of the two processes.
However, it is clear that low O and Mg isotope values
do not exist in the same part of the profile (Fig. 7), and
hence explaining the observed isotope patterns in the
reaction zone by contact-parallel fluid flux would re-
quire at least three fluids: a high-d18O–high-d26Mg fluidin Zone V, a low-d18O–low-d26Mg fluid in Zone IV and a
low-d18O–moderate-d26Mg fluid in Zone III. However,
even this complex scenario would not explain the out-
liers at the contacts between Zones III and IV and IV and
V, or indeed the trace element variability observed by
Miller et al. (2009). Figure 7 therefore demonstrates that
no single fluid composition can be identified that wouldexplain the path through O–Mg isotope space by advec-
tive contact-parallel fluid flow. Hence, these alterations
cannot be explained by different degrees of equilibra-
tion with the same external fluid composition. Diffusive
isotope fractionation is, therefore, the most likely cause
of the observed Mg isotope patterns. This process isdiscussed and modelled below.
Background from the literature on metasomaticreaction zonesThe metasomatic reaction zone at the contact of the ser-
pentinite and glaucophane schist has a layered struc-
ture with three zones (Zones II, III and IV), in whichsignificant changes in mineralogy occur as described
above and by Miller et al. (2009). Such a layered struc-
ture is characteristic for a diffusion-controlled reaction
zone; numerous similar examples can be found in the
literature (e.g. Fukuyama et al., 2006). The formation of
the intermediate layers is driven by the strong chemicalgradient between the serpentinite and the glaucophane
schist. Once a layer is formed that separates the two
lithologies, the continuous growth of the layer requires
the diffusive transport of elements. Diffusion-controlled
reaction layers have been extensively discussed in sev-
eral classical papers (Fisher, 1973; Joesten, 1977).
These studies applied the methods of irreversiblethermodynamics to explain the detailed sequence of
layers and interpreted them in terms of the relative mo-
bility of the oxide components. Recent experimental
studies on the kinetics of multi-layer formation also un-
equivocally document that the formation of these layers
is diffusion controlled (Gardes & Heinrich, 2011; Gardeset al., 2011). Furthermore, the direction of growth of the
single layers can be variable, depending on the mobility
of the various components. Hence, a layer may grow
only at either one end of the layer or at both [see, for ex-
ample, the discussion for the reaction FoþQtz¼En
(Abart et al., 2004, 2009)]. In general, the whole process
is considered a multi-component diffusion process, inwhich gradients in the chemical potentials of the oxide
components drive the mass flux. Even in cases where
the diffusing species are not oxide components (e.g. in
an aqueous fluid), thermodynamic treatment of these
processes allows the description of the fluxes with
Onsager coefficients of the oxide components. Thesecoefficients are directly related to the mobility and the
diffusion coefficients of the components (e.g. Fisher,
Fig. 9. Mg isotopic compositions of mineral separates. Theseare similar, and hence rule out equilibrium fractionation of anisotopically light chlorite from a buffered fluid composition asthe cause of light whole-rock Mg isotope ratios.
Journal of Petrology, 2015, Vol. 56, No. 1 45
at MB
LW
HO
I Library on January 20, 2015
http://petrology.oxfordjournals.org/D
ownloaded from
1973). For the present case it was shown by Miller et al.
(2009) that the mineralogical sequence found within the
reaction zone can be explained at isobaric, isothermal
conditions by continuously varying the chemical poten-
tial of MgO and CaO (at T¼ 430�C and P¼1�2 GPa) andtherefore the single reaction zones (or each point across
the zone on a thin-section scale) reflect local equilib-
rium. However, it should be noted that this does not ne-
cessarily imply that MgO and CaO are mobile
components in this reaction zone. An additional com-
plexity here compared with the cases discussed in the
classical literature is that the reaction zone is apparentlyan open system, as is indicated by the enrichment of
fluid-mobile elements such as Li and B and depletion of
LILE and Si. There are new models available that con-
sider open-system fluxes in reaction zones (e.g.
Ashworth & Birdi, 1990). However, the aim of this study
is not to decipher the kinetics of the reaction zone in fulldetail. Instead, it focuses on implications for the frac-
tionation of stable isotopes. We, therefore, give a sim-
plified scenario for the formation of Zones II–IV in which
isotope fractionation is observed.
Reaction mechanismsAs mentioned above, there are, in principle, various
possibilities for each of the reactions occurring at the
layer interfaces, which determine the direction of the
layer growth. The reactions at the interfaces in turn arecoupled to the relative mobility of the oxide compo-
nents. Here we assume that MgO, CaO, Na2O and H2O
are the more mobile components across the reaction
zone and, in addition, assume that the chemical poten-
tial of SiO2 and perhaps other components such as K2O
are buffered or at least affected by the fluid in this par-
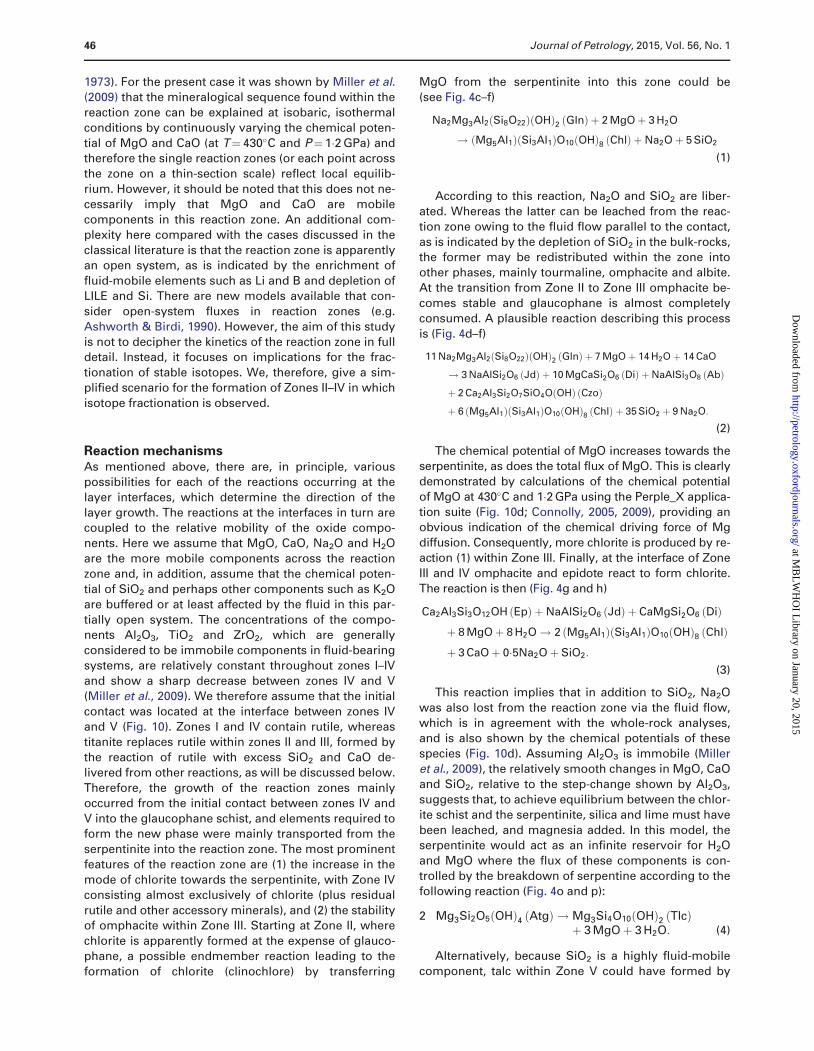
tially open system. The concentrations of the compo-nents Al2O3, TiO2 and ZrO2, which are generally
considered to be immobile components in fluid-bearing
systems, are relatively constant throughout zones I–IV
and show a sharp decrease between zones IV and V
(Miller et al., 2009). We therefore assume that the initial
contact was located at the interface between zones IVand V (Fig. 10). Zones I and IV contain rutile, whereas
titanite replaces rutile within zones II and III, formed by
the reaction of rutile with excess SiO2 and CaO de-
livered from other reactions, as will be discussed below.
Therefore, the growth of the reaction zones mainly
occurred from the initial contact between zones IV and
V into the glaucophane schist, and elements required toform the new phase were mainly transported from the
serpentinite into the reaction zone. The most prominent
features of the reaction zone are (1) the increase in the
mode of chlorite towards the serpentinite, with Zone IV
consisting almost exclusively of chlorite (plus residual
rutile and other accessory minerals), and (2) the stabilityof omphacite within Zone III. Starting at Zone II, where
chlorite is apparently formed at the expense of glauco-
phane, a possible endmember reaction leading to the
formation of chlorite (clinochlore) by transferring
MgO from the serpentinite into this zone could be
(see Fig. 4c–f)
Na2Mg3Al2ðSi8O22ÞðOHÞ2 Glnð Þ þ 2 MgOþ 3 H2O
! Mg5Al1Þ Si3Al1ð ÞO10ðOHð Þ8 Chlð Þ þNa2Oþ 5 SiO2
(1)
According to this reaction, Na2O and SiO2 are liber-
ated. Whereas the latter can be leached from the reac-
tion zone owing to the fluid flow parallel to the contact,
as is indicated by the depletion of SiO2 in the bulk-rocks,the former may be redistributed within the zone into
other phases, mainly tourmaline, omphacite and albite.
At the transition from Zone II to Zone III omphacite be-
comes stable and glaucophane is almost completely
consumed. A plausible reaction describing this process
is (Fig. 4d–f)
11 Na2Mg3Al2ðSi8O22ÞðOHÞ2 Glnð Þ þ 7 MgOþ 14 H2Oþ 14 CaO
! 3 NaAlSi2O6 Jdð Þ þ 10 MgCaSi2O6 Dið Þ þNaAlSi3O8 Abð Þ
þ 2 Ca2Al3Si2O7SiO4O OHð Þ Czoð Þ
þ 6 ðMg5Al1ÞðSi3Al1ÞO10ðOHÞ8 Chlð Þ þ 35 SiO2 þ 9 Na2O:
(2)
The chemical potential of MgO increases towards the
serpentinite, as does the total flux of MgO. This is clearly
demonstrated by calculations of the chemical potential
of MgO at 430�C and 1�2 GPa using the Perple_X applica-
tion suite (Fig. 10d; Connolly, 2005, 2009), providing anobvious indication of the chemical driving force of Mg
diffusion. Consequently, more chlorite is produced by re-
action (1) within Zone III. Finally, at the interface of Zone
III and IV omphacite and epidote react to form chlorite.
The reaction is then (Fig. 4g and h)
Ca2Al3Si3O12OH Epð Þ þNaAlSi2O6 Jdð Þ þ CaMgSi2O6 Dið Þ
þ 8 MgOþ 8 H2O! 2 ðMg5Al1ÞðSi3Al1ÞO10ðOHÞ8 Chlð Þ
þ 3 CaOþ 0�5Na2Oþ SiO2:
(3)
This reaction implies that in addition to SiO2, Na2O
was also lost from the reaction zone via the fluid flow,
which is in agreement with the whole-rock analyses,and is also shown by the chemical potentials of these
species (Fig. 10d). Assuming Al2O3 is immobile (Miller
et al., 2009), the relatively smooth changes in MgO, CaO
and SiO2, relative to the step-change shown by Al2O3,
suggests that, to achieve equilibrium between the chlor-
ite schist and the serpentinite, silica and lime must have
been leached, and magnesia added. In this model, theserpentinite would act as an infinite reservoir for H2O
and MgO where the flux of these components is con-
trolled by the breakdown of serpentine according to the
following reaction (Fig. 4o and p):
2 Mg3Si2O5ðOHÞ4 Atgð Þ !Mg3Si4O10ðOHÞ2 Tlcð Þþ 3 MgOþ 3 H2O: (4)
Alternatively, because SiO2 is a highly fluid-mobile
component, talc within Zone V could have formed by
46 Journal of Petrology, 2015, Vol. 56, No. 1
at MB
LW
HO
I Library on January 20, 2015
http://petrology.oxfordjournals.org/D
ownloaded from
reaction of aqueous SiO2 with serpentine, as follows:
Mg3Si2O5ðOHÞ4 Atgð Þ þ 2 SiO2
!Mg3Si4O10ðOHÞ2 Tlcð Þ þ H2O: (5)
Alternatively, chlorite in Zone IV could have formedby the breakdown of serpentine according to the follow-
ing reaction:
2 Mg3Si2O5ðOHÞ4 Atgð Þ þ Al2O3
! ðMg5Al1ÞðSi3Al1ÞO10ðOHÞ8 Chlð Þ þMgOþ SiO2: (6)
However, this would require an influx of Al2O3, andthis would also imply that chlorite in Zone IV had grown
into the serpentinite zone, which is inconsistent with the
immobile element pattern across the reaction zone.
So far we have considered only the flux of compo-
nents through the intergranular fluid, implicitly assum-
ing an interconnected fluid network in the rock. In the
next section we give arguments that other diffusion
pathways in the rock can be ignored as they are
insignificant.
Diffusion pathways and efficiencyWithin the reaction layers, which consist of polycrystal-
line and multi-phase material, there are various diffu-
sion pathways available (e.g. Watson & Baxter, 2007;
Dohmen & Milke, 2010). For the present purpose wecan broadly classify them into three types: lattice diffu-
sion (i.e. diffusion within the grain interiors), grain
Fig. 10. (a) Distribution of the present metamorphic zones with respect to the serpentinite contact. (b) Relative Mg concentrationsand mineral assemblages at t¼0. (c) Relative Mg concentrations and mineral assemblages as diffusion progresses. (d) Variation ofchemical potentials (m) of MgO, Al2O3 and SiO2 for compositions along the measured profile.
Journal of Petrology, 2015, Vol. 56, No. 1 47
at MB
LW
HO
I Library on January 20, 2015
http://petrology.oxfordjournals.org/D
ownloaded from

boundary diffusion (i.e. diffusion along mineral–mineral
contacts), and fluid diffusion (i.e. diffusion along water-
rich fluid present in grain edges and pores). We assume
that the fluid is interconnected and forms a network for
diffusive transport through the bulk-rocks (Watson,1991). Here we discuss the potentially most efficient dif-
fusion pathway and estimate a diffusion coefficient for
Mg.
Diffusion within the grain boundaries and through
the fluid can be generally considered as many orders of
magnitude faster than lattice diffusion (e.g. Watson &
Baxter, 2007). For the present system we have to con-sider a relatively low temperature (�430�C; Miller et al.,
2009) at which diffusion within the lattice is usually ex-
tremely sluggish. Experimental data for diffusion of the
relevant elements (e.g. Mg, O, Si) are rare for the min-
erals of interest but we give a few numerical examples
here to illustrate the insignificance of diffusive transportthrough the mineral grains. For example, the tracer dif-
fusion coefficient of Mg for pure diopside (Zhang et al.,
2010) can be used as an estimate for omphacite, from
which we obtain Dl¼3�1� 10–27 m2 s–1 at 400�C. To our
knowledge there are no relevant diffusion data available
for chlorite, epidote, antigorite, talc, and tourmaline. Toconsider another value, we have calculated Dl of Sr in
albite from the Arrhenius relationship (Cherniak, 1996),
which gives 1�19� 10–26 m2 s–1 at 400�C. From these
two numbers we can infer that even after 100 kyr the
diffusion penetration distance of Mg within the minerals
is of the order of (or maybe less than) a few nano-
meters, which strongly indicates that diffusive ex-change within the mineral volumes can be ignored and
that significant mass transport is confined to fluid-filled
channels.
However, whether or not the diffusive flux through
these media is more efficient for a given element also
depends—for simple mass-balance reasons—on theirvolume fraction and on the relative concentrations of
the element (Dohmen & Chakraborty, 2003; Dohmen &
Milke, 2010). Even in cases where the lattice diffusion
coefficient is small, the leakage flux from the fluid or the
grain boundary into the adjacent mineral can be signifi-
cant. Mass transport along dry grain boundaries is not
much more efficient than through the mineral lattices,owing to the very small volume fraction of grain boun-
daries—with the exception of highly incompatible elem-
ents (Dohmen & Milke, 2010). The solubility of Mg (and
other elements) in the fluid has, therefore, an additional
control on its mobility during diffusive mass transfer.
We apply a grain boundary diffusion model (Mishin &Herzig, 1995) to estimate whether the leakage flux into
the minerals can be ignored. The segregation of elem-
ents into the grain boundaries (equivalent to a partition
coefficient) is explicitly considered, as an extension of
the classification scheme of Harrison (1961). According
to this model the bulk diffusivity is dominated by
grain-boundary diffusion (Dohmen & Milke 2010, fig. 8),if s(d/2d)(Dgb/Dl) � 1, where s denotes the segregation
coefficient, d the grain size, and d the grain boundary
width. Because the mathematics would be equivalent if
we replaced the grain boundary diffusion medium by a
fluid diffusion medium, we set Dgb¼Dfluid¼10–8–10–9
m2 s–1 for Mg2þ (Oelkers & Helgeson, 1988) for a tem-
perature of �400�C and a pressure of 0�5 GPa.The width of the fluid channel (the geometry of the
grain boundary triple junction) is of the order of 1mm,
and significantly larger than a grain boundary width,
which is generally estimated to be a few nanometers.
The least-known parameter here is the fluid–mineral
partition coefficient of Mg. Here we use solubilities of
Mg reported by Manning (2004) as proxies: 100 mmolkg�1 H2O for Zone V and 5 mmol kg�1 H2O in Zone I.
From the MgO contents and the bulk-rock densities re-
ported by Miller et al. (2009) we can derive a fluid to
bulk-rock partition coefficient for Mg of the order of
10–3. Using this number, we obtain values for s(d/2)(Dgb/
Dl) of the order of 1010, indicating that even on the basisof our poorly constrained parameters we can ignore the
contribution of lattice diffusion to the bulk flux. We can
further conclude that lattice diffusion would be a very
inefficient process for the exchange of Mg isotopes be-
tween the fluid and chlorite.
The time necessary to form the reaction zone can becalculated from the integrated flux of MgO required, as
is performed in our diffusion model. Because the fluid
network is the dominant diffusion pathway, the inte-
grated flux of MgO, leading to the formation of the vari-
ous layers, depends on five factors: the chemical
gradient, the diffusion coefficient and the solubility of
Mg in the fluid, the volume fraction or cross-sectionalarea of the fluid channel, and finally the total time until
the system was frozen. The solubility of Mg depends on
many factors, such as temperature and pH, and can be
in fact very small [e.g. see thermodynamic calculations
for a granulite phase assemblage of Dohmen &
Chakraborty (2003)]. In contrast, the diffusion coeffi-cients of aqueous species in fluids are fairly similar and
show a very weak temperature dependence (Oelkers &
Helgeson, 1988; Watson & Baxter, 2007). Consequently,
the different relative mobilities and integrated fluxes of
the various oxide components are caused by their dif-
ferent fluid solubilities (Frantz & Mao, 1976; Ketcham &
Carlson, 2012). The LILE and SiO2 are therefore themost mobile components, even if the system is con-
trolled by diffusive flux only and not by advective flux.
The present sequence in the metasomatic reaction zone
indicates that Mg was mobile, but Si, Ca and Na were
even more mobile. In contrast, Ti and Al were almost
immobile. Hence, we can conclude that Mg was muchmore soluble than Al or Ti but less soluble than Si, Na
and Ca. This can be demonstrated by mass balance,
based on the assumption that Al2O3 is immobile (Miller
et al., 2009). The calculation results in a 50% depletion
of SiO2 and an enrichment of 300–500% in MgO in the
chlorite schist, as well as an enrichment of CaO to 140%
in Zone II and 200% in Zone III. Further, the total massof elements lost or gained from Zones II, III and IV can
be calculated using the rock densities, the thickness of
48 Journal of Petrology, 2015, Vol. 56, No. 1
at MB
LW
HO
I Library on January 20, 2015
http://petrology.oxfordjournals.org/D
ownloaded from
each zone, and the mass loss or gain of each element
using the composition of the protolith (Zone I). The re-
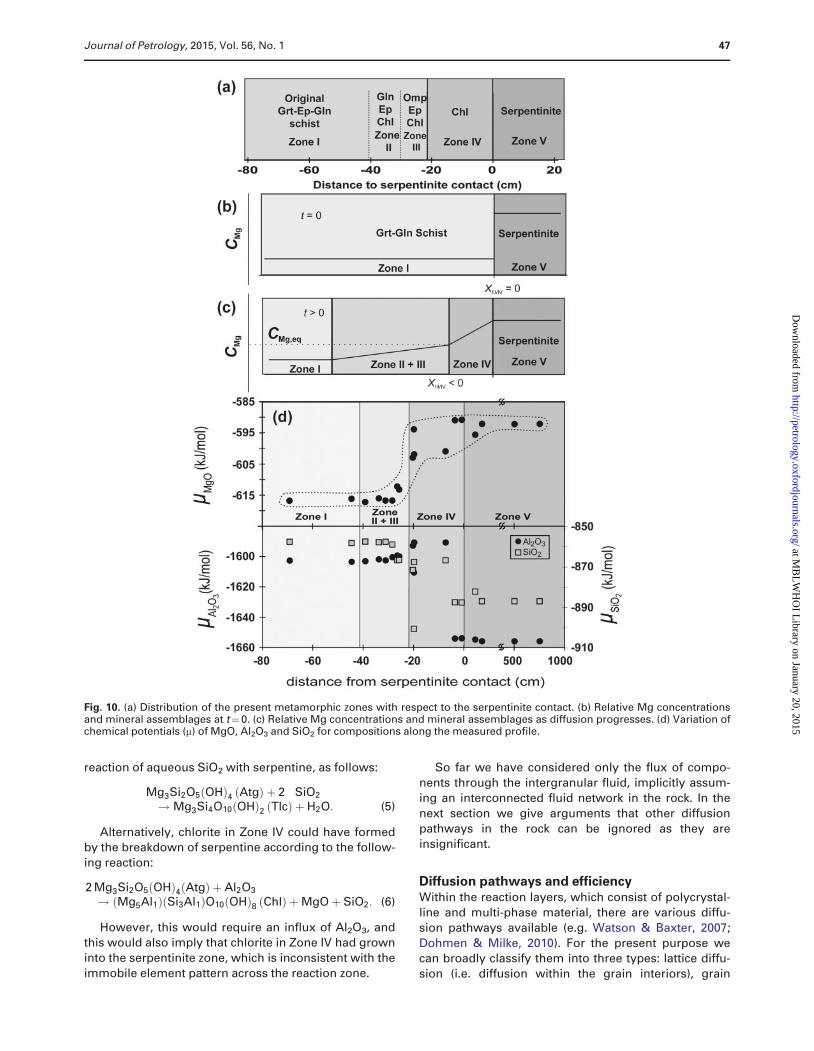
sults show that a total of 203 kg m–2 SiO2 was lost from
the 40 cm thick blackwall (Zones II–IV), and 125 kg m–2
MgO was gained (Fig. 11). From the reactions Atgþ2SiO2¼TlcþH2O and 2Atg¼Tlcþ3MgOþ 3H2O, the
release of this amount of SiO2 and MgO could lead to
the formation of an 18–22 cm thick layer of talc each.
Thus, in a closed system with no contact-parallel fluid
transport, there should be a talc layer �40 cm thick, ra-
ther than the millimeter-thick layer actually observed.
This strongly suggests that Si was leached from theblackwall by advecting fluids, requiring the dissolution
of serpentine, by the reaction Atg¼3MgOþ 2SiO2þ2H2O. To produce 125 kg m–2 MgO, therefore, an
�11 cm thick layer of serpentine would require dissol-
ution, providing 37 kg m–2 of H2O. However, the black-
wall gained 46 kg m–2 of H2O, meaning that externalinflux of H2O is required.
Constraints for the origin of the d26Mg anomalyTo explain the observed d26Mg values, interaction be-
tween fluid and minerals in the reaction zone must have
been confined to certain zones, with attainment of only
local equilibrium. This strongly points to kinetic controlson fluid–mineral exchange in the reaction zone. Grain-
boundary network diffusion would (in contrast to purely
advective fluid flux) create an isotopically heteroge-
neous fluid. This case can be further subdivided into
two different situations depending on the mechanism
of equilibration: (1) equilibration with the fluid occursduring the reaction by mineral replacement (Putnis,
2009); (2) equilibration with the fluid postdates the for-
mation of the minerals and occurs by diffusion through
the mineral volumes. The discussion above on diffusion
coefficients for the minerals argues against the latter
possibility. However, these two cases would imply dif-
ferent constraints for the amount and local distributionof the fluid as a function of time. In both cases, the
d26Mg profile across the reaction zone would reflect the
Mg isotope composition of the fluid (i.e. bulk-rock
d26Mg would mirror fluid d26Mg), given that the major
mineral hosts of Mg in the reaction zone do not show
Mg isotopic fractionation amongst each other [similarto other studies of the offset between such minerals (Li
et al., 2011); Fig. 9]. Assuming local isotopic equilibrium
between the fluid and the minerals this would imply for
case (2) that the spatial distribution of d26Mg in the fluid
was identical to that finally obtained across the different
zones. Because the low-d26Mg zone is located within the
dominant metasomatic zone, it seems more likely thatboth the formation of the reaction zone and the nega-
tive anomaly were created by the same process and at
the same time. In this case [case (1)] only those min-
erals would be affected that are newly formed by the
mineral replacement reaction in the presence of fluid.
The isotopic composition of these minerals would resultfrom the mass balance with the fluid as defined by the
reaction stoichiometry. For example, considering
reaction (3), 1 MgO from diopside is combined with 8
MgO from the fluid to form chlorite. Thus, the Mg iso-
tope composition of the chlorite is dominated by the
fluid, which can be supported by a more detailed mass-balance calculation: we assume that the growth of
chlorite and omphacite is produced by the uptake of
MgO from the fluid at the layer contacts as discussed
above. The isotopic composition of the newly formed
minerals is then the result of the mass balance between
the reaction partners. Assuming a constant and lowd26Mg value for the fluid and a constant but relatively
high d26Mg value of the solid reactants (as given by the
garnet–glaucophane schist, ��0�2%) the resulting com-
position at each point along the profile can be calcu-
lated using the amount of MgO to be added from the
fluid to reach the measured MgO content (Fig. 5):
d 26Mgfinal ¼ ðMgOinitial=MgOfinalÞ d 26Mgsolid
þððMgOfinal–MgOinitialÞ=MgOfinalÞd 26Mgfluid:
This model results in good agreement with the
observed d26Mg profile when we assume d26Mgfluid¼–1�2% (Fig. 5). In this case, MgO has been transferred
from the serpentinite zone through the fluid network
Fig. 11. Mass-balance plot showing the relative influence ofvariation of whole-rock MgO, SiO2 and CaO abundances in thereaction zone normalized to the Al2O3 abundance of the proto-lith as represented by sample PSIII-A7 (–69�3 cm). SiO2 andCaO are significantly depleted in Zone IV relative to Al2O3,whereas MgO shows a steady increase throughout Zones IIIand IV. The different scales for MgO (right axis) and SiO2 andCaO (left axis) should be noted. The element abundances inthe serpentinite (Zone V) are shown relative to their averageabundances in the samples at 5 m and 10 m distance from thecontact, but not normalized to their Al2O3 content owing to thelow Al content of serpentinite. The arrows at the top depictbulk removal of silica from the profile with an increasingamount from Zone II to III to IV. The numerical values are givenin kg per square meter of reaction zone cross-section. CaO andMgO show a dominant flux across the reaction zone and val-ues are given for the mass transfer at the boundaries betweenadjacent zones.
Journal of Petrology, 2015, Vol. 56, No. 1 49
at MB
LW
HO
I Library on January 20, 2015
http://petrology.oxfordjournals.org/D
ownloaded from
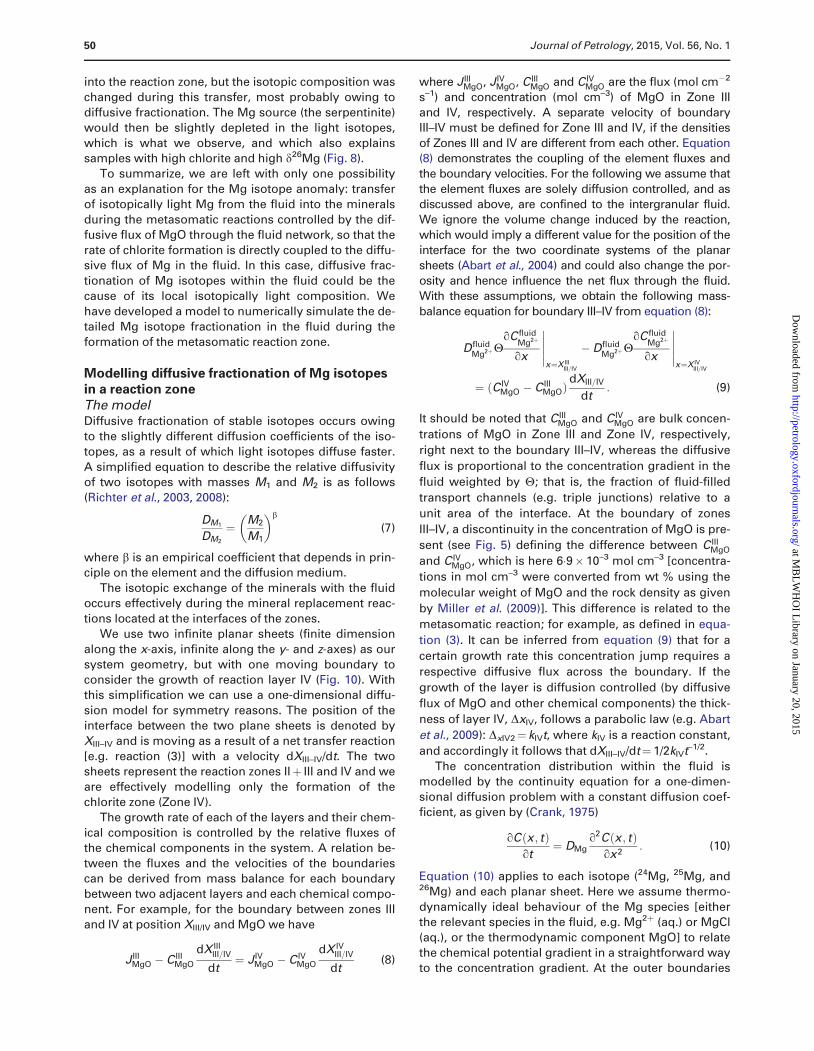
into the reaction zone, but the isotopic composition was
changed during this transfer, most probably owing to
diffusive fractionation. The Mg source (the serpentinite)
would then be slightly depleted in the light isotopes,
which is what we observe, and which also explainssamples with high chlorite and high d26Mg (Fig. 8).
To summarize, we are left with only one possibility
as an explanation for the Mg isotope anomaly: transfer
of isotopically light Mg from the fluid into the minerals
during the metasomatic reactions controlled by the dif-
fusive flux of MgO through the fluid network, so that the
rate of chlorite formation is directly coupled to the diffu-sive flux of Mg in the fluid. In this case, diffusive frac-
tionation of Mg isotopes within the fluid could be the
cause of its local isotopically light composition. We
have developed a model to numerically simulate the de-
tailed Mg isotope fractionation in the fluid during the
formation of the metasomatic reaction zone.
Modelling diffusive fractionation of Mg isotopesin a reaction zoneThe modelDiffusive fractionation of stable isotopes occurs owing
to the slightly different diffusion coefficients of the iso-
topes, as a result of which light isotopes diffuse faster.
A simplified equation to describe the relative diffusivityof two isotopes with masses M1 and M2 is as follows
(Richter et al., 2003, 2008):
DM1
DM2
¼ M2
M1
� �b
(7)
where b is an empirical coefficient that depends in prin-ciple on the element and the diffusion medium.
The isotopic exchange of the minerals with the fluid
occurs effectively during the mineral replacement reac-
tions located at the interfaces of the zones.
We use two infinite planar sheets (finite dimension
along the x-axis, infinite along the y- and z-axes) as our
system geometry, but with one moving boundary toconsider the growth of reaction layer IV (Fig. 10). With
this simplification we can use a one-dimensional diffu-
sion model for symmetry reasons. The position of the
interface between the two plane sheets is denoted by
XIII–IV and is moving as a result of a net transfer reaction
[e.g. reaction (3)] with a velocity dXIII–IV/dt. The twosheets represent the reaction zones IIþ III and IV and we
are effectively modelling only the formation of the
chlorite zone (Zone IV).
The growth rate of each of the layers and their chem-
ical composition is controlled by the relative fluxes of
the chemical components in the system. A relation be-
tween the fluxes and the velocities of the boundariescan be derived from mass balance for each boundary
between two adjacent layers and each chemical compo-
nent. For example, for the boundary between zones III
and IV at position XIII/IV and MgO we have
J IIIMgO � C III
MgO
dX IIIIII=IV
dt¼ J IV
MgO � C IVMgO
dX IVIII=IV
dt(8)
where J IIIMgO, J IV
MgO, C IIIMgO and C IV
MgO are the flux (mol cm�2
s–1) and concentration (mol cm–3) of MgO in Zone III
and IV, respectively. A separate velocity of boundary
III–IV must be defined for Zone III and IV, if the densities
of Zones III and IV are different from each other. Equation(8) demonstrates the coupling of the element fluxes and
the boundary velocities. For the following we assume that
the element fluxes are solely diffusion controlled, and as
discussed above, are confined to the intergranular fluid.
We ignore the volume change induced by the reaction,
which would imply a different value for the position of the
interface for the two coordinate systems of the planarsheets (Abart et al., 2004) and could also change the por-
osity and hence influence the net flux through the fluid.
With these assumptions, we obtain the following mass-
balance equation for boundary III–IV from equation (8):
D fluidMg2þH
oC fluidMg2þ
ox
�����x¼X III
III=IV
� D fluidMg2þH
oC fluidMg2þ
ox
�����x¼X IV
III=IV
¼ ðC IVMgO � C III
MgOÞdXIII=IV
dt: (9)
It should be noted that C IIIMgO and C IV
MgO are bulk concen-
trations of MgO in Zone III and Zone IV, respectively,
right next to the boundary III–IV, whereas the diffusive
flux is proportional to the concentration gradient in the
fluid weighted by H; that is, the fraction of fluid-filled
transport channels (e.g. triple junctions) relative to a
unit area of the interface. At the boundary of zones
III–IV, a discontinuity in the concentration of MgO is pre-
sent (see Fig. 5) defining the difference between C IIIMgO
and C IVMgO, which is here 6�9� 10–3 mol cm–3 [concentra-
tions in mol cm–3 were converted from wt % using the
molecular weight of MgO and the rock density as given
by Miller et al. (2009)]. This difference is related to the
metasomatic reaction; for example, as defined in equa-
tion (3). It can be inferred from equation (9) that for a
certain growth rate this concentration jump requires a
respective diffusive flux across the boundary. If the
growth of the layer is diffusion controlled (by diffusive
flux of MgO and other chemical components) the thick-
ness of layer IV, DxIV, follows a parabolic law (e.g. Abart
et al., 2009): DxIV2¼ kIVt, where kIV is a reaction constant,
and accordingly it follows that dXIII–IV/dt¼ 1/2kIVt–1/2.
The concentration distribution within the fluid ismodelled by the continuity equation for a one-dimen-
sional diffusion problem with a constant diffusion coef-
ficient, as given by (Crank, 1975)
oCðx ; tÞot
¼ DMgo2Cðx ; tÞ
ox2: (10)
Equation (10) applies to each isotope (24Mg, 25Mg, and26Mg) and each planar sheet. Here we assume thermo-
dynamically ideal behaviour of the Mg species [either
the relevant species in the fluid, e.g. Mg2þ (aq.) or MgCl
(aq.), or the thermodynamic component MgO] to relate
the chemical potential gradient in a straightforward wayto the concentration gradient. At the outer boundaries
50 Journal of Petrology, 2015, Vol. 56, No. 1
at MB
LW
HO
I Library on January 20, 2015
http://petrology.oxfordjournals.org/D
ownloaded from

of the system we assume a fixed concentration, which
implicitly means that the concentration of Mg and its
isotopes is buffered by a sufficient flux from the right
and into the left side of the system (positive flux from
Zone IV and into Zone I). For the boundary at x¼XIII–IV
one condition is given by equation (9) and the second
condition follows from the local equilibrium at the inter-
face, which implies for the fluid the same concentration
at both sides next to the boundary:
C fluidMg ðX III
III=IVÞ ¼ C fluidMg ðX IV
III=IVÞ: (11)
It should be noted here that even though the overall
reaction rate is controlled by diffusion through the inter-
connected fluid network, the isotopic re-equilibration of
the solids with the fluid occurs by the localized dissol-
ution–reprecipitation processes at the interfaces of the
reaction zones. Once a mineral (e.g. chlorite) is formedby this process its isotopic composition becomes frozen
owing to the inefficient solid-state diffusion rates.
Modelling resultsThe continuity equation (10) with the boundary condi-
tions (9) and (11) was solved numerically for each Mg
isotope using the explicit method of finite differencesand the front tracking method to account for the moving
boundary (see Appendix and Crank, 1975). The set of in-
put parameters is as follows: H was estimated to be be-
tween 1�10–3 and 4� 10–4; b¼0�05 and 0�1; DMg¼10–8
�10–9 m2 s–1; the initial concentration distribution (Mg
in the serpentinite Zone V and in Zone I, see above); thereaction constant kIV. The diffusion coefficient was esti-
mated from Oelkers & Helgeson (1988) considering
T¼ 430�C and P¼ 1�2 GPa as determined by Miller et al.
(2009). Because the data of Oelkers & Helgeson (1988)
are only for a maximum pressure of 0�5 GPa, and owing
to the effect of the tortuosity, there is at least an order
of magnitude uncertainty in DMg. The rate constant kIV
was varied, resulting in different values of the total time
required to form the �20 cm thick Zone IV. Examples of
calculations in this parameter space are illustrated in
Fig. 12.
A quasi steady state is reached after time scales of
only a few years owing to the relatively fast diffusivityin the fluid (Fig. 12). In this steady state a linear concen-
tration gradient for the total Mg in both planar sheets of
the model has developed (Fig. 12a) and also the profile
for d26Mg has a stable shape (Fig. 12b). At the interface
between Zone III and Zone IV a kink appears in the con-
centration profile as well as in the isotope profile. The
difference in the Mg concentration gradient (the slope)between Zone III and Zone IV is a direct consequence of
equation (9). The concentration gradient in Zone IV is
larger than in Zone III and the difference in the corres-
ponding diffusion fluxes is compensated by the forma-
tion of new chlorite and hence growth of Zone IV.
Because of this mass-balance constraint the differencebetween these slopes is directly coupled to the chosen
growth constant. The faster the growth rate, the higher
the diffusive flux needed to form chlorite faster, and
hence the difference between the slopes needs to
be larger according to equation (9) (Fig. 12a–h).
Consequently, a critical growth rate exists where the
algorithm becomes unstable simply because themaximum possible difference in the diffusive fluxes
between the two zones is defined by the initial concen-
tration difference between Zone I and Zone V. In this
limiting case, the growth of Zone IV is solely controlled
by the diffusive flux of MgO and the growth rate, as
described here by dXIII–IV/dt, can be directly derived
from equation (9). Assuming a steady-state flux (linearconcentration gradient in each zone for this model
geometry) and that the diffusive flux of MgO in Zone III
is significantly smaller than in Zone IV, equation (9) can
be integrated to obtain the classical parabolic rate law
for diffusion-controlled layer growth:
Dx2 ¼ 2D fluidMg2þH
C fluidMg2þðX IV
IV=VÞ � C fluidMg2þðX IV
III=IVÞC IV
MgO � C IIIMgO
t : (12)
This relation defines the upper boundary for the growth
constant, which is consistent with the mass-balance
constraint at the interface of Zone III and IV given by
equation (9). For the set of input parameters used in
Fig. 12 the maximum growth rate is 2�75� 10–10 cm2 s–1,
which is very close to those chosen in Fig. 12a and b.
The concentration gradients in Zones III and IV become
effectively identical if the growth constant is much
smaller (Fig. 12c, e and g), which would be equivalent
to a situation where the flux of other chemical compo-
nents control the growth rate of Zone IV. In the extreme
case, the diffusive fractionation of the Mg isotopes
would be eliminated, as illustrated in Fig. 12h.
The most relevant result of this simulation is that the
value for d26Mg is almost constant at the moving
boundary (relative to the d26Mg variations caused by
diffusion) for a range of values for the growth constant
kIV, where the growth is at least partly controlled by dif-
fusion of Mg. This is expected to be reflected by the iso-tope composition of Mg that is incorporated into the
chlorite formed at the respective position. Therefore, ac-
cording to this model, the entire chlorite zone would
have a d26Mg composition that changes only subtly
with time and profile position. The final isotope profile
and the maximum negative d26Mg anomaly depend notonly on the value of b (e.g. compare Fig. 13b with
Fig. 12d) but also very strongly on the concentration
gradient (e.g. Fig. 13h). To obtain a value of approxi-
mately �1�0 for d26Mg (for b¼ 0�05), the concentration
within the fluid has to change by more than one order
of magnitude from the serpentinite zone to the garnet–
glaucophane schist. Our estimated values for the Mgconcentration cover roughly the range for the solubility
reported for Mg (Manning, 2004): 100 mmol kg–1 H2O
for Zone V and 5 mmol kg–1 H2O in Zone I.
The shape of the profile does not reveal any strong
indication for the overall time scale of its formation pro-
cess owing to the steady-state mechanism of growth.
Journal of Petrology, 2015, Vol. 56, No. 1 51
at MB
LW
HO
I Library on January 20, 2015
http://petrology.oxfordjournals.org/D
ownloaded from

However, the thickness of Zone IV, which is, at leastpartly, controlled by the diffusive flux of MgO to pro-
duce diffusive fractionation of the Mg isotopes, does
yield such temporal information. From equation (12)
and our set of input parameters, we can infer that a total
time of about 100 kyr is required to form the observed
thickness of Zone IV. Uncertainty on this estimate couldbe up to a factor of 10, given the uncertainties on the in-
put parameters, in particular the Mg concentration in
the fluid. It should be noted that without the specific
boundary condition given by equation (9), such a large
isotopic fractionation would not survive for such a long
Fig. 12. Modelled diffusion profiles of Mg (a, c, e and g) and d26Mg (b, d, f and h) in the fluid across the melange zone and their evo-lution with time. For simplification only one moving boundary was introduced, the interface between Zones III and IV, the positionof which can be recognized here by the kink in the concentration and isotope profiles [indicated by an arrow in (a) and (b)]. The Mgand d26Mg concentration profiles show a quasi-steady-state shape with a linear concentration gradient within the two different dif-fusion media and a roughly constant concentration at the interface. The sets of figures for Mg and d26Mg illustrate the effect of vari-able growth rates (as defined by the growth constant kIV) for otherwise constant input parameters. With decreasing growthconstant (and correspondingly longer time scales of evolution) the kink at the interface for Mg becomes lees pronounced and theisotope anomaly becomes smaller. The model results in (c) and (d) are for a case where we obtain roughly constant values ofaround �1�3% for d26Mg at the interface between Zones III and IV.
52 Journal of Petrology, 2015, Vol. 56, No. 1
at MB
LW
HO
I Library on January 20, 2015
http://petrology.oxfordjournals.org/D
ownloaded from

time, but would be homogenized owing to the large dif-fusion coefficients of Mg in the fluid, as occurs if the
growth rate is too small (Fig. 12h). It is the flux from the
fluid to the newly formed solids (e.g. chlorite), which act
as a significant sink and thereby buffer the isotopic
anomaly during layer growth. It should be noted that
the duration of reaction zone growth could be
constrained much better if the parameter b and the con-centration gradient in the fluid were better constrained.
This would require data on solubility and speciation of
elements at the relevant pressure and temperature in
equilibrium with natural rock compositions.
In any case, in this context �100 kyr is unlikely to be
the time that the two original lithologies (Zones I and V)
Fig. 13. Similar diagrams to those in Fig. 12 illustrating the effects of input parameters other than kIV on the magnitude of the iso-tope anomaly observed. In (a) and (b) a larger b was chosen compared with (c) and (d) in Fig. 12, producing a larger isotope anom-aly by roughly a factor of two. In (c) and (d) DMg is one order of magnitude faster compared with the other cases illustrated,basically reducing the time scale by a factor of 10 [compare with (c) and (d) in Fig. 12]. In (e) and (f) the porosity was reduced, whichcorrespondingly increases the time scale to obtain the same rim width [compare with equation (12)] and the same magnitude forthe isotope anomaly. In (g) and (h) the concentration gradient was reduced (solubility of Mg in the serpentinite zone), which also in-creases the time scale to obtain the same rim width and isotope anomaly.
Journal of Petrology, 2015, Vol. 56, No. 1 53
at MB
LW
HO
I Library on January 20, 2015
http://petrology.oxfordjournals.org/D
ownloaded from
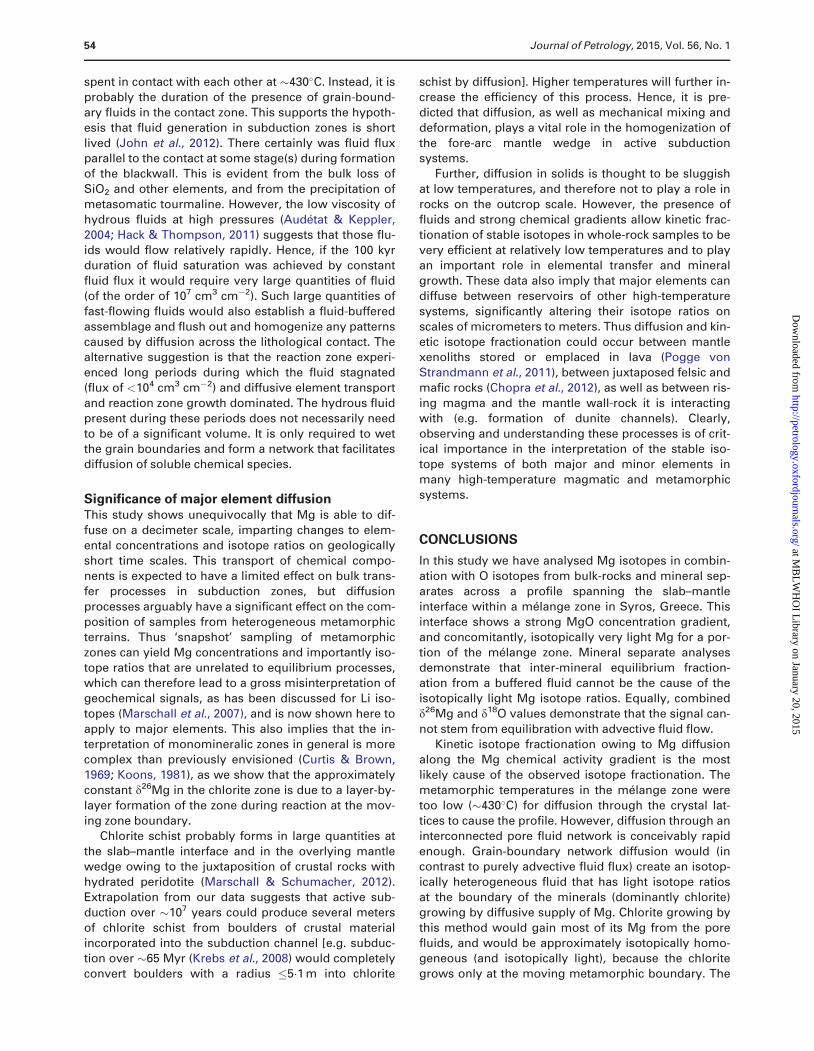
spent in contact with each other at �430�C. Instead, it is
probably the duration of the presence of grain-bound-
ary fluids in the contact zone. This supports the hypoth-
esis that fluid generation in subduction zones is short
lived (John et al., 2012). There certainly was fluid fluxparallel to the contact at some stage(s) during formation
of the blackwall. This is evident from the bulk loss of
SiO2 and other elements, and from the precipitation of
metasomatic tourmaline. However, the low viscosity of
hydrous fluids at high pressures (Audetat & Keppler,
2004; Hack & Thompson, 2011) suggests that those flu-
ids would flow relatively rapidly. Hence, if the 100 kyrduration of fluid saturation was achieved by constant
fluid flux it would require very large quantities of fluid
(of the order of 107 cm3 cm�2). Such large quantities of
fast-flowing fluids would also establish a fluid-buffered
assemblage and flush out and homogenize any patterns
caused by diffusion across the lithological contact. Thealternative suggestion is that the reaction zone experi-
enced long periods during which the fluid stagnated
(flux of <104 cm3 cm�2) and diffusive element transport
and reaction zone growth dominated. The hydrous fluid
present during these periods does not necessarily need
to be of a significant volume. It is only required to wetthe grain boundaries and form a network that facilitates
diffusion of soluble chemical species.
Significance of major element diffusionThis study shows unequivocally that Mg is able to dif-
fuse on a decimeter scale, imparting changes to elem-
ental concentrations and isotope ratios on geologicallyshort time scales. This transport of chemical compo-
nents is expected to have a limited effect on bulk trans-
fer processes in subduction zones, but diffusion
processes arguably have a significant effect on the com-
position of samples from heterogeneous metamorphic
terrains. Thus ‘snapshot’ sampling of metamorphic
zones can yield Mg concentrations and importantly iso-tope ratios that are unrelated to equilibrium processes,
which can therefore lead to a gross misinterpretation of
geochemical signals, as has been discussed for Li iso-
topes (Marschall et al., 2007), and is now shown here to
apply to major elements. This also implies that the in-
terpretation of monomineralic zones in general is morecomplex than previously envisioned (Curtis & Brown,
1969; Koons, 1981), as we show that the approximately
constant d26Mg in the chlorite zone is due to a layer-by-
layer formation of the zone during reaction at the mov-
ing zone boundary.
Chlorite schist probably forms in large quantities at
the slab–mantle interface and in the overlying mantlewedge owing to the juxtaposition of crustal rocks with
hydrated peridotite (Marschall & Schumacher, 2012).
Extrapolation from our data suggests that active sub-
duction over �107 years could produce several meters
of chlorite schist from boulders of crustal material
incorporated into the subduction channel [e.g. subduc-tion over �65 Myr (Krebs et al., 2008) would completely
convert boulders with a radius �5�1 m into chlorite
schist by diffusion]. Higher temperatures will further in-
crease the efficiency of this process. Hence, it is pre-
dicted that diffusion, as well as mechanical mixing and
deformation, plays a vital role in the homogenization of
the fore-arc mantle wedge in active subductionsystems.
Further, diffusion in solids is thought to be sluggish
at low temperatures, and therefore not to play a role in
rocks on the outcrop scale. However, the presence of
fluids and strong chemical gradients allow kinetic frac-
tionation of stable isotopes in whole-rock samples to be
very efficient at relatively low temperatures and to playan important role in elemental transfer and mineral
growth. These data also imply that major elements can
diffuse between reservoirs of other high-temperature
systems, significantly altering their isotope ratios on
scales of micrometers to meters. Thus diffusion and kin-
etic isotope fractionation could occur between mantlexenoliths stored or emplaced in lava (Pogge von
Strandmann et al., 2011), between juxtaposed felsic and
mafic rocks (Chopra et al., 2012), as well as between ris-
ing magma and the mantle wall-rock it is interacting
with (e.g. formation of dunite channels). Clearly,
observing and understanding these processes is of crit-ical importance in the interpretation of the stable iso-
tope systems of both major and minor elements in
many high-temperature magmatic and metamorphic
systems.
CONCLUSIONS
In this study we have analysed Mg isotopes in combin-
ation with O isotopes from bulk-rocks and mineral sep-
arates across a profile spanning the slab–mantle
interface within a melange zone in Syros, Greece. This
interface shows a strong MgO concentration gradient,
and concomitantly, isotopically very light Mg for a por-
tion of the melange zone. Mineral separate analysesdemonstrate that inter-mineral equilibrium fraction-
ation from a buffered fluid cannot be the cause of the
isotopically light Mg isotope ratios. Equally, combined
d26Mg and d18O values demonstrate that the signal can-
not stem from equilibration with advective fluid flow.
Kinetic isotope fractionation owing to Mg diffusionalong the Mg chemical activity gradient is the most
likely cause of the observed isotope fractionation. The
metamorphic temperatures in the melange zone were
too low (�430�C) for diffusion through the crystal lat-
tices to cause the profile. However, diffusion through an
interconnected pore fluid network is conceivably rapid
enough. Grain-boundary network diffusion would (incontrast to purely advective fluid flux) create an isotop-
ically heterogeneous fluid that has light isotope ratios
at the boundary of the minerals (dominantly chlorite)
growing by diffusive supply of Mg. Chlorite growing by
this method would gain most of its Mg from the pore
fluids, and would be approximately isotopically homo-geneous (and isotopically light), because the chlorite
grows only at the moving metamorphic boundary. The
54 Journal of Petrology, 2015, Vol. 56, No. 1
at MB
LW
HO
I Library on January 20, 2015
http://petrology.oxfordjournals.org/D
ownloaded from

growth of the chlorite zone is rate-limited by Mg diffu-
sion, suggesting that the interpretation of monominer-
alic zones in general is exceedingly complex.
In this study we present a novel, detailed, diffusive
model of these processes, which can numerically re-create the observed Mg concentrations and isotope
ratios. With our input parameters, a total time of �100
kyr is required to form the isotopic profile and grow the
chlorite zone. Instead of reflecting the time the original
lithologies spent in contact at �430�C, this probably
represents the duration of grain-boundary fluid pres-
ence, supporting the hypothesis that fluid generation insubduction zones occurs in relatively short-lived pulses
compared with the time scales of subduction and
exhumation.
The data and model show that Mg is able to diffuse
on a meter scale, and that chlorite schists in subduction
zones are likely to form by this process. Boulders ofcrustal material of over 10 m in diameter could be con-
verted to chlorite within �65 Myr by diffusion, providing
another mechanism in addition to mechanical and ad-
vective mixing by which the fore-arc mantle wedge can
homogenize. In addition, the data suggest that ‘snap-
shot’ sampling of metamorphic zones (or indeederupted mantle xenoliths) will not yield equilibrium Mg
concentrations or isotope ratios, potentially leading to
misinterpretation of these rocks.
ACKNOWLEDGEMENTS
The authors wish to thank Chris Coath for assistance in
method development. Dave Miller is acknowledged for
discussion and assistance with the samples. Timm
John, Rainer Abart, Alasdair Skelton, Richard Ketcham,
Fangzhen Teng and John Brady are thanked forreviews. Jorg Hermann is also thanked for careful
editing.
FUNDING
Analyses were funded by NERC grant NER/C510983/1.
P.P.v.S. is supported by NERC Research Fellowship
NE/I020571/1.
REFERENCES
Abart, R., Kunze, K., Milke, R., Sperb, R. & Heinrich, W. (2004).Silicon and oxygen self diffusion in enstatite polycrystals:the Milke et al. (2001) rim growth experiments revisited.Contributions to Mineralogy and Petrology 147(6), 633–646.
Abart, R., Petrishcheva, E., Fischer, F. D. & Svoboda, J. (2009).Thermodynamic model for diffusion controlled reaction rimgrowth in a binary system: application to the forsterite–enstatite–quartz system. American Journal of Science 309,114–131.
Ashworth, J. R. & Birdi, J. J. (1990). Diffusion modeling of cor-onas around olivine in an open system. Geochimica etCosmochimica Acta 54, 2389–2401.
Audetat, A. & Keppler, H. (2004). Viscosity of fluids in subduc-tion zones. Science 202, 513–516.
Bach, W., Jons, N. & Klein, F. (2013). Metasomatism within theoceanic crust. In: Harlov, D. E. & Austrheim, H. (eds)Metasomatism and the Chemical Transformation of Rock.Berlin: Springer, pp. 253–288.
Bebout, G. E. (2012). Metasomatism in subduction zones of sub-ducted oceanic slabs, mantle wedges, and the slab–mantleinterface. In: Harlov, D. E. & Austrheim, H. (eds)Metasomatism and the Chemical Transformation of Rock.Berlin: Springer, pp. 289–350.
Bourdon, B., Tipper, E. T., Fitoussi, C. & Stracke, A. (2010).Chondritic Mg isotope composition of the Earth.Geochimica et Cosmochimica Acta 74, 5069–5083.
Breeding, C. M., Ague, J. J. & Brocker, M. (2004).Fluid–metasedimentary rock interactions in subduction-zone melange: Implications for the chemical composition ofarc magmas. Geology 32, 1041–1044.
Brocker, M. & Enders, M. (2001). Unusual bulk-rock compos-itions in eclogite-facies rocks from Syros and Tinos(Cyclades, Greece): implications for U–Pb zircon geochron-ology. Chemical Geology 175(3–4), 581–603.
Carmody, L., Barry, P. H., Shervais, J. W., Kluesner, J. W. &Taylor, L. A. (2014). Oxygen isotopes in subducted oceaniccrust: A new perspective from Siberian diamondiferouseclogites. Geochemistry, Geophysics, Geosystems (in press).
Carmody, L., Barry, P. H., Shervais, J. W., Kluesner, J. W. &Taylor, L. A. (2013). Oxygen isotopes in subducted oceaniccrust: A new perspective from Siberian diamondiferouseclogites. Geochemistry, Geophysics, Geosystems 14,3479–3493.
Chakraborty, S. (1997). Rates and mechanisms of Fe–Mg inter-diffusion in olivine at 980�–1300�C. Journal of GeophysicalResearch: Solid Earth 102(B6), 12317–12331.
Cherniak, D. J. (1996). Strontium diffusion in sanidine andalbite, and general comments on strontium diffusion inalkali feldspars. Geochimica et Cosmochimica Acta 60,5037–5043.
Chopra, R., Richter, F. M., Watson, E. B. & Scullard, C. R. (2012).Magnesium isotope fractionation by chemical diffusion innatural settings and in laboratory analogues. Geochimica etCosmochimica Acta 88, 1–18.
Connolly, J. A. D. (2005). Computation of phase equilibria by lin-ear programming: A tool for geodynamic modeling and itsapplication to subduction zone decarbonation. Earth andPlanetary Science Letters 236, 524–541.
Connolly, J. A. D. (2009). The geodynamic equation of state:what and how. Geochemistry, Geophysics, Geosystems 10,Q10014.
Crank, J. (1975). The Mathematics of Diffusion. Oxford: OxfordUniversity Press.
Curtis, C. D. & Brown, P. E. (1969). Metasomatic development ofzoned ultabasic bodies in Unst, Shetland. Contributions toMineralogy and Petrology 24, 275–292.
Dauphas, N., Teng, F. Z. & Arndt, N. T. (2010). Magnesium andiron isotopes in 2�7 Ga Alexo komatiites: Mantle signatures,no evidence for Soret diffusion, and identification of diffu-sive transport in zoned olivine. Geochimica etCosmochimica Acta 74, 3274–3291.
Desmons, J. & O’Neil, R. (1978). Oxygen and hydrogen isotopecompositions of eclogites and associated rocks from theeastern Sesia zones (Western Alps, Italy). Contributions toMineralogy and Petrology 67, 79–85.
Dohmen, R. & Chakraborty, S. (2003). Mechanism and kineticsof element and isotopic exchange mediated by a fluidphase. American Mineralogist 88(8–9), 1251–1270.
Dohmen, R. & Milke, R. (2010). Diffusion in polycrystalline ma-terials: grain boundaries, mathematical models, and experi-mental data. In: Zhang, Y. X. & Cherniak, D. J. (eds) Diffusionin Minerals and Melts. Mineralogical Society of America and
Journal of Petrology, 2015, Vol. 56, No. 1 55
at MB
LW
HO
I Library on January 20, 2015
http://petrology.oxfordjournals.org/D
ownloaded from

Geochemical Society, Reviews in Mineralogy andGeochemistry 72, 921–970.
Durr, S., Altherr, R., Keller, J., Okrusch, M. & Seidel, E., (1978).The median Aegean crystalline belt: stratigraphy, structure,metamorphism, magmatism. In: Cloos, H., Roeder, D.,Schmidt, H. (eds) Alps, Apennines, Hellenides. Stuttgart,Inter-Union Commission on Geodynamics Scientific ReportNo. 38, Schweizerbart, 455–477.
Eiler, J. M., Valley, J. W. & Stolper, E. M. (1996). Oxygen isotoperatios in olivine from the Hawaii Scientific Drilling Project.Journal of Geophysical Research (B) 101, 11807–11813.
Elliott, T., Jeffcoate, A. & Bouman, C. (2004). The terrestrialLi isotope cycle: light-weight constraints on mantle convection.Earth and Planetary Science Letters 220(3–4), 231–245.
Fisher, G. W. (1973). Nonequilibrium thermodynamics as amodel for diffusion-contolled metamorphic processes.American Journal of Science 273, 897–924.
Frantz, J. D. & Mao, H. K. (1976). Bimetasomatism resultingfrom intergranular diffusion. 1. Theoretical model for mono-mineralic reaction zone sequences. American Journal ofScience 276, 817–840.
Fukuyama, M., Nishiyama, T., Urata, K. & Mori, Y. (2006). Steady-diffusion modelling of a reaction zone between a metamor-phosed basic dyke and a marble from Hirao-dai, Fukuoka,Japan. Journal of Metamorphic Geology 24, 153–168.
Gallagher, K. & Elliott, T. (2009). Fractionation of lithium iso-topes in magmatic systems as a natural consequence ofcooling. Earth and Planetary Science Letters 278, 286–296.
Galy, A., Yoffe, O., Janney, P. E., Williams, R. W., Cloquet, C.,Alard, O., Halicz, L., Wadhwa, M., Hutcheon, I. D., Ramon, E.& Carignan, J. (2003). Magnesium isotope heterogeneity ofthe isotopic standard SRM980 and new reference materialsfor magnesium-isotope-ratio measurements. Journal ofAnalytical Atomic Spectrometry 18, 1352–1356.
Gardes, E. & Heinrich, W. (2011). Growth of multilayered polycrystal-line reaction rims in the MgO–SiO2 system, part II: modelling.Contributions to Mineralogy and Petrology 162, 37–49.
Gardes, E., Wunder, B., Wirth, R. & Heinrich, W. (2011). Growthof multilayered polycrystalline reaction rims in theMgO–SiO2 system, part I: experiments. Contributions toMineralogy and Petrology 161, 1–12.
Hack, A. C. & Thompson, A. B. (2011). Density and viscosity ofhydrous magmas and related fluids and their role in subduc-tion zone processes. Journal of Petrology 52, 1333–1362.
Handler, M. R., Baker, J. A., Schiller, M., Bennett, V. C. & Yaxley,G. M. (2009). Magnesium stable isotope composition ofEarth’s upper mantle. Earth and Planetary Science Letters282, 306–313.
Harrison, L. G. (1961). Influence of dislocations on diffusion kin-etics in solids with particular reference to alkali halides.Transactions of the Faraday Society 57, 1191–1199.
Hecht, J. (1984). Geological map of Greece 1:50,000, SyrosIsland. Athens: Institute of Geology and Mineral Exploration.
Jeffcoate, A. B., Elliott, T., Kasemann, S. A., Ionov, D., Cooper,K. & Brooker, R. (2007). Li isotope fractionation in peridotitesand mafic melts. Geochimica et Cosmochimica Acta 71,202–218.
Joesten, R. (1977). Evolution of mineral assemblage zoning indiffusion metasomatism. Geochimica et CosmochimicaActa 41, 649–670.
John, T., Gussone, N., Podladchikov, Y. Y., Bebout, G. E.,Dohmen, R., Halama, R., Klemd, R., Magna, T. & Seitz, H. M.(2012). Volcanic arcs fed by rapid pulsed fluid flow throughsubducting slabs. Nature Geoscience 5, 489–492.
Keiter, M., Piepjohn, K., Ballhaus, C., Lagos, M. & Bode, M.(2004). Structural development of high-pressure meta-morphic rocks on Syros island (Cyclades, Greece). Journalof Structural Geology 26, 1433–1445.
Keiter, M., Ballhaus, C. & Tomaschek, F. (2011). A new geolo-gical map of the Island of Syros (Aegean Sea, Greece): impli-cations for lithostratigraphy and structural history of theCycladic Blueschist Unit. Geological Society of America,Special Papers 481, 43 pp.
Ketcham, R. A. & Carlson, W. D. (2012). Numerical simulation ofdiffusion-controlled nucleation and growth of porphyro-blasts. Journal of Metamorphic Geology 30, 489–512.
Koons, P. O. (1981). A study of natural and experimental metasom-atic assemblages in an ultramafic–quartzofeldspathic metasom-atic system from the Haast Schist, South Island, New Zealand.Contributions to Mineralogy and Petrology 78, 189–195.
Krebs, M., Maresch, W. V., Schertl, H.-P., Munker, C., Baumann, A.,Draper, G., Idleman, B. & Trapp, E. (2008). The dynamics of intra-oceanic subduction zones: A direct comparison between fossilpetrological evidence (Rio San Juan Complex, DominicanRepublic) and numerical simulation. Lithos103, 106–137.
Li, W. Y., Teng, F. Z., Xiao, Y. & Huang, J. (2011). High-tempera-ture inter-mineral magnesium isotope fractionation in eclog-ite from the Dabie orogen, China. Earth and PlanetaryScience Letters 304, 224–230.
Manning, C. E. (2004). The chemistry of subduction-zone fluids.Earth and Planetary Science Letters 223, 1–16.
Marschall, H. R. & Schumacher, J. C. (2012). Arc magmassourced from melange diapirs in subduction zones. NatureGeoscience 5, 862–867.
Marschall, H. R., Ludwig, T., Altherr, R., Kalt, A. & Tonarini, S.(2006). Syros metasomatic tourmaline: Evidence for veryhigh-d11B fluids in subduction zones. Journal of Petrology47, 1915–1942.
Marschall, H. R., Pogge von Strandmann, P. A. E., Seitz, H. M.,Elliott, T. & Niu, Y. L. (2007). The lithium isotopic compos-ition of orogenic eclogites and deep subducted slabs. Earthand Planetary Science Letters 262, 563–580.
Miller, D. P., Marschall, H. R. & Schumacher, J. C. (2009).Metasomatic formation and petrology of blueschist-facieshybrid rocks from Syros (Greece): Implications for reactionsat the slab–mantle interface. Lithos 107(1–2), 53–67.
Mishin, Y. & Herzig, C. (1995). Diffusion in fine-grained mater-ials: Theoretical aspects and experimental possibilities.Nanostructured Materials 6(5–8), 859–862.
Oelkers, E. H. & Helgeson, H. C. (1988). Calculation of thethermodynamic and transport properties of aqueous spe-cies at high pressures and temperatures: Aqueous tracer dif-fusion coefficients of ions to 1000�C and 5 kb. Geochimica etCosmochimica Acta 52, 63–85.
Okrusch, M. & Brocker, M. (1990). Eclogites associatedwith high-grade blueschists in the Cyclades archipelago,Greece—a review. European Journal of Mineralogy 2,451–478.
Penniston-Dorland, S. C., Sorensen, S. S., Ash, R. D. & Khadke,S. V. (2010). Lithium isotopes as a tracer of fluids in a sub-duction zone melange: Franciscan Complex, CA. Earth andPlanetary Science Letters 292(1–2), 181–190.
Penniston-Dorland, S. C., Bebout, G. E., Pogge vonStrandmann, P. A. E., Elliott, T. & Sorensen, S. S. (2012).Lithium and its isotopes as tracers of subduction zone fluidsand metasomatic processes: Evidence from the CatalinaSchist, California, USA. Geochimica et Cosmochimica Acta77, 530–545.
Pogge von Strandmann, P. A. E., Elliott, T., Marschall, H. R.,Coath, C., Lai, Y. J., Jeffcoate, A. B. & Ionov, D. A. (2011).Variations of Li and Mg isotope ratios in bulk chondrites andmantle xenoliths. Geochimica et Cosmochimica Acta 75,5247–5268.
Pogge von Strandmann, P. A. E., Opfergelt, S., Lai, Y. J.,Sigfusson, B., Gislason, S. R. & Burton, K. W. (2012). Lithium,magnesium and silicon isotope behaviour accompanying
56 Journal of Petrology, 2015, Vol. 56, No. 1
at MB
LW
HO
I Library on January 20, 2015
http://petrology.oxfordjournals.org/D
ownloaded from

weathering in a basaltic soil and pore water profile in Iceland.Earth and Planetary Science Letters 339–340, 11–23.
Putnis, A. (2009). Mineral replacement reactions. In: Oelkers, E.H. & Schott, J. (eds) Thermodynamics and Kinetics ofWater–Rock Interaction. Mineralogical Society of Americaand Geochemical Society, Reviews in Mineralogy andGeochemistry 70, 87–124.
Richter, F. M., Davis, A. M., DePaolo, D. J. & Watson, E. B.(2003). Isotope fractionation by chemical diffusion betweenmolten basalt and rhyolite. Geochimica et CosmochimicaActa 67, 3905–3923.
Richter, F. M., Watson, E. B., Mendybaev, R. A., Teng, F. Z. &Janney, P. E. (2008). Magnesium isotope fractionation in sili-cate melts by chemical and thermal diffusion. Geochimica etCosmochimica Acta 72, 206–220.
Ridley, J. (1984). Evidence of a temperature-dependent blueschistto eclogite transformation in high-pressure metamorphism ofmetabasic rocks. Journal of Petrology 25, 852–870.
Rosenbaum, G., Avigad, D. & Sanchez-Gomez, M. (2002). Coaxialflattening at deep levels of orogenic belts: evidence fromblueschists and eclogites on Syros and Sifnos (Cyclades,Greece). Journal of Structural Geology 24, 1451–1462.
Rudnick, R. L. & Ionov, D. A. (2007). Lithium elemental and iso-topic disequilibrium in minerals from peridotite xenolithsfrom far-east Russia: Product of recent melt/fluid–rock reac-tion. Earth and Planetary Science Letters 256, 278–293.
Sanford, R. F. (1982). Growth of ultramafic reaction zones ingreenschist to amphibolite facies metamorphism. AmericanJournal of Science 282, 543–616.
Seck, H. A., Kotz, J., Okrusch, M., Seidel, E. & Stosch, H. G.(1996). Geochemistry of a meta-ophiolite suite: An associ-ation of metagabbros, eclogites and glaucophaniteson the island of Syros, Greece. European Journal ofMineralogy 8, 607–623.
Sorensen, S. S. & Barton, M. D. (1987). Metasomatism and par-tial melting in a subduction complex: Catalina Schist, south-ern California. Geology 15, 115–118.
Teng, F. Z., McDonough, W. F., Rudnick, R. L. & Walker, R. J.(2006). Diffusion-driven extreme lithium isotopic fraction-ation in country rocks of the Tin Mountain pegmatite. Earthand Planetary Science Letters 243, 701–710.
Teng, F. Z., Li, W. Y., Ke, S., Marty, B., Dauphas, N., Huang, S.,Wu, F.-Y. & Pourmand, A. (2010). Magnesium isotopic com-position of the Earth and chondrites. Geochimica etCosmochimica Acta 74, 4150–4166.
Teng, F. Z., Dauphas, N., Helz, R. T., Gao, S. & Huang, S. C.(2011). Diffusion-driven magnesium and iron isotope frac-tionation in Hawaiian olivine. Earth and Planetary ScienceLetters 308(3–4), 317–324.
Tipper, E. T., Galy, A. & Bickle, M. J. (2006). Riverine evidencefor a fractionated reservoir of Ca and Mg on the continents:Implications for the oceanic Ca cycle. Earth and PlanetaryScience Letters 247(3–4), 267–279.
Trotet, F., Vidal, O. & Jolivet, L. (2001). Exhumation of Syrosand Sifnos metamorphic rocks (Cyclades, Greece). Newconstraints on the P–T paths. European Journal ofMineralogy 13, 901–920.
Vogel, D. E. & Garlick, G. D. (1970). Oxygen-isotope ratios inmetamorphic eclogites. Contributions to Mineralogy andPetrology 28, 183–191.
Wang, Z., Bucholz, C., Shimizu, N. & Eiler, J. (2011). Oxygen iso-tope constraints on the origin of high-Cr garnets from kim-berlites. Earth and Planetary Science Letters 312, 337–347.
Watson, E. B. (1991). Diffusion in fluid-bearing and slightly-melted rocks: experimental and numerical approaches illus-trated by iron transport in dunite. Contributions toMineralogy and Petrology 107, 417–434.
Watson, E. B. & Baxter, E. F. (2007). Diffusion in solid-Earth sys-tems. Earth and Planetary Science Letters 253, 307–327.
Whitney, D. L. & Evans, B. W. (2010). Abbreviations for names ofrock-forming minerals. American Mineralogist 95, 185–187.
Zhang, X. Y., Ganguly, J. & Ito, M. (2010). Ca–Mg diffusion in di-opside: tracer and chemical inter-diffusion coefficients.Contributions to Mineralogy and Petrology 159, 175–186.
Zheng, Y. F. (1991). Calculation of oxygen isotope fractionationin metal-oxides. Geochimica et Cosmochimica Acta 55,2299–2307.
Zheng, Y. F. (1993a). Calculation of oxygen isotope fraction-ation in anhydrous silicate minerals. Geochimica etCosmochimica Acta 57, 1079–1091.
Zheng, Y. F. (1996). Oxygen isotope fractionations involvingapatites: Application to paleotemperature determination.Chemical Geology 127(1–3), 177–187.
APPENDIX
Numerical solution method of the diffusionreaction modelWe used a finite-difference scheme to numerically solve
the moving boundary problem governed by equations(9)–(11). The x–t space is separated into a grid with equi-
distant steps dx and dt. The concentration at each grid
point is denoted by Cn,m where n and m represent the
respective coordinates of the grid point and hence Cn,m
is the concentration of the isotope at position ndx at
time mdt. The moving boundary was considered by
using a front tracking method as described by Crank(1975). The interface of Zone III–IV is changing continu-
ously during the evolution of the reaction zone but the
grid system in the finite-difference model is fixed with a
set of equidistant grid points as illustrated in Fig. A1. To
consider the variable position of the interface in the
model, a new variable pj is introduced, which is simplydefined as the fractional distance between the position
of the boundary and the grid point i behind this moving
boundary at time jdt (Fig. A1). Consequently, the value
of pj is given by
pj ¼XIII–IVðtÞ � iox
ox(A1)
where XIII–IV(t) is given by a parabolic rate law with
growth constant k (see main text). Using the Langrangiantype interpolation formulae it can be shown that for the
grid point i with idx<XIII–IV(t) and (iþ1)dx>XIII–IV(t)
the following numerical approximations for the first
and the second derivative of the concentration after the
distance variable x can be derived (Crank, 1975):
o2C
ox2
�����x¼iox
¼ 2
ox2
Ci�1;j
pj þ 1� Ci ;j
pjþ CB;j
pjðpj þ 1Þ
� �(A2)
oC
ox
�����x¼X IV
III–IV
¼ 1
ox
pj Ci�1;j
pj þ 1� ðpj þ 1ÞCi ;j
pjþ ð2pj þ 1ÞCB;j
pjðpj þ 1Þ
� �(A3)
o2C
ox2
�����x¼ðiþ1Þox
¼ 2
ox2
CB;j
ð1� pjÞð2� pjÞ� Ciþ1;j
1� pjþ Ciþ2;j
2� pj
� �(A4)
Journal of Petrology, 2015, Vol. 56, No. 1 57
at MB
LW
HO
I Library on January 20, 2015
http://petrology.oxfordjournals.org/D
ownloaded from

oC
ox
�����x¼X III
III–IV
¼ 1
ox
ð2pj � 3ÞCB;j
ð1� pjÞð2� pjÞþ ð2� pjÞCiþ1;j
1� pj� ð1� pjÞCiþ2;j
2� pj
� �:
(A5)
CB,j is the concentration at the moving boundary at time
jdt. We applied the explicit finite-difference scheme
(Crank, 1975) and thus with equations (A1)–(A5) the set
of governing equations can be expressed as follows.
For n< i and n> iþ1:
Cn;jþ1 ¼ Cn;j þDot
ox2ðCn�1;j � 2Cn;j þ Cnþ1;jÞ: (A6)
For n¼ i and n¼ iþ1
Ci ;jþ1 ¼ Ci ;j þ2Dot
ox2
Ci�1;j
pj þ 1� Ci;j
pjþ CB;j
pjðpj þ 1Þ
� �: (A7)
Ciþ1;jþ1 ¼ Ciþ1;j
þ 2Dot
ox2
CB;j
ð1� pjÞð2� pjÞ� Ciþ1;j
1� pjþ Ciþ2;j
2� pj
� �:
(A8)
The boundary condition at x¼XIII–IV(t) [equations (9)
and (11)] can be expressed as
�DHox
pj Ci�1;j
pj þ 1� ðpj þ 1ÞCi;j
pjþ ð2pj þ 1ÞCB;j
pj ðpj þ 1Þ
� �
¼ dXIII–IV
dtðC IV
Mg � C IIIMgÞ
� DHox
ð2pj � 3ÞCB;j
ð1� pj Þð2� pj Þþ ð2� pjÞCiþ1;j
1� pj� ð1� pj ÞCiþ2;j
2� pj
� �:
(A9)
Equation (A9) can be used to calculate CB,j after each
time step:
CB;j ¼pj Ci�1;j
pjþ1 �ðpjþ1ÞCi ;j
pj� ð2�pj ÞCiþ1;j
1�pjþ ð1�pj ÞCiþ2;j
2�pjþ vIII–IVðC IV
Mg�C III
MgÞox
DH
�ð2pjþ1Þpj ðpjþ1Þ þ
ð2pj�3Þð1�pj Þð2�pj Þ
:
(A10)
For the simulation a Cþþ program was written,
where the following iterative procedure was applied to
each of the Mg isotopes.
1. Initialization of the concentration distribution for
j¼ 0, which defines the values Cn,0 (see Fig. 10b).
2. Set j¼ jþ 1 and calculate pj from equation (A1)
and CB,j from equation (A10).
3. Calculate Cn,jþ1 for n¼ (1,. . ., N – 1) with equations(A6)–(A8). The values of C0,jþ1 and CN,jþ1 are
defined by the initial value owing to the fixed
boundary condition (meaning infinite reservoirs at
the two ends of the model system).
4. Start again with step (2) until jdt¼ total time.
Fig. A1.
58 Journal of Petrology, 2015, Vol. 56, No. 1
at MB
LW
HO
I Library on January 20, 2015
http://petrology.oxfordjournals.org/D
ownloaded from