Extraction of non-timber forest products in the Forests of Biligiri Rangan Hills, India. 3....
17
EXTRACTION OF NON-TIMBER FOREST PRODUCTS IN THE FORESTS OF BILIGIRI RANGAN HILLS, INDIA. 6. FUELWOOD PRESSURE AND MANAGEMENT OPTIONS 1 UMA SHANKAR, RAVI HEGDE, AND K. S. BAWA 2 Urea Shankar (Tata Energy Research Institute, Ghoshpara, Hakimpara, Siliguri 734 401, India), Ravi Hedge (Tata Energy Research Institute, 50/7 Palace Road, Bangalore 560 052, India), and K. S. Bawa, (Department of Biology, University of Massachusetts, Boston, MA 02125, USA). EXTRACTIONOF NoN-TIMBER FOREST PRODUCTS IN THE FORESTS OF BILIGIRI RANGAN HILLS, INDIA. 6. FUELWOODPRESSURE AND MANAGEMENTOPTIONS. Economic Botany 52(3):320- 336. 1998. Fuelwood is a predominant source of domestic energy for the Soliga, an aboriginal tribe, and non-Soliga people inhabiting the core and the fringe of the Biligiri Rangaswamy Temple (BRT) wildlife sanctuary in Karnataka, India. Approximately 7000 Soliga and 66000 non-Soliga people depend on the 540 km2 sanctuary for fuelwood. The demand for fuelwood is estimated to be 134.7 t d -~ or 49165 t y-~ against production of 66 024 t y-i for the entire sanctuary. Consumption patterns vary. with the season and the altitude. The pressure for fuel- wood is far greater on the fringe (85.8%) than in the core (14.2%). The fuelwood supply emanates from an activity zone of 20.1% of the total forest area which produces only 27% of the total demand. Furthermore, only selected species are preferred for fuel use, indicating that only a certain percentage of total productivity is available for extraction. Thus, the demand- supply gap is far greater than it actually appears. A wide gap between demand and supply demonstrates that the BRT forests cannot cater to the fuelwood needs sustainably with the prevailing patterns of extraction. Probable consequences of fuelwood extraction on biodiversity are discussed, and management options to meet energy requirement and to conserve biodiver- sity are explored. Key Words: fuelwood; sustainability; consequences on biodiversity; management options; Soliga. India meets most of its domestic energy re- quirement from non-commercial fuel sources. Commercial fuels (petroleum, coal, and electric- ity) in the domestic sector contribute only about 25% of the total demand. Among various non- commercial fuels, fuelwood, agricultural resi- dues, and livestock refuse contribute about 65%, 20%, and 15% respectively (NCAER 1985). No consensus exists on the current demand for fuel- wood in the country. Fuelwood consumption es- timates vary by a factor of 100%, i.e., from 146 to 305 million metric tons per year (Lele, Mitra, and Kaul 1994). The rural sector is estimated to share 85% of the total fuelwood consumption, and the balance (15%) is consumed by the urban sector (MEF 1987). Received 30 December 1996; accepted 25 January 1998. 2Correspondence. Standing biomass in Indian forests is estimat- ed to be 8,357.9 million metric tons with a mean of 130.5 t ha i (Ravindranath et al. 1992). If 1% of the standing stock is taken as annual extract- able yield (Chaturvedi 1994), the total possible supply of wood from Indian forests would be 83.6 million metric tons. Clearly, a big gap ex- ists between the demand and the supply of fuel- wood in the country. The gap is steadily increas- ing due to burgeoning population on the one hand and depleting forest resources (supply base) on the other. The demand-supply gap can be bridged partly by expanding the fuelwood supply resource base (natural forest cover, plan- tations, agricultural residue, and livestock re- fuse) and partly by increasing production per unit area. There is much variation in local abundance of fuelwood due to unequitable geographical dis- tribution of the fuelwood resource supply base. Since fuelwood is a cheap commodity and trans- Economic Botany 52(3) pp. 320-336. 1998 9 1998 by The New York Botanical Garden, Bronx, NY 10458 U.S.A.
-
Upload
uasbangalore -
Category
Documents
-
view
2 -
download
0
Transcript of Extraction of non-timber forest products in the Forests of Biligiri Rangan Hills, India. 3....
EXTRACTION OF NON-TIMBER FOREST PRODUCTS IN THE FORESTS OF BILIGIRI RANGAN HILLS, INDIA. 6. FUELWOOD PRESSURE AND MANAGEMENT OPTIONS 1
UMA SHANKAR, RAVI HEGDE, AND K. S. BAWA 2
Urea Shankar (Tata Energy Research Institute, Ghoshpara, Hakimpara, Siliguri 734 401, India), Ravi Hedge (Tata Energy Research Institute, 50/7 Palace Road, Bangalore 560 052, India), and K. S. Bawa, (Department of Biology, University of Massachusetts, Boston, MA 02125, USA). EXTRACTION OF NoN-TIMBER FOREST PRODUCTS IN THE FORESTS OF BILIGIRI RANGAN HILLS, INDIA. 6. FUELWOOD PRESSURE AND MANAGEMENT OPTIONS. Economic Botany 52(3):320- 336. 1998. Fuelwood is a predominant source of domestic energy for the Soliga, an aboriginal tribe, and non-Soliga people inhabiting the core and the fringe of the Biligiri Rangaswamy Temple (BRT) wildlife sanctuary in Karnataka, India. Approximately 7000 Soliga and 66000 non-Soliga people depend on the 540 km 2 sanctuary for fuelwood. The demand for fuelwood is estimated to be 134.7 t d -~ or 49165 t y-~ against production of 66 024 t y-i for the entire sanctuary. Consumption patterns vary. with the season and the altitude. The pressure for fuel- wood is far greater on the fringe (85.8%) than in the core (14.2%). The fuelwood supply emanates from an activity zone of 20.1% of the total forest area which produces only 27% of the total demand. Furthermore, only selected species are preferred for fuel use, indicating that only a certain percentage of total productivity is available for extraction. Thus, the demand- supply gap is far greater than it actually appears. A wide gap between demand and supply demonstrates that the BRT forests cannot cater to the fuelwood needs sustainably with the prevailing patterns of extraction. Probable consequences of fuelwood extraction on biodiversity are discussed, and management options to meet energy requirement and to conserve biodiver- sity are explored.
Key Words: fuelwood; sustainability; consequences on biodiversity; management options; Soliga.
India meets most of its domestic energy re- quirement from non-commercial fuel sources. Commercial fuels (petroleum, coal, and electric- ity) in the domestic sector contribute only about 25% of the total demand. Among various non- commercial fuels, fuelwood, agricultural resi- dues, and livestock refuse contribute about 65%, 20%, and 15% respectively (NCAER 1985). No consensus exists on the current demand for fuel- wood in the country. Fuelwood consumption es- timates vary by a factor of 100%, i.e., from 146 to 305 million metric tons per year (Lele, Mitra, and Kaul 1994). The rural sector is estimated to share 85% of the total fuelwood consumption, and the balance (15%) is consumed by the urban sector (MEF 1987).
Received 30 December 1996; accepted 25 January 1998.
2 Correspondence.
Standing biomass in Indian forests is estimat- ed to be 8,357.9 million metric tons with a mean of 130.5 t ha i (Ravindranath et al. 1992). If 1% of the standing stock is taken as annual extract- able yield (Chaturvedi 1994), the total possible supply of wood from Indian forests would be 83.6 million metric tons. Clearly, a big gap ex- ists between the demand and the supply of fuel- wood in the country. The gap is steadily increas- ing due to burgeoning population on the one hand and depleting forest resources (supply base) on the other. The demand-supply gap can be bridged partly by expanding the fuelwood supply resource base (natural forest cover, plan- tations, agricultural residue, and livestock re- fuse) and partly by increasing production per unit area.
There is much variation in local abundance of fuelwood due to unequitable geographical dis- tribution of the fuelwood resource supply base. Since fuelwood is a cheap commodity and trans-
Economic Botany 52(3) pp. 320-336. 1998 �9 1998 by The New York Botanical Garden, Bronx, NY 10458 U.S.A.
19981 UMA SHANKAR ET AL.: NON-TIMBER FOREST PRODUCTS, INDIA, 6 321
portation costs are exorbitant, fuelwood cannot be carried to a consumption center which is dis- tant from the production center. Hence, policy formulation and planning for bridging the fuel- wood demand-supply gap must be undertaken on a local basis. Consequently, there have been a number of attempts to quantify the pressures for fuelwood on specific forest areas in India (Fernandes, Menon, and Viegas 1988; Ganesan 1993; Maitra 1992; Malhotra et al. 1990a,b, 1991; PHCC 1991) as well as abroad (Gunati- lake, Senaratne, and Abeygunawardena 1993; Gunatilleke, Gunatilleke, and Abeygunawardena 1993; Wall and Reid 1993).
This paper quantifies the demand for and pro- duction of fuelwood in the Biligiri Rangaswamy Temple (BRT) wildlife sanctuary. Specifically, our objectives are: 1) to estimate the extraction and production of fuelwood in the sanctuary, 2) to assess the sustainability of current fuelwood extraction and probable consequences of extrac- tion on biodiversity, and 3) to discuss policy im- plications for improved management of fuel- wood supply resource base.
STUDY AREA
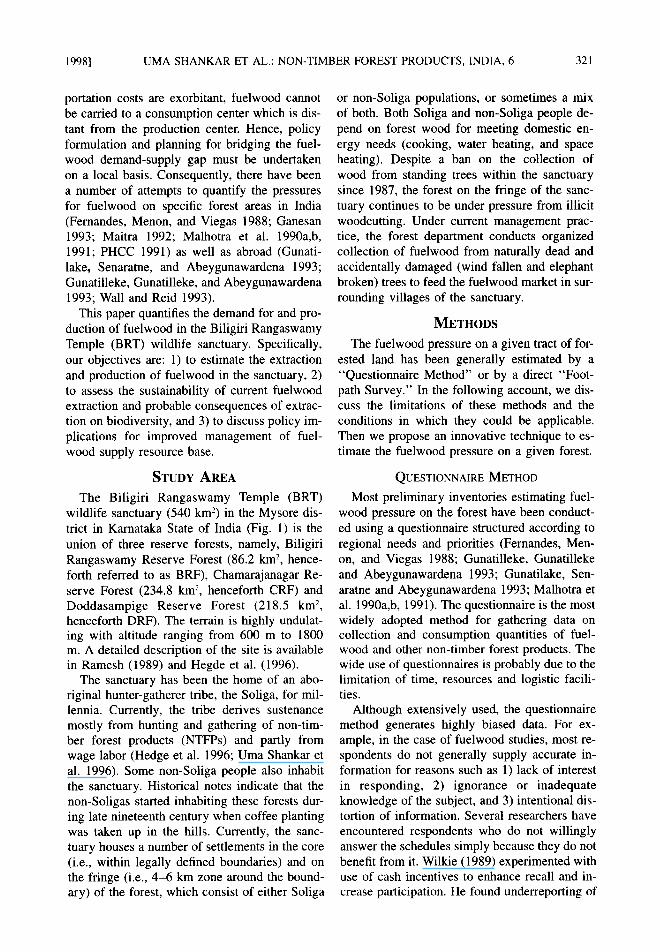
The Biligiri Rangaswamy Temple (BRT) wildlife sanctuary (540 km 2) in the Mysore dis- trict in Karnataka State of India (Fig. 1) is the union of three reserve forests, namely, Biligiri Rangaswamy Reserve Forest (86.2 km 2, hence- forth referred to as BRF), Chamarajanagar Re- serve Forest (234.8 km 2, henceforth CRF) and Doddasampige Reserve Forest (218.5 km 2, henceforth DRF). The terrain is highly undulat- ing with altitude ranging from 600 m to 1800 m. A detailed description of the site is available in Ramesh (1989) and Hegde et al. (1996).
The sanctuary has been the home of an abo- riginal hunter-gatherer tribe, the Soliga, for mil- lennia. Currently, the tribe derives sustenance mostly from hunting and gathering of non-tim- ber forest products (NTFPs) and partly from wage labor (Hedge et al. 1996; Uma Shankar et al. 1996). Some non-Soliga people also inhabit the sanctuary. Historical notes indicate that the non-Soligas started inhabiting these forests dur- ing late nineteenth century when coffee planting was taken up in the hills. Currently, the sanc- tuary houses a number of settlements in the core (i.e., within legally defined boundaries) and on the fringe (i.e., 4 -6 km zone around the bound- ary) of the forest, which consist of either Soliga
or non-Soliga populations, or sometimes a mix of both. Both Soliga and non-Soliga people de- pend on forest wood for meeting domestic en- ergy needs (cooking, water heating, and space heating). Despite a ban on the collection of wood from standing trees within the sanctuary since 1987, the forest on the fringe of the sanc- tuary continues to be under pressure from illicit woodcutting. Under current management prac- tice, the forest department conducts organized collection of fuelwood from naturally dead and accidentally damaged (wind fallen and elephant broken) trees to feed the fuelwood market in sur- rounding villages of the sanctuary.
METHODS
The fuelwood pressure on a given tract of for- ested land has been generally estimated by a "Questionnaire Method" or by a direct "Foot- path Survey." In the following account, we dis- cuss the limitations of these methods and the conditions in which they could be applicable. Then we propose an innovative technique to es- timate the fuelwood pressure on a given forest.
QUESTIONNAIRE METHOD
Most preliminary inventories estimating fuel- wood pressure on the forest have been conduct- ed using a questionnaire structured according to regional needs and priorities (Fernandes, Men- on, and Viegas 1988; Gunatilleke, Gunatilleke and Abeygunawardena 1993; Gunatilake, Sen- aratne and Abeygunawardena 1993; Malhotra et al. 1990a,b, 1991). The questionnaire is the most widely adopted method for gathering data on collection and consumption quantities of fuel- wood and other non-timber forest products. The wide use of questionnaires is probably due to the limitation of time, resources and logistic facili- ties.
Although extensively used, the questionnaire method generates highly biased data. For ex- ample, in the case of fuelwood studies, most re- spondents do not generally supply accurate in- formation for reasons such as 1) lack of interest in responding, 2) ignorance or inadequate knowledge of the subject, and 3) intentional dis- tortion of information. Several researchers have encountered respondents who do not willingly answer the schedules simply because they do not benefit from it. Wilkie (1989) experimented with use of cash incentives to enhance recall and in- crease participation. He found underreporting of
322 ECONOMIC BOTANY [VOL. 52
Fig. 1. Map of the Biligiri Rangaswamy Temple (BRT) wildlife sanctuary showing settlements, non-forest land and fuelwood extraction areas. Areas of extraction are shown in gray. Settled areas, plantations, and other agricultural areas are shown as enclosures bounded by the heavy line.
1998] UMA SHANKAR ET AL.: NON-TIMBER FOREST PRODUCTS, INDIA, 6 323
killed animals by hunters when cross-checked with the other villagers. Inadequate knowledge of quantities might also lead to incorrect report- ing (Malhotra et al. 1991). For example, if a respondent is asked how much fuelwood he/she requires for daily consumption for his/her fam- ily, the response could be incorrect merely be- cause the respondent is estimating a weight that is rarely measured. The uncertainty (error) com- ponent in such an answer could be very high.
Intentional distorting of the information on a questionnaire is quite possible, especially in the case of items that are banned from collection. For instance, if a respondent is asked about the quantity of fuelwood gathered from the forest, the answer may be manipulated to a significant extent. We have noticed in the BRT sanctuary that respondents do not readily supply correct information about the quantities of fuelwood and other forest products gathered from the forest for fear of punishment. If the respondents are con- federated, the answers vary greatly.
It is interesting to note in this context that most of the gatherers have adequate knowledge about the forest legislation pertaining to restric- tions on gathering from the forest. However, they are unsure of the exemptions since forest officials only dictate to them about practices banned within the forest boundaries. Bernard et al. (1984) and Bernard et al. (1986) concluded that "on average, about half of what informants report is incorrect in some way." However, the questionnaire method is useful for a rapid as- sessment and to collect qualitative information such as the names of species used for fuelwood.
FOOTPATH SURVEY METHOD
A few studies estimating pressure on the for- est for fuelwood have relied upon the data ob- tained from direct observations of outgoing fuel- wood (headload, bicycleload, cartload) from the "entry paths" of the forest, a technique called "footpath survey" (Appasamy 1993; Ganesan 1993). For example, the Palni Hills Conserva- tion Council (PHCC) used the footpath survey technique for estimating fuelwood pressure on the 912 ha Kadavakurichi Reserve Forest in Tamilnadu, which is surrounded by a number of villages (Appasamy 1993). A total of 43 entry paths into the forest were identified. A vigil was kept simultaneously on each path from dawn to dusk, one day each week for 7 consecutive
weeks, and the quantity of outgoing fuelwood was recorded.
The results obtained from the footpath survey on fuelwood collection quantity carry limited scientific value. One major factor discounting the acceptability of footpath survey data is the frequency of sampling. In case of Kadavakurichi Reserve Forest, for example, 7 days of obser- vations comprise only 1.91% sample, a rather low sample size. Appasamy (1993) points out that seasonal variations also were not considered in the PHCC survey. Seasonal variations could be great, depending on the rainfall pattern and agricultural operations in the area. It is generally observed that during monsoon season, especially on rainy days, people may not collect fuelwood. Conversely, during pre-monsoon dry season, heavy collection might occur for storing fuel- wood supplies for use during the monsoon pe- riod, when finding dry fuelwood becomes diffi- cult. Similarly, the intensity of fuelwood collec- tion could be much lower during the harvest than during the pre- and post-harvest seasons. Landless laborers might collect and sell fuel- wood during non-labor days to generate income. Besides seasonal variations within a year, vari- ations from year to year may also affect collec- tion patterns.
The footpath survey could be applicable to those small areas where the boundary of the for- est is well defined, and the entry paths are lim- ited and accurately known. In large forest areas surrounded by villages, however, it is extremely difficult to precisely measure the quantity of fuelwood carried away from the forest, because of the innumerable unknown entry points. In fact, the entire forest fringe is vulnerable to the collection and transport of fuelwood and other forest products. Logistically, the footpath survey is not feasible in large forest areas because the manpower requirement for observation and the quantity of weighing instruments would be enor- mous. Since the survey ideally should be con- ducted for the whole year, it is impracticable and uneconomical.
The footpath survey is of particularly limited value when the forest area is subject to collec- tion by the people living within the forest boundary (i.e., core of the forest) because they may not be observed at the entry paths. Also, collectors prefer to transport the fuelwood and other forest products through "loopholes" to es- cape from the forest vigil. Nevertheless, footpath
324 ECONOMIC BOTANY [VOL. 52
surveys have been tried in a large area of Mu- dumalai wildlife sanctuary (321 km 2) and a re- serve forest (200 km 2) close to it in Tamilnadu by Ganesan (1993). This survey was restricted to only "key entry points" into the forest for a period of three consecutive months, and yielded useful information.
ESTIMATION OF FUELWOOD PRESSURE ON THE BRT SANCTUARY
We deploy a technique based on the con- sumption rather than the extraction patterns. The technique is particularly suitable for a very large forest land for which the accurate number of en- try paths, or collection points is not known. Un- like the footpath survey which requires enor- mous manpower for vigilance and other logis- tics, our technique is comparatively simple and utilizes demographic data. The footpath survey focuses on the "collection quantity," whereas we focus on the "consumption quantity" of the fuelwood. Our assumption is that if people de- pend solely on the forest for fuel, and if they consume all the fuelwood which is collected (i.e., if no exports are made), then the total con- sumption quantity will correspond to the total collection quantity. Although this is not always the case, we first estimate the fuelwood con- sumption based on this assumption, and then in- troduce correction coefficients to account for the variability which might occur. The consumption quantity of fuelwood is a direct function of the required fuelwood for an "average person" (av- eraged over male, female and children of all age classes) for an "average day" (averaged over different seasons) multiplied by the number of people who depend on the forest for fuelwood.
The consumption quantity of fuelwood was estimated by the following approach. First, all settlements (Soliga as well as non-Soliga) and other institutional agencies which depend partly or exclusively on the forest for fuelwood were identified. This was done by scanning the Sur- vey of India toposheets for the sanctuary area and listing all the settlements. The 1972 version of the toposheets (1:50000) was used. Under- standably, the settlements established after the toposheet survey in 1972 do not exist on the toposheets, and the settlements which have been abandoned after the toposheet survey remain marked on the toposheets. We updated the to- posheets by deleting the abandoned settlements and marking the new settlements on the basis of
information from Soligas. A few institutional agencies that consume fuelwood from the forest, such as schools, voluntary organizations and ho- tels, were also identified. The census data for non-Soliga settlements were gathered from Gov- ernment Taluka Offices at Yelandur, Chamara- janagar and Kollegal, and those for Soligas were obtained from the Vivekananda Girijana Kaly- ana Kendra, a voluntary organization active in the welfare of the Soligas in BR Hills since 1980. Second, we estimated fuelwood consump- tion per capita per day. A reconnaissance survey of the BRT sanctuary showed that a family con- sumes fuelwood typically for cooking, water heating, and space heating. The procedure for estimation of fuelwood consumption separately for cooking, and water and space heating is dis- cussed in detail below.
ESTIMATION OF FUELWOOD CONSUMPTION FOR COOKING
Traditionally, a family cooks two major meals a day, one in early morning and the other in early evening. The cooking of the mid-day meal is a rare practice because the people in this area are accustomed to working in the forest or ag- ricultural fields from morning to evening with- out returning home for lunch; the lunch is car- ried to the workplace. Therefore, breakfast and lunch are cooked together in the morning. Some households consume fuelwood in the afternoons during typhoons.
In the BRT sanctuary, three microclimatic zones can be distinguished; 1) year-round dry zone at foothills, 2) seasonally dry zone at mid altitude, and 3) cool zone at high altitude. Pre- sumably, fuelwood consumption varies between settlements located at different altitudes primar- ily due to temperature variability, and second- arily due to different cooking habits. To account for this variation, we measured household fuel- wood consumption for ten families each in the three climatic zones. The first household was se- lected as and when encountered in each zone. Each family was visited during afternoon (1600 to 1800 h) before cooking of the evening meal. The fuelwood available to each family was weighed. While selecting the families, we took care that each family had enough fuelwood for consumption and did not schedule fuelwood col- lection from the forest during the next 24 h, to avoid the risk of fuelwood consumption other than what has been weighed, or mixing of
1998] UMA SHANKAR ET AL.: NON-TIMBER FOREST PRODUCTS, INDIA, 6 325
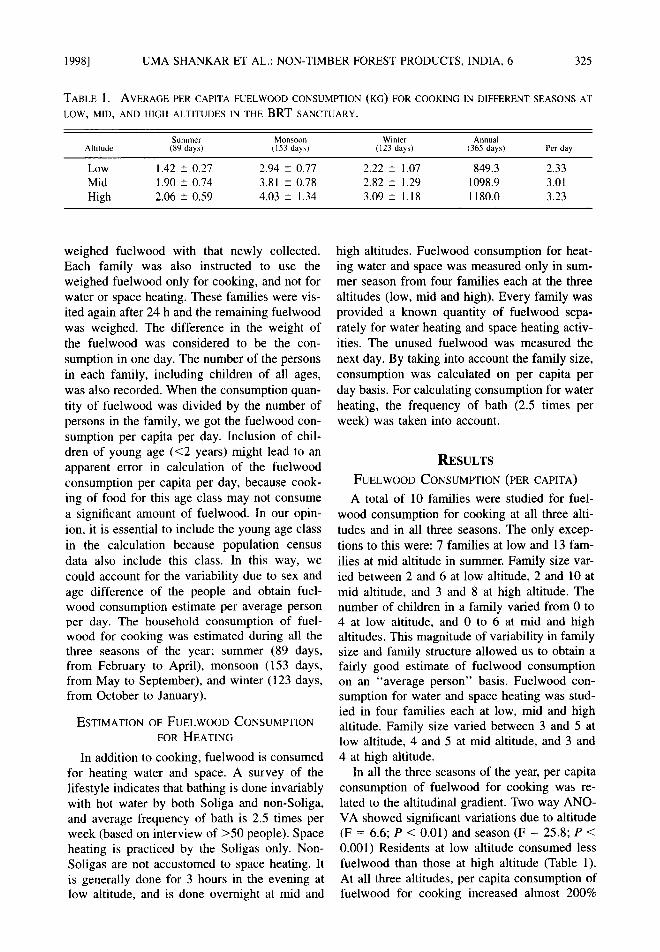
TABLE 1. AVERAGE PER CAPITA FUELWOOD CONSUMPTION (KG) FOR COOKING IN DIFFERENT SEASONS AT
LOW, MID, AND HIGH ALTITUDES IN THE BRT SANCTUARY.
Summer Monsoon Winter Annual Altitude (89 days) (153 days) (123 days) (365 days) Per day
Low 1.42 --_ 0.27 2.94 -+ 0.77 2.22 _+ 1.07 849.3 2.33 Mid 1.90 +_ 0.74 3.81 _+ 0.78 2.82 _+ 1.29 1098.9 3.01 High 2.06 -+ 0.59 4.03 _+ 1.34 3.09 _+ 1.18 1180.0 3.23
weighed fuelwood with that newly collected, Each family was also instructed to use the weighed fuelwood only for cooking, and not for water or space heating. These families were vis- ited again after 24 h and the remaining fuelwood was weighed. The difference in the weight of the fuelwood was considered to be the con- sumption in one day. The number of the persons in each family, including children of all ages, was also recorded. When the consumption quan- tity of fuelwood was divided by the number of persons in the family, we got the fuelwood con- sumption per capita per day. Inclusion of chil- dren of young age (<2 years) might lead to an apparent error in calculation of the fuelwood consumption per capita per day, because cook- ing of food for this age class may not consume a significant amount of fuelwood. In our opin- ion, it is essential to include the young age class in the calculation because population census data also include this class. In this way, we could account for the variability due to sex and age difference of the people and obtain fuel- wood consumption estimate per average person per day. The household consumption of fuel- wood for cooking was estimated during all the three seasons of the year; summer (89 days, from February to April), monsoon (153 days, from May to September), and winter (123 days, from October to January).
ESTIMATION OF FUELWOOD CONSUMPTION
FOR HEATING
In addition to cooking, fuelwood is consumed for heating water and space. A survey of the lifestyle indicates that bathing is done invariably with hot water by both Soliga and non-Soliga, and average frequency of bath is 2.5 times per week (based on interview of >50 people). Space heating is practiced by the Soligas only. Non- Soligas are not accustomed to space heating. It is generally done for 3 hours in the evening at low altitude, and is done overnight at mid and
high altitudes. Fuelwood consumption for heat- ing water and space was measured only in sum- mer season from four families each at the three altitudes (low, mid and high). Every family was provided a known quantity of fuelwood sepa- rately for water heating and space heating activ- ities. The unused fuelwood was measured the next day. By taking into account the family size, consumption was calculated on per capita per day basis. For calculating consumption for water heating, the frequency of bath (2.5 times per week) was taken into account.
RESULTS
FUELWOOD CONSUMPTION (PER CAPITA)
A total of 10 families were studied for fuel- wood consumption for cooking at all three alti- tudes and in all three seasons. The only excep- tions to this were: 7 families at low and 13 fam- ilies at mid altitude in summer. Family size var- ied between 2 and 6 at low altitude, 2 and 10 at mid altitude, and 3 and 8 at high altitude. The number of children in a family varied from 0 to 4 at low altitude, and 0 to 6 at mid and high altitudes. This magnitude of variability in family size and family structure allowed us to obtain a fairly good estimate of fuelwood consumption on an "average person" basis. Fuelwood con- sumption for water and space heating was stud- ied in four families each at low, mid and high altitude. Family size varied between 3 and 5 at low altitude, 4 and 5 at mid altitude, and 3 and 4 at high altitude.
In all the three seasons of the year, per capita consumption of fuelwood for cooking was re- lated to the altitudinal gradient. Two way ANO- VA showed significant variations due to altitude (F = 6.6; P < 0.01) and season (F = 25.8; P < 0.001) Residents at low altitude consumed less fuelwood than those at high altitude (Table 1). At all three altitudes, per capita consumption of fuelwood for cooking increased almost 200%
326 ECONOMIC BOTANY [VOL. 52
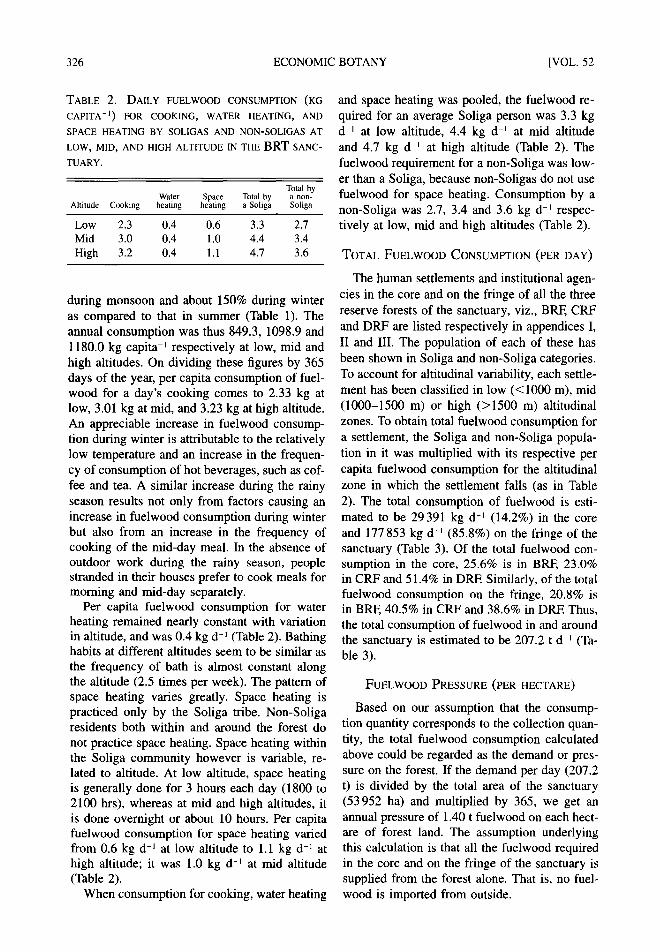
TABLE 2. DAILY FUELWOOD CONSUMPTION (KG
CAPITA - l ) FOR COOKING, WATER HEATING, AND
SPACE HEATING BY SOLIGAS AND NON-SOLIGAS AT
LOW, MID, AND HIGH ALTITUDE IN THE BRT SANC-
TUARY.
Total by Water Space Total by a non-
Altitude Cooking heating heating a Soliga Soliga
Low 2.3 0.4 0.6 3.3 2.7 Mid 3.0 0.4 1.0 4.4 3.4 High 3.2 0.4 1.1 4.7 3.6
during monsoon and about 150% during winter as compared to that in summer (Table 1). The annual consumption was thus 849.3, 1098.9 and 1180.0 kg capita -~ respectively at low, mid and high altitudes. On dividing these figures by 365 days of the year, per capita consumption of fuel- wood for a day's cooking comes to 2.33 kg at low, 3.01 kg at mid, and 3.23 kg at high altitude. An appreciable increase in fuelwood consump- tion during winter is attributable to the relatively low temperature and an increase in the frequen- cy of consumption of hot beverages, such as cof- fee and tea. A similar increase during the rainy season results not only from factors causing an increase in fuelwood consumption during winter but also from an increase in the frequency of cooking of the mid-day meal. In the absence of outdoor work during the rainy season, people stranded in their houses prefer to cook meals for morning and mid-day separately.
Per capita fuelwood consumption for water heating remained nearly constant with variation in altitude, and was 0.4 kg d -J (Table 2). Bathing habits at different altitudes seem to be similar as the frequency of bath is almost constant along the altitude (2.5 times per week). The pattern of space heating varies greatly. Space heating is practiced only by the Soliga tribe. Non-Soliga residents both within and around the forest do not practice space heating. Space heating within the Soliga community however is variable, re- lated to altitude. At low altitude, space heating is generally done for 3 hours each day (1800 to 2100 hrs), whereas at mid and high altitudes, it is done overnight or about 10 hours. Per capita fuelwood consumption for space heating varied from 0.6 kg d -~ at low altitude to 1.1 kg d l at high altitude; it was 1.0 kg d -~ at mid altitude (Table 2).
When consumption for cooking, water heating
and space heating was pooled, the fuelwood re- quired for an average Soliga person was 3.3 kg d ~ at low altitude, 4.4 kg d -~ at mid altitude and 4.7 kg d ~ at high altitude (Table 2). The fuelwood requirement for a non-Soliga was low- er than a Soliga, because non-Soligas do not use fuelwood for space heating. Consumption by a non-Soliga was 2.7, 3.4 and 3.6 kg d -~ respec- tively at low, mid and high altitudes (Table 2).
TOTAL FUELWOOD CONSUMPTION (PER DAY)
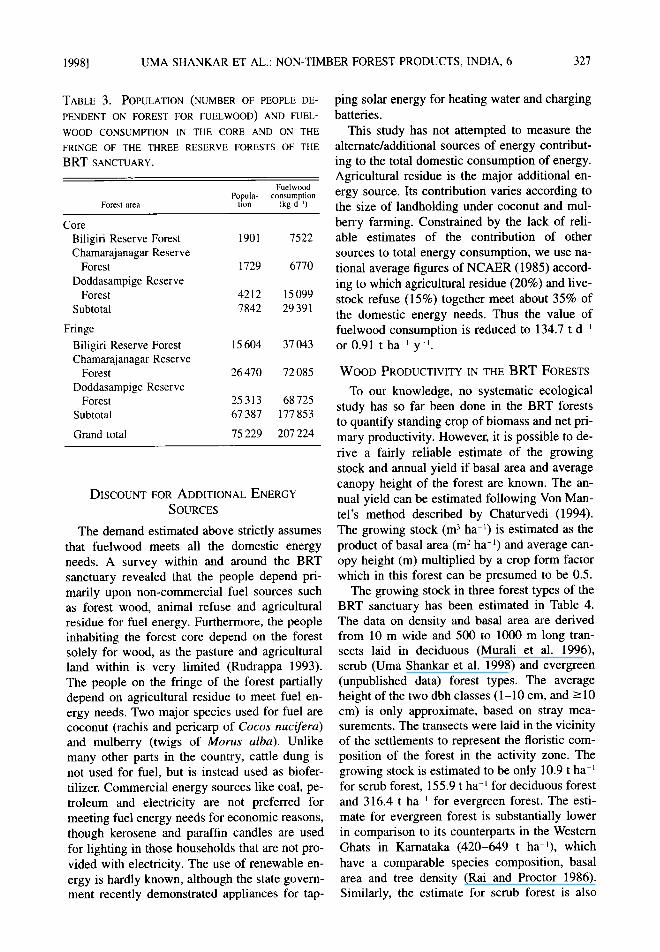
The human settlements and institutional agen- cies in the core and on the fringe of all the three reserve forests of the sanctuary, viz., BRF, CRF and DRF are listed respectively in appendices I, II and III. The population of each of these has been shown in Soliga and non-Soliga categories. To account for altitudinal variability, each settle- ment has been classified in low (<1000 m), mid (1000-1500 m) or high (>1500 m) altitudinal zones. To obtain total fuelwood consumption for a settlement, the Soliga and non-Soliga popula- tion in it was multiplied with its respective per capita fuelwood consumption for the altitudinal zone in which the settlement falls (as in Table 2). The total consumption of fuelwood is esti- mated to be 29391 kg d -1 (14.2%) in the core and 177 853 kg d -1 (85.8%) on the fringe of the sanctuary (Table 3). Of the total fuelwood con- sumption in the core, 25.6% is in BRF, 23.0% in CRF and 51.4% in DRE. Similarly, of the total fuelwood consumption on the fringe, 20.8% is in BRF, 40.5% in CRF and 38.6% in DRE. Thus, the total consumption of fuelwood in and around the sanctuary is estimated to be 207.2 t d ~ (Ta- ble 3).
FUELWOOD PRESSURE (PER HECTARE)
Based on our assumption that the consump- tion quantity corresponds to the collection quan- tity, the total fuelwood consumption calculated above could be regarded as the demand or pres- sure on the forest. If the demand per day (207.2 t) is divided by the total area of the sanctuary (53 952 ha) and multiplied by 365, we get an annual pressure of 1.40 t fuelwood on each hect- are of forest land. The assumption underlying this calculation is that all the fuelwood required in the core and on the fringe of the sanctuary is supplied from the forest alone. That is, no fuel- wood is imported from outside.
1998] UMA SHANKAR ET AL.: NON-TIMBER FOREST PRODUCTS, INDIA, 6 327
TABLE 3. POPULATION (NUMBER OF PEOPLE DE-
PENDENT ON FOREST FOR FUELWOOD) AND FUEL-
WOOD CONSUMPTION IN THE CORE AND ON THE
FRINGE OF THE THREE RESERVE FORESTS OF THE
BRT SANCTUARY.
Fuelwood Popula- consumption
Forest area tlon (kg d ~)
Core Biligiri Reserve Forest 1901 7522 Chamarajanagar Reserve
Forest 1729 6770 Doddasampige Reserve
Forest 4212 15 099 Subtotal 7842 29 391
Fringe Biligiri Reserve Forest 15 604 37 043 Chamarajanagar Reserve
Forest 26 470 72 085 Doddasampige Reserve
Forest 25 313 68 725 Subtotal 67 387 177 853
Grand total 75 229 207 224
DISCOUNT FOR ADDITIONAL ENERGY SOURCES
The demand estimated above strictly assumes that fuelwood meets all the domestic energy needs. A survey within and around the BRT sanctuary revealed that the people depend pri- marily upon non-commercial fuel sources such as forest wood, animal refuse and agricultural residue for fuel energy. Furthermore, the people inhabiting the forest core depend on the forest solely for wood, as the pasture and agricultural land within is very limited (Rudrappa 1993). The people on the fringe of the forest partially depend on agricultural residue to meet fuel en- ergy needs. Two major species used for fuel are coconut (rachis and pericarp of Cocos nucifera) and mulberry (twigs of Morus alba). Unlike many other parts in the country, cattle dung is not used for fuel, but is instead used as biofer- tilizer. Commercial energy sources like coal, pe- troleum and electricity are not preferred for meeting fuel energy needs for economic reasons, though kerosene and paraffin candles are used for lighting in those households that are not pro- vided with electricity. The use of renewable en- ergy is hardly known, although the state govern- ment recently demonstrated appliances for tap-
ping solar energy for heating water and charging batteries.
This study has not attempted to measure the alternate/additional sources of energy contribut- ing to the total domestic consumption of energy. Agricultural residue is the major additional en- ergy source. Its contribution varies according to the size of landholding under coconut and mul- berry farming. Constrained by the lack of reli- able estimates of the contribution of other sources to total energy consumption, we use na- tional average figures of NCAER (1985) accord- ing to which agricultural residue (20%) and live- stock refuse (15%) together meet about 35% of the domestic energy needs. Thus the value of fuelwood consumption is reduced to 134.7 t d ' or 0.91 t h a ' y - l .
WOOD PRODUCTIVITY IN THE B R T FORESTS
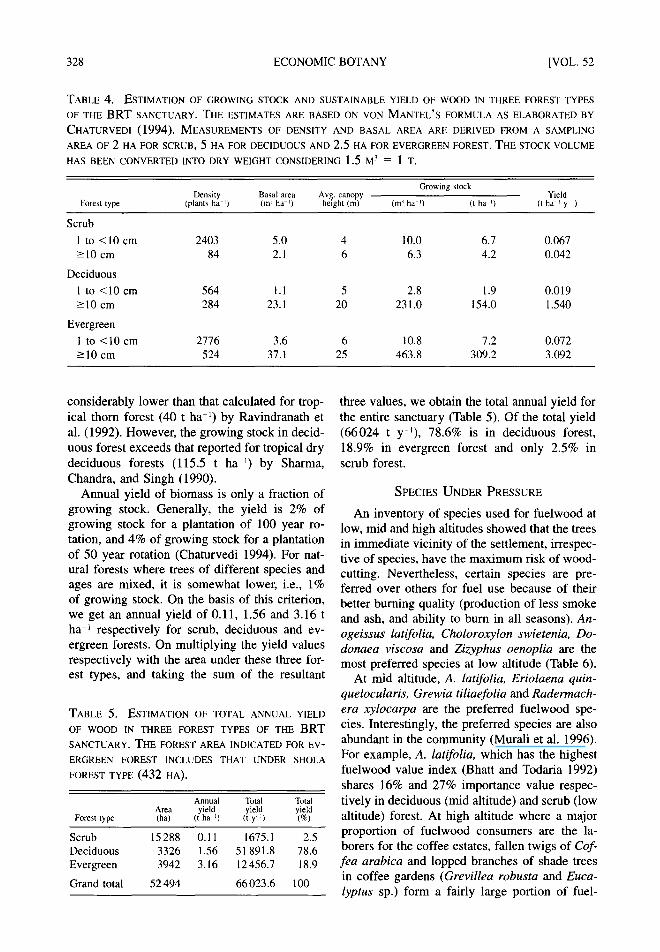
To our knowledge, no systematic ecological study has so far been done in the BRT forests to quantify standing crop of biomass and net pri- mary productivity. However, it is possible to de- rive a fairly reliable estimate of the growing stock and annual yield if basal area and average canopy height of the forest are known. The an- nual yield can be estimated following Von Man- tel's method described by Chaturvedi (1994). The growing stock (m 3 ha -~) is estimated as the product of basal area (m 2 ha -x) and average can- opy height (m) multiplied by a crop form factor which in this forest can be presumed to be 0.5.
The growing stock in three forest types of the BRT sanctuary has been estimated in Table 4. The data on density and basal area are derived from 10 m wide and 500 to 1000 m long tran- sects laid in deciduous (Murali et al. 1996), scrub (Uma Shankar et al. 1998) and evergreen (unpublished data) forest types. The average height of the two dbh classes (1-10 cm, and >-10 cm) is only approximate, based on stray mea- surements. The transects were laid in the vicinity of the settlements to represent the floristic com- position of the forest in the activity zone. The growing stock is estimated to be only 10.9 t ha for scrub forest, 155.9 t ha- ' for deciduous forest and 316.4 t ha- ' for evergreen forest. The esti- mate for evergreen forest is substantially lower in comparison to its counterparts in the Western Ghats in Karnataka (420-649 t ha '), which have a comparable species composition, basal area and tree density (Rai and Proctor 1986). Similarly, the estimate for scrub forest is also
328 ECONOMIC BOTANY [VOL 52
TABLE 4. ESTIMATION OF GROWING STOCK AND SUSTAINABLE YIELD OF WOOD 1N THREE FOREST TYPES OF THE BRT SANCTUARY. THE ESTIMATES ARE BASED ON VON MANTEL'S FORMULA AS ELABORATED BY CHATURVEDI (1994). MEASUREMENTS OF DENSITY AND BASAL AREA ARE DERIVED FROM A SAMPLING AREA OF 2 HA FOR SCRUB, 5 HA FOR DECIDUOUS AND 2.5 HA FOR EVERGREEN FOREST. THE STOCK VOLUME HAS BEEN CONVERTED INTO DRY WEIGHT CONSIDERING 1.5 M 3 = 1 T.
Growing stock Density Basal area Avg. canopy Yield
Forest type (plants ha ~) (m 2 ha ~) height (m) (m ~ ha ~) (t ha ~) (t ha ~ y ~)
Scrub
1 to <10 cm ->10 cm
Deciduous
1 to <10 cm ~10 cm
Evergreen
1 to <10 cm >-10 cm
2403 5.0 4 10.0 6.7 0.067 84 2.1 6 6.3 4.2 0.042
564 1.1 5 2.8 1.9 0.019 284 23.1 20 231.0 154.0 1.540
2776 3.6 6 10.8 7.2 0.072 524 37.1 25 463.8 309.2 3.092
considerably lower than that calculated for trop- ical thorn forest (40 t ha 1) by Ravindranath et al. (1992). However, the growing stock in decid- uous forest exceeds that reported for tropical dry deciduous forests (115.5 t ha ~) by Sharma, Chandra, and Singh (1990).
Annual yield of biomass is only a fraction of growing stock. Generally, the yield is 2% of growing stock for a plantation of 100 year ro- tation, and 4% of growing stock for a plantation of 50 year rotation (Chaturvedi 1994). For nat- ural forests where trees of different species and ages are mixed, it is somewhat lower, i.e., 1% of growing stock. On the basis of this criterion, we get an annual yield of 0.11, 1.56 and 3.16 t ha i respectively for scrub, deciduous and ev- ergreen forests. On multiplying the yield values respectively with the area under these three for- est types, and taking the sum of the resultant
TABLE 5. ESTIMATION OF TOTAL ANNUAL YIELD OF WOOD IN THREE FOREST TYPES OF THE BRT SANCTUARY. THE FOREST AREA INDICATED FOR EV- ERGREEN FOREST INCLUDES THAT UNDER SHOLA FOREST TYPE (432 HA).
Annual Total Total Area yield yield yield
Forest type (ha) (t ha ~) (t y-~) (%)
Scrub 15288 0.11 1675.1 2.5 Deciduous 3326 1.56 51 891.8 78.6 Evergreen 3942 3.16 12 456.7 18.9
Grand total 52 494 66 023.6 100
three values, we obtain the total annual yield for the entire sanctuary (Table 5). Of the total yield (66024 t y-J), 78.6% is in deciduous forest, 18.9% in evergreen forest and only 2.5% in scrub forest.
SPECIES UNDER PRESSURE
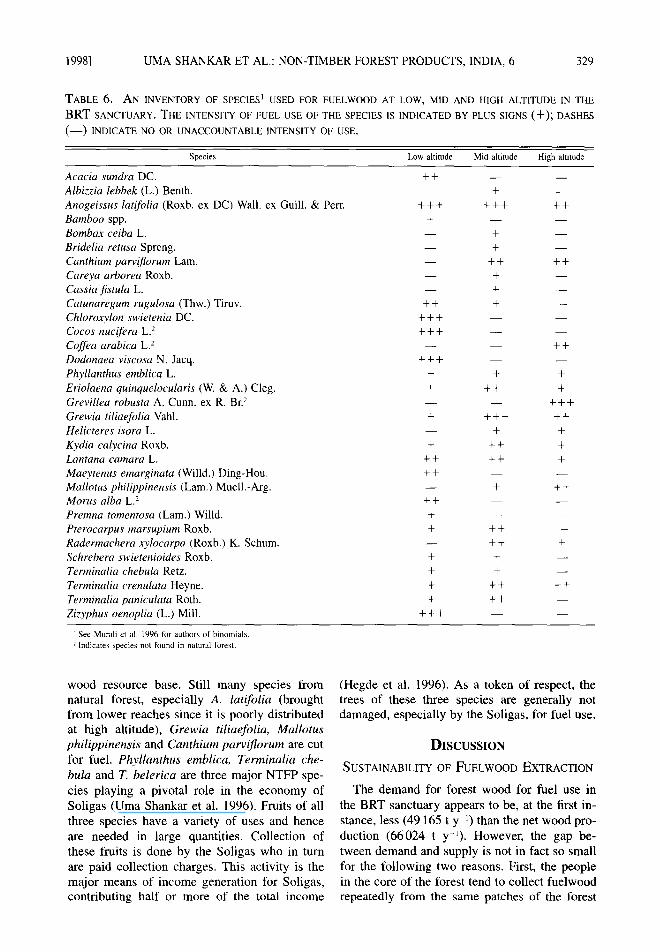
An inventory of species used for fuelwood at low, mid and high altitudes showed that the trees in immediate vicinity of the settlement, irrespec- tive of species, have the maximum risk of wood- cutting. Nevertheless, certain species are pre- ferred over others for fuel use because of their better burning quality (production of less smoke and ash, and ability to burn in all seasons). An- ogeissus latifolia, Choloroxylon swietenia, Do- donaea viscosa and Zizyphus oenoplia are the most preferred species at low altitude (Table 6).
At mid altitude, A. latifolia, Eriolaena quin- quelocularis, Grewia tiliaefolia and Radermach- era xylocarpa are the preferred fuelwood spe- cies. Interestingly, the preferred species are also abundant in the community (Murali et al. 1996). For example, A. latifolia, which has the highest fuelwood value index (Bhatt and Todaria 1992) shares 16% and 27% importance value respec- tively in deciduous (mid altitude) and scrub (low altitude) forest. At high altitude where a major proportion of fuelwood consumers are the la- borers for the coffee estates, fallen twigs of Cof- fea arabica and lopped branches of shade trees in coffee gardens (Grevillea robusta and Euca- lyptus sp.) form a fairly large portion of fuel-
1998] UMA SHANKAR ET AL.: NON-TIMBER FOREST PRODUCTS, INDIA, 6 329
TABLE 6. AN I N V E N T O R Y OF SPECIES I USED FOR F U E L W O O D AT L O W , MID A N D HIGH A L T I T U D E IN THE
BRT S A N C T U A R Y . THE INTENSITY OF FUEL USE OF THE SPECIES 1S INDICATED BY PLUS SIGNS (-4-); DASHES
( - - ) INDICATE NO OR U N A C C O U N T A B L E INTENSITY OF USE.
Species Low altitude Mid altitude High altitude
Acacia sundra DC. Albizzia lebbek (L.) Benth. Anogeissus latifolia (Roxb. ex DC) Wall. ex Guill. & Pert. Bamboo spp. Bombax ceiba L. Bridelia retusa Spreng. Canthium parviflorum Lam. Careya arborea Roxb. Cassia fistula L. Catunaregum rugulosa (Thw.) Tiruv. Chloroxylon swietenia DC. Cocos nucifera L. 2 Coffea arabica L. 2 Dodonaea viscosa N. Jacq. Phyllanthus emblica L. Eriolaena quinquelocularis (W. & A.) Cleg. Grevillea robusta A. Cunn. ex R. Br. 2 Grewia tiliaefolia Vahl. Helicteres isora L. Kydia calycina Roxb. Lantana camara L. Maeytenus emarginata (Willd.) Ding-Hou. Mallotus philippinensis (Lain.) Muell.-Arg. Morus alba L. 2 Premna tomentosa (Lam.) Willd. Pterocarpus marsupium Roxb. Radermachera xylocarpa (Roxb.) K. Schum. Schrebera swietenioides Roxb. Terminalia chebula Retz. Terminalia crenulata Heyne. Terminalia paniculata Roth. Zizyphus oenoplia (L.) Mill.
+ + + + + + ++ A- _ _ _ _
- - ++ ++
++ + - - +++ - - _ _
+ + + - - _ _
_ _ _ _ + +
+++ - - _ _
+ + + + +++ +
_ _ _ _ +++ + +++ ++
- - + +
+ ++ + ++ ++ + ++ - - _ _
- - + + +
++ - - _ _
+ ++ - - - - + + +
+ + - - + + - - + ++ ++ + ++ - -
+ + + - - _ _
i See Murali et al. 1996 for authors of binomials. 2 Indicates species not found in natural forest.
wood resource base. Still many species from natural forest, especially A. latifolia (brought from lower reaches since it is poorly distributed at high altitude), Grewia tiliaefolia, Mallotus philippinensis and Canthium parviflorum are cut for fuel. Phyllanthus emblica, Terminalia che- bula and T. belerica are three major NTFP spe- cies playing a pivotal role in the economy of Soligas (Uma Shankar et al. 1996). Fruits of all three species have a variety of uses and hence are needed in large quantities. Collection of these fruits is done by the Soligas who in turn are paid collection charges. This activity is the major means of income generation for Soligas, contributing half or more of the total income
(Hegde et al. 1996). As a token of respect, the trees of these three species are generally not damaged, especially by the Soligas, for fuel use.
DISCUSSION
SUSTAINABILITY OF FUELWOOD EXTRACTION
The demand for forest wood for fuel use in the BRT sanctuary appears to be, at the first in- stance, less (49 165 t y ~) than the net wood pro- duction (66024 t y-~). However, the gap be- tween demand and supply is not in fact so small for the following two reasons. First, the people in the core of the forest tend to collect fuelwood repeatedly from the same patches of the forest
330 ECONOMIC BOTANY [VOL. 52
in their surroundings. It is most likely that the forest land in closest proximity to the settlement experiences maximum intensity of collection, with a progressive decline as one moves away from the settlement. After the supply from the closer points begins to decline, people walk fur- ther and further into the forest widening the area of the impacted zone. On the other hand, the people residing on the fringe of the forest tend to invade the forest boundary from outside to collect fuelwood. They gather fuelwood first from the outermost zone of the forest, but start intruding deeper and deeper as the supply dwin- dles. Supposedly, the outermost 1-2 km zone would be affected the most, since the time of stay, and with it the risk of arrest for performing illicit woodcutting would increase with the dis- tance penetrated into the forest. Hence, while there would be continuously dilating "impacted- holes" in the core, the "impacted-periphery" of the forest would be shrinking simultaneously. It could be concluded that the forest cover under impacted-holes, and impacted-periphery, would actually be the one pressured for fuelwood cut- ting. Thus, if only impacted area is taken into consideration for calculating the pressure per hectare forest land (not the area of the whole forest as done above), the calculated figure of 0.91 t ha -~ will rise substantially.
It is hardly possible to precisely estimate the forest cover under impact-zone due to the un- predictable direction and distance travelled by a fuelwood collector. Nevertheless, we attempt here to crudely estimate the area under impact- zone by toposheet survey method. We marked on 1:50000 scale toposheets the forest area around each settlement which is reached by the fuelwood collectors (Fig. 1). For this we visited all the settlements within the sanctuary and questioned local inhabitants about their fuel- wood collection activities. The collection is done on easily accessible terrains along the roads (paved or unpaved) and footpaths. In other words, microlevel geography is an important de- terminant of the selection of area for fuelwood extraction. We considered this factor while marking the toposheets. Similarly, the forest area impacted by fuelwood extraction was marked along entire boundary of the forest by recogniz- ing potential entry paths, roads, footpaths and population centers. The area under impact-zone is estimated to be 20.1% of the total sanctuary area or 10854 ha. The wood production from
activity zone would thus amount to 13 271 t y J, or only 27% of the total demand.
The second factor which further widens the gap between demand and supply is selective use of particular species for fuel. The supply esti- mate takes into account the productivity of all the species occurring in the community. If the productivity of the species not preferred for fuel- wood is deducted from the total, the supply es- timate will go down. However, the quantum of such reduction in supply would depend upon the relative dominance of the species preferred and not preferred for fuel use. Since a quantitative conclusion is difficult to make using the data presented, it could be said that the demand-sup- ply gap is surely more than what is calculated above, and it should be taken into consideration in policy-planning for fuelwood management.
ECOLOGICAL IMPACTS
It is apparent that if the harvested quantity exceeds the production capacity, one would not only lose the growing stock but also biodiver- sity. The time taken for such a total loss would depend upon the gap between the harvest rate and production rate; the greater the harvest rate over the production rate, the smaller the time taken in ecosystem conversion. Innumerable ex- amples of this phenomenon can be found in In- dia (Satin 1994) as well as other countries. Bio- diversity can be influenced by fuelwood extrac- tion activity even if the harvest rate is lower than the production rate. What matters most is the nature of material extracted. The wood for fuel is derived from live, dead and damaged trees and woody shrubs. Although dried wood is pre- ferred from dead and damaged logs because it is ready for immediate use, branches of large standing trees are cut, and even small trees and saplings are felled whenever need arises.
Extraction of fuelwood from dead and dam- aged trees may disturb basic ecosystem func- tions in general, and biodiversity in particular. The most obvious impact of removal of dead and damaged wood is a degradation of litter sup- plying nutrients to the soil. Decline in supply of litter hampers not only the soil recharge with nutrients, but also eliminates the whole decom- position network. Decomposition of litter is a crucial link in nutrient recycling process in ter- restrial ecosystems; the decaying wood harbors many decomposer species, including sapro- phytes, termites, insects etc.
1998] UMA SHANKAR ET AL.: NON-TIMBER FOREST PRODUCTS, INDIA, 6 331
Extraction of fuelwood from live plants, whether the whole plant is taken or only a part of it, poses no less serious threats than extraction from dead and damaged individuals. Lopping of twigs and branches creates openings in canopy, which in turn increases light interception, alters microhabitat on the forest floor and influences the regeneration process. Twigs and branches in most tree species are the potential sites for flow- er and fruit development. A reduction in these sites may lead to lower fruit and seed production in the ensuing season, and would thus affect the natural regeneration as well as populations of animals dependent upon flowers and fruits. For species that primarily depend on seeds for re- generation and in which seed mortality from fac- tors such as predation, loss of viability, germi- nation failure, etc. is greater, extraction of twigs and branches may be expensive to the popula- tion.
Harvest of whole plants may bring drastic changes in stand density, basal area and popu- lation structure. Species preferred for fuel use exhibit greater probability of undergoing such changes. If harvested continuously and in large amounts, the preferred species might even face local extinction. Our studies in scrub forest in the BRT sanctuary in Mysore district show that a pole (tree sapling) is most vulnerable to cutting once it attains a dbh of 5 cm (Uma Shankar et al. 1998). This hampers the establishment of newly recruited individuals in the population and causes a positive skew in the population structure. Those species which are preferred for fuel use have maximum chance of removal at the pole stage. Pole cutting also affects other ecological attributes. The density of the popu- lation declines and basal areas are reduced, which may bring changes in hydrological cycle by increasing the rate of erosion of soil and nu- trients through run-off and leaching. The pole stage is the period of fastest growth in the trees' life; thus the rate of growth of the forest and in turn the rate of carbon sequestration in biomass declines if excessive numbers of poles are re- moved. However, removal of poles within pre- scribed limits can be permitted if regeneration is good and silvicultural thinning of the natural forest is required.
The method of extraction also influences bio- diversity. The biomass accumulated annually in the forest through net primary productivity is ap- portioned to bole and small twigs and branches.
It is important to extract biomass in a way which would have the least harmful consequences on ecosystem functioning. It is also widely debated whether to permit the extraction of naturally dead trees, accidentally damaged trees, or both of these categories. Histologically, naturally dead and accidentally damaged tissues differ pri- marily in their moisture retaining capacity, and consequently serve as substrate for different va- riety of microfauna and micro flora. While nat- urally dead tissues harbor a mostly decomposer community, damaged tissues largely support pests and borer insects which are harmful to oth- er trees in the community.
MANAGEMENT OPTIONS
The present practices of fuelwood extraction, if continued, may have a drastic effect on the ecosystem structure and function. Heavy extrac- tion of fuelwood in a wildlife sanctuary, de- signed to protect biodiversity, is most discour- aging. Even if our estimates of extraction were significantly reduced, say by hal l the impact of extraction would still be substantial because much of the extraction is concentrated on the periphery. With increase in population and con- tinuing lack of alternative fuels, the extraction is likely to increase without management interven- tions.
Presently, the management of the sanctuary is the responsibility of the Karnataka Forest De- partment (KFD), but we are not aware of any management plans that seek to address the fuel- wood issue. The main concerns of the KFD management plans are the prevention of en- croachments, illicit cutting of timber, curtailment of fire, eradication of weeds, and the mainte- nance of wild populations of large mammals. With limited human, financial, and technical re- sources, the ability of the KFD to monitor threats to biodiversity and to develop mecha- nisms that maintain biodiversity in the face of human pressures is limited.
Obvious global remedies for the "fuelwood crisis" are thought to be relatively simple: more trees in the form of energy plantations, better stoves for rural families, and alternative fuels (usually fossils fuels) for urban and industrial consumers (FAO 1990). However, implementa- tion of the global recommendations has dem- onstrated that these strategies often need to be tailored to meet local conditions (Veer and Ene- voldsen 1993). In this context, strategies to re-
332 ECONOMIC BOTANY [VOL. 52
solve the fuelwood crisis in the BRT sanctuary may be worked out at three different levels: greater productivity, efficient use, and alterna- tive fuel sources.
Energy plantations of indigenous species in degraded lands, particularly around settlements and in the periphery of the sanctuary may pro- vide one of the means to enhance productivity. Because the level of demand and the location of consumption centers in and around the BRT for- ests is known, the area that should be brought under fuelwood plantations can be calculated. Information about the choice of species, yield potential, and economics of establishing planta- tions is available (Chaturvedi 1985, Sharma 1992).
One way of reducing the gap between demand and supply is to harness maximum energy po- tential of the wood through efficient burning de- vices. In the BRT sanctuary, fuelwood is burnt in a highly inefficient manner in open spaces or old-fashioned mud-chulhas (stoves). There is ample scope for introduction of improved stoves. Feasibility of multi-fuel stoves such as those offered by a Philippine firm can be tested in the BRT sanctuary and similar areas (Anon- ymous 1993a). Impact of fuelwood extraction on biodiversity can be minimized if dependence on wood-based fuels can be reduced by promoting alternative fuel sources. Also as the era of fossil fuels such as coal, kerosene, liquefied petroleum gas is approaching its end, use of renewable and non-conventional energy sources must be pro- moted. This can be achieved through demon- strations of modern appliances, training consum- ers and providing incentives to help them afford new technology. Feasibility of some energy technologies, such as solar photovoltaic systems, windmills, biogas and briquetting should be as- sessed in and around the BRT sanctuary in light of the feedback provided by several researchers (Anonymous 1993b; Bagemann 1993; Nayar 1993; Tewari 1992; Venkata Ramana 1991).
Appropriate mechanisms would be required to develop energy plantations, to increase efficient use of fuels, and to introduce alternative sources of energy. Fortunately, institutions exist in the area to create such mechanisms. Moreover, these institutions have the mandate to manage natural resources and safeguard the livelihood of the So- ligas. The Karnataka Forest Department (KFD) is in the process of initiating the joint forest management program, which in other parts of
the country has involved local communities in protection and regeneration of the degraded for- ests in exchange for the use of forest products. The non-government organization, Vivekananda Girijana Kalyana Kendra (VGKK), representing Soligas, has been engaged in a wide range of community development projects. The two or- ganizations (KFD and VGKK) have the poten- tial to develop a coordinated program for con- servation and sustained utilization of natural re- sources of the area.
ACKNOWLEDGMENTS This paper represents contribution number 53 of a research program
in Conservation of Biodiversity and Environment jointly coordinated by the Tata Energy Research Institute and the University of Massachusetts at Boston. The program is supported in part by the MacArthur Founda- tion. The authors are grateful to Dr. K.S. Murali, Dr. H. Sudarshan, and Shri Somasundaram for their help at various stages of this study.
LITERATURE CITED
Anonymous. 1993a. Commercializing multi-fuel stoves in Philippines. RERIC News 16(2):8.
Anonymous. 1993b. Briquetting of agricultural wastes--an overview. TIDE 3:250-254.
Appasamy, P. P. 1993. Role of non-timber forest prod- ucts in subsistence economy: the case of a joint for- estry project in India. Economic Botany 47:258- 267.
Bagemann, S. H. A. 1993. Solar electricity for light- ening and other basic needs in rural areas. TIDE 3: 235-244.
Bernard, H. R., P. Killworth, D. Dronenfeld, and L. Sailer. 1984. The problem of informant accuracy: the validity of retrospective data. Annual Review of Anthropology 13:495-517.
- - , P. J. Pelto, O. Werner, J. Boster, A. K. Rom- ney, A. Johnson, C. R. Ember, and A. Kasakoff. 1986. The construction of primary data in cultural anthropology. Current Anthropology 27:382-396.
Bhatt, B. P., and N. P. Todaria. 1992. Fuelwood char- acteristics of some Indian mountain species. Forest Ecology and Management 47:363-366.
Chatnrvedi, A. N. 1985. Firewood farming on degrad- ed lands. UP Forest Bulletin No. 50.
�9 1994. Management of India's forest resources. Khanna Bandhu, Dehradun.
FAO. 1990. A decade of wood energy activities within the Nairobi Programme of Action. FAO, Rome.
Fernandes, W., G. Menon, and P, Viegas. 1988. For- ests, environment and tribal economy: deforestation, impoverishment and marginalisation in Orissa. In- dian Social Institute, New Delhi.
Ganesan, B. 1993. Extraction of non-timber forest products, including fodder and fuelwood, in Mudu- malai, India. Economic Botany 47:268-274.
Gunatilake, H. M., D. M. A. H. Senaratne, and P. Abeygunawardena. 1993. Role of non-timber forest
1998] UMA SHANKAR ET AL.: NON-TIMBER FOREST PRODUCTS, INDIA, 6 333
products in the economy of peripheral communities of Knuckles National Wilderness Area of Sri Lanka: a farming systems approach. Economic Botany 47: 275-281.
Gunatilleke, I. A. U. N., C. V. S. Gunatilleke, and P. Abeygunawardeua. 1993. Interdisciplinary research towards management of non-timber forest resources in lowland rain forests of Sri Lanka. Economic Bot- any 47:282-290.
Hegde, R., S. Suryaprakash, L. Achoth, and K. S. Bawa. 1996. Extraction of non-timber forest prod- ucts in the forests of Biligiri Rangan Hills, India. 1. Contribution to rural income. Economic Botany 50: 243-251.
Lele, U., K. Mitra, and O. N. Kaul. 1994. Environ- ment, development and poverty: a report of the in- ternational workshop on India's forest management and ecological revival. Occasional Paper No. 3, Cen- ter for International Forestry Research (CIFOR), Ja- karta, Indonesia.
Maitra, A. K. 1992. Fuelwood and energy sources for village communities of mountain areas: a case study of Kulu district. Pages 111-112 in A. Agarwal, ed., The price of forests. Center for Science and Envi- ronment, New Delhi.
Malhotra, K. C., S. Chandra, T. S. Vasulu, L. Ma- jumdar, and S. Kundu. 1990a. Joint management of forest lands in West Bengal: a case study of Jam- boni range in Midnapore district. Indian Institute of Bio-Social Research and Development (IBRAD), Calcutta.
Malhotra, K. C., T. S. Vasulu, G. Yadav, L. Majum- dar, M. Adhikari, and S. Kundu. 1990b. Joint for- est management in West Bengal: study of nontimber forest produce and FPC structure and performance in Jamboni range, Midnapore district. Indian Insti- tute of Bio-Social Research and Development (IBRAD), Calcutta.
, D. Deb, M. Dutta, T. S. Vasulu, G. Yadav, and M. Adhikari, 1991. Role of non-timber forest produce in village economy: a household survey in Jamboni range, Midnapore district, West Bengal. in- dian Institute of Bio-Social Research and Develop- ment.
MEF (Ministry of Environment and Forests). 1987. The state of forest report. Forest Survey of India, Dehradun.
Murali, K. S., Uma Shankar, R. Uma Shaanker, K. N. Ganeshaiah, and K. S. Bawa. 1996. Extraction of non-timber forest products in the forests of Bili- giri Rangan Hills, India. 2. Impact of NTFP extrac- tion on regeneration, population structure, and spe- cies composition. Economic Botany 50:252-269.
Nayar, C. V. 1993. Small scale wind electricity gen- eration design criteria. TIDE 3:111-131.
NCAER (National Council of Applied Economic Re- search). 1985. Domestic fuel survey with special reference to kerosene. Vols. I and II, New Delhi.
PHCC (Palni Hills Conservation Council). 1991. Ka- davakurichi interface forestry--surveys and analy- sis. Kodaikanal, Tamil Nadu, India.
Rai, S. N., and J. Proctor. 1986. Ecological studies on four rainforests in Karnataka, India. I. Environment, structure, floristics and biomass. Journal of Ecology 74:439-454.
Ramesh, B. R. 1989. Evergreen forests of the Biligirir- angan hills, south India. Ph.D. thesis, French Insti- tute, Pondicherry, India. p. 171.
Ravindranath, N. H., B. S. Somashekhar, M. Gadgil, and Xu Deying. 1992. Carbon emissions and se- questration in forests: case studies from seven de- veloping countries. III. India and China. In W. Mak- undi and J. Sathaye, series eds., Climate change di- vision, Environmental Protection Agency, Washing- ton, DC, USA. pp. 128-165.
Rudrappa, S. 1993. Land-use change in the B.R. Hills. M.S. Thesis. University of Wisconsin, USA.
Satin, M. 1994. Leaving the women in the woods. Down To Earth 3:31-36.
Sharma, R. B., M. Chandra, and K. P. Singh. 1990. Variations in forest biomass and productivity. In: En- vironmental degradation of Obra-Renukoot-Singrau- li area and its impact on natural and derived eco- systems, in J. S. Singh, K. P. Singh and M. Agrawal, eds., Final Technical Report, Banaras Hindu Uni- versity, Varanasi. pp. 88-102.
Sharma, R. D. 1992. Economics of fuelwood produc- tion in wastelands. Concept Publishing, New Delhi, 188 p.
Tewari, S. K. 1992. Power generation using wing tur- bines: status and issues. TIDE 2:161-175.
Uma Shankar, K. S. Murali, R. Uma Shaauker, K. N. Gaueshaiah, and K. S. Bawa. 1998. Extraction of non-timber forest products in the forests of Bili- girl Rangan Hills, India. 4. Impact on floristic di- versity and population structure in a thorn scrub for- est. Economic Botany 52:302-315.
Uma Shankar, K. S. Murali, R. Uma Shaanker, K. N. Ganeshaiah, and K. S. Bawa. 1996. Extraction of non-timber forest products in the forests of Bili- giri Rangan Hills, India. 3. Productivity, extraction and prospects of sustainable harvest of amla Phyl- lanthus emblica (Euphorbiaceae). Economic Botany 50:270-279.
Veer, C., and K. Enevoldsen. 1993. Wood in rural en- ergy planning: issues and strategies for discussion. TIDE 3:323-337.
Venkata Ramana, P. 1991. Biogas programme in In- dia. TIDE 1:1-12.
Wall, J. P., and N. Reid. 1993. Domestic fuelwood use in a rural township in eastern Australia: evidence for resource depletion and implications for management. Commonwealth Forestry Review 72:31-37.
Wilkie, D. S. 1989. Impact of roadside agriculture on subsistence in the Ituri forest of northeastern Zaire. American Journal of Physical Anthropology 78:485- 494.
334 ECONOMIC BOTANY [VOL. 52
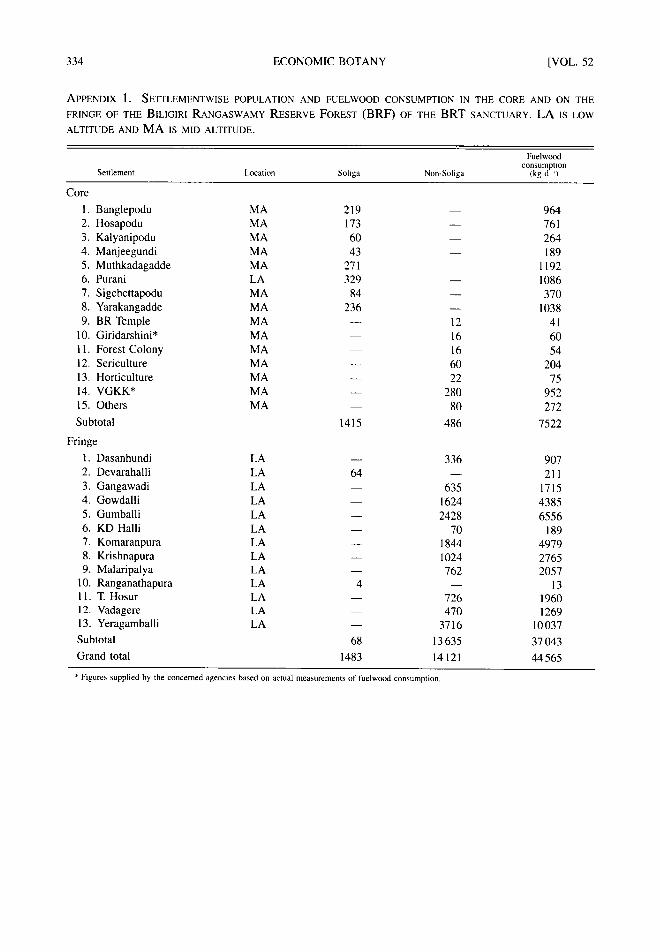
APPENDIX 1. SETTLEMENTWISE POPULATION AND FUELWOOD CONSUMPTION 1N THE CORE AND ON THE
FRINGE OF THE BILIG1RI RANGASWAMY RESERVE FOREST ( B R F ) OF THE B R T SANCTUARY. L A IS LOW
ALTITUDE AND M A IS MID ALTITUDE.
Fuelwood consumption
Settlement Location Soliga Non-Soliga (kg d k)
Core
1. Banglepodu MA 219 - - 964
2. Hosapodu MA 173 - - 761
3. Kalyanipodu MA 60 - - 264
4. Manjeegundi MA 43 - - 189
5. Muthkadagadde MA 271 - - 1192 6. Purani LA 329 - - 1086
7. Sigebettapodu MA 84 - - 370
8. Yarakangadde MA 236 - - 1038
9. BR Temple MA - - 12 41
10. Giridarshini* MA - - 16 60
11. Forest Colony MA - - 16 54
12. Sericulture MA - - 60 204
13. Horticulture MA - - 22 75
14. VGKK* MA - - 280 952
15. Others MA - - 80 272
Subtotal 1415 486 7522
Fringe
1. Dasanhundi LA - - 336 907
2. Devarahal l i LA 64 - - 211
3. Gangawadi LA - - 635 1715
4. Gowdal l i LA - - 1624 4385
5. Gumbal l i LA - - 2428 6556
6. KD Halli LA - - 70 189
7. Komaranpura LA - - 1844 4979
8. Krishnapura LA - - 1024 2765
9. Malar ipalya LA - - 762 2057 10. Ranganathapura LA 4 - - 13
11. T. Hosur LA - - 726 1960
12. Vadagere LA - - 470 1269
13. Yeragamball i LA - - 3716 10 037
Subtotal 68 13 635 37 043
Grand total 1483 14 121 44565
* Figures supplied by the concerned agencies based on actual measurements of fuelwood consumption.
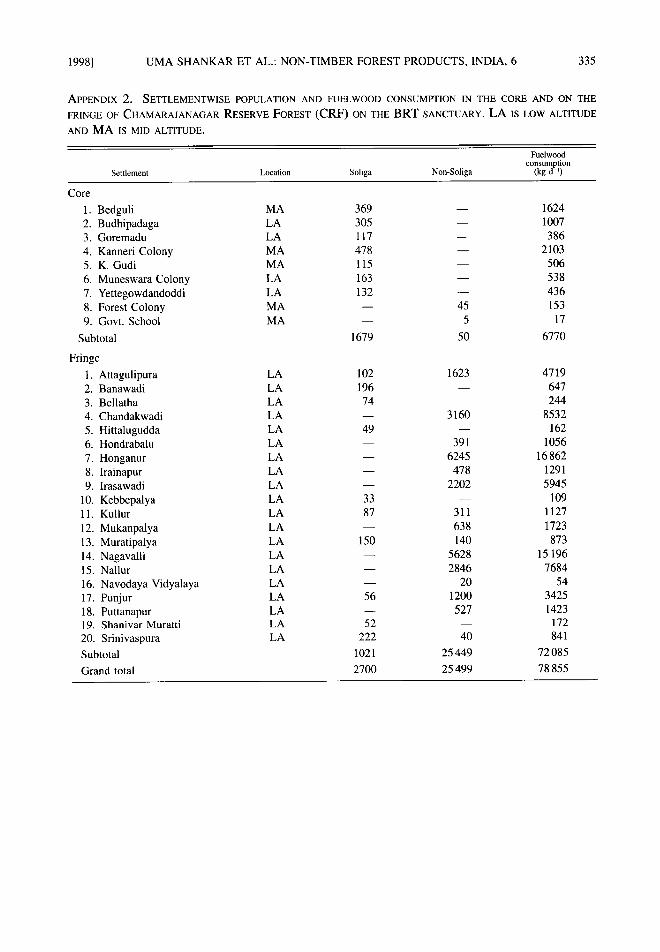
1998] UMA SHANKAR ET AL.: NON-TIMBER FOREST PRODUCTS, INDIA, 6 335
APPENDIX 2. SETTLEMENTWISE POPULATION AND FUELWOOD CONSUMPTION IN THE CORE AND ON THE
FRINGE OF CHAMARAJANAGAR RESERVE FOREST ( C R F ) ON THE B R T SANCTUARY. L A IS LOW ALTITUDE
AND M A IS MID ALTITUDE.
Fuelwood consumption
Settlement Location Soliga Non-Soliga (kg d ~)
Core
1. Bedguli MA 369 - - 1624 2. Budhipadaga LA 305 - - 1007
3. Goremadu LA 117 - - 386
4. Kanneri Colony MA 478 - - 2103 5. K. Gudi MA 115 - - 506
6. Muneswara Colony LA 163 - - 538
7. Yettegowdandoddi LA 132 - - 436
8. Forest Colony MA - - 45 153
9. Govt. School MA - - 5 17
Subtotal 1679 50 6770
Fringe
1. Attagulipura LA 102 1623 4719
2. Banawadi LA 196 - - 647
3. Bellatha LA 74 - - 244 4. Chandakwadi LA - - 3160 8532 5. Hittalugudda LA 49 - - 162 6. Hondrabalu LA - - 391 1056 7. Honganur LA - - 6245 16862
8. Irainapur LA - - 478 1291
9. Irasawadi LA - - 2202 5945
10. Kebbepalya LA 33 - - 109 11. Kullur LA 87 311 1127
12. Mukanpalya LA - - 638 1723
13. Muratipalya LA 150 140 873
14. Nagavalli LA - - 5628 15 196 15. Nallur LA - - 2846 7684
16. Navodaya Vidyalaya LA - - 20 54 17. Punjur LA 56 1200 3425
18. Puttanapur LA - - 527 1423 19. Shanivar Muratti LA 52 - - 172 20. Srinivaspura LA 222 40 841
Subtotal 1021 25 449 72 085
Grand total 2700 25 499 78 855
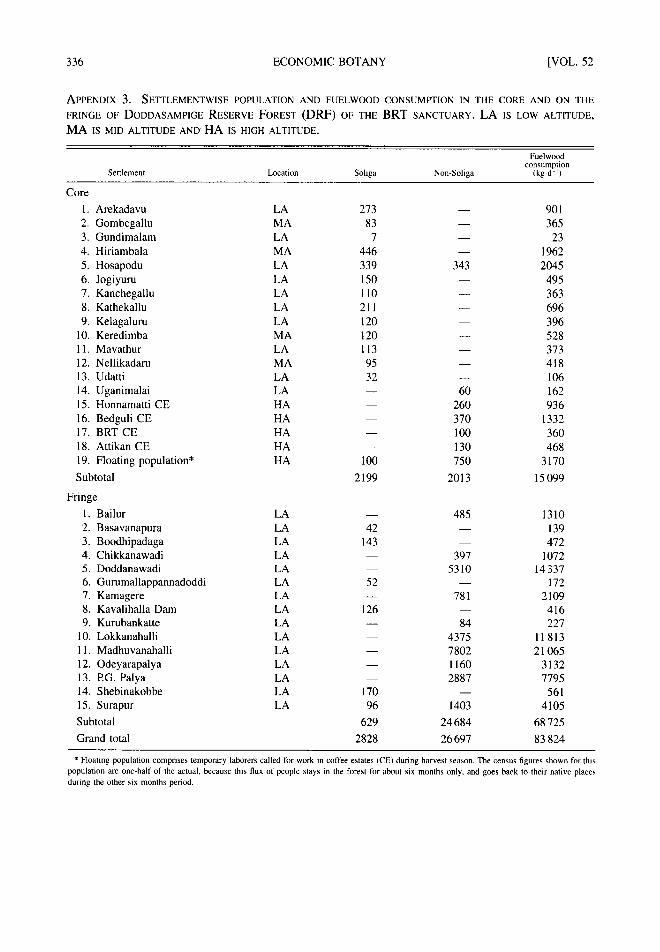
336 ECONOMIC BOTANY [VOL. 52
APPENDIX 3. SETTLEMENTWISE POPULATION AND FUELWOOD CONSUMPTION IN THE CORE AND ON THE
FRINGE OF DODDASAMPIGE RESERVE FOREST ( D R F ) OF THE BRT SANCTUARY. LA is LOW ALTITUDE,
M A IS MID ALTITUDE AND H A IS HIGH ALTITUDE.
Fuelwood consumption
Settlement Location Soliga Non-Soliga (kg d 1)
Core
1. Arekadavu LA 273 - - 901
2. Gombegal lu MA 83 - - 365
3. Gundimalam LA 7 - - 23
4. Hir iambala MA 446 - - 1962
5. Hosapodu LA 339 343 2045
6. Jogiyuru LA 150 - - 495
7. Kanchegal lu LA 110 - - 363
8. Kathekallu LA 211 - - 696
9. Kelagaluru LA 120 - - 396
10. Keredimba MA 120 - - 528
11, Mavathur LA 113 - - 373
12. Nel l ikadaru MA 95 - - 418
13. Udatti LA 32 - - 106
14. Uganimala i LA - - 60 162
15. Honnamatt i CE HA - - 260 936
16. Bedguli CE HA - - 370 1332
17. BRT CE HA - - 100 360
18. Att ikan CE HA - - 130 468
19. Floating population* HA 100 750 3170
Subtotal 2199 2013 15 099
Fringe
1. Bailur LA - - 485 1310
2. Basavanapura LA 42 - - 139
3. Boodhipadaga LA 143 - - 472
4. Chikkanawadi LA - - 397 1072
5. Doddanawadi LA - - 5310 14 337 6. Gurumallappannadoddi LA 52 - - 172
7. Kamagere LA - - 781 2109
8. Kaval ihal la Dam LA 126 - - 416
9. Kurubankatte LA - - 84 227
10. Lokkanahal l i LA - - 4375 11 813
11. Madhuvanahal l i LA - - 7802 21 065
12. Odeyarapalya LA - - 1160 3132
13. P.G. Palya LA - - 2887 7795
14. Shebinakobbe LA 170 - - 561
15. Surapur LA 96 1403 4105
Subtotal 629 24 684 68 725
Grand total 2828 26697 83 824
* Floating population comprises temporary laborers called for work in coffee estates (CE) during harvest season. The census figures shown for this population are one-half of the actual, because this flux of people stays in the forest fnr about six months only, and goes back to their native places during the other six months period.