Extraction of Antioxidants from Aloe vera Leaf Gel: a Response Surface Methodology Study
12
Extraction of Antioxidants from Aloe vera Leaf Gel: a Response Surface Methodology Study Seol Kim & Leonid Asnin & Awraris D. Assefa & Eun Young Ko & Kavita Sharma & Se Won Park Received: 19 November 2013 /Accepted: 3 February 2014 # Springer Science+Business Media New York 2014 Abstract Extraction of antioxidants from aloe gel powder with water–ethanol solvents was studied using response sur- face methodology. The independent variables were solvent composition, temperature, extraction time, and the liquid-to- solid (L/S) ratio. The concentrations of potentially antioxidant compounds (aloin A and B, aloesin, total phenolics, and total carbohydrates) and a few indicators of antioxidant capacity (DPPH, FRAP, CUPRAC) served as the response functions. It was found that aloe gel contains both phenolic and non- phenolic antioxidants, and it was supposed that the phenolic fraction consists almost exclusively of chromones and anthrones. Different approaches to the optimization of extrac- tion procedures are discussed, and here, the maximum recov- ery yield of antioxidants is achieved with 34 % ethanol at 60 °С and a L/S ratio of 46 in 1 h. The use of 90 % ethanol results in a higher antioxidant capacity of the product, but also results in a much lower extraction yield, decreasing the overall pro- ductivity of the process. Keywords Response surface methodology (RSM) . Antioxidants . Extraction . Aloe vera Introduction Aloe vera (L.) Burm. f., also known as Aloe barbadensis Mill, is the most famous species of the genus Aloe and probably one of the most commercially important, being cultivated globally (International Aloe Science Council 2004) on an area of 23,600 to satisfy the great demand of the pharmaceutical, cosmetic, and food industries (Eshun and He 2004; Waller et al. 2004). Functional foods, including health and soft drinks, are other fields of utilization of A. vera gel, grown in an important segment of the aloe industry (Eshun and He 2004; Park and Hyung 2006; Ahlawat and Khatkar 2011). During the last decade, there has been developing interest in antioxidant properties of A. vera gel extracts (Rodríguez et al. 2010). In part, this interest may be explained by a quest for new areas of application of A. vera products. The substitution of synthetic food additives in order to prevent oxidative processes in foodstuff may be one such application. In the experiments by Hu et al. (2003), an ethanol A. vera extract demonstrated radical scavenging potential comparable to that of the synthetic antiox- idant butylated hydroxytoluene. The authors, however, obtained the samples from the whole leaves rather than from the leaf gel. According to Rajasekaran et al. (2005), an ethanolic extract of the A. vera leaf gel reduced the oxidative stress in diabetic rats. Lee et al. (2000) suggested the use of aloe gel in anti-aging agents, since it contains phenolic compounds which are known to function as free radical terminators (Shahidi et al. 1992). A few phenolic-type substances, derivatives of aloesin, with anti- oxidant activity were isolated from aloe gel (Lee et al. 2000; Yagi et al. 2002). A chromon from A. vera with unspecified structure was found to be useful in protection against kidney damage induced by the chemotherapeutic agent cisplatin and associated with the generation of reactive oxygen species (Choung 2006). In addition to low molecular weight com- pounds, glycoproteins (Yagi et al. 2003) and polysaccharides (Liu et al. 2007) of A. vera may possess the activity in question. Electronic supplementary material The online version of this article (doi:10.1007/s12161-014-9822-x) contains supplementary material, which is available to authorized users. S. Kim : A. D. Assefa : E. Y. Ko : K. Sharma : S. W. Park (*) Department of Molecular Biotechnology, College of Life and Environmental Sciences, Konkuk University, 1 Hwayang-dong, Gwangjin-Gu, Seoul 143-701, Republic of Korea e-mail: [email protected] L. Asnin Department of Chemistry and Biotechnology, Perm National Research Polytechnic University, Perm 614990, Russian Federation, Russia Food Anal. Methods DOI 10.1007/s12161-014-9822-x
Transcript of Extraction of Antioxidants from Aloe vera Leaf Gel: a Response Surface Methodology Study
Extraction of Antioxidants from Aloe vera Leaf Gel: a ResponseSurface Methodology Study
Seol Kim & Leonid Asnin & Awraris D. Assefa &
Eun Young Ko & Kavita Sharma & Se Won Park
Received: 19 November 2013 /Accepted: 3 February 2014# Springer Science+Business Media New York 2014
Abstract Extraction of antioxidants from aloe gel powderwith water–ethanol solvents was studied using response sur-face methodology. The independent variables were solventcomposition, temperature, extraction time, and the liquid-to-solid (L/S) ratio. The concentrations of potentially antioxidantcompounds (aloin A and B, aloesin, total phenolics, and totalcarbohydrates) and a few indicators of antioxidant capacity(DPPH, FRAP, CUPRAC) served as the response functions. Itwas found that aloe gel contains both phenolic and non-phenolic antioxidants, and it was supposed that the phenolicfraction consists almost exclusively of chromones andanthrones. Different approaches to the optimization of extrac-tion procedures are discussed, and here, the maximum recov-ery yield of antioxidants is achieved with 34 % ethanol at 60°С and a L/S ratio of 46 in 1 h. The use of 90 % ethanol resultsin a higher antioxidant capacity of the product, but also resultsin a much lower extraction yield, decreasing the overall pro-ductivity of the process.
Keywords Response surface methodology (RSM) .
Antioxidants . Extraction . Aloe vera
Introduction
Aloe vera (L.) Burm. f., also known as Aloe barbadensisMill,is the most famous species of the genus Aloe and probably oneof the most commercially important, being cultivated globally(International Aloe Science Council 2004) on an area of23,600 to satisfy the great demand of the pharmaceutical,cosmetic, and food industries (Eshun and He 2004; Walleret al. 2004). Functional foods, including health and softdrinks, are other fields of utilization of A. vera gel, grown inan important segment of the aloe industry (Eshun and He2004; Park and Hyung 2006; Ahlawat and Khatkar 2011).
During the last decade, there has been developing interest inantioxidant properties of A. vera gel extracts (Rodríguez et al.2010). In part, this interest may be explained by a quest for newareas of application of A. vera products. The substitution ofsynthetic food additives in order to prevent oxidative processesin foodstuff may be one such application. In the experiments byHu et al. (2003), an ethanol A. vera extract demonstrated radicalscavenging potential comparable to that of the synthetic antiox-idant butylated hydroxytoluene. The authors, however, obtainedthe samples from the whole leaves rather than from the leaf gel.According to Rajasekaran et al. (2005), an ethanolic extract ofthe A. vera leaf gel reduced the oxidative stress in diabetic rats.Lee et al. (2000) suggested the use of aloe gel in anti-agingagents, since it contains phenolic compounds which are knownto function as free radical terminators (Shahidi et al. 1992). Afew phenolic-type substances, derivatives of aloesin, with anti-oxidant activity were isolated from aloe gel (Lee et al. 2000;Yagi et al. 2002). A chromon from A. vera with unspecifiedstructure was found to be useful in protection against kidneydamage induced by the chemotherapeutic agent cisplatin andassociated with the generation of reactive oxygen species(Choung 2006). In addition to low molecular weight com-pounds, glycoproteins (Yagi et al. 2003) and polysaccharides(Liu et al. 2007) of A. veramay possess the activity in question.
Electronic supplementary material The online version of this article(doi:10.1007/s12161-014-9822-x) contains supplementary material,which is available to authorized users.
S. Kim :A. D. Assefa : E. Y. Ko :K. Sharma : S. W. Park (*)Department of Molecular Biotechnology, College of Life andEnvironmental Sciences, Konkuk University, 1 Hwayang-dong,Gwangjin-Gu, Seoul 143-701, Republic of Koreae-mail: [email protected]
L. AsninDepartment of Chemistry and Biotechnology, Perm NationalResearch Polytechnic University, Perm 614990, Russian Federation,Russia
Food Anal. MethodsDOI 10.1007/s12161-014-9822-x
While it is of practical interest to obtain an extract with thehighest antioxidant capacity, this is not a trivial task becausemany compounds of different nature, both hydrophilic andlipophilic, contribute to the antioxidant potency of the leaf gel,and because many experimental parameters influence theefficacy of extraction, solvent composition, extraction time,temperature, and solid-to-liquid ratio being the most impor-tant. There have been few reports in literature relating to thetopic (Tang et al. 2011; Wang et al. 2011, He et al. 2012).None of them considered a liquid–solid extraction of antiox-idants thoroughly, except the work by Hu et al. (2005), whichfocused on the optimization of extraction with supercriticalfluid rather than with a range of solvents. A few studies weredevoted to the effect of the solvent on the yield and biologicalactivities of the extracts, but without attempting to optimizethe process (Habeeb et al. 2007; Loots et al. 2007). Thus, theproblem of the isolation of the antioxidant fraction from thealoe gel still requires a focused and systematic investigation,which is the purpose of the present work.
A water–ethanol system was selected as the extractant inthis study, based on previous reports (Hu et al. 2005; Wanget al. 2011) and because of low cost and low toxicity of thesolvents. The effect of four process parameters enumeratedabove on the yield and chemical composition of the productwas examined using response surface methodology (Demingand Morgan 1993), a statistical technique proved to be usefulin optimizing complex extraction procedures (Li et al. 2010).Several methods were applied to characterize different aspectsof the antioxidant activity of the extracts: the 2,2-diphenyl-1-picrylhydrazyl (DPPH) assay (Brand-Williams et al. 1995),Cu(II) reduction capacity (CUPRAC) assay (Apak et al.2004), and ferric reducing antioxidant power (FRAP) assay(Benzie and Strain 1996). While the DPPH method evaluatesthe free radical scavenging capacity of a sample, theCUPRAC and FRAP methods evaluate the content of reduc-ing species with a certain redox potential, to better understandthe relationship between antioxidant power and chemicalcomposition of extracts, total phenolic content, and the con-centrations of typical aloe phenolic compounds, the anthrone-C-glycosides aloin A and B, and the chromone aloesin. Theamount of total polysaccharides extracted was also measured.
Materials and Methods
Chemicals
In this study, ethanol and water were used as extractionsolvents. Ethanol (DAEJUNG Chemicals, Korea) was of 99% purity. Water was purified using a Millipore Milli-Q Ref-erence system. Solvents for chromatography, acetonitrile, andwater were both of HPLC grade (DAEJUNG). Hydrochloricacid, phenol, and sulfuric acid were also supplied by
DAEJUNG. Ammonium acetate, ferric trichloride hexahy-drate, and 2,4,6-tripyridyl-s-triazine (TPTZ) were fromJUNSEI (Japan). Sodium acetate and DPPH were from Fluka(Switzerland). Acetic acid, the Folin–Ciocalteu reagent, andsodium carbonate were from Sigma-Aldrich (Switzerland).Standards of aloin A, D-mannose, and gallic acid were pur-chased from Sigma-Aldrich as well as Neocuproin. Aloin B,aloesin, and 6-hydroxy-2,5,7,8-tetramethylchromane-2-carboxylic acid (Trolox) were obtained from the ChromaDex(USA), Santa Cruz Biotechnology, Inc. (USA), and MP Bio-medical (USA), respectively. All reagents used for analysiswere of analytical or higher purity grade.
Plant Material
Freeze-dried A. vera powder was a gift fromKim JeongMoonAloe Co., LTD (Seoul, Korea). This product was preparedfrom the inner gel of 3-year-old plants collected from a plan-tation on Jeju Island (Korea) in 2012.
Extraction and Sample Preparation
Each extraction experiment used 8 g of the Aloe powder andwas performed in duplicate. The sample was mixed with 240–480 ml of a water–ethanol mixture in a 500-ml Erlenmeyerflask. The extraction process was performed in a thermostatedshaking water bath at agitation rate 180 rpm. Extraction con-ditions were set according to an experimental design planexplained below. Once extraction was completed, the super-natant was separated from the insoluble solid by centrifuga-tion at 9,000 rpm for 10 min at 4 °С. The remaining solidphase was then washed with a small volume of the extractionsolvent and was centrifuged again. The two supernatantphases were pooled together, followed by concentration underreduced pressure using a rotary evaporator. The semi-driedextract was then freeze-dried at −70 °С and homogenizedusing liquid nitrogen. The extract stock solution for analyticalassays was prepared by dissolving 250 mg of the powder inthe same solvent that was used for extraction in a 25-mlmeasuring flask. If not used immediately, the solution wasstored in a freezer at −20 °С.
Experimental Design
The response surface methodology was applied to investigatethe effects of experimental conditions on the extraction yieldand on the composition of extract. The independent variableswere extraction time (x1) varying within a 1–4-h range, theethanol percentage x2 of water–ethanol solvent (0–100 %,v/v), temperature x3 (25–60 °С), and the liquid-to-solid (L/S)ratio x4 (30–60 ml/g). The response variables were extractionyield, concentrations of aloins A and B, aloesin, total poly-saccharides, and total phenolics, as well antioxidant activities,
Food Anal. Methods
which were evaluated according to different approaches. Aninscribed central composite design was used in this study with16 factorial points, 8 axial points, and 2 replicates at the centerpoint, which gave 26 experiments in total. All the experimen-tal runs were performed randomly to minimize the effect ofunexpected variability in the observed response.
The independent variables or factors were coded accordingto the following equation:
X i ¼ xi−x0Δxi
ð1Þ
where Xi is the coded value of the factor, xi its actual value, x0the actual value at the center point, andΔxi the step change inthe variable xi. The levels of the experimental variables in thecoded and uncoded coordinates are given in Table 1. Exper-imental data were fitted to the following second-order poly-nomial model:
Y ¼ β0 þXi¼1
k
βiX i þXi¼1
k
βiiX2i þ
Xk−1i¼1
Xj>i
k
βijX iX i ð2Þ
where Y is the predicted response, β0 is the interceptioncoefficient, βi are the linear terms, βii are the quadratic terms,and βij are the interaction terms. Response surface regressionfollowed by analysis of variance (ANOVA) to assess good-ness of fit and significance of regression coefficients wasperformed using Minitab 16 (Minitab Inc., USA) software.
Determination of Aloin A, Aloin B, Aloesin, and TotalChromones and Anthrones
The aloe chromones and anthrones were determined bymeansof HPLC using an Agilent 1100 chromatograph (Agilent,USA) equipped with a solvent delivery system, an auto-sampler, a DAD detector, and a ChemStation data acquisitionsystem. The chromatographic column was a Kromasil 100-5C18 (250×4.6 mm) which was protected with a C18-typeguard column from Phenomenex (USA). The column wasthermostated at 25 °С. The separation was performed usinga binary gradient consisting of A (70:30 (v/v) acetonitrile–water) and B (0.001 M CuSO4 in water acidified with 0.5 %(v/v) acetic acid). The elution program was as follows: 0–10min, 20–25 % of solvent A; 10–20 min, an isocratic step at 25% A; 20–30 min, 25–40 % A; 30–40 min, 40–50 % A. Eachrun was preceded by a 10-min re-equilibration step at 20 % ofsolvent A. The flow rate was set at 1 ml/min. The injectionvolume was 20 μl. Aloins were monitored at a wavelength of360 nm, whereas chromones, including aloesin, were moni-tored at 298 nm. The detector responses were calibrated withrespect to each analyte by means of the external standard
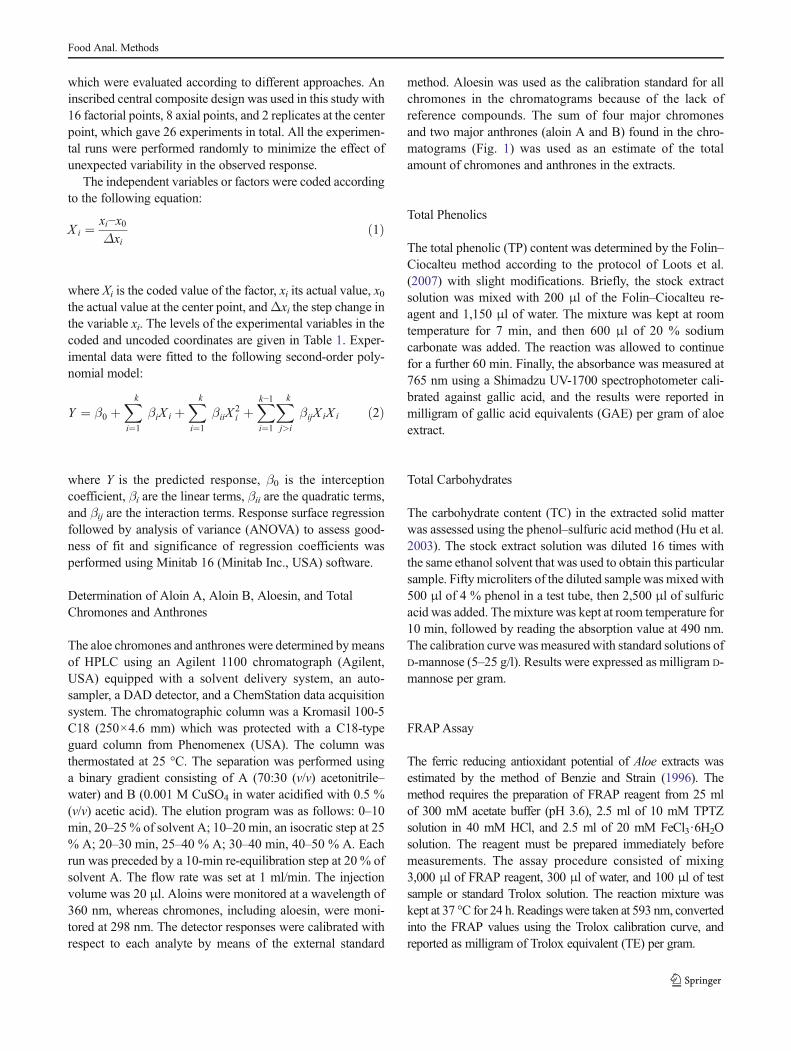
method. Aloesin was used as the calibration standard for allchromones in the chromatograms because of the lack ofreference compounds. The sum of four major chromonesand two major anthrones (aloin A and B) found in the chro-matograms (Fig. 1) was used as an estimate of the totalamount of chromones and anthrones in the extracts.
Total Phenolics
The total phenolic (TP) content was determined by the Folin–Ciocalteu method according to the protocol of Loots et al.(2007) with slight modifications. Briefly, the stock extractsolution was mixed with 200 μl of the Folin–Ciocalteu re-agent and 1,150 μl of water. The mixture was kept at roomtemperature for 7 min, and then 600 μl of 20 % sodiumcarbonate was added. The reaction was allowed to continuefor a further 60 min. Finally, the absorbance was measured at765 nm using a Shimadzu UV-1700 spectrophotometer cali-brated against gallic acid, and the results were reported inmilligram of gallic acid equivalents (GAE) per gram of aloeextract.
Total Carbohydrates
The carbohydrate content (TC) in the extracted solid matterwas assessed using the phenol–sulfuric acid method (Hu et al.2003). The stock extract solution was diluted 16 times withthe same ethanol solvent that was used to obtain this particularsample. Fifty microliters of the diluted sample was mixed with500 μl of 4 % phenol in a test tube, then 2,500 μl of sulfuricacid was added. Themixture was kept at room temperature for10 min, followed by reading the absorption value at 490 nm.The calibration curve was measured with standard solutions ofD-mannose (5–25 g/l). Results were expressed as milligram D-mannose per gram.
FRAPAssay
The ferric reducing antioxidant potential of Aloe extracts wasestimated by the method of Benzie and Strain (1996). Themethod requires the preparation of FRAP reagent from 25 mlof 300 mM acetate buffer (pH 3.6), 2.5 ml of 10 mM TPTZsolution in 40 mM HCl, and 2.5 ml of 20 mM FeCl3·6H2Osolution. The reagent must be prepared immediately beforemeasurements. The assay procedure consisted of mixing3,000 μl of FRAP reagent, 300 μl of water, and 100 μl of testsample or standard Trolox solution. The reaction mixture waskept at 37 °C for 24 h. Readingswere taken at 593 nm, convertedinto the FRAP values using the Trolox calibration curve, andreported as milligram of Trolox equivalent (TE) per gram.
Food Anal. Methods
CUPRAC Assay
The procedure of the CUPRAC assay was adopted fromApaket al. (2004). Briefly, 1 ml of 10 mM CuCl2 solution, 1 ml ofammonium acetate buffer (pH 7), and 1 ml of 7.5 mMneocuproine solution were mixed together in a test tube. Tothis mixture were added x milliliter of extract sample (orstandard) solution and (1−x) milliliter of water. The tubeswere then left in a dark place for 6 h and the absorbance wasmeasured at 450 nm. The assay was calibrated with standardsolutions of Trolox to express results in TE units.
DPPH Assay
The evaluation of the radical scavenging activity of the ex-tracts with the DPPH free radical was carried out using theprotocol described by Sharma and Bhat (2009) with somemodifications. Two working solutions of DPPH with a con-centration of 0.1 mM were prepared, one in pure ethanol andanother in 60 % ethanol. The former solution was used toanalyze aloe extracts obtained with pure ethanol. The water–ethanol DPPH solution was used for the evaluation of extracts
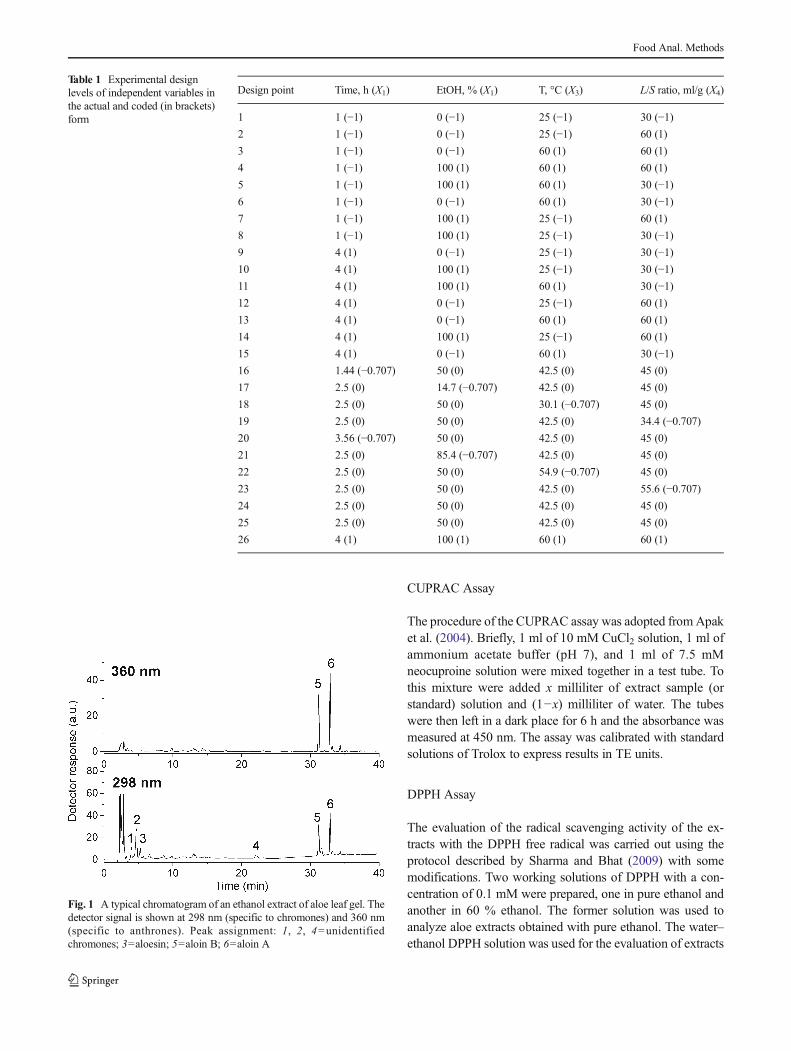
Table 1 Experimental designlevels of independent variables inthe actual and coded (in brackets)form
Design point Time, h (X1) EtOH, % (X1) T, °С (X3) L/S ratio, ml/g (X4)
1 1 (−1) 0 (−1) 25 (−1) 30 (−1)2 1 (−1) 0 (−1) 25 (−1) 60 (1)
3 1 (−1) 0 (−1) 60 (1) 60 (1)
4 1 (−1) 100 (1) 60 (1) 60 (1)
5 1 (−1) 100 (1) 60 (1) 30 (−1)6 1 (−1) 0 (−1) 60 (1) 30 (−1)7 1 (−1) 100 (1) 25 (−1) 60 (1)
8 1 (−1) 100 (1) 25 (−1) 30 (−1)9 4 (1) 0 (−1) 25 (−1) 30 (−1)10 4 (1) 100 (1) 25 (−1) 30 (−1)11 4 (1) 100 (1) 60 (1) 30 (−1)12 4 (1) 0 (−1) 25 (−1) 60 (1)
13 4 (1) 0 (−1) 60 (1) 60 (1)
14 4 (1) 100 (1) 25 (−1) 60 (1)
15 4 (1) 0 (−1) 60 (1) 30 (−1)16 1.44 (−0.707) 50 (0) 42.5 (0) 45 (0)
17 2.5 (0) 14.7 (−0.707) 42.5 (0) 45 (0)
18 2.5 (0) 50 (0) 30.1 (−0.707) 45 (0)
19 2.5 (0) 50 (0) 42.5 (0) 34.4 (−0.707)20 3.56 (−0.707) 50 (0) 42.5 (0) 45 (0)
21 2.5 (0) 85.4 (−0.707) 42.5 (0) 45 (0)
22 2.5 (0) 50 (0) 54.9 (−0.707) 45 (0)
23 2.5 (0) 50 (0) 42.5 (0) 55.6 (−0.707)24 2.5 (0) 50 (0) 42.5 (0) 45 (0)
25 2.5 (0) 50 (0) 42.5 (0) 45 (0)
26 4 (1) 100 (1) 60 (1) 60 (1)
Fig. 1 A typical chromatogram of an ethanol extract of aloe leaf gel. Thedetector signal is shown at 298 nm (specific to chromones) and 360 nm(specific to anthrones). Peak assignment: 1, 2, 4=unidentifiedchromones; 3=aloesin; 5=aloin B; 6=aloin A
Food Anal. Methods
obtained with solvents containing 50 or less percents of eth-anol. Dilution of the assay mixture with water in this case wasnecessary because a white precipitate was observed otherwise.
The assay procedure was carried out as follows. Twohundred fifty microliters of the stock extract solution wasmixed with 2.5 ml of a respective DPPH solution and wasmade up to 3 ml with ethanol or 60 % ethanol. The mixturewas shaken vigorously and left in a dark place for 80 min.Preliminary experiments have shown that such a long intervalis required to accomplish the reaction. The absorbance wasmeasured at a wavelength of 517 nm. Pure ethanol or 60 %ethanol were used as references accordingly. The same mea-surements were carried out with standard Trolox solutions todetermine a calibration curve. The antiradical activity wasexpressed in terms of TE.
Results and Discussion
Raw experimental data are presented in Table 2. Their primaryanalysis was made using the correlation analysis techniques asdescribed below. For a more detailed consideration, a multipleregression method in combination with ANOVA wasemployed, the results of which are given in Tables S1–S24in supporting information. The response surface models thusobtained were used for the optimization of extraction condi-tions with respect to the recovery yield of antioxidants. Final-ly, the nature of aloe oxidants is discussed based on the presentfindings.
Correlation Analysis
The correlation coefficient for two random variables, x and y,which are supposed to be in a certain relation to each other, is
equal to R ¼ffiffiffiffiffiffiffiffiffiffiffiffiffiffiffiffiffiffiffiffiffiffiffiffi1− σΔy=σy
� �q2 (Minkin 2011). The variance
σΔy2 characterizes the scatter of data around the best fit straight
line y(x) and σy2 is the variance of y. If σΔy
2 accounts for a halfof σy
2, R will be ca. 0.7. We shall consider this value as avoluntary border between unimportant and important correla-tion. The lack of any correlation may be suggested with aconfidence probability of greater than 0.99 if |R|<0.3. Thiscondition was proposed based on the significance criterion forR published in Miller and Miller (2005). Table 3 presents thecorrelation coefficients of responses with each other. Strong(|R|>0.9) and well explainable correlations are found betweenaloin A and B, and between either aloin or the extraction yield.In this latter case, the correlation is negative as water-enrichedsolvents are necessary for a high extraction yield but ethanol-enriched solvent facilitates the extraction of lipophilic aloins.These two anthrones also strongly correlated with total phe-nolic content, suggesting that the conditions favorable to theextraction of aloins are also so for the isolation of the whole
phenolic fraction. Its content negatively correlates with theextraction yield and with the values of the antioxidant assaysFRAP and CUPRAC. The values of the DPPH test do notcorrelate with any of the measured parameters, not even withthe other antioxidant assays.We explain this finding by a largescatter of data associated with this test.
Response Surface Models
Analysis of response surfaces gives the most complete infor-mation concerning relationships between influencing factorsand dependent variables. The results of this analysis are pre-sented in Tables S1–S24 in the supporting information, and asummary is given in Table 4. As can be seen from Table 4, thefull second-order model (Eq. 2) perfectly approximates theresponse surface for the extraction yield (EY) and the concen-trations of aloin A and B in the extract. Approximation is stillsatisfactory for TP and TC as well as for the FRAP assay andthe concentration of aloesin, in which case the adjusted coef-ficient of determination Radj
2 > 0.78. The CUPRAC assay ischaracterized by a low determination coefficient and theDPPH assay, which demonstrates the lack of fitting, and isdue to the above-mentioned large scatter of data, rather thandue to imperfection within the model, as deduced from theanalysis of variance (Table S6). Interestingly, when we con-sider the products of EY and a response function rather thanthe response functions themselves, the quality of fitting isimproved for most responses (Table 5). It is dramaticallyimproved for the DPPH and CUPRAC assays, with Radj
2
values increasing from 0.15 to 0.91, and from 0.63 to 0.94,respectively. The value EY⋅Y is the recovery yield of thecharacteristic Y or, in other words, the amount of Y in theextract expressed per gram of the sample (aloe powder).
Effect of Experimental Conditions
According to the data in Table 4, all responses depend onsolvent composition as the correlation analysis predicted,constituting a non-linearly response in most cases. Moreover,the ethanol percentage is the most important of all the vari-ables, which follows from the comparison of the model coef-ficients in Tables S1–S6 (see supporting information). In thecases of EY, aloins, antioxidant assays (except DPPH, whichis not considered in this section because of poor statisticalindicators), and TP, the factor of ethanol percentage interactswith other factors (temperature for EY, FRAP, CUPRAC, andTP; L/S for aloin A, aloin B, and TP). It interacts with thefactor of time for aloin A, but not for aloin B. Extraction timeaffects the concentrations of both aloins in the extract. Theinfluence is negative, that is, the concentration of the anthronsis lowered with a longer extraction period. Obviously, it is dueto the reactivity of aloins that experience oxidation with asubsequent polyphenolic condensation (Waller et al. 2004) in
Food Anal. Methods
a course of extraction. Process duration also affects TC and theresults of the FRAP test through interaction terms, althoughthe effect is minor, accounting for not more than 3 % of eitherindicator’s value with any combination of variables. Temper-ature also influences the total concentration of phenolics as
well as the extraction yield of the antioxidant species, asmeasured by the FRAP and CUPRAC assays. This influenceis positive, although nonlinear in the case of TP, and theFRAP-detected species. The situation is somewhat differentwith the CUPRAC-active antioxidants. The effect of
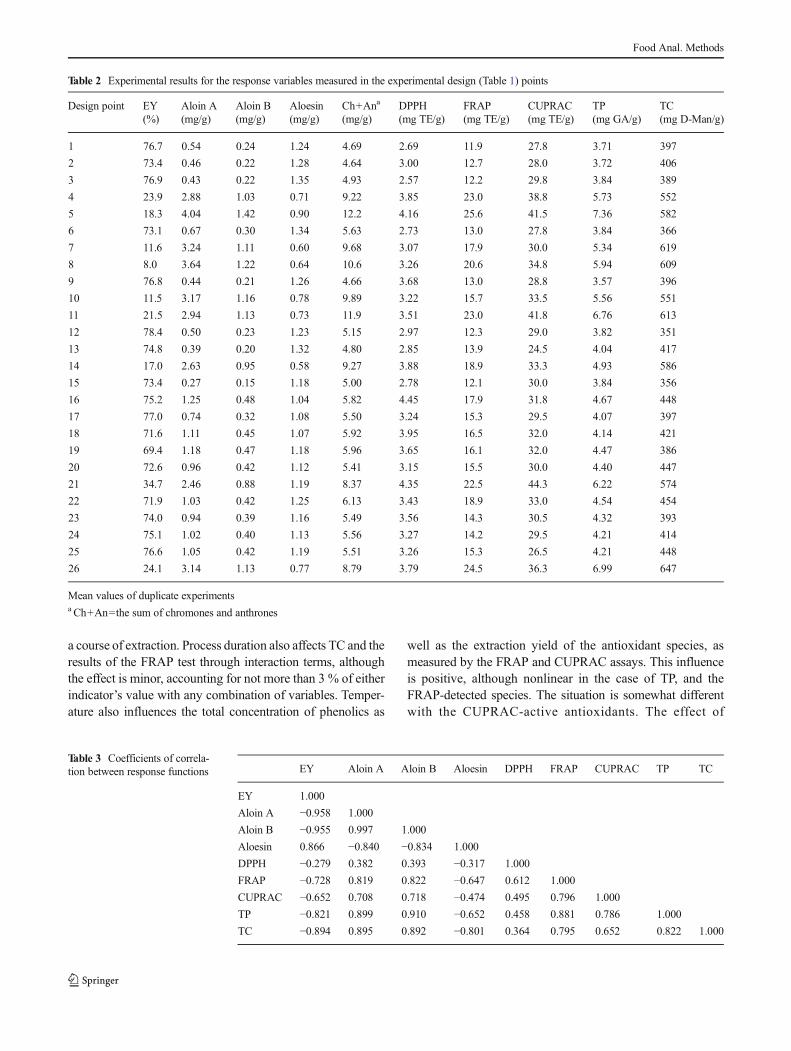
Table 3 Coefficients of correla-tion between response functions EY Aloin A Aloin B Aloesin DPPH FRAP CUPRAC TP TC
EY 1.000
Aloin A −0.958 1.000
Aloin B −0.955 0.997 1.000
Aloesin 0.866 −0.840 −0.834 1.000
DPPH −0.279 0.382 0.393 −0.317 1.000
FRAP −0.728 0.819 0.822 −0.647 0.612 1.000
CUPRAC −0.652 0.708 0.718 −0.474 0.495 0.796 1.000
TP −0.821 0.899 0.910 −0.652 0.458 0.881 0.786 1.000
TC −0.894 0.895 0.892 −0.801 0.364 0.795 0.652 0.822 1.000
Table 2 Experimental results for the response variables measured in the experimental design (Table 1) points
Design point EY(%)
Aloin A(mg/g)
Aloin B(mg/g)
Aloesin(mg/g)
Ch+Ana
(mg/g)DPPH(mg TE/g)
FRAP(mg TE/g)
CUPRAC(mg TE/g)
TP(mg GA/g)
TC(mg D-Man/g)
1 76.7 0.54 0.24 1.24 4.69 2.69 11.9 27.8 3.71 397
2 73.4 0.46 0.22 1.28 4.64 3.00 12.7 28.0 3.72 406
3 76.9 0.43 0.22 1.35 4.93 2.57 12.2 29.8 3.84 389
4 23.9 2.88 1.03 0.71 9.22 3.85 23.0 38.8 5.73 552
5 18.3 4.04 1.42 0.90 12.2 4.16 25.6 41.5 7.36 582
6 73.1 0.67 0.30 1.34 5.63 2.73 13.0 27.8 3.84 366
7 11.6 3.24 1.11 0.60 9.68 3.07 17.9 30.0 5.34 619
8 8.0 3.64 1.22 0.64 10.6 3.26 20.6 34.8 5.94 609
9 76.8 0.44 0.21 1.26 4.66 3.68 13.0 28.8 3.57 396
10 11.5 3.17 1.16 0.78 9.89 3.22 15.7 33.5 5.56 551
11 21.5 2.94 1.13 0.73 11.9 3.51 23.0 41.8 6.76 613
12 78.4 0.50 0.23 1.23 5.15 2.97 12.3 29.0 3.82 351
13 74.8 0.39 0.20 1.32 4.80 2.85 13.9 24.5 4.04 417
14 17.0 2.63 0.95 0.58 9.27 3.88 18.9 33.3 4.93 586
15 73.4 0.27 0.15 1.18 5.00 2.78 12.1 30.0 3.84 356
16 75.2 1.25 0.48 1.04 5.82 4.45 17.9 31.8 4.67 448
17 77.0 0.74 0.32 1.08 5.50 3.24 15.3 29.5 4.07 397
18 71.6 1.11 0.45 1.07 5.92 3.95 16.5 32.0 4.14 421
19 69.4 1.18 0.47 1.18 5.96 3.65 16.1 32.0 4.47 386
20 72.6 0.96 0.42 1.12 5.41 3.15 15.5 30.0 4.40 447
21 34.7 2.46 0.88 1.19 8.37 4.35 22.5 44.3 6.22 574
22 71.9 1.03 0.42 1.25 6.13 3.43 18.9 33.0 4.54 454
23 74.0 0.94 0.39 1.16 5.49 3.56 14.3 30.5 4.32 393
24 75.1 1.02 0.40 1.13 5.56 3.27 14.2 29.5 4.21 414
25 76.6 1.05 0.42 1.19 5.51 3.26 15.3 26.5 4.21 448
26 24.1 3.14 1.13 0.77 8.79 3.79 24.5 36.3 6.99 647
Mean values of duplicate experimentsa Ch+An=the sum of chromones and anthrones
Food Anal. Methods
temperature in this case is coupled with the effect of solventcomposition through the interaction term X2X3 (EtOH×Temp). The L/S ratio affects most response functions consid-ered, except CUPRAC and aloesin content. The importance ofthis variable ranges from minor for FRAP, EY, and TC tomoderate for aloin A and B, and TP as follows from relativecontributions of L/S-related terms to the total value of aresponse function. For example, the sum of the terms X1X4
and X42 does not exceed −1.5 % of the FRAP value for any
combination of variables, while for aloin A, a respectivecontribution varies from −120 to +60 %. To avoid misunder-standing, it must be noted that partial contributions can exceed100 % in the modulus because some of them are positive andsome are negative, giving after summation the whole value ofa response. As seen from the above instances, the L/S ratio
effect may be negative, or may vary from negative to positive,depending on experimental conditions. It contradicts a com-mon expectation that the amount of solute in the liquid phaseincreases with the volume of solvent. Consequently, otherphysicochemical phenomena besides solubility play a role.
Optimization of Extraction Parameters and Validationof the Models
Two approaches to optimization are considered in this study.The first one is targeted at achieving the maximum value of aselected response variable in the extract. The second approachconsists of the optimization of the product EY⋅Y. This allowsus to attain a high level of a target property along with thehighest possible EY, which is of interest in the context ofcommercial production. The respective calculations were car-ried out using the response surface models described above bymeans of the Response Optimizer utility of the Minitab16software. A summary of the results is given in Table 6.
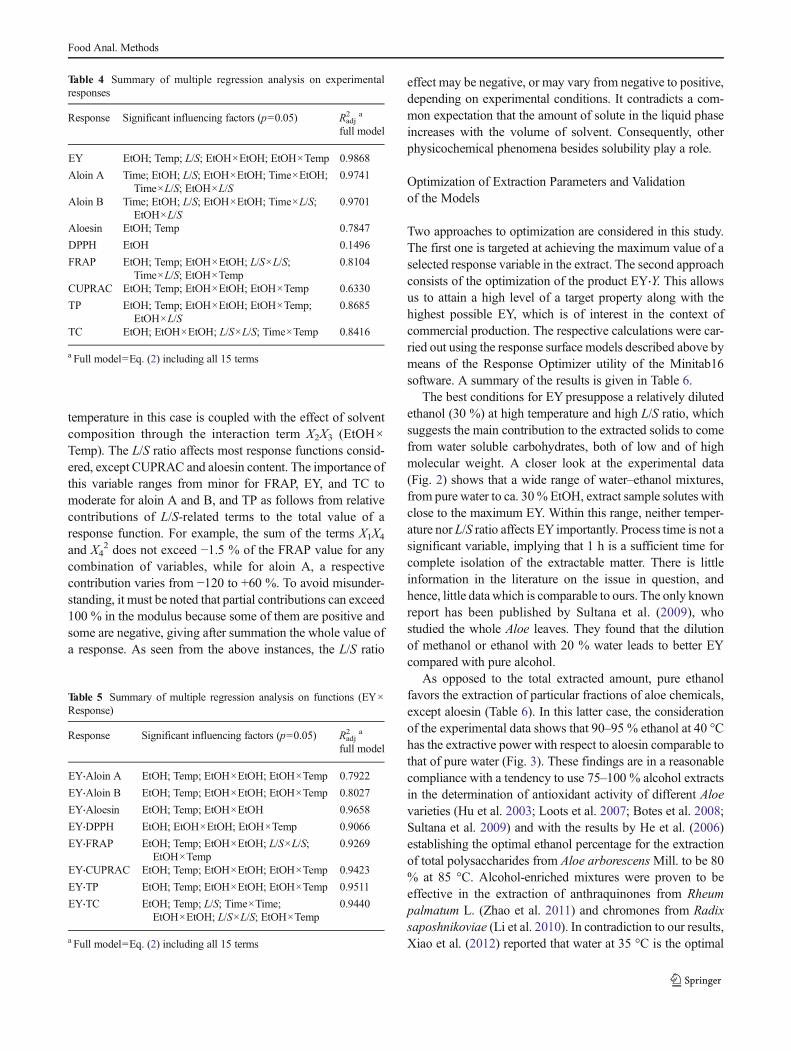
The best conditions for EY presuppose a relatively dilutedethanol (30 %) at high temperature and high L/S ratio, whichsuggests the main contribution to the extracted solids to comefrom water soluble carbohydrates, both of low and of highmolecular weight. A closer look at the experimental data(Fig. 2) shows that a wide range of water–ethanol mixtures,from pure water to ca. 30% EtOH, extract sample solutes withclose to the maximum EY. Within this range, neither temper-ature nor L/S ratio affects EYimportantly. Process time is not asignificant variable, implying that 1 h is a sufficient time forcomplete isolation of the extractable matter. There is littleinformation in the literature on the issue in question, andhence, little data which is comparable to ours. The only knownreport has been published by Sultana et al. (2009), whostudied the whole Aloe leaves. They found that the dilutionof methanol or ethanol with 20 % water leads to better EYcompared with pure alcohol.
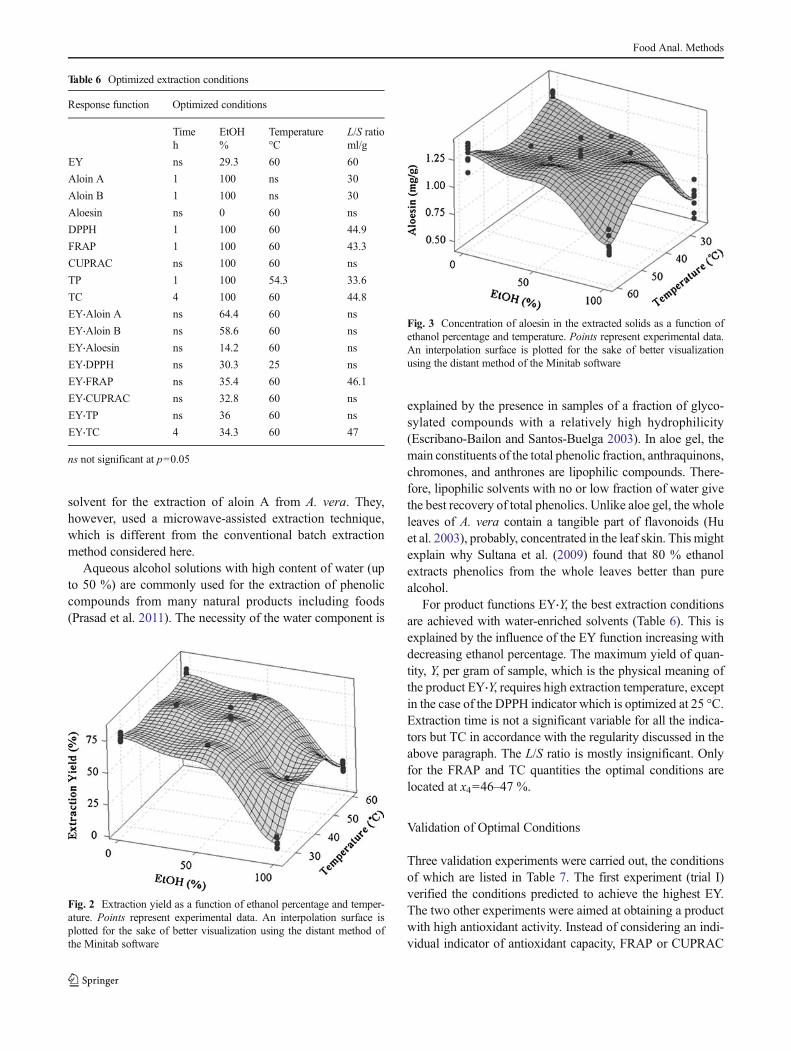
As opposed to the total extracted amount, pure ethanolfavors the extraction of particular fractions of aloe chemicals,except aloesin (Table 6). In this latter case, the considerationof the experimental data shows that 90–95 % ethanol at 40 °Сhas the extractive power with respect to aloesin comparable tothat of pure water (Fig. 3). These findings are in a reasonablecompliance with a tendency to use 75–100 % alcohol extractsin the determination of antioxidant activity of different Aloevarieties (Hu et al. 2003; Loots et al. 2007; Botes et al. 2008;Sultana et al. 2009) and with the results by He et al. (2006)establishing the optimal ethanol percentage for the extractionof total polysaccharides from Aloe arborescensMill. to be 80% at 85 °С. Alcohol-enriched mixtures were proven to beeffective in the extraction of anthraquinones from Rheumpalmatum L. (Zhao et al. 2011) and chromones from Radixsaposhnikoviae (Li et al. 2010). In contradiction to our results,Xiao et al. (2012) reported that water at 35 °С is the optimal
Table 4 Summary of multiple regression analysis on experimentalresponses
Response Significant influencing factors (p=0.05) Radj2 a
full model
EY EtOH; Temp; L/S; EtOH×EtOH; EtOH×Temp 0.9868
Aloin A Time; EtOH; L/S; EtOH×EtOH; Time×EtOH;Time×L/S; EtOH×L/S
0.9741
Aloin B Time; EtOH; L/S; EtOH×EtOH; Time×L/S;EtOH×L/S
0.9701
Aloesin EtOH; Temp 0.7847
DPPH EtOH 0.1496
FRAP EtOH; Temp; EtOH×EtOH; L/S×L/S;Time×L/S; EtOH×Temp
0.8104
CUPRAC EtOH; Temp; EtOH×EtOH; EtOH×Temp 0.6330
TP EtOH; Temp; EtOH×EtOH; EtOH×Temp;EtOH×L/S
0.8685
TC EtOH; EtOH×EtOH; L/S×L/S; Time×Temp 0.8416
a Full model=Eq. (2) including all 15 terms
Table 5 Summary of multiple regression analysis on functions (EY×Response)
Response Significant influencing factors (p=0.05) Radj2 a
full model
EY⋅Aloin A EtOH; Temp; EtOH×EtOH; EtOH×Temp 0.7922
EY⋅Aloin B EtOH; Temp; EtOH×EtOH; EtOH×Temp 0.8027
EY⋅Aloesin EtOH; Temp; EtOH×EtOH 0.9658
EY⋅DPPH EtOH; EtOH×EtOH; EtOH×Temp 0.9066
EY⋅FRAP EtOH; Temp; EtOH×EtOH; L/S×L/S;EtOH×Temp
0.9269
EY⋅CUPRAC EtOH; Temp; EtOH×EtOH; EtOH×Temp 0.9423
EY⋅TP EtOH; Temp; EtOH×EtOH; EtOH×Temp 0.9511
EY⋅TC EtOH; Temp; L/S; Time×Time;EtOH×EtOH; L/S×L/S; EtOH×Temp
0.9440
a Full model=Eq. (2) including all 15 terms
Food Anal. Methods
solvent for the extraction of aloin A from A. vera. They,however, used a microwave-assisted extraction technique,which is different from the conventional batch extractionmethod considered here.
Aqueous alcohol solutions with high content of water (upto 50 %) are commonly used for the extraction of phenoliccompounds from many natural products including foods(Prasad et al. 2011). The necessity of the water component is
explained by the presence in samples of a fraction of glyco-sylated compounds with a relatively high hydrophilicity(Escribano-Bailon and Santos-Buelga 2003). In aloe gel, themain constituents of the total phenolic fraction, anthraquinons,chromones, and anthrones are lipophilic compounds. There-fore, lipophilic solvents with no or low fraction of water givethe best recovery of total phenolics. Unlike aloe gel, the wholeleaves of A. vera contain a tangible part of flavonoids (Huet al. 2003), probably, concentrated in the leaf skin. This mightexplain why Sultana et al. (2009) found that 80 % ethanolextracts phenolics from the whole leaves better than purealcohol.
For product functions EY⋅Y, the best extraction conditionsare achieved with water-enriched solvents (Table 6). This isexplained by the influence of the EY function increasing withdecreasing ethanol percentage. The maximum yield of quan-tity, Y, per gram of sample, which is the physical meaning ofthe product EY⋅Y, requires high extraction temperature, exceptin the case of the DPPH indicator which is optimized at 25 °С.Extraction time is not a significant variable for all the indica-tors but TC in accordance with the regularity discussed in theabove paragraph. The L/S ratio is mostly insignificant. Onlyfor the FRAP and TC quantities the optimal conditions arelocated at x4=46–47 %.
Validation of Optimal Conditions
Three validation experiments were carried out, the conditionsof which are listed in Table 7. The first experiment (trial I)verified the conditions predicted to achieve the highest EY.The two other experiments were aimed at obtaining a productwith high antioxidant activity. Instead of considering an indi-vidual indicator of antioxidant capacity, FRAP or CUPRAC
Table 6 Optimized extraction conditions
Response function Optimized conditions
Timeh
EtOH%
Temperature°С
L/S ratioml/g
EY ns 29.3 60 60
Aloin A 1 100 ns 30
Aloin B 1 100 ns 30
Aloesin ns 0 60 ns
DPPH 1 100 60 44.9
FRAP 1 100 60 43.3
CUPRAC ns 100 60 ns
TP 1 100 54.3 33.6
TC 4 100 60 44.8
EY⋅Aloin A ns 64.4 60 ns
EY⋅Aloin B ns 58.6 60 ns
EY⋅Aloesin ns 14.2 60 ns
EY⋅DPPH ns 30.3 25 ns
EY⋅FRAP ns 35.4 60 46.1
EY⋅CUPRAC ns 32.8 60 ns
EY⋅TP ns 36 60 ns
EY⋅TC 4 34.3 60 47
ns not significant at p=0.05
Fig. 2 Extraction yield as a function of ethanol percentage and temper-ature. Points represent experimental data. An interpolation surface isplotted for the sake of better visualization using the distant method ofthe Minitab software
Fig. 3 Concentration of aloesin in the extracted solids as a function ofethanol percentage and temperature. Points represent experimental data.An interpolation surface is plotted for the sake of better visualizationusing the distant method of the Minitab software
Food Anal. Methods
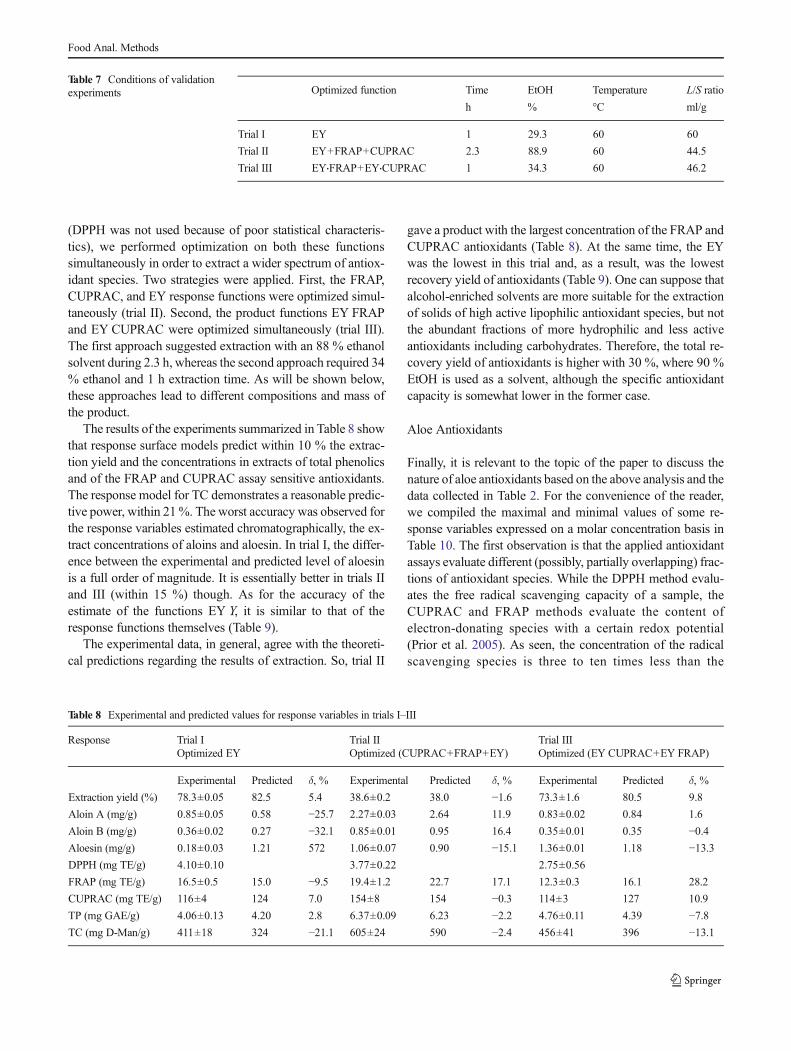
(DPPH was not used because of poor statistical characteris-tics), we performed optimization on both these functionssimultaneously in order to extract a wider spectrum of antiox-idant species. Two strategies were applied. First, the FRAP,CUPRAC, and EY response functions were optimized simul-taneously (trial II). Second, the product functions EY FRAPand EY CUPRAC were optimized simultaneously (trial III).The first approach suggested extraction with an 88 % ethanolsolvent during 2.3 h, whereas the second approach required 34% ethanol and 1 h extraction time. As will be shown below,these approaches lead to different compositions and mass ofthe product.
The results of the experiments summarized in Table 8 showthat response surface models predict within 10 % the extrac-tion yield and the concentrations in extracts of total phenolicsand of the FRAP and CUPRAC assay sensitive antioxidants.The response model for TC demonstrates a reasonable predic-tive power, within 21%. The worst accuracy was observed forthe response variables estimated chromatographically, the ex-tract concentrations of aloins and aloesin. In trial I, the differ-ence between the experimental and predicted level of aloesinis a full order of magnitude. It is essentially better in trials IIand III (within 15 %) though. As for the accuracy of theestimate of the functions EY Y, it is similar to that of theresponse functions themselves (Table 9).
The experimental data, in general, agree with the theoreti-cal predictions regarding the results of extraction. So, trial II
gave a product with the largest concentration of the FRAP andCUPRAC antioxidants (Table 8). At the same time, the EYwas the lowest in this trial and, as a result, was the lowestrecovery yield of antioxidants (Table 9). One can suppose thatalcohol-enriched solvents are more suitable for the extractionof solids of high active lipophilic antioxidant species, but notthe abundant fractions of more hydrophilic and less activeantioxidants including carbohydrates. Therefore, the total re-covery yield of antioxidants is higher with 30 %, where 90 %EtOH is used as a solvent, although the specific antioxidantcapacity is somewhat lower in the former case.
Aloe Antioxidants
Finally, it is relevant to the topic of the paper to discuss thenature of aloe antioxidants based on the above analysis and thedata collected in Table 2. For the convenience of the reader,we compiled the maximal and minimal values of some re-sponse variables expressed on a molar concentration basis inTable 10. The first observation is that the applied antioxidantassays evaluate different (possibly, partially overlapping) frac-tions of antioxidant species. While the DPPH method evalu-ates the free radical scavenging capacity of a sample, theCUPRAC and FRAP methods evaluate the content ofelectron-donating species with a certain redox potential(Prior et al. 2005). As seen, the concentration of the radicalscavenging species is three to ten times less than the
Table 7 Conditions of validationexperiments Optimized function Time
h
EtOH
%
Temperature
°С
L/S ratio
ml/g
Trial I EY 1 29.3 60 60
Trial II EY+FRAP+CUPRAC 2.3 88.9 60 44.5
Trial III EY⋅FRAP+EY⋅CUPRAC 1 34.3 60 46.2
Table 8 Experimental and predicted values for response variables in trials I–III
Response Trial IOptimized EY
Trial IIOptimized (CUPRAC+FRAP+EY)
Trial IIIOptimized (EY CUPRAC+EY FRAP)
Experimental Predicted δ, % Experimental Predicted δ, % Experimental Predicted δ, %
Extraction yield (%) 78.3±0.05 82.5 5.4 38.6±0.2 38.0 −1.6 73.3±1.6 80.5 9.8
Aloin A (mg/g) 0.85±0.05 0.58 −25.7 2.27±0.03 2.64 11.9 0.83±0.02 0.84 1.6
Aloin B (mg/g) 0.36±0.02 0.27 −32.1 0.85±0.01 0.95 16.4 0.35±0.01 0.35 −0.4Aloesin (mg/g) 0.18±0.03 1.21 572 1.06±0.07 0.90 −15.1 1.36±0.01 1.18 −13.3DPPH (mg TE/g) 4.10±0.10 3.77±0.22 2.75±0.56
FRAP (mg TE/g) 16.5±0.5 15.0 −9.5 19.4±1.2 22.7 17.1 12.3±0.3 16.1 28.2
CUPRAC (mg TE/g) 116±4 124 7.0 154±8 154 −0.3 114±3 127 10.9
TP (mg GAE/g) 4.06±0.13 4.20 2.8 6.37±0.09 6.23 −2.2 4.76±0.11 4.39 −7.8TC (mg D-Man/g) 411±18 324 −21.1 605±24 590 −2.4 456±41 396 −13.1
Food Anal. Methods
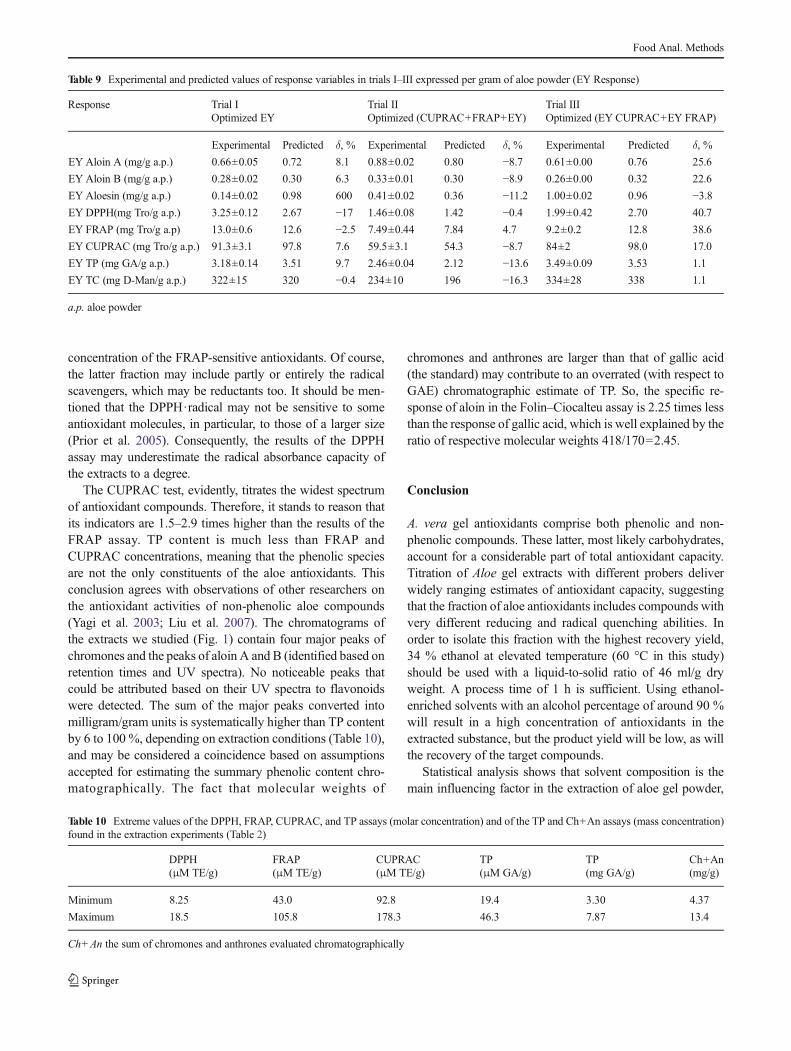
concentration of the FRAP-sensitive antioxidants. Of course,the latter fraction may include partly or entirely the radicalscavengers, which may be reductants too. It should be men-tioned that the DPPH·radical may not be sensitive to someantioxidant molecules, in particular, to those of a larger size(Prior et al. 2005). Consequently, the results of the DPPHassay may underestimate the radical absorbance capacity ofthe extracts to a degree.
The CUPRAC test, evidently, titrates the widest spectrumof antioxidant compounds. Therefore, it stands to reason thatits indicators are 1.5–2.9 times higher than the results of theFRAP assay. TP content is much less than FRAP andCUPRAC concentrations, meaning that the phenolic speciesare not the only constituents of the aloe antioxidants. Thisconclusion agrees with observations of other researchers onthe antioxidant activities of non-phenolic aloe compounds(Yagi et al. 2003; Liu et al. 2007). The chromatograms ofthe extracts we studied (Fig. 1) contain four major peaks ofchromones and the peaks of aloin A and B (identified based onretention times and UV spectra). No noticeable peaks thatcould be attributed based on their UV spectra to flavonoidswere detected. The sum of the major peaks converted intomilligram/gram units is systematically higher than TP contentby 6 to 100 %, depending on extraction conditions (Table 10),and may be considered a coincidence based on assumptionsaccepted for estimating the summary phenolic content chro-matographically. The fact that molecular weights of
chromones and anthrones are larger than that of gallic acid(the standard) may contribute to an overrated (with respect toGAE) chromatographic estimate of TP. So, the specific re-sponse of aloin in the Folin–Ciocalteu assay is 2.25 times lessthan the response of gallic acid, which is well explained by theratio of respective molecular weights 418/170=2.45.
Conclusion
A. vera gel antioxidants comprise both phenolic and non-phenolic compounds. These latter, most likely carbohydrates,account for a considerable part of total antioxidant capacity.Titration of Aloe gel extracts with different probers deliverwidely ranging estimates of antioxidant capacity, suggestingthat the fraction of aloe antioxidants includes compounds withvery different reducing and radical quenching abilities. Inorder to isolate this fraction with the highest recovery yield,34 % ethanol at elevated temperature (60 °С in this study)should be used with a liquid-to-solid ratio of 46 ml/g dryweight. A process time of 1 h is sufficient. Using ethanol-enriched solvents with an alcohol percentage of around 90 %will result in a high concentration of antioxidants in theextracted substance, but the product yield will be low, as willthe recovery of the target compounds.
Statistical analysis shows that solvent composition is themain influencing factor in the extraction of aloe gel powder,
Table 9 Experimental and predicted values of response variables in trials I–III expressed per gram of aloe powder (EY Response)
Response Trial IOptimized EY
Trial IIOptimized (CUPRAC+FRAP+EY)
Trial IIIOptimized (EY CUPRAC+EY FRAP)
Experimental Predicted δ, % Experimental Predicted δ, % Experimental Predicted δ, %
EY Aloin A (mg/g a.p.) 0.66±0.05 0.72 8.1 0.88±0.02 0.80 −8.7 0.61±0.00 0.76 25.6
EY Aloin B (mg/g a.p.) 0.28±0.02 0.30 6.3 0.33±0.01 0.30 −8.9 0.26±0.00 0.32 22.6
EY Aloesin (mg/g a.p.) 0.14±0.02 0.98 600 0.41±0.02 0.36 −11.2 1.00±0.02 0.96 −3.8EY DPPH(mg Tro/g a.p.) 3.25±0.12 2.67 −17 1.46±0.08 1.42 −0.4 1.99±0.42 2.70 40.7
EY FRAP (mg Tro/g a.p) 13.0±0.6 12.6 −2.5 7.49±0.44 7.84 4.7 9.2±0.2 12.8 38.6
EY CUPRAC (mg Tro/g a.p.) 91.3±3.1 97.8 7.6 59.5±3.1 54.3 −8.7 84±2 98.0 17.0
EY TP (mg GA/g a.p.) 3.18±0.14 3.51 9.7 2.46±0.04 2.12 −13.6 3.49±0.09 3.53 1.1
EY TC (mg D-Man/g a.p.) 322±15 320 −0.4 234±10 196 −16.3 334±28 338 1.1
a.p. aloe powder
Table 10 Extreme values of the DPPH, FRAP, CUPRAC, and TP assays (molar concentration) and of the TP and Ch+An assays (mass concentration)found in the extraction experiments (Table 2)
DPPH(μM TE/g)
FRAP(μM TE/g)
CUPRAC(μM TE/g)
TP(μM GA/g)
TP(mg GA/g)
Ch+An(mg/g)
Minimum 8.25 43.0 92.8 19.4 3.30 4.37
Maximum 18.5 105.8 178.3 46.3 7.87 13.4
Ch+An the sum of chromones and anthrones evaluated chromatographically
Food Anal. Methods
followed by temperature and L/S ratio. Extraction time, whenhigher than 1 h, feebly affects the efficacy of the process.Second-order polynomial models do not always approximatethe raw experimental data with high accuracy, and even fail togive an adequate fit to the concentration of aloesin and to theCUPRAC assay results. On the contrary, composite data (ex-traction yield×response) can be well approximated bysecond-order polynomials (Radj
2 >0.9) for all the response var-iables considered, except for the concentrations of aloins, inwhich case Radj
2 >0.76. Although the rationale beyond such animprovement in statistical indicators is not clear, the use of thecomposite response function may be recommended for engi-neering and design calculations in the aloe industry.
Acknowledgments This paper resulted from the Konkuk Universityresearch support program.
Compliance With Ethics RequirementsThe authors declare that the design, performance, and reporting of
research funded under the Bio-industry Technology Development Pro-gram (111093-3) grants is free from bias resulting from investigatorfinancial conflicts of interest. No financial relationship with other insti-tutions or private industry has influenced the results of this study.
Conflict of Interest Seol Kim declares that he has no conflict ofinterest. Leonid Asnin declares that he has no conflict of interest. AwrarisD. Assefa declares that he has no conflict of interest. Eun Young Kodeclares that he has no conflict of interest. Kavita Sharma declares that hehas no conflict of interest. SeWon Park declares that he has no conflict ofinterest. This article does not contain any studies with human or animalsubjects.
References
Ahlawat KS, Khatkar BS (2011) Processing, food application andsafety of Aloe vera products: a review. J Food Sci Technol48(5):525–533
Apak R, Güçlü K, Özyürek M, Karademir SE (2004) Novel totalantioxidant capacity index for dietary polyphenols and vita-mins C and E, using their cupric ion reducing capability inthe presence of neocuproine: CUPRAC method. J Agric FoodChem 5:7970–7981
Benzie IFF, Strain JJ (1996) The ferric reducing ability of plasma (FRAP)as a measure of “antioxidant power”: the FRAP assay. AnalBiochem 239:70–76
Botes L, van der Westhuizen FH, Loots DT (2008) Phytochemicalcontents and antioxidant capacities of two Aloe greatheadii var.davyana extracts. Molecules 13:2169–2180
Brand-Williams W, Cuvelier ME, Berset C (1995) Use of a free radicalmethod to evaluate antioxidant activity. Lebensm Wiss Technol 28:25–30
Choung SY (2006) In: Park YI, Lee SK (eds) New perspectives on Aloe.New York, Springer
Deming SM, Morgan SL (1993) Experimental design: a chemometricapproach, 2nd edn. Elsevier, Amsterdam
Escribano-Bailon MT, Santos-Buelga C (2003) In: Santos-Buelga C,Williamson G (ed) Methods in polyphenol analysis. The RoyalSociety of Chemistry, Cambridge
Eshun K, He Q (2004) Aloe vera: a valuable ingredient for the food,pharmaceutical and cosmetic industries—a review. Crit Rev FoodSci Nutr 44:91–96
Habeeb F, Shakir E, Bradbury F, Cameron P, Taravati MR, DrummondAJ, Gray AI, Ferro VA (2007) Screening methods used to determinethe anti-microbial properties of Aloe vera inner gel. Methods 42:315–320
He L, Song X-L, Lu W (2006) Studies on optimization of ex-traction process and superoxide scavenging capability ofpolysaccharides from Aloe arborescens Mill. Amino AcidsBiotic Res 28(2):35–37
He ZP, Wu ZM, Han Y (2012) Reflux extraction of aloetic anthraqui-nones. Adv Mater Res 441:522–525
Hu Y, Xu J, Hu Q (2003) Evaluation of antioxidant potential of Aloe vera(Aloe barbadensis Miller) extracts. J Agric Food Chem 51:7788–7791
Hu Q, Hu Q, Xu J (2005) Free radical-scavenging activity of Aloe vera(Aloe barbadensis Miller) extracts by supercritical carbon dioxideextraction. Food Chem 91:85–90
International Aloe Science Council (2004) http://www.iasc.orgLee KY, Weintraub ST, Yu BP (2000) Isolation and identification of a
phenolic antioxidant from Aloe barbadensis. Free Radic Biol Med28:261–265
Zhao L-C, Liang J, Li W, Cheng K-M, Xia X, Deng X, Yang G-L (2011)The use of response surface methodology to optimize theultrasound-assisted extraction of five anthraquinones from Rheumpalmatum L. Molecules 16:5928–5937
Liu C-h, Wang C-h, Xu Z-l, Wang Y (2007) Isolation, chemical charac-terization and antioxidant activities of two polysaccharides from thegel and the skin of Aloe barbadensisMiller irrigated with sea water.Process Biochem 42:961–970
LiW, Wang Z, Sun Y-s, Chen L, Han L-k, Zheng Y-n (2010) Applicationof response surface methodology to optimise ultrasonic-assistedextraction of four chromones in Radix saposhnikoviae. PhytochemAnal 22:313–321
Loots DT, van ber Westhuizen FH, Botes L (2007) Aloe ferox leaf gelphytochemical content, antioxidant capacity, and possible healthbenefits. J Agric Food Chem 55:6891–6896
Miller JN, Miller JC (2005) Statistics and chemometrics for analyticalchemistry, 5th edn. Pearson Education Ltd., Harlow
Minkin B (2011) Core concepts in data analysis: summarization, corre-lation and visualization. Springer, London
Park YI, Hyung JT (2006) In: Park YI, Lee SK (eds) New perspectives onAloe. Springer, New York
Prasad KN, Hassan FA, Yang B, Kong KW, Ramanan RN, AzlanA, Ismail A (2011) Response surface optimisation for theextraction of phenolic compounds and antioxidant capacitiesof underutilised Mangifera pajang Kosterm peels. FoodChem 128:1121–1127
Prior RL, Wu X, Schaich K (2005) Standardized methods forthe determination of antioxidant capacity and phenolics infoods and dietary supplements. J Agric Food Chem 53:4290–4302
Rajasekaran S, SivagnanamK, Subramanian S (2005)Modulatory effectsof Aloe vera leaf gel extract on oxidative stress in rats treated withstreptozotocin. J Pharm Pharmacol 57:241–246
Rodríguez ER, Martín JD, Romero CD (2010) Aloe vera as afunctional ingredient in foods. Crit Rev Food Sci Nutr 50(4):305–326
Shahidi F, Wanasundara PK, Janitha PD (1992) Phenolic antioxidants.Crit Rev Food Sci Nutr 32:67–103
Sharma OP, Bhat TK (2009) DPPH antioxidant assay revisited. FoodChem 113:1202–1205
Sultana B, Anwar F, Ashraf M (2009) Effect of extraction solvent/technique on the antioxidant activity of selected medicinal plantextracts. Molecules 14:2167–2180
Food Anal. Methods
Tang YM, Jiao S, Leng L, Tang PC, Liu J, Feng H (2011)Optimization of process parameters of extraction antioxidantsfrom Aloe using response surface methodology. Chin J BioprocEng 1:24–28
Waller TA, Pelley RP, Strickland FM (2004) In: Reynolds T (ed) Aloes:the genus Aloe. CRC, Boca Raton
Wang GH, SU P, Zhang F, Hou XY, Yang Y, Guo ZK (2011) Comparisonof microwave-assisted extraction of aloe-emodin in aloe withSoxhlet extraction and ultrasound-assisted extraction. Sci China54:231–236
Xiao X, Song W, Wang J, Li G (2012) Microwave-assisted extractionperformed in low temperature and in vacuo for the extraction oflabile compounds in food samples. Anal Chim Acta 712:85–93
Yagi A, Kabash A, Okamura N, Haraguchi H, Moustafa SM, Khalifa TI(2002) Antioxidant, free radical scavenging and anti-inflammatoryeffects of aloesin derivatives in Aloe vera. Planta Med 68(11):957–960
Yagi A, Kabash A, Mizuno K, Moustafa SM, Khalifa TI, Tsuji H (2003)Radical scavenging glycoprotein inhibiting cyclooxygenase-2 andthromboxane a2 synthase from Aloe vera gel. Planta Med 69(3):269–271
Food Anal. Methods