Efficient Annotation of Semantic Segmentation Datasets for ...
Proceedings of HYDRO 2013 INTERNATIONAL, 4-6 Dec 2013, IIT Madras, INDIA
1
Extended Abstract AT-SITE DESIGN RAINFALL ESTIMATION WITH DIAGONISTIC CHECK FOR NONSTATIONARITY: AN APPLICATION TO MUMBAI RAINFALL DATASETS
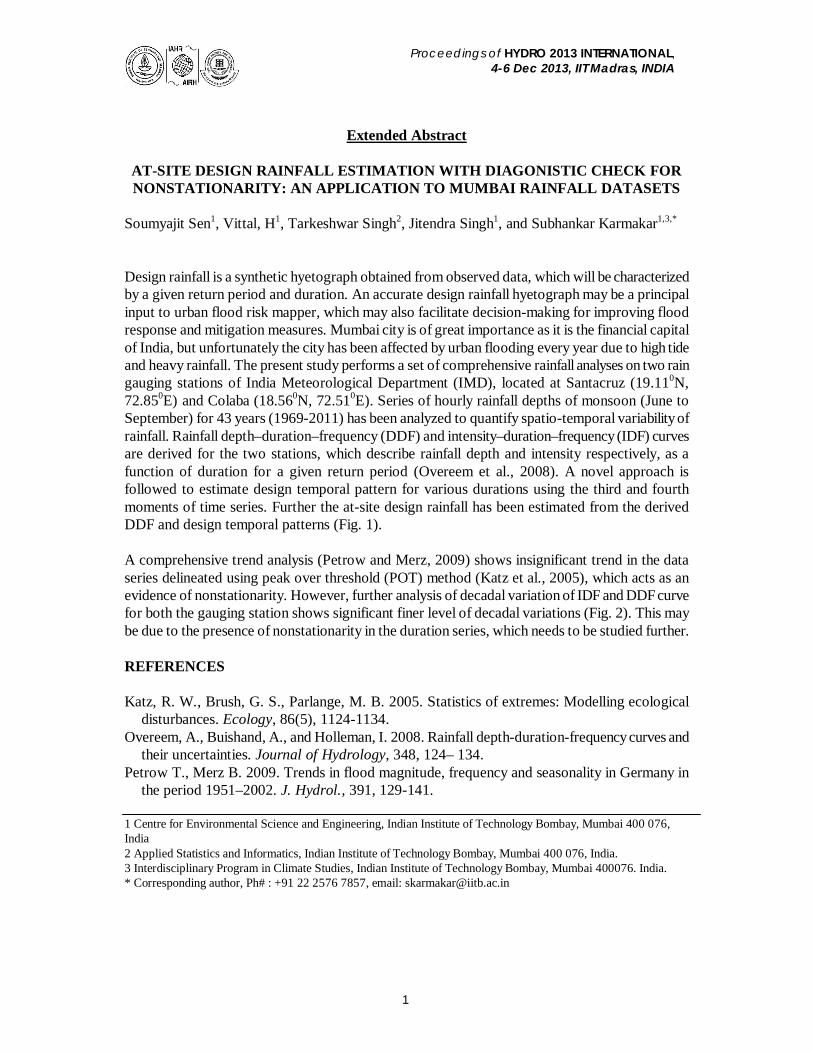
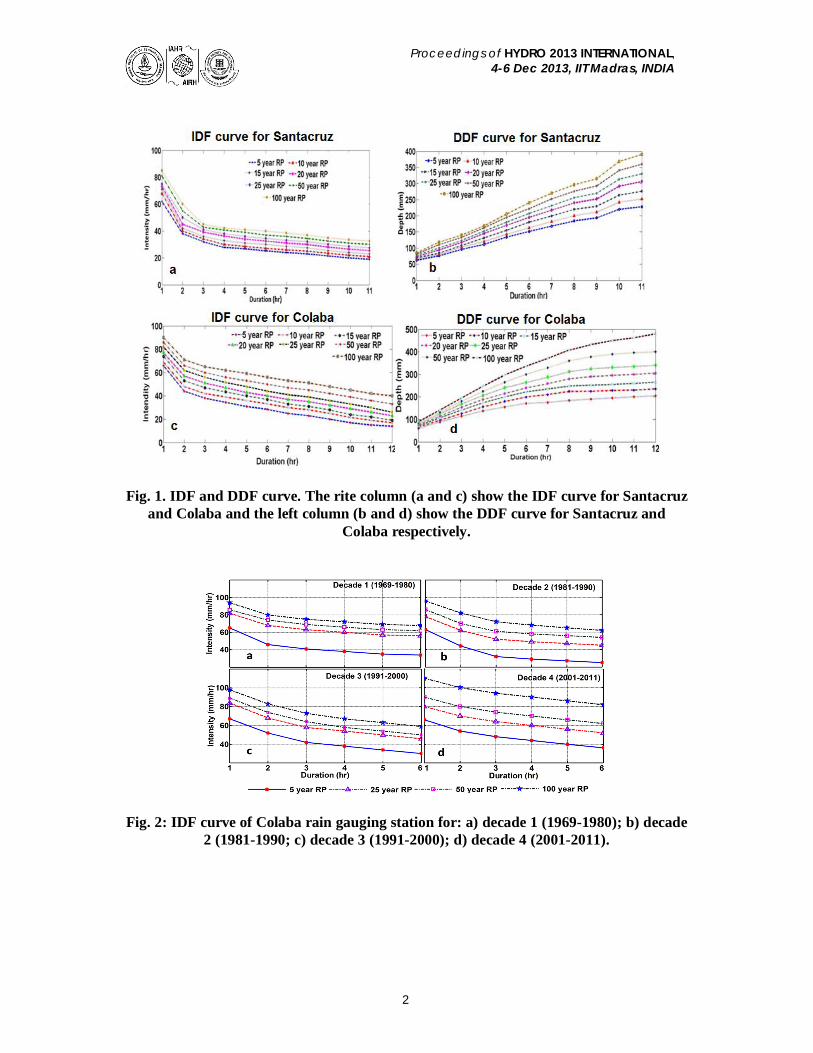
Soumyajit Sen1, Vittal, H1, Tarkeshwar Singh2, Jitendra Singh1, and Subhankar Karmakar1,3,* Design rainfall is a synthetic hyetograph obtained from observed data, which will be characterized by a given return period and duration. An accurate design rainfall hyetograph may be a principal input to urban flood risk mapper, which may also facilitate decision-making for improving flood response and mitigation measures. Mumbai city is of great importance as it is the financial capital of India, but unfortunately the city has been affected by urban flooding every year due to high tide and heavy rainfall. The present study performs a set of comprehensive rainfall analyses on two rain gauging stations of India Meteorological Department (IMD), located at Santacruz (19.110N, 72.850E) and Colaba (18.560N, 72.510E). Series of hourly rainfall depths of monsoon (June to September) for 43 years (1969-2011) has been analyzed to quantify spatio-temporal variability of rainfall. Rainfall depth–duration–frequency (DDF) and intensity–duration–frequency (IDF) curves are derived for the two stations, which describe rainfall depth and intensity respectively, as a function of duration for a given return period (Overeem et al., 2008). A novel approach is followed to estimate design temporal pattern for various durations using the third and fourth moments of time series. Further the at-site design rainfall has been estimated from the derived DDF and design temporal patterns (Fig. 1). A comprehensive trend analysis (Petrow and Merz, 2009) shows insignificant trend in the data series delineated using peak over threshold (POT) method (Katz et al., 2005), which acts as an evidence of nonstationarity. However, further analysis of decadal variation of IDF and DDF curve for both the gauging station shows significant finer level of decadal variations (Fig. 2). This may be due to the presence of nonstationarity in the duration series, which needs to be studied further. REFERENCES Katz, R. W., Brush, G. S., Parlange, M. B. 2005. Statistics of extremes: Modelling ecological
disturbances. Ecology, 86(5), 1124-1134. Overeem, A., Buishand, A., and Holleman, I. 2008. Rainfall depth-duration-frequency curves and
their uncertainties. Journal of Hydrology, 348, 124– 134. Petrow T., Merz B. 2009. Trends in flood magnitude, frequency and seasonality in Germany in
the period 1951–2002. J. Hydrol., 391, 129-141. 1 Centre for Environmental Science and Engineering, Indian Institute of Technology Bombay, Mumbai 400 076, India 2 Applied Statistics and Informatics, Indian Institute of Technology Bombay, Mumbai 400 076, India. 3 Interdisciplinary Program in Climate Studies, Indian Institute of Technology Bombay, Mumbai 400076. India. * Corresponding author, Ph# : +91 22 2576 7857, email: [email protected]
Proceedings of HYDRO 2013 INTERNATIONAL, 4-6 Dec 2013, IIT Madras, INDIA
2
Fig. 1. IDF and DDF curve. The rite column (a and c) show the IDF curve for Santacruz
and Colaba and the left column (b and d) show the DDF curve for Santacruz and Colaba respectively.
Fig. 2: IDF curve of Colaba rain gauging station for: a) decade 1 (1969-1980); b) decade 2 (1981-1990; c) decade 3 (1991-2000); d) decade 4 (2001-2011).

Proceedings of HYDRO 2013 INTERNATIONAL, 4-6 Dec 2013, IIT Madras, INDIA
3
Full paper
AT-SITE DESIGN RAINFALL ESTIMATION WITH DIAGONISTIC CHECK FOR NONSTATIONARITY: AN APPLICATION TO MUMBAI RAINFALL DATASETS
Soumyajit Sen1, Vittal, H1, Tarkeshwar Singh2, Jitendra Singh1, and Subhankar Karmakar1,3,*
Abstract: Design rainfall is a synthetic hyetograph obtained from observed data, which will be characterized by a given return period and duration. An accurate design rainfall hyetograph may be a principal input to urban flood risk, which may also facilitate decision-making for improving flood response and mitigation measures. Mumbai city is of great importance as it is the financial capital of India, but unfortunately the city has been affected by urban flooding every year due to high tide and heavy rainfall. The present study performs a set of comprehensive rainfall analyses on two rain gauging stations of India Meteorological Department (IMD), located at Santacruz (19.110N, 72.850E) and Colaba (18 .560N, 72 .510E). Series of hourly rainfall depths of monsoon (June to September) for 43 years (1969-2011) has been analyzed to quantify spatio-temporal variability of rainfall. Rainfall depth–duration–frequency (DDF) and intensity–duration–frequency (IDF) curves are derived for the two stations, which describe rainfall depth and intensity respectively, as a function of duration for a given return period. A novel approach is followed to estimate design temporal pattern for various durations using the third and fourth moments of time series. Further the at-site design rainfall has been estimated from the derived DDF and design temporal patterns. A comprehensive trend analysis shows insignificant trend in the data series delineated using peak over threshold (POT) method, which acts as an evidence of nonstationarity. However, further analysis of decadal variation of IDF and DDF curve for both the gauging station shows significant finer level of decadal variability. This may be due to the presence of nonstationary in the duration. Keywords: Design rainfall; DDF; IDF; Mumbai; Nonstationarity
1 Centre for Environmental Science and Engineering, Indian Institute of Technology Bombay, Mumbai 400 076, India 2 Applied Statistics and Informatics, Indian Institute of Technology Bombay, Mumbai 400 076, India. 3 Interdisciplinary Program in Climate Studies, Indian Institute of Technology Bombay, Mumbai 400076. India. * Corresponding author, Ph# : +91 22 2576 7857, email: [email protected]
Proceedings of HYDRO 2013 INTERNATIONAL, 4-6 Dec 2013, IIT Madras, INDIA
4
INTRODUCTION Rainfall is an integral component in the hydrologic cycle. Engineers must be able to quantify rainfall in order to design structures impacted by or dealing with the collection, conveyance, and storage of excess rainfall. Quantification of rainfall is generally done using intensity-duration-frequency (IDF) and depth-duration frequency (DDF) curves. These two tools are used by engineers to design safe and cost efficient structures for certain return periods, thus accepting a certain amount of risk that the capacity may be exceeded. IDF curves provide rainfall intensity for a given duration and return period (Sivapalan and Bloschl, 1998; Grimaldi and Serinaldi, 2006), whereas, the DDF provides the information on rainfall depth versus duration for a given return period (Overeem et al., 2008). For design of hydraulic structures IDF curve gives the better result while DDF gives the better result in case of flood modelling studies and also, the DDF curve can incorporate observed temporal pattern and IDF curve can incorporate synthetic temporal pattern. In past, there have been many attempts on estimation of design rainfall (Sivapalan and Bloschl, 1998; Burlando and Rosso, 1996; Henekar et al., 2001; Norlida et al. 2011). All the major works have been conducted, with the implementation of annual maxima approach which does not consider multiple occurrences of extreme events in a year (Katz et al., 2005). In view of that, here we apply peak over threshold (POT) based EVT (Shane and Lynn, 1964; Todorovic and Zelenhasic, 1970) to compute the IDF and DDF curves for the two gauging stations of Mumbai, located at Santacruz (19.110N, 72.850E) and Colaba (18.560N, 72.510E). Research attempts on design rainfall estimation for Indian case studies are limited as compared to other countries (Gupta and Lokanandham, 2008). Mumbai city is of great importance as it is the financial capital of India, but unfortunately the city has been affected by urban flooding every year due to high tide and heavy rainfall. Being a coastal city, the risk associated with flood is much higher than other non-coastal urban areas in India. Mumbai has limited rain gauging stations with long past records, when the region has high spatial variability of rainfall (Kumar et al., 2008), which may lead to more complexity in flood modelling. Hence, a comprehensive estimation of IDF and DDF curves, and subsequent design rainfall estimation with substantially longer data sets, might be essential inputs to flood modelling for this overpopulated, flood prone urban region. The major works that has been conducted in design rainfall estimation is based on the assumption of stationary time series. However, due to the potential impact of climate change, anthropogenic activities, global warming, urbanization etc., are continuously influencing the hydrological variable, the assumption would no longer be valid (Milly et al., 2008; Strupczewski et al., 2009). Hence, prior estimating the design rainfall, it is necessary to check for the presence of non-stationary in the time series, especially for Mumbai, as the urbanization may have the impact on the variation of rainfall. Hence, the aim of this work is to at-site design rainfall estimation for Colaba and Santacruz rain gauge stations in Mumbai. A novel approach is followed to estimate design temporal pattern for various durations using the third and fourth moments of time series and also the diagnostic test for checking nonstationary in rainfall data is performed for two rain gauging stations. Further, the decadal variability of IDF and DDF curves is also analyzed.
Proceedings of HYDRO 2013 INTERNATIONAL, 4-6 Dec 2013, IIT Madras, INDIA
5
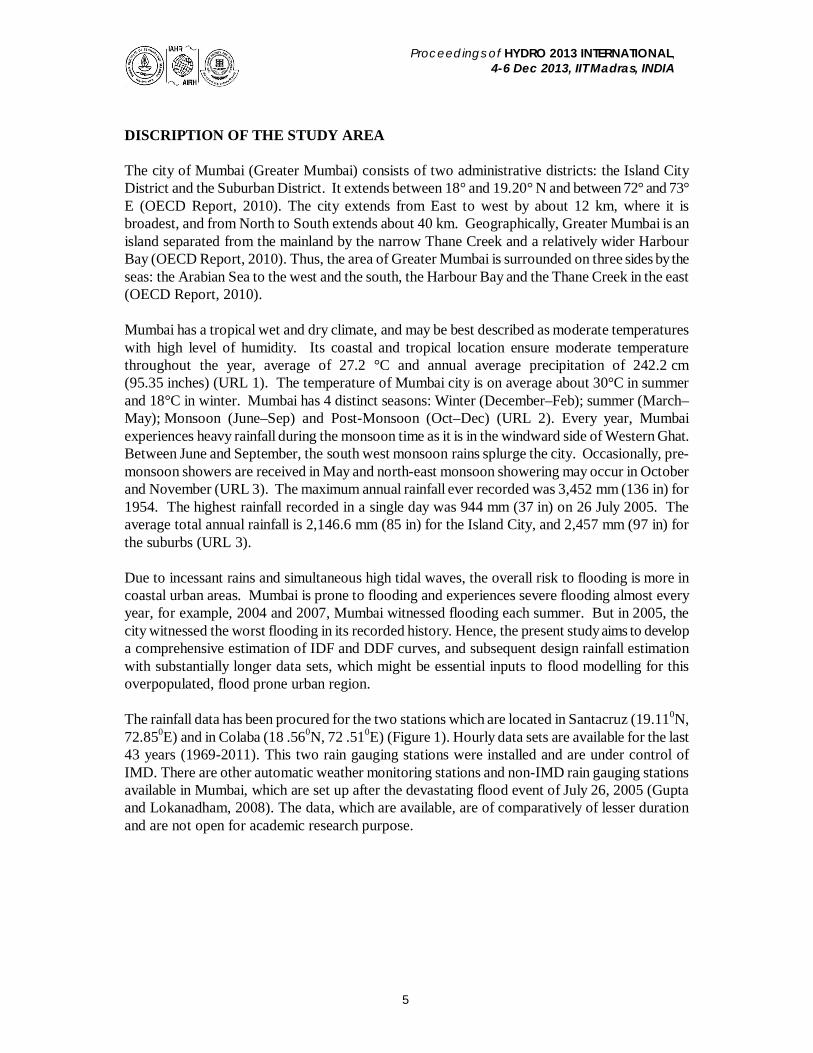
DISCRIPTION OF THE STUDY AREA The city of Mumbai (Greater Mumbai) consists of two administrative districts: the Island City District and the Suburban District. It extends between 18° and 19.20° N and between 72° and 73° E (OECD Report, 2010). The city extends from East to west by about 12 km, where it is broadest, and from North to South extends about 40 km. Geographically, Greater Mumbai is an island separated from the mainland by the narrow Thane Creek and a relatively wider Harbour Bay (OECD Report, 2010). Thus, the area of Greater Mumbai is surrounded on three sides by the seas: the Arabian Sea to the west and the south, the Harbour Bay and the Thane Creek in the east (OECD Report, 2010). Mumbai has a tropical wet and dry climate, and may be best described as moderate temperatures with high level of humidity. Its coastal and tropical location ensure moderate temperature throughout the year, average of 27.2 °C and annual average precipitation of 242.2 cm (95.35 inches) (URL 1). The temperature of Mumbai city is on average about 30°C in summer and 18°C in winter. Mumbai has 4 distinct seasons: Winter (December–Feb); summer (March–May); Monsoon (June–Sep) and Post-Monsoon (Oct–Dec) (URL 2). Every year, Mumbai experiences heavy rainfall during the monsoon time as it is in the windward side of Western Ghat. Between June and September, the south west monsoon rains splurge the city. Occasionally, pre-monsoon showers are received in May and north-east monsoon showering may occur in October and November (URL 3). The maximum annual rainfall ever recorded was 3,452 mm (136 in) for 1954. The highest rainfall recorded in a single day was 944 mm (37 in) on 26 July 2005. The average total annual rainfall is 2,146.6 mm (85 in) for the Island City, and 2,457 mm (97 in) for the suburbs (URL 3). Due to incessant rains and simultaneous high tidal waves, the overall risk to flooding is more in coastal urban areas. Mumbai is prone to flooding and experiences severe flooding almost every year, for example, 2004 and 2007, Mumbai witnessed flooding each summer. But in 2005, the city witnessed the worst flooding in its recorded history. Hence, the present study aims to develop a comprehensive estimation of IDF and DDF curves, and subsequent design rainfall estimation with substantially longer data sets, which might be essential inputs to flood modelling for this overpopulated, flood prone urban region. The rainfall data has been procured for the two stations which are located in Santacruz (19.110N, 72.850E) and in Colaba (18 .560N, 72 .510E) (Figure 1). Hourly data sets are available for the last 43 years (1969-2011). This two rain gauging stations were installed and are under control of IMD. There are other automatic weather monitoring stations and non-IMD rain gauging stations available in Mumbai, which are set up after the devastating flood event of July 26, 2005 (Gupta and Lokanadham, 2008). The data, which are available, are of comparatively of lesser duration and are not open for academic research purpose.
Proceedings of HYDRO 2013 INTERNATIONAL, 4-6 Dec 2013, IIT Madras, INDIA
6
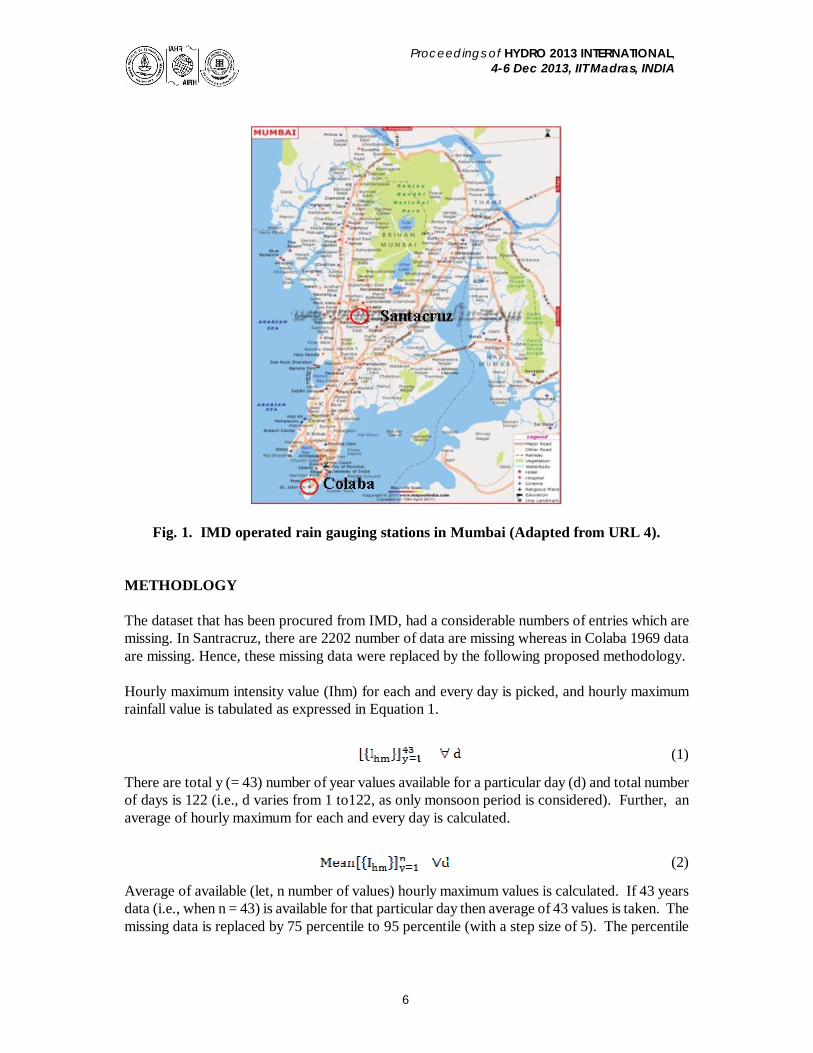
Fig. 1. IMD operated rain gauging stations in Mumbai (Adapted from URL 4).
METHODLOGY The dataset that has been procured from IMD, had a considerable numbers of entries which are missing. In Santracruz, there are 2202 number of data are missing whereas in Colaba 1969 data are missing. Hence, these missing data were replaced by the following proposed methodology. Hourly maximum intensity value (Ihm) for each and every day is picked, and hourly maximum rainfall value is tabulated as expressed in Equation 1.
(1)
There are total y (= 43) number of year values available for a particular day (d) and total number of days is 122 (i.e., d varies from 1 to122, as only monsoon period is considered). Further, an average of hourly maximum for each and every day is calculated.
(2)
Average of available (let, n number of values) hourly maximum values is calculated. If 43 years data (i.e., when n = 43) is available for that particular day then average of 43 values is taken. The missing data is replaced by 75 percentile to 95 percentile (with a step size of 5). The percentile

Proceedings of HYDRO 2013 INTERNATIONAL, 4-6 Dec 2013, IIT Madras, INDIA
7
replacement is done for each date and each hour separately. Suppose R is the missing data point for a particular date and an hour. If full day data is missing, then R can be denoted as:
(3)
where Ih is the missing value of a particular hour for a specific date. After the percentile replacement, each date will have 5 row vectors of 5 different percentile values (for 75p to 95p, with a step size of 5). Percentile values (P) are denoted as:
d (4)
Further, the highest value from each row vector is picked, and is mathematically expressed as:
(5)
Subsequently, for all p and d, [SM]p is compared with Equation 2. If for a particular day, the percentile value, which exceeds the hourly maximum average value, then all hour data is replaced by that percentile. Therefore,
If (6)
Then particular p value will be selected, which will replace the for a particular date. Here we have customized as threshold value. The rainfall corresponding to the percentile value which is exceeding the customized threshold value is considered to replace all the missing values of all hours of that particular day. The proposed method for replacement of the missing data showed robust response as it is significantly comparable with the hourly maximum average data, before fitting the missing values. Further, we have conducted the measure of uncertainty involved in the missing data replacement by the concept of modified statistical entropy, which is termed as Principle of Maximum Entropy (POME) (Singh, 1997). The results show the uncertainty is less for the proposed methodology. The rainfall extreme variables (peak, duration and frequency) are extracted with the implementation of POT method. However, for POT method, the selection of threshold should be optimal so that, so that the occurrences of exceedance event meet to Poisson process but must be set low enough to ensure that enough data is selected for sufficient estimation for distribution parameters (Coles, 2001). Hence, we here use Graphical Method (GM) to select the optimal threshold, which is based on the stability of the shape and scale parameters of GPD parameters and can be obtained by constructing a mean residual life plot (MRLP), which is given as the local of the points (Coles, 2001);
Proceedings of HYDRO 2013 INTERNATIONAL, 4-6 Dec 2013, IIT Madras, INDIA
8
u
i maxi =1u
n1u , - u :u <x xn
(8)
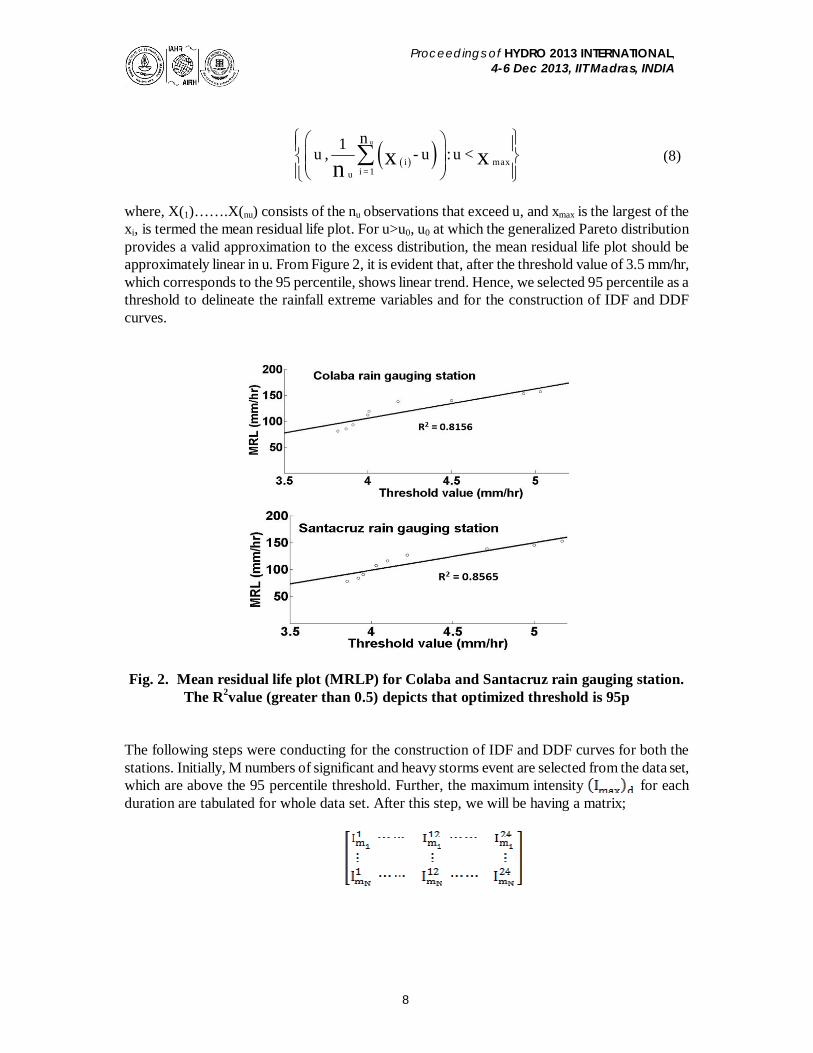
where, X(1)…….X(nu) consists of the nu observations that exceed u, and xmax is the largest of the xi, is termed the mean residual life plot. For u>u0, u0 at which the generalized Pareto distribution provides a valid approximation to the excess distribution, the mean residual life plot should be approximately linear in u. From Figure 2, it is evident that, after the threshold value of 3.5 mm/hr, which corresponds to the 95 percentile, shows linear trend. Hence, we selected 95 percentile as a threshold to delineate the rainfall extreme variables and for the construction of IDF and DDF curves.
Fig. 2. Mean residual life plot (MRLP) for Colaba and Santacruz rain gauging station.
The R2value (greater than 0.5) depicts that optimized threshold is 95p
The following steps were conducting for the construction of IDF and DDF curves for both the stations. Initially, M numbers of significant and heavy storms event are selected from the data set, which are above the 95 percentile threshold. Further, the maximum intensity for each duration are tabulated for whole data set. After this step, we will be having a matrix;
Proceedings of HYDRO 2013 INTERNATIONAL, 4-6 Dec 2013, IIT Madras, INDIA
9
where, N is the length of the each column and j varies from 1 to 24. Each column of above matrix along with total volume of extreme rainfall events are fitted into Generalized Paretto Distribution (GPD) and respective return period is estimated for each duration. Further, for DDF curve, we are considering set of for a particular return period where, D is the total depth of rainfall. Further, the a non parametric Mann-Kendal and Sen slope estimator (Petrow and Merz 2009) is performed, to check the presence of nonstationarity in the delineated extreme event series. The results of the prescribed methodology are given in the subsequent section. RESULTS According to the above mentioned methodology IDF and DDF curves are generated for Santacruz and Colaba rain gauging station data.
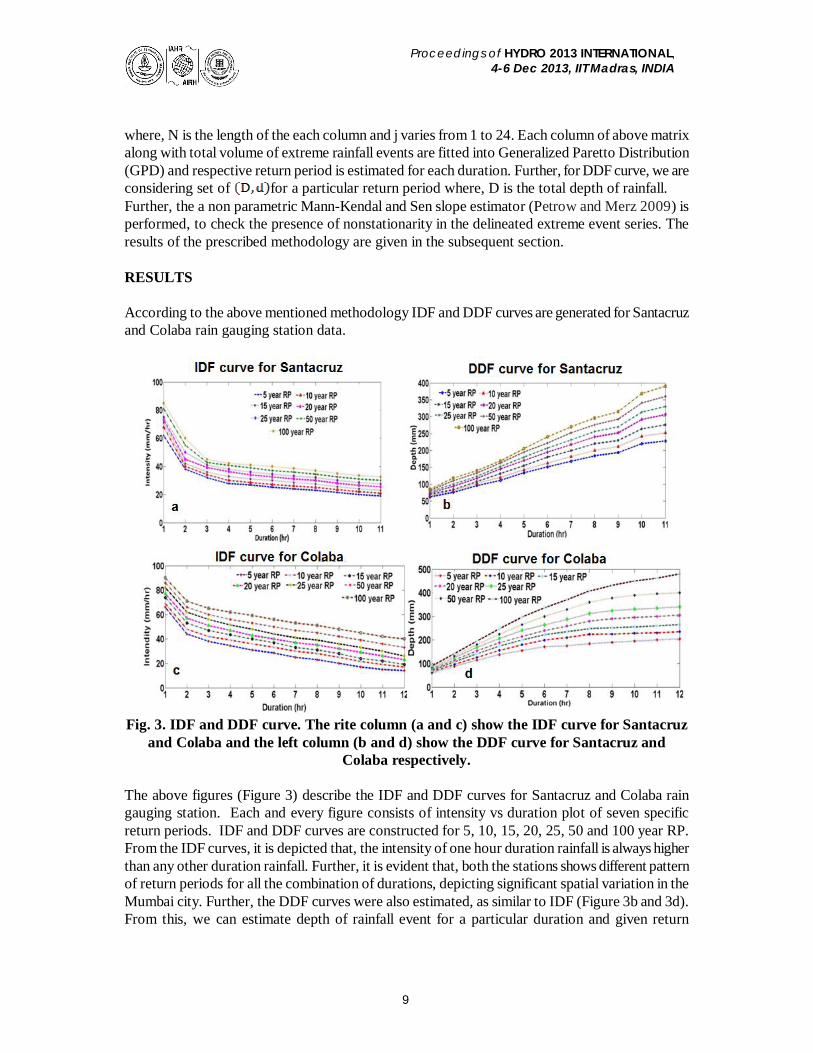
Fig. 3. IDF and DDF curve. The rite column (a and c) show the IDF curve for Santacruz
and Colaba and the left column (b and d) show the DDF curve for Santacruz and Colaba respectively.
The above figures (Figure 3) describe the IDF and DDF curves for Santacruz and Colaba rain gauging station. Each and every figure consists of intensity vs duration plot of seven specific return periods. IDF and DDF curves are constructed for 5, 10, 15, 20, 25, 50 and 100 year RP. From the IDF curves, it is depicted that, the intensity of one hour duration rainfall is always higher than any other duration rainfall. Further, it is evident that, both the stations shows different pattern of return periods for all the combination of durations, depicting significant spatial variation in the Mumbai city. Further, the DDF curves were also estimated, as similar to IDF (Figure 3b and 3d). From this, we can estimate depth of rainfall event for a particular duration and given return
Proceedings of HYDRO 2013 INTERNATIONAL, 4-6 Dec 2013, IIT Madras, INDIA
10
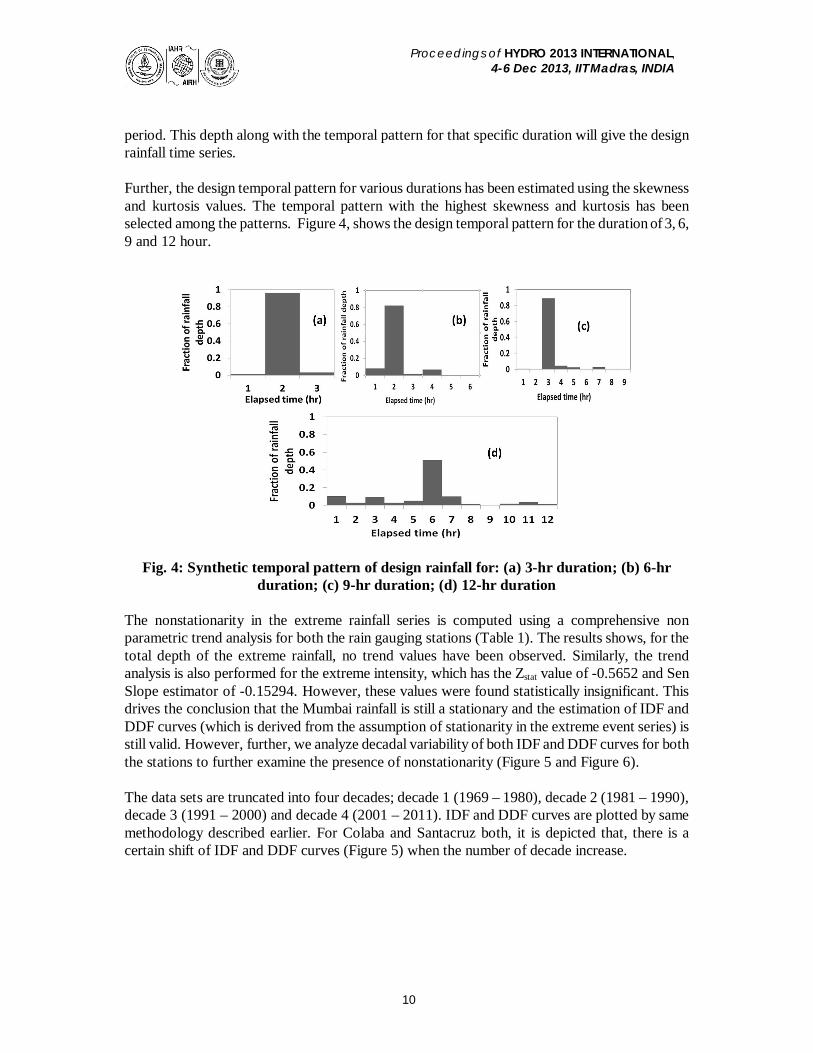
period. This depth along with the temporal pattern for that specific duration will give the design rainfall time series. Further, the design temporal pattern for various durations has been estimated using the skewness and kurtosis values. The temporal pattern with the highest skewness and kurtosis has been selected among the patterns. Figure 4, shows the design temporal pattern for the duration of 3, 6, 9 and 12 hour.
Fig. 4: Synthetic temporal pattern of design rainfall for: (a) 3-hr duration; (b) 6-hr duration; (c) 9-hr duration; (d) 12-hr duration
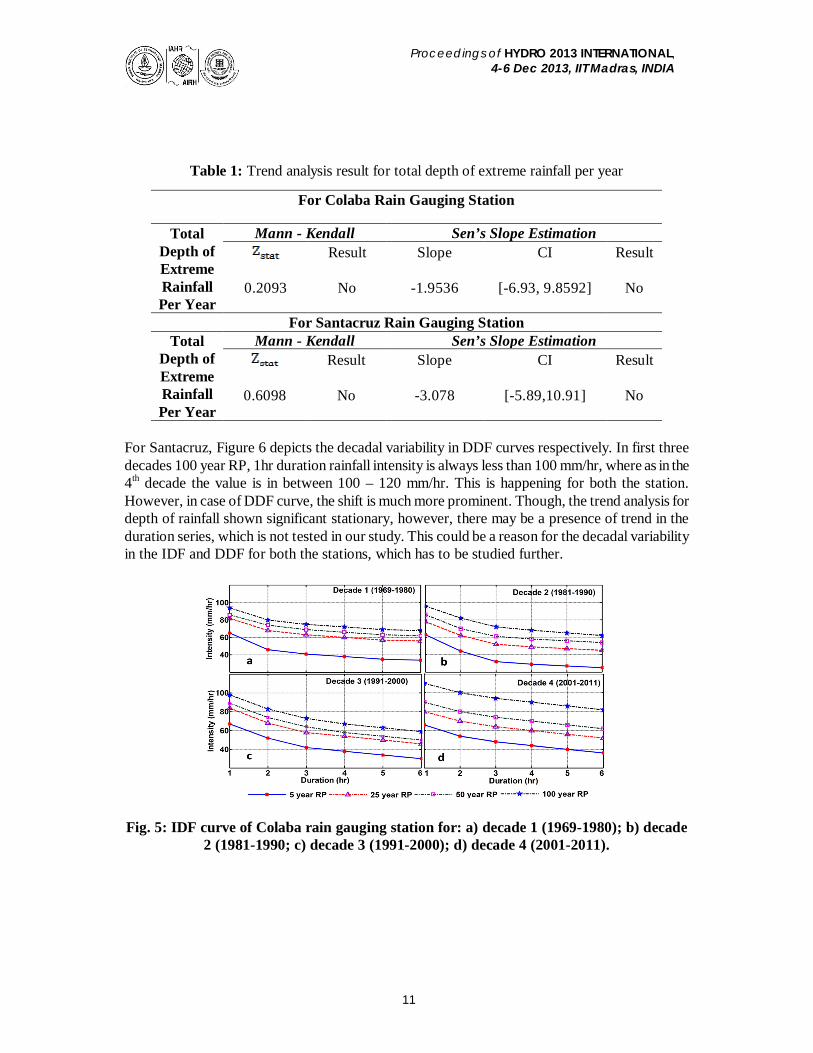
The nonstationarity in the extreme rainfall series is computed using a comprehensive non parametric trend analysis for both the rain gauging stations (Table 1). The results shows, for the total depth of the extreme rainfall, no trend values have been observed. Similarly, the trend analysis is also performed for the extreme intensity, which has the Zstat value of -0.5652 and Sen Slope estimator of -0.15294. However, these values were found statistically insignificant. This drives the conclusion that the Mumbai rainfall is still a stationary and the estimation of IDF and DDF curves (which is derived from the assumption of stationarity in the extreme event series) is still valid. However, further, we analyze decadal variability of both IDF and DDF curves for both the stations to further examine the presence of nonstationarity (Figure 5 and Figure 6). The data sets are truncated into four decades; decade 1 (1969 – 1980), decade 2 (1981 – 1990), decade 3 (1991 – 2000) and decade 4 (2001 – 2011). IDF and DDF curves are plotted by same methodology described earlier. For Colaba and Santacruz both, it is depicted that, there is a certain shift of IDF and DDF curves (Figure 5) when the number of decade increase.
Proceedings of HYDRO 2013 INTERNATIONAL, 4-6 Dec 2013, IIT Madras, INDIA
11
Table 1: Trend analysis result for total depth of extreme rainfall per year
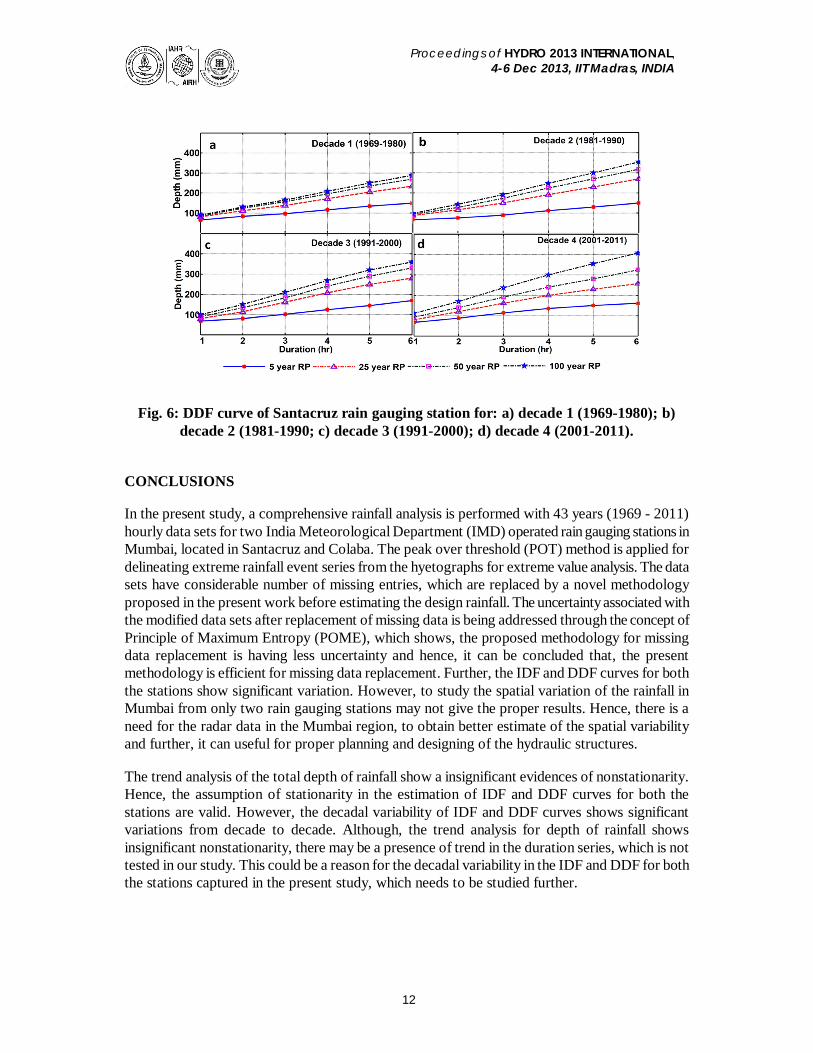
For Santacruz, Figure 6 depicts the decadal variability in DDF curves respectively. In first three decades 100 year RP, 1hr duration rainfall intensity is always less than 100 mm/hr, where as in the 4th decade the value is in between 100 – 120 mm/hr. This is happening for both the station. However, in case of DDF curve, the shift is much more prominent. Though, the trend analysis for depth of rainfall shown significant stationary, however, there may be a presence of trend in the duration series, which is not tested in our study. This could be a reason for the decadal variability in the IDF and DDF for both the stations, which has to be studied further.
Fig. 5: IDF curve of Colaba rain gauging station for: a) decade 1 (1969-1980); b) decade 2 (1981-1990; c) decade 3 (1991-2000); d) decade 4 (2001-2011).
For Colaba Rain Gauging Station
Total Depth of Extreme Rainfall Per Year
Mann - Kendall Sen’s Slope Estimation Result Slope CI Result
0.2093 No -1.9536 [-6.93, 9.8592] No
For Santacruz Rain Gauging Station Total
Depth of Extreme Rainfall Per Year
Mann - Kendall Sen’s Slope Estimation Result Slope CI Result
0.6098 No -3.078 [-5.89,10.91] No
Proceedings of HYDRO 2013 INTERNATIONAL, 4-6 Dec 2013, IIT Madras, INDIA
12
Fig. 6: DDF curve of Santacruz rain gauging station for: a) decade 1 (1969-1980); b) decade 2 (1981-1990; c) decade 3 (1991-2000); d) decade 4 (2001-2011).
CONCLUSIONS
In the present study, a comprehensive rainfall analysis is performed with 43 years (1969 - 2011) hourly data sets for two India Meteorological Department (IMD) operated rain gauging stations in Mumbai, located in Santacruz and Colaba. The peak over threshold (POT) method is applied for delineating extreme rainfall event series from the hyetographs for extreme value analysis. The data sets have considerable number of missing entries, which are replaced by a novel methodology proposed in the present work before estimating the design rainfall. The uncertainty associated with the modified data sets after replacement of missing data is being addressed through the concept of Principle of Maximum Entropy (POME), which shows, the proposed methodology for missing data replacement is having less uncertainty and hence, it can be concluded that, the present methodology is efficient for missing data replacement. Further, the IDF and DDF curves for both the stations show significant variation. However, to study the spatial variation of the rainfall in Mumbai from only two rain gauging stations may not give the proper results. Hence, there is a need for the radar data in the Mumbai region, to obtain better estimate of the spatial variability and further, it can useful for proper planning and designing of the hydraulic structures.
The trend analysis of the total depth of rainfall show a insignificant evidences of nonstationarity. Hence, the assumption of stationarity in the estimation of IDF and DDF curves for both the stations are valid. However, the decadal variability of IDF and DDF curves shows significant variations from decade to decade. Although, the trend analysis for depth of rainfall shows insignificant nonstationarity, there may be a presence of trend in the duration series, which is not tested in our study. This could be a reason for the decadal variability in the IDF and DDF for both the stations captured in the present study, which needs to be studied further.
Proceedings of HYDRO 2013 INTERNATIONAL, 4-6 Dec 2013, IIT Madras, INDIA
13
ACKNOWLEDGEMENTS
We thank the India Meteorological Department (IMD) for providing the rainfall data and Mumbai Metropolitan Region Development Authority (MMRDA) for their valuable inputs. REFERENCES Burlando, P., and Rosso, R. 1996. Scaling and multiscaling models of depth-duration-frequency
curves for storm precipitation. Journal of Hydrology,187, 45-64. Coles, S.G. 2001. An introduction to statistical modelling of extreme values, London, Springer. Girimaldi, S., and Serinaldi, F. 2006. Design hyetographs analysis with 3 - couplas function.
Hydrological Sciences - Journal - des Sciences Hydrologiques, 51, 223-238. Gupta, K., and Lokanadham, B. 2008. Characterization of spatial and temporal distribution of
monsoon rainfall in Mumbai, India. 11th International Conference on Urban Drainage, Edinburgh, Scotland, UK
Heneker, T. M., Lambert, M. F., and Kuczera, G. 2001. A Point Rainfall model for risk-based
design. Journal of Hydrology, 247, 54-71. Katz, R. W., Brush, G. S., Parlange, M. B. 2005. Statistics of extremes: Modelling ecological
disturbances. Ecology, 86(5), 1124-1134. Kumar, A., Dudhia, J., Rotunno, R.,Niyogi, D., and Mohanty, U, C. 2008. Analysis of the 26 July
2005 heavy rain event over Mumbai, India using the Weather Research and Forecasting (WRF) model, Quarterly Journal Of The Royal Metrological Society , 325
Milly, P. C. D., Betancourt, J., Falkenmark, M., Hirsch, R. M., Kundzewicz, Z. W., Lettenmaier,
D. P., and Stouffer, R.J. 2008. Stationarity Is Dead: Whither Water Management, Climate change. Science. 319, 573-574.
Norlida, M, D., Abustan, I., Abdullah, R., Yahaya, A. S., Sazali1, O., Mohd Nor, M. D., and
Lariyah, M. S. 2011. Intensity-Duration-Frequency Estimation using Generalized Pareto Distribution for Urban Area in a Tropical Region, 12nd International Conference on Urban Drainage
Overeem, A., Buishand, A., and Holleman, I. 2008. Rainfall depth-duration-frequency curves and
their uncertainties. Journal of Hydrology, 348, 124– 134. Petrow T., Merz B. 2009. Trends in flood magnitude, frequency and seasonality in Germany in
the period 1951–2002. J. Hydrol., 391, 129-141.
Proceedings of HYDRO 2013 INTERNATIONAL, 4-6 Dec 2013, IIT Madras, INDIA
14
Shane, R. M., Lynn, W. R. 1964. Mathematical model for flood risk evaluation. J. Hydraul. Eng., 90, 1-20.
Singh, V. P. 1997. The use of entropy and water resources. Hydrological Processes, 11, 587-626 Strupczewski, W.G., Kochanek, K., Feluch, W., Bogdanowicz, E., Singh, V.P. 2009. On seasonal
approach to nonstationary flood frequency analysis. Physics and Chemistry of the Earth. 34, 612-618.
Todorovic, P. Z., Zelenhasic, E. 1970. A stochastic model for flood analysis. Water Resour. Res.,
6, 1641-1648.
URL 1: http://en.wikipedia.org/wiki/Mumbai#Climate (accessed on June 09, 2013)
URL 2: http://en.wikipedia.org/wiki/Climate_of_Mumbai (accessed on June 10, 2013)
URL 3: http://en.wikipedia.org/wiki/Mumbai#Geography (accessed on June 12, 2013) URL 4: http://www.mapsofindia.com/maps/maharashtra/mumbai-map.htm (accessed on June 14,
2013)
Copyright © 2022 FDOKUMEN