
Refolding strategies from inclusion bodies in a structural genomics project
Upload
khangminh22Category
view
3download
0
Institut für Organische Chemie III der Universität Ulm /
Institut für Angewandte Biotechnologie Hochschule Biberach
Dissertation zur Erlangung
des Doktorgrades Dr. rer. nat.
der Fakultät für Naturwissenschaften
der Universität Ulm
vorgelegt von
Bastian Heim, M. Sc.
Laupheim
2020
Expression, Purification, Refolding and Structure Analysis of Stabilized G protein-coupled Receptors Expressed
in E. coli Inclusion Bodies


Dekan der Fakultät für Naturwissenschaften:
Prof. Dr. Thomas Bernhardt
Erstgutachter: Prof. Dr. Tanja Weil
Universität Ulm
Zweitgutachter & Betreuer: Prof. Dr. Hans Kiefer
Hochschule Biberach
Institut der Anfertigung Institut für Angewandte Biotechnologie, Hochschule Biberach
Promotionsdatum: 14.05.2020

„ A really good idea can be recognized by the fact that its realization seems excluded from the outset. “
Albert Einstein

“There is no perfect method, but if there were, it would be crystallography”
Martin Caffrey

Abstract page I
Abstract
G protein–coupled receptors are membrane proteins involved in signal
transduction across the biological lipid bilayer. This receptor class represent both
the largest membrane protein and drug target family, accounting for ~800
members encoded in the human genome. GPCRs are distributed across nearly
all of the body’s organs and tissues, which makes them a key regulatory element
in a broad range of normal and pathological processes. The structure
determination of G protein-coupled receptors with high-resolution crystals is a key
focus in membrane protein biology to understand the basic mechanism of their
activation and signaling for structure-based drug design. High-resolution crystal
structures in combination with multiple complex structures for a specific target are
a prerequisite for a successful structure-based drug discovery. Currently,
obtaining X-ray structures of membrane proteins is still far from becoming routine
due to their notorious instability in detergent micelles, the inherent conformational
flexibility, bottlenecks in overexpressing large quantities of the recombinant
receptor and the hydrophobic protein surface, which often impairs crystallization.
In the present project, we overexpressed two G protein-coupled receptors in
Escherichia coli inclusion bodies. One of these two receptors is the sphingosine-
1-phosphate receptor 1 with known structure, which was used for validation
purposes. The second receptor was the orphan G protein-coupled receptor 3 with
unknown structure. Both receptors were refolded in vitro by detergent exchange
into detergent micelles. The monomeric form of the refolded receptors was
isolated by size exclusion chromatography and quality checked using a thermal
stability assay. Receptor stability was optimized for higher thermal stability
through improving refolding conditions into mixed lipid detergent micelles. Ligand
binding was shown for both receptors, which were crystallized in the lipidic cubic
phase. Beside crystal formation for both receptors in different crystallization
conditions, the reproduction of sphingosine-1-phosphate receptor 1
crystallization conditions resulted in crystal formation. Harvested crystals were
analyzed at a synchrotron beamline, which resulted in non-diffracting potential
protein crystals for both receptors.
Contents page II
Contents
Abstract .............................................................................................................. I
Contents............................................................................................................. II
List of abbreviations ........................................................................................ V
1 Introduction ............................................................................................. 1
1.1 G protein-coupled receptors ............................................................................... 1
1.1.1 GPCRs mode of action ....................................................................................... 2
1.1.2 Activation of GPCRs ........................................................................................... 4
1.1.3 Structural features of GPCRs ............................................................................. 7
1.2 Sphingosine-1 phosphate receptor, an example of a GPCR with known structure ........................................................................................................... 10
1.3 Orphan G protein-coupled receptor 3, a GPCR example with unknown structure ........................................................................................................... 13
1.4 Structure determination of GPCRs for targeted drug discovery ........................ 16
1.4.1 Structure-based drug discovery ........................................................................ 18
1.4.2 GPCR expression strategies ............................................................................ 20
1.4.3 Strategies for isolation, refolding and purification of GPCRs ............................. 24
1.4.4 Crystallization in lipidic cubic phase and X-ray structure analysis ..................... 33
1.5 Aim of the study ................................................................................................ 38
2 Materials and Methods ......................................................................... 39
2.1 Construction of expression plasmids ................................................................ 39
2.1.1 DNA gel electrophoresis ................................................................................... 39
2.1.2 Restriction digestion ......................................................................................... 39
2.1.3 DNA sequencing .............................................................................................. 40
2.1.4 PCR cloning and colony PCR for removal of thrombin cleavage site ................ 41
2.2 Construction of S1P1 and GPR3 expressing clones .......................................... 43
2.3 Protein expression and preparation of inclusion bodies .................................... 44
2.3.1 Clone selection for S1P1 and GPR3 expression ............................................... 44
2.3.2 Media comparison ............................................................................................ 44
2.3.3 Protein expression and inclusion body isolation conditions ............................... 45
2.4 Protein analytical methods ............................................................................... 45
2.4.1 Total protein concentration determination ......................................................... 45
2.4.2 SDS-PAGE ....................................................................................................... 46
2.4.3 Western blot ..................................................................................................... 47
2.5 Dialysis ............................................................................................................. 48
2.6 Concentration by ultrafiltration .......................................................................... 48
Contents page III
2.7 Thrombin cleavage ........................................................................................... 49
2.8 Chromatography ............................................................................................... 49
2.8.1 Ni-IMAC purification using spin columns........................................................... 49
2.8.2 Ni-IMAC purification and refolding for experiments with KSI tag on an ÄKTA purifier system .................................................................................................. 50
2.8.3 Ni-IMAC purification and refolding for GPCRs without KSI tag ......................... 50
2.8.4 Refolding into lipid detergent mixed micelles .................................................... 51
2.8.5 SEC for isolation of monomeric receptors ......................................................... 51
2.9 CPM assay ....................................................................................................... 51
2.9.1 Detection of ligand binding by CPM assay ........................................................ 52
2.10 Protein identification by mass spectrometry ...................................................... 52
2.11 Crystallization in LCP ....................................................................................... 53
2.11.1 Isolation of refolded S1P1 and GPR3 for crystallization in LCP ......................... 53
2.11.2 Preparation of crystallization screening solutions ............................................. 54
2.11.3 LCP crystallization ............................................................................................ 54
2.11.4 Crystal harvesting ............................................................................................. 56
2.11.5 Recording of diffraction data at SLS ................................................................. 56
3 Results ................................................................................................... 58
3.1 Expression, purification and refolding of KSI-tagged S1P1 and GPR3 .............. 58
3.1.1 DNA sequencing, selection of production strain and expression optimization for S1P1 ............................................................................................................ 58
3.1.2 S1P1 purification, refolding and thrombin cleavage ........................................... 65
3.1.3 Expression of S1P1 and GPR3 in KSI-free pET23 vector system ..................... 73
3.2 Detection and improvement of S1P1 and GPR3 refolding ................................. 75
3.2.1 Establishment of the CPM assay ...................................................................... 76
3.2.2 Refolding of S1P1 and GPR3 purified by Ni-IMAC ............................................ 77
3.2.3 Detergent screening for optimization of GPCR refolding ................................... 78
3.2.4 Optimization of GPCR refolding conditions by use of DoE ................................ 81
3.2.5 Ligand binding to S1P1 and GPR3 .................................................................... 89
3.2.6 Effect of phospholipid and sterol additives on GPCR refolding and receptor stability ............................................................................................................. 92
3.3 Crystallization of GPCRs by LCP ..................................................................... 94
3.3.1 Crystallization screening of S1P1 and GPR3 .................................................... 94
3.3.2 Grid screen crystallization of S1P1 and GPR3 ................................................ 104
4 Discussion ........................................................................................... 109
4.1 GPCR expression and purification .................................................................. 109
4.1.1 Optimization of GPCR expression and IB isolation ......................................... 109
4.1.2 Thrombin cleavage of S1P1: establishment and optimization .......................... 110
Contents page IV
4.2 Refolding of S1P1 and GPR3 .......................................................................... 113
4.2.1 CPM assay establishment and measurement of GPCR refolding ................... 113
4.2.2 Detergent refolding screen ............................................................................. 114
4.2.3 Optimization of receptor stability by DoE ........................................................ 115
4.2.4 Stabilizing effects of lipids in mixed micelles and ligand binding ..................... 115
4.3 LCP crystallization of S1P1 and GPR3 ............................................................ 117
4.3.1 Formation of the LCP ..................................................................................... 117
4.3.2 Crystallization and crystal harvesting .............................................................. 118
4.3.3 X-ray crystallography ...................................................................................... 119
5 Conclusion and outlook ..................................................................... 121
6 Attachment .......................................................................................... 123
6.1 Crystallization screen ..................................................................................... 123
6.2 Grid-Screen .................................................................................................... 145
7 Bibliography ........................................................................................ 150
8 List of figures ...................................................................................... 171
9 List of tables ........................................................................................ 177
Acknowledgment .......................................................................................... 179
List of abbreviations page V
List of abbreviations
A Ampere
Ab Antibody
Aβ Amyloid β protein
AD Alzheimer disease
AF64394 (4-Chloro-2-isopropoxy-benzyl)-(5-phenyl-[1,2,4]triazolo-
[1,5-a]pyrimidin-7-yl)-amine
Ala Alanine
AlwnI Restriction enzyme from Acinetobacter Iwoffii
AmpR Ampicillin resistance gene
APP Amyolid pre-cursor protein
AU Arbitrary unit
BCA Bichinchonic acid
β-LG β-Lactoglobulin
bp Base pair
BRIL apocytochrome b562RIL
BSA Bovine serum albumin
cAMP cyclic adenosine monophosphate
CHS Cholesteryl-Hemisuccinate
CMC Critical micelle concentration
CNS Central nervous system
CPM 7-Diethylamino-3-(4-maleimidophenyl)-4-methylcoumarin
cryo-EM Cryo-electron microscopy
CTC Cubic ternary complex
Cu2+ Cupper ion
List of abbreviations page VI
CV Column volume
Cys Cysteine
D2.50 Most conserved aspartate in helix II
Da Dalton
DAG Diacylglyerol
DDM n-Dodecyl-β-D-maltopyranoside
DM n-decyl-β-D-maltoside
DMSO Dimethylsulfoxide
DNA Desoxyribonucleic acid
DoE Design of Experiments
DRY Motif composed of aspartate, arginine, tyrosine
DSF Differential scanning fluorimetry
DYKDDDDK Amino acid sequence (one letter code) of the FLAG-tag
E. coli Escherichia coli
EDTA Ethylendiaminetetraacetic acid
EL Extracellular loop
EmGFP Emerald green fluorescent protein
ERY Motif composed of glutamate, arginine, tyrosine
et al. et alli
FDA US Food and Drug Administration
FT Flow through
Fos 12 n-Dodecylphosphocholine (Fos-Choline 12)
Fos 14 n-Tetradecylphosphocholine (Fos-Choline 14)
FWD Forward
GEF Guanine nucleotide exchange factor
List of abbreviations page VII
GPCR G protein-coupled receptor
GPR3 G protein-coupled receptor 3
GRK G protein-coupled receptor kinases
GTP / GDP Guanosine triphosphate / Guanosine diphosphate
HCl Hydrochloric acid
HD Huntington disease
HEPES 4-(2-Hydroxyethyl)piperazine-1-ethanesulfonic acid, N-(2-
Hydroxyethyl)piperazine-N′-(2-ethanesulfonic acid)
His Histidine
HPLC High performance liquid chromatography
HRP Horse radish peroxidase
IB Inclusion body
IL Intracellular loop
IMAC Immobilized metal affinity chromatography
IP3 Inositol triphosphate
IPTG Isopropyl β-D-thiogalactoside
KSI Ketosteroisomerase
LB Media according to Luria and Bertani
LCP Lipidic cubic phase
LCP-FRAP Fluorescence recovery after photo bleaching
LPA Lysophosphatidic acid
LVPRGS Leucine Valine Proline Arginine Glycine Serine; thrombin
cleavage site
MAG Monoacylglycerole
MAPK Mitogen-activated protein kinase
List of abbreviations page VIII
MBP Maltose binding protein
MES 2-(N-Morpholino)ethanesulfonic acid, 4-
Morpholineethanesulfonic acid
Met Methionine
MgCl2 Magnesium chloride
MW Molecular weight
MS Mass spectrometry
MS Multiple sclerosis
MS/MS Tandem mass spectrometry
MWCO Molecular weight cut off
N1.50 Most conserved asparagin in helix I
NaCl Sodium chloride
NAM Negative allosteric modulator
NaOH Sodium hydroxide
Ni-IMAC Nickel immobilized metal affinity chromatography
NMR Nuclear magnetic resonance
NPxxY Motif composed of asparagine, proline, any amino acid,
tyrosine
NTA Nitrilotriacetic acid
OD Optical density
P5-7.50 Most conserved proline in helix V-VII
PAM Positive allosteric modulator
PBS Phosphate buffered saline
PDB Protein data base
PDC Protein detergent complex
List of abbreviations page IX
PEG Polyethylene glycol
PES Polyethersulfone
Q2 Goodness of prediction
R3.50 Most conserved arginine in helix III
RRMS Relapsing remitting multiple sclerosis
R2 Goodness of fit
REV reverse
rpm Rounds per minute
RT Room temperature
S3.39 Serine in helix III, 11 amino acids towards the N-terminus
calculated from the most conserved amino acid in helix III
S1P Sphingosine-1-phosphate
S1P1 Sphingosine-1-phosphate receptor 1
SDS Sodium dodecyl sulfate
SDS-PAGE Sodium dodecyl sulfate polyacrylamide gel
electrophoresis
SEC Size exclusion chromatography
Sf Spodoptera frugiperda
siRNA small interfering ribonucleic acid
SLS Swiss light source
TB Terrific Broth
TBS Tris buffered saline
TBST Tris buffered saline with addition of Tween20
TCS Thrombin cleavage site
TEMED Tetramethylethylendiamine
List of abbreviations page X
TEV Tobacco etch virus
TM Melting point
Tris Tris-aminoethan
TrxA Thioredoxin A
UV Ultra violet
V Volt
W4.50 Most conserved tryptophan in helix IV
W146 hydrate R-3-amino-4-(3-hexylphenylamino)-4-oxobutylphosphonic
acid hydrate, [(3R)-3-amino-4-[(3-hexylphenyl)amino]-4-
oxobutyl]-phosphonic acid (ML056)
WxP Motif composed of trytophane, any amino acid, proline
XhoI Restriction enzyme from Xanthomonas holcicola
3D Three-dimensional
7TM 7 Transmembrane α-helices
Introduction page 1
1 Introduction
G protein-coupled receptors (GPCR) are important drug targets. Many orally
administered drugs target GPCRs, due to their substantial involvement in human
pathophysiology (1). Agents that target GPCRs nowadays include 475 drugs
accounting for around 34 % of all drugs approved by the US Food and Drug
Administration (FDA) (1). In the time period between 2011-2015, drugs targeting
GPCRs account for aggregated sales of around US$ 890 billion (2). Top selling
blockbuster drugs acting on GPCRs are for example the anti-coagulant Plavix®
(Sanofi-Aventis), Abilify® (Bristol-Myers-Squibb) a drug used against depression
and schizophrenia and Singulair® (Merck) for treatment of asthma. Therefore
GPCRs illustrate the big nature of unexplored opportunities for biochemical
research and therapeutic development (2).
1.1 G protein-coupled receptors
GPCRs represent the largest protein superfamily in the human proteome with
over 800 genes, of which about 400 are olfactory receptors, encoding for these
transmembrane receptors (3–7). Most drug targets belong to the big protein
receptor families namely GPCR, ion channels, kinases and nuclear hormone
receptors (8). GPCRs are of outmost interest as pharmacological targets as they
regulate numerous diverse physiological processes and have drug-suitable sites
that are accessible at the cell surface (1). GPCRs are integral membrane proteins
located in the plasma membrane and share a common architecture of seven
transmembrane (7TM) α-helices (3,9). The well conserved transmembrane helix
domains across the cellular membrane are composed of about 25-35 amino acid
residues for each domain with a high degree of hydrophobicity (10). Within the
plasma membrane, the GPCRs communicate signals across the membrane in
response to a variety of extracellular stimuli (11). These extracellular stimuli
include photons, ions, small molecules, peptides and proteins, which are
transmitted across the membrane over a distance of ~ 30 Å to elicit intracellular
responses (3).
Introduction page 2
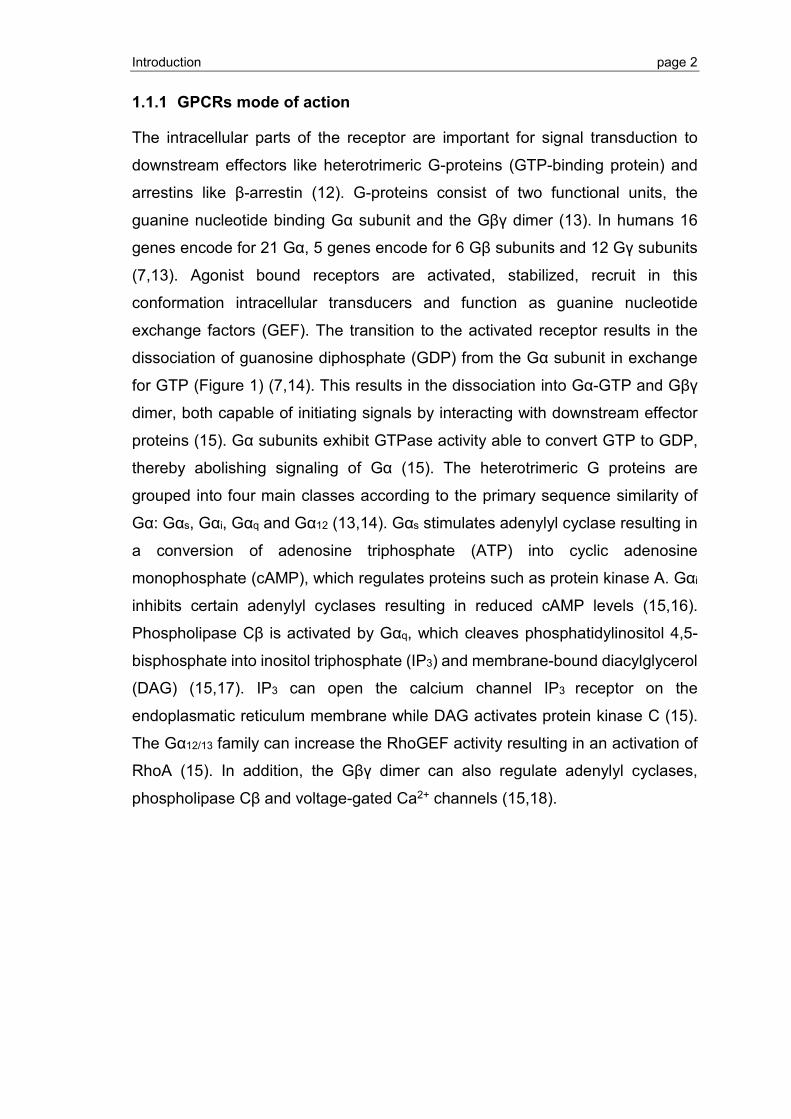
1.1.1 GPCRs mode of action
The intracellular parts of the receptor are important for signal transduction to
downstream effectors like heterotrimeric G-proteins (GTP-binding protein) and
arrestins like β-arrestin (12). G-proteins consist of two functional units, the
guanine nucleotide binding Gα subunit and the Gβγ dimer (13). In humans 16
genes encode for 21 Gα, 5 genes encode for 6 Gβ subunits and 12 Gγ subunits
(7,13). Agonist bound receptors are activated, stabilized, recruit in this
conformation intracellular transducers and function as guanine nucleotide
exchange factors (GEF). The transition to the activated receptor results in the
dissociation of guanosine diphosphate (GDP) from the Gα subunit in exchange
for GTP (Figure 1) (7,14). This results in the dissociation into Gα-GTP and Gβγ
dimer, both capable of initiating signals by interacting with downstream effector
proteins (15). Gα subunits exhibit GTPase activity able to convert GTP to GDP,
thereby abolishing signaling of Gα (15). The heterotrimeric G proteins are
grouped into four main classes according to the primary sequence similarity of
Gα: Gαs, Gαi, Gαq and Gα12 (13,14). Gαs stimulates adenylyl cyclase resulting in
a conversion of adenosine triphosphate (ATP) into cyclic adenosine
monophosphate (cAMP), which regulates proteins such as protein kinase A. Gαi
inhibits certain adenylyl cyclases resulting in reduced cAMP levels (15,16).
Phospholipase Cβ is activated by Gαq, which cleaves phosphatidylinositol 4,5-
bisphosphate into inositol triphosphate (IP3) and membrane-bound diacylglycerol
(DAG) (15,17). IP3 can open the calcium channel IP3 receptor on the
endoplasmatic reticulum membrane while DAG activates protein kinase C (15).
The Gα12/13 family can increase the RhoGEF activity resulting in an activation of
RhoA (15). In addition, the Gβγ dimer can also regulate adenylyl cyclases,
phospholipase Cβ and voltage-gated Ca2+ channels (15,18).
Introduction page 3
Figure 1: A classical example of GPCR signaling pathway. Inactive GPCRs are activated by agonist binding, the activated receptor G protein complex is formed, GDP is exchanged for GTP. Gα-GTP and Gβγ subunits separate and activate downstream effectors. (19), CC BY 4.0, https://creativecommons.org/licenses/by/4.0/.
G-proteins biochemically function in a GTPase cycle, after activation and
dissociation the Gα subunit signaling is terminated by the intrinsic GTPase
activity through hydrolysis of GTP to GDP. The hydrolysis increases by binding
of GTPase activating proteins. The Gβγ signaling is terminated by re-association
with Gα-GDP (15). In cases of continuous agonist stimulation, the receptor
activity can be modulated by phosphorylation with a second-messenger protein
kinase or a family of GPCR kinases (GRK) (19).
Introduction page 4
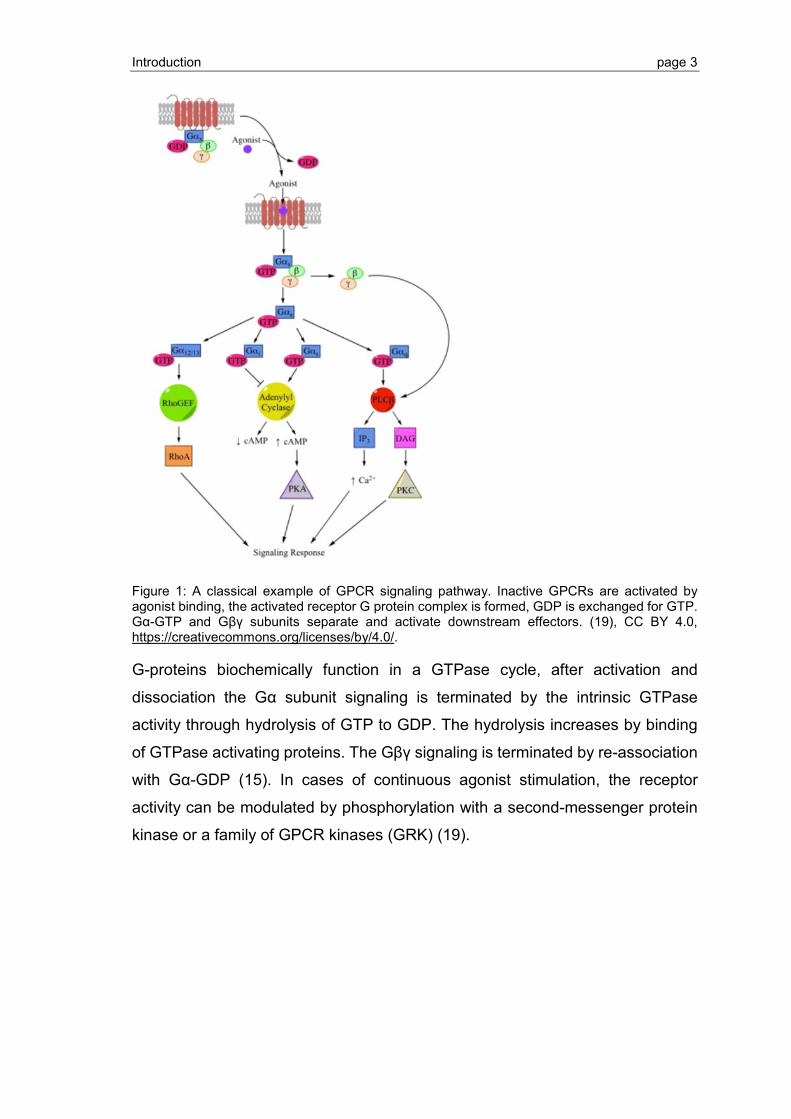
Figure 2: GPCR desensitization after phosphorylation through GRK, the GPCR is internalized promoted through arrestin binding. The binding of arrestin sterically hinders the receptor-G protein interaction. The receptor is either degraded or recycled back to the cell surface. (19), CC BY 4.0, https://creativecommons.org/licenses/by/4.0/.
After the GPCR was phosphorylated by GRK, β-arrestin is recruited to the
receptor leading to the inhibition of receptor-G protein interaction via steric
hindrance (19). The receptor-β-arrestin complex is removed from the cell surface
through endocytosis, which occurs via clathrin-coated vesicles (7,19). β-arrestin
mediates this process by interacting with components of the clathrin-coated-pit
machinery. The pits are pinched off the cell surface by action of the GTPase
Dynamin, the receptor is then either recycled or degraded in lysosomes (7).
GPCRs control crucial physiological and cellular processes, are involved in
human pathophysiology and pharmacological tractability (1,3,9). Therefore, the
elucidation of the structure is of great importance for the determination of the
receptor function, receptor interactions, pathogenesis and a structure-based drug
development.
1.1.2 Activation of GPCRs
GPCRs are activated by binding of naturally produced (endogenous) or externally
administered (exogenous) ligands. Ligands can be classified as agonists, inverse
agonists and antagonists. GPCRs are not simple on/off switches, mostly they
exhibit a basal level of guanosine triphosphate (GTP) exchange activity in the
absence of a ligand. This indicates that there is an equilibrium population of the
Introduction page 5
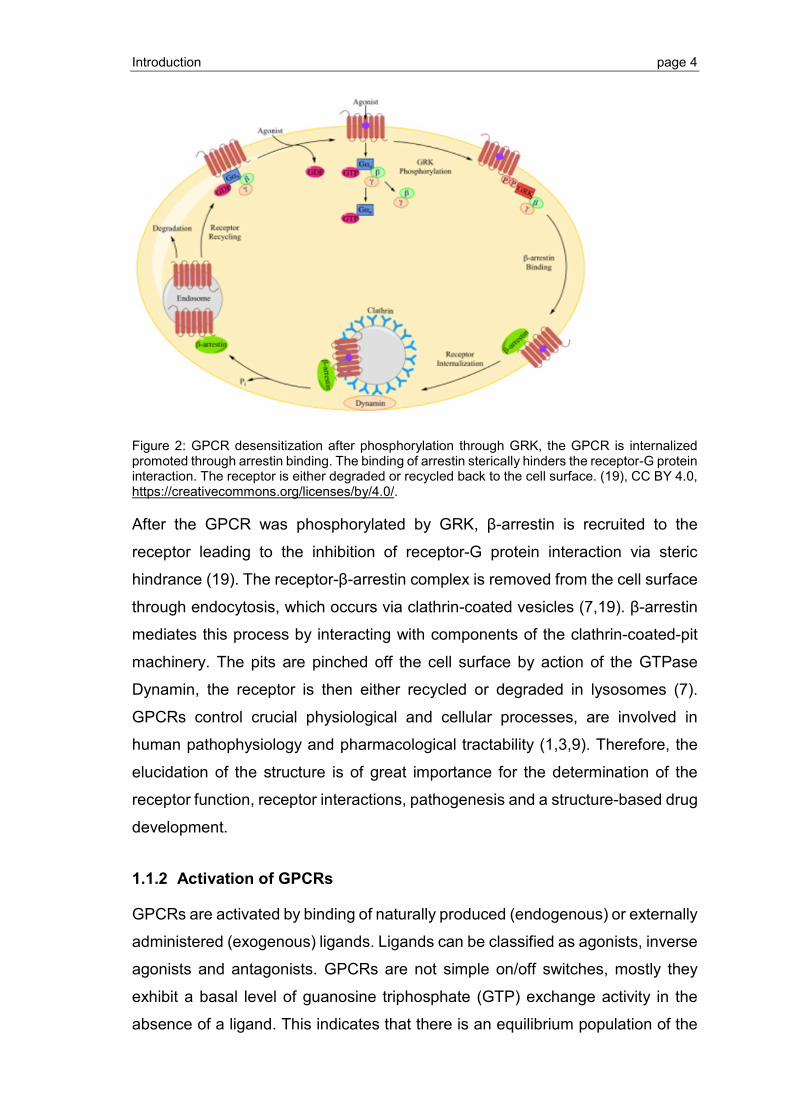
receptor in an active conformation (9). A good way for the explanation of ligand
binding is the cubic ternary complex (CTC) model. The CTC model is an
equilibrium model for interactions between receptors, ligands, and G-proteins.
This model generalizes traditional binary mass action occupancy models for
receptor-ligand interactions (20).
Figure 3: Basic CTC building model including the six faces of the typical cubic building block. These include the inactive face, active face, G-protein face, G-protein-free face, ligand face and ligand free face. Ri represents the inactive receptor and Ra indicates the activated receptor. A is the synonym for the ligand and G for G-protein (20).
In the CTC model a diverse set of transducer molecules (G-proteins) and ligand
molecules (like hormones) can interact. Ri and Ra represent the inactive and
active receptor conformations. In this model, one receptor can only bind one
ligand (A) and / or one G-protein (G) at a time. Nevertheless, different receptors
can compete for G-proteins and ligands. The CTC model consist of eight distinct
types of receptor species, which are shown at the edge of the cube and define all
allowed transitions between the receptor species: Ri, Ra, ARi, ARa, RiG, RaG,
ARiG and ARaG (20). Receptor activation by ligand binding is not obligatory. The
ligand can also bind without activation of the receptor, which can also
spontaneously be activated without first binding to a ligand. The CTC model can
be extended by different scenarios. The extension includes for each face of the
cube a set of receptor species sharing a common feature. Using the basic CTC
model, the extended CTC model results (Figure 3). In the CTC model, different
receptors interact only through their competition for the common pool of ligands
and G-proteins. The CTC model can further be extended including the equilibrium
constants for the transition between the active and inactive receptor
conformations. The CTC model describes the three-way interaction between
Introduction page 6
receptor, G-proteins and ligands. These ligands include agonists, inverse
agonists, antagonists and neutral antagonists. Agonists bind to the receptors and
induce a conformational change to an active state, which increases signaling
effects. Inverse agonists shift the receptor conformational equilibrium toward an
inactive conformation inhibiting the basal activity. Antagonists prevent binding of
agonists or inverse agonists without affecting the dynamic conformational
equilibrium, which prevents agonist-dependent receptor activation. Neutral
antagonists do not affect the basal activity but compete with inverse agonists or
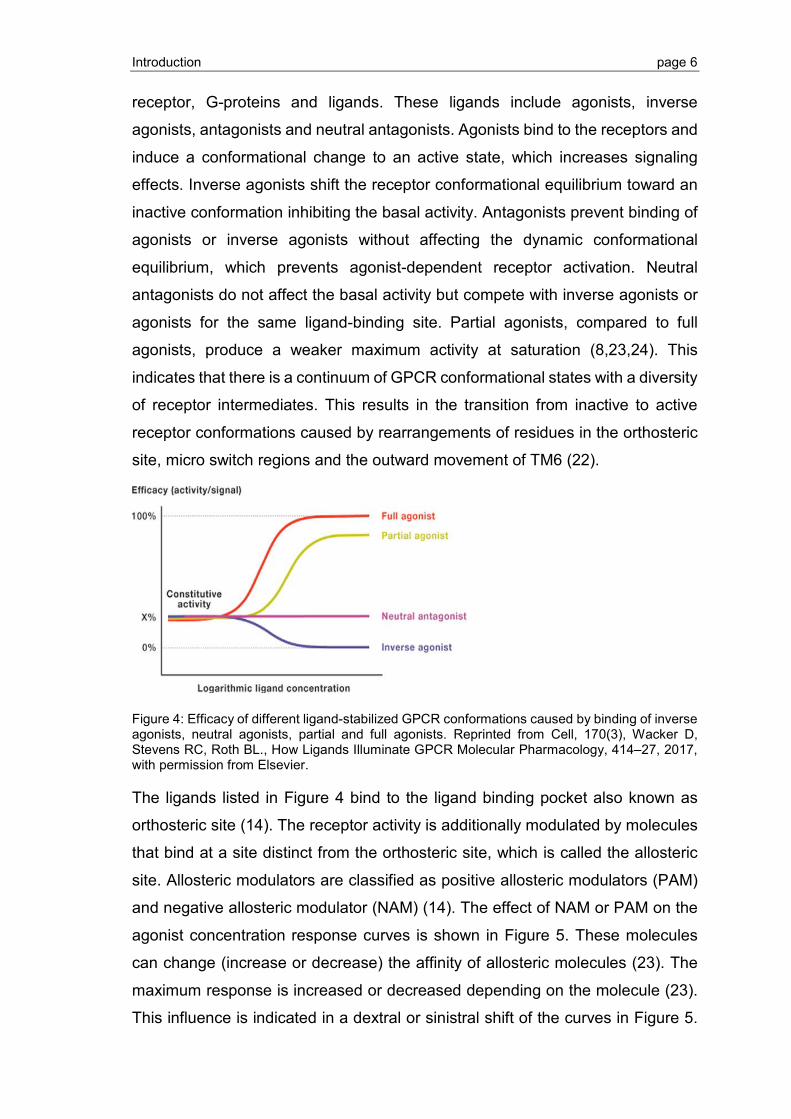
agonists for the same ligand-binding site. Partial agonists, compared to full
agonists, produce a weaker maximum activity at saturation (8,23,24). This
indicates that there is a continuum of GPCR conformational states with a diversity
of receptor intermediates. This results in the transition from inactive to active
receptor conformations caused by rearrangements of residues in the orthosteric
site, micro switch regions and the outward movement of TM6 (22).
Figure 4: Efficacy of different ligand-stabilized GPCR conformations caused by binding of inverse agonists, neutral agonists, partial and full agonists. Reprinted from Cell, 170(3), Wacker D, Stevens RC, Roth BL., How Ligands Illuminate GPCR Molecular Pharmacology, 414–27, 2017, with permission from Elsevier.
The ligands listed in Figure 4 bind to the ligand binding pocket also known as
orthosteric site (14). The receptor activity is additionally modulated by molecules
that bind at a site distinct from the orthosteric site, which is called the allosteric
site. Allosteric modulators are classified as positive allosteric modulators (PAM)
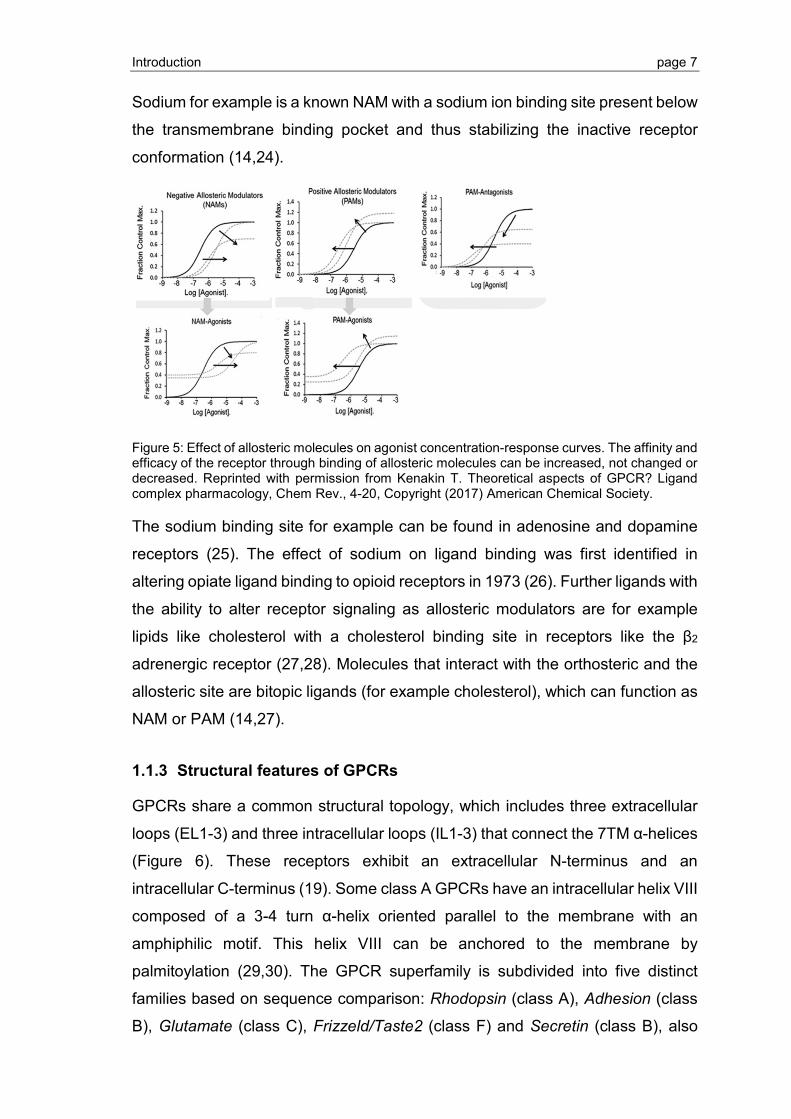
and negative allosteric modulator (NAM) (14). The effect of NAM or PAM on the
agonist concentration response curves is shown in Figure 5. These molecules
can change (increase or decrease) the affinity of allosteric molecules (23). The
maximum response is increased or decreased depending on the molecule (23).
This influence is indicated in a dextral or sinistral shift of the curves in Figure 5.
Introduction page 7
Sodium for example is a known NAM with a sodium ion binding site present below
the transmembrane binding pocket and thus stabilizing the inactive receptor
conformation (14,24).
Figure 5: Effect of allosteric molecules on agonist concentration-response curves. The affinity and efficacy of the receptor through binding of allosteric molecules can be increased, not changed or decreased. Reprinted with permission from Kenakin T. Theoretical aspects of GPCR? Ligand complex pharmacology, Chem Rev., 4-20, Copyright (2017) American Chemical Society.
The sodium binding site for example can be found in adenosine and dopamine
receptors (25). The effect of sodium on ligand binding was first identified in
altering opiate ligand binding to opioid receptors in 1973 (26). Further ligands with
the ability to alter receptor signaling as allosteric modulators are for example
lipids like cholesterol with a cholesterol binding site in receptors like the β2
adrenergic receptor (27,28). Molecules that interact with the orthosteric and the
allosteric site are bitopic ligands (for example cholesterol), which can function as
NAM or PAM (14,27).
1.1.3 Structural features of GPCRs
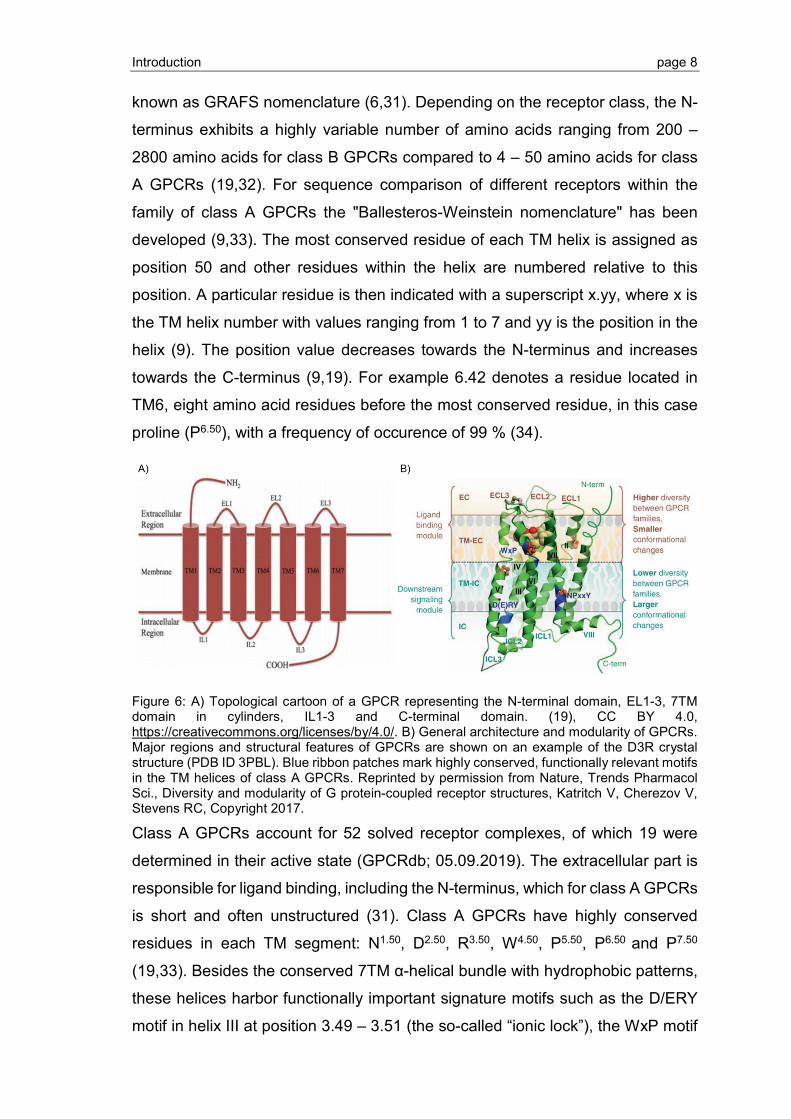
GPCRs share a common structural topology, which includes three extracellular
loops (EL1-3) and three intracellular loops (IL1-3) that connect the 7TM α-helices
(Figure 6). These receptors exhibit an extracellular N-terminus and an
intracellular C-terminus (19). Some class A GPCRs have an intracellular helix VIII
composed of a 3-4 turn α-helix oriented parallel to the membrane with an
amphiphilic motif. This helix VIII can be anchored to the membrane by
palmitoylation (29,30). The GPCR superfamily is subdivided into five distinct
families based on sequence comparison: Rhodopsin (class A), Adhesion (class
B), Glutamate (class C), Frizzeld/Taste2 (class F) and Secretin (class B), also
Introduction page 8
known as GRAFS nomenclature (6,31). Depending on the receptor class, the N-
terminus exhibits a highly variable number of amino acids ranging from 200 –
2800 amino acids for class B GPCRs compared to 4 – 50 amino acids for class
A GPCRs (19,32). For sequence comparison of different receptors within the
family of class A GPCRs the "Ballesteros-Weinstein nomenclature" has been
developed (9,33). The most conserved residue of each TM helix is assigned as
position 50 and other residues within the helix are numbered relative to this
position. A particular residue is then indicated with a superscript x.yy, where x is
the TM helix number with values ranging from 1 to 7 and yy is the position in the
helix (9). The position value decreases towards the N-terminus and increases
towards the C-terminus (9,19). For example 6.42 denotes a residue located in
TM6, eight amino acid residues before the most conserved residue, in this case
proline (P6.50), with a frequency of occurence of 99 % (34).
Figure 6: A) Topological cartoon of a GPCR representing the N-terminal domain, EL1-3, 7TM domain in cylinders, IL1-3 and C-terminal domain. (19), CC BY 4.0, https://creativecommons.org/licenses/by/4.0/. B) General architecture and modularity of GPCRs. Major regions and structural features of GPCRs are shown on an example of the D3R crystal structure (PDB ID 3PBL). Blue ribbon patches mark highly conserved, functionally relevant motifs in the TM helices of class A GPCRs. Reprinted by permission from Nature, Trends Pharmacol Sci., Diversity and modularity of G protein-coupled receptor structures, Katritch V, Cherezov V, Stevens RC, Copyright 2017.
Class A GPCRs account for 52 solved receptor complexes, of which 19 were
determined in their active state (GPCRdb; 05.09.2019). The extracellular part is
responsible for ligand binding, including the N-terminus, which for class A GPCRs
is short and often unstructured (31). Class A GPCRs have highly conserved
residues in each TM segment: N1.50, D2.50, R3.50, W4.50, P5.50, P6.50 and P7.50
(19,33). Besides the conserved 7TM α-helical bundle with hydrophobic patterns,
these helices harbor functionally important signature motifs such as the D/ERY
motif in helix III at position 3.49 – 3.51 (the so-called “ionic lock”), the WxP motif
Introduction page 9
in helix VI and the NPxxY motif in helix VII at position 7.49 – 7.53 (33,35). The
comparison of experimental GPCR structures reveals a greater structural
diversity in the extracellular than in the intracellular modules, which seems to
reflect the evolutionary pressure of recognizing hundreds of endogenous ligands
while transferring their signals to only dozens of interacting partners (3). The
orthosteric binding site recognizing ligand binding is generated by TM3, TM5 –
TM7 and extracellular loops (9), various stabilizing secondary structure elements,
disulfide bonds and interaction with the 7TM bundle (29). One common structural
feature of EL2 is a conserved disulfide bridge connecting the loop with the tip of
helix III forming a β-strand, serving as covalent linker between helix III and helix
V. It keeps the binding pocket open and readily accessible for ligands (29). Ligand
binding induces structural changes in the positions of TM5 – TM6 relative to TM3
with an outward movement of TM6 of ~14 Å leading to a collapse of the sodium
binding pocket formed by two conserved residues D2.50 and S3.39 (9,19,36). This
sodium binding pocket is further formed with three water molecules and is only
found in inactive class A GPCRs indicating that this pocket stabilizes the inactive
receptor conformation (19,37,38). The combination of the 3D structural
information with biochemical knowledge showed the influence of varying
chemical groups at specific positions towards the biological activity (39). For
structure-guided drug discovery and to gain insight into the mode of action at
molecular level, high-resolution structures of GPCRs in complex with various
ligands are necessary (40).
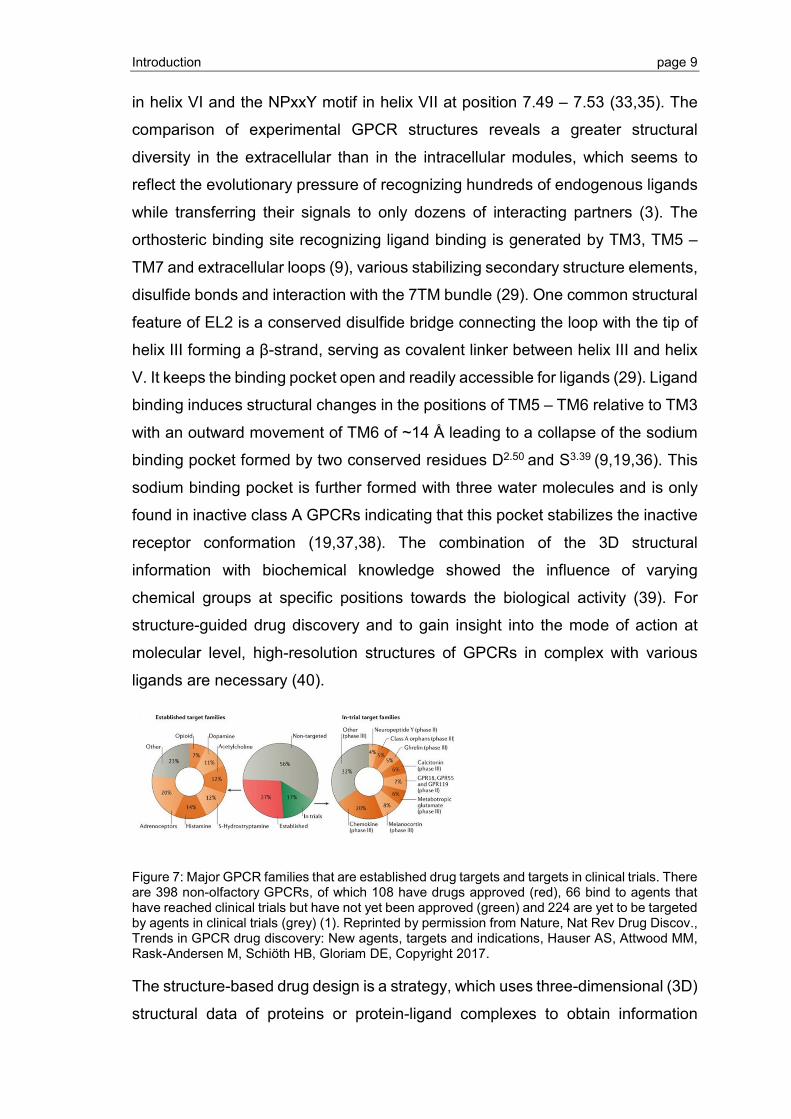
Figure 7: Major GPCR families that are established drug targets and targets in clinical trials. There are 398 non-olfactory GPCRs, of which 108 have drugs approved (red), 66 bind to agents that have reached clinical trials but have not yet been approved (green) and 224 are yet to be targeted by agents in clinical trials (grey) (1). Reprinted by permission from Nature, Nat Rev Drug Discov., Trends in GPCR drug discovery: New agents, targets and indications, Hauser AS, Attwood MM, Rask-Andersen M, Schiöth HB, Gloriam DE, Copyright 2017.
The structure-based drug design is a strategy, which uses three-dimensional (3D)
structural data of proteins or protein-ligand complexes to obtain information
Introduction page 10
regarding the mode of ligand binding. Success rates for drugs targeting GPCRs
are, with values of 78 %, 39 % and 29 % for phases I, II and III, slightly higher
than the FDA’s average of 70 %, 33 % and 25-30 % for all investigated agents,
which may reflect the high level of experience targeting GPCRs (1). A shift for
GPCR-targeted agents from areas such as hypertension, allergy, analgesics,
schizophrenia and depression into novel areas such as Alzheimer disease (AD),
obesity, multiple sclerosis (MS), cardiovascular defects, hypocalcaemia and
several cancers was observed within the last five years (1,39). GPCR targets for
central nervous system (CNS) diseases are the most abundant, accounting for
124 (26 %) of all approved drugs and with 79 agents in clinical trials. These
include in particular malfunction in GPCR-mediated neurotransmission leading to
multiple neurological and psychiatric disorders such as MS or AD (1). Another big
field of indication are GPCR-targeted agents in oncology. These include agents
for treatment of prostate cancer or basal cell carcinoma. The identification of
chemical modulators of structurally unknown and orphan GPCRs, which have
been identified in a large number over the past few years, will improve the
understanding and exploitation of the chemical space of ligands and molecular
features of specific GPCR binding sites (41,42). Orphan GPCRs are receptors
with unknown endogenous ligands. These orphan GPCRs represent a group of
potentially novel targets for the treatment of a diverse set of indications with
various physiological effects (1,43). The orphan receptors GPR7, GPR8 and
GPR18 for example are investigate in their role regarding the treatment of pain
(44). Two important GPCRs, which were investigated in this thesis, are the
sphingosine-1 phosphate receptor 1 (S1P1) and the orphan G protein-coupled
receptor 3.
1.2 Sphingosine-1 phosphate receptor, an example of a GPCR with known structure
Sphingolipids are important plasma-membrane lipids, where sphingosine-1
phosphate (S1P) is the endogenous ligand for the sphingosine-1-phosphate
receptor family comprising five GPCR members (S1P1-5) with high sequence
similarity within the ligand-binding region. This receptor family also binds a
second endogenous ligand, namely lysophosphatidic acid (LPA) (45,46). S1P
receptors show differential expression across a variety of tissues and cell types
Introduction page 11
regulating physiological processes including cell differentiation, vascular
stabilization, inflammation, CNS homeostasis, lymphocyte biology and
determination of T-cell phenotype (46,47). S1P1 couples to Gαi/o and induces
intracellular signaling such as inhibition of cAMP accumulation, intracellular Ca2+
increase, MAPK activation and small GTPase Rac activation (48). The natural
ligand S1P is a lysophospholipid derived from phosphorylation of sphingosine by
sphingosine kinase I and acts as an intracellular or extracellular mediator (49,50).
Intracellularly, S1P can bind to target proteins such as histone deacetylase ½
while extracellularly S1P binds to GPCRs. S1P plays roles in the pathogenesis
of various diseases including cancer, fibrosis and MS. Therefore the S1P1
receptor has become an attractive drug target due to the involvement in disease
development (46,50–52). The S1P1 expressed on lymphocytes guides these cells
in their migration from lymph nodes that contain low S1P levels to the blood,
where the S1P concentration is higher (50). Downregulation or desensitization of
S1P1 on lymphocytes enables the migration into tissues with low S1P
concentrations (49,50). Desensitization of S1P1 induces leukopenia resulting in a
huge interest from pharmaceutical industries with its therapeutic potential for the
treatment of autoimmune disease and other pathologies (50). The research for
the mechanism of S1P1 toward lymphocyte migration resulted in the discovery of
the nonselective S1P1-5 receptor modulator fingolimod (FTY720/Gilenya). This
ligand leads to a rapid and reversible lymphopenia, a property that is used as a
mechanistic basis to treat autoimmune conditions (46,49). Fingolimod sequesters
circulating lymphocytes, resulting in decreased peripheral blood lymphocyte
count and increased numbers of lymphocytes in the secondary lymphoid organs
(48). This effect can be explained by the induced downregulation of S1P1 on the
cell surface by sustained internalization and receptor degradation (48).
Fingolimod is an orally administered prodrug, approved in 2010 for the treatment
of relapsing remitting multiple sclerosis (RRMS), a chronic autoimmune and
neurodegenerative disease of the CNS associated with irreversible progression
of disabilities (46,53,54). For exhibiting its affinity, the prodrug is phosphorylated
by the sphingosine kinase 2 (46,50). Neurological consequences of MS are
reflected in physical and cognitive impairments such as fatigue, pain, depression
and bladder dysfunction (54). A key aspect of the MS pathology is believed in the
activation of autoimmune lymphocytes within the periphery, leading to cell
Introduction page 12
proliferation and maturation within lymphoid tissues (54). These cells egress into
the blood stream and are able to cross the blood-brain barrier. In the brain these
cells can affect the CNS by their auto aggressive nature producing inflammation,
demyelination, axonal damage and neurodegeneration (54). Tissue damages in
the early stage of the disease can be overcome to some extent by endogenous
CNS repair mechanisms. These mechanisms include remyelination, regeneration
and restoration of adequate nerve conduction (54). Untreated, this repair
mechanisms provide only partial recovery because CNS repair increasingly fails
due to recurring inflammatory attacks (54). Novel MS treatments include effects
on immune system with reduction of inflammation in CNS to promote
neuroprotection and repair for reaching a balance between CNS damage and
endogenous repair processes (54). Besides the involvement of S1P1 towards MS,
the expression of the orphan GPR3 was shown to be significantly reduced in
patients with poor disease progression. Therefore the GPR3 revealed to have a
high prognostic value for MS long-term progression as a good candidate
biomarker (55,56). The S1P1 belongs to the lipid GPCRs and was chosen as a
positive control based on its published X-ray structure in 2012. The receptor in
complex with the selective antagonist (R)-3-amino-(3-hexylphenylamino)-4-
oxobutylphosphonic acid (W146 hydrate; (ML056)) served as positive control for
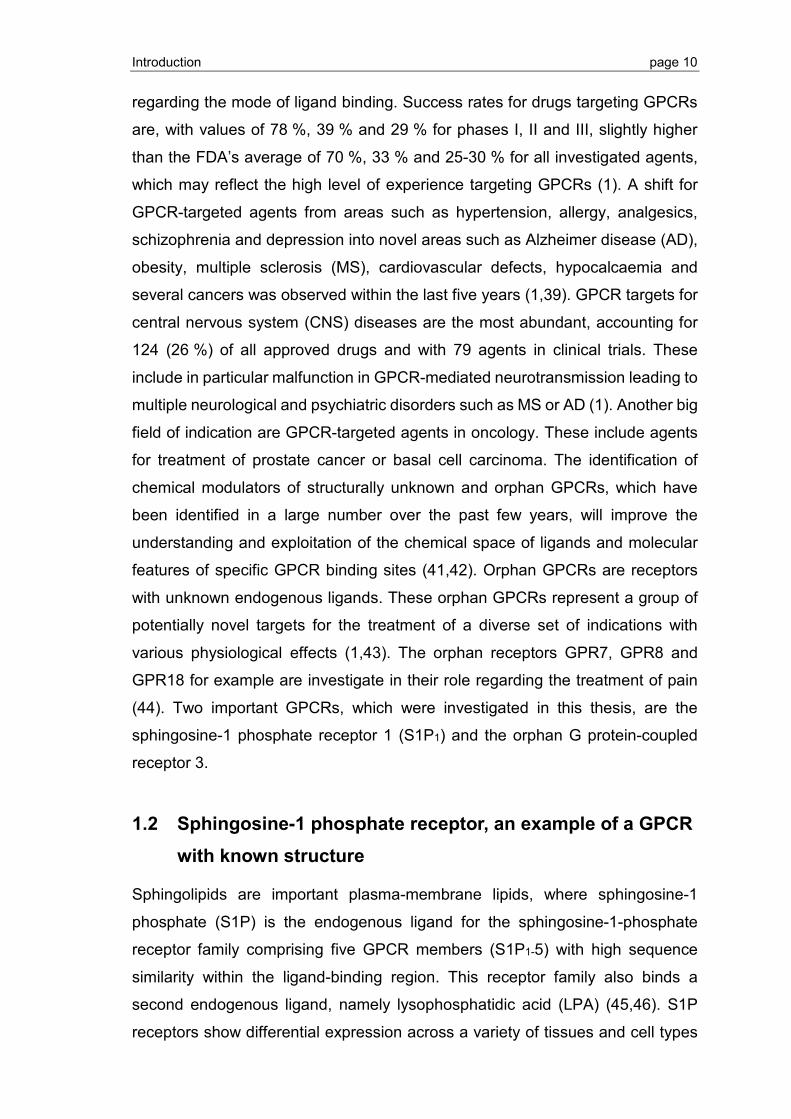
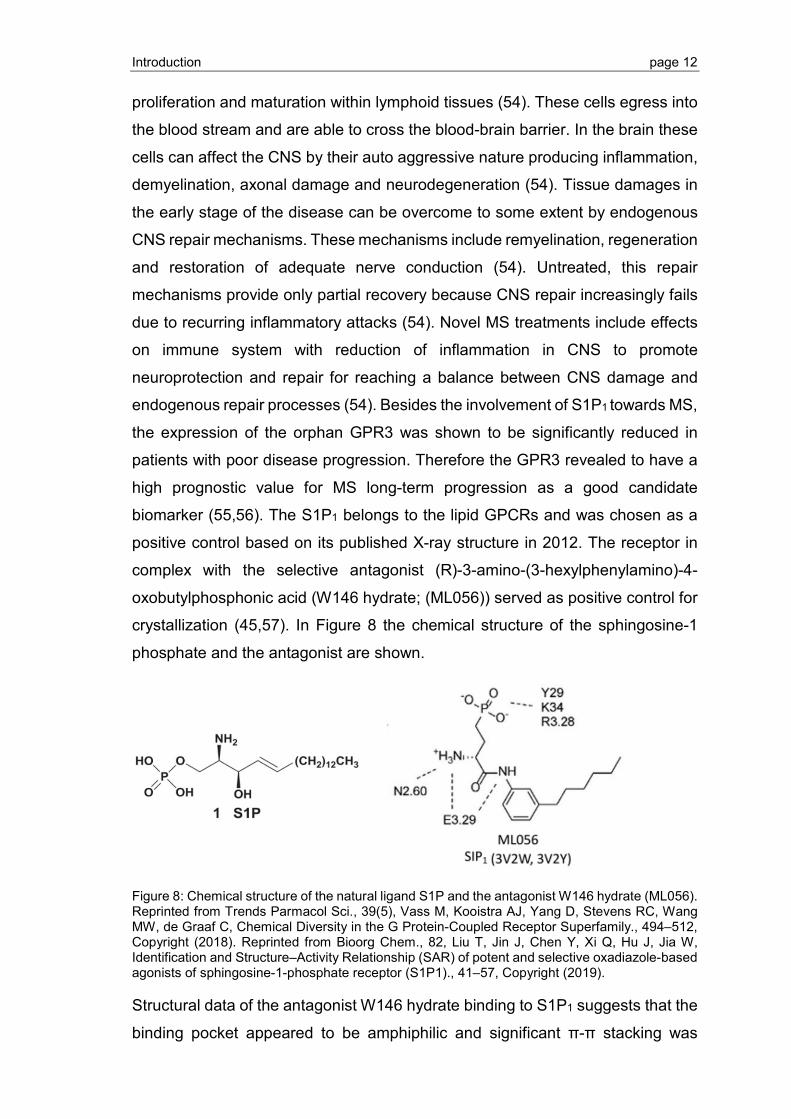
crystallization (45,57). In Figure 8 the chemical structure of the sphingosine-1
phosphate and the antagonist are shown.
Figure 8: Chemical structure of the natural ligand S1P and the antagonist W146 hydrate (ML056). Reprinted from Trends Parmacol Sci., 39(5), Vass M, Kooistra AJ, Yang D, Stevens RC, Wang MW, de Graaf C, Chemical Diversity in the G Protein-Coupled Receptor Superfamily., 494–512, Copyright (2018). Reprinted from Bioorg Chem., 82, Liu T, Jin J, Chen Y, Xi Q, Hu J, Jia W, Identification and Structure–Activity Relationship (SAR) of potent and selective oxadiazole-based agonists of sphingosine-1-phosphate receptor (S1P1)., 41–57, Copyright (2019).
Structural data of the antagonist W146 hydrate binding to S1P1 suggests that the
binding pocket appeared to be amphiphilic and significant π-π stacking was
Introduction page 13
observed between phenylalanine 125 and the aromatic heterocyclic region (45).
The phosphonate head group of the antagonist is surrounded by a ring of
positively charged and polar residues contributed by helices III, VII, EL2 and the
N-terminal capping helix (45). The phenyl acyl tail of the antagonist inserts into a
large aromatic pocket consisting of residues from helices III, V, VI, VII and EL2
(45). Four aromatic residues providing the potential for specific interactions and
further short aliphatic residues forming the binding pocket, resulting in selective
hydrophobic interactions within the pocket with a preferred low-energy minimum
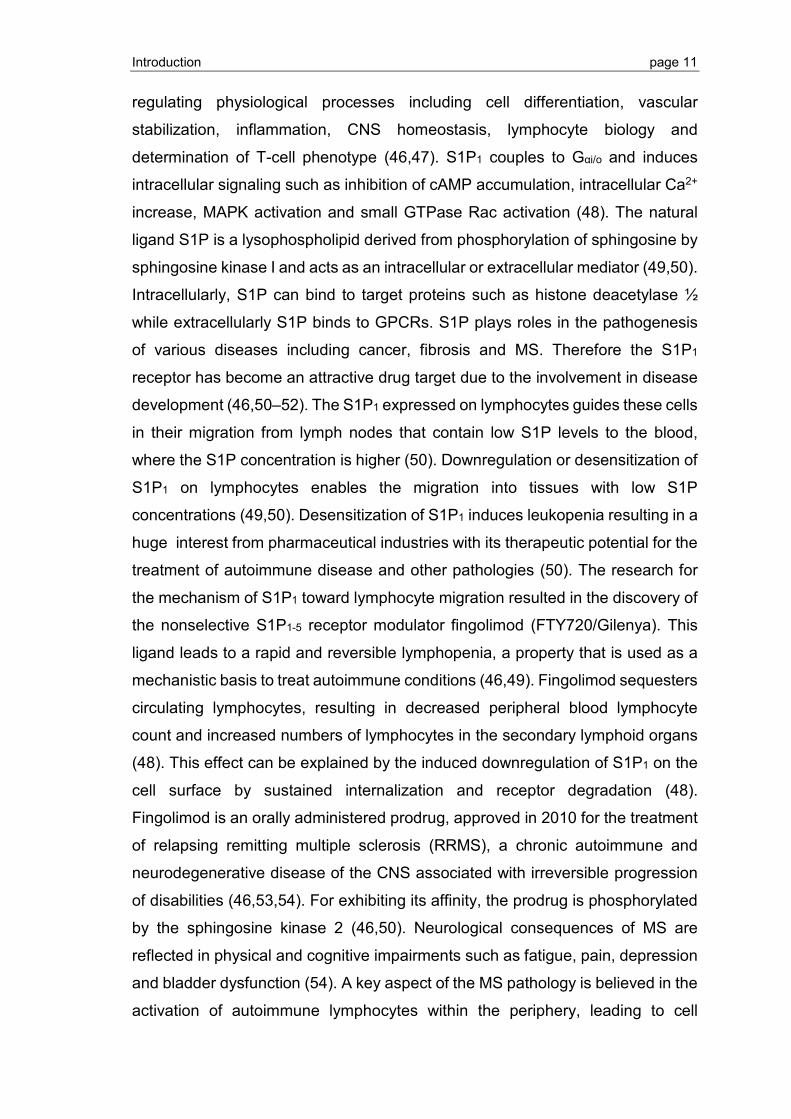
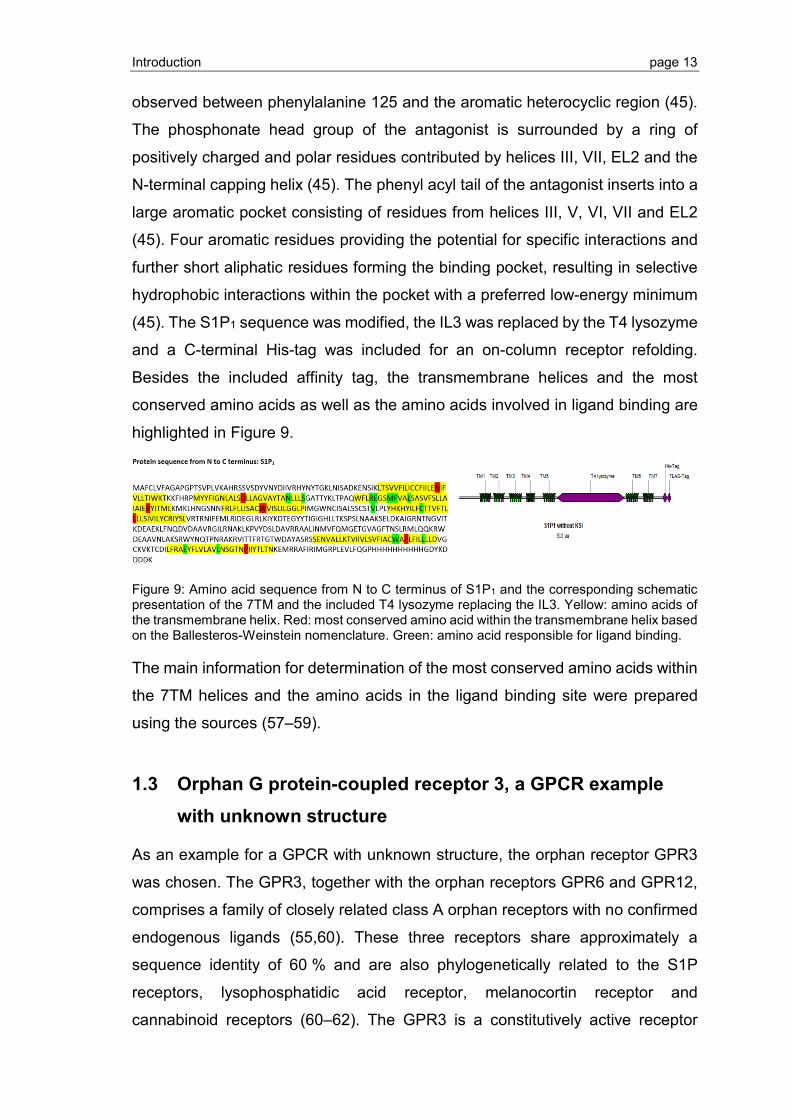
(45). The S1P1 sequence was modified, the IL3 was replaced by the T4 lysozyme
and a C-terminal His-tag was included for an on-column receptor refolding.
Besides the included affinity tag, the transmembrane helices and the most
conserved amino acids as well as the amino acids involved in ligand binding are
highlighted in Figure 9.
Figure 9: Amino acid sequence from N to C terminus of S1P1 and the corresponding schematic presentation of the 7TM and the included T4 lysozyme replacing the IL3. Yellow: amino acids of the transmembrane helix. Red: most conserved amino acid within the transmembrane helix based on the Ballesteros-Weinstein nomenclature. Green: amino acid responsible for ligand binding.
The main information for determination of the most conserved amino acids within
the 7TM helices and the amino acids in the ligand binding site were prepared
using the sources (57–59).
1.3 Orphan G protein-coupled receptor 3, a GPCR example with unknown structure
As an example for a GPCR with unknown structure, the orphan receptor GPR3
was chosen. The GPR3, together with the orphan receptors GPR6 and GPR12,
comprises a family of closely related class A orphan receptors with no confirmed
endogenous ligands (55,60). These three receptors share approximately a
sequence identity of 60 % and are also phylogenetically related to the S1P
receptors, lysophosphatidic acid receptor, melanocortin receptor and
cannabinoid receptors (60–62). The GPR3 is a constitutively active receptor

Introduction page 14
signaling through Gαs protein coupling by acting through elevated cAMP levels
(44,60,63). Besides G protein coupling, the GPR3 is also signaling through non-
G protein-mediated mechanisms like β-arrestin2 interaction (64). GPR3 is highly
expressed in the CNS in hippocampus, amygdala, hypothalamus, cerebral cortex
and cerebellum (55,60). To a lesser extent, the GPR3 is also found in peripheral
tissues such as eye, lung, kidney, liver, ovary and testes (55,60). In oocytes,
GPR3 can activate Gαs and the resulting continuous cAMP signaling is
responsible for the meiotic arrest of oocytes (63). Some studies offered that the
bioactive lipids such as lysophosholipid S1P are endogenous ligands of GPR3,
which could not be confirmed by other independent research groups (44,55,65).
GPR3 is highly expressed in the CNS, (66) showed that GPR3 is involved in
reaction to stress, aggressive behaviors, increased anxiety-like and despair-like
behaviors (44). Studies suggest that GPR3 is involved in morphine-induced
antinociception, which implies that this receptor plays a role in pain modulation
and may also be a target for neuropathic pain therapy (44,55). A high-throughput
functional genomic screen identified a link between the constitutively active
orphan GPR3 as a modulator of amyloid-β (Aβ) production in Alzheimer’s
Disease (AD) (55,67). AD is a progressive chronic brain disorder resulting in a
neurodegenerative disease, initially characterized by short-term memory loss and
progressive impairment of most cognitive functions (55). AD is therefore the most
common type of dementia (68). There are two distinct hallmarks for AD, which
are the amyloid plaque formation and neurofibrillary tangles consisting of the
hyper phosphorylated microtubule-associated protein tau (60,69). Amyloid
plaques are produced from accumulation of Aβ proteins, which are generated
after sequential cleavage of the β-amyloid precursor protein (APP) by the β- and
γ-secretases (60,67). The major species of amyloid protein synthesized from this
cleavage are the Aβ40 and Aβ42, with Aβ42 being the more fibrogenic species
(60). According to their role in Aβ generation the β- and γ-secretases are
regarded as the two major targets in AD drug discovery (68). It was shown that
GPR3 increases the γ-secretase activity in vitro by co-transducing hippocampal
neuronal cells with a substrate for γ-secretase that produces Aβ in the absence
of an effect on Notch receptor proteolysis (60,68). The overexpression of GPR3
in an AD cell culture and mouse model resulted in increased Aβ secretion. While
the ablation of GPR3 using siRNA decreased the amount of Aβ produced,
Introduction page 15
demonstrating that endogenous GPR3 is involved in amyloid-β formation
(60,67,69). It was further shown that GPR3 is highly expressed in the normal
human brain, specifically in areas implicated in AD, which can become
overexpressed in a subset of patients with sporadic AD (60,69). GPR3 modulates
the trafficking and localization of the γ-secretase complex to membrane domains,
where it can more efficiently process the β-secretase product C99 (69). In
addition, the downregulation of β-arrestin2 and the non-G protein mediated
mechanism by GPR3, led to a reduction in accumulation of the APP C-terminal
fragments Aβ40 and Aβ42 (60,68). This outcome is similar to the result produced
by an inhibitor of γ-secretase (60). The involvement of GPR3 in the amyloid
cascade made this receptor an interesting pharmacological AD target for drug
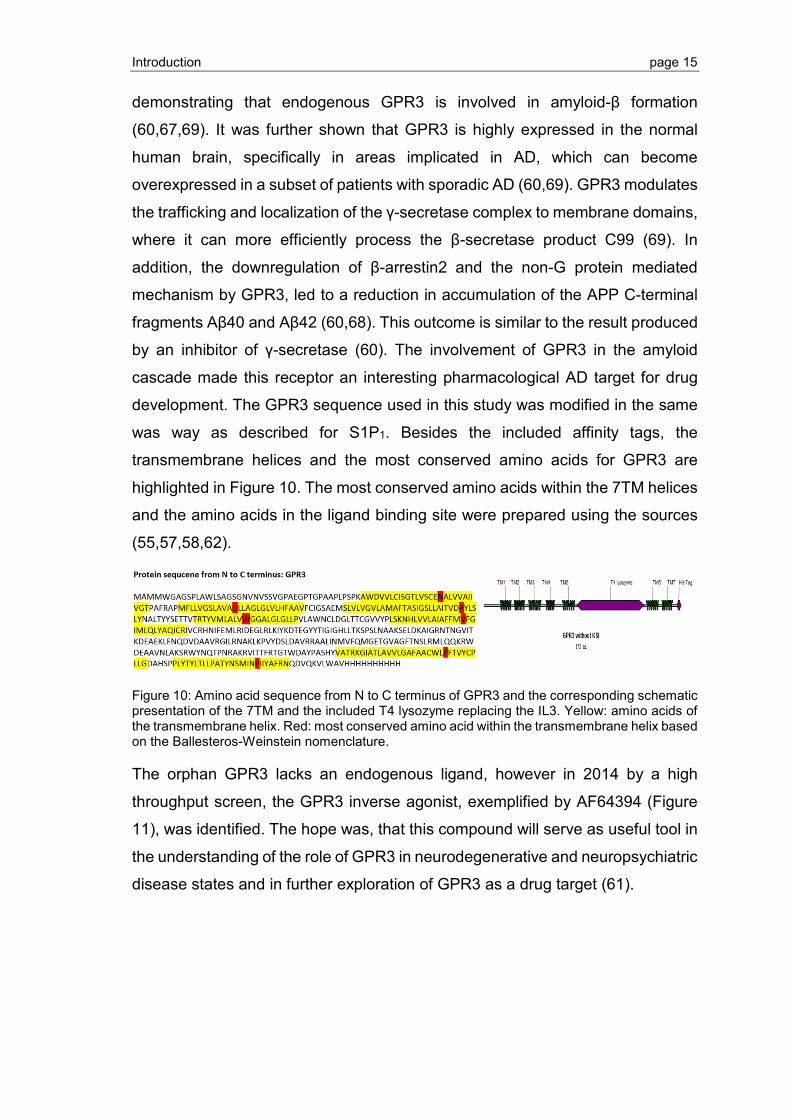
development. The GPR3 sequence used in this study was modified in the same
was way as described for S1P1. Besides the included affinity tags, the
transmembrane helices and the most conserved amino acids for GPR3 are
highlighted in Figure 10. The most conserved amino acids within the 7TM helices
and the amino acids in the ligand binding site were prepared using the sources
(55,57,58,62).
Figure 10: Amino acid sequence from N to C terminus of GPR3 and the corresponding schematic presentation of the 7TM and the included T4 lysozyme replacing the IL3. Yellow: amino acids of the transmembrane helix. Red: most conserved amino acid within the transmembrane helix based on the Ballesteros-Weinstein nomenclature.
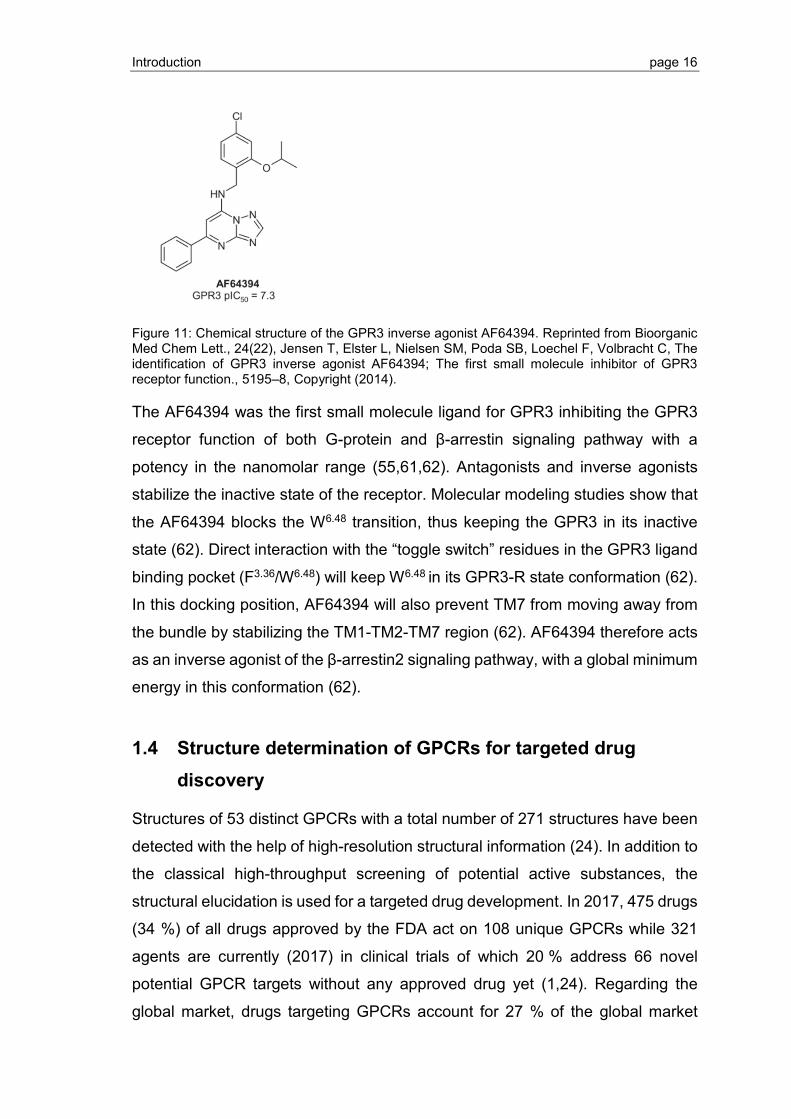
The orphan GPR3 lacks an endogenous ligand, however in 2014 by a high
throughput screen, the GPR3 inverse agonist, exemplified by AF64394 (Figure
11), was identified. The hope was, that this compound will serve as useful tool in
the understanding of the role of GPR3 in neurodegenerative and neuropsychiatric
disease states and in further exploration of GPR3 as a drug target (61).
Introduction page 16
Figure 11: Chemical structure of the GPR3 inverse agonist AF64394. Reprinted from Bioorganic Med Chem Lett., 24(22), Jensen T, Elster L, Nielsen SM, Poda SB, Loechel F, Volbracht C, The identification of GPR3 inverse agonist AF64394; The first small molecule inhibitor of GPR3 receptor function., 5195–8, Copyright (2014).
The AF64394 was the first small molecule ligand for GPR3 inhibiting the GPR3
receptor function of both G-protein and β-arrestin signaling pathway with a
potency in the nanomolar range (55,61,62). Antagonists and inverse agonists
stabilize the inactive state of the receptor. Molecular modeling studies show that
the AF64394 blocks the W6.48 transition, thus keeping the GPR3 in its inactive
state (62). Direct interaction with the “toggle switch” residues in the GPR3 ligand
binding pocket (F3.36/W6.48) will keep W6.48 in its GPR3-R state conformation (62).
In this docking position, AF64394 will also prevent TM7 from moving away from
the bundle by stabilizing the TM1-TM2-TM7 region (62). AF64394 therefore acts
as an inverse agonist of the β-arrestin2 signaling pathway, with a global minimum
energy in this conformation (62).
1.4 Structure determination of GPCRs for targeted drug discovery
Structures of 53 distinct GPCRs with a total number of 271 structures have been
detected with the help of high-resolution structural information (24). In addition to
the classical high-throughput screening of potential active substances, the
structural elucidation is used for a targeted drug development. In 2017, 475 drugs
(34 %) of all drugs approved by the FDA act on 108 unique GPCRs while 321
agents are currently (2017) in clinical trials of which 20 % address 66 novel
potential GPCR targets without any approved drug yet (1,24). Regarding the
global market, drugs targeting GPCRs account for 27 % of the global market
Introduction page 17
sales (1). Nevertheless, around 87 % of all GPCRs lack structural information and
52 % of GPCR miss structural templates from the same receptor family, which
would enable a reliable homology modelling (24). Another limitation is the poor
representation of active (18) and intermediate (12) receptor states (24), which
show higher conformational dynamics and are therefore difficult to crystallize.
Research on structure determination aims to reduce the limitation of GPCR
structure information. The principal methods for structure determination are X-ray
crystallography and cryo-electron microscopy (cryo-EM). X-ray crystallography
uses protein crystals and is the preferred technique to analyze protein structural
details (70) as well as detailed information regarding ligand binding (71). Major
challenges herein are the expression, purification and crystallization of proteins,
where crystals are required to be well-ordered to obtain sufficient diffraction. X-
ray crystallography does not allow examination of the protein in solution or
domain movements. Besides finding crystallization conditions, appropriate
freezing conditions and radiation damage are further challenges to overcome for
structure determination by this method (70,72). Nevertheless, several strategies
and tools for structural analysis have been developed for GPCRs. These efforts
have accelerated determination of GPCR crystal structures in recent years.
Structure determination is also achieved to a lesser extend with cryo-EM, a
rapidly advancing field. Cryo-EM of non-crystalline single particles is a
biophysical technique, which can be used for the structure determination of
biological macromolecules and assemblies (72). Technical and computational
advancements increased the signal to noise ratio and allowed near-atomic-detail
structures of membrane proteins. The lower size limit was pushed to 64 kDa
making the cryo-EM suitable for the structure determination of 7TM α-helical
GPCR monomers for which 8 structures have already been determined (24,73).
The advantage of this technique is a minimal engineering of GPCRs owing to
lower requirements for conformational homogeneity and stability. The
macromolecules are embedded in a close-to-native environment, where
individual conformational states can be distinguished (72). Drawbacks of the
cryo-EM in comparison to the X-ray structure determination are longer data
acquisition time and lower resolution, which lacks the possibility for a detailed
view into the chemical environment of the ligand bound receptor (72).
Nevertheless, this technique is becoming an important tool for drug discovery to
Introduction page 18
complement other structural biology methods. Cryo-EM could enable structural
determination for intractable targets, which are not accessible to X-ray
crystallography because of missing crystal formation (24,72). To get insights into
the dynamic conformational landscape of receptors and their binding interface
with G proteins, the structural information is mainly combined with
complementary information determined by nuclear magnetic resonance (NMR)
spectroscopy (24). One big advantage of NMR for structure determination at
atomic resolution is the use of protein in solution (74). By use of the NMR
spectroscopy the motion of segments and domains is observable. NMR
spectroscopy enables the detection of atomic distances, orientations, bond
angles and chemical shifts as input for structure determination (74).
Disadvantages of the NMR spectroscopy in comparison to the X-ray
crystallography are the lower resolving power and the limitation with higher
molecular masses of the protein of interest (75).
1.4.1 Structure-based drug discovery
Since the first structures of rhodopsin in 2000, which was purified from bovine rod
outer segment membranes and the β2 adrenergic receptor in 2007, the number
of GPCR structures increased almost exponentially (19,76–79). The delay of 7
years between 2000 and 2007 was due to a need for numerous technological
advances required to express, purify and crystallize these lipid-soluble targets
(Figure 12) (19). High-resolution structural information of GPCRs are necessary
for the targeted drug development and providing templates for structure-based
drug design.
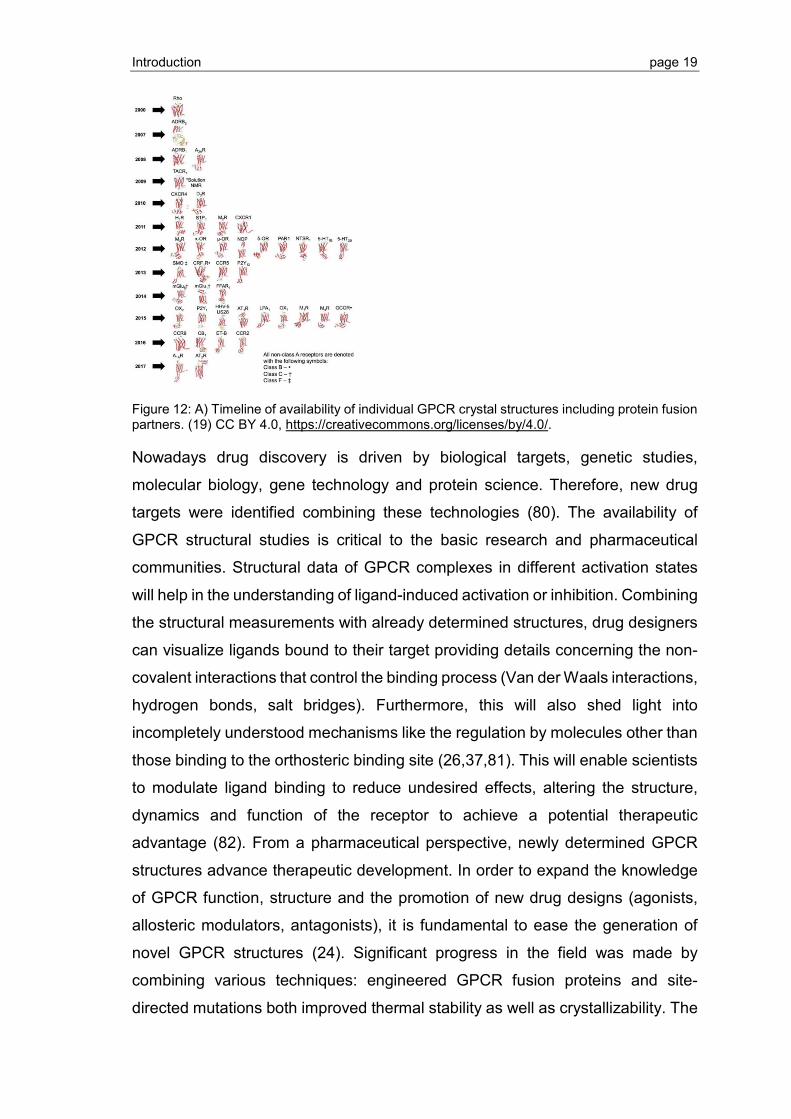
Introduction page 19
Figure 12: A) Timeline of availability of individual GPCR crystal structures including protein fusion partners. (19) CC BY 4.0, https://creativecommons.org/licenses/by/4.0/.
Nowadays drug discovery is driven by biological targets, genetic studies,
molecular biology, gene technology and protein science. Therefore, new drug
targets were identified combining these technologies (80). The availability of
GPCR structural studies is critical to the basic research and pharmaceutical
communities. Structural data of GPCR complexes in different activation states
will help in the understanding of ligand-induced activation or inhibition. Combining
the structural measurements with already determined structures, drug designers
can visualize ligands bound to their target providing details concerning the non-
covalent interactions that control the binding process (Van der Waals interactions,
hydrogen bonds, salt bridges). Furthermore, this will also shed light into
incompletely understood mechanisms like the regulation by molecules other than
those binding to the orthosteric binding site (26,37,81). This will enable scientists
to modulate ligand binding to reduce undesired effects, altering the structure,
dynamics and function of the receptor to achieve a potential therapeutic
advantage (82). From a pharmaceutical perspective, newly determined GPCR
structures advance therapeutic development. In order to expand the knowledge
of GPCR function, structure and the promotion of new drug designs (agonists,
allosteric modulators, antagonists), it is fundamental to ease the generation of
novel GPCR structures (24). Significant progress in the field was made by
combining various techniques: engineered GPCR fusion proteins and site-
directed mutations both improved thermal stability as well as crystallizability. The
Introduction page 20
driving force behind GPCR drug discovery are new techniques to aid GPCR
expression, purification and crystallization (76).
1.4.2 GPCR expression strategies
Still today, GPCR structure determination is far from being a routine procedure.
Crystallization for structure determination of GPCRs requires enough pure and
stable protein. Protein expression levels vary between different cell lines and
expression hosts, so it is very important to screen for the optimal cell line and
expression conditions before setting up large-scale productions (83).
1.4.2.1 Protein expression in yeasts, insect and mammalian cells
For crystallographic studies transient expression using baculovirus and insect
cells are the most common expression system yielding in milligram amounts of
GPCRs per liter cell culture (83). The main part of these cells used for GPCR
expression are Spodoptera frugiperda Sf9 and to a lesser extend the Sf21 cells
(83). Sf9 cells for example were used to express human sphingosine-1-
phosphate receptor 1 (S1P1), the chemokine receptor CXCR4, the β2-
adrenoceptor and many more (59,78,84). The expression of GPCR in insect cells
is based on infection with lytic baculovirus, a modified Autographa californica
multiple nuclear polyhedrosis virus (83). The virus was genetically modified so
that the polyhedrin gene can be replaced with the gene of interest, which is under
the control of a strong polyhedrin promoter. This gene is expressed in very late
stage of infection resulting in a high level expression of the target gene (83).
Insect cells are then transfected with the recombinant bacmid to produce a virus
with the gene of interest (83). The virus is amplified usually in two successive
rounds of infection and finally used for protein expression (83). For efficient
protein expression multiplicities of infection in a range of 5-10 viral particles per
insect cell are necessary (83). Beside expensive complex growth media, the
expression of GPCR in insect cells is a time-consuming procedure of several
months for large-scale experiments. Insect cells have different membrane
compositions compared to mammalian cells, for example these cells are low in
cholesterol and high in phosphatidylinositol membrane contents (83). Many
posttranslational modifications in insect cells are similar to those in mammalian
cells. Nevertheless, differences are known in some glycosylation patterns, for
Introduction page 21
example N-glycosylation of short pauci-mannose glycoforms, which may result in
an immature protein (83,85). GPCRs are heavily posttranslationally modified
(palmitoylation, phosphorylation) and mammalian cells have all necessary
cellular and enzymatic machinery for correct post-translational processing,
folding and insertion into the membrane (83). With regard to structure
determination, posttranslational modifications can interfere with crystallization
due to its heterogeneity and flexibility. Posttranslational modifications can be
removed by point mutations or truncations if these are not needed for protein
folding. GPCRs for example expressed in insect cells are mostly deglycosylated
by peptide-N-glucosidase F (PNGase F), an amidase that cleaves between an
asparagine side chain and N-acetylglucosamine (83). In some instances, the
deglycosylation might be disadvantage because high-quality crystals were
obtained with the glycosylated GPCR for example the S1P1 (45). Attempts at
overexpression of GPCRs in mammalian cells sometimes results in low
expression or mixtures of functionally folded and unfolded protein. In this case,
the unfolded protein form is not suitable for structural studies (83). The first crystal
structure of a GPCR (bovine rhodopsin with engineered disulfide bond) produced
by heterologous expression was expressed in the mammalian COS-1 cell line
(83,86). Protein expression in mammalian cells is performed either as transient
or stable expression (83). Transient transfection is done with non-replicative
viruses for example the Semliki Forest Virus carrying a GPCR gene. Another
method uses cationic compounds, which form a complex with plasmid DNA
enabling the insertion into the cell (83). The incorporation of these cassettes can
be random or specific using a recombinase (83). Stable transfected cells, which
were co-transfected with a marker gene like GFP, can be enriched by
fluorescence activated cell sorting and screened for the highest expression levels
(83,87). Compared to stable transfection, in transient transfection the gene of
interest does not integrate into the genome and this method is difficult to scale-
up (83). Inducible promoters allow the expression at time points, when the cells
have reached a defined density compared to constitutive promoters expressing
the gene of interest continuously, which may be toxic to the cells (83,85). In order
to achieve overexpression without heterogeneity and incomplete glycosylation,
the HEK293S(TetR) GnTI- cells were developed by Reeves P. (88) with a
tetracyclin-inducible expression system under control of a cytomegalovirus

Introduction page 22
promoter (88). These cells lack N-acetylglucosaminyltransferase I so the N-linked
glycosylation is restricted to Man5GlcNAc2 N-glycans, this resulted in a protein
concentration of 0.5 mg protein per liter growth medium (83). Mammalian cell
lines will gain more prominence in future structural studies of GPCRs due to the
possibility of human-like post translational modifications, the receptor refolding
into the cell membrane and the increase in expression level. A further host for
GPCR expression are yeast strains which have fast growth rates to high cell
densities, low cost of media and can be easily genetically modified (85).
Furthermore yeasts can perform most of the posttranslational modifications while
glycosylation patterns and membrane compositions (higher ergosterol and lower
cholesterol contents) are different from that in mammalian (83). Widely used
yeast strains for the production of GPCRs are Saccharomyces cerevisiae and
Pichia pastoris (83,85,89). P. pastoris for example has been used for the
expression and crystallographic studies of histamine H1 receptor fused with T4
lysozyme and human A2A receptor while S. cerevisiae is more suitable for cloning
of protein constructs due to a quick assemble of PCR fragments by yeast
homologous recombination (83,90,91). Furthermore, protease-deficient P.
pastoris SMD1163 strain were used in optimized expression protocols. By
addition of “chemical chaperones” such as dimethylsulfoxide (DMSO), glycerol or
histidine the folding of these GPCRs was optimized (83,85). Expression systems
are optimized to yield large quantities of recombinant GPCRs for structural
studies. To get there, expression systems requiring minimal human interference
and short cultivation times would be of advantage.
1.4.2.2 Protein expression in Escherichia coli
E. coli has proven to be the single-most successful recombinant expression
system for the determination of protein structures deposited in the Protein Data
Bank (PDB) (92). E. coli as expression system is advantageous due to short
doubling times, high cell densities, inexpensive media, easy scale-up and the
ease of genetic manipulation by transformation (83,85). E. coli lacks major
posttranslational modifications like glycosylation, palmitoylation or
phosphorylation. The lipid composition of the inner bacterial membrane differs
significantly from that of eukaryotic cells and conditions for correct formation of
disulfide bonds within the periplasm are suboptimal (83). Functional expression

Introduction page 23
of GPCRs was established into the inner membrane of E.coli by fusion of an N-
terminal fusion partner such as maltose binding protein (MBP) (93). Higher
expression level in the inner membrane were achieved with N-terminal MBP and
C-terminal thioredoxin TrxA (94). Crystallographic studies of three
thermostabilized variants of the rat neurotensin NTS1 receptor were published
after expression into E. coli inner membrane (95). GPCRs can also be expressed
as inclusion bodies (IB) if membrane insertion is impaired or higher protein
concentrations show cellular toxicity. Expression levels can be increased by
fusion to different partners. The fusion to the ketosteroid isomerase for example
can also lead to protein expression into E. coli IB due to its hydrophobicity (96).
An advantage of protein expression into E. coli IB is the protection from
proteolytic digestion. E. coli IB contain the recombinant protein in misfolded state
and as non-native aggregates. IBs and therefore the protein of interest can be
isolated to achieve high level of purity (83). Expression of GPCRs as E. coli IB
and subsequent purification and refolding can be used for structural studies. The
crystal structure of one in E. coli expressed GPCR (95) and one solid state NMR
structure of a refolded GPCR derived from E. coli IB is deposited in the PDB (97).
In this work, we used the vector system (pET series, Novagen) to transform E.
coli with the gene for GPCR expression. The pET vectors possess the pMB1
(ColE1-derivative) as origin of replication with 15-20 copies per cell (98), a C-
terminal His10 tag, an ampicillin resistence gene (AmpR), the lac repressor, the
T7 promotor and terminator (98). In combination with the phage T7 RNA
polymerase, lac promoter and lac operator encoded in the E. coli genome
(prophage λDE3), enabling the GPCR expression through induction with
isopropyl-β-D-thiogalactopyranosid (IPTG). T7 lysozyme can be co-expressed by
a compatible plasmid pLysS to further inhibit small amounts of T7 RNA
polymerase available through leaky expression of its gene (98). For first
expression screens in E. coli, BL21 (DE3) and derivatives of the K-12 lineage are
a good choice. E. coli Tuner (DE3) is a BL21 derivative, which possess a lac
permease (lacY1 (DE3)) mutation allowing a uniform entry of IPTG into LacY-
cells. This mechanism produces a concentration dependent, homogenous level
of induction (98,99). BL21 derivatives lack genes encoding for the Lon protease
and the outer membrane protease OmpT, both responsible for degradation of
foreign proteins within the cell or after cell lysis (98). Furthermore, this strain was
Introduction page 24
modified by exchanging the wild-type operator by the derivative lacOc converting
the lac operon into a constitutive one (98). The gal+ modification permits the full
utilization of lactose as energy source and the hsdSB mutation prevents the loss
of plasmids through inhibition of DNA methylation and degradation (98,100). DE3
indicates that the host is a lysogen of λDE3 carrying a chromosomal copy of the
T7 RNA polymerase gene under control of the lacUV5 promoter. Another BL21
derivative is the E. coli BLR (DE3), a recombinase A (recA-) deficient strain. For
many recombinant proteins, the formation of correct disulfide bonds is vital for
attaining their biologically active three-dimensional conformation (98). Disulfide
bond formation in E. coli can be achieved for example in the SHuffle® T7 Express
strains (BL21 (DE3) background, NEB) and the SHuffle® T7 (K-12 background,
NEB) strain. Both expression strains have trxB- and gor- mutations, they lack the
expression of thioredoxin-thioredoxin reductase (trxB) and the glutaredoxin-
glutaredoxin reductase (gor), which generates a reducing environment with a
huge impact on disulfide bond formation (98,101,102). Besides these mutations,
these expression strains can co-express a chromosomal copy of the disulfide
bond isomerase DsbC. This isomerase promotes the correction of mis-oxidized
proteins into their correct form (98,103). Regarding the recombinant expression,
E. coli has always been the preferred microbial cell factory as suitable host for
the expression of stably folded, globular proteins from prokaryotes and
eukaryotes.
1.4.3 Strategies for isolation, refolding and purification of GPCRs
GPCRs expressed in mammalian, insect or yeast cells are incorporated into the
host membrane. To perform biophysical studies, structural and functional
analysis, GPCRs are extracted from membrane lipid bilayer environment. These
receptors are purified to homogeneity while maintaining the folded and
functionally active state (83,85). The combination of hypotonic buffer and
repeated freeze-thaw-cycles is sufficient to break mammalian and insect cells for
the isolation of GPCRs. The isolation of GPCRs incorporated into bacterial
membranes needs harsher conditions due to the presence of a cell wall. Harsher
conditions include for example freeze-thaw-cycles in a hypotonic buffer with a
combination of shear stress like shaking with beads or sonication (83,91,95).
Detergents are needed for a successful isolation and solubilization of GPCRs,
Introduction page 25
either from eukaryotic or prokaryotic expression systems. Protease inhibitors are
also included into the isolation process to prevent proteolytic digestion of GPCRs
outside their native membrane environment by proteases (83).
1.4.3.1 GPCR expression in E. coli IB
To streamline production of GPCRs, we explored a generic method based on IB
production in E. coli, purification by IMAC, refolding as part of the IMAC step and
a final polishing by SEC. Ideally, proteins are expressed in E. coli in the native
and active state at high levels and are then purified by affinity chromatography
with the aid of engineered tags at the N- or C-terminus (104) such as an N-
terminal deca histidine-tag (His-tag). This tag is used for the isolation and
purification of GPCRs by immobilized metal affinity chromatography (IMAC). Ni2+
nitrilotriacetic acid (NTA) and Co2+ carboxyl-methylaspartate (CMA) both tolerate
the detergent concentrations used for solubilization. The His-tag is used for a first
purification step using Ni2+ or Co2+ IMAC (83,105). A robust purification protocol
is needed to eliminate impurities, allowing at the same time to exchange for
detergents or adjusting their concentration (106). As an alternative to IMAC, the
N-terminus can also be modified with a FLAG-tag (DYKDDDDK) instead of a His-
tag (83). Having two affinity tags (His-tag and FLAG-tag) at either end of the
GPCR molecule is an advantage. Using two different affinity chromatographic
methods for purification ensures that the purified construct is intact at both N- and
C-terminus (83,107). Affinity tags are very useful in purification but they can
interfere with crystallogenesis due to their flexibility. This effect is also observed
with flexible natural N- and C-termini. Tags can be removed by proteases such
as thrombin, which is the only protease with practically intact activity in all
detergents, or the tobacco etch virus (TEV) protease (83). Overexpression of
GPCRs in E. coli often exceed 2 % of the total cellular protein. High levels of
recombinant proteins tend to aggregate instead of properly fold within the
cytoplasm. In combination with tags like the KSI, the recombinant protein is
expressed into IB (104,108,109). An additional factor for the expression of
GPCRs in E. coli IB is the hydrophobic nature of the receptor (104). The
aggregation of membrane proteins within the cytoplasm might block the
machinery responsible for establishing the correct topology (110). An explanation
could be that eukaryotic membrane proteins expressed in E. coli might not

Introduction page 26
integrate into the bacterial membrane due to different signal recognition particles,
responsible for membrane insertion (111).
1.4.3.2 IB isolation and solubilization of GPCRs
Disruption of harvested bacterial cells is achievable by combining freeze-thaw
cycles of resuspended cells, lysozyme treatment and mechanical force like
sonication or use of a French press (83,112,113). The buffer for IB isolation
contains buffer components, protease inhibitors and Triton X100 for solubilization
of lipids and membrane-associated proteins and fragments (109,113,114). After
cell disruption, insoluble IBs are obtained by centrifugation, washed and stored
afterwards at – 80 °C until further use (114). IB protein has to be refolded to the
native state (108). Solubilization is achieved by denaturants such as urea (up to
8 M), guanidine HCl (up to 6 M) or strong detergents like sodium dodecyl sulfate
(SDS; 1-2 % (w/v)) in combination with a sonication step (110,113,115,116). For
most GPCRs, Urea and guanidine HCl are not applicable due to insolubility, so
SDS is most often used instead (116,117). GPCRs within the isolated IBs also
have to be solubilized using detergents before any further purification. On
molecular level, detergents consist of a hydrophilic polar head group and a
hydrophobic non-polar tail group making them amphiphilic molecules. The polar
head group of detergents can be ionic (cationic or anionic), non-ionic or
zwitterionic and has a strong attraction for aqueous solvent molecules (85). Ionic
detergents are well-known for being harsh. These detergents, e.g. SDS, disrupt
helix-helix interaction of membrane proteins leading to unfolding or denaturing.
Non-ionic detergents with uncharged hydrophilic head groups are the most
common detergents used in membrane protein research for solubilization,
stabilization, crystallization and functional determination (118). In comparison to
ionic detergents, mild detergents break lipid-lipid and protein-lipid interactions
rather than protein-protein interactions (118). The most commonly used
detergents in membrane protein research are the non-denaturing detergents n-
dodecyl-β-D-maltoside (DDM) and n-decyl-β-D-maltoside (DM) (118).
Zwitterionic detergents combine properties of ionic and non-ionic detergents,
which are milder than ionic detergents and are also used for crystallization and
NMR spectroscopy studies (118). Detergent molecules persist as monomers in
water solution and form detergent micelles at concentrations higher than their
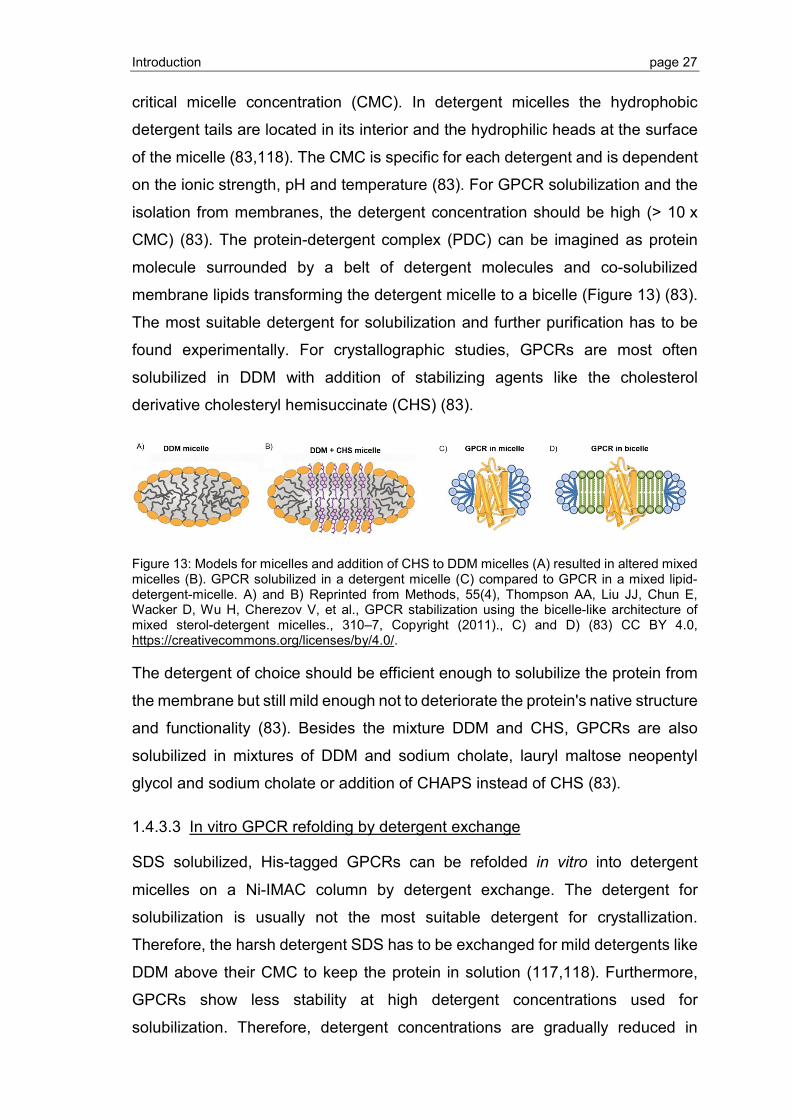
Introduction page 27
critical micelle concentration (CMC). In detergent micelles the hydrophobic
detergent tails are located in its interior and the hydrophilic heads at the surface
of the micelle (83,118). The CMC is specific for each detergent and is dependent
on the ionic strength, pH and temperature (83). For GPCR solubilization and the
isolation from membranes, the detergent concentration should be high (> 10 x
CMC) (83). The protein-detergent complex (PDC) can be imagined as protein
molecule surrounded by a belt of detergent molecules and co-solubilized
membrane lipids transforming the detergent micelle to a bicelle (Figure 13) (83).
The most suitable detergent for solubilization and further purification has to be
found experimentally. For crystallographic studies, GPCRs are most often
solubilized in DDM with addition of stabilizing agents like the cholesterol
derivative cholesteryl hemisuccinate (CHS) (83).
Figure 13: Models for micelles and addition of CHS to DDM micelles (A) resulted in altered mixed micelles (B). GPCR solubilized in a detergent micelle (C) compared to GPCR in a mixed lipid-detergent-micelle. A) and B) Reprinted from Methods, 55(4), Thompson AA, Liu JJ, Chun E, Wacker D, Wu H, Cherezov V, et al., GPCR stabilization using the bicelle-like architecture of mixed sterol-detergent micelles., 310–7, Copyright (2011)., C) and D) (83) CC BY 4.0, https://creativecommons.org/licenses/by/4.0/.
The detergent of choice should be efficient enough to solubilize the protein from
the membrane but still mild enough not to deteriorate the protein's native structure
and functionality (83). Besides the mixture DDM and CHS, GPCRs are also
solubilized in mixtures of DDM and sodium cholate, lauryl maltose neopentyl
glycol and sodium cholate or addition of CHAPS instead of CHS (83).
1.4.3.3 In vitro GPCR refolding by detergent exchange
SDS solubilized, His-tagged GPCRs can be refolded in vitro into detergent
micelles on a Ni-IMAC column by detergent exchange. The detergent for
solubilization is usually not the most suitable detergent for crystallization.
Therefore, the harsh detergent SDS has to be exchanged for mild detergents like
DDM above their CMC to keep the protein in solution (117,118). Furthermore,
GPCRs show less stability at high detergent concentrations used for
solubilization. Therefore, detergent concentrations are gradually reduced in
Introduction page 28
further purification steps to values slightly above their CMC, usually 2-3 x CMC
(83). Refolding is achieved by washing with an excess of buffer at different
detergent concentrations, with supplemented CHS (104). Furthermore, refolding
can be achieved by addition of lipids to the detergent mixture to perform refolding
into mixed-micelles (119). Refolded GPCRs can be eluted from Ni-IMAC by
addition of imidazole to the refolding buffer. In addition to the receptor refolding
efficiency, the stability of the receptor also is considered. GPCRs refolded into
detergent micelles show less stability compared to their native lipid environment.
Furthermore, very pure samples with only the protein of interest (for example the
monomeric form of the receptor) are a prerequisite for crystallization studies. An
immobilized ligand for example (if available) would enable a ligand-affinity
chromatography for the purification and separation of properly folded GPCR with
preserved ligand-binding properties from misfolded and unfolded GPCR
molecules (83). In some cases, ion exchange chromatography might be
necessary for a further purification step to remove contaminants or unwanted
receptor variants. Even though, size exclusion chromatography (SEC) is often
considered as a polishing purification step before performing structural studies
(83). The SEC can also be used for the isolation of monomers, the selection of
receptor complexes with ligands or macromolecular complexes (83,120–122).
For further crystallization studies, the refolded receptors have to be stabilized
(123).
1.4.3.4 Optimization of GPCR stability by use of the CPM assay
The stability optimization, in addition to other biophysical properties such as
homodispersity and solubility, is statistically predictive of successful
crystallization (123). Refolding pattern and stability of GPCRs can be analyzed
by differential scanning fluorimetry (DSF), using the cysteine-reactive dye 7-
Diethylamino-3-(4-maleimidophenyl)-4-methylcoumarin (CPM) also known as
CPM assay (123). Hydrophobic dyes such as SYPRO Orange, commonly used
for DSF of soluble proteins, are not compatible with membrane proteins. This is
due to their strong fluorescence in the presence of detergents practically masking
the melting transitions (123,124). CPM fluorescence on the other hand is
dependent on its covalent reaction with free cysteins. These cysteins are
frequently located at helix-helix interaction sites within the transmembrane
Introduction page 29
regions. These regions become exposed upon denaturation and can be used
both for soluble and membrane proteins (25,123). Protein unfolding profiles are
analyzed by different softwares such as the analysis software Origin using the
fluorescence signal as a function of temperature. The melting temperature TM is
at the inflection point of the curve and can be derived from a Boltzmann-Fit. The
curve provides information about the extent of folded receptor, and TM is relative
measure of protein stability (123,125,126). Structural changes of proteins during
heating can also be studied by techniques such as differential scanning
calorimetry, dynamic light scattering or circular dichroism spectroscopy. These
methods require larger amounts of material compared to the CPM assay and
often suffer from poor signal-to-noise ratio due to high background caused by the
detergents used (123). Receptor stability is maximized by screening different
detergents and detergent combinations. The addition of binding partners like
agonist or antagonists to keep the receptor in a particular stable conformational
state can also increase the stability (83).
1.4.3.5 Optimization using Design of Experiments (DoE)
A useful tool to optimize parameter settings in processes is the design of
experiments (DoE). Here, we applied it to GPCR expression, refolding and
stability optimization. A set of experiments is selected which is representative for
the desired problem. In most cases, these experiments are grouped
symmetrically around a standard experiment, whereby this standard experiment
is also referred to as a central point (127). Through screening experiments, the
most influential factors and their applicable areas can be identified, whereby
4 – 10 factors can be investigated simultaneously. Full factorial test plans can be
created in which all combinations of factor levels are investigated. This enables
both the effect of individual factors on the target variables and all interactions
between the factors to be determined. However, as the number of factors
increases, the number of experiments required increases sharply. Therefore,
these experiments are usually carried out at the beginning of an experimental
phase. The aim here is to examine as many factors as possible with regard to
their influence on the target variables in order to be able to exclude factors with
no effect on the target variables at an early stage (127). In the evaluation of these
screening experiments, the summary of fit plot is considered after the analysis of
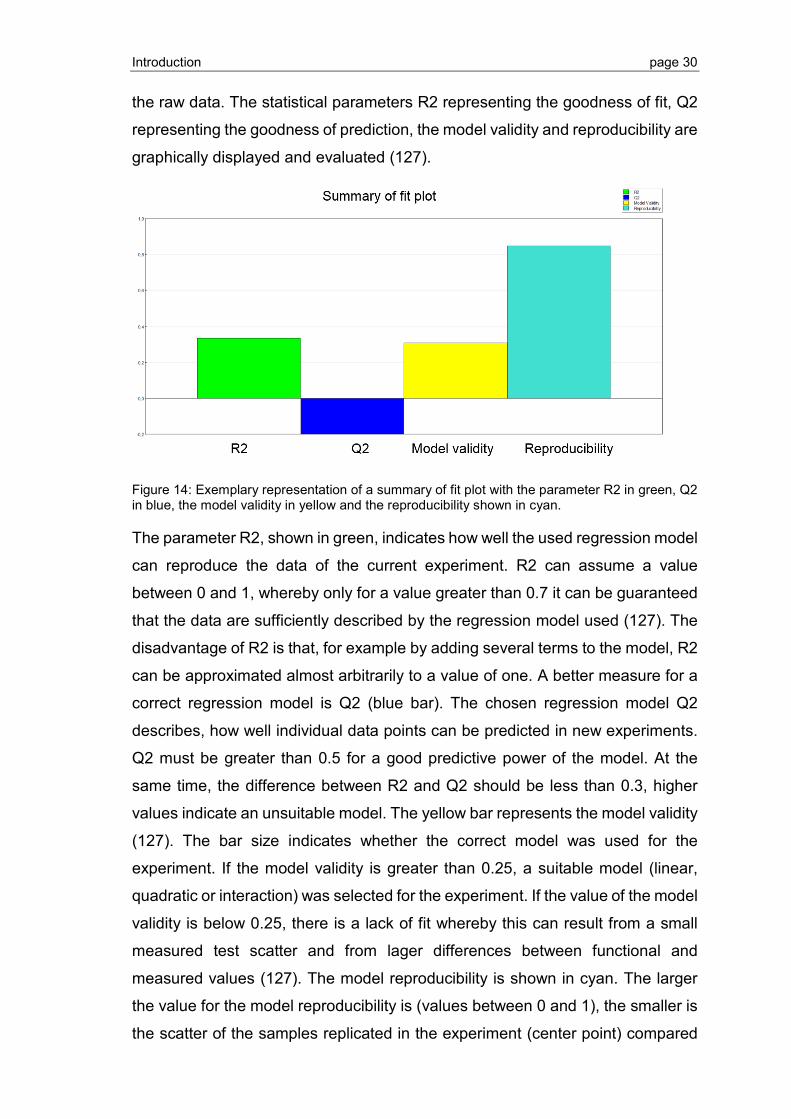
Introduction page 30
the raw data. The statistical parameters R2 representing the goodness of fit, Q2
representing the goodness of prediction, the model validity and reproducibility are
graphically displayed and evaluated (127).
Figure 14: Exemplary representation of a summary of fit plot with the parameter R2 in green, Q2 in blue, the model validity in yellow and the reproducibility shown in cyan.
The parameter R2, shown in green, indicates how well the used regression model
can reproduce the data of the current experiment. R2 can assume a value
between 0 and 1, whereby only for a value greater than 0.7 it can be guaranteed
that the data are sufficiently described by the regression model used (127). The
disadvantage of R2 is that, for example by adding several terms to the model, R2
can be approximated almost arbitrarily to a value of one. A better measure for a
correct regression model is Q2 (blue bar). The chosen regression model Q2
describes, how well individual data points can be predicted in new experiments.
Q2 must be greater than 0.5 for a good predictive power of the model. At the
same time, the difference between R2 and Q2 should be less than 0.3, higher
values indicate an unsuitable model. The yellow bar represents the model validity
(127). The bar size indicates whether the correct model was used for the
experiment. If the model validity is greater than 0.25, a suitable model (linear,
quadratic or interaction) was selected for the experiment. If the value of the model
validity is below 0.25, there is a lack of fit whereby this can result from a small
measured test scatter and from lager differences between functional and
measured values (127). The model reproducibility is shown in cyan. The larger
the value for the model reproducibility is (values between 0 and 1), the smaller is
the scatter of the samples replicated in the experiment (center point) compared
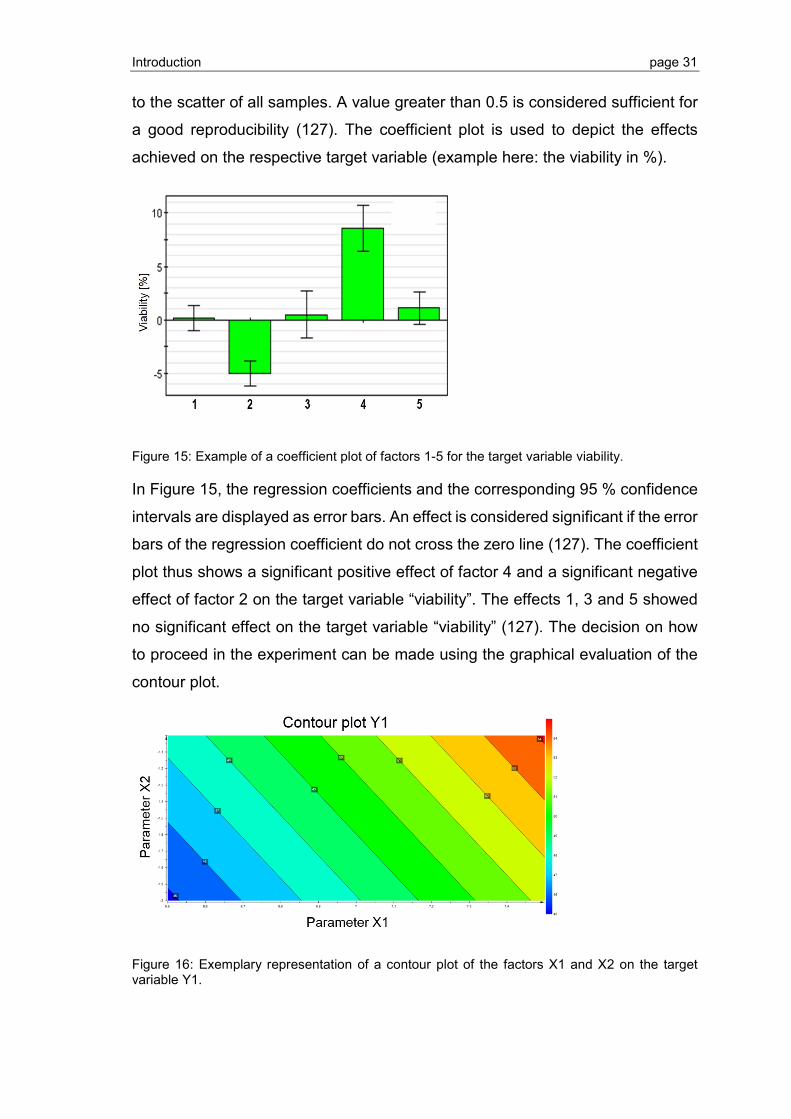
Introduction page 31
to the scatter of all samples. A value greater than 0.5 is considered sufficient for
a good reproducibility (127). The coefficient plot is used to depict the effects
achieved on the respective target variable (example here: the viability in %).
Figure 15: Example of a coefficient plot of factors 1-5 for the target variable viability.
In Figure 15, the regression coefficients and the corresponding 95 % confidence
intervals are displayed as error bars. An effect is considered significant if the error
bars of the regression coefficient do not cross the zero line (127). The coefficient
plot thus shows a significant positive effect of factor 4 and a significant negative
effect of factor 2 on the target variable “viability”. The effects 1, 3 and 5 showed
no significant effect on the target variable “viability” (127). The decision on how
to proceed in the experiment can be made using the graphical evaluation of the
contour plot.
Figure 16: Exemplary representation of a contour plot of the factors X1 and X2 on the target variable Y1.
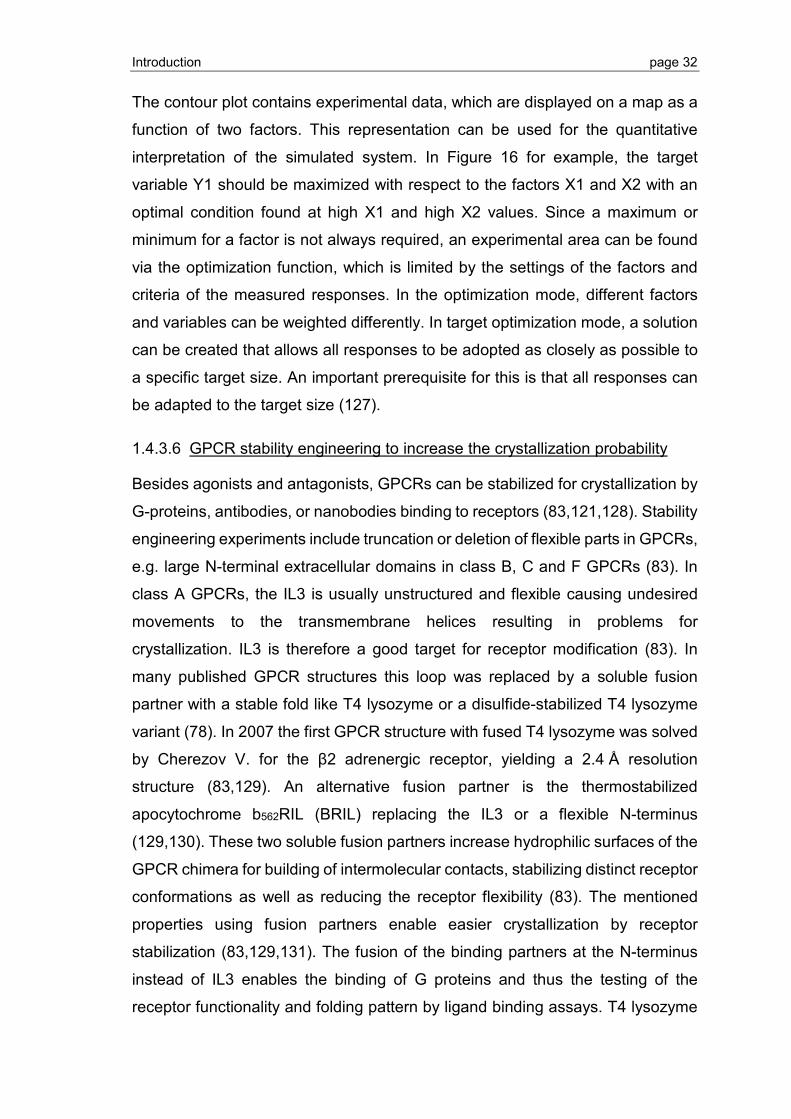
Introduction page 32
The contour plot contains experimental data, which are displayed on a map as a
function of two factors. This representation can be used for the quantitative
interpretation of the simulated system. In Figure 16 for example, the target
variable Y1 should be maximized with respect to the factors X1 and X2 with an
optimal condition found at high X1 and high X2 values. Since a maximum or
minimum for a factor is not always required, an experimental area can be found
via the optimization function, which is limited by the settings of the factors and
criteria of the measured responses. In the optimization mode, different factors
and variables can be weighted differently. In target optimization mode, a solution
can be created that allows all responses to be adopted as closely as possible to
a specific target size. An important prerequisite for this is that all responses can
be adapted to the target size (127).
1.4.3.6 GPCR stability engineering to increase the crystallization probability
Besides agonists and antagonists, GPCRs can be stabilized for crystallization by
G-proteins, antibodies, or nanobodies binding to receptors (83,121,128). Stability
engineering experiments include truncation or deletion of flexible parts in GPCRs,
e.g. large N-terminal extracellular domains in class B, C and F GPCRs (83). In
class A GPCRs, the IL3 is usually unstructured and flexible causing undesired
movements to the transmembrane helices resulting in problems for
crystallization. IL3 is therefore a good target for receptor modification (83). In
many published GPCR structures this loop was replaced by a soluble fusion
partner with a stable fold like T4 lysozyme or a disulfide-stabilized T4 lysozyme
variant (78). In 2007 the first GPCR structure with fused T4 lysozyme was solved
by Cherezov V. for the β2 adrenergic receptor, yielding a 2.4 Å resolution
structure (83,129). An alternative fusion partner is the thermostabilized
apocytochrome b562RIL (BRIL) replacing the IL3 or a flexible N-terminus
(129,130). These two soluble fusion partners increase hydrophilic surfaces of the
GPCR chimera for building of intermolecular contacts, stabilizing distinct receptor
conformations as well as reducing the receptor flexibility (83). The mentioned
properties using fusion partners enable easier crystallization by receptor
stabilization (83,129,131). The fusion of the binding partners at the N-terminus
instead of IL3 enables the binding of G proteins and thus the testing of the
receptor functionality and folding pattern by ligand binding assays. T4 lysozyme
Introduction page 33
fusion into the IL3 inhibits the downstream signaling of G proteins due to steric
hindrance (130). Instead of working with soluble fusion partners, ligands,
antibodies and nanobodies, which can provide stabilization for structural studies
and lock the receptor in a particular conformation, thermostabilizing mutations
can also be used (83). A very successful way for increasing the thermostability of
GPCRs is the alanine scanning mutagenesis, where each amino acid residue
was mutated to alanine or leucine if alanine mutation was already present (83).
Important amino acids with stabilizing effects determined in the alanine scanning
can be tested for thermostability and refolding by CPM assay or radioligand
binding assay (83). The receptors are locked in a specific conformation
depending on the ligand used (83,129). Other point mutations for example can
be used to remove N-glycosylation sites through changing involved asparagine
residues to aspartate or glutamate, which are not required for expression and
receptor folding (83).
1.4.4 Crystallization in lipidic cubic phase and X-ray structure analysis
For a long time only a few GPCR crystal structures have been available, therefore
drug discovery programs had to rely on high throughput testing of potential
ligands and binding or functional measurements. Structure-based drug discovery
is a strategy using the three-dimensional atomic structure of a protein or a ligand-
protein complex to obtain information regarding the mode of ligand binding. There
are two main fields of application for structure-based drug discovery, first the
discovery of new drug series using structure-based virtual screening and second
the optimization of lead candidates by the 3D structure. Lead optimization is done
for example to reduce possible side-effects caused by off-target binding or
lowering the used concentration through higher binding affinity. For the
determination of 3D structures, the X-ray crystallography is still considered the
best experimental technique capable of revealing structural details at an atomic
level. In comparison to soluble proteins, membrane proteins form less ordered
crystals introducing a further level of complication. This feature is reflected in the
acquisition of X-ray data of poorer quality and lower resolution, causing structure
determination of membrane proteins to be intrinsically more complicated than
structure determination of soluble proteins. Crystallization of membrane proteins
such as GPCRs is generally considered more challenging than for soluble

Introduction page 34
proteins. They can be crystallized in two major environments, which are
detergents (termed in surfo by Vadim Cherezov and Martin Caffrey) and lipid
bilayer structures (132). The in surfo methods make use of detergent- or
surfactant-solubilized membrane protein preparations directly used in
crystallization trials. These experiments include techniques namely vapor
diffusion, micro-dialysis and batch crystallization that are being employed on
soluble proteins and can also be applied to membrane proteins (132). Vapor
diffusion is the most frequently used method, and the typical experimental setup
involves either a hanging or sitting drop (132). The in surfo method has been
used for membrane proteins but this method is associated with the disadvantage
of being a destabilizing environment for proteins solubilized in detergent micelles
leading to aggregation and denaturation (132). In these detergent micelles, larger
areas of the protein surface are covered by detergents so the crystals have a high
solvent content and consequently this results in a poor crystal packing (130,133).
In contrast the bilayer methods, which include the bicelle, vesicle and the in meso
methods were used to overcome these problems (132). The bicelle and vesicle
methods have the advantage of being lipid-bilayer based in contrast to the in surfo
method, which uses detergent micelles (132).
1.4.4.1 Lipidic cubic phase, the method of choice for GPCR crystallization
The in meso crystallogenesis takes place in and from a bicontinuous lipidic
mesophase (132) with the cubic or sponge phase as the hosting medium and
protein reservoir from which crystals grow (132). The lipidic cubic phase (LCP)
was very successful for membrane proteins and was first introduced in 1996 by
Landau E. and Rosenbusch J. (134). For crystallization of membrane proteins in
LCP, the purified (by affinity and size exclusion chromatography) and
concentrated protein detergent complex (PDC) is transferred into the lipid matrix.
This membrane-like environment stabilizes sensitive proteins. In this crystal the
protein molecules can make contacts through both polar and non-polar
interactions, contributing to better order and diffraction (78,135). The most critical
step of crystallization in LCP is the formation of this bicontinuous cubic phase,
which is guided by the phase diagram of monoolein that has been the most
successful lipid used for in meso crystallogenesis (130,132). The phase diagram
(Figure 17) is a concise summary of phase propensity as water content and
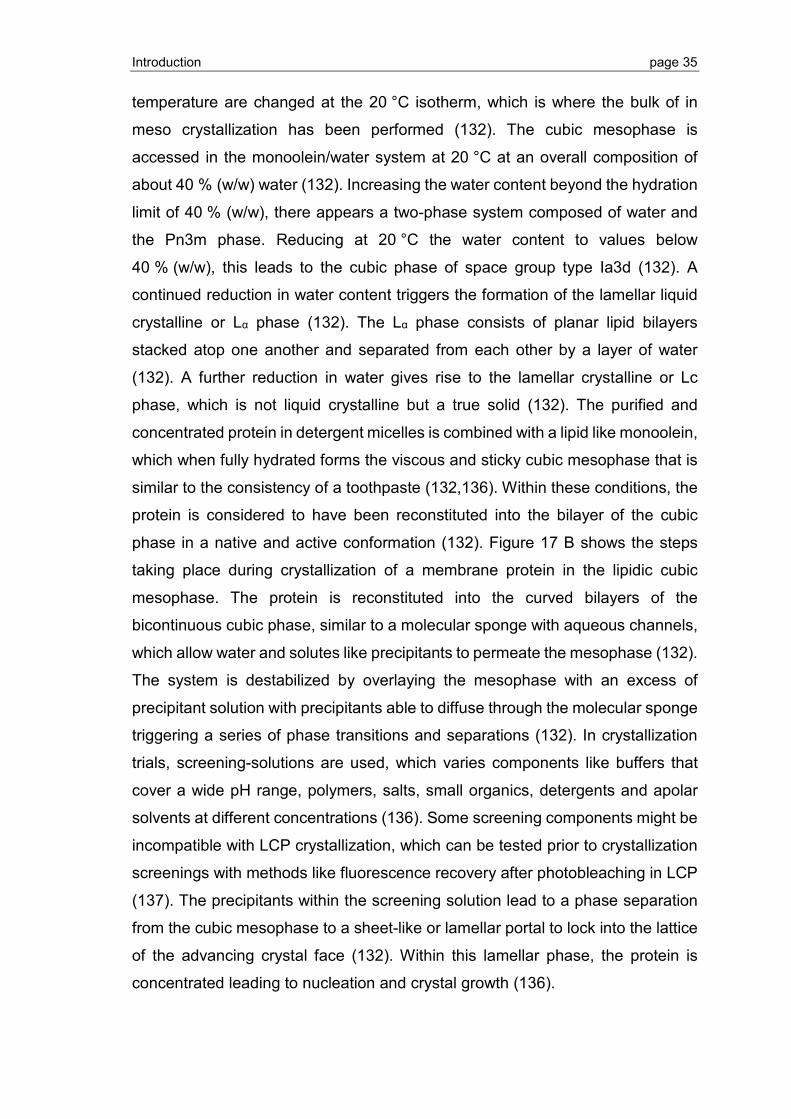
Introduction page 35
temperature are changed at the 20 °C isotherm, which is where the bulk of in
meso crystallization has been performed (132). The cubic mesophase is
accessed in the monoolein/water system at 20 °C at an overall composition of
about 40 % (w/w) water (132). Increasing the water content beyond the hydration
limit of 40 % (w/w), there appears a two-phase system composed of water and
the Pn3m phase. Reducing at 20 °C the water content to values below
40 % (w/w), this leads to the cubic phase of space group type Ia3d (132). A
continued reduction in water content triggers the formation of the lamellar liquid
crystalline or Lα phase (132). The Lα phase consists of planar lipid bilayers
stacked atop one another and separated from each other by a layer of water
(132). A further reduction in water gives rise to the lamellar crystalline or Lc
phase, which is not liquid crystalline but a true solid (132). The purified and
concentrated protein in detergent micelles is combined with a lipid like monoolein,
which when fully hydrated forms the viscous and sticky cubic mesophase that is
similar to the consistency of a toothpaste (132,136). Within these conditions, the
protein is considered to have been reconstituted into the bilayer of the cubic
phase in a native and active conformation (132). Figure 17 B shows the steps
taking place during crystallization of a membrane protein in the lipidic cubic
mesophase. The protein is reconstituted into the curved bilayers of the
bicontinuous cubic phase, similar to a molecular sponge with aqueous channels,
which allow water and solutes like precipitants to permeate the mesophase (132).
The system is destabilized by overlaying the mesophase with an excess of
precipitant solution with precipitants able to diffuse through the molecular sponge
triggering a series of phase transitions and separations (132). In crystallization
trials, screening-solutions are used, which varies components like buffers that
cover a wide pH range, polymers, salts, small organics, detergents and apolar
solvents at different concentrations (136). Some screening components might be
incompatible with LCP crystallization, which can be tested prior to crystallization
screenings with methods like fluorescence recovery after photobleaching in LCP
(137). The precipitants within the screening solution lead to a phase separation
from the cubic mesophase to a sheet-like or lamellar portal to lock into the lattice
of the advancing crystal face (132). Within this lamellar phase, the protein is
concentrated leading to nucleation and crystal growth (136).
Introduction page 36
Figure 17: A) Temperature-composition phase diagram of the monoolein/water system determined under ‘conditions of use’ in the heating and cooling directions from 20 °C. The phases Ia3d and Pn3m represent cubic phases. Reprinted with permission from Cryst. Growth Des. 2008, 8, 12, 4244-4254 Copyright © 2008 American Chemical Society. B) Schematic representation of the crystallization of an integral membrane protein from the LCP. The protein is reconstituted into the bicontinuous cubic phase (bottom left quadrant) and the added precipitants shift the equilibrium away from stability in the cubic membrane leading to a phase separation. In this phase separation, the proteins diffuse into a sheet-like or lamellar portal (upper left quadrant) to lock into the lattice of the advancing crystal face (upper right quadrant). Lipid: light yellow oval tail; Detergent: pink with oval tail; Lipid: purple; Protein: blue; Aqueous channels: dark blue. Reprinted with permission from Cryst. Growth Des. 2008, 8, 12, 4244-4254 Copyright © 2008 American Chemical Society.
By use of glass sandwich plates the imaging of LCP crystallization trials and the
detection of protein crystals growing is achieved with microscopes using
brightfield transmitted light mode and cross-polarizes (135). Additionally, UV
illumination and fluorescent dyes might be used to visualize protein crystals (135).
The use of cross-polarizers enhances the visibility of protein crystals, which
usually appear birefringent on a dark background while the cubic phase itself is
optically isotropic and non-birefringent (136). Grown crystals within the wells of
the glass sandwich plates can be harvested according to (138) and frozen in
liquid nitrogen until measurement at a synchrotron beamline.
1.4.4.2 X-ray crystallography for structure analysis
Crystals are needed for X-ray structure determination in order to bypass the
limitation of the signal to noise ratio by a single molecule. An orderly arrangement
of several billion macromolecules in a single crystal can notably amplify the
desired signal (139). In each crystal, the identical molecules are arranged in a 3D
symmetrical arrangement of the same molecules with a periodic order, called the
lattice. The smallest repeating unit of this lattice is known as unit cell (75). When
monochromatic X-rays hit a crystal, they are scattered by the electrons of the
atoms within the crystal lattice. Most of the scattered waves cancel out each other
Introduction page 37
by destructive interference, some of them interfere constructively, giving rise to
so-called diffracted intensities that can be captured and measured by detectors.
The crystal structure is encoded in the diffracted X-rays. The direction of the
diffracted beam are defined by the shape and symmetry of the unit cell. The
intensity is defined by the location of all atoms within the unit cell. The larger the
unit cell, the more diffracted beams (called ‘reflections’) are observed (139). To
determine the type of crystal lattice and the size of the unit cell, the spatial
arrangement of the measured spots can be used (75). To obtain the structure of
the individual diffracting motif, the Fourier transformation of the structure factors
is calculated. The structure factors, also called F values, represent the reflection
amplitudes and phases. These information’s and calculations are needed to
initially approximate the electron-density distribution in the crystal (75,139). The
3D arrangement in space of the intensities scattered by the crystal can be
geometrically described as the FT of the original lattice called the reciprocal lattice
(75). If the sides and angles of the reciprocal lattice are measured from the
diffraction images, the sides and angles of the direct lattice can be calculated
(75,140). To collect diffraction data from a crystal, it is necessary to mount the
crystal in a stable frame and to rotate this frame when X-rays hit the crystal. The
exact rotation range in this method of data collection will depend on the crystal
symmetry with higher symmetry space groups require smaller overall rotations to
collect a complete dataset (75). One important indicator of diffraction quality for
macromolecular crystallography is the distance from the center of each image
and the position of the farthest away diffraction spots. The more distant spots
provide higher resolution information (75). Images produced during data
collection as geometric 2D spots must be turned into intensities associated with
the 3D reciprocal lattice related to the crystal lattice (75). This task is carried out
by the so-called integration programs, software specifically designed for
integration of X-ray data such as XDS (141). XDS select a certain number of
diffraction spots across all images and use their location in the 3D reciprocal
space to determine cell parameters, lattice type and crystal orientation. Based on
these determinations, the program predicts the position of all potential diffraction
spots in the reciprocal space. Atomic coordinates and B-factors, that indicates
the true static or dynamic mobility of an atom can be used to calculate structure
factors with the structure factor amplitude and the determined structure factor
Introduction page 38
phases. If an inverse Fourier transform is calculated with these quantities, the
resulting electron density map exactly matches the initial model (75). The electron
density distribution is converted into a 3D model for the interpretation of the
protein structure. The electron density distribution is used to interpret the
respective amino acid in the polypeptide chain. At medium resolution around 3 Å,
the course of the polypeptide chain can be determined, for example, as an alpha
helix. At high resolution around 2 Å and higher the conformation of the
polypeptide chain and the first amino acid residues can be determined for
structure determination (75).
1.5 Aim of the study
Still today, GPCR structure determination is far from being a routine procedure.
To get there, expression systems requiring minimal human interference and short
cultivation times would be of advantage. In the present study, we aimed to
develop a generic method to simplify and speed up the GPCR structure
determination. Therefore, we decided to use E. coli as expression host instead of
insect cells, which are the standard expression host described in literature, for a
faster and increased expression level of GPCRs. As test case, the S1P1 and
GPR3 were chosen. S1P1 with known structure served as positive control, while
GPR3 was the target to elucidate an unknown receptor structure. In a first step,
a robust, generic expression and isolation protocol for both receptors was
developed. As IB proteins have to be refolded to the native state in vitro, a key
step was the development of a protocol for GPCR refolding by detergent
exchange. An experimental setup able for a reproducible refolding step was
investigated. Various optimization steps were performed to increase receptor
stability and to improve the refolding process. Different detergents and
combinations as well as the inclusion of lipids, to mimic the native environment
of both GPCRs, were investigated. In order to monitor the receptor refolding,
ligand binding and to optimize the refolding yield, a thermofluor-based refolding
assay was included to the generic process development. In the end, a generic
expression and refolding process for GPCRs should be established, so that
GPCRs can be co-crystallized with a ligand binding partner in LCP in a fast,
inexpensive and reproducible way. These crystals can then be used for X-ray
structure elucidation.
Materials and Methods page 39
2 Materials and Methods
All chemicals listed in the Materials and Methods section were purchased from
Sigma Aldrich, Thermo Fisher and Carl Roth GmbH & Co KG if not otherwise
stated.
2.1 Construction of expression plasmids
The original expression plasmids (pET31) carrying genes for S1P1 and GPR3,
were obtained by Dr. René Handrick and Alba Signes (both Institute of Applied
Biotechnology, University of Applied Sciences Biberach). The genetic information
of S1P1 corresponds to that of the published version in (45) with the intracellular
loop 3 replaced by the T4 lysozyme. The gene for GPR3 was engineered
similarly, i.e. the intracellular loop 3 was also replaced by T4 lysozyme. Both
genes were optimized regarding the codon usage for expression in E. coli.
2.1.1 DNA gel electrophoresis
DNA gel electrophoresis was performed on 1 % agarose gels in TAE buffer
(40 mM Tris base; 1 mM EDTA; 20 mM acetic acid). For the preparation of 1 %
agarose gels, 1 g agarose was weighed and filled to 100 ml with TAE buffer. This
solution was heated in the microwave until the agarose was completely dissolved.
The agarose solution was cooled down and GelRed (Roti®-Gel stain) was added
at a temperature of about 50 °C. The agarose gels were poured into gel
chambers, the corresponding combs inserted and the gel was left to cool. The
gel was placed in the chamber and filled with TAE buffer. After removal of the
comb, 6 µl of the 1 kb DNA size marker was applied to the gel in addition to the
samples to be analyzed. DNA gel electrophoresis was performed at a constant
voltage of 110 V. The fluorescence of the separated DNA was imaged using a
Fusion FX (Vilber) imager. Using a UV transilluminator the desired DNA could be
cut out of the agarose gel. The DNA was extracted and purified using a DNA
purification kit (Genaxxon) according to the manual.
2.1.2 Restriction digestion
For restriction digestion with NcoI, XhoI or AlwnI 2 x tango buffer was mixed with
nuclease free water and the DNA to be digested. To this mix, the respective
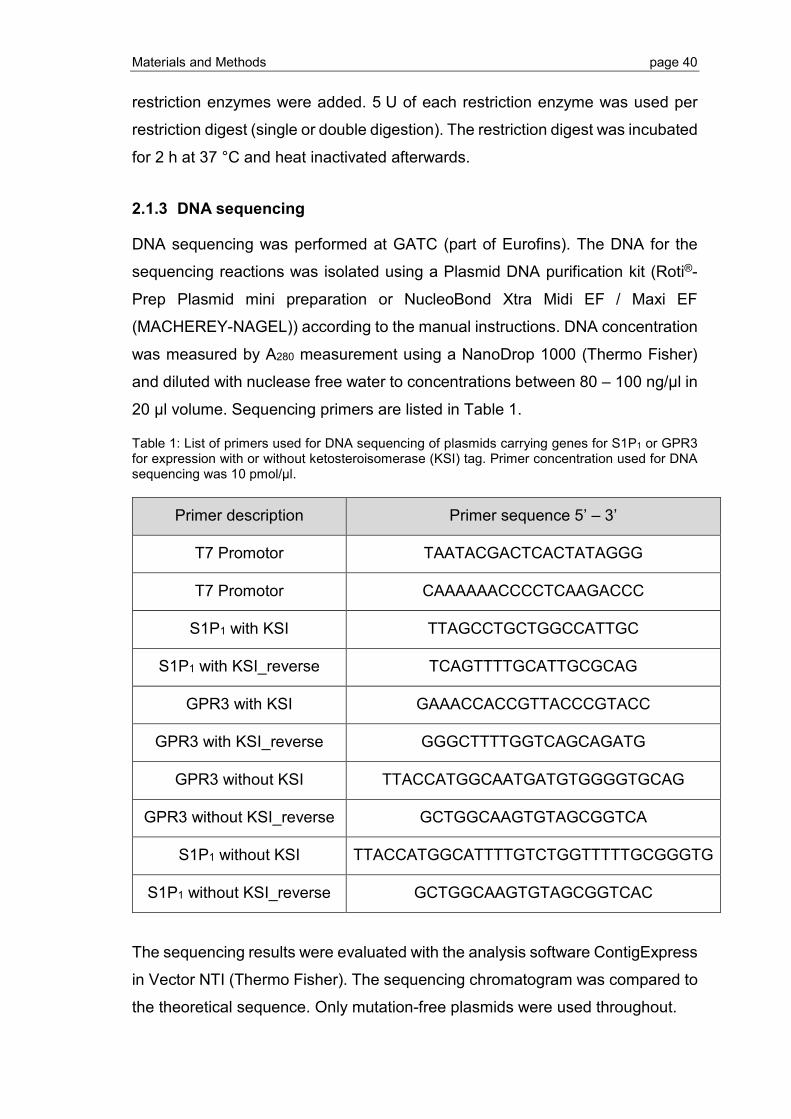
Materials and Methods page 40
restriction enzymes were added. 5 U of each restriction enzyme was used per
restriction digest (single or double digestion). The restriction digest was incubated
for 2 h at 37 °C and heat inactivated afterwards.
2.1.3 DNA sequencing
DNA sequencing was performed at GATC (part of Eurofins). The DNA for the
sequencing reactions was isolated using a Plasmid DNA purification kit (Roti®-
Prep Plasmid mini preparation or NucleoBond Xtra Midi EF / Maxi EF
(MACHEREY-NAGEL)) according to the manual instructions. DNA concentration
was measured by A280 measurement using a NanoDrop 1000 (Thermo Fisher)
and diluted with nuclease free water to concentrations between 80 – 100 ng/µl in
20 µl volume. Sequencing primers are listed in Table 1.
Table 1: List of primers used for DNA sequencing of plasmids carrying genes for S1P1 or GPR3 for expression with or without ketosteroisomerase (KSI) tag. Primer concentration used for DNA sequencing was 10 pmol/µl.
Primer description Primer sequence 5’ – 3’
T7 Promotor TAATACGACTCACTATAGGG
T7 Promotor CAAAAAACCCCTCAAGACCC
S1P1 with KSI TTAGCCTGCTGGCCATTGC
S1P1 with KSI_reverse TCAGTTTTGCATTGCGCAG
GPR3 with KSI GAAACCACCGTTACCCGTACC
GPR3 with KSI_reverse GGGCTTTTGGTCAGCAGATG
GPR3 without KSI TTACCATGGCAATGATGTGGGGTGCAG
GPR3 without KSI_reverse GCTGGCAAGTGTAGCGGTCA
S1P1 without KSI TTACCATGGCATTTTGTCTGGTTTTTGCGGGTG
S1P1 without KSI_reverse GCTGGCAAGTGTAGCGGTCAC
The sequencing results were evaluated with the analysis software ContigExpress
in Vector NTI (Thermo Fisher). The sequencing chromatogram was compared to
the theoretical sequence. Only mutation-free plasmids were used throughout.
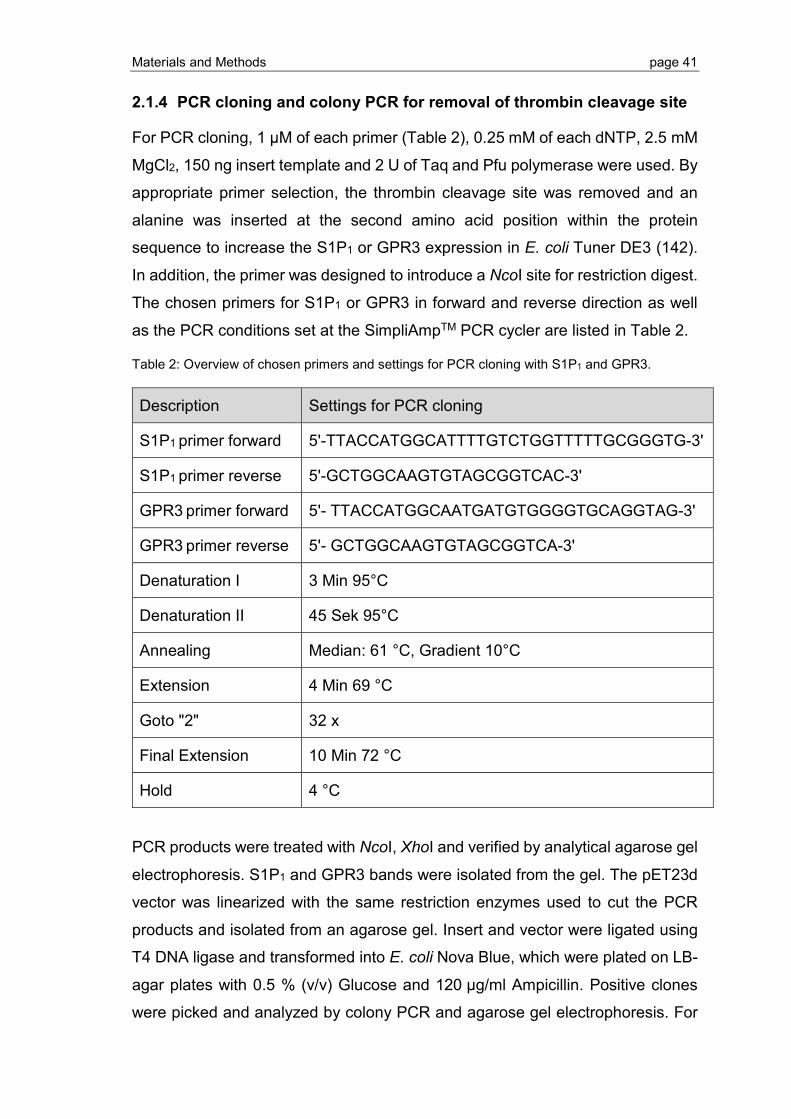
Materials and Methods page 41
2.1.4 PCR cloning and colony PCR for removal of thrombin cleavage site
For PCR cloning, 1 µM of each primer (Table 2), 0.25 mM of each dNTP, 2.5 mM
MgCl2, 150 ng insert template and 2 U of Taq and Pfu polymerase were used. By
appropriate primer selection, the thrombin cleavage site was removed and an
alanine was inserted at the second amino acid position within the protein
sequence to increase the S1P1 or GPR3 expression in E. coli Tuner DE3 (142).
In addition, the primer was designed to introduce a NcoI site for restriction digest.
The chosen primers for S1P1 or GPR3 in forward and reverse direction as well
as the PCR conditions set at the SimpliAmpTM PCR cycler are listed in Table 2.
Table 2: Overview of chosen primers and settings for PCR cloning with S1P1 and GPR3.
Description Settings for PCR cloning
S1P1 primer forward 5'-TTACCATGGCATTTTGTCTGGTTTTTGCGGGTG-3'
S1P1 primer reverse 5'-GCTGGCAAGTGTAGCGGTCAC-3'
GPR3 primer forward 5'- TTACCATGGCAATGATGTGGGGTGCAGGTAG-3'
GPR3 primer reverse 5'- GCTGGCAAGTGTAGCGGTCA-3'
Denaturation I 3 Min 95°C
Denaturation II 45 Sek 95°C
Annealing Median: 61 °C, Gradient 10°C
Extension 4 Min 69 °C
Goto "2" 32 x
Final Extension 10 Min 72 °C
Hold 4 °C
PCR products were treated with NcoI, XhoI and verified by analytical agarose gel
electrophoresis. S1P1 and GPR3 bands were isolated from the gel. The pET23d
vector was linearized with the same restriction enzymes used to cut the PCR
products and isolated from an agarose gel. Insert and vector were ligated using
T4 DNA ligase and transformed into E. coli Nova Blue, which were plated on LB-
agar plates with 0.5 % (v/v) Glucose and 120 µg/ml Ampicillin. Positive clones
were picked and analyzed by colony PCR and agarose gel electrophoresis. For
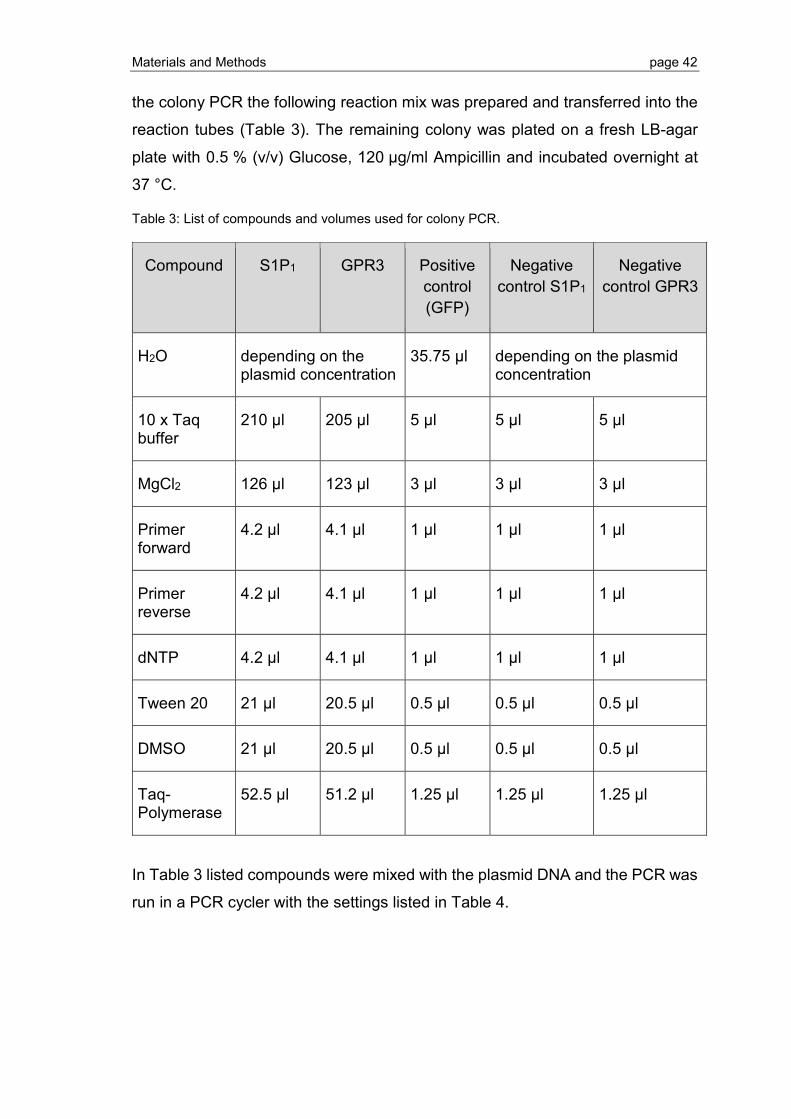
Materials and Methods page 42
the colony PCR the following reaction mix was prepared and transferred into the
reaction tubes (Table 3). The remaining colony was plated on a fresh LB-agar
plate with 0.5 % (v/v) Glucose, 120 µg/ml Ampicillin and incubated overnight at
37 °C.
Table 3: List of compounds and volumes used for colony PCR.
Compound S1P1 GPR3 Positive control (GFP)
Negative control S1P1
Negative control GPR3
H2O depending on the plasmid concentration
35.75 µl depending on the plasmid concentration
10 x Taq buffer
210 µl 205 µl 5 µl 5 µl 5 µl
MgCl2 126 µl 123 µl 3 µl 3 µl 3 µl
Primer forward
4.2 µl 4.1 µl 1 µl 1 µl 1 µl
Primer reverse
4.2 µl 4.1 µl 1 µl 1 µl 1 µl
dNTP 4.2 µl 4.1 µl 1 µl 1 µl 1 µl
Tween 20 21 µl 20.5 µl 0.5 µl 0.5 µl 0.5 µl
DMSO 21 µl 20.5 µl 0.5 µl 0.5 µl 0.5 µl
Taq-Polymerase
52.5 µl 51.2 µl 1.25 µl 1.25 µl 1.25 µl
In Table 3 listed compounds were mixed with the plasmid DNA and the PCR was
run in a PCR cycler with the settings listed in Table 4.
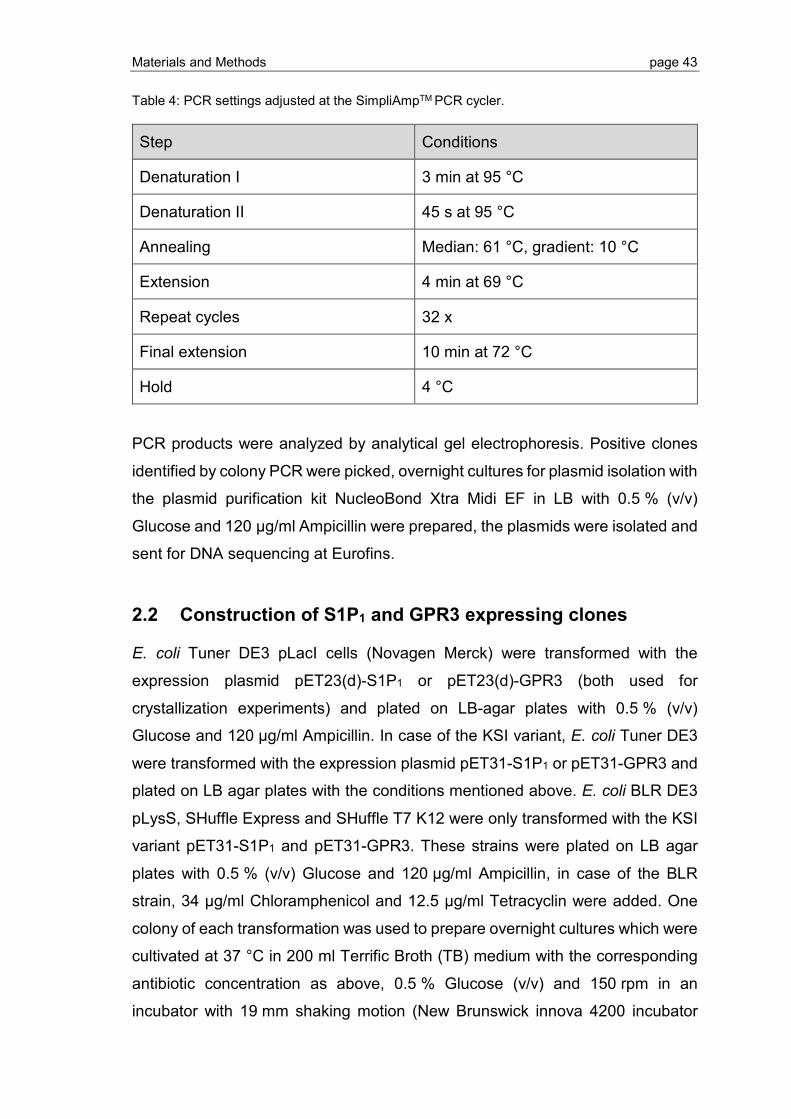
Materials and Methods page 43
Table 4: PCR settings adjusted at the SimpliAmpTM PCR cycler.
Step Conditions
Denaturation I 3 min at 95 °C
Denaturation II 45 s at 95 °C
Annealing Median: 61 °C, gradient: 10 °C
Extension 4 min at 69 °C
Repeat cycles 32 x
Final extension 10 min at 72 °C
Hold 4 °C
PCR products were analyzed by analytical gel electrophoresis. Positive clones
identified by colony PCR were picked, overnight cultures for plasmid isolation with
the plasmid purification kit NucleoBond Xtra Midi EF in LB with 0.5 % (v/v)
Glucose and 120 µg/ml Ampicillin were prepared, the plasmids were isolated and
sent for DNA sequencing at Eurofins.
2.2 Construction of S1P1 and GPR3 expressing clones
E. coli Tuner DE3 pLacI cells (Novagen Merck) were transformed with the
expression plasmid pET23(d)-S1P1 or pET23(d)-GPR3 (both used for
crystallization experiments) and plated on LB-agar plates with 0.5 % (v/v)
Glucose and 120 µg/ml Ampicillin. In case of the KSI variant, E. coli Tuner DE3
were transformed with the expression plasmid pET31-S1P1 or pET31-GPR3 and
plated on LB agar plates with the conditions mentioned above. E. coli BLR DE3
pLysS, SHuffle Express and SHuffle T7 K12 were only transformed with the KSI
variant pET31-S1P1 and pET31-GPR3. These strains were plated on LB agar
plates with 0.5 % (v/v) Glucose and 120 µg/ml Ampicillin, in case of the BLR
strain, 34 µg/ml Chloramphenicol and 12.5 µg/ml Tetracyclin were added. One
colony of each transformation was used to prepare overnight cultures which were
cultivated at 37 °C in 200 ml Terrific Broth (TB) medium with the corresponding
antibiotic concentration as above, 0.5 % Glucose (v/v) and 150 rpm in an
incubator with 19 mm shaking motion (New Brunswick innova 4200 incubator
Materials and Methods page 44
shaker). The overnight cultures were used to prepare a fresh culture with 500 ml
TB medium with the settings mentioned above. After reaching an OD600 nm of 2.0
the culture was used to prepare glycerol stocks, which were stored at -80 °C until
further use. To prepare glycerol stocks, the bacterial suspension was centrifuged
for 10 min at 5500 x g (Sorvall Evolution RC). The bacterial cell pellet was
resuspended in sterile TB medium supplemented with 50 % sterile glycerol.
2.3 Protein expression and preparation of inclusion bodies
2.3.1 Clone selection for S1P1 and GPR3 expression
Expression was performed in duplicates in 250 ml shaking flasks containing 50 ml
LB medium supplemented with 0.5 % (w/v) glucose and the corresponding
antibiotics. Growth was performed at 37 °C and 150 rpm on a shaking incubator.
Protein expression was induced by addition of 2 mM isopropyl-β-D-
thiogalactoside (IPTG). After induction, one shaking flask was incubated at 25 °C
and 90 rpm and the other shaking flask at 37 °C and 150 rpm. Samples (5 ml)
were taken after 1 h, 2 h, 3 h, 4 h and 24 h and frozen at -20 °C after centrifugation
at 15000 x g until further analysis. Samples were resuspended in PBS (137 mM
NaCl; 2.7 mM KCl; 10.1 mM Na2HPO4; 1.8 mM KH2PO4; pH 7.5) supplemented
with 2 % (w/v) SDS, treated for 30 min with 1 mg/ml Lysozyme at room
temperature and ultrasonicated for 10 s. After centrifugation for 10 min at
15000 x g the supernatant was loaded onto a Ni-IMAC resin (Cube Biotech),
which was equilibrated with PBS in a mobicol spin column and incubated for
45 min under constant shaking. The Ni-IMAC resin was washed with PBS with
2 % (w/v) SDS and eluted with PBS with 2 % (w/v) SDS and 100 µM EDTA.
2.3.2 Media comparison
E. coli Tuner DE3 transformed with pET31+S1P1 were compared regarding
growth and expression in LB and TB medium both supplemented with 0.5 % (w/v)
Glucose and 120 µg/ml Ampicillin (Figure 20 in section 3.1.1). For the growth
curve, the E. coli cultures were incubated in both media at 37 °C and 150 rpm as
well as 25 °C and 90 rpm. The OD600 nm was measured hourly. In addition to the
growth experiment the protein expression in both media was investigated, the
cultures were therefore incubated at 37 °C and 150 rpm until an OD600 nm of ≥ 1.0.
Materials and Methods page 45
The S1P1 expression was induced by addition of 2 mM IPTG and growth
continued for 1 h at 37 °C respectively 25 °C with 150 rpm.
2.3.3 Protein expression and inclusion body isolation conditions
After selecting suitable expression clones and a suitable medium, protein
expression was optimized by means of DoE (conditions are listed in Table 7
section 3.1.1). In this DoE, the expression temperature, IPTG concentration as
well as OD600 nm at induction, shaking frequency and filling volume were
optimized. The prepared glycerol stocks (E. coli Tuner DE3 transformed with
pET23d+S1P1 or pET23d+GPR3 respectively pET31+S1P1 or pET31-GPR3)
were used to inoculate 500 ml TB medium with 70 µg/ml Ampicillin and
0.5 % Glucose (v/v). These expression cultures were incubated at 37 °C and
150 rpm until they reached an OD600 nm ≥ 2.0. Protein expression was induced by
adding 2 mM of IPTG and growth continued for 1 h at 25 °C and 150 rpm. The
expression cultures (500 ml culture volume per 2 l shaking flask) were harvested
by centrifugation (10 min at 5500 x g and 4 °C), resuspended in 20 ml PBS and
stored at -80 °C. Bacterial pellets were treated with three freeze-thaw cycles and
incubated afterwards in the presence of 1 mg/ml lysozyme for 1 h at 37 °C. After
lysozyme treatment, the bacterial suspension was ultrasonicated for 7 min using
a tip sonicator (Bandelin Sonoplus) while being kept on ice. After sonication,
1 % (v/v) Triton-X100 and 5 mM EDTA were added and the sample was
incubated for 15 min on a rotary shaker (Multi-Rotator PTR-60 Grant-bio). IBs
were harvested by centrifugation (Heraeus Multifuge 3SR+) for 40 min at
14500 x g. After this centrifugation step, IB pellets were washed twice with 10 ml
PBS pH 7.5 containing 0.5 % (v/v) Triton-X100 and 5 mM EDTA. Pellets were
stored at -80 °C until further use.
2.4 Protein analytical methods
2.4.1 Total protein concentration determination
Total protein concentration was determined either by bicinchoninic acid assay
(BCA) or by A280 measurement.

Materials and Methods page 46
2.4.1.1 Concentration determination using BCA
The BCA assay was performed in 96 well plates (Greiner Bio-One). Samples
were diluted depending on the expected concentration in the respective buffer. A
calibration curve was recorded using BSA as standard. A560 was measured in a
SpectraMax M5E plate reader (Molecular Devices) and protein concentration was
determined from linear regression of the standard curve.
2.4.1.2 Photometric concentration determination
Concentration of purified protein was determined by A280 measurement using a
NanoDrop 1000 photometer. The absorption coefficient (M-1 cm-1) used for KSI
constructs was 86915 for GPR3, 80510 for S1P1 and for KSI-free constructs the
coefficient was 83810 for GPR3 and 77405 for S1P1.
2.4.2 SDS-PAGE
Sodium dodecyl sulfate polyacrylamide gel electrophoresis (SDS-PAGE) was
performed according to Laemmli (143,144) on 12.5 % acrylamide SDS gels and
prepared according to the protocol in Table 5. For analyzes with SDS-PAGE,
20 µl protein samples were mixed with 5 µl of 5 x loading buffer (375 mM TRIS
pH 6.8; 20 % (w/v) SDS; 20 % (v/v) Glycerol; 0.02 % (w/v) Bromophenol blue).
Besides 20 µl of the prepared protein solution, 3 µl of the prestained protein
ladder (11 – 245 kDa, BioFroxx) were loaded onto the gels. Samples were not
heated prior to loading. In order to be able to make comparisons between
different experiments, similar sample amounts were loaded onto the gels. The
PAGE was run at constant 20 mA per gel. Gels were stained for 1 h with
Coomassie brilliant blue staining solution (0.1 % Coomassie brilliant blue; 45 %
(v/v) Ethanol; 10 % acetic acid). Destaining was performed for 30 min in
destaining solution 1 (40 % (v/v) Ethanol; 7 % (v/v) acetic acid) followed by
overnight incubation in destaining solution 2 (5 % (v/v) Ethanol; 7 % (v/v) acetic
acid). SDS Gels were imaged using a Fusion FX (Vilber) imager.
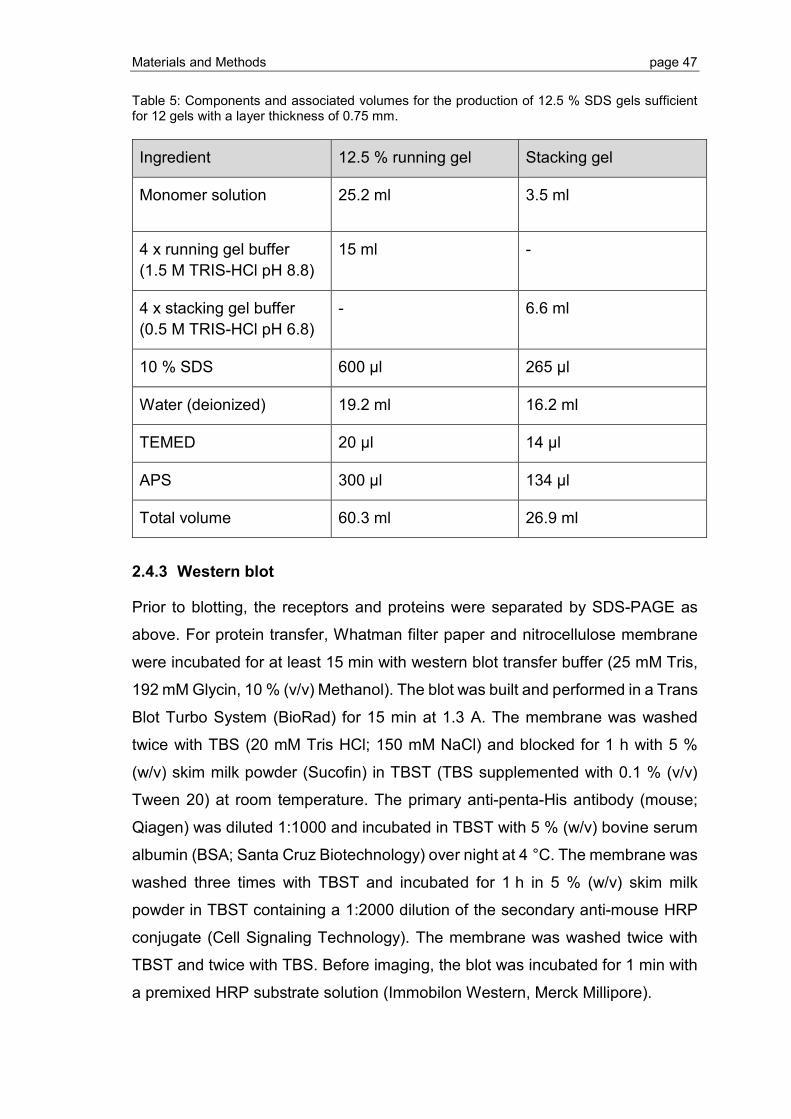
Materials and Methods page 47
Table 5: Components and associated volumes for the production of 12.5 % SDS gels sufficient for 12 gels with a layer thickness of 0.75 mm.
Ingredient 12.5 % running gel Stacking gel
Monomer solution 25.2 ml 3.5 ml
4 x running gel buffer (1.5 M TRIS-HCl pH 8.8)
15 ml -
4 x stacking gel buffer (0.5 M TRIS-HCl pH 6.8)
- 6.6 ml
10 % SDS 600 µl 265 µl
Water (deionized) 19.2 ml 16.2 ml
TEMED 20 µl 14 µl
APS 300 µl 134 µl
Total volume 60.3 ml 26.9 ml
2.4.3 Western blot
Prior to blotting, the receptors and proteins were separated by SDS-PAGE as
above. For protein transfer, Whatman filter paper and nitrocellulose membrane
were incubated for at least 15 min with western blot transfer buffer (25 mM Tris,
192 mM Glycin, 10 % (v/v) Methanol). The blot was built and performed in a Trans
Blot Turbo System (BioRad) for 15 min at 1.3 A. The membrane was washed
twice with TBS (20 mM Tris HCl; 150 mM NaCl) and blocked for 1 h with 5 %
(w/v) skim milk powder (Sucofin) in TBST (TBS supplemented with 0.1 % (v/v)
Tween 20) at room temperature. The primary anti-penta-His antibody (mouse;
Qiagen) was diluted 1:1000 and incubated in TBST with 5 % (w/v) bovine serum
albumin (BSA; Santa Cruz Biotechnology) over night at 4 °C. The membrane was
washed three times with TBST and incubated for 1 h in 5 % (w/v) skim milk
powder in TBST containing a 1:2000 dilution of the secondary anti-mouse HRP
conjugate (Cell Signaling Technology). The membrane was washed twice with
TBST and twice with TBS. Before imaging, the blot was incubated for 1 min with
a premixed HRP substrate solution (Immobilon Western, Merck Millipore).
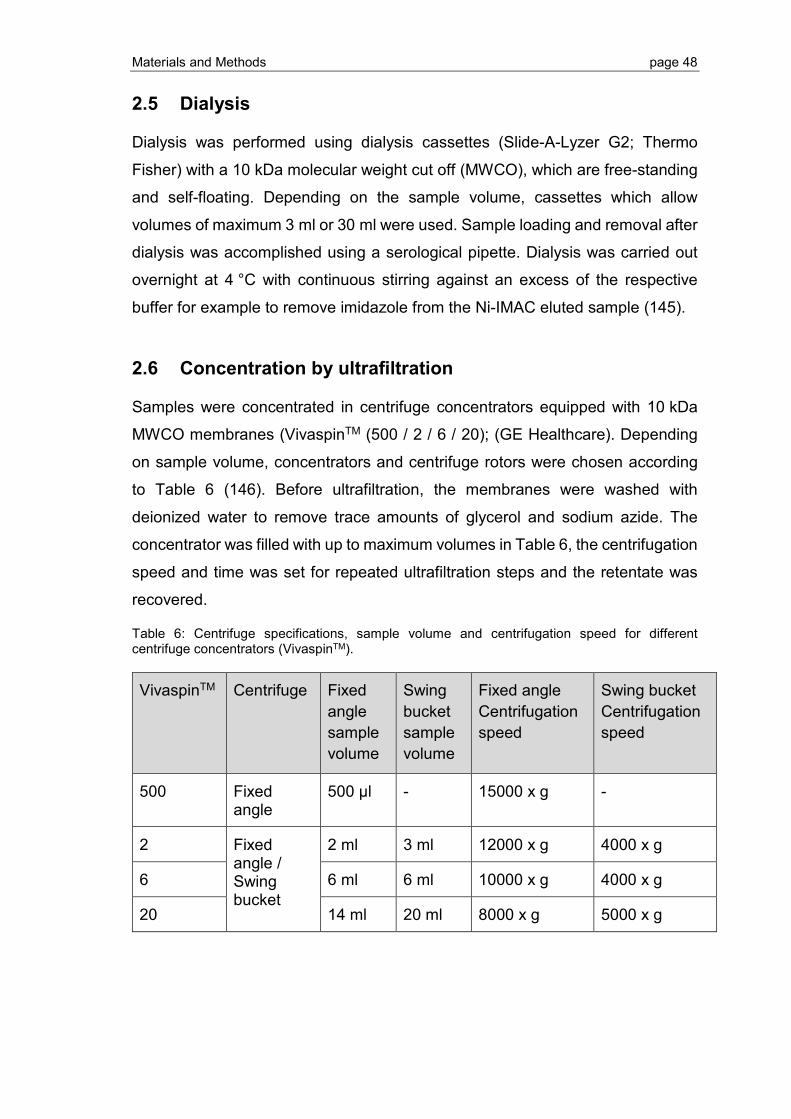
Materials and Methods page 48
2.5 Dialysis
Dialysis was performed using dialysis cassettes (Slide-A-Lyzer G2; Thermo
Fisher) with a 10 kDa molecular weight cut off (MWCO), which are free-standing
and self-floating. Depending on the sample volume, cassettes which allow
volumes of maximum 3 ml or 30 ml were used. Sample loading and removal after
dialysis was accomplished using a serological pipette. Dialysis was carried out
overnight at 4 °C with continuous stirring against an excess of the respective
buffer for example to remove imidazole from the Ni-IMAC eluted sample (145).
2.6 Concentration by ultrafiltration
Samples were concentrated in centrifuge concentrators equipped with 10 kDa
MWCO membranes (VivaspinTM (500 / 2 / 6 / 20); (GE Healthcare). Depending
on sample volume, concentrators and centrifuge rotors were chosen according
to Table 6 (146). Before ultrafiltration, the membranes were washed with
deionized water to remove trace amounts of glycerol and sodium azide. The
concentrator was filled with up to maximum volumes in Table 6, the centrifugation
speed and time was set for repeated ultrafiltration steps and the retentate was
recovered.
Table 6: Centrifuge specifications, sample volume and centrifugation speed for different centrifuge concentrators (VivaspinTM).
VivaspinTM Centrifuge Fixed angle sample volume
Swing bucket sample volume
Fixed angle Centrifugation speed
Swing bucket Centrifugation speed
500 Fixed angle
500 µl - 15000 x g -
2 Fixed angle / Swing bucket
2 ml 3 ml 12000 x g 4000 x g
6 6 ml 6 ml 10000 x g 4000 x g
20 14 ml 20 ml 8000 x g 5000 x g

Materials and Methods page 49
2.7 Thrombin cleavage
Thrombin protease (GE Healthcare) was used to remove the KSI tag (114,147–
149). 1 U of thrombin is defined as the amount of enzyme required to cleave 1 mg
of a test protein in a digestion buffer at 20 °C for 16 h (150). S1P1 or GPR3 were
purified by Ni-IMAC prior to thrombin digestion (151) and dialyzed to remove
imidazole (145). Different thrombin amounts, buffer compositions and incubation
times were investigated as outlined in the result section (149,151).
2.8 Chromatography
Spin columns with Ni-NTA (Qiagen) and Mobicols (MoBiTec) filled with Ni-IMAC
resin (Cube Biotech) as well as prepacked Ni-IMAC columns (1 ml and 5 ml
HisTrap FF, GE healthcare) connected to an ÄKTA purifier chromatography
system (GE Healtchare) were used for the isolation, purification and refolding of
S1P1 and GPR3. Prepacked SEC columns HiLoad 16/60 or 26/60 Superdex
200 pg (GE healthcare) were used for the isolation of the monomeric receptors.
Proteins were detected by A280 nm.
2.8.1 Ni-IMAC purification using spin columns
The Ni-NTA spin columns (Qiagen) with a binding capacity of 300 µg His-tagged
protein were equilibrated with 600 µl equilibration buffer (PBS pH 7.5; 2 % (w/v)
SDS; 150 mM NaCl) and centrifuged for 2-5 min at 890 x g. In case of Mobicol
spin columns, the Ni-NTA resin material (Cube Biotech) with a binding capacity
of 80 mg protein per ml column material was loaded into the Mobicol prior to
protein purification. The Mobicol loaded with Ni-NTA column material was
centrifuged for 2-5 min at 890 x g and equilibrated afterwards with 600 µl
equilibration buffer. The purification procedure in the following was the same for
both spin column types. In the following purification protocol, only spin columns
are mentioned for both Ni-NTA spin columns and Mobicols. The purification
protocol was modified from Walls D. et al. (114). S1P1 and GPR3 IBs were
solubilized in equilibration buffer by sonication for 2 min using a tip sonicator. The
sample was centrifuged for 40 min at 14500 x g (110). The supernatant (up to
600 µl per centrifugation step) was loaded onto a pre-equilibrated spin column.
The spin column was centrifuged for 5 min at 270 x g. This step was repeated
Materials and Methods page 50
until the defined sample volume was loaded. The spin column was washed twice
with 600 µl equilibration buffer with a centrifugation step for 2-5 min at 890 x g. In
case of detergent exchange, the spin column was washed twice with wash buffer
(PBS pH 7.5; 0.1 mg/ml – 1.0 mg/ml Fos-Choline 14; 5 mM Imidazole) with a
centrifugation step for 2-5 min at 890 x g. Bound receptor was eluted either in
equilibration buffer supplemented with 0.5 M EDTA or in case of detergent
exchange in wash buffer with 250 mM Imidazole by a centrifugation step of 2-
5 min at 890 x g. The eluate was collected.
2.8.2 Ni-IMAC purification and refolding for experiments with KSI tag on an ÄKTA purifier system
Harvested S1P1 and GPR3 IBs were solubilized in 10 ml equilibration buffer (PBS
pH 7.5; 2 % (w/v) SDS; 150 mM NaCl) per 250 ml expression culture volume by
sonication for 2 min using a tip sonicator. One tablet of a protease inhibitor
cocktail (cOmpleteTM mini EDTA-free; Roche) was added to each IB
solubilization. The sample was centrifuged for 40 min at 20 °C and 14500 x g.
The supernatant was loaded onto a prepacked HisTrap FF 1 ml column at a flow
rate of 0.2 ml/min, which was equilibrated with 5 CV equilibration buffer. Bound
S1P1 and GPR3 was washed with 30 CV equilibration buffer followed by a
washing step with 30 CV wash buffer (PBS pH 7.5; 0.1 mg/ml – 1.0 mg/ml n-
Dodecylphosphocholine (Fos-Choline 12) or n-Tetradecylphosphocholine (Fos-
Choline 14) respectively DDM (Anatrace)) (108,152). Bound receptor was eluted
through addition of 250 mM Imidazole in the wash buffer. Wash and elution steps
were carried out at a flow rate of 1.0 ml/min.
2.8.3 Ni-IMAC purification and refolding for GPCRs without KSI tag
Isolation and solubilization of IB was done as mentioned above (section 2.8.2). A
prepacked HisTrap FF 1 ml column was equilibrated with 5 CV equilibration
buffer. The supernatant was loaded afterwards at a flow rate of 0.2 ml/min. On-
column bound S1P1 and GPR3 were washed with 15 CV equilibration buffer.
Receptor refolding was achieved with detergent exchange with a modified
purification and refolding protocol from Hanson et al. (45). S1P1 and GPR3 were
washed with 15 CV refolding buffer 1 (50 mM HEPES pH 7.5; 800 mM NaCl;
10 % (v/v) Glycerole; 25 mM Imidazole; 10 mM MgCl2; 1 mg/ml DDM (Anatrace);

Materials and Methods page 51
0.2 mg/ml CHS (Anatrace)) followed by 15 CV refolding buffer 2 (50 mM HEPES
pH 7.5; 500 mM NaCl; 10 % (v/v) Glycerole; 50 mM Imidazole; 0.5 mg/ml DDM;
0.1 mg/ml CHS). Receptors were eluted in 10 CV elution buffer (25 mM HEPES
pH 7.5; 500 mM NaCl; 10 % (v/v) Glycerole; 200 mM Imidazole; 0.5 mg/ml DDM;
0.01 mg/ml CHS). Wash, refolding and elution steps were carried out at
1.0 ml/min.
2.8.4 Refolding into lipid detergent mixed micelles
Purification and refolding was carried out as described in chapter 2.8.3. Column-
bound receptor was washed with 10 CV each of refolding buffer 1 and refolding
buffer 2, both supplemented with lipids. Mixed micelles were produced containing
90% detergent and 10% lipid by mass. The lipid solution was chosen as a mixture
of 4.5 % L-α-phosphatidylcholine, 4.5 % brain extract type V and 1 % cholesterol.
In an additional step prior to elution, column-bound receptors were washed with
10 CV refolding buffer without lipids and eluted from the column using 200 mM
imidazole in the refolding buffer. This step was intended to remove excess lipids
but not those strongly bound to the protein. Full-length S1P1 and GPR3
monomers were isolated by SEC chromatography in refolding buffer without lipid
addition.
2.8.5 SEC for isolation of monomeric receptors
SEC was carried out on an ÄKTA purifier system connected to a HiLoad 16/60 or
a 26/60 Superdex 200 pg column. Prior to separation of the target receptors, the
column was equilibrated with 1.5 CV MilliQ water, followed by 2 CV PBS and
1 CV equilibration buffer (before crystallization screen: 25 mM HEPES pH 7.5;
500 mM NaCl; 10 % (v/v) Glycerol; 0.5 mg/ml DDM; 0.01 mg/ml CHS). The
loaded sample (volume < 4 % of bed volume) eluted within 1 CV of equilibration
buffer. In the end, the SEC column was regenerated by 1 CV 1 M NaOH, 2 CV
MilliQ water and 2 CV 20 % ethanol.
2.9 CPM assay
Thermal stability was determined according to Alexandrov et al. (123). Briefly, the
CPM dye was dissolved in DMSO to prepare a stock solution at 4 mg/ml, which
Materials and Methods page 52
was stored at -80 °C until further use. The stock solution was diluted 1:40 with
CPM assay dilution buffer (20 mM HEPES pH 7.5; 200 mM NaCl; 0.025 %
(w/v) DDM). The CPM assay was prepared in a total volume of 130 µl in a
separate 96 well plate. For the thermal denaturation assay (CPM assay) 8 µg of
the dialyzed and concentrated S1P1 or GPR3 were used. Both receptors were
diluted to 120 µl (0.07 mg/ml) with the respective refolding buffer. Prior to the
measurement, 10 µl of the diluted dye solution were added, thoroughly mixed and
incubated for at least 5 min at room temperature to allow equilibration of the
protein with the buffer components. After incubation, 100 µl of each sample was
transferred in a 96 well plate (FrameStar® 480 Roche). The CPM assay was
performed on a qPCR plate cycler (LightCycler® 480; Roche) with a linear
temperature increase of 0.5 °C per minute between 20 °C and 90 °C and
fluorescence recording at 450 nm excitation / 500 nm emission. The apparent TM
was derived from a sigmoidal Boltzmann-Fit (y = 𝐴𝐴1 − 𝐴𝐴21+𝑒𝑒(𝑥𝑥− 𝑥𝑥0)/𝑑𝑑𝑥𝑥) using the software
Origin (OriginLab) (123,153,154).
2.9.1 Detection of ligand binding by CPM assay
Detection of ligand binding to GPCRs by CPM assay was performed with 8 µg of
the respective protein. GPR3 with the antagonist W146 hydrate (R-3-amino-4-(3-
hexylphenylamino)-4-oxobutylphosphonic acid hydrate) and S1P1 with the
inverse agonist AF64394 (Takeda Pharmaceutical) as well as experiments
without ligand addition served as assay controls. For ligand binding detection
using the CPM assay, the concentration of the antagonist W146 and inverse
agonist AF64394 was increased from 0 nM to 100 µM. The CPM assay and the
assay evaluation were done as described above. A shift in TM indicated increased
stability caused by ligand binding.
2.10 Protein identification by mass spectrometry
Sample preparation and MS/MS analysis were performed by University of
Hohenheim (https://www.uni-hohenheim.de/organisation/einrichtung/modul-1-
mass-spectrometry-unit). S1P1 and GPR3 were both cut out from Coomassie
stained SDS-gels and digested in-gel using trypsin (Roche) according to (155).
Samples were analyzed on a Q Exactive hybrid quadrupole orbitrap MS (Thermo
Materials and Methods page 53
Fisher). Proteome Discoverer and the tandem MS data analysis software (both
Thermo Fisher) were used as search engine for protein identification against the
internal sequence database of the University of Hohenheim. The visualization
software Scaffold 4 (Proteome Software) was used to validate MS/MS-based
peptide and protein identifications. Peptide identifications were accepted, if the
protein threshold was ≥ 99 % and the peptide threshold was ≥ 95 % with a
Sequest XCorr value of ≥ 2.0.
2.11 Crystallization in LCP
Crystallization of both GPCRs was carried out in LCP (156,157). The following
chapters describe the steps to be taken for isolation, refolding, monomer isolation
and concentration for crystallization screenings in LCP, crystal harvesting and
diffraction pattern experiments.
2.11.1 Isolation of refolded S1P1 and GPR3 for crystallization in LCP
For crystallization in LCP, IBs of 10 l bacterial culture volume with S1P1 and
GPR3 were isolated and solubilized in equilibration buffer (50 mM HEPES
pH 7.5; 2 % (w/v) SDS; 100 mM NaCl) described in section 2.8.3. Solubilized
receptor was loaded onto 4 connected, prepacked HisTrap FF 5 ml column at a
flow rate of 0.2 ml/min. The Ni-IMAC columns were equilibrated with 5 CV
equilibration buffer (section 2.8.3). On-column bound S1P1 and GPR3 were
washed with 10 CV equilibration buffer. Receptor refolding into mixed micelles
was performed as described in section 2.8.3. In contrast to section 2.8.3, the
refolding buffer 1 (50 mM HEPES pH 7.5; 0.9 mg/ml DDM; 0.18 mg/ml CHS;
0.02 mg/ml L-α-Phosphatidylcholine; 0.02 mg/ml Glycerolipids; 0.01 mg/ml
Cholesterol) was used. Refolding was continued using refolding buffer 2 (50 mM
HEPES pH 7.5; 0.45 mg/ml DDM; 0.09 mg/ml CHS; 0.02 mg/ml L-α-
Phosphatidylcholine; 0.02 mg/ml Glycerolipids; 0.01 mg/ml Cholesterol). Both
refolding buffers were used with 10 CV. In a further step, the column was washed
with 2 CV refolding buffer 2 supplemented with 10 µM W146 hydrate for S1P1 or
10 µM AF64394 for GPR3. The column was removed, incubated for 2 h at room
temperature followed by overnight incubation at 4 °C. After this incubation step,
the receptor was washed using 10 CV refolding buffer 3 (50 mM HEPES pH 7.5;
0.5 mg/ml DDM; 0.1 mg/ml CHS). The bound receptor was step-eluted and
Materials and Methods page 54
collected with 10 CV elution buffer (25 mM HEPES pH 7.5; 0.5 mg/ml DDM;
0.01 mg/ml CHS; 200 mM Imidazole). The elution fractions were analyzed by
SDS-PAGE, the respective fractions were pooled and concentrated by
ultrafiltration. The monomeric form of the concentrated S1P1 or GPR3 was
isolated with SEC as described in section 2.8.5. The sample volume was < 2 %
of bed volume. The SEC column was equilibrated and run with SEC equilibration
buffer (50 mM Tris pH 7.5; 150 mM NaCl; 0.5 mg/ml DDM; 0.01 mg/ml CHS).
Samples containing the monomeric receptor were concentrated and used for
lipidic cubic phase (LCP) crystallization. Concentrated monomers of S1P1 and
GPR3 were quality checked by SDS-PAGE and verified by CPM assay for
refolding and ligand binding.
2.11.2 Preparation of crystallization screening solutions
Custom-made crystallization screening solutions were prepared using a
dragonfly® screen optimization robot (TTP LabTech) (158). The robot is a liquid-
handling system designed for protein crystallization with a dedicated software
application to set up crystallization plates with variable solvent composition (159).
This robot was used prior to the first crystallization screening to create one
crystallization screen based on the published crystallization conditions for S1P1
(45) termed S1P1 screen. An overview of the screen solutions used in the first
crystallization are listed in Table 15 in the result section. The composition of the
custom-made crystallization screening solutions and the screen solution
according to Hanson et al. (45) are shown in the attachment section 6.1 in Table
17 to Table 28. Screening solutions used in the grid screen experiments
(prepared with the dragonfly® screen optimization robot) were based on
successful crystallization conditions for S1P1 or GPR3 from the first crystallization
screen. The robot was programmed and equipped with disposable tips, a 96 well
plate (Greiner Bio-One) and reservoirs with the stock solutions. The composition
of the grid screens for S1P1 and GPR3 are shown in Table 29 to Table 32 in
section 6.2.
2.11.3 LCP crystallization
LCP crystallization was set up by mixing protein solution with monoolein
(Anatrace) (132,135,157,160–165). The protein was kept on ice while warming
Materials and Methods page 55
the monoolein up to 37 °C. Microliter syringes (Hamilton) were cleaned
meticulously with 70 % ethanol and dried in air stream. Concentrated S1P1 or
GPR3 was mixed with molten monoolein at a volume ratio of 40 % protein solution
and 60 % lipid. Before starting the mixing process, calculation how much volume
of each component is needed using the following equation (density of monoolein:
0.94 g/cm3):
Volume of protein (µl) = Volume of monoolein (µl) ∙ 0.94 ∙ 46
Syringes were held horizontally and filled with the appropriate volume of
monoolein using a 100 µL pipette. The tip of the pipette was inserted into the
bottom of the syringe, and the molten monoolein was slowly transferred into the
syringe. Air bubbles were removed by moving the plunger up and down. The
monoolein was pushed all the way up and the exact amount of monoolein in the
syringe was read out. After that, a syringe coupler was attached and the
monoolein was pushed into the coupler. A second syringe was filled with the
calculated protein volume as above and air was removed. Both syringes were
connected and the two components were mixed by pushing the plungers in
iteratively as shown in Caffrey M. (136,160). The first couple of strokes were done
manually. The cubic mesophase was reached through mixing both solutions for
at least 100 times using a syringe mixer (TTP LabTech). While mixing, the sample
initially turned white and opaque but later became translucent and clear indicating
LCP formation. During the mixing procedure, the screening plates were adapted
to room temperature (20 °C). The LCP was pushed into one of the two syringes.
The LCP containing syringe was equipped with a syringe tip, which was filled with
the generated LCP and clamped into the mosquito LCP crystallization robot (TTP
LabTech). A 96-well Laminex glass crystallization plate (Molecular Dimension)
was inserted into the robot. The LCP crystallization robot was programmed to
overlay of 50 nl of LCP with 800 nl of screening solution. The air humidity was
increased by means of water vapor before start of the crystallization screen. All
screening solutions are summarized in the chapter attachment section 6.1 and
section 6.2. After setting up the crystallization experiments, the plate was
removed and covered with a thin Laminex glass plate (Molecular Dimension).
Lastly, the plate was incubated at 20 °C in the hotel-based protein crystallization
Materials and Methods page 56
imager (rock imager 182, formulatrix). At regular intervals, pictures of the
individual plates were taken.
2.11.4 Crystal harvesting
Crystals were harvested according to (11,138) using MicroMounts with different
sizes (MiTeGen), storage pucks and a microscope (Olympus SZX10) equipped
with polarization filters (SZX-PO and SZX-AN). All crystallization plates were
inspected under normal light and with crossed polarized filters and wells with
crystals suitable for harvesting were marked. The chosen well was opened using
glass cutting tools and tweezers. Therefore, two concentric circles were drawn
with the glass cutting tool (138). The glass between the two circles was broken
by applying pressure to the glass, which was removed with tweezers. The
remaining mesophase was overlaid with 3 µl of the prepared cryo solution.
Depending on the crystallization conditions, a few microliters of screening
solution were mixed with a cryoprotectant. As cryoprotectant glycerol or various
PEGs were used at concentrations of > 30 % (v/v). Crystals were harvested using
MicroMounts and washed within the cryoprotectant solution before these crystals
were frozen in liquid nitrogen until diffraction analysis at the swiss light source
(SLS) at Villigen (Switzerland).
2.11.5 Recording of diffraction data at SLS
The preserved crystals were used to carry out diffraction experiments at the
protein crystallography beamline X10SA-PXII at the SLS. Data were collected at
100 K using the cryo-cooled MicroMounts in a cryo-stream. The X-ray beam and
the diffraction pattern were detected with a PILATUS 6M (25 Hz) detector
operated in shutterless data collection mode. The sample-to-detector distance
was varied between 20 cm and 60 cm. The beam size was adjusted according to
crystal dimensions to optimize the signal to noise ratio for data collection. The
typical beam size was 10 µm x 30 µm. The microbeam on this beamline provided
1.5 x 10¹² photons s-1 respectively at 12.0 keV with a flux of about 30 %
(166,167). The MicroMount carrying the harvested crystal was positioned on the
Goniometer. The X, Y and Z coordinates (X = crystal position along the rotaion
axis; Y = position along the axis perpendicular to X and Z; Z = position along the
beam axis) were adjusted by means of the motorized goniometer to position the
Materials and Methods page 57
crystal in the focal plane of the microscope that includes the rotation axis of the
goniometer and the cross-hairs of the camera (166). If the crystal was clearly
visible, the positioning and measurement with the X-ray beam was easily
possible. If the crystal was not clearly visible, for example surrounded by
mesophase, the crystal had to be located by diffraction rastering. After each
measurement, the MicroMount carrying the harvested crystal on the Goniometer
within the cryo-stream was exchanged for a new one. The analysis of the
diffraction data was done with the analysis software ADXV.
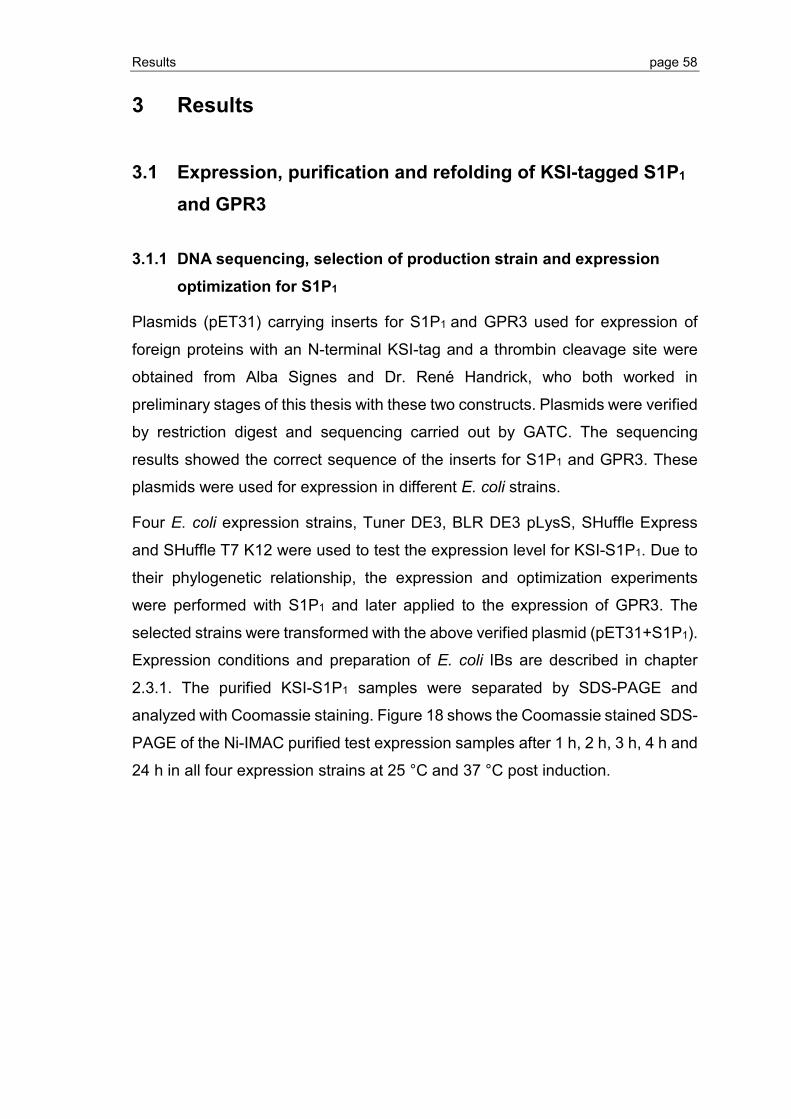
Results page 58
3 Results
3.1 Expression, purification and refolding of KSI-tagged S1P1 and GPR3
3.1.1 DNA sequencing, selection of production strain and expression optimization for S1P1
Plasmids (pET31) carrying inserts for S1P1 and GPR3 used for expression of
foreign proteins with an N-terminal KSI-tag and a thrombin cleavage site were
obtained from Alba Signes and Dr. René Handrick, who both worked in
preliminary stages of this thesis with these two constructs. Plasmids were verified
by restriction digest and sequencing carried out by GATC. The sequencing
results showed the correct sequence of the inserts for S1P1 and GPR3. These
plasmids were used for expression in different E. coli strains.
Four E. coli expression strains, Tuner DE3, BLR DE3 pLysS, SHuffle Express
and SHuffle T7 K12 were used to test the expression level for KSI-S1P1. Due to
their phylogenetic relationship, the expression and optimization experiments
were performed with S1P1 and later applied to the expression of GPR3. The
selected strains were transformed with the above verified plasmid (pET31+S1P1).
Expression conditions and preparation of E. coli IBs are described in chapter
2.3.1. The purified KSI-S1P1 samples were separated by SDS-PAGE and
analyzed with Coomassie staining. Figure 18 shows the Coomassie stained SDS-
PAGE of the Ni-IMAC purified test expression samples after 1 h, 2 h, 3 h, 4 h and
24 h in all four expression strains at 25 °C and 37 °C post induction.
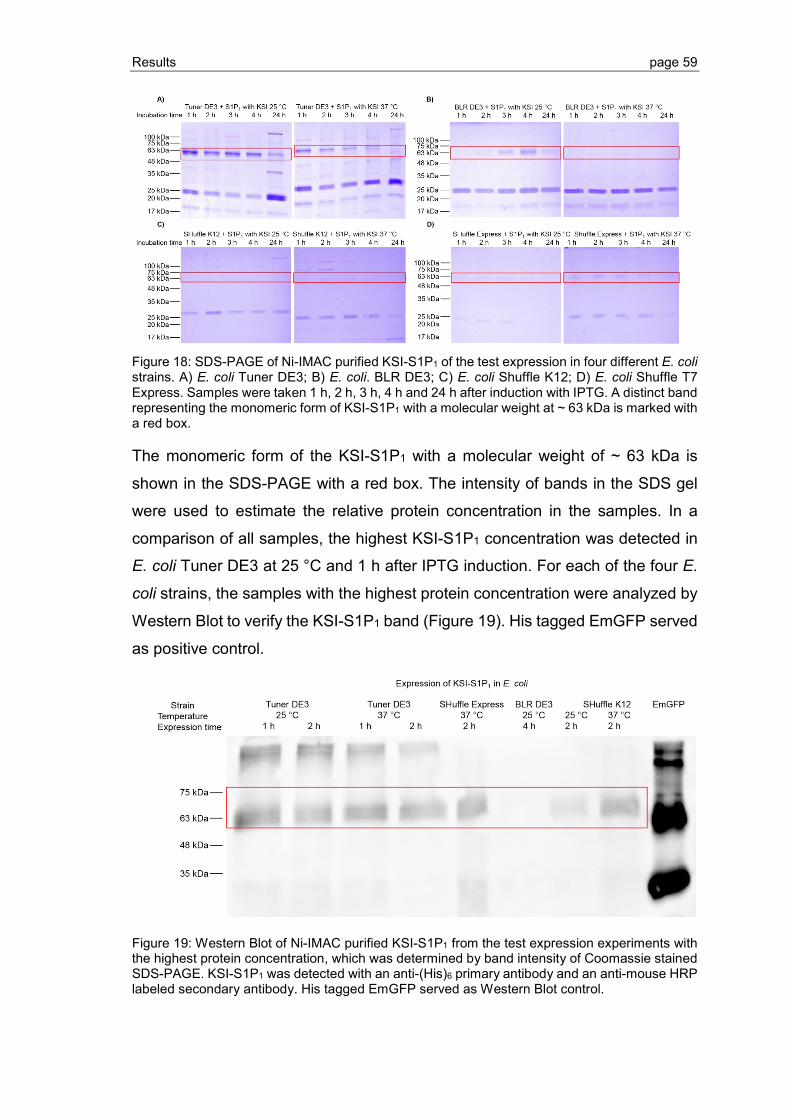
Results page 59
Figure 18: SDS-PAGE of Ni-IMAC purified KSI-S1P1 of the test expression in four different E. coli strains. A) E. coli Tuner DE3; B) E. coli. BLR DE3; C) E. coli Shuffle K12; D) E. coli Shuffle T7 Express. Samples were taken 1 h, 2 h, 3 h, 4 h and 24 h after induction with IPTG. A distinct band representing the monomeric form of KSI-S1P1 with a molecular weight at ~ 63 kDa is marked with a red box.
The monomeric form of the KSI-S1P1 with a molecular weight of ~ 63 kDa is
shown in the SDS-PAGE with a red box. The intensity of bands in the SDS gel
were used to estimate the relative protein concentration in the samples. In a
comparison of all samples, the highest KSI-S1P1 concentration was detected in
E. coli Tuner DE3 at 25 °C and 1 h after IPTG induction. For each of the four E.
coli strains, the samples with the highest protein concentration were analyzed by
Western Blot to verify the KSI-S1P1 band (Figure 19). His tagged EmGFP served
as positive control.
Figure 19: Western Blot of Ni-IMAC purified KSI-S1P1 from the test expression experiments with the highest protein concentration, which was determined by band intensity of Coomassie stained SDS-PAGE. KSI-S1P1 was detected with an anti-(His)6 primary antibody and an anti-mouse HRP labeled secondary antibody. His tagged EmGFP served as Western Blot control.
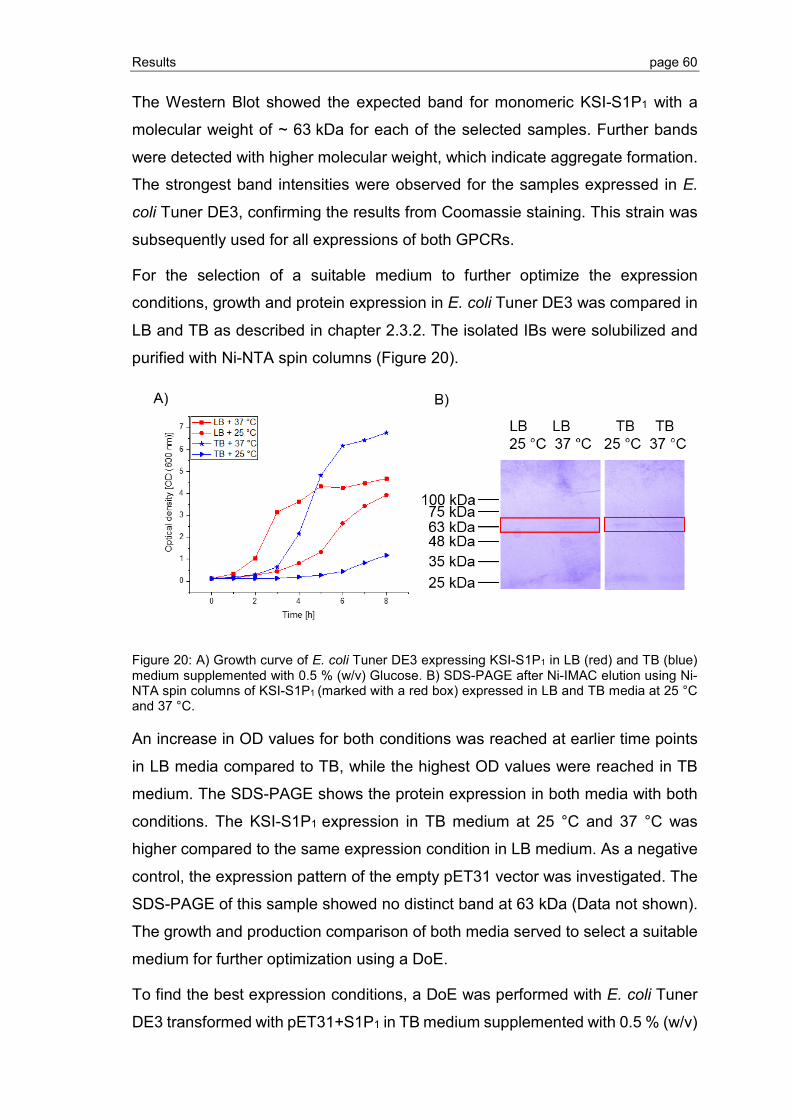
Results page 60
The Western Blot showed the expected band for monomeric KSI-S1P1 with a
molecular weight of ~ 63 kDa for each of the selected samples. Further bands
were detected with higher molecular weight, which indicate aggregate formation.
The strongest band intensities were observed for the samples expressed in E.
coli Tuner DE3, confirming the results from Coomassie staining. This strain was
subsequently used for all expressions of both GPCRs.
For the selection of a suitable medium to further optimize the expression
conditions, growth and protein expression in E. coli Tuner DE3 was compared in
LB and TB as described in chapter 2.3.2. The isolated IBs were solubilized and
purified with Ni-NTA spin columns (Figure 20).
Figure 20: A) Growth curve of E. coli Tuner DE3 expressing KSI-S1P1 in LB (red) and TB (blue) medium supplemented with 0.5 % (w/v) Glucose. B) SDS-PAGE after Ni-IMAC elution using Ni-NTA spin columns of KSI-S1P1 (marked with a red box) expressed in LB and TB media at 25 °C and 37 °C.
An increase in OD values for both conditions was reached at earlier time points
in LB media compared to TB, while the highest OD values were reached in TB
medium. The SDS-PAGE shows the protein expression in both media with both
conditions. The KSI-S1P1 expression in TB medium at 25 °C and 37 °C was
higher compared to the same expression condition in LB medium. As a negative
control, the expression pattern of the empty pET31 vector was investigated. The
SDS-PAGE of this sample showed no distinct band at 63 kDa (Data not shown).
The growth and production comparison of both media served to select a suitable
medium for further optimization using a DoE.
To find the best expression conditions, a DoE was performed with E. coli Tuner
DE3 transformed with pET31+S1P1 in TB medium supplemented with 0.5 % (w/v)
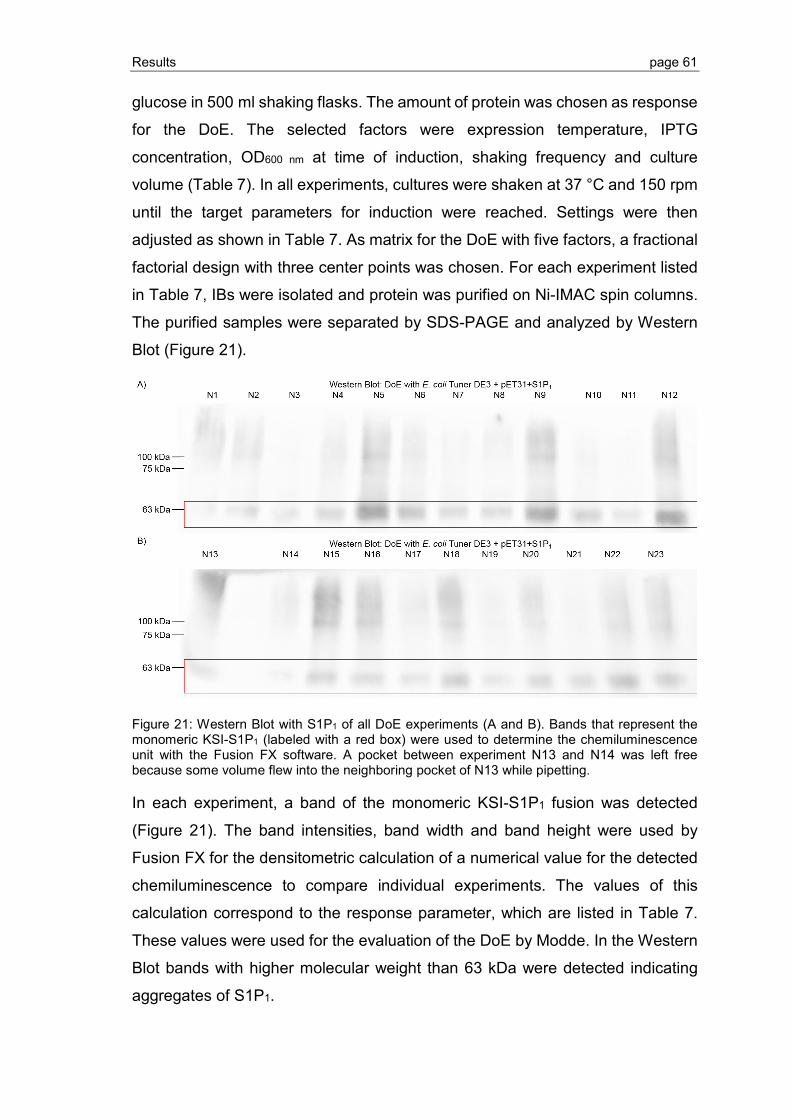
Results page 61
glucose in 500 ml shaking flasks. The amount of protein was chosen as response
for the DoE. The selected factors were expression temperature, IPTG
concentration, OD600 nm at time of induction, shaking frequency and culture
volume (Table 7). In all experiments, cultures were shaken at 37 °C and 150 rpm
until the target parameters for induction were reached. Settings were then
adjusted as shown in Table 7. As matrix for the DoE with five factors, a fractional
factorial design with three center points was chosen. For each experiment listed
in Table 7, IBs were isolated and protein was purified on Ni-IMAC spin columns.
The purified samples were separated by SDS-PAGE and analyzed by Western
Blot (Figure 21).
Figure 21: Western Blot with S1P1 of all DoE experiments (A and B). Bands that represent the monomeric KSI-S1P1 (labeled with a red box) were used to determine the chemiluminescence unit with the Fusion FX software. A pocket between experiment N13 and N14 was left free because some volume flew into the neighboring pocket of N13 while pipetting.
In each experiment, a band of the monomeric KSI-S1P1 fusion was detected
(Figure 21). The band intensities, band width and band height were used by
Fusion FX for the densitometric calculation of a numerical value for the detected
chemiluminescence to compare individual experiments. The values of this
calculation correspond to the response parameter, which are listed in Table 7.
These values were used for the evaluation of the DoE by Modde. In the Western
Blot bands with higher molecular weight than 63 kDa were detected indicating
aggregates of S1P1.

Results page 62
Table 7: List of selected factors, their values and the measured response (S1P1 amount) for the DoE to optimize expression of S1P1. The amount of S1P1 was determined by Western Blot. Each band intensity was used for the calculation of the densitometric unit, a numerical value determined with the software Fusion FX for the evaluation of protein amount.
Batch number
Expression temperature [°C]
IPTG [mM]
Induction OD(600 nm)
Shaking frequence [rpm]
Filling volume [%]
S1P1
densitometric unit
N1 25 2 1 90 25 490.729
N5 25 4 3 90 25 6.356.400
N8 25 4 1 150 25 1.884.739
N9 25 2 3 150 25 6.397.837
N12 25 4 1 90 50 6.040.046
N13 25 2 3 90 50 1.241.228
N15 25 2 1 150 50 2.081.280
N20 25 4 3 150 50 1.919.636
N2 31 2 1 90 25 1.701.384
N6 31 4 3 90 25 3.521.926
N16 31 4 1 150 50 1.639.244
N18 31 2 3 150 50 2.561.160
N3 37 4 1 90 25 926.953
N4 37 2 3 90 25 2.000.900
N7 37 2 1 150 25 1.871.657
N10 37 4 3 150 25 2.479.112
N11 37 2 1 90 50 1.157.052
N14 37 4 3 90 50 454.774
N17 37 4 1 150 50 1.155.995
N19 37 2 3 150 50 1.125.944
N21 N22 N23
37 37 37
4 4 4
3 3 3
150 150 150
50 50 50
1.679.731 2.519.642 2.229.545
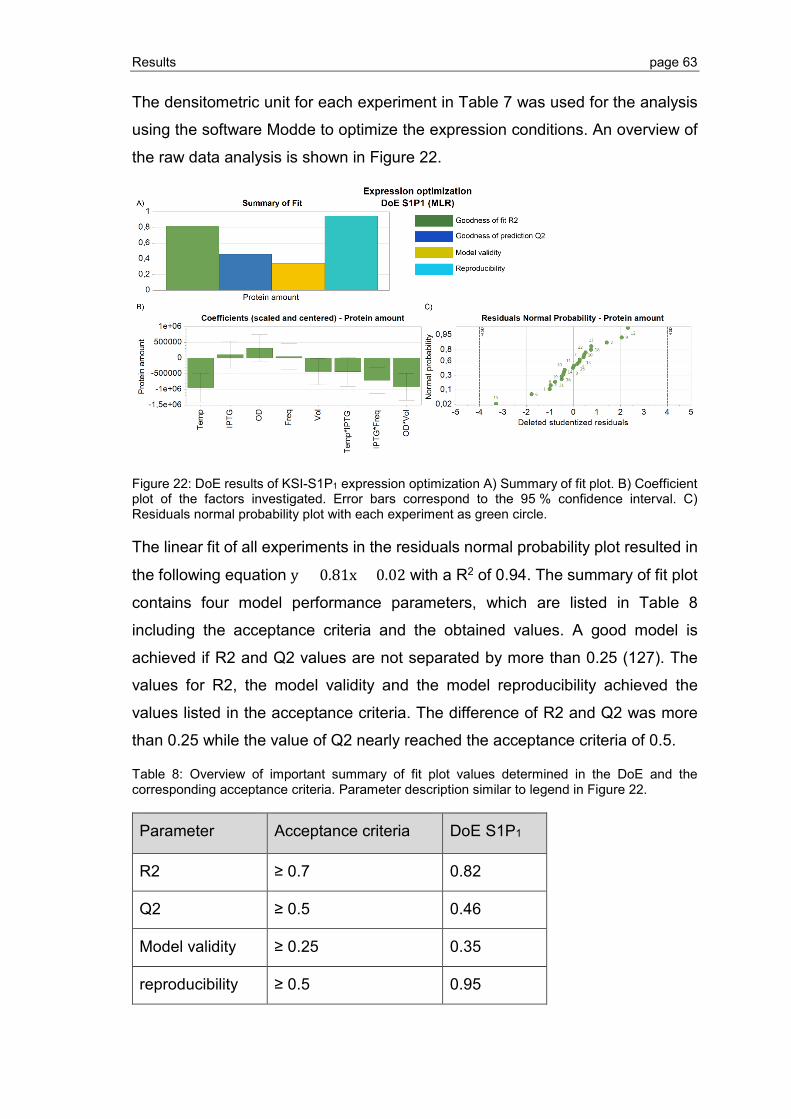
Results page 63
The densitometric unit for each experiment in Table 7 was used for the analysis
using the software Modde to optimize the expression conditions. An overview of
the raw data analysis is shown in Figure 22.
Figure 22: DoE results of KSI-S1P1 expression optimization A) Summary of fit plot. B) Coefficient plot of the factors investigated. Error bars correspond to the 95 % confidence interval. C) Residuals normal probability plot with each experiment as green circle.
The linear fit of all experiments in the residuals normal probability plot resulted in
the following equation y = 0.81x + 0.02 with a R2 of 0.94. The summary of fit plot
contains four model performance parameters, which are listed in Table 8
including the acceptance criteria and the obtained values. A good model is
achieved if R2 and Q2 values are not separated by more than 0.25 (127). The
values for R2, the model validity and the model reproducibility achieved the
values listed in the acceptance criteria. The difference of R2 and Q2 was more
than 0.25 while the value of Q2 nearly reached the acceptance criteria of 0.5.
Table 8: Overview of important summary of fit plot values determined in the DoE and the corresponding acceptance criteria. Parameter description similar to legend in Figure 22.
Parameter Acceptance criteria DoE S1P1
R2 ≥ 0.7 0.82
Q2 ≥ 0.5 0.46
Model validity ≥ 0.25 0.35
reproducibility ≥ 0.5 0.95
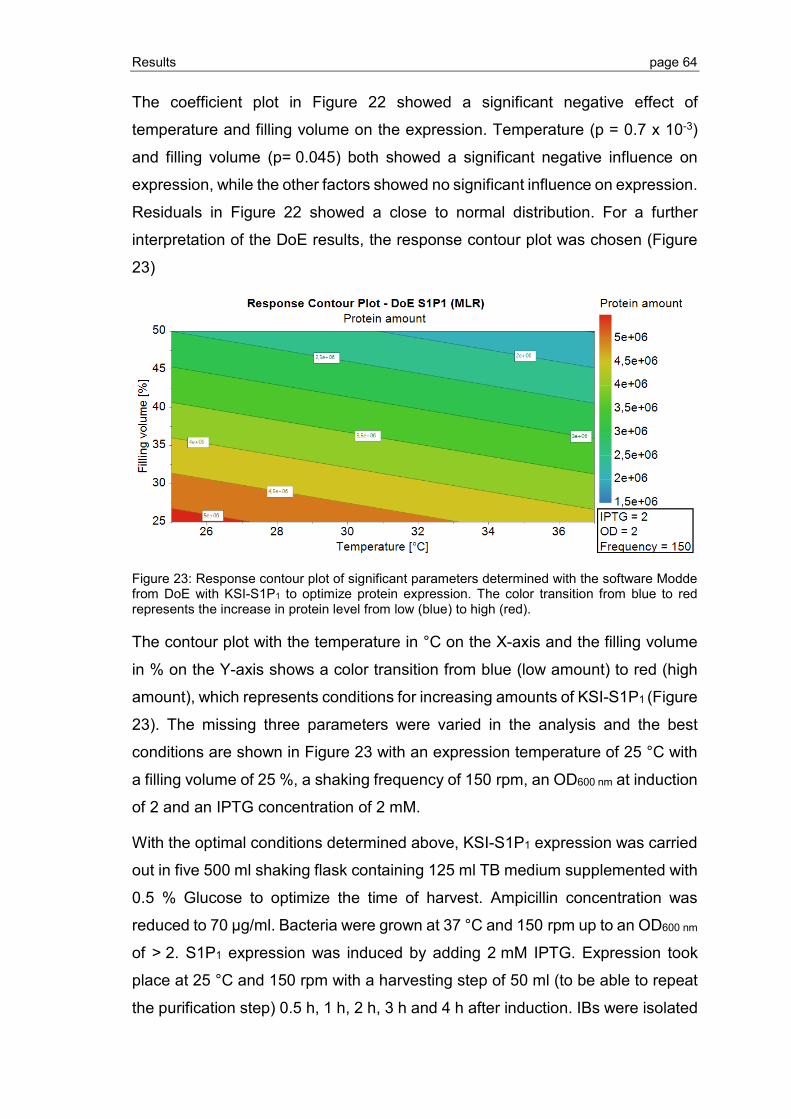
Results page 64
The coefficient plot in Figure 22 showed a significant negative effect of
temperature and filling volume on the expression. Temperature (p = 0.7 x 10⁻³)
and filling volume (p= 0.045) both showed a significant negative influence on
expression, while the other factors showed no significant influence on expression.
Residuals in Figure 22 showed a close to normal distribution. For a further
interpretation of the DoE results, the response contour plot was chosen (Figure
23)
Figure 23: Response contour plot of significant parameters determined with the software Modde from DoE with KSI-S1P1 to optimize protein expression. The color transition from blue to red represents the increase in protein level from low (blue) to high (red).
The contour plot with the temperature in °C on the X-axis and the filling volume
in % on the Y-axis shows a color transition from blue (low amount) to red (high
amount), which represents conditions for increasing amounts of KSI-S1P1 (Figure
23). The missing three parameters were varied in the analysis and the best
conditions are shown in Figure 23 with an expression temperature of 25 °C with
a filling volume of 25 %, a shaking frequency of 150 rpm, an OD600 nm at induction
of 2 and an IPTG concentration of 2 mM.
With the optimal conditions determined above, KSI-S1P1 expression was carried
out in five 500 ml shaking flask containing 125 ml TB medium supplemented with
0.5 % Glucose to optimize the time of harvest. Ampicillin concentration was
reduced to 70 µg/ml. Bacteria were grown at 37 °C and 150 rpm up to an OD600 nm
of > 2. S1P1 expression was induced by adding 2 mM IPTG. Expression took
place at 25 °C and 150 rpm with a harvesting step of 50 ml (to be able to repeat
the purification step) 0.5 h, 1 h, 2 h, 3 h and 4 h after induction. IBs were isolated

Results page 65
and GPCRs purified on Ni-IMAC spin columns. KSI-S1P1 expression was
analyzed with Coomassie stained SDS-PAGE and by Western Blot (Figure 24).
Figure 24: Different time points of harvest for KSI-S1P1 expression with conditions determined above. Expression was analyzed by Coomassie stained SDS-PAGE (left) and Western Blot (right). Bands representing monomeric KSI-S1P1 are marked with a red box. His tagged EmGFP served as positive control.
For all time points of harvest, a band representing the monomeric KSI-S1P1 was
detected. Band intensity was highest 1 h after induction both on SDS-PAGE and
Western Blot. Compared to the expression in Figure 20, the protein level was
increased, most likely due to optimized conditions and the reduction of ampicillin
concentration. The above determined optimal expression conditions were used
for all further expression experiments. Additionally, these expression conditions
were successfully applied to the KSI-GPR3 expression (Data not shown).
3.1.2 S1P1 purification, refolding and thrombin cleavage
The thrombin cleavage was established with KSI-S1P1 refolded in Fos-Choline
14 micelles. By using spin columns loaded with Ni-NTA slurry, the thrombin
cleavage was compared with KSI-S1P1 column-bound and in solution. For
establishing the cleavage, different concentrations of thrombin and durations of
incubation were tested. In order to make the thrombin cleavage site more
accessible, low urea concentrations were added to the cleavage reaction in order
to improve the yield of thrombin cleavage. To improve the receptor refolding and
to increase the sample purity, protein purification and refolding was carried out
with prepacked Ni-IMAC columns using the ÄKTA purifier chromatography
system. In further steps to improve the thrombin digestion with the aim of a
complete thrombin cleavage, different detergents in combination with the
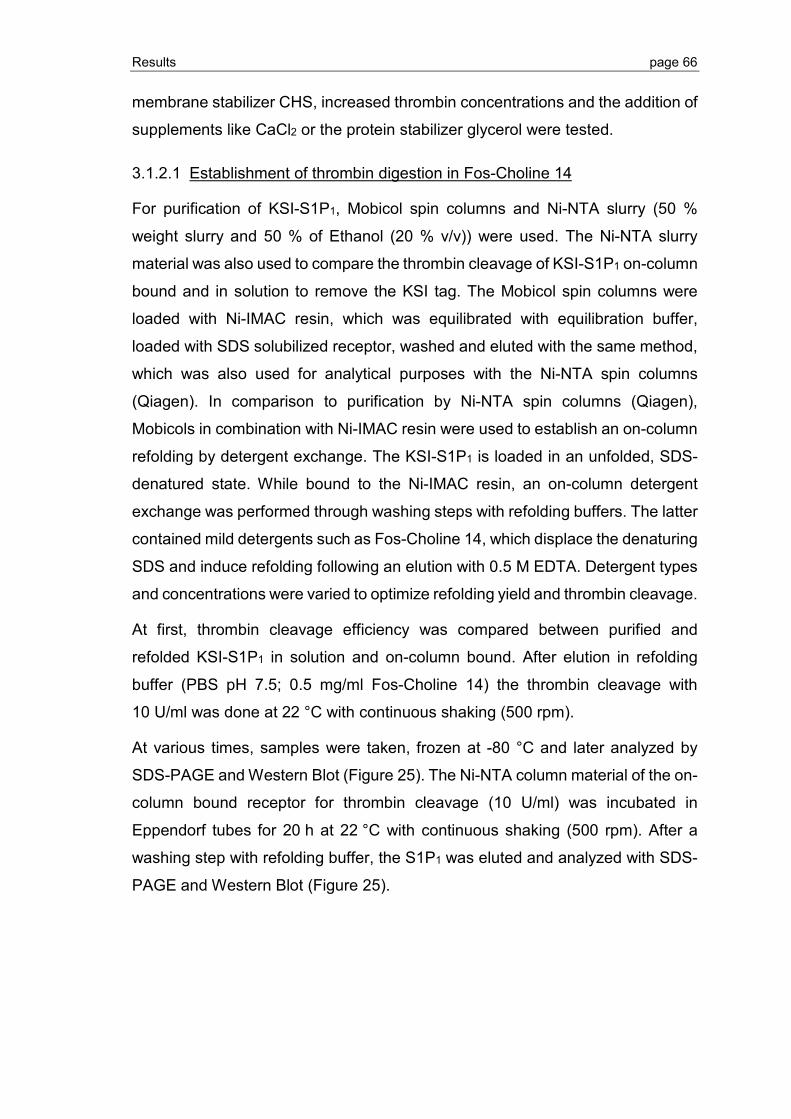
Results page 66
membrane stabilizer CHS, increased thrombin concentrations and the addition of
supplements like CaCl2 or the protein stabilizer glycerol were tested.
3.1.2.1 Establishment of thrombin digestion in Fos-Choline 14
For purification of KSI-S1P1, Mobicol spin columns and Ni-NTA slurry (50 %
weight slurry and 50 % of Ethanol (20 % v/v)) were used. The Ni-NTA slurry
material was also used to compare the thrombin cleavage of KSI-S1P1 on-column
bound and in solution to remove the KSI tag. The Mobicol spin columns were
loaded with Ni-IMAC resin, which was equilibrated with equilibration buffer,
loaded with SDS solubilized receptor, washed and eluted with the same method,
which was also used for analytical purposes with the Ni-NTA spin columns
(Qiagen). In comparison to purification by Ni-NTA spin columns (Qiagen),
Mobicols in combination with Ni-IMAC resin were used to establish an on-column
refolding by detergent exchange. The KSI-S1P1 is loaded in an unfolded, SDS-
denatured state. While bound to the Ni-IMAC resin, an on-column detergent
exchange was performed through washing steps with refolding buffers. The latter
contained mild detergents such as Fos-Choline 14, which displace the denaturing
SDS and induce refolding following an elution with 0.5 M EDTA. Detergent types
and concentrations were varied to optimize refolding yield and thrombin cleavage.
At first, thrombin cleavage efficiency was compared between purified and
refolded KSI-S1P1 in solution and on-column bound. After elution in refolding
buffer (PBS pH 7.5; 0.5 mg/ml Fos-Choline 14) the thrombin cleavage with
10 U/ml was done at 22 °C with continuous shaking (500 rpm).
At various times, samples were taken, frozen at -80 °C and later analyzed by
SDS-PAGE and Western Blot (Figure 25). The Ni-NTA column material of the on-
column bound receptor for thrombin cleavage (10 U/ml) was incubated in
Eppendorf tubes for 20 h at 22 °C with continuous shaking (500 rpm). After a
washing step with refolding buffer, the S1P1 was eluted and analyzed with SDS-
PAGE and Western Blot (Figure 25).
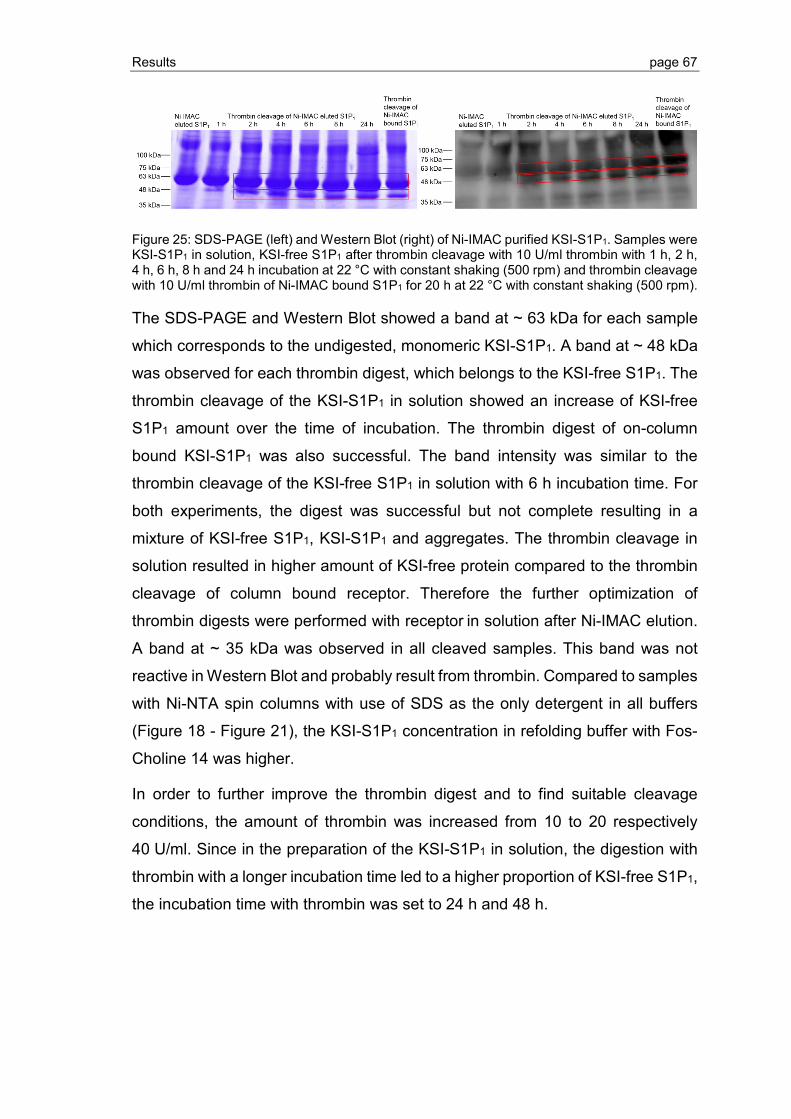
Results page 67
Figure 25: SDS-PAGE (left) and Western Blot (right) of Ni-IMAC purified KSI-S1P1. Samples were KSI-S1P1 in solution, KSI-free S1P1 after thrombin cleavage with 10 U/ml thrombin with 1 h, 2 h, 4 h, 6 h, 8 h and 24 h incubation at 22 °C with constant shaking (500 rpm) and thrombin cleavage with 10 U/ml thrombin of Ni-IMAC bound S1P1 for 20 h at 22 °C with constant shaking (500 rpm).
The SDS-PAGE and Western Blot showed a band at ~ 63 kDa for each sample
which corresponds to the undigested, monomeric KSI-S1P1. A band at ~ 48 kDa
was observed for each thrombin digest, which belongs to the KSI-free S1P1. The
thrombin cleavage of the KSI-S1P1 in solution showed an increase of KSI-free
S1P1 amount over the time of incubation. The thrombin digest of on-column
bound KSI-S1P1 was also successful. The band intensity was similar to the
thrombin cleavage of the KSI-free S1P1 in solution with 6 h incubation time. For
both experiments, the digest was successful but not complete resulting in a
mixture of KSI-free S1P1, KSI-S1P1 and aggregates. The thrombin cleavage in
solution resulted in higher amount of KSI-free protein compared to the thrombin
cleavage of column bound receptor. Therefore the further optimization of
thrombin digests were performed with receptor in solution after Ni-IMAC elution.
A band at ~ 35 kDa was observed in all cleaved samples. This band was not
reactive in Western Blot and probably result from thrombin. Compared to samples
with Ni-NTA spin columns with use of SDS as the only detergent in all buffers
(Figure 18 - Figure 21), the KSI-S1P1 concentration in refolding buffer with Fos-
Choline 14 was higher.
In order to further improve the thrombin digest and to find suitable cleavage
conditions, the amount of thrombin was increased from 10 to 20 respectively
40 U/ml. Since in the preparation of the KSI-S1P1 in solution, the digestion with
thrombin with a longer incubation time led to a higher proportion of KSI-free S1P1,
the incubation time with thrombin was set to 24 h and 48 h.
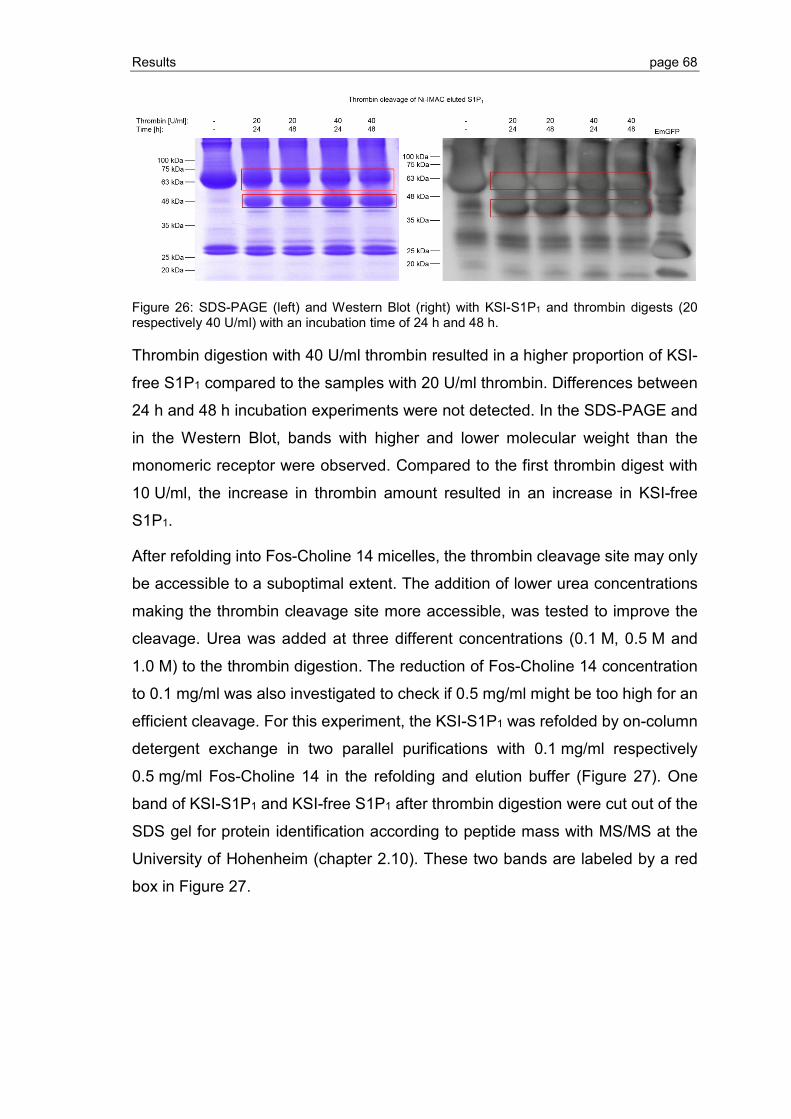
Results page 68
Figure 26: SDS-PAGE (left) and Western Blot (right) with KSI-S1P1 and thrombin digests (20 respectively 40 U/ml) with an incubation time of 24 h and 48 h.
Thrombin digestion with 40 U/ml thrombin resulted in a higher proportion of KSI-
free S1P1 compared to the samples with 20 U/ml thrombin. Differences between
24 h and 48 h incubation experiments were not detected. In the SDS-PAGE and
in the Western Blot, bands with higher and lower molecular weight than the
monomeric receptor were observed. Compared to the first thrombin digest with
10 U/ml, the increase in thrombin amount resulted in an increase in KSI-free
S1P1.
After refolding into Fos-Choline 14 micelles, the thrombin cleavage site may only
be accessible to a suboptimal extent. The addition of lower urea concentrations
making the thrombin cleavage site more accessible, was tested to improve the
cleavage. Urea was added at three different concentrations (0.1 M, 0.5 M and
1.0 M) to the thrombin digestion. The reduction of Fos-Choline 14 concentration
to 0.1 mg/ml was also investigated to check if 0.5 mg/ml might be too high for an
efficient cleavage. For this experiment, the KSI-S1P1 was refolded by on-column
detergent exchange in two parallel purifications with 0.1 mg/ml respectively
0.5 mg/ml Fos-Choline 14 in the refolding and elution buffer (Figure 27). One
band of KSI-S1P1 and KSI-free S1P1 after thrombin digestion were cut out of the
SDS gel for protein identification according to peptide mass with MS/MS at the
University of Hohenheim (chapter 2.10). These two bands are labeled by a red
box in Figure 27.
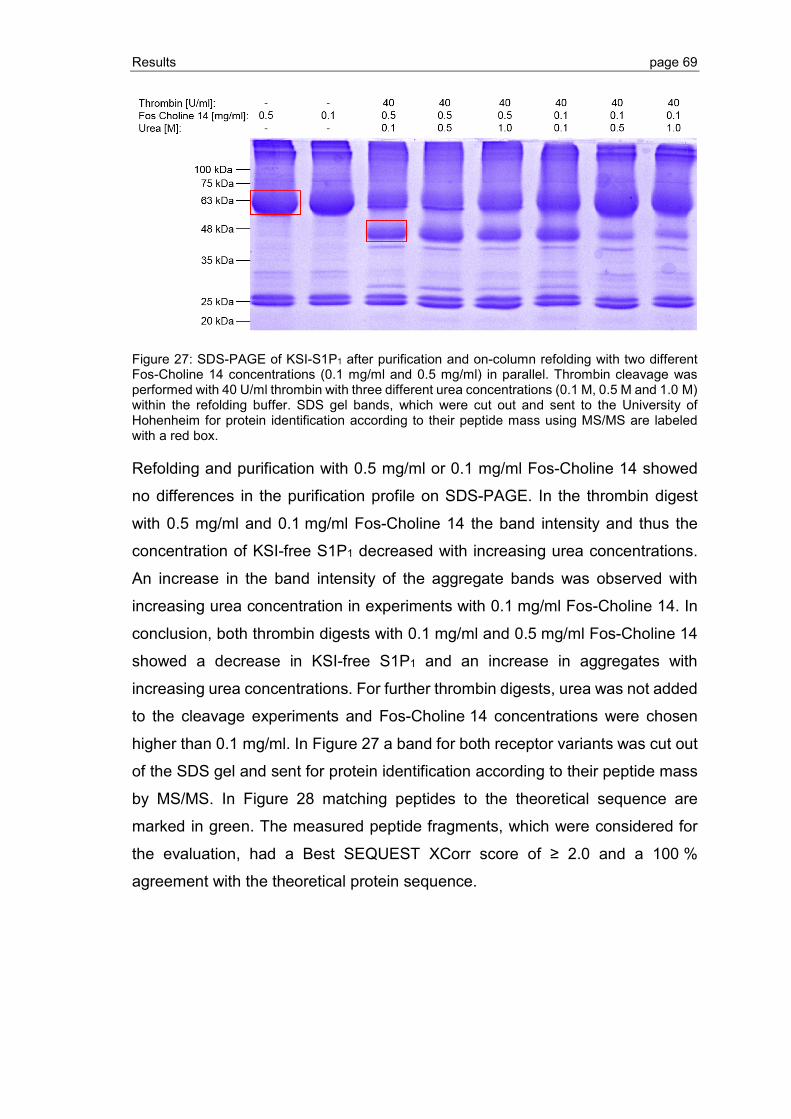
Results page 69
Figure 27: SDS-PAGE of KSI-S1P1 after purification and on-column refolding with two different Fos-Choline 14 concentrations (0.1 mg/ml and 0.5 mg/ml) in parallel. Thrombin cleavage was performed with 40 U/ml thrombin with three different urea concentrations (0.1 M, 0.5 M and 1.0 M) within the refolding buffer. SDS gel bands, which were cut out and sent to the University of Hohenheim for protein identification according to their peptide mass using MS/MS are labeled with a red box.
Refolding and purification with 0.5 mg/ml or 0.1 mg/ml Fos-Choline 14 showed
no differences in the purification profile on SDS-PAGE. In the thrombin digest
with 0.5 mg/ml and 0.1 mg/ml Fos-Choline 14 the band intensity and thus the
concentration of KSI-free S1P1 decreased with increasing urea concentrations.
An increase in the band intensity of the aggregate bands was observed with
increasing urea concentration in experiments with 0.1 mg/ml Fos-Choline 14. In
conclusion, both thrombin digests with 0.1 mg/ml and 0.5 mg/ml Fos-Choline 14
showed a decrease in KSI-free S1P1 and an increase in aggregates with
increasing urea concentrations. For further thrombin digests, urea was not added
to the cleavage experiments and Fos-Choline 14 concentrations were chosen
higher than 0.1 mg/ml. In Figure 27 a band for both receptor variants was cut out
of the SDS gel and sent for protein identification according to their peptide mass
by MS/MS. In Figure 28 matching peptides to the theoretical sequence are
marked in green. The measured peptide fragments, which were considered for
the evaluation, had a Best SEQUEST XCorr score of ≥ 2.0 and a 100 %
agreement with the theoretical protein sequence.
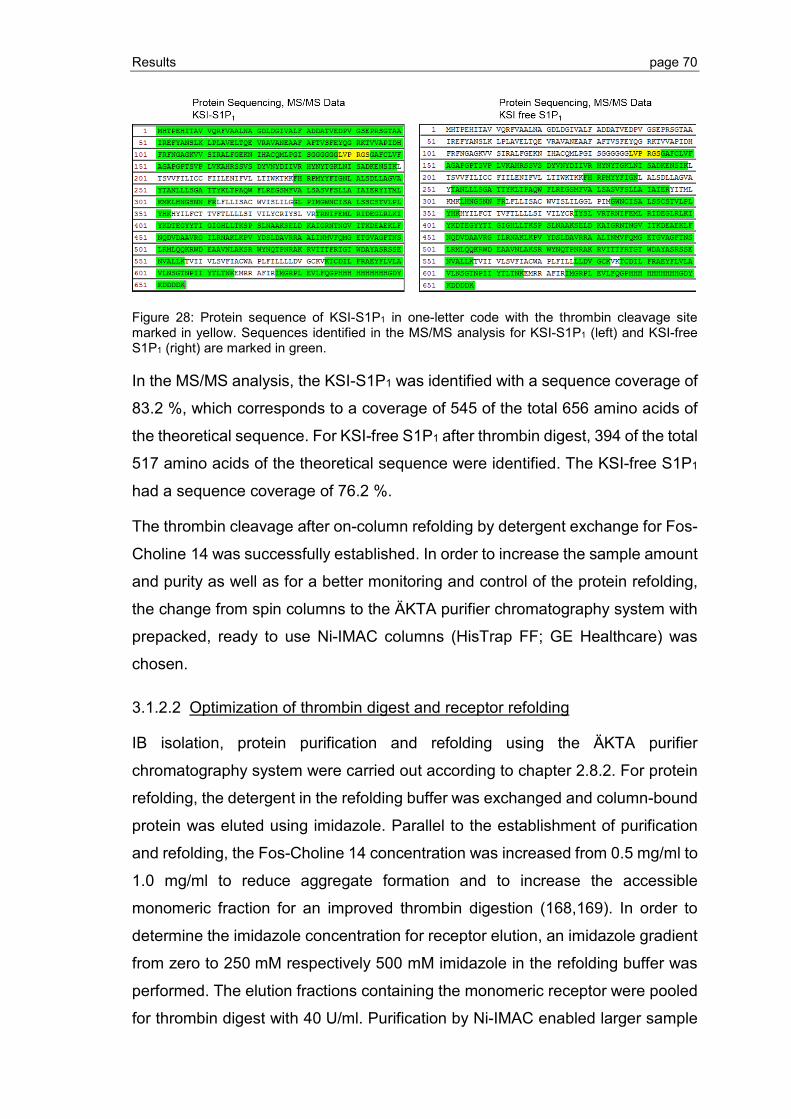
Results page 70
Figure 28: Protein sequence of KSI-S1P1 in one-letter code with the thrombin cleavage site marked in yellow. Sequences identified in the MS/MS analysis for KSI-S1P1 (left) and KSI-free S1P1 (right) are marked in green.
In the MS/MS analysis, the KSI-S1P1 was identified with a sequence coverage of
83.2 %, which corresponds to a coverage of 545 of the total 656 amino acids of
the theoretical sequence. For KSI-free S1P1 after thrombin digest, 394 of the total
517 amino acids of the theoretical sequence were identified. The KSI-free S1P1
had a sequence coverage of 76.2 %.
The thrombin cleavage after on-column refolding by detergent exchange for Fos-
Choline 14 was successfully established. In order to increase the sample amount
and purity as well as for a better monitoring and control of the protein refolding,
the change from spin columns to the ÄKTA purifier chromatography system with
prepacked, ready to use Ni-IMAC columns (HisTrap FF; GE Healthcare) was
chosen.
3.1.2.2 Optimization of thrombin digest and receptor refolding
IB isolation, protein purification and refolding using the ÄKTA purifier
chromatography system were carried out according to chapter 2.8.2. For protein
refolding, the detergent in the refolding buffer was exchanged and column-bound
protein was eluted using imidazole. Parallel to the establishment of purification
and refolding, the Fos-Choline 14 concentration was increased from 0.5 mg/ml to
1.0 mg/ml to reduce aggregate formation and to increase the accessible
monomeric fraction for an improved thrombin digestion (168,169). In order to
determine the imidazole concentration for receptor elution, an imidazole gradient
from zero to 250 mM respectively 500 mM imidazole in the refolding buffer was
performed. The elution fractions containing the monomeric receptor were pooled
for thrombin digest with 40 U/ml. Purification by Ni-IMAC enabled larger sample

Results page 71
volumes to be loaded. Elution occurred at imidazole concentrations of ~ 250 mM
for both Fos-Choline 14 concentrations. For further purification and refolding
steps, a step elution with 250 mM imidazole in the refolding buffer was chosen.
All thrombin digestion experiments with imidazole eluted S1P1 were not
successful. Imidazole at concentrations of more than 50 mM might interfere with
thrombin digests (114). To enable the thrombin digest after Ni-IMAC elution,
imidazole was removed by overnight dialysis against an excess of refolding buffer
with 0.5 mg/ml Fos-Choline 14 prior to thrombin digest. Thrombin concentration
was raised from 40 U/ml to 200 U/ml with the aim of a complete digest within 24 h
at 22 °C (Figure 29) with the addition of 2.5 mM CaCl2 based on the comparison
with published thrombin cleavage buffers in (145,170).
Figure 29: Chromatogram (A) and SDS-PAGE of KSI-S1P1 purified by Ni-IMAC (B). In the chromatogram the conductivity was shown in brown and the UV signal in blue. The S1P1 was step eluted with 250 mM imidazole and 0.5 mg/ml Fos-Choline 14. The supernatants of the IB washing steps, the flow through of sample loading as well as sample washing and protein elution were applied as samples. The thrombin cleavage with 200 U/ml after dialysis and the sample with addition of 2.5 mM CaCl2 were analyzed.
In Figure 29 KSI-S1P1 is not detected in the IB wash steps, in the Ni-IMAC flow
through and in the protein refolding step. The band pattern of the sample on SDS-
PAGE was not affected by dialysis. The thrombin digest with dialyzed S1P1 and
the experiment with CaCl2 addition was much better compared to the thrombin
digest without the dialysis step.
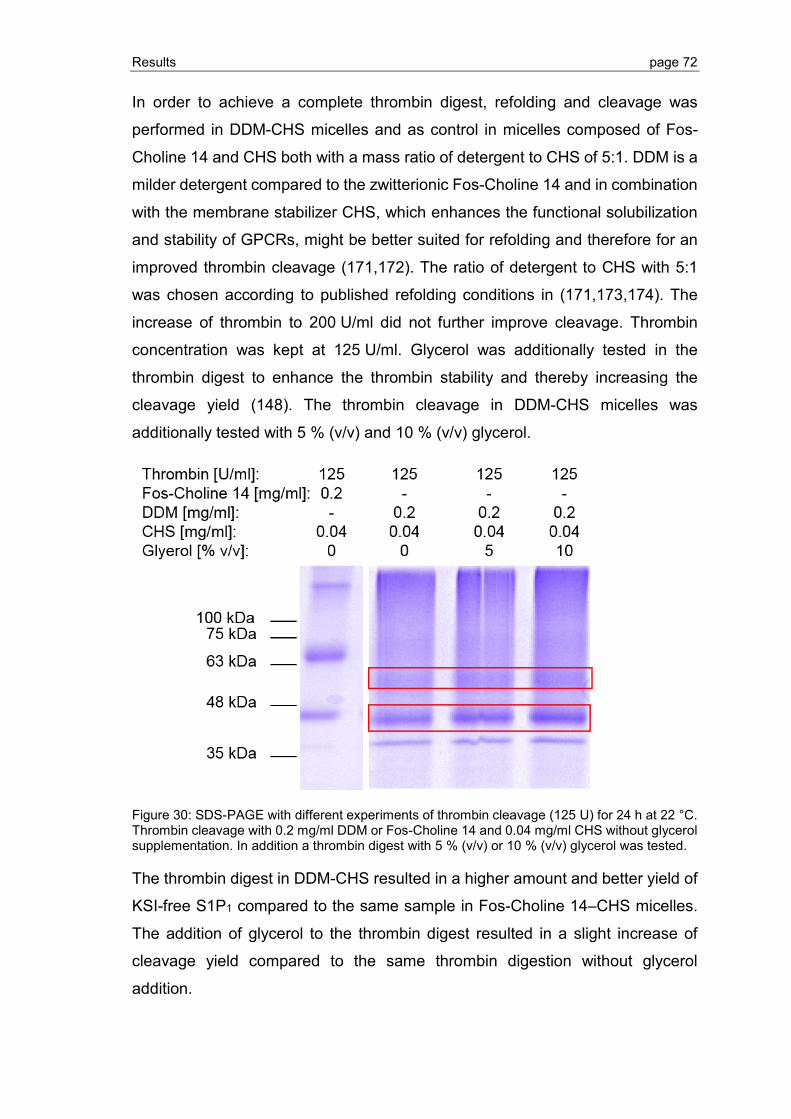
Results page 72
In order to achieve a complete thrombin digest, refolding and cleavage was
performed in DDM-CHS micelles and as control in micelles composed of Fos-
Choline 14 and CHS both with a mass ratio of detergent to CHS of 5:1. DDM is a
milder detergent compared to the zwitterionic Fos-Choline 14 and in combination
with the membrane stabilizer CHS, which enhances the functional solubilization
and stability of GPCRs, might be better suited for refolding and therefore for an
improved thrombin cleavage (171,172). The ratio of detergent to CHS with 5:1
was chosen according to published refolding conditions in (171,173,174). The
increase of thrombin to 200 U/ml did not further improve cleavage. Thrombin
concentration was kept at 125 U/ml. Glycerol was additionally tested in the
thrombin digest to enhance the thrombin stability and thereby increasing the
cleavage yield (148). The thrombin cleavage in DDM-CHS micelles was
additionally tested with 5 % (v/v) and 10 % (v/v) glycerol.
Figure 30: SDS-PAGE with different experiments of thrombin cleavage (125 U) for 24 h at 22 °C. Thrombin cleavage with 0.2 mg/ml DDM or Fos-Choline 14 and 0.04 mg/ml CHS without glycerol supplementation. In addition a thrombin digest with 5 % (v/v) or 10 % (v/v) glycerol was tested.
The thrombin digest in DDM-CHS resulted in a higher amount and better yield of
KSI-free S1P1 compared to the same sample in Fos-Choline 14–CHS micelles.
The addition of glycerol to the thrombin digest resulted in a slight increase of
cleavage yield compared to the same thrombin digestion without glycerol
addition.
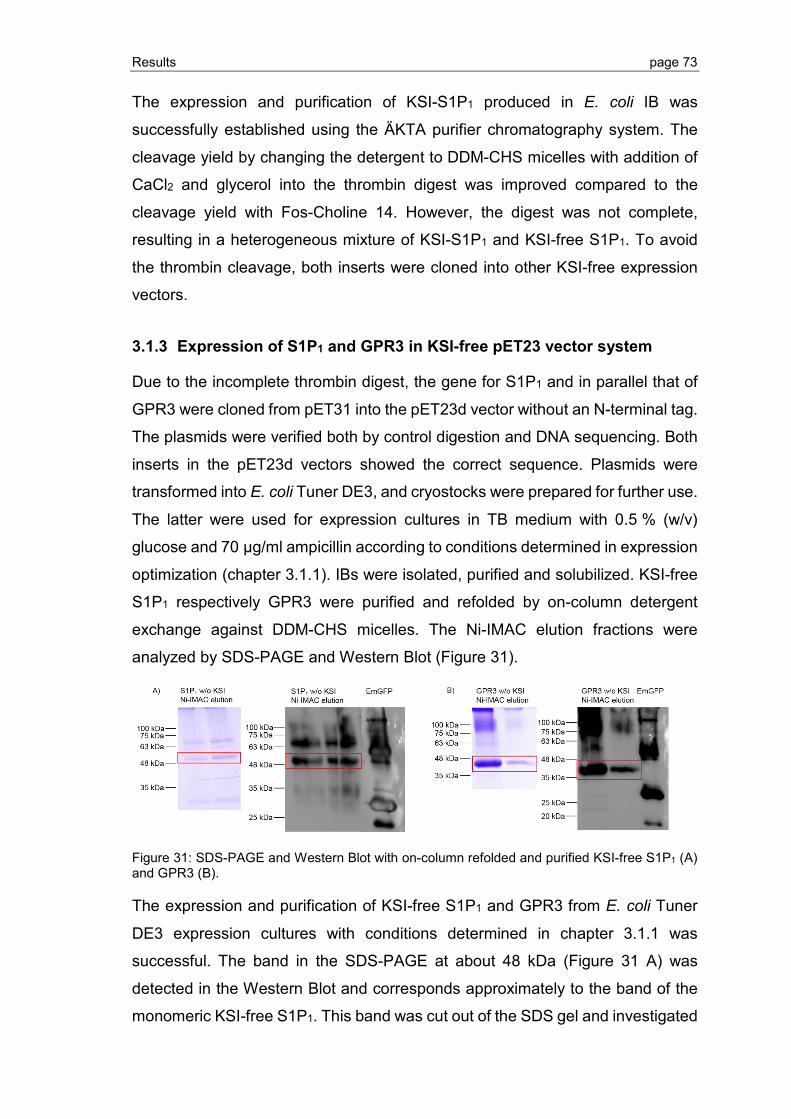
Results page 73
The expression and purification of KSI-S1P1 produced in E. coli IB was
successfully established using the ÄKTA purifier chromatography system. The
cleavage yield by changing the detergent to DDM-CHS micelles with addition of
CaCl2 and glycerol into the thrombin digest was improved compared to the
cleavage yield with Fos-Choline 14. However, the digest was not complete,
resulting in a heterogeneous mixture of KSI-S1P1 and KSI-free S1P1. To avoid
the thrombin cleavage, both inserts were cloned into other KSI-free expression
vectors.
3.1.3 Expression of S1P1 and GPR3 in KSI-free pET23 vector system
Due to the incomplete thrombin digest, the gene for S1P1 and in parallel that of
GPR3 were cloned from pET31 into the pET23d vector without an N-terminal tag.
The plasmids were verified both by control digestion and DNA sequencing. Both
inserts in the pET23d vectors showed the correct sequence. Plasmids were
transformed into E. coli Tuner DE3, and cryostocks were prepared for further use.
The latter were used for expression cultures in TB medium with 0.5 % (w/v)
glucose and 70 µg/ml ampicillin according to conditions determined in expression
optimization (chapter 3.1.1). IBs were isolated, purified and solubilized. KSI-free
S1P1 respectively GPR3 were purified and refolded by on-column detergent
exchange against DDM-CHS micelles. The Ni-IMAC elution fractions were
analyzed by SDS-PAGE and Western Blot (Figure 31).
Figure 31: SDS-PAGE and Western Blot with on-column refolded and purified KSI-free S1P1 (A) and GPR3 (B).
The expression and purification of KSI-free S1P1 and GPR3 from E. coli Tuner
DE3 expression cultures with conditions determined in chapter 3.1.1 was
successful. The band in the SDS-PAGE at about 48 kDa (Figure 31 A) was
detected in the Western Blot and corresponds approximately to the band of the
monomeric KSI-free S1P1. This band was cut out of the SDS gel and investigated
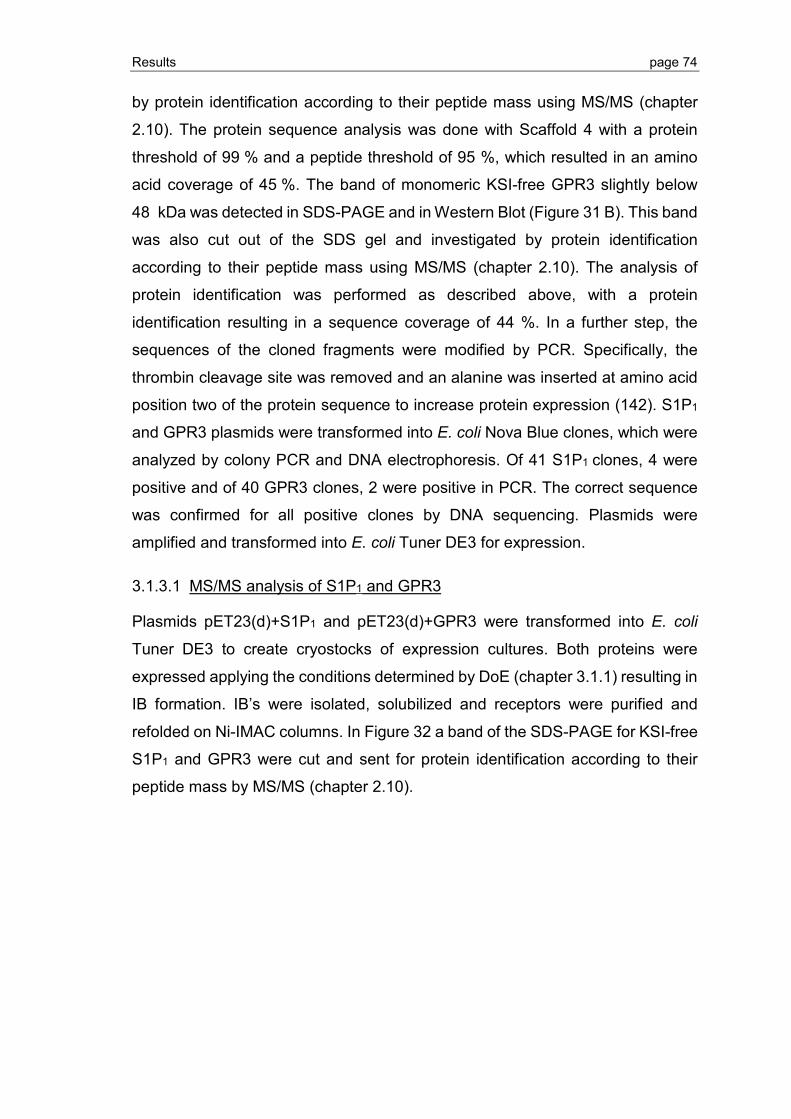
Results page 74
by protein identification according to their peptide mass using MS/MS (chapter
2.10). The protein sequence analysis was done with Scaffold 4 with a protein
threshold of 99 % and a peptide threshold of 95 %, which resulted in an amino
acid coverage of 45 %. The band of monomeric KSI-free GPR3 slightly below
48 kDa was detected in SDS-PAGE and in Western Blot (Figure 31 B). This band
was also cut out of the SDS gel and investigated by protein identification
according to their peptide mass using MS/MS (chapter 2.10). The analysis of
protein identification was performed as described above, with a protein
identification resulting in a sequence coverage of 44 %. In a further step, the
sequences of the cloned fragments were modified by PCR. Specifically, the
thrombin cleavage site was removed and an alanine was inserted at amino acid
position two of the protein sequence to increase protein expression (142). S1P1
and GPR3 plasmids were transformed into E. coli Nova Blue clones, which were
analyzed by colony PCR and DNA electrophoresis. Of 41 S1P1 clones, 4 were
positive and of 40 GPR3 clones, 2 were positive in PCR. The correct sequence
was confirmed for all positive clones by DNA sequencing. Plasmids were
amplified and transformed into E. coli Tuner DE3 for expression.
3.1.3.1 MS/MS analysis of S1P1 and GPR3
Plasmids pET23(d)+S1P1 and pET23(d)+GPR3 were transformed into E. coli
Tuner DE3 to create cryostocks of expression cultures. Both proteins were
expressed applying the conditions determined by DoE (chapter 3.1.1) resulting in
IB formation. IB’s were isolated, solubilized and receptors were purified and
refolded on Ni-IMAC columns. In Figure 32 a band of the SDS-PAGE for KSI-free
S1P1 and GPR3 were cut and sent for protein identification according to their
peptide mass by MS/MS (chapter 2.10).
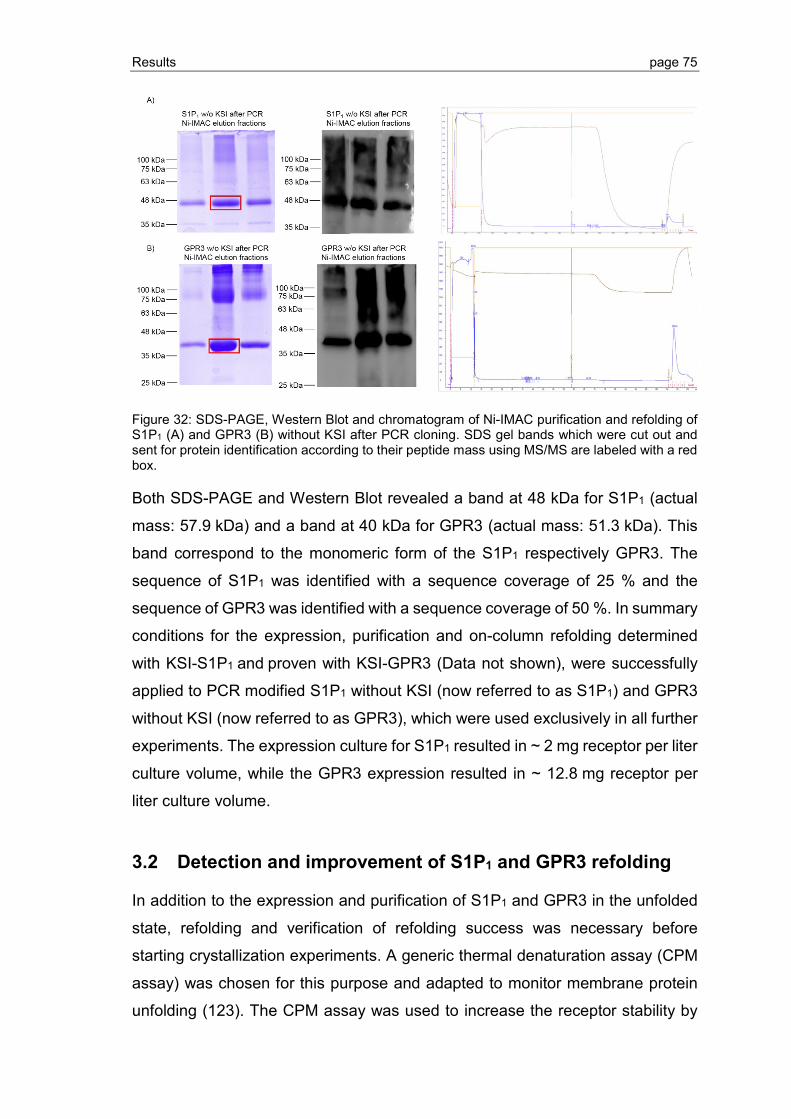
Results page 75
Figure 32: SDS-PAGE, Western Blot and chromatogram of Ni-IMAC purification and refolding of S1P1 (A) and GPR3 (B) without KSI after PCR cloning. SDS gel bands which were cut out and sent for protein identification according to their peptide mass using MS/MS are labeled with a red box.
Both SDS-PAGE and Western Blot revealed a band at 48 kDa for S1P1 (actual
mass: 57.9 kDa) and a band at 40 kDa for GPR3 (actual mass: 51.3 kDa). This
band correspond to the monomeric form of the S1P1 respectively GPR3. The
sequence of S1P1 was identified with a sequence coverage of 25 % and the
sequence of GPR3 was identified with a sequence coverage of 50 %. In summary
conditions for the expression, purification and on-column refolding determined
with KSI-S1P1 and proven with KSI-GPR3 (Data not shown), were successfully
applied to PCR modified S1P1 without KSI (now referred to as S1P1) and GPR3
without KSI (now referred to as GPR3), which were used exclusively in all further
experiments. The expression culture for S1P1 resulted in ~ 2 mg receptor per liter
culture volume, while the GPR3 expression resulted in ~ 12.8 mg receptor per
liter culture volume.
3.2 Detection and improvement of S1P1 and GPR3 refolding
In addition to the expression and purification of S1P1 and GPR3 in the unfolded
state, refolding and verification of refolding success was necessary before
starting crystallization experiments. A generic thermal denaturation assay (CPM
assay) was chosen for this purpose and adapted to monitor membrane protein
unfolding (123). The CPM assay was used to increase the receptor stability by
Results page 76
detergent screening, optimization of the refolding buffer composition, ligand
binding as well as refolding into mixed-micelle composed of detergent and lipids.
Higher receptor stability will increase the likelihood of a successful protein
crystallization.
3.2.1 Establishment of the CPM assay
The basis for establishing the refolding assay was provided by A. Alexandrov’s
publication in 2008 (123) in which β-LG was used for assay optimization and as
positive control. The assay is based on the reaction of a fluorescent probe (CPM)
with free cysteins becoming exposed upon denaturation. Samples were heated
from 20 to 90 °C while monitoring fluorescence of the reaction product. The
transition temperature TM of the protein can thus be detected by determining the
inflection point of the sigmoidal melting curve. At first, results form (123) were
reproduced using β-LG at various concentrations. The resulting melting curves
are shown in Figure 33. Reproducibility and robustness of the CPM assay
assessed in 18 replicates of ß-LG denaturation (Figure 33).
Figure 33: A) Unfolding transition of repeated CPM assays with 4 µg, 8 µg, 10 µg, 12 µg, 16 µg and 20 µg β-LG after blank deduction. The CPM assay was performed in triplicates. B) Unfolding transition of the CPM assay with 8 µg β-LG in triplicates after blank deduction, the assay was repeated 18 times for measurement of reproducibility and robustness.
A sigmoidal transition was detected for all samples with 4 µg to 20 µg β-LG
(Figure 33 A). An overall sigmoidal fluorescence increase, apparently consisting
of at least two transitions, was observed for all samples containing protein, but
not for buffer-only and buffer-dye negative controls. The melting curves differed
in the intensity of the fluorescence signal, which was higher with an increasing
amount of β-LG that was also observed in (123). The most consistent results
Results page 77
regarding curves and melting point were obtained using 8 µg and 10 µg β-LG per
experiment. These samples were used as positive control for further CPM
assays. By fitting to the Boltzmann sigmoidal equation (chapter 2.9), TM values
of these samples were calculated. The mean value of TM for 8 µg β-LG was
74.7 °C ± 1.6 °C and the mean value of TM for 10 µg β-LG was 75.9 °C ± 1.0 °C
compared to reported TM values of 75 °C – 76 °C for β-LG in (123). The
experiment with 8 µg β-LG was used to show reproducibility and robustness of
the CPM assay (Figure 33 B). Differences within these 18 CPM assays were
detected in the maximum value of the fluorescence signal. For each of the CPM
assays, the TM was additionally determined as above. The mean value of the TM
was 71.4 °C ± 2.9 °C compared to 75 °C – 76 °C in (123). The reproducibility and
robustness of the CPM assay was successfully demonstrated with β-LG. This
established assay is thus suitable for detecting the protein refolding.
3.2.2 Refolding of S1P1 and GPR3 purified by Ni-IMAC
The CPM assay was then used to assess the folding state of S1P1 and GPR3.
Both receptors were isolated from E. coli IB in the SDS solubilized, denatured
state and bound to the Ni-IMAC column via their His tag. On-column refolding of
S1P1 or GPR3 required exchanging the denaturing SDS for a milder detergent or
detergent-lipid mixture, providing a more membrane-like environment (175,176).
The refolding of bound S1P1 or GPR3 in detergent micelles was achieved by a
detergent exchange on the Ni-IMAC column. Prior to the CPM assay, the elution
fractions containing S1P1 or GPR3 were dialyzed over night against the refolding
buffer (without imidazole). The CPM assay for determining the refolding of S1P1
and GPR3 is shown in Figure 34. 10 µg of each protein were used in the CPM
assay, which was done in triplicates.
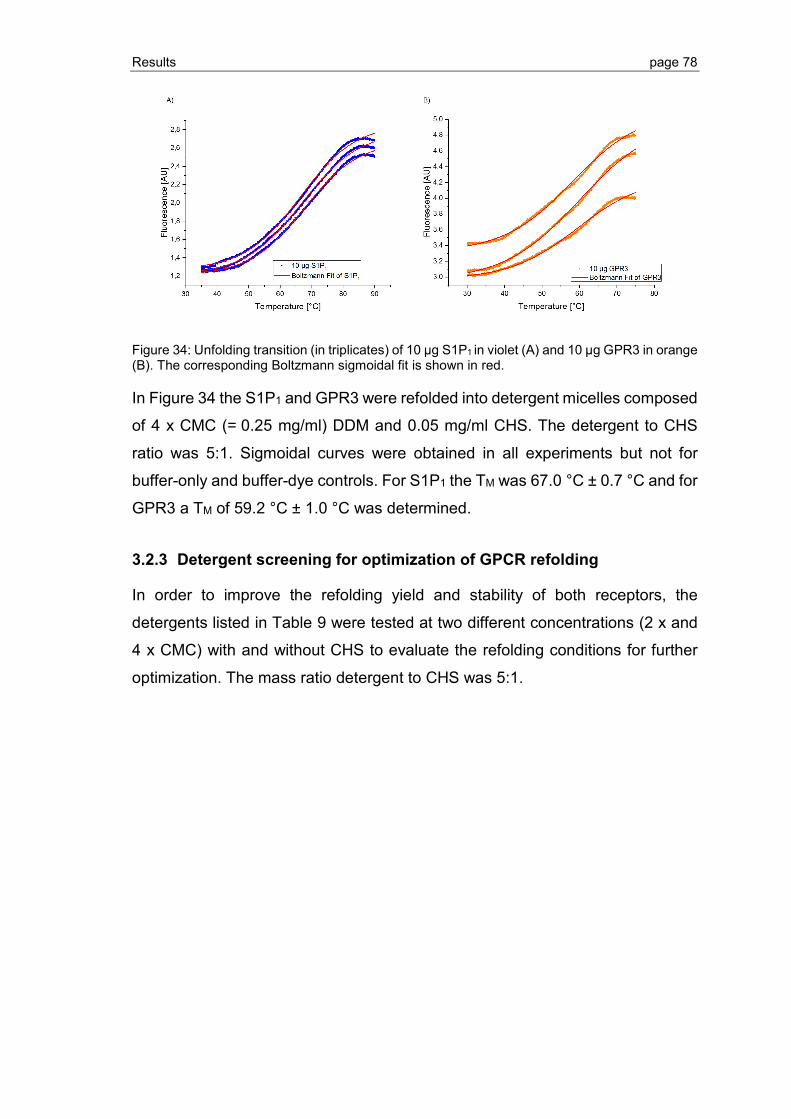
Results page 78
Figure 34: Unfolding transition (in triplicates) of 10 µg S1P1 in violet (A) and 10 µg GPR3 in orange (B). The corresponding Boltzmann sigmoidal fit is shown in red.
In Figure 34 the S1P1 and GPR3 were refolded into detergent micelles composed
of 4 x CMC (= 0.25 mg/ml) DDM and 0.05 mg/ml CHS. The detergent to CHS
ratio was 5:1. Sigmoidal curves were obtained in all experiments but not for
buffer-only and buffer-dye controls. For S1P1 the TM was 67.0 °C ± 0.7 °C and for
GPR3 a TM of 59.2 °C ± 1.0 °C was determined.
3.2.3 Detergent screening for optimization of GPCR refolding
In order to improve the refolding yield and stability of both receptors, the
detergents listed in Table 9 were tested at two different concentrations (2 x and
4 x CMC) with and without CHS to evaluate the refolding conditions for further
optimization. The mass ratio detergent to CHS was 5:1.
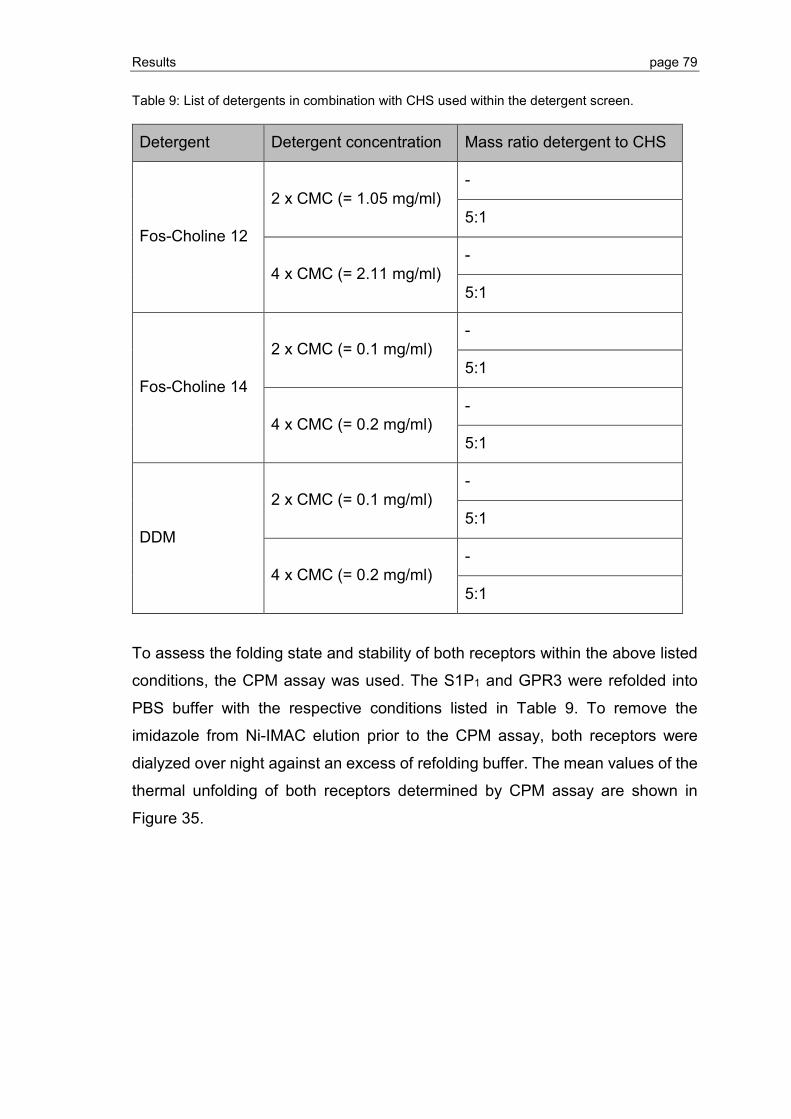
Results page 79
Table 9: List of detergents in combination with CHS used within the detergent screen.
Detergent Detergent concentration Mass ratio detergent to CHS
Fos-Choline 12
2 x CMC (= 1.05 mg/ml) -
5:1
4 x CMC (= 2.11 mg/ml) -
5:1
Fos-Choline 14
2 x CMC (= 0.1 mg/ml) -
5:1
4 x CMC (= 0.2 mg/ml) -
5:1
DDM
2 x CMC (= 0.1 mg/ml) -
5:1
4 x CMC (= 0.2 mg/ml) -
5:1
To assess the folding state and stability of both receptors within the above listed
conditions, the CPM assay was used. The S1P1 and GPR3 were refolded into
PBS buffer with the respective conditions listed in Table 9. To remove the
imidazole from Ni-IMAC elution prior to the CPM assay, both receptors were
dialyzed over night against an excess of refolding buffer. The mean values of the
thermal unfolding of both receptors determined by CPM assay are shown in
Figure 35.
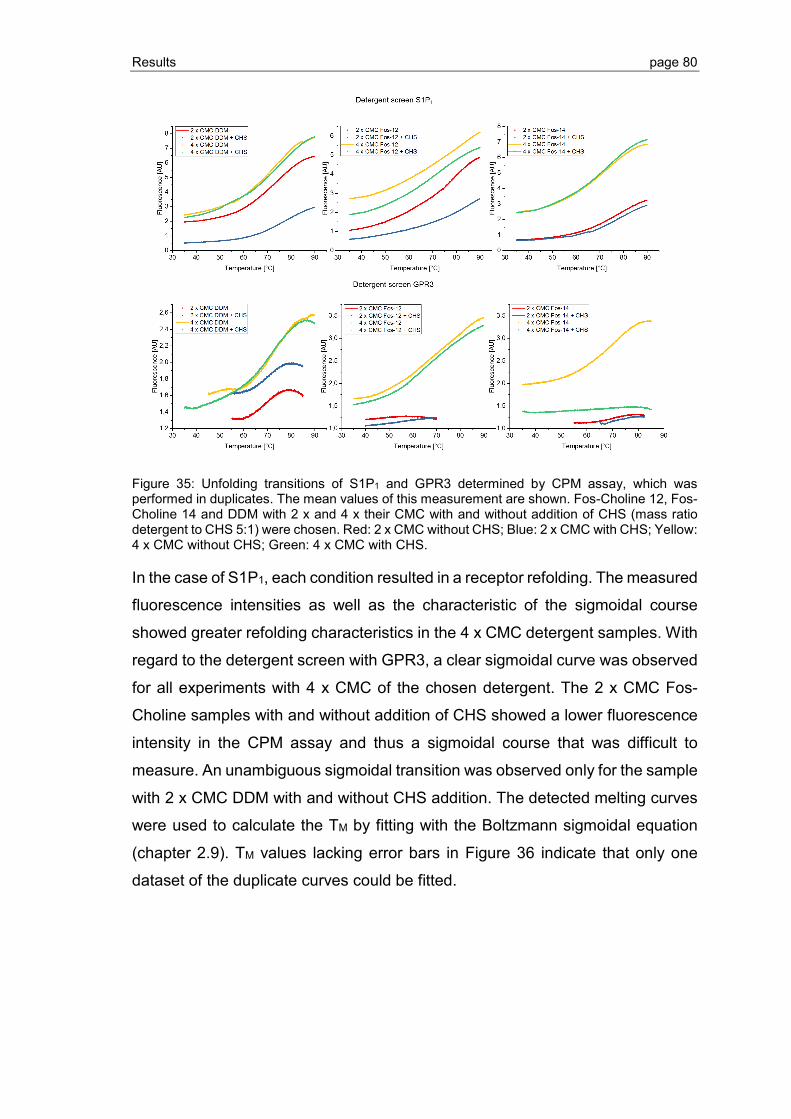
Results page 80
Figure 35: Unfolding transitions of S1P1 and GPR3 determined by CPM assay, which was performed in duplicates. The mean values of this measurement are shown. Fos-Choline 12, Fos-Choline 14 and DDM with 2 x and 4 x their CMC with and without addition of CHS (mass ratio detergent to CHS 5:1) were chosen. Red: 2 x CMC without CHS; Blue: 2 x CMC with CHS; Yellow: 4 x CMC without CHS; Green: 4 x CMC with CHS.
In the case of S1P1, each condition resulted in a receptor refolding. The measured
fluorescence intensities as well as the characteristic of the sigmoidal course
showed greater refolding characteristics in the 4 x CMC detergent samples. With
regard to the detergent screen with GPR3, a clear sigmoidal curve was observed
for all experiments with 4 x CMC of the chosen detergent. The 2 x CMC Fos-
Choline samples with and without addition of CHS showed a lower fluorescence
intensity in the CPM assay and thus a sigmoidal course that was difficult to
measure. An unambiguous sigmoidal transition was observed only for the sample
with 2 x CMC DDM with and without CHS addition. The detected melting curves
were used to calculate the TM by fitting with the Boltzmann sigmoidal equation
(chapter 2.9). TM values lacking error bars in Figure 36 indicate that only one
dataset of the duplicate curves could be fitted.
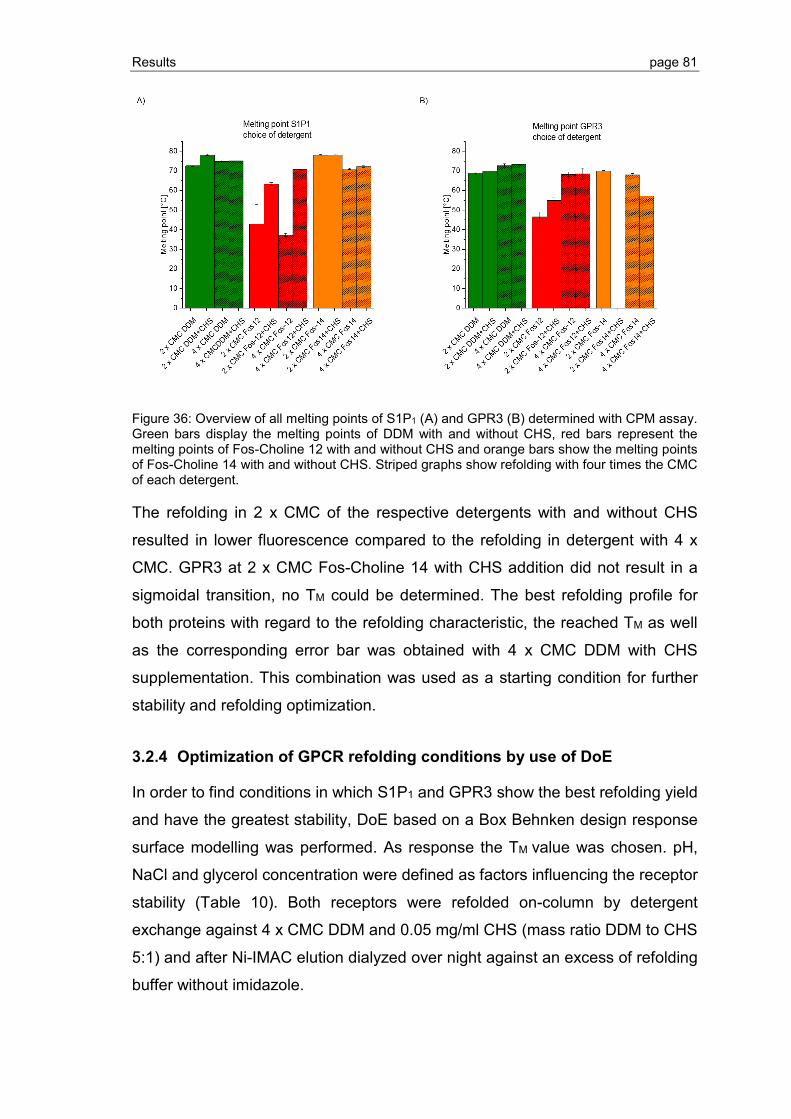
Results page 81
Figure 36: Overview of all melting points of S1P1 (A) and GPR3 (B) determined with CPM assay. Green bars display the melting points of DDM with and without CHS, red bars represent the melting points of Fos-Choline 12 with and without CHS and orange bars show the melting points of Fos-Choline 14 with and without CHS. Striped graphs show refolding with four times the CMC of each detergent.
The refolding in 2 x CMC of the respective detergents with and without CHS
resulted in lower fluorescence compared to the refolding in detergent with 4 x
CMC. GPR3 at 2 x CMC Fos-Choline 14 with CHS addition did not result in a
sigmoidal transition, no TM could be determined. The best refolding profile for
both proteins with regard to the refolding characteristic, the reached TM as well
as the corresponding error bar was obtained with 4 x CMC DDM with CHS
supplementation. This combination was used as a starting condition for further
stability and refolding optimization.
3.2.4 Optimization of GPCR refolding conditions by use of DoE
In order to find conditions in which S1P1 and GPR3 show the best refolding yield
and have the greatest stability, DoE based on a Box Behnken design response
surface modelling was performed. As response the TM value was chosen. pH,
NaCl and glycerol concentration were defined as factors influencing the receptor
stability (Table 10). Both receptors were refolded on-column by detergent
exchange against 4 x CMC DDM and 0.05 mg/ml CHS (mass ratio DDM to CHS
5:1) and after Ni-IMAC elution dialyzed over night against an excess of refolding
buffer without imidazole.

Results page 82
Table 10: DoE plan for maximization of S1P1 and GPR3 stability. Response parameter was the TM of S1P1 and GPR3 determined by CPM assay. As factors the pH, NaCl and glycerol concentrations were chosen.
Experiment pH NaCl concentration [M]
Glycerol [% (v/v)]
S1P1 TM [°C]
GPR3 TM [°C]
N1 5 0 5 51.9 65.0
N2 9 0 5 43.1 49.0
N3 5 1 5 57.3 53.5
N4 9 1 5 - 33.4
N5 5 0.09 0 53.5 58.0
N6 9 0.09 0 - 49.9
N7 5 0.09 10 63.2 61.4
N8 9 0.09 10 - 54.4
N9 7 0 0 52.7 56.3
N10 7 1 0 60 58.0
N11 7 0 10 50 57.8
N12 7 1 10 54.7 62.1
N13 7 0.09 5 50.1 57.4
N14 7 0.09 5 51.8 58.7
N15 7 0.09 5 51.6 58.3
No TM value due to missing sigmoidal curve in CPM assay could be determined
for S1P1 in experiments N4, N6 and N9, which were all at pH 9. These three
experiments were excluded for evaluation. The fourth DoE approach for S1P1 at
pH 9 (N2) resulted in the lowest TM value overall. Also for GPR3, those conditions
resulted in the lowest TM values.
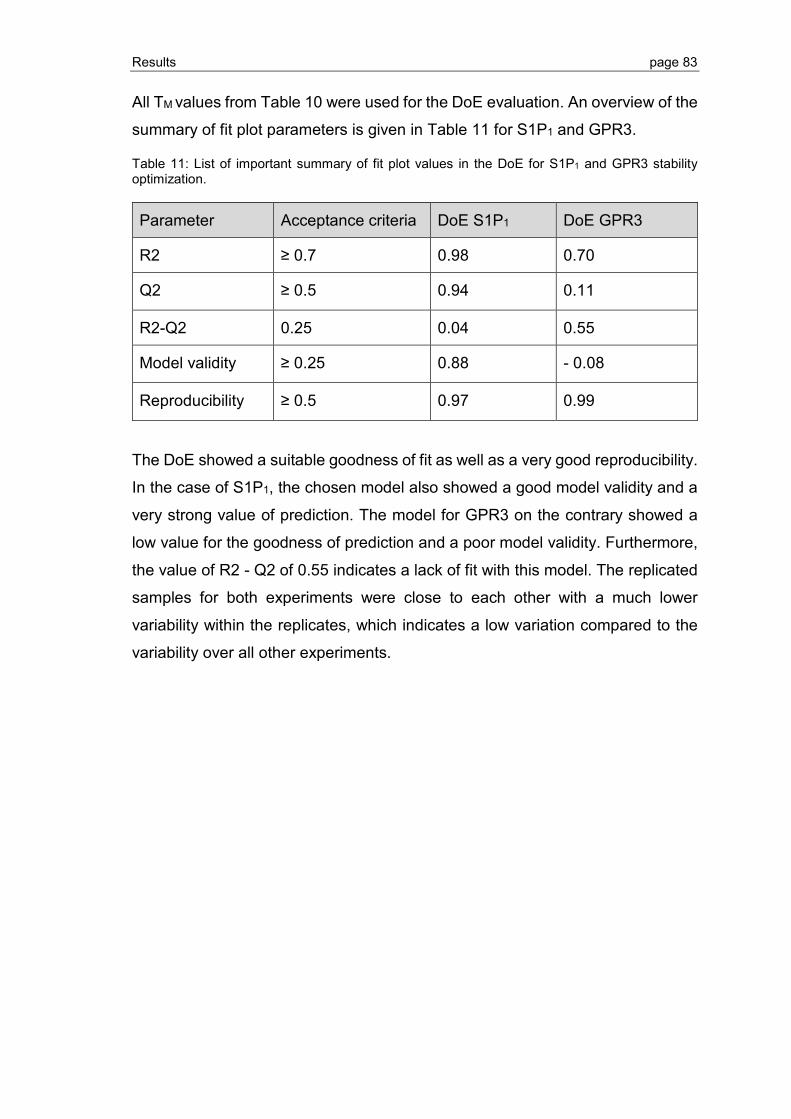
Results page 83
All TM values from Table 10 were used for the DoE evaluation. An overview of the
summary of fit plot parameters is given in Table 11 for S1P1 and GPR3.
Table 11: List of important summary of fit plot values in the DoE for S1P1 and GPR3 stability optimization.
Parameter Acceptance criteria DoE S1P1 DoE GPR3
R2 ≥ 0.7 0.98 0.70
Q2 ≥ 0.5 0.94 0.11
R2-Q2 0.25 0.04 0.55
Model validity ≥ 0.25 0.88 - 0.08
Reproducibility ≥ 0.5 0.97 0.99
The DoE showed a suitable goodness of fit as well as a very good reproducibility.
In the case of S1P1, the chosen model also showed a good model validity and a
very strong value of prediction. The model for GPR3 on the contrary showed a
low value for the goodness of prediction and a poor model validity. Furthermore,
the value of R2 - Q2 of 0.55 indicates a lack of fit with this model. The replicated
samples for both experiments were close to each other with a much lower
variability within the replicates, which indicates a low variation compared to the
variability over all other experiments.
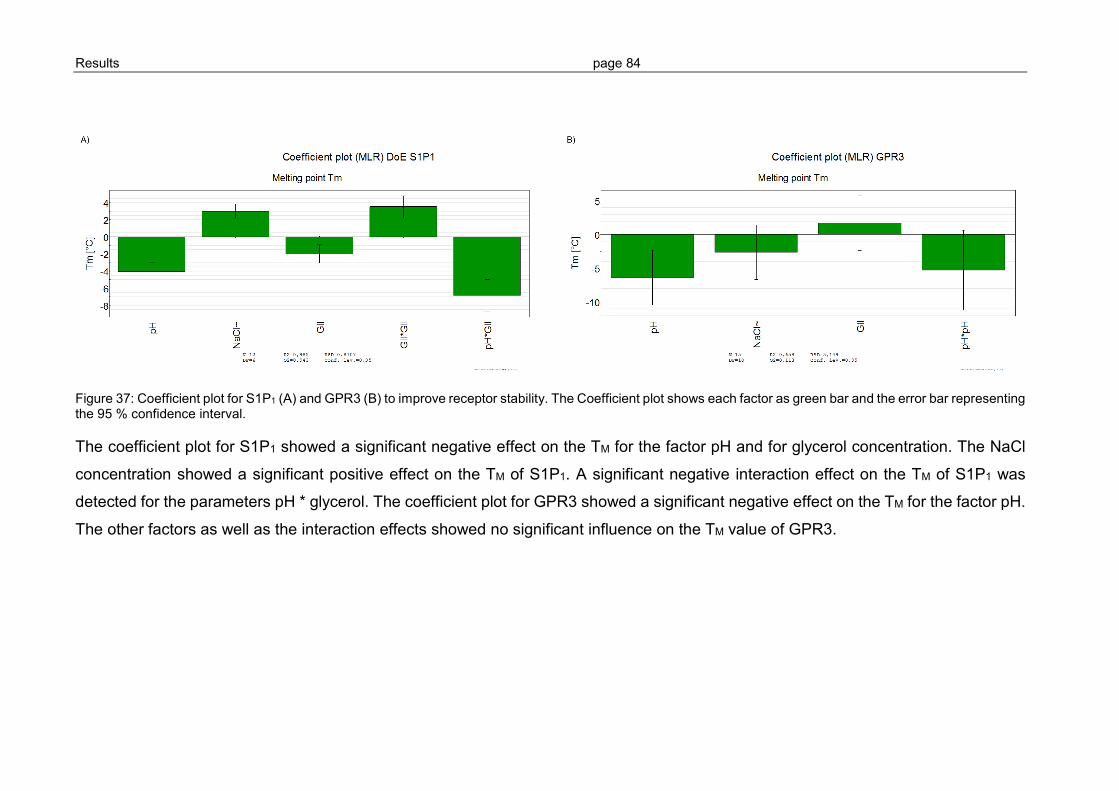
Results page 84
Figure 37: Coefficient plot for S1P1 (A) and GPR3 (B) to improve receptor stability. The Coefficient plot shows each factor as green bar and the error bar representing the 95 % confidence interval.
The coefficient plot for S1P1 showed a significant negative effect on the TM for the factor pH and for glycerol concentration. The NaCl
concentration showed a significant positive effect on the TM of S1P1. A significant negative interaction effect on the TM of S1P1 was
detected for the parameters pH * glycerol. The coefficient plot for GPR3 showed a significant negative effect on the TM for the factor pH.
The other factors as well as the interaction effects showed no significant influence on the TM value of GPR3.
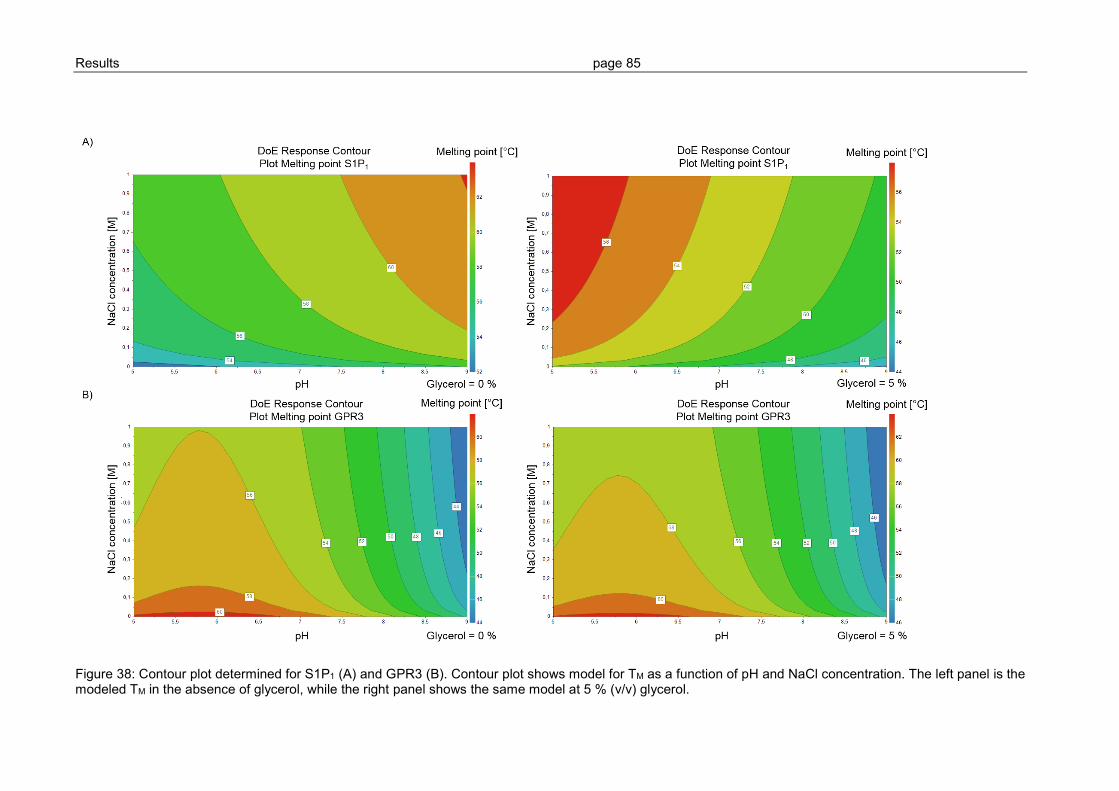
Results page 85
Figure 38: Contour plot determined for S1P1 (A) and GPR3 (B). Contour plot shows model for TM as a function of pH and NaCl concentration. The left panel is the modeled TM in the absence of glycerol, while the right panel shows the same model at 5 % (v/v) glycerol.
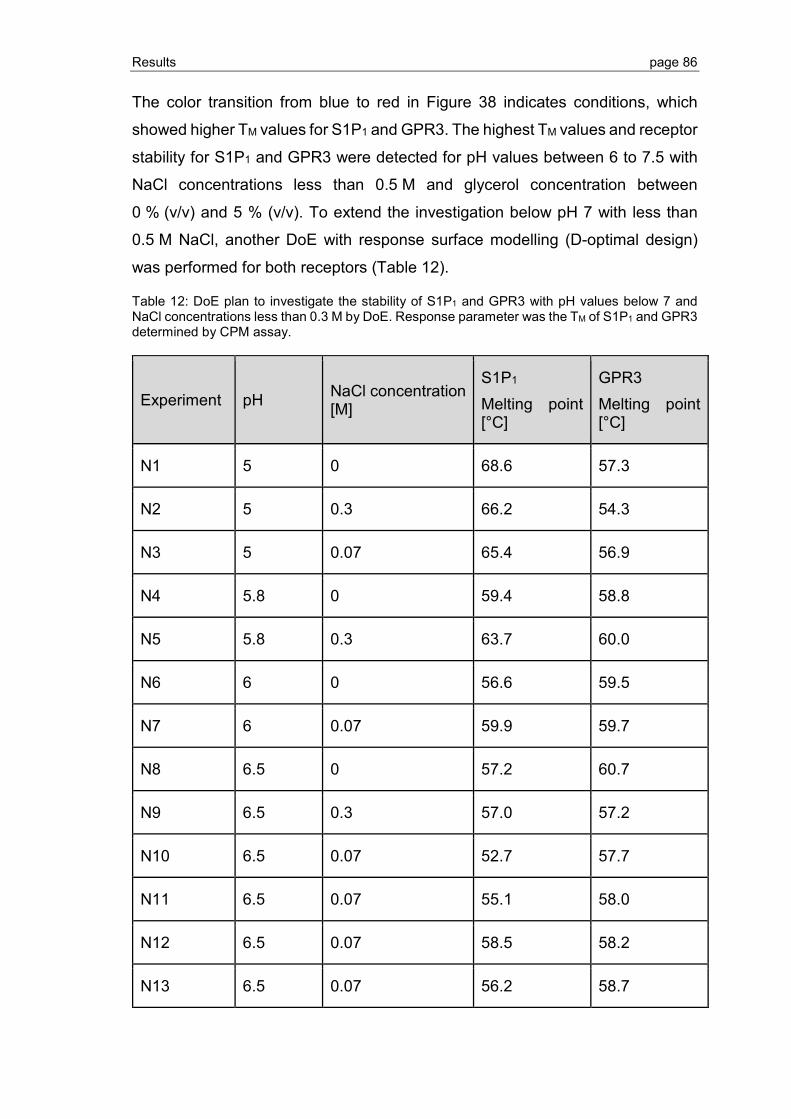
Results page 86
The color transition from blue to red in Figure 38 indicates conditions, which
showed higher TM values for S1P1 and GPR3. The highest TM values and receptor
stability for S1P1 and GPR3 were detected for pH values between 6 to 7.5 with
NaCl concentrations less than 0.5 M and glycerol concentration between
0 % (v/v) and 5 % (v/v). To extend the investigation below pH 7 with less than
0.5 M NaCl, another DoE with response surface modelling (D-optimal design)
was performed for both receptors (Table 12).
Table 12: DoE plan to investigate the stability of S1P1 and GPR3 with pH values below 7 and NaCl concentrations less than 0.3 M by DoE. Response parameter was the TM of S1P1 and GPR3 determined by CPM assay.
Experiment pH NaCl concentration [M]
S1P1 Melting point [°C]
GPR3 Melting point [°C]
N1 5 0 68.6 57.3
N2 5 0.3 66.2 54.3
N3 5 0.07 65.4 56.9
N4 5.8 0 59.4 58.8
N5 5.8 0.3 63.7 60.0
N6 6 0 56.6 59.5
N7 6 0.07 59.9 59.7
N8 6.5 0 57.2 60.7
N9 6.5 0.3 57.0 57.2
N10 6.5 0.07 52.7 57.7
N11 6.5 0.07 55.1 58.0
N12 6.5 0.07 58.5 58.2
N13 6.5 0.07 56.2 58.7
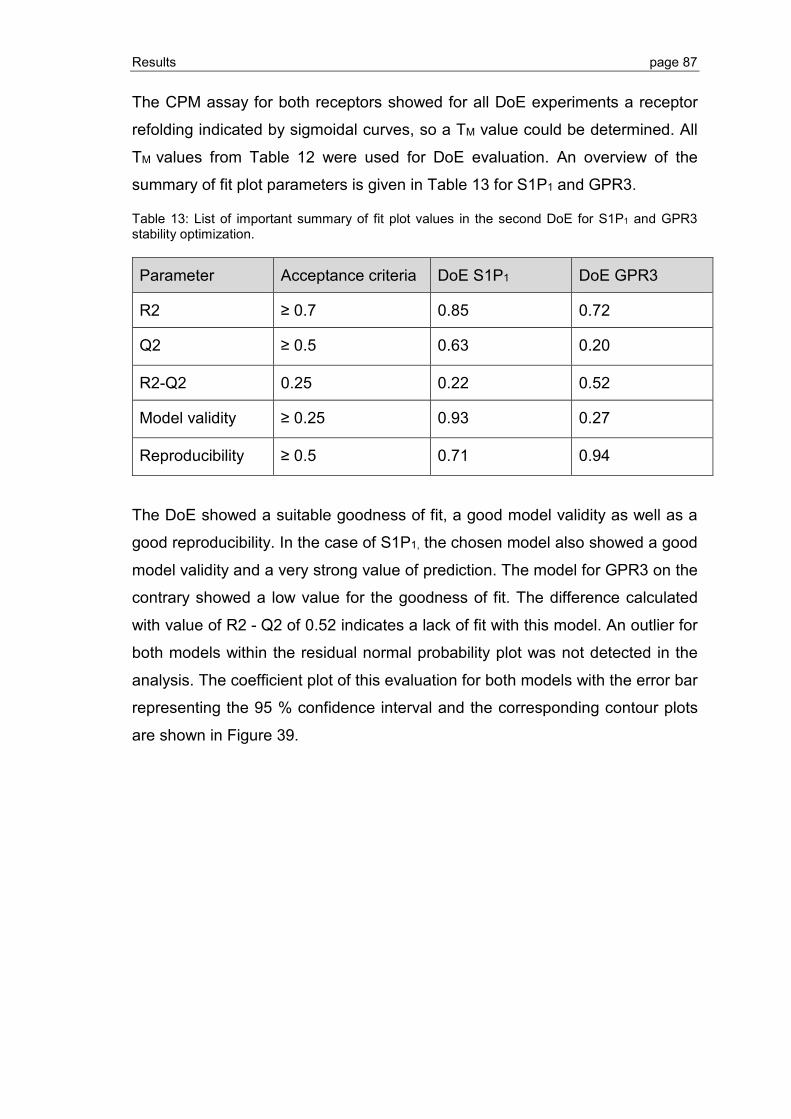
Results page 87
The CPM assay for both receptors showed for all DoE experiments a receptor
refolding indicated by sigmoidal curves, so a TM value could be determined. All
TM values from Table 12 were used for DoE evaluation. An overview of the
summary of fit plot parameters is given in Table 13 for S1P1 and GPR3.
Table 13: List of important summary of fit plot values in the second DoE for S1P1 and GPR3 stability optimization.
Parameter Acceptance criteria DoE S1P1 DoE GPR3
R2 ≥ 0.7 0.85 0.72
Q2 ≥ 0.5 0.63 0.20
R2-Q2 0.25 0.22 0.52
Model validity ≥ 0.25 0.93 0.27
Reproducibility ≥ 0.5 0.71 0.94
The DoE showed a suitable goodness of fit, a good model validity as well as a
good reproducibility. In the case of S1P1, the chosen model also showed a good
model validity and a very strong value of prediction. The model for GPR3 on the
contrary showed a low value for the goodness of fit. The difference calculated
with value of R2 - Q2 of 0.52 indicates a lack of fit with this model. An outlier for
both models within the residual normal probability plot was not detected in the
analysis. The coefficient plot of this evaluation for both models with the error bar
representing the 95 % confidence interval and the corresponding contour plots
are shown in Figure 39.
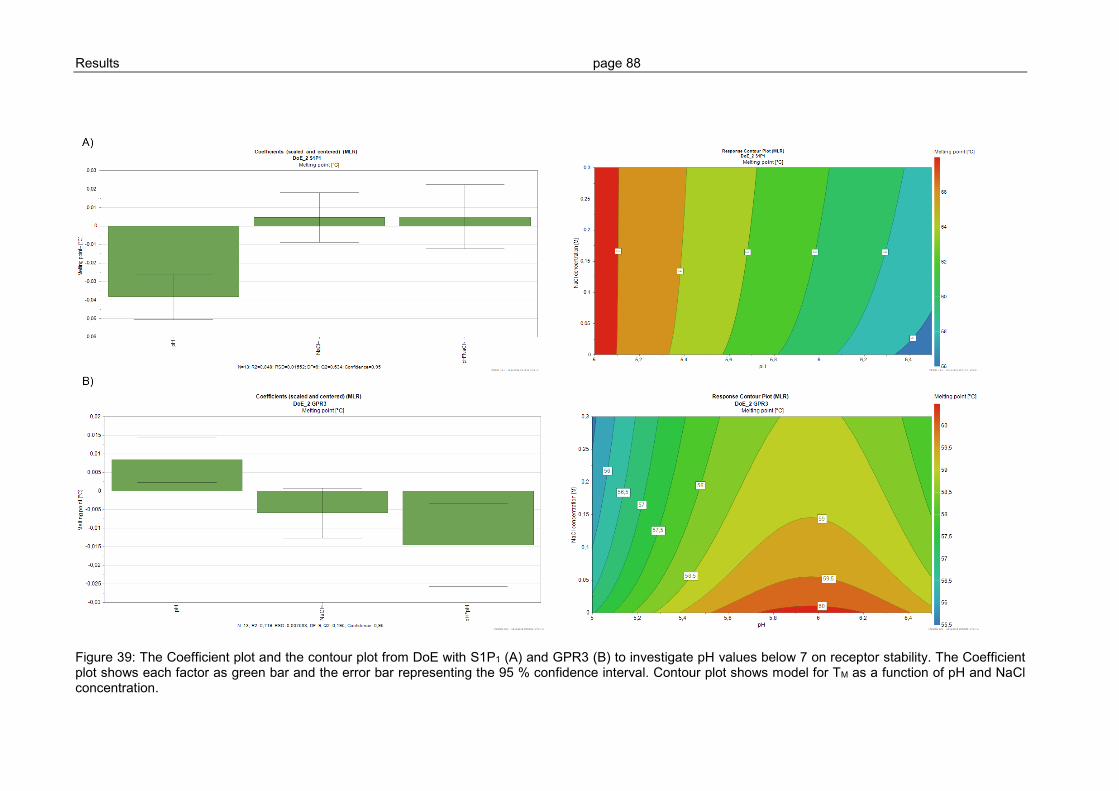
Results page 88
Figure 39: The Coefficient plot and the contour plot from DoE with S1P1 (A) and GPR3 (B) to investigate pH values below 7 on receptor stability. The Coefficient plot shows each factor as green bar and the error bar representing the 95 % confidence interval. Contour plot shows model for TM as a function of pH and NaCl concentration.
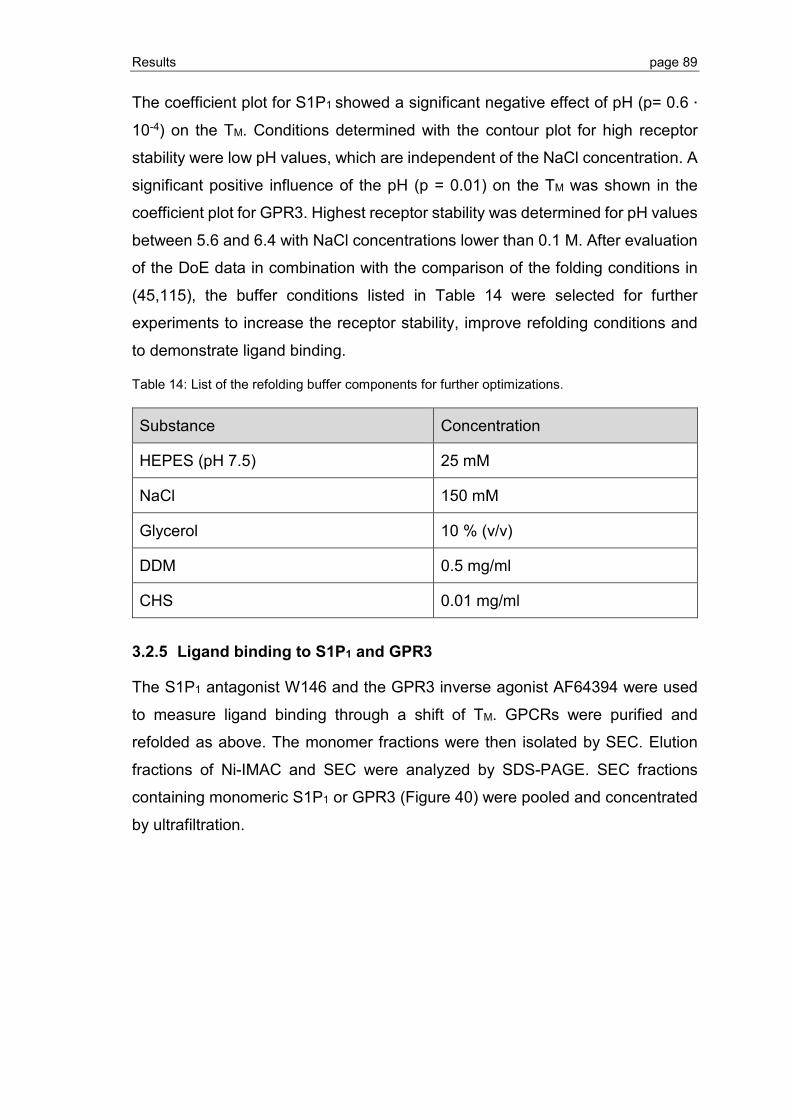
Results page 89
The coefficient plot for S1P1 showed a significant negative effect of pH (p= 0.6 ∙
10-4) on the TM. Conditions determined with the contour plot for high receptor
stability were low pH values, which are independent of the NaCl concentration. A
significant positive influence of the pH (p = 0.01) on the TM was shown in the
coefficient plot for GPR3. Highest receptor stability was determined for pH values
between 5.6 and 6.4 with NaCl concentrations lower than 0.1 M. After evaluation
of the DoE data in combination with the comparison of the folding conditions in
(45,115), the buffer conditions listed in Table 14 were selected for further
experiments to increase the receptor stability, improve refolding conditions and
to demonstrate ligand binding.
Table 14: List of the refolding buffer components for further optimizations.
Substance Concentration
HEPES (pH 7.5) 25 mM
NaCl 150 mM
Glycerol 10 % (v/v)
DDM 0.5 mg/ml
CHS 0.01 mg/ml
3.2.5 Ligand binding to S1P1 and GPR3
The S1P1 antagonist W146 and the GPR3 inverse agonist AF64394 were used
to measure ligand binding through a shift of TM. GPCRs were purified and
refolded as above. The monomer fractions were then isolated by SEC. Elution
fractions of Ni-IMAC and SEC were analyzed by SDS-PAGE. SEC fractions
containing monomeric S1P1 or GPR3 (Figure 40) were pooled and concentrated
by ultrafiltration.
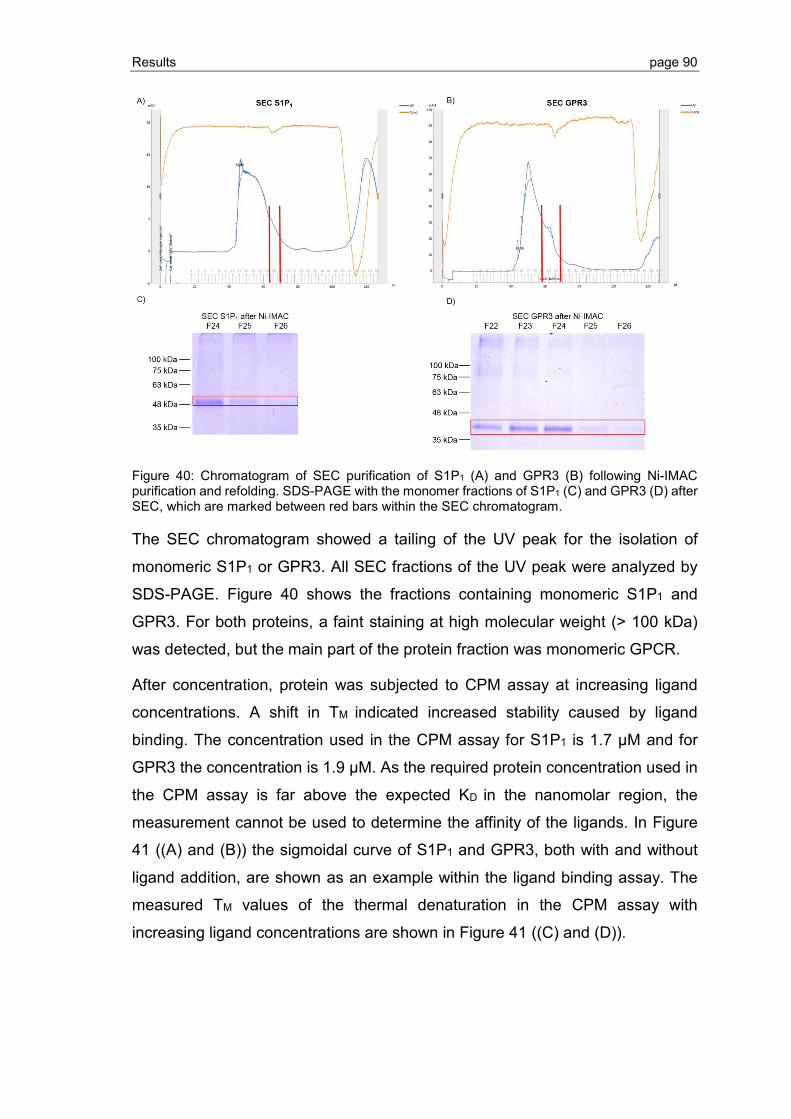
Results page 90
Figure 40: Chromatogram of SEC purification of S1P1 (A) and GPR3 (B) following Ni-IMAC purification and refolding. SDS-PAGE with the monomer fractions of S1P1 (C) and GPR3 (D) after SEC, which are marked between red bars within the SEC chromatogram.
The SEC chromatogram showed a tailing of the UV peak for the isolation of
monomeric S1P1 or GPR3. All SEC fractions of the UV peak were analyzed by
SDS-PAGE. Figure 40 shows the fractions containing monomeric S1P1 and
GPR3. For both proteins, a faint staining at high molecular weight (> 100 kDa)
was detected, but the main part of the protein fraction was monomeric GPCR.
After concentration, protein was subjected to CPM assay at increasing ligand
concentrations. A shift in TM indicated increased stability caused by ligand
binding. The concentration used in the CPM assay for S1P1 is 1.7 µM and for
GPR3 the concentration is 1.9 µM. As the required protein concentration used in
the CPM assay is far above the expected KD in the nanomolar region, the
measurement cannot be used to determine the affinity of the ligands. In Figure
41 ((A) and (B)) the sigmoidal curve of S1P1 and GPR3, both with and without
ligand addition, are shown as an example within the ligand binding assay. The
measured TM values of the thermal denaturation in the CPM assay with
increasing ligand concentrations are shown in Figure 41 ((C) and (D)).
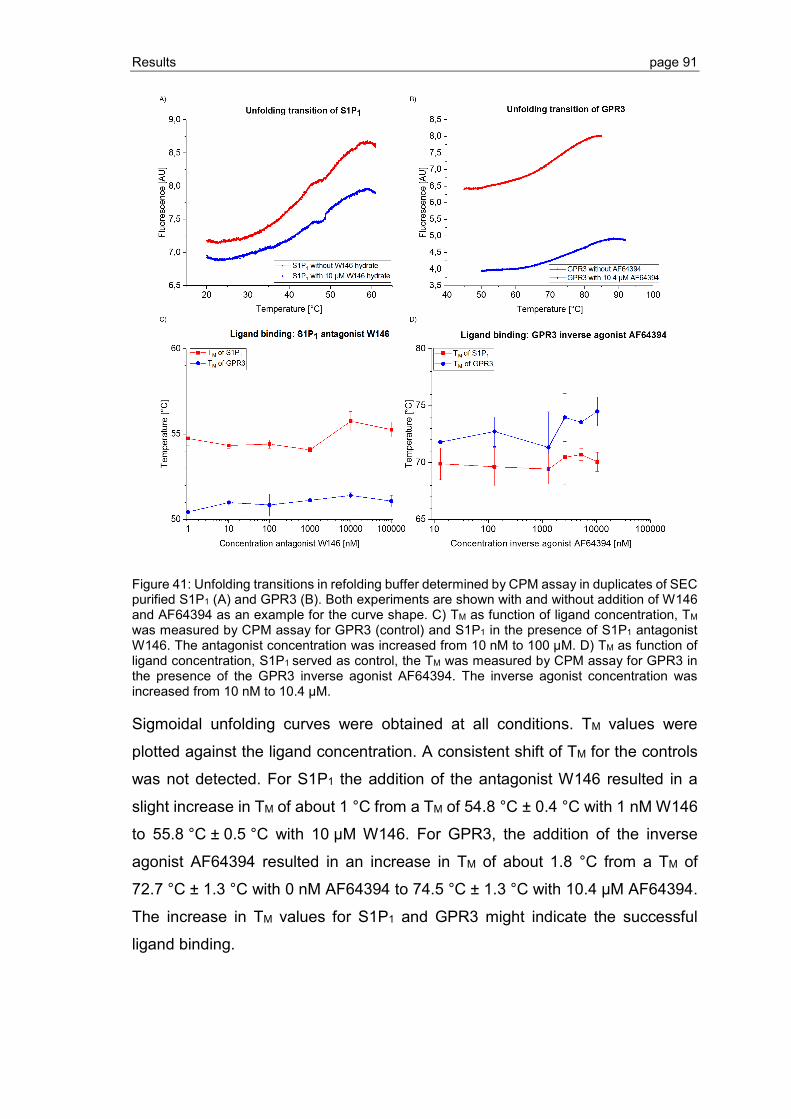
Results page 91
Figure 41: Unfolding transitions in refolding buffer determined by CPM assay in duplicates of SEC purified S1P1 (A) and GPR3 (B). Both experiments are shown with and without addition of W146 and AF64394 as an example for the curve shape. C) TM as function of ligand concentration, TM was measured by CPM assay for GPR3 (control) and S1P1 in the presence of S1P1 antagonist W146. The antagonist concentration was increased from 10 nM to 100 µM. D) TM as function of ligand concentration, S1P1 served as control, the TM was measured by CPM assay for GPR3 in the presence of the GPR3 inverse agonist AF64394. The inverse agonist concentration was increased from 10 nM to 10.4 µM.
Sigmoidal unfolding curves were obtained at all conditions. TM values were
plotted against the ligand concentration. A consistent shift of TM for the controls
was not detected. For S1P1 the addition of the antagonist W146 resulted in a
slight increase in TM of about 1 °C from a TM of 54.8 °C ± 0.4 °C with 1 nM W146
to 55.8 °C ± 0.5 °C with 10 µM W146. For GPR3, the addition of the inverse
agonist AF64394 resulted in an increase in TM of about 1.8 °C from a TM of
72.7 °C ± 1.3 °C with 0 nM AF64394 to 74.5 °C ± 1.3 °C with 10.4 µM AF64394.
The increase in TM values for S1P1 and GPR3 might indicate the successful
ligand binding.
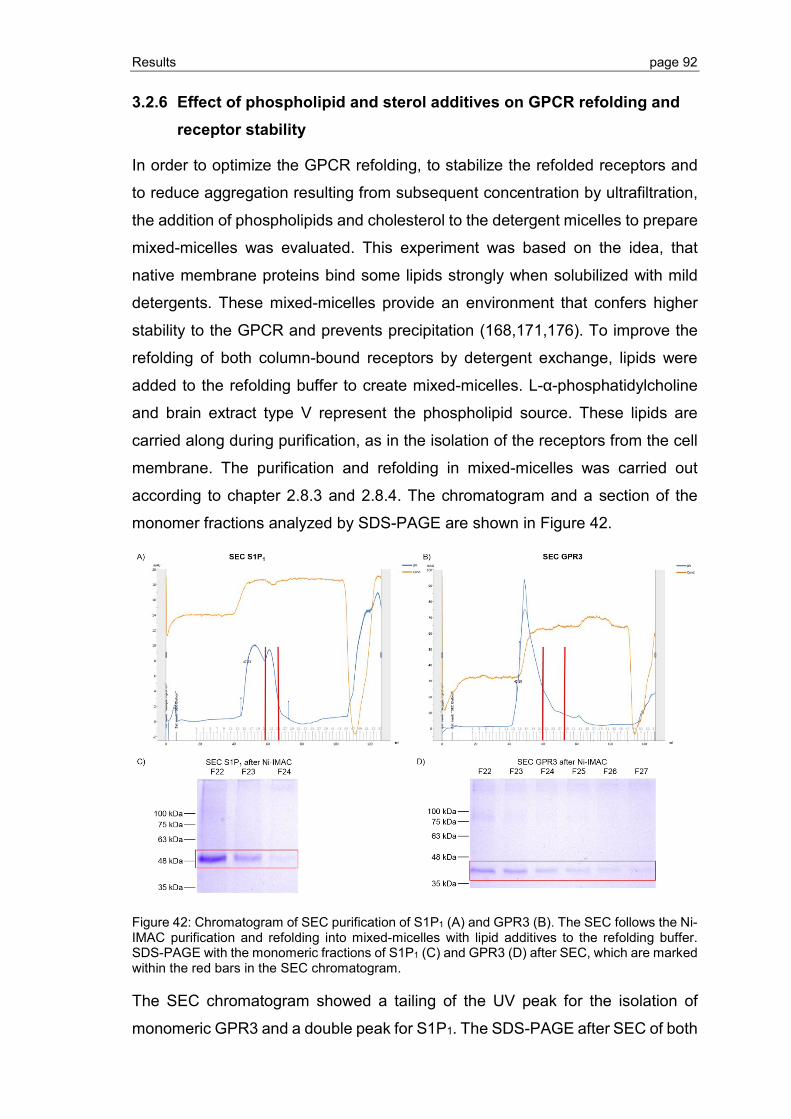
Results page 92
3.2.6 Effect of phospholipid and sterol additives on GPCR refolding and receptor stability
In order to optimize the GPCR refolding, to stabilize the refolded receptors and
to reduce aggregation resulting from subsequent concentration by ultrafiltration,
the addition of phospholipids and cholesterol to the detergent micelles to prepare
mixed-micelles was evaluated. This experiment was based on the idea, that
native membrane proteins bind some lipids strongly when solubilized with mild
detergents. These mixed-micelles provide an environment that confers higher
stability to the GPCR and prevents precipitation (168,171,176). To improve the
refolding of both column-bound receptors by detergent exchange, lipids were
added to the refolding buffer to create mixed-micelles. L-α-phosphatidylcholine
and brain extract type V represent the phospholipid source. These lipids are
carried along during purification, as in the isolation of the receptors from the cell
membrane. The purification and refolding in mixed-micelles was carried out
according to chapter 2.8.3 and 2.8.4. The chromatogram and a section of the
monomer fractions analyzed by SDS-PAGE are shown in Figure 42.
Figure 42: Chromatogram of SEC purification of S1P1 (A) and GPR3 (B). The SEC follows the Ni-IMAC purification and refolding into mixed-micelles with lipid additives to the refolding buffer. SDS-PAGE with the monomeric fractions of S1P1 (C) and GPR3 (D) after SEC, which are marked within the red bars in the SEC chromatogram.
The SEC chromatogram showed a tailing of the UV peak for the isolation of
monomeric GPR3 and a double peak for S1P1. The SDS-PAGE after SEC of both
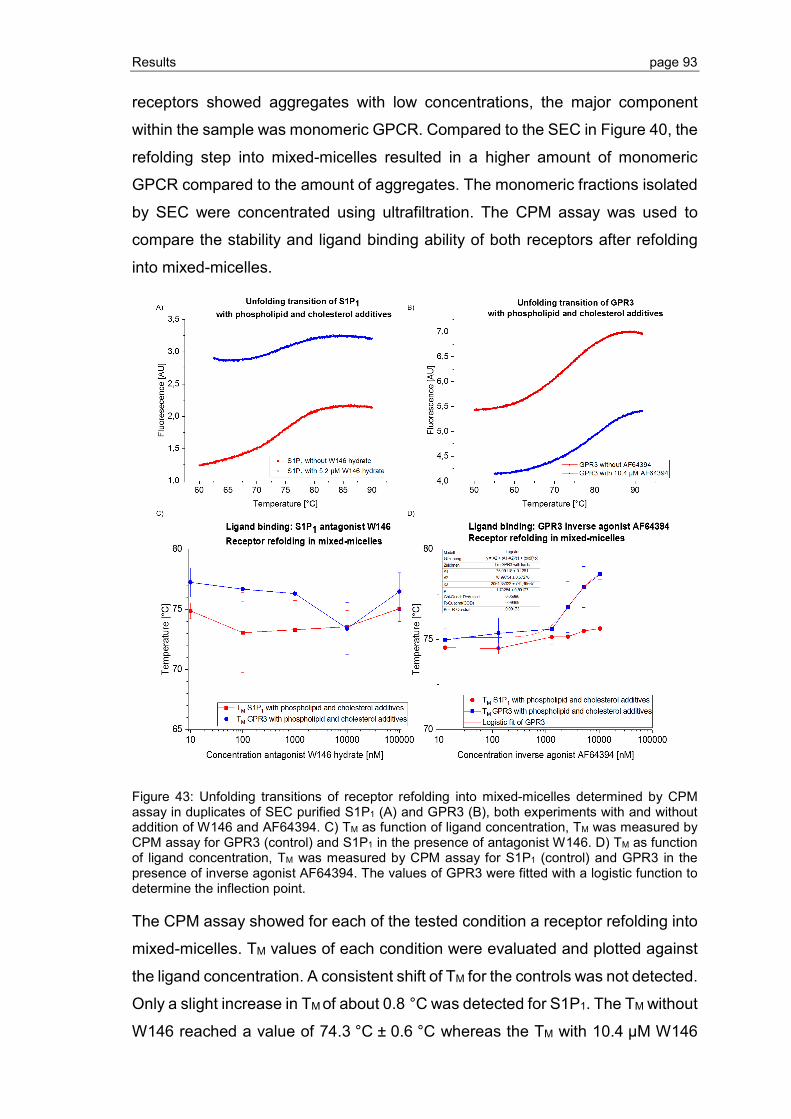
Results page 93
receptors showed aggregates with low concentrations, the major component
within the sample was monomeric GPCR. Compared to the SEC in Figure 40, the
refolding step into mixed-micelles resulted in a higher amount of monomeric
GPCR compared to the amount of aggregates. The monomeric fractions isolated
by SEC were concentrated using ultrafiltration. The CPM assay was used to
compare the stability and ligand binding ability of both receptors after refolding
into mixed-micelles.
Figure 43: Unfolding transitions of receptor refolding into mixed-micelles determined by CPM assay in duplicates of SEC purified S1P1 (A) and GPR3 (B), both experiments with and without addition of W146 and AF64394. C) TM as function of ligand concentration, TM was measured by CPM assay for GPR3 (control) and S1P1 in the presence of antagonist W146. D) TM as function of ligand concentration, TM was measured by CPM assay for S1P1 (control) and GPR3 in the presence of inverse agonist AF64394. The values of GPR3 were fitted with a logistic function to determine the inflection point.
The CPM assay showed for each of the tested condition a receptor refolding into
mixed-micelles. TM values of each condition were evaluated and plotted against
the ligand concentration. A consistent shift of TM for the controls was not detected.
Only a slight increase in TM of about 0.8 °C was detected for S1P1. The TM without
W146 reached a value of 74.3 °C ± 0.6 °C whereas the TM with 10.4 µM W146

Results page 94
resulted in a value of 75.1 °C ± 1.1 °C. Refolding of GPR3 into mixed-micelles
with addition of the inverse agonist AF64394 resulted in a TM increase of about
5.7 °C. The TM without addition of inverse agonist was 72.9 °C ± 0.1 °C whereas
the addition of 10.4 µM AF64394 resulted in TM of 78.6 °C ± 0.3 °C. Fitting these
values with a logistic function resulted in an inflection point of ~ 3 µM AF64394
with a maximum TM of ~79 °C (fit see Figure 43 D).
In conclusion, the receptor stability was increased and the on-column refolding
was optimized through various steps. These steps included detergent screening,
buffer optimization, ligand addition and creation of mixed-micelles instead of
detergent micelles for receptor refolding. These optimization steps resulted in an
established process for receptor purification, isolation and refolding. By applying
the optimized conditions, the receptor stability was increased for further steps
such as crystallization in LCP.
3.3 Crystallization of GPCRs by LCP
3.3.1 Crystallization screening of S1P1 and GPR3
After establishing a refolding and purification scheme for monomeric GPCRs,
larger amounts were prepared for crystallization screening in the LCP. For this
purpose, IBs of five expression runs with 2 l culture volume each were purified by
Ni-IMAC in SDS. Refolding was achieved by detergent exchange for refolding
buffer, supplemented with phospholipids and cholesterol. Mixed-micelles were
produced from 90% detergent and 10% lipid by mass at various lipid
compositions. Detergent was exchanged for 10 CV of refolding buffer 1 and 2.
Refolding buffer 2 contained 12.5 µM W146 for S1P1 and 10 µM AF64394 for
GPR3. After overnight incubation, receptors were eluted, analyzed by SDS-
PAGE and concentrated before SEC. Monomeric fractions were identified by
SDS-PAGE, pooled and concentrated by ultrafiltration. Figure 44 (S1P1) and
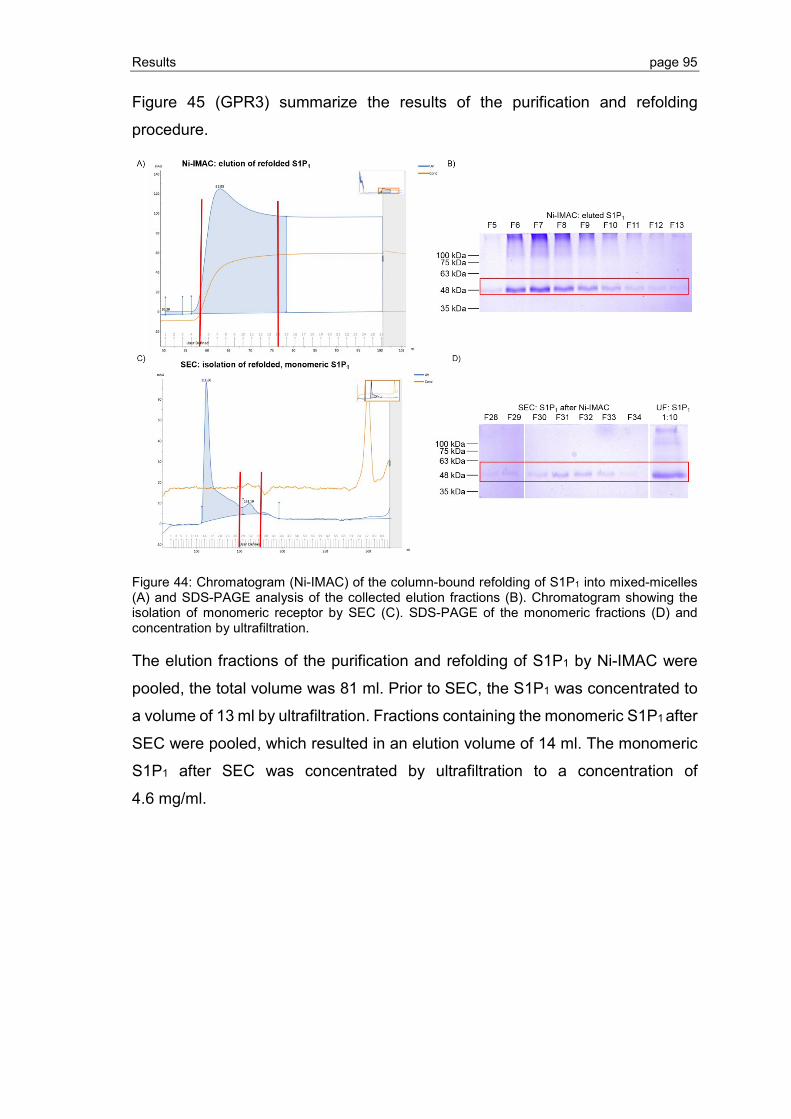
Results page 95
Figure 45 (GPR3) summarize the results of the purification and refolding
procedure.
Figure 44: Chromatogram (Ni-IMAC) of the column-bound refolding of S1P1 into mixed-micelles (A) and SDS-PAGE analysis of the collected elution fractions (B). Chromatogram showing the isolation of monomeric receptor by SEC (C). SDS-PAGE of the monomeric fractions (D) and concentration by ultrafiltration.
The elution fractions of the purification and refolding of S1P1 by Ni-IMAC were
pooled, the total volume was 81 ml. Prior to SEC, the S1P1 was concentrated to
a volume of 13 ml by ultrafiltration. Fractions containing the monomeric S1P1 after
SEC were pooled, which resulted in an elution volume of 14 ml. The monomeric
S1P1 after SEC was concentrated by ultrafiltration to a concentration of
4.6 mg/ml.

Results page 96
Figure 45: A) Refolding of GPR3 into mixed-micelles with Ni-IMAC. Pooled elution fractions are marked with red bars in the chromatogram. B) SDS-PAGE of the purification and refolding into mixed-micelles of column-bound GPR3. C) Isolation of the monomeric GPR3 fraction by SEC. Collected fractions are marked with red bars. D) SDS-PAGE analysis of the SEC and the concentration step by ultrafiltration.
Prior to SEC, the GPR3 after Ni-IMAC elution was concentrated by ultrafiltration
from 144 ml to 9.5 ml. Monomeric fractions after SEC were concentrated with a
pool volume of 12 ml to a few hundred microliter with a concentration of 16 mg/ml.
Prior to crystallization screenings, monomeric S1P1 and GPR3 were tested for a
successful refolding into mixed-micelles. The ligand binding ability was tested
with 12.5 µM W146 for S1P1 and 10 µM AF64394 for GPR3 (Figure 46).
Figure 46: Unfolding transitions of S1P1 (A) and GPR3 (B) refolded into mixed-micelles. TM values were determined with and without ligand addition to the assay samples.
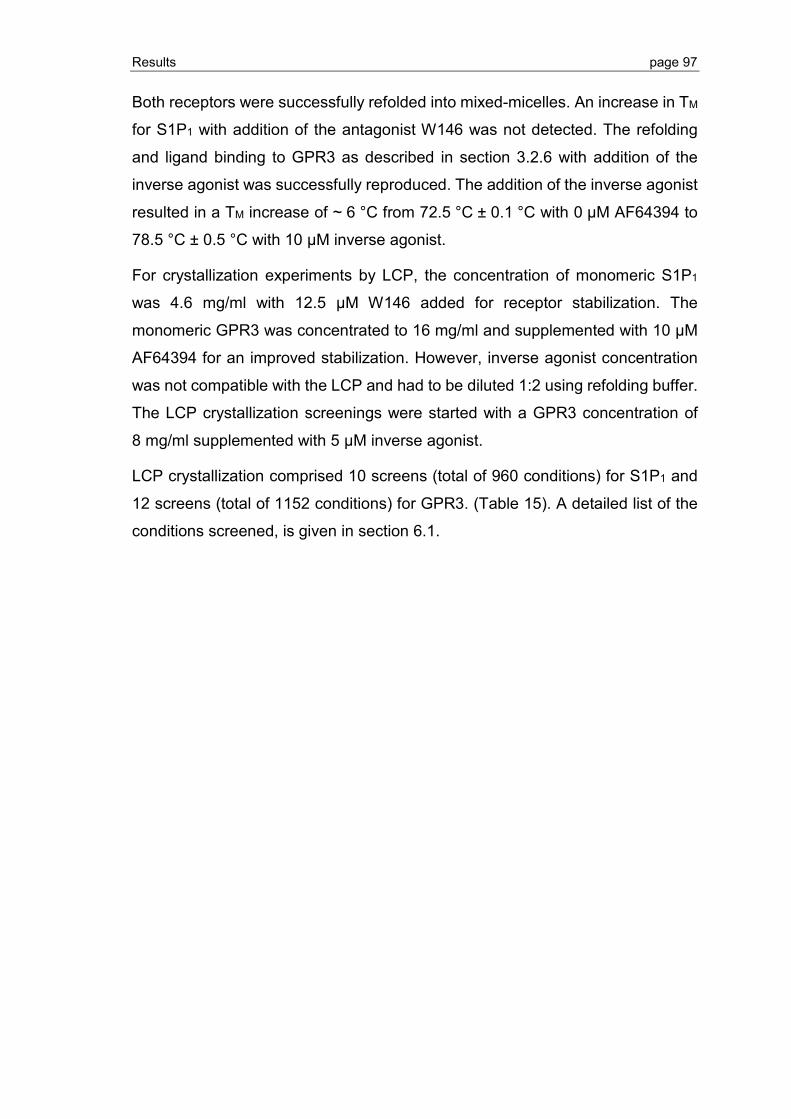
Results page 97
Both receptors were successfully refolded into mixed-micelles. An increase in TM
for S1P1 with addition of the antagonist W146 was not detected. The refolding
and ligand binding to GPR3 as described in section 3.2.6 with addition of the
inverse agonist was successfully reproduced. The addition of the inverse agonist
resulted in a TM increase of ~ 6 °C from 72.5 °C ± 0.1 °C with 0 µM AF64394 to
78.5 °C ± 0.5 °C with 10 µM inverse agonist.
For crystallization experiments by LCP, the concentration of monomeric S1P1
was 4.6 mg/ml with 12.5 µM W146 added for receptor stabilization. The
monomeric GPR3 was concentrated to 16 mg/ml and supplemented with 10 µM
AF64394 for an improved stabilization. However, inverse agonist concentration
was not compatible with the LCP and had to be diluted 1:2 using refolding buffer.
The LCP crystallization screenings were started with a GPR3 concentration of
8 mg/ml supplemented with 5 µM inverse agonist.
LCP crystallization comprised 10 screens (total of 960 conditions) for S1P1 and
12 screens (total of 1152 conditions) for GPR3. (Table 15). A detailed list of the
conditions screened, is given in section 6.1.

Results page 98
Table 15: Summary of all screening solutions used for crystallization screening. Screens marked with a dot were used in crystallization screening for S1P1 or GPR3. The crystallization screen according to Hanson et al. 2012 (45) was prepared based on the published crystallization conditions.
Screen Manufacturer S1P1 GPR3 Variation
Morpheus Screen Molecular Dimension ● ● complex screen
MemMeso Screen Molecular Dimension ● ● complex screen
Anion Screen Qiagen ● ● salt: anions
Cation Screen Qiagen ● ● salt: cations
Classic-I-Screen Qiagen ● ● salt; precipitants
Classic-II-Screen Qiagen ● ● salt; precipitants
PEG-Screen Qiagen ● ● salt; PEGs
PEG-II-Screen Qiagen ● ● salt; PEGs
pH-clear Screen Qiagen ● ● salt; pH
Screen according to literature (45)
self-made ● ● salt; precipitants
pH-clear II Screen Qiagen - ● salt; pH; precipitants
Cryo Screen Qiagen - ● cryo solutions
An example of crystal growth in LCP is shown in Figure 47 for the S1P1
crystallization and in Figure 48 for the GPR3 crystallization. Crystal growth was
monitored over 54 days for S1P1 and 37 days for GPR3 at defined time intervals
at 20 °C.
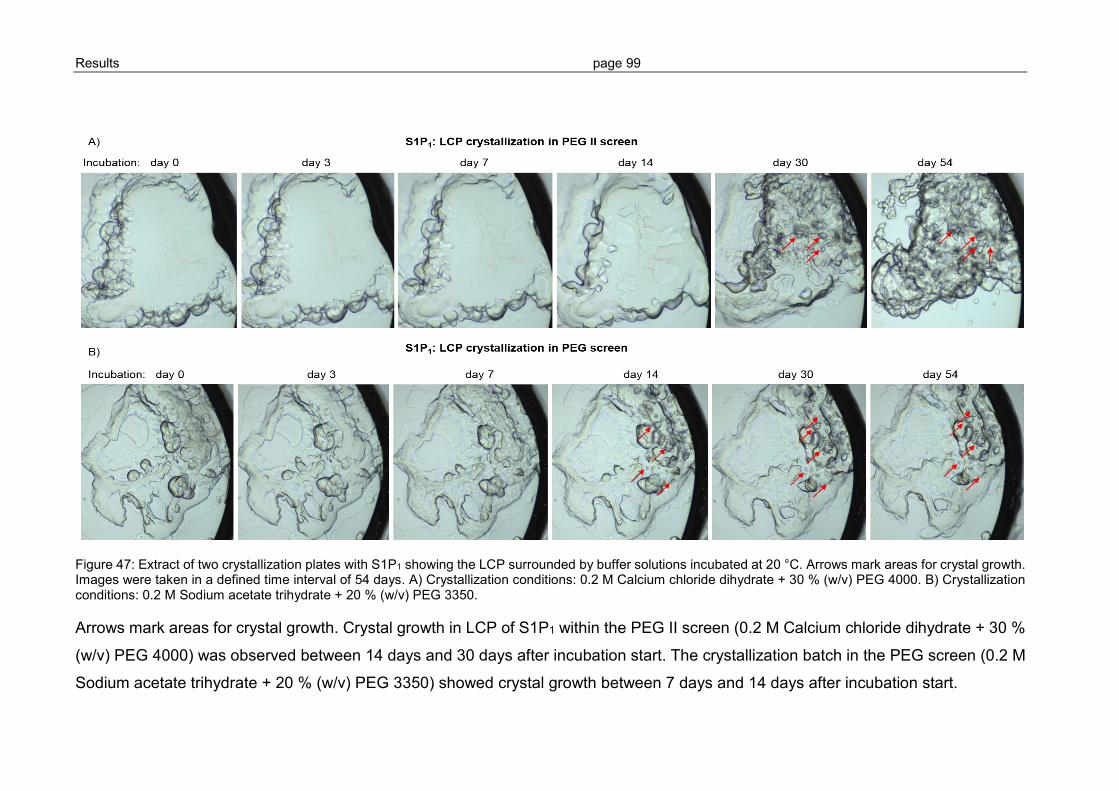
Results page 99
Figure 47: Extract of two crystallization plates with S1P1 showing the LCP surrounded by buffer solutions incubated at 20 °C. Arrows mark areas for crystal growth. Images were taken in a defined time interval of 54 days. A) Crystallization conditions: 0.2 M Calcium chloride dihydrate + 30 % (w/v) PEG 4000. B) Crystallization conditions: 0.2 M Sodium acetate trihydrate + 20 % (w/v) PEG 3350.
Arrows mark areas for crystal growth. Crystal growth in LCP of S1P1 within the PEG II screen (0.2 M Calcium chloride dihydrate + 30 %
(w/v) PEG 4000) was observed between 14 days and 30 days after incubation start. The crystallization batch in the PEG screen (0.2 M
Sodium acetate trihydrate + 20 % (w/v) PEG 3350) showed crystal growth between 7 days and 14 days after incubation start.
Results page 100
Figure 48: Extract of the LCP surrounded by buffer solutions of two GPR3 crystallization plates incubated at 20 °C. Arrows mark areas for crystal growth. The images were taken in a defined time interval of 37 days. A) Crystallization conditions: 0.1 M MES pH 6.5 + 0.6 M Zinc acetate dihydrate. B) Crystallization conditions: 0.1 M Bis-Tris pH 6.5 + 2 M (NH4)2SO4.
Areas for crystal growth are labeled with red arrows. GPR3 crystallization in LCP with the Cation screen (0.1 M MES pH 6.5 + 0.6 M
Zinc acetate dihydrate) was observed between 14 days and 37 days after incubation start. The crystallization in the Classic II screen
(0.1 M Bis-Tris pH 6.5 + 2 M (NH4)2SO4) showed the beginning of crystal growth between 14 days and 37 days after incubation start.
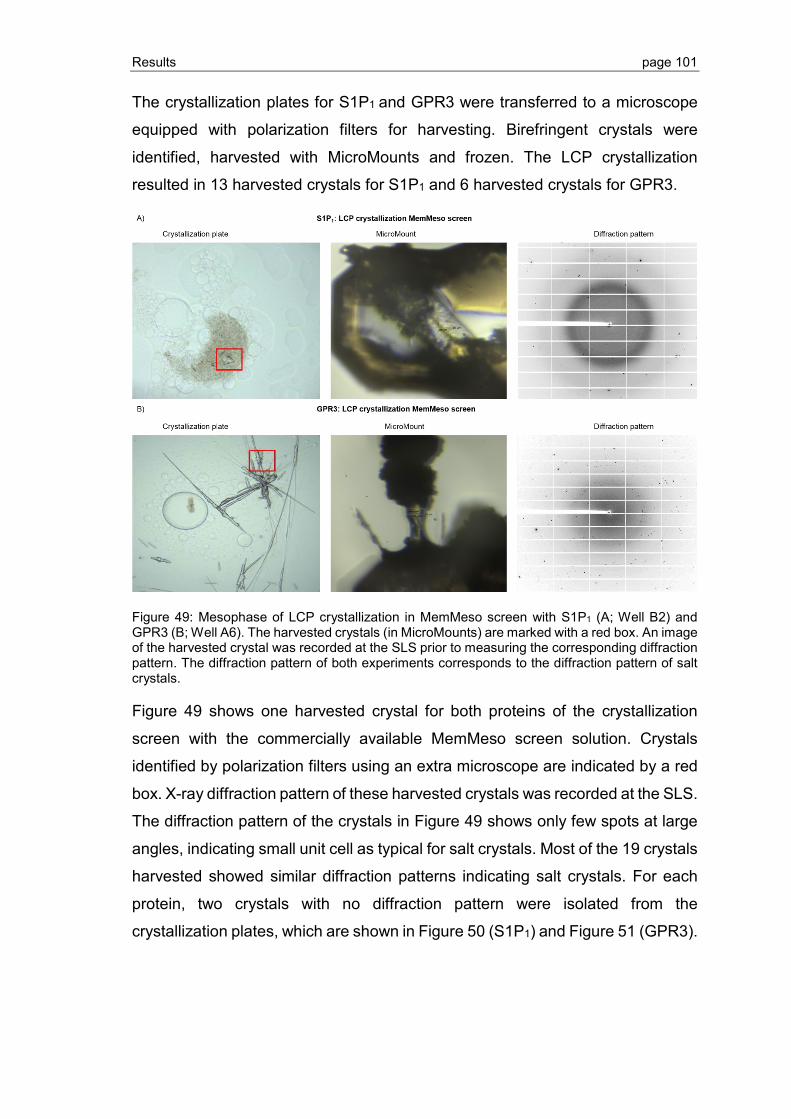
Results page 101
The crystallization plates for S1P1 and GPR3 were transferred to a microscope
equipped with polarization filters for harvesting. Birefringent crystals were
identified, harvested with MicroMounts and frozen. The LCP crystallization
resulted in 13 harvested crystals for S1P1 and 6 harvested crystals for GPR3.
Figure 49: Mesophase of LCP crystallization in MemMeso screen with S1P1 (A; Well B2) and GPR3 (B; Well A6). The harvested crystals (in MicroMounts) are marked with a red box. An image of the harvested crystal was recorded at the SLS prior to measuring the corresponding diffraction pattern. The diffraction pattern of both experiments corresponds to the diffraction pattern of salt crystals.
Figure 49 shows one harvested crystal for both proteins of the crystallization
screen with the commercially available MemMeso screen solution. Crystals
identified by polarization filters using an extra microscope are indicated by a red
box. X-ray diffraction pattern of these harvested crystals was recorded at the SLS.
The diffraction pattern of the crystals in Figure 49 shows only few spots at large
angles, indicating small unit cell as typical for salt crystals. Most of the 19 crystals
harvested showed similar diffraction patterns indicating salt crystals. For each
protein, two crystals with no diffraction pattern were isolated from the
crystallization plates, which are shown in Figure 50 (S1P1) and Figure 51 (GPR3).
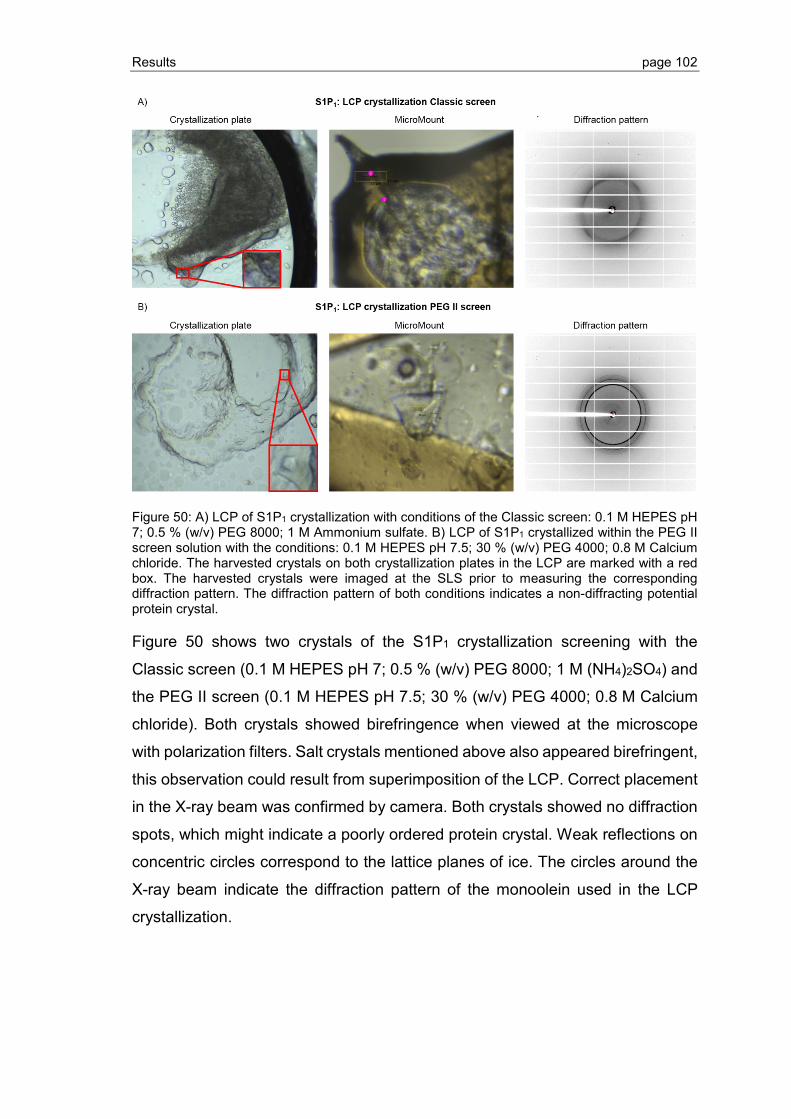
Results page 102
Figure 50: A) LCP of S1P1 crystallization with conditions of the Classic screen: 0.1 M HEPES pH 7; 0.5 % (w/v) PEG 8000; 1 M Ammonium sulfate. B) LCP of S1P1 crystallized within the PEG II screen solution with the conditions: 0.1 M HEPES pH 7.5; 30 % (w/v) PEG 4000; 0.8 M Calcium chloride. The harvested crystals on both crystallization plates in the LCP are marked with a red box. The harvested crystals were imaged at the SLS prior to measuring the corresponding diffraction pattern. The diffraction pattern of both conditions indicates a non-diffracting potential protein crystal.
Figure 50 shows two crystals of the S1P1 crystallization screening with the
Classic screen (0.1 M HEPES pH 7; 0.5 % (w/v) PEG 8000; 1 M (NH4)2SO4) and
the PEG II screen (0.1 M HEPES pH 7.5; 30 % (w/v) PEG 4000; 0.8 M Calcium
chloride). Both crystals showed birefringence when viewed at the microscope
with polarization filters. Salt crystals mentioned above also appeared birefringent,
this observation could result from superimposition of the LCP. Correct placement
in the X-ray beam was confirmed by camera. Both crystals showed no diffraction
spots, which might indicate a poorly ordered protein crystal. Weak reflections on
concentric circles correspond to the lattice planes of ice. The circles around the
X-ray beam indicate the diffraction pattern of the monoolein used in the LCP
crystallization.
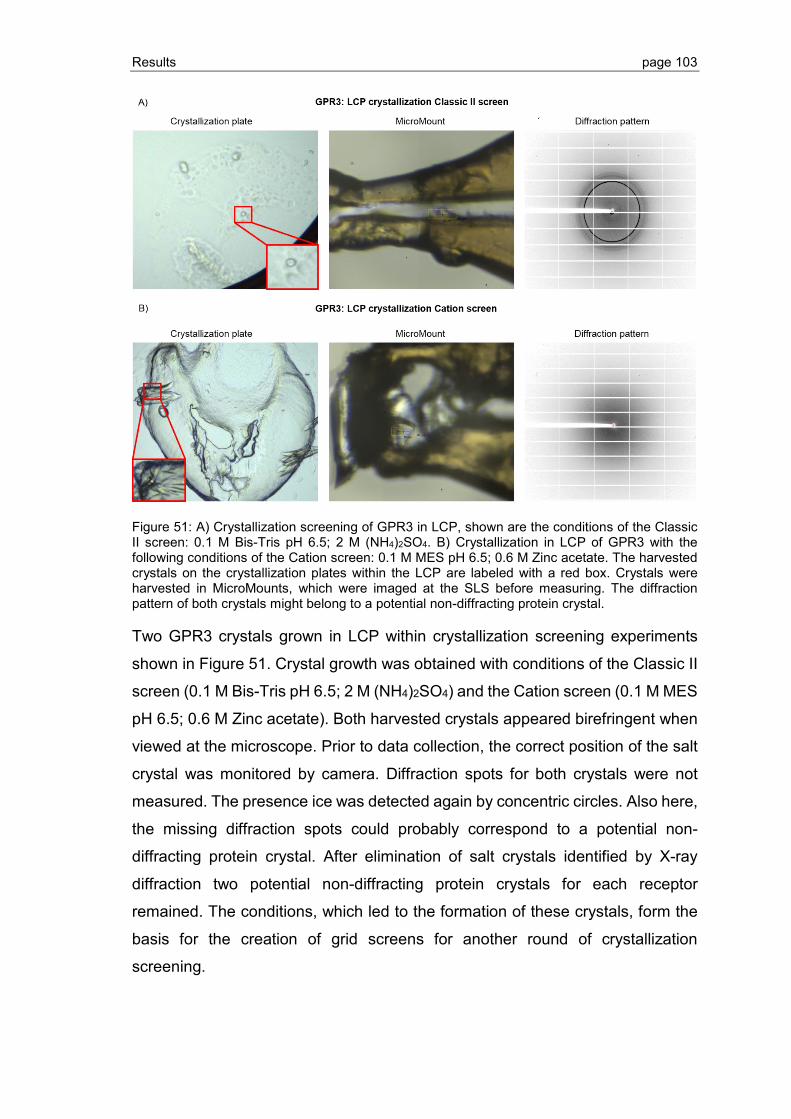
Results page 103
Figure 51: A) Crystallization screening of GPR3 in LCP, shown are the conditions of the Classic II screen: 0.1 M Bis-Tris pH 6.5; 2 M (NH4)2SO4. B) Crystallization in LCP of GPR3 with the following conditions of the Cation screen: 0.1 M MES pH 6.5; 0.6 M Zinc acetate. The harvested crystals on the crystallization plates within the LCP are labeled with a red box. Crystals were harvested in MicroMounts, which were imaged at the SLS before measuring. The diffraction pattern of both crystals might belong to a potential non-diffracting protein crystal.
Two GPR3 crystals grown in LCP within crystallization screening experiments
shown in Figure 51. Crystal growth was obtained with conditions of the Classic II
screen (0.1 M Bis-Tris pH 6.5; 2 M (NH4)2SO4) and the Cation screen (0.1 M MES
pH 6.5; 0.6 M Zinc acetate). Both harvested crystals appeared birefringent when
viewed at the microscope. Prior to data collection, the correct position of the salt
crystal was monitored by camera. Diffraction spots for both crystals were not
measured. The presence ice was detected again by concentric circles. Also here,
the missing diffraction spots could probably correspond to a potential non-
diffracting protein crystal. After elimination of salt crystals identified by X-ray
diffraction two potential non-diffracting protein crystals for each receptor
remained. The conditions, which led to the formation of these crystals, form the
basis for the creation of grid screens for another round of crystallization
screening.
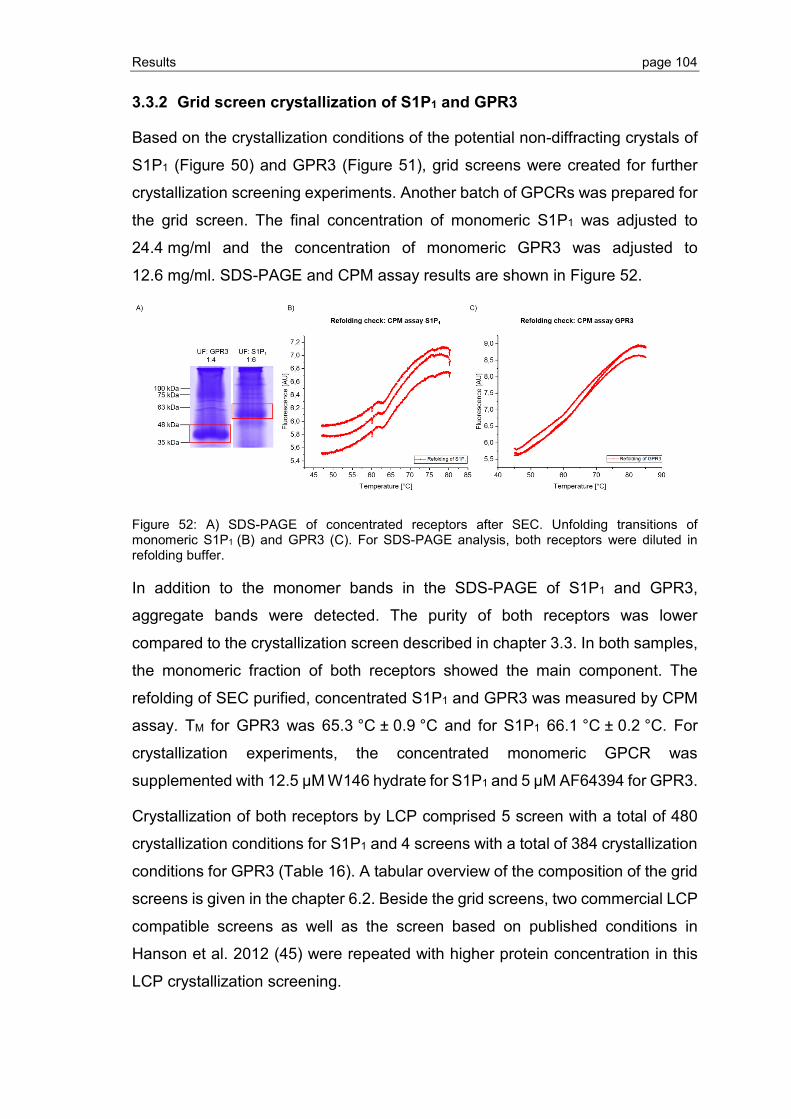
Results page 104
3.3.2 Grid screen crystallization of S1P1 and GPR3
Based on the crystallization conditions of the potential non-diffracting crystals of
S1P1 (Figure 50) and GPR3 (Figure 51), grid screens were created for further
crystallization screening experiments. Another batch of GPCRs was prepared for
the grid screen. The final concentration of monomeric S1P1 was adjusted to
24.4 mg/ml and the concentration of monomeric GPR3 was adjusted to
12.6 mg/ml. SDS-PAGE and CPM assay results are shown in Figure 52.
Figure 52: A) SDS-PAGE of concentrated receptors after SEC. Unfolding transitions of monomeric S1P1 (B) and GPR3 (C). For SDS-PAGE analysis, both receptors were diluted in refolding buffer.
In addition to the monomer bands in the SDS-PAGE of S1P1 and GPR3,
aggregate bands were detected. The purity of both receptors was lower
compared to the crystallization screen described in chapter 3.3. In both samples,
the monomeric fraction of both receptors showed the main component. The
refolding of SEC purified, concentrated S1P1 and GPR3 was measured by CPM
assay. TM for GPR3 was 65.3 °C ± 0.9 °C and for S1P1 66.1 °C ± 0.2 °C. For
crystallization experiments, the concentrated monomeric GPCR was
supplemented with 12.5 µM W146 hydrate for S1P1 and 5 µM AF64394 for GPR3.
Crystallization of both receptors by LCP comprised 5 screen with a total of 480
crystallization conditions for S1P1 and 4 screens with a total of 384 crystallization
conditions for GPR3 (Table 16). A tabular overview of the composition of the grid
screens is given in the chapter 6.2. Beside the grid screens, two commercial LCP
compatible screens as well as the screen based on published conditions in
Hanson et al. 2012 (45) were repeated with higher protein concentration in this
LCP crystallization screening.
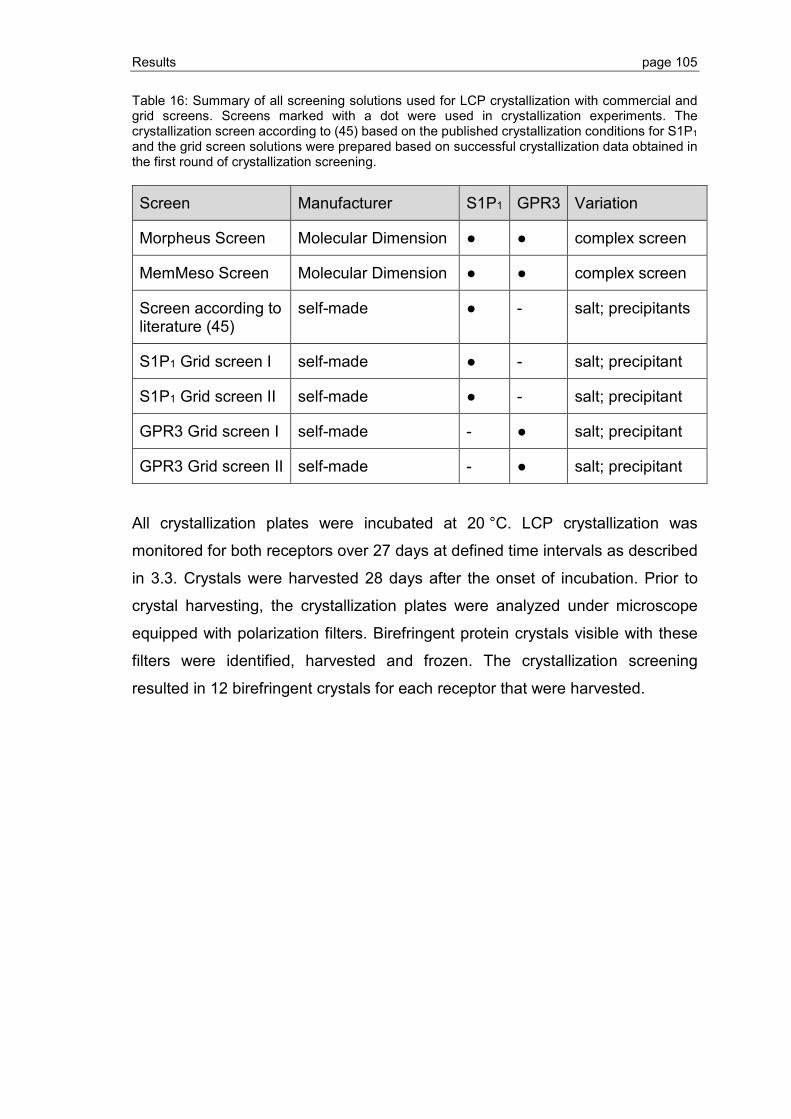
Results page 105
Table 16: Summary of all screening solutions used for LCP crystallization with commercial and grid screens. Screens marked with a dot were used in crystallization experiments. The crystallization screen according to (45) based on the published crystallization conditions for S1P1 and the grid screen solutions were prepared based on successful crystallization data obtained in the first round of crystallization screening.
Screen Manufacturer S1P1 GPR3 Variation
Morpheus Screen Molecular Dimension ● ● complex screen
MemMeso Screen Molecular Dimension ● ● complex screen
Screen according to literature (45)
self-made ● - salt; precipitants
S1P1 Grid screen I self-made ● - salt; precipitant
S1P1 Grid screen II self-made ● - salt; precipitant
GPR3 Grid screen I self-made - ● salt; precipitant
GPR3 Grid screen II self-made - ● salt; precipitant
All crystallization plates were incubated at 20 °C. LCP crystallization was
monitored for both receptors over 27 days at defined time intervals as described
in 3.3. Crystals were harvested 28 days after the onset of incubation. Prior to
crystal harvesting, the crystallization plates were analyzed under microscope
equipped with polarization filters. Birefringent protein crystals visible with these
filters were identified, harvested and frozen. The crystallization screening
resulted in 12 birefringent crystals for each receptor that were harvested.
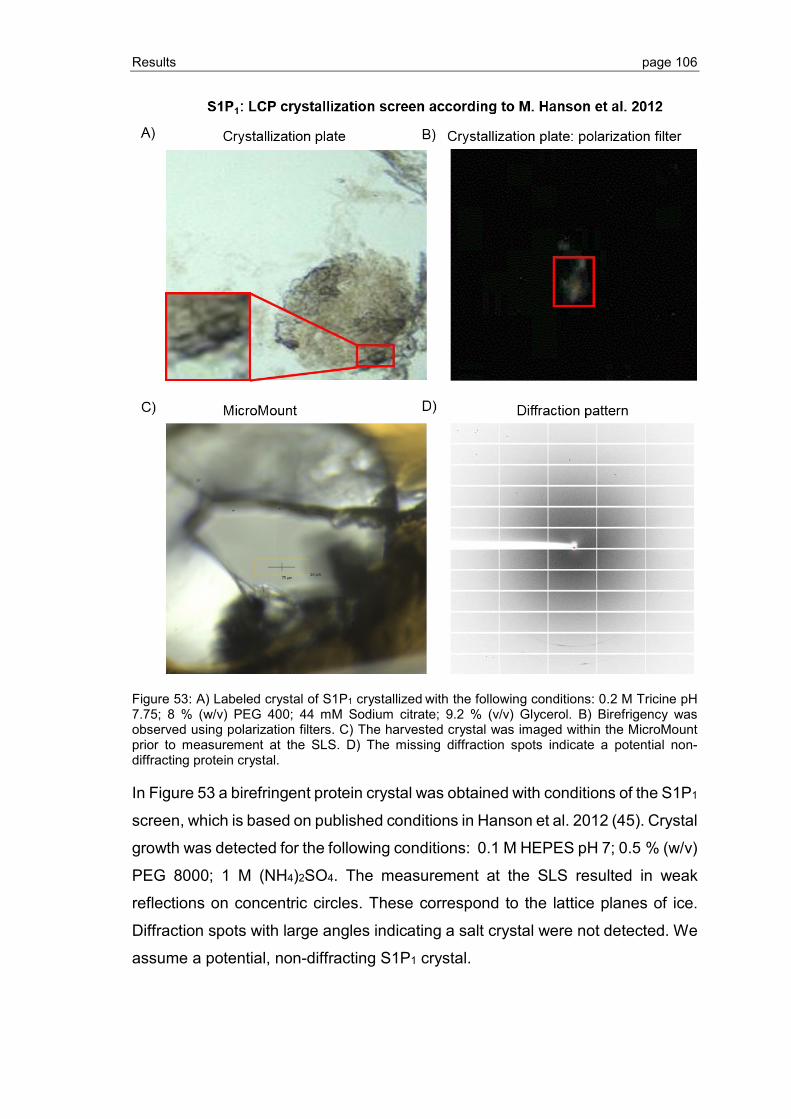
Results page 106
Figure 53: A) Labeled crystal of S1P1 crystallized with the following conditions: 0.2 M Tricine pH 7.75; 8 % (w/v) PEG 400; 44 mM Sodium citrate; 9.2 % (v/v) Glycerol. B) Birefrigency was observed using polarization filters. C) The harvested crystal was imaged within the MicroMount prior to measurement at the SLS. D) The missing diffraction spots indicate a potential non-diffracting protein crystal.
In Figure 53 a birefringent protein crystal was obtained with conditions of the S1P1
screen, which is based on published conditions in Hanson et al. 2012 (45). Crystal
growth was detected for the following conditions: 0.1 M HEPES pH 7; 0.5 % (w/v)
PEG 8000; 1 M (NH4)2SO4. The measurement at the SLS resulted in weak
reflections on concentric circles. These correspond to the lattice planes of ice.
Diffraction spots with large angles indicating a salt crystal were not detected. We
assume a potential, non-diffracting S1P1 crystal.
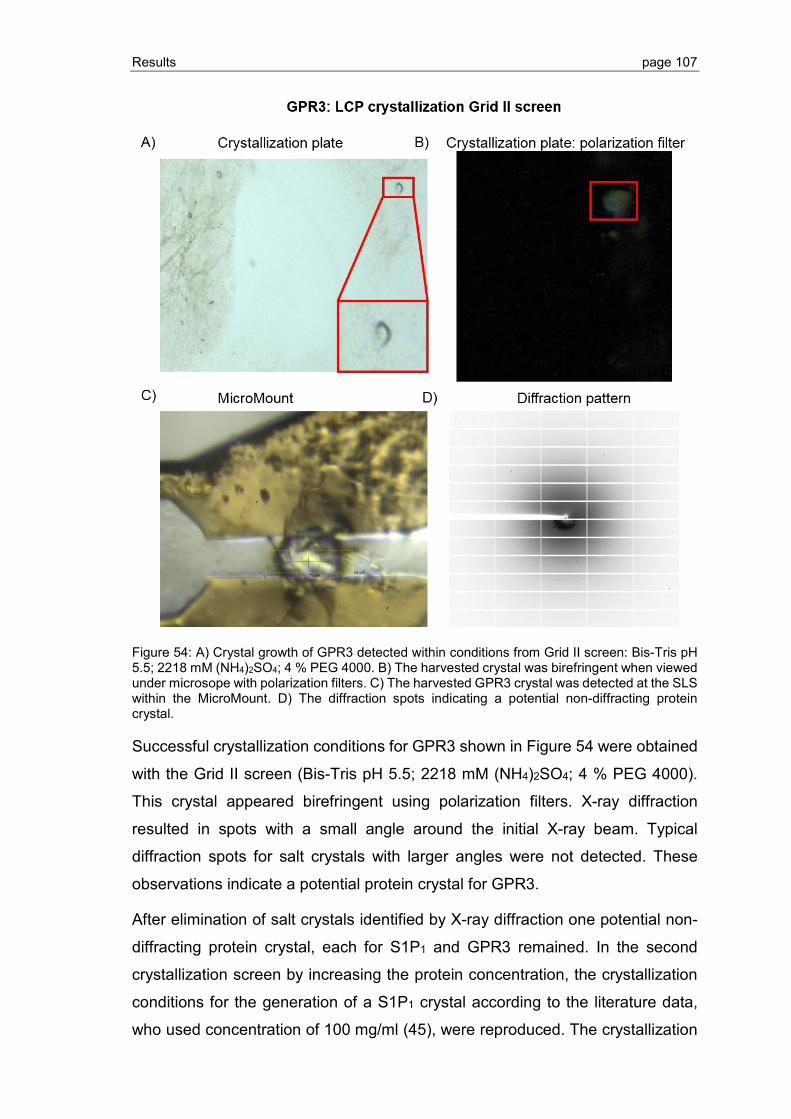
Results page 107
Figure 54: A) Crystal growth of GPR3 detected within conditions from Grid II screen: Bis-Tris pH 5.5; 2218 mM (NH4)2SO4; 4 % PEG 4000. B) The harvested crystal was birefringent when viewed under microsope with polarization filters. C) The harvested GPR3 crystal was detected at the SLS within the MicroMount. D) The diffraction spots indicating a potential non-diffracting protein crystal.
Successful crystallization conditions for GPR3 shown in Figure 54 were obtained
with the Grid II screen (Bis-Tris pH 5.5; 2218 mM (NH4)2SO4; 4 % PEG 4000).
This crystal appeared birefringent using polarization filters. X-ray diffraction
resulted in spots with a small angle around the initial X-ray beam. Typical
diffraction spots for salt crystals with larger angles were not detected. These
observations indicate a potential protein crystal for GPR3.
After elimination of salt crystals identified by X-ray diffraction one potential non-
diffracting protein crystal, each for S1P1 and GPR3 remained. In the second
crystallization screen by increasing the protein concentration, the crystallization
conditions for the generation of a S1P1 crystal according to the literature data,
who used concentration of 100 mg/ml (45), were reproduced. The crystallization
Results page 108
conditions for GPR3 resulting from the crystallization screening were also
reproduced with the grid screen II. In both crystallization screening experiments,
conditions for a successful and reproducible crystallization in LCP resulting in
potential protein crystals were obtained.
Discussion page 109
4 Discussion
4.1 GPCR expression and purification
4.1.1 Optimization of GPCR expression and IB isolation
Plasmids (pET31) carrying an insert for S1P1 or GPR3 both with an N-terminal
KSI-tag and a thrombin cleavage site, were used for protein expression in E. coli
IB. The expression experiments and subsequent optimizations were performed
with S1P1 and later applied to the expression of GPR3. The optimization resulted
in a protocol for GPCR overexpression in E. coli Tuner DE3 IB.
For the evaluation of the best expression conditions by SDS-PAGE and Western
Blot, similar amounts of protein were used for purification and analysis. Prior to
analysis, IBs were isolated, solubilized and purified in buffer containing SDS. The
anionic detergent SDS is an efficient solubilizer of proteins expressed in E. coli
IB in micelles in the non-functional state (116,177). Lowering the SDS
concentration to levels below the CMC enables the formation of intramolecular
contacts between the receptor alpha helices (119). SDS suppresses
intramolecular contacts for native tertiary structure, preventing aggregation and
oligomerization, which results in a good starting point for in vitro refolding by
detergent exchange (119). On the SDS-PAGE, a band at ~ 63 kDa was identified
as the monomeric band of S1P1 with a theoretical molecular weight of 75.9 kDa.
This anomalous membrane protein migration behavior in SDS-PAGE, also called
“gel shift”, is based on the SDS loading on membrane proteins, which can load
up to 2-fold greater amounts of SDS than globular polypeptides resulting in a
faster gel migration compared to the real molecular weight (178). The “gel shift”
was also observed for GPR3.
In addition to the monomeric receptor, other bands with a lower and higher
molecular weight were also detected. Higher molecular weight bands were
expected due to aggregation driven by hydrophobic interaction of the solubilized
receptors. A decrease in protein amount with longer incubation times was
observed mainly for S1P1. Longer expression may result from proteolytic
degradation or to some degree in an IB degradation with longer incubation.
Discussion page 110
The evaluation of the SDS-PAGE indicated a higher protein expression at 25 °C
than at 37 °C. Lowering the expression temperature can increase the protein
concentration, which was for example also shown for human Oxytocin receptor
by Kiefer et al. (110). This effect could also be applied to membrane proteins,
which tend to aggregate into IB when overexpressed in E. coli. Aggregation into
IB might be caused by the fact that eukaryotic membrane proteins use secretion
signals different from prokaryotic proteins (179). Also, due to the N-terminal tag,
proper membrane insertion with a translocated N-terminus would have been
unlikely. Expression temperatures for a desired IB formation in E. coli strains are
reported at 37 °C as well as at temperatures below 30 °C (179,180). Decreasing
the expression temperature results in a decreased aggregation due to the
temperature dependency of hydrophobic interactions (98).
TB medium is a good medium of choice for the overexpression of recombinant
proteins (98,181). This medium is nutrient-rich, contains higher concentration of
yeast extract and tryptone with additional glycerol and a strong phosphate buffer
enabling higher bacterial cell densities in comparison to LB medium (152,181). In
TB medium induction of protein expression is advised at an OD600nm value of 1-3
with a reduced temperature for optimized protein expression (182). In many
cases, induction of target protein expression is induced with 1 mM IPTG or less
(100,182,183). Depending on the induction OD600 nm and the chosen expression
strain, higher IPTG concentrations for induction are needed, which was also
shown by Chen Y. et al. (182).
In summary, conditions for the successful expression, isolation, refolding and
purification of S1P1 and GPR3 in E. coli IBs were identified. Both receptors were
overexpressed with an N-terminal KSI tag in E. coli IB (74). The tag had to be
removed by thrombin cleavage after receptor isolation and purification.
4.1.2 Thrombin cleavage of S1P1: establishment and optimization
Flexible structures in proteins including recombinant tags, may prevent
crystallization or impair crystal diffraction quality (184). For tag removal,
proteases such as thrombin, a serine protease, are used. Thrombin, compared
to other proteases like TEV, have a higher (up to 100-fold) catalytic rate constant
(148). For tag removal, a thrombin cleavage site was introduced between the N-
terminal KSI tag and the protein sequence (149). Thrombin was chosen as
Discussion page 111
protease of choice for tag cleavage due to its activity in the presence of
detergents required for use with membrane proteins (184). Thrombin recognizes
the protein sequence LVPRGS and cleaves between arginine and glycine
resulting in two products, the KSI tag and the KSI-free receptor with glycine and
serine remaining at the receptor sequence (149,185).
In order to perform thrombin cleavage experiments, the S1P1 was solubilized in
SDS, purified using Ni-IMAC columns and refolded by detergent exchange. In
order to avoid the loss of Ni2+ ions and to preserve the chromatography column,
the protein elution was changed from EDTA to imidazole. The adjustment,
however, had a disadvantage, the thrombin cleavage with imidazole-eluted S1P1
was not successful, which might be caused by an interference of the imidazole
with the thrombin cleavage (186,187). Removal of imidazole indeed restored
thrombin activity (Figure 29).
By detergent exchange, intermediate states occur and mixed micelles composed
of SDS and Fos-Choline 14 arise. The milder detergent Fos-Choline 14 was
intended to induce formation of the tertiary protein structure upon binding to the
hydrophobic surface of TM segments (188). In these mixed SDS-Fos-Choline 14
micelles, S1P1 is expected to contain considerable alpha-helical structure,
serving as a good starting point for the formation of tertiary contacts (188).
Thrombin cleavage was tested both with column-bound S1P1 (145,149) and after
elution. Besides the monomer receptor band, aggregates and unexpected
degradation products were detected for both experiments (Figure 25).
Unexpected bands with a molecular weight lower than the KSI-free monomeric
protein, might result from nonspecific digestion by protease contaminants (151),
which could result from a carry-over during the purification and refolding process.
Higher thrombin amounts did accelerate the cleavage process resulting in an
increased cleavage yield (145). An excess of thrombin may also result in
unwanted proteolysis at secondary sites, resulting in unexpected bands on the
SDS-PAGE (189). Due to easier handling and slightly higher cleavage efficiency,
thrombin cleavage was continued in solution only.
After refolding into Fos-Choline 14 micelles, the thrombin cleavage site may be
less accessible compared to a native folded protein within the membrane. Urea
at low concentrations leads to a perturbation, but not a complete denaturation of
Discussion page 112
protein structure resulting in a better accessibility of the thrombin cleavage site
(190). At low urea concentrations (< 2 M), hydrophobic interactions are reduced,
which are the major interactions leading to protein aggregation (191). Therefore,
the thrombin digestion with higher Fos-Choline 14 concentrations in combination
with low urea concentrations, to increase the accessibility to the thrombin
cleavage site, were compared. Low urea concentrations in combination with
higher Fos-Choline 14 concentrations resulted in a better thrombin cleavage
yield. Protein aggregation may conceal the thrombin cleavage site. Compared to
the controls without urea, the aggregate band intensity on the SDS-PAGE was
reduced (Figure 27). Urea typically increases the CMC of detergents (192).
Lowering the CMC results in a loss of micelles and might interfere with the
receptor folding. This hypothesis is supported by the increase of aggregate bands
on the SDS-PAGE in comparison to the samples with 0.1 M urea.
Instead of the zwitterionic Fos-Choline 14, the mild detergent DDM at different
concentrations in combination with CHS, were tested in order to achieve
complete digestion. This combination, which is widely used in literature for
refolding and crystallization, has been shown to increase the thickness of the
hydrocarbon layer allowing the micelle to better mimic the natural membrane
environment (171). CHS functions as a protein stabilizer as shown by thermal
stability assay with a shift towards higher TM values (171,193). This stabilizing
effect can reduce aggregate formation and may enhance the accessibility of the
thrombin cleavage site. The stabilizing effect of CHS was higher within DDM than
within Fos-Choline 14 micelles. The thrombin cleavage in DDM compared to Fos-
Choline 14 was better, reaching values of 80-90 % (Figure 30). Higher amounts
of KSI-free S1P1 in DDM compared to Fos-Choline 14 might result from the fact
that some detergents can have inhibitory effects on proteases (184). The
supplementation with Glycerol was tested in the thrombin digestion to enhance
the stability and to increase the cleavage success (148). A slight increase in the
amount of KSI-S1P1 as expected was observed in combination with increasing
the DDM concentration.
In many published cleavage buffers, CaCl2 is included. In combination with the
use of increased thrombin concentrations, the cleavage might be optimized
(145,150,170). Increasing the thrombin concentration to 200 U/ml resulted in an
improved cleavage but not a complete digestion. Nevertheless, an unspecific
Discussion page 113
cleavage at secondary sites through thrombin used at high concentration were
not detected (148).
The thrombin digestion was successful but resulted in a heterogeneous sample
and an incomplete digestion. To avoid heterogeneity due to incomplete cleavage,
tag-free expression of S1P1 and GPR3 was attempted. The flexible thrombin
cleavage site was also removed to avoid interference with crystallization. The
amino acid sequence in proteins influences the expression level of recombinant
proteins in E. coli with an alanine at the second amino acid position reported to
have the strongest positive effect (142). As part of the modification, the insertion
of alanine at the second amino acid position positively influenced the expression
level as expected. Despite the removal of the KSI-tag, both receptors were still
expressed as aggregates in E. coli IB. Expression in E. coli IB results from a
combination effect of hydrophobicity and protein aggregation (194). In the
following, tag-free S1P1 and GPR3 (referred to as S1P1 and GPR3) were used
exclusively in all experiments concerning receptor stabilization, ligand binding
and crystallization.
4.2 Refolding of S1P1 and GPR3
For crystallization and structure analysis of proteins obtained from IBs, high
refolding yields, conformational homogeneity and monodispersity are a
prerequisite. This requires a simple and robust assay able to probe folding state
and stability of many different constructs, specifically here, GPCRs. The melting
temperature TM is a commonly used, generic and convenient indicator to compare
protein stability at different conditions.
4.2.1 CPM assay establishment and measurement of GPCR refolding
The CPM assay is a suitable method to detect refolding success and stability of
membrane proteins, as shown in literature (171,195,196). This assay reduces the
required amount of protein compared to other analytical techniques such as
differential scanning calorimetry or circular dichroism spectroscopy (123,153).
In the CPM assay, the unfolding transition can be described by a two-state model
with a transition from native folded (lower plateau) to the denatured, unfolded
state (upper plateau) (123). It was first established with the positive control β-LG
Discussion page 114
(123). The TM measured for β-LG was ~ 4 °C below the value reported by
Alexandrov et al. (123). The similar fact resulting from technical limitations of the
qPCR plate cycler, similar to the one used in this thesis, for the detection of the
emission maximum, was reported by Crichton P. et al. (125).
When applied to S1P1 and GPR3, the eluent imidazole proved to interfere with
the CPM assay as described previously (153,169), which is why imidazole was
then removed by dialysis or SEC prior to the assay. In the absence of imidazole,
unfolding of S1P1 and GPR3 resulted in sigmoidal transition curves indicating
successful protein refolding. Minor differences in TM and fluorescence intensity
showed high assay reproducibility. The CPM assay was successfully established
and used for detecting refolding of S1P1 and GPR3.
4.2.2 Detergent refolding screen
The detergent screen was carried out as a preliminary test for the selection of a
suitable detergent mixture for stabilization and crystallization experiments. High
TM values indicate a higher receptor stability within a more native-like
environment for the GPCRs (83,171). Three detergents (Fos-Choline 12; Fos
Choline 14; DDM) at two concentration levels each, with and without
supplementation of CHS, were tested. GPCRs show less stability at high
detergent concentrations (> 10 x CMC) commonly used for solubilization (197).
Detergent concentration was therefore reduced to improve receptor stability (83).
Receptor stability in Fos-Choline 14 as determined by TM was higher than in Fos-
Choline 12. This is consistent with reports indicating that longer hydrocarbon
chains improve thermal stability (White et al. and Kohl et al. (198,199)). Also, Ren
H. et al. 2009 (152) found in a test series with Fos-Cholines 9-16, that the Fos-
Choline 14 was the most effective detergent regarding protein stabilization
(152,200).
DDM, as a mild and uncharged detergent, is widely used to solubilize and
stabilize a variety of membrane proteins (126). Due to the zwitterionic head
group, Fos-Cholines are considered to be stronger detergents than the
uncharged DDM and are therefore more commonly used in the GPCR isolation
from eukaryotic or bacterial membranes than for refolding (152,201).
Discussion page 115
Consistently, GPCR TM values as well as fluorescence intensity were higher for
refolding experiments in DDM than in Fos-Choline.
Mixed micelles composed of two or more detergents form bicelle-like structures,
which are closer to a lipid bilayer and therefore better protect membrane proteins
from thermal inactivation (83,171). Moreover, the sterol framework of CHS may
influence the micelle fluidity similar to cholesterol in lipid membranes and thereby
stabilizes the solubilized GPCRs (28,171). The slight stabilization effect resulting
from CHS addition was observed for S1P1 and GPR3. Consequently, CHS was
added in subsequent experiments. Due to the broad application of DDM and
since the TM values of S1P1 and GPR3 only differed marginally when refolded in
DDM or Fos-Choline 14, we decided to use DDM in combination with CHS for
further optimization (126,152,181,201).
4.2.3 Optimization of receptor stability by DoE
Further factors potentially influencing receptor stability were investigated by DoE.
Glycerol for example is a stabilizing additive and can be used for stabilization of
water-soluble and membrane proteins in detergent micelles (123,202,203). A
slight stabilizing effect of glycerol was shown through a color shift in the contour
plot (Figure 38).
S1P1 contains an ERY motif and GPR3 a homologous DRY motif in helix III, which
are known sites for pH dependent protonation and might influence receptor
stability (13,204,205). Extreme pH often destabilize proteins and can induce pH
dependent destabilization (206). In a pH screening, the best stabilizing conditions
for S1P1 and GPR3 were detected as expected for near physiological pH values
between 6 and 7.5.
Sodium chloride is known as a factor with a positive influence on receptor
stability. Sodium ions can interact with the sodium binding pocket of GPCRs and
increase TM (25). A stabilizing effect of sodium chloride on both receptors was
detected.
4.2.4 Stabilizing effects of lipids in mixed micelles and ligand binding
Mixed lipid-detergent micelles can induce higher receptor affinity to ligands by
altering the energy landscape of receptor conformations (9). GPCRs refolded into
Discussion page 116
mixed detergent micelles are stabilized and can gain their functional conformation
including correct disulfide bond formation (85,168,207). Similar to CHS,
phospholipid in mixed-micelles enhances protein stability by creating an
environment closer to the native surrounding of membrane proteins (85,172). The
addition of phospholipids and cholesterol in mixed detergent-lipid micelles was
used in an attempt to reduce aggregation and optimize refolding and stability, as
inclusion body proteins are expected to be devoid of lipids. As expected, the
addition of lipids for receptor refolding showed the stabilizing effect on both
receptors by increasing the TM by 5 – 13 °C in comparison to refolding into mixed
detergent micelles.
Ligands such as agonists, antagonist and inverse agonists can induce a
preferential receptor conformation and increase the likelihood of successful
crystallization by reducing conformational heterogeneity (130). To date, most of
the solved GPCR structures are in an inactive receptor conformation with bound
antagonist, because such stabilized receptors crystallize more easily (9,208).
Depending on the ligand, receptors are captured either in the active or inactive
conformation. Proper refolding results in the native conformation capable of
ligand binding, which can be measured with an increase in TM (25,57).
Ligand binding to both receptors was investigated to confirm refolding into the
native conformation. The S1P1 antagonist W146 with a Ki of 10-77 nM and the
GPR3 inverse agonist AF64394 with a Ki of 100 nM were used. A slight increase
in TM of 1-2 °C was measurable when ligand was added to either refolded
receptor. The measured increase in TM for S1P1 and GPR3 was lower than
reported TM values for other membrane proteins. The stability increase of these
membrane proteins, which was determined by DSF, varied between 4 °C and
16 °C (25,154,209,210). An explanation for the slightly lower increase could be
that the Ki in detergent micelles was higher compared to mixed detergent-lipid-
micelles, which can also prevent precipitation (168,171,176).
Addition of the inverse agonist to GPR3, refolded into mixed detergent-lipid
micelles, resulted in an further increase of the TM by ~ 5.7 °C compared to 1.8 °C
in case of refolding into mixed detergent micelles.
Binding of both ligands should be high-affinity, i.e. Kd is expected to be in the
nanomolar range. In a typical binding experiment, where the protein
Discussion page 117
concentration is far below the Kd, the inflection point would correspond to the Kd
(Figure 43 D). However, due to the detection limit of the CPM assay, here we had
to use receptor concentrations of about 1 µM, preventing Kd determination.
Instead, the inflection point would be in the range of the protein concentration,
which is the case for GPR3 (3 µM). For S1P1 data obtained does not allow
determining the inflection point with sufficient accuracy. The higher ligand
concentration in comparison to the receptor concentration might be required for
sufficient saturation of the binding sites since both receptors were refolded in
mixed detergent-lipid micelles and not in their native environment. The observed
decrease of the absolute fluorescence upon ligand addition might result from a
quenching effect caused by the ligand itself. Furthermore, free cysteins in ligand-
bound GPCR might be shielded by the ligand directly or through conformational
effects resulting in a lower fluorescence signal.
For crystallization experiments, a finally optimized refolding and purification
scheme including suitable buffer conditions, detergent and lipid concentrations
for S1P1 and GPR3 was established. In addition, suitable ligand concentrations
were identified.
4.3 LCP crystallization of S1P1 and GPR3
4.3.1 Formation of the LCP
For LCP formation, the purified, refolded and concentrated monomeric receptors
were combined with monoolein forming the viscous and sticky cubic mesophase
(211). The stabilizing, membrane-like environment of the LCP is advantageous
for promoting crystal packing to type I crystals, where crystal contacts are formed
between polar and non-polar parts of the protein (135,211). Under conditions of
crystallogenesis, crystals grown in LCP are usually smaller in size compared to
the ones from standard crystallization experiments using vapor diffusion (212). In
LCP, the S1P1 or GPR3 are transferred from the detergent micelles used for
refolding into the bilayer of the cubic phase, which is considered to provide a
more native like conformation (211). GPR3 was stabilized by the inverse agonist
(211). For the crystallization experiments, the conditions described in Caffrey M.
(213) were selected such that the cubic mesophase Pn3m described in the
temperature-composition phase diagram of monoolein/water was created. Not all
Discussion page 118
conditions of the screens used are compatible with the LCP. Caffrey and
Cherezov (211) reported that some conditions are incompatible with the LCP and
destroy the cubic phase, therefore preventing crystallization (161). E.g. the use
of small organic molecules like 2-methyl-2,4-pentanediol (MPD) as precipitants
can completely dissolve the lipids inhibiting the formation of the LCP (11).
Dependent on the crystallization conditions, Caffrey and Cherezov (211) reported
the occurrence of different phases. In both crystallization experiments some of
the reported phases were observed. These phases included the dried-out lipid
mesophase, the crystalline Lc phase, the hexagonal phase and some swollen Lα
phases.
A database search on the biological macromolecule crystallization database
revealed that 280 GPCR structures were published in the past 20 years with pH
values in crystallization experiments between 3.5 and 9.0. The major proportion
of structures (~ 220) were achieved for pH values between 5.0 and 7.5. Caffrey
and Cherezov (211) reported hydrolysis and fatty acid release in precipitant
solutions above pH 9, which was also observed for some performed
crystallization experiments through formation of small vesicles seen under
microscope.
Also the protein sample composition can prevent LCP formation, in the first
crystallization trial with GPR3, the formation of LCP could only be created after
diluting the GPCR/ligand solution with refolding buffer. The inverse agonist at
10 µM resulted in a methanol concentration of 0.25 % (v/v), which was probably
negatively interfering with the phase behavior of the LCP (211). Dilution by a
factor of two led to the creation of the LCP.
4.3.2 Crystallization and crystal harvesting
Building blocks for stable crystal lattices are monodisperse GPCRs (214).
Nonspecific aggregates or precipitated protein in solution reduces the likelihood
of regular association essential for crystal lattice formation (214). The LCP can
act as size filter and has the ability to remove large-size impurities such as protein
aggregates from poisoning the crystal growth (135). Protein aggregates appear
as a brownish aggregate as well as birefringent crystals when viewed using a
microscope (211,215). Brownish aggregates were seen in some crystallization
experiments. To some kind, these aggregates appeared as birefringent false
Discussion page 119
positive crystals within the LCP. Many reports in literature suggest that the target
protein for crystallization should reach purity values of more than 90 %
(90,203,216,217). Verified by SDS-PAGE, the required sample purity within the
crystallization screening was achieved. A successful crystallization in LCP was
observed for both receptors, so the sample purity for a crystal formation was
sufficient. The harvested crystals were all identified according to their birefringent
appearance on a dark background using a microscope in bright-field mode and
with crossed-polarizers (136). Some crystals dissolved during harvest, when they
were removed from the LCP. The dissolution indicates conditions resulting in
crystal instabilities or the formation of instable microcrystalline structures instead
of a crystal (212,218). Beside the dissolution of lipids inhibiting the formation of
the LCP, slight temperature variations and the mesophase surrounding buffer
conditions can also dissolve weak crystals during harvesting (169). Based on
successful crystallization conditions in the crystallization screening, which
resulted in two conditions for each receptor, grid screens (variations of the
successful crystallization conditions) were created.
4.3.3 X-ray crystallography
In both crystallization experiments, a total of 43 crystals for both receptors were
successfully harvested. A driving force for nucleation is protein concentration.
With increasing protein concentration, the system gets more supersaturated. In
the supersaturated state for LCP crystallization, the highest achievable protein
concentration should be used to support nucleation (136,156). For both
receptors, successful crystallization conditions resulting in potential non-
diffractive protein crystals were determined. Within the grid screen, successful
crystallization conditions for both receptors were reproduced. These conditions
did not result in crystallization formation for the corresponding negative control.
Successful crystallization conditions by Hanson et al. (45) report initial S1P1
concentrations of 100 mg/ml. The S1P1 concentration in the crystallization screen
with 4.6 mg/ml was probably too low. The effect of increasing the protein
concentration for successful crystallization for S1P1 was verified within the grid
screen experiment. Here, the concentration of S1P1 was increased to 24.4 mg/ml.
The increase in S1P1 concentration yielded a non-diffractive potential protein
crystal, which was identified under conditions based on the published
Discussion page 120
crystallization by Hanson et al. (45). A further increase in S1P1 concentration as
well as increasing sample purity may help in structure determination by increasing
the probability of stable crystal formation and increasing diffraction (219). For
GPR3, the crystallization screening resulted in two potential non-diffracting
protein crystals. Similar to S1P1, the GPR3 concentration of 8 mg/ml was also too
low. Within the grid screen II, crystallization conditions for GPR3 were also
reproduced. Similar to the observation and explanation for S1P1, a further
increase in GPR3 concentration for crystallization may help in future structure
determinations.
Poorly or nearly non-diffracting crystals might result from a low signal-to-noise
ratio due to a combination of background scatter from adhering mesophase or
inhomogeneous regions within the harvested crystal (118,161). The detergent
torus may also keep proteins apart such that side-to-side contacts to other
proteins are weakened. This results in a lower crystal density and may result in a
reduced diffraction (219).
Of the 43 crystals harvested, 37 proved to be salt crystals as indicated by
diffraction spots at large angles. All these crystals had shown birefringency under
cross-polarized filters. However, defects in the LCP can lead to a conversion into
a highly birefringent lamellar or hexagonal phase (135). This might be an
explanation why these salt crystals appeared as potential birefringent protein
crystals (false positives). The formation of salt crystals was expected due to the
fact that in many of the screening solution different salts in partly high
concentrations are used as precipitants. Many of the crystals examined showed
a ring around the initial beam resulting from ice diffraction. During crystal
harvesting as well as handling steps for final measurements, ice crystals may
have formed around the investigated crystal.
Strategies to improve poorly diffracting membrane protein crystals is an
optimization of lead conditions by testing closely related successful crystallization
conditions with small changes (197). These changes may result in starting
conditions for a successful crystallization experiment by optimizing the
precipitants. Besides optimizing surrounding crystallization conditions, increasing
the sample purity and sample concentration as well as varying the detergent lipid
composition and concentration may increase the probability of crystal growth.
Conclusion and outlook page 121
5 Conclusion and outlook
In this thesis we were able to overexpress, isolate and refold stabilized sequence
variants of two human GPCRs (S1P1 and GPR3) from E. coli IBs. Both receptors
were purified in SDS under denaturing conditions via engineered histidine tags.
Refolding was achieved by detergent exchange while bound to the Ni-IMAC
column. In the first part of the study, both receptors were expressed with a KSI
fusion, which had to be cleaved off using the protease thrombin. The thrombin
cleavage was not complete, leaving a mixture of undigested and digested
receptor. Therefore, constructs lacking the KSI fusion were produced to avoid
thrombin cleavage altogether. Both tag-free GPCRs were successfully expressed
by using the established expression conditions. Refolding conditions for both
receptors were optimized based on thermal stability by TM monitoring. DDM-CHS
mixtures resulted in the highest TM values in comparison to other detergent
mixtures tested. Receptor stability and reduction of receptor aggregation was
further improved by varying solvent composition and addition of phospholipids
and cholesterol to create mixed micelles. By TM monitoring, ligand binding to
S1P1 and GPR3 was shown. For crystallization experiments in LCP, refolded,
purified and concentrated monomeric S1P1 and GPR3 were used. In a first
crystallization screening, successful crystallization conditions for both receptors
were identified. X-ray diffraction experiments resulted in two non-diffractive
potential protein crystals of each receptor. In a follow-up grid crystallization
screen, increased concentrations of both receptors were used. For S1P1,
conditions similar to the published crystallization (45) resulted in further non-
diffractive crystals. Also for GPR3, conditions close to those determined in the
first screen returned more crystals.
The methods and optimizations established in this study could serve as a generic
technique to express, purifiy and refold GPCRs from E. coli IBs. Furthermore,
these refolded receptors may potentially be used for crystallization in LCP,
although we haven't shown successful production of diffracting crystals yet.
In the future, it would be interesting to investigate the applicability of this
production process to GPCRs containing the native IL3 instead of the T4
lysozyme replacement. This would allow applying functional assays such as the
ligand-induced G protein activation. For future crystallization experiments, the
Conclusion and outlook page 122
protein concentration and purity should be further increased. Crystallization
conditions such as incubation temperature and duration as well as precipitant
concentration and composition could also be considered for further
improvements. Optimization of crystallization screens could be done in high
throughput mode, for example by including pre-screening assays such as the
fluorescence recovery after photo bleaching also known as LCP-FRAP. LCP-
FRAP with microgram quantities of protein material can be used as a pre-
crystallization assay to select a suitable range of conditions for crystallization and
eliminate conditions that are not compatible with protein diffusion from
subsequent crystallization screens.

Attachment page 123
6 Attachment
6.1 Crystallization screen
Table 17: List of the composition of the Morpheus screen (Molecular Dimension).

Attachment page 124
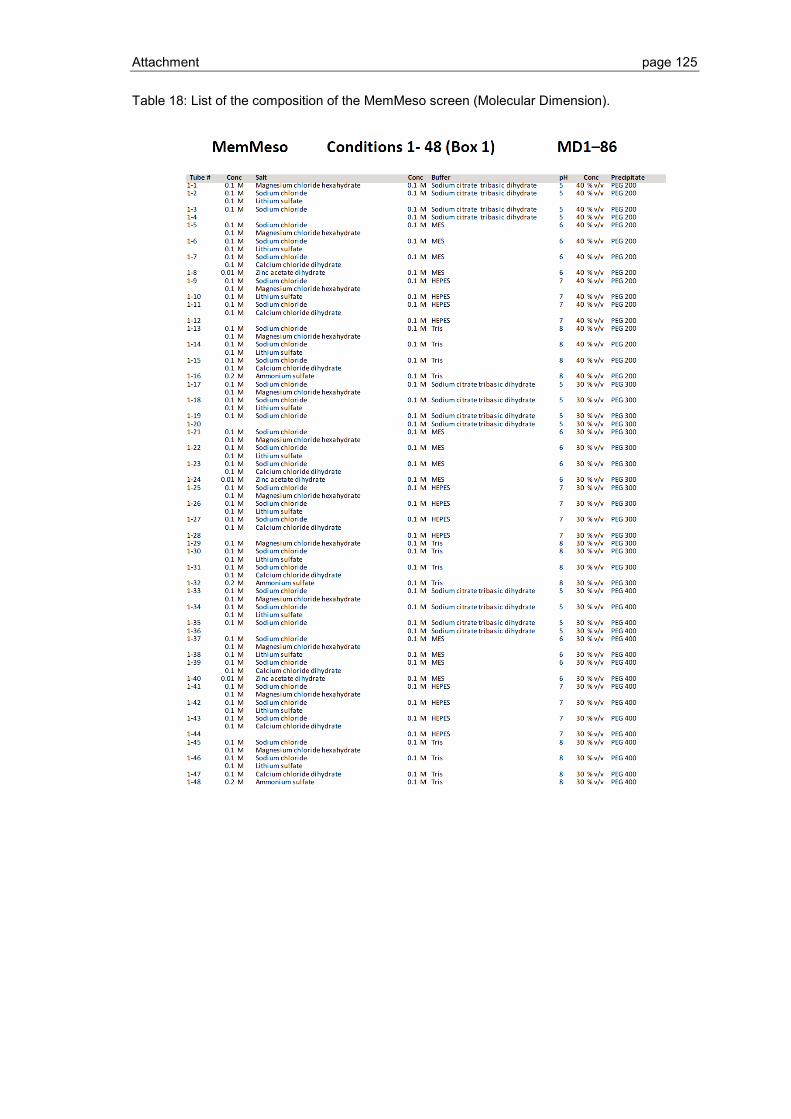
Attachment page 125
Table 18: List of the composition of the MemMeso screen (Molecular Dimension).
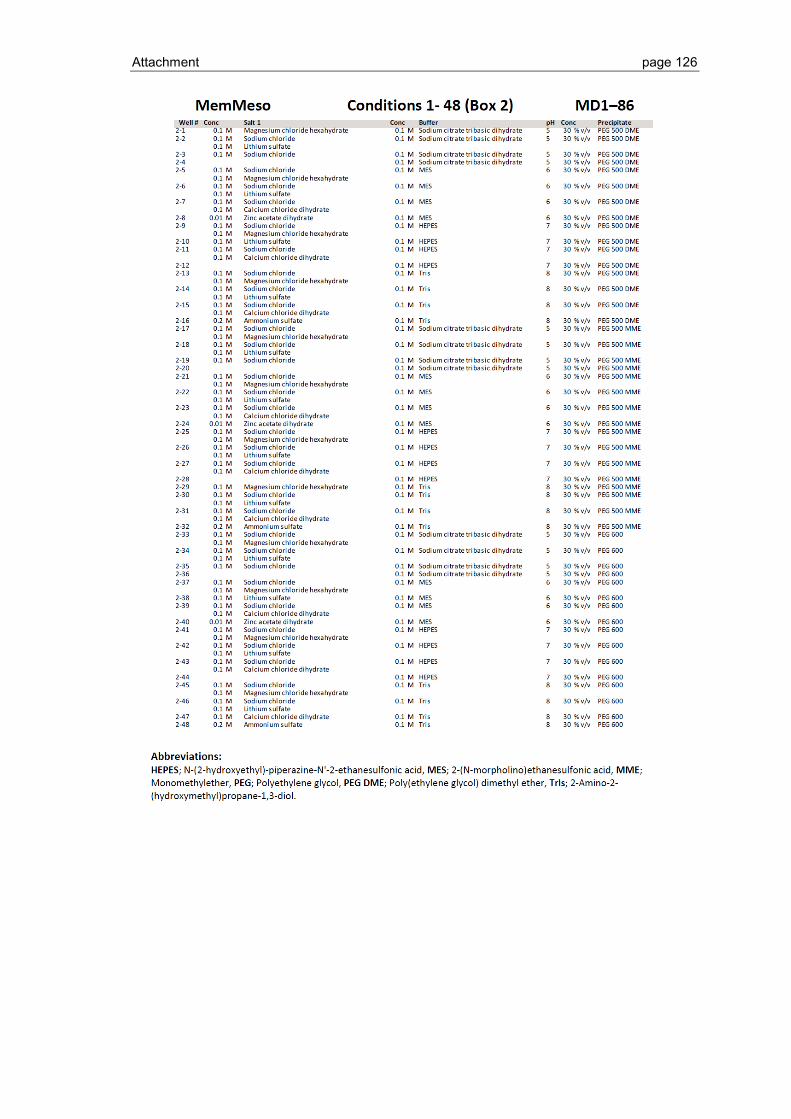
Attachment page 126
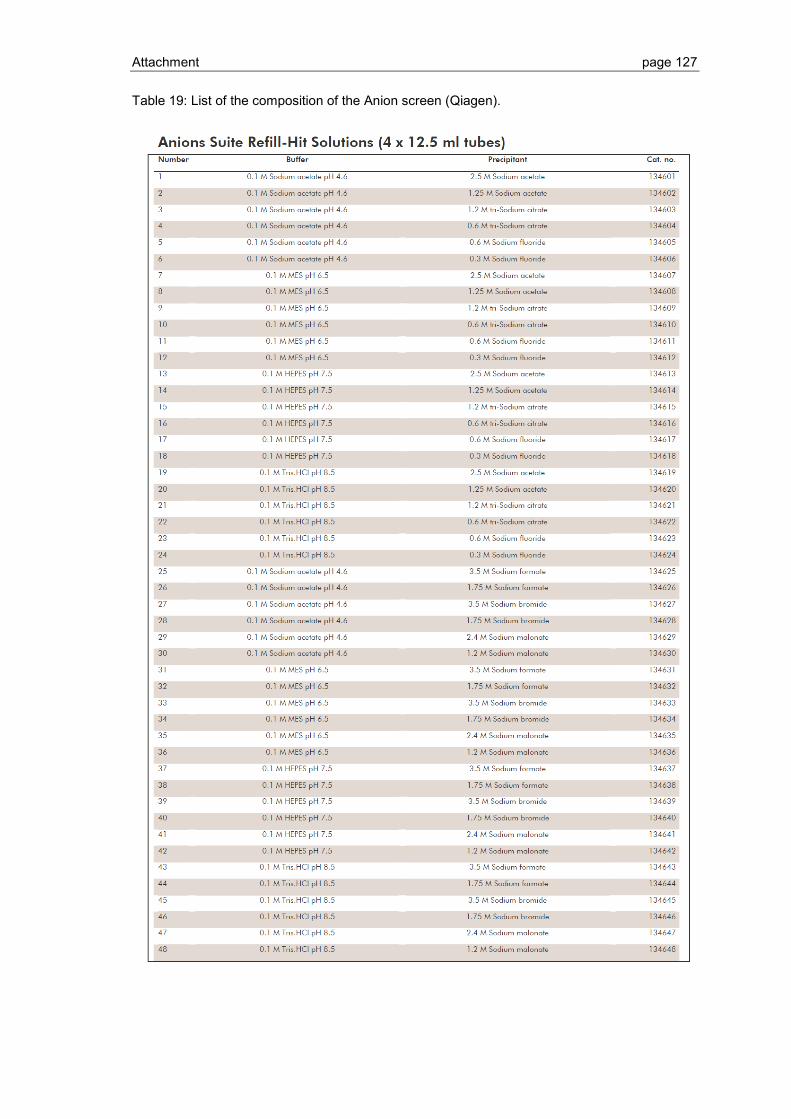
Attachment page 127
Table 19: List of the composition of the Anion screen (Qiagen).
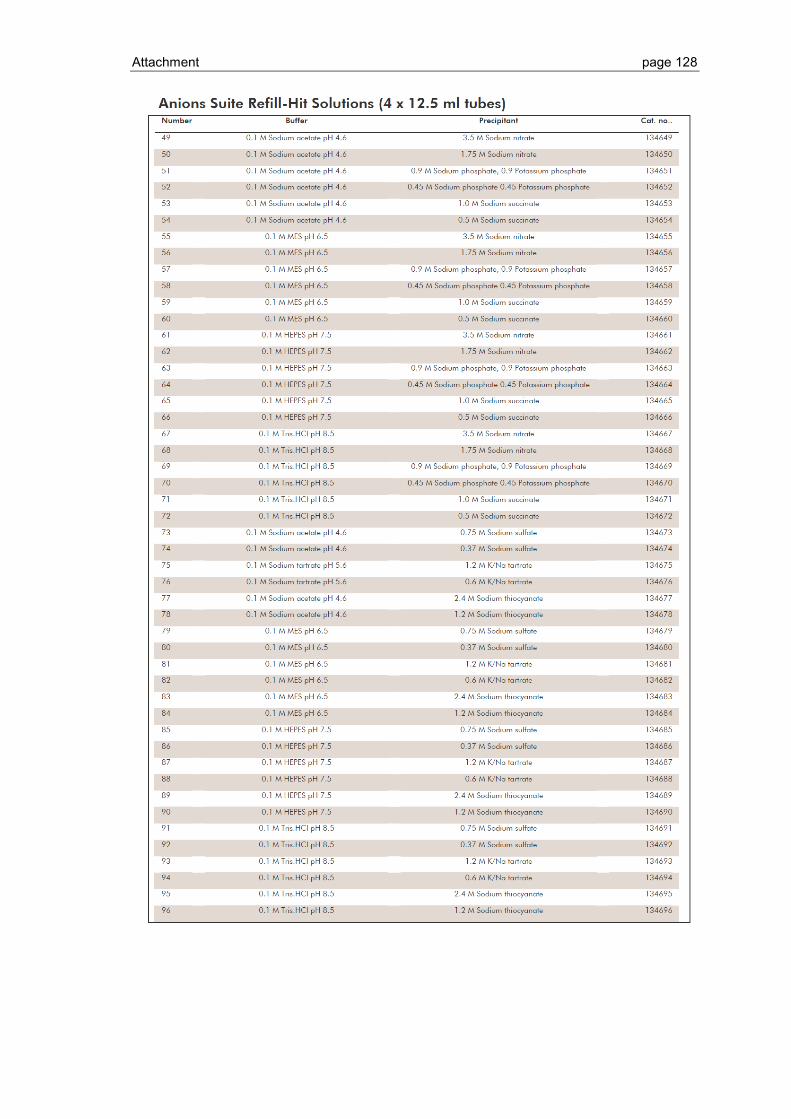
Attachment page 128
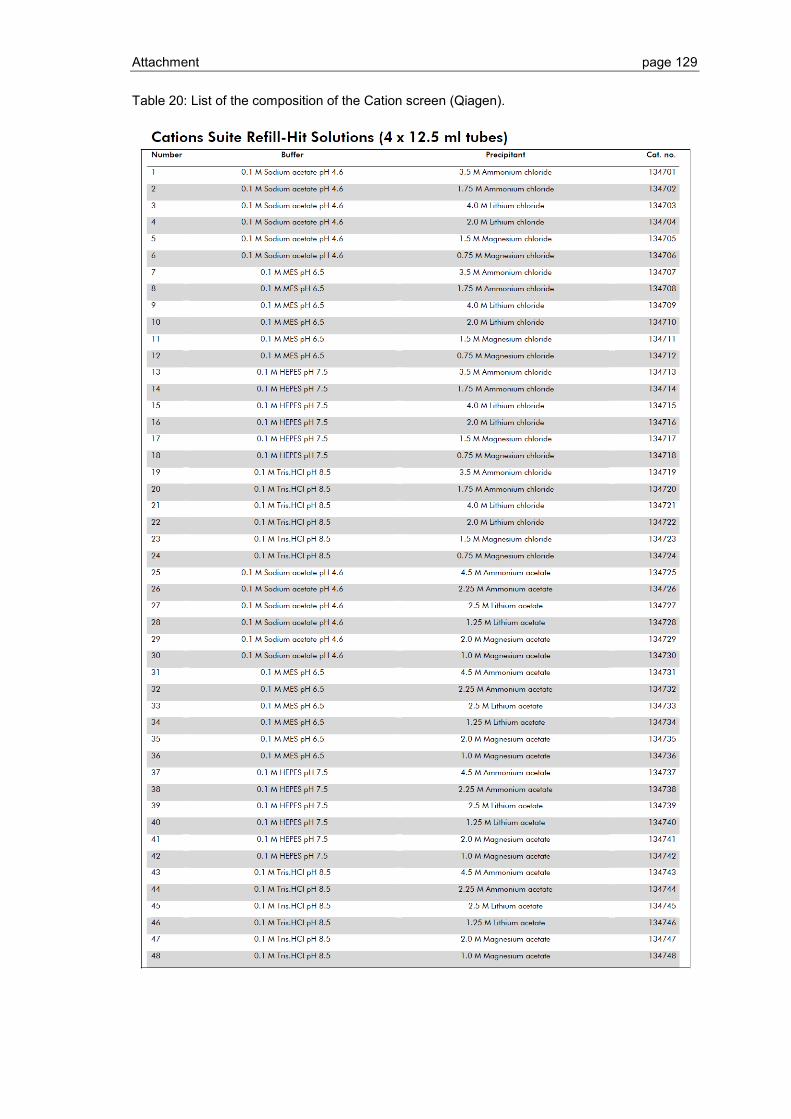
Attachment page 129
Table 20: List of the composition of the Cation screen (Qiagen).
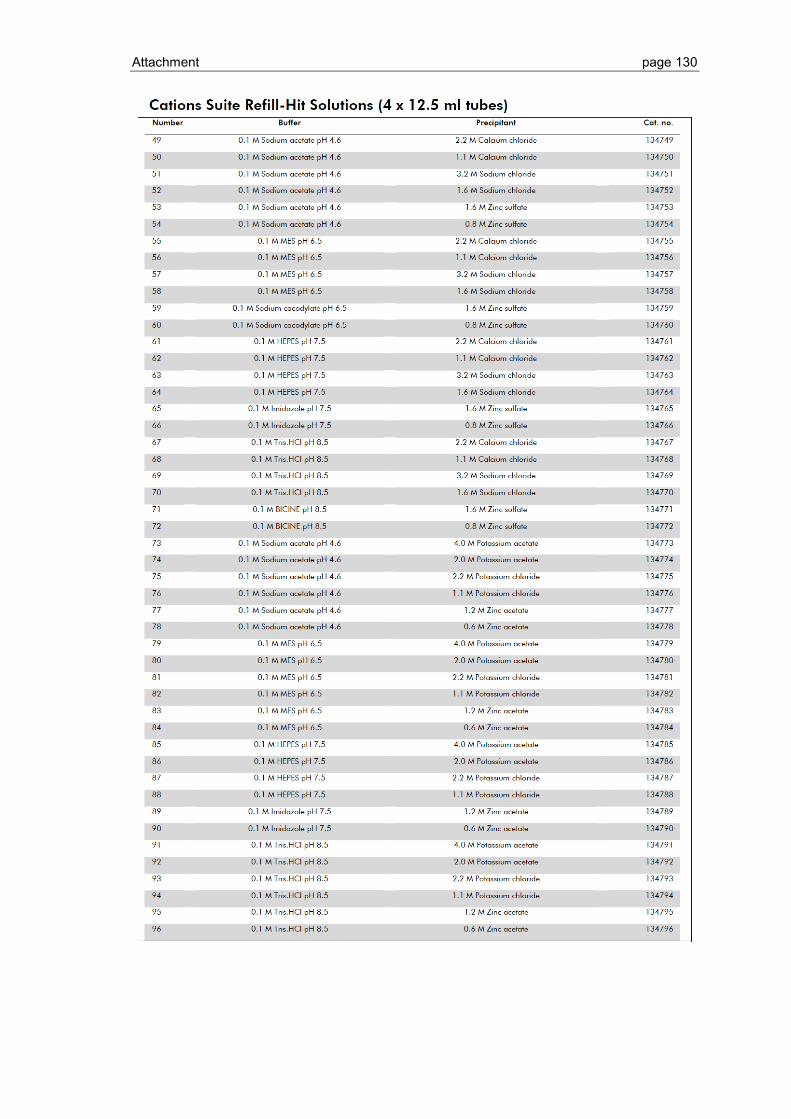
Attachment page 130
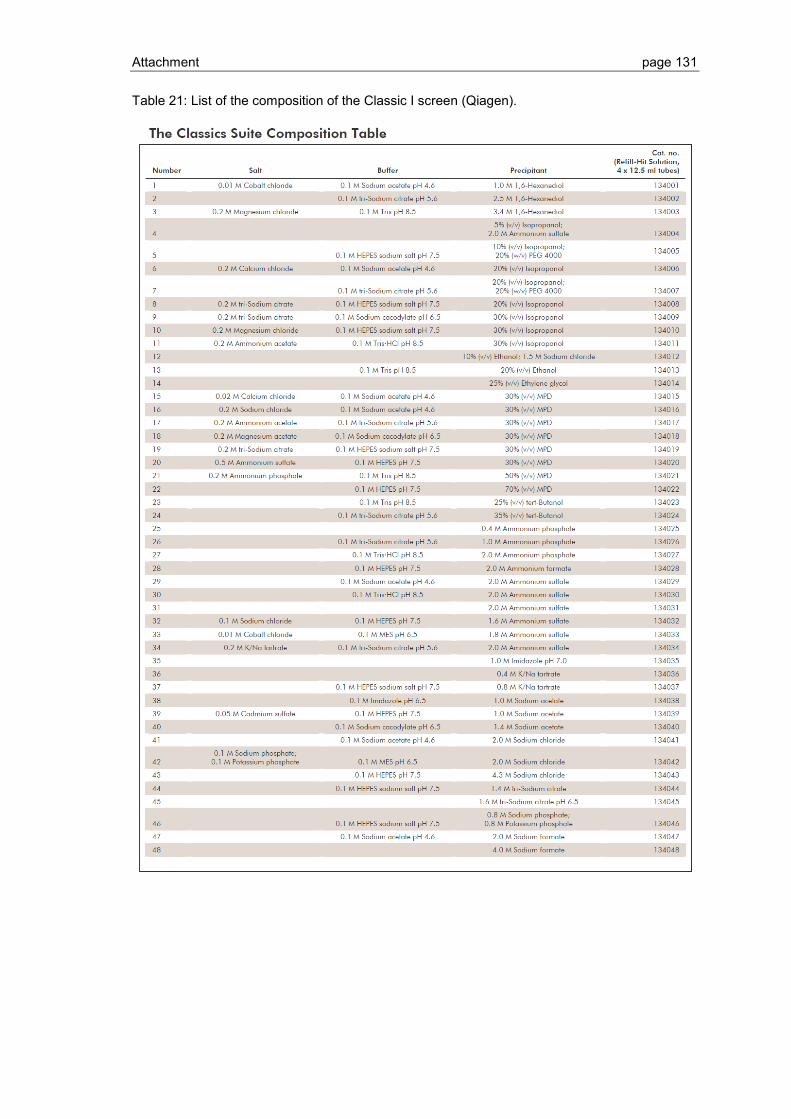
Attachment page 131
Table 21: List of the composition of the Classic I screen (Qiagen).
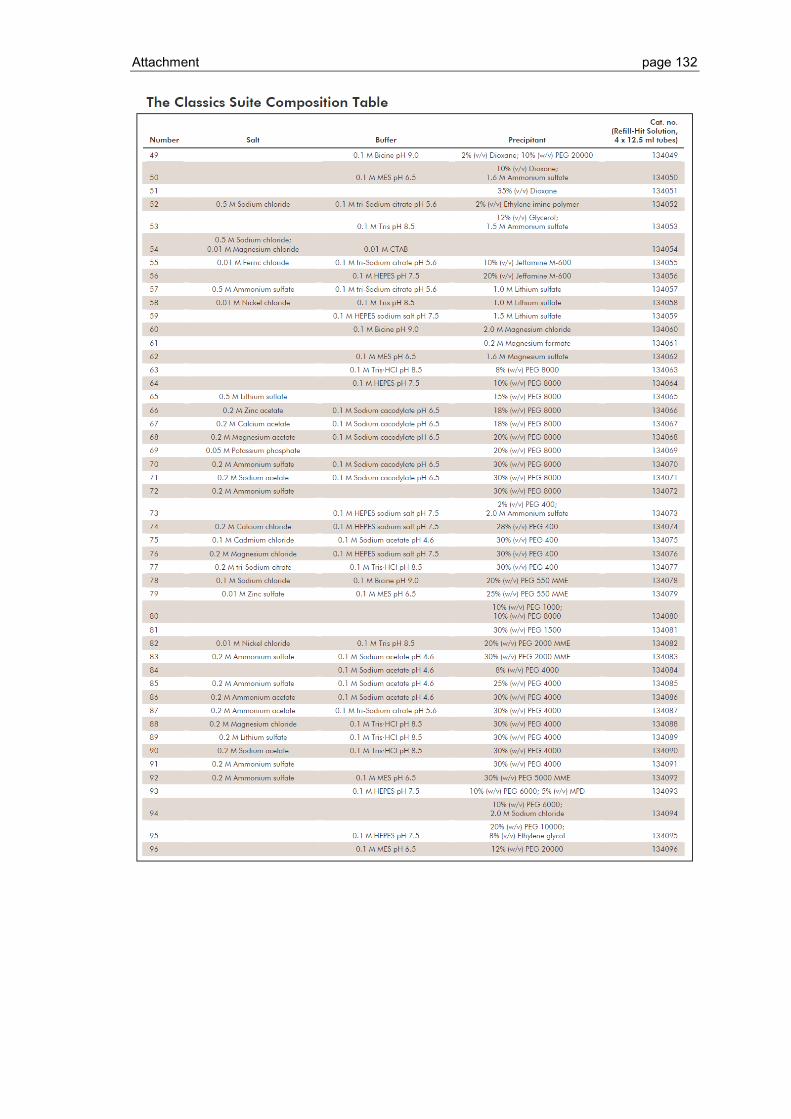
Attachment page 132

Attachment page 133
Table 22: List of the composition of the Classic II screen (Qiagen).
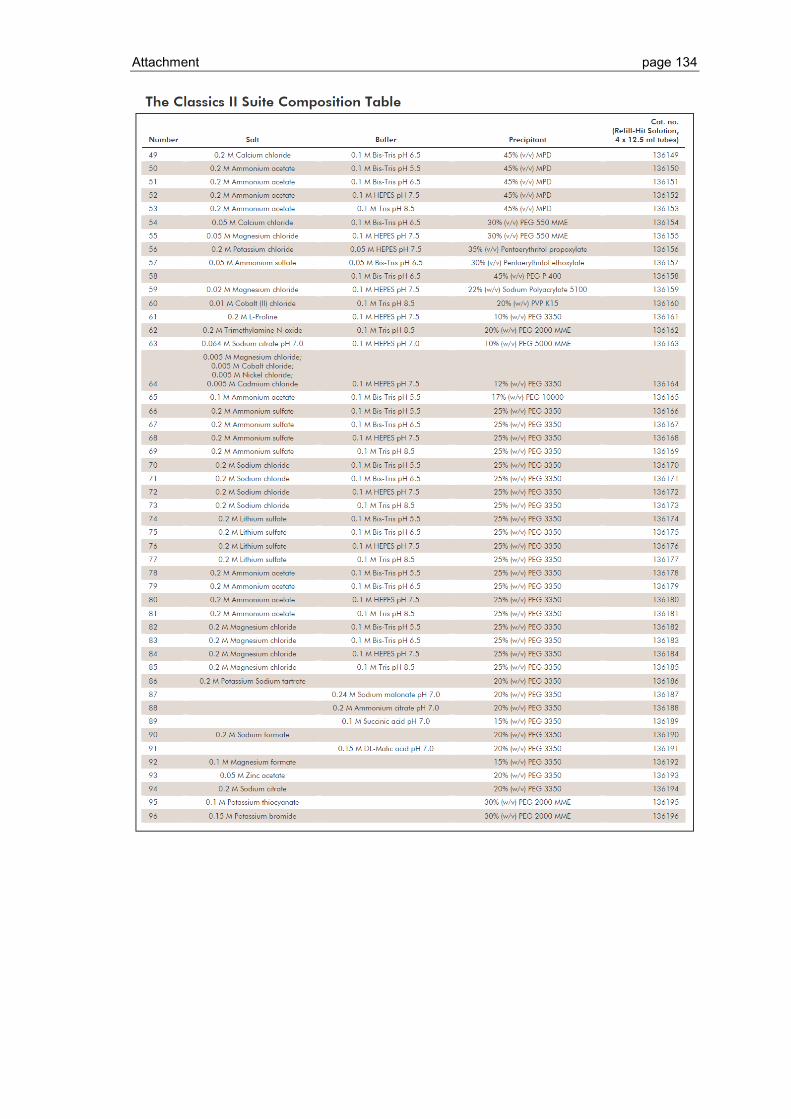
Attachment page 134
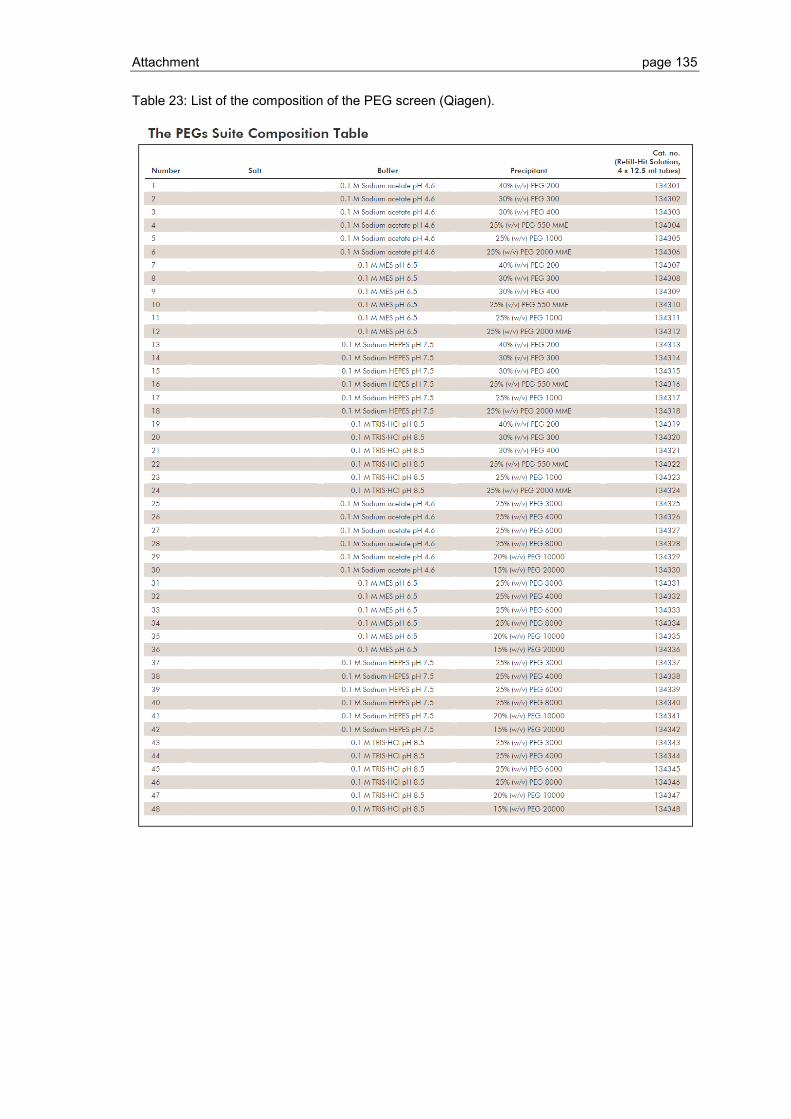
Attachment page 135
Table 23: List of the composition of the PEG screen (Qiagen).
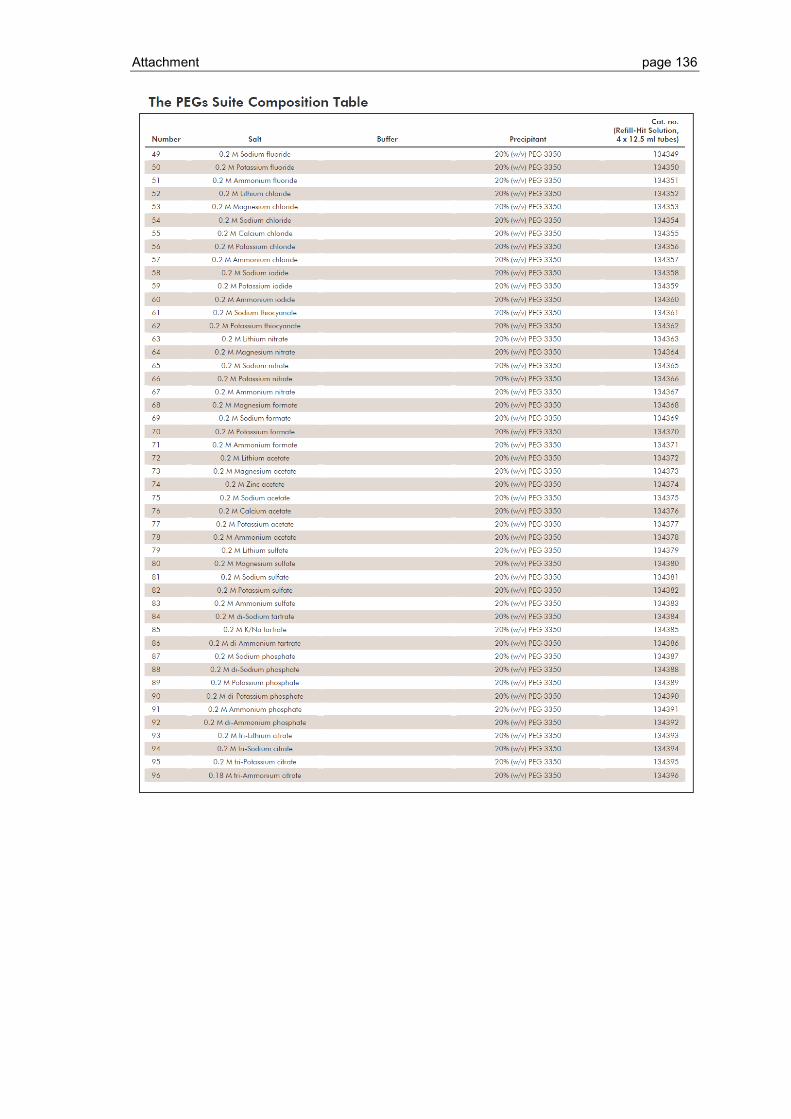
Attachment page 136
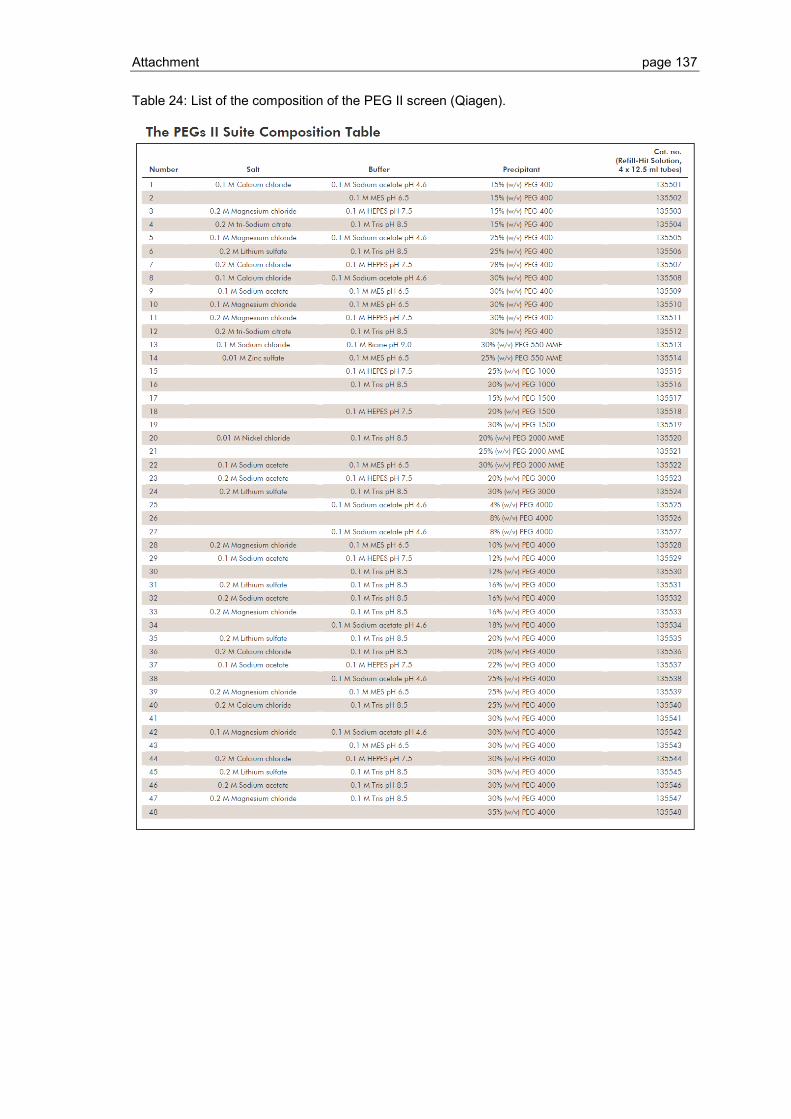
Attachment page 137
Table 24: List of the composition of the PEG II screen (Qiagen).
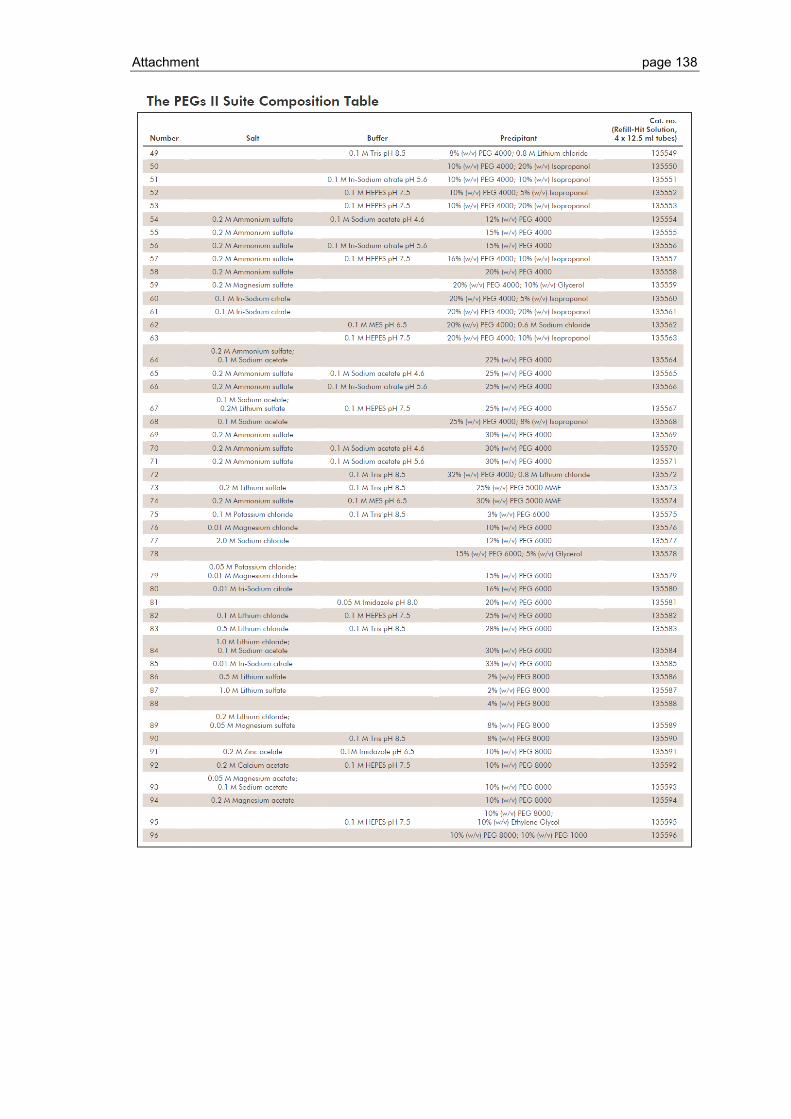
Attachment page 138
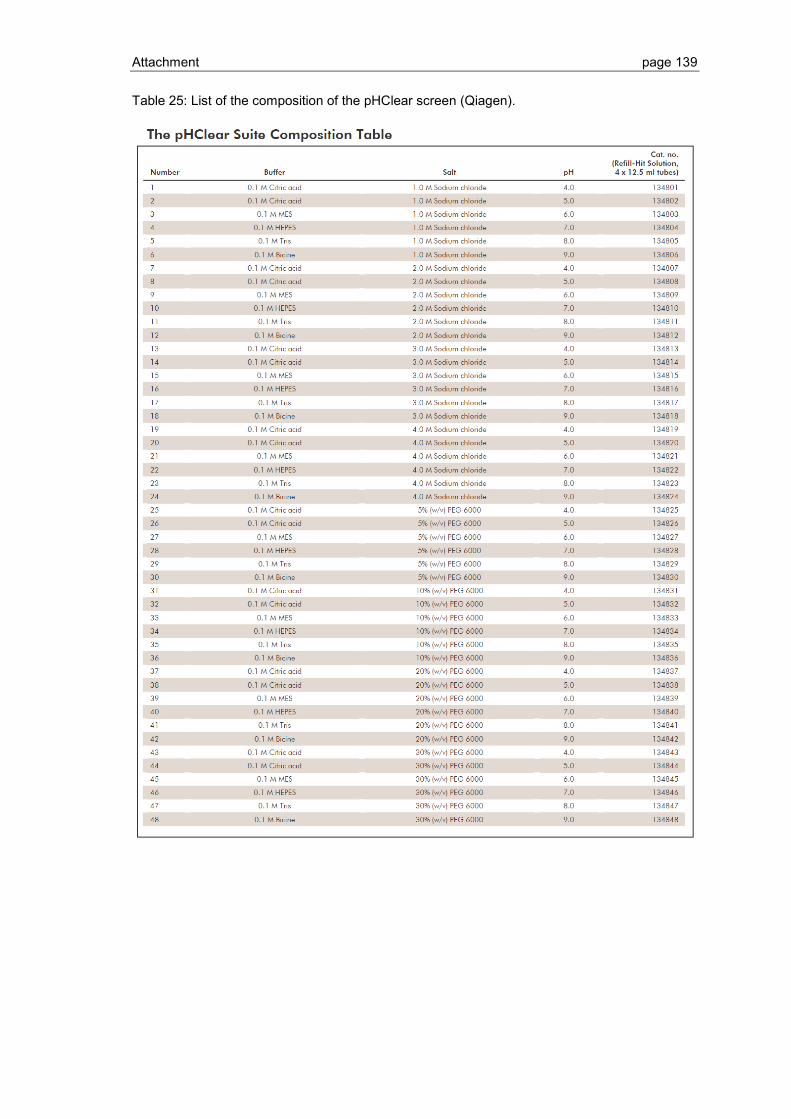
Attachment page 139
Table 25: List of the composition of the pHClear screen (Qiagen).

Attachment page 140
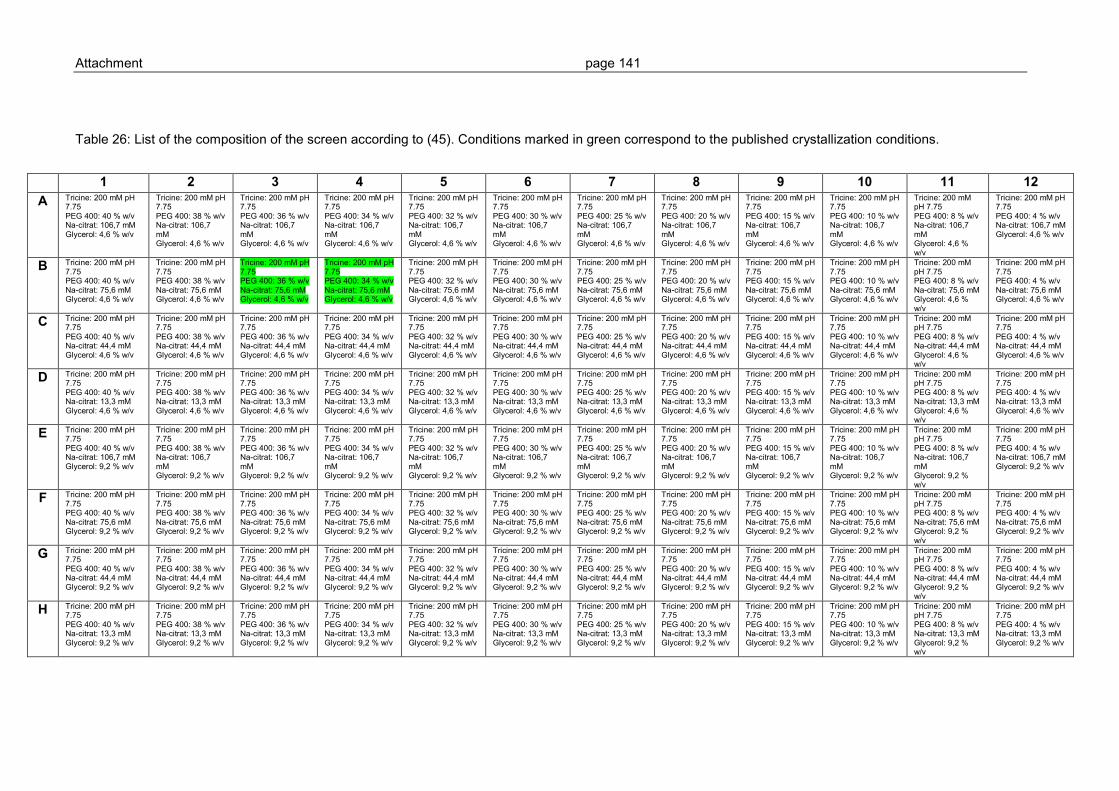
Attachment page 141
Table 26: List of the composition of the screen according to (45). Conditions marked in green correspond to the published crystallization conditions.
1 2 3 4 5 6 7 8 9 10 11 12 A Tricine: 200 mM pH
7.75 PEG 400: 40 % w/v Na-citrat: 106,7 mM Glycerol: 4,6 % w/v
Tricine: 200 mM pH 7.75 PEG 400: 38 % w/v Na-citrat: 106,7 mM Glycerol: 4,6 % w/v
Tricine: 200 mM pH 7.75 PEG 400: 36 % w/v Na-citrat: 106,7 mM Glycerol: 4,6 % w/v
Tricine: 200 mM pH 7.75 PEG 400: 34 % w/v Na-citrat: 106,7 mM Glycerol: 4,6 % w/v
Tricine: 200 mM pH 7.75 PEG 400: 32 % w/v Na-citrat: 106,7 mM Glycerol: 4,6 % w/v
Tricine: 200 mM pH 7.75 PEG 400: 30 % w/v Na-citrat: 106,7 mM Glycerol: 4,6 % w/v
Tricine: 200 mM pH 7.75 PEG 400: 25 % w/v Na-citrat: 106,7 mM Glycerol: 4,6 % w/v
Tricine: 200 mM pH 7.75 PEG 400: 20 % w/v Na-citrat: 106,7 mM Glycerol: 4,6 % w/v
Tricine: 200 mM pH 7.75 PEG 400: 15 % w/v Na-citrat: 106,7 mM Glycerol: 4,6 % w/v
Tricine: 200 mM pH 7.75 PEG 400: 10 % w/v Na-citrat: 106,7 mM Glycerol: 4,6 % w/v
Tricine: 200 mM pH 7.75 PEG 400: 8 % w/v Na-citrat: 106,7 mM Glycerol: 4,6 % w/v
Tricine: 200 mM pH 7.75 PEG 400: 4 % w/v Na-citrat: 106,7 mM Glycerol: 4,6 % w/v
B Tricine: 200 mM pH 7.75 PEG 400: 40 % w/v Na-citrat: 75,6 mM Glycerol: 4,6 % w/v
Tricine: 200 mM pH 7.75 PEG 400: 38 % w/v Na-citrat: 75,6 mM Glycerol: 4,6 % w/v
Tricine: 200 mM pH 7.75 PEG 400: 36 % w/v Na-citrat: 75,6 mM Glycerol: 4,6 % w/v
Tricine: 200 mM pH 7.75 PEG 400: 34 % w/v Na-citrat: 75,6 mM Glycerol: 4,6 % w/v
Tricine: 200 mM pH 7.75 PEG 400: 32 % w/v Na-citrat: 75,6 mM Glycerol: 4,6 % w/v
Tricine: 200 mM pH 7.75 PEG 400: 30 % w/v Na-citrat: 75,6 mM Glycerol: 4,6 % w/v
Tricine: 200 mM pH 7.75 PEG 400: 25 % w/v Na-citrat: 75,6 mM Glycerol: 4,6 % w/v
Tricine: 200 mM pH 7.75 PEG 400: 20 % w/v Na-citrat: 75,6 mM Glycerol: 4,6 % w/v
Tricine: 200 mM pH 7.75 PEG 400: 15 % w/v Na-citrat: 75,6 mM Glycerol: 4,6 % w/v
Tricine: 200 mM pH 7.75 PEG 400: 10 % w/v Na-citrat: 75,6 mM Glycerol: 4,6 % w/v
Tricine: 200 mM pH 7.75 PEG 400: 8 % w/v Na-citrat: 75,6 mM Glycerol: 4,6 % w/v
Tricine: 200 mM pH 7.75 PEG 400: 4 % w/v Na-citrat: 75,6 mM Glycerol: 4,6 % w/v
C Tricine: 200 mM pH 7.75 PEG 400: 40 % w/v Na-citrat: 44,4 mM Glycerol: 4,6 % w/v
Tricine: 200 mM pH 7.75 PEG 400: 38 % w/v Na-citrat: 44,4 mM Glycerol: 4,6 % w/v
Tricine: 200 mM pH 7.75 PEG 400: 36 % w/v Na-citrat: 44,4 mM Glycerol: 4,6 % w/v
Tricine: 200 mM pH 7.75 PEG 400: 34 % w/v Na-citrat: 44,4 mM Glycerol: 4,6 % w/v
Tricine: 200 mM pH 7.75 PEG 400: 32 % w/v Na-citrat: 44,4 mM Glycerol: 4,6 % w/v
Tricine: 200 mM pH 7.75 PEG 400: 30 % w/v Na-citrat: 44,4 mM Glycerol: 4,6 % w/v
Tricine: 200 mM pH 7.75 PEG 400: 25 % w/v Na-citrat: 44,4 mM Glycerol: 4,6 % w/v
Tricine: 200 mM pH 7.75 PEG 400: 20 % w/v Na-citrat: 44,4 mM Glycerol: 4,6 % w/v
Tricine: 200 mM pH 7.75 PEG 400: 15 % w/v Na-citrat: 44,4 mM Glycerol: 4,6 % w/v
Tricine: 200 mM pH 7.75 PEG 400: 10 % w/v Na-citrat: 44,4 mM Glycerol: 4,6 % w/v
Tricine: 200 mM pH 7.75 PEG 400: 8 % w/v Na-citrat: 44,4 mM Glycerol: 4,6 % w/v
Tricine: 200 mM pH 7.75 PEG 400: 4 % w/v Na-citrat: 44,4 mM Glycerol: 4,6 % w/v
D Tricine: 200 mM pH 7.75 PEG 400: 40 % w/v Na-citrat: 13,3 mM Glycerol: 4,6 % w/v
Tricine: 200 mM pH 7.75 PEG 400: 38 % w/v Na-citrat: 13,3 mM Glycerol: 4,6 % w/v
Tricine: 200 mM pH 7.75 PEG 400: 36 % w/v Na-citrat: 13,3 mM Glycerol: 4,6 % w/v
Tricine: 200 mM pH 7.75 PEG 400: 34 % w/v Na-citrat: 13,3 mM Glycerol: 4,6 % w/v
Tricine: 200 mM pH 7.75 PEG 400: 32 % w/v Na-citrat: 13,3 mM Glycerol: 4,6 % w/v
Tricine: 200 mM pH 7.75 PEG 400: 30 % w/v Na-citrat: 13,3 mM Glycerol: 4,6 % w/v
Tricine: 200 mM pH 7.75 PEG 400: 25 % w/v Na-citrat: 13,3 mM Glycerol: 4,6 % w/v
Tricine: 200 mM pH 7.75 PEG 400: 20 % w/v Na-citrat: 13,3 mM Glycerol: 4,6 % w/v
Tricine: 200 mM pH 7.75 PEG 400: 15 % w/v Na-citrat: 13,3 mM Glycerol: 4,6 % w/v
Tricine: 200 mM pH 7.75 PEG 400: 10 % w/v Na-citrat: 13,3 mM Glycerol: 4,6 % w/v
Tricine: 200 mM pH 7.75 PEG 400: 8 % w/v Na-citrat: 13,3 mM Glycerol: 4,6 % w/v
Tricine: 200 mM pH 7.75 PEG 400: 4 % w/v Na-citrat: 13,3 mM Glycerol: 4,6 % w/v
E Tricine: 200 mM pH 7.75 PEG 400: 40 % w/v Na-citrat: 106,7 mM Glycerol: 9,2 % w/v
Tricine: 200 mM pH 7.75 PEG 400: 38 % w/v Na-citrat: 106,7 mM Glycerol: 9,2 % w/v
Tricine: 200 mM pH 7.75 PEG 400: 36 % w/v Na-citrat: 106,7 mM Glycerol: 9,2 % w/v
Tricine: 200 mM pH 7.75 PEG 400: 34 % w/v Na-citrat: 106,7 mM Glycerol: 9,2 % w/v
Tricine: 200 mM pH 7.75 PEG 400: 32 % w/v Na-citrat: 106,7 mM Glycerol: 9,2 % w/v
Tricine: 200 mM pH 7.75 PEG 400: 30 % w/v Na-citrat: 106,7 mM Glycerol: 9,2 % w/v
Tricine: 200 mM pH 7.75 PEG 400: 25 % w/v Na-citrat: 106,7 mM Glycerol: 9,2 % w/v
Tricine: 200 mM pH 7.75 PEG 400: 20 % w/v Na-citrat: 106,7 mM Glycerol: 9,2 % w/v
Tricine: 200 mM pH 7.75 PEG 400: 15 % w/v Na-citrat: 106,7 mM Glycerol: 9,2 % w/v
Tricine: 200 mM pH 7.75 PEG 400: 10 % w/v Na-citrat: 106,7 mM Glycerol: 9,2 % w/v
Tricine: 200 mM pH 7.75 PEG 400: 8 % w/v Na-citrat: 106,7 mM Glycerol: 9,2 % w/v
Tricine: 200 mM pH 7.75 PEG 400: 4 % w/v Na-citrat: 106,7 mM Glycerol: 9,2 % w/v
F Tricine: 200 mM pH 7.75 PEG 400: 40 % w/v Na-citrat: 75,6 mM Glycerol: 9,2 % w/v
Tricine: 200 mM pH 7.75 PEG 400: 38 % w/v Na-citrat: 75,6 mM Glycerol: 9,2 % w/v
Tricine: 200 mM pH 7.75 PEG 400: 36 % w/v Na-citrat: 75,6 mM Glycerol: 9,2 % w/v
Tricine: 200 mM pH 7.75 PEG 400: 34 % w/v Na-citrat: 75,6 mM Glycerol: 9,2 % w/v
Tricine: 200 mM pH 7.75 PEG 400: 32 % w/v Na-citrat: 75,6 mM Glycerol: 9,2 % w/v
Tricine: 200 mM pH 7.75 PEG 400: 30 % w/v Na-citrat: 75,6 mM Glycerol: 9,2 % w/v
Tricine: 200 mM pH 7.75 PEG 400: 25 % w/v Na-citrat: 75,6 mM Glycerol: 9,2 % w/v
Tricine: 200 mM pH 7.75 PEG 400: 20 % w/v Na-citrat: 75,6 mM Glycerol: 9,2 % w/v
Tricine: 200 mM pH 7.75 PEG 400: 15 % w/v Na-citrat: 75,6 mM Glycerol: 9,2 % w/v
Tricine: 200 mM pH 7.75 PEG 400: 10 % w/v Na-citrat: 75,6 mM Glycerol: 9,2 % w/v
Tricine: 200 mM pH 7.75 PEG 400: 8 % w/v Na-citrat: 75,6 mM Glycerol: 9,2 % w/v
Tricine: 200 mM pH 7.75 PEG 400: 4 % w/v Na-citrat: 75,6 mM Glycerol: 9,2 % w/v
G Tricine: 200 mM pH 7.75 PEG 400: 40 % w/v Na-citrat: 44,4 mM Glycerol: 9,2 % w/v
Tricine: 200 mM pH 7.75 PEG 400: 38 % w/v Na-citrat: 44,4 mM Glycerol: 9,2 % w/v
Tricine: 200 mM pH 7.75 PEG 400: 36 % w/v Na-citrat: 44,4 mM Glycerol: 9,2 % w/v
Tricine: 200 mM pH 7.75 PEG 400: 34 % w/v Na-citrat: 44,4 mM Glycerol: 9,2 % w/v
Tricine: 200 mM pH 7.75 PEG 400: 32 % w/v Na-citrat: 44,4 mM Glycerol: 9,2 % w/v
Tricine: 200 mM pH 7.75 PEG 400: 30 % w/v Na-citrat: 44,4 mM Glycerol: 9,2 % w/v
Tricine: 200 mM pH 7.75 PEG 400: 25 % w/v Na-citrat: 44,4 mM Glycerol: 9,2 % w/v
Tricine: 200 mM pH 7.75 PEG 400: 20 % w/v Na-citrat: 44,4 mM Glycerol: 9,2 % w/v
Tricine: 200 mM pH 7.75 PEG 400: 15 % w/v Na-citrat: 44,4 mM Glycerol: 9,2 % w/v
Tricine: 200 mM pH 7.75 PEG 400: 10 % w/v Na-citrat: 44,4 mM Glycerol: 9,2 % w/v
Tricine: 200 mM pH 7.75 PEG 400: 8 % w/v Na-citrat: 44,4 mM Glycerol: 9,2 % w/v
Tricine: 200 mM pH 7.75 PEG 400: 4 % w/v Na-citrat: 44,4 mM Glycerol: 9,2 % w/v
H Tricine: 200 mM pH 7.75 PEG 400: 40 % w/v Na-citrat: 13,3 mM Glycerol: 9,2 % w/v
Tricine: 200 mM pH 7.75 PEG 400: 38 % w/v Na-citrat: 13,3 mM Glycerol: 9,2 % w/v
Tricine: 200 mM pH 7.75 PEG 400: 36 % w/v Na-citrat: 13,3 mM Glycerol: 9,2 % w/v
Tricine: 200 mM pH 7.75 PEG 400: 34 % w/v Na-citrat: 13,3 mM Glycerol: 9,2 % w/v
Tricine: 200 mM pH 7.75 PEG 400: 32 % w/v Na-citrat: 13,3 mM Glycerol: 9,2 % w/v
Tricine: 200 mM pH 7.75 PEG 400: 30 % w/v Na-citrat: 13,3 mM Glycerol: 9,2 % w/v
Tricine: 200 mM pH 7.75 PEG 400: 25 % w/v Na-citrat: 13,3 mM Glycerol: 9,2 % w/v
Tricine: 200 mM pH 7.75 PEG 400: 20 % w/v Na-citrat: 13,3 mM Glycerol: 9,2 % w/v
Tricine: 200 mM pH 7.75 PEG 400: 15 % w/v Na-citrat: 13,3 mM Glycerol: 9,2 % w/v
Tricine: 200 mM pH 7.75 PEG 400: 10 % w/v Na-citrat: 13,3 mM Glycerol: 9,2 % w/v
Tricine: 200 mM pH 7.75 PEG 400: 8 % w/v Na-citrat: 13,3 mM Glycerol: 9,2 % w/v
Tricine: 200 mM pH 7.75 PEG 400: 4 % w/v Na-citrat: 13,3 mM Glycerol: 9,2 % w/v
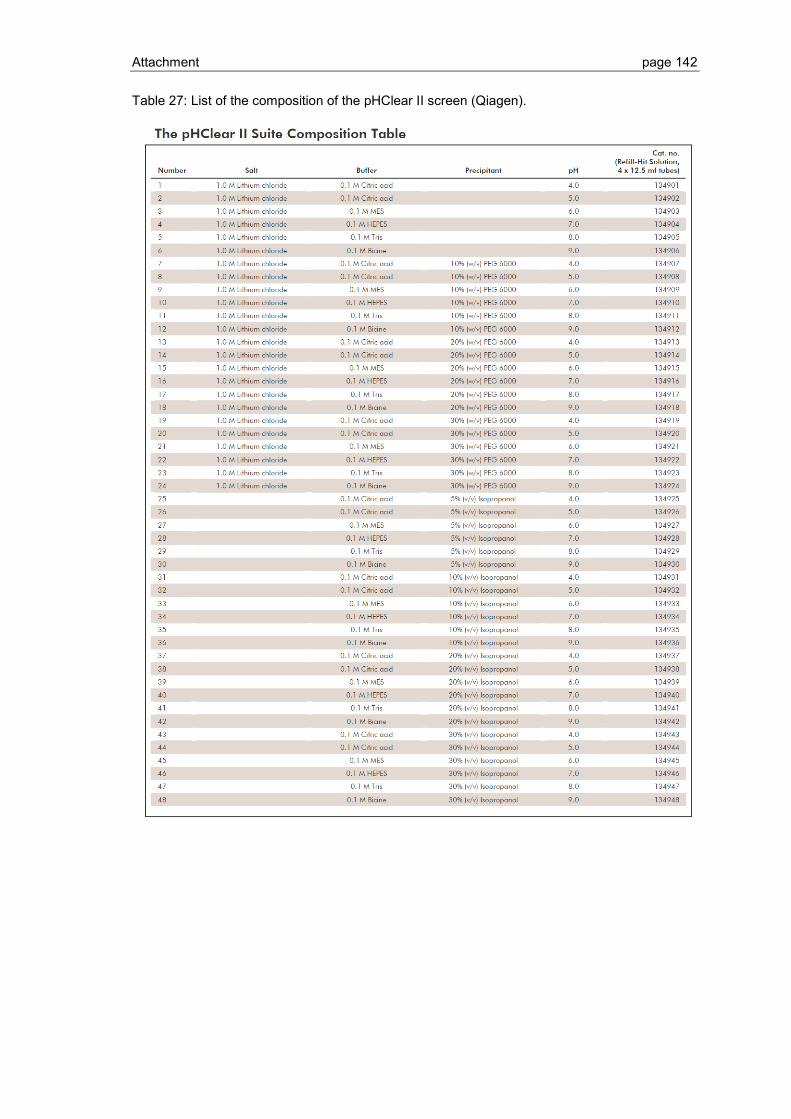
Attachment page 142
Table 27: List of the composition of the pHClear II screen (Qiagen).
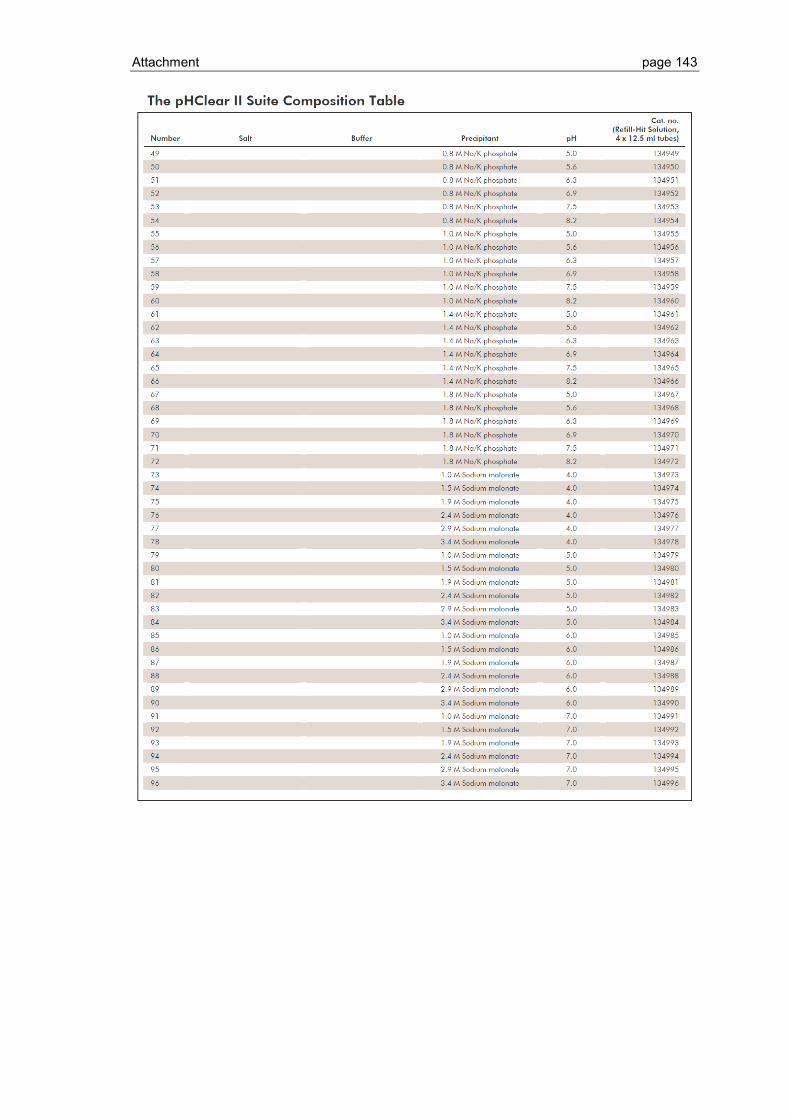
Attachment page 143
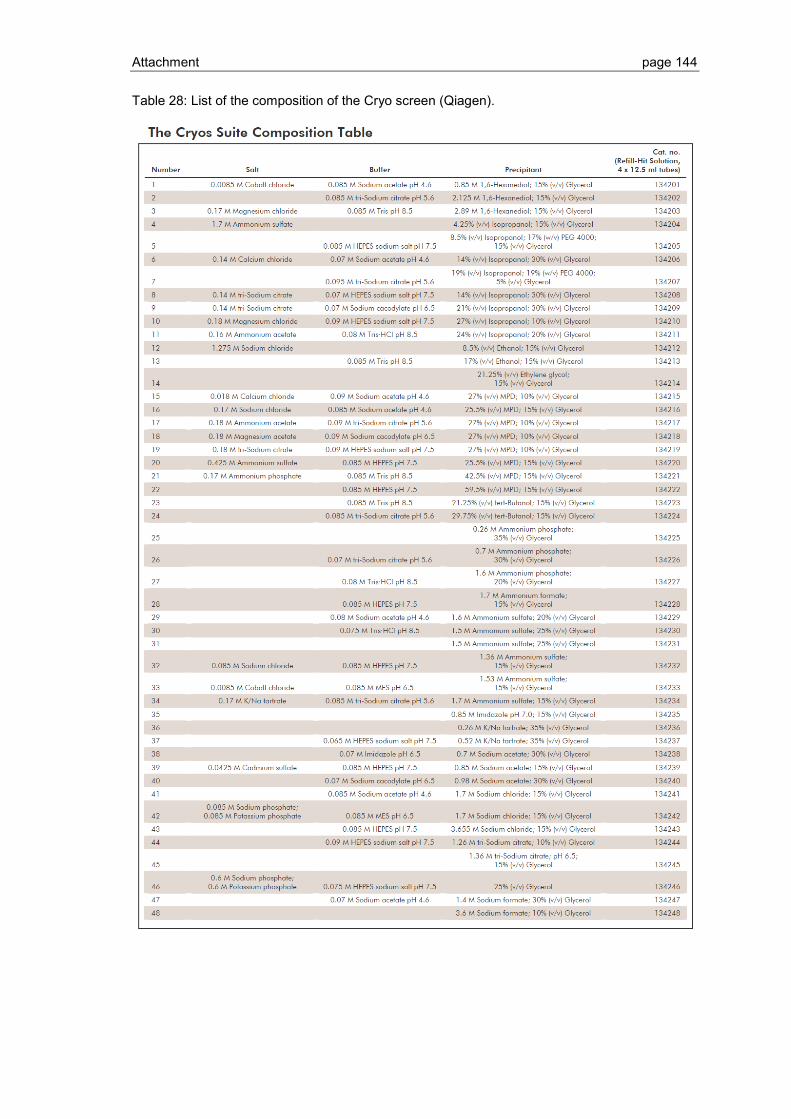
Attachment page 144
Table 28: List of the composition of the Cryo screen (Qiagen).
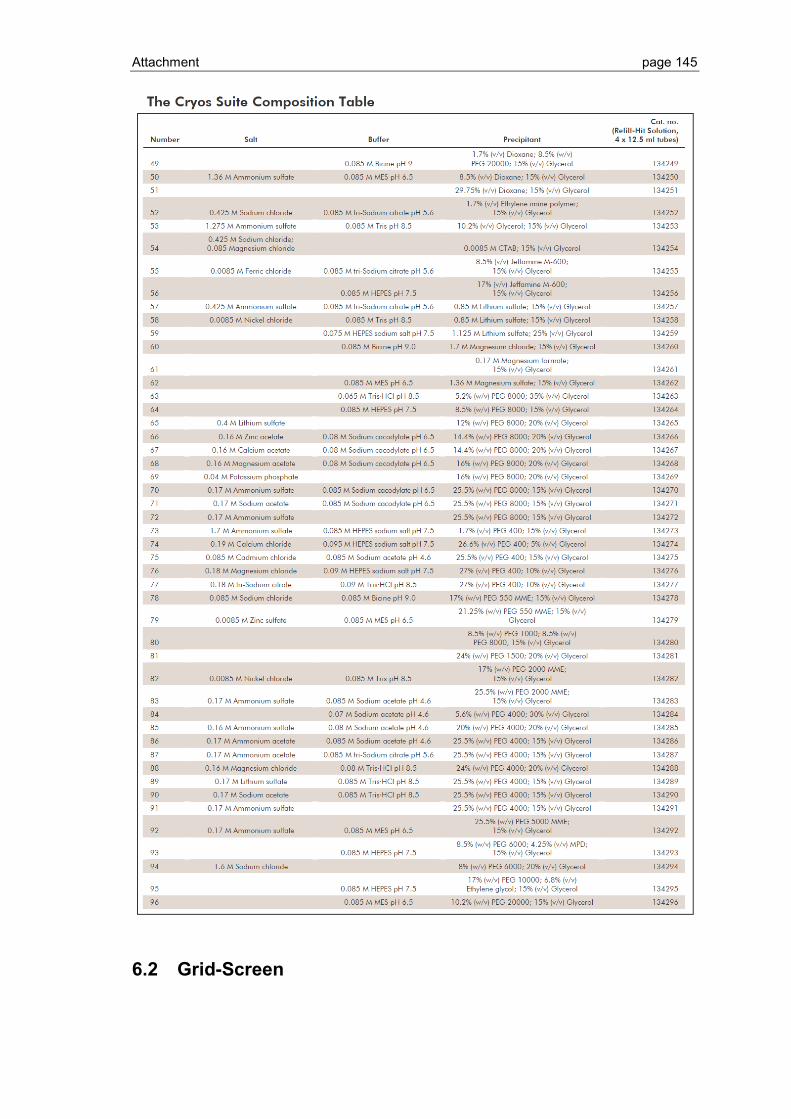
Attachment page 145
6.2 Grid-Screen
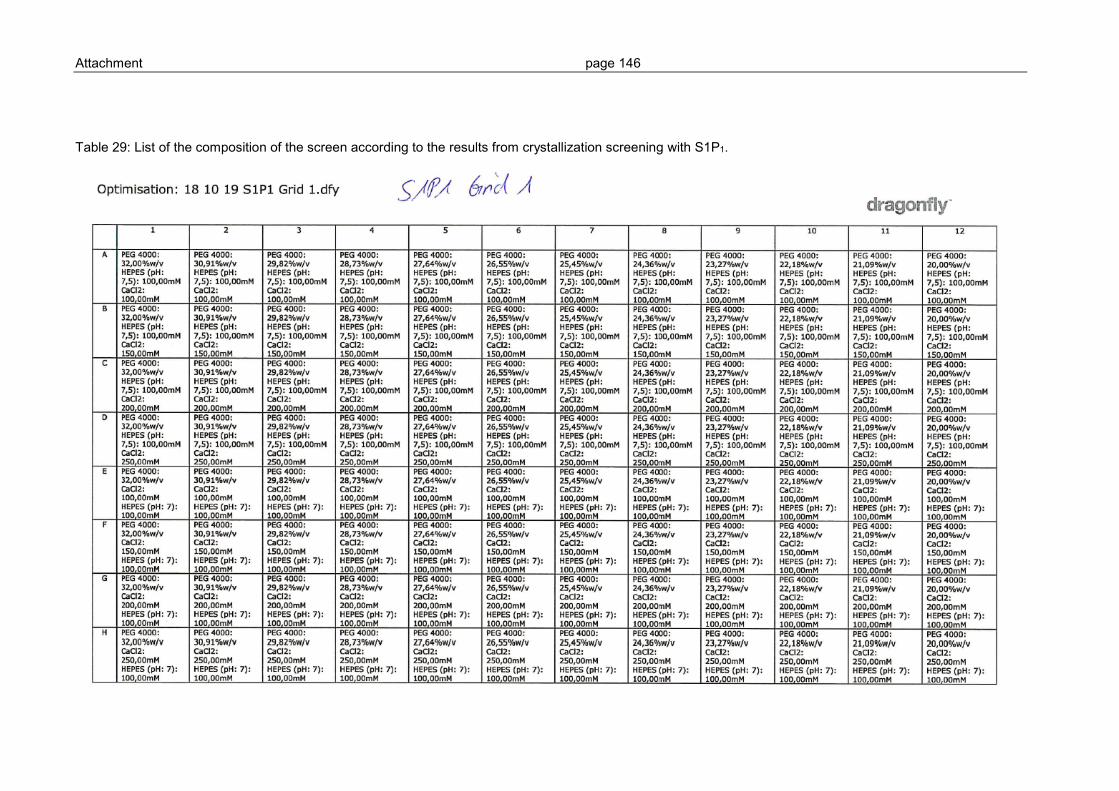
Attachment page 146
Table 29: List of the composition of the screen according to the results from crystallization screening with S1P1.

Attachment page 147
Table 30: List of the composition of the screen according to the results from crystallization screening with S1P1.
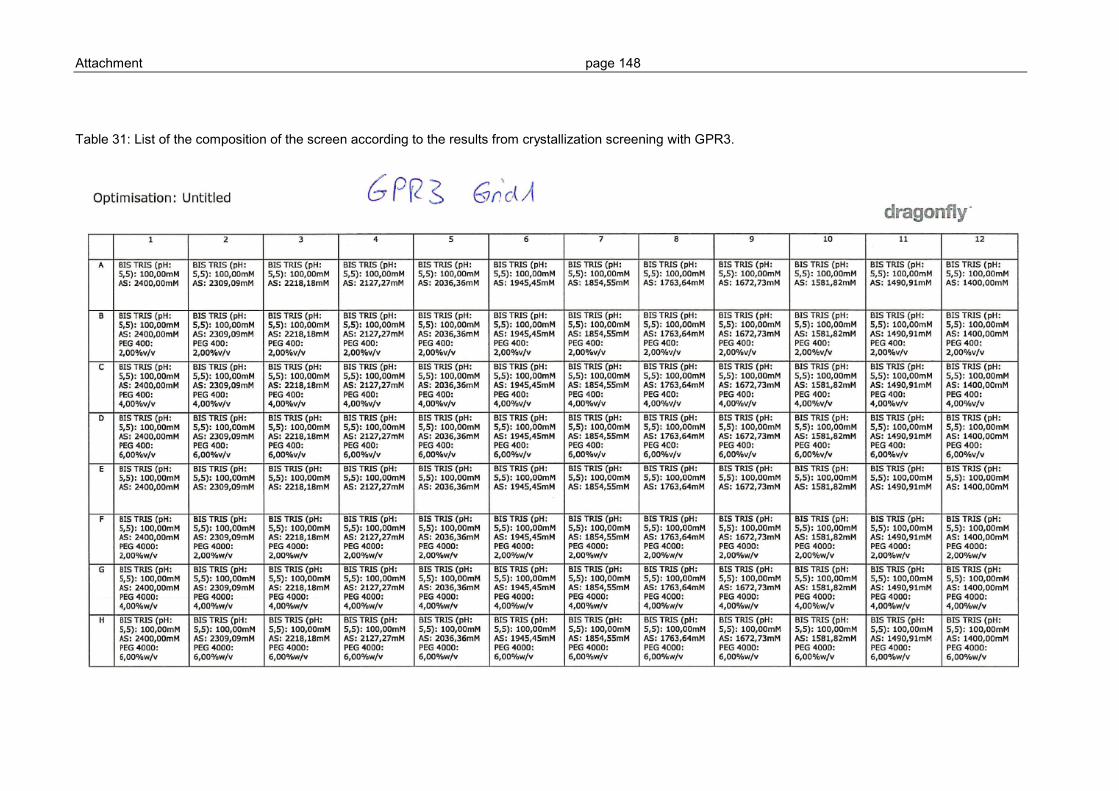
Attachment page 148
Table 31: List of the composition of the screen according to the results from crystallization screening with GPR3.
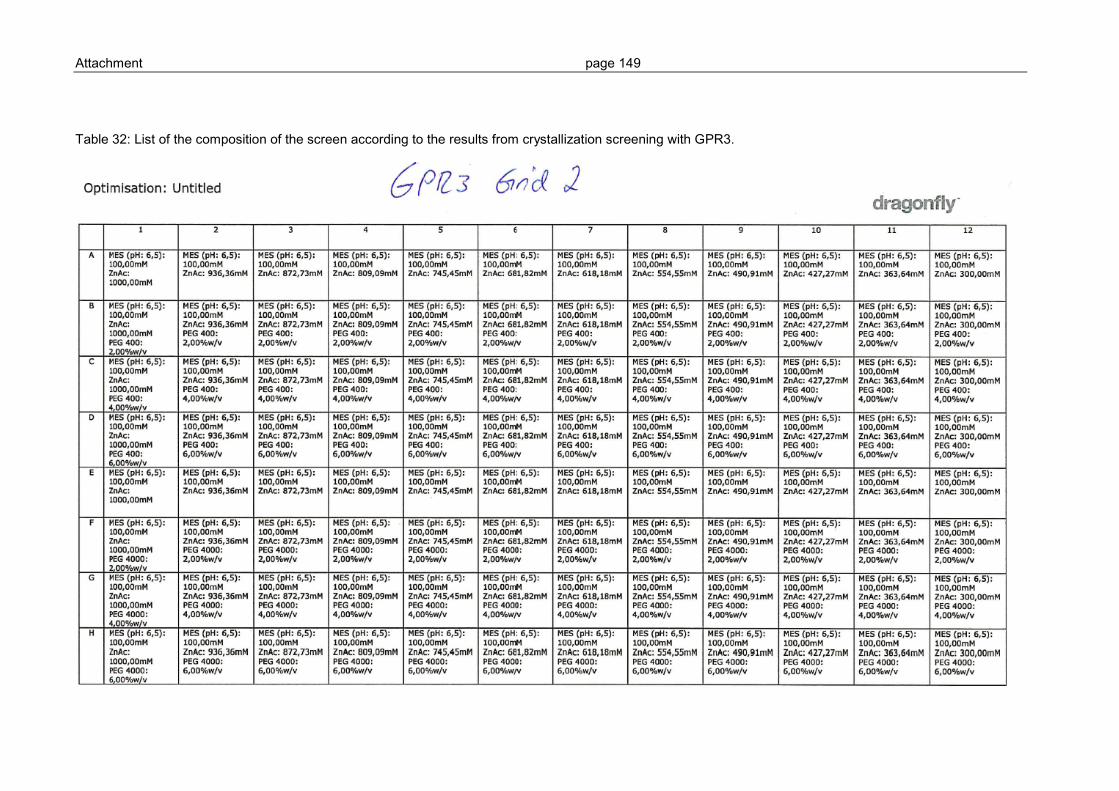
Attachment page 149
Table 32: List of the composition of the screen according to the results from crystallization screening with GPR3.
Bibliography page 150
7 Bibliography
1. Hauser AS, Attwood MM, Rask-Andersen M, Schiöth HB, Gloriam DE.
Trends in GPCR drug discovery: New agents, targets and indications. Nat
Rev Drug Discov. 2017;16(12):829–42.
2. Oprea TI, Waller A, Mathias SL, Tudose I, Ma’ayan A, Gaulton A, et al.
Unexplored therapeutic opportunities in the human genome. Nat Rev Drug
Discov. 2018;17(5):317–32.
3. Stevens RC, Cherezov V, Katritch V, Abagyan R, Kuhn P, Rosen H, et al.
The GPCR Network: a large-scale collaboration to determine human
GPCR structure and function. Nat Rev Drug Discov. 2013;12(1):25–34.
4. Venter JC, Gocayne JD, Amanatides P, Ballew RM, Huson DH, Adams
MD, et al. The Sequence of the Human Genome. Science (80- ).
2001;291(5507):1304–51.
5. Frazier M, Gibbs RA, Muzny DM, Scherer SE, Bouck JB, Sodergren EJ, et
al. Initial sequencing and analysis of the human genome. Nature.
2001;409(6822):860–921.
6. Robert F, C. LM, Lars-Gustav L, B. SH. The G-Protein-Coupled Receptors
in the Human Genome Form Five Main Families . Phylogenetic Analysis,
Paralogon Groups, and Fingerprints. Mol Pharmacol. 2003;63(6):1256–72.
7. Pierce KL, Premont RT, Lefkowitz RJ. Seven-transmembrane receptors.
Nat Rev Mol Cell Biol. 2002;3(9):639–50.
8. Rask-Andersen M, Masuram S, Schiöth HB. The Druggable Genome :
Evaluation of Drug Targets in Clinical Trials Suggests Major Shifts in
Molecular Class and Indication. Annu Rev Pharmacol Toxicol. 2014;54:9–
26.
9. Weis WI, Kobilka BK. The Molecular Basis of G Protein-Coupled Receptor
Activation. Annu Rev Biochem. 2018;87(July):897–919.
10. Kroeze WK, Douglas J, Roth BL. G-protein-coupled receptors at a glance.
J Cell Sci. 2003;116(24):4867–9.
Bibliography page 151
11. Cherezov V, Abola E, Stevens RC. Toward drug design: recent progress in
the structure determination of GPCRs a membrane portein family with high
potential as pharmaceutical targets. Methods Mol Biol. 2010;654(1):141–
68.
12. Jastrzebska B, Tsybovsky Y, Palczewski K. Complexes between
photoactivated rhodopsin and transducin: progress and questions.
Biochem J. 2010;428(1):1–10.
13. Moreira IS. Structural features of the G-protein/GPCR interactions. Biochim
Biophys Acta - Gen Subj. 2014;1840(1):16–33.
14. Wacker D, Stevens RC, Roth BL. How Ligands Illuminate GPCR Molecular
Pharmacology. Cell. 2017;170(3):414–27.
15. Syrovatkina V, Alegre KO, Dey R, Huang XY. Regulation, Signaling, and
Physiological Functions of G-Proteins. J Mol Biol. 2016;428(19):3850–68.
16. Wettschureck N, Offermanns S. Mammalian G Proteins and Their Cell
Type Specific Functions. Physio Rev. 2005;85:1159–204.
17. Rhee SG, Bae YS. Regulation of Phosphoinositide- specific Phospholipase
C Isozymes *. J Biol Chem. 1997;272(24):15045–9.
18. Khan SM, Sleno R, Gora S, Zylbergold P, Laverdure J, Labbé J, et al. The
Expanding Roles of G bg Subunits in G Protein – Coupled Receptor
Signaling and Drug Action. Pharmacol Rev. 2013;65:545–77.
19. Gacasan SB, Baker DL, Parrill AL. G protein-coupled receptors: The
evolution of structural insight. AIMS Biophys. 2017;4(3):491–527.
20. Weiss JM, Morgan PH, Lutz MW, Kenakin TP. The Cubic Ternary Complex
Receptor - Occupancy Model I. Model Description. Journal of Theoretical
Biology, Volume 178, Issue 2, 21 January 1996, Pages 151-167.
21. B. Gacasan S, L. Baker D, L. Parrill A. G protein-coupled receptors: the
evolution of structural insight. AIMS Biophys. 2017;4(3):491–527.
22. Thal DM, Glukhova A, Sexton PM, Christopoulos A. Structural insights into
G-protein-coupled receptor allostery. Nature. 2018;559(7712):45–53.
23. Kenakin T. Theoretical aspects of GPCR?ligand complex pharmacology.
Chem Rev. 2017;117(1):4–20.

Bibliography page 152
24. Munk C, Mutt E, Isberg V, Nikolajsen LF, Bibbe JM, Flock T, et al. An online
resource for GPCR structure determination and analysis. Nat Methods.
2019;16(2):151–62.
25. White KL, Eddy MT, Gao ZG, Han GW, Lian T, Deary A, et al. Structural
Connection between Activation Microswitch and Allosteric Sodium Site in
GPCR Signaling. Structure. 2018;26(2):1–11.
26. Fenalti G, Giguere PM, Katritch V, Huang X, Thompson AA, Cherezov V,
et al. Molecular control of delta-opioid receptor signalling. Nature.
2014;506(7487):191–6.
27. Vsevolod K, Vadim C, Stevens RC. Structure function of the GPCR
superfamily. Annu Rev Pharmacol Toxicol. 2013;53:531–56.
28. Hanson MA, Cherezov V, Griffith MT, Roth CB, Jaakola VP, Chien EYT, et
al. A Specific Cholesterol Binding Site Is Established by the 2.8 A Structure
of the Human β2-Adrenergic Receptor. Structure. 2008;16(6):897–905.
29. Katritch V, Cherezov V, Stevens RC. Diversity and modularity of G protein-
coupled receptor structures. Trends Pharmacol Sci. 2012;33(1):17–27.
30. Chini B, Parenti M. G-protein-coupled receptors, cholesterol and
palmitoylation: Facts about fats. J Mol Endocrinol. 2009;42(5):371–9.
31. Schiöth HB, Lagerström MC. Structural diversity of g proteincoupled
receptors and significance for drug discovery. Nat Rev Drug Discov.
2008;7(4):339–57.
32. Tara M, Gil B, Slawomir F, Palczewski K. Sequence Analyses of G-Protein-
Coupled Receptors: Similarities to Rhodopsin. Biochemistry.
2003;42(10):2759–67.
33. Ballesteros JA, Weinstein H. Integrated methods for the construction of
three-dimensional models and computational probing of structure-function
relations in G protein-coupled receptors. Methods Neurosci.
1995;25(C):366–428.
34. Isberg V, Graaf C De, Bortolato A, Cherezov V, Katritch V, Gloriam DE.
Generic GPCR Residue Numbers - Aligning Topology Maps Minding The
Gaps. Trends Pharmacol Sci. 2015;36(1):22–31.
Bibliography page 153
35. Nygaard R, Frimurer TM, Holst B, Rosenkilde MM, Schwartz TW. Ligand
binding and micro-switches in 7TM receptor structures. Trends Pharmacol
Sci. 2009;30(5):249–59.
36. Devree BT, Mahoney JP, Vélez-ruiz GA, Rasmussen SGF, Kuszak AJ,
Edwald E, et al. Allosteric coupling from G protein to the agonist binding
pocket in GPCRs. Nature. 2016;535(7610):182–6.
37. Liu W, Chun E, Thompson AA, Chubukov P, Xu F, Katritch V, et al.
Structural basis for allosteric regulation of GPCRS by sodium ions. Science
(80- ). 2012;337:232–6.
38. Lebon G, Edwards PC, Leslie AGW, Tate CG. Molecular Determinants of
CGS21680 Binding to the Human Adenosine A2A Receptor. Mol
Pharmacol. 2015;87(6):907–15.
39. Lounnas V, Ritschel T, Kelder J, Mcguire R, Bywater RP, Foloppe N.
Current progress in Structure-Based Rational Drug Design marks a new
mindset in drug discovery. Comput Struct Biotechnol J. 2013;5(6):1–14.
40. Stauch B, Cherezov V. Serial Femtosecond Crystallography of G Protein –
Coupled Receptors. Annu Rev Biophys. 2018;47(March):18.1-18.21.
41. Vass M, Kooistra AJ, Yang D, Stevens RC, Wang MW, de Graaf C.
Chemical Diversity in the G Protein-Coupled Receptor Superfamily. Trends
Pharmacol Sci. 2018;39(5):494–512.
42. Yin H, Chu A, Li W, Wang B, Shelton F, Otero F, et al. Lipid G protein-
coupled receptor ligand identification using β-arrestin PathHunterTM assay.
J Biol Chem. 2009;248(18):12328–38.
43. Roth BL, Kroeze WK. Integrated Approaches for Genome-wide
Interrogation of the Druggable Non-olfactory G Protein-coupled Receptor.
2015;290(32):19471–7.
44. Nourbakhsh F, Atabaki R, Roohbakhsh A. The role of orphan G protein-
coupled receptors in the modulation of pain: A review. Life Sci.
2018;212:59–69.
Bibliography page 154
45. Hanson MA, Roth CB, Jo E, Griffith MT, Scott FL, Reinhart G, et al. Crystal
Structure of a Lipid G Protein-Coupled Receptor. Science (80- ).
2012;335:851–5.
46. Liu T, Jin J, Chen Y, Xi Q, Hu J, Jia W, et al. Identification and Structure–
Activity Relationship (SAR) of potent and selective oxadiazole-based
agonists of sphingosine-1-phosphate receptor (S1P1). Bioorg Chem.
2019;82(September 2018):41–57.
47. Garris CS, Victoria A, Hla T, May H. Sphingosine-1-phosphate receptor 1
signalling in T cells : trafficking and beyond. Immunology. 2014;142:347–
53.
48. Kihara Y, Mizuno H, Chun J. Lysophospholipid receptors in drug discovery.
Exp Cell Res. 2015;333(2):171–7.
49. Birker-Robaczewska M, Bolli M, Rey M, De Kanter R, Kohl C, Lescop C, et
al. S1P1 modulator-induced Gαi signaling and β-arrestin recruitment are
both necessary to induce rapid and efficient reduction of blood lymphocyte
count in vivo. Mol Pharmacol. 2018;93(2):109–18.
50. Martínez-Morales JC, Romero-Ávila MT, Reyes-Cruz G, García-Sáinz JA.
S1P1 receptor phosphorylation, internalization and interaction with Rab
proteins: effects of sphingosine 1-phosphate, FTY720-P, phorbol esters
and paroxetine. Biosci Rep. 2018;38(6):1–50.
51. Gräler MH. Cellular Physiology and Biochemistr y Biochemistry Targeting
Sphingosine 1-phosphate (S1P) Levels and S1P Receptor Functions for
Therapeutic Immune Interventions. Cell Physiol Biochem. 2010;26(1):79–
86.
52. Noguchi K, Chun J. Roles for lysophospholipid S1P receptors in multiple
sclerosis. Crit Rev Biochem Mol Biol. 2011;46(1):2–10.
53. Albert R, Hinterding K, Brinkmann V, Guerini D, Müller-Hartwieg C, Knecht
H, et al. Novel immunomodulator FTY720 is phosphorylated in rats and
humans to form a single stereoisomer. Identification, chemical proof, and
biological characterization of the biologically active species and its
enantiomer. J Med Chem. 2005;48(16):5373–7.

Bibliography page 155
54. Chun J, Hartung H. Mechanism of Action of Oral Fingolimod (FTY720) in
Multiple Sclerosis. Clin Neuropharmacol. 2010;33(2):91–101.
55. Morales P, Isawi I, Reggio PH. Towards a better understanding of the
cannabinoid-related orphan receptors GPR3, GPR6, and GPR12. Drug
Metab Rev. 2018;0(0):1–20.
56. Hecker M, Paap BK, Goertsches RH, Kandulski O, Fatum C, Koczan D, et
al. Reassessment of blood gene expression markers for the prognosis of
relapsing-remitting multiple sclerosis. PLoS One. 2011;6(12):1–12.
57. Blaho VA, Chun J. ‘Crystal’ Clear? Lysophospholipid Receptor Structure
Insights and Controversies. Trends Pharmacol Sci. 2018;39(11):953–66.
58. Cvicek V, Goddard WA, Abrol R. Structure-Based Sequence Alignment of
the Transmembrane Domains of All Human GPCRs: Phylogenetic,
Structural and Functional Implications. Vol. 12, PLoS Computational
Biology. 2016. 1–31 p.
59. Hanson MA, Roth CB, Jo E, Rosen H, Raymon. Crystal Structure of a Lipid
G Protein – Coupled Receptor. Science (80- ). 2012;335:851–6.
60. Laun AS, Shrader SH, Brown KJ, Song ZH. GPR3, GPR6, and GPR12 as
novel molecular targets: their biological functions and interaction with
cannabidiol. Acta Pharmacol Sin. 2018;(April):1–9.
61. Jensen T, Elster L, Nielsen SM, Poda SB, Loechel F, Volbracht C, et al.
The identification of GPR3 inverse agonist AF64394; The first small
molecule inhibitor of GPR3 receptor function. Bioorganic Med Chem Lett.
2014;24(22):5195–8.
62. Morales P, Hurst DP, Reggio PH. Methods for the Development of In Silico
GPCR Models. 1st ed. Vol. 593, Methods in Enzymology. Elsevier Inc.;
2017. 405–448 p.
63. Yang C, Wei Y, Qi S, Chen L, Zhang Q, Ma J, et al. The G Protein Coupled
Receptor 3 Is Involved in cAMP and cGMP Signaling and Maintenance of
Meiotic Arrest in Porcine Oocytes. PLoS One. 2012;7(6):1–9.
Bibliography page 156
64. Horré K, Ciesielska M, De Kloe G, Thathiah A, Vandewyer E, Snellinx A, et
al. β-arrestin 2 regulates Aβ generation and γ-secretase activity in
Alzheimer’s disease. Nat Med. 2013;19(1):43–9.
65. Ding J, Jiang B, Shi F, Li Y, Dong F, Zhang B, et al. Sphingosine 1-
phosphate acts as an activator for the porcine Gpr3 of constitutively active
G protein-coupled receptors. J Zhejiang Univ Sci B. 2012;13(7):555–66.
66. Valverde O, Vanderhaeghen P, Sperlagh B, Ledent C, Vassart G, Baranyi
M, et al. GPR3 Receptor, a Novel Actor in the Emotional-Like Responses.
PLoS One. 2009;4(3):1–10.
67. Amantha T, Kurt S, Marcel H, Pascal M. The Orphan G Protein–Coupled
Receptor 3 Modulates Amyloid-Beta Peptide Generation in Neurons.
Science (80- ). 2009;323(February):946–51.
68. Huang Y, Skwarek-Maruszewska A, Horre K, Vandewyer E, Wolfs L,
Snellinx A, et al. Loss of GPR3 reduces the amyloid plaque burden and
improves memory in Alzheimer’s disease mouse models. Sci Transl Med.
2015;7(309):1–10.
69. Thathiah A, De Strooper B. The role of G protein-coupled receptors in the
pathology of Alzheimer’s disease. Nat Rev Neurosci. 2011;12(2):73–87.
70. Hunter MS, DePonte DP, Shapiro DA, Kirian RA, Wang X, Starodub D, et
al. X-ray diffraction from Membrane protein nanocrystals. Biophys J.
2011;100(1):198–206.
71. Coudrat T, Christopoulos A, Sexton PM, Wootten D. Structural features
embedded in G protein-coupled receptor co-crystal structures are key to
their success in virtual screening. PLoS One. 2017;12(4):1–29.
72. Renaud J-P, Ashwin C, Ciferri C, Liu W, Rémigy H-W, Stark H, et al. Cryo-
EM in drug discovery: achievements, limitations and prospects. Nat Publ
Gr. 2018;17(7):471–92.
73. Khoshouei M, Radjainia M, Baumeister W, Danev R. Croy-EM structure of
haemoglobin at 3.2 A determined with the Volta phase plate. Nat Commun.
2017;8(May):1–6.

Bibliography page 157
74. Opella SJ, Marassi FM. Structure determination of proteins by NMR
spectroscopy. Chem Rev. 2004;104(8):3587–606.
75. Lottspeich F, Solodkoff ZL, Engels JW. Bioanalytik. Spektrum Akad Verlag.
2012;
76. Thal DM, Vuckovic Z, Draper-Joyce CJ, Liang YL, Glukhova A,
Christopoulos A, et al. Recent advances in the determination of G protein-
coupled receptor structures. Curr Opin Struct Biol. 2018;51:28–34.
77. Palczewski K, Kumasaka T, Hori T, Behnke CA, Motoshima H, Fox BA, et
al. Crystal Structure of Rhodopsin: A G Protein-Coupled Receptor. Science
(80- ). 2000;289(August):739–45.
78. Cherezov V, Rosenbaum DM, Hanson M a, Søren GF, Thian FS, Kobilka
TS, et al. High resolution crystal structure of an engineered human beta2-
adrenergic G protein-coupled receptor. Science (80-).
2007;318(5854):1258–65.
79. Rasmussen SGF, Choi H-J, Rosenbaum DM, Kobilka TS, Thian FS,
Edwards PC, et al. Crystal structure of the human β2 adrenergic G-protein-
coupled receptor. Nature. 2007;450(7168):383–8.
80. Anderson AC. The Process of Structure-Based Drug Design. Chem Biol.
2003;10:787–97.
81. Wu H, Wang C, Gregory KJ, Han GW, Cho HP, Xia Y, et al. Structure of a
class C GPCR metabotropic glutamate receptor 1 bound to an allosteric
modulator. Science (80- ). 2014;344(April):58–65.
82. Xiang J, Chun E, Liu C, Jing L, Al-Sahouri Z, Zhu L, et al. Successful
Strategies to Determine High-Resolution Structures of GPCRs. Trends
Pharmacol Sci. 2016;37(12):1055–69.
83. Milic D, Veprintsev DB. Large-scale production and protein engineering of
G protein-coupled receptors for structural studies. Front Pharmacol.
2015;6(66):1–24.
84. Wu B, Chien EYT, Mol CD, Fenalti G, Liu W, Katritch V, et al. Structures of
the CXCR4 Chemokine GPCR with small-molecule and cyclic peptide
antagonists. Science (80- ). 2010;330(6007):1066–71.
Bibliography page 158
85. Moraes I. The Next Generation in Membrane Protein Structure
Determination. 2016. 1–187 p.
86. Standfuss J, Xie G, Edwards PC, Burghammer M, Oprian DD, Schertler
GFX. Crystal Structure of a Thermally Stable Rhodopsin Mutant. J Mol Biol.
2007;372(5):1179–88.
87. Mancia F, Patel SD, Rajala MW, Scherer PE, Nemes A, Schieren I, et al.
Optimization of Protein Production in Mammalian Cells with a Coexpressed
Fluorescent Marker. Struct Biol. 2004;12:1355–60.
88. Reeves PJ, Callewaert N, Contreras R, Khorana HG. Structure and
function in rhodopsin : High-level expression of rhodopsin with restricted
and homogeneous N-glycosylation by a tetracycline- HEK293S stable
mammalian cell line. PNAS. 2002;99(21):13419–24.
89. Yang H, Murphy AS. Functional expression and characterization of
Arabidopsis ABCB , AUX 1 and PIN auxin transporters in
Schizosaccharomyces pombe. plant J. 2009;59:179–91.
90. Shiroishi M, Kobayashi T, Ogasawara S, Tsujimoto H. Production of the
stable human histamine H 1 receptor in Pichia pastoris for structural
determination. Methods. 2011;55(4):281–6.
91. Yurugi-kobayashi T, Asada H, Shiroishi M, Shimamura T, Iwata S,
Kobayashi T. Comparison of functional non-glycosylated GPCRs
expression in Pichia pastoris. Biochem Biophys Res Commun.
2009;380(2):271–6.
92. Zhou R Bin, Lu HM, Liu J, Shi JY, Zhu J, Lu QQ, et al. A systematic analysis
of the structures of heterologously expressed proteins and those from their
native hosts in the RCSB PDB archive. PLoS One. 2016;11(8):1–19.
93. Weiß HM, Grisshammer R. Purification and characterization of the human
adenosine A2a receptor functionally expressed in Escherichia coli. Eur J
Biochem. 2002;269:82–92.
94. Tucker J, Grisshammer R. Purification of a rat neurotensin receptor
expressed in Escherichia coli. Biochem J. 1996;317:891–9.
Bibliography page 159
95. Egloff P, Hillenbrand M, Klenk C, Batyuk A, Heine P, Balada S, et al.
Structure of signaling-competent neurotensin receptor 1 obtained by
directed evolution in Escherichia coli. Proc Natl Acad Sci USA.
2014;111(6):E655–62.
96. Banères J. Refolding of G-Protein-Coupled Receptors. In: Structural
Biology of Membrane Proteins. 2011. p. 1–12.
97. Park SH, Das BB, Casagrande F, Tian Y, Kiefer H, Marassi FM, et al.
Structure of the Chemokine Receptor CXCR1 in Phospholipid Bilayers.
2012;491(7426):779–83.
98. Rosano GL, Ceccarelli EA. Recombinant protein expression in Escherichia
coli: Advances and challenges. Front Microbiol. 2014;5(APR):1–17.
99. Khlebnikov A, Keasling JD. Effect of lacY Expression on Homogeneity of
Induction from the P tac and P trc Promoters by Natural and Synthetic
Inducers. Biotechnol Prog. 2002;18:672–4.
100. Menzella HG, Ceccarelli EA, Gramajo HC. Novel Escherichia coli Strain
Allows Efficient Recombinant Protein Production Using Lactose as Inducer.
Biotechnol Bioeng. 2003;82(7):809–17.
101. Derman A, Prinz WA, Belin D, Beckwith J. Mutations That Allow Disulfide
Bond Formation in the Cytoplasm of Escherichia coli. Science (80- ).
1993;262:1744–7.
102. Stewart EJ, Åslund F, Beckwith J. Disulfide bond formation in the
Escherichia coli cytoplasm : an in vivo role reversal for the thioredoxins.
EMBO J. 1998;17(19):5543–50.
103. Lobstein J, Emrich CA, Jeans C, Faulkner M, Riggs P, Berkmen M. SHuffle
, a novel Escherichia coli protein expression strain capable of correctly
folding disulfide bonded proteins in its cytoplasm. Microb Cell Fact.
2012;11(56):1–16.
104. Rogl H, Kosemund K, Kühlbrandt W, Collinson I. Refolding of Escherichia
coli produced membrane protein inclusion bodies immobilised by nickel
chelating chromatography. FEBS Lett. 1998;432(1–2):21–6.
Bibliography page 160
105. A. B, J. F. Purification of proteins using polyhistidine affinity tags. Methods
Enzym. 2000;326:245–54.
106. Taniguchi R, Inoue A, Sayama M, Uwamizu A, Yamashita K, Hirata K, et
al. Structural insights into ligand recognition by the lysophosphatidic acid
receptor LPA6. Nat Publ Gr. 2017;548(7667):356–60.
107. Kobilka BK. Amino and carboxyl terminal modifications to facilitate the
production and purification of a GPCR. Anal Biochem. 1995;231(1):269–
71.
108. Michalke K, Huyghe C, Lichiere J, Graviere ME, Siponen M, Sciara G, et
al. Mammalian G protein-coupled receptor expression in Escherichia coli:
II. Refolding and biophysical characterization of mouse cannabinoid
receptor 1 and human parathyroid hormone receptor 1. Anal Biochem.
2010;401(1):74–80.
109. Singh A, Upadhyay V, Upadhyay AK, Singh SM, Panda AK. Protein
recovery from inclusion bodies of Escherichia coli using mild solubilization
process. Microb Cell Fact. 2015;14(41):1–10.
110. Kiefer H, Vogel R, Maier K. Bacterial expression of G-protein-coupled
receptors: prediction of expression levels from sequence. Recept channels.
2000;7(2):109–19.
111. Cymer F, Von Heijne G, White S. Mechanisms of integral membrane
protein insertion and folding. Bone. 2008;23(1):1–7.
112. Kiefer H, Krieger J, Olszewski JD, Von Heijne G, Prestwich GD, Breer H.
Expression of an olfactory receptor in Escherichia coli: Purification,
reconstitution, and ligand binding. Biochemistry. 1996;35(50):16077–84.
113. Palmer I, Wingfield PT. Preparation and extraction of insoluble (Inclusion
body) proteins from Escherichia coli. Curr Protoc Protein Sci. 2004;(8 M):1–
25.
114. Walls D, Lourghran ST. Protein Chromatography Methods and Protocols.
2011. 1–539 p.
Bibliography page 161
115. Park SH, Casagrande F, Chu M, Maier K, Kiefer H, Opella SJ. Optimization
of purification and refolding of the human chemokine receptor CXCR1
improves the stability of proteoliposomes for structure determination.
Biochim Biophys Acta - Biomembr. 2012;1818(3):584–91.
116. Singh SM, Panda AK. Solubilization and Refolding of Bacterial Inclusion
Body Proteins. J Biosci Bioeng. 2005;99(4):303–10.
117. Kiefer H, Maier K, Vogel R. Refolding of G-protein-coupled receptors from
inclusion bodies produced in Escherichia coli. Biochem Soc Trans.
1999;27(6):908–12.
118. Moraes I, Evans G, Sanchez-Weatherby J, Newstead S, Stewart PDS.
Membrane protein structure determination - the next generation. Biochim
Biophys Acta. 2014;1838(1 Pt A):78–87.
119. Schmidt P, Bender BJ, Kaiser A, Gulati K, Scheidt HA, Hamm HE, et al.
Improved in Vitro Folding of the Y 2 G Protein-Coupled Receptor into
Bicelles. Front Mol Biosci. 2018;4(January):1–12.
120. Lebon G, Warne T, Edwards PC, Bennett K, Langmead CJ, Leslie AGW,
et al. Agonist-bound adenosine A2A receptor structures reveal common
features of GPCR activation. Nature. 2011;474(7352):521–5.
121. Ring AM, Manglik A, Kruse AC, Enos MD, Weis WI, Garcia KC, et al.
Adrenaline-activated structure of β2-adrenoceptor stabilized by an
engineered nanobody. Nature. 2013;502(7472):575–9.
122. Kruse AC, Hu J, Pan AC, Arlow DH, Rosenbaum DM, Rosemond E, et al.
Structure and dynamics of the M3 muscarinic acetylcholine receptor.
Nature. 2012;482(7386):552–6.
123. Alexandrov AI, Mileni M, Chien EYT, Hanson MA, Stevens RC. Microscale
Fluorescent Thermal Stability Assay for Membrane Proteins. Structure.
2008;16(3):351–9.
124. Yeh AP, Mcmillan A, Stowell MHB. Rapid and simple protein-stability
screens : application to membrane proteins. Acta Cryst. 2006;D62:451–7.
Bibliography page 162
125. Crichton PG, Lee Y, Ruprecht JJ, Cerson E, Thangaratnarajah C, King MS,
et al. Trends in thermostability provide information on the nature of
substrate, inhibitor, and lipid interactions with mitochondrial carriers. J Biol
Chem. 2015;290(13):8206–17.
126. Kang HJ, Lee C, Drew D. Breaking the barriers in membrane protein
crystallography. Int J Biochem Cell Biol. 2013;45(3):636–44.
127. Eriksson L, Johansson E, Kettaneh-Wold N, Wikström C, Wold S. Design
of Experiments: Principles and Applications. Vol. 46. 2008. 1–425 p.
128. Rasmussen SGF, DeVree BT, Zou Y, Kruse AC, Chung KY, Kobilka TS, et
al. Crystal structure of the β2 adrenergic receptor-Gs protein complex.
Nature. 2011;477(7366):549–57.
129. Vaidehi N, Grisshammer R, Tate CG. How Can Mutations Thermostabilize
G-Protein-Coupled Receptors? Trends Pharmacol Sci. 2016;37(1):37–46.
130. Xiang J, Chun E, Liu C, Jing L. Successful Strategies to Determine High-
Resolution Structures of GPCRs. Trends Pharmacol Sci.
2016;37(12):1055–69.
131. Sun B, Bachhawat P, Chu ML-H, Wood M, Ceska T, Sands ZA, et al.
Crystal structure of the adenosine A 2A receptor bound to an antagonist
reveals a potential allosteric pocket. Proc Natl Acad Sci. 2017;1–6.
132. Caffrey M, Cherezov V. Crystallizing Membrane Proteins Using Lipidic
Mesophases. Nat Protoc. 2009;4(5):706–31.
133. Ostermeier C, Michel H. Crystallization of membrane proteins. Curr Opin
Struct Biol. 1997;7(5):697–701.
134. Landau EM, Rosenbusch JP. Lipidic cubic phases: a novel concept for the
crystallization of membrane proteins. Proc Natl Acad Sci U S A.
1996;93(25):14532–5.
135. Cherezov V. Lipidic Cubic Phase Technologies for Membrane Protein
Structural Studies. Curr Opin Struct Biol. 2011;21(4):559–66.
136. Caffrey M. A comprehensive review of the lipid cubic phase or in meso
method for crystallizing membrane and soluble proteins and complexes.
Acta Crystallogr Sect FStructural Biol Commun. 2015;71:3–18.
Bibliography page 163
137. Fenalti G, Abola EE, Wang C, Wu B, Cherezov V. Fluorescence recovery
after photobleaching in lipidic cubic phase (LCP-FRAP): A
precrystallization assay for membrane proteins. 1st ed. Vol. 557, Methods
in Enzymology. Elsevier Inc.; 2015. 417–437 p.
138. Li D, Boland C, Aragao D, Walsh K, Caffrey M. Harvesting and Cryo-cooling
Crystals of Membrane Proteins Grown in Lipidic Mesophases for Structure
Determination by Macromolecular Crystallography. J Vis Exp.
2012;67(e4001):1–8.
139. Wlodawer A, Minor W, Dauter Z, Jaskolski M. Protein crystallography for
non-crystallographers, or how to get the best (but not more) from published
macromolecular structures. FEBS J. 2008;275(1):1–21.
140. Rapaport D, Herrmann JM. Membrane Biogenesis IN Series Editor. 2013.
1–400 p.
141. Kabsch W. XDS. Acta Crystallogr Sect D Biol Crystallogr. 2010;66(2):125–
32.
142. Tats A, Remm M, Tenson T. Highly expressed proteins have an increased
frequency of alanine in the second amino acid position. BMC Genomics.
2006;7(28):1–13.
143. Laemmli UK. Cleavage of structural proteins during the assembly of the
head of bacteriophage T4. Nature. 1970;227:680–5.
144. Garca-Descalzo L, Garca-Lpez E, Alczar A, Baquero F, Ci C. Gel
Electrophoresis of Proteins. Gel Electrophor - Princ Basics. 2012;
145. Hefti MH, Toorn CJGVV Der, Dixon R, Vervoort J. A Novel Purification
Method for Histidine-Tagged Proteins Containing a Thrombin Cleavage
Site. Anal Biochem. 2001;295:180–5.
146. Healthcare G. Instructions: Vivaspin 500, 2, 6, 20. GE Healthc Instr. 2015;
147. Esmon CT, Owen WG, Jackson M. The Conversion of Prothrombin to
Thrombin. J Biol Chem. 1974;249(2):594–605.
148. Waugh DS. An overview of enzymatic reagents for the removal of affinity
tags. Protein Expr Purif. 2011;80(2):283–93.
Bibliography page 164
149. Jenny RJ, Mann KG, Lundblad RL. A critical review of the methods for
cleavage of fusion proteins with thrombin and factor Xa. Protein Expr Purif.
2003;31(1):1–11.
150. Novagen. Thrombin Kits. EMD Chem Inc. 2011;1–5.
151. Tsukamoto H, Fukudome K, Kohara J, Nakatake H, Kimoto M. Preparation
of recombinant murine tumor necrosis factor-α in Escherichia coli: A rapid
method to remove tags from fusion proteins by thrombin-cleavage and ion-
exchange chromatography. Protein Expr Purif. 2007;56(1):138–44.
152. Ren H, Yu D, Ge B, Cook B, Xu Z, Zhang S. High-level production,
solubilization and purification of synthetic human GPCR chemokine
receptors CCR5, CCR3, CXCR4 and CX3CR1. PLoS One. 2009;4(2):1–
15.
153. Liu W, Hanson MA, Stevens RC, Cherezov V. LCP-Tm: An assay to
measure and understand stability of membrane proteins in a membrane
environment. Biophys J. 2010;98(8):1539–48.
154. Glukhova A, Jörg M, Vecchio EA, Scammells PJ, May LT, Christopoulos A,
et al. Structure of the Adenosine A1 Receptor Reveals the Basis for
Subtype Selectivity. Cell. 2017;168(5):867–77.
155. Shevchenko A, Wilm M, Vorm O, Mann M. Mass spectrometric sequencing
of proteins from silver-stained polyacrylamide gels. Anal Chem.
1996;68(5):850–8.
156. Ma P, Weichert D, Aleksandrov LA, Jensen TJ, Riordan JR, Liu X, et al.
The cubicon method for concentrating membrane proteins in the cubic
mesophase. Nat Protoc. 2017;12(9):1745–62.
157. Caffrey M. A comprehensive review of the lipid cubic phase or in meso
method for crystallizing membrane and soluble proteins and complexes.
Acta Crystallogr Sect FStructural Biol Commun. 2015;71:3–18.
158. O’Neil PK, Richardson LGL, Paila YD, Piszczek G, Chakravarthy S, Noinaj
N, et al. The POTRA domains of Toc75 exhibit chaperone-like function to
facilitate import into chloroplasts. Proc Natl Acad Sci.
2017;114(24):E4868–76.
Bibliography page 165
159. Shaw Stewart P, Mueller-Dieckmann J. Automation in biological
crystallization. Acta Crystallogr Sect FStructural Biol Commun.
2014;70(6):686–96.
160. Caffrey M, Porter C. Crystallizing Membrane Proteins for Structure
Determination using Lipidic Mesophases Part 1 : Preparing the
Crystallization Plates Part 2 : Preparing the Lipid Syringe Part 3 : Preparing
the Protein Syringe Part 4 : Mixing Protein Solution and Lipid : Mak. J Vis
Exp. 2010;3:1–5.
161. Caffrey M. Crystallizing membrane proteins for structure-function studies
using lipidic mesophases. Biochem Soc Trans. 2011;39:725–32.
162. Cheng RKY, Fiez-Vandal C, Schlenker O, Edman K, Aggeler B, Brown DG,
et al. Structural insight into allosteric modulation of protease-activated
receptor 2. Nature. 2017;545(7652):112–5.
163. Zabara A et al. The nanoscience behind the art of in-meso crystallization
of membrane proteins. R Soc Chem. 2017;1–10.
164. Lin GG, Scott JG. Preparation of Microcrystals in Lipidic Cubic Phase for
Serial Femtosecond Crystallography. Nat Protoc. 2014;9(9):2123–34.
165. Albrecht R. Purification and LCP Crystallization of 6 Transmembrane
Histidine Kinases. Protoc Max Planck Inst. 2018;(August).
166. Huang CY, Olieric V, Ma P, Panepucci E, Diederichs K, Wang M, et al. In
meso in situ serial X-ray crystallography of soluble and membrane proteins.
Acta Crystallogr Sect D Biol Crystallogr. 2015;71:1238–56.
167. Huang C-Y, Olieric V, Howe N, Warshamanage R, Weinert T, Panepucci
E, et al. In situ serial crystallography for rapid de novo membrane protein
structure determination. Commun Biol. 2018;1(1):124.
168. Seddon AM, Curnow P, Booth PJ. Membrane proteins, lipids and
detergents : not just a soap opera. Biochim Biophys Acta. 2004;1666:105–
17.
169. Wlodawer A. Protein Crystallography. 2017. 1–671 p.
Bibliography page 166
170. Araújo a P, Oliva G, Henrique-Silva F, Garratt RC, Cáceres O, Beltramini
LM. Influence of the histidine tail on the structure and activity of
recombinant chlorocatechol 1,2-dioxygenase. Biochem Biophys Res
Commun. 2000;272(2):480–4.
171. Thompson AA, Liu JJ, Chun E, Wacker D, Wu H, Cherezov V, et al. GPCR
stabilization using the bicelle-like architecture of mixed sterol-detergent
micelles. Methods. 2011;55(4):310–7.
172. Ghosh E, Kumari P, Jaiman D, Shukla AK. Methodological advances: The
unsung heroes of the GPCR structural revolution. Nat Rev Mol Cell Biol.
2015;16(2):69–81.
173. Zheng Y, Han GW, Abagyan R, Wu B, Stevens RC, Cherezov V, et al.
Structure of CC Chemokine Receptor 5 with a Potent Chemokine
Antagonist Reveals Mechanisms of Chemokine Recognition and Molecular
Mimicry by HIV. Immunity. 2017;46(6):1005-1017.e5.
174. Batyuk A, Galli L, Ishchenko A, Han GW, Gati C, Popov PA, et al. Native
phasing of x-ray free-electron laser data for a G protein-coupled receptor.
Sci Adv. 2016;2(9):1–9.
175. Xu F, Hanson MA, Stevens RC, Cherezov V. Development of an
Automated High Throughput LCP-FRAP Assay to Guide Membrane
Protein Crystallization in Lipid Mesophases. Cryst Growth Des.
2011;11:1193–201.
176. Serebryany E, Zhu GA, Yan ECY. Artificial membrane-like environments
for in vitro studies of purified G-protein coupled receptors. Biochim Biophys
Acta - Biomembr. 2012;1818(2):225–33.
177. Maire M. Interaction of membrane proteins and lipids with solubilizing
detergents. Biochim Biophys Acta. 2000;1508:86–111.
178. Rath A, Glibowicka M, Nadeau VG, Chen G, Deber CM. Detergent binding
explains anomalous SDS-PAGE migration of membrane proteins. Proc
Natl Acad Sci. 2009;106(6):1760–5.
179. Hattab G, Warschawski DE, Moncoq K, Miroux B. Escherichia coli as host
for membrane protein structure determination: A global analysis. Sci Rep.
2015;5:1–10.
Bibliography page 167
180. Miyake R, Kawamoto J, Wei YL, Kitagawa M, Kato I, Kurihara T, et al.
Construction of a low-temperature protein expression system using a cold-
adapted bacterium, Shewanella sp. strain Ac10, as the host. Appl Environ
Microbiol. 2007;73(15):4849–56.
181. Fan J, Heng J, Dai S, Shaw N, Zhou B, Huang B, et al. An efficient strategy
for high throughput screening of recombinant integral membrane protein
expression and stability. Protein Expr Purif. 2011;78(1):6–13.
182. Chen YW, Burgess-Brown NA, Mahajan P, Strain-Damerell C, Gileadi O,
Gräslund S. Structural Genomics General Applications. 2014. 73–94 p.
183. Baneres JL, Martin A, Hullot P, Girard JP, Rossi JC, Parello J. Structure-
based analysis of GPCR function: Conformational adaptation of both
agonist and receptor upon leukotriene B4 binding to recombinant BLT1. J
Mol Biol. 2003;329(4):801–14.
184. Vergis JM, Wiener MC. The variable detergent sensitivity of proteases that
are utilized for recombinant protein affinity tag removal. Protein Expr Purif
. 2011;78(2):139–42.
185. Arnau J, Lauritzen C, Petersen GE, Pedersen J. Current strategies for the
use of affinity tags and tag removal for the purification of recombinant
proteins. Protein Expr Purif. 2006;48(1):1–13.
186. Zhang H, Qiao A, Yang D, Yang L, Dai A, De Graaf C, et al. Structure of
the full-length glucagon class B G-protein-coupled receptor. Nature.
2017;546(7657):259–64.
187. Kaihua Z, Beili W, Qiang Z. Structure of the human P2Y12 receptor in
complex with an antithrombotic drug. Nature. 2014;509(7498):115–8.
188. Kiefer H. In vitro folding of alpha-helical membrane proteins. Biochim
Biophys Acta - Biomembr. 2003;1610(1):57–62.
189. Dian C, Baráth P, Knaust R, Mcsweeney S, Moss E, Hristova M, et al.
Overcoming protein instability problems during fusion protein cleavage. Life
Sci News 10 Amersham Biosci. 2002;1–5.
Bibliography page 168
190. O’Malley MA, Naranjo A, Lazarova T, Robinson AS. Analysis of Adenosine
A2 a Receptor Stability: Effects of Ligands and Disulfide Bonds.
Biochemistry. 2010;49(43):9181–9.
191. Singh SM, Sharma A, Upadhyay AK, Singh A, Garg LC, Panda AK.
Solubilization of inclusion body proteins using n -propanol and its refolding
into bioactive form. Protein Expr Purif. 2012;81(1):75–82.
192. Di Bartolo N, Compton ELR, Warne T, Edwards PC, Tate CG, Schertler
GFX, et al. Complete Reversible Refolding of a G-Protein Coupled
Receptor on a Solid Support. PLoS One. 2016;(March):1–16.
193. Ding WX, Qi XR, Li P, Maitani Y, Nagai T. Cholesteryl hemisuccinate as a
membrane stabilizer in dipalmitoylphosphatidylcholine liposomes
containing saikosaponin-d. Int J Pharm. 2005;300(1–2):38–47.
194. Schumann W, Ferreira LCS. Production of recombinant proteins in
Escherichia coli. Genet Mol Biol. 2004;27(3):442–53.
195. Bae HE, Ha B, Chae PS, Mortensen JS, Loland CJ, Hariharan P, et al.
Asymmetric maltose neopentyl glycol amphiphiles for a membrane protein
study: effect of detergent asymmetricity on protein stability. Chem Sci.
2018;10(4):1107–16.
196. Qin L, Kufareva I, Holden LG, Wang C, Zheng Y, Zhao C, et al. Crystal
structure of the chemokine receptor CXCR4 in complex with a viral
chemokine. Sciencexpress. 2015;(January):1–11.
197. Privé GG. Detergents for the stabilization and crystallization of membrane
proteins. Methods. 2007;41(4):388–97.
198. White MA, Clark KM, Grayhack EJ, Dumont ME. Characteristics Affecting
Expression and Solubilization of Yeast Membrane Proteins. J Mol Biol.
2007;365(3):621–36.
199. Kol S, Braun C, Thiel G, Doyle DA, Sundström M, Gourdon P, et al.
Heterologous expression and purification of an active human TRPV3 ion
channel. FEBS J. 2013;280(23):6010–21.
200. Wiktor M, Hartley O, Grzesiek S. Characterization of structure, dynamics,
and detergent interactions of the anti-HIV chemokine variant 5P12-
Bibliography page 169
RANTES. Biophys J. 2013;105(11):2586–97.
201. Carpenter EP, Beis K, Cameron AD, Iwata S. Overcoming the challenges
of membrane protein crystallography. Curr Opin Struct Biol.
2008;18(5):581–6.
202. Postis VLG, Deacon SE, Roach PCJ, Wright GSA, Xia X, Wright GSA, et
al. A high-throughput assay of membrane protein stability. 2008;25(8):617–
24.
203. M. TT, B. P, Tessema M, Stroud RM. General qPCR and Plate Reader
Methods for Rapid Optimization of Membrane Protein Purification and
Crystallization Using Thermostability Assays. Curr Protoc Protein Sci.
2015;77:1–20.
204. Ghanouni P, Schambye H, Seifert R, Lee TW, Rasmussen SGF, Gether U,
et al. The Effect of pH on β 2 Adrenoceptor Function. J Biol Chem.
2000;275(5):3121–7.
205. Jaakola V, Griffith MT, Hanson MA, Cherezov V, Ellen YT, Lane JR, et al.
The 2.6 Â Crystal Structure of a Human A2A Adenosine Receptor Bound
to an Antagonist. Science (80- ). 2008;322(5905):1211–7.
206. Santos SP, Bandeiras TM, Pinto AF, Teixeira M, Carrondo MA, Romão C
V. Thermofluor-based optimization strategy for the stabilization and
crystallization of Campylobacter jejuni desulforubrerythrin. Protein Expr
Purif. 2012;81(2):193–200.
207. Nagy JK, Lau FW, Bowie JU, Sanders CR. Mapping the oligomeric
interface of diacylglycerol kinase by engineered thiol cross-linking:
Homologous sites in the transmembrane domain. Biochemistry.
2000;39(14):4154–64.
208. Coudrat T, Simms J, Christopoulos A, Wootten D, Sexton PM. Improving
virtual screening of G protein-coupled receptors via ligand-directed
modeling. Vol. 13, PLOS Computational Biology. 2017. e1005819 p.
209. Chun E, Thompson AA, Liu W, Roth CB, Griffith MT, Katritch V, et al.
Fusion partner toolchest for the stabilization and crystallization of G protein-
coupled receptors. Structure. 2012;20:967–76.

Bibliography page 170
210. Chrencik JE, Roth CB, Terakado M, Kurata H, Omi R, Kihara Y, et al.
Crystal Structure of Antagonist Bound Human Lysophosphatidic Acid
Receptor 1. Cell. 2015;161(7):1633–43.
211. Caffrey M, Cherezov V. Crystallizing membrane proteins using lipidic
mesophases. Nat Protoc. 2009;4:706–31.
212. Cherezov V, Hanson M a, Griffith MT, Hilgart MC, Sanishvili R, Nagarajan
V, et al. Rastering strategy for screening and centring of microcrystal
samples of human membrane proteins with a sub-10 microm size X-ray
synchrotron beam. J R Soc Interface. 2009;6 Suppl 5(June):S587–97.
213. Caffrey M. On the mechanism of membrane protein crystallization in lipidic
mesophases. Cryst Growth Des. 2008;8(1):4244–54.
214. Gutmann DAP, Mizohata E, Newstead S, Ferrandon S, Postis V, Xia X, et
al. A high-throughput method for membrane protein solubility screening:
The ultracentrifugation dispersity sedimentation assay. Protein Sci.
2007;16(12):1422–8.
215. Li D, Howe N, Dukkipati A, Shah STA, Bax BD, Edge C, et al. Crystallizing
Membrane Proteins in the Lipidic Mesophase. Experience with Human
Prostaglandin E2 Synthase 1 and an Evolving Strategy. Cryst Growth Des.
2014;14(4):2034–47.
216. Corin K, Baaske P, Geissler S, Wienken CJ, Duhr S, Braun D, et al.
Structure and function analyses of the purified GPCR human vomeronasal
type 1 receptor 1. Sci Rep. 2011;1(172):1–6.
217. Yin W, Zhou XE, Yang D, De Waal PW, Wang M, Dai A, et al. Crystal
structure of the human 5-HT1Bserotonin receptor bound to an inverse
agonist. Cell Discov. 2018;4(12):1–13.
218. Aherne M, Lyons J a., Caffrey M. A fast, simple and robust protocol for
growing crystals in the lipidic cubic phase. J Appl Crystallogr.
2012;45(6):1330–3.
219. Cherezov V, Clogston J, Papiz MZ, Caffrey M. Room to move: crystallizing
membrane proteins in swollen lipidic mesophases. J Mol Biol.
2006;357(5):1605–18.
List of figures page 171
8 List of figures
Figure 1: A classical example of GPCR signaling pathway. Inactive GPCRs are activated by agonist binding, the activated receptor G protein complex is formed, GDP is exchanged for GTP. Gα-GTP and Gβγ subunits separate and activate downstream effectors. (19), CC BY 4.0, https://creativecommons.org/licenses/by/4.0/. .................................................... 3
Figure 2: GPCR desensitization after phosphorylation through GRK, the GPCR is internalized promoted through arrestin binding. The binding of arrestin sterically hinders the receptor-G protein interaction. The receptor is either degraded or recycled back to the cell surface. (19), CC BY 4.0, https://creativecommons.org/licenses/by/4.0/. .................................................... 4
Figure 3: Basic CTC building model including the six faces of the typical cubic building block. These include the inactive face, active face, G-protein face, G-protein-free face, ligand face and ligand free face. Ri represents the inactive receptor and Ra indicates the activated receptor. A is the synonym for the ligand and G for G-protein (20). .............................................................. 5
Figure 4: Efficacy of different ligand-stabilized GPCR conformations caused by binding of inverse agonists, neutral agonists, partial and full agonists. Reprinted from Cell, 170(3), Wacker D, Stevens RC, Roth BL., How Ligands Illuminate GPCR Molecular Pharmacology, 414–27, 2017, with permission from Elsevier. ................................................................................... 6
Figure 5: Effect of allosteric molecules on agonist concentration-response curves. The affinity and efficacy of the receptor through binding of allosteric molecules can be increased, not changed or decreased. Reprinted with permission from Kenakin T. Theoretical aspects of GPCR? Ligand complex pharmacology, Chem Rev., 4-20, Copyright (2017) American Chemical Society. .............................................................................................................. 7
Figure 6: A) Topological cartoon of a GPCR representing the N-terminal domain, EL1-3, 7TM domain in cylinders, IL1-3 and C-terminal domain. (19), CC BY 4.0, https://creativecommons.org/licenses/by/4.0/. B) General architecture and modularity of GPCRs. Major regions and structural features of GPCRs are shown on an example of the D3R crystal structure (PDB ID 3PBL). Blue ribbon patches mark highly conserved, functionally relevant motifs in the TM helices of class A GPCRs. Reprinted by permission from Nature, Trends Pharmacol Sci., Diversity and modularity of G protein-coupled receptor structures, Katritch V, Cherezov V, Stevens RC, Copyright 2017. ........ 8
Figure 7: Major GPCR families that are established drug targets and targets in clinical trials. There are 398 non-olfactory GPCRs, of which 108 have drugs approved (red), 66 bind to agents that have reached clinical trials but have not yet been approved (green) and 224 are yet to be targeted by agents in clinical trials (grey) (1). Reprinted by permission from Nature, Nat Rev Drug Discov., Trends in GPCR drug discovery: New agents, targets and indications, Hauser AS, Attwood MM, Rask-Andersen M, Schiöth HB, Gloriam DE, Copyright 2017. ............................................................................. 9
Figure 8: Chemical structure of the natural ligand S1P and the antagonist W146 hydrate (ML056). Reprinted from Trends Parmacol Sci., 39(5), Vass M, Kooistra AJ, Yang D, Stevens RC, Wang MW, de Graaf C, Chemical Diversity in the G Protein-Coupled Receptor Superfamily., 494–512, Copyright (2018). Reprinted from Bioorg Chem., 82, Liu T, Jin J, Chen Y, Xi Q, Hu J, Jia W, Identification and Structure–Activity Relationship (SAR) of
List of figures page 172
potent and selective oxadiazole-based agonists of sphingosine-1-phosphate receptor (S1P1)., 41–57, Copyright (2019). .................................... 12
Figure 9: Amino acid sequence from N to C terminus of S1P1 and the corresponding schematic presentation of the 7TM and the included T4 lysozyme replacing the IL3. Yellow: amino acids of the transmembrane helix. Red: most conserved amino acid within the transmembrane helix based on the Ballesteros-Weinstein nomenclature. Green: amino acid responsible for ligand binding........................................................................... 13
Figure 10: Amino acid sequence from N to C terminus of GPR3 and the corresponding schematic presentation of the 7TM and the included T4 lysozyme replacing the IL3. Yellow: amino acids of the transmembrane helix. Red: most conserved amino acid within the transmembrane helix based on the Ballesteros-Weinstein nomenclature. .......................................... 15
Figure 11: Chemical structure of the GPR3 inverse agonist AF64394. Reprinted from Bioorganic Med Chem Lett., 24(22), Jensen T, Elster L, Nielsen SM, Poda SB, Loechel F, Volbracht C, The identification of GPR3 inverse agonist AF64394; The first small molecule inhibitor of GPR3 receptor function., 5195–8, Copyright (2014). ................................................................ 16
Figure 12: A) Timeline of availability of individual GPCR crystal structures including protein fusion partners. (19) CC BY 4.0, https://creativecommons.org/licenses/by/4.0/. .................................................. 19
Figure 13: Models for micelles and addition of CHS to DDM micelles (A) resulted in altered mixed micelles (B). GPCR solubilized in a detergent micelle (C) compared to GPCR in a mixed lipid-detergent-micelle. A) and B) Reprinted from Methods, 55(4), Thompson AA, Liu JJ, Chun E, Wacker D, Wu H, Cherezov V, et al., GPCR stabilization using the bicelle-like architecture of mixed sterol-detergent micelles., 310–7, Copyright (2011)., C) and D) (83) CC BY 4.0, https://creativecommons.org/licenses/by/4.0/. ............................... 27
Figure 14: Exemplary representation of a summary of fit plot with the parameter R2 in green, Q2 in blue, the model validity in yellow and the reproducibility shown in cyan. ................................................................................................. 30
Figure 15: Example of a coefficient plot of factors 1-5 for the target variable viability. ............................................................................................................ 31
Figure 16: Exemplary representation of a contour plot of the factors X1 and X2 on the target variable Y1. ...................................................................................... 31
Figure 17: A) Temperature-composition phase diagram of the monoolein/water system determined under ‘conditions of use’ in the heating and cooling directions from 20 °C. The phases Ia3d and Pn3m represent cubic phases. Reprinted with permission from Cryst. Growth Des. 2008, 8, 12, 4244-4254 Copyright © 2008 American Chemical Society. B) Schematic representation of the crystallization of an integral membrane protein from the LCP. The protein is reconstituted into the bicontinuous cubic phase (bottom left quadrant) and the added precipitants shift the equilibrium away from stability in the cubic membrane leading to a phase separation. In this phase separation, the proteins diffuse into a sheet-like or lamellar portal (upper left quadrant) to lock into the lattice of the advancing crystal face (upper right quadrant). Lipid: light yellow oval tail; Detergent: pink with oval tail; Lipid: purple; Protein: blue; Aqueous channels: dark blue. Reprinted with permission from Cryst. Growth Des. 2008, 8, 12, 4244-4254 Copyright © 2008 American Chemical Society. ................................................................... 36

List of figures page 173
Figure 18: SDS-PAGE of Ni-IMAC purified KSI-S1P1 of the test expression in four different E. coli strains. A) E. coli Tuner DE3; B) E. coli. BLR DE3; C) E. coli Shuffle K12; D) E. coli Shuffle T7 Express. Samples were taken 1 h, 2 h, 3 h, 4 h and 24 h after induction with IPTG. A distinct band representing the monomeric form of KSI-S1P1 with a molecular weight at ~ 63 kDa is marked with a red box. ................................................................................................. 59
Figure 19: Western Blot of Ni-IMAC purified KSI-S1P1 from the test expression experiments with the highest protein concentration, which was determined by band intensity of Coomassie stained SDS-PAGE. KSI-S1P1 was detected with an anti-(His)6 primary antibody and an anti-mouse HRP labeled secondary antibody. His tagged EmGFP served as Western Blot control. ............................................................................................................. 59
Figure 20: A) Growth curve of E. coli Tuner DE3 expressing KSI-S1P1 in LB (red) and TB (blue) medium supplemented with 0.5 % (w/v) Glucose. B) SDS-PAGE after Ni-IMAC elution using Ni-NTA spin columns of KSI-S1P1
(marked with a red box) expressed in LB and TB media at 25 °C and 37 °C. ... 60
Figure 21: Western Blot with S1P1 of all DoE experiments (A and B). Bands that represent the monomeric KSI-S1P1 (labeled with a red box) were used to determine the chemiluminescence unit with the Fusion FX software. A pocket between experiment N13 and N14 was left free because some volume flew into the neighboring pocket of N13 while pipetting. ....................... 61
Figure 22: DoE results of KSI-S1P1 expression optimization A) Summary of fit plot. B) Coefficient plot of the factors investigated. Error bars correspond to the 95 % confidence interval. C) Residuals normal probability plot with each experiment as green circle. .............................................................................. 63
Figure 23: Response contour plot of significant parameters determined with the software Modde from DoE with KSI-S1P1 to optimize protein expression. The color transition from blue to red represents the increase in protein level from low (blue) to high (red). ............................................................................ 64
Figure 24: Different time points of harvest for KSI-S1P1 expression with conditions determined above. Expression was analyzed by Coomassie stained SDS-PAGE (left) and Western Blot (right). Bands representing monomeric KSI-S1P1 are marked with a red box. His tagged EmGFP served as positive control. ............................................................................................................. 65
Figure 25: SDS-PAGE (left) and Western Blot (right) of Ni-IMAC purified KSI-S1P1. Samples were KSI-S1P1 in solution, KSI-free S1P1 after thrombin cleavage with 10 U/ml thrombin with 1 h, 2 h, 4 h, 6 h, 8 h and 24 h incubation at 22 °C with constant shaking (500 rpm) and thrombin cleavage with 10 U/ml thrombin of Ni-IMAC bound S1P1 for 20 h at 22 °C with constant shaking (500 rpm). ........................................................................................................ 67
Figure 26: SDS-PAGE (left) and Western Blot (right) with KSI-S1P1 and thrombin digests (20 respectively 40 U/ml) with an incubation time of 24 h and 48 h. ..... 68
Figure 27: SDS-PAGE of KSI-S1P1 after purification and on-column refolding with two different Fos-Choline 14 concentrations (0.1 mg/ml and 0.5 mg/ml) in parallel. Thrombin cleavage was performed with 40 U/ml thrombin with three different urea concentrations (0.1 M, 0.5 M and 1.0 M) within the refolding buffer. SDS gel bands, which were cut out and sent to the University of Hohenheim for protein identification according to their peptide mass using MS/MS are labeled with a red box. ................................................ 69
List of figures page 174
Figure 28: Protein sequence of KSI-S1P1 in one-letter code with the thrombin cleavage site marked in yellow. Sequences identified in the MS/MS analysis for KSI-S1P1 (left) and KSI-free S1P1 (right) are marked in green. ..... 70
Figure 29: Chromatogram (A) and SDS-PAGE of KSI-S1P1 purified by Ni-IMAC (B). In the chromatogram the conductivity was shown in brown and the UV signal in blue. The S1P1 was step eluted with 250 mM imidazole and 0.5 mg/ml Fos-Choline 14. The supernatants of the IB washing steps, the flow through of sample loading as well as sample washing and protein elution were applied as samples. The thrombin cleavage with 200 U/ml after dialysis and the sample with addition of 2.5 mM CaCl2 were analyzed. ............ 71
Figure 30: SDS-PAGE with different experiments of thrombin cleavage (125 U) for 24 h at 22 °C. Thrombin cleavage with 0.2 mg/ml DDM or Fos-Choline 14 and 0.04 mg/ml CHS without glycerol supplementation. In addition a thrombin digest with 5 % (v/v) or 10 % (v/v) glycerol was tested. ..................... 72
Figure 31: SDS-PAGE and Western Blot with on-column refolded and purified KSI-free S1P1 (A) and GPR3 (B). ............................................................................ 73
Figure 32: SDS-PAGE, Western Blot and chromatogram of Ni-IMAC purification and refolding of S1P1 (A) and GPR3 (B) without KSI after PCR cloning. SDS gel bands which were cut out and sent for protein identification according to their peptide mass using MS/MS are labeled with a red box. ....... 75
Figure 33: A) Unfolding transition of repeated CPM assays with 4 µg, 8 µg, 10 µg, 12 µg, 16 µg and 20 µg β-LG after blank deduction. The CPM assay was performed in triplicates. B) Unfolding transition of the CPM assay with 8 µg β-LG in triplicates after blank deduction, the assay was repeated 18 times for measurement of reproducibility and robustness. ......................................... 76
Figure 34: Unfolding transition (in triplicates) of 10 µg S1P1 in violet (A) and 10 µg GPR3 in orange (B). The corresponding Boltzmann sigmoidal fit is shown in red. .................................................................................................................. 78
Figure 35: Unfolding transitions of S1P1 and GPR3 determined by CPM assay, which was performed in duplicates. The mean values of this measurement are shown. Fos-Choline 12, Fos-Choline 14 and DDM with 2 x and 4 x their CMC with and without addition of CHS (mass ratio detergent to CHS 5:1) were chosen. Red: 2 x CMC without CHS; Blue: 2 x CMC with CHS; Yellow: 4 x CMC without CHS; Green: 4 x CMC with CHS. .............................. 80
Figure 36: Overview of all melting points of S1P1 (A) and GPR3 (B) determined with CPM assay. Green bars display the melting points of DDM with and without CHS, red bars represent the melting points of Fos-Choline 12 with and without CHS and orange bars show the melting points of Fos-Choline 14 with and without CHS. Striped graphs show refolding with four times the CMC of each detergent. ................................................................................... 81
Figure 37: Coefficient plot for S1P1 (A) and GPR3 (B) to improve receptor stability. The Coefficient plot shows each factor as green bar and the error bar representing the 95 % confidence interval........................................................ 84
Figure 38: Contour plot determined for S1P1 (A) and GPR3 (B). Contour plot shows model for TM as a function of pH and NaCl concentration. The left panel is the modeled TM in the absence of glycerol, while the right panel shows the same model at 5 % (v/v) glycerol. ................................................... 85
Figure 39: The Coefficient plot and the contour plot from DoE with S1P1 (A) and GPR3 (B) to investigate pH values below 7 on receptor stability. The Coefficient plot shows each factor as green bar and the error bar
List of figures page 175
representing the 95 % confidence interval. Contour plot shows model for TM as a function of pH and NaCl concentration. .................................................... 88
Figure 40: Chromatogram of SEC purification of S1P1 (A) and GPR3 (B) following Ni-IMAC purification and refolding. SDS-PAGE with the monomer fractions of S1P1 (C) and GPR3 (D) after SEC, which are marked between red bars within the SEC chromatogram. ......................................................................... 90
Figure 41: Unfolding transitions in refolding buffer determined by CPM assay in duplicates of SEC purified S1P1 (A) and GPR3 (B). Both experiments are shown with and without addition of W146 and AF64394 as an example for the curve shape. C) TM as function of ligand concentration, TM was measured by CPM assay for GPR3 (control) and S1P1 in the presence of S1P1 antagonist W146. The antagonist concentration was increased from 10 nM to 100 µM. D) TM as function of ligand concentration, S1P1 served as control, the TM was measured by CPM assay for GPR3 in the presence of the GPR3 inverse agonist AF64394. The inverse agonist concentration was increased from 10 nM to 10.4 µM. .................................................................... 91
Figure 42: Chromatogram of SEC purification of S1P1 (A) and GPR3 (B). The SEC follows the Ni-IMAC purification and refolding into mixed-micelles with lipid additives to the refolding buffer. SDS-PAGE with the monomeric fractions of S1P1 (C) and GPR3 (D) after SEC, which are marked within the red bars in the SEC chromatogram. ............................................................................... 92
Figure 43: Unfolding transitions of receptor refolding into mixed-micelles determined by CPM assay in duplicates of SEC purified S1P1 (A) and GPR3 (B), both experiments with and without addition of W146 and AF64394. C) TM as function of ligand concentration, TM was measured by CPM assay for GPR3 (control) and S1P1 in the presence of antagonist W146. D) TM as function of ligand concentration, TM was measured by CPM assay for S1P1 (control) and GPR3 in the presence of inverse agonist AF64394. The values of GPR3 were fitted with a logistic function to determine the inflection point. .......................................................................... 93
Figure 44: Chromatogram (Ni-IMAC) of the column-bound refolding of S1P1 into mixed-micelles (A) and SDS-PAGE analysis of the collected elution fractions (B). Chromatogram showing the isolation of monomeric receptor by SEC (C). SDS-PAGE of the monomeric fractions (D) and concentration by ultrafiltration. ............................................................................................... 95
Figure 45: A) Refolding of GPR3 into mixed-micelles with Ni-IMAC. Pooled elution fractions are marked with red bars in the chromatogram. B) SDS-PAGE of the purification and refolding into mixed-micelles of column-bound GPR3. C) Isolation of the monomeric GPR3 fraction by SEC. Collected fractions are marked with red bars. D) SDS-PAGE analysis of the SEC and the concentration step by ultrafiltration. .................................................................. 96
Figure 46: Unfolding transitions of S1P1 (A) and GPR3 (B) refolded into mixed-micelles. TM values were determined with and without ligand addition to the assay samples. ................................................................................................ 96
Figure 47: Extract of two crystallization plates with S1P1 showing the LCP surrounded by buffer solutions incubated at 20 °C. Arrows mark areas for crystal growth. Images were taken in a defined time interval of 54 days. A) Crystallization conditions: 0.2 M Calcium chloride dihydrate + 30 % (w/v) PEG 4000. B) Crystallization conditions: 0.2 M Sodium acetate trihydrate + 20 % (w/v) PEG 3350. ..................................................................................... 99
Figure 48: Extract of the LCP surrounded by buffer solutions of two GPR3 crystallization plates incubated at 20 °C. Arrows mark areas for crystal
List of figures page 176
growth. The images were taken in a defined time interval of 37 days. A) Crystallization conditions: 0.1 M MES pH 6.5 + 0.6 M Zinc acetate dihydrate. B) Crystallization conditions: 0.1 M Bis-Tris pH 6.5 + 2 M (NH4)2SO4. .............................................................................................. 100
Figure 49: Mesophase of LCP crystallization in MemMeso screen with S1P1 (A; Well B2) and GPR3 (B; Well A6). The harvested crystals (in MicroMounts) are marked with a red box. An image of the harvested crystal was recorded at the SLS prior to measuring the corresponding diffraction pattern. The diffraction pattern of both experiments corresponds to the diffraction pattern of salt crystals. ............................................................................................... 101
Figure 50: A) LCP of S1P1 crystallization with conditions of the Classic screen: 0.1 M HEPES pH 7; 0.5 % (w/v) PEG 8000; 1 M Ammonium sulfate. B) LCP of S1P1 crystallized within the PEG II screen solution with the conditions: 0.1 M HEPES pH 7.5; 30 % (w/v) PEG 4000; 0.8 M Calcium chloride. The harvested crystals on both crystallization plates in the LCP are marked with a red box. The harvested crystals were imaged at the SLS prior to measuring the corresponding diffraction pattern. The diffraction pattern of both conditions indicates a non-diffracting potential protein crystal. ............... 102
Figure 51: A) Crystallization screening of GPR3 in LCP, shown are the conditions of the Classic II screen: 0.1 M Bis-Tris pH 6.5; 2 M (NH4)2SO4. B) Crystallization in LCP of GPR3 with the following conditions of the Cation screen: 0.1 M MES pH 6.5; 0.6 M Zinc acetate. The harvested crystals on the crystallization plates within the LCP are labeled with a red box. Crystals were harvested in MicroMounts, which were imaged at the SLS before measuring. The diffraction pattern of both crystals might belong to a potential non-diffracting protein crystal. .......................................................... 103
Figure 52: A) SDS-PAGE of concentrated receptors after SEC. Unfolding transitions of monomeric S1P1 (B) and GPR3 (C). For SDS-PAGE analysis, both receptors were diluted in refolding buffer. ............................................... 104
Figure 53: A) Labeled crystal of S1P1 crystallized with the following conditions: 0.2 M Tricine pH 7.75; 8 % (w/v) PEG 400; 44 mM Sodium citrate; 9.2 % (v/v) Glycerol. B) Birefrigency was observed using polarization filters. C) The harvested crystal was imaged within the MicroMount prior to measurement at the SLS. D) The missing diffraction spots indicate a potential non-diffracting protein crystal. ............................................................................... 106
Figure 54: A) Crystal growth of GPR3 detected within conditions from Grid II screen: Bis-Tris pH 5.5; 2218 mM (NH4)2SO4; 4 % PEG 4000. B) The harvested crystal was birefringent when viewed under microsope with polarization filters. C) The harvested GPR3 crystal was detected at the SLS within the MicroMount. D) The diffraction spots indicating a potential non-diffracting protein crystal. ............................................................................... 107
List of tables page 177
9 List of tables
Table 1: List of primers used for DNA sequencing of plasmids carrying genes for S1P1 or GPR3 for expression with or without ketosteroisomerase (KSI) tag. Primer concentration used for DNA sequencing was 10 pmol/µl. ..................... 40
Table 2: Overview of chosen primers and settings for PCR cloning with S1P1 and GPR3. .............................................................................................................. 41
Table 3: List of compounds and volumes used for colony PCR. .................................. 42
Table 4: PCR settings adjusted at the SimpliAmpTM PCR cycler. ................................. 43
Table 5: Components and associated volumes for the production of 12.5 % SDS gels sufficient for 12 gels with a layer thickness of 0.75 mm. ........................... 47
Table 6: Centrifuge specifications, sample volume and centrifugation speed for different centrifuge concentrators (VivaspinTM). ................................................ 48
Table 7: List of selected factors, their values and the measured response (S1P1 amount) for the DoE to optimize expression of S1P1. The amount of S1P1 was determined by Western Blot. Each band intensity was used for the calculation of the densitometric unit, a numerical value determined with the software Fusion FX for the evaluation of protein amount. ................................. 62
Table 8: Overview of important summary of fit plot values determined in the DoE and the corresponding acceptance criteria. Parameter description similar to legend in Figure 22. ......................................................................................... 63
Table 9: List of detergents in combination with CHS used within the detergent screen. ............................................................................................................. 79
Table 10: DoE plan for maximization of S1P1 and GPR3 stability. Response parameter was the TM of S1P1 and GPR3 determined by CPM assay. As factors the pH, NaCl and glycerol concentrations were chosen. ....................... 82
Table 11: List of important summary of fit plot values in the DoE for S1P1 and GPR3 stability optimization. ............................................................................. 83
Table 12: DoE plan to investigate the stability of S1P1 and GPR3 with pH values below 7 and NaCl concentrations less than 0.3 M by DoE. Response parameter was the TM of S1P1 and GPR3 determined by CPM assay. ............. 86
Table 13: List of important summary of fit plot values in the second DoE for S1P1 and GPR3 stability optimization. ...................................................................... 87
Table 14: List of the refolding buffer components for further optimizations. ................. 89
Table 15: Summary of all screening solutions used for crystallization screening. Screens marked with a dot were used in crystallization screening for S1P1 or GPR3. The crystallization screen according to Hanson et al. 2012 (45) was prepared based on the published crystallization conditions. ...................... 98
Table 16: Summary of all screening solutions used for LCP crystallization with commercial and grid screens. Screens marked with a dot were used in crystallization experiments. The crystallization screen according to (45) based on the published crystallization conditions for S1P1 and the grid screen solutions were prepared based on successful crystallization data obtained in the first round of crystallization screening. ................................... 105
Table 17: List of the composition of the Morpheus screen (Molecular Dimension). .... 123
Table 18: List of the composition of the MemMeso screen (Molecular Dimension). ... 125
Table 19: List of the composition of the Anion screen (Qiagen). ................................ 127
List of tables page 178
Table 20: List of the composition of the Cation screen (Qiagen). ............................... 129
Table 21: List of the composition of the Classic I screen (Qiagen). ............................ 131
Table 22: List of the composition of the Classic II screen (Qiagen). ........................... 133
Table 23: List of the composition of the PEG screen (Qiagen). ................................. 135
Table 24: List of the composition of the PEG II screen (Qiagen)................................ 137
Table 25: List of the composition of the pHClear screen (Qiagen). ............................ 139
Table 26: List of the composition of the screen according to (45). Conditions marked in green correspond to the published crystallization conditions. ........ 141
Table 27: List of the composition of the pHClear II screen (Qiagen). ......................... 142
Table 28: List of the composition of the Cryo screen (Qiagen). ................................. 144
Table 29: List of the composition of the screen according to the results from crystallization screening with S1P1. ................................................................ 146
Table 30: List of the composition of the screen according to the results from crystallization screening with S1P1. ................................................................ 147
Table 31: List of the composition of the screen according to the results from crystallization screening with GPR3. .............................................................. 148
Table 32: List of the composition of the screen according to the results from crystallization screening with GPR3. .............................................................. 149
Acknowledgment page 179
Acknowledgment
I want to offer my sincere thanks to my supervisor Prof. Dr. Hans Kiefer for giving
me the opportunity to carry out this very exciting and challenging PhD project at
the Institute of Applied Biotechnology (IAB) Biberach. I want to thank him for his
guidance and supervision as well as his great scientific interest in my work and
helpful advice during the whole time.
I would also like to thank Prof. Dr. Tanja Weil from the University of Ulm for the
kind supervision and appraisal of this PhD thesis as first examiner.
Furthermore, I want to thank Dr. Marcus Hartmann from the Max Planck Institute
for Developmental Biology Tübingen for the cooperation on crystallization using
LCP and the recording of diffraction data at the SLS in Villigen (Switzerland).
I want to thank the whole institute of applied biotechnology from the University of
Applied Sciences Biberach (Germany) and all colleagues for the beautiful and
instructive time, here. It has been a big pleasure and a lot of fun to work with all
of you. Special thanks goes to Sven Mathias, Phillipp Müller and Dr. René
Handrick for interesting and expedient discussions and ideas.
My very special thanks go to my parents Inge and Johannes Heim, who made
my studies and much more possible for me, who helped me day after day, who
supported and accompanied me and who were always there for me.
Last but not least I would like to thank my girlfriend Sarah Scheffold, who always
stood by me, supported me during my studies and my PhD thesis, inspired me
and distracted me.
I would like to dedicate this thesis to my family.
This study was supported by the Cooperative Research Training Group
Pharmaceutical Biotechnology stated by the Postgraduate Scholarships Act of
the Ministry for Science Research and Arts of the federal state government of
Baden-Württemberg, Germany.

Acknowledgment page 180
Eigenständigkeitserklärung –
Declaration of independence
Ich versichere hiermit, dass ich die Arbeit selbständig angefertigt habe und keine
anderen als die angegebenen Quellen und Hilfsmittel benutzt sowie die wörtlich
oder inhaltlich übernommenen Stellen als solche kenntlich gemacht habe.
Ich erkläre hiermit, dass die von mir vorgelegte Dissertation bisher nicht im In-
oder Ausland in dieser oder ähnlicher Form in einem anderen
Promotionsverfahren vorgelegt wurde.
I, Bastian Heim, hereby declare that this thesis was prepared by me
independently. I was using only the references and resources stated here. The
work has so far not been submitted to any audit commission.
Ulm, date: 17.10.2019 ……………………………
Signature

Acknowledgment page 181
Publications
Publication
Bastian Heim, René Handrick, Hans Kiefer
Refolding of two G protein-coupled receptors from E. coli inclusion bodies
Finalisation
Oral presentation
Bastian Heim, Tanja Weil, Hans Kiefer
Expression, purification, refolding and structure analysis of G protein-coupled
receptors expressed in E. coli inclusion bodies
68th Annual Meeting of the DGHM, Ulm (September 2016)
Bastian Heim, Tanja Weil, Hans Kiefer
Expression, purification, refolding and structure analysis of G protein-coupled
receptors expressed in E. coli inclusion bodies
BW-CAR Kick-off, Stuttgart (November 2016)
Bastian Heim, Hans Kiefer
Design of Experiments (DoE)
BW-CAR, Stuttgart (June 2017)
Acknowledgment page 182
Poster
Bastian Heim, Tanja Weil, Hans Kiefer
Expression, purification and refolding of stabilized G protein-coupled receptors
expressed in E. coli inclusion bodies for structure analysis
Keystone Symposia GPCR Structure and Function: Taking GPCR Drug Development and Discovery to the Next Level, Santa Fe New Mexico, USA (February 2018)
Bastian Heim, Tanja Weil, Hans Kiefer
Expression, purification and refolding of stabilized G protein-coupled receptors
expressed in E. coli inclusion bodies for structure analysis
BW-CAR Forschungstag, Stuttgart (July 2018)
Copyright © 2022 FDOKUMEN