teaching writing analytical exposition text by using dictogloss ...
Upload
khangminh22Category
view
0download
0
HAL Id: tel-03059710https://tel.archives-ouvertes.fr/tel-03059710
Submitted on 13 Dec 2020
HAL is a multi-disciplinary open accessarchive for the deposit and dissemination of sci-entific research documents, whether they are pub-lished or not. The documents may come fromteaching and research institutions in France orabroad, or from public or private research centers.
L’archive ouverte pluridisciplinaire HAL, estdestinée au dépôt et à la diffusion de documentsscientifiques de niveau recherche, publiés ou non,émanant des établissements d’enseignement et derecherche français ou étrangers, des laboratoirespublics ou privés.
Exposition humaine aux composés organiquessemi-volatils (COSV) en environnement intérieur par
ingestion de poussières : évaluation de la bioaccessibilitéorale des COSV
G. Raffy
To cite this version:G. Raffy. Exposition humaine aux composés organiques semi-volatils (COSV) en environnementintérieur par ingestion de poussières : évaluation de la bioaccessibilité orale des COSV. Médecinehumaine et pathologie. Université Rennes 1, 2018. Français. �NNT : 2018REN1B053�. �tel-03059710�

THESE DE DOCTORAT
DE L'UNIVERSITE DE RENNES 1
COMUE UNIVERSITE BRETAGNE LOIRE
ECOLE DOCTORALE N° 605 Biologie Santé Spécialité : « Epidémiologie, Analyse de Risque, Recherche Clinique »
Par
Gaëlle RAFFY
Exposition humaine aux composés organiques semi-volatils (COSV) en environnement intérieur par ingestion de poussières : évaluation de la bioaccessibilité orale des COSV Thèse présentée et soutenue à Rennes, le 12 décembre 2018 Unité de recherche : Institut de recherche en santé, environnement et travail - Irset - Inserm UMR 1085
Rapporteurs avant soutenance : Valérie DESAUZIERS Professeur de l’IMT, IMT Mines Alès Cyril FEIDT Professeur d’université, Université de Lorraine
Composition du Jury : Président : Laurent VERNHET Professeur d’université, Irset-Inserm UMR 1085 Examinateurs : Sophie ACHARD Maître de conférences, Université de Paris-Descartes
Sébastien DENYS Directeur santé environnement, Santé publique France Valérie DESAUZIERS Professeur de l’IMT, IMT Mines Alès Cyril FEIDT Professeur d’université, Université de Lorraine Aurore GELY-PERNOT Maître de conférences, Irset-Inserm UMR 1085
Dir. de thèse : Barbara LE BOT Professeur d’université, EHESP / Irset-Inserm UMR 1085 Co-dir. de thèse : Corinne MANDIN Chef d’unité, Centre Scientifique et Technique du Bâtiment (CSTB)


Page 5
REMERCIEMENTS
Je remercie en tout premier lieu Barbara Le Bot et Corinne Mandin, respectivement directrice et
co-directrice de ma thèse, qui m’ont proposé un sujet de recherche dans la continuité de mes
activités au Léres et qui ont su, tout au long de ces trois années, me conseiller scientifiquement,
m’encourager et me rassurer, tout en respectant mon autonomie. Je suis ressortie boostée de
toutes nos réunions de travail et n’aurais pu souhaiter un encadrement plus bienveillant. Je me
réjouis de la perspective de travailler encore en leur compagnie pour les années qui viennent,
aussi bien scientifiquement qu’humainement parlant.
Luc Multigner et Philippe Quénel m’ont accueillie au sein de l’équipe 9 de l’IRSET « évaluation
des expositions et recherche épidémiologique sur l'environnement, la reproduction et le déve-
loppement (3ERD) » dont ils sont co-responsables. Je les remercie sincèrement de m’avoir inté-
grée au cœur de cette équipe de recherche dynamique et multidisciplinaire.
Je remercie Valérie Desauziers et Cyril Feidt de s’être rendus disponibles pour donner leur avis
sur ce manuscrit à titre de rapporteurs. Merci également à Sophie Achard, Sébastien Denys, Au-
rore Gely-Pernot et Laurent Vernhet pour avoir bien voulu examiner ce travail et participer au ju-
ry de soutenance.
Un grand merci aux membres de mon comité de thèse, Guillaume Boulanger, Matthieu Delan-
noy, Fabien Mercier, Philippe Glorennec, Aurélie Pelfrêne et Pascale Quignon, grâce à qui
chaque rencontre, en orientant et validant les différentes étapes de ce projet, s’est avérée des
plus constructives.
Merci à l’ADEME, au CSTB, et à l’EHESP pour leur contribution financière qui a permis la réalisa-
tion de ce projet.
Merci de nouveau à Philippe Quénel et à Barbara Le Bot, mais aussi à Fleur Chaumet et aux ser-
vices formation et ressources humaines de l’EHESP, qui ont assuré le montage administratif de
ce doctorat réalisé dans le cadre de la formation continue de l’EHESP.
Merci au réseau doctoral en santé publique grâce à qui j’ai pu bénéficier d’une formation pluri-
disciplinaire très enrichissante et de belles rencontres avec les doctorants d’autres parcours.

Page 6
Merci à tous les collègues du Léres et de l’unité micropolluants avec qui j’ai à cœur de continuer
à travailler. Merci notamment à Gaëlle S. pour avoir assuré le bon fonctionnement de l’ASE et du
Thermo GC/MS et partagé avec moi ses solutions tout au long ma thèse !
Je remercie chaleureusement les occupants du bureau 001, Lise et Alexis pour la belle aventure
que représentent ces trois ans de thèse passés en leur compagnie, Malé pour sa présence infail-
lible et son bissap, Jade à qui je souhaite le meilleur en ce début de parcours, et Gary Burkhart,
dont la présence spirituelle a été source d’inspiration au quotidien.
Merci à mes parents, à mes beaux-parents et à toute ma famille et mes amis pour leur soutien
durant ces trois années. Merci au Panama qui m’a permis de maintenir une vie sociale le mer-
credi soir. Après tout, même quand son bocal est plein, on a toujours le temps de boire un verre
avec ses amis !
Enfin et surtout, merci à Guillaume, Juliette et Jeanne, mes gros cailloux, qui m’ont permis de
garder le cap en me recentrant sur l’essentiel.
Page 7
SOMMAIRE
LISTE DES SIGLES & ACRONYMES 9
LISTE DES TABLEAUX 13
LISTE DES FIGURES 15
INTRODUCTION 17
CHAPITRE 1 : CONTEXTE SCIENTIFIQUE 19
1. LES COMPOSES ORGANIQUES SEMI-VOLATILS (COSV) 19
1.1. DEFINITION DES COSV 19
1.1. SOURCES DE COSV EN ENVIRONNEMENT INTERIEUR 19
1.2. REPARTITION DES COSV EN ENVIRONNEMENT INTERIEUR 25
1.3. TOXICITE DES COSV 26
2. CONTAMINATION DE L’AIR ET DES POUSSIERES EN ENVIRONNEMENT INTERIEUR 29
2.1. CONTAMINATION DE L’AIR ET DES POUSSIERES DES LOGEMENTS. 30
2.1. CONTAMINATION DE L’AIR ET DES POUSSIERES DES ECOLES (ARTICLE SCIENTIFIQUE N°1) 31
3. LES VOIES D’EXPOSITION AUX COSV 67
3.1. L’INGESTION 67
3.2. L’INHALATION 68
3.3. LE CONTACT CUTANE 68
3.4. CONTRIBUTION RELATIVE DE CHAQUE VOIE 68
4. NOTIONS DE BIOACCESSIBILITE ET BIODISPONIBILITE 69

Page 8
4.1. DEFINITION DE LA BIOACCESSIBILITE 70
4.2. DEFINITION DE LA BIODISPONIBILITE 70
5. QUESTIONS DE RECHERCHE 72
6. OBJECTIFS DE LA THESE 72
CHAPITRE 2 : LA BIOACCESSIBILITE DES COSV DANS LES POUSSIERES- REVUE DE LA
LITTERATURE (ARTICLE SCIENTIFIQUE N°2) 73
CHAPITRE 3 : PROPOSITION D’UNE METHODE SIMPLIFIEE DE MESURE DES COSV DANS LES
POUSSIERES 99
1. DEVELOPPEMENT DE LA METHODE (ARTICLE SCIENTIFIQUE N°3) 100
2. APPLICATION A DES ECHANTILLONS REELS 151
2.1. SELECTION DES ECHANTILLONS 152
2.2. BIOACCESSIBILITE DES COSV DANS 7 ECHANTILLONS DE POUSSIERE DE SALLES DE CLASSE 157
CONCLUSION ET PERSPECTIVES 171
1. ACQUISITION DE DONNEES COMPLEMENTAIRES SUR LA BIOACCESSIBILITE DES COSV 171
2. EVOLUTION DE LA METHODE SIMPLIFIEE 171
3. VALIDATION IN VIVO DES DONNEES 172
4. PERSPECTIVES SUR L’INHALATION 173
5. PERSPECTIVES SUR LE CONTACT CUTANE 174
6. EVALUATION GLOBALE DE L’EXPOSITION HUMAINE AUX COSV EN ENVIRONNEMENT INTERIEUR 175
REFERENCES 177
VALORISATION SCIENTIFIQUE 187
Page 9
LISTE DES SIGLES & ACRONYMES
4,4’-DDE : 2,2-bis(p-chlorophényl)-1,1-dichloroéthylène
4,4’-DDT : 4,4’-dichlorodiphényltrichloroéthane
ADEME : Agence de l’Environnement et de la Maîtrise de l’Energie
AHTN : 7-Acétyl-1,1,3,4,4,6-hexaméthyl-1,2,3,4-tetrahydronaphthalène (tonalide)
ANSES : Agence nationale de sécurité sanitaire en charge de l'alimentation, de l'environnement
et du travail
BA : bioacessibilité
BARGE : Bioaccessibility research group of Europe
BBP : butyl benzyl phtalate
BDE : bromodiphényl éther
BPA : Bisphenol A
CG/MS/MS : chromatographie gazeuse couplée à la spectrométrie de masse en tandem
CIRC : Centre International de Recherche sur le Cancer
CLP : classification, labelling and packaging
CLS : concentration limite de sélection
COSV: composé organique semi-volatil
COTV : composé organique très volatil
COV : composé organique volatil
CSTB : Centre Scientifique et Technique du Bâtiment
DBP : dibutyl phtalate
DEHP : di-2-ethylhexyl phtalate

Page 10
DEP : diethyl phtalate
DiBP : diisobutyl phtalate
DiDP : diisodecyl phtalate
DiNP : diisononyl phtalate
DiUP : diisoundecyl phtalate
DL : dioxin like
DMEP : di-2-méthoxyéthyl phtalate
DMP : dimethyl phtalate
DNOP : dioctyl phtalate
DPHP : di-2-propylheptyl phtalate
DTDP : diisotridecyl phtalate
ECHA : European Chemicals agency
ECOS : Exposition cumulée aux composés organiques semi-volatils
EHESP : Ecole des Hautes Etudes en Santé Publique
HAP : hydrocarbure aromatique polycyclique
HCH : hexachlorocyclohexane
HHCB : 1,3,4,6,7,8-hexahydro-4,6,6,7,8,8,-hexamethyl-cyclopenta[g]benzopyran (galaxolide)
Irset : Institut de recherche en santé, environnement et travail
ISO : International Organization for Standardization
KOA : coefficient de partage entre l’octanol et l’air
KOW : coefficient de partage entre l’octanol et l’eau
LD : limite de détection
LERES : Laboratoire d’Etudes et de Recherche en Environnement et Santé

Page 11
LQ : limite de quantification
NDL : non dioxin like
NF : Norme Française
NIST : National Institute of Standards & Technology
OQAI : Observatoire de la Qualité de l’Air Intérieur
PBDE : polybromodiphényléther
PBT : persistant, bioaccumulable et toxique
PCB : polychlorobiphényle
PLE : pressurized liquid extraction (extraction liquide à haute pression)
PNSE : Plan National Santé Environnement
POP : polluant organique persistant
PVC : Polychlorure de vinyle
SRM : Standard Reference Material
TBP : tributylphosphate
TD : thermodésorption
tPtB : très persistant et très bioaccumulable
US EPA : agence américaine de protection de l’environnement
VTR : valeur toxicologique de référence


Page 13
LISTE DES TABLEAUX
Tableau 1 : Usages et sources de COSV dans les poussières sédimentées .................................... 20
Tableau 2 : HAP présents dans la liste de l’ECHA des substances extrêmement préoccupantes
candidates en vue d’une autorisation ............................................................................................ 28
Tableau 3 : liste des COSV retenus pour les mesures de bioaccessibilité orale .......................... 151
Tableau 4: Concentrations limite de sélection (CLS) des phtalates et des PBDE ......................... 155
Tableau 5 : Liste des échantillons sélectionnés ............................................................................ 156
Tableau 6 : Concentrations des COSV dans les blancs et les contrôles d’extraction fortifiés ..... 159
Tableau 7 : Concentrations des COSV dans le blanc et les contrôles d'incubation fortifiés ........ 160
Tableau 8 : Concentrations des COSV bioaccessibles, non-bioacessibles et totales dans le
SRM 2585...................................................................................................................................... 162
Tableau 9 : Concentrations en COSV bioaccessibles et non-bioaccessibles dans 7 échantillons de
poussières d’école (France, 2013-2017) ...................................................................................... 164
Tableau 10 : Bioaccessibilité des COSV dans 7 échantillons de poussières d’école (France, 2013-
2017) ............................................................................................................................................. 165
Tableau 11 : Comparaison de la bioacessibilité des HAP avec les données de la litérature........ 168
Tableau 12 : Comparaison entre bioaccessibilité et biodisponibilité de quatre phtalates. ......... 169


Page 15
LISTE DES FIGURES
Figure 1 : Structure chimique générique des phthalates ............................................................... 21
Figure 2 : Structure chimique de quelques HAP ............................................................................ 22
Figure 3 : Structure chimique des PCB ........................................................................................... 23
Figure 4 : Structure chimique des PBDE ......................................................................................... 24
Figure 5 : Structure chimique de la pyréthrine et de quelques exemples de pyréthrinoïdes ....... 25
Figure 6 : Equilibre des COSV en environnement intérieur ........................................................... 26
Figure 7 : Effets sur la santé des expositions aux HAP ................................................................... 27
Figure 8 : Les principales étapes du projet ECOS-Habitat .............................................................. 30
Figure 9 : Les voies d'exposition aux COSV en environnement intérieur ...................................... 67
Figure 10 : Contribution relative de chaque voie d'exposition ...................................................... 69
Figure 11 : Représentation schématique des notions de bioaccessibilité et biodisponibilité orale
........................................................................................................................................................ 71
Figure 12 : Relation entre bioaccessibilité et biodisponibilité ....................................................... 72
Figure 13 : Concentrations en phtalates mesurées dans les échantillons de la campagne nationale
« écoles » de l’OQAI (2013-2017) ................................................................................................. 153
Figure 15 : Concentrations en PBDE mesurées dans les échantillons de la campagne nationale
« écoles » de l’OQAI (2013-2017) ................................................................................................. 153
Figure 16 : Classement des échantillons selon leur masse de poussière disponible (reliquat) ... 154
Figure 17 : concentrations totale et bioaccessible, et bioaccessibilité des COSV dans
7 échantillons de poussières d’école (France 2013-2017) ........................................................... 166

Page 16
Figure 18 : Relation entre bioaccessibilité et Kow des COSV de 7 échantillons de poussières d'école
(France, 2013-2017) ....................................................................................................................... 167
Figure 19 : Relation entre bioaccessibilité et Kow des PCB de 7 échantillons de poussières d'école
(France 2013-2017)........................................................................................................................ 168
Figure 20 : Schéma d'une monocouche de Caco-2 cultivée sur un support filtrant perméable
.................................................................................................................. Erreur ! Signet non défini.
Figure 21 : Considérer la bioaccessibilité pour évaluer l’exposition aux COSV en environnement
intérieur ........................................................................................................................................ 175
Figure 22 : Support de médiation scientifique ............................................................................. 188

Page 17
INTRODUCTION
Poussière : «particules qui se sont déposées sur des objets, des surfaces, des planchers et de la mo-
quette à l'intérieur d'un bâtiment. Ces particules peuvent comprendre des particules de sol qui ont
été apportées dans l'environnement intérieur à partir de l'extérieur ainsi que de la matière orga-
nique » [1]. Ainsi est définie la poussière par l’agence américaine de protection de l’environnement
(US EPA) dans son Manuel sur les facteurs d'exposition (Exposure Factor Handbooks). Cette définition
est celle retenue dans le cadre de ces travaux de thèse, en lien avec une exposition de la population
générale à l’exclusion de toute exposition professionnelle.
La poussière est une matrice hétérogène faite de particules provenant de sources intérieures (éro-
sion des matériaux, desquamation de la peau) et extérieures (particules de sol transférées à
l’intérieur par le vent, les animaux de compagnie, les chaussures, etc.). Sa composition dépend es-
sentiellement du type d'aménagement intérieur, du comportement des occupants et des environs
du bâtiment. La poussière est ainsi constituée de matières organiques : fragments d’origine humaine
(principalement des squames contenant du squalène et du cholestérol), fibres (d’origine naturelle
comme le coton ou la cellulose, ou issues de la pétrochimie (polypropylène)), micro-plastiques, parti-
cules provenant de l’abrasion des tissus, des meubles et des surfaces, suies, pollen, etc. ; de parti-
cules inorganiques : quartz, albite, calcite, dolomie, etc. ; et d’organismes vivants (bactéries, moisis-
sures) [2–11].
La poussière domestique sert donc de réservoir pour divers polluants provenant de l'intérieur et de
l'extérieur. Elle peut contenir des métaux toxiques comme l’antimoine, l’arsenic, le cadmium, le
chrome, le cuivre, le manganèse, le plomb, le strontium et le vanadium, ainsi que des polluants or-
ganiques non volatils ou semi-volatils, comme des composés bromés, fluorés, chlorés, etc.
[8,9,12]. Les composés organiques semi-volatils (COSV) sont parfois suspectés d’effets néfastes
pour la santé et notamment de perturbation endocrinienne. C’est sur ces derniers que se portent les
présents travaux de thèse.
La poussière est un important vecteur d’exposition humaine aux COSV. Les populations y sont en ef-
fet exposées par ingestion et en particulier les enfants qui passent du temps au sol, ont de fréquents
contacts mains-bouche ou mettent à la bouche des jouets ou de la nourriture tombés au sol. On es-
time à 40, 30, et 20 mg/jour les quantités de poussières ingérées par les enfants de 1 à 6 ans, de 6 à

Page 18
12 ans et de plus de 12 ans, respectivement [1]. Les populations sont également exposées à la pous-
sière par contact cutané et par inhalation des particules les plus fines.
Cette problématique est un enjeu de santé publique. L’Observatoire de la Qualité de l’air intérieur,
missionné par les pouvoirs publics pour mieux connaître la qualité de l’air intérieur, a inclus la thé-
matique « poussières » dans ses programmes de recherche1. Dans la continuité de son prédécesseur,
le Plan National Santé Environnement 3 (2015-2019) prévoit d’une part d’« agir pour une meilleure
qualité de l’air intérieur », d’autre part de « réduire l’exposition aux perturbateurs endocriniens »2.
Dans le domaine de l’air, des valeurs limites réglementaires ont déjà été établies pour certains com-
posés organiques volatils (COV) dont le benzène et le formaldéhyde, mais à ce jour, aucune valeur de
référence n’a été préconisée pour les COSV dans les poussières. Établir de telles préconisations re-
quiert de bien estimer la dose à laquelle est exposée la population en environnement intérieur.
Dans ce contexte, cette thèse a pour objet de mieux caractériser l’exposition humaine aux COSV en
environnement intérieur par ingestion de poussière, et pour ce faire, de considérer la fraction bioac-
cessible (libérée dans le tractus gastro-intestinal après ingestion).
Ce manuscrit est constitué de trois chapitres :
Le premier chapitre présente les COSV en termes de sources et de toxicité, puis établit leur présence
et leurs niveaux de concentration en environnement intérieur, plus particulièrement dans les écoles,
en s’appuyant sur un premier article scientifique. Les différentes voies d’exposition sont ensuite dé-
crites avec les notions importantes de bioaccessibilité et biodisponibilité.
Le deuxième chapitre présente la bioaccessibilité orale des COSV en se basant sur un article scienti-
fique de type revue de la littérature.
Le troisième chapitre propose une nouvelle méthode simplifiée pour la mesure de la bioaccessibilité
de ces COSV, qui fait l’objet d’un troisième article scientifique.
Enfin la dernière partie inscrit ce projet dans un contexte plus large que l’exposition par ingestion en
établissant des perspectives considérant également la bioaccessibilité par inhalation et par contact
cutané, afin de caractériser de manière globale l’exposition aux COSV en environnement intérieur.
1 http://www.oqai.fr
2https://solidarites-sante.gouv.fr/sante-et-environnement/les-plans-d-action-nationaux/article/le-plan-national-sante-environnement-pnse3-2015-2019

Page 19
CHAPITRE 1 : CONTEXTE SCIENTIFIQUE
1. LES COMPOSES ORGANIQUES SEMI-VOLATILS (COSV)
1.1. DEFINITION DES COSV
Selon la norme NF ISO 16000-6 [13], les COSV sont définis par leur point d’ébullition, situé entre
(240°C à 260°C) et (380°C à 400°C). Ils se distinguent ainsi des composés organiques volatils
(COV) dont le point d’ébullition se situe entre (50°C à 100°C) et (240°C à 260°C) et des composés
organiques très volatils (COTV) dont le point d'ébullition se situe entre <0°C et (50°C à 100°C). La
norme précise toutefois que le point d’ébullition peut être difficile à déterminer pour certains
composés qui se décomposent avant l’ébullition à pression atmosphérique. Les COSV peuvent
alors être définis selon leur tension de vapeur, et c’est ainsi que Weschler et Nazaroff, dans leur
article de référence de 2008 sur les COSV dans les environnements intérieurs [14], définissent les
COSV comme des composés organiques avec une tension de vapeur comprise entre 10-14 et 10-4
atm (10-9 à 10 Pa).
Une approche originale pour définir les COSV a également été proposée par Võ et Morris [15].
Ces auteurs se basent sur le ratio d’évaporation d’un composé dans des conditions ambiantes
d’évaporation : un composé volatil est défini comme un composé qui s'évapore de plus de 95 %
de sa masse en 6 mois , un composé non volatil comme un composé qui s'évapore de moins de
5 % de sa masse en 6 mois, et un composé semi-volatil est un composé qui s'évapore entre 5 et
95 % de sa masse en 6 mois.
1.1. SOURCES DE COSV EN ENVIRONNEMENT INTERIEUR
De nombreuses études bibliographiques internationales ont investigué la présence de COSV en
environnement intérieur [14,16–18]. Pas moins de 25 familles chimiques de COSV ont été réper-
toriées, parmi lesquelles alcaloïdes, alkylphénols, dioxines et furanes, muscs, esters organophos-
phatés, organo-étains, parabènes et triclosan, composés perfluorés, phénols, phtalates, poly-
bromodiphényléthers (PBDE), polychlorobiphényles (PCB), polychlorobenzènes, hydrocarbures
aromatiques polycycliques (HAP), etc.

Chapitre 1 : contexte scientifique
Page 20
Le Tableau 1, issu des travaux de Mercier et al. [12], présente les différents usages et sources de
COSV en environnement intérieur. Ces sources sont liées aux activités des occupants (tabagisme,
sous-produits de combustion, utilisation de cosmétiques, produits de soins, produits d’entretien
et détergents, biocides), à l’équipement et à l’ameublement (télévisions, ordinateurs, textiles,
mousses de polyuréthane, moquettes), aux matériaux de construction (sols synthétiques, pein-
tures, joints) ainsi qu’à la contamination apportée par l’air extérieur (fumées industrielles, trafic
routier, applications de pesticides, sous-produits de combustion).
TABLEAU 1 : USAGES ET SOURCES DE COSV DANS LES POUSSIERES SEDIMENTEES
Tableau adapté de la publication de Mercier et al. (2011), Environ. Sci. Technol [12]
Parmi les familles les plus fréquemment retrouvées en environnement intérieur, les phtalates,
les HAP, les PCB, les PBDE et les pyréthrinoïdes sont présentés plus en détails ci-après.


Chapitre 1 : contexte scientifique
Page 23
substitué) et le décachlorobiphényl (entièrement substitué).[23] Les PCB se distinguent en deux
catégories, selon le rapprochement de leur structure et de leur toxicité avec les dioxines (Figure
3) [24]. Les NDL (non dioxin like) –PCB sont moins toxiques que les DL(dioxin like)-PCB, mais ils
sont retrouvés plus abondamment dans l’environnement [25].
Repris de la publication de Abella et al. (2016), life sciences.[26]
FIGURE 3 : STRUCTURE CHIMIQUE DES PCB
Les PCB ont été produits à l'échelle industrielle pendant plus de cinquante ans, en raison de leurs
remarquables propriétés physico-chimiques (stabilité chimique et thermique, faible volatilité,
propriétés diélectriques, ininflammabilité, point d'ébullition élevé, miscibilité aux solvants orga-
niques, etc.). Ils ont ainsi été utilisés comme fluides caloporteurs, lubrifiants hydrauliques,
fluides diélectriques pour transformateurs et condensateurs, etc. A l’intérieur des bâtiments, ils
étaient utilisés pour l'isolation des fils en PVC, comme retardateurs de flamme, comme additifs
(dans les produits d'étanchéité, les adhésifs, les peintures), etc. La production de PCB a été in-
terdite en 1987 par le congrès américain et par la convention de Stockholm sur les polluants or-
ganiques persistants (POPs) en 2001 [23]. Cependant, les PCB, du fait même de cette persis-
tance, sont toujours présents aujourd’hui en environnement intérieur [27].
LES PBDE
Les polybromodiphényléthers (PBDE) sont constitués de deux noyaux benzéniques aux atomes
d’hydrogène substitués par des atomes de brome dans diverses proportions (Figure 4). De même
que les PCB, les PBDE comptent 209 congénères, qui sont regroupés en fonction du nombre


Chapitre 1 : contexte scientifique
Page 27
Agency) des substances extrêmement préoccupantes candidates en vue d'une autorisation, en
raison de leurs propriétés perturbatrices du système endocrinien.
Par ailleurs, le DEHP a été classé en 2013 comme agent peut-être cancérogène par le Centre In-
ternational de Recherche sur le Cancer (CIRC).
TOXICITE DES HAP
Certains HAP, dont le benzo[a]anthracène, le benzo[a]pyrène et le dibenz[ah]anthracène, repré-
sentent une menace sérieuse pour la santé et le bien-être des humains du fait de leurs effets
cancérigènes, mutagènes et tératogènes [22]. Bien que les HAP plus légers soient considérés
comme moins toxiques, ils peuvent réagir avec d'autres polluants (comme l'ozone, les oxydes
d'azote et le dioxyde de soufre) pour former d’autres molécules plus toxiques. Les effets à court-
terme et à long terme sur la santé des HAP ont fait l’objet d’une revue bibliographique [22] et
sont résumés dans le schéma ci-dessous.
Diagramme repris de la publication de Ki-Hyun Kim (2013), Environment International [22]
FIGURE 7 : EFFETS SUR LA SANTE DES EXPOSITIONS AUX HAP
Parmi les 16 substances jugées prioritaires par l’agence américaine de protection de
l’environnement (US EPA), le CIRC a classé le benzo(a)pyrène comme cancérogène pour
l’Homme (groupe 1), le dibenzo(a,h)anthracène comme probablement cancérogène (groupe 2A)
et le naphtalène, le benzo(a)anthracène, le chrysène, le benzo(b)fluoranthène, le be-
no(k)fluoranthène et l’indeno(1,2,3-cd)pyrène comme peut-être cancérogène (groupe 2B). En
Europe, 5 substances ont été ajoutées à la liste de l’ECHA des substances extrêmement préoccu-
pantes candidates en vue d'une autorisation (Tableau 2).


Chapitre 1 : contexte scientifique
Page 29
TOXICITE DES PYRETHRINOÏDES
Les pyréthrinoïdes sont considérés comme moins toxiques pour les humains que les pesticides
organochlorés et organophosphorés, même si le groupement α-cyano confère une plus forte
toxicité aux pyréthrinoïdes de type II [31]. Bien que leur toxicité soit en théorie spécifique aux in-
sectes, les pyréthrinoïdes synthétiques sont également très toxiques pour les organismes aqua-
tiques [54]. Chez les humains, une exposition environnementale et professionnelle aux pyréthri-
noïdes pourrait être liée à l'altération de la qualité du sperme et à des modifications des taux
d’hormones thyroïdiennes et reproductrices [32]. L'exposition pendant la grossesse pourrait af-
fecter la taille à la naissance, le système immunitaire, le développement neurologique et l'équi-
libre hormonal chez les enfants [32,55,56]. L’évaluation par le CIRC de la deltaméthrine, de
l’ensfenvalerate et de la perméthrine, réalisée en 1991, n’a pas permis de statuer quant au ca-
ractère cancérogène de ces substances (groupe 3).
2. CONTAMINATION DE L’AIR ET DES POUSSIERES EN ENVIRONNEMENT INTERIEUR
La toxicité suspectée ou avérée des COSV pour la santé humaine, associée à la multiplicité des
sources de COSV à l’intérieur des bâtiments, a rendu nécessaire la mesure de leurs concentra-
tions dans les différents milieux de l’environnement intérieur. Ces mesures sont en effet néces-
saires pour évaluer l’exposition humaine à ces composés et les risques pour la santé associés à
leur présence.
Missionné par les Pouvoirs Publics, l'Observatoire de la qualité de l'air intérieur (OQAI) a été créé
en 2001 pour « mieux connaître la pollution intérieure, ses origines et ses dangers, notamment
grâce à des campagnes de mesures »4. Sous tutelle des ministères en charge du Logement, de
l’Ecologie et de la Santé, de l'Agence de l'environnement et de la maîtrise de l'énergie (ADEME)
et de l’Agence nationale de sécurité sanitaire en charge de l'alimentation, de l'environnement et
du travail (ANSES), l’OQAI est opéré par le Centre Scientifique et Technique du bâtiment. Les tra-
vaux réalisés dans le cadre de l’OQAI ont permis de documenter les concentrations intérieures
en COSV dans les bâtiments en France.
4 http://www.oqai.fr

Chapitre 1 : contexte scientifique
Page 30
2.1. CONTAMINATION DE L’AIR ET DES POUSSIERES DES LOGEMENTS.
En partenariat avec l’EHESP, l’OQAI a tout d’abord dressé une image représentative de la conta-
mination des logements français dans le cadre du projet ECOS-Habitat (Exposition cumulée aux
composés organiques semi-volatils dans l’habitat) [57]. Décliné en 8 étapes (Figure 8) allant de la
sélection des substances d’intérêt jusqu’à l’évaluation des risques liés à la présence cumulée de
multiples COSV dans les logements, le projet s’est construit sur deux campagnes nationales de
collecte d’échantillons organisées entre 2003 et 2009 : la campagne « Logements » conduite en
2003-2005, qui a permis la collecte de filtres de prélèvements de particules en suspension dans
l’air intérieur [58], et le projet Plomb-Habitat, en 2008-2009, durant lequel ont été collectées des
poussières sédimentées [59].
Figure reprise de Pelletier (2017), mémoire de thèse [60]
FIGURE 8 : LES PRINCIPALES ETAPES DU PROJET ECOS-HABITAT
Dans les poussières sédimentées, la fréquence de détection des phtalates, de trois HAP (anthra-
cène, benzo(a)pyrène et phénanthrène), des muscs (galaxolide et tonalide), du BDE 209, de la
perméthrine, du bisphénol-A et du tributylphosphate était supérieure à 98 %, tandis que la plu-
part des BDE (congénères 28, 85, 100, 119, 153 et 154) et 4 PCB sur 10 (congénères 28, 31, 77 et
126) étaient détectés dans moins de la moitié des logements. En termes de concentrations, les
plus élevées ont été mesurées pour les phtalates, le bisphénol-A, la perméthrine et la galaxolide,
allant de plusieurs μg/g à des valeurs maximales supérieures à 1 mg/g pour le DEHP, le DiBP, le
DiNP, le BBP et la perméthrine. Des concentrations médianes de plusieurs centaines de ng/g

Chapitre 1 : contexte scientifique
Page 31
étaient ensuite observées pour le BDE 209, la tonalide, le phénanthrène et le
tributylphosphate.[61]
Dans les particules en suspension dans l’air, les HAP, le DEHP, le DiNP et le triclosan ont été dé-
tectés dans plus de 98 % des logements et 27 autres COSV ont été quantifiés dans plus de la moi-
tié des logements. En termes de concentration, les médianes les plus élevées ont été mesurées
pour les phtalates avec des valeurs allant de 1 ng/m3 jusqu’à 46 ng/m3 pour le DEHP. Des valeurs
médianes de plusieurs centaines de pg/m3 ont ensuite été mesurées pour certains HAP, suivis
par le triclosan, la perméthrine et les autres HAP avec des concentrations jusqu’à 100 pg/m3.[62]
Cette étude d’envergure nationale a permis de rendre compte des niveaux de concentrations et
de la multiplicité du nombre de substances auxquelles est exposée la population.
2.1. CONTAMINATION DE L’AIR ET DES POUSSIERES DES ECOLES (ARTICLE SCIENTIFIQUE N°1)
L’OQAI s’intéresse également et prioritairement à la qualité de l’air des lieux de vie fréquentés
par des populations plus vulnérables comme les enfants. Lors de la phase pilote de la campagne
nationale « écoles », l’OQAI a travaillé avec l’EHESP pour définir les techniques de prélèvement à
mettre en place pour la campagne nationale. Testé dans 90 salles de classe de 30 écoles bréti-
liennes, le protocole de mesure a permis une première description des concentrations en COSV
dans les écoles. Ce projet pilote a donné lieu à une publication, qui constitue le premier article
scientifique sur lequel repose ce travail de thèse. Cet article comporte deux volets principaux : la
description des niveaux de contamination, ainsi que la comparaison de deux méthodes de prélè-
vements des poussières sédimentées, à l’aide d’une lingette ou avec un aspirateur. Concernant
les données de contamination des poussières, la comparaison des résultats entre logements et
écoles montre des niveaux de contamination similaires pour la plupart des COSV, à l’exception
de certains phtalates : le DiBP et le DBP sont ainsi environ trois fois, le DEHP cinq fois, le DiNP
huit fois, et le BBP douze fois plus concentrés dans les poussières des écoles que dans les pous-
sières des logements. De telles observations ont également été faites en 2010 au Danemark [63]
et en 2018 en Espagne [64]. L'exposition plus élevée des enfants aux DiBP, DBP, BBP, DEHP et
DiNP à l'école qu'à la maison doit donc être prise en compte dans les évaluations des risques et
les études épidémiologiques, car elle est non négligeable.

Chapitre 1 : contexte scientifique
Page 32
Semi-volatile organic compounds in the air and dust of 30 French
schools: a pilot study
Abstract The contamination of indoor environments with chemical compoundsreleased by materials and furniture, such as semi-volatile organic compounds(SVOCs), is less documented in schools than in dwellings—yet children spend16% of their time in schools, where they can also be exposed. This study is oneof the first to describe the contamination of the air and dust of 90 classroomsfrom 30 nursery and primary schools by 55 SVOCs, including pesticides,phosphoric esters, musks, polycyclic aromatic hydrocarbons (PAHs),polychlorobiphenyls (PCBs), phthalates, and polybromodiphenylethers(PBDEs). Air samples were collected using an active sampling method, and dustsamples were collected via two sampling methods (wiping and vacuumcleaning). In air, the highest concentrations (median >100 ng/m3) weremeasured for diisobutyl phthalate (DiBP), dibutyl phthalate (DBP), diethylphthalate (DEP), bis(2-ethylhexyl) phthalate (DEHP), and galaxolide. In dust,the highest concentrations (median >30 lg/g) were found for DEHP, diisononylphthalate (DiNP), DiBP, and DBP. An attempt to compare two floor dustsampling methods using a single unit (ng/m²) was carried out. SVOCconcentrations were higher in wiped dust, but frequencies of quantification weregreater in vacuumed dust.
G. Raffy1,2,3, F. Mercier1,2,3,O. Blanchard1,2, M. Derbez4,C. Dassonville4, N. Bonvallot1,2,P. Glorennec1,2, B. Le Bot1,2,3
1EHESP – School of Public Health Sorbonne Paris Cit�e,
Rennes, France, 2Irset-Inserm UMR 1085 – Research
Institute for Environmental and Occupational Health,
Rennes, France, 3LERES – Environment and Health
Research Laboratory, Rennes, France, 4CSTB – Scientific
and Technical Centre for Building, OQAI – French Indoor
Air Quality Observatory, Universit�e Paris Est, Marne-la-
Vall�ee, France
Key words: SVOCs; Children’s exposure; Indoor air; Dust;
School; Sampling.
Ga€elle Raffy
LERES – Environment and Health Research Laboratory
EHESP – School of Public Health, Avenue du Pr L�eon
Bernard, 35043 Rennes Cedex, France
Tel.: + 332 99 022 922
Fax: + 332 99 022 929
e-mail: [email protected].
Received for review 26 January 2015. Accepted for
publication 10 February 2016.
Practical ImplicationsThis pilot study shows that phthalate concentrations in schools are not negligible and should be considered in riskassessment via air inhalation or dust ingestion.
Introduction
People spend more than 80% of their time indoors(Hussein et al., 2012; Klepeis et al., 2001), where theyare exposed to a wide range of chemical compoundssuch as semi-volatile organic compounds (SVOCs),emitted by building materials and consumer products.SVOCs include a group of chemical compounds definedby their volatility and vapor pressure: Their boilingpoint is between 240°C and 400°C, and their vaporpressure ranges from 1/1014 to 1/104 atm (Weschler andNazaroff, 2008; WHO, 1989).
Some SVOCs have been present in indoor environ-ments since the 1950s (Weschler, 2009). Polybro-
modiphenylethers (PBDEs), for example, have beenused as flame retardants in products such as foamcushioning, mattresses, and electronic devices; poly-chlorobiphenyls (PCBs) originated from heat transferfluids or joint sealants (Kohler et al., 2005), andalthough no longer manufactured, are still present inindoor environments; phthalates are used as plasticiz-ers, especially for flexible polyvinyl chloride (PVC)(Weschler, 2009); polycyclic aromatic hydrocarbons(PAHs) develop during incomplete combustion pro-cesses such as heating with fossil fuels, cooking, or out-door motorized traffic (Fromme et al., 2004).Pesticides may be added to carpets, paints, or furnish-ings, or they can be brought into the home after being
114
Indoor Air 2017; 27: 114–127 © 2016 John Wiley & Sons A/S. Published by John Wiley & Sons Ltdwileyonlinelibrary.com/journal/inaPrinted in Singapore. All rights reserved INDOOR AIR
doi:10.1111/ina.12288

Chapitre 1 : contexte scientifique
Page 33
used outdoors (Rudel and Perovich, 2009). Syntheticmusks, as a group of fragrance ingredients, have beenwidely used in a range of personal care products (Roo-sens et al., 2007).
SVOCs are suspected of having adverse health effectssuch as reprotoxic and neurotoxic effects (Fournieret al., 2014). Children are more vulnerable to theharmful effects of pollutants because major systems oftheir organism are still immature. Children’s exposureto SVOCs during development (in utero, infants, andchildren) can result in permanent alterations in tissuestructure and function, notably because of endocrine-disrupting mechanisms (Rudel and Perovich, 2009).
The physical and chemical properties of SVOCs leadto their emission into indoor air and then to their parti-tion between air (gas and particulate phases) and sur-faces (settled dust) (Weschler and Nazaroff, 2010).People are thus exposed through air inhalation, dustingestion, and dermal contact. Children are moreexposed than adults because they have higher ventila-tion rates and higher levels of physical activity (Rivaset al., 2014). Their specific behavior (crawling on thefloor, hand-to-mouth contact, object-to-mouth con-tact) may also contribute to a higher ingestion of set-tled dust (EPA, 2011; Oomen, 2008), even thoughcurrent estimates of children’s exposure to SVOC viadust are subject to a high level of uncertainty.
Numerous studies relating to household contamina-tion by SVOCs (Ali et al., 2012; Blanchard et al., 2014;Kanazawa et al., 2010; Le Cann et al., 2011; Meekerand Stapleton, 2010; Mercier et al., 2011) have beenpublished in recent years. Studies investigating SVOCcontamination in air and/or dust at school are lessnumerous (Cequier et al., 2014; Harrad et al., 2010;Lim et al., 2014; Mizouchi et al., 2015; Sofuoglu et al.,2010; Toms et al., 2015; Wallner et al., 2012; Wu et al.,2010), but they indicate that SVOCs are also present inschool environments. It is important to gain betterknowledge of SVOC contamination in school build-ings. Indeed, although children spend nearly 70% oftheir time at home, where they are exposed to SVOCs,they also spend 16% of their time at school (Conradet al., 2013; Zmirou et al., 2002), so the exposure toSVOCs within the school environment might also con-tribute to children’s personal exposure. In this context,the French indoor air quality observatory (OQAI),already concerned about schools’ indoor pollutants(Canha et al., 2015; Wei et al., 2015), decided toinclude the SVOC measurements in its nationwide sur-vey involving 600 classrooms between 2013 and 2017.Ahead of this, a pilot study was necessary to developan appropriate strategy for measuring SVOCs, usingthe most suitable sampling and analytical tools. Duringthis exploratory phase, and without any prior knowl-edge of SVOC concentrations in French schools, sev-eral issues had to be faced—such as blank pollutionsand suitability of the calibration range.
Nevertheless, the prime objective of this study wasto report the contamination levels of 55 SVOCs in theair and dust of 90 classrooms. These SVOCs hadalready been selected for their health interest (Bonval-lot et al., 2010). They belong to several chemical fami-lies (organochlorines, organophosphates, pyrethroids,phosphoric ester, musks, PAHs, phthalates, PBDEs,and PCBs) and were to be analyzed simultaneously,using a single analytical method. This study also pre-sented an opportunity to compare two settled dustsampling methods—one using wipes, the other a vac-uum cleaner. This comparison, carried out using amass/surface unit for both types of sampling, aimed atselecting the more appropriate sampling method forthe national campaign—although it was also of interestbecause it had not often been reported in the scientificliterature.
Materials and methods
School selection
Thirty schools located in Ille-et-Vilaine, Brittany,France, joined the study on a voluntary basis duringthe 2009–2010 academic year. There were 16 nurseryschools (attended by children aged 2–5) and 14 primaryschools (children aged 6–11). Further characteristicsare described in Supporting Information (SI) (TableS1). Three classrooms were investigated in each school.
SVOC selection
SVOCs were selected using a ranking method based ontoxicity and indoor exposure levels (Bonvallot et al.,2010). In short, data on settled dust concentrations indwellings were collected with a literature review for156 SVOCs. These concentrations were then comparedto toxicity reference doses retrieved from toxicity data-bases or calculated from no observed effect levels(NOELs) (or lowest observed effect levels (LOELs))and uncertainty factors. The top-ranked compoundswere phthalates, pesticides, short-chain chlorinatedparaffins, pentaBDEs (BDE-85, 99, 100 and 119), per-fluorinated compounds, organotins, PCBs, and PAHs.Of these chemicals, we studied those which could besimultaneously analyzed using gas chromatographycoupled with mass spectrometry (GC/MS). The finallist of compounds included 55 SVOCs from 11 chemi-cal classes: 12 organochlorines (a-endosulfan, a-hexa-chlorocyclohexane (a-HCH), c-hexachlorocyclohexane(c-HCH also known as lindane), aldrin, cis-chlordane,dichlorodiphenyldichloroethylene (4,40-DDE),dichlorodiphenyltrichloroethane (4,40-DDT), dieldrin,endrin, heptachlor, metolachlor, and trans-chlordane),three organophosphates (diazinon, dichlorvos, andchlorpyrifos), one triazine (atrazine), one oxadiazolone(oxadiazon), five pyrethroids (cyfluthrin, cypermethrin,
115
SVOCS in schools

Chapitre 1 : contexte scientifique
Page 34
deltamethrin, permethrin, and tetramethrin), one phos-phoric ester (tributylphosphate), two polycyclic musks(galaxolide and tonalide), seven PAHs (acenaphthene,anthracene, benzo(a)pyrene, fluoranthene, fluorene,phenanthrene, and pyrene), 11 PCBs (PCB 28, 31, 52,77, 101, 105, 118, 126, 138, 153, and 180), eight phtha-lates (bis(2-ethylhexyl) phthalate (DEHP), butyl benzylphthalate (BBP), di(methoxyethyl) phthalate (DMEP),dibutyl phthalate (DBP), diethyl phthalate (DEP), dii-sobutyl phthalate (DiBP), diisononyl phthalate(DiNP), and dimethyl phthalate (DMP), and 4 PBDEs(BDE 85, 99, 100, and 119).
Air sampling
Air samples were collected on a 76-mm polyurethanefoam (PUF) (SKC, Eighty Four, PA, USA) that hadpreviously been cleaned with dichloromethane (DCM)using pressurized liquid extraction (PLE) and insertedin a 22 9 100 mm glass tube (SKC, Eighty Four, PA,USA). Particulate matter was collected on a 25-mmquartz fiber filter (QFF) (Whatman, Maidstone, Kent)fitted in front of the PUF. The air was pumpedthrough the device using a GilAir-5 pump (Sensidyne,St. Petersburg, FL, USA). The sampling device wasinstalled in a position representative of the whole class-room, and if possible, in the middle of the room, awayfrom emitting materials and drafts, and at the chil-dren’s airway height (1.30 m). To avoid introducingpotentially emitting materials to the classroom, siliconewas chosen (for its inertness) for the tubing betweenthe glass tube and the pump, while metallic laboratoryclamps and holders were used to secure the samplingdevice in place. The pump was stored in a noise-insu-lated wooden box to avoid disturbing the occupants ofthe classroom. The air sampling method was inspiredby Bouvier et al. (2006). Air was sampled continuouslyfor 4.5 days during a normal school week (from Mon-day morning to Friday afternoon) at 2 l/min, thusallowing about 12.6 m3 of air to be collected. The flowrate was checked before and after sampling with a Gili-brator-2 flowrate meter (Sensidyne, St. Petersburg, FL,USA). At the end of the sampling period, the samplingdevice was transported back to the laboratory in anicebox. The PUF and filters were then wrappedtogether in foil paper previously cleaned with DCMand stored at �18°C in an amber glass vial for up to amonth (Blanchard, 2001) prior to analysis. A fieldblank sample was taken for each investigated school(i.e., one field blank for three classrooms).
Dust sampling
To avoid any disturbance of air sampling, dust wassampled either during the week preceding air samplingor just after the end of air sampling. Two differentmethods were used for sampling settled dust. The first
method consisted of vacuuming dust settled on thefloor in a cellulose thimble using a modified vacuumcleaner. A 10–12 m² area in which children spend mosttime was measured and vacuumed slowly (about0.5 m²/min). This dust sampling method is fullydescribed elsewhere (Blanchard et al., 2014) and in SIpage 2. The second method consisted of collecting set-tled dust using a damp wipe on a 0.1 m² floor surface.The floor area to be sampled was a smooth surfacesuch as stone, wooden, or plastic floor, chosen in anarea where the children spend most time. Three wipesper classroom were collected, and a sampling blankwas made for each school investigated (i.e., one fieldblank for every 3 classrooms). This dust samplingmethod was adapted from elsewhere (Le Bot et al.,2010) and is also fully described in SI page 2.
Vacuumed dust preparation
After collection, the content of each cellulose cartridgewas passed through a pre-cleaned (DCM) 100-lm sieveusing a vibrating stainless steel sieve apparatus toremove coarse material (cotton and debris) and thusobtain a more homogeneous sample. The sieved dustwas then weighed and stored at �18°C in an amberglass flask hermetically sealed until chemical analysis(Blanchard et al., 2013).
Sample extraction and analysis
Full details on the reagents and chemicals used foranalyses are provided in SI page 2. A detailed descrip-tion of the extraction method for vacuumed dust andair samples, using pressurized liquid extraction, isalready available elsewhere (Blanchard et al., 2014;Mercier et al., 2014) and is also provided in SI page 3.For wiped dust, extraction was performed on 200 mgof sieved dust. Wiped dust samples were defrosted(1 hour at room temperature in amber vials) and thentransferred into glass centrifuge tubes. After adding8 ml of DCM and 100 ng of each surrogate standard(fenpropathrin and methoprotryne), the tubes werecentrifuged at 630 g for 2 min, then sonicated for20 min at a temperature below 30°C and centrifugedagain at 1400 g for 5 min. After freezing the sample toseparate the water released by the wipe from the sol-vent, 5 ml of the DCM extract was collected andmixed with the other two wipe extracts from the sameclassroom. The combined extract was then concen-trated to 1 ml, cleaned up on Chromabond� NH2 glasscolumns (Macherey-Nagel, Duren, Germany) pre-washed with 6 ml of DCM and eluted with 5 ml ofDCM. After concentrating to 0.5 ml and adding 1 lgof 2,3,4-trichloronitrobenzene (TCNB) as internalstandard (ISTD), the final extract was stored at �18°Cprior to analysis. All extracts were then analyzedusing gas chromatography coupled to tandem mass
116
Raffy et al.

Chapitre 1 : contexte scientifique
Page 35
spectrometry. A detailed description of the analyticalmethod is already available elsewhere (Mercier et al.,2014) and is also fully described in SI page 3.
Analysis of highly concentrated compounds
As little data about concentrations found in schoolswas available prior to this study, concentrations of sev-eral compounds appeared to exceed the top of the cali-bration range, and analyses of less concentratedextracts were needed. However, analyzing each sampletwice or more would have exceeded the initial budget.Therefore, in an attempt to evaluate the SVOC concen-trations above the upper limit (UL) of the calibrationrange, seven extracts for air samples and 32 extractsfor dust samples were diluted by a factor of 20 for airsamples, up to 200 for vacuumed dust samples and upto 1000 for wiped dust samples. These extracts werechosen from those that needed dilution and are there-fore not representative. The calculated concentrations,presented in Tables S10–S12, were only used for dustsampling method comparison and as information forthe upcoming nationwide survey. However, as the con-centrations of BBP, DEHP, and DiNP in vacuumeddust and BBP and DEHP in wiped dust were greaterthan UL in all the samples, results from the dilutedextracts could be considered characteristic of theschools studied and were used in this work.
Comparison between floor dust sampling methods
To compare the concentrations found in vacuumeddust and in wiped dust, the classrooms where vacu-umed dust had been collected on a soft surface (such ascarpets or rugs) were removed from the databasebecause wiped dust was never sampled on such sur-faces. Only those samples collected on hard surfaceswere therefore considered for comparison. Regardingvacuumed dust, the total mass of sampled dust wasweighed and the sampled surface was measured. Con-centration in vacuumed dust in ng/m² could thus becalculated to compare concentrations using the sameunit: concentration per surface (ng/m²) = concentra-tion per mass (ng/g) 9 total mass (g)/sampled surface(m²). The comparison was performed for the 14 com-pounds quantified at least 10 times in matching vacu-umed and wiped dust samples (i.e., paired data fromthe same classroom). Greater than UL concentrationswere not included in this comparison unless theybelonged to the 32 extracts that were diluted.
Quality assurance and quality control
Limits of quantification (LOQs) were defined as thelowest concentration of a substance for which the rela-tive standard deviation (RSD) of replicate analyseswas lower than 20% (Gonz�alez et al., 2014). Quadratic
calibration curves were established for each compoundby analyzing at least five calibration solutions rangingfrom LOQs to ULs. The values for LOQs and ULs foreach matrix are displayed in Table S2. Compoundswere quantified with TCNB as ISTD. Laboratoryblank and quality control (QC) samples were extractedand analyzed to control contamination from all con-sumables and check for method accuracy. A detaileddescription of their preparation is provided in SI page4. Field blank samples were extracted and analyzed likeother samples. When either a field blank sample or alaboratory blank sample showed a concentrationgreater than 30% of the concentration found in theassociated samples, the results in these samples werenot validated and were removed from the data. Wherethe contamination was less than 30% of the concentra-tion found in associated samples, the concentrationsfor these samples were reported without blank correc-tion. Other conditions regarding data validation aredetailed in SI page 4.
Air sampling conditions were tested with an evalua-tion of PUF retention capacity according to the Frenchnorm XP X 43-058 (AFNOR, 2007). A mix of 44SVOCs was spiked onto the QFFs fitted in front ofthree clean PUFs, at a concentration greater than themaximum observed in samples. A second PUF wasinstalled in series after one of the PUFs. Air was thensampled through the devices at 2 l/min for 4.5 days.Air was also sampled in parallel through three clean,non-spiked, witness PUFs, with a second PUF in seriesfor one of these. The recovery of each SVOC in thespiked devices was then assessed after correction by theconcentration measured in the witness PUFs. Accord-ing to the norm, the method is valid for a substance ifit has a recovery between 60 and 120%. PUFs in serieswere analyzed for substances not fitting these require-ments.
Statistical analysis
Descriptive statistics of the data were produced usingExcel (Microsoft� Office, Redmond, WA, USA). Tobe able to rank the values for the calculation of per-centiles, concentrations below the LOQ were assigneda value of LOQ/2 and concentrations above the UL ofthe calibration range were assigned a value equal toUL. This practice has an impact on percentiles: forexample, if more than 5% of values are >UL then the95th percentile and any above will be >UL. Percentileswere therefore described as ‘> UL’ where relevant inTable 1 and in Tables S6–S9. Spearman rank correla-tion was used to test the association between SVOClevels in each type of dust (error rate of 5%) (XLSTAT� software, Microsoft� Office). Boxplots wererepresented graphically by GraphPad Prism version5.01 for Windows, GraphPad Software, San Diego,California, USA, http://www.graphpad.com.
117
SVOCS in schools

Chapitre 1 : contexte scientifique
Page 36
Results
Field blank samples for air & wiped dust
In air samples, five phthalates (BBP, DEHP, DMP,DiNP, and DEP) were present in field blank samples atvarious concentrations. DiNP was most frequentlydetected, resulting in the cancellation of 32 results. Forthe other phthalates, five to seven results could not bevalidated. Insufficient cleaning of the polyurethanefoam was suspected to be the source of DiNP contami-nation, and this was addressed in subsequent works(Blanchard et al., 2014). Field blank wipe samples werealso affected by phthalate contamination: BBP, DBP,DEHP, DiNP, DEP, DiBP, and DMP were found in2–10 samples (depending on the molecule), and thiscaused the cancellation of 36 results, for which an obvi-ous source has yet to be clearly identified.
Evaluation of the air sampling method
As shown in Table S3, recoveries were within 60% and120% for 38 of 44 compounds. Of these 38 com-pounds, the lowest recovery was observed for diazinon(66%), whereas all other recoveries were between 80and 110%. For these compounds and for a 4.5-daysampling at 2 l/min, PUF retention capacities were≥200 ng for PCBs and certain pesticides, ≥500 ng forpyrethroids, PAHs, PBDEs and other pesticides,≥2.5 lg for tributylphosphate, ≥10 lg for musks, and≥100 lg for phthalates. However, null or poor recover-ies were observed for aldrin (0%), dichlorvos (13%),tetramethrin (0%), acenaphthene (8%), anthracene(37%), and benzo(a)pyrene (1%). The conditions ofthis test were those of a worst case scenario, as thewhole substance was present at the beginning of thesampling period and would therefore have 4.5 days toreach its breakthrough volume or suffer from degrada-tion—whereas in real conditions, substances would becaught on the PUF throughout the sampling periodand might not reach their breakthrough volume orhave time to be degraded. Nevertheless, concentrationsreported in this work for these six compounds couldnot be validated and were removed from the reportedresults (Table 1 and Tables S6 and S7).
SVOC concentrations in air QC samples and SRM 2585
Concentrations and associated RSD and recovery datawere satisfactory as presented in SI pages 4 & 5 andsummarized in Tables S4 and S5.
SVOC concentrations in air
Of the 90 classrooms investigated, 84 air samples werekept for analysis. The remaining six were not analyzedbecause the sampled air volume was less than 90% of
the expected volume of 12.6 m3. For the first 22extracts analyzed, the concentration of several com-pounds—particularly musks and several phthalates—could not be evaluated because they were very oftenabove the UL of the calibration range, and so were notreported in the final results. An upper concentrationlevel was added to the calibration range for the remain-ing 62 samples. For these 62 samples, the results of themost frequently quantified substances are displayed inTable 1 while results for all substances can be seen inTables S6 and S7. Of the 55 compounds analyzed, 33were quantified at least once while 22 were never quan-tified (cis-chlordane, trans-chlordane, 4,40-DDE, hep-tachlor, PCB 77, 105, 118, 126, 138, 153, and 180, 4,40-DDT, endrin, metolachlor, atrazine, oxadiazon, cyflu-thrin, deltamethrin, tetramethrin, benzo(a)pyrene, andBDE 85 and 119). The concentration of most of thecompounds was in the calibration range with theexception of eight (galaxolide, tonalide, phenanthrene,DMP, DiBP, DBP, BBP, and DEHP). The highestconcentrations (median >50 ng/m3) were measured forfour phthalates (DiBP, DBP, DEP, and DEHP) andone musk (galaxolide). Intermediate concentrations(median from 1 to 40 ng/m3) were measured for DiNP,tonalide, BBP, DMP, phenanthrene, fluorene,tributylphosphate, c-HCH, and acenaphthene, indecreasing order of concentration. Seven compoundswere only found in 10% to 30% of the samples (fluo-ranthene, a-HCH, PCB28, pyrene, PCB 52, PCB31,and BDE 99).
SVOC concentrations in vacuumed settled dust
Of the 55 compounds analyzed, 42 were quantified atleast once and 13 were never quantified (cis-chlordane,aldrin, heptachlor, metolachlor, dichlorvos, cyfluthrin,deltamethrin, tetramethrin, atrazine, PCB 126, ace-naphthene, and BDE 85 and 119). Results of the mostfrequently quantified substances are displayed inTable 1, and all results can be seen in Tables S6 andS8. Greater than 30 lg/g median concentrations werereached for DEHP, DiNP and DiBP (>50 lg/g), andDBP (36 lg/g). The median concentrations measuredfor 10 compounds (BBP, DEP, galaxolide, phenan-threne, tonalide, pyrene, permethrin, DMP, fluoran-thene, and tributylphosphate) ranged from 0.1 to morethan 3 lg/g. Eight compounds were only quantified in10–40% of the samples (fluorene, anthracene, benzo(a)pyrene, c-HCH, 4,40-DDT, PCB 101, BDE99, andPCB 138).
SVOC concentrations in wiped settled dust
Of the 55 compounds analyzed, 34 were quantified atleast once while 21 were never quantified (cis-chlor-dane, trans-chlordane, 4,40-DDE, aldrin, endrin, hep-tachlor, metolachlor, dichlorvos, diazinon, cyfluthrin,
118
Raffy et al.

Ch
ap
itre 1
: con
texte
scien
tifiqu
e
Page
37
Table 1 SVOC concentrations in French classrooms (Brittany, France, 2010)
Air (ng/m3) Vacuumed dust (<100 lm fraction) (ng/g) Wiped dust (ng/m²)
Substance LOQ UL N 5th% 50th% 95th% F LOQ UL N 5th% 50th% 95th% F LOQ UL N 5th% 50th% 95th% F
Organochlorinated pesticides
a-HCH 0.4 20 59 <0.4 <0.4 3.4 24% 26 1 320 89 <26.3 <26.3 <26.3 2% 20 830 81 <20 <20 <20 1%
c-HCH 1.0 50 62 <1.0 2.0 7.2 79% 66 3 290 89 <65.8 <65.8 247 18% 40 2 080 81 <40 <40 <40 4%
4,40-DDT 1.0 50 62 <1.0 <1.0 <1.0 0% 66 3 290 89 <65.8 <65.8 177 15% 40 2 080 81 <40 <40 <40 2%
Pyrethroids
Permethrin 1.0 50 62 <1.0 <1.0 <1.0 2% 66 3 290 89 <65.8 279 1 961 61% 40 2 080 81 <40 <40 578 27%
Phosphoric ester
Tributylphosphate 1.0 50 62 2.0 4.7 12.4 100% 66 3 290 89 <65.8 103 401 74% 40 2 080 79 <40 <40 190 20%
Musks
Galaxolide 1.0 50 62 46 >50 >50 100% 66 3 290 89 304 965 2 191 98% 40 2 080 65 148 335 1 213 97%
Tonalide 1.0 50 62 10 20 >50 100% 66 3 290 89 <65.8 337 915 88% 40 2 080 81 <40 170 642 63%
PAHs
Acenaphthene 1.0 50 62 * * * 53% 66 3 290 89 <65.8 <65.8 <65.8 0% 40 2 080 81 <40 <40 <40 0%
Fluorene 1.0 50 62 2.5 5.5 13 100% 66 3 290 89 <65.8 <65.8 268 40% 40 2 080 81 <40 <40 175 9%
Phenanthrene 1.0 50 62 4.8 8.7 18 100% 66 3 290 89 <65.8 363 907 92% 40 2 080 75 <40 <40 539 45%
Anthracene 1.0 50 62 * * * 2% 66 3 290 89 <65.8 <65.8 127 40% 40 2 080 81 <40 <40 <40 1%
Fluoranthene 1.0 50 62 <1.0 <1.0 1.6 29% 66 3 290 89 <65.8 184 751 85% 40 2 080 81 <40 <40 441 32%
Pyrene 1.0 50 62 <1.0 <1.0 1.2 18% 66 3 290 89 <65.8 285 760 90% 40 2 080 80 <40 <40 525 40%
Benzo(a)pyrene 1.0 50 62 * * * 0% 66 3 290 89 <65.8 <65.8 172 27% 40 2 080 81 <40 <40 125 6%
PCBs
PCB 31 0.4 20 62 <0.4 <0.4 0.6 15% 26 1 320 89 <26.3 <26.3 <26.3 2% 20 830 81 <20 <20 <20 0%
PCB 28 0.4 20 62 <0.4 <0.4 0.9 19% 26 1 320 89 <26.3 <26.3 <26.3 6% 20 830 81 <20 <20 <20 0%
PCB 52 0.4 20 62 <0.4 <0.4 0.5 16% 26 1 320 89 <26.3 <26.3 48 7% 20 830 81 <20 <20 <20 2%
PCB 101 0.4 20 62 <0.4 <0.4 <0.4 2% 26 1 320 89 <26.3 <26.3 107 13% 20 830 81 <20 <20 <20 1%
PCB 138 0.4 20 62 <0.4 <0.4 <0.4 0% 26 1 320 89 <26.3 <26.3 79 10% 20 830 81 <20 <20 <20 1%
Phthalates
DMP 1.0 50 53 6.7 13 >50 100% 66 3 290 54 <65.8 252 1 680 87% 40 2 080 79 <40 <40 555 39%
DEP 8.0 800 53 85 221 515 100% 526 52 600 76 739 2 890 6 560 93% 333 33 300 65 <333 1 310 5 200 66%
DiBP 8.0 800 62 352 >800 >800 100% 526 52 600 89 41 000 > 52 600 > 52 600 100% 333 33 300 71 11 000 >33 300 >33 300 100%
DBP 8.0 800 62 66 228 744 100% 526 52 600 89 11 000 38 200 > 52 600 100% 333 33 300 64 4 220 15 200 >33 300 100%
BBPa,b 1.0 50 56 3.7 19 >50 100% 66 3 290 22 11 400 105 000 468 000 100% 40 2 080 22 6 750 73 600 1 940 000 100%
DEHPa,b 8.0 800 58 49 108 417 100% 526 52 600 28 275 000 1 430 000 5 830 000 100% 333 33 300 28 86 900 1 210 000 4 520 000 100%
DiNPa 8.0 800 30 8.2 35 214 93% 526 52 600 32 258 000 1 030 000 4 100 000 100% 333 33 300 77 33 000 >33 300 >33 300 100%
PBDEs
BDE 99 1.0 50 62 <1.0 <1.0 4.9 13% 66 3 290 89 <65.8 <65.8 340 12% 40 2 080 81 <40 <40 <40 2%
LOQ, limit of quantitation; UL, upper limit of the calibration range; N, number of classrooms, F, frequency of classrooms with concentrations >LOQ; a-HCH, a-hexachlorocyclohexane; c-HCH, c -hexachlorocyclohexane (Lindane); 4,40-DDT,
dichlorodiphenyltrichloroethane; PAH, polycyclic aromatic hydrocarbon; PCB, polychlorobiphenyl; DMP, dimethyl phthalate; DEP, diethyl phthalate; DiBP, diisobutyl phthalate; DBP, dibutyl phthalate; BBP, butyl benzyl phthalate; DEHP, bis(2-ethylhexyl)
phthalate; DiNP, diisononyl phthalate; PBDE, polybromodiphenylether.aConcentrations from less concentrated extracts for vacuumed dust.bConcentrations from less concentrated extracts for wiped dust.
*Unvalidated air sampling method, substance subject to degradation.
119
SVOC
Sin
schools

Chapitre 1 : contexte scientifique
Page 38
deltamethrin, tetramethrin, atrazine, acenaphthene,PCB 28, 31, 77, 126 and 180, and BDE 85 and 119).Results of the most frequently quantified substancesare displayed in Table 1, and all results can be seen inTables S6 and S9. Greater than 2 lg/m² median con-centrations were reached for DEHP, BBP, DiNP andDiBP (>33 lg/m²), and DBP (15 lg/m²). The medianconcentrations measured for musks and DEP rangedfrom 0.2 to 1.5 lg/m². Six compounds (phenanthrene,pyrene, DMP, fluoranthene, permethrin, andtributylphosphate) were only found in 10–45% of thesamples.
SVOC concentrations in vacuumed dust vs. wiped dust
Frequencies of quantification for the 14 compoundsquantified more than 10 times in paired dust samplesare shown in Table 2. These were higher in vacuumeddust than in wiped dust, except in the case of fivephthalates (DiBP, DBP, BBP, DEHP, and DiNP)found in 100% of the samples with both methods.Figure 1 shows the distribution of SVOC concentra-tions in vacuumed dust and wiped dust for these 14compounds: concentrations measured in wiped dustwere always larger than in vacuumed dust by a factorof 9–26 (ratio of the medians shown in Table 2).
Concentrations measured in the same room withboth sampling methods were compared for each indi-
vidual substance using Spearman correlation coeffi-cients. These coefficients are summarized in Table 2.Significant correlations were observed for galaxolide,tonalide, fluoranthene, pyrene, DBP, DEHP, DiBP,and DiNP (P < 0.05). No significant correlations wereobserved for permethrin, tributylphosphate, phenan-threne, BBP, DEP, and DMP.
Discussion
SVOC selection
The ranking method used for the selection of SVOCswas preliminary based on dust contamination indwellings, so SVOCs present in products havingspecific uses in schools may have been missed. How-ever, the selection of SVOCs was initially based on abibliographic search, then extended using expert judg-ment, so that the number of compounds potentiallynot included would be limited—as proven by thelarge number of SVOCs ultimately included in theranking (n = 156). Nevertheless, the differences in thecontamination levels between schools and dwellingsmay have constituted a limit to this exercise becauseSVOCs may have ended up being differently ranked,had contamination in schools been considered. Thislimit was reduced by the choice of the analyticalmethod allowing measurement of 55 compounds,
Table 2 Paired data comparison of wiped dust vs. vacuumed dust
Frequencies of quantification Median concentration (5th–95th%) (ng/m²)
Spearman’s
correlation
coefficient
Vacuumed dust
(<100 lm fraction) (%) Wiped dust (%) N
Vacuumed dust
(<100 lm fraction) Wiped dust Ratio Wd/Vda r P value
Pyrethroids
Permethrin 56 25 10 13 (9–74) 310 (267–855) 23 0.59 0.077
Phosphoric ester
Tributylphosphate 66 19 11 17 (3–43) 158 (142–190) 9 0.05 0.892
Musks
Galaxolide 97 96 48 22 (10–51) 433 (273–719) 20 0.36 0.011
Tonalide 83 61 34 18 (7–47) 215 (177–362) 12 0.55 0.001
PAHs
Fluoranthene 78 30 16 9 (4–70) 211 (161–404) 23 0.70 0.003
Phenanthrene 89 46 23 12 (7–82) 234 (170-355) 11 0.25 0.252
Pyrene 86 40 21 11 (6–44) 221 (154–492) 20 0.73 0.000
Phthalates
BBP 100 100 13 5500 (1590–23 300) 73 600 (18 900–305 000) 13 0.38 0.199
DBP 100 100 36 600 (278–2600) 10 900 (6490–17 000) 18 0.41 0.013
DEHP 100 100 14 88 700 (9600–189 000) 1 390 000 (146 000–2 440 000) 16 0.72 0.005
DEP 92 64 24 84 (51–229) 1930 (1330–2740) 23 0.24 0.262
DiBP 100 100 27 3140 (881–20 100) 41 300 (22 300–197 000) 13 0.51 0.007
DiNP 100 100 17 60 700 (18 400–121 000) 661 000 (326 000–1 200 000) 11 0.66 0.005
DMP 83 39 15 7 (5–29) 183 (141–319) 26 0.36 0.189
In bold: significant correlation (P value <0.05).
PAH, polycyclic aromatic hydrocarbon; BBP, butyl benzyl phthalate; DBP, dibutyl phthalate; DEHP, bis(2-ethylhexyl) phthalate; DEP, diethyl phthalate; DiBP, diisobutyl phthalate; DiNP, diisononyl
phthalate; DMP, dimethyl phthalate.aRatio of median in wiped dust vs median in vacuumed dust.
120
Raffy et al.

Chapitre 1 : contexte scientifique
Page 39
rather than just those SVOCs that were initiallysorted. Moreover, it was useful to measure the samecompounds in schools and dwellings as this helpedcompare the profiles of SVOC contamination in dif-ferent indoor environments.
Analytical method
The analysis of 55 target compounds from differentchemical classes does present an analytical challenge.Most methods previously published were dedicated tothe analysis of a specific family of compounds,whereas multiresidue analytical methods were rarelyreported (Mercier et al., 2014). However, the ultimategoal of the method development was to be able toanalyze hundreds of samples within a nationwide sur-vey. This is why the multiresidue approach wasadopted, entailing compromises between analyticalperformance and the constraints that are inherent tolarge-scale studies, such as environmental samplingissues (e.g., limited availability of daily dust samples)and economic viability. As described by Mercier et al.(2014), these compromises were achieved by (i) the
choice to use only PUF for air sampling without anyresin adsorbents, which are more expensive andrequire more complex extraction procedures, (ii)automation of the extraction procedure, (iii) simplifi-cation of the clean-up procedure, (iv) the use ofnative rather than labeled surrogate standards, and(v) the use of tandem mass spectrometry for its selec-tivity and sensitivity. The laboratory obtained Cofrac(French Committee for Accreditation) accreditationin accordance with the ISO/CEI 17025 standard forthis method.
Our LOQs, however, were relatively high for 4chemical families (organochlorines, organophos-phates, PCBs, and PBDEs). In air (Table S13), Wil-son et al. (2003), Lim et al. (2014), and Bradmanet al. (2014) reported concentrations below our LOQfor PBDEs. In dust (Table S14), concentrations lowerthan our LOQ were also reported by Wilson et al.(2003), Dalvie et al. (2014), and Harrad et al. (2010).LOQs are often based on the signal-to-noise (S/N)ratio approach. This approach was impractical withour system, because smoothing was applied to thesignal, making S/N ratios meaningless. The standard
Per
met
hrin (n
= 1
0)
Tributy
lphosp
hate
(n =
11)
Gal
axolid
e (n
= 4
8)
Tonalid
e (n
= 3
4)
Fluora
nthen
e (n
= 1
6)
Phen
anth
rene
(n =
23)
Pyr
ene
(n =
21)
BBP (n
= 1
3)
DBP (n
= 3
6)
DEHP (n
= 1
4)
DEP (n
= 2
4)
DiB
P (n
= 2
7)
DiN
P (n
= 1
7)
DM
P(n
= 1
5)
1.0×1000
1.0×1001
1.0×1002
1.0×1003
1.0×1004
1.0×1005
1.0×1006
1.0×1007
Vacuumed dust (<100 µm fraction)Wiped dust
Co
ncen
trati
on
(n
g/m
²)
Fig. 1 SVOC concentrations in vacuumed and wiped dust for substances quantified in matched samples
121
SVOCS in schools

Chapitre 1 : contexte scientifique
Page 40
deviation approach, described by Gonz�alez et al.(2014), was used instead, making comparison withother studies more difficult. However, these higherLOQs might also be a consequence of our mul-tiresidue approach and would probably have beenlower using dedicated methods. Nevertheless, themultiresidue method allowed for the simultaneousanalysis of multiple compounds in an economicallysound way while still providing valuable informationabout the relative presence of SVOCs in classrooms.
Evaluation of air sampling method
Tested concentrations were greater than the highestconcentrations reported in samples and showed thatthe air sampling method was fit for purpose, except forthe six compounds for which null or poor recoverieswere observed. The hypothesis of a low breakthroughvolume was verified on acenaphthene for which 4% ofthe spiked amount was measured in the second, in ser-ies, PUF (Table S3). However, for aldrin, dichlorvos,tetramethrin, anthracene, and benzo(a)pyrene, theamount left in the second PUF was null, which meansthat these molecules are probably also subject to degra-dation. During the 4.5-day sampling period, PUFswere only kept in their glass cartridge and were there-fore exposed to sunlight and variations of room tem-perature. Photolysis has indeed been reported, forexample, for aldrin (Burrows et al., 2002), tetramethrin(EPA 2010), and benzo(a)pyrene (Zhang et al., 2006).
Contamination levels of SVOCs in schools
The data presented in this study were compared toother studies reported in scientific literature from2003 to 2015, including studies in primary or elemen-tary schools and in nursery schools and day care cen-ters where the children’s age matched those attendingFrench nursery schools (2–5 years old). Summariesof these comparisons are available in SupportingInformation (Tables S13 and S14). These summariesmention the sampling techniques used, as SVOC con-centrations can only be compared if sampled in asimilar manner. Sampling for the present study wasconducted from November 2009 to June 2010, cover-ing three seasons (autumn, winter, and spring).Ambient and indoor meteorological conditions werenot monitored in this study, although these wouldaffect SVOC emissions (Clausen et al., 2012; Wuet al., 2016). Likewise, seasonal effects on SVOCemissions were reported (Cao et al., 2014). Moreover,the choice of dust fraction to be analyzed is alsoimportant, as SVOC concentrations vary significantlywith particle size: in general, concentration of toxicchemicals in dust increases as particle size decreases(Cao et al., 2012; Mercier et al., 2011). Cao et al.also emphasize that dust with particle size less than
100 lm, which we chose, should be paid more atten-tion because it is more relevant to human exposure.Sieved fractions between 63 lm to 500 lm werereported in the literature relating to SVOCs inschools (Bradman et al., 2014; Clausen et al., 2003;Gaspar et al., 2014; Harrad et al., 2010; Mizouchiet al., 2015; Wallner et al., 2012; Wilson et al., 2003).Sometimes larger particles and sand deposits wereremoved, but the dust was not sieved (Fromme et al.,2013, 2014). Nevertheless, the number of studies inschools was limited so different sampling conditionsand dust particle size fractions were considered eventhough this constitutes a limitation of the compar-ison of our results with the literature.
In air (Table S13), in comparison with other studies,concentrations measured in these 30 French schoolswere always similar or slightly lower than what hadbeen observed elsewhere, except DiBP which was moreconcentrated in our study (>800 ng/g) than in that ofFromme et al. (2013) (468 ng/g) or Gaspar et al.(2014) (100 ng/g). Such a discrepancy was alsoobserved in French dwellings (Blanchard et al., 2014)and could be explained by the gradual substitution ofDBP by DiBP.
In dust, Morgan et al. (2007) used wipes to sampledust settled on the floor in Ohio day care centers. Theyreported 140 ng/m² of (cis + trans) permethrin whichis more than reported in the present study (<40 ng/m²).This higher level was confirmed in vacuumed dust(1554 ng/g vs. 279 ng/g). Regarding other compoundsin vacuumed dust (Table S14), PAH concentrationswere of the same order as in North Carolina, USA:phenanthrene, fluoranthene, and pyrene concentra-tions were 338, 437, and 354 ng/g, respectively (Wilsonet al., 2003), vs. 363, 184, and 285 ng/g, respectively, inthis study. A slightly lower concentration of 98 ng/gwas measured for pyrene in Denmark (Langer et al.,2010). In all studies, phthalates, and particularlyDEHP and DiNP, are found in higher concentrationsthan other substances. Medians found for DEP, DBP,DEHP, and DiNP in our study are within the range ofother studies: DEP, measured at 2.89 lg/g in thisstudy, is at most twice as concentrated as in Denmark(2.20 lg/g), Germany or California, USA (1.40 lg/gfor both); the range of concentrations for DBP, mea-sured at 38.2 lg/g in this study, go from 1.87 lg/g(North Carolina, USA) to 52.0 lg/g (South Korea);likewise, DEHP and DiNP, respectively, quantified at1430 lg/g and 1030 lg/g in this study are within therange of other studies (from 172 lg/g in California,USA, to 3350 lg/g in Austria for DEHP and from302 lg/g in Germany to 946 lg/g in South Korea forDiNP). However, DiBP and BBP were at least twice asconcentrated in French schools: the median concentra-tion for DiBP, greater than 52 lg/g, is higher than inDenmark (23 lg/g), Germany (20 l/g) or California,USA (9.3 lg/g); the French concentration for BBP
122
Raffy et al.

Chapitre 1 : contexte scientifique
Page 41
(105 lg/g) was also higher than in other studies, rang-ing from 3.72 (North Carolina, USA) to 46.8 l/g (Cali-fornia, USA) (Clausen et al., 2003; Fromme et al.,2013; Gaspar et al., 2014; Hutter et al., 2013; Kimet al., 2013; Langer et al., 2010; Wallner et al., 2012;Wilson et al., 2003). The frequent presence of PVCflooring (in 70% of classrooms) could explain thehigher concentration of BBP in school dust, as morethan 70% of BBP produced is used as a plasticizer inpolymer products, mainly PVC for flooring (ECHA,2009). The presence of DiBP might be related to its usein such children’s products as crayons, erasers, andschool bags (ECHA, 2010).
Our results were compared to two others French sur-veys that investigated a similar list of compounds:Blanchard et al. (2014) investigated air and dust in 30dwellings in Brittany, using similar sampling tech-niques and the same analytical method and Mandinet al. (Mandin et al., 2013) measured SVOCs in 145dust samples from household vacuum cleaners usingthe same (albeit more sensitive) analytical method. Inair, compared to the 30 dwellings, concentrationsfound in schools are up to twice as high fortributylphosphate, musks, PAHs and phthalates exceptBBP which is about eight times more concentrated inschools than in dwellings. Concentrations found indust are similar for tributylphosphate, musks, PAHs,and the three less concentrated phthalates (DMP,DEP, and DMEP). However, the other phthalates aremore concentrated in schools by factors of aroundthree (DiBP, DBP), five (DEHP), eight (DiNP), andtwelve (BBP). Langer et al. (2010) compared phthalateand PAH contamination in homes and day care cen-ters. They found that with the exception of DEP, con-centrations of phthalates in dust were higher in daycare centers than in homes, whereas PAH concentra-tions were similar, confirming our observations inschools and pre-schools.
Sources of phthalates include personal care productsand cosmetics, PVC flexible pipe, PVC flooring, andwall covering (Mercier et al., 2011). In nursery schools,Kim et al. (2013) found that DEHP concentrationscorrelated significantly with the area of PVC flooring.DiNP probably follows the same trend, as it startedreplacing DEHP, as well as DBP and BBP, in responseto the restriction of their use in Europe (Blanchardet al., 2014). Descriptions of French dwellings avail-able on the OQAI website (www.oqai.fr) show thepresence of PVC or linoleum flooring in 18–26% ofrooms, vs 60% of classrooms at a national level (70%in this study) for PVC flooring only. This supports thehypothesis that higher phthalate concentrations inschools might be associated with the presence of PVCflooring, either because of the material itself orbecause of the application of floor care chemicalproducts (Bi et al., 2015). Children’s higher exposureto DiBP, DBP, BBP, DEHP, and DiNP at school com-
pared to at home should thus be considered in bothrisk assessments and epidemiological studies, as it maycontribute substantially to exposure.
Comparison of vacuum and wipe sampling methods and results
The wipe sampling method is easy to implement, silent,and fast (less than 10 min per classroom) whereas thevacuum cleaner sampling method that requires morepreparation is slower (about 20 minutes per classroom)and noisy. In addition, a recurrent issue that occurredin this study and was also observed by Kim et al.(2013) and Harrad et al. (2010), was the lack of dustfor vacuuming. In general, classrooms are cleaned on adaily basis, so reaching the mass of dust necessary foranalysis meant sampling large areas and organizing thesampling according to the school cleaning schedule,which sometimes could not be achieved.
More compounds can be quantified using the vac-uum cleaner, which is inherent to the sampling method:LOQs were based on analysis of 200 mg of dust whenavailable, or three wipes. The median quantity of dustsampled with a wipe is 30 mg (Le Bot et al., 2010) (i.e.,90 mg for three wipes), so the LOQs in wipes wereoften more than double those in vacuumed dust. How-ever, concentrations measured in wiped dust werehigher than in vacuumed dust. Several hypotheses mayexplain this difference. First, as shown by Cettier et al.(2015) for the collection of PCBs and pesticides, wipesampling is efficient, particularly in the presence ofdust. Indeed, wipe sampling allows the thorough col-lection of all dust present on the floor, including fineand large particles, as the wipe’s moisture can helpunstick stuck dust or collect SVOCs released by thesurface of the floor material. Second, the fraction col-lected with the vacuum cleaner misses those fine andlarge particles, as the finest pass through the cellulosethimble or are stuck in it and the largest (fractiongreater than 100 lm) are eliminated through the siev-ing process. Third, the depression created by the vac-uum cleaner may disturb the partitioning of themolecules between gas-phase and dust, possiblyaccording to their volatility. These hypotheses mayexplain the absence of significant correlation betweenthe two sampling methods for permethrin,tributylphosphate, phenanthrene, BBP, DEP, andDMP as the dust composition may have differedbetween classrooms.
In the past 10 years, sampling involving both vac-uuming and wiping methods has been described inscientific literature: Watkins et al. (2013) measuredPBDEs in office air, vacuumed dust, and surfacewipes and observed a significant correlation betweenBDE 209 in dust and in surface wipes (r = 0.69,P = 0.007), although their methodology was differentto ours; the surface wipes were sampled onundisturbed ‘dusty’ surfaces such as bookshelves or
123
SVOCS in schools

Chapitre 1 : contexte scientifique
Page 42
filing cabinets. In addition, they compared concen-trations in mass per mass for dust versus mass persurface for wipes. Wu et al. (2010) found significantcorrelations between floor dust (in ng/g) and surfacedust (in pg/cm²) for BDE 183, 100, and 99, but notfor the other PBDEs. Morgan et al. (2007) measuredpyrethroid concentrations in dust and hard floorsurface wipes, but again these concentrations cannotbe compared due to different concentration units(ng/g vs. ng/cm²). Wason et al. (2013) studied corre-lations of organophosphate and pyrethroid concen-trations between dust and kitchen or living roomfloor wipes, still in inhomogeneous units, in whichdiazinon, chlorpyrifos, permethrin, and cyfluthrinshowed significant correlations, at least for kitchenwipes, whereas no significant correlation was estab-lished for cypermethrin. Comparisons between vacu-umed and wiped dust using a homogeneous unit(mass/surface) are rarely performed despite the use-fulness of considering dust contamination, not onlyin ng/g of a specific sieved fraction, but also in ng/m². Both types of dust sampling have been shownto be useful to characterize human exposure to dust.The wipe method represents surface loading, and asLioy et al. (2002) explained, it can be used to esti-mate the amount of material available on a surfaceand the amount available for contact by a person.It was designed and used to imitate the hand’s abil-ity to pick up and retain particles (Le Bot et al.,2010), so wiped dust seems suitable for the evalua-tion of children’s exposure. Vacuumed dust providesmore knowledge in terms of dust contamination andis useful to characterize potential sources inside oroutside a home (Lioy et al., 2002), yet can also beused as a proxy of dust exposure: Meeker et al.(2013) showed that some organophosphate flameretardants in vacuumed house dust were related tohuman urinary metabolites; Bennett et al. (2014)showed that PBDEs, not only in floor wipes butalso in vacuumed dust, were correlated with serumlevels.
Conclusion
This study which presents the contamination levels ofSVOCs in schools for the first time in France has cer-tain limitations relating to relatively high LOQs forsome substances, the lack of data above the upper limitof the calibration range, the as yet unresolved issue ofcontaminated wipe blanks and the occasional difficultyvacuuming enough dust. Furthermore, the glass car-tridges used for air sampling might not be suitable forthe analysis of photosensitive compounds. Some ofthese limitations could be overcome: for example, themass of vacuumed dust could be maximized with well-timed dust sampling performed before any scheduledhousekeeping and allowing enough time to sample a
large floor surface; alternatively, an extraction tech-nique such as thermal desorption, requiring less dust,could be developed; air could be sampled using a light-proof device; LOQs could be lowered using a last gen-eration, more sensitive, detector or with an increase ofthe injection volume. Nevertheless, the multiresiduemethod allows simultaneous analysis of multiple com-pounds in an economically sound way while still pro-viding valuable information about the relative presenceof SVOCs in classrooms. This shows in particular thatDiBP, DBP, BBP, DEHP, and DiNP in dust are foundmore frequently in schools than in homes. These find-ings suggest that school exposure is not negligible forphthalates, demanding further investigation as theexposure would be underestimated in this work as aresult of the lack of data above ULs. The comparisoncarried out between dust sampling with wipes, or witha vacuum cleaner, was for the first time reported usingthe same unit (ng/m²) and shows that sampling tech-nique has an impact on SVOC measurement in dust:Dust sampling allows more compounds to be measuredwhereas wipe sampling leads to greater concentrations.The choice of the sampling method should of course beobjective driven and consider the practical implementa-tion and contamination levels. The use of vacuumeddust could be favored when the concentrations are toolow to be quantified with the wipe method.
Acknowledgement
We are grateful to the administrators and head-tea-chers of the schools that participated in the study. Theauthors thank Delphine Pell�e, Ga€elle Saramito,Erwann Gilles, Karine Elandaloussi, Isabelle Mora-telli, and Emilie Surget from the LERES for their con-tributions to this work.
Funding sources
This study was supported by the French indoor airquality observatory (OQAI), funded by the Ministriesin charge of Housing, Environment, and Health, theEnvironment and Energy Management Agency(ADEME), the Scientific and Technical Centre forBuilding and the French Agency for Food, Environ-mental, and Occupational Health & Safety (ANSES).
Supporting Information
Additional Supporting Information may be found inthe online version of this article:Table S1. Characteristics of schools and classrooms.Table S2. SVOCs of interest for the study.Table S3. Air sampling method evaluation.Table S4. SVOC concentrations in air QC samples (ng/m3).
124
Raffy et al.

Chapitre 1 : contexte scientifique
Page 43
Table S5. SVOC concentrations in SRM 2585 (ng/g).Table S6. SVOC concentrations in French classrooms(Brittany, France, 2010).Table S7. SVOC concentrations in air (ng/m3) in class-rooms (Brittany, France, 2010).Table S8. SVOC concentrations in vacuumed dust (<100 lm fraction) (ng/g) in classrooms (Brittany,France, 2010).Table S9. SVOC concentrations in wiped dust (ng/m²)in classrooms (Brittany, France, 2010).Table S10. SVOC concentrations from less concen-trated extracts in air (ng/m3) in classrooms (Brittany,
France).Table S11. SVOC concentrations from less concen-trated extracts in vacuumed dust (< 100 lm fraction)(ng/g) in classrooms (Brittany, France).Table S12. SVOC concentrations from less concen-trated extracts in wiped dust (ng/m²) in classrooms(Brittany, France).Table S13. SVOCs in air of nursery and primaryschools in ng/m3.Table S14. SVOCs in dust of nursery and primaryschools in ng/g.
References
AFNOR (2007) XP X 4358, Ambiant air –
Determination of crop protection sub-
stances (pesticides) in ambiant air – active
sampling, Saint Denis La Plaine, France,
Association franc�aise de normalisation.
Ali, N., Dirtu, A.C., Eede, N, Van Den
Goosey, E., Harrad, S., Neels, H.,
t’Mannetje, A., Coakley, J., Douwes, J.
and Covaci, A. (2012) Occurrence of
alternative flame retardants in indoor
dust from New Zealand: indoor sources
and human exposure assessment, Che-
mosphere, 88, 1276–1282.
Bennett, D.H., Moran, R.E., Wu, X., Tulve,
N.S., Clifton, M.S., Col�on, M., Weath-
ers, W., Sj€odin, A., Jones, R. and Hertz-
Picciotto, I. (2014) Polybrominated
diphenyl ether (PBDE) concentrations
and resulting exposure in homes in Cali-
fornia: relationships among passive air,
surface wipe and dust concentrations,
and temporal variability, Indoor Air, 25,
220–229.
Bi, X., Yuan, S., Pan, X., Winstead, C. and
Wang, Q. (2015) Comparison, associa-
tion, and risk assessment of phthalates in
floor dust at different indoor environ-
ments in Delaware, USA, J. Environ. Sci.
Heal. Part A, 50, 1428–1439.
Blanchard, O. (2001) Mise au point des tech-
niques de pr�el�evement et d’analyse des
biocides dans l’environnement int�erieur,
Rapport INERIS – CSTB, October 2001.
Blanchard, O., Mercier, F., Ramalho, O.,
Mandin, C., Le Bot, B. and Glorennec, P.
(2013) Measurements of semi-volatile
organic compounds in settled dust: influ-
ence of storage temperature and dura-
tion, Indoor Air, 24, 125–135.
Blanchard, O., Glorennec, P., Mercier, F.,
Bonvallot, N., Chevrier, C., Ramalho,
O., Mandin, C. and Lebot, B. (2014)
Semi-volatile organic compounds in
indoor air and settled dust in 30 French
dwellings, Environ. Sci. Technol., 48,
3959–3969.
Bonvallot, N., Mandin, C., Mercier, F., Le
Bot, B. and Glorennec, P. (2010) Health
ranking of ingested semi-volatile organic
compounds in house dust: an application
to France, Indoor Air, 20, 458–472.
Bouvier, G., Blanchard, O., Momas, I. and
Seta, N. (2006) Pesticide exposure of non-
occupationally exposed subjects com-
pared to some occupational exposure: a
French pilot study, Sci. Total Environ.,
366, 74–91.
Bradman, A., Castorina, R., Gaspar, F.,
Nishioka, M., Col�on, M., Weathers, W.,
Egeghy, P.P., Maddalena, R., Williams,
J., Jenkins, P.L. and McKone, T.E.
(2014) Flame retardant exposures in Cali-
fornia early childhood education environ-
ments, Chemosphere, 116, 61–66.
Burrows, H.D., Canle L, M., Santaballa, J.
A. and Steenken, S. (2002) Reaction
pathways and mechanisms of pho-
todegradation of pesticides, J. Pho-
tochem. Photobiol. B Biol., 67, 71–108.
Canha, N., Mandin, C., Ramalho, O.,
Wyart, G., Rib�eron, J., Dassonville, C.,
H€anninen, O., Almeida, S.M. and Der-
bez, M. (2015) Assessment of ventilation
and indoor air pollutants in nursery and
elementary schools in France, Indoor Air,
doi:10.1111/ina.12222.
Cao, Z., Xu, F., Covaci, A., Wu, M., Yu, G.,
Wang, B., Deng, S. and Huang, J. (2014)
Differences in the seasonal variation of
brominated and phosphorus flame retar-
dants in office dust, Environ. Int., 65,
100–106.
Cao, Z.-G., Yu, G., Chen, Y.-S., Cao, Q.-
M., Fiedler, H., Deng, S.-B., Huang, J.
and Wang, B. (2012) Particle size: a miss-
ing factor in risk assessment of human
exposure to toxic chemicals in settled
indoor dust, Environ. Int., 49, 24–30.
Cequier, E., Ionas, A.C., Covaci, A., Marc�e,
R.M., Becher, G. and Thomsen, C.
(2014) Occurrence of a broad range of
legacy and emerging flame retardants in
indoor environments in Norway, Environ.
Sci. Technol., 48, 6827–6835.
Cettier, J., Bayle, M.-L., B�eranger, R., Bil-
loir, E., Nuckols, J.R., Combourieu, B.
and Fervers, B. (2015) Efficiency of wipe
sampling on hard surfaces for pesticides
and PCB residues in dust, Sci. Total Envi-
ron., 505, 11–21.
Clausen, P.A., Lindeberg Bille, R.L., Nils-
son, T., Hansen, V., Svensmark, B. and
Bøwadt, S. (2003) Simultaneous extrac-
tion of di(2-ethylhexyl) phthalate and
nonionic surfactants from house dust.
Concentrations in floor dust from 15
Danish schools, J. Chromatogr. A, 986,
179–190.
Clausen, P.A., Liu, Z., Kofoed-Sørensen, V.,
Little, J. and Wolkoff, P. (2012) Influence
of temperature on the emission of di-(2-
ethylhexyl)phthalate (DEHP) from PVC
flooring in the emission cell FLEC, Envi-
ron. Sci. Technol., 46, 909–915.
Conrad, A., Seiwert, M., H€unken, A., Quar-
coo, D., Schlaud, M. and Groneberg, D.
(2013) The German environmental survey
for children (GerES IV): reference values
and distributions for time-location pat-
terns of German children, Int. J. Hyg.
Environ. Health, 216, 25–34.
Dalvie, M. A, Sosan, M.B., Africa, A.,
Cairncross, E. and London, L. (2014)
Environmental monitoring of pesticide
residues from farms at a neighbouring
primary and pre-school in the Western
Cape in South Africa, Sci. Total Environ.,
466-467, 107, 1078–1084.
ECHA (2009) Background document for ben-
zyl butyl phthalate (BBP), Helsinki, Fin-
land, European Chemicals Agency.
ECHA (2010) Background document for Dii-
sobutyl phthalate (DIBP), Helsinki, Fin-
land, European Chemicals Agency.
EPA (2010) Reregistration Eligibility Deci-
sion (RED) Document for Tetramethrin,
Washington, DC, Environmental Protec-
tion Agency.
EPA (2011) Exposure Factors Handbook:
2011 Edition, Washington, DC, Environ-
mental Protection Agency.
Fournier, K., Glorennec, P. and Bonvallot,
N. (2014) An exposure-based framework
for grouping pollutants for a cumulative
risk assessment approach: case study of
indoor semi-volatile organic compounds,
Environ. Res., 130, 20–28.
Fromme, H., Lahrz, T., Piloty, M., Geb-
hardt, H., Oddoy, A. and R€uden, H.
(2004) Polycyclic aromatic hydrocarbons
inside and outside of apartments in an
urban area, Sci. Total Environ., 326, 143–
149.
125
SVOCS in schools

Chapitre 1 : contexte scientifique
Page 44
Fromme, H., Lahrz, T., Kraft, M., Fem-
bacher, L., Dietrich, S., Sievering, S.,
Burghardt, R., Schuster, R., Bolte, G.
and V€olkel, W. (2013) Phthalates in Ger-
man daycare centers: occurrence in air
and dust and the excretion of their
metabolites by children (LUPE 3), Envi-
ron. Int., 61, 64–72.
Fromme, H., Lahrz, T., Kraft, M., Fem-
bacher, L., Mach, C., Dietrich, S., Bur-
kardt, R., V€olkel, W. and G€oen, T.
(2014) Organophosphate flame retardants
and plasticizers in the air and dust in Ger-
man daycare centers and human biomon-
itoring in visiting children (LUPE 3),
Environ. Int., 71, 158–163.
Gaspar, F.W., Castorina, R., Maddalena,
R.L., Nishioka, M.G., McKone, T.E.
and Bradman, A. (2014) Phthalate expo-
sure and risk assessment in california
child care facilities, Environ. Sci. Tech-
nol., 48, 7593–7601.
Gonz�alez, O., Blanco, M.E., Iriarte, G., Bar-
tolom�e, L., Maguregui, M.I. and Alonso,
R.M. (2014) Bioanalytical chromato-
graphic method validation according to
current regulations, with a special focus
on the non-well defined parameters limit
of quantification, robustness and matrix
effect, J. Chromatogr. A, 1353, 10–27.
Harrad, S., Goosey, E., Desborough, J. and
Abou-Elwafa Abdallah, M. (2010) Dust
from U.K. primary school classrooms
and daycare centers: the significance of
dust as a pathway of exposure of young
U.K. children to brominated flame retar-
dants and polychlorinated biphenyls,
Environ. Sci. Technol., 44, 4198–4202.
Hussein, T., Paasonen, P. and Kulmala, M.
(2012) Activity pattern of a selected
group of school occupants and their fam-
ily members in Helsinki-Finland, Sci.
Total Environ., 425, 289–292.
Hutter, H.-P., Haluza, D., Piegler, K.,
Hohenblum, P., Fr€ohlich, M., Scharf, S.,
Uhl, M., Damberger, B., Tappler, P.,
Kundi, M., Wallner, P. and Moshammer,
H. (2013) Semivolatile compounds in
schools and their influence on cognitive
performance of children, Int. J. Occup.
Med. Environ. Health, 26, 628–635.
Kanazawa, A, Saito, I., Araki, A., Takeda,
M., Ma, M., Saijo, Y. and Kishi, R.
(2010) Association between indoor expo-
sure to semi-volatile organic compounds
and building-related symptoms among
the occupants of residential dwellings,
Indoor Air, 20, 72–84.
Kim, W., Choi, I., Jung, Y., Lee, J., Min, S.
and Yoon, C. (2013) Phthalate levels in
nursery schools and related factors, Envi-
ron. Sci. Technol., 47, 12459–12468.
Klepeis, N.E., Nelson, W.C., Ott, W.R.,
Robinson, J.P., Tsang, A.M., Switzer, P.,
Behar, J. V, Hern, S.C. and Engelmann,
W.H. (2001) The national human activity
pattern survey (NHAPS): a resource for
assessing exposure to environmental pol-
lutants, J. Expo. Anal. Environ. Epi-
demiol., 11, 231–252.
Kohler, M., Tremp, J., Zennegg, M., Seiler,
C., Minder-Kohler, S., Beck, M., Liene-
mann, P., Wegmann, L. and Schmid, P.
(2005) Joint sealants: An overlooked dif-
fuse source of polychlorinated biphenyls
in buildings, Environ. Sci. Technol., 39,
1967–1973.
Langer, S., Weschler, C.J., Fischer, A.,
Bek€o, G., Toftum, J. and Clausen, G.
(2010) Phthalate and PAH concentra-
tions in dust collected from Danish
homes and daycare centers, Atmos. Envi-
ron., 44, 2294–2301.
Le Bot, B., Gilles, E., Durand, S. and
Glorennec, P. (2010) Bioaccessible and
quasi-total metals in soil and indoor dust,
Eur. J. Mineral., 22, 651–657.
Le Cann, P., Bonvallot, N., Glorennec, P.,
Deguen, S., Goeury, C. and Le Bot, B.
(2011) Indoor environment and children’s
health: recent developments in chemi-
cal, biological, physical and social
aspects, Int. J. Hyg. Environ. Health, 215,
1–18.
Lim, Y.-W., Kim, H.-H., Lee, C.-S., Shin,
D.-C., Chang, Y.-S. and Yang, J.-Y.
(2014) Exposure assessment and health
risk of poly-brominated diphenyl ether
(PBDE) flame retardants in the indoor
environment of elementary school stu-
dents in Korea, Sci. Total Environ., 470–
471, 1376–1389.
Lioy, P.J., Freeman, N.C.G. and Millette,
J.R. (2002) Dust: A metric for use in
residential and building exposure
assessment and source characterization,
Environ. Health Perspect., 110, 969–
983.
Mandin, C., Mercier, F., Lucas, J.-P.,
Ramalho, O., Blanchard, O., Bonvallot,
N., Raffy, G., Gilles, E., Glorennec, P.
and Le Bot, B. (2013) Semi-volatile
organic compounds in home settled dust:
a nationwide survey in France. In: Inter-
national Society for Environmental Epi-
demiology (eds) Conference on
Environment and Health, 19–23 August
2013, Basel, Switzerland.
Meeker, J.D. and Stapleton, H.M. (2010)
House dust concentrations of
organophosphate flame retardants in
relation to hormone levels and semen
quality parameters, Environ. Health Per-
spect., 118, 318–323.
Meeker, J.D., Cooper, E.M., Stapleton,
H.M. and Hauser, R. (2013) Urinary
metabolites of organophosphate flame
retardants: Temporal variability and
correlations with house dust concentra-
tions, Environ. Health Perspect., 121,
580–585.
Mercier, F., Glorennec, P., Thomas, O. and
Le Bot, B. (2011) Organic contamination
of settled house dust, a review for expo-
sure assessment purposes, Environ. Sci.
Technol., 45, 6716–6727.
Mercier, F., Gilles, E., Saramito, G.,
Glorennec, P. and Le Bot, B. (2014) A
multi-residue method for the simultane-
ous analysis in indoor dust of several
classes of semi-volatile organic com-
pounds by pressurized liquid extraction
and gas chromatography/tandem mass
spectrometry, J. Chromatogr. A, 1336,
101–111.
Mizouchi, S., Ichiba, M., Takigami, H.,
Kajiwara, N., Takamuku, T., Miya-
jima, T., Kodama, H., Someya, T. and
Ueno, D. (2015) Exposure assessment
of organophosphorus and organobro-
mine flame retardants via indoor
dust from elementary schools and
domestic houses, Chemosphere, 123,
17–25.
Morgan, M.K., Sheldon, L.S., Croghan,
C.W., Jones, P. A, Chuang, J.C. and
Wilson, N.K. (2007) An observational
study of 127 preschool children at their
homes and daycare centers in Ohio:
environmental pathways to cis- and
trans-permethrin exposure, Environ.
Res., 104, 266–274.
Oomen, A.G. (2008) Exposure to chemicals
via house dust, New York, Springer.
Rivas, I., Viana, M., Moreno, T., Pandolfi,
M., Amato, F., Reche, C., Bouso, L.,�Alvarez-Pedrerol, M., Alastuey, A., Sun-
yer, J. and Querol, X. (2014) Child expo-
sure to indoor and outdoor air pollutants
in schools in Barcelona, Spain, Environ.
Int., 69, 200–212.
Roosens, L., Covaci, A. and Neels, H. (2007)
Concentrations of synthetic musk com-
pounds in personal care and sanitation
products and human exposure profiles
through dermal application, Chemo-
sphere, 69, 1540–1547.
Rudel, R. A and Perovich, L.J. (2009) Endo-
crine disrupting chemicals in indoor and
outdoor air, Atmos. Environ. (1994),43,
170–181.
Sofuoglu, A, Kiymet, N., Kavcar, P. and
Sofuoglu, S.C. (2010) Polycyclic and
nitro musks in indoor air: a primary
school classroom and a women’s sport
center, Indoor Air, 20, 515–522.
Toms, L.-M.L., Mazaheri, M., Brommer,
S., Clifford, S., Drage, D., Mueller,
J.F., Thai, P., Harrad, S., Morawska,
L., Harden, F.A (2015) Polybrominated
diphenyl ethers (PBDEs) in dust from
primary schools in South East Queens-
land, Australia, Environ. Res., 142,
135–140.
Wallner, P., Kundi, M., Moshammer, H.,
Piegler, K., Hohenblum, P., Scharf, S.,
Fr€ohlich, M., Damberger, B., Tappler, P.
and Hutter, H.-P. (2012) Indoor air in
schools and lung function of Austrian
school children, J. Environ. Monit., 14,
1976–1982.
Wason, S.C., Julien, R., Perry, M.J., Smith,
T.J. and Levy, J.I. (2013) Modeling expo-
sures to organophosphates and
126
Raffy et al.

Chapitre 1 : contexte scientifique
Page 45
pyrethroids for children living in an
urban low-income environment, Environ.
Res., 124, 13–22.
Watkins, D.J., McClean, M.D., Fraser, A.J.,
Weinberg, J., Stapleton, H.M. and Web-
ster, T.F. (2013) Associations between
PBDEs in office air, dust, and surface
wipes, Environ. Int., 59, 124–132.
Wei, W., Boumier, J., Wyart, G., Ramalho,
O. and Mandin, C. (2015) Cleaning prac-
tices and cleaning products in nurseries
and schools: to what extent can they
impact indoor air quality? Indoor Air,
doi:10.1111/ina.12236.
Weschler, C.J. (2009) Changes in indoor pol-
lutants since the 1950s, Atmos. Environ.,
43, 153–169.
Weschler, C.J. and Nazaroff, W.W. (2008)
Semivolatile organic compounds in
indoor environments, Atmos. Environ.,
42, 9018–9040.
Weschler, C.J. and Nazaroff, W.W. (2010)
SVOC partitioning between the gas phase
and settled dust indoors, Atmos. Environ.,
44, 3609–3620.
WHO (1989) Indoor air quality: Organic pol-
lutants (EURO Reports and Studies No.
111.). Geneva, Switzerland, World
Health Organization.
Wilson, N.K., Chuang, J.C., Lyu, C., Men-
ton, R. and Morgan, M.K. (2003) Aggre-
gate exposures of nine preschool children
to persistent organic pollutants at day
care and at home, J. Expo. Anal. Environ.
Epidemiol., 13, 187–202.
Wu, Q., Baek, S.-Y., Fang, M. and Chang,
Y.-S. (2010) Distribution and fate of
polybrominated diphenyl ethers in indoor
environments of elementary schools,
Indoor Air, 20, 263–270.
Wu, Y., Cox, S.S., Xu, Y., Liang, Y.,
Won, D., Liu, X., Clausen, P. A.,
Rosell, L., Benning, J.L., Zhang, Y.
and Little, J.C. (2016) A reference
method for measuring emissions of
SVOCs in small chambers, Build. Envi-
ron., 95, 126–132.
Zhang, L.H., Li, P.J., Gong, Z.Q. and Oni
Adeola, A. (2006) Photochemical behav-
ior of benzo[a]pyrene on soil surfaces
under UV light irradiation, J. Environ.
Sci. (China), 18, 1226–1232.
Zmirou, D., Gauvin, S., Pin, I., Momas,
I., Just, J., Sahraoui, F., Le Moullec,
Y., Br�emont, F., Cassadou, S.,
Albertini, M., Lauvergne, N., Chiron,
M. and Labb�e, A. (2002) Five
epidemiological studies on transport
and asthma: objectives, design and
descriptive results, J. Expo. Anal.
Environ. Epidemiol., 12, 186–196.
127
SVOCS in schools

Chapitre 1 : contexte scientifique
Page 46
1/21
Semi-volatile organic compounds in the air and dust of 30 French
schools: a pilot study
RAFFY Gaëlle1,2,3*
; MERCIER Fabien1,2,3
; BLANCHARD Olivier1,2
; DERBEZ Mickaël4; DASSONVILLE Claire
4;
BONVALLOT Nathalie1,2
; GLORENNEC Philippe1,2
; LE BOT Barbara1,2,3
1EHESP - School of public health Sorbonne Paris Cité, Rennes, France 2 Irset-Inserm UMR 1085- Research Institute for Environmental and Occupational Health, Rennes, France 3LERES - Environment and health research laboratory, Rennes, France 4Université Paris Est, CSTB - Scientific and technical center for building, OQAI - French indoor air quality
observatory, Marne-la-Vallée, France
Supporting information
Dust sampling. ........................................................................................................................................................ 2
Reagents and chemicals .......................................................................................................................................... 2
Sample extraction .................................................................................................................................................... 3
Sample analysis ....................................................................................................................................................... 3
Preparation of laboratory blank and quality control (QC) samples ......................................................................... 4
Data validation process ........................................................................................................................................... 4
SVOC concentrations in air QC samples ................................................................................................................ 4
SVOC concentrations in SRM 2585 ....................................................................................................................... 5
References ............................................................................................................................................................. 20
Table S1. Characteristics of schools and classrooms .............................................................................................. 5
Table S2. SVOCs of interest for the study .............................................................................................................. 6
Table S3. Air sampling method evaluation ............................................................................................................. 7
Table S4. SVOC concentrations in air QC samples (ng/m3) ................................................................................... 8
Table S5. SVOC concentrations in SRM 2585 (ng/g) ............................................................................................ 9
Table S6. SVOC concentrations in French classrooms (Brittany, France, 2010) ................................................. 10
Table S7. SVOC concentrations in air (ng/m3) in classrooms (Brittany, France, 2010) ....................................... 12
Table S8. SVOC concentrations in vacuumed dust (< 100 µm fraction) (ng/g) in classrooms (Brittany, France, 2010) ..................................................................................................................................................................... 13
Table S9. SVOC concentrations in wiped dust (ng/m²) in classrooms (Brittany, France, 2010) .......................... 14
Table S10. SVOC concentrations from less concentrated extracts in air (ng/m3) in classrooms (Brittany, France) .............................................................................................................................................................................. 15
Table S11. SVOC concentrations from less concentrated extracts in vacuumed dust (< 100 µm fraction) (ng/g) in classrooms (Brittany, France) ............................................................................................................................... 15
Table S12. SVOC concentrations from less concentrated extracts in wiped dust (ng/m²) in classrooms (Brittany, France) .................................................................................................................................................................. 15
Table S13. SVOCs in air of nursery and primary schools in ng/m3 ...................................................................... 16
Table S14. SVOCs in dust of nursery and primary schools in ng/g ...................................................................... 18

Chapitre 1 : contexte scientifique
Page 47
2/21
Dust sampling.
To avoid any disturbance of air sampling, dust was sampled either during the week preceding air sampling or
just after the end of air sampling. Two different methods were used for sampling settled dust. The first method
consisted of vacuuming dust settled on the floor using a modified vacuum cleaner (LG Electronics, Seoul, South
Korea): the nozzle was covered with aluminum foil and dust was collected in a cellulose thimble (Whatman,
Maidstone, Kent) placed at the entrance of the tube in order to avoid any contact with the internal parts of the
vacuum cleaner, thus limiting foreign contamination of the sample. A 10 to 12 m² area in which children spend
most time was measured and vacuumed slowly (about 0.5 m² per minute). The amount of dust present in the
cellulose cartridge was then visually checked: if it was insufficient, another area was selected, measured and
vacuumed. This procedure was repeated until the cellulose cartridge was at least half full. The cartridge was then
wrapped in aluminum foil previously cleaned with DCM, transported back to the laboratory in an ice-box and
kept in a freezer prior to extraction. The second method consisted of collecting settled dust using a damp wipe
(Aramsco, Paulsboro, USA) on a 0.1 m² square floor surface delimited by a cardboard template (atelier du cadre,
Carentoir, France). The cardboard template was cleaned using a wipe and phthalate free gloves were worn in
order to avoid external contamination of the sample. The floor surface area to be sampled was a smooth surface
such as stone, wooden or plastic floor, chosen in an area where the children spend most time, and where
possible, was a smooth surface such as a stone, wooden or plastic floor. A wipe was removed from its package
and laid flat in a corner of the template. It was then slowly moved from side to side and from top to bottom, as if
drawing an “S” shape. The wipe was then folded in two, keeping the collected dust inside the fold and applied
with the same slow motion, perpendicular to the previous passage. The wipe was folded once more, keeping the
dust inside, and applied over the edges and corners of the template (NF X 46-032, 2008). The wipe was then
rolled and inserted into a glass amber vial, previously cleaned with DCM. The same procedure was performed
twice more, to collect three wipes per classroom. A sampling blank was made for each school investigated (i.e.
one field blank for every 3 classrooms) using another wipe that was taken out of its package, folded, rolled and
inserted into a glass amber vial in the same way as for the samples. Wipes were transported back to the
laboratory in an ice-box and kept in a freezer prior to analysis.
Reagents and chemicals
Certified standards of aldrin, cis- and trans-chlordane, 4,4’-DDE, 4,4’-DDT, dieldrin, alpha-endosulfan, endrin,
heptachlor, metolachlor, alpha-HCH, gamma-HCH (lindane), chlorpyrifos, diazinon, dichlorvos, atrazine,
oxadiazon, cyfluthrin, cypermethrin, deltamethrin, permethrin, tetramethrin, tributylphosphate, acenaphthene,
anthracene, benzo[a]pyrene, fluoranthene, fluorene, phenanthrene, pyrene, PCB 77, 105, 126,
butylbenzylphthalate (BBP), di-n-butylphthalate (DBP), di(2-ethylhexyl)phthalate (DEHP), diethylphthalate
(DEP), diisobutylphthalate (DiBP), diisononylphthalate (DiNP), dimethoxyethylphthalate (DMEP),
dimethylphthalate (DMP), fenpropathrin (surrogate standard), methoprotryne (surrogate standard) and the
internal standard (ISTD) 2,3,4-trichloronitrobenzene (TCNB) were purchased from Dr. Ehrenstorfer GmbH
(Augsburg, Germany). Purity of certified standards was above 97 %, except for permethrin (94 %). Acetone and
dichloromethane (DCM) (PLUS-for residual pesticide analysis) were purchased from Carlo Erba Reagents (Val

Chapitre 1 : contexte scientifique
Page 48
3/21
de Reuil, France). Individual standard stock solutions (1 g/L) were prepared in acetone by accurately weighing
25 mg (± 0.1 mg) of certified standards into 25 mL volumetric flasks and stored at -18°C. Nonane solutions (50
mg/L) of BDE 85, 99, 100 and 119 were purchased from Wellington Laboratories (Guelph, ON, Canada).
Cyclohexane solutions (10 mg/L) of galaxolide (HHCB) and tonalide (AHTN) were obtained from Dr.
Ehrenstorfer GmbH (Augsburg, Germany). A mixture (PCB Mix 21) containing 10 mg/L of 8 PCBs (PCB 28,
31, 52, 101, 118, 138, 153 and 180) in cyclohexane was supplied by Dr. Ehrenstorfer GmbH (Augsburg,
Germany). Calibration solutions were prepared by appropriate dilution of individual standard stock solutions and
commercial solutions in DCM.
The Standard Reference Material SRM 2585 (Organic Contaminants in House Dust) was purchased from the
National Institute of Standards and Technology (NIST, Gaithersburg, MD, USA). Celite® 545 was purchased
from Merck KGaA (Darmstadt, Germany). Chromabond® NH2 (aminopropyl modified silica) glass columns (3
mL / 500 mg) were purchased from Macherey-Nagel GmbH & Co. KG (Düren, Germany).
Sample extraction
For air samples (gas and particulate phases), semivolatile organic compounds (SVOCs) were extracted from
polyurethane foam (PUF) and quartz fiber filter (QFF) together using a pressurized liquid extractor (PLE) ASE
(Accelerated Solvent Extractor) 350 (Dionex Corporation, Sunnyvale, USA). The QFF was placed on top of a
cellulose filter at the bottom of each stainless steel cell. The PUF was then inserted into the cell and another
cellulose filter was placed on top after adding 100 ng of each surrogate standard (fenpropathrin and
methoprotryne). Extractions were performed once with DCM. Organic extracts were concentrated to 0.5 mL at
30°C under a nitrogen stream, spiked with 1 µg of ISTD and stored at -18°C prior to analysis.
SVOC extractions from vacuumed dust were performed on 200 mg of sieved dust. After adding 100 ng of each
surrogate standard, extractions were performed using PLE. Organic extracts were concentrated to 10 mL at 30°C
under a nitrogen stream. A volume of 500 µL was transferred into a 1.5 mL amber glass vial and spiked with
1 µg of ISTD. This aliquot was dedicated to quantification of the most concentrated compounds, such as
phthalates. The remaining 9.5 mL were concentrated to 1 mL and transferred onto Chromabond® NH2 glass
columns prewashed with 6 mL of DCM. Elution was performed with 5 mL of DCM. The extracts were then
concentrated to 0.5 mL and spiked with 1 µg of ISTD. All extracts were stored at -18°C prior to analysis.
Sample analysis
All extracts were analyzed using a gas chromatograph (GC) (Trace GC Ultra) coupled to a mass spectrometer
(MS) (TSQ Quantum GC) operated in electron impact ionization (EI) mode (70 eV) (Thermo Scientific). The
GC system was equipped with a TriPlus Autosampler and a Programmable Temperature Vaporizing (PTV)
injector fitted with an empty baffled glass liner. Calibration solutions and sample extracts were injected (1 µL) in
splitless mode. Helium was used as column carrier gas at a constant flow rate of 2 mL/min. Chromatographic
separation was performed on a Rtx-PCB capillary column (60 m length x 0.25 mm I.D., 0.25 µm film thickness)

Chapitre 1 : contexte scientifique
Page 49
4/21
supplied by Restek (Lisses, France). The triple quadrupole MS was operated in multiple reaction monitoring
(MRM) mode and the two most sensitive and specific transitions were monitored for each compound.
Preparation of laboratory blank and quality control (QC) samples
For air samples, cleaned PUFs were used as laboratory blank samples and QC samples consisted of cleaned
PUFs spiked with the calibration solution at a concentration of twice or eight times the LOQ. These were
prepared with each batch of nine samples. For vacuumed dust samples, laboratory blank samples consisted of
Celite (2800 mg) and QC samples were made of 200 mg of the NIST (National Institute of Standards and
Technology) SRM 2585 which contains indicative, reference or certified concentrations of several target
compounds (Mercier et al., 2014). Both were prepared with each batch of nine samples. For wiped dust samples,
wipes freshly removed from their packaging were used as laboratory blank samples and QC samples were
performed by spreading 200 mg of SRM 2585 onto wipes also freshly removed from their packaging. These
were prepared with the samples of each six classrooms.
Data validation process
The data validation protocol of the method contained several conditions including (i) the area of the ISTD in
samples had to be within ± 25% of its area in calibration solutions, (ii) the determination coefficient of the
calibration curve had to be greater than 0.995, (iii) the concentration of a substance in the laboratory blank
sample had to be lower than 30% of the concentration measured in the associated samples, (iv) the measured
concentration in calibration check solutions, injected every 10 samples, had to be within ±25% of its nominal
concentration value, (v) the measured concentration of the calibration solution at the LOQ level had to be within
±50% of its nominal concentration value, and (vi) the concentration measured in the Standard Reference
Material 2585 had to be within the limits set for the current year. If those conditions were not met, samples
would either be re-analyzed or re-extracted if possible. For laboratory blanks, the validation conditions were as
described in the main document ("When either a field blank sample or a laboratory blank sample showed a
concentration greater than 30 % of the concentration found in the associated samples, the results in these samples
were not validated and were removed from the data. If the contamination was less than 30% of the concentration
found in associated samples, the concentrations for these samples were reported without blank correction").
SVOC concentrations in air QC samples
Concentrations measured in air QC samples and associated RSD and recovery data are summarized in SI
Table 4. For low level (LOQ x 2) and high level (LOQ x 8) QCs, measured concentrations ranged from 77 to
124% and 79 to 119% respectively of the spiked concentrations, indicating good accuracy of results. For the low
level QCs, RSD ranged from 11% to 34% for all compounds except phthalates, for which RSD ranged from 13%
to 48%, because of occasional background contamination. For the high level QCs, RSD ranged from 8% to 33%.
Overall, precision of the results was satisfactory: of the 55 compounds analyzed, RSD were below 25% for 47
compounds in low level QCs, and for 50 compounds in high level QCs.

Chapitre 1 : contexte scientifique
Page 50
5/21
SVOC concentrations in SRM 2585
Concentrations measured in SRM 2585 are summarized in SI Table 5. Overall they were in a good agreement
with the indicative, reference or certified concentrations for the SRM 2585 extracted as vacuumed dust where
they ranged from 75% to 125% of the indicative, reference or certified concentrations with the exception of
heptachlor (60%), 4,4’-DDE (68%) and PCB 153 (73%). Measured concentrations were less accurate in
SRM2585 extracted as wiped dust, where they ranged from 50% to 140% - although they fell between 75% and
125% for 25 of the 31 quantified compounds. The measured concentration of anthracene was about twice the
certified value in SRM 2585 extracted as vacuumed dust (217%) or wiped dust (194%), confirming the findings
of Mercier et al (2012, 2014). Method precision was satisfactory: RSDs for SRM 2585 extracted as vacuumed
dust ranged from 10% to 24% and from 14% to 30% for SRM 2585 extracted as wiped dust.
Table S1. Characteristics of schools and classrooms
This study
French Survey
(Guillam et al., 2011) (2009-2010) (2010)
Schools characteristics n=30 n=466 Building's year of construction
Before 1946 22% 27% Between 1946 and 2000 64% 56% After 2000 13% 8%
Heating energy
gas 63% 43% oil 13% 30% electricity 10% 20%
Ventilation
Natural 70% 85% Mechanical 30% 15%
Outdoor environment
Urban 47% 44% Rural 53% 35% Residential 18%
Classrooms characteristics
Age of children n=90 n=985 2 to 5 years old 49% 49% 6 to 11 years old 51% 51%
Number of Children n=90 n=936 Average 24.4 23.7
Story n=90 n=924 Ground floor 80% 76% 2nd floor 16% 21% 3rd floor 4% 3%
Floor covering n=90 n=960 PVC 70% 60% Stone 34% 32% Wood 10% 9%
Wall covering n=90 n=949 Paint 78% 90% Wall paper 29% 12%

Chapitre 1 : contexte scientifique
Page 51
6/21
Table S2. SVOCs of interest for the study
Air
(ng/m3)
Vacuumed dust
(< 100 µm fraction)
(ng/g)
Wiped dust
(ng/m²)
Air
(ng/m3)
Vacuumed dust
(< 100 µm fraction)
(ng/g)
Wiped dust
(ng/m²)
Substance LOQ UL LOQ UL LOQ UL LOQ UL LOQ UL LOQ UL
Organochlorinated pesticides: PAHs:
α-HCH 0.4 20 26 1 320 20 830 Acenaphtene 1.0 50 66 3 290 40 2 080
γ-HCH 1.0 50 66 3 290 40 2 080 Fluorene 1.0 50 66 3 290 40 2 080
Heptachlor 0.4 20 26 1 320 20 830 Phenanthrene 1.0 50 66 3 290 40 2 080
Metolachlor 1.0 50 66 3 290 40 2 080 Anthracene 1.0 50 66 3 290 40 2 080
Aldrin 1.0 50 66 3 290 40 2 080 Fluoranthene 1.0 50 66 3 290 40 2 080
Trans-chlordane 0.4 20 26 1 320 20 830 Pyrene 1.0 50 66 3 290 40 2 080
Cis-chlordane 0.4 20 26 1 320 20 830 Benzo(a)pyrene 1.0 50 66 3 290 40 2 080
Alpha-endosulfan 1.0 50 66 3 290 40 2 080
4,4'-DDE 0.4 20 26 1 320 20 830 PCBs:
Dieldrin 1.0 50 66 3 290 40 2 080 PCB 31 0.4 20 26 1 320 20 830
Endrin 1.0 50 66 3 290 40 2 080 PCB 28 0.4 20 26 1 320 20 830
4,4'-DDT 1.0 50 66 3 290 40 2 080 PCB 52 0.4 20 26 1 320 20 830
PCB 101 0.4 20 26 1 320 20 830
Organophosphorus pesticides: PCB 77 0.4 20 26 1 320 20 830
Dichlorvos 1.0 50 66 3 290 40 2 080 PCB 118 0.4 20 26 1 320 20 830
Diazinon 1.0 50 66 3 290 40 2 080 PCB 153 0.4 20 26 1 320 20 830
Chlorpyrifos 1.0 50 66 3 290 40 2 080 PCB 105 0.4 20 26 1 320 20 830
PCB 138 0.4 20 26 1 320 20 830
Other pesticides: PCB 126 0.4 20 26 1 320 20 830
Atrazine 1.0 50 66 3 290 40 2 080 PCB 180 0.4 20 26 1 320 20 830
Oxadiazon 1.0 50 66 3 290 40 2 080
Phthalates:
Pyrethroids: DMP 1.0 50 66 3 290 40 2 080
Tetramethrin 1.0 50 66 3 290 40 2 080 DEP 8.0 800 526 52 600 333 33 300
Permethrin 1.0 50 66 3 290 40 2 080 DiBP 8.0 800 526 52 600 333 33 300
Cyfluthrin 1.0 50 66 3 290 40 2 080 DBP 8.0 800 526 52 600 333 33 300
Cypermethrin 1.0 50 66 3 290 40 2 080 DMEP 1.0 50 66 3 290 40 2 080
Deltamethrin 1.0 50 66 3 290 40 2 080 BBP 1.0 50 66 3 290 40 2 080
DEHP 8.0 800 526 52 600 333 33 300
Phosphoric ester : DiNP 8.0 800 526 52 600 333 33 300
Tributylphosphate 1.0 50 66 3 290 40 2 080
PBDEs:
Musks: BDE 100 1.0 50 66 3 290 40 2 080
Galaxolide 1.0 50 66 3 290 40 2 080 BDE 119 1.0 50 66 3 290 40 2 080
Tonalide 1.0 50 66 3 290 40 2 080 BDE 99 1.0 50 66 3 290 40 2 080
BDE 85 1.0 50 66 3 290 40 2 080
LOQ: limit of quantitation. UL: upper limit of the calibration range.
α-HCH: α-hexachlorocyclohexane, γ-HCH: γ-hexachlorocyclohexane (Lindane), 4,4'-DDE: dichlorodiphenyldichloroethylene, 4,4'-DDT: dichlorodiphenyltrichloroethane, PAHs: polycyclic aromatic hydrocarbons, PCBs: polychlorobiphenyls, DMP: dimethyl-phthalate, DEP: diethyl phthalate, DiBP: diisobutyl-phthalate, DBP: dibutyl-phthalate, DMEP: di(methoxyethyl)-phthalate, BBP: butyl benzyl phthalate, DEHP: bis(2-ethylhexyl)-phthalate, DiNP: diisononyl-phthalate, PBDEs: polybromodiphenylethers.

Chapitre 1 : contexte scientifique
Page 52
7/21
Table S3. Air sampling method evaluation
Spiked
mass
(ng)
Spiked
concentration
(ng/m3)a
Measured /
spiked
concentration
(%) for glass
cartridges
(n=3)
Measured /
spiked
concentration
(%) in second
PUF in series
(n=1)b
Spiked
mass
(ng)
Spiked
concentration
(ng/m3)
Measured /
spiked
concentration
(%) for glass
cartridges
(n=3)
Measured /
spiked
concentration
(%) in second
PUF in series
(n=1)b
Organochlorinated pesticides: PAHs (continued):
α -HCH 200 16 102 ± 6 Phenanthrene 500 40 100 ± 4
γ -HCH 500 40 98 ± 5 Anthracene 500 40 31 ± 6 0
Aldrin 500 40 0 ± 0 0 Fluoranthene 500 40 106 ± 4
Alpha-endosulfan 500 40 86 ± 3 Pyrene 500 40 85 ± 4
4,4'-DDE 200 16 96 ± 2 Benzo(a)pyrene 500 40 1 ± 1 0
Dieldrin 500 40 97 ± 5 PCBs:
4,4'-DDT 500 40 110 ± 6 PCB 31 200 16 97 ± 8
Organophosphated pesticides: PCB 28 200 16 99 ± 1
Dichlorvos 500 40 13 ± 1 0 PCB 52 200 16 99 ± 2
Diazinon 500 40 66 ± 2 PCB 101 200 16 96 ± 7
Chlorpyrifos 500 40 91 ± 5 PCB 118 200 16 98 ± 3
Other pesticides: PCB 153 200 16 97 ± 3
Oxadiazon 500 40 102 ± 5 PCB 105 200 16 99 ± 5
Pyrethroids: PCB 138 200 16 99 ± 2
Tetramethrin 500 40 0 ± 0 0 PCB 180 200 16 99 ± 6
Permethrin 2500 200 95 ± 3 Phthalates:
Cyfluthrin 500 40 89 ± 3 DEP 1E+05 8000 97 ± 2
Cypermethrin 500 40 87 ± 6 DiBP 1E+05 8000 96 ± 1
Deltamethrin 500 40 81 ± 17 DBP 1E+05 8000 93 ± 2
Phosphoric ester : BBP 1E+05 8000 100 ± 4
Tributylphosphate 2500 200 99 ± 4 DEHP 1E+05 8000 95 ± 1
Musks: DiNP 1E+05 8000 85 ± 4
Galaxolide 10000 800 91 ± 4 PBDEs:
Tonalide 10000 800 93 ± 2 BDE 100 500 40 85 ± 5
PAHs: BDE 99 500 40 95 ± 7
Acenaphtene 500 40 8 ± 0 4 BDE 85 500 40 86 ± 8
Fluorene 500 40 81 ± 8 abased on 12,5m3 sampled at 2 L/min from Monday 8:30 to Friday 16:30 ; bMeasured / spiked concentration (%) in PUF in series = (concentration in PUF in series after spiked PUF - concentration in PUF in series after witness PUF)/spiked concentration .
α-HCH: α-hexachlorocyclohexane, γ-HCH: γ-hexachlorocyclohexane (Lindane), 4,4'-DDE: dichlorodiphenyldichloroethylene, 4,4'-DDT: dichlorodiphenyltrichloroethane, PAHs: polycyclic aromatic hydrocarbons, PCBs: polychlorobiphenyls, DEP: diethyl phthalate, DiBP: diisobutyl-phthalate, DBP: dibutyl-phthalate, BBP: butyl benzyl phthalate, DEHP: bis(2-ethylhexyl)-phthalate, DiNP: diisononyl-phthalate, PBDEs: polybromodiphenylethers. This evaluation was carried out for the 44 compounds that were more often quantified and later selected for the national campaign.
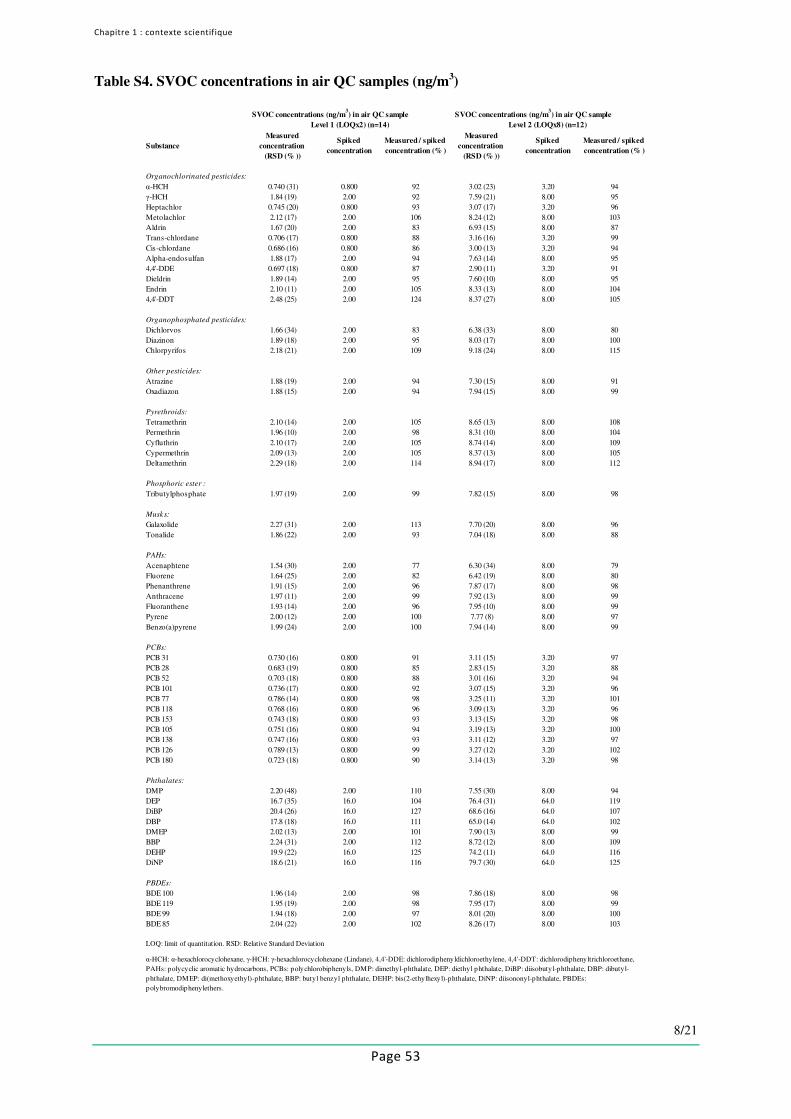
Chapitre 1 : contexte scientifique
Page 53
8/21
Table S4. SVOC concentrations in air QC samples (ng/m3)
Substance
Measured
concentration
(RSD (% ))
Spiked
concentration
Measured / spiked
concentration (% )
Measured
concentration
(RSD (% ))
Spiked
concentration
Measured / spiked
concentration (% )
Organochlorinated pesticides:
α-HCH 0.740 (31) 0.800 92 3.02 (23) 3.20 94γ-HCH 1.84 (19) 2.00 92 7.59 (21) 8.00 95Heptachlor 0.745 (20) 0.800 93 3.07 (17) 3.20 96Metolachlor 2.12 (17) 2.00 106 8.24 (12) 8.00 103Aldrin 1.67 (20) 2.00 83 6.93 (15) 8.00 87Trans-chlordane 0.706 (17) 0.800 88 3.16 (16) 3.20 99Cis-chlordane 0.686 (16) 0.800 86 3.00 (13) 3.20 94Alpha-endosulfan 1.88 (17) 2.00 94 7.63 (14) 8.00 954,4'-DDE 0.697 (18) 0.800 87 2.90 (11) 3.20 91Dieldrin 1.89 (14) 2.00 95 7.60 (10) 8.00 95Endrin 2.10 (11) 2.00 105 8.33 (13) 8.00 1044,4'-DDT 2.48 (25) 2.00 124 8.37 (27) 8.00 105
Organophosphated pesticides:
Dichlorvos 1.66 (34) 2.00 83 6.38 (33) 8.00 80Diazinon 1.89 (18) 2.00 95 8.03 (17) 8.00 100Chlorpyrifos 2.18 (21) 2.00 109 9.18 (24) 8.00 115
Other pesticides:
Atrazine 1.88 (19) 2.00 94 7.30 (15) 8.00 91Oxadiazon 1.88 (15) 2.00 94 7.94 (15) 8.00 99
Pyrethroids:
Tetramethrin 2.10 (14) 2.00 105 8.65 (13) 8.00 108Permethrin 1.96 (10) 2.00 98 8.31 (10) 8.00 104Cyfluthrin 2.10 (17) 2.00 105 8.74 (14) 8.00 109Cypermethrin 2.09 (13) 2.00 105 8.37 (13) 8.00 105Deltamethrin 2.29 (18) 2.00 114 8.94 (17) 8.00 112
Phosphoric ester :
Tributylphosphate 1.97 (19) 2.00 99 7.82 (15) 8.00 98
Musks:
Galaxolide 2.27 (31) 2.00 113 7.70 (20) 8.00 96Tonalide 1.86 (22) 2.00 93 7.04 (18) 8.00 88
PAHs:
Acenaphtene 1.54 (30) 2.00 77 6.30 (34) 8.00 79Fluorene 1.64 (25) 2.00 82 6.42 (19) 8.00 80Phenanthrene 1.91 (15) 2.00 96 7.87 (17) 8.00 98Anthracene 1.97 (11) 2.00 99 7.92 (13) 8.00 99Fluoranthene 1.93 (14) 2.00 96 7.95 (10) 8.00 99Pyrene 2.00 (12) 2.00 100 7.77 (8) 8.00 97Benzo(a)pyrene 1.99 (24) 2.00 100 7.94 (14) 8.00 99
PCBs:
PCB 31 0.730 (16) 0.800 91 3.11 (15) 3.20 97PCB 28 0.683 (19) 0.800 85 2.83 (15) 3.20 88PCB 52 0.703 (18) 0.800 88 3.01 (16) 3.20 94PCB 101 0.736 (17) 0.800 92 3.07 (15) 3.20 96PCB 77 0.786 (14) 0.800 98 3.25 (11) 3.20 101PCB 118 0.768 (16) 0.800 96 3.09 (13) 3.20 96PCB 153 0.743 (18) 0.800 93 3.13 (15) 3.20 98PCB 105 0.751 (16) 0.800 94 3.19 (13) 3.20 100PCB 138 0.747 (16) 0.800 93 3.11 (12) 3.20 97PCB 126 0.789 (13) 0.800 99 3.27 (12) 3.20 102PCB 180 0.723 (18) 0.800 90 3.14 (13) 3.20 98
Phthalates:
DMP 2.20 (48) 2.00 110 7.55 (30) 8.00 94DEP 16.7 (35) 16.0 104 76.4 (31) 64.0 119DiBP 20.4 (26) 16.0 127 68.6 (16) 64.0 107DBP 17.8 (18) 16.0 111 65.0 (14) 64.0 102DMEP 2.02 (13) 2.00 101 7.90 (13) 8.00 99BBP 2.24 (31) 2.00 112 8.72 (12) 8.00 109DEHP 19.9 (22) 16.0 125 74.2 (11) 64.0 116DiNP 18.6 (21) 16.0 116 79.7 (30) 64.0 125
PBDEs:
BDE 100 1.96 (14) 2.00 98 7.86 (18) 8.00 98BDE 119 1.95 (19) 2.00 98 7.95 (17) 8.00 99BDE 99 1.94 (18) 2.00 97 8.01 (20) 8.00 100BDE 85 2.04 (22) 2.00 102 8.26 (17) 8.00 103
α-HCH: α-hexachlorocyclohexane, γ-HCH: γ-hexachlorocyclohexane (Lindane), 4,4'-DDE: dichlorodiphenyldichloroethylene, 4,4'-DDT: dichlorodiphenyltrichloroethane, PAHs: polycyclic aromatic hydrocarbons, PCBs: polychlorobiphenyls, DMP: dimethyl-phthalate, DEP: diethyl phthalate, DiBP: diisobutyl-phthalate, DBP: dibutyl-phthalate, DMEP: di(methoxyethyl)-phthalate, BBP: butyl benzyl phthalate, DEHP: bis(2-ethylhexyl)-phthalate, DiNP: diisononyl-phthalate, PBDEs: polybromodiphenylethers.
SVOC concentrations (ng/m3) in air QC sample
Level 1 (LOQx2) (n=14)
SVOC concentrations (ng/m3) in air QC sample
Level 2 (LOQx8) (n=12)
LOQ: limit of quantitation. RSD: Relative Standard Deviation

Chapitre 1 : contexte scientifique
Page 54
9/21
Table S5. SVOC concentrations in SRM 2585 (ng/g)
Substance Indicative, reference or
certified concentration
Measured concentration
(RSD (% ))
Measured / Indicative,
reference or certified
concentration (% )
Measured concentration
(RSD (% ))
Measured / Indicative,
reference or certified
concentration (% )
Organochlorinated pesticides:
γ-HCH 4.1b
< 65.8 - < 62.5 -
Heptachlor 166b
99.9 (12) 60 83.0 (18) 50
Trans-chlordane 277b
341 (17) 123 294 (18) 106
Cis-chlordane 174b
166 (15) 95 150 (22) 86
4,4'-DDE 261a
177 (14) 68 165 (21) 63
Dieldrin 88.0b
89.5 (21) 102 109 (23) 124
4,4'-DDT 111a
125 (18) 113 131 (29) 118
Organophosphated pesticides:
Diazinon 396c
380 (14) 96 343 (17) 87
Chlorpyrifos 279c
244 (21) 87 282 (19) 101
Pyrethroids:
Tetramethrin 356c
350 (22) 98 361 (24) 101
Permethrin 4970c
4322 (22) 87 3910 (17) 79
Cyfluthrin 3730c
3024 (24) 81 3280 (16) 88
Cypermethrin 4050c
3439 (19) 85 3680 (19) 91
Phosphoric ester :
Tributylphosphate 306c
255 (20) 83 247 (16) 81
Musks:
Galaxolide 1540c
1460 (14) 95 1350 (15) 88
Tonalide 1840c
1730 (14) 94 1680 (17) 91
PAHs:
Phenanthrene 1920a
1710 (12) 89 1480 (18) 77
Anthracene 96.0a
208 (21) 217 186 (26) 194
Fluoranthene 4380a
2630 (16) 83 3370 (19) 77
Pyrene 3290a
2740 (17) 83 2620 (20) 80
Benzo(a)pyrene 1140a
897 (23) 79 1230 (30) 108
PCBs:
PCB 31 14.0a
<26.3 - < 25 -
PCB 28 13.4a
<26.3 - < 25 -
PCB 52 21.8a
20.4 (18) 94 20.6 (15) 94
PCB 101 29.8a
34.5 (15) 116 31.9 (17) 107
PCB 118 26.3a
29.6 (12) 112 < 25 -
PCB 153 40.2a
29.3 (15) 73 < 25 -
PCB 105 13.2a
<26.3 - < 25 -
PCB 138 27.6a
33.1 (14) 120 30.7 (14) 111
PCB 180 18.4a
20.3 (21) 110 19.8 (18) 108
Phthalates:
DMP 2550c
2104 (10) 83 2350 (20) 92
DEP 8240c
7700 (11) 93 7650 (20) 93
DiBP 6670c
6370 (18) 96 5230 (21) 78
DBP 33300c
28900 (16) 87 23900 (19) 72
BBPd
98700c
82700 (22) 84 > 3130 -
DEHPd
552000c
436000 (16) 79 > 50000 -
DiNPd
182000c
157000 (13) 86 > 50000 -
PBDEs:
BDE 100 145a
134 (20) 92 118 (22) 81
BDE 99 892a
753 (14) 84 647 (21) 73
BDE 85 43.8a
47.4 (20) 108 61.1 (18) 140
a Certified concentration.
b Reference concentration.
c Indicative concentration taken from Mercier et al. (J. Chromatogr. A 1336 (2014) 101-111)
a Concentrations from less concentrated extracts used for SRM2585 extracts extracted as vacuumed dust QC sample (n=3)
γ-HCH: gamma-hexachlorocyclohexane (Lindane), 4,4'-DDE: dichlorodiphenyldichloroethylene, 4,4'-DDT: dichlorodiphenyltrichloroethane, PAHs: polycyclic aromatic hydrocarbons, PCBs: polychlorobiphenyls, DMP: dimethyl-phthalate, DEP: diethyl phthalate, DiBP: diisobutyl-phthalate, DBP: dibutyl-phthalate, BBP: butyl benzyl phthalate, DEHP: bis(2-ethylhexyl)-phthalate, DiNP: diisononyl-phthalate, PBDEs: polybromodiphenylethers.
LOQ: limit of quantitation. RSD: Relative Standard Deviation
SVOC concentrations (ng/g) in SRM 2585
extracted as vacuumed dust QC control (n=12)d
SVOC concentrations (ng/g) in SRM 2585
extracted as wiped dust QC control (n=10)

Ch
ap
itre 1
: con
texte
scien
tifiqu
e
Page
55
10/21
Table S6. SVOC concentrations in French classrooms (Brittany, France, 2010)
Air (ng/m3) Vacuumed dust (< 100 µm fraction) (ng/g) Wiped dust (ng/m²)
Substance LOQ UL N 5th% 50th% 95th% F LOQ UL N 5th% 50th% 95th% F LOQ UL N 5th% 50th% 95th% F
Organochlorinated
pesticides:
α-HCH 0.4 20 59 <0.4 <0.4 3.4 24% 26 1 320 89 <26.3 <26.3 <26.3 2% 20 830 81 <20 <20 <20 1% γ-HCH 1.0 50 62 <1.0 2.0 7.2 79% 66 3 290 89 <65.8 <65.8 247 18% 40 2 080 81 <40 <40 <40 4% Heptachlor 0.4 20 62 <0.4 <0.4 <0.4 0% 26 1 320 89 <26.3 <26.3 <26.3 0% 20 830 81 <20 <20 <20 0% Metolachlor 1.0 50 62 <1.0 <1.0 <1.0 0% 66 3 290 89 <65.8 <65.8 <65.8 0% 40 2 080 81 <40 <40 <40 0% Aldrin 1.0 50 62 * * * 2% 66 3 290 89 <65.8 <65.8 <65.8 0% 40 2 080 81 <40 <40 <40 0% Trans-chlordane 0.4 20 62 <0.4 <0.4 <0.4 0% 26 1 320 89 <26.3 <26.3 <26.3 1% 20 830 81 <20 <20 <20 0% Cis-chlordane 0.4 20 62 <0.4 <0.4 <0.4 0% 26 1 320 89 <26.3 <26.3 <26.3 0% 20 830 81 <20 <20 <20 0% Alpha-endosulfan 1.0 50 62 <1.0 <1.0 <1.0 5% 66 3 290 89 <65.8 <65.8 <65.8 1% 40 2 080 81 <40 <40 <40 1% 4,4'-DDE 0.4 20 62 <0.4 <0.4 <0.4 0% 26 1 320 89 <26.3 <26.3 <26.3 2% 20 830 81 <20 <20 <20 0% Dieldrin 1.0 50 62 <1.0 <1.0 1.0 6% 66 3 290 89 <65.8 <65.8 <65.8 2% 40 2 080 81 <40 <40 <40 1% Endrin 1.0 50 62 <1.0 <1.0 <1.0 0% 66 3 290 89 <65.8 <65.8 <65.8 4% 40 2 080 81 <40 <40 <40 0% 4,4'-DDT 1.0 50 62 <1.0 <1.0 <1.0 0% 66 3 290 89 <65.8 <65.8 177 15% 40 2 080 81 <40 <40 <40 2%
Organophosphated
pesticides:
Dichlorvos 1.0 50 62 * * * 2% 66 3 290 89 <65.8 <65.8 <65.8 0% 40 2 080 81 <40 <40 <40 0% Diazinon 1.0 50 62 <1.0 <1.0 1.2 6% 66 3 290 89 <65.8 <65.8 <65.8 2% 40 2 080 81 <40 <40 <40 0% Chlorpyrifos 1.0 50 62 <1.0 <1.0 <1.0 2% 66 3 290 89 <65.8 <65.8 <65.8 3% 40 2 080 81 <40 <40 <40 2%
Other pesticides:
Atrazine 1.0 50 62 <1.0 <1.0 <1.0 0% 66 3 290 89 <65.8 <65.8 <65.8 0% 40 2 080 81 <40 <40 <40 0% Oxadiazon 1.0 50 62 <1.0 <1.0 <1.0 0% 66 3 290 89 <65.8 <65.8 110 9% 40 2 080 81 <40 <40 <40 1%
Pyrethroids:
Tetramethrin 1.0 50 62 * * * 0% 66 3 290 89 <65.8 <65.8 <65.8 0% 40 2 080 81 <40 <40 <40 0% Permethrin 1.0 50 62 <1.0 <1.0 <1.0 2% 66 3 290 89 <65.8 279 1 961 61% 40 2 080 81 <40 <40 578 27% Cyfluthrin 1.0 50 62 <1.0 <1.0 <1.0 0% 66 3 290 89 <65.8 <65.8 <65.8 0% 40 2 080 81 <40 <40 <40 0% Cypermethrin 1.0 50 62 <1.0 <1.0 <1.0 2% 66 3 290 89 <65.8 <65.8 <65.8 4% 40 2 080 81 <40 <40 <40 1% Deltamethrin 1.0 50 62 <1.0 <1.0 <1.0 0% 66 3 290 89 <65.8 <65.8 <65.8 0% 40 2 080 81 <40 <40 <40 0%
Phosphoric ester :
Tributylphosphate 1.0 50 62 2.0 4.7 12.4 100% 66 3 290 89 <65.8 103 401 74% 40 2 080 79 <40 <40 190 20%
Musks:
Galaxolide 1.0 50 62 46 >50 >50 100% 66 3 290 89 304 965 2 191 98% 40 2 080 65 148 335 1 213 97% Tonalide 1.0 50 62 10 20 >50 100% 66 3 290 89 <65.8 337 915 88% 40 2 080 81 <40 170 642 63% PAHs:
Acenaphtene 1.0 50 62 * * * 53% 66 3 290 89 <65.8 <65.8 <65.8 0% 40 2 080 81 <40 <40 <40 0% Fluorene 1.0 50 62 2.5 5.5 13 100% 66 3 290 89 <65.8 <65.8 268 40% 40 2 080 81 <40 <40 175 9% Phenanthrene 1.0 50 62 4.8 8.7 18 100% 66 3 290 89 <65.8 363 907 92% 40 2 080 75 <40 <40 539 45% Anthracene 1.0 50 62 * * * 2% 66 3 290 89 <65.8 <65.8 127 40% 40 2 080 81 <40 <40 <40 1% Fluoranthene 1.0 50 62 <1.0 <1.0 1.6 29% 66 3 290 89 <65.8 184 751 85% 40 2 080 81 <40 <40 441 32% Pyrene 1.0 50 62 <1.0 <1.0 1.2 18% 66 3 290 89 <65.8 285 760 90% 40 2 080 80 <40 <40 525 40% Benzo(a)pyrene 1.0 50 62 * * * 0% 66 3 290 89 <65.8 <65.8 172 27% 40 2 080 81 <40 <40 125 6%

Ch
ap
itre 1
: con
texte
scien
tifiqu
e
Page
56
11/21
Air (ng/m3) Vacuumed dust (< 100 µm fraction) (ng/g) Wiped dust (ng/m²)
Substance LOQ UL N 5th% 50th% 95th% F LOQ UL N 5th% 50th% 95th% F LOQ UL N 5th% 50th% 95th% F
PCBs:
PCB 31 0.4 20 62 <0.4 <0.4 0.6 15% 26 1 320 89 <26.3 <26.3 <26.3 2% 20 830 81 <20 <20 <20 0% PCB 28 0.4 20 62 <0.4 <0.4 0.9 19% 26 1 320 89 <26.3 <26.3 <26.3 6% 20 830 81 <20 <20 <20 0% PCB 52 0.4 20 62 <0.4 <0.4 0.5 16% 26 1 320 89 <26.3 <26.3 48 7% 20 830 81 <20 <20 <20 2% PCB 101 0.4 20 62 <0.4 <0.4 <0.4 2% 26 1 320 89 <26.3 <26.3 107 13% 20 830 81 <20 <20 <20 1% PCB 77 0.4 20 62 <0.4 <0.4 <0.4 0% 26 1 320 89 <26.3 <26.3 <26.3 2% 20 830 81 <20 <20 <20 0% PCB 118 0.4 20 62 <0.4 <0.4 <0.4 0% 26 1 320 89 <26.3 <26.3 42 8% 20 830 81 <20 <20 <20 1% PCB 153 0.4 20 62 <0.4 <0.4 <0.4 0% 26 1 320 89 <26.3 <26.3 73 9% 20 830 81 <20 <20 <20 1% PCB 105 0.4 20 62 <0.4 <0.4 <0.4 0% 26 1 320 89 <26.3 <26.3 <26.3 3% 20 830 81 <20 <20 <20 1% PCB 138 0.4 20 62 <0.4 <0.4 <0.4 0% 26 1 320 89 <26.3 <26.3 79 10% 20 830 81 <20 <20 <20 1% PCB 126 0.4 20 62 <0.4 <0.4 <0.4 0% 26 1 320 89 <26.3 <26.3 <26.3 0% 20 830 81 <20 <20 <20 0% PCB 180 0.4 20 62 <0.4 <0.4 <0.4 0% 26 1 320 89 <26.3 <26.3 <26.3 4% 20 830 81 <20 <20 <20 0%
Phthalates:
DMP 1.0 50 53 6.7 13 >50 100% 66 3 290 54 <65.8 252 1 680 87% 40 2 080 79 <40 <40 555 39% DEP 8.0 800 53 85 221 515 100% 526 52 600 76 739 2 890 6 560 93% 333 33 300 65 <333 1 310 5 200 66% DiBP 8.0 800 62 352 >800 >800 100% 526 52 600 89 41 000 > 52 600 > 52 600 100% 333 33 300 71 11 000 >33 300 >33 300 100% DBP 8.0 800 62 66 228 744 100% 526 52 600 89 11 000 38 200 > 52 600 100% 333 33 300 64 4 220 15 200 >33 300 100% DMEP 1.0 50 62 <1.0 <1.0 <1.0 2% 66 3 290 89 <65.8 <65.8 <65.8 4% 40 2 080 81 <40 <40 142 9% BBPab 1.0 50 56 3.7 19 >50 100% 66 3 290 22 11 400 105 000 468 000 100% 40 2 080 22 6 750 73 600 1 940 000 100% DEHPab 8.0 800 58 49 108 417 100% 526 52 600 28 275 000 1 430 000 5 830 000 100% 333 33 300 28 86 900 1 210 000 4 520 000 100% DiNPa 8.0 800 30 8.2 35 214 93% 526 52 600 32 258 000 1 030 000 4 100 000 100% 333 33 300 77 33 000 >33 300 >33 300 100%
PBDEs:
BDE 100 1.0 50 62 <1.0 <1.0 1.9 8% 66 3 290 89 <65.8 <65.8 140 8% 40 2 080 81 <40 <40 <40 1% BDE 119 1.0 50 62 <1.0 <1.0 <1.0 0% 66 3 290 89 <65.8 <65.8 <65.8 0% 40 2 080 81 <40 <40 <40 0% BDE 99 1.0 50 62 <1.0 <1.0 4.9 13% 66 3 290 89 <65.8 <65.8 340 12% 40 2 080 81 <40 <40 <40 2% BDE 85 1.0 50 62 <1.0 <1.0 <1.0 0% 66 3 290 89 <65.8 <65.8 <65.8 0% 40 2 080 81 <40 <40 <40 0%
LOQ: limit of quantitation. UL: upper limit of the calibration range. N: number of classrooms. F: frequency of classrooms with concentrations > LOQ. α-HCH: α-hexachlorocyclohexane, γ-HCH: γ -hexachlorocyclohexane (Lindane), 4,4'-DDE: dichlorodiphenyldichloroethylene, 4,4'-DDT: dichlorodiphenyltrichloroethane, PAHs: polycyclic aromatic hydrocarbons, PCBs: polychlorobiphenyls, DMP: dimethyl-phthalate, DEP: diethyl phthalate, DiBP: diisobutyl-phthalate, DBP: dibutyl-phthalate, DMEP: di(methoxyethyl)-phthalate, BBP: butyl benzyl phthalate, DEHP: bis(2-ethylhexyl)-phthalate, DiNP: diisononyl-phthalate, PBDEs: polybromodiphenylethers. aConcentrations from less concentrated extracts for vacuumed dust bConcentrations from less concentrated extracts for wiped dust *Unvalidated air sampling method, substance subject to degradation or low breakthrough volume. In grey : substance never quantified

Chapitre 1 : contexte scientifique
Page 57
12/21
Table S7. SVOC concentrations in air (ng/m3) in classrooms (Brittany, France, 2010)
Substancea LOQ UL N Nc<LOQ NLOQ<c<UL Nc>UL min 5th% 25th% 50th% 75th% 95th% max F
Organochlorinated pesticides:
a-HCH 0.4 20 59 45 14 0 <0.4 <0.4 <0.4 <0.4 <0.4 3.4 12 24%g-HCH 1.0 50 62 13 49 0 <1 <1 1.1 2.0 2.6 7.2 12 79%Chlorpyrifos-ethyl 1.0 50 62 61 1 0 <1 <1 <1 <1 <1 <1 4.1 2%
Aldrinb 1.0 50 62 61 1 0 * * * * * * * 2%
Alpha-endosulfan 1.0 50 62 59 3 0 <1 <1 <1 <1 <1 <1 2.0 5%Dieldrin 1.0 50 62 58 4 0 <1 <1 <1 <1 <1 1.0 2.4 6%
Organophosphated pesticides:
Dichlorvosb 1.0 50 62 61 1 0 * * * * * * * 2%
Diazinon 1.0 50 62 58 4 0 <1 <1 <1 <1 <1 1.2 3.1 6%
Pyrethroids:
Permethrin 1.0 50 62 61 1 0 <1 <1 <1 <1 <1 <1 2.1 2%Cypermethrin 1.0 50 62 61 1 0 <1 <1 <1 <1 <1 <1 2.9 2%
Phosphoric ester :
Tributylphosphate 1.0 50 62 0 62 0 1.3 2.0 3.5 4.7 6.7 12 28 100%
Musks:
Galaxolide 1.0 50 62 0 5 57 14 46.2 >50 >50 >50 >50 >50 100%Tonalide 1.0 50 62 0 51 11 3.5 10 16 20 36 >50 >50 100%
PAHs:
Acenaphteneb 1.0 50 62 29 33 0 * * * * * * * 53%
Fluorene 1.0 50 62 0 62 0 1.1 2.5 4.1 5.5 7.3 13 18 100%Phenanthrene 1.0 50 62 0 61 1 1.6 4.8 6.4 8.7 12 18 >50 100%
Anthraceneb 1.0 50 62 61 1 0 * * * * * * * 2%
Fluoranthene 1.0 50 62 44 18 0 <1 <1 <1 <1 1.1 1.6 8.3 29%Pyrene 1.0 50 62 51 11 0 <1 <1 <1 <1 <1 1.2 3.6 18%
PCBs:
PCB31 0.4 20 62 53 9 0 <0.4 <0.4 <0.4 <0.4 <0.4 0.6 2.6 15%PCB28 0.4 20 62 50 12 0 <0.4 <0.4 <0.4 <0.4 <0.4 0.9 4.2 19%PCB52 0.4 20 62 52 10 0 <0.4 <0.4 <0.4 <0.4 <0.4 0.5 0.5 16%PCB101 0.4 20 62 61 1 0 <0.4 <0.4 <0.4 <0.4 <0.4 <0.4 0.6 2%
Phthalates:
DMP 1.0 50 53 0 49 4 4.1 6.7 10.0 12.6 27.9 >50 >50 100%DEP 8.0 800 53 0 53 0 40 85 158 221 282 515 684 100%DiBP 8.0 800 62 0 22 40 207 352 652 >800 >800 >800 >800 100%DBP 8.0 800 62 0 59 3 37 66 146 228 352 744 >800 100%DMEP 1.0 50 62 61 1 0 <1 <1 <1 <1 <1 <1 1.1 2%BBP 1.0 50 56 0 37 19 1.5 3.7 8.0 19 >50 >50 >50 100%DEHP 8.0 800 58 0 57 1 27 49 72 108 165 417 >800 100%DiNP 8.0 800 30 2 28 0 <8 8.2 25 35 62 214 416 93%
PBDEs:
BDE 100 1.0 50 62 57 5 0 <1 <1 <1 <1 <1 1.9 3.1 8%BDE 99 1.0 50 62 54 8 0 <1 <1 <1 <1 <1 4.9 8.5 13%
LOQ: limit of quantitation. UL: upper limit of the calibration range. N: number of classrooms. Nc<LOQ: number of samples whose concentration is less than LOQ.
NLOQ<c<UL: number of samples whose concentration is between LOQ and UL. Nc>UL : number of samples whose concentration is above UL. F: frequency of classrooms with concentrations > LOQ.
aOnly substances quantified at least once reported.
*Unvalidated sampling method, substance subject to degradation or low breakthrough volume
α-HCH: α-hexachlorocyclohexane, γ-HCH: γ-hexachlorocyclohexane (Lindane), PAHs: polycyclic aromatic hydrocarbons, PCBs: polychlorobiphenyls, DMP: dimethyl-phthalate, DEP: diethyl phthalate, DiBP: diisobutyl-phthalate, DBP: dibutyl-phthalate, DMEP: di(methoxyethyl)-phthalate, BBP: butyl benzyl phthalate, DEHP: bis(2-ethylhexyl)-phthalate, DiNP: diisononyl-phthalate, PBDEs: polybromodiphenylethers.

Chapitre 1 : contexte scientifique
Page 58
13/21
Table S8. SVOC concentrations in vacuumed dust (< 100 µm fraction) (ng/g) in classrooms
(Brittany, France, 2010)
Substancea
LOQ UL N Nc<LO NLOQ<c< Nc>U min 5th% 25th% 50th% 75th% 95th% max F
Organochlorinated pesticides:
α-HCH 26.3 1 320 89 87 2 0 <26.3 <26.3 <26.3 <26.3 <26.3 <26.3 33.8 2%
γ-HCH 65.8 3 290 89 73 16 0 <65.8 <65.8 <65.8 <65.8 <65.8 247 482 18%
Trans-chlordane 26.3 1 320 89 88 1 0 <26.3 <26.3 <26.3 <26.3 <26.3 <26.3 84.3 1%
Alpha-endosulfan 65.8 3 290 89 88 1 0 <65.8 <65.8 <65.8 <65.8 <65.8 <65.8 144 1%
4,4'-DDE 26.3 1 320 89 87 2 0 <26.3 <26.3 <26.3 <26.3 <26.3 <26.3 116 2%Dieldrin 65.8 3 290 89 87 2 0 <65.8 <65.8 <65.8 <65.8 <65.8 <65.8 331 2%
Endrin 65.8 3 290 89 85 4 0 <65.8 <65.8 <65.8 <65.8 <65.8 <65.8 606 4%
4,4'-DDT 65.8 3 290 89 76 13 0 <65.8 <65.8 <65.8 <65.8 <65.8 177 583 15%
Organophosphated pesticides:
Diazinon 65.8 3 290 89 87 2 0 <65.8 <65.8 <65.8 <65.8 <65.8 <65.8 160 2%
Chlorpyrifos 65.8 3 290 89 86 3 0 <65.8 <65.8 <65.8 <65.8 <65.8 <65.8 1 250 3%
Other pesticides:
Oxadiazon 65.8 3 290 89 81 8 0 <65.8 <65.8 <65.8 <65.8 <65.8 110 373 9%
Pyrethroids:
Permethrin 65.8 3 290 89 35 52 2 <65.8 <65.8 <65.8 279 730 1 960 4 500 61%
Cypermethrin 65.8 3 290 89 85 4 0 <65.8 <65.8 <65.8 <65.8 <65.8 <65.8 2 470 4%
Phosphoric ester :
Tributylphosphate 65.8 3 290 89 23 64 2 <65.8 <65.8 <65.8 103 166 401 > 3290 74%
Musks:
Galaxolide 65.8 3 290 89 2 87 0 <65.8 304 564 965 1 358 2 190 3 480 98%
Tonalide 65.8 3 290 89 11 78 0 <65.8 <65.8 187 337 506 915 12 700 88%
PAHs:
Fluorene 65.8 3 290 89 53 36 0 <65.8 <65.8 <65.8 <65.8 111 268 465 40%
Phenanthrene 65.8 3 290 89 7 81 1 <65.8 <65.8 240 363 521 907 > 3290 92%
Anthracene 65.8 3 290 89 53 36 0 <65.8 <65.8 <65.8 <65.8 86 127 702 40%
Fluoranthene 65.8 3 290 89 13 75 1 <65.8 <65.8 122 184 323 751 > 3290 85%
Pyrene 65.8 3 290 89 9 79 1 <65.8 <65.8 194 285 449 760 > 3290 90%Benzo(a)pyrene 65.8 3 290 89 65 24 0 <65.8 <65.8 <65.8 <65.8 70 172 860 27%
PCBs:
PCB31 26.3 1 320 89 87 1 1 <26.3 <26.3 <26.3 <26.3 <26.3 <26.3 > 1320 2%
PCB28 26.3 1 320 89 84 4 1 <26.3 <26.3 <26.3 <26.3 <26.3 <26.3 > 1320 6%
PCB52 26.3 1 320 89 83 5 1 <26.3 <26.3 <26.3 <26.3 <26.3 48.1 > 1320 7%
PCB101 26.3 1 320 89 77 12 0 <26.3 <26.3 <26.3 <26.3 <26.3 107 608 13%
PCB77 26.3 1 320 89 87 2 0 <26.3 <26.3 <26.3 <26.3 <26.3 <26.3 209 2%
PCB118 26.3 1 320 89 82 7 0 <26.3 <26.3 <26.3 <26.3 <26.3 42.2 391 8%PCB153 26.3 1 320 89 81 8 0 <26.3 <26.3 <26.3 <26.3 <26.3 73.3 541 9%
PCB105 26.3 1 320 89 86 3 0 <26.3 <26.3 <26.3 <26.3 <26.3 <26.3 292 3%
PCB138 26.3 1 320 89 80 9 0 <26.3 <26.3 <26.3 <26.3 <26.3 78.5 556 10%
PCB180 26.3 1 320 89 85 4 0 <26.3 <26.3 <26.3 <26.3 <26.3 <26.3 261 4%
Phthalates:
DMP 65.8 3 290 54 7 47 0 <65.8 <65.8 122 252 531 1 680 2 780 87%
DEP 526 52 600 76 5 71 0 263 739 2 330 2 890 3 840 6 560 10 400 93%
DiBP 526 52 600 89 0 26 63 23 050 41 020 > 52600 > 52600 > 52600 > 52600 > 52600 100%DBP 526 52 600 89 0 64 25 8 010 11 000 23 200 38 200 > 52600 > 52600 > 52600 100%
DMEP 65.8 3 290 89 85 4 0 <65.8 <65.8 <65.8 <65.8 <65.8 <65.8 5 890 4%
BBPb 65.8 3 290 22 8 520 11 400 53 000 105 000 216 000 468 000 1 930 000 100%
DEHPb 526 52 600 28 226 000 275 000 709 000 1 430 000 2 240 000 5 830 000 9 280 000 100%
DiNPb 526 52 600 32 166 000 258 000 617 000 1 030 000 2 150 000 4 100 000 9 570 000 100%
PBDEs:
BDE100 65.8 3 290 89 82 7 0 <65.8 <65.8 <65.8 <65.8 <65.8 140 241 8%
BDE99 65.8 3 290 89 78 11 0 <65.8 <65.8 <65.8 <65.8 <65.8 340 575 12%
LOQ: limit of quantitation. UL: upper limit of the calibration range. N: number of classrooms. Nc<LOQ: number of samples whose concentration is less
than LOQ. NLOQ<c<UL: number of samples whose concentration is between LOQ and UL. Nc>UL : number of samples whose concentration is above UL.
F: frequency of classrooms with concentrations > LOQ.α-HCH: α-hexachlorocyclohexane, γ-HCH: γ-hexachlorocyclohexane (Lindane), 4,4'-DDE: dichlorodiphenyldichloroethylene, 4,4'-DDT: dichlorodiphenyltrichloroethane, PAHs: polycyclic aromatic hydrocarbons, PCBs: polychlorobiphenyls, DMP: dimethyl-phthalate, DEP: diethyl-phthalate, DiBP: diisobutyl-phthalate, DBP: dibutyl-phthalate, DMEP: di(methoxyethyl)-phthalate, BBP: butyl-benzyl-phthalate, DEHP: bis(2-ethylhexyl)-phthalate, DiNP: diisononyl-phthalate, PBDEs: polybromodiphenylethers. aOnly substances quantified at least once reported.
bConcentrations from less concentrated extracts

Chapitre 1 : contexte scientifique
Page 59
14/21
Table S9. SVOC concentrations in wiped dust (ng/m²) in classrooms (Brittany, France, 2010)
Substancea LOQ UL N Nc<LOQ NLOQ<c<UL Nc>UL min 5th% 25th% 50th% 75th% 95th% max F
Organochlorinated pesticides:
α-HCH 20 830 81 80 1 0 <20 <20 <20 <20 <20 <20 78 1%
γ-HCH 40 2 080 81 78 3 0 <40 <40 <40 <40 <40 <40 329 4%
Alpha-endosulfan 40 2 080 81 80 1 0 <40 <40 <40 <40 <40 <40 337 1%Dieldrin 40 2 080 81 80 1 0 <40 <40 <40 <40 <40 <40 146 1%
4,4'-DDT 40 2 080 81 79 2 0 <40 <40 <40 <40 <40 <40 229 2%
Organophosphated pesticides:
Chlorpyrifos 40 2 080 81 79 2 0 <40 <40 <40 <40 <40 <40 328 2%
Other pesticides:
Oxadiazon 40 2 080 81 80 1 0 <40 <40 <40 <40 <40 <40 600 1%
Pyrethroids:
Permethrin 40 2 080 81 59 21 1 <40 <40 <40 <40 146 578 >2080 27%
Cypermethrin 40 2 080 81 80 1 0 <40 <40 <40 <40 <40 <40 1 442 1%
Phosphoric ester :
Tributylphosphate 40 2 080 79 63 14 2 <40 <40 <40 <40 <40 190 >2080 20%
Musks:
Galaxolide 40 2 080 65 2 63 0 <40 148 258 335 703 1 213 1 624 97%
Tonalide 40 2 080 81 30 51 0 <40 <40 <40 170 232 642 2 044 63%
PAHs:
Fluorene 40 2 080 81 74 7 0 <40 <40 <40 <40 <40 175 376 9%
Phenanthrene 40 2 080 75 41 33 1 <40 <40 <40 <40 225 539 >2080 45%
Anthracene 40 2 080 81 80 1 0 <40 <40 <40 <40 <40 <40 296 1%
Fluoranthene 40 2 080 81 55 25 1 <40 <40 <40 <40 161 441 >2080 32%Pyrene 40 2 080 80 48 32 0 <40 <40 <40 <40 182 525 1 924 40%
Benzo(a)pyrene 40 2 080 81 76 5 0 <40 <40 <40 <40 <40 125 308 6%
PCBs:
PCB52 20 830 81 79 2 0 <20 <20 <20 <20 <20 <20 200 2%PCB101 20 830 81 80 1 0 <20 <20 <20 <20 <20 <20 366 1%
PCB118 20 830 81 80 1 0 <20 <20 <20 <20 <20 <20 290 1%
PCB153 20 830 81 80 1 0 <20 <20 <20 <20 <20 <20 128 1%
PCB105 20 830 81 80 1 0 <20 <20 <20 <20 <20 <20 96 1%PCB138 20 830 81 80 1 0 <20 <20 <20 <20 <20 <20 150 1%
Phthalates:
DMP 40 2 080 79 48 31 0 <40 <40 <40 <40 161 555 1 058 39%DEP 333 33 330 65 22 43 0 <333 <333 <333 1 314 1 951 5 201 17 520 66%
DiBP 333 33 333 71 0 32 39 6 785 10 954 22 405 >33330 >33330 >33330 >33330 100%
DBP 333 33 330 64 0 46 18 2 636 4 219 8 380 15 200 >33 330 >33 330 >33 330 100%
DMEP 40 2 080 81 74 7 0 <40 <40 <40 <40 <40 142 310 9%
BBPb 40 2 080 22 5 238 6 752 13 760 73 630 404 300 1 937 000 4 378 000 100%
DEHPb 333 33 333 28 48 180 86 870 380 700 1 212 000 2 345 000 4 522 000 6 395 000 100%
DiNP 333 33 333 77 0 4 73 17 056 32 959 >33330 >33330 >33330 >33330 >50000 100%
PBDEs:
BDE100 40 2 080 81 80 1 0 <40 <40 <40 <40 <40 <40 193 1%
BDE99 40 2 080 81 79 2 0 <40 <40 <40 <40 <40 <40 406 2%
LOQ: limit of quantitation. UL: upper limit of the calibration range. N: number of classrooms. Nc<LOQ: number of samples whose concentration is less than
LOQ. NLOQ<c<UL: number of samples whose concentration is between LOQ and UL. Nc>UL : number of samples whose concentration is above UL. F:
frequency of classrooms with concentrations > LOQ.
aOnly substances quantified at least once reported.
α-HCH: α-hexachlorocyclohexane, γ-HCH: γ-hexachlorocyclohexane (Lindane), 4,4'-DDT: dichlorodiphenyltrichloroethane, PAHs: polycyclic aromatic hydrocarbons, PCBs: polychlorobiphenyls, DMP: dimethyl-phthalate, DEP: diethyl phthalate, DiBP: diisobutyl-phthalate, DBP: dibutyl-phthalate, DMEP: di(methoxyethyl)-phthalate, BBP: butyl benzyl phthalate, DEHP: bis(2-ethylhexyl)-phthalate, DiNP: diisononyl-phthalate, PBDEs: polybromodiphenylethers.
bConcentrations from less concentrated extracts

Chapitre 1 : contexte scientifique
Page 60
15/21
Table S10. SVOC concentrations from less concentrated extracts in air (ng/m3) in classrooms
(Brittany, France)
Table S11. SVOC concentrations from less concentrated extracts in vacuumed dust (< 100 µm
fraction) (ng/g) in classrooms (Brittany, France)
Table S12. SVOC concentrations from less concentrated extracts in wiped dust (ng/m²) in
classrooms (Brittany, France)
Substance N min 5th% 25th% 50th% 75th% 95th% max
Musks:
Galaxolide 7 54 59 75 108 124 145 150
Phthalates:
DiBP 5 593 605 653 730 2030 2220 2260
N: number of classrooms.
DiBP: diisobutyl-phthalate
Substance N min 5th% 25th% 50th% 75th% 95th% max
Phthalates:
DiBP 30 58 600 88 800 132 000 273 000 890 000 1 880 000 2 300 000
BBP 22 8 520 11 400 53 000 105 000 216 000 468 000 1 930 000
DEHP 28 226 000 275 000 709 000 1 430 000 2 240 000 5 830 000 9 280 000
DiNP 32 166 000 258 000 616 000 1 030 000 2 150 000 4 100 000 9 570 000
N: number of classrooms.
DiBP: diisobutyl-phthalate, BBP: butyl benzyl phthalate, DEHP: bis(2-ethylhexyl)-phthalate, DiNP: diisononyl-phthalate.
Substance N min. perc. 5 perc. 25 median perc. 75 perc. 95 max.
Phthalates:
DiBP 16 41310 49060 87830 173900 339900 977600 1797000
BBP 27 5238 6752 13760 73630 404300 1937000 4378000
DEHP 24 48180 86870 380700 1212000 2345000 4522000 6395000
DiNP 21 112700 241900 614900 894200 1479000 2499000 6550000
DiBP: diisobutyl-phthalate, BBP: butyl benzyl phthalate, DEHP: bis(2-ethylhexyl)-phthalate, DiNP: diisononyl-phthalate
N: number of classrooms.

Ch
ap
itre 1
: con
texte
scien
tifiqu
e
Page
61
16/21
Table S13. SVOCs in air of nursery and primary schools in ng/m3
Organochlorinated pesticides
Reference Country, year Type of school Sampling method mean / median n γ-HCH Chlorpyrifos Aldrin
Wilson 2003 USA (North Carolina), 1997 Daycare center XAD-2/QFF mean 4 5.74 13.7 2.08
Kawahara, 2005 Japan, 20033 Nursery school / 1 kindergaten
Chromosorb 102 / QFF median 2 0
Morgan 2014 USA (North Carolina), 2002 Daycare center XAD-2/QFF median 13 < 0.09 0.82Cequier 2014 Norway, 2012 Primary school PUF/QFF median 6This study France, 2009/2010 Primary school PUF/QFF median 62 2.0 <1 <1
Organophosphated pesticides
Reference Country, year Type of school Sampling method mean / median n Dichlorvos Diazinon
Wilson 2003 USA (North Carolina), 1997 Daycare center XAD-2/QFF mean 4 4.3
Kawahara, 2005 Japan, 20033 Nursery school / 1 kindergaten
Chromosorb 102 / QFF median 2 13 0
Morgan 2014 USA (North Carolina), 2002 Daycare center XAD-2/QFF median 13 2.27This study France, 2009/2010 Primary school PUF/QFF median 62 <1 <1
Phosphoric ester
Reference Country, year Type of school Sampling method mean / median n Tributylphosphate
Marklund 2005 Sweden, 2005 Daycare centerIsolute NH2 SPE columns
mean - 3.7
Fromme 2014 Germany, 2012 Daycare center PUF median 2.2Cequier 2014 Norway, 2012 Primary school PUF/QFF median 6 3This study France, 2009/2010 Primary school PUF/QFF median 62 4.7
Musks
Reference Country, year Type of school Sampling method mean / median n Galaxolide Tonalide
Sofuoglu 2010 Turkey, 2009 Primary school PUF / GFF mean 10a 269.8 13.8
Fromme 2004 Germany, 2000/2001 Kindergartens PUF median 74 101 44This study France, 2009/2010 Primary school PUF/QFF median 62 >50 20.5
PAHs
Reference Country, year Type of school Sampling method mean / median n Acenaphtene Fluorene Phenanthrene Anthracene Fluoranthene Pyrene
Wilson 2003 USA (North Carolina), 1997 Daycare center XAD-2/QFF mean 4 26 6.09 17.4 0.68 0.71 0.364This study France, 2009/2010 Primary school PUF/QFF median 62 1.1 5.5 8.7 <1 <1 <1

Ch
ap
itre 1
: con
texte
scien
tifiqu
e
Page
62
17/21
PCBs PBDEs
Reference Country, year Type of school Sampling method mean / median n PCB28 PCB52 PCB101 BDE100 BDE99
Wilson 2003 USA (North Carolina), 1997 Daycare center XAD-2/QFF mean 4 12.9 5.29 0.647 0.135 0.279Lim 2014 Korea 2010/2011 Elementary school PUF/GFF mean 54 0.135 0.279Bradman 2014 USA (California), 2010/2011 Child care or preschool PUF median 40 0.12Cequier 2014 Norway, 2012 Primary school PUF/QFF median 6 0.008 0.023This study France, 2009/2010 Primary school PUF/QFF median 62 <0,4 <0,4 <0,4 <1 <1
Phthalates
Reference Country, year Type of school Sampling method mean / median n DMP DEP DiBP DBP BBP DEHP DiNP
Wilson 2003 USA (North Carolina), 1997 Daycare center XAD-2/QFF mean 4 488 144Fromme 2004 Germany, 2000/2001 Kindergartens PUF median 74 331 353 1188 458Fromme 2013 Germany 2011/2012 Daycare center PUF/GFF median 60 76 183 468 227 194 102Gaspar 2014 USA (California), 2014 Child care or preschool PUF median 40 210 100 520 10 10This study France, 2009/2010 Primary school PUF/QFF median 62 12.6 221 > 800 228 19.1 108 35.2
PBDEs
Reference Country, year Type of school Sampling method mean / median n BDE100 BDE99
Wilson 2003 USA (North Carolina), 1997 Daycare center XAD-2/QFF mean 4 0.135 0.279Lim 2014 Korea 2010/2011 Elementary school PUF/GFF mean 54 0.135 0.279Bradman 2014 USA (California), 2010/2011 Child care or preschool PUF median 40 0.12Cequier 2014 Norway, 2012 Primary school PUF/QFF median 6 0.008 0.023This study France, 2009/2010 Primary school PUF/QFF median 62 <1 <1
a 10 replicates in 1 school
GFF: Glass Fiber Filter, QFF: quartz fiber filter, SPE: solid phase extraction.γ-HCH: gamme-hexachlorocyclohexane (Lindane), PAHs: polycyclic aromatic hydrocarbons, PCBs: polychlorobiphenyls, DMP: dimethyl-phthalate, DEP: diethyl phthalate, DiBP: diisobutyl-phthalate, DBP: dibutyl-phthalate, BBP: butyl benzyl phthalate, DEHP: bis(2-ethylhexyl)-phthalate, DiNP: diisononyl-phthalate, PBDEs: polybromodiphenylethers.

Ch
ap
itre 1
: con
texte
scien
tifiqu
e
Page
63
18/21
Table S14. SVOCs in dust of nursery and primary schools in ng/g
Reference Country, year Type of school Sampling method; sieving fraction mean / median n γ-HCH Alpha-endosulfan Dieldrin Endrin 4,4'-DDT
Wilson 2003 USA (North Carolina), 1997 Daycare HVS3; 150µm mean 4 19 9 70 11Dalvie 2014 South Africa, 2010 1 Primary / 1 preschool vacuuming in bag by technician; NA single value 1/1 20/20
Morgan 2014USA (North Carolina), 2000/2001
Daycare HVS3; 150µm median 13 < 2 < 2
This study France, 2009/2010 Primary schoolvacuuming in cellulose thimble; 100µm
median 89 <65.8 <65.8 <65.8 <65.8 <65.8
Reference Country, year Type of school Sampling method; sieving fraction mean / median n Diazinon Chlorpyrifos
Wilson 2003 USA (North Carolina), 1997 Daycare HVS3; 150µm mean 4 34 107Dalvie 2014 South Africa, 2010 1 Primary / 1 preschool vacuuming in bag by technician; NA single value 1/1 60/30
Morgan 2014USA (North Carolina), 2000/2001
Daycare HVS3; 150µm median 13 65.2 142
This study France, 2009/2010 Primary schoolvacuuming in cellulose thimble; 100µm
median 89 <65.8 <65.8
Reference Country, year Type of school Sampling method; sieving fraction mean / median n Permethrin Cypermethrin
Dalvie 2014 South Africa, 2010 1 Primary / 1 preschool vacuuming in bag by technician; NA single value 1/1 170/170Morgan 2007 USA (Ohio), 2001 Daycare center HVS3 median 23 1554 (cis+trans)
Morgan 2014USA (North Carolina), 2000/2001
Daycare HVS3; 150µm median 13 1662 (cis+trans)
This study France, 2009/2010 Primary schoolvacuuming in cellulose thimble; 100µm
median 89 279 <65.8
Phosphoric ester
Reference Country, year Type of school Sampling method; sieving fraction mean / median n Tributylphosphate
Fromme 2014 Germany, 2012 Daycare center vacuuming with a dust filder holder median 10 < 300Mizouchi 2015 Japan, 2009/2010 Elementary schools vacuuming with paper bag ; 250 µm median 12 <10
Cequier 2014 Norway 2014 Primary schoolvacuuming using forensic filter ; large particles and hair removed
median 6 43.5
Brommer 2015 UK, 2011/2012Primary schools / daycare centers
vacuuming in a 25 µm nylon sock median 28 120
This study France, 2009/2010 Primary schoolvacuuming in cellulose thimble; 100µm
median 89 103
Reference Country, year Type of school Sampling method; sieving fraction mean / median n Fluorene Phenanthrene Anthracene Fluoranthene Pyrene Benzo(a)pyrene
Wilson 2003 USA (North Carolina), 1997 Daycare HVS3 vacuuming; 150µm mean 4 25 338 45 437 354 191Langer 2010 Denmark, 2009 Daycare center Vacuuming on a glass fiber filter; - median 151 98 11
This study France, 2009/2010 Primary schoolvacuuming in cellulose thimble; 100µm
median 89 <65.8 363 <65.8 184 285 <65.8
Organochlorinated pesticides
Organophosphated pesticides
Pyrethroids
PAHs

Ch
ap
itre 1
: con
texte
scien
tifiqu
e
Page
64
19/21
Reference Country, year Type of school Sampling method; sieving fraction mean / median n PCB31 PCB28 PCB52 PCB101 PCB77 PCB118 PCB153 PCB105 PCB138 PCB180
Wilson 2003 USA (North Carolina), 1997 daycare HVS3 vacuuming; 150µm mean 4 37 32 19 4 20 17 11 19 11
Harrad 2010 UK, 2007/2008 primary schoolvacuuming in a 25µm mesh size sock; -
median 36 3.6 3.6 2.8 1.6 1.1 1.7 1.6 0.7
This study France, 2009/2010 primary schoolvacuuming in cellulose thimble; 100µm
median 89 <26.3 <26.3 <26.3 <26.3 <26.3 <26.3 <26.3 <26.3 <26.3 <26.3
Phthalates
Reference Country, year Type of school Sampling method; sieving fraction mean / median n DMP DEP DiBP DBP BBP DEHP DiNP
Wilson 2003 USA (North Carolina), 1997 Daycare HVS3 vacuuming; 150µm mean 4 1 870 3 720Langer 2010 Denmark, 2009 Daycare center Vacuuming on a glass fiber filter; - median 151 2 200 23 000 38 000 17 000 500 000
Kim 2013 Seoul, 2012 Nursery schoolvacuuming of surface dust in thimble; 100µm
median 50 2 100 52 000 50 400 3 030 000 946 000
Fromme 2013 Germany 2011/2012 Daycare center Vacuuming on a glass fiber filter; - median 60-63 300 1 400 20 000 21 000 6 000 302 000
Wallner 2012 Austria, 2012 Primary schoolvacuuming by school personnel; 63µm
median 36 34 000
Clausen 2003 Denmark, 2003 School HVS3 vacuuming; 500µm mean 15 3 214 000Gaspar 2014 USA (California), 2010/2011 Child care or preschool HVS3 vacuuming on carpet; 150µm median 39 1 400 9 300 13 700 46 800 172 200
Hutter 2013 Austria, 2012 Elementary schoolsvacuuming by school personnel; 63µm
median 9 3 350 000
This study France, 2009/2010 Primary schoolvacuuming in cellulose thimble; 100µm
median 89 252 2 890 > 52 600 38 200 105 000 1 430 000 1 030 000
PBDEs
Reference Country, year Type of school Sampling method; sieving fraction mean / median n BDE100 BDE99
Wilson 2003 USA (North Carolina), 1997 daycare HVS3 vacuuming; 150µm mean 4
Harrad 2010 UK, 2007/2008 primary schoolvacuuming in a 25µm mesh size sock; -
median 36 6.6 36
Wu 2010 South Korea, 2010 Elementary schoolvaccuming in washable dust collector; 212µm
medians 13/6 1,16/3,54 6,44/50,9
Lim 2014 Korea 2010/2011 Elementary schoolvacuuming in bag by technician; 500µm
mean 54 67.7 215.8
Bradman 2014 USA (California), 2010/2011 Child care or preschool HVS3 vacuuming on carpet; 150µm median 39 211.5 1031.1
Toms 2015Australia, 2011/2012
primary schoolvacuuming in a 25µm mesh size sock; 500 µm
mean 28 10.0 101.7
Cequier 2014 Norway 2014 Primary schoolvacuuming using forensic filter ; large particles and hair removed
median 6 7.95 42.4
This study France, 2009/2010 primary schoolvacuuming in cellulose thimble; 100µm
median 89 <65.8 <65.8
HVS3: High Volume Small Surface Sampler
PCBs
γ-HCH: gamme-hexachlorocyclohexane (Lindane), 4,4'-DDT: dichlorodiphenyltrichloroethane, PAHs: polycyclic aromatic hydrocarbons, PCBs: polychlorobiphenyls, DMP: dimethyl-phthalate, DEP: diethyl phthalate, DiBP: diisobutyl-phthalate, DBP: dibutyl-phthalate, BBP: butyl benzyl phthalate, DEHP: bis(2-ethylhexyl)-phthalate, DiNP: diisononyl-phthalate, PBDEs: polybromodiphenylethers.

Chapitre 1 : contexte scientifique
Page 65
20/21
References
Bradman, A., Castorina, R., Gaspar, F., Nishioka, M., Colón, M., Weathers, W., Egeghy, P.P., Maddalena, R., Williams, J., Jenkins, P.L. and McKone, T.E. (2014) Flame retardant exposures in California early childhood education environments, Chemosphere, 116, 61–66.
Brommer, S. and Harrad, S. (2015) Sources and human exposure implications of concentrations of organophosphate flame retardants in dust from UK cars, classrooms, living rooms, and offices, Environ.
Int., 83, 202–207.
Cequier, E., Ionas, A.C., Covaci, A., Marcé, R.M., Becher, G. and Thomsen, C. (2014) Occurrence of a broad range of legacy and emerging flame retardants in indoor environments in Norway, Environ. Sci. Technol., 48, 6827–6835.
Clausen, P.A., Lindeberg Bille, R.L., Nilsson, T., Hansen, V., Svensmark, B. and Bøwadt, S. (2003) Simultaneous extraction of di(2-ethylhexyl) phthalate and nonionic surfactants from house dust. Concentrations in floor dust from 15 Danish schools, J. Chromatogr. A, 986, 179–190.
Dalvie, M. a, Sosan, M.B., Africa, A., Cairncross, E. and London, L. (2014) Environmental monitoring of pesticide residues from farms at a neighbouring primary and pre-school in the Western Cape in South Africa, Sci. Total Environ., 466-467, 1078–1084.
Fromme, H., Lahrz, T., Piloty, M., Gebhardt, H., Oddoy, A. and Rüden, H. (2004) Polycyclic aromatic hydrocarbons inside and outside of apartments in an urban area, Sci. Total Environ., 326, 143–9.
Fromme, H., Lahrz, T., Kraft, M., Fembacher, L., Dietrich, S., Sievering, S., Burghardt, R., Schuster, R., Bolte, G. and Völkel, W. (2013) Phthalates in German daycare centers: occurrence in air and dust and the excretion of their metabolites by children (LUPE 3), Environ. Int., 61, 64–72.
Fromme, H., Lahrz, T., Kraft, M., Fembacher, L., Mach, C., Dietrich, S., Burkardt, R., Völkel, W. and Göen, T. (2014) Organophosphate flame retardants and plasticizers in the air and dust in German daycare centers and human biomonitoring in visiting children (LUPE 3), Environ. Int., 71, 158–163.
Gaspar, F.W., Castorina, R., Maddalena, R.L., Nishioka, M.G., McKone, T.E. and Bradman, A. (2014) Phthalate exposure and risk assessment in california child care facilities, Environ. Sci. Technol., 48, 7593–7601.
Guillam, M.-T., Gallien, J., Ezannic, J., Segala, C., Riberon, J. and Derbez, M. (2011) Enquête descriptive
nationale sur les écoles et les crèches et leurs pratiques d’aération, Observatoire de la qualité de l’air intérieur - Sépia Santé, http://www.oqai.fr/userdata/documents/408_422_OQAI_2011_Enquete_descriptive_ecoles.
Harrad, S., Goosey, E., Desborough, J. and Abou-Elwafa Abdallah, M. (2010) Dust from U.K. primary school classrooms and daycare centers: the significance of dust as a pathway of exposure of young U.K. children to brominated flame retardants and polychlorinated biphenyls, Environ. Sci. Technol., 44, 4198–4202.
Hutter, H.-P., Haluza, D., Piegler, K., Hohenblum, P., Fröhlich, M., Scharf, S., Uhl, M., Damberger, B., Tappler, P., Kundi, M., Wallner, P. and Moshammer, H. (2013) Semivolatile compounds in schools and their influence on cognitive performance of children, Int. J. Occup. Med. Environ. Health, 26, 628–635.
Kawahara, J., Horikoshi, R., Yamaguchi, T., Kumagai, K. and Yanagisawa, Y. (2005) Air pollution and young children’s inhalation exposure to organophosphorus pesticide in an agricultural community in Japan, Environ. Int., 31, 1123–32.
Kim, W., Choi, I., Jung, Y., Lee, J., Min, S. and Yoon, C. (2013) Phthalate levels in nursery schools and related factors, Environ. Sci. Technol., 47, 12459–12468.
Langer, S., Weschler, C.J., Fischer, A., Bekö, G., Toftum, J. and Clausen, G. (2010) Phthalate and PAH concentrations in dust collected from Danish homes and daycare centers, Atmos. Environ., 44, 2294–2301.

Chapitre 1 : contexte scientifique
Page 66
21/21
Lim, Y.-W., Kim, H.-H., Lee, C.-S., Shin, D.-C., Chang, Y.-S. and Yang, J.-Y. (2014) Exposure assessment and health risk of poly-brominated diphenyl ether (PBDE) flame retardants in the indoor environment of elementary school students in Korea, Sci. Total Environ., 470-471, 1376–1389.
Marklund, A., Andersson, B. and Haglund, P. (2005) Organophosphorus flame retardants and plasticizers in air from various indoor environments, J. Environ. Monit., 7, 814–9.
Mizouchi, S., Ichiba, M., Takigami, H., Kajiwara, N., Takamuku, T., Miyajima, T., Kodama, H., Someya, T. and Ueno, D. (2015) Exposure assessment of organophosphorus and organobromine flame retardants via indoor dust from elementary schools and domestic houses, Chemosphere, 123, 17–25.
Morgan, M.K., Sheldon, L.S., Croghan, C.W., Jones, P. a, Chuang, J.C. and Wilson, N.K. (2007) An observational study of 127 preschool children at their homes and daycare centers in Ohio: environmental pathways to cis- and trans-permethrin exposure, Environ. Res., 104, 266–274.
Morgan, M.K., Wilson, N.K. and Chuang, J.C. (2014) Exposures of 129 preschool children to organochlorines, organophosphates, pyrethroids, and acid herbicides at their homes and daycares in North Carolina, Int. J.
Environ. Res. Public Health, 11, 3743–3764.
NF X 46-032 (2008) Méthodologie de mesure du plomb dans les poussières au sol.
Sofuoglu, a, Kiymet, N., Kavcar, P. and Sofuoglu, S.C. (2010) Polycyclic and nitro musks in indoor air: a primary school classroom and a women’s sport center, Indoor Air, 20, 515–22.
Toms, L.-M.L., Mazaheri, M., Brommer, S., Clifford, S., Drage, D., Mueller, J.F., Thai, P., Harrad, S., Morawska, L. and Harden, F. a. (2015) Polybrominated diphenyl ethers (PBDEs) in dust from primary schools in South East Queensland, Australia, Environ. Res., 142, 135–140.
Wallner, P., Kundi, M., Moshammer, H., Piegler, K., Hohenblum, P., Scharf, S., Fröhlich, M., Damberger, B., Tappler, P. and Hutter, H.-P. (2012) Indoor air in schools and lung function of Austrian school children, J.
Environ. Monit., 14, 1976–1982.
Wilson, N.K., Chuang, J.C., Lyu, C., Menton, R. and Morgan, M.K. (2003) Aggregate exposures of nine preschool children to persistent organic pollutants at day care and at home, J. Expo. Anal. Environ.
Epidemiol., 13, 187–202.
Wu, Q., Baek, S.-Y., Fang, M. and Chang, Y.-S. (2010) Distribution and fate of polybrominated diphenyl ethers in indoor environments of elementary schools, Indoor Air, 20, 263–270.


Chapitre 1 : contexte scientifique
Page 68
phtalates [66], notamment le DEHP [67,68] et certains retardateurs de flamme halogénés [69,70]
dont les PBDE [71–73].
3.2. L’INHALATION
L’homme respire jusqu’à 16 m3 d’air par jour [74] et se retrouve ainsi exposé aux COSV présents
dans l’air. L’inhalation comme voie d’exposition aux COSV a été étudiée dans la littérature
[75,76]. Elle est considérée comme voie d’exposition majoritaire pour les COSV les plus volatils,
en particulier en l’absence d’évaluation de l’exposition par contact cutané. [77,78]
3.3. LE CONTACT CUTANE
L’exposition aux COSV par contact cutané a longtemps été ignorée ou considérée négligeable. En
2012, Weschler et Nazaroff ont commencé à s’y intéresser et se sont rendu compte que cette
voie pourrait être responsable d’une exposition égale ou supérieure à l’inhalation pour certains
COSV [79]. Elle est désormais de plus en plus étudiée et parfois considérée comme voie majori-
taire, notamment pour les phtalates les plus légers [67,68,80–82] et les HAP [81]. De plus le port
de vêtements pourrait accélérer ou retarder l’exposition cutanée selon le nombre de jours écou-
lés depuis le dernier lavage [83,84]. Pour les retardateurs de flamme bromés, Abdallah et Harrad
ont montré que l’exposition due au contact direct avec du tissu d’ameublement traité est supé-
rieure au contact direct avec de la poussière contaminée [85].
3.4. CONTRIBUTION RELATIVE DE CHAQUE VOIE
La contribution de chaque voie d’exposition a été calculée pour le projet ECOS-Habitat durant les
travaux de thèse de Maud Pelletier. La Figure 10 montre les résultats médians pour les enfants
âgés de 2 à 3 ans. La contribution relative de chaque voie diffère selon le composé en fonction
de leur volatilité. Pour les COVS les plus volatils5 (fluorène, anthracène, aldrine, dieldrine, tona-
lide, galaxolide, tributylphosphate, DEP, DBP, DiBP, PCB 28, PCB 31 et PCB 52), l'inhalation et le
contact cutané avec la phase gazeuse sont les principales voies d'exposition, tandis que pour les
5 Log Koa (coefficient de partage octanol air) < 9[34]

Chapitre 1 : contexte scientifique
Page 69
COVS moins volatils6 (DEHP, DiNP et BDE 154), l'ingestion de poussière est la principale voie
d'exposition.
Figure reprise de la publication de Pelletier et al. (2017), Environ. Int. [35]
FIGURE 10 : CONTRIBUTION RELATIVE DE CHAQUE VOIE D'EXPOSITION
4. NOTIONS DE BIOACCESSIBILITE ET BIODISPONIBILITE
Afin d'évaluer les risques associés à la présence de COSV dans les environnements intérieurs ou
d'établir un lien entre COSV et problématique de santé dans les études épidémiologiques, l'ex-
position humaine aux COSV dans les environnements intérieurs doit être évaluée précisément. À
cette fin, les trois voies d'exposition : (1) exposition par ingestion de poussière ou de particules,
(2) exposition par inhalation d'air et (3) exposition par contact cutané doivent être
agrégées.[35,77]
Les concentrations utilisées pour ce faire sont en général les concentrations totales présentes
dans les milieux. Or, la totalité de la concentration n’est pas absorbée par l’organisme et il con-
vient ici d’introduire les notions de biodisponibilité et de bioaccessibilité.
6 Log Koa (coefficient de partage octanol air) > 9[34]

Chapitre 1 : contexte scientifique
Page 70
4.1. DEFINITION DE LA BIOACCESSIBILITE
La fraction bioaccessible d’un composé est la quantité qui est libérée dans un fluide biologique
et devient disponible pour l’absorption.[86] On parle de bioaccessibilité orale pour définir la
quantité libérée par la salive et les fluides gastro-intestinaux après ingestion de poussières ou de
particules [87–89]. On parle de bioaccessibilité par inhalation concernant la fraction libérée par
les fluides pulmonaires après inhalation de particules [90]. Enfin, on parle de bioaccessibilité cu-
tanée concernant la fraction libérée par la sueur et le sébum après un contact cutané avec des
poussières ou des particules [91]. Ainsi, la bioaccessibilité est toujours relative à une matrice
(poussières, particules, sols, aliments, médicaments, etc.).
La bioaccessibilité absolue est le ratio entre la quantité libérée dans le fluide et la quantité totale
initialement présente dans la matrice.
( )
Pour les substances dont on connait la valeur toxicologique de référence (VTR), la bioaccessibili-
té peut également être exprimée par rapport à la bioaccessibilité dans la matrice avec laquelle la
VTR a été calculée (par exemple dans l’huile). On parle alors de bioaccessibilité relative.
4.2. DEFINITION DE LA BIODISPONIBILITE
La fraction biodisponible est définie comme la quantité qui a traversé une membrane biologique
et atteint la circulation systémique [86,89]. Cette membrane est la paroi intestinale pour la bio-
disponibilité orale [87–89], la barrière pulmonaire pour la biodisponibilité pulmonaire [90,92] et
la peau pour la biodisponibilité cutanée [93].
La biodisponibilité absolue est le ratio entre la quantité absorbée dans la circulation systémique
et la quantité initialement présente dans la matrice.
( )
De même que pour la bioaccessibilité, on peut exprimer la biodisponibilité de manière relative
par rapport à la matrice à partir de laquelle on a calculé la VTR d’une substance donnée.
Les notions de bioaccessibilité et biodisponibilité pour la voie orale sont illustrées sur la Figure
11.

Chapitre 1 : contexte scientifique
Page 71
Figure reprise de la publication de Denys et al. (2009), Environnement, Risques & Santé [88]
FIGURE 11 : REPRESENTATION SCHEMATIQUE DES NOTIONS DE BIOACCESSIBILITE ET BIODISPONIBILITE ORALE
La biodisponibilité est la notion la plus pertinente à connaître pour affiner la dose d'exposition et
établir le lien entre contamination environnementale et exposition humaine. Cependant, la bio-
disponibilité est difficile à évaluer, principalement pour des raisons éthiques, puisqu’elle suppose
une ingestion de poussière contaminée, et des mesures dans des matrices biologiques qui peu-
vent être invasives.
La bioaccessibilité, qui peut se mesurer en laboratoire par des tests in vitro, offre donc une al-
ternative intéressante à la biodisponibilité. La bioaccessibilité n’intègre pas les pertes dues au
passage à travers les parois et à des réactions métaboliques. Elle sera donc toujours égale ou su-
périeure à la biodisponibilité (Figure 12), ce qui peut être un atout du fait de son caractère con-
servatoire [87], dans d’autres domaines que celui de cette thèse, comme par exemple dans la
gestion des sols pollués.

Chapitre 1 : contexte scientifique
Page 72
Figure reprise de la publication de Collins et al. (2015), Environ. Int. [87]
FIGURE 12 : RELATION ENTRE BIOACCESSIBILITE ET BIODISPONIBILITE
5. QUESTIONS DE RECHERCHE
Dans ce contexte et dans la perspective d’une meilleure connaissance de la contribution envi-
ronnementale dans l’exposition humaine aux COSV, les questions posées à la recherche sont :
Comment mesurer les concentrations environnementales en COSV pour mieux évaluer
l’exposition humaine à ces substances ?
Quelle est la bioaccessibilité des COSV présents dans les particules et les poussières ?
6. OBJECTIFS DE LA THESE
L’objectif de cette thèse est de répondre au volet « ingestion » de la question de recherche. Ces
travaux de thèse se sont donc concentrés sur l’exposition par ingestion de poussière et sur la
bioaccessibilité orale des COSV. Ils se sont organisés en trois points :
Revue de la littérature scientifique du domaine
Développement et validation d’une méthode simple de mesure de la bioaccessibilité des
COSV dans les poussières
Production de données de bioaccessibilité pour plusieurs familles de COSV

Page 73
CHAPITRE 2 : LA BIOACCESSIBILITE DES COSV DANS
LES POUSSIERES- REVUE DE LA LITTERATURE
(ARTICLE SCIENTIFIQUE N°2)
La première partie de ce travail de thèse a consisté en une revue bibliographique axée sur la
bioaccessibilité orale des COSV dans les poussières. Nombreuses quand la matrice considérée
est le sol, ou quand les substances d’intérêt sont les métaux, les recherches sont plus rares et
encore jeunes en ce qui concerne les polluants organiques dans les poussières. Toutefois une
vingtaine d’articles ont été réunis, qui montrent une forte disparité des bioaccessibilités mesu-
rées. Dues à la nature des COSV ou des poussières étudiées, ces disparités peuvent également
avoir pour origine des méthodes de mesures très différentes. Cette revue bibliographique sou-
ligne ainsi la nécessité d’une méthode harmonisée, en écho aux propositions de Collins et son
équipe [87], mais également d’une méthode de mesure simplifiée.
Les résultats de cette revue de la littérature ont fait l’objet d’un article publié en mars 2018 dans
Journal of Hazardous Materials, qui est présenté dans la suite du chapitre.
Un tableau récapitulatif des réactifs et conditions opératoires des méthodes reportées dans la
littérature pour la mesure de la bioaccessibilité des COSV est également disponible en fin de
chapitre (page 87).
Par ailleurs, les valeurs de bioaccessibilité documentées dans cette revue ont été utilisées dans
le cadre de la thèse de Maud Pelletier pour estimer l’exposition de la population aux COSV dans
les logements français [35] (article disponible dans la partie « Valorisation scientifique de ce ma-
nuscrit »).

Chapitre 2 : la bioaccessibilité des COSV dans les poussières- Revue de la littérature
Page 74
Contents lists available at ScienceDirect
Journal of Hazardous Materials
journal homepage: www.elsevier.com/locate/jhazmat
Oral bioaccessibility of semi-volatile organic compounds (SVOCs) in settleddust: A review of measurement methods, data and influencing factors
Gaëlle Raffya,⁎, Fabien Merciera, Philippe Glorenneca, Corinne Mandinb, Barbara Le Bota
aUniv Rennes, Inserm, EHESP, Irset (Institut de recherche en santé, environnement et travail) - UMR_S 1085, F 35000, Rennes, FrancebUniversité Paris Est, CSTB – Scientific and Technical Center for Building, OQAI - French Indoor Air Quality Observatory, 84 Avenue Jean Jaurès Champs-sur-Marne
77447 Marne-la-Vallée Cedex 2, France
G R A P H I C A L A B S T R A C T
A R T I C L E I N F O
Keywords:
Human exposureIndoor environmentDust ingestionBioavailabilityPollutant
A B S T R A C T
Many semi-volatile organic compounds (SVOCs), suspected of reprotoxic, neurotoxic or carcinogenic effects,were measured in indoor settled dust. Dust ingestion is a non-negligible pathway of exposure to some of theseSVOCs, and an accurate knowledge of the real exposure is necessary for a better evaluation of health risks. Tothis end, the bioaccessibility of SVOCs in dust needs to be considered. In the present work, bioaccessibilitymeasurement methods, SVOCs’ oral bioaccessibility data and influencing factors were reviewed. SVOC bioac-cessibilities (%) ranged from 11 to 94, 8 to 100, 3 to 92, 1 to 81, 6 to 52, and 2 to 17, for brominated flameretardants, organophosphorus flame retardants, polychlorobiphenyls, phthalates, pesticides and polycyclicaromatic hydrocarbons, respectively. Measurements method produced varying results depending on the inclu-sion of food and/or sink in the model. Characteristics of dust, e.g., organic matter content and particle size, alsoinfluenced bioaccessibility data. Last, results were influenced by SVOC properties, such as octanol/water par-tition coefficient and migration pathway into dust. Factors related to dust and SVOCs could be used in predictionmodels. To this end, more bioaccessibility studies covering more substances should be performed, using methodsthat are harmonized and validated by comparison to in-vivo studies.
https://doi.org/10.1016/j.jhazmat.2018.03.035Received 29 November 2017; Received in revised form 18 March 2018; Accepted 19 March 2018
⁎ Corresponding author at: EHESP/LERES, 15 avenue du Pr. Léon-Bernard, CS 74 312, 35043 Rennes Cedex, France.E-mail address: [email protected] (G. Raffy).
Journal of Hazardous Materials 352 (2018) 215–227
Available online 21 March 20180304-3894/ © 2018 Elsevier B.V. All rights reserved.
T
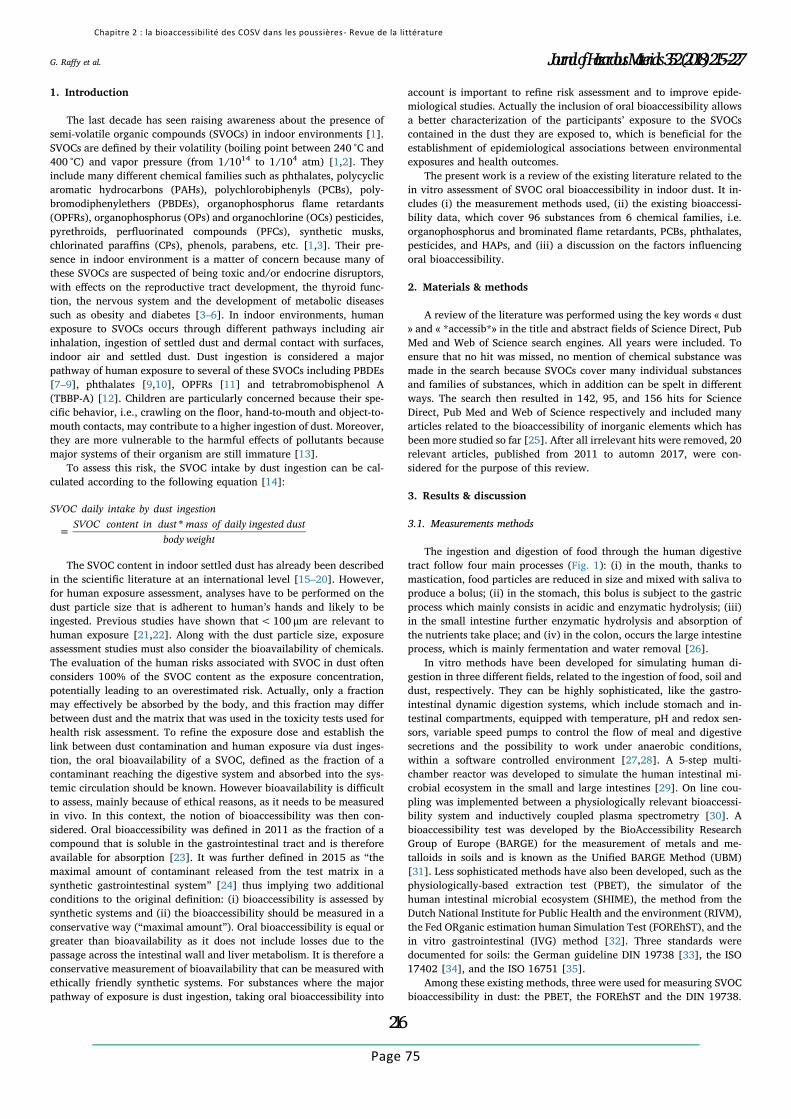
Chapitre 2 : la bioaccessibilité des COSV dans les poussières- Revue de la littérature
Page 75
1. Introduction
The last decade has seen raising awareness about the presence ofsemi-volatile organic compounds (SVOCs) in indoor environments [1].SVOCs are defined by their volatility (boiling point between 240 °C and400 °C) and vapor pressure (from 1/1014 to 1/104 atm) [1,2]. Theyinclude many different chemical families such as phthalates, polycyclicaromatic hydrocarbons (PAHs), polychlorobiphenyls (PCBs), poly-bromodiphenylethers (PBDEs), organophosphorus flame retardants(OPFRs), organophosphorus (OPs) and organochlorine (OCs) pesticides,pyrethroids, perfluorinated compounds (PFCs), synthetic musks,chlorinated paraffins (CPs), phenols, parabens, etc. [1,3]. Their pre-sence in indoor environment is a matter of concern because many ofthese SVOCs are suspected of being toxic and/or endocrine disruptors,with effects on the reproductive tract development, the thyroid func-tion, the nervous system and the development of metabolic diseasessuch as obesity and diabetes [3–6]. In indoor environments, humanexposure to SVOCs occurs through different pathways including airinhalation, ingestion of settled dust and dermal contact with surfaces,indoor air and settled dust. Dust ingestion is considered a majorpathway of human exposure to several of these SVOCs including PBDEs[7–9], phthalates [9,10], OPFRs [11] and tetrabromobisphenol A(TBBP-A) [12]. Children are particularly concerned because their spe-cific behavior, i.e., crawling on the floor, hand-to-mouth and object-to-mouth contacts, may contribute to a higher ingestion of dust. Moreover,they are more vulnerable to the harmful effects of pollutants becausemajor systems of their organism are still immature [13].
To assess this risk, the SVOC intake by dust ingestion can be cal-culated according to the following equation [14]:
=
SVOC daily intake by dust ingestion
SVOC content in dust mass of daily ingested dust
body weight
*
The SVOC content in indoor settled dust has already been describedin the scientific literature at an international level [15–20]. However,for human exposure assessment, analyses have to be performed on thedust particle size that is adherent to human’s hands and likely to beingested. Previous studies have shown that< 100 μm are relevant tohuman exposure [21,22]. Along with the dust particle size, exposureassessment studies must also consider the bioavailability of chemicals.The evaluation of the human risks associated with SVOC in dust oftenconsiders 100% of the SVOC content as the exposure concentration,potentially leading to an overestimated risk. Actually, only a fractionmay effectively be absorbed by the body, and this fraction may differbetween dust and the matrix that was used in the toxicity tests used forhealth risk assessment. To refine the exposure dose and establish thelink between dust contamination and human exposure via dust inges-tion, the oral bioavailability of a SVOC, defined as the fraction of acontaminant reaching the digestive system and absorbed into the sys-temic circulation should be known. However bioavailability is difficultto assess, mainly because of ethical reasons, as it needs to be measuredin vivo. In this context, the notion of bioaccessibility was then con-sidered. Oral bioaccessibility was defined in 2011 as the fraction of acompound that is soluble in the gastrointestinal tract and is thereforeavailable for absorption [23]. It was further defined in 2015 as “themaximal amount of contaminant released from the test matrix in asynthetic gastrointestinal system” [24] thus implying two additionalconditions to the original definition: (i) bioaccessibility is assessed bysynthetic systems and (ii) the bioaccessibility should be measured in aconservative way (“maximal amount”). Oral bioaccessibility is equal orgreater than bioavailability as it does not include losses due to thepassage across the intestinal wall and liver metabolism. It is therefore aconservative measurement of bioavailability that can be measured withethically friendly synthetic systems. For substances where the majorpathway of exposure is dust ingestion, taking oral bioaccessibility into
account is important to refine risk assessment and to improve epide-miological studies. Actually the inclusion of oral bioaccessibility allowsa better characterization of the participants’ exposure to the SVOCscontained in the dust they are exposed to, which is beneficial for theestablishment of epidemiological associations between environmentalexposures and health outcomes.
The present work is a review of the existing literature related to thein vitro assessment of SVOC oral bioaccessibility in indoor dust. It in-cludes (i) the measurement methods used, (ii) the existing bioaccessi-bility data, which cover 96 substances from 6 chemical families, i.e.organophosphorus and brominated flame retardants, PCBs, phthalates,pesticides, and HAPs, and (iii) a discussion on the factors influencingoral bioaccessibility.
2. Materials & methods
A review of the literature was performed using the key words « dust» and « *accessib*» in the title and abstract fields of Science Direct, PubMed and Web of Science search engines. All years were included. Toensure that no hit was missed, no mention of chemical substance wasmade in the search because SVOCs cover many individual substancesand families of substances, which in addition can be spelt in differentways. The search then resulted in 142, 95, and 156 hits for ScienceDirect, Pub Med and Web of Science respectively and included manyarticles related to the bioaccessibility of inorganic elements which hasbeen more studied so far [25]. After all irrelevant hits were removed, 20relevant articles, published from 2011 to automn 2017, were con-sidered for the purpose of this review.
3. Results & discussion
3.1. Measurements methods
The ingestion and digestion of food through the human digestivetract follow four main processes (Fig. 1): (i) in the mouth, thanks tomastication, food particles are reduced in size and mixed with saliva toproduce a bolus; (ii) in the stomach, this bolus is subject to the gastricprocess which mainly consists in acidic and enzymatic hydrolysis; (iii)in the small intestine further enzymatic hydrolysis and absorption ofthe nutrients take place; and (iv) in the colon, occurs the large intestineprocess, which is mainly fermentation and water removal [26].
In vitro methods have been developed for simulating human di-gestion in three different fields, related to the ingestion of food, soil anddust, respectively. They can be highly sophisticated, like the gastro-intestinal dynamic digestion systems, which include stomach and in-testinal compartments, equipped with temperature, pH and redox sen-sors, variable speed pumps to control the flow of meal and digestivesecretions and the possibility to work under anaerobic conditions,within a software controlled environment [27,28]. A 5-step multi-chamber reactor was developed to simulate the human intestinal mi-crobial ecosystem in the small and large intestines [29]. On line cou-pling was implemented between a physiologically relevant bioaccessi-bility system and inductively coupled plasma spectrometry [30]. Abioaccessibility test was developed by the BioAccessibility ResearchGroup of Europe (BARGE) for the measurement of metals and me-talloids in soils and is known as the Unified BARGE Method (UBM)[31]. Less sophisticated methods have also been developed, such as thephysiologically-based extraction test (PBET), the simulator of thehuman intestinal microbial ecosystem (SHIME), the method from theDutch National Institute for Public Health and the environment (RIVM),the Fed ORganic estimation human Simulation Test (FOREhST), and thein vitro gastrointestinal (IVG) method [32]. Three standards weredocumented for soils: the German guideline DIN 19738 [33], the ISO17402 [34], and the ISO 16751 [35].
Among these existing methods, three were used for measuring SVOCbioaccessibility in dust: the PBET, the FOREhST and the DIN 19738.
G. Raffy et al. Journal of Hazardous Materials 352 (2018) 215–227
216

Chapitre 2 : la bioaccessibilité des COSV dans les poussières- Revue de la littérature
Page 76
These methods often come from the experiences gained on soil [36,37]and replicate part or all of the four processes involved in human di-gestion through in vitro simulations.
3.1.1. Mouth in vitro process
The simulation of the action of saliva is implemented in the BARGEprotocol [38], the German standard DIN 19738 [39,40], and theFOREhST [41]. It consists in extracting the dust in a pH neutral aqueoussolution containing salts (NaCl, NaSCN or KSCN, Na2SO4, NaHCO3,NaOH, KCl, KH2PO4 or NaH2PO4, CaCl2), proteins (mucin, α-amylase),urea and uric acid, and food (whole milk, skimmed milk and denaturedskimmed milk [39] or organic creamy infant food, baby milk powder,and sunflower oil [41]). The solution is stirred for up to 30min at 37 °C.This first process is sometimes considered of limited interest because
the extraction time, which should not exceed 2min to be physiologicalrelevant, and the neutral pH do not have much impact on the dissolu-tion of SVOCs, compared to the following processes [24,37].
3.1.2. Stomach in vitro process
The gastric process is present in all models reported in the literature.The dust is introduced in an acidic (pH < 2.5) synthetic gastric fluidcontaining pepsin, the enzyme for the degradation of proteins. Salts(NaCl, KCl, KH2PO4 or NaH2PO4, CaCl2, NH4Cl) are added in theBARGE and DIN 19738 methods. The authors applying PBET methodsadd different types of salts (sodium malate and tri-sodium citrate) andacids (lactic and acetic) [42–46], or mucin (protein responsible for thegel texture) [47]. At this stage, food components (starch, yeast extract,casein, pectin, xylan, arabinogalactan, etc.) can be added to simulatethe fed state [45,48]. The solutions are then stirred for 1 to 2 h at 37 °C.
3.1.3. Small intestine in vitro process
The small intestine in vitro process is also present in all the modelsreported in the literature. In physiological terms, this process is of aparticular importance for bioaccessibility because of the long incuba-tion time and because it is where the absorption through the intestinalwall takes place. In this process, the dust is brought into contact withthe intestinal juice at a neutral pH (between 6.5 and 8), either followingneutralization of the pH of the preceding gastric solution or after cen-trifugation, recovery of the dust and introduction in a freshly preparedintestinal solution. In most models, neutralization of the solution isobtained via the addition of bicarbonate, as bicarbonate is the ion se-creted in the human body to neutralize gastric secretion in the lumen[49]. Intestinal solutions always include pancreatin (a mixture of di-gestive enzymes produced by the pancreas) and bile salts (produced bythe liver, intended for lipid digestion and promoting absorption in thesmall intestine). Various other salts are also added, as well as urea andalbumin [38] and lipase [38,45]. Again at this stage, dietary compo-nents can be added [45,48]. Some authors also add an adsorbent tocapture the compounds as they are released in the digestive fluids, thusmimicking the passage of compounds through the intestinal wall[42,45,50]. The solutions are stirred 4 to 7 h at 37 °C. After incubation,dust is separated from the digestive fluid by centrifugation. However, iffoam particles, originating from product weathering, are present indust, separation is achieved by filtering the digestive fluid through glasswool [45].
Because of the presence of bile, which promotes the solubilization ofhydrophobic organic compounds through the formation of micelles, thefraction of intestinal bioaccessibility is often greater than the fraction ofgastric bioaccessibility [51,52]. This was experimentally demonstrated,as shown in Fig. 2, where the distribution of bioaccessible SVOC is onaverage 35% in the gastric fluid and 65% in the small intestine fluid.
Fig. 1. Human digestive system showing SVOC oral bioaccessibility and bioa-vailability.
Fig. 2. Partition of in vitro evaluation of SVOCabsorption between stomach and small intes-tine.PAH, phthalate, and DDT data are from thework of Wang et al. [44,76,95]. PCB data arefrom the work of Kang et al. [75].Nap: naphthalene, Acy: acenaphthylene, Aceacenaphthene, Fl: fluorene, Phe phenanthrenes,Ant: anthracene, Flu: fluoranthene, Pyr: pyrene,BaA: benzo(a) anthracene, Chr: chrysene, B(b+ k)F: benzo(b+ k)fluoranthene, BaP:Benzo(a)Pyrene, DMP: dimethyl phthalate,DEP: diethyl phthalate, DPRP: di-n-propylphthalate, DiBP: diisobutyl phthalate, DBP: di-n- butyl phthalate, DMEP: bis (2-methoxyethyl)phthalate, DHP: di-n-hexyl phthalate, BBP:butyl benzyl phthalate, DEHP: di- 2-ethylhexylphthalate, DCHP: dicyclohexyl phthalate,
DnOP: di-n-octyl phthalate, DNP: dinonyl phthalate, DiDP: di-iso-decyl phthalate, DDT: dichlorodiphenyltrichloroethane.
G. Raffy et al. Journal of Hazardous Materials 352 (2018) 215–227
217

Chapitre 2 : la bioaccessibilité des COSV dans les poussières- Revue de la littérature
Page 77
3.1.4. Colon in vitro process
The inclusion of the large intestine process (colon extended PBET)was reported by Abdallah et al. [46], Fang and Stapleton [45], andKademoglou et al. [48]. Indeed, according to Tilston et al. [53], therecould be absorption at the level of the colon, along with water removal.The inclusion of this process is above all a conservative approach be-cause the prolonged incubation time and the presence of carbohydratesin the colon could increase the bioaccessibility of persistent organicpollutants [46], although this was not always confirmed [54]. Thesynthetic solution, at a nearly neutral pH, contains salts, mucin, cy-steine hydrochloride (a reducing agent used to promote anaerobicconditions [53]), bile salts, haemin and food components. The solutionsare kept at 37 °C for 8 to 16 h. For flame retardants, the additionalbioaccessibility provided by the colon incubation ranged from 11 to32% of the total bioaccessibility [46], as shown in Fig. 3.
3.1.5. Microbial activity
The SHIME (Simulator of Human Intestinal Microbial Ecosystem)simulates the GI tract form stomach to colon including enzymatic andmicrobial activities and has mostly been used for studying the inter-actions between food and microbiota [55]. Siciliano et al. used both theSHIME and a sterile in vitro digestion method to assess the bioacces-sibility of PAHs in soils. They concluded that the release of PAHs indigestive fluids was not influenced by microbial activities [56], whichcan explain why SHIME was never further used with dust samples.
3.1.6. Physiological parameters
Authors always seek to produce physiologically relevant methods.The temperature of the human body, 37 °C, is respected by all authors.The pH values, close to 6.5 for saliva, close to neutrality in the smallintestine and colon compartments, and acidic (pH < 2.5) in the gastricmedium are physiologically relevant [55]. Authors used relevant in-cubation times, except for the mouth compartment with long incuba-tion times of up to 30min [39,40]. All authors also apply shaking totheir system to simulate the peristaltic movements of human digestion.
3.1.7. Specific human populations
Models used for the analysis of dust aim towards physiological re-levance, but they did not consider specific conditions relative to somehuman populations. In the field of food studies, however, where moresophisticated in vitro digestion models are applied, specific gastro-in-testinal conditions of the infants and elderly can be simulated [57]. Forinfants’ gastric conditions, a limited stomach capacity, a relatively highgradient pH (3.2–6.5), and a reduced pepsin secretion are considered,as well as a lower bile salt concentration in the intestinal phase [57].These specific models could be applied for the evaluation of SVOC
bioaccessibility in studies where the population of interest is mainlychildren.
3.1.8. A step towards the in vitro evaluation of bioavailability
Bioaccessible SVOCs are released in the GI tract while bioavailableSVOCs are those who reached the systemic circulation (Fig. 1). Bioac-cessible SVOCs become bioavailable once they have crossed the in-testinal wall and undergone presystemic metabolisms (both intestinaland hepatic) [58]. A step towards the evaluation of bioavailability canbe reached in vitro using Caco-2 cells to mimic the transport across theintestinal epithelium. Indeed, Caco-2 cells can be cultivated as mono-layers on semipermeable membrane where they develop the morpho-logic characteristics of epithelium cells, possessing a brush border andtight junctions between adjacent cells [59,60]. In their review, Cui et al.mentioned that HT29-MTX goblet cells are sometimes cultured withCaco-2 cells, because they can produce the mucus that otherwise lacksto Caco-2 cells monolayers. They also emphasized the need to evaluatethe toxicity of the investigated substance towards Caco-2 cells, beforeusing them, because if the behavior of the Caco-2 cells is compromised,the transmembrane passage could be affected [32]. Kang et al. at-tempted to measure the uptake by Caco-2 cells of BDE-28, −47, −99and −153, respectively, and reported absorption rates of 30%, 26%,41% and 59% respectively [51]. Likewise, Pan et al. measured an ab-sorption rate of 42% for BDE-209 [52]. In both studies, authors onlyconsidered the cell uptake, ignoring the transfer between cells. Theymay therefore have underestimated the overall transfer across the Caco-2 cells monolayer. Still, using Caco-2 cells can help for a better as-sessment of a SVOC human internal dose.
3.1.9. Method validation
The validation of a SVOC bioaccessibility assessment method in-volves two major steps. From an analytical point of view, the extractionof the digestive fluids and of any adsorbent included to the model, andthe instrumental analysis of the extracted SVOCs, must be performedusing quality control steps, as proposed by Rodríguez-Navas et al [61].Once this analytical validation is achieved, then the bioaccessibilitydata produced by the method should be validated by comparison tobioavailability data measured in vivo, taking into account the meta-bolism and the fate of the substance in the body. However, in vivo datarelated to the bioavailability in dust are really scarce. Huwe et al.produced data for the bioavailability of PBDEs, measured in rats thathad ingested a reference dust material, the SRM 2585, with knownSVOC contents [62]. Pan et al. found a correlation between the bioac-cessibility of BDE-209 in dust, measured with a PBET method and itsrelative bioavailability measured in rats’ blood (slope 0.63; r² 0.73,p=0.031) [52]. Plichta and Fromme produced bioavailability data forphthalates by measuring the urine concentrations of piglets that hadingested contaminated dust [63].
This lack of data on SVOC bioavailability in dust led us to extendour review to soil studies, where more bioavailability tests were con-ducted. In 2004, Pu et al. measured the absolute bioavailability ofphenanthrene in the blood of rats that had ingested contaminated soils,and its bioaccessibility in the same soils using a PBET method.Depending on the type of soil investigated, bioavailability varied be-tween 15% and 49%, whereas bioaccessibilities varied between 18%and 89%. The authors found a linear relationship between bioaccessi-bility and bioavailability (r²= 0.53, p < 0.05), thus encouraging theuse of bioaccessibility to predict bioavailability but also emphasizingthe need for more studies, covering more chemicals and more types ofsoils [64]. More recently, James et al. assessed the PAH bioavailabilityin juvenile swines, by measuring their blood concentrations after theingestion of contaminated soils. Bioavailability varied from 0 to 40%according to the PAH and the soil. In this study, however, no re-lationship could be established between partition coefficients into si-mulated intestinal fluids and bioavailability [65]. However in a pre-vious study, James et al. had added a C18 membranes to simulate lipid
Fig. 3. Partition of in vitro evaluation of SVOC absorption between sto-mach+ small intestine and colon. Data are from the work of Abdallah et al.[46].HBCD: hexabromocyclododecane, TBBP: tetrabromobisphenol, BDE: bromodi-phenylether.
G. Raffy et al. Journal of Hazardous Materials 352 (2018) 215–227
218

Chapitre 2 : la bioaccessibilité des COSV dans les poussières- Revue de la littérature
Page 78
sinks and had then found a linear relationship between the bioacces-sibility of PAHs in soils, measured with an in vitro digestion model(IVD) in the presence of a C18 membrane, and their bioavailability,measured in swines’ blood serum (slope=0.85, r²= 0.42, p < 0.07)[66].
The relative bioavailability of PCBs (101, 138, 153 and 180) in soilwas assessed by measuring concentrations found in swines’ adiposetissue: values were all greater than 45%, independently of the in-vestigated soil or PCB congener [67]. For PCBs 52 and 118 in soil, therelative bioavailability measured in rats’ blood was greater than 87%and could not be linked to their bioaccessibility measured by PBET,which produced underestimated results (40%–80%) [68].
Li et al. estimated the soil bioavailability of DDT and its metabolites(DDTr) by measuring their concentration in mice’s adipose tissues aftersoil ingestion: values varied from 18% to 65% depending on the type ofsoil. They compared it to DDTr bioaccessibility using a PBET modelwith and without Tenax® TA as a sorptive sink. When adding Tenax® TAin the model, DDTr bioaccessibility increased up to 22 fold, and couldthen be linked by a linear regression to bioavailability (slope= 1.2,r²= 0.62, p= 0.065) [69].
An in vivo/in vitro validation study was also undertaken for PFOAin food, and showed a good correlation (r= 0.76, p < 0.01) betweenPFOA bioaccessibility, assessed with the UBM method, and its bioa-vailability measured in rats’ liver [70].
Lack of data for bioavailability validation in dust studies are notonly due to ethical concerns, but also practical difficulties. Actually, itcan be difficult to have enough dust with a sufficient SVOC content sothat consequent bioavailable concentrations measured after ingestionare meaningful. However, before bioaccessibility values can be reliedupon in risk assessment and epidemiological studies, they must be va-lidated versus in vivo studies and so more of these studies should beperformed taking into account the metabolism and the fate of thesubstance in the body. Moreover, due caution should be applied whenchoosing the animal species for in vivo validation: Duan et al. showedthat swine’s and rat’s bioavailability measurements of benzo[a]pyrenein soils were correlated, but bioavailability was underestimated byabout a quarter in the rat study, which should be taken into account[71]. While rats are more often considered for in vivo measurements,swines are recommended because their digestive system is comparableto that of children in terms of body size, gut physiology and geneticprofile, and because they produce more conservative bioavailabilityestimates.
For optimal dust bioaccessibility measurements, advantage shouldbe taken from the experience and feedback from validation studiesperformed in the field of outdoor soils. In addition, efforts should bemade towards method simplification, so they can be applied on nu-merous samples with a minimal cost and be eventually used in epide-miological studies to establish refined associations between the pre-sence of SVOCs indoor and health outcome in populations.
3.2. SVOC bioaccessibilities in dust reported in the literature
Bioaccessibility data related to SVOC in dust reported in the lit-erature were compiled and are shown as percentages in Fig. 4. Datacomparison was limited by the differences in measurement methods,the nature of the dust (settled dust or dust collected from air con-ditioning filter) and its particle size (sieving fraction from 20–60 μmto< 250 μm). Some of these limitations (inclusion of food or adsorbentin the measurement method) are visually shown in Fig. 4.
3.2.1. Brominated flame retardants (BFRs)
The bioaccessibility of BFRs has been the most widely documentedwith 162 results (143 for PBDEs [45–47,50–52,72] and 19 for alter-native BFRs (2-ethylhexyl-tetrabromo-benzoate (EH-TBB), bis(2-ethyl-hexyl) tetrabromophthalate (BEH-TEBP), tetrabromobisphenol A(TBBP-A) and hexabromocyclododecanes (HBCDs) [45,46,73]). For
PBDEs, valued ranged from 11 to 71% (median 37%) with the lowestbioaccessibilities observed for BDE-209 (11–63%, median 19%). Foralternative BFRs, bioaccessibilities ranged from 12% to 94% (median37%). Highest bioaccessibilities were observed for alternative BFRs, asdetermined by Abdallah, when using Tenax® TA in their CE-PBETmodel (72-94%) [46]. Data are reported in Table 1 and graphicallydisplayed in Fig. 4.
3.2.2. Organophosphorus flame retardants
OPFR bioaccessibilities were only recently reported with 22 resultspublished in 3 articles in 2014 [45], 2015 [42], and 2016 [41] for tris(2-chloroethyl) phosphate (TCEP), tris(1-chloro-2-propyl) phosphate(TCPP), tris(1,3-dichloro-2-propyl) phosphate (TDCPP), and triphenylphosphate (TPHP). Reported bioaccessibilities, shown in Table 2 and inFig. 4, ranged from 8% to 103%, depending on the compound and themeasurement method.
3.2.3. PCBs
Fifty-two values documenting the bioaccessibility of PCBs werepublished in three articles in 2012 [39] and 2013 [74,75]. Overall,values ranged from 3% to 92% (median 22%), depending on the con-gener and the measurement method used (data shown in Table 3 andFig. 4). In the presence of food, valued ranged from 41 to 92% (median74%, n=5) [39]. Without food, bioaccessibility values, ranging from 3to 46% (median 20%, n=42) [74,75], might have been under-estimated.
3.2.4. Phthalates
The bioaccessibility of phthalates in dust was published in threearticles in 2012 [43], 2013 [76], and 2015 [42]. Thirteen values werereported that ranged from 1% to 81% with a median of 13% (Table 4and Fig. 4). However, these values were obtained using a PBET methodwithout sorbent and might have been underestimated (see discussionbelow). A right evaluation of the bioaccessibility of phthalates isnevertheless crucial, with respect to the high contamination levelsfound in indoor dust.
3.2.5. Pesticides
The bioaccessibility of pesticides in dust was assessed in three ar-ticles published in 2012, 2013, and 2016. Investigated substances weremainly organochlorine pesticides [39,44], fipronil [40], piperonylbutoxide [39] and permethrine [39]. Reported bioaccessibilities, shownin Table 5 and Fig. 4, ranged from 6 to 52% (median 14%). In theabsence of food they ranged from 6 to 40% (median 12%, n=14).They increased in the presence of food, from 29% to 52% (median 41%,n=5), thus showing again the conservative aspect of adding food tothe model, as not to underestimate oral bioaccessibility.
3.2.6. PAHs
The bioaccessibility of PAHS was only reported in one article from2011 on air conditioning filter dust [77], and ranged from 2% to 17%(median 7%). Reported values for PAHs are the lowest, compared to allother chemical families (Table 6). These in vitro tests were performedwithout sorptive sink. In soil studies, the addition of a sorptive sink tothe in vitro model caused an increase of PAHs bioaccessibility, by afactor of 1.2 to 2.8 [78], or from 4 to 7 % to 16-31% [79]. Even takingthis increase into account, PAHs would remain among the less bioac-cessible substances, and it is therefore even more important to taketheir bioaccessibility into account for a more accurate estimate of theexposure dose.
3.3. Discussion on the factors influencing oral bioaccessibility
The oral bioaccessibility of SVOCs in dust is influenced by differentfactors that can be classified in three categories: (i) factors related to themeasurement method, (ii) factors related to the dust as a matrix and
G. Raffy et al. Journal of Hazardous Materials 352 (2018) 215–227
219
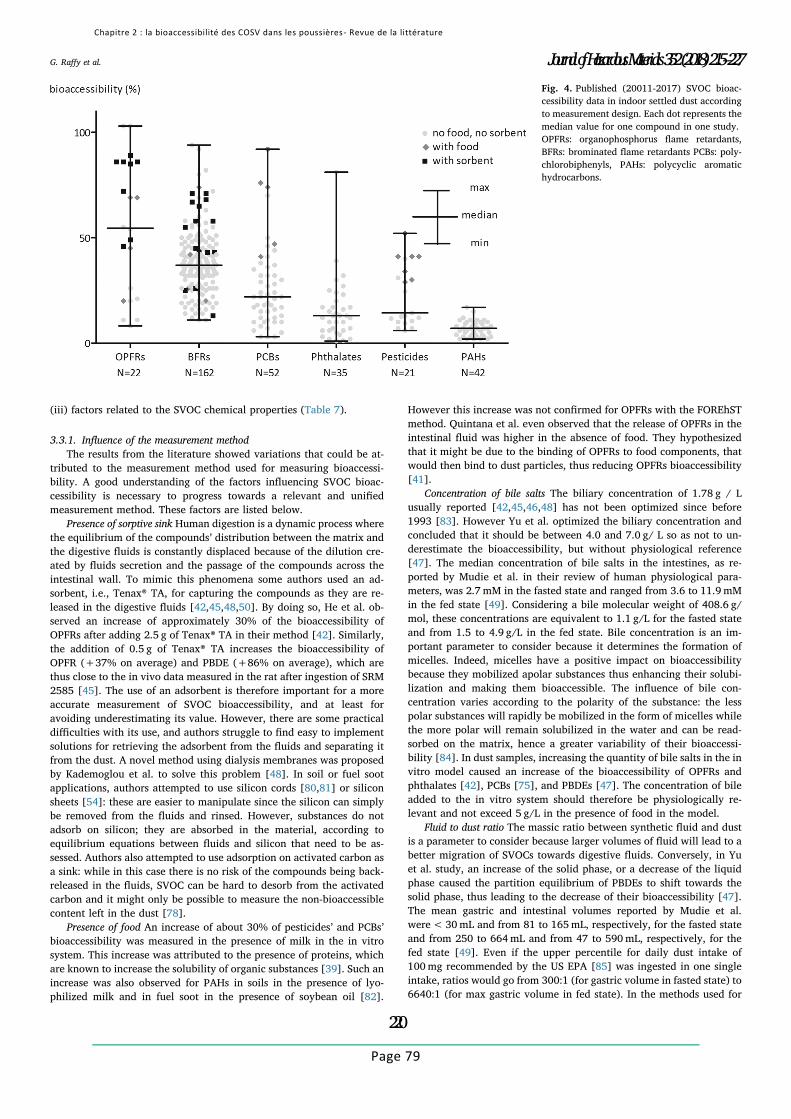
Chapitre 2 : la bioaccessibilité des COSV dans les poussières- Revue de la littérature
Page 79
(iii) factors related to the SVOC chemical properties (Table 7).
3.3.1. Influence of the measurement method
The results from the literature showed variations that could be at-tributed to the measurement method used for measuring bioaccessi-bility. A good understanding of the factors influencing SVOC bioac-cessibility is necessary to progress towards a relevant and unifiedmeasurement method. These factors are listed below.
Presence of sorptive sink Human digestion is a dynamic process wherethe equilibrium of the compounds’ distribution between the matrix andthe digestive fluids is constantly displaced because of the dilution cre-ated by fluids secretion and the passage of the compounds across theintestinal wall. To mimic this phenomena some authors used an ad-sorbent, i.e., Tenax® TA, for capturing the compounds as they are re-leased in the digestive fluids [42,45,48,50]. By doing so, He et al. ob-served an increase of approximately 30% of the bioaccessibility ofOPFRs after adding 2.5 g of Tenax® TA in their method [42]. Similarly,the addition of 0.5 g of Tenax® TA increases the bioaccessibility ofOPFR (+37% on average) and PBDE (+86% on average), which arethus close to the in vivo data measured in the rat after ingestion of SRM2585 [45]. The use of an adsorbent is therefore important for a moreaccurate measurement of SVOC bioaccessibility, and at least foravoiding underestimating its value. However, there are some practicaldifficulties with its use, and authors struggle to find easy to implementsolutions for retrieving the adsorbent from the fluids and separating itfrom the dust. A novel method using dialysis membranes was proposedby Kademoglou et al. to solve this problem [48]. In soil or fuel sootapplications, authors attempted to use silicon cords [80,81] or siliconsheets [54]: these are easier to manipulate since the silicon can simplybe removed from the fluids and rinsed. However, substances do notadsorb on silicon; they are absorbed in the material, according toequilibrium equations between fluids and silicon that need to be as-sessed. Authors also attempted to use adsorption on activated carbon asa sink: while in this case there is no risk of the compounds being back-released in the fluids, SVOC can be hard to desorb from the activatedcarbon and it might only be possible to measure the non-bioaccessiblecontent left in the dust [78].
Presence of food An increase of about 30% of pesticides’ and PCBs’bioaccessibility was measured in the presence of milk in the in vitrosystem. This increase was attributed to the presence of proteins, whichare known to increase the solubility of organic substances [39]. Such anincrease was also observed for PAHs in soils in the presence of lyo-philized milk and in fuel soot in the presence of soybean oil [82].
However this increase was not confirmed for OPFRs with the FOREhSTmethod. Quintana et al. even observed that the release of OPFRs in theintestinal fluid was higher in the absence of food. They hypothesizedthat it might be due to the binding of OPFRs to food components, thatwould then bind to dust particles, thus reducing OPFRs bioaccessibility[41].
Concentration of bile salts The biliary concentration of 1.78 g / Lusually reported [42,45,46,48] has not been optimized since before1993 [83]. However Yu et al. optimized the biliary concentration andconcluded that it should be between 4.0 and 7.0 g/ L so as not to un-derestimate the bioaccessibility, but without physiological reference[47]. The median concentration of bile salts in the intestines, as re-ported by Mudie et al. in their review of human physiological para-meters, was 2.7mM in the fasted state and ranged from 3.6 to 11.9 mMin the fed state [49]. Considering a bile molecular weight of 408.6 g/mol, these concentrations are equivalent to 1.1 g/L for the fasted stateand from 1.5 to 4.9 g/L in the fed state. Bile concentration is an im-portant parameter to consider because it determines the formation ofmicelles. Indeed, micelles have a positive impact on bioaccessibilitybecause they mobilized apolar substances thus enhancing their solubi-lization and making them bioaccessible. The influence of bile con-centration varies according to the polarity of the substance: the lesspolar substances will rapidly be mobilized in the form of micelles whilethe more polar will remain solubilized in the water and can be read-sorbed on the matrix, hence a greater variability of their bioaccessi-bility [84]. In dust samples, increasing the quantity of bile salts in the invitro model caused an increase of the bioaccessibility of OPFRs andphthalates [42], PCBs [75], and PBDEs [47]. The concentration of bileadded to the in vitro system should therefore be physiologically re-levant and not exceed 5 g/L in the presence of food in the model.
Fluid to dust ratio The massic ratio between synthetic fluid and dustis a parameter to consider because larger volumes of fluid will lead to abetter migration of SVOCs towards digestive fluids. Conversely, in Yuet al. study, an increase of the solid phase, or a decrease of the liquidphase caused the partition equilibrium of PBDEs to shift towards thesolid phase, thus leading to the decrease of their bioaccessibility [47].The mean gastric and intestinal volumes reported by Mudie et al.were< 30mL and from 81 to 165mL, respectively, for the fasted stateand from 250 to 664mL and from 47 to 590mL, respectively, for thefed state [49]. Even if the upper percentile for daily dust intake of100mg recommended by the US EPA [85] was ingested in one singleintake, ratios would go from 300:1 (for gastric volume in fasted state) to6640:1 (for max gastric volume in fed state). In the methods used for
Fig. 4. Published (20011-2017) SVOC bioac-cessibility data in indoor settled dust accordingto measurement design. Each dot represents themedian value for one compound in one study.OPFRs: organophosphorus flame retardants,BFRs: brominated flame retardants PCBs: poly-chlorobiphenyls, PAHs: polycyclic aromatichydrocarbons.
G. Raffy et al. Journal of Hazardous Materials 352 (2018) 215–227
220

Ch
ap
itre 2
: la b
ioa
ccessib
ilité d
es C
OSV
da
ns le
s po
ussiè
res- R
evu
e d
e la
littéra
ture
Page
80
Table 1
Bioaccessibility (%) of brominated flame retardants in indoor settled dust.
Method CE-PBET CE-PBET CE-PBET PBET PBET CE-PBET +Tenax® TA
PBET PBET CE-PBET PBET PBET PBET PBET PBET PBET PBET PBET
n 1 1 1 6 6 17 2 3 3 44 44 44 44 1 1 1 1Sieving <250 μm <250 μm <250 μm <100 μm <100 μm <53 μm 63-125 μm 25-500 μm 25-500 μm <250 μm <250 μm <250 μm <250 μm <250 μm <250 μm <250 μm <250 μm
EH-TBB 43BEH-TEBP 13α-HBCD 12 32 16 82 92β-HBCD 16 34 14 69 80γ-HBCD 19 37 14 51 72TBBP-A 51 94BDE 17 45 48 56 35 20 60 56 55 49BDE 28 74 38 35 29 37 36 50 33 40BDE 28, 33 65 48BDE 49 58BDE 47 26 71 34 50 58 38 32 26 22 34 43 39 45BDE 66 36 38 34 28 26 33 57 38 39BDE 100 68 34 36 53 46 37 26 20 40 42 45 45BDE 99 20 71 32 35 41 32 24 18 16 27 34 35 47BDE 85 32 50 39 48 19 42 37 45 40BDE 85, 155 67BDE 154 58 39 28 32 49 36 32 26 36 55 42 47BDE 153 42 55 39 38 48 41 36 25 26 32 49 33 42BDE 138 43 27 42 52 25 35 30 41 35 39BDE 183 44 32 37 44 38 41 27 28 17 39 22 36BDE 190 51 31 41 35 46 17 51 36BDE 203, 200 25BDE 209 63 26 11 11 14 23 19 19 19Reference [73] [73] [73] [51] [52] [45] [50] [46] [46] [72] [72] [72] [72] [47] [47] [47] [47]
PBET: physiologically-based extraction test, CE: colon-extended, BEH-TEBP: bis(2-ethylhexyl) tetrabromophthalate, HBCD: hexabromocyclododecane, TBBP-A: tetrabromobisphenol A, BDE: bromodiphenyl ether.
G.Raffyet
al.
Journal of Hazardous Materials 352 (2018) 215–227
221

Chapitre 2 : la bioaccessibilité des COSV dans les poussières- Revue de la littérature
Page 81
the measurements of dust bioaccessibility, the fluid:dust ratio rangedfrom 20 to 133 for gastric fluids and from 67 to 300 for intestinal fluids.Yu et al. studied this ratio and concluded that it should be between 150and 200 [47]. Collins et al. recommend a minimum ratio of 100:1, eventhough they appreciate that a higher ratio may be more realistic, butwould lead to detection problems [24]. Besides, in their review ofbioaccessibility in soil, Rostami and Juhasz reported that little
Table 2
Bioaccessibility (%) of organophosphate flame retardants in indoor settled dust.
Method UBM (without food) FOREhST (with food) PBET PBET+ Tenax®TA
CE-PBET+Tenax® TA
n 1 pooled sample of 10house dust
1 pooled sample from 5car dust
1 pooled sample of 10house dust
1 pooled sample from 5car dust
19 1 17
Sieving 20–60 μm 20–60 μm 20–60 μm 20–60 μm <150 μm <53 μm
TCEP 103 103 69 69 54 72 86TCPP 26 11 45 20 55 89 86TDCPP 21 11 20 49 85TPP 8.2 46 86Reference [41] [41] [41] [41] [42] [42] [45]
UBM: Unified BioAccessibility Research Group of Europe (BARGE) Method, FOREhST: Fed ORganic estimation human Simulation Test, PBET: physiologically-basedextraction test, TCEP: tris(2-chloroethyl) phosphate, TCPP: tris(2-chloroisopropyl) phosphate, TDCPP: tris(1,3-dichloro-2-propyl) phosphate, TPP: triphenylpho-sphate.
Table 3
Bioaccessibility (%) of polychlorobiphenyls (PCBs) in indoor settled dust.
Method PBET PBET DIN 19738 DIN 19738+milkpowder
n 18 120 outdoor, 40indoor dustsamples
6 to 9 3
Sieving <100 μm <100 μm <63 μm <63 μm
PCB 18 30PCB 28 38 36 70 74PCB 37 46PCB 44 17PCB 52 22PCB 70 32PCB 74 12PCB 77 32 6PCB 81 28PCB 87 37PCB 99 10PCB 101 3 50 76PCB 105 3PCB 114 27PCB 118 23 10PCB 119 3PCB 123 12PCB 126 41PCB 128/158 44PCB 138 22 19 47PCB 144 32PCB 151 5PCB 153 24 16 41PCB 153/157 35PCB 156 10PCB 157 18PCB 167 18PCB 168 18PCB 169 29PCB 170 21PCB 177 11PCB 180 7 13 92PCB 183 15 24PCB 187 22PCB 189 8PCB 194 15 10PCB 199 17Reference [75] [74] [39] [39]
PBET: physiologically-based extraction test.
Table 4
Bioaccessibility (%) of phthalates in indoor settled dust.
Method PBET PBET PBET PBETn 19 40 40 14Sieving < 150 μm <63 μm 63–100 μm <100 μm
DMP 81 39 27 32DEP 30 20 25DPRP 23 24DiBP 13 13 17DBP 3 10 7 15DMEP 6 1DHP 17 12BBP 5 14 17 12DEHP 1 16 6 10DCHP 7 4DnOP 2 2 13DNP+DiDP 6 10Reference [42] [76] [76] [43]
PBET: physiologically-based extraction test, DMP: dimethyl phthalate, DEP:diethyl phthalate, DPRP: di-n-propylphthalate, DiBP: diisobutyl phthalate, DBP:dibutyl phthalate, DMEP: bis (2-methoxyethyl) phthalate, DHP: di-n-hexylphthalate, BBP: butyl benzyl phthalate, DEHP: di-2-ethylhexyl phthalate,DCHP: dicyclohexyl phthalate, DnOP: di-n-octyl phthalate, DNP: dinonylphthalate, DiDP: di-isodecyl phthalate (DiDP).
Table 5
Bioaccessibility (%) of pesticides in indoor settled dust.
Method DIN 19738 PBET DIN 19738 DIN 19738+milkpowder
n 37 120 outdoor, 40indoor dustsamples
6 to 9 3
Sieving <150 μm <100 μm <63 μm <63 μm
DDTs 24.5 7a 30a
HCHs 10.4 31b 52b
CHLs 12.6Drins 11.7HCB 14.3Mirex 9.4PCP 12 34PBO 7 41Methoxychlor 10 29Chlorpyrifos 13 41Permethrine 6 41Fipronil 40Reference [40] [44] [39] [39]
PBET: physiologically-based extraction test, DDTs: dichlorodiphenyltri-chloroethanes (ap,p’-DDT), HCHs: hexachlorocyclohexane(bLindane), CHLs:Heptachlor, transchlordane, cis-chlordane, trans-nonachlor, and cis-nonachlor,Drins: aldrin, dieldrin and endrin, HCB: hexachlorobenzene, PCP: penta-chlorophenol, PBO: piperonyl butoxide.
G. Raffy et al. Journal of Hazardous Materials 352 (2018) 215–227
222
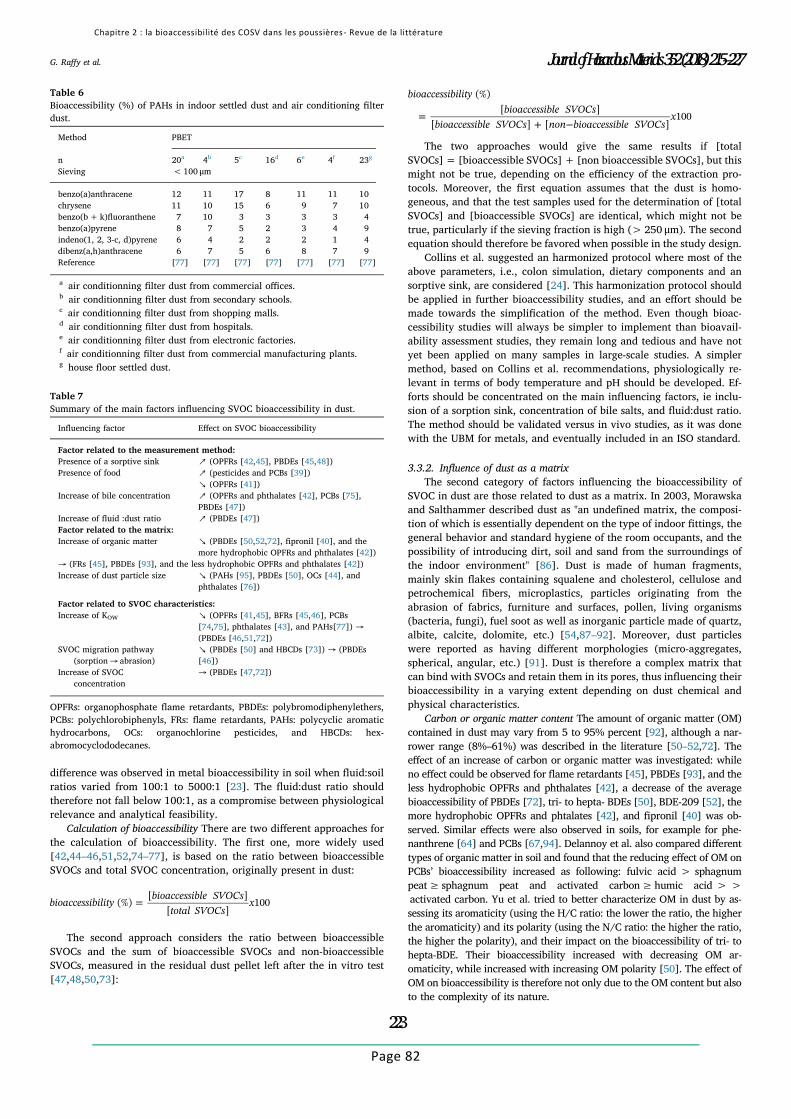
Chapitre 2 : la bioaccessibilité des COSV dans les poussières- Revue de la littérature
Page 82
difference was observed in metal bioaccessibility in soil when fluid:soilratios varied from 100:1 to 5000:1 [23]. The fluid:dust ratio shouldtherefore not fall below 100:1, as a compromise between physiologicalrelevance and analytical feasibility.
Calculation of bioaccessibility There are two different approaches forthe calculation of bioaccessibility. The first one, more widely used[42,44–46,51,52,74–77], is based on the ratio between bioaccessibleSVOCs and total SVOC concentration, originally present in dust:
=bioaccessibilitybioaccessible SVOCs
total SVOCsx(%)
[ ]
[ ]100
The second approach considers the ratio between bioaccessibleSVOCs and the sum of bioaccessible SVOCs and non-bioaccessibleSVOCs, measured in the residual dust pellet left after the in vitro test[47,48,50,73]:
=+ −
bioaccessibility
bioaccessible SVOCs
bioaccessible SVOCs non bioaccessible SVOCsx
(%)
[ ]
[ ] [ ]100
The two approaches would give the same results if [totalSVOCs]= [bioaccessible SVOCs]+ [non bioaccessible SVOCs], but thismight not be true, depending on the efficiency of the extraction pro-tocols. Moreover, the first equation assumes that the dust is homo-geneous, and that the test samples used for the determination of [totalSVOCs] and [bioaccessible SVOCs] are identical, which might not betrue, particularly if the sieving fraction is high (> 250 μm). The secondequation should therefore be favored when possible in the study design.
Collins et al. suggested an harmonized protocol where most of theabove parameters, i.e., colon simulation, dietary components and ansorptive sink, are considered [24]. This harmonization protocol shouldbe applied in further bioaccessibility studies, and an effort should bemade towards the simplification of the method. Even though bioac-cessibility studies will always be simpler to implement than bioavail-ability assessment studies, they remain long and tedious and have notyet been applied on many samples in large-scale studies. A simplermethod, based on Collins et al. recommendations, physiologically re-levant in terms of body temperature and pH should be developed. Ef-forts should be concentrated on the main influencing factors, ie inclu-sion of a sorption sink, concentration of bile salts, and fluid:dust ratio.The method should be validated versus in vivo studies, as it was donewith the UBM for metals, and eventually included in an ISO standard.
3.3.2. Influence of dust as a matrix
The second category of factors influencing the bioaccessibility ofSVOC in dust are those related to dust as a matrix. In 2003, Morawskaand Salthammer described dust as "an undefined matrix, the composi-tion of which is essentially dependent on the type of indoor fittings, thegeneral behavior and standard hygiene of the room occupants, and thepossibility of introducing dirt, soil and sand from the surroundings ofthe indoor environment" [86]. Dust is made of human fragments,mainly skin flakes containing squalene and cholesterol, cellulose andpetrochemical fibers, microplastics, particles originating from theabrasion of fabrics, furniture and surfaces, pollen, living organisms(bacteria, fungi), fuel soot as well as inorganic particle made of quartz,albite, calcite, dolomite, etc.) [54,87–92]. Moreover, dust particleswere reported as having different morphologies (micro-aggregates,spherical, angular, etc.) [91]. Dust is therefore a complex matrix thatcan bind with SVOCs and retain them in its pores, thus influencing theirbioaccessibility in a varying extent depending on dust chemical andphysical characteristics.
Carbon or organic matter content The amount of organic matter (OM)contained in dust may vary from 5 to 95% percent [92], although a nar-rower range (8%–61%) was described in the literature [50–52,72]. Theeffect of an increase of carbon or organic matter was investigated: whileno effect could be observed for flame retardants [45], PBDEs [93], and theless hydrophobic OPFRs and phthalates [42], a decrease of the averagebioaccessibility of PBDEs [72], tri- to hepta- BDEs [50], BDE-209 [52], themore hydrophobic OPFRs and phtalates [42], and fipronil [40] was ob-served. Similar effects were also observed in soils, for example for phe-nanthrene [64] and PCBs [67,94]. Delannoy et al. also compared differenttypes of organic matter in soil and found that the reducing effect of OM onPCBs’ bioaccessibility increased as following: fulvic acid > sphagnumpeat≥ sphagnum peat and activated carbon≥ humic acid > >activated carbon. Yu et al. tried to better characterize OM in dust by as-sessing its aromaticity (using the H/C ratio: the lower the ratio, the higherthe aromaticity) and its polarity (using the N/C ratio: the higher the ratio,the higher the polarity), and their impact on the bioaccessibility of tri- tohepta-BDE. Their bioaccessibility increased with decreasing OM ar-omaticity, while increased with increasing OM polarity [50]. The effect ofOM on bioaccessibility is therefore not only due to the OM content but alsoto the complexity of its nature.
Table 6
Bioaccessibility (%) of PAHs in indoor settled dust and air conditioning filterdust.
Method PBET
n 20a 4b 5c 16d 6e 4f 23g
Sieving < 100 μm
benzo(a)anthracene 12 11 17 8 11 11 10chrysene 11 10 15 6 9 7 10benzo(b+ k)fluoranthene 7 10 3 3 3 3 4benzo(a)pyrene 8 7 5 2 3 4 9indeno(1, 2, 3-c, d)pyrene 6 4 2 2 2 1 4dibenz(a,h)anthracene 6 7 5 6 8 7 9Reference [77] [77] [77] [77] [77] [77] [77]
a air conditionning filter dust from commercial offices.b air conditionning filter dust from secondary schools.c air conditionning filter dust from shopping malls.d air conditionning filter dust from hospitals.e air conditionning filter dust from electronic factories.f air conditionning filter dust from commercial manufacturing plants.g house floor settled dust.
Table 7
Summary of the main factors influencing SVOC bioaccessibility in dust.
Influencing factor Effect on SVOC bioaccessibility
Factor related to the measurement method:
Presence of a sorptive sink ↗ (OPFRs [42,45], PBDEs [45,48])Presence of food ↗ (pesticides and PCBs [39])
↘ (OPFRs [41])Increase of bile concentration ↗ (OPFRs and phthalates [42], PCBs [75],
PBDEs [47])Increase of fluid :dust ratio ↗ (PBDEs [47])Factor related to the matrix:
Increase of organic matter ↘ (PBDEs [50,52,72], fipronil [40], and themore hydrophobic OPFRs and phthalates [42])
→ (FRs [45], PBDEs [93], and the less hydrophobic OPFRs and phthalates [42])Increase of dust particle size ↘ (PAHs [95], PBDEs [50], OCs [44], and
phthalates [76])
Factor related to SVOC characteristics:
Increase of KOW ↘ (OPFRs [41,45], BFRs [45,46], PCBs[74,75], phthalates [43], and PAHs[77]) →(PBDEs [46,51,72])
SVOC migration pathway(sorption→ abrasion)
↘ (PBDEs [50] and HBCDs [73]) → (PBDEs[46])
Increase of SVOCconcentration
→ (PBDEs [47,72])
OPFRs: organophosphate flame retardants, PBDEs: polybromodiphenylethers,PCBs: polychlorobiphenyls, FRs: flame retardants, PAHs: polycyclic aromatichydrocarbons, OCs: organochlorine pesticides, and HBCDs: hex-abromocyclododecanes.
G. Raffy et al. Journal of Hazardous Materials 352 (2018) 215–227
223

Chapitre 2 : la bioaccessibilité des COSV dans les poussières- Revue de la littérature
Page 83
Dust particle size and pore volumes An increase of SVOC bioaccessi-
bility associated to the decrease of dust particles was observed for PAHs[95], PBDEs [50], OCPs [44], and phthalates [76]. These observations areexpected because smaller dust particles have larger specific surface areaper mass unit, allowing better contact and dissolution in digestive fluids.Therefore, the right particle size to be analyzed has to be chosen for re-levant human exposure assessment: not only will this have an impact ontotal concentration of SVOCs in dust, but also on their bioaccessibility.Similarly to smaller particle size, larger pore volumes were associated withhigher bioaccessibility because they also offer a larger specific area moreeasily accessible to digestive fluids [50].
Sample aging In soils, the bioaccessibility of persistent organic pollu-tants (POPs) decreases when their residence time increases, through theaging process which allows POPs to be absorbed in organic matter anddiffuse into the matrix nanopores [23]. Fang and Stapleton compared thebioaccessibility of OPFRs and BDEs in two series of samples, sampled in2006 and 2010, respectively [45]. Except for BDE-209, the 2006 bioac-cessibility serie was significantly lower than the 2010′s, thus confirmingthe observations made on soils. BDE-209 might be present in the dust, notonly via sorption on dust surface, but also within the fibers, via materialsabrasion, and would therefore be less concerned by the aging process (seealso “Influence of the SVOC migration pathway” below).
The bioaccessibility of SVOC could be predicted based on a knowledgeof the matrix and the total SVOC content, which are easier to measure thanthe bioaccessibility itself. To this end, the matrix influence parametersneed to be ranked depending on their respective impact on bioaccessi-bility. Yu et al. compared the different parameters, i.e., OM content, po-larity and aromaticity of OM, particle size, surface area, and pore volumeof dust, using multiple linear regression [50]. Only OM content and porevolume remained in the statistical model. The bioaccessibility of tri- tohepta-BDEs could thus be calculated according to the equation: bioac-cessibility (%)=45.05− 0.49×OM%+1.79×pore volume [50]. Forthe same reasons as stated above, BDE-209 measurements did not fit thisequation. Further studies should be undertaken to integrate the agingprocess and the way the SVOC integrated dust in the model and a morecomprehensive equation proposed.
3.3.3. Influence of the SVOC’s chemical properties
The third category of factors that influence the bioaccessibility arethose related to the SVOC chemical properties, such as the octanol/water partition coefficient (KOW) that could be used to predict thepropensity of SVOCs to migrate from dust to digestive fluids.
Kow SVOCs with higher KOW are more hydrophobic and less likelyto solubilize in aqueous digestive fluids. A decreasing trend in bioac-cessibility was thereby observed with increasing log Kow for OPFRs[41,45], BFRs [45,46,48], PCBs [74,75], phthalates [43], and PAHs[77], although this trend could not be confirmed in two others studiesrelated to PBDEs [46,51,72], showing that other parameters are also toconsider.
SVOC migration pathway The presence of SVOC in indoor dust canarise through three mechanisms: (i) via volatilization and re-con-densation of the SVOC on dust particles (air mediated transfer), (ii) viadirect transfer from horizontal surfaces to dust, and (iii) via weatheringor abrasion of polymers [96–98]. In the first two cases, the SVOC issorbed onto the surfaces of dust particles, whereas in the third case, theSVOC is a constituent of dust particles [73,96]. These migration path-ways could lead to different bioaccessibilities, and sorbed SVOCs couldbe more bioaccessible than constitutive SVOCs. Yu et al. hypothesizedthat these different migration pathways could explain the lower PBDEsbioaccessibility in indoor dust than in outdoor dust since indoor dust ismore likely to contain fragments of materials than outdoor dust [72]. Intheir next study, they compared the bioaccessibility of PBDE-spikeddust versus unspiked dust and observed no change in the bioaccessi-bility of tri- to hepta- BDEs whereas BDE-209 bioaccessibility washigher in the spiked dust, thus confirming a different behavior of BDE-209, that could originate from material abrasion [50]. Indeed, Webster
et al. observed that the repartition of bromine of highly BDE-209 con-taminated dust was heterogeneous in house dust and concentrated inscattered highly contaminated particles, suggesting an abrasion originof BDE-209 in dust [96], although Abdallah et al. did not observe thisheterogeneous repartition when trying to explain the lower bioacces-sibility of BDE-209 in their dust samples [46]. However, in a more re-cent study, an experimental chamber was used to compare the bioac-cessibility of HBCDs in a pre-characterized dust that had been enrichedby HBCDs originating from treated textile via the two migrationpathway: HBCDs bioaccessibility in dust contaminated via volatiliza-tion (35%) was greater than in dust contaminated by abrasion (15%)[73]. This study confirms the general tendency of sorbed compoundsbeing more bioaccessible than constitutive ones, although more studiesneed to be performed with other SVOCs sources.
Level of SVOC concentration A variation of the amount of SVOCpresent in dust before it is submitted to bioaccessibility test showed noimpact of the SVOC concentration [47,72].
Enantiomeric form of the SVOC No difference was observed in thebioaccessibility of the 3 main HBCDs diastereoisomers (α, β, and γ), butthis does not preclude the existence of an effect on their bioavailability[46].
A summary of the influencing factors related to the measurementmethod, the matrix and the SVOC is shown in Table 7.
4. Conclusion
SVOC bioaccessibilities show large variations, from 1 to 100%. It istherefore important to take bioaccessibility into account for a betterassessment of human exposure. It is particularly relevant for PAHs,which is the chemical family displaying the lowest bioaccessibilitiesand would therefore be more prone to exposure assessment errors. It isalso important for phthalates, because the high concentrations mea-sured in indoor dust could be put into perspective knowing theirbioaccessibility. Bioaccessibility studies are easier to implement thanbioavailability studies. However existing methods need to be (i) sim-plified, based on their most influencing parameters: inclusion of asorptive sink and/or food, bile concentration and fluid:dust ratio, (ii)harmonized via interlaboratory calibrations, and (iii) validated versusin-vivo studies, preferably using swine. Predictions of the bioaccessiblefraction could be made for compounds mainly concerned by the ad-sorption migration pathways, based on a knowledge of the SVOC con-tent of the dust, its organic matter content and its pore sizes. Within achemical family, further equations could be established based on theirKow. However, more bioaccessibility data need to be acquired, on manydifferent dust samples, for building and validating such models.Moreover, the bioaccessibility of SVOCs in dust has been assessed fordifferent chemical families, including OPFRs, BFRs, phthalates, OCPpesticides, and PAHs, but more studies are needed to address the lack ofknowledge on other compounds and chemical families found in settleddust, such as bisphenols, triclosan, perfluorinated compounds, pyre-throids, etc.
5. Declaration of interest
None.
Acknowledgment
This research did not receive any specific grant from fundingagencies in the public, commercial, or not-for-profit sectors.
References
[1] C. Weschler, W.W. Nazaroff, Semivolatile organic compounds in indoor environ-ments, Atmos. Environ. 42 (2008) 9018–9040, http://dx.doi.org/10.1016/j.atmosenv.2008.09.052.
G. Raffy et al. Journal of Hazardous Materials 352 (2018) 215–227
224

Chapitre 2 : la bioaccessibilité des COSV dans les poussières- Revue de la littérature
Page 84
[2] WHO, Indoor Air Quality: Organic Pollutants (EURO Reports and Studies No. 111,
(1989).[3] N. Bonvallot, C. Mandin, F. Mercier, B. Le Bot, P. Glorennec, Health ranking of
ingested semi-volatile organic compounds in house dust: an application to France,Indoor Air 20 (2010) 458–472, http://dx.doi.org/10.1111/j.1600-0668.2010.00667.x.
[4] X. Li, Y. Gao, J. Wang, G. Ji, Y. Lu, D. Yang, H. Shen, Q. Dong, L. Pan, H. Xiao,B. Zhu, Exposure to environmental endocrine disruptors and human health, Publ.Health Emerg. 1 (2016) 47, http://dx.doi.org/10.21037/phe.2016.11.01.
[5] M. Giulivo, M. Lopez de Alda, E. Capri, D. Barceló, Human exposure to endocrinedisrupting compounds: their role in reproductive systems, metabolic syndrome andbreast cancer. a review, Environ. Res. 151 (2016) 251–264, http://dx.doi.org/10.1016/j.envres.2016.07.011.
[6] K.H. Wong, T.S. Durrani, Exposures to endocrine disrupting chemicals in consumerproducts – a guide for pediatricians, Curr. Probl. Pediatr. Adolesc. Health Care(2017) 1–12, http://dx.doi.org/10.1016/j.cppeds.2017.04.002.
[7] H. Fromme, G. Becher, B. Hilger, W. Völkel, Brominated flame retardants – ex-posure and risk assessment for the general population, Int. J. Hyg. Environ. Health219 (2016) 1–23, http://dx.doi.org/10.1016/j.ijheh.2015.08.004.
[8] L. Bramwell, S.V. Glinianaia, J. Rankin, M. Rose, A. Fernandes, S. Harrad, T. Pless-Mulloli, Associations between human exposure to polybrominated diphenyl etherflame retardants via diet and indoor dust, and internal dose: a systematic review,Environ. Int. 92–93 (2016) 680–694, http://dx.doi.org/10.1016/j.envint.2016.02.017.
[9] M. Pelletier, N. Bonvallot, O. Ramalho, C. Mandin, W. Wei, G. Raffy, F. Mercier,O. Blanchard, B. Le Bot, P. Glorennec, Indoor residential exposure to semivolatileorganic compounds in France, Environ. Int. 109 (2017) 81–88, http://dx.doi.org/10.1016/j.envint.2017.08.024.
[10] S. Langer, G. Bekö, C. Weschler, L.M. Brive, J. Toftum, M. Callesen, G. Clausen,Phthalate metabolites in urine samples from Danish children and correlations withphthalates in dust samples from their homes and daycare centers, Int. J. Hyg.Environ. Health 217 (2014) 78–87, http://dx.doi.org/10.1016/j.ijheh.2013.03.014.
[11] L. Zhou, M. Hiltscher, W. Püttmann, Occurrence And Human Exposure AssessmentOf Organophosphate Flame Retardants (Opfrs) In Indoor Dust From VariousMicroenvironments Of The Rhine/Main Region, Indoor Air, Germany, 2017, http://dx.doi.org/10.1111/ina.12397.
[12] M.A.E. Abdallah, Environmental occurrence, analysis and human exposure to theflame retardant tetrabromobisphenol-A (TBBP-A)-a review, Environ. Int. 94 (2016)235–250, http://dx.doi.org/10.1016/j.envint.2016.05.026.
[13] A. Ferguson, R. Penney, H. Solo-gabriele, A review of the field on children’s ex-posure to environmental contaminants: a risk assessment approach, Int. J. Environ.Res. Public. Health 14 (2017), http://dx.doi.org/10.3390/ijerph14030265.
[14] G. Bekö, C. Weschler, S. Langer, M. Callesen, J. Toftum, G. Clausen, Children’sphthalate intakes and resultant cumulative exposures estimated from urine com-pared with estimates from dust ingestion, inhalation and dermal absorption in theirhomes and daycare centers, PLoS One 8 (2013) e62442, , http://dx.doi.org/10.1371/journal.pone.0062442.
[15] K. Larsson, C.H. Lindh, B.A. Jönsson, G. Giovanoulis, M. Bibi, M. Bottai,A. Bergström, M. Berglund, Phthalates, non-phthalate plasticizers and bisphenols inSwedish preschool dust in relation to children's exposure, Environ. Int. (2017),http://dx.doi.org/10.1016/j.envint.2017.02.006.
[16] S.D. Mitro, R.E. Dodson, V. Singla, G. Adamkiewicz, A.F. Elmi, M.K. Tilly, A.R. Zota,Consumer product chemicals in indoor dust: a quantitative meta-analysis of U.S,Stud. Environ. Sci. Technol. 50 (2016) 10661–10672, http://dx.doi.org/10.1021/acs.est.6b02023.
[17] G. Raffy, F. Mercier, O. Blanchard, M. Derbez, C. Dassonville, N. Bonvallot,P. Glorennec, B. Le Bot, Semi-volatile organic compounds in the air and dust of 30French schools: a pilot study, Indoor Air 27 (2016) 114–127, http://dx.doi.org/10.1111/ina.12288.
[18] B.L. Wang, S.T. Pang, J.P. Sun, X.L. Zhang, X.L. Li, Y.G. Sun, X.M. Lu, Q. Zhang,Levels of polychlorinated biphenyls in settled house dust from urban dwellings inChina and their neurodevelopmental effects on preschool-aged children, Sci. TotalEnviron. 505 (2015) 402–408, http://dx.doi.org/10.1016/j.scitotenv.2014.10.026.
[19] K. Kademoglou, F. Xu, J.A. Padilla-Sanchez, L.S. Haug, A. Covaci, C.D. Collins,Legacy and alternative flame retardants in Norwegian and UK indoor environment:implications of human exposure via dust ingestion, Environ. Int. (2017), http://dx.doi.org/10.1016/j.envint.2016.12.012.
[20] Y. Ma, S. Harrad, Spatiotemporal analysis and human exposure assessment onpolycyclic aromatic hydrocarbons in indoor air, settled house dust, and diet: a re-view, Environ. Int. 84 (2015) 7–16, http://dx.doi.org/10.1016/j.envint.2015.07.006.
[21] Z. Cao, G. Yu, Y. Chen, C. Liu, K. Liu, T. Zhang, B. Wang, S. Deng, J. Huang,Mechanisms influencing the BFR distribution patterns in office dust and implica-tions for estimating human exposure, J. Hazard. Mater. 252–253 (2013) 11–18,http://dx.doi.org/10.1016/j.jhazmat.2013.02.043.
[22] Z. Cao, G. Yu, Y. Chen, Q.-M. Cao, H. Fiedler, S.-B. Deng, J. Huang, B. Wang,Particle size: a missing factor in risk assessment of human exposure to toxic che-micals in settled indoor dust, Environ. Int. 49 (2012) 24–30, http://dx.doi.org/10.1016/j.envint.2012.08.010.
[23] I. Rostami, A. Juhasz, assessment of persistent organic pollutant (POP) bioavail-ability and bioaccessibility for human health exposure assessment: a critical review,Crit. Rev. Environ. Sci. Technol. 41 (2011) 623–656, http://dx.doi.org/10.1080/10643380903044178.
[24] C.D. Collins, M. Craggs, S. García-Alcega, K. Kademoglou, S. Lowe, Towards aunified approach for the determination of the bioaccessibility of organic pollutants,
Environ. Int. 78 (2015) 24–31, http://dx.doi.org/10.1016/j.envint.2015.02.005.[25] A. Turner, Oral bioaccessibility of trace metals in household dust: a review,
Environ. Geochem. Health 33 (2011) 331–341, http://dx.doi.org/10.1007/s10653-011-9386-2.
[26] M. Boland, Human digestion – a processing perspective, J. Sci. Food Agric. 96(2016) 2275–2283, http://dx.doi.org/10.1002/jsfa.7601.
[27] O. Ménard, T. Cattenoz, H. Guillemin, I. Souchon, A. Deglaire, D. Dupont,D. Picque, Validation of a new in vitro dynamic system to simulate infant digestion,Food Chem. 145 (2014) 1039–1045, http://dx.doi.org/10.1016/j.foodchem.2013.09.036.
[28] M. Minekus, P. Marteau, R. Havenaar, J.H.J. Huis in't Veld, A multicompartmentaldynamic computer-controlled model simulating the stomach and small intestine,Altern. Lab. Anim. 23 (1995) 197–209.
[29] K. Molly, M. Vande Woestyne, W. Verstraete, Development of a 5-step multi-chamber reactor as a simulation of the human intestinal microbial ecosystem, Appl.Microbiol. Biotechnol. 39 (1993) 254–258.
[30] M.A. Herrera, M. Rosende, M.A.Z. Arruda, M. Miró, On-line coupling of physiolo-gically relevant bioaccessibility testing to inductively coupled plasma spectrometry:proof of concept for fast assessment of gastrointestinal bioaccessibility of micro-nutrients from soybeans, Anal. Chim. Acta 939 (2016) 1–9, http://dx.doi.org/10.1016/j.aca.2016.07.030.
[31] S. Denys, J. Caboche, K. Tack, G. Rychen, J. Wragg, M.R. Cave, C. Jondreville,C. Feidt, In vivo validation of the unified BARGE method to assess the bioaccessi-bility of arsenic, antimony, cadmium, and lead in soils, Environ. Sci. Technol. 46(2012) 6252–6260.
[32] X. Cui, P. Xiang, R. He, A. Juhasz, L.Q. Ma, Advances in in vitro methods to evaluateoral bioaccessibility of PAHs and PBDEs in environmental matrices, Chemosphere150 (2016) 378–389, http://dx.doi.org/10.1016/j.chemosphere.2016.02.041.
[33] DIN 19738, Soil Quality – Bioaccessibility of Organic and Inorganic Pollutants fromContaminated Soil Material, (2004).
[34] NF EN ISO 17402, Soil Quality: Requirements and Guidance for the Selection andApplication of Methods for the Assessment of Bioavailability of Contaminants inSoil and Soil Materials, (2011).
[35] ISO/DIS 16751, Soil Quality - Environmental Availability of non-polar Compounds -Determination of the Potential Bioavailable Fraction and the non-BioavailableFraction Using a Strong Adsorbent or Complexing Agent, (2015).
[36] J. Wragg, M.R. Cave, N. Basta, E. Brandon, S. Casteel, S. Denys, C. Gron, A. Oomen,K. Reimer, K. Tack, T. Van de Wiele, An inter-laboratory trial of the unified BARGEbioaccessibility method for arsenic, cadmium and lead in soil, Sci. Total Environ.409 (2011) 4016–4030, http://dx.doi.org/10.1016/j.scitotenv.2011.05.019.
[37] J.R. Dean, R. Ma, Approaches to assess the oral bioaccessibility of persistent organicpollutants: a critical review, Chemosphere 68 (2007) 1399–1407, http://dx.doi.org/10.1016/j.chemosphere.2007.03.054.
[38] Barge/ Ineris, UBM Procedure for the Measurement of Inorganic ContaminantBioaccessibility from Solid Matrices, (2011), pp. 1–10.
[39] H. Ertl, W. Butte, Bioaccessibility of pesticides and polychlorinated biphenyls fromhouse dust: in-vitro methods and human exposure assessment, J. Expo. Sci. Environ.Epidemiol. (2012) 1–10.
[40] J.M. Starr, W. Li, S.E. Graham, K.D. Bradham, D.M. Stout II., A. Williams, J. Sylva,Using paired soil and house dust samples in an in vitro assay to assess the postingestion bioaccessibility of sorbed fipronil, J. Hazard. Mater. 312 (2016) 141–149,http://dx.doi.org/10.1016/j.jhazmat.2016.03.053.
[41] J.B. Quintana, M. Rosende, R. Montes, T. Rodríguez-Álvarez, R. Rodil, R. Cela,M. Miró, In-vitro estimation of bioaccessibility of chlorinated organophosphateflame retardants in indoor dust by fasting and fed physiologically relevant extrac-tion tests, Sci. Total Environ. (2016), http://dx.doi.org/10.1016/j.scitotenv.2016.11.210.
[42] R. He, Y. Li, P. Xiang, C. Li, C. Zhou, S. Zhang, X. Cui, L.Q. Ma, Organophosphorusflame retardants and phthalate esters in indoor dust from different microenviron-ments: bioaccessibility and risk assessment, Chemosphere 150 (2016) 528–535,http://dx.doi.org/10.1016/j.chemosphere.2015.10.087.
[43] Y. Kang, Y.B. Man, K.C. Cheung, M.H. Wong, Risk assessment of human exposure tobioaccessible phthalate esters via indoor dust around the pearl river delta, Environ.Sci. Technol. 46 (2012) 8422–8430.
[44] W. Wang, M.-J. Huang, F. Wu, Y. Kang, H.-S. Wang, K.C. Cheung, M.H. Wong, Riskassessment of bioaccessible organochlorine pesticides exposure via indoor andoutdoor dust, Atmos. Environ. 77 (2013) 525–533, http://dx.doi.org/10.1016/j.atmosenv.2013.04.071.
[45] M. Fang, H.M. Stapleton, Evaluating the bioaccessibility of flame retardants inhouse dust using an in vitro Tenax bead-assisted sorptive physiologically basedmethod, Environ. Sci. Technol. 48 (2014) 13323–13330, http://dx.doi.org/10.1021/es503918m.
[46] M.A.E. Abdallah, E. Tilston, S. Harrad, C.D. Collins, In vitro assessment of thebioaccessibility of brominated flame retardants in indoor dust using a colon ex-tended model of the human gastrointestinal tract, J. Environ. Monit. 14 (2012)3276–3283, http://dx.doi.org/10.1039/c2em30690e.
[47] Y.-X. Yu, Y. Pang, X.-Y. Zhang, C. Li, Z.-Q. Yu, J. Fu, Optimization of an in vitromethod to measure the bioaccessibility of polybrominated diphenyl ethers in dustusing response surface methodology, J. Environ. Sci. 23 (2011) 1738–1746, http://dx.doi.org/10.1016/S1001-0742(10)60571-2.
[48] K. Kademoglou, A.C. Williams, C.D. Collins, Bioaccessibility of PBDEs present inindoor dust: a novel dialysis membrane method with a Tenax TA® absorption sink,Sci. Total Environ. 621 (2018) 1–8, http://dx.doi.org/10.1016/j.scitotenv.2017.11.097.
[49] D.M. Mudie, G.E.G.L. Amidon, G.E.G.L. Amidon, Physiological parameters for oraldelivery and in vitro testing, Mol. Pharm. 7 (2010) 1388–1405, http://dx.doi.org/
G. Raffy et al. Journal of Hazardous Materials 352 (2018) 215–227
225

Chapitre 2 : la bioaccessibilité des COSV dans les poussières- Revue de la littérature
Page 85
10.1021/mp100149j.
[50] Y.-X. Yu, D. Yang, X. Wang, N. Huang, X.-Y. Zhang, D. Zhang, J. Fu, Factors in-fluencing on the bioaccessibility of polybrominated diphenyl ethers in size-specificdust from air conditioner filters, Chemosphere 93 (2013) 2603–2611, http://dx.doi.org/10.1016/j.chemosphere.2013.09.085.
[51] Y. Kang, W. Pan, S. Liang, L. Zeng, Q. Zhang, J. Luo, X. Guo, In vitro digestion andabsorption of BDE-28, −47, −99 and −153 in indooor dust and its implication inrisk assessemnt, Ecotoxicol. Environ. Saf. 134 (2016) 11–16, http://dx.doi.org/10.1016/j.ecoenv.2016.08.017 Part1.
[52] W. Pan, Y. Kang, L. Zeng, Q. Zhang, J. Luo, M.H. Wong, Comparison of in vitrodigestion model with in vivo relative bioavailability of BDE-209 in indoor dust andcombination of in vitro digestion/Caco-2 cell model to estimate the daily intake ofBDE-209 via indoor dust, Environ. Pollut. 218 (2016) 497–504, http://dx.doi.org/10.1016/j.envpol.2016.07.029.
[53] E. Tilston, G.R. Gibson, C.D. Collins, Colon extended physiologically based extrac-tion test (CE-PBET) increases bioaccessibility of soil-bound PAH, Environ. Sci.Technol. 45 (2011) 5301–5308, http://dx.doi.org/10.1021/es2004705.
[54] Y. Zhang, J.J. Pignatello, S. Tao, B. Xing, Bioaccessibility of PAHs in fuel soot as-sessed by an in vitro digestive model with absorptive sink: effect of food ingestion,Environ. Sci. Technol. 49 (2015) 14641–14648, http://dx.doi.org/10.1021/acs.est.5b04342.
[55] A. Guerra, L. Etienne-Mesmin, V. Livrelli, S. Denis, S. Blanquet-Diot, M. Alric,Relevance and challenges in modeling human gastric and small intestinal digestion,Trends Biotechnol. 30 (2012) 591–600, http://dx.doi.org/10.1016/j.tibtech.2012.08.001.
[56] S.D. Siciliano, B.D. Laird, C.L. Lemieux, Polycyclic aromatic hydrocarbons are en-riched but bioaccessibility reduced in brownfield soils adhered to human hands,Chemosphere 80 (2010) 1101–1108, http://dx.doi.org/10.1016/j.chemosphere.2010.04.061.
[57] C.S. Levi, P. Alvito, A. Andrés, R. Assunção, R. Barberá, S. Blanquet-Diot,C. Bourlieu, A. Brodkorb, A. Cilla, A. Deglaire, S. Denis, D. Dupont, A. Heredia,S. Karakaya, C.V.L. Giosafatto, L. Mariniello, C. Martins, O. Ménard, S.N. El,G.E. Vegarud, E. Ulleberg, U. Lesmes, Extending in vitro digestion models to specifichuman populations: perspectives, practical tools and bio-relevant information,Trends Food Sci. Technol. (2016) 60, http://dx.doi.org/10.1016/j.tifs.2016.10.017.
[58] J.M. Carbonell-capella, M. Buniowska, F.J. Barba, J. Esteve, A. Fr, Analyticalmethods for determining bioavailability and bioaccessibility of bioactive com-pounds from fruits and vegetables : a review, Compr. Rev. Food Sci. Food Saf. 13(2014), http://dx.doi.org/10.1111/1541-4337.12049.
[59] I.J. Hidalgo, T.J. Raub, R.T. Borchardt, Characterization of the human colon car-cinoma cell line (Caco-2) as a model system for intestinal epithelial permeability,Gastroenterology 96 (1989) 736–749, http://dx.doi.org/10.1016/0016-5085(89)90897-4.
[60] E. Le Ferrec, O. Fardel, Applications using Caco-2 and TC7 cells for drug metabo-lism studies, in: A.V. Lyubimov (Ed.), Encycl. Drug Metab. Interact. 6-Volume Set,first ed., John Wiley & Sons, Inc, 2012, , http://dx.doi.org/10.1002/9780470921920.edm061.
[61] C. Rodríguez-Navas, M. Rosende, M. Miró, In-vitro physiologically based extractionof solid materials: Do we have reliable analytical methods for bioaccessibility stu-dies of emerging organic contaminants? Trends Anal. Chem. (2017), http://dx.doi.org/10.1016/j.trac.2017.03.005.
[62] J.K. Huwe, H. Hakk, D.J. Smith, J.J. Diliberto, V. Richardson, H.M. Stapleton,L.S. Birnbaum, Comparative absorption and bioaccumulation of polybrominateddiphenyl ethers following ingestion via dust and oil in male rats, Environ. Sci.Technol. 42 (2008) 2694–2700, http://dx.doi.org/10.1021/es702644k.
[63] V. Plichta, H. Fromme, Bioavailability of plasticizers in dust and food after oraladministration in pigs, Int. Soc. Expo. Sci. (2016), p. 246.
[64] X. Pu, L.S. Lee, R.E. Galinsky, G.P. Carlson, Evaluation of a rat model versus aphysiologically based extraction test for assessing phenanthrene bioavailabilityfrom soils, Toxicol. Sci. 79 (2004) 10–17, http://dx.doi.org/10.1093/toxsci/kfh091.
[65] K. James, R.E. Peters, M.R. Cave, M. Wickstrom, E.G. Lamb, S.D. Siciliano,Predicting polycyclic aromatic hydrocarbon bioavailability to mammals from in-cidentally ingested soils using partitioning and fugacity, Environ. Sci. Technol. 50(2016) 1338–1346, http://dx.doi.org/10.1021/acs.est.5b05317.
[66] K. James, R.E. Peters, B.D. Laird, W.K. Ma, M. Wickstrom, G.L. Stephenson,S.D. Siciliano, Human exposure assessment: a case study of 8 PAH contaminatedsoils using in vitro digestors and the juvenile swine model, Environ. Sci. Technol. 45(2011) 4586–4593, http://dx.doi.org/10.1021/es1039979.
[67] M. Delannoy, A. Fournier, A. Tankari Dan-Badjo, J. Schwarz, S. Lerch, G. Rychen,C. Feidt, Impact of soil characteristics on relative bioavailability of NDL-PCBs inpiglets, Chemosphere 139 (2015) 393–401, http://dx.doi.org/10.1016/j.chemosphere.2015.06.098.
[68] X. Pu, L.S. Lee, R.E. Galinsky, G.P. Carlson, Bioavailability of 2,3’,4,4’,5-penta-chlorobiphenyl (PCB118) and 2,2’,5,5’-tetrachlorobiphenyl (PCB52) from soilsusing a rat model and a physiologically based extraction test, Toxicology 217(2006) 14–21, http://dx.doi.org/10.1016/j.tox.2005.08.012.
[69] C. Li, H. Sun, A. Juhasz, X. Cui, L.Q. Ma, Predicting the relative bioavailability ofDDT and its metabolites in historically contaminated soils using a Tenax-improvedphysiologically based extraction test (TI-PBET), Environ. Sci. Technol. 50 (2016)1118–1125, http://dx.doi.org/10.1021/acs.est.5b03891.
[70] K. Li, C. Li, N.Y. Yu, A. Juhasz, X. Cui, L.Q. Ma, In vivo bioavailability and in vitrobioaccessibility of perfluorooctanoic acid (PFOA) in food matrices: correlation
analysis and method development, Environ. Sci. Technol. 49 (2015) 150–158,http://dx.doi.org/10.1021/es505075z.
[71] L. Duan, R. Naidu, Y. Liu, Z. Dong, M. Mallavarapu, P. Herde, T. Kuchel,K.T. Semple, Comparison of oral bioavailability of benzo[a]pyrene in soils using ratand swine and the implications for human health risk assessment, Environ. Int. 94(2016) 95–102, http://dx.doi.org/10.1016/j.envint.2016.04.041.
[72] Y.-X. Yu, Y.-P. Pang, C. Li, J.-L. Li, X.-Y. Zhang, Z.-Q. Yu, J.-L. Feng, M.-H. Wu, G.-Y. Sheng, J.-M. Fu, Concentrations and seasonal variations of polybrominated di-phenyl ethers (PBDEs) in in- and out-house dust and human daily intake via dustingestion corrected with bioaccessibility of PBDEs, Environ. Int. 42 (2012)124–131, http://dx.doi.org/10.1016/j.envint.2011.05.012.
[73] S. García-Alcega, C. Rauert, S. Harrad, C.D. Collins, Does the source migrationpathway of HBCDs to household dust influence their bio-accessibility? Sci. TotalEnviron. 569–570 (2016) 244–251, http://dx.doi.org/10.1016/j.scitotenv.2016.04.178.
[74] W. Wang, M.-J. Huang, J.-S. Zheng, K.C. Cheung, M.H. Wong, Exposure assessmentand distribution of polychlorinated biphenyls (PCBs) contained in indoor and out-door dusts and the impacts of particle size and bioaccessibility, Sci. Total Environ.463–464 (2013) 1201–1209, http://dx.doi.org/10.1016/j.scitotenv.2013.04.059.
[75] Y. Kang, Y. Yin, Y. Man, L. Li, Q. Zhang, L. Zeng, J. Luo, Bioaccessibility of poly-chlorinated biphenyls in workplace dust and its implication for risk assessment,Chemosphere 93 (2013) 924–930, http://dx.doi.org/10.1016/j.chemosphere.2013.05.057.
[76] W. Wang, F. Wu, M. Huang, Y. Kang, Size fraction effect on phthalate esters ac-cumulation, bioaccessibility and in vitro cytotoxicity of indoor / outdoor dust, andrisk assessment of human exposure, J. Hazard. Mater. 261 (2013) 753–762, http://dx.doi.org/10.1016/j.jhazmat.2013.04.039.
[77] Y. Kang, K.C. Cheung, M.H. Wong, Mutagenicity, genotoxicity and carcinogenic riskassessment of indoor dust from three major cities around the Pearl River Delta,Environ. Int. 37 (2011) 637–643, http://dx.doi.org/10.1016/j.envint.2011.01.001.
[78] C.D. Collins, M. Mosquera-Vazquez, J.L. Gomez-Eyles, P. Mayer, V. Gouliarmou,F. Blum, Is there sufficient “sink” in current bioaccessibility determinations of or-ganic pollutants in soils? Environ. Pollut. 181 (2013) 128–132, http://dx.doi.org/10.1016/j.envpol.2013.05.053.
[79] C. Li, X. Cui, Y.Y. Fan, Y. Teng, Z.R. Nan, L.Q. Ma, Tenax as sorption sink for in vitrobioaccessibility measurement of polycyclic aromatic hydrocarbons in soils, Environ.Pollut. 196 (2014) 47–52, http://dx.doi.org/10.1016/j.envpol.2014.09.016.
[80] A. Juhasz, P. Herde, E. Smith, Oral relative bioavailability ofDichlorodiphenyltrichloroethane (DDT) in contaminated soil and its predictionusing in vitro strategies for exposure refinement, Environ. Res. 150 (2016)482–488, http://dx.doi.org/10.1016/j.envres.2016.06.039.
[81] V. Gouliarmou, C.D. Collins, E. Christiansen, P. Mayer, Sorptive physiologicallybased extraction of contaminated solid matrices: Incorporating silicone rod as ab-sorption sink for hydrophobic organic contaminants, Environ. Sci. Technol. 47(2013) 941–948, http://dx.doi.org/10.1021/es303165u.
[82] M. Guney, G.J. Zagury, Bioaccessibility and other key parameters in assessing oralexposure to PAH-contaminated soils and dust: a critical review, Hum. Ecol. RiskAssess. 22 (2016) 1396–1417, http://dx.doi.org/10.1080/10807039.2016.1185691.
[83] M.V. Ruby, A. Davis, T.E. Link, R. Schoof, R.L. Chaney, G.B. Freeman, P. Bergstrom,Development of an in-vitro screening-test to evaluate the in-vivo bioaccessibility ofingested mine-waste lead, Environ. Sci. Technol. 27 (1993) 2870–2877, http://dx.doi.org/10.1021/es00049a030.
[84] M.R. Cave, J. Wragg, I. Harrison, C.H. Vane, T. van de Wiele, E. de Groeve,C.P. Nathanail, M. Ashmore, R. Thomas, J. Robinson, P. Daly, Comparison of batchmode and dynamic physiologically based bioaccessibility tests for PAHs in soilsamples, Environ. Sci. Technol. 44 (2010) 2654–2660, http://dx.doi.org/10.1021/es903258v.
[85] U.S EPA, Exposure Factors Handbook 2011 (2011) EPA/600/R-090/052F.[86] L. Morawska, T. Salthammer, Fundamentals of indoor particles and settled dust,
Indoor Environ. Airborne Part. Settled Dust, (2003), pp. 3–47, http://dx.doi.org/10.1016/S0074-6142(05)80002-6.
[87] J.M. Macher, Review of methods to collect settled dust and isolate culturable mi-croorganisms, Indoor Air 11 (2001) 99–110, http://dx.doi.org/10.1034/j.1600-0668.2001.110204.x.
[88] F. Gyntelberg, P. Suadicani, J.W. Nielsen, P. Skov, O. Valbjorn, P.A. Nielsen,T. Schneider, O. Jorgensen, P. Wolkoff, C.K. Wilkins, S. Gravesen, S. Norn, Dust andthe sick building syndrome, Indoor Air-Int. J. Indoor Air Qual. Clim. 4 (1994)223–238, http://dx.doi.org/10.1111/j.1600-0668.1994.00003.x.
[89] C. Weschler, S. Langer, A. Fischer, G. Bekö, J. Toftum, G. Clausen, Squalene andcholesterol in dust from danish homes and daycare centers, Environ. Sci. Technol.45 (2011) 3872–3879, http://dx.doi.org/10.1021/es103894r.
[90] R. Dris, J. Gasperi, C. Mirande, C. Mandin, M. Guerrouache, V. Langlois, B. Tassin, Afirst overview of textile fibers, including microplastics, in indoor and outdoor en-vironments, Environ. Pollut. (2016) 1–6, http://dx.doi.org/10.1016/j.envpol.2016.12.013.
[91] Y. Yang, L. Liu, Y. Xiong, G. Zhang, H. Wen, J. Lei, L. Guo, Y. Lyu, A comparativestudy on physicochemical characteristics of household dust from a metropolitancity and a remote village in China, Atmos. Pollut. Res. 7 (2016) 1090–1100, http://dx.doi.org/10.1016/j.apr.2016.06.009.
[92] W. Butte, B. Heinzow, Pollutants in house dust as indicators of indoor contamina-tion. In reviews of environmental contamination and toxicology, in: G.W. Ware(Ed.), Rev. Environ. Contam. Toxicol. 2002 2002, pp. 1–46.
G. Raffy et al. Journal of Hazardous Materials 352 (2018) 215–227
226

Chapitre 2 : la bioaccessibilité des COSV dans les poussières- Revue de la littérature
Page 86
[93] Y. Kang, W. Pan, S. Liang, N. Li, L. Zeng, Q. Zhang, J. Luo, Assessment of relative
bioavailability of heavy metals in soil using in vivo mouse model and its implicationfor risk assessment compared with bioaccessibility using in vitro assay, Environ.Geochem. Health 38 (2016) 1183–1191, http://dx.doi.org/10.1007/s10653-015-9782-0.
[94] M. Delannoy, J. Schwarz, A. Fournier, G. Rychen, C. Feidt, Effects of standardhumic materials on relative bioavailability of NDL-PCBs in juvenile swine, PLoSOne 9 (2014) 1–16, http://dx.doi.org/10.1371/journal.pone.0115759.
[95] W. Wang, F. Wu, J.-S. Zheng, M.H. Wong, Risk assessments of PAHs and Hg ex-posure via settled house dust and street dust, linking with their correlations inhuman hair, J. Hazard. Mater. 263 (2013) 627–637, http://dx.doi.org/10.1016/j.jhazmat.2013.10.023.
[96] T.F. Webster, S. Harrad, J.R. Millette, R.D. Holbrook, J.M. Davis, H.M. Stapleton,J.G. Allen, M.D. Mcclean, C. Ibarra, M.A. Abdallah, A. Covaci, Identifying transfermechanisms and sources of environments using environmental forensic microscopy,Environ. Sci. Technol. (2009) 3067–3072, http://dx.doi.org/10.1021/es803139w.
[97] V. Sukiene, N. von Goetz, A.C. Gerecke, M.I. Bakker, C.J.E. Delmaar,K. Hungerbuehler, Direct and air-mediated transfer of labeled SVOCs from indoorsources to dust, Environ. Sci. Technol. (2017), http://dx.doi.org/10.1021/acs.est.6b06051 acs.est.6b06051.
[98] C. Rauert, S. Harrad, Mass transfer of PBDEs from plastic TV casing to indoor dustvia three migration pathways - A test chamber investigation, Sci. Total Environ. 536(2015) 568–574, http://dx.doi.org/10.1016/j.scitotenv.2015.07.050.
G. Raffy et al. Journal of Hazardous Materials 352 (2018) 215–227
227

Chapitre 2 : la bioaccessibilité des COSV dans les poussières- Revue de la littérature
Page 87
Tableau récapitulatif des méthodes reportées dans la littérature pour la mesure des COSV dans les poussières page 1 de 12
1 2 3
BARGEDIN 19738 (Saliva +
PBET )
DIN 19738 (Saliva +
PBET + milk
powder)
Réactifs pour 1L mg
NaCl 298 mg 1670 x
NaSCN ou KSCN 200 mg (K) 500 (Na) x (Na)
Na2SO4 570 mg 1830 x
NaHCO3 500 x
NaOH 1.80 ml of 1.0 M
KCl 896 mg 1500 x
KH2PO4 ou NaH2PO4 888 mg (Na) 2000 (K) x (K)
CaCl2 · 2 H2O 500 x
Mucin 50 mg 62.5 x
α-amylase 145 mg 20.8 x
Urea 200 mg (K) 8.33 x
Uric acid 15 mg 0.83 x
Conditions opératoires
Ratio Volume de solution / Masse de
poussière (mL/g)15 15 15
pH 6.5 ± 0.5 6.4
température 37°C 37°C 37°C
agitation shake 200 rpm
durée 5 - 15 min 30 min 30 min
Réactifs pour 1L mg
NaCl 2752 mg 2900 x
KCl 824 mg 700 x
KH2PO4ou NaH2PO4 266 mg (Na) 270 (K) x (K)
HCl (for adjusting pH) 8.3 ml of 37% HCl x
CaCl2 400 mg
NH4Cl 306 mg
KHCO3
Pepsin 1000 mg 17.5 x
Mucin 1000 mg 52.5 x
Whole milk powder x
Sodium malate
Tri-sodium citrate
Lactic acid
Glacial acetic acid
Glucose 650 mg
Glucuronic acid 20.0 mg
Urea 85.0 mg
Glucosaminehydrochloride 330 mg
Bovine Serum Albumine 1000 mg
Cystein
Glycine
Dietary components :
Nutrilon (56% lactose, 12% fat, 10% casein)
Starch (potato)
Peptone water
Tryptone (vegetable)
Yeast extract
Casein
Pectin (citrus)
Xylan (oat)
Arabinogalactan (larch)
Guar gum
Inulin (chicory)
Conditions opératoires
Ratio Volume de solution / Masse de
poussière (mL/g)32.5 50 50
pH 0.9 - 1.0 2 2
durée 1 hr 2hrs 2hrs
température 37°C 37°C 37°C
agitation end-over-end rotation
200 rpm
Bouche
Estomac
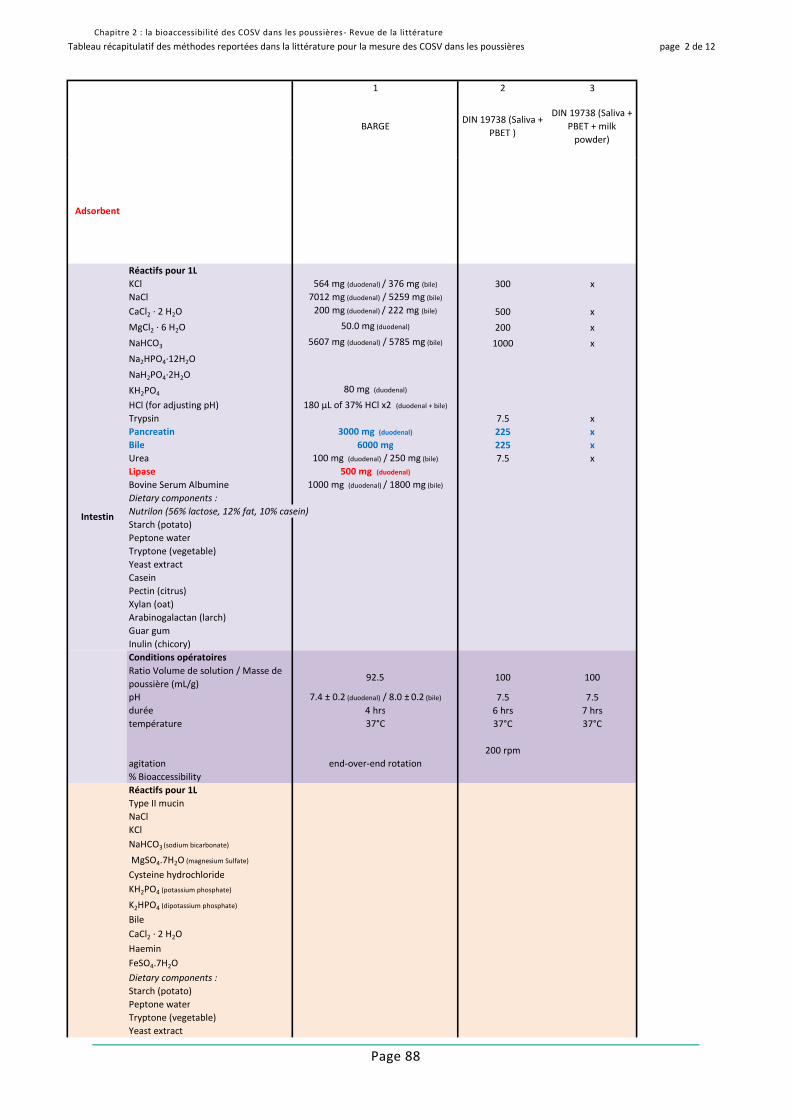
Chapitre 2 : la bioaccessibilité des COSV dans les poussières- Revue de la littérature
Page 88
Tableau récapitulatif des méthodes reportées dans la littérature pour la mesure des COSV dans les poussières page 2 de 12
1 2 3
BARGEDIN 19738 (Saliva +
PBET )
DIN 19738 (Saliva +
PBET + milk
powder)
Adsorbent
Réactifs pour 1L
KCl 564 mg (duodenal) / 376 mg (bile) 300 x
NaCl 7012 mg (duodenal) / 5259 mg (bile)
CaCl2 · 2 H2O 200 mg (duodenal) / 222 mg (bile) 500 x
MgCl2 · 6 H2O 50.0 mg (duodenal) 200 x
NaHCO3 5607 mg (duodenal) / 5785 mg (bile) 1000 x
Na2HPO4·12H2O
NaH2PO4·2H2O
KH2PO480 mg (duodenal)
HCl (for adjusting pH) 180 µL of 37% HCl x2 (duodenal + bile)
Trypsin 7.5 x
Pancreatin 3000 mg (duodenal) 225 x
Bile 6000 mg 225 x
Urea 100 mg (duodenal) / 250 mg (bile) 7.5 x
Lipase 500 mg (duodenal)
Bovine Serum Albumine 1000 mg (duodenal) / 1800 mg (bile)
Dietary components :
Nutrilon (56% lactose, 12% fat, 10% casein)
Starch (potato)
Peptone water
Tryptone (vegetable)
Yeast extract
Casein
Pectin (citrus)
Xylan (oat)
Arabinogalactan (larch)
Guar gum
Inulin (chicory)
Conditions opératoires
Ratio Volume de solution / Masse de
poussière (mL/g)92.5 100 100
pH 7.4 ± 0.2 (duodenal) / 8.0 ± 0.2 (bile) 7.5 7.5
durée 4 hrs 6 hrs 7 hrs
température 37°C 37°C 37°C
agitation end-over-end rotation
200 rpm
% Bioaccessibility
Réactifs pour 1L
Type II mucin
NaCl
KCl
NaHCO3 (sodium bicarbonate)
MgSO4.7H2O (magnesium Sulfate)
Cysteine hydrochloride
KH2PO4 (potassium phosphate)
K2HPO4 (dipotassium phosphate)
Bile
CaCl2 · 2 H2O
Haemin
FeSO4.7H2O
Dietary components :
Starch (potato)
Peptone water
Tryptone (vegetable)
Yeast extract
Intestin

Chapitre 2 : la bioaccessibilité des COSV dans les poussières- Revue de la littérature
Page 89
Tableau récapitulatif des méthodes reportées dans la littérature pour la mesure des COSV dans les poussières page 3 de 12
1 2 3
BARGEDIN 19738 (Saliva +
PBET )
DIN 19738 (Saliva +
PBET + milk
powder)
Casein
Pectin (citrus)
Xylan (oat)
Arabinogalactan (larch)
Guar gum
Inulin (chicory)
Microbiota (fecal material from a
healthy human adult that included
Fecal Coliforms, Bifidobacteria,
Enterococci, Staphylococci and
Clostridia)
Anaerobe
Aerobe
Conditions opératoires
Ratio Volume de solution / Masse de
poussière (mL/g)
pH
durée
température
agitation
% Bioaccessibility
Comparaison avec in-vivo
method validated in-
vivo for organic and
inorganic
contaminants
Référence /
Journal /
Pays
Starr 2016 / Journal
of Hazardous
Materials / USA
Ertl 2012 / Journal
of Exposure Science
and Environmental
Epidemiology /
Germany
Colon

Chapitre 2 : la bioaccessibilité des COSV dans les poussières- Revue de la littérature
Page 90
Tableau récapitulatif des méthodes reportées dans la littérature pour la mesure des COSV dans les poussières page 4 de 12
Réactifs pour 1L
NaCl
NaSCN ou KSCN
Na2SO4
NaHCO3
NaOH
KCl
KH2PO4 ou NaH2PO4
CaCl2 · 2 H2O
Mucin
α-amylase
Urea
Uric acid
Conditions opératoires
Ratio Volume de solution / Masse de
poussière (mL/g)
pH
température
agitation
durée
Réactifs pour 1L
NaCl
KCl
KH2PO4ou NaH2PO4
HCl (for adjusting pH)
CaCl2
NH4Cl
KHCO3
Pepsin
Mucin
Whole milk powder
Sodium malate
Tri-sodium citrate
Lactic acid
Glacial acetic acid
Glucose
Glucuronic acid
Urea
Glucosaminehydrochloride
Bovine Serum Albumine
Cystein
Glycine
Dietary components :
Nutrilon (56% lactose, 12% fat, 10% cas
Starch (potato)
Peptone water
Tryptone (vegetable)
Yeast extract
Casein
Pectin (citrus)
Xylan (oat)
Arabinogalactan (larch)
Guar gum
Inulin (chicory)
Conditions opératoires
Ratio Volume de solution / Masse de
poussière (mL/g)
pH
durée
température
agitation
Bouche
Estomac
4 5 6 7
PBET PBET PBET PBET
8.75 g
x x
1.25 g 125 mg 10 mg 10 mg
3.56 g 3.56 g
500 mg 500 mg
500 mg 500 mg
420 µL 425 µL
500 µL 500 µL
100 20 133 40
2.5 1.5 1.6-1.9 1.6-1.9
1 hr 1 hr 2 hrs 2 hrs
37°C 37°C 37°C 37°C
150 rpm shaken shaken shaken
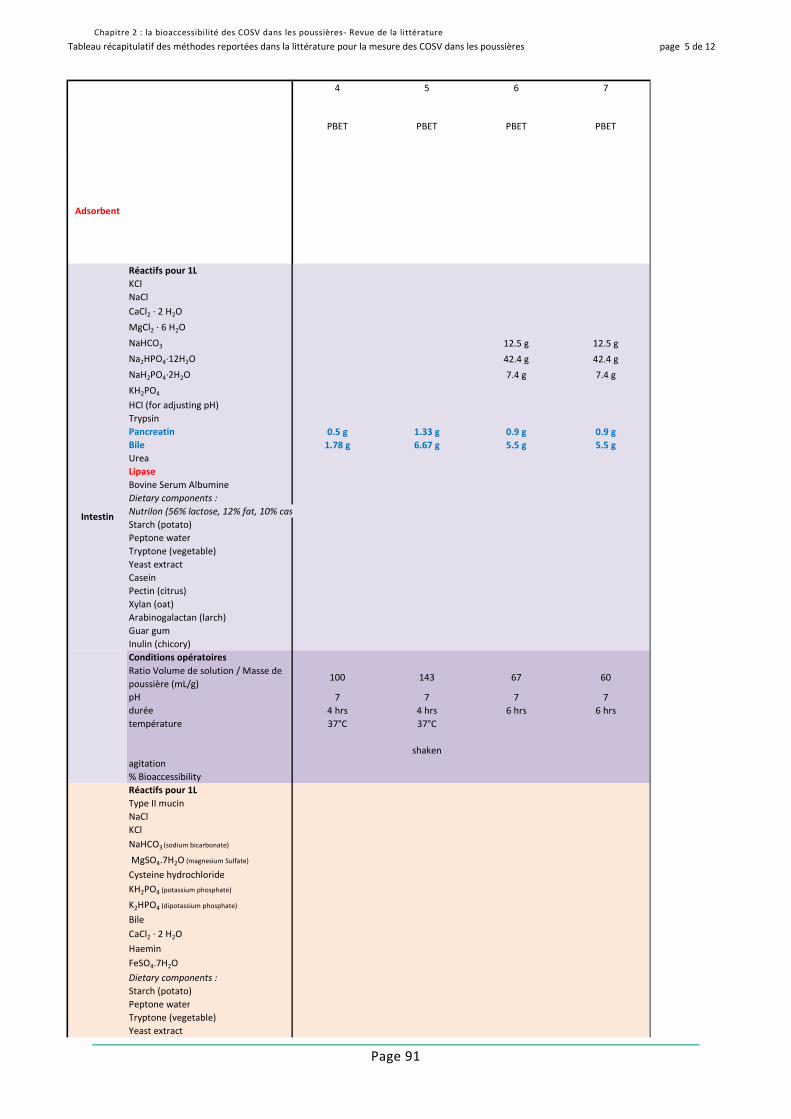
Chapitre 2 : la bioaccessibilité des COSV dans les poussières- Revue de la littérature
Page 91
Tableau récapitulatif des méthodes reportées dans la littérature pour la mesure des COSV dans les poussières page 5 de 12
Adsorbent
Réactifs pour 1L
KCl
NaCl
CaCl2 · 2 H2O
MgCl2 · 6 H2O
NaHCO3
Na2HPO4·12H2O
NaH2PO4·2H2O
KH2PO4
HCl (for adjusting pH)
Trypsin
Pancreatin
Bile
Urea
Lipase
Bovine Serum Albumine
Dietary components :
Nutrilon (56% lactose, 12% fat, 10% cas
Starch (potato)
Peptone water
Tryptone (vegetable)
Yeast extract
Casein
Pectin (citrus)
Xylan (oat)
Arabinogalactan (larch)
Guar gum
Inulin (chicory)
Conditions opératoires
Ratio Volume de solution / Masse de
poussière (mL/g)
pH
durée
température
agitation
% Bioaccessibility
Réactifs pour 1L
Type II mucin
NaCl
KCl
NaHCO3 (sodium bicarbonate)
MgSO4.7H2O (magnesium Sulfate)
Cysteine hydrochloride
KH2PO4 (potassium phosphate)
K2HPO4 (dipotassium phosphate)
Bile
CaCl2 · 2 H2O
Haemin
FeSO4.7H2O
Dietary components :
Starch (potato)
Peptone water
Tryptone (vegetable)
Yeast extract
Intestin
4 5 6 7
PBET PBET PBET PBET
12.5 g 12.5 g
42.4 g 42.4 g
7.4 g 7.4 g
0.5 g 1.33 g 0.9 g 0.9 g
1.78 g 6.67 g 5.5 g 5.5 g
100 143 67 60
7 7 7 7
4 hrs 4 hrs 6 hrs 6 hrs
37°C 37°C
shaken

Chapitre 2 : la bioaccessibilité des COSV dans les poussières- Revue de la littérature
Page 92
Tableau récapitulatif des méthodes reportées dans la littérature pour la mesure des COSV dans les poussières page 6 de 12
Casein
Pectin (citrus)
Xylan (oat)
Arabinogalactan (larch)
Guar gum
Inulin (chicory)
Microbiota (fecal material from a
healthy human adult that included
Fecal Coliforms, Bifidobacteria,
Enterococci, Staphylococci and
Clostridia)
Anaerobe
Aerobe
Conditions opératoires
Ratio Volume de solution / Masse de
poussière (mL/g)
pH
durée
température
agitation
% Bioaccessibility
Comparaison avec in-vivo
Référence /
Journal /
Pays
Colon
4 5 6 7
PBET PBET PBET PBET
He 2015 /
Chemosphère /
China
Wang 2013 (PAH) /
Journal of
Hazardous Materials
/ China ; Wang 2013
(Phthalates) /
Journal of
Hazardous Materials
/ China ; Wang 2013
(PCBs) / Science of
the Total
Environment /
China ; Wang 2013
(Ocs) / Atmospheric
Environment /
China ; Kang 2012
/Environmental
Science &
Technology / China ;
Kang 2011 /
Environmental
International /
China ; Kang 2013 /
Chemosphère /
China.
Yu 2012 /
Environment
International /
China
Yu 2011 / Journal of
Environmental
Sciences / China

Chapitre 2 : la bioaccessibilité des COSV dans les poussières- Revue de la littérature
Page 93
Tableau récapitulatif des méthodes reportées dans la littérature pour la mesure des COSV dans les poussières page 7 de 12
Réactifs pour 1L
NaCl
NaSCN ou KSCN
Na2SO4
NaHCO3
NaOH
KCl
KH2PO4 ou NaH2PO4
CaCl2 · 2 H2O
Mucin
α-amylase
Urea
Uric acid
Conditions opératoires
Ratio Volume de solution / Masse de
poussière (mL/g)
pH
température
agitation
durée
Réactifs pour 1L
NaCl
KCl
KH2PO4ou NaH2PO4
HCl (for adjusting pH)
CaCl2
NH4Cl
KHCO3
Pepsin
Mucin
Whole milk powder
Sodium malate
Tri-sodium citrate
Lactic acid
Glacial acetic acid
Glucose
Glucuronic acid
Urea
Glucosaminehydrochloride
Bovine Serum Albumine
Cystein
Glycine
Dietary components :
Nutrilon (56% lactose, 12% fat, 10% cas
Starch (potato)
Peptone water
Tryptone (vegetable)
Yeast extract
Casein
Pectin (citrus)
Xylan (oat)
Arabinogalactan (larch)
Guar gum
Inulin (chicory)
Conditions opératoires
Ratio Volume de solution / Masse de
poussière (mL/g)
pH
durée
température
agitation
Bouche
Estomac
8 9 10 11
PBET + Tenax CE-PBET CE-PBET CE-PBET
? x x
10 mg 1.25 g 1.25 g 1.25 g
3.56 g 4 g ? 4g ?
500 mg 500 mg 500 mg
500 mg 500 mg 500 mg
420 µL 420 µL 420 µL
500 µL 500 µL 500 µL
800 mg ? 800 mg ? 800 mg ?
5.0 g 5.0 g
3.4 g 3.4 g
6.1 g 6.1 g
4.5 g 4.5 g
3.0 g 3.0 g
2.0 g 2.0 g
2.0 g 2.0 g
2.0 g 2.0 g
1.0 g 1.0 g
1.0 g 1.0 g
200 112.5 160 100
2 2.5 2.5 2.5
2 hrs 1.5 hrs 1 hr 1 hr
37°C 37°C 37°C 37°C
shaken shaken gently mixed

Chapitre 2 : la bioaccessibilité des COSV dans les poussières- Revue de la littérature
Page 94
Tableau récapitulatif des méthodes reportées dans la littérature pour la mesure des COSV dans les poussières page 8 de 12
Adsorbent
Réactifs pour 1L
KCl
NaCl
CaCl2 · 2 H2O
MgCl2 · 6 H2O
NaHCO3
Na2HPO4·12H2O
NaH2PO4·2H2O
KH2PO4
HCl (for adjusting pH)
Trypsin
Pancreatin
Bile
Urea
Lipase
Bovine Serum Albumine
Dietary components :
Nutrilon (56% lactose, 12% fat, 10% cas
Starch (potato)
Peptone water
Tryptone (vegetable)
Yeast extract
Casein
Pectin (citrus)
Xylan (oat)
Arabinogalactan (larch)
Guar gum
Inulin (chicory)
Conditions opératoires
Ratio Volume de solution / Masse de
poussière (mL/g)
pH
durée
température
agitation
% Bioaccessibility
Réactifs pour 1L
Type II mucin
NaCl
KCl
NaHCO3 (sodium bicarbonate)
MgSO4.7H2O (magnesium Sulfate)
Cysteine hydrochloride
KH2PO4 (potassium phosphate)
K2HPO4 (dipotassium phosphate)
Bile
CaCl2 · 2 H2O
Haemin
FeSO4.7H2O
Dietary components :
Starch (potato)
Peptone water
Tryptone (vegetable)
Yeast extract
Intestin
8 9 10 11
PBET + Tenax CE-PBET CE-PBET CE-PBET
200 mg Tenax
added just after the
addition of
intestinal solution
500 mg, stored in
trap made of
100µm stainless
stell mesh, inserted
in gastric solution
then kept in small
intestine solution
500 mg, stored in
cellulose
membrane,
inserted in gastric
solution then kept
in small intestine
solution
12.5 g
42.4 g
7.4 g
0.9 g 0.5 g 0.5 g 0.5 g
5.5 g 1.78 g 1.78 g 1.78 g
1.6 g
5.0 g 5.0 g
3.4 g 3.4 g
6.1 g 6.1 g
4.5 g 4.5 g
3.0 g 3.0 g
2.0 g 2.0 g
2.0 g 2.0 g
2.0 g 2.0 g
1.0 g 1.0 g
1.0 g 1.0 g
300 112.5 160 100
7 6.5 7 7
6 hrs 4hrs 4hrs 4 hrs
37°C
gently mixed
4 g 4 g 4 g
4.5 g 4.5 g 4.5 g
4.5 g 4.5 g 4.5 g
1.5 g 1.5 g 1.5 g
1.25 g 1.25 g 1.25 g
800 mg 800 mg 800 mg
500 mg 500 mg 500 mg
500 mg 500 mg
400 mg 400 mg 400 mg
189 mg 189 mg 0.15 g
50 mg 50 mg 50 mg
5 mg 5 mg 5 mg
5.0 g 5.0 g 5.0 g
3.4 g 3.4 g 5.0 g
6.1 g 6.1 g 5.0 g
4.5 g 4.5 g 4.5 g

Chapitre 2 : la bioaccessibilité des COSV dans les poussières- Revue de la littérature
Page 95
Tableau récapitulatif des méthodes reportées dans la littérature pour la mesure des COSV dans les poussières page 9 de 12
Casein
Pectin (citrus)
Xylan (oat)
Arabinogalactan (larch)
Guar gum
Inulin (chicory)
Microbiota (fecal material from a
healthy human adult that included
Fecal Coliforms, Bifidobacteria,
Enterococci, Staphylococci and
Clostridia)
Anaerobe
Aerobe
Conditions opératoires
Ratio Volume de solution / Masse de
poussière (mL/g)
pH
durée
température
agitation
% Bioaccessibility
Comparaison avec in-vivo
Référence /
Journal /
Pays
Colon
8 9 10 11
PBET + Tenax CE-PBET CE-PBET CE-PBET
3.0 g 3.0 g 3.0 g
2.0 g 2.0 g 2.0 g
2.0 g 2.0 g 2.0 g
2.0 g 2.0 g 2.0 g
1.0 g 1.0 g 1.0 g
1.0 g 1.0 g 1.0 g
100 100 100 à 120
6.5 6.5
16 hrs 16 hrs 8 hrs
measurements in
very close
agreement with
reported PBDE
bioavailability
measures from an in
vivo rat exposure
study using indoor
dust. (comparaison
avec Huwe 2008)
Yu 2013 /
Chemosphere /
China
Fang 2014 /
Environmental
Science &
Technology / USA
(North Carolina)
Kademoglou 2018 /
STOTEN / UK
Abdallah 2012 /
Journal of
Environmental
Monitoring / UK

Chapitre 2 : la bioaccessibilité des COSV dans les poussières- Revue de la littérature
Page 96
Tableau récapitulatif des méthodes reportées dans la littérature pour la mesure des COSV dans les poussières page 10 de 12
Réactifs pour 1L
NaCl
NaSCN ou KSCN
Na2SO4
NaHCO3
NaOH
KCl
KH2PO4 ou NaH2PO4
CaCl2 · 2 H2O
Mucin
α-amylase
Urea
Uric acid
Conditions opératoires
Ratio Volume de solution / Masse de
poussière (mL/g)
pH
température
agitation
durée
Réactifs pour 1L
NaCl
KCl
KH2PO4ou NaH2PO4
HCl (for adjusting pH)
CaCl2
NH4Cl
KHCO3
Pepsin
Mucin
Whole milk powder
Sodium malate
Tri-sodium citrate
Lactic acid
Glacial acetic acid
Glucose
Glucuronic acid
Urea
Glucosaminehydrochloride
Bovine Serum Albumine
Cystein
Glycine
Dietary components :
Nutrilon (56% lactose, 12% fat, 10% cas
Starch (potato)
Peptone water
Tryptone (vegetable)
Yeast extract
Casein
Pectin (citrus)
Xylan (oat)
Arabinogalactan (larch)
Guar gum
Inulin (chicory)
Conditions opératoires
Ratio Volume de solution / Masse de
poussière (mL/g)
pH
durée
température
agitation
Bouche
Estomac
12 13 14 15 16
SHIME Simuator of the human
intestinal microbial
ecosystem
FOREhSTFed Organic
Estimation human
Simultation Test
FOREhSTFed Organic
Estimation human
Simultation Test
IVG
(in vitro
gastrointestinal
method)
RBALP
(relative
bioaccessibility
leaching
procedure)
=
Barge
+
Food
Components
16.6666667
37°C
130 rpm
5
0.1 M
1.3 mL of 5 M x
0.1 M
10 mg
4 g
0.4 g
0.5 g
0.4 M
5 g
3 g
3 g
3 g
2 g
1 g
1 g
10 53.1666667 100 100
1.5 1.6 1.5 1.5
2 hrs 2 hrs 2hrs 1 hr
37°C 37°C 37°C 37°C
150 rpm
70 rpm
end over end
rotation 30
rpm

Chapitre 2 : la bioaccessibilité des COSV dans les poussières- Revue de la littérature
Page 97
Tableau récapitulatif des méthodes reportées dans la littérature pour la mesure des COSV dans les poussières page 11 de 12
Adsorbent
Réactifs pour 1L
KCl
NaCl
CaCl2 · 2 H2O
MgCl2 · 6 H2O
NaHCO3
Na2HPO4·12H2O
NaH2PO4·2H2O
KH2PO4
HCl (for adjusting pH)
Trypsin
Pancreatin
Bile
Urea
Lipase
Bovine Serum Albumine
Dietary components :
Nutrilon (56% lactose, 12% fat, 10% cas
Starch (potato)
Peptone water
Tryptone (vegetable)
Yeast extract
Casein
Pectin (citrus)
Xylan (oat)
Arabinogalactan (larch)
Guar gum
Inulin (chicory)
Conditions opératoires
Ratio Volume de solution / Masse de
poussière (mL/g)
pH
durée
température
agitation
% Bioaccessibility
Réactifs pour 1L
Type II mucin
NaCl
KCl
NaHCO3 (sodium bicarbonate)
MgSO4.7H2O (magnesium Sulfate)
Cysteine hydrochloride
KH2PO4 (potassium phosphate)
K2HPO4 (dipotassium phosphate)
Bile
CaCl2 · 2 H2O
Haemin
FeSO4.7H2O
Dietary components :
Starch (potato)
Peptone water
Tryptone (vegetable)
Yeast extract
Intestin
12 13 14 15 16
SHIME Simuator of the human
intestinal microbial
ecosystem
FOREhSTFed Organic
Estimation human
Simultation Test
FOREhSTFed Organic
Estimation human
Simultation Test
IVG
(in vitro
gastrointestinal
method)
RBALP
(relative
bioaccessibility
leaching
procedure)
addition of a
C18
membrane
12.5 g 12.5 g
0.9 g 0.9 g 0.5 g
6 g 6 g 1.75 g
15 150 100
6.5 6.5 7
5 hrs 2 hrs 4 hrs
37°C 37°C
150 rpm
70 rpm
30 rpm end
over end
rotation
8.00%

Chapitre 2 : la bioaccessibilité des COSV dans les poussières- Revue de la littérature
Page 98
Tableau récapitulatif des méthodes reportées dans la littérature pour la mesure des COSV dans les poussières page 12 de 12
Casein
Pectin (citrus)
Xylan (oat)
Arabinogalactan (larch)
Guar gum
Inulin (chicory)
Microbiota (fecal material from a
healthy human adult that included
Fecal Coliforms, Bifidobacteria,
Enterococci, Staphylococci and
Clostridia)
Anaerobe
Aerobe
Conditions opératoires
Ratio Volume de solution / Masse de
poussière (mL/g)
pH
durée
température
agitation
% Bioaccessibility
Comparaison avec in-vivo
Référence /
Journal /
Pays
Colon
12 13 14 15 16
SHIME Simuator of the human
intestinal microbial
ecosystem
FOREhSTFed Organic
Estimation human
Simultation Test
FOREhSTFed Organic
Estimation human
Simultation Test
IVG
(in vitro
gastrointestinal
method)
RBALP
(relative
bioaccessibility
leaching
procedure)
1.1 x 10⁸ CFU mL
-1
2.25 x 10⁷ CFU mL
-1
2098.1666667
6
18 hrs 2 hrs
37°C 37°C
150 rpm 130 rpm
1.2 - 21 %
corrélation
avec in vivo
pour les HAP :
slope 0.85, r²
= 0.45, p<
0.07
Mauvaise
corrélation
avec in vivo
study
Siciliano
Chemosphere 2010
/ Canada (PAHs
Soils)
Quintana,
2016, StotenJames 2010 / EST / canada

Page 99
CHAPITRE 3 : PROPOSITION D’UNE METHODE
SIMPLIFIEE DE MESURE DES COSV DANS LES
POUSSIERES
La revue bibliographique développée au chapitre précédent a montré l’existence de plusieurs
méthodes de mesure de la bioaccessibilité orale des COSV dans les poussières. Elle a également
mis en évidence le manque d’harmonisation entre ces méthodes. On peut ici faire un parallèle
avec les nombreux travaux menés sur la bioaccessibilité des métaux dans les sols, qui a conduit
dans un premier temps à une harmonisation sous la forme de la méthode BARGE (Bioaccessibili-
ty research group of Europe) [94–96]. Bien que complète et harmonisée, cette méthode présen-
tait une complexité de mise en œuvre qui a pu freiner de nombreux utilisateurs. Une méthode
plus simple a alors été proposée, centrée sur la digestion acide en phase gastrique, dont les per-
formances sont équivalentes à la méthode de référence [97].
En ce qui concerne les COSV, les méthodes les plus performantes, comme celle de Fang et Sta-
pleton qui a montré une corrélation entre bioaccessibilité et biodisponibilité des PBDE dans la
poussière de référence SRM 2585 [98], n’ont pas été mises en œuvre dans le cadre de grandes
campagnes d’analyse. Ce peut être par manque de moyen ou d’intérêt scientifique, mais il est
plus probable que ce manque de déploiement à grande échelle soit dû à la complexité de la mise
en œuvre, ces méthodes requérant une longue phase de préparation, de nombreux réactifs, de
multiples extractions, et plusieurs jours voire semaines entre la préparation des fluides digestifs
et l’injection des extraits finaux.
La connaissance de la bioaccessibilité doit pourtant se déployer sur un grand nombre
d’échantillons de diverses origines afin de pouvoir cerner et in fine modéliser les facteurs
d’influence décrits dans le chapitre précédent. L’objet de ce chapitre est donc de proposer une
méthode simple et robuste qui permette de mesurer la bioaccessibilité des COSV dans les pous-
sières de nombreux échantillons.

Chapitre 3 : proposition d’une méthode simplifiée de mesure des COSV dans les poussières
Page 100
1. DEVELOPPEMENT DE LA METHODE (ARTICLE SCIENTIFIQUE N°3)
Les méthodes existantes les plus complètes mises en exergues lors de la revue bibliographique
ont servi de référence pour le développement de la méthode simplifiée. Il s’agit des méthodes
proposée par Fang et Stapleton [98] et Kademoglou et al. [99], qui comportent un adsorbant
permettant de capter les COSV au fur et à mesure de leur libération dans les fluides digestifs, et
ainsi imiter la dynamique du passage des COSV à travers la paroi intestinale. Ces méthodes pour-
suivent également l’incubation intestinale jusqu’au colon et tiennent compte de l’influence de la
présence d’aliments sur la bioaccessibilité.
Quatre étapes de simplification de ces méthodes de référence ont été nécessaires pour aboutir à
la méthode simplifiée :
- - changement de type d’adsorbant
- élimination de la digestion gastrique
- élimination de l’analyse des fluides digestifs
- optimisation de l’incubation intestinale
Les deux méthodes de références ont été utilisées pour mesurer la bioaccessibilité de plusieurs
PBDE dans la poussière de référence SRM 2585 du NIST (National Institute of Standards & Tech-
nology). Des données relatives à la biodisponibilité de certains PBDE dans le SRM 2585 existent
également [100]. La poussière SRM 2585 a été testée avec la méthode simplifiée, et les données
produites ont permis sa validation par comparaison aux données existantes.
Les travaux de développement de cette nouvelle méthode d’analyse ont fait l’objet du troisième
article de ce projet de thèse, qui a été préparé en vue d’une soumission à Environmental Science
and Technology. Les co-auteurs incluent Katerina Kademoglou et Christopher Collins, qui ont
partagé leur protocole sur la méthode de référence en me formant à sa mise en œuvre dans leur
laboratoire de l’université de Reading (juillet 2016).

Chapitre 3 : proposition d’une méthode simplifiée de mesure des COSV dans les poussières
Page 101
1
Oral bioaccessibility of SVOCs in indoor settled 1
dust: a simplified in vitro method applied to 2
polybrominated diphenyl ethers (PBDEs), and 3
pyrethroids. 4
Gaëlle Raffy*a, Corinne Mandin
b, Katerina Kademoglou
cd, Christopher Collins
c, Fabien 5
Merciera and Barbara Le Bot
a 6
aUniv Rennes, Inserm, EHESP, Irset (Institut de recherche en santé, environnement et travail) - 7
UMR_S 1085, F 35000 Rennes, France 8
bUniversité Paris Est, CSTB - Scientific and technical center for building, OQAI - French indoor 9
air quality observatory, 84 avenue Jean Jaurès Champs-sur-Marne 77447 Marne-la-Vallée 10
Cedex 2, France. 11
cSoil Research Centre, Department of Geography and Environmental Science, University of 12
Reading, Whiteknights Campus, RG6 6DW Reading, UK 13
dRECETOX, Masaryk University, Kamenice 753/5, pavilion A29, 62500 Brno, Czech Republic 14
15
KEYWORDS 16

Chapitre 3 : proposition d’une méthode simplifiée de mesure des COSV dans les poussières
Page 102
2
17
ABSTRACT 18
Dust ingestion is a non-negligible pathway of human exposure to indoor chemical pollutants 19
including several semi-volatile organic compounds (SVOCs). To better assess this human 20
exposure, it is necessary to consider the oral bioaccessibility of SVOCs, i.e. the fraction of 21
pollutants released from the dust matrix in the digestive tract following dust ingestion. A few 22
methods have been described in the literature for this purpose, but they were never applied on a 23
large number of samples because of their complexity. In this context, a simple method for the 24
extraction of the bioaccessible fraction of SVOCs was proposed. This novel method consists of 25
incubating 200 mg of dust for 20 hours at 37 °C in 40 mL of neutral pH water containing bile 26
and pancreatin. An insert made of 500 mg of sorptive material (XAD®
-2) is added to act as a 27
sink for the SVOCs released in solution. This method produced comparable results to those 28
obtained with non-simplified methods for the bioaccessibility of PBDEs in SRM 2585. It was 29
then used to measure the bioaccessibility of pyrethroids and PBDEs in 30 settled dust samples. 30
For the three compounds that were more frequently detected, i.e. permethrin, BDE 47 and 31
BDE 99, median bioaccessibilities ranged from 37 to 48%. Doses considered for human 32
exposure could therefore be lowered by a minimum of 50 %, thus emphasizing the importance of 33
considering oral bioaccessibility when assessing human exposure to indoor pollutants via dust 34
ingestion. 35
INTRODUCTION 36

Chapitre 3 : proposition d’une méthode simplifiée de mesure des COSV dans les poussières
Page 103
3
Since the 1950s, the presence of semivolatile organic compounds (SVOCs) indoors1 has been 37
reported worldwide in dwellings,2–8
schools,9–13
and other indoor environments (cars, offices, 38
hospitals, mosques, etc.).14–18
This presence is subject of concern for human health since most of 39
the SVOCs are endocrine disruptors with effects on the reproductive tract development, the 40
thyroid function, the nervous system and the development of metabolic diseases.19–21
SVOCs are 41
characterized by their vapor pressure (from10-14
to 10-4
atm) and their boiling point (between 42
240 °C and 400 °C).22,23
Due to these properties, SVOCs equilibrate between the gaseous and 43
particulate phases of air, surfaces, and settled dust. Human are thus exposed to SVOCs via 44
inhalation of air, dermal contact with air, dust and surfaces, and also by ingestion of dust. Human 45
exposure is most often quantified based on the environmental concentration.24
However, only a 46
fraction of this concentration penetrates the body. For dust ingestion, the bioaccessible 47
concentration is defined as the concentration that is released in the gastro-intestinal tract, from 48
the dust into the gastric and intestinal fluids, and is susceptible to become bioavailable.25
The 49
bioavailable concentration is the fraction reaching the digestive system and absorbed into the 50
systemic circulation; it is consequently the concentration of interest to accurately assess human 51
exposure. However, assessing the bioavailability of SVOCs necessitates performing in vivo 52
studies that are costly and ethically challenging. On the other hand, bioaccessibility can be 53
assessed with in vitro studies, and provides an interesting proxy to bioavailability. 54
Studies investigating the bioaccessibility of SVOCs in indoor dust are still scarce and new. 55
Nonetheless, about twenty studies have been reported since 2011.26
So far these studies have 56
only been used to document data on a limited number of samples due to the complexity and cost 57
of the measurement methods, even though they are easier to implement than in vivo methods. 58
Some of these studies were of particular interest because the measurement methods used were 59

Chapitre 3 : proposition d’une méthode simplifiée de mesure des COSV dans les poussières
Page 104
4
the most advanced and conservative, as they included a sorbent to simulate the dynamic of the 60
digestion, and pursued the in vitro digestion process to the colon stage. These methods were used 61
to produce bioaccessibility data for polybrominated diphenyl ethers (PBDEs)27,28
and 62
pyrethroids29
, which are two chemical families belonging to SVOCs. 63
PBDEs were used as flame retardants in furniture polyurethane foam, wire and cable insulation, 64
electronics, and computers.30
Their use has been limited in Europe and the United States,31,32
but 65
they are persistent in indoor dust because of their chemical stability, although debromination of 66
higher brominated congeners via the effect of natural sunlight might lead to an enrichment of the 67
lower brominated congeners’ content.33
Their presence indoors is subject to concern: suggestion 68
for impaired neurodevelopmental health 34–36
associated with early life exposure to PBDEs was 69
reported. Exposure to PBDEs from house dust could also interfere with the thyroid function, 37,38
70
the timing of puberty, 39
and be linked to altered semen quality.40
71
Pyrethroids are synthetic substances that have been formulated based on the naturally occurring 72
pyrethrins. They are used outdoors as pesticides for crops, forestry, horticulture and gardens, and 73
indoors to control lice and fleas. They are also used as arthropod repellants in clothing and 74
carpet.41
Concerns are raised about environmental and occupational exposure to pyrethroids and 75
altered semen quality, changes in serum thyroid and male reproductive hormones. 41
Exposure 76
during pregnancy could affect birth size, immune system, neurodevelopment and hormonal 77
balance in children.41–43
Indoor settled dust plays a role in human exposure to pyrethroids, as the 78
pyrethroid dust content in French dwellings was associated with the household insecticide use,44
79
and dust ingestion accounted for 11% of permethrin exposure via ingestion.45
80

Chapitre 3 : proposition d’une méthode simplifiée de mesure des COSV dans les poussières
Page 105
5
A better knowledge of the bioaccessibility of these compounds is necessary to better assess to 81
what extent humans are exposed to them indoors via dust ingestion. So far, existing measurement 82
methods have never been deployed on a large number of samples because of their cost and 83
complexity, thus emphasizing the need of a simple and robust bioaccessibility measurement 84
method. 85
Within this context and in order to provide a tool for a finer assessment of human exposure to 86
these compounds, the present work has three objectives: (i) to develop a simplified method for 87
the evaluation of the oral bioaccessibility of SVOCs in indoor dust, (ii) to validate this simplified 88
method by comparing its results with data from the literature, and (iii) to document the oral 89
bioaccessibility of five PBDEs (BDE 47, 85, 99, 100, and 153) and four pyrethroids 90
(tetramethrin, permethrin, cyfluthrin, and cypermethrin) in 30 settled dust samples collected in 91
French classrooms. 92
MATERIALS AND METHODS 93
Selection of PBDEs and pyrethroids. The list of compounds of interest selected for this project 94
was based on a hierarchization work that considered SVOC toxicity and indoor concentrations 95
reported in the literature.19 Briefly, data on the SVOC concentrations found in residential indoor 96
settled dust were collected from the scientific literature and compared with toxicity reference 97
doses. Among the top-ranked compounds that included phthalates, short-chain chlorinated 98
paraffins, organophosphorus compounds, polychlorinated biphenyls, organochlorines, 99
perfluorinated compounds, polycyclic aromatic hydrocarbons, etc., we chose the two families of 100
compounds for which bioaccessibility data had already been reported in the literature using 101
advanced method as mentioned in the introduction. More specifically, we chose one tetra-BDE 102

Chapitre 3 : proposition d’une méthode simplifiée de mesure des COSV dans les poussières
Page 106
6
(BDE 47), 3 penta-BDEs (BDE 85, 99, and 100) and one hexa-BDE (BDE 153). For pyrethroids, 103
in addition to permethrin and cyfluthrin that were ranked in the hierarchization, we also added 104
tetramethrin and cypermethrin, since they were present in the standard reference material 105
(SRM 2585) used to control analyses. 106
Reagents and chemicals. Certified standards of tetramethrin, permethrin, cyfluthrin, 107
cypermethrin, fenpropathrin, and 2,3,4-trichloronitrobenzene (TCNB) were purchased from LGC 108
Labor GmbH (Augsburg, Germany). Nonane/toluene (10%) solutions (50 mg/L) of BDE 47, 85, 109
99, 100 and 153, and nonane/toluene (3%) mixture (5 mg/L) of 13
C12-BDE 47, 99 and 153 were 110
purchased from Wellington Laboratories Inc. (Guelph, ON, Canada). The Standard Reference 111
Material SRM 2585 (Organic Contaminants in House Dust) 46
was purchased from the National 112
Institute of Standards and Technology (NIST, Gaithersburg, MD, USA). Bile salts, pepsin from 113
porcine gastric mucosa, pancreatin from porcine stomach, and Celite® 545 were purchased from 114
Merck KGaA (Darmstadt, Germany). Chromabond® NH2 (aminopropyl modified silica) glass 115
columns (3 mL / 500 mg) were purchased from Macherey-Nagel GmbH & Co. KG (Düren, 116
Germany). Evian mineral water in glass bottles (Cachat source, SAEME, France) was purchased 117
rom France Boisson (Rueil-Malmaison ; France). 118
Selection of dust samples. A national campaign was organized in France by the Indoor Air 119
Quality Observatory (OQAI), between 2013 and 2017, to assess indoor air quality in French 120
schools. Air and dust samples were collected in 600 classrooms and analyzed for several 121
parameters (airborne particles, volatile and semi-volatile organic compounds, nitrogen dioxide, 122
metals, etc.). For this study, we selected 30 samples from the national campaign based on two 123
criteria: (i) the amount of dust remaining after analysis had to be sufficient (> 220 mg) and (ii) 124
the PBDE content, assessed as part of the national campaign, had to represent as many 125
Chapitre 3 : proposition d’une méthode simplifiée de mesure des COSV dans les poussières
Page 107
7
concomitant congeners as possible, in relatively high concentration, in order to be able to 126
measure their bioaccessibility. The pyrethroids content could not be used as a criterion at this 127
stage, because they were not included in the national campaign analysis, except permethrin, 128
which was quantified in all samples. The 30 samples correspond to 13 preschools and 17 129
elementary schools, located in all of the French regions. 130
Dust sample collection and preparation. Dust collection was performed by trained technical 131
operators. Dust samples were collected on classrooms’ loor using a vacuum cleaner speci ically 132
designed to avoid any contamination resulting from the contact between the sample and the 133
vacuum cleaner’s parts: dust was collected in a cellulose thimble fitted at the entrance of the 134
tube, where a custom-made Teflon nozzle was fitted. Teflon was chosen as an inert material 135
towards the organic pollutants of this study. Upon reception in the laboratory, samples were 136
stored in the freezer at -20 °C before being sieved through a 100 µm sieve. The <100 µm fraction 137
was stored in the freezer at -20 °C in clean amber glass vials until analysis. 138
In vitro release of bioaccessible SVOCs. The simplified method for extracting the 139
bioaccessible SVOC content in dust consists of an in vitro simulation of the intestinal digestion, 140
including only the small intestine (4 hours) and colon (16 hours) incubations, in the presence of 141
an adsorbent, which serves as a sink for SVOCs, thus mimicking the transfer of SVOCs through 142
the intestinal wall and promoting the liberation of SVOCs from the dust matrix47
. The adsorbent 143
used in this work is Amberlite® XAD
®-2, a polymeric adsorbent widely used to adsorb organic 144
compounds from air48
and water49
. An XAD®-2 insert was designed to allow the intestinal 145
solution to flow freely around the XAD®-2 beads, while retaining the beads apart from the dust 146
particles. This insert consists of 500 mg of XAD®-2 trapped in a 70 x 58 mm, 110 mesh, nylon 147
gauze pocket (Hebei Reking Wire Mesh CO., Ltd, Hebei, China). In order to maintain the 148

Chapitre 3 : proposition d’une méthode simplifiée de mesure des COSV dans les poussières
Page 108
8
XAD®
-2 insert submerged, a 9 mm diameter glass marble was added in the pocket before closing 149
it using 25 mm paper clips (Lyreco, Marly, France) A picture of the insert in available in 150
Supplement Information (SI) (SI Figure 1). XAD®-2 inserts were cleaned prior to use with 151
dichloromethane using an Accelerated Solvent Extractor ASE 350 (Dionex Corporation, 152
Sunnyvale, California, United States). Intestinal solution was prepared by adding 1.78 g of bile 153
salts and 0.5 g of pancreatin to 1 L of water, in accordance with previous work28
. Evian water, a 154
natural mineral groundwater known for its very stable mineral content and conductivity (509 155
µS/cm), was used for this purpose.50
A fluid:dust ratio of 200:1 was respected as a safe 156
compromise between physiological relevance and analytical feasibility26
: 200 mg of dust were 157
added to 40 mL of intestinal solution in a Duran® 100 mL amber glass bottle (DWK Life 158
Sciences GmbH, Wertheim, Germany). The solution was left to incubate at 37 °C in a TH 15 159
incubator hood (Edmund Bühler GmbH, Bodelshausen, Germany) for 20 hours with a 125 rpm 160
agitation to mimic the gastro-intestinal tract peristaltic movement. At the end of the incubation, 161
the XAD®
-2 inserts were removed from the solution, rinsed with the intestinal solution to 162
remove any dust left on surface, and hang out on a metallic wire under the hood until dry. 163
Meanwhile the intestinal solution and its dust content were transferred to 50 mL Kimax 164
centrifuged tubes (Gerresheimer, Düsseldorf, Germany) and centrifuged at 2500 g for 20 min. 165
After separation, the intestinal solution was discarded and the residual dust was lyophilized in an 166
Alpha 1-2 freeze drier (Christ, Osterode am Harz, Germany) until dry. The XAD®-2 insert, 167
containing the bioaccessible SVOC content, and the residual dust, containing the non-168
bioaccessible SVOC content, were then treated separately, albeit using the same extraction and 169
analytical methods (Figure 2). 170

Chapitre 3 : proposition d’une méthode simplifiée de mesure des COSV dans les poussières
Page 109
9
Extraction of PBDEs and pyrethroids in XAD®-2 and residual dust. The extraction 171
procedure has already been described in previous works51
. Briefly, surrogate standards 172
(fenpropathrin, and 13
C12-BDE 47, 99, and 153) were added to each sample then extractions were 173
performed with dichloromethane by pressurized liquid extraction (PLE) using the Accelerated 174
Solvent Extractor ASE 350 (Dionex Corporation, Sunnyvale, California, United States). Organic 175
extracts were concentrated to 1 mL and quantitatively transferred onto Chromabond® NH2 glass 176
columns prewashed with 6 mL of dichloromethane. Elution was performed with 5 mL of 177
dichloromethane. Organic extracts were then concentrated to 0.5 mL, spiked with an internal 178
standard (2,3,4-TCNB), transferred into a 1.5 mL amber glass vial and stored at -18 °C prior to 179
analysis. 180
Analysis of PBDEs and pyrethroids in XAD®-2 and residual dust. The analytical method 181
was also described previously51
. Briefly, analyses of organic extracts were performed using a gas 182
chromatograph (GC) Trace GC Ultra coupled to a mass spectrometer (MS/MS) TSQ Quantum 183
GC operated in electron impact ionization (EI) mode (70 eV) (Thermo Scientific, Waltham, 184
Massachusetts, United States). The GC system was equipped with a TriPlus Autosampler and a 185
PTV (Programmable Temperature Vaporizing) injector. Calibration solutions and organic 186
extracts were injected (1 µL) in splitless mode. Helium was used as column carrier gas at a 187
constant flow rate of 2 mL/min. Chromatographic separation was performed on a Rtx-PCB 188
capillary column (60 m length x 0.25 mm I.D., 0.25 µm film thickness) supplied by Restek 189
(Lisses, France). The mass spectrometer (triple quadrupole) was operated in the Multiple 190
Reaction Monitoring (MRM) mode and the two most sensitive and specific transitions were 191
monitored for each compound. The concentration in each sample was calculated by internal 192
calibration, using at least 5 of the 8 points calibration curves. 193
Chapitre 3 : proposition d’une méthode simplifiée de mesure des COSV dans les poussières
Page 110
10
Calculation of bioaccessibility. The percentage of bioaccessibility was calculated according 194
to the following formulae: 195
( ) [ ][ ] [ ]
QA/QC. The limits of detection (LODs) and limits of quantification (LOQs) are reported in 196
Table 4. Incubation blank and quality control (QC) samples were incubated, extracted and 197
analyzed to control contamination from all consumables and to check for method accuracy. 198
Incubation blanks consisted of an XAD®-2 insert immerged in 40 mL of the intestinal solution. 199
Incubation QC samples consisted of XAD®-2 inserts immerged in 40 mL of the intestinal 200
solution previously spiked with the target compounds at a concentration of once (Level 1) or 201
eight times (Level 2) the analytical LOQ. The NIST standard reference material SRM 2585 was 202
also tested: an XAD®-2 insert was immerged in 40 mL of intestinal solution containing 200 mg 203
of SRM 2585. One incubation blank, and two each of Level 1, Level 2 and SRM 2585 incubation 204
QC samples were prepared for every batch of 7 or 8 samples. Extraction blanks and QC samples 205
were also analyzed with each XAD®-2 or dust extraction batch to monitor the pollution and the 206
accuracy of the ASE extraction method. Extraction blanks samples consisted of a cleaned 207
XAD®
-2 insert for XAD®-2 extractions, and of diatomaceous earth (Celite
® 545) for dust 208
extractions. Extraction QC samples consisted of a cleaned XAD®-2 insert or Celite
® 545, spiked 209
at Level 2. In addition, for dust extractions, 200 mg of SRM 2585 were extracted to assess the 210
concentration of the reference material, as certified or indicative values are known for several 211
compounds. These QC procedures comply with the principles described by Rodríguez-Navas, 212
Rosende and Mir to ensure a proper validation of analytical results.52 213
Statistical analysis. GraphPad Prism® version 5.01 for Windows (GraphPad Software, LaJolla 214
CA, USA) was used for graphical data display and statistical analysis. Prior to statistical 215

Chapitre 3 : proposition d’une méthode simplifiée de mesure des COSV dans les poussières
Page 111
11
analysis, all bioaccessibility percentages were converted into fractions and arc-sine 216
transformed28
. Multiple t-tests (unpaired; p < 0.05) were performed to assess statistically 217
significant differences between bioaccessibility and bioavailability. 218
RESULTS AND DISCUSSION 219
Four steps towards simplifying the in vitro method 220
As mentioned in the introduction, the methods developed and / or used previously by the 221
authors,28
Fang and Stapleton27
and Wang et al.,29
are the most inclusive. In addition to the 222
gastric and small intestine process that are present in all in vitro methods26
, they also consider the 223
colon stage in the incubation process and they mimic the dynamic of the digestion using Tenax® 224
TA as a sorptive sink. These common characteristics along with the whole in vitro process are 225
represented in Figure 1, and these inclusive methods have been used as a reference based on 226
which we started a four-step simplification process. 227
First step – Use of an XAD®-2 insert. Prior to Kang et al. investigating different sorptive sink 228
solutions (silica, poly(ethylene-co-vinyl acetate) (polyE), Tenax® TA, and C18) and 229
recommending silica polyE to predict PAHs bioavailability of indoor dust53
, Tenax® TA used to 230
be the favored option and has been used by Fang and Stapleton to measure the bioaccessibility of 231
PBDEs in the reference material SRM 258527
, with a very good correlation to their 232
bioavailability measured in vivo on rats that had ingested the same material54
. However Tenax® 233
TA is rather expensive, and would not be appropriate in the prospect of documenting the 234
bioaccessibility of a large number of dust samples, since the cost, either for using new material 235
for each sample, or for the operator time required to recycle the materiel for several successive 236
uses, would be prohibitive and contrary to the aim of simplifying the method. In this project, 237
XAD®
-2 was tested as an alternative to Tenax® TA. XAD
®-2 presents several advantages: (i) it 238

Chapitre 3 : proposition d’une méthode simplifiée de mesure des COSV dans les poussières
Page 112
12
is quite inexpensive so it can be disposed of after use, without the need of being recycled, (ii) its 239
mesh size (20-60) is appropriate for the mesh size of the nylon mesh (110) that is used for the 240
insert in the present study, and (iii) it is suitable for extraction with dichloromethane, which has 241
been the solvent of choice for the extraction of SVOCs in dust in our previous works7,13,51
. The 242
suitability of XAD®-2 for measuring the bioaccessibility of SVOCs in dust was assessed by 243
comparison to Tenax® TA using the SRM 2585 reference material, which was submitted to one 244
hour of gastric incubation followed by four hours of intestinal incubation in the presence of 245
500 mg of sorbent. Since no bioaccessible BDE 153 was detected in the presence of Tenax® TA, 246
which could be due to an insufficient incubation time for this compound, the comparison was 247
only carried out for the pyrethroids and the remaining PBDEs. As shown in SI Chart1, a good 248
correlation (slope = 0.945, r² = 0.978) was established between the bioaccessibility results 249
obtained with Tenax® TA and XAD
®-2. Therefore, the insert made of 500 mg of XAD
®-2 was 250
deemed suitable for the measurement of the bioaccessibility of SVOCs in indoor settled dust. 251
Second step – removal of the analysis of the digestive fluid. After leaving the dust matrix, 252
SVOCs are released into the synthetic digestive fluid, from where they are adsorbed onto XAD®-253
2. XAD®
-2 is an infinite sink from which SVOCs will not desorb in the conditions of the 254
incubation. The pyrethroids and PBDEs, with Log KOW (octanol/water partition coefficient) 255
greater than 4.73, are hydrophobic compounds. Once released in the fluid, they would either be 256
adsorbed on XAD® -2 or back trapped in dust, but they should not remain in the fluid. To check 257
this hypothesis, SVOC concentrations in the digestive fluid were monitored at two different 258
stages of the incubation (after intestinal incubation (4 hours) and after colon incubation 259
(20 hours) for triplicates of SRM 2585. The percentage of bioaccessible SVOC in the digestive 260
fluid was calculated: 261

Chapitre 3 : proposition d’une méthode simplifiée de mesure des COSV dans les poussières
Page 113
13
( ) ( ) ( ) ( )
The results in the fluid, presented in SI Table 1, are below the LOD for all PBDEs and reach a 262
maximum of 3% of the total bioaccessible content after 4 hours and 1% after 20 hours for 263
pyrethroids. The contribution of SVOC concentration in digestive fluid in the assessment of 264
bioaccessible SVOC can therefore be considered negligible and the analysis of digestive fluid 265
removed from the protocol as a way towards simpli ication and saving o operator’s time. 266
Third step – optimization of the intestinal incubation 267
The intestinal phase is one of the main steps of human digestion because it is there that the 268
absorption of nutriments through the intestinal wall takes place. It is a crucial step in in vitro 269
digestive systems because of the duration of incubation that allows more time for the dynamic of 270
the release of SVOCs from the dust matrix.26
While intestinal incubation, representing digestion 271
in the small intestine, ends after about 4 hours, it can be pursued further to also consider the large 272
intestine or colon, which has been shown to considerably increase the resulting bioaccessibility. 273
Synthetic digestive fluid simulating colon fluid is different from small intestine fluid, as it 274
contains mucin, L-cystein, haemin, iron and different salts, but no pancreatin.28
. In addition, 275
durations of incubation differ with 4 hours in small intestine and 16 hours in colon, within the 276
range of physiologically relevant values.55
In the present effort of simplification, the hypothesis 277
was made that the duration of incubation was the crucial step in the additional bioaccessibility 278
brought by colon incubation, as it would give more time to SVOCs with slower kinetics to be 279
released from the dust and adsorbed onto XAD®-2. To test this hypothesis, triplicates of 280
SRM 2585 where submitted to one hour of gastric incubation in Evian water at pH 2.5, followed, 281

Chapitre 3 : proposition d’une méthode simplifiée de mesure des COSV dans les poussières
Page 114
14
after pH neutralization to 7 using saturated sodium bicarbonate, by either 4 or (4 + 16 =) 20 282
hours of incubation in the presence of bile salts. Results are shown in Chart 1. The additional 283
incubation time increased the bioaccessibility by a factor of 1.2 for tetramethrin, about 3 for the 284
other pyrethroids, and about 2.5 for PBDEs. Tetramethrin, being the less hydrophobic compound 285
(log KOW = 4.73), is already more bioaccessible after 4 hours than the other compounds (54% vs. 286
max 21%) and would be less impacted by the additional incubation. Bioaccessibility results 287
obtained after the 20 hours-incubation are in agreement with the authors’ previous results, 288
obtained with the non-simplified method, for BDE 47 (54% in the current study, 51% in the 289
previous study), BDE 100 (39% current, 40% previous), and BDE 153 (26% current, 32% 290
previous)28
. These results confirmed the hypothesis that the most important factor for assessing 291
SVOC bioaccessibility is the duration of incubation. Moreover, the change of synthetic fluid 292
between intestinal and colon incubation is not necessary and a simplified media made of bile 293
salts is sufficient to reproduce results obtained for intestinal and colon digestion with more 294
complex media. 295
Fourth step – removal of the gastric incubation 296
Incubation in gastric conditions is an important step for the in vitro assessment of 297
bioaccessibility of metals and is in fact the only relevant compartment as metals are liberated in 298
the stomach via the action of acidity.56
However, for organic compounds, liberation in gastric 299
conditions have been shown inferior to intestinal conditions for polycyclic aromatic 300
hydrocarbons (PAHs),57
phthalates,58
and polychlorinated biphenyls (PCBs).59
301
When dust is submitted to immersion, part of it dissolves in the digestive fluid, thus favoring 302
the release of the SVOCs that it contained. We made the hypotheses that (i) dust dissolution in 303
digestive fluids may be impacted by the gastric and intestinal conditions of the experiment, and 304

Chapitre 3 : proposition d’une méthode simplifiée de mesure des COSV dans les poussières
Page 115
15
(ii) a greater amount of dissolved dust could be linked to a greater SVOC bioaccessibility. To 305
test these hypotheses, the amount of dissolved dust and the associated SVOC bioaccessibilities in 306
SRM 2585 triplicates were tested for sixteen different gastric and intestinal conditions, described 307
in SI Table 2. Results are shown in SI Chart 2. An increase of the percentage of dissolved dust 308
was always associated with an increase of bioaccessibility, although the strength of the 309
correlation varied depending on the compound, with r² ranging from 0.17 for BDE 99, to 0.54 for 310
tetramethrin. A non-parametric correlation test was also performed, which showed that the 311
correlation was significant for all the compounds but BDE 99 and BDE 153 (SI Table 3). 312
Moreover, the highest percentages of dust dissolution (> 58%) were obtained in the presence 313
of pancreatin (tests 13, 15 and 16 in SI Table 2) even if dust was not submitted to gastric 314
incubation. Pancreatin is a mixture of digestive enzymes (amylase, lipase, trypsin, and protease) 315
produced by the pancreas to break down proteins, fats and carbohydrates in the small 316
intestine.25,61,62
The role of pancreatin in bioaccessibility tests has already been documented in 317
the literature: it was involved in the dehalogenation process of halonitromethanes63
and on the 318
degradation of pyrethroids in the digestive fluid prior to absorption.29
It was also reported as a 319
surfactant that, along with bile salts, enhances the bioaccessibility of p,p′-DDT in contaminated 320
soils,64
although this effect was weak on PAHs.65
A comparison between bioaccessibility results 321
obtained in the presence of pancreatin with or without gastric incubation was carried out for 322
SRM 2585. Results are shown in Chart 2. The intestinal-only process, including bile salts and 323
pancreatin, produced greater results than those obtained with the gastro-intestinal process 324
including bile salts for most compounds, and comparable results to those obtained with the 325
gastro-intestinal process based on a buffer solution. 326

Chapitre 3 : proposition d’une méthode simplifiée de mesure des COSV dans les poussières
Page 116
16
Therefore the gastric incubation was not considered necessary for measuring SVOC 327
bioaccessibility in dust and the step was removed from the process. This is a major event for the 328
simplification of the method, because it eliminates the need for pH adjustment to 2.5, the 329
necessity to handle the XAD®
-2 inserts between the gastric and intestinal phases, and last the 330
need for pH readjustment to 7.0, such saving operator labor time. 331
Evaluation of time and money saving. An attempt to compare the time necessary to perform 332
each step of the reference and simplified methods has been made and is summarized in Table 1. 333
The time spent for one sample with the simplified method (2 hours and 20 minutes) has been 334
evaluated to less than half the time spent on the reference method (nearly 5 hours), which can be 335
translated in money saving as operator’s time o ten contributes to more than hal to the cost o an 336
analysis. Further substantial savings could be obtained with the change of sorbent, with an 337
estimated 1 to 12 ratio between the cost of 500 mg of XAD®
-2 and the cost of 500 mg of 338
Tenax®
TA. These savings would be very valuable when assessing the SVOC bioaccessible 339
content of many samples in larger studies. 340
341
Method validation. 342
A comparison was first carried out between bioaccessibilities measured for PBDEs in 343
SRM 2585 with this method and the two non-simplified methods for which data for PBDEs were 344
also available. The first non-simplified method (method A) is the authors’ previous work, based 345
on Tilston et al.’s method,66
including Tenax® TA, retained in a dialysis membrane, as an 346
adsorbent.28
The other method (method B) is the one developed by Fang and Stapleton, also 347
based on Tilston et al.’s work,66
with Tenax® TA retained in a stainless steel gaze and with the 348
addition of lipase among the intestinal components.27
As shown in Chart 3, bioaccessibility data 349
Chapitre 3 : proposition d’une méthode simplifiée de mesure des COSV dans les poussières
Page 117
17
produced by the simplified method were greater than those obtained with the non-simplified 350
method A, but lower than those obtained with the non-simplified method B. The fact that method 351
B produces greater results could be linked to the presence of lipase, which may act as an 352
additional component favoring the release of hydrophobic compounds from dust. On the 353
contrary, the lower results obtained with method A could be due to the membrane which can 354
slow down the kinetics of the adsorption on Tenax® TA with the increase of molecular weight.
67 355
It is satisfactory that the simplified method should produce intermediate results compared to non-356
simplified methods as this comforts its reliability. 357
We also compared the results obtained through the simplified method with in vivo 358
bioavailability data, bearing in mind that bioaccessibility data should be greater than 359
bioavailability as they do not include any metabolism past the intestinal barrier.68
In 2008, Huwe 360
et al. administered SRM 2585 to rats and measured the concentrations of 15 PBDEs, including 361
those of interest in the present study, in liver and adipose tissues, as well as in feces54
. To 362
calculate the resulting bioavailability, shown in Chart 3, the following equation was applied: 363 ( ) ( ) . 364
Non-significant differences were observed between bioavailability and bioaccessibilities 365
measured with the simplified method for BDE 47 and BDE 85 (p>0.05). A lower recovery of 366
BDE 99 (65%) was observed by Huwe et al., which caused the calculated bioavailability to rise 367
(from 43.7% to 67.1%). While we are not able to assess the origin of this lower recovery, it is 368
worth noting that the non-corrected percentage retained of 43.7 ±5.2% is not significantly 369
different from our simplified bioaccessibility of 48.2 ±7.7% (p>0.05). Nonetheless, 370
bioavailability was significantly higher than simplified bioaccessibility for BDE 100 (p=0.0002) 371
and BDE 153 (p<0.001). Two phenomena, hypothesized by Abdallah and Stuart in their work on 372

Chapitre 3 : proposition d’une méthode simplifiée de mesure des COSV dans les poussières
Page 118
18
human milk, 69
could explain these higher values: the first one is the debromination of more 373
highly brominated BDE compound such as BDE 209, although this is unlikely to be the main 374
mechanism in rats, contrary to fish species.54
Debromination was also reported in indoor 375
environments by the action of sunlight or bacteria degradation, but SRM 2585 is unlikely to be 376
subject to debromination as the dust was sterilized46
and stored in darkness. The second 377
phenomena hypothesized by Abdallah and Stuart was the bioaccumulation of BDE 153 over time 378
in fatty tissues, explained by the longer BDE 153 half-life (6.5 years), although this is not 379
relevant to the length of rat studies (<14 weeks). Huwe at al. observed that BDE 153 has a higher 380
bioconcentrating potential than BDE 154, another hexa-brominated congener, which could be 381
explained by the low metabolism of BDE 153 compared to BDE 154.54
The case of BDE 153 382
seems peculiar and more studies, on different types of dust, would be necessary to assess 383
whether the bioaccessibility measurement method needs to be optimized for this compound or if 384
a correction factor should be applied based on in vivo phenomena explaining the difference 385
between this BDE and the other congeners. Regarding pyrethroids, there is neither 386
bioaccessibility data nor bioavailability data available to date for SRM 2585. Such data would be 387
necessary to validate the results from the present work. 388
QA/QC results. 389
All extraction blank and QC samples in this study were compliant to our protocols. SVOC 390
measurements were < limit of detection (LOD) in all extraction blanks. For XAD-2 extraction 391
QCs, measured concentrations were within 89 and 106% of the spiked value, with a relative 392
standard deviation (RSD) ranging from 5 to 17% (SI Table 4-A). For dust extraction QCs spiked 393
in Celite® 545, performances were also satisfactory, with measured concentrations between 93 394
and 104% of the spiked value, and RSDs ranging from 3 to 16% (SI Table 4-B). Regarding the 395

Chapitre 3 : proposition d’une méthode simplifiée de mesure des COSV dans les poussières
Page 119
19
extractions of SRM 2585, measured concentrations were between 82 and 115% of the certified 396
or reference value, and RSDs ranged between 3 and 18% (Table 2). 397
Incubation blank and QC samples were also assessed: concentrations in incubation blanks were 398
all below the LOD and confirm the absence of any source of contamination from the XAD-2 399
insert, intestinal fluid, and glassware. Incubation QCs confirm the capacity of XAD®-2 to adsorb 400
the SVOCs released in the intestinal fluid. For the lower spiking level, the concentrations 401
measured were between 62 and 100% of the spiked concentrations, with RSD ranging from 14 to 402
38% (SI Table 5-A). These greater RSD percentages are not surprising because SVOCs were 403
spiked at the LOQ level. For the higher spiking level, measured concentrations were within 67 404
and 94% of the spiked concentrations with RSDs ranging from 12 to 23%, except for BDE 153 405
that showed a 49% RSD, which could be due to an occasional lack of instrumental sensibility (SI 406
Table 5-B). For both spiking levels, the lowest recoveries concerned tetramethrin. This is also 407
true for SRM 2585, when comparing the sum of the bioaccessible and non-bioaccessible 408
concentrations to the total measured concentration (Table 3). While recoveries were all 409
satisfactory, ranging from 77% to 110%, the lowest value concerns tetramethrin and the 410
possibility of a minor loss caused by degradation during the incubation process cannot be 411
excluded. 412
Bioaccessibility of pyrethroids and PBDEs in 30 school dust samples. 413
The distribution of bioaccessible and total (bioaccessible + non-bioaccessible) pyrethroid and 414
PBDE concentrations found in classrooms are shown in Table 4 and graphically represented in 415
Chart4. To allow for a meaningful calculation of bioaccessibility for each sample, after removal 416
of all concentrations < LOD/2 in XAD®-2 or dust, results between LOD/2 and LOQ for XAD
®-2 417
were kept, provided that the concentration in the corresponding residual dust was > LOQ, in 418
Chapitre 3 : proposition d’une méthode simplifiée de mesure des COSV dans les poussières
Page 120
20
order to avoid a meaningless null bioaccessibility. If the concentration in the corresponding dust 419
was < LOQ then the results in XAD®
-2 and residual dust were both removed. Likewise, results 420
between LOD/2 and LOQ for dust were kept if the corresponding XAD®-2 concentration was 421
>LOQ, to avoid a meaningless 100% bioaccessibility. If the concentration in the corresponding 422
XAD®
-2 was < LOQ then the results in residual dust and XAD®
-2 were both removed. 423
Bioaccessibility data are shown in Chart4. Median bioaccessibilities ranged from 0% (for 424
BDE 153) to 100 % (for tetramethrin), even though these two compounds might not be the most 425
representative of the study as they were only quantified 5 times and once, respectively. For the 426
three compounds that were more frequently detected, i.e. permethrin (n=28), BDE 47 (n=26) and 427
BDE 99 (n=24), median bioaccessibilities ranged from 37 to 48%. The variability between 428
samples was moderate, with a difference between the 75th
and 25th
percentiles of 25, 22, and 28% 429
for permethrin, BDE 47, and BDE 99, respectively, although values as low as 10% (for BDE 99) 430
or as high as 92 % (also for BDE 99) could also be observed. Chart4 also shows that measured 431
bioaccessibilities were not dependent on the initial SVOC content present in the dust. A 432
comparison with results from the literature was undertaken. As explained in our previously 433
published literature review, SVOC bioaccessibilities can vary according to the measurement 434
method that is being used, one of the main influencing factors being the presence of an adsorbent 435
acting as a “sink” or SVOCs released rom the dust into the digestive solution26,68
. The scientific 436
literature on the subject is still scarce, and to the best of our knowledge, only four articles 437
documenting the bioaccessibility of SVOCs in dust, measured in the presence of an adsorbent, 438
have been published so far, on organophosphate flame retardants (OPFRs)27
, PBDEs27,28
, and 439
more recently on pyrethroids29
and polycyclic aromatic hydrocarbons (PAHs)53
. For pyrethroids 440
and PBDEs, our results are in accordance with those published previously (Table 5). While more 441

Chapitre 3 : proposition d’une méthode simplifiée de mesure des COSV dans les poussières
Page 121
21
data are needed for the compounds not frequently detected in our studies, it is worth considering 442
the bioaccessibility of PBDEs and the less volatile pyrethroids permethrin and cypermethrin, as 443
the resulting impact on human exposure could be lowered by a minimum of 50 %. Moreover, for 444
an accurate assessment of the effect of environmental exposure on human health, the 445
bioaccessibility of SVOCs should be considered individually for each sample, because of the 446
wide range between minima and maxima. 447
448
Proposal of a simplified method. In this project, a new simplified method is proposed for the 449
evaluation of the bioaccessibility of SVOCs in indoor settled dust. This simplified method, 450
which no longer includes a gastric compartment, consists of 20 hours of incubation at a neutral 451
pH in the presence of bile, pancreatin, and XAD-2 as sorbent sink. The analysis of indoor 452
environmental samples showed some limitations to the use of the XAD®
-2 insert as dust fibers 453
tend to be caught in the insert’s creases, which necessitate some tedious manual removal. One 454
way around this problem could be to heat seal the insert and give it a flat square shape that would 455
eliminate the presence of creases. Another way around this problem would be to pursue the use 456
of a cellulose membrane, as in the authors’ previous work,28 only by selecting a membrane with 457
bigger pore size, to favor the adsorption of SVOC with slower kinetics of release and adsorption. 458
Another limit to this method is the lack of inter-laboratory studies carried on the same 459
environmental samples. However, the validation data are satisfactory and the first results are 460
promising as they are consistent with previous studies. The bioaccessible SVOC fraction is the 461
concentration of choice for human exposure assessment studies and for more precise associations 462
between indoor environmental exposure to dust and health outcome in epidemiological studies. 463
Using the present method, the knowledge of this bioaccessible fraction is made easy and cost 464

Chapitre 3 : proposition d’une méthode simplifiée de mesure des COSV dans les poussières
Page 122
22
efficient as it only necessitates the analysis of the XAD®
-2 inserts, emphasizing the simplicity of 465
the method as a strength for the analysis of numerous samples in the future. 466
SUPPORTING INFORMATION 467
Additional Supporting Information may be found in the online version of this article: 468
SI Figure 1: Design of the XAD®-2 insert 469
SI Table 1: Percentage of bioaccessible SVOC in the digestive fluid after 4 or 20 hours of 470
intestinal incubation for SRM 2585 triplicates. 471
SI Table 2: Impact of sixteen different gastric and intestinal conditions on SRM 2585 472
dissolution 473
SI Table 3: Spearman test of the correlation between bioaccessibility and dust dissolution 474
SI Table 4: SVOC concentrations in extraction QC samples 475
SI Table 5: SVOC concentrations in incubation QC samples 476
SI Chart 1: Comparison between SVOC bioaccessibilities measured with Tenax® TA and 477
XAD®
-2 in 3 replicates of SRM 2585. 478
SI Chart 2: Effect of dust dissolution on SVOC bioaccessibility 479
ACKNOWLEDGEMENT 480
The authors thank the French Environment & Energy Management Agency (ADEME) for their 481
financial support towards sample analysis. Gaëlle Raffy thanks the CSTB and EHESP for 482
financing her PhD. Katerina Kademoglou wishes to acknowledge the RECETOX Research 483

Chapitre 3 : proposition d’une méthode simplifiée de mesure des COSV dans les poussières
Page 123
23
Infrastructure (LM2015051) and the Postdoc@MUNI project 484
(CZ.02.2.69/0.0/0.0/16_027/0008360) for funding her post-doctoral studies. The authors also 485
thank Gaëlle Saramito, as a technical referee, for her involvement in maintaining all analytical 486
instruments in good working order. 487
REFERENCES 488
(1) Weschler, C. Changes in Indoor Pollutants since the 1950s. Atmos. Environ. 2009, 43 (1), 489
153–169. 490
(2) Civan, M. Y.; Kara, U. M. Risk Assessment of PBDEs and PAHs in House Dust in 491
Kocaeli, Turkey: Levels and Sources. Environ. Sci. Pollut. Res. 2016, 23 (23), 23369–23384. 492
(3) Coelho, S. D.; Sousa, A. C. A.; Isobe, T.; Kim, J. W.; Kunisue, T.; Nogueira, A. J. A.; 493
Tanabe, S. Brominated, Chlorinated and Phosphate Organic Contaminants in House Dust from 494
Portugal. Sci. Total Environ. 2016, 569–570, 442–449. 495
(4) Mandin, C.; Mercier, F.; Ramalho, O.; Lucas, J.-P.; Gilles, E.; Blanchard, O.; Bonvallot, 496
N.; Glorennec, P.; Le Bot, B. Semi-Volatile Organic Compounds in the Particulate Phase in 497
Dwellings: A Nationwide Survey in France. Atmos. Environ. 2016, 136, 82–94. 498
(5) Mitro, S. D.; Dodson, R. E.; Singla, V.; Adamkiewicz, G.; Elmi, A. F.; Tilly, M. K.; 499
Zota, A. R. Consumer Product Chemicals in Indoor Dust: A Quantitative Meta-Analysis of U.S. 500
Studies. Environ. Sci. Technol. 2016, 50 (19), 10661–10672. 501
(6) Bennett, D. H.; Moran, R. E.; Wu, X.; Tulve, N. S.; Clifton, M. S.; Colón, M.; Weathers, 502
W.; Sjödin, A.; Jones, R. S.; Hertz-Picciotto, I. Polybrominated Diphenyl Ether (PBDE) 503
Concentrations and Resulting Exposure in Homes in California: Relationships among Passive 504

Chapitre 3 : proposition d’une méthode simplifiée de mesure des COSV dans les poussières
Page 124
24
Air, Surface Wipe and Dust Concentrations, and Temporal Variability. Indoor Air 2014, 25 (2), 505
220–229. 506
(7) Blanchard, O.; Glorennec, P.; Mercier, F.; Bonvallot, N.; Chevrier, C.; Ramalho, O.; 507
Mandin, C.; Le Bot, B. Semivolatile Organic Compounds in Indoor Air and Settled Dust in 30 508
French Dwellings. Environ. Sci. Technol. 2014, 48, 3959–3969. 509
(8) Al-Omran, L. S.; Harrad, S. Polybrominated Diphenyl Ethers and “Novel” Brominated 510
Flame Retardants in Floor and Elevated Surface House Dust from Iraq: Implications for Human 511
Exposure Assessment. Emerg. Contam. 2015, 1–7. 512
(9) Larsson, K.; Lindh, C.; Jönsson, B. A.; Giovanoulis, G.; Bibi, M.; Bottai, M.; Bergström, 513
A.; Berglund, M. Phthalates, Non-Phthalate Plasticizers and Bisphenols in Swedish Preschool 514
Dust in Relation to Children’s Exposure. Environ. Int. 2017, No. March. 515
(10) Maragkidou, A.; Arar, S.; Al-Hunaiti, A.; Ma, Y.; Harrad, S.; Jaghbeir, O.; Faouri, D.; 516
Hämeri, K.; Hussein, T. Occupational Health Risk Assessment and Exposure to Floor Dust 517
PAHs inside an Educational Building. Sci. Total Environ. 2016. 518
(11) Toms, L.-M. L.; Mazaheri, M.; Brommer, S.; Clifford, S.; Drage, D.; Mueller, J. F.; Thai, 519
P.; Harrad, S.; Morawska, L.; Harden, F. a. Polybrominated Diphenyl Ethers (PBDEs) in Dust 520
from Primary Schools in South East Queensland, Australia. Environ. Res. 2015, 142 (2014), 521
135–140. 522
(12) Mizouchi, S.; Ichiba, M.; Takigami, H.; Kajiwara, N.; Takamuku, T.; Miyajima, T.; 523
Kodama, H.; Someya, T.; Ueno, D. Exposure Assessment of Organophosphorus and 524

Chapitre 3 : proposition d’une méthode simplifiée de mesure des COSV dans les poussières
Page 125
25
Organobromine Flame Retardants via Indoor Dust from Elementary Schools and Domestic 525
Houses. Chemosphere 2015, 123, 17–25. 526
(13) Raffy, G.; Mercier, F.; Blanchard, O.; Derbez, M.; Dassonville, C.; Bonvallot, N.; 527
Glorennec, P.; Le Bot, B. Semi-Volatile Organic Compounds in the Air and Dust of 30 French 528
Schools: A Pilot Study. Indoor Air 2016, 27, 114–127. 529
(14) Harrad, S.; Abdallah, M. A. E.; Oluseyi, T. Polybrominated Diphenyl Ethers and 530
Polychlorinated Biphenyls in Dust from Cars, Homes, and Offices in Lagos, Nigeria. 531
Chemosphere 2016, 146, 346–353. 532
(15) Boudehane, A.; Lounas, A.; Moussaoui, Y.; Balducci, C.; Cecinato, A. Levels of Organic 533
Compounds in Interiors (School, Home, University and Hospital) of Ouargla City, Algeria. 534
Atmos. Environ. 2016, 144, 266–273. 535
(16) Kadi, M. W.; Ali, N.; Albar, H. M. S. Phthalates and Polycyclic Aromatic Hydrocarbons 536
(PAHs) in the Indoor Settled Carpet Dust of Mosques, Health Risk Assessment for Public. Sci. 537
Total Environ. 2018, 627, 134–140. 538
(17) Lucattini, L.; Poma, G.; Covaci, A.; de Boer, J.; Lamoree, M.; Leonards, P. A Review of 539
Semi-Volatile Organic Compounds (SVOCs) in the Indoor Environment: Occurrence in 540
Consumer Products, Indoor Air and Dust. Chemosphere 2018, 201, 466–482. 541
(18) Baurès, E.; Blanchard, O.; Mercier, F.; Surget, E.; Rivier, A.; Gangneux, J.; Florentin, A. 542
Science o the Total Environment Indoor Air Quality in Two French Hospitals : Measurement o 543
Chemical and Microbiological Contaminants. Sci. Total Environ. 2018, 642, 168–179. 544

Chapitre 3 : proposition d’une méthode simplifiée de mesure des COSV dans les poussières
Page 126
26
(19) Bonvallot, N.; Mandin, C.; Mercier, F.; Le Bot, B.; Glorennec, P. Health Ranking of 545
Ingested Semi-Volatile Organic Compounds in House Dust: An Application to France. Indoor 546
Air 2010, 20 (6), 458–472. 547
(20) Li, X.; Gao, Y.; Wang, J.; Ji, G.; Lu, Y.; Yang, D.; Shen, H.; Dong, Q.; Pan, L.; Xiao, H.; 548
et al. Exposure to Environmental Endocrine Disruptors and Human Health. Public Heal. Emerg. 549
2016, 1, 47–47. 550
(21) Giulivo, M.; Lopez de Alda, M.; Capri, E.; Barceló, D. Human Exposure to Endocrine 551
Disrupting Compounds: Their Role in Reproductive Systems, Metabolic Syndrome and Breast 552
Cancer. A Review. Environ. Res. 2016, 151, 251–264. 553
(22) Weschler, C.; Nazaroff, W. W. Semivolatile Organic Compounds in Indoor 554
Environments. Atmos. Environ. 2008, 42 (40), 9018–9040. 555
(23) WHO. Indoor Air Quality: Organic Pollutants (EURO Reports and Studies No. 111.). 556
World Health Organization: Geneva, Switzerland 1989. 557
(24) Bekö, G.; Weschler, C.; Langer, S.; Callesen, M.; To tum, J.; Clausen, G. Children’s 558
Phthalate Intakes and Resultant Cumulative Exposures Estimated from Urine Compared with 559
Estimates from Dust Ingestion, Inhalation and Dermal Absorption in Their Homes and Daycare 560
Centers. PLoS One 2013, 8 (4). 561
(25) Rostami, I.; Juhasz, A. Assessment of Persistent Organic Pollutant (POP) Bioavailability 562
and Bioaccessibility for Human Health Exposure Assessment: A Critical Review. Crit. Rev. 563
Environ. Sci. Technol. 2011, 41 (7), 623–656. 564
Chapitre 3 : proposition d’une méthode simplifiée de mesure des COSV dans les poussières
Page 127
27
(26) Raffy, G.; Mercier, F.; Glorennec, P.; Mandin, C.; Le Bot, B. Oral Bioaccessibility of 565
Semi-Volatile Organic Compounds (SVOCs) in Settled Dust: A Review of Measurement 566
Methods, Data and Influencing Factors. J. Hazard. Mater. 2018, 352 (November 2017), 215–567
227. 568
(27) Fang, M.; Stapleton, H. M. Evaluating the Bioaccessibility of Flame Retardants in House 569
Dust Using an in Vitro Tenax Bead-Assisted Sorptive Physiologically Based Method. Environ. 570
Sci. Technol. 2014, 48 (22), 13323–13330. 571
(28) Kademoglou, K.; Williams, A.; Collins, C. Bioaccessibility of PBDEs Present in Indoor 572
Dust: A Novel Dialysis Membrane Method with a Tenax TA® Absorption Sink. Sci. Total 573
Environ. 2018, 621 (November), 1–8. 574
(29) Wang, J.; Lin, K.; Taylor, A.; Gan, J. In Vitro Assessment of Pyrethroid Bioaccessibility 575
via Particle Ingestion. Environ. Int. 2018, 119 (May), 125–132. 576
(30) La Guardia, M. J.; Hale, R. C.; Harvey, E. Detailed Polybrominated Diphenyl Ether 577
(PBDE) Congener Composition of the Widely Used Penta-, Octa-, and Deca-PBDE Technical 578
Flame-Retardant Mixtures. Environ. Sci. Technol. 2006, 40 (20), 6247–6254. 579
(31) US EPA. Technical Fact Sheet – Polybrominated Diphenyl Ethers (PBDEs) and 580
Polybrominated Biphenyls (PBBs) 581
http://www.epa.gov/fedfac/pdf/technical_fact_sheet_pbde_pbb.pdf. 582
(32) UNEP. Stockholm Convention on Persistent Organic Pollutants (POPs) 583
http://chm.pops.int/TheConvention/Overview/tabid/3351/Default.aspx. 584

Chapitre 3 : proposition d’une méthode simplifiée de mesure des COSV dans les poussières
Page 128
28
(33) Stapleton, H. M.; Dodder, N. G. Decabromodiphenyl Ether in House Dust By Natural 585
Sunlight. Env. Toxicol Chem 2008, 27 (2), 306–312. 586
(34) Chevrier, C.; Warembourg, C.; Le Maner-Idrissi, G.; Lacroix, A.; Dardier, V.; Le Sourn-587
Bissaoui, S.; Rouget, F.; Monfort, C.; Gaudreau, E.; Mercier, F.; et al. Childhood Exposure to 588
Polybrominated Diphenyl Ethers and Neurodevelopment at Six Years of Age. Neurotoxicology 589
2016, 54, 81–88. 590
(35) Vuong, A. M.; Yolton, K.; Poston, K. L.; Xie, C.; Webster, G. M.; Sjödin, A.; Braun, J. 591
M.; Dietrich, K. N.; Lanphear, B.; Chen, A. Prenatal and Postnatal Polybrominated Diphenyl 592
Ether (PBDE) Exposure and Measures of Inattention and Impulsivity in Children. Neurotoxicol. 593
Teratol. 2017, 64 (April), 20–28. 594
(36) Vuong, A. M.; Yolton, K.; Xie, C.; Webster, G. M.; Sjödin, A.; Braun, J. M.; Dietrich, K. 595
N.; Lanphear, B.; Chen, A. Childhood Polybrominated Diphenyl Ether (PBDE) Exposure and 596
Neurobehavior in Children at 8 Years. Environ. Res. 2017, 158 (July), 677–684. 597
(37) Jacobson, M. H.; Barr, D. B.; Marcus, M.; Muir, A. B.; Lyles, R. H.; Howards, P. P.; 598
Pardo, L.; Darrow, L. A. Serum Polybrominated Diphenyl Ether Concentrations and Thyroid 599
Function in Young Children. Environ. Res. 2016, 149, 222–230. 600
(38) Vuong, A. M.; Braun, J. M.; Webster, G. M.; Thomas Zoeller, R.; Hoofnagle, A. N.; 601
Sjödin, A.; Yolton, K.; Lanphear, B.; Chen, A. Polybrominated Diphenyl Ether (PBDE) 602
Exposures and Thyroid Hormones in Children at Age 3 Years. Environ. Int. 2018, 117 603
(February), 339–347. 604

Chapitre 3 : proposition d’une méthode simplifiée de mesure des COSV dans les poussières
Page 129
29
(39) Harley, K. G.; Rauch, S. A.; Chevrier, J.; Kogut, K.; Parra, K. L.; Trujillo, C.; Lustig, R. 605
H.; Greenspan, L. C.; Sj�din, A.; Bradman, A.; et al. Association of Prenatal and Childhood 606
PBDE Exposure with Timing of Puberty in Boys and Girls. Environ. Int. 2017, 100, 132–138. 607
(40) Yu, Y. jiang; Lin, B. gui; Liang, W. bo; Li, L. zhong; Hong, Y. de; Chen, X. chao; Xu, X. 608
yu; Xiang, M. deng; Huang, S. Associations between PBDEs Exposure from House Dust and 609
Human Semen Quality at an E-Waste Areas in South China–A Pilot Study. Chemosphere 2018, 610
198, 266–273. 611
(41) Saillen ait, A.; Ndiaye, D.; Sabaté, J. Pyrethroids : Exposure and Health E ects – An 612
Update. Int. J. Hyg. Environ. Health 2015, 218, 281–292. 613
(42) Furlong, M. A.; Barr, D. B.; Wolff, M. S.; Engel, S. M. Prenatal Exposure to Pyrethroid 614
Pesticides and Childhood Behavior and Executive Functioning. Neurotoxicology 2017, 62, 231–615
238. 616
(43) Viel, J. F.; Warembourg, C.; Le Maner-Idrissi, G.; Lacroix, A.; Limon, G.; Rouget, F.; 617
Monfort, C.; Durand, G.; Cordier, S.; Chevrier, C. Pyrethroid Insecticide Exposure and 618
Cognitive Developmental Disabilities in Children: The PELAGIE Mother-Child Cohort. 619
Environ. Int. 2015, 82, 69–75. 620
(44) Glorennec, P.; Serrano, T.; Fravallo, M.; Warembourg, C.; Monfort, C.; Cordier, S.; Viel, 621
J.-F.; Le Gléau, F.; Le Bot, B.; Chevrier, C. Determinants o Children’s Exposure to Pyrethroid 622
Insecticides in Western France. Environ. Int. 2017, 104 (November 2016), 76–82. 623
(45) Darney, K.; Bodin, L.; Bouchard, M.; Côté, J.; Volatier, J.; Desvignes, V. Aggregate 624
Exposure of the Adult French Population to Pyrethroids. Toxicol. Appl. Pharmacol. 2018. 625

Chapitre 3 : proposition d’une méthode simplifiée de mesure des COSV dans les poussières
Page 130
30
(46) Poster, D. L.; Kucklick, J. R.; Schantz, M. M.; Vander Pol, S. S.; Leigh, S. D.; Wise, S. 626
A. Development of a House Dust Standard Reference Material for the Determination of Organic 627
Contaminants. Environ. Sci. Technol. 2007, 41 (8), 2861–2867. 628
(47) Collins, C. D.; Mosquera-Vazquez, M.; Gomez-Eyles, J. L.; Mayer, P.; Gouliarmou, V.; 629
Blum, F. Is There Su icient “sink” in Current Bioaccessibility Determinations o Organic 630
Pollutants in Soils? Environ. Pollut. 2013, 181, 128–132. 631
(48) Hayward, S. J.; Lei, Y. D.; Wania, F. Sorption of a Diverse Set of Organic Chemical 632
Vapors onto XAD-2 Resin: Measurement, Prediction and Implications for Air Sampling. Atmos. 633
Environ. 2011, 45 (2), 296–302. 634
(49) Daignault, S. A.; Noot, D. K.; Williams, D. T.; Huck, P. M. A Review of the Use of XAD 635
Resins to Concentrate Organic Compounds in Water. Water Res. 1988, 22 (7), 803–813. 636
(50) Vingerhoeds, M. H.; Nijenhuis-de Vries, M. A.; Ruepert, N.; van der Laan, H.; Bredie, 637
W. L. P.; Kremer, S. Sensory Quality of Drinking Water Produced by Reverse Osmosis 638
Membrane Filtration Followed by Remineralisation. Water Res. 2016, 94, 42–51. 639
(51) Mercier, F.; Gilles, E.; Saramito, G.; Glorennec, P.; Le Bot, B. A Multi-Residue Method 640
for the Simultaneous Analysis in Indoor Dust of Several Classes of Semi-Volatile Organic 641
Compounds by Pressurized Liquid Extraction and Gas Chromatography/Tandem Mass 642
Spectrometry. J. Chromatogr. A 2014, 1336, 101–111. 643
(52) Rodríguez-Navas, C.; Rosende, M.; Miró, M. In-Vitro Physiologically Based Extraction 644
of Solid Materials: Do We Have Reliable Analytical Methods for Bioaccessibility Studies of 645
Emerging Organic Contaminants? Trends Anal. Chem. 2017. 646

Chapitre 3 : proposition d’une méthode simplifiée de mesure des COSV dans les poussières
Page 131
31
(53) Kang, Y.; Zeng, D.; Man, Y. B.; Liu, J.; Yang, Y.; Li, S.; Situ, K.; Xiong, W.; Zeng, L.; 647
Zhang, Q.; et al. Comparison of Sorption Kinetics of PAHs by Sorptive Sinks and Caco-2 Cell 648
and the Correlation between Bioaccessibility and Bioavailability of PAHs in Indoor Dust. Sci. 649
Total Environ. 2018, 645, 170–178. 650
(54) Huwe, J. K.; Hakk, H.; Smith, D. J.; Diliberto, J. J.; Richardson, V.; Stapleton, H. M.; 651
Birnbaum, L. S. Comparative Absorption and Bioaccumulation of Polybrominated Diphenyl 652
Ethers Following Ingestion via Dust and Oil in Male Rats. Environ. Sci. Technol. 2008, 42 (7), 653
2694–2700. 654
(55) Guerra, A.; Etienne-Mesmin, L.; Livrelli, V.; Denis, S.; Blanquet-Diot, S.; Alric, M. 655
Relevance and Challenges in Modeling Human Gastric and Small Intestinal Digestion. Trends 656
Biotechnol. 2012, 30 (11), 591–600. 657
(56) Le Bot, B.; Gilles, E.; Durand, S.; Glorennec, P. Bioaccessible and Quasi-Total Metals in 658
Soil and Indoor Dust. Eur. J. Mineral. 2010, 22 (5), 651–657. 659
(57) Wang, W.; Wu, F.; Zheng, J.-S.; Wong, M. H. Risk Assessments of PAHs and Hg 660
Exposure via Settled House Dust and Street Dust, Linking with Their Correlations in Human 661
Hair. J. Hazard. Mater. 2013, 263, 627–637. 662
(58) Wang, W.; Wu, F.; Huang, M.; Kang, Y. Size Fraction Effect on Phthalate Esters 663
Accumulation , Bioaccessibility and in Vitro Cytotoxicity of Indoor / Outdoor Dust , and Risk 664
Assessment of Human Exposure. J. Hazard. Mater. 2013, 261, 753–762. 665

Chapitre 3 : proposition d’une méthode simplifiée de mesure des COSV dans les poussières
Page 132
32
(59) Kang, Y.; Yin, Y.; Man, Y.; Li, L.; Zhang, Q.; Zeng, L.; Luo, J. Bioaccessibility of 666
Polychlorinated Biphenyls in Workplace Dust and Its Implication for Risk Assessment. 667
Chemosphere 2013, 93 (6), 924–930. 668
(60) ISO/DIS 16751. Soil Quality - Environmental Availability of Non-Polar Compounds - 669
Determination of the Potential Bioavailable Fraction and the Non-Bioavailable Fraction Using a 670
Strong Adsorbent or Complexing Agent. 2015. 671
(61) Boland, M. Human Digestion - a Processing Perspective. J. Sci. Food Agric. 2016, 96 (7), 672
2275–2283. 673
(62) Dean, J. R.; Ma, R. Approaches to Assess the Oral Bioaccessibility of Persistent Organic 674
Pollutants: A Critical Review. Chemosphere 2007, 68 (8), 1399–1407. 675
(63) Yin, J.; Wu, B.; Liu, S.; Hu, S.; Gong, T.; Cherr, G. N.; Zhang, X.-X.; Ren, H.; Xian, Q. 676
Rapid and Complete Dehalogenation of Halonitromethanes in Simulated Gastrointestinal Tract 677
and Its Influence on Toxicity. Chemosphere 2018. 678
(64) Juhasz, A.; Herde, P.; Smith, E. Oral Relative Bioavailability of 679
Dichlorodiphenyltrichloroethane (DDT) in Contaminated Soil and Its Prediction Using in Vitro 680
Strategies for Exposure Refinement. Environ. Res. 2016, 150, 482–488. 681
(65) Tang, X.-Y.; Tang, L.; Zhu, Y.-G.; Xing, B.-S.; Duan, J.; Zheng, M.-H. Assessment of 682
the Bioaccessibility of Polycyclic Aromatic Hydrocarbons in Soils from Beijing Using an in 683
Vitro Test. Environ. Pollut. 2006, 140 (2), 279–285. 684


Chapitre 3 : proposition d’une méthode simplifiée de mesure des COSV dans les poussières
Page 136
36
TABLES 704
Table 1: Evaluation of operator's time in hours, for a batch of 8 samples 705
Reference method
Simplified
method
Media preparation 2:00 0:30
Inserts preparation 1:00 1:00
Sample preparation 0:30 0:30
Gastric incubation 0:15
Conversion to intestinal conditions 2:00
Intestinal incubation 0:15
Small intestine incubation 0:15
Centrifugation 0:30 0:30
Resuspension of residual dust in colon fluid 0:30
Colon incubation 0:15
Centrifugation 0:30
Small intestinal fluid LL extraction + concentration + purification 8:00
Colon fluid extraction + concentration + purification 8:00
Dust extraction + concentration + purification 8:00 8:00
Sorbent extraction + concentration + purification 8:00 8:00
Total time 39:45 18:45
Time per sample 4:58 2:20
706

Chapitre 3 : proposition d’une méthode simplifiée de mesure des COSV dans les poussières
Page 137
37
Table 2: Total SVOC concentrations in SRM 2585 707
n
Total
concentration
(ng/g)
RSD
(%)
Certified or
reference
concentration in
SRM 2585 (ng/g)
Total / Certified
or reference
concentration
(%)
Pyrethroids
Cyfluthrin 4 3063 15% 3730 82%
Cypermethrin 4 3192 18% 4050 79%
Permethrin 4 5710 3% 4970 115%
Tetramethrin 4 330 18% 356 93%
PBDEs
BDE 47 4 531 6% 497 107%
BDE 85 4 42.7 10% 43.8 97%
BDE 99 4 823 5% 892 92%
BDE 100 4 130 8% 145 90%
BDE 153 3 137 10% 119 115%
708
709
Table 3: bioaccessible and non-bioaccessible SVOC concentrations in SRM 2585. 710
n
Bioaccessible
concentration
(ng/g)
RSD
(%)
Non-
bioaccessible
concentration
(ng/g)
RSD
(%)
Bioaccessible
+ non-
bioaccessible
concentrations
(ng/g)
Bioaccessible
+ non-
bioaccessible
/ total
concentration
in Table 2
(%)
Bioaccessibility
(%)
RSD
(%)
Pyrethroids
Cyfluthrin 8 1530 14% 1480 45% 3008 98% 53% 16%
Cypermethrin 8 1680 16% 1530 19% 3213 101% 52% 13%
Permethrin 8 3310 12% 2510 15% 5813 102% 57% 7%
Tetramethrin 8 211 22% 44.0 69% 255 77% 83% 13%
PBDEs
BDE 47 8 396 13% 188 23% 583 110% 68% 9%
BDE 85 8 18.9 25% 23.3 22% 42.2 99% 45% 14%
BDE 99 8 373 12% 389 10% 762 93% 49% 8%
BDE 100 8 68.6 4% 67.9 13% 136 105% 50% 7%
BDE 153 6 45.2 44% 77.6 60% 123 89% 40% 41%
711
712
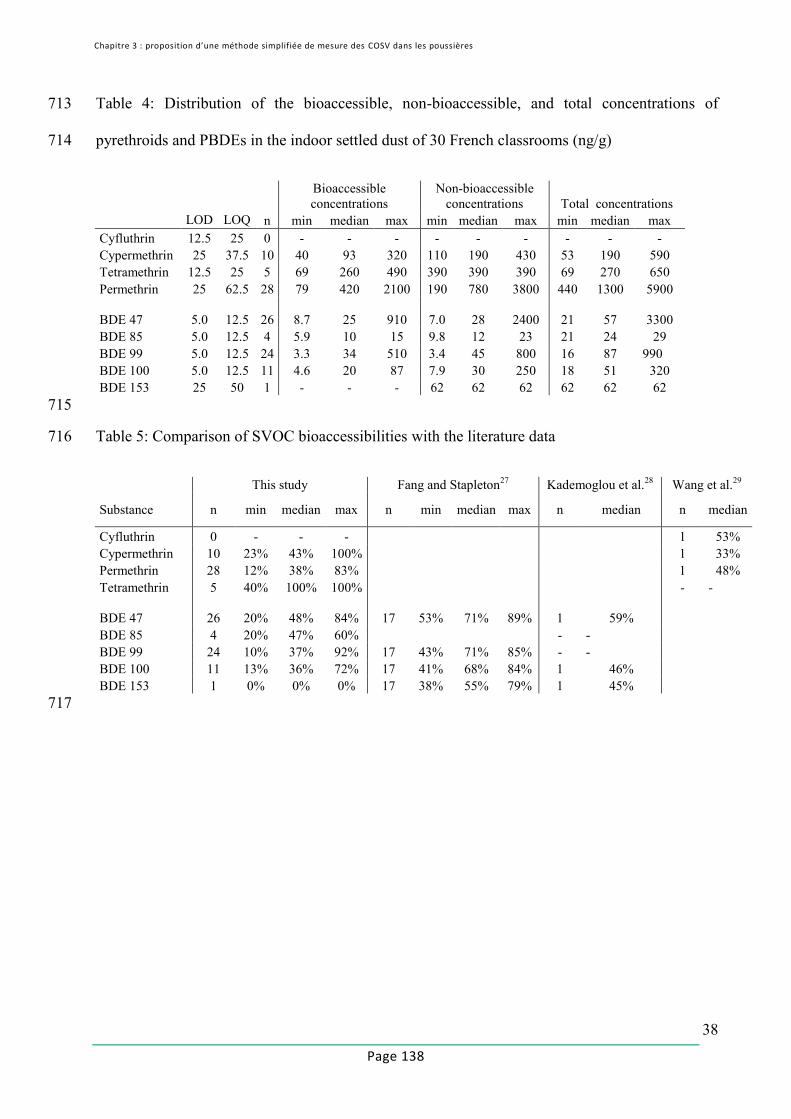
Chapitre 3 : proposition d’une méthode simplifiée de mesure des COSV dans les poussières
Page 138
38
Table 4: Distribution of the bioaccessible, non-bioaccessible, and total concentrations of 713
pyrethroids and PBDEs in the indoor settled dust of 30 French classrooms (ng/g) 714
Bioaccessible
concentrations
Non-bioaccessible
concentrations Total concentrations
LOD LOQ n min median max min median max min median max
Cyfluthrin 12.5 25 0 - - - - - - - - -
Cypermethrin 25 37.5 10 40 93 320 110 190 430 53 190 590
Tetramethrin 12.5 25 5 69 260 490 390 390 390 69 270 650
Permethrin 25 62.5 28 79 420 2100 190 780 3800 440 1300 5900
BDE 47 5.0 12.5 26 8.7 25 910 7.0 28 2400 21 57 3300
BDE 85 5.0 12.5 4 5.9 10 15 9.8 12 23 21 24 29
BDE 99 5.0 12.5 24 3.3 34 510 3.4 45 800 16 87 990
BDE 100 5.0 12.5 11 4.6 20 87 7.9 30 250 18 51 320
BDE 153 25 50 1 - - - 62 62 62 62 62 62
715
Table 5: Comparison of SVOC bioaccessibilities with the literature data 716
This study Fang and Stapleton27
Kademoglou et al.28
Wang et al.29
Substance n min median max n min median max n median n median
Cyfluthrin 0 - - - 1 53%
Cypermethrin 10 23% 43% 100% 1 33%
Permethrin 28 12% 38% 83% 1 48%
Tetramethrin 5 40% 100% 100% - -
BDE 47 26 20% 48% 84% 17 53% 71% 89% 1 59%
BDE 85 4 20% 47% 60% - -
BDE 99 24 10% 37% 92% 17 43% 71% 85% - -
BDE 100 11 13% 36% 72% 17 41% 68% 84% 1 46%
BDE 153 1 0% 0% 0% 17 38% 55% 79% 1 45%
717

Chapitre 3 : proposition d’une méthode simplifiée de mesure des COSV dans les poussières
Page 139
39
CHARTS 718
719
Tetra
met
hrin
Perm
ethrin
Cyf
luth
rin
Cyp
erm
ethrin
BDE 4
7
BDE 1
00
BDE 9
9
BDE 8
5
BDE 1
53
0
20
40
60
4 hours incubation 20 hours incubation
SD
Mean
bio
accessib
ility
(%
)
720
Chart 1: Effect of the duration of intestinal incubation on the bioaccessibility of pyrethroids and 721
PBDEs in triplicates of SRM 2585. 722

Chapitre 3 : proposition d’une méthode simplifiée de mesure des COSV dans les poussières
Page 140
40
Tetra
met
hrin
Perm
ethr
in
Cyfluth
rin
Cyp
erm
ethr
in
BDE 4
7
BDE 1
00
BDE 9
9
BDE 8
5
BDE 1
53
0
20
40
60
80
100
Test n Gastric conditions (37°C, 1 hour) Intestinal condition (37°C)
test 13 1 Buffer, pH 2.6c, pepsin
d20 hours, pancreatin
g
test 15 1 Evian water, pH 2.5 afterb, pepsin
d20 hours, bile salts
e,pancreatin
g
test 16 5 / 20 hours, bile saltse,pancreatin
g
bio
access
ibili
ty (
%)
723
Chart 2: Effect of in vitro gastro-intestinal conditions on SVOC bioaccessibilities in SRM 2585.
724
bimmersion of 200 mg of dust in 40 mL of Evian water followed by acidification at pH 2.5 725
with 35% HCl, cimmersion of 200 mg of dust in 40 mL of pH 2.6 Citrate-Phosphate Buffer, 726
dpepsin concentration: 1.25g/L,
ebile salts concentration: 1.78g/L,
gpancreatin concentration: 0.5 727
g/L. 728

Chapitre 3 : proposition d’une méthode simplifiée de mesure des COSV dans les poussières
Page 141
41
BDE 4
7
BDE 1
00
BDE 9
9
BDE 8
5
BDE 1
53
0
20
40
60
80
100
0
20
40
60
80
100
bioaccessibility - non simplified method28
bioaccessibility - non simplified method inc. lipase27
bioaccessibility - simplified method (this project)
bioavailability54
n=8 n=8n=8 n=8 n=6
bio
acce
ssib
ility
(%
) bio
ava
ilab
ility (%
)
729
Chart 3: Bioaccessibility and bioavailability of PBDEs in SRM 2585. Error bars represent one 730
SD of triplicate measurements except indicated otherwise on the chart. 731
732

Chapitre 3 : proposition d’une méthode simplifiée de mesure des COSV dans les poussières
Page 142
42
Tetra
met
hrin (n
=5)
Perm
ethrin
(n=2
8)
Cyf
luth
rin (n
=0)
Cyp
erm
ethrin
(n=1
0)
BDE 4
7 (n
=26)
BDE 1
00 (n
=11)
BDE 9
9 (n
=24)
BDE 8
5 (n
=4)
BDE 1
53 (n
=1)
0
20
40
60
80
100
0
20
40
60
80
100
200
400
600
800
1000100020003000400050006000
Bioaccessible concentration (ng/g)
Total concentration (ng/g)Bioaccessibility (%)
Bio
accessib
ility
(%
)
Co
ncen
tratio
n (n
g/g
)
733 Chart 4: Bioaccessibility and bioaccessible and total concentrations of pyrethroids and PBDEs in 734
the indoor settled dust of 30 French classrooms 735
736

Chapitre 3 : proposition d’une méthode simplifiée de mesure des COSV dans les poussières
Page 143
SUPPORTING INFORMATION
Oral bioaccessibility of SVOCs in indoor settled
dust: a simplified in vitro method applied to
polybrominated diphenyl ethers (PBDEs), and
pyrethroids.
Gaëlle Raffy*a, Corinne Mandin
b, Katerina Kademoglou
cd, Christopher Collins
c, Fabien
Merciera and Barbara Le Bot
a
aUniv Rennes, Inserm, EHESP, Irset (Institut de recherche en santé, environnement et travail)
- UMR_S 1085, F 35000 Rennes, France
bUniversité Paris Est, CSTB - Scientific and technical center for building, OQAI - French
indoor air quality observatory, 84 avenue Jean Jaurès Champs-sur-Marne 77447 Marne-la-
Vallée Cedex 2, France.
cSoil Research Centre, Department of Geography and Environmental Science, University of
Reading, Whiteknights Campus, RG6 6DW Reading, UK
dRECETOX, Masaryk University, Kamenice 753/5, pavilion A29, 62500 Brno, Czech
Republic
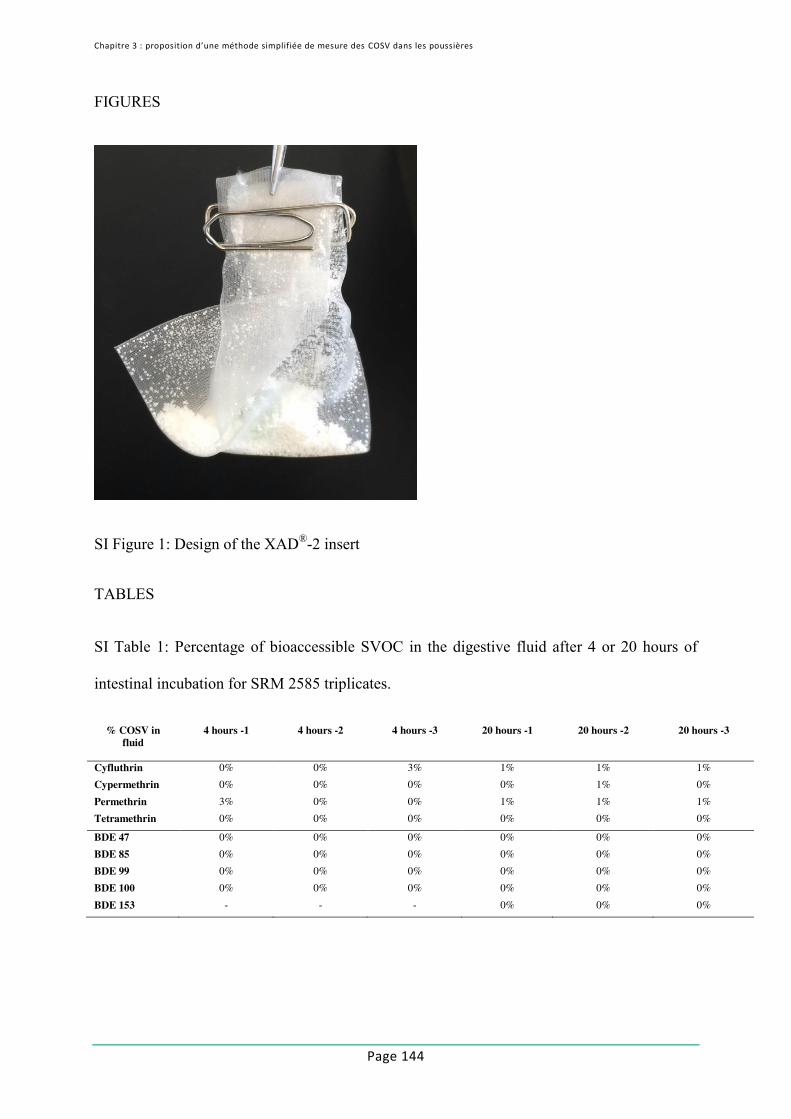
Chapitre 3 : proposition d’une méthode simplifiée de mesure des COSV dans les poussières
Page 144
FIGURES
SI Figure 1: Design of the XAD®-2 insert
TABLES
SI Table 1: Percentage of bioaccessible SVOC in the digestive fluid after 4 or 20 hours of
intestinal incubation for SRM 2585 triplicates.
% COSV in
fluid
4 hours -1 4 hours -2 4 hours -3 20 hours -1 20 hours -2 20 hours -3
Cyfluthrin 0% 0% 3% 1% 1% 1%
Cypermethrin 0% 0% 0% 0% 1% 0%
Permethrin 3% 0% 0% 1% 1% 1%
Tetramethrin 0% 0% 0% 0% 0% 0%
BDE 47 0% 0% 0% 0% 0% 0%
BDE 85 0% 0% 0% 0% 0% 0%
BDE 99 0% 0% 0% 0% 0% 0%
BDE 100 0% 0% 0% 0% 0% 0%
BDE 153 - - - 0% 0% 0%

Chapitre 3 : proposition d’une méthode simplifiée de mesure des COSV dans les poussières
Page 145
SI Table 2: Impact of sixteen different gastric and intestinal conditions on SRM 2585
dissolution
Test n Gastric conditions (37°C, 1 hour) pH Neutralization Intestinal conditions (37°C) % Dust dissolution
1 3 Evian water, pH 2.5 beforea
addition of saturated NaHCO3
4 hours 44.0% ± 2.0%
2 3 Buffer, pH 2.6c / 30.7% ± 6.7%
3 3 Buffer, pH 2.6c 4 hours 23.4% ± 9.3%
4 3 Buffer, pH 2.6c 24 hours 30.3% ± 1.5%
5 3 Evian water, pH 2.5 afterb 4 hours 47.5% ± 5.2%
6 3 Evian water, pH 2.5 afterb 4 hours, bile saltse 43.4% ± 2.1%
7 3 Evian water, pH 2.5 afterb 20 hours, bile saltse 48.2% ± 3.4%
8 3 Evian water, pH 2.5 afterb 20 hours 43.6% ± 2.7%
9 1 Evian water, pH 2.5 afterb 24 hours 43.8%
10 1 Evian water, pH 2.5 beforea 20 hours 53.8%
11 3 Evian water, pH 2.5 afterb 20 hours, lipasef 55.5% ± 2.3%
12 3 Buffer, pH 2.6c, pepsined 20 hours 48.6% ± 3.2%
13 1 Buffer, pH 2.6c, pepsined 20 hours, pancreating 58.3%
14 3 Evian water, pH 2.5 afterb, pepsined 20 hours, bile saltse 41.7% ± 3.5%
15 1 Evian water, pH 2.5 afterb, pepsined 20 hours, bile saltse,pancreating 58.9%
16 5 / / 20 hours, bile saltse,pancreating 58.6% ± 3.0%
aimmersion of 200 mg of dust in 40 mL of Evian water previously acidified at pH 2.5 with 35% HCl bimmersion of 200 mg of dust in 40 mL of Evian water followed by acidification at pH 2.5 with 35% HCl cimmersion of 200 mg of dust in 40 mL of pH 2.6 Citrate-Phosphate Buffer dpespine concentration: 1.25g/L ebile salts concentration: 1.78g/L flipase concentration: 1.6 g/L gpancreatin concentration: 0.5 g/L
SI Table 3: Spearman test of the correlation between bioaccessibility and dust dissolution

Chapitre 3 : proposition d’une méthode simplifiée de mesure des COSV dans les poussières
Page 146
SI Table 4: SVOC concentrations in extraction QC samples
(A) SVOC concentrations in XAD-2 extraction QC samples spiked at Level 2 (8 x LOQ) in XAD-2 insert
LOQx8 (ng/g)
n Measured
concentration (ng/g) RSD (%)
Measured / spiked concentration (%)
Pyrethroids
Cyfluthrin 100 3 92 15% 92% Cypermethrin 100 3 96 17% 96% Permethrin 500 3 520 17% 103% Tetramethrin 100 3 89 11% 89%
PBDEs
BDE 47 100 3 94 7% 94% BDE 85 100 3 96 5% 96% BDE 99 100 3 96 11% 96% BDE 100 100 3 93 8% 93% BDE 153 200 3 210 13% 106%
(B) SVOC concentrations in dust extraction QC samples spiked at Level 2 (8 x LOQ) in Celite® 545
LOQx8 (ng/g)
n Measured
concentration (ng/g) RSD (%)
Measured / spiked concentration (%)
Pyrethroids
Cyfluthrin 100 3 93 15% 93% Cypermethrin 100 3 95 16% 95% Permethrin 500 3 480 3% 97% Tetramethrin 100 3 95 15% 95%
PBDEs
BDE 47 100 3 100 6% 101% BDE 85 100 3 90 8% 90% BDE 99 100 3 100 11% 104% BDE 100 100 3 94 14% 94% BDE 153 200 2 190 10% 93%
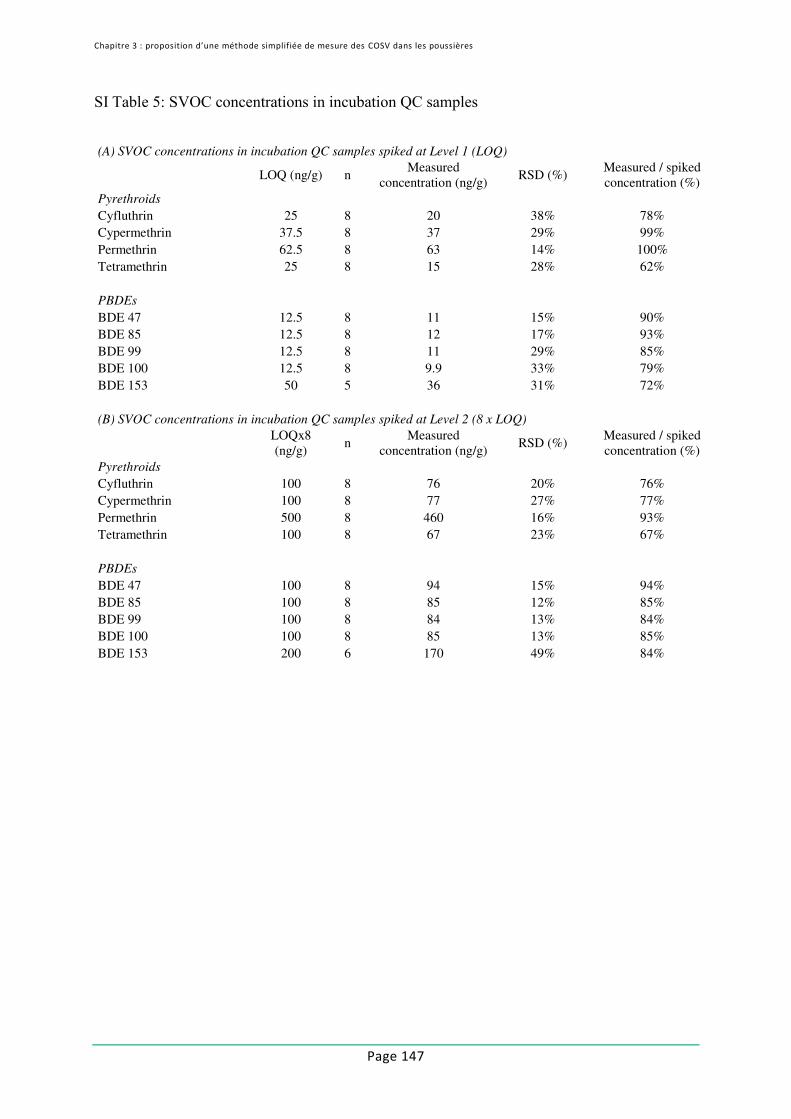
Chapitre 3 : proposition d’une méthode simplifiée de mesure des COSV dans les poussières
Page 147
SI Table 5: SVOC concentrations in incubation QC samples
(A) SVOC concentrations in incubation QC samples spiked at Level 1 (LOQ)
LOQ (ng/g) n
Measured concentration (ng/g)
RSD (%) Measured / spiked concentration (%)
Pyrethroids
Cyfluthrin 25 8 20 38% 78% Cypermethrin 37.5 8 37 29% 99% Permethrin 62.5 8 63 14% 100% Tetramethrin 25 8 15 28% 62%
PBDEs
BDE 47 12.5 8 11 15% 90% BDE 85 12.5 8 12 17% 93% BDE 99 12.5 8 11 29% 85% BDE 100 12.5 8 9.9 33% 79% BDE 153 50 5 36 31% 72%
(B) SVOC concentrations in incubation QC samples spiked at Level 2 (8 x LOQ)
LOQx8 (ng/g)
n Measured
concentration (ng/g) RSD (%)
Measured / spiked concentration (%)
Pyrethroids
Cyfluthrin 100 8 76 20% 76% Cypermethrin 100 8 77 27% 77% Permethrin 500 8 460 16% 93% Tetramethrin 100 8 67 23% 67%
PBDEs
BDE 47 100 8 94 15% 94% BDE 85 100 8 85 12% 85% BDE 99 100 8 84 13% 84% BDE 100 100 8 85 13% 85% BDE 153 200 6 170 49% 84%

Chapitre 3 : proposition d’une méthode simplifiée de mesure des COSV dans les poussières
Page 148
CHARTS
20 40 60 80
20
40
60
80
Tetramethrine
PermethrinCyfluthrin
Cypermethrin
BDE47
BDE100BDE99
BDE85
Slope 0.9450 ± 0.05804
r² 0.9779
Bioaccessibility using Tenax®
Bio
accessib
ility
usin
g X
AD
-2®
SI Chart 1: Comparison between SVOC bioaccessibilities measured with Tenax
® TA and
XAD®
-2 in 3 replicates of SRM 2585. Error bars represent one SD.

Chapitre 3 : proposition d’une méthode simplifiée de mesure des COSV dans les poussières
Page 149
Tetramethrin
20 40 600
20
40
60
80
100
1
2
34 5
6
7
89 1011
12 13
14
1516
Slope 0.8488 ± 0.2091
r² 0.5406
% dust dissolution
bio
access
ibili
ty (
%)
Permethrin
20 40 600
20
40
60
80
100
1
2
3
4
56
7
89
10
11
12 13
1415
16
Slope 0.8951 ± 0.3661
r² 0.2992
% dust dissolution
bio
access
ibili
ty (
%)
Cyfluthrin
20 40 600
20
40
60
80
100
1
2
3
4
56
7
8
910
1112
13
14 15
16
Slope 0.8447 ± 0.3702
r² 0.2710
% dust dissolution
bio
access
ibili
ty (
%)
Cypermethrin
20 40 600
20
40
60
80
100
1
2
3
4
56
7
89 10
11
12 13
1415
16
Slope 0.7837 ± 0.3305
r² 0.2865
% dust dissolution
bio
accessib
ility
(%
)
SI Chart 2: Effect of dust dissolution on pyrethroids’ bioaccessibility

Chapitre 3 : proposition d’une méthode simplifiée de mesure des COSV dans les poussières
Page 150
BDE 47
20 40 600
20
40
60
80
100
1
2
3
4
56
7
89
10
11
12 13
1415
16
Slope 0.9450 ± 0.4429
r² 0.2454
% dust dissolution
bio
accessib
ility
(%
)BDE 100
20 40 600
20
40
60
80
100
1
2
3
4
56
7
8910
11
12
13
14
15
16
Slope 0.7899 ± 0.3234
r² 0.2987
% dust dissolution
bio
accessib
ility
(%
)
BDE 99
20 40 600
20
40
60
80
100
1
2
3
4
56
7
8910
11
1213
14 15
16
Slope 0.5282 ± 0.3107
r² 0.1711
% dust dissolution
bio
accessib
ility
(%
)
BDE 85
20 40 600
20
40
60
80
100
1
2
3
4
56
7
89
101112
13
14 15
16
Slope 0.9153 ± 0.2499
r² 0.4893
% dust dissolution
bio
accessib
ility
(%
)
BDE 153
20 40 600
20
40
60
80
100
1
2
3 4
56
7
89
10
11
12 1314
1516
Slope 0.6153 ± 0.3355
r² 0.1937
% dust dissolution
bio
access
ibili
ty (
%)
SI Chart 2: Effect of dust dissolution on PBDEs’ bioaccessibility

Chapitre 3 : proposition d’une méthode simplifiée de mesure des COSV dans les poussières
Page 151
2. APPLICATION A DES ECHANTILLONS REELS
La méthode simplifiée d’analyse de la bioaccessibilité des COSV dans les poussières a été mise en
œuvre sur 30 échantillons, comme indiqué dans l’article précédent, pour les PBDE et les pyré-
thrinoïdes. Pour 7 de ces échantillons (correspondant à une série d’analyse), une mesure de la
bioaccessibilité d’une liste beaucoup plus complète de COSV a également été réalisée. Cette liste
est adaptée de la liste des composés d’intérêt présentés dans le premier article de ce mémoire
et est détaillée dans le Tableau 3. Elle exclut les composés pour lesquels aucune concentration
supérieure à la LQ n’a été mesurée dans aucun des extraits bioaccessibles ou non-bioaccessible
des échantillons ni du SRM 2585.
TABLEAU 3 : LISTE DES COSV RETENUS POUR LES MESURES DE BIOACCESSIBILITE ORALE
Famille Substance
Pesticides organophosphorés Chlorpyriphos-éthyl et diazinon
Pesticides organochlorés 4,4’-DDE, 4,4’-DDT, aldrine, α-endosulfan, α-HCH, dieldrine et γ-HCH
Oxadiazolones Oxadiazon
Pyréthrinoïdes Cyfluthrine, cyperméthrine, perméthrine et tétraméthrine
Esters phosphoriques Tributylphosphate
Muscs polycycliques Galaxolide (HHCB) et tonalide (AHTN)
Hydrocarbures aromatiques polycy-cliques (HAP)
Acénaphtène, anthracène, benzo[a]pyrène, fluoranthène, fluorène, phénanthrène et pyrène
Polychlorobiphényles (PCB) PCB 28, 31, 52, 101, 105, 118, 138, 153 et 180
Phtalates BBP, DBP, DEHP, DEP, DiBP et DiNP
Polybromodiphényléthers (PBDE) BDE 47, 85, 99, 100 et 153
La suite de ce chapitre explique plus précisément le choix de sélectionner des poussières collec-
tées dans des établissements scolaires et la méthode de sélection des 30 échantillons. En deu-
xième partie sont présentés les résultats de mesure de la bioaccessibilité de la liste complète des
COSV pour les 7 échantillons.

Chapitre 3 : proposition d’une méthode simplifiée de mesure des COSV dans les poussières
Page 152
2.1. SELECTION DES ECHANTILLONS
La méthode simplifiée a été appliquée à 30 échantillons de poussière déposée au sol de la cam-
pagne nationale « écoles » menée en France par l’Observatoire de la Qualité de l’air intérieur de
2013 à 2017. Le choix de poussières issues de salles de classe est justifié d’une part par les fortes
concentrations en certains COSV (notamment les phtalates) qui les caractérisent, d’autre part du
fait de l’exposition spécifique des enfants de 3 à 11 ans qui fréquentent l’école 16 % de leur
temps. Dans le cadre de la campagne nationale « écoles », des échantillons de poussière sédi-
mentées de 600 salles de classe ont été prélevées entre 2013 et 2017. Pour la détermination de
COSV et des métaux, ils ont été tamisés à 100µm, puis stockés au congélateur dans des condi-
tions permettant la conservation des COSV. Trente échantillons de cette collection ont été utili-
sés pour le présent projet.
La solution du tirage au sort pour la sélection des 30 échantillons n’a pas été retenue, d’une part
car pour de nombreux échantillons, le reliquat de poussière disponible était inférieur à la prise
d’essai de 200 mg définie dans le cadre du développement de la méthode de mesure de bioac-
cessibilité. D’autre part, il était pertinent de s’intéresser principalement aux PBDE pour lesquels
la validation par des données de biodisponibilité avait été possible pour le SRM 2585. Certaines
données in vivo sont également disponibles permettant la validation de la bioaccessibilité des
phtalates, mais la présence des phtalates dans les échantillons n’a pas été retenue comme cri-
tère de sélection, du fait de leur caractère ubiquitaire dans les échantillons de la campagne na-
tionale « écoles » (Figure 13). En revanche les échantillons contenant des PBDE sont plus rares
(Figure 14) et ont été sélectionnés de manière privilégiée.
La sélection de 30 échantillons s’est donc opérée selon trois critères :
- Masse de poussière disponible
- Présence de PBDE dans l’échantillon
- Concomitance de plusieurs PBDE différents

Chapitre 3 : proposition d’une méthode simplifiée de mesure des COSV dans les poussières
Page 153
Phtalates
DEP (n
=326
)
DiB
P (n=2
44)
DBP (n
=314
)
BBP (n
=269
)
DEH
P (n=2
49)
DiN
P (n=2
40)
1.01002
1.01003
1.01004
1.01005
1.01006
1.01007
1.01008
CLS
CLS: concentration limite de sélection
Co
nce
ntr
atio
n (
ng/
g)
FIGURE 13 : CONCENTRATIONS EN PHTALATES MESUREES DANS LES ECHANTILLONS DE LA CAMPAGNE NATIONALE
« ECOLES » DE L’OQAI (2013-2017)
PBDE
BDE 4
7 (n
=243
)
BDE 1
00 (n
=70)
BDE 9
9 (n
=255
)
BDE 8
5 (n
=6)
BDE 1
53 (n
=27)
1
10
100
1000
CLS
CLS : concentration limite de sélection
Co
nce
ntr
atio
n (
ng/
g)
FIGURE 14 : CONCENTRATIONS EN PBDE MESUREES DANS LES ECHANTILLONS DE LA CAMPAGNE NATIONALE « ECOLES »
DE L’OQAI (2013-2017)

Chapitre 3 : proposition d’une méthode simplifiée de mesure des COSV dans les poussières
Page 154
DISPONIBILITE DE POUSSIERE RESTANTE APRES LES ANALYSES DE COSV ET DE METAUX
La prise d’essai nécessaire pour la détermination de la bioaccessibilité étant de 200 mg, tous les
échantillons contenant moins de 220 mg de poussière ont été écartés, les 20 mg d’écart corres-
pondant à une marge de sécurité pour permettre le prélèvement de la prise d’essai de 200 mg et
pallier à d’éventuelles incertitudes de pesée ainsi qu’à la possibilité de prises d’essai multiples
pour l’analyse des COSV par thermo désorption GC/MS/MS (prise d’essai de 2 mg). Sur les 582
échantillons disponibles au laboratoire, 253 présentaient un reliquat de moins de 220 mg et ont
été écartés tandis que les 329 échantillons présentant un reliquat de poussière supérieur à
220 mg ont été conservés pour la suite de la sélection.
0 200 400 6001
10
100
1000
10000
100000
220
253 échantillons avec reliquat < 220 mg
329 échantillons avec reliquat > 220 mg
nombre d'échantillons
Reliq
uat
de p
ou
ssiè
re (
mg
)
FIGURE 15 : CLASSEMENT DES ECHANTILLONS SELON LEUR MASSE DE POUSSIERE DISPONIBLE (RELIQUAT)
PRESENCE DE PBDE DANS LES ECHANTILLONS
La deuxième étape de la sélection a consisté à se concentrer sur les échantillons contenant un ou
plusieurs PBDE avec des concentrations suffisamment élevées pour pouvoir être quantifiés ana-
lytiquement en tenant compte de leur bioaccessibilité. Les concentrations mesurées par TD-
GC/MS/MS pendant la campagne nationale « écoles » ont été utilisées pour cette étape.
Afin de tenir compte de la répartition des COSV entre le XAD®-2 et la poussière résiduelle et sa-
chant que dans chaque compartiment la concentration mesurée devait être supérieure à la LQ

Chapitre 3 : proposition d’une méthode simplifiée de mesure des COSV dans les poussières
Page 155
analytique afin que l’équation « bioaccessibilité = concentration bioaccessible / (concentration
bioaccessible + concentration non-bioaccessible) » ne soit pas entachée d’une trop forte incerti-
tude, la procédure suivante a été adoptée, basée sur le ratio de bioaccessibilité mesurée lors du
développement sur la poussière de référence SRM 2585 :
- Pour les substances dont la bioaccessibilité (« BA ») mesurée dans le SRM 2585 est supé-
rieure à 50 %, la concentration limite de sélection (CLSbioacc>50) a été calculée ainsi :
CLSbioacc>50=LQanalytique/(100-BA). Par exemple, pour une substance bioaccessible à 70 %, la
concentration non-bioaccessible est de 30 %. Si sa LQ analytique est de 12,5 ng/g alors ne se-
ront sélectionnés que les échantillons dont la concentration est supérieure à 42 ng/g.
- Pour les substances dont la bioaccessibilité est inférieure à 50 % dans le SRM 2585, la con-
centration limite de sélection (CLSbioacc<50) a été calculée ainsi : CLSbioacc<50=LQanalytique/BA. Par
exemple, pour une substance bioaccessible à 30 %, la concentration non-bioaccessible est de
70 %. Si sa LQ analytique est de 12,5 ng/g alors ne seront sélectionnées que les échantillons
dont la concentration est supérieure à 18 ng/g.
Les concentrations limite de sélection (CLS) sont détaillées dans le Tableau 4 pour les PBDE ainsi
que pour les phtalates et visibles sur les Figure 13s et Figure 14.
TABLEAU 4: CONCENTRATIONS LIMITE DE SELECTION (CLS) DES PHTALATES ET DES PBDE
Substance Bioaccessibilité dans SRM2585
LQ analytique (ng/g)
CLS (ng/g)
CLS arrondie (ng/g)
DEP 100% 2500 ∞ ∞
DiBP 50% 1000 2000 2000
DBP 31% 1000 3230 3500 BBP 45% 1000 2220 2500 DEHP 9% 1000 11100 12000 DiNP 7% 1000 14300 15000
BDE47 57% 12.5 29 30 BDE100 49% 12.5 26 30 BDE99 39% 12.5 32 35
BDE85 36% 12.5 35 35 BDE153 68% 50 156 150
Pour la suite de la sélection, les échantillons avec des concentrations mesurées pendant la cam-
pagne nationale « écoles » inférieures à la CLS ont été exclus.
Au terme de cette deuxième étape, tous les échantillons contenant au moins un PBDE ont été
conservés, soit 49 échantillons sur les 329 issus de l’étape précédente.

Chapitre 3 : proposition d’une méthode simplifiée de mesure des COSV dans les poussières
Page 156
CONCOMITANCE DE PLUSIEURS PBDE DIFFERENTS
La troisième étape de la sélection a consisté à classer les 49 échantillons selon le nombre de
PBDE différents qu’ils contenaient :
- 7 échantillons contenaient 3 PBDE différents ;
- 13 échantillons contenaient 2 PBDE différents ;
- 29 échantillons ne contenaient qu’un PBDE.
Les 20 échantillons contenant au moins deux PBDE différents ont été sélectionnés. Afin d’arriver
à un total de 30, 10 échantillons supplémentaires ont été sélectionnés par tirage sort parmi les
29 ne contenant qu’un PBDE. La sélection finale des 30 échantillons de l’étude est présentée
dans le Tableau 5.
TABLEAU 5 : LISTE DES ECHANTILLONS SELECTIONNES
Echantillons sélectionnés
Année de pré-lèvement
Masse pous-sière restante
Concentrations mesurées par TD-GC/MS/MS (ng/g) nombre de PBDE diffé-
rents BDE 47 BDE 85 BDE 99 BDE 100 BDE 153
Ech. 01 2015 1148.6 489.9 481.9 53.6 3 Ech. 02 2017 1872.0 91.1 158.9 35.4 3 Ech. 03 2015 1980.3 819.3 96.3 37.0 3 Ech. 04 2016 2663.2 252.1 246.3 65.0 3 Ech. 05 2014 568.4 53.5 205.0 30.0 3 Ech. 06 2014 680.8 41.6 69.6 2 Ech. 07 2015 995.1 94.1 1 Ech. 08 2016 1312.5 33.6 65.9 2 Ech. 09 2016 1527.9 38.5 192.3 31.0 3 Ech. 10 2013 402.6 30.8 47.8 2 Ech. 11 2017 2291.8 67.9 155.6 29.2 3 Ech. 12 2013 3307.2 40.1 103.6 2 Ech. 13 2015 704.2 54.9 1 Ech. 14 2015 676.1 103.9 1 Ech. 15 2013 1084.3 59.8 1 Ech. 16 2014 914.2 35.6 1 Ech. 17 2015 308.7 564.8 50.5 2 Ech. 18 2014 223.1 33.8 54.7 2 Ech. 19 2017 374.5 32.4 51.3 2 Ech. 20 2016 376.2 37.1 54.2 2 Ech. 21 2016 378.7 88.9 1 Ech. 22 2014 374.8 26.2 40.9 2 Ech. 23 2013 292.1 49.1 1 Ech. 24 2017 942.2 850.8 233.1 86.8 3 Ech. 25 2017 513.1 63.6 69.3 2 Ech. 26 2017 641.5 75.2 97.0 2 Ech. 27 2017 645.1 96.4 118.5 2 Ech. 28 2016 756.8 725.5 255.2 2 Ech. 29 2017 288.3 43.0 1 Ech. 30 2015 304.4 53.4 1

Chapitre 3 : proposition d’une méthode simplifiée de mesure des COSV dans les poussières
Page 157
2.2. BIOACCESSIBILITE DES COSV DANS 7 ECHANTILLONS DE POUSSIERE DE SALLES DE CLASSE
BLANCS ET CONTROLES QUALITE
De même que pour l’analyse des PBDE et des pyréthrinoïdes, l’analyse de la liste complète de
COSV s’est accompagnée de blancs et de contrôle qualité relatifs aux méthodes d’extraction et à
l’incubation intestinale.
Les blancs et les contrôles de l’étape d’extraction à haute température et à haute pression (PLE –
pressurized liquid extraction) des COSV sont présentés dans le Tableau 6 dans lequel les colonnes
« insert XAD®-2 » correspondent aux conditions d’extraction de la phase bioaccessible, tandis
que les colonnes « Celite® » correspondent aux conditions d’extraction de la fraction non-
bioaccessible. Les blancs, dont la concentration est inférieure à la LQ pour toutes les substances,
témoignent de l’absence de pollution extérieure pendant l’extraction. Les concentrations forti-
fiées dans les contrôles sont correctement re-quantifiées, avec des concentrations mesurées
comprises entre 70 et 130 % de la valeur fortifiée pour toutes les substances, à l’exception de
l’acénaphtène, légèrement sous-quantifié pour la fraction non-bioaccessible (66%).
Comme expliqué dans l’article précédent, le blanc et les contrôles d’incubation permettent de
s’assurer de l’absence de contamination provenant des réactifs et de la verrerie utilisés pour
l’incubation, de vérifier la capacité du XAD-2 à adsorber tous les COSV présents en solution dans
le liquide intestinal synthétique, ou de contrôler d’éventuelles dégradations dues à la présence
d’enzymes et à des conditions de température relativement élevées (37 ± 1°C) ± pendant un
temps relativement long (20 heures). Les concentrations mesurées dans le blanc d’incubation
(Tableau 7) sont toutes inférieures à la LQ, à l’exception du DiNP dont la concentration (1600
ng/g) est toutefois négligeable au regard des concentrations bioaccessibles mesurées dans les
échantillons de poussières associés (entre 24 900 et 449 000 ng/g). Pour toutes les familles chi-
miques à l’exception des phtalates et de l’aldrine, les concentrations mesurées dans le contrôle
d’incubation fortifiées au Niveau 2, correspondant au milieu de la gamme de calibration (5 x LQ),
sont comprises entre 76 et 120 %, de la concentration fortifiée. Pour ces mêmes substances, les
concentrations mesurées pour le Niveau 1, correspondant à la LQ, sont comprises entre 71 et
140 % de la concentration fortifiée, à l’exception du tributylphosphate (170 %), du fluorène
(200 %), et du phénanthrène (190 %). Les concentrations bioaccessibles proches de la LQ dans
les échantillons pourraient donc être également surévaluées. Cependant, le tributylphosphate
ne semble pas concerné puisque la plus faible concentration bioaccessible (201 ng/g) est asso-

Chapitre 3 : proposition d’une méthode simplifiée de mesure des COSV dans les poussières
Page 158
ciée à la plus faible bioaccessibilité (57 %). Le phénanthrène n’est pas impacté non plus puisque
la plus faible concentration bioaccessible retrouvée correspond au Niveau 2 de fortification
(94 ng/g). Pour le fluorène, la concentration bioaccessible retrouvée dans l’échantillon numéro
24 (Tableau 9), associée à une bioaccessibilité de 44 % (Tableau 10) pourrait être impactée, bien
qu’une bioaccessibilité plus forte (48 %) ait été mesurée dans un autre échantillon. En ce qui
concerne l’aldrine, non retrouvée dans le contrôle de Niveau 1 et légèrement sous-quantifiée
dans le contrôle de Niveau 2 (64 %), les valeurs non détectées pourraient être des faux-négatifs.
L’unique valeur reportée, 34 ng/g pour l’échantillon numéro 29 (Tableau 9), pourrait être sous-
évaluée. En ce qui concerne les phtalates, deux cas se distinguent, avec d’un côté le DEP, bien re-
quantifié pour les deux niveaux de fortification, et les autres phtalates, re-quantifiés entre 4 % et
26 % seulement de leur concentration de fortification. L’ajout de pancréatine dans le milieu in-
testinal synthétique semble responsable de cette perte de phtalates. En effet, la pancréatine est
un mélange d'enzymes digestives (amylase, lipase, trypsine et protéase) qui hydrolysent les pro-
téines en oligopeptides (trypsine), l'amidon en oligosaccharides (amylase) et les triglycérides en
acides gras et glycérol (lipase) [89]. Parmi ces enzymes, la lipase, testée individuellement, n’a pas
eu d’impact sur les phtalates, malgré sa capacité à hydrolyser les fonctions esters. En revanche,
la trypsine a été reportée dans la littérature pour sa capacité à former des complexes avec les
phtalates [101,102] et est donc très probablement responsable de leur faible taux de recouvre-
ment. Ce phénomène est également susceptible de se produire in vivo et doit donc être pris en
compte.

Chapitre 3 : proposition d’une méthode simplifiée de mesure des COSV dans les poussières
Page 159
TABLEAU 6 : CONCENTRATIONS DES COSV DANS LES BLANCS ET LES CONTROLES D’EXTRACTION FORTIFIES
Blanc Blanc
LQ
(ng/g)
Concentration
fortifiée (ng/g)
Concentration
mesurée
(ng/g)
Concentration
mesurée
(ng/g)
Concentration
mesurée /
concentration
fortifiée (%)
Concentration
mesurée
(ng/g)
Concentration
mesurée
(ng/g)
Concentration
mesurée /
concentration
fortifiée (%)
Pesticide organophosphoré
Diazinon 12.5 100 < LQ 81 81% < LQ 84 84%
Chlorpyrifos-ethyl 12.5 100 < LQ 120 123% < LQ 100 101%
Pesticide organochloré
a-HCH 5 40 < LQ 46 115% < LQ 49 123%
g-HCH 12.5 100 < LQ 89 89% < LQ 88 88%
Aldrin 12.5 100 < LQ 76 76% < LQ 92 92%
Alpha-endosulfan 12.5 100 < LQ 78 78% < LQ 71 71%
4,4'-DDE 5 40 < LQ 39 99% < LQ 39 97%
Dieldrin 12.5 100 < LQ 81 81% < LQ 130 130%
4,4'-DDT 12.5 100 < LQ 110 113% < LQ 100 104%
Oxadiazolone
Oxadiazon 12.5 100 < LQ 92 92% < LQ 88 88%
Retardateur de flamme organophosphoré
Tributylphosphate 187.5 500 < LQ 470 93% < LQ 500 100%
Musc
Galaxolide 62.5 500 < LQ 470 94% < LQ 470 94%
Tonalide 62.5 500 < LQ 460 92% < LQ 490 98%
HAP
Acenaphtene 12.5 100 < LQ 70 70% < LQ 66 66%
Fluorene 12.5 100 < LQ 84 84% < LQ 87 87%
Phenanthrene 25 100 < LQ 81 81% < LQ 79 79%
Anthracene 25 100 < LQ 76 76% < LQ 77 77%
Fluoranthene 12.5 100 < LQ 91 91% < LQ 93 93%
Pyrene 12.5 100 < LQ 97 97% < LQ 94 94%
Benzo(a)pyrene 12.5 100 < LQ 98 98% < LQ 100 100%
PCB
PCB31 5 40 < LQ 35 87% < LQ 37 92%
PCB28 5 40 < LQ 35 87% < LQ 38 94%
PCB52 5 40 < LQ 37 92% < LQ 40 100%
PCB101 5 40 < LQ 33 83% < LQ 36 91%
PCB118 5 40 < LQ 42 106% < LQ 38 96%
PCB153 5 40 < LQ 44 111% < LQ 39 98%
PCB105 5 40 < LQ 40 99% < LQ 40 101%
PCB138 5 40 < LQ 45 112% < LQ 48 121%
PCB180 5 40 < LQ 50 125% < LQ 49 123%
Phtalate
DEP 2500 4000 < LQ 3300 81% < LQ 3600 89%
DiBP 1000 4000 < LQ 3300 84% < LQ 3500 88%
DBP 1000 4000 < LQ 3400 85% < LQ 3500 88%
BBP 1000 4000 < LQ 3600 90% < LQ 4100 102%
DEHP 1000 4000 < LQ 3200 79% < LQ 3800 95%
DiNP 1000 4000 < LQ 3600 89% < LQ 3900 97%
Extraction inserts XAD-2 Extraction Célite
Contrôle Contrôle

Chapitre 3 : proposition d’une méthode simplifiée de mesure des COSV dans les poussières
Page 160
TABLEAU 7 : CONCENTRATIONS DES COSV DANS LE BLANC ET LES CONTROLES D'INCUBATION FORTIFIES
Blanc
Niveau 1
(LQ)
(ng/g)
Niveau 2
(5 x LQ)
(ng/g)
Concentration
mesurée
(ng/g)
Concentration
mesurée (ng/g)
Concentration
mesurée /
concentration
fortifiée (%)
Concentration
mesurée (ng/g)
Concentration
mesurée /
concentration
fortifiée (%)
Pesticide organophosphoré
Diazinon 12.5 100 < LQ 14 ± 1 110% 76 ± 1 76%
Chlorpyrifos-ethyl 12.5 100 < LQ 14 ± 0 110% 100 ± 15 100%
Pesticide organochloré
a-HCH 5 40 < LQ 6.1 ± 1.1 120% 47 ± 3 120%
g-HCH 12.5 100 < LQ 13 ± 1 100% 99 ± 5 99%
Aldrin 12.5 100 < LQ 0 - 64 ± 9 64%
Alpha-endosulfan 12.5 100 < LQ 8.8 ± 0.7 71% 89 ± 11 89%
4,4'-DDE 5 40 < LQ 5.9 ± 1.0 120% 34 ± 2 85%
Dieldrin 12.5 100 < LQ 15 ± 2 120% 94 ± 4 94%
4,4'-DDT 12.5 100 < LQ 13 ± 1 100% 91 ± 23 91%
Oxadiazolone
Oxadiazon 12.5 100 < LQ 15 ± 1 120% 79 ± 7 79%
Retardateur de flamme organophosphoré
Tributylphosphate 187.5 500 < LQ 315 ± 11 170% 520 ± 32 100%
Musc
Galaxolide 62.5 500 < LQ 87 ± 5 140% 490 ± 4 98%
Tonalide 62.5 500 < LQ 77 ± 0 120% 490 ± 40 98%
HAP
Acenaphtene 12.5 100 < LQ 16 ± 0 130% 79 ± 1 79%
Fluorene 12.5 100 < LQ 25 ± 1 200% 110 ± 6 110%
Phenanthrene 25 100 < LQ 47 ± 1 190% 120 ± 9 120%
Anthracene 25 100 < LQ 23 ± 0 91% 77 ± 8 77%
Fluoranthene 12.5 100 < LQ 15 ± 3 120% 82 ± 2 82%
Pyrene 12.5 100 < LQ 16 ± 2 130% 89 ± 4 89%
Benzo(a)pyrene 12.5 100 < LQ 14 ± 0 120% 87 ± 1 87%
PCB
PCB31 5 40 < LQ 5.8 ± 0.4 120% 39 ± 4 97%
PCB28 5 40 < LQ 4.5 ± 0.8 90% 39 ± 6 98%
PCB52 5 40 < LQ 6.0 ± 1.7 120% 42 ± 5 110%
PCB101 5 40 < LQ 5.3 ± 0.9 110% 34 ± 1 86%
PCB118 5 40 < LQ 5.8 ± 0.2 120% 39 ± 1 96%
PCB153 5 40 < LQ 6.9 ± 0.3 140% 41 ± 2 100%
PCB105 5 40 < LQ 5.7 ± 0.3 110% 39 ± 3 98%
PCB138 5 40 < LQ 7.0 ± 1.4 140% 41 ± 1 100%
PCB180 5 40 < LQ 5.5 ± 0.3 110% 42 ± 0 100%
Phtalate
DEP 2500 4000 < LQ 2500 ± 96 99% 3300 ± 110 82%
DiBP 1000 4000 < LQ 150 ± 9 15% 160 ± 7 4%
DBP 1000 4000 < LQ 160 ± 8 16% 170 ± 6 4%
BBP 1000 4000 < LQ 230 23% 120 ± 25 3%
DEHP 1000 4000 < LQ 260 ± 4 26% 720 ± 520 18%
DiNP 1000 4000 1600 220 ± 9 22% 470 ± 300 12%
Concentration
fortifiéeNiveau 2 (n=2)Niveau 1 (n=2)

Chapitre 3 : proposition d’une méthode simplifiée de mesure des COSV dans les poussières
Page 161
SRM 2585
Le Tableau 8 montre les concentrations de COSV bioaccessibles, non-bioaccessibles et totales,
ainsi que la bioaccessibilité des COSV dans le matériau de référence SRM 2585. Les bioaccessibi-
lités sont très différentes selon le type de COSV et varient de 14 % pour le DiNP à 100 % pour le
tributylphosphate et le lindane (γ-HCH). Outres les données existantes pour les PBDE présentées
dans l’article précédent, la bioaccessibilité des retardateurs de flamme organosphosphorés
(OPEs) [103,104] et des hexabromocyclododecanes[105] dans le SRM 2585 a déjà été documen-
tée dans la littérature. Cependant, pour la liste des COSV du présent projet, il s’agit de la pre-
mière mesure de bioaccessibilité dans le SRM 2585. Ces données devront être complétées sur de
plus nombreux réplicats, et pourront ainsi servir dans le futur d’éléments de comparaison pour
la communauté scientifique.

Chapitre 3 : proposition d’une méthode simplifiée de mesure des COSV dans les poussières
Page 162
TABLEAU 8 : CONCENTRATIONS DES COSV BIOACCESSIBLES, NON-BIOACESSIBLES ET TOTALES DANS LE SRM 2585
Concentration
bioaccessible
(ng/g, n=2)
Non-
bioaccessible
concentration
(ng/g, n=2)
Concentrations
bioaccessible +
non-
bioaccessible
(ng/g, n=2)
Concentration
totale
(ng/g, n=1)
Cocnentrations
bioaccessible +
non-
bioaccessible /
concentration
totale (%)
Bioaccessibil ité
(%, n=2)
Pesticide organophosphoré
Diazinon 197 ± 22 25 ± 2.8 222 ± 20 219 101 ± 8.9% 89 ± 2.3%
Chlorpyrifos-ethyl 104 ± 8.3 114 ± 40 218 ± 49 287 76 ± 17% 49 ± 7%
Pesticide organochloré
a-HCH - - - - - -
g-HCH 6.9 ± 0.12 - 6.9 ± 0.12 4.78 144 ± 2.6% 100%
Aldrin - - - - - -
Alpha-endosulfan - - - - - -
4,4'-DDE 134 ± 12 68 ± 1.8 202 ± 13 205 99 ± 6.5% 66 ± 1.3%
Dieldrin 78 ± 1.2 21 ± 2.9 99 ± 1.8 73 135 ± 2.5% 79 ± 2.6%
4,4'-DDT 30 ± 0.25 41 ± 3.2 71 ± 3.4 62 115 ± 5.5% 43 ± 1.7%
Oxadiazolone
Oxadiazon 14 ± 0.83 5.6 ± 0.41 19 ± 1.2 16 118 ± 7.7% 71 ± 0.25%
Retardateur de flamme organophosphoré
Tributylphosphate 284 ± 1.7 - 284 ± 1.7 256 111 ± 0.66% 100%
Musc
Galaxolide 1640 ± 15 202 ± 17 1840 ± 32 1 616 114 ± 2% 89 ± 0.74%
Tonalide 1550 ± 58 200 ± 10 1750 ± 47 1 629 108 ± 2.9% 89 ± 0.90%
HAP
Acenaphtene 11 ± 0.12 11 ± 0.95 22 ± 0.82 15 152 ± 5.7% 49 ± 2.4%
Fluorene 33 ± 0.27 25 ± 5.7 58 ± 6 43 136 ± 14% 57 ± 5.4%
Phenanthrene 975 ± 20 244 ± 17 1220 ± 3.5 1 218 100 ± 0.29% 80 ± 1.4%
Anthracene 43 ± 0.58 97 ± 1 140 ± 0.44 181 77 ± 0.24% 31 ± 0.51%
Fluoranthene 3180 ± 178 581 ± 68 3760 ± 246 3 977 94 ± 6.2% 85 ± 0.8%
Pyrene 2870 ± 141 517 ± 61 3390 ± 202 3 447 98 ± 5.9% 85 ± 0.89%
Benzo(a)pyrene 355 ± 12 261 ± 2.4 615 ± 9.2 663 93 ± 1.4% 58 ± 1%
PCB
PCB31 12 ± 0.39 2.7 ± 0.024 15 ± 0.37 14 101 ± 2.5% 82 ± 0.63%
PCB28 8.8 ± 0.81 1.7 ± 0.53 11 ± 1.3 12 88 ± 11% 84 ± 3%
PCB52 17 ± 0.83 5.9 ± 0.18 23 ± 0.65 25 89 ± 2.6% 74 ± 1.5%
PCB101 18 ± 0.027 10 ± 0.24 29 ± 0.27 28 103 ± 0.96% 64 ± 0.51%
PCB118 17 ± 1.3 9.2 ± 0.95 26 ± 2.3 28 93 ± 8.3% 64 ± 0.52%
PCB153 14 ± 0.85 13 ± 2.1 27 ± 3 28 98 ± 11% 52 ± 2.6%
PCB105 6.7 ± 0.49 4 ± 1.4 11 ± 1.9 10 109 ± 20% 63 ± 6.8%
PCB138 16 ± 0.63 11 ± 0.62 27 ± 0.0077 27 102 ± 0.029% 58 ± 2.3%
PCB180 6.5 ± 0.017 12 ± 0.7 19 ± 0.72 21 90 ± 3.4% 34 ± 1.2%
Phtalate
DEP 7070 ± 45 539 ± 24 7610 ± 21 6 965 109 ± 0.3% 93 ± 0.34%
DiBP 2300 ± 39 418 ± 5.4 2720 ± 34 5 097 53 ± 0.66% 85 ± 0.39%
DBP 8070 ± 230 2030 ± 122 10100 ± 108 27 180 37 ± 0.4% 80 ± 1.4%
BBP 33800 ± 197 6060 ± 97 39800 ± 294 86 400 46 ± 0.34% 85 ± 0.13%
DEHP 31800 ± 1480154000 ±
14600
186000 ±
16100509 800 36 ± 3.2% 17 ± 0.69%
DiNP 11700 ± 548 70100 ± 571 81800 ± 23 169 300 48 ± 0.014% 14 ± 0.67%
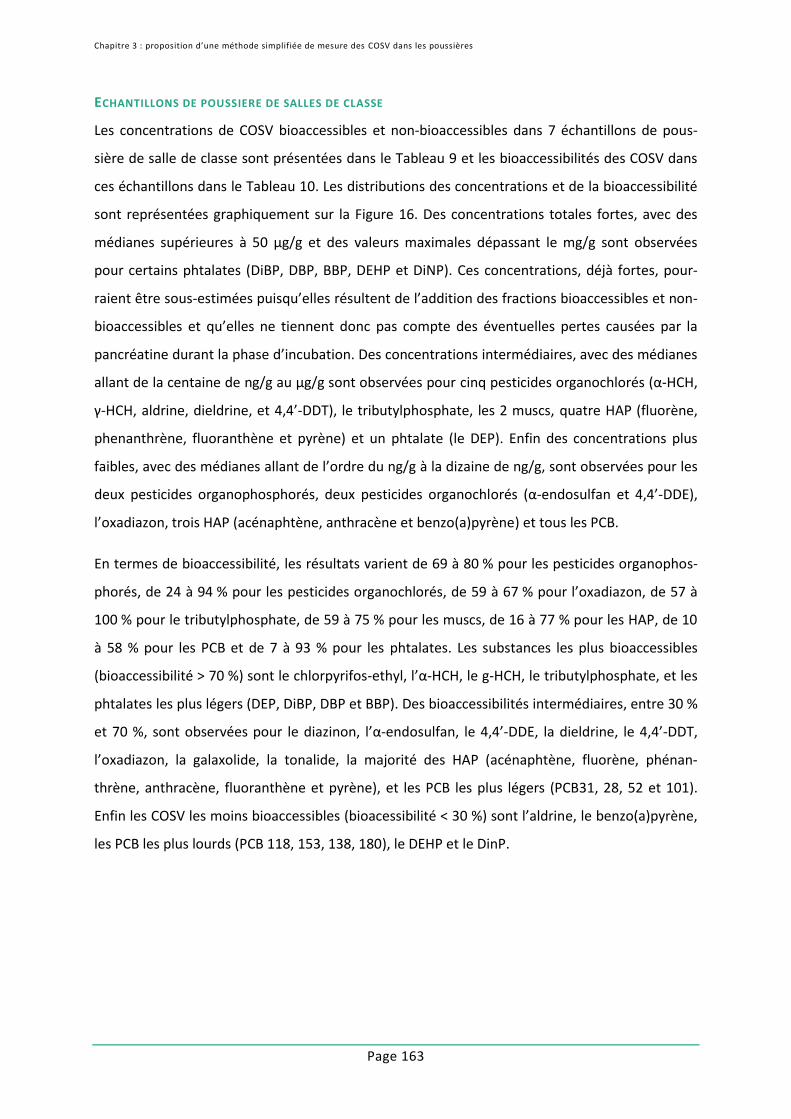
Chapitre 3 : proposition d’une méthode simplifiée de mesure des COSV dans les poussières
Page 163
ECHANTILLONS DE POUSSIERE DE SALLES DE CLASSE
Les concentrations de COSV bioaccessibles et non-bioaccessibles dans 7 échantillons de pous-
sière de salle de classe sont présentées dans le Tableau 9 et les bioaccessibilités des COSV dans
ces échantillons dans le Tableau 10. Les distributions des concentrations et de la bioaccessibilité
sont représentées graphiquement sur la Figure 16. Des concentrations totales fortes, avec des
médianes supérieures à 50 µg/g et des valeurs maximales dépassant le mg/g sont observées
pour certains phtalates (DiBP, DBP, BBP, DEHP et DiNP). Ces concentrations, déjà fortes, pour-
raient être sous-estimées puisqu’elles résultent de l’addition des fractions bioaccessibles et non-
bioaccessibles et qu’elles ne tiennent donc pas compte des éventuelles pertes causées par la
pancréatine durant la phase d’incubation. Des concentrations intermédiaires, avec des médianes
allant de la centaine de ng/g au µg/g sont observées pour cinq pesticides organochlorés (α-HCH,
γ-HCH, aldrine, dieldrine, et 4,4’-DDT), le tributylphosphate, les 2 muscs, quatre HAP (fluorène,
phenanthrène, fluoranthène et pyrène) et un phtalate (le DEP). Enfin des concentrations plus
faibles, avec des médianes allant de l’ordre du ng/g à la dizaine de ng/g, sont observées pour les
deux pesticides organophosphorés, deux pesticides organochlorés (α-endosulfan et 4,4’-DDE),
l’oxadiazon, trois HAP (acénaphtène, anthracène et benzo(a)pyrène) et tous les PCB.
En termes de bioaccessibilité, les résultats varient de 69 à 80 % pour les pesticides organophos-
phorés, de 24 à 94 % pour les pesticides organochlorés, de 59 à 67 % pour l’oxadiazon, de 57 à
100 % pour le tributylphosphate, de 59 à 75 % pour les muscs, de 16 à 77 % pour les HAP, de 10
à 58 % pour les PCB et de 7 à 93 % pour les phtalates. Les substances les plus bioaccessibles
(bioaccessibilité > 70 %) sont le chlorpyrifos-ethyl, l’α-HCH, le g-HCH, le tributylphosphate, et les
phtalates les plus légers (DEP, DiBP, DBP et BBP). Des bioaccessibilités intermédiaires, entre 30 %
et 70 %, sont observées pour le diazinon, l’α-endosulfan, le 4,4’-DDE, la dieldrine, le 4,4’-DDT,
l’oxadiazon, la galaxolide, la tonalide, la majorité des HAP (acénaphtène, fluorène, phénan-
thrène, anthracène, fluoranthène et pyrène), et les PCB les plus légers (PCB31, 28, 52 et 101).
Enfin les COSV les moins bioaccessibles (bioacessibilité < 30 %) sont l’aldrine, le benzo(a)pyrène,
les PCB les plus lourds (PCB 118, 153, 138, 180), le DEHP et le DinP.

Chapitre 3 : proposition d’une méthode simplifiée de mesure des COSV dans les poussières
Page 164
TABLEAU 9 : CONCENTRATIONS EN COSV BIOACCESSIBLES ET NON-BIOACCESSIBLES DANS 7 ECHANTILLONS DE POUSSIERES D’ECOLE (FRANCE, 2013-2017)
Substance LD LQ nEch-24X
030918
Ech-25X
030918
Ech-26X
030918
Ech-27X
030918
Ech-28X
030918
Ech-29X
030918
Ech-30X
030918
Ech-24D
060918
Ech-25D
060918
Ech-26D
060918
Ech-27D
060918
Ech-28D
060918
Ech-29D
060918
Ech-30D
060918
Diazinon 12.5 1 16 7
Chlorpyrifos-ethyl 5 12.5 1 17 4
a-HCH 2 5 1 1 070 111
g-HCH 5 12.5 6 145 16 75 96 14 947 111 9 4 13 8 92 11
Aldrin 5 12.5 1 34 109
Alpha-endosulfan 5 12.5 4 66 16 29 52 32 16 20 26
4,4'-DDE 2 5 4 2 2 3 7 5 5 6 15
Dieldrin 5 12.5 3 44 64 183 37 70 172
4,4'-DDT 5 12.5 1 32 70
Oxadiazon 5 12.5 4 18 16 15 18 9 8 10 13
Tributylphosphate 62.5 187.5 4 201 301 434 608 151 202 49
Galaxolide 25 62.5 7 1 360 2 360 2 600 2 570 1 090 978 3 000 490 1 020 1 620 1 060 369 508 1 550
Tonalide 25 62.5 7 239 1 140 606 470 197 126 515 105 598 423 212 72 58 255
Acenaphtene 5 12.5 6 17 14 19 19 18 23 58 47 44 19 20 14
Fluorene 5 12.5 7 34 93 80 91 69 64 85 42 443 415 369 148 136 93
Phenanthrene 12.5 25 7 94 190 287 328 212 193 285 28 223 137 146 111 119 102
Anthracene 12.5 25 5 14 16 47 7 26 45 28 32 28 22
Fluoranthene 5 12.5 7 35 106 183 179 81 63 121 19 120 125 104 94 82 70
Pyrene 5 12.5 7 67 145 260 257 101 82 174 36 137 179 134 102 101 107
Benzo(a)pyrene 5 12.5 6 14 11 17 12 6 14 60 36 43 52 28 32
PCB31 2 5 1 8 5
PCB28 2 5 1 6 4
PCB52 2 5 3 6 7 6 9 8 9
PCB101 2 5 5 7 10 3 2 4 19 23 8 5 6
PCB118 2 5 3 5 5 4 13 13 10
PCB153 2 5 3 7 10 1 36 41 7
PCB105 2 5 0
PCB138 2 5 3 8 9 3 30 36 11
PCB180 2 5 2 2 4 14 30
DEP 1000 2500 2 1 780 5 940 6 840 4 890 2 850 2 780 5 200 646 518
DiBP 200 1000 7 111 000 330 000 264 000 109 000 124 000 129 000 64 200 12 900 80 800 98 200 24 400 23 900 47 400 11 000
DBP 200 1000 7 6 600 56 700 447 000 366 000 43 700 51 500 26 700 1 330 17 500 139 000 77 000 8 610 14 600 4 740
BBP 200 1000 7 24 100 99 800 1 100 000 994 000 20 000 103 000 640 000 4 250 37 600 592 000 416 000 4 090 32 000 227 000
DEHP 200 1000 7 385 000 211 000 59 900 55 000 73 800 82 900 36 100 825 000 1 470 000 463 000 426 000 784 000 629 000 239 000
DiNP 200 1000 7 449 000 31 300 38 500 33 700 157 000 145 000 24 900 1 030 000 259 000 294 000 298 000 2 140 000 1 180 000 220 000
Concentrations bioaccessibles Concentrations non-bioaccessibles

Chapitre 3 : proposition d’une méthode simplifiée de mesure des COSV dans les poussières
Page 165
TABLEAU 10 : BIOACCESSIBILITE DES COSV DANS 7 ECHANTILLONS DE POUSSIERES D’ECOLE (FRANCE, 2013-2017)
Famille Chimique Substance LD LQ n Ech 24 Ech 25 Ech 26 Ech 27 Ech 28 Ech 29 Ech 30
Diazinon 12.5 1 69%
Chlorpyrifos-ethyl 5 12.5 1 80%
a-HCH 2 5 1 91%
g-HCH 5 12.5 6 94% 80% 85% 92% 91% 91%
Aldrin 5 12.5 1 24%
Alpha-endosulfan 5 12.5 4 67% 49% 60% 67%
4,4'-DDE 2 5 4 24% 28% 31% 31%
Dieldrin 5 12.5 3 55% 48% 51%
4,4'-DDT 5 12.5 1 31%
Oxadiazolone Oxadiazon 5 12.5 4 66% 67% 60% 59%
Retardateur de
flamme
organophosphoré
Tributylphosphate 62.5 187.5 4 57% 60% 100% 93%
Galaxolide 25 62.5 7 73% 70% 62% 71% 75% 66% 66%
Tonalide 25 62.5 7 69% 66% 59% 69% 73% 69% 67%
Acenaphtene 5 12.5 6 22% 22% 30% 49% 47% 61%
Fluorene 5 12.5 7 44% 17% 16% 20% 32% 32% 48%
Phenanthrene 12.5 25 7 77% 46% 68% 69% 66% 62% 74%
Anthracene 12.5 25 5 24% 36% 60% 20% 54%
Fluoranthene 5 12.5 7 65% 47% 59% 63% 46% 44% 63%
Pyrene 5 12.5 7 65% 51% 59% 66% 50% 45% 62%
Benzo(a)pyrene 5 12.5 6 18% 24% 28% 19% 18% 30%
PCB31 2 5 1 58%
PCB28 2 5 1 58%
PCB52 2 5 3 40% 46% 38%
PCB101 2 5 5 28% 30% 30% 27% 35%
PCB118 2 5 3 29% 29% 30%
PCB153 2 5 3 16% 19% 15%
PCB105 2 5 0
PCB138 2 5 3 20% 21% 20%
PCB180 2 5 2 10% 12%
DEP 1000 2500 2 90% 93%
DiBP 200 1000 7 90% 80% 73% 82% 84% 73% 85%
DBP 200 1000 7 83% 76% 76% 83% 84% 78% 85%
BBP 200 1000 7 85% 73% 65% 70% 83% 76% 74%
DEHP 200 1000 7 32% 13% 11% 11% 9% 12% 13%
DiNP 200 1000 7 30% 11% 12% 10% 7% 11% 10%
Phthalate
PCB
Pesticide
organophosphoré
Pesticide
organochloré
Musc
HAP

Chapitre 3 : proposition d’une méthode sim
plifiée de mesure des C
OSV
da
ns le
s po
ussiè
res
Page
16
6
Diazinon (n=1)
Chlorpyrifos-ethyl (n=1)
a-HCH (n=1)
g-HCH (n=6)
Aldrin (n=1)
Alpha-endosulfan (n=4)
44'-DDE (n=4)
Dieldrin (n=3)
44'-DDT (n=1)
Oxadiazon (n=4)
Tributylphosphate (n=4)
Galaxolide (n=7)
Tonalide (n=7)
Acenaphtene (n=6)
Fluorene (n=7)
Phenanthrene (n=7)
Anthracene (n=5)
Fluoranthene (n=7)
Pyrene (n=7)
Benzo(a)pyrene (n=6)
PCB31 (n=1)
PCB28 (n=1)
PCB52 (n=3)
PCB101 (n=5)
PCB118 (n=3)
PCB153 (n=3)
PCB105 (n=0)
PCB138 (n=3)
PCB180 (n=2)
DEP (n=2)
DiBP (n=7)
DBP (n=7)
BBP (n=7)
DEHP (n=7)
DiNP (n=7)
0
10
20
30
40
50
1 0
00
2 0
00
3 0
00
500 0
00
1 0
00 0
00
1 5
00 0
00
2 0
00 0
00
Bio
acce
ssib
le c
once
ntra
tion
(ng/g
)
Tota
l concentra
tion (n
g/g
)
Concentration (ng/g)
Diazinon (n=1)
Chlorpyrifos-ethyl (n=1)
a-HCH (n=1)
g-HCH (n=6)
Aldrin (n=1)
Alpha-endosulfan (n=4)
44'-DDE (n=4)
Dieldrin (n=3)
44'-DDT (n=1)
Oxadiazon (n=4)
Tributylphosphate (n=4)
Galaxolide (n=7)
Tonalide (n=7)
Acenaphtene (n=6)
Fluorene (n=7)
Phenanthrene (n=7)
Anthracene (n=5)
Fluoranthene (n=7)
Pyrene (n=7)
Benzo(a)pyrene (n=6)
PCB31 (n=1)
PCB28 (n=1)
PCB52 (n=3)
PCB101 (n=5)
PCB118 (n=3)
PCB153 (n=3)
PCB105 (n=0)
PCB138 (n=3)
PCB180 (n=2)
DEP (n=2)
DiBP (n=7)
DBP (n=7)
BBP (n=7)
DEHP (n=7)
DiNP (n=7)
0
20
40
60
80
100
Bioaccessibility (%)
FIGU
RE 1
6 : C
ON
CEN
TR
AT
ION
S TO
TA
LE ET
BIO
AC
CESSIB
LE, E
T B
IOA
CC
ESSIBILIT
E DES C
OSV
DA
NS 7
ECH
AN
TILLO
NS D
E
POU
SSIERES D’ECOLE (FR
AN
CE 2
01
3-2
01
7)

Chapitre 3 : proposition d’une méthode simplifiée de mesure des COSV dans les poussières
Page 167
Pour les substances détectées dans plus de trois échantillons différents, les plus faibles varia-
tions inter-échantillons (écart-type < 10 %) sont atteintes pour les pesticides organochlorés,
l’oxadiazon, les muscs, trois HAP (le fluoranthène, le pyrène et le benzo(a)pyrène) et les phta-
lates. Des variations inter-échantillons plus importantes (écart-type > 10 %) sont atteintes pour
le tributylphosphate et quatre HAP (acénaphtène, fluorène, phénanthrène et anthracène). Si
cette tendance se confirmait, les implications seraient importantes, puisqu’au premier groupe
pourrait être attribuée une valeur de bioaccessibilité estimée et assortie d’une incertitude con-
nue, tandis que pour le second groupe, la mesure in vitro de la bioaccessibilité serait nécessaire.
La Figure 17 montre la relation entre le coefficient octanol-eau (KOW) des COSV et leur bioacces-
sibilité. Une corrélation est observée entre augmentation du KOW et baisse de la bioaccessibilité
(r²= 0.64). Si l’on ne considère que les PCB (Figure 18), alors cette corrélation est beaucoup plus
marquée (r² = 0.84). Ainsi pour les PCB, du fait de la faible variabilité inter échantillon et de cette
corrélation, un modèle de prédiction de leur bioaccessibilité peut être facilement envisagé.
4 6 80
20
40
60
80
100
DEP (n=2)
Alpha-endosulfan (n=4)
g-HCH (n=6)
Diazinon (n=1)
Tributylphosphate (n=3)
Acenaphtene (n=6)
Fluorene (n=7)
a-HCH (n=1)
DiBP (n=7)
Anthracene (n=5)
DBP (n=7)
Phenanthrene (n=7)
BBP (n=7)
Oxadiazon (n=4)
Dieldrin (n=3)
Fluoranthene (n=7)Pyrene (n=7)
Chlorpyrifos-ethyl (n=1)
Galaxolide (n=7)Tonalide (n=7)
PCB31 (n=1)PCB28 (n=1)
Aldrin (n=1)
44'-DDE (n=4)
PCB52 (n=3)
Benzo(a)pyrene (n=6)
PCB101 (n=5)PCB118 (n=3)44'-DDT (n=1)
PCB138 (n=3)
PCB153 (n=3)
DEHP (n=7)PCB180 (n=2) DiNP (n=7)
r² 0.6401
KOW
Bio
accessib
ilité
(%
)
FIGURE 17 : RELATION ENTRE BIOACCESSIBILITE ET KOW DES COSV DE 7 ECHANTILLONS DE POUSSIERES D'ECOLE (FRANCE, 2013-
2017)

Chapitre 3 : proposition d’une méthode simplifiée de mesure des COSV dans les poussières
Page 168
6 7 80
20
40
60PCB31 (n=1)PCB28 (n=1)
PCB52 (n=3)
PCB101 (n=5)PCB118 (n=3)
PCB138 (n=3)
PCB153 (n=3)
PCB180 (n=2)
r² 0.8473
KOW
Bio
accessib
ilité
(%
)
FIGURE 18 : RELATION ENTRE BIOACCESSIBILITE ET KOW DES PCB DE 7 ECHANTILLONS DE POUSSIERES D'ECOLE (FRANCE 2013-
2017)
Pour quatre HAP, des données de bioaccessibilité ont été produites très récemment par Kang et
al. [106] pour 8 échantillons de poussière en utilisant une méthode de mesure intégrant diffé-
rents types d’adsorbants, dont le Tenax®-TA. Les auteurs ont également documenté la biodispo-
nibilité des COSV pour ces huit mêmes échantillons, obtenus à partir d’une étude in vivo chez la
souris. Ces résultats ont été comparés aux résultats obtenus sur les 7 échantillons dans le Ta-
bleau 11.
TABLEAU 11 : COMPARAISON DE LA BIOACESSIBILITE DES HAP AVEC LES DONNEES DE LA LITERATURE
Cette étude
(bioaccessibilité) Kang et al. [92]
(bioaccessibilité (Tenax-Ta)) Kang et al. [92]
(biodisponibilité)
Substance n min max n min max n min max
Phenanthrène 7 46% 77% 8 38% 69% 8 45% 91%
Fluoranthène 7 44% 65% 8 30% 68% 8 19% 72%
Pyrene 7 45% 66% 8 40% 63% 8 15% 56%
Benzo(a)pyrène 6 18% 30% 8 40% 82% 8 32% 75%

Chapitre 3 : proposition d’une méthode simplifiée de mesure des COSV dans les poussières
Page 169
Les résultats de bioaccessibilité obtenus sont très comparables avec ceux de cette étude pour le
phénanthrène, le fluoranthène et le pyrène, mais ils sont supérieurs pour le benzo(a)pyrène. De
même, si l’on s’intéresse aux résultats de biodisponibilité, ils sont comparables bien que légère-
ment plus dispersés pour les trois premiers HAP, et supérieurs pour le benzo(a)pyrène. La mé-
thode de bioaccessibilité semble donc adaptée pour certains phtalates, mais reste toutefois à va-
lider pour le benzo(a)pyrène, qui est le HAP le plus hydrophobe de la liste investiguée.
En ce qui concerne les phtalates, des travaux ont été menés en Allemagne par Veronika Plichta,
dans le cadre de son doctorat encadré par Pr. Hermann Fromme. Ces travaux ont permis de do-
cumenter la biodisponibilité de quatre phtalates, à partir d’une étude basée sur l’analyse des
taux d’excrétion urinaire de cochons ayant ingéré 5 échantillons de poussières différents [107].
Les résultats sont présentés dans le Tableau 12 et permettent de distinguer deux cas de figure :
pour le DBP et le BBP, la bioaccessibilité mesurée à l’aide de la méthode simplifiée produit des
résultats supérieurs à la biodisponibilité, tandis que pour le DEHP et le DiNP, la biodisponibilité
des phtalates est plus forte que la bioaccessibilité mesurée avec la méthode simplifiée. Ces ré-
sultats sont obtenus pour des échantillons de poussières distincts, mais cela ne suffit pas à expli-
quer une telle disparité, du moins pour le DEHP. En effet, l’une des conclusions des travaux de
Veronika Plichta porte sur la faible variabilité inter-échantillons de la biodisponibilité du DEHP.
Une valeur supérieure à 40 % est donc attendue pour la bioaccessibilité des phtalates sur les
poussières de cette étude.
TABLEAU 12 : COMPARAISON ENTRE BIOACCESSIBILITE ET BIODISPONIBILITE DE QUATRE PHTALATES.
Cette étude (bioacessibilité) Plichta [107] (biodisponibili-
té)
Substance n min max n min max
DBP 7 76% 85% 5 39% 69%
BBP 7 65% 85% 7 9% 54%
DEHP 7 9% 32% 7 39% 45%
DiNP 7 7% 30% 7 23% 75%
CONCLUSION SUR LA METHODE
Ce chapitre a décrit le développement d’une méthode de mesure simplifiée de la bioaccessibilité
des COSV dans les poussières, et a montré l’intérêt d’une telle méthode pour des applications
sur de grands nombres d’échantillons. Les résultats obtenus sont cohérents avec des résultats de
bioaccessibilité produits par des méthodes de référence pour plusieurs familles de COSV dont les

Chapitre 3 : proposition d’une méthode simplifiée de mesure des COSV dans les poussières
Page 170
PBDE, les pyréthrinoïdes et les HAP (à l’exception du benzo(a)pyrène). Par rapport aux données
de biodisponibilité existantes, les bioaccessibilités résultantes de la méthode simplifiée sont glo-
balement comparables pour les PBDE et les HAP (toujours à l’exception du benzo(a)pyrène).
Elles sont en revanche surestimées pour deux phtalates (le DBP et le BBP) et sous estimées pour
les deux phtalates les plus lourds (DEHP et DiNP), ainsi que pour le benzo(a)pyrène. Ces résultats
demandent à être confirmés dans un premier temps sur les 23 échantillons non retraités. Ce-
pendant, alors qu’il est attendu que la bioaccessibilité soit supérieure à la biodisponibilité,
l’inverse est inconcevable et une évolution de la méthode sera certainement nécessaire pour ces
substances. La documentation de la bioaccessibilité orale des COSV est également nécessaire
pour un plus grand nombre d’échantillons afin de voir si se confirment les tendances observées
pour certaines substances comme les PCB, dont les bioaccessibilités, peu variables d’un échantil-
lon à l’autre pourraient être estimées sans besoin de mesure.

Page 171
CONCLUSION ET PERSPECTIVES
Ces travaux de thèse avaient pour objectif de mettre au point une méthode simplifiée permet-
tant de mesurer la bioaccessibilité des COSV dans les poussières afin d’évaluer plus finement
l’exposition humaine aux COSV en environnement intérieur par ingestion de poussière. Une telle
méthode a été développée, qui a pu être validée en partie pour certaines familles de COSV et qui
demande à être améliorée pour d’autres. Dans tous les cas les éléments permettant la validation
de cette méthode sont perfectibles, ce qui ouvre des perspectives pour la suite de ce travail de
thèse. De plus, ce projet de thèse s’intéressait au volet « ingestion de poussière » de l’exposition
humaine aux COSV, laissant les volets « inhalation » et « contact cutané » à explorer. Ces diffé-
rentes perspectives sont détaillées dans cette partie finale du manuscrit.
1. ACQUISITION DE DONNEES COMPLEMENTAIRES SUR LA BIOACCESSIBILITE DES COSV
Dans le cadre de ce manuscrit, la bioaccessibilité a été documentée pour 30 échantillons pour les
PBDE et les pyréthrinoïdes, mais seulement pour 7 échantillons pour les autres familles de COSV.
Pour les 23 échantillons complémentaires, les acquisitions GC/MS/MS ont été réalisées et les
données brutes sont disponibles. Leur retraitement permettra de documenter davantage la
bioaccessibilité de ces COSV et en particulier leur dispersion selon les échantillons.
2. EVOLUTION DE LA METHODE SIMPLIFIEE
A l’heure actuelle, la méthode simplifiée n’est pas satisfaisante pour documenter la bioaccessibi-
lité des phtalates, en particulier du DiNP et du DEHP. Non seulement ces substances sont retrou-
vées en environnement intérieur avec les concentrations les plus fortes (jusqu’à 2 mg/g dans ce
projet) mais c’est également la voie d’exposition la plus importante [35]. Il est donc crucial
d’estimer correctement la bioaccessibilité orale de ces substances. L’évolution de la méthode
simplifiée est possible en jouant sur l’ajustement d’un ou plusieurs paramètres, dont la prise
d’essai de la poussière, la masse ou la nature de l’adsorbant présent dans l’insert, la durée
d’incubation, et les concentrations de bile et de pancréatine dans le milieu intestinal. Sachant
que les phtalates sont au minimum 20 fois plus concentrés que la plupart des autres substances,

Conclusion et perspectives
Page 172
l’optimisation du premier curseur (taille de la prise d’essai) sera à privilégier dans un premier
temps.
3. VALIDATION IN VIVO DES DONNEES
Bien que l’avantage des méthodes d’évaluation de bioaccessibilité provienne du fait qu’elles uti-
lisent des outils in vitro plutôt qu’in vivo, elles ne peuvent s’affranchir d’une étape finale de vali-
dation. Des études in vivo sont alors nécessaires pour documenter la biodisponibilité des subs-
tances d’intérêt, qui sera ensuite utilisée comme valeur de référence pour valider la méthode
in vitro.
A ce jour, il n’existe que très peu de données documentant la biodisponibilité des COSV dans la
poussière. Concernant la liste des COSV d’intérêt pour ce projet, il n’existe à ma connaissance
que les 3 études décrites dans le Chapitre 3 de ce mémoire :
- L’étude de Huwe et al. sur la biodisponibilité des PBDE dans le SRM 2585 mesurée chez le rat
[100], qui a été utilisée pour le présent projet ainsi qu’il est décrit dans l’Article Scientifique
n°3 ;
- L’étude de Veronika Plichta sur la biodisponibilité des phtalates dans 5 poussières différentes
mesurée chez le cochon [107]. Ces 5 échantillons de poussières sont disponibles au Léres
dans le cadre d’un accord avec Veronika Plichta et Hermann Fromme de l’Autorité bavaroise
de la santé et de la sécurité alimentaire (Bayerisches Landesamt für Gesundheit und Lebens-
mittelsicherheit) en Allemagne. Ils seront utilisés pour valider la méthode simplifiée sur les
phtalates, une fois qu’elle sera opérationnelle après son évolution.
- L’étude de Kang et al. sur la biodisponibilité des HAP dans 8 poussières différentes mesurées
chez la souris [106], qui ne sont à l’heure actuelle pas disponibles au Léres.
De nouvelles études sont donc nécessaires pour compléter ces données de validation et couvrir
l’ensemble des COSV d’intérêt.
Pour investiguer la biodisponibilité orale d’une substance, plusieurs étapes préalables seront né-
cessaires :
- Identification des COSV prioritaires, c’est-à-dire ceux pour lesquels l’ingestion est une voie
importante d’exposition ;

Conclusion et perspectives
Page 173
- Identification de l’espèce animale la plus pertinente : bien que les rats soient plus souvent
considérés pour les mesures in vivo, les porcs sont recommandés parce que leur système di-
gestif est comparable à celui des humains en termes anatomiques et physiologiques [108].
Cependant les quantités de poussières contaminées nécessaires pour que la concentration
des biomarqueurs soit mesurable dans les tissus peut constituer un frein à l’utilisation des
porcs ;
- Identifications des biomarqueurs biologiques et de leur localisation chez l’animal (sang, foie,
tissus adipeux, etc.), grâce à des recherches bibliographiques sur le métabolisme des subs-
tances d’intérêt. L’étude de Mi et al. qui s’intéresse à l’absorption, à la distribution dans les
tissus, au métabolisme et à l’élimination du BDE 209 chez les rats [109] est un modèle, mais
la métabolomique peut également être mise à contribution, comme le décrivent Gao et al.
concernant l’exposition humaine aux HAP [110] ;
- Constitution de stocks de plusieurs échantillons de poussières aux caractéristiques physico-
chimiques variées permettant de couvrir la plus grande diversité de types de poussière pos-
sible ;
- Définition d’un plan d’expérience respectueux des 3 R (Replacement, Reduction, Refine-
ment).
Ces étapes constituent ainsi les composantes d’une des principales perspectives de ce projet de
thèse.
4. PERSPECTIVES SUR L’INHALATION
Le paragraphe 3 du 1er Chapitre de ce manuscrit (page 67) présentait les différentes voies
d’exposition humaine aux COSV en environnement intérieur. Pour l’inhalation comme pour
l’ingestion, les notions de bioaccessibilité et de biodisponibilité sont à considérer. Un travail bi-
bliographique a déjà été réalisé sur ce sujet dans le cadre d’une collaboration entre le CSTB,
l’EHESP et l’institut suédois Swetox (Swedisk Toxicology Research Center), qui a donné lieu à un
article de revue publié dans le journal Environment International, dont le titre est « Bioaccessibi-
lity and bioavailability of environmental semi-volatile organic compounds via inhalation: A review
of methods and models ». Cet article est disponible dans la partie « Valorisation Scientifique » de
ce manuscrit. Il aborde la bioaccessibilité et la biodisponibilité des COSV sous les angles de
l’expérimentation et de la modélisation et met en évidence deux grands défis : le développe-

Conclusion et perspectives
Page 174
ment et la validation des méthodes in vitro et in vivo pour un large éventail de COSV, et des ap-
proches de modélisation qui doivent tenir compte de l'ensemble du système respiratoire et de la
variabilité biologique humaine [86].
Comme pour la bioaccessibilité orale, la bioaccessibilité pulmonaire s’arrête à la membrane. Ce-
pendant, et en parallèle avec l’utilisation des cellules Caco-2 pour l’ingestion, des approches bio-
logiques utilisant des cultures de cellules hAECN (human Airway Epithelial Cells of Nasal origin)
ont été documentées pour évaluer l’exposition à des polluants gazeux à l’interface air-liquide,
qui pourraient faire le lien entre les études in vitro et in vivo [111]. Ici encore de plus nom-
breuses études sont toutefois nécessaires pour mieux cerner cette approche.
5. PERSPECTIVES SUR LE CONTACT CUTANE
La troisième voie d’exposition est le contact cutané. L’intérêt pour cette voie n’est que récent,
comme expliqué au Chapitre 1 (page 68), mais l’exposition cutanée est moins négligeable qu’on
ne le supposait a priori [112]. La bioaccessibilité cutanée des COSV dans les particules adhérant à
la peau n’a été que très étudiée. Néanmoins deux revues de la littérature ont été réalisées, l’une
par Abdallah et al. sur l’absorption cutanée des retardateurs de flamme [113], l’autre par Beriro
et al. sur la biodisponibilité in vitro des HAP dans le sol [93]. Les connaissances de la barrière cu-
tanée acquises dans le domaine de la recherche pharmaceutique et cosmétique sont mises à
profit, et des modèles équivalents à la peau humaine (HSE, Human Skin Equivalent model) sont
notamment utilisés pour mesurer la biodisponibilité des substances [113]. Enfin Beriro et al. sou-
lignent la complémentarité des études in vitro avec des approches in vivo et in silico [93].


Page 177
REFERENCES
[1] U.S. EPA., Update for Chapter 5 of the Exposure Factors Handbook, in: Expo. Factors Handb. 2011 Ed., 2018.
[2] J.M. Macher, Review of methods to collect settled dust and isolate culturable microorganisms., Indoor Air. 11 (2001) 99–110. doi:10.1034/j.1600-0668.2001.110204.x.
[3] F. Gyntelberg, P. Suadicani, J.W. Nielsen, P. Skov, O. Valbjorn, P.A. Nielsen, T. Schneider, O. Jorgensen, P. Wolkoff, C.K. Wilkins, S. Gravesen, S. Norn, Dust and the Sick Building Syndrome, Indoor Air-International J. Indoor Air Qual. Clim. 4 (1994) 223–238. doi:DOI 10.1111/j.1600-0668.1994.00003.x.
[4] C. Weschler, S. Langer, A. Fischer, G. Bekö, J. Toftum, G. Clausen, Squalene and cholesterol in dust from danish homes and daycare centers, Environ. Sci. Technol. 45 (2011) 3872–3879. doi:10.1021/es103894r.
[5] R. Dris, J. Gasperi, C. Mirande, C. Mandin, M. Guerrouache, V. Langlois, B. Tassin, A first overview of textile fibers, including microplastics, in indoor and outdoor environments, Environ. Pollut. (2016) 1–6. doi:10.1016/j.envpol.2016.12.013.
[6] Y. Zhang, J.J. Pignatello, S. Tao, B. Xing, Bioaccessibility of PAHs in Fuel Soot Assessed by an in Vitro Digestive Model with Absorptive Sink: Effect of Food Ingestion, Environ. Sci. Technol. 49 (2015) 14641–14648. doi:10.1021/acs.est.5b04342.
[7] Y. Yang, L. Liu, Y. Xiong, G. Zhang, H. Wen, J. Lei, L. Guo, Y. Lyu, A comparative study on physicochemical characteristics of household dust from a metropolitan city and a remote village in China, Atmos. Pollut. Res. 7 (2016) 1090–1100. doi:10.1016/j.apr.2016.06.009.
[8] W. Butte, B. Heinzow, Pollutants in house dust as indicators of indoor contamination. In Reviews of Environmental Contamination and Toxicology, in: Rev. Environ. Contam. Toxicol. Ware G. W., Ed. , Ed.; 2002, 2002: pp. 1–46.
[9] P. Glorennec, J.-P. Lucas, C. Mandin, B. Le Bot, French children’s exposure to metals via ingestion of indoor dust, outdoor playground dust and soil: Contamination data, Environ. Int. 45 (2012) 129–134. doi:10.1016/j.envint.2012.04.010.
[10] L. Morawska, T. Salthammer, Fundamentals of Indoor Particles and Settled Dust, in: Indoor Environ. Airborne Part. Settled Dust, 2003: pp. 3–47. doi:10.1016/S0074-6142(05)80002-6.
[11] Å. Gustafsson, A.M. Krais, A. Gorzas, Å. Bergman, P. Gerde, Physical and chemical characterization of respirable fractions from residential household dust in Sweden, Submitt. to Environ. Res. (2017) Sept1.
[12] F. Mercier, P. Glorennec, O. Thomas, B. Le Bot, Organic contamination of settled

Page 178
house dust, a review for exposure assessment purposes, Environ. Sci. Technol. 45 (2011) 6716–6727. doi:10.1021/es200925h.
[13] ISO 16000-6, Indoor air -- Part 6: Determination of volatile organic compounds in indoor and test chamber air by active sampling on Tenax TA sorbent, thermal desorption and gas chromatography using MS or MS-FID, (2011).
[14] C. Weschler, W.W. Nazaroff, Semivolatile organic compounds in indoor environments, Atmos. Environ. 42 (2008) 9018–9040. doi:10.1016/j.atmosenv.2008.09.052.
[15] U.T. Võ, M.P. Morris, Nonvolatile, semivolatile, or volatile: Redefining volatile for volatile organic compounds, J. Air Waste Manage. Assoc. 64 (2014) 661–669. doi:10.1080/10962247.2013.873746.
[16] L. Lucattini, G. Poma, A. Covaci, J. de Boer, M. Lamoree, P. Leonards, A review of semi-volatile organic compounds (SVOCs) in the indoor environment: occurrence in consumer products, indoor air and dust, Chemosphere. 201 (2018) 466–482. doi:10.1016/j.chemosphere.2018.02.161.
[17] R.A. Rudel, L.J. Perovich, Endocrine disrupting chemicals in indoor and outdoor air, Atmos. Environ. 43 (2009) 170–181. doi:10.1016/j.atmosenv.2008.09.025.
[18] N. Bonvallot, C. Mandin, F. Mercier, B. Le Bot, P. Glorennec, Health ranking of ingested semi-volatile organic compounds in house dust: an application to France, Indoor Air. 20 (2010) 458–472. doi:10.1111/j.1600-0668.2010.00667.x.
[19] I. Katsikantami, S. Sifakis, M.N. Tzatzarakis, E. Vakonaki, O.I. Kalantzi, A.M. Tsatsakis, A.K. Rizos, A global assessment of phthalates burden and related links to health effects, Environ. Int. 97 (2016) 212–236. doi:10.1016/j.envint.2016.09.013.
[20] Y. Ma, S. Harrad, Spatiotemporal analysis and human exposure assessment on polycyclic aromatic hydrocarbons in indoor air, settled house dust, and diet: A review, Environ. Int. 84 (2015) 7–16. doi:10.1016/j.envint.2015.07.006.
[21] M.R. Cave, J. Wragg, D.J. Beriro, C. Vane, R. Thomas, M. Riding, C. Taylor, An overview of research and development themes in the measurement and occurrences of polyaromatic hydrocarbons in dusts and particulates, J. Hazard. Mater. 360 (2018) 373–390. doi:10.1016/j.jhazmat.2018.08.038.
[22] K.H. Kim, S.A. Jahan, E. Kabir, R.J.C. Brown, A review of airborne polycyclic aromatic hydrocarbons (PAHs) and their human health effects, Environ. Int. 60 (2013) 71–80. doi:10.1016/j.envint.2013.07.019.
[23] G. Chatel, E. Naffrechoux, M. Draye, Avoid the PCB mistakes: A more sustainable future for ionic liquids, J. Hazard. Mater. 324 (2017) 773–780. doi:10.1016/j.jhazmat.2016.11.060.
[24] M.R. Bell, Endocrine-disrupting actions of PCBs on brain development and social and reproductive behaviors, Curr. Opin. Pharmacol. 19 (2014) 134–144. doi:10.1016/j.coph.2014.09.020.
[25] M. Yao, T. Hu, Y. Wang, Y. Du, C. Hu, R. Wu, Polychlorinated biphenyls and its
Page 179
potential role in endometriosis, Environ. Pollut. 229 (2017) 837–845. doi:10.1016/j.envpol.2017.06.088.
[26] V. Abella, T. Pérez, M. Scotece, J. Conde, C. Pirozzi, J. Pino, F. Lago, M.Á. González-gay, A. Mera, R. Gómez, O. Gualillo, Pollutants make rheumatic diseases worse : Facts on polychlorinated biphenyls ( PCBs ) exposure and rheumatic diseases, Life Sci. 157 (2016) 140–144. doi:10.1016/j.lfs.2016.06.010.
[27] C. Weschler, Changes in indoor pollutants since the 1950s, Atmos. Environ. 43 (2009) 153–169. doi:10.1016/j.atmosenv.2008.09.044.
[28] M.J. La Guardia, R.C. Hale, E. Harvey, Detailed polybrominated diphenyl ether (PBDE) congener composition of the widely used penta-, octa-, and deca-PBDE technical flame-retardant mixtures, Environ. Sci. Technol. 40 (2006) 6247–6254. doi:10.1021/es060630m.
[29] H.M. Stapleton, N.G. Dodder, Decabromodiphenyl Ether in House Dust By Natural Sunlight, Env. Toxicol Chem. 27 (2008) 306–12.
[30] W. Tang, D. Wang, J. Wang, Z. Wu, L. Li, M. Huang, S. Xu, D. Yan, Pyrethroid pesticide residues in the global environment: An overview, Chemosphere. 191 (2018) 990–1007. doi:10.1016/j.chemosphere.2017.10.115.
[31] E. Marettova, M. Maretta, J. Legáth, Effect of pyrethroids on female genital system. Review, Anim. Reprod. Sci. 184 (2017) 132–138. doi:10.1016/j.anireprosci.2017.07.007.
[32] A. Saillenfait, D. Ndiaye, J. Sabaté, Pyrethroids : Exposure and health effects – An update, Int. J. Hyg. Environ. Health. 218 (2015) 281–292.
[33] J. Spitzen, T. Koelewijn, W.R. Mukabana, W. Takken, Effect of insecticide-treated bed nets on house-entry by malaria mosquitoes: The flight response recorded in a semi-field study in Kenya, Acta Trop. 172 (2017) 180–185. doi:10.1016/j.actatropica.2017.05.008.
[34] C. Weschler, W.W. Nazaroff, SVOC partitioning between the gas phase and settled dust indoors, Atmos. Environ. 44 (2010) 3609–3620. doi:10.1016/j.atmosenv.2010.06.029.
[35] M. Pelletier, N. Bonvallot, O. Ramalho, C. Mandin, W. Wei, G. Raffy, F. Mercier, O. Blanchard, B. Le Bot, P. Glorennec, Indoor Residential Exposure to Semivolatile Organic Compounds in France, Environ. Int. 109 (2017) 81–88. doi:https://doi.org/10.1016/j.envint.2017.08.024.
[36] W. Wei, C. Mandin, O. Ramalho, Influence of indoor environmental factors on mass transfer parameters and concentrations of semi-volatile organic compounds, Chemosphere. 195 (2018) 223–235. doi:10.1016/j.chemosphere.2017.12.072.
[37] S. Benjamin, E. Masai, N. Kamimura, K. Takahashi, R.C. Anderson, P.A. Faisal, Phthalates impact human health: Epidemiological evidences and plausible mechanism of action, J. Hazard. Mater. (2017). doi:10.1016/j.jhazmat.2017.06.036.

Page 180
[38] C. Desdoits-Lethimonier, O. Albert, B. Le Bizec, E. Perdu, D. Zalko, F. Courant, L. Lesné, F. Guillé, N. Dejucq-Rainsford, B. Jégou, Human testis steroidogenesis is inhibited by phthalates, Hum. Reprod. 27 (2012) 1451–1459. doi:10.1093/humrep/des069.
[39] M. Giulivo, M. Lopez de Alda, E. Capri, D. Barceló, Human exposure to endocrine disrupting compounds: Their role in reproductive systems, metabolic syndrome and breast cancer. A review, Environ. Res. 151 (2016) 251–264. doi:10.1016/j.envres.2016.07.011.
[40] O. Albert, B. Jégou, A critical assessment of the endocrine susceptibility of the human testis to phthalates from fetal life to adulthood, Hum. Reprod. Update. 20 (2014) 231–249. doi:10.1093/humupd/dmt050.
[41] C. Park, W. Choi, M. Hwang, Y. Lee, S. Kim, S. Yu, I. Lee, D. Paek, K. Choi, Associations between urinary phthalate metabolites and bisphenol A levels, and serum thyroid hormones among the Korean adult population - Korean National Environmental Health Survey (KoNEHS) 2012–2014, Sci. Total Environ. (2017). doi:10.1016/j.scitotenv.2017.01.144.
[42] K.H. Wong, T.S. Durrani, Exposures to Endocrine Disrupting Chemicals in Consumer products - A Guide for Pediatricians, Curr. Probl. Pediatr. Adolesc. Health Care. (2017) 1–12. doi:10.1016/j.cppeds.2017.04.002.
[43] X. Li, Y. Gao, J. Wang, G. Ji, Y. Lu, D. Yang, H. Shen, Q. Dong, L. Pan, H. Xiao, B. Zhu, Exposure to environmental endocrine disruptors and human health, Public Heal. Emerg. 1 (2016) 47–47. doi:10.21037/phe.2016.11.01.
[44] M. Tsai, P. Kuo, Y. Ko, The association between phthalate exposure and asthma, (2012) 28–36. doi:10.1016/j.kjms.2012.05.007.
[45] G. Bekö, M. Callesen, C. Weschler, J. Toftum, S. Langer, T. Sigsgaard, A. Høst, T. Kold Jensen, G. Clausen, Phthalate exposure through different pathways and allergic sensitization in preschool children with asthma, allergic rhinoconjunctivitis and atopic dermatitis, Environ. Res. 137 (2015) 432–439. doi:10.1016/j.envres.2015.01.012.
[46] S.M. Engel, M.S. Wolff, Causal Inference Considerations for Endocrine Disruptor Research in Children’s Health, Annu. Rev. OfPublic Heal. 34 (2013) 139–159. doi:10.1146/annurev-publhealth-031811-124556.
[47] C. Chevrier, C. Warembourg, G. Le Maner-Idrissi, A. Lacroix, V. Dardier, S. Le Sourn-Bissaoui, F. Rouget, C. Monfort, E. Gaudreau, F. Mercier, N. Bonvallot, P. Glorennec, G. Muckle, B. Le Bot, S. Cordier, Childhood exposure to polybrominated diphenyl ethers and neurodevelopment at six years of age, Neurotoxicology. 54 (2016) 81–88. doi:10.1016/j.neuro.2016.03.002.
[48] A.M. Vuong, K. Yolton, K.L. Poston, C. Xie, G.M. Webster, A. Sjödin, J.M. Braun, K.N. Dietrich, B. Lanphear, A. Chen, Prenatal and postnatal polybrominated diphenyl ether (PBDE) exposure and measures of inattention and impulsivity in children, Neurotoxicol. Teratol. 64 (2017) 20–28. doi:10.1016/j.ntt.2017.09.001.
[49] A.M. Vuong, K. Yolton, C. Xie, G.M. Webster, A. Sjödin, J.M. Braun, K.N. Dietrich, B. Lanphear, A. Chen, Childhood polybrominated diphenyl ether (PBDE) exposure and

Page 181
neurobehavior in children at 8 years, Environ. Res. 158 (2017) 677–684. doi:10.1016/j.envres.2017.07.028.
[50] M.H. Jacobson, D.B. Barr, M. Marcus, A.B. Muir, R.H. Lyles, P.P. Howards, L. Pardo, L.A. Darrow, Serum polybrominated diphenyl ether concentrations and thyroid function in young children, Environ. Res. 149 (2016) 222–230. doi:10.1016/j.envres.2016.05.022.
[51] A.M. Vuong, J.M. Braun, G.M. Webster, R. Thomas Zoeller, A.N. Hoofnagle, A. Sjödin, K. Yolton, B. Lanphear, A. Chen, Polybrominated diphenyl ether (PBDE) exposures and thyroid hormones in children at age 3 years, Environ. Int. 117 (2018) 339–347. doi:10.1016/j.envint.2018.05.019.
[52] K.G. Harley, S.A. Rauch, J. Chevrier, K. Kogut, K.L. Parra, C. Trujillo, R.H. Lustig, L.C. Greenspan, A. Sj�din, A. Bradman, B. Eskenazi, Association of prenatal and childhood PBDE exposure with timing of puberty in boys and girls, Environ. Int. 100 (2017) 132–138. doi:10.1016/j.envint.2017.01.003.
[53] Y. jiang Yu, B. gui Lin, W. bo Liang, L. zhong Li, Y. de Hong, X. chao Chen, X. yu Xu, M. deng Xiang, S. Huang, Associations between PBDEs exposure from house dust and human semen quality at an e-waste areas in South China–A pilot study, Chemosphere. 198 (2018) 266–273. doi:10.1016/j.chemosphere.2018.01.150.
[54] A.J. Thatheyus, A.D. Gnana Selvam, Synthetic Pyrethroids: Toxicity and Biodegradation, Appl. Ecol. Environ. Sci. 1 (2013) 33–36. doi:10.12691/aees-1-3-2.
[55] M.A. Furlong, D.B. Barr, M.S. Wolff, S.M. Engel, Prenatal exposure to pyrethroid pesticides and childhood behavior and executive functioning, Neurotoxicology. 62 (2017) 231–238. doi:10.1016/j.neuro.2017.08.005.
[56] J.F. Viel, C. Warembourg, G. Le Maner-Idrissi, A. Lacroix, G. Limon, F. Rouget, C. Monfort, G. Durand, S. Cordier, C. Chevrier, Pyrethroid insecticide exposure and cognitive developmental disabilities in children: The PELAGIE mother-child cohort, Environ. Int. 82 (2015) 69–75. doi:10.1016/j.envint.2015.05.009.
[57] P. Glorennec, F. Mercier, O. Blanchard, N. Bonvallot, O. Ramalho, C. Mandin, B. Le Bot, Cumulative indoor exposures to Semi-Volatile Organic Compounds (SVOCs) in France: the ECOS project, in: Indoor Air Conf., 2011.
[58] S. Kirchner, J.-F. Arenes, C. Cochet, M. Derbez, C. Duboudin, P. Elias, A. Grégoire, B. Jédor, J.-P. Lucas, N. Pasquier, M. Pigneret, O. Ramalho, État de la qualité de l’air dans les logements français, Environnement, Risques & Santé. 6 (2007) 259–269.
[59] J.-P. Lucas, B. Le Bot, P. Glorennec, A. Etchevers, P. Bretin, L. Bellanger, C. Mandin, F. Douay, Lead contamination in French children’s homes and environment, Environ. Res. 116 (2012) 58–65. doi:10.1016/j.envres.2012.04.005.
[60] M. Pelletier, Expositions agrégées aux composés organiques semi- volatils dans l’habitat et risques sanitaires associés, 2017.
[61] C. Mandin, F. Mercier, J.-P. Lucas, O. Ramalho, O. Blanchard, N. Bonvallot, G. Raffy, E. Gilles, P. Glorennec, B. Le Bot, ECOS-POUSS: A nationwide survey of semi-volatile organic compounds in home settled dust, in: Indoor Air 2014 - 13th Int. Conf. Indoor

Page 182
Air Qual. Clim., 2014.
[62] C. Mandin, F. Mercier, O. Ramalho, J.-P. Lucas, E. Gilles, O. Blanchard, N. Bonvallot, P. Glorennec, B. Le Bot, Semi-volatile organic compounds in the particulate phase in dwellings: A nationwide survey in France, Atmos. Environ. 136 (2016) 82–94. doi:10.1016/j.atmosenv.2016.04.016.
[63] S. Langer, C. Weschler, A. Fischer, G. Bekö, J. Toftum, G. Clausen, Phthalate and PAH concentrations in dust collected from Danish homes and daycare centers, Atmos. Environ. 44 (2010) 2294–2301. doi:10.1016/j.atmosenv.2010.04.001.
[64] M. Velázquez-Gómez, S. Hurtado-Fernández, S. Lacorte, Differential occurrence, profiles and uptake of dust contaminants in the Barcelona urban area, Sci. Total Environ. 648 (2018) 1354–1370. doi:10.1016/j.scitotenv.2018.08.058.
[65] U.S. EPA., Exposure Factors Handbook: 2011 Edition, 2011. doi:EPA/600/R-090/052F.
[66] J.M. Weiss, Å. Gustafsson, P. Gerde, Å. Bergman, C. Lindh, A.M. Krais, Daily intake of phthalates, MEHP, and DINCH by ingestion and inhalation, Chemosphere. (2018). doi:10.1016/j.chemosphere.2018.05.094.
[67] L. Wang, M. Gong, Y. Xu, Y. Zhang, Phthalates in dust collected from various indoor environments in Beijing, China and resulting non-dietary human exposure, Build. Environ. (2017). doi:http://dx.doi.org/10.1016/j.buildenv.2017.08.006.
[68] G. Fan, J. Xie, H. Yoshino, H. Zhang, Z. Li, N. Li, J. Liu, Y. Lv, S. Zhu, U. Yanagi, K. Hasegawa, N. Kagi, X. Zhang, J. Liu, Common SVOCs in house dust from urban dwellings with schoolchildren in six typical cities of China and associated non-dietary exposure and health risk assessment, Environ. Int. 120 (2018) 431–442. doi:10.1016/j.envint.2018.08.031.
[69] J.H. Tay, U. Sellström, E. Papadopoulou, J.A. Padilla-Sánchez, L.S. Haug, C.A. de Wit, Assessment of dermal exposure to halogenated flame retardants: Comparison using direct measurements from hand wipes with an indirect estimation from settled dust concentrations, Environ. Int. 115 (2018) 285–294. doi:10.1016/j.envint.2018.03.038.
[70] M.A.E. Abdallah, Environmental occurrence, analysis and human exposure to the flame retardant tetrabromobisphenol-A (TBBP-A)-A review, Environ. Int. 94 (2016) 235–250. doi:10.1016/j.envint.2016.05.026.
[71] H. Fromme, G. Becher, B. Hilger, W. Völkel, Brominated flame retardants - Exposure and risk assessment for the general population, Int. J. Hyg. Environ. Health. 219 (2016) 1–23. doi:10.1016/j.ijheh.2015.08.004.
[72] L. Bramwell, S. V. Glinianaia, J. Rankin, M. Rose, A. Fernandes, S. Harrad, T. Pless-Mulloli, Associations between human exposure to polybrominated diphenyl ether flame retardants via diet and indoor dust, and internal dose: A systematic review, Environ. Int. 92–93 (2016) 680–694. doi:10.1016/j.envint.2016.02.017.
[73] M. Hou, Y. Wang, H. Zhao, Q. Zhang, Q. Xie, X. Zhang, R. Chen, J. Chen, Halogenated flame retardants in building and decoration materials in China: Implications for human exposure via inhalation and dust ingestion, Chemosphere. 203 (2018) 291–299.

Page 183
doi:10.1016/j.chemosphere.2018.03.182.
[74] U.S EPA, Exposure Factors Handbook 2011 Edition (Final Report). U.S. Environmental Protection Agency, Washington, DC, EPA/600/R-09/052F, 2011.
[75] J. Little, C. Weschler, W.W. Nazaroff, Z. Liu, E.A.C. Hubal, E. a Cohen Hubal, Rapid methods to estimate potential exposure to semivolatile organic compounds in the indoor environment, Environ. Sci. Technol. 46 (2012) 11171–8. doi:10.1021/es301088a.
[76] S. Shi, B. Zhao, Modeled exposure assessment via inhalation and dermal pathways to airborne semivolatile organic compounds (SVOCs) in residences, Environ. Sci. Technol. 48 (2014) 5691–5699. doi:10.1021/es500235q.
[77] M. Pelletier, N. Bonvallot, P. Glorennec, Aggregating exposures & cumulating risk for semivolatile organic compounds: A review, Environ. Res. 158 (2017) 649–659. doi:10.1016/j.envres.2017.06.022.
[78] E.D. Schreder, N. Uding, M.J. La Guardia, Inhalation a significant exposure route for chlorinated organophosphate flame retardants, Chemosphere. 150 (2016) 499–504. doi:10.1016/j.chemosphere.2015.11.084.
[79] C. Weschler, W.W. Nazaroff, SVOC exposure indoors: fresh look at dermal pathways, Indoor Air. 22 (2012) 356–77. doi:10.1111/j.1600-0668.2012.00772.x.
[80] G. Bekö, C. Weschler, S. Langer, M. Callesen, J. Toftum, G. Clausen, Children’s Phthalate Intakes and Resultant Cumulative Exposures Estimated from Urine Compared with Estimates from Dust Ingestion, Inhalation and Dermal Absorption in Their Homes and Daycare Centers, PLoS One. 8 (2013). doi:10.1371/journal.pone.0062442.
[81] M.W. Kadi, N. Ali, H.M.S. Albar, Phthalates and polycyclic aromatic hydrocarbons (PAHs) in the indoor settled carpet dust of mosques, health risk assessment for public, Sci. Total Environ. 627 (2018) 134–140. doi:10.1016/j.scitotenv.2018.01.146.
[82] Z. Bu, J. Wang, W. Yu, B. Li, Dermal exposure to phthalates in home environment: Handwipes, influencing factors and implications, Build. Environ. 133 (2018) 1–7. doi:10.1016/j.buildenv.2018.02.013.
[83] G. Morrison, H. Li, S. Mishra, M. Buechlein, Airborne phthalate partitioning to cotton clothing, Atmos. Environ. 115 (2015) 149–152. doi:10.1016/j.atmosenv.2015.05.051.
[84] M. Gong, C. Weschler, Y. Zhang, Impact of Clothing on Dermal Exposure to Phthalates: Observations and Insights from Sampling Both Skin and Clothing, Environ. Sci. Technol. 50 (2016) 4350–4357. doi:10.1021/acs.est.6b00113.
[85] M.A.E. Abdallah, S. Harrad, Dermal contact with furniture fabrics is a significant pathway of human exposure to brominated flame retardants, Environ. Int. 118 (2018) 26–33. doi:10.1016/j.envint.2018.05.027.
[86] W. Wei, N. Bonvallot, Å. Gustafsson, G. Raffy, P. Glorennec, A. Krais, O. Ramalho, B. Le Bot, C. Mandin, Bioaccessibility and bioavailability of environmental semi-volatile

Page 184
organic compounds via inhalation: A review of methods and models, Environ. Int. 113 (2018) 202–213. doi:10.1016/j.envint.2018.01.024.
[87] C. Collins, M. Craggs, S. García-Alcega, K. Kademoglou, S. Lowe, ‘Towards a unified approach for the determination of the bioaccessibility of organic pollutants,’ Environ. Int. 78 (2015) 24–31. doi:10.1016/j.envint.2015.02.005.
[88] S. Denys, J. Caboche, C. Feidt, B. Hazebrouck, F. Dor, C. Dabin, A. Floch-Barneaus, K. Tack, Biodisponibilité et bioaccessibilité des métaux et metalloïdes des sols pollués pour la voie orale chez l’homme, Environnement, Risques & Santé. 8 (2009) 433–438.
[89] I. Rostami, A. Juhasz, Assessment of Persistent Organic Pollutant (POP) Bioavailability and Bioaccessibility for Human Health Exposure Assessment: A Critical Review, Crit. Rev. Environ. Sci. Technol. 41 (2011) 623–656. doi:10.1080/10643380903044178.
[90] F. Kastury, E. Smith, A. Juhasz, A critical review of approaches and limitations of inhalation bioavailability and bioaccessibility of metal(loid)s from ambient particulate matter or dust, Sci. Total Environ. 574 (2017) 1054–1074. doi:10.1016/j.scitotenv.2016.09.056.
[91] G. Pawar, M.A.E. Abdallah, E.V. De Sáa, S. Harrad, Dermal bioaccessibility of flame retardants from indoor dust and the influence of topically applied cosmetics, J. Expo. Sci. Environ. Epidemiol. 44 (2016) 1–6. doi:10.1038/jes.2015.84.
[92] M. Guney, R.P. Chapuis, G.J. Zagury, Lung bioaccessibility of contaminants in particulate matter of geological origin, Environ. Sci. Pollut. Res. 23 (2016) 24422–24434. doi:10.1007/s11356-016-6623-3.
[93] D.J. Beriro, M.R. Cave, J. Wragg, R. Thomas, G. Wills, F. Evans, A review of the current state of the art of physiologically-based tests for measuring human dermal in vitro bioavailability of polycyclic aromatic hydrocarbons ( PAH ) in soil, 305 (2016) 240–259.
[94] J. Wragg, M.R. Cave, N. Basta, E. Brandon, S. Casteel, S. Denys, C. Gron, A. Oomen, K. Reimer, K. Tack, T. Van de Wiele, An inter-laboratory trial of the unified BARGE bioaccessibility method for arsenic, cadmium and lead in soil, Sci. Total Environ. 409 (2011) 4016–4030. doi:10.1016/j.scitotenv.2011.05.019.
[95] S. Denys, J. Caboche, K. Tack, G. Rychen, J. Wragg, M.R. Cave, C. Jondreville, C. Feidt, In Vivo Validation of the Unified BARGE Method to Assess the Bioaccessibility of Arsenic, Antimony, Cadmium, and Lead in Soils, Environ. Sci. Technol. 46 (2012) 6252–6260.
[96] Barge/Ineris, UBM procedure for the measurement of inorganic contaminant bioaccessibility from solid matrices., (2011) 1–10.
[97] B. Le Bot, C. Arcelin, E. Briand, P. Glorennec, Sequential digestion for measuring leachable and total lead in the same sample of dust or paint chips by ICP-MS, J. Environ. Sci. Heal. Part A. 46 (2011) 63–69. doi:10.1080/10934529.2011.526902.
[98] M. Fang, H.M. Stapleton, Evaluating the bioaccessibility of flame retardants in house dust using an in vitro Tenax bead-assisted sorptive physiologically based method, Environ. Sci. Technol. 48 (2014) 13323–13330. doi:10.1021/es503918m.

Page 185
[99] K. Kademoglou, A. Williams, C. Collins, Bioaccessibility of PBDEs present in indoor dust: A novel dialysis membrane method with a Tenax TA® absorption sink, Sci. Total Environ. 621 (2018) 1–8. doi:10.1016/j.scitotenv.2017.11.097.
[100] J.K. Huwe, H. Hakk, D.J. Smith, J.J. Diliberto, V. Richardson, H.M. Stapleton, L.S. Birnbaum, Comparative absorption and bioaccumulation of polybrominated diphenyl ethers following ingestion via dust and oil in male rats, Environ. Sci. Technol. 42 (2008) 2694–2700. doi:10.1021/es702644k.
[101] Y. Wang, G. Zhang, L. Wang, Potential toxicity of phthalic acid esters plasticizer: Interaction of dimethyl phthalate with trypsin in vitro, J. Agric. Food Chem. 63 (2015) 75–84. doi:10.1021/jf5046359.
[102] Z. Chi, J. Zhao, W. Li, A. Araghi, S. Tan, In vitro assessment of phthalate acid esters-trypsin complex formation, Chemosphere. 185 (2017) 29–35. doi:10.1016/j.chemosphere.2017.07.003.
[103] H. Guo, X. Zheng, S. Ru, R. Sun, B. Mai, Size-dependent concentrations and bioaccessibility of organophosphate esters (OPEs) in indoor dust: A comparative study from a megacity and an e-waste recycling site, Sci. Total Environ. 650 (2019) 1954–1960. doi:10.1016/j.scitotenv.2018.09.340.
[104] J.B. Quintana, M. Rosende, R. Montes, T. Rodríguez-Álvarez, R. Rodil, R. Cela, M. Miró, In-vitro estimation of bioaccessibility of chlorinated organophosphate flame retardants in indoor dust by fasting and fed physiologically relevant extraction tests, Sci. Total Environ. (2016). doi:10.1016/j.scitotenv.2016.11.210.
[105] S. García-Alcega, C. Rauert, S. Harrad, C. Collins, Does the source migration pathway of HBCDs to household dust influence their bio-accessibility?, Sci. Total Environ. 569–570 (2016) 244–251. doi:10.1016/j.scitotenv.2016.04.178.
[106] Y. Kang, D. Zeng, Y.B. Man, J. Liu, Y. Yang, S. Li, K. Situ, W. Xiong, L. Zeng, Q. Zhang, J. Luo, W. Pan, F. Jiang, M.H. Wong, Comparison of sorption kinetics of PAHs by sorptive sinks and caco-2 cell and the correlation between bioaccessibility and bioavailability of PAHs in indoor dust, Sci. Total Environ. 645 (2018) 170–178. doi:10.1016/j.scitotenv.2018.07.102.
[107] V. Plichta, Bioavailability of plasticizers in dust and food after oral administration in pigs, 2017.
[108] L.J. Henze, N.J. Koehl, J.P. O’Shea, E.S. Kostewicz, R. Holm, B.T. Griffin, The pig as a preclinical model for predicting oral bioavailability and in vivo performance of pharmaceutical oral dosage forms: a PEARRL review, J. Pharm. Pharmacol. (2018). doi:10.1111/jphp.12912.
[109] X.-B. Mi, L.-J. Bao, C.-C. Wu, C.S. Wong, E.Y. Zeng, Absorption, tissue distribution, metabolism, and elimination of decabrominated diphenyl ether (BDE-209) in rats after multi-dose oral exposure, Chemosphere. 186 (2017) 749–756. doi:10.1016/j.chemosphere.2017.08.049.
[110] P. Gao, E. da Silva, L. Hou, N.D. Denslow, P. Xiang, L. Ma, Human exposure to polycyclic aromatic hydrocarbons: Metabolomics perspective, Environ. Int. 119 (2018)

Page 186
466–477. doi:10.1016/j.envint.2018.07.017.
[111] G. Bardet, S. Achard, T. Loret, V. Desauziers, I. Momas, N. Seta, A model of human nasal epithelial cells adapted for direct and repeated exposure to airborne pollutants, Toxicol. Lett. 229 (2014) 144–149. doi:10.1016/j.toxlet.2014.05.023.
[112] H. Ertl, W. Butte, Bioaccessibility of pesticides and polychlorinated biphenyls from house dust: in-vitro methods and human exposure assessment, J. Expo. Sci. Environ. Epidemiol. (2012) 1–10.
[113] M.A.E. Abdallah, G. Pawar, S. Harrad, Evaluation of in vitro vs. in vivo methods for assessment of dermal absorption of organic flame retardants: A review, Environ. Int. 74 (2015) 13–22. doi:10.1016/j.envint.2014.09.012.
[114] C.P. Wild, Complementing the genome with an “exposome”: The outstanding challenge of environmental exposure measurement in molecular epidemiology, Cancer Epidemiol. Biomarkers Prev. 14 (2005) 1847–1850. doi:10.1158/1055-9965.EPI-05-0456.
[115] S.M. Rappaport, M.T. Smith, Epidemiology Environment and disease risks, Sci. (New York, NY). 330 (2010) 460–461. doi:10.1126/science.1192603.
[116] A. Peters, G. Hoek, K. Katsouyanni, Understanding the link between environmental exposures and health: Does the exposome promise too much?, J. Epidemiol. Community Health. 66 (2012) 103–105. doi:10.1136/jech-2011-200643.
[117] Y. Cui, D. Balshaw, From the Outside In: Integrating External Exposures into the Exposome Concept, in: Unraveling Expo., 2019.

Page 187
VALORISATION SCIENTIFIQUE
ARTICLES SCIENTIFIQUES ASSOCIES AU PROJET
M. Pelletier, N. Bonvallot, O. Ramalho, C. Mandin, W. Wei, G. Raffy, F. Mercier, O. Blanchard, B.
Le Bot, P. Glorennec, Indoor Residential Exposure to Semivolatile Organic Compounds in France,
Environ. Int. 109 (2017) 81–88. doi:https://doi.org/10.1016/j.envint.2017.08.024.
W. Wei, N. Bonvallot, Å. Gustafsson, G. Raffy, P. Glorennec, A. Krais, O. Ramalho, B. Le Bot, C.
Mandin, Bioaccessibility and bioavailability of environmental semi-volatile organic compounds
via inhalation: A review of methods and models, Environ. Int. 113 (2018) 202–213.
doi:10.1016/j.envint.2018.01.024.
COMMUNICATIONS ORALES DANS DES CONGRES SCIENTIFIQUES INTERNATIONAUX
Human exposure to semi-volatile organic compounds (SVOCs) via dust ingestion: a review of in-
fluencing factors, Indoor Air 2016 (Gand, Belgique, 3-8/07/2016)
Bioaccessibility of semi-volatile organic compounds (SVOCs) in settled dust, ISES (International
Society of Exposure Sciences - Utrecht, Pays-Bas, 9-13/10/2016)
Assessment of the oral bioaccessibility of semi-volatile organic compounds in indoor settled dust
using a simplified method, 9th International Workshop on Chemical Bioavailability in the Terres-
trial Environment (Varsovie, Pologne, 5-8/11/2017)
COMMUNICATIONS AFFICHEES DANS DES CONGRES NATIONAUX ET INTERNATIONAUX
Characterisation of human exposure to semivolatile organic compounds (SVOCs) through indoor
dust ingestion: measurement of SVOC bioaccessibility, 4th Day of the Young Researchers of Irset
(Rennes, France, 8/12/2015)
Bioaccessibility of semivolatile organic compounds (SVOCs) in settled dust, EDCEH (European
Doctoral College on Environment & Health) (Rennes, France, 6-8/6/2016)
Evaluation de la bioaccessibilité orale des COSV contenus dans les poussières des bâtiments. In:
Journée des doctorants du CSTB, Journée des doctorants du CSTB (Paris, France, 4/10/2016)

Page 188
Assessment of the oral bioaccessibility of semi-volatile organic compounds (SVOCs) in indoor
settled dust, Rencontres scientifiques du réseau doctoral en santé publique (Rennes, France,
14/03/2017)
Assessment of the oral bioaccessibility of semi-volatile organic compounds (SVOCs) in indoor set-
tled dust using a simplified method, 6th Day of the Young Researchers of Irset (Rennes, France,
11/1/2018)
Assessment of the oral bioaccessibility of semi-volatile organic compounds (SVOCs) in indoor set-
tled dust using a simplified method, 1st European Exposure Science Strategy Workshop (Dort-
mund, Germany, 19-20/06/2018)
MEDIATION SCIENTIFIQUE
Participation à la fête de la science : Pollution domestique : la santé en danger ? (Rennes, France,
6-8/10/2017)
Intervention dans une école primaire : Qu’y-a-t-il dans l’air de ma maison ? (Rennes, France,
5/12/2017)
FIGURE 20 : SUPPORT DE MEDIATION SCIENTIFIQUE

Page 189
Contents lists available at ScienceDirect
Environment International
journal homepage: www.elsevier.com/locate/envint
Indoor residential exposure to semivolatile organic compounds in France
Maud Pelletiera,b, Nathalie Bonvallota,b, Olivier Ramalhoc, Corinne Mandinc, Wenjuan Weic,Gaëlle Raffya,b,d, Fabien Merciera,b,d, Olivier Blancharda,b, Barbara Le Bota,b,d,Philippe Glorenneca,b,⁎
a EHESP - School of Public Health, Sorbonne Paris Cité, Rennes, Franceb INSERM-U1085, Irset-Research Institute for Environmental and Occupational Health, Rennes, Francec University of Paris-Est, Scientific and Technical Center for Building (CSTB), Health and Comfort Department, French Indoor Air Quality Observatory (OQAI), 84 Avenue
Jean Jaurès, Champs sur Marne, 77447 Marne la Vallée Cedex 2, Franced LERES-Environment and Health Research Laboratory (Irset and EHESP Technologic Platform), Rennes, France
A R T I C L E I N F O
Keywords:
Aggregate exposureCumulative exposureChemicalsMonte Carlo simulationIndoor air qualityDermal exposure
A B S T R A C T
Multiple chemicals are emitted in residential accommodation. Aggregate Daily Doses (ADD) (ng/kg-bw/d) wereestimated for 32 semivolatile organic compounds (SVOCs) of different chemical families that are frequentlydetected in French dwellings in both air and settled dust. Daily doses were determined using steady-state modelsfor the population, categorized into 11 age groups covering birth to age 30. Three routes of exposure were takeninto account: dust ingestion, inhalation (gaseous and particulate phases) and dermal contact with the gaseousphase of air. Contamination levels were preferentially retrieved from large, nationwide representative datasets.A two-dimensional probabilistic approach was used to assess parametric uncertainty and identify the most in-fluential factors. For children aged 2 to 3 years, ADD estimates spanned orders of magnitude, with median valuesranging from 8.7 pg/kg-bw/d for 2,2′,3,4,4′-pentabromodiphenylether (BDE 85) to 1.3 μg/kg-bw/d for di-iso-butyl phthalate (DiBP). Inhalation, ingestion and dermal pathway contributed at varying levels, and dependingon compound, air was the dominant medium for 28 of the 32 compounds (either by inhalation or dermalcontact). Indoor exposure estimate variance was mainly driven by indoor contamination variability, and sec-ondarily by uncertainty in physical and chemical parameters. These findings lend support to the call for cu-mulative risk assessment of indoor SVOCs.
1. Introduction
Both consumer product use and the production of chemicals havebeen rising constantly since the mid-20th century, and many of thesechemicals are semivolatile organic compounds (SVOCs). SVOCs includecompounds from various chemical families: phthalates, bisphenols,polycyclic aromatic hydrocarbons (PAHs), organophosphorus (OPs),organochlorines (OCs), synthetic musks, polychlorinated biphenyls(PCBs) and polybromodiphenylethers (PBDEs).
The health effects of SVOCs have been assessed by numerous studieson both humans and animals; some are suspected of having reprotoxic(Casas et al., 2013; Rubin, 2011), neurotoxic (Baldi et al., 2001; Blanc-Lapierre et al., 2012; Elbaz et al., 2009; Zaganas et al., 2013) or car-cinogenic effects (Armstrong et al., 2004; IARC, 2015a, 2015b).
SVOCs are emitted by volatilization from their source materials andcontaminate other compartments; in some cases, they can also migratedirectly from source (Sukiene et al., 2017). In the indoor environment,
they are found in the gas phase, airborne particles, settled dust(Weschler and Nazaroff, 2008) and on any other available surfaces suchas walls, ceiling and flooring – as well as on human skin and clothing. Inaddition to dietary exposure and dermal contact with consumer pro-ducts, humans are continuously exposed to these chemicals throughvarious pathways, including inhalation of indoor air (gaseous andparticulate phases), ingestion of settled dust and dermal contact withindoor air and settled dust (on floor and other surfaces). Many authorshave assessed indoor exposure to certain families of SVOCs (phthalates,PBDEs, etc.), taking into account one or more exposure media via oral,respiratory (and sometimes dermal) pathways (Bekö et al., 2013;Gaspar et al., 2014; Linares et al., 2010; Mitro et al., 2016; Roosenset al., 2010; Trudel et al., 2011; Wilson et al., 2003). Mitro et al. (2016)recently estimated indoor exposures based on US dust surveys and anair contamination model. Here, we seek to use measurement data toassess the exposure of a large population and estimate the associateduncertainty.
http://dx.doi.org/10.1016/j.envint.2017.08.024Received 19 May 2017; Received in revised form 25 August 2017; Accepted 28 August 2017
⁎ Corresponding author at: EHESP - School of Public Health, Sorbonne Paris Cité, Rennes, France.E-mail address: [email protected] (P. Glorennec).
Environment International 109 (2017) 81–88
0160-4120/ © 2017 Elsevier Ltd. All rights reserved.
MARK

Page 190
The objective of this study was to estimate the indoor exposure ofpeople of various age groups, to 32 SVOCs from different chemical fa-milies frequently detected in French dwellings (Blanchard et al., 2014;Mandin et al., 2014, 2016). Three routes of exposure were taken intoaccount: dust ingestion, inhalation of air (gaseous and particulatephases) and dermal contact with the gaseous phase of air. Contamina-tion levels were preferentially retrieved from large, representative da-tasets. A two-dimensional probabilistic approach was used to assess theuncertainty associated with the different parameters, and identify themost impacting factors.
2. Methods
2.1. Target population
To address exposure across a broad section of the population, weestimated exposures for 11 age groups from birth to age 30 (as an ex-ample of an adult), following the U.S. Environmental Protection Agency(U.S. EPA, 2005) recommendations as to which age groups should beconsidered within a health risk assessment.
2.2. Compounds selection
32 SVOCs were selected on the basis of their health interest(Bonvallot et al., 2010), and because they were detected in both the airand the settled dust of French dwellings (Blanchard et al., 2014; Mandinet al., 2014, 2016).
2.3. Exposure model
The Aggregate Daily Doses (ADD) (ng/kg-bw/d) were assessed bysumming internal (uptake) daily doses from dust ingestion (DDing-dust),inhalation of air (both gaseous and particulate phases) (DDinh-air) anddermal contact with gas phase (DDderm-gas).
Very few studies included the dermal exposure to dust pathwaywhen assessing aggregate exposures to SVOCs. Trudel et al. (2011)studied dermal exposure to 8 PBDEs in dust. Even though they over-estimated this pathway using in vitro experimental data with acetone ascarrier vehicle (Roper et al., 2006), they found the contribution ofdermal exposure to dust to be consistently< 20%, even for the mostcontaminated region, and for every age group (below 1 year to 65 yearsof age). Bekö et al. (2013) estimated indoor exposure to five phthalatesand found a very low (< 1%) contribution of dermal exposure to dust,in comparison to other pathways. Since this pathway is typically foundto be minor and required uptake parameters are ill-suited to dust ex-posure even when available, dermal exposure to dust was not addressedin this work.
2.4. Equations for exposure dose estimation
Daily Doses (DD) can be estimated in steady-state conditions usingthe following equations. These were adapted from relationships de-veloped by Bekö et al. (2013) and Weschler and Nazaroff (2012, 2014).
Ingestion of settled dust:
=× × × ×
BWDD
C DI f f ting‐dust
dust oral dust
(1)
where Cdust is the SVOC concentration in settled dust (ng/g), DI is theamount of dust ingested by an individual per day (g/d), foral is the oralbioavailability of the SVOC (−), fdust is the bioaccessibility of the SVOCfrom the dust (−), t is the fraction of time spent in dwellings (−), BW isthe body weight (kg), and DDing-dust is expressed in ng/kg-bw/d.
Inhalation of indoor air:
=+ × × ×
DD(C C ) IR f t
BWinh‐air
part gas pulm
(2)
where Cpart is the SVOC particulate phase concentration (ng/m3), Cgas isthe SVOC gas phase concentration (ng/m3), IR is the inhalation rate foran individual per day (m3/d), fpulm is the pulmonary bioavailability ofthe SVOC (−), t is the fraction of time spent in dwellings (−), BW is thebody weight (kg), and DDinh-air is expressed in ng/kg-bw/d.
Dermal contact with the gas phase:
=× × ×
DDC k BSA t
BWderm‐gas
gas p‐g
(3)
where Cgas is the SVOC gas phase concentration (ng/m3), kp-g is theSVOC transdermal permeability coefficient (m/h), BSA is the bodysurface area (m2), t is the daily duration exposure (h/d), BW is the bodyweight (kg), and DDderm-gas is expressed in ng/kg-bw/d. The steady-state model adapted by Weschler and Nazaroff (2012, 2014) used toestimate kp-g is described in more detail in Supplemental Material (seeS1). This requires use of the SVOC octanol/water partition coefficients(log (Kow)), Henry's law constants (H) and coefficients describing theexternal transport of a gaseous SVOC from the bulk indoor air to theboundary layer adjacent to the skin (ɣd).
The ADD for a single SVOC for an individual was then calculated bysumming the previous doses according to the following equation, andexpressed in ng/kg-bw/d:
= + +ADD DD DD DDing‐dust inh‐air derm‐gas (4)
2.5. Parameter estimation for exposure model
Parameter distributions were constructed or retrieved from the lit-erature as detailed below. Some of these parameters will be the samefor all SVOCs (ɣd, BW, BSA, IR, DI and t) while others will vary fromone compound to another (foral, fdust, fpulm, log (Kow), H, Cdust, Cpart andCgas).
2.5.1. Physical and chemical parameters
For each SVOC, measured or estimated values of log (Kow) and H at25 °C were retrieved from: online databases - Hazardous SubstancesData Bank (HSBD) and ChemIDplus (http://toxnet.nlm.nih.gov/),Chemspider (http://www.chemspider.com/), and Chemicalize (http://www.chemicalize.org/); toxicological and environmental data sheetsfrom the French National Competence Center for Industrial Safety andEnvironmental Protection (INERIS) (http://www.ineris.fr/substances/fr/page/21); online calculators - Chemexper (https://www.chemexper.com/) and ACD/Labs (http://www.acdlabs.com/); EPI Suite software(U.S. EPA, 2013, v4.1) and the Handbook of Physical-Chemical Prop-erties and Environment Fate for Organic Chemicals (Mackay et al.,2010a, 2010b, 2010c, 2010d). Particular attention was paid to avoidingduplicates (EPI Suite software, HSBD and ChemIDplus often used thesame sources for these parameters). Furthermore, only values at thereference temperature of 25 °C were selected, in order to obtain com-parable data between compounds and estimate DD at a constant tem-perature. At least two values were available for each SVOC. Where atleast 15 values for log (Kow) and H were available, distributions werefitted. Otherwise, we used either triangular distributions having at leastthree values (minimum, average and maximum), or uniform distribu-tions for two retrieved values. See Table S1 for corresponding dis-tributions and input parameters for each SVOC.
2.5.2. Contamination data
Contamination data were provided from measurements taken inrecent French housing surveys. Concentration levels in settled dustcollected from vacuum cleaner bags were retrieved from a nationalsurvey covering the 3.6 million French dwellings that were home to atleast one child aged 6 months to 6 years in 2008–2009, using 145samples (Mandin et al., 2014). Concentration levels in airborne Parti-culate Matter (PM) of 10 μm in diameter were retrieved from a nationalsurvey covering the 24.7 million French main residences, using 285
M. Pelletier et al. Environment International 109 (2017) 81–88
82

Page 191
samples (Mandin et al., 2016). PM samples were collected from eachliving room over a period of one week, and assumed to be re-presentative of each dwelling as a whole. SVOC gas phase concentra-tions were not available at national scale; data from 30 French dwell-ings (Blanchard et al., 2014) were used as a surrogate.
Modeling was established regarding the percentage of samplesabove the limit of detection (LOD) or the limit of quantification (LOQ)for the retrieved studies. For settled dust and PM measurements, log-normal distributions were fitted using summary statistics when> 75%of data were above LOD (Burmaster and Hull, 1997). This concerns 20and 14 compounds, for settled dust and PM measurements respectively.Where detection frequency ranged from 20 to 75%, the maximum-likelihood estimation (MLE) was used to estimate lognormal distribu-tions (Helsel, 2011; Helsel and Hirsch, 1992). This statistical methodcould be used to estimate the undetected data in the studies of Mandinet al. (2014, 2016), because sample sizes were large enough - with 145and 285 samples for dust and PM respectively. The number of com-pounds concerned was 7 for settled dust and 11 for PM measurements.Where detection frequency ranged from 1 to 20%, custom distributionwas modeled with discrete probability for the quantified values, andcontinuous uniform probability from 0 to LOD and from LOD to LOQ.The number of compounds concerned was 5 for settled dust and 7 forPM measurements. For the gas phase measurements, the Blanchardet al. (2014) sample size (n = 30) was too small to use MLE. So, wheredetection frequency ranged from 1 to 99%, custom distribution wasmodeled using continuous uniform probability from 0 to LOQ anddiscrete probability for the quantified values. For all three media, aliterature survey was conducted to retrieve specific data when detectionfrequency was< 1%. Publications were selected in the following orderof preference: conducted in Europe, post-2000 and providing samplesize, measurement method, LOD and/or LOQ values and percentage ofsamples above the LOD and/or LOQ. Where a lower LOD or LOQ wasused, other contamination information was used instead of the initially-selected data (Blanchard et al., 2014; Mandin et al., 2014, 2016). SeeTable S2 for corresponding distributions and input parameters for eachSVOC in each medium.
2.5.3. Exposure media properties
Assessment of DDderm-gas (Eq. 3) requires use of a transdermal per-meability coefficient, kp-g, estimated using the specific physical andchemical parameters of each SVOC, and a non-specific mass transportcoefficient, ɣd. This last describes the external transport of an SVOCfrom the gas phase in the core of a room through the boundary layeradjacent to the skin, see Eq. 1 (Supplemental Material). A triangulardistribution was modeled for ɣd, using the minimum and maximumvalues found in the literature and the generally assumed value of 6 m/has most likely (Pandrangi and Morrison, 2008; Tamas et al., 2006;Weschler and Nazaroff, 2008). See Table S3 for corresponding dis-tribution and input parameters.
2.5.4. Bioaccessibility and bioavailabilities
Bioaccessibility in dust (fdust) is the fraction of pollutant releasedfrom settled dust into the gastrointestinal tract and available for ab-sorption (Rostami and Juhasz, 2011). For each SVOC, fdust was re-trieved from the literature survey performed by Raffy et al. (2016). Oralbioavailability (foral) is the fraction of a contaminant reaching the di-gestive system and absorbed into systemic circulation (Rostami andJuhasz, 2011). Pulmonary bioavailability (fpulm) is the fraction of acontaminant reaching the alveolar system and absorbed into systemiccirculation. For each SVOC, foral and fpulm were retrieved from the fol-lowing online databases: the HSBD (https://toxnet.nlm.nih.gov/cgi-bin/sis/htmlgen?HSDB) and the Agency for Toxic Substances and Dis-ease Registry (ATSDR) (https://www.atsdr.cdc.gov/). For each com-pound displaying at least three available values, triangular distributionswere modeled (minimum, average and maximum values). Where onlytwo values were retrieved, uniform distributions were modeled
(minimum and maximum). Where only a single value was available,triangular distributions were modeled between this value (as the like-liest), and the minimum and the maximum values retrieved from othercompounds belonging to the same chemical family. Finally, if no valuewas found for an SVOC, a uniform distribution was modeled betweenthe minimum and the maximum values found for the other compoundsfrom the same chemical family - or from the entire studied chemicalfamilies taken together if no other compound from the same chemicalfamily was assessed. See Table S4 for corresponding distributions andinput parameters for each SVOC.
2.5.5. Human body parameters
The World Health Organization (WHO, 2006) has identified andsuggested common critical life stages for use in exposure and risk as-sessment. Because these were not available for every parameter and agegroup for populations living in France, we used the U.S. EPA ExposureFactors Handbook (U.S. EPA, 2011). The potential influence of this iscovered in the discussion section. We compiled the distribution ofhuman body weight (BW), body surface area (BSA), dust ingestion (DI),inhalation rate (IR) and time spent in dwellings (t). Lognormal dis-tributions were used for BW, BSA and DI. Normal distributions wereused for IR and t. See Table S5 for corresponding distributions and inputparameters.
2.6. Simulation
DD from all three routes of exposure (Eqs. (1) to (3)) and ADD (Eq.(4)) were estimated using Crystal Ball® software (Oracle©, version11.1.1.3.00). Latin Hypercube two-dimensional simulations were car-ried out with 500,000 runs for each SVOC, and each age group. Two-dimensional simulations take into account both the uncertainty (lack ofknowledge about a parameter) and the variability (heterogeneity of aparameter in a population) of the input parameters. The followingparameters were considered variable (i.e. high variability in relation touncertainty): Cdust, Cpart, Cgas, ɣd, BW, BSA, IR and t, whereas log (Kow),H, foral, fdust and fpulm, were considered uncertain. DI was consideredboth uncertain and variable. Sensitivity analysis was performed in aone-dimensional simulation by assessing the contribution of each inputparameter to ADD variance (the output), using linear regression.
3. Results
ADD (ng/kg-bw/d) estimates for the 32 SVOCs for children aged 2to 3 years are shown in Fig. 1. We are presenting results for this specificsegment because young children are more vulnerable than the rest ofthe population in terms of exposure to contaminants (due to morefrequent contact with the ground and deposited dust, carrying objectsin their mouths, higher inhalation rates, etc.) and more sensitive interms of effects (due to ongoing development of the main organ sys-tems, which continues after birth). Detailed results for ADD and thethree DD from each exposure route for all 11 age groups (birth to age30) are shown in Tables S8 to S18. ADD estimations spanned orders ofmagnitude, with median values ranging from 8.7 pg/kg-bw/d for2,2′,3,4,4′-pentabromodiphenylether (BDE 85) to 1.3 μg/kg-bw/d fordiisobutyl phthalate (DiBP) for children aged 2 to 3 years. Variability ofADD (relative interpercentile range, see Table S6) ranged from 1.2 for2,2′,4,4′,5-pentabromodiphenylether (BDE 99) to 12 for 2,3,3′,4,4′-pentachlorobiphenyl (PCB 105), with a median value of 4. The medianuncertainty on the mean was 40%, ranging from 11% for the benzo[a]pyrene to 230% for 2,3′,4,4′,5-pentachlorobiphenyl (PCB 118) (seedetailed relative errors in Table S13).
The relative contribution of exposure pathways to aggregatedmedian exposure is presented in Fig. 1 (bottom panel) for children aged2 to 3 years. The relative contributions made by each route of exposureto total indoor estimates differ by compound, and could be related totheir degree of volatility. For the most volatile SVOCs - that is those
M. Pelletier et al. Environment International 109 (2017) 81–88
83

Page 192
compounds having an octanol-air partition coefficient (log (Koa)) valueof 9 or less (see Table S1) and expected to be primarily gaseous(Weschler and Nazaroff, 2012), inhalation and dermal contact with thegas phase were the dominant routes of exposure: fluorene, anthracene,aldrin, dieldrin, tonalide, galaxolide, tributylphosphate, diethylphthalate (DEP), dibutyl phthalate (DBP), DiBP and 2,4,4′-tri-chlorobiphenyl (PCB 28), 2,4′,5-trichlorobiphenyl (PCB 31) and2,2′,5,5′-tetrachlorobiphenyl (PCB 52). For less volatile SVOCs - that isthose compounds having a log (Koa) value of 13 or greater (see TableS1) and expected to be primarily in the particle phase (Weschler andNazaroff, 2012), dust ingestion was the dominant route of exposure:diethylhexyl phthalate (DEHP), di-isononyl phthalate (DiNP) and2,2′,4,4′,5,6′-hexabromodiphenylether (BDE 154). The contributionmade by different pathways was more contrasted for SVOCs having alog (Koa) value of between 9 and 13 (see Table S1). On the whole, airwas the dominant exposure medium (sum of inhalation and dermalcontact> 50% of ADD) for 28 compounds out of 32, while dust was themajor contributor for DEHP, DiNP, benzyl butyl phthalate (BBP) and2,2′,4,5,5′-pentachlorobiphenyl (PCB 101). Overall, dust ingestion ismore contributive to exposure for less volatile chemicals, although thisis not the case with BBP and PCB 101, both of which are found in re-latively high concentrations in dust.
Relative contributions of exposure pathways for P95 values weresimilar to median values. Notable exceptions were that higher con-tributions from dust ingestion were found for PCB 118, 2,2′,3,4,4′,5′-hexachlorobiphenyl (PCB 138) and 2,2′,4,4′,5,5′-hexachlorobiphenyl(PCB 153), and higher contributions from inhalation were found forbenzo[a]pyrene and DBP.
The main sensitivity analysis results are shown in Fig. 2 (see Table
S7 for detailed results). These reveal that contamination parameters aremost influential: Cgas, Cpart and Cdust, the only exception being H forBDE 99. Their relative contributions to ADD variance ranged from 30%for galaxolide (Cpart) and BDE 99 (H) to 89% for fluorene (Cgas). Formost compounds, the other influential parameters (having contribu-tions higher than 10%) are the other contamination parameters: Cgas,Cpart and Cdust, and also fpulm. For some compounds, other influentialparameters are fdust (DEHP and DiNP) alongside physical and chemicalparameters: log (Kow) and H (lindane and BDE 99). Furthermore,compounds have been ranked by volatility in Fig. 2 (based on their log(Koa) values), from most volatile (fluorene) to least volatile (DiNP).Among the most volatile SVOCs, Cgas tended to be the more influentialparameter, while Cdust and Cpart appeared influential for the least vo-latile. Lastly, we note that within each age group, human parameterswere not influential.
ADD (ng/kg-bw/d) estimates for the 32 SVOCs for four age groupsare shown in Fig. 3: infants aged 0 to 1 months, infants aged 1 to3 months, children aged 2 to 3 years and adults aged 21 to 30 years. Asexpected, ADD decreases with age because of increasing BW - exceptwithin the [0–1 month] category where the dust ingestion rate equals0 mg, and ADD may be lower in comparison with other groups. This istrue in particular of compounds making a major contribution to dustingestion (PCB 101, BBP, DEHP and DiNP). Detailed results for ADDacross all 11 age groups (birth to age 30) are shown in Tables S8 to S18.
4. Discussion
Indoor exposure to 32 SVOCs was modeled using contaminationmeasurements from dwellings and human body parameters. ADD
Fig. 1. Top panel of the graph shows Aggregate
daily dose of each SVOC for a child aged 2 to
3 years (ng/kg-bw/d), percentiles 5th, 25th, 75th
and 95th are presented in box plot format. The
bottom panel of the graph shows the contribution
made by each route of exposure (ingestion, in-
halation and dermal exposure from air) to total
indoor exposure, based on the median value es-
timated for each SVOC for children aged 2 to
3 years (ng/kg-bw/d).
M. Pelletier et al. Environment International 109 (2017) 81–88
84

Page 193
spanned orders of magnitude from 8.7 pg/kg-bw/d to 1.3 μg/kg-bw/d.Inhalation, ingestion and dermal pathway all contributed, though dif-ferently across compounds. Indoor exposure estimations were influ-enced more by variability in indoor concentrations (Cgas, Cpart and Cdust)than by uncertainty in physical and chemical parameters.
Study strengths include: 1) estimation of indoor exposure to nu-merous SVOCs from different chemical families via gas- and particle-phase inhalation, dermal contact with gas phase, and ingestion of set-tled dust; 2) use of field measurements in dust, particulate and gaseousphases; 3) use, when available, of large and nationwide representativedatasets; 4) choice of a two-dimensional probabilistic approach, and 5)consideration of many age groups.
Study limitations include: 1) use of an exposure model that neglectsdynamic conditions; 2) use of different data sets for different exposuremedia, and 3) uncertainty analysis being restricted to parameter un-certainty.
We used steady-state models to estimate indoor exposure to SVOCs.Because indoor air measurements were performed over a period of oneweek, and settled dust being collected in a vacuum cleaner, we assumedthat equilibrium had been reached. Because we frequently move fromone environment into another, or between rooms having differentconcentrations, equilibrium is rarely achieved for the transfer from airto skin. A transient model developed by Gong et al. (2014) consideredconvective mass transfer resistance in the boundary air layer adjacent
Fig. 2. Relative contribution (%) of key para-
meters (Cgas, Cpart, Cdust, fpulm, fdust, log (Kow) and
H) to total variation of Aggregate daily doses
from exposures to 32 indoor SVOCs (ng/kg-bw/
d) for children aged 2 to 3 years. Only relative
contributions above 10% are represented. Bold
font indicates the more influential parameter for
each SVOC. Compounds are ranked according to
their volatility (based on their log (Koa) values)
from the most volatile (fluorene) to the least vo-latile (DiNP).
Fig. 3. Aggregate daily dose of each SVOC for four age groups (ng/kg-bw/d).
M. Pelletier et al. Environment International 109 (2017) 81–88
85

Page 194
to the skin. Morrison et al. (2016) have recently improved this model byincluding skin surface lipids, which increase overall resistance to SVOCuptake from air. However, because these models require parametersthat are not available for all compounds, default parameters are em-ployed - rendering a probabilistic assessment difficult.
For contamination data in the three media when the detection fre-quency was< 1% (Blanchard et al., 2014; Mandin et al., 2014, 2016) aliterature survey was conducted to retrieve other contamination in-formation, which was then employed (instead of the initially-targeteddata) where a lower LOD or LOQ was used by the authors (see TableS2). This concerned settled dust and gas phase concentrations for the2,4,4′-tribromodiphenylether (BDE 28), and gas phase concentrationalone for 12 other SVOCs: benzo[a]pyrene, PCB 31, PCB 105, PCB 118,PCB 138, PCB 153, BDE 47, BDE 85, BDE 99, 2,2′,4,4′,6-pentabromo-diphenylether (BDE 100), 2,2′,4,4′,5,5′-hexabromodiphenylether (BDE153) and BDE 154.
To put our results into perspective, this indoor aggregate multi-media and multipathway exposure assessment was compared to the fewother studies investigating the same exposure pathways, namely: Beköet al. (2013), Gaspar et al. (2014) and Mitro et al. (2016), who in-vestigated phthalates and galaxolide for children aged 3 to 6 years inDenmark, California (US) and 14 states of the US, respectively. OurADD estimated median values for children aged 3 to 6 years (see TableS14) were compared to: estimated median values for DBP and DEHP(Bekö et al., 2013; Gaspar et al., 2014); estimated median values forDiBP, BBP and DEP (Bekö et al., 2013), and estimated average valuesfor DBP, DEHP, DiBP, BBP, DEP and galaxolide (Mitro et al., 2016).Similar results were found for DBP, DEHP and DEP. For DiBP, we founda median value equal to 1.1 μg/kg-bw/d, consistent with the 1.5 μg/kg-bw/d found by Bekö et al. (2013). Using a dust contamination level forthis compound that was seven times lower, Mitro et al. (2016) found alower exposure level equal to 0.1 μg/kg-bw/d. This difference in con-centration data between French and US samples may also reflect a shiftin the use of phthalates as a result of changes to the formulation ofplasticizers. For BBP, we found a median value equal to 0.1 μg/kg-bw/d, consistent with the 0.2 μg/kg-bw/d of Mitro et al. (2016). Using adust contamination level for this compound that was four times lower,Bekö et al. (2013) found a lower exposure level equal to 0.01 μg/kg-bw/d. Regarding galaxolide, our exposure level of 0.05 μg/kg-bw/d isconsistent with Mitro et al. (2016) who found 0.1 μg/kg-bw/d - in linewith dust contamination that was twice as high as ours.
Pathway contributions were found to be similar to Mitro et al.(2016) for DBP, DEP and galaxolide, with inhalation as the main routeof exposure (> 50%), followed by dermal absorption from the gasphase and dust ingestion. Pathway contribution estimates from Beköet al. (2013) for DiBP, BBP and DEHP are also similar to our findings,with total uptake dominated by dermal absorption from the gas phasefor DiBP, and dust ingestion for BBP and DEHP. The results of thepresent study were also comparable to Gaspar et al. (2014), with dustingestion dominating total uptake of DEHP.
In addition to the indoor exposure in dwellings assessed by thisstudy, other sources of exposure (e.g. diet and personal care products)and other indoor environments (e.g. schools and offices) for many ofthese compounds contribute to total exposure, as well as direct dermalcontact with surfaces. The use of personal care products, directly ap-plied to skin or inhaled from aerosols, could have a non-negligiblecontribution to total exposure for some compounds, e.g., for certainphthalates (Romero-Franco et al., 2011) and musks (Zhang et al.,2017). Most of the studies addressing SVOC exposure assessment alsolooked at dietary ingestion (Beamer et al., 2012; Duggan et al., 2003;Lorber, 2007; Roosens et al., 2010; Trudel et al., 2011; Wilson et al.,2003; Wormuth et al., 2006). This could naturally lead to higher ADDestimates and different pathway contributions. Diet has been shown tobe an important source of exposure for certain compounds: e.g. somePBDEs (Trudel et al., 2011) and some phthalates (Wilson et al., 2003).However, several authors who have performed exposure assessments on
both indoor and diet exposure found that dietary ingestion was not themain route of exposure for chlorpyrifos (Beamer et al., 2012; Dugganet al., 2003), DEP, BBP and DiNP (Wormuth et al., 2006), some PBDEs(Lorber, 2007), some PCBs and some OCs (Wilson et al., 2003). Forcertain compounds, exposure via dietary ingestion could also equalexposure via non-dietary ingestion: e.g. DEHP (Wormuth et al., 2006),and anthracene, phenanthrene, benzo[a]pyrene and fluorene (Wilsonet al., 2003). To put our results in perspective, we compared them tothose of the French infant total diet study (ANSES, 2016a, 2016b). Wecompared to lower bound (LB) and upper bound (UB) median estimatesfor children aged 2 to 3 years. For 6 PCBs (sum of PCB 28, 52, 101, 138,153 and 2,2′,3,4,4′,5,5′-heptachlorobiphenyl (PCB 180)) our medianresidential indoor ADDs were about one order of magnitude lower thandietary exposure estimates (LB and UB). For 7 PBDEs (sum of BDE 28,47, 99, 100, 153, 154 and 2,2′,3,4,4′,5′,6-heptabromodiphenylether(BDE 183)) they were about one order of magnitude higher (LB andUB). For DEHP they were of the same order of magnitude (LB and UB).For DiNP and lindane they were of the same order of magnitude as theLB estimates and about one order of magnitude lower than the UB. ForBBP, DEP and DBP they were of the order of magnitude of UB estimates,and one order of magnitude higher than the LB. For DiBP they wereabout one or two orders of magnitude higher than UB and LB respec-tively. For chlorpyrifos, dieldrin and aldrin they were of the same orderof magnitude, in comparison with the LB estimates, and about twoorders of magnitude lower, in comparison with the UB.
Compared to more traditional deterministic approaches, probabil-istic methods (e.g. Monte Carlo simulations) have the main advantageof addressing input parameters featuring both uncertainty and varia-bility. ADD estimations were mainly dependent on variability in indoorconcentrations (Cgas, Cpart and Cdust), and secondarily by uncertainty infpulm and physical and chemical parameters. Uncertainty of parametersis related to lack of total knowledge, whereas data variability refers totrue heterogeneity. An interesting finding is that although input para-meter uncertainty has been accused of causing broad uncertainty inexposure estimates (Pelletier et al., 2017; Salthammer and Schripp,2015), it appeared to contribute less to total variance of ADD than didvariability. For every compound but one, variability of a concentrationexplains at least 40% of ADD variance; in half of all cases, this exceeded60%. Concentrations of a chemical within dwellings span orders ofmagnitude, especially as a result of the presence (or absence) of asource in the dwelling. Physical and chemical parameters can either bemeasured experimentally or calculated using other chemical properties.Depending on which of these methods is used, it follows that valuesvary by one order of magnitude or more (Finizio et al., 1997) - andthese uncertainties are propagated in the calculation of DDderm-gas andthen ADD. Up to 34% of ADD variation for aldrin could be explained byuncertainty in fpulm (see Table S7) because data for most of the SVOCswere unavailable. Indeed, data were available for just two compounds:2,2′,4,4′-tetrabromodiphenylether (BDE 47) and benzo[a]pyrene,leading to modeling of uniform distribution between 0 and 100% formost compounds (see Table S4) and to potential overestimation of in-halation exposure. The same limit was encountered for the other uptakefractions (foral and fdust), though to a lesser extent. For most SVOCs, inrespect of foral, even where pharmacokinetics studies were available andprovided qualitative evidence that the SVOC was absorbed followingoral exposure, no quantitative data describing in vivo oral absorptionwere available in the literature. Moreover, in laboratory animals, ab-sorption of a compound can also depend strongly on experimentalparameters, such as the carrier vehicle employed (Huwe et al., 2008).For example, gastrointestinal lindane bioavailability in rats ranged from6% when the compound was suspended in water to 99% when given inoil. A further aspect is that we used PM10 measurements, whereas asmaller sampling fraction would have been more representative of re-spirable particles - this may result in an overestimation of the inhalationpathway for those SVOCs mainly present in the particulate phase (BDE47, BDE 99, benzo[a]pyrene, PCB 118, PCB 138 and PCB 153). Human
M. Pelletier et al. Environment International 109 (2017) 81–88
86

Page 195
body parameters (BW, BSA, IR, DI and t) are highly variable and, to alesser extent, uncertain. Özkaynak et al. (2011) found significant un-certainty on DI, and this result led us to consider both uncertainty andvariability for this parameter in our study. Nevertheless, we found thathuman body parameters made a marginal or null contribution (seeTable S7) to the variance of ADD for a child aged 2 to 3 years, for eachSVOC. It is however important to bear in mind both that we ran themodel age-group by age-group, and that these parameters can have abroader impact when applied to a more diverse population.
Recent studies have investigated and modeled the clothing effect.Morrison et al. (2016) have shown that frequency of bathing andchanging clothes were influential in terms of dermal uptake. In addi-tion, introduction to the model of a skin surface lipid film, and its in-teractions with clothing, may affect results. The authors assessed theinfluence of clothing on the dermal uptake of two phthalates (DEP andDBP). They found that clean clothes were protective against air pollu-tants, whereas worn clothes, because they had adsorbed air pollutants,increased dermal uptake. Because only clean clothes could be con-sidered protective, we decided to not take into account the role ofclothing in this study, making the assumption that the total body sur-face area was exposed to the gaseous phase.
5. Conclusions
This indoor aggregate multimedia and pathway exposure assess-ment considered a wide range of pollutants, across a broad population.It reveals that exposure spanned orders of magnitude, from pg/kg-bw/dto μg/kg-bw/d and was mainly dependent on indoor SVOC con-taminations. Within the boundaries of the conceptual model we used,exposure variability overwhelmed its uncertainty. Air was the dominantmedium for most compounds, either by inhalation or dermal contact.Along with evidence of these compounds causing similar toxic effects(Fournier et al., 2014; Mitro et al., 2016), these findings lend support tothe call for cumulative risk assessment of indoor SVOCs.
Acknowledgments
This work was supported by a doctoral Grant (Maud Pelletier) fromFondation de France (Grant Number 2014-00053331) and Agence del’Environnement et de la Maîtrise de l’énergie (Grant Number TEZ14-36).
The authors declare having no competing financial interests.
Appendix A. Supplementary data
Supplementary data to this article can be found online at http://dx.doi.org/10.1016/j.envint.2017.08.024.
References
ANSES, 2016a. Etude de l'Alimentation Totale infantile 2 (EATi) – Tome 2 – Partie 3:composés organiques. Rapport d'expertise collective. https://www.anses.fr/fr/system/files/ERCA2010SA0317Ra-Tome2-Part3.pdf.
ANSES, 2016b. Etude de l'Alimentation Totale infantile 2 (EATi) – Tome 2 – Partie 4:résultats relatifs aux résidus de pesticides. Rapport d'expertise collective. https://www.anses.fr/fr/system/files/ERCA2010SA0317Ra-Tome2-Part4.pdf.
Armstrong, B., Hutchinson, E., Unwin, J., Fletcher, T., 2004. Lung cancer risk after ex-posure to polycyclic aromatic hydrocarbons: a review and meta-analysis. Environ.Health Perspect. 112, 970–978.
Baldi, I., Filleul, L., Mohammed-Brahim, B., Fabrigoule, C., Dartigues, J.F., Schwall, S.,Drevet, J.P., Salamon, R., Brochard, P., 2001. Neuropsychologic effects of long-termexposure to pesticides: results from the French Phytoner study. Environ. HealthPerspect. 109, 839–844.
Beamer, P.I., Canales, R.A., Ferguson, A.C., Leckie, J.O., Bradman, A., 2012. Relativepesticide and exposure route contribution to aggregate and cumulative dose in youngfarmworker children. Int. J. Environ. Res. Public Health 9 (1), 73–96.
Bekö, G., Weschler, C.J., Langer, S., Callesen, M., Toftum, J., Clausen, G., 2013. Children'sphthalate intakes and resultant cumulative exposures estimated from urine comparedwith estimates from dust ingestion, inhalation and dermal absorption in their homesand daycare centers. PLoS One 8 (4), e62442.
Blanchard, O., Glorennec, P., Mercier, F., Bonvallot, N., Chevrier, C., Ramalho, O.,Mandin, C., Le Bot, B., 2014. Semivolatile organic compounds in indoor air andsettled dust in 30 French dwellings. Environ. Sci. Technol. 48, 3959–3969.
Blanc-Lapierre, A., Bouvier, G., Garrigou, A., Canal-Raffin, M., Raherison, C., Brochard,P., Baldi, I., 2012. Chronic central nervous system effects of pesticides: state-of-the-art. Rev. Epidemiol. Sante. 60 (5), 389–400.
Bonvallot, N., Mandin, C., Mercier, F., Le Bot, B., Glorennec, P., 2010. Health ranking ofingested semi-volatile organic compounds in house dust: an application to France.Indoor Air 20, 458–472.
Burmaster, D.E., Hull, D.A., 1997. Using lognormal distributions and lognormal prob-ability plots in probabilistic risk assessments. Hum. Ecol. Risk. Assess. 3 (2), 235–255.
Casas, M., Chevrier, C., Den Hond, E., Fernandez, M.F., Pierik, F., Philippat, C., Slama, R.,Toft, G., Vandentorren, S., Wilhelm, M., Vrijheid, M., 2013. Exposure to brominatedflame retardants, perfluorinated compounds, phthalates and phenols in Europeanbirth cohorts: ENRIECO evaluation, first human biomonitoring results, and re-commendations. Int. J. Hyg. Environ. Health 216 (3), 230–242.
Duggan, A., Charnley, G., Chen, W., Chukwudebe, A., Hawk, R., Krieger, R.I., Ross, J.,Yarborough, C., 2003. Di-alkyl phosphate biomonitoring data: assessing cumulativeexposure to organophosphate pesticides. Regul. Toxicol. Pharmacol. 37 (3), 382–395.
Elbaz, A., Clavel, J., Rathouz, P.J., Moisan, F., Galanaud, J.P., Delemotte, B., Alperovitch,A., Tzourio, C., 2009. Professional exposure to pesticides and Parkinson disease. Ann.Neurol. 66, 494–504.
Finizio, A., Mackay, D., Bidleman, T., Harner, T., 1997. Octanol-air partition coefficient asa predictor of partitioning of semivolatile organic chemicals to aerosols. Atmos.Environ. 31, 2289–2296.
Fournier, K., Glorennec, P., Bonvallot, N., 2014. An exposure-based framework forgrouping pollutants for a cumulative risk assessment approach: case study of indoorsemi-volatile organic compounds. Environ. Res. 130, 20–28.
Gaspar, F.W., Castorina, R., Maddalena, R.L., Nishioka, M.G., McKone, T.E., Bradman, A.,2014. Phthalate exposure and risk assessment in California child care facilities.Environ. Sci. Technol. 48 (13), 7593–7601.
Gong, M., Zhang, Y., Weschler, C.J., 2014. Predicting dermal absorption of gas phasechemicals: transient model development, evaluation, and application. Indoor Air 24,292–306.
Helsel, D.R., 2011. Statistics for Censored Environmental Data Using Minitab and R. Vol.77 John Wiley & Sons.
Helsel, D.R., Hirsch, R.M., 1992. Statistical Methods in Water Resources. Vol. 49 Elsevier.Huwe, J.K., Hakk, H., Smith, D.J., Diliberto, J.J., Richardson, V., Stapleton, H.M.,
Birnbaum, L.S., 2008. Comparative absorption and bioaccumulation of poly-brominated diphenyl ethers following ingestion via dust and oil in male rats. Environ.Sci. Technol. 42 (7), 2694–2700.
IARC, 2015a. Polychlorinated biphenyls and polybrominated biphenyls, IARC Monogr.Eval. Carcinog. Risk Chem. Hum., Vol. 107. http://monographs.iarc.fr/ENG/Monographs/vol107/index.php.
IARC, 2015b. Some organophosphate insecticides and herbicides: diazinon, glyphosate,malathion, parathion, and tetrachlorvinphos, IARC Monogr. Eval. Carcinog. RiskChem. Hum., Vol. 112. http://monographs.iarc.fr/ENG/Monographs/vol112/index.php.
Linares, V., Perelló, G., Nadal, M., Gómez-Catalán, J., Llobet, J.M., Domingo, J.L., 2010.Environmental versus dietary exposure to POPs and metals: a probabilistic assess-ment of human health risks. J. Environ. Monit. 12 (3), 681–688.
Lorber, M., 2007. Exposure of Americans to polybrominated diphenyl ethers. J. Expo. Sci.Environ. Epidemiol. 18 (1), 2–19.
Mackay, D., Shiu, W.Y., Ma, K.C., Lee, S.C., 2010a. Handbook of physical-chemicalproperties and environmental fate for organic chemicals. In: Introduction andHydrocarbons. Vol. 1 CRC Pressed.
Mackay, D., Shiu, W.Y., Ma, K.C., Lee, S.C., 2010b. Handbook of physical-chemicalproperties and environmental fate for organic chemicals. In: HalogenatedHydrocarbons. Vol. 2 CRC Pressed.
Mackay, D., Shiu, W.Y., Ma, K.C., Lee, S.C., 2010c. Handbook of physical-chemicalproperties and environmental fate for organic chemicals. In: Oxygen ContainingCompounds. Vol. 3 CRC Pressed.
Mackay, D., Shiu, W.Y., Ma, K.C., Lee, S.C., 2010d. Handbook of physical-chemicalproperties and environmental fate for organic chemicals. In: Nitrogen and SulfurContaining Compounds and pesticides. Vol. 4 CRC Pressed.
Mandin, C., Mercier, F., Lucas, J.-P., Ramalho, O., Blanchard, O., Bonvallot, N., Raffy, G.,Gilles, E., Glorennec, P., Le Bot, B., 2014. ECOS-POUSS: A Nationwide Survey ofSemi-Volatile Organic Compounds in Home Settled Dust. Proceedings of the IndoorAir Conference 2014, July 7–12 2014, Hong Kong. Vol. VI. pp. 143–148.
Mandin, C., Mercier, F., Ramalho, O., Lucas, J.P., Gilles, E., Blanchard, O., Bonvallot, N.,Glorennec, P., Le Bot, B., 2016. Semi-volatile organic compounds in the particulatephase in dwellings: a nationwide survey in France. Atmos. Environ. 136, 82–94.
Mitro, S.D., Dodson, R.E., Singla, V., Adamkiewicz, G., Elmi, A.F., Tilly, M.K., Zota, A.R.,2016. Consumer product chemicals in indoor dust: a quantitative meta-analysis ofU.S. studies. Environ. Sci. Technol. 50 (19), 10661–10672.
Morrison, G.C., Weschler, C.J., Bekö, G., 2016. Dermal uptake directly from air undertransient conditions: advances in modeling and comparisons with experimental re-sults for human subjects. Indoor Air 26 (6), 913–924.
Özkaynak, H., Xue, J., Zartarian, V.G., Glen, G., Smith, L., 2011. Modeled estimates of soiland dust ingestion rates for children. Risk Anal. 31 (4), 592–608.
Pandrangi, L.S., Morrison, G.C., 2008. Ozone interactions with human hair: ozone uptakerates and product formation. Atmos. Environ. 42, 5079–5089.
Pelletier, M., Bonvallot, N., Ramalho, O., Blanchard, O., Mercier, F., Mandin, C., Le Bot,B., Glorennec, P., 2017. Dermal absorption of semivolatile organic compounds fromthe gas phase: sensitivity of exposure assessment by steady state modeling to keyparameters. Environ. Int. 102, 106–113.
M. Pelletier et al. Environment International 109 (2017) 81–88
87

Page 196
Raffy, G., Mercier, F., Glorennec, P., Mandin, C., Le Bot, B., 2016. Human exposure tosemi-volatile organic compounds (SVOCs) via dust ingestion: a review of influencingfactors. Indoor air conference, Ghent. http://www.isiaq.org/docs/Papers/Paper853.pdf.
Romero-Franco, M., Hernández-Ramírez, R.U., Calafat, A.M., Cebrián, M.E., Needham,L.L., Teitelbaum, S., Wolff, M.S., López-Carrillo, L., 2011. Personal care product useand urinary levels of phthalate metabolites in Mexican women. Environ. Int. 37 (5),867–871.
Roosens, L., Cornelis, C., D'Hollander, W., Bervoets, L., Reynders, H., Van Campenhout,K., Van Den Heuvel, R., Neels, H., Covaci, A., 2010. Exposure of the Flemish popu-lation to brominated flame retardants: model and risk assessment. Environ. Int. 36(4), 368–376.
Roper, C.S., Simpson, A.G., Madden, S., Serex, T.L., Biesemeier, J.A., 2006. Absorption of[14C]-tetrabromodiphenyl ether (TeBDE) through human and rat skin in vitro. DrugChem. Toxicol. 29 (3), 289–301.
Rostami, I., Juhasz, A.L., 2011. Assessment of persistent organic pollutant (POP) bioa-vailability and bioaccessibility for human health exposure assessment: a critical re-view. Crit. Rev. Environ. Sci. Technol. 41 (7), 623–656.
Rubin, B.S., 2011. Bisphenol A: an endocrine disruptor with widespread exposure andmultiple effects. J. Steroid Biochem. 127, 27–34.
Salthammer, T., Schripp, T., 2015. Application of the Junge- and Pankow-equation forestimating indoor gas/particle distribution and exposure to SVOCs. Atmos. Environ.106, 467–476.
Sukiene, V., von Goetz, N., Gerecke, A.C., Bakker, M.I., Delmaar, C.J., Hungerbuhler, K.,2017. Direct and air-mediated transfer of labeled SVOCs from indoor sources to dust.Environ. Sci. Technol. 51 (6), 3269–3277.
Tamas, G., Weschler, C.J., Bako-Biro, Z., Wyon, D.P., Strom-Tejsen, P., 2006. Factorsaffecting ozone removal rates in a simulated aircraft cabin environment. Atmos.Environ. 40, 6122–6133.
Trudel, D., Scheringer, M., von Goetz, N., Hungerbühler, K., 2011. Total consumer ex-posure to polybrominated diphenyl ethers in North America and Europe. Environ.
Sci. Technol. 45 (6), 2391–2397.U.S. EPA, 2005. Guidance on Selecting Age Groups for Monitoring and Assessing
Childhood Exposures to Environmental Contaminants. National Center forEnvironmental Assessment, Washington, DC; EPA/630/P-03/003F. (Available from:National Technical Information Service, Springfield, VA, and online at http://epa.gov/ncea).
U.S. EPA, 2011. Exposure Factors Handbook.U.S. EPA, 2013. Estimation Program Interface (EPI) Suite. (last updated on 15.3.2013,
Version EPI 4.11).Weschler, C.J., Nazaroff, W.W., 2008. Semivolatile organic compounds in indoor en-
vironments. Atmos. Environ. 42, 9018–9040.Weschler, C.J., Nazaroff, W.W., 2012. SVOC exposure indoors: fresh look at dermal
pathways. Indoor Air 22, 356–377.Weschler, C.J., Nazaroff, W.W., 2014. Dermal uptake of organic vapors commonly found
in indoor air. Environ. Sci. Technol. 48, 1230–1237.WHO, 2006. Principles for Evaluating Health Risks in Children Associated with Exposure
to Chemicals. International Programme on Chemical Safety, World HealthOrganization, Geneva (Environmental Health Criteria 237).
Wilson, N.K., Chuang, J.C., Lyu, C., Menton, R., Morgan, M.K., 2003. Aggregate exposuresof nine preschool children to persistent organic pollutants at day care and at home. J.Expo. Anal. Environ. Epidemiol. 13 (3), 187–202.
Wormuth, M., Scheringer, M., Vollenweider, M., Hungerbühler, K., 2006. What are thesources of exposure to eight frequently used Phthalic acid esters in Europeans? RiskAnal. 26 (3), 803–824.
Zaganas, I., Kapetanaki, S., Mastorodemos, V., Kanavouras, K., Colosio, C., Wilks, M.F.,Tsatsakis, A.M., 2013. Linking pesticide exposure and dementia: what is the evi-dence? Toxicology 307, 3–11.
Zhang, X., Yu, Y., Gu, Y., Li, X., Zhang, X., Yu, Y., 2017. In vitro determination oftransdermal permeation of synthetic musks and estimated dermal uptake throughusage of personal care products. Chemosphere 173, 417–424.
M. Pelletier et al. Environment International 109 (2017) 81–88
88

Page 197
Contents lists available at ScienceDirect
Environment International
journal homepage: www.elsevier.com/locate/envint
Review article
Bioaccessibility and bioavailability of environmental semi-volatile organiccompounds via inhalation: A review of methods and models
Wenjuan Weia,⁎, Nathalie Bonvallotb,c, Åsa Gustafssond,e, Gaëlle Raffyb,c,g, Philippe Glorennecb,c,Annette Kraisd,f, Olivier Ramalhoa, Barbara Le Botb,c,g, Corinne Mandina
aUniversity of Paris-Est, Scientific and Technical Center for Building (CSTB), Health and Comfort Department, French Indoor Air Quality Observatory (OQAI), 84 Avenue
Jean Jaurès, Champs sur Marne, 77447 Marne la Vallée Cedex 2, Franceb EHESP-School of Public Health, Sorbonne Paris Cité, Rennes, Francec INSERM-UMR 1085, Irset-Research Institute for Environmental and Occupational Health, Rennes, Franced Swetox, Karolinska Institute, Unit of Toxicology Sciences, Forskargatan 20, SE-151 36 Södertälje, Swedene Department of Chemistry, Umeå University, Linnaeus väg 6, SE-901 87 Umeå, SwedenfDepartment of Occupational and Environmental Medicine, Department of Laboratory Medicine, Lund University, SE-221 85, Lund, Swedeng LERES-Environment and Health Research Laboratory (Irset and EHESP Technologic Platform), Rennes, France
A R T I C L E I N F O
Handling Editor: R.J. Latcher
Keywords:
SVOCsRespiratory tractAbsorptionDepositionInhalation exposureInternal dose
A B S T R A C T
Semi-volatile organic compounds (SVOCs) present in indoor environments are known to cause adverse healtheffects through multiple routes of exposure. To assess the aggregate exposure, the bioaccessibility and bioa-vailability of SVOCs need to be determined.
In this review, we discussed measurements of the bioaccessibility and bioavailability of SVOCs after in-halation. Published literature related to this issue is available for 2,3,7,8-tetrachlorodibenzo-p-dioxin and a fewpolycyclic aromatic hydrocarbons, such as benzo[a]pyrene and phenanthrene. Then, we reviewed commonmodeling approaches for the characterization of the gas- and particle-phase partitioning of SVOCs during in-halation. The models are based on mass transfer mechanisms as well as the structure of the respiratory system,using common computational techniques, such as computational fluid dynamics. However, the existing modelsare restricted to special conditions and cannot predict SVOC bioaccessibility and bioavailability in the wholerespiratory system.
The present review notes two main challenges for the estimation of SVOC bioaccessibility and bioavailabilityvia inhalation in humans. First, in vitro and in vivo methods need to be developed and validated for a wide rangeof SVOCs. The in vitro methods should be validated with in vivo tests to evaluate human exposures to SVOCs inairborne particles. Second, modeling approaches for SVOCs need to consider the whole respiratory system.Alterations of the respiratory cycle period and human biological variability may be considered in future studies.
1. Introduction
Semi-volatile organic compounds (SVOCs) are defined as moleculeswith vapor pressures between 10−9 and 10 Pa at 25 °C (Weschler andNazaroff, 2008). SVOCs originate from indoor and outdoor sources andare widely present in people's everyday lives (Blanchard et al., 2014).Common indoor environmental SVOCs include phthalate esters used asplasticizers; polybrominated diphenyl ethers (PBDEs) and poly-chlorinated biphenyls (PCBs) used as flame retardants; organochlorineand organophosphorus pesticides; synthetic musks; polycyclic aromatichydrocarbons (PAHs); and alkylphenols used as additives in detergents,fuels, lubricants, polymers, and other products. These compounds are
present in the gas phase and absorbed on airborne particles, settleddust, and indoor surfaces (Bi et al., 2015; Blanchard et al., 2014;Mandin et al., 2016).
Most SVOCs cause adverse health effects, including neurotoxic andreprotoxic effects (Fournier et al., 2014). Chemicals such as organo-chlorines (e.g., dichlorodiphenyltrichloroethane and PCBs), brominatedcompounds (e.g., PBDEs), bisphenol A, PAHs, alkylphenols, pesticides,and a variety of phthalate esters have endocrine-disrupting properties(De Coster and Van Larebeke, 2012). In addition, some phthalate estershave been shown to play a role in atopic diseases such as asthma, ec-zema and rhinitis (Bekö et al., 2015; Bornehag et al., 2004; Hsu et al.,2012; Jaakkola and Knight, 2008; Kolarik et al., 2008). PAHs,
https://doi.org/10.1016/j.envint.2018.01.024Received 30 August 2017; Received in revised form 22 January 2018; Accepted 23 January 2018
⁎ Corresponding author at: Centre Scientifique et Technique du Bâtiment (CSTB), Direction Santé-Confort - Observatoire de la Qualité de l'Air Intérieur (OQAI), 84 Avenue Jean Jaurès,Champs sur Marne, 77447 Marne la Vallée Cedex 2, France.
E-mail address: [email protected] (W. Wei).
Environment International 113 (2018) 202–213
0160-4120/ © 2018 Elsevier Ltd. All rights reserved.
T

Page 198
especially benzo[a]pyrene (BaP), and some organochlorine and orga-nophosphate pesticides are also known to be carcinogenic compoundsaccording to the International Agency for Research on Cancer. Inhala-tion exposure may play an important role in the exposure to SVOC, suchas some PAHs and phthalate esters (Jaakkola and Knight, 2008; Kimet al., 2013; Pelletier et al., 2017). If it is less obvious for other SVOCs,the contribution of the inhalation route to indoor SVOC exposure hasbeen estimated as being important for PBDEs, PCBs, pesticides, musks,and phthalate esters with high volatility (Pelletier et al., 2017).
Human exposure to environmental SVOCs can occur via the inges-tion of settled dust, dermal absorption, and inhalation (Weschler andNazaroff, 2008), as the compounds partition between different phasesin the air, on indoor surfaces, and in settled dust. The SVOC con-centrations in the gas phase, particle phase, and settled dust are com-monly used for the estimation of human exposure to environmentalSVOCs (Pelletier et al., 2017). However, the use of rough concentra-tions may overestimate the uptake of SVOCs because a fraction of theSVOCs may not be bioaccessible or bioavailable. To improve the healthrisk assessment associated with the multiple routes of SVOC exposure,the bioaccessible or bioavailable concentrations should be determined(Semple et al., 2004). The definitions of bioaccessibility and bioavail-ability from the perspectives of toxicologists and environmental scien-tists are diverse (Reichenberg and Mayer, 2006; Semple et al., 2004). Inthe present study, the bioaccessible fraction of a compound is defined asthe amount that is released into the body fluid and available for ab-sorption (Caboche et al., 2011; Collins et al., 2015; Rostami and Juhasz,2011), whereas the bioavailable fraction is defined as the amount thatcan cross a biological membrane and reach systemic circulation (Collinset al., 2015; Rostami and Juhasz, 2011; Yu et al., 2012). Using thebioavailability increases the accuracy of the exposure assessment. Dueto difficulties in the measurement of the bioavailability, as it requiresmeasurements in human biological endpoints, SVOC bioaccessibleconcentrations from environmental media can be used as a substitute.The fraction of a compound released into the fluid of an organism (thebioaccessible fraction) is higher than that subsequently transferred intothe bloodstream (the bioavailable fraction) (Kastury et al., 2017).
The bioaccessibility and bioavailability of a number of SVOCs via
ingestion and dermal contact have been studied through in vitro and in
vivo tests, respectively. In the in vitro bioaccessibility studies, the ab-sorption of SVOCs was studied employing real or simulated humangastrointestinal (He et al., 2016; Juhasz et al., 2014; Kang et al., 2012;Wang et al., 2013; Yu et al., 2012) or skin receptor (Beriro et al., 2016)fluids. In the in vivo bioavailability studies, human or animal subjectswere exposed to SVOCs by ingestion (Wu et al., 2007) or dermal contact(Abdallah et al., 2015; Morrison et al., 2016; Wester et al., 1990), andthe SVOC concentration in the blood, urine, or organism was measured(Beriro et al., 2016; Koch et al., 2005).
The bioaccessibility and bioavailability of inhaled metals in ambientparticles have been critically reviewed (Boisa et al., 2014; Kastury et al.,2017; Wiseman, 2015). Significant methodological differences wereobserved among the studies within the compositions of leaching agentsused during the extraction and the use of static versus dynamic methods.The bioaccessibility and bioavailability of inhaled SVOCs have rarelybeen studied. Inhaled SVOCs may exist in both the gas and particlephases, which can deposit in respiratory tracts by four mechanisms andbecome bioaccessible (Fig. 1) (Pankow, 2001): the deposition of gas-phase compounds (GD: gas deposition), deposition of gas-phase com-pounds evaporated from the inhaled particles (EGD: evaporated gasdeposition), deposition of inhaled particles followed by the depositionof the gas-phase compounds evaporated from the deposited particles(PDEGD: particle deposition and evaporated gas deposition), and de-position of inhaled particles followed by the diffusion of compoundsfrom the deposited particles to the fluid of the respiratory tracts (PDD:particle deposition and diffusion). These four general mechanisms canbe applied to a number of compounds including SVOCs.
Thus, in this paper we aim to (1) review the existing measurement
methods addressing the bioaccessibility and bioavailability of SVOCsvia inhalation, (2) review the existing mathematical models addressingthe bioaccessibility and bioavailability of SVOCs and other chemicalcompounds relevant for SVOCs via inhalation, and (3) discuss the keychallenges to determining the SVOC bioaccessibility and bioavailabilityvia inhalation.
To carry out the review, peer-reviewed papers were retrieved using“bioaccessibility” OR “bioavailability” AND “inhalation” as key wordsin the Google Scholar, Science Direct, and PubMed search engines, re-gardless of the date of publication.
2. Measurements of SVOC bioaccessibility and bioavailability
following inhalation
2.1. SVOC bioaccessibility (in vitro tests)
Five articles have been found on the bioaccessible fraction that issoluble in the fluid environment of a target organism that address thedesorption of SVOCs due to the PDEGD and PDD mechanisms. Three ofthem were published after the year 2000. The bioaccessibility of certainparticle-phase PAHs was measured in vitro using synthetic lung fluids,and the desorbed PAHs were extracted with solvents (Gerde andScholander, 1989).
The in vitro method frequently differs from one study to another.Woodstove particles containing BaP were added into phospholipid ve-sicles to simulate the transport of particle-phase BaP into biomem-branes (Bevan and Yonda, 1985). After 18 h of incubation in phos-pholipid vesicles at 37 °C, the BaP was extracted with ethyl acetate at50 °C. Meanwhile, the total extractable amount of BaP in the woodstoveparticles was assessed by adding 2 g of BaP into 9ml of toluene andplacing the mixture at 70–80 °C for 48–72 h. The results showed that98–100% of the particle-phase BaP was extractable with toluene, ofwhich 25% entered the phospholipid vesicles. This value has not beencompared to data from in vivo studies.
Gerde et al. measured the bioaccessibility of 120 μg of inhaledparticle-phase BaP by extraction in 17ml of 1-octanol as a syntheticlung fluid at 37 °C in a cylindrical glass reactor with a two-bladed im-peller (Gerde et al., 2001). The inhaled particles were BaP-coated dieselsoot containing 14.5 ng BaP per μg soot (25% of a monomolecularlayer). The soot-adsorbed BaP decreased from 25% to 16% within 48 h.This value is similar to that of the in vivo study obtained 5.6monthsafter the inhalation exposure of dogs to the same particles. Therefore,the authors concluded that 36% of the total soot-adsorbed BaP, i.e., 9%of the monomolecular layer, was bioaccessible, and that the remainingBaP was retained on the particles in the lung. However, when thecarrier particles were composed of silica in powder form with a 3.5 μmdiameter and pores of 80 Å in diameter, the bioaccessible fraction of100mg of BaP/silica powder extracted with 17ml of 1-octanol in astirred reactor under the same temperature was> 85% within 5minafter inhalation (Ewing et al., 2006). This value has not been comparedto data from in vivo studies.
Borm et al. measured the bioaccessibility of five different inhaledparticle-phase PAHs in saline containing dipalmitoylphosphatidylcho-line (DPPC) in different concentrations (100–10,000 μg/ml) in the darkin a shaking water bath for 24 h at 37 °C (Borm et al., 2005). The stu-died particles were reference diesel and four types of carbon black withdifferent properties, i.e., with the surface area ranging from 20 to300m2/g. The carbon black particles contained 0.001–191 ng PAHs permg particle. The leachable PAHs were extracted for 60 s using tertiarybutyl methyl ether. The fraction of PAHs desorbed from the particlesinto the DPPC solutions was<1.2% for phenanthrene,< 0.4% forpyrene,< 1.0% for anthracene,< 1.3% for chrysene, and<1.3% forfluoranthene. These results were compared with the data of thePAH–DNA adducts obtained 13weeks after the inhalation exposure ofrats to the same particles. The results of the in vivo study showed that asmall fraction of these particle-phase PAHs could become bioavailable
W. Wei et al. Environment International 113 (2018) 202–213
203

Page 199
when the particles have a high PAH content.A summary of the results from these studies on SVOC bioaccessi-
bility is presented in Table 1. Together, the literature describes thebioaccessibility of 7 PAHs (BaP, benzo[k]fluoranthene, phenanthrene,pyrene, anthracene, chrysene, and fluoranthene) following an inhala-tion scenario. The bioaccessibilities of BaP and benzo[k]fluoranthenevary between 25% and>85%, while the bioaccessibilities of the other5 PAHs are< 1.3%. The methods for measuring the bioaccessibility ofSVOCs in lung lining fluids differed between studies. There are manyfactors that may affect the bioaccessibility, depending on the method.For example, different SVOC-carrier particles were used, includingwoodstove particles, diesel soot, carbon black, and silica, and theirdifferent physical and chemical properties may affect the bioaccessi-bility of the SVOCs. Additionally, different fluids were used to simulatethe lung lining fluid following a scenario of particle deposition withinthe airways: water, phospholipid vesicles, 1-octanol, and DPPC. Theextraction mediums include ethyl acetate, 1-octanol, tertiary butylmethyl ether, and toluene, which also have different properties thatmay affect the bioaccessibility of the SVOCs. Moreover, the time ofincubation and the temperature varied among these studies, and bothare factors that can affect the results. More studies are needed to ex-plain the differences across the compounds and studies.
In summary, the determined bioaccessible fraction may depend onmany different parameters such as the composition and volume of thesimulated lung fluid, the nature of the particles, the extraction time, thetemperature, and the agitation. Various methods have been reported,resulting in difficulties in comparing the results among the studies.Therefore, it is important to validate the in vitro results using data fromin vivo studies. Moreover, the proper quality control/quality assuranceof the analysis of the extraction fluid is essential for bioaccessibilitymeasurements (Rodríguez-Navas et al., 2017). Guney et al. suggesteddeveloping more rigor measurement methods for future studies of in-halation exposure (Guney et al., 2016).
2.2. SVOC bioavailability (in vivo and ex vivo tests)
Ten articles have been found on the bioavailable fraction thatreaches the systemic circulation of a subject, and four of them werepublished after the year 2000. The bioavailability of 2,3,7,8-tetra-chlorodibenzo-p-dioxin and some PAHs via particle-phase inhalationwas measured in human and animal subjects. Measurements of theSVOC bioavailability in humans were performed in vivo by Gardineret al., where the bioavailability of pyrene was analyzed in five non-smokers who worked in plants manufacturing carbon black (Gardineret al., 1992). In this study, the pyrene in the air of the working en-vironment was assumed to be the only source of exposure, and theconcentration of 1-hydroxypyrene was measured in their urine at theend of the working shift as an indicator of the bioavailability of pyrene.The results varied largely from one individual to another. The averageconcentration of 1-hydroxypyrene was 0.3 μmol 1-hydroxy-pyrene permol creatinine, while the average pyrene concentration in airborne
particles was 8mg/m3. Although there were no control groups in thestudy, the urine values of the workers on the Monday, after a weekendwithout working in the plant, were lower than the rest of the week'svalues (p-value= 0.000137). The authors noted that due to the di-versity of SVOC sources in everyday human life, this method can beapplied to only special cases.
Investigations of bioavailability have more frequently been carriedout in animals, e.g., rats and dogs. Gerde et al. measured the in vivo
bioavailability of inhaled particle-phase BaP in 3 dogs (Gerde et al.,2001). The inhaled particles were BaP-coated diesel soot containing14.5 ng BaP per μg soot (25% of a monomolecular layer). The particleswere pushed once into the dog lungs over a 4–5 s period, and the dogswere apneic for the next 2min. Blood samples were taken continuouslyfor 1 h directly after the exposure. Eighteen percent of the soot-ad-sorbed BaP was bioavailable within 4.3 min after inhalation. Other in
vivo bioavailability tests in animals using similar methods are sum-marized in Table 2 (Gøtze et al., 1994; Nessel et al., 1992; Rameshet al., 2002, 2001; Withey et al., 1993, 1992). Samples have been takenof blood, lung tissues, and liver tissues. The bioavailability of particle-phase 2,3,7,8-tetrachlorodibenzo-p-dioxin was found to be 100%(Nessel et al., 1992), while the bioavailability of particle-phase BaP wasfound to vary between 25% (Ramesh et al., 2002) and 65% (Rameshet al., 2001). When the concentration of the particle-phase pyreneranged between 200 and 800mg/m3, the pyrene concentration in theblood ranged between 2.5 and 23.4 μg/g (Withey et al., 1992).
Fouchécourt et al. housed 4 rats in cages containing PAH-con-taminated soil for 3 days to study the exposure via inhalation, ingestion,and dermal absorption (Fouchécourt et al., 1999). The rat lungs wereexposed to PAHs directly by the inhalation of contaminated soil andindirectly by blood circulation. However, the contribution of each routewas not quantified or distinguished. While the soil contained 13 PAHs,only 3 (BaP, fluoranthene, and pyrene) were detected in the lung aftersacrificing the exposed rats. The cytochrome P450-dependent mono-oxygenase activity, followed by 7-ethoxyresorufin O-deethylase (EROD)activity measurement, a biomarker of chemical exposure (Whyte et al.,2000) in the lungs, showed that the composition of the carrier particlescan affect the absorption and bioavailability of the particle-phaseSVOCs (Fouchécourt et al., 1999).
The SVOC bioavailability can also be measured ex vivo in an isolatedand perfused lung (IPL) (Tornquist et al., 1988). Ewing et al. measuredthe bioavailability of the inhaled particle-phase BaP in 10 rats (Ewinget al., 2006). The inhaled particles were BaP-coated silica in powderform containing 1.3 ng BaP per μg silica powder. The rat lungs wereexcised and kept ventilated ex vivo in an artificial thoracic chamber at37 °C and perfused with albumin buffer. The particles were pushed intothe IPL over a one-minute period while rebreathing was prevented bymaintaining a constant downstream flow in the lungs. The lung lobeswere dissected, and the amount of BaP deposited in the lung tissues wasanalyzed. The bioavailability of the inhaled particle-phase BaP wasdose-dependent and was approximately 100% under sub-saturationdosing regimens. It has been noted by the U.S. Food and Drug
Fig. 1. Model schematics for the evaluation of the bioaccessibility and bioavailability via inhalation.
W. Wei et al. Environment International 113 (2018) 202–213
204

Page
20
0
Table 1
Measurements of the SVOC bioaccessibility via inhalation.
Reference SVOC Vaporpressure(Pa)
Particle Particlesize (μm)
SVOC content(ng/mg particle)
Synthetic lung medium Leachingtemperature(°C)
Leaching time Extractionmedium
Extractiontemperature(°C)
Extraction time Agitation Analyticalinstrument
Bioaccessibility
(Bevan andYonda,1985)
BaP 7.3×10⁻⁷ Woodstoveparticle
NA 1.5 ± 0.1 Phospholipid vesicles 37 18 h Ethyl acetate 50 NA Bath-typesonicator
HPLC 25%
(Gerde et al.,2001)
BaP 7.3×10⁻⁷ Diesel soot 1.3 ± 0.2 14,500 1-octanol (120 μg particle in17ml liquid)
37 20 s 1-octanol 37 8min Two-bladedimpeller(15mmdiameter,12mmheight,400 rpm)
HPLC 36%
(Ewing et al.,2006)
BaP 7.3×10⁻⁷ Silica 3.5 1300 ± 60 1-octanol (100mg particle in17ml 1-octanol)
37 5min 1-octanol 37 NA Stirring HPLC >85%
(Bevan andYonda,1985)
BkF 1.3×10⁻⁷ Woodstoveparticle
NA 0.22 ± 0.02 Phospholipid vesicles 37 18 h Ethyl acetate 50 NA Bath-typesonicator
HPLC 68%
(Borm et al.,2005)
Phe 1.6×10⁻² Diesel orcarbonblackparticle
NA 0.001–191 Dipalmitoylphosphatidylcholine(3–60mg particle in 3ml saline)
37 24 h Tertiarybutylmethylether
NA 60 s Shakingwater bath
HPLC <1.2%
(Borm et al.,2005)
Pyr 6.0×10⁻⁴ Diesel orcarbonblackparticle
NA 0.001–191 Dipalmitoylphosphatidylcholine(3–60mg particle in 3ml saline)
37 24 h Tertiarybutylmethylether
NA 60 s Shakingwater bath
HPLC <0.4%
(Borm et al.,2005)
Ant 8.7×10⁻⁴ Diesel orcarbonblackparticle
NA 0.001–191 Dipalmitoylphosphatidylcholine(3–60mg particle in 3ml saline)
37 24 h Tertiarybutylmethylether
NA 60 s Shakingwater bath
HPLC <1%
(Borm et al.,2005)
Chr 8.3×10⁻⁷ Diesel orcarbonblackparticle
NA 0.001–191 Dipalmitoylphosphatidylcholine(3–60mg particle in 3ml saline)
37 24 h Tertiarybutylmethylether
NA 60 s Shakingwater bath
HPLC <1.3%
(Borm et al.,2005)
Flu 1.2×10⁻³ Diesel orcarbonblackparticle
NA 0.001–191 Dipalmitoylphosphatidylcholine(3–60mg particle in 3ml saline)
37 24 h Tertiarybutylmethylether
NA 60 s Shakingwater bath
HPLC <1.3%
BaP: benzo[a]pyrene, BkF: benzo[k]fluoranthene, Phe: phenanthrene, Pyr: pyrene, Ant: anthracene, Chr: chrysene, Flu: fluoranthene, NA: not available, HPLC: high-performance liquid chromatography. Vapor pressures were calculated at 25 °Cusing the EPI Suite program developed by the U.S. Environmental Protection Agency.
W.Wei
etal.
Environment International 113 (2018) 202–213
205

Page
20
1
Table 2
Measurements of the SVOC bioavailability via inhalation.
Reference SVOC Vaporpressure(Pa)
Particle Particlediameter(μm)
SVOC content(ng/mgparticle)
Animal Method Exposure time Biologicalendpoints
Samplingperiod
Analyticalinstrument
Bioavailability
(Nessel et al.,1992)
TCDD 2.0×10⁻⁷ Soil < 20 72.2 ppm Female Sprague-Dawley rats (200–250 g) In vivo 1, 7, or 28 d Liver tissue Afterexposure
GC–MS 100%
(Gardiner et al.,1992)
Pyr 6.0×10⁻⁴ Carbon black NA 8mg/m3 Humans In vivo 5 d Urine Afterexposure
HPLC 0.3 μmol 1-hydroxy-pyrene per molcreatinine
(Withey et al.,1992)
Pyr 6.0×10⁻⁴ Micro-condensationaerosol
1.6–2.7 200mg/m3 Pregnant Wistar rats (250–300 g) In vivo 95min Blood Afterexposure
HPLC 2.5 ± 0.7 μg/g blood
(Withey et al.,1992)
Pyr 6.0×10⁻⁴ Micro-condensationaerosol
1.6–2.7 200mg/m3 Pregnant Wistar rats (250–300 g) In vivo 95min Lung Afterexposure
HPLC 1.6 ± 0.4 μg/g organ
(Withey et al.,1992)
Pyr 6.0×10⁻⁴ Micro-condensationaerosol
1.6–2.7 350mg/m3 Pregnant Wistar rats (250–300 g) In vivo 95min Blood Afterexposure
HPLC 5.4 ± 0.9 μg/g blood
(Withey et al.,1992)
Pyr 6.0×10⁻⁴ Micro-condensationaerosol
1.6–2.7 350mg/m3 Pregnant Wistar rats (250–300 g) In vivo 95min Lung Afterexposure
HPLC 4.7 ± 0.7 μg/g organ
(Withey et al.,1992)
Pyr 6.0×10⁻⁴ Micro-condensationaerosol
1.6–2.7 500mg/m3 Pregnant Wistar rats (250–300 g) In vivo 95min Blood Afterexposure
HPLC 12.1 ± 1.4 μg/g blood
(Withey et al.,1992)
Pyr 6.0×10⁻⁴ Micro-condensationaerosol
1.6–2.7 500mg/m3 Pregnant Wistar rats (250–300 g) In vivo 95min Lung Afterexposure
HPLC 9.4 ± 1.8 μg/g organ
(Withey et al.,1992)
Pyr 6.0×10⁻⁴ Micro-condensationaerosol
1.6–2.7 650mg/m3 Pregnant Wistar rats (250–300 g) In vivo 95min Blood Afterexposure
HPLC 19.2 ± 3.1 μg/g blood
(Withey et al.,1992)
Pyr 6.0×10⁻⁴ Micro-condensationaerosol
1.6–2.7 650mg/m3 Pregnant Wistar rats (250–300 g) In vivo 95min Lung Afterexposure
HPLC 14.8 ± 2.4 μg/g organ
(Withey et al.,1992)
Pyr 6.0×10⁻⁴ Micro-condensationaerosol
1.6–2.7 800mg/m3 Pregnant Wistar rats (250–300 g) In vivo 95min Blood Afterexposure
HPLC 23.4 ± 4.4 μg/g blood
(Withey et al.,1992)
Pyr 6.0×10⁻⁴ Micro-condensationaerosol
1.6–2.7 800mg/m3 Pregnant Wistar rats (250–300 g) In vivo 95min Lung Afterexposure
HPLC 14.8 ± 1.9 μg/g organ
(Fouchécourtet al.,1999)
Pyr 6.0×10⁻⁴ Coke plant soil < 10 54 Male adult Sprague-Dawley rats (200-220 g) In vivo 88 ± 2 h Lung tissue Afterexposure
HPLC 327 ng/g organ
(Withey et al.,1993)
BaP 7.3×10⁻⁷ Micro-condensationaerosol
0.61–0.88 200mg/m3 Pregnant Wistar rats (250–350 g) In vivo 95min Blood Afterexposure
HPLC 2.7 μg/g blood
(Withey et al.,1993)
BaP 7.3×10⁻⁷ Micro-condensationaerosol
0.61–0.88 350mg/m3 Pregnant Wistar rats (250–350 g) In vivo 95min Blood Afterexposure
HPLC 4.4 μg/g blood
(Withey et al.,1993)
BaP 7.3×10⁻⁷ Micro-condensationaerosol
0.61–0.88 500mg/m3 Pregnant Wistar rats (250–350 g) In vivo 95min Blood Afterexposure
HPLC 13.7 μg/g blood
(Withey et al.,1993)
BaP 7.3×10⁻⁷ Micro-condensationaerosol
0.61–0.88 650mg/m3 Pregnant Wistar rats (250–350 g) In vivo 95min Blood Afterexposure
HPLC 18.8 μg/g blood
(Withey et al.,1993)
BaP 7.3×10⁻⁷ Micro-condensationaerosol
0.61–0.88 800mg/m3 Pregnant Wistar rats (250–350 g) In vivo 95min Blood Afterexposure
HPLC 21.9 μg/g blood
(continued on next page)
W.Wei
etal.
Environment International 113 (2018) 202–213
206

Page
20
2
Table 2 (continued)
Reference SVOC Vaporpressure(Pa)
Particle Particlediameter(μm)
SVOC content(ng/mgparticle)
Animal Method Exposure time Biologicalendpoints
Samplingperiod
Analyticalinstrument
Bioavailability
(Gøtze et al.,1994)
BaP 7.3×10⁻⁷ Urban airparticle
NA NA Male Sprague-Dawley rats (350 g) In vivo NA Lung tissue Afterexposure
HPLC 29–60%
(Fouchécourtet al.,1999)
BaP 7.3×10⁻⁷ Coke plant soil < 10 21 Male adult Sprague-Dawley rats (200-220 g) In vivo 88 ± 2 h Lung tissue Afterexposure
HPLC 648 ng/g organ
(Gerde et al.,2001)
BaP 7.3×10⁻⁷ Diesel soot 1.3 ± 0.2 14,500 1-year-old beagle dogs In vivo 4–5 s Blood Within 1 hafterexposure
HPLC 18% in 4.3min, 36% in5.6months
(Ramesh et al.,2001)
BaP 7.3×10⁻⁷ Carbon black NA 0.1–2.5 mg/m3
10-week-old male and female F344 rats In vivo 4 h Blood andlung tissue
0.5–4 hafterexposure
HPLC 65% in 2 h
(Ramesh et al.,2002)
BaP 7.3×10⁻⁷ Carbon black NA 100 μg/m3 8-week-old male Fisher-344 rats (200 g) In vivo 4 d Lung tissue Within 72 hafterexposure
Reverse-phaseHPLC andfluorescencedetector
25%
(Ewing et al.,2006)
BaP 7.3×10⁻⁷ Silica 3.5 1300 ± 60 Female Sprague-Dawley rats (325 ± 19 g) Ex vivo 1min Lung tissue Afterexposure
HPLC 95–100%
(Fouchécourtet al.,1999)
Flu 1.2×10⁻³ Coke plant soil < 10 78 Male adult Sprague-Dawley rats (200-220 g) In vivo 88 ± 2 h Lung tissue Afterexposure
HPLC 284 ng/g organ
(Fouchécourtet al.,1999)
BbF 6.7×10⁻⁵ Coke plant soil < 10 39 Male adult Sprague-Dawley rats (200-220 g) In vivo 88 ± 2 h Lung tissue Afterexposure
HPLC <40 ng/g organ
(Fouchécourtet al.,1999)
BkF 1.3×10⁻⁷ Coke plant soil < 10 14 Male adult Sprague-Dawley rats (200-220 g) In vivo 88 ± 2 h Lung tissue Afterexposure
HPLC <40 ng/g organ
(Fouchécourtet al.,1999)
BgP 1.3×10⁻⁸ Coke plant soil < 10 12 Male adult Sprague-Dawley rats (200-220 g) In vivo 88 ± 2 h Lung tissue Afterexposure
HPLC <40 ng/g organ
(Fouchécourtet al.,1999)
IP 4.0×10⁻⁸ Coke plant soil < 10 15 Male adult Sprague-Dawley rats (200-220 g) In vivo 88 ± 2 h Lung tissue Afterexposure
HPLC <40 ng/g organ
(Fouchécourtet al.,1999)
Phe 1.6×10⁻² Coke plant soil < 10 97 Male adult Sprague-Dawley rats (200-220 g) In vivo 88 ± 2 h Lung tissue Afterexposure
HPLC <40 ng/g organ
(Fouchécourtet al.,1999)
Ace 2.9×10⁻¹ Coke plant soil < 10 141 Male adult Sprague-Dawley rats (200-220 g) In vivo 88 ± 2 h Lung tissue Afterexposure
HPLC <40 ng/g organ
(Fouchécourtet al.,1999)
Ant 8.7×10⁻⁴ Coke plant soil < 10 33 Male adult Sprague-Dawley rats (200-220 g) In vivo 88 ± 2 h Lung tissue Afterexposure
HPLC <40 ng/g organ
(Fouchécourtet al.,1999)
Chr 8.3×10⁻⁷ Coke plant soil < 10 <0.1 Male adult Sprague-Dawley rats (200-220 g) In vivo 88 ± 2 h Lung tissue Afterexposure
HPLC <40 ng/g organ
(Fouchécourtet al.,1999)
BaA 4.1×10⁻⁵ Coke plant soil < 10 2 Male adult Sprague-Dawley rats (200-220 g) In vivo 88 ± 2 h Lung tissue Afterexposure
HPLC <40 ng/g organ
(Fouchécourtet al.,1999)
DaA 1.3×10⁻⁷ Coke plant soil < 10 3 Male adult Sprague-Dawley rats (200-220 g) In vivo 88 ± 2 h Lung tissue Afterexposure
HPLC <40 ng/g organ
TCDD: 2,3,7,8-tetrachlorodibenzo-p-dioxin, Flu: fluoranthene, BbF: benzo[b]fluoranthene, BkF: benzo[k]fluoranthene, BaP: benzo[a]pyrene, BgP: benzo[g, h, i]perylene, IP: Indeno[1,2,3,-c,d]pyrene, Phe: phenanthrene, Ace: acenaphthene, Ant:anthracene, Pyr: pyrene, Chr: chrysene, BaA: benzo[a]anthracene, DaA: dibenz[a,h]anthracene, NA: not available, GC–MS: gas chromatography–mass spectrometry, HPLC: high-performance liquid chromatography. Vapor pressures were calculatedat 25 °C using the EPI Suite program developed by the U.S. Environmental Protection Agency.
W.Wei
etal.
Environment International 113 (2018) 202–213
207

Page 203
Administration and other associations that data from unrestrained an-imals that are chronically instrumented for telemetry are preferable todata from restrained animals (U.S. Food and Drug Administration,2001).
The results reported in Table 2 suggest that the bioavailability fol-lowing an inhalation exposure to particle-phase SVOCs depends on thecontent of SVOCs on the carrier particles as well as the substrate anddiameter of the particles. The ratio of the SVOC concentration in theorgans or blood to the SVOC content in the particles increases with theSVOC content in the particles. The exposed subject, exposure protocol,dosing regimen, and sampling method differ from one study to another,resulting in difficulties in interpreting and comparing the results. Sometest conditions, such as stuffing particles down the lung and remainingapneic after exposure, differ from normal breathing. Although animaltests are often considered relevant to human exposure assessment, thetranslation of animal data to equivalent human data remains challen-ging (Kastury et al., 2017). Moreover, animal testing raises ethicalconcerns. As a conclusion, data on bioaccessibility and bioavailabilityvia inhalation are available only for very few SVOCs.
3. Modeling of SVOC bioaccessibility and bioavailability following
inhalation
The modeling approaches to address the bioaccessibility and bioa-vailability of compounds via inhalation are shown in Fig. 1. For inhaledcompounds in the gas phase, the deposition rate along the respiratorytract (the GD mechanism) should be considered. Inhaled compounds inthe particle phase may evaporate into the gas phase and then deposittogether with the other inhaled gas-phase compounds (the EGD me-chanism), or they may be retained in the particles. The compounds inthe deposited particles may transfer into the mucus of the respiratorytract via evaporated gas deposition (the PDEGD mechanism) or diffu-sion (the PDD mechanism). The fraction of an inhaled compound that isdeposited along the respiratory tract due to the four abovementionedmechanisms is the bioaccessible fraction. Models addressing each of thefour mechanisms were reviewed. The models on the inhaled gas- andparticle-phase compounds are presented in Sections 3.1 and 3.2, re-spectively. The fraction of a bioaccessible compound that can transferacross the tissue to reach the blood circulation is defined as beingbioavailable. Models addressing this mass transfer process were re-viewed and are presented in Section 3.3. Overall, forty-four articleshave been found on the modeling of the bioaccessibility and bioavail-ability via inhalation; twenty-nine of them were published after the year2000, and six of them were published over the past five years.
3.1. Deposition of inhaled gas-phase compounds
No specific model has been developed to address the deposition ofinhaled gas-phase SVOCs along the respiratory tract, i.e., the GD me-chanism. Some mass transfer models did not target any specific com-pound (Davies, 1985; Kimbell et al., 1997). Other models were ori-ginally developed for formaldehyde, ozone, chlorine, or VOCs (Bushet al., 2001; Kepler et al., 1998; Padaki et al., 2009).
Davies considered inhaled gas-phase compounds absorbed in the re-spiratory tract through the diffusion of the gas molecules to the surface ofthe airway and assumed a tube shape of the respiratory tract (Davies,1985). Therefore, the dynamic concentration of the inhaled compoundsalong the respiratory tract depends on the geometry and diffusion coef-ficient of the tube, and the flow rate of the inhaled gas. Moreover, theabsorption of the inhaled gas into the fluid of the respiratory tract de-pends on the physicochemical properties of the inhaled compounds,particularly the octanol/water partition coefficient and water solubility(Nielsen et al., 2008). Compounds that are very soluble in water absorbrapidly into the fluid of the upper airways and can reach the deeperairways and lungs after the diffusion of the inhaled compounds intoupper airways reaches equilibrium (Davies, 1985).
Although the human respiratory tract is three-dimensional, it isdifficult to specify the air velocity everywhere within the respiratorytract (Miller et al., 1985). Therefore, a one-dimensional airway wasassumed to simplify the three-dimensional equation of continuity tosimulate the concentrations of inhaled gas-phase ozone and chlorinealong the respiratory tract (Bush et al., 2001; Miller et al., 1985). Theradial flux of the inhaled gas towards the mucus of an airway wasconsidered, and the one-dimensional mass transport along the airwaywas described as
∂∂ + ∂
∂ = ∂∂ − −C
tU
C
xD
C
x Rk C C
2( )
2
2 g R (1)
where t is the time, x is the distance along the x-axis, C is the averageairway concentration of the compound at x and t, R is the airway radius,U is the average air velocity through the cross section of the airway, D isthe effective dispersion coefficient, kg is the gas-phase mass transfercoefficient, and CR is the concentration of the compound in the gasphase immediately adjacent to the mucus. Since SVOCs are differentfrom ozone and chlorine, the mass transfer parameters, e.g., D and kg,should be determined for each SVOC, and the one-dimensional modelshould be modified accordingly to simulate the gas-phase SVOC de-position.
Although the one-dimensional model may be reasonable for thelower respiratory tract, it is not valid in nasal passages due to the shapeof the nasal passages and the airflow patterns. Thus, Kimbell et al.developed a three-dimensional computational fluid dynamics (CFD)model that incorporated airflow patterns and the diffusion of the in-haled gas to quantify the delivery of a compound to a rat's nasal pas-sages (Kimbell et al., 1997, 1993). Kepler et al. used this method tomodel the nasal absorption of formaldehyde in rhesus monkeys andconcluded that the total nasal wall uptake of formaldehyde was 90%(Kepler et al., 1998). This value may vary among SVOCs since they aregenerally much less soluble in water than formaldehyde. Moreover, theuse of the one-dimensional model is restricted to symmetrically bran-ched airways, and the mass transfer parameters are applied to idealizedgeometric and flow conditions (Keshavarzi et al., 2009). To overcomethese disadvantages, CFD technology has been used to construct three-dimensional airway models (Padaki et al., 2009; Taylor et al., 2007).
Combining the CFD nasal model and the one-dimensional airwaymodel, dynamic models of the whole respiratory system were devel-oped (Overton et al., 2001; Schroeter et al., 2013). Human respiratorytracts were divided into 24 generations (the division point where oneairway branches into multiple airways) from the trachea to the alveolarsacs, and in each generation, one-dimensional symmetrically branchedairways were constructed. The absorption of inhaled gas-phase for-maldehyde and hexamethylene diisocyanate was analyzed using nasal-airway models. These models may be used to predict the absorption ofSVOCs along the human respiratory tract if some characteristic para-meters, e.g., the dispersion and overall mass transfer coefficients of theSVOCs, are determined.
In conclusion, the abovementioned models were all developed ori-ginally for general compounds or specific compounds, such as ozoneand formaldehyde; none were developed particularly for SVOCs.Therefore, the mass transfer parameters for SVOCs need to be de-termined before using the models. Three limitations of the above-mentioned models may be addressed in the future. First, a respiratorycycle includes both inhalation and exhalation. Inhaled compounds areabsorbed in the fluid of the respiratory tract, but 30% of them maydesorb during exhalation (Medinsky and Bond, 2001), i.e., the washin-washout effect (Johanson, 1991). This bi-directional transport of in-haled gas-phase compounds between the inhaled air flow and theairway tissue has not been well characterized. Thus, the amount ofinhaled compounds that is bioaccessible or bioavailable may be over-estimated. Second, in the abovementioned models, only nasal inhala-tion was considered, while oral inhalation was neglected. In real life, afraction of air may be inhaled through the mouth, especially by
W. Wei et al. Environment International 113 (2018) 202–213
208

Page 204
children, the elderly, and people with diseases or performing physicalactivities. Finally, the properties of the airway mucus and alveolarsurfactant have not been considered in the models. Thus, the fate of theinhaled SVOCs in the mucus and surfactant has not been modeled.SVOC concentrations in airway and alveolar tissues may decrease withtime due to the fate of SVOCs, which may enhance the mass transfer ofSVOCs from the inhaled airflow to the respiratory tract.
3.2. Deposition of inhaled particle-phase compounds
While GD is the direct deposition of the inhaled gas-phase com-pounds along the respiratory tract, EGD, PDEGD, and PDD are asso-ciated with the deposition of the inhaled particle-phase compoundsalong the respiratory tract and the desorption of the compounds fromthe inhaled particles to the fluid of the respiratory tract (Fig.1).
3.2.1. Particle deposition along the respiratory tract
The deposition of inhaled particles along the respiratory tract hasbeen well modeled in past decades. Mechanisms of particle depositioninclude inertial impaction, sedimentation, diffusion, interception, andelectrostatic precipitation, which are related to the particle's mo-mentum, gravity, size, shape, and electrostatic charges, respectively(Carvalho et al., 2011). The existing models can be generally classifiedinto five categories. First, the typical-path lung models (Schum and Yeh,1980; Yeh and Schum, 1980) consider the dynamic deposition of par-ticles in anatomical respiratory tracts. Respiratory tracts are dividedinto a number of generations, e.g., 25 generations for humans (Yeh andSchum, 1980), and in each generation, all the airways are assumed tohave the same geometric parameters. Second, considering the variationin the geometric parameters of airways in the same generation, sto-chastic models incorporating Monte Carlo simulation were developed(Koblinger and Hofmann, 1990, 1985) in which the geometric para-meters of airways are randomly selected in accordance with their dis-tributions in each generation. Third, to simplify the calculation of thestochastic models, multiple-path models use a number of structurallydifferent airways derived from the stochastic model to represent thegeometry of the airways (Asgharian et al., 2010, 2001). Moreover, withthe development of computational technologies, the dynamic deposi-tion of inhaled particles can be modeled in 3-dimensional respiratorytracts using the computational fluid-particle dynamics (CFPD) method(Koullapis et al., 2017). Finally, empirical models of the steady-statedeposition of particles for the general population were developed basedon in vivo tests of the particle deposition in human airways (Chenget al., 1996) and lungs (Asgharian et al., 1995). A number of individualsshould be measured to reduce the variability in an empirical model.Models of the deposition of inhaled particles in the human respiratorytract have been reviewed and presented elsewhere (Hofmann, 2011;Sturm, 2012). Therefore, we do not present detailed models of particledeposition in the present review.
The deposited fraction of inhaled particles is size-dependent.Inhaled ultrafine particles can efficiently deposit in the respiratory tractduring spontaneous breathing. For particles< 100 nm in diameter, themean deposited fraction for the total respiratory tract is 0.66 by particlenumber and 0.58 by particle mass concentration for healthy people atrest (Daigle et al., 2003). Swift et al. used radon progeny aerosols for adeposition study and found that the nasal deposition rate can be> 95%for particles< 1 nm in diameter (Swift et al., 1992). Moreover, nasallydeposited ultrafine particles can subsequently translocate via the ol-factory nerve and accumulate in the olfactory bulb of the brain (Mistryet al., 2009; Oberdörster et al., 2004; Peters et al., 2006).
3.2.2. Desorption of particle-phase compounds into airway fluid
The desorption rate of the particle-phase compounds in the re-spiratory tract depends on the gas/particle and liquid/particle partitioncoefficients (Pankow, 2001). For small-molecule compounds with highvolatility, e.g., nicotine in tobacco smoke, the fraction deposited into
the respiratory tract due to the EGD mechanism is much larger thanthat due to the PDEGD and PDD mechanisms (Pankow, 2001). Thisprocess can be simplified by compound deposition in a denuder tube(Liu et al., 2017) and described as (Lipowicz and Piadé, 2004)
⎜ ⎟⎜ ⎟⎛⎝ − ⎞
⎠ − ∅ ∂∂ = − ∅ ∂
∂⎛⎝∂∂
⎞⎠− −v
r
R
C
x
D
r rrC
rπNDdF C C2 1 (1 ) (1 ) 2 ( )
2
2
g gg eq
(2)
⎜ ⎟⎛⎝ − ⎞
⎠∅∂∂ = −v
r
R
C
xπNDdF C C2 1 2 ( )
2
2
pg eq
(3)
where v is the air flow velocity, Cg and Cp are the gas- and particle-phase concentrations of the inhaled compound, respectively, Ceq is thegas-phase concentration if the equilibrium partitioning of the inhaledcompound between the gas and particle phases is reached, r and x arethe radial and axial dimensions, respectively, R is the tube radius, N isthe particle number concentration, D is the gas diffusion coefficient, d isthe particle diameter, ϕ is the volume fraction of particles, and F is theFuchs-Sutugin correction factor. A major limitation of the model is thatdeposition of particle-phase compounds is neglected in the model be-cause the EGD mechanism is the dominant deposition mechanism forsmall-molecule compounds with high volatility. However, the EGDmechanism may not be dominant compared to the PDEGD and PDDmechanisms for SVOCs due to their low volatility.
Therefore, Liu et al. took into account the dynamic partitioning ofinhaled SVOCs between the gas and particle phases in the human head,tracheobronchial, and alveolar regions and developed a model to ad-dress the SVOC deposition associated with the GD, EGD, and PDEGDmechanisms (Liu et al., 2017). The model considered both inhalationand exhalation. During inhalation, the concentrations of the gas- andparticle-phase SVOCs in the airflow of a region are described as
⎜ ⎟
⎜ ⎟= − + ⎛⎝ − ⎞
⎠+ ⎛
⎝− ⎞
⎠
VC
tQ C C h A
C
KC
V v C A
V ρ
C ρ
C KC
d
d( )1
g1g0 g1 m1 1
s1
s1g1
1 t mp1 p
p p
sp1 p
mp1 pg1
(4)
⎜ ⎟
= − −
+ ⎛⎝
− ⎞⎠
VC
tQ C C Q
D C
CC
V v C A
V ρC
C ρ
C K
d
d( )1
sp1sp0 sp1
1 mpout
mp1sp1
1 t mp1 p
p pg1
sp1 p
mp1 p (5)
= − −VC
tQ C C QD C
d
d( )1
mp1mp0 mp1 1 mpout (6)
where V1 and Vp are the volumes of the present region and of a singleparticle, respectively, Cg1 and Cg0 are the gas-phase SVOC concentra-tions in the present and previous regions, respectively, t is the time, Q isthe breathing rate, hm1 is the mass transfer coefficient over the surfaceof the respiratory tract, A1 and Ap are the surface areas of the presentregion and of a single particle, respectively, Cs1 and Csp1 are the SVOCconcentrations in the present region in the airway wall and particlephase, respectively, Ks1 is the gas-mucus partition coefficient, vt is themass transfer coefficient around the inhaled particles, Cmp0 and Cmp1
are the particle mass concentrations in the present and previous re-gions, respectively, ρp is the particle density, Csp0 is the particle-phaseSVOC concentration in the previous region, D1 is the deposition fractionof the inhaled particles in the present region, and Cmpout is the particlemass concentration of the inhaled particles.
The results show that most of the gas-phase SVOCs are deposited(the GD mechanism) in the head region, while the particle-phase SVOCstravel deeper into the respiratory tract. As the particles go deeper, theSVOC content on the particles decreases due to the evaporation of theparticle-phase SVOCs into the gas phase (the EGD mechanism). Theevaporation effect is more significant for particles of small size andSVOCs with high volatility. The study provided the gas- and particle-
W. Wei et al. Environment International 113 (2018) 202–213
209

Page 205
deposition values in each region, but the bioaccessibility value was notprovided because the desorption of SVOCs from deposited particles intothe mucus (the PDD mechanism) was not modeled. This model hasthree limitations. First, the geometry of the respiratory system waslargely simplified. For example, the alveolar region was modeled as asphere. This simplification lacks anatomical support. Second, the SVOCconcentrations in the gas and particle phases in each of the three re-gions were assumed to be uniform. However, due to the complexity ofthe human respiratory system and the progressive deposition of theinhaled compounds, the gradient of the SVOC concentration in eachregion may not be neglected. Finally, the model does not consider themucociliary clearance and alveolar macrophage clearance of particles,which influences the particle mass concentration. Also, the model doesnot consider the fate of SVOCs in the airway and alveolar walls, whichcan influence the SVOC concentration in the tissue and the masstransfer of the inhaled SVOCs in the respiratory system.
Desorption of particle-phase compounds from the deposited parti-cles into the respiratory fluid (the PDD mechanism) has rarely beenstudied. This process depends on the solubility of the compound in thefluid (Gerde and Scholander, 1989) and is associated with energychanges (Risby et al., 1988). Considering a particle as a sphere, thedesorption of a particle-phase PAH from the outer surface into anaqueous phase was described by Gerde and Scholander (1989)
= = − = < <C t
C t
D C t
d C tt t
( )
( 0)1
2
( 0), for 0s
s
L Lsat
s siso
(7)
= = = ⎧⎨⎩− − ⎫⎬⎭ >C t
C t
K C
C t
D t t
K dt t
( )
( 0) ( 0)exp
2 ( ), fors
s
L Lsat
s
L iso
L siso
(8)
where Cs is the surface concentration of the PAH on the depositedparticles, t is the time, tiso is the time to reach the linear adsorptionisotherm of the saturated solution, DL is the diffusion coefficient of thePAH in the fluid, CLsat is the saturated PAH concentration in the fluid, dsis the diameter of the sphere, and KL is the coefficient of the linearadsorption isotherm in the fluid. Moreover, the desorption of a particle-phase PAH from a pore into an aqueous phase was described by Gerdeand Scholander (1989)
= −Q
t
πd D C
x
d
d 4
p2
L Lsat
(9)
where Q is the amount of the PAH in the pore, dp is the pore diameter,and x is the distance into the pore. When the fluid was water, the PAHson the outer surface and in the pores of the deposited particles desorbedwithin 4 s and 10min, respectively (Gerde and Scholander, 1989). Thismodel should be integrated in a particle-deposition model in futurestudies to provide a full understanding of SVOC deposition due to thePDD mechanism.
3.3. Mass transfer of inhaled compounds across the tissue
Modeling the mass transfer of inhaled compounds across the epi-thelium into the blood circulation corresponds to a bioavailabilityevaluation. Two types of models exist for gas-phase and particle-phasecompounds.
For gas-phase compounds, all the studies focused on the exchange ofoxygen at the level of the alveolar region. Two geometric structures forthe alveolar sac were assumed, i.e., the spherical model (Suresh et al.,2005) and the layered model (Reynolds et al., 2010; Roy and Secomb,2014). Suresh et al. studied the liquid breathing of human lungs fortreating acute lung injuries and developed a spherical model of alveolargas exchange in partial liquid ventilation (Suresh et al., 2005). Thespherical model considers an alveolar sac as a spherical shell with avariable volume encapsulated by a tissue layer and surrounded by acapillary blood compartment (Fig. 2). For the partial liquid ventilation,the volume encapsulated by the tissue is filled with a liquid layer ofperfluorocarbon and the inhaled gas (Suresh et al., 2005). For the
breathing of a healthy lung, the volume encapsulated by the tissue isfilled with only gas (Pavelka and Roth, 2005). The mass transfer in thealveolar tissue was assumed to be driven by diffusion (Suresh et al.,2005). The spherical structure of the alveolar sac has not been validatedusing measured data because the model describes the mass transfer in asingle alveolar sac. An expanded model on the whole alveolar regionhas not been developed yet. The layered model considers three layers inthe alveolar region: the air space, the tissue, and the blood (Fig. 2)(Reynolds et al., 2010; Roy and Secomb, 2014). The mass transfer ofcompounds across the tissue was assumed to be driven by diffusion. Thesimplification of the geometric structure compared to the sphericalmodel allows the expansion of the layered model to the whole alveolarregion. However, compared to the measured values, the layered modeltends to overestimate the concentrations of compounds in the blood(Roy and Secomb, 2014).
For particle-phase compounds, a study on the transport of particle-phase nicotine in the lungs assumed a 3-layer structure of the alveolarregion: the airway fluid containing nicotine desorbed from the inhaledparticles, the tissue, and the blood (Gowadia and Dunn-Rankin, 2010).The mass transfer of nicotine across the tissue was assumed to be drivenby diffusion (Gowadia and Dunn-Rankin, 2010). The mass transfer ofthe deposited compounds in the mucus through the airway tissue hasbeen modeled in many studies (George and Hlastala, 2011; Tian andLongest, 2010a, 2010b). The compound concentration in the airwaytissue (Ct) at any time (t) can be described by the reaction-diffusionequation (Asgharian et al., 2012, 2011; Schroeter et al., 2006)
− ∂∂ + ∂
∂ = + +C
tD
C
rK C
V C
V K C( )t
t
2t
2 f tmax t
t m t (10)
where Dt is the diffusion coefficient of the compound in the tissue, r isthe radial dimension of the tissue, Kf is the first-order rate constant ifthe reaction of the compound in the tissue initiates, Vt is the tissuevolume, and Vmax and Km are Michaelis-Menten rate constants. In thesemodels, the permselectivity of the epithelium is not considered, whichallows the development of a simplified physical model. However, theerrors in the results due to the simplification have never been studied.
4. Perspectives on determining the bioaccessibility and
bioavailability of inhaled SVOCs
Many studies have reported the bioaccessibility and bioavailabilityof SVOCs via the ingestion of soil or settled dust (Fang and Stapleton,2014; He et al., 2016; Quintana et al., 2017; Wang et al., 2013), and thebioaccessibility and bioavailability of PAHs via dermal contact havebeen reviewed and presented elsewhere (Beriro et al., 2016), but theliterature on inhalational exposure remains scarce. The existing studieson the bioaccessibility or bioavailability of inhaled SVOCs involved2,3,7,8-tetrachlorodibenzo-p-dioxin and some PAHs, especially BaP.However, no data are available for the other SVOCs present in indoorenvironments, such as phthalate esters, flame retardants, and PCBs.Specific experimental conditions known to influence the results are ofcrucial importance, such as the temperature, agitation, extractionduration, composition of the lung lining fluid, extraction method andsolid/liquid ratio in the bioaccessibility tests (Basta and Juhasz, 2014;Stefaniak et al., 2010; Turner, 2011) and in the biological endpoints(blood, tissue or urine) in bioavailability tests. Analytical methods todetermine the bioaccessibility and bioavailability differ widely fromone study to another (Carbonell-Capella et al., 2014; Wiseman, 2015).
Within modeling, the model developed by Liu et al. focused onSVOCs and considered the deposition of both gas- and particle-phaseinhaled SVOCs (Liu et al., 2017), while the model developed by Gerdeand Scholander focused on PAH desorption from the deposited particlesinto the surrounding liquid (the PDD mechanism) (Gerde andScholander, 1989). Due to these pioneering works, the SVOC depositionassociated with the GD, EGD, PDEGD, and PDD mechanisms can bequantitatively predicted under some assumptions and simplifications.
W. Wei et al. Environment International 113 (2018) 202–213
210

Page 206
The other existing models in the literature frequently consider only onephase because they do not focus on modeling SVOCs. A number ofparameters should be determined before applying these models toSVOCs. Four mechanisms exist for characterizing gas- and particle-phase SVOC deposition (GD, EGD, PDEGD, and PDD) and estimatingthe bioaccessibility of the inhaled SVOCs in both gas and particlephases. These mechanisms have not yet been considered together in onemodel. The following four points may be considered in future modelingapproaches for improvements.
First, mass transfer models may be developed for the whole re-spiratory system or for different regions, e.g., the extrathoracic, tra-cheobronchial and alveolar regions (Hofmann, 2011). However, for thepurpose of bioaccessibility and bioavailability studies, a model con-sidering the whole respiratory system is needed because the con-centration of an inhaled compound in one region can interfere with thatin another region. Moreover, an empirical model of the deposition ofinhaled particles considered both the nasal and oral airways (Chenget al., 1996), while other models considered nasal inhalation to be theonly inlet of air. A calculation of the SVOC bioavailability and bioac-cessibility including both the nasal and oral airways may be developed.
Second, the washin-washout effect plays an important role in therespiratory uptake of inhaled compounds (Johanson, 1991). The in-haled compounds absorbed on the surface of the respiratory epitheliummay not be able to diffuse across the epithelium by the end of inhala-tion. For example, the time for nicotine to diffuse across the epitheliumdiffers from one region to another, e.g., 10−5 s in the pulmonary regionand 0.7 s in the tracheobronchial region (Gowadia and Dunn-Rankin,2010). A fraction of the inhaled nicotine deposited on the epitheliummay be lost in the exhaled breath due to the slow diffusion rate, leadingto a reduction in the amount of compound that is bioaccessible orbioavailable. As suggested by Medinsky and Bond, up to 30% of inhaledgas is exhaled (Medinsky and Bond, 2001). For inhaled particles,Heyder suggested that their deposition fraction increases with theparticle size, particle density, and respiratory cycle period (Heyder,2004). The impact of the respiratory cycle period on the availabilityand accessibility of inhaled SVOCs in the gas and particle phases may bequantified in models.
Third, the mucociliary clearance and alveolar macrophage clear-ance of inhaled particles may be considered to better address the de-posited particle mass concentration along the respiratory tract. Thedeposition of particle-phase SVOCs may depend on the substrate of theparticles, as mentioned above for diesel and silica particles. The prop-erties of the airway mucus, alveolar surfactant, and inhaled particle-phase SVOCs may be considered to characterize the fate of inhaledSVOCs in airway and alveolar tissues to improve the existing masstransfer model.
Finally, a large variation in the deposited amount of inhaled
particles exists across individuals, which is influenced by the morpho-logical factors of the airways, distribution factors of inhaled particles,and breathing patterns among human individuals (Cuddihy et al., 1979;Heyder et al., 1982). Hofmann et al. studied the variation among in-dividuals caused by differences in the airway morphology and con-cluded that the variation in the extrathoracic deposition was a majorsource of the difference in the total deposition (Hofmann et al., 2002).A variation in the deposition due to variations in the respiratory cycleperiod and volumetric flow rate of the air also exists within an in-dividual (Cuddihy et al., 1979; Heyder et al., 1982). Although somestudies investigated the influence of individuals' biological variabilityon the deposition of particles, the influence of this variation on theabsorption of the inhaled gas and the desorption of the deposited par-ticle-phase SVOCs into the fluid of the respiratory tract has never beenstudied. This variability may be addressed using probabilistic modelsthat incorporate physical mass transfer models.
5. Conclusion
Bioaccessibility and bioavailability of SVOCs in the gas and particlephases along the human respiratory tract are essential to evaluate theuptake of inhaled SVOCs and to more accurately assess the associatedhealth risks. The existing in vitro, in vivo, and ex vivo methods have beencarried out for 2,3,7,8-tetrachlorodibenzo-p-dioxin and a few PAHs.Valid methods should be developed for the quantification of otherSVOCs. Regarding the modeling of the SVOC bioaccessibility andbioavailability, we suggest developing modeling approaches based onthe whole respiratory system. The model should incorporate mechan-isms of the gas- and particle-phase SVOC mass transfer, particle de-position, gas- and particle-phase SVOC absorption to the respiratorytract, and respiratory cycle period. Additionally, the model should ac-count for individual differences, such as the lung morphology andbreathing pattern. Lastly, the model and the measurement method ofbioaccessibility should be validated using data from in vivo studies.
Acknowledgments
This research received funding from the People Program (MarieCurie Actions) of the European Union Seventh Framework Programme(FP7/2007-2013) under REA grant agreement n. PCOFUND-GA-2013-609102, through the PRESTIGE Program coordinated by CampusFrance (PRESTIGE-2015-3-0016).
References
Abdallah, M.A.E., Pawar, G., Harrad, S., 2015. Evaluation of 3D-human skin equivalentsfor assessment of human dermal absorption of some brominated flame retardants.
Fig. 2. Schematics of the alveolar sac (a) spherical model (b) layered model.
W. Wei et al. Environment International 113 (2018) 202–213
211

Page 207
Environ. Int. 84, 64–70. http://dx.doi.org/10.1016/j.envint.2015.07.015.Asgharian, B., Wood, R., Schlesinger, R.B., 1995. Empirical modeling of particle deposi-
tion in the alveolar region of the lungs: a basis for interspecies extrapolation. Toxicol.Sci. 27, 232–238. http://dx.doi.org/10.1093/toxsci/27.2.232.
Asgharian, B., Hofmann, W., Bergmann, R., 2001. Particle deposition in a multiple-pathmodel of the human lung. Aerosol Sci. Technol. 34, 332–339. http://dx.doi.org/10.1080/02786820119122.
Asgharian, B., Hofmann, W., Bergmann, R., 2010. Particle deposition in a multiple-pathmodel of the human lung. Aerosol Sci. Technol. 34, 332–339. http://dx.doi.org/10.1080/02786820119122.
Asgharian, B., Price, O.T., Schroeter, J.D., Kimbell, J.S., Jones, L., Singal, M., 2011.Derivation of mass transfer coefficients for transient uptake and tissue disposition ofsoluble and reactive vapors in lung airways. Ann. Biomed. Eng. 39, 1788–1804.http://dx.doi.org/10.1007/s10439-011-0274-9.
Asgharian, B., Price, O.T., Schroeter, J.D., Kimbell, J.S., Singal, M., 2012. A lung dosi-metry model of vapor uptake and tissue disposition. Inhal. Toxicol. 24, 182–193.http://dx.doi.org/10.3109/08958378.2012.654857.
Basta, N.T., Juhasz, A., 2014. Using in vivo bioavailability and/or in vitro gastrointestinalbioaccessibility testing to adjust human exposure to arsenic from soil ingestion. Rev.Mineral. Geochem. 79, 451–472. http://dx.doi.org/10.2138/rmg.2014.79.9.
Bekö, G., Callesen, M., Weschler, C.J., Toftum, J., Langer, S., Sigsgaard, T., Høst, A., KoldJensen, T., Clausen, G., 2015. Phthalate exposure through different pathways andallergic sensitization in preschool children with asthma, allergic rhinoconjunctivitisand atopic dermatitis. Environ. Res. 137, 432–439. http://dx.doi.org/10.1016/j.envres.2015.01.012.
Beriro, D.J., Cave, M.R., Wragg, J., Thomas, R., Wills, G., Evans, F., 2016. A review of thecurrent state of the art of physiologically-based tests for measuring human dermal invitro bioavailability of polycyclic aromatic hydrocarbons (PAH) in soil. J. Hazard.Mater. 305, 240–259. http://dx.doi.org/10.1016/j.jhazmat.2015.11.010.
Bevan, D.R., Yonda, N.T., 1985. In vitro technique to study elution of benzo[a]pyrenefrom particulates into biomembranes with application to woodstove particulates.Anal. Biochem. 150, 105–110. http://dx.doi.org/10.1016/0003-2697(85)90446-4.
Bi, C., Liang, Y., Xu, Y., 2015. Fate and transport of phthalates in indoor environmentsand the influence of temperature: a case study in a test house. Environ. Sci. Technol.49, 9674–9681. http://dx.doi.org/10.1021/acs.est.5b02787.
Blanchard, O., Glorennec, P., Mercier, F., Bonvallot, N., Chevrier, C., Ramalho, O.,Mandin, C., Le Bot, B., 2014. Semivolatile organic compounds in indoor air andsettled dust in 30 French dwellings. Environ. Sci. Technol. 48, 3959–3969. http://dx.doi.org/10.1021/es405269q.
Boisa, N., Elom, N., Dean, J.R., Deary, M.E., Bird, G., Entwistle, J.A., 2014. Developmentand application of an inhalation bioaccessibility method (IBM) for lead in the PM10size fraction of soil. Environ. Int. 70, 132–142. http://dx.doi.org/10.1016/j.envint.2014.05.021.
Borm, P.J.A., Cakmak, G., Jermann, E., Weishaupt, C., Kempers, P., Van Schooten, F.J.,Oberdörster, G., Schins, R.P.F., 2005. Formation of PAH-DNA adducts after in vivoand vitro exposure of rats and lung cells to different commercial carbon blacks.Toxicol. Appl. Pharmacol. 205, 157–167. http://dx.doi.org/10.1016/j.taap.2004.10.020.
Bornehag, C.G., Sundell, J., Weschler, C.J., Sigsgaard, T., Lundgren, B., Hasselgren, M.,Hägerhed-Engman, L., 2004. The association between asthma and allergic symptomsin children and phthalates in house dust: a nested case-control study. Environ. HealthPerspect. 112, 1393–1397. http://dx.doi.org/10.1289/ehp.7187.
Bush, M.L., Zhang, W., Ben-Jebria, A., Ultman, J.S., 2001. Longitudinal distribution ofozone and chlorine in the human respiratory tract: simulation of nasal and oralbreathing with the single-path diffusion model. Toxicol. Appl. Pharmacol. 173,137–145. http://dx.doi.org/10.1006/taap.2001.9182.
Caboche, J., Perdrix, E., Malet, B., Alleman, L.Y., 2011. Development of an in vitromethod to estimate lung bioaccessibility of metals from atmospheric particles. J.Environ. Monit. 13, 621–630. http://dx.doi.org/10.1039/c0em00439a.
Carbonell-Capella, J.M., Buniowska, M., Barba, F.J., Esteve, M.J., Frígola, A., 2014.Analytical methods for determining bioavailability and bioaccessibility of bioactivecompounds from fruits and vegetables: a review. Compr. Rev. Food Sci. Food Saf. 13,155–171. http://dx.doi.org/10.1111/1541-4337.12049.
Carvalho, T.C., Peters, J.I., Williams, R.O., 2011. Influence of particle size on regionallung deposition – what evidence is there? Int. J. Pharm. 406, 1–10. http://dx.doi.org/10.1016/j.ijpharm.2010.12.040.
Cheng, K.H., Cheng, Y.S., Yeh, H.C., Guilmette, R.A., Simpson, S.Q., Yang, Y.H., Swift,D.L., 1996. In vivo measurements of nasal airway dimensions and ultrafine aerosoldeposition in the human nasal and oral airways. J. Aerosol Sci. 27, 785–801. http://dx.doi.org/10.1016/0021-8502(96)00029-8.
Collins, C.D., Craggs, M., Garcia-Alcega, S., Kademoglou, K., Lowe, S., 2015. Towards aunified approach for the determination of the bioaccessibility of organic pollutants.Environ. Int. 78, 24–31. http://dx.doi.org/10.1016/j.envint.2015.02.005.
Cuddihy, R.G., McClellan, R.O., Griffith, W.C., 1979. Variability in target organ deposi-tion among individuals exposed to toxic substances. Toxicol. Appl. Pharmacol. 49,179–187.
Daigle, C.C., Chalupa, D.C., Gibb, F.R., Morrow, P.E., Oberdörster, G., Utell, M.J.,Frampton, M.W., 2003. Ultrafine particle deposition in humans during rest and ex-ercise. Inhal. Toxicol. 15, 539–552. http://dx.doi.org/10.1080/08958370304468.
Davies, C.N., 1985. Absorption of gases in the respiratory tract. Ann. Occup. Hyg. 29,13–25.
De Coster, S., Van Larebeke, N., 2012. Endocrine-disrupting chemicals: associated dis-orders and mechanisms of action. J. Environ. Public Health. http://dx.doi.org/10.1155/2012/713696.
Ewing, P., Blomgren, B., Ryrfeldt, A., Gerde, P., 2006. Increasing exposure levels cause anabrupt change in the absorption and metabolism of acutely inhaled benzo(a)pyrenein the isolated, ventilated, and perfused lung of the rat. Toxicol. Sci. 91, 332–340.
Fang, M., Stapleton, H.M., 2014. Evaluating the bioaccessibility of flame retardants inhouse dust using an in vitro Tenax bead-assisted sorptive physiologically basedmethod. Environ. Sci. Technol. 48, 13323–13330. http://dx.doi.org/10.1021/
es503918m.Fouchécourt, M.O., Arnold, M., Berny, P., Videmann, B., Rether, B., Rivière, J.L., 1999.
Assessment of the bioavailability of PAHs in rats exposed to a polluted soil by naturalroutes: induction of EROD activity and DNA adducts and PAH burden in both liverand lung. Environ. Res. 80, 330–339.
Fournier, K., Glorennec, P., Bonvallot, N., 2014. An exposure-based framework forgrouping pollutants for a cumulative risk assessment approach: case study of indoorsemi-volatile organic compounds. Environ. Res. 130, 20–28. http://dx.doi.org/10.1016/j.envres.2014.01.007.
Gardiner, K., Hale, K.A., Calvert, I.-A., Rice, C., Harrington, J.M., 1992. The suitability ofthe urinary metabolite 1-hydroxypyrene as an index of poly nuclear aromatic hy-drocarbon bioavailability from workers exposed to carbon black. Ann. Occup. Hyg.36, 681–688.
George, S.C., Hlastala, M.P., 2011. Airway gas exchange and exhaled biomarkers. Compr.Physiol. 1, 1837–1859. http://dx.doi.org/10.1002/cphy.c090013.
Gerde, P., Scholander, P., 1989. Mass transfer rates of polycyclic aromatic hydrocarbonsbetween micron-size particles and their environment–theoretical estimates. Environ.Health Perspect. 79, 249–258.
Gerde, P., Muggenburg, B. a, Lundborg, M., Dahl, a R., 2001. The rapid alveolar ab-sorption of diesel soot-adsorbed benzo[a]pyrene: bioavailability, metabolism anddosimetry of an inhaled particle-borne carcinogen. Carcinogenesis 22, 741–749.http://dx.doi.org/10.1093/carcin/22.5.741.
Gøtze, J.P., Lindeskog, P., Törnquist, C.S., 1994. Effects of induction and age-dependentenzyme expression on lung bioavailability, metabolism, and DNA binding of urbanair particulate-absorbed benzo[a]pyrene, 2-nitrofluorene, and 3-amino-1,4-dimethyl-5H-pyridol-(4,3)-indole. Environ. Health Perspect. 102, 147–156.
Gowadia, N., Dunn-Rankin, D., 2010. A transport model for nicotine in the tracheo-bronchial and pulmonary region of the lung. Inhal. Toxicol. 22, 42–48.
Guney, M., Chapuis, R.P., Zagury, G.J., 2016. Lung bioaccessibility of contaminants inparticulate matter of geological origin. Environ. Sci. Pollut. Res. 23, 24422–24434.http://dx.doi.org/10.1007/s11356-016-6623-3.
He, R., Li, Y., Xiang, P., Li, C., Zhou, C., Zhang, S., Cui, X., Ma, L.Q., 2016.Organophosphorus flame retardants and phthalate esters in indoor dust from dif-ferent microenvironments: bioaccessibility and risk assessment. Chemosphere 150,528–535. http://dx.doi.org/10.1016/j.chemosphere.2015.10.087.
Heyder, J., 2004. Deposition of inhaled particles in the human respiratory tract andconsequences for regional targeting in respiratory drug delivery. In: Proceedings ofthe American Thoracic Society, pp. 315–320.
Heyder, J., Gebhart, J., Stahlhofen, W., Stuck, B., 1982. Biological variability of particledeposition in the human respiratory tract during controlled and spontaneous mouth-breathing. Aerosol Sci. Technol. 26, 137–147.
Hofmann, W., 2011. Modelling inhaled particle deposition in the human lung-a review. J.Aerosol Sci. 42, 693–724. http://dx.doi.org/10.1016/j.jaerosci.2011.05.007.
Hofmann, W., Asgharian, B., Winkler-Heil, R., 2002. Modeling intersubject variability ofparticle deposition in human lungs. J. Aerosol Sci. 33, 219–235. http://dx.doi.org/10.1016/S0021-8502(01)00167-7.
Hsu, N.Y., Lee, C.C., Wang, J.Y., Li, Y.C., Chang, H.W., Chen, C.Y., Bornehag, C.G., Wu,P.C., Sundell, J., Su, H.J., 2012. Predicted risk of childhood allergy, asthma, andreported symptoms using measured phthalate exposure in dust and urine. Indoor Air22, 186–199. http://dx.doi.org/10.1111/j.1600-0668.2011.00753.x.
Jaakkola, J.J.K., Knight, T.L., 2008. The role of exposure to phthalates from polyvinylchloride products in the development of asthma and allergies: a systematic reviewand meta-analysis. Environ. Health Perspect. 116, 845–853. http://dx.doi.org/10.1289/ehp.10846.
Johanson, G., 1991. Modelling of respiratory exchange of polar solvents. Ann. Occup.Hyg. 35, 323–339. http://dx.doi.org/10.1093/annhyg/35.3.323.
Juhasz, A.L., Weber, J., Stevenson, G., Slee, D., Gancarz, D., Rofe, A., Smith, E., 2014. Invivo measurement, in vitro estimation and fugacity prediction of PAH bioavailabilityin post-remediated creosote-contaminated soil. Sci. Total Environ. 473–474,147–154. http://dx.doi.org/10.1016/j.scitotenv.2013.12.031.
Kang, Y., Man, Y.B., Cheung, K.C., Wong, M.H., 2012. Risk assessment of human exposureto bioaccessible phthalate esters via indoor dust around the Pearl River Delta.Environ. Sci. Technol. 46, 8422–8430. http://dx.doi.org/10.1021/es300379v.
Kastury, F., Smith, E., Juhasz, A.L., 2017. A critical review of approaches and limitationsof inhalation bioavailability and bioaccessibility of metal(loid)s from ambient par-ticulate matter or dust. Sci. Total Environ. 574, 1054–1074.
Kepler, G.M., Richardson, R.B., Morgan, K.T., Kimbell, J.S., 1998. Computer simulation ofinspiratory nasal airflow and inhaled gas uptake in a rhesus monkey. Toxicol. Appl.Pharmacol. 150, 1–11. http://dx.doi.org/10.1006/taap.1997.8350.
Keshavarzi, B., Ultman, J.S., Borhan, A., 2009. Numerical Simulation of Ozone Uptake inthe Respiratory Tract During Steady Inspiratory Flow. (Proc. ITP-09 63).
Kim, K.-H., Jahan, S.A., Kabir, E., Brown, R.J.C., 2013. A review of airborne polycyclicaromatic hydrocarbons (PAHs) and their human health effects. Environ. Int. 60,71–80. http://dx.doi.org/10.1016/j.envint.2013.07.019.
Kimbell, J.S., Gross, E.A., Joyner, D.R., Godo, M.N., Morgan, K.T., 1993. Application ofcomputational fluid dynamics to regional dosimetry of inhaled chemicals in the upperrespiratory tract of the rat. Toxicol. Appl. Pharmacol. 121, 253–263.
Kimbell, J.S., Godo, M.N., Gross, E. a, Joyner, D.R., Richardson, R.B., Morgan, K.T., 1997.Computer simulation of inspiratory airflow in all regions of the F344 rat nasal pas-sages. Toxicol. Appl. Pharmacol. 145, 388–398. http://dx.doi.org/10.1006/taap.1997.8206.
Koblinger, L., Hofmann, W., 1985. Analysis of human lung morphometric data for sto-chastic aerosol deposition calculations. Phys. Med. Biol. 30, 541–556. http://dx.doi.org/10.1088/0031-9155/30/6/004.
Koblinger, L., Hofmann, W., 1990. Monte Carlo modeling of aerosol deposition in humanlungs. Part I: simulation of particle transport in a stochastic lung structure. J. AerosolSci. 21, 661–674. http://dx.doi.org/10.1016/0021-8502(90)90121-D.
Koch, H.M., Bolt, H.M., Preuss, R., Angerer, J., 2005. New metabolites of di(2-ethylhexyl)phthalate (DEHP) in human urine and serum after single oral doses of deuterium-labelled DEHP. Arch. Toxicol. 79, 367–376. http://dx.doi.org/10.1007/s00204-004-
W. Wei et al. Environment International 113 (2018) 202–213
212

Page 208
0642-4.Kolarik, B., Naydenov, K., Larsson, M., Bornehag, C.G., Sundell, J., 2008. The association
between phthalates in dust and allergic diseases among Bulgarian children. Environ.Health Perspect. 116, 98–103. http://dx.doi.org/10.1289/ehp.10498.
Koullapis, P., Kassinos, S.C., Muela, J., Perez-Segarra, C., Rigola, J., Lehmkuhl, O., Cui, Y.,Sommerfeld, M., Elcner, J., Jicha, M., Saveljic, I., Filipovic, N., Lizal, F., Nicolaou, L.,2017. Regional aerosol deposition in the human airways: the SimInhale benchmarkcase and a critical assessment of in silico methods. Eur. J. Pharm. Sci. http://dx.doi.org/10.1016/j.ejps.2017.09.003.
Lipowicz, P.J., Piadé, J.J., 2004. Evaporation and subsequent deposition of nicotine frommainstream cigarette smoke in a denuder tube. J. Aerosol Sci. 35, 33–45. http://dx.doi.org/10.1016/S0021-8502(03)00385-9.
Liu, C., Zhang, Y., Weschler, C.J., 2017. Exposure to SVOCs from inhaled particles: theimpact of desorption. Environ. Sci. Technol. 51, 6220–6228. http://dx.doi.org/10.1021/acs.est.6b05864.
Mandin, C., Mercier, F., Ramalho, O., Lucas, J.P., Gilles, E., Blanchard, O., Bonvallot, N.,Glorennec, P., Le Bot, B., 2016. Semi-volatile organic compounds in the particulatephase in dwellings: a nationwide survey in France. Atmos. Environ. 136, 82–94.http://dx.doi.org/10.1016/j.atmosenv.2016.04.016.
Medinsky, M.A., Bond, J.A., 2001. Sites and mechanisms for uptake of gases and vapors inthe respiratory tract. Toxicology 160, 165–175.
Miller, F.J., Overton, J.H., Jaskot, R.H., Menzel, D.B., 1985. A model of the regionaluptake of gaseous pollutants in the lung. Toxicol. Appl. Pharmacol. 79, 11–27.
Mistry, A., Stolnik, S., Illum, L., 2009. Nanoparticles for direct nose-to-brain delivery ofdrugs. Int. J. Pharm. 379, 146–157. http://dx.doi.org/10.1016/j.ijpharm.2009.06.019.
Morrison, G.C., Weschler, C.J., Bekö, G., Koch, H.M., Salthammer, T., Schripp, T., Toftum,J., Clausen, G., 2016. Role of clothing in both accelerating and impeding dermalabsorption of airborne SVOCs. J. Expo. Sci. Environ. Epidemiol. 26, 113–118. http://dx.doi.org/10.1038/jes.2015.42.
Nessel, C.S., Amoruso, M.A., Umbreit, T.H., Meeker, R.J., Gallo, M.A., 1992. Pulmonarybioavailability and fine particle enrichment of 2,3,7,8-tetrachlorodibenzo-p-dioxin inrespirable soil particles. Fundam. Appl. Toxicol. 19, 279–285. http://dx.doi.org/10.1093/toxsci/19.2.279.
Nielsen, E., Østergaard, G., Larsen, J.C., 2008. Toxicological Risk Assessment ofChemicals A Practical Guide. Informa Healthcare USA, Inc., New York.
Oberdörster, G., Sharp, Z., Atudorei, V., Elder, A., Gelein, R., Kreyling, W., Cox, C., 2004.Translocation of inhaled ultrafine particles to the brain. Inhal. Toxicol. 16, 437–445.http://dx.doi.org/10.1080/08958370490439597.
Overton, J.H., Kimbell, J.S., Miller, F.J., 2001. Dosimetry modeling of inhaled for-maldehyde: the human respiratory tract. Toxicol. Sci. 64, 122–134.
Padaki, A., Ultman, J.S., Borhan, A., 2009. Ozone uptake during inspiratory flow in amodel of the larynx, trachea and primary bronchial bifurcation. Chem. Eng. Sci. 64,4640–4648. http://dx.doi.org/10.1016/j.ces.2009.05.017.
Pankow, J.F., 2001. A consideration of the role of gas/particle partitioning in the de-position of nicotine and other tobacco smoke compounds in the respiratory tract.Chem. Res. Toxicol. 14, 1465–1481.
Pavelka, M., Roth, J., 2005. Functional Ultrastructure: Atlas of Tissue Biology andPathology, 1st ed. Springer-Verlag, Vienna. http://dx.doi.org/10.1007/b137527.
Pelletier, M., Bonvallot, N., Ramalho, O., Mandin, C., Wei, W., Raffy, G., Mercier, F.,Blanchard, O., Le Bot, B., Glorennec, P., 2017. Indoor residential exposure to semi-volatile organic compounds in France. Environ. Int. 109, 81–88. http://dx.doi.org/10.1016/j.envint.2017.08.024.
Peters, A., Veronesi, B., Calderón-Garcidueñas, L., Gehr, P., Chen, L.C., Geiser, M., Reed,W., Rothen-Rutishauser, B., Schürch, S., Schulz, H., 2006. Translocation and potentialneurological effects of fine and ultrafine particles a critical update. Part. FibreToxicol. 3, 13. http://dx.doi.org/10.1186/1743-8977-3-13.
Quintana, J.B., Rosende, M., Montes, R., Rodríguez-Álvarez, T., Rodil, R., Cela, R., Miró,M., 2017. In-vitro estimation of bioaccessibility of chlorinated organophosphateflame retardants in indoor dust by fasting and fed physiologically relevant extractiontests. Sci. Total Environ. 580, 540–549. http://dx.doi.org/10.1016/j.scitotenv.2016.11.210.
Ramesh, A., Greenwood, M., Inyang, F., Hood, D.B., 2001. Toxicokinetics of inhaledbenzo[a]pyrene: plasma and lung bioavailability. Inhal. Toxicol. 13, 533–555. http://dx.doi.org/10.1080/08958370118859.
Ramesh, A., Hood, D.B., Inyang, F., Greenwood, M., 2002. Comparative metabolism,bioavailability, and toxicokinetics of benzo[A]pyrene in rats after acute oral, in-halation, and intravenous administration. Polycycl. Aromat. Compd. 22, 969–980.http://dx.doi.org/10.1080/10406630290104121.
Reichenberg, F., Mayer, P., 2006. Two complementary sides of bioavailability: accessi-bility and chemical activity of organic contaminants in sediments and soils. Environ.Toxicol. Chem. 25, 1239–1245. http://dx.doi.org/10.1897/05-458R.1.
Reynolds, A., Bard Ermentrout, G., Clermont, G., 2010. A mathematical model of pul-monary gas exchange under inflammatory stress. J. Theor. Biol. 264, 161–173.http://dx.doi.org/10.1016/j.jtbi.2010.01.011.
Risby, T.H., Sehnert, S.S., Jiang, L., Dhingra, B.S., 1988. A model for the release of ad-sorbed molecules from the surfaces of airborne particulate matter based on liquid-phase desorption from amorphous carbon blacks. Environ. Health Perspect. 77,141–149.
Rodríguez-Navas, C., Rosende, M., Miro, M., 2017. In-vitro physiologically based ex-traction of solid materials: do we have reliable analytical methods for bioaccessibilitystudies of emerging roganic contaminants? Trends Anal. Chem. 91, 42–52.
Rostami, I., Juhasz, A.L., 2011. Assessment of persistent organic pollutant (POP) bioa-vailability and bioaccessibility for human health exposure assessment: a critical re-view. Crit. Rev. Environ. Sci. Technol. 41, 623–656. http://dx.doi.org/10.1080/
10643380903044178.Roy, T.K., Secomb, T.W., 2014. Theoretical analysis of the determinants of lung oxygen
diffusing capacity. J. Theor. Biol. 351, 1–8. http://dx.doi.org/10.1016/j.jtbi.2014.02.009.
Schroeter, J.D., Kimbell, J.S., Bonner, A.M., Roberts, K.C., Andersen, M.E., Dorman, D.C.,2006. Incorporation of tissue reaction kinetics in a computational fluid dynamicsmodel for nasal extraction of inhaled hydrogen sulfide in rats. Toxicol. Sci. 90,198–207. http://dx.doi.org/10.1093/toxsci/kfj072.
Schroeter, J.D., Kimbell, J.S., Asgharian, B., Tewksbury, E.W., Sochaski, M., Foster, M.L.,Dorman, D.C., Wong, B. a, Andersen, M.E., 2013. Inhalation dosimetry of hexam-ethylene diisocyanate vapor in the rat and human respiratory tracts. Inhal. Toxicol.25, 168–177. http://dx.doi.org/10.3109/08958378.2013.768314.
Schum, M., Yeh, H.-C., 1980. Theoretical evaluation of aerosol deposition in anatomicalmodels of mammalian lung airways. Bull. Math. Biol. 42, 1–15.
Semple, K.T., Doick, K.J., Jones, K.C., Burauel, P., Craven, A., Harms, H., 2004. Definingbioavailability and bioaccessibility of contaminated soil and sediment is complicated.Environ. Sci. Technol. 38, 228A–231A.
Stefaniak, A.B., Abbas Virji, M., Harvey, C.J., Sbarra, D.C., Day, G.A., Hoover, M.D., 2010.Influence of artificial gastric juice composition on bioaccessibility of cobalt- andtungsten-containing powders. Int. J. Hyg. Environ. Health 213, 107–115. http://dx.doi.org/10.1016/j.ijheh.2009.12.006.
Sturm, R., 2012. Modeling the deposition of bioaerosols with variable size and shape inthe human respiratory tract - a review. J. Adv. Res. 3, 295–304. http://dx.doi.org/10.1016/j.jare.2011.08.003.
Suresh, V., Anderson, J.C., Grotberg, J.B., Hirschl, R.B., 2005. A mathematical model ofalveolar gas exchange in partial liquid ventilation. J. Biomech. Eng. 127, 46–59.http://dx.doi.org/10.1016/j.ajme.2016.03.005.
Swift, D.L., Montassier, N., Hopke, P.K., Karpen-Hayes, K., Cheng, Y.S., Su, Yin Fong, Yeh,Hsu Chi, Strong, J.C., 1992. Inspiratory deposition of ultrafine particles in humannasal replicate cast. J. Aerosol Sci. 23, 65–72. http://dx.doi.org/10.1016/0021-8502(92)90318-P.
Taylor, A.B., Borhan, A., Ultman, J.S., 2007. Three-dimensional simulations of reactivegas uptake in single airway bifurcations. Ann. Biomed. Eng. 35, 235–249. http://dx.doi.org/10.1007/s10439-006-9195-4.
Tian, G., Longest, P.W., 2010a. Transient absorption of inhaled vapors into a multilayermucus-tissue-blood system. Ann. Biomed. Eng. 38, 517–536. http://dx.doi.org/10.1007/s10439-009-9808-9.
Tian, G., Longest, P.W., 2010b. Development of a CFD boundary condition to modeltransient vapor absorption in the respiratory airways. J. Biomech. Eng. Asme 132,51003. http://dx.doi.org/10.1115/1.4001045.
Tornquist, S., Nicklasson, M., Soderkvist, P., Nybom, L., Toftgard, R., 1988.Bioavailability of benzo(a)pyrene deposited in the lung. Correlation with dissolutionfrom urban air particulates and covalently bound DNA adducts. Drug Metab. Dispos.16, 842–847.
Turner, A., 2011. Oral bioaccessibility of trace metals in household dust: a review.Environ. Geochem. Health 33, 331–341. http://dx.doi.org/10.1007/s10653-011-9386-2.
U.S. Food and Drug Administration, 2001. ICH S7A Safety Pharmacology Studies forHuman Pharmaceuticals. ICH Guidel. (doi:fr13jy01-67).
Wang, W., Wu, F.Y., Huang, M.J., Kang, Y., Cheung, K.C., Wong, M.H., 2013. Size fractioneffect on phthalate esters accumulation, bioaccessibility and in vitro cytotoxicity ofindoor/outdoor dust, and risk assessment of human exposure. J. Hazard. Mater. 261,753–762. http://dx.doi.org/10.1016/j.jhazmat.2013.04.039.
Weschler, C.J., Nazaroff, W.W., 2008. Semivolatile organic compounds in indoor en-vironments. Atmos. Environ. 42, 9018–9040. http://dx.doi.org/10.1016/j.atmosenv.2008.09.052.
Wester, R.C., Maibach, H.I., Bucks, D.A.W., Sedik, L., Melendres, J., Liao, C., Dizio, S.,1990. Percutaneous absorption of [14C]DDT and [14C]benzo[a]pyrene from soil.Fundam. Appl. Toxicol. 15, 510–516. http://dx.doi.org/10.1016/0272-0590(90)90037-K.
Whyte, J.J., Jung, R.E., Schmitt, C.J., Tillitt, D.E., 2000. Ethoxyresorufin- O -deethylase(EROD) activity in fish as a biomarker of chemical exposure. Crit. Rev. Toxicol. 30,347–570. http://dx.doi.org/10.1080/10408440091159239.
Wiseman, C.L.S., 2015. Analytical methods for assessing metal bioaccessibility in airborneparticulate matter: a scoping review. Anal. Chim. Acta 877, 9–18. http://dx.doi.org/10.1016/j.aca.2015.01.024.
Withey, J.R., Shedden, J., Law, F.P.C., Abedini, S., 1992. Distribution to the fetus andmajor organs of the rat following inhalation exposure to pyrene. J. Appl. Toxicol. 12,223–231.
Withey, J.R., Shedden, J., Law, F.C.P., Abedini, S., 1993. Distribution of benzo[a]pyrenein pregnant rats following inhalation exposure and a comparison with similar dataobtained with pyrene. J. Appl. Toxicol. 13, 193–202. http://dx.doi.org/10.1002/jat.2550130310.
Wu, N., Herrmann, T., Paepke, O., Tickner, J., Hale, R., Harvey, E., La Guardia, M.,McClean, M.D., Webster, T.F., 2007. Human exposure to PBDEs: associations of PBDEbody burdens with food consumption and house dust concentrations. Environ. Sci.Technol. 41, 1584–1589. http://dx.doi.org/10.1021/es0620282.
Yeh, H.C., Schum, G.M., 1980. Models of human lung airways and their application toinhaled particle deposition. Bull. Math. Biol. 42, 461–480. http://dx.doi.org/10.1007/BF02460796.
Yu, Y.-X., Pang, Y.-P., Li, C., Li, J.-L., Zhang, X.-Y., Yu, Z.-Q., Feng, J.-L., Wu, M.-H.,Sheng, G.-Y., Fu, J.-M., 2012. Concentrations and seasonal variations of poly-brominated diphenyl ethers (PBDEs) in in- and out-house dust and human daily in-take via dust ingestion corrected with bioaccessibility of PBDEs. Environ. Int. 42,124–131.
W. Wei et al. Environment International 113 (2018) 202–213
213

Page 209
Human exposure to semi-volatile organic compounds (SVOCs) via dust
ingestion: a review of influencing factors Gaëlle Raffy1,2,3*, Fabien Mercier1,2,3, Philippe Glorennec1,2, Corinne Mandin4, Barbara Le Bot 1,2,3
1 EHESP - School of public health Sorbonne Paris Cité, Rennes, France 2 Irset-Inserm UMR 1085- Research Institute for Environmental and Occupational Health, Rennes, France 3 LERES - Environment and health research laboratory, Rennes, France 4 Université Paris Est, CSTB - Scientific and technical center for building, OQAI - French indoor air quality observatory, Marne-la-Vallée, France *[email protected]
SUMMARY
Dust ingestion is a non-negligible pathway of human exposure to several SVOCs. To get a better knowledge on this human exposure, a review of the literature was performed on its influencing factors including (1) the fraction of dust that enters the body via hand to mouth contact: dust with particle size < 100 µm was deemed more relevant to human exposure, and (2) the fraction of pollutant released in the digestive tract, i.e. the bioaccessibility of SVOCs: the composition of the matrix, the dust particle size, the physicochemical characteristics of the pollutant, the way the SVOC has contaminated dust, i.e. through adsorption or material abrasion, and the use of Tenax as a sink were among the main determinants. PRACTICAL IMPLICATIONS
Taking bioaccessibility into account allows a better estimation of the exposure dose via dust ingestion and thus a more accurate human risk assessment. In vitro studies are proxies of bioavailability data and are easier to implement particularly from an ethical point of view.
KEYWORDS Bioaccessibility, dust particle size INTRODUCTION
Humans are exposed to a wide range of indoor chemical pollutants including SVOCs, which are suspected of adverse health effects such as reprotoxic and neurotoxic effects (Fournier et al., 2014). Dust ingestion is a non-negligible pathway of human exposure to several SVOCs (Bekö et al., 2015; Tue et al., 2013). To improve this human exposure assessment, it is necessary to consider the fraction of dust that will enter the body via hand to mouth contact and the quantity of pollutants released in the digestive tract. The present work reviews the literature related to the size of ingested dust particles and the bioaccessibility of indoor SVOCs. DUST PARTICLE SIZE
The size of ingested dust particle is very important, particularly because SVOC concentrations vary significantly with particle size. First, in general, concentration of toxic chemicals in dust increases as particle size decreases (Lewis et al., 1999). Second, studies show that fine particles adhere better to human's hands than larger ones (Cao et al., 2012). The size of dust particles adherent to hands was measured and a particle size distribution of 29 ± 22 µm was

Page 210
reported (Cao et al., 2013). Furthermore if < 150 µm was considered as skin adherent dust fraction, 86% of this fraction would be in a 9.3-105 µm range (Kefeni and Okonkwo, 2014). SVOC BIOACCESSILITY IN DUST
Regarding bioaccessibility, most reported methods simulated the gastrointestinal tract, dust being successively submitted to synthetic gastric and intestinal fluid (Yu et al., 2011). The model was sometimes extended to saliva (Ertl and Butte, 2012) or colon (Abdallah et al., 2012) digestion. The presence of food could be considered with the addition of milk powder (Ertl and Butte, 2012). Tenax beads were also used as an adsorption sink to estimate the dynamic absorption of SVOCs (Fang and Stapleton, 2014). SVOC bioaccessibility is influenced by several factors related to the matrix: the organic carbon content was often associated with a decrease of bioaccessibility, for example for polybrominated diphenyl ethers (PBDEs) (Yu et al., 2012, 2013) or the more hydrophobic organophosphorous flame retardants and phthalate esters, but no effect was noticed on the less hydrophobic ones (He et al., 2015). A decrease of dust particle size (Wang et al., 2013c; Wang et al., 2013b) or an increase of dust pore volumes (Yu et al., 2013) lead to a larger specific surface area which was linked to an increase of SVOC bioaccessibility. Dust aging was tested for flame retardants and showed a decrease of their bioaccessibility for older dust samples (Fang and Stapleton, 2014). SVOC bioaccessibility was also influenced by factors related to the compound itself. For example, substances with higher octanol-water partition coefficients (Kow) were less bioaccessible (Kang et al., 2012, 2013; Wang et al., 2013a). For PBDEs, congeners that had integrated dust by adsorption were more bioaccessible than BDE 209 whose presence in dust is suspected to originate from material abrasion (Yu et al., 2013), although this origin could not be confirmed (Abdallah et al., 2012). SVOC bioaccessibility was not influenced by the pollutant’s concentration (Yu et al., 2011). Last, SVOC bioaccessibility was positively influenced by parameters of the method itself such as the use of Tenax (Fang and Stapleton, 2014) or milk powder (Ertl and Butte, 2012) and the increase of the concentration of bile in the intestinal solution (He et al., 2015). This emphasizes the need of a physiologically relevant, standardized measurement protocol (Collins et al., 2015). Overall, measured bioaccessibilities were subject to a large variability, ranging from < 20% for BDE 209 (Yu et al., 2013), polycyclic aromatic hydrocarbons (Kang et al., 2011) or high molecular weight phthalates (Wang et al., 2013d), up to > 60% for OPFRs, low molecular weight PBDEs (Fang and Stapleton, 2014) or tetrabromobisphenol A and hexabromocyclodecanes (Abdallah et al., 2012). This confirms that taking bioaccessibility into account allows a better estimation of the ingested dose, whereas the latter could be overestimated when the studied pollutants are considered 100% bioaccessible. CONCLUSIONS
Bioaccessibility data are useful for a better quantification of SVOC exposure doses and thus for a better estimation of associated health risks. However more studies are needed to assess SVOC bioaccessibilities, which should be compared to in-vivo studies for validation. REFERENCES
Abdallah, M.A.-E., Tilston, E., Harrad, S. and Collins, C. (2012) In vitro assessment of the

Page 211
bioaccessibility of brominated flame retardants in indoor dust using a colon extended model of the human gastrointestinal tract, J. Environ. Monit., 14, 3276–3283.
Bekö, G., Callesen, M., Weschler, C.J., Toftum, J., Langer, S., Sigsgaard, T., Høst, A., Kold Jensen, T. and Clausen, G. (2015) Phthalate exposure through different pathways and allergic sensitization in preschool children with asthma, allergic rhinoconjunctivitis and atopic dermatitis, Environ. Res., 137, 432–439.
Cao, Z., Yu, G., Chen, Y., Liu, C., Liu, K., Zhang, T., Wang, B., Deng, S. and Huang, J. (2013) Mechanisms influencing the BFR distribution patterns in office dust and implications for estimating human exposure, J. Hazard. Mater., 252-253, 11–18.
Cao, Z.-G., Yu, G., Chen, Y.-S., Cao, Q.-M., Fiedler, H., Deng, S.-B., Huang, J. and Wang, B. (2012) Particle size: a missing factor in risk assessment of human exposure to toxic chemicals in settled indoor dust, Environ. Int., 49, 24–30.
Collins, C.D., Craggs, M., Garcia-Alcega, S., Kademoglou, K. and Lowe, S. (2015) ‘Towards a unified approach for the determination of the bioaccessibility of organic pollutants’, Environ. Int., 78, 24–31.
Ertl, H. and Butte, W. (2012) Bioaccessibility of pesticides and polychlorinated biphenyls from house dust: in-vitro methods and human exposure assessment, J. Expo. Sci.
Environ. Epidemiol., 1–10. Fang, M. and Stapleton, H.M. (2014) Evaluating the bioaccessibility of flame retardants in
house dust using an in vitro Tenax bead-assisted sorptive physiologically based method, Environ. Sci. Technol., 48, 13323–13330.
Fournier, K., Glorennec, P. and Bonvallot, N. (2014) An exposure-based framework for grouping pollutants for a cumulative risk assessment approach: case study of indoor semi-volatile organic compounds, Environ. Res., 130, 20–28.
He, R., Li, Y., Xiang, P., Li, C., Zhou, C., Zhang, S., Cui, X. and Ma, L.Q. (2015) Organophosphorus flame retardants and phthalate esters in indoor dust from different microenvironments: Bioaccessibility and risk assessment, Chemosphere, 2010, 1–8.
Kang, Y., Cheung, K.C. and Wong, M.H. (2011) Mutagenicity, genotoxicity and carcinogenic risk assessment of indoor dust from three major cities around the Pearl River Delta, Environ. Int., 37, 637–643.
Kang, Y., Man, Y.B., Cheung, K.C. and Wong, M.H. (2012) Risk Assessment of Human Exposure to Bioaccessible Phthalate Esters via Indoor Dust around the Pearl River Delta, Environ. Sci. Technol., 46, 8422–8430.
Kang, Y., Yin, Y., Man, Y., Li, L., Zhang, Q., Zeng, L. and Luo, J. (2013) Bioaccessibility of polychlorinated biphenyls in workplace dust and its implication for risk assessment, Chemosphere, 93, 924–930.
Kefeni, K.K. and Okonkwo, J.O. (2014) Distribution of polybrominated diphenyl ethers and dust particle size fractions adherent to skin in indoor dust, Pretoria, South Africa, Environ. Sci. Pollut. Res., 21, 4376–4386.
Lewis, R.G., Fortune, C.R., Willis, R.D., Camann, D.E. and Antley, J.T. (1999) Distribution of pesticides and polycyclic aromatic hydrocarbons in house dust as a function of particle size, Environ. Health Perspect., 107, 721–726.
Tue, N.M., Takahashi, S., Suzuki, G., Isobe, T., Viet, P.H., Kobara, Y., Seike, N., Zhang, G., Sudaryanto, A. and Tanabe, S. (2013) Contamination of indoor dust and air by polychlorinated biphenyls and brominated flame retardants and relevance of non-dietary exposure in Vietnamese informal e-waste recycling sites, Environ. Int., 51, 160–167.
Wang, W., Huang, M.-J., Zheng, J.-S., Cheung, K.C. and Wong, M.H. (2013) Exposure assessment and distribution of polychlorinated biphenyls (PCBs) contained in indoor and outdoor dusts and the impacts of particle size and bioaccessibility., Sci. Total Environ., 463-464, 1201–1209.

Page 212
Wang, W., Huang, M., Wu, F., Kang, Y., Wang, H.-S., Cheung, K.C. and Wong, M.H. (2013) Risk assessment of bioaccessible organochlorine pesticides exposure via indoor and outdoor dust, Atmos. Environ., 77, 525–533.
Wang, W., Wu, F., Zheng, J. and Wong, M.H. (2013) Risk assessments of PAHs and Hg exposure via settled house dust and street dust, linking with their correlations in human hair, J. Hazard. Mater., 263, 627–637.
Wang, W., Wu, F., Huang, M. and Kang, Y. (2013) Size fraction effect on phthalate esters accumulation , bioaccessibility and in vitro cytotoxicity of indoor / outdoor dust , and risk assessment of human exposure, J. Hazard. Mater., 261, 753–762.
Yu, Y., Pang, Y., Zhang, X., Li, C., Yu, Z. and Fu, J. (2011) Optimization of an in vitro method to measure the bioaccessibility of polybrominated diphenyl ethers in dust using response surface methodology, J. Environ. Sci., 23, 1738–1746.
Yu, Y., Pang, Y., Li, C., Li, J., Zhang, X., Yu, Z., Feng, J., Wu, M., Sheng, G. and Fu, J. (2012) Concentrations and seasonal variations of polybrominated diphenyl ethers ( PBDEs ) in in- and out-house dust and human daily intake via dust ingestion corrected with bioaccessibility of PBDEs, Environ. Int., 42, 124–131.
Yu, Y., Yang, D., Wang, X., Huang, N., Zhang, X., Zhang, D. and Fu, J. (2013) Factors influencing on the bioaccessibility of polybrominated diphenyl ethers in size-specific dust from air conditioner filters, Chemosphere, 93, 2603–2611.

Page 213
Bioaccessibility of semi-volatile organic compounds (SVOCs) in settled
dust Gaëlle Raffy1,2,3*, Fabien Mercier1,2,3, Philippe Glorennec1,2, Corinne Mandin4, Barbara Le Bot 1,2,3
1 EHESP - School of public health Sorbonne Paris Cité, Rennes, France 2 Irset-Inserm UMR 1085- Research Institute for Environmental and Occupational Health, Rennes, France 3 LERES - Environment and health research laboratory, Rennes, France 4 Université Paris Est, CSTB - Scientific and technical center for building, OQAI - French indoor air quality observatory, Marne-la-Vallée, France *[email protected]
Humans are exposed to a wide range of indoor chemical pollutants including semi-volatile organic compounds (SVOCs), which are suspected of adverse health effects such as reprotoxic and neurotoxic effects. Dust ingestion is a non-negligible pathway of human exposure to several of these compounds. To improve this human exposure assessment, it is necessary to consider the bioaccessibility of SVOCs, i.e. the fraction of pollutants released in the digestive tract following the ingestion of dust. The present work reviews the literature for the methods, measured values, and influencing factors related to the bioaccessibility of SVOCs in indoor dust. Reported bioaccessibility measurement methods simulate the gastrointestinal tract, with dust samples being successively submitted to synthetic gastric and intestinal fluids. Models were sometimes extended to include the role of saliva or colon. Milk proteins, Tenax® beads or Caco-2 cells could also be added for a better physiological relevance. So far, SVOC bioaccessibility in dust has not been well documented in the scientific literature. However, the available articles show that measured bioaccessibilities ranged from < 20% for bromodiphenylether (BDE) 209, polycyclic aromatic hydrocarbons (PAHs) or high molecular weight phthalates, up to > 60% for organophosphorous flame retardants (OPFRs), low molecular weight polybromodiphenylether (PBDEs), hexabromocyclododecanes or tetrabromobisphenol A. SVOC bioaccessibility is influenced by several factors related to the matrix. An increase of organic carbon content was often associated with a decrease of bioaccessibility: this was observed for PBDEs or the more hydrophobic OPFRs and phthalate esters, but no effect was noticed on the less hydrophobic ones. A decrease of dust particle size or an increase of dust pore volumes lead to a larger specific surface area which was linked to an increase of bioaccessibility. SVOC bioaccessibility was also influenced by factors related to the compound itself. For example, substances with higher octanol-water partition coefficients (Kow) were less bioaccessible. For PBDEs, congeners that had integrated dust by adsorption were more bioaccessible than BDE 209 whose presence in dust is suspected to originate from material abrasion. Bioaccessibility was not influenced by the pollutant’s concentration. Bioaccessibility data are useful for a better quantification of SVOC exposure doses, which could otherwise be overestimated when the pollutant’s total concentration is considered. However, more studies are needed, which should be compared to in-vivo studies for validation.


Page 215
This method was used to produce bioaccessibility data for the SVOCs present in the dust reference material SRM 2585, analyzed in triplicates. Measured bioaccessibilities (in %) ranged from 25 to 76, 37 to 83, 27 to 78, 23 to 95, and 0 to 39 for pyrethroids, PAHs, PCBs, phthalates and PBDEs, respectively. These results are comparable to those already reported in the literature for PCBs and phtalates (3 to 92 % and 1 to 81 %, respectively), however they were higher in the literature for PBDEs (11 to 71 %) and lower for PAHs (2 to 17 %) (Raffy et al., 2016). A decreasing trend was observed between the bioaccessibility of SVOCs and their octanol-water coefficient partition (Kow), as shown in Figure 2 below (r²=0.6).
Figure 2: bioaccessibility as a function of the SVOC's Kow
These results are preliminary and the measurements method still needs to be optimized then compared to the few available in-vivo data, using rats for PBDEs (Huwe et al., 2008) and using piglets for phthalates (Plichta and Fromme, 2016). Following development and validation of the simplified method, bioaccessibility will be assessed for school dust samples within a national survey in order to help filling the gap between contamination data and children’s exposure to SVOCs in indoor dust. References:
Abdallah, M.A.E., Tilston, E., Harrad, S., Collins, C.D., 2012. In vitro assessment of the bioaccessibility of brominated flame retardants in indoor dust using a colon extended model of the human gastrointestinal tract. J. Environ. Monit. 14, 3276–3283.
Bramwell, L., Glinianaia, S. V., Rankin, J., Rose, M., Fernandes, A., Harrad, S., Pless-Mulloli, T., 2016. Associations between human exposure to polybrominated diphenyl ether flame retardants via diet and indoor dust, and internal dose: A systematic review. Environ. Int. 92–93, 680–694.
Ertl, H., Butte, W., 2012. Bioaccessibility of pesticides and polychlorinated biphenyls from house dust: in-vitro methods and human exposure assessment. J. Expo. Sci. Environ. Epidemiol. 1–10.
Fromme, H., Becher, G., Hilger, B., Völkel, W., 2016. Brominated flame retardants - Exposure and risk assessment for the general population. Int. J. Hyg. Environ. Health 219, 1–23.
Huwe, J.K., Hakk, H., Smith, D.J., Diliberto, J.J., Richardson, V., Stapleton, H.M., Birnbaum, L.S., 2008. Comparative absorption and bioaccumulation of polybrominated diphenyl ethers following ingestion via dust and oil in male rats. Environ. Sci. Technol. 42, 2694–2700.
Langer, S., Bekö, G., Weschler, C., Brive, L.M., Toftum, J., Callesen, M., Clausen, G., 2014. Phthalate metabolites in urine samples from Danish children and correlations with phthalates in dust samples from their homes and daycare centers. Int. J. Hyg. Environ. Health 217, 78–87.
Plichta, V., Fromme, H., 2016. Bioavailability of plasticizers in dust and food after oral administration in pigs Veronika, in: International Society of Exposure Science. p. 246.
Quintana, J.B., Rosende, M., Montes, R., Rodríguez-Álvarez, T., Rodil, R., Cela, R., Miró, M., 2016. In-vitro estimation of bioaccessibility of chlorinated organophosphate flame retardants in indoor dust by fasting and fed physiologically relevant extraction tests. Sci. Total Environ.
Raffy, G., Mercier, F., Glorennec, P., Mandin, C., Le Bot, B., 2016. Bioaccessibility of semi-volatile organic compounds (SVOCs) in settled dust, in: International Society of Exposure Sciences, Utrecht, The Netherlands, October 9-13, 2016.
R² = 0.5953
0%
20%
40%
60%
80%
100%
120%
2.00 4.00 6.00 8.00 10.00
Bio
acc
ess
ibil
ity
Kow
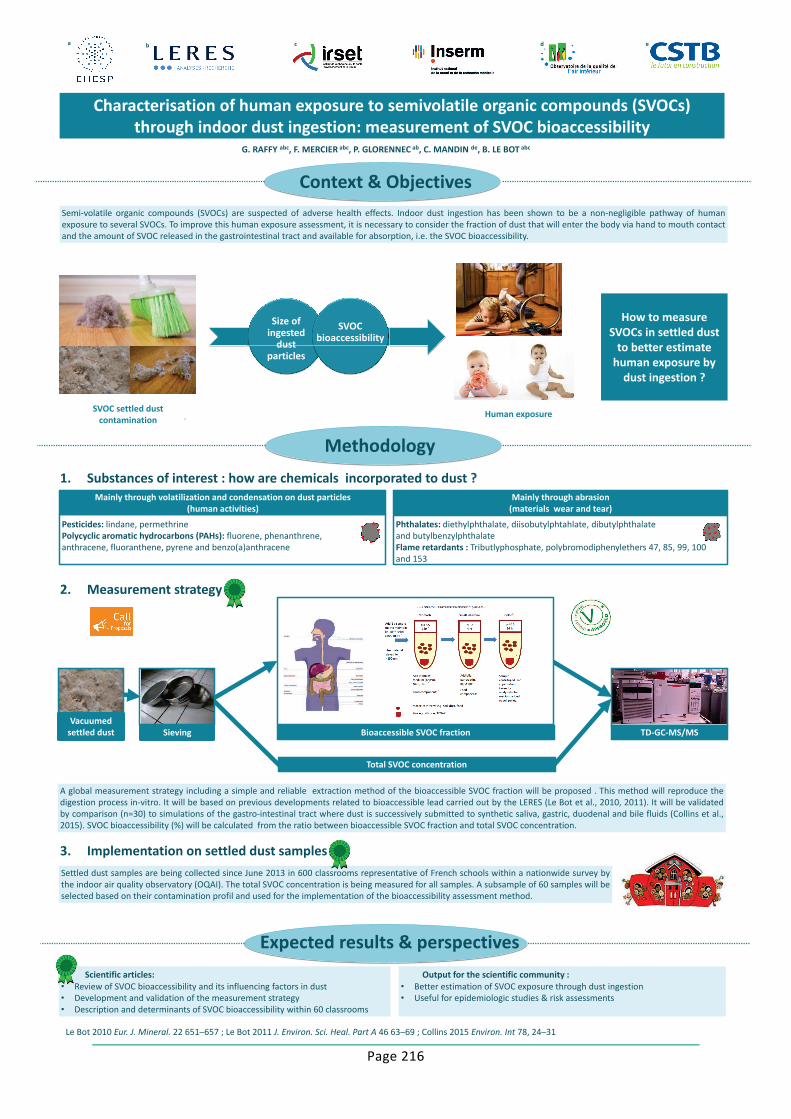
Page 216
2. Measurement strategy
Characterisation of human exposure to semivolatile organic compounds (SVOCs)
through indoor dust ingestion: measurement of SVOC bioaccessibility
Context & Objectives
G. RAFFY abc, F. MERCIER abc, P. GLORENNEC ab, C. MANDIN de, B. LE BOT abc
Methodology
1. Substances of interest : how are chemicals incorporated to dust ?
Expected results & perspectives
Semi-volatile organic compounds (SVOCs) are suspected of adverse health effects. Indoor dust ingestion has been shown to be a non-negligible pathway of human
exposure to several SVOCs. To improve this human exposure assessment, it is necessary to consider the fraction of dust that will enter the body via hand to mouth contact
and the amount of SVOC released in the gastrointestinal tract and available for absorption, i.e. the SVOC bioaccessibility.
SVOC settled dust
contamination Human exposure
Size of ingested
dust particles
SVOC bioaccessibility
How to measure
SVOCs in settled dust
to better estimate
human exposure by
dust ingestion ?
Mainly through volatilization and condensation on dust particles
(human activities)
Mainly through abrasion
(materials wear and tear)
Pesticides: lindane, permethrine
Polycyclic aromatic hydrocarbons (PAHs): fluorene, phenanthrene,
anthracene, fluoranthene, pyrene and benzo(a)anthracene
Phthalates: diethylphthalate, diisobutylphtahlate, dibutylphthalate
and butylbenzylphthalate
Flame retardants : Tributlyphosphate, polybromodiphenylethers 47, 85, 99, 100
and 153
3. Implementation on settled dust samples
Bioaccessible SVOC fraction
Total SVOC concentration
Vacuumed
settled dust Sieving TD-GC-MS/MS
y
A global measurement strategy including a simple and reliable extraction method of the bioaccessible SVOC fraction will be proposed . This method will reproduce the
digestion process in-vitro. It will be based on previous developments related to bioaccessible lead carried out by the LERES (Le Bot et al., 2010, 2011). It will be validated
by comparison (n=30) to simulations of the gastro-intestinal tract where dust is successively submitted to synthetic saliva, gastric, duodenal and bile fluids (Collins et al.,
2015). SVOC bioaccessibility (%) will be calculated from the ratio between bioaccessible SVOC fraction and total SVOC concentration.
Le Bot 2010 Eur. J. Mineral. 22 651–657 ; Le Bot 2011 J. Environ. Sci. Heal. Part A 46 63–69 ; Collins 2015 Environ. Int 78, 24–31
Settled dust samples are being collected since June 2013 in 600 classrooms representative of French schools within a nationwide survey by
the indoor air quality observatory (OQAI). The total SVOC concentration is being measured for all samples. A subsample of 60 samples will be
selected based on their contamination profil and used for the implementation of the bioaccessibility assessment method.
s
Output for the scientific community :
• Better estimation of SVOC exposure through dust ingestion
• Useful for epidemiologic studies & risk assessments
Scientific articles:
• Review of SVOC bioaccessibility and its influencing factors in dust
• Development and validation of the measurement strategy
• Description and determinants of SVOC bioaccessibility within 60 classrooms
• Re
a b c d e

Page 217
•
•
•
•

Page 218
CONCLUSION ET PERSPECTIVES1. Les connaissances sur la bioaccessibilité des COSV sont
fragmentaires. Des études complémentaires sont nécessaires, couvrant de plus nombreux COSV et utilisant une méthodeharmonisée et validée.
2. Ce projet de thèse vise ainsi à documenter la bioaccessibilité d’unevingtaine de COSV dans 60 échantillons de poussières de la Campagne Nationale Ecole (OQAI).
PRINCIPAUX RÉSULTATSANALYSE DE LA LITTÉRATURE SCIENTIFIQUE :
1. Bioaccessibilité des COSV dans les poussières documentée dansseulement 16 articles scientifiques (2011-2016)
2. Forte variabilité des bioaccessibilités mesurées varient de < 20% à > 60% => intérêt de prendre la bioaccessibilité en compte pour mieuxquantifier les doses d’exposition, et ainsi mieux caractériser les risques pour la santé.
3. Bioaccessibilité des COSV influencée par des paramètres relatifs à la nature de la poussière (teneur en matière organique, taille des particules) et aux caractéristiques des COSV (KOW, voie d’intégrationdans la poussière) : ces facteurs pourraient être utilisés dans des modèles de prédiction de la bioaccessibilité.
4. Bioaccessibilité des COSV aussi influencée par des facteurs relatifsà la méthode de mesure (inclusion d’un adsorbant, concentration biliaire) : ces facteurs doivent être maîtrisés et harmonisés pour permettre de meilleures comparaisons inter-laboratoires.
Gaëlle Raffy
CONTEXTE ET OBJECTIFSContexte
04-10-2016
Objectif> Evaluation de la bioaccessibilité orale des COSV contenus dans les
poussières des bâtiments :
– Revue de la littérature scientifique du domaine
– Développement et validation d’une méthode simple de mesure de la
bioaccessibilité des COSV dans les poussières.
– Production de données de bioaccessibilité pour plusieurs familles de
COSV (phtalates, pesticides organochlorés et pyréthrinoïdes,
hydrocarbures aromatiques polycycliques (HAP), retardateurs de flamme
bromés et organophosphorés).
ETAT D'AVANCEMENTRevue de la littérature scientifiqueLes méthodes d’évaluation de la bioaccessibilité sont des simulations in-vitro de
la digestion :
> Compartiment salivaire : pH 6,5, T = 37°C, durée = 0,5 hour .
> Compartiment gastrique : pepsine, composés alimentaires, pH < 2,5,
T = 37°C, durée 1 à 2 heures.
> Compartiment intestinal : pancreatine, bile, composés alimentaires,
6,5<pH<8, T = 37°C, durée 4 à 7 heures.
=> Ajout d’un adsorbant (Tenax®) pour simuler la dynamique de l’absorption
pendant la digestion
=> Concentration biliaire : de 0,23 à 6,7g/L (de 0,23 à 2,2 g/L chez l’homme)
> Colon : composés alimentaires, T=37°C, durée 8 à 16 heures.
> Utilisation de cellules Caco-2 pour simuler le transport à travers la paroi
intestinale.
La bioaccessibilité des COSV est influencée par des paramètres propres à la
matrice, à la nature du COSV, et à la méthode de mesure :
Les bioaccessibilités mesurées dans la littérature varient de < 20% (PAHs) à >
60% (OPFRs) :
> Les COSV (composés organiques semi-volatils) sont suspectés d ’effets
néfastes pour la santé (effets cancérogènes, reprotoxiques et neurotoxiques).
> Les concentrations de COSV retrouvées dans les poussières des logements
et des écoles sont sujettes à préoccupation.
> L’ingestion de poussières est une voie d’exposition non négligeable à certains
COSV, et les enfants, du fait de contacts sol-main-bouche fréquents sont tout
particulièrement concernés.
> Seule la fraction bioaccessible des COSV, définie comme la fraction de
polluant libérée dans le tractus gastro-intestinal et disponible à l’absorption,
est responsable de l’exposition humaine par ingestion poussière.
Encadrement – Barbara Le Bot, directrice, EHESP ; Corinne Mandin, co-directrice, CSTB
Contact – [email protected]
> JOURNEE DES DOCTORANTS> CSTB - PARIS
Evaluation de la bioaccessibilité orale des COSV contenus dans les poussières des bâtiments
BFR: brominated flame retardant, OPFR: organophosphorus flame retardant, PAH: polycyclic aromatic hydrocarbon, PCB: polychlorobiphenyl
Chaque point représente la valeur médiane de la bioaccessibilité d’un COSV dans une étude.
Factor related to the matrix characteristics: Effect on SVOC bioaccessibility
Dust organic content ↗
↘ (PBDEs, fipronil, and the more hydrophobic
OPFRs and PAEs)
→ (FRs, OCPs, PBDEs, and the less hydrophobic
OPFRs and PAEs)
Dust particle ↗ ↘ (PAHs, PBDEs, OCPs)
Factor related to SVOC characteristics: Effect on SVOC bioaccessibility
KOW ↗↘ (PCBs, PBDEs, PAEs, PAHs)
→ (PBDEs)
SVOC content in dust ↗ → (PBDEs)
How the SVOC got in dust
(sorp on → abrasion)
↘ (PBDEs and HBCDs)
→ (PBDEs)
Factor related to the bioaccessibility
measurement method:Effect on SVOC bioaccessibility
Presence of tenax ↗ (OPFRs, PBDEs)
Presence of food ↗ (pesticides and PCBs)
Bile concentration ↗ ↗ (OPFRs + PAEs, PCBs , PBDEs)

Page 219
•
•
•
•
•
•
•
•
•
•
•
•
•

Page 220
CONCLUSION AND PROSPECTS1. Proposal of a simple and robust method to measure the SVOC
bioaccessibility in many dust samples.
2. Need to improve and validate the simplified method using in-vivo testing.
3. This project will document the bioaccessibility of about 30 SVOCs in 30 dust samples from the National School Campaign (CSTB/OQAI).
4. This project is the first step towards a better evaluation of human exposure to SVOCs in dust and particles, considering their oral, pulmonary and dermal bioaccessibility
MAIN RESULTSON THE SIMPLIFIED MEASUREMENT METHOD
1. Repeatable method for the analysis of dust, Tenax and liquid. Majority of CVs <20%, all <33% (except dieldrin and oxadiazon in dust).
2. Mass balance between 80 and 120% of the contamination value(except cypermethrin and g-HCH)
3. Less than 5% of COSVs bioaccessible in liquid phase liquid analysis could be avoided
4. Bioavailable concentration of PBDE measured in-vivo in rats for SRM2585
aim: to obtain greater bioaccessible concentrations.
Gaëlle Raffy
CONTEXT AND OBJECTIVESContext
Objectives> Evaluation of the oral bioaccessibility of SVOCs in indoor settled dust:
– Review of the scientific literature.
– Development and validation of a simple method for measuring the
bioaccessibility of SVOCs in dust.
– Production of bioaccessibility data for several SVOC families
(organochlorine and organophosphorus pesticides, pyrethroids, polycyclic
aromatic hydrocarbons (PAHs), polychlorobiphenyls (PCBs), phthalates
and polybromodiphenylethers (PBDEs).
STATE OF PROGRESS36 substances of interest Simplified measurement
method> SVOCs (semi-volatile organic compounds) are suspected of having adverse
health effects (carcinogenic, reprotoxic and neurotoxic effects).
> The concentrations of SVOCs found in indoor settled dust are subject to
concern.
> Dust ingestion is a non-negligible exposure pathway for some SVOCs.
Children, because of frequent hand-to-mouth contact, are particularly
concerned.
> Only the bioaccessible fraction of SVOCs, defined as the fraction of pollutant
released into the gastrointestinal tract and available for absorption, is
responsible for human exposure by dust ingestion.
Supervisors – Barbara Le Bot, EHESP ; Corinne Mandin, CSTB
Contact – [email protected]
> 6th Day of the Young Researchers of Irset
> 11-01-2018
ASSESSMENT OF THE ORAL BIOACCESSIBILITY OF SEMI-VOLATILE ORGANIC COMPOUNDS (SVOCs) IN
INDOOR SETTLED DUST USING A SIMPLIFIED METHOD
Famille chimique COSV
Diazinon
Chlorpyrifos-ethyl
g-HCH
4,4'-DDE
Dieldrin
03-Oxadiazolone Oxadiazon
Tetramethrine
Permethrin
Cyfluthrin
Cypermethrin
05-OPFR Tributylphosphate
Acenaphtene
Fluorene
Phenanthrene
Anthracene
Fluoranthene
Pyrene
Benzo(a)pyrene
Galaxolide
Tonalide
PCB31
PCB28
PCB52
PCB101
PCB118
PCB138
DEP
DiBP
DBP
BBP
DEHP
BDE47
BDE100
BDE99
BDE85
BDE153
09-Phthalate
10-PBDE
07-PAH
01-OP
02-OC
04-Pyrethroid
06-Musk
08-PCB
Bioaccessible SVOC ratio (R, %) in the standard referencematerial SRM 2585
*Huwe et al., 2008. Environ. Sci. Technol. 42, 2694–2700
SVOC
Bioaccessible
SVOC in
SRM2585
Bioavailable SVOC
in SRM2585
In vivo study on
rats (all tissues)*
BDE47 39% 69.4 ± 11.4 %
BDE100 26% 78.4 ± 7.6 %
BDE99 26% 43.7 ± 5.2 %
BDE85 35% 39.3 ± 10.2 %
BDE153 0% 73.1 ± 9.1 %

Page 221
EUROPEAN PROSPECTS
Working towards a better evaluation of human
exposure to SVOCs in dust and airborne particles,
considering their oral, pulmonary and dermal
bioaccessibility
Need to establish partnership for the production of
in-vivo data to validate the in-vitro methods
RESULTS
Gaëlle Raffy1, Fabien Mercier1, Corinne Mandin2, Barbara Le Bot1
CONTEXT
MATERIAL & METHOD
39 substances of interest Simplified measurement
method
> SVOCs are suspected of having adverse health effects (carcinogenic, reprotoxic
and neurotoxic effects).
> The concentrations of SVOCs in indoor settled dust are subject to concern.
> Dust ingestion is a non-negligible exposure pathway for some SVOCs. Children,
because of frequent hand-to-mouth contact, are particularly concerned.
> Only the bioaccessible fraction of SVOCs, defined as the fraction of pollutant
released into the gastrointestinal tract and available for absorption, is responsible
for human exposure by dust ingestion.
> To date, measurement methods have never been applied on many samples due to
their complexity, hence the need for a simplified method
> ISES Europe 2018
> Dortmund (DE)
> 19-20 June 2018
ASSESSMENT OF THE ORAL BIOACCESSIBILITY OF
SEMI-VOLATILE ORGANIC COMPOUNDS (SVOCs) IN
INDOOR SETTLED DUST USING A SIMPLIFIED METHOD
Bioaccessible SVOC ratio (b-ac, %) in the standard reference
material SRM 2585 (n=3)
In-vitro / in-vivo
data comparison
1Univ Rennes, EHESP, IRSET (Research Center for Environmental and Occupational Health)-UMR_S1085, F-35000 Rennes, France 2Université Paris Est, CSTB - Scientific and technical center for building, OQAI - French indoor air quality observatory, Marne-la-Vallée, France
Emails: [email protected], [email protected]
CONCLUSION Proposal of a simple and robust
method to measure the SVOC
bioaccessibility in many dust
samples.
Need to improve and validate the
simplified method using in-vivo
testing.
Chemical family SVOC
Diazinon
Chlorpyrifos-ethyl
4,4'-DDE
Dieldrin
03-Oxadiazolones Oxadiazon
Tetramethrin
Permethrin
Cyfluthrin
Cypermethrin
05-Organophosphorus
05-flame retardantsTributylphosphate
Galaxolide
Tonalide
Acenaphtene
Fluorene
Phenanthrene
Anthracene
Fluoranthene
Pyrene
Benzo(a)pyrene
PCB28
PCB31
PCB52
PCB101
PCB105
PCB118
PCB138
PCB153
PCB180
DEP
DiBP
DBP
BBP
DEHP
DiNP
BDE47
BDE100
BDE99
BDE85
BDE153
10-Polybromo-
10-diphenyl ethers
10-(PBDEs)
07-Polycylic
07-aromatic
07-hydrocarbons
07-(PAHs)
03-Organophosphorus
03-pesticides (OPs)
03-Organochlorinated
03-pesticides (OCs)
04-Pyrethroids
06-Musks
08-Polychloro-
08-biphenyls
08-(PCBs)
09-Phthalates
SVOC
contaminated
dust
Bioaccessible
SVOC
Bioavailable
SVOC
Small Intestine

Titre : Exposition humaine aux composés organiques semi-volatils (COSV) en environnement intérieur par ingestion de poussières : évaluation de la bioaccessibilité orale des COSV
Mots clés : qualité de l’air intérieur ; écoles ; exposition humaine ; ingestion de poussière ; biodisponibilité ; polluant.
Résumé : La qualité de l’environnement intérieur est aujourd’hui un sujet de préoccupation majeur en santé publique. Les populations passent près de 90 % de leur temps en environnement intérieur où elles sont exposées à des polluants comme les composés organiques semi-volatils (COSV) suspectés d’effets néfastes pour la santé. L’ingestion de poussières est une voie d’exposition non négligeable à certains de ces COSV, en particulier chez les enfants. Pour caractériser cette exposition, il est nécessaire de prendre en compte la bioaccessibilité orale des COSV, définie comme la fraction de polluant libérée dans le tractus gastro-intestinal et disponible à l’absorption. Dans ce contexte, les objectifs de cette thèse sont de (i) développer et valider une méthode simple à mettre en œuvre pour la mesure de la bioaccessibilité orale des COSV dans les poussières et (ii) produire des données
de bioaccessibilité pour des COSV d’intérêt sanitaire. Cette thèse sur articles est constituée de trois chapitres : un contexte scientifique, qui présente les sources et la toxicité des COSV, puis décrit leur présence dans l’air et les poussières des écoles, avant d’aborder les différentes voies d’exposition humaine ; un état de l’art sur la bioaccessibilité orale des COSV dans les poussières ; la proposition d’une méthode simplifiée pour la mesure de cette bioaccessibilité, sa validation et son application à de premiers échantillons. Ces travaux se concluent sur un contexte plus large que l’ingestion en établissant des perspectives considérant également la bioaccessibilité par inhalation et par contact cutané, afin de caractériser de manière globale l’exposition aux COSV en environnement intérieur.
Title : Human exposure to semi-volatile organic compounds (SVOCs) in indoor environments by dust ingestion: evaluation of SVOCs’ oral bioaccessibility
Keywords: indoor air quality; school; human exposure; dust ingestion; bioavailability; pollutant.
Abstract: The quality of indoor environments is now a major public health concern. People spend nearly 90% of their time indoors where they are exposed to pollutants such as semi-volatile organic compounds (SVOCs) suspected of adverse health effects. Dust ingestion is a significant route of exposure to some of these SVOCs, especially for children. To characterize this exposure, it is necessary to consider the oral bioaccessibility of SVOCs, defined as the fraction of pollutant released into the gastrointestinal tract and available for absorption. In this context, the objectives of this PhD thesis are to (i) develop and validate a simple method for measuring the oral bioaccessibility of SVOCs in indoor dust and
(ii) produce bioaccessibility data for SVOCs of health interest This article-based thesis consists of three chapters: a scientific context, which presents the sources and toxicity of SVOCs, then describes their presence in school air and dust, before addressing the different routes of human exposure; a state of the art on the oral bioaccessibility of SVOCs in dust; and the proposal of a simplified method for measuring this bioaccessibility, its validation, and its application to first samples. This work concludes on a broader context than ingestion by establishing perspectives that also consider inhalation and dermal bioaccessibility, in order to characterize the overall exposure to COSV in indoor environments.
Institut de recherche en santé, environnement et travail, Irset - Inserm UMR 1085
9 avenue du Prof. Léon Bernard, 35000 RENNES
Copyright © 2022 FDOKUMEN